Geological Science Education and Conceptual Change
487
Science and Mathematics Education Centre Geological Science Education and Conceptual Change Glenn David Vallender This thesis is presented for the award of Doctor of Philosophy of Curtin University of Technology June 2010
-
Upload
khangminh22 -
Category
Documents
-
view
3 -
download
0
Transcript of Geological Science Education and Conceptual Change

Science and Mathematics Education Centre
Geological Science Education and Conceptual Change
Glenn David Vallender
This thesis is presented for the award of Doctor of Philosophy
of Curtin University of Technology
June 2010

ii
Declaration To the best of my knowledge and belief this thesis contains no material previously
published by any other person except where due acknowledgment has been made.
This thesis contains no material which has been accepted for the award of any other
degree or diploma in any university.

iii
ABSTRACT
Geological science is a fascinating subject of learning. We live with and are
surrounded by the results of complex natural phenomena such as plate tectonics,
earth system interactions and natural hazards such as volcanoes, earthquakes and
tsunamis. We are also one of the products of billions of years of biological evolution.
These topics form an essential part of all science curricula and are a vital part of an
individual’s scientific literacy, yet the geological sciences struggle for existence in
most secondary schools, many tertiary institutions and especially teacher training
establishments. A selective overview of the international geological and geoscience
curricula is presented. This thesis investigates key issues associated with the teaching
and learning of geological science: curriculum and assessment issues,
conceptualisations of geological time, biological evolution (within a geological
context) and visual spatialisation aspects such as visual penetration ability.
Geological science is discussed and differentiated from the generalised label of earth
or geoscience and the environmentally oriented Earth Systems Science.
The theoretical framework is grounded in constructivist principles and conceptual
change theory. Conceptual change in this thesis is viewed as an evolutionary and
ecological mechanism of learning within a multidimensional and individually
intentional world view. The conceptual status of geological science is investigated
from a wide age range of respondents from three different cultural settings: Lebanon,
Israel and New Zealand. Data gathering used a modification of pre-validated
questionnaires, unstructured respondent interviewing and selective analysis of
secondary data. Internal triangulation enhanced reliability issues generated by
questionnaire methodology. A case study approach was utilised for discussion of
geological science curriculum issues.
The history of geological science, conceptualising geological time and student
understandings of the fossil record are placed within a conceptual change context.
Here, conceptual change theory itself is evolutionary in nature and fits well with an
analogous concept of punctuationism. In short, the rise of conceptual change theory
from a ‘Piagetian’ stasis over the last 30 years has shown a rapid diversification of

iv
approach and ‘niche’ since the mid 1980’s. New Zealand is used as a case study for
the status of geological science in a national secondary school Science curriculum.
Through stratigraphy, the fossil record and rock deformation, geological science
uniquely involves ‘Deep Time’. The GeoTSAT questionnaire instrument asks
questions about conceptualisation of relative geological time as deduced from
correlation of stratigraphic columns and Steno’s laws of superposition. In essence all
age groups from age 13 to 40 years are cognitively able to correlate strata but all
groups also demonstrate the same kinds of misconceptions and difficulties. Aspects
of diachronic thinking are applied to the interpretation of responses to the GeoTSAT
questionnaire. Developing manageable teaching techniques in teacher training
institutions that are relevant to the geological sciences for conceptualising scalar
dimensions of time, mass and distance are important challenges for educators.
Visual spatialisation of deformed rock strata is a key skill in interpreting a geological
history. The GeoTSAT questionnaire asks respondents to complete block diagrams
of simple geological structures. All age groups again have the same kinds of
difficulties in mental rotation and other spatialisation skills such as visual penetration
ability. Visual penetration ability is further investigated with the use of a ‘hands on
3-D model.
The GeoVAT instrument asks questions about the nature of fossils, the relative
timing of geological and fossil events in Earths history and the links of fossil
organisms with their life environments. The challenge for educators is to find ways
of pedagogically strengthening the contextual links of learning about extant life with
extinct life and the importance of the fossil record in the training of biology teachers.
Improving the connections between the geological sciences, biology and
environments is a key challenge for educators. The thesis concludes with a summary
of findings, limitations and future directions for teaching and learning geological
science in school curricula.

v
ACKNOWLEDGEMENTS
This thesis would not have happened without the love and encouragement of my
parents who instilled a love of learning and a desire to understand the world. Dad,
who was a philosopher, great listener, practical man and encourager who had not
only the ability and vision to provide opportunities, but also allowed his two children
to follow their own paths. Mum was always there with that quiet loving support that
is too easily taken for granted. Thank you Mum. Leaving your families to live in a
far away country so that your children could have a better opportunity in life was a
worthwhile and courageous sacrifice. Thank you both and I love you heaps. And
Dad, I hope you have now found your very own universal space/time string.
To Elaine, thank you for putting up with years of my ‘oddball’ study that must seem
to have gone on forever and ever, and for making me think about how others might
read and understand this stuff when I probably should have been digging the garden
or painting the roof or doing something else. This thesis is also for you. I love you
for you being you and your enormous gift for giving your talents to the world
through music and Girl Guides. My life with you has been enriched beyond words.
To Professor David Treagust at SMEC, thank you for sharing your wisdom and
allowing me to ramble on and guiding me to find direction in a conceptual swimming
pool throughout this journey. This thesis would not have got there without you and I
hope that the conceptual vitality of the geological sciences becomes a more
important place in the teaching of teachers and that more research is conducted into
this exciting and relatively untouched field.
To my colleagues and friends over the last 37 years and especially questionnaire co-
ordinators, your comments and discussions about science teaching and learning have
often, more than you think, redirected and shaken my thinking: thank you.
Lastly, I would like to thank those students and teachers who have contributed their
thinking in supplying the data. In amongst the ‘saboteurs’ there is revealed a
conceptual flower bed which helps provide a small window into how we all think
about essential concepts of geological science and how we can teach and learn better.

vi
TABLE OF CONTENTS
Abstract Acknowledgements Table of Contents List of Tables List of Figures
iiiv
vixi
xiv
CHAPTER 1: INTRODUCTION AND OUTLINE Page
1.1 1.2 1.3 1.4 1.5 1.6 1.7 1.8 1.9 1.10
Introduction Geological time Evolution Conceptual Change Significance Purpose of Research Research Problems Research Questions Towards Defining Geological Science Thesis Overview
123456678
12
CHAPTER 2: LITERATURE REVIEW: GEOLOGICAL TIME AND GEOSPATIALISATION 2.1 2.2 2.3 2.4 2.5 2.6 2.7 2.8 2.9
Introduction Geological Time Geospatialisation Development of Conceptions of Time Thinking About Scale Conceptual Development of Geospatialisation Visual Penetration Ability (VPA) Diachronic Thinking and Spatialisation Chapter Summary
161618202832384043
CHAPTER 3: INTERNATIONAL GEOSCIENCE CURRICULA: A SELECTIVE OVERVIEW 3.1 3.2 3.3 3.4 3.5 3.6 3.7 3.8 3.9
Introduction Earth Systems Science Traditional Geology: The Canadian Experience International Comparisons The IGEO Global Curricula Surveys Are There National Standards? Comparison of USA and New Zealand Curricula International Geoscience Curricula Prognosis Chapter Summary
444659616667697376

vii
CHAPTER 4: ASPECTS OF CONCEPTUAL CHANGE 4.1 4.2 4.3 4.4 4.5 4.6 4.7 4.8 4.9
Introduction Conceptualising Concepts The Geoscience Concept Inventory Conceptual Change and Punctuationism Conceptual Change and Geological Time Conceptual Ecologies Conceptual Change and the Fossil Record Conceptual Change and the Teacher Chapter Summary
79819396
102105109112116
CHAPTER 5: METHODOLOGY 5.1 5.2 5.3 5.4 5.5 5.6 5.7 5.8 5.9 5.10 5.11
Introduction The Research Problem Methodology Methods Data Collection GeoTSAT Validation Data Analysis GeoVAT Validation Trustworthiness and Limitations Ethical Issues Chapter Summary
117117119120122123125126127128129
CHAPTER 6: ABOUT TIME AND SCALE 6.1 6.2 6.3 6.3 6.4 6.5 6.6
Introduction An Illustrative Study for Scales of Time, Size and Mass 6.2.1 New Zealand Thirteen Year old Student Responses 6.2.2 New Zealand Sixteen Year old Student Responses Summary of Illustrative Scales Study Replicating ‘Boundaries of Size’ Scales 6.3.1 Response of Year 12 Students to ‘Boundaries of Size/ Scale Looking at Scales of Mass 6.4.1 Discussion of Responses of Year nine Students A Multi-Variate Cluster Analysis of Scales of Size Responses 6.5.1 Other Geological Scales Looking at Time and Biological Evolution 6.6.1 Concluding Comments
131131133136138138139139140140143144147
CHAPTER 7: SPATIALISATION AND THE GEOSCIENCES 7.1 7.2 7.3
Introduction Rationale for Geo-spatial Structures Questions Summary and Discussion
148150153
CHAPTER 8: AN INVESTIGATION OF VISUAL PENETRATION ABILITY (VPA)
8.1 8.2 8.3 8.4
Introduction Method Results Discussion
158158160165

viii
8.5 8.6 8.7 8.8
New Zealand Year Nine Responses New Zealand Year Eleven Responses Comments on Verbal Responses Summary
165167169170
CHAPTER 9: NEW ZEALAND: A CASE STUDY FOR THE STATUS OF GEOLOGY IN A NATIONAL CURRICULUM
9.1 9.2 9.3 9.4 9.5 9.6 9.7 9.8 9.9 9.10 9.11 9.12 9.13 9.14 9.15 9.16 9.17
Introduction A Guide to the New Zealand National Science Curriculum Aims of this Chapter Historical Perspectives School Deciles School Deciles and Targeted Funding Unit Standards and Achievement Standards What are the Current (2002–2010) Assessment Opportunities for Geology and Evolution in the New Zealand National Qualifications Framework (NQF)? 9.8.1 General Discussion 9.8.2 Assessment of Evolution in the Revised Science and Biology Curricula 9.8.3 NCEA Science Levels Two and Three 9.8.4 Discussion NCEA Level 1 Geological Science: Unit Standards versus Achievement Standards 9.9.1 Achievement Standard 90190 “Aspects of Geology”: What are the key criteria? 9.9.2 Unit Standard 6538 “Describe the formation of major rock types and describe the rock cycle”: What are the key criteria? 9.9.3 What are the Differences? Geology, Evolution and the 2007- 2010 Science Curriculum Review Assessing Geoscience in the New Zealand Science curriculum: What about Geological Science? Discussion What is Actually Assessed: AS 90190 “Aspects of Geology” Results Gaining Credit in Geoscience Standards: A Discussion Where do Evolution Related Qualification Credits come from? Chapter Summary Postscript
173174178178179181186188
188191
191193194
196
196196197
202
204206210214217219
CHAPTER 10: GEOLOGY AND EVOLUTION: GeoVAT SURVEY RESULTS
10.1 10.2 10.3 10.4
Introduction New Zealand Case Study for Teaching Evolution in a National Curriculum: Summary Rationale for the GeoVAT Earth Science and Evolution Survey Questionnaire. AUB Primary School Teacher Trainees: Conceptualisations of Evolution, Fossils and Geological Time
224226
228
229
229

ix
10.5 10.6 10.7 10.8 10.9 10.10 10.11 10.12 10.13 10.14 10.15 10.16 10.17 10.18 10.19
10.4.1 GeoVAT Question 1 Result Interpretations for AUB Primary School Trainees: Ideas About Fossils 10.4.2 Summary Question 3 Fossils and Time: AUB Primary teacher trainee responses 10.5.1 Discussion of Results for GeoVAT Question 3 New Zealand Secondary Teacher Trainee Ideas About Fossils. 10.6.1 GeoVAT Question 1 Findings for NZ Secondary Teacher Trainees 10.6.2 Discussion: NZ Secondary Teacher Trainee Responses New Zealand Year 12 (16/17 year olds) Responses to GeoVAT 10.7.1 Section B: Conceptions about the uses of fossils (AC Year 12 students: 16/17 year olds) New Zealand AC Year13 (17/18 year olds) Responses to GeoVAT 10.8.1 Discussion: AC Year 13 Cross Sections Summary for AC Year 13 Responses to Question 3 New Zealand Year 9 (13/14 year olds) Responses to GeoVAT New Zealand Year 11 (15/16 year olds)Responses to GeoVAT Israeli (IS) Student Responses to GeoVAT New Zealand First Year University Geology Student (UC1) Responses to GeoVAT New Zealand Second Year University Geology Student (UC2) Responses to GeoVAT New Zealand Geology Postgraduate Responses to GeoVAT Comparison of UC Secondary Teacher Trainee and AUB Primary School Teacher Trainees Responses for GeoVAT Question 3 Summary of Cohort Means for GeoVAT Question 3 New Zealand University Geology Students Chapter Summary
232233
223235235
240246249
256
262263265270272276
278
280283283283286289
CHAPTER 11: GeoTSAT: GEOLOGICAL TIME SURVEY RESULTS 11.1 11.2 11.3 11.4 11.5 11.6 11.7 11.8
Introduction About the Instrument Questions Findings for the American University of Beirut Secondary School Trainees 11.3.1 Results Discussion Findings for the American University of Beirut Primary School Teacher Trainees. Summary Israeli Secondary School Student Responses to GeoTSAT 11.6.1 Précis of Co-ordinator and Translators Comments 11.6.2 Summary of Israeli Grade 10 Results 11.6.3 Israeli Grade 8 Results for GeoTSAT Questionnaire 11.6.4 Summary Discussion of Israeli Grade 8 Results New Zealand Secondary School Student Responses 11.7.1 Year 11 Demographics 11.7.2 Year 11 Results 11.7.3 Year 13 Results University of Canterbury First Year Geology Students 11.8.1 First Year Geology Student Results
291291292
295297
301301301302303303304304304305307307

x
11.9 11.10
11.8.2 Summary of Results 11.8.3 UC Second Year Geology Students –Summary of Results 11.8.4 UC Postgraduate Geology Students 11.8.5 Results Summary for Postgraduate Geology Students NZ Secondary School Teacher Trainees: GeoTSAT Results 11.9.1 Results Summary for NZ Secondary School Teacher Trainees Chapter Summary
309311312313314316317
CHAPTER 12: DISCUSSION CONCLUSIONS AND LIMITATIONS 12.1 12.2 12.3 12.4 12.5 12.6 12.7
Introduction Curricula and Geological Science The GeoTSAT Instrument The GeoVAT Instrument Limitations Implications for Teaching and Learning Finale
319322326328332334335
REFERENCES
APPENDIX 1 Examples of letters
APPENDIX 2 The GeoTSAT Questionnaire
APPENDIX 3 Chapter 9 New Zealand Curriculum Data
APPENDIX 4 Scale of Objects Questionnaire
APPENDIX 5 The GeoVAT Questionnaire
APPENDIX 6 Chapter 10 GeoVAT Data
APPENDIX 7 GeoTSAT Results
APPENDIX 8 Statistics
337
364
366
374
391
396
402
430
451

xi
LIST OF TABLES
Table Page
1.1 Definitions summary of geological science and geoscience. 10
2.1 Experiences and geological time correlatives 30
2.2 Some possible scaling categories 32
3.1 Comparison of System Earth Project content (Germany) with
common geological science content.
47
3.2 Typical characteristics of system-thinking for rock cycle concept with cognitive difficulty based on Bloom’s taxonomy.
50
3.3 The rock cycle concept and Bloom’s taxonomy 50
3.4 Typical characteristics of system-thinking for geological time with cognitive difficulty based on Bloom’s taxonomy.
51
3.5 A selected analysis of the Australian (NSW)Earth and Environmental Science Curriculum and Geology
58
3.6 The pan-Canadian Grades 11-12 Earth Science knowledge requirements.
60
3.7 Inclusion of ‘8 geological science commonalities’ as represented in different countries’ Earth Science curricula.
61
3.8 Percentage of statements in Science curricula relating to geological science components.
64
3.9 Question A.1. Summary: are there national Earth Science standards?
68
3.10 The New Zealand geoscience curriculum content. (Ministry of Education, 2007-2010).
70
3.11 The United States national geoscience curriculum content standards.
71
3.12 Summary: Barriers to establishing Earth Science standards. 74
4.1 Summary of key ‘punctuations’ in conceptual change evolution. 98
4.2 Life spans, authors and geological concepts. 103
4.3 A generalised model for threshold concept pedagogic development. 115
5.1 Country data sources. 122
5.2 Summary of instruments used. 122
5.3 Summary of respondent samples. 123
5.4 Summary statistics of response reliability. 126
6.1 Student responses to time scale order 134
6.2 Student responses to size scale boundaries 134
6.3 ‘Free’ responses to number scale boundaries 135

xii
6.4 Sixteen year old responses to Time scale boundaries 137
6.5 Sixteen year old responses to Size scale boundaries 137
6.6 Sixteen year old responses to Number scale boundaries 137
6.7 Year 12 Ashburton College: Individual response distribution of rankings of Size boundaries. (Appendix 4).
394
6.8 Year 9 Ashburton College: Individual response distribution of rankings of Size boundaries (Appendix 4).
395
6.9 Mean response distributions for scale of mass of a tablespoon of salt. 140
6.10 Year 9 cluster groups for scale of size rankings. 141
6.11 Year 12 cluster groups for scale of size rankings. 141
6.12 Scale and units of time. 143
7.1 New Zealand curriculum with visual-spatial components. 150
7.2 Required GeoTSAT geological spatialisation skills. 151
7.3 Summary of AUB (primary) results for questions 7 and 8 (Appendix 7).
431
7.4 Summary of results for AUB (secondary) questions 7 and 8 (Appendix 7).
433
7.5 Summary of Questions7 and 8 for NZ secondary teacher trainees (Appendix 7).
436
7.6 Summary of results for AC Year thirteen (Appendix 7). 437
7.7 Summary of results for AC Year 11 (Appendix 7). 440
7.8 Summary of results for UC first year students (Appendix 7). 440
7.9 Summary of results for UC second year students (Appendix 7). 442
7.10 Summary of results for UC Postgraduate students (Appendix 7). 445
7.11 Summary of Israeli percentages of incorrect answers for each age group for the GeoTSAT geological structures (Appendix 7).
446
7.12 Percentage of incorrect answers to GeoTSAT spatialisation questions per cohort (Appendix 7).
450
9.1 The 2007 (November) New Zealand National Science Curriculum. 175
9.2 Decile band comparisons. 185
9.3 Unit Standards versus Achievement Standards summary. 195
9.4 Framework for the New Zealand Earth Science strand of the National Science curriculum.
200
9.5 Framework for the New Zealand Living World Strand of the National Science curriculum for evolution.
201
9.6 Earth Systems principles (Appendix 3) 378
9.7 Levels 1 - 3 NCEA external examinations for geological science 203
9.8 Achievement standard descriptors for Figure 9.22. 209

xiii
9.9 Descriptors for Evolution related national assessment standards. 216
9.10 Geoscience curriculum changes 221
10.1 UC secondary trainee responses to Q. 2 Section A of GeoVAT 236
10.2 NZ Secondary teacher trainees response comparison for Section A question 1 (Appendix 6).
412
10.3 Comparison of AC Year 12 with secondary teacher trainees for GeoVAT (Appendix 6).
412
10.4 Comparison of high school age cohorts for ideas about fossils (Appendix 6).
413
10.5 Years 12 and 13 comparison with AUB and UC secondary teacher trainees for Question 1 Section A: Ideas about Fossils (Appendix 6)
414
10.6 Other suggestions in explanation for the absence of fossils (Appendix 6).
415
10.7 Comparison of Year 11 responses to Section A question 1 (Appendix 6).
415
10.8 Comparison of Year 9 responses to Section A question 1 (Appendix 6).
416
10.9 Evolution Achievement Objectives in the 2007 revised curriculum (Appendix 6).
405
10.10 Typical content for the teaching of evolution in Biology. (Based on pre-revised 1994 Biology curriculum) (Appendix 6).
406
10.11 Summary of Means for question 3 GeoVAT (Age 13 to postgraduate).
284
10.12 Comparison of UC Geology students’ results for ideas about fossils.
287
11.1 Question 1.b results: Age order of fossil. 292
11.2 Q.3.Distribution of fossil ages based on relative dating of strata. 294
11.3 AUB Secondary teacher trainee responses to question 4: Correlation of strata.
294
11.4 AUB primary teacher trainee results for Q.3. 299
11.5 AUB primary teacher trainee responses to question 4: Correlation of strata.
300
11.6 Israeli (IS) Grade 10 results to GeoTSAT (Q’s 1 – 5). 302
11.7 Israeli (IS) Grade 8 results to GeoTSAT (Q’s 1 – 5). 303

xiv
LIST OF FIGURES
Figure Page
1.1 The essentials of geological science 11
1.2 Thesis conceptualisation 15
2.1 Chronological age conceptual status map for ‘time’ 20
2.2 Conceptual ecology map for understanding diachronic thinking 25
2.3 Factors influencing conceptions of scale 29
2.4 Anticline 34
2.5 Syncline 34
2.6 Cropped graphic selection from Piburn et al. 2002. 35
2.7 USGS 3-D picture of San Francisco geology. 35
2.8 Surface expression of folds 35
2.9 A partial dissociation model of mapping spatial ability 37
3.1 Comparison of Earth Systems Science and traditional Geology 48
3.2 A Hierarchical taxonomy of ontologies. 55
3.3 Country cluster dendrogram analysis for Table 2.7. 62
3.4 Cluster analysis of percentages of statements about Geology in different countries’ Science curricula.
63
3.5 Geology content clusters for table 3.8. 65
3.6 Geology: country clusters for table 3.8. 65
3.7 Selected 2002 IGEO survey questions. 66
4.1 Concept map of pre and post instructional conceptions. 83
4.2 Historical summary of conceptual status. 84
4.3 New Zealand Year 11 student B – male aged 15 years. 86
4.4 New Zealand Year 11 student A – female aged 15 years. 86
4.5 Examples of association concept maps of the rock cycle. 88
4.6 A concept map of plate tectonics. 89
4.7 Venn style diagram of conceptual change 89
4.8 Textbook conceptual diagrams for geological convection cells. 95
4.9 A ‘punctuationist’ model for conceptual change. 96
4.10 The ‘change’ in conceptual change. 101
4.11 Evolution of conceptual change about fossils 106
4.12 Life span overlaps for selected authors for geological time CC. 107
4.13 The bigger picture - Key conceptual changes in the history of paleontology
108

xv
4.14 Life spans of selected ‘modern’ authors in the history of paleontology.
110
4.15 The bigger picture - key conceptual changes in the history of paleontology.
111
5.1 Key conceptual elements of methodology. 121
6.1 Cluster analysis (dendrogam) for Year 12 responses for scale of size. 142
6.2 Cluster analysis (dendrogram) of Year 9 responses for Size scales. 142
6.3 Times ‘progressive arrow’ versus ‘analogous speciation’. 146
7.1 Ranked degree of VPA difficulty for geological structures. 154
7.2 Percentage of incorrect responses by age group. 155
7.3 Mean Percentages of incorrect responses per age group. 156
7.4 A plunging anticline (Appendix 7). 440
7.5 Plunging syncline block diagram (Appendix 7). 449
8.1 Plasticine model used for VPA investigation. 159
8.2 Correct responses for 3-D model sections. 160
8.3 NZ age 13/14 years responses to longitudinal section. 160
8.4 NZ age 13/14 years responses to cross (transverse) section. 161
8.5 NZ age 13/14 years for diagonal section. 162
8.6 NZ age 16/17 years for longitudinal section. 163
8.7 NZ age 16/17 years responses for cross section. 164
8.8 NZ age 16/17 years responses for diagonal section. 164
8.9 The Diagonal cut response. 167
8.10 Typical graduate teacher responses to 3-D model problems. 168
8.11 Summary of correct responses to sectional cuts. 171
9.1 Candidate numbers for NCEA Level one Science (age 15/16yr). 177
9.2 Government funding allocation per decile. 182
9.3 School Deciles and Achievement in geoscience assessments. 183
9.4 School deciles and candidate numbers for AS 90190 “Aspects of Geology”.
184
9.5 Map of New Zealand school regions (Appendix 3). 379
9.6 Percent change of candidate numbers for NCEA Level 1 Science. 189
9.7 School deciles and evolution related assessment standards. 190
9.8 Evolution standards for NCEA Level 1 Science 191
9.9 NCEA Level 2 External Assessments of Biology and Evolution 193
9.10 NCEA Level 3 External Assessments of Biology and Evolution. 193
9.11 Science Achievement Aims for The Living World strand. 198

xvi
9.12 Dendrogram of regional clusters of school deciles (Appendix 3) 379
9.13 Regional clusters and Geology credits gained (Appendix 3) 380
9.14 Percentage of low decile schools and school numbers per region (Appendix 3).
381
9.15 Number of secondary schools teaching geoscience as represented by results gaining credit (Appendix 3).
382
9.16 Standards contributing to results gaining credit in geological science (Appendix 3).
384
9.17 Regional results that gain credits in Geology (Appendix 3). 385
9.18 Percent change in results gaining credit for Geology 2005 – 2006 (Appendix 3)
387
9.19 Comparison of regional changes in results gaining credit for Geology 2005 – 2007 (Appendix 3).
388
9.20 Mean percentage change in Geology standard credits (Appendix 3).
388
9.21 Comparison of mean achievement results for NCEA Level 1 Science (Appendix 3)
389
9.22 Achievement in selected Earth Science achievement standards. 209
9.23 Results comparisons for all Earth Science Assessment Standards 2006.
211
9.24 Results gaining credits for Earth Science Unit standards. 212
9.25 New Zealand evolution related standards and credits gained. 215
9.26 Deciles and Percentage “Pass rates” for evolution related standards.
217
9.27 Mean number of results gaining credit ‘passes’ for Achievement Science national achievement standards 2002 -2008.
220
9.28 Total number of New Zealand secondary schools offering Geology assessment standards (Appendix 3).
390
10.1 A New Zealand Year 12 ‘evolution’ concept map (Appendix 6) 402
10.2 A contrasting New Zealand Year 12 ‘evolution; concept map (Appendix 6).
403
10.4 AUB response summary for question 1 of GeoVAT. 230
10.5 Dendrogram clusters for AUB primary school trainees. 232
10.6 AUB primary school trainee responses to Section B, Q 3. Fossils and time (Appendix 6).
418
10.7 UC Secondary teacher trainee responses to GeoVAT Question 1 (Appendix 6).
419
10.8 UC secondary school trainee responses to Section B , Q3 results (Appendix 6).
420

xvii
10.9 UC secondary school trainee responses to Section B, question 2a. 239
10.10 AC Year 12 responses to Section B, question 2a. 252
10.11 AC Year 12 distribution of responses for GeoVAT Q 3 (Appendix 6). 421
10.12 Cluster dendrogram for AC Year 12 responses to Question 3. 255
10.13 Typical Year 13 responses to Section B, question 2a of GeoVAT. 261
10.14 AC Year 13 distribution of responses for GeoVAT question 3 (Appendix 6).
422
10.15 Typical Year 9 responses to question 2a of GeoVAT. 268
10.16 Distribution of responses for GeoVAT question 3 for AC Year 9 (Appendix 6).
423
10.17 Typical Year 11 responses to question 2a Section B – cross sections.
271
10.18 Distribution of responses for GeoVAT question 3 for AC Year 11 (Appendix 6).
424
10.19 Typical IS Grade 11 responses to Section B question 2a. 274
10.20 Typical IS Grade 12 (NZ Year 13) for Section B question 2a 275
10.21 Distribution of responses for question 3 for IS Grade 11 (Appendix 6).
425
10.22 Distribution of responses for question 3 for IS Grade 12 (Appendix 6).
426
10.23 Typical UC first year geology student cross sections. 278
10.24 Typical UC second year geology student – cross sections. 280
10.25 UC second Year responses to GeoVAT question 3 (Appendix 6) 427
10.26 Typical post graduate geology responses to question 2a - cross sections.
282
10.27 Cohort means analysis for GeoVAT question 3: time estimations. 284
10.28 UC Geology student first year responses to GeoVAT question 3 (Appendix 6).
428
10.29 Responses recorded as ‘False’ for Section B, Q3 GeoVAT. 287
10.30 Cluster groups for all UC Data for Q1 GeoVAT: Ideas about fossils. 288
10.31 Post graduate geology student responses to GeoVAT question 3 (Appendix 6).
429
11.1 Times Arrow: Relative and absolute geological time. 292
11.2 Typical response from AUB primary trainees for Question 5 GeoTSAT. 300
11.3 Biostratigraphic correlation for two locations. 309
11.4 Question 4 – Biostratigraphic correlation logic for three locations. 310
12.1 Thesis conceptualisation. 321

1
CHAPTER ONE
GEOLOGICAL SCIENCE EDUCATION
1.1 Introduction
As a rarish geology/biology graduate teaching secondary school science and biology,
in New Zealand, I have long been interested in the status of the earth sciences in
school curricula, tertiary institutions and secondary teacher training. An interest in
geomorphology at the age of 15, sparked by Harold Venz, a geography teacher, led
to the eventual discovery of a subject called geology and a realisation that hills were
not just hills; they weren’t just surface features but had depth and told a deeper,
longer and more interesting story than the ‘Wars of the Roses’ and ‘Othello’. I
always wondered why schools never taught geological science but left it to be
accidentally discovered for those bound for university study.
In New Zealand, lecturers at university are not, as a rule, specifically trained in the
pedagogy of their specialist subject. Consequently, the development and position of
the teaching and learning of the earth sciences in many countries of the world is a
major concern to the international geological community as well as at a national
level. In Britain for example the introduction of the national Science curriculum in
1989 contained an earth science component that was new (King, 2001; Oversby,
1996) but one poorly integrated and implemented. In New Zealand also, the 1994
introduction of earth science and astronomy as Planet Earth and Beyond into the
national science curriculum was heralded with earth science being accorded equal
recognition with physics, chemistry and biology at the senior high school level (age
fifteen to eighteen years) where high stakes national qualifications dominate the
curriculum. This development occurred after no serious recognition in all previous
national curricula except physical geography courses. In today's world especially, an
educated population significantly benefits from a knowledge and understanding
about earth resources, materials, geological processes, history, natural hazards and
evolution (Turner, 1996). The US National Science Teachers’ Association and the
American Geological Institute (2004) clearly outlines the unique values that the earth

2
sciences bring to student’s and populations’ developing scientific literacy.
Geological science is the glue that holds the geosciences together.
Of complementary importance, educators also need to be better informed on how and
why students conceptualise specific aspects of earth science so that teaching and
learning can be enhanced and further developed. Results in the New Zealand
experience of a new National Certificate of Educational Achievement (NCEA)
(www. nzqa.govt.nz), assessment system suggests that there is a desperate need to
understand how and what earth and geological sciences are being taught and how
students and teachers conceptualise key geological ideas.
This thesis focuses on specific aspects of conceptual change within a manageable
international framework and attempts to investigate key concepts that help define the
earth sciences as a unique discipline of learning: biological evolution,
geospatialisation and geological time and history. Chapter 9 specifically describes a
case study of the status of geological science in a national Science curriculum.
1.2 Geological Time
Earth science is an historical science discipline that interprets the evidence provided
by the natural laboratory of the Earth to give a scientific understanding of its history
and processes. Geological history cannot be interpreted successfully without
reference to relative time and absolute (radiometric) time. Understanding geological
time and its place in this interpretation is a unique and fundamental characteristic of
the discipline. Conceptual development of time relationships is linked with an
essentially Piagetian view of cognitive development and spatial visualisation of 3-D
structures, crosscutting relationships and geological event time sequencing. The
ability to spatially visualise geological structures is a fundamental activity to be
mastered for progress in the geological sciences. Together with an understanding of
students’ knowledge and how it develops (constructivism and conceptual change),
understanding the teaching and learning of these skills forms a key aspect of this
thesis. Indeed, Mathewson (1999) points out the importance of visual–spatial
thinking for scientific creativity. Similarly, Orion, Ben-Chaim and Kali (1997)

3
showed that interviewed students claimed that only their earth science courses
required development of spatial-visual thinking skills. Kali and Orion, in their paper
on spatial abilities of high school students in a geological context (1996), suggest
that further research on the visual penetration abilities of students would be fruitful.
This aspect is addressed in the geological time and spatial ability test instrument
(GeoTSAT).
Again, recent key work by Dodick and Orion (2001) and Trend (2000) have begun
investigations into conceptions (and perceptions) of geologic time with various
groups. This thesis builds on previous work across a wide age range and across
different cultures and curricula.
Dodick and Orion in particular build on the work of Ault (1981; 1982) and
Montangero’s (1996) diachronic time concepts in developing instruments
(GeoTSAT) for investigating geological time conceptions. This research helps
answer for example, the question -‘at what cognitive, curricular and cultural point do
students visually and spatially penetrate a geological structure’? This research
intends to develop further these instruments and apply them to measure conceptual
change in an international framework.
1.3 Evolution
Like the biological sciences, nothing in the earth sciences makes sense except in the
light of physical, chemical and biological evolution (Dobzhansky, 1973). Along with
the conceptual development of ‘Deep Time’, evolution and the fossil record are
unique and important characteristics of the earth sciences. Evolution of living
organisms as seen through their fossil remains is intimately related to this sense of
‘Deep Time’ and modern biological principles are used as a key for unravelling the
past history of life.
Understanding evolutionary principles is a unifying theme and understanding
geological history is dependent on an understanding of the fossil record. Because
geologists have been more directly involved in ‘digging up’ the past, the fossil record

4
has been studied more often within a geological framework such as for strata
correlational history rather than a biological one. But of course there is more to
paleontology than this. Perhaps this helps explain why there has been little
connection between biology and paleontology and confusion when curricula are
developed for ‘evolution’ sections in the biological sciences in high schools. Indeed,
Woods and Scharmann (2001b) readily point out “if we are, as a science education
community, to do justice with respect to evolutionary theory, how might we more
effectively integrate evolutionary theory within the biology curriculum?” (p.1). In
New Zealand, for example, the Year 12 national biology curriculum has recently
removed from assessment, the evidence for evolution and there is no mention of
paleontology per se in any curriculum: although implied, it is not adequately
integrated with the teaching of biology and geoscience.
This thesis will investigate how students conceptualise fossils and the fossil record,
its place as a scientific unifying theory and how earth scientists use it to construct an
understanding of Earth history.
1.4 Conceptual Change
Underpinning this project is the notion of conceptual change (Bezzi, 1996b) where
according to Tyson, Venville, Harrison and Treagust (1996) conceptual change is
considered to be the building of knowledge (constructivism) through actively
generating and testing ideas. Macbeth (2000) described conceptual change as being
about how students’ understandings of the natural world changes from what they
bring with them into the classroom (world view) compared to what they take away
with them. There is a vast literature base on conceptual change (Duschl & Gitomer,
1991; Hashweh, 1986; Kuhn, 1962; (Posner, 1982; Strike, 1992; Tyson, 1997;
Vosniadou, 1994, 2003) which describes a picture of how conceptual change theory
itself is evolving (See Chapter 4) and becoming vastly more complex and
multidirectional (Ohlsson, 2009; Treagust & Duit, 2008; Vosniadou, 2007a;
Vosniadou, 2007b; Vosniadou, 2009). Ohlsson’s resubsumption is a very long way
from Posner et al.’s ‘weak accommodation’!
5
Just how and when do students develop their concepts of geological time (deep time)
and evolution, and within different curricular and cultural settings? Conceptual
development and understanding of the fossil record is fundamental to the biological
and earth sciences and is the cornerstone of evolutionary theory. A study by
Desmastes, Settlage and Good (1995) investigating patterns of students' conceptual
restructuring within the theoretical framework of biological evolution used
conceptual change theory to define some limits of the theory and suggest other
models of restructuring. This study has some implications for this research. Cobern’s
(1994) conceptions of worldviews of student’s on the teaching of evolution have
been roundly ‘counter pointed’ by Smith’s (1994) argument on the teaching of
evolution. By understanding how conceptions (and misconceptions) develop and
maintained, there is a better chance of improving teaching techniques and enhancing
student understanding of evolutionary principles and geological time and spatial
visualisation within an earth science context. The notion of persuasion (Woods,
2001a) as a metaphor for conceptual change processes is examined by investigating
aspects of curriculum design and ‘what teachers do’. This thesis investigates how this
knowledge construction occurs in an earth science context.
1.5 Significance
Geoscience education research is a late developer and as geological and
environmental change becomes more obvious, it exposes how under taught and
understood this subject is at the primary and secondary levels around the world. The
development of computer modelling of 3-D geological structures is a good example
of how relatively new teaching methods have built on an understanding of student
conceptualisation and spatial visualisation of geological structures (Kali, 2003) (See
Chapter 7). Better understanding of ‘where students are at’ in terms of their
conceptualisation abilities has implications for teaching techniques and curriculum
development. It means that courses can be structured to meet student (and teacher
trainee) cognitive needs rather than perpetuate current models of teaching the broader
earth sciences and geological science. Educational research within the earth sciences
is not vast, but because we depend so much on the Earth for our well being the earth
sciences have been gaining ground as a subject and discipline of learning through

6
linkage with environmentalism and Earth System Science (Mayer, 1999). This thesis
is designed to add to our understanding of how students conceptualise fundamental
aspects of earth science and how curriculum development, and teacher training can
be enhanced. Researchers will benefit by an understanding of earth science
conceptualisation from within an international framework. Both areas of study
(paleontology and geologic time) are unique to the earth sciences and, as Orion and
Kali (2005) have shown, there are many future directions and spin-offs that can
happen. For example, the developments of new learning tools and better targeted
syllabi and curricula have the potential for globally improving geological science
education.
1.6 Purpose of the Research
The purpose of this research is to investigate, define and evaluate developmental
changes in conceptualisation of two key aspects of student understandings within the
earth sciences. These two aspects involve conceptualisation of biological evolution,
as embedded in the sub-disciplines of paleontology and paleoenvironment, and
conceptualisation of geological time itself as related to geological structures,
correlation, and sequencing, and of course the fossil record as related to evolution.
These concepts are the fundamental cornerstones of any understanding of earth
science contexts. An important objective of this research is to investigate
conceptualisation (and conceptual change) of biological evolution and geological
time across international (cross-cultural) boundaries, wide age ranges and within
different curricula. It is an attempt to look at the conceptual status of students at
various ages and within different cultures and science curricula. In particular, this
research specifically addresses questions related to conceptions which students’ hold
for key aspects of earth science education: time, structure and fossils.
1.7 Research Problems
Cognitive development and understanding of geological processes and histories is
dependent on the development of workable (understandable) conceptions of
processes, time and space. As a historical science, earth science or geoscience
demands an understanding and conceptualisation of the immensity of geological time

7
(Deep-Time) and its relativities, and an understanding of the evolution of life within
this time framework. How individuals develop their conceptions of biological
evolution and geological time within different cultural and curricular frameworks
forms the basis of this research project.
A challenge for educators of earth science at all levels is to develop more efficient
and relevant ways of teaching these concepts and move students forward to a more
useful and sophisticated understanding and conceptualisation of how the Earth
works, what it is made of and its history. Indeed, there has been a strong call in the
past decade from the international earth science community (e.g. (Akhatar, 1996;
Cooray, 1996; Mayer, 1997; Stow, 1996) to improve and enhance the role that this
discipline can play within science curricula. Data on geoscience curricula (Clark,
2006; King, 2003, 2007) has been gathered from Europe, South Africa, North
America, South America, Eastern, Southern and Western Asia, and Australasia,
indicating that the call has been slowly answered (See chapter 2). A deeper
understanding of student conceptual development of evolution and geological time
through a range of ages and within different cultural and curricular frameworks may
provide insights into developing further earth science education and teacher training
education within a constructivist framework.
1.8 Research Questions
The fundamental question being addressed in this project relates to how students
within a wide range of ages and within different cultural and curricular settings
develop and change their conceptions of geological time, biological evolution and
the fossil record. Conceptual change within different settings forms a focus for this
research and attempts to address perceived teaching and learning issues for earth
science education, primarily in schools but also in teacher education institutes and
universities.

8
Research Question 1
What are the characteristics of international Geoscience curricula and their
implementation, with particular case study reference to the New Zealand curriculum?
Research Question 2
How do students aged between 12 and 40 years develop their conceptions of
evolution and the fossil record, geological time and 3-D geological structures?
Research Question 3
What is the influence of diachronic thinking on conceptions of geological time,
structures and fossils?
Research Question 4
What is the influence of visual/spatialisation on conceptions of geological structures?
Research Question 5
How do conceptualisations of fossils, geological time and geological structures vary
with age of respondent?
1.9 Towards Defining Geological Science
“Understanding is always a journey never a destination”
(Fortey, 2005, p.25).
It is not surprising that different conceptual understandings of what is actually meant
by Geoscience exist: they represent the evolutionary growth of knowledge and
contexts. Indeed, these different conceptualisations and understandings of what
might constitute Geological Science is a common cause of confusion and has
important influences on curriculum design, content delivery and assessment. The title
‘Geoscience’ has different ‘global’ meanings relative to Science/Geography/
Environmental/Earth Systems curricula but has a history in western culture very
much controlled by British eighteenth century colonialist thinking. Geology as a
descriptive name is a term no longer easily understood by many people including

9
educators, and, more often than not has the connotation of being just about “boring
old rocks and fossils”. Rarely is geology seen as a vital historical science that
investigates the physics and chemistry of ‘beneath our feet’ and the history of this
planet and its life.
Although some recent local attempts such as the ANSTO (Australian Nuclear
Science and Technology Organisation) initiative in Australia has improved science
enrolments in New South Wales by encouraging a careers-based core (Australian
Government, 2007), locally (and globally) the study of ‘Science’ in schools has been
in decline since the late 1960’s (Venville, 2008). The Geosciences are particularly
vulnerable due largely to lack of resourcing, incompetent teachers and teacher
training, and perceptions of value. The term Geoscience, containing the word
‘Science’, may also carry negative perceptions for many educators and students.
Geography is in many schools largely a social science and looks at people
distributions and interactions in connection with natural landscapes. Issues
surrounding ‘branding’ and naming do not escape subjects of learning. It is likely
that the nature of Geoscience (not geological science) will continue to broaden and
be more multidisciplinary rather than deepen and narrow in a response to global
environmental change and educational trends. In schools, an effect of this is shown
by an increased connection of Science with social science by attempting to show how
Science is relevant to people.
For the purposes of this thesis, Earth Science (ES), Geoscience (GS), Geology (GL)
and Earth Systems Science (ESS) are not considered synonymous but the core Gê -
the Earth, is. The key features of these descriptive titles is summarised in Table 1.1.
Despite the neptunist/vulcanist controversy, geology was first taught as a fledgling
stand-alone subject (rather than as part of ‘natural history philosophy’) by Abraham
Werner around 1775 at the Mining Academy in Freiberg in Germany (Ireton, 2003).
Although a mineralogist Werner taught stratigraphy, but in the process, erroneously
taught that earth materials all precipitated from sea water thus beginning the debate
about the origin of basalt and other igneous rocks. The essential elements of
commonly interrelated titles used to describe the Earth and geological sciences are
shown in Table 1.1. The intent is to establish that although the various ‘species’ of
geoscience are closely related they have different purposes and meaning in different

10
curricula. For example, describing and explaining the physics of seismic waves is not
the same as describing and explaining the effect of seismic waves on people and
property.
Table 1.1 Definitions summary of Geological Science and Geoscience.
Title Description
Earth Science (ES)
and Geoscience (GS)
Synonymous with Earth Science, Geoscience focuses on the teaching and constructivist learning of the solid and fluid components of planet earth and its place in the solar system and combined with a study of the history of life. Earth Science is much broader in approach than Geological science.
Earth Systems
Science
(ESS)
Focus is on the teaching and constructivist learning of interacting systems of the hydrosphere, biosphere, lithosphere (or geosphere) and the atmosphere. Emphasis is on the scientific investigation of processes and connections with ‘Gaian’ type environmentalism and natural hazards as a motivating core. Have strong links with human interactions and the environment (geography) and effects of global system interactions. It views the study of the Earth as a holistic web of interacting and interdependent cycles and chains which need to be understood in order to prevent environmental collapse.
Geological Science
(GL)
Focus is on the teaching and constructivist learning of the solid Earth – plate tectonics, deformation and consequent structures, rock cycle, mineralogy, economic minerals, natural hazards (volcanoes, earthquakes, tsunamis, and landslides), paleontology, geological history and the physics and chemistry of the Earth’s interior. It is process and composition dominated and uses multi disciplinary scientific methodology.
Geography
(GG)
A traditional subject discipline often split into physical and human geography. Physical geography commonly focuses on the evolution of surface features, weather and climate, and the impact of natural hazards. Human geography focuses on the interaction of people with physical and political landscapes. Appears to be close to an Earth Systems approach in content by connecting social and environmental issues with surface geological processes. Physical geology is not physical geography.
As pointed out by Mayer and Armstrong (1990) (in Duschl & Smith, (2001), the
traditional geological sciences of “surface mapping and mining”, Earth science as a
subject of learning appears to be moving towards a “causal modelling of science” for
making predictions that are environmentally and socially based (Duschl & Smith,
p.269). Duschl and Smith also make no mention of paleontology, tectonics, earth
history, geochronology, soils, and natural hazards. Causal modelling of the earth is
based on the growth of Earth Systems Science (ESS) as an innovative way of

11
connecting students with the Earth and Science by using the Earth as the context for
teaching ‘Science’ and global environmental problems. Certainly, remote
geophysical sensing, for example, has enabled a view of the Earth’s interior not
possible when reliant on surface observations. Geological science is essentially the
‘nuts and bolts’ of the scientific gathering and testing of information (remote as well
as physical), about how the earth works, what it is made of and its physical, chemical
and biological history. Satellite imagery cannot extract the fossil record nor analyse
the inside of granite or meteorites. It seems that Earth Science as an originally broad
North American based context has evolved into a partially global ESS ‘species’.
Geological science (GL) is the same ‘genus’ but a different ‘species’.
Figure 1.1. The essentials of geological science.
Because GL, ESS, ES and GS are related but not synonymous there is continual
room for misunderstanding. This thesis assumes the simplified interpretation of
geological science as shown in Figure 1.1 and it is beyond the scope of this chapter
Geochronology Physical and biological Earth history Radioisotope geological time Stratigraphic geological time Magneto chronology Tree Ring analysis
Geophysics Earth’s interior Geological Structures Plate tectonics Magnetism and Paleomagnetism Seismology Remote sensing Thermal histories
Natural Hazards Volcanism Seismology Mass movement Geological engineering Medical geology Geomorphology
Geochemistry Rocks Mineral resources Soils Element cycles (C, N, O, S, P, H2O) Rock Cycle Weathering
Geobiology Paleontology Paleoecology Evolution
Geological Science (The Solid Earth Sciences)

12
to argue the specific place of each sub-discipline and topic. All classification systems
are a source of endless debate but inevitably diverts attention from the real issue:
defining geological science is important for the development of school and university
courses and curricula. Geological science (GL) then is a close relative of GS, ESS
and GG but it is not the same. Three cornerstones of geological science are
investigated in this thesis: evolution through the fossil record, geological time and
geological structures. These three sub-disciplines are the defining issues for
understanding geological history and are not addressed in depth neither by ESS nor
GS. An educated population deserves the opportunity to learn about geological
science but not to the exclusiveness of systems thinking and environmentalism.
1.10 Thesis Overview
This thesis addresses broad issues of conceptual change within a geological science
context. The key geological issues involve geological time, geospatialisation,
connections of geological science with biological evolution and curriculum delivery.
Modified questionnaire instruments are used to gather information on
geospatialisation abilities and student understandings of evolution and geological
time. Information is gathered from a cross section of student ages and from different
cultures. The following summarises the key issues discussed in each chapter.
Chapter 1 presents a rationale and background for the genesis of this thesis with
research questions being posed and the significance of the work justified. It is the
culmination of a life time’s interest in geology and specifically geological science
education: the lost and found orphan of the sciences. Because related titles described
as geoscience and Earth Systems Science are commonly interchanged and rarely
defined it was considered important to provide guidance on what geological science
means in the context of this thesis. The purpose of this brief overview is to clarify
and provide guidance for the structure of this thesis.
Chapter 2 provides a summary of the literature base for the two key geological
science elements addressed in this thesis: geological time and geospatialisation.
Geological science education research is in its infancy and this is reflected in the
current rapid expansion of research into the cognitive, teaching and learning aspects

13
of the wider issues of geoscience, Earth Systems Science and the narrower,
geological science.
Chapter 3 takes a selective look at the global picture for geoscience curricula and
specifically addresses aspects of research question 1: What are the characteristics of
international Geoscience curricula? This chapter discusses curricula comparisons and
provides some case studies. The key issues discussed address the decline and role of
geological science in curricula and the place of geological science within Earth
Systems Science.
Chapter 4 synthesises a general view of conceptual change theory within a
geoscience and geological framework and gives details of the conceptualisation of
the defining aspects of Geological science: the fossil record and evolution, geological
time and spatial/visualisation of geologic structures such as faults and folds. These
are key aspects of research question 2. Conceptual change issues surrounding
teachers, learners and institutions are also discussed.
Chapter 5 outlines the research approach and methodology used to address the
research questions. Survey questionnaires were modified and adapted from
previously validated work by Kali and Orion (1996), Dodick and Orion (2003) and
Trend (2001) for gathering data on conceptions of geologic time, fossils and
evolution and geologic visual spatial aptitudes for geological structures.
Questionnaires were prepared so that a minimum of translation of responses for non-
English writers was required. This chapter also discusses issues of validity and
reliability of using questionnaires and interviews. Ethical issues guiding data
gathering involve a requirement for informed consent, confidentiality of responses to
questions and a code of trustworthiness. Quantitative and qualitative data are used.
This work is grounded within a constructivist paradigm whereby learners are
assumed to evolve a personal construct of specific topics in geological science and
expressed as a conceptual ecology and driven by individual intention and motivation.
Chapter 6 discusses in detail conceptual issues associated with geological time and
addresses key aspects of research question 3: what is the influence of diachronic
thinking on conceptions of geological time and fossils? Geological time is probably

14
the defining concept of geological science as this contributes a unifying theme for all
the other sciences. It is here that conceptual and perceptual ideas about geological
time are linked with perceptions about other scalar dimensions such as mass and
distance.
Chapters 7 and 8 investigate and discuss issues of visual/spatialisation reasoning
within a geological structures context and specifically addresses research question 4:
what is the influence of visual/spatialisation on conceptions of geological structures?
Chapter 7 specifically looks at the ability of students to visually penetrate a solid
object in the context of rock exposures and their underlying tectonic structures. This
is further investigated with the novel use of a plasticine model outlined in Chapter 8.
This also acts as a triangulation with the paper and pen exercises used in the
GeoTSAT and GeoVAT questionnaires.
Chapter 9 provides for the first time, a detailed analysis of a case study describing
and discussing the status of teaching and learning geological science in the New
Zealand curriculum. Issues of curriculum and assessment are critically discussed.
This also addresses research question 1: what are the characteristics of international
Geoscience curricula and their implementation, with particular case study reference
to the New Zealand curriculum? For reference Chapter 9 data are placed into
Appendix 3 for reference.
Chapter 10 presents the findings and analysis of responses to questionnaires on
fossils and evolution. Comparisons are made between different countries from
students of similar age from 13 years to around 40 years and addresses research
question 5: What is the influence of respondent age on conceptions of geological
time, structure and fossils?
Chapter 11 presents the results and findings to the GeoTSAT questionnaire and also
specifically addresses research question 5: what is the influence of respondent age on
conceptions of geological time, structure and fossils?
Chapter 12 attempts to make some meaningful conclusions and evaluations of
findings with some suggestions for further research. Connections between the

15
conceptual statuses of student responses are discussed and linked with ideas about
conceptual change in an attempt to find a way forward for geological science in
school curricula and one that is aligned to the cognitive and ontological status of
learners and teachers. Conceptual change is not only complexly multidimensional
and difficult to attain, but to be successful also needs to be in tune with learners’
conceptual status, pedagogy and a visionary curriculum. Figure 1.2 summarises the
integration of research questions and methodology with the aspects of geological
education addressed in this thesis. Grounded conceptual change theory permeates
each issue and provides the conceptual framework for discussion. These issues
involve curriculum delivery and development, student conceptualisations and
perceptions of geological time, fossils, evolution and geospatialisation.
Figure 1.2. Thesis conceptualisation summary.
Geological Science
Education
GeoVAT Cross age conceptual status of Fossils and Evolution Research Question 5
Curricula International
comparisons and New Zealand as a case
study Research Question 1
GeoTSAT Cross age conceptual status of Geological time and Scale Research Questions 2 and 3
Cross age investigation of Visual Penetration Ability
(VPA Geocognition) Research Question 4

16
CHAPTER TWO
LITERATURE REVIEW
2.1 Introduction
The purpose of this chapter is to provide the reader with a summary of the essential
literature associated with the two key concepts addressed in this thesis and which
largely defines geology: geological time and geospatialisation. These concepts are
investigated and described in detail in chapters 6, 7, 8, 10 and 11). Developing
conceptual and perceptual understanding of Earth’s history (Deep Time) through
scientific interpretation of macro and micro scale geological structures is a
fundamental objective of geological education. Furthermore, the links between visual
spatialisation of geological structures and time embodies the unique contribution that
geological science makes to scientific literacy. In essence, geological education
research is in its infancy with much to learn about the relationships between the
neuro-cognitive aspects of time scale and space when related to geological structures.
2.2 Geological Time
A modern view of the cognitive aspects of time can be traced back to the Piagetian
intellectual developmental studies of children during the 1950’s and 60’s (Piaget,
1952; 1969; Piaget & Inhelder, 1969) where developmental studies themselves are
time or diachronically related in the sense of formative causative explanations for
individual world views. Along with the application of time related studies in physics
and astronomy such as gravity and Big Bang theories diachronic cognitive
development is also implicated in our understanding of geological time. With
diachronic thinking, Nicolaus Steno in the 17th century and James Hutton in the 18th
century then gave the world an evidence based method for unravelling geological
events in relative time. Understanding absolute (radiometric) geological time had to
wait until the early 20th century. Following on from these early studies of child
development the work of Zwart (1976) was influential in beginning further research
into relational temporal cognitive development (later to become the diachronic
thinking schema of Montangero and used by Dodick and Orion, 2003), where an
understanding of time lies in the development of sequencing the ‘before’ and after’

17
relationships of natural phenomena. Hume (1978) underscored the central
educational value of knowing about geological time. It was thought that children
organised geological time relationally. These underlying cognitive aspects of making
sense of geological relationships were first investigated by Ault (1981) on children
aged 3 to 8 years old and found that although these students were able to sequence
strata relationally (Steno’s law of superposition), they could not place these stratal
sequences within a geological context. The research suffered form focussing on
temporal sequencing itself rather than sequencing within a geological context.
Friedman (1982; 1989; 1990; 2000; 2002; 2003) has built on the work of Piaget and
has been influential in further cognitive research of how young children develop their
conceptions and perceptions of time. Developmental studies opened the question of
investigating the relationships between temporal cognitive development and
knowledge based subject specific context. Dodick and Orion (2003a) point out the
difference between geological event-based temporal sequencing and the cognitive
processes underlying it. Studies by Noonan-Pulling and Good (1999), Marques and
Thompson (1997) and Trend (1997, 1998, 2000; 2001a; 2001b) investigated the
temporal sequencing of high school aged students. Trend in particular has shown
how students ranging in age from 11 years to primary school trainees tend to lump
time related events into categories that are easily related to a persons lifetime as
extremely ancient, less ancient and recent.
An individual’s conceptual knowledge evolves through time (See Chapter 6) and the
development of an evocative memory is a prerequisite for diachronic thinking
(Montangero, 1996). ‘Thinking in time’ and ‘explaining in time’ are rich areas for
future research as applied to geological education. As Montangero (1996)
demonstrates, by the age of 5 years children have already developed the cognitive
knowledge that underlies being able to think diachronically and already have an
understanding of past, present and future that enables them to reconstruct a sequence
of events. What they don’t have are the geological conceptual frameworks that allow
them to make sense of relational, durational and scalar aspects of geological history.
This requires carefully managed and well resourced learning experiences among
which fieldwork is critical. Seminal research by Orion and Hofstein (1991) and
Orion (1993; 2003) clearly show the importance of the linkages between seeing
geological structures in the real macro world and its connection to temporal
sequencing of geological events.

18
Recent work by Libarkin and Anderson (2005), Libarkin, Dahl, Beilfuss and Boone
(2005), Dahl, Anderson, and Libarkin (2005) has shown that US college age students
have little idea of the absolute age of the Earth and the scale of geological time in
general. Many have a naïve view of how the age of the Earth is even worked out and
the evolution of life. Through the development of a Geoscience Concept Inventory
(GCI) Libarkin and Anderson (2005) confirmed the poor understanding of geological
history and the time relativity of events that produced the observed geological
evidence. Dahl et al (2005) even found that teachers were poor at using the laws of
superposition and uncomfortable with dating geological events. These studies begin a
new phase of research into geocognition and geological time based studies and
suggests that future research needs to look at innovative ways of teaching geological
time. Underlying much of the understanding of geological time is perception of
scale. Recent research by Tretter, Jones, Andre, Negishi, & Minogue, (2006a) and
Tretter, Jones, & Minogue, (2006b) point the way towards developing the teaching of
scalar dimensions within a geological time context. Some of these aspects are fully
discussed in Chapter 6. Useful literature reviews are to be found with Manduca and
Mogk (2006) and Orion and Ault (2007).
2.3 Geospatialisation
As is so often the case in educational research, earlier work by Piaget and colleagues
on child development (Piaget, 1952; 1968; Piaget, Inhelder & Szeminska, 1960;
Piaget & Inhelder, 1967) has set the scene for research into cognitive spatialisation
abilities. It was not until the late 1970’s that research into spatialisation abilities
specifically within a geographic and geological mapping context was begun to be
explored (Crossley and Whitehead, 1979; 1980). This established an early
connection with place, space and geological structures within a field based context.
Little published work on geospatialisation occurred through the early 1980’s
although Piburn (1980) began his studies into geospatialisation that was to bear fruit
twenty years later as part of the Hidden Earth Curriculum Project when computer
assisted graphics became established and expanded (Piburn, Reynolds, Leedy,
McAuliffe, Birk & Johnston, 2005; Reynolds, Johnson, Piburn, Leedy, Coyan, &
Busch, 2005). Another centre of interest in geospatialisation developed in the late
1990’s in Israel where studies of high school age students’ spatialisation abilities
were undertaken (Kali & Orion, 1996; Kali, Orion & Mazor, 1997: Orion, Ben-

19
Chaim & Kali, 1997). Kali and Orion (1996) were the first to investigate the
uniqueness of visual penetration ability in the identification of and interpretation of
geological structures. This requires what Kali and Orion (1996) call visual
penetration ability (VPA), a unique feature of geological science and which is
investigated and discussed in detail in Chapters 7 and 8. Kali‘s work also
investigated spatial visualisation relationships with concrete models of structures as
seen in the field and the effectiveness of the use of computer aided 3-D graphics for
teaching geological structures Computer software was then developed to assist
students in developing their 3-D perceptions (Kali, 2002; 2003; Kali, Orion &
Mazor, 1997). The findings of the Hidden Earth Curriculum Project and the work of
Kali and Orion indicate that well thought out and prepared software programmes do
make a difference to learning 3-D skills and improves ability to interpret geological
structures. Black, (2005) investigated spatial ability and geological conceptual
understandings.
Geological structures are formed through time but the identification and
interpretation of these remnants of geological processes depends on visual
spatialisation abilities. These abilities are cognitively based on how the brain
processes object information and the position of these objects within space: the so
called ventral and dorsal neurological pathways Current geospatialisation work is
grounded in neurocognitive research and investigates ways in which teaching can
take advantage of new understandings of how the brain interprets the position of
objects in space within a geological context (Blazhenkova & Kozhevnikov, 2009;
Kastens, 2010). Geological objects such as large scale fold and fault structures have
to be identified, located in space and interpreted from minimal (usually surficial)
information. Significant recent work by Kastens, 2007; Kastens, Ishikawa & Liben,
2006; Kastens & Ishikawa, 2006; Kastens, Agrawal & Liben, 2009.) has steadily
increased our understanding of visual spatialisation skills within a geoscience and
geological context. Manduca and Mogk, (2006) provide a useful summary of the key
elements to spatial thinking and directions for future research into this important
aspect of geological (and geoscience) thinking.
The following sections of this chapter outline in detail critical aspects of what the
literature says about geospatialisation and geological time, the two key aspects of
geoscience education addressed in this thesis.

20
2.4 Development of Conceptions of Time
Friedman (1990; 1982; 1989; 2000; 2002; 2003) has carried out many investigations
into the child’s development of the perception of time through investigating how
young children one to five years old perceive unidirectional transformations involved
with gravity and time. Figure 2.1 summarises the age related conceptual status for
understanding about time.
Individuals Age 25y Characteristics 24 23 22 21 Relational time conceptions continue to develop via 20 rate, velocity, distance, acceleration and space/time. 19 18 17 16 Becoming aware of other people’s sense of time
Development of time and space abstraction. Time less definable.
14 ‘Loose’ concept of time. More aware of the future. Start to use concept of generation, century and forefathers.
13 Time is a static concept 12 Less confident. Conceptualisation of the tempo of time
still formative 11 Sense of the infinity of time developing 10 Recognition of duration and developing explanation of
origins 9 Beginning to explain phenomena within a time
(diachronic) framework 8 7 6 5 Able to mentally travel in time (MTT) (Busby, 2005) 4 Recognition of serial events. 3 Developing sensitivity and awareness of unidirectional
changes in gravity and time. 2 Sensorimotor dominant view of the world 1
Figure 2.1. Chronological age conceptual status map for ‘time’
[after Ault (1981), Friedman (2003) and Langone (2000)]

21
In Piaget’s progressive ‘stagist’ mechanisms of arrow like progress towards the
formalisation aspects of adulthood, the child conceives time as “a co-seriation of
successive spatial states” (Piaget, 1969).This is a relativistic conceptual view of time
and Piaget considered the child’s conceptions of time to be complete by about the
age of ten. If only things were that simple. In 1927 when Piaget wrote about the
child’s conception of time a modern appreciation of geologic time was only just
emerging and the impact of plate tectonic theory, geochronology and geophysical
techniques were still 30 years away. Indeed, Piaget did not investigate conceptual
development of the child’s view of geologic time and he was limited by assumptions
about a child’s strong connectedness between motion and time.
The geological sciences depend on an understanding of fixed physical rock
exposures and fossil content for any understanding of relative geological time rather
than connection with physical motion and counting durational time. Studies of
student thinking about geological time are also constrained by the gap between
individual knowledge and conceptual understanding. The relational concept of ‘older
and younger’ is perhaps more important than durational geological time from a
constructivist point of view. Ault (and Piaget) did not investigate the
conceptualisation of ‘deep time’ (Dodick, 2007, 2003a). Understanding how
geologists use and conceptualise geologic time requires teaching interventions to
produce conceptual change understandings of geologic time from a serial view to a
relational and durational view.
According to Ault (1981) children by the age of ten are able to infer relative ages of
layering but only rarely within a rock outcrop exposure context in the real world. At
age ten, when children were confronted with rock exposures in the field, they
equated age with the physical and surficial characteristics of the layers rather than
relative position in the stratigraphic column. Young children apparently recognise
layering but not in a relational sense. Indeed, at age 14 years (and beyond) a concept
of relational time is still very developmental and it is only by age 18 years and
exposure to adequate training in geology that relational aspects within geological
contexts become confirmed.

22
Recent findings by Busby and Suddendorf (2005) support the conclusion that “the
ability to recall past events and the ability to predict future events (i.e., mental time
travel) emerge in tandem between the ages of 3 and 5 years” (Busby & Suddendorf,
p. 362). Younger children (<3 years old) may have different understandings of the
terms yesterday, today and tomorrow but may still be able to mentally travel in time.
Clearly then, a formative perception of relational time is established very early on in
child development and Busby and Suddenndorf’s evidence shows that young
children are able to mentally travel in time. The ability to mentally travel in time is
essential for future mental development of geological time. The temporal
mechanisms by which geological time is organised and understood involves
experience and practice of the principles of geological strata relationships. The
ability to mental travel in time is dependent on attributes such as “recursion, self
awareness, metarepresentation and the ability to dissociate current from imagined
states” (Busby & Suddendorf, p. 363). Furthermore, there appears to be no gender
difference in the ability to report on time related events such as those events having
occurred yesterday, those today and those in the future and at the tender age of five.
Interestingly, it is not until the early teens that an apparent sense of the infinity of
time begins to develop.
Montangero (1992; 1996) has developed a model for diachronic thinking; a model
indicating how process schemes interact to help form a web of conceptualising time.
Figure 2.2 shows a conceptual model of the major underlying variables involved in
understanding time. These schemes of transformations, temporal organisation,
linkages and synthesis form the cognitive basis in which time is perceived and
utilised in understanding the world. It is unfortunate that the link with geological
(deep) time has not been intensively investigated. Indeed, Dodick and Orion (2003)
point this out as a limitation to Ault’s (1981) work. In Montangero’s model of
diachronic thinking, the processes of transformation involve an individual’s
observation and recognition of changes and differences in natural phenomena.
Change implies time dependence, and it appears that awareness of unidirectional
change begins to develop about the age of four (Friedman, 2000). Geo/biological
events mark movement in time. Transformative recognition of geological change is
based on the principles of ‘uniformitarianism’ and ‘actualism’. In this sense,
uniformitarianism and actualism are considered close relatives of one another

23
whereby interrelated geological processes operating today provide a key to
scientifically unlock the past history of the earth in geological and biological
contexts. Indeed, the history of uniformitarianism and actualism are instructive
conceptual change notions about geological time which are closely bound to the
history of geology, the concept of catastrophism, and Charles Lyell and the
Darwinian revolution in understanding connections between geological and
biological events.
Essentially, by the end of the nineteenth century, geological thinking (built from
Hutton’s earlier, 1785 ideas), was dominated by Lyell’s uniformitarianist concepts of
geological history and anti-catastrophist. But uniformitarianism (in terms of
uniformity of process), failed to take cognisance of rates and duration of time (Lyell
took it that rates of geological change have always been the same even though he
recognised recent historical differential rates of change). This implied a concept of a
steady state and cyclical earth history where it was the cyclical nature of change that
was considered real. In Hutton’s immortal words “no vestige of a beginning - no
prospect of an end” (Hutton, 1788), the Earth simply recycled itself (even though a
mechanism was not known at that time and plate tectonic theory was still about 180
years in the future).
In an effort to overcome the non-progressivist nature of Lyell’s unformitarianism, the
concept of actualism was invented to account for differential rates of change that act
under physical constants and unchanging laws of nature. In other words, rather than
fixed and uniform geological processes, it was the ‘laws’ of nature themselves that
were unchanging and which governed rates and durations of observable and
measurable geological events and therefore time. The problem was (and is?), what is
meant by “constant” and is this really a controlling constraint for understanding
geological history? According to Gould (1987), ‘actual’ in most European languages
means ‘present’ rather than ‘real’ (as in English), and from which the geologists’
dictum, “the present is the key to the past” is derived. Actualism is what Gould
(1987) defines as “the so-called principle of simplicity: don’t invent extra, fancy, or
unknown causes, however plausible in logic, if available [geological] processes
suffice” (p. 120). This is an important application of ‘Occam’s razor’ to geology
because it enables the most parsimonious inductive explanation of field observations

24
and measurements. Montangero’s transformative and constructive learning processes
to an understanding of geological change occur through concepts such as
uniformitarianism. From this concept came the concept of the rock cycle - a key
concept in understanding change and time. Trend (2005), however, sounds a warning
when “research suggests that failure to grasp the concept of deep time can become a
barrier to children’s and teachers’ further engagement with geoscience” (p. 372).
Furthermore, Trend suggests that a scientific appreciation of geological time and its
links with environmentalism and earth systems may be crucial to an understanding of
our planet’s future. Certainly, Orion and Fortner (2003b) clearly show these linkages
and the importance of connecting the ‘real world’ of field geology with the ‘indoors’
learning world.
The ability to correlate (geologically) is a cognitive diachronic process of temporal
organisation and is essentially controlled by age, experiences and training.
Geological correlation of geographically separated rocks as belonging to the same
age is based on comparing fossil content rock strata relationships. Question one in
the GeoTSAT questionnaire gathers information on the temporal organisational
approaches in identifying correlative rock layers. Montangero’s interstage linkage is
the ‘glue’ that binds and connects temporal organisation with transformative process.
These linkages are constructivist in nature and developmentally controlled (Dodick
& Orion, 2003a; Montangero, 1996). Montangero (1996) points out that “The
generalisation of the idea that apparently immutable things have an origin thus
appears at the same age as the emergence of an advanced type of diachronic thinking,
that is to say about the age of ten.” (p. 75). By the beginning of secondary school (at
around the age of 13), students have assimilated (but not necessarily accommodated)
adult concepts and explanations and often begin to incorporate them into their own
worldviews. Indeed, the fact that at this age, for example, students refuse to “apply a
familiar schema to the question of the origin of the universe” (Montangero, 1996, p.
75) supports the idea of conceptual change occurring within a diachronic framework
in a ‘Vosniadouian’ type fashion. That is, without learner intent and intentional
teaching, exposure to different conceptual explanations of geological phenomena less
effective conceptual change would occur. Diachronic thinking is thinking across and
through a perception of time. The key elements involved with diachronic thinking are

25
synthesised in Figure 2.2 and are derived essentially from Ault (1981), Montangero
(1996), and Dodick and Orion (2005).
Figure 2.2. Conceptual ecology map for understanding diachronic thinking. [After Ault (1981) Montangero (1996) and Dodick & Orion (2005)]
Knowledge States
Axiological Empirical Organisational
Transformations Temporal Organisation Interstage linkages Synthesis
Conceptual Reorganisation
TIME
Ratio/Scale/Boundary Thinking Past / Present / Future Perceptions
Sensorimotor perceptions (Friedman, 2000) and pre- frontal lobe maturation (Kwon, 2000). Visual spatial abilities
GEOLOGICAL TIME
Measures of Relational Time
Measures of Durational Time
Steno’s ‘Laws’ Uniformitarianism
/actualism Correlation Order of geological
events/sequencing
Magnetic reversals Radioactivity Growth rings Varves Phyletic gradualism Phyletic punctuationism
Rhythm Perception

26
Indeed, intention generates engagement and without intent learning does not happen.
Intention is also somewhat controlled by interest, attitudes, values and perceptions
both by teachers and learners (Vosniadou, 2003, 2007a; Vosniadou, 2007b).
We claim that instruction-induced conceptual change requires the deliberate use of top-down, intentional learning mechanisms to be achieved. (Vosniadou, 2007b. p. 50)
Montangero’s temporal organisation scheme defines the steps involved in making
sense of a transformational process such as the use of the principle of
uniformitarianism in understanding geological history. It is an evolutive learning
process in which conceptual transformations are understood and applied. Geological
time is understood through empirically derived and tested organising ideas such as
Steno’s Laws explaining rock strata relationships, correlation, chronostratigraphy
using radioactivity and magnetic reversal data and biostratigraphy. Biostratigraphy is
the use of index fossils to define periods of time in the geological and fossil record.
The geological time scale in use today is an end point of temporal organisation: a
point in which Montangero (1996) would consider a dynamic synthesis defining “the
development of a field as a single conceptual reorganisation” (p. 170).
Human beings are very good at conceptual reduction but in the process forget or miss
out the details and worse, add-in irrelevant or incorrect ideas. This is what makes the
teacher’s job complex and difficult. Establishing and changing conceptual
understandings is not easy. It seems that to make sense of the world conceptual
reduction or simplification of a concept to a dichotomy is necessary. It is
intellectually easier to reduce conceptualisation to yes/no, black/white, right/wrong,
primitive/advanced and just and unjust. From a structuralist point of view, it makes
sense for survival to reduce conceptualisation to the minimum – the details can be
argued about later. From a learning point of view, it makes sense to reduce ideas
(especially new ideas) to cognitively manageable levels. Steven J Gould (1987;
2002) had a lot to say about dichotomies but is best summed up as stating,
“dichotomies are useful or misleading, not true or false. They are simplifying models
for organising thought”. (Gould, 1987, p. 9). The uniformitarianism/catastrophism
dichotomy is a key dichotomy in geological thought not only in the history of
western science and philosophy but also in the evolution of thinking about geological

27
time and earth history. Deep Time as a western philosophical construct was
embodied in the ideas of repetitive cycles and directional arrows with progression
from primitive to advanced, young to old and right from wrong. The negative
influence of Judeo-Christian thought about time had, until Steno, Hutton, Lyell and
Darwin, held centre stage and it is only fundamentalist groups today who still cling
to the idea of literal religious thought. Formative teenage minds (and untrained
teachers) unsurprisingly find the complexity of Deep-Time and the evolution of life
all too difficult without recourse to exaggerated and naïve dichotomous
simplification. In a sense, dichotomies are a ‘brain wired’ dynamic synthesis (in the
Montangeron model) where forming a whole “single process of change” from a set
of successive stages occurs. It is little wonder that teaching and learning about
geological time is a challenge to educationalists and learners.
It can be argued that geology uniquely provides a transformative learning mechanism
for the development of diachronic thinking and its application to a conceptualisation
of what McPhee (1981) first described as ‘Deep-Time’. In an unpublished report as
part of a Royal Society (NZ) teaching fellowship, Vallender (1997) investigating
Earth Science education in New Zealand, found that out of 90 first year university
geology students (aged 18-19 years and effectively before any geological training),
57% did not know the scientifically accepted age of the Earth of 4.6 billion years.
Out of 30 primary and secondary school teacher trainees, only 50% knew the age of
the Earth. Typically, first year students at university and teacher training college
were also naïve about how relative dating works (by correlation of rock layers) and
were suspicious of radiometric dating techniques thinking that the only kind of
radiometric dating technique was carbon dating. Chapter 9 discusses in detail several
aspects of the New Zealand Science curriculum that impact on this kind of thinking
about geological time. Essentially students are just not sufficiently exposed to an
understanding of radiometric dating technology and its triangulation with other
dating techniques.
As previously mentioned, research by Trend (2000) suggests that primary teacher
trainees in the United Kingdom conceptualise the geological past in distinct clusters:
extremely ancient, less ancient and recent. Furthermore, Trend suggests that it is
ignorance of the geological timescale and relativity of key global geological events

28
that retards the conceptual understanding of ‘deep time’. Key geological events
which mark the passage of time include the fossil record, periods of mountain
building and eustatic sea level changes. Results in this thesis corroborate this point of
view.
Perhaps these students had also not been exposed to diachronic thinking in a
geological context? Dodick and Orion (2005) accurately point out that Montangero’s
schemata for diachronic thinking provides an evolving cognitive model for
developing diachronic thinking about geological time.
2.5 Thinking About Scale
Conceptualising scalar dimensions is fundamental to a scientific understanding of
our world and our place in the universe. Indeed, making sense of geological time is
very much dependent on building conceptions and developing perceptions of scale
(AAAS, 1989). Dimensional scale is viewed as an important unifying theme:
wherever one goes in science, there is the problem of scale. Gould (2001) makes
clear the point that an understanding of scale is persistently related to the human
body in space and time. For example, when a class of students of 13 and 18 years
were asked in an informal classroom situation to describe five seconds, they used a
relative scale of length often physically using hands to measure a length and then
scaling five seconds into this length. It was interesting that no one used a relative
scale of mass – it seems that time is conceived as a linear length scale. In contrast it
seems that when distances become too large (eg distance from Perth to Auckland),
for a relativistic comprehension, scale is switched into a time scale so that distances
become times (Tretter et al. 2006). In other words, one does not state the distance
from Perth to Auckland or Hong Kong to London in kilometres, but in time. Perhaps
this phenomenon indicates a neuronal tipping point from relativistic perceptions into
that part of the brain dealing with calculations (Kunzig, 1997; Paivio, 1986) and
relativism. Paivio (1986) suggested that the ability to conceptualise the very small
and the very large (including time and in particular geological time), an individual
lacks the experiences at these extreme ends of dimensional scales. Without
experiences, spatial information simply cannot be stored (and then retrieved) in the
brain. Experience is needed to place geological time into an individual’s

29
preconceived and preformed scaling systems. Similarly, Deheane (2002) suggested
that size may be represented in a similar way to number. Figure 2.3 is an attempt to
summarise the connections between conceptualising and perceiving scale within our
world.
Figure 2.3. Factors influencing conceptions of scale (after (Tretter, 2006).
A different conceptual leap is required for perceiving geological time compared to
linear dimensions, where both distance and time are beyond a calculable value and a
relativistic comprehension. To speculate, the subatomic world seems to be a
conceptual scaling leap that is likely to require scale experiences that go beyond the
experiential time of a high school student. Providing meaningful opportunity for
these experiences is the teacher’s challenge. Yet secondary teachers insist on
teaching ‘the atom’ and the ‘ion’ to students at age 13-15 years, and anecdotally,
teachers often wonder why their students “don’t get it”. Clearly, high school age
Scale Conceptions
Experiences and Perceptions of the World
DIRECT Sequential Holistic Visual Kinaesthetic
INDIRECT Sub atomic Intergalactic Deep Time Evolution
Dimensional Comparatives
Ratios Proportions Growth Exemplars
Cognitive mapping, entrainment and categorisation processes
Scale Perceptions

30
students (and many beginning college age students) seem to think mostly in
relativistic time durational terms. In other words, whatever scalar and spatial view
individuals have of the world, it is relative to their bodies, and in particular, for
geological time, the span of a human lifetime. After all, a single healthy human
lifetime is only about 0.0085% of a million years and one million years is only
0.02% of four and a half thousand million years! Little wonder that the seventy one
million year duration of the cretaceous (0.158% of earth history) is misunderstood
and not comprehended. What is your concept of 0.0085% of a million? At what point
on your mental number line (Kunvig, 1997) does your comprehension of 0.0085%
become meaningful or meaningless? And yet for geologists, conceiving scales of
time in a meaningful way is a fundamental attribute in making some kind of sense of
Deep-Time and earth history. Table 2.1 attempts to show the geological connections
with the direct experiences required for making sense of scale in the geological
world.
Table 2.1. Experiences and geological time correlatives.
Experiences
(see Figure 5.3)
Geological Time Correlatives
Sequential
(seriation)
Relative order of geological events
Correlation
Steno’s Laws
Holistic Earth History (local and global)
Naturalism
Visual Rock outcrop exposures
Spatialisation, visual penetration ability
Fossils
Natural hazards –earthquakes, volcanoes, tsunamis, floods, droughts, landslides.
Kinaesthetic Feeling and holding fossils as representatives of ‘Deep-Time’, rocks and minerals.
Touching rock outcrop exposures; touchstones.
The challenge for teachers of geology is to provide meaningful direct experiences for
students to learn about the scale of geological time. Techniques that provide
comparative experiences of time ordered phenomena such as geological field work
through a stratigraphic column or physically measuring time through techniques such
as growth ring analysis may be a step towards this goal.

31
Fieldwork is not only an essential element of geoscience education and clearly an
important technique for developing skills and perceptions (Drummond, 2001; Kern,
1986; Orion, 1993, 2003a, 1997; Plymate, 2005; Riggs, 2003) but is also crucial to
blending and developing indigenous peoples’ understandings of the natural landscape
(Riggs, 2005). Studies show (Orion, 1993) that there is a clear advantage for students
being exposed to the real world through investigative application types of fieldwork
as opposed to a ‘look and see – back in the bus’ type of approach. The challenge for
teachers (at all levels) is to develop manageable, cost effective and conceptually
meaningful field experiences for geoscience education. Recent work by Clary,
Brzuszek, and Wandersee, (2009) indicates another way of making powerful learning
connections about geological time by having students develop conceptual statements
and conceptual mapping within an informal educational setting outside the
classroom.
Trend’s work (2001) on investigating how geological time is conceived by 17 year
olds (and this thesis, Chapters 10 and 11) suggest a strong connection between time
scale and distance scale. Indeed, this suggestion was supported in recent work by
Hardin, Jones and Figueras (2005) where a strong connection between distance and
time categorisation was found. However, merely being able to correlate distance
scales with a time scale is very different from correlating distances and size with
geological time. Understanding geological time is beyond most individual
experiences and this helps explain why, in Ault’s (1981) work, children were able to
conceive relative time but were unable to transfer this ability to the real world at a
geological rock exposure in the field. Trend (2000) also found that geological time,
as represented by geological events, was conceived by primary teacher trainees as
falling into three large categories: extremely ancient, less ancient and geologically
recent. It seems that some kind of ‘cognitive lumping’ occurs when the mental
timeline scale (and other scaling categories in the brain) can not accommodate values
outside relativistic experiences. Table 2.2 presents some possible scaling categories
with geological time as unimaginably ancient.

32
Table 2.2. Some possible scaling categories.
Mental Time Travel Size Numbers
Unimaginably ancient Unimaginably small Unimaginably infinite
Extremely ancient Atomic Minus three
Ancient Very small Minus two
Recent past Small Minus one
NOW ME ZERO
Near future Large One
One life time Very large Two
Future Huge Three
Unimaginable future Unimaginably large Unimaginably infinite
2.6. Conceptual Development of Geospatialisation
Understanding complex geological structures that have been produced by multiple
deformation episodes is largely dependent on an observer’s ability to visualise these
structures in 3-D. Modern efficient software construction of 3D maps and diagrams
may have crucial importance in the economic development of a mineral rich
geological structure and also enables deciphering of the geological history of an area.
This chapter investigates the importance of spatialisation and describes results from
pen and paper exercises in the GeoTSAT instrument. Much of our understanding of
the development of spatialisation skills stems from the early work of Piaget and
Inhelder (1967) and developed further especially by Siegel and White (1975),
Seddon, & Shubber, 1985, Vandenberg, 1978 and many others. It was not until the
mid 1980’s that spatialisation abilities began to be applied to the geological sciences.
According to Devlin (2001), a key developmental stage is the pubertal concrete stage
transition to projective and Euclidian visual spatialisation. Results reported in this
thesis straddle this age boundary and beyond.
The ability to spatially visualise is fundamental to an understanding of the geometry
of objects and the physical space we inhabit. Survival depends on the ability to judge

33
distances, anticipate directions and visualise objects in 3-D space. We are part of
space and volume. Spatial abilities are also implicated in visualising molecular
structures, engineering structures, gaming and modelling. Spatial ability is an
important intelligence and in chemistry, for example, recognition of molecular shape,
identification of p-orbital’s and rotation about carbon bonds is an important ability
for a deeper understanding of molecular structures and consequent properties
(Coleman, 1998). Similarly, in the teaching and learning of biochemical molecules
spatially visualising DNA, for example, is important for developing perceptions of
gene locations, mutational changes and genetics. Similarly, the ability to spatially
visualise protein molecular shapes is important for a better understanding of how
proteins can catalyse reactions. In the medical sciences the development of MRI and
CAT scans require visual spatialisation abilities for accurate diagnosis and
development of treatments. CAT scans and x-ray scans are routinely used for
example, in penetrating hidden structures such as fossil dinosaur bones in eggs. X-
rays are also used in the investigation of archaeological sites especially those of
cultural significance.
Geological structures often display distorted rock strata, and the ability to predict
extensions of strata into the unseen 3-D space is a skill that has been used by miners
for centuries. Baldwin and Wallace (2004), along with other researchers (Ben-
Chaim, 1988; Black, 2005; Broadfoot, 1993; Kali, Orion, & Mazor, 1997, clearly
point out the importance of spatialisation abilities to the understanding of geological
structures as a means of interpreting structural histories. Black (2007) succinctly
points out that spatialisation in its many forms is a crucial element in the design of
Earth Science curricula and that a deeper understanding of this ability would help
address many conceptual difficulties. Along with the teaching of graphic design and
geometric aspects of mathematics, teaching geology may provide unique
opportunities for teaching spatialisation skills. Teaching spatialisation in a geological
context is unique in the sense that geological structures such as domes, anticlines and
synclines are placed in a historical geological time perspective. No other subject can
do this. Figures 2.4 and 2.5 shows typical large scale fold structures that geologists
are often confronted with in the field.

34
Figure 2.4 Anticline. Figure 2.5. Syncline.
Field experiences in geology courses can provide a connection with 3-D
spatialisation that no other subject of learning can provide. Orion (1993) clearly
shows the links between success in geology and exposure to fieldwork but actually
measuring the influence of field experiences on the development of spatial abilities is
difficult due to the complex interacting nature of variable learning experience (Orion,
2003a) and the social novelty attitudes of students when placed in the field. Typical
Biology fieldwork exercises for example, focus on two dimensional surficial
distribution aspects rather than connection with a three dimensional world. An
example of this is a typical lawn study where distribution of plant species is
observed. The time aspect of growth and succession is often deemphasised in
biological fieldwork in favour of observing distributions. Indeed, anecdotal and
personal experiences with Year 12 (age 16/17 years) students in a forest environment
indicate that students of this age often have difficulty connecting depth, and height.
Forest stratification exercises for example, suggest a difficulty with perceiving
species layering (strata) even when immersed and being a part of the forest. Students
often see only the 2-D layering and disconnected from a forest volume. A question
worth future investigation may be student visualisation perceptions of forest bird
predators such as Eagles flying in a three dimensional forest. Even more so,
visualising many other species in three dimensional interacting space webs is likely
to be even more difficult for the majority of this age group to conceptualise and
perceive.
Orion, Ben-Chaim and Kali (1997) report significant improvements in spatialisation
ability after field work training, but it is difficult to tease out the precise interactive
contribution between field learning and all other simultaneous learning in other
subjects. In other words, learning spatial orientations is more complex than single
correlations between fieldwork and observed geological structures. Translations of
various scales of distance and orientation are an important aspect of conceptualising

35
natural geological structures. For understanding geological structures it is desirable
to expose students to a wide variety of learning experiences which are linked to the
real world outside the classroom (Marques, Paria & Kempa, 2003). This means that
for geology, field relationships investigated within a ‘natural real-world field’
perspective, rather than in the virtual digital world, have a powerful influence on the
cognitive development of spatialising geological structural relationships. However,
the power of modern digital modelling and graphic rendering such as programmes
like The VR Worx 2.0 [Computer Software] (Kali, 2002), and the VR Toolbox
Curriculum (http://www.vrtoolbox.com/educators/educators.html) enables the 3-D
treatment of geological problem solving and can provide unique perspectives which
enable us to ‘see beneath our feet’. Other software programmes such as Geo3D (Kali
& Orion, 1997) have been specifically developed for teaching aspects of structural
geology which requires visual penetration ability (VPA).
Figures 2.6., 2.7 and 2.8 illustrate the ability of modern computerised graphic
rendering and Geographic Information Systems (GIS) to present 3-D visualisation of
geological structures.
Figure. 2.6. Cropped graphic selection from Piburn et al. 2002.
Figure. 2.7. USGS 3-D picture of San Francisco geology.
Figure. 2.8. Surface expression of folds (http:// reynolds.asu.edu/geomap3d/gm3d_hollidaysburg_n.jpg.)

36
The power of 3-D imaging is found in enabling the observers’ ability to visually
penetrate through animation and to be able to ‘see through and round corners’. The
ability to control rotation of images enables trained personnel to visualise subsurface
geology that is only just being made available to local and national planners. The
application of 3-D geology imaging has enormous potential for mitigation of
potential natural disasters and is a clear link with ‘systems thinking’ where
integration of disciplines such as computer graphics, geographic information systems
and geology interact. But its potential is dependent on trained conceptual
understanding of spatial visualisation of geological structures and the gathering of
accurate field data. However despite the power of rotational manipulation and
animation onscreen, maps and diagrams on a computer screen do not and can not
convey the sense of geological time and scale that can only be appreciated in the
field by those with relevant academic training. In observing a geological outcrop,
trained geologists appear to differ from learner geologists in their approach to
outcrop interpretation Kastens, Ishikawa and Liben (2006). In the field, experts use
spatial information to investigate the relationships between rock strata patterns
whereas untrained learners do not. Only when learners are provided with scale
models of the geology of an area that they begin to think spatially (Kastens, Agrawal
& Liben, 2009).
According to Kastens et al. (2006) “many participants’ difficulties with the task seem
rooted in their failure to perceive or record the kinds of spatial information necessary
to solve the posed problems, rather than in their difficulty in integrating the spatial
information in hand” (p. 425). Perhaps this difficulty also indicates the importance of
the need for development of concepts of scale (i.e. real world field scales versus the
table top model world), before developing concepts that can be combined into a
workable ‘geological’ view. The fact that novices in the Kastens et al. study
concentrated on the rock exposure in front of them and failed to make spatial
comparisons with physical surroundings when in the field, perhaps suggests that they
were unaware of the scalar differences or were unable to relate these scalar
differences from the laboratory to the field. Perhaps these novices also lacked the
confidence for interpreting a single outcrop yet alone its relationship with the ‘wider
world’. Besides, how do they know that a single outcrop is actually connected to the

37
larger scale geological structure being observed? Perceiving and conceptualising the
hidden view of the Earth is difficult without having planned learning experiences.
Research by Hegarty, Montello, Richardson, Ishikawa and Lovelace (2006) and
others (discussed below), suggest that amongst several models, a partial dissociation
model (i.e. large scale and small scale spatialisation are not completely cognitively
separated) (Figure 2.9), best explains an individuals’ perception of the relationships
between large scale (geological outcrops in the field) and the small scale (laboratory
models). The ability of experts to transpose spatial information at a small scale to the
larger scale (and vice versa) may help explain why experts in Kastens et al. (2009)
work use spatial information and novices do not. Designing teaching strategies that
assist in the development of this ability (Ishikawa & Kastens, 2005; Kali, 1997, Kali
et al., 2002, Orion, 1993, 1997, Piburn et al., 2002; Reynolds, 2002, Kastens et al.,
2006; 2009) is a challenge for secondary school geoscience and geography educators
but especially so at undergraduate level. Investigation of the cognitive development
of visual penetration ability remains a rich area of future research. What controls the
overlap and is it ‘teachable’?
Figure 2.9. A partial dissociation model of mapping spatial ability (After Hegarty et
al., 2006).
Isolation from the ‘real’ world
Overlap
Visual input. Spatial representations and
inferences
Updating and spatial learning relative to the sensing of body motion.
Large scale spatial locatory layout learning (E.g. The geological outcrop)
Small scale spatial locatory layout learning. (E.g. Modelling in the laboratory)

38
2.7 Visual Penetration Ability (VPA)
Early attempts by Zavotka (1987) and Bezzi (1991) using computer software
indicated that spatial abilities can be improved with appropriate teaching techniques,
although Black (2005) offers a caution in that much more research is needed to
identify the nature of any improvements and what connections there are to teaching
and learning. For example, although Black (2005) found that mental rotation ability
was the best predictor of scores on earth science concept (ESC) tests, there is little
research completed on visual penetration ability. This is a primary concern for visual
spatialisation of geological structures. Notwithstanding this, using Linn and
Petersen’s (1985) classification of spatial abilities, visual penetration ability would
include aspects of both visual perception and visual spatialisation. For example,
according to Linn and Petersen, visual perceptions include the “overcoming of
distracting cues”. Evidence by Kali and Orion (1996) and confirmed in this study of
simple tests of visual penetration ability for geological structure models and
diagrams (see Chapter 7 for details). This is because students dominantly rely on
seeking answers from exposed external surfaces as they are generally unable to
visually penetrate the structure. In other words, their visual perception ability in
overcoming distracting cues is the most common difficulty when dealing with
geological phenomenon. However, there may be significant issues associated with
the visual translation of 3-D block diagrams represented on 2-D paper. Few
spatialisation studies deal in any depth with visual penetration ability (VPA). This
issue is also addressed in Chapters 7 and 8.
Later efforts by Kali (1997; 2002) has extended efforts on software development for
teaching spatial development for geological structures. The “GeoWall system” is a
new technology that enables projection of stereographic images that can be viewed
by students in 3-D (Anthamatten, 2006) and has been developed for use by
geography students in aiding learning in cartography and geographic information
systems (GIS). The full potential of this method of viewing geological structures in
3-D is yet to be seen and it is likely that costs, training and accessibility will be
controlling factors.

39
Perceptualising and visualising, for example, the effect of faulting and rotation
superimposed on folded geological structures is a spatialisation problem unique to
the study of geology and much is still to be learned about how this ability works and
how it can be trained and developed. Developing 3-D software programs that are
manageable and pedagogically meaningful presents a challenge to the teaching of
structural geology, and geomorphology.
Kali, Orion and Mazor (1997) divided spatial skills into two categories of
manipulation of two or three dimensional objects and computer graphics of 3-D
objects. Student spatial visualisation was based on previous work of McGee, (1979),
Linn and Peterson (1985), Ben Chaim et al., (1988), Bezzi (1991) and Broadfoot
(1993). Kali, (2003) continued efforts to provide software for student conceptual
development of the rock cycle and its inherent systems thinking. However, the links
between use of virtual 3-D software for conceptualising the rock cycle and the
required degree of conceptual shift (especially in terms of the need for systems
thinking and integration) has yet to be evaluated.
In the 2007 New Zealand curriculum document for Science education (Education,
2006), the rock cycle concept only appears at the Science curriculum level five
(student ages of 13 to 14 years) achievement objective as an implied part of “Earth
Cycles: Investigate the processes that shape and change the surface features of planet
Earth”. From a Geoscience curriculum perspective it is even more intriguing that
subsequent revisions of this 2006 draft consultative document do not acknowledge
the rock cycle in the curriculum at all (see Chapter 9 for details).
However, for geological studies, visual spatialisation skills are important in
developing scientific concepts of how the rock cycle is interconnected with Earth’s
structure, composition and history. Indeed, geologists are required to envision
distorted and often geographically isolated rock outcrops in their original form to
derive a geological history. It is hardly surprising that it took a long time for
geological histories of the European Alps and the Southern Alps of New Zealand to
emerge from complex geometries produced by multiple episodes and different
directions of forces needed to distort originally horizontal layers of rock that were
once buried 20km below present sea level.

40
A small study conducted by Titus and Horsman (2009) on spatial visualisation in the
geosciences included some material on visual penetration ability. In this study it was
found that there was little difference between male and female VPA with females
often outscoring males. It was also found that practice significantly improved
performance on all types of spatial problems giving support to Piburn et al’s. (2002)
findings.
2.8 Diachronic Thinking and Spatialisation
The ability to think spatially and visually impacts greatly on an individual’s
conceptual world view and is also implicated in the cognitive development of
diachronic thinking (Dodick, 2003). Investigations of organisational-temporal-
diachronic relationships which develop in young children aged 8 to 12 years,
(Montangero, 1996) suggest that the ratio of spatio-temporal solutions to spatial
problems which involves decision making of a person’s place in space and time,
tends to increase with age. Without an ability to observe and mentally manipulate
objects in space, the organisational structures of diachronic thinking (see Chapter 3),
and the making sense of geological observations cannot happen. This in turn impedes
construction of geological histories that are based on the stratigraphic and cross-
cutting laws of superposition.
According to Dodick and Orion (2006) extracting geological histories based on
correlation (giving equal age to geographically separated rock strata), requires a
spatial-visual demand that is greater than that required for perceiving superposition
based on stratigraphic age order alone. Superposition simply requires knowledge and
comprehension of ‘oldest bed at the bottom’ in a vertical sequence of strata
(assuming strata have not been overturned) whereas correlation requires visualisation
of strata from different localities and landscape cues: a spatial visualisation problem
unique to the geological sciences. Further testing by Dodick and Orion suggested that
geological correlation of strata requires “the highest level of visual-spatial thinking in
order to temporally order its contents” (p.11). This kind of visualisation skill
involves perception, rotation, visualisation and penetration especially where rock
strata is contorted and requires ‘matching’.

41
Most diagrams in books are two dimensional but the ability to three dimensionally
‘match’ correlated strata requires a much higher order of thinking. Actually
visualising stratigraphic relationships in the field or even by aerial photograph is a
prerequisite for gaining an enhanced understanding of local (and global) earth
histories. The folding and faulting of rock strata holds many secrets to the multi
origins of landscapes and what lies beneath our feet. Neither Piaget and Inhelder
(1967), Black (2007), Dodick and Orion (2006) nor Piburn et al. (2006) investigated
visual penetration ability of geological structures. Indeed, Black’s (2005) work on
spatial ability using a space relations test developed by Bennett, Seashore and
Wesman (1991) focused on rotation and surface development rather than on visual
penetration. Furthermore, in her study of pre-service elementary and middle school
teachers, Black (2007) reported positive correlations between Earth Science
conceptual understandings and spatial abilities and claimed that the Earth Sciences
can be a useful vehicle for improving spatialisation abilities, in particular mental
rotation. Unfortunately this work also did not specifically investigate VPA but found
and confirmed that mental rotation ability is moderately correlated with success in
Earth Science concept tests such as that developed by Libarkin Anderson, Boone,
Beilfus and Dahl (2002). As Black (2007) has pointed out;
“… if a relationship exists between Earth science conceptual understanding and spatial ability, curricula may hopefully be developed to facilitate both spatial abilities necessary for Earth science conceptual understanding and understanding of spatially-related Earth science concepts that are associated with misconceptions and other broader conceptual problems”. (p.4)
For geographers and earth and environmental scientists, spatial literacy is a
fundamental skill (King, 2006) but also one that presents many difficulties for
students. An example of this is mentally moving between 2-D representations and 3-
D (and especially 4-D for the geological sciences). Making a movie in the mind of 3-
D changes to rock materials from origin to today (geological time) is an ultimate aim
of geological thinking from measurable observations. Even in today’s digital and
visual world it is necessary to be able to spatially visualise a sense of location on a
topographic map or a street map, and for geologists, making sense of 3-D depth from
external observations of highly deformed strata on a 2-D sheet of paper takes
considerable skill and training. Little wonder that current digital representations of

42
MRI, CT, ground penetrating radar, x-rays and sonar have opened our eyes to being
able to ‘see inside’.
Research by Douglas and Bilkey (2007), indicates a strong linkage between people
who are tone deaf and their ability to rotate 3-D cubic objects. This has led these
researchers of neuropsychology to suggest that there are common brain processing
mechanisms between hearing musical pitch and spatial ability: an area worthy of
further research in the context of visually spatialising geological structures and strata
deformation processes and consequences.
Although Mathewson (1999) took a ‘general science’ look at visual – spatial thinking
and categorised types of visualisations commonly used in the Sciences, VPA per se
was neither adequately categorised nor discussed. In Mathewson’s (1999) “master
images of Science” (p.40), the closest VPA comes in his categorisation system is in
“Gestalt”, a grouping which deals with figural closure, proximity, grouping,
continuity, similarity and orientations. Mathewson points out the dominance of
alphanumeric systems at the expense of visual – spatial thinking. VPA is a form of
perceptual extension imaging and is closely related to Ekstrom, French, Hartman, &
Dermen (1976) ideas of spatial relationships as the ability to manipulate an image
into some other kind arrangement. Visual penetration requires the mental
manipulation of surface stratification features that need to be mentally changed into
‘hidden continuations’ from the perception and visualisation of surface features, to
the ‘inside’. It is unfortunate that Baldwin and Wallace-Hall’s tests of rotation (2004)
given to high school and college age students, and using Ekstrom et al.’s validated
tests of the 1960’s, does not address the issue of visual penetration ability.
Creative visualisation of concepts as an aid to explain natural phenomena is well
established in the links between the ‘artist’ and the ‘scientist’ (Fazekas, 2004) but the
ability to visually penetrate a geological structure is a skill that is uniquely required
for the deciphering of historically distorted and confused rock strata. It rarely appears
as a part of instructional and curriculum design for neither the sciences in general nor
the geosciences in particular. Completing isometric drawings in a graphics class is
not quite the same thing as visually penetrating a geological structure where issues of
scale and connection with object identification and the real world are a necessity.

43
Learning a spatial sense is complexly experiential with many variables and it is
difficult to measure (if not impossible) the contribution these different experiences
have on learning processes. Piburn, Reynolds, Leedy, McAuliffe, Birk, and
Johnson, (2002) in their study of spatial visualisation in the geological sciences
indicate that ‘scientists’ score highly on spatialisation abilities and that the
importance of spatial abilities in the sciences is “as important as verbal ability” (p.2).
Indeed, high school and college age students apparently have higher scores on
traditional measures of spatial ability than is true of other students of their age and
ability (Carter, LaRussa & Bodner, 1987; Pallrand, 1984; Piburn, 1980).
2.9 Chapter Summary
This literature review discusses and synthesises the key conceptual issues
surrounding the cornerstones of geological science education that is addressed in this
thesis: geological time, scale and geospatialisation. The review shows how the
seminal work of Piaget, Inhelder and Montangero on child development has been
gradually built on by later researchers. These researchers are notably, Ault, Dodick,
Libarkin, Manduca, Mogk, Orion, Trend and Tretter for geological time and scale
with Black, Ishikawa Kali, Kastens, Libarkin, Orion, Piburn, and Reynolds for
geospatialisation. These researchers have made a significant difference (especially in
the sense of connecting neurocognitive science with geospatialisation skills) to our
understanding of how students perceive and conceive their geological worlds. The
challenge is for the educational community to find ways of including this research
into school and college curricula and for geoscience education researchers to
continue building on this base. As Kastens (2010) points out, object and spatial
visualisation are the defining skills for interpreting geological phenomena and that
geological science has the potential for developing and motivating individuals in
both object and spatial visualisation abilities.

44
CHAPTER THREE
INTERNATIONAL GEOSCIENCE CURRICULA:
A SELECTIVE OVERVIEW
3.1 Introduction
There are many geoscience/geology/earth science and science organisations but few
dedicated specifically to international geoscience education. Recent developments
from the education and cognitive science research section through the Carleton
University website (http://serc.carleton.edu/) are welcome specific additions to the
literature in geoscience education. As with all educational research dissemination and
actioning of research findings at the classroom level for best practice are challenges
yet to be realised.
The IUGS (International Union of Geological Sciences) is the largest Geological
organisation in the world and has the affiliated Commission on Geoscience
Education Training and Technology (COGE) responsible for supporting and
encouraging the development of Geoscience educational issues. One stated objective
of the IUGS is to “assist the International Geoscience Education Organisation
(IGEO) to undertake a world wide survey of the Earth Science perspective of school
and outreach education”. Aspects of results to this survey are discussed in this
chapter. To meet this objective, the IGEO has in process for publication, the results
of a 20 country response to a wide ranging questionnaire on the status of geoscience
education. Results are to be eventually published in the IUGS journal “Episodes”.
The first conference for the fledgling IGEO occurred in 1993 at Southampton
University. This organisation was inaugurated with a constitution at the second
conference in Sydney in 2003, and is now affiliated to the International Union of
Geological Sciences (IUGS). Southampton was the first international attempt to co-
ordinate and discuss strategies for the enhancement of teaching and learning in the
geological sciences in schools, tertiary institutions and institutions outside the main
stream such as museums. This first conference also focussed on gathering ‘global’
data on the status of geoscience education in curricula and looked for a way forward

45
in the teaching and learning of geological science. Information was formalised in the
publication of conference proceedings (Stow, 1996). Further IGEO surveys were
conducted on the status of geoscience education in 2002 and 2006 with a clear
recognition of the low status of the geological sciences in curricula around the world
and acknowledgement of the vitality of a geoscience literate society. The fourth
international conference of IGEO in Calgary in 2003 further enhanced this view by
using the theme of the conference “Earth Science for the Global Community”.
Twenty five countries were represented at this conference. IGEO conferences are
internationally unique specifically in the pursuit of geoscience education in the
classroom and out of the classroom. An important conclusion reached was the
recognition that there is a huge lack of information on specific Earth Science
curricula from a wider range of countries despite efforts to gather data. This finding
may not only reflect the values placed on Earth Science education in international
science/geography curricula by educationalists (and politicians) but also the physical
difficulty of gathering information. Different systems are difficult to rationalise and
standardise. Interested and qualified people are needed to provide information.
Nevertheless, as detailed in Chapter 1, the status and definition of Earth Science as a
subject of teaching and learning in school curricula is precarious, undervalued and
under resourced.
In essence, the IGEO grew from the key teacher training centre at Keele University
(UK) and under the leadership of David Thompson from the early 1970’s. It was my
privilege to be with David for a short but influential visit in 1985. This centre was
(and still is) one of the few teacher training institutions in the world to have
established, well-resourced and dedicated courses in the teaching of geological
science. Research in geoscience education spread from Keele to other centres such as
the Weizmann Institute in Israel, University of Aviero in Portugal (Marques, 1997)
and Ohio State University in the USA (Mayer, 1999).
This chapter focuses on the general status of the teaching of geological science from
an international perspective based on a selection of countries and specifically
addresses research question 1. Gaining valid, reliable and current information on
more countries is extremely difficult and requires the resources of an internationally
significant organisation with considerable resources and dedicated personnel. This

46
information sets the scene for a detailed case study investigation of the status of
Earth Science education and assessment in the national curriculum of New Zealand
(See Chapter 9).
3.2 Earth Systems Science
The second IGEO conference was held in Hilo, Hawaii in 1997, and was themed by
Earth Systems Science, a consequence of science education reforms (largely in
response to political/social and environmentalist concerns and developed by NASA
in the mid 1980’s) from Ohio State University, and the trialling of Earth Systems
Science for the teaching of geology in Japan. The future of Earth Systems Science
remains to be seen. In Ian Clark’s presidential address on a vision for Geoscience
education for the 21st century at the 2006 IGEO conference in Bayreuth (Germany)
(Hlawastsch, 2006), Earth System Science is seen as a way of teaching Earth Science
as an integrating context for including science values, environmentalism and
sustainability issues. However, Earth Systems Science appears to be somewhat at the
expense of the traditional ‘Earth materials’, ‘Earth structure’, ‘Earth resources’ and
‘Earth history’ approach to a geoscience curricula. The relative absence of a coherent
and standardised teaching of geological science in schools in Germany, for example,
has led to the recent development of the “System Earth Project” (a project again
derived from the evolution of the Earth Systems Science concept), in order to “meet
the requirements of interdisciplinary science and geography teaching”. (Hlawatsch,
et al. 2006. p.3).
In a sense, curricula reforms encapsulate the socio/political issues of the time. For the
early 21st century, ‘climate change’ is a key issue that dominates politics, economics
and education and is reflected in the Earth Systems model of teaching science. King
(2007) has provided a scheme to analyse the solid earth component of typical Earth
Science courses including Earth Systems (See Table 3.1 and Chapter 9).
Nearly three decades later since ESS was promoted (Earth System Science
Committee, 1988; Johnson, 2006), ESS has matured somewhat to become an
important consideration and inclusion in science curriculum reforms such as in

47
New Zealand (See Chapter 9) and in many other countries.
“Teaching and learning of Earth System Science in which state, process and understanding are represented as inseparable elements whether for breadth, depth or their combination is ideal for learning science in the classroom.” (Johnson (2006). p. 208). Well, perhaps?
Table 3.1. Comparison of System Earth Project content (Germany) with common Geological Science content.
German System Earth Project
(After Hlawatsch & Bayreuber, 2006)
8 Element Content Scheme
for Common Geological Science
(After King, 2007, pers.com)
The rock cycle: documents of the Earth’s history.
Geological time.
Origin and development of life. Evolution of life.
None Earth materials.
Convection in the atmosphere, hydrosphere and lithosphere.
Earth Energy.
System Earth – an introduction.
The Carbon Cycle.
Climate and history of climate change.
Chemistry and physics of the atmosphere.
Plate tectonics and volcanism.
Earth as interacting systems (environmentalism/sustainability)
None Natural Hazards.
Resources and recycling.
The water cycle and the protection of drinking water.
Earth resources and environment.
Earthquakes and wave energy.
Earth’s interior.
Investigating the Earth.
These Earth System Project topics (www.isb.bayern.de/isb/download.asp.)
introduced into the German curriculum (Fachlerplan fuer Erdkunde) has built on the
traditional discipline of geography to develop an integrated science framework for
geoscience education across all levels of schools with a CD ROM made available.
However, geological science is a vast discipline and cannot be easily fitted into
already overcrowded curricula especially where there has been no tradition of having
been so and remains limited in the System Erde Project. The ability to ‘wedge’
geological science into science curricula via environmentalism (as in the New South
Wales (Australia) curriculum) is a significant barrier to improving the place and role

48
of geological science in global curricula reforms. What do you put in and what do
you leave out and why? What should students leave school knowing about geological
science? As for teacher training in the geosciences, Lewis (2008) poses the question
“How much college-level geoscience content is enough to provide a secondary
teacher with a conceptual framework and a sense of the nature of geoscience”?
Earth Systems Science (ESS) Traditional Geology (TG)
(Interactive connections) (Analytical and reductive)
Figure 3.1. Comparison of Earth Systems Science with traditional Geology
These topics also reveal an important conceptual change in Geoscience (and Science)
curriculum thinking from the earlier and traditional ‘nuts and bolts’ constructivist
notions of Earth composition, structure and processes, to interacting ‘systems’
thinking with people and social issues at the centre. For the Earth System Project,
studying geological time and history seems to be the trade off for the inclusion of
environmentalism (http://www.systemerde.ipn.uni-kiel.de/materialien_Sek2_2.html).
Germany rarely experiences volcanic eruptions, earthquakes and tsunamis which are
common place on the Pacific rim.
Earth Systems Science demands considerable conceptual integration and an ability to
perceive connections from diverse scientific disciplines. Indeed, this prerequisite
ability indicates a crucial catch 22 aspect of learning about complex systems such as
Earth systems. How can one understand system connections and interactions (e.g.
between the biosphere and the Geosphere) without initial conceptual construction of
Lithosphere
Biosphere
Atmosphere
Hydrosphere
People and environment
Geology
History
Resources
Structure Materials

49
system components before conceptualising system interactions? Conceptually, ESS
curricula look at interrelationships of natural phenomena with people and
environmentalism as the context, whereas traditional geology curricula focus on
components. ESS reveals the current curriculum socialisation of Science as a subject
of learning rather than just the ‘Science’. It is also less constructivist than traditional
courses in the sense that it focuses on system interactions rather than ‘scaffolding’
understanding of the scientific component concepts making up the systems.
When compared to a traditional geology curriculum such as the Pan Canadian Earth
Science curriculum for grades 11-12 (age 16-18 years), the differences between an
ESS philosophy and a constructivist (‘bottom up’ component) philosophy is clear.
Traditional geology approaches include more on component knowledge such as the
Earth’s interior, rock and mineral classification and geological history rather than on
interacting cycles and systems on which humans depend. ESS reflects the increased
‘socialisation’ values of Science curricula and addresses the common call to the
question: ‘how is Science useful to society’? It is the job of teachers to translate these
knowledge expectations into manageable and meaningful chunks of learning that are
pitched at the cognitive level of the average student.
Ben-Zvi-Assaraf and Orion (2005; 2009) have explored the many issues surrounding
the conceptual development of student skills in systems thinking within the context
of the water cycle. They found that there were two major factors influencing systems
thinking skills development of students aged ten years:
(1) The students’ individual cognitive abilities and (2) their level of involvement in the knowledge integration activities during their inquiry-based learning both indoors and outdoors (Ben-Zvi & Orion, 2005, p.1).
How these two influencing factors vary with increasing age is a research question
worthy of consideration. “Level of involvement” is likely to vary with motivation
and intent. The ability to conceive and perceive interacting cycles within cycles and
webs within webs requires a complex and high order systems thinking skill that
develops with age. Kali et al. (2003b) in work related to student thinking about the
rock cycle also indicate student cognitive limitations in ability to integrate system
interactions. In the author’s 36 years of teaching ecology to students aged 16 to 19,

50
the inability to connect ecological systems appears to be a barrier to better
understanding of ecological system interactions. Ben Zvi and Orion have categorised
the characteristics of systems thinking and this is shown below. Systems’ thinking
has evolved from system dynamics and is essentially a learning construction of
understanding the linking of webs and chains. However, systems’ thinking has
evolved from industrial systems dynamics and is essentially a learning construction
of understanding the linking of webs and chains. However, in the Earth Sciences
these webs and chains are complexly interwoven and require higher order thinking
skills to make sense of geological phenomena and their interactions with other
natural systems such as the biosphere. The cognitive difficulty for each of Ben –
Zvi’s and Orion’s ‘rock’ cycle concept is based on the use of Bloom’s taxonomy
(Table 3.2) and rock cycle concept (Table 3.3).
Table 3.2. Typical characteristics of system thinking for rock cycle concept with
cognitive difficulty based on Bloom’s taxonomy (After Ben-Zvi & Orion, 2005).
Table 3.3. The rock cycle concept and Bloom’s taxonomy.
Ability of students to Identify:
Rock Cycle example Cognitive
level
Components Igneous, metamorphic and sedimentary rock classes. Low
Processes Weathering, erosion, transport, deposition, melting, crystallisation, lithification, metamorphism.
Medium
Relationships Transformation of rock classes High
Organisation Concept mapping High
Generalisations Rock cycle is dynamic and continuous High
Hidden dimensions Chemical and physical environments Very High
Cyclicity Geologic events and processes transform rock into different classes
Very High
Temporal thinking Link with geological time and past geological events.
Very High
As shown in Table 3.3, the rock cycle concept as a system requires an understanding
of the components and processes and how they work. Although these aspects
Bloom’s Taxonomic Descriptors Cognitive Level
Analytic, Evaluative, Creative Very High
Application High
Explanation and comprehension Medium
Descriptive and rote memory Low

51
constitute relatively low to medium level cognitive abilities, they are essential to
enable a construction of system interactions. In short, the components and processes
provide the knowledge base upon which everything else hangs. However, having
knowledge of the components of this system is a first construction for many students
which in itself, requires considerable literacy skills for 15 year olds despite being
designated a low cognitive level. Explanatory knowledge of components is likely to
be an important prerequisite for system interactions. Furthermore, it is likely that a
sophisticated understanding of system interactions does mean sophisticated
understanding of the components and process involved (Booth Sweeny, 2000). Table
3.4 identifies teaching and learning issues associated with geological time and a
systems thinking approach.
Table 3.4. Typical characteristics of system thinking for geological time with cognitive difficulty based on Bloom’s taxonomy (After Ben-Zvi & Orion, 2005).
Systems thinking also requires forward and backward thinking skills (positive and
negative feedback loops) which enable linkage of complex components in interacting
systems. Feedback loops require a very high cognitive level. Research by Gudovitch
Ability of students to Identify:
Geological History Cognitive level
Components Recognition of the fossil record, species identification, relative geologic time, absolute geologic time, correlation and Steno’s principles of superposition.
Low to medium
Processes Fossilisation, bedding structures, igneous intrusions, metamorphism.
Medium to high
Relationships Cross cutting relationships and sequential geological events.
High
Organisation Correlation diagrams. Mapping. High
Generalisations Understanding Earth’s history High
Hidden dimensions Perception of time, measurement of ‘deep time’, plate tectonic mechanisms for change through time.
Very High
Cyclicity Uniformitarianism and catastrophism. Very High
Temporal thinking Link with current geological processes. Very High

52
(1997) and Kali et al. (2003) indicate that important learning steps (construction
scaffolding) are needed for students to establish and construct adequate notions of
system interactions and connections for understanding and application. Building a
student’s ability to ‘bootstrap’ their conceptual understandings of a scientific
explanation of the world is an ultimate goal of science education.
The suggested learning steps of Gudovitch and Kali (1997) include:
1. Knowledge of the Geosphere, hydrosphere, biosphere and atmosphere
Earth Systems.
2. Awareness of interactions between systems.
3. Knowledge and understanding of specific process mechanisms
4. Understanding of reciprocal component mechanisms
5. Overall systems perceptions.
It is hardly surprising that Kali et al. (2003) suggested that understanding and
applying systems thinking are needed to ‘solve’ environmental issues in connection
with earth systems, for example, requiring students to have a high cognitive level of
operation. However, this is unlikely to happen with most students aged 13 to 18
years. In short, a student’s ability to achieve meaningful connections between
component interactions and between different systems, webs and chains is of a high
thinking order that perhaps few high school students are able to achieve. Maybe this
is why many high school biology students at age 16-18 years have difficulty fully
understanding ecological interactions: teaching system interactions is not part of
what is taught. This situation may severely limit the implementation of the goals of
Earth Systems Science. However, Ben–Zvi and Orion (2005) suggest that high
school students are able to cope with systems thinking, but how well, is determined
by complex factors of cognitive barriers and teaching deliveries with established
connections to fieldwork and learning outside the classroom (LEOTC), and also
content-based teaching such as that promoted by Csapo (1999). Individuals
understand different parts of system interactions with varying levels of success but
teaching it is another issue and has constraint implications for teacher training and
resources. Talking about ‘systems’ is one thing but teaching and understanding them
in their scientific context is quite another. Mixing social science in terms of socio-
scientific issues with ‘science’ is fraught with boundary difficulties (Sadler, 2004).

53
There is much research still to be done on investigating the cognitive and
conceptual abilities of teenagers (and undergraduates) in their understandings
of systems thinking and on investigating the place of Earth Systems Science in
Science curricula and the ability of students to learn and apply systems thinking
principles to Geoscience. As Sibley et al. (2007) point out in their exploration of the
use of box diagrams to test student understanding and conceptual awareness of cyclic
interactions within the water, carbon and rock cycles, students need to have
knowledge of a systems ‘jig–saw’ components in order to understand or put together
the whole picture. In other words, students often fail to perceive the transformative
process connections that systems are constructed of and focus on the components
without making the connections. Connecting the chains to the webs and then the
systems is a difficult task for most students of University freshman and sophomore
age (18 to 21 years). Box diagrams are essentially directing templates for students to
demonstrate their understanding of system component connections. Also, using box
diagrams may heave inherent bias (such as filling in a clockwise manner as reported
by Sibley et al.) as well as students perhaps requiring prior training in using these
boxes. Furthermore, expected connections would need to be ‘customised’ for
different age of students as high school students are unlikely to be able to connect
sophisticated chemical componentry to systems. The concept of a ‘geological
reservoir’ may be beyond the cognitive ability of average 15 year olds. If, in Sibley
et al.’s analysis, most students at age 18 to 21years focus on components, rather than
processes, then students aged 15 are likely to struggle with knowing the basic
components yet alone system process interactions interpretations and explanations.
Implementing well resourced ESS successfully in junior high school and high school
(age 11 to 18 years) curricula may therefore demand too much of a cognitive leap
and much research needs to be done to establish exactly what typical high school
students of age 15 to 18 years are able to achieve.
According to Libarkin et al. (2006) ESS requires students to first understand the
processes involved in a system such as in the rock cycle, and that this understanding
is controlled by individuals’ ontological points of view. The ontological categories
(and cognitive abilities) held by students determines the degree of conceptual change
(and hence system interactions) that students can achieve. This study by Libarkin et

54
al. describes and confirms the cognitive and ontological barriers that need to be
addressed if ESS is to be used for teaching geoscience and environmental
interactions in a systems context. This was the original intention, as derived from
NASA (1988) and Ireton et al. (1997) where ‘Science’ was taught in a systems
context, and later developed for social/environmental/science values purposes
(Mayer, 1995; 1997; Mayer, Fortner & Kumano 1999).
As Libarkin et al. (2005) point out, learning in ESS depends on students’ being able
to understand processes and that this is controlled by an individual’s ontology.
Sustainable change of ontological student views is the challenge of conceptual
change. Ontological misconceptions compete with scientific conceptions for
dominance. In particular, ”constraint based interactions” (CBI) (Chi, 1994) is an
ontological category relevant to systems thinking. For the geosciences, conceptual
links that are ontologically fixed, between Libarkin’s et al. (2005a) ‘matter’ or
component (e.g. mineral properties) and ‘process’ or evolution of explanations (e.g.
crystallisation) are crucial for understanding, for example, aspects of the rock cycle.
The rock cycle is fundamental to lithosphere system interactions and, in turn, links to
all other ‘Earth systems’. Libarkin et al. (2005) used a hierarchical taxonomy of
ontologies (Figure 3.2) to investigate student conceptions of fossils. In effect these
authors found that this taxonomy requires considerable formalisation of cognitive
abilities for students to grasp. Conceptualising systems is a complex matter. In any
event, Libarkin et al. (2005) indicate that generally, undergraduate college-age
students are conceptually at levels 1 and 2 (Figure 3.2). This implies that student
ontological views need to be seriously addressed before specific topic teaching takes
place.
Only one student out of the 61 interviewed for this study was found to sit at a
Process level ontologically, indicating that students may not be ready for ESS
instruction at the start of an introductory course. (Libarkin et al. 2006, p.6)
For younger students aged 13 to 15 years, many are likely to be at ontological level 1
and these students in particular are likely to benefit from geological fieldwork with
specific and well-structured topic instruction. Building on the work of others (Orion
1993; Orion & Hofstein 1994; McLoughlin, (2004)), Elkins & Elkins (2007) showed

55
that field-based courses also positively influenced geoscience concept learning for
first year university geology students. Once beyond the ‘novelty of the learning
environment’ (socially and physically), students improve their connectivity with
geological concepts. There is little doubt that social and place novelty along with
contact hours in the field are significant (and testable) variables in achieving
understanding of geoscience concepts such as stratigraphy and geological structures.
However, the challenge is to plan and prepare well-connected field experiences for
specific geological phenomena. Here, the selective use of Libarkin and Anderson’s
Geoscience Concept Inventory (GCI) is a useful conceptual ‘pre-test’ starting point
in measuring changes in geoscience conceptual understanding as a result of field-
based experiences.
Figure 3.2. A hierarchical taxonomy of ontologies (After Libarkin et al., 2005)
Learning geology from fieldwork is more likely to be successful when students
actually do the ‘dip and strike’ measurements or ‘dig the fossils out’ or collect rock
samples and make the conceptual connections for themselves (from clear objectives),
rather than by being shown, lectured and asked impossible questions at outcrops
from a bus window in a howling wind. Making scalar connection with the ‘real
world’ may be the key factor in developing geological skills.
Level 5 (high)
Level 4 Level 3 Level 2 Level 1
(Low)
Systems
Full Processing
Partially Explanatory
Transformative
Mechanisms
Material
(Components)

56
Briefly, in England and Wales, there has always been a tension between geography
as the ‘home’ of the geological sciences, with topics including earthquakes and plate
tectonics, and Science, with topics such as rocks, minerals, weathering and the rock
cycle. Geography ‘socialises’ geological science in the sense that easily observed
surface features and how people interact with these features becomes a focal point.
The main tension between geography and Earth Science as vehicles for teaching
solid earth, geological science is the focus on social aspects in geography rather than
the scientific aspects. In England, recent curriculum reforms for key stage 4 for 14 to
16 year olds (King, pers. com.) suggest that a new course in Earth and Environmental
Science may be a way of including geological science as an integrator for
environmental science in a similar way that ESS has been developed. It is also
suggested that environmental science is within a geological time and biological
context. This is a similar approach to the Australian Earth Science curriculum
reforms of 1997 to 2002 (Hafner, 2003) after the collapse of geological science in the
Australian science curriculum and represents a variant of ESS thinking. Australian
earth and environmental science courses are available for students aged 16 to 18
years with contributing earlier courses delivered via the Science programme. The
Years 7-10 geological science contains the same topic content as the stage 6 higher
school certificate course in New South Wales.
The development of the Australian Earth and Environmental Science course for
senior high school students is an attempt to integrate geological science with systems
and cyclic thinking within an environmental context. Understanding the environment
and how people interact within it is the main reason for studying geological
phenomena rather than investigating the science of geology per se. A rationale for
Earth and Environmental Science has been provided by the New South Wales Board
of Studies and is quoted below.
“Earth and Environmental Science in Stage 6 Science is the study of the Earth and
its processes. The course aims to provide an understanding of systems and
processes in both aquatic and terrestrial environments. It seeks to explore changes
that have occurred during Earth’s history, including changes in the lithosphere,
atmosphere, hydrosphere, cryosphere and biosphere, and the evolution of
organisms since the origin of life on Earth.

57
“The study of planet Earth and its environments recognises that while humans are
part of nature they continue to have a greater influence on the environment than
any other species. Earth and Environmental Science is built on the premise that the
natural environment is the host to all local environments and that, therefore, an
understanding of the natural environment is fundamental to any analysis of more
specific local environments”. (Earth and Environmental Studies, Board of Studies,
New South Wales, Australia. p. 6)
Table 3.5 summarises the essential content of the Australian Earth and
Environmental Science course within the framework used by King (2007) for
geological science (geology) content that is common in geological science courses
throughout the world (Given the current state of knowledge). In this scheme, King
(2007) acknowledges the difficulty and debateability of assigning content knowledge
and concepts to a generalised scheme. However, the intent of this scheme is to find
overall patterns and connections for curriculum content inclusion of essential solid
earth geological science concepts within the frameworks of different countries
science curricula. The elements which make up this “8 element common content
scheme” are also shown in Table 2.5.
For New South Wales in Australia, the Earth and Environmental Higher School
Certificate course (HSC) requires 240 hours of tuition (New South Wales Board of
Studies, 2002) over a two year period. There are three core modules and one of four
options, so it is still possible for many students to miss out on key aspects of
geological science such as ‘geological time’, the fossil record and evolution. The
Earth and Environmental Science course appears to be structured for students
entering the workplace as well as for those wishing to further their studies (See page
7 of the stage 6 New South Wales syllabus).

58
Table 3.5. A selected analysis of the Australian (NSW) Earth and Environmental Science curriculum and Geology
2007 Australian Earth and Environmental Science
(Stage 6, HSC, ages 16-18)
‘8 Element Common Content Scheme’
for Geological Science
(After King, 2007)
* The evidence provided by geological records suggests that there have been climatic variations over Earth’s history. * Outline the main stages involved in the growth of the Australian continent over geological time as a result of plate tectonic processes. * Identify that geological time is divided into eons on the basis of fossil evidence of different life forms.
* Gather and analyse information from a geological time scale and secondary sources to identify and date the major evolutionary advances made by plants and animals.
* Gather information from secondary sources and use available evidence to identify the relationship between mass extinctions and the divisions of the geological time scale
Geological Time
* Compare uses of relative and absolute dating methods in determining sequences in the evolution of life forms.
* The Cambrian event.
Evolution of life
* Describe the relationship between the density of Earth materials and the layered structure of the Earth.
* Define fossil fuels as ‘useful organic-matter-derived Earth materials’
Earth materials
* The properties of economically important Earth materials formed from organic material (fossil fuels).
* The search for alternative sources of fuels.
* Describe the four types of mass motions of water: surface currents, deep circulation, tides, tsunamis, and identify the energy source for each.
Earth Energy
* Interacting subsystems of the Earth that together produce a unique biome.
* The course aims to provide an understanding of systems and processes in both aquatic and terrestrial environments.
Earth as a System
* Natural disasters are often associated with tectonic activity and environmental conditions caused by this activity may contribute to the problems experienced by people.
Natural Hazards
* Identifies the origins of Earth’s resources evaluates the use of the Earth’s resource describes and locates available resources in
* Australian environments and evaluates the impact of resource utilisation on the Australian environment. Australian resources and biotic impacts on the environment.
Resources and Environment
* P2 applies the processes that are used to test and validate models, theories and laws of science with particular emphasis on first-hand investigations in Earth and Environmental Science.
Investigating the Earth

59
It seems then that although the New South Wales experience of developing Earth
Science curriculum for senior high school students is cognisant of systems thinking,
this is not the primary reason for studying geological science. There is a broad
coverage of geological science principles and content and there is importantly,
coverage of geological time and evolution within the geological context, but the
curriculum is also clearly related to the New South Wales environment and the
impact of humans upon this environment. The Australian curriculum has a
preliminary course (containing prerequisite content from earlier years, ages 13-15
years), and the HSC. The assessment tasks for this curriculum, like New Zealand to
some extent, are based on Bloom’s taxonomy of cognitive ability and are non-
ranking.
It is noteworthy that ESS and recently reformed Science curricula (e.g. in New
Zealand) attempt to increase the ‘socialisation’ of Science by reference to human
interaction with the environment. Indeed, modern catchwords are ‘social
sustainability’, ‘numeracy’, literacy’, climate change’ and ‘environmental’. Does this
represent a politicisation of curricula or educational advancement? With the
inclusion of environmentalism as a focal point in ESS, the ‘Science’ necessarily
(arguably) becomes diluted and indicates an example of the way in which curricula
become overcrowded. It is unfortunate that altering curricula is unlikely to change
student conceptual ontologies about science. However, this is a question worth
investigating. Sustainable and scientifically meaningful conceptual change is clearly
more complicated than altering a single variable! Geological science does not have
its own place in the curriculum for England and Wales. All students between the ages
of 5 and 16 years in England and Wales are required to follow a national curriculum.
3.3 An Evolving ‘Traditional’ Geology Approach: The Canadian Experience
When the Canadian Earth Science curriculum for senior high school students is
investigated within the same ‘common content of geological science scheme’ (after
King, 2007), it is clear (and disappointing) that along with natural hazards, the two
key concepts of geological time and evolution of life are absent. Table 3.6
summarises the key elements of the Canadian high school Earth Science content.

60
Table 3.6. The pan-Canadian Grades 11-12 Earth Science knowledge requirements (www.cmec.ca/science/framework/)
Pan Canadian Earth Science
(Grades 11-12 , ages 16-18)
‘8 Element Common Content Scheme’ for
Geological Science
(After King, 2007, pers.com)
None Geological time
None Evolution of life
330-2. Classify rocks according to their structure, chemical composition and method of formation
Earth materials
332-1. Analyse energy and matter transfer in the water cycle.
Earth Energy
330-5. Describe the composition and structure of the atmosphere.
330-6. Describe the dominant factors that produce seasonal weather phenomena.
332-1. Describe interactions of components of the hydrosphere, including the cryosphere.
332-3. Describe major interactions among the hydrosphere, lithosphere, and atmosphere.
Earth as a System
None Natural Hazards
330-4. Analyse the interactions between the atmosphere and human activities.
Resources and Environment
330-1. Describe theories and evaluate the limits of our understanding of Earth's internal structure.
Investigating the Earth
The Canadian curriculum indicates a mixture of ‘traditional’ geology content
(Earth’s interior and rock classification), with aspects of ‘modernist’ Earth systems
science in the form of describing interactions between the hydrosphere (Ocean)
lithosphere (Rocks) and the atmosphere (Gas). Like the Australian curriculum, the
senior content is built on similar content taught at the junior level. As with many
‘revised’ geoscience curricula, Earth Systems concepts are clearly enunciated and
indeed form a significant part of ensuring geological concepts are delivered in a
curriculum through integration with environmentalism. For a high latitude country
like Canada, understanding the ‘cryosphere’ as continental ice sheets is important
and illustrates the importance of local natural environments to people.

61
3.4 International Comparisons
In an attempt to find general similarities in the geology content included in different
countries Earth Science curricula, multivariance cluster analysis (Kovach, 2003) was
performed for country wide data displayed in Table 3.7 and expressed as a
dendrogram (Figure 3.3).
Table 3.7. Inclusion of the ‘8 Geological Science Commonalities’ as represented in different countries Earth Science curricula (IGEO 2002 database)
‘8 Element Common Content
Scheme’ for Geological
Science (After King,
2007)
US
A
Scotlan
d
Taiw
an
Japan
Sou
th K
orea
New
Zealan
d
Israel
Au
stralia
Sou
th A
frica
Can
ada (age 16-18)
Germ
any
En
gland
Mode
Geol. Time 1 0 1 1 0 0 0 2 0 0 0 0 0
Evolution 1 1 1 2 1 0 1 1 1 0 0 1 1
Energy 1 1 1 2 3 2 1 1 1 1 1 1 1
Materials 1 1 1 1 1 0 1 1 1 1 1 1 1
Systems 1 1 0 1 1 1 1 1 0 1 1 1 1
Hazards 3 1 1 1 1 1 1 2 0 0 0 1 1
Resources 3 1 1 1 1 0 0 1 1 1 0 1 1
Investigation 3 1 1 2 1 0 0 1 1 1 0 1 1
Key: None = 0 Yes = 1 Partial = 2 Unknown = 3

62
Figure 3.3. Country cluster dendrogram analysis for Table 2.7.
As shown in Figure 3.3, there are three clusters of countries with similar geological
science content inclusion in their Earth Science curricula. Geological content is
based on King’s (2007) generalised “8 geology scheme” for geological content for
each country’s Earth Science curriculum. These clusters are shaded. The geological
content included in Earth Science curricula is shown in Table 2.7. Country cluster C
appears to be subdivided into two smaller clusters of equal similarity in terms of
geology content inclusion. Cluster B would indicate that although Germany is in this
cluster the geology content is a little different. Differences are likely to be reflected
in each country’s focus or emphasis on particular geological aspects that are unique
to them. For example, in Germany there are few active geological (solid earth)
hazards such as earthquakes and active volcanism so this is not included in Earth
Science curricula.
Figure 3.4 presents a dendrogram again derived from King (2007), but clusters the
percentage of statements relating to ‘geology’ as the solid earth component within
Science curricula for each country. The challenge is to increase the data available for
more countries.
Country Clusters for Similarity of GeologyContent
Minimum Varaiance: Squared Euclidean - Data log(e) transformed
S KoreaScotlandEnglandIsraelNZS AfricaCanadaGermanyAustraliaTaiwanJapanUSA
4.8 4 3.2 2.4 1.6 0.8 0
C
A
B

63
Figure 3.4. Cluster analysis of percentages of statements about Geology in different
countries Science curricula. (Data derived from King, 2007).
An interpretation of the dendrogram in Figure 3.4 would suggest that of the four
country clusters, Israel is separated by its emphasis on topics such as systems,
materials and evolution of life. This is a significantly different geology content
emphasis to other countries (See Table 3.7). Indeed, 77% of geology statements in
the Israeli curriculum are focused on systems and materials. It is clear that the
inclusion of the American-lead ESS in particular, since the mid 1990’s on Earth
Science curricula, has been significant with the Israeli curriculum registering four
times the percentage of statements in their science curriculum than that of the USA
national standard statements and two times that of the Earth Systems Science
curriculum. A key element of the Israeli curriculum is about teaching the
understanding of system interactions and environmentalism in a country dependent
on water for survival. Teaching systems such as the water cycle and the rock cycle
not only enables more efficient means of teaching concepts involved in the nature of
science (Orion, 2005) but also enables learning of key geological processes and
phenomena.
Country Clusters for Similarity of GeologyContent
Minimum Variance: Squared Euclidean - Data log(e) transformed
USA Nat stdEnglandJapanScotlandUSA ESSS. AfricaTaiwanIsrael
24 20 16 12 8 4 0

64
Table 3.8 Percentage of statements in Science curricula relating to geological science components (After King, (2007)
Country
Geology Components
New
Z
ealand
US
A E
SS
US
A N
at’l S
td’s
Israel
Japan
Scotland
S. A
frica
Taiw
an
Suggested
for England
Averag
e
Materials 4 10 10 33 26 25 23 18 23 19%
Resources 0 17 29 0 17 8 23 36 13 18%
Systems 67 21 10 44 9 33 0 0 17 22%
Investigation 33 34 5 0 13 8 15 3 23 15%
Energy 25 7 5 0 9 8 38 18 3 13%
Evolution 0 7 19 11 9 8 8 3 7 9%
Hazards 17 0 14 11 9 8 0 18 7 9%
Geol. Time 0 3 10 0 9 0 0 3 7 4%
Of ‘traditional’ geological content, earth materials and resources remain the most
important, together making up an average of 39% of curriculum statements in Earth
Science. Although the national US standards are reasonably well balanced for
content, the standards remain a recommendation for curricula rather than actual. As
might be expected from an economic point of view, the South African curriculum
focuses on materials, resources and energy. Energy issues are by far the most
important not only within the curriculum but also across country curricula. Similar
‘economic’ arguments can be advanced for Taiwan, where the focus is on resources,
hazards and materials. It is important to point out that the “8 element scheme” used
for analysis does not specifically include aspects such as geological structures and
spatialisation, but are implicated in topics such as geological hazards and materials.
The inclusion and growth of ‘Earth Systems’ into curricula since the mid 1990’s is
significant with New Zealand’s 2010 revised curriculum being of particular note.
From the author’s perspective, the most disappointing aspect of this analysis is the
diminution of the single most important topic that geology brings to a scientific
literacy: geological time. It remains the least mentioned topic in curricula yet is
educationally significant for all sciences. As mentioned elsewhere, nothing in the
Sciences makes a lot of sense without the framework of geological time. The low

65
status of geological time as an aspect of earth science is illustrated in Figure 3.5
dendrogram, where clustering analysis was performed for 13 countries. A similar
analysis was carried out for King’s data on seven countries and is shown in Figure
3.6.
Figure 3.5. Geology: content clusters for Table 3.8
Figure 3.6 Geology: country clusters for Table 3.8
Country Clusters for Geology Components
Minimum Variance: Squared Euclidian -Data log (e) transformed
USA Japan ScotlandNew ZealandTaiwan South KoreaSouth AfricaIsrael AustraliaCanadaGermanyEngland
60 50 40 30 20 10 0
Geology Content in Earth ScienceCurricula
Minimum Variance: Squared Euclidean - Data log(e)transformed
InvestigationResourcesGeol. TimeEnergyMaterialsSystemsEvolutionHazards
3 2.5 2 1.5 1 0.5 0

66
Both dendrograms illustrate the low status of geological time as a topic for Earth
Science curricula. However, for King’s data, geological time is clustered with
geological hazards, both of which are closely related by making up the least
mentioned topics in curricula statements in King’s database.
3.5 The 2002 IGEO International Survey: Summary
A précised selection of key school and university Earth Science research questions
from the 2002 IGEO survey are shown in Figure 3.7 (Dowse, 2004). Although US-
oriented, the questions are designed (with varying interpretation problems) for an
international audience to gain some insight into the status of geoscience education at
a global level. Solutions for difficulties in geoscience education can come only after
information gathering.
A SCIENCE EDUCATION STANDARDS
1. Does your country have defined national Earth science education standards?
2. Do local school districts or other political subdivisions have defined earth science
education standards of learning?
3. Are there system deficiencies that make the implementation of established science
standards difficult or impossible? (For example, lack of teacher training or
qualifications, lack of funds to support development of materials and purchase of
supplies, lack of qualified teacher trainers, some level of system disinterest, etc.)
4. Are there local, regional or national tests, which provide baseline information on
student learning in the Earth sciences? If so, are these tests required and how are
the resulting test data used? If there are many varieties of local, regional or national
tests, give an overview of these tests rather than a test-by-test evaluation.
B PROGNOSIS FOR THE FUTURE:
1. What do you see as the major problems facing geoscience education in your
country?
2. What changes do you expect to see in the next three years?
3. What specific support could the global geoscience community provide to facilitate
geoscience education in your country?
Figure 3.7. Selected 2002 IGEO survey questions

67
3.6 Are There National Standards? A Discussion
Although a relatively small dataset (16 countries), the sample is from a diverse range
in terms of culture, socio-economics and educational history. However, in essence,
European colonialism of the late eighteenth and early nineteenth century has left its
mark and remains the most powerful influence on many school curricula. In
particular British colonial attitudes towards education appear to have had an
important influence, often to the extent, that in New Zealand for example,
examination papers were written in England and student papers were sent to and
marked in England up until the 1930’s (Grant, 2003). It is only in recent times that
much more attention has being given to first nation values for inclusive enrichment
of curricula (Freeman, 2007; Riggs, 2004; Riggs, 2003; Semken, 2007). In essence,
research by these authors confirms the fundamental importance of people’s cultural
connections to the land (place-based concepts) and points the way to the
development of meaningful learning of geological science concepts to the land that is
likely to be hard-wired into the brain. As Freeman (2007, p.1) points out, “Place –
based teaching methods in geoscience merit further study at the undergraduate and
graduate level”. The power of placed–based learning is constructed learning
connection between culture, history and traditions within a modern geoscience
process context. In New Zealand, the indigenous Maōri population has finely tuned
religious, political, social and cultural connections to the land and learning rewards
may be achieved through developing a curriculum for school students around this
concept. Understanding placed–based cultural and physical environmental roots can
be a powerful motivator to make sense of a scientific geological history in a modern
cultural context.
So, are there national standards for geoscience education across different countries?
Table 3.9 indicates that the answer is a qualified yes (often depending on the
implemented definition of ‘standard’), with 69% of this sample in the affirmative.
Standards may define the curriculum but in some countries such as New Zealand,
‘standards’ are also used as national assessment standards and are derived from
national curriculum statements. This situation generates a tension between standards
as statements of subject-content intent and statements of curriculum for national
assessment qualifications. New Zealand curriculum statements are framed as

68
achievement aims and achievement objectives with specific learning objectives
(SLO’s) the equivalent of a ‘syllabus’. However, in the 2007 reviewed curriculum,
SLO’s are not defined and are left to teachers to construct. This is an area of political
division and concern. It is unfortunate that in the IGEO survey of 2002 (and 2006),
‘standards’ are not defined (Dowse, 2002). However, in large state-wide countries
such as the USA and Australia, standards are not compulsory because compulsion
may be perceived to be counter to state wishes and a threat to state control and
autonomy. As a consequence, standards appear to be strong recommendations for
educational ideals and consistencies rather than directives. Having national standards
available does not necessarily mean they are implemented. Smaller countries such as
New Zealand, Wales, Scotland and Israel could be considered city states, and as
such, it makes sense for these countries to have national (and manageable)
curriculum standards for teaching, learning and assessment.
Table 3.9. Question A.1. Summary: Are there national Earth Science standards?
Country Yes No Response Summary
Argentina Y Details not provided
Australia Y Assessment is state controlled.
Bangladesh Y Specific ES curricula but mostly part of geography.
Brazil N No specific ES curricula but part of natural sciences and geography
Canada N Education is a provincial responsibility
Indonesia N Partially. Have national standards in ‘geographical science’.
Israel Y But not phrased in a ‘standards form’. Specific to elementary, junior high & high school.
South Korea Y For all elementary and secondary schools.
Mozambique N Earth Science syllabus not included in curricula at any level. Geography dominates.
New Zealand Y As part of the national science curriculum years 1-13 and assessed by standard criteria from age 15 to 19.
Norway Y For grades 1, 5 and 8.
Philippines Y As part of the Science learning Competencies.
South Africa N 1996 revisions never implemented. 2000 revisions placed ES in geography.
Taiwan (ROC)
Y ES standards specifically for grades 9 and 10.
UK/.Wales Y Limited 7% ES 11-16 year olds. PhysICAL geography a key element.
USA Y Nat Science Standards adopted in 1996 but not compulsory.
% (N =16) 69 31

69
3.7 U.S.A. and New Zealand Geoscience Curricula: A comparison
New Zealand and the U.S.A are hugely different in demography and culture, but
share some common ancestry in educational evolution. Both countries derive a
western educational philosophy from a variable but essentially British colonial origin
and in the US in particular (Ireton, 2003), the National Education Associations
(NEA) Committee of Ten recommendations in 1894 introduced Science into schools
with geoscience (as in NZ), in the form of physical geography.
Tables 3.10 and 3.11 compare the New Zealand revised and gazetted (November,
2007) Geoscience curriculum and the USA national standards for equivalent student
age groups (US grades 9-12 and NZ Years 9-13 = age 14 to 18 years). The
commonalities in concept/content are recorded in red. A quick word search indicates
that in the US standards there is an emphasis on energy and atmosphere. Perhaps this
reflects a continents’ preoccupation with maintenance of status and the need for
energy to fuel an economy as well as a perceived educational need to relate the
extraction and use of energy with its impact on major issues such as global climate
change? The New Zealand geoscience curriculum focuses on Earth systems in terms
of composition, structure, process, natural hazards and human activities.
Investigation of “interacting systems” focuses on heat distribution and the cycling of
carbon. To be clear, the November 2007 New Zealand curriculum is to be fully
implemented into classrooms in 2010 and this will include updated and aligned
assessment standards of which the geoscience strand will involve the greatest change
(See Chapter 9 for a detailed postscript on science curriculum reforms). The current
1994 New Zealand curriculum and assessment standards will remain in place until
2011 and a major pedagogic challenge awaits the implementation of “how to teach
the complex chemical, geological and biological systems interactions for NZ Year
11, 15 year old students.

70
Table 3.10. The New Zealand Geoscience curriculum content (Ministry of Education, 2007 - 2010).
Note: CL = Curriculum level. .AO = Achievement Objective. Red = common
curriculum content intent with US curriculum standards.
CL Earth Systems Interacting Systems Astronomy
L5 Age
13/14
Investigate the composition, structure, and features of the geosphere, hydrosphere, and atmosphere.
Investigate how heat from the Sun, the Earth, and human activities is distributed around Earth by the geosphere, hydrosphere, and atmosphere
Investigate the conditions on the planets and their moons, and the factors affecting them
L6 Age
15/16
Investigate the external and internal processes that shape and change the surface features of New Zealand.
Develop an understanding of how the geosphere, hydrosphere, atmosphere, and biosphere interact to cycle carbon around Earth.
Investigate the interactions between the solar, lunar, and Earth cycles and the effect of these on Earth.
L7
Age 16/17
Develop an understanding of the causes of natural hazards and their interactions with human activity on Earth.
Explain the nature and life cycles of different types of stars in terms of energy changes and time.
L8
Age 17/18
Develop an in-depth understanding of the interrelationship between human activities and the geosphere, hydrosphere, atmosphere, and biosphere over time.
Explore recent astronomical events or discoveries, showing understanding of the concepts of distance and time.

71
Table 3.11. The United States national Geoscience curriculum content standards
Concept Content for grades 9-12
Energy in the Earth System
(Red = common to NZ curriculum intent at age 13/14)
Earth systems have internal and external sources of energy, both of which create heat. The sun is the major external source of energy. Two primary sources of internal energy are the decay of radioactive isotopes and the gravitational energy from the earth's original formation.
The outward transfer of earth's internal heat drives convection circulation in the mantle that propels the plates comprising earth's surface across the face of the globe.
Heating of earth's surface and atmosphere by the sun drives convection within the atmosphere and oceans, producing winds and ocean currents.
Global climate is determined by energy transfer from the sun at and near the earth's surface. This energy transfer is influenced by dynamic processes such as cloud cover and the earth's rotation, and static conditions such as the position of mountain ranges and oceans
Geochemical Cycles
(Red = common to NZ curriculum intent at age 15/16)
The earth is a system containing essentially a fixed amount of each stable chemical atom or element. Each element can exist in several different chemical reservoirs. Each element on earth moves among reservoirs in the solid earth, oceans, atmosphere, and organisms as part of geochemical cycles.
Movement of matter between reservoirs is driven by the earth's internal and external sources of energy. These movements are often accompanied by a change in the physical and chemical properties of the matter. Carbon, for example, occurs in carbonate rocks such as limestone, in the atmosphere as carbon dioxide gas, in water as dissolved carbon dioxide, and in all organisms as complex molecules that control the chemistry of life.
Origin and Evolution of the Earth System
(Red = common to NZ curriculum intent at age 15/16)
The sun, the earth, and the rest of the solar system formed from a nebular cloud of dust and gas 4.6 billion years ago. The early earth was very different from the planet we live on today.
Geologic time can be estimated by observing rock sequences and using fossils to correlate the sequences at various locations. Current methods include using the known decay rates of radioactive isotopes present in rocks to measure the time since the rock was formed.
Interactions among the solid earth, the oceans, the atmosphere, and organisms have resulted in the ongoing evolution of the earth system.
We can observe some changes such as earthquakes and volcanic eruptions on a human time scale, but many processes such as mountain
building and plate movements take place over hundreds of millions of years.
Evidence for one-celled forms of life--the bacteria--extends back more than 3.5 billion years. The evolution of life caused dramatic changes in the composition of the earth's atmosphere, which did not originally contain oxygen.
Origin and Evolution of the Universe
The origin of the universe remains one of the greatest questions in science. The "big bang" theory places the origin between 10 and 20 billion years ago, when the universe began in a hot dense state; according to this theory, the universe has been expanding ever since.
Early in the history of the universe, matter, primarily the light atoms hydrogen and helium, clumped together by gravitational attraction to form countless trillions of stars. Billions of galaxies, each of which is a gravitationally bound cluster of billions of stars, now form most of the visible mass in the universe.
Stars produce energy from nuclear reactions, primarily the fusion of hydrogen to form helium. These and other processes in stars have led to the formation of all the other elements.

72
The key difference between these two national curriculum standards (for student
ages 13 to 18 years) is that the 2007 NZ geoscience curriculum aims and objectives
do not overtly recognise the significance of geological time, the fossil record,
stratigraphy, and geological histories, and in particular, the connection of the
geosphere with the biosphere in terms of biological evolution. In a curious sense, the
defining elements of geological science (Geological time, stratigraphy, history and
the fossil record) are commonly reduced or absent in many other curricula as well
(See Table 3.9). The ‘unpicking’ of the NZ curriculum to define the intended
direction of the aims and objectives will have to wait until around 2010 before being
implemented into schools. It is interesting that the NZ 1969 Science syllabus clearly
recognised the importance of fossils as evidence of evolution, geological history and
geological processes (Department of Education., 1968).
Level 8 (Year 13) of the NZ Science curriculum recognises aspects of ‘time’ for
earth’s systems, but very few students (and schools) actually end up learning this
material (See Chapter 9 for details). The U.S.A. standards carry a degree of
‘unpicking’ and clearly indicate the importance of earth history, the evolution of life
and measurement of geological time. The NZ curriculum leads from general
composition, structure and features of the geosphere, atmosphere and hydrosphere at
ages 13-14 years to processes controlling surface features at age 15 and then to
looking at causes of natural hazards and human interactions over time. This leaves
little room for investigating the fossil record, geological history and geological
processes in a combined tuition time of around eighty to hundred hours in three
years. The emphasis is on interacting systems.
It is indeed an educational concern that the single most important contribution that
the geological sciences make to a scientific understanding of the Earth (Geological
time and history through stratigraphy and the fossil record) does not have a presence
in the 2007 level 1 Planet Earth strand of the NZ national Science curriculum. This
was recognised in the 1994 geoscience curriculum (See Chapter 9). The absence of
conceptual development of geological time and the fossil record in the NZ
curriculum inevitably impacts on a student’s conceptualisation of the origin and
evolution of life when studied in the biological sciences (Living World strand).

73
A significant problem with the national USA geoscience standards is achieving
consistent national implementation in an autonomous state wide federation, rather
than absence of the key elements of geological science. Measuring geological time,
biostratigraphic correlation and geological history is clearly indicated in the U.S.A
curriculum but not in the NZ curriculum. It is also unfortunate that King (2007) does
not clearly acknowledge and include the key geological elements of biostratigraphic
correlation, geological history and the fossil record in other country’s geoscience
curricula: the “eight elements” do not clearly cover these aspects. To reiterate, this
comparison is relevant only to students aged 13 to 18 years largely because these are
the years in which ‘high stakes’ national or state wide qualifications become
important to future student learning and careers. For the NZ curriculum, preparing
assessment standards (and tasks/exams) that are derived from the revised 2007
curriculum may provide a considerable pedagogical challenge. At curriculum level 6
for example, exactly what are student’s expected to know and understand about
system interactions for cycling carbon? There is a lack of research here.
The astronomy section of the NZ curriculum fares little better than the geological
science section in comparison to the U.S.A. curriculum. It is intriguing that the NZ
‘astronomy’ objectives do not include the origin and evolution of the universe but
focus instead on the nature of stars, features of planets and moons, spatial
relationships and astronomical events and discoveries. Indeed, the NZ astronomy
section at all levels makes no mention of a scientific understanding of the origin and
evolution of the universe.
3.8 International Geoscience Curricula Prognosis
Respondent perceptions that are considered to be significant barriers to the
development of geoscience content curricula (Dowse, 2002) are summarised in Table
2.12.

74
Table 3.12. Summary - Barriers to establishing Earth Science standards
Country Response Summary
Argentina Lack of trained and qualified teachers. Lack of resources. Insufficient time.
Australia Lack of trained and qualified teachers. Little money for upgrading qualifications.
Bangladesh Lack of money. Lack of trained and qualified teachers.
Brazil Low status and lack of Earth Science in curricula. Poor standard of students entering University.
Canada Lack of training. Little institutional support in junior and secondary schools.
Indonesia Overcrowded curricula. Lack of trained teachers. Lack of money. Lack of resources.
Israel Reluctance of teachers to make changes.
Japan Lack of money. Lack of resources. Systemic changes needed. ES now elective and integrated.
Korea Fear that the number of students (schools) offering ES will decrease.
Mozambique Lack of trained and qualified teachers. Out of date syllabus. Lack of money and resources
New
Zealand
Lack of trained and qualified teachers, resources. Low historical status of ES in curriculum.
Norway Lack of qualified teachers.
Philippines Lack of trained and qualified teachers. Out of date resources.
South Africa Lack of trained and qualified teachers, resources and money.
UK/Wales Lack of trained and qualified teachers. Poor resources. Negative teacher attitudes.
USA No response, but likely to be state socio/political barriers such as that involved with the teaching of the fossil record, geological time and biological evolution.
As presented in Table 3.12, the major barriers to development and implementation of
geoscience curricula are based around inadequate resourcing and lack of trained and
qualified geoscience teachers. Most ‘geologists’ will of course become geologists
rather than teachers. This is often coupled with historical curriculum development
issues in which geoscience has not been a significant part of curricula and perhaps
not currently considered of high enough status to warrant funding and integration
into science and/or geography courses. Indeed, the 2007 revision of the New Zealand
science curriculum for example indicates the influence of global environmental
issues and perceptions of what ‘expert’ panels consider being cognitively possible by

75
students and guided by the politics of the time (Pooley, 2005). This is shown by a
movement away from ‘nuts and bolts’ inductive constructivism of scientific concepts
and towards broad, transferable skills and ‘socialised science’ conceptual
development and for the geosciences, within an environmental Earth Systems:
“ ..Earth provides all the resources required to sustain life except
energy from the Sun, and that as humans, we act as guardians of these
finite resources”
And,
Students can then confront the issues facing our planet and make informed decisions about the protection and wise use of our Earth’s resource. (The NZ National Curriculum, 2007, p.28).
Globally, it is likely that geological science in schools (and universities) will
continue to struggle for survival within science curricula and undergo various
‘metamorphic’ changes that integrate topical and fashionable (local and global)
environmental issues and values. Lewis and Baker (2009) in their call for a new
research agenda for the Geoscience education loudly express the deep seated issues
of Geoscience education in the Unites States of America and elsewhere. They call for
action research and the use of multiple and mixed method educational research to
address the qualified teacher supply issue as well as asking for new directions in
pedagogy and geocognition.
A prophetic last word on the future of geoscience (and geological science) education
goes to David Thompson (1997).
Much will depend on the quality of the avenues of communication which
are opened and maintained by groups which have access to power and
finance and spare time to instigate, underpin, encourage and further
professionalise individual teachers, school departments and teacher
training institutions with their own national curriculum. (p. 173)

76
3.9 Chapter Summary
This chapter addresses research question 1: international geoscience curricula design
and implementation with particular case study reference to curricula in New Zealand.
There is little known about the formal status of geological science within an
individual country’s curriculum: there is a large variation in intent and
implementation. It is also surprisingly difficult to obtain reliable information largely
because of the many different locations and emphases of geological science in
curricula. This chapter focused on geological science curriculum content rather than
‘astronomy’ content. Many Science curricula also appear to be in a relatively
common state of revision and changes frequently occur which accommodate newer
foci such as ESS or ‘how the earth works’ or ‘environmental geology’. The IGEO
has attempted to survey the status of geological science curricula globally but this
remains a work in progress. Currently available information is outlined. This chapter
identified key issues involved with geological science curricula and discussed
similarities and differences between different countries.
The essential global problems facing geological science education within curriculum
frameworks appear to be:
1. Obtaining sufficient trained and qualified teachers of geological science
2. Providing adequate resources and funding
3. Generating increased conceptual value in teachers’ and politicians’
perceptions of the vitality of the geological sciences to enable an educated
population to make scientific links for informed decision-making about
how the earth works, what it is made of, its history and what people do to it.
4. How to integrate meaningful geological science content in already
overcrowded curricula in a time when science education internationally
searches for ways to be meaningfully assessable and relevant for young
people, especially those who do not extend their scientific literacy beyond
the age of sixteen.
5. Establishing and maintaining complementary cross curricula relationships
such as those between geography, environmental studies and biology.

77
Earth Systems Science as a teaching philosophy is discussed along with the issues
associated with systems thinking and cognitive development. Earth systems science
is successful at integrating environmentalism especially where fieldwork is well
established and integrated with course structures (Ben-Zvi-Assaraf & Orion, 2009).
However, this is largely at the expense of the essential tenets of geological science
such as geological time, the fossil record, earth materials and structure. ESS also
competes with geography and the social sciences in the many countries that share a
British colonial educational ancestry. A comparison of a small country (NZ) (See
Chapter 9 for details) with a national curriculum and qualification framework
system, and a large federal state country (U.S.A.) with largely state control and an
idealistic benchmark standards of content, illustrates key issues involved with the
implementation of geological science content. Although the problems are similar, the
scale and politics are hugely different. In essence, ESS sees the Earth as a context for
teaching Science and Environmentalism (including socio-scientific issues) rather
than geological science as a science.
It is unfortunate that the current (2009) NZ geological science curriculum content
does not recognise the key elements that make geological science so vital: time,
fossils, history, earth materials and structure. These scientific topics have been
removed from the previous curriculum largely on the grounds that students and
teachers are disinterested, that teachers lack resources and training, and that teaching
geological history is beyond the ability of students, and that the content failed to
generate motivated engagement. (Pollock, 2009). Lack of trained geoscientists,
inadequate infrastructure and lack of resources are important factors but secondary
school student diachronic geocognition of relative time and comprehension of
evidence for geological history (especially when combined with well managed and
appropriate fieldwork) is not. The only place where ‘time’ is involved in the NZ
geoscience curriculum is at level 8 (final secondary school year and aged 17/18
years), but very few students (and schools) study geological science at this level (See
Chapter 9 for details).
The current emphasis in the NZ curriculum for example is on processes, systems and
human interaction in terms of natural hazard impacts, but most other known
countries curricula recognise and teach the key geological science elements of

78
‘Deep-Time’, geological history, Earth materials and structure. It is unfortunate that
there is, as yet, inadequate curriculum information from central European countries,
South America and mainland Asia: time will tell. The 2010 IGEO conference in
Johannesburg may update our knowledge base. What should 16 to 18 year old
students leaving school know about geological science? According to the revised and
realigned Level 1 (age 15/16 years) New Zealand Science curriculum and the Planet
Earth and Beyond strand of 2010 (NZQA, 2009a), students should be able to
demonstrate an understanding of:
(a) The formation of surface features in the SW Pacific,
(http://www.tki.org.nz/e/community/ncea/docs/science1_13_int_sept09.doc)
This assessment standard involves internal effects of plate tectonic movement (as
scarily displayed by the September 4th 2010 ML 7.1 earthquake in Canterbury),
volcanism, mountain building processes and external processes of erosion and
weathering.
and
(b) The Carbon Cycle
(http://www.tki.org.nz/e/community/ncea/docs/science1_14_int_sept09.doc),
(NZQA, 2009b).
This assessment standard focuses on greenhouse gases, sequestering of carbon and
system interactions, acidification of oceans and global climate change.
Is this geological science, environmental science or geography? Is there more to
geological science and even general geoscience than this? If so, what content should
students leaving school know about and how is it included in already overcrowded
curricula where there are few qualified geoscientists and where there has been no
tradition of teaching? Will removing geological science from external examination
(See Chapter 9 postscript) be the final straw for learning about geology?

79
CHAPTER FOUR
ASPECTS OF CONCEPTUAL CHANGE
4.1 Introduction
“…a general recognition of the principles of punctuational change - leading us to
understand that learning generally proceeds through plateaus of breakthroughs,
and that important changes in our lives occur more often by rapid transition than
by gradual accretion - might provide some distinct service in our struggles to fulfil
the ancient and honorable Socratic injunction: know thyself.”
(Gould, 2002, p. 957).
This chapter addresses key theoretical conceptual change aspects of research
question 2: How do students aged between 12 and 40 years develop their conceptions
of evolution and the fossil record, geological time and 3-D geological structures? It
also briefly discusses evolutionary aspects of conceptual change theory from within a
geological science framework. Analysis of questionnaire findings of what
conceptions actually are for students is addressed in chapters 7, 8 and 10.
The ability to change our views of the world is surprisingly difficult because this
involves a memory and understanding of the past, an understanding of the
implications of the new and a willingness to take a risk. Perhaps that’s a reason why
people are so territorial and tribal - the risk of making changes has to be perceived to
be not only intelligible and understandable, but also be of a potentially greater
benefit than any current understanding. Making changes to a concept about
observable phenomena in the world is essentially a cost/benefit exercise. Is the devil
you think you know, better than the devil you don’t? Or does it really matter?
Conceptual change (CC) is about the way we all construct an understanding of the
world through time and is an historical record of shifting conceptions with varying
rates of intensity and longevity. It is a coming to know as well as a coming to accept
and persuasion (Murphy & Alexander, 2004; Vosniadou, 2001a; Woods & Murphy,
2001). But what causes these shifts (or not) within an Earth Science context is a key
subject matter for this thesis.

80
I wonder how William Buckland, Robert Jameson, Charles Darwin and Charles Lyell
felt when they were finally confronted with irrefutable field and empirical evidence
that was at odds to not only their personal world-view constructs but also selected
western societies views of the early to mid nineteenth century. Gottlieb Werner and
his neptunistic followers must also have been rocked (by hot lava and cold granite)
when the Huttonian model of an ancient Earth (Baxter, 2003; Hutton, 1788; Jones,
1996; Repcheck, 2003) was firmly established by Playfair (Playfair, 1802). What
exactly was it that made Charles Lyell abandon a young earth view (Gribbin, 2002)
and embrace again the Huttonian vision of an ancient earth with modern geological
processes being used to explain geological features, and now enshrined as the
concept of uniformitarianism with a scattering of catastrophes thrown in? And what
is ancient anyway? How did these influential thinkers (in the western world at least
and not that easily either), change their conceptions of their worlds and translate
them into perceptions for others to ponder?
It is also similarly clear that epistemological and historical factors rarely find
expression within school or university courses (Thompson, 2000) as for example, in
the place of plate tectonic theory within earth science curricula. Why did it take so
long for people to abandon myths and legends as explanations of fossils (Jones,
1996) and the development of empirical science methodology over untested theory?
What role does culture and genetics have to play in the business of changing
conceptions at individual and institutional levels within a constructivist paradigm of
learning? Posner, Strike, Hewson and Gertzog (1982) clearly outlined the essential
prerequisites for conceptual change, and argument, abandonment and refinement has
occurred ever since (Duit, 1999a, 1999b; Gess-Newsome, 2003a, 2003b; Pintrich,
1993; Tyson, 1997; Vosniadou, 1992).
The history of geological science is intimately connected to our changing
conceptions of the way the world is, how it was and how it works.
Uniformitarianism, biological evolution and Steno’s principles of age relationships
are fundamental concepts used in constructing a plausible, testable and fruitful view
of how the planet works. This chapter attempts to look at some of these connections,
place some conceptual changes into an earth science perspective and then relate these
ideas to a view of how learners learn and teachers teach some of these fundamental

81
aspects of geology. The notion of conceptual change as an evolutionary and
ecological process via punctuated equilibrium within an educational setting will be
explored (Aubusson, 2002; Gersick, 1991). Eldridge and Gould (1972), who have
applied punctuationism to organisational science, do, however, correctly caution that
punctuated equilibrium as a model is not likely to be the only mechanism of change
and that it is always dangerous to apply a model from one domain (evolutionary
biology) to another such as ‘change management’, and by inference, in the context of
this thesis; conceptual change in learning and teaching within the Earth Sciences.
Conceptual change implies the impact of a time dimension, and essentially, any
analysis of a change in conception is measured through time. As an historical
science, geology is not only uniquely set in its ability to explore the teaching and
learning of what makes the planet tick but also the history of geology uniquely shows
not only ‘revolutions’ in thinking about how the Earth works but it also chronicles
the changes in conceptualisation of these processes. The ‘permantisists’, ‘neptunists’
and ‘evolutionists’ offer good examples, and these concepts will be discussed in
more detail later. Conceptual change is likely to be revolutionary in outcome but
evolutionary in process, and like studies of mtDNA in the evolution of modern
human beings of the last 2 million years or so (Templeton, 2002), the mutation rates
represent discarded (but dormant) conceptions. Perhaps this is why we have gone
well beyond ‘cold’ conceptual change (Vosniadou, 2009)Conceptual change is about
the how and why learning (or not) takes place and as a concept derived from early
constructivist views of Piaget, Derrida and Foucault about the nature of reality
(Matthews, 2003); the concept is too big to be easily pigeonholed.
4.2 Conceptualising Concepts
How does one conceptualise the world we live in? Music, prose and art are some
ways, but when it comes to conceptualising the many integrated and interdependent
processes that are involved in a scientific understanding of natural phenomena,
things become a little more complex. In Cobern, Gibson and Underwood (1999)
work on 9th grade student conceptualisations of nature, it is clear that the degree of
scientific literacy that a student acquires is somewhat dependent on the extent to
which a concept of ‘science’ is integrated into a students cultural and cognitive
ecology. In Cobern et al’s study (1999), it appeared that very little ‘science’ was

82
invoked by these youngsters to ‘explain the world’: it was the students’ personal
experiences with nature that counted. I suspect that this is not uncommon amongst
adults as well. Indeed, a major research question addressed in this thesis is to
demonstrate how much change occurs in key geological concepts across a wider age
range. Clark (2004) discussed the connecting and planning power of concept
mapping in the development of courses of instruction in structural geology but in this
discussion, the concept map is used to illustrate the power of connecting ideas on
conceptual change and which can be applied to geological ideas. It is the
interconnectedness and visualisation of these connections that is important.
The diagram shown in Figure 4.1 summarises key aspects of the formation of pre-
instructional conceptions, conceptions, misconceptions and perceptions. The use of
pre-instructional terminology (Duit, 2003) harks back to the early days of the
Learning in Science Project at the Waikato University Education department (Bell,
2005; Gilbert, Osbourne & Fensham, 1982). The legacy of this research is an
integrated consideration and inclusion of student prior learning by teachers on the
way they teach, especially within the sciences. However, personal experience of
what once applied to high school students of the 1970’s and 1990’s does not appear
to so easily apply to students of the twenty first century. The prior learning of today’s
young digital expert is quite different to the analogue mechanist of prior times.
Indeed, the gap between origin time of research and implementation of educational
research findings appears to be widening as schools struggle with curriculum change,
knowledge explosion and societal change (McIntyre, 2005).

83
Figure 4.1. Concept map of pre and post instructional conceptions (Adapted and
modified from Gilbert, 1982 and Duit & Treagust, 2003).
Conceptual change description and definition is diffuse in nature depending on
emphasis, usage and author but Tyson et al. (1997) and Harrison and Treagust (2000)
have summarised key historical events for the development of conceptual change
theory (Figure 4.2) conceptualises the issue of conceptual status as a concept map. In
practical terms, conceptual status is important because this is the position where the
learner is along the road to changing conceptions of specific topics. Conceptual
status is influenced by epistemic changes in experiences, information, organisation
and knowledge.
Axiological World view Culture Status Inheritance Observations Experiences Development
Pre-instructional Conceptions
Perceptions
Post-instructional Conceptions
Weak Neutral Strong
Weak Neutral Strong
Misconceptions

84
Figure 4.2. Historical summary of conceptual status.
What actually constitutes a conceptual change is a matter of debate (Carey, 1984;
Dagher, 1994; Thagard, 1992; Vosniadou, 1994) and depends on prevailing
worldviews. Essentially, conceptual change occurs at several levels analogous to
biological macro and microevolution. However, conceptual change is not the same as
knowledge addition. For example, it is one thing ‘knowing’ that basalt is different to
granite, but it is quite another in comprehending that the difference is due to different
cooling rates and chemistry. Indeed, the concept of rate is a complex one, and the
idea that the rate of process itself may change at changing rates is even more baffling
Teaching
Epistemic conceptual restructuring as an adding-on of new knowledge
Strong = Carey (1985) Radical = Vosniadou ((1994) Accommodation = Posner et al (1982) Conceptual exchange = Hewson (1992) ‘Tree switching’ = Thagard (1992) Reconceptualisation = Dykstra (1992)
Weak = Posner et al. (1982) Assimilation = Posner et al. (1982) Conceptual change = Hewson (1992) Extension = Dykstra (1992)
Conceptual competition (revision)
Addition of new concepts to pre-existing
ones
Replacement of old concept
Rejection of new concept and
keep the old
Diminished status but concept still retained
(Hewson & Hewson, 1992; Vosniadou, 2007b, 2009)
Concept extinction
Posnerian conditions of D.I. P.F. (Dissatisfaction, Intelligibility, Plausibility, Fruitfulness)
Concept partly or wholly reinstated

85
to many students. As White (1994) points out, concepts have fuzzy boundaries and
conceptions are “systems of explanation” (p.118). Quite vague really.
Concept maps are powerful metacognitive techniques and have evolved from the
original cognitive psychology work of Ausubel (1968). Since the mid 1980’s
(Novak, 1984) the use of concept mapping has been integrated into teaching
strategies and continues to be developed for use in assessment (Liu, 2004; Van Zele,
2004). Liu (2004) looked at using concept mapping for assessing and promoting
relational conceptual change within a multidimensional framework. In particular, Liu
used directed concept mapping or the “digraph” (p. 377) as a means of assessing
conceptual change. Analysis of student concept maps focussed on relationships
relevant to ontology and epistemology and within Posnerian conditions for
conceptual change.
For Clark and James (2004), however, providing the big picture of a course of
instruction in structural geology helped ‘pre-form’ student learning and reinforce
prior conceptual understandings. Indeed, prior knowledge (Alao & Guthrie, 1999;
Glasson, 1989) is considered to be an important predictor of conceptual
understanding, at least at high school level. However, Alao and Guthrie also report
that little is known about the effects of learner strategies and motivation on
conceptual understanding and by inference, conceptual change. From a personal
perspective, although concept maps as a strategy of teaching, are commonly used for
‘pre-testing’ students’ prior knowledge and reinforcement exercises, there is little
evidence of concept mapping being used for assessment purposes in the manner
established by Van Zele. Indeed, although Alao and Guthrie use knowledge tests as a
measure of conceptual understanding, there is a considerable difference between
searching for student prior conceptualisation and their prior knowledge. ‘Pre-testing’
does not search for concepts held by students; it finds (usually) only loosely
associated key words that the learner knows about a topic. And besides, it is not easy,
in a teaching sense, to actually deal with what is found out. Often ‘pre-testing’ is
done for political reasons rather than educational ones. In other words, finding out
and then being able to use this information on the depth of conceptualisation that a
student has about a topic (such as the origin of granite or the concept of Deep Time)
is a different game altogether. Perhaps this difference reflects the huge gap between

86
educational research and classroom practice. Where is the ‘fruitfulness’ in adding yet
another layer of assessment tasks on already overburdened assessment systems, and
especially if standards based assessment (SBA) is used for high stakes? To illustrate
a typical ‘pre-test’ concept map, the author asked his Year 11 students (aged 15
years), what they thought Earth Science involved. Two examples are shown in
figures 4.3 and 4.4. Concept maps are synonymous with association maps.
Figure 4.3. New Zealand Year 11 student B – male aged 15 years
Figure. 4.4. New Zealand Year 11 student A – female aged 15 years.
Bearing in mind that these students have had about ten weeks of instruction in Earth
Science in the previous two years and an unknown amount of time at primary school,
what they express should reflect key ideas (hesitantly concepts) of their learning
about the Earth. This appears to be the case but is discussed in more detail in Chapter
6. What was interesting out of the 14 examples was that there was a distinct lack of
development of interconnections; maps just make one-word connections to the topic
Earth Science What Does It Involve?
Earthquakes
Volcanoes
Natural disasters
SoilMountains
Space
Planets
Tectonic Plates Rocks
Earth Science What Does It Involve?
Rock studies Earth
Earth’s crust
Continental drift Matter
Volcanoes- How they are made

87
given although in the first example there is the beginning of a second layer or a
subset of associated concepts, in Figure 4.4 a connection of volcanoes and
earthquakes with natural disasters. But note that this student did not directly associate
planets with space but that Earth Science involves planets and that mountains and
volcanoes appear to be separate things especially if an association of volcanoes with
natural disasters had already been established!
What is interesting about these ‘maps’ is that they represent prior knowledge that
each student has associated with Earth Science as a subject of learning. This prior
knowledge is based on 14 years of personal constructs and a little bit of formal
instruction. To what extent these ‘ideas’ (facts?) are concepts is a difficult question
to answer, but no doubt ideas are meaningful world views of these students at that
time. One cannot construct a concept without knowledge. Fifteen year olds are
certainly beginning to make deeper level connections within a science context.
Concept mapping is clearly a vital and useful tool (but not for all learners) in
developing conceptualisations and is making important contributions to teaching and
learning. In the development of web-based learning the use of concept mapping is
particularly valuable (it gives an initial ‘bigger picture’ as shown by Clark and
James, 2004) and is well illustrated in the development of the Earth Science
programme at the Centre for Science Education, University of South Carolina. A
good example of the use of a concept map in their programme on Earth Science is
shown in Figure 4.6 and has been copied directly from their website on
http://cse.cosm.sc.edu/hses/RthCrust/PlateTec/frames.htm. What is interesting in this
concept map is that it shows a hint of connection between an important Kuhnian
revolution in how we think about the Earth with evidence and usefulness of the
theory of plate tectonics. No doubt, depending on the age of the student, extension of
what is meant by “profound effect on geologic thought” can be included, as well as
how the theory explains previously unexplained phenomena.

88
Figure 4.5. Examples of association concept maps of the rock cycle.
Teaching students how to ‘read’ concept maps is another issue altogether and
learning style may be important in the teaching of how to construct a concept map
For example, tactile and audio learners do not find concept maps particularly useful
and tend to shy away from their use (Kostovich, Poradzisz, Wood, & O'Brien,
2007). Kostovich et.al. found that although their study indicated no learning style
preference for construction of concept maps there is evidence for learning style
influences on concept map interpretations. Perhaps a degree of spatial/visualisation is
required as well as adequate training in their use is required. Although concept
mapping is a powerful strategy for conceptualising concepts, it is not for everyone,
and they can be time consuming and difficult to use for teaching and learning.
Concept maps used by adults tend to be hierarchical and Safayeni, Debentseva and
Canas (2005) make the case for the development of cyclic concept maps. Two
concept maps of the rock cycle are shown in Figure 4.5. (www.
earthscienceeducation.com/ and www.eos.ubc.ca/courses/eosc221/rock_cycle) is a
good example of a cyclic concept map showing feedback loops and intra-conceptual
relationships. The use of concept maps in analysing student abilities in linking ideas
in systems thinking has been recently studied by Ben-Zvi, Assaraf and Orion (2005;
2009; Turcotte, 2006). Learning how to develop (and teach) system interactions,
feedback loops and hidden dimensions is complex and challenging. Ben Zvi and
Orion (2005) found that only 30-40% of respondents understood the cyclic nature of
a system and that a cyclic perception only appeared from students who had
previously developed an ability to identify dynamic relationships within the system.

89
Figure 4.6. A concept map of plate tectonics from (CSE, Univ. S. Carolina).
Note that the concept map of plate tectonics shows a typical hierarchical system,
whereas the rock cycle diagram is closed and has feedback loops. In another kind of
‘concept map’ (adapted from Pintrich et al. 1993), conceptual change can be viewed
as a kind of Venn diagram (Figure. 4.7). In this diagram, overlapping boxes indicate
interrelationships, but not intensity of causality. The challenge is to connect the
isolated Posnerian CC conditions with effective conceptual change.
Figure. 4.7 Venn style diagram of conceptual change (Adapted from Pintrich et
al. 1983).
Classroom, institutional, cultural and
contextual factors and resources
Individual
motivation attitude and intent
Individual cognitive Level
Posnerian conditions
for CC

90
Conceptualisation of conceptual change has moved since 1993 (and 1982) towards a
much more inclusive, diverse and complex understanding (including intentional
conceptual change) of how students (and teachers) construct their view of scientific
world. Duit and Treagust (2003) and Treagust and Duit (2008) neatly summarise the
‘limits’ of the ‘classical conceptual change approaches’ and show the complexity of
conceptual change. In an effort to bridge the widening gaps between the classroom
and the theory, this complexity may well benefit from an application of ‘cladistic’
thinking and metacognitive approaches. Indeed, Georghiades (2000)considers that
teaching metacognitive skills to younger students (8-11 year olds) would improve the
longevity and transferability of their conceptualisation processing. But then puberty
and testosterone gets in the way at the high school level, and job security takes over
from there!!
The idea of intentional conceptual change has been extensively addressed by Sinatra
and Pintrich (2003). Intentional conceptual change implies that not all conceptual
change is intentional and that some learning cognitively occurs spontaneously (that
is, without intent), as phenomena are observed and measured. There is also the
possibility of the intention not to change. The question is really one of ‘to what
extent is intentional conceptual change part of the learning process? And, what
drives the motivations for ‘intent to change (evolve?) concepts of, for example,
natural phenomena such as the causes of earthquakes and tsunamis and
crystallisation processes? Learning is intentional but not always successful and
meaningful (Figure 4.1). Mixed in with this idea is the notion of conceptual status
(Harrison, 2000; Hewson, 1992) whereby concepts held by the learner are kept,
discarded, modified or exchanged in varying degrees according to personal
constructs and/or learning circumstances or “intellectual position” (Harrison &
Treagust. p.375). Although success may be in the eye of the beholder, it is not always
successful in the eye of the ‘scientist’. Clearly, conceptual change is much more than
just ‘conceptually’ going from process to intent. It is the ‘change’ bit that is
important to teaching and learning (see later section on conceptual change and the
teacher). However, as an example, a shift from thinking about the Earth as having the
continents fixed in position and fossils as being inorganic, to the opposite concepts
required a change in cognitive and psychological perspectives within a cultural
setting. And this was in the adult learning world! This accepted shift in thinking

91
about explaining the changing nature of the planets geological history also required
time – something that the classroom teacher does not have much of. And, in the cases
of Hutton and Darwin, without the aid of a Playfair or a Huxley, even more time may
have been required! Perhaps more effort to understand resistance to conceptual
change would be more fruitful for learning?
The case of James Hutton is a particular case in point and illustrates the personal and
cultural complexities involved in intentional conceptual change. For example,
without the cultural climate of an evolving Scottish Enlightenment, the deistic
teachings of the mathematician Colin MacLaurin, his connections with the workings
of the human body with a recyclable and beneficent Earth (Hutton’s medical thesis
from Leiden University was on the circulation of blood), and the personal drive to
‘make a mark’, Hutton would not have been able to conceptualise an Earth that had
“no vestige of a beginning nor prospect of an end” (Hutton, 1788). Hutton saw a
beneficent Earth through his work as an innovative farmer breaking in the soil, but he
must also have been sufficiently dissatisfied with contemporary biblical explanations
for the timing and origins of the Earth and its features. His conceptual journey took a
long time and was dominated in a heroically scientific search for evidence, but most
of all, his ancient Earth concept and uniformitarianist mechanisms appeared suddenly
(punctuationally?) on the geological stage in a classically punctuated fashion.
Although he was aware of volcanoes and earthquakes, it was a pity that he lived
where there was no active volcanism and an even greater pity that he was not alive in
1880 when Scotland had its largest earthquake (http://www.earthquakes.bgs.ac.uk/.)
From a conceptual point of view, Hutton began with experiential sensations and
information gathered about what he saw in the field that allowed him to develop
perceptions about this information. These perceptions then led him to develop
conceptions. Hutton had the motivation and intention to change his understandings of
how the soil and the mountains got there and he went on to develop the concept of
uniformitarianism later to be used so effectively by Charles Lyell. These conceptual
changes reveal an evolutionary process. Although not well presented, Hutton’s
conceptual change about the history of the Earth was not well received in the context
of his time (Baxter, 2003), but a fuller understanding and verification of his
conceptions had to wait for the twentieth century.

92
Intentional conceptual change clearly involves learning and its associated cognitive
processing within a constructivist paradigm, but it is the connection with the intent to
learn and to actually take on shifts in conceptual development that measures the
degree of learning. Although teachers do make a difference, issues of student
motivation, self-esteem, drive and cognitive abilities seriously influence individual
learning outcomes (Vosniadou, 2007). Intent to learn (as measured by a perceived
degree of conceptual shift in individuals and institutions) is constrained by
sociological, cultural and individual motivations and by current dominant
worldviews of science and its utility in society. Conceptual change is laden with
value clashes; this is what makes the learning process complex. To use an
evolutionary analogy for speciation, Dawkins (2004) discusses and defends the
notion of directional progress, but directional progress within conceptual change is
only seen looking backwards. Idealistic ‘scientific’ concepts eventually accepted by
learners are unpredictable when looking forward from the learners’ point of view in
space and time. A progressive, value-laden view of conceptual change is a
prejudicial view of how learners learn (and how teachers should teach). Recognition
of this has led to the development of a multidimensional approach to understanding
conceptual change (Tyson et al. 1997). However, it is also much easier to assess a
predetermined path for accountability than to assess the real conceptual changes that
occur in an individuals learning. The challenge of teaching science is to fashion the
manageable catalysts that move conceptions in desirable directions. But the
directions are not predictable nor necessarily linear or progressive. Perceptions are,
in a sense, the shapes that are left after the bubbles of concepts have been rearranged,
either by teaching intent or otherwise.
The notion of persuasion in the evolution of individual conceptual change is
important. Persuasion is also intimately connected with intention and assessment,
and attempts to measure the differences (not always very successfully). The success
of persuasion in catalysing conceptual change is linked strongly to individual belief
systems, perceptions, culture and upbringing of both the learner and the teacher.
Murphy and Alexander (2004) ably point out that persuasion is an interactive process
in which individual perceptions are changed. As the catalyst, this is clearly what
teachers try to do, but measuring the effectiveness of persuasion on conceptual
change is validly and reliably difficult to do.

93
Petty and Cacioppas’ (1986) early views on the central and peripheral routes taken
by learners towards change would suggest that the learners predisposition to change
is in command and that the central route is more lasting and powerful than the
peripheral.
4.3 The Geoscience Concept Inventory
Following the development of conceptual test inventories for biology and physics
(Anderson, 2002; Pollock, 2004), Libarkin, Anderson, Boone Beilfuss and Dahl
(2002) and her team have developed a geoscience concept inventory (GCI) in an
attempt to establish a measure of conceptual benchmarking for students of the Earth
Sciences. Although validity and selection of questions is debateable, the GCI
attempts to elicit existing conceptual information about topics such as volcanoes,
mountains, Ice Ages, earth’s interior, earth’s magnetic field, formation of the earth,
geological time and sequencing of geological events. As an example of an
application of GCI (Dahl, 2005) aimed at a group of pre-service and in-service
teachers found that over 60% of both cohorts thought that single celled organisms
were already existing when the earth first formed.
Other ‘misconceptions’ reported in Dahl et al.‘s work are:
The most accurate method of dating rocks is by Carbon dating.
Height of mountains can be used calculate the age of the earth.
Volcanoes are associated with tropical climates.
Gravity is caused by the earth’s magnetism.
The extinction of the dinosaurs ranged from 150 mya to 200,000 years ago.
The first humans appeared from 10,000 years ago to 2003 years ago.
The use of conceptual inventories for capturing snapshots of student conceptual
development may play an important future role in the development of curricula and
content delivery. For example, there is little point in developing a curriculum if the
concepts involved are beyond the cognitive levels of the learner. As Libarkin (2006)
shows,
“This disconnect between faculty perceptions and realities of the models that
students are bringing with them to the classroom suggests that identifying and

94
discussing student ideas is a vital part of instruction as has been suggested by
K-12 researchers (p.7).”
How this is actually achieved and acted upon in a ‘live’ school and classroom
situation is another matter altogether. Experience tells me that this sounds good on
paper but not so easy and dubiously effective in reality (i.e. when divorced from the
research situation). The problem is that there are too many other variables such as
individual motivation, intention, cognitive ability and socialisation issues that are not
controllable.
It is useful to have a reasonable understanding of what students are able to do based
on objective and validated information before proceeding to deliver a topic of
learning. A concept inventory such as the GCI is one tool that can provide
information needed for not only for understanding where individuals are at, but also
for curriculum development. It is important to know what kind of ‘best practice’
pedagogy can be used for the delivery of content on topics such as plate tectonics,
earthquakes, volcanism, the rock cycle and geological time. The teaching of Science
in an Earth Science context developed by the Earth Science Education Unit at Keele
University (www. earthscienceeducation.com) is a case in point. This is constructed
on the conceptual development of teachers and learners. Indeed, the development of
concept tests is based on Bloom’s taxonomy for conceptual application, analysis and
comprehension and has been used to assess (formatively and summatively) and to aid
development of conceptual understanding in undergraduate geology classes
(McConnell, 2006). An important trade off in using concept tests for formative and
summative assessment is that of time. In a secondary school for example, the three to
four extra hours that is imposed upon an already crowded subject content may not be
perceived as ‘fruitful’. However McConnell et al. (2006) report quantifiable
improvements in student understanding and engagement. The ‘fruitfulness’ has to be
taught and managed. In their discussion of ‘interactionist’ (affect, belief and extra -
rational) factors of conceptual ecologies of pre service teachers understandings of
the nature of science Southerland et al. (2006), confirmed the complexities of
conceptual change.

95
An example of a recent conceptual change difficulty is that reported by Selles-
Martinez (2006) at the International Geoscience Education (IGEO) in Bayreuth.
Selles-Martinez suggests that students’ conceptions of the mantle are influenced by
inaccurate textbook portrayal of the mantle as a liquid. Students apparently conceive
the mantle as a liquid because the explanation provided in textbooks consistently
show convection currents generated in a saucepan of water. It is also likely that
students’ conceive the mantle as two dimensional rather than three dimensional as a
result of simplistic two dimensional textbook diagrams. A typical example of this
concept is shown in Figure 4.8 (http:// pubs.usgs.gov/gip/dynamic/unanswered.html).
Figure 4.8. Textbook conceptual diagrams for geological convection cells.
This kind of diagram is unlikely to mean a lot to a 14 year old except for them to
make the clear connection between boiling liquid water and the earth’s mantle.
Where is the exemplar 3-D diagram of mantle convection?

96
4.4 Conceptual Change and Punctuationism
Assembling and constructing ideas about observable phenomena is time and culture
dependent. Is conceptual change directionally progressive or just responsive to
selection pressures? Does conceptual change evolve? If so, how and why?
Figure 4.9. A punctuationist model for conceptual change (adapted from Eldredge
and Gould, (1972)).
Time
Posnerian/ Hewsonian punctuations
Conceptual change
Conceptual change
Piagetian Stasis.
Kuhnian/Toulminian/Lakatosian ‘punctuations’.
Modernist ‘adaptive radiation’.
1950’s
1970’s
1980’s
1990’s
2000’s

97
As mentioned previously the ‘change’ in conceptual change is time related and it is
only by viewing conceptual change through time that an appreciation can be made of
the role this model has in current understandings of learning. Figure 4.9 is an attempt
to show the broad historical development of the conceptual change model of
learning. It is placed within an evolutionary punctuationist framework based on the
original diagram from Eldredge and Gould. It is interesting that the concept of
evolutionary punctuated equilibrium as used to explain aspects of the fossil record
was developed contemporaneously with Thomas Kuhn’s work on the mechanisms of
scientific revolutions.
Indeed, Gould (2002) goes so far as to state that Kuhn’s work on scientific
revolutions was the single most important influence that he received on the
development of the theory of punctuated equilibria.
… if I were to cite any one factor as probably most important
among the numerous influences that predisposed my own mind
toward joining Niles Eldredge in the formulation of punctuated
equilibrium, I would mention my reading, as a first year graduate
student in 1963, of one of the 20th centuries most influential works
at the interface of philosophy, sociology and the history of ideas:
Thomas Kuhn’s ‘The Structure of Scientific Revolutions’, 1962.
(Gould, 2002, p.967)
The notion that conceptual change is gradualistic, directional and progressive is
implicit in the idea that learning is constructed by moving from one concept (or
misconception) to another concept (or misconception). Indeed, understanding what is
meant by ‘change’ is important. Change can be seen as a restructuring of prior
knowledge (Duit, 2003), or it can be seen as an exchange of pre-instructional
conceptions. Duit and Treagust (2003) suggest that the latter is a misinterpretation.
In a Gouldian analogous sense, changing specific scientific conceptions could be
interpreted as the equivalent of allopatric speciation events and subject to many
selection pressures (Mayr, 1982). Understanding the connections and drivers of these
selection pressures underlies how conceptual change may occur. It remains to be
seen which of the modernist adaptive radiation models will survive and spawn their

98
own periods of conceptual stasis, extinction or continued radiation. How much ‘spin’
can be put on conceptual ecologies, status and intentional change? Will multi -
dimensional framework models survive or will conceptual ecology models, status
and intent and persuasion models adaptively radiate? In any event the real world of
classroom interaction and contingency will likely be the controlling factor. In other
words, the gap between classroom manageability and environment and conceptual
change theory is likely to be too large for meaningful change. The data shown in
Table 4.1 is another way of making sense of a brief history of the punctuations in
conceptual change evolution. But tables of information tend to be ‘cold’ and do not
often place ideas into any contextual framework. Without this, the richness of
historical intelligibility is lost.
Table 4. 1. Summary of key ‘punctuations’ in conceptual change evolution.
Proponents Key concepts Date
Piaget Derrida Foucault
‘Stage’theory, interviewing and cognitive psychology Early constructivism
1950’s 1960’s
Toulmin Kuhn Thagard Lakatos Von Glasersfeld
Conceptual ecologies ‘Scientific revolutions’ ‘Conceptual revolutions’ Modernist constructivism
1970’s
Gilbert et al. Osborne et al. Posner et al. Hewson et al. Strike et al.
Knowledge of the pre instructional worlds of learners. Learning in Science Project (LISP) in New Zealand. Conditions for ‘cold’ conceptual change Increased use of learner meta cognitive levels Beginning of CC approaches to teaching Conceptual ecologies revisited
1980’s
Hennessey et al. Hewson et al. Vosniadou et al. Treagust et al.
Merging of social constructivism and culture Multiperspective epistemological frameworks extend the concept of conceptual change Multi dimensional conceptual change
1990’s
Pintrich et al. Sinatra et al. Duit et al. Limon et al.
Complexity of intentional CC and persuasion Merging of CC with cognitive psychology
2000’s

99
Although over 10 years ago (but 20 years since Eldredge and Gould), Gersick’s
(1991) views of revolutionary change theory in organisational systems are
conceptualised as a punctuated equilibrium where there are long periods of stability
and stasis of current models only to be changed by rapid ‘adaptive radiation’ of new
ideas. Gersick applied punctuated equilibrium theory to several research areas
including individuals, groups, biology, science and organisations and found
commonalities of mechanisms for change. The key understanding from Gersick’s
work was that change in each of the commonalities did not appear to be linear,
progressive and directional but rather, punctuational. This ‘directionality’ concept in
issues concerned with conceptualisation of geological time, the fossil record and
evolution is further discussed in chapter 6. Recent work by Lyytinen & Newman
(2006) has also applied evolutionary punctuational ideas to information system and
development change, with its attendant socio technical implications. It is suggested
here, that shifting scientific concepts for students of any age evolves as a punctuated
mechanism and is controlled by cultural, sociological and individual selection
pressures in the ‘need to know’, and obeying the laws of minimum effort and risk.
This ‘need to know’ involves not only an individual and institutional intention to
change but also one that follows the ‘cold Posnerian conditions’ for conceptual
change. There also has to be an ability for institutions and individuals to be able to
change.
New knowledge and understanding of how the brain learns (or not) is an example of
a selection pressure for conceptual shifts. It is interesting that the punctuated
equilibrium model for conceptual change has not been applied to teaching and
learning. For example, Kwon and Lawson (2000) clearly demonstrated the
connection between maturation of prefrontal lobe activity and social experiences and
the ability of 13 to 16 year olds at recognising and rejecting irrelevant science
concepts and developing hypothetico-deductive reasoning. This of course has major
implications for spatialisation skills and conceptions of time in geological reasoning.
This is especially important (Thatcher, 1987), as this growth spurt seems to occur
primarily in the prefrontal lobes at ages 14 to 16 years. It is this variation in
prefrontal lobe development that makes teaching (Kwon, 2000) such an interesting
occupation! For Treagust and his colleagues, (Tyson, Venville, Harrison & Treagust
1997) in asking the question “Is the age of the individual relevant to a theory of

100
conceptual change” (p.395), the answer, based on modern understandings of how the
brain develops and works, has to be yes. Conceptual development of geological time
is to some extent age dependent, as is the visual–spatialisation skills needed to
interpret geological structures This aspect has important implications for earth
science curriculum development and reform (Liben, Kastens, Agrawal, Christenson.
& Myers, 2009).
In the multi dimensional modernist world of Tyson et al. (1997), which recognises
the complexity of conceptual change, it is unlikely that conceptual change unfolds in
a Judeo-Christian, progressive, and directional sense where one misconception is
corrected by good teaching practice to miraculously change into the ‘expected’
newer, more sophisticated and ‘scientifically’ acceptable concept. This parallels the
directionality and progressivism so ardently argued against and considered by
Eldredge and Gould in their views of biological evolutionary mechanisms by
punctuation. This helps explain why it took so long for Hutton’s concept of an
ancient and unimaginable ‘deep time’ world to be accepted by the scientific
community of his time. Punctuated evolution is characterised by long periods of
(conceptual) stasis followed by rapid diversification. These changes operate at multi
levels from large-scale paradigm shifts (Kuhn’s ‘scientific revolutions’) to
individuals’ daily conceptual shifts. Either way, change in thinking evolves through
time. When Tyson et al. (1997) posed the question as to whether the age of the
learner matters, their conclusion was yes. Furthermore, conceptual change can only
be interpreted (and implemented) within a time frame. The idea of an extra terrestrial
lump of rock (bolide) impact as an explanation of the great extinctions at the end of
the Cretaceous period in ‘our’ times or the final destruction of the diluvial (water
derived) Wernerian concept of rock formation took time to develop and evolve.
Acceptance (and intention to accept) is a critical aspect of conceptual change.
Duit and Treagust (2003) briefly mention what is meant by the ‘change’ in
conceptual change, and indicate (along with Matthews, 2003) that construction of
knowledge is different to construction of beliefs. This of course has implications for
classroom teaching of science knowledge and science concepts. Duit and Treagust
consider conceptual change to be a restructuring of prior knowledge but have often
been misinterpreted as changes in student pre-instructional conceptions. These ideas

101
can be ‘translated’ or reconceptualised into visual statements (Figure 4.10). In 3.10,
Longbottom’s work on reconceptualising science education (Longbottom, 1999), he
makes pertinent reference to conceptual change as comparing the thinking of learners
to that of ‘scientists’. Thagard (1991) takes the alternative view that relationships
between competing concepts builds new knowledge rather than changes to the
concepts themselves.
Figure 4.10. The ‘change’ in conceptual change.
Translating words into pictures demonstrates how reconceptualising a concept is
such an important part of the learning process and forges new neuronal links in
cognitive processes. This brings a whole new meaning to ‘forcing square pegs
(student conceptions) into round holes (scientific, political and institutional
conceptions)’.
(a) Restructured prior knowledge
Pre instructional concept Desirable ‘Scientific’ post instructional concept
(b) Changes in prior knowledge
‘Teaching
‘Teaching’
Conceptual status, tension and competition (Conceptualphilia and Conceptualphobia)
(c) Thagardian interpretation
Concept relationships build new knowledge

102
4.5 Conceptual Change and Geological Time
As implied earlier, the conceptual development of geological “deep time’ has been
one of the crucial concepts in human understanding of how the Earth has come to be
a key element of what geology is all about. No other discipline of learning involves
time is such a way, and the discovery of the Earth’s age is one of the great
contributions geology has made to our understanding of the history of the Earth. It
seems that a number of key conceptual changes at various epistemological,
ontological and social/affective levels, within a multidimensional Posnerian
framework are at work for this to happen. These conceptual changes were themselves
embedded in their own time frame and in the end, the empirical evidence became too
great to ignore (Eicher, 1968).
Conceptual change in our understanding of geological (Deep) time has followed a
punctuated pattern. Up to Hutton’s seminal work (Hutton, 1788), concepts of
geological time were dominated and controlled by politico/religious teachings and
visions of a young and fixed Earth (Gould, 1987). Time was viewed in a temporal
and unchanging way with the concept of geological time yet to come. This temporal
and religious concept of time held for centuries but became seriously shaky when the
true nature of fossils became clear and Nicolaus Steno (Cutler, 2004) developed the
rules of stratigraphic superposition and cross cutting relationships in understanding
the nature of relative time. On top of this, the Wernerian neptunists’ concepts of rock
being precipitated from water lost to the plutonist empirical evidence gathered by
Hutton. The concept of ‘Deep Time”, first coined by McPhee (1981), was the
product of a long period of enlightened thinking after the planet had been removed
from its centrality in space and thought. To this end, the data in Table 4.2 show the
key authors in contemporary times for the conceptual development of geological
time. It is beyond the scope of this thesis to provide historical details but suffice to
say, these people represent the key conceptual changes. It is remarkable that the
period between 1665 and 1875 paved the way for the modern interpretation of Earth
history. This essentially involved a conceptual change from short-term fixist and
temporal thinking about the age and origins of the Earth to a dynamic and old Earth.
By placing the key researchers in their life times relative to each other, a better
picture of the complexity of conceptual change can be appreciated.

103
Table 4.2. Life spans, authors and geological concepts.
Author Relative Life Spans Key Concept Held and Promoted
James Ussher 1581-1656 = 75y Based on biblical generational chronologies, Earth is 6000 years old
Nicolaus Steno 1638-1686 = 48y Described the rules of relative stratigraphic ages.
Comte de Buffon 1707-1788 = 81y Idea that Earth is older than 6000y based on cooling rate of iron (a minor player).
James Hutton 1726-1797 = 71y Based on ‘plutonist’ ideas of molten material and recycling, the Earth is very very old and explained by uniformity of process (uniformitarianism).
John Playfair 1748-1819 = 71y Rewrote Hutton’s work
Abraham Werner 1749-1817 = 68y All Earth’s materials were ‘neptunist’ in origin and precipitated out of water.
Georges Cuvier 1769-1832 = 63y Earth formed by catastrophic processes
William Smith 1769-1839 = 70y Similar fossils identify rock strata as the same age. Produced the first geological map.
Charles Lyell 1797-1875 = 78y Championed Hutton’s uniformitarianism, where the present geological processes and rates explains Earth history.
Jean B. de Lamarck
1744-1829 = 85y Characteristics of living organisms were acquired through use.
Charles Darwin 1809-1882 = 73y A very long Earth history required to accommodate evolution by natural selection.
Alfred R Wallace
1823-1913 = 100y Co-founder of evolution by natural selection.
James Dana 1850-1892 = 42y Contraction by cooling explained the permanent nature of the Earth.
Alfred Wegener 1880-1930 = 50y Continents move horizontally
The information presented in Table 4.2 places in time and social context the
conceptual leaps that took place in the evolution of an understanding of the great age
of the Earth within an epistemological and ontological framework of the authors’
times. Figure 4.12 attempts to place the key authors (and their concepts) into their
linear lifespan relationships because conceptual evolution needs to be seen in the
context of the authors’ lifetime worldviews and in their real time context. Conceptual

104
change cannot be separated from their historical and contemporary contexts, and as
stated by Vosniadou (2003) “in order to fully understand conceptual change we have
to investigate how individuals learn in social contexts” (p.402). Vosniadou went on
to describe the need to understand other variables involved in conceptual change
such as individual cognitive, social and motivation, educational settings and the
broader cultural interactions.
Apart from the incorrect ‘old Earth’ views of Aristotle (who was also terribly
confused about the origin of fossils), Herodotus, Theophrastus, Leonardo Da Vinci
and a few others, the period from about AD1600 paved the way to a rapid and
influential period of change about the way people viewed the history of the Earth. It
is not surprising that the work of Nicolaus Steno, James Hutton (and his ‘bulldog’
Playfair), and Charles Lyell are regarded as the founders of ‘Geology’ as a science
and who set the stage for the rapid ‘adaptive radiation’ of modern conceptualisation
about the Earth. Clearly, the concept of an Earth that is fixed, temporal and at the
centre of the universe, to one of an Earth that is dynamic, limited, and a speck of dust
in the Universe did not happen in a progressive, linear, A to B type fashion. When
properly scaled into time, the explosion of understanding about the Earth in the “age
of enlightenment and renaissance’ came as a punctuation on a long stasis of temporal
and ignorant thinking of the dark ages, classical times and the earlier myths and
legends and the wonderment of observed natural phenomena and objects (Figure
4.11). The Scottish enlightenment was indeed a conceptual explosion that led to
adaptive radiation of the scientific theory of evolution. Concepts are like bubbles that
expand, break or fuse, and to be properly understood retrospective conceptual
changes have to be seen in the context of their times (social/affective factors) and
with hindsight power of evidence and persuasion. The masculine Euro-centric nature
of these great scientific conceptual leaps (in the Kuhnian sense) is well noted, but
Murray (2003) also points out that this Euro-centric enlightenment is real even when
the quality and quantity of research is taken into account. The geological conceptual
challenges of today were generated in the 18th and 19th centuries and they centred on
the conceptualisation of deep time, fossil records, stratigraphy and evolution, and a
better understanding of the interior of the earth and the forces that govern its
operation.

105
4.6 Conceptual Ecologies
In an attempt to place conceptual change in a metaphorical and analogous context of
a living biological ecological system the notion of a conceptual ecology was used by
Aubusson (2002), to help effect and explain the change process for a school shifting
from a ‘transmissive’ approach to a constructivist approach to science teaching and
learning. Here, the teaching and learning of science was seen as an evolving
ecological system controlled by ‘environmental’ factors and interactions: a
potentially useful way of conceptualising conceptual change. However, what
Aubusson found was that “planned innovation is an inappropriate way to attempt
change, since the consequences of implementation are unpredictable” (p.43).
Besides, there are so many independent variables involved with change that this is
hardly surprising. Nevertheless, an ecological approach to understanding conceptual
change greatly assists in providing an understanding of many interdependent and
interacting ‘chains and web’ variables. As an example, Figures 4.13 and 4.15 attempt
to illustrate a different perspective by scaling today’s rapid conceptual radiation
about the nature of fossils and geological time into a linear view of the last 22,000
years (and not in conventional geological relative time order). It also attempts to
apply punctuationism ideas to a different scaling of conceptual changes of ideas
about fossils. The conceptual punctuations of the last 400 years is striking when
placed into this context, and illustrates the unique power of Deep Time thinking that
geology has given us and that when conceptual ideas are scaled into real time,
concepts (like biological species) evolve and rapidly adaptively radiate.
Conceptual ecologies also involve dissemination of conceptual information. For
schools this usually means textbooks and DVD’s. An analysis of misconceptions,
errors and oversimplifications of geological concepts and processes such as plate
tectonics, weathering and sedimentary rocks (King, C, 2009) reveals a significant set
of geological misconceptions that are perpetuated and reinforced in textbooks largely
as a result of authors who do not have clear conceptual understandings of geological
science. Do teachers do the same thing in the classroom when transliterating complex
earth systems into simple systems?

106
-22000
-21000
-20000
-19000
-18000
-17000
-16000
-15000
-14000
-13000
-12000
-11000
-10000
-9000
-8000
-7000
-6000
-5000
-4000
-3000
-2000
-1000
Today
Figure 4.11. Evolution of conceptual change about fossils.
Hunting and Gathering Ice Ages
Early Grecian ideas about fossils Plato/Aristotle/Theophrastus
Rapid conceptual radiation about Fossils and Deep Time.
(3% of temporal time since development of cities)
Development of Cities
Time zone of conceptual stasis and incubation
Recognition of ‘fossils’ as natural discrete objects in
Acheulean stone tools up to 200,000 years ago
Early Agriculture

107
Figure 4.12. Life spans of selected authors for geological time conceptual change.
Time (in years)
1650 1750 1800 1850 19001700
Steno
Buffon
Ussher
Hutton
Playfair
Werner
Cuvier
Darwin
Smith
Lyell
Lamarck
Wallace
Dana
Wegener
Hooke
Aut
hors

108
Figure 4.13. The bigger picture - Key conceptual changes in the history of paleontology
Dark Ages
Classical
Myths, legends and guesses. Fossils often recognised as remains of ‘giants’. Xenophanes (520BC) and Xanthos (480BC) indicate that fossils were the remains of once living things. Aristotle (345BC) was confused about the origin of fossils. Theophrastus (374BC- 287C) botanist, student of and successor to Aristotle incorrectly stated that fossils were not the remains of once living organisms.
Da Vinci follows Aristotle but the Christian church follows Theophrastus Humans are separate from the rest of living things Geocentrism dominates
Destruction of geocentrism and homocentrism. Evolution of evolutionary theory. Fossils recognised as organic remains. Scientific study of fossils begins. Notions of social ‘progress’ confused with fossil record.
Renaissance
Modern
500 -1100AD Little thought about anything. Ideas of Theophrastus probably dominate.

109
4.7 Conceptual Change and the Fossil Record Despite some classical writers recognising the origin of fossils as the remains of once
living organisms (Figure 3.13), it seems odd to us today that it took so long for the
truth about the origin of fossils to become accepted. In Frank Dawson Adam’s
(1958) masterly compilation of the birth and development of the geological sciences
he points out some curious concepts that were held about the nature and origin of
“figured stones”, until that is, one places these concepts within the sociological and
religious contexts of the time.
Some common concepts about the origin of fossils held in the Middle Ages (Adams,
1958) suggests that they were considered as:
1. Manifestations of occult powers
2. The force of evil intended to mislead people
3. Irradiations from space
4. Jokes and sports of nature
5. The ‘creators’ failed and discarded practice attempts at life
6. Spontaneously formed in the earth
7. Formed in the earth from seeds
Some of these concepts (4, 5, 6 and 7) are reviewed in the GeoTSAT concept
questionnaire (See Appendix 3) and evidence shows that some, mercifully few of
these concepts, are still held by respondents at all ages surveyed (See Chapter 6). The
conceptual evolution of the place of fossils in natural history has been much longer
in gestation than that for the conceptual evolution of geological time (Figure 4.15).
The more abstract and difficult concept of geological time could really only develop
after the true nature of fossils was perceived and accepted, and the restrictions of
religious dogma were subdued. For this, we have essentially Nicolaus Steno and
James Hutton to thank for opening up the concept of deep time. Figure 4.14 shows
the place of author life spans in the development of ideas about fossils and the fossil
record.

110
Figure 4.14. Life spans of selected ‘modern’ authors in the history of paleontology
Agricola
Newton
1400 1500 1550 17001450
Steno
Encelius
Cuvier
Smith
Brongniart
Time AD (in years)
1650 1750 1800
Gesner
Hooke
Da Vinci
1600
Aut
hors

111
Figure 4.15. The bigger picture - Key conceptual changes in the history of paleontology
Dark Ages
Classical
Myths, legends and guesses. Fossils often recognised as remains of ‘giants’. Xenophanes (520BC) and Xanthos (480BC) indicate that fossils were the remains of once living things. Aristotle (345BC) was confused about the origin of fossils. Theophrastus (374BC- 287C) botanist, student of and successor to Aristotle incorrectly stated that fossils were not the remains of once living organisms.
Da Vinci follows Aristotle but the Christian church follows Theophrastus Humans are separate from the rest of living things Geocentrism dominates
Destruction of geocentrism and homocentrism. Evolution of evolutionary theory. Fossils recognised as organic remains. Scientific study of fossils begins. Notions of social ‘progress’ confused with fossil record.
Renaissance
Modern
500 -1100AD Little thought about anything. Ideas of Theophrastus probably dominate.

112
4.8 Conceptual Change and the Teacher
Conceptual change theory is an important vehicle for helping to improve teaching
and learning. According to Vosniadou (2001b), in the designing of learning
environments there must be consideration of the value of learning tasks as well as
developing a research-based curriculum. This is easier said and written about than
implementing at the classroom level. Unfortunately the gap between grounded and
scholarly research based ideas about teaching and learning have a hard time finding
their way into the classroom (like much educational research). The reasons for this
are complex but essentially it is because of lack of time to implement, lack of
connection with curriculum and assessment demands and the accommodation of
fruitfulness of research findings. Old traditions die hard! Teachers are wary of
validity issues for their individual school variables. Indeed, Duit and Treagust (2003)
lament the lack of connection between educational research and teachers and
teaching and indeed make the glaring point that to bridge the gap between teachers,
teaching and learning, conceptual change theory has to be made more simple
(intelligible), and manageable (fruitful). For the earth sciences, Libarkin et al.
(2005a), point out the lack of grounded research for college/university age students’
(age 18+) conceptualisations, and attempt to begin debate on this issue in their article
on college age students’ ideas about the Earth. Libarkin also goes on to indicate, that:
“Curricular reform efforts should acknowledge the influence of mental perspectives,
especially when addressing conceptual change” (p.25). This acknowledgement
eventually led to the development of the Geology Concept Inventory (GCI) and
discussed in section 4.3 as a means of establishing student prior conceptualisation
and knowledge understanding of geology, but is yet to be customised for different
age groups.
This thesis attempts to address some of these issues as part of a cross-age conceptual
change study with particular reference to biological evolution and the fossil record,
geological time and geological structures through the lens of visual penetration
ability. There is very little point in developing earth science curricula especially via
complex systems integration of differing subject concepts (such as Earth Systems
Science) which are not cognitively manageable by the learner, and indeed, the

113
teacher. Systems’ thinking is a complex cognitive approach to learning that is good
for older students but not so good for teenagers.(Ben-Zvi-Assaraf & Orion, 2005).
The speed of social change and the slowness of institutions to respond produce an
ever-increasing gap. The ‘cold’ Posnerian conditions for CC apply also to teachers
and these conditions are especially exposed in any curriculum and/or assessment
reform. This does not necessarily mean being successful when students’ assessments
show that they have reached acceptably similar views to ‘scientists’ views. For
teachers, the educational challenge is to provide relevant, motivating and
conceptually fruitful opportunities for conceptual learning to happen and the
implementation of multi-dimensional aspects in enabling conceptual change may be
beyond institutions’ and teachers’ capacity to handle. Vosniadou and Kollias, (2003)
indicate that intentional conceptual change is goal-directed and deliberate and under
the control of the learner so assessment necessities may be a hindrance to shifting
learner conceptual views.
However, teachers are largely controlled by assessment demands. The problem for
teachers is that relatively few students (especially aged 13 to 17 years) are
sufficiently motivated and independent for self-directed learning to happen. Thirty
six years of classroom teaching tells me that development of socialisation skills
dominate thought processes. Science curricula and syllabi dominate a teacher’s life
and there is tension between covering what a curriculum demands (and attendant
accountabilities) and the need to cover what is cognitively accessible by the learner.
The balance between curriculum depth and width is also a constant tension for
teachers. A key element for teachers is enabling learners to become aware of their
own conceptions and perceptions about the world and to help them move from a
concrete physical perception to a more abstract model. This process requires learning
and teaching time and echoes the difficulty of curriculum breadth versus depth. The
theory is fine but the practice is difficult given the realities of a science classroom
environment, assessment practicalities and accountabilities. Addressing conceptual
development in learners discovering geological time may need the strong
connections between the real world outside the classroom from field evidence and
the abstraction desired. This development is strongly age related because intellectual
capacity changes with age. What appears to be important is that curricula and its
delivery must be matched to cognitive levels of learners and have the flexibility to

114
enable teachers to take into account prior learner knowledge and offer appropriate
learning opportunities for students to ‘safely’ change the way they think about the
world. The challenge for curriculum reform is to reduce the tension between the
needs of teachers to have prescription and the needs of the curriculum to have
generic breadth and flexibility.
From a classroom teacher’s perspective there is a huge gulf between:
a) Recognition of specific and desirable scientific conceptualisations within key
concepts of geology and
b) Being able to develop programmes and teach for enhancing conceptual
change but within the manageable realities of the classroom.
Children (and adults) rarely do what the textbooks say they should! Just as
assessment is the proxy driver of the curriculum and dynamics of individual student
behaviours, attitudes, epistemologies and axiological ecologies group dynamic
interactions within an individual class drives the ability of a teacher to implement
strategies for the kinds of conceptual changes needed for and individuals ‘real’
learning. That is, learning where better models for understanding and usefulness are
accepted (accommodated?) within an individuals changing scientific world view.
Indeed, the concept of geology as a discipline of study in a curriculum is a global
conceptual barrier. For example in the New Zealand experience of curriculum reform
of 1994 where geology was introduced as an equal partner to the traditional science
subjects, this was accompanied with a howl of protest by teachers who considered
this to be an imposition. Similar protests were echoed in the United Kingdom at a
similar time (King, 2001). Furthermore, the NZ Science curriculum revisions of
2008-10 continue to provide challenges to the status of geological science in
curricula. Old habits die hard, but see Chapter 9 for an update to the NZ curriculum
reforms.
“….anomalies are often recognized that are inconvenient to a theory, and
most scientists are now aware that if the theory cannot ultimately
accommodate them, then a new theory will be necessary”. (Kelly, L.R.,
1997, p.1)

115
A recent and important addition to the complexity of conceptual change theory
involves that of the notion of threshold concepts (TC) (Carstensen & Bernhard, 2008;
Land, 2008; Lucas, 2007; Stokes, King & Libarkin, 2007; Trend, 2009; Truscott,
2006). In essence this invokes the idea of ‘transformation’ where a key concept in a
discipline is pivotal in providing a step to conceptual change. For example, the ‘core’
concepts of mutation and HOx genes are critical scaffolding steps for transforming
naïve concepts of evolutionary processes into more scientifically acceptable
concepts. In a sense, ‘threshold concepts’ act as triggers for cognitively primed and
motivated individuals to explore. The challenge is to find the pedagogic resources
that sustainably triggers interest and enables open-mindedness to create actual
conceptual change. Trend (2009) outlines a possible way of using threshold concepts
and motivational theory to enable conceptual change in learning about geological
time (Table 4.3). This schema can be applied to many other geological concepts such
as plate tectonics, structures and the rock cycle. This scheme as summarised and
modified from Deci, Vallerand, Pelletier and Ryan (1991), Hidi & Renninger, (2006)
and Trend (2009) and shows promise for providing ‘scaffolded’ opportunity for
student conceptual change. Unfortunately, the gap between educational research and
classroom realities is huge.
Table 4.3. A generalised model for ‘threshold concept’ pedagogic development.
Individual Interest Phases
Triggered Maintained Emerged Developed
Autonomous
Prior knowledge determined. Challenges presented. Starter activities given. Interest ignited. E.g. Pre tuition concept map. DVD. Story telling.
Exposed to and challenged with new and different explanatory concepts of geological phenomena. E.g. Geological environments.
An individual small scale study, inquiry investigation or practical. E.g. Measuring rates of weathering.
Selection of individual role in a class group study. E.g. Recorder of data or trouble shooter.
Competent
Appropriate activities and tasks are presented to students based on knowledge of differentiated learning styles and age group.
Teacher direction and guidance to ensure acceptable engagement. Depends on age group.
Teacher enables appropriate tasks to be completed.
Self selected tasks with teacher direction, guidance or supervision.
Sel
f D
eter
min
atio
n
Socialised
Co-operative, collaborative learning and behaviour activities developed
Liaison with other groups in class
Self selected responsibility for co-operative tasks
Peer presentation of findings organised by group members of a class.
116
4.9 Chapter Summary
This chapter identifies conceptual change issues that are related to geological
education and discusses punctuationism as a model for the evolution of conceptual
change theory and uses this to show how key geological science concepts have
evolved. Here, conceptual change theory is firmly placed within a timescale.
Research question two asks broadly: how do students aged 12 years to graduate
develop their conceptions of the fossil record and geological time? This chapter
discusses the conceptual evolution of the underlying scientific concepts that students
of geology aspire to move to. The chapter discusses the topics of geological time
(Deep Time) and the fossil record (paleontology) within a conceptual change
framework. Issues of conceptual change as related to the teacher and the learner for
geological education were discussed. It is here that the cognitive-situative divide
(Vosniadou, 2007) becomes most apparent and that the multi-dimensional nature of
conceptual change provides a major challenge for implementation by the teacher in
the classroom environment and for the learner in their formative worlds.
This thesis is about geological education and conceptual change. Without an
understanding of the evolution of conceptual change theory and its relevance to
geological science (by punctuationism, gradualism, ecologically or not at all), having
an understanding of why geological science is in the global and local state that it is
currently in would not be possible. This chapter attempts to set the theoretical
conceptual change framework for geological education within a curriculum and
student conceptual context for geological time, history, fossils and geological
structures.

117
CHAPTER FIVE
METHODOLOGY
5.1 Introduction
The purpose of this project is to investigate, define and evaluate aspects of
developmental changes in the conceptualisation of key aspects of students’
understandings within the earth sciences and specifically, geological science. These
aspects also involve student conceptualisation of biological evolution (as embedded
in the disciplines of paleontology and paleoenvironments and therefore directly
related to geological science), and conceptualisation of geological time as related to
geological structures, correlation, and sequencing of geological strata. In addition,
aspects of relevant geological science curricula issues are investigated. This work is
an attempt to look a little deeper at common conceptions (and misconceptions) as
held by students of various ages and within different cultures and curricula. It builds
on the work of others and one in which the application of cognitive research to the
geological sciences is emerging as of increasing importance. This research effort is
grounded within the so called constructivist paradigm where qualitative responses to
conceptual probing questions by questionnaire are supported by quantitative analysis
to tease out relationships.
5.2 The Research Problem
Cognitive development and understanding of geological processes and histories is
dependent on the development of workable (and understandable) conceptions of
processes (e.g. systems), time and space. As a historical and often ‘pattern seeking’
science, geological science demands an understanding and conceptualisation of the
immensity of geological time (deep time) and its relativities, and a connected
understanding of the evolution of life within this time framework. How individuals
develop and express their conceptions of biological evolution, geological time and
spatialisation within different cultural and curricular frameworks forms the basis of
this research project.

118
A challenge for educators of geological science (at all levels) is to develop more
efficient and relevant ways of teaching geological concepts and move students
forward to a more useful and sophisticated understanding. Indeed, there has been a
strong call from the international earth science community to improve the role of
Earth Science in science curricula (Akhatar, 1996; Cooray, 1996; Mayer, 1997;
Stow, 1996.) Data on global curricula (King, 2003, 2008) has been gathered from
Europe, South Africa, North America, South America, Eastern, Southern and
Western Asia, and Australasia indicating that the call has been slowly answered and
variously implemented (See Chapter 3).
As King (2008) points out,
A clear imperative is for the evaluation tools devised in some countries to be
tested in other regions and curriculum situations, including the Geological
Spatial Aptitude Test of Kali and Orion (1996), the Geological Time
Aptitude Test of Dodick and Orion (2003b), the Earth Systems thinking tests
of Ben-Zvi-Assaraf & Orion (2005), the Outdoor Activity evaluation scale of
Vasconceles & Salvador (2003) and the Geoscience Concept Inventory of
Libarkin & Anderson (2005) and revised 2008). (p. 26).
This thesis attempts to build on these beginning geocognitive aspects of geological
and geo/earth/ science education and modifies and adapts the GeoTSAT (Kali &
Orion, 1996) and GeoTAT (Dodick & Orion, 2003b) instruments in combination
with Trend (2001) and Tretter et al. (2006).
The foundational objectives to this study are guided by the following research
questions:
Research Question 1
What are the characteristics of international Geoscience curricula and their
implementation, with particular case study reference to the New Zealand curriculum?
Research Question 2
How do students aged between 12 and 40 develop their conceptions of evolution and
the fossil record, geological time and 3-D geological structures?

119
Research Question 3
What is the influence of diachronic thinking on conceptions of geological time,
structures and fossils?
Research Question 4
What is the influence of visual/spatialisation on conceptions of geological structures?
Research Question 5
How do conceptualisations of fossils, geological time and geological structures vary
with age of respondent?
In effect, these research questions ask about the relationships and baseline
conceptions of students of different ages and backgrounds in their understanding of
fossils and the fossil record (and its relationship to biological evolution), elucidating
geological histories and spatialisation reasoning for geological structures. This
research effort is grounded in a constructivist perspective for conceptual status and
change within a geological science context.
5.3 Methodology
This thesis sets out to investigate key aspects of geological science education within
a constructivist and conceptual change framework. Specific aspects of geology
involve geological time, geospatialisation, concepts of evolution and the fossil
record, and curriculum and assessment issues. A constructivist paradigm (Anderson
& Arsenault, 2001; Guba & Lincoln, 1994; Patton, 1990) essentially informs and
controls the methods that are used to investigate the research questions (See Section
5.2).
“Constructivism …aims at understanding and reconstructing knowledge with
the goal of moving consensus and more informed ways of knowing”.
(Anderson & Arsenault, p. 120).
These aspects thus involve a positivistic and grounded theory approach to gather
information about the conceptual development of a cross age sample of respondents
through pre validated and modified questionnaires as well as by case study.

120
Conceptual change theory provides the grounded framework for positivistic
interpretation of data. In line with Patton’s common sense approach to research
paradigms, the breadth of research questions addressed in this thesis demands a
mixed set of methods that will enable valid and reliable data gathering for
meaningful interpretation. Interpretations of data, as informed by conceptual change
theory, is viewed in this thesis from a multidimensional point of view (Tyson et al,
1997) and as defined by Duit and Treagust (2003), conceptual change refers to the
processes of the reconstruction of learning pathways which enable students to form
more sophisticated scientific explanations of scientific phenomena but in this case,
geological phenomena. In effect this means making meaningful learning changes to
the way individuals think through research based teaching.
In essence then, this is a mixed method study involving quantitative analysis,
qualitative unstructured interview questioning, structured and pre-validated
questionnaires, as well as the use of secondary source analyses. A case study
approach is also used (Chapter 9) to provide a more detailed and specific study of
aspects of geological science education in the New Zealand Science curriculum with
special reference to the 2008-2010 reforms. This case study has stretched over
several years.
5.4 Methods
Figure 5.1 summarises the methods used for data gathering to inform curriculum and
geological conceptualisation issues. Limited information via secondary source
surveys such as the 2003 and 2006 International Geoscience Education Organisation
(IGEO) surveys are currently available for describing a general picture of the global
status of general geoscience (and its major sub discipline of geology). The 2010
IGEO conference in Johannesburg will ideally provide an update on the global status.
Similarly, secondary source information is equally difficult to obtain for current New
Zealand curriculum reform issues as associated with changes in the geoscience and
geological science assessment standards and curriculum. A postscript in Chapter 9
and data presentation in Appendix 8 describes the most up to date curriculum
reforms available. Literature availability is often buried in unpublished departmental

121
reports and requires considerable bureaucracy via the Official Information Act, 1982,
to extract. Data may be well out of date before receipt.
The only way of gathering information from other countries was to use
questionnaires. For the Israeli sample, questions were translated into Hebrew and
some written answers were translated back into English. Questionnaires were
designed for minimal written answer responses and the spatialisation tasks do not
require this: they require block diagram completion. For the Lebanese samples,
students were fluent in English and translation was not required.
Typically, questionnaires are efficient and valid means of collecting data. However,
they do suffer from issues of return rates, ‘saboteurs’ and reliability much of this can
be overcome by careful construction and trialling. The use of pre validated
questionnaires for GeoTSAT and GeoVAT enhanced trustworthiness.
Figure 5.1. Key conceptual elements of methodology
Aspects of Geological Science Education
Global Overview of Geoscience Education
Chapter 3 IGEO Surveys International curricula Secondary source analysis
Curriculum Issues
Visual/Spatialisation Relationships
Chapters 7 and 8 2D – paper and pen Cross age comparisons Questionnaire analysis Verbal responses
New Zealand Case Study Chapter 9
NZ Qualifications Authority NZ Ministry of Education Secondary source analysis
GeoVAT Chapter 10
Pilot study Conceptualisation of fossils, evolution and time Questionnaire Cross age differences
GeoTSAT Chapter 11
Pilot study Geological Time and spatialisation questionnaire
Conceptualisation issues

122
5.5 Data Collection
Table 5.1 summarises the instrumentation and analytical methods for the research
questions and Table 5.2 shows the respondent country sources and Table 5.3 shows a
summary of students’ sample ages. Triangulation with historical data and individual
interviews enhances reliability and in particular, enables a detailed analysis of
student thinking on visual penetration abilities and their conceptions of ‘Deep Time’
and the role of fossils in their conceptualisations of geological history.
Table 5.1. Summary of instruments used
Table 5.2. Country data sources
Country Source
Respondent Ages (Years)
Comment
New Zealand (AC) (UC)
13 - 30 The author’s secondary school Univ. Canterbury Teacher Training College and Geological Sciences Department
Lebanon (AUB)
19 - 24 English speaking primary and secondary teacher trainees
Israel (IS) 14 - 18 Co-ordinator’s kibbutz school near Eilat
Research Question
Instrument Type of Data Data Analysis
1 Secondary data sources Quantitative Narrative, means analysis and clustering
2 Geol time and spatial aptitude test (GeoTSAT) and the Geol evolution aptitude (GeoVAT) test.
Qualitative and quantitative
Semi structured interviews, questionnaires, ANOVA, multivariate clustering
3 GeoTSAT, GeoVAT Qualitative and quantitative
Multivariate clustering.
SimStat: Internal consistency reliability analysis.
Narrative
4 GeoTSAT, GeoVAT Qualitative and quantitative
Narrative and correlations
5 GeoTSAT and GeoVAT Qualitative and quantitative
Unstructured interviews, questionnaires, ANOVA, multivariate clustering.

123
Table 5.3. Summary of respondent samples.
Student Sample Mean Age Mean n
AUB Lebanon Secondary teacher trainees 22 9
AUB Lebanon Primary teacher trainees 19 9
UC (NZ) Secondary teacher trainees 27 9
UC Postgraduate geology students 27 10
UC Year 3 geology students 22 15
UC Year 2 geology students 21 9
UC Year 1 geology students 20 24
AC (NZ) Year 13 students 18 23
AC Year 12 students 17 13
AC Year 11 students 15 13
AC Year 10 students 14 12
AC Year 9 students 13 13
TOTAL (N) 150 Note that respondent numbers vary from question to question and cohort to cohort.
5.6 GeoTSAT (Geological Time and Spatial Aptitude Test) Validation
The decision to use a pre validated questionnaire instrument was deliberate. Why
reinvent the wheel? In Jonathan Osborne’s dinner speech at the NARST conference
(2007) as outgoing president, he stated:
Basically, I want to make a case for a bit more armchair science
education research. What I mean by that is epitomised for me by a student question to a colleague who is an educational psychologist – Guy Claxton – who had just given a seminar. If you have never read any of his writings or heard him speak then I would commend him to you. The strange thing about Guy Claxton is that he is an educational psychologist who has never collected one piece of data. At the end of a seminar, this student had the temerity to say – ‘What you have just been talking about is really interesting – tell me, have you ever collected any data on that?’ What was Guy’s response? ‘Good God no, there is enough data out there in the world without me going out there and collecting any more”. (p.5) and,
Are we as a community rushing to undertake empirical work
when more time spent ferreting out secondary data [and] critically examining the theoretical ideas that guide our work might be more useful? (p. 7).
Dodick and Orion (2003c) validated the original GeoTAT instrument (and
subsequently modified for use in this thesis as GeoTSAT) for construct validation,

124
content validation and question validation with the final version being administered in
1992-2000 to a total of 285 grade 7-12 students (Age 12-18 years). This in turn was
based on the earlier work of Kali (1993) and Kali & Orion (1996). The development
of this questionnaire instrument was in turn based on the earlier work of Gardner
(1975), Koballa (1984) and Orion and Hofstein (1991). Statistical comparative
analysis was carried out using principal factor with varimax rotation and Cronbach
analysis which tested for internal consistency and reliability of the questions after pre-
testing.
Geospatial abilities were tested using 3-D block diagrams in the GeoTSAT
instrument. These diagrams are in effect ‘completion’ tests where students are
required to use their geospatial abilities (especially visual penetration ability) to
complete the continuation of strata onto one or more sides of a block diagram. Details
of each completion test for the GeoTSAT instrument is outlined in Chapter 7. Testing
geospatial ability to translate a plan view into a cross sectional view was tested for in
the GeoVAT instrument.
The GeoVAT and GeoTSAT content (appendices 2 and 5) were validated for use by
expert review and in particular, review by Professor Jacque Montangero to validate
the fit of questions for cognitive diachronic thinking. In other words, the questions
were validated for content that would enable the testing of diachronic thinking within
a geological science context. The use of a non-geological puzzle for internal
triangulation was not included in this thesis questionnaire (GeoTSAT) as there was no
intention to investigate the impact of geological training on conceptual status. Pre-
testing of 116 Israeli grade 10 non geology students and 21 geology students was
carried out to moderate for ambiguity, difficulty and response times. The original
instrument was completed in 45 minutes and for this thesis, up to one hour was
recommended. Providing this time for completion was out of the researchers control
and may well be a significant limiting factor in provision of a larger sample size.
Teachers and co-ordinators are busy people and questionnaire completion is an
intrusion on tuition time as well as being perceived by respondents as taking time
away from their studies. Prior learning in biology or geology was not considered for
investigation in this thesis, so the effect of this variable is unknown and deserves
further investigation and control. In essence, the GeoTSAT questionnaire (See

125
appendix 2) gathers some demographic data and cross references the testing of
conceptualisation of relative time and comprehension and application of the laws of
superposition. It also provides information about a range of visual/spatialisation skills
(Linn & Peterson, 1985) and across different ages. In particular, rotation and visual
penetration ability (VPA) is investigated using a variety of pen and paper 3-D
exercises and ‘hands on’ plasticine models. Visual penetration ability as related to
geological structure was first investigated by Kali (1993), Kali and Orion (1993;
1996; Orion, 1997a) and (Orion, 1994; Orion, 1997a, 1997b). Kali and Orion’s work
was also pilot tested on 64 Israeli fifteen year olds and statistically validated (Kali &
Orion, 1996). Prior to this, most visual/spatialisation educational research was
concerned with chemical molecular structures and geometry and not the geological
sciences (Bishop, 1980; Mitchelmore, 1980; Mundy, 1987). A concise literature
review of visual spatialisation research is outlined in Kali & Orion (1996). However,
Kali and Orion used pen and paper exercises and not a ‘hands on’ 3-D model as
developed for this thesis work on visual penetration ability (VPA). The decision to
use a plasticine model for investigating visual penetration ability (VPA) was an
attempt to enhance the pen and paper exercises developed for the GeoTSAT and
GeoVAT instruments and to allow learners to touch and visually see the 3-D version
of the pen and pencil block diagrams. The results and details of this investigation are
outlined in Chapter 8.
5.7 Data Analysis
Statistical analysis involved the use of multivariate statistical programming (MVSP)
clustering (Kovach, 1998) and ANOVA. MVSP clustering is a statistical package
with a variety of possible techniques. In this thesis, a minimum variance (sum of
squares cluster using Ward’s method) hierarchical technique was selected to provide
clusters based on how much variation there is within each cluster for selected
variables. In successive rounds of clustering, selection is based on which two factors
would provide the least increase in within-cluster variation. In this way, a
parsimonious dendrogram (A ‘similarity’ tree diagram showing relationships of
clustered variables) is produced. Multivariate clustering analysis enables data to be
looked at from different perspectives which include multiple variables that are
common to all samples. As an example, the use of multivariate clustering analysis

126
clusters the percentage of statements relating ‘geology’ as the solid earth component
within Science curricula from each country. This enables a measure of statistical
similarities to be made where countries can be grouped into countries with the
greatest similarity of data.. Clustering of countries into similarity groups enables new
perspectives to be found and new questions to be asked.
ANOVA was used to investigate and determine variation in responses to the
GeoVAT and GeoTSAT questionnaires. Interpretations of data and qualitative
information are based on generally accepted scientific conceptualisations as
expressed in peer reviewed publications.
An initial pilot study given to NZ Year 11 students for question construct validity
issues was carried out and some of these results are included in the AC Year 11
findings.
Cronbach’s Alpha statistic for internal consistency of cohort responses for specific
questions of the GeoVAT and GeoTSAT questionnaires was completed with the use
of SimStat statistical programme (Peledeau, 1996). Table 5.4 shows the results of
this analysis. These results indicate that student responses to questions in both the
GeoVAT and GeoTSAT instruments are reliable and validate conclusions based on
the student responses.
Table 5.4. Summary statistics of response reliability.
GeoTSAT Q’s 7a, 7b, 7c, 7d, 8a(i), 8a(ii), 8b, 8c.
GeoVAT Q1
GeoVAT Q3
Mean Inter-item correlation 0.45 0.42 0.55
Cronbach’s alpha 0.85 0.93 0.97
Standardised item alpha 0.85 0.93 0.97
Valid cases 111 208 115
5.8 GeoVAT (Geological Evolution Aptitude Test) Questionnaire Validation
This adapted and modified questionnaire (See Appendix 5) is based on instruments
trialled (albeit on a relatively small sample) and implemented by Trend (1998; 2000;

127
2001a), Tretter (2006), Dodick, and Orion (2000b; 2003a; 2003c) and Dodick
(2007). Section A of the GeoTSAT instrument investigates the dichotomous student
true/false conceptual ideas about fossils, the fossil record and the nature of science.
These true/false responses were ‘teased out’ in further questions by asking for
explanation. These dichotomous responses enabled the gathering of unambiguous
information of student conceptualisation about fossils. It also enabled the
identification of those students with confused and antagonistic views of evolution.
Questions were asked about the geological usefulness of fossils in an evolutionary
and stratigraphic (relative geological time) context and so triangulates somewhat
with the GeoTSAT instrument. Section B question 2a also tests students ability to
visually rotate a plane map area into a cross section and triangulates with questions 6
and 7 from the GeoTSAT instrument on geological structures. Other questions
(Section B, question 2c) attempts to probe conceptions held about the linkages
between geological environments and the fossil record (after Dodick & Orion).
These environments are further investigated with Section B question 2d on a ‘look
and sound like’ perception of the early Earth and today. Section B, question 3a is an
adaptation and modification of that originally used by Trend (2001) and asks for
students to place geological events into a time frame. Later work by Tretter et al.
(2006) (also founded on Trend’s 2001 study) and Jones, Tretter, Taylor and Oppewal
(2008) was adapted and used to investigate conceptual status and applications of
scale to geological contexts. Findings in this thesis are spread across an age range of
13 to graduate geologists, primary and secondary school teacher trainees from New
Zealand and Lebanon, and also across a range of secondary school classes from New
Zealand and Israel. High school student ages ranged from 13 to 18 years.
5.9 Trustworthiness and Limitations
An investigation’s trust depends on reliability and validity of collected data.
Embedded in this are notions of demonstrable credibility and ethically obtained
information. Similarly, instruments are not valid unless they are reliable and
constrained to their purpose. Questionnaires are good and bad for providing
information. For example, in the dichotomous true/false question of Section A,
students are forced to make decisions on their ideas about fossils, the fossil record,
the nature of science, and styles of rates of change for biological evolution. Keeping

128
in mind the maxim ‘garbage-in-garbage out’, questionnaires also enable a degree of
quantitative analysis. To improve trustworthiness and provide an internal cross
referencing triangulation, students were then asked to explain any two of their
decisions which they thought were true. This for example revealed again, the well
established notion that many students still do not (or cannot) separate the scientific
aspects from the word ‘theory’ when related to biological evolution.
The key limitation in data gathering for this thesis (without the resources of the
OECD for example) was an inability to obtain large samples with complete sets of
answers. Once questionnaires are handed over to co-ordinators in another country,
there is a loss management control. It is typical that few responders have complete
papers, and there is reliance (like the fossil record) on making inferences based on
skewed, incomplete and biased samples but nevertheless, evidence. In the end, one
goes with the data that one gets, and it is impossible to ‘redo’ data gathering unless
there is an unlimited time frame.
This study does not use statistical analyses of questionnaires to generate statistically
representative conclusions; rather, it uses gathered information to provide insights
and snapshots of the conceptual and perceptual status of a wide age range of
responders in a geological science context. Guba and Lincoln (1989) consider
trustworthiness in a qualitative gathering of information as referring to the general
‘quality’ of a piece of research and involves findings and conclusions that are
transferable, dependable, credible and confirmable. The methodology and findings in
this thesis are based on these notions. Findings in this thesis are transferable in the
sense that they are open to scrutiny, application and replication in a validly similar
educational environment. Small sample size for statistical analysis is always an issue
however, this is also ameliorated by the limited responses to validated questions.
5.10 Ethical Issues
Like all research, ethical behaviour and data management with informed consent and
protection of privacy is essential to provide trust in data gathering and results. This
thesis research did not require identification of individuals nor specific institutions
but does identify origin countries of data sources, as this provides the basis for

129
curricula and cultural parameters which influence conceptualisations. All data and
information gathering from people is an intrusion and as Steven Pinker (Pinker,
2002) has pointed out, there is no such thing as a ‘blank slate’: people come with
their nurtured and genetic ontologies and world views. So does the reader of this
thesis. This research effort is about investigating further, geological
conceptualisations held by students of a wide age range and not about intruding and
prying on individual belief systems. It is the conceptualisations (and misconceptions)
that count, rather than where the ideas come from, except that a respondent’s
geographic locality is just one of the many ontological and axiological factors that
influence the development of geological conceptions. This is an issue of
investigation for this thesis. For example Lebanon is predominantly a Muslim
culture, Israel a Judaic culture and New Zealand predominantly secular. Culture
influences curricula which in turn influences teacher training which in turn
influences teaching and learning.
All participants (Co-ordinators and respondents) in data gathering were informed in
writing of the purpose of the questionnaires and were free to choose anonymously of
their participation. In the researchers own school, colleagues were willing
participants in administration of questionnaires. Because information is anonymous
(apart from country of origin and institution) confidentiality is not an issue. The
focus is on gathering information about ontological conceptualisation of geological
science. Along with return rates and completion rates, accountability is an important
issue in questionnaire data gathering. The researcher is transparently accountable for
the protocols and gathering of information through audit trails (Anderson, 2001), but
the respondents are free to respond to questions in any way they want. This is despite
suggestions requesting honesty in answering. Most respondents will therefore just
answer the questions they want to answer in any way they want with no way of
ensuring respondents be accountable for their decisions. In short, the ethical
behaviour of a respondent is critical for reliability of data but this is often overlooked
as being largely unmanageable. Reliability of responses is therefore left to be
managed and mitigated by internal cross referencing of questions and triangulation of
data sources. The researcher has to make decisions on inclusion and exclusion of
data and is left to make sense of a distribution of responses from the honest and

130
engaged, the dishonest and disengaged and the ignorant to the informed. A holistic
view point of individual responses was used in this thesis data collection.
All recorded data remain confidential and anonymous for five years and stored in a
secure electronic form (CD-ROM/Key Drive and in pdf format). All respondents are
volunteers and ethical cognisance of individual and collective rights were respected.
Ethical committee forms for questionnaires have been completed and approved with
cultural sensitivity and protocols being observed where required.
5.11 Chapter Summary
This chapter describes the theoretical basis, research questions, methodology and
methods used in this thesis. Perfection does not exist and especially so from any data
and information gathering instrument where human responses are required.
Trustworthiness of findings is therefore based on the degree of validity and reliability
of responses generated from questionnaire construction, quantitative support, subject
content and ‘readability’ by respondents. Internal consistency and triangulation is
‘built-in’ and validated instruments are employed. Results data are internally
statistically consistent and reliable (See statistics in Appendix 8). Universally
representative conclusions from data collection about geological conceptual status
are not professed, but this thesis attempts to replicate (with some modification),
enhance and discover new ideas and support old ones through valid and reliable
instruments with cognisance to the ethics involved. Findings from across a wide age
range and with some social cultural independence enhances reliability, decreases
cultural bias and gets a little closer to respondents’ conceptions of geological time,
geospatialisation and biological evolution.

131
CHAPTER SIX
ABOUT TIME
6.1 Introduction
Time continues to attract considerable attention from authors writing from a wide range of perspectives, but rarely do educational researchers address geological time (Trend, 2000. p.539).
Geological time is a cornerstone concept of the geological sciences and without an
understanding of this dimension nothing in the natural world makes a lot of sense.
This chapter addresses aspects of research question 3: What is the influence of
diachronic thinking on conceptions of geological time, structures and fossils?
Developing a diachronic sense of time and its application to geological phenomena is
a perquisite conceptualisation for geological processes and products.
From infinity to attoseconds and billions of years, scales of time are difficult to
comprehend. Not only is the perception of time fundamental to our conceptions of
space and geology but also to our daily lives. Indeed, with the brains biochemical
seat of time perception now reasonably identified as in the basal ganglia of the brain
(Driesen, 2001; Meck, 2005), the perception of time is implicated in the time twisted
behavioural displays seen with people diagnosed with Attention Deficit and
Hyperactivity Disorder (ADHD), Attention Deficit Disorder (ADD) and Parkinson’s
disease. Certainly, when personally observing students in a science class who have
been authentically diagnosed as having ADD and/or ADHD, their abnormally
mismatched adolescent perceptions of time durations and task completion
expectations becomes very clear.
In Damasio’s article (2006), in which he discusses the brain structures that are
involved in piecing together and remembering our experiences of time, investigations
with brain damaged individuals suggest that the hippocampus and the temporal lobes
on the sides of our head are directly implicated in how time relative memories are
constructed. Events are placed in time order by this part of the brain along with a
scale of relativity (Damasio, 2006). This “mind time” has implications for the way

132
we develop (or not) our conceptualisations of geological Deep-Time, and indeed, the
way in which we ‘read’ and perceive the rock record at a physical rock outcrop on
the side of a local road or when we gaze over the edge of the Grand Canyon or
wonder at the karst topography surrounding Guilin in China.
From a social point of view, Waugh (1999) suggests that in the Christian faith, God
invented our universal time, this, despite the fact that different cultures have different
social perceptions and values of time. For example, the ‘Dreamtime’ of Australian
Aboriginals is quite different to that of the Muslim Wahabinist sect where
apparently, the past is always carried with the present. However, the first verse of the
biblical Genesis story was discovered (in a cuneiform tablet in the 1870’s, near
Mosul in Iraq) to have been a myth copied by the Jews of an even earlier Chaldean
account of ‘origins’ about 700 BC. Agriculture and cities had evolved and appeared
about nine thousand years before this (See Chapter 4, Figure 4.11) so creation myths
(and questions about time) have been around for a very long time (relativistically and
durationally). Creation myths and legends all attempt to account for whether time
had a beginning or not but all scientifically fail because they require unmeasurable
and untestable acts of faith.
Earth scientists and geologists today have become conditioned into thinking in
millions and billions of years. The ‘billions’ of years is of course that much more
difficult to perceive and conceptualise although as Ault (1981) has shown in his
study of children’s conceptions of time and geological time, their conceptions do not
appear to act as a barrier to their understanding of geological time. As has been
shown by Trend (1997; 2000; 2001a), young students aged 11 years, young adults
aged 17 years and primary teacher trainees tend to lump their understandings of
geological time into blocks of time from extremely ancient to less ancient and finally
to modern. This chapter looks at how students of different ages develop their
concepts of geological time and the unique place geological time has to teaching and
learning in the earth sciences. Trend’s (2002) study has been adopted, adapted and
used in the GeoVAT instrument (Section B, question 3) as a basis for teasing out
some of these ‘deep time’ conceptions and perceptions held by students of different
ages.

133
6.2 An Illustrative Study for Scales of Time, Size and Mass
Based on availability of respondents and a reasonable age and ‘learning’ gap, a class
of New Zealand rural high school 13 year olds (n =22) and 16 year olds (n =24) were
asked in a minimally directed way to write descriptions in their own words of how
they would describe their perceptions of scales of time, size and number. Results are
presented below. The number of responses is in brackets.
6.2.1 New Zealand Thirteen Year Old Student Responses
Out of 22 responses, three were minimal responses but indicated that these students
did have a concept of scale. For one of these minimal responses, the only written
response for a time scale was “a minute ago”, as if to simply say that they recognised
past and present (the now) but the future was not recorded. For size, this student
indicated a “t –rex” as the largest size they could conceptualise. On the other hand,
perhaps limitations of written language expression and lack of intent precluded
further explanation? These invalid responses may also indicate what Montangero
(1996, p. 29) calls “the gulf which can divide recognitive knowledge or knowledge
which can be activated on request, from spontaneously evoked knowledge”. In other
words, these students had the knowledge but did not want to say.
Most responses indicated time as stretching from seconds to millennia and only one
recognised a geological deep time of a million years as the largest unit of time in
their scale. The number of respondents was 22 with 5 ‘did not attempts’. When
gently asked as to why they had not responded, the common answer was concerned
with a lack of ability and confidence to express in words what they thought. In other
words, a literacy difficulty. Being able to express ideas in a meaningful way is a
common problem which can sometimes be overcome by verbal descriptions. Two of
the ‘did not attempt’ students could not be bothered. There was insufficient time to
pursue this issue with providing these students with the opportunity to verbalise their
thoughts.

134
Table 6.1. Student responses to time scale order (Not selected from any list)
Number of respondents
(n = 17)
Time scale order Responses
10 Millenniums, century, decades, years, months, days, hours, minutes, seconds, milliseconds
2 Millennia, century, year, month, second, minutes, hours
1 Millennium, seconds
1 Millisecond, hour
1 The smallest time I can think of is 0.0001 and the oldest time I can think of is 1 million years
1 Old people, young people
1 O’clock, year, half past, quarter past, 10 past, 5 past, 1 past, seconds, milliseconds
1 One minute ago
Table 6.1 shows student descriptions of a time scale ordering of events. It is likely
that students perceive the ‘boundary’ gap between ‘their’ millennia (which they saw
as thousands of years), and seconds, as their ‘distance’ gap. It seems that their
experiences do not allow them to reach out beyond the millennia of the past and they
probably see millennia as stretching into the past and the future. For these students,
geological time is not within their experiences and so all unimaginable time is
lumped together as “millennia” or as in one case, connected with ‘dinosaurs’.
Table 6.2. Student responses to size scale boundaries (not selected from a list)
Number of Respondents
(n =15)
Size Scale ‘Boundary’
4 Extra small, small, medium, large, XL, XXL, XXXL, XXXXL
2 Small, large
2 Milligram, tonne
2 The smallest size is 1cm the biggest size is I million kilometres
2 Little, small, tiny, big, huge, giant, gargantuan, King Kong
1 Millimetre, kilometre
1 Small, big, huge
1 King Kong, bugs

135
Size scale descriptions (Tables 6.2 and 6.3) were dominantly relative to human body
size as most responses used the size of clothing that a person could get into as their
reference category. Small, big and huge seemed to have some meaning for many
others. Others used the biggest animal and smallest animal they knew as their
reference point with no one using shrubs and trees as their reference category. Still
others used a dichotomous scale of “small and large” with one trying to ‘fill in the
gap’ with small, big and huge. Two respondents confused mass with size.
Table. 6.3. ‘Free’ responses to number scale boundaries (n = 14)
Zero to infinity (1 respondent)
1, 2, 3…… (1)
The smallest number is 1, the biggest is 1000000000000… (3)
Infinity,1 billion, 10 billion, 100 billion, 1 trillion, 10 trillion, infinity(1)
Zero to 100 (3)
1 to infinity (2)
1 to 999999999 (1)
Largest is infinity, middle is one hundred and fifty and smallest is 0.1 (1)
Infinity, zero, infinity (1)
In this class sample, the idea that numbers start at zero or one or multiples thereof is
encapsulated. The concept of negative (below zero) as being part of their number
perception and conception scale has not yet developed in these 13 year olds. Perhaps
this is why this age student has so much trouble conceptualising below zero
temperatures or older than ‘now’ time or smaller than a millimetre in size. So
conceptualising atoms (and parts of atoms) along with conceptualising geological
time is likely to be cognitively beyond these students until their personal and
educational experiences teaches them otherwise. Many students do not stay in
educational systems long enough for these experiences to mature. It is also
interesting that in Tretter’s et al. (2006) study, high school students categorise or
lump “textbook to atom size” objects into the “small” (See Appendix 4). This is
analogous to students’ lumping geological time events into Trend’s “extremely
ancient” category. Elementary school aged students do the same but include “me” as

136
a reference point. As age increases, refinement of size subdivision increases in
sophistication. In effect, the relative ‘intrascale’ and ‘interscale’ boundaries of time
and distance are expanded with experiences and age. This illustrative study lends
support to this supposition with senior high school students refining their scale
boundaries. For conceptualising geological time, students need to be exposed to
experiences of fossil lineages, stratigraphic columns, ice cores and radiometric dating
and all within a real world outdoor context.
6.2.2 New Zealand Sixteen Year Old Student Responses
These students have the advantage of an additional three years learning experiences
and their responses generally reflect this. Are their scale boundaries of time, size and
distance significantly different to younger students? Their responses are recorded in
Tables 6.4, 6.5 and 6.6. The number of respondents was 11.
Overall, it was interesting that these students tended to dichotomise their responses
into two large categories rather than to divide into the minutiae, as if there was some
kind of recognition that mental scale boundaries are more complicated than at first
glance. Class discussion after collection of ideas indicated that this group of older
students did not so readily place the human body as the first reference point in their
scale for size, but many did use their own age as a beginning reference point for
their time scale. For some, time only began from their own birth. Most considered
the ‘Big Bang’ to be the beginning of everything although one student thought there
was a need for a little time before the ‘Big Bang’ in order to get ready for it. Junior
students had not yet been seriously exposed to the concept of the ‘Big Bang’. Future
research on student conceptual evolution of ideas about the origin of the universe
may shed light on how scalar perceptions are developed and applied to scientific
explanations. Another student considered that everything before the birth of Christ (a
dominantly Christian group) should be lumped together and that anything beyond a
thousand years into the future was too difficult to comprehend and should therefore
be lumped together as “the future”. Although recognised as eons or millions of years,
geological time did not appear to be connected with any geological events that mark
Earth history. This aspect is investigated and discussed more fully in Chapter 11.
Geological ‘Deep-Time is beyond their experiences. Indeed, ‘thinking in time’ and

137
‘explaining in time’ adds a new dimension to our knowledge of beings and things’.
(Montangero, 1996, p. 12).
Table 6.4. Sixteen year old responses to Time scale boundaries (n = 11).
Seconds to thousands of years (1 respondent)
Minutes to centuries millions of years back to decades in the future(1)
Big Bang, forever but a little time before the Big Bang (1)
Milliseconds to Eons (1)
Before Christ to infinity. Everything BC is lumped together and all the future is lumped together after 1000 years (2)
Milliseconds to millenniums (2)
No time, nothing, to 100th’s of a second to centuries (1)
Sixteen years in the past to fifteen years in the future (1)
From my age 16 and up (1)
Table 6.5. Sixteen year old responses to Size scale boundaries (n = 11).
1cm to 2m (1 respondent)
1cm to about dinosaur size (1)
Milligrams to tonnes (1)
Millimetres to kilometres (1)
Sub atomic to universal (1)
1m to hundreds of kilometres(1)
Microscopic to unobservable (2)
Centimetres to kilometres, atom to planet (1)
1cm to 1000cm (1)
Table. 6.6. Sixteen year old responses to Number scale boundaries (n =11).
1-100 (2 respondents)
1 to one hundred thousand (1)
One to millions (1)
Infinity (1)
1 to ten(1)
0 to infinity(3)
Negative infinity to infinity (1)
1 to 1000 (1)

138
6.2.3 Summary of Illustrative Scales Study
Although an illustrative study only, responses suggest that high school age students,
like their older counterparts, teacher trainees, hypothetically first look for scale
boundaries that are large scale, and then refine the boundaries that match their
experiences. In terms of time boundaries, students rarely have boundaries that
encompass geological time. Time scales appear to begin at the ‘seconds’ level or at
the birth age of the individual. Although ‘millions of years’ is stated in some
responses, geological time as a boundary is in this study not differentiated. It is
simply not within the experiences of most students despite minimal exposure in the
New Zealand National Science Curriculum (See chapter 9). Respondents appear to
have their own unique view of mental size scale boundaries. This small study
supports the findings of Trend (2001b; 2001c) and that of Tretter et al. (2006) with
regard to the ‘lumping’ of time and other scalar values. There is much room for
further research on this critical learning aspect for science literacy.
6.3 Replicating ‘Boundaries of Size’ Scales
Tretter et al.’s findings (2006) are based on the previous work of Trend (2000) in an
investigation of understanding of geological time, and attempts to identify conceptual
scale boundaries of size by using a “Scale of Objects” (SOQ) questionnaire and a
rank card sorting exercise of size of objects. This study does not replicate any card
sorting exercise as outlined in Tretter et al. (2006). Comprehending conceptual
boundaries of scale is fundamental to a conception and perception of geological time.
Trend’s work (and this thesis) focuses on geological time but conceptions and
perceptions of scale are intimately related to each other. An attempt to replicate
Tretter et al.’s questionnaire was conducted with a New Zealand Year 9 class (aged
13 years, and the same group used in the illustrative study above where n = 18), and
a Year 12 class (aged 16 years and also the same group used in the illustrative study
where n = 22). With minor modifications made to ‘fit’ a New Zealand context, the
‘size objects’ were identical. Appendix 4 presents the ‘Scale of Objects’ questionnaire
adapted and modified from Tretter et al. 2006 that was given to students.

139
6.3.1 Responses of Year Twelve Students to ‘Boundaries of Size’ Scale
Tables 6.7 and 6.8 in Appendix 4 show the response distributions of scales of size of
common objects for a class of 22 New Zealand Year 12 students (average age of 16
years 6 months) and a class of 18 Year 9 students with an average age of 13 years and 4
months. The NZ Year 12 (age 16 years) student results indicate a closer agreement with
actual results and considerably less ‘fuzziness’ at the extreme ends of the scale. In other
words, older secondary school students seem to have less indecision at the large and
small scale ends of the size of objects. Actual results indicate a linear hierarchy, and
these year 12 students responses approach this pattern more closely than Year 9 (age 13
years) students. Objects 1 (width of human hair) 9 (diameter of a human cell), 14
(diameter of a bacterium), and 4 (diameter of a virus) posed the most difficult sizes to
distinguish. Question one was evenly split between the actual and one magnitude
different. The evidence suggests that this cohort ‘lumped’ these inexperienced small
sizes together as ‘unknown’. Similarly, the ‘large sizes’ (questions 18, 3, 5 and 13 in
Tables 6.7 and 6.8 in Appendix 4) seem to have provided similar problems of
differentiation. Familiar items such as human height, elephant height and school bus size
seem to be the ‘reference’ point for size comparison - familiar to inexperienced. The
Year 12 students have difficulty in deciding the width of a human hair. The indecision
on the length of a football field is explained by half deciding it is less than 100m and the
other half deciding on more than 100m in length. Students were not given direction on
whether the 100m ‘boundary’ was inclusive or exclusive; they just had to make a
decision.
6.4 Looking at Scales of Mass
When a different class of 30 students aged 13 (Year 9) were asked individually to
‘guess’ the mass of a tablespoon of salt they grossly underestimated this mass. For
example, the mean mass given by this class was 15.2 g with a range of 9.5g (one student)
to 21g. The actual was 9.5g. When one student was asked to explain how they arrived at
his answer, he stated that “they had heard that one tablespoon was 10mL” and thought
that it was “just little bit more than this”. This student had confused volume of 10mL for
mass. So, for this student, the mass was given as the only value he knew about a
tablespoon. For 13 year olds, the concepts of mass and volume appear to be very blurred
and when asked if they really had no idea, a third of the class put their hands up. The

140
same question under the same conditions was asked of 14 year olds through to 16 year
olds. The results of this age group comparison is shown in Table 6.9.
Table 6.9. Mean response distributions for scale of mass of a tablespoon of salt.
NZ Year Level Class Mean (Actual = 9.5g)
9 15.2g
10 16.4
11 13.6
12 12.1
6.4.1 Discussion of Responses of Year Nine Students
Year nine students’ responses (Table 6.11 in Appendix 4) indicate considerably greater
difficulty differentiating size of objects large and small, outside their common
experiences. This is shown by the accurate identification of sizes of objects close to
familiar things and easily scale referenced from the size of an elephant or the human
body. The relative visualisation of lengths less than 1/100th of a millimetre and lengths
greater than ‘a long car journey’ seems to defeat many younger students but fewer older
students. Age and experience refine conceptual scale boundaries of size of objects.
6.5 A Multivariate Cluster Analysis of Size Responses
Tables 6.10 and 6.11 and Figures 6.1 and 6.2 illustrate an attempt to identify respondent
age differences in the statistical size clustering of an objects’ size. Analysis was carried
out using minimum variance clustering for MVSP vers.3.13n (Kovach, 1998). Groups or
clusters are generated from numbers of responses (decisions) for each size category
presented in the questionnaire. Cluster lists are not ranks but merely represent clusters of
responses of equal variation. Being a tiny sample, it is dangerous to make general
conclusions.
Comparing Year 12 and Year 9 data shown in Tables 6.10 and 6.11, younger (Year 9)
students have greater difficulty separating and refining small size and large size objects
than do older year 12 students. This finding is shown by the Year 9 group having more
clusters and being much less defined. Cluster 4 for the Year 9 cohort indicates
confidence in judging size of objects within their experiences with much less confidence
in the other clusters. This is similar to the Year 12 cohort cluster 2 with a less clear

141
confidence with the very large and the very small. Some decisions such as a football
field being in the same cluster as the size of a virus is more difficult to explain. Perhaps
the cluster result indicates difficulty in deciding whether a football field is less than or
more than 100m. Do they know?
Table 6.10. Year 9 cluster groups for scale of size rankings.
Cluster 1 Cluster 2 Cluster 3
Earth to Moon
Earth to Sun
Auckland to Invercargill
Satellite altitude
Earth diameter
Rice grain
Ant length
Postage stamp
Pencil length
Human height
Elephant height
School bus
Football field
Pine tree
Tallest building
C atom nucleus diameter
Virus diameter
H atom diameter
Human cell diameter
Bacteria diameter
Human hair diameter
Table 6.11. Year 12 cluster groups for scale of size rankings.
Cluster 1 Cluster 2 Cluster 3 Cluster 4
Human hair diameter
Earth to Moon
Football field
Virus diameter
Earth diameter
Satellite altitude
H atom diameter
Elephant height
Auckland to Invercargill
Human cell diameter
Tallest building
H atom diameter
Rice grain
Pine tree
Earth to Sun
School bus
Postage stamp
Pencil length
Bacteria diameter
Adult height

142
Figure.6.1. Cluster analysis (dendrogam) for Year 12 responses for scale of size.
Figure. 6.2. Cluster analysis (dendrogram) of Year 9 responses for ‘size’ scales.
For comparison, a modern scale of time (Table 6.12) with their units has been
produced by Labrador (2006) where physical measurement of durational time
stretches from attoseconds to billions of years. It is likely that students perceive all
those units below one second as being lumped together with other boundaries of time
at one second, one year and then in centuries and then in millions. A million years
Year 9 (age 13) Size Scale Analysis
Minimum Variance Cluster Analysis
Squared Euclidean - Data log (e)
Adult height 11Bacteria 4Pencil length 10Postage stamp 9School bus 13Earth to Sun 21Pine tree 14Rice grain 8H atom 2Tallest building 16Human cell 5Auck to Inv 18Elephant height 12Atom nucleus 1Satellite altitude 17Earth diameter 19Virus 3Football field 15Earth to Moon 20Human hair 6
30 25 20 15 10 5 0
Year 12 (age 16) Scale of Size
Minimum Variance Cluster Analysis
Squared Euclidean - Data log (e)
Width of human hair Bacteria diameter Human cell diameter H atom diameter Virus diameter C nucleus diameter Tallest building Pine tree Football field School bus Elephant height Human adult height New pencil length Postage stamp Length of an ant Rice grain Earth diameter Satellite altitude Auckland to InvercargillEarth to Sun Earth to Moon
60 50 40 30 20 10 0

143
appears to be perceived as being no different to millions of millions of years. As
Einstein said, “The only incomprehensible thing about the universe is that it is
comprehensible” (Life Magazine, 1950, p.10).
Table. 6.12. Scale and units of time (modified from Labrador, 2006) Note that this
has been arranged ‘geologically’ from the oldest at the bottom to the youngest at the top)
Time Unit Description
Planck Time 10 -43 second: the shortest possible time duration.
Attosecond Billionth of a billionth of a second
Femtosecond Millionth of a billionth of a second
Picosecond Thousandth of a billionth of a second
Nanosecond Billionth of a second
Microsecond Millionth of a second
Millisecond Thousandth of a second
Tenth of a second
Second
Minute
Hour
Day Comprehensible human experiences of time
Year
Century
Thousand years
A Million years ago Near the end of the Cenozoic era and appearance and dominance of Homo.erectus.
A Billion years ago Near the beginning of the Paleozoic era
Billions of years ago Age of the Earth at 4.6 billion years ago
Age of the Universe at 13 to 15 billion years ago
6.6 Other Geological Scales
The scalar concepts of earthquake magnitude and intensity provide a unique dilemma
for many students. How and where do they place these concepts onto their
categorised mental scales? Earthquake magnitude is concerned with energy release
and ground shaking motion. Intensity is concerned with what is felt and seen during

144
energy release. There is only one magnitude for each earthquake but many intensities
depending on how far away from the epicentre an individual is. There is often
confusion between ‘feeling’ kinaesthetic scales and instrumentally measured and
calibrated ‘number’ scales and student discussions of earthquake magnitude often
reveals (anecdotally) an inability to grasp the idea of the ‘Richter scale of magnitude’
as being open ended and that like a temperature scale, it is theoretically possible to
have a negative earthquake magnitude. For students whose experiences and scales of
number only begin at zero, this is hardly surprising. The student responses for both
age groups suggests that very few have a grasp of numbers stretching less than zero.
It is as if numbers start at zero (or one) and go forward to infinity for many students
although one older student did conceive of an infinite negative and an infinite
positive. The ‘Now’ ‘Me’ ‘Zero’; equivalents are the beginning scalar boundary
reference points. For older students who do have a grasp of negative numbers, these
students fail to grasp the connection between energy release and ground shaking
motion as measured on a scale based on calibrated instruments. Refinement and
conceptual differentiation of scale proceeds with age. Nieto-Obregon (2001) has
devised a useful circular ‘chronoscalimeter’ for aiding visual perception of relative
geological time.
Development of an understanding of scale then is experiential in nature and it seems
that people also have a genetically innate sense of number, size, time and relativity
which is triggered by experiences of the natural world’s four dimensions. Survival in
the ‘real’ biological world depends on the ability to make the right judgements based
on experiences of the physical world. In the words of Gee (1999) “Deep Time is like
an endless dark corridor, with no landmarks to give it scale” (p. 26). It is the
teachers’ challenge to interpret the landmarks that are visible (such as the fossil
record, radioactivity and starlight) and the means of finding new ones (field
relationships) to help make sense of geological time through provision of tactile and
theoretical student experiences of geological time.
6.8 Looking at Time and Biological Evolution
Understanding biotic evolution is impeded by the difficulty in comprehending the
nature, tempo and meaning of geological time. As D’Arcy Thompson (1942) stated

145
in his attempt to comprehend the different worlds of people, insects and bacteria,
“The predominant factors are no longer those of our scale; we have come to the edge
of a world of which we have no experience, and where all our preconceptions must
be recast” (p. 771). Little wonder that discussion of geological time and biotic
evolution shakes confidence and rattles conceptual worlds. There is little dispute that
the greatest contribution the Earth sciences have provided to our conceptualisation of
the world is that of geological time (Gould, 1987; McPhee, 1981; Orion & Ault,
2007). However, it is the nestling of biological evolution within a ‘proper’ scale of
geological time that causes the greatest disturbance. As mentioned in Chapter 4, the
intertwined conceptual worlds of gradualism and punctuationism offer scientific
theory explanations for the observable fossil record and possible mechanisms of
evolution, but the power of worldview religious social constructs (such as biblical
Judeo-Christian thought and the Qur-an of Islam) confuse the paradigms of science
and religion as explanations of the natural world, in this case, geological time and
biotic evolution. In Islamic thought, scientific evidence is in the service of God
where the understanding of nature is a kind of bridge to getting closer to God
(Dagher & Boujaoude, 1997). These religious ideas directly influence the way people
construct their view of biotic evolution and geological time.
Gould (1987), attempts to metaphorically rationalise the historical march of time as a
directional ‘arrow’ with intertwined cyclical repetitions of mechanisms. For example,
biotic homologous structures is a term used by biologists for describing shared
features generated along the historical arrow of time and analogous features is a term
used for describing similar functional structures within repetitive but separate cycles
of time within different taxonomic lineages. The use of homology and analogy is
recognition of arrows and cycles of events through time. Little wonder that young
students (and old) struggle to make sense of naturalistic biotic evolution on a time
scale that is beyond their experiences. Global Earth Science curricula (Chapter 4)
reflect these conceptual and historical difficulties of matching geological time with
biotic evolution. Fossils, as the remains of once living organisms preserve the
homologous record of times arrow through countless analogous intertwined spirals.
These spirals are blindly directionless (See Figure 6.3) and simply represent an
organism’s response to environmental change (at that point in time) and are not
responses to “times arrow”. Times arrow is independent and exists as a by product of

146
natural events. As are oxidation and reduction and electricity and magnetism to
chemistry and physics, so to are cycles and arrows of time to geology. Without the
connection to deep geological time, patterns and mechanisms of biotic evolution
become meaningless. Evolution is indeed a ‘blind’ populational DNA response to
environmental change and is independent of time (Dawkins & Wong, 2004; Mayr,
2001).
Figure 6.3. Times ‘progressive arrow’ versus ‘analogous speciation’
The early eighteenth century western intellectual world was (and is?) dominated by
Judeo-Christian religious views of a progressive evolution of the Earth.
Consequently, it is hardly surprising that a realistic scale of geological time was not
clearly understood when James Hutton (Hutton, 1788) wrote his now famous closing
lines: “The result, therefore, of our present enquiry is, that we find no vestige of a
beginning,--no prospect of an end”, (p. 304). But of course there was a beginning,
one simply beyond comprehension at the time. It is interesting to note that the first
part of this famous quote (“The result, therefore, of our present enquiry is…..”), is
rarely included and suggests that Hutton was aware of other peoples’ research (and
controversies of the time such as neptunism versus plutonism), and the potential
research that might provide refinement to his concept of never ending cycles of
change through his perceived scales of unimaginable geological time. Refinement of
deep geological time and the evolution of life within this framework eventually came
(amongst many others), with Lyell, Darwin, Wallace and Holmes. Hutton was also
keenly aware of the continual nature of time (“Times Arrow”)? and his thinking
began the conceptual changes needed for a better comprehension of Earth’s history.
Times non-directional spiral arrows of analogous biotic
speciation.
Times directional homologous ‘historical’ arrow

147
James Hutton (1726-1797)
“….the course of nature, cannot be limited by time, which must proceed in a continual succession” (Hutton, 1788, Vol.1, part 2, p. 215)
(http://www.amnh.org/... /earth/p_hutton.html)
6.9 Concluding Comments
This chapter has looked at the geological time aspects of research question 3: What is
the influence of diachronic thinking on conceptions of geological time, structures
and fossils? Discussion has been further developed into investigations of student
conceptualisations of scale and found that teaching and learning about scale is likely
to be a significant factor in the development of scientific conceptualisations of
geological time and its application to geological phenomena.
Landscapes, like life, evolve through time, and in conclusion to this chapter a
pictorial metaphor for geological time by Salvador Dali’s 1934 warped sense of a
decomposing, dripping and melting clock (which is neatly and subtly connected to a
geological ‘natural’ landscape theme, and complete with vertical strata in the bottom
right hand corner), seems to sum up how people conceive and perceive but fail to
comprehend the infinite vastness of deep geological (and space) time. The
uniqueness of geological science lies in its contribution to learning and scientific
literacy by application of scales of time to earth history. The challenge for educators
is to find effective ways of developing in students a geological sense of time and one
that connects with biological, physical and chemical evolution.
(http://www.allposters.com/-sp/Clock-Explosion_i96971_.htm?aid=999826)

148
CHAPTER SEVEN
SPATIALISATION AND GEOLOGICAL STRUCTURES
7.1 Introduction
Research question 2 asks:
How do students aged between 12 and 40 develop their conceptions of evolution and
the fossil record, geological time and 3-D geological structures?
Research question 3 asks: what is the influence of visual/spatialisation on
conceptions of geological structures? The ability to spatially reason and visualise
hidden structures and infer their deformational histories is an important aspect of
geological science not only at a macro scale but also at a micro scale. Spatialisation
ability is investigated with the use of the GeoTSAT instrument given to the following
cohorts. Note that respondent sample sizes are shown in Table 5.3, Chapter 5.
American University of Beirut (AUB) Primary Teacher Trainees
AUB Secondary Teacher Trainees
University of Canterbury (UC) Secondary. Teacher Trainees
UC 1st Year Geology students
UC 2nd Year Geology students
UC Geology Post Graduates
Ashburton College (AC) Year 13
AC Year 11
Israeli (IS) Grade 8
IS Grade 10
IS Grade 12
Geology fieldtrip, West Coast New Zealand

149
This chapter is an attempt to piece together primary data from students aged 13 years
to graduate (40 years) on the GeoTSAT instrument, for their conceptualisation and
visual-spatialisation reasoning for 3-D (block diagram) geological structures (see
Appendix 2). This wide range of respondent age and culture provides a control for
mono cultural bias and enables age related geospatial comparisons.
It is the visual penetration ability component that is specifically addressed in this
thesis and further investigated, discussed and described in Chapter 8). Although
surface developments and rotations are important aspects of geological structures,
solving geological structure problems uniquely involves VPA. Visualising hidden
three dimensional directions of rock strata and being able to place oneself inside a
cube and look outwards in 3-D for example are skills that are valuable for
understanding geological structures. Further investigation of VPA was specifically
suggested as a ‘fruitful’ area of future research by Kali and Orion (1996).
To make sense of geological structures, their origin, history and reconstruction,
necessitates the ability to visualise hidden structures based on fragmented and
disoriented surface features. The teaching and learning of geology uniquely enables
development of this visual penetrative spatial intelligence and enhances and
combines this ability with the real world of fieldwork. The research challenge is to
investigate the factors that trigger spatial abilities that are connected with geological
structures and to implement these findings into the classroom.
As Libarkin and Brick (2002) state; “….the development and validation of tools for
the assessment of visualisation in the Earth Sciences is a relatively untouched field of
research”(p.453), and indeed, with the power of current computer modelling and
game theory, students are persistently exposed to visual and kinaesthetic learning as
opposed to audio learning. The challenge is to develop cognitively manageable,
economically cheap and conceptually sound visualisation software for enhancing the
development of 3-D to 4-D spatial visualisation of geological phenomena. Table 7.1
shows subject areas within the New Zealand curriculum in which students require
spatial – visualisation skills. Most New Zealand students then are exposed to a
variety of curriculum areas that provide them with an opportunity to develop their

150
spatialisation abilities albeit with restricted time within each discipline area.
Continuity of development is best placed within mathematics and the sciences.
Table 7.1. New Zealand curriculum with visual-spatial components.
Subject Area Topic with a visual-spatial component
Mathematics Tessellations, reflections, rotations, geometry
Graphics Technical drawing, computer aided design, building plans
Art Cubism, tessellations, portraits, theatre scenic art.
Geography Location, maps and mapping, geographic information systems
Chemistry Molecular and atomic shape rotations
Biology Ecology, cell structure and shape, organic molecules.
Physics Harmonic motion, Newtonian mechanics.
Astronomy Structure of the Universe, stars, galaxies, space.
Geology Structures, interior, volcanism, seismology, sequencing, correlation.
As mentioned in Chapter 2, recent work (Blazhenkova, & Kozhevnikov, 2009;
Kastens, 2010; Kozhevnikov, Kossly, & Shepard. 2005) have firmly placed
geospatialisation skills within a definable cognitive learning style where individuals
tend to be ‘spatially’ or ‘object identification’ oriented. This appears to have a likely
genetic component for use of different neurological pathways in the brain
(Blajenkova, Kozhevnikov & Motes, 2006a). Geospatial abilities such as VPA
require both attributes. The challenge for geoscience educators is to develop
programmes of instruction that cater for both learning styles that will develop geo-
visual spatialisation abilities. For example, identification and classification exercises
and activities for rocks, minerals and fossils and tasks for mental rotations and VPA
for geological structures and ICT enabled, await exciting future development.
7.2 Rationale for the Geo-Spatial Structures Questions
Block diagrams (See Appendix 2 for the GeoTSAT instrument) were used to test
visual/spatial ability to draw strata continuation in folded strata (Questions 7a-d) and
tilted (Question 8b) strata geological situations. This corresponds to Kali and Orion’s
(1996) validated tests of ‘completion’ questions 8a and 8c, cross sectional ability as

151
well as visual penetration ability. The ability to translate in what Kali & Orion called
a ‘construction’ test where a simple geological surface map is required to be
translated into a cross section was not tested in this GeoTSAT but was tested in the
GeoVAT instrument in Section B, question 2a (See Appendix 5). The results to this
are fully discussed in Chapter 10. No instructions were given on what a cross or
transverse section is, nor were respondents told that strata were of equal thickness,
and that there may be more than one correct answer. Responses were entirely
undirected and ‘raw’. Table 7.2 shows the types of structure and spatialisation
required for each question.
Table 7.2. Required GeoTSAT geological spatialisation skills.
Geological structure Spatialisation Skill
Non geological: letters e and G (Q6) Mental rotation
A horizontal syncline (Q7a) 3-D surface continuation of strata
A horizontal anticline (Q7b). 3-D surface continuation of strata
A plunging anticline (Q7c). 3-D surface continuation of strata and VPA
A faulted horizontal syncline (Q7d). 3-D surface continuation of strata and VPA
Plunging syncline (Q8a) and a sphere (Q8c).
Cross Sectional rotation and VPA
Inclined flat layers (Q8b). Cross sectional rotation and VPA
The following diagrams illustrate accepted models used in the GeoTSAT instrument
and based on that of Thomas (1966).
Question 7a Question 7b
(Horizontal syncline) (Horizontal anticline)

152
Questions 7c and 8a Question 7d
(Plunging anticline) (Faulted horizontal syncline)
Question 8b Question 8c
Inclined horizontal strata A sphere
Student responses were compared to the accepted ‘answers’. The horizontal syncline
(7a) and horizontal anticline (7b) indicate a simple fold of strata and assuming no
overturning of strata. Diagrams show the three surface patterns when sliced through
three different axes. Question 8b is more complex in that an anticline (upfold of
strata) has also been tilted towards the observer and subsequently planed off. This
produces different surface patterns on the three faces of the block. Question 7d
introduces the combination of a horizontal syncline cut by a fault. Students were
required to spatially visualise the surface pattern for this combination. Question 8b
was a simple originally horizontal sequence of strata that had been tilted with no
folding. Question 8c asks students to visually penetrate the inside of the Earth when
cut through the middle. In effect this means respondents are required to be able to
visualise a transverse section of a sphere.
Respondents were asked to draw the continuation of strata on each exposed face of
the block diagrams or to draw a cross section. Questions 7 a, b, c and d had two faces
exposed. Question 8a required two cross sections at right angles to each other. To be
completely correct respondents needed to be correct for question 7c. Question 7c was
essentially looking for a response that showed up-folding of strata on the front face
of the block diagram. Insufficient data prevented any evidence of gender differences
in responses. Appendix 7 presents the results of student responses to their spatial
reasoning of these typical geological scenarios. ANOVA of cohorts for questions 7
and 8 of the GeoTSAT instrument (See Appendix 8) suggest that that are differences
in the means for correct responses but that these differences are largely due to age

153
and experience rather than the kinds of spatialisation difficulties exhibited. Despite
increased probability of type-1 errors this is elucidated by t- test analysis.
7.3 Summary and Discussion
This chapter discusses general issues of geospatialisation skills such as VPA and
describes the rationale for the geological structure exercises in the GeoVAT and
GeoTSAT questionnaire instruments. It builds on the work of Kali and Orion (1996)
and provides supporting evidence for how respondents across all age groups prefer to
copy existing block diagram faces when unsure or are unable to visually penetrate
hidden structures. Although the importance and significance of spatial reasoning
within geological science has long been understood, (Bradshaw, 1969; Chadwick,
1978), only recently have these abilities begun to be investigated (Ben-Chaim, 1988;
Ishikawa, & Montello, 2006; Kastens, 2007; 2009; 2010; Liben, 2009). VPA is a
critical attribute for making sense of geological structures not only from field
mapping but also from modern use of 3-D software. This chapter briefly investigates
and builds on the earlier work of Kali and Orion with respect to a validated
instrument being but one used and adapted for a wider age range of respondent.
Chapter 8 expands on the use of ’hands on’ modelling for investigating VPA. The
evolution of crustal deformation through time is unique to geological science and the
visual spatialisation and comprehension of this is crucial for making sense of earth
history - the aim of geological science and probably all sciences. As the technologies
of gps and GIS are extended, so will our 3-D understanding of geological structural
deformation.
Although each geological block diagram in the GeoTSAT instrument has its own set
of difficulties, recording the total mean percentages for incorrect responses across
all cohorts provides a measure of VPA difficulty as presented in the structural
problems. The findings are summarised in Figure 7.1.

154
Ranked Mean percentages for ALL Cohorts for Incorrect Responses
18
28
50 52
807671
54
0
10
20
30
40
50
60
70
80
90
100
7a 8c 8b 7b
8a(ab+
xy)
7d 7c
Total m
ean
Question
Per
centa
ge
Inco
rrec
t
Figure 7.1. Ranked degree of VPA difficulty for geological structures.
Not surprisingly, as structural complexity and VPA demand increases, the percentage
of correct answers decreases. Although only one face is required to be completed,
Q7c caused the greatest difficulty across all cohorts. This is likely to be a result of
the high VPA demand caused by the hidden direction of a pitching anticline and the
need to visualise how different planar sections effect the strata directions. It also
presupposes prior knowledge about geological structures. It is unlikely that any of
the cohorts other than post secondary geology students would have this knowledge.
In New Zealand for example, geological structures (in any form) are not taught at
secondary school and so responses are purely those of ’native’ or naïve VPA. The
mean percentage of correct responses for all cohorts for all questions is 54%
suggesting that there is a degree of VPA already developed but also that VPA
remains highly underdeveloped even into graduate level and especially for teacher
trainees (See Figure 7.10). Not surprisingly, geology students at second year level
and graduate level have the most developed VPA suggesting the power of specific
training and learning experiences such as fieldwork (See Figure 7.10). There is little
doubt that developing valid and well resourced learning experiences with a strong
connection to the real world outside the classroom and ‘up close’ to a rock exposure
enhances visual spatialisation. However, it is only in fieldwork that dimensionality,
scale, complexity and new investigational problem solving skills can be taught
(King, 2008). With augmentation from information technology, connecting the real
world to the virtual world further enhances spatialisation skills (Orion et al. 1997;
Riggs, 2004; Riggs, & Tretinjak, 2003; Smith, 2005).

155
Mean Scores for GeoTSAT Incorrect Responses
0
10
20
30
40
50
60
70
80
90
100
7a 7b 7c 7d 8a(ab+xy) 8b 8c
Questions
Per
cen
tag
e o
f In
corr
ect
Res
po
nse
s
IS G8
IS G10
IS G12
AC year 11
AC year 13
UCL1
UC L2
UCPost Grad
UC SecondaryTeacher TraineesAUB Primary TeacherTraineesAUB SecondaryTeacher Trainees
Figure 7.2. Percentage of incorrect responses by age group.
Question 7d is similar to 7c in difficulty largely because of the VPA required to ‘see’
the effect of vertical disruption on the syncline. Most answers were correct for the
side face but not the top face as well.
Figure 7.11 shows the incorrect responses per question per age group and combines
the mean incorrect responses for the GeoTSAT spatial structure questions. The
overwhelming finding is that geology students are significantly advanced in VPA
relative to other cohorts, but there is little difference between all other age groups.
Indeed, graduate teacher trainees are little different in their VPA than the children
they will be teaching. For example only 16% of University of Canterbury
postgraduate geology students were incorrect for all structural VPA questions, but
there was effectively no difference between the AUB secondary, AUB primary and
Israeli 13 year olds in percentage of correct answers. Although the NZ secondary
teacher trainees do not score well in questions 7 and 8 of the GeoTSAT instrument
(Mean of 53% correct responses), they have performed significantly better than their
AUB counterparts who are from a different social culture, school and university
curricula. Possible reasons for this include the degree and content of geological
science exposure in school curricula and exposure to fieldwork where geospatial
experiences are part of object identification and spatial learning. Identifying what
geological objects are from unusual spatial orientations is a first step to unravelling
structural histories. Comparing responses from isolated and ‘independent’ samples
provides information that generates further research questions.

156
Age Group Means for Combined Incorrect Responses to Questions 7 and 8 of the GeoTSAT Structures (see appendix)
72
74
47
73
52
64
55
55
67
19
16
0 10 20 30 40 50 60 70 80
Israel G8 (13/14yrs) (n=21)
Israel G10 (15/16yrs) (n = 15)
Israel G12 (17/18yrs) (n = 23)
AC (NZ) y11 (15yrs) (n =13)
AC (NZ) y13 (17yrs) (n = 23)
UCL1 (NZ) (21yrs) (n = 24)
UC L2 (NZ) (22yrs) (n = 9)
UCPG (NZ) (27yrs) (n = 10)
UC (NZ) Secondary Teacher Trainees (27yrs) (n = 9)
AUB (Leb) Primary Teacher Trainees (19yrs) (n = 7)
AUB (Leb) Secondary Teacher Trainees (22yrs) (n = 9)
Ag
e G
rou
ps
(N
=1
63
)
Mean Percentage of Incorrect Responses for GeoTSAT Structures Q's 7 and 8
Figure 7.3. Mean percentages of incorrect responses per age group.
The findings in this small study (See Chapter 8 for the details of student responses to
the VPA investigation), confirm that spatial reasoning is a critical area for a
meaningful unravelling of earth’s structural history and that learning geological
science is another tool that enables an individuals visual-spatial development: a key
competency that is often absent from or minimalist in school curricula (Liben,
Kastens, Agrawal, Christenson & Myers, 2009). Underdeveloped spatial reasoning
reflects curriculum priorities and histories. Although significant progress has been
made with 3-D virtual reality (VR) tools using Geographic Information Systems
(GIS) (Bo Huang & Hui Lin, 1999; Dong, Hu & Wang, 2010; Smith, 2005), specific
application of VR to geological processes and in particular, geological structures
education, remains a work in progress (Kali, Orion, & Mazor, 1997; Kali, 2002;
2003). In the end, it is likely that for a full appreciation of geospatial relationships
connection with the real world as in the field will be required. Improved
understanding of the neurocognitive mechanisms and connections with VR presents
a rich area of future research. VPA is particularly important to the geological
sciences as the Earth is mostly hidden from view and being able to ‘see inside’,

157
rotate and mentally manipulate observable geological surface patterns provides a
unique way of making sense of geological history. Orion and Ault (2007) sum up the
significance of developing geospatial skills that are diachronically related:
Making sense of earth’s processes and patterns, structures and changes, systems and cycles, depends upon visualization and spatial reasoning as well as recognising bias in the human-scale perception of events.
(Orion, & Ault (Jr), 2007, p.66.)

158
CHAPTER EIGHT
3-D MODELLING AND VISUAL PENETRATION ABILITY (VPA)
8.1 Introduction
This chapter addresses specifically the 3-D visual/spatialisation aspects of research
questions 2 and 4:
Research Question 2
How do students aged between 12 and 40 years develop their conceptions of
evolution and the fossil record, geological time and 3-D geological structures?
Research Question 4
What is the influence of visual/spatialisation on conceptions of geological structures?
As discussed in Chapter 7 the perception and interpretation of rock deformation
relies on the ability to visually penetrate in the’ minds eye’ as it were, solid rock.
During tectonic activity rocks in the right physical position and condition are able to
deform plastically and produce complex styles of folding and refolding. Faulting or
breaks in rock strata occurs in more brittle rock. Discussion in this chapter is
restricted to investigating VPA for a simple geological fold structure but across a
wide age range of respondents.
8.2 Method
Developing and using a ‘hands on’ 3-D model for investigating VPA was selected as
an additional triangulation of questionnaire ‘paper and pen’ exercises for geological
structure problems. It has always struck me that so many teenage learners (especially
boys) are highly kinaesthetic and that being able to touch and manipulate a 3-D
model of a simple geological structure may provide a confidence that looking at a 2-
D representation couldn’t. Exposing learners to ‘real’ 3-D problems rather than
‘virtual’ 3-D pictures was a positive and indeed added interest and curiosity to
geological structures problem solving. The key value in the use of 3-D models is

159
their ability to be ‘pulled apart’. Learners want to see their answers and, as McLeay
(2006) pointed out, it also caters for different learning styles. The results to this
study triangulate with the GeoTSAT paper and pen exercises for VPA.
A small plasticine model (Figure 8.1) was presented to individual students (with no
collaboration with other students) for investigating their VPA. Plasticine was
selected because of its ability to be used many times and ‘fixed’ many times. It
consisted of a simple two layer anticlinal fold structure (Figure 8.1). Students from
available classes at a New Zealand secondary school of ages ranging from 13 to 18
and their science graduate teachers were individually asked to draw what they
thought the inside surfaces would look like (VPA) after the structure was cut with a
knife and pulled apart. Unlike Titus and Horsham’s study (2009) where the VPA
exercise consisted of a single angled transverse cut, this study included section cuts
which were longitudinal, vertical transverse (or cross) and diagonal.
Research question 4 asks how visual spatialisation influences the development of
conceptualisation of geological structure. Understanding geological structure and the
history of deformation requires a spatial ability, which for geology is largely VPA. In
response to research question 2 this chapter investigates the status of VPA in a small
sample of students but across a wide age range (13 years to adult age). Developing
ways of teaching VPA and other spatial skills is dependent on having an
understanding of perceptual and conceptual spatial status.
Figure 8.1. Plasticine model used for VPA investigation.

160
For the diagonal cut, students were asked to draw what they thought the upper
surface in plan view (looking down on the top surface) would look like when the cut
diagonal ‘lid’ section was removed. Completion requires mental rotation and VPA.
8.3 Results
Correct responses to models sectional cuts are shown in Figure 8.2 and all results are
detailed in Figures 8.2 to 8.8.
A. Longitudinal B. Transverse C. Diagonal Cut (Plan View)
Figure 8.2. Correct responses for 3-D model sections.
Category Responses for Longitudinal Section NZ Year 9 age 13/14 years
(n = 13) Female Male Total
1. Correct two horizontal strata 2 1 3
2. Rectangular centre with variations.
2 1 3
3. Central horizontal strip
2 3 5
4. Other
0 1 1
0 1 1
Figure 8.3. NZ age 13/14 years responses to longitudinal section.

161
Category Responses for Cross Section NZ Year 9 Age 13/14
(n =16) Female Male Total
1. Correct 2 3 5
2. Other 2 4 6
1 1 2
No colour recorded 1 1 2
No colour recorded 0 1 1
Figure 8.4. NZ age 13/14 responses to cross (transverse) section.
Category Responses Diagonal Section NZ Year 9 Age 13/14 years
(Plan View) Female Male Total
1. Correct 2 3 5
2. Diagonal split 2 0 2
3. Central horizontal strip 2 2 4

162
Category Responses Diagonal Section NZ Year 9Age 13/14 years
(Plan View n = 7) Female Male Total
3. Other 1 0 1
1 2 3
0 1 1
0 1 1
Figure 8.5. NZ age 13/14 years for diagonal section.
Category Responses NZ Year 11 Age 15/16 years
Longitudinal Section (n =13) Female Male Total
1. Correct 4 3 7
2. Central horizontal strip 6 5 11
3. Central rectangle 2 3 5
4. Cross section pattern copy 0 1 1
Category Responses NZ Year 11 Age 15/16 years
Cross Section Female Male Total
1. Correct 5 3 8
2. Circular Centre 2 5 7
3. Rectangular Centre 4 3 7
4. Blue top and bottom strips 1 0 1

163
Category Responses NZ Year 11 Age 15/16 years
Diagonal Section (n = 15) Female Male Total
1. Correct 2 4 6
2. Central horizontal strip 7 2 9
3. Rectangular Centre 3 5 8
4. Other 0 1 1
Category Responses NZ Year 12 Age 16/17 years
Longitudinal Section (n = 12) Female Male Total
1. Correct 3 1 4
2. Central horizontal strip 1 1 2
3. Rectangular Centre 2 1 3
4. Other 1 1 2
0 1 1
Figure 8.6. NZ age 16/17 years for longitudinal section.

164
Category Responses NZ Year 12 Age 16/17 years
Cross Section (n = 9) Female Male Total
1. Correct 4 2 6
2. Circular Centre 2 0 2
3. Other 0 1 1
1 0 1
Figure 8.7. NZ age 16/17 years responses for cross section.
Category Responses NZ Year 13 Age 16/17 years
Diagonal Section (Plan View) (n = 11) Female Male Total
1. Correct 1 0 1
2. Other 1 0 1
1 1 2
4 1 5
0 2 2
Figure 8.8. NZ age 16/17 years responses for diagonal section.

165
8.4 Discussion
“…reasoning for non-penetrative answers showed a dependency of students on the patterns exposed on the external faces”. (Kali & Orion, 1996, p.383.)
In other words, students who are unable to visually penetrate a solid object in terms
of visualising where rock layers might extend to rely on guessing this internal
extension from the pattern they see on the outside. After all, what other choices do
they have if they can not ‘see’ inside the structure? For example, Year 9 students
typically draw the lines which correspond to the ‘cut marks’ on the outside of the
model but do not know where to actually put them. They know that they do not
know. Nearly all students were very keen to be shown ‘what the answer is’ and often
exhibited surprise when shown the answer by the ‘opening up’ of the model either as
thinking that they were right but did not express their thought or surprise that they
the answer was nowhere near their visual penetrative thought patterns. The dry-erase
cube (Kuiper, 2008) is another tool recently developed in an effort to improve
student 3-D perceptions. Outcrop patterns are marked on the cube and then
manipulated for VPA. It is dry erase because markings can be removed. The
advantage of using plasticine is that younger students (13-18 years) are familiar with
the material and enjoy the tactile feel. It enables students to hold and look all around
the structure from any 3-D angle. But they can only ‘see inside’ with VPA. The
material can be easily moulded into different shapes with varying complexity of
structure and easily cut along planes of different angles. Respondents are required to
listen to verbal instructions.
8.5 New Zealand Year Nine (Aged 13 years) Responses
The origin of the central rectangular pattern by Year 9 students for the longitudinal
section puzzle is difficult to explain. It seems that students do not ‘close’ the lines
they draw because of uncertainty or perhaps lack of perception as to where the
boundaries go, so by drawing a circle or a rectangle in the centre, all options are
covered and they therefore are not at risk of “being wrong” (e.g. Figure 8.11). It may
also be caused by misperception of the cross sectional ends of the model as they are
exposed to full view and often closely looked at by respondents before drawing their

166
answers. In this case, the cross section becomes the answer because this is all the
respondent sees. A large proportion (38%) of Year 9 students drew a central
horizontal strip. This perhaps indicates that students recognised the need for a colour
to go along the length of the model but had no idea where to put it. In short, the
majority of Year 9 students (aged 13) were unable to visually penetrate a longitudinal
section. Intriguingly, Year 9 respondents were also unable to perceive the correct
relative proportions of the upper blue layer (strata) and the lower red layer. That is,
they seem to be unable to perceive that the upper blue layer is very much thinner
than the lower red layer.
Responses to the cross sectional ‘puzzle’ show that 33% of the Year 9 responses
were correct with 53% drawing a central area surrounded by the ‘outside’ blue layer.
This outcome is despite the fact that the correct pattern is exposed at each end of the
model. It seems that this sample of students were unable to perceive that the inside
pattern was going to be the same as that exposed at the ends. Most Year 9 students in
this sample could not visually penetrate the model. It is also difficult to understand
why some students divided the cross section into quadrants and halves. Perhaps these
students did not fully understand what was meant by a cross section and simply made
up an answer based on the cut marks they saw on the outside surfaces or just drew ‘a
cross’. Either way, these students were clearly unable to visually penetrate the
structure, or, in Kali and Orion’s terminology, were “non penetrative” in their
answers, and indeed, many were unable to even translate the exposed ends of the
model to being the same all the way through the model. Kali and Orion’s study only
investigated grade 12 (age 16/17years). Students were reliant on verbal instructions
of what they had to do and no clues were provided by ‘opening’ the model before
drawing their diagrams. The students who drew central circles were also unlikely to
have perceived that the red ‘inner’ layer extended to the bottom. It seems that many
of the Year 9 students simply visualise “a blob of colour” with no boundaries.
The diagonal section puzzle for Year 9 students proved to be a more formidable
problem with less than 30% being correct and 23% drawing a horizontal strip for the
cross section puzzle. Only two students (11%) copied the outside diagonal surface
cut and 35% of this age group appeared to have little idea and simply copied what
they had done for the cross section. It seems that ‘lifting the lid off the top’ of the

167
model and when cut on a diagonal is too difficult to visually penetrate. Even when
asked to draw or describe what the inside pattern would look like when cut
horizontally along the length of the model, these younger students were unable to
visually penetrate. The added complication of a diagonal cut was too difficult.
8.6 New Zealand Year Eleven (Aged 15 years) Responses
The percentage of correct responses for each ‘cut’ of the model is summarised in
Table 7.1 in Chapter 7. Year 11 students have similar difficulties to all other age
groups for visually penetrating the diagonal cut but appear to be more visually
penetrative than their young colleagues for the longitudinal and the cross sections. It
is still somewhat surprising to me as an experienced teacher that 15/16 year olds
cannot easily transfer on inspection, the exposed cross sectional ends of the model to
the unseen inside. Only half of this sample was able to do this. Year 11 students in
this sample are effectively no different in their response than all other year levels.
Similarly very few students are able to correctly penetrate the diagonal cut, the main
difficulty being the inability to know where the boundaries ‘begin’. For example,
(Figure 8.9), the most common error was to not take the inner layer to the right hand
edge of the model but rather to enclose it as an inner rectangle. Curved boundaries of
the diagonal and cross section are rarely drawn. Note that the sides are splayed out
and not straight.
Most common error Correct response (plan view)
Figure 8.9. The diagonal cut response (The fold is horizontal).
Kali and Orion’s work was concerned with Israeli grade12 students. These students
are the equivalent to New Zealand Year 13 students aged 17/18 years and in their
final year of high school study. Although only 6 teachers (both mathematics
Inner layer is drawn rectangular and enclosed and not perceived as beginning at the ‘edge’ or stretching to the edge.
Boundary separation increases with angle of cut.

168
teachers) agreed to complete the VPA cross sections, only one out of six cross
section responses were correct. The scans below (Figure 8.10) show common
secondary school teachers’ responses.
A. Longitudinal section
B. Cross section
C. Diagonal section
A correct response
Figure 8.10. Typical graduate teacher responses to 3-D model problems.
Although only six adult teacher responses (three female and three male) were
recorded, these responses suggest that even adults without experiences and practice
(one was a PhD holder) have difficulty visually penetrating the hidden structure
pattern. Their responses when shown the pattern by actually cutting the model was
the same as their students: “I thought it was like that but wasn’t sure”. The scans
above indicate that like their students, they search for clues to the inside pattern from
the observable outside pattern and fail to visually penetrate. The best performed
group were the Year 12, 16/17 year olds for the cross section. Most were able to
grasp the visual connection that the exposed end of the model was the same as taking
a cross section through the middle. The teachers were not confident about this and
were well off the mark for all other sections. The incorrect teacher response for the

169
diagonal section indicates a common approach to visual penetration tasks: “copy a
side that can be seen and don’t worry about the invisible inside”. For the diagonal
cross section it is an important visualisation that the fold curvature generates
boundaries that are not parallel. As the angle of cut increases, the degree of
boundary separation increases, but most responses for all age groups draw parallel
boundaries. For the diagonal cut, only 13/43 (33%) of all responses from age 13 to
60+ were correct. The diagonal section is the equivalent of GeoTSAT question 8a,
where visualising the effect of angle change (the apparent view) on two surfaces is
required. All age groups were similar in their spread of responses: visual penetration
ability is much the same across all age groups in this small study. Visualising hidden
patterns through three axis changes is a complex task with little or no training! Little
wonder that second year geology students of age 20-23 years have difficulty forming
the necessary neuronal pathways when exposed to stereonet analysis of fold
structures and kinematics. With a little bit of appropriate genetics and lots of valid
and structured VPA training exercises, practise makes perfect.
8.7 Comments on Verbal Responses to the 3-D Model VPA Exercise
When respondents were asked if they would like to take part in a piece of research
for learning about geological structures, very few refused point blank and those that
did were curious to know what was involved and were prepared to “give it a go”.
Respondents were verbally told as clearly as possible what they were required to do.
They were shown the plasticine model, allowed to hold it and look at it and then
asked if they would draw the hidden structure when it was cut along the
demonstrated sections. At the end of the exercise, the model was actually cut open
and the respondent shown the answer: an advantage of using the plasticine model
(even if it was a very simple two strata fold). The fold asked to be visually penetrated
was an anticline, but it would have been possible to invert it and use it as a syncline.
Actually cutting the model and having ‘a look inside’ was always appreciated and
usually met with exclamations like, “Ah, so that’s what it is like” or “I was wrong
then!” or “I got that right”. A box was drawn for them to put their answer in for the
longitudinal and diagonal sections but not the transverse section as this was thought
to provide too much direction and would not allow them to show that they realised
the transverse section was the same as the ends and so was more square in shape.

170
Respondents were told that for the diagonal section they were to draw what the
pattern would look like in plan view or looking down on top of the surface when the
cut section was removed. This was demonstrated to the students so it was clear what
they were to draw. In some cases it appears that respondents forget that they were to
draw the plan view for the diagonal cut, and simply drew the diagonal side view cut
in much the same way as in the GeoTSAT instrument (Appendix 2), when faces are
simply copied onto the completion face. Mentally rotating the side view to the
hidden top view provides a challenge for many and across all age groups. In nearly
all cases there was a verbal show of lack of confidence in being able to do the task
correctly. The teachers were the most verbal at expressing before they even started
how they would not be able to do it because, for example, “I have never been any
good at this” or “what if I get it wrong?”
Recent work by Kastens, Agrawal and Liben (2009) report on the reasoning
processes that geologists and geology students undergo when confronted with field
scale outcrops. In Kastens et al study (2209) there were no folding or faulting
complexities: just a simple two strata structure spread over several ‘outcrops’
artificially buried and in which participants were required to eventually visually
penetrate. This begs the question ‘does VPA direct object identification, does object
identification come before VPA or both equally? As similar to responses recorded in
this investigation, there appears to be an age independent and a common approach of
using given, observable features as the response rather than individuals developing
and using their own spatial approach. This is rather like students rewording given
information in an examination question and using this as their answer rather than
using individual application of observed evidence. This approach was common in the
VPA problem solving across all age groups.
8.8 Summary
Not only is there much to be learnt about how students develop their spatial literacy
but VPA is an emerging spatial skill research topic (King, 2006; Liben, Christensen,
Kastens, & Agrawal, 2008; Liben, Kastens, Agrawal, Christensen, & Myers, 2009),
VPA is required in many fields such as chemistry, engineering and medicine, but
VPA is especially important in the geological sciences where so much of the ‘rock

171
evidence’ is hidden. Geological deformation carries the story of geological change.
Mental rotation is not VPA. Rather VPA requires the individual to mentally
‘explode’ a structure and to visualise the hidden continuation of stratal directions
when viewed from a variety of unusual angles.
In this small study, the overall conclusion is that although the type of error made in
VPA is much the same across all age groups VPA does tend to increase with age
(Figure 8.11); but not simply.
Percentage of Correct Answers for NZ students to 3-D Model
Sectional Cuts
0
10
20
30
40
50
60
70
80
Year 9 (13/14years)
Year 11 (15/16years)
Year 12 (16/17years
Graduate teachers50 + years
Age Group
Per
cent
age
of C
orre
ct A
nsw
ers
Longitudinal
Transverse
Diagonal
Figure 8.11. Summary of correct responses to sectional cuts.
The youngest age group was very weak at visualising the longitudinal section but
from age 15 years onwards there was no difference in the percentage of correct
answers. Graduate teacher responses were only better than the Year 11 students for
the diagonal cut which required a higher degree of VPA experiences. Males also
tended to outperform females in this study, although Titus and Horsham (2009)
found that in their study there was no difference in VPA but there was for mental
rotation. In support of Kali and Orion (1996), incorrect answers commonly indicated
the copying of an exposed block diagram face.
Findings are tantalising and point the way for further in-depth research with larger
samples to tease out what processes are operating for VPA and how novice learners
and practicing geologists develop their VPA skills. Kastens et al. (2009) and Liben et
al. (2008) have begun this task.

172
Investigating how visual-spatial reasoning is involved in interpreting geological
maps is an area of rich future research. Future VPA research would also benefit from
the development of a set of graded, structured puzzles that would gather information
about intervention strategies across different age groups.

173
CHAPTER NINE
NEW ZEALAND – A CASE STUDY
THE STATUS OF GEOLOGICAL SCIENCE IN A NATIONAL
CURRICULUM
9.1 Introduction
In tomorrow’s precarious world, an educated population would significantly benefit
from scientific knowledge and understanding of earth materials, geological
processes, geological history, natural hazards and the evolution of life. The study of
the fossil record is a cornerstone of geological science and is also intimately linked
with understanding biological evolution. These topics and their subdivisions are
fundamental to the study of geological science within any Science curriculum.
Turner and Frodeman (1996) and Cooray (1996) clearly outlined the vital and unique
values that the Earth Sciences bring to a student’s developing scientific literacy. A
poignant summary by the American Geological Society (after a century or so of
Earth Science education in American curricula) on why Earth Science is important
indicates what kind of role the study of Earth Science has in our Society and schools.
However, the mechanism of implementation on global (and local) scales is ultimately
left up to the educational practitioners.
To ensure a scientifically literate society, one that maintains wise stewardship
of Earth’s precious resources, the American Geological Institute, in co-
ordination with its Member Societies, endorses the National Research
Council’s National Science Education Standards (1996) and agrees that Earth
science should be: included as part of the science curriculum at all grade
Levels, offered as a core credit science course for high school graduation and
assessed through state-mandated science tests and exit exams. Ultimately,
however, the future lies in the hands of students, parents, grandparents,
teachers, school administrators, school board officials, and politicians at all
Levels of government.
The future of Earth science literacy—indeed, the future itself—lies in your
hands. (http://www.geosociety.org/graphics/eo/Why_Earth_Science.pdf).

174
These sentiments about Earth Science education are universal and are especially
relevant to New Zealand for the current major revision (2006 to 2009) of the national
Science curriculum, where Earth Science in the form of “Planet Earth and Beyond”
may provide unique and essential learning experiences for the 21st century citizen.
Will this learning opportunity still be there in 100 (5000?) years time?
One consequence of diminished Earth Science curricula (and political, global and
local environmental concerns) has been the development of Earth Systems Science in
an attempt to connect science, technology, society and environmentalism within a
scientific framework (Hafner, 2000; Mayer, 1995; Mayer, Kumano, & Fortner,
1999). The result has been to conceptually change reductionistic Science (via
traditional British hierarchical subject thinking) to one of inductionist and holistic
with values and Earth guardianship at its core (Smith, 2004). Earth Science education
internationally struggles for survival (See Chapter 3) not only in schools but also in
colleges and universities (Akhatar, 1996; Sharma, 2003). National enrolment
numbers for Geology in Australian secondary schools, for example, had declined to
just over a thousand by 1998 and as a result geology became connected to
‘environmental science’, but in a very different and applied form (Dekkers & De
Laeter, 1997). Key issues of teacher training, curriculum development and
assessment directly impact on the way (or not) Earth Science is taught, learnt and
valued (King, 2001, 2003). These are as relevant globally as they are to the New
Zealand curriculum. This chapter needs to be read in conjunction with Appendix 3.
9.2 A Guide to the National New Zealand Science Curriculum
In the New Zealand curriculum, achievement aims provide the contextual details of
achievement objectives. These objectives effectively control (along with assessment
standards) what is actually taught in the classroom. This chapter provides details of
the Geological Science and evolution related objectives. The 2007 NZ curriculum is
available online at http://nzcurriculum.tki.org.nz.
In essence, the science curriculum is one of several essential learning areas that
provide opportunities for developing a student’s world view from a scientific
perspective where science is seen as a way of investigating, understanding and

175
explaining the natural world. The geological sciences are recognised within this
framework. A key element is the integration of ideas about the nature of science
across all ages. The conceptual basis for the curriculum, however, remains
historically connected to reductionist science through the separate subject disciplines
of physics, chemistry, biology, astronomy and geology. Unlike physics, chemistry
and biology, neither geology nor astronomy can be studied as examinable ‘stand
alone’ yearly subjects in the national qualification framework from Year 11 onwards.
Rather, geology and astronomy are selected for study by schools as a part (or
‘strand’) of Science and driven by the perceived need for the gaining of credits in
high stakes pre-requisitional national examinations known as the National Certificate
of Educational Achievement (NCEA).
The achievement objectives and their detailed achievement aims for science
education are presented in five strands across all levels and is shown in Table 9.1.
Table 9.1 The 2007 (November) New Zealand National Science Curriculum.
Achievement Objective Strands Achievement Aims
The Nature of Science Understanding about Science; Investigating; Communicating; Participating; Contributing.
The Living World (Biology) Life processes, ecology, evolution.
Planet Earth and Beyond (Geology and Astronomy)
Earth System; Interacting Systems; Astronomical Systems.
The Physical World (Physics) Physical Enquiry; Physics concepts; Applying physics.
The Material World (Chemistry) Properties of materials; Chemical reactions; Particles.
What teachers teach in the classroom is controlled by the curriculum and this in turn
impacts on the conceptual development of students (and also teachers). Perhaps more
crucially, it influences the numbers of students who are engaged in learning
geological science. Providing school courses with sufficient resources (trained and
qualified staff, materials, and funding) is often dependent on the numbers of students
participating and if numbers are low, resources are more difficult to justify. Most (if
not all) teaching and learning is directed towards the gaining of qualifications and, as
a consequence, assessment tasks (which are derived from curricula objectives)
effectively control what teachers teach. If funds, resources and teachers are in short

176
supply (very common), negative selection pressure reduces those subjects with the
fewer numbers of students and also those perceived to be of less value. These
‘fringe’ subjects like geology and astronomy are the first to be questioned for their
viability as well as their scientific usefulness. Indeed, the status of Astronomy (along
with Geology) in the New Zealand curriculum is precarious (See Figure 9.1).
Geology and Astronomy in the current New Zealand curriculum are lumped together
under the “Planet Earth and Beyond” strand of the national Science curriculum. In
2006, the percentage of candidates enrolled in Geology and Astronomy were both
less than 15% of all candidates enrolled for Level 1 Science standards both declining
compared to Physics, Chemistry and Biology. It is notable that for the initial
examinations for the National Certificate in Educational Achievement (NCEA) in
2002 Geology enrolments were higher than Biology but declined rapidly after this
(Figure 9.1). Why is the number of candidates for the Planet Earth and Beyond
strand declining to below 15% of all candidates at a time when a greater
understanding of how our planet functions is needed? This is especially so in a
country waiting for the next magnitude 8+ earthquake.
The initial decline may have been a consequence of poor results and schools
subsequently choosing not to offer Geology, especially if it was perceived that
students were less likely to be successful in comparison to other science standards.
This decline may also reflect teaching competence with few trained and qualified
teachers of the Earth Sciences (Lee, 1995) and teacher training issues, resourcing and
historical values attached to the subject. Prior to 1993, geology as a separate subject
of national assessment did not exist, so the infrastructure and traditions were never
firmly established in secondary schools. Indeed, geological science was not included
in the Science syllabus of 1968 for Form 5 (age 15/16) but was included for Years 9
and 10 (first two years of secondary school ages 13 and 14 years) as “The Earth’s
Crust”.
“11.1. Simple survey of the geological history of the school district.
Fossils as evidence of evolution and change. Formation of coal and
oil; accumulation of mineral deposits. Landscape as the current
expression of natural agencies on the Earth’s crust e.g., weathering,
erosion, volcanism and earthquakes”. (Department of Education,
1969, p.16).

177
Plate tectonics was in hot debate at this time, but in this syllabus there was an aspect
(Section 12) on “Man’s use of the Earth’s resources”. As a consequence of this
syllabus, teaching geological science was uncommon in secondary schools until the
introduction of the 1993 Science curriculum. Geography was about surface features.
The candidate numbers for NCEA Level 1 Science examinations are shown in Figure
9.1. With the current four strands to the national Science curriculum an equal spread
of teaching time around 23% to 27% of candidates per strand would be a reasonable
expectation. All data excludes those students who are enrolled in the national
correspondence school.
Candidate Numbers for Externally Examined National Level 1 Science Achievement Standards in New Zealand
(for students aged 15/16 years)(Data source: www.nzqa)
0
4000
8000
12000
16000
20000
24000
28000
32000
36000
40000
2002
2003
2004
2005
2006
2007
2008
2009
Year
Nu
mb
er
of
Ca
nd
ida
tes
Biology (90188)
Chemistry (90189)
Geology (90190)
Physics (90191)
Astronomy (90192)
Figure 9.1: Candidate Numbers for NCEA Level 1 Science (aged 15/16 years).
178
9.3 Aims of this Chapter
Research Question 1 asks: What are the characteristics of international Geoscience
curricula and their implementation, with particular case study reference to the New
Zealand curriculum?
This chapter focuses on national assessment tasks and curriculum issues in New
Zealand as the drivers for the teaching and learning of Geoscience and evolution.
Evolution (in terms of the micro/macro/ molecular fossil record, and mechanisms) is
fundamental to the learning of Geology and Biology and illustrates an important
juxtaposition of subjects neither of which (arguably) are sufficiently taught in the
New Zealand curriculum. Biology in particular is dominated by Mendelian genetics,
DNA, cell structure and function and ecology. It appears that evolution is a minor
part of a student’s learning in Biology despite it being the reality concept that makes
sense of living (and extinct) things. Paleontology is not examinable. In the 2006
NCEA Level 2 Biology assessment suite (composed of five achievement standards),
evolution questions comprised 7% of the total (3 questions out of 42). This chapter
also describes the relevant standards that have been developed in New Zealand for
these two subjects.
Assessment opportunities enable learners to demonstrate authentic levels of
knowledge, thinking and comprehension. In comparison to other traditional science
subjects (Physics, Chemistry and Biology), earth science and evolution assessment
opportunities are limited, with geological science especially, in continuous decline
(Figure 9.1). This decline in candidate numbers for geological science is significant
and the main reasons are historically, politically and resource based.
9.4 Historical Perspectives
High stakes national summative (qualification producing) assessment in New
Zealand has undergone a revolution in the past decade. The New Zealand
Qualifications Authority (NZQA) was established in 1990. A national assessment
system has moved from norm referenced ranking by external examination (from
1936 to 2001 via school certificate, university entrance, bursary and scholarship
179
examinations and based largely on British hierarchical thinking), to standards based
(SBA) or criterion referenced assessment (CRA) with the introduction of a new
national assessment certificate in educational achievement known as the NCEA in
2000. NCEA operates under the national qualifications framework (NQF). The
highest Level examinations at secondary school are scholarship examinations and
provide a means of identifying high achieving critical thinkers in their final year
(Year 13) of secondary school at the age of about 18 years before entering university.
Scholarship examinations are administered by NZQA and undergo a rigorous
‘triangulated’ system of setting, marking, critiquing, moderating and revising. The
vast majority of final year secondary students sit what is called NCEA Level 3 in
various subjects both internally (i.e. set by individual schools, and moderated by
NZQA) and externally (set and managed by NZQA).
Movement to criterion referenced assessment has not been a painless experience,
politically, philosophically nor practically, but nonetheless is now firmly established
as the New Zealand qualifications system. A detailed review report commissioned by
NZQA (Zepke, 2005) evaluates the impact of SBA on many aspects of teaching and
learning. Along with workload issues and moderation, the creation of a single,
national qualifications framework that is standards based remains controversial
(Alison, 2007; Hipkins, 2010; Lee, 2001; Philips, 2003). No doubt, the introduction
and evolution of SBA for secondary schools will show in the future (if not already),
an excellent example of how conceptual change actually occurs.
9.5 School Deciles
In New Zealand, decile ratings (derived from national census data) are very broad
socio-economic indicators of deprivation which are used by the Ministry of
Education for operational funding of schools. Schools with low decile ratings are
provided with more funding than those with higher ratings. In January 2005 the
ethnicity factor (proportion of students in schools of Maori and Pacifika origins and
English for Speakers of other Languages) was removed from the decile rating
criteria. Although school deciles are incomplete measures and potentially misleading
they do provide a reviewable and statistically representative snapshot of the socio-

180
economic status of a schools population. There are two important limitations of the
assigned decile ratings (Johnston, 2005):
1) They are blunt and broad indicators for entire schools and do not predict an
individual student’s socio-economic circumstances.
2) They provide no information about the distribution of socio-economic
dynamics in an individual school’s student population.
Schools are able to apply for review of decile ratings if there are perceptions of
significant social change. Examples of this may be an increase in overseas immigrant
workers contributing increased numbers of students into a school or loss of school
age families from a mesh block. Mesh blocks are geographic census data gathering
areas of about 70 households. Any achievement comparisons of schools and regions
need to take into account this decile indicator because student performance is
correlated to socio–economic status. Deciles used in this thesis do not include
ethnicity as decile data were derived from the 2006 Ministry of Education’s schools
directory statistics data (www.minedu.govt.nz). Nonetheless, there are clear links
between ethnicity, socio-economic status and achievement (Johnston, 2005; Lillis,
1999; Ministry of Education, 2009). Schools (Secondary and primary) with more
than 120 students require a random sample of the total roll for gathering information
in assigning a decile rating. Ethnicity data was removed from decile calculations in
2007.
School deciles are calculated from the following criteria:
Household income - percentage of households with income in the lowest 20
per cent nationally.
Occupation - percentage of employed parents in the lowest skilled
occupational groups.
Household crowding - number of people in the household divided by the
number of bedrooms.
Educational qualifications - percentage of parents with no tertiary or school
qualifications.
Income support - percentage of parents who received a benefit in the previous
year.

181
Statistically representative data for these criteria are gathered from small geographic
contributing areas called mesh blocks (60-100 households).These mesh blocks often
correspond to suburban areas in towns and cities. Representation is based on the size
of school with usually 300 student addresses which are then plotted onto the mesh
block locations. From here, census data using the criteria above for each household is
used to assign a school decile. It is important to note that a decile rating does not
reflect the total distribution of socio-economic circumstances within a school; it
represents the proportion and degree of social deprivation of students in a school.
Schools are ranked separately for each indicator and then the rankings are summed
for each school to enable government funding allocations. Any meaningful
comparisons of school achievement data should be from the same decile ratings.
Each school is part of a larger geographic region such as Canterbury or Auckland or
Wellington or Westland. Figure 9.5 in Appendix 3 shows the geographic locality of
these educational administrative regions in New Zealand to provide a ‘spatial’
locality map for regional data shown in Figures 9.1, and 9.12 in Appendix 3. The
total population of New Zealand, barely the size of a large state city, was around 4.4
million in 2009 and only about 850,000 people in the whole of the South Island, NZ:
a very small country with only 434 secondary schools of various kinds.
9.6 School Deciles and Targeted Funding
Decile ratings are importantly related to central government funding: the lower the
school decile the greater the funding per student. Targeted funding is intended to
reduce the impact of high social deprivation on student achievement through
increased resourcing. Figure 9.2 shows the relationship between funding types and
school decile ratings. Exactly how this increased funding is spent by schools, and its
effectiveness on improving academic achievement (presumably by measuring
increases in results gaining credits for NCEA assessment standards) in low decile
schools (deciles 1- 3) has yet to be shown. Evidence for 2005 geoscience assessment
results suggests that increase in funding for low band decile schools has had no effect
on educational achievement (Figures 9.2 and 9.3).

182
Government Funding Generated by Deciles Per Pupil(Data source: NZ Min. Ed. 2006)
731
441
301
189159
134110
8669
42
00
100
200
300
400
500
600
700
800
1 2 3 4 5 6 7 8 9 10 11
Decile
NZ
$ p
er
pu
pil
Avg Tageted Fundingfor Ed Achievement
Special Ed Grant
Careers Info Grant
Total $ per pupil
Figure 9.2. Government funding allocation per decile (2006 data)
Although subject to change, there are essentially three funding types that are
generated directly from school decile ratings: targeted funding for educational
achievement (TFEA), special education grants (SEG) and careers information grants
(CIG).
Figure 9.3 indicates that as decile rating decreases, the funding exponentially
increases. 17% (Decile band 1-3), of all secondary schools having generated results
that gained credits in geoscience assessments for 2005 received an average TFEA of
$375.64 per student with middle band decile schools receiving an average of $84.60
per student. In other words, low decile band schools receive on average of just under
4 times the amount of money for educational achievement as do deciles 4 -7 schools.
Although funding for SEG and CIG are quite low per student, low decile schools do
receive more per student. When educational achievement in the geosciences are
compared to the targeted funding regime (See Figure 9.4), it is clear that receiving
3.75 times more money per student than mid decile schools, this funding does not
appear to be directly effective.
Decile Band Percentages 1-3 =17% 4-7 = 39% 8-10 = 36% 11 = No decile = 8% N = 434 schools (2005 data)

183
Percentage of Schools Per Decile With No Credits Gained in any Geology Standard Counting
Towards NCEA Levels 1 to 3for 2005
53
26
13
2325
52
10
36
1114
39
0
10
20
30
40
50
60
1 2 3 4 5 6 7 8 9 10 11
Decile (Red is lowest decile band, Blue is middle, Purple is high,
Yellow is no decile private schools)
Pe
rce
nta
ge
of
sc
ho
ols
w
ith
no
Ge
olo
gy
Cre
dit
s G
ain
ed
Figure 9.3. School deciles and achievement in Geoscience assessments.
Figure 9.4 shows the percentage of NZ secondary schools (N = 434) for each decile
which did not gain credits in geoscience assessment tasks for national frameworks
qualifications at Levels 1 to 3 in 2005. On average, 43% of low band decile schools,
19% of mid band decile schools, and 15% of high decile schools did not record any
credits in geoscience for 2005. In this respect it is somewhat surprising that private
schools are similar to decile one schools but this might reflect the fact that many of
these private schools do not offer any geoscience standards for assessment, rather
than reflecting a lack of student achievement. In fact regional data supports this (See
Figure 9.10). The teaching of geology has not been a traditional teaching subject and
is therefore still not taught. It is notable that as a result of widespread concern about
how examination results are recorded, from 2007 onwards, failure rates are recorded
in national school statistics for both externally and internally assessed standards
(www.nzqa.govt.nz/news/info/ncea-improve-bkgrnder.doc). Internally assessed
achievement standards are scientific investigations and research tasks.

184
NCEA standards-based assessment was introduced in 2002. Figure 9.4 shows the
historical changes in the number of candidates gaining credits per school decile for
the Level 1 NCEA geology standard AS 90190: “Aspects of Geology”. This is a key
standard because it has the highest number of candidates in a geological science
related assessment task at secondary school (See Figure 9.1). Historically, decile one
schools (and private schools) have always had low numbers of achievers in this
standard, but deciles 2 and 3 schools (after an initial boost in 2003) show significant
decreases from 2004. Did these schools ‘try out’ AS 90190 in 2002 and then find it
to be too difficult for the majority of their students? Did many schools perceive after
2003 that there was little point in pursuing a subject in which few students could
achieve excellence and/or merit, and in so doing reduce the “pass rates’ and hence a
perceived reduction in school status and competitive ‘quality? If so, why? Do
Science departments really have the expertise, resources and energy to persevere
with teaching geological science? Why have decile 5 schools recorded the greatest
decline in candidate numbers in 2005? Although there are general trends of decline
across all deciles, decile 9 schools have shown increases until 2005. Research needs
to be carried out on why it is that unit standards and NZASE standards are increasing
at the expense of achievement standard 90190 “Aspects of Geology”.
.
School Deciles and Candidate Numbers for AS 90190 "Aspects of Geology"
2002 -2005
0
500
1000
1500
2000
2500
3000
3500
4000
4500
1 2 3 4 5 6 7 8 9 10 11
Decile (11 = private schools with no decile)
Note: that there is no data for numbers of candidates who attempt but fail
To
tal
Ca
nd
ida
te
Nu
mb
ers
2002
2003
2004
2005
Figure 9.4. School deciles and candidate numbers for AS 90190 “Aspects of Geology” as represented by results gaining credit (RGC): 2002 – 2005 (N = 434 schools).

185
To place this case study in perspective, Table 9.2 shows the percentages of school
decile banding of secondary schools in 2006 (and in schools where national
qualifications in earth science are recorded), compared with the decile banding
proportions for the total number of schools on record. Figure 9.4 shows the mean
percentages of each school decile recording results gaining credit (RGC) in the Earth
Science assessment standard. Data are sourced from the school directory of the NZ
Ministry of Education. The secondary schools data used in this case study have
similar broad decile band proportions to the total NZ school population (but prior to
readjustment post 2006). Decile 8 schools form the highest proportion of secondary
schools, receive the third to lowest funding allocation per student (Figure 9.2) and
along with decile 9 schools outperform all other schools for results gaining credits in
Earth Science assessment standards (Figure 9.3). Deciles 4, 6 and 10 schools are
similar in performance with decile 10 schools not receiving funding for educational
achievement specifically generated from their decile rating. Private independent
schools (11 on Figure 9.4) do not receive government funding and have much lower
numbers of students gaining credits. This reflects the fact that few of these schools
offer their students AS 90190 as an external examination.
Table 9.2 Decile Band Comparisons in 2006
Decile Bands All Primary and Secondary
schools
(N = 2597)
Mean Percentage of Secondary Schools per Decile
(N = 434)
1 – 3 (low)
4 – 7 (middle)
8 – 10 (high)
11 = Private schools
with no decile.
30% (27%)
38% (43%)
30% (25%)
2% (5%)
This study N = 434 secondary schools.
Bold italics = 2006 school directory data for all NZ schools (primary and secondary) where N = 2597.
(Rounded percentages)
1 = 4%
2 = 7%
3 = 6%
4 = 7%
5 = 11%
6 = 10%
7 = 11%
8 = 14%
9 = 9%
10 = 13%
11 = 8%
(Note: As from 2007 decile ratings were readjusted to around 10% at each decile but
data presented is based on the 2006 data. The percentage of Maori students in

186
schools for example was removed from the criteria for decile calculations. However,
what changes in individual school deciles that have occurred are not likely to
significantly impact on conclusions).
9.7 Unit Standards and Achievement Standards
Unit standards and achievement standards are the current styles of national
assessment examinations (up until 2010, when unit standards will be removed). This
section describes what these standards are.
Student evidence of understanding and knowledge is evaluated against written
criteria called achievement standards or unit standards and given a credit or point
value. Unit standard assessment tasks are administered and often set by an individual
school but they do not identify or assess Levels of understanding. It is an assessment
task that is either achieved or not with moderated provisions for reassessment. Unit
standards operate through the use of elements and performance criteria that define
the standard. An example is shown below for one element of US 18982
“Demonstrate Knowledge of Earth Science”. This particular example is from the
New Zealand Association of Science Educators (NZASE) unit standards and is
derived from curriculum Levels 4/5 (for lower ability students in Year 11). It carries
two credits towards NCEA Level 1 but critically, does not permit students to advance
to Years 12 and 13 Sciences.
Exemplar:
US 18982: ‘Demonstrate Knowledge of the Earth’ assessment criteria.
Element 1 : Describe the structure of the Earth.
Performance criteria
1.1 The description outlines features of the Earth’s structure.
Range: three of - mantle, core, crust, plates, volcanoes.
The introduction of unit standards pre-date achievement standards. Achievement
standards are externally and internally assessed but recognise different Levels of
understanding by awarding achievement as achieved (A), achieved with merit (M) or
achieved with excellence (E). Regardless of quality of the achievement (A, M or E),

187
the credit points received are the same. That is, if a standard carries three credits (as
in Aspects of Geology AS 90190 Level 1, Year 11), students do not receive more
credits if they achieve with excellence rather than merit. This fact may have an
influence on student motivation especially where students are driven by and value
comparative ranking success rather than achievement of criteria for excellence.
Students who attend but do not attempt examinations have this detailed on their
record of learning. All assessment tasks are required to be valid with reference to the
criteria set down in the achievement and unit standards, be fair, where candidates
know exactly what is required, and sufficient to allow candidates to demonstrate their
learning. It must be appreciated that achievement and unit standards provide the
criteria for assessment of only parts of the national curricula. Assessment tasks do
not attempt to ‘test’ the whole curriculum. Students receive for example, in Level 1
Science, a three hour external achievement standard examination composed of five
different papers, one for Physics, Chemistry, Biology and two for Planet Earth and
Beyond. Planet Earth and Beyond is divided into Aspects of Geology and Aspects of
Astronomy with the Geology generating three credits and Astronomy two credits.
Time recommended to complete the Geology examination is 30 minutes. Each of the
other achievement standard assessment papers in Physics, Chemistry and Biology
generate five credits each. There is much debate about the validity, purpose and
usefulness of credit values when criterion referenced assessment is used as well as
the relationship between curriculum statements and assessment tasks (Alison, 2008;
Ministry of Education, 2006). For example, the key Geology standard AS 90190
demands assessment of selected parts of the curriculum objectives in “Planet Earth
and Beyond” and has been criticised for not including more of the curriculum
achievement aims. Indeed, revisions of the standards in 2004 removed all assessment
of the mineralogy component of AS 90190. This begs the question: “if it is not going
to be assessed why bother teaching it”? Assessment standards have been constructed
by Ministry of Education contracted ‘subject experts’ and are derived from aspects of
the “Planet Earth and Beyond” strand of the science curriculum.
Geoscience is taught essentially within the national Science curriculum under “Planet
Earth and Beyond” strand of the Science curriculum as “Aspects of Geology and
Aspects of Astronomy” but there are parts of Earth Science such as natural hazards
taught and assessed in Geography. Evolution (and paleontology) as sub disciplines of

188
the geological sciences are not mentioned in the current curriculum but their study is
implied within a study of geological history and correlation of rock strata.
Declining numbers of students (Figure 9.1) attempting the geology component of the
Planet Earth and Beyond standard (about 70% over seven years) remains an
important issue for the future of the geosciences in the school curriculum. Other
Bio/Geoscience topics such as fossils and evolution are also taught to various depths
in the national Biology curriculum and are outlined below. The national Science
curriculum is currently in the first stages of revision and the impact of any revisions
on Earth Science assessment is yet to be seen.
9.8 What are the Current (2002–2010) Assessment Opportunities for
Geology and Evolution in the New Zealand National Qualifications
Framework (NQF)?
The current national science curriculum was introduced in 1994 and assessed up until
2002 by norm referencing using scaling and percentage marks for individual student
work. IN 2002 the first standard based assessments used the standard criteria outlined
in the tables below. Several standards have since expired (eg US 6359
“Measurement of Geological Time”) or undergone revision, especially the New
Zealand Association of Science Educators (NZASE) certificate standards. The
standards used for assessment opportunities are detailed in Appendix 3. The
standards detailed in this thesis are valid and relevant to data analysis of student
numbers and results.
9.8.1 General Discussion
Firstly, it is important to note that although the school leaving age is 16 years the
New Zealand curriculum is compulsory only up to the end of Year 10 (second year
of secondary school - about age 14 years). Internal and external theory assessment
examinations only assess selected (and reviewable) aspects of the curriculum aims.
External examinations are set, managed, marked and supervised by NZQA and
internal assessments are managed and marked by the school. Of the internal
assessments, practical investigations and research assignments are available for unit
and achievement standards. Currently, the total number of credits available for

189
assessing evolution and geology is 49 of which 30 are generated from internally
assessed unit standards. At Level 1 Science, Achievement Standard (AS) 90190
(“Aspects of Geology”) has a credit value of three compared to five each for physics,
chemistry and biology. The other two credits are assigned to AS 90192 (Aspects of
Astronomy) as space science. The percent change in the number of candidates for
Level 1 Science achievement standards is compared in Figure 9.6. Clearly, the
percentage of candidates involved in learning and presenting for examination in
‘Planet Earth and Beyond’ at NCEA Level 1 has declined in comparison to other
‘sciences’. On a positive note, prior to 1994 there was only one norm referenced
Science examination containing physics, chemistry and biology. There were no
questions on ‘Geology’ and questions were predominantly descriptive with some
explanation expected and none requiring a higher thinking Level of discussion and
linking of ideas (Arguably appropriate and valid for 15/16 year olds). Prior to 1994
geoscience was not externally examined and generally not seriously taught at any
curriculum Level. In 2008, Geology continues to show the highest percent change in
numbers of candidates with Astronomy levelling off.
Percent Change in Candidate Numbers for Level 1 Science
2002 - 2008
-24-22-20-18-16-14-12-10
-8-6-4-202468
101214
Biology(90188)
Chemistry(90189)
Physics(90191)
Geology(90190)
Astronomy(90192)
Externally Examined Science Achievement Standards
Per
cen
t C
han
ge
in C
and
idat
e N
um
ber
s
2002
2003
2004
2005
2006
2007
2008
Figure 9.6. Percent change of candidate numbers for NCEA Level 1 Science.
In effect, despite geological topics under the Planet Earth and Beyond strand being
entrenched in the national Science curriculum, there continues to be teacher training

190
issues, infrastructure and resource issues and an increasingly selective student body
which produces a steady decline in the teaching and learning of Earth Science. A
significant issue is the widening gap between freedom of course choice by students
and what schools actually offer because insufficient numbers of teachers are trained
in the Earth Sciences and so do not understand the educational values of using for
example, an Earth Systems approach to learning about our planet. It seems that the
New Zealand Science curriculum is in transit from a reductionist compartmentalised
Science to a holistic Science. In the race for ‘league table’ status, schools are
unlikely to offer candidates subjects where there is less likelihood of comparative
success.
Biology provides the most opportunities for learning about the fact of biological
evolution, but this remains very limited until Level 3. Although the study of the
fossil record is an essential part of any discussion of biological evolution, this aspect
is conspicuous by its absence and minimalism at secondary school in NZ (See
assessment opportunities for Geology and evolution in Appendix 3).
Figure 9.7. School deciles and evolution related assessment standards.
The first national examinations in Level 3 NCEA Biology occurred in 2004, but even
so, the number of candidates achieving credits in “Patterns of Evolution” (AS
Percentage of Results Gaining Credit Per Decile for Evolution Related Standards for 2005
05
101520253035404550556065707580
1 2 3 4 5 6 7 8 9 10 11
Decile
Per
cen
tag
e
AS 90459
AS 90717
AS 90719
AS 90772
Private schools w ith no decile

191
90717) and “Human Evolution” (AS 90719) is quite small (Figure 9.7). Figure 9.7
also shows the relationship between results gaining credit (that is, candidates who
pass) with school decile ratings shows that as school deciles decrease the percentage
of results gaining credit decrease but with some minor exceptions. These exceptions
are likely to be related to candidate numbers. AS 90772 (“Describe the factors and
processes involved in the evolution of NZ plants and animals”) is a Year 12, NCEA
Level 2 and curriculum Level 7 Science standard and not a Biology standard.
Decile 6 schools have performed well in this. Even with the revised decile
distributions of 2007, lower decile schools still have lower pass rates (Ministry of
Education, 2008, 2009).
9.8.2 Assessment of Evolution in the Revised NZ Science and Biology Curricula
A key conceptual change to the national science and biology curricula includes a
formal recognition (in terms of externally examined achievement standards) of
biological evolution (Figures 9.8, 9.9., and 9.10). In detail, however, this change is
not so obvious. The following discussion outlines the relevant draft standards (for
implementation in 2010 - 2012).
Figure 9.8. Evolution standards for NCEA Level 1 Science (15/16 year olds).
9.8.3 NCEA Science Levels Two and Three
There are no proposed specific achievement objectives in biology, chemistry and
physics standards within the national science curriculum for Levels 2 and 3, but
would instead be part of achievement objectives 2.2 and 3.2 (See Table 9.3) and
internally assessed. AS 90772 is removed in these draft standards. Indeed, this
standard only achieved just over 500 results gaining credit in 2007 (See Figure 9.21
in Appendix 3).
Current: AS 90188 Has no evolution content
Proposed Standard B 1.3 (4 credits, external examination) “Explain the importance of variation within a changing environment”
Inheritable nature of DNA; phenotypic expression; variation and adaptation to environment.

192
Topics could be oceanography, global warming, or bio fuels. In other words,
traditional science subject disciplines are replaced with a thematic/project approach
that integrates scientific understandings and used to inform decision making
processes about socio/scientific issues. The achievement objectives proposed for
Levels 2 and 3 Science are:
Achievement Objective (AO) 2.2 (8 credits. Internally assessed)
Understand and communicate a socio-scientific issue identifying personal and
societal actions
AO 3.2 (8 credits. Internally assessed)
Make informed judgments about the social, ethical, and personal implications
relating to a major scientific issue / controversy.
The study and assessment of evolutionary principles, causal mechanisms and
evidence at Levels 2 and 3 Science appears to be significantly diminished if not
eliminated. Although there may be social issues with evolution, there is no scientific
issue: in the sense that there is only debate over refinement of understanding. It could
be argued that rather than socio scientific issues being used to help develop reflective
and moral decision making (Zeidler, Sadler, Applebaum, & Callahan, 2009; Zeidler,
Sadler, Simmons, & Howes, 2005; Reis & Galvao, 2009), socio-scientific issues are
not relevant to Science per se, especially when the emphasis is on social dimensions
and moral decision making rather than on the science. Many socio-scientific issues
may also be beyond the cognitive abilities of 15 to 18 year olds, yet alone the ability
of teachers to deliver. What is the difference between a scientific debate (not the
emotive controversy), and a socio-scientific issue? Evolution as a scientific theory is
not controversial (Scott, 2004) but the interpretation of specific evidence may be.
The pedagogic complexity of using socio-scientific issues as a context for teaching
science concepts and NOS deserves further research. As to be expected, biology for
Levels 2 and 3 contain content on evolution but this is now proposed at Level 2, to
be formalised as external assessment standards.

193
Figure 9.9. NCEA Level 2 External Assessments of Biology and Evolution Content.
Achievement Standard (AS) 3.3 (4 credits)
“Responses of Organisms to their environment” Key concept is that responses are a result of evolution i.e. adaptation to the environment, selective advantage and survival in the environment.
AS 3.5 (4 credits) Note: this standard is equivalent to AS 90717.
“Describe evolutionary processes leading to speciation” Concepts include: brief history of the evolution of evolutionary theory such as punctuationism and gradualism, macroevolution and speciation, mutation, Hox genes, gene pools, heterozygote advantage, founder effect and polyploidy.
AS 3.6 ( 4 credits) Note: AS 3.6 is equivalent to AS 90719
“Describe trends in human evolution” Emphasis is on trends (such as culture as a dominant selection pressure rather than on specific fossils, interpretation of dispersal evidence, adaptive value of bipedalism, natural selection and patterns of evolution as related to humans.
Figure 9.10. NCEA Level 3 External Assessments of Biology and Evolution Content.
9.8.4 Discussion
Eldredge (2008) neatly points out that how evolution is thought about influences the
way it is taught and incorporated within curricula. For example, paleontologists and
taxonomists perceive evolution as a “taxic” change through time from a common
ancestor whereas a geneticist might perceive evolution as a “permanent change in
genetic information”. Eldredge perceived these as taxic and transformationist in
character and not as competitors but as two valid and useful ways of viewing
evolution, especially when causal processes are integrated. The fact that most
teachers of biology (and also biology curriculum developers), are ‘genetically
oriented’ they tend to be transformationist in thinking rather than paleoenvironmental
and taxonomic. In other words, the power of genetics viewed from the perspective of
living organisms and genetic change in populations, dominates the biology
AS 2.5 (3 credits)
“Explain how the interaction between ecological factors and natural selection leads to genetic changes within populations”. Genetic changes in populations arise from selection pressure or genetic drift. Concepts include: sources of variation and how natural selection acting on phenotypes result in allele frequency changes in the gene pool.
AS 2.7 (4 credits) “Understand that DNA and the environment interact in gene expression”. Concepts include: Central dogma, effect of environment on gene expression and control of gene expression over time.

194
curriculum because this is the dominant view of curriculum developers. This is
illustrated by the achievement objective for AS 2.7. As discussed in Chapter 3,
paleontology and in particular, geological time, are ‘taxic’ in approach, but is not
reflected in this curriculum and indeed, has been removed.
The link between understanding the nature of science (NOS) and acceptance and
comprehension of evolution has been well documented (Bishop, 1990; Brem, 2003;
Farber, 2003; Leach, 1997; Lederman, 1992) and is clearly important in potentially
making a difference to the way evolution is perceived. Acceptance however means
different things to different cultures and individuals. In the NZ biology curriculum,
the NOS strand is incorporated into all assessment standards (www. nzase.co.nz.)
and provides an opportunity to develop meaningful student (and teacher)
understandings of how the nature of science impacts on, for example, evolution.
However, although there is significant correlation between NOS perception and
acceptance of evolution, Lombrozo, Thanukos, & Weisberg (2008) accurately
caution that the efficacy of this connection deserves considerably more research,
especially specific aspects of NOS understandings about scientific theory and
interpretation of valid evidence. Similarly, actually making a difference in the
classroom is also a long way from just having appropriate connections written into a
curriculum. Indeed, it is not always obvious that these NOS ideas are crucial to an
understanding and acceptance of evolution, but the stereotyped views of science
investigation as being ‘fair testing’ are. ‘Pattern testing’ is recognised in the NZ
Science curriculum but is rarely used for assessment purposes.
9.9 NCEA Level 1 Geological Science: Unit Standards versus Achievement
Standards
Although the national New Zealand Science curriculum is currently under review the
assessment standard criteria used for national qualifications will not change until
2010. Unit standards (competency standards) criteria in the Earth Science and
Science domains have undergone revision in 2006 but are still derived from the
national Science curriculum. Table 9.3 contrasts unit standards with achievement
standards. As pointed out previously, the NZASE certificate assessments are derived
from curriculum Levels 3, 4 and 5 and are designed for lower achieving Year 11

195
students (15 year olds), whereas achievement standards and unit standards are
derived from curriculum Level 6 for the same age group. Curriculum Level 6 is a NZ
accepted average achievement level for students. The increase in the number of
schools (Figure 9.11, Appendix 3), from 2005 to 2008 recording student credits
gained from the lower NZASE standards and the increase shown for Level 1 unit
standards comes at the expense of the Level 1 achievement standard AS 90190. The
reasons for this deserve further investigation but are likely to involve: teacher
competence issues such as lack of trained and qualified Earth Science teachers (Lee,
1995); historically lower subject status; lack of resources; lower credit value and
perceived school needs to ‘meet the needs of students’ by enabling maximum
individual credit accrual for the least amount of effort. National assessment tasks
drive what is taught in the classroom.
Table 9.3. Unit Standards versus Achievement Standards summary.
UNIT STANDARDS ACHIEVEMENT STANDARDS
Summative and formative theory, practical scientific investigations and research standards managed by the school.
Only summative and formative practical investigations and research standards managed by the school.
Theory, research and practical components externally moderated by NZQA. Exams are internally set.
Practical and research components moderated by NZQA. External exams are contractually set, moderated and managed by NZQA.
Highly likely to be the same theory exam and practical each year for each standard because of teacher workload issues.
Different and moderated exam papers each year but derived from the same criteria. Practical likely to be the same each year.
Are either passed or failed (competency based) and composed of elements (E) and performance criteria (PC).
Are achieved, merit achieved or excellently achieved. Enables students to demonstrate Level of understanding.
Sitting supervised by classroom teacher Not supervised by classroom teacher.
Credit value of 3 points. Lower curriculum Level NZASE standards have a credit value of 2.
Credit value of 3 points
Able to be reassessed. Not reassessed.
Do not assess the same aspects of the curriculum to achievement standards.
NZ Assoc. of Science Educators (NZASE) assessment tasks are commercially available.
Students pay an entry fee. Papers are not purchased.
Difficult authenticity and reliability issues such as ‘teaching the test’ or ‘to the test’ and teacher bias.
Fewer authenticity issues.
10% moderated by NZQA 10% moderated by NZQA

196
9.9.1 Achievement Standard 90190: “Aspects of Geology”: What are the key
criteria?
The assessment material for AS 90190 (the key and only geology achievement
standard for Science at Year 11, NCEA Level 1 and derived from curriculum Level
6), involves development of descriptive, explanatory and discursive questions. It is
worth three credits and is set and supervised externally. The criteria for assessment
include: (Note postscript discussion of Geology content changes).
a) Types of rocks (all of the following):
b) Igneous: Rhyolite, pumice, granite. Andesite and Diorite. Basalt, Scoria,
Gabbro and Obsidian.
c) Metamorphic: Slate, Schist, Gneiss and Marble.
d) Sedimentary: Conglomerate, Sandstone, Siltstone, Mudstone, Limestone and
Coal.
e) Formation (origins) of rocks.
f) Design and use of classification keys for identifying rocks (not obligatory).
g) Rock cycle and links to environment and geological events.
h) Relative age relationships from undeformed stratigraphic columns with links
to explanatory sequential geological events.
9.9.2 Unit Standard 6358: “Describe the formation of major rock types and
describe the rock cycle”: What are the key criteria?
This standard represents an ‘equivalent’ unit standard for geology assessment that
counts towards a national certificate qualification in Science at Year 11, NCEA
Level 1 and derived from national science curriculum Level 6. This curriculum was
established in 1993. This standard is worth three credits, moderated by NZQA and is
set and supervised internally by the classroom teacher or Science department.
The criteria for assessment include:
a) Description of igneous rocks in terms of source material cooling and location.
Rock types include knowing one from granite and gabbro and two from
rhyolite, basalt, andesite, scoria, pumice, obsidian and ignimbrite.

197
b) Description of metamorphic rocks in terms of source material, heat and
pressure and sequence of events. Rock types include knowing two from slate,
schist, marble and gneiss.
c) Description of sedimentary rocks in terms of source material and
environment of deposition. Rock types include knowing two from
conglomerate, sandstone, siltstone and limestone.
d) Description of the rock cycle with links to geological processes.
9.9.3 What are the Differences?
There is a narrower range (sufficiency) requirement for unit standards implying
unequal expectations. For example, knowledge of all rock types is required for AS
90190 whereas seven out of 17 years are required for US 6358. Although not
obligatory for AS 90190, design and use of classification keys for identification of
rock types may be examined and still needs to be taught. Identification keys are not
included in US 6358 criteria but are included as part of one element in US 6357 but
confined to identifying rock classes (Igneous, Metamorphic & Sedimentary) and not
rock types. The key difference is that AS 90190 includes assessment of the
fundamental concept of relative geological time through the use of fossils, the laws
of superposition and possible explanatory geological histories. US 6358 does not
include these basic geological concepts and so the majority of students leave school
knowing nothing about the greatest contribution that geology has given to science.
9.10 Geology, Evolution and the 2007- 2010 Science Curriculum Review
The draft curriculum review document was released for public and professional
discussion in August 2006 with the final version available in November 2007. The
boxes below extract the relevant proposed curriculum achievement aims for
biological evolution and geological time. The challenge for New Zealand teachers is
to build the expertise for teaching biological evolutionary concepts and accurate
concepts of geological time across all Levels with the development of valid, and
equitable national assessment tasks in a criterion referenced environment. Fossils and
the fossil record are not specifically mentioned in any part of the revised Science
curriculum. Furthermore, in the September final draft of the national Science
curriculum, there is an emphasis on internal and external geological processes but

198
this is divorced from what geology contributes to our understanding of the world:
‘deep geological time’.
Science Achievement Aims for Living World Strand – Biological Evolution
“Students will understand the processes that drive change in groups of living things
over long periods of time and be able to discuss the implications of these changes”.
Science Achievement Aims for Planet Earth and Beyond Strand
- Earth Systems
“Students will investigate and understand the spheres of the Earth System –
geosphere (rocks and soil), hydrosphere (water), atmosphere (air) and biosphere
(life)”
Science Achievement Aims for Planet Earth and Beyond Strand
- Interacting Earth System
“Students will investigate and understand that the hydrosphere atmosphere, geosphere and biosphere are interconnected by a complex web of processes”.
Figure 9.11. Science Achievement Aims for The Living World strand.
It should be noted that these achievement objectives thematically thread through the
science curriculum from Year 1 to Year 13 (ages 5 to 18 years) so students are
exposed to thinking in evolutionary terms in biology from the beginning of their
school education years. This introduction of evolution as a guiding theme across all
Levels is new to the New Zealand science curriculum and has not been without
Evolution Objectives at Level 6 (age 15/16 or year 11) Living World Strand “Explore patterns in the inheritance of genetically controlled
characteristics. Explain the importance of variation within a changing environment.”
Life, ecology, and evolution Objectives at Level 8 Living World Strand (Age 17/18 or year 13 - the final year of secondary in New Zealand) “Understand the relationship between organisms and their environment”
and “Explore the evolutionary processes that have resulted in the diversity of
life on Earth and appreciate the place and impact of humans within these processes”.

199
disagreement. This disagreement came largely from ‘special character’ Christian-
based schools (w.w.w.minedu.govt.nz/web/downloadable/dl11958_v1
/supplementarydraftcurriculumreport-25022007-lift.doc) who possibly see this as a
threat to fundamental beliefs about the world and a perceived tension between
Science, religion and materialism. Anti biological evolution ideas based on religious
thought is of course pseudoscience and has no place in a Science curriculum
(Allchin, 2004; Eve, 2007; Lederman, 2008). In a recent New Zealand Geological
Society newsletter article, Campbell (2008) suggests that the Ministry of Education
has a ‘laissez faire’ attitude towards the teaching of evolution and schools are seen as
free to decide their own approach to its teaching. Misconceptions about the nature of
science and scientific theories are not, it seems, confined to the US. Furthermore,
Campbell implies that anecdotal evidence suggests that like those in the US
(Berkman, 2008), some New Zealand teachers of biology hold creationist ideas
themselves or are wary of community and even colleague pressure when teaching
evolution, and therefore are scientifically compromised. This is an area of important
future research.
King, (in press.), has developed a scheme in which to analyse the solid earth
geological components (geosphere) of Earth Systems Science from a variety of
national curricula. King analyses curricula from the USA, Israel, Japan, Scotland,
South Africa and Taiwan. This scheme was used to analyse the relationship between
Earth System Science and solid Earth geology in the New Zealand Science
curriculum and is presented in Tables 9.4 and 9.5.

200
Table. 9.4. Framework for the New Zealand Earth Science strand of the national
Science curriculum.
8 Elements Earth Science Analysis Scheme
(After King, 2007, pers. com)
Age Group
Earth Science Achievement Objectives from the New Zealand national Science and Biology
curricula as related to the
“Framework for Earth Systems Education”
(After Mayer, 1997)
Geological Time 5-18y None.
Evolution of Life 5-18 None.
Earth Materials 13-14 Investigate the composition, structure and features of the hydrosphere and atmosphere.
Earth Energy 13-14 Investigate how heat from the Sun, the Earth and human activities is distributed around the Earth by the hydrosphere and the atmosphere.
Earth as a System 11-12
13-14
15-16
15-16
Investigate the water cycle and the effect on climate, landforms and life.
Investigate the external and internal processes that shape and change the surface features of NZ.
Develop an understanding of how the four spheres interact to cycle Carbon.
Develop an in-depth understanding of the interrelationships between human activities and the atmosphere, geosphere, hydrosphere and biosphere over time
Natural Hazards 16-17 Develop an understanding of the causes of natural hazards and their interactions with human activity on Earth.
Resources
and environment
11-12 Develop an understanding that water, air, rocks and soil, and life make up our planet and appreciate that these are also the Earth’s resources.
Investigating the Earth
5-18 None.

201
Table 9.5. Framework for the New Zealand Living World strand of the National
Science curriculum for evolution.
Key Evolution Element of the Earth Science Analysis Scheme
(After King, 2007, pers. com)
Age Group
Earth Science Achievement Objectives from the New Zealand national Biology curricula as related to the “Framework for Earth Systems Education”
(After Mayer, 1997)
Evolution of Life 5-6y
7-8
9-12
13-14
15-16
17-18
Explain how we know that some living things from the past are now extinct.
Explore how the groups of living things we have in the world have changed over long periods of time. Some living things in NZ are quite different from other living things in other areas of the world.
Describe the basic processes by which genetic information is passed from one generation to the next.
Explain the importance of variation within a changing environment.
Explain how the interaction between ecological factors and natural selection leads to genetic changes within populations.
Explore the evolutionary processes that have resulted in the diversity of life on Earth and appreciate the place and impact of humans within these processes.
The eight element scheme of King is an attempt to identify the key Earth Science
concepts that are pertinent to Earth Science curricula. For the New Zealand Earth
Science component of the national Science curriculum, it is clear that the exclusion
of geological time, evolution (in a geological context), and investigation is a
significant dilution of the values an earth science literacy that may provide for future
citizens (AGI, 2004). A key exclusion from the Living World strand (Table 9.5)
appears to be the links between evolution and geological time. Nothing in biological
evolution makes sense without reference to geological time (Baker, 2000). And
scientific literacy is incomplete without it (Orion, 2007).
In terms of the well known Earth Systems (ESS) understandings (Table 9.6
Appendix 3), and although a systems approach has been invoked, the New Zealand
science curriculum does not satisfy much of the understandings that ESS is founded
on, such as understandings 1 (The uniqueness of planet Earth), 5 (Age and evolution
of the planet) and 7 (Careers).. Understanding 6 (Place of Earth in the universe) is

202
catered for in the astronomy section of the Planet Earth and Beyond strand of the
Science curriculum.
Geological time is a crucial conceptual element of scientific literacy and one of the
‘gifts’ of geological science to our modern scientific understanding of our planet’s
history (See Chapter 7). Orion (2007) and King (pers. com) point out that geological
time is an essential concept for inclusion in any Earth System course and its
exclusion in the New Zealand Science curriculum deprives students from making
scientific connections about how the planet functions and the bio/geological
processes involved. Other essential learning concepts expressed by Orion include:
development of 3-D spatial visualisation skills, development of deep time and space
dimensions and development of cyclic and systems thinking in units of teaching and
learning.
9.11 Assessing Geoscience in the New Zealand Science Curriculum: What
About Geological Science?
The New Zealand Science curriculum has undergone many revisions since 2005. The
curriculum strand title “Planet Earth and Beyond” has also ‘morphed’ into “Planetary
Science” leaving the status of geological science somewhat in confusion. The current
final draft of November 2008 is open for general comment in preparation for
implementation (but not without some criticism from the Secondary School
Principal’s Association and others, regarding a perceived short and difficult timeline
and pedagogical issues surrounding subject integration of key competencies such as
thinking skills, subject language and self management), in 2010. Alignment of
external assessment tasks with standard achievement objectives is currently
underway and unit standard alignment is still to be reviewed for implementation in
2010
(http://www.minedu.govt.nz/~/media/MinEdu/Files/TheMinistry/AssessmentPosition
PaperSep2010.pdf.) The issue of operating, nationally, a dual, competency-based
unit standard and criterion-based achievement standard system remains an issue.
‘Teaching’ the ‘Nature of Science’ is reflected in the internal assessment of ‘pattern
seeking’ and ‘fair testing’ investigations, and the researching of secondary
information. Integrated with this are the social ‘key competencies’ of ‘managing self’

203
and ‘relating to others’. If a school selects five external assessments then this is to be
completed in two examination times.
Table 9.7 summarises the changes in externally assessed geological science
objectives and contexts from the 2004 - 2010 achievement standard to that proposed
for 2011. Time will tell what content will end up in examination in 2011, and the mix
of assessment styles.
Table 9.7. Levels 1 - 3 NCEA external examinations for geological science
(age 15/16 years).
Current AS 90190 (2002 -2010). “Aspects of Geology “. (3 credits). Note that assessment of minerals was removed in 2004.
Proposed Standard AS 1.3 (Nov. 2008 and implemented 2011) “Investigate the external and internal processes that shape and change the surface features of New Zealand” 4 credits.
Formation of selected igneous, metamorphic and sedimentary rocks
Indo-Australian and Pacific tectonic plate movement along the Alpine Fault
The rock cycle as linked to geological events and environments
Types of volcanoes and plate boundary
Relative stratigraphic age relationships Earthquakes and plate movement
Weathering. Erosion by wind, ice, earthquakes. Landslips and sediment deposition.
Sequential geological histories
Simple rock cycle
Level Two NCEA External Exams for Geological Science (Age 16/17 years)
Current AS 90762 (2004 -2010) “Describe NZ’s Geological History” (3 credits) Geological processes include: Plate tectonic subduction and spreading, mountain building and peneplanation. Geological events include: Pre Gondwanaland events; breakup of Gondwanaland; rock types associated with major orogenies; tertiary peneplanation; Ice Ages.
Proposed Standard 2.5 (Nov. 2008) “Develop an understanding of the causes of natural hazards”. (4 credits) Causes of earthquakes, volcanoes, landslides, tsunamis, storms, meteorite hits, tectonic activity, extreme weather, storm surges.
Proposed Standard 2.6 (Nov. 2008) “Develop an understanding of the interaction of natural hazards with human activity”. (4 Credits). Effect and consequences of AS 2.5.

204
Level Three NCEA External Exams for Geological Science (Age 17/18)
Current AS 90731 (2004 – 2010) “Describe geological processes affecting NZ”. (2 Credits) “1. Plate tectonics: simple plate tectonic theory including subduction zones, deep sea trenches, mid-oceanic ridges, and transform faults. 2. Seismic activity: the cause, nature, measurement, and distribution of earthquakes, knowledge of P and S waves. This will include the description, detection, measurement and use of P and S waves in locating earthquake epicentres and determining the nature of the Earth’s internal structure. 3. Measurement of earthquakes is limited to the Richter and Modified Mercalli scales. 4. Volcanic activity: types and locations of dormant and active volcanoes and volcanic activity areas, associated phenomena such as geothermal activity, relationship between magma type and volcanic features”.
Proposed standard 3.5 (Nov. 2008) “Develop an understanding of the interrelationship between the geosphere, hydrosphere, atmosphere and biosphere over time”. (4 credits) Geosphere, Biosphere, Atmosphere and Hydrosphere – how these interrelate on a global scale. Note that the current Achievement Objective states: “Develop an in-depth understanding of the interrelationship between human activities and the geosphere, hydrosphere, atmosphere, and biosphere over time”, whereas the proposed aligned standard above, does not specifically connect human activities with earth systems.
9.12 Discussion
The proposed standards at Level 1 indicate significant change from a standard
requiring conceptual knowledge and understanding of the formation of rocks,
geological environments, geological time and geological histories, to one dominated
by physical geological processes as explanation for observable surface features. The
key elements of geological science such as deep time and geological history have
been removed not only from Level 1, but also do not reappear as examinable
materials in any achievement standard. Emphasis appears to be on the consequences
of plate tectonics such as types of volcano, boundaries and earthquakes, rather than
on geological explanations of mechanisms. This is a significant reduction in enabling
students to develop a concept of the Earth’s global and local geological history and
an understanding of the accumulated multi-disciplinary scientific evidence. Having a
meaningful perception and conception of geological events enhances understanding
of the universe and the interrelationships between different science disciplines.
Furthermore, the deep time and perceptions of scales of time have an important
impact on the conceptualisation of biological evolution.

205
As Libarkin et al. (2007) point out;
“Consideration of the role that deep time has to play in shaping our
geologic conceptions should be an important point to consider when
developing new curricula or pedagogies. Future studies could investigate
….. and evaluate the impact of time related curricula on students’ Earth
related conceptual models”. (Libarkin, et al, 2007, p. 421).
Although there is currently no specific supporting research evidence, possible
reasons for this change in geoscience and geological science curricula include:
Inadequate understanding by curriculum developers of what geological
science actually is and why it is vital for making sense of all sciences. For
example there were no geologists on the Science writing panels.
Dominance of assessment for accountability and comparability rather than a
curriculum for developing a scientific understanding of the planet and the
universe. For example, this is supported in Hipkins (2010) on the evolution of
the NCEA,
“…positive cluster principals were curriculum innovators. They
were likely to say their school had initiated curriculum and
pedagogical changes aligned with the directions signalled in NZC,
and to hold the view that a breadth of learning experiences and
multiple learning pathways can legitimately contribute to an NCEA
qualification” (p. 53).
Perception that students are cognitively unable to comprehend deep time and
relative geologic events.
Perception that students (and teachers) are bored and disinterested by learning
about the formation of rocks, rock types and the rock cycle.
Perception that geological science is of low status relative to other sciences.
This perception is supported by assessment standards having a lower credit
value and in the 2007 reforms, removal from external examination
(http://nzcurriculum.tki.org.nz/e/community/ncea/science.php).
Perception that earth systems science better satisfies a demand for showing
how science is relevant to society and that this will enable better informed
citizen decision making in the future.

206
The proposed standards (especially for Level 1) are strongly based on theory and
leave little room for development of practical activities (except for aspects of
weathering and erosion). Although these standards are in draft form, and that
changes are to be expected, there is a clear change in the curriculum at Levels 2 and
3; from geological processes to socio/environmentalism. For example, the causes of
natural hazards are developed into standard 2.6 where human activity interacts with
natural hazards. In fact, geological phenomena are only seen as hazards if people are
involved. Time will tell what the detailed unpacking of explanatory notes will dictate
what teachers actually end up teaching the curriculum. Appendix 3 provides a
detailed summary of where Geology qualifications come from in the current New
Zealand curriculum.
9.13 What is Actually Assessed? – AS 90190 “Aspects of Geology”
Achievement standard AS 90190 is a key standard for the teaching and learning of
the Earth Sciences as this is where most credits in geology are generated in the
national qualifications framework in secondary school. It was first examined in 2002
and contained criteria on formation of rocks, geological history, relative dating and
observable properties of minerals. Revision of standards at the end of 2004 saw the
elimination of minerals from examinable material from AS 90190 so that students
are now expected to have knowledge of types of rock, the formation of igneous,
metamorphic and sedimentary rocks and an understanding of relative age
relationships in simple (non overturned) stratigraphic columns. The analysis of the
stratigraphic columns addresses the order in which geological events occur and their
relationships to geological processes. Classification keys for rocks may also be
assessed but has only been asked in the 2002 examination for AS 90190. The full
description of the AS 90190 criteria is available on www.nzqa.govt.nz.
Based on the arguably valid Bloom’s taxonomy, students are assessed according to
the quality of answers by:
a) Description - requires the student to be able to recognise, name, draw, give
characteristics of or an account of.
b) Explanation - requires the student to provide a reason as to how or why
something (concept or observation) occurs.

207
c) Discussion - requires the student to show understanding by linking scientific
ideas. It may involve students in justifying, relating, evaluating, comparing
and contrasting, analysing.
Questions are also constructed so as to enable students to achieve the standards
criteria in a balanced sufficiency distribution of questions requiring description,
explanation and discussion. Many questions are ‘scaffolded’ so that students can gain
credit for a discussion answer that is explanatory rather than discursive and
descriptive rather than explanatory. Discussion requires high level skills at linking
ideas, and only skilled students are able to achieve this level of understanding.
Results reflect a students’ overall level of achievement from a pre-determined
sufficiency statement. The sufficiency statement specific to each standard is carefully
adjusted during marking time to ensure some control over unexpected and aberrant
interpretations of questions and to reduce result variations. This may at times be a
contentious issue and is often misinterpreted as ‘scaling’ rather than managed and
controlled adjustment.
Typical examples of descriptive, explanatory and discussion questions from the
November 2006 exams for Geology AS 90190 are shown below.
AS 90190 “Aspects of Geology” 2006 Exam Questions Examples.
Descriptive: “Describe what is meant by the term ‘stratigraphic column”.
Explanatory: “Granite is light in colour and gabbro is dark in colour. Explain why
these two rocks differ in colour”.
Discussion: “Discuss the differences in the formation of granite and basalt.”
Teachers have always relied on examination questions as powerful indicators of
‘syllabus’ and standard criteria interpretations so that teachers can better prepare
their students for examination. However, poorly explained and narrow criteria of
standard 90190 severely limit what can actually be asked and in turn limit the ‘shelf
life’ of the assessment standards. Over time, it eventually becomes easier for teachers
to ‘second guess’ the questions because there is a limit as to what can actually be
asked. Questions cannot be asked outside these criteria. Many individual questions
are ‘scaffolded’ to enable students to demonstrate their level of understanding.

208
Assessment schedules are available for download and discussion from
www.nzqa.govt.nz. Considerable debate has ensued over the actual and potential
manipulation of accepted judgement statements for students (and therefore school)
performance in comparison to Profiles of Expected performance (PEP). The
following is taken from the NZQA website (nzqa.govt.nz/nqfdocs/ncea-
resource/pep/2006/90190-pep-06.pdf) and details the performance expectations for
the 2006 external exam for AS 90190. Use of PEP’s is controversial.
“Profiles of Expected Performance (PEP’s) are established for each
externally assessed achievement standard using a combination of historical
data and the informed professional judgements of examiners, markers and
NZQA staff. Each PEP provides NZQA and the leaders of marking panels
with a measure against which to gauge the real-time progress of marking.
Where outcomes begin to deviate from the PEP’s, NZQA and panel leaders
consider whether: An amendment to the marking schedule will correct the
discrepancy· There is an explicable and defensible reason for any change in
performance· Any further action is required or justified.” (p.1)
For the AS 90190 external examination for 2006 it was expected that 44 -50% of
candidates would fail (N = Not achieved), 33–38% would achieve (A), 11–17%
would achieve with merit (M) and 2-5% would achieve with excellence (E).
Compare this with Figure 8.22 (1 is AS 90190), where the averaged results from
2002 to 2005 were 49.5% N, 39.3% A, 9.4% M and 1.9% E. These results indicate
that expectations were achieved for failure and achievement but not for merit and
excellence, which were below expectations. Is the historical 50% pass/fail mindset
from pre 2002 scaled and norm referenced external exams alive and well in an SBA
environment? The derivation, use, management and relationship to actual student
performance remain a critical area debate for SBA validity, reliability and
authenticity of student results.
Figure 9.18 in Appendix 3 shows the quality of performance for selected Earth
Science achievement standards from 2002 to 2005. The descriptors for selected
standards are shown in Table 9.8. Over all standards in Figure 9.22, the average ‘pass
rate’ is 50% thus begging the question of why is this not significantly different to that
achieved in the previous norm referenced system of ‘scaled’ percentage marks , and

209
does the achievement standard criteria really differentiate those students with higher
Level thinking skills?
Averaged Results for Selected Earth Science Related Achievement Standards 2002 - 2005
0%
10%
20%
30%
40%
50%
60%
70%
80%
90%
100%
1 2 3 4 5 6 7 8 9 10 11
Achievement Standards
Perc
enta
ge o
f Candid
ate
s
Excellence
Merit
Achieved
Not Achieved
Figure 9.22: Achievement in selected Earth Science achievement standards.
Table 9.8. Achievement standard descriptors for Figure 9.22.
AS No.
Level Domain Title
1 90190 1 Science Aspects of Geology
2 90192 1 Science Aspects of Astronomy
3 90331 2 Geography Natural landscapes
4 90719 3 Science Human evolution
5 90717 3 Biology Processes and patterns of evolution
6 90316 2 Science NZ geological history and processes and the nature and life cycle of stars
7 90731 3 Science Geological processes affecting NZ
8 90772 2 Science Evolution of NZ plants and animals
9 90764 2 Science Life cycle of stars
10 90767 2 Science NZ geological history
11 90314 2 Science NZ endemic life
Planet Earth and Beyond

210
9.14 Results Gaining Credit in Geoscience Standards: A Discussion
Figure 9.23 shows candidate achievement comparisons for geoscience unit standards
and other NCEA Science standards for 2006. Level 1constitutes the main area of
formalised contribution to teaching and learning about planet Earth as relatively few
students gain credits after this. This is mainly a result of so few secondary schools
offering Science at Year 12 and 13 (Figure 9.28, Appendix 3,). Indeed in 2007, there
were only 177 (41%) schools offering Geology at level 1, 50 schools at Level 2
(11%) and 26 schools at Level 3 (6%). Achievement is defined here as the number of
results in that year that gain students credit and not ‘quality’ of understanding as in
merit or excellence. There are 2.5 times as many candidates gaining credits in
physics as there are in geology, 2.4 times as many in chemistry and 1.6 times as
many in biology. Geological science is in serious decline as a subject of learning. In
summary, despite “Planet Earth and Beyond” being established and formalised into
the 1994 New Zealand Science curriculum reforms currently, very few schools, and
therefore students, have an opportunity to learn about geological science. What is
taught is Level 1 (with seriously declining numbers) AS 90910 “Aspects of
Geology” and NZASE unit standards with a scattering of other unit standards in
Geology at Levels 2 and 3. As the future of NZASE unit standards is in doubt (see
postscript) even fewer students will have an opportunity to learn about the geology of
our planet.

211
Number of Results Gaining Credit (RGC) for All Earth Science Assessment Standards in 2006 Compared to Phys, Chem. and Biol.
(N = 434 schools in 17 Regions. Data source: NZQA)
125
567
2609
57
123
78
6
27
18
5
26
20117
0
781
377
3718
3502
13506
20370
8402
8476
1226
6
0 5000 10000 15000 20000 25000
L1 ES US Geol Resources
L1 ES US Minerals and rocks
L1 ES US Rock types and Rock Cycle
L1 ES US Geol. Time
NZASE Weather
NZASE Earth Science
NZASE Earth and Space
L2 ES US Geol Features
L2 ES US Geology of an Area
L2 ES US Fossils
L3 ES US NZ Geol Hist
L3 ES US PT and SW Pacific
L3 ES US Geol Hazards
L3 ES US Hydrographs
L3 ES US Geol Hist in SW Pacific
L1 Sc AS GEOLOGY
L1 Sc AS Biol
L1 Sc AS Chem
L1 Sc AS Phys
L1 Sc AS Astronomy
L3 Sc AS Geol proc and Stars
L3 Sc AS Evolution
L3 Sc AS Geol Processes
NC
EA
Ass
essm
ent
Sta
nd
ard
s
(L1-
3 =
NC
EA
leve
l, N
ZA
SE
= N
Z A
sso
c. o
f S
cien
ce E
du
cato
rs, U
S =
Un
it S
tan
dar
d, A
S =
Ach
ieve
men
t S
tan
dar
d, S
c =
Sci
ence
do
mai
n, E
S =
Ear
th S
cien
ce D
om
ain
)
Number of Results Gaining Credit
Figure 9. 23. Results comparisons for all Earth Science Assessment Standards 2006.

212
Number of Results Gaining Credit (Passes)for Internally Assessed Unit Standards in Earth Science
(Source: NZQA)
0
250
500
750
1000
1250
1500
1750
2000
2250
2500
2750
3000
3250
3500
3750
4000
4250
4500
4750
5000
2002 2003 2004 2005 2006 2007 2008
Year
Nu
mb
er o
f R
GC
6356
6357
6358
18981 (NZASE)
18982 (NZASE)
18989 (NZASE)
6359
6360
6361
6362
6363
6364
6365
8153
21614
Key to Earth Science Unit Standard Numbers
L1 US 6356 Report on a geological resource in NZ L1 US 6357 Identify common minerals and rocks L1 US 6358 Describe the formation of major rock types and describe the rock cycle L1 NZASE US18981 Demonstrate basic knowledge of weather L1 NZASE US18982 Demonstrate knowledge of Earth Science L1 NZASE US18989 Demonstrate knowledge of Earth and Space L1 US 6359 Demonstrate knowledge of the measurement of geological time L2 US 6360 Identify geological features from recorded visual information L2 US 6361 Investigate and report on the geology in an area L2 US 6362 Demonstrate an understanding of fossils L3 US 6363 Demonstrate knowledge of the geological history of NZ L3 US 6364 Use plate tectonics to explain distribution of major NZ and SW Pacific geological
features L3 US 6365 Demonstrate knowledge of natural hazards L3 US 8153 Explain factors affecting water resources and its management, plot and interpret
hydrographs L3 US 21614 Describe the geological history of an area in the SW Pacific
Note: L1 is Level 1 of NCEA and set for Year 11 (15/16 year olds). NZASE is set for lower ability Year 11 students at curriculum Levels 3, 4 and 5. NCEA Level 1 Unit Standards (US) is set for curriculum Level 6 (Ministry of Education, 2007).
Figure 9.24. Results gaining credits for Earth Science Unit standards.

213
Figure 9.24 tells an important story and tracks the changing pattern of where students
gain their qualifications in earth science and what many schools are offering their
students, for an earth science education. Unit standards are totally internally
managed. The NZASE standards have undergone some revision in 2008 but the
assessment tasks have remained essentially the same each year. Although there is a
rigorous external moderation system, teachers are able to ‘teach to the test’, and even
‘teach the test’ (see Table 9.3). NZASE assessment tasks are derived from the lower
curriculum Levels 3, 4 and 5 rather than curriculum Level 6 for all other NCEA
Level 1 qualifications. They are designed for lower achieving 15 year old students
and significant debate is yet to be had on the future retention of these standards as
counting towards the national qualification of NCEA Level 1. Based on a premise of
non duplication of standards, recent (September 2009) curriculum revisions indicate
that unit standards will be removed.
Since the introduction of standards based and criterion referenced assessment in 2002
there has been a rapid increase in the number of students gaining their Earth Science
credits from unit standards in particular, from the NZASE option. The 2008 results
indicate an interesting decline in two of the three NZASE earth science unit
standards but not geological science. 2009 results will not be available until May
2010. There is a continuing increase in the NZASE standard 18982: Demonstrate
knowledge of Earth Science and the Level 6 curriculum standard 6358: formation of
rocks and the rock cycle. A decline in the number of students gaining credits in 6357:
identifying rocks and minerals is noted, and likely to continue to decline. It is also
likely that as the number of students gaining credits in the curriculum Level 6
externally assessed achievement standard AS 90190 (Aspects of Geology) decreases,
the number of students gaining credit in the internally assessed US 6358, has
increased. Does this reflect schools competitive desires to have more students
‘passing’ by offering a perceived easier pathway to gaining credits? And, how much
subject choice do students really get? Either way, the number of students gaining
credits in the earth sciences is in decline and places in jeopardy the survival of this
subject in the NZ national curriculum. In concert with 2009 curriculum reforms
where geological and earth science will no longer be externally assessed, survival is
in even more question and doubt. Senior Level earth science standards have always
been low in number and remain static at less than 250 students per standard.

214
9.15 Where Do Evolution Related Qualification Credits Come From?
Although relatively few students gain credits in Biology standards
(www.nzqa.govt.nz/qualifications/ssq/statistics/nqf-stats.) at NCEA Level 1
compared to Biology in Science standards, (maximum of 6572 for AS 90163
“Describe transfer of genetic information” compared to 20,000 in Biology in
Science for 2006), there are no evolution related standards for assessment.
Consequently, students currently are formally taught very little about scientific
explanations and mechanisms for the evolution of life until senior secondary school.
Figure 9.25 and standard descriptors (Table 9.9) show the standards which contribute
to credits in the assessment of biological evolution. It is notable that unlike Geology
standards, credits are gained essentially through achievement standards rather than
unit standards and reflect traditional ‘pre 2004 SBA’ teaching. This is shown by the
fact that AS 90459, AS 90717 and AS 90719 were already part of what was taught in
Biology before SBA. The lower number of results gaining credit for AS 90772 is a
standard for assessing the evolution of New Zealand’s plants and animals within the
Science domain (Level 2) and not Biology, again reflecting the fact that few schools
offer Science at NCEA Levels 2 and 3.

215
Number of Results Gaining Credits in Evolution Related Standards2002 - 2008
(Note: Key refers to assessment standard code numbers)(Source: www.nzqa)
0
500
1000
1500
2000
2500
3000
3500
4000
4500
5000
5500
6000
6500
7000
7500
8000
2002 2003 2004 2005 2006 2007 2008
Year
No
.of R
esu
kts
th
at
ga
ine
d c
red
it (p
ass
es)
6308
6311
90459
6317
6318
6321
6362
90717
90719
90314
90772
Figure 9.25. New Zealand evolution related standards and credits gained.
Note: Results gaining credit do not indicate total candidate numbers per subject.
NZQA did not hold the number of entries for unit and internally assessed
achievement standards prior to 2008; as from 2008 schools/tertiary providers will
have to send to NZQA the number of students who attempted standards but did not
gain an achieve or higher. Unit standards do not carry Levels of achievement they are
competency based only. Schools and tertiary providers only send in results (i.e.
Achieve, Merit, Excellence -A, M, E) and not the number of students who attempted
standards but did not achieve them. As from 2010 unit standards will be phased out.

216
Table 9.9 Descriptors for Evolution related national assessment standards.
Assessment Standard Descriptions (red indicates main credit sources)
1 US L2 Biology 6308 (Unit standard, NCEA Level 2 Biology domain, standard number)
Explain how genetic change occurs within populations.
2 US L2 Biology 6311 Reasons for the special characteristics of New Zealand's flora and fauna.
3 AS L2 Biology 90459 Describe genetic variation and change (about 25% is evolution related).
4 US L3 Biology 6317 Explain the process of speciation
5 US L3 Biology 6318 Interpret scientific information for human evolution
6 US L3 Biology 6321 Scientific views of human biological evolution
7 US L2 Science 6362 Demonstrate understanding of fossils
8 AS L3 Biology 90717 Processes and patterns of evolution
9 AS L3 Biology 90719 Describe trends in human evolution
10 US L4 Biology 8105 Explain the principles of evolution and biogeography
11 AS L2 Science 90314 Describe aspects of NZ’s endemic life
12 AS L2 Science 90772 Describe the factors and processes involved in the evolution of New Zealand plants and animals (replaced AS 90314 in 2005)
Achievement results for evolution related standards also reflect the well established
fact that as socio economic deprivation declines so do ‘pass’ rates or achievement
(Figure 9.22) in standards assessments. Although decile 6 schools only contributed
50 candidates (out of a total of 1493 in 2005) for AS 90772 it is unclear why their
success rate for this standard is so high. Low decile schools also contribute fewer
candidates. Private schools do not have decile ratings and therefore do not receive
government funding assistance. These schools have fee paying students and therefore
are more likely to have high socio-economic status with high expectations and values
for academic success. Pass rates may also reflect to some extent, what students
choose to be the standard(s) that are most likely to provide them with success. For
example, students may be entered in all biology assessments for a particular NCEA
Level but on the day of examination choose to sit or answer only those questions and
papers that they perceive to be important. This issue of completing all papers in a
single three hour examination has been partially addressed by enabling passes with

217
endorsements of ‘grade’ Level to be placed on the record of learning. This is an
attempt to motivate students into thinking beyond ‘just a pass’.
Figure 9.26. Deciles and Percentage “Pass rates” for evolution related standards.
Although there are twelve assessment standards that are available for the teaching
and learning of biological evolution principles, Figure 9.26 shows that AS 90459, AS
90717 and AS90719 are the standards that teachers teach. At NCEA Level 2 AS
90459 provide only a small percentage actually related to evolution ideas. There are
far fewer candidates in AS 90772 because very few schools offer Science at Year 12.
Although there is a similar trend, the gap between AS 90717 and AS 90719 is
perhaps best explained by fewer numbers of students entering AS 90717 rather than
quality of student. Perhaps “Human evolution” has more appeal than “processes and
patterns”?
9.16 Chapter Summary
1. The Geology component of the Planet Earth and Beyond strand is an
established part of the NZ national Science curriculum but with continuously
and significantly declining numbers of candidates attempting and/or being
taught by schools. This decline is a serious concern if an uneducated public
(and politicians) are required to make informed conclusions and decisions on
0
10
20
30
40
50
60
70
80
1 2 3 4 5 6 7 8 9 10 11
Per
cen
tag
e
Decile
Percentage of 'Passes' Per Decile for Evolution Related Achievement Standards for 2005
AS 90459
AS 90717
AS 90719
AS 90772
Private schools with no decile

218
climate change, evolution of life, environmentalism, Earth materials (rock,
mineral and soil) and geological processes. Geology as a discipline of
learning in secondary school in New Zealand continues to struggle for
survival and is in effect dead beyond Year 11 and dying at Year 11. In one of
the world’s most tectonically active regions and dependence on soils for an
agriculturally-based economy, understanding of geological processes and the
impact of human intervention on geological/environmental issues is vital for
future economic sustainability.
2. Schools appear to be choosing to offer less demanding assessment standards
such as NZASE and unit standards at the expense of achievement standards.
These enable students to express higher orders of thinking for meeting the
perceived needs of teaching and learning for the geological sciences whereas
unit standards and NZASE unit standards do not. Achievement standards
such as AS 90190 also do not assess the same conceptual content as the
equivalent unit standards and are externally assessed.
3. Data suggests that schools have not fully embraced the teaching and learning
of geological science as part of the ‘new’ reformed 1994 national Science
curriculum and continue to teach in a slightly modified form what they taught
prior to its introduction. Curriculum conceptual traditions die hard. The Level
of geological literacy in the general population (and within the teaching
profession) is very low.
4. Assessment (and teaching) of Geology and evolution has always been and
continues to be, minimally represented in the national Science curriculum and
is actually studied by relatively few pupils compared to other traditional
sciences. Fossils and paleontology continue to be minimalised in the New
Zealand science and biology curricula.
5. The national Science curriculum is currently nearing the end of its review
after 13 years of implementation. The draft was released for comment in
August 2006 with continued recognition of the importance of evolution and
geology at all Levels of Science. Assessment standards are in review for
alignment with a final science curriculum statement. The completed
curriculum and achievement standards-based assessments are due for
implementation in 2010-2013. This will change the geological concepts

219
taught and assessed and increase the demands for improved and adequate
pedagogic resourcing, training and funding (See postscript for current status).
6. High stakes assessment remains the crucial educational driving force and
political ingredient in the teaching and learning continuum. Decisions on
issues of funding, resourcing and teacher training for implementation of a
reviewed curriculum (after 2010) are yet to be addressed.
7 Addressing issues for improvement of educational achievement and candidate
numbers for the geological sciences in low decile regions and schools is a
challenge. Data for the teaching and learning of geology in schools suggests
that increasing funding alone (via government Targeted Funding for
Educational Achievement: TFEA) to low decile schools does not appear to be
effective in raising achievement Levels in this subject area.
8. The Nature of Science within the curriculum is seen as an overarching strand
and aspects are integrated within all standards. Although this is beneficial to
enhancing an understanding of biological evolution, geological time content
is removed from the Planet Earth strand. This retards a better understanding
of science in general and biological evolution in particular.
9. Analysis of data can never keep up with the latest set of results but this
analysis shows how geological science was reborn, grew and died in NZ.
9.17 Postscript
Late November 2009 developments from the NZ Ministry of Education and its
operations arm NZQA, announced several curriculum reforms as related to national
qualifications. These will impact on the content and assessment for geological
science and geoscience. In essence, criterion referenced unit standards will disappear
(Except industry training organisations) so that only internally and externally
assessed achievement standards will be operational. NZASE unit standard
assessment will also disappear or be modified and external examinations will be of
three hours with a maximum of three papers. Geological science will not be
externally examined at Level 1, therefore reinstating the traditional reductionist
sciences of physics, chemistry and biology to pre 1994 subject status. Because unit
standards will not be available, the lower achieving students will also not be able to
study the earth science standards. In effect the growth of NZASE standards

220
contributing to NCEA Level 1will no longer exist and the existence of Science as a
partner to the traditional senior high school reductionist hierarchy of Physics,
Chemistry and Biology are in jeopardy. However, NZASE standards are likely to
remain for lower achieving students but not count towards NCEA Level. The final
format and philosophy remains to be seen. Figure 8.27 shows the pass rates for
externally assessed achievement standards.
Comparison of Mean Number of Results Gaining Credit for the National Science Achievement Standards 2002 -2008
(Note: RGC is the number of entries minus those that did not pass)(Source: www.nzqa)
341 270 465 237 463
10155 10081
20220 20492
14111
331 298 333 394 493
0
3000
6000
9000
12000
15000
18000
21000
24000
Astronomy Geology Physics Chemistry Biology
Science Subject
Ave
rag
e N
um
ber
of
RG
C
NCEA Level 1
NCEA Level 2
NCEA Level 3
Figure 9.27. Mean number of results gaining credit ‘passes’ for Achievement Science
national achievement standards 2002 -2008.
Bearing in mind that learning geological and/or geoscience in NZ can only be done
(excluding minor aspects in geography) through the Science standards, Figure 9.23
details the average number of candidates over the last seven years who have entered
for achievement standards and who have gained credits i.e. passed. Despite Planet
Earth and Beyond being successfully introduced as an equal curriculum partner to
the other sciences in 2002 for the introduction of NCEA into NZ culture, there is
about a 96% loss of students from Year 11 (aged 15/16 at NCEA Level 1) to those
who gain credits at Levels 2 and 3 NCEA Science. Schools simply did not take up
the option of offering senior students a general science course but rather kept to the
traditional reductionist hierarchy. Conceptual change is indeed difficult to
sustainably produce. The challenge for future earth science teachers and others who
value the unique contributions of geoscience and in particular, geological science, to

221
science literacy and an informed understanding of how the earth works, is to find
ways in which geological science and geoscience can be sustainably integrated into a
Science curriculum. In effect, the current science reforms push the geosciences
curriculum back to 1968 where there was no externally assessed geological science
or geoscience. Yet NZ is a geologically volatile, dynamic and unique place!
Table 9.10 Geoscience curriculum changes.
NCEA Level 1 (students aged 15/16years): The first qualifications year. What Changed in external national assessment of Geoscience?
1968 Curriculum
1994
Curriculum
2002 NCEA
standards
2004 NCEA standards
revised
2011
Curriculum
No geological or geoscience externally assessed.
Properties and uses of minerals and rocks.
Formation of rock types.
Geological history.
A NZ natural resource.
Minerals, rock formation and the rock cycle.
Geological history.
Rocks.
Geological
history
The carbon cycle.
Plate tectonic processes and erosional forces involved in shaping surface features.
As can be seen from Table 9.10, there have been significant changes to geological
and geoscience education curricula over the last 40 years. These changes range from
recognition within the science curriculum of the importance and value of the
geosciences in the 1994 curriculum relative to the existing physics, chemistry and
biology, to its inclusion as a reduced credit standard in the initial NCEA standards.
When revision of standards occurred in 2004, there was the removal of minerals
from the assessable material (as derived from the Planet Earth and Beyond
curriculum strand), and finally in the current revisions, rocks, geological history and
minerals have been removed. These are replaced by assessable standards (internally
only) on the carbon cycle (recognising the influence of Earth Systems) and the role
of plate tectonics as an internal process and the erosion/deposition cycle as effecting
surface features (See Chapter 3 for the 2010 achievement standards for
understanding the formation of surface features and the cycling of Carbon). The key
attributes of geological science such as ‘Deep Time’, structure, earth materials, earth
history and the fossil record are removed from Level 1 (for 15/16 year olds).
222
In a proposed geological science content (NZQA draft matrix, Nov. 2009) for Year
12 Science, one paper will be externally assessed on “the causes of natural hazards”
(4 credits) and another internally assessed paper looks at the “formation of rocks
(formerly at Level 1) and its links to the geological history of an area” (4 credits). At
Year 13 Science, one externally assessed paper looks at the “relationship between
Earth system processes and the causes of global problems” (4 credits) and an internal
paper looks at the “geological history of New Zealand” (4 credits). Of the
approximately 55 schools currently offering senior Science, how many will do the
external examinations in 5 years time? Indeed, whilst the number of schools offering
NCEA Levels 2 and 3 Science remains low but static, the number of schools with
students gaining credits in the Geology achievement standard at Level 1 is steadily
declining with the number of schools offering lower curriculum level unit standards
(NZASE) and internally assessed unit standards is increasing (see Appendix 3,
Figure 9.28). The only access students will have for studying these key geological
concepts will be at Years 12 and 13 Science Levels 2 and 3 NCEA. The record
shows (See Chapter 12, p.330) that in 2008 only around 6000 students nationally
entered for Level 2 Science and 25% of tuition time teaching geology. There were
1018 candidates (www.nzqa) entered for Geology at Level 2 in 2008, of which only
572 were successful. The statistics for Level 3 Science indicate 795 entered and 438
were successful. In short, there are very few successful candidates at senior school
Level in NZ who can demonstrate an acceptable knowledge and understanding of
geological science.
Will the next NZ Science curriculum ‘reform’ (AD 2035?) be up to the task of
establishing and sustaining the vitality of geological science with adequate
resourcing and teacher training? Who will do it, and is geological science and
geoscience so boring and unimportant that students, teachers and future decision
makers are uninspired? And what about the connections between geological science
and biological science? Do the current biology reforms measure up and connect with
geoscience? Current reforms are due for implementation beginning in 2011 with
Level 1 NCEA.
Analysis of historical changes of GCSE Earth Science coverage in the national
curriculum for the UK (King, 2007) shows a similar story to that of NZ where there

223
is “a bleak conclusion and an inconvenient truth” (p. 5). Successive curriculum
revisions have eroded the geological science content so that little remains. For New
Zealand students, learning about how the Earth works, its history and connection
with the evolution of life will be the pleasure of a tiny percentage of people.
The NZ geoscience (and geological sciences) curriculum experience so far, is echoed
in King and Hughes (2007).
“……..it is a great shame that the Earth science content of science specifications, [the UK curriculum] which significantly improved in the 2000 specifications, has now taken a big step backwards. This seems particularly perverse at a time when understanding the Earth and its processes is becoming more and more scientifically important, and are likely to have a major impact on future generations”.(p.6).

224
CHAPTER TEN
GEOLOGY AND EVOLUTION: GeoVAT SURVEY RESULTS
10.1 Introduction
As oxidation is to reduction so is the study of paleontology to an understanding of
the evolution of life. Lyell, Darwin, and Russell were products of the western ‘Age
of Enlightenment’ and their thinking formed the basis of geological science (as in the
modern form of paleontology and paleoecology), and of the evolution of life on
Earth. As Charles Lyell (1862) stated:
“Geology is the science which investigates the successive changes that
have taken place in the organic and inorganic kingdoms of nature”.
(Vol. 1. Ch.1.p.1.).
The connections between geological science and evolution are indeed historical and
profound. Ever since fossils were recognised and accepted as the remains of once
living organisms, the questions began: how, what, where, when and why but in a
testable and accountable manner. From a teaching and learning perspective the
challenge of conceptualising scientific views of the evolution of life has shaped
curricula (or not) and the way people perceive the world’s natural history.
Investigating the history of life has been traditionally closely linked to the geological
sciences, (particularly the study of sedimentary rock and biostratigraphy) rather than
in Biology. Perhaps this is due to fossils having to be dug out of the ground: a task
done by the geologist rather than the biologist and that Biology teachers tend to focus
on structure, function and genetics rather than paleontology and paleoecology. A
significant conceptual challenge for teachers and curriculum developers is to bridge
the content gap between the teaching and learning of extant life and the teaching and
learning of extinct life and to integrate the paleobiological aspects of the geological
sciences with those of the biological sciences. In Spain for example evolution was
first introduced into the curriculum in 1901 and today makes up less than 7% of the
Biology curriculum (Barbera, 1999). The fact that the teaching of evolution in Spain
was entirely absent for forty years indicates the power of politics, religion and

225
contemporary social issues on the construction of school curricula and in particular,
societal values about biological evolution. Needless to say, political and religious
issues of teaching biological evolution in the USA are extensively discussed.
Based on textbook analyses using word counts, other countries such as the People’s
Republic of China (PRC), USSR and the USA (Swarts, Anderson & Swetz, 1994)
indicate that the teaching of evolution forms a relatively small portion of Biology
curricula. Swarts, et al. (1994) also show that the former PRC textbook coverage of
evolution is considerably less than the USA coverage but that the former USSR
coverage is comparable and slightly more than the top USA textbook coverage. In a
study of Turkish pre-service Biology students’ acceptance of evolutionary theory
(Deniz, 2007), it was found that these students’ world views, their understanding of
evolutionary theory and their parents educational levels were key factors in
acceptance of biological evolution but not at the exclusion of other conceptual views
(individual as well as cultural). Interpretations of the Qur’an dominate individual and
Turkish societal thinking about biological evolution in much the same way literal and
fundamental interpretations of the Bible dominates some Christian thinking about
evolution. It is beyond the scope of this chapter to investigate these cultural
relationships, but suffice to say cultural values and belief systems are clearly
important in the development of a sensitive approach to the teaching and learning of
evolution: a cornerstone of the geological sciences and a testable explanation for the
‘grandeur’ of life phenomena on this planet.
This chapter is organised into the following sections:
A New Zealand case study for teaching evolution in a national curriculum
Findings for different age groups for GeoVAT questions 1 and 3
Chapter Summary
Connections between geological science and evolution within a teaching and
learning framework are examined and research question 2 is addressed: How do
students aged between 12 and 40 years develop their conceptions of evolution and
the fossil record, geological time and 3-D geological structures? This chapter
describes and discusses the results of the GeoVAT questionnaire (Appendix 5) given
to students of different ages and educational systems and the conceptions they hold

226
about the evolution of life and aspects of the fossil record. Figures 10.1 and 10.2 in
Appendix 6 illustrate typical conceptions held by students aged 16 years for
evolution. A New Zealand case study of the status for evolution in a national
curriculum is presented. It builds on the work of Dodick, (2002a; 2007) and Dodick
and Orion, (2003b). In particular, Dodick (2007) stresses the use of the fossil record
as an aid to ‘cement’ the links between geological time and biological evolution.
This is a key teaching and learning challenge for Biology curricula developers and
teachers.
Currently, Biology curricula in general focus on abstract ideas of micro-evolutionary
population gene frequency changes rather than the paleontological and
paleoecological issues. In other words there is little curriculum statement recognition
of morphological change through time and the linkage between natural selection and
constantly changing environments (biological and physical) at taxonomic levels
higher than the species level. It is likely a mistake to justify absence of geological
time and the fossil record from curricula on the grounds that it is too difficult or
abstract for secondary school students – it effectively removes the opportunity for
students to develop their conceptual awareness of time, biological evolution and the
fossil record. These connections are also best addressed by use of field work and real
fossil specimens. Data result Tables 10.2 to 10.8 for this chapter are presented in
Appendix 6.
10.2 New Zealand Case Study for Teaching Evolution in a National
Curriculum: A Summary
This case study (See Appendix 6 for full details) illustrates how biological evolution
is not fully connected with the geological sciences. In total, it amounts to a relatively
small part (maximum of 20% to 25%) of a full year course in Year 13 Biology.
Geological time, cladistics and the fossil record are the grist with which we
understand the evolution and history of life on this planet, but this is not fully
committed to the New Zealand (and many other countries) Biology curricula (see
Chapters 3 and 9). The reasons for this are likely to be found in the political histories
of curriculum evolution, notions of what constitutes subject disciplines, teacher
training and the driving forces of teaching for student assessment and national

227
qualifications. Examination questions are designed to enable students to demonstrate
their level of understanding through the use of descriptive, explanatory and
discursive or discussion type questions. Discussion type questions involve critical
thinking and the linking of related ideas. This demands higher cognitive skills.
Typical Achievement Standard examination questions on evolution cover aspects of
trends and patterns in human evolution but fails to significantly connect with the
fossil record and geological time: the key drivers for environmental change and in
turn, ultimately, macroevolution. Students in New Zealand who learn Biology are
exposed to serious evolutionary thinking, mechanisms and evidence only at ages 16
to 19 years and are likely to finish their formal schooling with a biased (via
limitations of standards criteria) and hazy understanding of this crucial area of
scientific literacy. In essence, they do not gain any depth of the conceptual
connections between geological time, the fossil record and evolution. As stated by
Dodick and Orion (2003b), there is convincing argument for Biology teachers and
curriculum developers to more fully acknowledge the ‘mutualism’ of the fossil
record and geology for a better conceptual understanding of biological evolution and
the nature of science (NOS) or ‘how science works”.
“We suggest that implementing a unit that integrates the fossil record
(macroevolution) and the genetic mechanism of evolution might alleviate
many of the problems that students have in understanding this complex
topic. If non-biology majors’ benefit from this exposure there is good
reason to think that biology students will also benefit from it” (Dodick &
Orion, 2003b. p.189).
Producing a conceptual change in curriculum development and implementation is a
challenge not easily overcome. This would involve the whole process of change in
infra structure, intentions and satisfying of the general ‘Posnerian’ conditions for
conceptual change.
The current NZ 2010 Biology curriculum (1994 version) did not, and the 2007
revisions have yet to action (by way of assessment standards), the crucial connection
between the fossil record, geological time and the study of paleontology and

228
paleoecology. In so doing, a more sophisticated understanding of the origin and
evolution of New Zealand’s biota is possible. Indeed, although in the ‘Living World’
strand of the revised 2007 NZ national Science curriculum evolution is an
acknowledged connecting thread through all year levels, it is not yet specifically and
formally expressed as an assessment standard. Note that the NZ Science curriculum
assesses four strands of science: Physics, Chemistry, Biology and Planet Earth and
Beyond. The revised 2007 Biology curriculum is yet to be fully ‘unpacked’ to reveal
the intent and content of the achievement objectives. However, revisionary 2009
models of Biology assessment content would suggest that fossils and geological time
are not seriously acknowledged in the national Science curriculum and is not part of
the Biology assessment standards, which focus on variation and change in Year 11
and evolutionary processes, speciation and human evolution at Year 13.
10.3 Rationale for the GeoVAT Earth Science and Evolution Survey
Questionnaire
The following section investigates responses from selected evolution related
questions (Questions 1 and 3) from the GeoVAT instrument (See Appendix 5). These
questions specifically address the evolution and fossil record aspect of research
question 2.
These research questions elicit respondent conceptions (and perceptions) about
fossils (Section A.1 of the questionnaire) and fossils and time (Section B.3 of the
questionnaire). The intention was to investigate how students of different ages firstly,
think about fossils, and secondly how they think about geological time as related to
key bio/geological events. Trend’s research (2001) indicates that the in-service
education of primary teachers in the UK (of similar age to the American University
of Beirut (UB) and pre-service primary trainees data presented here), do not have a
“secure grasp of deep time, either in absolute or relative terms” (Trend, 2001, p.215).
There appears to be a general tendency to lump relative geological events into large
chunks: ‘incomprehensibly very old’, ‘old’ and ‘young’, in what Trend (2001) calls
“extremely ancient”, moderately ancient” and less ancient” (p.191). Links between
evolution of life as seen through the fossil record and its geological context was not
explored in Trend’s work. Libarkin, Kurdziel and Anderson (2007) in their work on

229
American College age students, suggests that there is a disconnection between
conceptions of absolute geological time frames with biological events making a more
sophisticated comprehension and conception of biological evolution difficult. They
go on to suggest that developing teaching strategies for an earlier teaching of
geological time would be beneficial for building stronger connections between
geological time and biological and geological events. In other words, building
connections between scale of time and relative positioning (in terms of relative
events) in a similar manner to that of other scientific concepts such as atomic theory,
energy and genetics is likely to accelerate and promote the conceptual development
of a scientific understanding of geological time and the place of the fossil record
within this framework. This in turn would promote a deeper conceptualisation of
biological evolution. In effect, student conceptual developmental experiences for
geological time, paleoecology and their connection to evolution is too little and too
late.
10.4 American University of Beirut (AUB) Primary School Teacher Trainees:
Conceptualisations of Evolution, Fossils and Geological Time
This small, all female student class sample of primary teacher trainees had an
average age of 19 years and 5 months. Although 52% (n=19) of this cohort were
born in Lebanon, other students were born in Spain, Saudi Arabia, Kuwait, Jordan
and the USA. Around 68% were affiliated to Islam with the remainder either
Christian or atheist. The dominantly favoured school subjects were English,
Mathematics and Biology.
10.4.1 GeoVAT Question 1 Result Interpretations for AUB Primary School
Trainees: Ideas about Fossils
As discussed in Chapter 4 it took centuries for an accurate conceptual understanding
and acceptance of what fossils are. Questions 1 to 10 (Figure 10.3, Appendix 6) are
intended to probe student conceptions of fossils. It is clear that fossils are not by this
cohort, conceived as being tricks of the ‘devil’, failed creations of a God or grown
from seeds in rocks. These are 14th century conceptions of fossils. Question 4
appears to have posed more of a challenge perhaps due to unclear understandings of
what was meant by ‘accident of nature’ or by genuine lack of conception of how

230
fossils form. It is clear that the majority of respondents understood fossils as being
the preserved remains of once living organisms, but it is less clear as to whether they
are the preserved remains of only extinct organisms. In other words, 21% of
respondents thought that fossils can only be the preserved remains extinct organisms.
This raises the conceptual difficulty of deciding when is a once living organism, a
fossil? Of course, many organisms are still extant and are preserved as fossils
because of the arbitrary time constraint of around 10,000 years. It is significant that
all respondents considered fossils to be important and interesting and many
respondents explained why in question 1c. Figure 9.4 shows the response agreements
for GeoVAT Question 1.
Figure 10.4. AUB response summary for question 1 of GeoVAT.
The majority of these primary teacher trainees (74%) incorrectly thought that Charles
Darwin was the first to think of evolution. Perhaps this choice suggests that there is a
lack of general knowledge of the history of science and particularly the history of the
scientific theory of evolution. Perhaps it also indicates a lack of understanding of
how Science builds on what has gone before. It is surprising that 26% of this small
study group think that fossils do not support the fact and scientific theory of
evolution. It is not known why some respondents think this: perhaps it is a denial of
evidence that is too powerful to deal with when in conflict with established concepts.
The fact that humans have evolved from ancestral apes is also only agreed with by
42% of the respondents. To have a scientific view of this requires an understanding
of what ‘apes’ are from a biological perspective. It is likely that many students in this
cohort do not have this background and ‘apes’ will produce an emotional response
rather than viewed from within a biological context. For some reason there are those
that want to place Homo sapiens separate from the rest of the animal kingdom and
hypothetically, these students may see people not as ‘apes’ but as humans. It is a
AUB Percentage Agreement with Expected Responses
50%
22%
28%
Agree
General agreement
Disagree

231
little surprising that 47% had little idea of the age of the oldest fossils currently
known and of these, none ventured to state their own guess at a numerical age.
Perhaps they just had no idea (see Chapter 6 for discussion of student perceptions of
various scales).
Only 37% of respondents correctly identified birds as the modern descendants of
dinosaurian ancestors. The reasons for this is worthy of considerable more
investigation. Of even more concern was the 26% of respondents who correctly
identified DNA as being the universal protein coding genetic molecule of all living
organisms. Perhaps this cohort were non-biology students but it is a surprising result
given that global Biology curricula focus on molecular biology and the central role
DNA plays in the maintenance and evolution of life.
Questions 16 and 17 are intended to probe understanding of the rate of speciation in
terms of the concepts of gradualism and punctuationism. Responses confirm that
most respondents in this cohort consider the speed of speciation to be a slow gradual
process (95%) with very few (26%) considering that speciation as recorded in the
fossil record consists of a long period of stasis followed by a short period of time in
which new species appear. Of course no respondent considered that the Earth was
made in six or seven days. Few primary school trainees (and secondary) will ever
reach this level of conceptualisation of the fossil record and as Dodick (2003c) points
out, students of all ages have difficulty with learning about evolution.
Questions 12 and 18 relate to concepts of the Nature of Science. All respondents
acceptably considered that a ‘scientific theory’ is not just a guess and only 11%
conceived the ‘scientific method’ to be only a controlled testing of hypotheses.
Science as a discipline of learning seems to be conceived by this cohort as something
more that just experiments.
The dendrogram in Figure 10.5 is derived from a multivariate clustering by minimum
variance technique (Kovach, 1998) of responses to Q3 on fossils and time. True/false
responses are considered equivalent to presence/absence data. There appears to be
four clusters of responses:

232
Cluster 1 = Questions 13, 15 and 16
Cluster 2 = Question 10
Cluster 3 = Questions 6, 4, 18, 7, 12, 2,1, 3 and 14
Cluster 4 = Questions 5, 17, 11, 8, and 9.
AUB Responses: Q1 Ideas About Fossils
Min
mu
m V
aria
nce
Squared Euclidean - Data log(e) transformed
Q9Q8Q11Q17Q5Q14Q3Q1Q2Q12Q7Q18Q4Q6Q10Q16Q15Q13
15 12.5 10 7.5 5 2.5 0
Figure 10.5. Dendrogram clusters for AUB primary school trainees. Clusters are those questions with equal distributions of true/false responses and are colour coded in Figure 9.3 in Appendix 6.
10.4.2 Summary
Although an understanding of fossils is generally considered to be important and
interesting there are perceptual and conceptual ‘scales of time’ difficulties. There are
also gaps in the understanding of the rates of speciation, DNA as a universal self
replicating gene coding molecule, and difficulties about the contextual meanings of
key words such as ‘ape’ and dinosaur. Conceptualising the place of common ancestry
in its correct evolutionary context is an area of future research. Understanding ‘rate
of change’ is also a difficulty for high school and university students not only in the
geological sciences but also in physical and chemical science.
Students appear to understand what fossils are or are not, but have confused ideas on
the detail of their interpretation and usefulness. For example, they cannot put an
actual age to the oldest fossils known and have trouble reconciling people as ‘apes’
in much the same way as “people are not animals” (NZ Year 12 Biology student).

233
All responses suggested that all students understood Science to be more than just a
guessing game but that around 26% did not consider fossils to support the fact and
scientific theory of biological evolution. As Catley (2005) correctly points out,
establishing and developing a pedagogy for teaching systematics, phylogeny and
cladistics would go a long way to enable a better conceptualisation of evolution and
especially the linkage between micro and macro evolution.
10.5 Question 3 Fossils and Time: AUB Primary Trainee Responses
Figure 10.6 in Appendix 6 shows the responses to student perceptions of relative
bio/geological events for GeoVAT question 3. Events are arranged in time
succession rather than in question order. There is considerable variation in the
number of responses for each event perhaps indicating lack of confidence in being
able to provide a meaningful response or a lack of understanding of the question. For
example, the large variation in responses to question one suggests either an inability
to properly scale the event or disinterest. ‘Saboteurs’ are not unknown in
questionnaires and clearly a response of “a million million years ago” for the
development of plate tectonic theory is either a sabotage or disinterest. Even with a
thousand response returns, there will always be the outrageous. In any case,
conceptualisation and perception of geological time is analogous in difficulty to the
scale of atomic and subatomic particles in chemistry, and gravitational forces in
physics.
10.5.1 Discussion of AUB Primary Trainee Results for GeoVAT Question 3
Responses reveal a number of issues that support the work of other researchers
(Trend, 2000, 2001a, 2001b; Dodick, 2000b; Dodick & Orion, 2003c). It is curious
that the majority of responses considered the extinction of the woolly mammoths to
have occurred 1 million to 1 billion years ago. This suggests that this cohort either
had never heard of woolly mammoths or had no idea when they became extinct or
did not care. It seems that if students do not know then they opt for the oldest age
category or randomly guess. For this cohort, they probably just did not know.
The time for the extinction of the dinosaurs elicited some interesting responses.
Ignoring the extremities, these students significantly underestimated the extinction

234
time. Perhaps 100,000 years to a million years ago is a perceptual boundary to be
used when the answer is unknown: ten million is perhaps perceived the same as one
million (Trend, 2005). As exposed in Chapter 6 when an events actual time is
unknown there is a reversion to an internalised relative time scale based on
experiential and innate senses of time. It seems as if anything goes if the actual
answer is not known and there appears to be no ‘cross referencing’ of decisions by
looking carefully and re rereading the time category relativities. Like the extinction
time of the dinosaurs, these primary teacher trainee respondents underestimated the
time of the Ice Age. Although in this case students underestimated the relative
timing, this is in line with other researchers’ findings (Dodick, 2005; Noonan, 1999;
White, 2004) where the implication was that there is often an overestimation of an
events timing when ‘the answer’ is unknown. This exaggeration of relative timing as
being over estimated or underestimated is likely to be related to the experiences and
knowledge of the student and the kind of events timing being estimated. For example
it is more likely that students will underestimate the timing of ‘The Ice Age’ and
overestimate the timing of the ‘first appearance of the birds’. In other words degree
of estimation is likely to be related to the specific event in question and its position
on an individual’s axiological, empirical and organisational point of view. Added to
this is the nature and extent of an individual’s formal education.
In this cohort, fifty percent of the event timing questions were incorrect with the
maximum percentage being correctly answered was 40%: for the appearance of the
first volcanoes. Only a third of the respondents knew (understood?) the correct
relative timing for the formation of the Moon. The formation of the Sun is clearly
overestimated and considered to be more than a billion billion years old suggesting
that it is so ancient that “you cannot say” and that a billion billion is as old as you can
get: and this despite the fact that the universe itself is only 12 to 15 billion years old!
For many students, the universe began when the Earth began and that all the stars
that can be seen today are all the same age and the earth is the same as them. This
also despite the fact that the Milky Way galaxy has stars of many different ages in it.
Respondents overestimate the age of the Milky Way galaxy, the Big Bang and the
beginning of time. These events are lumped together into what Trend (2001) says is
“extremely ancient”. Not beyond comprehension but beyond the existing experiences
of these students. Respondents also overestimated the age of the formation of the

235
Earth’s crust as being more than 5 billion years old. Few students could correctly
order the first appearances of trees, land animals or fish. No responses were recorded
for the B and D acceptable time categories.
10.6 New Zealand Secondary Teacher Trainee Ideas About Fossils
This cohort of University of Canterbury (UC) secondary school teacher trainees had
an average age of 22 years. Twenty two is a relatively young age for a postgraduate
one year teacher training course student who intends to enter the secondary school
teaching service in New Zealand. An average is more like 26 years being boosted by
workers who have changed direction. Responses are outlined and then discussed.
10.6.1 GeoVAT Question 1 Findings for NZ Secondary Teacher Trainees
This section begins with question 2 of section A of the GeoVAT questionnaire where
students were asked to write an explanation for any of the two statements from
question 1 that they thought were true. Writing explanations often reveals conceptual
status. Table 10.1 shows typical secondary teacher trainee explanations and Figures
10.7 and 10.8 in Appendix 6 show the distribution of responses to questions 1 and 3
respectively. Tables 10.2, 10.3 and 10.5 in Appendix 6 compare UC secondary
teacher trainee results to other cohorts for Q1: ideas about fossils.

236
Table 10.1. University of Canterbury (UC) secondary trainee responses to Q. 2
Section A of GeoVAT.
Statement Explanation of Statement
5 (a) Because oxygen stops it from decomposing
(b) Are skeletons that have been preserved
(c )Because I was told
(d) Fossilisation processes happen all the time
(e) Impressions left when the rock solidified around a dead creature
7 (a) Important for scientific study
(b) Proves that organisms once existed that don’t today
(c) Carbon dating gives age of fossils
10 Humans evolved from apes because of preserved skeletons and dating
11 Found bacteria so must be old
12 A scientific theory is a guess and we don’t know what the future will bring
13 Supported by the fossil record
15 All organisms have DNA with ATC and G.
16 Quoted by S. Gould in Punctuated equilibrium and supported by the fossil record
17 Slow history of evolution by gradual change
18 You can’t prove a hypothesis can only use evidence as support or not
Section A, Question 3 of the GeoVAT questionnaire asks students to write an
explanation for “why are fossils found at the tops of mountains”. The following
describes typical explanations from these 22 year old students.
“Plate tectonics pushed the sea floor up
Weathering and erosion exposed them
Mountains must have been immersed long ago
Plate tectonics pushed up fossils from lower levels
Lots of changes mountain tops may have been lakes or swamps
Once underwater
Different levels of ocean, movement and plate tectonics”.
Section B
Question 1 (a) asks students for their observations of illustrative evolutionary
changes that have occurred in the fossil feet (of horses) through a conformable
sedimentary sequence. Typical responses include:
“Changes are evident through time
Feet become more complex

237
Evolved! Become more adaptable to conditions – increase in toes changing
massively 4 legged to two legged.
Evolved from many toes through 3 to a foot only.
The foot went from having four toes too having a single toe or hoof like a
horse).
Between layer 1 and 4 the foot has reduced the number of toes
Entire foot has eroded to end up with one toe.
Loss of toes
Small bones disappear except the middle one
Reduced to a single flipper type structure
Question 1 (b) asks students to provide two possible reasons for the absence of
fossils. These are the responses:
“Unfavourable environmental change
Predators killed off all the species
Species extinction from climatic environmental change from asteroid impact
Fossils not deposited in that specific area
There are no extinct generations or no change in atmosphere
The rock may be too soft
Species did not live in this area and unfavourable conditions
Rock contained chemicals that eroded fossils
Period of volcanic activity where layers were laid very quickly
Animals moved to a different area. Wrong weather conditions for fossils
Could be under ice or could be a rock type that does not preserve fossils
Erosion (multiply forms) and a landslide
Too long ago, fossils have disintegrated or this animal did not exist then”.
Questions 2 (a) and (b) investigates student ability to translate plan view into cross
section (2a) and to express connections between fossil and living ecologies (2b). In
this case, it is an island in which there is an area of dinosaur eggs and another with a
dinosaur skeleton (See Appendix 5). Figure 10.9 shows some typical responses.
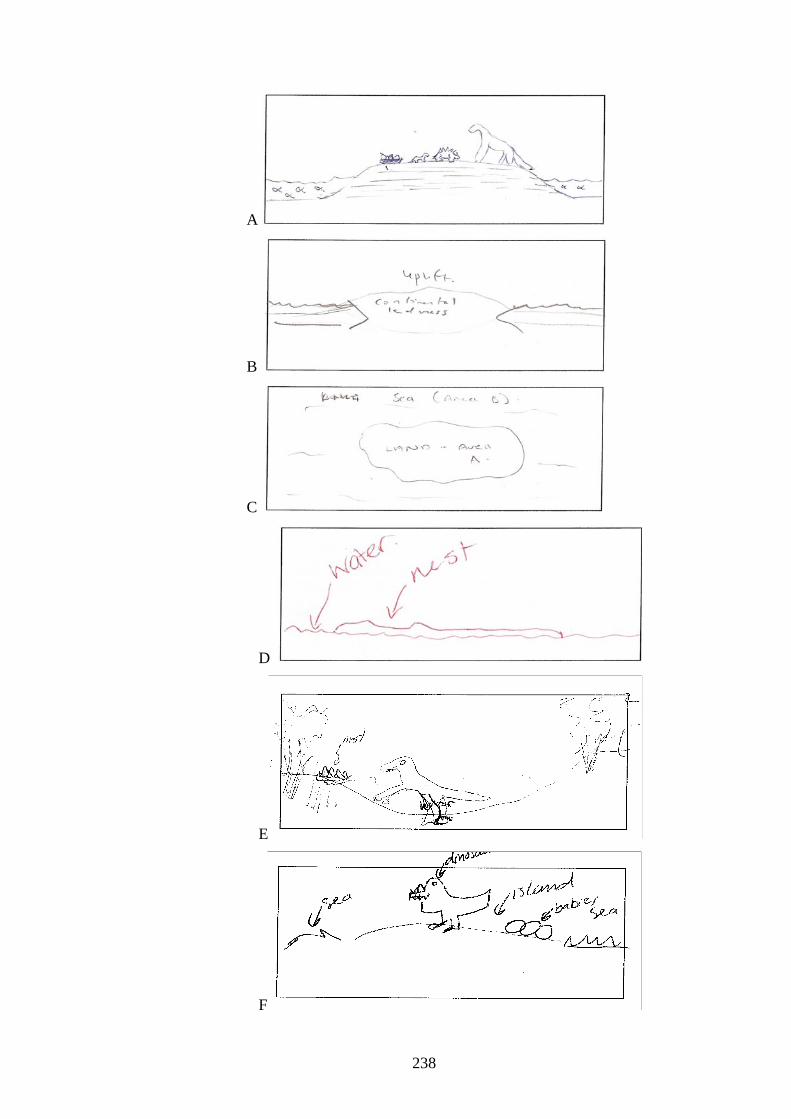
238
A
B
C
D
E
F

239
G
H
Figure 10.9. UC secondary school trainee responses to Section B, question 2a.
Question 2(c) intends to investigate explanatory conceptions of alternating marine
and terrestrial geological environments as expressed in the fossil record. The
following are the responses received.
“Caused by sea level change and rising land
Different levels of ocean, movement and formation of mountains – plate
tectonics.
They were once underwater
The island was flooded now and then but when the waters receded new
dinosaurs migrated to the island
Shows periods of the Ice Age when the sea level rose and fell
Area was close to the ocean and when water level rose the marine sediments
were deposited and when the water level fell it became dry land.
Sea once flowed through the area but due to plate tectonics the sea no longer
flowed but instead a river did as the Earth shifted”.

240
Question 2d asks students for their perceptions of what the world would look like
and sound like when it was first formed compared with today. The following outlines
what these adult secondary teacher trainees perceived.
First Formed Today
Brown and loud Green and quiet
Hot, brown and loud Green blue and loud
Brown and cold Less trees and loud
Large landmass and quiet Less land and blue
Green and blue Blue/green and noisy humans
Green and cold Green and noisy
No life with lots of earthquakes Green warm and loud
Volcanoes Green and quiet
More water and quiet Colourful and full of sound
Cold and quiet Green, cool and loud
Hot brown smoke and loud
10.6.2 Discussion: New Zealand Secondary School Trainee Responses
These responses are from New Zealand secondary school teacher trainees with an
average age of 22 years and who last studied geology in their Year 11 class, seven
years previously. Although a small cohort, many geological and scalar
misconceptions are revealed which appear to be typical responses.
One significant difference between the AUB primary trainees and UC secondary
trainees is that the AUB students considered Charles Darwin to be the first to think of
evolution (74%) whereas only 27% of the UC students did. Is there a difficulty in
interpreting what is meant by the question or do the AUB students really think that
the theory of evolution began with Charles Darwin, and if they do why? Table 9.2 in
Appendix 6 shows a comparison of responses between UC and AUB for ideas about
fossils for the same age and teacher trainees but from different ‘cultures’.
Clearly, modern interpretations of what fossils are override the rather ancient
concepts of fossils as suggested by statements 1 to 4. However, there are still ideas
present (around 20%), that fossils are considered to be just accidents (‘sports’) of

241
nature rather than the actual remains or traces of once living organisms. Whether this
is a misunderstanding of the word “accident” or an actual denial or even ignorance of
the correct origin of fossils requires further study. Question 9 indicates a point of
contrast between the two cohorts. Although there are a small proportion of responses
that indicate students’ consider Charles Darwin to be the first to think of evolution
(he wasn’t) for the UC cohort, the AUB cohort is significantly different: the majority
think this was correct. Perhaps this indicates a lack of teaching about the history of
science and how knowledge is built, or a cultural divide? Question 12 also indicates a
point of contrast for the nature of science and one for which the reasons are
unknown.
Questions 15 to 17 ask about a modern interpretation of rates of evolution, scale and
the genetic component of evolutionary processes. The difference between the two
cohorts for understanding that all living things do share the same basic DNA coding
system may partly be explained by misinterpretation of “DNA coding system”. AUB
students may have interpreted this to mean that because animals are different their
DNA is different (which makes them different organisms) rather than understanding
the broader meaning of DNA coding for the manufacture of proteins in the form of
the ‘base pairs’ Guanine, Adenine, Thymine and Cytosine. Although both cohorts
consider the speed of evolutionary speciation to be slow fewer UC students thought
so. This finding suggests that teaching of punctuationism and gradualism as concepts
in rates of evolution based on the evidence of the fossil record in Year 13 Biology
courses may have been effective in changing concepts about rates of speciation.
Perceiving and conceptualising rates of evolution are fraught with difficulties for
learners (and teachers) especially when rates of change, change at changing rates.
Applying the concept of changing rates of change in a geological sense requires
considerable cognitive development and experiences that few students get to
develop. Question 18 is revealing and asks about the nature of science. It seems that
AUB students think that ‘the scientific method’ is more than just controlled or fair
testing of variables where simple relationships between the dependent and
independent variables are ‘discovered’. Perhaps (in speculation), this reflects a
deeper understanding that the geological and historical sciences require more than
the mere testing of variables because the nature of the geological information does

242
not easily lend itself to controlled testing. For example, how do you test the
multivariable’s involved in explanation of an evolutionary fossil lineage such as
Homo sapiens? However, 73% of this UC secondary trainee cohort thinks that a
scientific methodology only involves controlled testing. I wonder why? Perhaps this
reflects the historical development of science education with a current hierarchical
system of science ‘subjects’ that has evolved from Greek mythology and philosophy.
Question 2 of section A is summarised in Table 10.4 in Appendix 6 and reveals a
variety of levels of understanding and ability to express explanations. Explaining
concepts is more difficult than merely describing and requires a clear comprehension
of the concept and a literacy level that enables expression. Reasoning for question 5
suggests a general lack of depth and superficial reasoning with the exception of two
explanations: abiotic environmental factors such as anaerobic conditions, and the
concept of burial. These two reasons indicate that some students are aware of
conditions needed for fossilisation to occur. Indeed, remains of once living
organisms often require these conditions to be preserved in rock. It was interesting
that one explanation only considered fossil impressions rather than whole organism
fossilisation or a cast. Indeed, the concept and process of fossil casts and moulds are
unlikely to have been taught as they do not appear in the New Zealand science
curricula except in unit standard 6362 (“Demonstrate an understanding of fossils”).
This standard requires an understanding of fossilisation processes, how fossils
provide evidence of environmental change and how they provide evidence of
evolution through geological time. Nationally however, only 274 students achieved
credits from 2003 to 2007 (See Chapter 12). So, there are very few students who
know any detail about the processes of fossilisation. As noted earlier, the fossil
record and the vitality of palaeontology as an area of learning is a missing link in the
teaching of Biology, which is almost exclusively neontological (study of living
organisms) rather than paleontological (study of the fossil record).
Explanations for question 7 suggest that students realise that the study of fossils is
important for furthering scientific knowledge (a generic statement for all scientific
endeavours) and that fossils provide concrete evidence of species extinctions. Of
more concern is the one response that indicates a lack of understanding of
radiometric dating and that fossils are only dated using isotopic carbon. Anecdotally,

243
most secondary students I talk to are wholly ignorant of the many other radioisotope
dating techniques such as Uranium to Lead decay, and rarely comprehend the
limitations of using carbon dating analysis and even more rarely, connect relative
dating and magneto-chronostratigraphy with dating fossils. Teaching radiometric
dating in a geological context does not appear specifically in any assessment
standard in New Zealand and therefore is simply not taught except at a senior physics
level. When radiometric dating is known about it is most commonly restricted to
Carbon -14 dating which has a limited application to around 50,000 years. The
concept of cross referencing data does not seem to be evident in any response. After
assessing hundreds of investigations for planning, doing, analysing and reporting,
only rarely do student reports indicate the importance of cross referencing an
experiment with independent methods of gathering data. Dating fossils is not
dependent on only one line of evidence but many (Dawkins, 2009).
Of the remaining explanations for a student-selected true statement (it might actually
be a false statement, but in their view is true) only one response was gathered for
each. However, the spread of explanations suggest a number of possibly common
misconceptions. For example, the misconception of a scientific theory as just a guess
and the implication that Science cannot predict the future suggests that at least one
student cannot separate the predictive power of science investigation as based on
evidence and falsification from an unknown and unpredictive future. At least one
student had read about punctuated equilbria as an interpretation of the scale of
geological time and its connection with the fossil record and speciation events. An
explanation given by one student to justify why question A1.17 is true revealed
misconceptions about what the meaning of evolution. This student confused
geological time as the evolutionary event rather than the populational speciation
event. In other words, there was confusion between the long period of time
(gradualism) as the producer of new species rather than the speciation events
themselves which occur over much shorter relative geological time periods
(punctuationism).
The single response to question A1.18 suggests that this student considers the
scientific method to be based on testing and proving hypotheses but that science can
only use evidence as support rather than as an absolute proof. Perhaps this student is

244
unclear of what is meant by ‘controlled testing’ but does appear to recognise some
limitations of the nature of science and its methodology as a way of knowing about
the world. It is unfortunate that there were no more responses from this cohort.
Responses to question 3 from section A indicate that although some students
accurately conceive tectonic forces as a cause of mountains which carries the fossils
up with them there remain many misconceptions because many students fail to
connect the origin of fossils (often marine in lifestyle) from the origin of mountains.
There is a tendency to focus on one issue: fossils or mountains. Many responses
implied that the fossils were simply exposed by erosion with the fossils already there
at height, with no uplifting. One response for example, suggests that the fossils were
formed in place at the top of a mountain in lakes or swamps as if the mountains were
always there, and another response implied that the mountains were once under water
as if they were already made but waiting to become mountains as seen today.
Clearly, some student concepts about the origin of mountains and the existence of
fossils at the top of them have not benefitted from the ideas of James Hutton since
the mid 1700’s.
For question 1a of GeoVAT Section B all responses recognise that there is a
reduction in the number of toes, but only one response links this with geological time
through the conformable stratigraphic sequence. But they were not asked to make
this link, merely describe what changes they observe in the skeletal remains.
Question 1b really asks students to link the fossil record with paleoenvironmental
change as explanation for the absence of fossils after stratum 4 and many responses
imply an understanding of this linkage albeit for example, blaming predators for
killing all the fossil animals (horses) is rather unlikely. However, only one of the 13
responses implied the idea of species extinction: a key fact of biological evolution
and a concept that is rarely taught in depth at secondary school, and in Biology
courses is often perceived as subservient to the ‘progressive evolution’ of a species to
a ‘better and more successful model’ rather than to extinction. Future investigations
for the reasons for this may offer insights into cultural biases of the nature of science.
Responses to question 2 (a) Section B indicate a range of abilities of these graduate
teacher trainees in translating plan view to cross sectional view. Sample C (Figure

245
10.9) for example simply copies the plan view. The conceptual and perceptual
difficulty exposed in this question is that of what to do with boundaries when at
depth, and how to mentally rotate structures. These are spatial-visual abilities needed
for 3-D visualisation of geological structures (See Chapters 6 and 7). Sample A
(Figure 10.9) is the only response that accurately shows these ‘vertical’ depth
boundaries. B and D show the most common conceptualisation of cross sections as
an island ‘floating’ on air as if there is nothing underneath. Similar problems occur
when students begin to learn how to draw geological maps and cross sections.
Response B seems to indicate that this student has tried to copy a visual image of
continental drift boundaries but was unable to visualise what was underneath the
’continental island’. The idea of invoking plate tectonics suggests that students have
little understanding of the tempo and rate of geological time and use plate tectonics
as a causal catchall for any geological change or process. Response G (Figure 10.9)
is interesting because it seems to display a connection with a rotational visual
spatialisation difficulty where the land and sea are mirror images. This also shows an
inability to draw depth boundaries.
Question 2c shows a sedimentary sequence of rock types that were deposited in a
summer season but under different geological environments: terrestrial and marine. It
seems that students did not read the information supplied with the question and failed
to connect the appearance of fossil skeletal remains with the summer season in a
terrestrial environment and the transgression of the sea in which there are no fossil
dinosaurs. Although there was recognition of possible eustatic changes (climatically
controlled sea level changes and possible tectonic rising and lowering of land) as an
explanation for the alternation of sediment deposition and the appearance of dinosaur
remains, the cyclical nature is not recognised or explained. These responses suggest
that students have very little conceptual understanding of the connections between
geological environment and sediment deposition.
The intention of question 2 (d) section B is to elicit student imaginations of the
early Earth compared with today expressed as a ‘look like - sound like’ perception.
The dominant difference is in the colour. The world is perceived today as green and
loud but brown and loud when the Earth first formed implying that the early Earth
had no life and full of earthquakes and volcanoes. This is in contrast to today where

246
there is abundant ‘green’ life colour and noise with the implication that life did not
arise until much later and that humans make the world noisy.
Question 3 investigates perceptions of timing relativities of major geological and
astronomical events. Events are adapted from that of Trend (2001).
10.7 New Zealand Year 12 (16/17 year olds) Responses to GeoVAT
The GeoVAT instrument was also given to a group of New Zealand Year 12
students. These students are in their second to last year of secondary schooling
before entering a University and were also a group who were learning Biology,
where they first encounter a scientific view of biological evolution (See Chapter 9 for
details of the NZ Biology standards). ANOVA analysis comparing the AC Year 12
group with UB and UC groups (Table 10.3 in Appendix 6) indicates that there is no
significant difference between responses (F =7.9. p = 0.01 and F crit. = 2.5) for
question 1 Section A: True/False ideas about fossils.
In effect this means that in this small sample of teacher trainee graduates from
different countries (who are 5 years older and university graduates) responded
similarly to questions about their conceptual understanding of fossils to a class of 17
year olds starting out in Biology. This result should not be generalised and applied to
larger populations because many variables are not able to be controlled for. This
suggests a need for collecting data from a much larger population. Hokayem and
BaouJoude (2008) suggest in their study of AUB biology students’ perceptions of
evolution, that variables such as epistemological beliefs, perception of religion,
science and nature, and perceptions of causality largely control the evolutionary
conceptual status of their students. It seems that this cohort of AC 16/17 year old
students know what fossils are, and are not, and that 50% of them consider Charles
Darwin to be the first to think of evolution. Interestingly, although 90% of these
students correctly thought that the oldest fossils were around 3.4 billion years old, the
graduate teacher trainees were not so sure. The older students also perceive the
scientific method as not just a guess whereas the younger AC students are less sure
where a third of them think it is just a guess. The nature of science and its
methodologies has recently received more importance in the 2007 NZ curriculum,

247
but teaching it is not so easy (Bickmore, Thompson, Grandy and Tomlin, (2009);
Hipkins & Barker, (2005). The 19% of AC Year 12 students who consider the Earth
to have been formed in six days are those students who appear to wrestle with their
non scientific religious beliefs, and the evidence as shown by rocks, fossils and
minerals. Questions 16 and 17 show that all respondents generally think that the
appearances of new species are slow and that evolution is a slow process. It is clearly
not a common understanding that all living organisms share the same basic DNA
coding system for making proteins. Sustainable and effective conceptual change
strategies for evolution are a major pedagogic challenge.
Section A question 2 asks for explanations of any two true statements. Here are the
responses from AC 16/17 year olds.
Q13 “Dinosaurs that were birds and they evolved and changed
Fossils have naturally evolved to suit environments
Q17 Slow change through time by the rocks they are in
Q7 Knowing the past will help the environmental future
Fossils tell us about the past and the future, and geography
Fossils are dead things compacted and pushed up.
They are amazing to look at and provide insight into history
Q8 Fossils can show us differences in animals
They provide information that is too logical to doubt
Q10 Fossils show we have evolved from apes
Q14 The bible says so.
[The Earth] was formed in 6 days, yes, but I also believe we are evolved from
apes. My theory is that the days of God are longer than ones on Earth (We
echo them).”
In interpreting these response explanations, it seems that these young students know
about fossils, see them as evidence of past life forms and connected to evolution, and
that they can be used to understand ancient environments which may have a
relevance to future environments. This suggests that some students have
independently understood the principle of uniformitarianism without really knowing
it. The ontologically and religiously controlled students’ responses to Q14 (e.g. “The
Earth was made in 6 days ..”), indicate conceptual conflicts and dilemmas. On one

248
hand the fossil record is recognised as being concrete evidence of biological
evolution but on the other, this can not be easily reconciled with a scientific view of
geological time, fossils and evolution without abandoning a religious view. So, a
mixture of concepts is employed and one that is echoed in the explanation above as
one that accepts the evolution of people from the common ape ancestry, but in a
modified view of time.
Section A Question 3 asks for explanation of why fossils can be found at the tops of
mountains. Here are some typical responses.
“Animals died at the tops of mountains
Died at the tops of mountains, covered by dirt and plants, and rain then
washes away the dirt to reveal the fossils.
I think they were left in the bottom environment at first then new rocks and
crust grew around it and slowly got raised to the top as old crust layer falls
and new ones grow in place.
Mountains were originally lower, below sea level. Fossils were placed there,
then the mountains rose.
I believe that the fossils that are found there are from animals that died at the
top and /or tectonic plates formed the mountains when they moved
Mountains rose through the sea carrying living and fossilised creatures up the
mountain.
By plate tectonic movement
Don’t know – perhaps the flood idea is right?”
Apart from literacy issues, these responses reveal a number of typical
misconceptions about fossils that are found exposed at the tops of mountains. Many
responses fail to connect the origin of the fossils to the location and simply focus on
the location. Other responses considered that the mountains were pre-formed and
later pushed up by plate tectonics, suggesting that there is little understanding of the
bigger picture of sediments, environments, living organisms, death, fossilisation,
burial and uplift. Again, it is disturbing that it is not uncommon for responses to be
‘fixist’, where the fossils were conceived to be already in place at the top of the
mountain and had no previous history. Others of course correctly recognise fossils as

249
being exposed at the tops of mountains by erosion. Only one response accepted the
information given, where the draining away of a great flood left the fossils exposed
at the top of a mountain. At least this individual read the question! It is curious that
fossils are nearly always referred to as “animals that have died” (and most likely to
be dinosaurian) rather than plants or other types such as trace fossils. Micro fossils
are never mentioned. In one response it is not explained how fossils were placed at
the top of the mountain and then the mountain rose! The conception that mountains
are pre-formed or held to have always been a mountain is a powerful one. Once a
mountain always a mountain, and this conception may have some connection to the
notion of the ‘fixicity’ and unchanging land, the world, and the things in it.
10.7.1 Section B: Conceptions About the Uses of Fossils (AC Year 12: 16/17 year
olds)
Q1. (a) Observations of fossil changes through time. Typical responses are:
Fossil feet become compressed and eroded away
Small bones disintegrate over time with layer #4 with only one
Lost one toe and evolved one large
Worn down by environmental changes
More developed in layer one, then worn down by pressure and decomposition
Long toed foot shortened then became a nub or hoof
Eaten away by parasites
Each year there is a greater weight put on the fossil and rock may have
broken the bones away
Loses a toe, becomes smaller and rounder then loses the second toe and
becomes smaller and rounder again.
It is interesting that several responses suggest that observable changes in the skeleton
are caused by physical factors in-situ by breakage, chemical decomposition or
compression rather than recognition of any evolutionary change. These responses
seem to disconnect the conformable rock sequence from the fossil remains and focus
on the individual skeleton remains rather than make a connection with an
evolutionary sequence. Given information (See Appendix 5) does however imply
that the remains are the same “land animal” but has undergone change. For these

250
responses, if the rock layers are not connected, then the fossil remains are also
disconnected so the only way in which the change can be explained is by internal
physical or chemical change (or in one case, “parasites”) rather than evolutionary
change. All responses recognise a physical change in the skeleton but none are
connected to time as represented by the rock layers. The paleontological and
evolutionary concept at the heart of this question concerns evolutionary trends
(Gregory, 2008) but this is well beyond the scope of this thesis (and student and
teacher knowledge?) but this notion is at the heart of this question where students
must first recognise morphological change and then connect them to geological time
as represented by the rock strata.
The rationale for question 1.b is derived from Dodick & Orion’s (2003 c; 2003c)
work on investigating the understanding of geological time, which in turn has been
derived and adapted from Montangero’s work on diachronic thinking (see Chapter
5). This question requires the conceptual integration of transformation, temporal
organisation and interstage linkage abilities and is therefore of a higher thinking
order than question 2c which requires only transformative diachronic skills. Here,
only a sequence of change is observed, recognised and described, but one where the
present is linked with the past. It seems that most responses of these 16/17 year olds
manage a transformative recognition of skeletal change but are unable to integrate
this with the complexity of a stratal rock sequence (and therefore geological time),
as a causal relationship. Recognition and explanation of relationships is a difficult
task for this age group as well as those students 4 to 5 years older. In other words,
these students are not yet ready to link observable change with the abstract idea of
geological time so that the development of diachronic thinking skills seems to be
represented here in a developmental and formative way. More research on defining at
what age students are able to make these higher order linkages remains to be
investigated. I suspect that this integrated diachronic linkage ability (understanding
observations that act through time), happens generally much later in life and well
beyond the school gate.
Question 1.b Section B asks for an explanation for the absence of fossil bones after
layer 4. This also requires the ability to integrate diachronic thinking, in particular,
causal relationships of fossilisation with unobservable environments and geological

251
processes. To answer this question demands the linkage between the stratal rock
sequences as representing passage of time with the occurrence of skeletal remains
within each rock layer. Here are some typical responses.
“Animals moved on or became extinct
Bones are completely worn away as species and environments change
The animals migrated
They were caught in a landslide
Erosion removed the top layers and were then replaced
Things stopped dying
Hot lava destroyed bones that remained
Caught in a landslide
Worn away over time”.
These responses suggest that those students, who are unable to apply integrated
diachronic thinking skills to a sedimentary rock sequence, invoke the idea that the
fossils were somehow removed in situ by chemical or mechanical means, for
example “worn away over time” or “destroyed by lava”. These responses indicate
that there is no cognitive connection (for this question) between the origin of the
fossil as a once living organism and its preservation in the rock record. Although
students know what fossils are, there is little connection with it having once had a
life in a paleoenvironment. Fossils did indeed once have a life. This is another level
of diachronic thinking that is worthy of further investigation. On the other hand,
responses suggest that many students of 16/17 years old do understand that the
absence of fossils in a stratal rock sequence is time related because the animal
“moved on” (migrated) or “became extinct” (not in existence) and therefore could
not be preserved.
Figure 10.10 shows two Year 12 responses to question 2a. Similar to the UC teacher
trainees, these responses show an inability to rotate the scene vertically through 900
and an inability to visualise boundaries at depth.

252
Figure 10.10. AC Year 12 responses to Section B, question 2a.
Only three responses were received for question 2b. This question asks for an
explanation of the presence of dinosaur eggs and adults on this island. These are the
responses;
“Plenty of food so dinosaurs did not have to travel far. This helps them
multiply better
This was their territory
Has a “nesting area” (given info on the diagram).
This question requires a transformative diachronic ability where students need to
conceptualise the life of the fossil through time. Although there is little information
given, these responses do indicate a conceptual status from being able to connect
fossils as once living organisms (first response) living in an environment in which
they had a “territory” and were successful at reproduction.
There were no responses for question 2c. Perhaps this required too much reading
and interpretation.

253
Question 2d Section B. First Formed Today Deserted and quiet Green and Loud Smaller and rumbly Bigger with Birds Brown with dinosaurs Cold with trees Hot and quiet Cold with humans A large ball with no animals Large and loud No forests, just nature Smog and cold Bigger and shaking Less forest and noisy No water and quiet Green with humans Bare Green with birds and people Red Green and loud Brown
An interpretation of responses to question 2d suggest that this cohort perceives that
when the Earth was first formed there was no life, it was hot, brown and quiet
compared with today where it is green (the colour of life?), noisy and teeming with
life. Noise is apparently the indicator of life today which was absent when first
formed. A common perception within all age groups indicates that the early Earth
was dominated by physical phenomena but today it is dominated by organic
phenomena mostly people and noise.
Placing geological events and ideas about fossils into relative times proved to be
equally difficult for Year 12 students (Table 10.4 and Figure 10.11, Appendix 6).
Similar patterns of time overestimation and underestimation occur as in other age
groups. For example, despite there being no event older than 13 billion years (age of
the Universe), most students place this event correctly as the oldest event but not
relative to all other events. It seems to be treated in isolation from relativity.
Questions 9, 3, 24, 23 and 14 (Formation of the Sun, Earth, Milky Way galaxy,
beginning of time and the Big Bang are all recorded as equal in age but estimated as
more than a million million years old - several orders of magnitude greater than they
are. It is as if these events are the oldest known so therefore they belong in the oldest
category regardless of relativity to the age ranges given. Do they take any notice of
instructions? Only 21% of responses were able to give the correct age of the oldest
rocks found in NZ (Question 22) suggesting there is little knowledge and perception
of geological time. It seems that more responses have overestimated than

254
underestimated the age. This may be a result of judgements relative to their
perceived incontrovertible oldest event.
Table 10.4 in Appendix 6 shows a comparison of all high school age data from AC
and IS (13 years to 18 years). Multi-variate analysis by minimum variance cluster
analysis (Kovach, 1998) of Year 12 data from Table 10.4 was then carried out to see
if there were any meaningful statistical groupings of geological and fossil events.
The resulting dendrogram is shown in Figure 10.12. It is not surprising that despite
53% of responses overestimate the scientific theory of plate tectonics as being more
than a thousand years old in conceptual origin (including outliers), most students
correctly isolate question 4 from others as the plate tectonic theory is mostly within
an ‘experiential’ memory and encountered in various subject areas and in newspapers
whenever there are earthquakes, tsunamis or volcanic eruptions. Plate tectonics is the
dominant concept in geological and geoscience curricula. Question 4 also recorded
the highest percentage of correct answers.
Cluster Analysis for AC Year 12 GeoVAT Q3
Min
imum
Var
ianc
e
Squared Euclidean - Data log(e) transformed
411186581571721161319201221021239241423
48 40 32 24 16 8 0

255
Clusters are: A. Beginning of time, Big Bang, Milky Way galaxy, Formation of Sun,
Formation of Earth, Formation of Moon, Formation of Earth’s crust, First rocks on Earth.
B. Countries oldest rocks, First fish, Opening of the Atlantic, First volcanoes, First life forms, First dinosaurs, First trees, First organisms with hard parts, First land animals, First birds.
C. Development of plate tectonic theory. D. Extinction of trilobites, woolly mammoths and large dinosaurs, The Ice
Age, First humans.
Figure 10.12. Cluster dendrogram for AC Year 12 responses to Question 3.
Figure 10.12 shows a cluster analysis of Year 12 responses to Q3 section B (From
Figure 10.11, Appendix 6) Cluster A, event 9 (Age for the formation of the Sun)
seemed to provide the greatest difficulty, where no response was correct and 95%
overestimated the time. It is as if the Sun is considered the oldest object around and
so “must have a huge age that is completely separate from all other events” (student
verbal response). Connecting events relative to each other appears to be a difficult
task as responses seem to treat each event on the questionnaire as a separate issue.
Cluster B seems to show that students look for similarities in the words rather than
the relativities of timings by lumping all the “firsts” together when they are widely
separated in times. For example lumping the first life forms on Earth with the first
fish and the first birds (but significantly, not the first humans), either indicates lack
of knowledge of an evolutionary story or searching for anything in the given
information that is similar or apparently relevant. Perhaps humans are too removed
(and often not considered to be animal) to make it into this group.
Cluster C is clearly an isolated and obvious answer, although the boundary of 100
may be a little ambiguous for some respondents. Cluster D follows a similar path:
where the common word is extinction. Hypothetically, because humans are perhaps
conceptually seen to be too removed from all the other animals, the only sensible
place they can be connected to is the Ice Age. These clusters seem to suggest that
time ordering of geological and fossil events for these 16/17 year olds is more
dependent on a prior knowledge base and search for similarities (classifying) rather

256
than fixing timing within a relativistic framework. Future research with a much
larger sample of this age group could investigate reasons why age estimates are
overestimated almost twice as much as those events that are underestimated.
10.8 New Zealand AC Year 13 (17/18 year olds) Responses to GeoVAT
Year 13 students in NZ are in their final year of secondary school before entry to a
university. These 39 students have had four and a half years of science training and
all were enrolled in NCEA Level 3 achievement standards for Biology (See Chapter
9 for curriculum details). The average age was 17 years and 3 months.
Tables 10.4, 10.5, 10.7 and 10.8 in Appendix 6 compare NZ Year 13 student
responses to ideas about fossils and other significant concepts of biological
evolution, to older and younger students. Questions 9, 10, 11, 15, 16 and 18 stand
out.
Across an age range of 16 to 22 years, results to question 9 indicate that the majority
of AUB Primary trainees (74% in Table 10.7) Charles Darwin to have been the first
to think of evolution (as an explanation for life’s variations), whereas most of the
New Zealand Year 13 students (mean of 62%) do not. Perhaps this primarily reflects
differences in curricula and curricula delivery? If so, what? On average, 32% of the
total NZ responses do not think that humans have evolved from apes whereas 42% of
the UB students do. Question 11 results suggest that the UB sample and AC students
are more secure in knowing the age of the oldest fossils on Earth but the UB and UC
older students are not. Interestingly, an average of 30% of the NZ sample think that a
scientific theory is just a guess but none of the UB sample thought this, suggesting a
need for enhancement of teaching about the nature of Science and what a scientific
theory really means. Indeed, as previously mentioned this is addressed in the NZ
science curriculum and implemented in 2010. To what extent and how, are the key
issues. Around 50% of the NZ samples appear to be unclear that all living things do
share the same basic DNA coding system but that again, only 26% of the UB cohort
thought this was correct. Perhaps there are interpretation difficulties with what is
meant by “basic DNA coding system” (This means that all living things share the
same base pairing rules for protein synthesis and so share common ancestry).

257
Around 62% of all responses do not consider new species to have appeared suddenly
in the fossil record (punctuationism) although it is significant that the Year 13 AC
cohort has the highest percentage that do. This aspect of speciation is taught directly
but minimally in the NZ Year 13 Biology curriculum, and is examinable. Question
18 is notable for the significantly different response of the UB cohort, where 89% of
responses consider the scientific method to be the control of variables.
Not surprisingly, when asked about supplying reasons for any two of their ‘true’
responses, the most common response was for question 7 (fossils are important and
interesting) was because they tell us about the natural history of life and
environments. It is curious that responses tend to link animals with fossils rather than
plants. And one response stated, “Fossils are a sort of time machine”. The following
are a selection of other ‘explanations’.
“God does not have anything to do with fossils.”
“A scientific theory is a guess until it is proven.”
“Earth was made in six days when the Big Bang happened –it was pretty quick”.
“Fossils are the bones of once living things.”
“Scientific method is checking hypothesis predictions against observations of reality
to see how truthful they are.”
“Yes, fossils are buried dead things but not one intermediate between changing
species has been found; and red blood cells found in millions of year old dinosaurs –
good one!” Where does this statement come from?
Statement 14 (See Table 10.5) also elicited typical strong creationist responses from
two students.
1. “The Earth was made in six days. For me it takes more faith to believe in a theory
that life happened by random chance and all the intricacies of the human body than
to believe in an all knowing and almighty God that designed everything. Saying that
a building has no architect is foolish in the same way our beautiful Earth and
organisms in the world must have a creator”
2. “Design is evident in the world – irreducible complexity. Therefore there must be a
designer – God”

258
The challenge for Biology teachers is to not only recognise and acknowledge pre-
existing conceptualisations (and incorrect pseudoscientific perceptions) about
evolution and the significance of the fossil record, but also to be able to present a
scientific theory that is demonstrably trustworthy, valid, reliable and overwhelming
in an effort to promote a conceptual crisis that actually shifts thinking. As Brem,
Ranney and Schindel (2003) point out:
“Our concern is that if the complexity of evolutionary theory and its
consequences is not appreciated by students, it may impair their ability
to make informed, independent decisions, and resist dogmatic pressure
from all sides. What options does this leave a Biology teacher?”
(p.199)
These responses reveal a range of conceptualisations about what these students
considered were worthwhile writing an ‘explanation’ for. There is little argument
about what fossils were, but there is some insecurity about how they were formed.
There are also importantly, insecurities about the concept of punctuated equilibria,
alluded to in question 16. NZ Year 13 students from the same institution as Year 12
students clearly benefit from tuition on rates of evolution in class where they
recognise the importance of stasis and punctuation in the fossil record as a measure of
rates of evolution. This is part of a Biology assessment standard. However this is in
contrast to the idea of gradualism where on average, over 83% of all responses
consider being the main feature of rate of evolution. How students conceptualise
‘rate’ in any science area is a rich field of future research. Statement 18 reveals
tantalising conceptions about the nature of the scientific method, where stereotyped
views of physical science methodology (Controlled hypothesis testing or ‘fair
testing’) tends to dominate over the comparative and ‘pattern’ seeking approaches
characteristic of the geological and biological (especially environmental and
ecological studies) sciences. It is unclear why the UB primary school teacher trainees
responded by overwhelmingly indicating that scientific methodology did not involve
only the controlled testing of hypotheses, whereas all others did. Does this reflect
differences in teacher training and curriculum delivery?

259
Question 3: Why are fossils found on tops of mountains? Year 13 Responses.
The following are typical explanatory responses provided for this question. Many
reveal a typical search for answers in the information given either because of fear of
ridicule, inability to express, laziness or genuine ignorance.
Typical explanatory responses include:
“The material was deposited on top [of the mountain]”
“Hasn’t been there long – since the last flood”
“Tectonic plate movement”
“Sea level changes”
“May have already been there”
In summary:
(a) Found in place at the top = 31% of responses (n = 39)
(b) Don’t know = 8%
(c ) Pushed by earth forces = 51%
(d) Confused responses = 10%
Findings for Section B Question 1 a: Observable skeletal changes in a stratigraphic
sequence indicate that most students were able to not only recognise a decrease in toe
number but also specifically linked this to time. At this age then students are able to
link structural evolution of fossil bones to geological time via recognition of a
stratigraphic sequence where the oldest is identified as the bottom layer (no
information was given about overturning or other tectonic change). Around 15% of
responses (n = 39) indicated a specific link with an evolutionary change, and around
10% simply recognise a change in shape without linking to any process. Other
reasons suggested for toe reduction included:
“Toes were not needed so they evolved” and Layer 1 were smaller moved slower
therefore less sturdier on feet” (Lamarckism is a common misconception).
“Toes are turning into a leg bone”.
“Change is caused by in-situ bacterial deformation”
“Was ground up and decayed in-situ”

260
Creationist response conceptions invoked the idea of “…degeneration and loss of
genetic information which results in less complex ‘feet’ with the “number of bones
complexity of mechanism reducing it”.
These responses suggest:
That degeneration is a substitute for biological evolution by recognising
change without having to say the E word. These students recognise skeletal
changes but do not acknowledge them as evolutionary in origin.
A lack of understanding of creationist rhetoric involving nonsensical and
incorrect ideas of ‘irreducible complexity’ in an attempt to use (rather
misuse) this terminology as a justification for non acceptance of biological
evolution. In short, these students can not contextually use creationist
pseudoscience propaganda as explanation for recognised change, when faced
with fossil evidence as shown in the stratigraphic sequence.
Fossil evidence is erroneously construed to be the remains of animals of “the
same type” and therefore they have not evolved. This alludes to the idea of
the meaningless biblical ‘kind’. As Scott (2004) points out, ‘progressive
creationists’ types or ‘kinds’ of organisms “are viewed as being genetically
limited :as a result, one kind cannot change into another” (p. 62).
Fossils are shown as being absent from stratigraphic layer 4, and students are asked
to supply possible reasons for this. Around 60% of responses indicated that the
animal portrayed became extinct, 36% said that the animals had immigrated, 8%
considered that the environmental conditions did not favour fossilisation and another
8% (3/39) considered the animal was unable to survive environmental change-
implying extinction. Table 10.6 in Appendix 6 presents several other respondent
reasons for explaining the absence of fossils from stratigraphic layer 4 and provides
an interpretation of the geological concepts that are involved.
Evidence statements in Table 10.6 also suggest that there is considerable
misconception of how fossils form and their relationship to the physical
environment. Although responses suggest that fossils are correctly known for what
they are, there is little scientific understanding of how they form. The connections
between the animals (and plants and bacteria) and their ecology is missing.

261
Section B, Question 2a, Cross Section Examples for AC Year 13 Students
Figure 10.13 shows examples of Year 13 student responses to cross sections A.
B
C
D
Figure 10.13. Typical Year 13 responses to Section B, question 2a of GeoVAT.

262
Q 2a Summary of Year 13 responses (Aged 17/18 years) (n = 39):
Don’t know = 23%
Direct copy of given sketch = 10%
Variation of given sketch = 5%
Clearly incorrect = 12%
Clearly correct cross section = 28%
No response = 15%
Indeterminate = 7%
10.8.1 Discussion: AC Year 13 Cross Sections
Overall, cross sections produced by these 17/18 year olds for question 2a display a
similar conceptual pattern to all other age groups: there are those who can rotate 2-D
into a slice, those who try, those who cannot and those who do not try. The scans
shown in Figure 10.10 have been selected to illustrate a perceived general trend in
sophistication from “I don’t know” to an increasing amount of detail. Cross section
A suggests that this student is unable to rotate a plan view but attempts to ‘redraw’
what is already given This is analogous to students attempting to reword given
information in a written theory question or those who attempt to copy patterns from a
3-D geological structure (Chapters 7 and 8 and GeoTSAT). Cross section B reveals a
typical compromise ‘floating land’ response where elements of both 2-D and an
incorrect cross section are drawn. These students are unable to think and ‘penetrate’
downwards and have difficulty with boundaries. The water (B) and land (A) are
directly derived from the given plan view. Diagrams C and D indicate a higher level
of understanding of what a cross section is and typically show the dilemma students
have as to what to do with the sea level water line: does it go right across (C) or is it
ignored (D)? Cross section D adds in more detail derived from given information
despite already having answered the question. Although ‘drawing literacy’ may be a
limitation akin to ‘narrative literacy’ for expression of conceptualisation, both C and
D clearly show these students are able to rotationally translate plan view into cross
sectional view. This ability has implications for visual penetration ability of
geological structures.

263
Question 2c seeks to find out conceptualisation of an alternating sequence of marine
and terrestrial environments. Examples of explanations are shown below.
Did not do = 33%
Repeated floods = 10%
Changing sea levels = 36%
Movement of tectonic plates (universal cause = 8%
Variable remainder = 13%
Other responses include:
“Area must be where the water rises to in high tide in summer”
Shows climate change”
“Water must have been rough to have no fossils”
Question 2d Summary of Perceptions of the Earth
First Formed: Hot, cold, barren, brown and quiet.
Today: Crowded, green and industrial. Busy, loud and noisy.
Responses here mimic other age group responses: in essence, it is the presence of
humans that is different.
10.9 Summary for Ashburton College (AC) Year 13 Responses to Question 3
Question 3 results are shown in Figure 10.14 in Appendix 6. Estimations of relative
time events are similar to the Year 12 cohort. Surprisingly, 91% thought that
development of the plate tectonic theory was > 100 years old – a gross
overestimation.
As indicated by the spread of responses Q1, (First appearance of fish), caused a
problem but it is significant in the sense that students underestimated the first
appearance time as perhaps suggesting an ignorance of the old age for this event and
an inability to place this event in a time-relative position. Similarly, responses to
Q18 suggest that these students have an immature (Relative to accepted scientific
ages), idea of the much older age for the first appearance of modern people than they
think. Perhaps this is related to perceptions of what ‘human’ actually means? But
either way, it is difficult to reconcile with their Year 12 counterparts where 47%

264
underestimated the age as opposed to 91% of Year 13 students from the same
institution. Extinction of dinosaurs and the first appearance of the birds were also
significantly underestimated in age. The age for the Big Bang and the formation of
the Sun (And implicitly the solar system), were both grossly overestimated in age in
a similar way to all other age groups as if they are recognised and perceived as the
oldest in age so therefore must fit the oldest ‘J’ category without relating the age
categories to one another. This supports Trend’s (2001) data where primary school
trainees’ (two years in advance of this AC Year 13 cohort), fundamental, ‘large
scale’ time divisions are recognised, but were lumped together and overestimated.
Exactly why this occurs is open to future investigation. T-test analysis indicates no
significant difference in event-time estimations when comparing the Year 12 and
Year 13 overall means for a correct relative age orders (see Appendix 5 for GeoVAT
questions).
Results are also similar for all other age groups suggesting that there is little
conceptual and perceptual change taking place over an age gap of ten years.
However, as Trend (2003) pointed out, results may say more about student
perceptions rather than their conceptions. The relationship between perceptions and
conceptions of deep time is a future area of ‘fruitful’ research. For example, to what
extent do students use cues in the events, and what are the key reference points for
assigning relative ages when unknown? Results for all age groups (with a gap of 9
years) also support Trend’s results that ‘Deep Time’ events are perceived in broad
categories rather than the scientific refined relativity. Limitations of ‘internal
feedback relationships’ of each event may significantly influence results as well as
individual knowledge base, world views and cognitive status.
Unless specific geological training is undergone, this conceptual status is likely to
remain probably for life. The challenge for educators is to address this static
conceptual (and perceptual) status. As Orion and Ault (2007) imply, research efforts
should “provide an understanding of student’s difficulties with learning processes”
identify appropriate and relevant teaching strategies and develop “cognitive capacity
for systems thinking” (p.67),

265
Commonly and unfortunately, without adequate pre-service and in-service training,
resourcing and funding which enables the development of integrated reductionist and
holistic values, this goal is likely to be unattainable and the unique properties of
Earth Systems Science and the underpinning principles of geological science will
continue to be lost. Although easy to state but more difficult to evaluate, Ault (1998)
aptly pointed out:
The role of the curriculum comes to an end once the learner achieves
independence in accessing, using, and evaluating knowledge according
to the relevant criteria of excellence. (p. 211).
10.10 New Zealand Year 9 (13/14 year olds) Responses to GeoVAT
This typical cohort of Year 9 students (first year of secondary school in NZ), had an
average age of 14 years and 7 months and the questionnaire was completed half way
through the year. Minimal tuition in Earth Science or Geology had been given to
these students and the results are expressed as percentages of the responses and then
compared to other cohorts. Table 10.7 records the response distribution for AC Year
9 students compared to other cohorts for responses to question 1 of GeoVAT.
When one considers the age range (13 to 22+ years), and students from different
countries, it is remarkable that even for this very small sample the results for each
question are in nearly all cases insignificantly different. The UB primary school
teacher trainees are different in questions 9, 10, 11, 15, 16 and 18 but all other results
by ANOVA are statistically indifferent (F = 19.7. p = 0.01. F crit. = 2.3). It seems
that the AC Year 9 have similar responses except that unsurprisingly, 79% of
responses consider Charles Darwin to be the first to think of evolution as a
mechanism for life’s diversity. This is similar to the UB responses but different to all
others. This is unsurprising because the responses reflect the fact that Charles Darwin
is known but these students have not been exposed to any teaching about biological
evolution. They simply associate Darwin with evolution and little knowledge of the
historical development of the theory. Question 16 is also similar to UB results. Year
9 AC students consider the rate of evolution to be gradual and they have no
knowledge of punctuationism like their elder students from the same institution.

266
Reasons given for Year 9 statements considered to be true include:
Fossils are important and interesting (statement 7) because they “tell us
about the past” (11 responses); that “scientific theories must be true and not
guessed at because this would be a waste of time” (2 responses); “we look
like chimps so we must have evolved from apes”. A common response
from all age groups is to not actually supply a reason, but merely supply a
statement of perceived fact. Students do not know why they know things -
they just know. Typically, reasons for finding fossils at the tops of
mountains is that the flood idea is correct and that animals just died up
there. Rarely do students of Year 9 age consider that mountains are raised
from the sea floor to be 8Km above sea level!
Other reasons include:
The Earth was made in six days because “my religion tells me this” and “all
through my primary school that was what we were taught in religious
studies” and “God sent down the rains and made the great flood, things
drowned and floated on the water and they got left at the top of the
mountain”. The power of religious dogma is very clear for some students
and is a concept at that time, perhaps more acceptable than a scientific
theory, especially when the nature of science is not understood and despite
enshrinement in the NZ national science curriculum of 2007 (Chapter 9).
Although significantly independent, question 1.a. section B (Appendix 5) responses
are also similar to all other groups. The changes are generally recognised but the
reasons are often confused. For example, “bone gets corroded away over time” or
“the bones deteriorate”. Most responses indicate a connection with geological time as
shown by the rock layers. This supports the early work of Ault (1981) where young
children are able to connect time with rock strata in terms of superposition, and
Montangero’s work (1996) where young children are able to detect diachronic
changes in observable physical transformations. Conceptual explanations are a
different matter.
Section B question 1b asks for explanations for absence of fossils in upper rock
strata. This is what these students typically say.

267
“Things making fossils became extinct”
“The ground rose up”
“The creature died out or stopped growing”
“Lack of oxygen below the surface”
These responses suggest that there is little connection with environment in a
biological sense and a poor understanding of spatial/geographic/ecologic
relationships associated with organismal distributions.
Question 2a asks students to display their understandings of spatial rotation from a
map plan view to a cross sectional view. Typical responses are shown in Figure
10.15.
A
B

268
C
D
Figure 10.15. Typical Year 9 responses to question 2a of GeoVAT.
These responses suggest similar conceptual thinking to all other age groups where
there is a range from “don’t know” to copying the plan view to partial cross section.
Scan E is interesting because this student seemed to know what a cross section meant
but had no idea how to translate the plan and ended up copying the given X-Y line
vertically. Students constantly look for answers in given information when they are
insecure. The older students were generally more sophisticated but still retained
juvenile elements. If students of 14 years old struggle to spatially visualise cross
sections and are generally unable to translate plan view to cross section, this is likely
to have significant effects on general subject learning.
Question 2b only elicited one response. “Was the dinosaurs territory and they had
families”. This indicates that some students of this age are able to identify and
connect fossil remains with life processes. Question 2c typical responses include:
“Dinosaurs died in certain seasons”
“Every second summer the area was flooded”
“Used to be a lake or river which dried up and land animals lived after fish died out”

269
“Would flood every now and again and dinosaurs were wipe out. Some survived and
then died and their fossils were in the land. This was a continuing pattern”
These responses suggest that students of age 14 years in this small sample were able
to make diachronic linkages with seasonal change as recorded in rock strata
(geological time), and with changes in stratal position of fossil preservations.
Question 2d responses are summarised below.
First Formed Today Brown, small and hot Green (5 responses) and bigger
Quiet (8 responses) Loud (6 responses)
Volcanic Cities and cars
Section B Question 3 elicits a student conceptual status for the nature of fossils and
perceptions and conceptions of bio/geological events through time. The results for
Year 9 students are compared to other groups from the same institution in Figure
10.16, Appendix 6. It is rremarkable that the mean overall relative time/event
distributions are so similar given the independent completion times and age
differences which in effect spans the secondary school years. Conceptual status of
relative placements of diachronic events appears to be much the same for each group
and there is a consistency for overestimating times especially for questions 3, 24 and
23. Placing what are considered the oldest events are simply connected to the oldest
age category without comparing the age relativities in the ranges. In short it seems
that students of all ages make judgements based on the events themselves rather than
using the given age categories as the relativity benchmark. Perhaps the reference
point for all events is compared with what the individual perceives to be
incontrovertible. It is interesting that the age for the formation of the Moon and the
first appearance of the birds gained the most correct answers. Overestimation of
event timing is common. Although these results are gathered from a small sample it
is remarkable that the means show no significant difference despite being from
across different age groups and independently completed (Table 10.13).

270
10.11 New Zealand Year 11 (15/16 year olds) Responses to GeoVAT
This cohort of 25 students has an average age of 15 years and 4 months and
represents (not statistically) an anecdotally typical 15 year old conceptual status. the
Response distributions for question 1 section A compared to other cohorts is shown
in Table 10.6 in Appendix 6.
The overall results for Year 11 students are remarkably similar to all other cohorts
with the exception of question 16 – punctuationism. The concept of punctuationism
is not encountered in NZ schools until their final year and then only if students study
Biology, so it is hard to explain why the Year 11 results are similar to Year 13 results
for this question. Gradualism is encountered in general knowledge and some science
and this may help explain the contrast in cohort results. Again, the dominant concept
displayed by this Year 11 cohort of science methodology is ‘controlled testing’.
Question 2 elicited the general consensus that fossils “show us animals [not plants]
from hundreds of years ago” and that fossils are just accidents because they happen”.
Typical ‘explanations’ for question 3 include:
“They were up there when they died”
“They got washed up there”
“Stuff above gets washed away so gets uncovered”
Question 2a Section B which asks students to show how they spatially think again
displayed commonalities’ with all other groups. Example A (Figure 10.17) is an
interesting attempt to translate plan view into cross sectional view. It shows a mixed
conceptual and perceptual state where elements of cross sectional view are conceived
and perceived, but also an inability to draw the cross sectional relationship between
the island and the sea. In the examples A and B below, there are clear elements of
‘copying’ the given diagram but also a cross sectional view.

271
A
B
Figure 10.17. Typical Year 11 responses to question 2a Section B – cross sections.
These examples for Year 11, along with all other age groups, consistently
demonstrate how respondents look for clues in the question and when not found
attempt to ‘rewrite’ the given material with their own spin. Thinking below the
surface in a cross sectional way presents challenges for this age group. Students of
this age were clearly able to make the connection between fossil evidence and the
idea that this evidence indicates life histories within a diachronic framework.
Question 2c provided too few returns for comment, but Section B question 3 results
are shown in Figure 10.18, Appendix 6.
The mean results indicate no significant difference in diachronic event categorisation
to all other age groups, strongly supporting the findings of others (Dodick, 2000b;
2003a; Downey, 1994; Trend, 1998, 2000a, 2001a; 2001), that many early formed
concepts are held onto tightly and simply modified or ignored until there is sufficient
dissatisfaction and cognitive ability to accommodate change. It is typical that even
for event 4 which recorded the highest percentage being correct, (Development of
plate tectonic theory) that this event is over estimated, with most ever estimates
indicating a time of between 100 and 1000 years. Development of concepts since the
late 1950’s is perhaps still well beyond the perceptual reach for teenagers (Figure

272
10.17, Appendix 6), where only 33% were correct. It is unlikely that any student
actually knew the answer, and indeed, the vast majority of all results failed to elicit
an attempt at an actual age. This appears to be just too difficult (or time consuming)
to respond to. Just like other age groups, the beginning of time and the formation of
the Milky Way galaxy events are considered to be synonymous with the oldest age
category. This again suggests that responses are not derived from consideration of
relative comparisons of provided time categories but by reference to a perceived
correct answer. Anything older than the oldest perceived age is ancient and is
therefore lumped into the oldest perceived category. ‘Lumping’ of categories rather
than ‘splitting’ is the most common approach (Trend, 1998, 2000b; 2001). That 93%
of responses underestimate the correct age for human origins suggest difficulties for
definition of ‘human’ especially when this cohort has virtually no knowledge of the
scientific view of human evolution. This cohort also like most other cohorts clearly
and unfortunately had no idea of the age of the oldest rocks in New Zealand. Do
you? (For NZ, about 540 million years ago: but only the last 12% of Earth’s history)!
10.12 Israeli (IS) Student Responses to GeoVAT
A small but tantalising sample from Israeli students provides an interesting and
useful comparison of responses to the conceptual status of ideas about evolution and
geological time for high school aged students. These students aged 15 and 18 years
and nurtured in a Middle Eastern culture but taught universal geological concepts
and contexts provide a measure of ‘internal triangulation’ and comparison.
Unfortunately, because responses are written in Hebrew and not translated, only
results to Section A question 1 and Section B question 2a and 3 were able to be
recorded. I would speculate that responses to other questions would be similar to
other cohorts.
Findings
Results to Section A question 1 (true/false responses to ideas about fossils and
geological events), are similar to all other high school age cohorts (Table 10.4,
Appendix 6) but with specific question differences. These are highlighted in blue. T-
test analysis indicates that there is no statistical difference between the two year

273
groups for IS samples. Across all cohorts however, sample sizes are too small to
make any other generalisations.
Although decreasing with age, it is interesting that the older AC Year 12 and 13
cohorts do not consider Charles Darwin to be the originator of the idea of evolution
but the IS Year 12 and 13 age groups do. Does this reflect differences in Biology and
science curricula, teaching and cultural values? About 40% of the IS Year 12
responses indicate that science is “just a guess” but at Year 13 (Grade 12) this idea
is reversed. When the AC Year 13 group is compared to the IS Year 13, 31% think it
true that a scientific theory is just a guess but the IS Year 13 group had 62% thinking
this. Why? Were students confused by the question? Or did this cohort really think
that a scientific theory is just a guess? Across all age groups, on average, 20% (N =
77) thought that the Earth was made in 6 days. The IS Year 12 students were the
least sure at 50% on this! Oh to have 300 samples! On average 59% of all responses
think that ‘the’ scientific method is only the controlled ‘fair’ testing of hypotheses.
The IS Year 13’s show the lowest percentage that (correctly), that this is not so.
Teaching the nature of ‘scientific investigations’ beyond controlled experiments is a
challenge for science teachers in developing an appreciation (as well as
implementation) that pattern seeking and comparative methods are also often used
are scientifically valid but take longer at school to complete.
Question 2a Section A looks at the ability to translate plan view into cross sectional
view and requires the visual/spatial ability to rotate as well as to place unseen
information (eg hidden rock strata and their boundaries) into correct positions
(Visual penetration ability). Figure 10.19 represents scans of a range of responses
from no cross-sectional perception to acceptable cross sections.

274
IS Grade 11 (=NZ Year 12, age 16/17) Selected Cross Section Responses
IS Grade 11 (A)
IS Grade 11 (B)
IS Grade 11 (C)
Figure 10.19. Typical IS Grade 11 responses to Section B question 2a.
Scan A for IS Grade 11 (Figure 10.19) appears to be a modified copy of the given
information (Appendix 5) where the dinosaur is simply copied along a diagonal line.
This is typical of students who have little idea of what a cross section is and so are
forced to copy what is already there but drawn differently to indicate that an attempt
has been made on the question. Scan B shows an interpretation where only half of
the ‘island’ is shown but with the rare addition of rock material making up the sea
floor. Scan C shows the most typical of accepted cross sections with a disconnected
‘bottom’ or sea floor.

275
IS Grade 12 (=NZ Year 13, age 17/18) Selected Responses
Grade 12 (A)
Grade 12 (B)
Grade 12 (C)
Figure 10.20 Typical IS Grade 12 responses (NZ Year 13) to Section B question 2a.
The IS Grade 12 scans (Figure 10.20) show a similar range of responses; from
acceptable (Scan A) to the ‘inverse’ of the given diagram (Scan B) and a minimalist
approach (Scan C). In common with responses across all cohorts, pictures of the
dinosaur skeleton and nest area are simply copied in. All responses for the IS Year
13 cohort showed cross sections indicating little difficulty in rotating the plan view to
276
the cross sectional but it is common for responses to ‘invert’ the land area above sea
level to one below sea level as in Scan B. Perhaps students perceive the ‘white’
island area (See Appendix 5) as a depression rather than an elevation. They also
often fail to connect the word information with the picture information.
Figures 10.21 and 10.22 in Appendix 6 show the distribution of results for the time
related events for Question 3, Section B. In summary, the Grade 11 students
overestimate the times for each event more than the Grade 12 students but both
cohorts are similar in their percentage of correct answers. It is surprising that 44% of
Grade 12 and 63% of Grade 11 students did not know the so recent advent of plate
tectonic theory. Like all other cohorts, the ‘beginning of time’ is commonly accorded
(incorrectly) the oldest time category of J (more than a million million years old).
Also, like other cohorts, very few know the age of the oldest rocks in their own
country. This is likely to be true of the whole population because geological science
and how rocks are scientifically dated is rarely taught.
10.13 New Zealand First Year University Geology Students (UC 1) Responses
to GeoVAT
Summary of Results
In common with all other cohorts, these students considered fossils to be important
and interesting because they tell us about the history of life. Responses are typically
knowledge-based statements rather than conceptual explanations using scientific
evidence. This is a common written examination answer problem.
The vast majority of responses correctly understand the need for uplift when
explaining why fossils can be found at the tops of mountains. In so doing this implies
an understanding that fossils were moved from the sea floor to altitude. Nevertheless,
a small number (3/28) considered that the organisms died in place on top of the
mountain, 4 responses were totally confused, one was a ‘saboteur’ and another
considered that the draining away of a great flood was correct. It is surprising that
30% of these first year geology students did not consider uplift to be a factor.

277
Again, although the majority of responses are correct in identifying changes in fossil
bones only 16/28 responses (57%) were linked to a diachronic basis. That is, most
students observed skeletal changes but they did not link these changes with rock
strata through time.
Most considered the absence of fossils to be caused by extinction or migration (68%)
with the remainder linking fossil absence with environmental change. None linked
migration with environmental change they just think the animals just disappeared.
Some responses suggested that “the bones disappeared from breaking down” and
“fossils could be eroded away and soil took their place”, suggesting significant
conceptual difficulties in explanation. In essence this cohort considered the early
earth to be hot, volcanic and loud and today, green, loud and “man made”.
Figure 10.23 shows representative scans of cross sections by UC first year students
for Section B question 2a (See Appendix 5 for the questionnaire).
A
B
C

278
D
Figure 10.23. Typical UC first year geology student cross sections.
Similar to other cohorts, these first year geology students (half way through their first
year) show a range of responses from inability to rotate plan view to the hidden cross
sectional view (A,B and C) to a complete cross section (D). The ability to position
‘hidden depth boundaries’ directly influences spatial reasoning and visual penetration
for geological structures in 3-D (See Chapters 7 and 8).
10.14 New Zealand Second Year Geology Student (UC2) Responses to
GeoVAT
Summary of Results
This cohort results for question one of the GeoVAT questionnaire are summarised in
Table 10.12. In essence, there is little difference in undergraduate and postgraduate
understandings of what fossils are and concepts surrounding them. It does seem
(thankfully) that postgraduates do have a more sophisticated view of the rate of
evolutionary change as expressed by the concepts of punctuationism and gradualism.
This cohort of second year geology students has a mean age of 22 years and 6
months. Explanations offered in response to question 2 ranges from “No one knows
the absolute truth apart from God –all we can do is guess”, to “Can’t think of
explanations – just know the facts”. This last response exemplifies the difficulties
students have with providing explanations– even at second year university level, and
there is a tendency to just make statements or reword the question rather than provide
an explanation.
‘Depth boundary’

279
Most responses for question 3 invoke plate tectonic uplift as a cause but one even
agreed with the question! Another confused response was: “You mean that the world
was originally flat but due to the older heavier oceanic crust and the sped up plate
tectonics, fossils that were deposited on the originally low sea floor were pushed up
much faster than currently because the older heavier plate has been subducted
almost fully except as small part of plate left subducting beneath the Andes in S.
America”. A little knowledge is a conceptually dangerous thing!
All responses for foot bone changes were correct except the confused and
pseudoscientific creationist viewpoint: “It is very likely that only a piece of each of
the bones have been found and altered to appear as changing or evolving –which
will later be proven to be a hoax like so many have. Changes within species do occur
but only as a result of a loss of genetic information, not the development of new
information”. What can one say? Reasons for the absence of fossils include a correct
understanding of unconformities, extinction, lack of preservation, migration and
unsuitable environments.
Question 2a has only so many possible responses. Figure 10.24 shows some of these
responses. Scan A appears to be a sort of mirror image where land is kept in the same
position but the sea is extended upwards instead of downwards as if the student did
not know where to place the sea/land boundary in a vertical section. Scan B is
unusual in that although a cross section s attempted, the sea / land boundary again
was unknown. Scan C is a correct response with clear understanding boundaries and
the need to have the sea shore in correct positions relative to the plan view. In
keeping with most responses, a picture of a dinosaur appears to be necessary to keep
a connection with given information. This response also recognised that sediment
forms on the sea floor from erosion of the land. And, these responses are from
second year university geology students going on 23 years old.

280
A
B
C
Figure 10.24. Typical UC second year geology student – cross sections.
All responses were correct for connecting life with the past except a creationist who
implied that fossilisation could not occur in a kind of denial of the fossil record. All
responses correctly invoked an environmental interpretation using geological
knowledge. The Earth when first formed was considered by this cohort to be
originally hot and loud and today, green and loud. Second year UC responses to
Section B, question 3 are shown in Figure 10.25 in Appendix 6 and described in the
combined responses in section 10.15 below.
10.15 New Zealand Geology Postgraduate Responses to GeoVAT
Summary of Results
This small cohort (n =10) with a mean age of 26 years and 6 months display a
modern view of what fossils are and all understand why the fossil record is
important. However, 40% considered Charles Darwin to be the first to think of
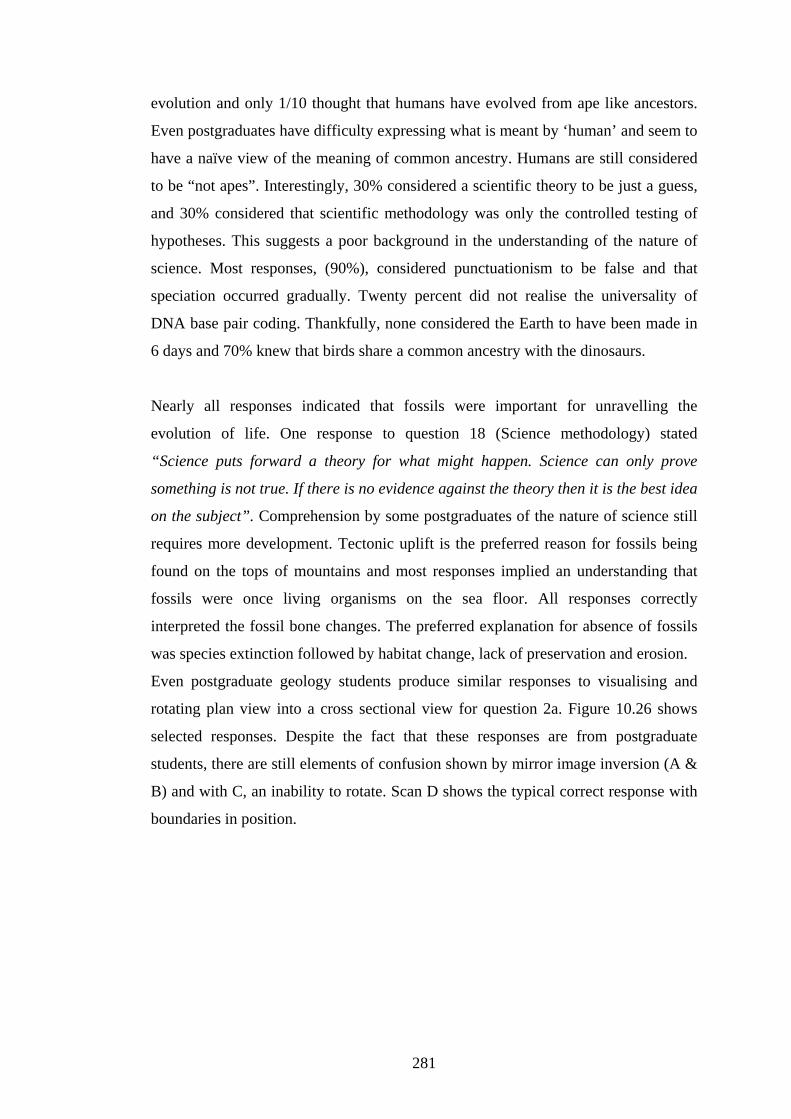
281
evolution and only 1/10 thought that humans have evolved from ape like ancestors.
Even postgraduates have difficulty expressing what is meant by ‘human’ and seem to
have a naïve view of the meaning of common ancestry. Humans are still considered
to be “not apes”. Interestingly, 30% considered a scientific theory to be just a guess,
and 30% considered that scientific methodology was only the controlled testing of
hypotheses. This suggests a poor background in the understanding of the nature of
science. Most responses, (90%), considered punctuationism to be false and that
speciation occurred gradually. Twenty percent did not realise the universality of
DNA base pair coding. Thankfully, none considered the Earth to have been made in
6 days and 70% knew that birds share a common ancestry with the dinosaurs.
Nearly all responses indicated that fossils were important for unravelling the
evolution of life. One response to question 18 (Science methodology) stated
“Science puts forward a theory for what might happen. Science can only prove
something is not true. If there is no evidence against the theory then it is the best idea
on the subject”. Comprehension by some postgraduates of the nature of science still
requires more development. Tectonic uplift is the preferred reason for fossils being
found on the tops of mountains and most responses implied an understanding that
fossils were once living organisms on the sea floor. All responses correctly
interpreted the fossil bone changes. The preferred explanation for absence of fossils
was species extinction followed by habitat change, lack of preservation and erosion.
Even postgraduate geology students produce similar responses to visualising and
rotating plan view into a cross sectional view for question 2a. Figure 10.26 shows
selected responses. Despite the fact that these responses are from postgraduate
students, there are still elements of confusion shown by mirror image inversion (A &
B) and with C, an inability to rotate. Scan D shows the typical correct response with
boundaries in position.

282
A
B
C
D
Figure 10.26. Typical post graduate geology responses to question 2a - cross sections.
The interpretation of the scenario for question 2 includes explanations related to
environment and habitat with recognition of a living community where populations
are breeding. Question 2c responses were dominated by statements like “variations in
sea level” but there was little connection with the detailed information given. Perhaps
questionnaire fatigue had set in?

283
This cohort of postgraduates considered the Earth to be hot, volcanic and loud when
first formed but blue, green and loud today (acknowledging the role of people?).
10.16 Comparison of UC Secondary Teacher Trainee and AUB Primary
School Teacher Trainees Responses for GeoVAT Question 3
Figures 10.6 and 10.8 in Appendix 6 indicate the spread of responses for Section B
question 3: relative geological and biological events in the earth’s history. Students
are aged from 20 to 30 years old. As for other cohorts, these responses are expressed
as under and over estimations of relative time events as well as those responses
which are correct. All cohort responses to question 3 in the GeoVAT instrument
were then compared in Table 10.13.
10.17 Summary of Cohort Means GeoVAT Section B, Question 3
Table 10.11 and Figure 10.27 summarise the results for student estimation of times
for question 3: fossils and relative time events. Across an age range of 13 years, on
average, 30% of combined cohort responses indicate an ability to correctly determine
the relative times of known geological and fossil events.
About 30% also under and over estimate relative time as represented by the
GeoVAT question 3 events in Appendix 5. The small cohort of postgraduate geology
students provides a measure of benchmarking but even here, 20% on average are
surprisingly still unable to make correct relative ‘time-event’ or diachronic choices.
Evidence also indicates (gratifyingly), that as age and experiences increase, the
degree of both over and under estimation of relative time events decreases and that
the amount of overestimation decreases more than the amount of underestimation.

284
Table 10.11 Summary of Means for question 3 GeoVAT (Age 13 to postgraduate).
GeoVAT Q3: Fossils and Relative Time Estimations Cohort Means Summary Arranged in Age Order
(N = 160)
0
10
20
30
40
50
60
70
80
90
NZ AC Y
ear 9
NZAC Yea
r 11
IS G
rade
11
(=NZ
Year 1
2)
IS G
rade
12
(=NZ
Year 1
3)
NZ AC Y
ear 1
3
AUB Prim
ary
Trai
nees
UC Firs
t yea
r Geo
logy s
tude
nts
UC Sec
ond
year
Geolo
gy st
udent
s
UC Sec
Tra
inees
UC Pos
tgra
duat
e Geo
logy
stud
ents
Cohort
Perc
enta
ge
% Time overestimate
% Time underestimate
% Correct
Linear (% Correct)
Linear (% Timeunder estimate)
Linear (% Timeover estimate)
Figure 10.27. Cohort means analysis for GeoVAT question 3: time estimations.
The psychological phenomenon of ‘forward telescoping’ of relative diachronic
events where ‘distant’ events are perceived as being more recent than they actually
are is supported by the data in this study where a lessened decreasing of under
estimation of events as age increases is shown. However, postgraduate geology
students (older and with more geological training), have a lessened percentage of
Cohort % Over estimate
% Under estimate
% Correct
NZ AC Year 9 (n=13) 57 33 10
NZAC Year 11 (n=25) 44 38 14
NZAC Year 12 (n=13) 52 29 18
IS Grade 11 (NZ Year 12) (n=9) 42 33 24
IS Grade 12 (NZ Year 13) (n=10) 27 45 28
NZ AC Year 13 (n=39) 41 38 14
AUB Primary Trainees(age 20+) (n=14) 43 43 13
UC First year Geology students (age 19+) (n= 28) 29 31 40
UC Second year Geology students (age 21) ( n=10) 20 38 43
UC Sec Trainees (age 24) (n=9) 34 26 42
UC Postgraduate Geology students (age 27) (n=10) 25 19 80
Combined Cohort Means (N = 160) 38 34 30

285
underestimation of events, and the gratifyingly highest percentage of correct
estimations of events. There is much room for testing the ‘scale’ of ‘forward
telescoping’ (or underestimation) when applied to estimations of many other
dimensions such as speed, distance, mass, temperature, mineral hardness and even
depth of groundwater bores as shown by Dickerson, Callahan, Sickle and Hay
(2005). Research by Catley and Novick (2009) suggests that there is no difference in
the time related estimations of biological events between College/University age
students who have and do not have biological backgrounds. However, they also
report that there was a greater variation within the weaker Biology background
students and that both groups were significantly inaccurate in their estimations. This
study supports these findings. However, Catley and Novick (2009) also clearly point
out the essential links between macro-evolutionary processes (the forgotten,
defocused and misunderstood link, at the expense of micro-evolutionary processes),
and geological time. Indeed, I would speculate that academic training in the
biological sciences (Chapter 9) tends to encourage and focus on the genetically
oriented micro processes before any discussion and linkage of macro evolutionary
linkages with paleontology and ‘Deep Time’.
Conceptualising ‘Deep Time’ is a significant scalar learning problem similar to the
difficulties involved in cognitively perceiving the size of atoms or the universe, or
the mass of a whale compared to a bacterium, or the volume of an object (See
chapter 5). Indeed, there is much to learn about the complexity of visual imaging and
perception development of scale. As Gail-Jones, Taylor and Broadwell (2009) point
out, even less is known about how visually impaired individuals develop their
perceptions of scale and it is how these individuals develop their scalar senses that
provides clues to understanding how sighted individuals develop theirs. The real
challenge for teachers is to find efficient ways of enabling students to develop an
appreciation of and perception of scales of dimensions to make better sense of
geological history (local and global) and the evolution of life. In Hildago, Fernando
and Otero’s work (2004) the issue of comprehension of time interval versus the
nominal scale is raised. In other words, students may accurately estimate a time but
do not comprehend what the interval of time represents. This is akin to being able to
read the words in a text but unable to comprehend what they mean. Comprehension
is all. So, when students are confronted with the geological time scale they can read

286
the numbers but struggle to comprehend not only the interval between events but also
its linkage with macro evolutionary events.
Teaching for geological time and its relationship to the evolution of life and
geological events is a significant challenge (conceptually and contextually) for
teachers and an even bigger challenge for curriculum developers and teacher training
organisations. Implicit, is that to better comprehend the importance of evolution there
has to be the building of more effective connections between the various sciences,
diachronic thinking abilities of students, fieldwork, argumentation, mathematics, data
processing and representation and individual world views. Specifically strengthening
the links between ecology and evolution (especially paleoecology) would also enable
a more sophisticated and connected understanding of evolution. Development of
meaningful resources to aid development of perceptions of scales of time is a
significant challenge yet to be addressed pedagogically as well as within curricula.
However, we forget how immature our teenagers (and undergraduates) are, and how
technologically and administratively immature schools are (that is, a schools
technological computer hardware usually lags well behind the software), so finding
appropriate manageable and meaningful pedagogy is a significant challenge.
Overcoming these teaching issues is not an easy task in classrooms dominated today
by systems of examination, accountability and teenage socialisation.
10.18 New Zealand University Geology Students
Figure 10.28 in Appendix 6 shows the UC first year student results for question 3,
Section B.and Table 10.12 and Figure 10.29 compare results for Section B, question
3. Few of these first year geology students (9%, n =12), were able to correctly
estimate the ‘beginning of time’ in relative time event terms from the GeoVAT
instrument. However, 42% were able to correctly estimate the formation of the Milky
Way Galaxy. It seems that connecting the origin of the Earth with the evolution of
the universe is too difficult. Overall, first year geology students equally
underestimate and overestimate the relative bio/geological events with only on
average, 40% of all questions being correct.

287
Table 10.12. Comparison of UC Geology students’ results for ideas about fossils.
Question 1 Section A GeoVAT
(N = 48)
UC Ist Year
(n = 28)
UC 2nd Year
(n =10)
UC Post
Graduate(n = 10)
1. Fossils are from seeds in rocks 100%F 100%F 100%F
2. Fossils are failed creations of God 96%F 100%F 100%F
3. Fossils are tricks of the devil 100%F 100%F 100%F
4. Fossils are accidents of nature 82%F 100%F 100%F
5.Fossils are preserved parts of once living organisms
96%T 100%T
100%T
6. Fossils are preserved remains of extinct org .only 100%F 100%F 90%F
7. Fossils are important & interesting 100%T 90%T 100%T
8. Fossils support the fact of evolution. 89%T 90%T 100%T
9. Charles Darwin first person to think of evolution. 43%F 20%F 40%F
10. Humans are evolved from apes. 61%T 70%T 90%T
11. Oldest know fossils are 3.4bya 68%T 80%T 90%T
12. A scientific theory is a guess. 75%F 80%F 70%F
13. Birds are from dinosaurs. 64%T 70%T 70%T
14. Earth was made in 6 days. 79%F 80%F 100%F
15. Common DNA code. 68%T 80%T 80%T
16. Punctuationism. 39%T 40%T 50%T
17. Gradualism. 93%T 90%T 90%T
18. The Sc. method is controlled testing only 64%T 80%T 30%T
GeoVAT Q3 Fossils and Time All False Responses for UC
0
20
40
60
80
100
1. Fossils are from seeds in rocks
2. Fossils are failed creations of...
3. Fossils are tricks of the devil
4. Fossils are accidents of nature
5.Fossils are preserved parts of...
6. Fossils are preserved remains ..
7. Fossils are important & interesting
8. Fossils support the fact of evol...
9. Charles Darwin first person to .. .
10. Humans are evolved from
apes.
11. Oldest know fossils are 3.4bya
12. A scientific theory is a guess.
13. Birds are from dinosaurs.
14. Earth was made in 6 days.
15. Comm
on DNA code.
16. Punctuationism.
17. Gradualism
.
18. The Sc. method is controlled t...
GeoVAT Q3
Per
cen
tag
e o
f F
alse
Res
po
nse
s
UC 1st YearGeology Students
UC 2nd YearGeology Students
UC PostgraduateGeology Students
Figure 10.29. Responses recorded as ‘False’ for Section B, Q3 GeoVAT.
A multi-variate cluster analysis (Figure 10.30) of UC data from Table 10.12 for ideas
about fossils (GeoVAT Section A, question 1) shows three distinct groups of

288
responses. It seems that there are stereotyped conceptual confusions about how
science investigates natural phenomena as well as an ignorance of the importance of
stasis, species extinctions and rate of evolutionary change. Even postgraduates have
an immature view of the history of evolutionary thought as shown by 60% of
responses indicating that Charles Darwin was the first to think of evolution. Teaching
the history of scientific thought is fraught with difficulties at secondary level, and it
is common to have little recognition of this topic in curricula. It is also likely that
science teachers have little training in this area.
All UC Data GeoVAT Q1. Ideas about Fossils and Events
Min
imum
Va
rianc
e
Squared Euclidean - Data log(e) transformed
4. Fossils are accidents of nature7. Fossils are important & interesting8. Fossils support the fact of evolution17. Gradualism.5.Fossils are preserved parts of once 2. Fossils are failed creations of God1. Fossils are from seeds in rocks3. Fossils are tricks of the devil6. Fossils are preserved remains of ex11. Oldest know fossils are 3.4bya15. Common DNA code.10. Humans are evolved from apes.14. Earth was made in 6 days.13. Birds are from dinosaurs.12. A scientific theory is a guess.9. Charles Darwin first person to think16. Punctuationism.18. The Sc. method is controlled testi
4.8 4 3.2 2.4 1.6 0.8 0
Figure 10.30. Cluster groups for all UC Data for Q1 GeoVAT: Ideas about fossils.
Surprisingly, most post-graduate students also considered Charles Darwin to be the
first to think of evolution. The history of science is rarely formally taught as an
integrative topic within the sciences and most students will learn by ‘osmosis’ and as
the moment, interest and need occurs. 25% think a scientific theory is just a guess
and 14% think the Earth was made in six days (8/58 were creationists). 90% think
evolution is gradual and 43% thought new species do not appear suddenly in a
punctuated fashion. In common with other cohorts, 58% thought ‘the’ scientific
method is only the controlled fair testing of hypotheses suggesting that other valid
scientific methodologies are poorly understood or used. This is a significant teaching
challenge to implement.

289
The postgraduate geology student cohort of 10 students unsurprisingly (and
thankfully) recorded the highest percentage (80%) of correct responses for section B
question 3 (Figure 10.31, Appendix 6). This cohort has the advantage of experience,
age and training. However, except for first year and second year geology students
where events were underestimated this cohort overestimated the events. There still
appears to be elements even at postgraduate level, of relative time comparisons of the
given events (i.e. internal relativities) rather than estimates based on factual
knowledge.
10.19 Chapter Summary
This chapter specifically addresses research question one:
How do students aged between 12 and 40 develop their conceptions of the fossil
record and geological time?
This chapter also looks in detail at the place of teaching and learning aspects of
biological evolution within the New Zealand national curricula and the conceptual
status of students from a wide age range and educational background. There is poor
curricular linkage between geological science, paleontology and paleoecology with
general concepts of biological evolution within the NZ national Science curriculum
of which Biology is a strand: The Living World. The reasons for this are likely to be
related to course structures in teacher training and the dominance of molecular
genetics (rather than the connections between population genetics, biogeography and
paleontology) as a context in school Biology courses. These in turn, are controlled by
national assessment standard criteria rather than holistic views of curricula. Selected
student concept maps are offered as an illustration of typical conceptualisations of
16/17 year old New Zealand students studying Biology (Figures 10.1 and 10.2).
These conceptualisations range from atheistic views to the incorrect regurgitated
rhetoric of creationistic pseudoscience.
This chapter also examines cohort responses to the GeoVAT evolution related
questions from a wide age range and different culturally set institutions. It appears
that the understanding and perceptions of scales of time and the conceptualisations of

290
the significance of the fossil record are much the same for all age group cohorts and
across these different cultural settings. This may reflect curricula evolution.
Responses to ideas about fossils and relative bio/geological events indicate that as
age increases the degree of overestimation and underestimation of relative diachronic
events decreases. It also seems that all age groups still consider that science
methodology operates essentially by a stereotypical ‘fair’ and controlled testing of
hypotheses with a limited understanding that the geological and biological sciences
often use ‘pattern’ seeking techniques using distributions of minerals or species as
well as historical and comparative data. The concept of punctuationism as an
explanation for evolution as seen in the fossil record is subordinate to the view of
gradual evolutionary speciation. On top of this, most responses (incorrectly) indicate
that Charles Darwin was the originator of the concept of biological evolution with
little knowledge of the historical roots of this concept. In concert with other recent
work on differences between Biology and non-biology majors and their teaching of
evolution and the impact of teacher preparation for teaching evolution (Nehm, &
Schofield 2007; Nehm, Sun Young Kim & Sheppard, 2009) much work is still
needed to explore the reasons why there is so little difference in this study’s age
cohorts having similar conceptual status for the understanding of fossils, the fossil
record and ‘Deep Time’. Placing these geological concepts into teaching, learning
and curricula reforms is a significant challenge for future educators.

291
CHAPTER ELEVEN
GeoTSAT – GEOLOGICAL TIME QUESTIONNAIRE RESULTS
11.1 Introduction
This chapter summarises and discusses the findings of different age group cohorts
with regard to conceptions of geological time and addresses research question 3:
What is the influence of diachronic thinking on conceptions of geological time?
Cohorts surveyed include:
1. American University of Beirut (AUB) primary and secondary school teacher
trainees.
2. University of Canterbury (UC) secondary school teacher trainees.
3. Israeli Grade 8 and 10 students (ages 13-15 years).
4. UC first year, second year and post graduate geology students.
As stated in Chapter 6, nothing in geology (and biology) makes much sense without
reference to time. Geological time is often expressed as ‘Deep Time’ hinting at the
complexity of comprehension rather than complexity of the concept. It forms a
cornerstone of geological education and is a defining characteristic of learning in
geological science. The second research question asks: How do students aged 12 to
40 years of age develop their conceptions of the fossil record, geological time and
geological structures. GeoTSAT is a validated instrument used to gather data on
geological time and spatialisation (See Chapter 5 for details and results reliability).
The rationale for use of a previously validated questionnaire is also outlined in
Chapter 5. This questionnaire contains conceptual questions about relative geological
time and elucidation of geological histories.
11.2 About the Instrument Questions
Questions 1-5 ask about geological history and relative geological time. Some
spatialisation skill is needed for interpreting block diagrams and the folded strata
diagram (Appendix 2). Importantly, some ability to connect geological environments
with rock type is also required but at a low level. Along with interpreting a

292
geological history, correlation of rock strata by recognition of equivalent or relative
age is also tested. No questions were asked of comprehension of absolute geological
time except in the GeoVAT instrument where responses were invited for students to
provide an absolute age where known. Interestingly this section was the least
responded to. Figure 11.1 illustrates the difference between relative and absolute
geological time measurement.
Relative Age (Correlation, superposition and cross cutting)
Older Younger
100 mya 10 mya Absolute Age in millions of years ago (Radiometric)
Figure 11.1. Times Arrow: Relative and absolute geological time.
11.3 Findings for the American University of Beirut Secondary School Trainees
Students in this cohort of 21 secondary school trainees from the American University
of Beirut (AUB) have a mean age of 22 years. Religious affiliation is dominantly
Islam (Druze) (76%) and Christian (24%). In common with other cohorts of non-
geology specialists there is generally a low value placed on the study of geology. For
this cohort, 61% considered Geology to be of low importance. Respondents also
considered plate tectonics, landforms, earthquakes and volcanoes to be the most
interesting geological topics with evolution, fossils, and mapping to be the most
troublesome topics. The complete GeoTSAT questionnaire can be viewed in
Appendix 2. Tables 11.1, 11.2 and 11.3 show results for AUB secondary school
trainees for questions 1b, 3 and 4 of the GeoTSAT questionnaire.
Table 11.1 Question 1.b results: Age order of fossil.
n =17 Gastropod 1
Oldest
Trilobite2
Clam 3
Ammonite4=
Coral 4=
Snail 6
Youngest % Correct 82% 23.5% 23.5% 17.5% 58.8% 64.7%

293
Q.1.b. Naming fossil of the same age (n = 18)
Ammonite and Coral = 44%
Coral and Snail = 33%
Clam and Ammonite = 5.5%
Ammonite, clam and gastropod = 5.5%
Did not do (DND) = 11%
Q.1.c. Actual responses in accounting for the formation of the rock exposure.
“Drought
Layer of sand provides habitat. Layers build on top of one another due to the
weather such as hurricanes. This causes rocks to break.
Layers over one another one covering the older one.
Gastropod found first – others on top.
“Caused by earthquakes and storms”.
Animals are trapped in sand due to erosion. Layers of earth have sedimented
on each other.
Sand covering layers.
Q.2. A Geological history. Response transcripts.
“Sea to land (trees) to Sea
One layer covered by another with teeth in it. After erosion of a layer another
one on top.
Oldest at the bottom. Ocean limestone – water level dropped- soil replaced
sea floor then ocean. (Correct sequence but no details).
Some just repeated the layers as given.
Sharks teeth shows once ocean and trees as land (No explanation of
sequence).
Deep water then evaporated with the sand becoming rock.
The ocean dried up and land ‘took over’, then flooded”.

294
Table 11.2 Q.3. Distribution of fossil ages based on relative dating of strata (my =
million years).
Age <80my 85 90 95 100 105 >110 Snail 5 8 (50%) 1 1 0 0 1 Coral 0 1 3 8 (47%) 4 0 1 Clam 0 0 1 0 0 8 (50%) 7
Making a connection between the numerical scale of 5million year intervals and the
biostratigraphy (strata or rock layers with fossils in them) is not always clear as
roughly 50% were incorrect for each stratum. Interestingly, there is overestimation at
the older end and underestimation at the younger end. All students managed to
identify that the relative coral stratum is in between 90my and 100my because of the
given boundaries.
Table 11.3 AUB Secondary teacher trainee responses to question 4: Correlation of
strata.
Response
Shark
1
Oldest
Urchin
2
Snail
3
Fish
4
Brachiopod
5
Gastropod
6
Clam
7
Coral
8
Ammonite
9
Trilobite
10
Youngest
1 1 2 3 4 5 6 7 8 9 10
2 1 2 3 4 5 6 7 8 9 10
3 3 5 1 2 8 7 4 6 10 9
4 1 2 3 4 5 6 7 5 9 10
5 1 3 2 8 7 5 6 4 9 10
6 1 2 3 8 5 6 7 4 9 10
7 - - - - - 8 7 9 10
8 1 2 3 4 5 6 7 8 9 10
9 1 2 3 4 5 6 7 8 9 10
10 1 2 3 4 5 6 7 - 9 10
11 2 2 1 4 5 10 9 8 7 6
12 1 2 3 4 5 6 7 8 9 10
13 3 6 2 10 5 1 4 7 8 9
14 9 10 6 2 4 7 8 3 1 5
6/14 correct = 43% for completely correct answer.
Q.5. Only 3 attempted this question and all were very confused responses.

295
11.3.1 Results Discussion
Questions 1 a – c attempts to probe student understanding of the relative age of
strata using a key fossil for each strata or rock bed but with folded strata. The
assumptions are that students conceive correctly that the oldest layer is at the bottom
(assuming no tectonic overturn), that strata with the same fossils in them are the
same age and that the beds were originally horizontal (Steno’s laws: see Chapter 2).
Results for this small cohort show that many students are unable to order these layers
(43% were able to have all correct) into the correct age order. These students are all
graduates and training to be secondary school teachers. Identifying that the ammonite
and coral were the same age posed a problem for 56% of this group. It seems that for
44% of these students (mean age of 22 years) they were unable to recognise that
fossils found in the same strata are the same age. Likely causes are that these
students simply look at the pictures of the fossils and their positions relative to one
another and fail to connect the strata with the fossil type and their relative age. This
is supported by the fact that the coral is higher in relative position than the ammonite
but students do not recognise these two fossils as being in the same layer. In fact,
33% stated that the coral and snail were the same age suggesting that because these
fossil pictures were at the same ‘height’ above the ammonite they are considered to
be the same age. Interestingly only one response suggested that the ammonite and the
trilobite were the same age even though they were roughly at the same ’height’ to
each other as the coral and snail. I can not explain why one student stated that the
gastropod, clam and ammonite were the same other than random disinterest choice. It
is also likely that students do not connect the folded nature of the rock layers with
their relative ages. They do not seem to be able to ‘follow’ the beds horizontally and
make the right connection with the fossils they contain.
Question 1c was designed to elicit student understanding of a simple geological
history in explanation of the cross section in question 1a (Appendix 2). Unfortunately
very few attempted this question, but of those that did, explanations indicate very
little understanding of possible geological events, other than recognition that there
were layers of rock one on top of the other. There was little connection made
between the fossils represented in the layers and their biological and geological
environments i.e. there was no connection with a marine environment.

296
Question 2 also elicits response to explanation of a geological history but provides
information on rock type and fossils. Responses suggest that there is a general lack of
understanding of rock sequence conformability in terms of deposition and the
geological environment. Students appear to connect “bits of tree” with whole trees
and therefore land. As I question 1c, the main difficulty seems to be connecting the
geological environment with what the fossils mean. No response recognised a
repetition or alternation of rock sequence and no response indicated a reason as to
why there were no fossils in the repeated sequence. There was no recognition that the
top bed was identical to the bottom bed and therefore had a similar geological origin.
Question 3 required students to make an absolute age estimates of fossils based on
their relative positions in a rock sequence. Results are shown in Table 11.2. Absolute
ages were provided for two igneous rock layers. Around 69% of responses correctly
identified the youngest fossil as being less than 90 mya but this was split between
assigning 85 or 80 mya. Based on work by Tretter, Jones and Minogue (2006) and
Trend (2000a), students probably do not see any difference between 85 and 80 mya:
it is just younger than the layer below it. Connecting the given relative ages as
absolutes also provides a challenge. It is surprising that three responses indicated that
the age of the snail was older than the 90mya igneous rock layer. Perhaps this
indicates disinterest and therefore ‘anything goes’ or a genuine ignorance of the law
of superposition. Similar reasoning goes for the oldest fossil at the bottom of the
sequence. However, responses to estimations of the age of the coral in the sequence
are more revealing. The reasoning is that the known age of the igneous layer above is
90my and the age of the igneous layer below is 100my, but many students seem
unable to decide that the age of the coral must be 95my. This is shown by less than
50% of responses being correct but with 29% guessing an impossible age of older
than 100my age. Do these students really understand the law of superposition or have
they just guessed? Furthermore, these results are typical of responses from age
groups from 13 to 23+ years..
Question 4 is a correlation exercise where an assumed knowledge base is that
students know that rock layers containing the same fossil type (index species) are of
the same age. They are asked to put the sequence in the correct relative age order.
Results shown in Table 11.3 reveal that less than half of this cohort of secondary

297
trainee teachers and university graduates were able to correctly identify the correct
complete sequence. Shaded responses show where individual responses differed
from the accepted sequence. It is likely the stumbling block is that if the student
looks at the snail in the centre top and correlates it with the snail in the right hand
column and the third layer down, what is underneath will not make sense because
they are not the same fossil. If the student correlates the gastropods first, there is a
better chance of correlating the other layers. The ability to make multiple correlations
is absent in those incorrect answers. The problem for this question was the
recognition that not all sequences were identical such that the fish scale underlies the
snail in the right hand column but not the centre: hence confusion. It is interesting
that 29% of responses failed to identify the oldest layer as that containing the
trilobite despite the fact that there is nothing else below it.
Question 5 was unfortunately only attempted by three students with insufficient
evidence for any kind of meaningful discussion. Perhaps the spatialisation required
for the cross sectional diagram was a challenge too difficult and too long for
respondents to overcome. Indeed, it seems ubiquitous that questionnaires that require
thinking about and spending time on respondents become more selective and less
reliable as the completion time increases. One response, however, indicates a
connection between tectonic forces and igneous intrusion and another comment
suggest that earthquakes are responsible. There was no attempt to connect geological
event possibilities in a correct time sequence.
11.4 Findings for American University of Beirut Primary School Teacher
Trainees
Responses to Question, 1.a indicate that primary trainees also have difficulty
identifying the equivalence in age between the ammonite and the coral. And likely
for the same reasons: perception of vertical and lateral positions coupled with the
difficulty of connecting the folded stratal contacts with the law of superposition.
Although the majority of both primary and secondary trainees correctly identified the
youngest layer, it is surprising that some didn’t (37%). This may be due to random
sabotage and disinterest or genuine misconception.

298
Question 1.b. acts as a ‘triangulation’ reference for Q.1.a.: the conceptual principles
are the same. There is significant difference between primary and secondary trainees
in responses to Q.1.b. Although less than half of the secondary trainees were correct
(44%), only 15% of the primary trainees were able to recognise the age equivalence
of the ammonite and coral. However, twice as many secondary trainee responses
indicate the age equivalence of the coral and snail as primary trainees. Fortunately
only one response from both primary and secondary indicate the age equivalence of
the clam and ammonite! The one response indicating that all of the fossils had
different ages can not be explained. In any case, about 10% of both sets of trainees
stated they did not know, suggesting that they genuinely could not work it out or
could not be bothered.
Actual responses for Q1.b for naming fossil of the same age
Ammonite and Coral = 15%
Coral and Snail = 15%
Clam and Ammonite = 0%
Ammonite, clam and gastropod = 0%
None the same age = 5%
Did not do (DND) = 50%
Don’t know = 10% (n =20)
Responses to Q1.c. suggest that few primary trainees were able to connect geological
events to explain the diagram. There was recognition however that the strata had
been altered in some way such as by compression. There was no connection of
environment of formation with the fossils found in the strata.
Examples of responses in accounting for the formation of the rock exposure for
Q.1.c.
“Earthquakes and mudslides”
“Soil piles up to form layers”
“By compression forces.”
“Rock sediments might have been entrapped in the layers which have been
subjected to compression”.

299
Q.2. Again, only one response. This response indicated however, knowledge of plate
tectonics, marine environments and an implied uplifting, but these ideas were totally
disconnected from the problem and was a typical immature response where only
known concepts were stated but completely disconnected from the purpose of the
question.
Q.3. Distribution of fossil ages based on relative dating of strata (Table 11.4).
Making the connection between an absolute date and a relative date also poses
difficulties for both cohorts. There is little evidence of recognition that the most
likely age for the coral is in between 90mya and 100mya. As a result, answers are
exaggerated as too low or too high. This relativity of scale is worthy of further
research. Although the response rate is too low for conclusionary discussion, it seems
that primary trainees are similar to secondary trainees in their responses to Q.3.
Students are able to give an absolute age based on relative position in the strata that
is correct, but it is often over and under estimated as if the absolute age is known but
perceptions of this number are not trusted. Q.3 also acts as a ‘triangulation’ for
ability to interpret relative time.
Table 11.4. AUB primary teacher trainee results for Q.3. (Number of responses).
Age <80my 85 90 95 100 105 >110 Snail 2 1 1 0 0 0 0 Coral 1 0 0 3 0 0 0 Clam 1 0 0 0 0 1 2
Question 4 (Correlation) appears to be too difficult for this cohort (rather than
dismissed). This question also cross references with previous questions but with the
added dimension of ‘missing’ strata at separated locations. For example the
ammonite is missing from the third location column and the fish scale is missing
from the second location column. Figures 11.3 and 11.4 details the logic of strata
correlation. Students were not asked to explain this as the key conceptual question
concerns geological correlation rather than geological history. Question 5 asks for a
geological history. Understanding geological correlation appears to not be part of this
cohort’s conceptual ecology presumably as a result of inadequate training or genuine
misconception.

300
This class of 21 primary trainees appear to be less confident in identifying the correct
relative time order from a simple stratigraphic column than their graduate secondary
school trainee counterparts. For example in Table 11.5, only half the primary trainees
managed to correctly identify the gastropod as representative of the oldest strata
whereas the majority (82%) of the secondary trainees were correct. On the other
hand the reverse was true of correctly identifying the trilobite as second to oldest.
Table 11.5 AUB primary teacher trainee responses to question 4: Correlation of
strata. (Numbers are the number of responses recorded).
Q.5. Student responses to relative age order of strata (assumes no strata overturning)
Only one student attempted this question with all others (n = 10) recording that they
had no idea (Figure 11.2).
Figure 11.2. Typical response from AUB primary trainees for Question 5 GeoTSAT.
Respondent (n = 14)
Gastropod 1
Oldest
Trilobite 2
Clam 3
Ammonite 4=
Coral 4=
Snail 6
Youngest 1 3 5 1 4 2 6 2 3 2 1 5 4 6 3 - - - None - - 4 6 1 4 3 5 2 5 3 2 4 1 5 6 6 1 2 3 4 5 6 7 1 2 3 4 5 6 8 1 3 2 6 4 5 9 4 1 5 2 3 6
10 1 3 2 4 6 5 11 6 5 1 2 3 4 12 1 3 2 4 5 6 13 1 2 3 4 6 6 14 1 2 3 4 5 6
% Correct 50% 43% 29% 50% 43% 64%

301
11.5 Summary
This cohort of primary school trainees indicate a similar response and conceptual
status to primary school trainees in New Zealand and is also typical of all other
cohorts. For example, expressing a geological history for question 5 is difficult and
requires a clear understanding of relative geological events and knowledge of
superposition. Connecting relative with absolute ages is generally manageable but
many students struggle and connecting geological events with geological
environments poses a general difficulty. Teaching and learning the connections of
geological processes, evidence and environments seems to be missing.
11.6 Israeli Secondary School Student Responses to GeoTSAT
The GeoTSAT questionnaire was given to two different age groups:
1) Geology students in Grade 10 who have just began to study Geology. Fifteen
students 16 years old and 66% female answered the questionnaire.
2) Geography students in Grade 8 (13-14 years old) mixed and higher ability
began studying ‘Introduction to Earth Science’ the previous year. Twenty one
students from a class of 26 responded; five students who did not respond to
the questionnaire. This outcome is typical of most questionnaires.
11.6.1 Précis of the Co-ordinators and Translators Comments
The Grade 8 class was of mixed and high ability. Questions that had connection to
depositional environments were quite easy for most of the students of both the
geology and the geography classes, perhaps reflecting managed and accessible
fieldwork with good rock exposures. This is in contrast to the New Zealand
responses and all other cohorts, again perhaps reflecting curriculum issues, local
school traditions such as whether fieldwork is undertaken, teaching strategies and
student conceptual status and interest. Structural geology questions (7 and 8) were
also quite easy for the Grade 10 students but very difficult for the Grade 8 students.
Grade 8 and 10 students did not answer question no. 2 and 5 as it appeared too
difficult for them. Table 11.6 presents the results of the Israeli Grade 10 responses to
questions 1-5 of the GeoTSAT questionnaire.

302
Table 11.6. Israeli (IS) Grade 10 results to GeoTSAT (Q’s 1 – 5). Question No. (n = 15) Good
answer Partial answer
Wrong answer
Did not give any answer
1a (marine layers) 12 3 0 0
1b 12 1 0 2
1c 6 4 0 5
2 (Rock layers) - - - -
3 12(80%) 1 1 1
4 (Correlation) 11 1 3
5 (Geological sequencing) 9 1 0 5
Rounded Means 10 (67%) 2(13%) 1(7%) 3(20%)
11.6.2 Summary of Israeli Grade 10 Results
With 80% of these 13/14 year olds with correct responses for question 1a, placing
strata in relative time order appears not to be difficult for this cohort. This outcome
suggests that students of this age are able to recognise the folded nature of the strata
and not misperceive the relative positions of fossil icons as is common in other
cohorts. Similarly, placing the fossils in the correct age order posed little difficulty.
However, when asked to describe how the rock exposure (Q1.c) might have been
formed (this may require a verbal explanation from the person in charge), only 40%
were able to do this. Typical responses indicate an interpretation of the question to
mean providing an explanation for “what the exposure looks like in the picture”
rather than connecting geological principles to an explanation: a universal difficulty
of students answering questions that have a deeper meaning.
It is difficult for this age group to visualise and connect abstract geological
environments to a 2-D structure. Teenagers can resort to superficial answers, and in
support of Dodick & Orion’s findings (2003), students need to also apply their
conceptual understandings of superposition to override the relational placement of
fossil icons (See Appendix 2). In addition, the ability to understand the significance
of an index fossil to strata is also needed to fully develop an answer. Question 2 was
not answered by any in this cohort. Clearly, question 3 (assigning absolute ages and
conceptualising relativity with strata) posed little difficulty with 80% being correct.
The correlational exercise (Q.4) also posed little difficulty indicating that at age
13/14 years the ability to correlate geological strata where there is missing strata has
already developed. Those students (n = 9/15) who answered question 5 (Sequencing)

303
also were correct in determining the correct age sequence but unfortunately did not
supply written answers of explanation so there is no information of conceptualisation
of geological environmental connections with just placing the sequence of events.
These results support the co-ordinators view that they are an excellent group and
significantly more advanced than the Grade 8 cohort.
11.6.3 Israeli Grade 8 Results for GeoTSAT Questionnaire
Table 11.7. Israeli (IS) Grade 8 results to GeoTSAT (Q’s 1 – 5).
Question No. (n = 21) Good answer
Partial answer
Wrong answer
Did not give any answer
1a (marine layers) 19 1 1 0
1b 16 0 0 5
1c 13 0 0 8
2 (Rock layers) 2 1 0 18
3 8(38%) 5 1 7
4 (Correlation) 4 7 0 10
5 (Geological sequencing) - - - -
Rounded Means 10(48%) 2(11%) 0.3(2%) 8(38%)
11.6.4 Summary Discussion of Israeli Grade 8 Results
Table 11.7 presents the results of the Israeli Grade 8 responses to questions 1-5 of the
GeoTSAT questionnaire. Although there were more of these 10/11 year old students
not responding to the questionnaire, fewer provided incorrect answers compared to
the grade 10 students. This cohort also shows that they are able to correctly place
strata into a correct relational order. However, for question 3 significantly more
students were correct in assigning an absolute time suggesting that this relationship
between relative and absolute time as expressed in a column is more difficult for the
grade 8 students. Both groups were considered excellent students by their co-
ordinator. Some students were also able to correctly sequence the geological events
for question 2. Question 4 posed a greater challenge for these younger students than
the grade 10 students. The number not attempting, partial answers and incorrect
answers were greater than the grade 10 students. Unfortunately no students attempted
the sequencing question. It seems that these 10 /14 year olds are able to identify
geological age relationships.

304
11.7 New Zealand Secondary School Student Responses
11.7.1 Year 11 Demographics
This small cohort (n =13) of typical year 11 students at Ashburton College (AC) had
a mean age of 15 years and 8 months. Reflecting a rapidly changing demography,
two were born in Australia, one in Tanzania and another in Kiribati. The most
favoured subject was physical education. For this group learning geological science
was of no importance and this is partially reflected in the lack of responses.
However, those that did respond to various questions provide an insight into
perceptual and conceptual difficulties. The most interesting geological topics
included formation of rocks, the rock cycle water, weather and volcanoes. The most
troubling topics were: pollution, geological sequencing and correlation and the
meaning of fossils.
11.7.2 Year 11 Results
Four of this group (31%) were incorrect in their age ordering (understanding
superposition) for question one. Responses suggest that these students in common
with all other groups look at relative icon placement rather than follow the strata.
Those that indicated that the snail and coral were the same age see them as being the
“same height” as each other and therefore the same age. Explaining how the clam
and ammonite are considered the same age is more difficult other than a random
selection of icons.
Question 2 was mostly answered in terms of merely describing what information was
given in the diagram with no attempt to link with geological events environments.
For example, this cohort’s responses show little recognition that rock containing
clams and sharks teeth indicate a marine environment and that these organisms were
living and dying in this environment. It is quite common for students to fail to make
the connection that fossil remains indicate a past life: they tend to focus on the dead
fossil aspect rather than the once living aspect. This is an area where a better liaison
between biology and geology would improve the connections of paleoecology with
fossil remains. In common with other groups, “bits of trees” also means, for 30% of
responses, mature living trees and a terrestrial environment rather than bits having

305
been transported and become part of sediment on the ocean floor. All 13 responses
were correct for question 3 suggesting that reading a relative stratigraphic column is
not a major difficulty. Although only four responded to question 4 on correlation
there appeared to be little difficulty in applying the ‘correlation rules’ (Figure 11.3),
suggesting this age group are quite able to solve relativity problems. Unfortunately
there was only one response to question 5. This response indicates significant
difficulties applying the superposition and cross cutting rules. Question 6 posed few
problems for the 11 responses as all were correct (62% were female).
11.7.3 Year 13 Results
Again, a small cohort of 14 students, but one that also reflects an increasingly diverse
ethnicity, cultural and scholastic backgrounds of students from Zimbabwe, China and
Romania. The most favoured school subjects for this cohort were physical education,
English, and Biology. In keeping with a wider subject selection policy than Year 11,
learning Geology was of little interest to this cohort (See Chapter 9 for details of the
NZ science curriculum). The most interesting geological topics for this cohort
included: the fossil record, volcanoes and the formation of rocks and the most
troubling topics involved understanding earthquakes, how fossils and rocks are
formed and for the single ‘creationist’ thinker, evolution. Conceptual conflicts are
rarely expressed but questionnaire responses indicate their presence.
Only a single response was incorrect for questions 1a and 1b suggesting little
difficulty in perceiving geological structure and relative ages of strata. The incorrect
response was the same as many others matching icons relative levels rather than
following the folded strata. Students expressed the following key explanations:
‘Folding of tectonic plates pushing together
Movement of earth causing unstraight lines
Streams could have washed away the rock sediment to form the vallies and sand
storms could have gathered to form the peaks.
Volcanoes erupted’
It seems that a common conceptual theme is a focus on the easily observed structures
rather than the explanations. Students in general do not see the folded strata in a

306
diachronic sense. That is, strata are not seen to represent the passage of time and
explainable through paleogeological environments based on the internal evidence of
the sediment and consequent structural history. There is a tendency to connect
disparate geological terms without explanation.
Students were able to recognise the cyclicity of strata but generally provide
descriptions and (again) little geological environment explanation. This is also in my
teaching experiences, typical of other subjects of learning especially where a certain
level of literacy is required. There was recognition of sea level change but there was
no connection with the effect of this on sediment deposition. In common with other
age groups, “bits of trees” is connected only with land and not transport and
sediment depositional processes.
Only two students were incorrect for assigning an age for question 3. Students
consider the age to be relative to the number given rather than the relative position of
the strata. That is, the snail is 95mya because counting is taken forward from 90 to
95mya. The clam was correctly aged as going down from 100 to 105mya.
Seven responses (54%) were incorrect for the strata correlation of question 4. It is
difficult to explain the various combinations as there appears to be no logic. For
example, the gastropod and clam were considered to be the youngest and in one case,
the coral was considered to be the youngest. Correlation is a problem for many in
this cohort in that recognition and comprehension of missing strata is a mystery.
Responses to question 5 on writing a sequence of geological events were very
elementary and in effect, simply describe the obvious features such as the tilting and
intrusion. There was little evidence of superposition and cross cutting relationships.
The unconformity was identified in some cases but not understood. Several
responses stated the intrusion as the first event as “it was at the bottom”. This
suggests an ignorance of cross-cutting relationships.

307
11.8 University of Canterbury First Year Geology Students
The mean age for this cohort of 29 students was 20 years and 5 months. Their most
favoured school subjects in order were: Geography, Biology, Physical Education and
then Science. None had studied geology after Year 11 (at age 15). Learning geology
was unimportant for 21% of this group, significant for 41% and very important for
40%. The most perceived difficult geological concepts included mapping, naming
fossils and visualising geological structures. Conceptualising geological time did not
appear to be a problem for this group and the time honoured necessary drudgery of
needing to have specific knowledge such as taxonomic names of fossils, names of
minerals and rocks and a very large jargon continues to take its toll on learning.
11.8.1 First Year Geology Student Results
Responses hint at a conceptual status. All except two students were able to correctly
identify the relative ages in the deformed cross section for question 1, and for
question 1b two did not recognise the equivalent age of the ammonite and coral,
implying that some students of this age group are still ‘distracted’ by the deformed
strata. This is in common with other errors from younger age groups where the
answer given was coral and snail suggesting a horizontal correlation rather than a
vertical one. That is, these students look across and see the fossil icons are at the
same horizontal ‘level’ (See Appendix 2 for diagram) and so must be the same age.
Question 1c was poorly answered. Although there was recognition of a marine
sedimentary sequence and correct ideas of erosion, deposition and uplift, relatively
few (n = 6/29) were able to identify and adequately explain the unconformity.
Question 2 responses were answered in much more detail. Although somewhat
confused there was clear conceptual understanding of links between geological
environment and rock formation. However, as in other cohorts, there is a tendency
(universal?) to simply reword the information given. One response considered the
rock material to be a lake, despite the presence of shark teeth and clams, so not all
are able to link environment with materials. Bits of trees seem to be associated
strictly with land and lakes rather than possible transportation into a marine
environment. This suggests that there is little conceptual linkage between sediment

308
type with a marine transgression and regression cycle and associated factors such as
water depth and distance from land. Postgraduates were able to do this.
The most common response to question 3 was to ‘sit on the fence’ and state that the
age of the coral was “between 90 and 100 million years old” rather than provide an
absolute age of 95 million years. There appears to be almost a fear of putting down
an actual number! However, the majority who ventured an absolute age were able to
correctly provide ages based on comparisons with known values.
Question 4 also probes the conceptual ability to correlate ‘biostrata’ when the
sequence is ‘broken’. That is, some strata are absent from some columns but when
taken collectively, a relative correlation is possible. More than half (52%) were able
to correctly correlate the strata. The most commonly incorrect response was to
somehow ignore the position of the sea urchin and placed the shark and the snail as
being conformable (i.e. in sequence). There is also the added complication (amongst
others) is that the strata below the snail contained different fossils and that the first
column has no snail. Correlation for this group has posed considerable difficulties. In
common with what Dodick and Orion (2003a) found, most high school students (and
older students) employ a ‘vertical’ superposition strategy to correlate rather than a 3-
D strategy when translating across different localities. Translating vertical strata
across a horizontal plane (and the geological concept of ‘facies change’ and the
interfingering of different sediment types on the ocean or lake floor) is a step that
even postgraduate geologists are still learning. A geological facies is a horizontal
change in environment where different types of sediment are deposited and so a
geological column has not only vertical change but also contemporaneous horizontal
change. Investigating how students learn to translate 3-D correlation is a future and
rich area of research.
The same difficulties of determining the age of the igneous intrusion was expressed
for question 5 as postgraduate students: the problem of where to place the igneous
intrusion. Most responses place the intrusion after tilting based on the assumption
that it was intruded perpendicular to the strata and is now shown as being ‘tilted’.
Only 6/23 or 26% identified the unconformity. Of these responses, there was a lack
of connection between the need for terrestrial erosion to account for the

309
unconformity. Explanations however were not specifically asked for: just an event
time ordering with relatively ambiguous information.
11.8.2 Summary of Results
In Montangero’s (1996) work on the development of diachronic thinking in children
(See Chapter 2, p.25 for details), it appears that although young children of 7-12
years old are able to recognise differences and order and date observable successive
changes, it is very rudimentary. In terms of sequencing and time ordering geological
events and strata by correlation, it seems that 21 year olds are able but still in a
formative state of diachronic thinking. Although correlation of geological strata
(Figure 11.3) requires a temporal organisation in terms of Montangero’s schema,
question 5 also requires a spatialisation recognition and connection with geographic
separation. The following diagram illustrates the complexity of correlation and the
need to translate information when there is conflicting information. In fact, the great
Devonian controversy outlined by Rudwick (1985) was in essence a ‘missing strata’
correlation problem.
Figure 11.3. Biostratigraphic correlation for two locations.(After Dodick, (2007)).
The correlated strata age-order based on fossil content (biostratigraphic), is A1, B2,
C3, D4, E5, but location 1 does not have fossil B and location 2 does not have fossil
D. This is the key conceptual stumbling block. Complexity increases if several
stratigraphic columns from many different localities have different strata and
therefore different geological histories but through the same time range.
Location A
Fossil
Separated by
many kilometres
Location B
Fossil
E5 Correlated E5
D4 C3
C3
B2
A1 Correlated A1

310
Linkage with abstract environmental change is an even bigger conceptual step to be
learnt and as Dodick and Orion (2003) point out, much can be done to improve the
conceptual status of especially middle school students (probably all), especially with
integration of fieldwork and ‘deconstruction’ of concepts of macro and micro time.
Location A Location B Location C
Separated by Many Kilometres
Figure 11.4. Question 4 – Biostratigraphic correlation logic for three locations.
The numbers in Figure 11.4 refer to the age order, and the colours show matching
age or correlated strata. The empirical knowledge required to solve this correlation
puzzle involves knowing that strata with the same fossils in them are the same age
(correlated) and that the oldest strata is at the bottom (superposition). There is also an
assumption that the stratigraphic columns have not been overturned by folding or
faulting. It is also necessary to recognise that the coral (3) is sitting on top of the
trilobite strata and is therefore younger, but is below the clam so must therefore be
older than the clam. The clam is correlated with location B clam but this strata is
absent from location C. Strata 4, 5 and 6 are conformable with the fish scale (7)
conformably younger than the brachiopod (6). The fish scale is absent from location
C but is older than the snail. The sea urchin and shark teeth are conformably younger
than the snail. Reasons for fossil and sediment absence are not asked but are due to
either erosion or removal (leaving a decipherable signature) or were never deposited.
Students, who were incorrect for this puzzle, were unable to make sense of the
absence in one location column of a key fossil type in terms of its relative age with
Gastropod
5
Brachiopod
6
Shark Teeth
10
Sea Urchin
9
Snail
8
Fish scale
7
Snail
8Brachiopod
6
Gastropod
5
Clam
4Ammonite
2
Clam
4
Coral
3Ammonite
2
Trilobite
1

311
those strata that are correlated. For example, the coral is absent from location B and
C, and fish scales are absent from locations A and B. Strata 9 and 10 are only present
in column C. Having three columns adds to the complexity, but in reality, a geologist
would work with many columns across hundreds of square kilometres and at
different depths. Geologically, correlation enables a sequential geological history and
a paleoecology to be inferred: a key aim of geological science. This puzzle is typical
of the kinds of problems (3-D and across time) that geological science uniquely deals
with. It is not surprising then that the modern use of computer aided 3-D pictures of
strata enables a much better visualisation of geological structure. However, 3-D
spatialisation remains a challenge for teaching and learning.
11.8.3 UC Second Year Geology Students – Summary of results
The mean age for this small cohort is 23 years and 6 months of whom five were
female and four male. Geography was the favoured school subject with biology the
next favoured. The most interesting geology topics for this group included: plate
tectonics (40%) earthquakes, engineering, evolution and paleontology. The most
difficult topics included geological time (40%), structure, paleontology, and optical
mineralogy. Do students only dislike the topics they do not understand or is it deeper
seated? This entire group indicated a deep commitment to their chosen discipline.
All of this age group were correct in their assignment of relative age relationships
with the folded strata distractor not a problem. Clearly this group knows that the
oldest stratum is at the bottom. Similarly, most students were correct in putting
together a geological history for question two but most missed the idea of eustatic
change (climatically controlled differential rising and lowering of sea level and
tectonic uplift of land). It was also noticed that there was a tendency to associate
sandstone only with a terrestrial environment rather than a marine environment.
Assigning absolute dates for question three to strata sequence was correctly
completed by all, but the single creationist view was conspicuous by its prejudice.
Although this student correctly identities the absolute ages it seems too hard to resist
not to make comment on the unreliability of dating methods, revealing a deeper
personal world conceptual view and an ignorance of how radiometric dating actually
works.

312
“90% of dating methods indicate a young age. It is the constant multiplier within the
equation that is altered to fit to a long age”. “”Don’t you find it weird that it takes
10 million years for 1m of sediment to be deposited? Shouldn’t it be highly
bioturbated”?
These statements reveal just what a difficult conceptual change that many students
have to make in learning to accommodate geological processes. Only one respondent
recognised and mentioned the unconformity but on the whole, the bigger geological
picture is diminished in favour of specific events. One student read the sequence as
increasing in age upwards, rather than the conventional geologists way of reading
from oldest to youngest as ‘bottom old to top young’.
Question 4 was correctly answered by all, including the young earth creationist,
indicating that there is little difficulty in diachronic thinking in relation to strata
correlation. The ability to connect geological environments with an accurate
sequencing of events for question five proved to be more difficult. The most
common problem was deciding on the relative age of the intrusion and recognising
the unconformity. Three students) did not specifically identify the unconformity but
instead stated an erosion surface implying that rock is uplifted above sea level for
surface erosion to occur. Only two students specifically stated the need for
subsidence (or sea level rise) to occur for the deposition of sediment making up the
unconformity. In short, the responses are generally correct but lacking in detail and
explanation and discussion. The timing of the igneous intrusion also caused
difficulties in providing a correct explanation.
11.8.4 UC Postgraduate Geology Students
This cohort of ten postgraduate students has a mean age of 26 years and 5 months
with the oldest at 36 and the youngest at 21. There were three females. All were born
in New Zealand apart from one born in the United Kingdom and another in Papua
New Guinea. Favourite high school subjects were: Science 1, Geography 2,
Woodwork 1, Outdoor education 1, Physical education 1, English 1 and Maths, 1.
Postgraduate status include 1 Postdoc, 1 PhD, 6 Masters, and 2, 4th year honours
students. The most disliked sub-disciplines included petrology, geophysics, and
geochemistry. Two expressed disinterest in fossils and four expressed the difficulties
313
of geological time and sequence stratigraphy. It would be interesting to explore more
about why post-graduates are selecting their specialist fields of study. Fifty percent
of respondents were studying aspects of engineering geology such as slope failure
and landscape evolution.
11.8.5 Results Summary for Postgraduate Geology Students
Reassuringly, question 1 posed no difficulty for this cohort of postgraduates. All
were able to identify the relative ages of strata and consequently identifying the
deliberate ‘distractor’ of folded strata all were able to identify the fossils of equal
age.
Question 1c asks for a geological story in explanation of the rock strata shown in
question 1a. Although responses were essentially correct, several responses indicate
assumptions and preconceptions. Typical responses focus only on the obvious folded
nature of the strata and the physical processes involved rather than the importance of
the fossil content and the associated paleoenvironmental implications. Several
responses stated trilobites as the oldest fossil but this was not a fossil in the sequence
implying the application of previous knowledge which is disconnected from the
question. Old concepts die hard. Only four responses identified the unconformity and
erosion event. Geological unconformities are breaks in sediment deposition and
periods of erosion implying uplift for exposure to the atmosphere.
Question 2 asks for another geological history for a sequence of rock strata but with
a necessary connection to paleoevironment. Nearly all successfully link geological
formation with environment. There are also indications of stereotyped conceptions of
lithology and formations such as sandstone being equated with a terrestrial
environment rather than eustatic changes of sea level with accompanying different
water depth for the sandstone with plant material in it.
Providing an absolute age for question 3 was incorrectly answered by only one
respondent and this corresponded to he non geologist thinking from today back in
time rather than the geological convention of working from the past to the present.
Only one respondent was incorrect for identifying the correct ages from the
correlation exercise (Question 4), implying that identifying relative ages is not an

314
issue although these respondents are experienced and trained geologists (See Chapter
6 for discussion about conceptual awareness of relative geological time).
Question 5 asks for a geological history for deformation (folding of strata),
unconformity (time break in deposition and period of erosion) and cross cutting
relationships – Steno’s laws of superposition. This question posed the greatest
difficulties even for this group of experts largely because students recognised the
need for more geological evidence to determine the exact relative age than is
provided in the diagram. The greatest difficulty appeared to be deciding on the
relative timing of the igneous intrusion. The intrusion must be younger than what it
cuts through but possibilities include: (a) immediately after deposition of strata while
they were still horizontal, (b) after strata had been tilted and uplifted and (c) the
youngest event in which the intrusion failed to penetrate the complete sequence.
11.9 New Zealand Secondary School Trainees - GeoTSAT Results
Of this small group of science graduates (N = 12) with a mean age of 27 years and 6
months, five were born in NZ, four in Canada, one in Malaysia and one in China.
The oldest student was 44 and the youngest 21. Favourite school subjects include
geography (16%), biology (25%), environmental education, chemistry and physics.
Volcanoes, plate tectonics, seismology and landforms were the topics students were
most interested in with the most difficult being perceived as rock identification,
geochemistry and age of the Earth (geological time). Learning geology was of low to
medium importance to this group.
Only three responses were incorrect for identifying the relative ages of strata and
naming the fossils of equal age. In each of these cases, the distractor of folded strata
and position of fossil icon proved difficult for some and in line with other groups.
These responses assigned the coral and snail to be equal in age rather than coral and
ammonite. Like other groups, it is likely to be the relative positions of icons that
determines response rather than looking at the strata. Coral is “the next one up” from
ammonite! In effect, the strata are disconnected with the fossil icon.

315
Question 1c asks for an explanation of how the cliff face exposure may have been
formed. Typical statements include:
“Pressure/folding and weathered down for unconformity
By earthquake
Plate compression
By volcanic eruptions
Risen up a fault line”.
Although all perceive the obvious two dimensional folded strata, the most common
explanation was to state “plate tectonics” as being responsible. Rarely (not only of
this age) do students see the strata as having been formed from eroded, transported
and deposited sediment. Perhaps it takes too long to write about especially with
literacy issues.
Question 2 asks for a geological history. As outlined in Chapters 2 and 6, question 2
requires the application of all of the elements involved in Montangero’s (1996) full
diachronic schema and first applied to secondary school students by Dodick and
Orion (2003). This cohort (like all others) recognises the obvious repeated nature of
the strata but demonstrate little explanatory power in terms of geological change.
Change (and more significantly rate of change; but this is beyond the scope of this
chapter) is the key element to diachronic thinking. Similar to other groups, this group
do not connect “bits of tree” as having been transported. They just see trees as
representative of land and with no connection to the kind of rock material
(sandstone) they are embedded in. In other words, fossil remains and rock are
disconnected and separate entities and even worse, are not connected to
environments or paleoenvironments. This supports Montangero’s findings that the
primary source of knowledge needed to contextually conceptualise time is empirical
knowledge: the ‘nut and bolts’ facts that understanding links to and the cause of
tension between the notion of ‘generic knowledge transferability’ and just plain
specific knowledge. For example, if students do not know the connections between
water depth and sedimentation principles, then it is impossible for them to connect
strata information with geological environment. This seems to be the case until
postgraduate geology training level. Furthermore, even although students may have

316
the empirical knowledge they also need the ability to apply this knowledge to
geological situations.
Only one response was incorrect for the absolute age of the coral for question 3, so
this group is able to place a date based on superposition (youngest at the top
assuming no overturning).
Out of the six responses to question 4 only three were wholly correct. The problem
seemed to be again the inability to apply the logic of correlation as shown in Figure
10.3 where missing strata confuses the relative order of strata. Even having been
taught correlation in classroom situations, students still have to be able to apply this
to an unfamiliar situation: the learners conundrum and the teachers frustration.
Question 5 again asks for a geological history based on relative age relationships in a
vertical cross section. Although not stated as an angular unconformity (One of
several different sorts) it was generally correctly identified as a geological event. The
tilting of strata was obvious to all but the igneous intrusion again proved a stumbling
block in the sense of the ambiguity of its origin. Also, a common approach was to
write a geological history from the present back to the past rather than the trained
geologists opposite way: old to young. Only the postgraduate geology students wrote
a history from oldest to youngest.
11.9.1 Results Summary for NZ Secondary School Teacher Trainees
These 27 year old secondary school teacher trainees are not specifically trained in
geology and most are likely to have very little secondary school education in
geological science. However, they respond to questions in much the same way as
students half their age. They are able to think diachronically and solve basic
correlation problems, but lack the empirical knowledge needed to link, explain and
express a geological history based on geological on superposition and correlation
principles. Connecting geological environments with geological events and placing
them in sequential order requires the full application of Montangero’s diachronic
scheme. This is a considerable challenge for this cohort. Perhaps the physicist Paul
Davies should have a final say about time?

317
“You can’t have time without space, or space without time, so if space
cannot be continued back through the Big Bang singularity, then
neither can time”. (Davies, 2006, p.80.)
11.10 Chapter Summary
This chapter addresses aspects of research question 2: How do students aged between
12 and 40 years develop their conceptions of the fossil record, geological time and 3-
D geological structures? In particular it presents the results and discussions of
conceptual issues related to relative geological time. These are questions 1 to 5 of the
GeoTSAT instrument. Note that findings to geological structure problems and
spatialisation issues derived from the GeoTSAT instrument are presented in Chapters
6 and 7.
The overall impression is that all cohorts have the same kinds of conceptual
difficulties when interpreting diagrams that ask questions about relative geological
events and time. For example, linking the significance of geological environments
with geological events and which are in the correct chronological sequence poses the
biggest difficulties. The ability to correlate strata from different localities that have
missing strata improves with age but still provides a challenge for all age groups as
even postgraduate geologist responses were not always fully convincing. Similarly,
Dodick and Orion (2003) found a significant difference in success at unravelling
these relative time puzzles between Grades 7-8 and 9-12. Although not specifically
asked, three dimensional aspects such as interfingering of strata on a horizontal plane
(technically known as sedimentary rock facies) make up part of an explanation for
geological histories and help explain missing strata in correlation exercises. It is
unlikely that these structural 3-D aspects of geology are taught at high school and
were specifically mentioned by several post secondary geology students as an aspect
with which they have the most difficulty.
Although there may be cognitive skills needed to elucidate relational evidence of
geological time through correlation, there may not be the necessary comprehension
of the geological information to determine a sequential geological history. This is a
significant teaching and learning challenge. It is clear that students who are able to

318
correlate strata are able to transform or use (in Montangero’s schema terminology,
Chapter 2, Figure 2.2) their experiences, organisational and spatial abilities to place
geological strata into a relative time order. All age groups investigated contain
students who are able to do this and so are able to make some sense out of geological
evidence. As Ben-Zvi-Assaraf and Orion (2005; 2009) have found, connecting
students with the real world in fieldwork situations and coupled with well planned
pedagogy there are significant benefits for developing not only spatial skills but also
diachronic skills: a unique attribute of geological science.
Immature visual-spatialisation ability may be a barrier to perceiving pen and paper
exercises but little is known about the development of this ability in the real world, in
the field. In general and hypothetically, students’ abilities to correlate geological
strata appears to be formative at ages 7-12 years, rudimentary at 12 -14 years, early
developed at age 16-18 years, developing at ages 18-25 and mature at ages 25-35
years. Investigating this hypothesis would be fruitful.

319
CHAPTER TWELVE
DISCUSSION
CONCLUSIONS, LIMITATIONS AND DIRECTIONS
12.1 Introduction
A new scientific truth does not triumph by convincing its opponents and
making them see the light, but rather its opponents eventually die, and a new
generation grows up that is familiar with it. (Max Planck, 1949, p.33)
This thesis takes a broad look at key conceptual aspects of teaching and learning
within the geological sciences. As well as the nature of conceptual change, these
aspects include crystallising student conceptualisations of geological time, scale,
biological evolution, the fossil record, and visual-spatialisation, with particular
emphasis on visual penetration ability (VPA).
An important curriculum development of the 1990’s was a change in science
education direction from the preparation of future scientists within specialist and
traditional deductive science subjects such as physics, chemistry and biology, to one
of holistic ‘science for all’ (Orion, 2007a) where education for scientific literacy,
citizenship and an informed appreciation of the fragile nature of our planet was
paramount. This notion is embodied in the principles of Earth System Science
discussed in Chapter 3, p.46. Geological and geoscience learning within local and
global curriculum reforms are discussed with New Zealand being a case study for the
status of geological education within these reforms. As Orion (2007) again states: “…
it seems that like previous reforms, there is a gap between the rhetoric and the actual
change in the classes”. (p. 111).
In other words, the gap between professional development and professional (and
political) change remains very wide. Demonstrable and sustained conceptual change
is not easy. The challenge for activating and effecting specific conceptual change
within the geological sciences such as the relationship between the fossil record and
biological evolution, and development of spatial reasoning, acutely remains. In terms

320
of curriculum reform, New Zealand represents an interesting case where not only has
there been an attempt at a conceptual shift in national assessment style and
philosophy (Chapter 9 and Appendix 3) but also recent reforms in the Science
curricula with, in particular, a shift in the status and role of geological science
education (http://www.tki.org.nz/e/community/ncea/sciences.php). Although not
always so (E.g. the mid-1800’s, USA, (Corgan & Stearns, 2008)), geological science
education has always been a difficult area to deal with in curricula especially when
related to biological evolution and modern understandings of how the Earth works.
As Mayer and colleagues (1995; 1997; 1999) point out, a hierarchical reductionist
view of science education might be successful at producing the next generation of
physicists, chemists and biologists, but is less successful at enabling a better
understanding of Earth’s complexly interacting geo-bio environmental systems.
Geological science is not environmental/earth systems science. Many of these issues
are discussed in Chapters 1, 2 and 9. The overarching purpose of this thesis is to
investigate aspects of the conceptual status of students in geological science over a
wide age range and different cultures, to investigate the impact of global geoscience
reforms and placed within a constructivist paradigm. The key aspects investigated in
this thesis are conceptualised in Figure 12.1.

321
Figure 12.1. Thesis conceptualisation.
The research questions posed in Chapter one included:
Research Question 1
What are the characteristics of international Geoscience curricula and their
implementation, with particular case study reference to the New Zealand curriculum?
Research Question 2
How do students aged between 12 and 40 years develop their conceptions of the
fossil record, geological time and 3-D geological structures?
Research Question 3
What is the influence of diachronic thinking on conceptions of geological time,
structures and fossils?
Geological Science
Education
GeoVAT Cross age conceptual status of Fossils and Evolution Research Question 5
Curricula International
comparisons and New Zealand as a
case study Research Question 1
GeoTSAT Cross age conceptual status of Geological time and Scale Research Questions 2 and 3
Cross age investigation of Visual Penetration Ability
(VPA Geocognition) Research Question 4

322
Research Question 4
What is the influence of visual/spatialisation on conceptions of geological structures?
Research Question 5
How do conceptualisations of fossils, geological time and geological structures vary
with age of respondent?
These research questions were investigated using pre-validated and modified
GeoTSAT and GeoVAT questionnaire instruments and the use of pre-existing
official New Zealand Government data for case study analysis. Data for this thesis
were also statistically tested for reliability using Cronbach’s alpha.
12.2 Curricula and Geological Science
The year 1957 was significant, being the International Geophysical Year (IGY), and
the beginning of nuclear proliferation and the cold war. As a scout in 1962 in Fiji, I
remember being in awe of a U2 ‘spy plane’ taking off with jet assisted takeoff and
jettisonable wing wheels: a marvel of technology at the time. It ended in the race to
the Moon and later, new discoveries were made about the sea floor and its
connection to the scientific theory of plate tectonics. From this came new biology,
physics, chemistry and earth science curricula. Research question 1 addresses some
of the consequences of these reforms from a geological science perspective. Prior to
1957, global curricula were dominated by British educational models and syllabi. In
the US, as in many other countries, for example, the 1890’s saw geology and
geography as the way to learn about the Earth. The Earth Science Curriculum Project
(ESCP) (Coash, 1963; Heller, 1963) developed in the U.S.A. was a significant
response to the 1957 IGY, where curriculum reform for teaching and learning earth
science began in a more modern form. Four years later, the ESCP textbook
(American Geological Institute, 1967) appeared and became the main source and
inspiration for teaching the earth sciences through the 1970’s and 80’s. It was a
forerunner of Earth Systems Science (ESS) without the focus on environmentalism.
About 6% of this widespread and influential textbook was devoted to geological
time, geological history and the fossil record. Along with spatial reasoning, they are
key elements of geological science and a focus for this thesis. The US K-12 national

323
standards (American Association for the Advancement of Science (AAAS)) for earth
science developed in the mid 1990’s reduced the influence and dominance of
reductionist discipline-based science and to keep pace with the knowledge explosion
about our planet (based on information technology) and to keep pace with changing
political notions of accountability, assessment and pedagogy.
In the UK, NZ, Australia, South Africa, India and other ‘commonwealth’ countries,
geography was (and still is) an important vehicle for teaching about Earth’s physical
processes albeit largely from a landform surficial perspective rather than a geological
science perspective (See Chapter 1). Geography is seen as an important bridge,
linking social science with Science and is the European forerunner of integrating
Earth Sciences with environmentalism and people in the form of ESS. In Germany,
ESS has started to be developed (Hlawatsch, 2006; Lucken, 2006) but little detail is
known of other central European countries and their ESS curriculum developments.
The entrenched power and infrastructures for teaching geography in commonwealth
countries may be an important factor in the slow uptake of ESS in these countries. In
other words, the level of ‘Posnerian dissatisfaction’ for producing conceptual change
may not yet have reached the critical mass for change. In any case, geological
science and the geosciences in general, have nearly always struggled to find a
meaningful place in an overcrowded, reductionist and hierarchical global science
curricula. The curricular tension between the dichotomies of depth versus breadth is
well illustrated by the deeper and narrower principles of geological science with the
addition of wider and social/environmentalist geoscience approach. The
socio/political use of curricular change has increased in some school curricula. This
has developed from the Science Technology and Society (STS) of the early 1980’s
and today’s socio-scientific issues (SSI) movements. For example, in the reshaped
2007 New Zealand national curriculum this is shown by an increasing classroom
emphasis on the ‘social curriculum’ in terms of ‘key competencies’ such as
“managing self”, “relating to others”, using “language, symbols and text” and the
nature of Science. New Zealand Levels 6 to 8 (students aged 15 to 18 years) are
required to “use relevant information to develop a coherent understanding of socio-
scientific issues that concern them, to identify responses at both personal and societal
levels” (Ministry of Education, 2007). As Zeidler et al. (2005) and Reis and Galvao
(2009) have pointed out, a ‘functional scientific literacy’ is strongly influenced by

324
discourse, culture, NOS and case based issues. Placing the social aspects in front of
the Science as socio-scientific issues de-emphasises the Science.
Key findings and conclusions include:
1. Research question 1 asks about the status of Geoscience (GS) curricula from
an international and local perspective. Geological science (GL) is a minor
part of international secondary school science curricula and competes for
space in overcrowded science curricula.
2. GL as defined in Chapter 1 has been superseded and outcompeted by the
introduction of the broader concepts of Geoscience (GS) since the mid 1970’s
largely as a response to obvious global and local environmental problems.
The New Zealand case study (Chapter 9) demonstrates how a Science
curriculum reform has enhanced environmental issues and linked them with
geoscience at the expense of geological science.
3. Earth Systems Science (ESS) is an attempt (since the early 1990’s) at an
integrated science course using ‘how the Earth works’ as the context for
teaching environmental values and the nature of science for enabling
informed future decision making about our planet (Mayer, 1990). Geological
science minimally survives under the ESS umbrella (or in the Australian
example, Earth and Environmental science), where little is taught globally
(until tertiary level) about geological time, geological history, geological
structures, paleontology and paleoenvironments. Geoscience curricula are
dominated by the study of earthquakes, volcanoes and plate tectonics and
their effects on the environment, people and landforms. A taxonomic
approach to GL has given way to a holistic global view of how the earth
works and the consequences of feedback loops and cycles associated with the
impact of people upon it. The ‘nuts and bolts’ reductionism and applications
of the science in the geology has to generally wait in most countries until
students are post secondary. As King (2008) points out, there is a real need
for more scholarly evaluations of ESS in different curricula contexts and
student geocognitive status. The newly implemented ESS aspects of the New
Zealand Science curriculum will have to wait for a few years before an
evaluation can be made.

325
4. Socialisation of science curricula has the potential to diminish general science
content internationally but in the NZ case study (Chapter 9) GL has been
pushed to near extinction. The Science curriculum barrel is full and
geological science is the first to go, especially when initially minimal in the
curriculum.
5. Implementing GL and GS curricula reforms requires a sustainable pre-service
teacher training education infrastructure and professional development that
provides more qualified Geoscience teachers into primary and secondary
schools. The common global issues for GS and GL teaching (see chapter 2)
include: a lack of trained and qualified teachers (Lee, 1995; Vallender, 1997),
inadequate funding, political ignorance of the significance of geological
science (Thompson, 1997), poorly developed professional development
courses and continual science curriculum revisions. Apart from traditionally
strong pockets of expertise (UK, Israel, some US states, Japan and some
others), there appears to be little improvement in the implementation of GL
and GS in the last decade (Orion, 2007b).
6. Assessment drives what is actually taught in secondary school classrooms
(and largely, university lecture rooms and laboratory’s) because teachers’
place first, the provision of opportunity for their students to gain national and
internationally recognised qualifications. Specific curriculum statements and
associated key competencies such as thinking skills, use of language,
symbols, jargon and values are often so broad that they can rarely be fully
met. The curriculum challenge for GL and GS and environmentalism is to
enable students to learn, appreciate and comprehend the balance between
reductionist science and its relationship to the bigger holistic picture of
Science as a way of informing about Planet Earth, how it works and what
people do to it.
7. Geological science is not environmental science, nor is it geoscience, but
there is a clear need to develop science curricula that adequately includes and
integrates the core educational values of what GL uniquely provides: Deep-
Time and Earth history, scale, the fossil record, fieldwork, geological
physical and chemical processes and visual spatialisation.

326
12.3 The GeoTSAT Instrument
The GeoTSAT instrument has been modified from that originally developed and
validated by Kali (1990) and Kali and Orion (1996). GeoTSAT addresses research
questions 2, 3 and 5. A paper and pen exercise, this instrument attempts to elicit
student understanding (and misunderstanding) of relative geological time and
structural spatialisation. Paper and pen exercises on spatialisation were augmented
with the use of a plasticine model. Questions are based on the concepts of geological
superposition, correlation, sequencing and paleoenvironments of rock formation.
Structural questions attempt to elicit information about visual penetration ability and
mental rotation. Conceptualising and applying understanding of Deep-Time is a
challenge for all age groups. My favourite story for a conceptualisation of geologic
time is that of the well known but quaint and out of date writings of Hendrik Willem
Van Loon (1926). “High up in the North in the land called Svithjod, there stands a
rock. It is a hundred miles high and a hundred miles wide. Once every thousand
years a little bird comes to this rock to sharpen its beak. When the rock has thus been
worn away, then a single day of eternity will have gone by”. What is good about this
myth is that it connects with what people can comprehend: a thousand years. And it
connects with peoples needs for stories. A million years stretches the mind but 4.6
billion years is beyond comprehension, especially when the length of a day
continuously changes. The issues surrounding comprehension of time and the
importance of teaching about scale are discussed in Chapter 6 and the results of
different age groups to questions on visual spatialisation of geological structures,
relative time and sequential histories are discussed in Chapter 11.
Without a cognitively meaningful concept of scale little of the natural world makes
sense. According to Orion and Ault (2007) studies of how people develop their
conceptions of geological time, systems and scale began only recently. These studies
were either ‘event based’ (Marques, 1997; Noonan-Pulling, 1999; Trend, 1998,
2001a; Tretter, 2006a), or ‘geocognitively based’ (Ault, 1981; Dodick, 2003a;
Ishikawa, 2006; Libarkin, 2004, 2005; Montangero, 1996). This thesis attempts both
approaches and builds on the efforts of these workers. Geocognitive spatialisation is
crucial for understanding geologic structures yet this appears to be one of the least

327
developed and recognised aspects of a students key competencies (Black, 2005;
Kastens, 2006; King, 2006).
Key findings and conclusions
1. The majority of respondents across all age groups are capable of correlating
strata and therefore correctly conceptualising relative time. However,
evidence discussed in Chapter 11 suggests that geocognitive ability to
perceive relative time through correlated geological strata is underdeveloped.
Furthermore, all age groups have similar difficulties in correlating geological
strata especially when there are ‘missing’ layers or ‘additional’ layers.
Respondents who are able to connect paleoenvironments with these ‘missing’
layers tend to be more successful at correlation of strata. Younger
respondents tend to be superficial in their answers. This is shown by answers
that use the relative positions of fossil icons rather than their stratigraphic
positions.
2. Evidence discussed in Chapters 7 and 8 suggest that spatially identifying the
connections between vertical change and horizontal change of rock type
(sedimentary facies) is difficult for all cohorts. The concept of
contemporaneous environmental change and its effect on the rock record (and
the fossil record) is a challenge even for postgraduate geology students.
3. As respondent age increases, spatialisation ability for geological structures
increases, but further research is needed to tease out the effects and influence
of specialist geological training, gender difference and teaching techniques.
Scanned examples shown in Appendix 7 show that the errors are similar for
all age groups.
4. Similar mental rotation difficulties are seen across all age groups especially
the ability to move from plan view to transverse or cross sectional view.
5. Results support those of Kali and Orion (1996), where the single most
common difficulty is to visually penetrate and to move from a ‘surface’ view
to a hidden ‘inside’ view. Gaining experiences in spatial visualisation is a
major challenge for school curriculum developers.
6. Although understanding ‘what to do’ in questions on visual penetration
ability is greatly improved with the use of a 3-D ‘hands on’ plasticine model,

328
the ability to visually penetrate remains difficult. Errors and misconceptions
presented were common to all age groups including some postgraduate
geology specialists. There is considerable scope for development and up
scaling and using ‘hands on’ modelling for providing learning experiences for
spatial development.
7. Linking a geological history to 2-D and 3-D (block diagram) rock exposure
diagrams is difficult for all cohorts. Describing a geological history requires a
correct sequence of events as well as knowing about and connecting
geological environments with rock formation.
8. The sample of postgraduate geology students is able to perceive alternative
sequential possibilities in geological history whereas many in all other
cohorts do not. In other words these respondents can see ambiguity (Ault,
1998). An excellent example of a geological ambiguity is distinguishing
between lithologic (rock) correlation and time correlation. Physical continuity
of rock units is not the same thing as time correlation. Time correlative units
are often determined by the fossil content, magnetic chronology or
radiometric dating. Just having rocks of the same type does not make them
the same age. It is important to note that geologically, rock types change
vertically due to changing environments through time and that horizontal
changes of sediment (and later rock type), occur at the same time or 4-D
contemporaneously. This kind of interrelated complexity and indeed the need
for clear written description is a major barrier (especially for today’s socially
sophisticated and electronically oriented students) to learning not only the
geological sciences but also the biological sciences.
12.4 The GeoVAT Instrument
Geological science informs and constrains timing and environment for the evolution
of life. The GeoVAT instrument is derived and modified from Dodick & Orion
(2003a) and Trend (2001a) and addresses research questions 3 and 5. It takes a
geocognitive paleogeologic approach as well as an ‘event’ based approach to
eliciting the conceptualisation of a cross-age set of cohorts (See Chapter 5). This
instrument asks about ideas on the nature and relative time origins of fossils and the
fossil record (event based) as well as asking about the meaning of fossils as

329
indicators of geologic environments and evolution (geocognitive). The relative time
aspects of this instrument correspond to the diachronic schema of Montangero (1996)
as outlined and discussed in Chapter 6. One question (Section B Q2a) triangulates
with the GeoTSAT instrument with regard to mental rotation by requiring a
transverse (cross) section to be drawn from plan view. This also requires a degree of
visual penetration ability. Chapter 10 outlines the findings for the GeoVAT
instrument as well as investigating key issues of evolution in constantly changing
curricula. New Zealand is used as a case study for the status of teaching evolution in
a western secondary school curriculum.
Key findings and conclusions
1. Having a more sophisticated perception of the scale of geologic time is not
only the unique contribution that geological science makes to an
understanding of our planet, but is crucial to a better understanding of the
evolution of life. The links between evolution and geological time have been
vastly and well documented (Alles, 2001; Alters, 2002; Catley, 2005, 2009;
Cummins, 1994; Dagher, 2005; Deniz, 2007; Dodick, 2007, 2003b; Griffith,
2004; Jensen, 1995; O'Brien, 2000).
2. Findings to the GeoVAT instrument (Chapter 10 and Appendix 6) indicate
that all cohorts across an age range of approximately 40 years do know what
fossils are but that even in this small study sample, the creationist
pseudoscientists are represented and are conspicuous by their dogmatism.
Indeed, recent work by Bickmore, Thompson, Grandy and Tomlin (2009)
point out the conceptual tensions between a learners desire for ‘certainty’ and
the presentation of the nature of science as being tentative. The
misconception being that science “proves the truth” rather than being
uncertain or ‘open ended’. The links between scientific testability and the
abstract concept of ‘certainty’ is difficult to teach to teenagers and
undergraduates. Understanding the fossil record and its links to unravelling
the history of life requires a measure of understanding about the nature of
science. Montgomery (2009) shows clearly the importance of focussing on
the scientific aspects of scientific controversies rather than the social impact
aspects. Using relevant aspects of the history of our understanding about the

330
fossil record may be useful in developing a better understanding of the
interconnectedness between evolution, fossils and geological science. What
actually is a scientific controversy? Clearly, using pseudoscience as a
counterpoint to scientific theory is illogical. In the New Zealand school
curriculum there is an internal assessment standard on scientific
‘controversies’ but far too often, selected ‘controversies’ are not only
misconceived as ‘social controversies’ (an issue for socio-scientific issues),
but they also do not investigate both sides of the science involved. The
evolution of life is not a scientific controversy.
3. The fact that a majority of respondents think that Charles Darwin was the
originator of the theory of evolution (Chapter 10 and Appendix 6) speaks
volumes for the lack of teaching (and poor representation in curricula
statements), about the history of science and the people who made it. Few
teachers are specialists in the history of science in much the same way that
most teachers of science are not specialists of geological science or
astronomy.
4. The majority of respondents in this study are aware that a scientific theory is
not just a guess but is a naturalistic explanation of observable phenomena
based on testable evidence and with the prospect of abandoning untenable
explanations. There is, however, a general lack of awareness of the notion of
punctuationism as an additional explanation for evolutionary processes found
within the fossil record. Respondents do know what fossils are but lack the
detail of geobiological interpretation. Similarly, despite genetics and in
particular, molecular genetics being the dominant current concepts of school
biology (Chapter 10 and Appendix 6); there is poor teaching and learning
linkage between these disciplines and biological evolution. This can be traced
to historically poor curriculum linkages between geological science and
biological science (Cummins, 1994; Deniz, 2007; Dodick, 2007; Dodick,
2005; Rutledge, 2000; Sinatra, 2003). Formal training in Biology tends to be
with the living world rather than the extinct. In the New Zealand case study
of evolution and biology in the curriculum, despite there being around a
national total of 42,418 students (www.educationcounts. govt.nz) studying at
Year 13 (level 3 NCEA) in July 2008, only around 4500 students (11%)
gained qualification credits in assessed standards on human evolution,

331
speciation and evolution in general at NCEA level 3. Level 3 is the final year
at high school prior to university level for New Zealand students. So, in fact,
the vast majority of students (89%) leave school never knowing about the key
issues, scientific information and mechanisms of biological evolution. Even
fewer have an opportunity to appreciate the connections between biological
evolution, the fossil record and geological time because of poor curriculum
linkage and lack of teacher training infra structures at both secondary and
tertiary levels. The details and status of student performance in biological
evolution related assessment standards are presented in Chapter 9. Of the
twelve assessment standards related to evolution, the vast majority of students
gain their credits from only three: one at Year 12 Biology and two at Year 13
Biology. The percentage of passes increases from an average of 25% at decile
1, to 70% at decile 10 increases with independent private schools achieving
70% passes. Deciles are a socio-economic indicator.
5. There are typically, poor teaching and learning connections between micro
and macro evolutionary concepts and processes (Dodick & Orion, 2005;
Hallden, 1998; Mayr, 2001). The study of paleoecology, paleoenvironments
and paleontology within biology curricula is a missing link in this conceptual
connection and future subject and curriculum reforms should reflect this
connection in much greater detail. In the recent (2007-2011) reforms and
implementation of the New Zealand curriculum for example, evolution is
clearly recognised as a guiding theme in science literacy throughout all the
schooling years, but does very poorly when connecting geological science
with biological science. Having a better conceptualisation of biological
evolution depends on a better conceptual status of geological time and
environments. Results to questions on perception of scale (Chapter 6) suggest
that as age (experiences and brain development) increases the perception of
time becomes more sophisticated and conceptualisation of the linkages
between time and evolution begin to crystallise. Building on the work of
Tretter et al. (2006a) and Trend (1998; 2000; 2001) evidence from a small
illustrative study of perceptions of various scales such as time, mass, number
and size suggest respondents from all age groups first look for experienced
scale-boundaries (usually their own bodies) and then refine their perceptions.

332
As the scale goes beyond their experiences there is a tendency to ‘lump’
values into large single categories.
6. It is unfortunate that science curricula typically do not promote a broader
understanding of scalar dimensions and their connections with most
disciplines of learning. The unique contributions of geological science to
science literacy should not be lost in future reforms. As Tretter, Jones &
Minogue (2006b) point out,
“The use of unifying themes that span the various branches
of science is recommended to enhance curricular
coherence in science instruction. Conceptions of spatial
scale are one such unifying theme”. (Tretter et al. (2006b),
p.1061).
It often appears that curricula reforms refine, reduce and rearrange rather than
inclusively develop a well resourced pedagogy for scalar dimensions of time,
distance and spatialisation. There is much to be done and geological science
provides a unique vehicle for developing student understanding of scale
perceptions for a better scientific literacy.
12.5 Limitations
1. A key intention of this study was to provide a snapshot across a wide age
range and different countries of origin, of conceptualisations held about
aspects of geological science. It does not statistically represent a wider
community and making generalisations would be invalid and unreliable. The
specific and general issues of reliability and validity of data collection for
questionnaires are addressed in Chapter 5. However, responses received
provide useful insights into the conceptual status of a wide age range of
respondents to aspects of visual spatialisation, interpretations of the fossil
record, understandings about biological evolution and geological time.
2. All research efforts have limitations of time and resources. This thesis is no
exception. Gaining access to schools and tertiary institutes for a large scale
quantitative study is beyond the capacity of the researcher. Being the school

333
co-ordinator for the PISA surveys and aware of the vast resources of the
OECD for surveying 15 year old students reinforces the difficulty of
achieving sufficient response returns just from one school let alone from 60
different countries!
3. Sample size is always an issue unless exhaustive trialling clearly establishes
the sampling size boundaries needed for quantitative representation. This is
beyond the scope of this study and the researcher. In this thesis data
collection instruments, the number and types of response to questions are
quite limited and there are sufficient responses that cover most potential
responses. As outlined in Chapter 5, in questionnaires there is little control
over who answers what, and in the end, the data collected is what it is.
Perfection does not exist.
4. Interpretations of responses are all the researchers, so internal bias is a
permanent part of the story. Oversimplification, misinterpretation and
inaccuracies are ever present but it is expected that replication by other
workers will add to and correct the inaccuracies in an effort to get closer to
the realities of the conceptual status and spatial perceptions of future
respondents.
5. Little analysis of gender issues were completed as this introduced another
layer of complexity. Future work could focus more specifically on gender
issues especially for spatialisation and VPA development and development of
scalar comprehension.
In summary, this mixed method study’s questionnaires are limited by small sample
size, are not statistically representative, suffer from researcher bias and are in parts,
in danger of being an oversimplification. In mitigation, internal triangulation (with
minimal respondent interviewing) and use of previously validated material and
publicly available data bring together a snapshot of conceptualisation and
perceptions of key geological phenomena and their relationships to science curricula,
teaching and learning.

334
12.6 Implications for Teaching and Learning
1. There is a need to develop and implement stronger and assessable curriculum
connections between geological, paleontological and biological science.
2. The geosciences and geological science specifically, struggle for existence in
most science and geography courses globally (Trend, 2009). There is a need
to develop an infrastructure of support with modern resources within teacher
training institutions, schools and universities.
3. Most secondary school teachers are not trained in geological or geoscience
and exhibit the same conceptual difficulties as their students. Their learning
experiences have been much the same as their students and as a result, many
schools simply do not teach the earth sciences and especially geological
science. In-service training is the vital link between a geologically informed
curriculum, teacher training and establishment of geological science as a vital
discipline for a citizen’s adequate science literacy (Trend, 2009).
4. Geological science is not Earth Systems Science nor is it Environmental
Science. It is the glue that holds the reductionist science hierarchy together.
By providing adequate tuition time by trained and qualified geoscientists in
developing concepts of scales of time and size, a better conceptualisation of
evolution and earth history can be achieved. This requires integration of
fieldwork, use of information technology (IT) and specially developed
software for improving spatialisation skills into a schools culture of learning.
Secondary school students at 13 years of age have naïve views of the natural
world but they are cognitively primed for development of conceptualisation
about how the Earth works, what it is made of and how it has evolved
through time. Curricula development lets them down.
5. Conceptual change research developed over the last 30 years (Ausubel, 1968;
Duit, 1999; Duit & Treagust, 2003; Treagust & Duit, 2008; Posner et al,
1982; Vosniadou 1992) point out the complexities of achieving and
maintaining conceptual change. A challenge for educational researchers is to
find more effective ways for not only classroom teachers but also policy
makers to change their conceptual status for the teaching and learning of
geological science. Clearly, these stakeholders are, in classical Posnerian
terms, not affectively dissatisfied enough to want to change the way they

335
think about the Earth as a dynamic and fragile planet, the evolution of life
within it and the connections of geological science to all other fields of
scientific endeavour.
12.7 Finale
The study of geological education has been a life long pursuit. Ever since hearing the
word ‘Geology’ in New Zealand in Year 11 (aged 15 years), I was fascinated by
what makes this planet tick and how the life on it and in it could be scientifically
explained. Geoscience in New Zealand schools in the early 1960’s was dominated by
physical geography in the form of geomorphology (today only about 35,000 students
nationally in NZ are enrolled at NCEA level 1 Geography) with lots of photographs
and diagrams of landforms found in ‘the textbook’ (Cotton, 1964) that could be
easily related to by teenagers. This ‘triggered’ an interest in questioning how the
surface of the Earth evolved (See Chapter 4, p.115 for notes about self determination
theory) and led eventually to other questions about the how and whys of geological
science and its specialist branches. After nearly a decade of teaching I finally wrote
an article (Vallender, 1981) suggesting that geological science and appropriate
fieldwork (not specifically physical geography or even physical geology) was a vital
part of a functional scientific literacy and should be more thoroughly included in
science curricula and be assessable in the same way as physics, chemistry and
biology. This eventually happened (partially however, because the credits gained in
examination success were not the same as the other traditional sciences) in the 1994
national curriculum revisions and movement to a standards based assessment system
but only to be slowly eroded away by 2010. This is a globally familiar curriculum
story.
Most students are intrinsically curious about our planet’s history; they want to know
what it is made of, how it got there and how it works. They also want to find out
more about what happens beneath their feet and the origin of hills, mountains and
valleys. Most high school students are cognitively primed for conceptual
development but the pedagogy and infra structures for teaching and learning
geological science in particular are not adequate globally or locally. The challenge is
to find ways of more fully integrating geological science into curricula and

336
developing a coherent conceptual change model of teaching and learning. And one
that future citizens have a more sophisticated conceptual awareness of scientific
theories of evolution, the significance of the fossil record, how plate tectonics works
and how earth systems interact. This cannot be done as an ‘add on’ or ‘plug in’. Nor
can it be achieved by integration alone. It is too big for this.
People should be able to make informed decisions about broader geoscience issues
based on accurate conceptions of scientific evidence (especially geological processes
as this provides the evidence that underpins the mechanisms of natural hazards and
an understanding of Earth history) rather than naïve misconceptions, myths and
legends. Geological science is uniquely suited to developing spatialisation skills and
makes linkage with all other sciences through geological time. The Earth will still be
here in 2 billion years time and what a geological story it will tell. Effecting
conceptual change in individual world views takes time but it is hoped that this thesis
not only supports prior research evidence but has also added new pieces to the jigsaw
of geological education within secondary school and tertiary curricula and provided a
stage for developing conceptual change teaching models based on a picture of
constructivism, student conceptual status and geocognition. Time will tell.

337
REFERENCES
Adams, F. D. (1958). The birth and development of the Geological Sciences. New York: Dover Publications, Inc.
American Geological Institute. (1967). Investigating the Earth: Earth Science
Curriculum Project. Boston, MA: American Geological Institute. National Science Foundation.
American Geological Institute (2004). Why Earth Science? Washington, DC:
National Science Teachers Association. Akhatar, A. (1996). Stimulation of awareness of geoscience among the mass
population of society. Paper presented at the 30th International Geological Congress, Beijing, PRC.
Alao, S., & Guthrie, J.T. (1999). Predicting conceptual understanding with cognitive
and motivational variables. The Journal of Educational Research, 92(4), 243-255.
Alison, J. (2007). Mind the gap: Policy change in practice, school qualifications
reform in New Zealand, 1980-2002. Unpublished PhD thesis. Massey University, Palmerston North, New Zealand.
Alison, J. (2008). The NCEA and how we got there: The role of PPTA in school
qualifications reform 1980-2002. New Zealand Journal of Teachers’ Work, 5(2), 119-138.
Allchin, D. (2004). Pseudohistory and pseudoscience. Science and Education\,
13,179-195. Alles, D. L. (2001). Using evolution as the framework for teaching biology. The
American Biology Teacher, 63(1), 20-24. Alters, B. J., & Nelson, C.E. (2002). Teaching evolution in higher education.
Evolution, 56, 1891-1901. American Association for the Advancement of Science (AAAS). (1989). Science for
all Americans. Washington, DC: AAAS. American Association for the Advancement of Science (AAAS). (1993).
Benchmarks for science literacy. New York: Oxford University Press. Anderson, D. L., Fisher, K M., & Norman, G.J. (2002). Development and evaluation
of the conceptual inventory of natural selection. Journal of Research in Science Teaching, 39(10), 952-978.
Anderson, G., & Arsenault, N. (2001). Fundamentals of educational research (5th
Ed.). London: RoutledgeFalmer.

338
Anthamatten, P., & Ziegler, S.S. (2006). Teaching Geography with 3-D visualisation technology. The Journal of Geography, 105(6), 231-237.
Aubusson, P. (2002). An ecology of science education. International Journal of
Educational Research, 24(1), 27-46. Ault, C. R. (1981). Children's concepts about time no barrier to understanding the
geologic past. Unpublished Doctoral dissertation, Cornell University, Ithaca, NY.
Ault, C. R. (1998). Criteria of excellence for geological enquiry: the necessity of
ambiguity. Journal of Research in Science Teaching, 35, 189-212. Ausubel, D. P. (1968). Educational psychology: A cognitive view. New York: Holt,
Reinhard and Winston. Baker, V. R. (2000). Conversing with the Earth: the geological approach to
understanding’. In R. Frodeman (Ed.), Earth Matters: The Earth Sciences, philosophy and the claims of the community, (pp. 2-10). Upper Saddle River, NJ: Prentice Hall.
Baldwin, T. K., & Wallace-Hall, M. (2004). Spatial ability development in the
Geosciences. Retrieved May 28th, 2006, from http://convention.allacademic.com/aera2004/session_info.html?c_session_id=3703&part_id1=902646&dtr_id=9762
Barbera, O., Zanon, B., & Perez-Pla, J. F. (1999). Biology curriculum in twentieth
century Spain. Science Education, 83, 97-111. Baxter, S. (2003). Revolutions in the Earth: James Hutton and the true age of the
world. London: Phoenix. Bell, B. (2005). Pedagogies developed in the Learning in Science Projects and
related theses. International Journal of Science Education: Special Issue 27(2), 159-182.
Ben-Chaim, D., Lappan, G., and Houang, R.T. (1988). The effect on spatial
visualization skills of middle school boys and girls. American Educational Research Journal, 25(1), 51-71.
Bennett, G. K., Seashore, H.G., and Wesman, A.G. (1991). DAT differential aptitude
tests for personnel and career assessment technical manual, (p. 41). San Antonio TX: The Psychological Corporation.
Ben-Zvi-Assaraf, O., & Orion, N. (2005). Development of system thinking skills in
the context of Earth System Education. Journal of Research in Science Teaching, 42(5), 518-560.
Ben-Zvi-Assaraf, O., & Orion, N. (2009). System thinking skills at the elementary
school level. Journal of Research in Science Teaching, 47(5), 540-563.

339
Berkman, M. B., Pacheco, J.S., & Plutzer, E. (2008). Evolution and creationism in America's classrooms: A national portrait, from Public Library of Science: (PLoS) Biology, 6(5): e124.doi:10.1371/journal.pbio.0060124
Bezzi, A. (1991). A Macintosh programme for improving three dimensional
thinking. Journal of Geological Education, 39, 284-288. Bezzi, A. (1996b). Is geology teaching also geology learning? An interactive
education approach to solve the dilemma. Paper presented at the Geoscience education and training. Joint special publication of the COGEOED of the IUGS and the AGID, no. 19 (pp. 463-480).
Bickmore, B. R., Thompson, K. R., Grandy, D. A., & Tomlin, T. (2009).
Commentary: On teaching the nature of science and the science religion interface. Journal of Geoscience Education, 57, (3), 168-177.
Bishop, A. J. (1980). Spatial abilities and mathematical education - A review.
Educational Studies in Mathematics, 11, 257-269. Bishop, B., & Anderson, C.W. (1990). Student conceptions of natural selection and
its role in evolution. Journal of Research in Science Teaching, 27, 415-427. Black, A. A. (2005). Spatial ability and Earth science conceptual understanding.
Journal of Geoscience Education, 53(4), 402-415. Black, A. A. (2007, April 15-18). Earth science conceptual understanding of pre-
service teachers: Relationships with content exam success and spatial visualisation. Paper presented at the NARST Annual International Conference, New Orleans.
Blajenkova, O., Kozhevnikov, M, & Motes, M. A. (2006a). Object and spatial
imagery: A new self-report imagery questionnaire. Applied Cognitive Psychology, 20, 239-263.
Blazhenkova, O., & Kozhevnikov, M. (2009). The new object-spatial-verbal
cognitive style model: Theory and measurement: Applied Cognitive Psychology, 23, 638-663.
Bo Huang & Hui Lin. (1999). GeoVR: a web-based tool for virtual reality
presentation from 2D GIS data. Computers & Geosciences, 25, 1167 -1175. Booth-Sweeny, L. (2000). Bathtub dynamics: Initial results of a systems thinking
inventory, from http://web.mit.edu/jsterman/www/bathtub.pdf. Bradshaw, M. J., & Jarman, E. A. (1969). Reading geological maps. London:
Hodder and Stoughton. Brem, S. K., Ranney, M., & Schindel, J. (2003). Perceived consequences of
evolution: College students perceive negative personal and social impact in evolutionary theory. Science Education, 87, 187-206.

340
Broadfoot, J. M. (1993). Spatial ability and earth science learning. Paper presented at the International conference on Science Education in Developing Countries: from theory to practice. Jerusalem, Israel.
Brumby, M. N. (1984). Misconceptions about the science of natural selection by
medical biology students. Science Education, 68, 493-503. Busby, J., & Suddendorf, T. (2005). Recalling yesterday and predicting tomorrow.
Cognitive Development, 20, 362-372. Campbell, A. (2008). The creep of creationism: Is it relevant to teaching Earth
Sciences? Geological Society of New Zealand Newsletter, (146), 23-26. Carey, S. (1984). Cognitive development: The descriptive problem. In M.Gazzoniga
(Ed.), Handbook for cognitive neuroscience. New York: Plenum Press. Carstensen, A. K., & Bernhard, J. (2008). Threshold concepts and keys to the portal
of understanding. In R. Land, Meyer, J.H.F. & Smith, J. (Ed.), Threshold concepts within the disciplines. (pp. 143-154). Rotterdam, The Netherlands: Sense Publishers.
Carter, C., LaRussa, M. & Bodner, G. (1987). A study of two measures of spatial
ability as predictors of success in different levels of general chemistry. Journal of Research in Science Teaching, 24(7), 645-657.
Catley, K. M. (2005). Darwin’s missing link: A novel paradigm for evolution
education. Science Education, 1, 1-17. Catley, K. M., & Novick, L. R. (2009). Digging deep: Exploring college students’
knowledge of macroevolutionary time. Journal of Research in Science Teaching, 46(1), 1-22.
Chadwick, P. (1978). Some aspects of the development of geological thinking.
Journal of Geological Teaching, 3, 142-148. Chi, M., T., Slotta, J. D., & de Leeuw, N. (1994). From things to processes: a theory
of conceptual change for learning science concepts. Learning & Instruction, 4, 27-43.
Chunhua Dong, Jianping Hu & Li Wang (2010). Application of a virtual geosciences
modelling system in digital city construction. Applied Mechanics and materials, 20-23, 1311-1314.
Clark, I. F. (2006). IGEO: State of Geoscience Education Survey: International
Geoscience Education Organisation. Clark, I. F., & James, P.R. (2004). Using concept maps to plan an introductory
structural geology course. Journal of Geoscience Education, 52(3), 7.

341
Clary, R. M., Brzuszek, R.F., & Wandersee, J.H. (2009). Students’ geocognition of deep time, conceptualized in an informal educational setting. Journal of Geoscience Education, 57(4), 275-285.
Coash, J. R. (1963). Earth Science in secondary schools. Geotimes. American
Geological Institute, 7, 26-29. Cobern, W. W. (1994). Point: Belief, understanding, and the teaching of evolution.
Journal of Research in Science Teaching, 31, 583-590. Cobern, W. W., Gibson, A. T., & Underwood, S.A. (1999). Conceptualizations of
nature: an interpretive study of 16 ninth graders' everyday thinking. Journal Research in Science Teaching, 36(5), 541-564.
Coleman, S. L., & Gotch, A. J. (1998). Spatial perception skills of chemistry
students. Journal of Chemical Education, 75(2), 206-209. Cooray, P. G. (1996). Earth-Science as a basic component of all education. In D. A.
V. Stow & G. J. H. McCall (Eds.) (Ed.), Joint special publication of the COGEOED of the IUGS and the AGID, no. 19 (pp. 803-810). Rotterdam, The Netherlands: A.A. Balkema.
Cotton, C. A. (1964). Geomorphology: An introduction to the study of landforms.
(7th ed). Christchurch: Whitcombe & Tombs. Crossley, J., & Whitehead, J. (1979). The teaching of geological maps. Geology
Teaching, 4, 56-61. Crossley, J., & Whitehead, J. (1980). The teaching of geological maps II. Geology
Teaching, Geology Teaching, 5, 15-19. Csapo´, B. I., (pp. 37–62). Lisse:, & Zeitlinger., S. (1999). Improving thinking
through the content of teaching. In J. E. H. v. L. In J.H.M. Hamers, & B. Csapo´ (Ed.), Teaching and learning thinking skills (pp. 37-62). Lisse: Swets & Zeitlinger.
Cummins, C. L., Demastes, S. S., & Hafner, M. S. 31, 445-448. (1994). Evolution:
Biological education's under-researched unifying theme. Journal of Research in Science Teaching, 31, 445-448.
Cutler, A. (2004). The seashell on the mountaintop: A story of science, sainthood,
and the humble genius who discovered a new history of the Earth. London: Arrow Books.
Dagher, Z. R. (1994). Does the use of analogies contribute to conceptual change?
Science Education, 78, 601-614. Dagher, Z. R., & Boujaoude, S. (1997). Scientific views and religious beliefs of
college students: The case of biological evolution. Journal of Research in Science Teaching,, 34, 429-445.

342
Dagher, Z. R., & Boujaoude, S. (2005). Students’ perceptions of the nature of evolutionary theory. Science Education, 1, 1-14.
Dahl, J., Anderson, S. W., & Libarkin, J. C. (2005). Digging into earth science:
alternative conceptions held by K-12 teachers. Journal of Science Education. Bogota., 6(2), 65-69.
Damasio, A. R. (2006). Remembering when. Scientific American Special Edition,
16, 34-41. Davies, P. (2006). The Goldilocks Enigma: Why is the Universe just right for life?
London: Penguin. Dawkins, R., & Wong, Y. (2004). The ancestor's tale: A pilgrimage to the dawn of
life. London: Weidenfield & Nicolson. Deci, E. L., Vallerand, R. J., Pelletier, L. G. & Ryan, R. M. (1991). Motivation and
education: The self-determnation perspective. The Educational Psychologist, 26, 325-346.
Dehaene, S. (2002). Verbal and nonverbal representations of numbers in the human
brain. In A. M. Galaburda, Kosslyn, S.M. & Christen, Y. (Eds.), The languages of the brain (pp. 179–198). Cambridge, MA: Harvard University Press.
Demastes, S. S., Settlage, J., & Good, R. (1995). Students' conceptions of natural
selection and its role in evolution: Cases of replication and comparison. Journal of Research in Science Teaching, 32, 535-550.
Deniz, H., Donnelly, L. A., & Yilmaz, I. (2007). Exploring the factors related to
acceptance of evolutionary theory among Turkish pre-service biology teachers: toward a more informative conceptual ecology for biological evolution. Journal of Research in Science Teaching, 2, 1-24.
Department of Education. (1968). Science for Forms III and IV. Wellington: A. R.
Shearer, Government printer, New Zealand. Department of, Education. (1969). Secondary school syllabus; Science. Wellington:
A. R. Shearer, Government Printer. Devlin, A. S. (2001). Mind and maze: Spatial cognition and environmental
behaviour. Westport, CT: Praeger. Dickerson, D., Callahan, T. J., Sickle, M. V., & Hay, G. (2005). Students'
conceptions of scale regarding groundwater. Journal of Geoscience Education, 53(4), 374-381.
Dobzhansky, T. (1973). Nothing in biology makes sense except in the light of
evolution. American Biology Teacher, 35, 125-129.

343
Dodick, J. (2007). Understanding evolutionary change within the framework of geological time. McGill Journal of Education, 42(2), 245-264.
Dodick, J. T., & Orion, N. (2002a). From dinosaurs to Darwin: evolution from the
perspective of "deep time": a curriculum for the science for all programme. Weizmann Institute of Science,. Israel.
Dodick, J., & Orion, N. (2003a). Cognitive factors affecting student understanding of
geologic time. Journal of Research in Science Teaching, 40,(4), 415-442. Dodick, J., & Orion, N. (2003b). Introducing evolution to non-biology majors via the
fossil record: A case study from the Israeli high school system. The American Biology Teacher., 65(3), 185-111.
Dodick, J. T., & Orion, N. (2003c). Measuring student understanding of "deep time".
Science Education. Wiley Periodicals, Inc, 87, 708-731. Douglas, K. M., & Bilkey, D. K. (2007). Amusia is associated with deficits in spatial
processing. Nature Neuroscience, 10, 915-921. Downey, M. T. (1994). After the dinosaurs: children's chronological thinking. Paper
presented at the annual meeting of the American Educational Research Association, New Orleans.
Dowse, M. (2004). IGEO Survey Compilation (p. 46). Unpublished International
Geoscience Education Organisation Survey. Driesen, J. L. (2001). Time and the human brain. Retrieved August 24, 2005, from
http://www.unisci.com/stories/20011/0227013.htm Drummond, C. N. (2001). Can field camps survive? Journal of Geoscience
Education, 49, 336. Duit, R. (1999). Conceptual change approaches in science education. In Schnotz, W.,
Vosniadou, S., & Carretero (Eds.), In New Perspectives on Conceptual Change. (pp. 263-282). Oxford: Pergamon.
Duit, R., & Treagust, D. F. (2003). Conceptual change: a powerful framework for
improving science teaching and learning. International Journal of Science Education, 25(6), 671-688.
Duschl, R. A., & Smith, M. J. (2001). Subject -specific instructional methods and
activities. Advances in Research on Teaching, 8, 269-289. Earth System Science Committee. (1988). Earth System Science: A closer view.
Washington D.C.: NASA. Ministry of Education. (2007). The New Zealand Curriculum. Wellington: Learning
Media Limited.

344
Eicher, D. L. (1968). Geologic Time. Englewood Cliffs: Prentice Hall. Ekstrom, R. B., French, J. W., Hartman, H. H., & Dermen, D. (1976). Kit of factor-
referenced cognitive tests. Educational Testing Service, Princeton, NJ. Eldredge, N. (2008). Casting an eye on complexity. Evolution Education Outreach,
1, 355-357. Eldredge, N., & Gould, S. J. (1972). Punctuated equilibria: an alternative to phyletic
gradualism. In T.J.M Schopf, (Ed). Models in paleobiology. (pp.82-115): San Francisco: Freeman, Cooper & Co.
Elkins, J. T., & Elkins, M. L. (2007). Teaching geology in the field: significant
geoscience concept gains in entirely field-based introductory geology courses. Journal of Geoscience Education, 55(2), 126-133.
Eve, R. A. (2007). Science education and belief in pseudoscience. Skeptic. Altadena:
13(3), 14-17. Farber, P. (2003). Teaching evolution & the nature of science. The American
Biology Teacher. 65(5) 347. Fazekas, A. (2004). Visions of space. Astronomy. Milwaukee, 32(7), 78-82. Fortey, R. (2005). The Earth: An intimate history. London: Harper Perennial. Ireton,
F. W. (2003). Brief history of earth science education, from http://www.earthscienceedrevolution.org/appendix/history.cfm
Freeman, C. B., Semken, S., Lawson, A., Oehrtman, M., Jensen, J., & Schaufele, C.
(2007). How old is the Earth? An exploration of geologic time through place-based inquiry. Paper presented at the Proceedings of the NARST 2007 Annual Meeting (New Orleans, LA, United States).
Friedman, W. J. (1982). Conventional time concepts and children's structuring of
time. In I. W. J. Friedman (Ed.), The developmental psychology of time. New York: (pp. 171-209). New York: Academic Press.
Friedman, W. J. (1989). The representation of temporal structure in children,
adolescents and adults. In E. Levin and D. Zakay, Time and human cognition: A life-span perspective, (Ed.), (pp. 259–304). North-Holland, Amsterdam.
Friedman, W. J. (1990). About time: Inventing the fourth dimension. Cambridge:
MIT Press. Friedman, W. J. (2000). Time in psychology. In P. J. N. Baert (Ed.), Time in
contemporary intellectual thought (pp. 295-314).Amsterdam: Elsevier. Friedman, W. J. (2002). Arrows of time in infancy: The causal representation of
temporal-causal invariances. Cognitive Psychology, 44(3), 252-296.

345
Friedman, W. J. (2003). Arrows of time in early childhood. Child Development, 74(1), 155-167.
Gardner, P. L. (1975). Attitudes to science: A review. Studies in Science Education,
2, 1-41. Gee, H. (1999). In search of deep time: Beyond the fossil record to a new history of
life. New York: The Free Press. Geological Society of New Zealand (n.d.). http: //www.gsnz.org.nz/ Georghiades, P. (2000). Beyond conceptual change learning in science education:
focusing on transfer, durability and metacognition. Educational Research, 42(2), 119-139.
Gersick, C. J. G. (1991). Revolutionary change theories: a multilevel exploration of
the punctuated equilibrium paradigm. The Academy of Management Review., 16(1), 10-35.
Gess-Newsome, J., Southerland, S. A., Johnston, A., & Woodbury, S. (2003a).
Educational reform, personal practical theories and dissatisfaction: The anatomy of change in college science teaching. American Educational Research Journal, 40(3), 731-734.
Gess-Newsome, J., Southerland, S. A., Johnston, A., & Woodbury, S. (2003b).
Educational Reform, Personal Practical Theories, and Dissatisfaction: The Anatomy of Change in College Science Teaching. American Educational Research Journal, 40(3), 731-734.
Gilbert, J. K., Osbourne, R. J., & Fensham, P. (1982). Children's science and its
implications for teaching. Science Education, 66, 625-633. Gilluly, J., Waters, A. C., & Woodford, A.O. (1958). Principles of Geology (2nd ed.).
San Francisco and London: W.H. Freeman & Co. Glasson, G. E. (1989). The effects of hands-on and teacher demonstration laboratory
methods on science achievement in relation to reasoning ability and prior knowledge. Journal of Research in Science Teaching, 26, 121-131.
Gould, S. J. (1987). Time's arrow time's cycle: Myth and metaphor in the discovery
of geological time. Cambridge, MA: Belknap Harvard University Press. Gould, S. J. (2002). The structure of evolutionary theory. Cambridge, MA and
London, England: Belknap Press of Harvard University Press. Grant, D. M. (2003). Those who can teach: A history of secondary education in New
Zealand from the Union perspective. Wellington: Steele Roberts Ltd. Gregory, T. (2008). Evolutionary trends. Evolution: Education and Outreach, 1(3),
259-273.

346
Gribbin, J. (2002). Science: A history. London: Penguin. Griffith, J. A., & Brem, S. K. (2004). Teaching evolutionary biology: Pressures,
stress, and coping. Journal of Research in Science Teaching, 41(8), 791-809. Guba, E. G., & Lincoln, Y. S. (1989). Fourth generation evaluation. Beverly Hills:
Sage Publications. Gudovitch, Y. (1997). The global carbon cycle as a model for teaching "earth
systems’’ in high school: Development, implementation, and evaluation. Unpublished master’s thesis. Weizmann Institute of Science, Rehovot, Israel [in Hebrew].
Hafner, R. (2003). The Development of the New South Wales Earth and
Environmental Science syllabus for 17/18 year olds. Paper presented at the Third International Conference on Geoscience Education., Sydney.
Hallden, O. (1988). The evolution of the species: pupil perspectives and school
perspectives. International Journal of Science Education, 10, 541-552. Hardin, B. J., Jones, M. G., & Figueras, O. (2005). More than clocks and calendars:
The construction of timekeepers by eleven kindergarten children in Mexico and the United States. Journal of Research in Childhood Education, 19, 223-224.
Harrison, A. G., & Treagust, D. F. (2000). Learning about atoms, molecules, and
chemical bonds: a case study of multiple-model use in grade 11 chemistry. Science Education, 84, 352-381.
Hegarty, M., Montello, D. R., Richardson, A.E., Ishikawa, T., & Lovelace, K.
(2006). Spatial abilities at different scales: Individual differences in aptitude-test performance and spatial -layout learning. Intelligence, 34, 151-176.
Heller, R. L. (1963). The Earth Science curriculum project. Journal of Research in
Science Teaching, 1, 272-275. Hewson, P. W., & Hewson, M. G. A. B. (1992). The status of students’ conceptions.
In R. Duit, F. Goldberg, & H. Niedderer (Eds.), Research in physics learning: Theoretical issues and empirical studies (pp. 59–73). Proceedings of an international workshop. Kiel, Germany: Institute for Science Education.
Hidi, S., & Reninger, K. A. (2006). The four phase model of interest development.
Educational Psychologist, 41(2), 111-127. Hildago, A., J., Fernando, S.I.E.S., & Otero, J.I.C.E. (2004). An analysis of the
understanding of geological time by students at secondary and postsecondary level. International Journal of Science Education, 26(7), 845-857.

347
Hipkins, R., & Neill, A. (2005). Shifting balances: The impact of Level 1 NCEA on the teaching of mathematics and science. Wellington: Report to the Ministry of Education.
Hipkins, R. (2010). The evolving NCEA: Findings from the NZCER national survey
of secondary schools 2009. New Zealand Council for Educational Research Te Runanga O Aotearoa Mo Te Rangahau I Te Matauranga. Wellington.
Hlawatsch, S., & Bayhruber, H. (2006). Earth Systems education in Germany:
project "System Earth". Paper presented at the Geoscience Ed V, Bayreuth. Hlawatsch, S., Obermaier, G., & Martin, U. (2006). Geoscience Education:
Understanding System Earth. Bayreuth, 18th – 21st September 2006, Schriftenreihe der Deutschen Gesellschaft für Geowissenschaften Heft 48 Series of the German Society of Geosciences.
Hokayem, H., & BouJaoude, S. (2008). College students’ perceptions of the theory
of evolution. Journal of Research in Science Teaching, 31(1), 1-23. http://www.ldeo.columbia.edu/edu/eesj/directors/kastens/talks_posters/posters/NSF_Liben021509.pdf
Hume, J. D. (1978). An understanding of geological time. Journal of Geological
Education, 26, 141–143. Hutton, J. (1788). Theory of the earth. Transactions of the Royal Society of
Edinburgh, 1(2), 209-304. Ireton, F. W. (2003). Brief history of earth science education, from
http://www.earthscienceedrevolution.org/appendix/history.cfm Ishikawa, T. & Kastens, K.A. (2005). Why some students have trouble with maps
and other spatial representations. Journal of Geoscience Education, 53(2), 184-208.
Ishikawa, T., & Montello, D.R. (2006). Spatial knowledge acquisition from direct
experience of the environment: individual differences in the development of metric knowledge and the integration of separately learned places. Cognitive Psychology, 52(2).
Jensen, M. S., & Finley, F.N. (1995). Teaching evolution using historical arguments
in a conceptual change strategy. Science Education, 79, 147-166. Johnson, D. R. (2006). Earth System Science: A model for teaching science as state,
process and understanding. Journal of Geoscience Education, 54(3), 202-208. Johnston, M. (2005). The relative achievement of secondary students across school
referenced socio-economic deciles in the NQF. Wellington: Unpublished draft report 2. New Zealand Qualifications Authority.

348
Jones, J. (1996). "James Hutton", in Daiches, D., Jones, P (Ed's), The Scottish Enlightenment, 1730 -1790: A hotbed of genius. Edinburgh: The Saltire Society.
Jones, M. G., Taylor, A. R., & Broadwell, B. (2009). Concepts of scale held by
students with visual impairment. Journal of Research in Science Teaching, 46(1), 24-36.
Jones, M. G., Tretter, T. R., Taylor, A., & Oppewal, T. (2008). Experienced and
novice teachers' concepts of spatial scale. International Journal of Science Education, 30(3), 409-429.
Kail, R.P.Y. (1990). Impact of practice on speeded mental rotation. Journal of
Experimental Child Psychology, 49, 227-244. Kali, Y. (1993). Research for characterisation of the spatial abilities required in
structural geology, and its implementation in the development of software for high school students. Unpublished master's thesis. Weizmann Institute of Sciences, Rehovot. Israel.
Kali, Y. (2002). CILT2000: Visualization and modelling. Journal of Science
Education and Technology, 11(3), 305-310. Kali, Y. (2003). A virtual journey within the rock-cycle: A software kit for the
development of systems-thinking in the context of the earth’s crust. Journal of GeoScience Education, 51(2), 165-170.
Kali, Y., & Orion, N. (1996). Spatial abilities of high school students in the
perception of geologic structures. Journal of Research in Science Teaching., 33(4), 369-391.
Kali, Y., Orion, N., & Elon, B. (2003). The effect of knowledge integration activities
on students’ perception of the earth’s crust as a cyclic system. Journal of Research in Science Teaching, 40, 545-565.
Kali, Y., Orion, N., & Mazor, E. (1997). Software for assisting high school students
in the spatial perception of geological structures. Journal of Geoscience Education, 45, 10-21.
Kastens, K. A. (2007). What we’ve learned so far about visualizations in Geoscience
education (and what we wish we knew). Paper presented at the Gordon Conference on visualization in science and education.
Kastens, K. A. (2010). Commentary: Object and spatial visualization in Geosciences.
Journal of Geoscience Education, 58(2), 52-57. Kastens, K. A., Ishikawa, T., & Liben, L. S., (2006). Visualizing a 3-D geological
structure from outcrop observations: Strategies used by geoscience experts, students and novices. Annual Meeting of the Geological Society of America and Exposition Abstracts with Program, 38(7) 425.

349
Kastens, K. A., and Ishikawa, T., 2006, Spatial thinking in the geosciences and cognitive sciences. In Manduca, C., Mogk, D., and Stillings, N. (Eds.), Earth and Mind: How Geoscientists Think and Learn about the Complex Earth: Geological Society of America Special Paper 413, p. 53-76. Denver, CO.
Kastens, K. A., Agrawal, S., & Liben, L. S. (2009). How students and field
geologists reason in integrating spatial observations from outcrops to visualize a 3-D geological structure. International Journal of Science Education, 31(3), 365- 393.
Kelly, L. R. (1997). Book review of Rudwick, M. J. S. (1985). The great Devonian
controversy: The shaping of scientific knowledge among gentlemanly specialists. Chicago: University of Chicago Press. Retrieved December 10th, 2009 from http://ww w.friesian.com/rudwick.htm.
Kern, E. L., & Carpenter, J.R. (1986). Effect of field activities on student learning.
Journal of Geological Education, 34, 180-183. King, C. (2001). The response of teachers to new subject areas in a national science
curriculum: The case of the earth science component. Science Education, 85(6), 636-664.
King, C. (2003, Aug). Geoscience and beyond: developing thinking and
investigational skills. Paper presented at the GeoSci Ed IV conference, Calgary.
King, C. (2007). Science in an Earth/Environmental context: Global, local,
individual science. School Science Review, 89, 35-44. King, C., & Hughes, E. (2007). Comparisons of the Earth Science related content of
GCSE Science specifications in England, Wales and Northern Ireland. Keele: United Kingdom. The Earth Science Education Unit. Keele University.
King, C. (2008). Geoscience Education: An overview. Studies in Science Education,
44(2), 187-222. King, C. J. H. (2009). An analysis of misconceptions in science textbooks: Earth
science in England and Wales. International Journal of Science Education First published on: 27 May 2009 (iFirst).
King, C. J. H. (In press.). What component of earth science should a science
curriculum contain - and what should form the core of a new Earth/environmental science GCSE? ASE School Science Review.
King, H. (2006, December). Understanding spatial literacy: cognitive and curriculum
perspectives. Planet, 17, 26-28. Koballa, T. (1984). Designing a Likert type scale to assess attitudes towards energy
conservation: A nine step process. Journal of Research in Science Teaching, 20, 709-723.

350
Kostovich, C. T., Poradzisz, M., Wood, K., & O'Brien, K. L. (2007). Learning style preference and student aptitude for concept maps. Journal of Nursing Education., 46(5), 225-232.
Kozhevnikov, M., Kossly, S., & Shepard, J. (2005). Spatial versus object visualizers:
A new characterization of viual cognitive style. Memory and Cognition, 33, 710-726.
Kovach, W. L. (1998). MVSP - A MultiVariate statistical package for Windows, ver
3.13n.: Kovach Computing Services, Pentraeth, Wales, U.K. Kuiper, Y. D. (2008). The dry-erase cube: Making three dimensional visualization
easy. Journal of Geoscience Education, 56(3), 261- 269. Kunzig, R. (1997). A head for numbers. Discover, 18, 108-115. Kwon, Y.-U., &
Lawson, A.E. (2000). Linking brain growth with the development of scientific reasoning ability and conceptual change during adolescence. Journal Research in Science Teaching, 37(1), 44-62.
Kwon, Y.-U., & Lawson, A.E. (2000). Linking brain growth with the development
of scientific reasoning ability and conceptual change during adolescence. Journal Research in Science Teaching, 37(1), 44-62.
Labrador, B. (2006). From instantaneous to eternal. Scientific American, 16, 24-25. Land, R., Meyer, J. H. F. & Smith, J. (2008). Threshold concepts within the
disciplines. (Vol. 16). Rotterdam, The Netherlands: Sense. Langone, J. (2000). The mystery of time. Washington, D.C.: National Geographic. Leach, J., Driver, R., Miller, R., Scott, P. (1997). A study in progression in learning
about "the nature of science"; Issues of conceptualisation and methodology. International Journal of Science Education, 19, 147-166.
Lederman, N. G. (1992). Students' and teachers' conceptions of the nature of science:
A review of research. Journal of Research in Science Teaching, 29, 331-359. Lederman, L. (2008). Science education and the future of humankind. Science News.
Washington, 173(16), 36. Lee, D. (1995). Earth Science education in New Zealand secondary schools -what do
teachers think? In Geological Society of New Zealand Newsletter (Vol. 109, pp. 21-23).
Lee, H., & Lee, G. (2001). The National Certificate of Educational Achievement
(NCEA): 'Fragile - handle with care'. New Zealand Annual Review of Education. Wellington: School of Education, Victoria University of Wellington, 10:2000, 24-36.

351
Lewis, E. B. (2008). Content is not enough: A history of secondary Earth Science teacher preparation with recommendations for today. Journal of Geoscience Education, 56(5), 445-455.
Lewis, E. B., & Baker, D. R. (2009). A call for a new Geoscience education research
agenda. Journal of Research in Science Teaching, 47(2), 121-129. Libarkin, J. (2006). College student conceptions of geological phenomena and their
importance in classroom instruction. Planet No. 17, 17. Libarkin, J. C., & Kurdziel, J. P. (2004). Time is everything: Geologic time as a
linchpin to a complete understanding of the Earth. Paper presented at the Paper presented at the 77th Annual meeting of the national Association of Research in Science Teaching., Vancouver, BC.
Libarkin, J. C., Anderson, S. W., Boone, W., Beilfuss, M., & Dahl, J. (2002). The
Geoscience Concept Test: a new assessment tool based on student misconceptions. Eos Transactions. American Geophysical Union, 83(47).
Libarkin, J. C., Anderson, S. W., Dahl, J. D., Beilfus, M. & Boone, W. (2005a).
Qualitative analysis of college students' ideas about the earth: interviews and open-ended questionnaires. Journal of Geoscience Education, 53, 17-26.
Libarkin, J. C., Kurdziel, J. P., & Anderson, S. W. (2007). College student
conceptions of geological time and the disconnect between ordering and scale. Journal of Geoscience Education., 55(5), 413-422.
Libarkin, J., & Anderson, S.W. (2005). Assessment of learning in entry-level
geoscience courses: Results of the geoscience concept inventory. Journal of Geoscience Education, 53, 394-401.
Libarkin, J., & Brick., C. (2002). Research methodologies in Science education,
visualisation and the Geosciences. Journal of Geoscience Education, 50(4), 449-455.
Liben, L. S., Christensen, A. E., Kastens, K. A., & Agrawal, S. (2008). Implications
for field geology instruction from a behavioural study on how students gather, represent, and integrate spatial information about dipping surfaces. Paper presented at the Annual Meeting of the Geological Society of America, Houston.
Liben, L. S., Kastens, K. A., Agrawal, S., Christensen, A. E., & Myers, L. J. (2009).
Spatial concepts are critical in Science education. Retrieved 9 July 2009, from http://www.educationcounts.govt.nz/__data/assets/pdf_file/0011/11234/dsau3-No_qualifications.pdf.
Lillis, D. A. (1999). Ethnic minority science students in New Zealand: Attitudes and
learning environments. Unpublished PhD, Curtin University of Technology, Perth.

352
Liu, X. (2004). Using concept mapping for assessing and promoting relational conceptual change in science. Science Education, 88, 373-396.
Lombrozo, T., Thanukos, A., & Weisberg, M. (2008). The importance of
understanding the nature of science for accepting evolution. Evo Edu Outreach, 1, 290-298.
Longbottom, J. E. (1999). What, how and why: reconceptualising science education.
Unpublished PhD thesis, University of Canterbury, Christchurch, New Zealand.
Lucas, U., & Mladenovic, R. (2007). The potential of threshold concepts: an
emerging framework for educational research and practice. London Review of Education, 5(3), 237-248.
Lucken, M., Hlawatsch, S., & Raack, N. (2006). Primary system competency with
"System Earth" education: Evaluation of the results of the German project 'Forschungdialog: System erde" in Geoscience Education: Understanding System Earth (p. 81). Paper presented at the Fifth GeoSciEd conference, Hannover. Germany.
Lyytinen, K., Newman, M. (2006). "Punctuated Equilibrium, Process Models and
Information System Development and Change: Towards a Socio-Technical Process Analysis," Case Western Reserve University, USA. Sprouts: Working Papers on Information Systems, 6(1). http://sprouts.aisnet.org/6-1.
Manduca, C. A. & Mogk, D. W. (2006). Earth and mind: how geologists think and
learn about the Earth. Special Paper 413, Geological Society of America. 188pp.
Marques, L. F., & Thompson, D. B. (1997). Portuguese students' understanding at
age 10/11 and 14/15 of the origin and nature of the Earth and the development of life. Research in Science and Technology Education, 15, 29-51.
Marques, L., Paria, J., & Kempa, R. (2003). A study of students' preconceptions of
the organisation and effectiveness of fieldwork in earth sciences education. Research in Science and Technological Education, 21, 265-278.
Mathewson, J. H. (1999). Visual-spatial thinking: an aspect of science overlooked by
educators. Science Education, 83(1), 33-54. Matthews, W. J. (2003). Constructivism in the classroom: epistemology, history, and
empirical evidence. Teacher Education Quarterly, 30(3), 51-64. Mayer, V. J. (1995). Using the Earth System for integrating the science curriculum.
Science Education, 79(4), 375-391. Mayer, V. J. (1997). Global science literacy: An Earth System View. Journal of
Research in Science Teaching, 34, 101-105.

353
Mayer, V. J., & Armstrong, R. (1990). What every 17 -year old should know about planet earth: The report of a conference of educators and geoscientists. Science Education, 74(2), 155-165.
Mayer, V. J., Kumano, Y. & Fortner, R.W. (1999). The role of system science in
future school science curricula. Studies in Science Education, 34, 71-91. Mayr, E. (1982). The growth of biological thought: diversity, evolution, and
inheritance. MA:Belknap Press of Harvard University. Mayr, E. (2001). What Evolution Is. New York: Basic Books (Perseus Books
Group). McConnell, D. A., Steer, D. N., Owens, K. D., Knott, J. R., Van Horn, S., Borowski,
W., Dick, J., Foos, A., Malone, M., McGrew, H., Greer, L., & Heaney, P. J. (2006). Using concept tests to assess and improve student conceptual understanding in introductory geoscience courses. Journal of Geoscience Education, 54, 61-68.
McGee, M. G. (1979). Human spatial abilities: psychometric studies and
environmental, genetic, hormonal and neurological influences. Psychological Bulletin, 86(5), 889-918.
McIntyre, D. (2005). Bridging the gap between research and practice. Cambridge
Journal of Education, 35(3), 357-382. McLeay, H. (2006). Imagery, spatial ability, and problem solving. Mathematics
Teaching., March(195), 36-39. McLoughlin, A. S. (2004). Engineering active and effective field trips. Clearing
House, 77, 160-163. McPhee, J. (1981). Basin and range. New York: Farrer, Straus and Giroux. Meck, W. H. (2005). Neuropsychology of timing and time perception. Brain and
Cognition, 58(1), 1-8. Ministry of Education. (1994). Biology in the New Zealand Curriculum. Wellington:
Learning Media. Ministry of Education. (2006). Achievement standards consistency review. Retrieved
18th September 2009, from http://www.minedu.govt.nz/NZEducation/EducationPolicies/Schools/Curriculum
Ministry of Education. (2007). The New Zealand Curriculum. Wellington. Learning
Media.

354
Ministry of Education. (2008). School leavers with little or no formal attainment. Retrieved 19th September 2009, from NCEA/NCEA/AchievementStandardsConsistencyReview.aspx
Ministry of Education. (2009). A focus on science achievement and engagement.
Wellington: Ministry of Education. http://www.minedu.govt.nz/NZEducation/EducationPolicies/Schools/Curriculum
Ministry of Education. (n.d.). http://www.minedu.govt.nz/ Ministry of Education. (1994). Biology in the New Zealand Curriculum. Wellington:
Learning Media. Mitchelmore, M. C. (1980). Three dimensional geometric drawing in three cultures.
Education Studies in Mathematics, 11, 205-216. Montangero, J. (1992). The development of the diachronic perspective in children. In
F. Macar: Time action and cognition (pp. 55-65): Amsterdam: Kluwer Academic Publishers.
Montangero, J. (1996). Understanding changes in time: London: Taylor and Francis. Montgomery, K. (2009). Using a historical controversy to teach critical thinking, the
meaning of 'theory' and the status of scientific knowledge. Journal of Geoscience Education, 57(3), 214-221.
Mundy, J. F. (1987). Spatial training for calculus students: Sex differences in
achievement an in visualisation ability. Journal for Research in Mathematics Education, 18, 126-140.
Murphy, P. K., & Alexander, P. A. (2004). Persuasion as a dynamic,
multidimensional process: An investigation of individual and intra-individual differences. Educational Research Journal, 41(2), 337-364.
Murray, C. (2003). Measuring achievement: the west and the rest. Public Interest,
(152), 65-73. National Astronomy and Space Administration (NASA). (1988). Earth System
Science: A closer view - Report of the Earth System Sciences Committee (ESSC). p. 208.
Nehm, R. H., Sun Young Kim., & Sheppard, K. (2009). Academic preparation in
Biology and advocacy for teaching evolution: Biology versus nonbiology teachers. Science Education, 46(1), 1-25.
New Zealand Council of Educational Research: http://ww w.nzcer.org.nz/ New Zealand Qualifications Authority: http:// www .nzqa.govt.nz/ncea/index.html

355
Nieto-Obregon, J. (2001). Geologic time scales, maps and the chronoscalimeter. Journal of Geoscience Education, 49, 25-29.
Noonan-Pulling, L. C., & Good, R. G. (1999). Deep time: middle school students'
ideas on the origins of earth and life on earth. Paper presented at the National Association for Research in Science Teaching Annual Meeting, Boston, MA.
Novak, J. D., & Gowin, D.R. (1984). Learning how to learn. New York: Cambridge
Press. NZQA. (2009a). Science 1.13: Demonstrate understanding of the formation of
surface features in New Zealand. Retrieved November 1st., 2009, from http://www.tki.org.nz/e/community/ncea/docs/science1_13_int_sept09.doc
NZQA. (2009b). Science 1.14: Demonstrate and understanding of the cycling of
Carbon. Retrieved November 1st, from http://www.tki.org.nz/e/community/ncea/docs/science1_14_int_sept09.doc
O'Brien, T. (2000). A toilet paper timeline of evolution. The American Biology
Teacher., 62(8), 578-583. Ohlsson, S. (2009). Resubsumption: A possible mechanism for conceptual change
and belief revision. Educational Psychologist. Philadelphia, 44(1), 20-32. Orion, N. (1993). A practical model for the development and implementation of field
trips as an integral part of the science curriculum. School Science and Mathematics, 93, 325–331.
Orion, N. (2003). The outdoor as a central learning environment in the global
Science Literacy Framework. In From theory to practice. In V. J. Mayer (Ed.), Implementing global science literacy (pp. 53 – 66). Columbus: Ohio State University Press.
Orion, N. (2007). A holistic approach for science education for all. Eurasia Journal
of Mathematics, Science & Technology Education, 3(2), 111-118. Orion, N., & Ault, C. R. (Jr). (2007). Learning Earth Sciences. In S. K. Abell, &
Lederman, N. G. (Ed.), Handbook of research in science education (pp.653-687). Mahwah, New Jersey: Erlbaum.
Orion, N., & Fortner, R. (2003). Mediterranean environmental education and earth
sciences through earth systems education. Mediterranean Journal of Educational Studies, 8(1), 97-111.
Orion, N., & Hofstein, A. (1991). The measurement of students’ attitudes towards
scientific field trips. Science Education, 75(5), 513-523. Orion, N., & Kali, Y. (2005). The effect of an earth-science learning program on
students' scientific thinking skills. Journal of Geoscience Education, 53(4), 387-394.

356
Orion, N., Ben-Chaim, D., & Kali, Y. (1997). Relationship between earth- science eduation and spatial visualization. Journal of Geoscience Education, 45, 129-132.
Orion, N., Hofstein, A., Tamir, P., & Giddings, G. J. (1997). Development and
validation of an instrument for assessing the learning environment of outdoor science activities. Science Education., 81, 161-171.
Osborne, J. F. (2007). In praise of armchair science education. Paper presented at the
NARST Conference, New Orleans. Oversby, J. (1996). Knowledge of earth science and the potential for its
development. School Science Review, 78(91-97). Paivio, A. (1986). Mental representations: A dual coding approach. New York:
Oxford University Press. Pallrand, G. S., F. (1984). Spatial ability and achievement in introductory physics.
Journal of Research in Science Teaching, 21(5), 507-516. Patton, M. Q. (1990). Qualitative evaluation and research methods (2nd ed.).
Newbury Park, CA: Sage. Peladeau, N. & Lacouture, Y. (1993). SIMSTAT: Bootstrap computer simulation
and statistical program for IBM computers. Behaviour Research Methods, Instruments & Computers, 25(3), 410’413
Petty, R. E., & Cacioppo, J. T. (1986). Communication and persuasion: Central and
peripheral routes to attitude change. New York: Springer-Verlag. Philips, D. J. (2003). Lessons from New Zealand's National Qualifications
Framework. Journal of Education and Work, 16(3), 289-304. Piaget, J. (1952). The origins of intelligence in children. New York: International
University Press. Piaget, J., Inhelder, B., & Szeminska, A. (1960). The child’s conception of geometry.
London: Routledge & Kegan Paul. Piaget, J., & Inhelder, B. (1967). The child’s conception of space. London:
Routledge & Kegan Paul. Originally published in 1948. Piaget, J. (1969). The child's conception of time. (translation: A.J.Pomerans): New
York: Basic Books. (Original: Le développement de la notion de temps chez l'enfant. Paris: P.U.F., 1927).
Piburn, M. (1980). Spatial reasoning as a correlate of formal thought and science
achievement for New Zealand students. Journal of Research in Science Teaching, 17(5), 443-448.

357
Piburn, M. D., Reynolds, S. J., Leedy, D. E., McAuliffe, C. M., Birk, J. P., & Johnson, J. K. (2002). The hidden earth: visualization of geologic features and their subsurface geometry. Paper presented at the National Association for Research in Science Teaching Annual Meeting.
Pinker, S. (2002). The blank slate: The modern denial of human nature: Penguin
Putman. Pintrich, P. R., Marx, R. W., & Boyle, R. A. (1993). Beyond cold conceptual change:
The role of motivational beliefs and classroom contextual factors in the process of conceptual change. Review of Educational Research, 6, 167-199.
Planck, M. (1937). Scientific autobiography and other papers (translated by. F.
Gaynor). New York, Philosophical Library. Playfair, J. (1802). Illustrations of the Huttonian theory of the Earth. Edinburgh:
William Creech. Plymate, G. T., Evans, K.R., Gutierrez, M., Erwin J., & Mantei, E. J. (2005). Alumni
of geology B.S. program express strong support for field geology and related field and laboratory experiences. Journal of Geoscience Education, 53(2), 215-217.
Pohl, R. R. (2002). Earth and Environmental Science: Your step by step guide to
exam success. Sydney: Pascal Press. Pollock, J. (2009). Changes in Geology education in New Zealand schools.
Geological Society of New Zealand Newsletter, 149, 23. Pollock, S. J. (2004). No single cause: Learning gains, student attitudes, and the
impacts of multiple effective reforms. Paper presented at the Physics Education Research Conference, California State University, Sacramento, CA.
Pooley, C. (2005). Conflict and tension: an analysis of the dichotomy which exists
within the science curriculum. NZ Science Teacher, (110), 26-29. Posner, G. J., Strike, K. A., Hewson, P., and Gertzog, W. A. (1982). Accommodation
of a scientific conception: Toward a theory of conceptual change. Science Education, 66, 211-277.
Reis, P., & Galvao, C. (2009). Teaching controversial socio-scientific issues in
Biology and Geology classes: A case study. Retrieved 13th December, 2009, from http://ejse.southwestern.edu
Repcheck, J. (2003). The man who found time: James Hutton and the discovery of
the earth's antiquity. London: Simon and Schuster.

358
Reynolds, S. J., Johnson, J. K., Piburn, M. D., Leedy, D. E., Coyan, J. A., & Busch, M. M. (2005).Vizualization in undergraduate geology courses. In J. K. Gilbert (Ed.), Visualization in science education (pp. 253-266). Boston: Kluwer.
Riggs, E. M. (2005). Field-based education and indigenous knowledge: Essential
components of geoscience education for native American communities. Science Education, 89, 296-313.
Riggs, E. M., & Riggs, D. M. (2003). Cross-cultural education of Geoscience
professionals: The conferences of the indigenous earth sciences project. Journal of Geoscience Education, 51(5), 527.
Riggs, E. M., & Tretinjak, C. A. (2003). Evaluation of the effectiveness of a
classroom and field-based curriculum sedimentation and change through time for pre-service elementary schoolteachers. Paper presented at the Geological Society of America annual meeting, Seattle, WA.
Rutledge, M. L., & Warden, M. (2000). Evolutionary theory, the nature of science &
high school biology teachers: critical relationship. The American Biology Teacher, 62(1), 23-31.
Sadler, T. D. (2004). Informal reasoning regarding socio-scientific issues: A critical
review of research. Journal of Research in Science Teaching, 41(5), 513-536. Safayeni, F., Derbentseva, N., & Canas, A. J. (2005). A theoretical note on concepts
and the need for cyclic concept maps. Journal of Research in Science Teaching, 42(7), 741-766.
Scott, E. C. (2004). Evolution vs Creationism: An Introduction. London, England:
University of California Press. Seddon, G. M., & Shubber, K. E. (1985). Learning the visualization of three
dimensional spatial relationships in diagrams at different ages in Bahrain. Research in Science and Technological Education, 3(2), 97-108.
Selles-Martinez, J. (2006). Misleading analogies of mantle dynamics introduce the
belief that it is liquid. Paper presented at the GeoSciEd V IGEO conference, Bayreuth.
Semken, S. (2007). Cognitive and affective outcomes of a Southwest Place-based
approach to teaching introductory geoscience. Paper presented at the Proceedings of the NARST 2007 Annual Meeting (New Orleans, LA, United States), New Orleans.
Sibley, D. F., Anderson, C. W., Heidemann, M., & Merrill, J. E. (2007). Box
diagrams to assess students' systems thinking about the rock, water and carbon cycles. Journal of Geoscience Education, 55(2), 138-147.

359
Siegel, A. W., & White, S. H. (1975). The development of spatial representations of large scale environments. In H. W. Reese (Ed.), Advances in Child Development and Behaviour (Vol. 10, pp. 9-55). New York: Academic Press.
Sinatra, G. M., & Pintrich, P. R. (Eds.). (2003). Intentional conceptual change.
Mahwah, NJ: Lawrence Erlbaum Associates. Sinatra, G. M., Southerland, S. A., McConaughy, F., & Demastes. J.W. (2003).
Intentions and beliefs in students' understanding and acceptance of biological evolution. Journal of Research in Science Teaching, 40(5), 510-528.
Smith, M. U. (1994). Counterpoint: Belief, understanding, and the teaching of
evolution. Journal of Research in Science Teaching, 31(5), 591-597. Smith, M. U., & Siegel, H. (2004). Knowing, believing, and understanding: What
goals for science education? Science & Education., 13, 553-582. Smith, S. (2005). Using virtual reality tools in design and technical graphics
curricula: An experience in learning. Engineering Design Graphics Journal, 69(1), 16-25.
Southerland, S. A., Johnston, A., & Sowell, S. (2006). Describing teachers’
conceptual ecologies for the Nature of Science. Science Education, 1, 1-33. Stokes, A., King, H., & Libarkin, J.C. (2007). Research in science education:
Threshold concepts. Journal of Geoscience Education, 55(5), 434-439. Stow, D. A. V., & McCall, G. J. H. (Eds.). (1996). Geoscience education and
training: Preparing for the 21st century. Rotterdam: A.A. Balkema. Strike, K. A., & Posner, G. J. (1992). A revisionist theory of conceptual change. In
R. A. Duschl & R. J. Hamilton (Eds.), Philosophy of science, cognitive psychology, and educational theory and practice. (pp. 147-176): New York: State University of New York Press.
Swarts, F. A., Anderson, O.R., & Swetz, F. J. (1994). Evolution in secondary high
school biology textbooks of the People's Republic of China, United States of America and the latter stages of the Soviet Socialist Republics. Journal of Research in Science Teaching, 31, 475-505.
Templeton, A. R. (2002). Out of Africa, again and again. Nature, 416, 45-51. Thagard, P. (1991). Concepts and conceptual change: Dordrecht, The Netherlands:
Kluwer. Thagard, P. (1992). Conceptual revolutions. Princeton, NJ: Princeton University
Press. Thatcher, R. W., Walker, R. A., & Giudice, S. (1987). Human cerebral hemispheres
develop at different rates and ages. Science, 236, 1110-1113.

360
Titus, S., & Horsman, E. (2009). Characterizing and improving spatial visualization skills. Journal of Geoscience Education, 57(4), 242-254.
The VR Worx 2.0 [Computer Software]. (2000). Pittsburgh, Pennsylvania: VR
Toolbox, Inc. Thomas, J. A. G. (1966). An introduction to geological maps. London: George Allen
& Unwin Ltd. Thompson, D. (1997). From a physical geology-geography education for a few aged
11-16 to an earth-environmental science education for all aged 4-16. Paper presented at the Second International Conference on Geoscience Education: learning about the earth as a system, University of Hawai'i, Hilo.
Thompson, D. A., W. (1942). On growth and form. (2nd. ed.). Cambridge, UK:
Cambridge Univ. Press. Thompson, D. B., Praia, J. & Marques, L. (2000). The importance of history and
epistemology in the designing of Earth Science curriculum materials for general science education. Research in Science & Technological Education, 18(1), 45-63.
Treagust, D. F., & Duit, R. (2008). Conceptual change: a discussion of theoretical,
methodological and practical challenges for science education. Cultural Studies of Science Education, (3), 287-328.
Trend, R. (1997). An investigation into understanding of geological time among 10-
and 11-year old children, with a discussion of implications for learning of other geological concepts. Paper presented at the Second International Conference on Geoscience Education, Hilo, Hawaii.
Trend, R. (1998). An investigation into understanding of geological time among 10-
and 11-year old children. International Journal of Science Education, 20(8), 973-988.
Trend, R. (2000). Conceptions of geological time among primary teacher trainees,
with reference to their engagement with geosciences, history and science. International Journal of Science Education, 22(5), 539-555.
Trend, R. D. (2001). Deep time framework: A preliminary study of U.K. primary
teachers' conceptions of geological time and perceptions of geoscience. Journal of Research in Science Teaching, 38(2), 191-221.
Trend, R. (2001a). An investigation into the understanding of geological time among
17-year-old students, with implications for the subject matter knowledge of future teachers. International Research in Geographical and Environmental Education, 10(3), 298-321.
Trend, R. D. (2005). Individual, situational and topic interest in geoscience among
11- and 12-year-old children. Research Papers in Education, 20(3), 271-302.

361
Trend, R. D. (2009). The power of deep time in geoscience education: linking ‘interest’, ‘threshold concepts’ and ‘self-determination theory’. Studia Universitatis Babe-Bolyai, Geologia, 54(1), 7-12.
Tretter, T. R., Jones, M. J., Andre, T., Negishi, A., & Minogue, J. (2006a).
Conceptual boundaries and distances: students’ and experts’ concepts of the scale of scientific phenomena. Journal of Research in Science Teaching, 43(3), 282-319.
Tretter, T. R., Jones. M. G., & Minogue, J. (2006b). Accuracy of scale conceptions
in Science: mental manoeuvrings across many orders of spatial magnitude. Journal of Research in Science Teaching, 43(10), 1061-1085.
Truscott, J. B., Boyle, A., Burkill, S., Libarkin, J. & Lonsdale, J. (2006). The concept
of time: can it be fully realised and taught? Planet, 17, 21-23. Turcotte, D. L. (2006). Modeling Geocomplexity: "A New Kind of Science". In C.
Manduca and D. Mogk (Eds.), Earth & Mind: How Geoscientists Think and Learn about the Earth. Geological Society of America.
Turner, C., & Frodeman, R. L. (1996). Place in contemporary political debates, II:
The Earth Sciences as paradigmatic science. Paper presented at the Geological Society of America Annual Meeting. Denver, CO (p. A-259). Denver, CO.
Tyson, L. M., Venville, G. J., Harrison, A. G., & Treagust, D. F. (1997). A
multidimensional framework for interpreting conceptual change events in the classroom. Science Education, 81, 397-404.
Vallender, G. D. (1981). Earth Science in New Zealand secondary schools. New
Zealand Science Teacher, 29, 5-11. Vallender, G. D. (1997). A study of Earth Science education in New Zealand.
(Unpublished report). Wellington: Royal Society New Zealand (RSNZ) Teaching Fellowship.
Van Loon, H. W. (1926). The story of mankind. Retrieved 22 August, 2009, from
http://www.authorama.com/story-of-mankind-3.html Van Zele, E. (2004). Improving the usefulness of concept maps as a research tool for
science education. International Journal of Science Education, 26(9), 1043-1064.
Vandenberg, S. G., & Kuse, A. R. (1978). Mental rotations, a group test of three
dimensional spatial visualization. Perceptual and Motor Skills, 47, 599-604. Vasconcelos, C., & Salvador, P. (2003). Scale for the evaluation of outdoor activities
in natural sciences. Paper presented at the Fourth GeoScEd IV Conference., Calgary, Canada.

362
Venville, G. J. (2008). Is the crisis in science education continuing? Current senior secondary science enrolment and tertiary entrance trends in Western Australia. Teaching Science, 54(2), 41-46.
von Glasersfeld, E. (1995). A constructivist approach to teaching. In L. P. Steffe & J.
Gale (Eds.), Constructivism in education (pp. 3-16). New Jersey: Hillsdale. Vosniadou, S. (1992). Knowledge acquisition and conceptual change. Applied
Psychology: an international review, 41, 347-357. Vosniadou, S. (1994). Capturing and modelling the process of conceptual change.
Learning & Instruction, 4(1), 45-70. Vosniadou, S. (2001a). What can persuasion research tell us about conceptual
change that we did not already know? International Journal of Educational Research, 35, 731-737.
Vosniadou, S. (2003). Exploring the relationship between conceptual change and
intentional learning. In G. M. Sinatra, & P. R. Pintrich, (Eds.), Intentional conceptual change: Mahwah, NJ: Erlbaum.
Vosniadou, S. (2007). The cognitive-situative divide and the problem of conceptual
change. Educational Psychologist, 42(1), 55-66. Vosniadou, S. (2007b). Conceptual change and education. Human Development, 50,
47-54. Vosniadou, S. (2009). Conceptual metaphor meets conceptual change: Yes to
embodiment, no to fragmentation. Human Development., 52(3), 198-205. Vosniadou, S., & Kollias, V. (2003). Using collaborative, computer supported model
building to promote conceptual change in science. In E. Corte, L. Verschaffel, N. Entwistle & J. van Merrienboer (Eds.)., Powerful Learning Environments: Unravelling basic components and dimensions. Advances in Learning and Instruction. Oxford: Pergamon Elsevier.
Vosniadou, S., Ioannides, C., Dimitrakopoulou, A., & Papademetriou, E. (2001b).
Designing learning environments to promote conceptual change in science. Learning and Instruction, 11, 381-419.
Waugh, A. (1999). Time. London: Headline Book Publishing. White, O. L. (2004). Analyzing college perceptions of geological time through the
use of graphic timelines. Paper presented at the National Association of Research in Science Teaching Annual Meeting, 77th, Vancouver, BC.
Woods, B. S., & Murphy, P. K. (2001). Separated at birth: the shared lineage of
research on conceptual change and persuasion. International Journal of Educational Research, 35, 633-649.

363
Woods, C. S., & Scharmann, L. C. (2001b). High school students' perceptions of evolutionary theory. Electronic Journal of Science Education, 6(Article 2).
Zavotka, S. (1987). Three dimensional computer animated graphics: A tool for
spatial instruction. Educational Communications and Technology Journal., 35, 133-144.
Zeidler, D. L., Sadler, T. D., Simmons, M. L., & Howes, E. V. (2005). Beyond STS:
A research-based framework for socio-scientific issues education. Science Education, 89(3), 357-377.
Zeidler, D. L., Sadler, T. D., Applebaum, S., & Callahan, B. E. (2009). Advancing
reflective judgment through socio-scientific issues. Journal of Research in Science Teaching, 46(1), 74-101.
Zepke, N., Leach, L., Brandon, J., Chapman, T., Neutze., Rawlins, P., & Scott, A.
(2005). Standards based assessment in the senior secondary school – A research synthesis. (NZQA contract). Palmerston North: Massey College of Education.
Zwart, P. J. (1976). About time: Philosophical inquiry into the origin and nature of
time. Amsterdam: North-Holland Publishing. Every reasonable effort has been made to acknowledge the owners of copyright material. I would be pleased to hear from any copyright owner who has been omitted or incorrectly acknowledged.

364
APPENDIX 1
Woodham Drive Ashburton 12 October 2004 The Principal Dear I have recently been in contact with your head of science faculty Mr Alan Munro. Mr Munro has agreed to allow his science students to act as a trial school for the pilot development of research instruments as part of my extramural doctoral research programme at the Science and Mathematics Education Centre (SMEC) at Curtin University in Perth. I teach at Ashburton College. The research involves the distribution of questionnaires to each year level of students studying science so that information can be gathered on several aspects of student conceptualisations of the fossil record and geological time in an Earth Science context. This N.Z. science strand is of considerable international educational research interest and has its own intrinsic value. Along with a questionnaire designed to gather information about the science curriculum taught in your school there are also questions for students designed to establish demographic data for statistical analysis purposes. Student participation is voluntary and no names are required. Any student’s wish not to be involved will be respected. Individuals will not be identifiable in thesis work or in any educational conferences or scholarly journals. The purpose of this letter is to inform you and to request your permission for your schools participation. It is estimated that the questionnaires would take a class up to 45 minutes (or allowance of one period) to complete. If you have any difficulties with the request, or would like further information concerning this research study, please contact me at the address above. I am very aware of the time these research questionnaires take, and I thank you for your support. Yours faithfully, Glenn Vallender (Doctoral Student)
Ph. … ...….. Fax. .………
Email. ge.vallender@

365
Woodham Drive Ashburton 12 October 2004 Dear Parents and Guardians, The purpose of this letter is to inform you about my visits to your child’s Science class and to request your permission to interview your child. I am a doctoral student in the Science and Maths Education Centre at the Curtin University of Technology in Perth, Western Australia, but I work and live in Ashburton, New Zealand. My research is concerned with the way in which students and adults develop their concepts of geological time and the fossil record, and the way in which different schools and tertiary institutions in different countries present their instruction. I have permission from the principal, Mr/Mrs/Dr XXXX and your child’s science teacher and head of science to enter the school to carry out properly conducted interviews and questionnaires with a number of students from each year level. Interviews will take between ten and twenty minutes and will not interfere with any teaching programme. I have found in the past that these discussions can be helpful as well as informative. Student participation for a discussion interview is entirely voluntary and involves answering further questions to tease out the details of their questionnaire responses, and to provide a cross reference for the collected data. Any student’s wish not to be involved will be respected. No individual will be identifiable and they will be reported anonymously in my thesis and in any subsequent educational conference or scholarly journal. Confidentiality is important and assured. Information gathered is totally independent of any school work and has no bearing on any assessment. If you have any questions or concerns, please feel free to contact me at the above address. If you can’t contact me personally, please leave a message and I will return your call. Thank you for your support. Yours faithfully, Glenn Vallender (Doctoral Student)
Ph. ……………. Fax. ……………
Email. ge.vallender@
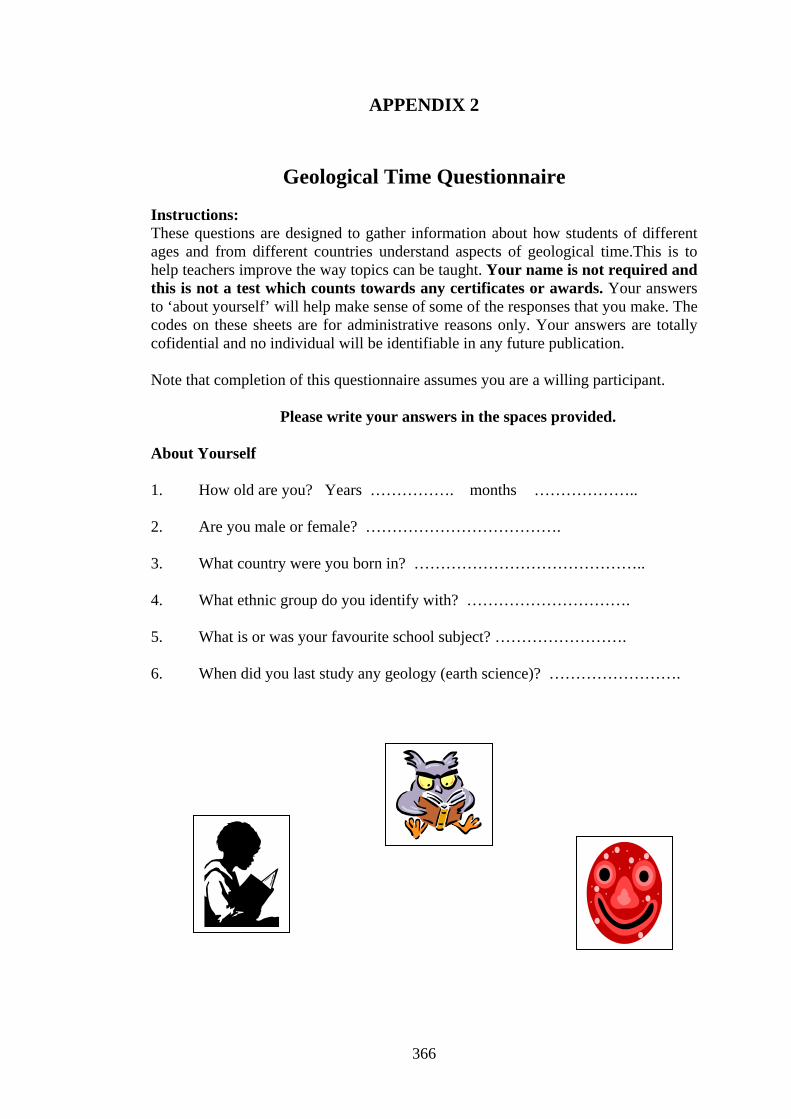
366
APPENDIX 2
Geological Time Questionnaire Instructions: These questions are designed to gather information about how students of different ages and from different countries understand aspects of geological time.This is to help teachers improve the way topics can be taught. Your name is not required and this is not a test which counts towards any certificates or awards. Your answers to ‘about yourself’ will help make sense of some of the responses that you make. The codes on these sheets are for administrative reasons only. Your answers are totally cofidential and no individual will be identifiable in any future publication. Note that completion of this questionnaire assumes you are a willing participant.
Please write your answers in the spaces provided.
About Yourself 1. How old are you? Years ……………. months ……………….. 2. Are you male or female? ………………………………. 3. What country were you born in? …………………………………….. 4. What ethnic group do you identify with? …………………………. 5. What is or was your favourite school subject? ……………………. 6. When did you last study any geology (earth science)? …………………….

367
Your Ideas About Fossils and Time. 1. The person in the diagram below is standing on top of layers of marine
sedimentary rock containing fossils. Imagine you are looking at an exposed sea cliff face.
( a) In the box above, place the fossils in order from the oldest fossil to the youngest fossil. (Clue: marine sedimentary rock is originally deposited in horizontal layers and the layers have not been tipped upside down). (b) Name the fossils which are the same age? …………………………………………………………………………………………………… …………………………………………………………………………………………………… (c) In the picture for question 1 above, describe how this rock exposure might
have been formed. …………………………………………………………………………………………………… ……………………………………………………………………………………………………
Gastropo
Trilobite
Cla
Ammonit
Coral
Snail Name of fossil in age order (1 is
oldest)
1. ………..…… 2. ………….…. 3. ………….…. 4. …………... 6. …………...

368
Snail
90 million years
Coral
Clam
100 million years
2. The illustration below represents a sequence of rock layers.
Describe the geological events and processes which might have created this sequence of layers based on their order of formation. The layers have not been tipped upside down. ……………………………………………………………………………………...… ………………………………………………………………………………………... 3. The following picture represents a rock exposure that contains three types of fossil animal (snail, coral and clam). Two layers of igneous rock lie between the layers containing the fossils. The ages of the igneous rock layers have been accurately dated in the laboratory by scientists and recorded beside the layers.
=limestone
=sandstone
= bits of tree
=clam
=shark’s tooth
= Igneous rock

369
What is the age (in years) of the three different fossils (snail, coral and clam). Ages are: a) snail …………… …… b) coral ………………… c) clam ………………… 4. The illustration below represents three different rock exposures containing fossils.
Write down the name of the fossils in order of age, from oldest to youngest
Youngest
1. ………………. 2 ………………. 3 ………………. 4………………. 5………………. 6………………. 7………………. 8………………. 9……………… 10 ……………..
Oldest

370
5. The following diagram illustrates a geological cross section. List, in time order, the events that might have happened to cause this situation.
Event one ……………………………………………………………………………….……… Event two ……………………………………………………………………………….……… Event three ………………………………………………………………………….………… Event four …………………………………………………………………………….……… Event five ……………………………………………………………………………………… Event six ……………………………………………………………………………………… 6. Look at the two letters below and then draw what you think they would look
like when they are upside down and back to front!
e G (a) Upside down
e G (b) Back to front
Riverbed today Bands are layers of different kinds of sedimentary rock
Igneous intrusion

371
7. The following block diagrams illustrate incomplete geological structures. Draw in where you think the rock layer continues on the side and/or top of the blocks.
(a) (b) (c)
Rock layer

372
(d) Sometimes rock layers can be broken and offset by faults. Draw on the diagram what you think the rock layer will look like on the top face and side face of this block diagram.
7 (a) This diagram is the same as 6 (c). Imagine that this block is cut vertically
down and split apart along the line from A to B. Draw a cross section of what you think the layers are like along this line when the two halves are separated.
Draw sections in the boxes
below A X Y A B B
X Y
This side has gone up
This side has gone down
Fault Line
Fault Line

373
7 (b) This block diagram shows rock layers represented by A, B, C and D. Draw in the box, what you think the layers look like when the block is cut vertically downwards along X and Y.
Draw lines in box X X Y Y D C C B B A A 7 (c) The earth is like a ball made from several internal layers. In the box below,
draw what you think the inside of the earth would look like if it was made of three layers and you cut it through the middle (cross-section).
Cross-section Thank you for your help. Your honest answers will help us better understand how we go about thinking and solving different kinds of geological problems.

374
APPENDIX 3
New Zealand:
Chapter Nine: A Case Study of Geological Science in a National Curriculum
Figure 9.5. New Zealand School Regions
Wairarapa
Canterbury
Central North Is.
Hawkes Bay
Gisborne
Northland
Manawatu
Nelson/Marlborough
Otago
Southland
Taranaki
Waikato
Wanganui
Westland
Bay of Plenty
Wellington
Auckland
Chatham Islands
200 Km

375
Assessment Opportunities for Geology and Evolution in the New Zealand
National Qualifications Framework (NQF) 2002 -2010.
Note that as from 2010 some of these standards will have been aligned with changes
in the 2007 national curriculum reforms. The geoscience strand has undergone
significant change to encompass an environmental/earth systems philosophy and a
decrease in geological science content. The unit standards detailed here will become
achievement standards and also aligned with the national science curriculum
changes. This is detailed in the postscript in Chapter 9.
Key to acronyms used in standard descriptor tables:
US = unit standard. AS = achievement standard. Int. = internally assessed
Ext. = externally assessed. NQF = National Qualifications Framework
Cr. = credit value.
Note:
1. For each of the assessment standards shown below, specific details of content
range and criteria are available on the NZQA website
2. Internal assessment means that moderated assessment is carried out within
the school and not by a national exam.
3. The following tables specify titles only for assessment of fossils, geological
time and evolution.
Biology NQF Level 4 (Year 14 = age 18/19)
Standard Description Credit
value
Mode
US 8105 Explain the principles of evolution and biogeography. 4Cr Int.
Scholarship Derived from level 3 (year 13) NCEA. 0Cr Ext
Biology NQF Level 3 (Year 13 = age 17/18)
US 6317 Explain the process of speciation 4Cr Int.
US 6318 Interpret scientific evidence for human evolution. 4Cr Int.
US 6321 Investigate and describe scientific views of human
biological evolution.
3Cr Int.

376
AS 90717 Describe patterns of evolution. 3Cr Ext.
AS 90719 Describe trends in human biological and cultural evolution. 3Cr Ext.
Biology NQF Level 2 (Year 12 = age 16/17)
US 6311 Explain reasons for the special characteristics of NZ’s flora
and fauna.
3Cr Int.
AS 90459 Describe genetic variation and change. 3Cr E
Biology NQF Level 1 (Year 11 = age 15/16)
N No opportunities at this level for topics about fossils, evolution and geological time.
N N
Science NQF Level 4
US 8140 Investigate, interpret and report on geological
features, landforms and active processes of a site.
5Cr Int
US 8145 Read geological maps and interpret geological history. 4Cr Int.
US 8147 Demonstrate a knowledge of the interior of the Earth
and geophysical fields
4Cr Int.
US 8152 Collect water samples for analysis 4Cr Int.
Scholarship No opportunities in these topics.
Science NQF Level 3
US 21614 Describe the geological history of an area in the
Southwest Pacific.
3Cr Int.
US 6365 Demonstrate knowledge of geological hazards 3Cr Int.
US 6364 Use plate tectonics to explain distribution of major NZ
and Southwest Pacific geological features.
4Cr Int.
US 8153 Explain factors affecting a water resource and
its management, and plot and interpret hydrographs.
4Cr Int.
AS 90731 Describe geological processes affecting New Zealand. 5Cr Ext.

377
Science NQF Level 2
US 6362 Demonstrate an understanding of fossils. 3Cr Int
US 6360 Identify geological features from recorded
visual information.
2Cr Int.
US 6361 Investigate and report on the geology in an area. 4Cr Int.
AS 90767 Describe NZ’s geological history. 3Cr Ext
AS 90772 Describe the factors and processes involved in the
evolution of NZ plants and animals.
4Cr Ext
Science NQF Level 1
US 6356 Report on a geological resource in New Zealand. 3Cr Int.
US 6357 Identify common minerals and rocks. 3Cr Int
US 6358 Describe the formation of major rock types and describe
the rock cycle.
3Cr Int
AS 90190 Describe aspects of Geology. (30 minute exam) 3Cr Ex
NZ Assoc. of Science Educators Certificate (NZASE) derived from Curriculum
Levels 4 and 5, NCEA Level 1
US 18981 Demonstrate Knowledge of Weather 2Cr Int
US 18982 Demonstrate Knowledge of Earth Science 2Cr Int
US 18989 Demonstrate Knowledge of Earth and Space 2Cr Int

378
Table 9.6. Earth Systems principles (Mayer 1997).
Where do Geology Qualification Credits Currently Come From?
Given that comparing achievement needs to account for equal deciles it is also useful
to compare regions of similar deciles and the standards that students are gaining
credit from in learning Geology.
Regional clusters A – D shown in Figure 9.12 were derived from multivariate cluster
analysis using a minimum variance agglomerative technique (Kovach, 1998) of the
percentage of each decile per school within each administrative region. Minimum
variance clustering focuses on determining by ‘sum of squared distances’ the least
amount of variation in each cluster. These clustered regions have similar school
decile profiles. For each regional cluster, the percentage of results which gained
credits in Geology were graphed against the assessment standards which generate
credit opportunities. For each regional cluster, the percentage of results which gained
credits in Geology were then graphed against the assessment standards which
generated credit opportunities for NCEA levels 1 to 3 (Figure 9.13). The dendrogram
(Figure 9.12) shows four clear clusters of schools with similar decile profiles, three
of which are rooted at similar distances. Westland region is unique by being rooted
Understanding Guiding Principle
Understanding 1 Earth is unique, a planet of rare beauty and great value
Understanding 2
Human activities, collective and individual, conscious and inadvertent, affect planet Earth.
Understanding 3
The development of scientific thinking and technology increases our ability to understand and utilise Earth and space.
Understanding 4:
The Earth system is composed of interacting subsystems of water, rock, ice, air, and life.
Understanding 5
Planet Earth is more than 4 billion years old and its subsystems are continually evolving.
Understanding 6
Earth is a small subsystem of a solar system within the vast and ancient universe.
Understanding 7 There are many people with careers that involve study of Earth's origin, processes, and evolution” (Mayer, 1997, p. 5)

379
at a significantly greater distance suggesting a significant regional difference in
socio-economic circumstances. Are results related to socio-economic factors and
regions? Further analysis and research (especially including regional ethnicity
distributions and other socio-economic indicators such as occupations and household
incomes) is needed to independently validate these clusters.
Min
imu
m V
aria
nce
Clu
ster
An
alys
is
Squared Euclidean - Data log(e) transformed
WestlandGisborneCentral North IsBay of PlentyNorthlandSouthlandTaranakiCanterburyOtagoWairarapaNelson/MarlborouManawatuWaikatoAucklandWellingtonHawkes BayWanganui
60 50 40 30 20 10 0
Figure 9.12. Dendrogram of regional clusters of school deciles.
A
B
C
D

380
Mean Percentage of Credits Gained for all Geology Standards for Regional Clusters
(Data source: www nzqa. govt.nz)
0
10
20
30
40
50
60
1 2 3 4 5 6 7 8 9
Assessment Standards
Pe
rce
nta
ge Cluster A
Cluster B
Cluster C
Cluster D
Figure 9.13. Regional clusters and Geology credits gained.
.
Key to Standards 1 = US L3 CL8 2 = US L2 CL7 3 = US L1 CL6 4 = US 18981 L1 CL4/5 5 = US 18982 L1 CL4/5 6 = US 18989 L1 CL4/5 7 = AS 90190 L1 CL6 8 = AS L2 CL7 9 = AS L3 CL8 US = Unit standard CL = Curriculum level L = NCEA level 18981 = ‘Weather’ 18982 = ‘Geology’ 18989 = ‘Earth in Space’
Regional Clusters with Similar Decile Profiles Cluster A = Wanganui, Hawkes Bay, Wellington, Auckland, Waikato. Cluster B = Manawatu, Nelson/Marlborough, Wairarapa, Otago, Canterbury. Cluster C = Taranaki, Southland, Northland, Bay
of Plenty, Central North Is, Gisborne.
'Cluster’ D = Westland.
Clusters are derived from ‘Minimum variance’ multivariate cluster analysis based on the percentage of schools per decile. N = 434 schools
5.8%
46% 45%
3.2%

381
Interpretations
Relationships between decile ratings, school regions (Figure 9.5) and where credits
are gained for the assessment standards of Geology in the NZ curriculum are shown
in Figure 9.14. In effect this figure shows what schools teach and what students do
for the gaining of credits in Geology, within statistically clustered geographic
regions of similar decile profiles.
1. The region of Westland has a small number of secondary schools (8) in a
large and remote geographic area (where earthquakes are common) with 25% of its
schools at deciles 1 to 3 (and over 60% at deciles 1-4) (Figure 9.14). Westland
(cluster D, Figure 9.13) not only has the lowest percentage of results gaining credit
for achievement standard 90190 (“Aspects of Geology”), but the also the highest
mean percentage of results gaining credit for curriculum levels 4/5 NZASE (unit
standards 18981and 18982). It is notable also for the lowest percentage of credits
from NZASE unit standard 18989 (“Earth in Space”), an astronomy unit. These
facts confirm the common relationship between achievement and decile rating.
Ranked Percentage of Deciles 1 - 3 and No. of Schools Per Region( Min. Ed. Data for deciles in July 2006)
0
20
40
60
80
100
Gis
born
eC
entra
l N I
Nor
thla
ndW
anga
nui
Haw
kes
Bay
Bay
of P
lent
yW
aika
toA
uckl
and
Man
awat
uW
estla
ndS
outh
land
Wel
lingt
onTa
rana
ki
Nel
son/
Mar
lbo.
..C
ante
rbur
yO
tago
Wai
arar
apa
Region
% of Deciles 1-3
No. of schools
Figure 9.14. Percentage of low decile schools and school numbers per region.
2. NCEA Levels 1 to 3 unit standards makes up a very small percentage of the
total contributions to total available credits in geoscience. Over 95% of schools in all
regions and across all deciles simply do not teach these unit standards as shown in
Figure 9.12 but 53% of all secondary schools offer level 1 AS 90190. The main
reason for this is that when the 1993 Science curriculum was introduced, geological

382
science was innovatively accepted as an equal partner to physics, chemistry and
biology by most schools despite sharing five credits with astronomy. As a result,
schools were obliged to teach geological science. As can be seen from Figure 9.15
there has been an increase in the number of schools offering unit standards at each
NCEA level and a decrease in the number of schools offering achievement standards
at level 1 in geological science, but an increase in schools offering NZASE courses.
Schools offering level 2 geological science standards are stable but declining at level
3. It is unknown how many schools offer geology standards but has had no students
gaining credits. It would be rare for a whole cohort at a school to fail examinations.
Number of Schools Recording Credits Gained in all Geology Standards (N = 434 schools)
(Data source: www. nzqa.)
0
50
100
150
200
250
USLevel 1
USLevel 2
USLevel 3
NZASE18981
NZASE18982
NZASE18989
ASLevel 1
ASLevel 2
ASLevel 3
Geology Standards Gaining Credit
Nu
mb
er
of
Sch
oo
ls R
eco
rdin
g C
red
its
2005
2006
2007
Figure 9.15. Number of secondary schools teaching geoscience as represented by results gaining credit (Student passes).
Achievement standards and unit standards are perceived as appropriate for the
majority of Year 11 students who intend to continue their academic studies, although
it is likely that unit standards are perceived by secondary teachers to be of lower
quality than achievement standards (Hipkins, 2005; Zepke, 2005). Students gaining
NZASE 18981 = “Demonstrate Basic Knowledge of Weather” NZASE 18982 = “Demonstrate Knowledge of Earth Science” NZASE 18989 = “Demonstrate Knowledge of Earth and Space”

383
credits in NZASE certificate courses such as US 18982 gain credits for NCEA level
one but these courses are non-advancing to levels two and three because they are
derived from lower curriculum levels and designed for lower ability students. It also
reflects the fact that Year 11 studies have been historically entrenched in the New
Zealand psyche as the single most important (and the first) qualification required for
successful transition to employment and academia. Note the decrease (16.5%) in the
number of schools that have not recorded any results gaining credits for AS 90190 in
2006, and an increase in all other standards except unit standards at level 3. The
increase in the number of schools recording credits for NZASE certificate credits (at
lower curriculum level expectations) is a concern for future viability of the subject.
This may reflect competition by schools to provide evidence that they are ‘adding
value’ by showing that more students are gaining credits. It may also reflect that
schools may perceive that in this subject area, there is a greater chance of gaining
credits for NCEA level one by doing NZASE certificate standards at the expense of
higher curriculum levels. This would enable schools to honour the idea of
Geoscience being an essential part of the curriculum but would also allow students to
gain credits in a subject area where there is less teacher competence, confidence, and
resourcing. This may suit perceived school and teacher needs but not necessarily
student needs. Students do not choose what courses of study are offered: school
Science departments do. Hypothetically, and supported by the increase of NZASE
and US credits, the gaining of credits in geoscience appears to be a more important
goal for schools than developing higher levels of student understanding about planet
Earth.
3. For students to advance their studies in geology beyond the compulsory
curriculum years of up to Year 10, the only way currently is for schools to offer the
subject of Science at Years 12 and 13 (i.e. NCEA Levels 2 and 3 or age 16/17/18) or
offer unit standards. Geology is not a stand alone subject and ideally makes up 25%
of a year’s course in Science. However, only 8% of 434 schools actually offered
Level 3 Science and 11% offered Level two Science, so studying Geology
effectively dies at age 16 (end of Year 11) and of those students who gained credits
in Geology at Level 1, 46% were at curriculum Level 4/5 and 45% at curriculum
level 6. The level of conceptual knowledge of geological processes across the whole
population is therefore likely to be very low.

384
The distributions of results gaining credit across all standards that contribute to
learning and assessment in the geological sciences for 2005 to 2007 (Figure 9.16)
Results are published in April of the following year on www. nzqa.
Distribution of Results Gaining Credit in Geology for National Means (N = 435 schools in 17 Regions)
0
10
20
30
40
50
60
70
All Unit Std's (Internallyassessed and at Curriculum
level 6)
NZ Assoc of Sc EducatorsNZASE (Internally assessed
and at curriculum levels3/4/5)
All Ach Stds (externallyassessed and at curriculum
level 6)
Pe
rce
nta
ge
of
RG
C
2005
2006
2007
Figure 9.16. Standards contributing to results gaining credit in geological science.
These results indicate that the numbers of schools (Figure 9.16) and therefore
candidate numbers learning and being assessed in the geological sciences, continues
to decline (note that Astronomy is not considered here as a geological science, but is
part of the Planet Earth and Beyond strand of the national curriculum). The key
aspect of these changes is that the growth of NZASE credits for NCEA level 1 (and
at the lower curriculum levels of 3, 4 and 5) is at the expense of the achievement
standards.
The achievement standard AS 90190 (Aspects of Geology) at Year 11 dominates
these credits with around only 40 to 50 schools gaining student credits in geology at
Years 12 and 13. Students gain their credits for level 1 NCEA in geological science
dominantly through internally assessed low curriculum level NZASE standards
rather than from higher level externally assessed examinations in achievement
standards. Only around 10% of credits gained come from unit standards which are
also internally assessed and do not cover the same concepts as achievement standard
AS 90190 “Aspects of Geology”.

385
Percentages of Total Geology Credits Gained Per Region in New Zealand for 2006
0 10 20 30 40 50 60 70
Auckland ( n = 96)
Bay of Plenty (n = 30)
Canterbury (n = 49)
Central North Island (n =13)
Gisborne (n = 9)
Hawkes Bay (n = 23)
Manawatu (n = 15)
Nelson/Marlborough (n =18)
Northland (n = 32)
Otago (n = 28)
Southland (n = 14)
Taranaki (n = 13)
Waikato (n = 30)
Wairarapa (n = 9)
Wanganui (n = 11)
Wellington (n = 37)
Westland (n = 8)
Region (No. of schools per region in brackets)
Percentage
CL 8 AS
CL 7 AS
CL 6 AS 90190
US 18989
US 18982
US 18981
CL 6 US
CL 7 US
CL 8 US
Figure 9.17 Regional results that gain credits in Geology.
N = 434 Secondary Schools. The new 2010 Science curriculum will change all this again with emphasis on Earth
Systems and Earth’s surface features rather than geological aspects of history, fossils
and time. A new curriculum implies different conceptual assessment and
comparative data will be not possible after 2011. It is likely that the current trends in
credit distributions will continue with the extinction of Year 11 geology imminent.
Key: CL = National Science curriculum level. 189xx = NZASE standards US = Unit Standards. AS =Achievement Standards

386
3. Figures 9.17 and 9.18 provide a breakdown of internal and external student
examination results that gain them credit in Geology assessment standards by
geographic region. Unit standards are internally assessed or in the case of
NZASE standards, ‘commercially’ available with essentially all students
sitting a pre-existing task.
Most unit standard assessment tasks are derived from materials developed by the
National Qualifications Authority in June 1998 (NZQA Assessment Guide). The
authenticity, validity and reliability issues involved (and associated NZQA
moderations) in the continued unmodified use of these materials for students in
gaining credit by unit standards in 2008 are obvious. Although NZASE unit
standards have undergone some ‘cosmetic’ revision in 2006, assessment tasks have
remained essentially the same.
Achievement standard 90190 “Aspects of Geology” (blue bars in Figure 9.17), is a
key geology assessment standard because the majority of schools and the maximum
number of students are involved and with the teaching and learning of geological
science at secondary school barely existing beyond this level. Hawkes Bay region is
notable for the large percentage of results (24%) generated from curriculum level
eight standards and the relatively low percentage (23%) generated from AS 90190. It
is even more notable that in this region there are no credits generated from
curriculum level 7 or Year 12. In fact, only 41% of all regions recorded any results
derived from Level 7 assessments and with large regions such as Canterbury and
Auckland having less than 3% of their results generated from this level. The percent
change in results gaining credits (Figure 9.20) from 2005 to 2006 also reveals
regional differences in choices that schools are making for the teaching of Geology
at national qualifications levels.

387
Percent Change in Regional Results Gaining Credit (RGC) In All Geology Assessment Standards from 2005 to 2006
(N = 435 schools in 17 regions)
-40
-30
-20
-10
0
10
20
30
Auckla
nd (
n = 9
6)
Bay o
f Plen
ty (n
= 3
0)
Cante
rbur
y (n
= 4
9)
Centra
l Nor
th Is
land
(n =
13)
Gisb
orne
(n =
8)
Hawke
s Bay
(n =
23)
Man
awatu
(n =
15)
Nelso
n/M
arlb
orou
gh (n
= 1
8)
North
land
(n =
32)
Ota
go (n
= 2
8)
South
land (n
= 1
4)
Taran
aki (
n =
13)
Waika
to (n
= 3
0)
Waira
rapa
(n =
9)
Wang
anui
(n =
11)
Wellin
gton
(n =
37)
Westl
and
(n =
8)
Regions
Per
cen
t ch
ang
e in
RG
C
CL 6 - 8 Unit standards
CL 4 & 5 NZASE Unit standards
CL 6 - 8 Achievement standards
Figure 9.18. Percent change in results gaining credit for Geology 2005 – 2006.
Other than very small increases in Southland and Gisborne regions, there is a clear
overall decrease in the percentage of students gaining credits from achievement
standards suggesting that these standards are perceived as not meeting the needs of
teachers and students and therefore not taught. These two regions which show
increases in results derived from achievement standards may represent traditionally
enthusiastic teachers and Science departments with large investments in resources.
Waikato region has a traditionally strong university Department of Earth Sciences
and a teachers’ training college of education; this may account for the relatively
small decrease in credits gained from achievement standards. The region has been
consistently strong in teaching the Earth Science and this tradition seems to have
been maintained indicated by small changes in results gaining credits from all
sources. Because so few schools offer curriculum levels 7 and 8 achievement
standards, level 6 (AS 90190) accounts for most of the decrease. In summary, the
average decrease in results derived from achievement standards is 10%, with an
average increase of 6% in curriculum level 4/5 NZASE standards and an average
increase of 4.5% in all other unit standards.

388
Comparison of Regional Percent Change in Results Gaining Credit for All Geology Standards 2005 - 2007
(N = 434 schools in 17 regions. Data source: NZQA)
-50
-40
-30
-20
-10
0
10
20
30
40
50
Auckla
nd (
n = 9
6)
Bay o
f Ple
nty
(n =
30)
Cante
rbur
y (n
= 49
)
Centra
l Nor
th Is
land
(n =
13)
Gisbor
ne (n
= 8
)
Hawke
s Bay
(n =
23)
Man
awat
u (n
= 1
5)
Nelson
/Mar
lboro
ugh
(n =
18)
North
land
(n =
32)
Otago
(n =
28)
South
land
(n =
14)
Taran
aki (
n = 1
3)
Wai
kato
(n =
30)
Wai
rara
pa (n
= 9
)
Wan
ganu
i (n
= 11
)
Wel
lingt
on (n
= 3
7)
Wes
tland
(n =
8)
NZ Region
Per
cen
t C
han
ge
in R
GC
Achievement Standards 2007NZASE unit standards 2007Unit Standards 2007Achievement standards 2006NZASE Unit standards 2006Unit standards 2006
Figure 9.19. Comparison of regional changes in results gaining credit for Geology
2005 – 2007.
Mean Percent Change in Results Gaining Credit for all Geology Standards 2005 - 2007
(N = 434 schools, 17 Regions)
-15
-10
-5
0
5
10
15
Unit Standards2006
NZASE Unitstandards
2006
Achievementstandards
2006
Unit Standards2007
NZASE UnitStandards
2007
AchievementStandards
2007
Standards
Mea
n P
erce
nt
Ch
ang
e
Figure 9.20. Mean percentage change in Geology standard credits.

389
Figure 9.19 shows the actual percent regional change and Figure 9.20 shows the
mean change for all geology standards that contributed to candidate results gaining
credit from 2005 to 2007. Importantly, the New Zealand Association of Science
Education (NZASE) standards continue to grow at the expense of all other geology
standards. Why? But note future changes discussed in the postscript.
Mean Pass Rate Percentages per achievement level for Science NCEA Level One Achievement standards
2002 - 2008
Ge
olo
gy
Ge
olo
gy
Ge
olo
gy
0
5
10
15
20
25
30
35
40
45
50
Achieve (Describes) Merit (Explains) Excellence(Discusses)
Achievement Level
Per
cen
tag
e o
f C
and
idat
es
Astronomy
Chemistry
Physics
Geology
Biology
Figure 9.21. Comparison of mean achievement results for NCEA Level 1 Science.
Figure 9.21 compares the percentage of achievement levels between externally
examined standards that contribute to the national Science curriculum at level 1
(15/16 year olds). Results are for external examinations and show the percentage of
students gaining descriptive achievement, explanatory merit and discursive
excellence from the introduction of NCEA Level 1 in 2002 to 2007. Physics,
chemistry and biology contribute five credits each whereas Geology contributes
three credits and Astronomy two credits (making up Planet Earth and Beyond).
Geology achievement performances are not significantly different to the national
means of 43% (43.1%) gaining achieve, 12% (10.3%) gaining merit and 2.9%
(2.2%) gaining excellence (Geology in brackets). It is important that achievement

390
levels of attainment are not construed as equating to broad percentage mark bands.
Excellence does not equate to students achieving 80% or more in any one
examination as in norm referencing. It equates to students who (a) demonstrate a
criteria referenced knowledge base via rigorously moderated questions and
assessment schedules, (b) are able to explain conceptually and (c) are able to link
ideas and concepts in explanation of geological principles as set out in the
achievement standard criteria.
Despite seriously declining candidate numbers in both Geology and Astronomy
(Figure 9.1 in text and 9.21 in this Appendix), arguments suggesting that students
who do not study Geology are disadvantaged on the grounds that it is more difficult
than the other sciences, is not supported by the evidence. Figure 9.21 indicates that
there is very little difference in achievement levels for each of the sciences offered at
level 1. Although Astronomy (like Geology) attracts fewer numbers of candidates
(Figure 9.1 in Chapter 9) it produces a higher number of students who achieve at
each level except for chemistry at merit and excellence levels.
Number of Schools Recording Credits Gained in all Geology Standards (N = 434 schools)
(Data source: www. nzqa.)
230
192
177
0
50
100
150
200
250
USLevel 1
USLevel 2
USLevel 3
NZASE18981
NZASE18982
NZASE18989
ASLevel 1
ASLevel 2
ASLevel 3
Geology Standards Gaining Credit
Nu
mb
er
of
Sc
ho
ols
Re
co
rdin
g C
red
its
2005
2006
2007
Figure 9.28. Total number of New Zealand secondary schools offering Geology assessment standards.

391
APPENDIX 4 Scale of Objects Questionnaire (SOQ) Assessment This sheet asks about your perceptions of objects of different sizes. Please consider each of the following objects and indicate the size of each one. Please ‘‘X’’ OR TICK the box that is closest to your own opinion. Please try to respond honestly to each item.
A B C D E F G H I J K L
<0.0000001mm
<0.001mm
.01mm to 1mm
1mm to 1cm
1cm to 1 dm
1dm to 1m
1m to 10 m
10m to 100m
100m to 1000m
1000m to 1million m
I million m to 1 billion m
>1billion m
1.Width of a human hair
2.Length of a football field
3.Distance from Earth to Moon
4.Diameter of a virus
5.Diameter of the Earth
6.Height of the world’s tallest Building
7.Diameter of a hydrogen atom

392
A B C D E F G H I J K L 8.Distance from Auckland to Invercargill
9.Diameter of a human cell
10.Diameter of the nucleus of a carbon atom
11.Length of an ant
Height of an elephant
12.Altitude of an artificial satellite above Earth
13.Diameter of a Bacterium
Height of a typical adult person
14.Length of a new Pencil
15 Length of a school Bus

393
A B C D E F G H I J K L 16.Distance from theEarth to the Sun
17.Length of a grain of white rice
18.Length of a postage stamp
19.Height of a mature pine tree
A B C D E F G H I J K L (Key was provided on a separate piece of paper) Key for tick-boxes: A: less than 1 billionth of a meter [less than 1 nanometer (1 nm)]; B: between 1 billionth and 1 millionth of a meter [between 1 nanometer (nm) and 1 micrometer (1 mm)]; C: between 1 millionth and 1 thousandth of a meter [between 1 micrometer (1 mm) and 1 millimeter (1 mm)]; D: between 1 thousandth and 1 hundredth of a meter [between 1millimeter (1 mm) and 1 centimeter (1 cm)]; E: between 1 hundredth and 1 tenth of a meter [between 1 centimeter (1 cm) and 1 decimeter (1 dm)]; F: between 1 tenth of a meter and 1 meter [between 1 decimeter (1 dm) and 1 meter (m)]; G:between 1 meter and 10 meters; H: between 10 meters and 100 meters; I: between 100 meters and 1000 meters; J: between 1000 meters and 1 million meters; K: between 1 million meters and 1 billion meters; L: over 1 billion meters

394
.Table 6.7. Year 12 Ashburton College: Individual response distribution of rankings of Size boundaries (after Tretter et al. 2006) n = 21
Object
Q’No.
Actual Size rank
Actual rank by categor
y A-L
Student mode score A -L
A
<0.
0000
001
mm
B <
0.01
mm
to
1m
m
C
0.01
mm
to
1c
m
D
1mm
to
1c
m
E
cm
to
1d
m
F
1dm
to
1m
G
1m t
o
10m
H
10m
to
10
0m
I 1
00m
to
10
00m
J 1
000m
to
1 m
illio
n
m
K
1 m
illio
n
m t
o 1
b
illio
n m
L
>1
bill
ion
m
Ag
reem
ent
(00
=ag
ree
)
Earth to Sun 18 21 L L 0 0 0 0 0 0 0 0 0 0 2 19 OO
Earth to Moon 3 20 K L 0 0 0 0 0 0 0 0 0 0 8 13 I
Earth diameter 5 19 K K 0 0 0 0 0 0 0 0 0 4 9 6 OO
Satellite altitude 13 17 J J 0 0 0 0 0 0 0 0 0 9 6 5 OO
Auckland to Invercargill
8 18 J J
0 0 0 0 0 0 0 0 0 14 6 0 OO
Tallest building 6 16 I I 0 0 0 0 0 0 0 0 16 7 0 0 OO
Football field 2 15 H H 0 0 0 0 0 0 0 11 10 0 0 0 OO
Pine tree 21 14 H H 0 0 0 0 0 0 0 19 1 0 0 0 OO
School bus 17 13 G G 0 0 0 0 0 0 15 3 3 0 0 0 OO
Elephant height 12 12 G G 0 0 0 0 0 0 20 1 0 0 0 0 OO
Human adult height 15 11 G G 0 0 0 0 0 1 19 0 0 0 0 0 OO
New pencil length 16 10 E E 0 0 0 0 14 5 1 0 0 0 0 0 OO
Postage stamp 20 9 E E 0 0 0 0 19 1 0 0 0 0 0 0 OO
Rice grain 19 8 D D 0 1 2 18 0 0 0 0 0 0 0 0 OO
Length of an ant 11 7 D D 1 2 3 14 1 0 0 0 0 0 0 0 OO
Width of human hair
1 6 C B
8 10 3 0 0 0 0 0 0 0 0 0 I
Human cell diameter
9 5 B A
14 5 2 0 0 0 0 0 0 0 0 0 I
Bacteria diameter 14 4 B A 13 6 1 0 0 0 0 0 0 0 0 0 I
Virus diameter 4 3 B A 17 3 0 1 0 0 0 0 0 0 0 0 I
H atom diameter 7 2 A A 20 1 0 0 0 0 0 0 0 0 0 0 OO
C nucleus diameter 10 1 A A 17 4 0 0 0 0 0 0 0 0 0 0 OO

395
Table 6.8. Year 9 Ashburton College: Individual response distribution of rankings of Size boundaries (after Tretter et al. 2006) n =19
Object
Q’n No.
Actual size rank
Actual by
category A-L
Student mode score
category A-L
A
<0.
0000
001
mm
B <
0.01
mm
to
1m
m
C
0.01
mm
to
1c
m
D
1mm
to
1c
m
E
cm
to
1d
m
F
1dm
to
1m
G
1m t
o 1
0m
H
10m
to
10
0m
I 1
00m
to
10
00m
J 1
000m
to
1
mill
ion
m
K
1 m
illio
n m
to
1 b
illio
n m
L
>1
bill
ion
m
Ag
reem
ent
(00
=ag
ree
)
Earth to Sun 18 21 L L 0 0 0 0 0 0 0 0 0 1 2 13 OO
Earth to Moon 3 20 K L 0 0 0 0 0 0 0 2 0 2 3 12 I
Earth diameter 5 19 K L 0 0 0 0 0 0 0 0 1 2 4 8 I
Satellite altitude 13 17 J K 0 0 0 0 0 0 0 2 2 2 7 2 I
Auckland to Invercargill
8 18 J J
0 0 0 0 0 0 0 0 1 9 5 2 OO
Worlds tallest building
6 16 I J
0 0 0 0 0 0 0 0 7 9 2 0 I
Football field 2 15 H H 0 0 0 0 0 0 0 9 7 0 0 0 OO
Pine tree 21 14 H G 0 0 0 0 0 0 9 6 0 0 1 0 I
School bus 17 13 G G 0 0 0 0 0 0 13 2 2 0 0 0 OO
Elephant height 12 12 G G 0 0 0 0 0 1 14 2 0 0 0 0 OO
Human adult height 15 11 G G 0 0 1 1 0 1 13 0 0 0 0 0 OO
New pencil length 16 10 E E 0 0 0 2 10 3 0 0 0 0 0 0 OO
Postage stamp 20 9 D D 0 1 6 1 6 1 1 0 0 0 0 0 OO
Rice grain 19 8 D C 1 5 4 3 2 0 0 0 0 0 0 0 I
Length of an ant 11 7 D B 2 9 3 3 0 0 0 0 0 0 0 0 I
Width of human hair 1 6 C A 11 1 2 2 2 0 0 0 0 0 0 0 I
Human cell diameter 9 5 B ? 5 2 4 2 2 0 1 0 0 0 0 0 I
Bacteria diameter 14 4 B A 6 2 4 0 0 1 0 0 0 0 0 0 I
Virus diameter 4 3 B A 7 0 3 0 1 2 0 0 0 1 0 0 I
H atom diameter 7 2 A ? 3 4 2 0 0 4 0 1 1 1 1 0 I
C nucleus diameter 10 1 A ? 6 1 1 1 1 2 2 0 1 0 0 0 I Red means significant indecision
Yellow means disagreement with actual (48-62%)
Blue means agreement with actual

396
APPENDIX 5
Earth Science and Evolution Questionnaire Instructions: These questions are designed to gather information about how students of different ages and from different countries understand aspects of fossils and evolution so that teachers can improve the way topics can be taught. Your name is not required and this is not a test which counts towards any certificates or awards. Your answers to ‘about yourself’ will help make sense of some of the responses that you make and any codes on these sheets are for administrative reasons only. The questions are for all age groups to respond to. Your answers are totally confidential and no individual will be identifiable in any future publication.
Please write your answers in the spaces provided where appropriate About Yourself (fill in only if you have not already done so or go to Section A) 1. How old are you? Years ……………. months ……………….. 2. Are you male or female? ………………………………. 3. What country were you born in? ……………………………….….… 4. What religious affiliation do you identify with? …………………… 5. What is or was your favourite school subject? ……………………… 6. When did you last study any geology (Earth Science)? ……………… Section A Ideas about fossils 1. Do you think the following ideas about fossils are true or false (tick in the true or false column). Your Ideas About Fossils True False
1 Fossils grow from seeds inside rocks
2 Fossils are the failed creations of God
3 Fossils are tricks of the devil
4 Fossils are just accidents of nature
5 Fossils are the preserved parts of once living organisms
6 Fossils are the preserved parts of extinct organisms only
7 Fossils are important and interesting
8 Fossils support the theory and fact of evolution
9 Charles Darwin was the first person to think of evolution
10 Human beings have evolved from apes
11 The oldest known fossils are about 3.4 billion years old
12 A scientific theory is just a guess

397
13 Birds are the living descendants of the dinosaurs
14 The Earth was made in six days
15 All living things share the same basic DNA coding system
16 New species appear suddenly in the fossil record after a long period of stability
17 The fossil record suggests that evolution occurs by slow and gradual change from one species into another
18 The scientific method only involves the controlled testing of hypotheses
2. Write an explanation for any two statements you thought were true
…………………………………………………………………………………… …………………………………………………………………………………… …………………………………………………………………………………… …………………………………………………………………………………… …………………………………………………………………………………… ……………………………………………………………………………………
3. Some people think that the draining away of a great flood of water explains how fossils can be found near the tops of high mountains. How do you think they got there?
…………………………………………………………………………………… …………………………………………………………………………………… …………………………………………………………………………………… ……………………………………………………………………………………

398
Section B Using Fossils 1. (a) The illustration below represents rock layers containing fossils. The
fossils are the remains of bones from the feet of an unidentified land living animal. Describe in words the changes that took place in the fossil feet between rock layer 1 and rock layer 4.
1. (b) Suggest 2 possible reasons for the absence of fossils after rock layer 4. ……………………………………………………………………………………….. ……………………………………………………………………………………….. ……………………………………………………………………………………….. 2. The illustration below represents a dinosaur excavation site. This excavation can be broken down into two areas A and B. X Y
1
2
3
4
5
6
7
Area B Area A B
B
A
Nest
Description of changes in foot bones ………………………………… ………………………………… ………………………………… ………………………………… ………………………………… ………………………………… ………………………………… …………………………………

399
Area A: This is built of sedimentary rock of land origin and contains the skeletons of dinosaurs. Two important points can be noted about this area:
1. The dinosaur skeletons range in size from very tiny to very large. This suggests that in this area, the age range of the dinosaurs was broad, ranging from newly hatched babies to fully-grown adults.
2. A large number of nests containing fossilised eggs were discovered. Area B: This area surrounds area A and is made of marine (ocean or seafloor) sedimentary rock containing fish. (a) Draw in the box a cross section from X to Y (see diagram above) of how this
excavation site might have looked when the dinosaurs were alive. 2 (b) What could you say about the fact that in one single area scientists have
found a species of dinosaur ranging in size and age from egg to adult? …………………………………………….………………………………………………… ………………………………………………………………………………………………… ………………………………………………………………………………………………… (c) When scientists dug down into this area they found an alternating
arrangement of layers consisting of marine (sea floor) sedimentary rock containing no fossils and land sedimentary rock containing dinosaur fossils (see illustration below).

400
In a geological sense what do you think this alternating arrangement of layers might mean? ………………………………………………………………………………………. ………………………………………………………………………………………. ………………………………………………………………………………………. ………………………………………………………………………………………. ………………………………………………………………………………………. ………………………………………………………………………………………. (d) What do you imagine the Earth would look like, and sound like when it was
first formed compared with today? Eg hot, cold, loud, quiet, green, brown, white, bigger, smaller etc.
First Formed Today Look like Sound like Look like Sound like

401
3. Fossils and Time This question is about your perception of some major geological events. Put the following individual geological events into what you think is their correct time of occurrence using the letters A to J below. Event 25 is done for you as an example. Age range to choose from:
A Less than 100 years ago B 100 to1000 years ago C 1000 to100,000 years ago D 100,000 to1 million years ago E 1 million to10 million years ago F 10 million to100 million years ago G 100 million to1 billion years ago (1 billion = 1000million) H 1 billion to5 billion years ago I 5 billion to one million million years ago J More than a million million years ago
Please write an answer for each event. Write the letter beside the event in the column marked age range.
Geological Event Age range I think it is (choose from
A-J)
Actual age in years
(If known) 1 The first fish appear on Earth 2 The Earth’s crust is formed 3 Formation of the Earth 4 Theory of plate tectonics is developed 5 Large dinosaurs became extinct 6 The Ice Age 7 First appearance of land animals 8 Trilobites became extinct 9 Formation of the Sun 10 Formation of the first rocks on Earth 11 Woolly Mammoths become extinct 12 Formation of the Moon 13 Appearance of the first life forms on Earth 14 Big Bang formation of the Universe 15 Appearance of the first birds 16 Appearance of the first dinosaurs 17 First life forms with shells or bones 18 Appearance of first humans 19 Eruption of the first volcanoes on Earth 20 The beginning and opening of the Atlantic
Ocean
21 Appearance of the first trees 22 Formation of the oldest rocks in your
country
23 The beginning of time 24 Formation of the Milky Way galaxy 25 Galileo was put under house arrest B AD 1616
THANK YOU FOR PARTICIPATING

402
APPENDIX 6
The association/concept maps in Figures 10.1 and 10.2 show elements of learnt
conceptual development about biological evolution but little indication of developed
linkages. That is, these maps illustrate a collective conceptual knowledge but with no
feedback linkages.
Figure 10.1. A New Zealand Year 12 ‘evolution’ concept map.

403
Figure 10.2. A contrasting New Zealand Year 12 ‘evolution; concept map.

404
New Zealand Case Study of Evolution in a National Curriculum
Background
Biology as a separate subject of learning in the New Zealand curriculum begins at
age 15 (NZ Year 11) and ends at age 17/18 at Year 13, the final year of secondary
schooling before entry to university. The majority of secondary schools begin
teaching Biology at Year 12 with an average age of 16 years of age. Current
contextual curriculum achievement aims (Ministry of Education, 1994) indicate
strong connections between genetics and evolution. Achievement objectives are
derived from the achievement aims. As mentioned in Chapter 8, the NZ curriculum
was revised in November 2007 (Ministry of Education, 2007) with full
implementation in 2011. This revision formally recognises evolution as a vital part
of biological science within the “Living World” strand of the science curriculum.
show The achievement objectives specifically for evolution content are shown in
Tables 10.1 (the 2007 revised NZ curriculum) and 10.2 (the 1994 curriculum) in
Chapter 10, but these broad statements for the 2007 curriculum reform are yet to be
unpacked into specific learning objectives. In tandem with those objectives are the
national assessment qualification standard statements which are derived from
curriculum objectives. Some qualification standards may change in focus as a result
of the 2007 curriculum revisions in biology but in effect ‘standards’ become the
content that teachers teach and what students learn.
Although the school leaving age is 16 years, curriculum Levels 1 to 6 are the years in
which ‘compulsory’ evolutionary concepts to which all students will be exposed.
The degree of exposure is determined by individual teacher expertise and school
department policies. After Level 5 (but mostly from Level 6), sciences in NZ split
into the traditional physics, chemistry and biology and as a consequence around 25-
30% of a Year 9 intake (first year high school students) will study biology at Year 12
(curriculum Level 7), and around 10-15% of that same Year 9 intake will study
biology in their final year at high school. As described in Chapter 8 very few schools
offer Levels 7 and 8 Science and as a consequence few students learn any detail of
biological evolution through this route. The only external examination for evolution
related aspects at Year 12, is part of an achievement standard on genetic variation
and change the same as currently. There are two external achievement standards at

405
Year 13 dealing with evolution: 1. Describe evolutionary processes leading to
speciation and 2. Describe trends in human evolution. It remains an issue that so few
students will ever study processes of biological evolution.
Table 10.9. Evolution Achievement Objectives in the 2007 revised curriculum (For implementation in 2010).
Curriculum Level (CL)
Achievement Objectives (2007 revised NZ curriculum)
Levels 1and 2 (Age 5/10 years)
Recognise that there are lots of different living things in the world and that they can be grouped in different ways. Explain how we know that some living things from the past are now extinct.
Levels 3 and 4 (Age 11/14 years)
Begin to group plants, animals and other living things into science- based classifications. Explore how the groups of living things we have in the world have change over long periods of time and appreciate that some living things in NZ are quite different from living things in other areas of the world.
Level 5 (Age 14/15 years)
Describe the basic processes by which genetic information is passed from one generation to the next.
Level 6 (Age 15/16 years)
Explore patterns in the inheritance of genetically controlled characteristics. Explain the importance of variation within a changing environment.
Level 7 (Age 16/17 years)
Explain how the interaction between ecological factors and natural selection leads to genetic changes within populations.
Level 8 (Age 17/18 years)
Explore the evolutionary processes that have resulted in the diversity of life on Earth and appreciate the place and impact of humans within these processes.
Curriculum Level 2 is the dominant entry point into biological studies at school and
beyond. Unit standards, which are competency based, is completed by significantly
fewer schools and students and are not discussed in detail here. Currently, Level 1
has no evolution content. As explained in chapter 9, national qualifications are
derived from achievement and/or unit standards and for evolution studies at
curriculum Level 2, the vast majority of students gain credits from the externally set
and managed examination AS 90459, “Describe genetic variation and change”.
Evolution makes up around 35% of this standard and involves the following topics:
allele and gene frequency changes, mutation as a source of variation, natural
selection, migration, genetic drift, founder effect and gene pool bottleneck. The links
between the genetic basis of evolutionary micro and macro evolution (and at the
molecular level) are clear, but the pedagogical and content links with the

406
morphological and deep time scale of the fossil record is not. It is also clear that after
36 years of classroom observation that students of biology (age 16 to 18 years) have
great difficulty conceptualising populations and populational genetic turnover. It is
precisely this link between populational genetic turnover, natural selection and
chance that is diminished (3 to 5 hours of tuition time at Year 12) from curricula on
evolution and also often fails to take into account the explanatory power of the fossil
record.
Table 10.10. Typical content for the teaching of evolution in Biology. (Based on pre-revised 1994 Biology curriculum).
Year 12 (CL2) (8 to 12 hours tuition time)
Year 13 (CL3) (20 to 25 hours tuition time)
Evidence for evolution: Comparative anatomy The fossil record Genetic code Protein analysis
Understanding the scientific theory and fact of evolution: Historical perspectives Review of evidence Neo-Darwinism Agents of gene pool change Types of natural selection Punctuationism and gradualism
Evolution in populations: Gene pools and gene flow Sources of variation Natural selection
Speciation: Types Isolating mechanisms
Speciation: Isolating mechanisms Rate of change Selection pressure Adaptive radiation
Modes of evolution: Extinction Patterns of evolution Analogous and homologous structures
Comparison of living hominoids
Comparison of hominid species: Main lineages Fossil locations
Trends in cultural evolution
Although many studies have been conducted on students’ conceptual frameworks
and ecologies on evolution, (Bishop, 1990; Brumby, 1984; Demastes, 1995; Dodick,
2007; Hallden, 1988), exploring specifically why students do not appear to translate
evolution as occurring at the population level rather than at the individual level is
worthy of further research. Perhaps this is related to notions of genes and genetics

407
being perceived as being only related to individuals rather than populations in a
similar way to time scales (and other scalar dimensions) being consistently related to
the individual as the primary reference point. Mayr (2001) succinctly pointed out the
connection between micro and macro evolutionary scales: a source of persistent
difficulty, misconception and perception about the evolution of new species, orders
and genera.
“ ..all macro evolutionary processes take place in populations and
in the genotypes of individuals, and are thus simultaneously micro
evolutionary processes”(Mayr, 2001, p.190).
For NZ curriculum Level 3, topics in AS 90719: Describe trends in human
evolution” include: trends and patterns in human biological (especially skeletal and
dextral) and cultural evolution. Explanatory notes for this standard indicate that
evidence relating to human evolution must be scientific evidence which is widely
accepted and presented in peer-reviewed scientific journals. This prevents the
inclusion of non scientific material. For AS 90717 “Describe processes and patterns
of evolution”, processes are limited to allopatric and sympatric speciation,
reproductive isolating mechanisms, the role natural selection, convergence,
divergence, adaptive radiation, co-evolution, punctuationism and gradualism.
Given that the national qualification standards effectively control what students will
actually study and what is actually examined, the two Level 3 standards specifically
related to evolution as ‘patterns and processes’, and ‘human biological and cultural
evolution, the curriculum is well covered by these standards. In 2006, there were a
total of 149,927 student results gaining credit (www.nzqa) in national qualifications
for all biology standards (See Chapter 8 for candidate number details) but the key
point is that although evolution, as a guiding principle of biology, is recognised and
acknowledged in the curriculum, relatively few students actually end up gaining
credits in this subject and thus gaining a more sophisticated scientific understanding
of evolutionary processes. It is not surprising that myths and legends are often
perpetuated in society with regard to the fact of biological evolution.

408
9.2.2 What sort of ‘Evolution’ Questions are Asked in National Exams?
This section will focus on achievement standards. Achievement standard assessment
questions in NZ evolved from original competency based standards (called unit
standards) in an attempt to recognise the different levels of achievement that students
perform at in an examination. Achievement standards were also developed to assess
different levels of understanding through the use of a broad application of Bloom’s
taxonomy of descriptive, explanatory and discursive style questions (see Chapter 9
for more details). Questions requiring discussion are intended to assess a higher level
of thinking and understanding. A balance of each level of question is generally
achieved. Unit standards on the other hand are either passed or failed based on
performance (answers) which conform to prerequisite criteria (see Chapter 9 for
details).
Questions from the 2007 Examination on Evolution from Level 2 (Year 12) AS
90459 “Genetic variation and change” national external examination.
Note that most questions have resource information that is not reproduced here.
Complete downloads are available on the NZQA website at
http://www.nzqa.govt.nz.
1 "Discuss how the processes involved in meiosis can contribute to genetic variation.
2. Define the term gene pool. 3. Explain how new alleles can enter and become established in a
population. 4. Two processes that could be responsible for the genetic change in the
New Zealand population of blowflies are genetic drift and natural selection.
Explain how each of these two processes works to change the allele frequencies of the populations.
5. Discuss why the arrival of the blowfly in New Zealand is considered to be an example of the Founder Effect rather than a Population Bottleneck".
Forty minutes are recommended for this examination and as can be seen, questions at
this curriculum Level, although accurately constrained by the standard requirements
on evolution, focus on sources of genetic variation and genetic change but do not
address speciation mechanisms or evidence for evolution. The fossil record
(paleontology and paleoecology) and its connection to geological time and

409
environmental change is not part of the curriculum at this level and consequently
students are not exposed to the conceptual connections between biological evolution
and geology. Achievement standards select aspects of the curriculum for national
qualification assessment tasks. It should be pointed out that unit standard questions
are internally set by the classroom teacher (with a measure of NZQA moderation),
and therefore students (nationally) sit different questions covering the same unit
standard criteria. Comparisons are therefore impossible. There are two discuss
questions, two explanatory and one descriptive. However, questions that are
discursive and explanatory commonly ‘scaffold’ down to enable students to
demonstrate the depth of their understanding. It is clear that connecting the fossil
record and geological events for this assessment standard is not what biologists
consider to be ‘biology’. Students at this level are expected to demonstrate
understanding of the mechanisms for genetic variation within a populational context
but it remains disconnected to geological and paleoecological events.
Questions from the 2007 Examination on Evolution from Level 3 (Year 13) AS
90717 “Patterns of Evolution” national external examination.
1(a) "Name and describe the pattern of evolution shown by the relationship between this nectar bat and its food plant.
(b) Explain the role of natural selection in the evolution of the features shown by the bat and its food plant.
(c) Discuss how geological history has affected the adaptive radiation and distribution of Celatoblatta species in the South Island.
(d) The phylogenetic tree suggests that there are two distinct populations of C. montana on Mt Taylor (in the Central region).
Explain the significance of these two populations. 2(a) Use the information from the table to describe how these different Libertia
species have evolved. (b) Explain how L. paniculata (2n = 76) could have evolved from L. puchella. L.
peregrinans, from inland Nelson, has a different chromosome number, and is different in appearance, from other populations of this species.
(c) Explain how this inland Nelson population could have evolved, AND give evidence from the table on the opposite page to support your answer.
(d) Explain how the data in the above diagram support the statement that “indigobird evolution shows adaptive radiation and punctuated equilibrium”.
(e) Indigobird speciation appears to be sympatric. Discuss how new indigobird species could evolve. You should include the role
of song and other isolating mechanisms in your answer".

410
Forty minutes are also recommended for this examination. This standard focuses on
speciation and modes of evolution with question 1c in particular, requiring students
to have knowledge and understanding of geological isolating mechanisms for species
such as glaciation imprinted on a background of plate tectonic activity. It is only in
this final secondary school year standard that students begin to come to grips with
organismal evolution connected to geological events and time. Unfortunately the
fossil record misses out again not only within the assessment standard but also
within the curriculum. The average percentage of results gaining credit (‘passes’) in
this standard was around 50% (See chapter 8 figure 8.8). With 50% of those who
enter biology AS 90717 failing this standard the number of students leaving
secondary school with adequate understanding of the patterns of evolution is very
low. It is not surprising then that the general population is ignorant of the facts of
biological evolutionary patterns and mechanisms. Few will go on to tertiary studies
and specialise in evolutionary theory and mechanisms because few who take this
examination go on to tertiary studies and specialize in paleontology.
Questions from the 2007 Examination on Evolution from Level 3 (Year 13,
17/18 year olds) AS 90719 “Trends in Human Evolution” external examination.
1(a) "The foot of the chimpanzee is different from that of hominins. (I) Describe ONE skeletal feature of the foot of the chimpanzee that differs
from that of a hominin. (ii) Explain how this difference is linked to bipedalism. (b) Describe two differences between the chimpanzee and hominin pelvic girdles
that are related to bipedalism. (c) Explain the relationship between the shape of the pelvic girdle and the ability
to walk bipedally. (d) Explain why the pelvic inlet is larger in Homo sapiens than in H. erectus. (e) The width of the pelvic inlet is related to locomotion. H. erectus had a
narrower pelvic inlet than modern humans, and walked more efficiently. Discuss how conflicting selection pressures have acted on the evolution of the
pelvic inlet in modern humans. 2(a) Explain TWO benefits to Homo erectus of using fire. (b) Describe the trend in brain volume shown in this graph. (c) Discuss the relationship between cranial capacity and cultural evolution in
hominins. Support your answer with reference to ONE aspect of cultural evolution in named hominin species. (Aspects of cultural evolution include, but are not limited to: tool use and manufacture; art; language; domestication of plants and animals.)

411
Most scientists agree that Homo erectus was the first hominin species to migrate out of Africa. Probable migration routes are shown below. (Diagram not included here). 3(a) Describe the relative speed at which this migration took place AND give
evidence to support your answer. Recent research suggests that climate change is related to the migration out of Africa of various hominin species. (b) Discuss the impact a change in climate from wet tropical to cooler drier
conditions would have on migration out of Africa by H. erectus. (c) Discuss what the ability to make a boat or raft indicates about the behaviour
and cultural evolution of Homo erectus".
In this standard, with a recommended forty minutes for completion, focus is on
skeletal comparisons of hominoids and hominins (ankle, pelvis and bipedalism),
cultural trends, cranial capacity and issues surrounding migration and dispersal of
hominins (humans) out of Africa. Hominoids include humans and the great apes.
Fossil lineages and localities are not part of this assessment standard, and
significantly, there is no connection with geological time and events. It is noteworthy
that in the Australian (New South Wales) HSC Earth and Environmental studies
course which is at the same level as New Zealand’s Year 13, there is considerable
content looking at geological history and environments through time but still
divorced from biology and evolution (Pohl, 2002). In NZ, the only places these
topics can be studied and assessed for national qualifications is in unit standards, and
vey few schools offer this topic and then there are very low numbers of students
enrolled. In effect, learning about earth history, paleontology and paleoecology in an
evolutionary biological context is extremely unusual and generally cursory in NZ
schools.

412
Chapter 10 GeoVAT Result Tables Table 10.2. NZ Secondary teacher trainee response comparison for
Section A question 1 (True/false ideas about fossils). Question statements GeoVAT Q.1. AUB % UC % 1. Fossils grow from seeds in rocks 100% F 100% F 2. Fossils are the failed creations of God 100% F 100% F 3. Fossils are tricks of the Devil 100% F 100% F 4. Fossils are just accidents of nature 79% F 87% F 5. Fossils are the preserved parts of once living things 84% T 100% T 6. Fossils are the preserved parts of extinct things only 79% F 93% F 7. Fossils are important and interesting 95% T 100% T 8. Fossils support the theory and fact of evolution 74% T 87% T 9. Charles Darwin was the first to think of evolution 26% F 73% F 10. Humans have evolved from apes 42% T 67% T 11. Oldest known fossils are about 3.4 billion years old 53% T 60% T 12. A scientific theory is just a guess 100% F 73% F 13. Birds are descendants of dinosaurs 37% T 40% T 14. The Earth was made in six days 100% F 80% F 15. All living things share the same basic DNA coding system 26% T 60% T 16. New species appear suddenly 26% T 40% T 17. Evolution is slow change from one species to another 95% T 73% T 18. Scientific method only involves controlled tests 11% T 73% T
Table 10.3. Comparison of AC Year 12 with secondary teacher trainees for GeoVAT
Question (n = 21 for AC Y12) AC Y12 UB UC
1. Fossils grow from seeds in rocks 100% F 100% F 100% F
2. Fossils are the failed creations of God 95% F 100% F 100% F
3. Fossils are tricks of the Devil 100% F 100% F 100% F
4. Fossils are just accidents of nature 86% F 79% F 87% F
5. Fossils are the preserved parts of once living things 100% T 84% T 100% T
6. Fossils are the preserved parts of extinct things only 86% F 79% F 93% F
7. Fossils are important and interesting 95% T 95% T 100% T
8. Fossils support the theory and fact of evolution 95% T 74% T 87% T
9. Charles Darwin was the first to think of evolution 52% F 26% F 73% F
10. Humans have evolved from apes 62% T 42% T 67% T
11. Oldest known fossils are about 3.4 billion years old 90% T 53% T 60% T
12. A scientific theory is just a guess 67% F 100% F 73% F
13. Birds are descendants of dinosaurs 62% T 37% T 40% T
14. The Earth was made in six days 81% F 100% F 80% F
15. All living things share the same basic DNA coding system 52% T 26% T 60% T
16. New species appear suddenly 33% T 26% T 40% T
17. Evolution is slow change from one species to another 81% T 95% T 73% T
18. Scientific method only involves controlled tests 43% T 11% T 73% T

413
Table 10.4. Comparison of high school age cohorts for ideas about fossils.
QUESTION 1
Section A GeoVAT
(T=True. F = False)
AC
Y13
(n = 39)
AC
Y12
(n=13)
AC
Y11
(n=25)
AC
Y9
(n=13)
IS
Y12
(n = 10)
IS
Y13
(n = 8)
1. Fossils are from seeds in rocks 100% F 100%F 100%F 100% F 100% F 100%F
2. Fossils are failed creations 100%F 95%F 96%F 100% F 70%F 100%F
3. Fossils are tricks of the devil 100% F 100%F 100%F 100% F 100%F 100%F
4. Fossils are accidents of nature 89% F 86%F 76%F 79% F 100%F 100%F
5.Fossils are preserved remains 95% T 100%T 96%T 86%T 100%T 100%T
6. Fossils are preserved extinct org. 87% F 86%F 68%F 67%F 90%F 100%F
7. Fossils are important & interest. 95% T 95%T 84%T 93%T 80%T 100%T
8. Supports the fact of evolution. 90%T 95%T 84%T 93%T 80%T 100%T
9. Darwin first for evolution. 62% F 52%F 36%F 21%F 20%F 13%F
10. Humans are evolved from apes. 74% T 62%T 80%T 79%T 70%T 62%T
11. 3.4 bya oldest fossils. 74% T 90%T 80%T 64%T 50%T 87%T
12. Sc. theory is a guess. 69% F 67%F 68%F 79%F 60%F 38%F
13. Birds are from dinosaurs. 44% T 62%T 64%T 33%T 50%T 75%T
14. Earth was made in 6 days. 77% F 81%F 84%F 86%F 50%F 100%F
15. Common DNA code. 38% T 52%T 48%T 43%T 70%T 62%T
16. Punctuationism. 51% T 33%T 52%T 29%T 50%T 62%T
17. Gradualism. 85% T 81%T 72%T 93%T 100%T 87%T
18. Sc. method = c. testing. 69% T 43%T 60%T 50%T 50%T 87%T

414
Table 10.5. Years 12 and 13 comparison with AUB and UC secondary teacher trainees for Question 1 Section A: Ideas about Fossils.
Question (n = 39 for AC Year 13) (T = true) AC Y13
AC Y12
UB Sec
trainees
UC Sec
trainees
1. Fossils grow from seeds in rocks 100% F 100% F 100% F 100% F
2. Fossils are the failed creations of God 100%F 95% F 100% F 100% F
3. Fossils are tricks of the Devil 100% F 100% F 100% F 100% F
4. Fossils are just accidents of nature 89% F 86% F 79% F 87% F
5. Fossils are the preserved parts of once living things
95% T 100% T 84% T 100% T
6. Fossils are the preserved parts of extinct things only
87% F 86% F 79% F 93% F
7. Fossils are important and interesting 95% T 95% T 95% T 100% T
8. Fossils support the theory and fact of evolution 90%T 95% T 74% T 87% T
9. Charles Darwin was the first to think of evolution 62% F 52% F 26% F 73% F
10. Humans have evolved from apes 74% T 62% T 42% T 67% T
11. Oldest known fossils are about 3.4 billion years old
74% T 90% T 53% T 60% T
12. A scientific theory is just a guess 69% F 67% F 100% F 73% F
13. Birds are descendants of dinosaurs 44% T 62% T 37% T 40% T
14. The Earth was made in six days 77% F 81% F 100% F 80% F
15. All living things share the same basic DNA coding system
38% T 52% 26% T 60% T
16. New species appear suddenly 51% T 33% T 26% T 40% T
17. Evolution is slow change from one species to another
85% T 81% T 95% T 73% T
18. Scientific method only involves controlled tests 69% T 43% T 11% T 73% T

415
Table 10.6. Other suggestions in explanation for the absence of fossils. Explanation for absence of
fossils Conceptualisation Interpretation
“Insufficient time to form fossils”
Unfavourable environment for fossilisation. Misconception of the link with time.
“The rock was not old enough to form fossils”
Misconception of fossilisation processes.
“Fossils were destroyed by metamorphism”
Misconception of rock types.
“There were no animals around for fossils to form”
A reasonable conception that there was nothing to be fossilised but no link with geological process.
“Bones decomposed before fossilisation could occur”
Unfavourable environment for fossilisation. Misconception of formation of fossils.
“A landslide removed the fossils”
Misconception that fossils are found within rock and not separate entities with different histories.
“All decayed and were ground away”
Misconception of fossilisation processes.
“Rock was too hard to form fossils”
Misconception of fossilisation processes.
Table 10.7. Comparison of Year 11 responses to Section A question 1.
QUESTION 1 Section A GeoVAT
AC Y13
AC Y12
AC Y11
AC Y9
UB PT
UC PT
1. Fossils are from seeds in rocks 100% F 100%F 100%F 100% F 100%F 100% F
2. Fossils are failed creations 100%F 95%F 96%F 100% F 100%F 100% F
3. Fossils are tricks of the devil 100% F 100%F 100%F 100% F 100%F 100% F
4. Fossils are accidents of nature 89% F 86%F 76%F 79% F 79%F 87% F
5.Fossils are preserved remains 95% T 100%T 96%T 86%T 84%T 100% T
6. Fossils are preserved extinct org. 87% F 86%F 68%F 67%F 79%F 93% F
7. Fossils are important & interest. 95% T 95%T 84%T 93%T 95%T 100% T
8. Supports the fact of evolution. 90%T 95%T 84%T 93%T 74%T 87% T
9. Darwin first for evolution. 62% F 52%F 36%F 21%F 26%F 73% F
10. Humans are evolved from apes. 74% T 62%T 80%T 79%T 42%T 67% T
11. 3.4 bya oldest fossils. 74% T 90%T 80%T 64%T 53%T 60% T
12. Sc. theory is a guess. 69% F 67%F 68%F 79%F 100%F 73% F
13. Birds are from dinosaurs. 44% T 62%T 64%T 33%T 37%T 40% T
14. Earth was made in 6 days. 77% F 81%F 84%F 86%F 100%F 80% F
15. Common DNA code. 38% T 52%T 48%T 43%T 26%T 60% T
16. Punctuationism. 51% T 33%T 52%T 29%T 26%T 40% T
17. Gradualism. 85% T 81%T 72%T 93%T 95%T 73% T
18. Sc. method = c. testing. 69% T 43%T 60%T 50%T 11%T 73% T

416
Table 10.8. Comparison of Year 9 responses to Section A question 1.
Question (n = 39 for AC Year 13) (T = true)
AC Y13
AC Y12
UB PT
UC PT
AC Y9
1. Fossils grow from seeds in rocks 100% F 100%F 100%F 100% F 100% F
2. Fossils are the failed creations of God 100%F 95%F 100%F 100% F 100% F
3. Fossils are tricks of the Devil 100% F 100%F 100%F 100% F 100% F
4. Fossils are just accidents of nature 89% F 86%F 79%F 87% F 79% F
5. Fossils are the preserved parts of once living things
95% T
100%T 84%T 100% T
86%T
6. Fossils are the preserved parts of extinct things only
87% F
86%F 79%F 93% F
67%F
7. Fossils are important and interesting 95% T 95%T 95%T 100% T 93%T
8. Fossils support the theory and fact of evolution
90%T
95%T 74%T 87% T
93%T
9. Charles Darwin was the first to think of evolution
62% F
52%F 26%F 73% F
21%F
10. Humans have evolved from apes 74% T 62%T 42%T 67% T 79%T
11. Oldest known fossils are about 3.4 billion years old
74% T
90%T 53%T 60% T
64%T
12. A scientific theory is just a guess 69% F 67%F 100%F 73% F 79%F
13. Birds are descendants of dinosaurs 44% T 62%T 37%T 40% T 33%T
14. The Earth was made in six days 77% F 81%F 100%F 80% F 86%F
15. All living things share the same basic DNA coding system
38% T
52%T 26%T 60% T
43%T
16. New species appear suddenly 51% T 33%T 26%T 40% T 29%T
17. Evolution is slow change from one species to another
85% T
81%T 95%T 73% T
93%T
18. Scientific method only involves controlled tests
69% T
43%T 11%T 73% T
50%T

417
Figure 10.3. AUB primary school trainee responses to GeoVAT Question 1. American Univ. of Beirut (AUB)
(Average age of 19 years 5months) Responses 1 = true 0 = False
Student Response ( n = 19 )
Section A, Question 1: Ideas about Fossils 1 2 3 4 5 6 7 8 9 10 11 12 13 14 15 16 17 18 19 Response Expected
1. Fossils grow from seeds in rocks 0 0 0 0 0 0 0 0 0 0 0 0 0 0 0 0 0 0 0 100% F F
2. Fossils are the failed creations of god 0 0 0 0 0 0 0 0 0 0 0 0 0 0 0 0 0 0 0 100% F F
3. Fossils are tricks of the Devil 0 0 0 0 0 0 0 0 0 0 0 0 0 0 0 0 0 0 0 100% F F
4. Fossils are just accidents of nature 0 0 1 0 1 0 0 0 1 0 0 0 1 0 0 0 0 0 0 79% F F
5. Fossils are the preserved parts of once living things 1 1 1 1 1 1 1 1 0 1 1 0 1 1 0 1 1 1 1 84% T T
6. Fossils are the preserved parts of extinct things only 0 0 0 0 0 0 0 0 1 0 0 1 0 1 0 1 0 0 0 79% F F
7. Fossils are important and interesting 1 1 1 1 1 1 1 1 1 1 1 1 1 1 1 1 0 1 1 95% T T
8. Fossils support the theory and fact of evolution 1 1 1 1 1 1 1 0 1 1 1 0 0 1 1 1 0 1 0 74% T T
9. Charles Darwin was the first to think of evolution 1 1 0 1 1 1 1 1 1 1 1 0 0 1 1 1 0 1 0 26% F F
10. Humans have evolved from apes 1 1 0 1 1 0 0 1 0 0 0 1 0 0 1 0 0 0 1 42% T T
11. Oldest known fossils are about 3.4 billion years old 1 1 0 1 0 1 1 1 1 1 0 0 0 0 0 0 1 1 0 53% T T
12. A scientific theory is just a guess 0 0 0 0 0 0 0 0 0 0 0 0 0 0 0 0 0 0 0 100% F F
13. Birds are descendants of dinosaurs 0 0 0 0 0 1 1 1 0 0 0 0 0 1 1 1 1 0 0 37% T T
14. The Earth was made in six days 0 0 0 0 0 0 0 0 0 0 0 0 0 0 0 0 0 0 0 100% F F
15. All living things share the same basic DNA coding system 0 0 0 0 0 0 1 0 0 1 0 0 0 1 1 0 0 1 0 26% T T
16. New species appear suddenly 0 0 0 0 0 0 1 0 0 1 0 0 0 1 1 0 0 1 0 26% T T
17. Evolution is slow change from one species to another 1 1 1 1 0 1 1 1 1 1 1 1 1 1 1 1 1 1 1 95% T T
18. Scientific method only involves controlled tests 0 0 0 0 0 0 0 0 0 0 1 0 0 0 0 1 0 0 0 89% F F
Key to colours
Grey = General agreement with expected
Red = Significant disagreement
Blue = agreement

418
Figure 10. 6. AUB primary school trainee responses to Section B, Q 3. Fossils and time. (No's refer to number of responses per Q). Red = Ranked Acceptable Age
(n = 7 to 14) Time Category Q. No. Question (After Trend, 2001) A B C D E F G H I J
% correct
Acceptable Age Key
4 Development of plate tectonic theory 0 2 0 1 0 1 0 2 0 1 0 AD 1960 Years ago with age bands 11 Extinction of the woolly mammoths 0 0 0 0 0 0 5 2 1 0 0 12,000 ya A =<100y
18 Appearance of first humans 2 0 0 0 0 0 0 2 0 2 0 2 mya B =100 -1000
6 The Ice Age 0 3 1 2 0 1 0 1 1 0 0 2.4 mya C = 1000 -100,000
5 Extinction of large dinosaurs 1 0 4 3 1 2 0 2 1 0 14 65 mya D = 100,000 -1 million
15 Appearance of the first birds 0 0 3 0 0 1 0 2 1 2 0 200 mya E = 1 million -10 million
16 Appearance of the first dinosaurs 1 2 2 0 0 0 2 2 1 0 20 220mya F = 10 million -100 million
8 Extinction of the trilobites 2 1 3 0 0 0 2 0 0 2 20 225 mya G = 100 million -1billion
20 Beginning of the Atlantic Ocean 0 0 0 0 0 1 0 1 2 2 0 230 mya H = 1billion - 5 billion
21 Appearance of the first trees 0 0 0 0 0 0 0 4 3 1 0 380 mya I = 5b -1million million
7 First appearance of land animals 0 0 0 0 3 3 0 0 2 2 0 400 mya J = >1million million
1 First fish to appear 2 0 0 0 1 2 3 2 1 3 21 500mya
22 Oldest rocks in your country 0 0 0 1 0 0 0 3 3 2 0 520 mya 1 billion = 1000 million
17 First life forms with shells or bones 1 2 0 1 0 1 0 3 1 0 0 560 mya bya = billion years ago
13 First life forms on Earth 1 1 0 0 1 1 0 3 2 1 30 3.5 bya Red = acceptable geological age
19 First volcanoes 1 0 1 1 2 0 1 4 0 0 40 4.1bya 10 First rocks on Earth 0 5 2 0 0 0 0 2 0 1 20 4 bya 2 Formation of the Earth's crust 0 0 1 0 0 0 0 3 4 3 27 4 bya
12 Formation of the Moon 2 0 0 0 0 0 0 3 0 4 33 4.3 bya 9 Formation of the Sun 0 1 0 0 0 1 0 1 0 5 0 4.6 bya 3 Formation of the Earth 3 0 0 0 0 0 0 3 1 4 9 4.6 bya
24 Formation of the Milky Way galaxy 2 1 0 0 0 0 0 2 0 4 0 10 bya 23 Beginning of time 0 1 1 0 0 0 0 0 1 6 11 13 bya 14 Big Bang formation of the Universe 0 1 2 0 0 0 0 0 2 5 20 13 bya

419
Figure 10.7. UC Secondary teacher trainee responses to GeoVAT Question 1 (Average age of 22 years 6 months) Responses 1 = true 0 = False
Student Response ( n = 15 ) Section A, Question 1: Ideas about Fossils 1 2 3 4 5 6 7 8 9 10 11 12 13 14 15 Response Expected
1. Fossils grow from seeds in rocks 0 0 0 0 0 0 0 0 0 0 0 0 0 0 0 100% F F
2. Fossils are the failed creations of God 0 0 0 0 0 0 0 0 0 0 0 0 0 0 0 100% F F
3. Fossils are tricks of the Devil 0 0 0 0 0 0 0 0 0 0 0 0 0 0 0 100% F F
4. Fossils are just accidents of nature 0 0 1 0 0 0 0 0 0 0 0 0 0 0 1 87% F F
5. Fossils are the preserved parts of once living things 1 1 1 1 1 1 1 1 1 1 1 1 1 1 1 100% T T
6. Fossils are the preserved parts of extinct things only 0 0 0 0 1 0 0 0 0 0 0 0 0 0 0 93% F F
7. Fossils are important and interesting 1 1 1 1 1 1 1 1 1 1 1 1 1 1 1 100% T T
8. Fossils support the theory and fact of evolution 0 1 1 1 1 1 1 1 1 1 1 1 1 1 0 87% T T
9. Charles Darwin was the first to think of evolution 0 0 0 0 0 0 1 1 0 0 1 0 0 0 1 73% F F
10. Humans have evolved from apes 0 0 1 1 1 0 1 1 1 1 1 0 1 0 1 33% F T
11. Oldest known fossils are about 3.4 billion years old 0 1 0 1 1 1 0 1 0 1 0 1 0 1 1 40% F T
12. A scientific theory is just a guess 0 0 0 1 0 0 0 0 1 0 1 0 0 0 1 73% F F
13. Birds are descendants of dinosaurs 0 1 1 0 0 1 0 0 1 0 0 1 0 0 1 60% F T
14. The Earth was made in six days 1 1 0 0 1 0 0 0 0 0 0 0 0 0 0 80% F F
15. All living things share the same basic DNA coding system 1 1 0 0 1 1 1 1 0 0 1 1 0 0 1 40% F T
16. New species appear suddenly 0 1 0 1 0 0 1 0 0 0 1 1 0 0 1 60% F T
17. Evolution is slow change from one species to another 0 1 0 0 1 1 1 1 1 0 1 1 1 1 1 27% F T
18. Scientific method only involves controlled tests 1 1 0 1 1 1 1 0 1 1 1 1 0 1 0 27% F F
Key to colours Grey = General agreement with expected Red = Significant disagreement Blue = agreement

420
Figure 10.8. UC secondary school trainee responses to Section B , Q3 results: Fossils and Time. UC secondary school trainees (No's refer to number of responses per Q).
Red = Ranked Acceptable Age (n = 9) Time Category
Q. No. Question (After Trend, 2001) A B C D E F G H I J
% correct
Acceptable Age Key
4 Development of plate tectonic theory 8 0 0 0 0 0 0 0 0 0 100 AD 1960 Years ago with age bands 11 Extinction of the woolly mammoths 0 0 2 0 2 2 1 0 0 0 25 12,000 ya A =<100y
18 Appearance of first humans 0 0 2 3 0 0 0 0 0 0 0 2 mya B =100 -1000
6 The Ice Age 0 0 4 0 1 3 0 0 0 0 14 2.4 mya C = 1000 -100,000
5 Extinction of large dinosaurs 0 0 0 0 1 3 0 0 0 0 75 65 mya D = 100,000 -1 million
15 Appearance of the first birds 0 0 0 0 2 0 3 0 0 0 60 200 mya E = 1 million -10 million
16 Appearance of the first dinosaurs 0 0 0 0 0 1 4 0 0 0 80 220mya F = 10 million -100 million
8 Extinction of the trilobites 0 0 0 0 0 3 2 0 0 0 40 225 mya G = 100 million -1billion
20 Beginning of the Atlantic Ocean 0 0 0 0 1 0 0 2 0 0 0 230 mya H = 1billion - 5 billion
21 Appearance of the first trees 0 0 0 0 1 0 2 0 0 0 66 380 mya I = 5b -1million million
7 First appearance of land animals 0 0 0 0 1 0 3 1 0 0 60 400 mya J = >1million million
1 First fish to appear 0 0 0 0 0 3 2 0 0 0 40 500mya mya = million years ago
22 Oldest rocks in your country 0 0 0 0 0 1 0 2 2 0 0 520 mya 1 billion = 1000 million years
17 First life forms with shells or bones 0 0 0 0 0 0 1 2 0 0 50 560 mya bya = billion years ago
13 First life forms on Earth 0 0 0 0 0 0 3 2 0 0 40 3.5 bya Red = acceptable geological age
19 First volcanoes 0 0 0 0 0 0 0 3 0 0 100 4.1bya 10 First rocks on Earth 0 0 0 0 1 0 1 2 3 0 29 4 bya 2 Formation of the Earth's crust 0 0 0 0 1 0 0 3 3 0 43 4 bya
12 Formation of the Moon 0 0 0 0 1 0 0 2 0 0 66 4.3 bya 9 Formation of the Sun 0 0 0 0 0 0 0 1 4 4 11 4.6 bya 3 Formation of the Earth 0 0 0 0 1 0 0 4 3 1 50 4.6 bya
24 Formation of the Milky Way galaxy 0 0 0 0 0 0 0 0 0 5 0 10 bya 23 Beginning of time 0 0 0 0 0 0 0 0 0 5 0 13 bya
Big Bang formation of the Universe 0 0 0 0 0 0 0 0 3 4 75 13 bya

421
Fossils and Time: GeoVAT Section B, Question 3.
Time Category (Red is correct response)
Q
A
B
C
D
E
F
G
H
I
J
n
% over estimate
% under estimate
% Correct
4 9 5 2 1 2 19 53 0 47
11 1 1 5 8 1 1 1 18 89 6 6 18 4 5 3 3 3 1 19 37 47 16 6 3 2 5 3 3 1 1 18 44 28 33
5 1 1 3 3 6 3 2 1 20 30 40 30 15 3 2 5 2 3 2 17 29 59 12 16 2 1 2 2 6 4 17 59 29 12
8 1 1 2 2 2 5 1 1 15 13 53 33 20 1 3 2 1 1 5 3 3 19 58 37 5 21 1 1 2 5 1 7 1 1 19 47 47 5 7 1 2 5 3 3 3 1 18 39 44 17
1 2 2 1 5 5 2 2 19 47 26 26 22 1 1 4 1 2 3 1 2 2 17 29 53 17 17 1 1 2 4 4 2 5 19 37 42 21
13 1 2 3 2 6 5 3 22 27 36 27 19 1 2 5 2 2 6 2 20 40 50 10 10 1 1 1 1 5 4 5 18 50 22 28
2 1 1 5 4 7 18 61 11 28 12 1 4 5 1 9 20 50 25 25 9 1 4 14 19 95 5 0
3 1 1 4 1 12 19 68 10 21 24 1 1 4 13 19 68 10 21 23 2 17 19 89 10 0
14 1 1 1 4 11 18 61 17 22 Mean % 52 29 18
Figure 10.11. AC Year 12 distribution of responses for GeoVAT question 3.

422
Time Category (Red is a correct response)
Q
A
B
C
D
E
F
G
H
I
J
n
% over estimate
% under estimate
% Correct
4 1 8 2 11 91 0 9
11 4 1 3 1 1 10 60 0 40
18 2 5 3 1 11 0 91 9
6 3 2 3 1 1 1 11 45 27 27
5 2 3 4 1 2 12 17 75 8
15 1 2 3 2 2 1 11 9 72 8
16 2 1 3 1 3 1 11 9 54 9
8 1 2 3 2 2 1 11 18 54 18
20 2 1 2 1 1 1 3 11 8 54 9
21 1 2 1 3 1 1 1 10 30 40 30
7 1 3 2 1 4 1 12 17 58 33
1 1 2 1 4 1 2 1 12 17 75 17
22 2 3 2 1 3 1 1 13 35 54 8
17 1 3 1 1 3 1 1 11 45 46 9
13 2 2 2 3 1 10 10 60 30
19 1 1 1 2 2 4 11 54 27 8
10 1 1 1 2 2 4 11 36 45 8
2 1 1 4 6 12 83 8 8
12 1 1 1 6 3 12 5 17 8
9 1 10 11 91 9 0
3 1 1 1 4 7 71 14 14
24 2 3 6 11 54 18 27
23 1 5 6 12 50 8 42
14 1 11 12 92 8 0
Y 13 Mean 41 38 14
Y12 Mean 52 29 18
Figure 10.14. AC Year 13 distribution of responses for GeoVAT question 3.

423
Time Category (red is a correct response)
AC Year 9 results
Q’n
A
B
C
D
E
F
G
H
I
J
n
% over estimate
% under estimate
% Correct
4 1 5 5 1 1 13 92 0 8 11 2 2 2 6 1 13 100 0 0 18 4 5 1 1 1 1 13 23 69 8
6 1 5 1 4 1 1 13 46 46 8 5 2 3 2 4 1 1 13 46 38 16
15 2 2 2 1 4 2 13 15 53 32
16 2 2 1 7 1 13 61 31 8 8 1 2 4 2 2 2 13 15 85 0
20 1 1 1 5 1 2 2 13 31 60 8 21 1 1 1 1 1 8 13 62 30 8
7 4 3 1 4 1 13 38 54 8 1 2 1 3 4 3 13 53 23 24
22 1 1 1 3 6 1 13 0 92 8
17 1 2 1 3 6 13 46 31 23 13 1 1 1 1 2 5 2 13 69 23 8 19 1 1 4 3 2 1 1 13 15 69 16
10 1 1 1 2 7 1 13 61 23 16 2 2 6 5 13 85 0 15
12 1 6 1 5 13 46 8 46
9 2 11 13 100 0 0 3 1 1 1 10 13 85 7 8
24 1 3 9 13 68 8 24
23 1 1 1 10 13 77 15 8 14 1 1 1 10 13 77 15 8
Y 9 Mean 57% 33% 10% Y 13 Mean 41% 38% 14% Y12 Mean 52% 29% 18% Combined
AC Means 49% 33% 15%
Figure 10.16. Distribution of responses for GeoVAT question 3 for AC Year 9
(n = 13).
KEY to Age Categories A = <100y B = 100 – 1000y C = 1000 – 100,000y D = 100,000 – 1mya E = 1mya – 10mya G = 100mya – 1bya H = 1bya – 5bya I = 5bya – 1mmya J = > 1mmya

424
Time Category (red is a correct response)
Q’n
A
B
C
D
E
F
G
H
I
J
n
% over estimate
% under estimate
% Correct
4 5 5 2 2 1 15 67 0 33 11 3 2 1 3 1 1 1 2 14 79 0 21 18 2 2 9 1 14 0 93 7
6 1 4 2 2 2 2 13 46 39 15 5 2 4 2 2 2 2 14 57 29 14
15 3 3 2 2 5 15 33 54 13
16 5 1 1 7 14 57 36 7 8 1 8 1 0 4 14 29 71 0
20 2 2 3 2 1 3 13 31 54 15 21 3 4 1 7 15 46 47 7
7 2 1 1 4 2 2 2 14 29 57 14 1 2 1 1 4 4 2 14 14 53 29
22 1 1 2 8 1 1 14 71 29 0
17 1 2 1 2 5 1 12 50 33 17 13 1 4 1 8 14 0 43 57 19 2 5 1 0 4 2 14 43 57 0
10 1 1 1 3 1 3 1 2 13 54 23 23 2 2 1 5 3 4 15 47 20 33
12 1 2 3 4 5 15 33 40 27
9 1 2 5 2 4 14 46 50 14 3 1 2 7 3 14 71 15 14
24 1 2 1 0 11 15 73 27 0
23 2 1 12 15 73 20 7 14 1 1 2 2 3 6 15 40 39 21
Mean 44 38 14
Figure 10.18. Distribution of responses for GeoVAT question 3 for AC Year 11 (n = 25).

425
Time Category
(red is a correct response)
Q
A
B
C
D
E
F
G
H
I
J
n
% over estimate
% under estimate
% Correct
4 3 3 1 1 8 63 0 37 11 1 2 2 2 7 57 14 29 18 1 1 1 1 1 5 40 40 20
6 1 4 0 1 1 1 8 38 62 0 5 3 4 1 1 9 22 33 45
15 1 1 4 6 0 33 27
16 1 1 4 6 0 33 67 8 1 4 1 6 17 17 67
20 1 1 2 4 0 50 50 21 1 1 1 3 33 33 33
7 1 2 4 7 0 43 57 1 1 1 1 1 2 2 8 50 38 13
22 0 1 5 6 100 0 0
17 2 1 0 3 0 100 0 13 2 1 0 4 7 57 43 0 19 1 0 1 1 3 66 33 0
10 2 1 1 1 5 66 33 20 2 1 4 2 7 29 14 57
12 1 2 2 5 40 20 40
9 1 2 0 1 4 8 63 38 0 3 1 1 0 5 2 9 78 22 0
24 1 2 0 3 6 50 50 0
23 1 5 6 83 0 17 14 1 1 0 4 6 67 33 0
Mean 42 33 24
Figure 10.21. Distribution of responses for question 3 for IS Grade 11.

426
Time Category
(red is a correct response)
N = 10
Q’n
A
B
C
D
E
F
G
H
I
J
n
% over estimate
% under estimate
% Correct
4 6 2 2 9 44 0 56 11 2 2 1 1 6 33 34 33 18 2 1 4 1 8 12 38 50
6 1 1 2 1 1 6 33 34 33 5 2 1 1 2 2 8 25 50 25
15 1 2 3 0 1 7 14 86 0
16 1 2 1 3 1 8 12 50 38 8 1 2 4 1 8 12 38 50
20 2 3 1 1 7 14 72 14 21 1 1 2 4 1 1 10 10 80 10
7 1 4 2 0 7 0 100 0 1 1 1 1 2 2 7 57 29 14
22 1 1 4 1 7 14 29 57
17 2 1 1 1 1 6 33 50 17 13 1 2 3 2 1 9 33 34 33 19 1 1 4 0 1 7 14 86 0
10 1 1 1 1 1 1 6 16 67 17 2 1 1 1 2 2 7 29 42 29
12 1 4 1 6 16 16 67
9 1 2 2 2 7 57 14 29 3 1 3 2 1 7 43 14 43
24 3 1 5 9 56 33 11
23 1 1 1 2 1 4 10 40 50 10 14 1 2 2 2 7 29 42 14
Mean 27 45 28
Figure 10.22. Distribution of responses for question 3 for IS Grade 12 (n = 10)

427
Fossils and Time: Section B, Question 3 GeoVAT Distribution of responses per question for UC Second Year (mean age 22y)
Time Category (red is a correct response)
Q
A
B
C
D
E
F
G
H
I
J
n
% over estimate
% under estimate
% Correct
4 8 8 0 0 100 11 4 1 2 1 8 50 0 50 18 2 3 2 1 8 13 63 25
6 1 5 1 1 8 0 88 13 5 1 2 5 8 0 38 63
15 1 1 2 4 8 0 100 0 16 1 2 5 8 0 38 63
8 3 1 4 8 0 50 50 20 1 1 4 1 1 8 13 75 13 21 1 1 2 2 2 8 25 50 25
7 3 1 4 8 0 50 50 1 1 1 1 4 1 8 13 38 50
22 1 2 1 3 1 8 13 50 38
17 1 1 2 4 8 0 50 50 13 1 1 2 4 8 0 50 50 19 1 2 1 1 2 1 8 13 63 25
10 1 2 4 1 8 13 38 50 2 1 6 1 8 88 13 0
12 1 6 1 8 13 13 75
9 1 1 4 2 8 75 25 0 3 1 4 3 8 38 13 50
24 1 4 3 8 38 13 50
23 1 3 4 8 50 13 38 14 1 4 3 8 38 13 50
Mean 20 38 43
Figure 10.25 UC second Year responses to GeoVAT question 3.

428
Distribution of responses per question for UC First Year (mean age 20y)
Time Category (red is a correct response)
Q
A
B
C
D
E
F
G
H
I
J
n
% over estimate
% under estimate
% Correct
4 10 1 1 12 17 0 83 11 10 2 1 13 30 0 70 18 4 4 2 1 11 9 73 18
6 1 5 3 1 1 1 12 17 75 8 5 1 8 1 1 11 18 9 73
15 1 2 1 3 2 1 1 11 18 64 18 16 1 2 6 2 11 18 27 55
8 4 2 4 1 1 12 17 50 33 20 3 3 1 3 1 11 9 64 27 21 1 2 1 3 2 2 14 50 29 21
7 1 3 3 4 1 12 8 58 33 1 1 4 8 1 14 7 36 57
22 1 2 1 3 2 2 11 36 36 27
17 1 3 5 1 1 11 18 36 45 13 6 3 1 1 11 18 55 27 19 2 3 4 1 1 11 45 18 36
10 1 1 1 7 2 12 17 25 58 2 2 7 1 2 12 25 17 58
12 2 4 4 1 11 45 18 36
9 1 3 5 3 12 67 8 25 3 1 7 2 2 12 33 8 58
24 5 7 12 58 0 42
23 1 1 9 11 81 9 9 14 1 4 8 13 62 8 31
Mean 29 31 40
Figure 10.28. UC Geology student first year responses to GeoVAT question 3.

429
Fossils and Time: Section B, Question 3 GeoVAT Distribution of responses per question for UC Postgraduate Geology students (mean age 27y)
Time Category (red is a correct response)
Q’n
A
B
C
D
E
F
G
H
I
J
n
% over estimate
% under estimate
% Correct
4 10 10 0 0 100
11 6 2 1 1 10 40 0 60
18 1 4 3 1 1 10 20 50 30
6 9 1 10 0 100 0
5 7 3 10 30 0 70
15 1 6 2 1 10 10 70 20
16 9 1 10 10 0 90
8 1 3 6 10 0 40 60
20 3 5 1 1 10 20 30 50
21 2 5 3 10 30 20 50
7 1 1 8 10 0 20 80
1 1 7 2 10 20 10 70
22 1 8 1 10 10 10 80
17 1 9 1 10 10 10 90
13 2 6 2 10 20 20 60
19 1 1 8 10 0 20 80
10 8 2 10 20 0 90
2 9 1 10 10 0 90
12 7 2 1 10 30 0 70
9 3 3 4 10 70 0 30
3 6 4 10 100 0 0
24 2 3 5 10 50 20 30
23 1 2 7 10 70 10 20
14 1 1 5 3 10 30 20 50
Mean 25 19 80
Figure 10.31. Post graduate geology student responses to GeoVAT question 3.

430
APPENDIX 7
GeoTSAT RESULTS American University of Beirut (AUB) Primary Teacher Trainees GeoTSAT Spatialisation As indicated in Chapter five, achieving a large sample of completed questions is an
ideal. It is unfortunate that time and resources do not allow for resending and redoing
questionnaires to achieve a higher level of response. Out of a class of 19 primary
teacher trainees (mean age of 19 years and 5 months), only 7 responded to the
geological structure questions. Questions were either too demanding or completion
time was inadequate. Hints that questions 7 and 8 were too difficult as a reason for
no response is suggested by an additional 5 responses stating that it was too hard:
and therefore they made no response. A typical response to question 8c, where a
simple visualisation of a cross section is required is shown below. Was this too hard?
Although another response showed concentric layering, it did not have the three
rings it had four. It seems again, that how students interpret questions controls how
they answer. The answer below is correct in showing a cross section but does not
show the layering: they didn’t read the question - or did they?
A typical response to question 8c
Results to Q.6. Mental rotation of letters G and e (n = 10)
Accepted Responses:
6 a. 1 6.a. 2 6.b.1 6.b.2
e and G upside down e and G right to left rotation
Results:
% correct for 6a. 1 = 60% % Correct for 6b. 1. = 80%
% Correct for 6a. 2. = 40% % Correct for 6b. 2. = 20%
% Correct for all rotations = 20%

431
It seems that the letter e in this exercise is less difficult to mentally rotate vertically
and horizontally than the G and that the most difficult task is mentally rotating the
capital G. As mentioned earlier, the ability to mentally rotate can be important for
deciphering complexly folded strata and these results hint at the need for further
study. For example are all letters equally difficult to rotate, and what about different
shapes? The few responses to questions 7 and 8, although frustrating, does provide a
glimpse of where these students are at spatial-geologically.
Table 7.3. Summary of AUB (primary) results for questions 7 and 8 (n =7).
It appears then that in this small sample of 20 year old primary teacher trainees from
Lebanon those that were prepared to give a response are not that able in completing
the block diagrams, with several indicating that they had no idea. As the complexity
of visual spatialisation increased (7c, 7d, 8a and 8b), responses were less confident
and generally simple copies of exposed faces were transposed onto other faces of the
block. The example response to Q7b was the only example of all cohorts that copied
the curved folded strata onto the top surface. It is as if the other surfaces do not exist.
Examples are shown below. Clearly, completing the side face was also too difficult
for this 21 year old. Q7c posed the greatest difficulties for all cohorts but this
example shows how continuing the line onto the front face was a solution
(incorrectly). Visually penetrating a 3-D geological structure and drawing the upper
curved surface is also too difficult for this 27 year old student (Q7c).
Q (AUB p) Correct Incorrect
7a 2 5 (71%)
7b 3 4 (57%)
7c 0 5 (100%)
7d 2 3 (60%)
8a (ab + xy) 1 6(86%)
8b 0 0
8c 1 4 (80%)

432
Q 7b Q7c Q7d (Cross Section)
There appears then to be little ability to visually penetrate or to follow strata onto a
different dimensional perspective for this cohort. This cohort had on average studied
some geology when they were about aged 15 but it is highly unlikely that their
course involved anything with structural geology and the nature of folded and faulted
strata. Having knowledge of this might help, but in general, these results support
Devlin’s view (2001) that projective (recognition of perspective view change) and
Euclidian (use of measurement) spatialisation development happens quite late and
requires structured learning experiences.
American University of Beirut (AUB) Secondary Teacher Trainees
GeoTSAT Spatialisation
Results to Q.6. Mental Rotation (n = 14)
e and G upside down e and G back to front
% correct for 6a. 1. = 76% % Correct for 6b. 1. = 66%
% Correct for 6a. 2. = 61% % Correct for 6b. 2. = 58%
% Correct for all rotations = 40%
This cohort of 14 responses from secondary teacher trainees with a mean age of 22
indicates an increase in overall results from their primary teacher trainee colleagues.
All respondents of this cohort were university graduates. Explaining the better
performance of the younger cohort for Q6b.1 (back to front e), is more difficult. The
upside down ‘e’ seems to be rotated more confidently than that of the back to front e
for the secondary trainees than the primary trainees. The lowest score for both
groups was the left to right rotation (lateral inversion) of G and there were twice as
many ‘older’ students correct for all rotations.

433
Table 7.4. Summary of results for AUB (secondary) questions 7 and 8 (n =8).
Although marginally better at rotation, this older cohort of teacher trainees seem to
be just as inadequate at completing and cross sectioning a geological block diagram
as their younger colleagues. The same types of error as (all other groups are
displayed where virtually all copied given strata directly onto another face. Another
common error was completing only one face suggesting a lack of visual penetrative
and 3-D ability. Questions 7d and 8a were beyond this cohort’s ability to complete
and involve application of VPA. Kali & Orion considered this response to be non-
penetrative in the sense that being able to ‘see inside from outside’ is needed.
UC (NZ) Secondary Teacher Trainees GeoTSAT Spatialisation
Results to Q.6. Mental Rotation (n = 9)
e and G upside down e and G back to front
% correct for 6a. 1. = 78% % Correct for 6b. 1. = 100 %
% Correct for 6a. 2. = 78% % Correct for 6b. 2. = 100%
% Correct for all rotations = 89%
For this small cohort of twenty seven year old graduates, rotating both letters
laterally was not a problem but vertical inversion for both letters was difficult for a
few (2/9). The development and teaching interventions for mental rotation about 3
axes deserves further study especially the application of computer assisted rotational
spatialisation. Indeed work by Kali (1997; 2002; 2003) has begun this task. Another
Q. AUB sec Correct Incorrect
7a 5 3 (38%)
7b 2 5 (71%)
7c 1 6 (86%)
7d 0 8 (100%)
8a (ab + xy) 2 6 (86%)
8b 2 6 (86%)
8c 5 3 (38%)

434
approach using the ‘hands on’ dry-erase cube (Kuiper, 2008), may also be of great
value and one that was employed in an adaptive way, for data gathering discussed in
chapter 7 on VPA. Advantages of this approach (with appropriate geological
structures) are that it is cheap, does not depend on electronics, is kinaesthetic enables
various levels of complexity and available for individuals and small groups. Work by
Liben et al. (2009) suggests strongly that more research for example is needed to
find the links between the cognitive (projective) development of 3D spatial
horizontality and effective pedagogy, especially for students aged 15 to 25. The
teaching and learning step that connects the real world (as geology seen in the field)
to 2D and 3D mapping, is a further significant challenge and one that could start in
the early to mid teens.
Examples of difficulties experienced by UC secondary respondents are shown
below.
1. Q7d
2. Q8a
3. Q8a 4. Q8b
Kali and Orion (1996) employed Friedman’s two way analysis of variance to test for
significant differences in performance on each of the structural problem types (for
between 101 and 34 responses for all structural problem types) enabled them to rank
the difficulty of the structural problems being tested. The most difficult structural
problem was drawing cross sections from complex structures at specific locations
such as that in the GeoVAT instrument Section B Q2a, GeoTSAT Q7d and Q8a. The

435
next least difficult were cross sections Q8b and 8c followed by block diagram face
completion tasks, Q7a, 7b and 7c.
Question 7d is more complex than questions 7a and 7b because it involves a faulted
syncline, (albeit, simply), visual penetration ability as well as completing the surface
appearance. A more complex structure would involve a plunging syncline and
horizontally (or strike slip) faulted structure. Question 8a involves cross sectioning a
plunging anticline but at two different axes. Typical responses shown above indicate
the difficulty respondents have with this structural problem. There appears to be little
evidence of VPA and difficulty completing the faces. Example 3 shows confusion
and indecision while example 2 shows solution by copying the side face onto a cross
section. Example 1 illustrates the most common error for question 7d. Where
attempted, the strata is simply continued across the fault with little visualisation of
the effect the normal fault has of disrupting the strata. If students have not
encountered the effects of faulted strata before, it is unlikely to be identified in a
complex block diagram. It is also unlikely that this age group are cognitively unable
to perform this visualisation (Piaget & Inhelder, 1967), but it demonstrates the power
of fieldwork and integrated pedagogies for teaching geological structures and 3D
spatialisation (Kail, 1990; Y. Kali, 2002; K. A. Kastens, Ishikawa, T., & Liben, L.S.,
2006; J. B. Libarkin, C., 2002; N. Orion, & Hofstein, A., 1991). Model making using
isometric ‘exploded view’ diagrams was always a great way to develop visual-
spatialisation skills but they are sill 2-D representations of 3-D. VPA is the ability to
‘explode’, pull apart and look inside geological structures as well as being able to
‘project’ to the outside surface. Figure 7.4 shows a typical textbook example of use
of a block diagram illustrating a plunging anticline. What is the pattern at the far end
like?
Figure 7.4. A plunging anticline (Gilluly, Waters & Woodford, 1958).

436
The most common error found for question 8c was the number of layers drawn.
Respondents seem to just draw a cross section but fail to read the need for only three
layers: a common error across all age groups. Question 8b is a simple tilted strata
problem requiring cross sectional VPA through one axis. The most common error,
and one that supports Kali and Orion’s results, is that of copying given information
onto the hidden cross section view. Hidden views require VPA. This group of
secondary teacher trainees do not have it. This is likely to reflect the lack of learning
experiences in the real world by observing geological exposures, no geological
training and minimal cross curricula spatialisation developing experiences. Indeed,
finding ways of teaching how to think 3 dimensionally (For teachers and students)
from inside the box looking out, and outside the box looking in, is a considerable
challenge for curricula and syllabus design. Table 7.5 presents the NZ secondary
trainee responses results.
Table 7.5. Summary of Questions7 and 8 for NZ secondary teacher trainees (n =7).
AC Year 13 New Zealand Secondary School Responses GeoTSAT
This cohort of final year secondary students (n = 23) had a mean age of 17 years and
9 months. The questionnaire was completed in normal class time in the third of a
four term year. All of these students were taking biology with only 10% taking two
sciences and 5% taking three sciences. Most of this cohort would enter a university
the following year.
Question Correct Incorrect
7a 6 1 (17%)
7b 4 2 (33%)
7c 2 5 (71%)
7d 0 4 (100%)
8a (ab + xy) 3 3 (50%)
8b 3 2 (40%)
8c 6 1 (17%)

437
Results to Q.6. AC Year 13 Mental rotation responses (n = 23)
e and G upside down e and G back to front
% correct for 6a. 1. = 78% % Correct for 6b. 1. = 100%
% Correct for 6a. 2. = 83% % Correct for 6b. 2. = 100%
% Correct for all rotations = 80%
Mental rotation appears not to be a major difficulty for this small cohort but oddly,
vertical rotation for both letters was more difficult than the lateral inversion. The
most common problem for incorrect answers was confusion of left to right when the
letters are inverted. This age group can mentally rotate.
Table 7.6. Summary of results for AC Year thirteen (n = 17 to 24).
Results for this age group (Table 6.6) follow a similar pattern to others: as
complexity increases and the need for VPA increases such as for fold structure
solutions, fewer responses are correct. Projecting strata onto two faces is difficult
(Q7d), and drawing the ‘exploded’ VPA faces with correct strata positions (Q8a) for
two cross sections is too difficult. 3-D Euclidean geometry ability seems to be poorly
developed. How has mathematics curricula changed for teaching and learning
geometry? The following examples show typical responses for Q8a: cross section
VPA on a plunging anticline.
Question No. Correct No. Incorrect
7a 21 3 (13%)
7b 10 13 (56%)
7c 3 20 (87%)
7d 7 16 (70%)
8a (ab) 0 20 (100%)
8a (xy) 0 20 (100%)
8b 9 8 (47%)
8c 18 3 (14%)

438
(a) Most common (b) ‘Face’ copying (c) ‘Face’ copying
No response to Q8a had the strata bedding plane correct. Strata were only translated
vertically downward rather than diagonally despite a partial answer being displayed
in Q.7.d (See (a) above). This suggests that these students were unable to visually
penetrate to the hidden strata dipping downwards and connecting with the front face
of the block. Diagrams (b) and (c) above suggest the common copying of the top
surface to the side face and the front face, which are of course parallel to a-b and x-y.
It seems difficult for students to be able to connect the ‘inside’ cross section a-b and
x-y with that of these parallel faces. In other words, they do not see the strata
patterns on the edge faces of the block as being the same as the cut away cross
sections. Questions 8b and c also follow common errors: diagonal strata copying of
one face for 8b and not putting the correct number of layers for Earth’s interior cross
section. Copying one face as a cross section suggests that this cohort is generally
unable to visually penetrate the cross section. In fact there is a tendency to just draw
diagonal lines (47% of responses) with an apparent ignorance of how X-Y cuts
vertically down through the strata. Although the correct position of strata bedding
planes is rarely seen, this was disregarded in favour of a correct pattern. However,
translating plan view into cross sectional view as in geological cross sections
requires relative positions of strata to be accurate. Geological cross sections are
important to enable visualisation of surface topography and geology and
relationships of strata at depth. Seeing inside and the hidden view is what structural
geology is all about: it is another piece to the jigsaw earth history. None of this
cohort has experienced geological block diagrams before.

439
AC Year 11 New Zealand Secondary School Responses GeoTSAT
Responses for this younger group of students (mean age of 15 years and 8 months
and the age group tested by the OECD PISA programme), indicates less difficulty
with rotation where only one of all responses was incorrect (n = 13). There appears
to be greater difficulty with cross sectioning and block diagram completion of
structures although the Earth’s interior cross section was less difficult. This is shown
by not only the greater variety of incorrect responses but also the higher number of
incorrect and random guessing type answers. The following table summarises the
results for questions 7 and 8 (n = 13):
Dominant responses for all structure completion tasks were again, copies of strata
patterns onto the block faces (including cross sections). Some examples are shown
below. There is also a tendency to just complete the patterns with no regard to its
expression on another block face. VPA is not yet developed. And moving from the
familiar to the unfamiliar is still formative.
(a) (b) (c)
Responses (a) and (b) illustrate a common incorrect answer, where given strata is
copied as if the single face given has to be repeated on all other faces. Diagram (c)
indicates recognition that there has been displacement (because the information says
so) but this response also does not indicate how the strata are disrupted on the top
surface. This requires VPA.

440
Table 7.7 . Summary of results for AC Year 11.
UC First Year Responses to GeoTSAT
Another small cohort of 16 to 24 responses, these students are all first year geology
students at a university and a year in advance of year 13, NZ secondary school
students. In general, errors are the same as all other cohorts. They have a mean age
of 20 years and 6 months but with the oldest student at 63 years old!
Only one response was incorrect for mental rotation of both letters, and that was the
63 year old male.
Table 7.8. Summary of results for UC first year students.
Question No. Correct No. Incorrect
7a 11 2 (15%)
7b 5 8 (62%)
7c 1 12 (92%)
7d 2 11 (85%)
8a (ab) 6 7 (54%)
8a (xy) 5 8 (62%)
8b 6 6 (50%)
8c 9 3 (25%)
Question No. Correct No. Incorrect
7a 3 19 (86%)
7b 7 14 (67%)
7c 3 19 (86%)
7d 5 16 (76%)
8a (ab) 3 15 (83%)
8a (xy) 0 17 (100%)
8b 12 4 (25%)
8c 13 3 (19%)

441
An unusual aspect of this group was that several students tried to draw 3-D
structures within the block e.g. Q7a and Q7b below: no other group tried to do this.
Some examples of this are shown below. Perhaps they were flexing a new found
spatial skill or perhaps it was a genuine way of ‘solving the problem’?
Q7b Q7c
Q8a
Q7d Q8b
With novice training in geology perhaps this group saw the boxes as the boundaries
to be drawn in rather than the edges of the block to be drawn on. Q7c reveals how
this respondent has attempted to complete the side face but has not been able to
reconcile the top with the end face. These examples show a measure of visual
penetration with completion of only one side and no penetration with the folded top
surface, thus ending up in a kind of ‘Esheresque’ muddle. Completion of cross
sections a-b and x-y for question 8 caused the same kind of visualisation difficulties
as all other groups. VPA is still in a developmental phase.
The example response to Q7d indicates an ability to recognise the continuation of
strata bedding of the front edge and side surface (with correct relative movement),
but an inability to perceive how a vertical movement along the fault would impact on
the top surface pattern of the syncline. There appears to be difficulty moving from
side surface that has moved vertically to the top surface which is drawn as a lateral
offset rather than a vertical offset where the syncline would appear to move inwards
(see accepted model answer). This example also attempted to draw a 3D picture
inside the block diagram. Drawing a cross section for inclined strata posed less

442
difficulty but with the same incorrect ‘face’ copying solution as all other groups as
shown in the example. Drawing a cross section of a sphere with 3 layers was not a
major problem for 79% of the responses.
UC Second Year Responses to GeoTSAT
The mean age for this cohort of 9 respondents was 22 years and 6 months. Not all
respondents answer all questions. All respondents were committed geology students
in their second year at a university. Only one student was incorrect for mental
rotation of both letters, and this was for the vertical rotation and not lateral rotation.
Mental rotation continues to be the least difficult visual spatialisation skill and in line
with other cohorts. Results to questions 7 and 8 are summarised below.
Table 7.9. Summary of results for UC second year students.
VPA appears less a problem and better developed for this cohort, but incorrect
responses are the same as all other cohorts: incomplete block faces, ‘face’ copying
and lack of VPA, especially (surprisingly) for question 7d which typically returned a
straight bedding plane rather than curved (See below). One response was “internal’
3D in the same way that many were at UC Level 2 (See below). Perhaps this
illustrates how respondents attempt to visually penetrate the block; by physically
drawing in the envisioned continuation of strata? Spatially visualising folded strata is
a difficult task even for 23 year old university geology students
Question No. Correct No. Incorrect
7a 9 0 (0%)
7b 7 2 (22%)
7c 4 5 (56%)
7d 6 3 (33%)
8a (ab) 8 1 (11%)
8a (xy) 6 3 (33%)
8b 9 0 (0%)
8c 9 0 (0%)

443
Q7c Q7d Q8a
Q7c example above is a good example of indecision. IT seems that this respondent
has started off with a ‘straight’ continuation of strata ‘around the corner’ but then
realised that it is folded upward but still not quite correct. Q7d above indicates a
typical 3-D attempt to draw in the VPA rather than just completing the top surface.
This example gives a clue as to how the solution is derived, where a VPA is actually
drawn in but en not ignored. Q8a is a typical response: the ab strata section is in the
correct direction but not in the correct position. Translating plan view to cross
section with all parts in the correct relative position appears to be of secondary
importance to getting the direction right. Section x-y for Q8a indicates a mirror copy
of the top surface. These results are typical of the VPA errors found in Kali and
Orion’s work of 1996.
Remembering that these responses are from 23 year old university geology students,
slicing a sphere in half and drawing the concentric layering inside (Q8c) provided
little difficulty. Spatial familiarity in a geological context is an important notion:
students need to be exposed to a variety of learning experiences in order to develop
better visualisation in seeing ‘inside’ and hidden patterns. There is much room for
cross curricular pedagogy in visual spatial learning.
UC Post Graduate Responses to GeoTSAT
The mean age for this post graduate geology cohort (n =10) was 26 years and 6
months. These students were studying geology at the PhD, MSc and BSc(Hons)
levels, so a high level of correct responses was expected.
All responses were correct for mental rotation of letters both for vertical and lateral
inversion. Mental rotation is not a problem for this age group. However, although the

444
percentage of incorrect responses for questions 7 and 8 were significantly lower (See
summary) than all other cohorts, there were still some responses indicating the same
kind of errors exhibited by all other cohorts: non penetrative VPA, incomplete
sections, copying ‘faces’ and ‘mirror imaging’ of strata such as in AC year 11 (a).
Kali and Orion (1996) indicated non penetrative responses to include: complete and
partial copying of faces, unfolding of two faces, 2 dimensional cross sectioning and
combining portions of each block diagram face. Drawing or attempting to draw a
cross section and drawing an ‘internal’ continuation of strata from one face (usually
the top) onto another ‘face’ were considered by Kali & Orion to be penetrative
responses. The diagram below shows examples of postgraduate responses.
1. Q7a 2. Q7c
3. Q8a
Example 1 above was the only response from all cohorts that showed an
interpretation of the horizontal syncline as plunging or pitching. It was labelled as a
synform. This MSc student simply drew a preconceived pattern rather than looking
at the given diagram. If it was plunging then the end pattern would be as below.
Plunging syncline (Figure 7.5) showing the end pattern
further splayed apart than that of a ‘horizontal’
syncline. As the angle of pitch increases, the ‘limbs’
move apart from an end view
Figure 7.5. Plunging syncline block diagram.
VPA skill involves perceiving how the cross section (not the longitudinal section)
changes as the angle of pitch changes. As well as perceiving the effect of where the
planar sections are. Response 2 for Q7c is a typical ‘mirror image’ copy of the top
surface and indicates that this respondent had no VPA for this structure. The end
completion pattern simply mirrors the top surface and does not connect with the side

445
face other than continuing the top bedding ‘around the corner’. This student was also
an MSc student. Example 3 for Q8a indicates a penetrative ability by attempting to
draw a continued 3-D drawing of the front end pattern; an unusual approach but one
that reveals the kind of 3d thinking going on. Table 6.10 summarises the results for
questions 7 and 8 of the GeoTSAT instrument. As can be seen, VPA and general
visual spatialisation has been further developed in this cohort as a result of three plus
years of postgraduate experiences in geology. Nonetheless, errors that are made are
similar to all other age groups.
Table .7.10. Summary of results for UC Postgraduate students.
Israeli (IS) Secondary Students Responses to GeoTSAT: Grades 8, 10 and 12.
This cohort consists of three age groups from a secondary school (Grades 8, 10 and
12). Response rates range from 5 to 23 as a result of question selection by the
respondent as well as inability to complete. Failure to respondent due to inability is
not measurable, but sometimes respondents show accurate response for some
questions but just leave the others out. Collectively there were 59 respondents. This
Israeli cohort collectively displayed the greatest variety of response to the GeoTSAT.
Results
Hebrew is a completely different written and spoken language to English and is a
barrier for gathering information. Response results are shown in table 6.11. For
Q No. Correct No. Incorrect
7a 9 1 (10%)
7b 9 1 (10%)
7c 8 2 (20%)
7d 8 2 (20%)
8a (ab) 8 2 (20%)
8a (xy) 7 3 (30%)
8b 10 0 (0%)
8c 10 0 (0%)

446
question one, the English letters e and G may have meant very little too many
respondents and so they ignored the question? The relationships between language,
hearing, writing and spatialisation are an area of fertile future research. Q6a, the
vertical rotation of letters e and G, was poorly answered by most respondents but
overall, mental rotation (like all other cohorts), is not a major difficulty for these
students aged 13 to 18. However, lateral rotation appeared to be much easier than
vertical rotation.
Table 7.11. Summary of Israeli percentages of incorrect answers for each age group for the GeoTSAT geological structures.
Q7a provided the least difficulty for all age groups. This may be due to the fact that
only the top surface is required to be completed. It is a different matter when two
faces are required to be connected, as this needs a degree of VPA and ‘projection’ or
completion ability as in Q7b. This question was better perceived than all other
geological structures. Although Q7c requires only the end pattern to be completed it
is complicated with the need for a higher degree of VPA. This is generated by the
folded nature of the strata. Only one response from 44 was correct and mirrors the
overall difficulty of this structure. Question 7d not only requires completion of two
surfaces, but has the added VPA difficulty of visualising the effect of vertical
movement of a fault on a horizontal fold for top and side surfaces of the block
diagram. This difficulty is common to all cohorts. A combination of error types were
displayed suggesting underdeveloped spatial reasoning and VPA. Q8a cross sections
again exposed the difficulty of rotating and ‘exploding’ the plunging anticline.
% of Incorrect Responses
Question IS Grade 8 IS Grade 10 IS Grade 12 All
7a 1/21 = 5% 0/15 = 0% 2/23 = 9% 5%
7b 14/19 = 74% 5/15 = 33% 15/23 = 65% 59%
7c 14/14 = 100% 14/14 = 100% 24/24 = 100% 100%
7d 9/9 = 100% 13/14 = 93% 17/19 = 89% 92%
8a (ab) 5/6 = 83% 13/15 = 87% 23/23 = 100% 93%
8a (xy) 5/5 = 100% 15/15 = 100% 22/22 =100% 100%
8b 5/6 = 83% 2/12 = 17% 10/20 = 50% 45%
8c 3/5 = 60% 3/11 = 27% 6/18 = 33% 36%

447
Again, few respondents recognise the given side surface as part of the solution! If
you can’t visually penetrate, then it will mean nothing. Question 8b revealed a better
correct answer rate from all age groups and also a large variety of solution. This is
likely due to the simpler nature of inclined planes. However, errors were in common
with all other cohorts mostly related to the inability to slice open and split to real the
inside face. It is the position of the cross section that appears to cause difficulties.
Many incorrect answers copy the front face but do not take identify that the cross
section XY does not precisely correspond to the front face. Other incorrect responses
are the same as that recorded by Kali and Orion particularly direct copying of the
front face occurs. Visual penetrative responses require the ability to split open the
block along the cross sectional line and visualise the strata pattern translated from
the given faces.
Selected examples of incorrect responses for Israeli secondary students.
1. IS Grade 8
Q7b Q7b
Q8a
Q8b 7d

448
2. IS Grade 10
Q7d Q7b
Q8a
Q7c Q8b
3. IS Grade 12
Q7a Q7b
Q8a
Q7d Q8b
The scanned illustrations of the IS secondary school cohort display a range of VPA
errors and 3-D visualisations across an age range of 13 to 17 years. Across all age
groups there are responses that range from a clear indication of 3-D VP ability to
partial VPA to no VPA and to simple copying of surface patterns onto any face.
Simple copying is often only on one face, suggesting a spatial disconnection between
block faces and therefore an undeveloped VPA and general spatialisation skills.
Along with question 7d of IS grade 8, question 7b also illustrates this disconnection
of block diagram surfaces. Indeed, Q7d of this group shows how this respondent

449
continues the fold limb in cross section straight across the top surface with no
connection with the side face and the effect of fault disruption. Is this just a
recognitional copy of question 7a? Cross section 8a illustrates a typical response
across all age groups from all cohorts for this puzzle: inability to split open and
visually penetrate the exposed surface downwards results in copying the fold onto a
surface. The cross section illustrated for Q8b was unusual but is an example of what
Kali and Orion (1996) described as an incorrect penetrative response. Bending the
layers appears to be an attempt to place the strata from two faces onto one, or trying
to combine by unfolding the two exposed surfaces onto a single block face.
Visualising the 3-D connections is a difficult task for this grade 8 age group.
Israeli grade 10 responses also show a developing VPA. The response to Q7d for
example indicates recognition of connected faces but then got stumped by the effect
of the fault movement on the strata exposed on the top surface. This also stumped
many students studying geology at higher levels. The side face correctly showed the
relative movement of strata but this was unable to be translated onto the top surface.
Q7b response was included to illustrate a correct response but one that attempts to
draw the 3D shape within the block much like that of UC Year 1 responses. The
example response to Q7c is typical in showing how the folded nature of the strata is
not visualised in cross section with any penetration. The side pattern is in all cases
simply ’continued round the corner’. The cross section illustrated for Q8a is unusual
in that a ‘negative’ picture is drawn in which the ‚curves’ of the folded strata are
simply copied onto the surfaces. No VPA is exhibited here. Q8b shows the ability to
visually penetrate but not with accuracy so this would be partially correct.
Grade 12 responses also show a range of error types. The response to Q7d is very
unusual in that the fold is simply continued with no connection to the block diagram.
There is certainly no connection of top and side surfaces of the block diagram. The
response shown for Q7b also shows the difficulty of visually penetrating the block
where there are folded strata. Only one side is continued and is disconnected from
the top surface. This response was unusual in that the strata is continued up an angle
rather than going straight across: a copy of the side face onto the end face. The cross
sections illustrated show typical responses where VPA occurs, but not where the
section line cuts the block. Q8a is a copy of curved surfaces nto an unimagined split

450
open surface. No VPA here. Q7a response is interesting as in indicates how this
student is starting to think with VPA. There is recognition of the fault movement on
the side face (although not completed) and its effect on the fold structure pattern on
the top surface. This is unusually drawn as a block being moved upward but not
planed off and the pattern drawn on the flat top surface. This kind of approach was
only seen in the UC second year cohort. It is a copy of the front surface correctly put
in position but not understood in terms of resultant strata pattern. As Kali and Orion
(1996) found, and this study supports, copying of one of the faces was the dominant
error for attempted VPA responses. This reflects an underdeveloped spatial sense
and lack of visual penetrative experiences.
Table 7.12. Percentage of incorrect answers to GeoTSAT spatialisation questions
per cohort (See Appendix 8 for t-Test statistical analysis).
Percentage of Incorrect Responses to GeoTSAT
Spatialisation Questions
Cohort 7a 7b 7c 7d 8a(i) 8a(ii) 8b 8c
AUB Prim. Teacher Trainees 38 71 86 100 86 86 86 38
AUB Sec. Teacher Trainees 71 57 100 60 86 86 0 80
UC Sec. Teacher Trainees 17 33 71 100 50 50 40 17
AC Year 13 13 56 87 70 100 100 47 14
AC Year 11 15 62 92 85 54 62 50 25
UC 1st Year Geology students 86 67 86 76 83 100 25 19
UC 2nd Year Geology students 0 22 56 33 11 33 0 0
UC Geology Post Graduates 10 10 20 20 20 30 0 0
IS Grade 8 5 74 100 100 83 100 83 60
IS Grade 10 0 33 100 93 87 100 17 27
IS Grade 12 9 65 100 89 100 100 50 33

451
APPENDIX 8 Statistical Data for Chapter 7: GeoTSAT Reliability Student
ID # Cohort Q 7a Q 7b Q 7c Q 7d Q 8a (i) Q 8a (ii) Q 8b Q 8c
See Key
below
'1' = correct responses, '0' = incorrect responses
1 1 1 1 0 1 0 0 0 2 1 1 1 0 1 0 0 0 3 1 0 1 0 0 0 0 0 4 1 0 0 0 0 0 0 0 5 1 0 0 0 0 0 0 1 6 1 0 0 0 0 7 1 0 0 1 1 8 2 1 1 1 0 0 0 0 1 9 2 1 1 0 0 0 0 0 1
10 2 1 0 0 0 0 0 0 1 11 2 1 0 0 0 0 0 0 0 12 2 1 0 0 0 0 0 0 0 13 2 0 0 0 0 1 1 0 0 14 2 0 0 0 0 1 1 1 0 15 2 0 0 1 0 16 3 1 1 1 0 1 1 1 1 17 3 1 1 1 0 1 1 1 1 18 3 1 1 1 0 1 1 1 1 19 3 1 1 1 0 0 0 0 1 20 3 1 0 1 1 0 0 0 1 21 3 1 0 0 0 0 1 22 3 0 0 0 23 4 1 1 1 1 0 0 1 1 24 4 1 1 1 1 0 0 1 1 25 4 1 1 1 1 0 0 1 1 26 4 1 1 0 1 0 0 1 1 27 4 1 1 0 1 0 0 1 1 28 4 1 1 0 1 0 0 1 1 29 4 1 1 0 1 0 0 1 1 30 4 1 1 0 0 0 0 1 1 31 4 1 1 0 0 0 0 1 1 32 4 1 1 0 0 0 0 0 1 33 4 1 0 0 0 0 0 0 1 34 4 1 0 0 0 0 0 0 1 35 4 1 0 0 0 0 0 0 1 36 4 1 0 0 0 0 0 0 1 37 4 1 0 0 0 0 0 0 1 38 4 1 0 0 0 0 0 0 1 39 4 1 0 0 0 0 0 0 1 40 4 1 0 0 0 0 0 0 1 41 4 1 0 0 0 0 0 0 42 4 1 0 0 0 0 0 0 43 4 1 0 0 0 0 44 4 0 0 0 0 45 4 0 0 0 0 46 4 0 0 0

452
47 5 1 1 1 1 1 1 1 1 48 5 1 1 0 1 1 1 1 1 49 5 1 1 0 0 1 1 1 1 50 5 1 1 0 0 1 1 1 1 51 5 1 1 0 0 1 1 1 1 52 5 1 0 0 0 1 0 1 1 53 5 1 0 0 0 0 0 0 1 54 5 1 0 0 0 0 0 0 1 55 5 1 0 0 0 0 0 0 1 56 5 1 0 0 0 0 0 0 0 57 5 1 0 0 0 0 0 0 0 58 5 0 0 0 0 0 0 0 0 59 5 0 0 0 0 0 0 60 6 1 1 1 1 1 0 1 1 61 6 1 1 1 1 1 0 1 1 62 6 1 1 1 1 1 0 1 1 63 6 0 1 0 1 0 0 1 1 64 6 0 1 0 1 0 0 1 1 65 6 0 1 0 0 0 0 1 1 66 6 0 1 0 0 0 0 1 1 67 6 0 0 0 0 0 0 1 1 68 6 0 0 0 0 0 0 1 1 69 6 0 0 0 0 0 0 1 1 70 6 0 0 0 0 0 0 1 1 72 6 0 0 0 0 0 0 1 1 73 6 0 0 0 0 0 0 0 1 74 6 0 0 0 0 0 0 0 0 75 6 0 0 0 0 0 0 0 0 76 6 0 0 0 0 0 0 0 0 77 6 0 0 0 0 0 0 78 6 0 0 0 0 0 79 6 0 0 0 0 80 6 0 0 0 0 81 6 0 0 0 0 82 6 0 0 83 7 1 1 1 1 1 1 1 1 84 7 1 1 1 1 1 1 1 1 85 7 1 1 1 1 1 1 1 1 86 7 1 1 1 1 1 1 1 1 87 7 1 1 0 1 1 1 1 1 88 7 1 1 0 1 1 1 1 1 89 7 1 1 0 0 1 0 1 1 90 7 1 0 0 0 1 0 1 1 91 7 1 0 0 0 0 0 1 1 92 8 1 1 1 1 1 1 1 1 93 8 1 1 1 1 1 1 1 1 94 8 1 1 1 1 1 1 1 1 95 8 1 1 1 1 1 1 1 1 96 8 1 1 1 1 1 1 1 1 97 8 1 1 1 1 1 1 1 1 98 8 1 1 1 1 1 1 1 1 99 8 1 1 1 1 1 0 1 1 100 8 1 1 0 0 0 0 1 1 101 8 0 0 0 0 0 0 1 1 102 9 1 1 0 0 0 0 0 0

453
103 9 1 1 0 0 0 0 0 0 104 9 1 1 0 0 0 0 0 0 105 9 1 1 0 0 0 0 0 1 106 9 1 1 0 0 0 0 0 1 107 9 1 0 0 0 1 1 108 9 1 0 0 0 109 9 1 0 0 0 110 9 1 0 0 0 111 9 1 0 0 112 9 1 0 0 113 9 1 0 0 114 9 1 0 0 115 9 1 0 0 116 9 1 0 117 9 1 0 118 9 1 0 119 9 1 0 120 9 1 0 121 9 1 0 123 9 0 0 124 10 1 0 0 0 0 0 0 0 125 10 1 0 0 0 0 0 0 0 126 10 1 0 0 0 0 0 1 0 127 10 1 0 0 0 0 0 1 1 128 10 1 0 0 0 0 0 1 1 129 10 1 1 0 0 0 0 1 1 130 10 1 1 0 0 0 0 1 1 131 10 1 1 0 0 0 0 1 1 132 10 1 1 0 0 0 0 1 1 133 10 1 1 0 0 0 0 1 1 134 10 1 1 0 0 0 0 1 1 135 10 1 1 0 0 0 0 1 136 10 1 1 0 0 0 0 137 10 1 1 0 0 1 0 138 10 1 1 1 1 0 139 11 0 0 0 0 0 0 0 0 140 11 0 0 0 0 0 0 0 0 141 11 1 0 0 0 0 0 0 0 142 11 1 0 0 0 0 0 0 0 143 11 1 0 0 0 0 0 0 0 144 11 1 0 0 0 0 0 0 0 145 11 1 0 0 0 0 0 0 1 146 11 1 0 0 0 0 0 0 1 147 11 1 0 0 0 0 0 0 1 148 11 1 0 0 0 0 0 0 1 149 11 1 0 0 0 0 0 0 1 150 11 1 0 0 0 0 0 1 1 151 11 1 0 0 0 0 0 1 1 152 11 1 0 0 0 0 0 1 1 153 11 1 0 0 0 0 0 1 1 154 11 1 0 0 0 0 0 1 1 155 11 1 1 0 0 0 0 1 1 156 11 1 1 0 1 0 0 1 1 157 11 1 1 0 1 0 0 1 158 11 1 1 0 0 0 1

454
159 11 1 1 0 0 0 1 160 11 1 1 0 0 0 161 11 1 1 0 0 162 11 0
Cohort Codes 1 AUB primary school teacher trainees 2 AUB secondary school teacher trainees 3 NZ secondary school trainees 4 AC Year 13 5 AC Year 11 6 UC First Year Geology students 7 UC Second Year Geology students 8 UC Postgraduate Geology students 9 IS Grade 8 10 IS Grade 10 11 IS Grade 12 Cronbach’s Internal Consistency Results (Peladeau & Lacouture, 1993) Mean inter-item correlation = 0.4447 (0.45) Cronbach’s alpha = 0.8488 (0.85) Standardised item alpha = 0.8486 (0.85) 111 valid cases and 63 invalid cases Note that total number of responses used for questions 1 and question 3 have had invalid responses removed. This explains why reliability data used is slightly different to that of other results.

455
SPSS Analysis Scale: ALL VARIABLES Case processing summary
N % Cases Valid Excludeda Total
111 0 111
100.00.0 100.0
a. Listwise deletion based on all variables in the procedure Reliability Statistics
Cronbach’s alpha N of items 0.849 7
Item-Total Statistics Scale mean
if question deleted
Scale variance if question deleted
Corrected question –Total correlation
Cronbach’s Alpha if question deleted
Question 7b Question 7c Question 7d Question 8a(i) Item 8a(ii) Question 8b Question 8c
2.37 2.66 2.61 2.61 2.68 2.29 2.08
3.653 3.882 3.767 3.730 3.948 3.734 4.293
0.634 0.644 0.668 0.692 0.623 0.601 0.403
0.824 0.823 0.819 0.815 0.826 0.830 0.855

456
GeoVAT Question 1 : Ideas about Fossils Reliability Data
Student ID #
Coh
ort
Q1
Q2
Q3
Q4
Q5
Q6
Q7
Q8
Q9
Q10
Q11
Q12
Q13
Q14
Q15
Q16
Q17
Q18
‘1’ = correct, ‘0’ = incorrect 1 1 1 1 1 1 1 1 1 1 1 1 1 1 1 1 1 1 1 1 2 1 1 1 1 1 1 1 1 1 1 1 1 1 1 1 1 1 1 1 3 1 1 1 1 1 1 1 1 1 1 1 1 1 1 1 1 1 1 1 4 1 1 1 1 1 1 1 1 1 1 1 1 1 1 1 1 1 1 1 5 1 1 1 1 1 1 1 1 1 1 1 1 1 1 1 1 1 1 1 6 1 1 1 1 1 1 1 1 1 1 1 1 1 1 1 1 1 1 1 7 1 1 1 1 1 1 1 1 1 1 1 1 1 1 1 1 1 1 1 8 1 1 1 1 1 1 1 1 1 1 1 1 1 1 1 1 1 1 1 9 1 1 1 1 1 1 1 1 1 1 1 1 1 1 1 1 1 1 1
10 1 1 1 1 1 1 1 1 1 1 1 1 1 1 1 1 1 1 1 11 1 1 1 1 1 1 1 1 1 1 1 1 1 1 1 1 0 1 1 12 1 1 1 1 1 1 1 1 1 0 1 1 1 1 1 1 0 1 1 13 1 1 1 1 1 1 1 1 1 0 1 1 1 1 1 1 0 1 1 14 1 1 1 1 1 1 1 1 1 0 1 1 1 1 1 1 0 1 1 15 1 1 1 1 1 1 1 1 1 0 1 1 1 1 1 1 0 1 1 16 1 1 1 1 1 1 1 1 1 0 0 1 1 1 1 1 0 1 1 17 1 1 1 1 1 1 1 1 1 0 0 1 1 1 1 1 0 1 1 18 1 1 1 1 1 1 1 1 1 0 0 0 1 0 1 1 0 1 0 19 1 1 1 1 1 1 1 1 1 0 0 0 1 0 1 0 0 1 0 20 1 1 1 1 1 1 1 1 1 0 0 0 1 0 1 0 0 1 0 21 1 1 1 1 1 1 1 1 1 0 0 0 0 0 1 0 0 1 0 22 1 1 1 1 1 1 1 1 1 0 0 0 0 0 0 0 0 1 0 23 1 1 1 1 0 1 1 1 1 0 0 0 0 0 0 0 0 1 0 24 1 1 1 1 0 1 1 1 1 0 0 0 0 0 0 0 0 1 0 25 1 1 1 1 0 1 1 1 0 0 0 0 0 0 0 0 0 1 0

457
26 1 1 1 1 0 1 1 1 0 0 0 0 0 0 0 0 0 1 0 27 1 1 0 1 0 1 1 1 0 0 0 0 0 0 0 0 0 0 0 28 2 1 1 1 1 1 1 1 1 1 1 1 1 1 1 1 1 1 1 29 2 1 1 1 1 1 1 1 1 1 1 1 1 1 1 1 1 1 1 30 2 1 1 1 1 1 1 0 1 1 1 1 1 1 1 1 1 1 1 31 2 1 1 1 1 1 1 0 1 1 1 1 1 1 1 1 1 1 0 32 2 1 1 1 1 1 1 0 1 1 0 1 1 1 1 1 1 1 0 33 2 1 1 1 1 1 1 0 1 1 0 1 1 1 1 1 0 1 0 34 2 1 1 1 1 1 1 0 1 1 0 1 1 1 1 1 0 1 0 35 2 1 1 1 1 1 1 0 1 1 0 1 0 0 1 1 0 1 0 36 2 1 1 1 1 1 1 0 1 1 0 1 0 0 1 0 0 1 0 37 2 1 1 1 1 1 0 0 1 1 0 0 0 0 1 0 0 0 0 38 3 1 1 1 1 1 1 1 1 1 1 1 1 1 1 1 1 1 1 39 3 1 1 1 1 1 1 1 1 1 1 1 1 1 1 1 1 1 1 40 3 1 1 1 1 1 1 1 1 1 1 1 1 1 1 1 1 1 1 41 3 1 1 1 1 1 1 1 1 1 1 1 1 1 1 1 1 1 0 42 3 1 1 1 1 1 1 1 1 0 1 1 1 1 1 1 1 1 0 43 3 1 1 1 1 1 1 1 1 0 1 1 1 1 1 1 0 1 0 44 3 1 1 1 1 1 1 1 1 0 1 1 1 1 1 1 0 1 0 45 3 1 1 1 1 1 1 1 1 0 1 1 0 0 1 1 0 1 0 46 3 1 1 1 1 1 1 1 1 0 1 1 0 0 1 0 0 1 0 47 3 1 1 1 1 1 0 1 1 0 0 0 0 0 1 0 0 0 0 48 4 1 1 1 1 1 1 1 1 1 1 1 1 1 1 1 1 1 1 49 4 1 1 1 1 1 1 1 1 1 1 1 1 1 1 1 1 1 1 50 4 1 1 1 1 1 1 1 1 0 1 1 1 1 1 1 1 1 1 51 4 1 1 1 1 1 1 1 1 0 1 1 1 1 1 1 1 1 1 52 4 1 1 1 1 1 1 1 1 0 1 1 1 1 1 1 1 1 1 53 4 1 1 1 1 1 1 1 1 0 1 0 1 0 0 1 0 1 0 54 4 1 1 1 1 1 1 1 1 0 1 0 1 0 0 1 0 1 0 55 4 1 0 1 1 1 1 1 1 0 0 0 0 0 0 0 0 1 0 56 4 1 0 1 1 1 1 0 0 0 0 0 0 0 0 0 0 1 0 57 4 1 0 1 1 1 0 0 0 0 0 0 0 0 0 0 0 1 0 58 5 1 1 1 1 1 1 1 1 1 1 1 1 1 1 1 1 1 1

458
59 5 1 1 1 1 1 1 1 1 1 1 1 1 1 1 1 1 1 1 60 5 1 1 1 1 1 1 1 0 1 1 1 1 1 1 1 1 1 1 61 5 1 1 1 1 1 1 1 0 1 1 1 1 1 1 1 1 1 1 62 5 1 1 1 1 1 1 1 0 1 1 1 1 1 1 1 1 1 1 63 5 1 1 1 1 1 1 1 0 1 0 1 0 0 0 1 0 1 0 64 5 1 1 1 1 1 1 1 0 1 0 1 0 0 0 1 0 1 0 65 5 1 1 1 1 1 1 1 0 0 0 0 0 0 0 0 0 1 0 66 5 1 0 0 0 0 0 0 0 0 0 0 0 0 0 0 0 1 0 67 5 1 0 0 0 0 0 0 0 0 0 0 0 0 0 0 0 1 0 68 6 1 1 1 1 1 1 1 1 1 1 1 1 1 1 1 1 1 1 69 6 1 1 1 1 1 1 1 1 1 1 1 1 1 1 1 1 1 1 70 6 1 1 1 1 1 1 1 1 1 1 1 1 1 1 1 1 1 1 72 6 1 1 1 1 1 1 1 1 1 1 1 1 1 1 1 1 1 1 73 6 1 1 1 1 1 1 1 1 1 1 1 1 1 1 1 1 1 1 74 6 1 1 1 1 1 1 1 1 1 1 1 1 1 1 1 1 1 1 75 6 1 1 1 1 1 1 1 1 1 1 1 1 1 1 1 1 1 1 76 6 1 1 1 1 1 1 1 1 1 1 1 1 1 1 1 1 1 1 77 6 1 1 1 1 1 1 1 1 1 1 1 1 1 1 1 1 1 1 78 6 1 1 1 1 1 1 1 1 1 1 1 1 1 1 1 1 1 1 79 6 1 1 1 1 1 1 1 1 1 1 1 1 1 1 1 1 1 1 80 6 1 1 1 1 1 1 1 1 1 1 1 1 1 1 1 1 1 1 81 6 1 1 1 1 1 1 1 1 1 1 1 1 1 1 1 1 1 1 82 6 1 1 1 1 1 1 1 1 1 1 1 1 1 1 1 1 1 1 83 6 1 1 1 1 1 1 1 1 1 1 1 1 1 1 1 1 1 1 84 6 1 1 1 1 1 1 1 1 1 1 1 1 1 1 0 1 1 1 85 6 1 1 1 1 1 1 1 1 1 1 1 1 1 1 0 1 1 1 86 6 1 1 1 1 1 1 1 1 1 1 1 1 0 1 0 1 1 1 87 6 1 1 1 1 1 1 1 1 1 1 1 1 0 1 0 1 1 1 88 6 1 1 1 1 1 1 1 1 1 1 1 1 0 1 0 0 1 1 89 6 1 1 1 1 1 1 1 1 1 1 1 1 0 1 0 0 1 1 90 6 1 1 1 1 1 1 1 1 1 1 1 1 0 1 0 0 1 1 91 6 1 1 1 1 1 1 1 1 0 1 1 1 0 1 0 0 1 1 92 6 1 1 1 1 1 1 1 1 0 1 1 1 0 1 0 0 1 1

459
93 6 1 1 1 1 1 1 1 1 0 1 1 1 0 1 0 0 1 1 94 6 1 1 1 1 1 1 1 1 0 1 1 0 0 1 0 0 1 1 95 6 1 1 1 1 1 1 1 1 0 1 1 0 0 1 0 0 1 1 96 6 1 1 1 1 1 1 1 1 0 1 1 0 0 1 0 0 1 0 97 6 1 1 1 1 1 1 1 1 0 1 1 0 0 1 0 0 1 0 98 6 1 1 1 1 1 1 1 1 0 1 1 0 0 1 0 0 1 0 99 6 1 1 1 1 1 1 1 1 0 0 0 0 0 0 0 0 1 0 100 6 1 1 1 1 1 1 1 1 0 0 0 0 0 0 0 0 1 0 101 6 1 1 1 1 1 1 1 1 0 0 0 0 0 0 0 0 1 0 102 6 1 1 1 1 1 1 1 1 0 0 0 0 0 0 0 0 0 0 103 6 1 1 1 1 1 1 0 1 0 0 0 0 0 0 0 0 0 0 104 6 1 1 1 1 0 1 0 1 0 0 0 0 0 0 0 0 0 0 105 6 1 1 1 1 0 1 0 1 0 0 0 0 0 0 0 0 0 0 106 6 1 1 1 1 0 0 0 0 0 0 0 0 0 0 0 0 0 0 107 6 1 1 1 1 0 0 0 0 0 0 0 0 0 0 0 0 0 0 108 7 1 1 1 1 1 1 1 1 1 1 1 1 1 1 1 1 1 1 109 7 1 1 1 1 1 1 1 1 1 1 1 1 1 1 1 1 1 1 110 7 1 1 1 1 1 1 1 1 1 1 1 1 1 1 1 1 1 1 111 7 1 1 1 1 1 1 1 1 1 1 1 1 1 1 1 1 1 1 112 7 1 1 1 1 1 1 1 1 1 1 1 1 1 1 1 0 1 1 113 7 1 1 1 1 1 1 1 1 1 1 1 1 1 1 1 0 1 1 114 7 1 1 1 1 1 1 1 1 1 1 1 1 1 1 1 0 1 0 115 7 1 1 1 1 1 1 1 1 0 0 1 1 1 1 0 0 1 0 116 7 1 1 1 1 1 1 1 1 0 0 1 1 0 1 0 0 1 0 117 7 1 1 1 1 1 1 1 1 0 0 1 0 0 1 0 0 1 0 118 7 1 1 1 1 1 1 1 1 0 0 1 0 0 0 0 0 0 0 119 7 1 1 1 1 1 0 1 1 0 0 1 0 0 0 0 0 0 0 120 7 1 0 1 0 1 0 0 0 0 0 0 0 0 0 0 0 0 0 121 8 1 1 1 1 1 1 1 1 1 1 1 1 1 1 1 1 1 1 123 8 1 1 1 1 1 1 1 1 1 1 1 1 1 1 1 1 1 1 124 8 1 1 1 1 1 1 1 1 1 1 1 1 1 1 1 1 1 1 125 8 1 1 1 1 1 1 1 1 1 1 1 1 1 1 1 1 1 1 126 8 1 1 1 1 1 1 1 1 1 1 1 1 1 1 1 1 1 1

460
127 8 1 1 1 1 1 1 1 1 1 1 1 1 1 1 1 1 1 1 128 8 1 1 1 1 1 1 1 1 1 1 1 1 1 1 1 1 1 1 129 8 1 1 1 1 1 1 1 1 1 1 1 1 1 1 1 1 1 1 130 8 1 1 1 1 1 1 1 1 1 1 1 1 1 1 1 1 1 1 131 8 1 1 1 1 1 1 1 1 0 1 1 1 1 1 1 1 1 1 132 8 1 1 1 1 1 1 1 1 0 1 1 1 1 1 1 1 1 1 133 8 1 1 1 1 1 1 1 1 0 1 1 1 1 1 1 1 1 1 134 8 1 1 1 1 1 1 1 1 0 1 1 1 1 1 0 1 1 1 135 8 1 1 1 1 1 1 1 1 0 1 1 1 1 1 0 0 1 1 136 8 1 1 1 1 1 1 1 1 0 1 1 1 1 1 0 0 1 1 137 8 1 1 1 1 1 1 1 1 0 1 1 1 1 1 0 0 1 1 138 8 1 1 1 1 1 1 1 1 0 1 1 1 0 1 0 0 1 0 139 8 1 1 1 1 1 1 1 1 0 1 1 0 0 1 0 0 1 0 140 8 1 1 1 1 1 1 1 1 0 1 1 0 0 1 0 0 0 0 141 8 1 1 1 1 1 0 1 1 0 0 0 0 0 1 0 0 0 0 142 8 1 1 1 1 1 0 1 1 0 0 0 0 0 1 0 0 0 0 143 8 1 1 1 1 1 0 0 0 0 0 0 0 0 0 0 0 0 0 144 8 1 1 1 1 1 0 0 0 0 0 0 0 0 0 0 0 0 0 145 8 1 1 1 1 1 0 0 0 0 0 0 0 0 0 0 0 0 0 146 8 1 1 0 1 0 0 0 0 0 0 0 0 0 0 0 0 0 0 147 9 1 1 1 1 1 1 1 1 1 1 1 1 1 1 1 1 1 1 148 9 1 1 1 1 1 1 1 1 1 1 1 1 1 1 1 1 1 1 149 9 1 1 1 1 1 1 1 1 1 1 1 1 1 1 1 1 1 1 150 9 1 1 1 1 1 1 1 1 0 1 1 1 1 1 1 1 1 1 151 9 1 1 1 1 1 1 1 1 0 1 1 1 0 1 1 0 1 1 152 9 1 1 1 1 1 1 1 1 0 1 1 1 0 1 1 0 1 1 153 9 1 1 1 1 1 1 1 1 0 1 1 1 0 1 0 0 1 1 154 9 1 1 1 1 1 1 1 1 0 1 1 1 0 1 0 0 1 0 155 9 1 1 1 1 1 1 1 1 0 1 0 1 0 1 0 0 1 0 156 9 1 1 1 1 1 0 1 1 0 1 0 1 0 1 0 0 1 0 157 9 1 1 1 0 1 0 1 1 0 1 0 0 0 1 0 0 1 0 158 9 1 1 1 0 0 0 1 1 0 1 0 0 0 0 0 0 1 0 159 9 1 1 1 0 0 0 1 1 0 1 0 0 0 0 0 0 0 0

461
160 9 0 0 0 0 0 0 1 1 0 1 0 0 0 0 0 0 0 0 161 9 0 0 0 0 0 0 1 1 0 1 0 0 0 0 0 0 0 0 162 9 0 0 0 0 0 0 1 1 0 1 0 0 0 0 0 0 0 0 163 9 0 0 0 0 0 0 1 1 0 1 0 0 0 0 0 0 0 0 164 9 0 0 0 0 0 0 1 1 0 1 0 0 0 0 0 0 0 0 165 9 0 0 0 0 0 0 1 1 0 1 0 0 0 0 0 0 0 0 166 9 0 0 0 0 0 0 1 1 0 1 0 0 0 0 0 0 0 0 167 9 0 0 0 0 0 0 1 1 0 0 0 0 0 0 0 0 0 0 168 9 0 0 0 0 0 0 1 1 0 0 0 0 0 0 0 0 0 0 169 9 0 0 0 0 0 0 1 1 0 0 0 0 0 0 0 0 0 0 170 10 1 1 1 1 1 1 1 1 1 1 1 1 1 1 1 1 1 1 171 10 1 1 1 1 1 1 1 1 1 1 1 1 1 1 1 1 1 0 172 10 1 1 1 1 1 1 1 1 1 1 1 1 1 1 0 0 1 0 173 10 1 1 1 1 1 1 1 1 1 0 1 1 0 1 0 0 1 0 174 10 1 1 1 1 1 1 1 1 0 0 0 1 0 1 0 0 1 0 175 10 1 1 1 0 0 0 1 1 0 0 0 1 0 1 0 0 1 0 176 10 1 1 1 0 0 0 0 0 0 0 0 1 0 1 0 0 0 0 177 11 1 1 1 1 1 1 1 1 1 1 1 1 1 1 1 1 1 1 178 11 1 1 1 1 1 1 1 1 1 1 1 1 1 1 1 1 1 1 179 11 1 1 1 1 1 1 1 1 1 1 1 1 1 1 1 1 1 1 180 11 1 1 1 1 1 1 1 1 1 1 1 1 1 1 1 1 1 1 181 11 1 1 1 1 1 1 1 1 1 1 1 1 1 1 1 1 0 0 182 11 1 1 1 1 1 1 1 1 1 1 1 1 1 1 1 1 0 0 183 11 1 1 1 1 1 1 1 1 1 1 1 1 1 1 0 1 0 0 184 11 1 1 1 1 1 1 1 1 1 1 1 1 1 1 0 1 0 0 185 11 1 1 1 1 1 1 1 1 1 0 1 1 0 1 0 1 0 0 186 11 1 1 1 1 1 1 1 1 1 0 1 1 0 1 0 0 0 0 187 11 1 1 1 1 1 1 1 1 1 0 1 1 0 1 0 0 0 0 188 11 1 1 1 1 1 1 1 1 0 0 1 0 0 1 0 0 0 0 189 11 1 1 1 1 1 1 1 1 0 0 0 0 0 0 0 0 0 0 190 11 1 1 1 0 1 1 1 0 0 0 0 0 0 0 0 0 0 0 191 11 1 1 1 0 1 0 1 0 0 0 0 0 0 0 0 0 0 0 192 12 1 1 1 1 1 1 1 1 1 1 1 1 1 1 1 1 1 1

462
193 12 1 1 1 1 1 1 1 1 1 1 1 1 1 1 1 1 1 1 194 12 1 1 1 1 1 1 1 1 1 1 1 1 1 1 1 1 1 1 195 12 1 1 1 1 1 1 1 1 1 1 1 1 1 1 1 1 1 1 196 12 1 1 1 1 1 1 1 1 1 1 1 1 1 1 1 1 1 1 197 12 1 1 1 1 1 1 1 1 0 1 1 1 1 1 0 0 1 1 198 12 1 1 1 1 1 1 1 1 0 1 1 1 1 1 0 0 1 1 199 12 1 1 1 1 1 1 1 1 0 1 1 1 0 1 0 0 1 1 200 12 1 1 1 1 1 1 1 1 0 0 1 1 0 1 0 0 1 1 201 12 1 1 1 1 1 1 1 1 0 0 1 1 0 1 0 0 1 1 202 12 1 1 1 1 1 1 1 1 0 0 0 1 0 1 0 0 1 1 203 12 1 1 1 1 1 1 1 1 0 0 0 1 0 1 0 0 1 1 204 12 1 1 1 1 1 1 1 1 0 0 0 1 0 1 0 0 1 1 205 12 1 1 1 1 1 1 1 1 0 0 0 1 0 1 0 0 1 1 206 12 1 1 1 0 1 0 1 0 0 0 0 1 0 1 0 0 1 1 207 12 1 1 1 0 1 0 1 0 0 0 0 1 0 1 0 0 1 1 208 12 1 1 1 0 0 0 1 0 0 0 0 1 0 1 0 0 1 1 209 12 1 1 1 0 0 0 1 0 0 0 0 1 0 1 0 0 1 0 210 12 1 1 1 0 0 0 0 0 0 0 0 1 0 1 0 0 0 0
1 = UCL1 2 = UC L2 3 = UC PG 4 = IS Y12 5 = IS Y13 6 = AC Y13 7 = AC 12 8 = AC Y11 9 = AC Y 9
10 = AUB Sec 11 =UC Sec
12 = AUB Prim

463
Reliability Statistics of Q1, Section A, GeoVAT Mean inter-item correlation = 0.4220 (0.42) Cronbach’s Alpha = 0.9292 (0.93) Standardised item Alpha = 0.9293 (0.93) 208 cases and 13 invalid

464
CeoVAT Reliability for Question 3: Fossils and Time. Student
ID #
Coh
ort
Q 1
Q 2
Q 3
Q 4
Q 5
Q 6
Q 7
Q 8
Q 9
Q 10
Q 11
Q 12
Q 13
Q 14
Q 15
Q 16
Q 17
Q 18
Q 19
Q 20
Q 21
Q 22
Q 23
Q 24
1 = correct 0 = incorrect 1 1 1 1 1 1 1 1 1 1 1 1 1 1 1 1 1 1 1 1 1 1 1 1 1 1 2 1 1 1 1 1 1 1 1 1 1 1 1 1 1 1 1 1 1 1 1 1 1 1 0 1 3 1 1 1 1 1 1 1 1 1 1 1 1 1 1 1 0 1 1 0 1 1 0 1 0 1 4 1 1 1 1 1 1 1 1 1 0 1 1 1 0 0 0 1 1 0 1 0 0 0 0 1 5 1 1 1 1 1 1 1 0 0 0 1 1 0 0 0 0 1 1 0 0 0 0 0 0 0 6 1 1 1 1 1 1 0 0 0 0 1 1 0 0 0 0 1 1 0 0 0 0 0 0 0 7 1 1 1 1 1 1 0 0 0 0 1 1 0 0 0 0 0 0 0 0 0 0 0 0 0 8 1 1 0 0 1 1 0 0 0 0 0 1 0 0 0 0 0 0 0 0 0 0 0 0 0 9 1 0 0 0 1 0 0 0 0 0 0 1 0 0 0 0 0 0 0 0 0 0 0 0 0
10 1 0 0 0 1 0 0 0 0 0 0 1 0 0 0 0 0 0 0 0 0 0 0 0 0 11 1 0 0 0 0 0 0 0 0 0 0 0 0 0 0 0 0 0 0 0 0 0 0 0 0 12 1 0 0 0 0 0 0 0 0 0 0 0 0 0 0 0 0 0 0 13 1 0 0 0 0 0 0 0 14 1 0 0 15 2 1 1 1 1 1 1 1 1 0 1 1 1 1 1 0 1 1 1 1 0 1 1 1 1 16 2 1 1 1 1 1 1 1 1 0 1 1 1 1 1 0 1 1 1 1 0 0 1 1 1 17 2 1 1 1 1 1 1 1 1 0 1 1 1 1 1 0 1 1 0 0 0 0 1 1 1 18 2 1 1 1 1 1 1 1 1 0 1 1 1 1 1 0 1 1 0 0 0 0 0 0 1 19 2 0 1 0 1 1 1 0 0 0 0 0 1 0 0 0 1 1 0 0 0 0 0 0 0 20 2 0 1 0 1 0 0 0 0 0 0 0 1 0 0 0 0 0 0 0 0 0 0 0 0 21 2 0 0 0 1 0 0 0 0 0 0 0 0 0 0 0 0 0 0 0 0 0 0 0 0

465
22 2 0 0 0 1 0 0 0 0 0 0 0 0 0 0 0 0 0 0 0 0 0 0 0 0 23 3 1 1 1 1 1 1 1 1 1 1 1 1 1 1 1 1 1 1 1 1 1 1 1 1 24 3 1 1 1 1 1 1 1 1 1 1 1 1 1 1 1 1 1 1 1 1 1 1 1 1 25 3 1 1 1 1 1 1 1 1 1 1 1 1 1 1 0 1 1 1 1 1 1 1 0 1 26 3 1 1 1 1 1 1 1 1 0 1 1 1 1 1 0 1 1 0 1 1 1 1 0 0 27 3 1 1 1 1 1 1 1 1 0 1 1 1 1 1 0 1 1 0 1 1 1 1 0 0 28 3 1 1 1 1 1 1 1 1 0 1 1 1 1 0 0 1 1 0 1 0 0 1 0 0 29 3 1 1 0 1 1 1 1 0 0 1 0 1 0 0 0 1 1 0 1 0 0 1 0 0 30 3 0 1 0 1 0 1 1 0 0 1 0 0 0 0 0 1 1 0 1 0 0 1 0 0 31 3 0 1 0 1 0 1 0 0 0 0 0 0 0 0 0 1 0 0 0 0 0 0 0 0 32 3 0 0 0 1 0 0 0 0 0 0 0 0 0 0 0 0 0 0 0 0 0 0 0 0 33 4 1 1 0 1 1 1 1 1 0 0 1 0 0 0 0 1 0 0 0 1 1 0 0 0 34 4 0 1 0 1 1 1 1 1 0 0 1 0 0 0 0 1 0 0 0 1 0 0 0 0 35 4 0 1 0 1 1 1 1 1 0 0 0 0 0 0 0 1 0 0 0 0 0 0 0 0 36 4 0 1 0 0 0 1 1 1 0 0 0 0 0 0 0 1 0 0 0 0 0 0 0 0 37 4 0 0 0 0 0 0 0 0 0 0 0 0 0 0 0 0 0 0 0 0 0 0 0 0 38 4 0 0 0 0 0 0 0 0 0 0 0 0 0 0 0 0 0 0 0 0 0 0 0 0 39 4 0 0 0 0 0 0 0 0 0 0 0 0 0 0 0 0 0 0 0 0 0 0 0 0 40 4 0 0 0 0 0 0 0 0 0 0 0 0 0 0 0 0 0 0 0 0 0 0 0 0 41 4 0 0 0 0 0 0 0 0 0 0 0 0 0 0 0 0 0 0 0 0 0 0 0 0 42 4 0 0 0 0 0 0 0 0 0 0 0 0 0 0 0 0 0 0 0 0 0 0 0 0 43 5 1 1 1 1 1 0 0 1 1 1 1 1 1 1 1 1 1 1 0 1 0 1 1 1 44 5 1 1 1 1 1 0 0 1 1 0 1 1 1 1 0 1 0 1 0 0 0 1 0 0 45 5 0 0 1 1 0 0 0 1 0 0 0 1 0 0 0 1 0 1 0 0 0 1 0 0 46 5 0 0 0 1 0 0 0 0 0 0 0 1 0 0 0 0 0 1 0 0 0 1 0 0 47 5 0 0 0 1 0 0 0 0 0 0 0 0 0 0 0 0 0 0 0 0 0 0 0 0 48 5 0 0 0 0 0 0 0 0 0 0 0 0 0 0 0 0 0 0 0 0 0 0 0 0 49 5 0 0 0 0 0 0 0 0 0 0 0 0 0 0 0 0 0 0 0 0 0 0 0 0

466
50 5 0 0 0 0 0 0 0 0 0 0 0 0 0 0 0 0 0 0 0 0 0 0 0 0 51 5 0 0 0 0 0 0 0 0 0 0 0 0 0 0 0 0 0 0 0 0 0 0 0 0 52 5 0 0 0 0 0 0 0 0 0 0 0 0 0 0 0 0 0 0 0 0 0 0 0 0 53 6 1 1 1 1 1 1 1 1 0 1 1 1 1 1 1 1 1 1 1 1 1 1 1 1 54 6 1 0 0 0 1 1 1 1 0 0 1 0 1 0 0 0 0 0 1 0 1 0 1 1 55 6 0 0 0 0 0 1 0 0 0 0 1 0 1 0 0 0 0 0 0 0 1 0 1 1 56 6 0 0 0 0 0 0 0 0 0 0 1 0 0 0 0 0 0 0 0 0 0 0 1 1 57 6 0 0 0 0 0 0 0 0 0 0 0 0 0 0 0 0 0 0 0 0 0 0 1 0 58 6 0 0 0 0 0 0 0 0 0 0 0 0 0 0 0 0 0 0 0 0 0 0 1 0 59 6 0 0 0 0 0 0 0 0 0 0 0 0 0 0 0 0 0 0 0 0 0 0 0 0
60 6 0 0 0 0 0 0 0 0 0 0 0 0 0 0 0 0 0 0 0 0 0 0 0 0
61 6 0 0 0 0 0 0 0 0 0 0 0 0 0 0 0 0 0 0 0 0 0 0 0 0
62 6 0 0 0 0 0 0 0 0 0 0 0 0 0 0 0 0 0 0 0 0 0 0 0 0
63 6 0 0 0 0 0 0 0 0 0 0 0 0 0 0 0 0 0 0 0 0 0 0 0 0
64 6 0 0 0 0 0 0 0 0 0 0 0 0 0 0 0 0 0 0 0 0 0 0 0 0
65 7 1 1 1 1 1 1 1 1 0 1 1 1 1 1 1 1 1 1 1 1 1 1 0 1 66 7 1 1 1 1 1 1 1 1 0 1 0 1 1 1 1 1 1 1 1 0 0 1 0 1 67 7 1 1 1 1 1 1 1 1 0 1 0 1 1 1 0 0 1 1 0 0 0 1 0 1 68 7 1 1 1 1 1 0 0 1 0 1 0 1 1 1 0 0 1 0 0 0 0 0 0 1 69 7 1 1 0 1 1 0 0 1 0 1 0 1 1 0 0 0 0 0 0 0 0 0 0 0 70 7 0 0 0 1 1 0 0 1 0 0 0 0 1 0 0 0 0 0 0 0 0 0 0 0 71 7 0 0 0 1 0 0 0 0 0 0 0 0 0 0 0 0 0 0 0 0 0 0 0 0 72 7 0 0 0 1 0 0 0 0 0 0 0 0 0 0 0 0 0 0 0 0 0 0 0 0 73 7 0 0 0 1 0 0 0 0 0 0 0 0 0 0 0 0 0 0 0 0 0 0 0 0 74 7 0 0 0 0 0 0 0 0 0 0 0 0 0 0 0 0 0 0 0 0 0 0 0 0
75 7 0 0 0 0 0 0 0 0 0 0 0 0 0 0 0 0 0 0 0 0 0 0 0 0
76 7 0 0 0 0 0 0 0 0 0 0 0 0 0 0 0 0 0 0 0 0 0 0 0 0
77 7 0 0 0 0 0 0 0 0 0 0 0 0 0 0 0 0 0 0 0 0 0 0 0 0

467
78 7 0 0 0 0 0 0 0 0 0 0 0 0 0 0 0 0 0 0 0 0 0 0 0 0
79 7 0 0 0 0 0 0 0 0 0 0 0 0 0 0 0 0 0 0 0 0 0 0 0 0
80 7 0 0 0 0 0 0 0 0 0 0 0 0 0 0 0 0 0 0 0 0 0 0 0 0
81 7 0 0 0 0 0 0 0 0 0 0 0 0 0 0 0 0 0 0 0 0 0 0 0 0
82 7 0 0 0 0 0 0 0 0 0 0 0 0 0 0 0 0 0 0 0 0 0 0 0 0
83 7 0 0 0 0 0 0 0 0 0 0 0 0 0 0 0 0 0 0 0 0 0 0 0 0
84 8 1 1 1 1 1 1 1 0 1 1 1 1 1 1 1 1 1 1 1 1 1 0 1 1 85 8 1 1 1 1 1 0 1 0 1 1 1 0 1 1 1 0 1 0 1 1 0 0 0 1 86 8 1 1 0 1 0 0 0 0 0 1 1 0 1 1 0 0 0 0 1 0 0 0 0 1 87 8 1 1 0 1 0 0 0 0 0 0 0 0 1 0 0 0 0 0 1 0 0 0 0 1 88 8 0 1 0 1 0 0 0 0 0 0 0 0 1 0 0 0 0 0 0 0 0 0 0 1 89 8 0 0 0 0 0 0 0 0 0 0 0 0 1 0 0 0 0 0 0 0 0 0 0 1 90 8 0 0 0 0 0 0 0 0 0 0 0 0 1 0 0 0 0 0 0 0 0 0 0 1 91 8 0 0 0 0 0 0 0 0 0 0 0 0 1 0 0 0 0 0 0 0 0 0 0 1 92 8 0 0 0 0 0 0 0 0 0 0 0 0 1 0 0 0 0 0 0 0 0 0 0 1 93 8 0 0 0 0 0 0 0 0 0 0 0 0 0 0 0 0 0 0 0 0 0 0 0 0 94 8 0 0 0 0 0 0 0 0 0 0 0 0 0 0 0 0 0 0 0 0 0 0 0 0 95 8 0 0 0 0 0 0 0 0 0 0 0 0 0 0 0 0 0 0 0 0 0 0 0 0 96 8 0 0 0 0 0 0 0 0 0 0 0 0 0 0 0 0 0 0 0 0 0 0 0 97 8 0 0 0 0 0 0 0 0 0 0 0 0 0 98 8 0 0 0 0 0 0 99 8 0 0 100 9 1 1 1 1 1 1 1 1 1 1 1 1 1 1 1 1 1 0 1 0 1 0 0 0 101 9 1 1 1 1 1 0 1 1 0 1 1 1 1 1 1 1 0 0 1 0 1 0 0 0 102 9 0 1 1 1 1 0 1 0 0 0 0 0 0 1 1 1 0 0 1 0 0 0 0 0 103 9 0 0 1 1 0 0 0 0 0 0 0 0 0 0 0 1 0 0 0 0 0 0 0 0 104 9 0 0 0 1 0 0 0 0 0 0 0 0 0 0 0 0 0 0 0 0 0 0 0 0 105 9 0 0 0 1 0 0 0 0 0 0 0 0 0 0 0 0 0 0 0 0 0 0 0 0

468
106 9 0 0 0 1 0 0 0 0 0 0 0 0 0 0 0 0 0 0 0 0 0 0 0 0 107 9 0 0 0 1 0 0 0 0 0 0 0 0 0 0 0 0 0 0 0 0 0 0 0 0 108 9 0 0 0 0 0 0 0 0 0 0 0 0 0 0 0 0 0 0 0 0 0 0 0 0 109 10 1 1 1 0 1 0 0 1 1 1 0 1 1 1 0 1 0 1 0 0 0 0 1 0 110 10 1 1 1 0 1 0 0 1 0 1 0 1 1 1 0 1 0 1 0 0 0 0 0 0
111 10 1 1 1 0 0 0 0 0 0 0 0 1 1 0 0 0 0 1 0 0 0 0 0 0
112 10 0 0 0 0 0 0 0 0 0 0 0 0 0 0 0 0 0 1 0 0 0 0 0 0
113 10 0 0 0 0 0 0 0 0 0 0 0 0 0 0 0 0 0 0 0 0 0 0 0 0
114 10 0 0 0 0 0 0 0 0 0 0 0 0 0 0 0 0 0 0 0 0 0 0 0 0
115 10 0 0 0 0 0 0 0 0 0 0 0 0 0 0 0 0 0 0 0 0 0 0 0 0
116 10 0 0 0 0 0 0 0 0 0 0 0 0 0 0 0 0 0 0 0 0 0 0 0 0
117 10 0 0 0 0 0 0 0 0 0 0 0 0 0 0 0 0 0 0 0 0 0 0 0 0
118 10 0 0 0 0 0 0 0 0 0 0 0 0 0 0 0 0 0 0 0 0 0 0 0 0
119 10 0 0 0 0 0 0 0 0 0 0 0 0 0 0 0 0 0 0 0 0 0 0 0 0
120 10 0 0 0 0 0 0 0 0 0 0 0 0 0 0 0 0 0 0 0 0 0 0 0 0
121 10 0 0 0 0 0 0 0 0 0 0 0 0 0 0 0 0 0 0 0 0 0 0 0 0
122 10 0 0 0 0 0 0 0 0 0 0 0 0 0 0 0 0 0 0 0 0 0 0 0 0
Cohort Key 1 = UCL1 2 = UC L2 3 = UC PG 4 = IS Y12 5 = IS Y13 6 = AC Y13 7 = AC 12 8 = AC Y11 9 = UC Sec 10 = AUB Prim

461
GeoVAT Data Reliability Statistics for Q3, Section B GeoVAT Cronbach’s Internal Consistency Results (Peladeau & Lacouture, 1993). Mean inter item-correlation = 0.5493 (0.55) Cronbach’s alpha = 0.9673 (0.97) Standardised item alpha = 0.9689 (0.97) 115 valid cases and 18 invalid cases. ANOVA (Excel) for Table 6.12, Appendix 7 - Spatialisation Questions 7 and 8 Incorrect Responses ANOVA Single Factor ά = 0.05 SUMMARY Cohort response per question Count Sum Average Variance Column 1 11 264 24 843.4 Column 2 11 550 50 472.2 Column 3 11 898 81.64 609.25 Column 4 11 826 75.09 753.49 Column 5 11 760 69.09 956.69 Column 6 11 847 77.00 790.60 Column 7 11 398 36.18 960.76 Column 8 11 313 28.45 582.67 One Way ANOVA
Source of Variation SS df MS F P-
value F
crit Between Groups 42242.36 7.00 6034.62 8.09 0.00 2.13 Within Groups 59690.73 80.00 746.13 Total 101933.09 87.00
As the F statistic (8.09) is greater than the F critical value (2.13) the Null hypothesis of equality of means is rejected and there are therefore differences in means for cohorts for correct answers to spatialisation questions 7 and 8 of the GeoTSAT questionnaire. Despite increased probability of type 1 errors, these differences were elucidated with individual t tests and recorded below. In effect, differences are largely due to age and experiences of cohorts rather than types of spatialisation difficulty exhibited.

462
SUMMARY of Table 7.12, Appendix 7 - Spatialisation Questions 7 and 8 (dF= 7) a = 2.365 @ 0.025 (99% confidence) and 1.895 @ a = 0.05 (95% confidence). SIMSTAT Programme (Peladreau & Lacoutre, 1993).
Comparison T Stat Reject Null Hypothesis of no significant difference if T Stat is > than ά at 95% confidence level That is, there is a significant difference in means of correct answers to questions 7 and 8 of GeoTSAT if T is > ±1.9 @ the 95% confidence level.
AC13 by AUBSEC 0.49 No
AC11 by AUBSEC 0.90 No
IS12 by AUBSEC -0.06 No
IS10 by AUBSEC 0.81 No
IS8 by AUBSEC -0.53 No
AC13 by AUBPRIM 1.81 No
IS12 by AUBPRIM 0.82 No
AC 11 by AUBPRIM 3.83 Yes
IS10 by AUBPRIM 1.62 No
IS8 by AUBPRIM -0.3 No
AC13 by UCSEC -1.4 No
AC11 by UCSEC -1.76 No
IS12 by UCSEC -2.52 Yes
IS10 by UCSEC -1.06 No
IS8 by UCSEC -3.58 Yes
AC13 by UCL1 0.67 No
AC11 by UCL1 1.09 No
IS12 by UCL1 -0.04 No
IS10 by UCL1 0.87 No
IS8 by UCL1 -0.54 No
AC13 by UCL2 -4.53 Yes
AC11 by UCL2 -8.08 Yes
IS12 by UCL2 -5.86 Yes
IS10 by UCL2 -3.80 Yes
IS8 by UCL2 -6.65 Yes
AC13 by UCPG -4.96 Yes
AC11 by UCPG -5.36 Yes
IS12 by UCPG -5.59 Yes
IS10 by UCPG -3.7 Yes
IS8 by UCPG -6.16 Yes