Genome-wide pooling approach identifies SPATA5 as a new susceptibility locus for alopecia areata
10
REPORT Genome-wide Association Study Identifies Genetic Variation in Neurocan as a Susceptibility Factor for Bipolar Disorder Sven Cichon, 1,2,3,45, * Thomas W. Mu ¨hleisen, 2,3,45 Franziska A. Degenhardt, 2,3 Manuel Mattheisen, 2,3,4 Xavier Miro ´, 5 Jana Strohmaier, 6 Michael Steffens, 4 Christian Meesters, 4 Stefan Herms, 2,3 Moritz Weingarten, 2,3 Lutz Priebe, 2,3 Britta Haenisch, 2,3 Michael Alexander, 2,3 Jennifer Vollmer, 2,3 Rene ´ Breuer, 6 Christine Schma ¨l, 6 Peter Tessmann, 2,3 Susanne Moebus, 7 H.-Erich Wichmann, 8,9,10 Stefan Schreiber, 11 Bertram Mu ¨ ller-Myhsok, 12 Susanne Lucae, 12 Ste ´phane Jamain, 13,14,15 Marion Leboyer, 13,14,15 Frank Bellivier, 13,14,15 Bruno Etain, 13,14,15 Chantal Henry, 13,14,15 Jean-Pierre Kahn, 16 Simon Heath, 17 Bipolar Disorder Genome Study (BiGS) Consortium, 18 Marian Hamshere, 19 Michael C. O’Donovan, 19 Michael J. Owen, 19 Nick Craddock, 19 Markus Schwarz, 20 Helmut Vedder, 20 Jutta Kammerer-Ciernioch, 20 Andreas Reif, 21 Johanna Sasse, 22 Michael Bauer, 22 Martin Hautzinger, 23 Adam Wright, 24,25 Philip B. Mitchell, 24,25 Peter R. Schofield, 26,27 Grant W. Montgomery, 28 Sarah E. Medland, 28 Scott D. Gordon, 28 Nicholas G. Martin, 28 Omar Gustafsson, 29 Ole Andreassen, 29,30 Srdjan Djurovic, 29,30,31 Engilbert Sigurdsson, 32 Stacy Steinberg, 33 Hreinn Stefansson, 33 Kari Stefansson, 33,34 Lejla Kapur-Pojskic, 35 Liliana Oruc, 36 Fabio Rivas, 37 Fermı ´n Mayoral, 37 Alexander Chuchalin, 38 Gulja Babadjanova, 38 Alexander S. Tiganov, 39 Galina Pantelejeva, 39 Lilia I. Abramova, 39 Maria Grigoroiu-Serbanescu, 40 Carmen C. Diaconu, 41 Piotr M. Czerski, 42 Joanna Hauser, 42 Andreas Zimmer, 5 Mark Lathrop, 17 Thomas G. Schulze, 43 Thomas F. Wienker, 4 Johannes Schumacher, 3 Wolfgang Maier, 44 Peter Propping, 3 Marcella Rietschel, 6,45 and Markus M. No ¨then 2,3,45 We conducted a genome-wide association study (GWAS) and a follow-up study of bipolar disorder (BD), a common neuropsychiatric disorder. In the GWAS, we investigated 499,494 autosomal and 12,484 X-chromosomal SNPs in 682 patients with BD and in 1300 controls. In the first follow-up step, we tested the most significant 48 SNPs in 1729 patients with BD and in 2313 controls. Eight SNPs showed nominally significant association with BD and were introduced to a meta-analysis of the GWAS and the first follow-up samples. Genetic variation in the neurocan gene (NCAN) showed genome-wide significant association with BD in 2411 patients and 3613 controls (rs1064395, p ¼ 3.02 3 10 8 ; odds ratio ¼ 1.31). In a second follow-up step, we replicated this finding in independent samples of BD, totaling 6030 patients and 31,749 controls (p ¼ 2.74 3 10 4 ; odds ratio ¼ 1.12). The combined analysis of all study samples yielded a p value of 2.14 3 10 9 (odds ratio ¼ 1.17). Our results provide evidence that rs1064395 is a common risk factor for BD. NCAN encodes neurocan, an extracellular matrix glycoprotein, which is thought to be involved in cell adhesion and migration. We found that expression in mice is localized within cortical and hippocampal areas. These areas are involved in cognition and emotion regulation and have previously been implicated in BD by neuropsychological, neuroimaging, and postmortem studies. 1 Institute of Neuroscience and Medicine (INM-1), Structural and Functional Organization of the Brain, Genomic Imaging, Research Center Juelich, D-52425 Juelich, Germany; 2 Department of Genomics, Life & Brain Center, University of Bonn, D-53127 Bonn, Germany; 3 Institute of Human Genetics, University of Bonn, D-53127 Bonn, Germany; 4 Institute of Medical Biometry, Informatics, and Epidemiology, University of Bonn, D-53127 Bonn, Germany; 5 Institute of Molecular Psychiatry, University of Bonn, D-53127 Bonn, Germany; 6 Department of Genetic Epidemiology in Psychiatry, Central Institute of Mental Health, University of Mannheim, D-68159 Mannheim, Germany; 7 Institute of Medical Informatics, Biometry, and Epidemiology, University Duisburg-Essen, D-45147 Essen, Germany; 8 Institute of Epidemiology, Helmholtz Zentrum Mu ¨ nchen, German Research Center for Environmental Health, D-85764 Neuher- berg, Germany; 9 Institute of Medical Informatics, Biometry and Epidemiology, Chair of Epidemiology, Ludwig-Maximilians-Universita ¨t, D-81377 Munich, Germany; 10 Klinikum Grosshadern, D-81377 Munich, Germany; 11 Institute of Clinical Molecular Biology, University of Kiel, D-24105 Kiel, Germany; 12 Max-Planck-Institute of Psychiatry, D-80804 Munich, Germany; 13 INSERM U 955, IMRB, Psychiatry Genetics, Fondation Fondamental, ENBREC, F-94010 Cre ´teil, France; 14 Faculty of Medicine, University of Paris Est, F-75005 Paris, France; 15 AP-HP, Henri Mondor-Albert Chenevier Group, Department of Psychiatry, F-94000 Cre ´teil, France; 16 Department of Psychiatry and Clinical Psychology, CHU de Nancy, Jeanne-d’Arc Hospital, F-54200 Toul, France, and Fondation Fondamental, F-94010 Cre ´teil, France; 17 Centre National de Ge ´notypage, F-91057 Evry, France; 18 A full list of authors is provided in the Supple- mental Data; 19 Department of Psychological Medicine, School of Medicine, Cardiff University, Heath Park, Cardiff CF14 4XN, United Kingdom; 20 Psychiatric Center Nordbaden, D-69168 Wiesloch, Germany; 21 Department of Psychiatry, University of Wu ¨rzburg, D-97070 Wu ¨rzburg, Germany; 22 Department of Psychiatry and Psychotherapy, University Hospital Carl Gustav Carus, D-01307 Dresden, Germany; 23 Department of Clinical and Developmental Psychology, Institute of Psychology, University of Tu ¨bingen, D-72074 Tu ¨bingen, Germany; 24 School of Psychiatry, University of New South Wales, NSW 2052, Australia; 25 Black Dog Institute, Prince of Wales Hospital, Randwick, NSW 2031, Australia; 26 Neuroscience Research Australia, Barker Street, Randwick, Sydney NSW 2031, Australia; 27 School of Medical Sciences, Faculty of Medicine, University of New South Wales, Sydney NSW 2052, Australia; 28 Queensland Institute of Medical Research, Brisbane, QLD 4006, Australia; 29 Department of Psychiatry, Oslo University Hospital, N-0407 Oslo, Norway; 30 Institute of Psychiatry, University of Oslo, N-0450 Oslo; 31 Department of Medical Genetics, Oslo University Hospital, N-0407 Oslo, Norway; 32 Department of Psychiatry, University of Iceland, National University Hospital, Hringbraut, IS-101 Reykjavı ´k, Iceland; 33 CNS Division, deCODE Genetics, Sturlugata 8, IS-101 Reykjavı ´k, Iceland; 34 School of Medicine, University of Iceland, IS-101 Reykjavik, Iceland; 35 Laboratory for Human Genetics, INGEB, University of Sarajevo, BA-71000 Sarajevo, Bosnia and Herzegovina; 36 Psychiatric Clinic, Clinical Center, University of Sarajevo, BA-71000 Sarajevo, Bosnia and Herzegovina; 37 Civil Hospital Carlos Haya, ES-29010 Ma ´laga, Spain; 38 Institute of Pulmonology, Russian State Medical University, 105077 Moscow, Russia; 39 Russian Academy of Medical Sciences, Mental Health Research Center, 115522 Moscow, Russia; 40 Biometric Psychiatric Genetics Research Unit, Alexandru Obregia Clinical Psychiatric Hospital, RO-041914 Bucharest, Romania; 41 Stefan S. Nicolau Institute of Virology, Romanian Academy, RO-030304 Bucharest, Romania; 42 Department of Psychiatry, Poznan University of Medical Sciences, PL-60-572 Poznan, Poland; 43 Department of Psychiatry and Psychotherapy, University Medical Center, University of Go ¨ttingen, D-37075 Go ¨ttingen, Germany; 44 Department of Psychiatry, University of Bonn, D-53127 Bonn, Germany 45 These authors contributed equally to this work *Correspondence: [email protected] DOI 10.1016/j.ajhg.2011.01.017. Ó2011 by The American Society of Human Genetics. All rights reserved. 372 The American Journal of Human Genetics 88, 372–381, March 11, 2011
-
Upload
independent -
Category
Documents
-
view
1 -
download
0
Transcript of Genome-wide pooling approach identifies SPATA5 as a new susceptibility locus for alopecia areata

REPORT
Genome-wide Association Study Identifies Genetic Variationin Neurocan as a Susceptibility Factor for Bipolar Disorder
Sven Cichon,1,2,3,45,* Thomas W. Muhleisen,2,3,45 Franziska A. Degenhardt,2,3 Manuel Mattheisen,2,3,4
XavierMiro,5 Jana Strohmaier,6Michael Steffens,4ChristianMeesters,4StefanHerms,2,3MoritzWeingarten,2,3
Lutz Priebe,2,3 Britta Haenisch,2,3Michael Alexander,2,3 Jennifer Vollmer,2,3 Rene Breuer,6 Christine Schmal,6
Peter Tessmann,2,3SusanneMoebus,7H.-ErichWichmann,8,9,10Stefan Schreiber,11BertramMuller-Myhsok,12
Susanne Lucae,12 Stephane Jamain,13,14,15Marion Leboyer,13,14,15 Frank Bellivier,13,14,15 Bruno Etain,13,14,15
Chantal Henry,13,14,15 Jean-Pierre Kahn,16 Simon Heath,17 Bipolar Disorder Genome Study(BiGS) Consortium,18 Marian Hamshere,19Michael C. O’Donovan,19Michael J. Owen,19 Nick Craddock,19
Markus Schwarz,20 Helmut Vedder,20 Jutta Kammerer-Ciernioch,20 Andreas Reif,21 Johanna Sasse,22
Michael Bauer,22 Martin Hautzinger,23 Adam Wright,24,25 Philip B. Mitchell,24,25 Peter R. Schofield,26,27
Grant W. Montgomery,28 Sarah E. Medland,28 Scott D. Gordon,28 Nicholas G. Martin,28 Omar Gustafsson,29
Ole Andreassen,29,30 Srdjan Djurovic,29,30,31 Engilbert Sigurdsson,32 Stacy Steinberg,33 Hreinn Stefansson,33
Kari Stefansson,33,34 Lejla Kapur-Pojskic,35 Liliana Oruc,36 Fabio Rivas,37 Fermın Mayoral,37
Alexander Chuchalin,38 Gulja Babadjanova,38 Alexander S. Tiganov,39 Galina Pantelejeva,39
Lilia I. Abramova,39MariaGrigoroiu-Serbanescu,40CarmenC.Diaconu,41PiotrM.Czerski,42 JoannaHauser,42
Andreas Zimmer,5Mark Lathrop,17 Thomas G. Schulze,43 Thomas F. Wienker,4 Johannes Schumacher,3
Wolfgang Maier,44 Peter Propping,3Marcella Rietschel,6,45 and Markus M. Nothen2,3,45
We conducted a genome-wide association study (GWAS) and a follow-up study of bipolar disorder (BD), a common neuropsychiatric
disorder. In the GWAS, we investigated 499,494 autosomal and 12,484 X-chromosomal SNPs in 682 patients with BD and in 1300
controls. In the first follow-up step, we tested the most significant 48 SNPs in 1729 patients with BD and in 2313 controls. Eight
SNPs showed nominally significant association with BD and were introduced to a meta-analysis of the GWAS and the first follow-up
samples. Genetic variation in the neurocan gene (NCAN) showed genome-wide significant association with BD in 2411 patients and
3613 controls (rs1064395, p ¼ 3.02 3 10�8; odds ratio ¼ 1.31). In a second follow-up step, we replicated this finding in independent
samples of BD, totaling 6030 patients and 31,749 controls (p ¼ 2.74 3 10�4; odds ratio ¼ 1.12). The combined analysis of all study
samples yielded a p value of 2.14 3 10�9 (odds ratio ¼ 1.17). Our results provide evidence that rs1064395 is a common risk factor for
BD. NCAN encodes neurocan, an extracellular matrix glycoprotein, which is thought to be involved in cell adhesion and migration.
We found that expression in mice is localized within cortical and hippocampal areas. These areas are involved in cognition and emotion
regulation and have previously been implicated in BD by neuropsychological, neuroimaging, and postmortem studies.
1Institute of Neuroscience andMedicine (INM-1), Structural and Functional Organization of the Brain, Genomic Imaging, ResearchCenter Juelich, D-52425
Juelich,Germany; 2Department ofGenomics, Life&BrainCenter, University of Bonn,D-53127 Bonn,Germany; 3Institute ofHumanGenetics, University of
Bonn, D-53127 Bonn, Germany; 4Institute of Medical Biometry, Informatics, and Epidemiology, University of Bonn, D-53127 Bonn, Germany; 5Institute of
Molecular Psychiatry, University of Bonn,D-53127 Bonn,Germany; 6Department ofGenetic Epidemiology in Psychiatry,Central Institute ofMentalHealth,
University of Mannheim, D-68159 Mannheim, Germany; 7Institute of Medical Informatics, Biometry, and Epidemiology, University Duisburg-Essen,
D-45147 Essen, Germany; 8Institute of Epidemiology, Helmholtz ZentrumMunchen, German ResearchCenter for Environmental Health, D-85764 Neuher-
berg, Germany; 9Institute of Medical Informatics, Biometry and Epidemiology, Chair of Epidemiology, Ludwig-Maximilians-Universitat, D-81377 Munich,
Germany; 10Klinikum Grosshadern, D-81377 Munich, Germany; 11Institute of Clinical Molecular Biology, University of Kiel, D-24105 Kiel, Germany;12Max-Planck-Institute of Psychiatry, D-80804 Munich, Germany; 13INSERM U 955, IMRB, Psychiatry Genetics, Fondation Fondamental, ENBREC,
F-94010 Creteil, France; 14Faculty of Medicine, University of Paris Est, F-75005 Paris, France; 15AP-HP, Henri Mondor-Albert Chenevier Group, Department
of Psychiatry, F-94000Creteil, France; 16Department of Psychiatry andClinical Psychology, CHUdeNancy, Jeanne-d’ArcHospital, F-54200 Toul, France, and
Fondation Fondamental, F-94010 Creteil, France; 17Centre National de Genotypage, F-91057 Evry, France; 18A full list of authors is provided in the Supple-
mentalData; 19Department of PsychologicalMedicine, School ofMedicine, Cardiff University,HeathPark, Cardiff CF144XN,UnitedKingdom; 20Psychiatric
Center Nordbaden, D-69168 Wiesloch, Germany; 21Department of Psychiatry, University of Wurzburg, D-97070 Wurzburg, Germany; 22Department of
Psychiatry and Psychotherapy, University Hospital Carl Gustav Carus, D-01307 Dresden, Germany; 23Department of Clinical and Developmental
Psychology, Institute of Psychology, University of Tubingen, D-72074 Tubingen, Germany; 24School of Psychiatry, University of New South Wales, NSW
2052, Australia; 25Black Dog Institute, Prince ofWales Hospital, Randwick, NSW2031, Australia; 26Neuroscience ResearchAustralia, Barker Street, Randwick,
Sydney NSW2031, Australia; 27School ofMedical Sciences, Faculty ofMedicine, University of New SouthWales, Sydney NSW2052, Australia; 28Queensland
Institute of Medical Research, Brisbane, QLD 4006, Australia; 29Department of Psychiatry, Oslo University Hospital, N-0407 Oslo, Norway; 30Institute of
Psychiatry, University ofOslo, N-0450Oslo; 31Department ofMedicalGenetics,OsloUniversityHospital, N-0407Oslo,Norway; 32Department of Psychiatry,
University of Iceland,NationalUniversityHospital, Hringbraut, IS-101 Reykjavık, Iceland; 33CNSDivision, deCODEGenetics, Sturlugata 8, IS-101 Reykjavık,
Iceland; 34School of Medicine, University of Iceland, IS-101 Reykjavik, Iceland; 35Laboratory for Human Genetics, INGEB, University of Sarajevo, BA-71000
Sarajevo, Bosnia andHerzegovina; 36Psychiatric Clinic, Clinical Center, University of Sarajevo, BA-71000 Sarajevo, Bosnia andHerzegovina; 37Civil Hospital
Carlos Haya, ES-29010Malaga, Spain; 38Institute of Pulmonology, Russian State Medical University, 105077Moscow, Russia; 39Russian Academy ofMedical
Sciences, Mental Health Research Center, 115522 Moscow, Russia; 40Biometric Psychiatric Genetics Research Unit, Alexandru Obregia Clinical Psychiatric
Hospital, RO-041914 Bucharest, Romania; 41Stefan S. Nicolau Institute of Virology, Romanian Academy, RO-030304 Bucharest, Romania; 42Department
of Psychiatry, PoznanUniversity ofMedical Sciences, PL-60-572 Poznan, Poland; 43Department of Psychiatry and Psychotherapy,UniversityMedical Center,
University of Gottingen, D-37075 Gottingen, Germany; 44Department of Psychiatry, University of Bonn, D-53127 Bonn, Germany45These authors contributed equally to this work
*Correspondence: [email protected]
DOI 10.1016/j.ajhg.2011.01.017. �2011 by The American Society of Human Genetics. All rights reserved.
372 The American Journal of Human Genetics 88, 372–381, March 11, 2011

Bipolar disorder (BD [MIM 125480]) is a highly heritable
disorder of mood, characterized by recurrent episodes of
mania and depression that are often accompanied by
behavioral and cognitive disturbances. Linkage and candi-
date-gene studies were the only available approaches for
unraveling the genetic underpinnings of the disorder until
the recent introduction of genome-wide association
studies (GWAS). To date, six GWAS using common SNPs
have been published.1–6 Although there has been only
limited consistency across studies regarding the top associ-
ated genomic regions,1–3,5,6 meta-analyses of some of these
studies have revealed common association signals: a meta-
analysis7 of the Baum et al.2 and Wellcome Trust Case
Control Consortium (WTCCC)1 data sets found evidence
of a consistent association between BD and variants in
the genes JAM3 (MIM 606871) (rs10791345, p ¼ 1 3
10�6) and SLC39A3 (MIM 612168) (rs4806874, p ¼ 5 3
10�6). A combined analysis4 of the Sklar et al.3 and
WTCCC1 studies, which included a total of 4387 patients
and 6209 controls, identified a genome-wide significant
association signal for BD in ANK3 (MIM 600465)
(rs10994336, p ¼ 9.1 3 10�9). The second strongest
finding was for rs1006737 in CACNA1C (MIM 114205)
(p ¼ 7 3 10�8). Further independent support for ANK3
rs10994336 has recently been found by Schulze et al.8 in
samples from Germany (overlapping with samples used
in the present GWAS; see Table S1 available online) and
the USA; the same study8 reported evidence for allelic
heterogeneity at the ANK3 locus. Although GWAS studies
of BD have identified a number of potentially relevant
genetic variants, the widely acknowledged formal
threshold for genome-wide significance of p ¼ 5 3 10�8
has been surpassed only for variation in ANK3 so far.
In the present study, we performed a GWAS and a two-
step follow-up study of clinically well-characterized BD
samples from Europe, the USA, and Australia. The GWAS
and replication I included only European BD samples
and produced genome-wide significant evidence for associ-
ation in the neurocan gene (NCAN [MIM 600826])
(rs1064395, p ¼ 3.02 3 10�8; odds ratio [OR] ¼ 1.31). We
then replicated this finding in large, independent samples
from Europe, the USA, and Australia (p ¼ 2.74 3 10�4;
OR¼ 1.12). A combined analysis across all samples, adding
up to 8441 patients with BD and 35,362 controls, gave
p ¼ 2.14 3 10�9 (OR ¼ 1.17). Further support for an
involvement of this gene in BD comes from our observa-
tion that Ncan expression in mice is localized within
cortical and hippocampal areas. These regions have
previously been implicated in BD by neuropsychological,
neuroimaging, and postmortem studies.
In the following text, we provide a phenotype descrip-
tion of the samples used in each step of our study
(GWAS, replication I, replication II), specifications of the
SNP genotyping, and the quality control (QC) measures
applied to the raw genotyping data:
The patients included in our GWAS and replication I step
received a lifetime diagnosis of BD according to the
The Ameri
DSM-IV9 criteria on the basis of a consensus best-estimate
procedure10 and structured diagnostic interviews.11,12
Protocols and procedures were approved by the local ethics
committees. Written informed consent was obtained from
all patients and controls. They were recruited from consec-
utive admissions to psychiatric inpatient units at (1) The
Central Institute of Mental Health, Mannheim (n ¼ 1081),
(2) Department of Psychiatry, Poznan University of
Medical Sciences, Poznan, Poland (n ¼ 446), (3) Alexandru
Obregia Clinical Psychiatric Hospital, Bucharest, Romania
(n ¼ 237), (4) Civil Hospital Carlos Haya, Malaga,
Spain (n ¼ 298), (5) Russian State Medical University,
Moscow (n ¼ 329), and (6) Kosevo Hospital, Sarajevo, Bos-
nia and Herzegovina (n ¼ 125). All controls of replication I
were also recruited by the abovementioned institutions.
All GWAS controls were drawn from three population-
based epidemiological studies: (1) PopGen13 (n ¼ 490),
(2) KORA14 (n ¼ 488), and (3) the Heinz Nixdorf Recall
Study (Risk Factors, Evaluation of Coronary Calcification,
and Lifestyle) (HNR,15 n ¼ 383). Ancestry was assigned to
patients and controls on the basis of self-reported ancestry.
More detailed sample descriptions are given in Table 1.
Lymphocyte DNA was isolated from ethylenediaminete-
traacetic acid anticoagulated venous blood by a salting-out
procedure using saturated sodium chloride solution16 or by
a Chemagic Magnetic Separation Module I (Chemagen,
Baesweiler, Germany). Genotyping was performed on Hu-
manHap550v3 BeadArrays (Illumina, San Diego, CA, USA).
QC was performed with PLINK17 (version 1.05). In detail,
the X-chromosomal heterozygosity rates were used to
determine the sex of each subject; subjects with a
discrepant sex status were excluded (five patients and three
controls). Subjects with a call rate (CR) < 0.97 were also
excluded (eight patients and 26 controls). Using iden-
tical-by-state (IBS) analysis, cryptically related individuals
(IBS > 1.65) were identified, and the DNA sample with
the lower CR was removed. For the identification of
possible population stratification, a multidimensional
scaling (MDS) analysis was performed. In total, seven
patients and 32 controls were excluded on the basis of
relatedness or outlier detection. SNPs with a CR < 0.98
and monomorphic SNPs were excluded (18,618 SNPs in
patients and 14,880 in controls). Additional markers were
excluded on the basis of nonrandom differences in miss-
ingness patterns with respect to phenotype and for signif-
icant results in the ‘‘pseudo’’ patient-control analysis using
control samples and a Cochran-Armitage test for linear
trend (TREND) (a total of 7101 SNPs in patients and
8076 in controls). SNPs with a minor allele frequency
(MAF) < 1% in patients or controls were excluded
(11,434 in patients and 12,155 in controls), as were SNPs
in Hardy-Weinberg disequilibrium (Hardy-Weinberg
equilibrium [HWE], pexact < 1 3 10�4, 351 SNPs in
controls; pexact < 1 3 10�6, 132 SNPs in patients). With
the use of the remaining patients and controls, a MDS
analysis was performed, first with patients and controls
from our GWAS sample and then with the GWAS sample
can Journal of Human Genetics 88, 372–381, March 11, 2011 373
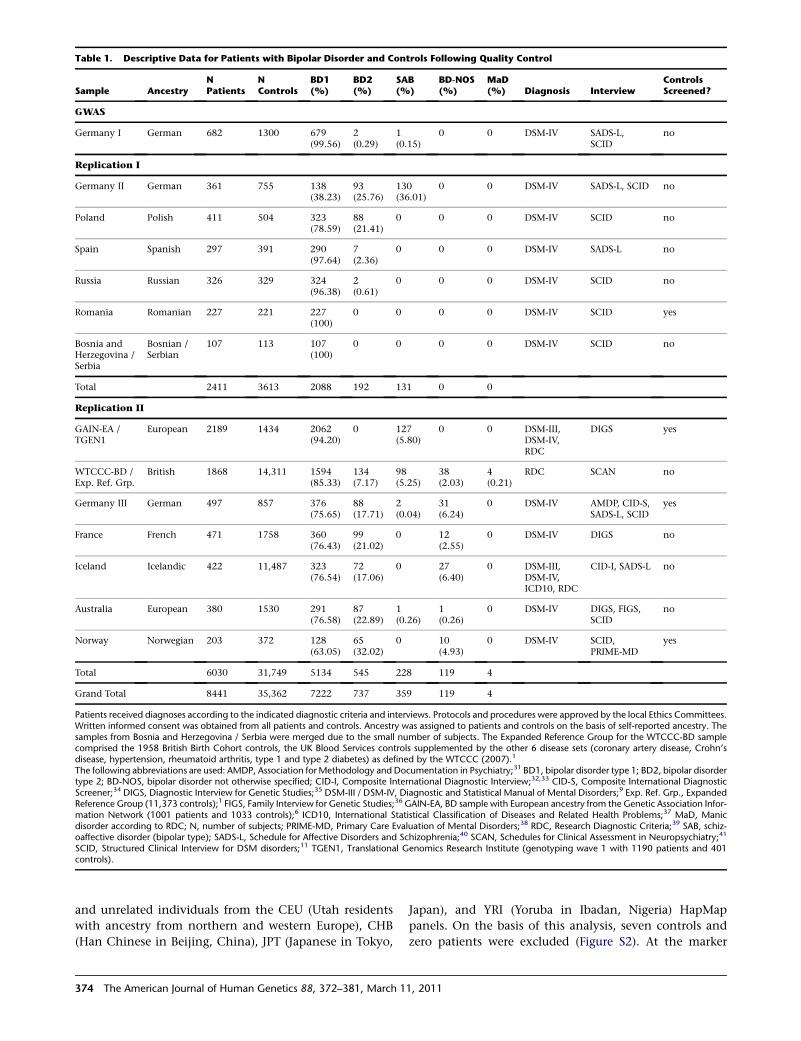
Table 1. Descriptive Data for Patients with Bipolar Disorder and Controls Following Quality Control
Sample AncestryNPatients
NControls
BD1(%)
BD2(%)
SAB(%)
BD-NOS(%)
MaD(%) Diagnosis Interview
ControlsScreened?
GWAS
Germany I German 682 1300 679(99.56)
2(0.29)
1(0.15)
0 0 DSM-IV SADS-L,SCID
no
Replication I
Germany II German 361 755 138(38.23)
93(25.76)
130(36.01)
0 0 DSM-IV SADS-L, SCID no
Poland Polish 411 504 323(78.59)
88(21.41)
0 0 0 DSM-IV SCID no
Spain Spanish 297 391 290(97.64)
7(2.36)
0 0 0 DSM-IV SADS-L no
Russia Russian 326 329 324(96.38)
2(0.61)
0 0 0 DSM-IV SCID no
Romania Romanian 227 221 227(100)
0 0 0 0 DSM-IV SCID yes
Bosnia andHerzegovina /Serbia
Bosnian /Serbian
107 113 107(100)
0 0 0 0 DSM-IV SCID no
Total 2411 3613 2088 192 131 0 0
Replication II
GAIN-EA /TGEN1
European 2189 1434 2062(94.20)
0 127(5.80)
0 0 DSM-III,DSM-IV,RDC
DIGS yes
WTCCC-BD /Exp. Ref. Grp.
British 1868 14,311 1594(85.33)
134(7.17)
98(5.25)
38(2.03)
4(0.21)
RDC SCAN no
Germany III German 497 857 376(75.65)
88(17.71)
2(0.04)
31(6.24)
0 DSM-IV AMDP, CID-S,SADS-L, SCID
yes
France French 471 1758 360(76.43)
99(21.02)
0 12(2.55)
0 DSM-IV DIGS no
Iceland Icelandic 422 11,487 323(76.54)
72(17.06)
0 27(6.40)
0 DSM-III,DSM-IV,ICD10, RDC
CID-I, SADS-L no
Australia European 380 1530 291(76.58)
87(22.89)
1(0.26)
1(0.26)
0 DSM-IV DIGS, FIGS,SCID
no
Norway Norwegian 203 372 128(63.05)
65(32.02)
0 10(4.93)
0 DSM-IV SCID,PRIME-MD
yes
Total 6030 31,749 5134 545 228 119 4
Grand Total 8441 35,362 7222 737 359 119 4
Patients received diagnoses according to the indicated diagnostic criteria and interviews. Protocols and procedures were approved by the local Ethics Committees.Written informed consent was obtained from all patients and controls. Ancestry was assigned to patients and controls on the basis of self-reported ancestry. Thesamples from Bosnia and Herzegovina / Serbia were merged due to the small number of subjects. The Expanded Reference Group for the WTCCC-BD samplecomprised the 1958 British Birth Cohort controls, the UK Blood Services controls supplemented by the other 6 disease sets (coronary artery disease, Crohn’sdisease, hypertension, rheumatoid arthritis, type 1 and type 2 diabetes) as defined by the WTCCC (2007).1
The following abbreviations are used: AMDP, Association forMethodology and Documentation in Psychiatry;31 BD1, bipolar disorder type 1; BD2, bipolar disordertype 2; BD-NOS, bipolar disorder not otherwise specified; CID-I, Composite International Diagnostic Interview;32,33 CID-S, Composite International DiagnosticScreener;34 DIGS, Diagnostic Interview for Genetic Studies;35 DSM-III / DSM-IV, Diagnostic and Statistical Manual of Mental Disorders;9 Exp. Ref. Grp., ExpandedReference Group (11,373 controls);1 FIGS, Family Interview for Genetic Studies;36 GAIN-EA, BD sample with European ancestry from the Genetic Association Infor-mation Network (1001 patients and 1033 controls);6 ICD10, International Statistical Classification of Diseases and Related Health Problems;37 MaD, Manicdisorder according to RDC; N, number of subjects; PRIME-MD, Primary Care Evaluation of Mental Disorders;38 RDC, Research Diagnostic Criteria;39 SAB, schiz-oaffective disorder (bipolar type); SADS-L, Schedule for Affective Disorders and Schizophrenia;40 SCAN, Schedules for Clinical Assessment in Neuropsychiatry;41
SCID, Structured Clinical Interview for DSM disorders;11 TGEN1, Translational Genomics Research Institute (genotyping wave 1 with 1190 patients and 401controls).
and unrelated individuals from the CEU (Utah residents
with ancestry from northern and western Europe), CHB
(Han Chinese in Beijing, China), JPT (Japanese in Tokyo,
374 The American Journal of Human Genetics 88, 372–381, March 1
Japan), and YRI (Yoruba in Ibadan, Nigeria) HapMap
panels. On the basis of this analysis, seven controls and
zero patients were excluded (Figure S2). At the marker
1, 2011

level, nonrandom missingness patterns were identified
with the use of PLINK’s ‘‘mishap’’ test, and another 1825
SNPs were excluded. In total, we excluded 20 patients
and 68 controls as well as 49,488 SNPs in the course of
our QC before association analysis. The effect of our QC
on the resulting p values with data sets has been depicted
in a quantile-quantile plot (Figure S1). The genomic infla-
tion factor (l) after QC was 1.071 (1.107 before QC).
The follow-up SNP set (replication I) was genotyped on
the MALDI TOF-based MassARRAY system with the use
of the iPLEX Gold assay (Sequenom, San Diego, CA,
USA). The iPLEX primer sequences and assay conditions
may be obtained from the authors upon request. Of the
top 79 SNPs from the GWAS, 18 were excluded from the
follow-up step on the basis of linkage disequilibrium
(LD), failed assay design, or poor genotype clustering in
the iPLEX genotyping assay. Of the remaining 61 SNPs,
13 did not pass our QC filters (six SNPs with CR < 0.95,
two SNPs with nonrandom differences in missingness
patterns between subsamples, one SNP with an MAF <
0.01 in controls, and four SNPs with deviations from
HWE [pexact < 1 3 10�4 in controls]). In total, 181 individ-
uals were excluded (n ¼ 31 cryptically related individuals,
n ¼ 150 with call rates < 95%). To identify the cryptically
related individuals (IBS > 1.65), we had computed an IBS
matrix on the basis of the quality-controlled GWAS sample
and all six replication samples.
For the replication II step, NCAN rs1064395 genotypes
were extracted from the following genome-wide data
sets: GAIN-EA6/TGEN1, WTCCC-BD,1 Germany III,
France, Iceland, Australia, and Norway, which are
described in Table 1 and Table S2.
The quality-controlled genotype data were subjected to
the following association tests: In the GWAS and replica-
tion I steps, analyses were computed with PLINK17 (version
1.05). Autosomal-wide analysis was performed via the
TREND test with 1 degree of freedom (df). The X chromo-
some (females and males combined) was analyzed via the
Wald test with 1 df. In replication I and the meta-analysis
(GWAS and replication I), autosomal and X-chromosomal
SNPs were investigated via the Cochran-Mantel-Haenszel
(CMH) test, stratified for ethnicity with the use of a 2 3
2 3 K table in which K ¼ 6, reflecting the six European
countries. The CMH test was two-tailed for all analyses.
To investigate the homogeneity of ORs for the replicated
SNPs, we used the Breslow-Day test. We selected p < 5 3
10�8 as the threshold for genome-wide significance,
assuming one million noncorrelated common SNPs in
the genome, as proposed by the Diabetes Genetics Initia-
tive18 and the International HapMap Consortium.19 In
the replication II step, NCAN rs1064395 was investigated
via logistic regression (assuming an additive effect), which
was a two-tailed test. NCAN rs1064395 was also investi-
gated with the use of a fixed-effects meta-analysis based
on the weighted Z-score method,20 which was two-tailed
for replication II samples (n ¼ 7) and for the combined
analysis of all study samples (n ¼ 14).
The Ameri
On the basis of the QC specifications and statistical
procedures described above, we performed a GWAS of
682 BD patients and 1300 controls (Table 1), using
499,494 autosomal SNPs and 12,484 X-chromosomal
SNPs. A genome-wide overview of the GWAS p values is
given in Figure 1A. In the first follow-up step (replication
I), we genotyped the most significant 48 SNPs (autosomal
SNPs: p % 7.57 3 10�5; X-chromosomal SNPs: p %
1.89 3 10�4; for SNPs in LD (r2 R 0.8), only the SNP
with the smallest GWAS p value was genotyped in the
follow-up) in six European follow-up samples comprising
a total of 1729 BD patients and 2313 controls (Table 1).
The same set of instruments was used across all centers.21
In the replication, we used phenotypically more relaxed
criteria than in the initial GWAS and also included patients
with a diagnosis of BD type II, schizoaffective disorder
(bipolar type), and BD not otherwise specified. To account
for possible heterogeneity, autosomal and X-chromosomal
we investigated SNPs via the CMH test and stratified them
with regard to ethnicity. Eight of the 48 SNPs showed
nominally significant association in the combined replica-
tion samples, all with the same alleles as in the GWAS
(Table 2, Table S3). This number of replicated SNPs is signif-
icantly higher than would be expected to occur by chance
(nexpected ¼ 2.4; p ¼ 2.11 3 10�4). The strongest evidence
for replication was obtained for rs1064395, which is
located in the 30 untranslated region of NCAN on
19p13.11 (p ¼ 4.61 3 10�4, OR ¼ 1.23), and for
rs11764590, which is located in an intron of MAD1L1
(MIM 602686) on 7p22.3 (p ¼ 0.0020, OR ¼ 1.18). Our
top GWAS signal, rs2774339, located in GNG4 (MIM
604388) on 1q42.3 (p ¼ 1.02 3 10�6; Figure S3) was not
replicated (p ¼ 0.5772). Given that our follow-up samples
were derived from six different European countries, we
specifically tested for possible heterogeneity by using the
replication data. In the case of the successfully replicated
SNPs, there was no evidence of ethnic heterogeneity
(Breslow-Day pmin ¼ 0.178). In support of this was the
observation that subtraction of any individual replication
sample did not markedly alter the effect sizes (Table S4).
In a subsequent analysis, we applied a meta-analysis
approach (CMH test) to combine all investigated samples.
SNP rs1064395 in NCAN surpassed the threshold for
genome-wide significance (p ¼ 3.02 3 10�8, OR ¼ 1.31;
Figure 1B); the minor allele (A) was overrepresented in
patients in comparison to controls (19.5% versus 15.3%).
The second-best result was found for MAD1L1
rs11764590 (p ¼ 1.28 3 10�7, OR ¼ 1.26; Figure 1B):
an excess of T alleles was observed in patients (26.0%
versus 21.6%). Another MAD1L1 marker, rs10278591,
which was in moderate LD with rs11764590 (r2 ¼ 0.70),
showed p ¼ 1.81 3 10�5. HapMap-based imputations of
our BD GWAS data provided additional support for
the NCAN and MAD1L1 regions (Figures S4a and S4b).
After QC of real genotypes, locus-targeted imputations
were performed in MACH (version 1.0.16) (Y. Li and G.R.
Abecasis, 2006, Am. Soc. Hum. Genet. abstract) with
can Journal of Human Genetics 88, 372–381, March 11, 2011 375

Figure 1. Association Results for theGWAS and the Two Best-SupportedGenes from the Follow-Up Study(A) Manhattan plot.(B) Regional association plots (RAPs) dis-playing NCAN and MAD1L1. The mostassociated marker from the GWAS(enlarged red diamond) is centered ina genomic window of 1 Mb (hg18, RefSeqgenes); its p value from the combined anal-ysis (meta) is shown (enlarged blue dia-mond). The LD strength (r2) between thesentinel SNP from the GWAS and its flank-ing markers is demonstrated by the red(high) to white (low) color bar. The recom-bination rate (cM/Mb; second y axis) isplotted in blue, according to HapMap-CEU. RAPs were generated with SNAP.42
phased haplotypes from the 60 HapMap CEU founders
(release 22) used as a reference. The imputations were
restricted to windows of 2 Mb on either side of the
sentinel SNP. Imputed SNPs with a MACH quality score
less than 95% were excluded before the association
analysis. Regional association plots for the other five
replicated SNPs are provided in Figures S4c–S4g and Figures
S5a–S5e.
In a second replication step, we sought further support
for the genome-wide significant finding in NCAN and
tested rs1064395 in BD samples from Europe (WTCCC-
BD,1 Germany III, France, Iceland, Norway), from the
USA (combined GAIN-EA6/TGEN1), and from Australia.
376 The American Journal of Human Genetics 88, 372–381, March 11, 2011
In all seven patient samples, the A
allele was overrepresented (Table 3).
Through logistic regression assuming
an additive effect, the GAIN-EA/
TGEN1 samples showed p ¼ 0.2047
(OR ¼ 1.09), WTCCC-BD/Expanded
Reference Controls showed p ¼0.0510 (OR ¼ 1.09), Germany III
samples showed p ¼ 0.2129 (OR ¼1.15), those from France showed
p ¼ 0.0066 (OR ¼ 1.28), those from
Iceland showed p ¼ 0.3385 (OR ¼1.10), those from Australia showed
p ¼ 0.3163 (OR ¼ 1.11), and those
from Norway showed p ¼ 0.7205
(OR ¼ 1.06). The fixed-effects meta-
analysis of these samples, totaling
6030 patients and 31,749 controls, re-
sulted in p¼ 2.743 10�4 (OR¼ 1.12).
The combined analysis of all study
samples (GWAS þ replication I þreplication II), with 8441 patients
and 35,362 controls, resulted in p ¼2.143 10�9 (OR¼ 1.17). An overview
of the significance levels and genetic
effect sizes of NCAN rs1064395 at all
steps of analysis is provided in Figure 2 and Table 3. It is
interesting to note that there is no improvement of the
OR when we perform an analysis of BD type I only
(OR ¼ 1.16), providing no strong evidence that genetic
variation in NCAN would have a much stronger effect in
BD type I compared to the other diagnoses included in
our study (BD type II, schizoaffective disorder [bipolar
type], and BD not otherwise specified).
Neurocan was originally described in the rat brain,22
where its expression decreases significantly in the first
week after birth.23 To validate whether Ncan is expressed
in brain areas previously implicated in BD,24 we performed
RNA in situ hybridization with whole mounts and sections
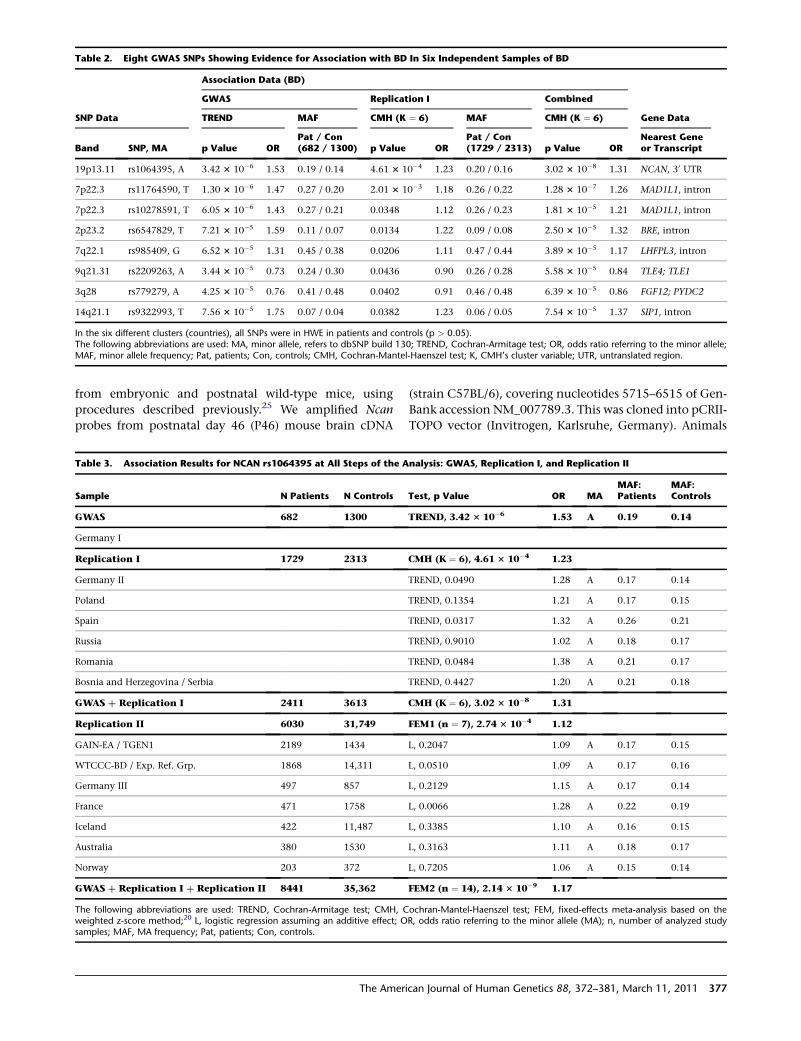
Table 2. Eight GWAS SNPs Showing Evidence for Association with BD In Six Independent Samples of BD
Association Data (BD)
GWAS Replication I Combined
SNP Data TREND MAF CMH (K ¼ 6) MAF CMH (K ¼ 6) Gene Data
Band SNP, MA p Value ORPat / Con(682 / 1300) p Value OR
Pat / Con(1729 / 2313) p Value OR
Nearest Geneor Transcript
19p13.11 rs1064395, A 3.42 3 10�6 1.53 0.19 / 0.14 4.61 3 10�4 1.23 0.20 / 0.16 3.02 3 10�8 1.31 NCAN, 30 UTR
7p22.3 rs11764590, T 1.30 3 10�6 1.47 0.27 / 0.20 2.01 3 10�3 1.18 0.26 / 0.22 1.28 3 10�7 1.26 MAD1L1, intron
7p22.3 rs10278591, T 6.05 3 10�6 1.43 0.27 / 0.21 0.0348 1.12 0.26 / 0.23 1.81 3 10�5 1.21 MAD1L1, intron
2p23.2 rs6547829, T 7.21 3 10�5 1.59 0.11 / 0.07 0.0134 1.22 0.09 / 0.08 2.50 3 10�5 1.32 BRE, intron
7q22.1 rs985409, G 6.52 3 10�5 1.31 0.45 / 0.38 0.0206 1.11 0.47 / 0.44 3.89 3 10�5 1.17 LHFPL3, intron
9q21.31 rs2209263, A 3.44 3 10�5 0.73 0.24 / 0.30 0.0436 0.90 0.26 / 0.28 5.58 3 10�5 0.84 TLE4; TLE1
3q28 rs779279, A 4.25 3 10�5 0.76 0.41 / 0.48 0.0402 0.91 0.46 / 0.48 6.39 3 10�5 0.86 FGF12; PYDC2
14q21.1 rs9322993, T 7.56 3 10�5 1.75 0.07 / 0.04 0.0382 1.23 0.06 / 0.05 7.54 3 10�5 1.37 SIP1, intron
In the six different clusters (countries), all SNPs were in HWE in patients and controls (p > 0.05).The following abbreviations are used: MA, minor allele, refers to dbSNP build 130; TREND, Cochran-Armitage test; OR, odds ratio referring to the minor allele;MAF, minor allele frequency; Pat, patients; Con, controls; CMH, Cochran-Mantel-Haenszel test; K, CMH’s cluster variable; UTR, untranslated region.
from embryonic and postnatal wild-type mice, using
procedures described previously.25 We amplified Ncan
probes from postnatal day 46 (P46) mouse brain cDNA
Table 3. Association Results for NCAN rs1064395 at All Steps of the A
Sample N Patients N Controls
GWAS 682 1300
Germany I
Replication I 1729 2313
Germany II
Poland
Spain
Russia
Romania
Bosnia and Herzegovina / Serbia
GWAS þ Replication I 2411 3613
Replication II 6030 31,749
GAIN-EA / TGEN1 2189 1434
WTCCC-BD / Exp. Ref. Grp. 1868 14,311
Germany III 497 857
France 471 1758
Iceland 422 11,487
Australia 380 1530
Norway 203 372
GWAS þ Replication I þ Replication II 8441 35,362
The following abbreviations are used: TREND, Cochran-Armitage test; CMH, Cweighted z-score method;20 L, logistic regression assuming an additive effect; Osamples; MAF, MA frequency; Pat, patients; Con, controls.
The Ameri
(strain C57BL/6), covering nucleotides 5715–6515 of Gen-
Bank accession NM_007789.3. This was cloned into pCRII-
TOPO vector (Invitrogen, Karlsruhe, Germany). Animals
nalysis: GWAS, Replication I, and Replication II
Test, p Value OR MAMAF:Patients
MAF:Controls
TREND, 3.42 3 10�6 1.53 A 0.19 0.14
CMH (K ¼ 6), 4.61 3 10�4 1.23
TREND, 0.0490 1.28 A 0.17 0.14
TREND, 0.1354 1.21 A 0.17 0.15
TREND, 0.0317 1.32 A 0.26 0.21
TREND, 0.9010 1.02 A 0.18 0.17
TREND, 0.0484 1.38 A 0.21 0.17
TREND, 0.4427 1.20 A 0.21 0.18
CMH (K ¼ 6), 3.02 3 10�8 1.31
FEM1 (n ¼ 7), 2.74 3 10�4 1.12
L, 0.2047 1.09 A 0.17 0.15
L, 0.0510 1.09 A 0.17 0.16
L, 0.2129 1.15 A 0.17 0.14
L, 0.0066 1.28 A 0.22 0.19
L, 0.3385 1.10 A 0.16 0.15
L, 0.3163 1.11 A 0.18 0.17
L, 0.7205 1.06 A 0.15 0.14
FEM2 (n ¼ 14), 2.14 3 10�9 1.17
ochran-Mantel-Haenszel test; FEM, fixed-effects meta-analysis based on theR, odds ratio referring to the minor allele (MA); n, number of analyzed study
can Journal of Human Genetics 88, 372–381, March 11, 2011 377

Figure 2. Genetic Effect Sizes and Significance Levels for NCANrs1064395 at All Steps of AnalysisForest plot shows odds ratios (orange diamonds) and their 95%confidence intervals (horizontal lines) of individual studysamples. The odds ratio referring to the meta-analysis of all studysamples is represented by the enlarged blue diamond. BiH / SRB,Bosnia and Herzegovina / Serbia.
were handled according to European and German laws. At
embryonic day 14.5 (E14.5), Ncan expression was confined
to the central nervous system (Figure 3A). However, Ncan
transcripts have also been described in the peripheral
nervous system in later developmental stages.26 Between
E14.5 and E16.5, Ncan was highly expressed in the cortical
plate, as well as in the ventricular zone of the basal ganglia
(Figures 3A–3C). In the subventricular zone of the
neocortex, the transcripts were located mainly in the
caudal region (Figure 3C), where neurocan proteins may
be involved in axon guidance.27 Ncan was also present in
the developing hippocampus (data not shown). After
birth, its general expression was found to be decreased. It
was detected in the dentate gyrus and CA1 of the hippo-
378 The American Journal of Human Genetics 88, 372–381, March 1
campus (Figure 3E), as well as in the cortical layer II
(Figure 3D) at P46. Its expression in the cortical layer II re-
mained unabated, at least up to P18, with higher expres-
sion in the frontal cortex (data not shown). On the
contrary, Ncan expression was not detected in any hippo-
campal area at this age.
To investigate whether NCAN andMAD1L1 are expressed
in the human brain, we analyzed the transcriptional expres-
sion of both genes in human hippocampus tissue samples
(n ¼ 148), using data from whole-genome HumanHT-12
Expression BeadChips (Illumina, San Diego, USA). Tissues
wereobtained fromsurgeryonpatientswithpharmaco-resis-
tantepilepsy.TotalRNAwas isolated fromfresh frozen tissues
and underwent QC via BioAnalyzer measurements (Agilent
Technologies, Waldbronn, Germany). The background of
expression profiles was subtracted and signals were normal-
ized (average-normalization)with Illumina’s GenomeStudio
software. The analysis showed thatNCAN andMAD1L1were
expressed in the hippocampus (Figure S6). For NCAN, an
average signal-intensity log2 ratio of 7.99 with a standard
deviation of 0.8 (intensities, min ¼ 5.82 and max ¼ 10.4)
was detected, and for MAD1L1, an average signal-intensity
log2 ratio of 5.21 with a standard deviation of 0.46 (intensi-
ties, min¼ 3.55 and max¼ 6.1) was detected.
Our GWAS and follow-up study of BD samples,
including a total of 43,803 individuals (8441 patients
and 35,362 controls), provided a significant level of statis-
tical support for the idea that common genetic variation in
NCAN is involved in the etiology of this common and
severe neuropsychiatric disorder. The overall p value for
the top-associated SNP, rs1064395, was 2.14 3 10�9
(OR ¼ 1.17). NCAN encodes neurocan (MIM 600826), an
extracellular matrix glycoprotein. The gene is highly ex-
pressed in the brain, and is thought to be involved in cell
adhesion andmigration. Tomap its spatiotemporal expres-
sion, we performed in situ hybridizations in embryonic
and postnatal wild-type mice. We observed that murine
Ncan was expressed in cortical and hippocampal areas
and could confirm that NCAN transcripts are highly abun-
dant in the human hippocampus. These brain regions,
Figure 3. Expression Patterns of Neuro-can inMouse Brain Areas Previously Impli-cated in BDRNA in situ hybridization of Ncan insagittal (A, C–E) and coronal (B) sectionsat E14.5 (A), E15.5 (B), E16.5 (C), and P46(D and E). In the embryo, Ncan is observedexclusively in the CNS, with high expres-sion in the cortical plate (Cp) and subven-tricular zone (Sz, arrow in C) of theneocortex and in the ventricular zone ofthe basal ganglia (Bg, A–C). Ncan was alsodetected in the hypothalamus (Ht) andamygdala (Am, B). In postnatal mice,Ncan expression in the cortex (Cx) isrestricted to layer II (arrow in D). In thehippocampus (E), it was detected at lowerintensity in the dentate gyrus (Dg) andCA1. Lv indicates the lateral ventricle.
1, 2011
which are involved in cognition and regulation of circuits
involved in emotion, have previously been implicated in
BD by neuropsychological, neuroimaging, and post-
mortem studies.28 Ncan-deficient mice show no obvious
defect in brain morphology, and basic synaptic transmis-
sion appears to be normal.26 However, the maintenance
of late-phase long-term potentiation in the hippocampal
CA1 region in null mutants is reduced, which could lead
to mild deficits in learning and memory;26 i.e., there are
disturbances in the mechanisms that underlie the cogni-
tive deficits observed in BD. This suggests that Ncan-defi-
cient mice should be reexamined for more subtle changes
in the brain, such as synaptic plasticity.
MAD1L1 (mitotic arrest deficient-like 1 [MIM 602686]) is
a component of the chromosome spindle-assembly check-
point inmitosis. Defects in mitotic checkpoints can lead to
aneuploidy, which may play a role in carcinogenesis and
aging.29 Homozygous knockout of Mad1l1 in mice confers
embryonic lethality, which indicates that it has an essen-
tial function in development.30 MAD1L1 is expressed in
the human hippocampus (Figure S6), although its neurobi-
ological effects have not been established.
In summary, the present study has identified a suscepti-
bility factor for BD, NCAN, and a potential BD suscepti-
bility factor, MAD1L1. Expression studies in mice provide
strong support for a role ofNCAN in BD, because its expres-
sion is localized to brain areas (cortex, hippocampus) in
which abnormalities have been identified in BD. These
abnormalities may be indicative of disturbances in key
neuronal circuits.
Supplemental Data
Supplemental Data include a list of members of the Bipolar
Disorder Genome Study (BiGS) Consortium, four tables, and six
figures and can be found with this article online at http://www.
cell.com/AJHG/.
Acknowledgments
We are grateful to all patients who contributed to this study. We
also thank all probands from the community-based cohorts of
PopGen, KORA, those from the Heinz Nixdorf Recall (HNR) study,
and the Munich controls. This study was supported by the
German Federal Ministry of Education and Research (BMBF),
within the context of the National Genome Research Network 2
(NGFN-2), the National Genome Research Network plus
(NGFNplus), and the Integrated Genome Research Network (IG)
MooDS (grant 01GS08144 to S.C. and M.M.N., grant 01GS08147
to M.R.). M.M.N. also received support from the Alfried Krupp
von Bohlen und Halbach-Stiftung. M.G.-S. was supported by the
Romanian Ministry for Education and Research (grant 42151/
2008). C.C.D. was supported by the SOP HRD and was financed
from the European Social Fund and by the RomanianGovernment
(contract POSDRU/89/1.5/S/64109). This study was also sup-
ported by the Polish Ministry of Science and Higher Education
(grant N N402 244035 to P.M.C.) The KORA research platform
was initiated and financed by the Helmholtz Center Munich,
German Research Center for Environmental Health, which is
The Ameri
funded by the BMBF and by the State of Bavaria. KORA research
was supported within the Munich Center of Health Sciences
(MC Health) as part of LMUinnovativ. The HNR cohort was estab-
lished with the support of the Heinz Nixdorf Foundation. We
acknowledge the Wellcome Trust Case Control Consortium
(www.wtccc.org.uk), itsmembership, and its funder, theWellcome
Trust, for generating and publishing data used for replication.
Recruitment of the French sample was supported by ANR (ANR
NEURO2006, MANAGE_BPAD), INSERM, AP-HP, and the Fonda-
Mental Foundation (www.fondation-fondamental.org). Recruit-
ment of the Australian BD sample was supported by the Australian
NHMRC program, grant number 510135. The Norwegian study
was supported by the Research Council of Norway (#167153/
V50, #163070/V50, #175345/V50) and by the South-East Norway
Health Authority (#123-2004). We are grateful to A. Becker,
Department of Neuropathology, University of Bonn, Germany,
for providing the human hippocampus tissue that was used in
the gene expression analysis.
Received: October 1, 2010
Revised: January 14, 2011
Accepted: January 29, 2011
Published online: February 24, 2011
Web Resources
The URLs for data presented herein are as follows:
The International HapMap Project, http://www.hapmap.org/
Online Mendelian Inheritance in Man (OMIM), http://www.ncbi.
nlm.nih.gov/Omim/
PLINK: Whole Genome Association Analysis Toolset, http://pngu.
mgh.harvard.edu/~purcell/plink/
Single Nucleotide Polymorphism database (dbSNP), http://www.
ncbi.nlm.nih.gov/projects/SNP/
SNAP: Aweb-based tool for identification and annotation of proxy
SNPs using HapMap, http://www.broadinstitute.org/mpg/snap/
References
1. Wellcome Trust Case Control Consortium. (2007). Genome-
wide association study of 14,000 cases of seven common
diseases and 3,000 shared controls. Nature 447, 661–678.
2. Baum, A.E., Akula, N., Cabanero, M., Cardona, I., Corona, W.,
Klemens, B., Schulze, T.G., Cichon, S., Rietschel, M., Nothen,
M.M., et al. (2008). A genome-wide association study impli-
cates diacylglycerol kinase eta (DGKH) and several other genes
in theetiologyof bipolardisorder.Mol. Psychiatry13, 197–207.
3. Sklar, P., Smoller, J.W., Fan, J., Ferreira, M.A., Perlis, R.H.,
Chambert, K., Nimgaonkar, V.L., McQueen, M.B., Faraone,
S.V., Kirby, A., et al. (2008). Whole-genome association study
of bipolar disorder. Mol. Psychiatry 13, 558–569.
4. Ferreira, M.A., O’Donovan, M.C., Meng, Y.A., Jones, I.R.,
Ruderfer, D.M., Jones, L., Fan, J., Kirov, G., Perlis, R.H., Green,
E.K., et al; Wellcome Trust Case Control Consortium. (2008).
Collaborative genome-wide association analysis supports
a role for ANK3 and CACNA1C in bipolar disorder. Nat. Genet.
40, 1056–1058.
5. Scott, L.J., Muglia, P., Kong, X.Q., Guan, W., Flickinger, M.,
Upmanyu, R., Tozzi, F., Li, J.Z., Burmeister, M., Absher, D.,
et al. (2009). Genome-wide association and meta-analysis of
can Journal of Human Genetics 88, 372–381, March 11, 2011 379
bipolar disorder in individuals of European ancestry. Proc.
Natl. Acad. Sci. USA 106, 7501–7506.
6. Smith, E.N., Bloss, C.S., Badner, J.A., Barrett, T., Belmonte, P.L.,
Berrettini, W., Byerley, W., Coryell, W., Craig, D., Edenberg,
H.J., et al. (2009). Genome-wide association study of bipolar
disorder in European American and African American individ-
uals. Mol. Psychiatry 14, 755–763.
7. Baum, A.E., Hamshere, M., Green, E., Cichon, S., Rietschel, M.,
Noethen, M.M., Craddock, N., and McMahon, F.J. (2008).
Meta-analysis of two genome-wide association studies of
bipolar disorder reveals important points of agreement. Mol.
Psychiatry 13, 466–467.
8. Schulze, T.G., Detera-Wadleigh, S.D., Akula, N., Gupta, A., Kas-
sem, L., Steele, J., Pearl, J., Strohmaier, J., Breuer, R., Schwarz,
M., et al; NIMH Genetics Initiative Bipolar Disorder Consor-
tium. (2009). Two variants in Ankyrin 3 (ANK3) are indepen-
dent genetic risk factors for bipolar disorder. Mol. Psychiatry
14, 487–491.
9. American Psychiatric Association (APA). (1994). Diagnostic
and Statistical Manual of Mental Disorders, Fourth Edition
(Washington, D.C.: American Pychiatric Association).
10. Leckman, J.F., Sholomskas, D., Thompson, W.D., Belanger, A.,
and Weissman, M.M. (1982). Best estimate of lifetime psychi-
atric diagnosis: a methodological study. Arch. Gen. Psychiatry
39, 879–883.
11. Spitzer, R.L., Williams, J.B., Gibbon,M., and First, M.B. (1992).
The Structured Clinical Interview for DSM-III-R (SCID). I:
History, rationale, and description. Arch. Gen. Psychiatry 49,
624–629.
12. Farmer, A.E., Wessely, S., Castle, D., and McGuffin, P. (1992).
Methodological issues in using a polydiagnostic approach to
define psychotic illness. Br. J. Psychiatry 161, 824–830.
13. Krawczak, M., Nikolaus, S., von Eberstein, H., Croucher, P.J., El
Mokhtari, N.E., and Schreiber, S. (2006). PopGen: population-
based recruitment of patients and controls for the analysis of
complex genotype-phenotype relationships. Community
Genet. 9, 55–61.
14. Wichmann, H.E., Gieger, C., and Illig, T.; MONICA/KORA
Study Group. (2005). KORA-gen—resource for population
genetics, controls and a broad spectrum of disease pheno-
types. Gesundheitswesen 67 (Suppl 1 ), S26–S30.
15. Schmermund, A., Mohlenkamp, S., Stang, A., Gronemeyer, D.,
Seibel, R., Hirche, H., Mann, K., Siffert, W., Lauterbach, K.,
Siegrist, J., et al. (2002). Assessment of clinically silent athero-
sclerotic disease and established and novel risk factors for
predicting myocardial infarction and cardiac death in healthy
middle-aged subjects: rationale and design of the Heinz
Nixdorf RECALL Study. Risk Factors, Evaluation of Coronary
Calcium and Lifestyle. Am. Heart J. 144, 212–218.
16. Miller, S.A., Dykes, D.D., and Polesky, H.F. (1988). A simple
salting out procedure for extracting DNA from human nucle-
ated cells. Nucleic Acids Res. 16, 1215.
17. Purcell, S., Neale, B., Todd-Brown, K., Thomas, L., Ferreira,
M.A., Bender, D., Maller, J., Sklar, P., de Bakker, P.I., Daly,
M.J., and Sham, P.C. (2007). PLINK: a tool set for whole-
genome association and population-based linkage analyses.
Am. J. Hum. Genet. 81, 559–575.
18. Saxena, R., Voight, B.F., Lyssenko, V., Burtt, N.P., de Bakker,
P.I., Chen, H., Roix, J.J., Kathiresan, S., Hirschhorn, J.N.,
Daly, M.J., et al; Diabetes Genetics Initiative of Broad Institute
of Harvard and MIT, Lund University, and Novartis Institutes
of BioMedical Research. (2007). Genome-wide association
380 The American Journal of Human Genetics 88, 372–381, March 1
analysis identifies loci for type 2 diabetes and triglyceride
levels. Science 316, 1331–1336.
19. International HapMap Consortium. (2005). A haplotype map
of the human genome. Nature 437, 1299–1320.
20. de Bakker, P.I., Ferreira, M.A., Jia, X., Neale, B.M., Raychaud-
huri, S., and Voight, B.F. (2008). Practical aspects of imputa-
tion-drivenmeta-analysis of genome-wide association studies.
Hum. Mol. Genet. 17 (R2), R122–R128.
21. Fangerau, H., Ohlraun, S., Granath, R.O., Nothen, M.M.,
Rietschel, M., and Schulze, T.G. (2004). Computer-assisted
phenotype characterization for genetic research in psychiatry.
Hum. Hered. 58, 122–130.
22. Rauch, U., Karthikeyan, L., Maurel, P., Margolis, R.U., and
Margolis, R.K. (1992). Cloning and primary structure of neuro-
can, a developmentally regulated, aggregating chondroitin
sulfate proteoglycan of brain. J. Biol. Chem. 267, 19536–
19547.
23. Milev, P., Monnerie, H., Popp, S., Margolis, R.K., and Margolis,
R.U. (1998). The core protein of the chondroitin sulfate
proteoglycan phosphacan is a high-affinity ligand of fibro-
blast growth factor-2 and potentiates its mitogenic activity.
J. Biol. Chem. 273, 21439–21442.
24. Martinowich, K., Schloesser, R.J., and Manji, H.K. (2009).
Bipolar disorder: from genes to behavior pathways. J. Clin.
Invest. 119, 726–736.
25. Miro, X., Zhou, X., Boretius, S., Michaelis, T., Kubisch, C.,
Alvarez-Bolado, G., and Gruss, P. (2009). Haploinsufficiency
of the murine polycomb gene Suz12 results in diverse malfor-
mations of the brain and neural tube. Dis Model Mech 2,
412–418.
26. Zhou, X.H., Brakebusch, C., Matthies, H., Oohashi, T., Hirsch,
E., Moser, M., Krug, M., Seidenbecher, C.I., Boeckers, T.M.,
Rauch, U., et al. (2001). Neurocan is dispensable for brain
development. Mol. Cell. Biol. 21, 5970–5978.
27. Watanabe, E., Aono, S., Matsui, F., Yamada, Y., Naruse, I., and
Oohira, A. (1995). Distribution of a brain-specific proteo-
glycan, neurocan, and the corresponding mRNA during the
formation of barrels in the rat somatosensory cortex. Eur. J.
Neurosci. 7, 547–554.
28. Frey, B.N., Andreazza, A.C., Nery, F.G., Martins, M.R.,
Quevedo, J., Soares, J.C., and Kapczinski, F. (2007). The role
of hippocampus in the pathophysiology of bipolar disorder.
Behav. Pharmacol. 18, 419–430.
29. Herzog, F., Primorac, I., Dube, P., Lenart, P., Sander, B., Mech-
tler, K., Stark, H., and Peters, J.M. (2009). Structure of the
anaphase-promoting complex/cyclosome interacting with
a mitotic checkpoint complex. Science 323, 1477–1481.
30. Iwanaga, Y., Chi, Y.H., Miyazato, A., Sheleg, S., Haller, K., Pelo-
ponese, J.M., Jr., Li, Y., Ward, J.M., Benezra, R., and Jeang, K.T.
(2007). Heterozygous deletion of mitotic arrest-deficient
protein 1 (MAD1) increases the incidence of tumors in mice.
Cancer Res. 67, 160–166.
31. The AMDP System. (1982). The AMDP-System Association of
Methodology and Documentation in Psychiatry. Manual
For the Assessment and Documentation of Psychopathology
(Berlin: Springer).
32. Peters, L., and Andrews, G. (1995). Procedural validity of
the computerized version of the Composite International
Diagnostic Interview (CIDI-Auto) in the anxiety disorders.
Psychol. Med. 25, 1269–1280.
33. Wittchen, H.U., Zhao, S., Abelson, J.M., Abelson, J.L., and
Kessler, R.C. (1996). Reliability and procedural validity of
1, 2011

UM-CIDI DSM-III-R phobic disorders. Psychol. Med. 26,
1169–1177.
34. Wittchen, H.U., Hofler, M., Gander, F., Pfister, H., Storz, S.,
Ustun, T.B., Muller, N., and Kessler, R.C. (1999). Screening
for mental disorders: performance of the Composite Interna-
tional Diagnostic-Screener (CID-S). Int. J. Methods Psychiatr.
Res. 8, 59–70.
35. Nurnberger, J.I., Jr., Blehar, M.C., Kaufmann, C.A., York-
Cooler, C., Simpson, S.G., Harkavy-Friedman, J., Severe, J.B.,
Malaspina, D., and Reich, T. (1994). Diagnostic interview for
genetic studies. Rationale, unique features, and training.
Arch Gen Psychiatry 51, 849–859, discussion 863–864.
36. Maxwell, M.E. (1992). Family Interview for Genetic Studies
(FIGS): Manual For FIGS. Clinical Neurogenetics Branch. In-
tramural Research Program (Bethesda, MD: National Institute
of Mental Health).
37. World Health Organization (WHO). (1992). The ICD 10 Clas-
sification of Mental and Behavioural Disorders. Clinical
Descriptions and Diagnostic Guidelines (Geneva: WHO).
The Ameri
38. Spitzer, R.L., Williams, J.B., Kroenke, K., Linzer, M., deGruy,
F.V., 3rd, Hahn, S.R., Brody, D., and Johnson, J.G. (1994).
Utility of a new procedure for diagnosing mental disorders
in primary care. The PRIME-MD 1000 study. JAMA 272,
1749–1756.
39. Spitzer, R.L., Endicott, J., and Robins, E. (1978). Research diag-
nostic criteria: rationale and reliability. Arch. Gen. Psychiatry
35, 773–782.
40. Endicott, J., and Spitzer, R.L. (1978). A diagnostic interview:
the schedule for affective disorders and schizophrenia. Arch.
Gen. Psychiatry 35, 837–844.
41. Wing, J.K., Babor, T., Brugha, T., Burke, J., Cooper, J.E., Giel, R.,
Jablenski, A., Regier, D., and Sartorius, N.; Schedules for Clin-
ical Assessment in Neuropsychiatry. (1990). SCAN. Arch. Gen.
Psychiatry 47, 589–593.
42. Johnson, A.D., Handsaker, R.E., Pulit, S.L., Nizzari, M.M.,
O’Donnell, C.J., and de Bakker, P.I.W. (2008). SNAP: a web-
based tool for identification and annotation of proxy SNPs
using HapMap. Bioinformatics 24, 2938–2939.
can Journal of Human Genetics 88, 372–381, March 11, 2011 381