Genome mapping and expression analyses of human intronic noncoding RNAs reveal tissue-specific...
25
Genome Biology 2007, 8:R43 comment reviews reports deposited research refereed research interactions information Open Access 2007 Nakaya et al. Volume 8, Issue 3, Article R43 Research Genome mapping and expression analyses of human intronic noncoding RNAs reveal tissue-specific patterns and enrichment in genes related to regulation of transcription Helder I Nakaya, Paulo P Amaral, Rodrigo Louro, André Lopes, Angela A Fachel, Yuri B Moreira, Tarik A El-Jundi, Aline M da Silva, Eduardo M Reis and Sergio Verjovski-Almeida Address: Departamento de Bioquimica, Instituto de Quimica, Universidade de São Paulo, 05508-900 São Paulo, SP, Brazil. Correspondence: Sergio Verjovski-Almeida. Email: [email protected] © 2007 Nakaya et al.; licensee BioMed Central Ltd. This is an open access article distributed under the terms of the Creative Commons Attribution License (http://creativecommons.org/licenses/by/2.0), which permits unrestricted use, distribution, and reproduction in any medium, provided the original work is properly cited. Expression of human totally intronic noncoding RNAs <p>An analysis of the expression of 7,135 human totally intronic noncoding RNA transcripts plus the corresponding protein-coding genes using oligonucleotide arrays has identified diverse intronic RNA expression patterns, pointing to distinct regulatory roles.</p> Abstract Background: RNAs transcribed from intronic regions of genes are involved in a number of processes related to post-transcriptional control of gene expression. However, the complement of human genes in which introns are transcribed, and the number of intronic transcriptional units and their tissue expression patterns are not known. Results: A survey of mRNA and EST public databases revealed more than 55,000 totally intronic noncoding (TIN) RNAs transcribed from the introns of 74% of all unique RefSeq genes. Guided by this information, we designed an oligoarray platform containing sense and antisense probes for each of 7,135 randomly selected TIN transcripts plus the corresponding protein-coding genes. We identified exonic and intronic tissue-specific expression signatures for human liver, prostate and kidney. The most highly expressed antisense TIN RNAs were transcribed from introns of protein- coding genes significantly enriched (p = 0.002 to 0.022) in the 'Regulation of transcription' Gene Ontology category. RNA polymerase II inhibition resulted in increased expression of a fraction of intronic RNAs in cell cultures, suggesting that other RNA polymerases may be involved in their biosynthesis. Members of a subset of intronic and protein-coding signatures transcribed from the same genomic loci have correlated expression patterns, suggesting that intronic RNAs regulate the abundance or the pattern of exon usage in protein-coding messages. Conclusion: We have identified diverse intronic RNA expression patterns, pointing to distinct regulatory roles. This gene-oriented approach, using a combined intron-exon oligoarray, should permit further comparative analysis of intronic transcription under various physiological and pathological conditions, thus advancing current knowledge about the biological functions of these noncoding RNAs. Published: 26 March 2007 Genome Biology 2007, 8:R43 (doi:10.1186/gb-2007-8-3-r43) Received: 17 October 2006 Revised: 17 January 2007 Accepted: 26 March 2007 The electronic version of this article is the complete one and can be found online at http://genomebiology.com/2007/8/3/R43
-
Upload
independent -
Category
Documents
-
view
2 -
download
0
Transcript of Genome mapping and expression analyses of human intronic noncoding RNAs reveal tissue-specific...
com
ment
reviews
reports
deposited research
refereed researchinteractio
nsinfo
rmatio
n
Open Access2007Nakayaet al.Volume 8, Issue 3, Article R43ResearchGenome mapping and expression analyses of human intronic noncoding RNAs reveal tissue-specific patterns and enrichment in genes related to regulation of transcriptionHelder I Nakaya, Paulo P Amaral, Rodrigo Louro, André Lopes, Angela A Fachel, Yuri B Moreira, Tarik A El-Jundi, Aline M da Silva, Eduardo M Reis and Sergio Verjovski-Almeida
Address: Departamento de Bioquimica, Instituto de Quimica, Universidade de São Paulo, 05508-900 São Paulo, SP, Brazil.
Correspondence: Sergio Verjovski-Almeida. Email: [email protected]
© 2007 Nakaya et al.; licensee BioMed Central Ltd. This is an open access article distributed under the terms of the Creative Commons Attribution License (http://creativecommons.org/licenses/by/2.0), which permits unrestricted use, distribution, and reproduction in any medium, provided the original work is properly cited.Expression of human totally intronic noncoding RNAs<p>An analysis of the expression of 7,135 human totally intronic noncoding RNA transcripts plus the corresponding protein-coding genes using oligonucleotide arrays has identified diverse intronic RNA expression patterns, pointing to distinct regulatory roles.</p>
Abstract
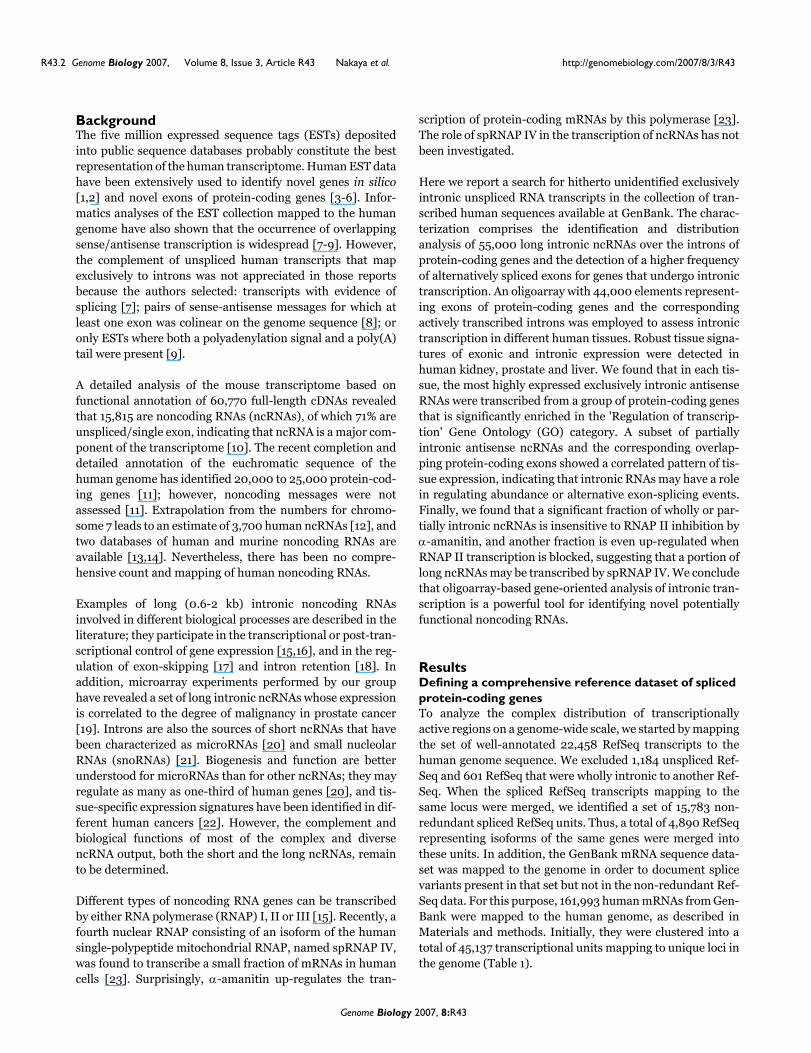
Background: RNAs transcribed from intronic regions of genes are involved in a number ofprocesses related to post-transcriptional control of gene expression. However, the complementof human genes in which introns are transcribed, and the number of intronic transcriptional unitsand their tissue expression patterns are not known.
Results: A survey of mRNA and EST public databases revealed more than 55,000 totally intronicnoncoding (TIN) RNAs transcribed from the introns of 74% of all unique RefSeq genes. Guided bythis information, we designed an oligoarray platform containing sense and antisense probes for eachof 7,135 randomly selected TIN transcripts plus the corresponding protein-coding genes. Weidentified exonic and intronic tissue-specific expression signatures for human liver, prostate andkidney. The most highly expressed antisense TIN RNAs were transcribed from introns of protein-coding genes significantly enriched (p = 0.002 to 0.022) in the 'Regulation of transcription' GeneOntology category. RNA polymerase II inhibition resulted in increased expression of a fraction ofintronic RNAs in cell cultures, suggesting that other RNA polymerases may be involved in theirbiosynthesis. Members of a subset of intronic and protein-coding signatures transcribed from thesame genomic loci have correlated expression patterns, suggesting that intronic RNAs regulate theabundance or the pattern of exon usage in protein-coding messages.
Conclusion: We have identified diverse intronic RNA expression patterns, pointing to distinctregulatory roles. This gene-oriented approach, using a combined intron-exon oligoarray, shouldpermit further comparative analysis of intronic transcription under various physiological andpathological conditions, thus advancing current knowledge about the biological functions of thesenoncoding RNAs.
Published: 26 March 2007
Genome Biology 2007, 8:R43 (doi:10.1186/gb-2007-8-3-r43)
Received: 17 October 2006Revised: 17 January 2007Accepted: 26 March 2007
The electronic version of this article is the complete one and can be found online at http://genomebiology.com/2007/8/3/R43
Genome Biology 2007, 8:R43
R43.2 Genome Biology 2007, Volume 8, Issue 3, Article R43 Nakaya et al. http://genomebiology.com/2007/8/3/R43
BackgroundThe five million expressed sequence tags (ESTs) depositedinto public sequence databases probably constitute the bestrepresentation of the human transcriptome. Human EST datahave been extensively used to identify novel genes in silico[1,2] and novel exons of protein-coding genes [3-6]. Infor-matics analyses of the EST collection mapped to the humangenome have also shown that the occurrence of overlappingsense/antisense transcription is widespread [7-9]. However,the complement of unspliced human transcripts that mapexclusively to introns was not appreciated in those reportsbecause the authors selected: transcripts with evidence ofsplicing [7]; pairs of sense-antisense messages for which atleast one exon was colinear on the genome sequence [8]; oronly ESTs where both a polyadenylation signal and a poly(A)tail were present [9].
A detailed analysis of the mouse transcriptome based onfunctional annotation of 60,770 full-length cDNAs revealedthat 15,815 are noncoding RNAs (ncRNAs), of which 71% areunspliced/single exon, indicating that ncRNA is a major com-ponent of the transcriptome [10]. The recent completion anddetailed annotation of the euchromatic sequence of thehuman genome has identified 20,000 to 25,000 protein-cod-ing genes [11]; however, noncoding messages were notassessed [11]. Extrapolation from the numbers for chromo-some 7 leads to an estimate of 3,700 human ncRNAs [12], andtwo databases of human and murine noncoding RNAs areavailable [13,14]. Nevertheless, there has been no compre-hensive count and mapping of human noncoding RNAs.
Examples of long (0.6-2 kb) intronic noncoding RNAsinvolved in different biological processes are described in theliterature; they participate in the transcriptional or post-tran-scriptional control of gene expression [15,16], and in the reg-ulation of exon-skipping [17] and intron retention [18]. Inaddition, microarray experiments performed by our grouphave revealed a set of long intronic ncRNAs whose expressionis correlated to the degree of malignancy in prostate cancer[19]. Introns are also the sources of short ncRNAs that havebeen characterized as microRNAs [20] and small nucleolarRNAs (snoRNAs) [21]. Biogenesis and function are betterunderstood for microRNAs than for other ncRNAs; they mayregulate as many as one-third of human genes [20], and tis-sue-specific expression signatures have been identified in dif-ferent human cancers [22]. However, the complement andbiological functions of most of the complex and diversencRNA output, both the short and the long ncRNAs, remainto be determined.
Different types of noncoding RNA genes can be transcribedby either RNA polymerase (RNAP) I, II or III [15]. Recently, afourth nuclear RNAP consisting of an isoform of the humansingle-polypeptide mitochondrial RNAP, named spRNAP IV,was found to transcribe a small fraction of mRNAs in humancells [23]. Surprisingly, α-amanitin up-regulates the tran-
scription of protein-coding mRNAs by this polymerase [23].The role of spRNAP IV in the transcription of ncRNAs has notbeen investigated.
Here we report a search for hitherto unidentified exclusivelyintronic unspliced RNA transcripts in the collection of tran-scribed human sequences available at GenBank. The charac-terization comprises the identification and distributionanalysis of 55,000 long intronic ncRNAs over the introns ofprotein-coding genes and the detection of a higher frequencyof alternatively spliced exons for genes that undergo intronictranscription. An oligoarray with 44,000 elements represent-ing exons of protein-coding genes and the correspondingactively transcribed introns was employed to assess intronictranscription in different human tissues. Robust tissue signa-tures of exonic and intronic expression were detected inhuman kidney, prostate and liver. We found that in each tis-sue, the most highly expressed exclusively intronic antisenseRNAs were transcribed from a group of protein-coding genesthat is significantly enriched in the 'Regulation of transcrip-tion' Gene Ontology (GO) category. A subset of partiallyintronic antisense ncRNAs and the corresponding overlap-ping protein-coding exons showed a correlated pattern of tis-sue expression, indicating that intronic RNAs may have a rolein regulating abundance or alternative exon-splicing events.Finally, we found that a significant fraction of wholly or par-tially intronic ncRNAs is insensitive to RNAP II inhibition byα-amanitin, and another fraction is even up-regulated whenRNAP II transcription is blocked, suggesting that a portion oflong ncRNAs may be transcribed by spRNAP IV. We concludethat oligoarray-based gene-oriented analysis of intronic tran-scription is a powerful tool for identifying novel potentiallyfunctional noncoding RNAs.
ResultsDefining a comprehensive reference dataset of spliced protein-coding genesTo analyze the complex distribution of transcriptionallyactive regions on a genome-wide scale, we started by mappingthe set of well-annotated 22,458 RefSeq transcripts to thehuman genome sequence. We excluded 1,184 unspliced Ref-Seq and 601 RefSeq that were wholly intronic to another Ref-Seq. When the spliced RefSeq transcripts mapping to thesame locus were merged, we identified a set of 15,783 non-redundant spliced RefSeq units. Thus, a total of 4,890 RefSeqrepresenting isoforms of the same genes were merged intothese units. In addition, the GenBank mRNA sequence data-set was mapped to the genome in order to document splicevariants present in that set but not in the non-redundant Ref-Seq data. For this purpose, 161,993 human mRNAs from Gen-Bank were mapped to the human genome, as described inMaterials and methods. Initially, they were clustered into atotal of 45,137 transcriptional units mapping to unique loci inthe genome (Table 1).
Genome Biology 2007, 8:R43

http://genomebiology.com/2007/8/3/R43 Genome Biology 2007, Volume 8, Issue 3, Article R43 Nakaya et al. R43.3
com
ment
reviews
reports
refereed researchdepo
sited researchinteractio
nsinfo
rmatio
n
A detailed analysis of the mapping coordinates of thesemRNA clusters with respect to the non-redundant RefSeqdataset revealed that 11,361 spliced and unspliced clustersmapped outside the non-redundant RefSeq dataset, repre-senting less well-characterized human transcripts. Asexpected, most of the mRNA clusters (14,575) were splicedand mapped to exons of RefSeq genes in the sense direction(Table 1). In addition, 2,559 spliced mRNA clusters mappedin the antisense direction with respect to the non-redundantRefSeq dataset, suggesting that 16% of the RefSeq genes havespliced natural antisense transcripts that overlap at least oneof their exons. Among these antisense messages, 1,414 arealready annotated as RefSeq transcripts. Such genomicorganization of sense-antisense gene pairs seems to havebeen conserved throughout vertebrate evolution [7,8,24,25].When the unspliced mRNA clusters were included, we founda total of 4,231 antisense messages with overlaps to exons inRefSeq genes, indicating that as many as 27% of the latterhave antisense counterparts. A complete list of these sense/antisense pairs with exon overlapping is given in Additionaldata file 1. This is in line with the prediction that over 20% ofhuman transcripts might form sense-antisense pairs [9]. As acontrol, we cross-referenced the previously known sense/antisense pairs to our dataset (see Materials and methods)and found that essentially 100% of known pairs [8,9] withevidence from RefSeq or mRNA are covered by our set. Inaddition, we found 1,116 RefSeqs with evidence of antisenseexon-overlapping messages not covered by Yelin et al. [8] and1,573 not covered by Chen et al. [9]. The complete list ofsense/antisense pairs identified here is given in Additionaldata file 1 along with data for the cross-reference to publishedsense/antisense pairs.
Most interestingly, we found 7,507 spliced and unsplicedmRNA clusters that are entirely intronic to the non-redun-dant RefSeq genes (Table 1). While 5,002 (67%) of thesemapped in the sense direction and may represent new exons
of the corresponding genes, 2,505 (33%) mapped exclusivelyto the introns of RefSeq genes in the antisense direction andthus comprise a set of antisense mRNA clusters with no over-lap to exons of sense messages that had not been appreciatedin the previous analyses. A complete list of the latter whollyintronic mRNA/RefSeq clusters and the corresponding pro-tein-coding RefSeq is given in Additional data file 1. Althoughthe strandedness of genomic mapping of these mRNAs wastaken as preliminary evidence of antisense transcription,direct experimental confirmation was obtained by microarrayassays, as described in the following sections. Owing to thefragmented nature of the transcript data in GenBank, some ofthese intronic antisense messages may originate from the 3'or 5' ends of overlapping sense-antisense transcripts of adja-cent genes. However, most of them could represent inde-pendent antisense transcriptional units, which became moreevident when data from the public EST repository were takeninto account, as described below.
Identification of long, unspliced, totally intronic transcriptsWe performed an extensive search for evidence of intronictranscription in the human dbEST collection (GenBank) com-prising 5,340,464 ESTs. Ambiguously mapping ESTsequences were filtered as described in Materials and meth-ods, and then the genomic coordinates of overlapping ESTsequences were used to merge 4,762,523 human ESTs into aset of 332,946 non-redundant EST clusters (Table 2). Toavoid sequences that may have been derived from genomiccontamination in the EST dataset, 210,181 EST singlets wereexcluded from further analyses; so only 34,398 spliced and88,367 unspliced EST clusters were considered (Table 2). Foreach of these clusters, a consensus contig sequence wasderived from the aligned genomic sequence (Figure 1). Asexpected, most ESTs (3,616,644) were grouped into 16,241spliced EST contigs mapping to exons of the RefSeq referencedataset (Table 2). In addition, a small number of spliced EST
Table 1
Evidence of intronic transcription in the human mRNA/RefSeq GenBank dataset
mRNA clusters with overlap to exons of non-redundant RefSeq dataset*
mRNA clusters wholly intronic to non-redundant RefSeq dataset
Antisense direction Sense direction Antisense direction Sense direction mRNA clusters not mapped to RefSeq dataset
Total
Spliced mRNA clusters† 2,559 (1,414)‡ 14,575 (14,369§) 1,049 (378) 780 (223) 4,181 (0) 23,144 (16,384)
Unspliced mRNA clusters† 1,672 (26) 7,463 (87) 1,456 (56) 4,222 (87) 7,180 (927) 21,993 (1,183)
Total 4,231 (1,440) 22,038 (14,456) 2,505 (434) 5,002 (310) 11,361 (927) 45,137 (17,567)
*The non-redundant dataset comprises 15,783 spliced RefSeq units. This was defined by mapping to the human genome sequence the total of 22,458 RefSeq sequences from GenBank, excluding 1,184 unspliced RefSeq and 601 RefSeq that were wholly intronic to another RefSeq and merging the remaining 20,673 spliced RefSeq sequences that mapped to the same locus into 15,783 spliced non-redundant RefSeq units (a total of 4,890 RefSeq that represent isoforms of the same gene were thus merged into these units). †mRNA clusters were obtained by mapping to the human genome sequence a total of 161,993 mRNA sequences followed by merging sequences with exon overlapping coordinates (see Materials and methods for details), resulting in a non-redundant set of 45,137 mRNA clusters. This set was aligned to the non-redundant RefSeq dataset and each mRNA cluster was classified as exonic, wholly intronic or mapping outside of any spliced non-redundant RefSeq unit. Sense/antisense orientation was annotated. ‡For each class, the number of mRNA clusters containing at least one RefSeq is shown in parentheses. §Excluding from the 15,783 spliced non-redundant RefSeq dataset a total of 1,414 RefSeq that map in the antisense direction with respect to another RefSeq.
Genome Biology 2007, 8:R43

R43.4 Genome Biology 2007, Volume 8, Issue 3, Article R43 Nakaya et al. http://genomebiology.com/2007/8/3/R43
clusters mapped to introns of the RefSeq genes. They mayconstitute fragments of novel exons in these genes, since themedian exon length in these spliced EST contigs is 233nucleotides (nt), similar to the median length of exons in theRefSeq reference dataset (141 nt).
The most interesting finding was that 55,139 unspliced ESTcontigs formed by grouping 190,583 ESTs mapped entirely tothe introns of genes in the RefSeq dataset (Table 2). A markedfeature of these unspliced, wholly intronic EST contigs is theirlow protein-coding potential; in silico analysis of the codingpotential using the normalized ESTScan2 score [26] pre-dicted that 98% of them are probably noncoding transcripts,supporting the idea that they represent a separate class ofnoncoding RNAs. To check whether ESTScan2 predicted thecoding potential of such a fragmented sequence dataset cor-rectly, we created a virtual dataset in silico composed of55,139 exonic fragments from RefSeq genes with exactly thesame lengths as the 55,139 wholly intronic EST contigs.ESTScan2 correctly predicted that 70% of these in silico-gen-erated virtual exonic fragments have coding potential. Thissupports the inference that since only a very few (approxi-mately 2%) of the wholly intronic EST contigs are predictedby ESTScan2 to have a protein-coding potential, most of theRNAs in this class (98%) are indeed noncoding messages.
Inspection of the length distribution curves (Figure 1) of thewholly intronic EST contigs reveals messages with lengthswell over 1,000 nt. The median length (573 nt) is 4.1 timesgreater than the median length of exons (141 nt) in the RefSeqreference dataset. On the basis of these findings, we call thesetranscriptional units long totally intronic noncoding (TIN)transcripts.
Most mammalian snoRNAs [21] and a large fraction of micro-RNAs [27] are derived from introns in protein-coding and
noncoding genes transcribed by RNAP II. To address the pos-sibility that some of the TIN transcripts are the sources ofthese known small RNAs, we compared the human genomiccoordinates of TIN sequences to those of 346 snoRNAs [28]and 383 microRNAs [29]. We found that 98 snoRNA ormicroRNA transcripts (14%) mapped to 86 TIN EST contigs,which may well be the sources of these small RNAs. The 86TIN EST contigs comprise a very small portion (0.2%) of theTIN transcript dataset. We postulate that the large remainingset could be the source of new snoRNAs and microRNAs aswell as of new types of ncRNAs.
Identification of long, unspliced, partially intronic transcriptsA set of unspliced partially intronic noncoding (PIN) ESTcontigs was identified. A PIN contig was defined as a contigthat overlaps an exon of a RefSeq gene and extends at least 30bases over both ends of the exon (Figure 1). In total, 12,592PIN EST contigs (median length 719 nt) were identified. Anestimated 90% of PIN transcripts have no or limited protein-coding potential as determined by ESTScan2 analysis. Bymatching the PIN contig sequences to ESTs from high-qualitydirectionally cloned EST libraries [7], to transcriptionallyactive regions (TARs) in whole-genome strand specific tilingarrays [30], and to the publicly available unspliced full-lengthmRNA dataset from GenBank we found that 5,992 PIN con-tigs (48%) have evidence of being transcribed antisense to thecorresponding RefSeq gene. It should be noted that the aboveEST and tiling array information was not taken as definiteevidence of antisense PIN transcription. Sense/antisensePINs were determined experimentally by oligoarray hybridi-zation as described in the following sections, using a pair ofseparate reverse complementary probes for each PIN in thearray, and the strand information was obtained by mappingthe actual 60-mer oligonucleotide single-stranded probe tothe genomic sequence and recording its strand direction.
Table 2
Classification of GenBank ESTs with respect to their genome mapping coordinates in relation to the set of non-redundant spliced Ref-Seq sequences
EST clusters with overlap to exons of RefSeq genes*
EST clusters wholly intronic to RefSeq genes
EST clusters mapped outside of RefSeq genes
Total
Spliced EST contigs 16,241 8,013 10,144 34,398
Number of exons of spliced EST contigs (median) 10 2 3
Total number of spliced ESTs in contigs 3,616,644 162,841 241,049 4,020,534
Number of spliced ESTs per contig (median) 91 3 4
Unspliced EST contigs 4,030 55,139 29,198 88,367
Total number of unspliced ESTs in contigs 56,752 190,583 140,091 387,426
Number of unspliced ESTs per contig (median) 4 2 2
Spliced EST singlets 1,053 6,205 6,631 13,889
Unspliced EST singlets 3,539 121,091 71,662 196,292
Total non-redundant EST clusters (contigs + singlets) 24,863 190,448 117,635 332,946
Total ESTs 3,677,988 480,720 459,433 4,618,141
*The reference dataset comprises 15,783 spliced non-redundant RefSeq units plus the evidence of additional splice variants obtained for each transcriptional unit from all mRNA sequences mapping to the same locus.
Genome Biology 2007, 8:R43

http://genomebiology.com/2007/8/3/R43 Genome Biology 2007, Volume 8, Issue 3, Article R43 Nakaya et al. R43.5
com
ment
reviews
reports
refereed researchdepo
sited researchinteractio
nsinfo
rmatio
n
Most RefSeq genes have intronic transcriptionOverall, we found that at least 11,679 RefSeq genes, corre-sponding to 74% of all spliced human genes in the referencedataset, have transcriptionally active introns to which TIN orPIN EST contigs were mapped. If we were to consider TIN orPIN EST singlets, the fraction of RefSeq genes with intronictranscription would increase to 86% of all RefSeq genes.
TIN and PIN transcripts are potential alternative splicing regulatorsWe found that the average frequency of exon skipping forgenes in the RefSeq reference dataset that show evidence ofPIN transcripts is 0.23, and the average frequency of exonskipping for exons immediately 3' to TIN transcripts is 0.22.These frequencies are significantly (p < 0.0001) higher thanthe average frequency of exon skipping (0.14) in the overallset of RefSeq genes (data not shown).
Next, we examined both the distribution of exon-skipping fre-quency across the different exons of protein-coding genes(Figure 2a) and the abundance of unspliced TIN EST contigsacross the different introns of the same genes (Figure 2b). Ahigher frequency of exon skipping was detected closer to the
5' ends of protein-coding genes (Figure 2a), and aconcomitantly higher abundance of unspliced TIN EST con-tigs was detected in the first two introns of these genes (Fig-ure 2b). It is known that the average size of first introns islarger than that of other introns when all human genes areconsidered together. To determine if the higher abundance ofTIN contigs in the first introns (Figure 2b) is predominantlydue to the longer size of first introns, we separated the genesaccording to first intron sizes. To that end, we split in two thepopulation of genes with a given number of introns; thosewhere the size of the first intron is similar to the average sizeof all other introns and those where the first intron is longerthan the remaining ones. We found that for the majority ofgenes with 6 to 12 introns, the average length of the firstintron is very similar to the average length of all other intronsin the same genes (for example, for genes with 7 introns thefraction is 348/553 = 0.63; Figure 2a,b). For this set of genes,one would expect a random distribution of TIN EST contigsacross the different introns if TINs were transcribed by spuri-ous RNAP II transcription. In contrast, we found an unevendistribution of TIN contigs (Figure 2b), which suggests thatTIN transcription may frequently be influenced by proximityto the gene promoter and might be regulated and driven by a
Length distribution of exons from RefSeq genes and of partially (PIN) and totally (TIN) intronic noncoding transcriptsFigure 1Length distribution of exons from RefSeq genes and of partially (PIN) and totally (TIN) intronic noncoding transcripts. The curves show the length distribution of three different classes of transcripts reconstructed from genomic mapping and assembly of RefSeq and ESTs from GenBank. Exons of protein-coding RefSeq (red line), TIN (black line) and PIN (blue line) contig sequences. TIN and PIN contigs resulted from assembly of all GenBank unspliced ESTs (in gold) that cluster to a given intronic region in a genomic locus, as shown in the scheme above the curves.
0
5
10
15
2060 240
420
600
780
960
1140
1320
1500
1680
1860
2040
2220
2400
2580
2760
2940
>30
01
Length (nt)
% o
f tot
al in
the
corr
espo
ndin
g cl
ass
EST clusteringESTclustering
Partially introniccontig sequence
(median size = 719nt)
Totally introniccontig sequence
Exons of a RefSeq gene(median size = 141nt)
ESTs
Genomic DNA sequence
(median size = 573nt)
Genome Biology 2007, 8:R43

R43.6 Genome Biology 2007, Volume 8, Issue 3, Article R43 Nakaya et al. http://genomebiology.com/2007/8/3/R43
so far uncharacterized mechanism favoring the first introns.It should be noted that for another fraction of genes with anygiven number of introns, the first intron is longer than theother introns (for example, for genes with 7 introns the frac-tion is 168/553 = 0.30), resulting in a significant correlationbetween frequency of TIN contigs and average intron length(Additional data file 2). The hypothesis is that more informa-tion is conveyed in the longer intronic regions of these partic-ular genes (see Discussion).
Design and overall performance of a gene-oriented intron-exon oligoarray platformThe analyses described so far have indicated the presence ofactive sites of totally and partially intronic transcription ofnoncoding messengers (TIN and PIN transcription) withinprotein-coding genes. Guided by this information, wedesigned a 44 k intron-exon oligoarray combining randomlyselected protein-coding genes along with the correspondingintronic transcripts. This permitted large-scale detection ofhuman intronic expression in a strand-specific, gene-ori-ented manner. A total of 8,780 probes from the commerciallyavailable set of Agilent 60-mer probes (Figure 3a, probe 5)were used, representing different exons in 6,954 unique ran-domly selected protein-coding genes, along with custom-designed intronic probes for the antisense or sense strand, asshown in Figure 3a. A pair of reverse complementary probesfor each of 7,135 TIN transcripts (Figure 3a, probes 3 and 4)was designed, thus independently detecting sense and anti-sense transcription in a given locus. Probes for 4,439 anti-sense PIN transcripts (Figure 3a, probe 1) were also designed.A probe representing each PIN-overlapped protein-codingexon was included (Figure 3a, probe 2).
We opted to use the 60-mer Agilent oligoarray technology toconstruct this custom-designed array because the probe char-acteristics and the hybridization and washing protocols inthis platform have been optimized to attain reproducibleresults [31]. Therefore, probe design followed Agilent recom-mendations with respect to GC content and melting tempera-ture (Tm), as detailed in Materials and methods, to ensure ahomogeneous and effective hybridization of fluorescent tar-gets. In fact, the reproducibility of expression in our experi-ments was fairly high, as evaluated by the correlationcoefficients obtained for the two-color raw intensities within
each slide and the correlation coefficients of inter-slide com-parisons. These correlation coefficients ranged from 0.914 to0.981 for intra-slide and from 0.915 to 0.949 for inter-slidecomparisons.
Probe specificity was ensured by selecting 60-mer sequenceswith a homopolymeric stretch no longer than 6 bases; in addi-tion, probes should not have 8 or more bases derived fromrepetitive regions of the genome. The selected probes have alow probability of cross-hybridization, as estimated by aBLAST search against the sequences of all transcribed humanmessages using the following criteria. All probes have 100%matches to the transcript sequences they represent, whichtranslates into a best-match BLAST bit-score of 119. A bit-score high-end cutoff for the second-best match of eachselected probe was set at 42.1, which would correspond tocross-hybridization with a maximum match of 21 bases withno gaps. This high-end cutoff level was determined from thebit-scores of the second-best hits for all the Agilent-designedcommercial probes for protein-coding genes included in ourplatform; it is a conservative cutoff that includes 90% of theAgilent-optimized probes (Additional data file 3). Commer-cial probes with bit-score cross-hybridization matches higherthan 42.1 were included because Agilent have tested each oftheir probes individually for absence of cross-hybridization[31]. Since we did not test individual probes, we opted to usethis conservative high-end cutoff parameter for the intronicprobes.
Negative controls in the oligoarray (1,198 Agilent commercialcontrol probes, see Materials and methods) includedsequences from adenovirus E1A transcripts, syntheticallygenerated mRNAs, Arabidopsis genes and control probesdesigned not to hybridize to targets because of secondarystructure. The hybridization and washing stringency condi-tions optimized by Agilent ensured that the raw signal inten-sities for these negative controls (median 34.3) in ourexperiments were low. For each experiment, the average neg-ative control intensity plus 2 standard deviations (SD) wasused as a low-limit cutoff to call the expressed and not-expressed genes.
Figure 3b shows the distribution of average intensities in the
Frequency of exon skipping and abundance of wholly intronic noncoding transcription in RefSeq genesFigure 2 (see following page)Frequency of exon skipping and abundance of wholly intronic noncoding transcription in RefSeq genes. (a) Distribution of exon skipping events along spliced RefSeq genes with 7, 8, 9 or 10 exons. Filled squares indicate the average frequency of skipping per exon for genes with evidence of TIN RNAs mapping to their introns. Open squares indicate the average frequency of skipping per exon for genes with no evidence in GenBank that TIN RNAs map to their introns. A significantly higher (p < 0.002) frequency of exon skipping was observed for RefSeq genes with TIN RNA transcription. (b) Distribution of TIN transcripts among the introns of RefSeq sequences with 7, 8, 9 or 10 introns selected from GenBank as being outside the 95% confidence level of significance (not correlated) in a Pearson correlation analysis between the abundance of TIN contigs per intron and the intron size (in nt). Bars indicate the average intron size (nt) for this selected set of genes. Triangles indicate the number of TIN contigs per intron for RefSeq genes for the same set.
Genome Biology 2007, 8:R43

http://genomebiology.com/2007/8/3/R43 Genome Biology 2007, Volume 8, Issue 3, Article R43 Nakaya et al. R43.7
com
ment
reviews
reports
refereed researchdepo
sited researchinteractio
nsinfo
rmatio
n
Figure 2 (see legend on previous page)
(b)
(a)
Ave
rage
freq
uenc
y of
ex
on s
kipp
ing
Exon number Exon number
0.20
0.15
0.10
0.05
0.00
0.20
0.15
0.10
0.05
0.00
0.20
0.15
0.10
0.05
0.00
0.20
0.15
0.10
0.05
0.00
2 3 4 5 6 7 8
348 non-correlated genes
0
50
100
150
200
250
300
350
0
3000
6000
9000
12000
15000
18000
Num
ber
ofT
IN c
ontig
s(
)
0
50
100
150
200
250
300
1 2 3 4 5 6 7 80
3000
6000
9000
12000
15000
18000
0
50
100
150
200
1 2 3 4 5 6 7 8 9
Intron number
0
3000
6000
9000
12000
15000
18000
0
50
100
150
200
250
300
350
0
3000
6000
9000
12000
15000
18000
mea
n in
tron
si
ze (
nt)
553 genes with TIN RNAs 583 genes with TIN RNAs87 genes with no TIN RNAs 77 genes with no TIN RNAs
528 genes with TIN RNAs45 genes with no TIN RNAs
514 genes with TIN RNAs25 genes with no TIN RNAs
Ave
rage
freq
uenc
y of
ex
on s
kipp
ing
Num
ber
ofT
IN c
ontig
s(
)
370 non-correlated genes
315 non-correlated genes 307 non-correlated genes
Intron number
mea
n in
tron
si
ze (
nt)
1 2 3 4 5 6 7 8 9 10
1 2 3 4 5 6 7
2 3 4 5 6 7
2 3 4 5 6 7 8 9 2 3 4 5 6 7 8 9 10
Genome Biology 2007, 8:R43

R43.8 Genome Biology 2007, Volume 8, Issue 3, Article R43 Nakaya et al. http://genomebiology.com/2007/8/3/R43
microarray experiments for genes called not-expressed(below the low-limit cutoff) and for protein-coding, antisenseor sense TIN and antisense PIN expressed transcripts. Thedistribution is skewed towards higher intensities for protein-coding transcripts and the median intensity is 351. The distri-bution of intensities is very similar for all types of intronic
transcripts, and is skewed towards lower intensities whencompared to that of protein-coding genes (Figure 3b). Never-theless, the median intensities (134 for antisense TIN, 126 forantisense PIN and 135 for sense TIN transcripts) were suffi-ciently above that of the negative controls to permit a consid-erable number of expressed intronic transcripts to be
Design and overall performance of the 44 k gene-oriented intron-exon expression oligoarrayFigure 3Design and overall performance of the 44 k gene-oriented intron-exon expression oligoarray. (a) Schematic view of the 44 k combined intron-exon expression oligoarray 60-mer probe design. Probe 1 is for the antisense PIN transcripts (blue arrow). Probes 3 and 4 are a pair of reverse complementary sequences designed to detect antisense or sense TIN transcripts (black and hashed black arrows, respectively) in a given locus. Sense exonic probes 2 and 5 are for the protein-coding transcripts (red block and red arrow). Note that the latter were not systematically designed for an exon near the TIN message; in most instances a distant, 3' exon of the gene has been probed instead. (b) Average signal intensity distribution for antisense TIN (solid black line), sense TIN (dashed line), antisense PIN (blue line), or sense protein-coding exonic (red line) probes. Average intensities from six different hybridization experiments with three different human tissues, namely liver, prostate and kidney, are shown. Only probes with intensities above the average negative controls plus 2 SD were considered. The average intensity distribution for probes below this low-limit detection cutoff is shown in the curve marked as 'Not expressed RNAs' (gray line).
2 4 5
31
Antisense PIN RNA Antisense TIN RNA
Sense TIN RNAProtein-codingGene
Sense exonic(a)
(b)
0
0.02
0.04
0.06
0.08
0.1
0.12
0.14
0.16
0.18
0.2
10 100 1,000 10,000
Average log intensity in all tissues
Fre
quen
cy w
ithin
eac
h cl
ass Protein-coding RNAs (probe 5)
Antisense TIN RNAs (probe 3)
Antisense PIN RNAs (probe1)Sense TIN RNAs (probe 4)Not expressed RNAs
Genome Biology 2007, 8:R43

http://genomebiology.com/2007/8/3/R43 Genome Biology 2007, Volume 8, Issue 3, Article R43 Nakaya et al. R43.9
com
ment
reviews
reports
refereed researchdepo
sited researchinteractio
nsinfo
rmatio
n
detected in all tissues. Discrimination between expressed andnot-expressed transcripts may be more critical for intronicmessages than for protein-coding ones, and a larger fractionof false-negatives may be present in the intronic data. Ourresults corroborate previous tiling array measurements inchromosomes 21 and 22 that showed that ncRNAs weregenerally expressed at lower levels than protein-coding ones[32].
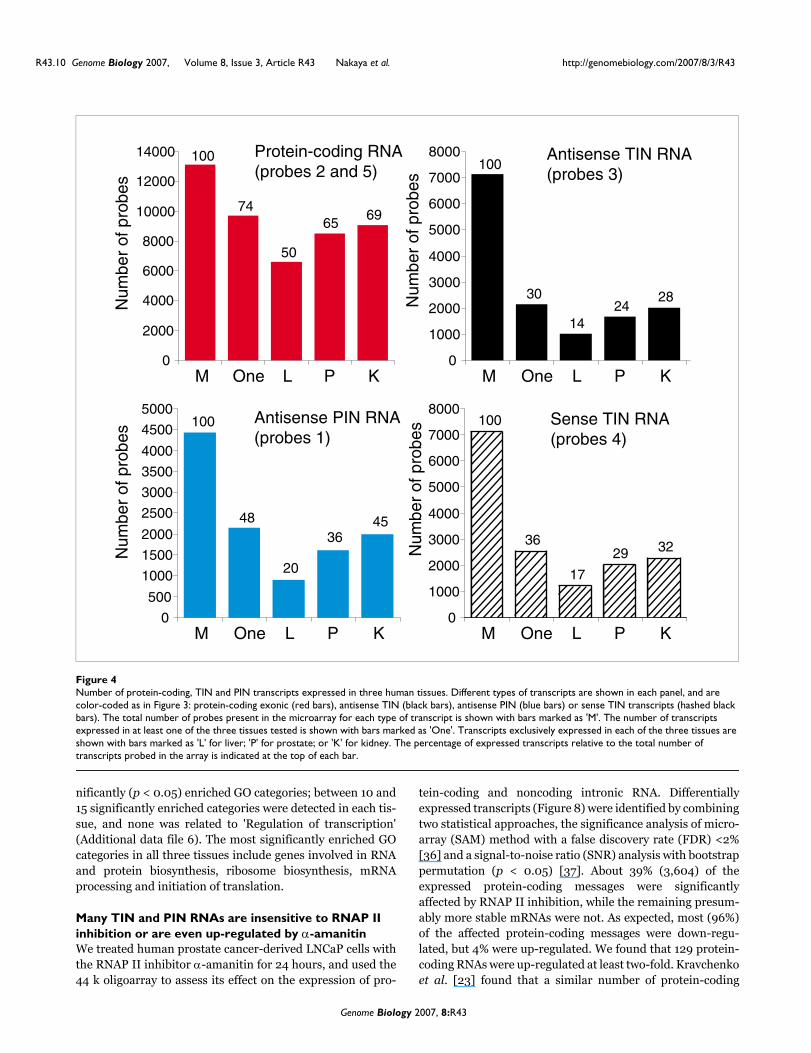
Partially and totally intronic noncoding transcripts expressed in three human tissuesGene expression profiles for human prostate, kidney and liverwere obtained with the 44 k intron-exon oligoarrays. Arrayswere hybridized with amplified Cy3- and Cy5-labeled cRNAobtained by in vitro linear amplification of poly(A)-contain-ing RNAs using T7-RNA polymerase. Figure 4 shows thenumber of protein-coding, TIN and PIN probes with signalsgreater than the negative control average plus 2 SD in at leastone of the three tissues examined, and in each separate tissue.It can be seen that while 74% of protein-coding messageswere expressed, only 30% of antisense TIN and 48% of anti-sense PIN transcripts were expressed in at least one tissue. Asimilar fraction of sense TIN transcription (36%) wasobserved, underscoring the natural transcription of senseintronic transcriptional units that has been observed else-where [30,33].
It can be seen that 50% to 69% of protein-coding transcriptswere expressed in each individual tissue, while 14% t o 32%antisense and sense TIN and 20% to 45% antisense PIN tran-scripts were detected (Figure 4). This reveals that the abun-dance of intronic transcripts was lower than that of protein-coding messages, in terms of both the diversity of messagesper tissue (Figure 4) and the relative distribution of signalintensities (Figure 3b).
The distribution along human chromosomes of the number ofTIN RNA transcriptional units expressed in liver (Figure 5,gray bars) clearly agreed with the distribution computed byinformatics analysis based on the entire GenBank EST data-set (Figure 5, black bars). Both distributions generally followthat of the number of RefSeq genes in each chromosome (Fig-ure 5, red bars). There are a few exceptions; for example,chromosomes 10 and 13 seem to contain a higher fraction ofexpressed TIN RNA transcriptional units than protein-codingRefSeq genes, and chromosomes 19 and X have lower ratiosof intronic transcriptional units to protein-coding genes.Interestingly, X chromosome inactivation (XCI) depends on asingle noncoding sense-antisense transcript pair, Xist andTsix, transcribed from a single locus on chromosome X. At theonset of XCI, Xist RNA accumulates on one of the two Xs,coating and silencing the chromosome in cis, a phenomenoncontrolled by a transient heterochromatic state that regulatestranscription [34].
Figure 6 shows the distribution of sense and antisense TINtranscripts simultaneously expressed from the same locus asa function of the fraction of transcripts expressed in each ofthe three tissues. Considering only the top 10% most highlyexpressed sense and antisense TIN transcripts (the top 10%)in each tissue, only 1% to 5% were detected simultaneouslyfrom both strands of the same introns in protein-codinggenes. Among the top 50% of intensities, over 83% to 90% ofintronic transcription events are specific to one strand. Evenwhen 100% of the expressed transcripts were considered,63% to 79% were found to be expressed exclusively from onestrand. This suggests that most of the sense and antisensemessages are independent transcriptional units. It is appar-ent that the most highly expressed intronic transcripts arestrand-specific, which again suggests a regulated cellularprocess.
Antisense TIN transcripts are enriched in introns of genes related to regulation of transcriptionWe selected the top 40% most highly expressed antisense TINtranscripts in each tissue and identified the protein-codinggenes to which these transcripts map. The GO annotation ofthese protein-coding genes was compared with the BiNGOtool [35] to the entire list of protein-coding genes in the arraythat showed evidence of antisense TIN transcription. The GOcategory 'Regulation of transcription, DNA-dependent' (GO:006355) was found to be significantly enriched in prostate (p= 0.002), kidney (p = 0.002) and liver (p = 0.022). A typicalGO enrichment analysis is shown for prostate in Figure 7a;similar results for kidney and liver are shown in Additionaldata file 4. The exact p values for all significantly enriched GOcategories can be found in Additional data file 4.
Among the top 40% most highly expressed antisense TINtranscripts mapping to 678 protein-coding genes in theprostate, 105 (16%) belong to 'Regulation of transcription,DNA-dependent' (Figure 7b). Analogous results wereobtained for liver and kidney, where 71 out of 409 (17%) and118 out of 812 (15%) of the genes, respectively, belong to 'Reg-ulation of transcription, DNA-dependent'. A total of 123unique genes related to 'Regulation of transcription' werefound in common among the 40% most highly expressedantisense TIN transcripts in prostate, kidney or liver. Most ofthese (69 genes, 56%) were expressed in all three tissues (Fig-ure 7b), while some were shared between two tissues and afew were only expressed in one. The 'Regulation of transcrip-tion' GO category includes genes encoding various DNA-binding proteins such as transcription factors, zinc fingersand nuclear receptors. The entire list of genes identified inFigure 7b can be found in Additional data file 5. Similaranalyses with the top 40% highly expressed sense TIN andantisense PIN transcripts did not identify any enriched GOcategory.
A similar analysis using the top 40% most highly expressedprotein-coding genes showed an entirely different set of sig-
Genome Biology 2007, 8:R43
R43.10 Genome Biology 2007, Volume 8, Issue 3, Article R43 Nakaya et al. http://genomebiology.com/2007/8/3/R43
nificantly (p < 0.05) enriched GO categories; between 10 and15 significantly enriched categories were detected in each tis-sue, and none was related to 'Regulation of transcription'(Additional data file 6). The most significantly enriched GOcategories in all three tissues include genes involved in RNAand protein biosynthesis, ribosome biosynthesis, mRNAprocessing and initiation of translation.
Many TIN and PIN RNAs are insensitive to RNAP II inhibition or are even up-regulated by α-amanitinWe treated human prostate cancer-derived LNCaP cells withthe RNAP II inhibitor α-amanitin for 24 hours, and used the44 k oligoarray to assess its effect on the expression of pro-
tein-coding and noncoding intronic RNA. Differentiallyexpressed transcripts (Figure 8) were identified by combiningtwo statistical approaches, the significance analysis of micro-array (SAM) method with a false discovery rate (FDR) <2%[36] and a signal-to-noise ratio (SNR) analysis with bootstrappermutation (p < 0.05) [37]. About 39% (3,604) of theexpressed protein-coding messages were significantlyaffected by RNAP II inhibition, while the remaining presum-ably more stable mRNAs were not. As expected, most (96%)of the affected protein-coding messages were down-regu-lated, but 4% were up-regulated. We found that 129 protein-coding RNAs were up-regulated at least two-fold. Kravchenkoet al. [23] found that a similar number of protein-coding
Number of protein-coding, TIN and PIN transcripts expressed in three human tissuesFigure 4Number of protein-coding, TIN and PIN transcripts expressed in three human tissues. Different types of transcripts are shown in each panel, and are color-coded as in Figure 3: protein-coding exonic (red bars), antisense TIN (black bars), antisense PIN (blue bars) or sense TIN transcripts (hashed black bars). The total number of probes present in the microarray for each type of transcript is shown with bars marked as 'M'. The number of transcripts expressed in at least one of the three tissues tested is shown with bars marked as 'One'. Transcripts exclusively expressed in each of the three tissues are shown with bars marked as 'L' for liver; 'P' for prostate; or 'K' for kidney. The percentage of expressed transcripts relative to the total number of transcripts probed in the array is indicated at the top of each bar.
100
74
50
6569
Protein-coding RNA(probes 2 and 5)
Antisense TIN RNA(probes 3)
Antisense PIN RNA(probes 1)
Sense TIN RNA(probes 4)
0
2000
4000
6000
8000
10000
12000
14000
M One L P K0
1000
2000
3000
4000
5000
6000
7000
8000
M One L P K
0
500
1000
1500
2000
2500
3000
3500
4000
4500
5000
M One L P K
Num
ber
of p
robe
s
0
1000
2000
3000
4000
5000
6000
7000
8000
M One L P K
100
30
1424
28
100
48
20
3645
100
36
17
29 32
Num
ber
of p
robe
s
Num
ber
of p
robe
sN
umbe
r of
pro
bes
Genome Biology 2007, 8:R43

http://genomebiology.com/2007/8/3/R43 Genome Biology 2007, Volume 8, Issue 3, Article R43 Nakaya et al. R43.11
com
ment
reviews
reports
refereed researchdepo
sited researchinteractio
nsinfo
rmatio
n
RNAs (70 transcripts) were up-regulated two-fold or more byα-amanitin in HeLa cells in experiments with Affymetrix oli-goarrays representing approximately 20,000 protein-codingtranscripts.
Markedly fewer of the expressed TIN antisense (12%) andsense (14%) transcripts were affected by α-amanitin. Similarfractions of antisense (16%, 42/265) and sense (15%, 49/326)TIN transcripts were up-regulated in α-amanitin treated cells(Figure 8). PIN antisense transcript levels exhibited anexpression pattern rather different from that of protein-cod-ing transcripts when RNAP II was inhibited: only 15% wereaffected, of which 12% (39/339) were up-regulated. Interest-ingly, 3 to 4 times as many TIN and PIN RNAs as protein-cod-ing messages (4%) were up-regulated by α-amanitin (Figure8).
Intriguingly, the intronic messages (both TIN and PIN tran-scripts) with significantly increased abundance in cells withblocked RNAP II transcription were transcribed from theintrons of protein-coding genes that are again enriched in the'Regulation of transcription' GO category (p = 0.02; Figure 9).A complete list of the noncoding intronic and protein-coding
transcripts that were up-regulated upon exposure to α-aman-itin and the exact p values for all significantly enriched GOcategories are shown in Additional data file 7.
We consider that the stringent criteria used, combining twostatistical methods to identify the differentially expressedtranscripts, may be conservative. Therefore, the proportion ofintronic messages that are up-regulated following α-amanitintreatment may be even greater than those reported here. Inany case, the number of intronic ncRNAs insensitive to inhi-bition, or up-regulated upon α-amanitin treatment, is likelyto be in the thousands when extrapolated to all the intronictranscripts found in human cells. Considering only the 55,139wholly intronic EST clusters, over a thousand are predicted tobe up-regulated if at least 13% are affected by 24 hours ofRNAP II inhibition.
Tissue signatures of TIN and PIN expressionTissue-specific signatures of intronic expression were deter-mined for prostate tumor, normal kidney and normal liver. Atotal of 419 antisense TIN (Figure 10a), 567 sense TIN (Figure10b) and 431 antisense PIN (Figure 10c) transcripts wereidentified, using a combination of two statistical approaches
Genomic distribution of intronic RNAsFigure 5Genomic distribution of intronic RNAs. Relative chromosome sizes (blue bars) and the fractional number of GenBank Refseq genes (red bars) mapped per chromosome are shown. The distribution along the chromosomes of wholly intronic sequence contigs resulting from mapping and assembly of all ESTs in GenBank relative to the RefSeq reference dataset is shown (black bars). The distribution along the chromosomes of intronic RNAs expressed in human liver, as detected by oligoarray hybridizations, is shown as gray ears. The numbers on the y-axis refer to the fractional distribution in each chromosome.
0
0.02
0.04
0.06
0.08
0.1
0.12
Chromosome number
Frac
tion
al d
istr
ibut
ion
Chromosome size
Number of GenBank RefSeq genes
Number of GenBank TIN RNAs
Number of expressed TIN RNAs
1 2 43 YX22212013 19181716151211109875 6 14
Genome Biology 2007, 8:R43

R43.12 Genome Biology 2007, Volume 8, Issue 3, Article R43 Nakaya et al. http://genomebiology.com/2007/8/3/R43
(see Materials and methods for details). A complete list of theintronic transcripts identified in tissue signatures, and thecorresponding spliced protein-coding genes mapping to thesame genomic loci, is provided in Additional data files 8-10.These tissue signatures comprise hundreds of differenttranscripts (Figure 10a-c) mapping to introns of genes withdiverse functions, and no particular GO category enrichmentcould be detected.
A tissue signature containing 2,809 protein-coding tran-scripts was also identified (Figure 10d). Analysis of GOenrichment (not shown) revealed that in liver the protein-coding tissue signature is enriched in GO categories related tourea cycle (GO: 006594), cysteine metabolism (GO: 006534),cholesterol biosynthesis (GO: 008203) and prostaglandinmetabolism (GO: 006693), while in kidney it is enriched inthe GO categories related to sodium and potassium iontransport (GO: 006834 and GO: 006813, respectively). In theprostate, no relevant GO categories were enriched, but pros-tate-specific genes such as KLK3 and TMEPAI were found.
We searched for co-regulated intronic and protein-codingpairs of messages that were simultaneously expressed fromthe same genomic locus in the same tissue, in order to identifynoncoding RNAs potentially involved in modulating geneexpression in a cis-acting manner. For this purpose, weinitially cross-referenced the tissue signature of antisensePIN RNAs (Figure 10c) with the protein-coding signature
(Figure 10d) to determine whether both signatures containedPIN-overlapped exons of the protein-coding gene transcribedfrom the opposite strand in the same genomic locus (Figure 3,probe 2). Considering all three tissues, we found 64 gene lociin which antisense PIN RNAs and PIN RNA-overlappedprotein-coding exon pairs were simultaneously detected inboth tissue signatures (Figure 11). The tissue expression pat-terns of PIN RNA and PIN RNA-overlapped exon pairs weresimilar in a subset of 49 loci (Additional data file 11; Figure11a, left and central panels). Interestingly, the 3' exon of theprotein-coding transcript in this subset (Figure 11a, rightpanel) follows the same pattern. This is the predominant pat-tern in the tissue signature. Conceivably, the similar relativelevels of antisense PIN RNA and protein-coding exonsindicate that the intronic RNA has a functional role in modu-lating the transcription or transcript stability of the corre-sponding protein-coding gene. Alternatively, the levels ofantisense PIN RNA and protein-coding message in each tis-sue may be similar because a common factor simultaneouslymodulates the transcription of both types of message from thesame locus.
In a smaller subset of nine loci, the 3' exon of the protein-cod-ing transcript (Figure 11b, right panel) does not follow thepattern of tissue expression of the PIN RNA and the corre-sponding PIN-overlapped exon of the protein-coding gene(Additional data file 11; Figure 11b, left and central panels). Inaddition, the PIN RNA (Additional data file 11; Figure 11c, leftpanel) in six loci has an inverted expression pattern relative tothat of the PIN RNA-overlapped exon (Figure 11c, centralpanel). In some tissues, there is an inverted pattern in therelative levels of PIN-overlapped exon and the 3' exon of theprotein-coding gene for these two sets (Figure 11b,c, centraland right panels), suggesting that the protein-coding messageis alternatively spliced in a tissue-dependent manner. Thesimilar levels of PIN RNAs and PIN-overlapped exons in Fig-ure 11b (central and right panels) suggest that, in these cases,the PIN RNA may be involved in exon retention of the pro-tein-coding gene, whereas the inverted pattern observed inFigure 11c (central and right panels) suggests that the PINRNA may favor skipping of the overlapped exon. The effect ofintronic RNAs on splicing has been documented in a recentreport, where overexpression of a naturally occurring anti-sense PIN RNA (Saf transcript) mapping to the first intron ofFas caused the retention of an alternative Fas exon that wascomplementary to the antisense PIN transcript [17].
An analogous cross-reference of tissue signatures fromintronic and protein-coding messages (Figure 10d) was per-formed using the antisense and sense TIN RNA tissuesignatures (Figures 10a,b). Among the three tissues, we com-piled 140 gene loci in which pairs of antisense or sense TINRNAs and the 3' protein-coding exon were simultaneouslydetected in the tissue signatures (Figure 12). A similar tissueexpression pattern of antisense TIN RNA and the 3' protein-coding exon pair was detected in a subset of 38 loci (Addi-
Sense-antisense TIN transcript pairs simultaneously detected at different ranges of signal intensities for each of three different tissuesFigure 6Sense-antisense TIN transcript pairs simultaneously detected at different ranges of signal intensities for each of three different tissues. The percentages of TIN transcript pairs simultaneously transcribed from the same genomic locus in both the sense and antisense orientations (full symbols), and detected at different ranges of signal intensities, are shown for each of three different tissues: liver (diamonds), prostate (triangles) and kidney (squares). The percentages of TIN messages transcribed in each tissue from only one of the two DNA strands (sense or antisense) are shown as open symbols.
0
10
20
30
40
50
60
70
80
90
100
100 90 80 70 60 50 40 30 20 10Percent most highly expressed messages
Per
cent
with
in e
ach
tissu
e
Genome Biology 2007, 8:R43

http://genomebiology.com/2007/8/3/R43 Genome Biology 2007, Volume 8, Issue 3, Article R43 Nakaya et al. R43.13
com
ment
reviews
reports
refereed researchdepo
sited researchinteractio
nsinfo
rmatio
n
tional data file 12; Figure 12a). For 16 pairs of antisense TIN/3' exon an inverted expression pattern was observed (Figure12b). Similar direct or inverted expression patterns werefound for 64 (direct) or 22 (inverted) pairs when sense TINand 3' protein-coding exons from the same locus were cross-referenced (Figure 12c,d, respectively). The slightly higherproportion (64/86 = 0.74) of directly correlated sense TIN/3'exon pairs compared to antisense TIN/3' exon pairs (38/54 =0.70) may have resulted from internal priming of intronicsegments of premature mRNAs containing stretches ofpoly(A) during cRNA amplification when the target was beingprepared. As for co-regulated PIN RNAs, the correlatedexpression of TIN RNAs and the 3' exons of protein-codingtranscripts may suggest that these noncoding RNAs have arole in modulating the transcription rate or the stability of thecorresponding protein-coding RNA.
DiscussionLong intronic unspliced transcripts in humansIn this work we have evaluated the contribution of introns inthe human genome to the production of noncoding RNAs bygathering data on expressed intronic sequences from publicdatabases, and in parallel by measuring expression with com-bined intron-exon oligoarrays. We focused on the unsplicedmessages that map totally (TIN) or partially (PIN) to intronicregions and found that most of the genes defined by RefSeqsequences (74%) undergo intronic transcription. This frac-tion is likely to prove even greater since intronic expressionhas not yet been assessed in different developmental stagesand physiological conditions. While some of the unsplicedintronic ESTs (mapping to the sense strand) may representhitherto-overlooked exons of alternatively spliced forms ofknown genes, a significant number of the sense and antisensetranscripts in this dataset is likely to derive from novel inde-pendent transcriptional units. This is supported by the low
Most highly expressed TIN transcripts map to genes related to regulation of transcriptionFigure 7Most highly expressed TIN transcripts map to genes related to regulation of transcription. TIN RNA expression data from three different human tissues (prostate, liver and kidney) were used to select the protein-coding genes to which the top 40% most highly expressed TIN transcripts map. The BiNGO program was used to identify significantly (p ≤ 0.05) enriched GO terms within the set of selected protein-coding genes. (a) GO-enriched categories for prostate are shown in color, which is related to the p value as indicated by the color-code bar. The exact p values for all significantly enriched GO categories are shown in Additional data file 4. GO category 'Regulation of transcription, DNA-dependent' (GO:006355) is the most significantly enriched (p = 0.002). Similar results were obtained for liver and kidney (see Additional data file 4). (b) Venn diagram for the 123 unique protein-coding genes belonging to GO:006355 category 'Regulation of transcription, DNA-dependent'. The number of genes in each tissue for which intronic transcription was detected is shown in parenthesis; the numbers of coincident and dissimilar genes among kidney, prostate and liver are shown in the circles.
(a)
Pr(105)
5.00E-2 <5.00E-7
(b)
Liver(71)
Kidney(118)
4 10
69
16
32 1Regulation of cellular metabolism
Transcription
Nucleobase, nucleoside,nucleotide and nucleic acid metabolism
Regulation of transcription
Regulation of nucleobase, nucleoside,nucleotide and nucleic acid metabolism
Cellular metabolism Regulation of metabolism
Metabolism
Regulation of transcription, DNA-dependent
Transcription, DNA-dependent
Prostate
Genome Biology 2007, 8:R43

R43.14 Genome Biology 2007, Volume 8, Issue 3, Article R43 Nakaya et al. http://genomebiology.com/2007/8/3/R43
protein-coding potential and long length of the TIN and PINEST contig sequences (medians of 573 nt and 719 nt,respectively), well above the typical lengths of exons of pro-tein-coding genes (median 141 nt).
The median length of the 55,000 TIN RNAs identified in allchromosomes in our analysis is in line with the lengthsobserved in previous reports by RACE analysis of non-anno-tated transcripts from 10 human chromosomes (averagelength 680 nt, range 173 to 4,650 [38]). Almost none of theTIN EST sequences (0.2%) matched known snoRNAs ormicroRNAs. Nevertheless, it remains possible that some longTIN messages are precursors of yet-undiscovered smallRNAs.
We found no correlation between intron size and the abun-dance of mapped TIN unspliced EST contigs for most of thegenes (approximately 60%) that showed evidence of intronictranscription, suggesting that most intronic transcriptiondoes not occur by chance. In addition, the consistent correla-tion between approximately 30% of TIN contigs and intronlength might support the 'genomic design' hypothesis[39,40], in the sense that transcription of the longer intronsin tissue and development-specific genes could carry regula-tory information [39,40]. In effect, we see a more abundant
expression of intronic antisense messages in genes with regu-latory functions (see discussion below).
We have shown that long TIN RNAs were correlated to thedegree of malignancy in prostate cancer [19]. To investigate ifthere is a preferential contribution of ESTs from tumor librar-ies to the set of TINs identified in this work, we compiled theinformation regarding normal or neoplastic tissue origin thatis documented in the Cancer Genome Anatomy Project(CGAP) database [41], and assigned it to the set of five millionESTs analyzed in this work. We found that 43% and 57% ofthe 5 million ESTs are derived from tumor or normal librar-ies, respectively. Interestingly, we found that the samedistribution (43% and 57%) was present in the set of 190,583ESTs included in the TIN contig dataset. Therefore, there isno biased contribution from tumor EST libraries to the TINdataset. Moreover, we found that 49% of the 55,139 TIN con-tigs contained at least one EST from a tumor library, suggest-ing that TIN transcription is equally present in normal andtumor tissues. These results corroborate the notion that TINtranscription is not an exclusive feature of neoplastic tissues,but rather part of the normal transcriptional output of thecells that may be partially dysfunctional in cancer disease.
Effect of RNAP II inhibitor α-amanitin on the abundance of protein-coding, antisense TIN, sense TIN and antisense PIN RNAsFigure 8Effect of RNAP II inhibitor α-amanitin on the abundance of protein-coding, antisense TIN, sense TIN and antisense PIN RNAs. Lines on each panel represent various transcripts for which the expression levels differed significantly between α-amanitin-treated prostate cells and untreated control cells. Each sample replica is shown in one column. Transcripts were selected by a SAM two-class test (FDR <0.2% to 2%) combined with a signal-to-noise test (p ≤ 0.05). For each line, expression intensities were normalized between the two conditions and colored as a function of the number of standard deviations from the mean value; (a) 3,604 significantly affected protein-coding transcripts; (b) 265 significantly affected antisense TIN transcripts; (c) 326 significantly affected sense TIN transcripts; (d) 339 significantly affected antisense PIN transcripts.
3,604 Protein-coding RNAs 265 AntisenseTIN RNAs 326 Sense TIN RNAs 339 Antisense PIN RNAs
Mock α-amanitin Mock α-amanitin Mock α-amanitinMock α-amanitin
st. dev.fr ommean
2
-2
(a) (b) (c) (d)
Genome Biology 2007, 8:R43

http://genomebiology.com/2007/8/3/R43 Genome Biology 2007, Volume 8, Issue 3, Article R43 Nakaya et al. R43.15
com
ment
reviews
reports
refereed researchdepo
sited researchinteractio
nsinfo
rmatio
n
Intronic transcripts may stabilize protein-coding transcripts or regulate their alternative splicingMost of the PIN and TIN RNAs selected in the tissue-specificsignatures have the same tissue expression patterns as thecorresponding protein-coding genes. This might indicate thattranscription of some PIN and TIN RNAs is linked to a cis-acting stabilization of the corresponding protein-coding tran-script [42-44]. Intronic transcripts may also act in trans, forexample, by controlling regional chromatin architecture asdemonstrated for some specific long ncRNAs [34,45,46].Overexpression of complete introns in the CFTR gene affectsthe expression of a large number of protein-coding messagesin trans, many of them related to CFTR function [47].
A few PIN RNAs selected in the tissue-specific signaturesshowed tissue expression patterns that correlated with thecorresponding protein-coding exon overlapped by the PINtranscript. However, the expression pattern of an exon closerto the 3' end of the same protein-coding gene was not corre-lated, suggesting that alternatively spliced isoforms of theprotein-coding transcripts were tissue-specific. Splicing isknown to be modulated by the binding of intronic splicingenhancer (ISE) and silencer (ISS) elements to regulatory fac-tors, favoring or blocking spliceosome formation [48]. SomePIN RNAs might regulate the skipping or retention of exonsby interacting either with splice signals or with ISE and ISSelements in pre-mRNAs. In fact, there are examples of controlof exon skipping by artificially introduced oligonucleotides inhuman cells [49], and some promising therapeutic strategies
Genes with increased intronic transcription in the presence of the RNAP II inhibitor α-amanitin are enriched in the 'Regulation of transcription' GO categoryFigure 9Genes with increased intronic transcription in the presence of the RNAP II inhibitor α-amanitin are enriched in the 'Regulation of transcription' GO category. Gene ontology analysis was performed on protein-coding genes that were shown in the experiment illustrated in Figure 8 to have up-regulated expression of antisense PIN transcripts and sense and antisense TIN transcripts upon exposure to α-amanitin. Significantly (p ≤ 0.05) enriched GO terms are shown in color, which is related to the p value as indicated by the color-code bar. The exact p values for all significantly enriched GO categories are shown in Additional data file 7.
Regulation of cellular metabolism
Cellular metabolism
Metabolism
Regulation of metabolism
Transcription
Nucleobase, nucleoside, nucleotideand nucleic acid metabolism
Regulation of transcription
Regulation of nucleobase, nucleoside,nucleotide and nucleic acid metabolism
Regulation of transcription, DNA-dependent
Transcription, DNA-dependent
5.00E-2 <5.00E-7
Genome Biology 2007, 8:R43

R43.16 Genome Biology 2007, Volume 8, Issue 3, Article R43 Nakaya et al. http://genomebiology.com/2007/8/3/R43
rely on antisense oligonucleotides that modulate exon-skip-ping [50]. As for exon retention, a recent report has identifieda long antisense noncoding transcript named Saf, whichmaps as a partially intronic transcript to the first intron ofFas, a gene encoding an apoptotic protein [17]. Overexpres-sion of Saf in Jurkat cells induced the expression of differentalternatively spliced Fas isoforms, in which an alternativeexon overlapped by Saf was retained and non-adjacent 3'exons were skipped, indicating that cis-acting antisenseintronic RNAs have a regulatory function [17].
Our present microarray analysis is conservative, in that weonly selected transcripts that had correlated patterns ofintronic and protein-coding messages and were also simulta-neously present in tissue-signatures. A more direct experi-mental approach, for example, over-expressing orsuppressing specific PIN transcripts and measuring theireffect on the splicing pattern of the overlapped exons, mightreveal novel candidates for antisense RNA regulators of exonusage that possibly contribute to a ubiquitous and under-appreciated mechanism of alternative splicing regulation.
Alternative splicing affects more than 70% of human protein-coding genes [51], in which exon skipping is the most frequentevent [52]. We found in silico evidence that cis-acting intronictranscription influences alternative splicing, that is, a higherincidence of noncoding transcription in the first introns alongwith higher skipping frequency of the first exons in the pro-tein-coding genes. In addition, the frequency of skipping forexons close to or overlapped by intronic transcripts was sig-nificantly higher than the average frequency of exon skippingin the overall set of human genes. In fact, exon skipping canbe artificially induced by introducing antisense oligonucle-otides that map to intron/exon junctions [49,50] or to whollyintronic regions [48].
The higher incidence of transcription in the first intron, closerto the gene promoter, might have other functionalimplications, such as the impairment of transcription by tran-scriptional interference [53,54], regulation of gene promoterusage [55], or regulation of the initiation of RNAP II tran-scription [15]. In the latter case, ncRNAs are known to func-tion as co-activators; protein-binding ncRNAs are expected toprovide a broad and diverse way of controlling mRNAtranscription [15,56]. We speculate that a high fraction of theintronic transcripts, especially the sense TIN RNAs, may actin trans, being parts of multi-component RNA-protein com-
plexes that regulate gene expression. There are thousands ofpotential RNA regulators, which may effectively amplify thecomplexity of a human genome with a limited number ofprotein-coding genes [11,57] through RNA-RNA, RNA-DNA,or RNA-protein interactions.
Biogenesis of TIN and PIN transcriptsWe evaluated the contribution of RNAP II to the biosynthesisof intronic ncRNAs in human cells by blocking its activitywith α-amanitin and measuring the levels of protein-codingand noncoding intronic messages. Remarkably, a considera-ble fraction (12% to 16%) of the wholly intronic or partiallyintronic antisense transcripts was up-regulated, a fraction 3-to 4-fold higher than that observed for protein-coding mes-sages (4%). In addition, fewer intronic (12% to 15%) than pro-tein-coding (39%) transcripts were sensitive to RNAP IIinhibition. Importantly, the sense TIN RNAs responded quitesimilarly to antisense TIN RNAs with respect to RNAP II inhi-bition, suggesting that these ncRNAs share similar propertiesthat are different from protein-coding messages. The refrac-tory behavior of intronic transcript expression after α-aman-itin treatment, and the apparent up-regulation of manyintronic transcripts, suggests that a different transcriptionalsystem may be involved in the biosynthesis of these longwholly intronic ncRNAs. A reasonable candidate is spRNAPIV, which is activated by α-amanitin [23], though the mecha-nism involved remains elusive. Further experimentation iswarranted to verify this hypothesis.
Advantages of a gene-oriented combined intron/exon expression array platformExperimental analysis using genome tiling arrays has permit-ted unbiased probing of transcribed regions in the humangenome [32,33,38,58,59]. Probing chromosomes 21 and 22revealed 5.3 kb of novel transcribed sequences within or over-lapping the intronic regions of well-characterized genes, ofwhich 2.7 kb (51%) are antisense to the protein-coding genes[32]. Tiling arrays of the whole human genome have extendedthese analyses, detecting messages in liver that map to 1,529and 1,566 novel intronic transcriptionally active regions(TARs) arising, respectively, from the antisense or the sensestrands of the corresponding gene [30]. Genome tiling arraysfor 10 human chromosomes revealed interlaced networks ofboth poly A+ and poly A- annotated transcripts and unanno-tated transcripts of unknown function [38]. It has becomeapparent that introns as well as intergenic regions constitutemajor sources of non-protein-coding RNAs [44], and tiling
Expression signature of intronic and protein-coding transcripts in human liver, prostate and kidneyFigure 10 (see following page)Expression signature of intronic and protein-coding transcripts in human liver, prostate and kidney. Transcripts with significantly different levels among prostate, kidney and liver samples were selected by a SAM multi-class test (FDR <0.002) combined with an ANOVA test (p ≤ 0.001) and hierarchically clustered as described in the Materials and methods. In each panel the selected transcripts are shown in the lines and sample replicas in the columns. For each line, expression intensities among the three tissues were normalized within each type of probe and colored as a function of the number of standard deviations from the mean value. (a) Tissue expression signature of 419 antisense TIN transcripts. (b) Tissue expression signature of 567 sense TIN transcripts. (c) Tissue expression signature of 431 antisense PIN transcripts. (d) Tissue expression signature of 2,809 protein-coding transcripts.
Genome Biology 2007, 8:R43

http://genomebiology.com/2007/8/3/R43 Genome Biology 2007, Volume 8, Issue 3, Article R43 Nakaya et al. R43.17
com
ment
reviews
reports
refereed researchdepo
sited researchinteractio
nsinfo
rmatio
n
Figure 10 (see legend on previous page)
(a) (b)
(c)
419 Antisense TIN RNAs 567 Sense TIN RNAs
431 Antisense PIN RNAs
Prostate Kidney Liver
Prostate Kidney Liver
Prostate Kidney Liver
Prostate Kidney Liver
(d)2,809 Protein -coding RNAs
2
st. dev.from mean
-2
Genome Biology 2007, 8:R43

R43.18 Genome Biology 2007, Volume 8, Issue 3, Article R43 Nakaya et al. http://genomebiology.com/2007/8/3/R43
arrays promise to help unravel the complex cellular programof intronic transcription.
Different physiological and pathological conditions are yet tobe probed by tiling arrays, and the amount and complexity ofthe information generated by high-density whole humangenome tiling arrays may make the experiments difficult toperform. In this context, we believe that a gene-oriented com-bined intron-exon expression array that samples the intronicnoncoding regions of the genome from which there is previ-ous evidence of transcription, along with the correspondingprotein-coding regions, will help to identify the particulargene families, biological processes or functional gene catego-ries of greatest relevance to any physiological condition understudy. In the present case, we have opted to probe in a com-bined intron-exon oligoarray approximately 15% (7,135 TINs)of the 55,139 wholly intronic genomic regions with evidenceof transcription. With such a platform we were able to inter-rogate the intronic expression of three different tissues, andwe found 1,915 sense and antisense TIN transcripts expressedin liver, 3,288 in prostate and 4,012 in kidney (Figure 4). Atotal of 4,296 unique intronic regions (60% of all probed TINloci) were actively transcribed in at least one tissue, as deter-mined by our combined intron-exon expression oligoarray.Thus, it is apparent that most of the 55,139 intronic regionswith evidence of transcription from EST and mRNA data canbe independently confirmed by direct hybridization, pointingto the best candidate set of intronic genomic regions to bestudied in more detail. High-density custom tiling arrays ofselected chromosome regions containing genes that are iden-tified as preferentially transcribed in a given tissue shouldpermit further detailed studies of intronic expression pat-terns. The information gathered from such complementaryapproaches should help accelerate the acquisition of informa-tion about the emerging diverse roles of intronic messages.
Tissue-specific intronic expression and enrichment of genes related to regulation of transcriptionTissue-specific expression signatures provide strong evidencethat intronic transcripts are physiologically relevant.Expression signatures of microRNAs have been reported toclassify human cancers [22], adding to the evidence that dif-ferent ncRNAs are tissue-specific and functionally important.
The present finding that the most abundant wholly intronicantisense RNAs are transcribed from introns of genes relatedto the regulation of transcription provides a clue to their func-tional relevance. A high degree of conservation is expected inthose intronic genomic regions that are under strong selectiveconstraints. In fact, conserved genomic regions have beenidentified by several different approaches in the introns ofgenes involved in transcriptional regulation [60-64]: identifi-cation of non-transcribed ultraconserved sequences [60],multispecies conserved sequences [61], sequences conservedin vertebrates but highly divergent among chimpanzees andhumans [62], short blocks of multiple-copy sequences(pyknons) [63], or conserved regions without transposoninsertions [64]. Our results add to these findings by showingthat conserved intronic DNA segments of genes involved intranscriptional regulation are the sources of one of the mostabundant intronic RNAs in three different human tissues.The possibility that regulatory genes are controlled byncRNAs transcribed at the same loci is appealing. It wouldrepresent an additional mechanism for regulating the regula-tors, in a rather sophisticated system for fine-tuning eukary-otic gene expression.
ConclusionOur approach has used an oligoarray-based gene-orientedcombined intron-exon expression platform as a practical andeffective compromise between a biased exon array that onlyprobes the protein-coding messages, and the whole humangenome tiling arrays. This approach has identified potentiallyfunctional intronic RNAs that are most abundantly tran-scribed from introns of genes involved in transcriptional reg-ulation. Further comparative analysis of intronictranscription under a different number of physiological andpathological conditions should advance current knowledgeabout the diverse biological roles of these noncoding RNAs inthe control of gene expression.
Materials and methodsCross-referencing of genomic coordinates of transcripts from different sequence datasetsThe analyzed sequence dataset comprises all human RefSeq,mRNA and EST sequences, of which the genome coordinateswere downloaded from the Genome Browser web page [65]
Expression signatures of antisense PIN RNAs and corresponding PIN RNA-overlapped exon pairs relative to their 3' protein-coding exonsFigure 11 (see following page)Expression signatures of antisense PIN RNAs and corresponding PIN RNA-overlapped exon pairs relative to their 3' protein-coding exons. A subset of 64 pairs of antisense PIN RNAs and corresponding PIN RNA-overlapped exons were identified among the tissue signatures shown in Figure 10 as having correlated patterns of expression: (a) 49 pairs were identified in which the 3' exon of the protein-coding transcript (right panel) follows a similar expression pattern to that of the PIN RNA/PIN RNA-overlapped exon pair (left and central panels); (b) 9 pairs were identified in which the 3' exon of the protein-coding transcript (right panel) does not follow the pattern of tissue expression of the PIN RNA and the corresponding PIN RNA-overlapped exon (left and central panels); (c) 6 pairs in which the PIN RNA (left panel) has an expression pattern inverted in relation to that of the PIN RNA-overlapped exon (central panel). Each line represents a genomic locus covered by three different types of probes (antisense PIN RNA, PIN RNA-overlapped protein-coding exon and 3' protein-coding exon). For each line, expression intensities among the three tissues were normalized within each type of probe and colored as a function of the number of standard deviations from the mean value.
Genome Biology 2007, 8:R43

http://genomebiology.com/2007/8/3/R43 Genome Biology 2007, Volume 8, Issue 3, Article R43 Nakaya et al. R43.19
com
ment
reviews
reports
refereed researchdepo
sited researchinteractio
nsinfo
rmatio
n
Figure 11 (see legend on previous page)
2
st. dev.from mean
-2
Antisense PIN RNA PIN-overlapped Exon
Exon Intron
Microarrayprobe
3' Exon
(a)
(c)
(b)
Prostate KidneyLiver Prostate KidneyLiver Prostate KidneyLiver
Genome Biology 2007, 8:R43

R43.20 Genome Biology 2007, Volume 8, Issue 3, Article R43 Nakaya et al. http://genomebiology.com/2007/8/3/R43
(hg17; NCBI Build 35, March 2005). First, sequences withpoor alignment quality (coverage <0.70 and identity <0.90)or mapped to more than one genomic region were removed.Second, we discarded sequences with complicated rearrange-ment patterns, such as T-cell receptor and immunoglobulingenes. ESTs and mRNAs that aligned to exons of two or morenon-overlapping RefSeqs from the same genomic strand werefiltered out as suspected chimeras. Sequencing errors in tran-scripts aligned to the genome sequence led to gaps that areinterpreted as introns by our parser. To avoid these falselyidentified introns, we joined adjacent exons whenever anintron of less than 30 bases was detected.
A bioinformatics tool was developed to handle the over fivemillion human ESTs efficiently. Essentially, this tool consistsof a package of scripts written in Perl that uses files of genomemapping coordinates directly obtained from the UCSCgenome browser. The use of coordinates avoids the computa-tionally intensive and parameter-dependent problems ofalignment-based programs. EST sequences with overlappingexons were merged into EST clusters using the genomicmapping coordinates. RefSeq and mRNA sequences wereprocessed separately and split into four sets according to thegenomic strand to which they mapped, and further sub-divided into spliced and unspliced groups of messages.Sequences from the same strand in each subgroup were
Expression signatures of wholly intronic RNAs relative to their 3' protein-coding exonsFigure 12Expression signatures of wholly intronic RNAs relative to their 3' protein-coding exons. Cross-referencing of the tissue signatures shown in Figure 10 identified subsets of TIN RNAs that have correlated patterns of expression relative to the 3' protein-coding exon signature from the corresponding genomic loci: (a) 38 pairs were identified in which the 3' exon of the protein-coding transcript (right panel) follows a similar expression pattern to that of the antisense TIN RNA (left panel); (b) 16 pairs were identified in which the 3' exon of the protein-coding transcript (right panel) follows a pattern of tissue expression inverted in relation to that of the antisense TIN RNA (left panel); (c) 64 pairs were identified in which the 3' exon of the protein-coding transcript (right panel) follows a similar expression pattern as that of the sense TIN RNA (left panel); (d) 22 pairs were identified where the 3' exon of the protein-coding transcript (right panel) follows a pattern of tissue expression inverted in relation to that of the sense TIN RNA (left panel). For each line in each panel, expression intensities among the three tissues were normalized within each type of probe and colored as a function of the number of standard deviations from the mean value.
st. dev.frommean
Antisense TIN RNA 3' Exon
(a)
(b)
Prostate KidneyLiver
2
-2
Sense TIN RNA 3' Exon
(c)
(d)
Exon Intron
Microarrayprobe
Exon Intron
Microarrayprobe
Prostate KidneyLiver Prostate KidneyLiver Prostate KidneyLiver
Genome Biology 2007, 8:R43

http://genomebiology.com/2007/8/3/R43 Genome Biology 2007, Volume 8, Issue 3, Article R43 Nakaya et al. R43.21
com
ment
reviews
reports
refereed researchdepo
sited researchinteractio
nsinfo
rmatio
n
merged into a transcriptional unit when their exons over-lapped at the same genomic locus. The mRNA dataset wasaligned against the RefSeq dataset to identify additionalsplice variants, intronic and antisense transcripts repre-sented in the mRNA collection, as detailed in Table 1. A com-plete list of sense/antisense transcript pairs identified here isgiven in Additional data file 1.
From the combined data described above, a reference datasetwas defined comprising the set of 15,783 spliced non-redun-dant RefSeq transcriptional units plus the evidence of addi-tional splice variants obtained for each transcriptional unitfrom all mRNA sequences mapping to the same locus. As acontrol to our filter and clustering procedures this referencedataset was cross-referenced to the lists of previously knownsense/antisense pairs [8,9]. First, we eliminated from thepublished lists of pairs those that were composed ofsequences that had been eliminated from the UCSC hg17database and, therefore, were not by definition in the datasetanalyzed here (181 pairs from [8], and 15 from [9]). Second,we eliminated from the published lists those pairs for whichthere was no evidence of sense/antisense overlap from Ref-Seq or mRNA, only from ESTs, since this was the criterionused in the present analysis to establish our reference dataset(1,002 pairs from [8] and 822 from [9]). Next, we found 45sequences from [8] and 159 from [9] that matched clusters inour dataset that contained only mRNAs, not RefSeqsequences. The remaining 1,432 pairs from [8] and 1,740from [9] comprise the pairs that were expected to be found inour RefSeq reference dataset. Of these, a total of 1,429(99.8%) from [8] and 1,734 (99.7%) from [9] were covered byour dataset; only 3 pairs from [8] and 6 from [9] were filteredout from our dataset because of various low quality criteriathat we had implemented (see filters above).
Subsequently, this RefSeq reference dataset was compared tothe total set of EST clusters in order to define those that wereexonic or wholly intronic to genes in the reference dataset.The genome mapping coordinates of each of the 55,139unspliced EST contigs identified as wholly intronic to RefSeqgenes (TIN RNAs, Table 2) are listed in Additional data file 13,and the file is formatted in a way that each entry can beuploaded as a track in the UCSC genome browser tool hg17assembly version of May 2004 and viewed. For whollyintronic RNAs, we recorded the relative position of the Ref-Seq intron to which the RNA mapped with respect to the totalnumber of introns of the respective RefSeq reference gene.
Partially intronic EST contigs were identified in a later step,by searching for evidence of two or more overlapping ESTsequences that mapped to an exon and covered the intronicregions flanking the exon on each side by more than 30 con-tiguous bases (unspliced extension of the exon). The genomemapping coordinates of each of the 12,592 EST contigs iden-tified as partially intronic to RefSeq genes (PIN RNAs) arelisted in Additional data file 14, and the file is formatted in a
way that each entry can be uploaded as a track in the UCSCgenome browser tool hg17 assembly version of May 2004 andviewed.
Only the genomic mapping coordinates of TIN and PIN con-tigs were recorded, not the genomic strand orientation; directexperimental determination of strandedness of transcriptionwas obtained by oligoarray hybridization, using a pair ofseparate reverse complementary probes for each TIN or PINin the array as described in the following sections.
Exon skipping frequenciesFor each exon of a gene from the RefSeq reference dataset, wecounted the number of times that it mapped to an exon (# inexon) or an intron (# in intron) in all the mRNA sequencesfrom the same subgroup (mRNAs and RefSeqs from the samelocus and on the same genomic strand). Exon skipping (ES)frequency was given by:
ES = 1 - [# in intron/(# in intron + # in exon)]
Design of the 44 k intron-exon oligoarrayOligonucleotide probes were designed for the sense and anti-sense strands of each of 7,135 totally (TIN) and 4,439 partially(PIN) intronic noncoding RNAs picked randomly from thelist of unspliced EST contigs with most abundant ESTs repre-senting each type of intronic transcript. First, for each PIN orTIN RNA, we selected all 60-mer sequences that satisfied aseries of conditions [31] as follows: probes should not have 8or more bases derived from repetitive regions of the genomeor homopolymeric stretches of 7 or more bases (low complex-ity); and they should have a GC content of 35% to 55% and aTm of 68-76°C. To reduce cross-hybridization, each 60-mersequence was searched by BLAST against a specific databasecomprising all human genomic regions for which the mRNAor EST data give any evidence of transcription. Those 60-mersequences for which the second best hits against this databasehad bit-scores equal to or lower than 42.1 were carried for-ward to the next step. They were mapped back to their respec-tive targets and one probe was selected closer to the 3' end ofeach target in the antisense direction, relative to the protein-coding genes. For each target, a second probe was selected forthe opposite strand by taking the reverse complementarysequence of the selected 60-mer, so that a pair of sense/anti-sense probes is present for each TIN and PIN candidateregion in the array. For PIN RNAs, the probe on the oppositestrand corresponds to the exon of the gene where the partiallyintronic message overlaps. To measure the transcriptionallevel of the protein-coding genes to which PIN and TIN RNAsmapped, we included in our array 14,074 elements corre-sponding to exons of 7,464 unique Agilent-designed probescontained in the Whole Human Genome Oligo Microarray set(matched by their Gene_Name annotations to the RefSeq ref-erence dataset genes to which the PIN and TIN RNAsmapped), together with the set of 2,256 positive and negativecontrol Agilent commercial probes (IS-44290-1-V1_eQC-V1)
Genome Biology 2007, 8:R43

R43.22 Genome Biology 2007, Volume 8, Issue 3, Article R43 Nakaya et al. http://genomebiology.com/2007/8/3/R43
designed for the Agilent human expression oligoarrays. Ourcustom-designed 44 k intron-exon oligoarrays were printedby Agilent Technologies. A list of all probes is available atGEO under accession number GPL4051, and also as Addi-tional data file 15. The genome mapping coordinates of eachof the intronic and exonic oligoarray probes are listed in Addi-tional data file 16, and the file is formatted in a way that eachentry can be uploaded as a track in the UCSC genome browsertool hg17 assembly version of May 2004 and viewed.
Human tissue samplesTotal RNA was purified from two pools of normal humanliver, each with samples from 5 individuals, and from normalkidney tissues obtained from 17 individuals. Four pools ofnormal kidney were prepared (three with four samples andone with five samples). In addition, two prostate tumor sam-ples were used. All samples were obtained from patients whosigned informed consent, and approval was received from theethics committees of the hospitals. Total RNA was purifiedusing Trizol (Invitrogen, Carlsbad, CA, USA) according to themanufacturer's instructions, followed by treatment withDNase I following the 'on-column DNase digestion' protocolof the Qiagen RNeasy kit (Qiagen, Valencia, CA, USA) toremove potential genomic DNA contamination. All RNAsamples were checked for purity using a ND-1000 spectro-photometer (NanoDrop Technologies, Wilmington, DE,USA) and for integrity by electrophoresis on a 2100 BioAna-lyzer (Agilent Technologies, Santa Clara, CA, USA).
α-Amanitin experiments with LNCaP cellsThe prostate carcinoma cell line LNCaP was obtained fromATCC and maintained in RPMI 1640 medium (Invitrogen)supplemented with 10% (vol/vol) fetal calf serum, 3 mM L-glutamine, 100 μg/ml streptomycin and 100 U/ml penicillin,at 37°C and 5% CO2. For RNAP II inhibition experiments, 8 ×10⁵ LNCaP cells were plated in p60 dishes and cultured for 2days, after which the medium was replaced by fresh mediumwith or without (mock) 50 μg/ml α-amanitin (Roche, Basel,Switzerland). After 24 h, the cells were washed once with ice-cold phosphate-buffered saline, harvested, pelleted andstored at -80°C. Total RNA was isolated using Qiagen RNeasykit and treated with DNase I following the 'on-column DNasedigestion' protocol (Qiagen). RNA quality was checked asdescribed above. Two biological replicas were processedseparately.
Sample labeling and microarray hybridization proceduresCy5- and Cy3-labeled cRNA was obtained using 300 ng totalRNA as template for amplification of poly(A) RNA by T7-RNApolymerase with the Agilent Low RNA Input FluorescentLinear Amplification kit. The T7-polymerase amplified cRNAlabeling approach advantageously replaces the reverse-tran-scriptase cDNA labeling used in early microarray experi-ments, because T7-RNA polymerase labeling of cRNApreserves the strand orientation of the original mRNA tem-
plate. Reverse-transcriptase labeling can eventually generatea complementary cDNA second strand and cause artifactuallabeling of a target with the opposite sense to that of the orig-inal message. For LNCaP cell line samples (mock-treated orα-amanitin-treated cells), 500 ng total RNA was used and acontrol in vitro synthesized mRNA (Agilent RNA Spike-Inkit) was spiked into the amplification and labeling assay. Forkidney tissue samples, the four pools from normal individualswere considered as replicas, and each pair was labeled witheither Cy3 or Cy5. Each liver sample pool, prostate tissuesample or LNCaP cell line sample was separately labeled inreplicate with Cy3 or Cy5. Hybridization of 750 ng each ofCy3- and Cy5-labeled cRNA was performed with an Agilent insitu Hybridization kit-plus, as recommended by the manufac-turer, using a total of six 44 k intron-exon expression oligoar-rays. Slides were washed and processed according to theAgilent 60-mer Oligo Microarray Processing protocol andscanned on a GenePix 4000B scanner (Molecular Devices,Sunnyvale, CA, USA). Data were extracted from the imageswith ArrayVision 8.0 (Imaging Research Inc., GE Healthcare,Piscataway, NJ, USA). Cy5- and Cy3-derived intensity datafrom the same sample were corrected for intensity-dependentdye biases [66] using a Lowess function implemented in the Rpackage [67]. The different experiments with human tissueswere normalized by the 40% trimmed mean intensity of allthe spots in each slide that were above the mean plus 2 SDintensity of 1,198 negative controls. The experiments with theLNCaP cells (mock- and α-amanitin-treated cells) were nor-malized by the 40% trimmed mean intensity of 300 controlprobes from a specific probe set on the array that reports thesignals from labeled targets generated from the syntheticspiked-in mRNA.
Statistical analysesFor tissue-specific expression profiles, the SAM approach wasemployed using as parameters: multi-class response, 1,000permutations, K-Nearest Neighbors Imputer, and FDR ≤0.002. Analysis of variance (ANOVA), implemented in theSpotFire Decision Site for Functional Genomics (SpotFireInc., Somerville, MA, USA) with cutoff p ≤ 0.001 was alsoused. Gene sets identified by SAM or ANOVA were combinedin order to identify a more restricted set of genes that showedstatistically significant changes of expression in a tissue byboth analyses.
For RNAP II inhibition experiments, the SAM approach wasemployed, using as parameters: two-class unpaired response,t-statistic, 1,000 permutations, K-Nearest NeighborsImputer, and FDRs ranging from 0.2% to 2%; a signal-to-noise ratio (SNR) analysis with 10 k permutations (p < 0.05)was performed. Gene sets identified by SAM or SNR werecombined in order to identify a more restricted set of genesthat showed statistically significant changes of expressionupon α-amanitin treatment by both analyses.
Genome Biology 2007, 8:R43

http://genomebiology.com/2007/8/3/R43 Genome Biology 2007, Volume 8, Issue 3, Article R43 Nakaya et al. R43.23
com
ment
reviews
reports
refereed researchdepo
sited researchinteractio
nsinfo
rmatio
n
GO enrichment analysesWe used BiNGO, the Biological Network Gene Ontology plug-in tool [35] version 1 from the Cytoscape package [68], with aGO database updated as of 17 June 2006. BiNGO analysisdoes not include eventual duplicate instances of the sameGene_ID in a given selected dataset; only one event iscounted for a given Gene_ID. We used the Hypergeometricstatistical test with Benjamini and Hochberg's FDR multipletesting correction, choosing a significance level of 0.05. Weused as the reference dataset all genes that were present inour 44 k intron-exon expression oligoarray, as follows: forprotein-coding genes, we used all Gene_IDs of protein-cod-ing probes in the array; for TIN and PIN RNAs, we used allGene_IDs to protein-coding genes for which there were TINor PIN RNA probes in the array mapping to the correspond-ing genomic loci.
Accession numbersRelated microarray data are deposited at Gene ExpressionOmnibus (GEO) under accession numbers[GenBank:GSE5452, GenBank:GSE5453].
Additional data filesThe following additional data are available with the onlineversion of this paper. Additional data file 1 lists sense/anti-sense transcript pairs with overlapping exons and with noexon overlap (wholly intronic) identified in the RefSeq andmRNA data from GenBank. Additional data file 2 showsabundance of wholly intronic noncoding transcription in Ref-Seq genes. Additional data file 3 shows the distribution ofBLAST bit-score for the second best hit of the 60-mer oligo-nucleotide probes from the microarray. Additional data file 4shows that the most highly expressed antisense TIN tran-scripts map to genes related to regulation of transcription.The table shows the exact p values for all significantlyenriched GO categories for each of the three tissues studied.Additional data file 5 is a list of 210 probes representingantisense TIN RNAs from 123 Gene IDs of genes related to'Regulation of transcription'.
Additional data file 6 provides gene ontology analyses withthe most highly expressed protein-coding transcripts in threedifferent human tissues. Additional data file 7 lists exact pvalues for all significantly enriched GO categories of geneswith up-regulated intronic transcription in the presence of α-amanitin. All exonic protein-coding and intronic non-codingRNAs up-regulated upon alpha-amanitin treatment are alsoshown. Additional data file 8 lists the tissue signatures of 431antisense PIN RNAs. Additional data file 9 lists the tissue sig-natures of 419 antisense TIN RNAs. Additional data file 10lists the tissue signatures of 567 sense TIN RNAs. Additionaldata file 11 is a comparison of tissue signatures between anti-sense PIN RNAs and exons of protein-coding genes. Addi-tional data file 12 is a comparison of tissue signatures betweenTIN RNAs and exons of protein-coding genes. Additional data
file 13 provides the genomic coordinates of all 55,139 TINRNAs (formatted for UCSC browser track, hg17 assembly ver-sion of May 2004). Additional data file 14 provides thegenomic coordinates of all 12,592 PIN RNAs (formatted forUCSC browser track, hg17 assembly version of May 2004).Additional data file 15 shows the 44 K platform design. Addi-tional data file 16 provides the Genomic coordinates of allintronic and exonic probes in the custom-designed 44 Kintron-exon oligoarray (formatted for UCSC browser track,hg17 assembly version of May 2004).Additional data file 1Sense/antisense transcript pairs with overlapping exons and with no exon overlap (wholly intronic) identified in the RefSeq and mRNA data from GenBankSense/antisense transcript pairs with overlapping exons and with no exon overlap (wholly intronic) identified in the RefSeq and mRNA data from GenBankClick here for fileAdditional data file 2Abundance of wholly intronic noncoding transcription in RefSeq genesAbundance of wholly intronic noncoding transcription in RefSeq genesClick here for fileAdditional data file 3Distribution of BLAST bit-score for the second best hit of the 60-mer oligonucleotide probes from the microarrayDistribution of BLAST bit-score for the second best hit of the 60-mer oligonucleotide probes from the microarrayClick here for fileAdditional data file 4The most highly expressed antisense TIN transcripts map to genes related to regulation of transcriptionThe table shows the exact p values for all significantly enriched GO categories for each of the three tissues studiedClick here for fileAdditional data file 5Probes representing antisense TIN RNAs from 123 Gene IDs of genes related to 'Regulation of transcription'probes representing antisense TIN RNAs from 123 Gene IDs of genes related to 'Regulation of transcription'Click here for fileAdditional data file 6Gene ontology analyses with the most highly expressed protein-coding transcripts in three different human tissuesGene ontology analyses with the most highly expressed protein-coding transcripts in three different human tissuesClick here for fileAdditional data file 7Exact p values for all significantly enriched GO categories of genes with up-regulated intronic transcription in the presence of α-amanitinAll exonic protein-coding and intronic non-coding RNAs up-regu-lated upon α-amanitin treatment are also shownClick here for fileAdditional data file 8Tissue signatures of 431 antisense PIN RNAsTissue signatures of 431 antisense PIN RNAsClick here for fileAdditional data file 9Tissue signatures of 419 antisense TIN RNAsTissue signatures of 419 antisense TIN RNAsClick here for fileAdditional data file 10Tissue signatures of 567 sense TIN RNAsTissue signatures of 567 sense TIN RNAsClick here for fileAdditional data file 11Comparison of tissue signatures between antisense PIN RNAs and exons of protein-coding genesComparison of tissue signatures between antisense PIN RNAs and exons of protein-coding genesClick here for fileAdditional data file 12Comparison of tissue signatures between TIN RNAs and exons of protein-coding genesComparison of tissue signatures between TIN RNAs and exons of protein-coding genesClick here for fileAdditional data file 13Genomic coordinates of all 55,139 TIN RNAsFormatted for UCSC browser track, hg17 assembly version of May 2004Click here for fileAdditional data file 14Genomic coordinates of all 12,592 PIN RNAsFormatted for UCSC browser track, hg17 assembly version of May 2004Click here for fileAdditional data file 15Design of the 44 K platformDesign of the 44 K platformClick here for fileAdditional data file 16Genomic coordinates of all intronic and exonic probes in the cus-tom-designed 44 K intron-exon oligoarrayFormatted for UCSC browser track, hg17 assembly version of May 2004Click here for file
AcknowledgementsThe authors thank Camila Egidio for help with testing the Agilent micro-array protocol. The authors also thank Dr Marcia Kubrusly (Hospital dasClínicas, Universidade de São Paulo) and Dr Marcello Barcinski (InstitutoNacional de Câncer, Rio de Janeiro) for providing the tissue samples. Thiswork was supported by a grant from Fundação de Amparo a Pesquisa doEstado de São Paulo, FAPESP to SVA, EMR and AMDS and by fellowshipsfrom FAPESP and Conselho Nacional de Desenvolvimento Científico eTecnológico, CNPq, Brasil.
References1. Reis EM, Ojopi EP, Alberto FL, Rahal P, Tsukumo F, Mancini UM, Gui-
maraes GS, Thompson GM, Camacho C, Miracca E, et al.: Large-scale transcriptome analyses reveal new genetic markercandidates of head, neck, and thyroid cancer. Cancer Res 2005,65:1693-1699.
2. Ferguson DA, Chiang JT, Richardson JA, Graff J: eXPRESSION: anin silico tool to predict patterns of gene expression. Gene ExprPatterns 2005, 5:619-628.
3. Gupta S, Zink D, Korn B, Vingron M, Haas SA: Genome wide iden-tification and classification of alternative splicing based onEST data. Bioinformatics 2004, 20:2579-2585.
4. Thanaraj TA, Clark F, Muilu J: Conservation of humanalternativesplice events in mouse. Nucleic Acids Res 2003, 31:2544-2552.
5. Kan Z, Rouchka EC, Gish WR, States DJ: Gene structure predic-tion and alternative splicing analysis using genomicallyaligned ESTs. Genome Res 2001, 11:889-900.
6. Modrek B, Lee CJ: Alternative splicing in the human, mouseand rat genomes is associated with an increased frequency ofexon creation and/or loss. Nat Genet 2003, 34:177-180.
7. Shendure J, Church GM: Computational discovery of sense-antisense transcription in the human and mouse genomes.Genome Biol 2002, 3:research0044.1-0044.14.
8. Yelin R, Dahary D, Sorek R, Levanon EY, Goldstein O, Shoshan A,Diber A, Biton S, Tamir Y, Khosravi R, et al.: Widespread occur-rence of antisense transcription in the human genome. NatBiotechnol 2003, 21:379-386.
9. Chen J, Sun M, Kent WJ, Huang X, Xie H, Wang W, Zhou G, Shi RZ,Rowley JD: Over 20% of human transcripts might form sense-antisensepairs. Nucleic Acids Res 2004, 32:4812-4820.
10. Okazaki Y, Furuno M, Kasukawa T, Adachi J, Bono H, Kondo S,Nikaido I, Osato N, Saito R, Suzuki H, et al.: Analysis of the mousetranscriptome based on functional annotation of 60,770 full-length cDNAs. Nature 2002, 420:563-573.
11. International Human Genome Sequencing Consortium: Finishingthe euchromatic sequence of the human genome. Nature2004, 431:931-945.
12. Scherer SW, Cheung J, MacDonald JR, Osborne LR, Nakabayashi K,Herbrick JA, Carson AR, Parker-Katiraee L, Skaug J, Khaja R, et al.:Human chromosome 7: DNA sequence and biology. Science2003, 300:767-772.
13. Pang KC, Stephen S, Engstrom PG, Tajul-Arifin K, Chen W, Wahlest-edt C, Lenhard B, Hayashizaki Y, Mattick JS: RNAdb - acomprehensive mammalian noncoding RNA database.Nucleic Acids Res 2005:D125-D130.
14. Griffiths-Jones S, Moxon S, Marshall M, Khanna A, Eddy SR, BatemanA: Rfam: annotating non-coding RNAs in complete genomes.Nucleic Acids Res 2005:D121-124.
Genome Biology 2007, 8:R43
R43.24 Genome Biology 2007, Volume 8, Issue 3, Article R43 Nakaya et al. http://genomebiology.com/2007/8/3/R43
15. Goodrich JA, Kugel JF: Non-coding-RNA regulators of RNApolymerase II transcription. Nat Rev Mol Cell Biol 2006,7:612-616.
16. Khochbin S, Lawrence JJ: An antisense RNA involved in p53mRNA maturation in murine erythroleukemia cells inducedto differentiate. EMBO J 1989, 8:4107-4114.
17. Yan MD, Hong CC, Lai GM, Cheng AL, Lin YW, Chuang SE: Identi-fication and characterization of a novel gene Saf transcribedfrom the opposite strand of Fas. Hum Mol Genet 2005,14:1465-1474.
18. Krystal GW, Armstrong BC, Battey JF: N-myc mRNA formsanRNA-RNA duplex with endogenous antisense transcripts.Mol Cell Biol 1990, 10:4180-4191.
19. Reis EM, Nakaya HI, Louro R, Canavez FC, Flatschart AV, AlmeidaGT, Egidio CM, Paquola AC, Machado AA, Festa F, et al.: Antisenseintronic non-coding RNA levels correlate to the degree oftumor differentiation in prostate cancer. Oncogene 2004,23:6684-6692.
20. Du T, Zamore PD: microPrimer: the biogenesis and function ofmicroRNA. Development 2005, 132:4645-4652.
21. Kiss T: Small nucleolar RNAs: an abundant group of noncod-ing RNAs with diverse cellular functions. Cell 2002,109:145-148.
22. Lu J, Getz G, Miska EA, Alvarez-Saavedra E, Lamb J, Peck D, Sweet-Cordero A, Ebert BL, Mak RH, Ferrando AA, et al.: MicroRNAexpression profiles classify human cancers. Nature 2005,435:834-838.
23. Kravchenko JE, Rogozin IB, Koonin EV, Chumakov PM: Transcrip-tion of mammalian messenger RNAs by a nuclear RNApolymerase of mitochondrial origin. Nature 2005, 436:735-739.
24. Dahary D, Elroy-Stein O, Sorek R: Naturally occurring anti-sense:transcriptional leakage or real overlap? Genome Res2005, 15:364-368.
25. Kiyosawa H, Yamanaka I, Osato N, Kondo S, Hayashizaki Y: Anti-sense transcripts with FANTOM2 clone set and their impli-cations for gene regulation. Genome Res 2003, 13:1324-1334.
26. Iseli C, Jongeneel CV, Bucher P: ESTScan: a program for detect-ing, evaluating, and reconstructing potential coding regionsin EST sequences. Proc Int Conf Intell Syst Mol Biol 1999, :138-148.
27. Rodriguez A, Griffiths-Jones S, Ashurst JL, Bradley A: Identificationof mammalian microRNA host genes and transcriptionunits. Genome Res 2004, 14:1902-1910.
28. The snoRNABase [http://www-snorna.biotoul.fr/]29. Griffiths-Jones S: The microRNA Registry. Nucleic Acids Res
2004:D109-111.30. Bertone P, Stolc V, Royce TE, Rozowsky JS, Urban AE, Zhu X, Rinn
JL, Tongprasit W, Samanta M, Weissman S, et al.: Global identifica-tion of human transcribed sequences with genome tilingarrays. Science 2004, 306:2242-2246.
31. Hughes TR, Mao M, Jones AR, Burchard J, Marton MJ, Shannon KW,Lefkowitz SM, Ziman M, Schelter JM, Meyer MR, et al.: Expressionprofiling using microarrays fabricated by an ink-jet oligonu-cleotide synthesizer. Nat Biotechnol 2001, 19:342-347.
32. Kampa D, Cheng J, Kapranov P, Yamanaka M, Brubaker S, Cawley S,Drenkow J, Piccolboni A, Bekiranov S, Helt G, et al.: Novel RNAsidentified from an in-depth analysis of the transcriptome ofhuman chromosomes 21 and 22. Genome Res 2004, 14:331-342.
33. Kapranov P, Drenkow J, Cheng J, Long J, Helt G, Dike S, Gingeras TR:Examples of the complex architecture of the human tran-scriptome revealed by RACE and high-density tiling arrays.Genome Res 2005, 15:987-997.
34. Sun BK, Deaton AM, Lee JT: A transient heterochromatic statein Xist preempts X inactivation choice without RNAstabilization. Mol Cell 2006, 21:617-628.
35. Maere S, Heymans K, Kuiper M: BiNGO: a Cytoscape plugin toassess overrepresentation of gene ontology categories inbiological networks. Bioinformatics 2005, 21:3448-3449.
36. Tusher VG, Tibshirani R, Chu G: Significance analysis of micro-arrays applied to the ionizing radiation response. Proc NatlAcad Sci USA 2001, 98:5116-5121.
37. Golub TR, Slonim DK, Tamayo P, Huard C, Gaasenbeek M, MesirovJP, Coller H, Loh ML, Downing JR, Caligiuri MA, et al.: Molecularclassification of cancer: class discovery and class predictionby gene expression monitoring. Science 1999, 286:531-537.
38. Cheng J, Kapranov P, Drenkow J, Dike S, Brubaker S, Patel S, Long J,Stern D, Tammana H, Helt G, et al.: Transcriptional maps of 10human chromosomes at 5-nucleotide resolution. Science2005, 308:1149-1154.
39. Vinogradov AE: Compactness of human housekeeping genes:selection for economy or genomic design? Trends Genet 2004,20:248-253.
40. Vinogradov AE: "Genome design" model: evidence from con-served intronic sequence in human-mouse comparison.Genome Res 2006, 16:347-354.
41. Cancer Genome Anatomy Project (CGAP) [http://cgap.nci.nih.gov/]
42. Cawley S, Bekiranov S, Ng HH, Kapranov P, Sekinger EA, Kampa D,Piccolboni A, Sementchenko V, Cheng J, Williams AJ, et al.: Unbiasedmapping of transcription factor binding sites along humanchromosomes 21 and 22 points to widespread regulation ofnoncoding RNAs. Cell 2004, 116:499-509.
43. Reis EM, Louro R, Nakaya HI, Verjovski-Almeida S: As antisenseRNA gets intronic. Omics 2005, 9:2-12.
44. Mattick JS, Makunin IV: Non-coding RNA. Hum Mol Genet 2006,15(Suppl 1):R17-29.
45. Sanchez-Elsner T, Gou D, Kremmer E, Sauer F: Noncoding RNAsof trithorax response elements recruit Drosophila Ash1 toUltrabithorax. Science 2006, 311:1118-1123.
46. Mayer C, Schmitz KM, Li J, Grummt I, Santoro R: Intergenic tran-scripts regulate the epigenetic state of rRNA genes. Mol Cell2006, 22:351-361.
47. Hill AE, Hong JS, Wen H, Teng L, McPherson DT, McPherson SA,Levasseur DN, Sorscher EJ: Micro-RNA-like effects of completeintronic sequences. Front Biosci 2006, 11:1998-2006.
48. Bruno IG, Jin W, Cote GJ: Correction of aberrant FGFR1 alter-native RNA splicing through targeting of intronic regulatoryelements. Hum Mol Genet 2004, 13:2409-2420.
49. De Angelis FG, Sthandier O, Berarducci B, Toso S, Galluzzi G, RicciE, Cossu G, Bozzoni I: Chimeric snRNA molecules carryingantisense sequences against the splice junctions of exon 51 ofthe dystrophinpre-mRNA induce exon skipping and restora-tion of a dystrophin synthesis in Delta 48-50 DMD cells. ProcNatl Acad Sci USA 2002, 99:9456-9461.
50. McClorey G, Fletcher S, Wilton S: Splicing intervention forDuchenne muscular dystrophy. Curr Opin Pharmacol 2005,5:529-534.
51. Johnson JM, Castle J, Garrett-Engele P, Kan Z, Loerch PM, ArmourCD, Santos R, Schadt EE, Stoughton R, Shoemaker DD: Genome-wide survey of human alternative pre-mRNA splicing withexon junction microarrays. Science 2003, 302:2141-2144.
52. Clark F, Thanaraj TA: Categorization and characterization oftranscript-confirmed constitutively and alternatively splicedintrons and exons from human. Hum Mol Genet 2002,11:451-464.
53. Prescott EM, Proudfoot NJ: Transcriptional collision betweenconvergent genes in budding yeast. Proc Natl Acad Sci USA 2002,99:8796-8801.
54. Martens JA, Laprade L, Winston F: Intergenic transcription isrequired to repress the Saccharomyces cerevisiae SER3 gene.Nature 2004, 429:571-574.
55. Geirsson A, Lynch RJ, Paliwal I, Bothwell AL, Hammond GL: Humantrophoblast noncoding RNA suppresses CIITA promoter IIIactivity in murine B-lymphocytes. Biochem Biophys Res Commun2003, 301:718-724.
56. Willingham AT, Orth AP, Batalov S, Peters EC, Wen BG, Aza-BlancP, Hogenesch JB, Schultz PG: A strategy for probing the functionof noncoding RNAs finds a repressor of NFAT. Science 2005,309:1570-1573.
57. Mattick JS: RNA regulation: a new genetics? Nat Rev Genet 2004,5:316-323.
58. Kapranov P, Cawley SE, Drenkow J, Bekiranov S, Strausberg RL,Fodor SP, Gingeras TR: Large-scale transcriptional activity inchromosomes 21 and 22. Science 2002, 296:916-919.
59. Rinn JL, Euskirchen G, Bertone P, Martone R, Luscombe NM, Hart-man S, Harrison PM, Nelson FK, Miller P, Gerstein M, et al.: Thetranscriptional activity of human chromosome 22. Genes Dev2003, 17:529-540.
60. Bejerano G, Pheasant M, Makunin I, Stephen S, Kent WJ, Mattick JS,Haussler D: Ultraconserved elements in the human genome.Science 2004, 304:1321-1325.
61. Sironi M, Menozzi G, Comi GP, Cagliani R, Bresolin N, Pozzoli U:Analysis of intronic conserved elements indicates that func-tional complexity might represent a major source of nega-tive selection on non-coding sequences. Hum Mol Genet 2005,14:2533-2546.
62. Pollard KS, Salama SR, Lambert N, Lambot MA, Coppens S, Pedersen
Genome Biology 2007, 8:R43
http://www.ncbi.nlm.nih.gov/entrez/query.fcgi?cmd=Retrieve&db=PubMed&dopt=Abstract&list_uids=2480234
http://www.ncbi.nlm.nih.gov/entrez/query.fcgi?cmd=Retrieve&db=PubMed&dopt=Abstract&list_uids=2480234
http://www.ncbi.nlm.nih.gov/entrez/query.fcgi?cmd=Retrieve&db=PubMed&dopt=Abstract&list_uids=2480234
http://www.ncbi.nlm.nih.gov/entrez/query.fcgi?cmd=Retrieve&db=PubMed&dopt=Abstract&list_uids=1695323

http://genomebiology.com/2007/8/3/R43 Genome Biology 2007, Volume 8, Issue 3, Article R43 Nakaya et al. R43.25
com
ment
reviews
reports
refereed researchdepo
sited researchinteractio
nsinfo
rmatio
n
JS, Katzman S, King B, Onodera C, Siepel A, et al.: An RNA geneexpressed during cortical development evolved rapidly inhumans. Nature 2006, 443:167-172.
63. Rigoutsos I, Huynh T, Miranda K, Tsirigos A, McHardy A, Platt D:Short blocks from the noncoding parts of the humangenome have instances within nearly all known genes andrelate to biological processes. Proc Natl Acad Sci USA 2006,103:6605-6610.
64. Simons C, Pheasant M, Makunin IV, Mattick JS: Transposon-freeregions in mammalian genomes. Genome Res 2006, 16:164-172.
65. UCSC Genome Browser [http://genome.ucsc.edu]66. Peixoto BR, Vencio RZ, Egidio CM, Mota-Vieira L, Verjovski-Almeida
S, Reis EM: Evaluation of reference-based two-color methodsfor measurement of gene expression ratios using spottedcDNA microarrays. BMC Genomics 2006, 7:35.
67. The R Project for Statistical Computing [http://www.r-project.org]
68. Shannon P, Markiel A, Ozier O, Baliga NS, Wang JT, Ramage D, AminN, Schwikowski B, Ideker T: Cytoscape: a software environmentfor integrated models of biomolecular interaction networks.Genome Res 2003, 13:2498-2504.
Genome Biology 2007, 8:R43