The noncoding RNA CcnA modulates the master cell cycle ...
38
HAL Id: hal-03649775 https://hal.archives-ouvertes.fr/hal-03649775 Submitted on 22 Apr 2022 HAL is a multi-disciplinary open access archive for the deposit and dissemination of sci- entific research documents, whether they are pub- lished or not. The documents may come from teaching and research institutions in France or abroad, or from public or private research centers. L’archive ouverte pluridisciplinaire HAL, est destinée au dépôt et à la diffusion de documents scientifiques de niveau recherche, publiés ou non, émanant des établissements d’enseignement et de recherche français ou étrangers, des laboratoires publics ou privés. The noncoding RNA CcnA modulates the master cell cycle regulators CtrA and GcrA in Caulobacter crescentus Wanassa Beroual, Karine Prévost, David Lalaouna, Nadia Ben Zaina, Odile Valette, Yann Denis, Meriem Djendli, Gaël Brasseur, Matteo Brilli, Marta Robledo Garrido, et al. To cite this version: Wanassa Beroual, Karine Prévost, David Lalaouna, Nadia Ben Zaina, Odile Valette, et al.. The noncoding RNA CcnA modulates the master cell cycle regulators CtrA and GcrA in Caulobacter crescentus. Plos Biology, 2022, 20 (2), pp.e3001528. 10.1371/journal.pbio.3001528. hal-03649775
-
Upload
khangminh22 -
Category
Documents
-
view
3 -
download
0
Transcript of The noncoding RNA CcnA modulates the master cell cycle ...

HAL Id: hal-03649775https://hal.archives-ouvertes.fr/hal-03649775
Submitted on 22 Apr 2022
HAL is a multi-disciplinary open accessarchive for the deposit and dissemination of sci-entific research documents, whether they are pub-lished or not. The documents may come fromteaching and research institutions in France orabroad, or from public or private research centers.
L’archive ouverte pluridisciplinaire HAL, estdestinée au dépôt et à la diffusion de documentsscientifiques de niveau recherche, publiés ou non,émanant des établissements d’enseignement et derecherche français ou étrangers, des laboratoirespublics ou privés.
The noncoding RNA CcnA modulates the master cellcycle regulators CtrA and GcrA in Caulobacter
crescentusWanassa Beroual, Karine Prévost, David Lalaouna, Nadia Ben Zaina, OdileValette, Yann Denis, Meriem Djendli, Gaël Brasseur, Matteo Brilli, Marta
Robledo Garrido, et al.
To cite this version:Wanassa Beroual, Karine Prévost, David Lalaouna, Nadia Ben Zaina, Odile Valette, et al.. Thenoncoding RNA CcnA modulates the master cell cycle regulators CtrA and GcrA in Caulobactercrescentus. Plos Biology, 2022, 20 (2), pp.e3001528. �10.1371/journal.pbio.3001528�. �hal-03649775�

RESEARCH ARTICLE
The noncoding RNA CcnA modulates the
master cell cycle regulators CtrA and GcrA in
Caulobacter crescentus
Wanassa Beroual1, Karine Prevost2, David LalaounaID2¤a, Nadia Ben Zaina1,
Odile Valette1, Yann Denis3, Meriem DjendliID1, Gael BrasseurID
1, Matteo BrilliID4,
Marta Robledo GarridoID5, Jose-Ignacio Jimenez-Zurdo5, Eric MasseID
2, Emanuele
G. BiondiID1¤b*
1 Aix-Marseille Universite, CNRS, LCB, IMM, Turing Center for Living Systems, Marseille, France,
2 Departement de biochimie et de genomique fonctionnelle, RNA Group, Universite de Sherbrooke,
Sherbrooke, Quebec, Canada, 3 Aix-Marseille Univ, CNRS, Plate-forme Transcriptome, IMM, Marseille,
France, 4 Pediatric Clinical Research Center "Romeo ed Enrica Invernizzi", Department of Biosciences,
University of Milan, Milan, Italy, 5 Grupo de Ecologıa Genetica de la Rizosfera, Estacion Experimental del
Zaidın, Consejo Superior de Investigaciones Cientıficas (CSIC), Granada, Spain
¤a Current address: Universite de Strasbourg, CNRS, ARN UPR 9002, Strasbourg, France
¤b Current address: Universite Paris-Saclay, CEA, CNRS, Institute for Integrative Biology of the Cell (I2BC),
Gif-sur-Yvette, France
Abstract
Bacteria are powerful models for understanding how cells divide and accomplish global reg-
ulatory programs. In Caulobacter crescentus, a cascade of essential master regulators
supervises the correct and sequential activation of DNA replication, cell division, and devel-
opment of different cell types. Among them, the response regulator CtrA plays a crucial role
coordinating all those functions. Here, for the first time, we describe the role of a novel factor
named CcnA (cell cycle noncoding RNA A), a cell cycle–regulated noncoding RNA (ncRNA)
located at the origin of replication, presumably activated by CtrA, and responsible for the
accumulation of CtrA itself. In addition, CcnA may be also involved in the inhibition of trans-
lation of the S-phase regulator, GcrA, by interacting with its 50 untranslated region (50 UTR).
Performing in vitro experiments and mutagenesis, we propose a mechanism of action of
CcnA based on liberation (ctrA) or sequestration (gcrA) of their ribosome-binding site
(RBS). Finally, its role may be conserved in other alphaproteobacterial species, such as
Sinorhizobium meliloti, representing indeed a potentially conserved process modulating cell
cycle in Caulobacterales and Rhizobiales.
Introduction
Caulobacter crescentus is a pivotal model organism to understand how basic functions of the
cell physiology are organized and coordinated through the cell cycle [1,2] (Fig 1A). C. crescen-tus combines the cultivation and genetic simplicity of a prokaryotic system with a regulatory
intricacy that is a paradigm of global regulatory programs of all living organisms.
PLOS Biology | https://doi.org/10.1371/journal.pbio.3001528 February 22, 2022 1 / 37
a1111111111
a1111111111
a1111111111
a1111111111
a1111111111
OPEN ACCESS
Citation: Beroual W, Prevost K, Lalaouna D, Ben
Zaina N, Valette O, Denis Y, et al. (2022) The
noncoding RNA CcnA modulates the master cell
cycle regulators CtrA and GcrA in Caulobacter
crescentus. PLoS Biol 20(2): e3001528. https://doi.
org/10.1371/journal.pbio.3001528
Academic Editor: Matthew K. Waldor, Brigham
and Women’s Hospital, UNITED STATES
Received: July 22, 2020
Accepted: January 5, 2022
Published: February 22, 2022
Copyright: © 2022 Beroual et al. This is an open
access article distributed under the terms of the
Creative Commons Attribution License, which
permits unrestricted use, distribution, and
reproduction in any medium, provided the original
author and source are credited.
Data Availability Statement: All fastQ files are
available from the Dryad database (doi:10.5061/
dryad.4mw6m909k).
Funding: This research was funded by the Agence
Nationale Recherche (ANR; ANR-17-CE20-0011-
01) to EGB. The funders had no role in study
design, data collection and analysis, decision to
publish, or preparation of the manuscript.
Competing interests: The authors have declared
that no competing interests exist.

Transcriptional regulation plays a major role during cell cycle progression. Several master
regulators controlling transcription (i.e., DnaA, GcrA, CcrM, and CtrA) are sequentially acti-
vated in order to induce transcription of hundreds of genes required at specific phases of the
cycle [3–5]. Each phase is under the control of the following well-defined factors: (i) the initia-
tion of the S-phase depends on DnaA; (ii) the first part of the S-phase depends on the epige-
netic module GcrA and CcrM; and (iii) the second part depends on CtrA, which is also the
regulator of the G1 phase of swarmer cells [6].
Other regulators of transcription intervene to fine-tune the cell cycle–regulated transcrip-
tion of genes that must be activated at specific phases of the cell cycle; for example, MucR and
SciP regulate CtrA activity [7–10]. The interconnections between DnaA, GcrA, CcrM, and
CtrA create an intricate network whose behavior emerges from the integration of multiple
master regulatory inputs. In particular, regulation of the essential response regulator CtrA is
critical, as it directly or indirectly controls all the other master regulators of the cell cycle [11].
CtrA is notably responsible for the direct transcriptional activation of key genes for cell divi-
sion and the biogenesis of polar structures (flagellum, stalk, and pili). CtrA also activates the
transcription of the gene encoding the orphan adenine methyl transferase CcrM, which, in
turn, is required for the regulation of many genes including the fine-tuned regulation of the
promoter P1 of ctrA [5]. Moreover, CtrA indirectly blocks chromosome replication initiation
promoted by DnaA by binding to sites in the origin of replication (CORI), resulting in DnaA
exclusion from the CORI [12,13].
Another master regulator, named GcrA, activates the transcription of the ctrA gene, which,
in turn, negatively feeds back on the transcription of gcrA [14–17]. GcrA activity is known to
be affected by the methylation status of its targets’ promoters. For instance, the GcrA-depen-
dent transcription of ctrA from its P1 promoter is activated by the conversion of a CcrM-meth-
ylated site from its full to the hemi-methylation state approximately after a third of DNA
replication [5]. P1 activation is, therefore, responsible for the first weak accumulation of CtrA
and predates the activation of the stronger P2 promoter, located downstream of P1. P2 is
under the control of phosphorylated CtrA (CtrA~P), responsible for the robust accumulation
of CtrA in the second half of DNA replication. CtrA at its highest level is then responsible for
the repression of its own P1 promoter and of gcrA transcription. Although the molecular
details of this biphasic activation of ctrA are still only partially understood, the stronger activa-
tion of P2 may underscore other posttranscriptional mechanisms reinforcing CtrA
accumulation.
Besides being finely regulated in time by the DnaA-GcrA-CcrM transcriptional cascade,
activation of CtrA requires phosphorylation by the CckA-ChpT phosphorelay [18], which is
linked to a sophisticated spatial regulation since the hybrid kinase CckA has a bipolar localiza-
tion [18–20]. At the swarmer pole, CckA acts as a kinase due to the presence of the atypical
kinase DivL and the DivK phosphatase PleC [9]. However, at the stalked pole, CckA is a phos-
phatase of CtrA because the kinase DivJ keeps the CtrA negative regulator DivK fully phos-
phorylated, turning the CckA-ChpT phosphorelay into a CtrA phosphatase. As CtrA~P blocks
the origin of replication, a complex degradation machinery ensures its cell cycle–dependent
degradation at the G1 to S-phase transition and after cell division in the stalk compartment. A
cascade of adapter proteins (CpdR, RcdA, and PopA) is responsible for the specific and highly
regulated proteolysis of CtrA [21,22].
Few cases of regulation of gene expression by ncRNAs have been characterized in C. cres-centus. For example, the SsrA noncoding RNA (ncRNA) (tmRNA) is a small RNA associated
to selected translating ribosomes to target the translated polypeptides for degradation. The
tmRNA has been linked to replication control in C. crescentus [23] and Escherichia coli [24].
More generally, only 27 ncRNAs were described in C. crescentus [25]. Among them, CrfA is a
PLOS BIOLOGY The non coding RNA CcnA controls cell cycle
PLOS Biology | https://doi.org/10.1371/journal.pbio.3001528 February 22, 2022 2 / 37
Abbreviations: CcnA, cell cycle noncoding RNA A;
CcnA, as, antisense of CcnA; DEG, differentially
expressed gene; LB, lysogeny broth; MAPS, MS2-
affinity purification coupled with RNA sequencing;
ncRNA, noncoding RNA; PYE, peptone yeast
extract; qRT-PCR, quantitative real-time PCR; RBS,
ribosome-binding site; RNAseq, RNA sequencing;
RPKM, reads per kilobase per million mapped
reads; SD, Shine–Dalgarno; TSS, transcriptional
start site; TY, tryptone-yeast; WT, wild-type; 50
UTR, 50 untranslated region.

Fig 1. CcnA is a cell cycle–regulated ncRNA. (A) Expression level of CcnA during the cell cycle of WT cells C.
crescentus. Cells were grown in PYE until OD600nm = 0.6 then synchronized according to material and methods. Total
RNA was extracted at indicated time points of the cell cycle. Expression of CcnA was then determined by qRT-PCR in
comparison to 16S rRNA level. Results are shown as mean (N = 3) +/− SD. Data are in S9 Table. Proteins
corresponding to the same time points were extracted and separated on a SDS-PAGE gel containing Phostag and Mn2+
to visualize CtrA phosphorylation. CtrA (Phostag) and MreB (in a normal Western blot) were revealed using specific
PLOS BIOLOGY The non coding RNA CcnA controls cell cycle
PLOS Biology | https://doi.org/10.1371/journal.pbio.3001528 February 22, 2022 3 / 37

ncRNA involved in adaptation to carbon starvation [26]. Another ncRNA, GsrN, is involved
in the response to multiple σT-dependent stresses [27]. Finally, ChvR has been recently charac-
terized as a ncRNA that is expressed in response to DNA damage, low pH, and growth in min-
imal medium [28]. However, as more recent approaches using RNA sequencing (RNAseq)
and postgenomic techniques expanded the plethora of ncRNA candidates to more than 100
(Zhou and colleagues, 2015). Predictions of their integration into the cell cycle circuit [29] sug-
gest that those new candidate ncRNAs should be deeply studied in order to find whether
ncRNAs are linked to cell cycle regulation. Indeed, ncRNA-mediated regulations can provide
network properties that are not always easily accessible through transcriptional regulation
only. For example, the phenomena like threshold-linear response of the mRNA target, the pri-
oritization of different targets, ultrasensitive response, and bistability are known regulatory
mechanisms mediated by ncRNAs [30,31], therefore representing good candidates as regula-
tors of a biological system showing rich dynamic behavior as the C. crescentus cell cycle.
Here, we investigated the role of a ncRNA, named CcnA, which is transcribed from a gene
located at the origin of replication of the C. crescentus chromosome. We characterized its role
in cell cycle regulation by using deletion mutants, CcnA overexpression strains, and silenced
strains obtained through expression of a CcnA antisense RNA. Results presented here identi-
fied the mRNAs of ctrA and gcrA, 2 master regulators of cell cycle, as important targets of the
CcnA ncRNA. Our results are supported by a multipronged approach, combining “MS2-affi-
nity purification coupled with RNA sequencing” (MAPS) assays, in vitro and in vivo experi-
ments. Finally, the role of CcnA in the closely related organism Sinorhizobium melilotisuggests an evolutionary conservation across alphaproteobacteria, further underscoring the
importance of this gene.
Results
CcnA expression is activated in predivisional cells
Based on previous results [32], we speculated that CCNA_R0094, here named cell cycle non-
coding RNA A (CcnA), has its peak of transcription after the accumulation of CtrA, in the sec-
ond half of the S-phase, when, the second ctrA promoter, P2, is activated. A synchronized
population of wild-type (WT) C. crescentus was used to collect cells at 15-min intervals in rich
medium (generation time is 96 min). We designed primers (amplifying between the 80 and
168 nt of the 182 nt long CcnA sequence; primers sequence is in S3 Table) to detect and pre-
cisely quantify CcnA RNA in the cells during cell cycle by quantitative real-time PCR
(qRT-PCR) (see Materials and methods) with respect to 16S RNA levels (Fig 1A). CcnA levels
start increasing after 45 min, coincidentally with CtrA protein levels (Fig 1A). More specifi-
cally, we measured both protein and phosphorylation levels of CtrA by Phos-Tag gels (Fig 1A).
CcnA levels increase as CtrA~P levels increase, suggesting that the transcription of ccnApotentially depends on phosphorylated CtrA. This observation prompted us to question
whether CtrA was involved in ccnA transcription. Consistent with this, a CtrA box was previ-
ously described upstream of the transcriptional start site (TSS) of ccnA [32,33].
polyclonal antibodies on nitrocellulose membranes. (B) Determination of the transcriptional +1 site of CcnA
ncRNA by primer extension. Total RNA extracted from WT cells or containing Plac-ccnA was used with a
radiolabelled oligo (bold sequence in C). The same oligo was used for ccnA sequencing (CGTA). The sequence is
presented as the reverse complement. The +1 signal is represented by the arrow. See S2A Fig for controls. Data are
representative of 2 independent experiments. (C) DNA 50 sequence of ccnA. Boxed gray “G” corresponds to the
transcriptional +1. Oligo use for the sequencing and primer extension is in bold. CtrA box promoter region is
underlined. CcnA, cell cycle noncoding RNA A; ncRNA, noncoding RNA; qRT-PCR, quantitative real-time PCR; WT,
wild-type.
https://doi.org/10.1371/journal.pbio.3001528.g001
PLOS BIOLOGY The non coding RNA CcnA controls cell cycle
PLOS Biology | https://doi.org/10.1371/journal.pbio.3001528 February 22, 2022 4 / 37
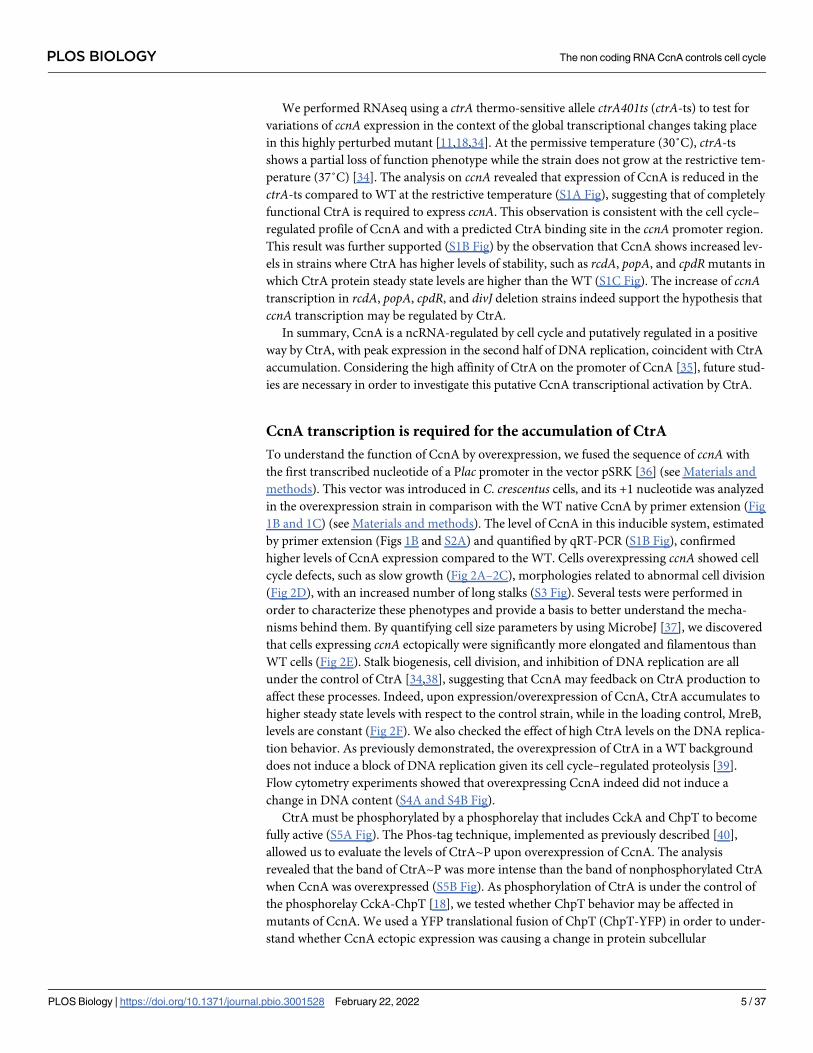
We performed RNAseq using a ctrA thermo-sensitive allele ctrA401ts (ctrA-ts) to test for
variations of ccnA expression in the context of the global transcriptional changes taking place
in this highly perturbed mutant [11,18,34]. At the permissive temperature (30˚C), ctrA-ts
shows a partial loss of function phenotype while the strain does not grow at the restrictive tem-
perature (37˚C) [34]. The analysis on ccnA revealed that expression of CcnA is reduced in the
ctrA-ts compared to WT at the restrictive temperature (S1A Fig), suggesting that of completely
functional CtrA is required to express ccnA. This observation is consistent with the cell cycle–
regulated profile of CcnA and with a predicted CtrA binding site in the ccnA promoter region.
This result was further supported (S1B Fig) by the observation that CcnA shows increased lev-
els in strains where CtrA has higher levels of stability, such as rcdA, popA, and cpdR mutants in
which CtrA protein steady state levels are higher than the WT (S1C Fig). The increase of ccnAtranscription in rcdA, popA, cpdR, and divJ deletion strains indeed support the hypothesis that
ccnA transcription may be regulated by CtrA.
In summary, CcnA is a ncRNA-regulated by cell cycle and putatively regulated in a positive
way by CtrA, with peak expression in the second half of DNA replication, coincident with CtrA
accumulation. Considering the high affinity of CtrA on the promoter of CcnA [35], future stud-
ies are necessary in order to investigate this putative CcnA transcriptional activation by CtrA.
CcnA transcription is required for the accumulation of CtrA
To understand the function of CcnA by overexpression, we fused the sequence of ccnA with
the first transcribed nucleotide of a Plac promoter in the vector pSRK [36] (see Materials and
methods). This vector was introduced in C. crescentus cells, and its +1 nucleotide was analyzed
in the overexpression strain in comparison with the WT native CcnA by primer extension (Fig
1B and 1C) (see Materials and methods). The level of CcnA in this inducible system, estimated
by primer extension (Figs 1B and S2A) and quantified by qRT-PCR (S1B Fig), confirmed
higher levels of CcnA expression compared to the WT. Cells overexpressing ccnA showed cell
cycle defects, such as slow growth (Fig 2A–2C), morphologies related to abnormal cell division
(Fig 2D), with an increased number of long stalks (S3 Fig). Several tests were performed in
order to characterize these phenotypes and provide a basis to better understand the mecha-
nisms behind them. By quantifying cell size parameters by using MicrobeJ [37], we discovered
that cells expressing ccnA ectopically were significantly more elongated and filamentous than
WT cells (Fig 2E). Stalk biogenesis, cell division, and inhibition of DNA replication are all
under the control of CtrA [34,38], suggesting that CcnA may feedback on CtrA production to
affect these processes. Indeed, upon expression/overexpression of CcnA, CtrA accumulates to
higher steady state levels with respect to the control strain, while in the loading control, MreB,
levels are constant (Fig 2F). We also checked the effect of high CtrA levels on the DNA replica-
tion behavior. As previously demonstrated, the overexpression of CtrA in a WT background
does not induce a block of DNA replication given its cell cycle–regulated proteolysis [39].
Flow cytometry experiments showed that overexpressing CcnA indeed did not induce a
change in DNA content (S4A and S4B Fig).
CtrA must be phosphorylated by a phosphorelay that includes CckA and ChpT to become
fully active (S5A Fig). The Phos-tag technique, implemented as previously described [40],
allowed us to evaluate the levels of CtrA~P upon overexpression of CcnA. The analysis
revealed that the band of CtrA~P was more intense than the band of nonphosphorylated CtrA
when CcnA was overexpressed (S5B Fig). As phosphorylation of CtrA is under the control of
the phosphorelay CckA-ChpT [18], we tested whether ChpT behavior may be affected in
mutants of CcnA. We used a YFP translational fusion of ChpT (ChpT-YFP) in order to under-
stand whether CcnA ectopic expression was causing a change in protein subcellular
PLOS BIOLOGY The non coding RNA CcnA controls cell cycle
PLOS Biology | https://doi.org/10.1371/journal.pbio.3001528 February 22, 2022 5 / 37

Fig 2. CcnA affects the cell cycle. (A) Growth curves following the expression of CcnA. WT cells and WT cells carrying either an empty pSRK (empty
vector) or a pSRK with ccnA under the control of an inducible Plac promoter (Plac-ccnA) were grown in PYE without IPTG. A volume of 200 μL of cells
back-diluted from stationary phase cultures to an OD600nm = 0.02 were then grown on 96 wells in PYE supplemented with 1 mM IPTG. Cell growth was
monitored overnight with a Spark-TM at 30˚C and a shaking (orbital) amplitude of 6 mm and a shaking (orbital) frequency of 96 rpm. Results are shown as
mean N = 3 biological replicates with 3 technical replicates. Raw data are provided in S7 Table. (B) Determination of the doubling time of cells expressing
CcnA. Doubling times of cells from (2A) were calculated by using the exponential growth equation (nonlinear regression) (Prism GraphPad 9.1.2).
Statistical analysis was performed using ANOVA with a Brown–Forsythe and Welch ANOVA tests and a Dunnett’s multiple comparisons test. ns,
difference not significant, ���: p.val = 0,0002. Data are in S9 Table. (C) WT cells, WT cells carrying either an empty vector or Plac-ccnA were grown
overnight in PYE at 30˚C and diluted to an OD600nm = 0.6. Samples were then serially diluted (100–10−6) and 4.5 μL of each dilution were spotted on a
PYE-Agar + 5 mM IPTG plate and incubated at 30˚C. WT cells without plasmid were used as negative control. (D) Phase contrast images of WT cells, WT
cells carrying an empty vector or Plac-ccnA grown in PYE without IPTG until OD600nm = 0.6. Scale bar = 2 μm. (E) Cells from (2D) were analyzed using
MicrobeJ [37] to assess cell length. Approximately 247 cells were analyzed for each condition, and statistical significance was determined using ANOVA
with Tukey multiple comparisons test. �: p.val = 0.0168 ����: p.val< 0.0001. Raw Data are provided in S8 Table. (F) WT cells, WT cells carrying an empty
vector or Plac-ccnA were grown in PYE at 30˚C until OD600nm = 0.6. Then, induction of Plac-ccnA was made by addition of IPTG 1 mM 30 min. As a
PLOS BIOLOGY The non coding RNA CcnA controls cell cycle
PLOS Biology | https://doi.org/10.1371/journal.pbio.3001528 February 22, 2022 6 / 37

localization and levels. Epifluorescent microscopy was used to observe the protein level of
ChpT-YFP (S5C Fig). Data were further analyzed by MicrobeJ (Materials and methods), and
results were compared to a strain carrying an empty vector showing that upon CcnA overex-
pression intensity and clustering of the signal increase in the ChpT-YFP strain background,
more specifically in elongated cells with long stalks (S5D and S5E Fig). Finally, we tested by
Western blot whether CcnA overexpression affected the protein level of ChpT, using antibod-
ies against the GFP protein that does recognize YFP and compared the levels of the ChpT-YFP
translational fusion in strains carrying either an empty vector or CcnA. Our results showed
that upon overexpression of CcnA, YFP-ChpT levels were higher than those of the empty vec-
tor (S5F Fig). This observation may suggest that CcnA overexpression increases CtrA phos-
phorylation by affecting the localization and levels of ChpT by an unknown mechanism so far.
In conclusion, an increase in CcnA expression induces an increase in the steady state levels
of CtrA protein, specifically in its phosphorylated form (CtrA~P). These changes in the CtrA
levels may well explain the cell cycle defects observed at the morphological and molecular lev-
els, notably increase of cell length, and long stalks.
The gene ccnA is located in the origin of replication (Fig 3A); therefore, its sequence, at
least partially, plays an essential role in the initiation of replication [41,42]. We attempted a
complete deletion of the ccnA sequence by 2-step recombination in the presence of an extra
copy of ccnA (Materials and methods), as previously described [43]. Considering that ccnAcoincides with an essential part of the origin of replication of the genome, the deletion of the
ccnA sequence was not successful, demonstrating that the genomic sequence of ccnA is essen-
tial [41]. We then applied different strategies to inactivate partial sequences of ccnA that kept
most of the origin of replication intact (S6 Fig) without success. Finally, we attempted to delete
the 45-bp long promoter region containing the CtrA box. The ccnA expression should be
under the control of CtrA; therefore, we hypothesized that the deletion of its box in the pro-
moter region should have a mild or no effect on the origin but impair the expression of the
ncRNA. The deletion of the promoter region was obtained, and the expression of ccnA in the
corresponding mutant was first tested by primer extension (Figs 3B and S7A) that showed the
absence of CcnA. We also used qRT-PCR (S1B Fig) using primers for ccnA and the 16S
sequence as reference (Materials and methods) in order to quantify the decrease of CcnA upon
deletion of its putative promoter (Δprom mutant). Upon deletion of the promoter region, we
observed a significant decrease of CcnA expression that may explain the cell cycle defects (phe-
notypes that are similar to silencing approach; see below) (S1B Fig).
The Δprom mutant was analyzed by growth curves (Fig 3C), and its morphology was
observed by microscopy (S8A Fig). This strain showed slow growth and more precisely a lon-
ger lag phase than the WT strain (Fig 3C). Western blots were performed using antibodies
against CtrA and MreB (Fig 3D). This mutant showed a decrease of CtrA steady state levels, as
expected considering the opposite effects in the overexpression strain (Fig 2F). On the con-
trary, MreB (loading control) remained stable, suggesting a specific effect on CtrA. As the dele-
tion of ccnA promoter removes also some elements of the origin of replication [42], we
performed flow cytometry analysis on synchronized populations to understand whether the
deletion of ccnA promoter of C. crescentus does not interfere with DNA replication initiation.
Flow cytometry analysis revealed that the markerless deletion of ccnA promoter does not have a
control of induction, WT cells carrying an empty vector were also incubated 30 min in presence of IPTG 1 mM and WT cells with no induction were used
as a control (NI = no IPTG) and (I = IPTG). Proteins were extracted and separated on a SDS-PAGE gel for Western blotting. CtrA and MreB (loading
control) proteins were revealed using specific polyclonal antibodies on nitrocellulose membranes. Results are representative of at least 2 independent
experiments (see S14 Fig for additional westerns). In comparison with the control strain (empty vector), cells over expressing CcnA show + 78% and + 54%
of CtrA in NI and I conditions, respectively. CcnA, cell cycle noncoding RNA A; WT, wild-type.
https://doi.org/10.1371/journal.pbio.3001528.g002
PLOS BIOLOGY The non coding RNA CcnA controls cell cycle
PLOS Biology | https://doi.org/10.1371/journal.pbio.3001528 February 22, 2022 7 / 37

Fig 3. Δprom cell cycle defects are rescued by CcnA in trans under the control of its own promoter. (A) Schematic representation of the origin of
replication and ccnA gene locus in C. crescentus. The origin of replication contains 5 full CtrA boxes, 2 strong and 5 weak DnaA boxes [44].
Transcription of hemE gene is important for DNA replication and can be negatively regulated by CtrA when present [44,45]. The chromosome replication
initiator protein DnaA unwinds the DNA from the AT Rich region on the chromosome when CtrA is absent. The ccnA gene is 182 nt long and contains 3
DnaA weak boxes, a CtrA box in its promoter region and a CtrA box in its terminal region. (B) Determination of the transcriptional +1 site of CcnA
ncRNA by primer extension. Total RNA extracted from WT cells, deleted ccnA promoter (Δprom), and containing PccnA-ccnA (Δprom + PccnA-ccnA)
were used with radiolabelled oligo. The same oligo was used for ccnA sequencing (CGTA). The +1 signal is represented by the arrow. See S7A Fig for
PLOS BIOLOGY The non coding RNA CcnA controls cell cycle
PLOS Biology | https://doi.org/10.1371/journal.pbio.3001528 February 22, 2022 8 / 37

strong effect on DNA replication but probably causes a delay in the initiation of DNA replication
(Fig 3E). Given the lower level of CtrA in the Δprom strain, we would expect DNA replication to
occur at a higher rate in this mutant. However, we observed normal initiation of DNA replication
in the WT strain with a shift in peak intensity from 30 min of the cell cycle demonstrating that
DNA replication has begun and a total shift from 1 chromosome (1N) to 2 chromosomes (2N) at
60 min whereas the Δprom strain remained blocked with 1N until 60 min and began to accumu-
late 2N content only at 60 min given the second peak that was observed. We estimated the per-
centage of 1N in Δprom cells at 34.65% +/− 3.88% and 2N at 63.85% +/- 3.46%.
We complemented the Δprom strain with a WT copy of ccnA under the control of its own
promoter in a low-copy vector (PccnA-ccnA). We were interested in understanding whether a
deletion of a portion of CORI was the sole reason of the Δprom phenotypes or whether it was
due to a lack of ccnA transcription.
Indeed, the Δprom was almost entirely complemented by an extra copy of the ccnA gene, as
DNA replication (Fig 3E), growth (S8B Fig), and CtrA levels (Fig 3D) were rescued by the
extra copy of CcnA, demonstrating that the phenotype of Δprom was mostly related to the
absence of CcnA.
An alternative, less invasive strategy with respect to the origin of replication was to overex-
press an antisense of CcnA (CcnA-as) in order to silence the RNA of CcnA. A reverse comple-
mentary sequence of ccnA driven by a Plac promoter was cloned, as described in the previous
section for the sense sequence and expressed in C. crescentus in order to demonstrate a nega-
tive effect on CcnA activity. Based on western blots, the expression of the CcnA-as, as the
Δprom strain, showed a decrease of CtrA steady state levels (S9A Fig). Flow cytometry analysis
also showed an accumulation of chromosomes (N� 3) in the presence of CcnA-as (S9B and
S9C Fig). Moreover, an increase of doubling time was observed (S9D Fig). These results sug-
gested that the expression of the antisense phenocopy Δprom, so it may indicate an inactiva-
tion of CcnA activity. This result, together with the viability of the ccnA Δprom strain, also
suggests that the inactivation of CcnA is not lethal.
In conclusion, both overexpression and low levels of CcnA showed consistent results that
suggested that CcnA promotes the accumulation of CtrA and possibly other genes expression
products. Therefore, we wondered if this activity was due to a direct binding by CcnA to the 50
untranslated region (50 UTR) of ctrA and potentially other genes.
CcnA potentially interacts with mRNAs of ctrA, gcrA, and other cell cycle genes
In order to identify RNAs that were targeted in vivo by CcnA and test whether ctrA mRNA
was a direct target of CcnA, we performed the technique called MAPS (MS2-affinity
controls. Data are representative of 2 independent experiments. (C) Growth curves of cells deleted from ccnA promoter. WT cells and Δprom cells were
grown overnight in PYE at 30˚C. A volume of 200 μL of cells back-diluted from stationary phase cultures to an OD600nm = 0.02 were then grown on 96
wells in PYE. Cell growth was monitored overnight with a Spark-TM at 30˚C and a shaking (orbital) amplitude of 6 mm and a shaking (orbital) frequency
of 96 rpm. Results are shown as mean N = 2 biological replicates with 3 technical replicates. Raw data are provided in S7 Table. (D) WT cells, Δprom cells,
Δprom cells carrying either a pMR10 low-copy plasmid harboring ccnA under the control of its own promoter (Δprom + PccnA-ccnA) or ccnA or its
antisense under the control of a Plac promoter (Δprom+ Plac-ccnA, Δprom + Plac-ccnA-as) were grown in PYE at 30˚C until OD600nm = 0.6. For Δprom+Plac-ccnA, Δprom + Plac-ccnA-as cells, expression of ccnA or its antisense was made by addition of IPTG 1 mM 30 min. Proteins were extracted and
separated on a SDS-PAGE gel for western blotting. CtrA and MreB (loading control) proteins were revealed using specific polyclonal antibodies on
nitrocellulose membranes. Results are representative of at least 2 independent experiments with similar results (see S7B and S14D Figs for controls). (E)
Flow cytometry profiles after SYTO 9 staining showing DNA content of synchronized WT cells, Δprom cells, Δprom cells carrying ccnA under its own
promoter (Δprom + PccnA-ccnA) and as controls WT cells carrying an empty low-copy plasmid pMR10 (WT + empty vector) or Δprom cells carrying and
empty low-copy plasmid pMR10 (Δprom + empty vector). Synchronization of cells was performed as described in Material and methods. Pure G1 (1N)
swarmer cells were isolated by Percoll for density gradient, and DNA replication over the cell cycle was followed on synchronized cells at different time
point. A total number of 300,000 particles were analyzed by flow cytometry using the blue laser (488 nm) and filter 525/30 nm. Results are representative of
3 biological replicates. CcnA, cell cycle noncoding RNA A; ncRNA, noncoding RNA; WT, wild-type.
https://doi.org/10.1371/journal.pbio.3001528.g003
PLOS BIOLOGY The non coding RNA CcnA controls cell cycle
PLOS Biology | https://doi.org/10.1371/journal.pbio.3001528 February 22, 2022 9 / 37

purification coupled with RNA sequencing) as previously described [46]. This technique relies
on the fusion of a ncRNA of interest with the RNA aptamer MS2 used as a tag at the 50 of the
ncRNA. MAPS approach involves the use of a protein called MS2-coat with a high affinity for
the MS2 RNA aptamer. This technique allows the identification of RNAs or proteins directly
interacting with a tagged RNA (S10 Fig). We indeed constructed a version of CcnA tagged
with an MS2 RNA aptamer able to bind the protein MS2-MBP immobilized on an amylose
resin. As a negative control, an untagged ccnA was cloned in order to compare results specific
to the MAPS technique. Strains expressing MS2-ccnA or ccnA (introduced in the same pSRK
plasmid type previously used for ccnA overexpression) were lysed, and soluble cell content was
loaded onto an amylose column containing MS2-MBP fusion. RNA was purified as previously
described (Materials and methods) [46].
Eluted RNAs, trapped in the amylose column in the presence of MS2-CcnA or non-tagged
CcnA, were characterized by RNAseq, and results were analyzed (S1 Table; see Materials and
methods for a detailed protocol of analysis). First, as a control, we looked for the presence of
reads in the vicinity of ccnA only in the MS2-CcnA strains (S11A Fig). Among other candidate
targets (S12 Fig), the ctrA mRNA was detected (S11B Fig). This result is in accord with our pre-
vious results that CcnA overexpression and down-regulation affected CtrA expression. The
extent of CcnA-regulated targets is bigger than just ctrA mRNA. As shown in S12 Fig and S1
Table, other mRNAs, including gcrA, are potentially targeted by CcnA. A general observation
of candidate targets of CcnA is that most of them belong to the CtrA and GcrA regulons, such
as those encoding motility proteins (S12 Fig, S1 Table).
We also tagged the 50 UTRs of ctrA with the MS2 aptamer (mRNAs generated by its P1 or
P2 promoter) in order to determine the putative interaction with CcnA. We expressed the
MS2-tagged UTRs in C. crescentus cells, and we looked for the enrichment of CcnA in the
MS2-P1 and MS2-P2 UTRs associated to the correct overexpression of the 50 UTRs (S11C
Fig). We demonstrated that only the UTR of ctrA mRNA transcribed by the P2 promoter pulls
down CcnA (S11D Fig). Although P1 obviously contains the sequence present in P2, it may
form different secondary structures that could mask the CcnA binding regions. This final
result consolidates the observation that CcnA may be indeed associated in vivo with the 50
UTR of ctrA expressed by the promoter P2 and not by P1. We also analyzed all possible inter-
action candidates bound to the 50 UTR of ctrA P1 and P2 (S1 Table). This analysis revealed
that several other noncharacterized ncRNAs might interact with the P1 and P2 50 UTRs of
ctrA. Their specific role should be investigated in future studies.
CcnA binds ctrA and gcrA mRNAs in vitroMAPS revealed a putative interaction between CcnA and P2-50 UTR of ctrA and, interestingly,
among master regulators of cell cycle, the gcrA mRNA (S1 Table, S12 Fig). To better character-
ize/validate these interactions, we performed in vitro probing experiments. Results showed 2
regions of protection by CcnA for ctrA 50 UTR from the promoter P2 (Fig 4A). Concerning
the gcrA mRNA 50 UTR, we used data derived from 50 RACE experiments at the genome scale
[32]. Results obtained with in vitro probing experiments for gcrA 50 UTR instead showed only
one region of protection by CcnA (Fig 4B). A common feature of both gcrA and ctrA P2 pro-
tections by CcnA was the sequence 50-GGGG-30 (Fig 4A and 4B) that corresponds to the
region of CcnA belonging to a loop (Loop A) (Fig 4C). EMSA experiments using P2-ctrA and
gcrA 50 UTRs confirmed the interaction with CcnA (WT). The binding is diminished with a
CcnA mutated in the Loop A (CcnAGGGG) (Fig 5A–5F). We also performed EMSA on mutated
P2-ctrA (P2-ctrACCCC) and gcrA (gcrACCCC), and there was also a decrease of the CcnA binding
(S2B and S2C Fig). However, CcnAGGGG was not able to compensate the mutations on P2-
PLOS BIOLOGY The non coding RNA CcnA controls cell cycle
PLOS Biology | https://doi.org/10.1371/journal.pbio.3001528 February 22, 2022 10 / 37

ctrA or grcA 50 UTRs. Considering the putative importance of the Loop A for the interaction
between CcnA, ctrA, and gcrA mRNAs, we searched for the presence of the GGGG motif in
the 50 UTRs of MAPS targets (S1 Table) in comparison with a dataset of UTRs randomly
selected in the genome of C. crescentus. Results showed that 35% of CcnA-bound MAPS-posi-
tive candidate targets possessed GGGG (p-value = 0.02) (S12 Fig).
As a stretch of CCCC, present in the Loop A region of CcnA, is protecting a putatively con-
served GGGG motif in P2 ctrA 50 UTR and gcrA 50 UTR, we constructed mutant of CcnA of
the Loop A by introducing mutations in the active loop “CCCC to GGGG” (CcnAGGGG). This
mutated version of CcnA was then tested in vivo using the same pSRK expression system as
previously. The mutation CcnAGGGG in Loop A reduced the growth defect phenotype of CcnA
overexpression (Fig 6A–6C). Flow cytometry analysis of the Loop A mutant revealed a
Fig 4. CcnA interacts directly in vitro with the 50 UTR of P2-ctrA mRNA and 50 UTR of gcrA mRNA. (A) Inline (MgCl2) probing of 50 end-radiolabeled
P2-ctrA+143 incubated in presence (+) or absence (−) of CcnA ncRNA. OH, alkaline ladder; T1, RNase T1 ladder. The numbers to the left indicate sequence
positions with respect to the +1 of the transcript. (B) Lead acetate probing of 50 end-radiolabeled gcrA+209 incubated in presence (+) or absence (−) of CcnA
ncRNA. OH, alkaline ladder; T1, RNase T1 ladder. The numbers to the left indicate sequence positions with respect to the +1 of the transcript. (C)
Secondary structure of CcnA RNA predicted using mFold algorithm [48]. The predicted free energy of the thermodynamic ensemble is −56.37 kcal/mol.
CcnA Loop A is shown in red and is composed of a stretch of « CCCC ». CcnA, cell cycle noncoding RNA A; ncRNA, noncoding RNA; 50 UTR, 50
untranslated region.
https://doi.org/10.1371/journal.pbio.3001528.g004
PLOS BIOLOGY The non coding RNA CcnA controls cell cycle
PLOS Biology | https://doi.org/10.1371/journal.pbio.3001528 February 22, 2022 11 / 37

Fig 5. CcnA mutation of Loop A decreases the interaction with the 50 UTR of P2-ctrA mRNA and 50 UTR of gcrA mRNA. (A)
Mutation of the ctrA mRNA (ctrAGGGG) and ncRNA CcnA (CcnAGGGG) binding site (shown in red in Fig 4A). Solid lines indicate CcnA
binding sites on ctrA. Boxed gray text corresponds to the nucleotides mutated. The translation start codon is shown in bold. (B)
Mutation of the gcrA mRNA (gcrAGGGG) and ncRNA CcnA (CcnAGGGG) binding site (shown in red in Fig 4B). Solid lines indicate CcnA
binding sites on gcrA. Boxed gray text corresponds to the nucleotides mutated. (C) A final concentration of 5 nM of P2-ctrA (+143 nt
from the P2-ctrA promoter) RNA fragment was incubated with increasing concentration of CcnA (top) or CcnAGGGG (bottom) ncRNA.
% bound RNA with ncRNA CcnA (black) or CcnAGGGG (white) is showed (D). Data represent the mean of 2 independent
PLOS BIOLOGY The non coding RNA CcnA controls cell cycle
PLOS Biology | https://doi.org/10.1371/journal.pbio.3001528 February 22, 2022 12 / 37

dominant negative phenotype similar to the antisense expression with accumulation of chro-
mosomes (n� 3) (Fig 6D and 6E). These results suggest that the growth defect phenotype
observed when inducing the WT version of CcnA could be mainly due to the interaction of
the Loop A of CcnA to the mRNAs of gcrA and ctrA. As the interaction between CcnA and
GcrA was confirmed in vitro, we asked whether this binding was suggesting a possible regula-
tion of CcnA on the GcrA protein levels. Therefore, we used the overexpression of CcnA and
measured the level of GcrA using western blot and anti-GcrA antibodies. The analysis of GcrA
in a ccnA overexpression strain revealed a decrease of GcrA steady state protein levels in com-
parison with a WT strain carrying the empty vector (S14B Fig), suggesting the presence of
both a CtrA-mediated inhibition of gcrA transcription and, in addition, a direct effect on GcrA
expression by CcnA binding to its mRNA. However, besides showing a direct interaction
between CcnA and the 50 UTR of gcrA, we are not able to disentangle the effect of CtrA regula-
tion on GcrA activity from a potential direct regulation of the gcrA mRNA by CcnA.
Taken together, those results suggest that the region corresponding to Loop A plays a signif-
icant role in the CcnA activity, confirming both the in vitro and the MAPS results shown previ-
ously. However, other regions can definitely play important roles in the activity of CcnA that
will require further analysis. Moreover, CcnA seems to have a second important target in the
cell, GcrA, for which the ncRNA potentially plays a negative role. Further analysis using INTA
RNA [47] confirmed that at the prediction level those UTRs are potentially able to interact
with the LoopA region of CcnA (S14E Fig).
CcnA affects the CtrA and GcrA regulons
RNAseq was used to compare the strains overexpressing ccnA to the strains expressing ccnA-as in biological triplicates in order to reveal RNAs affected by CcnA with the hypothesis that it
may show links with CtrA and GcrA regulons.
Differentially expressed genes (DEGs), identified when comparing the sense and antisense
expressing strains, were considered for the analysis (S12 Fig, S2 Table). These results were also
integrated with additional information such as (i) the presence of full or half CtrA binding
boxes as identified by a Position Weight Matrix scan of the C. crescentus genome [33]; (ii) the
abundance of reads from a ChIP-Seq experiment aimed at characterizing GcrA occupancy
[15]; (iii) the genes whose expression levels change significantly in a ΔccrM strain [49]; (iv) the
essential genes as revealed with Tn-seq [41]; (v) genes with cell cycle–dependent expression
[50]; (vi) genes positive in MAPS; and, finally, (vii) genes possessing the motif GGGG (comple-
mentary to CcnA LoopA). The analysis revealed 215 genes differentially expressed between the
2 conditions (CcnA versus CcnA-as). The CtrA regulon is composed of genes activated and
repressed by the phosphorylated form of CtrA, which recognizes a full palindromic or half site
[32]. Among the 215 genes, we found a statistically significant enrichment of CtrA binding
sites, both half and full [33]. To calculate significance of enrichments, we used a one-sided
binomial exact test (binom.test in R) and got a p-value = 0.0065 for the full site, and a p-
value = 0.0001 for the half site. This finding suggests that upon changes of CcnA levels, the
most affected regulon is CtrA’s.
We also looked for DEGs that could be part of the GcrA regulon. Many genes identified
contained a GcrA binding region, suggesting that the GcrA regulon is differentially modulated
experiments ± SD. Data are in S9 Table. (E) A final concentration of 5 nM of gcrA RNA fragment was incubated with increasing
concentration of CcnA (top) or CcnAGGGG (bottom). % bound RNA with ncRNA CcnA (black) or CcnAGGGG (white) is showed (F).
Data represent the mean of 2 independent experiments ± SD. Data are in S9 Table. CcnA, cell cycle noncoding RNA A; ncRNA,
noncoding RNA; 50 UTR, 50 untranslated region.
https://doi.org/10.1371/journal.pbio.3001528.g005
PLOS BIOLOGY The non coding RNA CcnA controls cell cycle
PLOS Biology | https://doi.org/10.1371/journal.pbio.3001528 February 22, 2022 13 / 37

Fig 6. CcnA Loop A mutant shows attenuated cell cycle defects. (A) Growth curves following the expression of
CcnA mutated in its Loop A (Plac-ccnAGGGG). WT cells and WT cells carrying either an empty pSRK (empty vector)
or a pSRK with ccnA under the control of an inducible Plac promoter (Plac-ccnA) or Plac-ccnAGGGG mutated in its
loop A were grown overnight in PYE without IPTG. A volume of 200 μL of cells back-diluted from stationary phase
cultures to an OD600nm = 0.02 were grown on 96 wells in PYE supplemented with 1 mM IPTG. Cell growth was
monitored overnight with a Spark-TM at 30˚C and a shaking (orbital) amplitude of 6 mm and a shaking (orbital)
frequency of 96 rpm. Results are shown as mean N = 3 biological with 3 technical replicates. Raw data are provided in
S7 Table. Note that all growth curves data of Figs 2, 6, and S9 were acquired in the same days of their respective
biological replicates and compared to each other. (B) Determination of the doubling time of cells expressing Plac-ccnAGGGG. Doubling times of cells from (6A) were calculated by using the exponential growth equation (nonlinear
regression) (Prism GraphPad 9.1.2). Statistical analysis was performed using ANOVA with a Brown–Forsythe and
Welch test with a Dunnett’s multiple comparisons test. ns, difference not significant, �: p.val = 0.0396 ���: p.
val = 0.0009. Raw data are provided in S7 Table. (C) WT cells, WT cells carrying an empty vector, Plac-ccnA or Plac-ccnAGGGG were grown overnight in PYE at 30˚C and diluted to an OD600nm = 0.6. Samples were then serially diluted
(100–10−6), and 4.5 μL of each dilution were spotted on a PYE-Agar plate with or without IPTG 1 mM and incubated
at 30˚C. WT cells without plasmid were used as negative control. (D) Flow cytometry profiles after SYTO 9 staining
showing DNA content of WT cells, WT cells carrying either an empty pSRK (empty vector) ccnA under the control of
a Plac promoter (Plac-ccnA) or ccnA Loop A variant (Plac-ccnAGGGG) grown in PYE until OD600nm = 0.3. Then,
induction of Plac-ccnA or Plac-ccnAGGGG was made by addition of IPTG 1 mM 30 min. Cells without induction were
grown for an additional 30 min as a control of growth phase. A total number of 300,000 particles were analyzed by flow
cytometry. (E) Proportions of cells harboring 1N, 2N, and�3N DNA in the population were analyzed by gating the
histograms in (E). Data are representative of 3–5 biological replicates. Statistical analyses were carried out using
ANOVA Tukey test. ns, difference not significant, ��: p.val< 0.01, ���: p.val< 0.001, ����: p.val< 0.0001. CcnA, cell
cycle noncoding RNA A; WT, wild-type.
https://doi.org/10.1371/journal.pbio.3001528.g006
PLOS BIOLOGY The non coding RNA CcnA controls cell cycle
PLOS Biology | https://doi.org/10.1371/journal.pbio.3001528 February 22, 2022 14 / 37

in presence (ccnA) or absence (ccnA-as) of CcnA. Most of the genes of S12 Fig are cell cycle
regulated as expected considering that both GcrA and CtrA are controlling those genes (S12
Fig). Therefore, RNAseq allowed getting a full picture of the effects of CcnA activity perturba-
tions, which affect a significant fraction of the transcriptome involved in cell cycle regulation.
We also tested if genes affected by overexpression and inactivation of CcnA were also
potentially interacting with CcnA, as revealed by MAPS analysis (S12 Fig, S1 Table). Results
showed that several genes that change expression levels in mutants of CcnA are in fact putative
direct targets of the ncRNA. Among those genes, many possessed the GGGG motif. For exam-
ple, among the cell cycle regulators (highlighted in red in S12 Fig), we found the mRNA
encoding the transcriptional regulator MraZ, involved in negative regulation of cell division
processes in E. coli [51], the GGDEF diguanylate cyclase DgcB, the flagellar protein FlaG, or
the polar organelle development protein PodJ. In addition, rodZ mRNA was also found among
the CcnA targets and is involved in cell elongation regulation and localizes at PG synthesis
sites within the cell [52]. Interstingly, a new study revealed genes expression changes following
a cold stress in C. crescentus and identified the ncRNAs that are up-regulated under this stress.
In particular, 31 ncRNAs including CcnA were conditionally expressed. In this study, CcnA
was identified as the most up-regulated ncRNA (11-fold), further suggesting that CcnA may
also be involved in a posttranscriptional response to cold stress [53]. These findings are consis-
tent with the in vivo targets of CcnA identified in our study, which are the mRNAs of cspA and
cspB encoding 2 cold shock proteins CspA and CspB [54]. Despite our primary goal to associ-
ate CcnA with the cell cycle, these data nonetheless support that CcnA might also have a signif-
icant role in responding to environmental stress. In the future, it will be worth testing the
response to various stresses as cold stress or osmotic stress using mutants of ccnA to under-
stand its role during unfavorable conditions.
In conclusion, the RNAseq results consolidate the potential effect of CcnA on CtrA and
GcrA regulons as regulator of CtrA and GcrA protein levels but also showing a CcnA link with
mRNAs of genes controlled by those master regulators as revealed by MAPS. Moreover, the
overexpression of ccnA-as shows opposite effects than the overexpression of WT ccnA.
Overexpression of CcnA complements cell cycle defects
As CcrM-dependent adenosine methylation sites (GAnTC) are connected to ctrA transcription
by its own P1 promoter, we asked whether the expression of CcnA (or its antisense) was rescu-
ing the ΔccrM mutant cell cycle severe phenotype [55], considering that CcrM methylation is
required to recruit GcrA at the P1 promoter region and therefore activate ctrA transcription
[17] (S13 Fig). We attempted to introduce the plasmid containing ccnA and ccnA-as in the
ΔccrM mutant and analyzed the different phenotypes. First, we were unable to introduce the
plasmid carrying ccnA-as into ΔccrM, suggesting an incompatibility between the 2 genetic con-
structs, while the electroporation frequency for WT was as expected. This can be explained con-
sidering that both CcrM and CcnA are important to properly express CtrA; therefore, removing
both mechanisms may be lethal. On the contrary, the expression of CcnA in ΔccrM was viable
and indeed able to suppress cell cycle defects of the mutant (Fig 7A). Notably, the severe mor-
phological defects of ΔccrM were rescued (Fig 7A–7C), as well as the motility defects (Fig 7D).
We also noticed that ΔccrM cells rescued by CcnA were not curved (S14A Fig). This suggests
that ΔccrM still retains some of the features that are independent from CtrA, as the cell curva-
ture depends on the gene creS (whose expression depends on GcrA and methylation) encoding
for the crescentin responsible for the cell curvature of C. crescentus [17].
We asked whether CcnA was indeed able to increase CtrA steady state levels in the ΔccrMstrain (Fig 7E). As most of the GcrA-CcrM–dependent promoters, ctrA P1 is sigma-70
PLOS BIOLOGY The non coding RNA CcnA controls cell cycle
PLOS Biology | https://doi.org/10.1371/journal.pbio.3001528 February 22, 2022 15 / 37

Fig 7. CcnA rescues the CcrM loss of function phenotype. (A) Phase contrast images of WT cells, WT cells carrying
an empty pSRK (empty vector), ΔccrM cells, ΔccrM carrying a plasmid with ccnA under the control of a Plac promoter
(ΔccrM+ Plac-ccnA) or ΔccrM cells carrying an empty vector (ΔccrM+ empty vector) grown in PYE at 30˚C until
OD600nm = 0.6. Scale bar = 2 μm. (B, C) Cells from (7A) were analyzed using MicrobeJ [37], and 374 cells were
analyzed to assess cell length and cell width. Statistical significance was determined using ANOVA with Sıdak’s
multiple comparisons test. ns, difference not significant ��: p.val = 0.0050 ����: p.val< 0.0001. Raw data are provided
in S8 Table. (D) Swarming assay on 0.25% soft agar plates. A volume of 1 μL of each culture from cultures of Fig 7A
was deposited into the soft agar and incubated at 30˚C for 5 to 6 d. N = 3. The diameter in cm of each mobility halo
was measured with Fiji and reported in S4 Table. Statistical significance was determined using ANOVA with Sıdak’s
multiple comparisons test. ns, difference not significant �: p.val = 0.0406, ���: p.val = 0.0003, ����: p.val< 0.0001. Data
are in S9 Table. (E) WT cells, ΔccrM cells, ΔccrM cells carrying an empty vector or Plac-ccnA were grown in PYE at
30˚C until OD600nm = 0.6. Then, induction of Plac-ccnA was made by addition of IPTG 1 mM 30 min. As a control of
induction, ΔccrM cells carrying an empty vector were also incubated 30 min in the presence of IPTG 1 mM. Proteins
were extracted and separated on a SDS-PAGE gel for Western blotting. CtrA and MreB (loading control) proteins
were revealed using specific polyclonal antibodies on nitrocellulose membranes. In comparison with the control strain
(empty vector), cells over expressing CcnA show + 35% and + 30% of CtrA in NI and I conditions, respectively. CcnA,
cell cycle noncoding RNA A; WT, wild-type.
https://doi.org/10.1371/journal.pbio.3001528.g007
PLOS BIOLOGY The non coding RNA CcnA controls cell cycle
PLOS Biology | https://doi.org/10.1371/journal.pbio.3001528 February 22, 2022 16 / 37

dependent, thus able to provide a basal level of transcription even in absence of methylation.
Results clearly showed that CcnA can increase CtrA steady state levels in the ΔccrM mutant
closer to the WT levels. Presumably, the lower level of CtrA depends on the amount of mRNA
corresponding to P2 that may be lower in the ΔccrM background. Moreover, the mechanism
by which CcnA increases CtrA protein levels is independent from CcrM, possibly acting on
the P2 promoter.
To provide a more complete characterization of CcnA role, we combined CcnA ectopic
expression (sense or antisense) with ΔpleC, a mutant impaired in the negative control of DivK
phosphorylation level. By considering that (i) DivK~P inhibits CtrA stability and activity and
(ii) that PleC is DivK’s phosphatase, CtrA levels in the ΔpleC mutant are low (Fig 8A). There-
fore, overexpression of CcnA might compensate the defects in this mutant, restoring a pheno-
type resembling the WT.
We introduced ccnA or ccnA-as in ΔpleC mutant and observed the morphology, motility in
soft agar plates, sensitivity to the CbK phage, and stalk length. In agreement with our reason-
ing, the ectopic expression of CcnA was able to rescue ΔpleC defects, restoring stalks and
motility while the expression of the CcnA-as caused a very severe phenotype (Fig 8B–8E). Elec-
tron microscopy was used to characterize more in details the phenotypes (Fig 8B). Results
showed that upon CcnA expression (Fig 8C), stalks were longer in the ΔpleC background cells
compared to WT cells (Fig 8D) and motility was also partially restored (Fig 8E). On the con-
trary, the expression of the antisense induced a severe growth and morphological phenotype
with absence of polar structures in the majority of cells (Fig 8C and 8D).
We asked whether this suppression was just obtained by increasing the level of CtrA or if it
was also able to affect the phosphorylation and, therefore, the activity of CtrA. We measured
CtrA~P by Phos-Tag technique (S15 Fig). This analysis revealed that the CcnA expression was
indeed able to increase protein levels of CtrA and slightly CtrA~P in ΔpleC.
Finally, we measured the sensitivity of C. crescentus to the phage CbK, which is adsorbed by
the flagellum and enters the cells by attachment to the pili structures (Fig 8F). As the main sub-
unit PilA of the pilus is completely under the control of CtrA, a ΔpleC mutant has an unfunc-
tional flagellum and no pili, making this strain resistant to CbK infection [56,57]. Results
showed that the expression of CcnA was able to completely restore the sensitivity of C. crescen-tus to CbK to WT levels, suggesting a de novo synthesis of the pili. The expression of CcnA-as
did not change the resistance to the phage infection of the ΔpleC mutant, as shown by phage-
induced lysis (Fig 8F).
Conservation of CcnA in the class AlphaproteobacteriaConsidering the key role of CcnA in C. crescentus coordinating CtrA and GcrA, two of the
principal master regulators of cell cycle, we asked whether its function was conserved in bacte-
ria that share the regulatory mechanisms by those master regulators. We considered a well-
known bacterial model, S. meliloti, a symbiotic nitrogen-fixing organism. S. meliloti shares
with C. crescentus most of the regulatory circuit driving cell cycle, including CtrA [40,60].
Therefore, we took advantage of the expression system we used for C. crescentus, which is com-
patible with expression in S. meliloti [36]. Expressing C. crescentus CcnA in S. meliloti slowed
growth and caused an abnormal cellular morphology (S16A Fig) in comparison with the same
vector expressing the empty plasmid. We therefore asked whether this alteration in cell mor-
phology was due to a change in CtrA steady state levels (S16B Fig). Indeed, the overexpression
of ccnA in S. meliloti cells showed an increase of CtrA proteins levels in comparison with the
strain containing the empty vector, suggesting a similar mechanism than C. crescentus. Results
showed that CcnA of C. crescentus is able to induce a cell cycle defect, which is branched cells
PLOS BIOLOGY The non coding RNA CcnA controls cell cycle
PLOS Biology | https://doi.org/10.1371/journal.pbio.3001528 February 22, 2022 17 / 37

Fig 8. CcnA rescues the pleiotropic phenotypes of ΔpleC. (A) Schematic representation of CtrA-DivK negative
feedback loop in C. crescentus. DivK phosphorylation level is controlled by its kinase DivJ and its phosphatase PleC. At
the swarmer cell pole, DivK must be dephosphorylated in order to enable the phosphorelay CckA-ChpT-CtrA. At the
stalk pole, the presence of DivJ/absence of PleC keeps DivK fully phosphorylated, leading to a block of CckA scaffold
DivL. The absence of PleC causes a decrease of CtrA [58], both at the phosphorylation and protein levels as CtrA-P
controls its own transcription from the promoter P2. (B) Electron microscopy images of WT cells, ΔpleC cells, and
ΔpleC cells carrying either Plac-ccnA or Plac-ccnA-as cells grown in PYE without IPTG at 30˚C until OD600nm = 0.6.
(C) Phase contrast images of ΔpleC cells carrying a plasmid with ccnA or its antisense ccnA-as under the control of a
Plac promoter (ΔpleC+ Plac-ccnA or ΔpleC+ Plac-ccnA-as) or ΔpleC cells carrying an empty vector (ΔpleC+ empty
vector) grown in PYE at 30˚C until OD600nm = 0.6. Induction of ccnA or ccnA-as was made when cells reached 0.6 by
the addition of IPTG 1 mM for 30 min. Scale bar = 2 μm. (D) Violin plots of stalks length per cell for each strain tested
in Fig 8C plus a WT C. crescentus as a control for normal stalk length. Stalk length was measured by using BacStalk
software [59]. Statistical significance was determined using ANOVA with Brown–Forsythe and Welch’s tests with a
Dunnett’s T3 multiple comparisons test. �: p.val = 0.0117; ����: p.val< 0.0001. Raw data are in S5 Table. (E) Swarming
assay on 0.25% soft agar plates. A volume of 1 μL of each culture from cultures of Fig 8C was deposited into the PYE
soft agar and incubated at 30˚C for 5 to 6 d. N = 3. The diameter in cm of each mobility halo was measured with Fiji
PLOS BIOLOGY The non coding RNA CcnA controls cell cycle
PLOS Biology | https://doi.org/10.1371/journal.pbio.3001528 February 22, 2022 18 / 37

and a clear cell division retard, similar to that observed in a delta-divJ mutant [40] and pre-
sumably linked to an increased level of CtrA.
The activity of C. crescentus CcnA in these 2 alphaproteobacterial species suggested that a
putative homologous gene should be present in S. meliloti. We therefore scanned the genomes
of the alphaproteobacterial species using GLASSgo [61] aiming to find CcnA homologs. We
found a conservation of CcnA in several closely related species (S16C Fig). As expected CcnA
has closer homologs in the Caulobacterales, but it can also be found in the other families except
for the Rickettsiales. Considering that Rickettsiae have experienced a massive reduction of the
genome, it is reasonable to speculate that CcnA may be a conserved factor that has coevolved
with CtrA, participating in the ancestors to its regulation of transcription. Taken together,
these results prompted us to compare 50 UTRs of ctrA in these 2 organisms in order to find
shared motifs potentially complementary to CcnA sequence and in conclusion involved in
ctrA translation. By using an in silico analysis made with the Clustal Omega software (Madeira
and colleagues, 2019), we found that the stretch of GGGG putatively interacting with CCCC of
CcnA within its Loop A is conserved in the ctrA 50 UTR of S. meliloti separated from the start
codon by 6 nucleotides instead of 3 for C. crescentus CcnA (S16D Fig). This may explain why
CcnA from C. crescentus is able to increase CtrA protein level in this species, even if a “CcnA-
like” homolog was not clearly detected in S. meliloti.
Discussion
The origin of replication of C. crescentus is necessary for replication of the chromosome and
therefore represents one of the most important regions of the genome. CtrA binding sites at
the origin of replication play an inhibitory role on the replication of DNA as they allow
CtrA~P to compete out the binding of DnaA [44]. Transcriptomic data indicated that some
parts were nonetheless transcribed; in particular, a short gene was found transcribed
(CCNA_R0094), corresponding to an essential genome region highlighted by the analysis of
TnSeq data [32,41,62]. This gene is surrounded by CtrA boxes at −23 bp from the TSS and at
the very end of the gene [33]. In the process of understanding the role of this ncRNA, belong-
ing to the origin of replication, named here CcnA, we found that CcnA is a regulator of cell
cycle, specifically linked to 2 master regulators, CtrA and GcrA. To the best of our knowledge,
this is one of the first demonstrations of a ncRNA playing a stress-independent role in the cell
cycle regulation of a bacterium. Examples of regulatory ncRNAs controlling key cellular func-
tions can be found elsewhere in addition to the nowadays classical RyhB pathways controlling
iron utilization in E. coli, such as the Qrr ncRNAs in Vibrio species, that participate in quorum
sensing, or NfiS, a positive regulator of the nitrogenase in Pseudomonas stutzeri A1501 [63],
which is folded into a compact structure that acts on the mRNA of nifK, encoding the β-sub-
unit of the MoFe protein of the nitrogenase enzymatic complex, enhancing its translation.
Using qRT-PCR, we clearly showed that CcnA starts accumulating in the second half of the
S-phase, coincidentally with the accumulation of CtrA, presumably as an effect of ctrA tran-
scription from its promoter P1. Using several approaches, we hypothesized that expression of
ccnA depends on cell cycle, presumably by CtrA. We also found that once CcnA starts to
and reported in S4 Table. Statistical significance was determined using ANOVA with Sıdak’s multiple comparisons
test. ns, difference not significant, �: p.val = 0.0242, ��: p.val = 0.0039, ����: p.val< 0.0001. Data are in S9 Table. (E)
CbK phage sensitivity assay. A bacterial layer of cultures from WT, ΔpleC + ccnA, ΔpleC, or ΔpleC + ccnA-as was
deposited into a PYE-Agar plate and incubated at 30˚C. CbK phages were serially diluted (100–10−8), and 4.5 μL of
each phage dilution were spotted on top of the cultures and incubated at 30˚C to visualize cells lysis. WT and ΔpleCcells were used as a control of the presence or absence of lysis, respectively. CcnA, cell cycle noncoding RNA A;
CtrA-P, CtrA phosphorylated; WT, wild-type.
https://doi.org/10.1371/journal.pbio.3001528.g008
PLOS BIOLOGY The non coding RNA CcnA controls cell cycle
PLOS Biology | https://doi.org/10.1371/journal.pbio.3001528 February 22, 2022 19 / 37

accumulate, it binds the mRNA of ctrA by base pairing using at least one region belonging to a
loop predicted to exist in its structure (Fig 4C). In vitro probing experiments on ctrA and gcrA50 UTRs showed that a stretch of CCCC is particularly important for CcnA to interact with its
target mRNAs, possibly stabilizing the interactions. We hypothesize that this binding of CcnA
on the ctrA 50 UTR frees the RBS enabling translation at higher rates and therefore causes an
increase in the protein levels. We predicted the structure of the 50 UTR starting from the TSS
of promoter P2 of the gene ctrA and it appears evident that the mRNA of ctrA has its putative
Shine–Dalgarno (SD) of the RBS at −6 from ATG sequestered in a stem (Fig 9A). Although
classically, ncRNAs pairing at the SD induce translational block, which is in disagreement with
our observations, probing revealed another region of the ctrA mRNA that is impacted in pres-
ence of CcnA (Fig 4A), which is more compatible with a positive regulation of ctrA translation
by CcnA. It has already been shown that a pairing of a ncRNA at the beginning of the coding
sequence can have an activating role [64]. Hence, we can imagine that both binding are impor-
tant and both responsible for the role of CcnA on ctrA. We attempted to construct a CcnA
mutant corresponding to this second interaction. Unfortunately, the introduction of this
mutation in CcnA makes the RNA unstable. Future studies on the structure of the ctrA 50 UTR
and CcnA may help elucidating this unorthodox positive mechanism of activation.
An intriguing question about CcnA is its functional relationship with the origin of replica-
tion. Why does ccnA belong to the origin of replication? It is fascinating to speculate that ccnAbelongs to the CORI as it must be fired at low levels of CtrA~P, therefore “using” high affinity
CtrA binding sites [42]. This allows the presence of CcnA when the second mRNA of ctrA,
generated from the P2 promoter, starts accumulating. CcnA may be potentially involved in the
translation of P2 mRNA of ctrA and therefore may act as a cell cycle timer through CtrA acti-
vation [66].
Indeed, CcnA plays a role in the regulation of the expression of CtrA as a putative activator
of translation. In our model (Fig 9B and 9C), the regulatory circuit created by CtrA-CcnA and
back to CtrA represents a positive feedback loop in which the regulatory layer controlled by
CcnA acts on top of a second layer of transcriptional auto-activation of ctrA on its second
strong promoter P2. In parallel, CtrA has a potential inhibitory activity on gcrA, creating a neg-
ative feedback loop in which GcrA activates ctrA, which, in turn, blocks gcrA. CcnA acts as
well on this feedback reinforcing a reduction of translation by direct binding onto the 50 UTR
of gcrA. Therefore, CcnA does not create new connections between master regulators of cell
cycle but in fact acts on a preexisting circuit, presumably increasing the robustness of the sys-
tem. This behavior by ncRNAs has been described before [67–69]. The role of ncRNAs is
therefore to consolidate the robustness of transcriptional circuits by introducing a fast post-
transcriptional control on the mRNAs produced by transcription factors. From this point of
view, CcnA may indeed act as key trigger for protein production linking transcription to trans-
lation. The importance of CcnA emerges when redundant mechanisms of CtrA control are
not present, such as the absence of CcrM (primary activator of CtrA expression in the second
half of S-phase). In all systems investigated so far, ncRNA-mediated regulations introduce a
rich variety of dynamical responses, but these have mainly been studied in the case of negative
regulation by the ncRNA on the target transcript. Among the peculiarities of ncRNA-mediated
negative regulation in bacteria, previous studies have observed a threshold linear response of
target abundance and the possibility of an ultrasensitive response in target abundance as a
function of the relative transcription rate of the ncRNA and the target [30,31]. Moreover,
ncRNAs may act as a fine-tuning of the affinity for different targets, but their effects might also
create, in complex networks, phenomena such as bistability and oscillations [70].
Is this CcnA-dependent mechanism, controlled by CtrA itself, also conserved in organisms
in which CtrA regulates the cell cycle? We studied C. crescentus CcnA in S. meliloti, where the
PLOS BIOLOGY The non coding RNA CcnA controls cell cycle
PLOS Biology | https://doi.org/10.1371/journal.pbio.3001528 February 22, 2022 20 / 37

Fig 9. Integration of CcnA in the cell cycle regulation model in C. crescentus. (A) Secondary structure prediction of
50 UTR of ctrA starting from the TSS of ctrA-P2 using « The DINAmelt Web server » –Two-state melting (folding)
with default parameters for RNA energy rules [65]. The predicted free energy of the thermodynamic ensemble is −25.5
kcal/mol. “GGAGG” ctrA-P2 RBS is framed in red and appears to be blocked in a stem loop. Binding site of CcnA
Loop A is indicated in red. (B) Throughout the cell cycle, the cascade of transcriptional activation of the gene ctrAinvolving GcrA and CcrM activates ctrA-P1 expression leading to its first protein accumulation. After the translation
and activation by phosphorylation of CtrA, CtrA~P will reach the origin of replication to inhibit DNA replication. Our
work suggests that simultaneously CtrA~P is potentially responsible of ccnA transcription. CcnA in return will create a
positive feedback loop on CtrA protein accumulation after its P2 expression. This suggests that CcnA may be a key
element of the second strong CtrA accumulation during the cell cycle. CcnA may also be a « CtrA-activity » modulator
as its other putative targets belongs to the CtrA regulon. Concomitantly, CcnA regulates negatively putatively the
translation of gcrA mRNA leading to a decrease of GcrA and presumably a correct and precise shut ON or OFF of the
2 master regulators. CcnA cell cycle expression window correlated in space and time with the activation and inhibition
of CtrA and GcrA, respectively. (C) CcnA is proposed to act negatively on gcrA mRNA translation avoiding a de novo
transcription of ctrA-P1 and at the same time positively on ctrA-P2 mRNA translation to regulate the second wave of
CtrA activation necessary for the expression of genes involved in fundamental processes such as cell division,
chemotaxis, DNA methylation, and biogenesis of polar structures. CcnA, cell cycle noncoding RNA A; RBS, ribosome-
binding site; TSS, transcriptional start site; 50 UTR, 50 untranslated region.
https://doi.org/10.1371/journal.pbio.3001528.g009
PLOS BIOLOGY The non coding RNA CcnA controls cell cycle
PLOS Biology | https://doi.org/10.1371/journal.pbio.3001528 February 22, 2022 21 / 37

role of CtrA has been investigated [40,60]. In these 2 organisms, CtrA is essential and controls
key cell cycle functions such as cell division and DNA replication. Consistently with our
hypothesis, the expression of C. crescentus CcnA causes the same molecular alterations as
described here in C. crescentus. Although more molecular investigation of homologous
ncRNA in other organisms must be explored, we can hypothesize that CcnA activity may be a
conserved mechanism of the regulation of the cell cycle. This new system of complex regula-
tory circuits carried out by CcnA indeed expand the key role of ncRNAs in bacteria, opening a
new activity that will need a thorough molecular investigation of mechanistic activity of this
ncRNA. The CcnA structure and consequent activity may be a new class of ncRNAs whose
role is still at its beginning of study. Interestingly, a prediction of target genes among several
homologs have revealed that targets usually fall into the chemotaxis and motility classes of
genes, suggesting a common function. This is not surprising considering that CtrA itself is
considered, in C. crescentus and most of alphaproteobacterial species, as a regulator of motility
[33,71].
In conclusion, the regulatory mechanism centered on CcnA represents an archetype of reg-
ulatory architecture. CtrA autoregulates itself via its promoter P2 and inhibits the expression
of GcrA via its binding site on the promoter region of gcrA. The same 2 connections are per-
formed by CcnA that activates CtrA translation and inhibits GcrA expression. This module on
top of a more classical transcriptional regulation presumably ensures a strong effect during cell
cycle. Taking advantage of the simplicity of this bacterial system, more specific experiments
must be performed in order to elucidate this network behavior.
Materials and methods
Strains, growth conditions, and molecular biology techniques
Strains used in this work are listed in S3 Table. C. crescentus strains were routinely cultured in
peptone-yeast extract (PYE) medium with appropriate amount of antibiotics (Solid: Kanamy-
cin 25 μg/ml, Tetracycline 2 μg/ml, Spectinomycin 100 μg/ml) (Liquid: Kanamycin 5 μg/ml,
Tetracycline 1 μg/ml, Spectinomycin 25 μg/ml) and 0.3% xylose or 0.2% glucose whenever
necessary. S. meliloti strains were cultured in tryptone-yeast (TY) extract medium with appro-
priate antibiotics (Streptomycin 500 μg/ml, Kanamycin 200 μg/ml). E. coli was grown in lysog-
eny broth (LB) medium. The cultures were grown at 30˚C or 37˚C as required for different
experiments. Synchronization of the C. crescentus cells was done using Percoll or Ludox as
described before [72]. E. coli strains were grown at 37˚C in LB or solid medium with required
amount of antibiotic supplements (Ampicillin 100 μg/ml, Kanamycin 50 μg/ml, Tetracycline
10 μg/ml) as necessary. C. crescentus cells were transformed with different plasmids by electro-
poration. Western blotting was performed as previously described [60] using antibodies
against CtrA, DnaA, GcrA, and MreB using 1:5,000 dilutions. Bands were quantified using
ImageJ [73]. pSRK vectors were constructed as previously described using primers listed in S3
Table amplified using the polymerase Q5 (NEB). Soft agar plates were prepared with 0.25%
agar; images were taken using an IC-Capture Camera at 75% of magnification. Phostag was
performed as previously described [60]. CbK phage sensitivity assay was also performed as pre-
viously described [56].
MS2-affinity purification coupled with RNA sequencing
Strains containing MS2-CcnA and MS2 UTRs of ctrA P1 and P2 were induced by 1 mM IPTG
for 30 min harvested and used to perform MAPS as previously described [74]. Analysis was
performed by the following protocol. Reads were mapped to the indexed C. crescentus NA1000
genome (NC_011916) with Bowtie2 (Langmead and colleagues, 2018) by using the following
PLOS BIOLOGY The non coding RNA CcnA controls cell cycle
PLOS Biology | https://doi.org/10.1371/journal.pbio.3001528 February 22, 2022 22 / 37

command: “bowtie2—qc-filter—threads 18—no-mixed—mp 10—no-discordant -x NA1000—
passthrough -1 R1_001.fastq.gz -2 R2_001.fastq.gz”, which only returns concordant align-
ments in the form of innies (mates face each other) with at least 10 of MAPQ score. As we
wanted to align reads that also fall outside coding sequences, we first mapped on the genome
and then we used genome regions defined as explained below to calculate the coverage of the
regions. In doing so, we need to consider that the paired libraries were obtained by using a
stranded protocol (Illumina). For this reason, we first split the genome alignments into 2 files,
one containing all pairs assigned with the flag 99/147 and the other reads pairs with flag 83/
163. Basically, in doing so, we are putting all pairs aligned on the genome with a certain orien-
tation in one file and all those aligned in reverse orientation in another. Each file is used as
input to BamCoverage (Ramirez and colleagues, 2016) to calculate coverage in 1 nt bins of the
genome. At this point, we used several files containing genome region coordinates (described
below) to calculate the coverage of the regions, by taking reads on the basis of the expected
alignment orientation with the transcript. For instance, when considering CDS, we will pro-
ceed similarly to what is done in standard RNAseq, i.e., we will calculate the coverage of the
CDS by summing all the genome coverage values that fall within the CDS in the expected ori-
entation. In this way, we were able to calculate the coverage of predefined regions that are not
present in the annotation file (i.e., the gff) of the NA1000 genome. Once obtained the coverage
for our regions, we analyzed them independently, by calculating a log2 ratio of the normalized
coverage in the MS-purified sample and the control. We defined as candidate targets for CcnA
all genes for which one of the regions have a log2 ratio of the coverage of at least 2 (4-fold
increase) using the RPM-transformed data. To avoid artifacts for small coverage values that
are subject to high experimental fluctuations, we also ask that each region has a coverage larger
than the lower 25% of the regions in the MS experiment.
Most tools developed to calculate sequencing coverage from RNAseq data usually rely on a
preexisting genome annotation, and among all features encoded in that file, they often focus
on “CDS” or “gene”. This can have problems, as, for instance, ncRNAs do not have a CDS
associated, and, therefore, tools strictly using CDS coordinates will completely overlook
ncRNAs. In the present context, we were interested in understanding if MAPS data might
allow inference about more detailed questions concerning a ncRNA target transcript. For
instance, if we can get information on the specific region of the transcript that is bound by the
ncRNA under examination. Together with defining a list of potentially bound transcripts in
the different MAPS experiments performed in this work, we also defined 50 and 30 UTRs for
each gene and analyzed the coverage of the 3 regions independently. The 50 UTR of a gene was
defined on the basis of the experimentally determined transcription starts sites from Zhou and
colleagues if the gene was present in their data, else as the 100 nt region upstream of the gene.
Similarly, to avoid considering short UTRs, if the UTR defined by Zhou and colleagues was
less than 100 nt, we define the 50 UTR as the 100-nucleotide region preceding the start of the
CDS or ncRNA. As there is no similar experimental data for 30 UTRs, we arbitrarily defined
these regions as the 250 nucleotides going from 50 nt within the CDS or ncRNA to 200 nt
downstream.
Microscopy analysis
Cells were observed on a 24 × 50 mm coverslip under a 0.15% agarose-PYE “pad” to immobi-
lize the cells. Samples were observed, thanks to an epifluorescent-inverted microscope Nikon
Eclipse TiE E PFS (100 × oil objective NA 1.45 Phase Contrast). Cells morphologies and fluo-
rescent images were analyzed using ImageJ and MicrobeJ [37,73]. Stalk length was measured
by using BacStalk software [75]. Electron microscopy (EM) was performed by placing 5 μL
PLOS BIOLOGY The non coding RNA CcnA controls cell cycle
PLOS Biology | https://doi.org/10.1371/journal.pbio.3001528 February 22, 2022 23 / 37

drops of the bacteria suspension for 3 min directly on glow discharged carbon coated grids
(EMS). The grids were then washed with 2 drops of 2% aqueous uranyl acetate and stained
with a third drop for 2 min. Grids were dried on filter paper and the samples were analyzed
using a Tecnai 200KV electron microscope (FEI), and digital acquisitions were made with a
numeric camera (Oneview, Gatan).
Quantitative real-time PCR for transcriptional analyses
RNAs were prepared from cultures at OD600* 0.6. The cells were harvested and frozen at
−80˚C. Total RNAs were isolated from the pellet using the Maxwell 16 LEV miRNA Tissue Kit
(Promega) according to the manufacturer’s instructions and an extra TURBO DNase (Invitro-
gen) digestion step to eliminate the contaminating DNA. The RNA quality was assessed by
Tape station system (Agilent). RNA was quantified at 260 nm (NanoDrop 1000; Thermo
Fisher Scientific). For cDNA synthesis, 1 μg total RNA and 0.5 μg random primers (Promega)
were used with the GoScript Reverse transcriptase (Promega) according to the manufacturer
instruction. qRT-PCR analyses were performed on a CFX96 Real-Time System (Bio-Rad). The
reaction volume was 15 μL and the final concentration of each primer was 0.5 μM. The cycling
parameters of the qRT-PCR were 98˚C for 2 min, followed by 45 cycles of 98˚C for 5 s, 60˚C
for 10 s. A final melting curve from 65˚C to 95˚C is added to determine the specificity of the
amplification. To determine the amplification kinetics of each product, the fluorescence
derived from the incorporation of EvaGreen into the double-stranded PCR products was mea-
sured at the end of each cycle using the SsoFast EvaGreen Supermix 2X Kit (Bio-Rad, France).
The results were analyzed using Bio-Rad CFX Maestro software, version 1.1 (Bio-Rad, France).
Based on beta-galactosidase data, fusing the ccnA promoter with the ORF of lacZ, we found
that CcnA transcription is high with levels around 104 Miller units. Therefore, the RNA16S
gene (also highly expressed) was used as a reference for normalization. For each point, a
technical duplicate was performed. The amplification efficiencies for each primer pairs were
comprised between 80% and 100%. All primer pairs used for qRT-PCR are reported in the
S3 Table.
Flow cytometry analysis
C. crescentus cells grown to exponential, stationary phase or synchronized were harvested and
stored in 70% ethanol at −20˚C until further use. DNA content of cells was analyzed with flow
cytometry by using the protocol as described in (Berge and colleagues, 2020) with slight
modifications.
For synchronized cultures, a population of pure G1 cells (swarmer cells) was obtained by
separation with density gradient with Percoll. Briefly, cells from an overnight culture were
diluted to OD = 0.1 and grown to 0.5 to 0.6, then centrifuged 5 min at 8,000g at 4˚C. The
supernatant was removed and the pellet resuspended in 750 μL of cold 1X M2-Salt and mixed
with 700 μL of cold Percoll and vortexed then centrifuged at 12,000g at 4˚C for 20 min. The
top band (predivisional and stalk cells) was removed and the bottom band (swarmer G1 cells)
was collected and washed 3 times in cold M2-Salt. The cells were then resuspended in 2 mL of
prewarmed PYE (30˚C). A volume of 200 μL of samples following the cell cycle were collected
every 15 min from t = 0 to t = 120 min and stored in 70% ethanol and processed as described
below.
Due to the small size of the bacterium C. crescentus, we used a threshold and a trigger with
the SSC signal (side scatter). The density plots obtained (small-angle scattering FSC versus
wide angle scattering SSC signals) were gated on the population of interest, filtered to remove
multiple events, and then analyzed for the fluorescence intensity (FL1 525/30 nm) of the DNA
PLOS BIOLOGY The non coding RNA CcnA controls cell cycle
PLOS Biology | https://doi.org/10.1371/journal.pbio.3001528 February 22, 2022 24 / 37

probe SYTO 9 Green Fluorescent Nucleic Acid Stain at a final concentration of 2 μM in the
buffer (10 mM Tris–HCl pH = 7.5; 1 mM EDTA; 0.01% triton X100; 50 mM Na-citrate). Pro-
portion of cells harboring 1N, 2N, and�3N DNA were analyzed by gating the peaks of the
Syto9 fluorescence histograms. Samples were run in the low-pressure mode (5 to 10K events/
s). A total number of 300 to 500K particles were collected per sample. Data were acquired with
a S3e cells sorter (Bio-Rad) using 488 and 561 nm lasers and were analyzed and plotted using
FlowJo v10.6. Data are representative of 3 to 5 biological replicates, and statistical analyses
were carried out with Prism.v8.2 using ANOVA test.
Probing experiments
Templates for in vitro probing, containing a T7 promoter, were obtained by PCR amplifica-
tion. Lead acetate degradation and inline probing assays were performed as previously
described [46]. In brief, 0.2 μM of in vitro–generated gcrA+209 and P2-ctrA+143, 50 end-
labeled were incubated with or without 1 μM CcnA ncRNA. Radiolabeled RNA was incubated
5 min at 90˚C with alkaline buffer or 5 min at 37˚C with ribonuclease T1 (0.1 U; Ambion) to
generate the Alkaline (OH) ladder and the T1 ladder, respectively. RNA was analyzed on an
8% acrylamide/7M urea gel.
RNA sequencing
Cultures were harvested at 0.6 OD600 and frozen in liquid nitrogen as previously described
[60]. Total RNA was prepared using RNeasy Mini Kit (Qiagen). Ribosomal RNAs were
removed (“depleted” samples) using the Bacterial RiboZero (Illumina), and libraries for MiSeq
(V3 cassette) were prepared using the Stranded True Seq RNAseq Kit (Illumina). For the anal-
ysis of S11 Fig, reads were mapped using the Galaxy platform [76] by Bowtie2, reduced to 10
bp reads per kilobase per million mapped reads (RPKM) in a Bedgraph format by BamCover-
age [77] and visualized by the Integrative Genomics Viewer (IGV) [78]. For analysis shown in
S12 Fig and S2 Table, read alignments were performed with bowtie2 [79] and the following
additional parameters:—no-discordant—no-mixed—no-unal–dovetail. The resulting sam file
was first converted into a bam file with samtools [80] and then used as input to HTSeq count
[81]. Abundance matrices for all annotated genes were assembled together after removal of
tRNA and rRNA genes and used for differential gene expression analysis by using the R pack-
age DESeq2 [82]. Selection of DEGs was based on the contrast among libraries from a strain
expressing the sense ncRNA CcnA and the strain expressing the corresponding antisense
ncRNA by applying the following thresholds: FDR< 0.01. We did not filter at a log fold
change threshold to let the DESeq2 algorithm exploits the estimation of dispersion to provide
a full list of likely DEGs. This resulted in 215 DEGS, ranging in absolute value from a log fold
change of 0.48 to a maximum of 2.9. Most of the DEGS are up-regulated (208, or 97% of the
total). The differential gene expression analysis was integrated with a number of available
information on the cell cycle of C. crescentus: essentiality data come from [83]; the list of genes
significantly changing their expression level during the cell cycle is from [84] and are based on
a RNAseq experiment comprising 5 time points during the cell cycle in triplicate; GcrA ChIP--
Seq data come from [85]. We downloaded the reads corresponding to the GcrA sample and
mapped them on the NA1000 genome to obtain a coverage profile. This profile was used to get
an average coverage for each gene by considering the window going from 200 nt upstream of
the ATG of the gene to 50 nt within the coding sequences. Data concerning the dependence of
genes from methylation come from [86] and were identified on the basis of a microarray anal-
ysis of strains engineered through removal of the gene encoding the methyltransferase (ccrM).
The presence of CtrA binding sites (full and half) is based on scanning the genome with the
PLOS BIOLOGY The non coding RNA CcnA controls cell cycle
PLOS Biology | https://doi.org/10.1371/journal.pbio.3001528 February 22, 2022 25 / 37

PWM obtained by [87] and a threshold of 70% of the maximum score, calculated as from [87].
Moreover, a site was indicated as present for a gene if it was found in the 250 nt upstream of
the ATG and a site was assigned to the closest gene. The heatmap figure was obtained with the
R package Pheatmap and integrates the above annotations with gene expression data in the
present work (S12 Fig). All fastQ files are available from the Dryad database (doi: 10.5061/
dryad.4mw6m909k) [88].
Primer extension
Transcriptional +1 of CcnA ncRNA was determined by primer extension. Briefly, 10 μg of
total RNA was incubated with 2 pmol of radiolabelled primer (EM5194) and 0.5 mM dNTPs
for 5 min at 65˚C, followed by 1 min on ice. Reverse transcription was initiated by adding Pro-
toScript II Buffer (1×), ProtoScript II (200 units, NEB) and DTT (5 mM). The reaction mixture
was incubated at 42˚C for 1 h. The enzyme was inactivated at 90˚C for 10 min. The reaction
was precipitated and then migrated on a denaturing 8% polyacrylamide gel. Gel was dried,
exposed to phosphor screens, and visualized using the Typhoon Trio (GE Healthcare)
instrument.
Electrophoretic Mobility Shift Assays (EMSA)
EMSA were performed according to Morita and colleagues [89], with some modifications. 50
end-radiolabeled ctrAp2, ctrAp2_LoopA, gcrA, or gcrA-LoopA was heated for 1 min at 90˚C
and put on ice for 1 min. ctrAp2 or ctrAp2_LoopA RNA was diluted at 5 nM in binding buffer
(50 mM Tris–HCl (pH 8.0), 25 mM MgCl2, 20 mM KCl, 12.5 μg/mL yeast tRNA), gcrA or
gcrA-LoopA RNA was diluted at 5 nM in binding buffer II (10 mM Tris–HCl (pH 7.0), 10 mM
MgCl2, 1,000 mM KCl, 12.5 μg/mL yeast tRNA) and mixed with CcnA or CcnA-LoopA at dif-
ferent concentrations (0 to 2,000 nM). Samples were incubated for 15 min at 37˚C, and reac-
tions were stopped by addition of 1 μL of nondenaturing loading buffer (1X TBE, 50%
glycerol, 0.1% bromophenol blue, 0.1% xylene cyanol). Samples were resolved on native poly-
acrylamide gels (5% acrylamide:bisacrylamide 29:1) in cold TBE 1X and migrated at 50 V, at
4˚C. Gels were dried, exposed to phosphor screens, and visualized using the Typhoon Trio
(GE Healthcare) instrument. Image Studio Lite software (LICOR) was used for densitometry
analysis.
Data deposited in the Dryad repository: https://doi.org/10.5061/dryad.4mw6m909k [88].
Supporting information
S1 Table. MAPS and reverse MAPS targets.
(XLSX)
S2 Table. RNAseq of strains overexpressing ccnA and ccnA-as.(XLSX)
S3 Table. Strains and primers used in this work.
(XLSX)
S4 Table. Diameters of halos cited in Figs 7 and 8.
(XLSX)
S5 Table. Stalk length measurement by BacStalk software cited in Figs 8 and S3.
(XLSX)
PLOS BIOLOGY The non coding RNA CcnA controls cell cycle
PLOS Biology | https://doi.org/10.1371/journal.pbio.3001528 February 22, 2022 26 / 37

S6 Table. RNAseq Rockhopper data cited in S1A Fig.
(XLSX)
S7 Table. Raw data of growth curves cited in Figs 2, 6, S8, and S9.
(XLSX)
S8 Table. Raw data of cell length and width measurements obtained by MicrobeJ cited in
Figs 2, 7, 8, S3, S8, and S14.
(XLSX)
S9 Table. Raw data of remaining figures.
(XLSX)
S1 Fig. (A) Transcription levels of CcnA in a CtrA thermosensitive strain (ctrAts). WT
cells were grown in PYE until OD600nm = 0.6, and ctrA-ts cells were grown in PYE until
OD600nm = 0.6 and kept for 1 h at the permissive temperature 30˚ C or shifted 1 h to the
restrictive temperature 37˚C. Total RNA was extracted in each condition and prepared for
RNAseq. Data were analyzed using Rockhopper [90,91] with the following parameters: strand
specific, paired end, verbose output (generation of raw and normalized counts for each tran-
scripts and RPKM value). Statistical analysis was performed using Kruskal–Wallis test with a
Dunn’s multiple comparisons test (Prism GraphPad 9.1.2), and results are shown as mean (N= 3) of normalized counts +/− SD, ns, difference not significant, � = p.val = 0.0225. Raw data
are provided in S6 Table. (B) Expression level of CcnA in C. crescentus strains carrying ccnAand ccnA-as in a pSRK plasmid with or without induction by addition of IPTG 1 mM 30 min
(related to Figs 1 and S9) and in different backgrounds (WT, ΔcpdR, ΔrcdA, ΔpopA, ΔdivJ, and
Δprom). Cells were grown in PYE at 30˚C, then the expression of ccnA was determined by
qRT-PCR and compared to 16S level. Results are presented as mean (N = 3) +/− SD. (C) WT
C. crescentus cells, or C. crescentus cells deleted from the genes cpdR (ΔcpdR), rcdA (ΔrcdA), or
popA (ΔpopA), belonging to the proteolysis machinery ClpXP of C. crescentus, were grown in
PYE at 30˚C until OD600nm = 0.6. Proteins were extracted and separated on a SDS-PAGE gel
for Western blotting. CtrA and MreB (loading control) were revealed using specific polyclonal
antibodies on nitrocellulose membranes. CcnA, cell cycle noncoding RNA A; PYE, peptone
yeast extract; qRT-PCR, quantitative real-time PCR; RNAseq, RNA sequencing; RPKM, reads
per kilobase per million mapped reads; WT, wild-type.
(TIF)
S2 Fig. (A) Determination of the transcriptional +1 site of CcnA by primer extension
related to Figs 1 and 5. Total RNA extracted from WT cells or containing Plac-ccnA and Plac-ccnA-Loop A were used with radiolabelled oligo. The reaction was done with (+) or without
(−) reverse transcriptase. The same oligo was used for ccnA sequencing (GCAT). The +1 signal
is represented by the arrow. (B) Mutation of the ctrA mRNA (ctrACCCC) and ncRNA CcnA
binding site. Solid lines indicate CcnA binding sites on ctrA. Boxed gray text corresponds to
the nucleotides mutated. The translation start codon is shown in bold. P2-ctrACCCC (+143 nt
from the P2-ctrA promoter) 5 nM RNA fragment was incubated with increasing concentration
of CcnA (bottom). Data represent the mean of 2 independent experiments. (C) Mutation of
the gcrA mRNA (gcrACCCC) and ncRNA CcnA binding site. Solid lines indicate CcnA bind-
ing sites on gcrA. Boxed gray text corresponds to the nucleotides mutated. gcrACCCC 5 nM
RNA fragment was incubated with increasing concentration of CcnA (bottom). Data represent
2 independent experiments. CcnA, cell cycle noncoding RNA A; ncRNA, noncoding RNA;
WT, wild-type.
(TIF)
PLOS BIOLOGY The non coding RNA CcnA controls cell cycle
PLOS Biology | https://doi.org/10.1371/journal.pbio.3001528 February 22, 2022 27 / 37

S3 Fig. Violin plots of stalks length per cell for a WT + Plac-ccnA strain tested in Fig 2D
compared to a WT C. crescentus used as a control for normal stalk length (same as 8D).
Stalk length was measured by using BacStalk software [59]. Statistical significance was deter-
mined using an unpaired t test with Welch’s correction for different SD. ����: p.val < 0.0001.
Raw data are in S5 Table. WT, wild-type.
(TIF)
S4 Fig. (A) Flow cytometry profiles after SYTO 9 staining showing DNA content of WT cells,
WT cells carrying either an empty pSRK (empty vector) or ccnA under the control of a Placpromoter (Plac-ccnA) grown in PYE until OD600nm = 0.6. Then, induction of Plac-ccnA was
made by addition of IPTG 10 mM overnight. A total number of 300,000 particles were ana-
lyzed per sample by flow cytometry. (B) Proportions of cells harboring 1N, 2N, and�3N
DNA in the population were analyzed by gating the histograms in (B). Data are representative
of 3 biological replicates. Statistical analyses were carried out using ANOVA Tukey test. ns, dif-
ference not significant, ���: p.val. < 0.001. PYE, peptone yeast extract; WT, wild-type.
(TIF)
S5 Fig. (A) Schematic of the CckA-ChpT-CtrA phosphorelay. CckA is a hybrid histidine
kinase; at the swarmer cell, it acts as a kinase and at the stalked cell pole as a phosphatase.
CckA autophosphorylates, then transphosphorylates the histidine phosphotransferase ChpT
that, in return, transphosphorylates CtrA and CtrA proteolysis adapter protein CpdR. (B) WT
cells carrying either an empty pSRK (empty vector) or ccnA under the control of a Plac pro-
moter (Plac-ccnA) were grown in PYE at 30˚C until OD600nm = 0.6. Then, the induction of
Plac-ccnA was made by addition of IPTG 1 mM 30 min. Proteins were extracted and separated
on a SDS-PAGE containing Phostag and Mn2+ to visualize CtrA phosphorylation level. CtrA
was revealed using specific polyclonal antibodies on nitrocellulose membrane. In comparison
with the control strain (empty vector), cells overexpressing CcnA show + 85% and + 45% in
NI and I conditions, respectively. (C) Phase contrast and epifluorescence images of PchpT-chpT::yfp cells carrying ccnA (Plac-ccnA) or an empty pSRK (empty vector) grown in PYE at
30˚C until OD600nm = 0.6. Scale bar = 2 μm. (D) Histograms showing quantification of
ChpT-YFP signal in PchpT-chpT::yfp cells carrying Plac-ccnA or an empty vector by using
MicrobeJ. Results are shown as fraction of total cells with absence of cluster, presence of clus-
ter, and presence of high-intensity cluster. At least 1,000 cells were analyzed for each condition.
Data are in S9 Table. (E) Histograms showing morphologies typology of cells related to S5C
and S5D with detected cluster using MicrobeJ software [37]. Data are in S9 Table. (F) PchpT-chpT::yfp cells carrying either an empty vector or Plac-ccnA were grown in PYE 30˚C until
OD600 = 0.6. Then, the induction of Plac-ccnA was made by addition of IPTG 1 mM 30 min.
Proteins were extracted and separated on a SDS-PAGE for Western blotting. GFP and MreB
(loading control) were revealed using specific polyclonal antibodies on nitrocellulose mem-
brane. PYE, peptone yeast extract; WT, wild-type.
(TIF)
S6 Fig. Schematic representation of the strategy used to study ccnA down-regulation phe-
notypes without lethality. Our only viable deletion obtained in this study was a 45-bp long
deletion comprising the CtrA box located within the promoter region of ccnA. Attempts to
delete the ccnA gene sequence could not be constructed.
(TIF)
S7 Fig. (A) Determination of the transcriptional +1 site of CcnA ncRNA by primer exten-
sion. Total RNA extracted from WT cells, deleted ccnA promoter (Δprom), and containing
PccnA-ccnA (Δprom + PccnA-ccnA) was used with radiolabelled oligo. The reaction was done
PLOS BIOLOGY The non coding RNA CcnA controls cell cycle
PLOS Biology | https://doi.org/10.1371/journal.pbio.3001528 February 22, 2022 28 / 37

with (+) or without (−) reverse transcriptase. The same oligo was used for ccnA sequencing
(GCAT). The sequence is presented as the reverse complement. The +1 signal is represented
by the arrow. (B) WT cells, Δprom cells, Δprom cells carrying either an empty pMR10 low-
copy plasmid (Δprom + empty vector) or harboring ccnA under the control of its own promoter
(Δprom + PccnA-ccnA) were grown in PYE at 30˚C until OD600nm = 0.6. Proteins were
extracted and separated on a SDS-PAGE for western blotting. CtrA and MreB (loading con-
trol) were revealed using specific polyclonal antibodies on nitrocellulose membranes. CcnA,
cell cycle noncoding RNA A; ncRNA, noncoding RNA; PYE, peptone yeast extract; WT, wild-
type.
(TIF)
S8 Fig. (A) Phase contrast images of WT cells, Δprom cells, Δprom cells carrying ccnA under
the control of its own promoter in a pMR10 low-copy plasmid (Δprom + PccnA-ccnA), WT
cells carrying an empty low-copy plasmid pMR10 (WT + empty vector) or Δprom cells carry-
ing an empty low-copy plasmid pMR10 (Δprom + empty vector) grown overnight in PYE at
30˚C until OD600nm = 0.6. Scale bar corresponds to 2 μm. Cells were analyzed using MicrobeJ
[92] to assess cell length. Approximately 422 cells were analyzed. Statistical significance was
determined using ANOVA with Tukey multiple comparisons test. ns, difference not signifi-
cant ���: p.val = 0.0001 and ����: p.val < 0.0001. Raw data are provided in S8 Table. (B)
Growth curves of Δprom cells complemented with ccnA. WT cells carrying an empty low-
copy plasmid pMR10 (WT + empty vector), Δprom cells carrying either ccnA under the control
of its own promoter in a pMR10 low-copy plasmid (Δprom + PccnA-ccnA) or an empty low-
copy plasmid pMR10 (Δprom + empty vector) were grown overnight in PYE. A volume of
200 μL of cells back-diluted from stationary phase cultures to an OD600nm = 0.02 were then
grown on 96 wells in PYE at 30˚C. Cell growth was monitored overnight with a Spark-TM at
30˚C and a shaking (orbital) amplitude of 6 mm and a shaking (orbital) frequency of 96 rpm.
Results are shown as mean N = 2 biological with 3 technical replicates per biological replicates.
Raw data are provided in S7 Table. PYE, peptone yeast extract; WT, wild-type.
(TIF)
S9 Fig. (A) WT cells, WT cells carrying either an empty pSRK (empty vector) or ccnA-asunder the control of a Plac promoter (Plac-ccnA-as) were grown in PYE at 30˚C until OD600nm
= 0.6. Then, the induction of Plac-ccnA-as was made by addition of IPTG 1 mM 30 min. As a
control of induction, WT cells carrying an empty vector were also incubated 30 min in pres-
ence of IPTG 1 mM and WT cells with no induction were used as a control. Δprom cells were
used as a comparison for CtrA levels. Proteins were extracted and separated on a SDS-PAGE
gel for western blotting. CtrA and MreB (loading control) proteins were revealed using specific
polyclonal antibodies on nitrocellulose membranes. (B) Flow cytometry profiles after SYTO 9
staining showing DNA content of WT cells, WT cells carrying either an empty pSRK (empty
vector) or ccnA-as under the control of a Plac promoter (Plac-ccnA-as) grown in PYE until
OD600nm = 0.6. Then, induction of Plac-ccnA-as was made by addition of IPTG 1 mM 1 h 30
min. A total number of 300,000 particles were analyzed per sample by flow cytometry. (C) Pro-
portions of cells harboring 1N, 2N, and�3N DNA in the population were analyzed by gating
the histograms in (C). Data are representative of 3 biological replicates. Sstatistical analyses
were carried out using ANOVA Tukey test. ����: p.val < 0.0001. Data are in S9 Table. (D)
Growth curves following the expression of CcnA antisense (Plac-ccnA-as). WT cells and
WT cells carrying either an empty pSRK (empty vector) or a pSRK with ccnA under the con-
trol of an inducible Plac promoter (Plac-ccnA) or Plac-ccnA-as were grown overnight in PYE
without IPTG. A volume of 200 μL of cells back-diluted from stationary phase cultures to an
OD600nm = 0.02 were grown on 96 wells in PYE supplemented with 1 mM IPTG. Cell growth
PLOS BIOLOGY The non coding RNA CcnA controls cell cycle
PLOS Biology | https://doi.org/10.1371/journal.pbio.3001528 February 22, 2022 29 / 37

was monitored overnight with a Spark-TM at 30˚C and a shaking (orbital) amplitude of 6 mm
and a shaking (orbital) frequency of 96 rpm. Doubling time of Plac-ccnA-as cells equals to
201.96 min +/− 11.66 with 1 mM IPTG. Results are shown as mean N = 3 biological with 3
technical replicates. Raw data are provided in S7 Table. PYE, peptone yeast extract; WT, wild-
type.
(TIF)
S10 Fig. Schematic of the MAPS technique. MAPS consists of the fusion of a ncRNA of inter-
est, here CcnA, with an RNA aptamer called MS2 [74]. In this technique, the protein MS2 is
used for its high affinity to the RNA MS2 from the bacteriophage MS2. For the experiment,
the MS2 protein is fused to the MBP. The fused ncRNA is overexpressed in vivo prior to cell
lysis. The soluble cellular (lysate) content is then transferred into a column containing an amy-
lose resin added in order to fix the MS2-MBP fusion. Once the lysate is passed through the col-
umn, a solution of maltose is used to pull down the MS2-CcnA complexes with RNAs or
proteins interacting with CcnA. The identification and characterization of direct in vivo part-
ners of CcnA is then made by Western blotting, mass spectrometry, or RNAseq. CcnA, cell
cycle noncoding RNA A; MAPS, MS2-affinity purification coupled with RNA sequencing;
MBP, maltose binding protein; ncRNA, noncoding RNA; RNAseq, RNA sequencing.
(TIF)
S11 Fig. (A) MAPS experiment was performed using an MS2-CcnA construct. Untagged
CcnA was used as a control. Cells were grown in PYE at 30˚C until OD600nm = 0.6 and har-
vested after induction of Plac-ms2-ccnA and Plac-ccnA by addition of IPTG 1 mM 30 min.
After pull-down and RNAseq, data were normalized using RPKM method. Mapped reads of
ccnA locus are visualized by using IGV. (B) Same as (A) but here mapped reads of ctrA locus
are visualized. The highest peak corresponds to a putative interaction site (CcnA in red; 50
UTR of ctrA mRNA in blue). (C) Same as (A) but MAPS was performed using MS2-50 UTRs
of ctrA generated by promoters ctrA P1 (UTR- P1-ctrA-ms2) or ctrA P2 (UTR- P2-ctrA -ms2).Mapped reads of P1 and P2 50 UTRs in the vicinity of ctrA mRNA were visualized. The red
line shows reads corresponding to transcription until 20 amino acids of ctrA. (D) Same as (C)
but here mapped reads in the vicinity of ccnA were visualized by using IGV. CcnA, cell cycle
noncoding RNA A; IGV, Integrative Genomics Viewer; MAPS, MS2-affinity purification cou-
pled with RNA sequencing; PYE, peptone yeast extract; RNAseq, RNA sequencing; RPKM,
reads per kilobase per million mapped reads; 50 UTR, 50 untranslated region.
(TIF)
S12 Fig. RNAseq and MAPS data integration. MAPS experiment was performed using an
MS2-CcnA construct. Untagged CcnA was used as a control. Cells were grown in PYE at 30˚C
until OD600nm = 0.6 and harvested after induction of Plac-ms2-ccnA and Plac-ccnA by addition
of IPTG 1 mM 30 min. After pull-down and RNAseq, reads were mapped to the indexed C.
crescentus NA1000 genome (NC_011916) and mRNAs potentially bound or not to CcnA were
identified. In parallel, an additional RNAseq of transcriptome of cells carrying either Plac-ccnA or Plac-ccnA-as was performed in order to analyze expression profiles of CcnA targets.
The figure summarizes the information regarding genes identified as differentially expressed
comparing the RNAseq results for strain carrying Plac-ccnA (CcnA-sense) and those for strain
carrying Plac-ccnA-as (CcnA-antisense) (see Materials and methods). On the left heatmap, we
show the fold change in the contrast CcnA-sense vs. CcnA-antisense, while on the right, we
show the corresponding DESeq2 normalized transcript abundances in the 2 genetic back-
grounds (combination of 3 biological replicates each). Several genes of interest (see text for
more details) are highlighted in colors: cell cycle factors, including CtrA and GcrA, are in red;
PLOS BIOLOGY The non coding RNA CcnA controls cell cycle
PLOS Biology | https://doi.org/10.1371/journal.pbio.3001528 February 22, 2022 30 / 37

polar and motility genes are in green. Binary (presence of CtrA binding sites, cell cycle depen-
dency, methylation dependency, essentiality) and COG annotations are represented in differ-
ent colors for clarity; quantitative information (number of GGGG patterns upstream of the
gene, enrichment in GcrA ChIP-seq reads, and number of MAPS experiments where the gene
was significantly enriched) are colored accordingly to the maps specified at the bottom left.
Data sources and methods are detailed in Material and methods. CcnA, cell cycle noncoding
RNA A; MAPS, MS2-affinity purification coupled with RNA sequencing; PYE, peptone yeast
extract; RNAseq, RNA sequencing.
(TIF)
S13 Fig. Schematic representation of the GcrA-CcrM epigenetic transcriptional regulation
of ctrA-P1. The expression of ctrA depends on the GcrA-CcrM module. CcrM mediates the
methylation of the P1 promoter of ctrA, recruiting GcrA, which, in turn, activates the tran-
scription of CtrA. In a ΔccrM background, the levels of CtrA are low. However, considering
that the ctrA P1 promoter is sigma70 dependent, transcription of ctrA will keep a basal low
expression.
(TIF)
S14 Fig. (A) Cell curvature of WT cells and ΔccrM+ Plac-ccnA from (6A) was determined
using MicrobeJ [37]. Approximately 683 cells were analyzed for each condition, and statistical
significance was determined using an unpaired t test. ����: p.val < 0.0001. The ΔccrM and
ΔccrM + empty vector cells were not considered for this analysis because the filamentous phe-
notypes observed in these 2 mutants result in cell curvature artifacts measurements that are
not consistent with the MicrobeJ analysis. Raw data are provided in S8 Table. (B) WT cells,
WT cells carrying an empty vector or Plac-ccnA were grown in PYE at 30˚C until OD600nm =
0.6. Then, induction of Plac-ccnA was made by addition of IPTG 1 mM 30 min. As a control of
induction, WT cells carrying an empty vector were also incubated 30 min in presence of IPTG
1 mM and WT cells with no induction were used as a control. (NI = no IPTG) and (I = IPTG).
Proteins were extracted and separated on a SDS-PAGE gel for western blotting. GcrA and
MreB (loading control) proteins were revealed using specific polyclonal antibodies on nitrocel-
lulose membranes. (C) Same as (B) but here proteins from a biological replicate of Plac-ccnAcells were extracted and separated on a SDS-PAGE gel for Western blotting. CtrA and MreB
(loading control) proteins were revealed using specific polyclonal antibodies on nitrocellulose
membranes. (D) WT cells, Δprom cells, Δprom cells carrying either a pMR10 low-copy plasmid
harboring ccnA under the control of its own promoter (Δprom + PccnA-ccnA) or ccnA, its anti-
sense under the control of a Plac promoter (Δprom+ Plac-ccnA, Δprom + Plac-ccnA-as) and an
empty pSRK used as a control (Δprom + empty vector) were grown in PYE at 30˚C until
OD600nm = 0.6. For Δprom+ Plac-ccnA, Δprom + Plac-ccnA-as cells, expression of ccnA or its
antisense was made by addition of IPTG 1 mM 30 min. As a control, Δprom cells carrying the
empty pSRK were also incubated 30 min in presence of IPTG 1 mM 30 min. Proteins were
extracted and separated on a SDS-PAGE gel for Western blotting. CtrA and MreB (loading
control) proteins were revealed using specific polyclonal antibodies on nitrocellulose mem-
branes. (E) INTA RNA analysis on the 50 UTRs of ctrA P2 and gcrA using CcnA as bait. For
both UTRs, the upper sequence corresponds to the target gene sequence while CcnA is in the
lower sequence. PYE, peptone yeast extract; WT, wild-type.
(TIF)
S15 Fig. ΔpleC+ Plac-ccnA or ΔpleC+ Plac-ccnA-as were grown in PYE at 30˚C until OD600nm
= 0.6. Then, induction of Plac-ccnA and Plac-ccnA-as was made by addition of IPTG 1 mM 30
min. In parallel, as a control, ΔpleC cells were grown in PYE at 30˚C until OD600nm = 0.6 and
PLOS BIOLOGY The non coding RNA CcnA controls cell cycle
PLOS Biology | https://doi.org/10.1371/journal.pbio.3001528 February 22, 2022 31 / 37

harvested. Proteins were extracted and separated on a SDS-PAGE gel containing Phostag and
Mn2+ to visualize CtrA phosphorylation level. As a Phostag control, an additional sample of
ΔpleC cells pellet was boiled 10 min in order to discriminate the migration on the gel of the
CtrA phosphorylated band from the nonphosphorylated band. CtrA was revealed using spe-
cific polyclonal antibodies on nitrocellulose membranes. PYE, peptone yeast extract.
(TIF)
S16 Fig. (A) Phase contrast images of S. meliloti WT cells, carrying either an empty pSRK
(empty vector) or ccnA under the control of a Plac promoter (Plac-ccnA) from C. crescentuswere grown in TY at 30˚C until OD600nm = 0.6. (B) WT S. meliloti carrying either an empty
vector or Plac-ccnA were grown in TY at 30˚C until OD600nm = 0.6. Then, the induction of
Plac-ccnA was made by addition of IPTG 1 mM 30 min. Proteins were extracted and separated
on a SDS-PAGE gel for Western blotting. CtrA and GroEL (loading control) proteins were
revealed using specific polyclonal antibodies on a nitrocellulose membrane. (C) Putative
homologs of ccnA in the class Alphaproteobacteria. Research of homologs was performed
using the online sRNA Homolog Finder GlassGo [93] using C. crescentus ccnA sequence as
query. The heatmap contains identity percentages shared by CcnA homologs in different spe-
cies and was then transformed into a distance matrix to build the dendrogram on the top.
Comparisons were done in pairs because a multiple alignment of all CcnA homologs contains
too many gaps. Data are in S9 Table. (D) ClustalOmega [94,95] alignment of 50 UTRs of ctrAfrom S. meliloti and C. crescentus starting from GGGG (red) motif near the start codon ATG
(green) until nucleotide +25. Clustal Omega was used with default parameters for RNA. “�”
represents a conserved nucleotide between the 2 sequences. TY, tryptone-yeast; WT, wild-
type.
(TIF)
Acknowledgments
We thank members of the Biondi and Masse’s laboratory for critical comments on the manu-
script. We thank the IMM Transcriptomic facility for the RNA preparation and the qRT-PCR
experiment; we also thank Artemis Kosta and Hugo le Guenno from the IMM Microscopy
platform for Electron Microscopy acquisition and analysis. We thank also Gael Panis and Pat-
rick Viollier for the phage CbK and also for providing the delta cpdR, rcdA, popA strains used
in this work. We thank Regis Hallez and Romain Mercier for MreB and GFP antibodies,
respectively, used in this study.
Author Contributions
Conceptualization: Marta Robledo Garrido, Jose-Ignacio Jimenez-Zurdo, Eric Masse,
Emanuele G. Biondi.
Data curation: Wanassa Beroual, David Lalaouna, Yann Denis, Gael Brasseur, Matteo Brilli,
Emanuele G. Biondi.
Formal analysis: Wanassa Beroual, Karine Prevost, David Lalaouna, Meriem Djendli, Matteo
Brilli.
Funding acquisition: Emanuele G. Biondi.
Investigation: Wanassa Beroual, Karine Prevost, David Lalaouna, Nadia Ben Zaina, Odile
Valette, Yann Denis, Gael Brasseur, Matteo Brilli, Marta Robledo Garrido, Jose-Ignacio
Jimenez-Zurdo, Eric Masse.
PLOS BIOLOGY The non coding RNA CcnA controls cell cycle
PLOS Biology | https://doi.org/10.1371/journal.pbio.3001528 February 22, 2022 32 / 37

Methodology: Wanassa Beroual, Karine Prevost, David Lalaouna, Nadia Ben Zaina, Odile
Valette, Yann Denis, Gael Brasseur, Matteo Brilli, Eric Masse.
Project administration: Emanuele G. Biondi.
Supervision: Emanuele G. Biondi.
Validation: Emanuele G. Biondi.
Writing – original draft: Emanuele G. Biondi.
Writing – review & editing: Wanassa Beroual, Matteo Brilli, Eric Masse.
References1. Collier J. Regulation of chromosomal replication in Caulobacter crescentus. Plasmid. 2012; 67:76–87.
https://doi.org/10.1016/j.plasmid.2011.12.007 PMID: 22227374
2. Skerker JM, Laub MT. Cell-cycle progression and the generation of asymmetry in Caulobacter crescen-
tus. Nat Rev Microbiol. 2004; 2:325–37. https://doi.org/10.1038/nrmicro864 PMID: 15031731
3. Collier J, Murray SR, Shapiro L. DnaA couples DNA replication and the expression of two cell cycle
master regulators. EMBO J. 2006; 25:346–56. https://doi.org/10.1038/sj.emboj.7600927 PMID:
16395331
4. Collier J, McAdams HH, Shapiro L. A DNA methylation ratchet governs progression through a bacterial
cell cycle. Proc Natl Acad Sci U S A. 2007; 104:17111–6. https://doi.org/10.1073/pnas.0708112104
PMID: 17942674
5. Reisenauer A, Shapiro L. DNA methylation affects the cell cycle transcription of the CtrA global regula-
tor in Caulobacter. EMBO J. 2002; 21:4969–77. https://doi.org/10.1093/emboj/cdf490 PMID: 12234936
6. Panis G, Murray SR, Viollier PH. Versatility of global transcriptional regulators in alpha-Proteobacteria:
from essential cell cycle control to ancillary functions. FEMS Microbiol Rev. 2015; 39:120–33. https://
doi.org/10.1093/femsre/fuu002 PMID: 25793963
7. Delaby M, Panis G, Viollier PH. Bacterial cell cycle and growth phase switch by the essential transcrip-
tional regulator CtrA. Nucleic Acids Res. 2019; 47:10628–44. https://doi.org/10.1093/nar/gkz846 PMID:
31598724
8. Fumeaux C, Radhakrishnan SK, Ardissone S, Theraulaz L, Frandi A, Martins D, et al. Cell cycle transi-
tion from S-phase to G1 in Caulobacter is mediated by ancestral virulence regulators. Nat Commun.
2014; 5:4081. https://doi.org/10.1038/ncomms5081 PMID: 24939058
9. Gora KG, Tsokos CG, Chen YE, Srinivasan BS, Perchuk BS, Laub MT. A cell-type-specific protein-pro-
tein interaction modulates transcriptional activity of a master regulator in Caulobacter crescentus. Mol
Cell. 2010; 39:455–67. https://doi.org/10.1016/j.molcel.2010.06.024 PMID: 20598601
10. Gora KG, Cantin A, Wohlever M, Joshi KK, Perchuk BS, Chien P, et al. Regulated proteolysis of a tran-
scription factor complex is critical to cell cycle progression in Caulobacter crescentus. Mol Microbiol.
2013; 87:1277–89. https://doi.org/10.1111/mmi.12166 PMID: 23368090
11. Laub MT, Chen SL, Shapiro L, McAdams HH. Genes directly controlled by CtrA, a master regulator of
the Caulobacter cell cycle. Proc Natl Acad Sci U S A. 2002; 99:4632–7. https://doi.org/10.1073/pnas.
062065699 PMID: 11930012
12. Marczynski GT, Shapiro L. Control of chromosome replication in caulobacter crescentus. Annu Rev
Microbiol. 2002; 56:625–56. https://doi.org/10.1146/annurev.micro.56.012302.161103 PMID:
12142494
13. Quon KC, Yang B, Domian IJ, Shapiro L, Marczynski GT. Negative control of bacterial DNA replication
by a cell cycle regulatory protein that binds at the chromosome origin. Proc Natl Acad Sci U S A. 1998;
95:120–5. https://doi.org/10.1073/pnas.95.1.120 PMID: 9419339
14. Fioravanti A, Fumeaux C, Mohapatra SS, Bompard C, Brilli M, Frandi A, et al. DNA Binding of the Cell
Cycle Transcriptional Regulator GcrA Depends on N6-Adenosine Methylation in Caulobacter crescen-
tus and Other Alphaproteobacteria. PLoS Genet. 2013; 9:e1003541. https://doi.org/10.1371/journal.
pgen.1003541 PMID: 23737758
15. Haakonsen DL, Yuan AH, Laub MT. The bacterial cell cycle regulator GcrA is a σ70 cofactor that drives
gene expression from a subset of methylated promoters. Genes Dev. 2015; 29:2272–86. https://doi.
org/10.1101/gad.270660.115 PMID: 26545812
PLOS BIOLOGY The non coding RNA CcnA controls cell cycle
PLOS Biology | https://doi.org/10.1371/journal.pbio.3001528 February 22, 2022 33 / 37

16. Holtzendorff J, Hung D, Brende P, Reisenauer A, Viollier PH, McAdams HH, et al. Oscillating global reg-
ulators control the genetic circuit driving a bacterial cell cycle. Science. 2004; 304:983–7. https://doi.
org/10.1126/science.1095191 PMID: 15087506
17. Mohapatra SS, Fioravanti A, Vandame P, Spriet C, Pini F, Bompard C, et al. Methylation-dependent
transcriptional regulation of crescentin gene (creS) by GcrA in Caulobacter crescentus. Mol Microbiol.
2020. https://doi.org/10.1111/mmi.14500 PMID: 32187735
18. Biondi EG, Reisinger SJ, Skerker JM, Arif M, Perchuk BS, Ryan KR, et al. Regulation of the bacterial
cell cycle by an integrated genetic circuit. Nature. 2006; 444:899–904. https://doi.org/10.1038/
nature05321 PMID: 17136100
19. Chen YE, Tropini C, Jonas K, Tsokos CG, Huang KC, Laub MT. Spatial gradient of protein phosphoryla-
tion underlies replicative asymmetry in a bacterium. Proc Natl Acad Sci U S A. 2011; 108:1052–7.
https://doi.org/10.1073/pnas.1015397108 PMID: 21191097
20. Jacobs C, Ausmees N, Cordwell SJ, Shapiro L, Laub MT. Functions of the CckA histidine kinase in Cau-
lobacter cell cycle control. Mol Microbiol. 2003; 47:1279–90. https://doi.org/10.1046/j.1365-2958.2003.
03379.x PMID: 12603734
21. Joshi KK, Berge M, Radhakrishnan SK, Viollier PH, Chien P. An Adaptor Hierarchy Regulates Proteoly-
sis during a Bacterial Cell Cycle. Cell. 2015; 163:419–31. https://doi.org/10.1016/j.cell.2015.09.030
PMID: 26451486
22. Ryan KR, Huntwork S, Shapiro L. Recruitment of a cytoplasmic response regulator to the cell pole is
linked to its cell cycle-regulated proteolysis. Proc Natl Acad Sci U S A. 2004; 101:7415–20. https://doi.
org/10.1073/pnas.0402153101 PMID: 15123835
23. Keiler KC, Shapiro L. tmRNA Is Required for Correct Timing of DNA Replication in Caulobacter cres-
centus. J Bacteriol. 2003; 185:573–80. https://doi.org/10.1128/JB.185.2.573-580.2003 PMID:
12511504
24. Wurihan W, Wunier W, Li H, Fan LF, Morigen M. Trans-translation ensures timely initiation of DNA repli-
cation and DnaA synthesis in Escherichia coli. Genet Mol Res. 2016;15. https://doi.org/10.4238/gmr.
15038407 PMID: 27706629
25. Landt SG, Abeliuk E, McGrath PT, Lesley JA, McAdams HH, Shapiro L. Small non-coding RNAs in
Caulobacter crescentus. Mol Microbiol. 2008; 68:600–14. https://doi.org/10.1111/j.1365-2958.2008.
06172.x PMID: 18373523
26. Landt SG, Lesley JA, Britos L, Shapiro L. CrfA, a small noncoding RNA regulator of adaptation to car-
bon starvation in Caulobacter crescentus. J Bacteriol. 2010; 192:4763–75. https://doi.org/10.1128/JB.
00343-10 PMID: 20601471
27. Tien M, Fiebig A, Crosson S. Gene network analysis identifies a central post-transcriptional regulator of
cellular stress survival. elife. 2018;7. https://doi.org/10.7554/eLife.33684 PMID: 29537368
28. Frohlich KS, Forstner KU, Gitai Z. Post-transcriptional gene regulation by an Hfq-independent small
RNA in Caulobacter crescentus. Nucleic Acids Res. 2018; 46:10969–82. https://doi.org/10.1093/nar/
gky765 PMID: 30165530
29. Beroual W, Brilli M, Biondi EG. Non-coding RNAs Potentially Controlling Cell Cycle in the Model Caulo-
bacter crescentus: A Bioinformatic Approach. Front Genet. 2018; 9:164. https://doi.org/10.3389/fgene.
2018.00164 PMID: 29899753
30. Levine E, Zhang Z, Kuhlman T, Hwa T. Quantitative characteristics of gene regulation by small RNA.
PLoS Biol. 2007; 5:e229. https://doi.org/10.1371/journal.pbio.0050229 PMID: 17713988
31. Mitarai N, Benjamin J-AM, Krishna S, Semsey S, Csiszovszki Z, Masse E, et al. Dynamic features of
gene expression control by small regulatory RNAs. Proc Natl Acad Sci U S A. 2009; 106:10655–9.
https://doi.org/10.1073/pnas.0901466106 PMID: 19541626
32. Zhou B, Schrader JM, Kalogeraki VS, Abeliuk E, Dinh CB, Pham JQ, et al. The global regulatory archi-
tecture of transcription during the Caulobacter cell cycle. PLoS Genet. 2015; 11:e1004831. https://doi.
org/10.1371/journal.pgen.1004831 PMID: 25569173
33. Brilli M, Fondi M, Fani R, Mengoni A, Ferri L, Bazzicalupo M, et al. The diversity and evolution of cell
cycle regulation in alpha-proteobacteria: a comparative genomic analysis. BMC Syst Biol. 2010; 4:52.
https://doi.org/10.1186/1752-0509-4-52 PMID: 20426835
34. Quon KC, Marczynski GT, Shapiro L. Cell cycle control by an essential bacterial two-component signal
transduction protein. Cell. 1996; 84:83–93. https://doi.org/10.1016/s0092-8674(00)80995-2 PMID:
8548829
35. Siam R, Brassinga AKC, Marczynski GT. A dual binding site for integration host factor and the response
regulator CtrA inside the Caulobacter crescentus replication origin. J Bacteriol. 2003; 185:5563–72.
https://doi.org/10.1128/JB.185.18.5563-5572.2003 PMID: 12949109
PLOS BIOLOGY The non coding RNA CcnA controls cell cycle
PLOS Biology | https://doi.org/10.1371/journal.pbio.3001528 February 22, 2022 34 / 37

36. Khan SR, Gaines J, Roop RM 2nd, Farrand SK. Broad-host-range expression vectors with tightly regu-
lated promoters and their use to examine the influence of TraR and TraM expression on Ti plasmid quo-
rum sensing. Appl Environ Microbiol. 2008; 74:5053–62. https://doi.org/10.1128/AEM.01098-08 PMID:
18606801
37. Ducret A, Quardokus EM, Brun YV. MicrobeJ, a tool for high throughput bacterial cell detection and
quantitative analysis. Nat Microbiol. 2016; 1:16077. https://doi.org/10.1038/nmicrobiol.2016.77 PMID:
27572972
38. Biondi EG, Skerker JM, Arif M, Prasol MS, Perchuk BS, Laub MT. A phosphorelay system controls stalk
biogenesis during cell cycle progression in Caulobacter crescentus. Mol Microbiol. 2006; 59:386–401.
https://doi.org/10.1111/j.1365-2958.2005.04970.x PMID: 16390437
39. McGrath PT, Iniesta AA, Ryan KR, Shapiro L, McAdams HH. A dynamically localized protease complex
and a polar specificity factor control a cell cycle master regulator. Cell. 2006; 124:535–47. https://doi.
org/10.1016/j.cell.2005.12.033 PMID: 16469700
40. Pini F, Frage B, Ferri L, De Nisco NJ, Mohapatra SS, Taddei L, et al. The DivJ, CbrA and PleC system
controls DivK phosphorylation and symbiosis in Sinorhizobium meliloti. Mol Microbiol. 2013; 90:54–71.
https://doi.org/10.1111/mmi.12347 PMID: 23909720
41. Christen B, Abeliuk E, Collier JM, Kalogeraki VS, Passarelli B, Coller JA, et al. The essential genome of
a bacterium. Mol Syst Biol. 2011; 7:528. https://doi.org/10.1038/msb.2011.58 PMID: 21878915
42. Taylor JA, Ouimet M-C, Wargachuk R, Marczynski GT. The Caulobacter crescentus chromosome repli-
cation origin evolved two classes of weak DnaA binding sites. Mol Microbiol. 2011; 82:312–26. https://
doi.org/10.1111/j.1365-2958.2011.07785.x PMID: 21843309
43. Skerker JM, Prasol MS, Perchuk BS, Biondi EG, Laub MT. Two-component signal transduction path-
ways regulating growth and cell cycle progression in a bacterium: a system-level analysis. PLoS Biol.
2005; 3:e334. https://doi.org/10.1371/journal.pbio.0030334 PMID: 16176121
44. Frandi A, Collier J. Multilayered control of chromosome replication in Caulobacter crescentus. Biochem
Soc Trans. 2019; 47:187–96. https://doi.org/10.1042/BST20180460 PMID: 30626709
45. Marczynski GT, Lentine K, Shapiro L. A developmentally regulated chromosomal origin of replication
uses essential transcription elements. Genes Dev. 1995; 9:1543–57. https://doi.org/10.1101/gad.9.12.
1543 PMID: 7601356
46. Lalaouna D, Carrier M-C, Semsey S, Brouard J-S, Wang J, Wade JT, et al. A 3’ external transcribed
spacer in a tRNA transcript acts as a sponge for small RNAs to prevent transcriptional noise. Mol Cell.
2015; 58:393–405. https://doi.org/10.1016/j.molcel.2015.03.013 PMID: 25891076
47. Mann M, Wright PR, Backofen R. IntaRNA 2.0: enhanced and customizable prediction of RNA–RNA
interactions. Nucleic Acids Res. 2017; 45:W435–9. https://doi.org/10.1093/nar/gkx279 PMID:
28472523
48. Zuker M. Mfold web server for nucleic acid folding and hybridization prediction. Nucleic Acids Res.
2003; 31:3406–15. https://doi.org/10.1093/nar/gkg595 PMID: 12824337
49. Gonzalez D, Collier J. DNA methylation by CcrM activates the transcription of two genes required for
the division of Caulobacter crescentus. Mol Microbiol. 2013; 88:203–18. https://doi.org/10.1111/mmi.
12180 PMID: 23480529
50. Fang G, Passalacqua KD, Hocking J, Llopis PM, Gerstein M, Bergman NH, et al. Transcriptomic and
phylogenetic analysis of a bacterial cell cycle reveals strong associations between gene co-expression
and evolution. BMC Genomics. 2013; 14:450. https://doi.org/10.1186/1471-2164-14-450 PMID:
23829427
51. Eraso JM, Markillie LM, Mitchell HD, Taylor RC, Orr G, Margolin W. The highly conserved MraZ protein
is a transcriptional regulator in Escherichia coli. J Bacteriol. 2014; 196:2053–66. https://doi.org/10.
1128/JB.01370-13 PMID: 24659771
52. Alyahya SA, Alexander R, Costa T, Henriques AO, Emonet T, Jacobs-Wagner C. RodZ, a component
of the bacterial core morphogenic apparatus. Proc Natl Acad Sci. 2009; 106:1239–44. https://doi.org/
10.1073/pnas.0810794106 PMID: 19164570
53. de Araujo HL, Martins BP, Vicente AM, Lorenzetti APR, Koide T, Marques MV. Cold Regulation of
Genes Encoding Ion Transport Systems in the Oligotrophic Bacterium Caulobacter crescentus. Gral-
nick JA, editor. Microbiol Spectr. 2021;9. https://doi.org/10.1128/Spectrum.00710-21 PMID: 34479415
54. Mazzon RR, Lang EAS, Silva CAPT, Marques MV. Cold Shock Genes cspA and cspB from Caulobacter
crescentus Are Posttranscriptionally Regulated and Important for Cold Adaptation. J Bacteriol. 2012;
194:6507–17. https://doi.org/10.1128/JB.01422-12 PMID: 23002229
55. Murray SM, Panis G, Fumeaux C, Viollier PH, Howard M. Computational and genetic reduction of a cell
cycle to its simplest, primordial components. PLoS Biol. 2013; 11:e1001749. https://doi.org/10.1371/
journal.pbio.1001749 PMID: 24415923
PLOS BIOLOGY The non coding RNA CcnA controls cell cycle
PLOS Biology | https://doi.org/10.1371/journal.pbio.3001528 February 22, 2022 35 / 37

56. Panis G, Lambert C, Viollier PH. Complete genome sequence of Caulobacter crescentus bacteriophage
φCbK. J Virol. 2012; 86:10234–5. https://doi.org/10.1128/JVI.01579-12 PMID: 22923796
57. Sommer JM, Newton A. Sequential regulation of developmental events during polar morphogenesis in
Caulobacter crescentus: assembly of pili on swarmer cells requires cell separation. J Bacteriol. 1988;
170:409–15. https://doi.org/10.1128/jb.170.1.409-415.1988 PMID: 2891681
58. Coppine J, Kaczmarczyk A, Petit K, Brochier T, Jenal U, Hallez R. Regulation of Bacterial Cell Cycle
Progression by Redundant Phosphatases. J Bacteriol. 2020; 202:e00345–20. https://doi.org/10.1128/
JB.00345-20 PMID: 32571969
59. Hartmann R, Teeseling MCF, Thanbichler M, Drescher K. BacStalk: A comprehensive and interactive
image analysis software tool for bacterial cell biology. Mol Microbiol 2020; 114: 140–150. https://doi.org/
10.1111/mmi.14501 PMID: 32190923
60. Pini F, De Nisco NJ, Ferri L, Penterman J, Fioravanti A, Brilli M, et al. Cell Cycle Control by the Master
Regulator CtrA in Sinorhizobium meliloti. PLoS Genet. 2015; 11:e1005232. https://doi.org/10.1371/
journal.pgen.1005232 PMID: 25978424
61. Lott SC, Schafer RA, Mann M, Backofen R, Hess WR, Voß B, et al. GLASSgo–Automated and Reliable
Detection of sRNA Homologs From a Single Input Sequence. Front Genet. 2018;9. https://doi.org/10.
3389/fgene.2018.00009 PMID: 29472945
62. Schrader JM, Zhou B, Li G-W, Lasker K, Childers WS, Williams B, et al. The coding and noncoding
architecture of the Caulobacter crescentus genome. PLoS Genet. 2014; 10:e1004463. https://doi.org/
10.1371/journal.pgen.1004463 PMID: 25078267
63. Zhan Y, Yan Y, Deng Z, Chen M, Lu W, Lu C, et al. The novel regulatory ncRNA, NfiS, optimizes nitro-
gen fixation via base pairing with the nitrogenase gene nifK mRNA in Pseudomonas stutzeri A1501.
Proc Natl Acad Sci U S A. 2016; 113:E4348–56. https://doi.org/10.1073/pnas.1604514113 PMID:
27407147
64. Jagodnik J, Chiaruttini C, Guillier M. Stem-Loop Structures within mRNA Coding Sequences Activate
Translation Initiation and Mediate Control by Small Regulatory RNAs. Mol Cell. 2017; 68:158–170.e3.
https://doi.org/10.1016/j.molcel.2017.08.015 PMID: 28918899
65. Markham NR, Zuker M. DINAMelt web server for nucleic acid melting prediction. Nucleic Acids Res.
2005; 33:W577–81. https://doi.org/10.1093/nar/gki591 PMID: 15980540
66. Kaczmarczyk A, Hempel AM, von Arx C, Bohm R, Dubey BN, Nesper J, et al. Precise timing of tran-
scription by c-di-GMP coordinates cell cycle and morphogenesis in Caulobacter. Nat Commun. 2020;
11:816. https://doi.org/10.1038/s41467-020-14585-6 PMID: 32041947
67. Dutta T, Srivastava S. Small RNA-mediated regulation in bacteria: A growing palette of diverse mecha-
nisms. Gene. 2018. https://doi.org/10.1016/j.gene.2018.02.068 PMID: 29501814
68. Mandin P, Guillier M. Expanding control in bacteria: interplay between small RNAs and transcriptional
regulators to control gene expression. Curr Opin Microbiol. 2013; 16:125–32. https://doi.org/10.1016/j.
mib.2012.12.005 PMID: 23415757
69. Nitzan M, Rehani R, Margalit H. Integration of Bacterial Small RNAs in Regulatory Networks. Annu Rev
Biophys. 2017; 46:131–48. https://doi.org/10.1146/annurev-biophys-070816-034058 PMID: 28532217
70. Liu D, Chang X, Liu Z, Chen L, Wang R. Bistability and oscillations in gene regulation mediated by small
noncoding RNAs. PLoS ONE. 2011; 6:e17029. https://doi.org/10.1371/journal.pone.0017029 PMID:
21437279
71. Greene SE, Brilli M, Biondi EG, Komeili A. Analysis of the CtrA pathway in Magnetospirillum reveals an
ancestral role in motility in alphaproteobacteria. J Bacteriol. 2012; 194:2973–86. https://doi.org/10.
1128/JB.00170-12 PMID: 22467786
72. Marks ME, Castro-Rojas CM, Teiling C, Du L, Kapatral V, Walunas TL, et al. The genetic basis of labo-
ratory adaptation in Caulobacter crescentus. J Bacteriol. 2010; 192:3678–88. https://doi.org/10.1128/
JB.00255-10 PMID: 20472802
73. Schneider CA, Rasband WS, Eliceiri KW. NIH Image to ImageJ: 25 years of image analysis. Nat Meth-
ods. 2012; 9:671–5. https://doi.org/10.1038/nmeth.2089 PMID: 22930834
74. Lalaouna D, Prevost K, Eyraud A, Masse E. Identification of unknown RNA partners using MAPS. Meth-
ods. 2017; 117:28–34. https://doi.org/10.1016/j.ymeth.2016.11.011 PMID: 27876680
75. Hartmann R, Teeseling MCF, van Thanbichler M, Drescher K. BacStalk: A comprehensive and interac-
tive image analysis software tool for bacterial cell biology. Mol Microbiol. https://doi.org/10.1111/mmi.
14501 PMID: 32190923
76. Afgan E, Baker D, van den Beek M, Blankenberg D, Bouvier D, Čech M, et al. The Galaxy platform for
accessible, reproducible and collaborative biomedical analyses: 2016 update. Nucleic Acids Res. 2016;
44:W3 –W10. https://doi.org/10.1093/nar/gkw343 PMID: 27137889
PLOS BIOLOGY The non coding RNA CcnA controls cell cycle
PLOS Biology | https://doi.org/10.1371/journal.pbio.3001528 February 22, 2022 36 / 37

77. Ramırez F, Dundar F, Diehl S, Gruning BA, Manke T. deepTools: a flexible platform for exploring deep-
sequencing data. Nucleic Acids Res. 2014; 42:W187–91. https://doi.org/10.1093/nar/gku365 PMID:
24799436
78. Robinson JT, Thorvaldsdottir H, Winckler W, Guttman M, Lander ES, Getz G, et al. Integrative geno-
mics viewer. Nat Biotechnol. 2011; 29:24–6. https://doi.org/10.1038/nbt.1754 PMID: 21221095
79. Langmead B, Salzberg SL, Slazberg SL. Fast gapped-read alignment with Bowtie 2. Nat Methods.
2012; 9:357–9. https://doi.org/10.1038/nmeth.1923 PMID: 22388286
80. Li H, Handsaker B, Wysoker A, Fennell T, Ruan J, Homer N, et al. The Sequence Alignment/Map format
and SAMtools. Bioinformatics. 2009; 25:2078–9. https://doi.org/10.1093/bioinformatics/btp352 PMID:
19505943
81. Anders S, Pyl PT, Huber W. HTSeq-A Python framework to work with high-throughput sequencing
data. Bioinformatics. 2015; 31:166–9. https://doi.org/10.1093/bioinformatics/btu638 PMID: 25260700
82. Love MI, Huber W, Anders S. Moderated estimation of fold change and dispersion for RNA-seq data
with DESeq2. Genome Biol. 2014; 15:550. https://doi.org/10.1186/s13059-014-0550-8 PMID:
25516281
83. Christen B, Abeliuk E, Collier JM, Kalogeraki VS, Passarelli B, Coller JA, et al. The essential genome of
a bacterium. Mol Syst Biol. 2011; 7:1–7. https://doi.org/10.1038/msb.2011.58 PMID: 21878915
84. Fang G, Passalacqua KD, Hocking J, Llopis PM, Gerstein MB, Bergman NH, et al. Transcriptomic and
phylogenetic analysis of a bacterial cell cycle reveals strong associations between gene co-expression
and evolution. BMC Genomics. 2013; 14:450. https://doi.org/10.1186/1471-2164-14-450 PMID:
23829427
85. Haakonsen DL, Yuan AH, Laub MT. The bacterial cell cycle regulator GcrA is a $σ$ 70 cofactor that
drives gene expression from a subset of methylated promoters. Genes Dev. 2015; 29:2272–86. https://
doi.org/10.1101/gad.270660.115 PMID: 26545812
86. Gonzalez D, Kozdon JB, Mcadams HH, Shapiro L, Collier J. The functions of DNA methylation by CcrM
in Caulobacter crescentus: A global approach. Nucleic Acids Res. 2014; 42:3720–35. https://doi.org/10.
1093/nar/gkt1352 PMID: 24398711
87. Brilli M, Fondi M, Fani R, Mengoni A, Ferri L, Bazzicalupo M, et al. The diversity and evolution of cell
cycle regulation in alpha-proteobacteria: A comparative genomic analysis. BMC Syst Biol. 2010;4.
https://doi.org/10.1186/1752-0509-4-4 PMID: 20100324
88. Beroual W, Biondi EG. The non-coding RNA CcnA modulates the master cell cycle regulators CtrA and
GcrA in Caulobacter crescentus. 2022. Dryad Digital Repository. Openly available via: https://doi.org/
10.1016/j.scitotenv.2021.152861 PMID: 34998768
89. Morita T, Maki K, Aiba H. Detection of sRNA-mRNA interactions by electrophoretic mobility shift assay.
Methods Mol Biol. 2012; 905:235–44. https://doi.org/10.1007/978-1-61779-949-5_15 PMID: 22736008
90. McClure R, Balasubramanian D, Sun Y, Bobrovskyy M, Sumby P, Genco CA, et al. Computational anal-
ysis of bacterial RNA-Seq data. Nucleic Acids Res. 2013; 41:e140. https://doi.org/10.1093/nar/gkt444
PMID: 23716638
91. De TB. novo assembly of bacterial transcriptomes from RNA-seq data. Genome Biol. 2015; 16:1.
https://doi.org/10.1186/s13059-014-0572-2 PMID: 25583448
92. Ducret A, Quardokus EM, Brun YV. MicrobeJ, a tool for high throughput bacterial cell detection and
quantitative analysis. Nat Microbiol. 2016; 1:16077. https://doi.org/10.1038/nmicrobiol.2016.77 PMID:
27572972
93. Lott SC, Schafer RA, Mann M, Backofen R, Hess WR, Voß B, et al. GLASSgo–Automated and Reliable
Detection of sRNA Homologs From a Single Input Sequence. Front Genet. 2018;9. https://doi.org/10.
3389/fgene.2018.00009 PMID: 29472945
94. Madeira F, Park Y mi, Lee J, Buso N, Gur T, Madhusoodanan N, et al. The EMBL-EBI search and
sequence analysis tools APIs in 2019. Nucleic Acids Res. 2019; 47:W636–41. https://doi.org/10.1093/
nar/gkz268 PMID: 30976793
95. Sievers F, Wilm A, Dineen D, Gibson TJ, Karplus K, Li W, et al. Fast, scalable generation of high-quality
protein multiple sequence alignments using Clustal Omega. Mol Syst Biol. 2011; 7:539. https://doi.org/
10.1038/msb.2011.75 PMID: 21988835
PLOS BIOLOGY The non coding RNA CcnA controls cell cycle
PLOS Biology | https://doi.org/10.1371/journal.pbio.3001528 February 22, 2022 37 / 37