Birth weight variants are associated with variable fetal ...

ORIGINAL ARTICLE
Genetic variants near the MGAT1 gene are associatedwith body weight, BMI and fatty acid metabolismamong adults and children
JA Jacobsson1, M Rask-Andersen1, U Riserus2, G Moschonis3, A Koumpitski3, GP Chrousos4,L Lannfelt2, C Marcus5, U Gyllensten6, HB Schioth1 and R Fredriksson1
1Department of Neuroscience, Functional pharmacology, Uppsala University, Uppsala, Sweden; 2Department of PublicHealth and Caring Sciences, Clinical Nutrition and Metabolism, Uppsala University, Uppsala, Sweden; 3Department ofNutrition and Dietetics, Harokopio University of Athens, Athens, Greece; 4First Department of Pediatrics, University ofAthens, Athens, Greece; 5Department for Clinical Science, Intervention and Technology, Karolinska Institute, Division ofPediatrics, National Childhood Obesity Centre, Stockholm, Sweden and 6Department of Genetics and Pathology, RudbeckLaboratory, Uppsala University, Uppsala, Sweden
Objective: Recently a genome-wide association analysis from five European populations identified a polymorphism locateddownstream of the mannosyl-(a-1,3)-glycoprotein-b-1,2-N-acetylglucosaminyltransferase (MGAT1) gene that was associatedwith body-weight. In the present study, associations between MGAT1 variants combined with obesity and insulin measurementswere investigated in three cohorts. Levels of fatty acids and estimated measures of D desaturases were also investigated amongadult men.Design: Six polymorphisms downstream of MGAT1 were genotyped in a cross-sectional cohort of 1152 Swedish men. Threepolymorphisms were further analyzed in a case-control study of 1076 Swedish children and in a cross-sectional study of 2249Greek children.Results: Three polymorphisms, rs12186500 (odds ratio (OR): 1.892, 95% confidence interval (CI): 1.237–2.895, P¼0.003),rs1021001 (OR: 2.102, 95% CI: 1.280–3.455, P¼0.003) and rs4285184 (OR: 1.587, 95% CI: 1.024–2.459, P¼0.038) wereassociated with a higher prevalence of obesity among the adult men and a trend for obesity was observed for rs4285184 amongthe Swedish (OR: 1.205, 95% CI: 0.987–1.471, P¼0.067) and Greek children (OR: 1.192, 95%CI: 0.978–1.454, P¼0.081).Association with body weight was observed for rs12186500 (P¼ 0.017) and rs4285184 (P¼0.024) among the men. Thers1021001 and rs4285184 were also associated with body mass index (BMI) in the two Swedish cohorts and similar trends wereobserved among the Greek children. The combined effect size for rs1021001 and rs4285184 on BMI z-score from a meta-analysis was 0.233 (95% CI:0.093–0.373, P¼0.001) and 0.147 (95% CI:0.057–0.236, P¼0.001), respectively. We furtherobserved associations between the genetic variants and fatty acids (Po0.039) and estimated measures of D desaturases(Po0.040), as well as interactions for rs12186500 (Po0.019) with an effect on BMI. No association was found with homeostaticmodel assessment-insulin resistance in any cohort but increased insulin levels, insulin response and decreased insulin sensitivitywere observed among the children (Po0.038).Conclusion: Genetic variants downstream MGAT1 seem to influence susceptibility to obesity. Moreover, these genetic variantsaffect the levels of serum unsaturated fatty acids and D desaturase indices, variables previously shown to correlate with obesity.
International Journal of Obesity (2012) 36, 119–129; doi:10.1038/ijo.2011.11; published online 8 February 2011
Keywords: MGAT1; body weight; BMI; insulin; fatty acids
Introduction
The prevalence of obesity increases tremendously in most
countries, almost with epidemic proportions. The environ-
mental contribution to obesity is apparent but a genetic
component can explain as much as 50–70% of the variation
in body weight.1 One approach to identifying genes that are
associated with obesity and obesity related phenotypes isReceived 5 October 2010; revised 21 December 2010; accepted 26 December
2010; published online 8 February 2011
Correspondence: Associate Professor R Fredriksson, Department of Neu-
roscience, Uppsala University, Functional pharmacology, Box 593, Uppsala
75124, Sweden.
E-mail: [email protected]
International Journal of Obesity (2012) 36, 119–129& 2012 Macmillan Publishers Limited All rights reserved 0307-0565/12
www.nature.com/ijo

genome-wide association studies (GWAs). During the last few
years a number of genome-wide association studies have
identified novel candidate genes for obesity.2–7 Recently a
genome-wide association analysis was conducted for body
weight and body mass index (BMI) in 3448 subjects from five
geographically and environmental distinct European popu-
lations, included in the EUROSPAN (European Special
Population Network) project. This study identified a gender
specific single nucleotide polymorphism (SNP), not pre-
viously reported, which was significantly associated with
body weight among women (7.3�10�8).8 This genetic
variant, rs12517906, is located 45 kb downstream of the
mannosyl (a-1,3)-glycoprotein b-1,2-N-acetylglucosaminyl-
transferase (MGAT1) gene and is part of one of two partially
connected linkage disequilibrium (LD) blocks.
MGAT1 encodes a transmembrane protein located in the
medial compartment of the golgi apparatus with its catalytic
domain within the lumen.9,10 MGAT1 is a typical house-
keeping gene but there are two MGAT1 transcripts in
humans with the larger one being exclusively expressed in
the brain.11 MGAT1 catalyzes the first step in the conversion
of oligomannose to N-glycans of glycoproteins.12,13 Proteins
on the cell surface that are N-glycosylated by MGAT1 are
required for cell–cell interactions and for the binding of
cytokines and other factors to the outer cell membrane.
N-linked glycosylation is further important for the folding of
some eukaryotic proteins.14
Post-translational modification, like glycosylation, can
affect the function of a single gene and mutations in these
glycosylation proteins may therefore have great effects on
the development of normal cells.15 Null mutations of mouse
Mgat1 have shown that this gene has a fundamental role in
the normal development 16–18 and mutation or dysregula-
tion of several enzymes dependent on MGAT1 action are
associated with human diseases.19–21
In the present study, we replicated the previously studied
rs12517906 in a population of Swedish men and explored
the genomic region further by genotyping an additional five
neighboring SNPs that might have an effect on metabolic
conditions of men. As no study has been carried out among
children we further genotyped three SNPs among children
and explored a possible gender effect. In order to study
ethnical differences, the study on children included one
Swedish and one Greek cohort. The association between
these SNPs and obesity was investigated in the three cohorts.
Furthermore, we examined the association with body
weight, BMI, insulin measurements and levels of serum fatty
acids as well as whether BMI or insulin sensitivity is modified
by the level of these fatty acids.
Subjects and methods
Uppsala Longitudinal Study of Adult Men (ULSAM)
The ULSAM is a population-based cohort initiated in 1970
and, described previously.22 All men born between 1920 and
1924 and residing in Uppsala, Sweden, were invited to
participate in a health survey; 82% of the invited men
participated (n¼2322). The design and selection criteria for
the cohort have been described previously.23 At baseline, age
50 years, height was measured to the nearest centimeter and
body weight to the nearest kilogram. BMI was calculated as
body weight divided by height squared (kg m�2). BMI z-score
was calculated by subtracting the mean BMI from individual
BMI and then dividing the difference with the standard
deviation. Blood glucose, serum insulin concentrations
during an intravenous glucose tolerance test, insulin re-
sponse and homeostatic model assessment-insulin resistance
(HOMA-IR) were measured and determined as described
previously.24 For analysis of the fatty acid composition of the
serum cholesterol esters, serum was extracted with a hexane-
isopropanol solution (1þ4) The percentage composition of
methylated fatty acids 14:0 to 20:5 was determined by gas
chromatography (a 25 m NB-351 silica capillary column, i.d.
0.32 mm, phase layer 0.20 mm) with the use of a flame
ionization detector and with helium as carrier gas. The ratio
between 20:4 (n-6)/20:3 (n-6), 18:3 (n-6)/18:2 (n-6) and 16:1
(n-7)/16:0 was used as indices of D-5 desaturase, D-6
desaturase and D-9 desaturase, respectively. Hypertension
prevalence was defined as hypertension treatment and/or a
supine diastolic blood pressure of 95 mm Hg or higher.
Hyperlipidemia prevalence was defined as serum cholesterol
above 6.5 mmol l�1 and/or serum triglycerides above
2.3 mmol l�1 and/or lipid-lowering medication. Diabetes pre-
valence was defined as fasting blood glucose above or equal to
6.7 mmol l�1 and glucose tolerance (indicated as the K-value
from intravenous glucose tolerance test) less or equal to 0.9 or
anti-diabetic therapy. Of the initial cohort of 2322 men, DNA
was available for 1152 men obtained from examination at 70
years of age. Measurements of serum fatty acids were available
for 958 men obtained from examination at 50 years of age.
The study was approved by the Ethics committee of Uppsala
University, Faculty of Medicine. All participants gave their
written informed consent.
Swedish children and adolescents
The cohort of Swedish children and adolescents comprised
two groups as described previously.25 One group consisting
of 551 severely obese children (286 girls and 265 boys)
enrolled at National Childhood Obesity Centre at Karolinska
University Hospital, Huddinge and the second group con-
sisting of 525 healthy and normal weight Swedish adoles-
cents (270 girls and 255 boys) recruited from 17 upper
secondary schools in the Stockholm area, Sweden. Body
weight and height were measured to the nearest 0.1 kg and
1 cm, respectively. BMI z-score was calculated relative to The
International Obesity Task Force (IOTF) definitions.26
Genomic DNA from all subjects (n¼1076) was extracted
from peripheral blood using QiaGen Maxiprep kit (Qiagen,
Hilden, Germany). Among the obese subjects, the level of
serum insulin was analyzed from blood samples drawn after
SNPs near MGAT1 influence obesity susceptibilityJA Jacobsson et al
120
International Journal of Obesity

12-h overnight fasting. Insulin resistance was assessed
through the homeostasis model assessment (HOMA¼(insulin (mU l�1)� glucose (mmol l�1))/22.5) and insulin
response was calculated using the Bergman minimal model
approach.27,28 The study was approved by the Regional
Committee of Ethics, Stockholm.
Greek children and adolescents
The cohort of Greek children comprised 2 658 school
children, attending the 5th and 6th grades of primary schools
located in municipalities within the prefectures of Attica,
Aitoloakarnania, Thessaloniki and Iraklio. This cohort was
part of the ‘Healthy Growth Study’, a large-scale cross-
sectional epidemiological study initiated in May 2007 and
completed in June 2009. An extended letter explaining the
aims of the current study and a consent form were provided to
each parent who had a child in one of the primary schools
participating in the study. Those parents who agreed to
participate in the study had to sign the consent form and
provide their contact details. Body weight and height were
measured in all study participants using standard procedures
and equipment. Body weight was measured to the nearest 10 g
using a Seca digital scale (Seca Alpha, Model 770, Hamburg,
Germany). Subjects were weighed without shoes in the
minimum clothing possible. Height was measured to the
nearest 0.1 cm using a commercial stadiometer (Leicester
Height Measure, Invicta Plastics Ltd, Oadby, UK) in standing
position, not wearing shoes, and keeping shoulders in a
relaxed position, arms hanging freely and head aligned in
Frankfurt plane. BMI z-score was calculated relative to the
International Obesity Task Force definitions.26 Blood samples
were obtained for biochemical and hematological screening
tests after a 12-h overnight fast. Blood was centrifuged for
plasma separations at 3000 r.p.m. for 15 min. Aliquots were
stored at �80 1C until further analyses. The level of plasma
glucose was determined using a commercially available
enzymatic colorimetric assay (Roche Diagnostics, Visalia,
Switzerland). The level of serum insulin was determined by
using a chemiluminescence immunoassay (Kyowa Medex Ltd,
Minami-Ishiki, Japan). Insulin resistance was assessed
through the homeostasis model assessment (HOMA¼ (insulin
(mU ml�1)� glucose (mmol l�1))/22.5). DNA for genotyping
was available for 2249 subjects (1116 girls and 1 133 boys).
Approval to conduct the study was granted by the Greek
Ministry of National Education and the Ethical Committee of
Harokopio University of Athens.
Genotyping and (LD) analysis
Six SNPs located downstream of MGAT1, rs17702447,
rs12517906, rs12186500, rs6886113, rs1021001 and
rs4285184 were genotyped in the ULSAM cohort. Three of
these, rs1286500, rs1021001 and rs4285184 were further
genotyped in the Swedish and Greek cohort of children and
adolescents. The genotyping of MGAT1 SNPs in the ULSAM
cohort was carried out at the SNP technology platform at
Uppsala University (http://www.genotyping.SE/) using an
Illumina GoldenGate Assay (Illumina Inc., San Diego, CA,
USA).29 The genotype call rate in the samples was 96.8%. The
genotyping in the Swedish and Greek children and adoles-
cents was carried out with pre-designed Taqman single-
nucleotide polymorphism genotyping assays (Applied
Biosystems, Foster City, CA, USA) and an ABI7900 genetic
analyzer with SDS 2.2 software at the Uppsala Genome
Center (http://www.genpat.uu.se/node462). The genotype
call rate was 94.8 and 98.2%, respectively. Test for deviation
from Hardy–Weinberg equilibrium was performed using the
Pearson’s w2-test (1 d.f.) and none of the SNPs did deviate
from Hardy Weinberg equilibrium in any of the studied groups.
Haploview30 was used for LD measurements according to
confidence intervals (CIs) by Gabriel et al.31 as well as graphical
representation of the LD structure indicated as r2. The LD
pattern was generated using HapMap data version 3, release
27 and CEUþTSI as analysis panel and the ULSAM data.
Statistical analyses
Among the Swedish men, subjects were categorized as
normal weight (BMI o25 kg m�2), overweight (BMI
X25 kg m�2) and obese (X30 kg m�2) Among the children
and adolescents, subjects were categorized as overweight and
obese using International Obesity Task Force BMI cut-off
values equivalent to adult BMI of 25 and 30, respectively.
Association with overweight and obesity was analyzed with
logistic regression and odds ratio (OR) with a 95% (CI).
Associations between genotypes and phenotypes were
analyzed in each cohort with linear regression, assuming
an additive model. Quantitative skewed variables were
normalized by transformation before analysis. For the
ULSAM cohort, covariates such as BMI, height, age as well
as diabetes, hypertension and hyperlipidemia prevalence
were tested for dependence on the response variables and
included in the model if significant. Interaction between
genotype and fatty acids on body weight, BMI levels as well
as HOMA-IR was analyzed by introducing an interaction
term (genotype� fatty acid) in the model and the subjects
were stratified into low and high levels of fatty acids based
on the median level in the cohort. Among the children and
adolescents, the models were adjusted for age, gender, BMI
and height when needed and interaction between genotype
and gender was analyzed by introducing an interaction term
(genotype� gender). Statistical analyses were performed
with PLINK (http://pngu.mgh.harvard.edu/purcell/plink/).32
Combined analysis was performed for BMI z-score using
meta-analysis with MIX 1.7 (http://www.meta-analysis-
made-easy.com/about/index.html).33 Due to the number of
SNPs and phenotypes tested the significant levels in the
different cohorts were adjusted with the false discovery rate
according to the procedure of Benjamini and Hochberg.34
A P-value less than 0.041, 0.040 and 0.047 was considered
statistically significant in the ULSAM cohort, the Swedish
cohort of children and in the cohort of Greek children,
respectively.
SNPs near MGAT1 influence obesity susceptibilityJA Jacobsson et al
121
International Journal of Obesity

Power calculations
For the case/control analyses, power calculations were carried
out for each SNPs with the CaTS power calculator (http://
www.sph.umich.edu/csg/abecasis/CaTS/index.html).35 In the
ULSAM cohort and for each SNP we had 80% power to detect
association with overweight and obesity with a relative risk
of 1.34 and 1.70, respectively. Among the Swedish children
we had 80% power to detect association with obesity with
a relative risk of 1.40 and among the Greek children we had
80% power to detect association with overweight and obesity
with a relative risk of 1.20 and 1.40, respectively.
Results
Samples
In this study, three different groups were analyzed and
descriptive characteristics are presented in Table 1. The first
cohort consists of men from the ULSAM. Of the total number
of 1152 subjects, age 50 years, 563 (48.8%) were considered
normal weight, 589 (51.1%) had a BMI over 25 kg m�2 and
54 (4.6%) had a BMI over 30 kg m�2 and were considered
overweight and obese, respectively. The second study group
consisted of 525 Swedish normal weight adolescents (270 girls
and 255 boys) and 551 Swedish obese children and adolescents
(286 girls and 265 boys). The third study group comprised
2249 Greek children (1140 girls and 1109 boys) from a large-
scale cross-sectional epidemiological study initiated in 2007.
In all 1305 (58.0%) of the children were normal weight, 944
(41.9%) were overweight and 267 (11.8%) were considered obese.
Genotyping and LD evaluation
Six SNPs were genotyped in the ULSAM cohort, one
previously studied by Johansson et al.8
According to the LD structure based on HapMap data these
SNPs are parts of two different haplotype blocks downstream
MGAT1 (Figure 1a). Based on the ULSAM data, four of the
genotyped SNPs, rs17702447, rs12517906, rs12186500 and
rs6886113 were tag SNPs located in one block and the
remaining two, rs1021001 and rs4285184 were located in the
second block (Figure 1b). Pair-wise LD tests between the SNPs
Table 1 Descriptive characteristics of the three cohorts, the ULSAM, Greek
children and Swedish children, stratified according to weight status
Characteristics All Normal weight Overweight Obese
ULSAM
N 1152 563 589 54
Age (years) 49.6±0.6 49.6±0.6 49.6±0.7 49.7±0.5
Body weight (kg) 77.4±10.0 71.4±6.8 84.7±8.2 100.1±10.3
Length (cm) 176.5±5.8 176.9±5.8 176.0±5.7 175.6±6.4
BMI z-score 1.1±0.8 0.6±0.5 1.8±0.4 2.64±0.2
Hypertension 173 (15%) 52 (9%) 100 (17%) 21 (39%)
Diabetes 7 (0.6%) 3 (0.5%) 3(0.5%) 1(2%)
Hyperlipidemia 702 (61%) 314 (56%) 350 (59%) 38 (70%)
Greek children
N (boys/girls) 2249
(1109/1140)
1982
(981/1001)
944
(506/438)
267
(159/108)
Age (years) 11.2±0.7 11.2±0.7 11.1±0.7 11.1±0.6
Body weight (kg) 45.3±11.1 38.7±6.3 50.8±6.5 64.5±9.5
Length (cm) 148.7±7.8 147.3±7.7 150.0±7.5 152.3±7.4
BMI z-score 0.9±1.2 �0.01±0.8 1.8±0.3 2.8±0.3
Swedish children and adolescents
N (boys/girls) 525 (255/270) 551 (265/286)
Age (years) 17.0±0.9 12.7±3.2
Body weight (kg) 63.6±9.9 91.2±29.5
Length (cm) 173.0±9.0 158.0±17.0
BMI z-score 0.06±0.8 3.5±0.6
Abbreviations: BMI, body mass index; ULSAM, Uppsala Longitudinal Study of
Adult Men. Values are geometric means±s.d. For disease prevalence the
values are number of subjects and percentage.
Figure 1 (a) Schematic structure of MGAT1 and the LD pattern based on HapMap data (v3, release 27 and CEUþTSI). The black triangles indicates haplotype
blocks defined by CI according to Gabriel et al.31 The diamonds represent the pair wise r2 (black r240.8, dark gray 0.8–0.5, moderate gray 0.6–0.4, light gray
0.4–0.2 and white r2o0.2). (b) The LD is expressed as r2 between the pairs of five SNPs genotyped in the ULSAM cohort. The haplotype analysis was performed
using Haploview 4.1.30
SNPs near MGAT1 influence obesity susceptibilityJA Jacobsson et al
122
International Journal of Obesity

revealed an overall weak LD except between rs17702447 and
rs12517906 (r2¼94) (Figure 1b). Due to this strong LD
between rs17702447 and rs12517906, rs17702447 was not
further analyzed. Three of the SNPs were furthermore
genotyped among children and adolescents and the same
LD structure as among the men was observed but the
pair-wise LD pattern for the Greek children revealed an
overall weaker LD for the three genotyped markers
(rs12186500-rs1021001 r2¼8%, rs1021001-rs4285184 r2¼41%,
rs12186500-rs4285184 r2¼11%).
Table 2 OR for overweight and obesity depending on MGAT1genotypes
ULSAM N Genotype, n (%) Allele frequency (%) HWE OR (95% CI) P*
G1 G2 G3 A1 A2
rs12517906 G4A
Normal weight 540 409 (76) 123 (23) 8 (1) 86.9 13.1 0.509
Overweight 575 431 (75) 136 (24) 8 (1) 86.2 13.8 0.585 1.068 (0.827–1.379) 0.614
Obese 52 37 (71) 15 (29) 0 (0) 85.6 14.4 0.574 1.132 (0.636–2.014) 0.673
rs12186500 G4A
Normal weight 519 208 (40) 251 (48) 60 (12) 63.0 37.0 0.251
Overweight 556 201 (36) 286 (51) 69 (13) 61.9 38.1 0.058 1.152 (0.956–1.389) 0.137
Obese 52 12 (23) 29 (56) 11 (21) 49.0 51.0 0.578 1.892 (1.237–2.895) 0.003
rs6886113 T4C
Normal weight 532 331 (62) 179 (34) 22 (4) 79.9 20.1 0.794
Overweight 565 360 (64) 178 (31) 27 (5) 79.0 21.0 0.438 1.014 (0.821–1.251) 0.899
Obese 52 32 (62) 14 (27) 6 (11) 75.0 25.0 0.058 1.275 (0.795–2.043) 0.313
rs1021001 C4G
Normal weight 540 417 (77) 114 (21) 9 (2) 87.7 12.3 0.687
Overweight 575 441 (77) 125 (22) 9 (1) 87.6 12.4 1.000 1.078 (0.834–1.394) 0.566
Obese 52 32 (61) 17 (33) 3 (6) 77.9 22.1 0.962 2.102 (1.280–3.455) 0.003
rs4285184 A4G
Normal weight 540 346 (64) 167 (31) 27 (5) 78.6 21.4 0.236
Overweight 572 351 (61) 187 (33) 34 (6) 77.7 22.3 0.184 1.177 (0.962–1.441) 0.114
Obese 52 25 (48) 23 (44) 4 (8) 70.2 29.8 1.000 1.587 (1.024–2.459) 0.038
Swedish children P**
rs12186500 G4A
Normal weight 523 157 (30) 260 (50) 106 (20) 54.9 45.1 1.000
Obese 500 158 (32) 226 (45) 116 (23) 54.2 45.8 0.057 1.028 (0.863–1.223) 0.759
rs1021001 C4G
Normal weight 517 398 (77) 109 (21) 10 (2) 88.0 12.0 0.419
Obese 499 360 (73) 127 (25) 12 (2) 85.0 15.0 1.000 1.193 (0.924–1.539) 0.086
rs4285184 A4G
Normal weight 511 301 (59) 177 (35) 33 (6) 76.0 24.0 0.912
Obese 507 268 (53) 201 (40) 38 (7) 73.0 27.0 0.465 1.205 (0.987–1.471) 0.067
Greek children P**
rs12186500 G4A
Normal weight 1289 373 (29) 625 (48) 291 (23) 53.2 46.8 0.364
Overweight 928 264 (28) 444 (48) 220 (24) 52.4 47.6 0.211 1.035 (0.918–1.166) 0.577
Obese 261 84 (32) 114 (44) 63 (24) 54.1 45.9 0.061 0.948 (0.789–1.139) 0.572
rs1021001 C4G
Normal weight 1294 965 (74) 311 (24) 18 (2) 86.6 13.4 0.845
Overweight 933 701 (75) 212 (23) 20 (2) 86.5 13.5 0.400 1.009 (0.847–1.202) 0.919
Obese 264 191 (72) 71 (27) 2 (1) 85.8 14.2 0.128 1.076 (0.828–1.396) 0.584
rs4285184 A4G
Normal weight 1289 696 (54) 498 (39) 95 (7) 73.3 26.7 0.120
Overweight 931 488 (53) 366 (39) 77 (8) 72.1 27.9 0.464 1.063 (0.930–1.216) 0.367
Obese 265 122 (46) 125 (47) 18 (7) 69.7 30.3 0.080 1.192 (0.978–.454) 0.081
Abbreviations: CI, confidence interval; HWE, Hardy–Weinberg equilibrium; OR, odds ratio; ULSAM, Uppsala Longitudinal Study of Adult Men. Data are number of
subjects in each group and number of subjects for each genotype (G) (% in each group). Allele frequency (A) for each group is given in percentage. OR with a 95 %
CI was calculated assuming an additive model. Association with overweight and obesity was determined comparing subjects with normal weight (BMI o25 kg m�2)
and overweight (BMI X25 kg m�2) and subjects with normal weight (BMI o25 kg m�2) and obesity (BMI X30 kg m�2). HWE indicate P-values for deviation from
Hardy–Weinberg equilibrium, excluded if Pp0.001. * Indicates P-values adjusted for diabetes, hypertension and hyperlipidemia prevalence. ** Indicates P-values
adjusted for age and gender.
SNPs near MGAT1 influence obesity susceptibilityJA Jacobsson et al
123
International Journal of Obesity

Obesity association analyses
The effect of the studied variants on overweight and obesity
was analyzed in the three cohorts (Table 2). None of the
variants were associated with overweight among the adult
men but carriers of the minor allele of rs1286500 (OR: 1.892,
95% CI: 1.237–2.895, P¼0.003), rs1021001 (OR: 2.102, 95%
CI: 1.280–3.455, P¼0.003) and rs4285184 (OR: 1.587, 95%
CI: 1.024–2.459, P¼0.038), had higher odds for having
obesity than non-carriers. Due to previously reported gender
differences for rs125179068 a possible interaction, among
the children, between genotype and gender was studied.
However, no gender interaction was found for the Swedish or
the Greek samples for any of the studied variants (rs1286500
P¼0.122/0.125, rs1021001 P¼ 0.103/0.988, rs4285184
P¼0.214/0.364). Among the Swedish children, no associa-
tion with obesity was observed for rs12186500 (OR: 1.028,
95% CI: 0.863–1.223, P¼ 0.759), but both rs1021001 (OR:
1.193, 95% CI: 0.924–1.539, P¼0.086) and rs4285184 (OR:
1.205, 95% CI: 0.987–1.471, P¼0.067) showed P-values that
were close to significant. These findings were replicated in
the Greek cohort of children and for rs4285184 there was a
difference in allele frequency between obese and normal
weight subjects, but this did not reach statistical significance
(OR 1.192, 95% CI: 0.978–1.454, P¼0.081). No association
between overweight or obesity was observed for the other
two SNPs.
Anthropometric associations
Associations between the studied genetic variants and
anthropometric data, such as body weight and BMI were
also investigated in the three cohorts (Table 3). No gender
genotype interaction was found among the children in body
weight or BMI for any of the studied variants (P40.05 for
all). Among the Swedish men, carriers of the minor allele of
rs1021001 (MAF 12.3%) and rs4285184 (MAF 21.4%) had
significantly higher BMI levels compared with carriers of the
major allele (P¼0.014 and P¼0.020) and carriers of the
minor allele of rs4285184 had also significantly higher body
weight (P¼0.024) compared with non-carriers. The
rs1286500 was associated with higher body weight
(P¼0.017, MAF 37.0%) and carriers of the minor allele also
exhibited increased BMI levels, but did not reach statistical
significance (P¼0.085). No association with body weight or
BMI was found for the previously associated variant,
rs12517906 (MAF 13.1%) (body weight P¼0.795, BMI
P¼0.464). Among the Swedish children and adolescents,
carriers of the minor allele of rs1021001 (MAF: normal
weight 12.0%, obese 15.0%) had higher BMI compared with
non-carriers and showed increased body weight (Table 3).
This was observed both among the normal weight (body
weight P¼0.048, BMI P¼0.009) and the obese subjects
(body weight P¼0.041, BMI P¼0.004). The rs4285184
(MAF: normal weight 24.0%, obese 27.0%) was associated
with body weight (P¼ 0.038) and BMI (P¼0.033) among the
normal weight subjects and with BMI (P¼0.025) among the
obese subjects. The genetic variant, rs12186500 (MAF:
normal weight 45.1%, obese 45.8%), was not associated
with body weight among the Swedish children (normal
weight P¼0.734, obese P¼0.801) as it was among the
Swedish adult men. Among the Greek children we observed
increased body weight for carriers of the minor allele of
Table 3 Association study of MGAT1 SNPs with body weight and BMI in the three cohorts
ULSAM Swedish children Greek children
Obese Normal weight
b P Add b P Add b P Add b P Add
rs12186500
Body weight (kg) 0.011 0.017 0.262 0.801 �0.057 0.734 0.022 0.341
BMI z-score 0.048 0.085 �0.020 0.639 �0.009 0.759 �0.019 0.556
rs1021001
Body weight (kg) 0.013 0.070 3.288 0.041 1.703 0.048 0.027 0.081
BMI z-score 0.095 0.014 0.192 0.004 0.117 0.009 0.644 0.119
rs4285184
Body weight (kg) 0.013 0.024 2.192 0.080 1.498 0.038 0.028 0.118
BMI z-score 0.071 0.020 0.121 0.025 0.068 0.033 0.027 0.239
rs12517906
Body weight (kg) �0.001 0.795
BMI z-score �0.028 0.464
rs6886113
Body weight (kg) 0.007 0.231
BMI z-score 0.026 0.501
Abbreviations: BMI, body mass index; SNP, single nucleotide polymorphism; ULSAM, Uppsala Longitudinal Study of Adult Men. b indicates transformed b-values.
P indicates P-values adjusted for significant covariates.
SNPs near MGAT1 influence obesity susceptibilityJA Jacobsson et al
124
International Journal of Obesity

rs1021001 (MAF 13.4%), which however did not reached
statistical significance (P¼0.081) (Table 3).
To study the combined effect on BMI a meta-analysis was
performed for two of the SNPs, rs1021001 and rs4285184
(Figure 2). The mean BMI z-score for carriers of the common
homozygote was compared with carriers of the rare homo-
zygote in the four groups. The rare homozygote had a
combined higher mean level of BMI z-score for both SNPs,
0.233 (95% CI 0.093–0.373, P¼0.001) for rs1021001 and
0.147 (95% CI 0.057–0.236, P¼ 0.001) for rs4285184. There
was no evidence of heterogeneity between risk estimates for
the two SNPs (rs1021001: P¼0.867, l2¼0% and rs4285184:
P¼0.513, l2¼0%).
Fatty acid associations
Serum fatty acids function as biomarkers for long-term
dietary fat intake but also reflect the endogenous fatty acid
synthesis. As serum fatty acids and desaturase indices have
been related to obesity36 we sought to further investigate
levels of obesity associated fatty acids among the adult men.
Carriers of the minor allele of three of the studied variants,
rs12517906 (MAF 13.1%), rs12186500 (MAF 37.0%) and
rs4285184 (MAF 21.4%), had decreased levels of linoleic acid
(18:2 (n-6)) (Table 4). Increased levels of palmitoleic acid
(16:1 (n-7)) were observed for all variants and were
significantly different for rs12186500, rs1021001 and
rs4285184 (Table 4). Furthermore, carriers of the minor
allele of four of the studied variants, rs12186500 (MAF
37.0%), rs6886113 (MAF 20.1%), rs1021001 (MAF 12.3%)
and rs4285184 (MAF 21.4%), had increased levels of D-6
desaturase and rs1021001 and rs4285184 were also asso-
ciated with increased D-9 desaturase activity (Table 4). In
addition, increased levels of g-linolenic acid (18:3 (n-6)) for
the minor allele were observed for rs12186500. To study if
the fatty acids and desaturases modulate the observed
Figure 2 Meta-analysis of the MGAT1 variants (a) rs1021001 and
(b) rs4285184. The effect of the rare allele on BMI z-score in the
four groups is presented as 95% CI.
Table 4 Association study of MGAT1 SNPs with fatty acid composition in the ULSAM cohort
ULSAM, n¼985 C:D rs12517906 rs12186500 rs6886113 rs1021001 rs4285184
Name b P-value b P-value b P-value b P-value b P-value
a-linolenic acid 18:3 (n-3) 0.004 0.454 0.000 0.984 0.003 0.810 0.001 0.933 0.002 0.694
Eicosapentaenoic acid 20:5 (n-3) 0.007 0.878 0.006 0.865 0.003 0.992 0.001 0.997 0.037 0.295
Linoleic acid 18:2 (n-6) �0.097 0.028 �0.058 0.042 �0.004 0.912 �0.001 0.974 �0.103 0.023
g-linolenic acid 18:3 (n-6) 0.064 0.175 0.069 0.039 0.055 0.148 0.062 0.181 0.069 0.062
Dihomo-g-linolenic acid 20:3 (n-6)) 0.007 0.547 0.004 0.795 �0.003 0.917 0.002 0.635 0.009 0.464
Arachidonic acid 20:4 (n-6) 0.032 0.514 0.044 0.137 0.030 0.313 0.028 0.375 0.054 0.192
Palmitic acid 16:0 0.001 0.583 0.001 0.264 0.001 0.471 0.001 0.596 0.001 0.336
Palmitoleic acid 16:1 (n-7) 0.084 0.064 0.078 0.016 0.065 0.076 0.103 0.018 0.078 0.020
D-5 desaturase 20:4 (n-6)/20:3 (n-6) �0.028 0.541 �0.049 0.149 �0.023 0.543 �0.046 0.309 �0.011 0.756
D-6 desaturase 18:3 (n-6)/18:2 (n-6) 0.083 0.084 0.092 0.007 0.076 0.040 0.096 0.039 0.080 0.020
D-9 desaturase 16:1 (n-7)/16:0 0.043 0.334 0.054 0.095 0.049 0.172 0.096 0.028 0.192 0.006
Abbreviations: SNP, single nucleotide polymorphism; ULSAM, Uppsala Longitudinal Study of Adult Men. b indicates transformed b-values. P indicates P-values
adjusted for significant covariates.
SNPs near MGAT1 influence obesity susceptibilityJA Jacobsson et al
125
International Journal of Obesity
genetic effects of MGAT1 on body weight and BMI, the
interaction between fatty acids and the studied SNPs was
analyzed. For BMI, we observed interactions between
rs12186500 and arachidonic acid (P¼0.0001), g-linolenic
acid (P¼0.008), D-6 desaturase (P¼0.019) and D-9 desatur-
ase (P¼0.007). When the subjects were stratified into low
and high levels of these measurements based on the median
levels in the cohort, the association between BMI and
rs12186500 was observed among subjects with high levels
of g-linolenic acid (P¼0.010), arachidonic acid (P¼0.003),
D-6 desaturase (P¼0.042) and D-9 desaturase (P¼0.026)
whereas no association was seen among subjects with low
levels (g-linolenic acid P¼0.354, arachidonic acid P¼0.853,
D-6 desaturase P¼0.501, D-9 desaturase P¼0.559). No
interactions were observed between the studied SNPs and
fatty acids or desaturases on body weight (P40.05 for all).
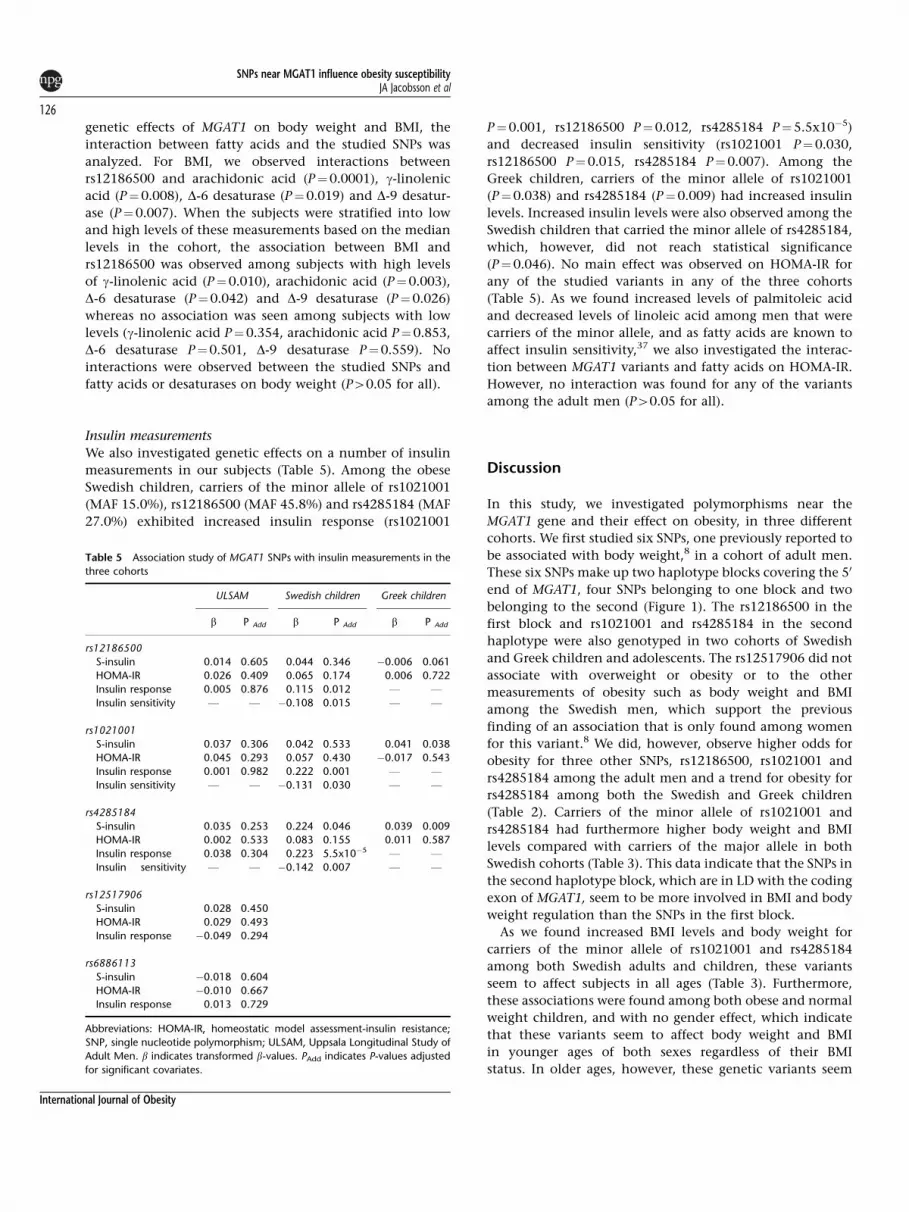
Insulin measurements
We also investigated genetic effects on a number of insulin
measurements in our subjects (Table 5). Among the obese
Swedish children, carriers of the minor allele of rs1021001
(MAF 15.0%), rs12186500 (MAF 45.8%) and rs4285184 (MAF
27.0%) exhibited increased insulin response (rs1021001
P¼0.001, rs12186500 P¼0.012, rs4285184 P¼5.5x10�5)
and decreased insulin sensitivity (rs1021001 P¼0.030,
rs12186500 P¼ 0.015, rs4285184 P¼0.007). Among the
Greek children, carriers of the minor allele of rs1021001
(P¼0.038) and rs4285184 (P¼0.009) had increased insulin
levels. Increased insulin levels were also observed among the
Swedish children that carried the minor allele of rs4285184,
which, however, did not reach statistical significance
(P¼0.046). No main effect was observed on HOMA-IR for
any of the studied variants in any of the three cohorts
(Table 5). As we found increased levels of palmitoleic acid
and decreased levels of linoleic acid among men that were
carriers of the minor allele, and as fatty acids are known to
affect insulin sensitivity,37 we also investigated the interac-
tion between MGAT1 variants and fatty acids on HOMA-IR.
However, no interaction was found for any of the variants
among the adult men (P40.05 for all).
Discussion
In this study, we investigated polymorphisms near the
MGAT1 gene and their effect on obesity, in three different
cohorts. We first studied six SNPs, one previously reported to
be associated with body weight,8 in a cohort of adult men.
These six SNPs make up two haplotype blocks covering the 50
end of MGAT1, four SNPs belonging to one block and two
belonging to the second (Figure 1). The rs12186500 in the
first block and rs1021001 and rs4285184 in the second
haplotype were also genotyped in two cohorts of Swedish
and Greek children and adolescents. The rs12517906 did not
associate with overweight or obesity or to the other
measurements of obesity such as body weight and BMI
among the Swedish men, which support the previous
finding of an association that is only found among women
for this variant.8 We did, however, observe higher odds for
obesity for three other SNPs, rs12186500, rs1021001 and
rs4285184 among the adult men and a trend for obesity for
rs4285184 among both the Swedish and Greek children
(Table 2). Carriers of the minor allele of rs1021001 and
rs4285184 had furthermore higher body weight and BMI
levels compared with carriers of the major allele in both
Swedish cohorts (Table 3). This data indicate that the SNPs in
the second haplotype block, which are in LD with the coding
exon of MGAT1, seem to be more involved in BMI and body
weight regulation than the SNPs in the first block.
As we found increased BMI levels and body weight for
carriers of the minor allele of rs1021001 and rs4285184
among both Swedish adults and children, these variants
seem to affect subjects in all ages (Table 3). Furthermore,
these associations were found among both obese and normal
weight children, and with no gender effect, which indicate
that these variants seem to affect body weight and BMI
in younger ages of both sexes regardless of their BMI
status. In older ages, however, these genetic variants seem
Table 5 Association study of MGAT1 SNPs with insulin measurements in the
three cohorts
ULSAM Swedish children Greek children
b P Add b P Add b P Add
rs12186500
S-insulin 0.014 0.605 0.044 0.346 �0.006 0.061
HOMA-IR 0.026 0.409 0.065 0.174 0.006 0.722
Insulin response 0.005 0.876 0.115 0.012 F FInsulin sensitivity F F �0.108 0.015 F F
rs1021001
S-insulin 0.037 0.306 0.042 0.533 0.041 0.038
HOMA-IR 0.045 0.293 0.057 0.430 �0.017 0.543
Insulin response 0.001 0.982 0.222 0.001 F FInsulin sensitivity F F �0.131 0.030 F F
rs4285184
S-insulin 0.035 0.253 0.224 0.046 0.039 0.009
HOMA-IR 0.002 0.533 0.083 0.155 0.011 0.587
Insulin response 0.038 0.304 0.223 5.5x10�5 F FInsulin sensitivity F F �0.142 0.007 F F
rs12517906
S-insulin 0.028 0.450
HOMA-IR 0.029 0.493
Insulin response �0.049 0.294
rs6886113
S-insulin �0.018 0.604
HOMA-IR �0.010 0.667
Insulin response 0.013 0.729
Abbreviations: HOMA-IR, homeostatic model assessment-insulin resistance;
SNP, single nucleotide polymorphism; ULSAM, Uppsala Longitudinal Study of
Adult Men. b indicates transformed b-values. PAdd indicates P-values adjusted
for significant covariates.
SNPs near MGAT1 influence obesity susceptibilityJA Jacobsson et al
126
International Journal of Obesity

to affect body weight and BMI more among the extremes
as we observed higher odds for obesity but not overweight.
The Greek children had an overall lower allele frequency
and weaker LD between the markers than the Swedish
subjects indicating ethnic differences for these variants and
may explain why only trends were observed among the
Greek subjects. Ethnical differences were also observed in the
previous GWA study of five geographically distinct European
populations, rs12517906 was highly significantly associated
with weight in their meta-analysis but only reached nominal
significance in two of the individual population samples.8
Despite these differences we observed evidence of an
association with BMI z-score for rs1021001 and rs4285184
for all cohorts. The combined effect size for the two SNPs on
BMI z-score from our meta-analysis was 0.3 and 0.1,
respectively.
The mechanism(s) by which these SNPs near the MGAT1
gene may contribute to the observed associations is unclear.
Given that the analyzed SNPs map to non-coding regions,
the likelihood that any of these SNPs represent the causal
variant is low. However, these genetic variants are both in LD
with the coding exon in MGAT1, a key enzyme involved in
glycosylation of proteins and lipids.38 Changes in MGAT1
expression caused by these variants may lead to altered
glycosylation, which may affect proteins and lipids that are
dependent on complete glycosylation. An altered glycosyla-
tion may cause misdirected sorting of these proteins and
alter their function,38 which in turn may be important for
body weight regulation.
Serum fatty acid composition is a biomarker for long term
dietary fat intake, but also reflects endogenous fatty acid
synthesis.39 The latter could also be influenced by genetic
variation and hormonal (for example, obesity-related hyper-
insulinemia) factors.39 The analyzed fatty acids have all been
correlated with obesity markers such as BMI.37 Especially, D-6
and D-9 desaturases show a strong positive association with
obesity.37 Furthermore, we have recently shown that variants
in the D-9 desaturase gene are associated with obesity in
adult men.40 Changed levels of serum palmitoleic acid due to
altered D-9 desaturase activation have also a significant
relation to obesity in children.41 In the present study the
MGAT1genetic variants are in addition to obesity and BMI,
associated with altered fatty acid composition, for example,
linoleic acid and palmitoleic acid, which may be due to
disturbance in the activation of D-6 desaturase and D-9
desaturase, respectively. However, whether these associations
are causal remains to be elucidated. In addition, we observed
interactions between rs12186500, and g-linolenic acid,
arachidonic acid, D-6 and D-9 desaturase. Carriers of the
minor allele of rs12186500 with high levels of these fatty
acids and desaturases had significantly higher BMI than
carriers of the major allele. The observed interaction with
g-linolenic acid and arachidonic acid might also be due to
altered D-6 desaturase activity.
As increased levels of fatty acids are known to be one of the
factors inducing insulin resistance37 and that the men in the
present study who were carriers of the minor allele also had
elevated levels of fatty acids, we hypothesized that these
subjects might also have an increased risk of developing
insulin resistance. We observed in addition an increased
insulin response and decreased insulin sensitivity among the
obese children. We found, however, no interaction effect
between these SNPs and fatty acids on HOMA-IR among the
Swedish men, so the altered fatty acid levels caused by the
variants in MGAT1 do not seem to modulate an increased
insulin resistance.
In conclusion, we genotyped six SNPs downstream MGAT1
in a cohort of Swedish adult men and observed associations
with obesity as well as increased body weight and BMI levels
for some of these variants. Two of them also associated with
body weight and BMI levels among Swedish children and
similar trends were observed among Greek children. The
analyzed SNPs were further associated with fatty acids and Ddesaturases, variables that have previously been shown to
correlate with obesity markers. Some of these fatty acids may
also modulate the observed genetic effect on BMI but not
insulin resistance.
Conflict of interest
The authors declare no conflict of interest.
Acknowledgements
The study was supported by the Swedish Research Council,
Novo Nordisk, Tore Nilsons foundation and Ahlens founda-
tion. RF was supported by the Goran Gustafsson foundation.
The SNP genotyping was performed by the SNP Technology
Platform, Uppsala, Sweden (http://www.genotyping.se) with
support from Uppsala University and the Knut and Alice
Wallenberg foundation and at the Uppsala Genome Centre.
We thank the Healthy Growth Study Group for their
contribution in this study. The Healthy Growth Study Group
consists of (1) Harokopio University Research Team/ Department
of Nutrition and Dietetics: Yannis Manios (Coordinator),
George Moschonis (Project manager), Katerina P Skenderi,
Evangelia Grammatikaki, Odysseas Androutsos, Sofia Tanagra,
Alexandra Koumpitski, Paraskevi-Eirini Siatitsa, Anastasia
Vandorou, Aikaterini-Efstathia Kyriakou, Vasiliki Dede, Maria
Kantilafti, Aliki-Eleni Farmaki, Aikaterini Siopi, Sofia Micheli,
Louiza Damianidi, Panagiota Margiola, Despoina Gakni,
Vasiliki Iatridi, Christina Mavrogianni, Kelaidi Michailidou,
Aggeliki Giannopoulou, Efstathoula Argyri, Konstantina
Maragkopoulou, Maria Spyridonos, Eirini Tsikalaki, Panagiotis
Kliasios, Anthi Naoumi, Konstantinos Koutsikas, Katerina
Kondaki, Epistimi Aggelou, Zoi Krommyda, Charitini Aga,
Manolis Birbilis, Ioanna Kosteria, Amalia Zlatintsi, Elpida
Voutsadaki, Eleni-Zouboulia Papadopoulou, Zoi Papazi, Maria
Papadogiorgakaki, Fanouria Chlouveraki, Maria Lyberi, Nora
SNPs near MGAT1 influence obesity susceptibilityJA Jacobsson et al
127
International Journal of Obesity

Karatsikaki-Vlami, Eva Dionysopoulou and Efstratia Daskalou
(2) Aristotle University of Thessaloniki/ School of Physical Education
and Sports Sciences: Vassilis Mougios, Anatoli Petridou,
Konstantinos Papaioannou, Georgios Tsalis, Ananis Karagkio-
zidis, Konstantinos Bougioukas, Afroditi Sakellaropoulou and
Georgia Skouli. (3) University of Athens/ Medical School: George
P Chrousos, Maria Drakopoulou and Evangelia Charman-
dari. Uppsala University/ Department of Neuroscience, Functional
Pharmacology: Helgi B Schioth, Robert Fredriksson, Markus
Sallman-Almen and Josefin Jacobsson.
References
1 Allison DB, Kaprio J, Korkeila M, Koskenvuo M, Neale MC,Hayakawa K. The heritability of body mass index among aninternational sample of monozygotic twins reared apart. Int JObes Relat Metab Disord 1996; 20: 501–506.
2 Speliotes EK, Willer CJ, Berndt SI, Monda KL, Thorleifsson G,Jackson AU et al. Association analyses of 249 796 individualsreveal 18 new loci associated with body mass index. Nat Genet2010; 42: 937–948.
3 Thorleifsson G, Walters GB, Gudbjartsson DF, Steinthorsdottir V,Sulem P, Helgadottir A et al. Genome-wide association yields newsequence variants at seven loci that associate with measures ofobesity. Nat Genet 2009; 41: 18–24.
4 Willer CJ, Speliotes EK, Loos RJ, Li S, Lindgren CM, Heid IM et al.Six new loci associated with body mass index highlight aneuronal influence on body weight regulation. Nat Genet 2009;41: 25–34.
5 Frayling TM, Timpson NJ, Weedon MN, Zeggini E, Freathy RM,Lindgren CM et al. A common variant in the FTO gene isassociated with body mass index and predisposes to childhoodand adult obesity. Science 2007; 316: 889–894.
6 Dina C, Meyre D, Gallina S, Durand E, Korner A, Jacobson P et al.Variation in FTO contributes to childhood obesity and severeadult obesity. Nat Genet 2007; 39: 724–726.
7 Scuteri A, Sanna S, Chen WM, Uda M, Albai G, Strait J et al.Genome-wide association scan shows genetic variants in theFTO gene are associated with obesity-related traits. PLoS Genet2007; 3: e115.
8 Johansson A, Marroni F, Hayward C, Franklin CS, Kirichenko AV,Jonasson I et al. Linkage and genome-wide association analysis ofobesity-related phenotypes: association of weight with theMGAT1 gene. Obesity (Silver Spring) 2010; 18: 803–808.
9 Kumar R, Yang J, Larsen RD, Stanley P. Cloning and expression ofN-acetylglucosaminyltransferase I, the medial golgi transferasethat initiates complex N-linked carbohydrate formation.Proc Natl Acad Sci USA 1990; 87: 9948–9952.
10 Pownall S, Kozak CA, Schappert K, Sarkar M, Hull E, Schachter Het al. Molecular cloning and characterization of the mouse UDP-N-acetylglucosamine:alpha-3-D-mannoside beta-1,2-N-acetylglu-cosaminyltransferase I gene. Genomics 1992; 12: 699–704.
11 Yip B, Chen SH, Mulder H, Hoppener JW, Schachter H.Organization of the human beta-1,2-N-acetylglucosaminyl-transferase I gene (MGAT1), which controls complex andhybrid N-glycan synthesis. Biochem J 1997; 321(Part 2):465–474.
12 Schachter H. Biosynthetic controls that determine the branchingand microheterogeneity of protein-bound oligosaccharides.Biochem Cell Biol 1986; 64: 163–181.
13 Schachter H. The ‘yellow brick road’ to branched complexN-glycans. Glycobiology 1991; 1: 453–461.
14 Schachter H. Mgat1-dependent N-glycans are essential forthe normal development of both vertebrate and invertebratemetazoans. Semin Cell Dev Biol 2010; 21: 609–615.
15 Lowe JB, Marth JD. A genetic approach to Mammalian glycanfunction. Annu Rev Biochem 2003; 72: 643–691.
16 Ioffe E, Stanley P. Mice lacking N-acetylglucosaminyltransferase Iactivity die at mid-gestation, revealing an essential role forcomplex or hybrid N-linked carbohydrates. Proc Natl Acad Sci USA1994; 91: 728–732.
17 Metzler M, Gertz A, Sarkar M, Schachter H, Schrader JW, MarthJD. Complex asparagine-linked oligosaccharides are required formorphogenic events during post-implantation development.EMBO J 1994; 13: 2056–2065.
18 Schachter H. The role of the GlcNAc(beta)1,2Man(alpha)-moiety in mammalian development. Null mutations of thegenes encoding UDP-N-acetylglucosamine:alpha-3-D-mannosidebeta-1,2-N-acetylglucosaminyltransferase I and UDP-N-acetylglu-cosamine:alpha-D-mannoside beta-1,2-N-acetylglucosaminyl-transferase I.2 cause embryonic lethality and congenitalmuscular dystrophy in mice and men, respectively. BiochimBiophys Acta 2002; 1573: 292–300.
19 Jaeken J, Carchon H, Stibler H. The carbohydrate-deficientglycoprotein syndromes: pre-golgi and golgi disorders? Glyco-biology 1993; 3: 423–428.
20 Charuk JH, Tan J, Bernardini M, Haddad S, Reithmeier RA, JaekenJ et al. Carbohydrate-deficient glycoprotein syndrome type IIAn autosomal recessive N-acetylglucosaminyltransferase II.deficiency different from typical hereditary erythroblastic multi-nuclearity, with a positive acidified-serum lysis test (HEMPAS).Eur J Biochem 1995; 230: 797–805.
21 Granovsky M, Fata J, Pawling J, Muller WJ, Khokha R, Dennis JW.Suppression of tumor growth and metastasis in Mgat5-deficientmice. Nat Med 2000; 6: 306–312.
22 Hedstrand H. A study of middle-aged men with particularreference to risk factors for cardiovascular disease. Ups J Med SciSuppl 1975; 19: 1–61.
23 Ingelsson E, Arnlov J, Sundstrom J, Zethelius B, Vessby B, Lind L.Novel metabolic risk factors for heart failure. J Am Coll Cardiol2005; 46: 2054–2060.
24 Zethelius B, Berglund L, Hanni A, Berne C. The interactionbetween impaired acute insulin response and insulin resistancepredict type 2 diabetes and impairment of fasting glucose: reportfrom a 20-year follow-up in the Uppsala longitudinal study ofadult men - ULSAM. Ups J Med Sci 2008; 113: 117–130.
25 Jacobsson JA, Danielsson P, Svensson V, Klovins J, Gyllensten U,Marcus C et al. Major gender difference in association of FTOgene variant among severely obese children with obesity andobesity related phenotypes. Biochem Biophys Res Commun 2008;368: 476–482.
26 Cole TJ, Bellizzi MC, Flegal KM, Dietz WH. Establishing astandard definition for child overweight and obesity worldwide:international survey. BMJ 2000; 320: 1240–1243.
27 Bergman RN. Minimal model: perspective from 2005. Horm Res2005; 64(Suppl 3): 8–15.
28 Kamel A, Norgren S, Elimam A, Danielsson P, Marcus C. Effects ofgrowth hormone treatment in obese prepubertal boys. J ClinEndocrinol Metab 2000; 85: 1412–1419.
29 Fan JB, Oliphant A, Shen R, Kermani BG, Garcia F, Gunderson KLet al. Highly parallel SNP genotyping. Cold Spring Harb Symp QuantBiol 2003; 68: 69–78.
30 Barrett JC, Fry B, Maller J, Daly MJ. Haploview: analysis andvisualization of LD and haplotype maps. Bioinformatics 2005; 21:263–265.
31 Gabriel SB, Schaffner SF, Nguyen H, Moore JM, Roy J, BlumenstielB et al. The structure of haplotype blocks in the human genome.Science 2002; 296: 2225–2229.
32 Purcell S, Neale B, Todd-Brown K, Thomas L, Ferreira MA, BenderD et al. PLINK: a tool set for whole-genome association andpopulation-based linkage analyses. Am J Hum Genet 2007; 81:559–575.
33 Bax L, Yu LM, Ikeda N, Tsuruta H, Moons KG. Developmentand validation of MIX: comprehensive free software for meta-
SNPs near MGAT1 influence obesity susceptibilityJA Jacobsson et al
128
International Journal of Obesity

analysis of causal research data. BMC Med Res Methodol 2006;6: 50.
34 Benjamini Y, Hochberg Y. Controlling the False Discovery Rate - aPractical and Powerful Approach to Multiple Testing. J R Stat SocSeries B Stat Methodol 1995; 57: 289–300.
35 Skol AD, Scott LJ, Abecasis GR, Boehnke M. Joint analysis is moreefficient than replication-based analysis for two-stage genome-wide association studies. Nat Genet 2006; 38: 209–213.
36 Warensjo E, Ohrvall M, Vessby B. Fatty acid composition andestimated desaturase activities are associated with obesity andlifestyle variables in men and women. Nutr Metab Cardiovasc Dis2006; 16: 128–136.
37 Riserus U. Fatty acids and insulin sensitivity. Curr Opin Clin NutrMetab Care 2008; 11: 100–105.
38 Koenderman AH, Koppen PL, Koeleman CA, van den EijndenDH. N-acetylglucosaminyltransferase III IV and V activities inNovikoff ascites tumour cells, mouse lymphoma cells and henoviduct. Application of a sensitive and specific assay by use of
high-performance liquid chromatography. Eur J Biochem 1989;181: 651–655.
39 Vessby B. Dietary fat and insulin action in humans. Br J Nutr2000; 83(Suppl 1): S91–S96.
40 Warensjo E, Ingelsson E, Lundmark P, Lannfelt L, Syvanen AC,Vessby B et al. Polymorphisms in the SCD1 gene: associationswith body fat distribution and insulin sensitivity. Obesity (SilverSpring) 2007; 15: 1732–1740.
41 Okada T, Furuhashi N, Kuromori Y, Miyashita M, Iwata F,Harada K. Plasma palmitoleic acid content and obesity inchildren. Am J Clin Nutr 2005; 82: 747–750.
This work is licensed under the Creative
Commons Attribution-NonCommercial-No
Derivative Works 3.0 Unported License. To view a copy
of this license, visit http://creativecommons.org/
licenses/by-nc-nd/3.0/
SNPs near MGAT1 influence obesity susceptibilityJA Jacobsson et al
129
International Journal of Obesity
Copyright © 2022 FDOKUMEN