Rorschach Interpretation With High-Ability Adolescent Females

Association of BMI and Cardiovascular Risk Stratification in theElderly African-American Females
Fahad Javed1,2,3, Emad F. Aziz3, Manpreet S. Sabharwal2, Girish N. Nadkarni2, Shahzeb A.Khan2, Juan P. Cordova2, Alexandre M. Benjo2, Dympna Gallagher1, Eyal Herzog3, Franz H.Messerli3, and F. Xavier Pi-Sunyer1,2
1New York Obesity Research Center, Division of Endocrinology, Diabetes, and Nutrition, StLuke’s-Roosevelt Hospital Center, Columbia University College of Physicians and Surgeons, NewYork, New York, USA2Department of Medicine, St Luke’s-Roosevelt Hospital Center, Columbia University College ofPhysicians and Surgeons, New York, New York, USA3Division of Cardiology, St Luke’s-Roosevelt Hospital Center, Columbia University College ofPhysicians and Surgeons, New York, New York, USA
AbstractWe aimed to estimate the association of BMI and risk of systemic hypertension in African-American females aged 65 years and older. In this retrospective, cross-sectional study, medicalcharts were randomly reviewed after obtaining institutional review board approval and datacollection was conducted for height, weight, BMI, age, ethnicity, gender, and hypertension. Amultivariable logistic regression analysis was performed. The mean BMI was significantly higherin hypertensive subjects than normotensives (30.3 vs. 29 kg/m2; P = 0.003). A higher proportionof hypertensive subjects had a BMI >23 kg/m2 as compared to normotensives (88.9% vs. 83.5%;P = 0.023). When the log odds of having a history of hypertension was plotted against BMI as acontinuous variable, we found that the odds showed an increasing trend with increasing BMI and asteep increase after a BMI of 23 kg/m2. When BMI was analyzed as a categorical variable, a BMIof 23–30 kg/m2 was found to have an odds ratio of 1.43 (95% confidence interval 1.01–2.13; P =0.05) and a BMI of >30 kg/m2 had an odds ratio of 1.76 (95% confidence interval 1.17–2.65; P =0.007) when compared to a BMI of <23 kg/m2. This association remained significant in bothunivariate and multivariate analysis. We conclude that BMI is an independent predictor ofhypertension in elderly African-American females. Our results indicate that the risk ofhypertension increased significantly at BMI of >23 kg/m2 in this ethnic group. Weight reductionto a greater extent than previously indicated could play an integral role in prevention and controlof high blood pressure in this particular population.
INTRODUCTIONObesity is designated as a major risk factor for the development of various cardiovascular(CV) diseases by the American Heart Association (1). According to the 2007–2008 NationalHealth and Nutritional Health Examination Survey (NHANES), 68% of US adults areoverweight or obese (2). The percentage of obesity among adults 20–74 years of age hasmore than doubled from 1976–1980 to 2007–2008, increasing from 15 to 33.8% (2,3).
Correspondence: Fahad Javed ([email protected]) or ([email protected]).DISCLOSUREThe authors declared no conflict of interest.
NIH Public AccessAuthor ManuscriptObesity (Silver Spring). Author manuscript; available in PMC 2012 June 1.
Published in final edited form as:Obesity (Silver Spring). 2011 June ; 19(6): 1182–1186. doi:10.1038/oby.2010.307.
NIH
-PA Author Manuscript
NIH
-PA Author Manuscript
NIH
-PA Author Manuscript

Obesity accounts for 2–6% of total health-care costs in several developed countries; someestimates put the figure as high as 7%. The true costs are undoubtedly much greater as notall obesity-related conditions are included in these calculations. In the United States, $147billions are spent on obesity each year (4).
Various anthropometric indexes such as BMI, waist or hip circumference, and waist-to-hipratio have been implicated to estimate the CV risks (5–11). Obesity significantly raises risksfor many fatal and morbid diseases including but not limited to hypertension, diabetesmellitus, coronary artery disease, depression, dyslipidemias, and various cancers. CVdisease is the leading cause of mortality in the elderly population (12), with comparativelyhigher incidence and prevalence observed in overweight and/or obese African-Americanpopulation (13). The age-adjusted death rate in African Americans exceeds the white peoplefor ischemic heart disease and stroke, which continues to be the leading cause of deathamong the African-American population (14). About 50% of the African-American females>60 year of age are obese (2). Studies have demonstrated an increased CV risk in peoplewith higher BMI, especially in elderly populations (15,16) Obesity has been shown to beassociated with increased arterial stiffness, which contributes to systemic hypertension andincreases the incidence and prevalence of this disease in the general population.
The World Health Organization (WHO) defines overweight and obesity as a BMI range of25–29.9 and ≥30 kg/m2, respectively. These values were obtained from the BMI andmortality associations in European populations, which were J-shaped with the nadir of thecurve between 18.5 and 25 kg/m2 (16–19). Similar finding were observed in Asianpopulations (20,21). These cutoffs have since been used as a standard in differentpopulations and ethnic groups with the assumption that different ethnic groups have similarmortality and morbidity risk at these BMI cutoffs. However, controversy regarding theoptimal BMI range in various ethnic populations still exists. It is translating into a muchbigger problem in elderly population complicated by the phenomenon of sarcopenic obesity(22). Wannamethee et al. concluded that the current BMI cutoffs were appropriate whenused to predict CV risk in 4,232 elderly men across 24 British towns (23). In contrast,certain recent studies conducted in Asian populations showed that Asians have a higherprevalence of CV disease, increased risk for diabetes mellitus, systemic hypertension,dyslipidemias, and albuminuria at comparatively lower BMI values (21,24,25). Thesephenomena could be explained, in part, by the findings demonstrating that Asian peoplehave lower BMI values but higher body fat percentage than the white or other ethnic groups(26). For this reason, a WHO international task force has recommended overweight statusfor these populations at BMI of ≥23 kg/m2 (27). However, these studies andrecommendations are limited to the Asian population.
Since the change in stratification parameters to define overweight and/or obesity in theAsian population, application of standardized cutoffs in other ethnicities are at risk of beingrendered obsolete and requires further investigation. The higher prevalence of obesity in theelderly African-American female population and a higher CV mortality in this populationled us to evaluate the relationship in this ethnic group. The primary objective of our studywas to examine the association of BMI and hypertension in African-American females ≥65years of age. The secondary end point was to determine specific BMI cutoff values as apredictor of hypertension in this ethnic population. Our study is unique as it evaluated therelationship between BMI and hypertension in an elderly African-American femalepopulation.
Javed et al. Page 2
Obesity (Silver Spring). Author manuscript; available in PMC 2012 June 1.
NIH
-PA Author Manuscript
NIH
-PA Author Manuscript
NIH
-PA Author Manuscript
METHODS AND PROCEDURESStudy design
This is a retrospective, cross-sectional study. The St Luke’s Roosevelt Hospital Centerinstitutional review board approved the study.
Subject selectionThe study population consisted of 962 African-American females of age 65 years or above.These patients were selected by reviewing consecutive medical records from the New YorkObesity Research Center.
Data collectionThe data for this study were collected from the New York Obesity Research Center at StLuke’s Roosevelt Hospital Center, affiliated with Columbia University (New York, NY).Medical charts were reviewed after obtaining institutional review board approval and datapertaining to height, weight, BMI, age, ethnicity, gender, and hypertension for the period ofJanuary 1998–July 2008 were collected. After screening based on ethnicity (i.e., African-American female population), 631 patients were found to have high blood pressure(diagnosed systemic hypertension and/or use of antihypertensive medications) and 331patients were without high blood pressure.
DefinitionsHeight of the patient was measured with a standard stadiometer, while patient was wearing athin pair of socks and the weight was measured with a standard electric beam scale. BMIwas calculated as weight in kg divided by height in m2 (kg/m2). WHO criteria was used fordefinitions pertaining to body weight ranges. Normal weight was defined as BMI of 20–24.9kg/m2, overweight as BMI of 25–29.9 kg/m2, obesity as BMI of ≥30 kg/m2, and morbidobesity as BMI ≥40 kg/m2.
Hypertension was defined as (i) previous diagnosis of hypertension, (ii) blood pressure ≥140mm Hg systolic or 90 mm Hg diastolic on at least two occasions, or (iii) use ofantihypertensive pharmacological therapy. The data for defining a patient as a hypertensiveor not was collected after careful review of the patient charts and examination reports.
History of diabetes mellitus was defined as (i) previous diagnosis of type 2 diabetes mellitusand/or (ii) use of antidiabetic medications.
Active smoking was defined as smoking within the previous 1 month. In our study, therewere only a few subjects who were active smokers (23 hypertensive and 9 normotensivesubjects).
Corticosteroid use was defined as daily use of corticosteroid therapy for any medicalcondition for a duration >3 weeks during the last 6 months.
Statistical analysisBMI was analyzed both as a continuous and categorical variable. Differences in the meanBMI between hypertensive and nonhypertensive participants were analyzed using theStudent t-test. For differences in the proportions in each BMI category between the twogroups, the χ2-test was used. Odds ratios and 95% confidence intervals for the associationsbetween explanatory variables and a history of hypertension were estimated usingmultivariable logistic regression models. P values <0.05 were considered to be statisticallysignificant. The association of hypertension and BMI was also graphed using the odds of
Javed et al. Page 3
Obesity (Silver Spring). Author manuscript; available in PMC 2012 June 1.
NIH
-PA Author Manuscript
NIH
-PA Author Manuscript
NIH
-PA Author Manuscript
hypertension and BMI as continuous variables and specific cutpoints were derived from thegraph. Estimates for the association between the primary explanatory variable of interest(BMI) and a history of hypertension were adjusted in multivariate models that includedpotential confounding covariates that were statistically significant in univariate logisticregression or which were significant components of the confounding pathway. Theinflection point for the incremental increase in odds for hypertension was derived from thefigure and then different cutpoints were analyzed until the starting point for the increasedrisk was estimated. BMI as a continuous and as a categorical variable was included indifferent models. Thus the categories were designated to be <23, 23–30, and >30 kg/m2 andthe odds were found to be 1.43 for 23–30 kg/m2 and 1.76, respectively when compared to aBMI of <23 kg/m2 which was statistically significant (Figure 1). These confoundersincluded a history of diabetes mellitus, history of smoking, history of corticosteroid use. Theassociation of hypertension and interactions between the confounders were also assessed.Statistical analysis was performed using STATA version 10 software package (STATA,College Station, TX).
RESULTSOut of a total of 962 subjects, 631 (65%) had a history of hypertension, while 331 (35%) didnot. The baseline characteristics of the subjects are shown in Table 1. Subjects with a historyof hypertension were found to have a higher prevalence of diabetes mellitus (25.8% vs.12.5%; P < 0.001) as compared to those without a history of hypertension.
Out of the 631 hypertensive patients, 219 (34.7%), 50 (7.9%), 38 (6%), and 33 (5.2%) wereon angiotensin-converting enzyme inhibitor (ACE-I), diuretic, β-blocker (BB) and calciumchannel blocker (CCB) monotherapy, respectively. Dual therapy included 34 (5.4%) on anACE-I and diuretic, 24 (3.8%) on an ACE-I and BB, 24 (3.8%) on a BB and diuretic, 129(20.4%) on ACE-I and CCB, 7 (1.1%) on CCB and diuretic, and 6 (0.9%) on a BB and CCBcombination therapy. A total of 62 (9%) were on three antihypertensive agents of which 50(7.9%) were on a CCB: ACE-I: diuretic regimen and 12 (1.9%) were on a BB: ACE-I:diuretic regimen. Only five (0.8%) were on other anti-hypertensive agents. The mean BMIwas not significantly higher in patients on BB (n = 104) when compared to those on otherantihypertensive medications (31 vs. 30 kg/m2, P = 0.16).
The distribution of the BMI of subjects is shown in Table 2. Subjects with a history ofhypertension had higher mean BMI as compared to those without (30.3 kg/m2 vs. 29 kg/m2;P = 0.003). The proportion of subjects in the overweight and obese categories was alsosignificantly higher in hypertensive subjects compared to nonhypertensive subjects (45% vs.37%; P = 0.023).
When a multivariable logistic regression analysis was done with hypertension as theindependent variable, we see that the odds ratio for hypertension increases exponentially forevery 1 kg/m2 increase after a BMI of 23 kg/m2, when BMI was analyzed as a continuousvariable (Table 3 and Figure 1). The association remained constant even after adjusting forconfounding factors including smoking, diabetes, and corticosteroid use. An interestingobservation was a steep increase in the odds for hypertension after a BMI of 23 kg/m2.Though we observed an increase in odds of hypertension with BMI ≤18 kg/m2, this was notstatistically significant (P = 0.85), as shown in Figure 1.
When BMI was analyzed as a categorical variable (Table 3), a BMI of 23–30 kg/m2 wasfound to have an odds ratio of 1.43 (95% confidence interval 1.01–2.13; P = 0.05) and aBMI of >30 kg/m2 had an odds ratio of 1.76 (95% confidence interval 1.17–2.65; P = 0.007)
Javed et al. Page 4
Obesity (Silver Spring). Author manuscript; available in PMC 2012 June 1.
NIH
-PA Author Manuscript
NIH
-PA Author Manuscript
NIH
-PA Author Manuscript

when compared to a BMI of <23 kg/m2. This association remained significant even afteradjusting for confounding factors.
DISCUSSIONOur study is unique in evaluating the relationship between BMI and hypertension in anelderly African-American female population in the United States. The prevalence ofhypertension increases with increase in BMI, which corresponds with previous studiespointing to a positive relationship between BMI and hypertension in various ethnicpopulations (13). The higher prevalence of hypertension may be secondary to the fact thatAfrican Americans have been shown to have a high blood pressure compared to other ethnicpopulations, with the additive effect of the postmenopausal status in this specific cohort. Therelative risk of being hypertensive as assessed by odds ratio was significantly higher with ahigher BMI and concomitant diabetes mellitus, which was constant in the multivariateanalysis.
We observed a novel yet robust finding when the curves were plotted for the log odds ofhypertension with BMI in this African-American female population (Figure 1). It displayeda positive association with log odds ratio of hypertension. The steep rise in slope from athreshold BMI ≥23 kg/m2 demonstrates the significant growth of hypertension risk after thisBMI value (P = 0.001). The results of our study suggest that in elderly African-Americanfemales a BMI <23 kg/m2, which falls into the normal weight category per WHOclassification, should be considered as target BMI to avoid hypertension. The results fromour study conflict with the recommendations of the US Department of Agriculture thathigher weights are accepted and preferred in the elderly (28). It has already been debatedthat definitions of ideal body weight in terms of CV risks should be segregated according toage (29). A recent Danish study by Thinggaard et al. comprised of a patient population withan age range of 70–95 years has shown increasing mortality with higher BMI in the femalepopulation, which supports our hypothesis (30). Similarly, a 23-year follow-up of 1,723patients in the Framingham Heart Study showed increased mortality with increasing BMI inthe elderly (31).
The pathophysiology of the relationship between obesity and hypertension is multifactorial.Obesity is associated with increased arterial stiffness that contributes to hypertension andincreases the incidence and prevalence of this disease in the general population. Arterialstiffness is strongly associated with obesity at any given age and increased stiffnessaugments the risk of CV disease in various populations (32–35). Age is an independent andpowerful determinant of large artery stiffness, so the risk of CV events may increase in theelderly population secondary to increased obesity-related arterial stiffness. However, there islimited data related to obesity-associated risk of CV disorders in the elderly. Othernoteworthy explanations of this association include more fat mass in females as compared tomen, an increase in the percent body fat with age in the elderly population (36),disproportionate distribution of fat and lean body mass in African Americans (37) andsedentary lifestyle (38). Furthermore, there is a difference in the attitudes and cultural beliefstoward body weight in addition to the fact that elderly African-American females have acomparatively lower exercise capacity (39,40).
Our study results strongly suggest a higher risk of systemic hypertension at a BMI of ≥23kg/m2, which as per WHO classification is rendered as normal BMI. This cutoff for BMIincidentally is the same as that recommended by the WHO committee for the Asianpopulation. Of note, we are reporting the association between BMI and hypertension in thispopulation but the cross-sectional nature of our study does not allow mortality and morbidityevaluation. In the Nurses Health Study, it has been shown that obesity and progressive
Javed et al. Page 5
Obesity (Silver Spring). Author manuscript; available in PMC 2012 June 1.
NIH
-PA Author Manuscript
NIH
-PA Author Manuscript
NIH
-PA Author Manuscript

weight gain with age are associated with increased risks for CV diseases and prematuremortality (41). Similarly, maintaining lower BMI values in elderly AfricanAmericans mayreduce the development of systemic hypertension, which is a critical risk factor forcerebrovascular accidents and coronary artery disease leading to higher morbidity andmortality (29). Previously, studies have shown that there exists an “obesity paradox”wherein people with a higher BMI have comparatively better CV prognosis as compared tonormal weight individuals. However, these studies put an emphasis on “purposeful” weightreduction that can be achieved by loss of more fat mass as opposed to lean muscle mass,which lowers mortality. Weight loss also helps in decreasing the risk for CV disease riskfactors (1,42). Our study strikingly demonstrated a higher incidence of hypertension at aBMI <18.5 kg/m2, Though not statistically significant, the trend is consistent with previousstudies that malnourishment is associated with increased CV mortality (31,43).
However, randomized studies are required to prove whether achieving a BMI <23 kg/m2
would translate into a decreased CV mortality in elderly African-American women.
This study further emphasizes the need of ethnic specific BMI cutoff modifications invarious populations as shown by the proposed changes in the recommendations by WHOTask Force for the Asian population (27).
Study limitationsThere are some limitations in our study, including its cross-sectional nature and lack offollow-up data. We could not assess the physical activity and dietary habits, including saltintake, which can influence BMI and hypertension and act as potential confounders. Thedata on other anthropometric variables were not available for all the study population andtherefore could not be compared in this study. The population included in our study wasurban females and thus the results may not extrapolate to the general population.
AcknowledgmentsWe are thankful to the entire research team of the New York Obesity Research Center (NYORC) for their untiringefforts in the completion of this study. This research project was supported by NYORC National Institute of Health(NIH) research grants.
References1. Poirier P, Giles TD, Bray GA, et al. American Heart Association; Obesity Committee of the Council
on Nutrition, Physical Activity, and Metabolism. Obesity and cardiovascular disease:pathophysiology, evaluation, and effect of weight loss: an update of the 1997 American HeartAssociation Scientific Statement on Obesity and Heart Disease from the Obesity Committee of theCouncil on Nutrition, Physical Activity, and Metabolism. Circulation. 2006; 113:898–918.[PubMed: 16380542]
2. Flegal KM, Carroll MD, Ogden CL, Curtin LR. Prevalence and trends in obesity among US adults,1999–2008. JAMA. 2010; 303:235–241. [PubMed: 20071471]
3. Flegal KM, Carroll MD, Ogden CL, Johnson CL. Prevalence and trends in obesity among USadults, 1999–2000. JAMA. 2002; 288:1723–1727. [PubMed: 12365955]
4. Sherry, B.; Blanck, G.; Pan, L.; Dietz, WH.; Balluz, L. Vital Signs: State-Specific ObesityPrevalence Among Adults—United States. Centers for Disease Control and Prevention; 2009.<http://www.cdc.gov/mmwr/preview/mmwrhtml/mm59e0803a1.htm?s_cid=mm59e0803a1_e%0D%0A> (2010)
5. Panagiotakos DB, Chrysohoou C, Pitsavos C, et al. Hierarchical analysis of anthropometric indicesin the prediction of 5-year incidence of hypertension in apparently healthy adults: the ATTICAstudy. Atherosclerosis. 2009; 206:314–320. [PubMed: 19368924]
Javed et al. Page 6
Obesity (Silver Spring). Author manuscript; available in PMC 2012 June 1.
NIH
-PA Author Manuscript
NIH
-PA Author Manuscript
NIH
-PA Author Manuscript

6. Brown CD, Higgins M, Donato KA, et al. Body mass index and the prevalence of hypertension anddyslipidemia. Obes Res. 2000; 8:605–619. [PubMed: 11225709]
7. Must A, Spadano J, Coakley EH, et al. The disease burden associated with overweight and obesity.JAMA. 1999; 282:1523–1529. [PubMed: 10546691]
8. Allison DB, Zhu SK, Plankey M, Faith MS, Heo M. Differential associations of body mass indexand adiposity with all-cause mortality among men in the first and second National Health andNutrition Examination Surveys (NHANES I and NHANES II) follow-up studies. Int J Obes RelatMetab Disord. 2002; 26:410–416. [PubMed: 11896498]
9. Gregg EW, Cheng YJ, Cadwell BL, et al. Secular trends in cardiovascular disease risk factorsaccording to body mass index in US adults. JAMA. 2005; 293:1868–1874. [PubMed: 15840861]
10. Unal B, Critchley JA, Capewell S. Modelling the decline in coronary heart disease deaths inEngland and Wales, 1981–2000: comparing contributions from primary prevention and secondaryprevention. BMJ. 2005; 331:614. [PubMed: 16107431]
11. Pischon T, Boeing H, Hoffmann K, et al. General and abdominal adiposity and risk of death inEurope. N Engl J Med. 2008; 359:2105–2120. [PubMed: 19005195]
12. Lloyd-Jones D, Adams R, Carnethon M, et al. Heart Disease and Stroke Statistics-2009 Update. AReport From the American Heart Association Statistics Committee and Stroke StatisticsSubcommittee. Circulation. 2008; 119:e21–e181. [PubMed: 19075105]
13. Crawford AG, Cote C, Couto J, et al. Prevalence of obesity, type II diabetes mellitus,hyperlipidemia, and hypertension in the United States: findings from the GE Centricity ElectronicMedical Record database. Popul Health Manag. 2010; 13:151–161. [PubMed: 20521902]
14. Towfighi A, Ovbiagele B, Saver JL. Therapeutic milestone: stroke declines from the second to thethird leading organ- and disease-specific cause of death in the united states. Stroke. 2010; 41:499–503. [PubMed: 20075347]
15. He Y, Jiang B, Wang J, et al. BMI versus the metabolic syndrome in relation to cardiovascular riskin elderly chinese individuals. Diabetes Care. 2007; 30:2128–2134. [PubMed: 17468350]
16. Song Y, Manson JE, Meigs JB, et al. Comparison of usefulness of body mass index versusmetabolic risk factors in predicting 10-year risk of cardiovascular events in women. Am J Cardiol.2007; 100:1654–1658. [PubMed: 18036364]
17. Report of a WHO Consultation. WHO Technical Report Series No 894. Obesity: Preventing andManaging the Global Epidemic.
18. Report of a WHO Expert Committee. WHO technical report series no 854. World HealthOrganization; Geneva, Switzerland: 1995. Physical Status: The Use and Interpretation ofAnthropometry.
19. Deurenberg P, Deurenberg Yap M, Wang J, Lin FP, Schmidt G. The impact of body build on therelationship between body mass index and percent body fat. Int J Obes Relat Metab Disord. 1999;23:537–542. [PubMed: 10375058]
20. Ko GT, Chan JC, Cockram CS, Woo J. Prediction of hypertension, diabetes, dyslipidaemia oralbuminuria using simple anthropometric indexes in Hong Kong Chinese. Int J Obes Relat MetabDisord. 1999; 23:1136–1142. [PubMed: 10578203]
21. The Asia-Pacific Perspective: Redefining Obesity and Its Treatment. International DiabetesInstitute; Victoria, Australia: 2000. <http://www.diabetes.com.au/research/report_obesity.htm>
22. Stephen WC, Janssen I. Sarcopenic-obesity and cardiovascular disease risk in the elderly. J NutrHealth Aging. 2009; 13:460–466. [PubMed: 19390754]
23. Goya Wannamethee S, Gerald Shaper A, Whincup PH, Walker M. Overweight and obesity and theburden of disease and disability in elderly men. Int J Obes Relat Metab Disord. 2004; 28:1374–1382. [PubMed: 15356666]
24. Deurenberg-Yap M, Chew SK, Deurenberg P. Elevated body fat percentage and cardiovascularrisks at low body mass index levels among Singaporean Chinese, Malays and Indians. Obes Rev.2002; 3:209–215. [PubMed: 12164474]
25. Thomas GN, Ho SY, Lam KS, et al. Hong Kong Cardiovascular Risk Factor Prevalence StudySteering Committee. Impact of obesity and body fat distribution on cardiovascular risk factors inHong Kong Chinese. Obes Res. 2004; 12:1805–1813. [PubMed: 15601976]
Javed et al. Page 7
Obesity (Silver Spring). Author manuscript; available in PMC 2012 June 1.
NIH
-PA Author Manuscript
NIH
-PA Author Manuscript
NIH
-PA Author Manuscript

26. Wang J, Thornton JC, Russell M, et al. Asians have lower body mass index (BMI) but higherpercent body fat than do whites: comparisons of anthropometric measurements. Am J Clin Nutr.1994; 60:23–28. [PubMed: 8017333]
27. The Asia-Pacific Perspective: Redefining Obesity and Its treatment. International DiabetesInstitute; Victoria, Australia: 2000. <http://www.diabetes.com.au/research/report_obesity.htm>
28. The Report of the Dietary Guidelines Advisory Committee on Dietary Guidelines for Americans.2005. <http://www.health.gov/dietaryguidelines/dga2005/report>
29. Krauss RM, Eckel RH, Howard B, et al. AHA Dietary Guidelines: revision 2000: A statement forhealthcare professionals from the Nutrition Committee of the American Heart Association.Circulation. 2000; 102:2284–2299. [PubMed: 11056107]
30. Thinggaard M, Jacobsen R, Jeune B, Martinussen T, Christensen K. Is the relationship betweenbmi and mortality increasingly u-shaped with advancing age? A 10-year follow-up of persons aged70–95 years. J Gerontol A Biol Sci Med Sci. 2010; 65A:526–531. [PubMed: 20089666]
31. Harris T, Cook EF, Garrison R, et al. Body mass index and mortality among nonsmoking olderpersons. The Framingham Heart Study. JAMA. 1988; 259:1520–1524. [PubMed: 3339789]
32. Zebekakis PE, Nawrot T, Thijs L, et al. Obesity is associated with increased arterial stiffness fromadolescence until old age. J Hypertens. 2005; 23:1839–1846. [PubMed: 16148607]
33. Iannuzzi A, Licenziati MR, Acampora C, et al. Carotid artery stiffness in obese children with themetabolic syndrome. Am J Cardiol. 2006; 97:528–531. [PubMed: 16461050]
34. Safar ME, Czernichow S, Blacher J. Obesity, arterial stiffness, and cardiovascular Risk. J Am SocNephrol. 2006; 17:109–111.
35. Kumanyika SK, Landis JR, Matthews-Cook YL, Almy SL, Boehmer SJ. Systolic blood pressuretrends in US adults between 1960 and 1980: influence of antihypertensive drug therapy. Am JEpidemiol. 1998; 148:528–538. [PubMed: 9753007]
36. Ding J, Kritchevsky SB, Newman AB, et al. Harris for the Health ABC Study. Effects of birthcohort and age on body composition in a sample of community-based elderly. Am J Clin Nutr.2007; 85:405–410. [PubMed: 17284736]
37. Aleman Mateo H, Lee SY, Javed F, et al. Elderly Mexicans have less muscle and greater total andtruncal fat compared to African-Americans and Caucasians with the same BMI. J Nutr HealthAging. 2009; 13:919–923. [PubMed: 19924354]
38. Zeno SA, Kim-Dorner SJ, Deuster PA, et al. Cardiovascular fitness and risk factors of healthyAfrican Americans and Caucasians. J Natl Med Assoc. 2010; 102:28–35. [PubMed: 20158133]
39. Millstein RA, Carlson SA, Fulton JE, et al. Relationships between body size satisfaction andweight control practices among US adults. Medscape J Med. 2008; 10:119. [PubMed: 18596944]
40. Lavie CJ, Kuruvanka T, Milani RV, Prasad A, Ventura HO. Exercise capacity in adult African-Americans referred for exercise stress testing: is fitness affected by race? Chest. 2004; 126:1962–1968. [PubMed: 15596699]
41. Willett WC, Manson JE, Stampfer MJ, et al. Weight, weight change, and coronary heart disease inwomen. Risk within the ‘normal’ weight range. JAMA. 1995; 273:461–465. [PubMed: 7654270]
42. Lavie CJ, Milani RV, Ventura HO. Obesity and cardiovascular disease: risk factor, paradox, andimpact of weight loss. J Am Coll Cardiol. 2009; 53:1925–1932. [PubMed: 19460605]
43. Liu L, Bopp MM, Roberson PK, Sullivan DH. Undernutrition and risk of mortality in elderlypatients within 1 year of hospital discharge. J Gerontol A Biol Sci Med Sci. 2002; 57:M741–M746. [PubMed: 12403803]
Javed et al. Page 8
Obesity (Silver Spring). Author manuscript; available in PMC 2012 June 1.
NIH
-PA Author Manuscript
NIH
-PA Author Manuscript
NIH
-PA Author Manuscript

Figure 1.Relationship between log odds ratio of hypertension with BMI.
Javed et al. Page 9
Obesity (Silver Spring). Author manuscript; available in PMC 2012 June 1.
NIH
-PA Author Manuscript
NIH
-PA Author Manuscript
NIH
-PA Author Manuscript
NIH
-PA Author Manuscript
NIH
-PA Author Manuscript
NIH
-PA Author Manuscript
Javed et al. Page 10
Table 1
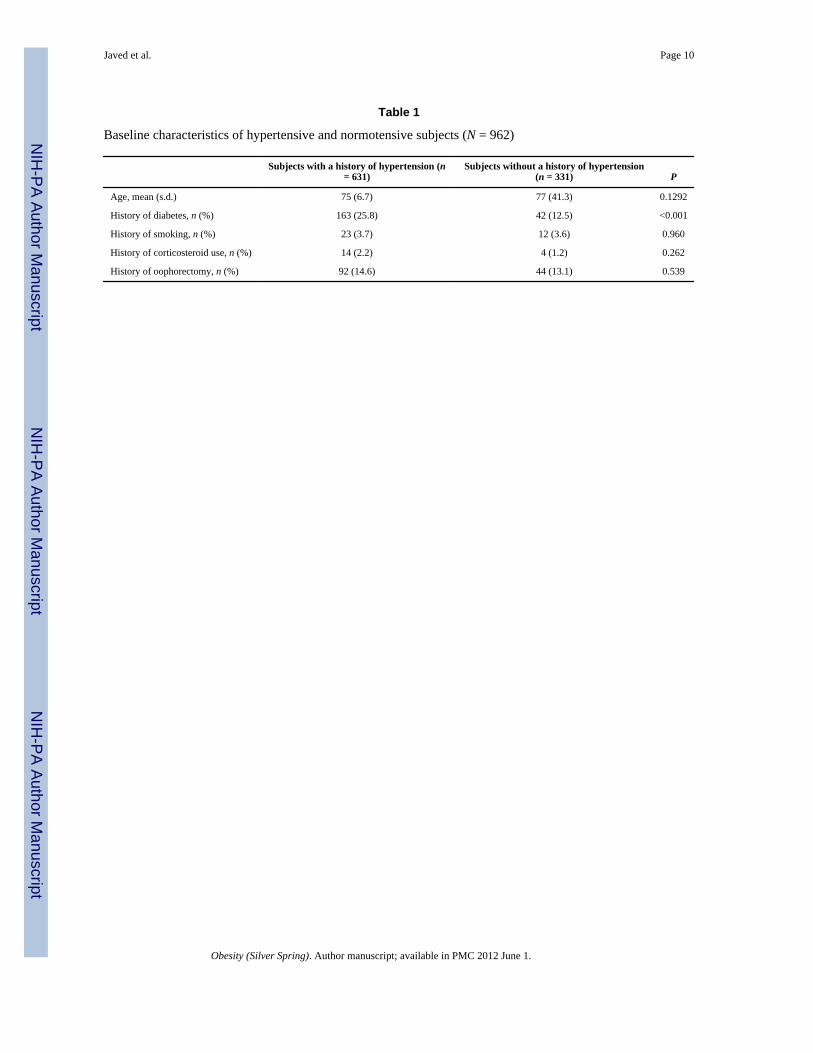
Baseline characteristics of hypertensive and normotensive subjects (N = 962)
Subjects with a history of hypertension (n= 631)
Subjects without a history of hypertension(n = 331) P
Age, mean (s.d.) 75 (6.7) 77 (41.3) 0.1292
History of diabetes, n (%) 163 (25.8) 42 (12.5) <0.001
History of smoking, n (%) 23 (3.7) 12 (3.6) 0.960
History of corticosteroid use, n (%) 14 (2.2) 4 (1.2) 0.262
History of oophorectomy, n (%) 92 (14.6) 44 (13.1) 0.539
Obesity (Silver Spring). Author manuscript; available in PMC 2012 June 1.

NIH
-PA Author Manuscript
NIH
-PA Author Manuscript
NIH
-PA Author Manuscript
Javed et al. Page 11
Table 2
Distribution of BMI among hypertensive and normotensive subjects (N = 962)
BMIa Subjects with a history of hypertension (n = 631) Subjects without a history of hypertension (n = 331) P
Mean (s.d.) 30.3 29 0.003
≤23 70 (11.09) 55 (16.42) 0.023
23–30 277 (43.90) 153 (45.67) 0.04
>30 284 (45.01) 127 (37.91) 0.023
aBMI in kg/m2.
Obesity (Silver Spring). Author manuscript; available in PMC 2012 June 1.

NIH
-PA Author Manuscript
NIH
-PA Author Manuscript
NIH
-PA Author Manuscript
Javed et al. Page 12
Table 3
Univariate and multivariate analysis of hypertension and BMI
Univariate analysis Multivariate analysis
Odds ratio of hypertension (95% CI) P Odds ratio of hypertension (95% CI) P
BMI 1.03 (1.01–1.05)a 0.004 1.03 (1.01–1.05)a 0.023
History of diabetes 2.43 (1.70–3.52) <0.001 2.33 (1.60–3.38) <0.001
History of smoking 1.02 (0.50–2.07) 0.960 0.92 (0.44–1.91) NS
History of corticosteroid use 1.88 (0.61–5.75) 0.270 1.96 (0.63–6.07) NS
BMI ≤23 1 (Ref) — 1 (Ref) —
BMI 23–30 1.43 (1.01–2.13) 0.05 1.41 (1.01–2.12) 0.05
BMI >30 1.76 (1.17–2.65) 0.007 1.59 (1.05–2.42) 0.028
CI, confidence interval.
aRise in odds ratio with rise in BMI of 1 kg/m2.
Obesity (Silver Spring). Author manuscript; available in PMC 2012 June 1.
Copyright © 2022 FDOKUMEN