Gene expression profiling reveals differences in microenvironment interaction between patients with...
10
| 790 | haematologica | 2009; 94(6) Original Article Acknowledgments: the authors would like to thank Arsène Burny for his scientific help and Christos Sotiriou’s group for its help in microarray experiments Funding: this work was financed by F.R.I.A. grant (Fonds de Recherche pour l’Industrie et l’Agriculture) and the Télévie fund, both of which are affiliated with the F.R.S-F.N.R.S. (Fonds de la Recherche Scientifique, FNRS). Manuscript received October 27, 2008. Revised version arrived January 20, 2009. Manuscript accepted January 27, 2009. Correspondence: Basile Stamatopoulos, Université Libre de Bruxelles, Institut Jules Bordet, Laboratoire d'Hématologie Expérimentale, Boulevard de Waterloo 121, 1000 Bruxelles, Belgium. E-mail: [email protected] The online version of this article contains a supplementary appendix. Background Zeta-associated protein 70 (ZAP70) is a widely recognized prognostic factor in chronic lymphocytic leukemia, but mechanisms by which its higher expression leads to a poor outcome must still be fully explained. Design and Methods In an attempt to unveil unfavorable cellular properties linked to high ZAP70 expression, we used gene expression profiling to identify genes associated with disparities in B cells from chronic lymphocytic leukemia patients expressing high versus low ZAP70 mRNA, measured by quantitative real-time PCR. Two groups of 7 patients were compared, select- ed on the basis of either high or low ZAP70 mRNA expression. Results Twenty-seven genes were differentially expressed with an FDR<10%, and several genes were significant predictors of treatment-free survival (TFS) and/or overall survival; PDE8A and FCRL family genes (down-regulated in ZAP70 + patients) could predict TFS and over- all survival; ITGA4 mRNA (up-regulated in ZAP70 + patients) could significantly predict overall survival. Importantly, gene set enrichment analysis revealed overrepresentation of adhesion/migration genes. We therefore investigated in vitro adhesion/migration capacity of chronic lymphocytic leukemia cells into a stromal microenvironment or in response to conditioned medium. We showed that ZAP70 + cells had better adhesion/migration capac- ities and only ZAP70 + patient cells responded to microenvironment contact by CXCR4 downregulation. Conclusions We concluded that several prognostic factors are the reflection of microenvironment inter- actions and that the increased adhesion/migratory capacity of ZAP70 + cells in their microenvironment can explain their better survival and thus the aggressiveness of the dis- ease. Key words: chronic lymphocytic leukemia, ZAP70, microarrays, microenvironment, prognosis. Citation: Stamatopoulos B, Haibe-Kains B, Equeter C, Meuleman N, Sorée A, De Bruyn C, Hanosset D, Bron D, Martiat P, and Lagneaux L. Gene expression profiling reveals differences in microenvironment interaction between patients with chronic lymphocytic leukemia expressing high versus low ZAP70 mRNA. Haematologica 2009; 94:790-799. doi:10.3324/haematol.2008.002626 ©2009 Ferrata Storti Foundation. This is an open-access paper. Gene expression profiling reveals differences in microenvironment interaction between patients with chronic lymphocytic leukemia expressing high versus low ZAP70 mRNA Basile Stamatopoulos, 1 Benjamin Haibe-Kains, 2,3 Carole Equeter, 2 Nathalie Meuleman, 1 Anne Sorée, 1 Cécile De Bruyn, 1 Delphine Hanosset, 1 Dominique Bron, 1 Philippe Martiat 1 and Laurence Lagneaux 1 1 Laboratory of Experimental Hematology, Faculty of Medicine, Institut Jules Bordet, Université Libre de Bruxelles (ULB), Brussels; 2 Functional Genomics and Translational Research Unit, Faculty of Medicine, Institut Jules Bordet, Université Libre de Bruxelles (ULB), Brussels, and 3 Machine Learning Group, Faculty of Sciences, Université Libre de Bruxelles (ULB), Brussels, Belgium ABSTRACT
Transcript of Gene expression profiling reveals differences in microenvironment interaction between patients with...

| 790 | haematologica | 2009; 94(6)
Original Article
Acknowledgments: the authorswould like to thank ArsèneBurny for his scientific help andChristos Sotiriou’s group for itshelp in microarray experiments
Funding: this work was financedby F.R.I.A. grant (Fonds deRecherche pour l’Industrieet l’Agriculture) and the Téléviefund, both of which areaffiliated with the F.R.S-F.N.R.S.(Fonds de la RechercheScientifique, FNRS).
Manuscript received October27, 2008. Revisedversion arrived January 20,2009. Manuscript acceptedJanuary 27, 2009.
Correspondence:Basile Stamatopoulos,Université Libre de Bruxelles,Institut Jules Bordet,Laboratoire d'HématologieExpérimentale, Boulevard deWaterloo 121, 1000 Bruxelles,Belgium.E-mail: [email protected]
The online version of this articlecontains a supplementaryappendix.
BackgroundZeta-associated protein 70 (ZAP70) is a widely recognized prognostic factor in chroniclymphocytic leukemia, but mechanisms by which its higher expression leads to a pooroutcome must still be fully explained.
Design and MethodsIn an attempt to unveil unfavorable cellular properties linked to high ZAP70 expression,we used gene expression profiling to identify genes associated with disparities in B cellsfrom chronic lymphocytic leukemia patients expressing high versus low ZAP70 mRNA,measured by quantitative real-time PCR. Two groups of 7 patients were compared, select-ed on the basis of either high or low ZAP70 mRNA expression.
ResultsTwenty-seven genes were differentially expressed with an FDR<10%, and several geneswere significant predictors of treatment-free survival (TFS) and/or overall survival; PDE8Aand FCRL family genes (down-regulated in ZAP70+ patients) could predict TFS and over-all survival; ITGA4 mRNA (up-regulated in ZAP70+ patients) could significantly predictoverall survival. Importantly, gene set enrichment analysis revealed overrepresentation ofadhesion/migration genes. We therefore investigated in vitro adhesion/migration capacityof chronic lymphocytic leukemia cells into a stromal microenvironment or in response toconditioned medium. We showed that ZAP70+ cells had better adhesion/migration capac-ities and only ZAP70+ patient cells responded to microenvironment contact by CXCR4downregulation.
ConclusionsWe concluded that several prognostic factors are the reflection of microenvironment inter-actions and that the increased adhesion/migratory capacity of ZAP70+ cells in theirmicroenvironment can explain their better survival and thus the aggressiveness of the dis-ease.
Key words: chronic lymphocytic leukemia, ZAP70, microarrays, microenvironment,prognosis.
Citation: Stamatopoulos B, Haibe-Kains B, Equeter C, Meuleman N, Sorée A, De Bruyn C,Hanosset D, Bron D, Martiat P, and Lagneaux L. Gene expression profiling reveals differences inmicroenvironment interaction between patients with chronic lymphocytic leukemia expressing highversus low ZAP70 mRNA. Haematologica 2009; 94:790-799. doi:10.3324/haematol.2008.002626
©2009 Ferrata Storti Foundation. This is an open-access paper.
Gene expression profiling reveals differences in microenvironment interactionbetween patients with chronic lymphocytic leukemia expressing high versus low ZAP70 mRNABasile Stamatopoulos,1 Benjamin Haibe-Kains,2,3 Carole Equeter,2 Nathalie Meuleman,1 Anne Sorée,1
Cécile De Bruyn,1 Delphine Hanosset,1 Dominique Bron,1 Philippe Martiat1 and Laurence Lagneaux1
1Laboratory of Experimental Hematology, Faculty of Medicine, Institut Jules Bordet, Université Libre de Bruxelles (ULB), Brussels;2Functional Genomics and Translational Research Unit, Faculty of Medicine, Institut Jules Bordet, Université Libre de Bruxelles(ULB), Brussels, and 3Machine Learning Group, Faculty of Sciences, Université Libre de Bruxelles (ULB), Brussels, Belgium
ABSTRACT
Comparison of ZAP70 high vs. low CLL patients
haematologica | 2009; 94(6) | 791 |
Introduction
Gene expression profile is a powerful tool to betterunderstand the biology, the clinical outcome and molecu-lar mechanisms implicated in chronic lymphocyticleukemia (CLL).1,2 This disease, characterized by the accu-mulation of monoclonal CD5+ B cells, displays an extreme-ly variable clinical course with overall survival times rang-ing from months to decades. A plethora of prognostic fac-tors classifying patients into poor or good predicted out-comes have been found in the last ten years: CD38 antigenexpression,3 microRNA expression,4 cytogenetic aberra-tions,5 mutational status of the immunoglobulin variableheavy chain region gene (IgVH)6 and its surrogate markersZAP70 (ζ-associated protein 70)1 and LPL (lipoproteinlipase).7
ZAP70 expression in CLL correlates strongly with IgVHmutation status8 and seems to be one of the most promis-ing prognostic factors for future clinical use. In 2003,Wiestner et al. found a 93% correlation between mutation-al status and ZAP70:1 patients with 20% of their B cellsexpressing ZAP70 by flow cytometry (FC) (i.e. at the samelevel as T cells) were generally unmutated; on the contrary,patients with less than 20% of their B cells expressingZAP70 generally had mutated IgVH. ZAP70 status deter-mination by FC, however, is often inaccurate at the posi-tivity limit because of the low resolution between the pos-itive (+) and negative (–) populations due to the gating pro-cedure and the choice of antibody.9 To offset these draw-backs, ZAP70 mRNA absolute quantification has beenproposed. In a previous study, we showed that ZAP70mRNA expression was highly correlated with IgVH muta-
tional status, in addition to survival and treatment-freetime.10 Moreover, we and others suggested that ZAP70could be an even better prognostic factor than mutationalstatus.10-12 We therefore used real-time RT-PCR quantifica-tion (qPCR) to select patients with high and low ZAP70expression and compared their gene expression profiles inorder to assess the biological significance of ZAP70 expres-sion in CLL. We hypothesized that a gene expression pro-file comparison of these two CLL subsets’ widely differingZAP70 expression would reveal gene expression patternsassociated not only with prognosis, but also with biology,particularly with regard to microenvironment interactionsimplicated in the survival of leukemic cells, a relevantaspect of the disease.
Design and Methods
Patients, sample collection, and RNA extractionThis study, approved by the Bordet Institute Ethics
Committee, was based on peripheral blood samplesobtained from CLL patients with informed consent andpresenting a typical CD19+CD5+CD23+ phenotype.Microarray and prognostication studies were based onCLL cells frozen at diagnosis before any treatment. Forfunctional studies such as migration and adhesion assays,CLL cells of untreated patients or patients who hadreceived no treatment for at least six months were used.The characteristics of patients included in gene expressioncomparison are summarized in Table 1. Peripheral bloodmononuclear cells were isolated by density-gradient cen-trifugation over Linfosep (Biomedics, Madrid, Spain). Bcells were purified with a CD19+ magnetic-bead system
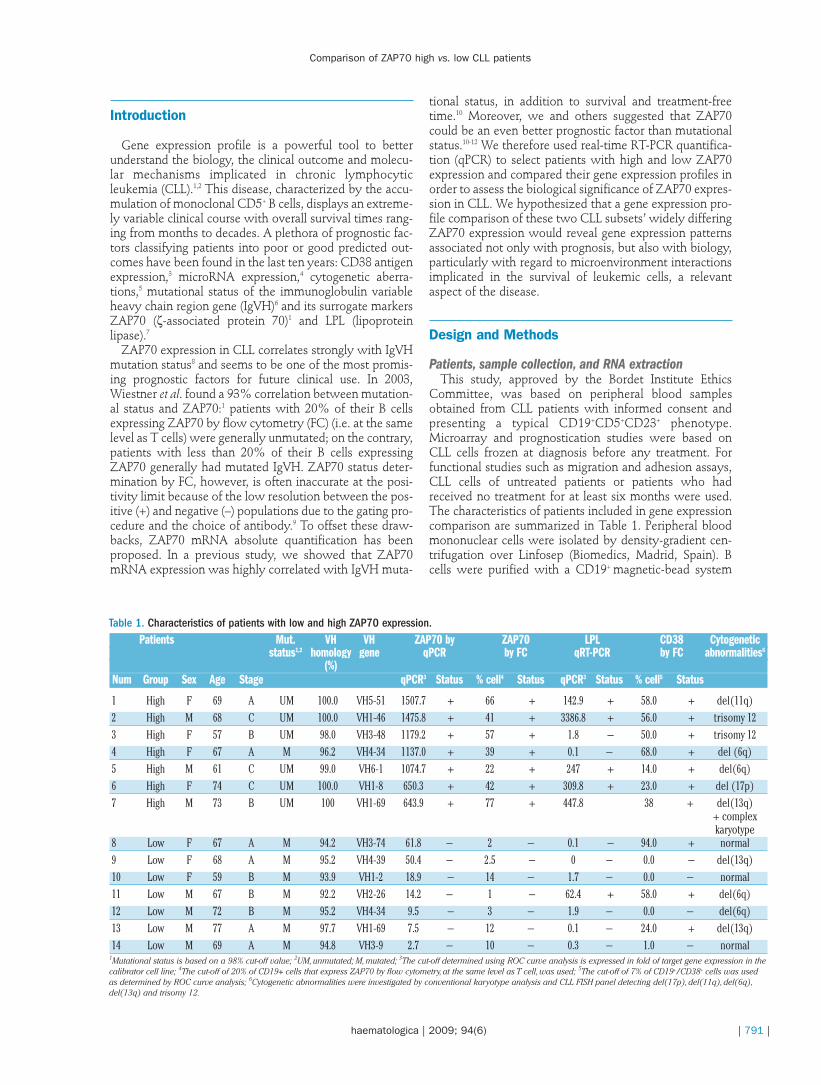
Table 1. Characteristics of patients with low and high ZAP70 expression.Patients Mut. VH VH ZAP70 by ZAP70 LPL CD38 Cytogenetic
status1,2 homology gene qPCR by FC qRT-PCR by FC abnormalities6
(%)Num Group Sex Age Stage qPCR3 Status % cell4 Status qPCR3 Status % cell5 Status
1 High F 69 A UM 100.0 VH5-51 1507.7 + 66 + 142.9 + 58.0 + del(11q)2 High M 68 C UM 100.0 VH1-46 1475.8 + 41 + 3386.8 + 56.0 + trisomy 123 High F 57 B UM 98.0 VH3-48 1179.2 + 57 + 1.8 − 50.0 + trisomy 124 High F 67 A M 96.2 VH4-34 1137.0 + 39 + 0.1 − 68.0 + del (6q)5 High M 61 C UM 99.0 VH6-1 1074.7 + 22 + 247 + 14.0 + del(6q)6 High F 74 C UM 100.0 VH1-8 650.3 + 42 + 309.8 + 23.0 + del (17p)7 High M 73 B UM 100 VH1-69 643.9 + 77 + 447.8 38 + del(13q)
+ complex karyotype
8 Low F 67 A M 94.2 VH3-74 61.8 − 2 − 0.1 − 94.0 + normal9 Low F 68 A M 95.2 VH4-39 50.4 − 2.5 − 0 − 0.0 − del(13q)10 Low F 59 B M 93.9 VH1-2 18.9 − 14 − 1.7 − 0.0 − normal11 Low M 67 B M 92.2 VH2-26 14.2 − 1 − 62.4 + 58.0 + del(6q)12 Low M 72 B M 95.2 VH4-34 9.5 − 3 − 1.9 − 0.0 − del(6q)13 Low M 77 A M 97.7 VH1-69 7.5 − 12 − 0.1 − 24.0 + del(13q)14 Low M 69 A M 94.8 VH3-9 2.7 − 10 − 0.3 − 1.0 − normal
1Mutational status is based on a 98% cut-off value; 2UM,unmutated; M,mutated; 3The cut-off determined using ROC curve analysis is expressed in fold of target gene expression in thecalibrator cell line; 4The cut-off of 20% of CD19+ cells that express ZAP70 by flow cytometry, at the same level as T cell,was used; 5The cut-off of 7% of CD19+/CD38+ cells was usedas determined by ROC curve analysis; 6Cytogenetic abnormalities were investigated by conventional karyotype analysis and CLL FISH panel detecting del(17p),del(11q),del(6q),del(13q) and trisomy 12.
B. Stamatopoulos et al.
| 792 | haematologica | 2009; 94(6)
(MidiMACS, Miltenyi Biotec, Bergish Gladbash,Germany), according to the manufacturer’s instructions.Mean B-cell purity was >98% as measured by FC. TotalRNA was extracted from purified CD19+ cells in a singlestep using TriPure Isolation Reagent (Roche AppliedScience, Vilvoorde, Belgium).
Gene expression profileMicroarray analysis was performed using 1.5 µg of
RNA with Affymetrix GeneChip® Human Genome U133Plus 2.0 Array, which contained more than 54,000 probesets for analysis of about 47,000 transcripts (Affymetrix,High Wycombe, United Kingdom). Amplification,hybridization, and scanning were done according to stan-dard Affymetrix protocols (www.affymetrix.com) (see alsoOnline Supplementary Appendix).
Bioinformatic analysisA comparative gene expression profile was determined
in 14 patients (7 ZAP70high and 7 ZAP70low patients). Weidentified significant differences between sample groupsusing BRB array tools (Biometric Research Branch,National Cancer Institute). Only genes defined as presentby the Affymetrix algorithm in at least 30% of either ofthe two groups were considered for further analysis, andwe calculated two-sample t tests (with a random variancemodel) of the two groups for each gene. We thenaddressed the multiple comparison problems by estimat-ing the false discovery rate (FDR) in a simple manner asthe ratio of expected number of false positives at thisgiven p value threshold to the number of positives actual-ly found. Using BRB gene set expression comparisontools, overrepresentation of gene ontology (GO) cate-gories, Biocarta, KEGG, and Broad/MIT pathways wereinvestigated by the Hotelling T-square test.
Flow cytometry analysis, IgVH gene mutational andcytogenetic abnormalities determination
Cytoplasmic ZAP70 protein by FC and IgVH mutation-al status were performed as previously described10 (see alsoOnline Supplementary Appendix). We evaluated the expres-sion of CD38, CXCR4 (chemokine (C-X-C motif) receptor4 or CD184) ) and CD69 on the cell surface by FC in aCD19+ gate with a panel of fluorochrome-labeled mono-clonal antibodies (phycoerythrin-conjugated, Immuno-source). Classical cytogenetic abnormalities by standardkaryotype analysis were investigated for the 14 patientsincluded in gene expression profile analysis. Additionalinterphase FISH was performed to screen for most com-mon aberrations using Chromoprobe Multiprobe® - CLLSystem (Cytocell, Amplitech, Compiegne, France).
Real-time PCR analysisWe used 25 ng of cDNA (produced by a standard
reverse transcription) in a qPCR reaction with SYBR®
Green PCR Master Mix (Applied Biosystems, Rotterdam,The Netherlands) and 0.32 µM of gene-specific forwardand reverse primers (Invitrogen Life technologies,Merelbeke, Belgium). Primer sequences are listed in theOnline Supplementary Table S1. Standard real-time PCRwas performed as previously described10 (OnlineSupplementary Appendix).
Co-culture of mesenchymal stromal cells and chroniclymphocytic leukemia cells
MSCs were generated from bone marrow (BM) aspi-rates of normal volunteers after obtaining informed con-sent, as previously described.13 Passage one or two MSCswere used for the co-culture experiment. In order to studythe influence of soluble factors produced by MSCs, condi-tioned serum-free medium (CM) from the culture of 1-day-old MSCs was prepared. Peripheral blood mononu-clear cells from CLL ZAP70 + and - patients and also fromhealthy donors were resuspended in RPMI-1640 + 10%FBS (Biowhittaker, Verviers, Belgium) at a final concentra-tion of 106/mL; 2 mL of cell suspension was placed in thewells of a 6-well plate or seeded on MSCs in identicalplates. In parallel experiments, cells were seeded onto 24mm Transwell diffusion chambers (0.4 µm microporousfilter; Corning Incorporated, NY, USA) and placed intostroma-coated 6-well plates. ZAP70, CD69, and CXCR4were all evaluated by FC in CLL cells cultured alone, with,and without contact with stromal cells. Moreover, in thecase of contact with stromal cells, we separated cells insuspension in the medium from cells adhering to the stro-mal microenvironment in order to measure the abovedescribed markers. We also measured CXCR4 expressionin fresh CLL blood samples from ZAP70 + and - patients.
Adhesion and migration assayCLL cell suspensions were incubated in fibronectin
(BDbioscience, Erembodegem, Belgium) precoated 24-well plates. After four hours of incubation, adherent cellswere collected by trypsinization, concentrated, and count-ed by a Trypan blue exclusion assay (Invitrogen): 106 cellswere also resuspended in 200 µL of medium and plated inthe upper chamber of a 6.6 mm diameter Transwell cul-ture insert in bare polycarbonate with a 5 µm pore size(Corning Incorporated, NY, USA). The lower chamber ofeach well contained 500 µL of medium alone, with SDF1α(stromal cell-derived factor 1 α also known as CXCL12 -chemokine (C-X-C motif) ligand 12) (200 ng/mL) (R&DSystems, Minneapolis, MN, USA) or MSC-CM. After fourhours of incubation, cells were recovered from the lowerchamber, concentrated and counted using a Trypan blueexclusion assay. Migration index was calculated as num-ber of cells transmigrating in the presence of the chemoat-tractant per number of cells transmigrated in absence ofthe chemoattractant. In the cells found in the lower cham-ber, ZAP70 was measured by FC in order to compare itsexpression in migrating versus non-migrating cells inresponse to MSC-CM.
Statistical analysisROC curve analyses were performed to determine the
“+” and “–” status cut-offs (for all studied variables) thatbest distinguished between + and – ZAP70 cases.Treatment-free survival (TFS) and overall survival (OS)distributions were plotted using Kaplan-Meier estimatesand were compared using the log-rank test. Significantdifferences were evaluated using the Wilcoxon matchedpairs or Mann Whitney test. All tests were two-sided. Aneffect was considered to be statistically significant atp<0.05, and all analyses were performed with PrismGraphPad 5.0 software.

Comparison of ZAP70 high vs. low CLL patients
haematologica | 2009; 94(6) | 793 |
Results
Patient selectionIn our previous study, ZAP70 was measured by qPCR in
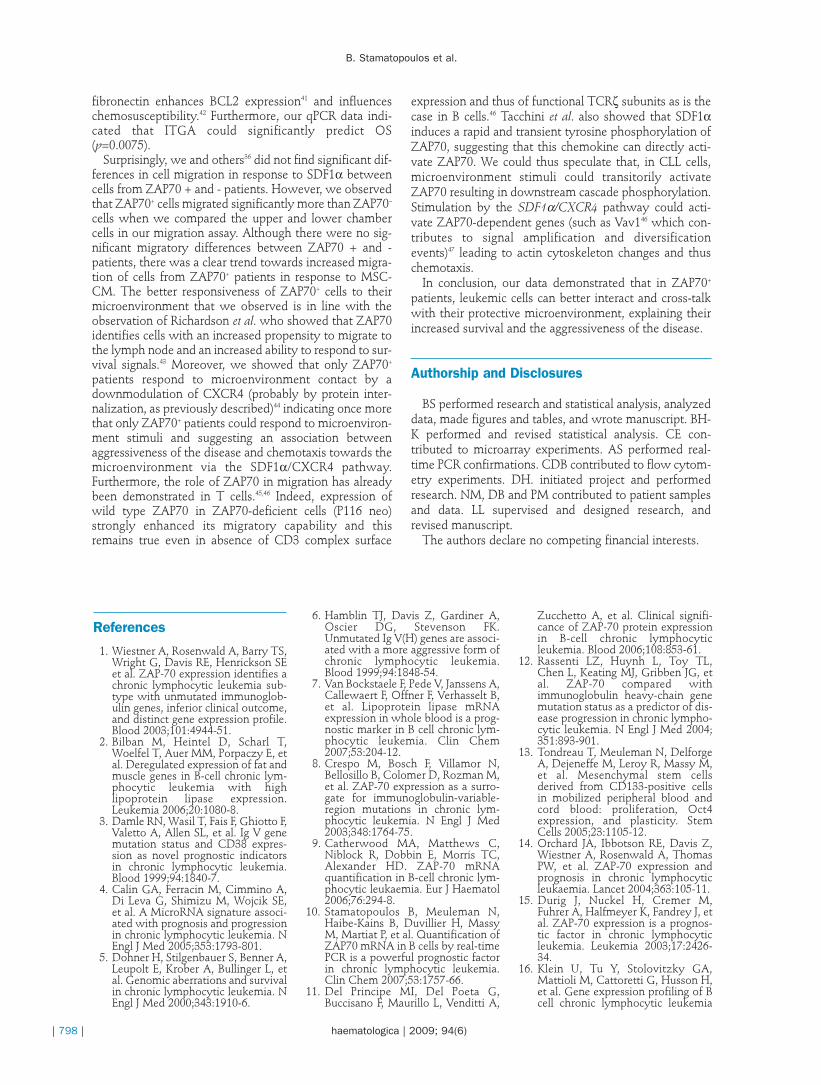
a 108 patient cohort.10 Based on these data, two groups of7 patients were chosen from the top-20 patients express-ing the highest or lowest levels of ZAP70 mRNA, afterchecking the yield and quality of RNA. The median TFS ofthe ZAP70high group was 12.1 months, while this valuereached 172.3 months in the ZAP70low group [p=0.0133;χ2(1)=6.132]. Moreover, the median OS was also signifi-cantly different [p=0.0018; χ2(1)=9.701]. ZAP70 averageexpression assessed by qPCR was 23.57±8.71 in the lowgroup and 1096±131.50 in the high group (p<0.0001).These results were confirmed in a patient cohort of 85patients with a median follow-up of 74 months (range 8-
299 months) (Figure 1A and B). This cohort was derivedfrom the 108 cohort patient cohort previously published10
for which enough RNA was available. The characteristicsof these patients are stated in the Online SupplementaryTable S2. ZAP70 expression was expressed as fold changeof ZAP70 in the Namalwa cell line and normalized withcyclophilin expression. Patients expressing ZAP70 with afold change above 114 were deemed “+”.
ZAP70-associated genes and validation of singletargets
Gene expression profile revealed 937 probe sets differ-entially expressed between the two prementioned groups(p<0.05) with a fold change of 1.5-fold (increase ordecrease), and a p<0.001 allowed us to identify a list of 135probe sets that were differentially expressed (OnlineSupplementary Table S3).
Figure 1. Disease progression and underlying gene expression in chronic lymphocytic leukemia patients with high versus low ZAP70expression. ZAP70 expression was expressed as fold change of ZAP70 in the Namalwa cell line and normalized with cyclophilin expres-sion. Patients expressing ZAP70 more than 114 fold were deemed “+” (n=41) while patients expressing ZAP70 with less than 114-foldwere deemed “–” (n=44). (A) Treatment-free survival as a function of ZAP70 measured by qPCR. (B) Overall Survival as a function ofZAP70 measured by qPCR plotted using Kaplan-Meier analysis and compared using the log-rank test. (C) Multidimensional scaling ofsamples using the ZAP70 gene expression signature (n=39, FDR<10%). Red samples represent ZAP70high and black samples representZAP70low patients. (D) Hierarchical clustering of 39 probe sets discriminated between ZAP70high and ZAP70low chronic lymphocytic leukemiasamples. Color scale indicates units of standard deviation from the mean expression of each gene.
A
C D
B
0 50 100 150 200 250Months
0 100 200 300Months
100
80
60
40
20
0
100
80
60
40
20
0
ZAP70– by qPCRZAP70+ by qPCR
ZAP70– by qPCRZAP70+ by qPCR
Median TFS: 172 months(n=44)
Median OS: undef.(n=44)
Median OS: 152 months(n=41)
p=0.0012p=0.0001 Median TFS: 20 months(n=41)
Cum
ulat
ive
TFS
Cum
ulat
ive
OS
B. Stamatopoulos et al.
| 794 | haematologica | 2009; 94(6)
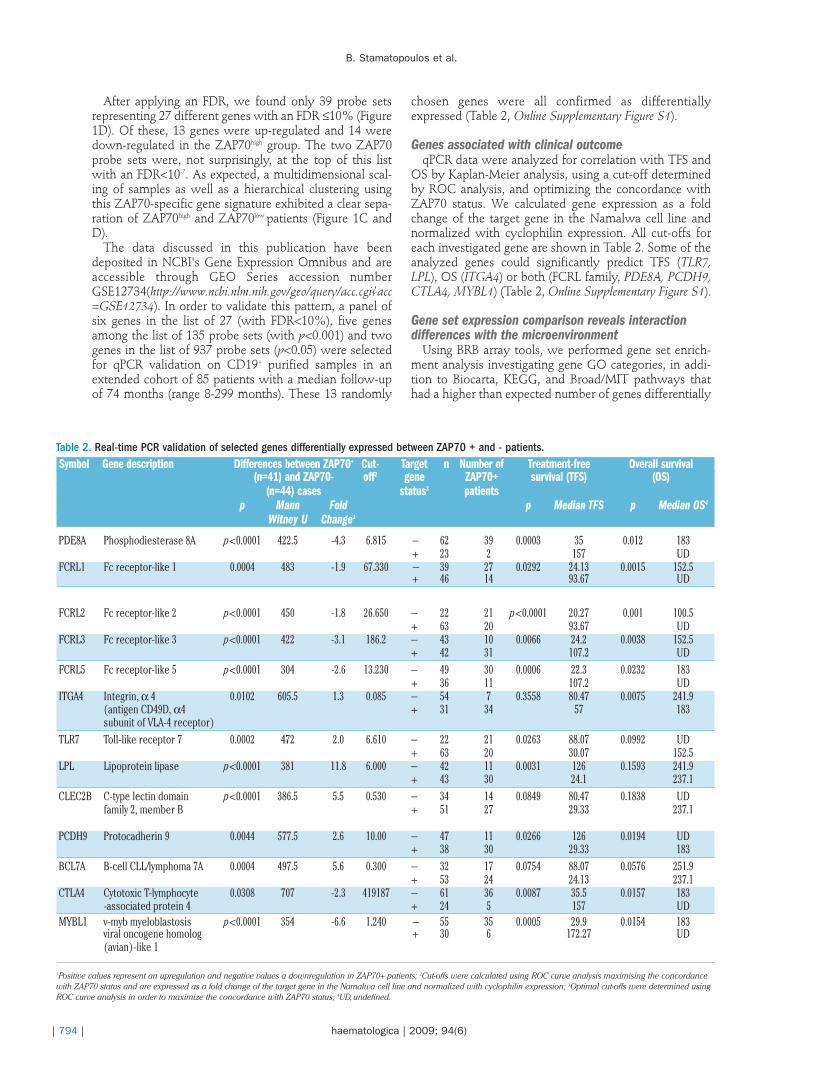
After applying an FDR, we found only 39 probe setsrepresenting 27 different genes with an FDR ≤10% (Figure1D). Of these, 13 genes were up-regulated and 14 weredown-regulated in the ZAP70high group. The two ZAP70probe sets were, not surprisingly, at the top of this listwith an FDR<10-7. As expected, a multidimensional scal-ing of samples as well as a hierarchical clustering usingthis ZAP70-specific gene signature exhibited a clear sepa-ration of ZAP70high and ZAP70low patients (Figure 1C andD).
The data discussed in this publication have beendeposited in NCBI's Gene Expression Omnibus and areaccessible through GEO Series accession numberGSE12734(http://www.ncbi.nlm.nih.gov/geo/query/acc.cgi?acc=GSE12734). In order to validate this pattern, a panel ofsix genes in the list of 27 (with FDR<10%), five genesamong the list of 135 probe sets (with p<0.001) and twogenes in the list of 937 probe sets (p<0.05) were selectedfor qPCR validation on CD19+ purified samples in anextended cohort of 85 patients with a median follow-upof 74 months (range 8-299 months). These 13 randomly
chosen genes were all confirmed as differentiallyexpressed (Table 2, Online Supplementary Figure S1).
Genes associated with clinical outcomeqPCR data were analyzed for correlation with TFS and
OS by Kaplan-Meier analysis, using a cut-off determinedby ROC analysis, and optimizing the concordance withZAP70 status. We calculated gene expression as a foldchange of the target gene in the Namalwa cell line andnormalized with cyclophilin expression. All cut-offs foreach investigated gene are shown in Table 2. Some of theanalyzed genes could significantly predict TFS (TLR7,LPL), OS (ITGA4) or both (FCRL family, PDE8A, PCDH9,CTLA4, MYBL1) (Table 2, Online Supplementary Figure S1).
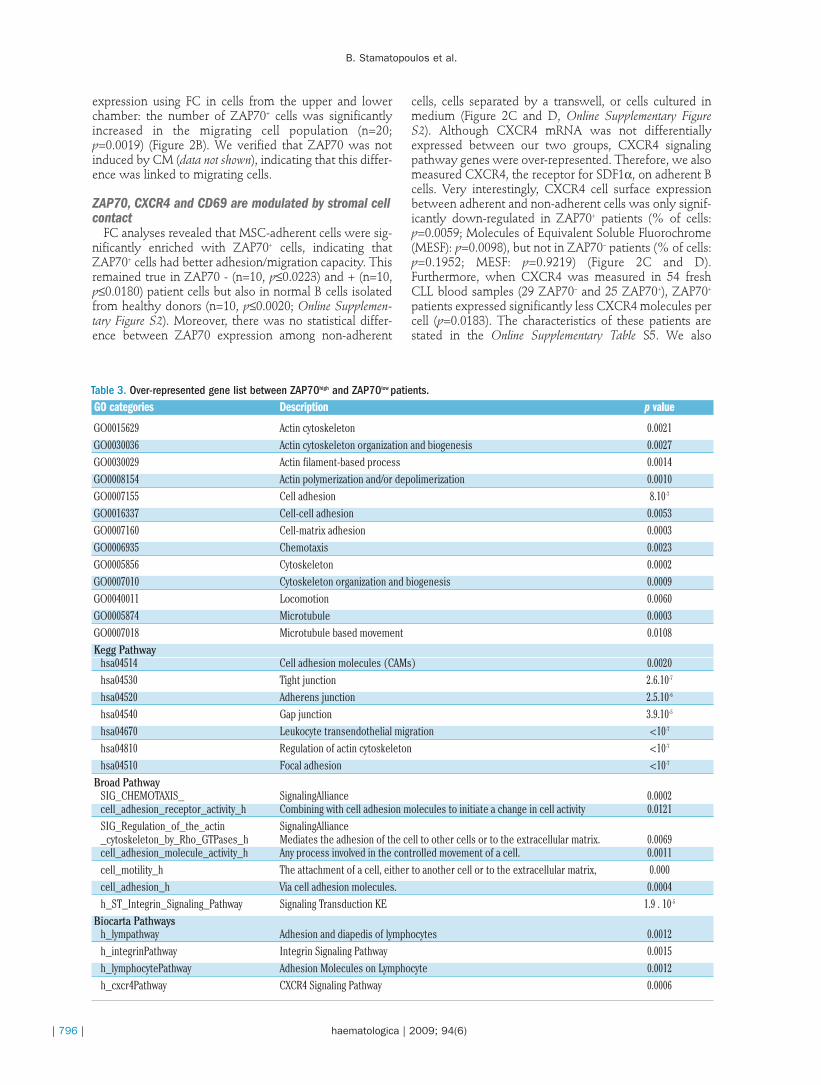
Gene set expression comparison reveals interactiondifferences with the microenvironment
Using BRB array tools, we performed gene set enrich-ment analysis investigating gene GO categories, in addi-tion to Biocarta, KEGG, and Broad/MIT pathways thathad a higher than expected number of genes differentially
Table 2. Real-time PCR validation of selected genes differentially expressed between ZAP70 + and - patients.Symbol Gene description Differences between ZAP70+ Cut- Target n Number of Treatment-free Overall survival
(n=41) and ZAP70- off2 gene ZAP70+ survival (TFS) (OS)(n=44) cases status3 patients
p Mann Fold p Median TFS p Median OS4
Witney U Change1
PDE8A Phosphodiesterase 8A p<0.0001 422.5 -4.3 6.815 − 62 39 0.0003 35 0.012 183+ 23 2 157 UD
FCRL1 Fc receptor-like 1 0.0004 483 -1.9 67.330 − 39 27 0.0292 24.13 0.0015 152.5+ 46 14 93.67 UD
FCRL2 Fc receptor-like 2 p<0.0001 450 -1.8 26.650 − 22 21 p<0.0001 20.27 0.001 100.5+ 63 20 93.67 UD
FCRL3 Fc receptor-like 3 p<0.0001 422 -3.1 186.2 − 43 10 0.0066 24.2 0.0038 152.5+ 42 31 107.2 UD
FCRL5 Fc receptor-like 5 p<0.0001 304 -2.6 13.230 − 49 30 0.0006 22.3 0.0232 183+ 36 11 107.2 UD
ITGA4 Integrin, α 4 0.0102 605.5 1.3 0.085 − 54 7 0.3558 80.47 0.0075 241.9(antigen CD49D, α4 + 31 34 57 183subunit of VLA-4 receptor)
TLR7 Toll-like receptor 7 0.0002 472 2.0 6.610 − 22 21 0.0263 88.07 0.0992 UD+ 63 20 30.07 152.5
LPL Lipoprotein lipase p<0.0001 381 11.8 6.000 − 42 11 0.0031 126 0.1593 241.9+ 43 30 24.1 237.1
CLEC2B C-type lectin domain p<0.0001 386.5 5.5 0.530 − 34 14 0.0849 80.47 0.1838 UDfamily 2, member B + 51 27 29.33 237.1
PCDH9 Protocadherin 9 0.0044 577.5 2.6 10.00 − 47 11 0.0266 126 0.0194 UD+ 38 30 29.33 183
BCL7A B-cell CLL/lymphoma 7A 0.0004 497.5 5.6 0.300 − 32 17 0.0754 88.07 0.0576 251.9+ 53 24 24.13 237.1
CTLA4 Cytotoxic T-lymphocyte 0.0308 707 -2.3 419187 − 61 36 0.0087 35.5 0.0157 183-associated protein 4 + 24 5 157 UD
MYBL1 v-myb myeloblastosis p<0.0001 354 -6.6 1.240 − 55 35 0.0005 29.9 0.0154 183viral oncogene homolog + 30 6 172.27 UD(avian)-like 1
1Positive values represent an upregulation and negative values a downregulation in ZAP70+ patients; 2Cut-offs were calculated using ROC curve analysis maximising the concordancewith ZAP70 status and are expressed as a fold change of the target gene in the Namalwa cell line and normalized with cyclophilin expression; 3Optimal cut-offs were determined usingROC curve analysis in order to maximize the concordance with ZAP70 status; 4UD,undefined.

Comparison of ZAP70 high vs. low CLL patients
haematologica | 2009; 94(6) | 795 |
expressed between our two classes of samples usingHotelling T-square test. In other words, among differen-tially expressed genes we examined whether an enrich-ment/abnormal rate of genes involved in a same path-way/function is overrepresented in comparison with whatis expected by hazard.
Interestingly, several GO categories/pathways involvedin migration, motility, adhesion, cytoskeleton, actin modi-fication, and microenvironment interaction (via theCXCR4 pathway) were significantly over-represented(Table 3). Additional details on involved genes are avail-able in the Online Supplementary Table S4.
B cells from ZAP70+ patients adhere better to fibronectinand ZAP70+ cells show higher migration capacity inresponse to stromal cell conditioned medium
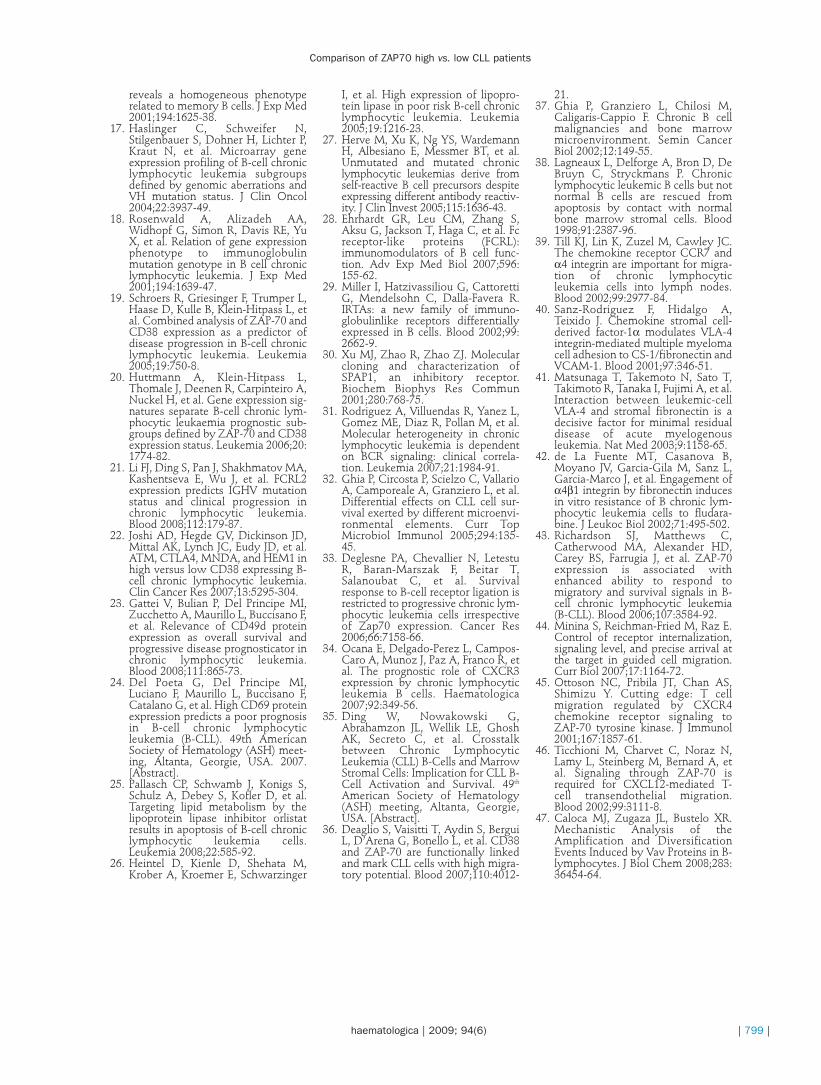
After subtraction of spontaneous plastic adhesion, wedemonstrated that cells isolated from ZAP70+ patients(n=12) adhered to fibronectin 2.7 fold more than cells fromZAP70– patients (n=12) (p=0.0110).
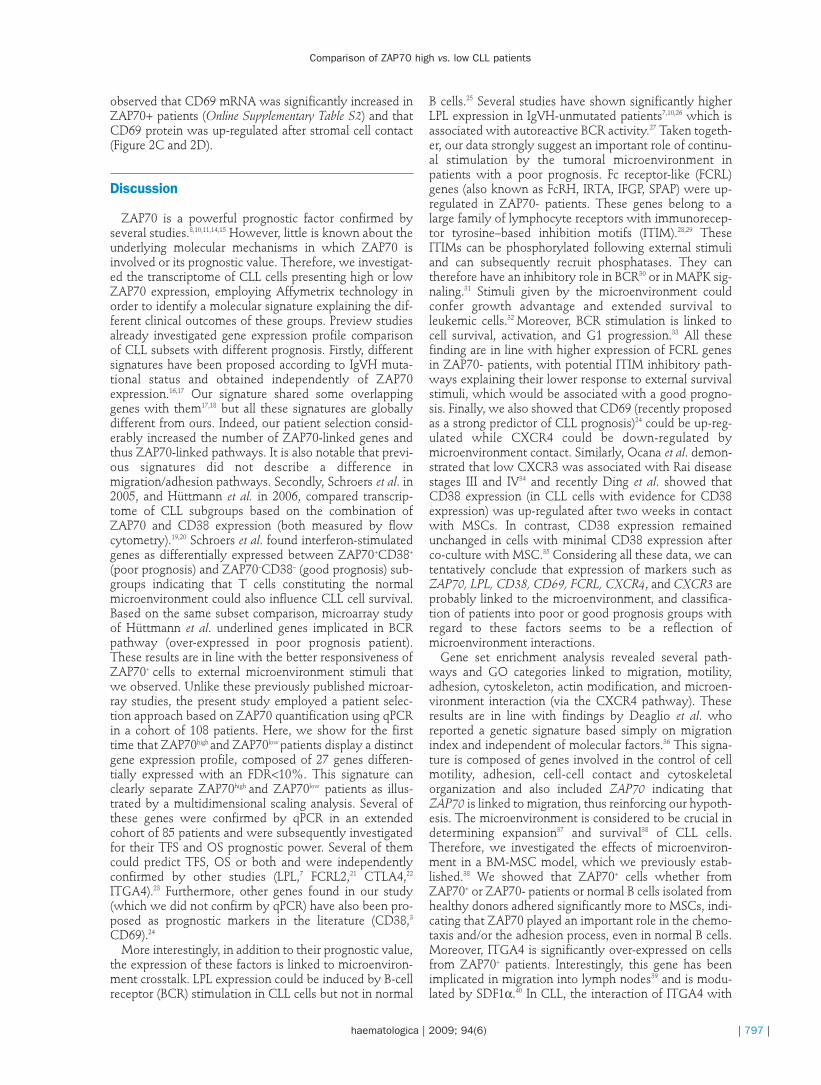
Migration in response to SDF1α was very low in com-parison to MSC-CM (p<0.0001). However, no significantdifference in terms of migration was found betweenZAP70+ (n=12) and - (n=12) patients (Figure 2A) but therewas a clear trend towards greater migration in cells fromZAP70+ patients. We also measured and compared ZAP70
Figure 2. Migration of chronic lymphocytic leukemia cells in response to SDF1α and MSC conditioned medium and modulation of ZAP70,CXCR4 and CD69 in response to the stromal microenvironment. (A) Results are expressed as the mean of migration index in responseto SDF1α or MSC conditioned medium (CM). (B) ZAP70 measured by FC in the upper and lower migration chamber. Chronic lymphocyt-ic leukemia cells from ZAP70– (C) and + (D) patients were co-plated either with stromal cells, with stromal cells separated by a 0.45 µmtranswell not allowing contact between the two cell types, or alone. After 4 h of incubation, ZAP70, CXCR4 and CD69 were measuredby FC on adherent and non-adherent cells. Furthermore, ZAP70 was measured on chronic lymphocytic leukemia cells cultured alone andin transwell conditions.
A
C
B
D
Non-adherent Adherent Non-adherent Adherentcells cells cells cells
Non-adherent Adherent Non-adherent Adherentcells cells cells cells
Non-adherent Adherent Non-adherent Adherentcells cells cells cells
SDF1α CM Non-migrating Migratingcells cells
p=0.1952
Alone
50
40
30
20
10
0
n=10
p≤0.0223
p=0.0019
p=0.3050
p=0.3298
n=10
p≤0.0180
150
100
50
0
80
60
40
20
0
80
60
40
20
0
Non-AdhAdh
Transw
ellAlone
Non-AdhAdh
Transw
ell
p=0.0020 p=0.0039 p=0.0039
p=0.0059 p=0.0098
p=0.0059
p=0.9219
CD69
pos
itive
cel
ls, %
CD69
pos
itive
cel
ls, %
CD69
MES
P*CX
CR4
MES
P*
CD69
MES
F*CX
CR4
MES
F*
CXCR
4 po
sitiv
e ce
lls, %
ZAP7
0pos
itive
cel
ls, %
ZAP7
0pos
itive
cel
ls, %
ZAP7
0pos
itive
cel
ls, %
mig
ratio
n in
dex
CXCR
4 po
sitiv
e ce
lls, %
Non-adherent Adherent Non-adherent Adherentcells cells cells cells
*MESF: Molecules of Equivalent Soluble Fluorochrome
100
90
50
70
100
50
0
1101009080706050
100
50
0
8000
6000
4000
2000
250002000015000100005000
0
20000
15000
10000
5000
0
10000
5000
0
ZAP70– patients ZAP70+ patients
ZAP70– (n=12)ZAP70+ (n=12)
B. Stamatopoulos et al.
| 796 | haematologica | 2009; 94(6)
expression using FC in cells from the upper and lowerchamber: the number of ZAP70+ cells was significantlyincreased in the migrating cell population (n=20;p=0.0019) (Figure 2B). We verified that ZAP70 was notinduced by CM (data not shown), indicating that this differ-ence was linked to migrating cells.
ZAP70, CXCR4 and CD69 are modulated by stromal cellcontact
FC analyses revealed that MSC-adherent cells were sig-nificantly enriched with ZAP70+ cells, indicating thatZAP70+ cells had better adhesion/migration capacity. Thisremained true in ZAP70 - (n=10, p≤0.0223) and + (n=10,p≤0.0180) patient cells but also in normal B cells isolatedfrom healthy donors (n=10, p≤0.0020; Online Supplemen-tary Figure S2). Moreover, there was no statistical differ-ence between ZAP70 expression among non-adherent
cells, cells separated by a transwell, or cells cultured inmedium (Figure 2C and D, Online Supplementary FigureS2). Although CXCR4 mRNA was not differentiallyexpressed between our two groups, CXCR4 signalingpathway genes were over-represented. Therefore, we alsomeasured CXCR4, the receptor for SDF1α, on adherent Bcells. Very interestingly, CXCR4 cell surface expressionbetween adherent and non-adherent cells was only signif-icantly down-regulated in ZAP70+ patients (% of cells:p=0.0059; Molecules of Equivalent Soluble Fluorochrome(MESF): p=0.0098), but not in ZAP70– patients (% of cells:p=0.1952; MESF: p=0.9219) (Figure 2C and D).Furthermore, when CXCR4 was measured in 54 freshCLL blood samples (29 ZAP70– and 25 ZAP70+), ZAP70+
patients expressed significantly less CXCR4 molecules percell (p=0.0183). The characteristics of these patients arestated in the Online Supplementary Table S5. We also
Table 3. Over-represented gene list between ZAP70high and ZAP70low patients.GO categories Description p value
GO0015629 Actin cytoskeleton 0.0021GO0030036 Actin cytoskeleton organization and biogenesis 0.0027GO0030029 Actin filament-based process 0.0014GO0008154 Actin polymerization and/or depolimerization 0.0010GO0007155 Cell adhesion 8.10-7
GO0016337 Cell-cell adhesion 0.0053GO0007160 Cell-matrix adhesion 0.0003GO0006935 Chemotaxis 0.0023GO0005856 Cytoskeleton 0.0002GO0007010 Cytoskeleton organization and biogenesis 0.0009GO0040011 Locomotion 0.0060GO0005874 Microtubule 0.0003GO0007018 Microtubule based movement 0.0108Kegg Pathway
hsa04514 Cell adhesion molecules (CAMs) 0.0020hsa04530 Tight junction 2.6.10-7
hsa04520 Adherens junction 2.5.10-6
hsa04540 Gap junction 3.9.10-5
hsa04670 Leukocyte transendothelial migration <10-7
hsa04810 Regulation of actin cytoskeleton <10-7
hsa04510 Focal adhesion <10-7
Broad PathwaySIG_CHEMOTAXIS_ SignalingAlliance 0.0002cell_adhesion_receptor_activity_h Combining with cell adhesion molecules to initiate a change in cell activity 0.0121SIG_Regulation_of_the_actin SignalingAlliance_cytoskeleton_by_Rho_GTPases_h Mediates the adhesion of the cell to other cells or to the extracellular matrix. 0.0069cell_adhesion_molecule_activity_h Any process involved in the controlled movement of a cell. 0.0011cell_motility_h The attachment of a cell, either to another cell or to the extracellular matrix, 0.000cell_adhesion_h Via cell adhesion molecules. 0.0004h_ST_Integrin_Signaling_Pathway Signaling Transduction KE 1.9 . 10-5
Biocarta Pathwaysh_lympathway Adhesion and diapedis of lymphocytes 0.0012h_integrinPathway Integrin Signaling Pathway 0.0015h_lymphocytePathway Adhesion Molecules on Lymphocyte 0.0012h_cxcr4Pathway CXCR4 Signaling Pathway 0.0006
Comparison of ZAP70 high vs. low CLL patients
haematologica | 2009; 94(6) | 797 |
observed that CD69 mRNA was significantly increased inZAP70+ patients (Online Supplementary Table S2) and thatCD69 protein was up-regulated after stromal cell contact(Figure 2C and 2D).
Discussion
ZAP70 is a powerful prognostic factor confirmed byseveral studies.8,10,11,14,15 However, little is known about theunderlying molecular mechanisms in which ZAP70 isinvolved or its prognostic value. Therefore, we investigat-ed the transcriptome of CLL cells presenting high or lowZAP70 expression, employing Affymetrix technology inorder to identify a molecular signature explaining the dif-ferent clinical outcomes of these groups. Preview studiesalready investigated gene expression profile comparisonof CLL subsets with different prognosis. Firstly, differentsignatures have been proposed according to IgVH muta-tional status and obtained independently of ZAP70expression.16,17 Our signature shared some overlappinggenes with them17,18 but all these signatures are globallydifferent from ours. Indeed, our patient selection consid-erably increased the number of ZAP70-linked genes andthus ZAP70-linked pathways. It is also notable that previ-ous signatures did not describe a difference inmigration/adhesion pathways. Secondly, Schroers et al. in2005, and Hüttmann et al. in 2006, compared transcrip-tome of CLL subgroups based on the combination ofZAP70 and CD38 expression (both measured by flowcytometry).19,20 Schroers et al. found interferon-stimulatedgenes as differentially expressed between ZAP70+CD38+
(poor prognosis) and ZAP70–CD38– (good prognosis) sub-groups indicating that T cells constituting the normalmicroenvironment could also influence CLL cell survival.Based on the same subset comparison, microarray studyof Hüttmann et al. underlined genes implicated in BCRpathway (over-expressed in poor prognosis patient).These results are in line with the better responsiveness ofZAP70+ cells to external microenvironment stimuli thatwe observed. Unlike these previously published microar-ray studies, the present study employed a patient selec-tion approach based on ZAP70 quantification using qPCRin a cohort of 108 patients. Here, we show for the firsttime that ZAP70high and ZAP70low patients display a distinctgene expression profile, composed of 27 genes differen-tially expressed with an FDR<10%. This signature canclearly separate ZAP70high and ZAP70low patients as illus-trated by a multidimensional scaling analysis. Several ofthese genes were confirmed by qPCR in an extendedcohort of 85 patients and were subsequently investigatedfor their TFS and OS prognostic power. Several of themcould predict TFS, OS or both and were independentlyconfirmed by other studies (LPL,7 FCRL2,21 CTLA4,22
ITGA4).23 Furthermore, other genes found in our study(which we did not confirm by qPCR) have also been pro-posed as prognostic markers in the literature (CD38,3
CD69).24
More interestingly, in addition to their prognostic value,the expression of these factors is linked to microenviron-ment crosstalk. LPL expression could be induced by B-cellreceptor (BCR) stimulation in CLL cells but not in normal
B cells.25 Several studies have shown significantly higherLPL expression in IgVH-unmutated patients7,10,26 which isassociated with autoreactive BCR activity.27 Taken togeth-er, our data strongly suggest an important role of continu-al stimulation by the tumoral microenvironment inpatients with a poor prognosis. Fc receptor-like (FCRL)genes (also known as FcRH, IRTA, IFGP, SPAP) were up-regulated in ZAP70- patients. These genes belong to alarge family of lymphocyte receptors with immunorecep-tor tyrosine–based inhibition motifs (ITIM).28,29 TheseITIMs can be phosphorylated following external stimuliand can subsequently recruit phosphatases. They cantherefore have an inhibitory role in BCR30 or in MAPK sig-naling.31 Stimuli given by the microenvironment couldconfer growth advantage and extended survival toleukemic cells.32 Moreover, BCR stimulation is linked tocell survival, activation, and G1 progression.33 All thesefinding are in line with higher expression of FCRL genesin ZAP70- patients, with potential ITIM inhibitory path-ways explaining their lower response to external survivalstimuli, which would be associated with a good progno-sis. Finally, we also showed that CD69 (recently proposedas a strong predictor of CLL prognosis)24 could be up-reg-ulated while CXCR4 could be down-regulated bymicroenvironment contact. Similarly, Ocana et al. demon-strated that low CXCR3 was associated with Rai diseasestages III and IV34 and recently Ding et al. showed thatCD38 expression (in CLL cells with evidence for CD38expression) was up-regulated after two weeks in contactwith MSCs. In contrast, CD38 expression remainedunchanged in cells with minimal CD38 expression afterco-culture with MSC.35 Considering all these data, we cantentatively conclude that expression of markers such asZAP70, LPL, CD38, CD69, FCRL, CXCR4, and CXCR3 areprobably linked to the microenvironment, and classifica-tion of patients into poor or good prognosis groups withregard to these factors seems to be a reflection ofmicroenvironment interactions.
Gene set enrichment analysis revealed several path-ways and GO categories linked to migration, motility,adhesion, cytoskeleton, actin modification, and microen-vironment interaction (via the CXCR4 pathway). Theseresults are in line with findings by Deaglio et al. whoreported a genetic signature based simply on migrationindex and independent of molecular factors.36 This signa-ture is composed of genes involved in the control of cellmotility, adhesion, cell-cell contact and cytoskeletalorganization and also included ZAP70 indicating thatZAP70 is linked to migration, thus reinforcing our hypoth-esis. The microenvironment is considered to be crucial indetermining expansion37 and survival38 of CLL cells.Therefore, we investigated the effects of microenviron-ment in a BM-MSC model, which we previously estab-lished.38 We showed that ZAP70+ cells whether fromZAP70+ or ZAP70- patients or normal B cells isolated fromhealthy donors adhered significantly more to MSCs, indi-cating that ZAP70 played an important role in the chemo-taxis and/or the adhesion process, even in normal B cells.Moreover, ITGA4 is significantly over-expressed on cellsfrom ZAP70+ patients. Interestingly, this gene has beenimplicated in migration into lymph nodes39 and is modu-lated by SDF1α.40 In CLL, the interaction of ITGA4 with
B. Stamatopoulos et al.
| 798 | haematologica | 2009; 94(6)
fibronectin enhances BCL2 expression41 and influenceschemosusceptibility.42 Furthermore, our qPCR data indi-cated that ITGA could significantly predict OS(p=0.0075).
Surprisingly, we and others36 did not find significant dif-ferences in cell migration in response to SDF1α betweencells from ZAP70 + and - patients. However, we observedthat ZAP70+ cells migrated significantly more than ZAP70–
cells when we compared the upper and lower chambercells in our migration assay. Although there were no sig-nificant migratory differences between ZAP70 + and -patients, there was a clear trend towards increased migra-tion of cells from ZAP70+ patients in response to MSC-CM. The better responsiveness of ZAP70+ cells to theirmicroenvironment that we observed is in line with theobservation of Richardson et al. who showed that ZAP70identifies cells with an increased propensity to migrate tothe lymph node and an increased ability to respond to sur-vival signals.43 Moreover, we showed that only ZAP70+
patients respond to microenvironment contact by adownmodulation of CXCR4 (probably by protein inter-nalization, as previously described)44 indicating once morethat only ZAP70+ patients could respond to microenviron-ment stimuli and suggesting an association betweenaggressiveness of the disease and chemotaxis towards themicroenvironment via the SDF1α/CXCR4 pathway.Furthermore, the role of ZAP70 in migration has alreadybeen demonstrated in T cells.45,46 Indeed, expression ofwild type ZAP70 in ZAP70-deficient cells (P116 neo)strongly enhanced its migratory capability and thisremains true even in absence of CD3 complex surface
expression and thus of functional TCRζ subunits as is thecase in B cells.46 Tacchini et al. also showed that SDF1αinduces a rapid and transient tyrosine phosphorylation ofZAP70, suggesting that this chemokine can directly acti-vate ZAP70. We could thus speculate that, in CLL cells,microenvironment stimuli could transitorily activateZAP70 resulting in downstream cascade phosphorylation.Stimulation by the SDF1α/CXCR4 pathway could acti-vate ZAP70-dependent genes (such as Vav146 which con-tributes to signal amplification and diversificationevents)47 leading to actin cytoskeleton changes and thuschemotaxis.
In conclusion, our data demonstrated that in ZAP70+
patients, leukemic cells can better interact and cross-talkwith their protective microenvironment, explaining theirincreased survival and the aggressiveness of the disease.
Authorship and Disclosures
BS performed research and statistical analysis, analyzeddata, made figures and tables, and wrote manuscript. BH-K performed and revised statistical analysis. CE con-tributed to microarray experiments. AS performed real-time PCR confirmations. CDB contributed to flow cytom-etry experiments. DH. initiated project and performedresearch. NM, DB and PM contributed to patient samplesand data. LL supervised and designed research, andrevised manuscript.
The authors declare no competing financial interests.
References
1. Wiestner A, Rosenwald A, Barry TS,Wright G, Davis RE, Henrickson SEet al. ZAP-70 expression identifies achronic lymphocytic leukemia sub-type with unmutated immunoglob-ulin genes, inferior clinical outcome,and distinct gene expression profile.Blood 2003;101:4944-51.
2. Bilban M, Heintel D, Scharl T,Woelfel T, Auer MM, Porpaczy E, etal. Deregulated expression of fat andmuscle genes in B-cell chronic lym-phocytic leukemia with highlipoprotein lipase expression.Leukemia 2006;20:1080-8.
3. Damle RN, Wasil T, Fais F, Ghiotto F,Valetto A, Allen SL, et al. Ig V genemutation status and CD38 expres-sion as novel prognostic indicatorsin chronic lymphocytic leukemia.Blood 1999;94:1840-7.
4. Calin GA, Ferracin M, Cimmino A,Di Leva G, Shimizu M, Wojcik SE,et al. A MicroRNA signature associ-ated with prognosis and progressionin chronic lymphocytic leukemia. NEngl J Med 2005;353:1793-801.
5. Dohner H, Stilgenbauer S, Benner A,Leupolt E, Krober A, Bullinger L, etal. Genomic aberrations and survivalin chronic lymphocytic leukemia. NEngl J Med 2000;343:1910-6.
6. Hamblin TJ, Davis Z, Gardiner A,Oscier DG, Stevenson FK.Unmutated Ig V(H) genes are associ-ated with a more aggressive form ofchronic lymphocytic leukemia.Blood 1999;94:1848-54.
7. Van Bockstaele F, Pede V, Janssens A,Callewaert F, Offner F, Verhasselt B,et al. Lipoprotein lipase mRNAexpression in whole blood is a prog-nostic marker in B cell chronic lym-phocytic leukemia. Clin Chem2007;53:204-12.
8. Crespo M, Bosch F, Villamor N,Bellosillo B, Colomer D, Rozman M,et al. ZAP-70 expression as a surro-gate for immunoglobulin-variable-region mutations in chronic lym-phocytic leukemia. N Engl J Med2003;348:1764-75.
9. Catherwood MA, Matthews C,Niblock R, Dobbin E, Morris TC,Alexander HD. ZAP-70 mRNAquantification in B-cell chronic lym-phocytic leukaemia. Eur J Haematol2006;76:294-8.
10. Stamatopoulos B, Meuleman N,Haibe-Kains B, Duvillier H, MassyM, Martiat P, et al. Quantification ofZAP70 mRNA in B cells by real-timePCR is a powerful prognostic factorin chronic lymphocytic leukemia.Clin Chem 2007;53:1757-66.
11. Del Principe MI, Del Poeta G,Buccisano F, Maurillo L, Venditti A,
Zucchetto A, et al. Clinical signifi-cance of ZAP-70 protein expressionin B-cell chronic lymphocyticleukemia. Blood 2006;108:853-61.
12. Rassenti LZ, Huynh L, Toy TL,Chen L, Keating MJ, Gribben JG, etal. ZAP-70 compared withimmunoglobulin heavy-chain genemutation status as a predictor of dis-ease progression in chronic lympho-cytic leukemia. N Engl J Med 2004;351:893-901.
13. Tondreau T, Meuleman N, DelforgeA, Dejeneffe M, Leroy R, Massy M,et al. Mesenchymal stem cellsderived from CD133-positive cellsin mobilized peripheral blood andcord blood: proliferation, Oct4expression, and plasticity. StemCells 2005;23:1105-12.
14. Orchard JA, Ibbotson RE, Davis Z,Wiestner A, Rosenwald A, ThomasPW, et al. ZAP-70 expression andprognosis in chronic lymphocyticleukaemia. Lancet 2004;363:105-11.
15. Durig J, Nuckel H, Cremer M,Fuhrer A, Halfmeyer K, Fandrey J, etal. ZAP-70 expression is a prognos-tic factor in chronic lymphocyticleukemia. Leukemia 2003;17:2426-34.
16. Klein U, Tu Y, Stolovitzky GA,Mattioli M, Cattoretti G, Husson H,et al. Gene expression profiling of Bcell chronic lymphocytic leukemia
Comparison of ZAP70 high vs. low CLL patients
haematologica | 2009; 94(6) | 799 |
reveals a homogeneous phenotyperelated to memory B cells. J Exp Med2001;194:1625-38.
17. Haslinger C, Schweifer N,Stilgenbauer S, Dohner H, Lichter P,Kraut N, et al. Microarray geneexpression profiling of B-cell chroniclymphocytic leukemia subgroupsdefined by genomic aberrations andVH mutation status. J Clin Oncol2004;22:3937-49.
18. Rosenwald A, Alizadeh AA,Widhopf G, Simon R, Davis RE, YuX, et al. Relation of gene expressionphenotype to immunoglobulinmutation genotype in B cell chroniclymphocytic leukemia. J Exp Med2001;194:1639-47.
19. Schroers R, Griesinger F, Trumper L,Haase D, Kulle B, Klein-Hitpass L, etal. Combined analysis of ZAP-70 andCD38 expression as a predictor ofdisease progression in B-cell chroniclymphocytic leukemia. Leukemia2005;19:750-8.
20. Huttmann A, Klein-Hitpass L,Thomale J, Deenen R, Carpinteiro A,Nuckel H, et al. Gene expression sig-natures separate B-cell chronic lym-phocytic leukaemia prognostic sub-groups defined by ZAP-70 and CD38expression status. Leukemia 2006;20:1774-82.
21. Li FJ, Ding S, Pan J, Shakhmatov MA,Kashentseva E, Wu J, et al. FCRL2expression predicts IGHV mutationstatus and clinical progression inchronic lymphocytic leukemia.Blood 2008;112:179-87.
22. Joshi AD, Hegde GV, Dickinson JD,Mittal AK, Lynch JC, Eudy JD, et al.ATM, CTLA4, MNDA, and HEM1 inhigh versus low CD38 expressing B-cell chronic lymphocytic leukemia.Clin Cancer Res 2007;13:5295-304.
23. Gattei V, Bulian P, Del Principe MI,Zucchetto A, Maurillo L, Buccisano F,et al. Relevance of CD49d proteinexpression as overall survival andprogressive disease prognosticator inchronic lymphocytic leukemia.Blood 2008;111:865-73.
24. Del Poeta G, Del Principe MI,Luciano F, Maurillo L, Buccisano F,Catalano G, et al. High CD69 proteinexpression predicts a poor prognosisin B-cell chronic lymphocyticleukemia (B-CLL). 49th AmericanSociety of Hematology (ASH) meet-ing, Altanta, Georgie, USA. 2007.[Abstract].
25. Pallasch CP, Schwamb J, Konigs S,Schulz A, Debey S, Kofler D, et al.Targeting lipid metabolism by thelipoprotein lipase inhibitor orlistatresults in apoptosis of B-cell chroniclymphocytic leukemia cells.Leukemia 2008;22:585-92.
26. Heintel D, Kienle D, Shehata M,Krober A, Kroemer E, Schwarzinger
I, et al. High expression of lipopro-tein lipase in poor risk B-cell chroniclymphocytic leukemia. Leukemia2005;19:1216-23.
27. Herve M, Xu K, Ng YS, WardemannH, Albesiano E, Messmer BT, et al.Unmutated and mutated chroniclymphocytic leukemias derive fromself-reactive B cell precursors despiteexpressing different antibody reactiv-ity. J Clin Invest 2005;115:1636-43.
28. Ehrhardt GR, Leu CM, Zhang S,Aksu G, Jackson T, Haga C, et al. Fcreceptor-like proteins (FCRL):immunomodulators of B cell func-tion. Adv Exp Med Biol 2007;596:155-62.
29. Miller I, Hatzivassiliou G, CattorettiG, Mendelsohn C, Dalla-Favera R.IRTAs: a new family of immuno-globulinlike receptors differentiallyexpressed in B cells. Blood 2002;99:2662-9.
30. Xu MJ, Zhao R, Zhao ZJ. Molecularcloning and characterization ofSPAP1, an inhibitory receptor.Biochem Biophys Res Commun2001;280:768-75.
31. Rodriguez A, Villuendas R, Yanez L,Gomez ME, Diaz R, Pollan M, et al.Molecular heterogeneity in chroniclymphocytic leukemia is dependenton BCR signaling: clinical correla-tion. Leukemia 2007;21:1984-91.
32. Ghia P, Circosta P, Scielzo C, VallarioA, Camporeale A, Granziero L, et al.Differential effects on CLL cell sur-vival exerted by different microenvi-ronmental elements. Curr TopMicrobiol Immunol 2005;294:135-45.
33. Deglesne PA, Chevallier N, LetestuR, Baran-Marszak F, Beitar T,Salanoubat C, et al. Survivalresponse to B-cell receptor ligation isrestricted to progressive chronic lym-phocytic leukemia cells irrespectiveof Zap70 expression. Cancer Res2006;66:7158-66.
34. Ocana E, Delgado-Perez L, Campos-Caro A, Munoz J, Paz A, Franco R, etal. The prognostic role of CXCR3expression by chronic lymphocyticleukemia B cells. Haematologica2007;92:349-56.
35. Ding W, Nowakowski G,Abrahamzon JL, Wellik LE, GhoshAK, Secreto C, et al. Crosstalkbetween Chronic LymphocyticLeukemia (CLL) B-Cells and MarrowStromal Cells: Implication for CLL B-Cell Activation and Survival. 49th
American Society of Hematology(ASH) meeting, Altanta, Georgie,USA. [Abstract].
36. Deaglio S, Vaisitti T, Aydin S, BerguiL, D’Arena G, Bonello L, et al. CD38and ZAP-70 are functionally linkedand mark CLL cells with high migra-tory potential. Blood 2007;110:4012-
21.37. Ghia P, Granziero L, Chilosi M,
Caligaris-Cappio F. Chronic B cellmalignancies and bone marrowmicroenvironment. Semin CancerBiol 2002;12:149-55.
38. Lagneaux L, Delforge A, Bron D, DeBruyn C, Stryckmans P. Chroniclymphocytic leukemic B cells but notnormal B cells are rescued fromapoptosis by contact with normalbone marrow stromal cells. Blood1998;91:2387-96.
39. Till KJ, Lin K, Zuzel M, Cawley JC.The chemokine receptor CCR7 andα4 integrin are important for migra-tion of chronic lymphocyticleukemia cells into lymph nodes.Blood 2002;99:2977-84.
40. Sanz-Rodriguez F, Hidalgo A,Teixido J. Chemokine stromal cell-derived factor-1α modulates VLA-4integrin-mediated multiple myelomacell adhesion to CS-1/fibronectin andVCAM-1. Blood 2001;97:346-51.
41. Matsunaga T, Takemoto N, Sato T,Takimoto R, Tanaka I, Fujimi A, et al.Interaction between leukemic-cellVLA-4 and stromal fibronectin is adecisive factor for minimal residualdisease of acute myelogenousleukemia. Nat Med 2003;9:1158-65.
42. de La Fuente MT, Casanova B,Moyano JV, Garcia-Gila M, Sanz L,Garcia-Marco J, et al. Engagement ofα4β1 integrin by fibronectin inducesin vitro resistance of B chronic lym-phocytic leukemia cells to fludara-bine. J Leukoc Biol 2002;71:495-502.
43. Richardson SJ, Matthews C,Catherwood MA, Alexander HD,Carey BS, Farrugia J, et al. ZAP-70expression is associated withenhanced ability to respond tomigratory and survival signals in B-cell chronic lymphocytic leukemia(B-CLL). Blood 2006;107:3584-92.
44. Minina S, Reichman-Fried M, Raz E.Control of receptor internalization,signaling level, and precise arrival atthe target in guided cell migration.Curr Biol 2007;17:1164-72.
45. Ottoson NC, Pribila JT, Chan AS,Shimizu Y. Cutting edge: T cellmigration regulated by CXCR4chemokine receptor signaling toZAP-70 tyrosine kinase. J Immunol2001;167:1857-61.
46. Ticchioni M, Charvet C, Noraz N,Lamy L, Steinberg M, Bernard A, etal. Signaling through ZAP-70 isrequired for CXCL12-mediated T-cell transendothelial migration.Blood 2002;99:3111-8.
47. Caloca MJ, Zugaza JL, Bustelo XR.Mechanistic Analysis of theAmplification and DiversificationEvents Induced by Vav Proteins in B-lymphocytes. J Biol Chem 2008;283:36454-64.