Whole-genome sequencing identifies recurrent mutations in chronic lymphocytic leukaemia
43
Whole-genome sequencing identifies a recurrent functional synonymous mutation in melanoma Jared J. Gartner a,1 , Stephen C. J. Parker a,1 , Todd D. Prickett a , Ken Dutton-Regester b , Michael L. Stitzel a , Jimmy C. Lin c , Sean Davis d , Vijaya L. Simhadri e , Sujata Jha f , Nobuko Katagiri e , Valer Gotea a , Jamie K. Teer a , Xiaomu Wei a , Mario A. Morken a , Umesh K. Bhanot g , NISC Comparative Sequencing Program a,2 , Guo Chen h , Laura L. Elnitski a , Michael A. Davies h , Jeffrey E. Gershenwald h , Hannah Carter i , Rachel Karchin i , William Robinson j , Steven Robinson j , Steven A. Rosenberg d , Francis S. Collins a , Giovanni Parmigiani k,l , Anton A. Komar f , Chava Kimchi-Sarfaty e , Nicholas K. Hayward b , Elliott H. Margulies a,m , and Yardena Samuels a,n,3 a National Human Genome Research Institute and d National Cancer Institute, National Institutes of Health, Bethesda, MD 20892; b Division of Genetics and Computational Biology, Queensland Institute of Medical Research, Brisbane, QLD 4006, Australia; c Department of Pathology and Immunology, Washington University School of Medicine, St. Louis, MO 63110; e Laboratory of Hemostasis, Division of Hematology, Center for Biologics Evaluation and Research, Food and Drug Administration, Bethesda, MD 20892; f Center for Gene Regulation in Health and Disease and the Department of Biological, Geological, and Environmental Sciences, Cleveland State University, Cleveland, OH 44115; g Department of Pathology, Memorial Sloan-Kettering Cancer Center, New York, NY 10065; h Department of Melanoma Medical Oncology, University of Texas MD Anderson Cancer Center, Houston, TX 77030; i Department of Biomedical Engineering, Institute for Computational Medicine, Johns Hopkins University, Baltimore, MD 21218; j Division of Medical Oncology, University of Colorado School of Medicine, Aurora, CO 80045; k Department of Biostatistics and Computational Biology, Dana Farber Cancer Institute, Boston, MA 02115; l Department of Biostatistics, Harvard School of Public Health, Boston, MA 02115; m Illumina United Kingdom, Chesterford Research Park, Little Chesterford, Nr Saffron Walden, Essex CB10 1XL, United Kingdom; and n Department of Molecular Cell Biology, Weizmann Institute of Science, Rehovot 76100, Israel Edited* by Bert Vogelstein, Johns Hopkins University, Baltimore, MD, and approved June 27, 2013 (received for review March 12, 2013) Synonymous mutations, which do not alter the protein sequence, have been shown to affect protein function [Sauna ZE, Kimchi- Sarfaty C (2011) Nat Rev Genet 12(10):683–691]. However, synon- ymous mutations are rarely investigated in the cancer genomics field. We used whole-genome and -exome sequencing to identify somatic mutations in 29 melanoma samples. Validation of one synonymous somatic mutation in BCL2L12 in 285 samples identi- fied 12 cases that harbored the recurrent F17F mutation. This mu- tation led to increased BCL2L12 mRNA and protein levels because of differential targeting of WT and mutant BCL2L12 by hsa-miR- 671–5p. Protein made from mutant BCL2L12 transcript bound p53, inhibited UV-induced apoptosis more efficiently than WT BCL2L12, and reduced endogenous p53 target gene transcription. This report shows selection of a recurrent somatic synonymous mutation in cancer. Our data indicate that silent alterations have a role to play in human cancer, emphasizing the importance of their investigation in future cancer genome studies. S ystematic melanoma whole-exome and -genome studies have uncovered numerous recurrent mutations as well as highly mutated genes that show functional consequences on melanoma growth (1–6). These studies focus exclusively on coding mutations and specifically on nonsynonymous mutations, insertion/deletion mutations as well as splice sites. Recently, noncoding mutations in the telomerase reverse transcriptase (TERT) promoter have been shown to generate new E-twenty-six (ETS) transcription factors binding motifs, leading to increased expression of telomerase re- verse transcriptase (7, 8). These studies highlight the impor- tance of adjusting our focus beyond the nonsynonymous coding mutations and evaluating all mutations in melanoma. To gain additional insight into the molecular alterations of melanoma, we report the sequence analysis of 29 melanoma samples and corresponding normal DNA. We performed whole- genome sequencing on 10 matched normal and metastatic tumor DNAs and reanalyzed a previously published melanoma whole- genome study (9, 10). Together with our previous whole-exome analysis of 14 melanoma samples (1) and an additional whole- exome analysis of four matched melanoma and normal samples, this study allows for an unbiased search for unique melanoma genes in a total of 29 samples from treatment naïve patients. Results In combined analysis, 13,098 somatic mutations were identified in gene coding regions. Of these mutations, 8,619 caused protein changes, including 7,974 missense, 514 nonsense, 27 small deletion, 11 insertion, and 93 splice site mutations. There were 4,479 silent (synonymous) substitutions (Dataset S1). A nonsynonymous to synonymous ratio of 1.93:1 was calculated, which is not higher than the nonsynonymous to synonymous ratio of 2.5:1 pre- dicted for nonselected mutations (11), suggesting that most are likely passenger mutations. The number of C > T/G > A tran- sitions was significantly greater than other nucleotide substitutions (P < 0.001) (SI Appendix, Fig. S1), which is consistent with a UV radiation (UVR) signature (12). Recurrent nonsynonymous mutations, including v-raf murine sarcoma viral oncogene homolog B1 (BRAF) V600E and trans- formation/transcription domain-associated protein (TRRAP) S722F substitutions, were found (1, 13) as well as 16 recurrent synonymous mutations (Table 1). Although synonymous muta- tions do not alter the protein sequence, they have been shown to affect protein levels and function (14, 15). However, to date, synonymous mutations have not been investigated in numerous published cancer genomes. We sought to determine whether these somatic synonymous mutations have a functional role in melanomagenesis. Additional screening of these 16 syn- onymous hotspot mutations in an additional 169 melanoma samples identified olfactory receptor family 4 subfamily C, mem- ber 3 (OR4C3) and BCL2L12 (SI Appendix, Fig. S2) each to have identical synonymous mutations in three and four additional cases, respectively. The frequency of these recurrent alterations in the validation sample is significantly elevated (P < 1 × 10 −7 and P < 1 × 10 −11 ), suggesting that they have either undergone Author contributions: J.J.G., S.C.J.P., T.D.P., and Y.S. designed research; J.J.G., S.C.J.P., T.D.P., K.D.-R., M.L.S., J.C.L., V.L.S., S.J., N.K., V.G., J.K.T., X.W., M.A.M., U.K.B., N.I.S.C.C.S.P., G.C., and L.L.E. performed research; K.D.-R., M.L.S., J.C.L., N.I.S.C.C.S.P., M.A.D., J.E.G., H.C., R.K., W.R., S.R., and S.A.R. contributed new reagents/analytic tools; J.J.G., S.C.J.P., T.D.P., K.D.-R., M.L.S., J.C.L., S.D., V.L.S., S.J., N.K., V.G., J.K.T., X.W., M.A.M., U.K.B., N.I.S.C.C.S.P., G.C., L.L.E., M.A.D., J.E.G., H.C., R.K., W.R., S.R., S.A.R., F.S.C., G.P., A.A.K., C.K.-S., N.K.H., E.H.M., and Y.S. ana- lyzed data; and J.J.G., S.C.J.P., T.D.P., K.D.-R., M.L.S., J.C.L., S.D., V.L.S., S.J., N.K., V.G., J.K.T., X.W., M.A.M., U.K.B., N.I.S.C.C.S.P., G.C., L.L.E., M.A.D., J.E.G., H.C., R.K., W.R., S.R., S.A.R., F.S.C., G.P., A.A.K., C.K.-S., N.K.H., E.H.M., and Y.S. wrote the paper. The authors declare no conflict of interest. *This Direct Submission article had a prearranged editor. Data deposition: The sequence reported in this paper has been deposited in the dbSNP, ClinVar database (accession no. 1057273). 1 J.J.G. and S.C.J.P. contributed equally to this work. 2 A complete list of the NISC Comparative Sequencing Program can be found in SI Text. 3 To whom correspondence should be addressed. E-mail: yardena.samuels@weizmann. ac.il. This article contains supporting information online at www.pnas.org/lookup/suppl/doi:10. 1073/pnas.1304227110/-/DCSupplemental. www.pnas.org/cgi/doi/10.1073/pnas.1304227110 PNAS | August 13, 2013 | vol. 110 | no. 33 | 13481–13486 GENETICS
-
Upload
independent -
Category
Documents
-
view
0 -
download
0
Transcript of Whole-genome sequencing identifies recurrent mutations in chronic lymphocytic leukaemia
Whole-genome sequencing identifies a recurrentfunctional synonymous mutation in melanomaJared J. Gartnera,1, Stephen C. J. Parkera,1, Todd D. Pricketta, Ken Dutton-Regesterb, Michael L. Stitzela, Jimmy C. Linc,Sean Davisd, Vijaya L. Simhadrie, Sujata Jhaf, Nobuko Katagirie, Valer Goteaa, Jamie K. Teera, Xiaomu Weia,Mario A. Morkena, Umesh K. Bhanotg, NISC Comparative Sequencing Programa,2, Guo Chenh, Laura L. Elnitskia,Michael A. Daviesh, Jeffrey E. Gershenwaldh, Hannah Carteri, Rachel Karchini, William Robinsonj, Steven Robinsonj,Steven A. Rosenbergd, Francis S. Collinsa, Giovanni Parmigianik,l, Anton A. Komarf, Chava Kimchi-Sarfatye,Nicholas K. Haywardb, Elliott H. Marguliesa,m, and Yardena Samuelsa,n,3
aNational Human Genome Research Institute and dNational Cancer Institute, National Institutes of Health, Bethesda, MD 20892; bDivision of Genetics andComputational Biology, Queensland Institute of Medical Research, Brisbane, QLD 4006, Australia; cDepartment of Pathology and Immunology, WashingtonUniversity School of Medicine, St. Louis, MO 63110; eLaboratory of Hemostasis, Division of Hematology, Center for Biologics Evaluation and Research,Food and Drug Administration, Bethesda, MD 20892; fCenter for Gene Regulation in Health and Disease and the Department of Biological, Geological, andEnvironmental Sciences, Cleveland State University, Cleveland, OH 44115; gDepartment of Pathology, Memorial Sloan-Kettering Cancer Center, New York,NY 10065; hDepartment of Melanoma Medical Oncology, University of Texas MD Anderson Cancer Center, Houston, TX 77030; iDepartment of BiomedicalEngineering, Institute for Computational Medicine, Johns Hopkins University, Baltimore, MD 21218; jDivision of Medical Oncology, University of ColoradoSchool of Medicine, Aurora, CO 80045; kDepartment of Biostatistics and Computational Biology, Dana Farber Cancer Institute, Boston, MA 02115;lDepartment of Biostatistics, Harvard School of Public Health, Boston, MA 02115; mIllumina United Kingdom, Chesterford Research Park, Little Chesterford,Nr Saffron Walden, Essex CB10 1XL, United Kingdom; and nDepartment of Molecular Cell Biology, Weizmann Institute of Science, Rehovot 76100, Israel
Edited* by Bert Vogelstein, Johns Hopkins University, Baltimore, MD, and approved June 27, 2013 (received for review March 12, 2013)
Synonymous mutations, which do not alter the protein sequence,have been shown to affect protein function [Sauna ZE, Kimchi-Sarfaty C (2011) Nat Rev Genet 12(10):683–691]. However, synon-ymous mutations are rarely investigated in the cancer genomicsfield. We used whole-genome and -exome sequencing to identifysomatic mutations in 29 melanoma samples. Validation of onesynonymous somatic mutation in BCL2L12 in 285 samples identi-fied 12 cases that harbored the recurrent F17F mutation. This mu-tation led to increased BCL2L12 mRNA and protein levels becauseof differential targeting of WT and mutant BCL2L12 by hsa-miR-671–5p. Protein made from mutant BCL2L12 transcript bound p53,inhibited UV-induced apoptosis more efficiently than WT BCL2L12,and reduced endogenous p53 target gene transcription. This reportshows selection of a recurrent somatic synonymous mutation incancer. Our data indicate that silent alterations have a role to playin human cancer, emphasizing the importance of their investigationin future cancer genome studies.
Systematic melanoma whole-exome and -genome studies haveuncovered numerous recurrent mutations as well as highly
mutated genes that show functional consequences on melanomagrowth (1–6). These studies focus exclusively on coding mutationsand specifically on nonsynonymous mutations, insertion/deletionmutations as well as splice sites. Recently, noncoding mutations inthe telomerase reverse transcriptase (TERT) promoter have beenshown to generate new E-twenty-six (ETS) transcription factorsbinding motifs, leading to increased expression of telomerase re-verse transcriptase (7, 8). These studies highlight the impor-tance of adjusting our focus beyond the nonsynonymous codingmutations and evaluating all mutations in melanoma.To gain additional insight into the molecular alterations of
melanoma, we report the sequence analysis of 29 melanomasamples and corresponding normal DNA. We performed whole-genome sequencing on 10 matched normal and metastatic tumorDNAs and reanalyzed a previously published melanoma whole-genome study (9, 10). Together with our previous whole-exomeanalysis of 14 melanoma samples (1) and an additional whole-exome analysis of four matched melanoma and normal samples,this study allows for an unbiased search for unique melanomagenes in a total of 29 samples from treatment naïve patients.
ResultsIn combined analysis, 13,098 somatic mutations were identifiedin gene coding regions. Of these mutations, 8,619 caused proteinchanges, including 7,974 missense, 514 nonsense, 27 small deletion,11 insertion, and 93 splice site mutations. There were 4,479 silent
(synonymous) substitutions (Dataset S1). A nonsynonymous tosynonymous ratio of 1.93:1 was calculated, which is not higherthan the nonsynonymous to synonymous ratio of 2.5:1 pre-dicted for nonselected mutations (11), suggesting that most arelikely passenger mutations. The number of C > T/G > A tran-sitions was significantly greater than other nucleotide substitutions(P < 0.001) (SI Appendix, Fig. S1), which is consistent with a UVradiation (UVR) signature (12).Recurrent nonsynonymous mutations, including v-raf murine
sarcoma viral oncogene homolog B1 (BRAF) V600E and trans-formation/transcription domain-associated protein (TRRAP)S722F substitutions, were found (1, 13) as well as 16 recurrentsynonymous mutations (Table 1). Although synonymous muta-tions do not alter the protein sequence, they have been shownto affect protein levels and function (14, 15). However, todate, synonymous mutations have not been investigated innumerous published cancer genomes. We sought to determinewhether these somatic synonymous mutations have a functionalrole in melanomagenesis. Additional screening of these 16 syn-onymous hotspot mutations in an additional 169 melanomasamples identified olfactory receptor family 4 subfamily C, mem-ber 3 (OR4C3) and BCL2L12 (SI Appendix, Fig. S2) each to haveidentical synonymous mutations in three and four additionalcases, respectively. The frequency of these recurrent alterationsin the validation sample is significantly elevated (P < 1 × 10⁻⁷ andP < 1 × 10⁻¹¹), suggesting that they have either undergone
Author contributions: J.J.G., S.C.J.P., T.D.P., and Y.S. designed research; J.J.G., S.C.J.P., T.D.P.,K.D.-R., M.L.S., J.C.L., V.L.S., S.J., N.K., V.G., J.K.T., X.W., M.A.M., U.K.B., N.I.S.C.C.S.P., G.C., andL.L.E. performed research; K.D.-R., M.L.S., J.C.L., N.I.S.C.C.S.P., M.A.D., J.E.G., H.C., R.K., W.R.,S.R., and S.A.R. contributed new reagents/analytic tools; J.J.G., S.C.J.P., T.D.P., K.D.-R., M.L.S.,J.C.L., S.D., V.L.S., S.J., N.K., V.G., J.K.T., X.W., M.A.M., U.K.B., N.I.S.C.C.S.P., G.C., L.L.E., M.A.D.,J.E.G., H.C., R.K., W.R., S.R., S.A.R., F.S.C., G.P., A.A.K., C.K.-S., N.K.H., E.H.M., and Y.S. ana-lyzed data; and J.J.G., S.C.J.P., T.D.P., K.D.-R., M.L.S., J.C.L., S.D., V.L.S., S.J., N.K., V.G., J.K.T.,X.W., M.A.M., U.K.B., N.I.S.C.C.S.P., G.C., L.L.E., M.A.D., J.E.G., H.C., R.K., W.R., S.R., S.A.R.,F.S.C., G.P., A.A.K., C.K.-S., N.K.H., E.H.M., and Y.S. wrote the paper.
The authors declare no conflict of interest.
*This Direct Submission article had a prearranged editor.
Data deposition: The sequence reported in this paper has been deposited in the dbSNP,ClinVar database (accession no. 1057273).1J.J.G. and S.C.J.P. contributed equally to this work.2A complete list of the NISC Comparative Sequencing Program can be found in SI Text.3To whom correspondence should be addressed. E-mail: [email protected].
This article contains supporting information online at www.pnas.org/lookup/suppl/doi:10.1073/pnas.1304227110/-/DCSupplemental.
www.pnas.org/cgi/doi/10.1073/pnas.1304227110 PNAS | August 13, 2013 | vol. 110 | no. 33 | 13481–13486
GEN
ETICS

relaxation of purifying selection (16) or been under selectionduring tumor development. Because BCL2L12 has previouslybeen linked to tumorigenesis (17), we screened the BCL2L12cytosine to thymine change at position 51 (F17F) in another87 melanoma samples. This screen identified six additionalsamples with the same alteration. This mutation, thus, occurred in10 of 256 melanomas (P < 1 × 10⁻³¹) in the combined vali-dation study, strongly suggesting that it has a functional role inmelanomagenesis. Consistent with this expectation, this nucleotideposition displays evidence of selection (SI Appendix, Fig. S3),suggesting that sequence variation at this site is not well-tolerated.Synonymous mutations have been shown to affect gene func-
tion by multiple mechanisms, including but not limited to thosemechanisms exerting effects on mRNA splicing, protein trans-lation, and expression (18). Our analyses suggest that the syn-onymous alteration in BCL2L12 does not affect splicing, becausethe mutation does not create a guanine thymine (GT) splicingconsensus dinucleotide that could compete with the donor splicesite of the first exon or encourage the use of seven cryptic GTsplice donor sites within its vicinity (SI Appendix, Table S1).Next, we determined whether BCL2L12 allelic expression is af-fected by the mutation by comparing the levels of mutant andWT BCL2L12 alleles. We used MALDI-TOF (Sequenom)analysis to quantitatively assess relative allelic abundance inpaired cDNA and genomic DNA (gDNA) from melanomasamples and found that, for 9 of 12 samples, the mutant BCL2L12T allele was more abundantly expressed than the WT C allele (P <0.01, Wilcoxon rank sum test) (Fig. 1 A and B). To test if theprotein made from mutant BCL2L12 transcript is expressedmore abundantly than WT BCL2L12, we constructed WT and
mutated versions of BCL2L12 cDNA and transiently transfectedthem. We found that the mRNA (SI Appendix, Fig. S4) andprotein levels (Fig. 1C) of mutant BCL2L12 were significantlyincreased relative to WT in multiple independent cotransfectionexperiments using GFP to control for transfection efficiency.There could be a number of reasons leading to the elevated
BCL2L12 protein expression levels: (i) increased mRNA levels(noticed above), (ii) enhanced mRNA translation, (iii) stabili-zation of protein against degradation, or (iv) all of the above.We, however, found no change in elongation/translation rates ofthe mutant BCL2L12 mRNA compared with the WT message(SI Appendix, Fig. S5) and no change in stability of protein(expressed in vivo and in vitro) to limited proteolysis. Theseresults largely rule out the F17F mutation having effects onBCL2L12 translation and protein stability.The elevated levels of mutant BCL2L12 mRNA could be
caused by increased transcription or increased RNA stability.The position corresponding to the mutation in BCL2L12 dis-plays high conservation across the mammalian lineage, suggest-ing functional constraints other than purely amino acid encoding(SI Appendix, Fig. S6A). However, position weight matrix scan-ning and ChIP analyses provide no support for a mechanisminvolving preferential binding of expressed transcription factorsto the WT or mutated BCL2L12 alleles (SI Appendix, Fig. S6 B–E).Increased stability of the mutant BCL2L12 mRNA could becaused by differential binding of protein or microRNA (miRNA)to mutant and WT BCL2L12 mRNA. Computational analysisshowed that several RNA binding proteins may interact with WTand mutant mRNAs in the region close to the site of mutation.However, gel-shift experiments of top candidate proteins did not
Table 1. Recurrent synonymous mutations in analysis of 29 melanoma tumors
Gene name Ref_seq ID Nucleotide change Amino acid change Tumor name
FCRL1 NM_052938.4 C741T I247I 96T91T
OR2T6 NM_001005471.1 C339T F113F 7T32T
PNLIPRP1 NM_006229.2 C600T F200F 32T55T
OR4C3 NM_001004702.1 C114T F38F 17T108T
OR8J3 NM_001004064.1 C186T F62F 55T01T
CPT1A NM_001876.3 C1638T F546F 05T43T
DNAH9 NM_001372.3 C6333T F2111F 24T01T
BCL2L12 NM_138639.1 C51T F17F 55T81T
PNKP NM_007254.3 C75T P25P 32T56T
TTN NM_133378.4 C10167T F3389F 130T23T
POTED NM_174981.3 G864A V288V 12T26T
GTSE1 NM_016426.6 C1782T S594S 24T55T
OR5H6 NM_001005479.1 C654T F218F 24TColo-829
FILIP1 NM_015687.2 G2475A R825R 17T24T
PPP1R3A NM_002711.3 G2844A T948T Colo-82951T
COL14A1 NM_021110.1 G4050A R1350R 23T32T
Identification of 16 recurrent mutations and their effects on their transcripts. All mutations were validatedthrough Sanger sequencing and subsequently evaluated in additional cohorts of melanoma.
13482 | www.pnas.org/cgi/doi/10.1073/pnas.1304227110 Gartner et al.
reveal any differential binding between the two mRNAs (SI Ap-pendix, Fig. S7).Finally, to evaluate if the mutation affects miRNA binding, we
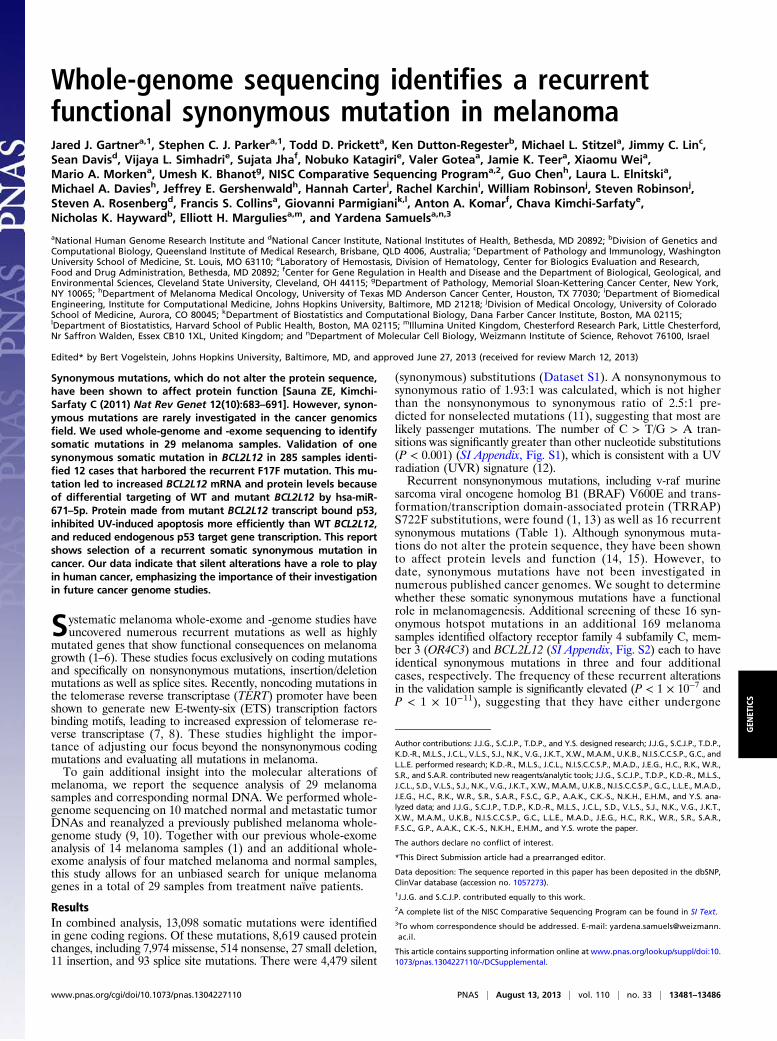
used the miRNA target prediction programs PITA (19) andmiRanda (20). A single miRNA (miR) common to both pro-grams, hsa-miR-671–5p, was predicted to bind the WT but notmutant BCL2L12 transcripts. The miRNA target site in its WTform has high complementarity to mature hsa-miR-671–5p. Fur-thermore, Genome Evolutionary Rate Profiling (GERP) analysis(21), which identifies evolutionarily constrained positions in mul-tiple genome alignments by quantifying substitution deficits acrossspecies, indicates that the target region exhibits high sequenceconservation (Fig. 2A) (22, 23). We hypothesized that loss of thistarget site in mutant BCL2L12 may lead to increased BCL2L12transcript levels. hsa-miR-671–5p has been shown previously to beexpressed in melanoma (24). Before targeting endogenousBCL2L12 with hsa-miR-671–5p, we used quantitative RT-PCR(qRT-PCR) analysis to detect the presence of transiently trans-fected miR mimic in melanoma cell lines (Fig. 2B). Furthermore,to show specificity of the miR mimic to target WT BCL2L12, wecotransfected WT or mutant BCL2L12 melanoma cell lines withnegative control miR or hsa-miR-671–5p mimic in the presence ofa specific miR inhibitor (anti–hsa-miR-671–5p). qRT-PCR anal-ysis shows that anti-miR inhibited and reversed the effect on WTBCL2L12 message by hsa-miR-671–5p. In mutant cell lines, littleto no effect was observed (Fig. 2C). The suppression of maturehsa-miR-671–5p mimic by cotransfection with anti–hsa-miR-671–5p was determined by qRT-PCR analysis (SI Appendix, Fig. S8).Our results indicate that WT BCL2L12 mRNA is a target for hsa-
miR-671–5p regulation, which leads to its steady state reduction.However, the recurrent BCL2L12 mutation reduces the affinity ofhsa-miR-671–5p binding, thus allowing mutant BCL2L12 mRNAand protein accumulation.BCL2L12 was previously shown to be amplified in glioblas-
toma, to bind p53, and to inhibit apoptosis (17). Together withour identification of a BCL2L12 hotspot mutation that increasesBCL2L12 expression levels, this finding suggests BCL2L12 tobe a candidate unique melanoma oncogene. We, therefore, in-vestigated whether the identified BCL2L12 C51T mutation mayaffect apoptosis.As a first step in assessing this possibility, we confirmed that
the mutation does not interfere with p53 binding. Efficientcomplex formation between endogenous p53 and overexpressedprotein transcribed from either WT or mutant BCL2L12 tran-script was seen in HEK293 cells (SI Appendix, Fig. S9). Theobserved interaction with p53, together with the enhanced ex-pression of protein made from mutant BCL2L12 transcript, mayrepress p53 activity. This repressed activity may lead to an in-creased ability of melanoma cells to resist p53-dependent in-duced apoptosis. To directly test this possibility, we assessed theBCL2L12 antiapoptotic activity after genotoxic stress in mela-noma cells that harbor either WT or mutant BCL2L12. We usedshRNA or siRNA to knockdown BCL2L12 expression inBCL2L12 WT (12T and SK-Mel-28) or mutant [75T, 79T (spe-cifically siRNA for 55T), and C025] cells (SI Appendix, Figs. S10and S11). In each case, the knockdown had little to no effect oncells harboring WT BCL2L12 but significantly reduced the via-bility of cells harboring mutant BCL2L12 post-UVR exposure
kDa WT F17F Vector
42 -BCL2L12
-GAPDH38
0.0
0.2
0.4
0.6
0.8
1.0
●
●
●
●
●
●
● ●
●
●
Frac
tion
T al
lele
input
cDNA
gDNA
* * * * * * * * *
cDNA
+RT -RT
gDNAA
B
C
55T
75T
79T
81T
C001
C021
C025
C083
D05
D24
MB1
110
MB4
90
●
●
●
●
Fig. 1. Abundance of the BCL2L12 transcript and BCL2L12protein. (A) Image of MALDI-TOF (Sequenom) spectrographsindicating peaks for unextended primer (arrows), C allele(filled arrowheads), and T allele (open arrowheads) forsample 55T cDNA. Unextended primer peak in the −RTcontrol confirms that allelic representation differences incDNA samples are not because of gDNA contamination.Paired gDNA from each sample was used as a control. (B) Boxplots show significantly higher T-allele representation incDNA (dark gray) compared with gDNA (light gray) in 9 of 12melanoma samples. Significance was calculated from 12measurements of each cDNA and gDNA sample using theWilcoxon rank sum test; asterisks indicate samples with P <0.01. (C) BCL2L12 protein levels in transiently transfectedHEK293T cells (Western blot analysis). Cells were transientlytransfected with BCL2L12 WT or mutant cDNA, and Westernblotting was done posttransfection.
Gartner et al. PNAS | August 13, 2013 | vol. 110 | no. 33 | 13483
GEN
ETICS
(Fig. 3 A and B). Because BCL2L12 has previously been shownto affect the expression of p53-dependent target genes (17), wetested if depletion of mutant BCL2L12 in melanoma cells resultsin differential activation of p53-dependent transcription on UVRtreatment compared with BCL2L12 depletion in WT-expressingcells. Indeed, we observed significant increases in p53-dependenttranscription of MDM2 in mutant cells stably depleted ofBCL2L12 compared with stably depleted WT cells after UVRexposure (Fig. 3C). Our results show that synonymous somaticmutations have important roles to play in cancer and alsosuggest the potential for the prosurvival nature of BCL2L12in melanoma.
DiscussionWe identified a recurrent synonymous somatic mutation inBCL2L12. This mutation appears in 12 of 285 samples, sug-gesting that this mutation is being selected for during tumordevelopment. Analysis of the publicly available TCGA mela-noma dataset supports this conclusion, as it also contains thismutation in 8 of 255 samples. Our study shows that the BCL2L12synonymous mutation has no effect on normal protein func-tion but instead, causes an accumulation of BCL2L12 mRNAand protein.Functional analysis of the mutated form of BCL2L12 suggests
that the mutant’s stability leads to overexpression, increasing theantiapoptotic signaling in melanoma cells and promoting cell
survival, which may lead to increased resistance to p53-dependentapoptosis. BCL2L12 knockdown experiments support this finding.The reduced viability of mutant lines after BCL2L12 knockdownand UVR exposure suggests that these lines are dependent onBCL2L12 expression for survival, a common occurrence known asoncogene addiction (25). In fact, for several of the mutant lines,stable knockdown of BCL2L12 led to cell death without any ex-posure to UVR, further supporting the role of BCL2L12 intumor survival.Interplay between altered miRNA binding and synonymous
mutations has been shown previously. A synonymous mutation inthe immunity-related GTPase family M gene altered miR-196binding and deregulated immunity-related GTPase familyM-dependent xenophagy in Crohn disease, implicating a synon-ymous mutation as a likely causal variant for this disease (26).However, a direct link between a synonymous mutation and theorigin of cancer has not been shown. This study, thus, shows thatsynonymous mutations may be selected in cancer and play a rolein tumorigenesis. Importantly, the selection mechanism maypossibly be through the relaxation of purifying selection and/orthe plasticity–relaxation–mutation mechanism as well as someother alternatives (16, 27–31) rather than positive selection. Thedata presented here cannot unambiguously select one specificmechanism. However, the presented genetic and functional datasupport our view that synonymous mutations should receive
A
B
C
Fig. 2. hsa-miR-671–5p represses WT BCL2L12expression. (A) Schematic representation of theBCL2L12 locus at hg18 coordinates chr19:54860211–54868985. Based on miRanda and PITA targetscanning predictions, hsa-miR-671–5p binds at thefirst coding exon and has high affinity to the WTversion but not the C51T version. GERP single nu-cleotide resolution evolutionary conservation scoresshow that this region is highly conserved. The hor-izontal line at GERP score = 2 indicates the generalthreshold that defines evolutionarily constrainedbases. For this plot, we only show GERP scores ≥0.(B) qRT-PCR analysis of precursor hsa-miR-671 inmelanoma cells. Graphs show experimental repli-cates of qRT-PCR analysis of precursor hsa-miR-671in mutant BCL2L12 (75T and 79T) compared withWT BCL2L12 (12T and SK-Mel-28) cells. Results arerepresentative of two independent experiments.Error bars are SD. (C) Anti–miR-671–5p rescues hsa-miR-671–5p–mediated knockdown of WT BCL2L12in melanoma cells. Graphs show experimental rep-licates of qRT-PCR of endogenous BCL2L12 levels in(i) wild type BCL2L12 (12T and Sk-Mel-28) and (ii)mutant BCL2L12 (75T and 79T) cell lines in thepresence of negative control miR (NC) or hsa-miR-671–5p (miR) plus 0 or 50 nM anti–miR-671–5p.Results are representative of two independentexperiments. Error bars are SD. Comparison of NC0with miR0 (*P < 0.01) or comparison of miR0 withmiR50 (**P < 0.04; Student t test).
13484 | www.pnas.org/cgi/doi/10.1073/pnas.1304227110 Gartner et al.

increasing attention, not only in their detection but also in theirfunctional assessment and elucidation of their role in cancer.
Materials and MethodsTumor Tissues. All DNA samples used in this study were derived from me-tastases. Samples used for whole-exome capture and prevalence screen wereextracted from cell lines established directly from patients’ tumors as de-scribed previously (32). DNA subjected to whole-genome sequencing wasextracted from optimum cutting temperature compound-embedded speci-mens as described previously (32). The clinical information associated withthe melanoma tumors used in this study is provided in SI Appendix, Table S2.
DNA Extraction. DNA was extracted using the DNeasy Blood and Tissue Kit(Qiagen) following the manufacturer’s instructions. DNA was eluted in 35 μL
elution buffer. DNA measurements were made using an ND-1000 UV-Visspectrophotometer from NanoDrop Technologies.
Whole-Genome Single Nucleotide Variants. For variant calling, only reads withmapping quality of Q30 or greater and bases with quality of Q20 or greaterwere considered. We used two related algorithms to make single positiongenotype calls in the normal and melanoma genomes. For all genomes, weused a Bayesian genotype caller named Most Probable Genotype (MPG) thathas been described previously (33).
To identify variant positions,wedevelopedanalgorithm similar toMPG calledMost Probable Variant (MPV). An important distinction betweenMPG andMPVis thatMPV identifies variant positions relative to a reference genotype, whereasMPG identifies genotypes without an a priori reference assumption.
Statistical Calculation of Significance. To evaluate whether the frequency ofa synonymous mutation is significantly higher than would be expected if themutation were neutral, we performed a statistical test. We only consideredthe validation samples to avoid biases. The null hypothesis is that theprobability of a mutation at a specific base is the neutral rate of 11.4mutations/Mb (i.e., P = 11.4e-6). We computed a one-sided P value using thepbinom function in the R statistical software.
Allelic Expression Analyses of Melanoma Samples. Allelic mRNA/cDNA repre-sentation analyses shown in Fig. 1A were determined using iPlex Gold SBE(Sequenom) using the mel_1 amplification and the mel_X extension primersets. For each melanoma sample, 12.5 ng cDNA or 20 ng gDNA were ali-quotted in 384-well format. Allelic cDNA representation was compared withpaired gDNA representation for each sample to identify statistically signifi-cant differences. Because cDNA variance did not appear to exhibit a normaldistribution, the more conservative Wilcoxon rank sum statistical test wasused to determine statistical significance.
Immunoprecipitation and Western Blotting. BCL2L12 subcellular fractionationwas performed as previously described (34). Briefly, the BCL2L12 overex-pressed HEK293T cells were harvested, washed with ice-cold PBS, and lysedin a hypotonic lysis buffer [10 mM Tris, pH 7.4, 10 mM NaCl, 3 mM MgCl2,1 mM EDTA, 1 mM EGTA, a mixture protease inhibitors (78415; Thermo Sci-entific)]. The cells were resuspended in 200 μL lysis buffer, incubated onice for 10 min, titurated through a p2 tip 15–20 times, and sonicated 2–3times; the total fraction was centrifuged for 15 min at 375 × g at 4 °C,resulting in a pellet that is the nuclear fraction and a supernatant that isthe postnuclear fraction. Postnuclear fractions were loaded on 10% (vol/vol) Bris·Tris gel and further analyzed using mouse monoclonal BCL2L12(1:1,000 dilution; Abcam) fragment antibody. The same membrane alsoprocessed later with GAPDH antibody.
HEK293 cells transiently transfected with BCL2L12-FLAG (WT, mutant, orempty vector) were gently washed two times in PBS and then lysed using 1.0 mL1% Nonidet P-40 lysis buffer [1% Nonidet P-40, 50 mM Tris·HCl, pH 7.5,150 mM NaCl, Complete Protease Inhibitor tablet, EDTA-free (Roche), 1 μMsodium orthovanadate, 1 mM sodium fluoride, 0.1% β-mercaptoethanol] perT-75flask for 20min on ice. Lysed cells were scraped and transferred into a 1.5-mLmicrocentrifuge tube. Extractswere centrifuged for 10min at 20,000×g at4 °C; 800 μL supernatantwere immunoprecipitated overnight using 30 μL anti-FLAG (M2) beads (Sigma Aldrich). The immunoprecipitates were washed andsubjected to SDS/PAGE and Western blotting as previously described (32).
Lentiviral shRNA. Constructs for stable depletion of BCL2L12 (RHS45330-NM_138639) were obtained from Open Biosystems and confirmed to effi-ciently knockdown BCL2L12 at the protein level. Lentiviral stocks wereprepared as previously described (35). Melanoma cell lines were infectedwith shRNA lentiviruses for each condition (vector and two differentBCL2L12-specific shRNAs). Selection of stable pooled clones was done in thepresence of 3 μg/mL puromycin containing normal medium for 3–5 d beforedetermining knockdown efficiency.
siRNA Depletion of Endogenous BCL2L12 in Melanoma Cells. Specific siRNA waspurchased from Dharmacon (Thermo Fisher Scientific) designed using theirsiRNA design program for human BCL2L12. Four independent siRNA mole-cules were used to transiently deplete BCL2L12 in malignant melanoma cells.Using DharmaEffect transfection reagent #1 specific for siRNA, melanomacells were tranfected with 50 nM siRNA molecules (#3 and #4) in the pres-ence of OptiMEM-I medium after cells were seeded into 96-well plates ata density of 2,000 cells/well 24 h before transfection. Cells were incubatedfor 24 h posttransfection before application of any genotoxic stressors.
Cell
Viab
ility
(%)
0
20
40
60
80
100
120
140
160
12T SKMel28 75T 79T 55T C025
WT F17F
* * * *
NC#3 siRNA#4 siRNA
A
B
C
02468
1012141618
pLK0.1 sh91 sh92
12T (WT-BCL2L12)Ce
ll vi
abili
ty (%
)
0
20
40
60
80
100
120
vector sh91 sh92
Cell
viab
ility
(%)
SK-Mel-28 (WT-BCL2L12)
0
5
10
15
20
25
30
pLK0.1 sh91 sh92
75T (F17F-BCL2L12)
Cell
viab
ility
(%)
* *
* p<0.002
Fold
cha
nge
(tra
nscr
ipt l
evel
s)
0
0.5
1
1.5
2
2.5
3
3.5
pLKO.1 sh91 sh92
12T (wild-type)75T (mutant)
MDM2
* p<0.05
** p<0.01
***
Fig. 3. Effects of the BCL2L12 (C51T; F17F) recurrent mutation on BCL2L12function. (A) Graphical representation showing the antiapoptotic effect ofBCL2L12 mutant cells compared with WT BCL2L12 cells post-UV treatment.The relative cell numbers after the cells were treated for 48 h with UV asestimated by CellTiter-Glo and plotted as percent survival. Error bars are SD.(B) Melanoma cells (WT, 12T or SK-Mel-28; mutant, 75T, 79T, 55T, or C025)transiently transfected with BCL2L12-specific siRNA were tested for sensi-tivity to UV-induced cell death. Shown are representative graphs from all celllines exposed to 50 kμJ UV light. Results were analyzed using Microsoft Exceland GraphPad Prism v5, and graphs are representative of experimentalreplicates. Error bars are SD (*P < 0.04 comparing siRNA with NC). (C) qRT-PCR analysis shows that depletion of mutant forms of BCL2L12 using specificshRNA increases p53-dependent target gene expression compared withdepletion of WT BCL2L12. Graphs show qRT-PCR analysis of WT BCL2L12(12T) and mutant BCL2L12 (75T) pooled clone mRNA expression levels forMdm2. Results shown are experimental replicates analyzed using Studentunpaired t test. Error bars are SD. * P < 0.05; **P < 0.01.
Gartner et al. PNAS | August 13, 2013 | vol. 110 | no. 33 | 13485
GEN
ETICS

Cell Viability Assays. Stably depleted pooled clones were seeded into 96-wellclear bottom opaque plates at 1,000 cells per well. Cells were incubated 24 hbefore exposure to UV light (50 kμJ) using a UV Stratalinker 2400 (Stra-tagene). Plates were then incubated for an additional 48 h before testing forcell viability using Cell-Titer-Glo (G7571). Plates were analyzed on a ThermoElectron Luminoskan reader. Data were then analyzed using Microsoft Excelto generate graphs and statistics.
miRNA Target Site Prediction. We used the two miRNA target site predictionplatforms PITA (19) and miRanda (20) to search for miRNA target site pre-dictions that overlap the C51T mutated position in BCL2L12. We executedthem with default prediction parameters and found that both platformspredict hsa-miR-671–5p to target the WT BCL2L12 mRNA overlapping posi-tion 51 but not the mutant mRNA.
miRNA Depletion of Endogenous BCL2L12 in Melanoma Cells A. Specific miRNAmimetic (hsa-miR-671–5p) was purchased from Sigma Aldrich (HMI0901) thatwas determined to potentially target human BCL2L12. A negative controlscrambled miR (NC) was purchased from Dharmacon (CN-001000-01; ThermoFisher Scientific). Using DharmaFECT transfection reagent #1 (T-2001) spe-cific for siRNA or miRNA, melanoma cells were tranfected with 20 nM has-miR-671–5p or NC molecules in the presence of OptiMEM-I medium aftercells were seeded into six-well plates at a density of 200,000 cells/well 24 hbefore transfection. Cells were incubated for 24 h posttransfection beforeextraction of miRNA and mRNA and qRT-PCR analysis.
Anti–miR-671–5p Rescue Assay. A specific anti-miRNAmimic (anti–hsa-miR-671–5p) was purchased from Qiagen (MIN0003880), which was determined to in-hibit the hsa-miR-671–5p mimic. An NC was purchased from Dharmacon(Thermo Fisher Scientific). Using DharmaEffect transfection reagent #1 specificfor siRNA or miRNA, melanoma cells were cotranfected with 20 nM hsa-miR-671–5p or NCmolecules plus either 0 or 50 nM anti–miR-671–5p in the presenceof OptiMEM-Imediumafter cells were seeded into six-well plates at a density of200,000 cells/well 24 h before transfection. Cells were incubated for 24 hposttransfection before extraction of miRNA and mRNA and qRT-PCR analysis.
Real-Time qPCR of miRNA Targeted Cell Lines. miRNA and mRNA wereextracted from transiently transfected melanoma to assess for knockdown ofendogenous BCL2L12 following the manufacturer’s protocol for the miRNeasyMini Kit (217004; QIAGEN); 1 μg total RNA was used for cDNA synthesis using
an miScript II Reverse Transcription Kit (218193; QIAGEN). cDNA was am-plified with the 5× HiFlex buffer to quantitate in parallel the miRNA andmRNA. To test for loss of BCL2L12 message, we followed the manufacturer’sprotocol and mixed primers and cDNA with QuantiTect SYBR Green PCRmaster mix at a final volume of 10 μL in triplicate (QIAGEN). qRT-PCR analysiswas done using the ABI 7900HT Fast Real-Time PCR System. Results wereanalyzed using Microsoft Excel and GraphPad Prism v5.0.
miRNA Rescue Experiment. A modified form of the hsa-miR-671–5p was cus-tom made from Sigma Aldrich, with a single site changed to represent thesynonymous mutation found in melanoma. Melanoma cells were seeded at∼300,000 cells per well in six-well plates and incubated overnight beforetransient transfection. Cells were transfected with hsa-miR-671–5p (miR), mod-hsa-miR-671–5p (mod-miR), or NC in triplicate; total miRNA/RNA was amplifiedusing themiScript miRNA cDNA Kit fromQiagen, and levels of BCL2L12messagewere detected using SYBR Green master mix (Qiagen) in triplicate. GAPDH wasused as an internal control to normalize between samples and generate graphsusing Microsoft Excel. All experiments were repeated two to three times.
ACKNOWLEDGMENTS. We thank Drs. Chris Schmidt and Peter Parsons forestablishment of the majority of melanoma cell lines and V. Maduro, H. OzelAbaan, and P. Cruz for generating the sequence data analyzed here. Wethank Dr. V. G. Prieto for pathologic review of the biospecimens from theMelanoma Informatics, Tissue Resource, and Pathology Core (MelCore) atMD Anderson. We thank Dr. T. Wolfsberg for bioinformatics help, J. Jiang forsequencing help, and J. Fekecs and D. Leja for graphical assistance. We thankDrs. T. Barber andM.Willard for critical comments on the manuscript. S.C.J.P. issupported by an NIGMS Postdoctoral Research Associate (PRAT) Fellowship.This work was supported by the Intramural Research Programs of the NationalHuman Genome Research Institute, by the Henry Chanoch Krenter Institute forBiomedical Imaging and Genomics, the estate of Alice Schwarz-Gardos, theestate of John Hunter, the Knell Family, the Peter and Patricia Gruber Award,National Cancer Institute Grant R21CA152432 (to R.K.), the National Institutesof Health, University of Texas MD Anderson Cancer Center Melanoma Special-ized Programs of Research Excellence Grant P50 CA093459, Cancer CenterSupport Grant (CCSG) Core Grant NCI 5P30 CA006516-46 (to G.P.), the HumanFrontier Science Program RGP0024 Grant (to A.A.K.), National Health andMedical Research Council of Australia Grants 1026112 and 613686, and a pub-lic–private partnership between the Intramural Research Programs of the Na-tional Human Genome Research Institute, the National Cancer Institute, andEli Lilly and Company coordinated by the Foundation for the National Insti-tutes of Health.
1. Wei X, et al. (2011) Exome sequencing identifies GRIN2A as frequently mutated inmelanoma. Nat Genet 43(5):442–446.
2. Hodis E, et al. (2012) A landscape of driver mutations in melanoma. Cell 150(2):251–263.3. Berger MF, et al. (2012) Melanoma genome sequencing reveals frequent PREX2
mutations. Nature 485(7399):502–506.4. Krauthammer M, et al. (2012) Exome sequencing identifies recurrent somatic RAC1
mutations in melanoma. Nat Genet 44(9):1006–1014.5. Nikolaev SI, et al. (2012) Exome sequencing identifies recurrent somatic MAP2K1 and
MAP2K2 mutations in melanoma. Nat Genet 44(2):133–139.6. Stark MS, et al. (2012) Frequent somatic mutations in MAP3K5 and MAP3K9 in
metastatic melanoma identified by exome sequencing. Nat Genet 44(2):165–169.7. Huang FW, et al. (2013) Highly recurrent TERT promoter mutations in human mela-
noma. Science 339(6122):957–959.8. Horn S, et al. (2013) TERT promoter mutations in familial and sporadic melanoma.
Science 339(6122):959–961.9. Parker SC, et al. (2012) Mutational signatures of de-differentiation in functional non-
coding regions of melanoma genomes. PLoS Genet 8(8):e1002871.10. Pleasance ED, et al. (2010) A comprehensive catalogue of somatic mutations from
a human cancer genome. Nature 463(7278):191–196.11. Sjoblom T, et al. (2006) The consensus coding sequences of human breast and co-
lorectal cancers. Science 314(5797):268–274.12. Greenman C, et al. (2007) Patterns of somatic mutation in human cancer genomes.
Nature 446(7132):153–158.13. Davies H, et al. (2002) Mutations of the BRAF gene in human cancer. Nature 417
(6892):949–954.14. Kimchi-Sarfaty C, et al. (2007) A “silent” polymorphism in the MDR1 gene changes
substrate specificity. Science 315(5811):525–528.15. Chamary JV, Parmley JL, Hurst LD (2006) Hearing silence: Non-neutral evolution at
synonymous sites in mammals. Nat Rev Genet 7(2):98–108.16. Hughes AL (2012) Evolution of adaptive phenotypic traits without positive Darwinian
selection. Heredity (Edinb) 108(4):347–353.17. Stegh AH, et al. (2010) Glioma oncoprotein Bcl2L12 inhibits the p53 tumor suppressor.
Genes Dev 24(19):2194–2204.18. Sauna ZE, Kimchi-Sarfaty C (2011) Understanding the contribution of synonymous
mutations to human disease. Nat Rev Genet 12(10):683–691.
19. Kertesz M, Iovino N, Unnerstall U, Gaul U, Segal E (2007) The role of site accessibilityin microRNA target recognition. Nat Genet 39(10):1278–1284.
20. John B, et al. (2004) Human microRNA targets. PLoS Biol 2(11):e363.21. Cooper GM, et al. (2005) Distribution and intensity of constraint in mammalian ge-
nomic sequence. Genome Res 15(7):901–913.22. Davydov EV, et al. (2010) Identifying a high fraction of the human genome to be
under selective constraint using GERP++. PLoS Comput Biol 6(12):e1001025.23. Goode DL, et al. (2010) Evolutionary constraint facilitates interpretation of genetic
variation in resequenced human genomes. Genome Res 20(3):301–310.24. Stark MS, et al. (2010) Characterization of the melanoma miRNAome by deep se-
quencing. PLoS One 5(3):e9685.25. Weinstein IB, Joe AK (2006) Mechanisms of disease: Oncogene addiction—a rationale
for molecular targeting in cancer therapy. Nat Clin Pract Oncol 3(8):448–457.26. Brest P, et al. (2011) A synonymous variant in IRGM alters a binding site for miR-196
and causes deregulation of IRGM-dependent xenophagy in Crohn’s disease. NatGenet 43(3):242–245.
27. Hughes AL (2007) Looking for Darwin in all the wrong places: The misguided quest forpositive selection at the nucleotide sequence level. Heredity (Edinb) 99(4):364–373.
28. Hughes AL (2008) The origin of adaptive phenotypes. Proc Natl Acad Sci USA 105(36):13193–13194.
29. Nei M (2005) Selectionism and neutralism in molecular evolution.Mol Biol Evol 22(12):2318–2342.
30. Jensen JD, Thornton KR, Bustamante CD, Aquadro CF (2007) On the utility of linkagedisequilibrium as a statistic for identifying targets of positive selection in non-equilibrium populations. Genetics 176(4):2371–2379.
31. Nishi N, Odagaki Y, Koyama T (2000) Pharmacological characterization of metabo-tropic glutamate receptor-mediated high-affinity GTPase activity in rat cerebral cor-tical membranes. Br J Pharmacol 130(7):1664–1670.
32. Palavalli LH, et al. (2009) Analysis of the matrix metalloproteinase family reveals thatMMP8 is often mutated in melanoma. Nat Genet 41(5):518–520.
33. Teer JK, et al. (2010) Systematic comparison of three genomic enrichment methodsfor massively parallel DNA sequencing. Genome Res 20(10):1420–1431.
34. Fazioli F, et al. (1993) Eps8, a substrate for the epidermal growth factor receptorkinase, enhances EGF-dependent mitogenic signals. EMBO J 12(10):3799–3808.
35. Prickett TD, et al. (2009) Analysis of the tyrosine kinome in melanoma reveals re-current mutations in ERBB4. Nat Genet 41(10):1127–1132.
13486 | www.pnas.org/cgi/doi/10.1073/pnas.1304227110 Gartner et al.
1
Supplementary Information:
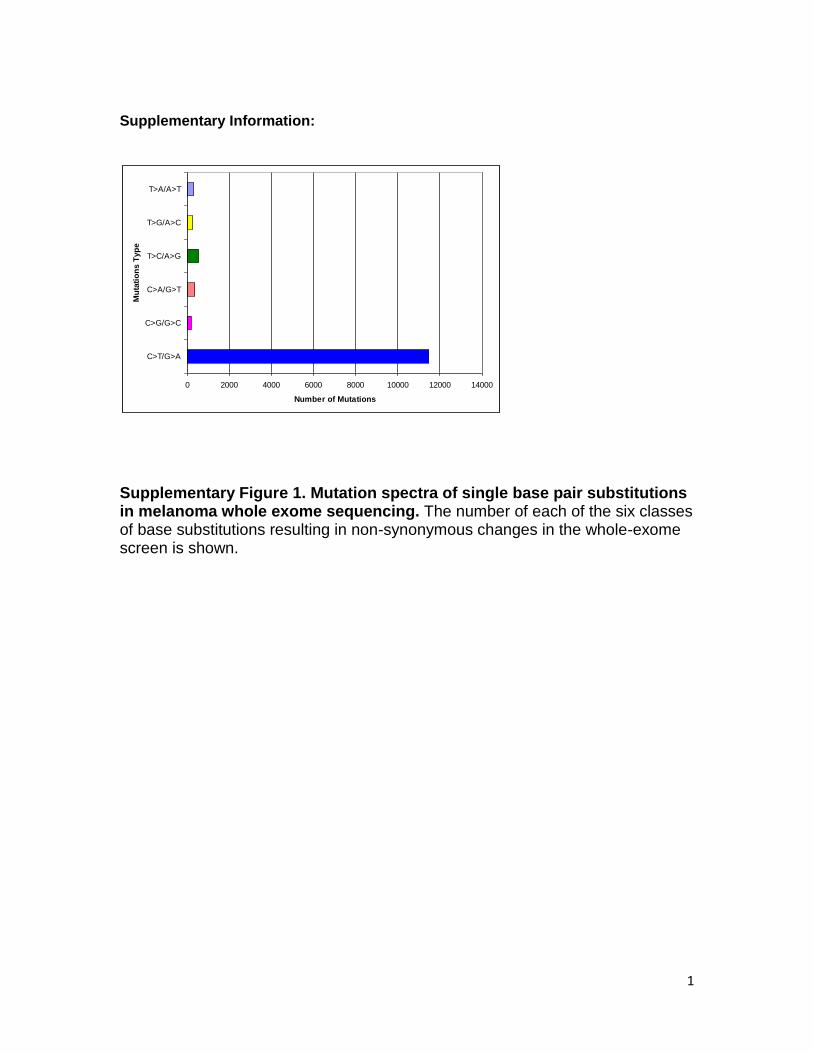
Supplementary Figure 1. Mutation spectra of single base pair substitutions in melanoma whole exome sequencing. The number of each of the six classes of base substitutions resulting in non-synonymous changes in the whole-exome screen is shown.
0 2000 4000 6000 8000 10000 12000 14000
C>T/G>A
C>G/G>C
C>A/G>T
T>C/A>G
T>G/A>C
T>A/A>T
Mu
tati
on
s T
yp
e
Number of Mutations
2
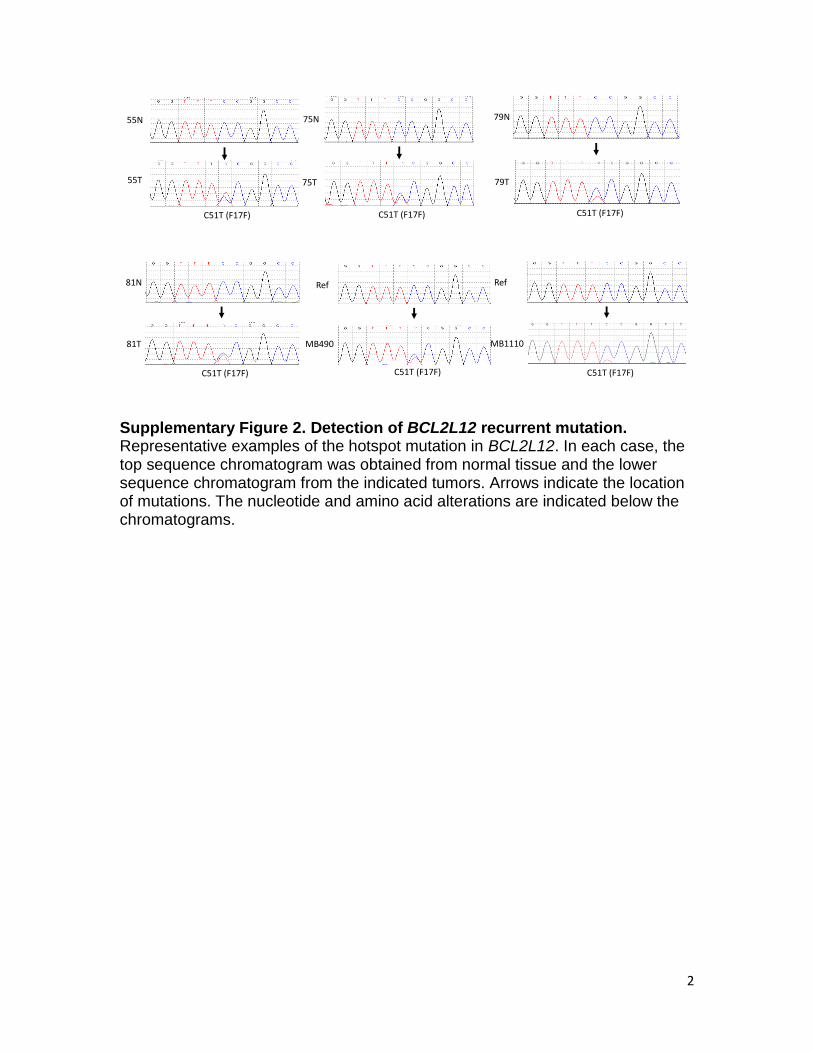
Supplementary Figure 2. Detection of BCL2L12 recurrent mutation. Representative examples of the hotspot mutation in BCL2L12. In each case, the top sequence chromatogram was obtained from normal tissue and the lower sequence chromatogram from the indicated tumors. Arrows indicate the location of mutations. The nucleotide and amino acid alterations are indicated below the chromatograms.
55N
55T
C51T (F17F)
75N
75T
C51T (F17F)
79N
79T
C51T (F17F)
81N
81T
C51T (F17F)
Ref
MB490
C51T (F17F)
Ref
MB1110
C51T (F17F)
3
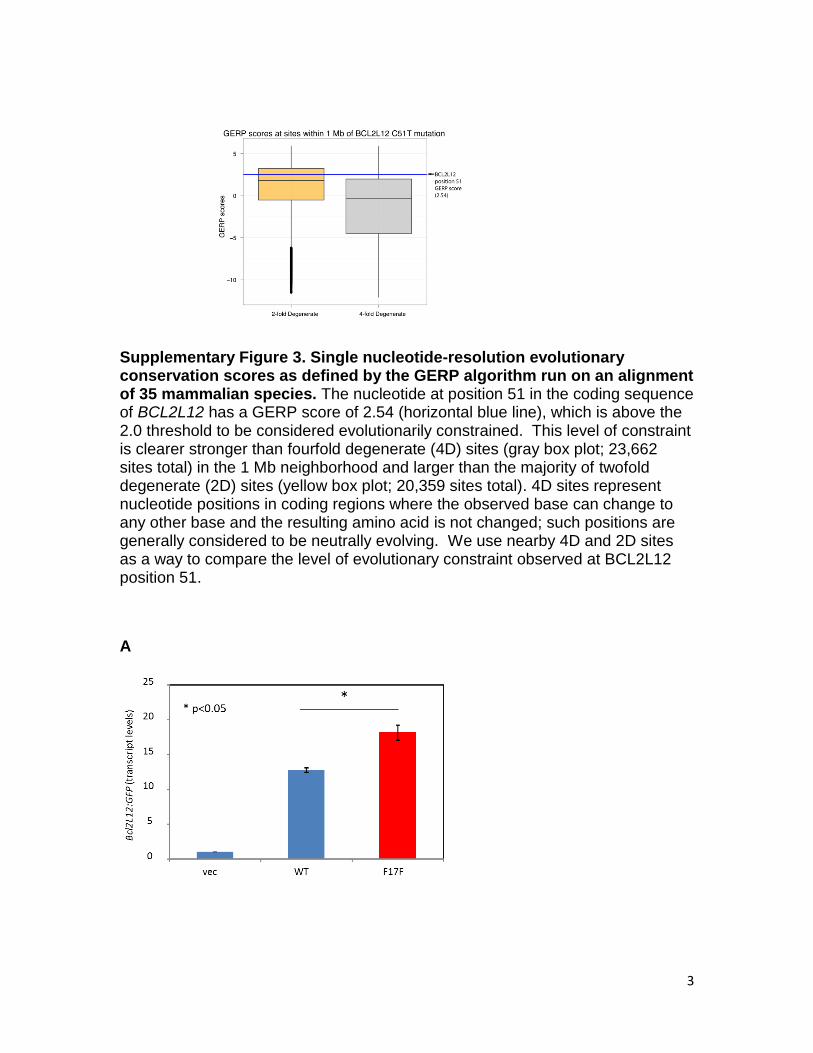
Supplementary Figure 3. Single nucleotide-resolution evolutionary conservation scores as defined by the GERP algorithm run on an alignment of 35 mammalian species. The nucleotide at position 51 in the coding sequence of BCL2L12 has a GERP score of 2.54 (horizontal blue line), which is above the 2.0 threshold to be considered evolutionarily constrained. This level of constraint is clearer stronger than fourfold degenerate (4D) sites (gray box plot; 23,662 sites total) in the 1 Mb neighborhood and larger than the majority of twofold degenerate (2D) sites (yellow box plot; 20,359 sites total). 4D sites represent nucleotide positions in coding regions where the observed base can change to any other base and the resulting amino acid is not changed; such positions are generally considered to be neutrally evolving. We use nearby 4D and 2D sites as a way to compare the level of evolutionary constraint observed at BCL2L12 position 51.
A

4
vect
or
BC
L2L1
2 (
WT)
BC
L2L1
2 (
F17F
)
a-BCL2L12
a-Tubulin
a-GFP
GFP+ + +
B i ii
Supplementary Figure 4. A qRT-PCR analysis of transiently expressed wild-type BCL2L12 or mutant (F17F) BCL2L12 or empty vector as control in HEK293T cells using BCL2L12- or GAPDH-specific primers. Error bars, sd. (n=3). (* comparison of WT to F17F; student’s t-test). B i. Western blot analysis of co-transfected HEK293T cells with GFP and BCL2L12 (wild-type or F17F mutant). ii. Experimental triplicates were analyzed and graphed using Microsoft Excel. Error bars, sd (n=3). (* p<0.05 comparison of WT or F17F to vector, ** p<0.03 comparison of F17F to WT; student’s t-test)
Bcl
2L
12
:GF
P
(rat
io)
0
1
2
3
4
5
6
7
Vector WT F17F
*
**
5
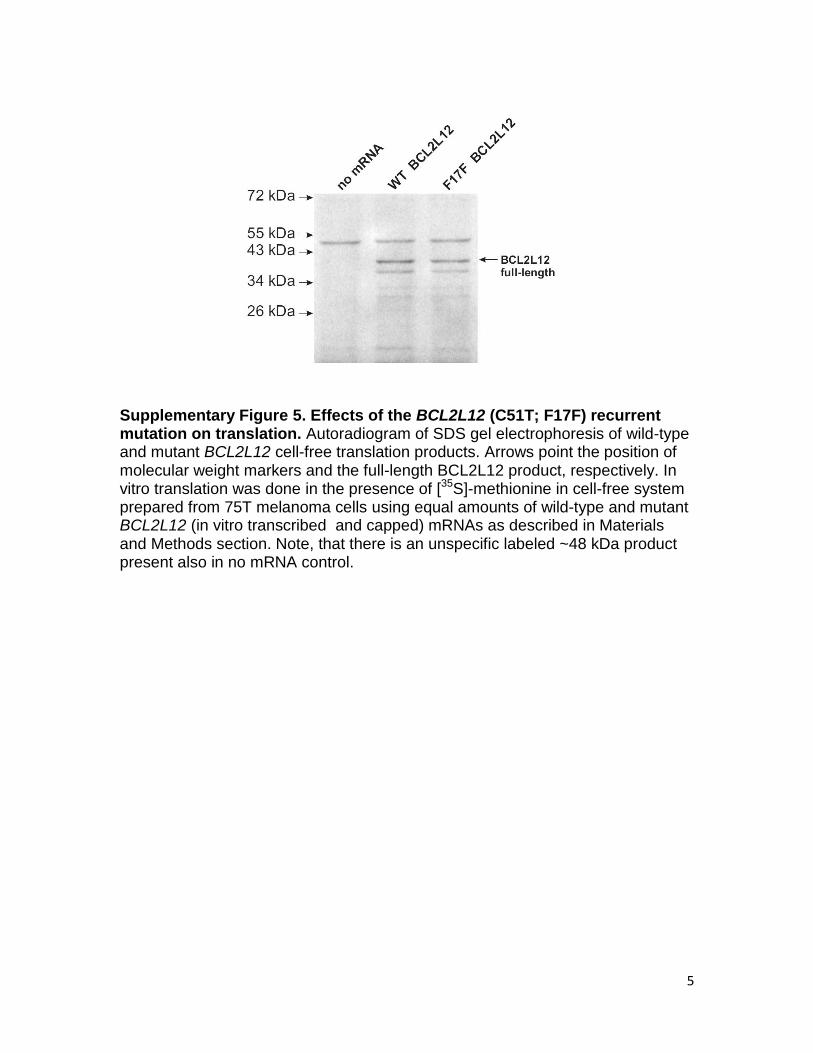
Supplementary Figure 5. Effects of the BCL2L12 (C51T; F17F) recurrent mutation on translation. Autoradiogram of SDS gel electrophoresis of wild-type and mutant BCL2L12 cell-free translation products. Arrows point the position of molecular weight markers and the full-length BCL2L12 product, respectively. In vitro translation was done in the presence of [35S]-methionine in cell-free system prepared from 75T melanoma cells using equal amounts of wild-type and mutant BCL2L12 (in vitro transcribed and capped) mRNAs as described in Materials and Methods section. Note, that there is an unspecific labeled ~48 kDa product present also in no mRNA control.
6
ELK4
ELK1
ETS1
DEAF1
GLI1
STAT3
51
STAT1
A
7
100bp200bp300bp400bp
100bp
200bp300bp400bp
100bp
200bp300bp400bp
STAT1
STAT3
DEAF1
75
T
79
T
81
T
MB
49
0
100bp
200bp300bp400bp
GAPDH
H3K4me3 ChIP
Sample BRAF STAT1 Chr5 (+) Chr5 (-)
79T 10.09 4.7 2.6 0.01
75T 18.7 39.9 6.1 0.04
Skmel28 3.86 6.33 1 0.01
BCL2L12
Sample H3K4me3 Deaf1 Stat1 Stat3 GFP
79T 6.093 0.003 0.013 0.022 0.010
75T 10.236 0.007 0.011 0.018 0.008
Skmel28 6.548 0.014 0.013 0.036 0.023
B
C
D
8
ChIP epitope
0
10
20
30
40
50
60
70
80
90
gDNA Input H3K4me3 Deaf1 Stat1 Stat3 Neg (GFP)
% T
all
ele
79T (C/T)
75 T (C/T)
Skmel28 (C/C)
E
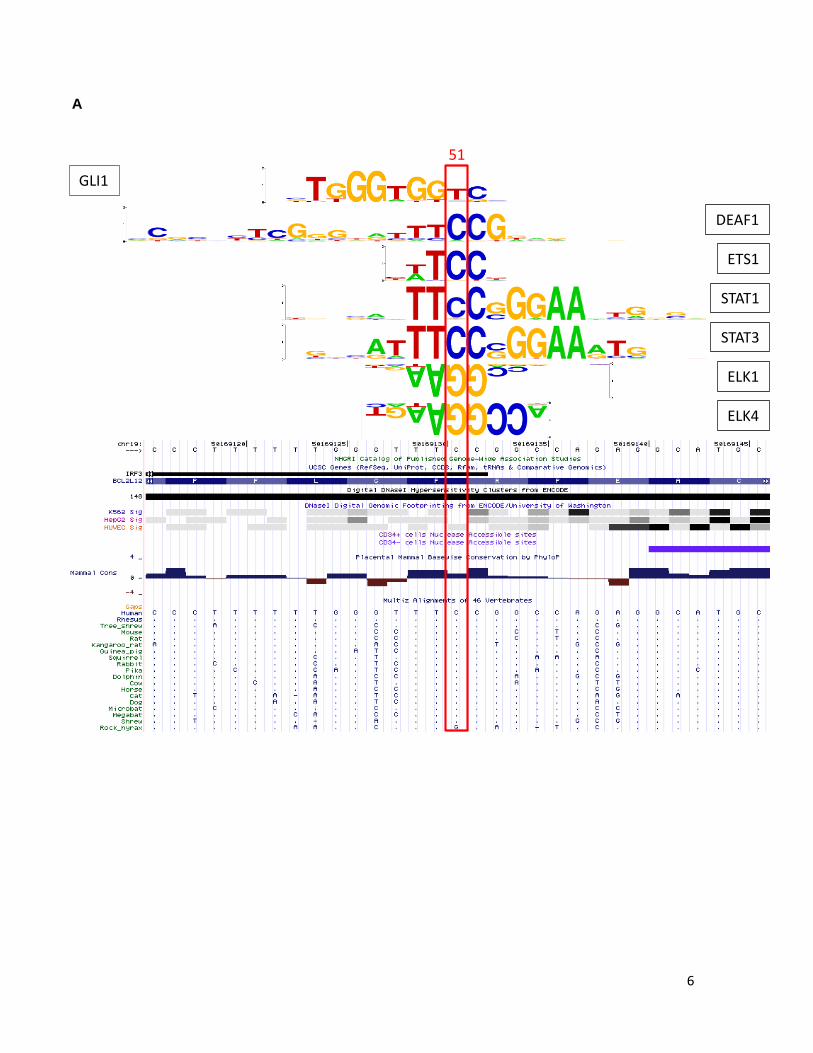
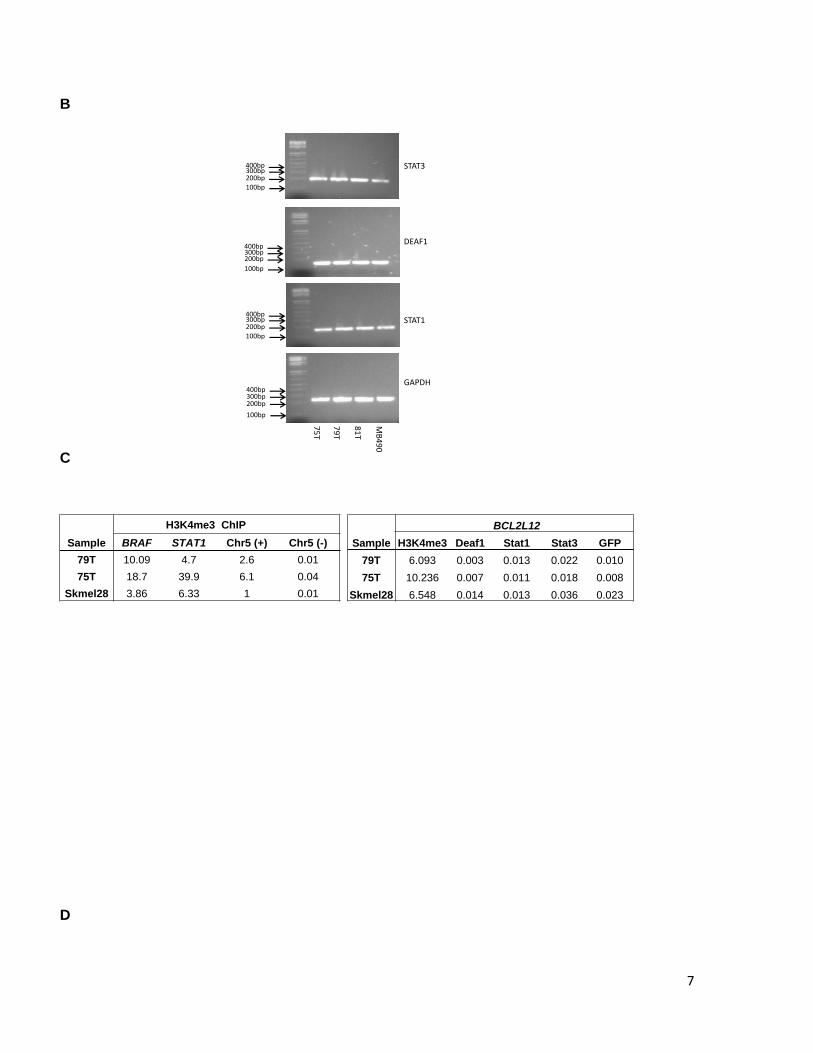
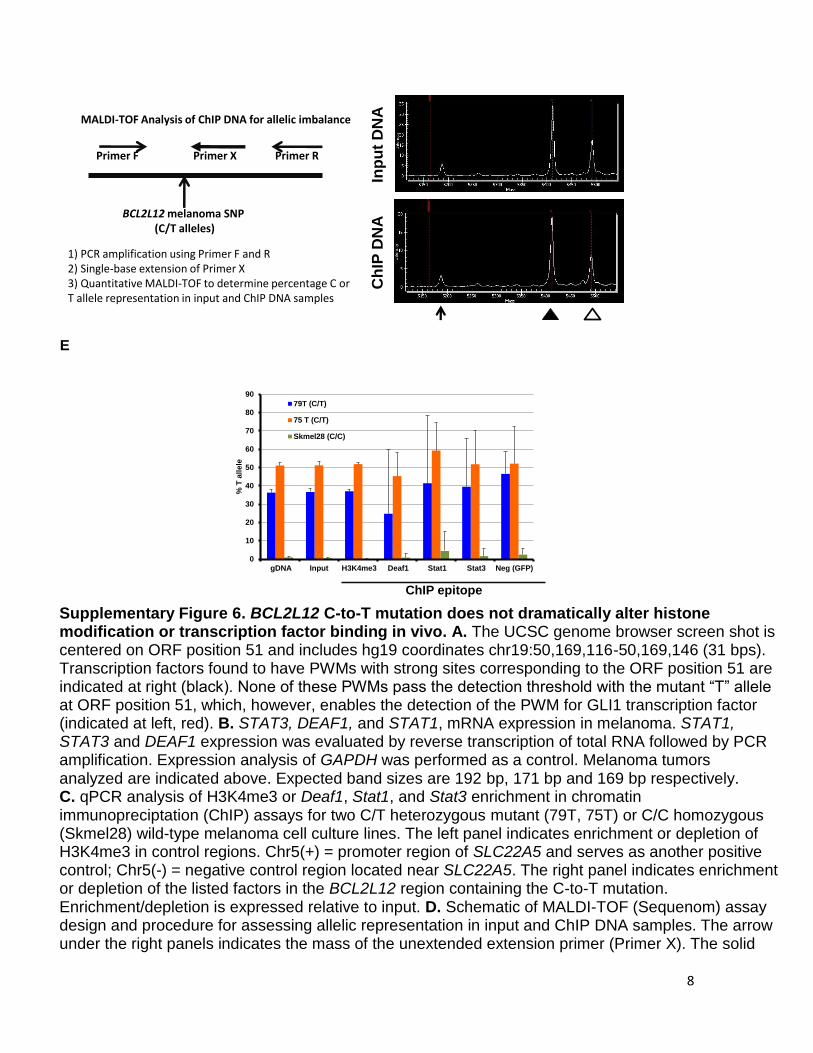
Supplementary Figure 6. BCL2L12 C-to-T mutation does not dramatically alter histone modification or transcription factor binding in vivo. A. The UCSC genome browser screen shot is centered on ORF position 51 and includes hg19 coordinates chr19:50,169,116-50,169,146 (31 bps). Transcription factors found to have PWMs with strong sites corresponding to the ORF position 51 are indicated at right (black). None of these PWMs pass the detection threshold with the mutant “T” allele at ORF position 51, which, however, enables the detection of the PWM for GLI1 transcription factor (indicated at left, red). B. STAT3, DEAF1, and STAT1, mRNA expression in melanoma. STAT1, STAT3 and DEAF1 expression was evaluated by reverse transcription of total RNA followed by PCR amplification. Expression analysis of GAPDH was performed as a control. Melanoma tumors analyzed are indicated above. Expected band sizes are 192 bp, 171 bp and 169 bp respectively. C. qPCR analysis of H3K4me3 or Deaf1, Stat1, and Stat3 enrichment in chromatin immunopreciptation (ChIP) assays for two C/T heterozygous mutant (79T, 75T) or C/C homozygous (Skmel28) wild-type melanoma cell culture lines. The left panel indicates enrichment or depletion of H3K4me3 in control regions. Chr5(+) = promoter region of SLC22A5 and serves as another positive control; Chr5(-) = negative control region located near SLC22A5. The right panel indicates enrichment or depletion of the listed factors in the BCL2L12 region containing the C-to-T mutation. Enrichment/depletion is expressed relative to input. D. Schematic of MALDI-TOF (Sequenom) assay design and procedure for assessing allelic representation in input and ChIP DNA samples. The arrow under the right panels indicates the mass of the unextended extension primer (Primer X). The solid
MALDI-TOF Analysis of ChIP DNA for allelic imbalance
BCL2L12 melanoma SNP(C/T alleles)
Primer F Primer RPrimer X
1) PCR amplification using Primer F and R2) Single-base extension of Primer X3) Quantitative MALDI-TOF to determine percentage C or T allele representation in input and ChIP DNA samples
Inp
ut
DN
AC
hIP
DN
A
9
and open arrowheads indicate the peak mass for the primer that has incorporated a “C” allele or “T” allele at the SNP position, respectively. Areas under each curve are measured to determine the relative amount of each allele. E. Plots of %T allele for gDNA, input chromatin, or ChIP samples (H3K4me3, Deaf1, Stat1, Stat3, negative control GFP) for three melanoma cell culture samples (79T, 75T, and Skmel28). Genotypes of each sample at the BCL2L12 SNP are indicated in parentheses. Neg=negative
10
TIAL1
GAPDH
MB
490
55
T
75
T
79
T
81
T
A3
75
SKM
el28
12
T
17
T
32
T
BCL2L12 Mutant BCL2L12 Wild Type
A
B
11
C
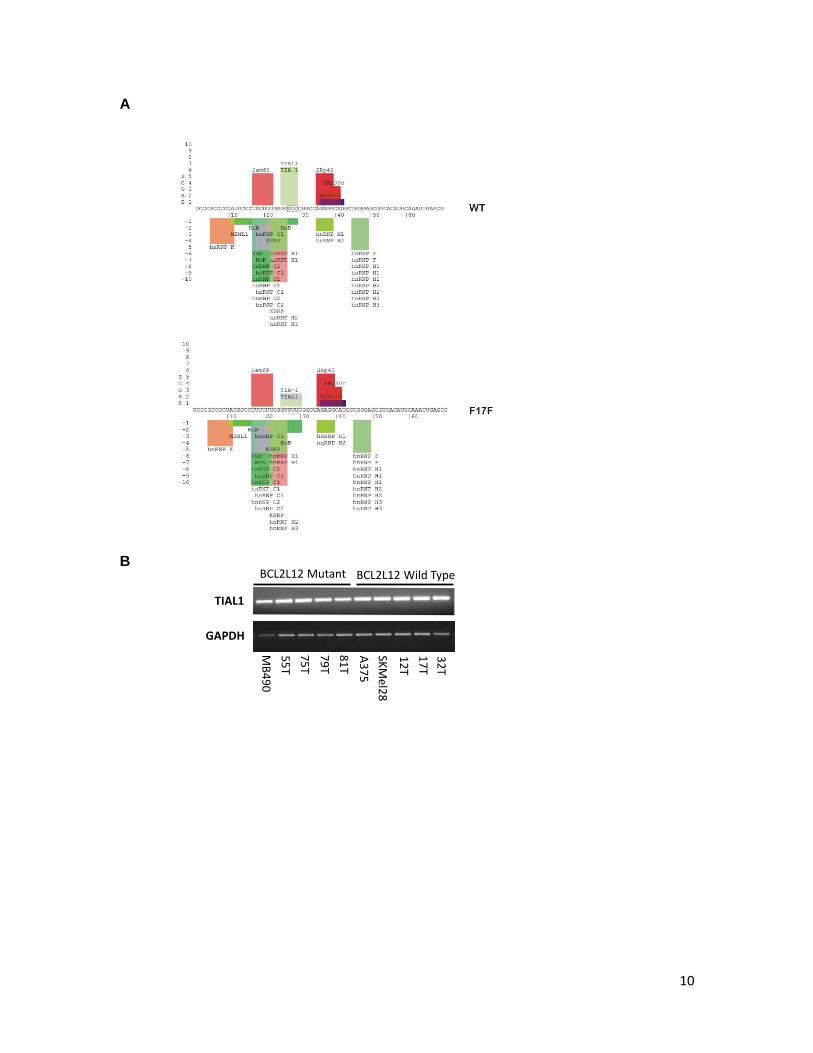
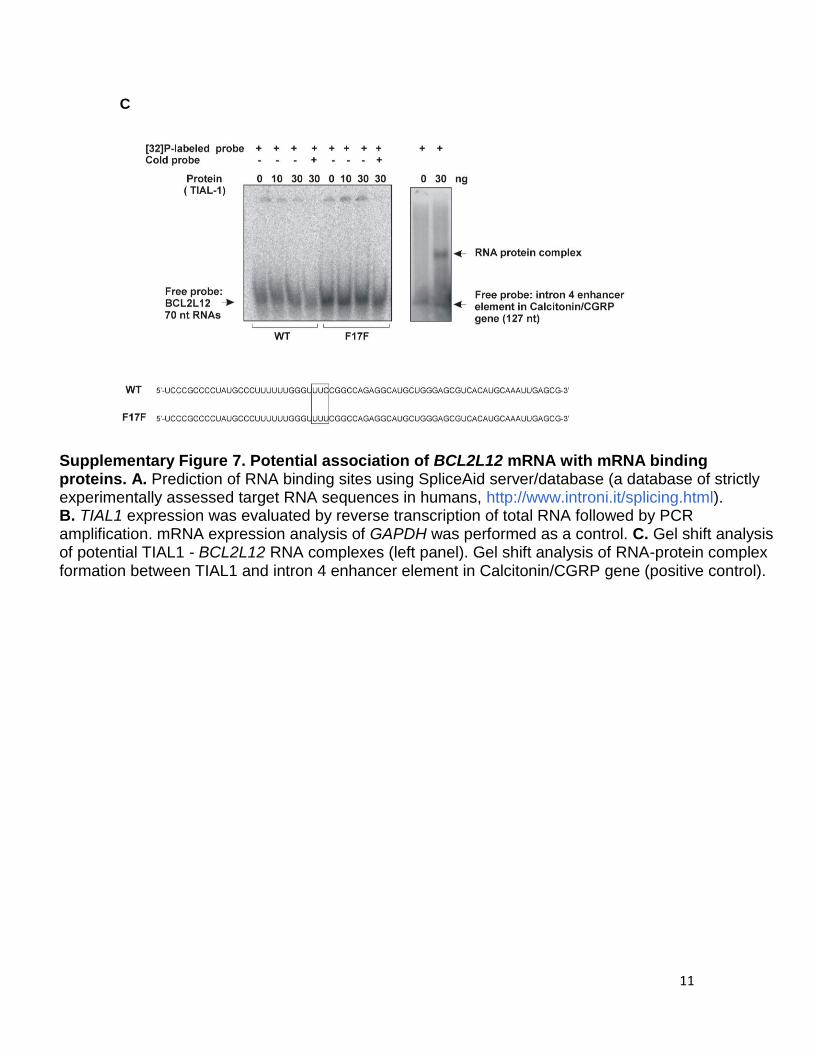
Supplementary Figure 7. Potential association of BCL2L12 mRNA with mRNA binding proteins. A. Prediction of RNA binding sites using SpliceAid server/database (a database of strictly experimentally assessed target RNA sequences in humans, http://www.introni.it/splicing.html). B. TIAL1 expression was evaluated by reverse transcription of total RNA followed by PCR amplification. mRNA expression analysis of GAPDH was performed as a control. C. Gel shift analysis of potential TIAL1 - BCL2L12 RNA complexes (left panel). Gel shift analysis of RNA-protein complex formation between TIAL1 and intron 4 enhancer element in Calcitonin/CGRP gene (positive control).
12
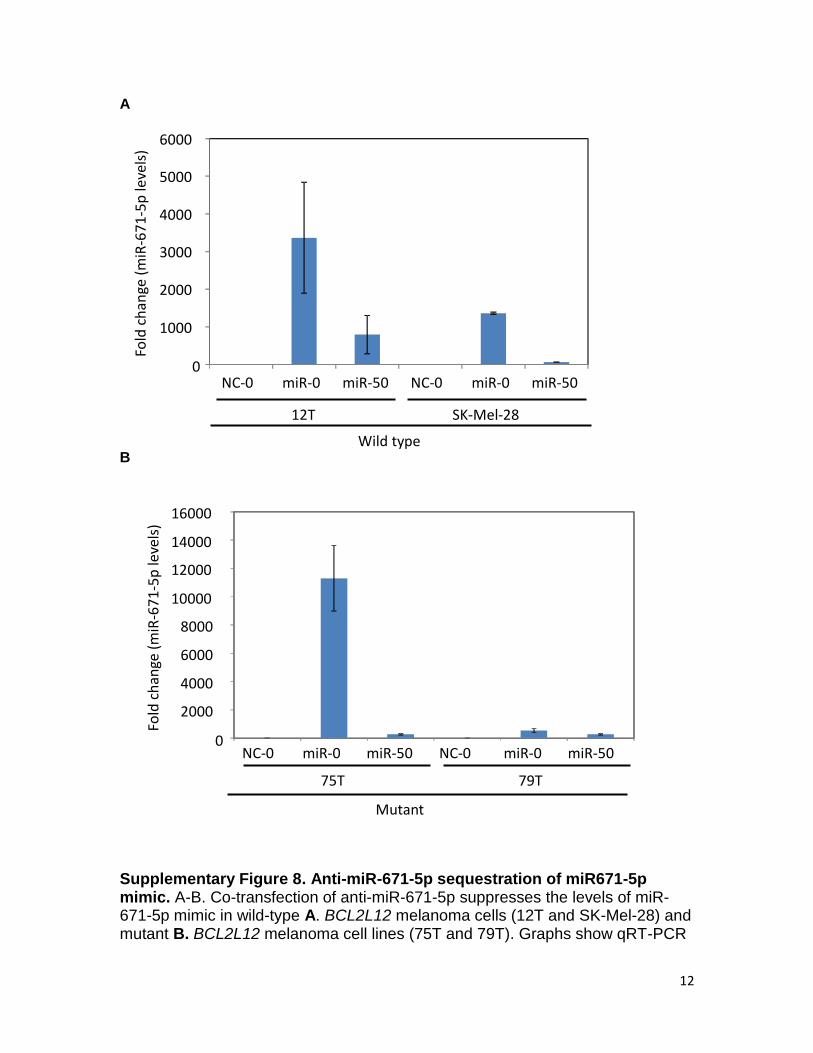
A B Supplementary Figure 8. Anti-miR-671-5p sequestration of miR671-5p mimic. A-B. Co-transfection of anti-miR-671-5p suppresses the levels of miR-671-5p mimic in wild-type A. BCL2L12 melanoma cells (12T and SK-Mel-28) and mutant B. BCL2L12 melanoma cell lines (75T and 79T). Graphs show qRT-PCR
0
1000
2000
3000
4000
5000
6000
NC-0 miR-0 miR-50 NC-0 miR-0 miR-50
Fold
ch
ange
(m
iR-6
71
-5p
leve
ls)
12T SK-Mel-28
Wild type
0
2000
4000
6000
8000
10000
12000
14000
16000
NC-0 miR-0 miR-50 NC-0 miR-0 miR-50
Fold
ch
ange
(m
iR-6
71-
5p
leve
ls)
75T 79T
Mutant

13
of mature miR-671-5p mimic levels in wild-type BCL2L12 (12T and SK-Mel-28) and mutant BCL2L12 (75T and 79T) cell lines in the presence of negative control miR (NC) or hsa-miR-671-5p (miR) plus 0nM or 50nM anti-miR-671-5p. Results are representative of two independent experiments. Error bars, sd.
14
vect
or
BC
L2L1
2-F
LAG
(W
T)
BC
L2L1
2-F
LAG
(F1
7F)
Lysates
a-Tubulin
a-BCL2L12
a-p53
FLAG IP
a-p53
IgG (Heavy chain)a-BCL2L12
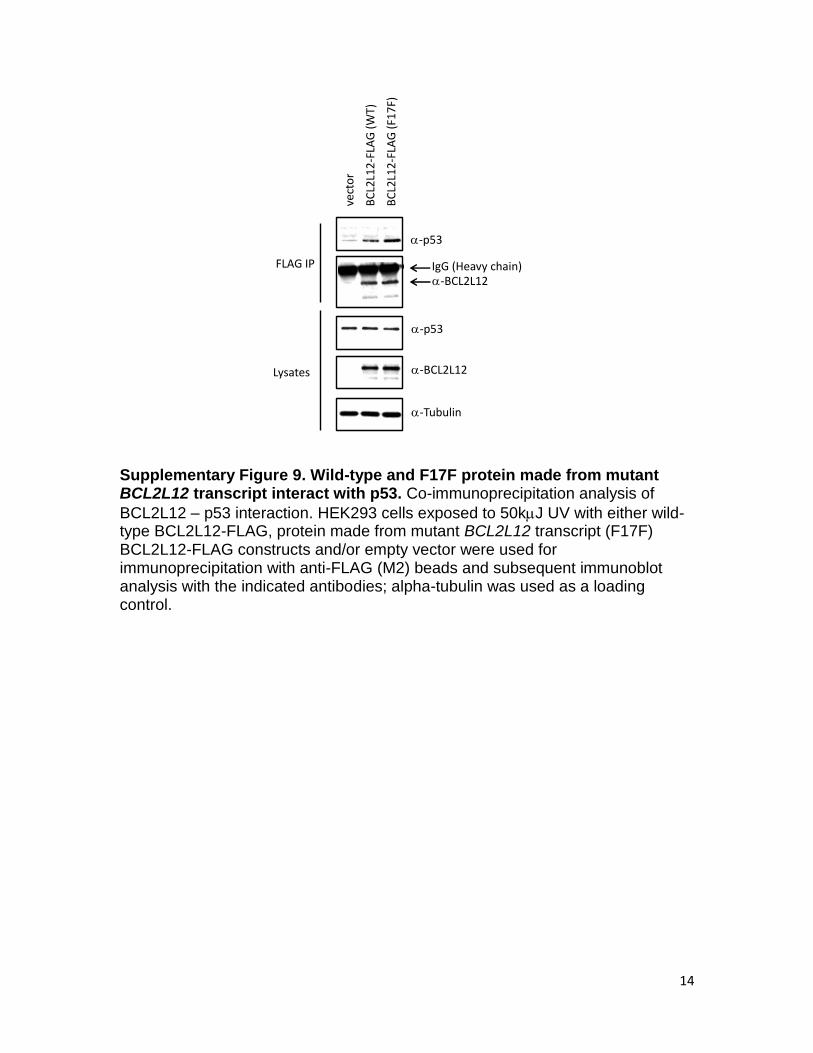
Supplementary Figure 9. Wild-type and F17F protein made from mutant BCL2L12 transcript interact with p53. Co-immunoprecipitation analysis of
BCL2L12 – p53 interaction. HEK293 cells exposed to 50kJ UV with either wild-type BCL2L12-FLAG, protein made from mutant BCL2L12 transcript (F17F) BCL2L12-FLAG constructs and/or empty vector were used for immunoprecipitation with anti-FLAG (M2) beads and subsequent immunoblot analysis with the indicated antibodies; alpha-tubulin was used as a loading control.

15
Ve
cto
r a
lon
e
pL
K0
.1
sh
91
sh
92
BCL2L12 (WT)
a-BCL2L12
a-Tubulin
+ + +
A B
Supplementary Figure 10. Targeted stable depletion of BCL2L12 in melanoma cells. A. shRNA mediated depletion of BCL2L12 was tested using transient transfection and immunoblotting of lysates from HEK293T cells. Lysates from HEK293T transiently transfected with BCL2L12 and either one of two BCL2L12-specific shRNAs or empty vector were immunoblotted using the indicated antibodies to show specificity. B. qRT-PCR analysis of the wild-type BCL2L12 depleted stable pooled cell line (12T) and the mutant (F17F) BCL2L12-depleted stable pooled cell line (75T) using BCL2L12- or GAPDH-specific primers. Error bars, sd.
0
0.2
0.4
0.6
0.8
1.0
1.2
pLK0.1 sh91 sh92
Fo
ld c
han
ge (
tran
scri
pt
lev
els)
SK-Mel-28 (WT-BCL2L12)
0
0.2
0.4
0.6
0.8
1.0
1.2
pLK0.1 sh91 sh92
12T (WT-BCL2L12)
Fo
ld c
han
ge (
tran
scri
pt
leve
ls)
* * * *
0
0.2
0.4
0.6
0.8
1.0
1.2
pLK0.1 sh91 sh92
75T (F17F-BCL2L12)
Fo
ld c
han
ge (
tran
scri
pt
leve
ls)
* *

16
NC
siR
NA
#2 s
iRN
A
#3 s
iRN
A
BCL2L12 (WT)
25
37
kDa
BCL2L12
Tubulin
A B
Supplementary Figure 11. Depletion of mutant BCL2L12 sensitizes melanoma cells to UV induced cell death. Depletion of mutant BCL2L12 sensitizes melanoma cells to UV induced cell death. A. Transient transfection of siRNA knocksdown exogenously expressed BCL2L12. HEK293T cell lysates co-transfected with BCL2L12 and siRNA were immunoblotted with anti-BCL2L12 and anti-GAPDH as loading control. B. Melanoma cells were depleted of endogenous BCL2L12 using two specific siRNA after transient transfection. Graphs are representative of transient experiments tested for depletion using qRT-PCR analysis in two wild-type BCL2L12 cell lines (12T and SK-Mel-28) or mutant BCL2L12 (75T, 79T, 55T and C025) cell lines using BCL2L12 or GAPDH –specific primers. Error bars, sd.
NC
#3 siRNA
#4 siRNA
0.00
0.20
0.40
0.60
0.80
1.00
1.20
12T SKMel28 75T 79T 55T C025
Fold
ch
ange
(tr
ansc
rip
t le
vels
)
WT F17F
17
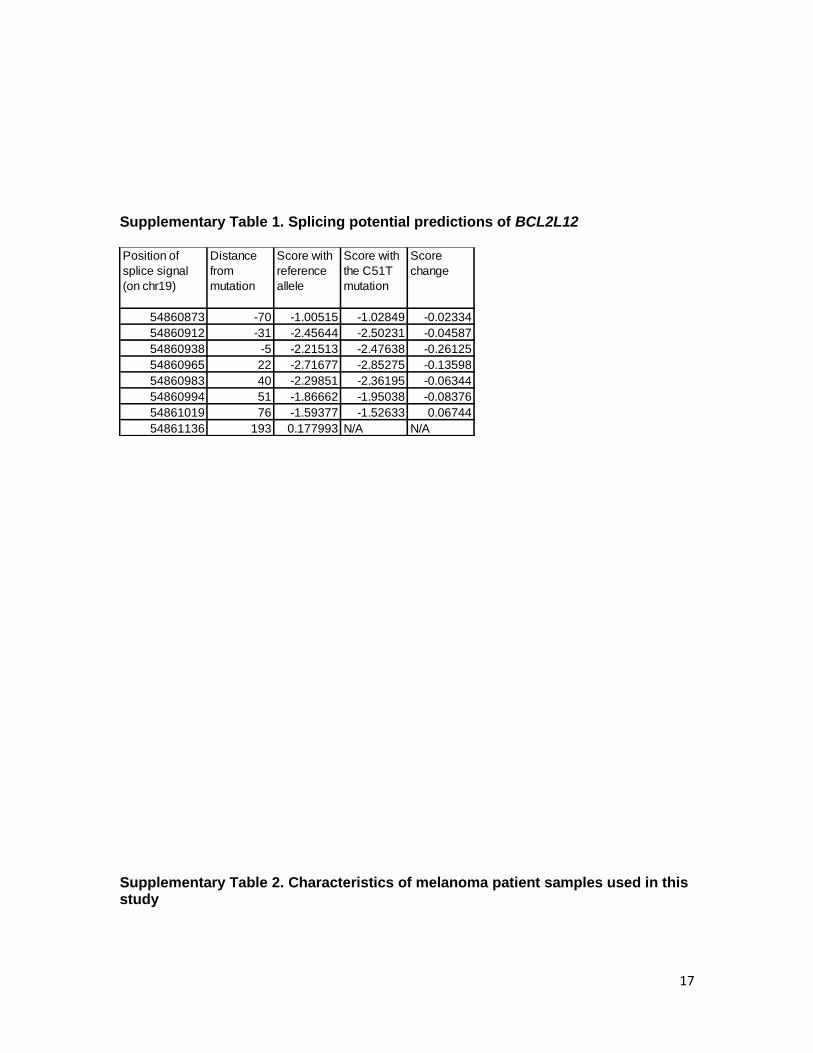
Supplementary Table 1. Splicing potential predictions of BCL2L12
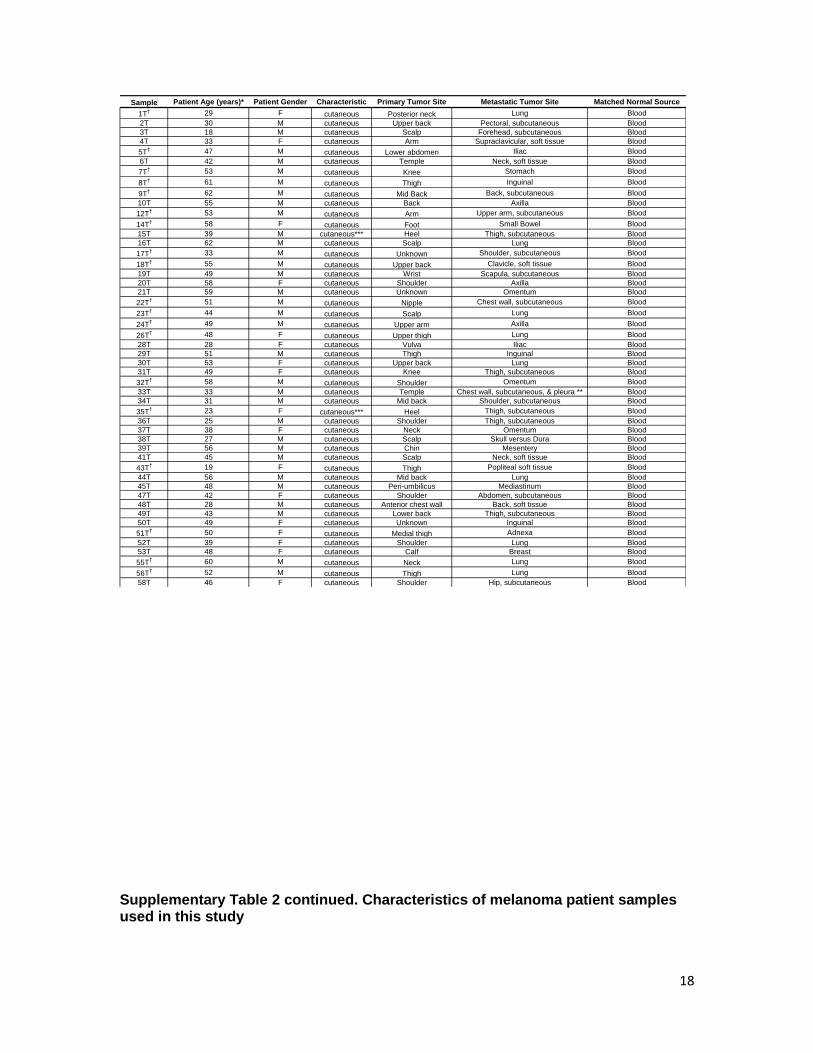
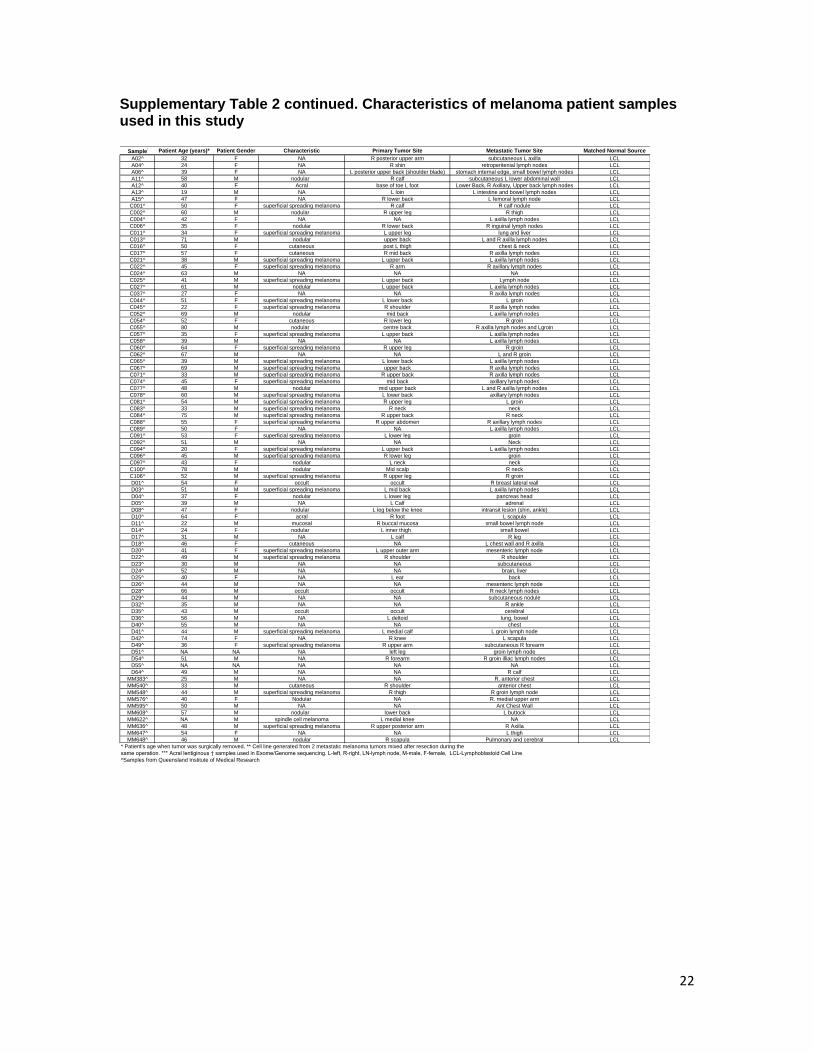
Supplementary Table 2. Characteristics of melanoma patient samples used in this study
Position of
splice signal
(on chr19)
Distance
from
mutation
Score with
reference
allele
Score with
the C51T
mutation
Score
change
54860873 -70 -1.00515 -1.02849 -0.02334
54860912 -31 -2.45644 -2.50231 -0.04587
54860938 -5 -2.21513 -2.47638 -0.26125
54860965 22 -2.71677 -2.85275 -0.13598
54860983 40 -2.29851 -2.36195 -0.06344
54860994 51 -1.86662 -1.95038 -0.08376
54861019 76 -1.59377 -1.52633 0.06744
54861136 193 0.177993 N/A N/A
18
Supplementary Table 2 continued. Characteristics of melanoma patient samples used in this study
Sample Patient Age (years)* Patient Gender Characteristic Primary Tumor Site Metastatic Tumor Site Matched Normal Source
1T† 29 F cutaneous Posterior neck Lung Blood
2T 30 M cutaneous Upper back Pectoral, subcutaneous Blood
3T 18 M cutaneous Scalp Forehead, subcutaneous Blood
4T 33 F cutaneous Arm Supraclavicular, soft tissue Blood
5T† 47 M cutaneous Lower abdomen Iliac Blood
6T 42 M cutaneous Temple Neck, soft tissue Blood
7T† 53 M cutaneous Knee Stomach Blood
8T† 61 M cutaneous Thigh Inguinal Blood
9T† 62 M cutaneous Mid Back Back, subcutaneous Blood
10T 55 M cutaneous Back Axilla Blood
12T† 53 M cutaneous Arm Upper arm, subcutaneous Blood
14T† 58 F cutaneous Foot Small Bowel Blood
15T 39 M cutaneous*** Heel Thigh, subcutaneous Blood
16T 62 M cutaneous Scalp Lung Blood
17T† 33 M cutaneous Unknown Shoulder, subcutaneous Blood
18T† 55 M cutaneous Upper back Clavicle, soft tissue Blood
19T 49 M cutaneous Wrist Scapula, subcutaneous Blood
20T 58 F cutaneous Shoulder Axilla Blood
21T 59 M cutaneous Unknown Omentum Blood
22T† 51 M cutaneous Nipple Chest wall, subcutaneous Blood
23T† 44 M cutaneous Scalp Lung Blood
24T† 49 M cutaneous Upper arm Axilla Blood
26T† 48 F cutaneous Upper thigh Lung Blood
28T 28 F cutaneous Vulva Iliac Blood
29T 51 M cutaneous Thigh Inguinal Blood
30T 53 F cutaneous Upper back Lung Blood
31T 49 F cutaneous Knee Thigh, subcutaneous Blood
32T† 58 M cutaneous Shoulder Omentum Blood
33T 33 M cutaneous Temple Chest wall, subcutaneous, & pleura ** Blood
34T 31 M cutaneous Mid back Shoulder, subcutaneous Blood
35T† 23 F cutaneous*** Heel Thigh, subcutaneous Blood
36T 25 M cutaneous Shoulder Thigh, subcutaneous Blood
37T 38 F cutaneous Neck Omentum Blood
38T 27 M cutaneous Scalp Skull versus Dura Blood
39T 56 M cutaneous Chin Mesentery Blood
41T 45 M cutaneous Scalp Neck, soft tissue Blood
43T† 19 F cutaneous Thigh Popliteal soft tissue Blood
44T 56 M cutaneous Mid back Lung Blood
45T 48 M cutaneous Peri-umbilicus Mediastinum Blood
47T 42 F cutaneous Shoulder Abdomen, subcutaneous Blood
48T 28 M cutaneous Anterior chest wall Back, soft tissue Blood
49T 43 M cutaneous Lower back Thigh, subcutaneous Blood
50T 49 F cutaneous Unknown Inguinal Blood
51T† 50 F cutaneous Medial thigh Adnexa Blood
52T 39 F cutaneous Shoulder Lung Blood
53T 48 F cutaneous Calf Breast Blood
55T† 60 M cutaneous Neck Lung Blood
56T† 52 M cutaneous Thigh Lung Blood
58T 46 F cutaneous Shoulder Hip, subcutaneous Blood

19
Supplementary Table 2 continued. Characteristics of melanoma patient samples used in this study
Sample Patient Age (years)* Patient Gender Characteristic Primary Tumor Site Metastatic Tumor Site Matched Normal Source
59T 64 F cutaneous Back Abdomen, subcutaneous Blood
60T† 46 M cutaneous Abdomen Flank, subcutaneous Blood
62T 58 F cutaneous Toe Thigh, subcutaneous Blood
63T 30 M cutaneous Mandible Small Bowel Blood
64T† 32 F cutaneous Unknown Ovary Blood
67T 29 M cutaneous Scapula Back, subcutaneous Blood
68T 49 M cutaneous Knee Lung Blood
69T 36 M cutaneous Thigh Axilla Blood
71T 67 M cutaneous Anterior shoulder Lung Blood
72T 53 M cutaneous Mid back Liver Blood
73T 45 F cutaneous Scapula Breast Blood
74T 40 F cutaneous Leg Lower extremity, subcutaneous Blood
75T 54 F cutaneous Arm Upper arm, subcutaneous Blood
76T 40 M cutaneous Scalp Neck, soft tissue Blood
77T 39 M cutaneous Posterior shoulder Lung Blood
78T 27 F cutaneous Back Lung Blood
79T 53 M cutaneous Mid back Supraclavicular, soft tissue Blood
80T 36 M cutaneous Calf Popliteal Blood
81T† 60 F cutaneous Arm Upper arm, subcutaneous Blood
82T 48 M cutaneous Scapula Axilla Blood
83T 33 F cutaneous Arm Back, subcutaneous Blood
84T 60 F cutaneous Calf Thigh, subcutaneous Blood
85T 44 M cutaneous Anterior chest wall Chest wall, subcutaneous Blood
86T 42 F cutaneous Forearm Liver Blood
87T 27 M cutaneous Upper arm Small bowel & mesentary ** Blood
88T† 37 F cutaneous Scalp Chest wall, subcutaneous Blood
90T 19 M cutaneous Occipital scalp Neck, soft tissue Blood
91T† 55 F cutaneous Shoulder Subcostal soft tissue Blood
92T 37 F cutaneous Inguinal Femur Blood
93T† 42 F cutaneous Finger Axilla Blood
94T 44 M cutaneous Unknown Adrenal gland Blood
95T 58 F cutaneous Unknown Inguinal Blood
96T† 49 M cutaneous Unknown Inguinal Blood
99T 57 M cutaneous Back Liver Blood
100T 28 M cutaneous Back Chest wall, soft tissue Blood
101T 58 M cutaneous Unknown Omentum Blood
103T 35 F cutaneous Shoulder Axilla Blood
104T 56 M cutaneous Ankle Thigh, subcutaneous Blood
105T 28 M cutaneous Upper back Neck, soft tissue Blood
106T 41 F cutaneous Calf Lung Blood
108T† 25 F cutaneous Heel Thigh, subcutaneous Blood
109T 58 M cutaneous Shoulder Scrotum Blood
110T 51 M cutaneous Unknown Axilla Blood
111T 41 M cutaneous Mid upper back Axilla Blood
112T 46 M cutaneous Lower back Inguinal Blood
113T 38 M cutaneous Posterior shoulder Axilla Blood
114T 22 M cutaneous Unknown Adrenal gland Blood
115T 41 M cutaneous Back Brain Blood
116T 29 M cutaneous Leg Thigh, subcutaneous Blood
20
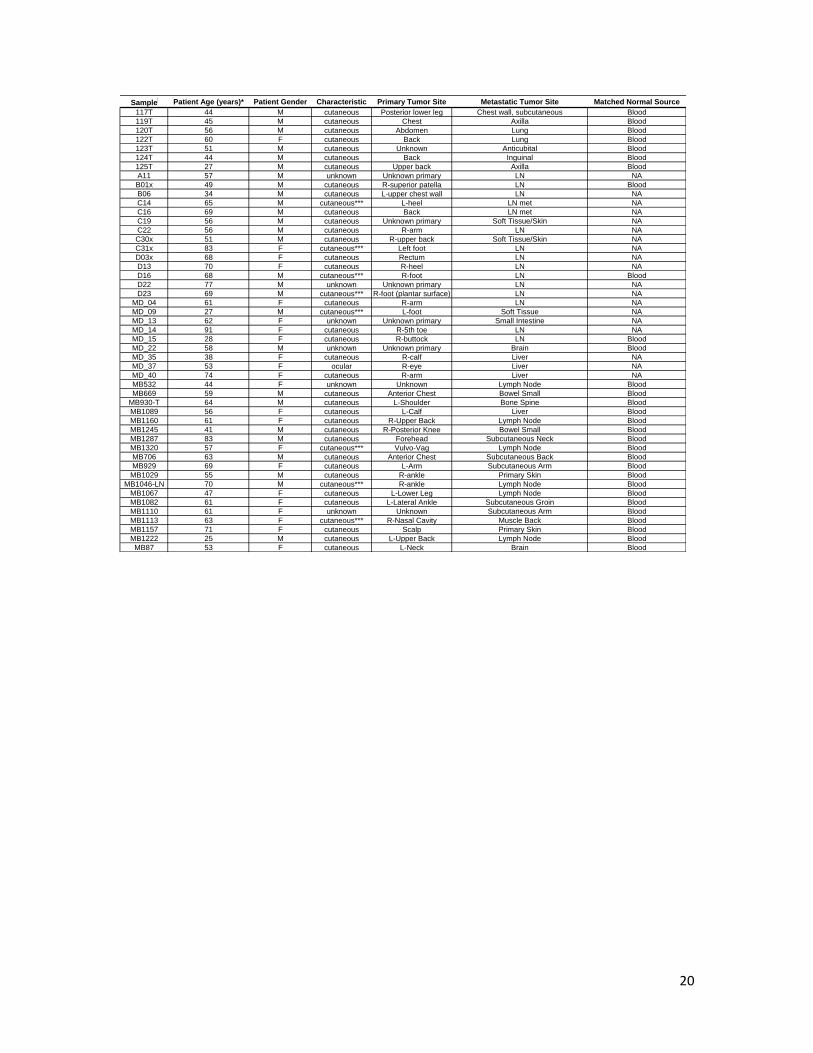
Sample Patient Age (years)* Patient Gender Characteristic Primary Tumor Site Metastatic Tumor Site Matched Normal Source
117T 44 M cutaneous Posterior lower leg Chest wall, subcutaneous Blood
119T 45 M cutaneous Chest Axilla Blood
120T 56 M cutaneous Abdomen Lung Blood
122T 60 F cutaneous Back Lung Blood
123T 51 M cutaneous Unknown Anticubital Blood
124T 44 M cutaneous Back Inguinal Blood
125T 27 M cutaneous Upper back Axilla Blood
A11 57 M unknown Unknown primary LN NA
B01x 49 M cutaneous R-superior patella LN Blood
B06 34 M cutaneous L-upper chest wall LN NA
C14 65 M cutaneous*** L-heel LN met NA
C16 69 M cutaneous Back LN met NA
C19 56 M cutaneous Unknown primary Soft Tissue/Skin NA
C22 56 M cutaneous R-arm LN NA
C30x 51 M cutaneous R-upper back Soft Tissue/Skin NA
C31x 83 F cutaneous*** Left foot LN NA
D03x 68 F cutaneous Rectum LN NA
D13 70 F cutaneous R-heel LN NA
D16 68 M cutaneous*** R-foot LN Blood
D22 77 M unknown Unknown primary LN NA
D23 69 M cutaneous*** R-foot (plantar surface) LN NA
MD_04 61 F cutaneous R-arm LN NA
MD_09 27 M cutaneous*** L-foot Soft Tissue NA
MD_13 62 F unknown Unknown primary Small Intestine NA
MD_14 91 F cutaneous R-5th toe LN NA
MD_15 28 F cutaneous R-buttock LN Blood
MD_22 58 M unknown Unknown primary Brain Blood
MD_35 38 F cutaneous R-calf Liver NA
MD_37 53 F ocular R-eye Liver NA
MD_40 74 F cutaneous R-arm Liver NA
MB532 44 F unknown Unknown Lymph Node Blood
MB669 59 M cutaneous Anterior Chest Bowel Small Blood
MB930-T 64 M cutaneous L-Shoulder Bone Spine Blood
MB1089 56 F cutaneous L-Calf Liver Blood
MB1160 61 F cutaneous R-Upper Back Lymph Node Blood
MB1245 41 M cutaneous R-Posterior Knee Bowel Small Blood
MB1287 83 M cutaneous Forehead Subcutaneous Neck Blood
MB1320 57 F cutaneous*** Vulvo-Vag Lymph Node Blood
MB706 63 M cutaneous Anterior Chest Subcutaneous Back Blood
MB929 69 F cutaneous L-Arm Subcutaneous Arm Blood
MB1029 55 M cutaneous R-ankle Primary Skin Blood
MB1046-LN 70 M cutaneous*** R-ankle Lymph Node Blood
MB1067 47 F cutaneous L-Lower Leg Lymph Node Blood
MB1082 61 F cutaneous L-Lateral Ankle Subcutaneous Groin Blood
MB1110 61 F unknown Unknown Subcutaneous Arm Blood
MB1113 63 F cutaneous*** R-Nasal Cavity Muscle Back Blood
MB1157 71 F cutaneous Scalp Primary Skin Blood
MB1222 25 M cutaneous L-Upper Back Lymph Node Blood
MB87 53 F cutaneous L-Neck Brain Blood
21
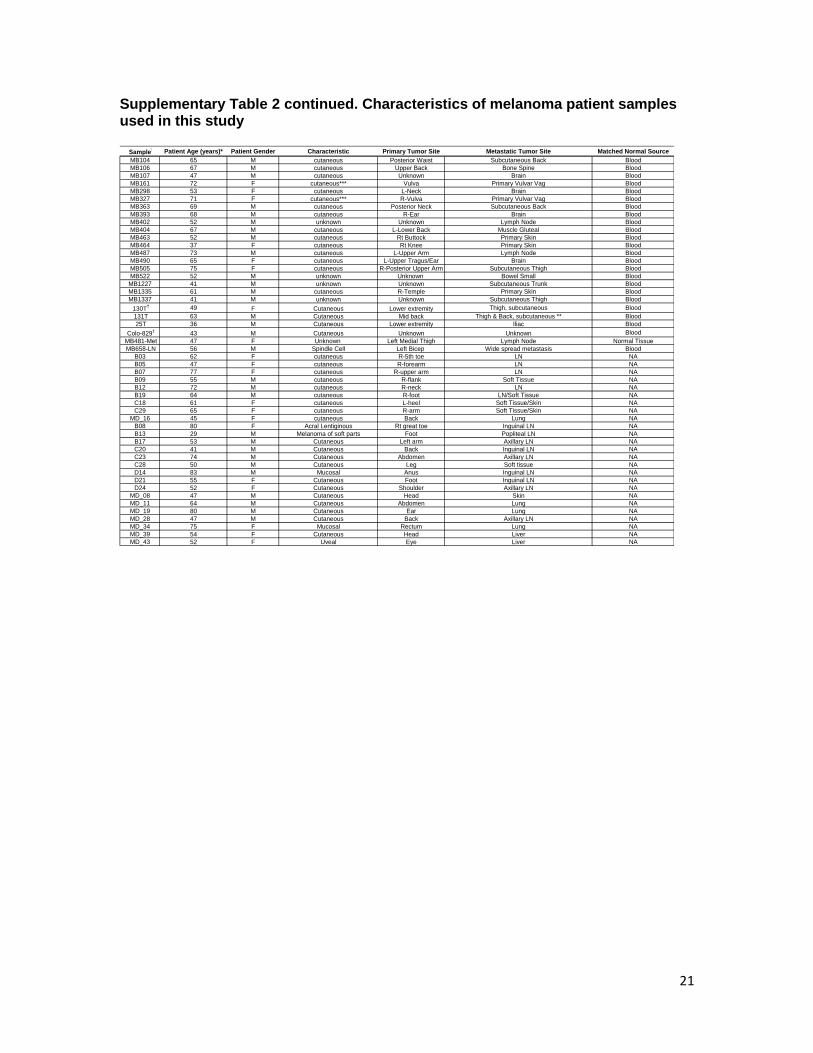
Supplementary Table 2 continued. Characteristics of melanoma patient samples used in this study
Sample Patient Age (years)* Patient Gender Characteristic Primary Tumor Site Metastatic Tumor Site Matched Normal Source
MB104 65 M cutaneous Posterior Waist Subcutaneous Back Blood
MB106 67 M cutaneous Upper Back Bone Spine Blood
MB107 47 M cutaneous Unknown Brain Blood
MB161 72 F cutaneous*** Vulva Primary Vulvar Vag Blood
MB298 53 F cutaneous L-Neck Brain Blood
MB327 71 F cutaneous*** R-Vulva Primary Vulvar Vag Blood
MB363 69 M cutaneous Posterior Neck Subcutaneous Back Blood
MB393 68 M cutaneous R-Ear Brain Blood
MB402 52 M unknown Unknown Lymph Node Blood
MB404 67 M cutaneous L-Lower Back Muscle Gluteal Blood
MB463 52 M cutaneous Rt Buttock Primary Skin Blood
MB464 37 F cutaneous Rt Knee Primary Skin Blood
MB487 73 M cutaneous L-Upper Arm Lymph Node Blood
MB490 65 F cutaneous L-Upper Tragus/Ear Brain Blood
MB505 75 F cutaneous R-Posterior Upper Arm Subcutaneous Thigh Blood
MB522 52 M unknown Unknown Bowel Small Blood
MB1227 41 M unknown Unknown Subcutaneous Trunk Blood
MB1335 61 M cutaneous R-Temple Primary Skin Blood
MB1337 41 M unknown Unknown Subcutaneous Thigh Blood
130T† 49 F Cutaneous Lower extremity Thigh, subcutaneous Blood
131T 63 M Cutaneous Mid back Thigh & Back, subcutaneous ** Blood
25T 36 M Cutaneous Lower extremity Iliac Blood
Colo-829†
43 M Cutaneous Unknown Unknown Blood
MB481-Met 47 F Unknown Left Medial Thigh Lymph Node Normal Tissue
MB658-LN 56 M Spindle Cell Left Bicep Wide spread metastasis Blood
B03 62 F cutaneous R-5th toe LN NA
B05 47 F cutaneous R-forearm LN NA
B07 77 F cutaneous R-upper arm LN NA
B09 55 M cutaneous R-flank Soft Tissue NA
B12 72 M cutaneous R-neck LN NA
B19 64 M cutaneous R-foot LN/Soft Tissue NA
C18 61 F cutaneous L-heel Soft Tissue/Skin NA
C29 65 F cutaneous R-arm Soft Tissue/Skin NA
MD_16 45 F cutaneous Back Lung NA
B08 80 F Acral Lentiginous Rt great toe Inguinal LN NA
B13 29 M Melanoma of soft parts Foot Popliteal LN NA
B17 53 M Cutaneous Left arm Axillary LN NA
C20 41 M Cutaneous Back Inguinal LN NA
C23 74 M Cutaneous Abdomen Axillary LN NA
C28 50 M Cutaneous Leg Soft tissue NA
D14 83 M Mucosal Anus Inguinal LN NA
D21 55 F Cutaneous Foot Inguinal LN NA
D24 52 F Cutaneous Shoulder Axillary LN NA
MD_08 47 M Cutaneous Head Skin NA
MD_11 64 M Cutaneous Abdomen Lung NA
MD_19 80 M Cutaneous Ear Lung NA
MD_28 47 M Cutaneous Back Axillary LN NA
MD_34 75 F Mucosal Rectum Lung NA
MD_39 54 F Cutaneous Head Liver NA
MD_43 52 F Uveal Eye Liver NA
22
Supplementary Table 2 continued. Characteristics of melanoma patient samples used in this study
Sample Patient Age (years)* Patient Gender Characteristic Primary Tumor Site Metastatic Tumor Site Matched Normal Source
A02^ 32 F NA R posterior upper arm subcutaneous L axilla LCL
A04^ 24 F NA R shin retroperitenial lymph nodes LCL
A06^ 39 F NA L posterior upper back (shoulder blade) stomach internal edge, small bowel lymph nodes LCL
A11^ 58 M nodular R calf subcutaneous L lower abdominal wall LCL
A12^ 40 F Acral base of toe L foot Lower Back, R Axillary, Upper back lymph nodes LCL
A13^ 19 M NA L loin L intestine and bowel lymph nodes LCL
A15^ 47 F NA R lower back L femoral lymph node LCL
C001^ 50 F superficial spreading melanoma R calf R calf nodule LCL
C002^ 60 M nodular R upper leg R thigh LCL
C004^ 42 F NA NA L axilla lymph nodes LCL
C006^ 35 F nodular R lower back R inguinal lymph nodes LCL
C011^ 34 F superficial spreading melanoma L upper leg lung and liver LCL
C013^ 71 M nodular upper back L and R axilla lymph nodes LCL
C016^ 50 F cutaneous post L thigh chest & neck LCL
C017^ 57 F cutaneous R mid back R axilla lymph nodes LCL
C021^ 38 M superficial spreading melanoma L upper back L axilla lymph nodes LCL
C022^ 45 F superficial spreading melanoma R arm R axillary lymph nodes LCL
C024^ 63 M NA NA NA LCL
C025^ 41 M superficial spreading melanoma L upper back Lymph node LCL
C027^ 61 M nodular L upper back L axilla lymph nodes LCL
C037^ 27 F NA NA R axilla lymph nodes LCL
C044^ 51 F superficial spreading melanoma L lower back L groin LCL
C045^ 22 F superficial spreading melanoma R shoulder R axilla lymph nodes LCL
C052^ 69 M nodular mid back L axilla lymph nodes LCL
C054^ 52 F cutaneous R lower leg R groin LCL
C055^ 80 M nodular centre back R axilla lymph nodes and Lgroin LCL
C057^ 35 F superficial spreading melanoma L upper back L axilla lymph nodes LCL
C058^ 39 M NA NA L axilla lymph nodes LCL
C060^ 64 F superficial spreading melanoma R upper leg R groin LCL
C062^ 67 M NA NA L and R groin LCL
C065^ 39 M superficial spreading melanoma L lower back L axilla lymph nodes LCL
C067^ 69 M superficial spreading melanoma upper back R axilla lymph nodes LCL
C071^ 33 M superficial spreading melanoma R upper back R axilla lymph nodes LCL
C074^ 45 F superficial spreading melanoma mid back axillary lymph nodes LCL
C077^ 48 M nodular mid upper back L and R axilla lymph nodes LCL
C078^ 60 M superficial spreading melanoma L lower back axillary lymph nodes LCL
C081^ 54 M superficial spreading melanoma R upper leg L groin LCL
C083^ 33 M superficial spreading melanoma R neck neck LCL
C084^ 75 M superficial spreading melanoma R upper back R neck LCL
C088^ 55 F superficial spreading melanoma R upper abdomen R axillary lymph nodes LCL
C089^ 50 F NA NA L axilla lymph nodes LCL
C091^ 53 F superficial spreading melanoma L lower leg groin LCL
C092^ 51 M NA NA Neck LCL
C094^ 20 F superficial spreading melanoma L upper back L axilla lymph nodes LCL
C096^ 45 M superficial spreading melanoma R lower leg groin LCL
C097^ 43 F nodular L neck neck LCL
C100^ 78 M nodular Mid scalp R neck LCL
C106^ 52 M superficial spreading melanoma R upper leg R groin LCL
D01^ 54 F occult occult R breast lateral wall LCL
D03^ 51 M superficial spreading melanoma L mid back L axilla lymph nodes LCL
D04^ 37 F nodular L lower leg pancreas head LCL
D05^ 39 M NA L Calf adrenal LCL
D08^ 47 F nodular L leg below the knee intransit lesion (shin, ankle) LCL
D10^ 64 F acral R foot L scapula LCL
D11^ 22 M mucosal R buccal mucosa small bowel lymph node LCL
D14^ 24 F nodular L inner thigh small bowel LCL
D17^ 31 M NA L calf R leg LCL
D18^ 46 F cutaneous NA L chest wall and R axilla LCL
D20^ 41 F superficial spreading melanoma L upper outer arm mesenteric lymph node LCL
D22^ 49 M superficial spreading melanoma R shoulder R shoulder LCL
D23^ 30 M NA NA subcutaneous LCL
D24^ 52 M NA NA brain, liver LCL
D25^ 40 F NA L ear back LCL
D26^ 44 M NA NA mesenteric lymph node LCL
D28^ 66 M occult occult R neck lymph nodes LCL
D29^ 44 M NA NA subcutaneous nodule LCL
D32^ 35 M NA NA R ankle LCL
D35^ 43 M occult occult cerebral LCL
D36^ 56 M NA L deltoid lung, bowel LCL
D40^ 55 M NA NA chest LCL
D41^ 44 M superficial spreading melanoma L medial calf L groin lymph node LCL
D42^ 74 F NA R knee L scapula LCL
D49^ 36 F superficial spreading melanoma R upper arm subcutaneous R forearm LCL
D51^ NA NA NA left leg groin lymph node LCL
D54^ 51 M NA R forearm R groin illiac lymph nodes LCL
D55^ NA NA NA NA NA LCL
D64^ 49 M NA NA R calf LCL
MM383^ 25 M NA NA R. anterior chest LCL
MM540^ 33 M cutaneous R shoulder anterior chest LCL
MM548^ 44 M superficial spreading melanoma R thigh R groin lymph node LCL
MM576^ 40 F Nodular NA R. medial upper arm LCL
MM595^ 50 M NA NA Ant Chest Wall LCL
MM608^ 57 M nodular lower back L buttock LCL
MM622^ NA M spindle cell melanoma L medial knee NA LCL
MM636^ 48 M superficial spreading melanoma R upper posterior arm R Axilla LCL
MM647^ 54 F NA NA L thigh LCL
MM648^ 46 M nodular R scapula Pulmonary and cerebral LCL
* Patient's age when tumor was surgically removed. ** Cell line generated from 2 metastatic melanoma tumors mixed after resection during the
same operation. *** Acral lentiginous † samples used in Exome/Genome sequencing. L-left, R-right, LN-lymph node, M-male, F-female, LCL-Lymphoblastoid Cell Line
^Samples from Queensland Institute of Medical Research
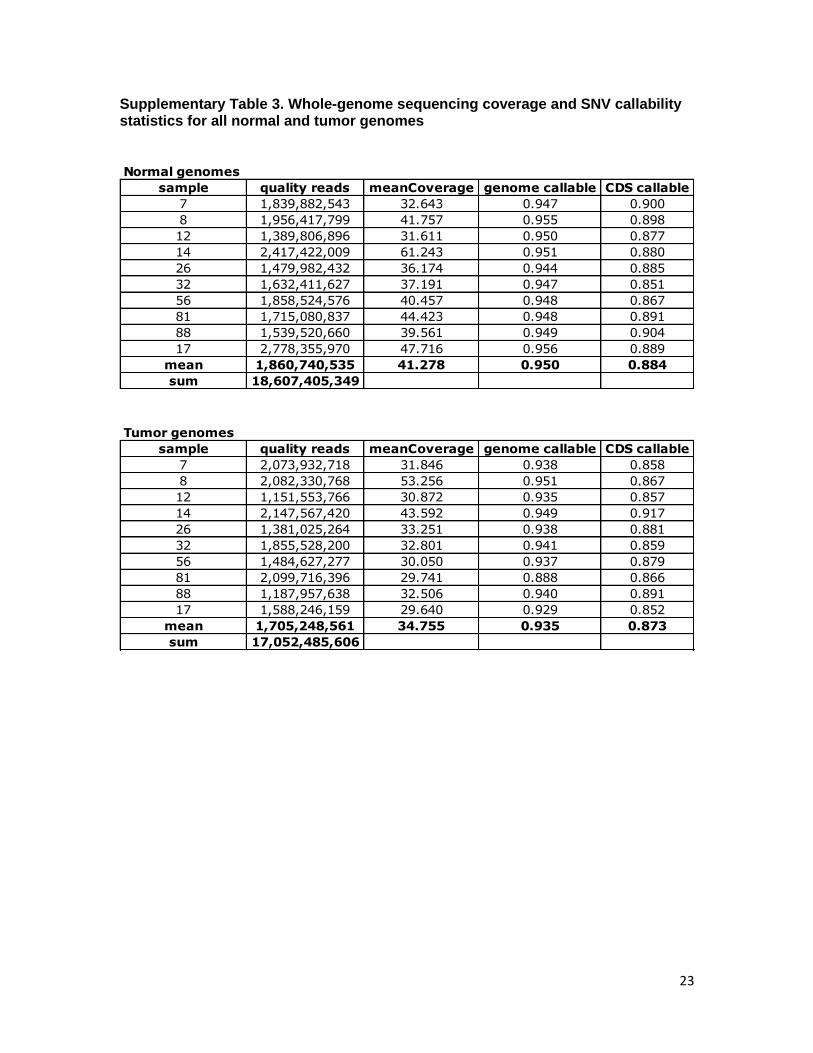
23
Supplementary Table 3. Whole-genome sequencing coverage and SNV callability statistics for all normal and tumor genomes
Normal genomes
sample quality reads meanCoverage genome callable CDS callable
7 1,839,882,543 32.643 0.947 0.900
8 1,956,417,799 41.757 0.955 0.898
12 1,389,806,896 31.611 0.950 0.877
14 2,417,422,009 61.243 0.951 0.880
26 1,479,982,432 36.174 0.944 0.885
32 1,632,411,627 37.191 0.947 0.851
56 1,858,524,576 40.457 0.948 0.867
81 1,715,080,837 44.423 0.948 0.891
88 1,539,520,660 39.561 0.949 0.904
17 2,778,355,970 47.716 0.956 0.889
mean 1,860,740,535 41.278 0.950 0.884
sum 18,607,405,349
Tumor genomes
sample quality reads meanCoverage genome callable CDS callable
7 2,073,932,718 31.846 0.938 0.858
8 2,082,330,768 53.256 0.951 0.867
12 1,151,553,766 30.872 0.935 0.857
14 2,147,567,420 43.592 0.949 0.917
26 1,381,025,264 33.251 0.938 0.881
32 1,855,528,200 32.801 0.941 0.859
56 1,484,627,277 30.050 0.937 0.879
81 2,099,716,396 29.741 0.888 0.866
88 1,187,957,638 32.506 0.940 0.891
17 1,588,246,159 29.640 0.929 0.852
mean 1,705,248,561 34.755 0.935 0.873
sum 17,052,485,606
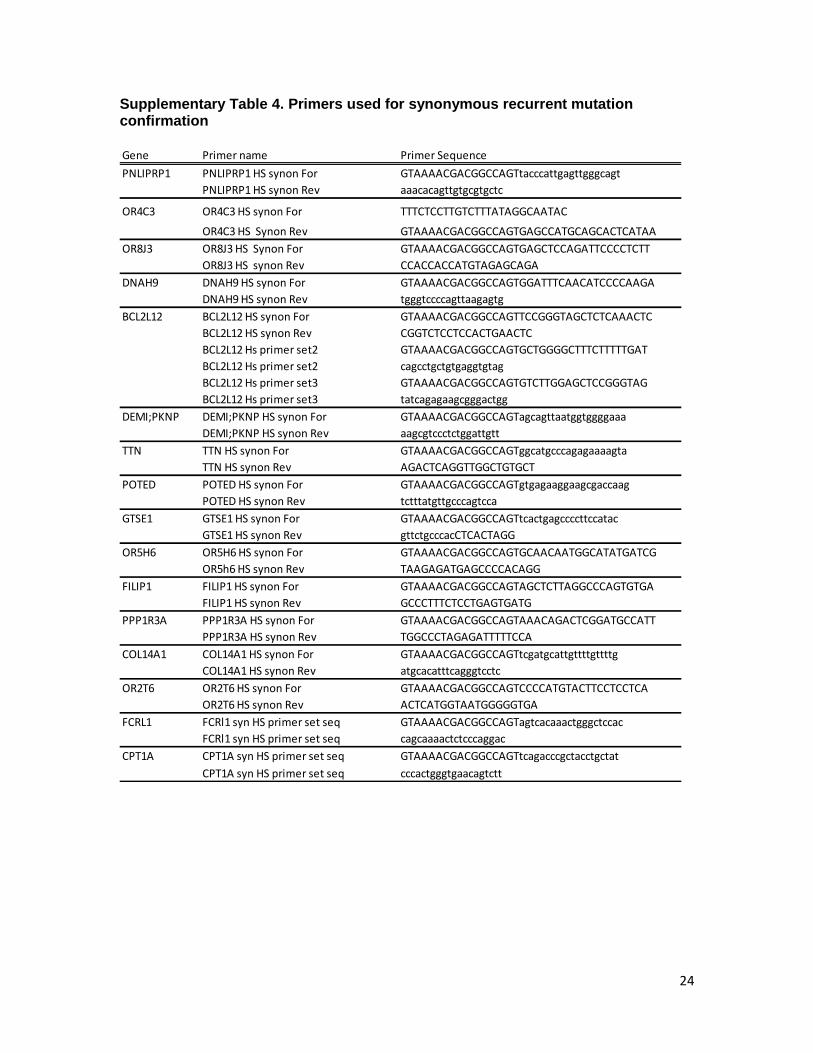
24
Supplementary Table 4. Primers used for synonymous recurrent mutation confirmation
Gene Primer name Primer Sequence
PNLIPRP1 PNLIPRP1 HS synon For GTAAAACGACGGCCAGTtacccattgagttgggcagt
PNLIPRP1 HS synon Rev aaacacagttgtgcgtgctc
OR4C3 OR4C3 HS synon For TTTCTCCTTGTCTTTATAGGCAATAC
OR4C3 HS Synon Rev GTAAAACGACGGCCAGTGAGCCATGCAGCACTCATAA
OR8J3 OR8J3 HS Synon For GTAAAACGACGGCCAGTGAGCTCCAGATTCCCCTCTT
OR8J3 HS synon Rev CCACCACCATGTAGAGCAGA
DNAH9 DNAH9 HS synon For GTAAAACGACGGCCAGTGGATTTCAACATCCCCAAGA
DNAH9 HS synon Rev tgggtccccagttaagagtg
BCL2L12 BCL2L12 HS synon For GTAAAACGACGGCCAGTTCCGGGTAGCTCTCAAACTC
BCL2L12 HS synon Rev CGGTCTCCTCCACTGAACTC
BCL2L12 Hs primer set2 GTAAAACGACGGCCAGTGCTGGGGCTTTCTTTTTGAT
BCL2L12 Hs primer set2 cagcctgctgtgaggtgtag
BCL2L12 Hs primer set3 GTAAAACGACGGCCAGTGTCTTGGAGCTCCGGGTAG
BCL2L12 Hs primer set3 tatcagagaagcgggactgg
DEMI;PKNP DEMI;PKNP HS synon For GTAAAACGACGGCCAGTagcagttaatggtggggaaa
DEMI;PKNP HS synon Rev aagcgtccctctggattgtt
TTN TTN HS synon For GTAAAACGACGGCCAGTggcatgcccagagaaaagta
TTN HS synon Rev AGACTCAGGTTGGCTGTGCT
POTED POTED HS synon For GTAAAACGACGGCCAGTgtgagaaggaagcgaccaag
POTED HS synon Rev tctttatgttgcccagtcca
GTSE1 GTSE1 HS synon For GTAAAACGACGGCCAGTtcactgagccccttccatac
GTSE1 HS synon Rev gttctgcccacCTCACTAGG
OR5H6 OR5H6 HS synon For GTAAAACGACGGCCAGTGCAACAATGGCATATGATCG
OR5h6 HS synon Rev TAAGAGATGAGCCCCACAGG
FILIP1 FILIP1 HS synon For GTAAAACGACGGCCAGTAGCTCTTAGGCCCAGTGTGA
FILIP1 HS synon Rev GCCCTTTCTCCTGAGTGATG
PPP1R3A PPP1R3A HS synon For GTAAAACGACGGCCAGTAAACAGACTCGGATGCCATT
PPP1R3A HS synon Rev TGGCCCTAGAGATTTTTCCA
COL14A1 COL14A1 HS synon For GTAAAACGACGGCCAGTtcgatgcattgttttgttttg
COL14A1 HS synon Rev atgcacatttcagggtcctc
OR2T6 OR2T6 HS synon For GTAAAACGACGGCCAGTCCCCATGTACTTCCTCCTCA
OR2T6 HS synon Rev ACTCATGGTAATGGGGGTGA
FCRL1 FCRl1 syn HS primer set seq GTAAAACGACGGCCAGTagtcacaaactgggctccac
FCRl1 syn HS primer set seq cagcaaaactctcccaggac
CPT1A CPT1A syn HS primer set seq GTAAAACGACGGCCAGTtcagacccgctacctgctat
CPT1A syn HS primer set seq cccactgggtgaacagtctt

25
Supplementary Table 5. Primers used for plasmid construction and RT-PCR
Online Methods Tumor tissues All DNA samples used in this study were derived from metastases. Samples used for whole-exome capture and prevalence screen were extracted from cell lines established directly from patients’ tumors as described previously (1) DNA subjected to whole-genome sequencing was extracted from OCT embedded specimens as described previously (1). Tissues used for Validation set 1 were fresh frozen melanoma tumors obtained from the University of Colorado Denver Skin Cancer Biorepository, Division of Medical Oncology. Tissue was collected at University of Colorado Hospital, Anschutz Medical Campus, under Institutional Review Board protocols. DNA was isolated from enriched macrodissected tumor isolates as previously described http://www.riedlab.nci.nih.gov. Tissue processing and storage was previously described by Morente et al (2). Tissues used for Validation set 2 of melanomas, were obtained from Optimum Cutting Temperature (OCT)–embedded frozen clinical specimens from the Melanoma Informatics, Tissue Resource, and Pathology Core (MelCore) at The University of Texas MD Anderson Cancer Center under Institutional Review Board-approved protocols. DNA isolation from the tumor-enriched isolates has been described previously (3). Tissue was further collected and cell lines established at Queensland Institute of Medical Research (41 stage III and 46 stage IV (AJCC) early passage metastatic melanoma cell lines). All cell lines were established as described previously (4-6) with informed patient consent under a protocol approved by the Queensland Institute of Medical Research Human Research Ethics Committee. The clinical information associated with the melanoma tumors used in this study is provided in Table S2. Melanoma tissue processing for Laser Capture Microdissection (LCM) H&E stained sections of fresh frozen melanoma tissues are prepared for initial histologic assessment. Sections are examined by a pathologist for the presence of tumor, estimation of tumor content, presence of inflammation and necrosis. Tissues with less than 70% tumor and/or significant areas of inflammation and necrosis are subjected to LCM. Laser Capture Microdissection (LCM) Laser capture microdissection (LCM) was performed in the Pathology Core Facility of MSKCC, New York, NY, using the Veritas Microdissection System (Arcturus). The
Gene Name Forward Primer Reverse Primer
Cloning wild type BCL2L12 pcDNA3.1
ctattctagagccaccatgggacggcccgctgggctg ttaagcggccgctcagtccaatggcaagttcaagtcc
Site-directed mutational primer for
inserting Phe17Phe change
ctatgcccttttttgggttttcggccagaggcatgctg cagcatgcctctggccgaaaacccaaaaaagggcatag
BCL2L12-FLAG tagged cloning primers
ctattctagagccaccatgggacggcccgctgggctgttcccgcccctatgcccttttttg ttaagcggccgctcacttatcgtcgtcatccttgtaatcgtccaatggcaagttcaagtcc
BCL2L12-real time primer set1cgagttcagtggaggagacc gcctaaggaaggcagctagg
BCL2L12-real time primer set2
aagacacgctgagggtccta cagggagcagggaagacat
Hdm2-real time primer set tatataccat gatctacagg ctgtctcactaattgctctc
STAT1 reverse transcription primer set ggtacgaacttcagcagcttg gaggtcatgaaaacggatgg
STAT3 reverse transcription primer set cttgacacacggtacctgga cttgcaggaagcggctatac
DEAF1 reverse transcription primer set gggaggctatgagcgagtg acacggtcaccttctccatc
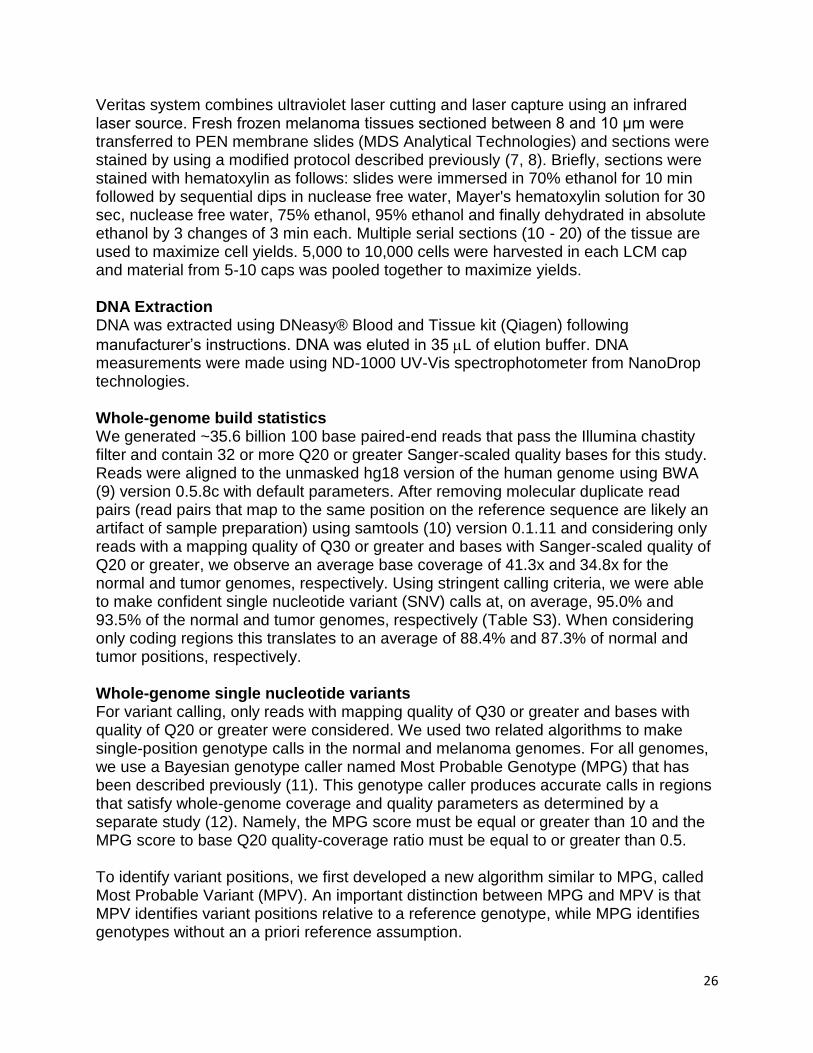
26
Veritas system combines ultraviolet laser cutting and laser capture using an infrared laser source. Fresh frozen melanoma tissues sectioned between 8 and 10 μm were transferred to PEN membrane slides (MDS Analytical Technologies) and sections were stained by using a modified protocol described previously (7, 8). Briefly, sections were stained with hematoxylin as follows: slides were immersed in 70% ethanol for 10 min followed by sequential dips in nuclease free water, Mayer's hematoxylin solution for 30 sec, nuclease free water, 75% ethanol, 95% ethanol and finally dehydrated in absolute ethanol by 3 changes of 3 min each. Multiple serial sections (10 - 20) of the tissue are used to maximize cell yields. 5,000 to 10,000 cells were harvested in each LCM cap and material from 5-10 caps was pooled together to maximize yields. DNA Extraction DNA was extracted using DNeasy® Blood and Tissue kit (Qiagen) following
manufacturer’s instructions. DNA was eluted in 35 L of elution buffer. DNA measurements were made using ND-1000 UV-Vis spectrophotometer from NanoDrop technologies. Whole-genome build statistics We generated ~35.6 billion 100 base paired-end reads that pass the Illumina chastity filter and contain 32 or more Q20 or greater Sanger-scaled quality bases for this study. Reads were aligned to the unmasked hg18 version of the human genome using BWA (9) version 0.5.8c with default parameters. After removing molecular duplicate read pairs (read pairs that map to the same position on the reference sequence are likely an artifact of sample preparation) using samtools (10) version 0.1.11 and considering only reads with a mapping quality of Q30 or greater and bases with Sanger-scaled quality of Q20 or greater, we observe an average base coverage of 41.3x and 34.8x for the normal and tumor genomes, respectively. Using stringent calling criteria, we were able to make confident single nucleotide variant (SNV) calls at, on average, 95.0% and 93.5% of the normal and tumor genomes, respectively (Table S3). When considering only coding regions this translates to an average of 88.4% and 87.3% of normal and tumor positions, respectively. Whole-genome single nucleotide variants For variant calling, only reads with mapping quality of Q30 or greater and bases with quality of Q20 or greater were considered. We used two related algorithms to make single-position genotype calls in the normal and melanoma genomes. For all genomes, we use a Bayesian genotype caller named Most Probable Genotype (MPG) that has been described previously (11). This genotype caller produces accurate calls in regions that satisfy whole-genome coverage and quality parameters as determined by a separate study (12). Namely, the MPG score must be equal or greater than 10 and the MPG score to base Q20 quality-coverage ratio must be equal to or greater than 0.5. To identify variant positions, we first developed a new algorithm similar to MPG, called Most Probable Variant (MPV). An important distinction between MPG and MPV is that MPV identifies variant positions relative to a reference genotype, while MPG identifies genotypes without an a priori reference assumption.

27
We validated SSNVs by PCR amplifying the regions in the tumor and normal genomes and then Sanger sequencing the products. Of 192 randomly chosen positions (96 in coding regions, and 96 in non-coding regions), we were able to successfully PCR amplify and sequence 181 in both genomes. Of these, we observed evidence for somatic variants concordant with the whole-genome data at 100% of the positions, suggesting that our method is highly specific. Exome Capture Exome capture was performed using the SureSelect Human All Exon System (Agilent Technologies, Santa Clara, CA). The manufacturer’s protocol for SureSelect Human All Exon System (Illumina Paired-End Sequencing Library Prep), version 1.0.1 was used, with the following modifications: Bioanalyzer steps were either performed using agarose gel or omitted. In the sample preparation step 9, samples were purified using Ampure XP beads (Agencourt/Beckman Coulter Genomics, Danvers, MA) according to the manufacturer’s protocols. In step 12, samples were purified with the QIAquick MinElute kit (Qiagen Inc., Valencia, CA). One column was used for each sample – the four 250
L post-amplification aliquots were pooled, and passed over the column in several spin
steps. Samples were eluted in 12 L buffer EB, and quantitated using the Qubit dsDNA BR Assay kit (Invitrogen Corp, Carlsbad, CA). In the post-hybridization amplification step 2, samples were purified with AMPure XP beads as described above. Samples
were then eluted in 30 L buffer EB. Illumina Sequencing Sequencing was performed on the Illumina GAIIx platform with version 4 chemistry and version 4 flowcells according to the manufacturer’s instructions. 76 base paired-end reads were generated. Exome read mapping and variant analysis Reads were initially aligned using ELAND (Illumina Inc, San Diego, CA). ELAND alignments were used to place reads in bins of about 100 thousand base pairs. Unmapped reads were placed in the bin of the mate pair if the mate was mapped. Cross_match (Phil Green, http://www.phrap.org) was utilized to align the reads assigned to each bin to the corresponding ~5Mb of genomic sequence. Cross_match alignments were converted to the SamTools bam format, and then genotypes were called using bam2mpg (11), http://research.nhgri.nih.gov/software/bam2mpg/). Bam2mpg was used to implement the Most Probable Genotype (MPG) algorithm, a Bayesian based method to determine the probability of each genotype given the data observed at that position. The quality score represents the difference of the log likelihoods of the most and second most probable genotype. The MPG was divided by the coverage at each position to calculate the MPG/coverage ratio. To eliminate common germline mutations from consideration, alterations observed in dbSNP130 or in the 1000 genomes were removed. We further limited the list to those variants above 5% minor allele frequency. Polymorphisms were further removed by examination of the sequence of the gene in genomic DNA from matched normal tissue. On average a mean depth of 115X or greater was achieved resulting in exome builds with at least
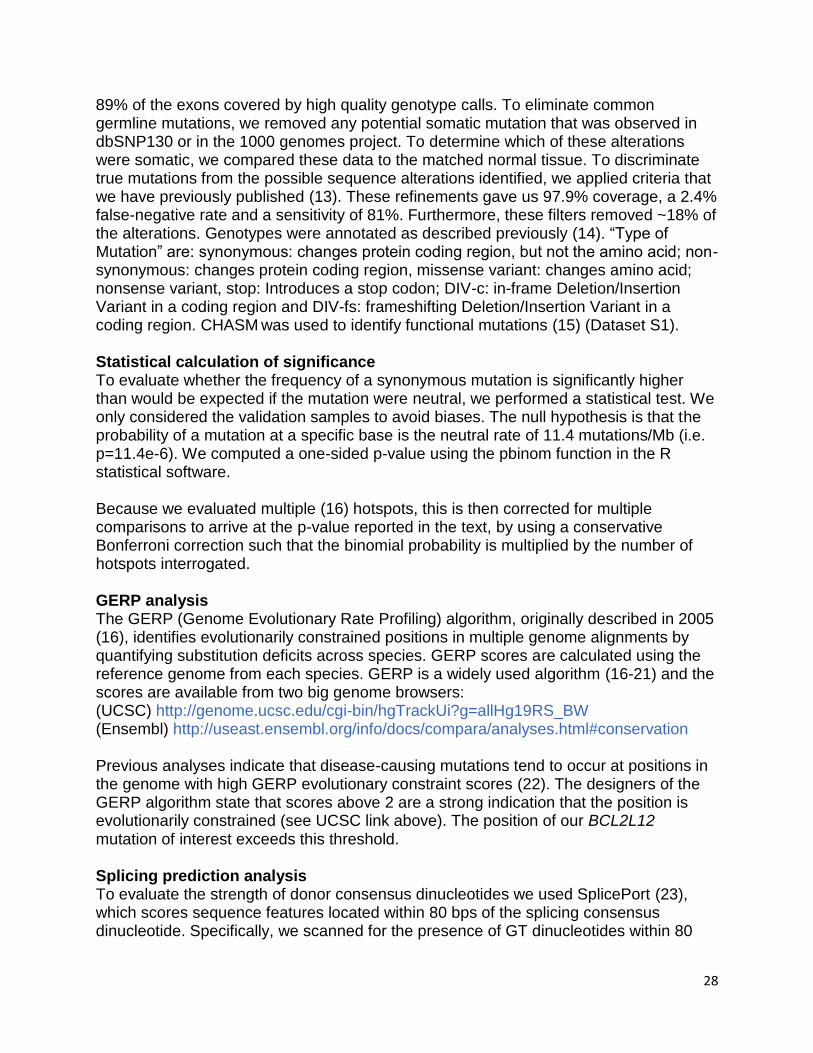
28
89% of the exons covered by high quality genotype calls. To eliminate common germline mutations, we removed any potential somatic mutation that was observed in dbSNP130 or in the 1000 genomes project. To determine which of these alterations were somatic, we compared these data to the matched normal tissue. To discriminate true mutations from the possible sequence alterations identified, we applied criteria that we have previously published (13). These refinements gave us 97.9% coverage, a 2.4% false-negative rate and a sensitivity of 81%. Furthermore, these filters removed ~18% of the alterations. Genotypes were annotated as described previously (14). “Type of Mutation” are: synonymous: changes protein coding region, but not the amino acid; non-synonymous: changes protein coding region, missense variant: changes amino acid; nonsense variant, stop: Introduces a stop codon; DIV-c: in-frame Deletion/Insertion Variant in a coding region and DIV-fs: frameshifting Deletion/Insertion Variant in a coding region. CHASM was used to identify functional mutations (15) (Dataset S1). Statistical calculation of significance To evaluate whether the frequency of a synonymous mutation is significantly higher than would be expected if the mutation were neutral, we performed a statistical test. We only considered the validation samples to avoid biases. The null hypothesis is that the probability of a mutation at a specific base is the neutral rate of 11.4 mutations/Mb (i.e. p=11.4e-6). We computed a one-sided p-value using the pbinom function in the R statistical software. Because we evaluated multiple (16) hotspots, this is then corrected for multiple comparisons to arrive at the p-value reported in the text, by using a conservative Bonferroni correction such that the binomial probability is multiplied by the number of hotspots interrogated. GERP analysis The GERP (Genome Evolutionary Rate Profiling) algorithm, originally described in 2005 (16), identifies evolutionarily constrained positions in multiple genome alignments by quantifying substitution deficits across species. GERP scores are calculated using the reference genome from each species. GERP is a widely used algorithm (16-21) and the scores are available from two big genome browsers: (UCSC) http://genome.ucsc.edu/cgi-bin/hgTrackUi?g=allHg19RS_BW (Ensembl) http://useast.ensembl.org/info/docs/compara/analyses.html#conservation
Previous analyses indicate that disease-causing mutations tend to occur at positions in the genome with high GERP evolutionary constraint scores (22). The designers of the GERP algorithm state that scores above 2 are a strong indication that the position is evolutionarily constrained (see UCSC link above). The position of our BCL2L12 mutation of interest exceeds this threshold. Splicing prediction analysis To evaluate the strength of donor consensus dinucleotides we used SplicePort (23), which scores sequence features located within 80 bps of the splicing consensus dinucleotide. Specifically, we scanned for the presence of GT dinucleotides within 80

29
bps of the mutation, which we scored with SplicePort independently with the reference and variant alleles (Table S1). Prediction of protein RNA-binding sites Prediction of RNA binding sites was done using SpliceAid server/database a database of strictly experimentally assessed target RNA sequences in humans, http://www.introni.it/splicing.html (24). Electrophoretic mobility shift assay (EMSA) Gel shift assays were done following standard protocols. BCL2L12 70 bp long RNA wild-type and mutant fragments harboring the site of mutation were body-labeled with [α-32P]-UTP following in vitro transcription. The RNA fragments were gel-purified and used in electrophoretic mobility shift assays with recombinant TIAL-1 protein available from Novus Biologicals, LLC, (Littleton, CO). A 127 nt long intron 4 enhancer element in Calcitonin/CGRP gene, that has been previously described to bind recombinant TIAL1 (25) was used as a positive control. Position weight matrix (PWM) analysis Position weight matrix (PWM) information was obtained for vertebrate specific TFs from the TRANSFAC (26) professional (release 11.4) and JASPAR 3 (27) databases. The search for PWM occurrences in the sequences of interest was performed as described in (28). The region containing the C>T variant at BCL2L12 CDS position 51 was searched independently with the reference and variant alleles. Logos of the PWMs were created using Weblogo version 2.8.2 (29) with sequences generated synthetically based on positional frequency information available in the TRANSFAC and JASPAR databases. PCR, sequencing and mutational analysis of melanoma samples Genes identified to harbor recurrent mutations were confirmed and further screened using two primer sets listed in Table S4 in an additional 153 melanoma samples. Mutational analysis, confirmation and determination of somatic status were carried out as previously described (1, 30). Chromatin Immunoprecipitation (ChIP) and qPCR enrichment Approximately 2e8 cells from each of three melanoma lines (79T, 75T, skmel28) were prepared for ChIP analysis as previously described (31)with the following modifications. Intact nuclei were isolated and chromatin was sheared on ice to an average size of 200-1000 bp using a Branson Sonifier 450 (constant duty cycle, 20% output; 9 cycles of 20 second sonication with 1 minute rest between each round of sonication). Chromatin preparations were split into 5 equal portions for ChIP analysis using 15 ug each of anti-H3K4me3 (Abcam, Cambridge, MA) or anti-Deaf1 (Bethyl Laboratories, Dallas, TX), anti-Stat1 (Santa Cruz, Santa Cruz, CA), anti-Stat3 (Santa Cruz), or GFP (Abcam) antibodies. ChIP enrichment was assessed by qPCR analysis using SYBR Green (Qiagen). Assays were performed in triplicate using 10 ng of input or ChIP DNA. Dissociation curve
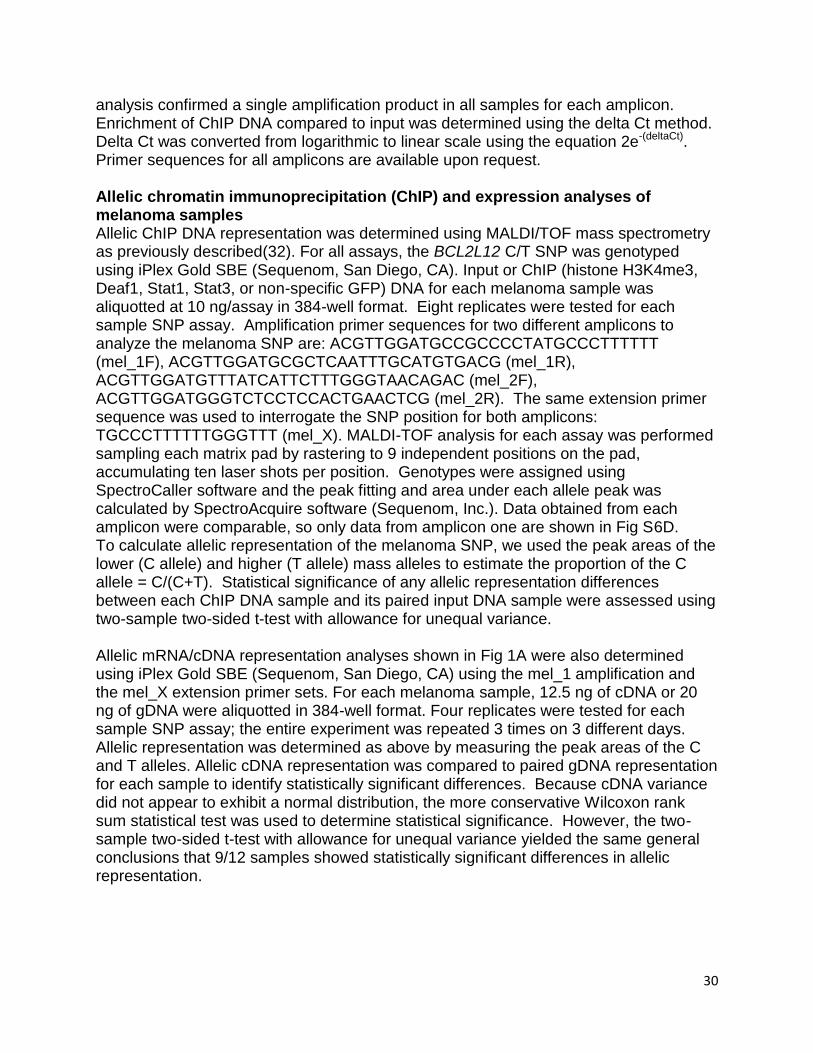
30
analysis confirmed a single amplification product in all samples for each amplicon. Enrichment of ChIP DNA compared to input was determined using the delta Ct method. Delta Ct was converted from logarithmic to linear scale using the equation 2e-(deltaCt). Primer sequences for all amplicons are available upon request. Allelic chromatin immunoprecipitation (ChIP) and expression analyses of melanoma samples Allelic ChIP DNA representation was determined using MALDI/TOF mass spectrometry as previously described(32). For all assays, the BCL2L12 C/T SNP was genotyped using iPlex Gold SBE (Sequenom, San Diego, CA). Input or ChIP (histone H3K4me3, Deaf1, Stat1, Stat3, or non-specific GFP) DNA for each melanoma sample was aliquotted at 10 ng/assay in 384-well format. Eight replicates were tested for each sample SNP assay. Amplification primer sequences for two different amplicons to analyze the melanoma SNP are: ACGTTGGATGCCGCCCCTATGCCCTTTTTT (mel_1F), ACGTTGGATGCGCTCAATTTGCATGTGACG (mel_1R), ACGTTGGATGTTTATCATTCTTTGGGTAACAGAC (mel_2F), ACGTTGGATGGGTCTCCTCCACTGAACTCG (mel_2R). The same extension primer sequence was used to interrogate the SNP position for both amplicons: TGCCCTTTTTTGGGTTT (mel_X). MALDI-TOF analysis for each assay was performed sampling each matrix pad by rastering to 9 independent positions on the pad, accumulating ten laser shots per position. Genotypes were assigned using SpectroCaller software and the peak fitting and area under each allele peak was calculated by SpectroAcquire software (Sequenom, Inc.). Data obtained from each amplicon were comparable, so only data from amplicon one are shown in Fig S6D. To calculate allelic representation of the melanoma SNP, we used the peak areas of the lower (C allele) and higher (T allele) mass alleles to estimate the proportion of the C allele = C/(C+T). Statistical significance of any allelic representation differences between each ChIP DNA sample and its paired input DNA sample were assessed using two-sample two-sided t-test with allowance for unequal variance. Allelic mRNA/cDNA representation analyses shown in Fig 1A were also determined using iPlex Gold SBE (Sequenom, San Diego, CA) using the mel_1 amplification and the mel_X extension primer sets. For each melanoma sample, 12.5 ng of cDNA or 20 ng of gDNA were aliquotted in 384-well format. Four replicates were tested for each sample SNP assay; the entire experiment was repeated 3 times on 3 different days. Allelic representation was determined as above by measuring the peak areas of the C and T alleles. Allelic cDNA representation was compared to paired gDNA representation for each sample to identify statistically significant differences. Because cDNA variance did not appear to exhibit a normal distribution, the more conservative Wilcoxon rank sum statistical test was used to determine statistical significance. However, the two-sample two-sided t-test with allowance for unequal variance yielded the same general conclusions that 9/12 samples showed statistically significant differences in allelic representation.
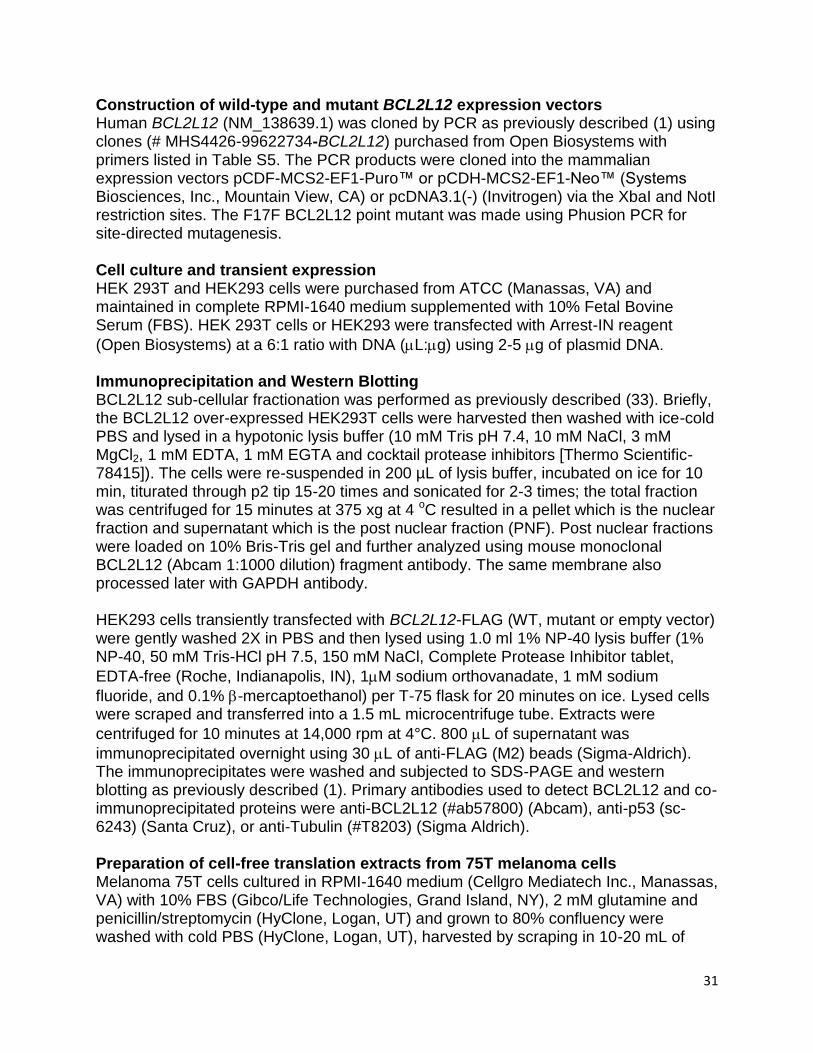
31
Construction of wild-type and mutant BCL2L12 expression vectors Human BCL2L12 (NM_138639.1) was cloned by PCR as previously described (1) using clones (# MHS4426-99622734-BCL2L12) purchased from Open Biosystems with primers listed in Table S5. The PCR products were cloned into the mammalian expression vectors pCDF-MCS2-EF1-Puro™ or pCDH-MCS2-EF1-Neo™ (Systems Biosciences, Inc., Mountain View, CA) or pcDNA3.1(-) (Invitrogen) via the XbaI and NotI restriction sites. The F17F BCL2L12 point mutant was made using Phusion PCR for site-directed mutagenesis. Cell culture and transient expression HEK 293T and HEK293 cells were purchased from ATCC (Manassas, VA) and maintained in complete RPMI-1640 medium supplemented with 10% Fetal Bovine Serum (FBS). HEK 293T cells or HEK293 were transfected with Arrest-IN reagent
(Open Biosystems) at a 6:1 ratio with DNA (L:g) using 2-5 g of plasmid DNA. Immunoprecipitation and Western Blotting BCL2L12 sub-cellular fractionation was performed as previously described (33). Briefly, the BCL2L12 over-expressed HEK293T cells were harvested then washed with ice-cold PBS and lysed in a hypotonic lysis buffer (10 mM Tris pH 7.4, 10 mM NaCl, 3 mM MgCl2, 1 mM EDTA, 1 mM EGTA and cocktail protease inhibitors [Thermo Scientific-78415]). The cells were re-suspended in 200 µL of lysis buffer, incubated on ice for 10 min, titurated through p2 tip 15-20 times and sonicated for 2-3 times; the total fraction was centrifuged for 15 minutes at 375 xg at 4 oC resulted in a pellet which is the nuclear fraction and supernatant which is the post nuclear fraction (PNF). Post nuclear fractions were loaded on 10% Bris-Tris gel and further analyzed using mouse monoclonal BCL2L12 (Abcam 1:1000 dilution) fragment antibody. The same membrane also processed later with GAPDH antibody. HEK293 cells transiently transfected with BCL2L12-FLAG (WT, mutant or empty vector) were gently washed 2X in PBS and then lysed using 1.0 ml 1% NP-40 lysis buffer (1% NP-40, 50 mM Tris-HCl pH 7.5, 150 mM NaCl, Complete Protease Inhibitor tablet,
EDTA-free (Roche, Indianapolis, IN), 1M sodium orthovanadate, 1 mM sodium
fluoride, and 0.1% -mercaptoethanol) per T-75 flask for 20 minutes on ice. Lysed cells were scraped and transferred into a 1.5 mL microcentrifuge tube. Extracts were
centrifuged for 10 minutes at 14,000 rpm at 4°C. 800 L of supernatant was
immunoprecipitated overnight using 30 L of anti-FLAG (M2) beads (Sigma-Aldrich). The immunoprecipitates were washed and subjected to SDS-PAGE and western blotting as previously described (1). Primary antibodies used to detect BCL2L12 and co-immunoprecipitated proteins were anti-BCL2L12 (#ab57800) (Abcam), anti-p53 (sc-6243) (Santa Cruz), or anti-Tubulin (#T8203) (Sigma Aldrich). Preparation of cell-free translation extracts from 75T melanoma cells Melanoma 75T cells cultured in RPMI-1640 medium (Cellgro Mediatech Inc., Manassas, VA) with 10% FBS (Gibco/Life Technologies, Grand Island, NY), 2 mM glutamine and penicillin/streptomycin (HyClone, Logan, UT) and grown to 80% confluency were washed with cold PBS (HyClone, Logan, UT), harvested by scraping in 10-20 mL of
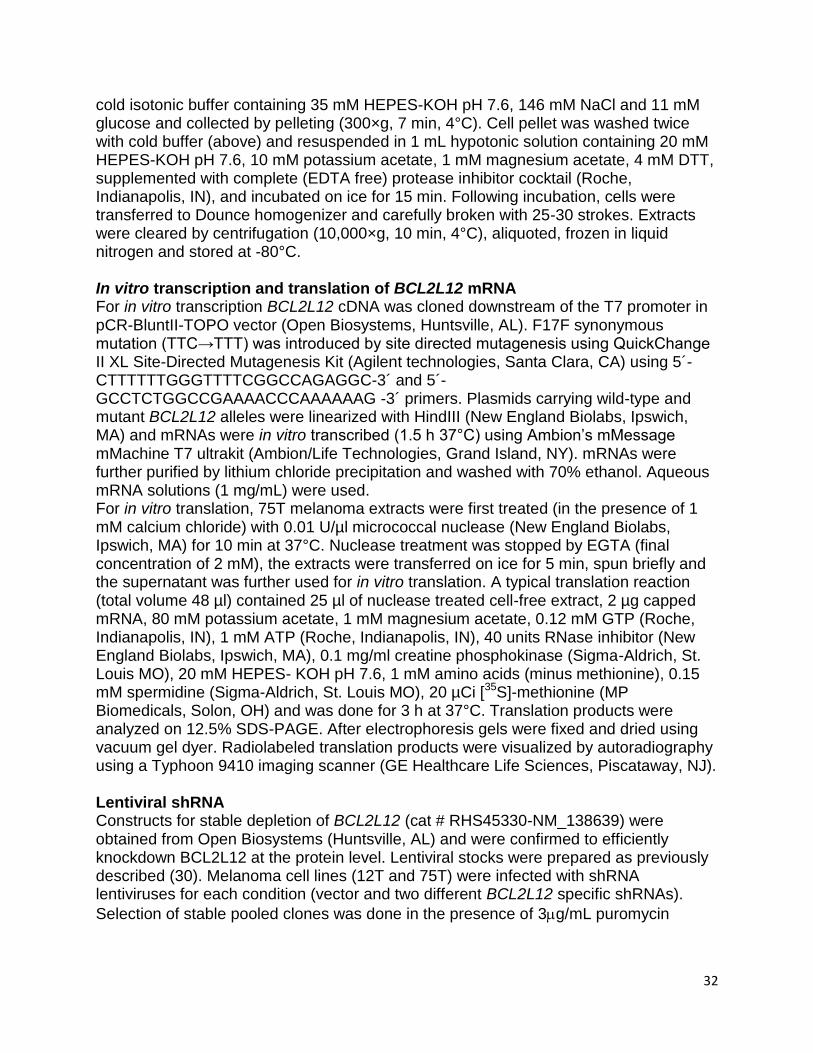
32
cold isotonic buffer containing 35 mM HEPES-KOH pH 7.6, 146 mM NaCl and 11 mM glucose and collected by pelleting (300×g, 7 min, 4°C). Cell pellet was washed twice with cold buffer (above) and resuspended in 1 mL hypotonic solution containing 20 mM HEPES-KOH pH 7.6, 10 mM potassium acetate, 1 mM magnesium acetate, 4 mM DTT, supplemented with complete (EDTA free) protease inhibitor cocktail (Roche, Indianapolis, IN), and incubated on ice for 15 min. Following incubation, cells were transferred to Dounce homogenizer and carefully broken with 25-30 strokes. Extracts were cleared by centrifugation (10,000×g, 10 min, 4°C), aliquoted, frozen in liquid nitrogen and stored at -80°C. In vitro transcription and translation of BCL2L12 mRNA For in vitro transcription BCL2L12 cDNA was cloned downstream of the T7 promoter in pCR-BluntII-TOPO vector (Open Biosystems, Huntsville, AL). F17F synonymous mutation (TTC→TTT) was introduced by site directed mutagenesis using QuickChange II XL Site-Directed Mutagenesis Kit (Agilent technologies, Santa Clara, CA) using 5´-CTTTTTTGGGTTTTCGGCCAGAGGC-3´ and 5´- GCCTCTGGCCGAAAACCCAAAAAAG -3´ primers. Plasmids carrying wild-type and mutant BCL2L12 alleles were linearized with HindIII (New England Biolabs, Ipswich, MA) and mRNAs were in vitro transcribed (1.5 h 37°C) using Ambion’s mMessage mMachine T7 ultrakit (Ambion/Life Technologies, Grand Island, NY). mRNAs were further purified by lithium chloride precipitation and washed with 70% ethanol. Aqueous mRNA solutions (1 mg/mL) were used. For in vitro translation, 75T melanoma extracts were first treated (in the presence of 1 mM calcium chloride) with 0.01 U/µl micrococcal nuclease (New England Biolabs, Ipswich, MA) for 10 min at 37°C. Nuclease treatment was stopped by EGTA (final concentration of 2 mM), the extracts were transferred on ice for 5 min, spun briefly and the supernatant was further used for in vitro translation. A typical translation reaction (total volume 48 µl) contained 25 µl of nuclease treated cell-free extract, 2 µg capped mRNA, 80 mM potassium acetate, 1 mM magnesium acetate, 0.12 mM GTP (Roche, Indianapolis, IN), 1 mM ATP (Roche, Indianapolis, IN), 40 units RNase inhibitor (New England Biolabs, Ipswich, MA), 0.1 mg/ml creatine phosphokinase (Sigma-Aldrich, St. Louis MO), 20 mM HEPES- KOH pH 7.6, 1 mM amino acids (minus methionine), 0.15 mM spermidine (Sigma-Aldrich, St. Louis MO), 20 µCi [35S]-methionine (MP Biomedicals, Solon, OH) and was done for 3 h at 37°C. Translation products were analyzed on 12.5% SDS-PAGE. After electrophoresis gels were fixed and dried using vacuum gel dyer. Radiolabeled translation products were visualized by autoradiography using a Typhoon 9410 imaging scanner (GE Healthcare Life Sciences, Piscataway, NJ). Lentiviral shRNA Constructs for stable depletion of BCL2L12 (cat # RHS45330-NM_138639) were obtained from Open Biosystems (Huntsville, AL) and were confirmed to efficiently knockdown BCL2L12 at the protein level. Lentiviral stocks were prepared as previously described (30). Melanoma cell lines (12T and 75T) were infected with shRNA lentiviruses for each condition (vector and two different BCL2L12 specific shRNAs).
Selection of stable pooled clones was done in the presence of 3g/mL puromycin
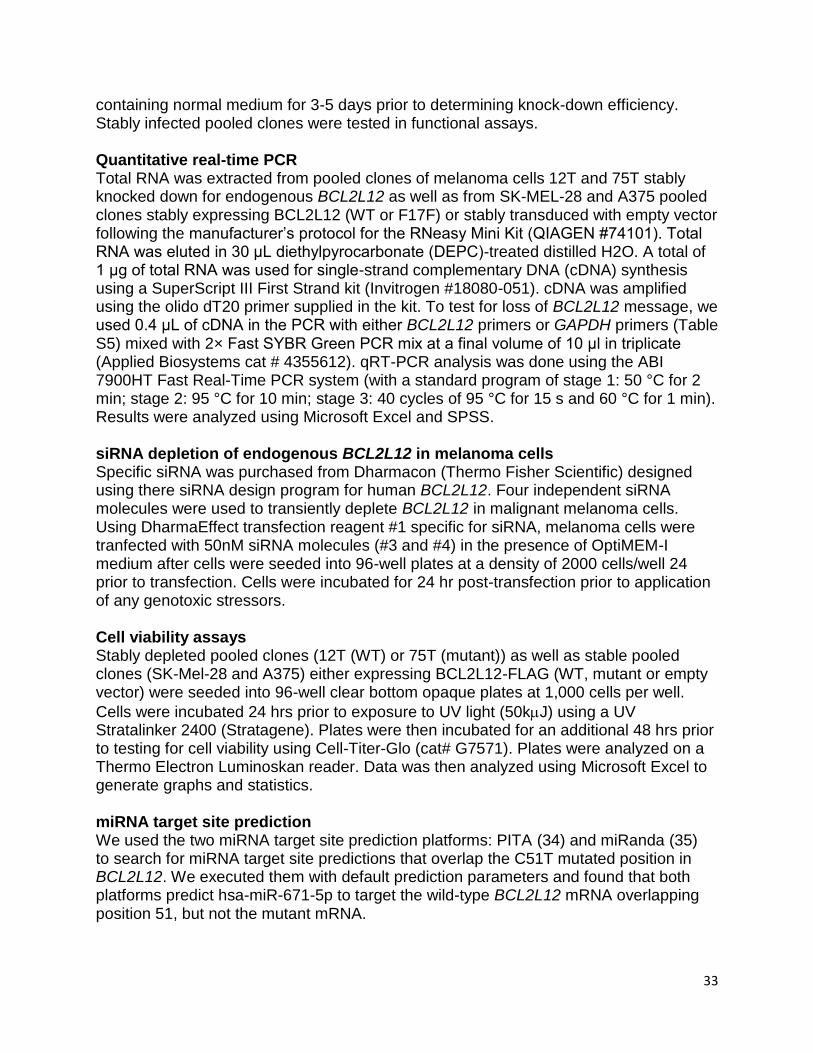
33
containing normal medium for 3-5 days prior to determining knock-down efficiency. Stably infected pooled clones were tested in functional assays. Quantitative real-time PCR Total RNA was extracted from pooled clones of melanoma cells 12T and 75T stably knocked down for endogenous BCL2L12 as well as from SK-MEL-28 and A375 pooled clones stably expressing BCL2L12 (WT or F17F) or stably transduced with empty vector following the manufacturer’s protocol for the RNeasy Mini Kit (QIAGEN #74101). Total RNA was eluted in 30 μL diethylpyrocarbonate (DEPC)-treated distilled H2O. A total of 1 μg of total RNA was used for single-strand complementary DNA (cDNA) synthesis using a SuperScript III First Strand kit (Invitrogen #18080-051). cDNA was amplified using the olido dT20 primer supplied in the kit. To test for loss of BCL2L12 message, we used 0.4 μL of cDNA in the PCR with either BCL2L12 primers or GAPDH primers (Table S5) mixed with 2× Fast SYBR Green PCR mix at a final volume of 10 μl in triplicate (Applied Biosystems cat # 4355612). qRT-PCR analysis was done using the ABI 7900HT Fast Real-Time PCR system (with a standard program of stage 1: 50 °C for 2 min; stage 2: 95 °C for 10 min; stage 3: 40 cycles of 95 °C for 15 s and 60 °C for 1 min). Results were analyzed using Microsoft Excel and SPSS. siRNA depletion of endogenous BCL2L12 in melanoma cells Specific siRNA was purchased from Dharmacon (Thermo Fisher Scientific) designed using there siRNA design program for human BCL2L12. Four independent siRNA molecules were used to transiently deplete BCL2L12 in malignant melanoma cells. Using DharmaEffect transfection reagent #1 specific for siRNA, melanoma cells were tranfected with 50nM siRNA molecules (#3 and #4) in the presence of OptiMEM-I medium after cells were seeded into 96-well plates at a density of 2000 cells/well 24 prior to transfection. Cells were incubated for 24 hr post-transfection prior to application of any genotoxic stressors. Cell viability assays Stably depleted pooled clones (12T (WT) or 75T (mutant)) as well as stable pooled clones (SK-Mel-28 and A375) either expressing BCL2L12-FLAG (WT, mutant or empty vector) were seeded into 96-well clear bottom opaque plates at 1,000 cells per well.
Cells were incubated 24 hrs prior to exposure to UV light (50kJ) using a UV Stratalinker 2400 (Stratagene). Plates were then incubated for an additional 48 hrs prior to testing for cell viability using Cell-Titer-Glo (cat# G7571). Plates were analyzed on a Thermo Electron Luminoskan reader. Data was then analyzed using Microsoft Excel to generate graphs and statistics. miRNA target site prediction We used the two miRNA target site prediction platforms: PITA (34) and miRanda (35) to search for miRNA target site predictions that overlap the C51T mutated position in BCL2L12. We executed them with default prediction parameters and found that both platforms predict hsa-miR-671-5p to target the wild-type BCL2L12 mRNA overlapping position 51, but not the mutant mRNA.

34
miRNA depletion of endogenous BCL2L12 in melanoma cells A specific miRNA mimetic (hsa-miR-671-5p) was purchased from Sigma Aldrich (HMI0901) which was determined to potentially target human BCL2L12. A negative control scrambled miR (NC) was purchased from Dharmacon (Thermo Fisher Scientific) (CN-001000-01). Using DharmaFECT transfection reagent #1 (T-2001) specific for siRNA or miRNA, melanoma cells were tranfected with 20nM has-miR-671-5p or NC molecules in the presence of OptiMEM-I medium after cells were seeded into 6-well plates at a density of 200,000 cells/well 24 prior to transfection. Cells were incubated for 24 hr post-transfection prior to extraction of miRNA and mRNA and qRT-PCR analysis. Anti-miR-671-5p rescue assay A specific anti-miRNA mimic (anti-hsa-miR-671-5p) was purchased from Qiagen (MIN0003880) which was determined to inhibit the hsa-miR-671-5p mimic. A negative control scrambled miR (NC) was purchased from Dharmacon (Thermo Fisher Scientific). Using DharmaEffect transfection reagent #1 specific for siRNA or miRNA, melanoma cells were co-tranfected with 20nM hsa-miR-671-5p or NC molecules plus either 0nM or 50nM anti-miR-671-5p in the presence of OptiMEM-I medium after cells were seeded into 6-well plates at a density of 200,000 cells/well 24 prior to transfection. Cells were incubated for 24 hr post-transfection prior to extraction of miRNA and mRNA and qRT-PCR analysis. Quantitative real-time PCR of miRNA targeted cell lines miRNA and mRNA was extracted from transiently transfected melanoma cells 75T, 79T, 12T and SK-Mel-28 to assess for knock-down of endogenous BCL2L12 following the manufacturer’s protocol for the miRNeasy Mini Kit (QIAGEN #217004). Total was eluted in 30 μL diethylpyrocarbonate (DEPC)-treated distilled H2O. A total of 1 μg of total RNA was used for single-strand complementary DNA (cDNA) synthesis using a miScript II Reverse Transcription kit (QIAGEN #218193). cDNA was amplified the 5X HiFlex buffer to quantitate in parallel the miRNA and mRNA. To test for loss of BCL2L12 message,
we used 1 μL of diluted cDNA (10ng/l) in the PCR with either BCL2L12 primers or GAPDH primers or mature miR (Table S5) or precursor-miR (QIAGEN #MP00003479) we followed manufacturer’s protocol and mixed primers and cDNA with QuantiTect SYBR Green PCR master mix at a final volume of 10 μl in triplicate (QIAGEN). qRT-PCR analysis was done using the ABI 7900HT Fast Real-Time PCR system (with a standard program of stage 1: 50 °C for 2 min; stage 2: 95 °C for 10 min; stage 3: 40 cycles of 95 °C for 15 s and 60 °C for 1 min). Results were analyzed using Microsoft Excel and GraphPad Prism v5.0.
Taqman assay – Custom Taqman probes were designed by ABI to detect the wild-type version of BCL2L12, mutant version of BCL2L12 (C51T), and an internal control (TBP). Taqman assays were run using the Universal Taqman PCR master mix (2X), the specific probes, cDNA template from each individual clone and DEPC-dH20 in a 10ml volume in triplicate in a 384-well plate and run on a HT-7900 Fast PCR machine (ABI). Data was analyzed and CTs were normalized against TBP samples and used to generate graphically representations. All experiments were repeated in triplicate (n=3).
35
miRNA rescue experiment – A modified form of the hsa-miR-671-5p was custom made from Sigma Aldrich with a single site changed to represent the synonymous mutation found in melanoma. Melanoma cells 12T (WT) and 79T (C51T/F17F) cells were seeded at ~300,000 cells per well in 6-well plates and incubated overnight prior to transient transfection. Cells were transfected with hsa-miR-671-5p (miR), mod-hsa-miR-671-5p (mod-miR) or NC in triplicate and allowed to incubate for 24-36 hrs prior to miRNA/RNA purification. Total miRNA/RNA was amplified using the miScript miRNA cDNA kit from Qiagen and levels of BCL2L12 message was detected using SYBR Green master mix (Qiagen) in triplicate. GAPDH was used as an internal control to normal between samples and to generate graphs using Micorsoft Excel. All experiments were repeated at two-three times. References
1. Palavalli LH, et al. (2009) Analysis of the matrix metalloproteinase family reveals that MMP8 is often mutated in melanoma. Nature genetics 41(5):518-520.
2. Morente MM, et al. (2006) TuBaFrost 2: Standardising tissue collection and quality control procedures for a European virtual frozen tissue bank network. Eur J Cancer 42(16):2684-2691.
3. Davies MA, et al. (2009) Integrated Molecular and Clinical Analysis of AKT Activation in Metastatic Melanoma. Clin Cancer Res 15(24):7538-7546.
4. Pavey S, et al. (2004) Microarray expression profiling in melanoma reveals a BRAF mutation signature. Oncogene 23(23):4060-4067.
5. Castellano M, et al. (1997) CDKN2A/p16 is inactivated in most melanoma cell lines. Cancer research 57(21):4868-4875.
6. Dutton-Regester K AL, Nancarrow DJ, Stark MS, O’Connor L, Lanagan C, Pupo GM, Tembe V, Carter CD, O’Rourke M, Scolyer RA, Mann GJ, Schmidt C, Herington A, Hayward NK (2012) Identification of TFG (TRK Fused Gene) as a putative tumour supressor gene in metastatic melanoma. Genes, Chromosomes and Cancer In Press.
7. Hasel C, Bhanot UK, Heydrich R, Strater J, & Moller P (2005) Parenchymal regression in chronic pancreatitis spares islets reprogrammed for the expression of NFkappaB and IAPs. Lab Invest 85(10):1263-1275.
8. Bhanot U, Kohntop R, Hasel C, & Moller P (2008) Evidence of Notch pathway activation in the ectatic ducts of chronic pancreatitis. The Journal of pathology 214(3):312-319.
9. Li H & Durbin R (2009) Fast and accurate short read alignment with Burrows-Wheeler transform. Bioinformatics (Oxford, England) 25(14):1754-1760.
10. Li H, et al. (2009) The Sequence Alignment/Map format and SAMtools. Bioinformatics (Oxford, England) 25(16):2078-2079.
11. Teer JK, et al. (2010) Systematic comparison of three genomic enrichment methods for massively parallel DNA sequencing. Genome research 20(10):1420-1431.
12. Ajay SS, Parker SC, Abaan HO, Fajardo KV, & Margulies EH (2011) Accurate and comprehensive sequencing of personal genomes. Genome research 21(9):1498-1505.
13. Wei X, et al. (2011) Exome sequencing identifies GRIN2A as frequently mutated in melanoma. Nature genetics 43(5):442-446.
14. Biesecker LG, et al. (2009) The ClinSeq Project: piloting large-scale genome sequencing for research in genomic medicine. Genome research 19(9):1665-1674.
15. Carter H, Samayoa J, Hruban RH, & Karchin R (2010) Prioritization of driver mutations in pancreatic cancer using cancer-specific high-throughput annotation of somatic mutations (CHASM). Cancer biology & therapy 10(6):582-587.

36
16. Cooper GM, et al. (2005) Distribution and intensity of constraint in mammalian genomic sequence. Genome research 15(7):901-913.
17. Thomas DJ, et al. (2007) The ENCODE Project at UC Santa Cruz. Nucleic acids research 35(Database issue):D663-667.
18. Flicek P, et al. (2012) Ensembl 2012. Nucleic acids research 40(Database issue):D84-90. 19. Schmidt D, et al. (2010) Five-vertebrate ChIP-seq reveals the evolutionary dynamics of
transcription factor binding. Science (New York, N.Y 328(5981):1036-1040. 20. Consortium EP, et al. (2012) An integrated encyclopedia of DNA elements in the human
genome. Nature 489(7414):57-74. 21. MacArthur DG, et al. (2012) A systematic survey of loss-of-function variants in human protein-
coding genes. Science (New York, N.Y 335(6070):823-828. 22. Cooper GM, et al. (2010) Single-nucleotide evolutionary constraint scores highlight disease-
causing mutations. Nature methods 7(4):250-251. 23. Dogan RI, Getoor L, Wilbur WJ, & Mount SM (2007) SplicePort--an interactive splice-site
analysis tool. Nucleic acids research 35(Web Server issue):W285-291. 24. Piva F, Giulietti M, Nocchi L, & Principato G (2009) SpliceAid: a database of experimental RNA
target motifs bound by splicing proteins in humans. Bioinformatics (Oxford, England) 25(9):1211-1213.
25. Zhu H, Hasman RA, Young KM, Kedersha NL, & Lou H (2003) U1 snRNP-dependent function of TIAR in the regulation of alternative RNA processing of the human calcitonin/CGRP pre-mRNA. Molecular and cellular biology 23(17):5959-5971.
26. Matys V, et al. (2003) TRANSFAC: transcriptional regulation, from patterns to profiles. Nucleic acids research 31(1):374-378.
27. Sandelin A, Alkema W, Engstrom P, Wasserman WW, & Lenhard B (2004) JASPAR: an open-access database for eukaryotic transcription factor binding profiles. Nucleic acids research 32(Database issue):D91-94.
28. Gotea V, et al. (2010) Homotypic clusters of transcription factor binding sites are a key component of human promoters and enhancers. Genome research 20(5):565-577.
29. Crooks GE, Hon G, Chandonia JM, & Brenner SE (2004) WebLogo: a sequence logo generator. Genome research 14(6):1188-1190.
30. Prickett TD, et al. (2009) Analysis of the tyrosine kinome in melanoma reveals recurrent mutations in ERBB4. Nature genetics 41(10):1127-1132.
31. Scacheri PC, Crawford GE, & Davis S (2006) Statistics for ChIP-chip and DNase hypersensitivity experiments on NimbleGen arrays. Methods Enzymol 411:270-282.
32. Amos-Landgraf JM, et al. (2006) X chromosome-inactivation patterns of 1,005 phenotypically unaffected females. American journal of human genetics 79(3):493-499.
33. Fazioli F, et al. (1993) Eps8, a substrate for the epidermal growth factor receptor kinase, enhances EGF-dependent mitogenic signals. The EMBO journal 12(10):3799-3808.
34. Kertesz M, Iovino N, Unnerstall U, Gaul U, & Segal E (2007) The role of site accessibility in microRNA target recognition. Nature genetics 39(10):1278-1284.
35. John B, et al. (2004) Human MicroRNA targets. PLoS Biol 2(11):e363.

Supporting InformationGartner et al. 10.1073/pnas.1304227110SI TextNISC Comparative Sequencing Program Authors. Jesse Becker, BettyBenjamin, Robert Blakesley, Gerry Bouffard, Shelise Brooks,Holly Coleman, Mila Dekhtyar, Michael Gregory, Xiaobin Guan,Jyoti Gupta, Joel Han, April Hargrove, Shi-ling Ho, Taccara
Johnson, Richelle Legaspi, Sean Lovett, Quino Maduro, CathyMasiello, Baishali Maskeri, Jenny McDowell, CasandraMontemayor, James Mullikin, Morgan Park, Nancy Riebow,Karen Schandler, Brian Schmidt, Christina Sison, Mal Stantripop,James Thomas, Pam Thomas, Meg Vemulapalli, and Alice Young.
Other Supporting Information Files
SI Appendix (PDF)Dataset S1 (XLS)
Gartner et al. www.pnas.org/cgi/content/short/1304227110 1 of 1