Non-coding recurrent mutations in chronic lymphocytic leukaemia
23
ARTICLE doi:10.1038/nature14666 Non-coding recurrent mutations in chronic lymphocytic leukaemia Xose S. Puente 1 , Silvia Bea ` 2 , Rafael Valde ´s-Mas 1 , Neus Villamor 3 , Jesu ´ s Gutie ´rrez-Abril 1 , Jose ´ I. Martı ´n-Subero 4 , Marta Munar 5 , Carlota Rubio-Pe ´rez 6 , Pedro Jares 7 , Marta Aymerich 3 , Tycho Baumann 8 , Rene ´e Beekman 2 , Laura Belver 9 , Anna Carrio 3 , Giancarlo Castellano 2 , Guillem Clot 2 , Enrique Colado 10 , Dolors Colomer 3 , Dolors Costa 3 , Julio Delgado 8 , Anna Enjuanes 7 , Xavier Estivill 11 , Adolfo A. Ferrando 9 , Josep L. Gelpı ´ 5 , Blanca Gonza ´lez 3 , Santiago Gonza ´lez 5 , Marcos Gonza ´lez 12 , Marta Gut 13 , Jesu ´ s M. Herna ´ndez-Rivas 12 , Mo ´nica Lo ´pez-Guerra 3 , David Martı ´n-Garcı ´a 2 , Alba Navarro 2 , Pilar Nicola ´s 14 , Modesto Orozco 5 ,A ´ ngel R. Payer 10 , Magda Pinyol 7 , David G. Pisano 15 , Diana A. Puente 1 , Ana C. Queiro ´s 4 , Vı ´ctor Quesada 1 , Carlos M. Romeo-Casabona 14 , Cristina Royo 2 , Romina Royo 5 , Marı ´a Rozman 3 , Nuria Russin ˜ol 2 , Itziar Salaverrı ´a 2 , Kostas Stamatopoulos 16 , Hendrik G. Stunnenberg 17 , David Tamborero 6 , Marı ´a J. Terol 18 , Alfonso Valencia 15 , Nuria Lo ´pez-Bigas 6 , David Torrents 5 , Ivo Gut 13 , Armando Lo ´pez-Guillermo 8 , Carlos Lo ´pez-Otı ´n 1 1 & Elı ´as Campo 3 1 Chronic lymphocytic leukaemia (CLL) is a frequent disease in which the genetic alterations determining the clinicobiological behaviour are not fully understood. Here we describe a comprehensive evaluation of the genomic landscape of 452 CLL cases and 54 patients with monoclonal B-lymphocytosis, a precursor disorder. We extend the number of CLL driver alterations, including changes in ZNF292, ZMYM3, ARID1A and PTPN11. We also identify novel recurrent mutations in non-coding regions, including the 39 region of NOTCH1, which cause aberrant splicing events, increase NOTCH1 activity and result in a more aggressive disease. In addition, mutations in an enhancer located on chromosome 9p13 result in reduced expression of the B-cell-specific transcription factor PAX5. The accumulative number of driver alterations (0 to $4) discriminated between patients with differences in clinical behaviour. This study provides an integrated portrait of the CLL genomic landscape, identifies new recurrent driver mutations of the disease, and suggests clinical interventions that may improve the management of this neoplasia. CLL is a B-cell neoplasia that exhibits a very heterogeneous course, with some patients following an indolent disease course, clearly contrasting with others experiencing an aggressive disease 1–3 . Patients have been classically categorized in two groups, depending on whether their tumour B cells express B-cell receptor (BCR) immunoglobulin with immunoglobulin heavy variable (IGHV) genes bearing somatic hyper- mutation (IGHV-mutated) or not (IGHV-unmutated) 4 . Further stud- ies have led to the identification of additional biological features with prognostic value for CLL patients 5–8 . However, the molecular mechan- isms responsible for the initiation and heterogeneous evolution of CLL remain largely unknown. Whole-genome sequencing (WGS) and whole-exome sequencing (WES) studies in CLL patients have identified recurrently mutated genes such as NOTCH1, SF3B1, TP53, BIRC3 and POT1, and delineated clonal evolution events in this neoplasia 9–15 . Moreover, recent works have profiled the transcriptome and the DNA methylome of many CLL cases 16–18 . Nevertheless, these studies have unveiled a high level of molecular heterogeneity, thus creating the need for integrated analysis of different genomic parameters in a larger number of patients. In this work, and as part of the International Cancer Genome Consortium (ICGC) project 19 , we have performed a comprehensive analysis of the genetic alterations driving the oncogenic transformation in 506 patients with monoclonal B-lymphocytosis (MBL) or CLL. We have also carried out additional genomic studies involving single nucleotide polymorph- ism (SNP) arrays, DNA methylation arrays, RNA sequencing (RNA-seq) analyses and gene expression arrays. Finally, we have performed clinical studies aimed at translating the observed molecular alterations into clin- ical applications for CLL patients. Mutational signatures in CLL subtypes We studied pre-treatment tumour and matched non-tumour samples from 506 patients (452 CLL and 54 MBL): 317 (62%) were IGHV-mutated (IGHV-MUT), 179 (35%) IGHV-unmutated (IGHV- UNMUT), and 10 (2%) undetermined (Extended Data Table 1 and Supplementary Table 1). We performed WGS of 150 tumour/normal pairs, and WES of 440 cases (including 84 with both WGS and WES data). Somatic mutations analysed using the Sidro ´n pipeline 10 revealed the presence of 359,456 substitutions and small indels in 1These authors jointly supervised this work. 1 Departamento de Bioquı ´mica y Biologı ´a Molecular, Instituto Universitario de Oncologı ´a (IUOPA), Universidad de Oviedo, 33006 Oviedo, Spain. 2 Institut d’Investigacions Biome ` diques August Pi i Sunyer (IDIBAPS), 08036 Barcelona, Spain. 3 Unitat de Hematologı ´a, Hospital Clı ´nic, IDIBAPS, Universitat de Barcelona, 08036 Barcelona, Spain. 4 Departament d’Anatomı ´a Patolo ` gica, Microbiologı ´a i Farmacologı ´a, Universitat de Barcelona, 08036 Barcelona, Spain. 5 Programa Conjunto de Biologı ´a Computacional, Barcelona Supercomputing Center (BSC), Institut de Recerca Biome ` dica (IRB), Spanish National Bioinformatics Institute, Universitat de Barcelona, 08028 Barcelona, Spain. 6 Research Unit on Biomedical Informatics, Department of Experimental and Health Sciences, Universitat Pompeu Fabra, 08003 Barcelona, Spain. 7 Unidad de Geno ´ mica, IDIBAPS, 08036 Barcelona, Spain. 8 Servicio de Hematologı ´a, Hospital Clı ´nic, IDIBAPS, 08036 Barcelona, Spain. 9 Institute for Cancer Genetics, Columbia University, New York 10032, USA. 10 Servicio de Hematologı ´a, Hospital Universitario Central de Asturias, 33011 Oviedo, Spain. 11 Center for Genomic Regulation (CRG), Pompeu Fabra University (UPF), Hospital del Mar Research Institute (IMIM), 08003 Barcelona, Spain. 12 Servicio de Hematologı ´a, IBSAL-Hospital Universitario de Salamanca, Centro de Investigacio ´ n del Ca ´ ncer, Universidad de Salamanca-CSIC, 37007 Salamanca, Spain. 13 Centro Nacional de Ana ´ lisis Geno ´ mico, Parc Cientı ´fic de Barcelona, 08028 Barcelona, Spain. 14 Ca ´ tedra Inter-Universitaria de Derecho y Genoma Humano, Universidad de Deusto, Universidad del Paı ´s Vasco, 48007 Bilbao, Spain. 15 Structural Biology and Biocomputing Programme, Spanish National Cancer Research Centre (CNIO), Spanish National Bioinformatics Institute, 28029 Madrid, Spain. 16 Institute of Applied Biosciences, Center for Research and Technology Hellas, 57001 Thermi, Thessaloniki, Greece. 17 Department of Molecular Biology, Faculty of Science, Nijmegen Centre for Molecular Life Sciences, Radboud University Nijmegen, 6500 HB Nijmegen, The Netherlands. 18 Servicio de Hematologı ´a, Hospital Clı ´nico de Valencia, 46010 Valencia, Spain. 00 MONTH 2015 | VOL 000 | NATURE | 1 G2015 Macmillan Publishers Limited. All rights reserved
-
Upload
independent -
Category
Documents
-
view
0 -
download
0
Transcript of Non-coding recurrent mutations in chronic lymphocytic leukaemia

ARTICLEdoi:10.1038/nature14666
Non-coding recurrent mutations inchronic lymphocytic leukaemiaXose S. Puente1, Silvia Bea2, Rafael Valdes-Mas1, Neus Villamor3, Jesus Gutierrez-Abril1, Jose I. Martın-Subero4, Marta Munar5,Carlota Rubio-Perez6, Pedro Jares7, Marta Aymerich3, Tycho Baumann8, Renee Beekman2, Laura Belver9, Anna Carrio3,Giancarlo Castellano2, Guillem Clot2, Enrique Colado10, Dolors Colomer3, Dolors Costa3, Julio Delgado8, Anna Enjuanes7,Xavier Estivill11, Adolfo A. Ferrando9, Josep L. Gelpı5, Blanca Gonzalez3, Santiago Gonzalez5, Marcos Gonzalez12,Marta Gut13, Jesus M. Hernandez-Rivas12, Monica Lopez-Guerra3, David Martın-Garcıa2, Alba Navarro2, Pilar Nicolas14,Modesto Orozco5, Angel R. Payer10, Magda Pinyol7, David G. Pisano15, Diana A. Puente1, Ana C. Queiros4, Vıctor Quesada1,Carlos M. Romeo-Casabona14, Cristina Royo2, Romina Royo5, Marıa Rozman3, Nuria Russinol2, Itziar Salaverrıa2,Kostas Stamatopoulos16, Hendrik G. Stunnenberg17, David Tamborero6, Marıa J. Terol18, Alfonso Valencia15,Nuria Lopez-Bigas6, David Torrents5, Ivo Gut13, Armando Lopez-Guillermo8, Carlos Lopez-Otın11 & Elıas Campo31
Chronic lymphocytic leukaemia (CLL) is a frequent disease in which the genetic alterations determining theclinicobiological behaviour are not fully understood. Here we describe a comprehensive evaluation of the genomiclandscape of 452 CLL cases and 54 patients with monoclonal B-lymphocytosis, a precursor disorder. We extend thenumber of CLL driver alterations, including changes in ZNF292, ZMYM3, ARID1A and PTPN11. We also identify novelrecurrent mutations in non-coding regions, including the 39 region of NOTCH1, which cause aberrant splicing events,increase NOTCH1 activity and result in a more aggressive disease. In addition, mutations in an enhancer located onchromosome 9p13 result in reduced expression of the B-cell-specific transcription factor PAX5. The accumulativenumber of driver alterations (0 to $4) discriminated between patients with differences in clinical behaviour. Thisstudy provides an integrated portrait of the CLL genomic landscape, identifies new recurrent driver mutations of thedisease, and suggests clinical interventions that may improve the management of this neoplasia.
CLL is a B-cell neoplasia that exhibits a very heterogeneous course, withsome patients following an indolent disease course, clearly contrastingwith others experiencing an aggressive disease1–3. Patients have beenclassically categorized in two groups, depending on whether theirtumour B cells express B-cell receptor (BCR) immunoglobulin withimmunoglobulin heavy variable (IGHV) genes bearing somatic hyper-mutation (IGHV-mutated) or not (IGHV-unmutated)4. Further stud-ies have led to the identification of additional biological features withprognostic value for CLL patients5–8. However, the molecular mechan-isms responsible for the initiation and heterogeneous evolution of CLLremain largely unknown.
Whole-genome sequencing (WGS) and whole-exome sequencing(WES) studies in CLL patients have identified recurrently mutatedgenes such as NOTCH1, SF3B1, TP53, BIRC3 and POT1, and delineatedclonal evolution events in this neoplasia9–15. Moreover, recent workshave profiled the transcriptome and the DNA methylome of many CLLcases16–18. Nevertheless, these studies have unveiled a high level ofmolecular heterogeneity, thus creating the need for integrated analysisof different genomic parameters in a larger number of patients. In this
work, and as part of the International Cancer Genome Consortium(ICGC) project19, we have performed a comprehensive analysis of thegenetic alterations driving the oncogenic transformation in 506 patientswith monoclonal B-lymphocytosis (MBL) or CLL. We have also carriedout additional genomic studies involving single nucleotide polymorph-ism (SNP) arrays, DNA methylation arrays, RNA sequencing (RNA-seq)analyses and gene expression arrays. Finally, we have performed clinicalstudies aimed at translating the observed molecular alterations into clin-ical applications for CLL patients.
Mutational signatures in CLL subtypesWe studied pre-treatment tumour and matched non-tumoursamples from 506 patients (452 CLL and 54 MBL): 317 (62%) wereIGHV-mutated (IGHV-MUT), 179 (35%) IGHV-unmutated (IGHV-UNMUT), and 10 (2%) undetermined (Extended Data Table 1 andSupplementary Table 1). We performed WGS of 150 tumour/normalpairs, and WES of 440 cases (including 84 with both WGS andWES data). Somatic mutations analysed using the Sidron pipeline10
revealed the presence of 359,456 substitutions and small indels in
1These authors jointly supervised this work.
1Departamento de Bioquımica y Biologıa Molecular, Instituto Universitario de Oncologıa (IUOPA), Universidad de Oviedo, 33006 Oviedo, Spain. 2Institut d’Investigacions Biomediques August Pi i Sunyer(IDIBAPS), 08036 Barcelona, Spain. 3Unitat de Hematologıa, Hospital Clınic, IDIBAPS, Universitat de Barcelona, 08036 Barcelona, Spain. 4Departament d’Anatomıa Patologica, Microbiologıa iFarmacologıa, Universitat de Barcelona, 08036 Barcelona, Spain. 5Programa Conjunto de Biologıa Computacional, Barcelona Supercomputing Center (BSC), Institut de Recerca Biomedica (IRB), SpanishNational Bioinformatics Institute, Universitat de Barcelona, 08028 Barcelona, Spain. 6Research Unit on Biomedical Informatics, Department of Experimental and Health Sciences, Universitat PompeuFabra, 08003 Barcelona, Spain. 7Unidad de Genomica, IDIBAPS, 08036 Barcelona, Spain. 8Servicio de Hematologıa, Hospital Clınic, IDIBAPS, 08036 Barcelona, Spain. 9Institute for Cancer Genetics,Columbia University, New York 10032, USA. 10Servicio de Hematologıa, Hospital Universitario Central de Asturias, 33011 Oviedo, Spain. 11Center for Genomic Regulation (CRG), Pompeu Fabra University(UPF), Hospital del Mar Research Institute (IMIM), 08003 Barcelona, Spain. 12Servicio de Hematologıa, IBSAL-Hospital Universitario de Salamanca, Centro de Investigacion del Cancer, Universidad deSalamanca-CSIC, 37007 Salamanca, Spain. 13Centro Nacional de Analisis Genomico, Parc Cientıfic de Barcelona, 08028 Barcelona, Spain. 14Catedra Inter-Universitaria de Derecho y Genoma Humano,Universidad de Deusto, Universidad del Paıs Vasco, 48007 Bilbao, Spain. 15Structural Biology and Biocomputing Programme, Spanish National Cancer Research Centre (CNIO), Spanish NationalBioinformatics Institute, 28029 Madrid, Spain. 16Institute of Applied Biosciences, Center for Research and Technology Hellas, 57001 Thermi, Thessaloniki, Greece. 17Department of Molecular Biology,Faculty of Science, Nijmegen Centre for Molecular Life Sciences, Radboud University Nijmegen, 6500 HB Nijmegen, The Netherlands. 18Servicio de Hematologıa, Hospital Clınico de Valencia, 46010Valencia, Spain.
0 0 M O N T H 2 0 1 5 | V O L 0 0 0 | N A T U R E | 1
G2015 Macmillan Publishers Limited. All rights reserved

WGS analyses (240–5,416 per tumour), and an average mutationburden of 0.87 mutations per megabase (Mb) (Extended Data Fig. 1and Supplementary Table 2). CLL and MBL samples had a similarmutation burden (0.87 versus 0.89 mutations Mb21, respectively,P 5 0.8), and were considered together for WGS analysis. The num-ber of somatic substitutions (excluding IG loci) was higher in IGHV-MUT tumours than in IGHV-UNMUT cases (2,847 versus 1,975,P , 3 3 1028) (Extended Data Fig. 1). Three main mutational signa-tures were identified (Extended Data Fig. 1): an age-related signatureinvolving C-to-T transitions at CpG sites; signature 2, characterizedby T:A . G:C transversions; and an activation-induced cytidine dea-minase (AID) signature20. This latter pattern was only detected onIG loci, although we also confirmed AID-induced mutations insome off-target genes highly expressed in the germinal centre21,22.Signature 2 was almost exclusively present in IGHV-MUT tumours,and its presence clearly separated IGHV-MUT from IGHV-UNMUTtumours (Extended Data Fig. 1).
Landscape of somatic mutationsWe combined somatic mutations from the 506 tumour/normal pairsdetected by either WGS or WES (excluding IG genes), resulting in atotal of 13,631 somatic mutations affecting protein-coding genes
(average 26.9 per tumour) and 951 copy number alterations(CNAs) (average 1.9) (Fig. 1 and Supplementary Table 3). We iden-tified 36 genes (tier 1) as recurrently mutated in CLL (false discoveryrate (FDR) , 10%), and 23 additional genes (tier 2) were significantlymutated in one subgroup (IGHV-MUT or IGHV-UNMUT), hadrecurrent or truncating mutations, or had driver mutations describedin other malignancies (Extended Data Table 2). Two genes (BTG2 andDTX1) were excluded as they are known targets of the SHMmachinery21. The remaining genes included most of the drivers prev-iously described by different WES studies9,11,13. The most frequentlymutated gene in CLL was NOTCH1 (57 cases, 12.6%), followed byATM (11%), SF3B1 (8.6%), BIRC3 (8.8%), CHD2 (6%), TP53 (5.3%)and MYD88 (4%). Furthermore, we identified 12 novel genes recur-rently mutated in CLL and not previously linked to this disease,including ZNF292, ARID1A, ZMYM3 and PTPN11. Most CLL drivergenes were preferentially mutated in IGHV-UNMUT tumours andhad subclonal mutations11 (Supplementary Fig. 1). Notably, a similarfrequency of mutated drivers was found in CLL and MBL cases ofsimilar IGHV gene SHM status (Extended Data Table 2).
We also identified some genes (tier 3) that probably contain drivermutations but were found in three or less CLL patients. This is the caseof activating mutations in the oncogenes KRAS and NRAS, truncating
Mutations
Truncating
Synonymous
Non-synonymous
Deletion
Gain
MB
L/C
LL
IGH
V M
UT
Co
mp
lex
Tri12
–1
3q
14
t(14;1
8)
–18p
+2p
16
AS
XL1
BIR
C3
TRA
F3E
GR
2N
FKB
2N
FKB
IEB
RA
FC
CN
D2
PTP
N11
Oth
er
SE
TD2
SY
NE
1Z
MY
M3
AR
ID1A
SE
TD1A
XP
O1
CN
OT3
ME
D12
NX
F1C
HD
2
ATR
XS
F3B
1Z
NF2
92M
GA
DD
X3X
BC
OR
PAX
5A
TMTP
53P
OT1
NO
TCH
1FB
XW
7M
YD
88K
LHL6
IRF4
t(14;1
8)
–18p
+2p
16
AS
XL1
BIR
C3
TRA
F3E
GR
2N
FKB
2N
FKB
IEB
RA
FC
CN
D2
PTP
N11
Oth
er
SE
TD2
SY
NE
1Z
MY
M3
AR
ID1A
SE
TD1A
XP
O1
CN
OT3
ME
D12
NX
F1C
HD
2
ATR
XS
F3B1
ZN
F292M
GA
DD
X3X
BC
OR
PAX
5A
TMTP
53P
OT1
NO
TCH
1FB
XW
7M
YD
88K
LHL6
IRF4 60 40 20
Mutated
cases (%)
NOTCH1 signalling
B-cell signalling
DN
A d
amag
e response
RN
A m
eta
bo
lism
No recurrent alteration
13q d
elet
ionC
ell
cyc
le
NF-κ
B s
ignalli
ng
Geno
me/c
hro
matin s
tructu
re
5%
10%
NOTCH1 signalling
NOTCH1
MGACNOT3MED12NXF1ZNF292
TRAF3
BIRC3
NFKB2
EGR2NFKBIENKAPDDX3X
XPO1
SF3B1Spliceosome
mRNA export
Exon Exon
Exon Exon
FBXW7TLR2
MYD88 BCL6BCORKLHL6
IRF4IKZF3
POT1
ARID1AZMYM3SETD1AHIST1H1B
ASXL1SETD2SYNE1
CHD2MLL2
ATMATR TP53
PAX5
CD79A/CD79B
IRAK1SPEN CREBBP
RNA metabolism NF-κB signalling Cell cycle Apoptosis
B-cell signalling DNA damage response Genome/chromatin structure
PTPN11
KRAS/NRAS
BRAF
ATM TP53
CCND2
CDKN1B CDKN2A
Proliferation
TP53
BAX
ANKHD1
BCR
Figure 1 | Significantly mutated genes and pathways. The outer layerrepresents the number of truncating, non-synonymous and synonymousmutations for 506 CLL (grey) and MBL (black) cases. Clinical classification aswell as IGHV-status is shown on the two outermost layers. Inner layers
show the most recurrently mutated genes grouped according to the biologicalpathways involved (bottom). The percentage of cases with mutations in eachgene is shown on the right.
2 | N A T U R E | V O L 0 0 0 | 0 0 M O N T H 2 0 1 5
G2015 Macmillan Publishers Limited. All rights reserved
RESEARCH ARTICLE

mutations in the tumour suppressors CDKN1B and CDKN2A, andrecurrent mutations in the transcription factor IKZF3. Mutations incomponents of the BCR and Toll-like receptor pathway were exclu-sively present in IGHV-MUT tumours. They included those inMYD88, CD79A, CD79B, TLR2 and IRAK1, detected in 22 of the278 IGHV-MUT cases, but in none of the 166 IGHV-UNMUT CLLpatients (P 5 4.1 3 1025), confirming the importance of the BCR andToll-like receptor pathways both in CLL pathobiology and as thera-peutic targets23. Collectively, eight main pathways are frequentlyaltered in CLL, including BCR signalling, cell cycle regulation, apop-tosis, DNA damage response, chromatin remodelling, NF-kB signal-ling, NOTCH1 signalling, and RNA metabolism (Fig. 1).
DNA structural alterationsAnalysis of structural variants confirmed the presence of known CNAssuch as loss of 13q14, 11q22-q23, 17p, 6q15-q21 and trisomy 12(Extended Data Fig. 2 and Supplementary Table 4). In addition, weidentified novel candidate CLL driver genes in regions of recurrentchromosomal alterations (Fig. 1). They included deletions involvingZNF292 at 6q15 (2.4%), deletions of 2q37 encompassing SP140 andSP110, loss of 3p21 (2%) affecting SMARCC1 and SETD2, and loss of10q24 (1.8%) involving NFKB2 (Supplementary Fig. 2).
Unlike other B-cell malignancies, translocations involving IGgenes were uncommon in CLL with the exception of BCL2 rearrange-ments (10 cases). They occurred exclusively in IGHV-MUT cases,and resulted in overexpression of BCL2 and recruitment of theSHM machinery (Extended Data Fig. 3). Analysis of WGS data usingSMUFIN24 also revealed the presence of 147 interchromosomal trans-locations in 43 out of 148 cases (Supplementary Table 5). Recurrenttranslocations involving chromosome 13q14 with different chromo-somal partners and associated with deletion or disruption of themicroRNA cluster miR-15a/miR-16 were identified in nine cases(P , 1028). We also detected 15 non-recurrent chromosomal trans-locations, one of them involving the IG locus (IGH-CBFA2T3), and14 predicted to originate in chimaeric genes, five of which could beconfirmed by RNA-seq (Supplementary Table 5).
Complex rearrangements (chromothripsis/chromoplexy)25,26 wereidentified in 15 out of 452 CLL cases (Extended Data Fig. 3), beingmore frequent in IGHV-UNMUT than in IGHV-MUT tumours(6% versus 1.8%, P , 0.05). Although these complex alterations didnot result in any recurrent rearrangement, we observed involvementof chromosome 13 in 4 out of 15 tumours, resulting in mir-15a/mir-16loss. Similar to previous studies27, mutations in TP53 were more fre-quent in tumours with chromothripsis (26% versus 4.6%, P , 0.006).Furthermore, SETD2 inactivation was more frequent in CLL cases
with chromothripsis than in non-chromothriptic cases (26% versus1.4%, P , 2 3 1024).
This analysis revealed significant relationships between severalalterations, including co-occurrence of NOTCH1 mutations andchromosome 12 trisomy28, trisomy 12 with trisomy 18 (q , 0.01),and the mutually exclusive pattern of 13q14 deletion and trisomy12 (q , 0.01). We also observed a higher co-occurrence of mutationsin NOTCH1 with those in MGA (q , 0.01), BCOR (q , 0.01) andBIRC3 (q , 0.05), or gain of 2p16 with loss of 18p (q , 0.01), amongothers (Supplementary Fig. 3).
Mutations in non-coding regionsThe presence of functional mutations outside of protein-codingregions remains an open question in cancer research29. We observedin one CLL case a previously described mutation in the TERT pro-moter (C228T)29. Eight mutations in mir-142 were identified in fivecases (Supplementary Fig. 4), with seven of them within AID targetconsensus (WRCY or WA), reinforcing it as a target of the SHM30.We also identified 88 mutations in non-coding regions present in atleast two WGS cases (Supplementary Table 6). Most of them werelocated either within hypermutated late-replication regions31, orwithin the 59-region of BACH2, BCL6, BTG2, CXCR4 and TCL1A,genes known to undergo SHM during the germinal centre reac-tion21,22. Most mutations were within the AID target sequence(WRCY), probably reflecting the passage of the respective progenitorcells through the germinal centre.
Notably, the most frequent recurrent non-coding mutation wasdetected in the 39 UTR of NOTCH1 (chr9: 139390152T . C), presentin 4 of the 150 cases with WGS data (Fig. 2a). Sequencing of thisregion in 356 cases with only WES data revealed seven additionaltumours with the same mutation, and two cases with a mutation sevenor nine bases downstream of the original one. RNA-seq from six ofthese 39 UTR NOTCH1-mutated tumours confirmed the presence of anovel splicing event within the last exon of NOTCH1 (Fig. 2a), whichwas absent in 290 tumours without these mutations (Extended DataFig. 4). This splicing event occurred preferentially between a crypticdonor site located in the coding region of the last exon of NOTCH1and a newly created acceptor site in the 39 UTR, resulting in a deletionthat includes the last 158 coding bases. Nevertheless, some splicingevents occurred between the canonical donor site on exon 33 and thenewly created acceptor site in the 39 UTR of exon 34 (Fig. 2a). Reversetranscription PCR (RT–PCR) analysis confirmed the presence of thisaberrant splicing only in cases with mutations in the 39 UTR (Fig. 2b).This within-exon splicing is predicted to remove a PEST domain ofNOTCH1 and to increase protein stability, as in the previously
b
a
d
c
NOTCH1 WT NOTCH1 3′UTR mut
2 19
5
64
1 11
34
14
30
11
41
14
48
14
91
14
1
27
7
177 bp
139390152
Exon 33
Exon 34
3′UTR139390145
AGGT
139390143 Cryptic donor site
PEST
p.P2514Rfs*4
530 bp
CAGAATCCAGACAG
14121086420
1.0
0.8
0.6
0.4
0.2
014121086420
1.0
0.8
0.6
0.4
0.2
0
e
Pro
bab
ility
Pro
bab
ility
Overall survival (years)Time to treatment (years)
NOTCH1 WTNOTCH1 coding mut
NOTCH1 3′UTR mut
NOTCH1 WT
NOTCH1 coding mut
NOTCH1 3′UTR mut
NOTCH1cleaved
β-actin
15 166 64 1448 1491
NOTCH1p.P2514Rfs*4
NOTCH1WT
NOTCH13′UTR mut
RNA-seqreads
Figure 2 | Activating mutations in the 39 UTRnon-coding region of NOTCH1. a, Mutant basesare shown in red and the number of casesdenoted by arrowheads. Aberrant spliced readsdetected by RNA-seq (red) are shown below.b, RT–PCR amplification shows the expected177-base-pair (bp) band in tumours with therecurrent 139390152T . C mutation, and a smallerone in cases with the 139390145 and 139390143mutations. WT, wild type. c, Western blot analysisshowing the accumulation of a lower molecularmass NOTCH1 protein in CLL cells with thep.P2514Rfs*4 or the 39 UTR mutation. b-actin wasused as loading control. d, e, Kaplan–Meier plotof time-to-treatment (d) or overall survival (e) ofCLL patients grouped on the basis of mutationsin the 39 UTR of NOTCH1, the presence ofNOTCH1 coding mutations, or NOTCH1wild type.
0 0 M O N T H 2 0 1 5 | V O L 0 0 0 | N A T U R E | 3
G2015 Macmillan Publishers Limited. All rights reserved
ARTICLE RESEARCH

described p.P2514Rfs*4 NOTCH1 mutation10. Western blot analysisconfirmed the presence of a smaller molecular mass band in 39-UTR-and p.P2514Rfs*4-mutated cells, which was absent in cells withoutmutations in NOTCH1 (Fig. 2c). Immunohistochemical analysisshowed a strong NOTCH1 nuclear signal in tumour cells frompatients with 39 UTR or p.P2514Rfs*4 mutations (Extended DataFig. 4). All cases with mutations in the 39 UTR of NOTCH1 belongedto the IGHV-UNMUT subgroup, accounting for up to 6.7% (12 out of179) of all IGHV-UNMUT cases. Patients with 39 UTR NOTCH1mutations had features of adverse prognosis (Extended Data Fig. 4)and behaved similarly to patients with coding mutations in NOTCH1in terms of the time to first treatment (TTT) and overall survival(Fig. 2d, e).
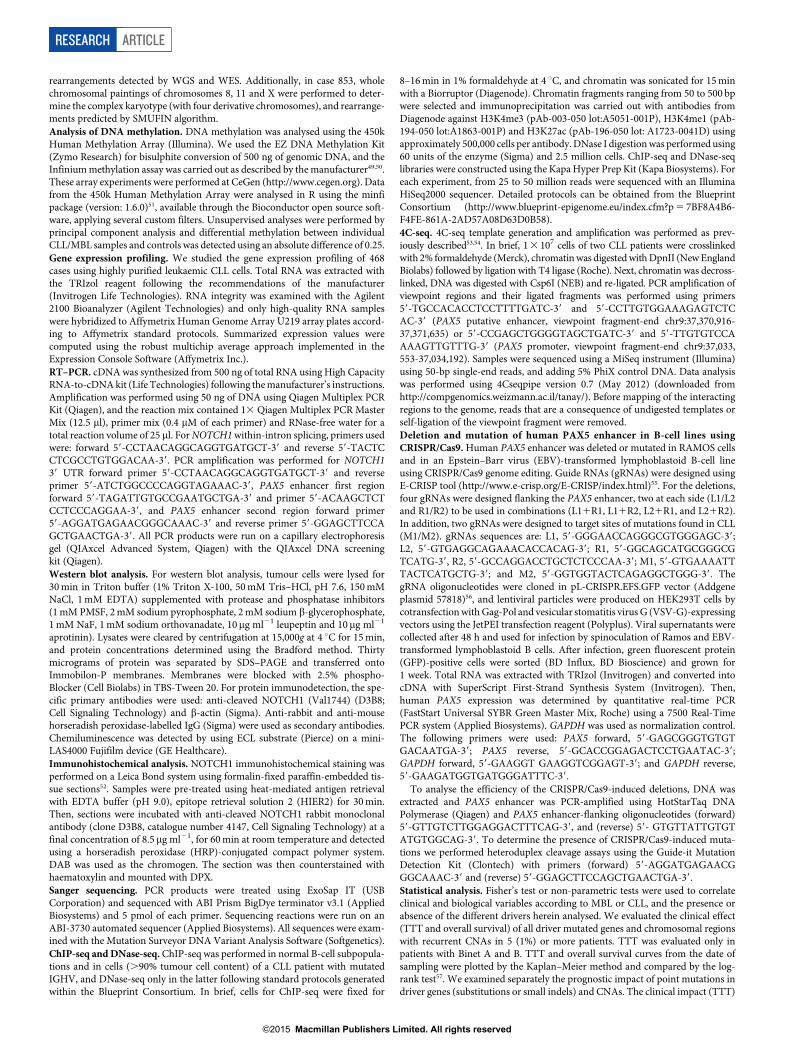
We further explored the presence of genome regions with highmutational density and found 24 loci enriched in somatic mutations(Fig. 3a). Most of them correspond either to recurrently mutatedgenes in CLL or to known targets of the SHM process. However, weidentified a densely mutated cluster in a small intergenic region ofchromosome 9p13, in which 17 different tumours had somaticmutations (Fig. 3b). This region is enriched for both lymphocyte-specific transcription factor binding sites and histone marksrelated to enhancer elements only in a lymphoblastoid B-cell line(Supplementary Fig. 5). DNase-seq and chromatin immunoprecipi-tation sequencing (ChIP-seq) analysis in normal B cells and CLL casesrevealed that the region contains an active enhancer characterized bya DNase I hypersensitive site and nucleosomes containing histone 3Lys4 methylation (H3K4me1) and H3K27 acetylation (H3K27ac)(Fig. 3b and Supplementary Fig. 5). Chromosome conformation cap-ture sequencing (4C-seq) analysis32 in tumour cells from two CLLpatients revealed that this potential enhancer shows high three-dimensional contact frequencies extending towards the telomere upto the PAX5 locus, located 330 kilobases (kb) away (Fig. 3c andSupplementary Fig. 5). Expression analysis of 15 genes located within1 Mb of this element revealed that the only gene showing a significant
expression difference correlated with the presence of mutationswithin the putative enhancer region was indeed PAX5 (averageexpression 87 versus 131, P 5 1.9 3 1024) (Extended Data Fig. 5).PAX5 encodes a transcription factor that has an essential role inB-cell differentiation33 and, based on the evidence provided above,is the most likely target of the identified enhancer region. CRISPR/Cas9-based genome editing of this region allowed us to demonstratethat either the introduction of a specific point mutation, or the dele-tion of this putative enhancer in a lymphoblastoid B-cell line or inRAMOS cells, resulted in a 40% reduction in the expression of PAX5(Extended Data Fig. 6).
Sequencing of this region in all CLL cases with WES data identified25 new cases with somatic mutations. We also found somatic muta-tions in this enhancer in diffuse large B-cell lymphomas (29%, 26out of 89), follicular lymphomas (23%, 20 out of 86) and mantle-celllymphomas (5%, 3 out of 66) (Supplementary Table 7). Interestingly,84% of CLL cases with mutations in this enhancer belong to theIGHV-MUT subgroup, accounting for up to 13% of IGHV-MUTCLL cases. Mutations in the PAX5 enhancer were the only recurrentalteration observed in 7 cases, while in 11 tumours this alteration wasonly combined with 13q14 deletion, raising the possibility that PAX5enhancer mutations might constitute driver events contributing to thedevelopment of these tumours.
Integrative analysisWe then integrated the standard genetic classification of CLL witha recent patient categorization in three subgroups based on a DNAmethylation signature of naive and memory B cells17,34 (Supple-mentary Table 1). The three epigenetic subgroups showed a distinctdistribution of genetic changes, IGHV gene repertoire and stereo-typed B-cell receptors (Extended Data Fig. 7). The intermediate grouphad moderate IGHV mutation levels, an intermediate contribution ofsignature 2 mutations, higher frequencies of SF3B1 and MYD88mutations, biased usage of the IGHV-3-21 and IGHV-1-18 genes
Density s
co
reH
isto
ne m
ark
enrichm
ent
Window coverage 36,500,000 37,000,000
Viewpoint
37,500,000 38,000,000 38,500,000
1 2 3 4 5 6 7 8 9 10 11 12 13 14 15 16 17 18 19 20 21 22
DNase I
H3K27ac
H3K4me1
H3K4me3
37,366,000 37,368,000 37,370,000 37,372,000 37,374,000 37,376,000
36,500,000
80th p%
20th p%1
0.10.01
0.001
Median
GN
E
RN
F38
ME
LK
PAX
5
ZC
CH
C7
GR
HP
RZ
BTB
5P
OLR
1EFB
X01
0TO
MM
5
FRM
PD
1
EX
OS
C3
DC
AF1
0
SH
B
ALD
H1B
1
AN
KR
D18
A
37,000,000 37,500,000 38,000,000 38,500,000
IGK locus IGL locus
PAX5 enhancer
BTG2
BCL6
BACH2
DTX1/BCL7AMIR142
S1PR2
BCL2
IRF8LRMP
ZFP36L1
TCL1A
CSMD3
CXCR4
SF3B1
PDE4D
c7orf10 PCDH15
BIRC3
NOTCH10.30
0.25
0.20
0.15
0.10
100
80
60
40
20
0
IGH locus
a
b
c
Figure 3 | Identification of somatic mutationsin a PAX5 enhancer. a, Regions with a highdensity of somatic mutations in 150 WGS analyses.Regions correspond to recurrently mutated genes(green), targets of SHM (red/orange), and otherregions (blue). b, Detailed view of a 9p13 regionshowing the accumulation of somatic mutations(arrowheads) in CLL tumours as well as DNase Ihypersensitivity and histone H3K27ac, H3K4me1and H3K4me3 enrichment from CLL tumour 110.c, 4C-seq analysis in CLL cells showing theinteraction frequencies of the enhancer with thesurrounding regions. p%, percentile.
4 | N A T U R E | V O L 0 0 0 | 0 0 M O N T H 2 0 1 5
G2015 Macmillan Publishers Limited. All rights reserved
RESEARCH ARTICLE

and increased frequency of stereotyped subset #2. These resultssupport the hypothesis that this group has a distinct genetic andepigenetic makeup17,34–36. We also found a highly significant correla-tion (r 5 0.64, P , 0.001) between the number of WGS mutations percase and the number of CpGs showing differential methylation ascompared to naive B cells (Extended Data Fig. 7). Similarly, the pro-portion of signature 2 mutations was also correlated with differentialmethylation in IGHV-MUT cases.
MBL cases were indistinguishable at the genomic, transcriptomicand epigenomic level from CLL cases assigned to the same IGHVsubgroup (Extended Data Fig. 7 and Extended Data Table 2), inaccordance with the overlapping biological features of both processes.Notably, the burden of driver alterations was significantly lower inpatients with MBL than with CLL (1.2 versus 1.7, for IGHV-MUTcases, P 5 8 3 1024), consistent with a model in which MBL/CLLevolution is accomplished by the progressive accumulation of driveralterations.
Clinical implicationsOur data support the hypothesis that the observed genomic differ-ences between the two major molecular subgroups of CLL might be inpart responsible for their different outcome. The average number ofdriver mutations in IGHV-UNMUT tumours was higher than inIGHV-MUT cases (3.5 versus 1.7, P , 10219), despite the 44% highermutational burden of IGHV-MUT tumours. We found that 88% ofcases had at least one driver mutation, with almost all IGHV-UNMUT tumours containing at least one driver alteration, while asmaller fraction was found in the IGHV-MUT subgroup (96% versus83%, P , 5 3 1025).
We evaluated the influence of the presence of each alteration on theTTT and overall survival from the time of sampling. The mutation ofseveral drivers and CNAs was significantly correlated with an adverseprognosis, in some cases independently from Binet stage and IGHVmutational status (Fig. 4a, Extended Data Fig. 8 and SupplementaryTable 8). We confirmed the independent prognostic value of knowngene mutations (SF3B1 and TP53), and identified novel independent
prognostic drivers for both shorter TTT (BRAF, ZMYM3, IRF4,NFKB2, 20p deletion, and 2p16 and 5q34 gains), and overall survival(ASXL1, POT1 and 14q24 deletion). Remarkably, the accumulativenumber of drivers (0 to $4) per tumour had a progressively worseeffect on outcome that could discriminate patient subsets differing bymore than 10 years in the median TTT, independently of IGHVstatus and Binet stage. They also showed prognostic value for overallsurvival, although not independent in the multivariate analysis(Fig. 4b, c). Finally, we examined the potential druggability of thealterations in genes and pathways identified in CLL patients37, findingcandidate drugs for 19 of the 59 driver genes in 42% of the CLLcases (190 out of 452) (Supplementary Fig. 6 and SupplementaryTables 9 and 10).
DiscussionIn this work, we have provided a comprehensive and integratedmolecular characterization of CLL. We have also unveiled new bio-logical aspects of this disease and identified novel driver genes pre-sumably implicated in its pathogenesis. The large number of differentgenomic alterations found in our cohort illustrates the enormousbiological heterogeneity of CLL. Notably, the use of WGS has allowedus to identify recurrent mutations in non-coding regions, includingthe 39 UTR of NOTCH1 and a PAX5 enhancer, resulting in markedalterations in the activity of these transcription factors of well-knownimportance in leukaemia and other malignancies38,39. Previous studieshave shown the effect of NOTCH1 mutations in CLL prognosis10,40.However, these studies may seriously underestimate the trueincidence of NOTCH1 deregulation in CLL, given our finding thatabout 20% of NOTCH1-mutated tumours contain mutations in the 39
non-coding region. These findings emphasize the value of largegenome-wide studies to discover new molecular alterations thatmay have a profound effect on cancer development and progression.
The evaluation of putative associations between these molecularalterations and the clinicopathological features of our cohort of CLLpatients has been challenging owing to the low frequency of manysignificantly mutated genes. Patients in which no recurrent alterations
–2q37
Overall survivalHazard ratio Hazard ratio
Time to treatmenta
–14q24
ASXL1+5q34
POT1NOTCH1
–11q/BIRC3–17p/TP53
–6q15/ZNF292–10q24/NFKB2
+8q24
–11q/ATM–15q15/MGA
Chromothripsis
IRF4Tri12
DDX3X+2p16
–20p
SF3B1–6p21/NFKBIE
BRAF–18p
ZMYM3FUBP1
b
Time to treatment (years)
121086420
Pro
bab
ility
1.0
0.8
0.6
0.4
0.2
0
c
Overall survival (years)14121086420
Pro
bab
ility
1.0
0.8
0.6
0.4
0.2
0
Number of drivers 0 1 2 3 ≥4
0 1 3 5 7 9 11 0 1 3 5 7 9 11
**
*
*
*
*
*
*
**
*
*
*
Figure 4 | Prognostic effects of individual alterations and number ofdrivers. a, Effect on overall survival (left) and time-to-treatment (right) foreach genomic alteration. Labels including genes and chromosomal regionsrepresent combined analysis of mutations and copy number alterations.Hazard ratios and 95% confidence intervals are shown. Alterations conferring
statistically significant (adjusted P , 0.05) hazard ratios are shown in colour(red for overall survival and blue for TTT), and those in which the effect wasindependent of Binet stage and IGHV-status are labelled with an asterisk.b, c, Kaplan–Meier plots of TTT (b) or overall survival (c) of CLL patientsgrouped by the number of driver mutations identified.
0 0 M O N T H 2 0 1 5 | V O L 0 0 0 | N A T U R E | 5
G2015 Macmillan Publishers Limited. All rights reserved
ARTICLE RESEARCH

were found had the best prognosis and near normal overall survival,suggesting that this study has uncovered most driver alterationsinvolved in CLL evolution, opening new avenues to explore the clin-ical impact of the heterogeneous molecular composition of the diseasein independent cohorts. Hopefully, this work will finally result in newopportunities for improving the clinical management and persona-lized treatment of CLL patients.
Online Content Methods, along with any additional Extended Data display itemsandSourceData, are available in the online version of the paper; references uniqueto these sections appear only in the online paper.
Received 23 February; accepted 15 June 2015.
Published online 22 July 2015.
1. Gaidano, G., Foa, R. & Dalla-Favera, R. Molecular pathogenesis of chroniclymphocytic leukemia. J. Clin. Invest. 122, 3432–3438 (2012).
2. Zenz, T., Mertens, D., Kuppers, R., Dohner, H. & Stilgenbauer, S. From pathogenesisto treatment of chronic lymphocytic leukaemia. Nature Rev. Cancer 10, 37–50(2010).
3. Pekarsky, Y., Zanesi, N. & Croce, C. M. Molecular basis of CLL. Semin. Cancer Biol.20, 370–376 (2010).
4. Hamblin, T. J., Davis, Z., Gardiner, A., Oscier, D. G. & Stevenson, F. K. Unmutated IgVH genes are associated with a more aggressive form of chronic lymphocyticleukemia. Blood 94, 1848–1854 (1999).
5. Damle, R. N. et al. Ig V gene mutation status and CD38 expression as novelprognostic indicators in chronic lymphocytic leukemia. Blood 94, 1840–1847(1999).
6. Crespo, M. et al. ZAP-70 expression as a surrogate for immunoglobulin-variable-region mutations in chronic lymphocytic leukemia. N. Engl. J. Med. 348,1764–1775 (2003).
7. Malek, S. N. The biology and clinical significance of acquired genomic copynumber aberrations and recurrent gene mutations in chronic lymphocyticleukemia. Oncogene 32, 2805–2817 (2013).
8. Dohner, H. et al. Genomic aberrations and survival in chronic lymphocyticleukemia. N. Engl. J. Med. 343, 1910–1916 (2000).
9. Quesada, V. et al. Exome sequencing identifies recurrent mutations of the splicingfactor SF3B1 gene in chronic lymphocytic leukemia. Nature Genet. 44, 47–52(2011).
10. Puente, X. S. et al. Whole-genome sequencing identifies recurrent mutations inchronic lymphocytic leukaemia. Nature 475, 101–105 (2011).
11. Landau, D. A. et al. Evolution and impact of subclonal mutations in chroniclymphocytic leukemia. Cell 152, 714–726 (2013).
12. Fabbri, G. et al. Analysis of the chronic lymphocytic leukemia coding genome: roleof NOTCH1 mutational activation. J. Exp. Med. 208, 1389–1401 (2011).
13. Ramsay, A. J. et al. POT1 mutations cause telomere dysfunction in chroniclymphocytic leukemia. Nature Genet. 45, 526–530 (2013).
14. Damm, F. et al. Acquired initiating mutations in early hematopoietic cells of CLLpatients. Cancer Discov. 4, 1088–1101 (2014).
15. Rossi, D. et al. Disruption of BIRC3 associates with fludarabinechemorefractoriness in TP53 wild-type chronic lymphocytic leukemia. Blood 119,2854–2862 (2012).
16. Ferreira, P. G. et al. Transcriptome characterization by RNA sequencing identifies amajor molecular and clinical subdivision in chronic lymphocytic leukemia.Genome Res. 24, 212–226 (2014).
17. Kulis, M. et al. Epigenomic analysis detects widespread gene-body DNAhypomethylation in chronic lymphocytic leukemia. Nature Genet. 44, 1236–1242(2012).
18. Oakes, C. C. et al. Evolution of DNA methylation is linked to genetic aberrations inchronic lymphocytic leukemia. Cancer Discov. 4, 348–361 (2014).
19. Hudson, T. J. et al. International network of cancer genome projects. Nature 464,993–998 (2010).
20. Alexandrov, L. B.et al. Signaturesof mutational processes inhumancancer. Nature500, 415–421 (2013).
21. Khodabakhshi, A. H. et al. Recurrent targets of aberrant somatic hypermutation inlymphoma. Oncotarget 3, 1308–1319 (2012).
22. Pasqualucci, L. et al. Hypermutation of multiple proto-oncogenes in B-cell diffuselarge-cell lymphomas. Nature 412, 341–346 (2001).
23. Byrd, J. C. et al. Targeting BTK with ibrutinib in relapsed chronic lymphocyticleukemia. N. Engl. J. Med. 369, 32–42 (2013).
24. Moncunill, V. et al. Comprehensive characterization of complex structuralvariations in cancer by directly comparing genome sequence reads. NatureBiotechnol. 32, 1106–1112 (2014).
25. Stephens, P. J. et al. Massive genomic rearrangement acquired in a singlecatastrophic event during cancer development. Cell 144, 27–40 (2011).
26. Baca, S. C. et al. Punctuated evolution of prostate cancer genomes. Cell 153,666–677 (2013).
27. Rausch, T. et al. Genome sequencing of pediatric medulloblastoma linkscatastrophic DNA rearrangements with TP53 mutations. Cell 148, 59–71 (2012).
28. Balatti, V. et al. NOTCH1 mutations in CLL associated with trisomy 12. Blood 119,329–331 (2012).
29. Huang, F. W. et al. Highly recurrent TERT promoter mutations in humanmelanoma. Science 339, 957–959 (2013).
30. Yamane, A. et al. Deep-sequencing identification of the genomic targets of thecytidine deaminase AID and its cofactor RPA in B lymphocytes. Nature Immunol.12, 62–69 (2011).
31. Lawrence, M. S. et al. Mutational heterogeneity in cancer and the search for newcancer-associated genes. Nature 499, 214–218 (2013).
32. Simonis,M., Kooren, J.&deLaat, W.An evaluation of3C-based methods tocaptureDNA interactions. Nature Methods 4, 895–901 (2007).
33. Revilla-i-Domingo, R. et al. The B-cell identity factor Pax5 regulates distincttranscriptional programmes in early and late B lymphopoiesis. EMBO J. 31,3130–3146 (2012).
34. Queiros, A. C. et al. A B-cell epigenetic signature defines three biologic subgroupsof chronic lymphocytic leukemia with clinical impact. Leukemia 29, 598–605(2015).
35. Strefford, J. C. et al. Distinct patterns of novel gene mutations in poor-prognosticstereotyped subsets of chronic lymphocytic leukemia: the case of SF3B1 andsubset #2. Leukemia 27, 2196–2199 (2013).
36. Agathangelidis, A. et al. Stereotyped B-cell receptors in one-third of chroniclymphocytic leukemia: a molecular classification with implications for targetedtherapies. Blood 119, 4467–4475 (2012).
37. Rubio-Perez, C. et al. In silico prescription of anticancer drugs to cohorts of 28tumor types reveals targeting opportunities. Cancer Cell 27, 382–396 (2015).
38. Lobry, C., Oh, P. & Aifantis, I. Oncogenic and tumor suppressor functions of Notchin cancer: it’s NOTCH what you think. J. Exp. Med. 208, 1931–1935 (2011).
39. O’Brien, P., Morin, P. Jr, Ouellette, R. J. & Robichaud, G. A. The Pax-5 gene: apluripotent regulator of B-cell differentiation and cancer disease. Cancer Res. 71,7345–7350 (2011).
40. Villamor, N. et al. NOTCH1 mutations identify a genetic subgroup of chroniclymphocytic leukemia patients with high risk of transformation and poor outcome.Leukemia 27, 1100–1106 (2013).
Supplementary Information is available in the online version of the paper.
Acknowledgements This work was funded by Spanish Ministry of Economy andCompetitiveness through the Instituto de Salud Carlos III (ISCIII) and Red Tematica deInvestigacion del Cancer (RTICC). We are grateful to E. Santos for his continuedsupportto thisproject, andN.Villahoz and M.C.Muro for their excellentwork in thecoordinationof the CLL Spanish Consortium. C.L.-O. is an Investigator of the Botin Foundationsupported by Banco Santander through its Santander Universities Global Division, andE.Ca. and D.T. are Institucio Catalana de Recerca i Estudis Avançats-Academiainvestigators. We acknowledge Partnership for Advanced Computing in Europe(PRACE) for awarding us access to resource Marenostrum based in Spain at the BSC,the Pershing Square Sohn Cancer Research Alliance and European Union’s FP7through the Blueprint Consortium.Weare also verygrateful to all patients with CLL whohave participated in this study.
Author Contributions The Chronic Lymphocytic Leukaemia Genome consortiumcontributed to this study as part of the International Cancer Genome Consortium.Investigator contributions are as follows: T.B., J.D., A.L.-G., A.R.P., M.G. and J.M.H.-R.contributed to sample collection and clinical annotation; M.R., N.V., E.Ca., E.Co.,J.M.H.-R. and M.G. were the pathologists who reviewed and confirmed the diagnoses;P.N., C.M.R.-C. andM.A.prepared and supervised thebioethical requirements;M.P., A.E.and C.R. processed samples and performed validation analysis; M.G., I.G. and D.A.P.were responsible for generating libraries, performing exome capture and sequencing;S.B., D.To., M.M., S.G., I.S., G.C., D.M.-G., A.C., X.E. and D.Cos. analysed copy numberalterations and structural variants; X.S.P., R.V.-M., J.G.-A. and V.Q. developed thebioinformaticpipeline for analysis of somaticmutations and performed functionaldataintegration; D.Col., M.L.-G. and B.G. were responsible for downstream validationanalysis and functional studies; A.N. and K.S. analysed IG gene rearrangements andstereotypes; J.I.M.-S., A.C.Q., G.C., R.B., R.G., N.R., H.G.S. and P.J. performed epigeneticand transcriptomic analysis and 4C-seq experiments; L.B. and A.A.F. performedenhancer analysis and CRISPR experiments; N.V., T.B., A.L.-G. and E.Ca. performedclinical and biological studies; J.L.G., R.R., M.O., D.G.P. and A.V. were in charge ofbioinformatics data management; N.L.-B., C.R.-P. and D.Ta. contributed to pathwayanalysis and in silico prescription. X.S.P., C.L.-O. and E.Ca. directed the research,analysed the data and wrote the manuscript.
Author Information Sequencing, expression and genotyping array data have beendeposited at the European Genome-Phenome Archive (EGA, http://www.ebi.ac.uk/ega/), which is hosted at the European Bioinformatics Institute (EBI), under accessionnumber EGAS00000000092. Reprints and permissions information is available atwww.nature.com/reprints. The authors declare no competing financial interests.Readers are welcome to comment on the online version of the paper. Correspondenceand requests for materials should be addressed to C.L.-O. ([email protected]) or E.C.([email protected]).
6 | N A T U R E | V O L 0 0 0 | 0 0 M O N T H 2 0 1 5
G2015 Macmillan Publishers Limited. All rights reserved
RESEARCH ARTICLE

METHODSPatients. The clinical and biological characteristics of the 506 patients are shownin Extended Data Table 1. Among these patients, 452 were diagnosed with CLLand 54 with MBL. Cases were defined as IGHV-MUT when the identity ofimmunoglobulin genes was less than 98%. The tumour samples were obtainedbefore administration of any treatment. All patients gave informed consent fortheir participation in the study following the International Cancer GenomeConsortium (ICGC) guidelines and the ICGC Ethics and Policy committee19.Collection and preparation of samples. Tumour samples were obtained fromfresh or cryopreserved mononuclear cells. To purify the CLL or MBL fraction,samples were incubated with a cocktail of magnetically labelled antibodies direc-ted against T cells, natural killer cells, monocytes and granulocytes (CD2, CD3,CD11b, CD14, CD15 and CD56), adjusted to the percentage of each contaminat-ing population (AutoMACS, Miltenyi Biotec). The degree of contamination bynon-CLL cells in the CLL fraction was assessed by immunophenotype and flowcytometry. DNA was extracted from purified samples by using a Qiagen kit, andthe quality of purified DNA was assessed by SYBR-green staining on agarose gelsand quantified using a Nanodrop ND-100 spectrophotometer. The tumour DNAand RNA samples for further genomic analysis contained $95% neoplastic cellsand the contamination by neoplastic cells in normal DNA was ,2%.WGS, WES and RNA-seq. For WGS, 2 mg of genomic DNA from each samplewas used for the construction of two short-insert paired-end sequencing libraries.One library was prepared using a standard TruSeqDNA Sample Preparation Kitv2 (Illumina Inc.) with some modifications. In short, following the fragmentation(CovarisE220) the libraries were size-selected on the agarose gel and processedthrough end-repair, adenylation and indexed adaptor ligation. The gel eluatewas directly amplified by 10 PCR cycles. The second library was prepared fol-lowing the same protocol as above, however, it included a heating step to 72 uCbefore adaptor ligation and was suddenly cooled down to 4 uC. This resultedin a biased proportion of high GC content reads and counterbalanced someof Illumina’s PCR sample preparation methods’ GC-bias, thus improving cov-erage of increased GC-content regions of the genome. Both types of libraries weresequenced in paired-end mode on Illumina GAIIx (2 3 151 bp) using Sequencingkit v4 or Illumina HiSeq2000 (2x101 bp) using TruSeq SBS Kit v3 (Illumina Inc.).
For other samples (Supplementary Table 1), the library preparation procedurewas modified to remove the PCR step during short-insert paired-end librarypreparation. The TruSeq DNA Sample Preparation Kit v2 (Illumina Inc.) andthe KAPA Library Preparation kit (Kapa Biosystems) were used. In brief, 2mg ofgenomic DNA was sheared on a Covaris E220, size-selected and concentratedusing AMPure XP beads (Agencourt, Beckman Coulter) to reach the fragmentsize of 220–480 bp. Fragmented DNA was end-repaired, adenylated and ligated toIllumina specific indexed paired-end adaptors. All libraries were quantified byLibrary Quantification Kit (Kapa Biosystems). Each library was sequenced usingTruSeq SBS Kit v3-HS (Illumina Inc.), in paired-end mode, 2 3 101-bp, in threesequencing lanes of HiSeq2000 flowcell v3 (Illumina Inc.) according to standardIllumina operation procedures with minimal yield of 85 Gb for each sample.Primary data analysis was carried out with the standard Illumina software RealTime Analysis (RTA 1.13.48) and followed by generation of FASTQ files.
For WES, 3 mg of genomic DNA from each sample were sheared and used forthe construction of a paired-end sequencing library as described in the paired-endsequencing sample preparation protocol provided by Illumina41. Enrichment ofexonic sequences was then performed for each library using either the Sure SelectHuman All Exon 50 Mb or All Exon1UTRs v4 kits (Supplementary Table 1)following the manufacturer’s instructions (Agilent Technologies). Exon-enrichedDNA was pulled down by magnetic beads coated with streptavidin (Invitrogen),followed by washing, elution and 18 additional cycles of amplification of thecaptured library. Enriched libraries were sequenced (2 3 76 bp) in one lane ofan Illumina GAIIx sequencer or in two lanes of a HiSeq2000 when using pools ofeight samples.
RNA was assayed for quantity and quality using Qubit RNA HS Assay (LifeTechnologies) and RNA 6000 Nano Assay on a Bioanalyzer 2100. RNA-seqlibraries were prepared from total RNA using the TruSeq RNA Sample PrepKit v2 (Illumina Inc.) with minor modifications. In brief, 0.5mg of total RNAwas used as the input material for poly-A-based messenger RNA enrichment witholigo-dT magnetic beads. Selected mRNA was fragmented (resulting RNA frag-ment size was 80–250 nucleotides, with the major peak at 130 nucleotides). Afterfirst and second strand cDNA synthesis the double-stranded complementaryDNA was end-repaired, 39 adenylated and the 39 ‘T’ nucleotide of the adaptorwas used for the Illumina indexed adapters ligation. The ligation product wasenriched by 10 cycles of PCR. Each library was sequenced using TruSeq SBS Kitv3-HS, in paired-end mode with a read length of 2 3 76 bp. We generated morethan 20 million paired-end reads for each sample in a fraction of a sequencinglane on HiSeq2000 (Illumina Inc.) following the manufacturer’s protocol. Image
analysis, base calling and quality scoring of the run were processed using themanufacturer’s software Real Time Analysis (RTA 1.13.48) and followed bygeneration of FASTQ sequence files.Read mapping and processing. For WGS and WES, reads from each library weremapped to the human reference genome (GRCh37) using BWA42 with the sameoption, and a BAM file was generated using SAMtools43. Reads from the samepaired-end libraries were merged, and optical or PCR duplicates were flaggedusing Picard (http://picard.sourceforge.net/index.shtml). For the identification ofsomatic substitutions and indels, we used the Sidron algorithm9,44. This algorithmwas adapted to identify subclonal mutations in which the mutant allele fractionis low, but supported by at least three reads. Visual inspection of recurrentmutational hotspots allowed the inclusion of some somatic mutations that wereoriginally discarded owing to the presence of an excess of mutant reads in thenon-tumour sample, or owing to low coverage, especially in the case of NOTCH1,in which a high GC content on exon 34 usually resulted in very low coverage byWES. In samples in which NOTCH1 coverage was too low to make a call, muta-tions were analysed by Sanger sequencing. A comparison of mutation calls bySidron and by Sanger sequencing of some of the most frequently mutated genes inCLL (SF3B1, TP53, MYD88) revealed more than 97% specificity and at least 90%sensitivity. Mutational signatures were extracted using the WTSI MutationalSignature Framework45. To estimate the presence of subclonal mutations inrecurrently mutated genes, the fraction of reads supporting a mutant allele wascalculated for those mutations in which the depth of coverage was at least 20reads. Flow cytometry analysis confirmed that the percentage of tumour cells wasat least 98%. A case was considered as having a clonal mutation when at least 80%of cells were estimated to contain the mutation, and the mutant allelic fractionwas within the 95% confidence interval.Analysis of CNAs and structural variants. For the identification of CNAs,tumour and normal DNA from 505 CLL patients were analysed usingAffymetrix SNP6.0 microarrays (Affymetrix) as previously described46. SNP arrayexperiments were carried out at CeGen (http://www.cegen.org). Additionally, for230 cases array-comparative genomic hybridization was performed in SurePrintG3 Human aCGH Microarray 1M (Agilent Technologies). Array-comparativegenomic hybridizations were performed at qGenomics (http://www.qgenomics.com). Nexus 6.0 Discovery Edition software (Biodiscovery) was used for globalanalysis and visualization. Copy number neutral loss of heterozygosity was con-sidered when the size of alteration was larger than 5 Mb. Acquired copy numberneutral loss of heterozygosity was observed in 28 regions, 16 of them affectingknown driver genes that already contained mutations, resulting in homozygousdeletion of mir-15a/mir-16 at 13q14, or inactivation of ATM and TP53(Supplementary Table 4). According to the literature, the presence of chromo-thripsis was considered when at least seven switches between two or more copynumber states were detected on an individual chromosome in which LOH wasretained, and chromoplexy was defined when at least three chained chromosomalrearrangements were detected in a tumour27,47. In one case in which genotypingdata were not available, we used exome2cnv48 to identify CNAs from WES data.
For the identification of breakpoints in WGS derived from structural variants,we used SMUFIN24, a program that directly compares sequence reads fromnormal and tumour samples, to identify chromosomal breakpoints correspond-ing to large structural variants at base-pair resolution. We analysed 150 tumour/normal whole-genome pairs setting the cross-sample contamination filter to 5%.Two WGS tumours (019 and 029) showed an abnormal number of breakpointsowing to the presence of sequence lanes with high error rates that interfere withSMUFIN and were not considered for this analysis. All predicted breakpoints thatwere not confirmed through the BAM file after manual inspection were systematic-ally discarded. A total of 48 out of 53 (91%) selected predicted breakpoints could beverified using PCR amplification followed by Sanger sequencing (SupplementaryTable 5). This verification rate is similar to the one observed in our initial descriptionof the method24. In addition, custom scripts were used to identify potential transloca-tions involving immunoglobulin genes either in WGS or WES. This resulted in theidentification of ten cases (5 WGS and 5 WES) containing putative translocationswith the BCL2 locus (nine with the t(14;18)(q32;q21), and one with thet(2;18)(p11;q21) translocation), all of which were confirmed by either Fluorescencein situ hybridization (FISH), cytogenetics or PCR (Extended Data Fig. 3).G-banding and FISH analysis. Conventional cytogenetics was performed onGiemsa-banded chromosomes (G-banding) obtained after a 72-h culture andstimulation with tetradecanoyl-phorbol-acetate. At least 20 G-banded meta-phases per sample were analysed. Results were described according to theInternational System for Human Cytogenetic Nomenclature. FISH analyseson fixed cells were performed using probes that interrogated for 11q23/ATM,13q14.3 and 17p13/TP53 deletions and trisomy 12 (Abbott Molecular). Twohundred nuclei were examined for each probe. LSI IGH/BCL2 dual colourfusion for the t(14;18)(q32;q21) (Abbot Molecular) was used to confirm BCL2
G2015 Macmillan Publishers Limited. All rights reserved
ARTICLE RESEARCH
rearrangements detected by WGS and WES. Additionally, in case 853, wholechromosomal paintings of chromosomes 8, 11 and X were performed to deter-mine the complex karyotype (with four derivative chromosomes), and rearrange-ments predicted by SMUFIN algorithm.Analysis of DNA methylation. DNA methylation was analysed using the 450kHuman Methylation Array (Illumina). We used the EZ DNA Methylation Kit(Zymo Research) for bisulphite conversion of 500 ng of genomic DNA, and theInfinium methylation assay was carried out as described by the manufacturer49,50.These array experiments were performed at CeGen (http://www.cegen.org). Datafrom the 450k Human Methylation Array were analysed in R using the minfipackage (version: 1.6.0)51, available through the Bioconductor open source soft-ware, applying several custom filters. Unsupervised analyses were performed byprincipal component analysis and differential methylation between individualCLL/MBL samples and controls was detected using an absolute difference of 0.25.Gene expression profiling. We studied the gene expression profiling of 468cases using highly purified leukaemic CLL cells. Total RNA was extracted withthe TRIzol reagent following the recommendations of the manufacturer(Invitrogen Life Technologies). RNA integrity was examined with the Agilent2100 Bioanalyzer (Agilent Technologies) and only high-quality RNA sampleswere hybridized to Affymetrix Human Genome Array U219 array plates accord-ing to Affymetrix standard protocols. Summarized expression values werecomputed using the robust multichip average approach implemented in theExpression Console Software (Affymetrix Inc.).RT–PCR. cDNA was synthesized from 500 ng of total RNA using High CapacityRNA-to-cDNA kit (Life Technologies) following the manufacturer’s instructions.Amplification was performed using 50 ng of DNA using Qiagen Multiplex PCRKit (Qiagen), and the reaction mix contained 13 Qiagen Multiplex PCR MasterMix (12.5 ml), primer mix (0.4 mM of each primer) and RNase-free water for atotal reaction volume of 25 ml. For NOTCH1 within-intron splicing, primers usedwere: forward 59-CCTAACAGGCAGGTGATGCT-39 and reverse 59-TACTCCTCGCCTGTGGACAA-39. PCR amplification was performed for NOTCH139 UTR forward primer 59-CCTAACAGGCAGGTGATGCT-39 and reverseprimer 59-ATCTGGCCCCAGGTAGAAAC-39, PAX5 enhancer first regionforward 59-TAGATTGTGCCGAATGCTGA-39 and primer 59-ACAAGCTCTCCTCCCAGGAA-39, and PAX5 enhancer second region forward primer59-AGGATGAGAACGGGCAAAC-39 and reverse primer 59-GGAGCTTCCAGCTGAACTGA-39. All PCR products were run on a capillary electrophoresisgel (QIAxcel Advanced System, Qiagen) with the QIAxcel DNA screeningkit (Qiagen).Western blot analysis. For western blot analysis, tumour cells were lysed for30 min in Triton buffer (1% Triton X-100, 50 mM Tris–HCl, pH 7.6, 150 mMNaCl, 1 mM EDTA) supplemented with protease and phosphatase inhibitors(1 mM PMSF, 2 mM sodium pyrophosphate, 2 mM sodium b-glycerophosphate,1 mM NaF, 1 mM sodium orthovanadate, 10mg ml21 leupeptin and 10 mg ml21
aprotinin). Lysates were cleared by centrifugation at 15,000g at 4 uC for 15 min,and protein concentrations determined using the Bradford method. Thirtymicrograms of protein was separated by SDS–PAGE and transferred ontoImmobilon-P membranes. Membranes were blocked with 2.5% phospho-Blocker (Cell Biolabs) in TBS-Tween 20. For protein immunodetection, the spe-cific primary antibodies were used: anti-cleaved NOTCH1 (Val1744) (D3B8;Cell Signaling Technology) and b-actin (Sigma). Anti-rabbit and anti-mousehorseradish peroxidase-labelled IgG (Sigma) were used as secondary antibodies.Chemiluminescence was detected by using ECL substrate (Pierce) on a mini-LAS4000 Fujifilm device (GE Healthcare).Immunohistochemical analysis. NOTCH1 immunohistochemical staining wasperformed on a Leica Bond system using formalin-fixed paraffin-embedded tis-sue sections52. Samples were pre-treated using heat-mediated antigen retrievalwith EDTA buffer (pH 9.0), epitope retrieval solution 2 (HIER2) for 30 min.Then, sections were incubated with anti-cleaved NOTCH1 rabbit monoclonalantibody (clone D3B8, catalogue number 4147, Cell Signaling Technology) at afinal concentration of 8.5 mg ml21, for 60 min at room temperature and detectedusing a horseradish peroxidase (HRP)-conjugated compact polymer system.DAB was used as the chromogen. The section was then counterstained withhaematoxylin and mounted with DPX.Sanger sequencing. PCR products were treated using ExoSap IT (USBCorporation) and sequenced with ABI Prism BigDye terminator v3.1 (AppliedBiosystems) and 5 pmol of each primer. Sequencing reactions were run on anABI-3730 automated sequencer (Applied Biosystems). All sequences were exam-ined with the Mutation Surveyor DNA Variant Analysis Software (Softgenetics).ChIP-seq and DNase-seq. ChIP-seq was performed in normal B-cell subpopula-tions and in cells (.90% tumour cell content) of a CLL patient with mutatedIGHV, and DNase-seq only in the latter following standard protocols generatedwithin the Blueprint Consortium. In brief, cells for ChIP-seq were fixed for
8–16 min in 1% formaldehyde at 4 uC, and chromatin was sonicated for 15 minwith a Biorruptor (Diagenode). Chromatin fragments ranging from 50 to 500 bpwere selected and immunoprecipitation was carried out with antibodies fromDiagenode against H3K4me3 (pAb-003-050 lot:A5051-001P), H3K4me1 (pAb-194-050 lot:A1863-001P) and H3K27ac (pAb-196-050 lot: A1723-0041D) usingapproximately 500,000 cells per antibody. DNase I digestion was performed using60 units of the enzyme (Sigma) and 2.5 million cells. ChIP-seq and DNase-seqlibraries were constructed using the Kapa Hyper Prep Kit (Kapa Biosystems). Foreach experiment, from 25 to 50 million reads were sequenced with an IlluminaHiSeq2000 sequencer. Detailed protocols can be obtained from the BlueprintConsortium (http://www.blueprint-epigenome.eu/index.cfm?p 5 7BF8A4B6-F4FE-861A-2AD57A08D63D0B58).4C-seq. 4C-seq template generation and amplification was performed as prev-iously described53,54. In brief, 1 3 107 cells of two CLL patients were crosslinkedwith 2% formaldehyde (Merck), chromatin was digested with DpnII (New EnglandBiolabs) followed by ligation with T4 ligase (Roche). Next, chromatin was decross-linked, DNA was digested with Csp6I (NEB) and re-ligated. PCR amplification ofviewpoint regions and their ligated fragments was performed using primers59-TGCCACACCTCCTTTTGATC-39 and 59-CCTTGTGGAAAGAGTCTCAC-39 (PAX5 putative enhancer, viewpoint fragment-end chr9:37,370,916-37,371,635) or 59-CCGAGCTGGGGTAGCTGATC-39 and 59-TTGTGTCCAAAAGTTGTTTG-39 (PAX5 promoter, viewpoint fragment-end chr9:37,033,553-37,034,192). Samples were sequenced using a MiSeq instrument (Illumina)using 50-bp single-end reads, and adding 5% PhiX control DNA. Data analysiswas performed using 4Cseqpipe version 0.7 (May 2012) (downloaded fromhttp://compgenomics.weizmann.ac.il/tanay/). Before mapping of the interactingregions to the genome, reads that are a consequence of undigested templates orself-ligation of the viewpoint fragment were removed.Deletion and mutation of human PAX5 enhancer in B-cell lines usingCRISPR/Cas9. Human PAX5 enhancer was deleted or mutated in RAMOS cellsand in an Epstein–Barr virus (EBV)-transformed lymphoblastoid B-cell lineusing CRISPR/Cas9 genome editing. Guide RNAs (gRNAs) were designed usingE-CRISP tool (http://www.e-crisp.org/E-CRISP/index.html)55. For the deletions,four gRNAs were designed flanking the PAX5 enhancer, two at each side (L1/L2and R1/R2) to be used in combinations (L11R1, L11R2, L21R1, and L21R2).In addition, two gRNAs were designed to target sites of mutations found in CLL(M1/M2). gRNAs sequences are: L1, 59-GGGAACCAGGGCGTGGGAGC-39;L2, 59-GTGAGGCAGAAACACCACAG-39; R1, 59-GGCAGCATGCGGGCGTCATG-39, R2, 59-GCCAGGACCTGCTCTCCCAA-39; M1, 59-GTGAAAATTTACTCATGCTG-39; and M2, 59-GGTGGTACTCAGAGGCTGGG-39. ThegRNA oligonucleotides were cloned in pL-CRISPR.EFS.GFP vector (Addgeneplasmid 57818)56, and lentiviral particles were produced on HEK293T cells bycotransfection with Gag-Pol and vesicular stomatitis virus G (VSV-G)-expressingvectors using the JetPEI transfection reagent (Polyplus). Viral supernatants werecollected after 48 h and used for infection by spinoculation of Ramos and EBV-transformed lymphoblastoid B cells. After infection, green fluorescent protein(GFP)-positive cells were sorted (BD Influx, BD Bioscience) and grown for1 week. Total RNA was extracted with TRIzol (Invitrogen) and converted intocDNA with SuperScript First-Strand Synthesis System (Invitrogen). Then,human PAX5 expression was determined by quantitative real-time PCR(FastStart Universal SYBR Green Master Mix, Roche) using a 7500 Real-TimePCR system (Applied Biosystems). GAPDH was used as normalization control.The following primers were used: PAX5 forward, 59-GAGCGGGTGTGTGACAATGA-39; PAX5 reverse, 59-GCACCGGAGACTCCTGAATAC-39;GAPDH forward, 59-GAAGGT GAAGGTCGGAGT-39; and GAPDH reverse,59-GAAGATGGTGATGGGATTTC-39.
To analyse the efficiency of the CRISPR/Cas9-induced deletions, DNA wasextracted and PAX5 enhancer was PCR-amplified using HotStarTaq DNAPolymerase (Qiagen) and PAX5 enhancer-flanking oligonucleotides (forward)59-GTTGTCTTGGAGGACTTTCAG-39, and (reverse) 59- GTGTTATTGTGTATGTGGCAG-39. To determine the presence of CRISPR/Cas9-induced muta-tions we performed heteroduplex cleavage assays using the Guide-it MutationDetection Kit (Clontech) with primers (forward) 59-AGGATGAGAACGGGCAAAC-39 and (reverse) 59-GGAGCTTCCAGCTGAACTGA-39.Statistical analysis. Fisher’s test or non-parametric tests were used to correlateclinical and biological variables according to MBL or CLL, and the presence orabsence of the different drivers herein analysed. We evaluated the clinical effect(TTT and overall survival) of all driver mutated genes and chromosomal regionswith recurrent CNAs in 5 (1%) or more patients. TTT was evaluated only inpatients with Binet A and B. TTT and overall survival curves from the date ofsampling were plotted by the Kaplan–Meier method and compared by the log-rank test57. We examined separately the prognostic impact of point mutations indriver genes (substitutions or small indels) and CNAs. The clinical impact (TTT)
G2015 Macmillan Publishers Limited. All rights reserved
RESEARCH ARTICLE

of TP53, ATM and BIRC3 mutations was relatively similar to that of the loss oftheir respective chromosomal region, that is, del(17p) (TP53) and del(11q) (ATMand BIRC3), respectively (Extended Data Fig. 8). Therefore, to evaluate the prog-nostic impact for each gene/region, both types of alterations were combined.Although the clinical effect of deletions and mutations was somehow differentfor del(6q15)/ZNF292 (Extended Data Fig. 8), owing to the fact that most pointmutations in ZNF292 were truncating, we also combined these two alterations toinvestigate the clinical effect. Finally, the number of cases with mutations orCNAs in the respective chromosomal region of 6p21/NFKBIE, 10q24/NFKB2,and 15q15/MGA was too small to perform a separate analysis and therefore wealso combined both types of alterations. Multivariate Cox regression analysis wasused to assess the independent prognostic impact from Binet stage and IGHVmutational status of each driver in the outcome of the patients. Proportionalhazards were checked using Schoenfeld’s test. We adjusted all the P values formultiple comparisons using the Benjamini–Hochberg correction. All statisticaltests were two-sided and statistical significance was considered to be significantwith an adjusted P # 0.05. All the analyses were performed using the SPSS 20software (http://www.ibm.com) or R software v3.1.3.
Recurrently mutated genes in CLL were defined considering number and typeof mutations, gene size and coverage, and local density of mutations derived fromthe 150 CLL/MBL WGS studies. To test whether a gene was mutated morefrequently than expected by chance, we calculated the basal probability for each
gene to suffer a non-synonymous mutation (Pns) as: Pns~nnsLd
(nnszns)EIn this equation, nns is the total number of possible non-synonymous muta-
tions for this gene, ns the total number of possible synonymous mutations, L is theeffective length of the gene open reading frame (ORF), defined as the sum of thenumber of bases of the ORF for that gene which are callable at 103 coverage forall exomes or whole genomes analysed, and E is the effective length of all codingregions analysed, defined as the sum of the total lengths of the coding regions thatare callable at 103 coverage for all exomes or whole genomes. Finally, d is the localdensity of mutations for this locus, which is determined by dividing the number ofsomatic mutations identified in the 150 WGS studies analysed in a 0.5-Mb regioncentred on the gene of interest. Thus, the probability P to find M or more non-synonymous mutations in a given gene from a set of N total number of somaticmutations in all patients is:
P~1{XM{1
j~0
N
j
� �pj
ns(1{pns)N{j
A score is computed by taking the base-10 logarithm of this probability (P).Genes for which more than 10% of somatic mutations caused a synonymouschange were removed. Finally, 1,000 Monte–Carlo simulations were performedto estimate the FDR based on the total number of mutations observed (N), and thelocal mutational density for each gene. To identify genes that might be recurrentlymutated in an IGHV subgroup, the same analysis was performed only withtumours belonging to the same group (IGHV-MUT or IGHV-UNMUT), andadjusting the local density of mutations for each subgroup according to the muta-tions obtained from WGS data. Genes were classified in three different tiers
(Extended Data Table 2). Tier 1 corresponds to those genes that were identifiedas statistically mutated in CLL as described above. Tier 2 includes those genes thatare not statistically mutated when analysing CLL, but appeared significant whenonly one subclass (IGHV-MUT or IGHV-UNMUT) was considered. In addition,genes showing either recurrent mutations affecting the same residue, or resulting inmainly loss-of-function mutations, were included in tier 2. Finally, genes classifiedin tier 3 include those genes that were not in tiers 1 or 2, but containing somaticmutations previously described as driver mutations in the literature.
A sample size of at least 500 tumours was selected during the ICGC studydesign, as this will give enough power to detect driver genes mutated in at least 3%of tumours19.In silico prescription. Drugs with potential therapeutic interactions with driveroncogenic protein products were retrieved as described37.
41. Bentley, D. R. et al. Accurate whole human genome sequencing using reversibleterminator chemistry. Nature 456, 53–59 (2008).
42. Li, H. & Durbin, R. Fast and accurate short read alignment with Burrows-Wheelertransform. Bioinformatics 25, 1754–1760 (2009).
43. Li, H. et al. The Sequence Alignment/Map format and SAMtools. Bioinformatics 25,2078–2079 (2009).
44. Puente, X. S. et al. Whole-genome sequencing identifies recurrent mutations inchronic lymphocytic leukaemia. Nature 475, 101–105 (2011).
45. Alexandrov, L. B., Nik-Zainal, S., Wedge, D. C., Campbell, P. J. & Stratton, M. R.Deciphering signatures of mutational processes operative in human cancer. CellRep. 3, 246–259 (2013).
46. Delgado, J. et al. Genomic complexity and IGHV mutational status are keypredictors of outcome of chronic lymphocytic leukemia patients with TP53disruption. Haematologica 99, e231–e234 (2014).
47. Edelmann, J. et al. High-resolution genomic profiling of chronic lymphocyticleukemia reveals new recurrent genomic alterations. Blood 120, 4783–4794(2012).
48. Valdes-Mas, R., Bea, S., Puente, D. A., Lopez-Otin, C. & Puente, X. S. Estimation ofcopy number alterations from exome sequencing data. PLoS ONE 7, e51422(2012).
49. Bibikova, M. et al. High density DNA methylation array with single CpG siteresolution. Genomics 98, 288–295 (2011).
50. Bibikova, M. et al. Genome-wide DNA methylation profiling using InfiniumR assay.Epigenomics 1, 177–200 (2009).
51. Aryee, M. J.et al. Minfi: a flexible and comprehensive Bioconductor package for theanalysis of Infinium DNA methylation microarrays. Bioinformatics 30, 1363–1369(2014).
52. Kluk, M. J. et al. Gauging NOTCH1 activation in cancer usingimmunohistochemistry. PLoS ONE 8, e67306 (2013).
53. van deWerken,H. J.et al.Robust4C-seqdataanalysis to screen for regulatory DNAinteractions. Nature Methods 9, 969–972 (2012).
54. van de Werken, H. J. et al. 4C technology: protocols and data analysis. MethodsEnzymol. 513, 89–112 (2012).
55. Heckl, D. et al. Generation of mouse models of myeloid malignancy withcombinatorial genetic lesions using CRISPR-Cas9 genome editing. NatureBiotechnol. 32, 941–946 (2014).
56. Heigwer, F., Kerr, G. & Boutros, M. E-CRISP: fast CRISPR target site identification.Nature Methods 11, 122–123 (2014).
57. Peto, R. & Pike, M. C. Conservatism of the approximation sigma (O-E)2-E in thelogrank test for survival data or tumor incidence data. Biometrics 29, 579–584(1973).
G2015 Macmillan Publishers Limited. All rights reserved
ARTICLE RESEARCH

G2015 Macmillan Publishers Limited. All rights reserved
RESEARCH ARTICLE

Extended Data Figure 1 | Molecular characterization of CLL and MBLsubtypes. a, CLL and MBL cases are divided according to the somatichypermutation mutational status of their clonotypic IGHV genes into IGHV-MUT (black) and IGHV-UNMUT (grey) subgroups. Clinical and moleculardata from 506 cases profiled with four different platforms are shown.Chromosome 13 is shown in detail. Und, undetermined. b, Box plot showing
the total number of somatic mutations identified in IGHV-MUT and IGHV-UNMUT cases by WGS (*P , 3 3 1028). c, Main mutational signaturesidentified by WGS. d, Relationship between total number of mutations andcontribution of signature 2 and the IGHV-status of tumours (red: IGHV-MUT;blue: IGHV-UNMUT; grey: undetermined).
G2015 Macmillan Publishers Limited. All rights reserved
ARTICLE RESEARCH

G2015 Macmillan Publishers Limited. All rights reserved
RESEARCH ARTICLE

Extended Data Figure 2 | Distribution of CNAs and structural variants in506 cases of CLL and MBL. a, The total number of CNAs detected percase is indicated on top. Clinicobiological characteristics of patients (CLL/MBLand IGHV status) are shown on the middle row (MBL and IGHV-UNMUTdepicted with green lines), together with the presence of chromothripsis. Themain DNA copy number alterations identified are shown on the bottom.The presence of a deletion is indicated by a red line, homozygous deletion by aBordeaux colour, blue lines indicate the presence of a gain, translocationt(14;18) is shown in green, grey lines represent the absence of alteration, andwhite lines indicate that no information is available for the t(14;18) for thatparticular case. b, Circular diagram representation of the distribution ofstructural variants detected in 148 WGS CLL samples. Displayed in the outerlayer we show recurrence in CNAs, followed by all the breakpoints derivedfrom large ( . 100 bp) intra- and inter-chromosomal rearrangements (darkblue) in the inner layer. For clarity, we have set the scale of CNAs to 20%, asthe maximum, showing sequence gains and losses, as positive (blue) and
negative (red) values, respectively. Rearrangements are displayed in absolutecounts, indicating that the values in each of the regions do not reflect therecurrence among samples, as some regions with high values derive from one ortwo cases, normally with complex karyotypes. We highlighted with dashedsquares those regions (3p21, 11q23, 13q14, 14q32 and 18q21) withrearrangements observed in more than 5% of cases with WGS. As torearrangement events, of a total of 358 breakpoints were detected across all 148samples, 41% of them correspond to interchromosomal translocations, while59% occurred within chromosomes. Chromosomes 11 and 13 appear as themost rearranged, entailing 25% of all the breaks, followed by chromosomes 3and 6 (with 8% each). Regarding interchromosomal rearrangementschromosomes 6, 8, 13 and 14 appear as the most translocated, being involved in32% of all translocations observed. Recurrent breakpoints are indicated byarrows: black arrows for rearrangements affecting 18q21 and BCL2 (four caseswith 14q32 and one case with 2p11) and blue arrows for rearrangementsaffecting 13q14 (nine cases with different chromosomes).
G2015 Macmillan Publishers Limited. All rights reserved
ARTICLE RESEARCH

G2015 Macmillan Publishers Limited. All rights reserved
RESEARCH ARTICLE

Extended Data Figure 3 | Schematic view of the translocations involvingBCL2 and patterns of complex structural variants in the WGS of a CLL case.a, A total of nine translocations t(14;18)(q32;q21) were identified, resultingin the fusion of the IGH enhancer on the 39 UTR of BCL2, as well as onetranslocation between the IGK locus on chromosome 2, t(2;18)(p11;q21),which affected the promoter region of BCL2. Cases with these translocationshad multiple somatic mutations in the 59-region of BCL2 (arrowheads andlollipops). RNA-seq data analysis revealed an allelic imbalance, with therearranged allele usually much more expressed that the germline allele (pie-charts within lollipops showing in red the mutant allele fraction detected byRNA-seq for each somatic mutation), probably reflecting the effect of thetranslocation on the expression of BCL2 and recruitment of the SHMmachinery to this locus. b, Gene expression analysis revealed that the presenceof the t(14;18)(q32;q21) resulted in overexpression of BCL2 in these caseswhen compared with other CLL or MBL cases. c, FISH analysis of CLL cellsfrom case 151 using a dual colour fusion probe for IGH (green) and BCL2 (red).Fusion signals are indicated with arrows. d, Case numbers and genomiccoordinates for the detected translocations between immunoglobulin genes andBCL2. e, Circular representation of structural variants detected in six CLLtumours with complex rearrangements including four cases with chromoplexia(samples 16, 141, 294 and 753), chromothripsis (sample 880) and combined(sample 853). Chromosomes are represented in the outer layer, regions
lost (red) and gained (blue) detected by SNP arrays are shown in the inner layer.Inter and intrachromosomal rearrangements are represented as black and bluelines, respectively. f, Reconstruction at base pair resolution of the resultingreorganized chromosomes in case 853 including der(X) in yellow, der(2) indark blue, der(8) in green, and der(11) in red. In these reconstructions, onlyreorganized fragments larger than 100 bp are represented unless they involveinterchromosomal translocations. Rearranged regions are not drawn to scale.Arrows denote inverted fragments relative to their normal and originalorientation. Flanking portions of the derivative chromosomes without detectedrearrangements are collapsed and shown as broken boxes. Estimated sizes(in Mb) for the resulting derivative chromosomes are shown on the left side,including the fraction (percentage) relative to the corresponding normalchromosome size. Asterisks indicate breakpoints that have been experimentallystudied and verified. Genes disrupted by breakpoints are displayed on the leftside of each of the proposed derivative chromosomes in purple. g, Whole-chromosome painting confirmed the sequencing reconstruction proposed in b.Simultaneous painting of chromosome 8 (green) and 11 (red) shows a normalchromosome 11 and a shorter chromosome der(11) as well as a normalchromosome 8 and der(8) that contains a fragment of chromosome 11inserted below the centromeric region. In addition, a small fragment ofchromosome 8 is detected in the telomeric region of derivative chromosome 2.
G2015 Macmillan Publishers Limited. All rights reserved
ARTICLE RESEARCH

Extended Data Figure 4 | Effect of activating mutations in the 39 UTR non-coding region of NOTCH1. a, Proportion of RNA-seq reads supporting anaberrant splicing in cases with or without mutations in the 39 UTR of NOTCH1(**P , 0.01). b, Immunohistochemistry of CLL cells with antibodies againstNOTCH1 showing the nuclear accumulation of NOTCH1 in cells with codingor non-coding mutations in NOTCH1 (case numbers are indicated inside).
Original magnification, 3100. c, Clinical and biological features of patientswith NOTCH1 mutations. Characteristics of patients with truncatingmutations in the coding region of NOTCH1, in the 39 UTR of NOTCH1, orwithout mutations in NOTCH1 for Binet, ZAP70, CD38, IGHV status andtrisomy 12.
G2015 Macmillan Publishers Limited. All rights reserved
RESEARCH ARTICLE

Extended Data Figure 5 | Effect of mutations in the PAX5 enhancer on gene expression. Comparative analysis of gene expression between IGHV-MUT CLLtumours with or without (WT) mutations in the PAX5 enhancer for 15 genes located around the recurrently mutated enhancer in CLL and MBL samples.
G2015 Macmillan Publishers Limited. All rights reserved
ARTICLE RESEARCH

Extended Data Figure 6 | PAX5 enhancer deletion downregulates PAX5expression in human B cell lines. a, PCR analysis of CRISPR/Cas9 deletion ofPAX5 enhancer in lymphoblastoid B cells (left) and RAMOS cells (right).b, Quantitative RT–PCR (RT–qPCR) analysis of PAX5 expression in PAX5enhancer deleted lymphoblastoid B cells (left) and RAMOS cells (right). Barsrepresent mean relative PAX5 mRNA levels after normalization to GAPDHexpression and relative to wild-type cells. Errors bars represent the s.d. betweentechnical triplicates of CRISPR/Cas9-induced mutations in PAX5 enhancer in
lymphoblastoid B cells (left) and RAMOS cells (right). c, PCR analysis ofCRISPR/Cas9-introduced mutations in the PAX5 enhancer in lymphoblastoidB cells (left) and RAMOS cells (right). d, RT–qPCR analysis of PAX5 expressionin PAX5-enhancer-mutated lymphoblastoid B cells (left) and RAMOS cells(right). Bars represent mean relative PAX5 mRNA levels after normalization toGAPDH expression and relative to wild-type cells. Error bars represent the s.d.between technical triplicates (*P , 0.05; **P , 0.01).
G2015 Macmillan Publishers Limited. All rights reserved
RESEARCH ARTICLE

G2015 Macmillan Publishers Limited. All rights reserved
ARTICLE RESEARCH

Extended Data Figure 7 | Distribution of genetic, epigenetic and expressionfeatures in CLL. Distribution of genetic features, family of IGHVrearrangements and BCR stereotypes in naive cell-like CLL cases, intermediateCLL and memory-cell-like CLL cases. a, Frequency of driver mutations.b, c, Copy number alterations (b) and contribution of signature 2 (c) accordingto the epigenetic classification (green: naive-like; red: memory-like; yellow:intermediate). MBL patients were excluded from this analysis. d, Usage ofIGHV families. e, Proportion of cases with stereotyped IGHV sequences.f, Number of cases of each of the stereotyped subsets identified in our series. Forthe analysis shown in e and f, both CLL and MBL patients were merged. Theasterisk on the top of the bars in a and b indicates that the frequency of thegenetic feature is higher than expected by chance in one particular epigenetic
subgroup (P , 0.05). CP, chromoplexy; CT, chromothripsis. g, Relationshipbetween genetic and epigenetic alterations in CLL. Correlation between thetotal number of somatic mutations detected by WGS per case and the numberof CpGs showing differential methylation per case as compared to naive B cells(r 5 0.64, P , 0.001). h, Correlation between the contribution of signature 2mutations and the number of differential CpGs as in a. Tumours are colouredaccording to their IGHV status. i, Comparative analysis of CLL and MBL.Principal component analysis of differential methylation (up) and geneexpression (bottom) data derived from either CLL tumours or MBL samples,reveals that MBL samples usually clustered with their corresponding IGHV-status CLL samples.
G2015 Macmillan Publishers Limited. All rights reserved
RESEARCH ARTICLE

Extended Data Figure 8 | Kaplan–Meier plot of time to first treatmentstratified by the type of aberration in ATM, BIRC3, TP53 and ZNF292genes. TTT curves of the 386 untreated patients with Binet stage A or B. Casesare stratified according to the gene mutation status: wild type (green line),
mutated and mutated1deleted (Mut, blue line) or deleted (Del, red line). Thelog-rank P-values comparing the mutated (blue line) and the deleted (red line)cases are shown.
G2015 Macmillan Publishers Limited. All rights reserved
ARTICLE RESEARCH

Extended Data Table 1 | Clinical information at the time of sampling of 452 patients with CLL and 54 with MBL
Sampling always before therapy; quantitative parameters are expressed as median (range); CD38 high: . 30% positive CLL cells; ZAP70 high: . 20% positive cells; IGHV-unmutated: . 98% identity with germline. OS, overall survival.*MBL only with CLL-like immunophenotype.{Lower values corresponded to small lymphocytic lymphoma.{MBL with low platelet count due to chronic liver disease.
G2015 Macmillan Publishers Limited. All rights reserved
RESEARCH ARTICLE

Extended Data Table 2 | Recurrently mutated genes in CLL and MBL by WGS, WES or CNAs
G2015 Macmillan Publishers Limited. All rights reserved
ARTICLE RESEARCH