17) Translocation in Acute Promyelocytic Leukaemia - UCL ...
266
Molecular Analysis of the t(15;17) Translocation in Acute Promyelocytic Leukaemia by Julian Borrow A thesis submitted for the degree of Doctor of Philosophy in the University of London Somatic Cell Genetics Laboratory Imperial Cancer Research Fund 44, Lincoln’s Inn Fields London and Department of Genetics and Biometry University College Gower Street London July 1992 1
-
Upload
khangminh22 -
Category
Documents
-
view
1 -
download
0
Transcript of 17) Translocation in Acute Promyelocytic Leukaemia - UCL ...
Molecular Analysis of the t(15;17) Translocation in Acute Promyelocytic
Leukaemia
by
Julian Borrow
A thesis submitted for the degree of Doctor of Philosophy in theUniversity of London
Somatic Cell Genetics Laboratory Imperial Cancer Research Fund
44, Lincoln’s Inn Fields London
and
Department of Genetics and Biometry University College
Gower Street London
July 1992
1

ProQuest Number: 10610946
All rights reserved
INFORMATION TO ALL USERS The quality of this reproduction is dependent upon the quality of the copy submitted.
In the unlikely event that the author did not send a com p le te manuscript and there are missing pages, these will be noted. Also, if material had to be removed,
a note will indicate the deletion.
uestProQuest 10610946
Published by ProQuest LLC(2017). Copyright of the Dissertation is held by the Author.
All rights reserved.This work is protected against unauthorized copying under Title 17, United States C ode
Microform Edition © ProQuest LLC.
ProQuest LLC.789 East Eisenhower Parkway
P.O. Box 1346 Ann Arbor, Ml 48106- 1346

A b s tr a c t
Acute promyelocytic leukaemia (APL, FAB M3) is a life- th reatening haem atological d isorder characterized by an abundance of malignant promyelocytes in the bone marrow and blood. The cytogenetic hallmark of these promyelocytes is a recurrent translocation between the long arms of chromosomes 15 and 17, t(15;17)(q22;ql 1.2-12) which is seen in almost all cases. In common with other specific chromosomal changes observed in neoplasia, the translocations breakpoints are thought to pinpoint genes involved in the genesis of the disease. The aim of this PhD was to clone the t(15; 17) breakpoint in APL and characterize the genes disrupted by this diagnostic translocation.
The positional cloning strategy chosen to clone the APL breakpoint required the construction of a N o t I linking library from chromosome 17q and the regional assignment of clones on a somatic cell hybrid mapping panel. One of the linking clones detected the translocation breakpoint as a band shift on pulsed field gel electrophoresis and was shown to span the breakpoint region on chromosome 17. Sequence analysis of cDNAs obtained from the region demonstrated that the retinoic acid receptor alpha gene (R A R A ), a member of the nuclear receptor superfamily, was disrupted by the translocation. The indictment of R A R A at the translocation breakpoint may help explain the unique response of APL patients to differentiation therapy with the high affinity ligand of R A R A , all-trans retinoic acid.
Using R A R A it was possible to walk over the translocation breakpoint and identify the breakpoint locus on chromosome 15, P M L . Fusion messages between R A R A and PML cDNAs were isolated, and two breakpoint positions were identified within P M L . Both PM L-RARA and R A RA -P M L fusion messages were isolated, indicating that both chromosome derivatives are transcriptionally active in APL. The P M L - R A R A message forms the basis of a diagnostic RT-PCR for APL. Variant APL translocations were also investigated.
2

T a h le o f C o n te n ts
T i t l e .................................................................................................................... 1A b s t r a c t ............................................................................................................2Table of C onten ts........................................................................................ 3Abbreviations.......................................................................................................11Acknowledgements............................................................................................. 1 3C h ap te r 1: In tro d u c tio n ...........................................................................14
1.1 The Genetic Basis of Cancer...............................................................1 41.1-1 Dominant Oncogenes............................................................1 51.1-2 Tumour Suppressor Genes...........................................171.1-3 The Multistep Nature of Cancer.......................................21
1.2 Chromosome Aberrations In Cancer .................................. 221.2-1 Structural Abnormalities.................................................... 231.2-2 Numerical Abnormalities..............................................25
1.3 Recurrent Chromosome Translocations......................................... 261.3-1 Deregulation Via Ig Enhancers.........................................271.3-2 Deregulation Via TCR Enhancers................................ 3 01.3-3 Gene Fusions.....................................................................3 21.3-4 Translocations.................................................................. 3 6
1.4 Acute Promyelocytic Leukaemia.............................................. 3 71.4-1 APL: Morphology............................................................3 71.4-2 APL: Cytogenetics............................................................401.4-3 APL: Candidate Genes.................................................... 43
1.5 Cloning Strategies.......................................................................... 451.6 Retinoids and their Receptors.................................................... 49
1.6-1 Physiological Functions................................................. 491.6-2 Retinoid Receptors................................................................5 11.6-3 Retinoids and Cancer..................................................... 5 4
1.7 Aims of Thesis................................................................................ 5 6C hap ter 2: M aterials and M ethods.................................................... 5 8
2.1 DNA Preparation and Digestion................................................. 5 8
2.1-1 Genomic DNA.................................................................... 5 8
2.1-2 Plasmid Preparations..................................................... 5 92.1-3 Bacteriophage Preparations......................................... 612.1-4 Measuring DNA Concentrations.................................. 632.1-5 Restriction Endonuclease Digestions..........................63
2.2 Southern Analysis..........................................................................63
3

2.2-1 Electrophoretic Size-Separation of DNA.................. 6 32.2-2 Southern Blotting............................................................642.2-3 Labelling Probes....................................................................6 5
2.3 Pulsed Field Gel Electrophoresis.............................................. 652.3-1 Preparation of Blocks.................................................... 652.3-2 Digestion and Electrophoresis........................................... 6 6
2.4 Tissue Culture................................................................................672.5 Linking Library Construction.................................................... 6 8
2.5-1 Vector arm preparation................................................6 8
2.5-2 Preparation of Suppressor Plasm id.......................... 6 82.5-3 Preparation of Insert DNA...........................................692.5-4 Ligation into M ?/EM LE3A.............................................7 02.5-5 Plaque L ifts......................................................................7 0
2.6 Genomic Library Construction.................................................. 712.7 Subcloning and Bacterial Colony L ifts....................................7 2
2.7-1 Subcloning..............................................................................7 22.7-2 Electroporation...................................................................... 7 22.7-3 Bacterial Colony L ifts.................................................... 7 32.7-4 a-C om plem enta tion ....................................................... 7 5
2.8 Sequencing...................................................................................... 7 52.9 RNA Protocols......................................................................................7 6
2.9-1 RNA Extraction................................................................ 7 62.9-2 Poly(A)+ RNA Isolation.......................................................7 72.9-3 Northern Blots................................................................. 7 7
2.10 RT-PCR............................................................................................ 7 82.10-1 Reverse Transcription.................................................7 82.10-2 PCR Amplifications...................................................... 7 82.10-3 RACE Technique............................................................7 9
2.11 APL Patient Samples.................................................................. 802.12 Statistics.............................................................................................. 802.13 Buffers and Solutions................................................................. 80
C hapter 3: C onstruction and Regional Localization of Clones from a 17q-specific N o t l Linking L ib ra ry .............................. 82
3.1 Properties of Linking Clones..................................................... 823.2 Construction of a Notl linking Library...................................8 5
3.2-1 Methods of Construction...............................................853.2-2 Choice of DNA Source.....................................................8 8
3.2-3 Library Efficiency........................................................... 9 1
4

3.2-4 Characterization of Library......................................... 933.3 Regional Assignment of Linking Clones on 17q.................... 94
3.3-1 The Somatic Cell Hybrid Mapping Panel.......................953.3-2 Mapping Results..............................................................9 63.3-3 Fine Mapping of Candidate BreakpointClones............................................................................................. 100
3.4 Discussion and Summary............................................................ 107C hap ter 4: Identification of the APL B reakpoint byPFGE......................................................................................................................110
4.1 Pulsed Field Gel Electrophoresis.................................................1104.1-1 PFGE: The Technique...................................................... 1104.1-2 PFGE: Physical Mapping.................................................1104.1-3 PFGE: Molecular Pathology................................................. 112
4.2 Detection of APL Breakpoint on PFGE..............................................1134.2-1 Cell Lines and Patient Material.........................................1134.2-2 Linking Clones used as PFGE Probes.............................. 114
4.3 Confirmation of Detection of the APL Breakpoint............... 1204.3-1 Band Shifts with Mlul and C l a l ...................................1204.3-2 Different APL Patients Have Similar PFGE Rearrangements................................................................................ 1214.3-3 The Aberrant PFGE Band is Lost DuringComplete Remission....................................................................121
4.4 Physical Mapping Around the APL Breakpoint................... 1234.4-1 LCN4A3 Contains Two CpG Islands............................ 1234.4-2 Construction of the Physical M ap............................... 125
4.5 Discussion and Summary.............................................................127C hapter 5: R A R A is In terrup ted by the APL t(15;17) T r a n s lo c a t io n .................................................................................................. 129
5.1 Detection of the APL Breakpoint on ConventionalSouthern Analysis........................................................................................ 129
5.1-1 LCN4A3/A Detects the APL Breakpoints On Southern Analysis.............................................................................1295.1-2 APL Breakpoints Cluster in a 12kb Regionof Chromosome 17...................................................................... 133
5.2 Isolation of RARA cDNAs from the APL BreakpointRegion.......................................................................................................... 135
5.2-1 Choice of Probe.................................................................1355.2-2 Choice of cDNA Libraries...............................................136
5

5.2-3 Results of cDNA Library Screens.....................................1375.2-4 Sequence Identity with R A R A ..................................... 138
5.3 The APL Breakpoints Occur in the First RARAIn tro n .........................................................................................................1405.4 Northern Analysis of the RARA gene in APL...........................1415.5 RARA Isoforms and CpG Islands......................................................144
5.5-1 The Alpha 1 Isoform is Associated withCpG Island 1 ................................................................................. 1455.5-2 Identification of the Human Alpha 2Isoform and its Association with CpG Island 2 .................. 147
5.6 Discussion and Summary............................................................ 1495.6-1 Mechanisms of Leukaemogenesis.................................... 1505.6-2 Differentiation Therapy with All-TransRetinoic Acid.................................................................................1535.6-3 Diagnosis and Monitoring.............................................. 153
C hapter 6 : Identification of the P M L Locus onChrom osom e 15..............................................................................................154
6.1 Construction and Characterization of GenomicPhage Libraries from APL Somatic Cell Hybrids............................ 154
6.1-1 Library Construction.......................................................1546.1-2 Isolation of the PML Locus........................................... 1566.1-3 PFGE Analysis of the PML Locus................................... 158
6.2 Screening an APL cDNA Library...............................................1596.2-1 Both PML-RARA and RARA-PML FusionMessages can be Expressed......................................................1606.2-2 Identification of a Second BreakpointPosition in P M L ............................................................................1626.2-3 The PML Gene Encodes MultipleAlternative Carboxy Termini.......................................i..........164
6.3 Discussion and Summary.............................................................. 164C hapter 7: Detection of P M L - R A R A and R A R A - P M LFusion T ranscrip ts by RT-PC R ............................................................... 168
7.1 RT-PCR - The Technique......................................................................1687.2 Analysis of PML-RARA Fusion Message Junctions............... 1707.3 Which Fusion Derivative MediatesLeukaemogenesis?....................................................................................... 1767.4 Clinical Applications..................................................................... 178
7.4-1 Diagnosis.............................................................................178
6

7.4-2 Monitoring Residual Disease........................................ 1797.5 Clinico-Molecular Correlations.....................................................1807.5 Discussion and Summary..............................................................184
C hap ter 8 : M olecular Analysis of Simple V arian tAPL Translocations..............................................................................................188
8.1 Variant Translocations.................................................................. 1888.2 Analysis of the t(X;15) APL Variant......................................... 1938.3 Analysis of the t(3;15) APL Variant......................................... 195
8.3-1 Construction of a Genomic t(3;15) PhageLibrary...............................................................................................1978.3-2 In Situ Hybridization Analysis of thet(3;15) APL Variant....................................................................198
8.4 Discussion and Summary.............................................................. 198C hap ter 9: D iscussion................................................................................. 201
9.1 Overview of Results..............................................................................2019.2 Retinoic Acid Receptors in Neoplasia........................................ 2059.3 The PML Gene.................................................................................. 207
9.3-1 The PML Gene Family.................................................... 2089.3-2 The "B Box" Defines a Subfamily of C3HC4
P ro te in s ..........................................................................................2109.3-3 Future Work............................................................................211
9.4 Properties of the PML-RARA Fusion Protein......................... 2139.5 Concluding Remarks....................................................................... 214
Appendix 1..........................................................................................................215Appendix 2 ..........................................................................................................221References...............................................................................................................229
7
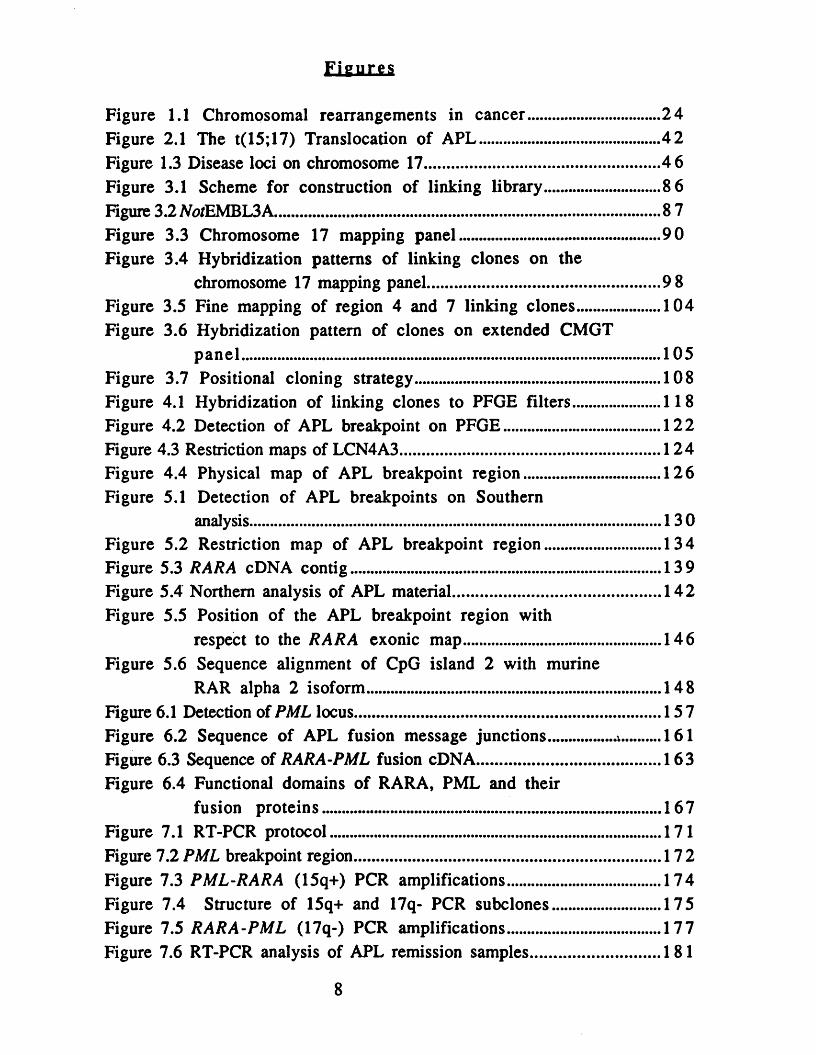
F ig u re s
Figure 1.1 Chromosomal rearrangements in cancer..............................24Figure 2.1 The t(15;17) Translocation of APL..........................................42Figure 1.3 Disease loci on chromosome 17.......................................................4 6Figure 3.1 Scheme for construction of linking library........................... 8 6
Figure 3.2 Afo/EMBL3A........................................................................................ 8 7Figure 3.3 Chromosome 17 mapping panel...............................................90Figure 3.4 Hybridization patterns of linking clones on the
chromosome 17 mapping panel...................................................... 9 8Figure 3.5 Fine mapping of region 4 and 7 linking clones..................... 104Figure 3.6 Hybridization pattern of clones on extended CMGT
p an e l................................................................................................. 105Figure 3.7 Positional cloning strategy......................................................... 108Figure 4.1 Hybridization of linking clones to PFGE filters......................118Figure 4.2 Detection of APL breakpoint on PFGE.....................................122Figure 4.3 Restriction maps of LCN4A3............................................................. 124Figure 4.4 Physical map of APL breakpoint region.................................126Figure 5.1 Detection of APL breakpoints on Southern
analysis............................................................................................... 130Figure 5.2 Restriction map of APL breakpoint region........................... 134Figure 5.3 RARA cDNA contig........................................................................ 139Figure 5.4 Northern analysis of APL material.................................................142Figure 5.5 Position of the APL breakpoint region with
respect to the RARA exonic map.............................................. 146Figure 5.6 Sequence alignment of CpG island 2 with murine
RAR alpha 2 isoform.................................................................... 148Figure 6.1 Detection of PML locus......................................................................157Figure 6.2 Sequence of APL fusion message junctions................ 161Figure 6.3 Sequence of RARA-PML fusion cDNA...........................................163Figure 6.4 Functional domains of RARA, PML and their
fusion proteins...............................................................................167Figure 7.1 RT-PCR protocol.............................................................................171Figure 7.2 PML breakpoint region......................................................................172Figure 7.3 PML-RARA (15q+) PCR amplifications...................................174Figure 7.4 Structure of 15q+ and 17q- PCR subclones........................175Figure 7.5 RARA-PML (17q-) PCR amplifications.................................. 177Figure 7.6 RT-PCR analysis of APL remission samples............................ 181
8

Figure 8.1 Southern analysis of variant APLs............................................ 194Figure 8.2 Positions of variant APL breakpoints.......................................196Figure 8.3 Chromosome painting and FISH analysis of t(3; 15)
APL variant.................................................................................... 199Figure A1 Detection of RFLPs...............................................................................217Figure A2.1 Regional assignment of CosH17.3 sequences....................... 222Figure A2.2 Sequence alignment of CosH17.3 with factor
VIII deletion junction................................................................. 227
9
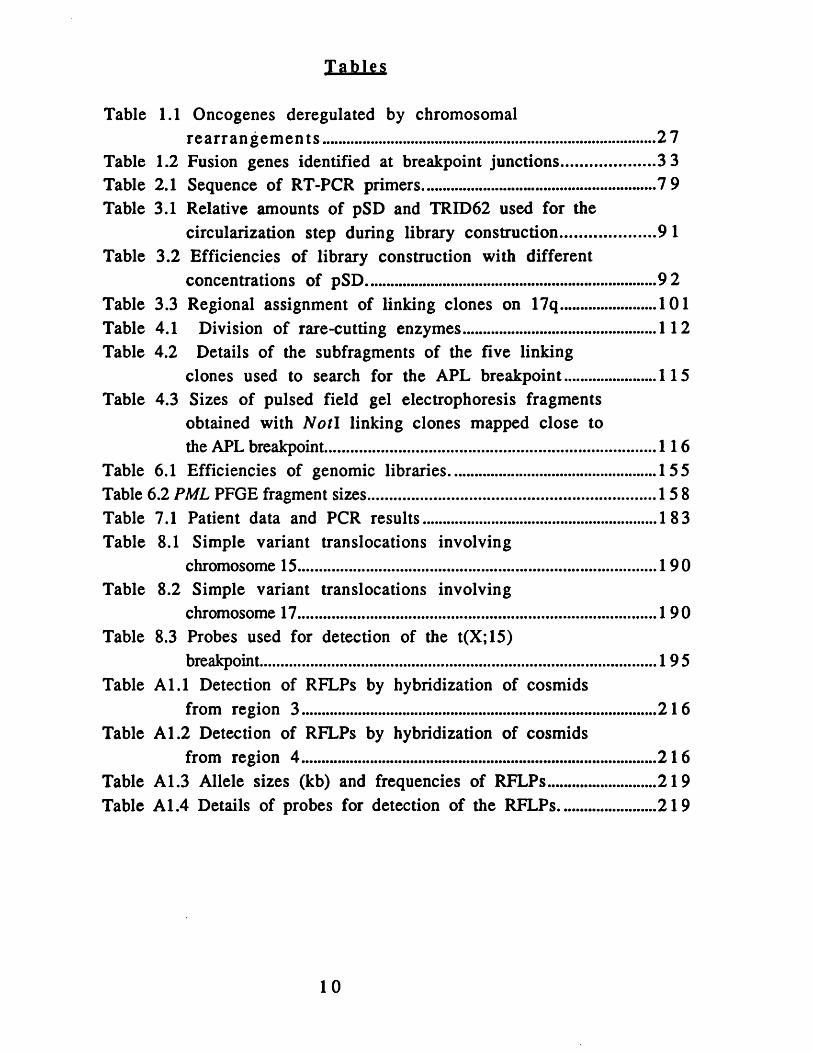
T a b le s
Table 1.1 Oncogenes deregulated by chromosomalrea rran g em en ts ............................................................................ 27
Table 1.2 Fusion genes identified at breakpoint junctions..................... 3 3Table 2.1 Sequence of RT-PCR primers..................................................... 7 9Table 3.1 Relative amounts of pSD and TRID62 used for the
circularization step during library construction...................... 9 1Table 3.2 Efficiencies of library construction with different
concentrations of pSD................................................................... 92Table 3.3 Regional assignment of linking clones on 17q......................101Table 4.1 Division of rare-cutting enzymes...............................................112Table 4.2 Details of the subfragments of the five linking
clones used to search for the APL breakpoint..................... 115Table 4.3 Sizes of pulsed field gel electrophoresis fragments
obtained with Notl linking clones mapped close tothe APL breakpoint............................................................................. 116
Table 6.1 Efficiencies of genomic libraries................................................155Table 6.2 PML PFGE fragment sizes..................................................................158Table 7.1 Patient data and PCR results.....................................................183Table 8.1 Simple variant translocations involving
chromosome 15................................................................................... 190Table 8.2 Simple variant translocations involving
chromosome 17................................................................................... 190Table 8.3 Probes used for detection of the t(X;15)
breakpoint............................................................................................195Table A 1.1 Detection of RFLPs by hybridization of cosmids
from region 3 ..................................................................................216Table A 1.2 Detection of RFLPs by hybridization of cosmids
from region 4 ..................................................................................216Table A 1.3 Allele sizes (kb) and frequencies of RFLPs......................... 219Table A 1.4 Details of probes for detection of the RFLPs.......................219
10

A b b r e v ia t io n s
AML acute myeloid leukaemiaAPC adenomatous polyposis coliAPL acute promyelocytic leukaemiaATP adenosine triphosphateATRA M -trans retinoic acidB-CLL B-cell chronic lymphocytic leukaemiaBL Burkitt's lymphomabp base pairCMGT chromosome mediated gene transfectantCML chronic myelogenous leukaemiaCRABP cellular retinoic acid binding proteinDOC deleted in colorectal carcinomara p e diethyl pyrocarbonateDie disseminated intravascular coagulationDNA deoxyribonucleic aciddNTPs deoxyribonucleoside triphosphatesDTT dith io threito lEDTA disodium ethylenediam inetetraacetatePCS fetal calf serumFISH fluorescence in situ hybridizationGAP GTPase activating proteinHBV hepatitis B virusH3C hepatocellular carcinomaHLH helix-loop-helixkb kilobase pairMOPS 3-(N-morpholino)propanesulfonic acidNF1 neurofibromatosis type 1
O/N over nightPBS A phosphate buffered saline APCR polymerase chain reactionPFGE pulsed field gel electrophoresisPMA phorbol 12-myristate 13-acetatePML promyelocytic leukaemia geneR/T room temperatureRA retinoic acid
11

RACE rapid amplification of cDNA endsRARA retinoic acid receptor alphaRARB retinoic acid receptor betaRARE retinoic acid response elementRARG retinoic acid receptor gammaRB retinoblastom aRBP retinol binding proteinRFLP restriction fragment length polymorphismRNA ribonucleic acidrp m revolutions per minuteRT-PCR reverse transcription-polymerase chain reactionSDS sodium dodecyl sulphateSH2 src homology 2 domainT-ALL T-cell acute lymphocytic leukaemiaUTR untranslated regionV(D)J variable (diversity) joiningVNTR variable number of tandem repeatsWT Wilms tumourYAC yeast artificial chromosomeZPA zone of polarizing activity
12

A c k n o w le d g e m e n ts
I would like to thank the Imperial Cancer Research Fund for providing me with the opportunity to undertake this research. I am most grateful for the guidance and direction provided by both of my supervisors, Dr. Ellen Solomon and Dr. Dallas Swallow, even after the partial combustion of the Somatic Cell Genetics laboratory .
It is impossible to mention all of the members of staff who have enlivened my stay at ICRF, but the following co-employees, past and present, have done more than their share to make laboratory life as stimulating as possible: Donny Black, Beth Gillard, Audrey Goddard, Philip Hedge, Kathy Howe, Karen Jones, Arthur Mackie, Pat Miller, Hans Nicholai, Katen Patel, Liz Ormondroyd, Jiannis Ragoussis, Sue Rider, Janet Shipley, Huw Thomas, Tristan Ward, Stuart Whitelaw, Mary Yagle and Weiming Xu.
I also thank the many haematologists who have made APL samples available for study at the ICRF. Their efforts were much appreciated.
13

Chanter 1
In tr o d u ct io n
1.1 The Genetic Basis of C ancer
In 1982 the first human oncogene (cancer-causing gene) was identified as the RAS gene (see references in Barbacid, 1986). The ensuing decade has seen an explosion in our knowledge of these genes and how their protein products drive every aspect of oncogenesis from initiation to metastasis. While information on dominantly-acting oncogenes has proliferated the first tumour suppressor genes have also been identified and unifying theories concerning the interaction of oncogenic viruses with the molecularmachinery of the cell have been presented. The concomitantadvances in human gene mapping have provided unprecedented opportunities for uncovering the molecular basis of both the common cancers (lung, colon, breast and prostate cancers) and the rarer tumours which have frequently served as m olecular paradigms for the more numerically important cancers. In short,our understanding of the genetic basis of cancer has beenrevolutionized within a single decade.
Epidemiologists have advanced many theories to explain the genesis of cancer, including radiation damage, viral infection, inherited predispositions, chemical mutagenesis and hormonal disregulation. Proponents of all theories have now realized that cancer is a multifactorial disease which arises through a complex interplay of factors, and that the dominant-acting oncogenes and tumour suppressor genes provide a common set of targets upon which the disparate causative factors all converge. Radiation and chemical mutagens directly damage the DNA encoding the oncogenes, whereas individuals from cancer fam ilies have inherited mutations within this same subset of genes. Viruses may upregulate cellular oncogenes, transduce mutated copies of cellular genes or encode their own viral proteins which interact with cellular tumour suppressor gene products. Hormones and
14

growth factors provide additional stimuli through molecularreceptors which are themselves targets for mutation. These data suggest that cancer should be viewed as a genetic disease.
1.1-1 Dominant Oncogenes
Direct evidence for the existence of oncogenes was provided by the analysis of acutely transforming animal retroviruses whichcontain individual genes whose expression is sufficient to trigger oncogenesis. The family of R A S oncogenes was identified from murine sarcoma viruses, while the avian myelocytomatosis and Abelson murine leukaemia viruses yielded the V-M Y C oncogene and the W-ABL oncogenes, respectively. The realization that these viral genes were mutated copies of transduced cellular genes (Frankel and Fischinger, 1976; Stehelin et al., 1976) prompted the isolation of the normal cellular equivalents of each viral oncogene. Over 20 viral oncogenes have been identified through this approach.
A com plim entary approach for the isolation of dom inant oncogenes was provided by a calcium precipitation technique which enabled DNA to be transfered from one mammalian cell toanother. These gene tran sfer assays e s tab lish ed thatapproxim ately 15% of human tumour cell lines contained dom inant oncogenes which could transfer the m alignant phenotype from donor to recipient (Shih et al.y 1979). Similar results could be obtained using DNA from fresh human tumour biopsies. Several sequential rounds of transfer perm itted the identification of the human transforming sequences themselves, which included members of the R A S gene family previously im plicated in tum ourigenesis through their transduction by retroviruses. The characteristics of two well-studied dominant oncogenes, RAS and M YC , will be reviewed.
The RAS gene family has three members, H-RAS> K-RAS and N- R A S j of which only H -R A S and K-R A S have been virally transduced. Mutations in these dominant oncogenes have been found in almost every type of human cancer, including the acute
15

myeloid leukaemias, with an overall incidence of 10-15%. Although RAS point mutations are found in diverse tumour types, the mutations themselves cluster at three particular codons within the genes. The p21 RAS proteins have sequence homology with G- proteins and are thought to function in signal transduction pathways which regulate growth and differentiation. In their active form they bind GTP which is converted by an intrinsic GTPase to a GDP-bound inactive form. The intrinsic GTPase activity of RAS is stimulated by a 120kd GTPase activating protein (GAP) which down regulates RAS from its active form. Oncogenic RAS proteins are insensitive to down regulation by GAP and are locked into a hyperactive state, thus providing a growth advantage to the cell (reviewed in Bollag and McCormick, 1991).
Unlike the membrane-associated RAS proteins, the products of the MYC gene family (C-MYC, N-MYC and L-MYC) are localized in the nucleus. In addition to retroviral transduction of C-MYC by the avian m yelocytom atosis virus, C -M Y C can be activated by juxtaposition next to enhancer elements in Burkitt's lymphoma (BL) (section 1.3-1) or by amplification in small cell lung carcinomas. A similar amplification of N-AfYC has been recorded in neuroblastoma and, less frequently, in retinoblastoma. The C-MYC protein contains a basic helix-loop-helix domain and a leucine zipper, both motifs thought to mediate dimerization between transcription factors. However, proof that MYC can bind DNA had to wait until a second nuclear protein, MAX, was described which specifically heterodimerizes with MYC and permits DNA binding as MYC-MAX heterodimers (Cole, 1991). Furthermore, the specific DNA sequence to which the MYC-MAX dimers bind has been identified (Blackwell et al.y 1990).
RAS and MYC are both examples of dominant oncogenes which are activated by alternative routes in multiple types of tumour in hum ans.
16

1.1-2 Tumour Suppressor Genes
The existence of a second class of gene involved in tumourigenesis, the tumour suppressor genes (sometimes referred to as recessive oncogenes) was surmised from evidence accrued from three different sources. In contrast to the growth promoting dominant oncogenes described above, the normal function of tumour suppressor genes is to restrain the growth of cells or prom ote their term inal d ifferentiation. Loss or m utational inactivation of both copies of a tumour suppressor gene may therefore predispose to cancer. Many excellent reviews have been published on this topic (Weinberg, 1991).
The first evidence for tumour suppressor genes was obtained from cell fusion studies in which the somatic cell hybridization of normal and tumourigenic cells resulted in the extinction of the tumourigenic phenotype (Harris et al., 1969). The implication behind these experiments was that the normal cell replaced certain sequences (suppressor genes) which had been lost or compromised in the tumour cell. Furthermore, since somatic cell fusions are karyotypically unstable, chromosome loss occurs at random and the loss of specific chromosomes can be correlated with the re-emergence of malignant traits (Stanbridge et al ., 1981). The converse of this is also true, since the re-introduction of specific chromosomes thought to harbour tumour suppressor genes will force a resumption of normal growth patterns.
The second line of evidence for tumour suppressor genes was provided in Knudson's treatise on the familial and sporadic forms of retinoblastoma (RB), a rare paediatric eye tumour (Knudson, 1971). Statistical analysis of the age of onset of the two forms and consideration of whether the disease occurred in one or both eyes led Knudson to propose that two "hits" were required for development of RB, and that in the familial form one of these events was inherited. In the sporadic form it was necessary for both "hits" to occur in the same cell as somatic mutations, hence the late onset and unilateral appearance of this form. The connection of this work with tumour suppressor genes became
17

apparent when it was realized that Knudson's genetic targets represented both alleles of a suppressor gene on chromosome 13. This gene has subsequently been cloned and encodes a 105kd nuclear phosphoprotein (Friend et al.9 1987; Lee et al., 1987).
The third body of data which supports the existence of tumour suppressor genes reflects the mutational mechanisms which a cell employs to inactivate both copies of the suppressor gene. After the first mutational event has occurred in a cell, the likelihood that a second independent mutation will inactivate the second copy is low (such events occur at a frequency of 1 0 * 6 per cell generation). Unless the inactivation of a single copy of the gene bestows some growth advantage through a gene dosage effect, then independent inactivation of the second allele is unlikely to occur. Instead, the remaining functional copy of the gene may be inadvertently elim inated as a consequence of chromosom e nondisjunction, gene conversion or mitotic recombination, which can lead to replacement of the chromosome region carrying the normal copy of the gene with a second copy of the mutant allele (Cavenee et al.y 1983). These events occur 100-1000 fold more frequently than independent mutation of the second allele. As predicted, both copies of the R B I gene in tumours frequently bear identical mutations.
The replacement of a entire chromosomal region with a duplicated copy of the homologous region from the mutated chromosome results in an additional molecular phenomenon which has been widely exploited by those seeking to identify tumour suppressor genes. This phenomenon, referred to as loss of heterozygosity, is reflected by a concomitant reduction to hom ozygosity (or hem izygosity) of the chromosomal regions surrounding the suppressor gene. Any linked markers which are polymorphic in normal tissue may lose their heterozygosity in tumour material (Cavenee et al.f 1983). Different types of tumour can thereby be screened for evidence of tumour suppressor genes using a set of polymorphic markers that span the entire genome. Many areas of allele loss have been identified which may eventually yield suppressor genes. Allele loss can be used in conjunction with other
18

cloning techniques, but was particu larly useful in the identification of a colon tumour suppressor gene at 18q21.3 (D C C ) (Fearon et al., 1990).
Allele loss studies suggest that inactivation of tumour suppressor genes is a common event in tumourigenesis. To date six tumour suppressor genes have been isolated through painstaking positional cloning strategies (with the exception of p53, see below) and many more will undoubtedly be described in the future. In particular the cloning of two tumour suppressor genes for breast (and ovarian) cancer and lung cancer on chromosomes 17q and 3p respectively is eagerly awaited since relatively little molecular data is available for either of these major causes of cancer mortality. In contrast three tumour suppressor genes which areinvolved in colon cancer have already been cloned andcharacterized. These are the D C C gene at 18q21.3 (Fearon et al.y1990), the adenomatous polyposis coli (A P C ) gene at 5q22 (Groden et al., 1991; Joslyn et al., 1991; Kinzler et al., 1991) and the p53 gene on the short arm of chromosome 17. Although all of these genes function to restrain cell proliferation, each one accomplishes this in a different way. D C C encodes a transmembrane protein which has homology to cell adhesion molecules, suggesting that its loss may promote metastasis through the failure to maintain cellcell contacts. Alternatively it may transduce a signal from anexternal ligand. The A P C protein product is localized on theinterior of the plasma membrane where its function is less clear.
In contrast to the other suppressor genes which were identified through positional cloning strategies, p53 was identified through its association with the large T-antigen of SV40 in virally- transformed cells, and was initially thought to act as a dominant oncogene. Early studies on p53 were eventually shown to have been performed using a mutant form of p53, and the wild-type protein was shown to inhibit transformation (Baker et al., 1990). Mutations in p53 can therefore promote tumourigenesis in one of two different ways, either through loss or inactivation of wild- type p53 (loss of tumour suppressor functions) or through the
19

creation of a dominant negative protein which inhibits the function of normal p53 through tetramerization.
The p53 gene, accurately described as the most frequently mutated gene in human cancer (reviewed in Weinberg, 1991), plays a central role in human cancer. Mutant p53 has been documented in all of the common cancers, including leukaemia, and in many rarer types. Unlike R A S which contains only three codons that are targets for mutation, p53 can be activated by alterations in over 30 different codons. Moreover, weak mutant p53 alleles are inherited in Li-Fraum eni syndrome which predisposes to a plethora of diverse tumour types (Malkin et al ., 1990; Srivastava et al., 1987). Similarly, mice deficient for p53 are susceptible to a variety of neoplasms (Donehower et al.> 1992). Viruses have also targeted p53 as a means to promote cell division, thus explaining the ability of SV40 large T-antigen and adenovirus E1A to bind (sequester) wild-type p53, and the need for the papillomavirus E 6 protein to target p53 for immediate destruc tion through the ub iqu itin -dependen t deg radation pathway. Exactly how p53 fulfils its normal role as a negative regulator of cell division is still unknown, although it may be capable of transcriptional regulation through specific DNA sequences.
The o ther tum our supp resso r genes, in c lu d in g the neurofibromatosis gene (NF1) at 17ql 1.2 (Cawthon et al., 1990; Viskochil et al., 1990; Wallace et al., 1990), the Wilms gene on chromosome 11 (Call et al.t 1990; Gessler et al., 1990) and the retinoblastoma gene on chromosome 13 (Friend et al., 1987; Lee et al.y 1987) also have diverse ways of controlling cell division. N F 1 encodes a protein called neurofibromin which is related to the mammalian GAP (GTPase activating protein) and is also capable of regulating the RAS GTPase. The oncogenic properties of RAS have already been discussed. The Wilms gene encodes a zinc finger protein whose function in part may be to antagonize the mitogen- induced transcription factor EGR-1 (early growth response-1 gene). The RB protein may also prove to act through the
20

sequestration of growth-promoting transcription factors, in this case the E2F transcription factor and MYC (Rustgi et al., 1991).
1.1-3 The Multistep Nature of Cancer
The dominant oncogenes and tumour suppressor genes encode two types of protein product whose respective activation or loss is required for tumourigenesis. Consideration of the frequently advanced ages of many patients who present with the common sporadic cancers suggested that several genetic changes must accumulate in a single cell for these tumours to arise. Many of these changes have now been documented for colonic cancer, and include changes in both dominant oncogenes and tumour suppressor genes. The progression of colonic cancer through clear stages of hyperplasic epithelium, polyp and metastatic carcinoma helped define the multistep progressive nature of cancer. Early events include the activation of K-R A S and allele loss on chromosome 5 (indicating the inactivation of the APC gene), while mutation of D C C and p53 occur later in the progression of the tumour. This order of gene mutation is not absolute.
The cooperation of oncogenes was also demonstrated by cotransfection studies performed on primary rat embryo fibroblasts (REFs) (Land et al., 1983). Transformation of REFs required co- transfection of R A S with a nuclear oncogene such as C-MYC or m utant p53. Further dem onstration of the in teraction of oncogenes is now provided by our greater understanding of the functions of tumour suppressor genes. For example, as mentioned above, RB may act to sequester MYC and neurofibromin may stimulate the intrinsic GTPase activity of RAS to hasten its reversion to its inactive form.
To summ arize, cancer may be viewed as a progressive accumulation of genetic lesions in dominant oncogenes and tumour suppressor genes.
21

1.2 Chromosome Aberrations In Cancer
Karyotypic analysis of advanced tumours rarely reveals a normal complement of chromosomes, but instead a tangle of rearranged chrom osom es which may contain deletions, translocations, inversions, heterogeneous staining regions and duplications (Solomon et al., 1991). In addition the cells may become polyploid. A minority of these changes directly reflect a subset of the genetic steps taken on the road to malignancy whereas the remainder may be functionally irrelevant. Many mutations such as point mutations and small deletions are not karyotypically visible, but a surprisingly high number of oncogenic events can be pinpointed through specific chromosome aberrations in cancer. One of the difficulties of this type of analysis is to distinguish the primary rearrangements from the irrelevant. Distinction may be facilitated by the following three guidelines.
1. S ince tum our karyotypes evolve con tinuously , any rearrangements which occur early in tumourigenesis, particularly as the sole chromosomal abnormality, are more likely to be causally related.
2. Specific chromosomal rearrangem ents that are observed repeatedly in cancer cells in multiple individuals are more likely to play a causal role. The case is further strengthened if the rearrangement is limited to a particular type or stage of tumour, although some types of rearrangement are found in many tumour types.
3. A link between a chromosomal aberration and cancer is highly likely if the aberration is seen to segregate with the disease through a pedigree in a predisposed family.
Most importantly, the powerful positional cloning methodologies of today permit the specific genes which are affected by these chromosomal rearrangements to be cloned and characterized.
22

The identification of specific recurrent chromosome aberrations has depended on detailed on-going cytogenetics analyses. The haematological malignancies (leukaemias and lymphomas) have in the past proved easier to analyse since they do not require disaggregation of tumour masses. Hence our knowledge of both the rearrangem ents and the genes affected by these rearrangements in the haematological malignancies proportionally outweighs that of the solid tumours. However, it should be noted that T and B lymphocytes are the only cells in the body which undertake extensive chromosomal rearrangements in the course of normal development (in order to recombine their antigen receptors). Many of the aberrations observed in haematological malignancies are directly attributable to the over-zealous activity of the V(D)J-recombinase, whose expression is restricted to these cell types. Moreover, even if the translocation breakpoints lack obvious heptamer-nonamer joining signals, the second hallmark of the V(D)J-recombinase, addition of extra nucleotides at the junction, is often apparent. Thus the lymphocytic malignancies may prove more prone to chromosomal rearrangem ents than other tumour types.
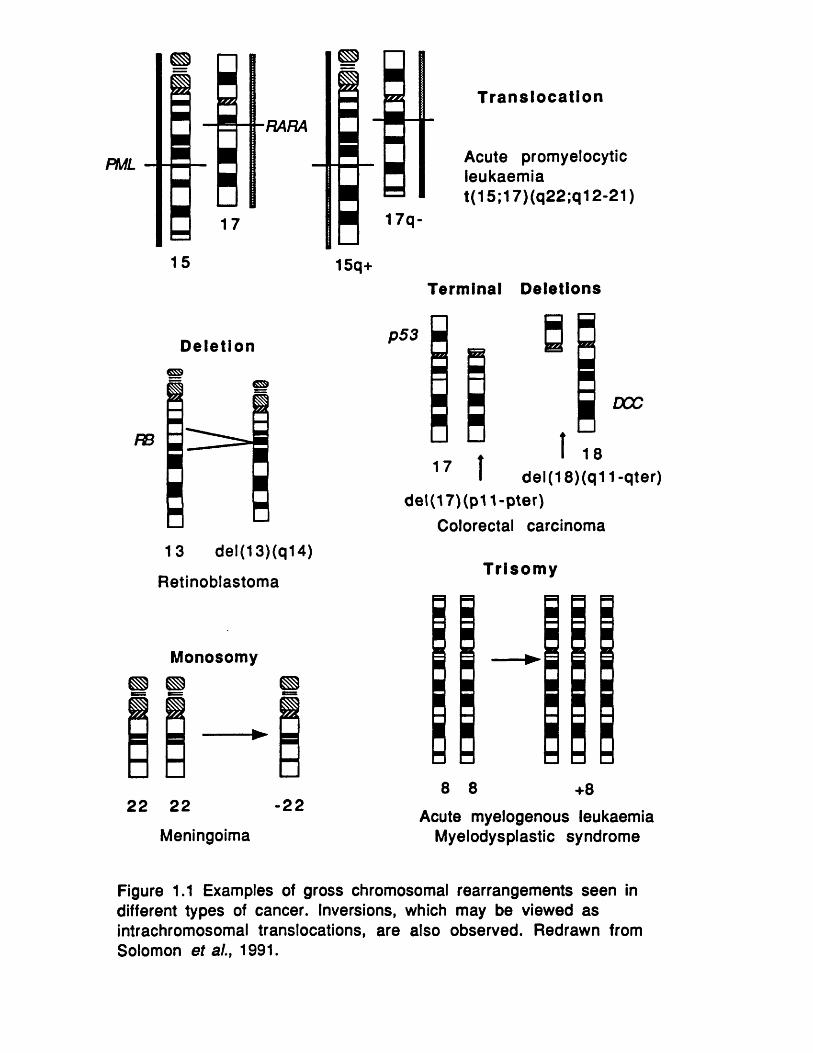
Chromosomal abnormalities may be classed as structural or num erical (Figure 1.1). S tructural abnorm alities include translocations, insertions, inversions, deletions and amplifications of specific chromosomal regions. Numerically abnorm alities normally present as trisomies or monosomies.
1.2-1 Structural Abnormalities
The first recurrent chromosome abnormality, the Philadelphia chromosome, was described in 1960 in chronic myelogenous leukaemia (CML) (Nowell and Hungerford, 1960). At first this minute chromosome was thought to result from deletion, but improved chromosome banding techniques enabled its re classification as a translocation between the long arms of chromosomes 9 and 22, t(9;22)(q34;ql 1) (Rowley, 1973) and heralded the arrival of a golden era for cytogenetics. It is now appreciated that the genes that lie at translocation breakpoints
23
PML
RARA
D e le t io ncss
RB
□
T r a n s l o c a t i o n
Acute promyelocytic leukaem iat(1 5 ;17 )(q22 ;q1 2-21)
15q+
13 del (13) (q14)
Retinoblastoma
T erm ina l D e le t io n s
p53z z BEE■ ■
“= =17 I
DOC
! 18del (18) (q11-qter)
de l(17)(p11-p ter)Colorectal carcinoma
T r i s o m y
M onosom y
22 22 -22
Meningoima
8 8 +8Acute myelogenous leukaemia
Myelodysplastic syndrome
Figure 1.1 Examples of gross chromosomal rearrangements seen in different types of cancer. Inversions, which may be viewed as intrachromosomal translocations, are also observed. Redrawn from Solomon et al., 1991.
acquire oncogenic potential as a result of the rearrangement and belong to the class of dominant oncogenes (section 1.3). Genes can also be activated by other structural rearrangements such as inversions.
In contrast deletions are thought to mark the positions of tumour suppressor genes. Cytogenetically visible deletions helped in the identification of several suppressor genes including the A P C gene, RB and the Wilms tumour gene. Occasionally translocations also serve to inactivate a tumour suppressor gene, and again provide invaluable information as to the precise position of the gene. Cloning of the NF1 gene was expedited by two familial reciprocal translocations (Cawthon et al.y 1990; Viskochil et al., 1990; Wallace et a l .y 1990). In leukaem ias and the p re leukaem ic myeloproliferative syndrome (MDS) deletions of 5q have been repeatedly observed, leading to the suggestion that a tumour suppressor gene is involved. Although a suppressor gene has yet to be identified, a large number of haematopoietic growth factors and their receptors are encoded within the commonly deleted region (IL-3, -4, -5,-9, M-CSF, GM-CSF, M-CSF receptor and platelet-derived growth factor receptor), and loss of one or more of these genes could trigger MDS (Groopman et al.y 1989).
Heterogeneous staining regions and double minute chromosomes result from high levels of gene amplification and tend to appear in late stages of development of tumours. Amplification units may include several genes, for example a region of chromosome 1 1 is amplified in breast cancers and melanomas which spans I N T 2 y HST1 and PRAD1 (see references in Solomon et al., 1991), but it is uncertain which of the am plified genes bestow a growth advantage and which are only co-amplified.
1.2-2 Numerical Abnormalities
The loss or gain of whole chromosomes in cancer may also provide a growth advantage, but the mechanisms by which this occurs are less clear. Monosomy may reflect the loss of a tumour suppressor gene, as evidenced in meningioma where both monosomy of
25

chromosome 2 2 and allele loss on the same chromosome has been observed (Dumanski et al., 1987). Trisomy would be expected to increase the gene dosage of all the expressed genes on a chromosome although presumably only a small number of these genes actually contribute to neoplasia. The most frequently observed trisomy is trisomy 8 seen in m yelodysplastic and myeloproliferative disease, acute myeloid leukaemia (AML) and acute lymphoblastic leukaemia (ALL) (Mitelman et al., 1990). The most common trisomy of solid tumours is trisomy of chromosome 7.
1.3 R ecu rren t Chrom osom e T ranslocations
Study of the recurrent chromosome translocations has yielded more molecular information about oncogenesis than any other type of chromosomal abnormality. The reason for this is that a translocation breakpoint pinpoints the genes responsible for the disease with enormous precision. In contrast, the determination of exactly which gene(s) on an entire chromosome provide a growth advantage on achievement of trisomy is less simple. A second reason which has favoured the analysis of translocations is the repeated involvement of the immunoglobulin and T-cell receptor genes in many of the lymphoid malignancies, which has provided a direct route for the isolation of oncogenic sequences. Furthermore, cloning breakpoints even without knowledge of either translocation partner has recently become feasible.
Translocations can be subdivided on the basis of the molecular mechanism used to activate genes at the breakpoint. Two different mechanisms are in force: 1 ) gene deregulation and 2 ) gene fusion. Gene deregulation results from the juxtaposition of strong enhancer or promoter elements next to a gene which has oncogenic potential when overexpressed. Gene fusion results in a chimaeric oncoprotein which draws its carcinogenic character equally from both of the fusion partners. Burkitt’s lymphoma (BL) and CML are traditionally cited as respective examples of each m echanism .
26

1.3-1 Deregulation Via Ig Enhancers
Translocations in Burkitt's lymphomas invariably juxtapose the C- M Y C oncogene on chromosome 8 to one of the three immunoglobulin loci on chromosomes 2, 14 or 22 (Table 1.1) (reviewed in Magrath, 1990). The oncogenic potential of C -M YC has already been addressed, and in the B-cell environment the Ig enhancers cause the overexpresion of this dominant oncogene. The isolation of the translocation breakpoints in BL was permitted by prior knowledge of the chromosomal positions of both the Ig loci and the C-MYC gene, and from their map positions both were correctly surmised to participate at the breakpoint. The position of the breakpoints within the C-M YC locus varies between the endemic and sporadic forms of BL, but also according to which of the Ig loci is used by the translocation. The establishment of the involvement of the Ig loci in B-cell neoplasia has permitted the cloning of five other translocation breakpoints (Table 1.1). The properties of these five genes, BCL1 f BCL2, BCL3, LYT-10 and IL3 will be discussed.
Table 1.1 Oncogenes deregulated by chromosomal rearrangements
A. Oncogenes juxtaposed next to Ig loci
Disease Translocation Gene Protein type
B urkitt's t(8;14)(q24;q32) MYC HLHlym phom a t(2 ;8 )(p l 1 ;q24) MYC HLH
t(8 ;22)(q24 ;q l 1) MYC HLHB-CLL t( l I;1 4 )(q l3 ;q 3 2 ) BCL1
(PRAD11) CyclinFollicular
lym phom at(14;18)(q32;q21) BCL2 Inner mitochondrial
m em b ran eB-CLL t(14 ;19)(q32 ;q l3 ) BCL3 CDC10 motifB-cell
lym phom at(10;14)(q24;q32) LYT-10 Homology to
NF-kBB-ALL t(5;14)(q31;q32) 1L3 growth factor
27

B. Oncogenes juxtaposed next to TCRDisease Translocation Gene Protein type
T-ALL t(8;14)(q24;q l 1) MYC HLHT-ALL t(7 ;19)(q35 ;p l3 ) LYL1 HLHT-ALL t(l;1 4 )(p 3 2 ;q l 1) TCL5
(TAL1,SCL)HLH
T-ALL t( l l;1 4 ) (p l5 ;q l 1) RBNT1(TTG1)
LIM domain
T-ALL t( l l;1 4 ) (p l3 ;q l 1) RBNT2(TTG2)
LIM domain
T-ALL t(7;9)(q35;q34) TAN1 (TCL3)
Notch homologue
T-ALL t( 10; 14)(q24 ;q l 1) HOX11(TCL3)
Homeodom ain
C. Oncogenes deregulated by o ther lociDisease R earrangem ent Genes Protein types
P arathyro idadenom a
in v ( l1)(p 15;q l3)? PTH deregs PRAD1
PR ADI is a G1 cyclin
B-CLL t(8;12)(q24;q22) BTG1deregs
MYC
MYC has an HLH dom ain
The B C L 1 locus was defined as the breakpoint locus on chromosome 11 of the recurrent t(ll;1 4 ) translocation found in B- cell chronic lymphocytic leukaemia, diffuse B-cell leukaemia and multiple myeloma (Tsujimoto et al., 1984), but identification of a transcription unit proved difficult. The transcription unit must lie within a few hundred kilobases of the breakpoint, this being the maximal distance over which enhancers can function. Unrelated cloning endeavours on chromosome 1 1 identified an oncogene, PRAD1, which was physically linked to B CL1 , and it was suggested that PR A D I might be the elusive BCL1 oncogene (Lammie et al., 1991). PR A D I itself encodes a cyclin-related protein (Motokura et a l ., 1991), adding to the evidence implicating cell cycle-regulatory proteins in cancer.
The t(14; 18) translocation of follicular lymphomas fuses the heavy chain Ig locus to the BCL2 gene on chromosome 18 resulting in its
28

deregulation (Bakhshi et al.y 1985; Cleary and Sklar, 1985; Tsuijimoto et al.> 1985). The BCL2 gene product is unique amongst oncoproteins due to its localization on the inner mitochondrial membrane, and acts to inhibit apoptosis (Hockenbery et al ., 1990). Apoptosis, or programmed cell death, is an active process that requires protein synthesis and should not be confused with necrotic cell death. BCL2 therefore promotes cell survival without increasing the growth rate or inhibiting differentiation, resulting in an expanded pool of lymphocytes which, in parallel to the effects of the Epstein-Barr virus in endemic BL or the human T- cell lymphotrophic virus in adult T-cell leukaem ia, is then susceptible to further genetic damage and progression towards malignancy. The pathway from B C L 2 leading to apoptotic inhibition remains to be delineated.
Returning to the theme that disruption of the cell cycle can lead to neoplasia, the putative oncogene isolated from the breakpoint of the t(14;19) translocation in B-CLL, termed B C L 3 , may function in the initiation of the cell cycle (McKeithan et al.t 1987; Ohno et al.y1990). This prediction is based on the presence of seven tandem copies of the 35 amino acid CDC10 motif which is only found in two classes of protein. The first, including three yeast genes CD C 10y SW14 and SW 16 , function in cell cycle initiation, while the second class are involved in cell lineage determination. It remains unproven to which class, if either, BCL3 belongs. Additionally, the human homologue of the Notch gene in Drosophila is a member of the second class of CDC10 proteins, and this gene (T A N 1 ) is rearranged in the t(7;9) translocation in T-ALL (Ellisen et al.f1991).
The gene LYT-10 juxtaposed to the immunoglobulin heavy chain locus by the t(10;14)(q24;q32) translocation is homologous to the NF-kB/REL family of transcription factors, suggesting that it is also involved in gene regulation (Neri et al.> 1991). DNA-binding activity of the LYT-10 protein has been documented in vitro. The translocation truncates the C-terminus of the protein, which encodes six full repeats of the 33 amino acid ankyrin domain (Neri et al.y 1991), although the significance of this is unclear. A second
29

m em ber of this fam ily has also been im plicated in lymphomagenesis (section 1.3-3), and futher mechanisms of action are discussed at that juncture.
The final insight into leukaemogenesis provided by the analysis of genes juxtaposed next to Ig enhancers comes from a type of pre- B-ALL with a t(5; 14) translocation and a pronounced eosinophilia. Here the deregulated "oncogene" is the growth factor IL3, suggesting that the leukaemia is caused by an autocrine IL3 loop and that the eosinophilia results from excess IL3 (Meeker et al.,1990). Moreover, this knowledge immediately suggests a route of therapeutic intervention, namely the adm inistration of IL3 antagonists. This is an important point, since the ultimate goal of cloning disease loci is to apply the knowledge gained for the benefit of the patient.
1.3-2 Deregulation Via TCR Enhancers
The TCR loci are responsible for the deregulation of at least seven oncogenes in T-cell neoplasms (Table 1.1), including TAN1 to which reference has already been made. Many of these deregulated genes are transcription factors.
Three transcription factors containing helix-loop-helix domains have been implicated in T-cell neoplasia; C-MYC, LYL1 (Mellentin et al., 1989)and TCL5 (also known as TALI or SCL1) (Begley et al., 1989; Chen et al., 1990; Finger et al., 1989) (Table 1.1). Each of these genes may regulate a series of other genes which could prom ote growth or block d ifferentiation . The ab ility of transcription factors to dimerize with one another provides another level of control, since an over-abundance of one protein which forms heterodimers in a stoichiometric fashion may upset a delicate equilibrium (M urre et al., 1989). This can lead to additional effects in other transcriptional pathways. Although the t(l;14) translocation through which the TCL5 gene was identified is rare, genomic analysis of TCL5 has shown that 25% of all cases of T-ALL contain a cytogenetically undetectable 90kb deletion which places TCL5 under the control of an uncharacterized locus
30

called SIL (Apian et al., 1990). This indicates that the involvement of transcription factors in T-cell neoplasia is more common than previously thought. A different type of transcription factor, the homeodomain protein HOX11, was identified at another T-cell translocation breakpoint (Hatano et al., 1991; Kennedy et al.,1991).
A new class of nuclear oncogene was identified by walking from the TCR delta locus over the breakpoints in two other translocations associated with T-ALL. The first of these genes was called rhombotin (RBNT1, orTTG-1) (Boehm et al., 1988; Boehm et al., 1990b; McGuire et al., 1989) since the gene was expressed in the rhombomeres of the mouse embryo. Moreover, expression of the gene was not detected in the normal lymphoid compartment suggesting that ectopic expression of R B N T 1 in a T-cell environment provides a growth advantage for these cells. Hints as to the function of this gene were obtained from the presence of two LIM domains which comprise the bulk of the protein. LIM domains are cysteine-rich regions (Freyd et al., 1990; Karlsson et al., 1990) which, although reminiscent of metal-binding finger domains, are not thought to mediate direct interactions with DNA since other LIM domain proteins contain DNA-binding domains (and transcriptional activation domains) in addition to their LIM motifs. Instead LIM domains may mediate protein dimerization, and RBNT1 could therefore regulate transcription through interactions with the DNA-binding LIM domain proteins (Boehm et al., 1990a). This interaction could mediate positive or negative regulation. A second putative oncogene belonging to this class, R B N T 2 (T T G - 2 ), has also been described which maps slightly further proximal on l i p (Boehm et al., 1991; Royer-Pokora et al.,1991).
The oncogenes isolated from T-cell neoplasms may therefore be visualized as a series of factors capable of d isregulating transcriptional pathways. Their activation may not always be attributable to ectopic or over-expression due to juxtaposition next to TCR enhancers, since occasionally the only known enhancer is left on the derivative chromosome (discussed in
31

Rabbitts and Boehm, 1991). Mundane explanations are that additional enhancers wait to be discovered or that the chromatin structure differs over the entire TCR/Ig locus and exerts a positional effect over the breakpoint. A lternatively (or additionally) it may be necessary to invoke other mechanisms such as promoter truncation or exon deletion to explain the activation of some of the breakpoint genes.
Finally, two examples of gene deregulation have recently been described that are not attributable to the effects of the TCR or Ig loci. These are the deregulation of the PR A D I oncogene by the parathyroid hormone regulatory elements as a result of an inversion on chromosome 11 in benign parathyroid adenoma (Rosenberg et al ., 1991), and the deregulation of C-MYC by the BTG1 locus on chromosome 12 (Rimokh et al., 1991) (Table 1.1).
1.3-3 Gene Fusions
The alternative molecular result of a chromosome translocation is an in-frame gene fusion which yields a chimaeric protein on translation. Gene fusions are more common in myeloid leukaemias and may prove to be the rule in solid tumours despite the description of only six translocation-related gene fusions to date (Table 1.2). Again, transcription factors dominate the list of fusion gene partners with the clear exception of the BCR and A BL genes which are fused in CML. Although the Philadelphia gene fusion was the first to be described, it is not representative of the majority of other fusions. BCR -AB L fusions are found in (almost) every case of CML (see section 8.1) and in some cases of ALL.
The cloning of the t(9;22) translocation breakpoint was expedited by the mapping of the human ABL proto-oncogene in the vicinity of the breakpoint on chromosome 9, and the functions of both the fusion partners are now well understood, as reviewed (Sawyers et a l ., 1991). A B L encodes a tyrosine kinase whereas BCR is a modular protein with an N-terminal serine kinase domain (Maru and Witte, 1991), a central domain with homology to the D B L
32
oncogene (Hart et al., 1991) and a C-terminal domain which acts as a GAP for the small G protein RAC (Diekmann et al., 1991).
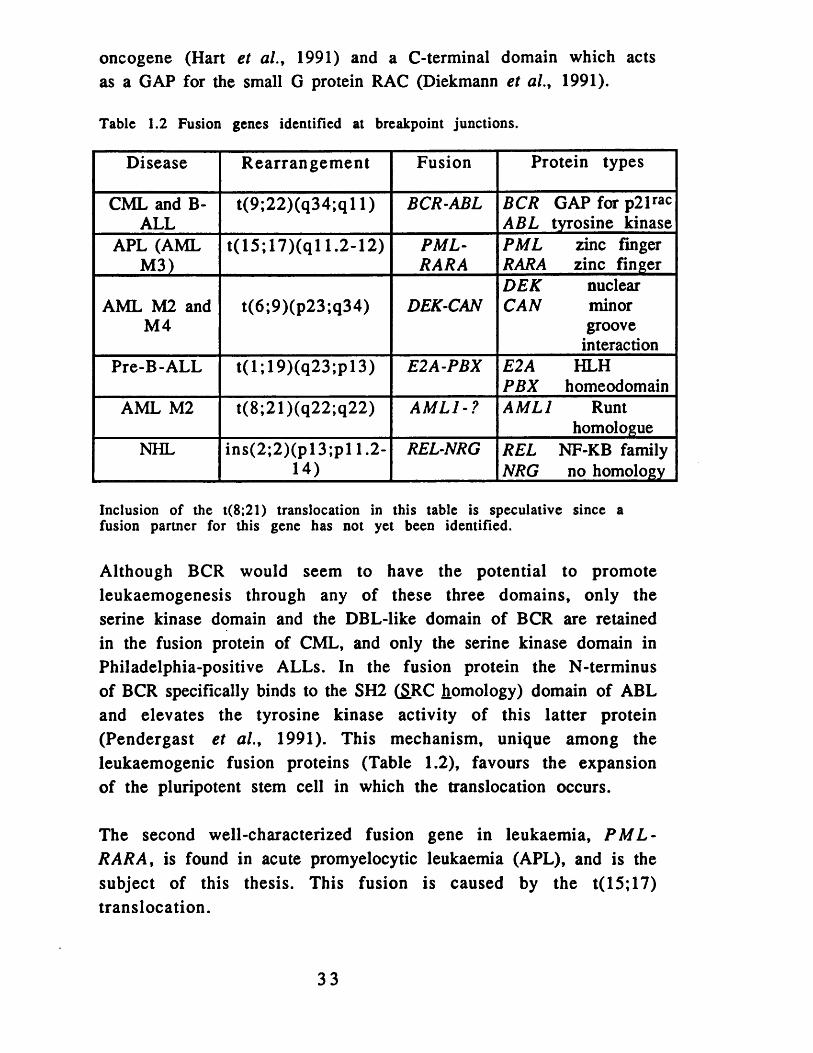
Table 1.2 Fusion genes identified at breakpoint junctions.
Disease R earrangem ent Fusion Protein types
CML and B- ALL
t(9 ;22)(q34;q l 1) BCR-ABL BCR GAP for p21rac ABL tyrosine kinase
APL (AML M3)
t(15 ;17 )(q l 1.2-12) PML-RARA
PML zinc finger RARA zinc finger
AML M2 and M4
t(6;9)(p23;q34) DEK-CANDEK nuclear CAN minor
groove interaction
Pre-B-ALL t(l;1 9 )(q 2 3 ;p l3 ) E2A-PBX E2A HLH PBX homeodomain
AML M2 t(8;21)(q22;q22) AML1-? AM L I Runthomologue
NHL in s(2 ;2 )(p l3 ;p l 1.2- 14)
REL-NRG REL NF-KB family NRG no homology
Inclusion of the t(8;21) translocation in this table is speculative since a fusion partner for this gene has not yet been identified.
Although BCR would seem to have the potential to promote leukaemogenesis through any of these three domains, only the serine kinase domain and the DBL-like domain of BCR are retained in the fusion protein of CML, and only the serine kinase domain in Philadelphia-positive ALLs. In the fusion protein the N-terminus of BCR specifically binds to the SH2 (S.RC homology) domain of ABL and elevates the tyrosine kinase activity of this latter protein (Pendergast et al., 1991). This mechanism, unique among the leukaemogenic fusion proteins (Table 1.2), favours the expansion of the pluripotent stem cell in which the translocation occurs.
The second well-characterized fusion gene in leukaemia, P M L - R A R A , is found in acute promyelocytic leukaemia (APL), and is the subject of this thesis. This fusion is caused by the t(15; 17) translocation.
33

The fusion protein formed by the t ( l ; 19) translocation in pre-B- cell leukaemia is more typical of leukaemogenic fusion proteins. Both the genes involved, E2A and P B X , are transcription factors,and the documented fusion product contains the N-terminaltransactivation and dimerization domains of E2A fused to the C- terminal homeodomain DNA-binding domain of PBX (Kamps et al ., 1990; Nourse et al ., 1990). The E 2 A gene encodes the two immunoglobulin enhancer binding proteins £12 and E47 and is normally expressed in B-lymphocytes. In contrast, the P B X gene is not transcribed in this lineage. The transactivation properties of E2A are therefore ectopically targeted to the genes usuallyregulated by PBX, while the fusion protein still retains the ability to dimerize with other helix-loop-helix proteins. The two proteins effectively swap their DNA-binding domains.
The t(l;1 9 ) translocation was cloned through the suspectedinvolvement of the E2A gene, whose function was already known, and led to the identification of the PBX gene whose function could be deduced from its homeodomain. A different approach was required to clone the breakpoint of the t(6;9) translocation found in acute myeloid leukaemias (AML) M2 and M4, since none of the genes previously mapped on chromosomes 6 or 9 appeared to be rearranged (von Lindern et al ., 1990). A positional cloning strategy directed towards the breakpoint on chromosome 9 subsequently identified both fusion partners at the t(6;9) junction as novel genes. The two genes, D E K and CAN> lacked overall homology with characterized genes but several pieces of data suggested that both may interact with DNA (von Lindern et al.,1992). Antibody staining revealed that DEK has a strictly nuclear localization, and that CAN, although mainly cytoplasmic, contains a leucine zipper motif and an amphipathic helix which both function as d im erization dom ains in other transcrip tion factors. Furthermore, CAN contains a motif repeated 14 times in the C- terminal part of the protein (and is therefore retained in the fusion) which closely resembles the DNA minor groove binding motif. This may prove to have DNA-binding capacity by itself even though minor groove interactions usually serve to stabilize specific interactions in the major groove. Both genes appear
34
expressed in the haematopoietic system hence ectopic expression of neither gene can be invoked to explain the transforming properties of the DEK-CAN fusion protein. Until the properties of DEK and CAN are more clearly defined it is difficult to predict exactly how the fusion protein causes transformation. Recently a second fusion partner for C A N , termed SET, has been described in acute undifferentiated leukaemia (von Lindern et al., 1992).
Another intriguing fusion protein is the REL-NRG chimaeric protein found in non-Hodgkin's lymphoma (NHL) as a result of an insertion on chromosome 2, which was discovered through direct analysis of the REL oncogene in these tumours (Lu et al., 1991). In birds the REL oncogene causes lymphoid tumours, and encodes a transcription factor that belongs to the NF-kB class of transcription factors. The \ -REL oncogene exerts its oncogenic potential through a dominant negative effect on NF-kB, that is, it dimerizes with NF- kB and thereby inhibits NF-kB function (Ballard et al., 1990). A similar role has been proposed for the v-ERBA oncogene which exerts a dominant negative effect through dimerization with its cellular homologue, the thyroid hormone receptor (Damm et al., 1989). This model may also be applicable to the REL-NRG fusion protein .
To complete the theme of the involvement of transcription factors in fusion proteins, the recently-cloned t(8;21) translocation breakpoint of AML has yielded a gene AM L I on chromosome 21 whose fusion partner on chromosome 8 remains to be cloned (Miyoshi et al., 1991; Shimizu et al., 1991). The A M L I gene is thought to encode a transcription factor since the gene is the human equivalent of the Drosophila gene runt (Daga et al., 1992), whose candidature as a transcription factor is based on the presence of a basic domain characteristic of such factors. In Drosophila the gene controls morphogenesis.
The series of chromosome translocations in leukaemia involving llq 2 3 are currently under scrutiny, but the mechanism at the breakpoint, be it deregulation or fusion, has yet to be established. The llq23 locus can be juxtaposed to at least 20 different loci in
35

the human genome (Young, 1992). Additionally a great many recurrent translocations in solid tumours await m olecular elucidation (Solomon et al., 1991). Whether the majority of these will also prove to involve transcription factors will be determined in the near future as positional cloning strategies are applied to clone the breakpoints.
1.3-4 Translocations: Cause or Effect?
The recurrent appearance of particular translocations in specific cancers is not proof that the translocations play a causal role in cancer despite, for example, the strong association of the Philadelphia chromosome with CML and the t(15;17) translocation with APL. However, three other lines of evidence suggest that this is the case. The most convincing evidence comes from transgenic mice in which the transgenes have been constructed to mimic the molecular rearrangements at the translocation breakpoint, and in the main engender a similar pathology in the mouse as seen in the human. For example, Ig-BCL2 transgenes recreate a disease which resembles human follicular lymphoma (MacDonald et al., 1989). The reconstitution of irradiated mice with bone marrow infected by retroviruses containing B C R -AB L constructs results in various haem atopoietic outgrow ths including a m yelopro lifera tive syndrome (see references in (Sawyers et al., 1991). This in vivo evidence is most persuasive.
Secondly, in vitro evidence is provided by the ability of the BCR- ABL protein to transform a variety of factor-dependent haematopoietic cell lines. Finally, the elegant demonstration that addition of an anti-sense oligonucleotide, which is complementary to the junction of the B C R -A B L fusion message, causes growth retardation of CML blasts (Szczylik et al., 1991) not only confirms the causality of the translocation but also suggests a novel therapeutic route. Similar inhibition of most fusion cDNAs may be possible.
A lthough translocations therefo re appear necessary for leukaemogenesis, they may not suffice by themselves to induce
36

the full malignant phenotype and additional mutations may be required. It is also unlikely that the strengths of all oncogenicrearrangements are equal.
1.4 A cute Prom velocvtic L eukaem ia
Acute promyelocytic leukaemia (APL) was described in 1957 as a distinct clinical entity on the basis of its rapid, fatal course, severe b leed in g and abundance o f m alignan t h y p erg ran u la r promyelocytes in the bone marrow (Hillestad, 1957). APL is now embodied in the French-American-British classification scheme as acute myeloid leukaemia (AML) M3 where its recognition as a separate disease is ju stified on the grounds of unique morphological, clinical, cytogenetic and molecular criteria as reviewed (Borrow and Solomon, 1992; Clarkson, 1991; Stone andMayer, 1990). These unique features of APL will be discussed.
1.4-1 APL: Morphological and Clinical Appearance
APL represents 10-15% of all cases of AML, and its diagnosis requires a minimal replacement of 25% of the bone marrow with malignant promyelocytes (Jones and Saleem, 1978). Although the dominant cell at presentation is the prom yelocyte this is attributable to a block in myeloid differentiation at the promyelocytic stage, and the identity of the more primitive cell type in which the translocation occurs is unknown. The peripheral blood WBC count is lower in APL than in other AMLs (< 3 ,0 0 0 /m m 3) which may reflect an earlier presentation of this disease since the peripheral blood count can rise rapidly if the disease goes unchecked. APL strikes significantly earlier in life than other myeloid leukaemias (the mean age at presentation is during the fourth decade) (Mertelsmann et al., 1980), with no bias between the sexes or between ethnic groups.
The most striking clinical feature of APL is the life-threatening coagulopathy which necessitates an early and accurate diagnosis of the disease (reviewed Tallman and Kwaan, 1992). This consumptive coagulopathy has been attributed to disseminated
37

intravascular coagulation (DIC) due to the release of procoagulants from the promyelocytic granules. The initiation of chemotherapy exacerbates this problem as large numbers of m alignant prom yelocytes die causing fu rther m assive re lease of procoagulants, and heparin is required to help re-establish hemostatic control. Although clotting disorders in leukaemia are not solely confined to APL, the severity and frequency of the problem are certainly enhanced. Once the possibility of early death due to haemorrhage has been overcome the prognosis for APL is good, with approximately 40% of patients enjoying first remission periods of over five years; the comparable figure for five year disease-free first remissions in other AMLs is 25-30%.
T reatm ent of APL has trad itionally been made using chem otherapy, with a com bination of daunorubicin and arabinosylcytosine proving a popular choice although other anthracyclines can be substituted for daunorubicin (see references in (Clarkson, 1991). A fraction of patients may receive bone marrow transplants, particularly during second rem ission. However, a major advance in the treatm ent of APL with im plications for other types of cancer was made by the observation that zW-trans retinoic acid (ATRA) can be used to achieve remission in the majority (23/24 in the initial series) of APL patients (Huang et al., 1988). These results were confined to the a ll- trans isomer of retinoic acid since other vitamin A derivatives, including the 13-c/s isomer, had not been reported to be so efficacious despite partial responses in both AML and myelodysplastic syndromes (Fontana et al., 1986 and references in Clarkson, 1991).
These remarkable results were confirmed in a series of 22 patients of which only one proved to be a non-responder (Castaigne et al.t 1990; Chomienne et al., 1990). The advantages of all-trans retinoic treatment seem four-fold:
1) The therapy was able to restore the ability of the promyelocytes to differentiate (hence the term "differentiation
38

th e rap y ”) w ithout dam aging the norm al bone m arrow com partm ent.
2) Since the promyelocytes continue down their normal pathway of differentiation instead of undergoing cytotoxic death, release of procoagulants was limited, lessening the risk of early death due to DIC.
3) Differentiation therapy and conventional chemotherapy are not mutually exclusive, and use of ATRA as consolidation therapyafter chemotherapy may prove the optimal therapeutic regime.Alternatively, the use of ATRA as first line treatment (to avoidDIC) could be supplemented by chemotherapy. Moreover, the side-effects of ATRA, which include skin and mucosal dryness, are more acceptable to the patient than the side effects of chem otherapy.
4) Administration of ATRA does not require hospitalization.
However, as patients receiving retinoic acid have been followed for longer periods of time it has emerged that retinoic acidresistant leukaemic clones arise and that the patients may relapse (Chen et al., 1991b; Muindi et al.9 1992), hence treatment with ATRA alone may not be advisable. Various mechanisms for retinoic acid resistance have been proposed, including induction of the P450 system and sequestration of ATRA by the cellular retinoic acid binding protein (CRABP) (Muindi et al ., 1992). Further discussion of the involvement of retinoids in cancer will be made in section 1.5.
APL also has a unique morphological appearance (reviewed Stone and Mayer, 1990). APL is divided into classical (FAB M3) and variant (FAB M3V) forms on the basis of morphology; classical APL has hypergranular promyelocytes whereas the variant form is labelled hypo- or microgranular (Golomb et al., 1980; McKenna et a/., 1982). The dense, coarse granules of the hypergranular form are prominent even on light microscopy, compared to the fine granules of the variant form which can be difficult to observe.
39

There is little else to distinguish the two forms although the M3Vpatients were reported to present with a higher leukocyte countand account for an increased percentage of female, non-white patients than their hypergranular counterparts (Davey et al .,1989). Both types dem onstrate the d istinc tive t( 15; 17)translocation (see below) and the attendant coagulopathy. M3V patients only represent approximately 25% of all APL patients.The molecular differences underlying the two morphological types are also unknown. Granules from both types contain anti-microbic enzymes such as myeloperoxidase (MPO) in addition to theprocoagu lan ts m entioned ea rlie r. C ytochem ical s ta in ing demonstrates chloroacetate esterase activity in most cases.
The striking hypergranularity of the malignant promyelocytes in APL is complemented by the presence of numerous Auer rods. Auer rods are restricted to myeloid leukaemias but are most abundant in APL, where they are are readily observed in thecytoplasm following the coalescence of primary granules into ahexagonal crystalline array. The periodicity of the Auer rods in APL may differ from that of other AMLs (Glorius and Houssay, 1973).
1.4-2 APL: Cytogenetics - the t(15:17)
As described in the preceding sections of the introduction, many types of cancer, especially the leukaemias, are characterized by specific, recurrent chromosomal abnormalities, typically reciprocal translocations. Since it was suspected even from the first cytogenetic analyses that these translocations might pinpoint oncogenic sequences, the association of a particular rearrangement with the clear-cut clinical entity of APL was sought. The earliest report of such an abnormality in APL described what appeared to be an interstitial deletion on the long arm of chromosome 17 in two patients using quinacrine banding (Golomb et al.t 1976). This observation was strengthened by a preceding report which also described a deletion in either chromosome 17 or 18 in a single APL patient, a six year-old girl (Engel et al.y 1967). These reports correctly focussed attention on chromosome 17.
40

The subsequent analysis of higher quality chromosome spreads from APL bone marrow enabled the deletion chromosome 17 to be re-interpreted as a reciprocal translocation between the long arms of chromosomes 15 and 17, t(15;17)(q22;q21) (Figure 1.2) (Rowley et al., 1977a). The exact position of the breakpoint on chromosome 17 has been debated, but a consensus of 17ql 1.2-12 was reached by the Human Gene Mapping consortium at HGM9. The translocation has never been observed in any other malignancy, except the rare promyelocytic blast crisis of CML, and is one of the idiosyncratic features of the disease. The two derivative chromosomes are generally referred to as the 15q+ and the 17q- chromosomes.
The incidence of the t(15;17) translocation in APL equals the association of the t(9;22) with CML, and it has been suggested that the t(15;17) may be found in every case of APL if optimal analysis is performed (Larson et al., 1984; Sheer et al., 1985). This requires the culture of the bone marrow for 24-48 hours prior to banding to permit the translocation-bearing malignant cells to outgrow the cytogenetically normal erythroblasts (Berger et al.y 1983). A case for geographical variation in the incidence of the t(15; 17) in APL has now been dismissed, and the translocation has been reported in APL patients across the world. However, the rate of detection does not usually reach 100%; for example, the incidence varied between 63% and 97% in two recent series of cases (Fenaux and Degos, 1991; Thomas et al.9 1991). Given the limited number of cells studied in a single cytogenetic analysis this is not unexpected, especially since translocations can be masked or present as more complex variations (see chapter 8). The second most commonly observed chromosomal abnormality in APL is trisomy of chromosome 8, and is observed in around 17% of patients (Berger et al.9 1991). As mentioned earlier trisomy 8 is the most common trisomy in cancer, and probably provides additional transforming potential.
41

15
PML
B
17
RARA
15q+
1 7q-
RARA-PMLPML-RARA
Figure 1.2 The cytogenetic hallmark of APL is the t(15;17)(q22;q12-21) translocation. The two derivative chrom osom es are referred to a s the 15q+ and the 17q-. RARA and PML refer to the genes disrupted by the translocation (see chapters 5 and 6).

1.4-3 APL: Candidate Breakpoint Genes
The universal association of APL with the t(15;17)(q22;ql 1-12) provoked considerable efforts to identify the genes at the breakpoint in a bid to unravel the molecular pathology of the disease. Efforts have been concentrated on chromosome 17 because a greater number of genes have been mapped on this chromosome. At the outset of this project all of the other chromosome breakpoints which had been identified had been cloned through the analysis of candidate genes. Candidate genes must fulfil two criteria before they are chosen for further analysis: 1) their map positions must be consistent with one of the breakpoint regions and 2) their functional disregulation could conceivably lead to the observed disease phenotype. For example, the involvement of both of the genes at the Burkitt's lymphomabreakpoints (C -M YC and the Ig loci) was predicted from thechromosomal assignments of these genes, and the Philadelphia chromosome breakpoint was cloned subsequent to the assignment of the C-ABL oncogene to chromosome nine. The candidate gene approach is restricted to mapped genes and since only 5% of the total estimated number of human genes have been mapped the limitations of this approach are clear. This strategy will, however, be the choice of the future as an increasing percentage of genes are mapped.
Nonetheless, several plausible candidate genes had been mapped in the vicinity of the breakpoints. The myeloperoxidase gene (M P O ) was initially mapped to 17ql2-24 and presented a logical target for rearrangement in APL since the expression of M P O is limited to the promyelocytic stage of myeloid differentiation. M P O could therefore be expected to contribute strong promyelocyte- specific enhancers or promoter elements which could deregulate oncogenic sequences at 15q22 (Weil et al.y 1988). Additionalanalyses of the M P O gene failed to reveal consistentrearrangements at this locus (Donti et al,y 1989; Miller et al.y 1989), even after pulsed-field gel electrophoretic (PFGE) analysis (Yano et al.y 1990). The MPO gene is now known to map at 17q22- 24, considerably further distal on 17q than the APL breakpoint.
43

A second plausible candidate gene was the granulocyte colony- stimulating factor (G - C S F ) gene mapped to 17ql 1.2-12 which encodes a growth and differentiation factor active towards APL blasts. The involvement of this gene was also eliminated through PFGE analysis (Tanaka et al.t 1990 and A. Goddard, unpublished results). Likewise the candidature of two proto-oncogenes localized within the breakpoint region on chromosome 17, ERBA1 and E R B B 2 , was not supported by PFGE studies (A. Goddard, unpublished observations) or by Southern analysis (Longo et al., 1990a). These two genes encode the thyroid hormone receptor and the epidermal growth factor receptor respectively. The dominant oncogene p53 was also considered as a candidate prior to its sublocalization towards the tip of the short arm of chromosome 17.
The retinoic acid receptor alpha gene (RARA) was not considered a strong candidate for APL since it had been mapped to 17q21 (Mattei et al ., 1988b) distal to the APL breakpoint consensus region at 17q 11.2-12, and no convincing link between retinoic acid receptors and cancer had ever been demonstrated (section 1.5). Furthermore, early studies reported a lack of rearrangement on Southern blots and no aberrant transcripts on Northernanalysis (Gallagher et al., 1989; Largman et al.t 1989). At this time the marked response of APL patients to ATRA had not beenconfirmed outside China. No PFGE analysis was reported using RARA .
It had been suggested that the C -F E S proto-oncogene on chromosome 15 could be involved at the APL breakpoint (Heisterkamp et al., 1982) although rearrangements were never reported in the gene. A more detailed analysis was performed recently for the cellular retinoic acid binding protein (CRABP) also on chromosome 15, which excluded the possibility that this genewas rearranged by the t(15;17) translocation (Guerts van Kessel etal ., 1991).
44
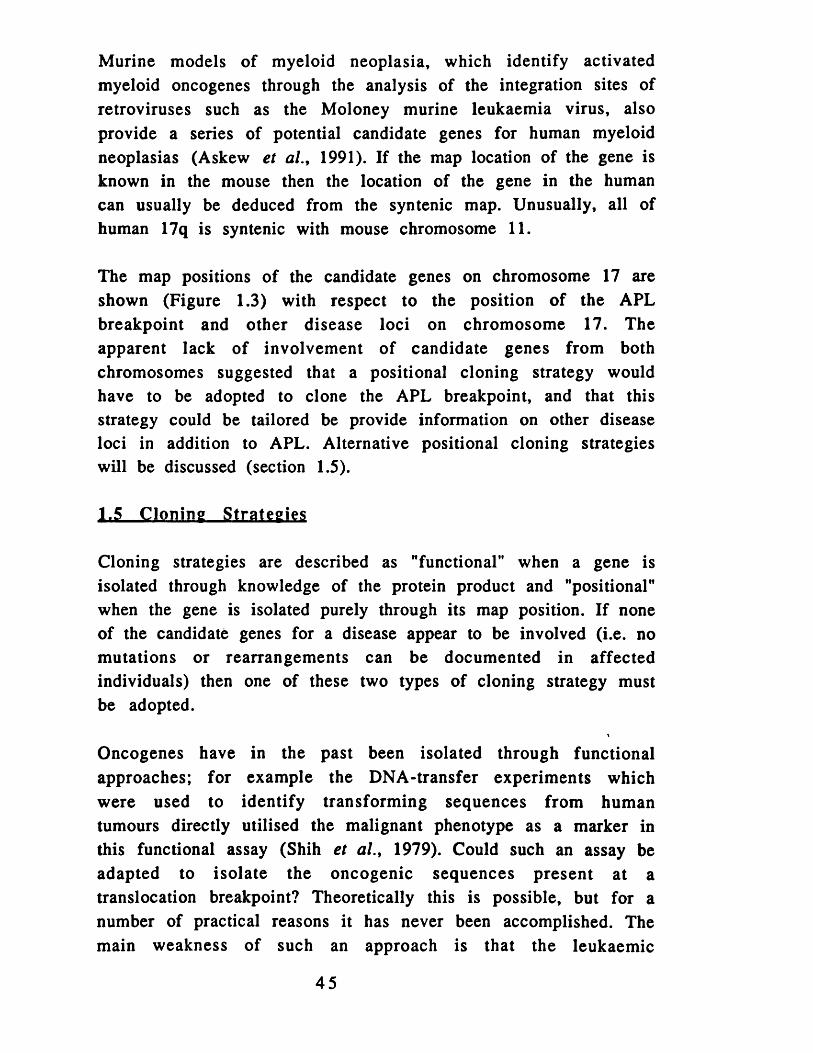
Murine models of myeloid neoplasia, which identify activated myeloid oncogenes through the analysis of the integration sites of retroviruses such as the Moloney murine leukaemia virus, also provide a series of potential candidate genes for human myeloid neoplasias (Askew et al., 1991). If the map location of the gene is known in the mouse then the location of the gene in the human can usually be deduced from the syntenic map. Unusually, all of human 17q is syntenic with mouse chromosome 11.
The map positions of the candidate genes on chromosome 17 are shown (Figure 1.3) with respect to the position of the APL breakpoint and other disease loci on chromosome 17. Theapparent lack of involvement of candidate genes from both chromosomes suggested that a positional cloning strategy would have to be adopted to clone the APL breakpoint, and that this strategy could be tailored be provide information on other disease loci in addition to APL. Alternative positional cloning strategieswill be discussed (section 1.5).
1.5 C loning S trategies
Cloning strategies are described as "functional" when a gene is isolated through knowledge of the protein product and "positional" when the gene is isolated purely through its map position. If none of the candidate genes for a disease appear to be involved (i.e. no mutations or rearrangements can be documented in affected individuals) then one of these two types of cloning strategy must be adopted.
Oncogenes have in the past been isolated through functionalapproaches; for example the DNA-transfer experiments whichwere used to identify transforming sequences from human tumours directly utilised the malignant phenotype as a marker in this functional assay (Shih et al., 1979). Could such an assay be adapted to isolate the oncogenic sequences present at a translocation breakpoint? Theoretically this is possible, but for a number of practical reasons it has never been accomplished. The main weakness of such an approach is that the leukaemic
45
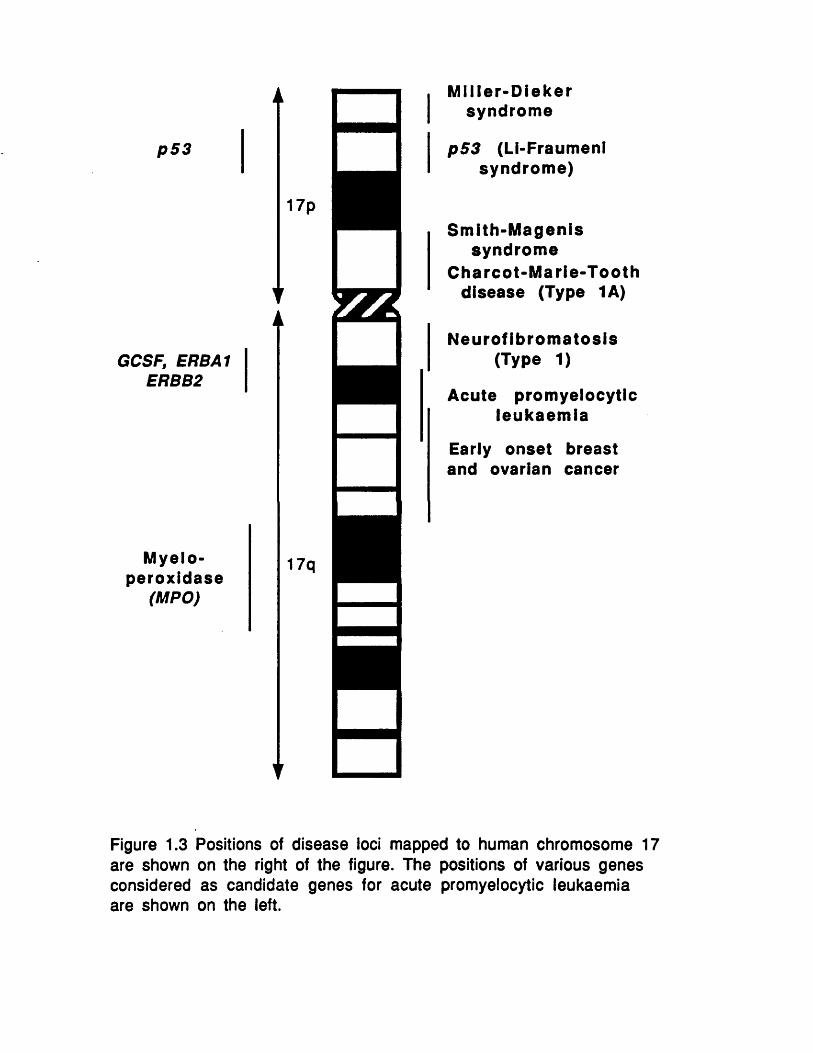
p 53
17p
GCSF, ERBA1 ERBB2
Myeloperoxidase
(MPO)
17q
/ / !
Miller-Diekersyndrome
p53 (Ll-Fraumeni syndrome)
Smith-Magenis syndrome
Charcot-Marie-Tooth disease (Type 1A)
Neurofibromatosis (Type 1)
Acute promyelocytic leukaemia
Early onset breast and ovarian cancer
Figure 1.3 Positions of d isease ioci mapped to human chrom osome 17 are shown on the right of the figure. The positions of various genes considered as candidate genes for acute promyelocytic leukaem ia are shown on the left.

rearrangem ent found at, say, the t( 15; 17) breakpoint is presumably only transforming in the environment of a myeloid progenitor cell and would be most unlikely to transform the NIH3T3 fibroblast line. The presence of T-cell markers on the only established t(15;17)-positive APL cell line, NB4 (Lanotte et al.,1991), suggests that the cell in which APL arises may be even more primitive, and may only exist as a fleeting entity within the bone marrow. The uncertaincy over the recipient cell line for transformation is therefore a drawback to a functional cloning strategy.
The subtraction of cDNA libraries constructed from two myeloid cell lines, one containing the t(15;17) translocation and one lacking the rearrangement, should identify genes which are differentially expressed between the two RNA sources. However, both partners of a gene fusion may normally be expressed prior to the fusion, hence this method could not guarantee the isolation of the breakpoint genes.
In contrast, positional cloning strategies are better suited for the identification of the APL breakpoint, although not every type of methodology used to identify cancer genes is applicable. Allele loss studies, for example, cannot be used to home in on the gene as loss of heterozygosity only occurs around tumour suppressor genes and the translocation has a dominant effect. Likewise no familial cases of APL have ever been reported (nor any of the leukaemias, although heritable mutations in p53 can impose an increased risk), so the use of linkage studies to identify the gene by tracing the inheritance of closely-linked markers through large pedigrees is ruled out.
Instead, a positional cloning strategy can be based on the observation that any genomic rearrangem ent such as a translocation or a deletion will cause a change in the physical map at the point where the broken chromosomal ends are re-ligated. The physical map is defined by the positions of rare-cutting restriction enzymes (see chapter 2), and the sizes of the restriction fragments at the breakpoints will be altered by the juxtaposition
47
of fragments from two disparate loci. These abnormal junction fragm ents will only be present in DNA containing the rearrangement, for example the t ( l5; 17) translocation. The use of pulsed field gel electrophoresis (PFGE, chapter 3) enables the resolution and detection of these aberrant fragments over large chromosomal distances. The aim of the positional cloning strategy is therefore to generate sufficient markers in the region of the translocation breakpoint so that at least one of them can be used to visualize the translocation on PFGE.
To further these aims, the Somatic Cell Genetics laboratory at ICRF has developed a series of tools for the analysis of chromosome 17. Chief amongst these is a somatic cell hybrid mapping panel (see chapter 1) which enables the localization of genes with respect to one another according to the breakpoints within the hybrids (Xu et al., 1988). The panel includes a number of chromosome- mediated gene transfectants (CMGTs), which are somatic cell hybrids containing multiple small fragments of chromosome 17,which permit fine scale mapping and ordering of even tightly-linked genes (Xu et al., 1988). This hybrid mapping panel is applicable to the study of disease loci anywhere on the chromosome, including the APL breakpoint, the neurofibromatosis type 1 gene and the recently assigned early onset breast andovarian cancer locus. These loci all lie an the long arm, whereas 17p harbours genes for Charcot-M arie-Tooth disease (a neuropathy) (Vance et al., 1989) and two mental retardation syndromes, Miller-Dieker and Smith-Magenis.
The laboratory has also previously reported the construction of somatic cell hybrids containing the APL 15q+ derivativechromosome but few other human chromosomes (Sheer et al., 1983). The segregation of the translocated chromosome away from the normal copies of chromosome 15 and 17 is an important step for the analysis of the breakpoint region. In addition, these hybrids provide a unequivocal means of determining if genes or anonymous markers lie above or below the translocation breakpoint. The selectable marker thymidine kinase, which maps
48

close to the telomere on 17q, was used in to select for the 15q+ chromosome in the derivation of these hybrids.
The positional cloning strategy used to identify the APL t(15;17) translocation breakpoint is described in detail in chapter 1. Like many cloning strategies it initially relied on the generation of a large number of anonymous DNA fragments to saturate the breakpoint region. Linking clones are among the most versatile of chromosomal markers (Frischauf, 1989). In general, cloning strategies subsequently rely on techniques such as PFGE, chromosome jumping or yeast artificial chromosomes to then bridge the gap between individual clones and genetic or somatic cell hybrid maps (reviewed in Poustka and Lehrach, 1986). The resolution of in situ hybridization techniques has also improved, and now also permits the ordering of closely linked markers. Combination of all of these techniques has allowed several hundred disease genes to be cloned and analysed (Collins, 1992).
1.6 Retinoids and th e ir Receptors
The discovery that one of the nuclear retinoic acid receptors is involved in the t(15; 17) translocation (chapter 4) prompted a review of the retinoids, their functions, their receptors and evidence which suggests that they play a role in cancer.
1.6-1 Physiological Functions
Retinoic acid belongs to the group of fat-soluble organic compounds termed the retinoids (vitamin A) which are required in the diet in small amounts since they cannot be synthesized by mammals. Lack of vitamin A can result in blindness and an increased risk of infection and death, particularly in children from developing countries. These symptoms of deficiency reflect the pleiotrophic effects that the retinoids exert over vision, m orphogenesis, d ifferen tia tion and ep ithelia l m aintenance (Blomhoff et al., 1990; Brockes, 1989; de Luca, 1991). Retinoids may also help keep neoplasia in check (section 1.6-3).
49
The requirement for retinoids in the visual cycle is one of the best understood functions of vitamin A derivatives. Incoming light causes the isomerization of a molecule of 11-c/s-retinal (bound to the protein opsin) to the sAl-trans isoform, the first step of visual signal transduction.
Extravisually, experiments on the chick limb bud have suggested that retinoids may control m orphogenesis during embryonic development. The digit pattern of the chick limb bud (234) is controlled by the zone of polarizing activity (ZPA) within the posterior region of the bud, which can be transplanted to the anterior region of the bud in a second chick embryo where it causes a mirror image duplication of the digits within the bud (432234). However, a bead of retinoic acid (RA) can elicit the same response, implying that a gradient of retinoic acid over the limb bud supplies positional information (reviewed in Brockes,1989). Support for the idea that RA can act as a natural morphogen has come from the demonstration of a physiological anteroposterior gradient of RA within the chick limb bud which decreases from the posterior margin (Thaller and Eichelle, 1987). An inverse gradient of cellular retinoic acid binding protein across the limb bud may steepen this RA gradient. Likewise RA can alsoalter the pattern of regenerating amphibian limbs and in fowl theabsence of retinoids during em bryogenesis resu lts in a developmental failure of the vascular system. In addition, RA is a potent teratogen.
Retinoids can also modulate differentiation. Rodents deprived ofvitamin A switch the differentiation program of epithelial surfaces so that the epithelial lining of their tracheas is replaced with squamous keratinized cells. More strikingly, two neoplastic cell lines, murine F9 teratocarcinima cells (Strickland and Mahdavi, 1978) and human myeloblastic HL60 cells (Breitman et al.y 1980), are induced into terminal differentiation by the application of retinoids.
50

1.6-2 Retinoid Receptors
Three main types of protein have been observed to bind retinoids, which collectively mediate the vascular transport, intracellular transport and the regulation of retinoid responsive genes,although more specialized retinoid binding proteins have beenobserved in the eye, uterus and epididymis (reviewed in Blomhoff et al.9 1990; de Luca, 1991). Since retinoids are water-insoluble, retinoid transport in the blood plasma is made possible by binding retinol to the retinol-binding protein (RBP) for delivery to the tissues. It is unclear how retinol enters the cell as a cell-surface receptor for RBP has not been identified, but once within the cell the retinoids are transported by non-covalent association with the retinol and retinoic acid binding proteins, CRBP and CRABP respectively . CRABP may also regulate the in tracellu larconcentration of free retinoic acid. Finally, the end effects of retinoids are m ediated through d ifferent ligand-dependenttranscription factors (RAR and RXR) which are members of the stero id -thyro id horm one recep to r fam ily . These nuclear transcription factors directly mediate the expression of retinoid- sensitive genes, which results in changes to the state of differentiation or supplies positional information. The nuclear retinoid-responsive transcription factors have been intensively studied, and much has been deduced about their function from comparison with other members of the same family.
The nuclear receptor genes are a large family which includes not only the retinoic acid receptors but also the steroid, thyroid hormone and vitamin D receptors together with "orphan” receptors whose ligands are unknown. A recent account describing the evolution of this gene family documented 32 members (Laudet et al.9 1992). From work on the oestrogen receptor and the glucocorticoid receptor a modular organization of six domains (A-F) was proposed for all family members (Green and Chambon, 1988), where the C and E regions are the most highly conserved and m ediate DNA-binding and ligand binding/dim erization respectively. The DNA-binding motif consists of a pair of zinc fingers which each coordinate a single atom of zinc between four
51

cysteine residues, although the two fingers are folded into a single unit. The positions of the cysteine residues are invariant in all but two of the family members. The receptors contain two transactivation domains, one in the A/B domain which is constitutively active, and a second in the E domain whose activity is ligand-inducible (Tasset et al., 1990; Tora et al.> 1989). The precise roles of the D and F domains remain unclear.
An elegant means to confirm the identity of the ligand for a receptor is provided by the "finger swap" protocol in which a chimaeric receptor is artificially constructed. To prove that the high affinity ligand for the retinoic acid receptor (RAR) was indeed retinoic acid, the DNA-binding finger domain of RAR A was replaced with that of the oestrogen receptor and was tested for its ability to activate a reporter plasmid coupled to an oestrogen response element. Reporter activity was observed only with retinoic acid at 10~s M, and no response could be elicited with other ligands (except retinol at elevated concentrations).
Two classes of nuclear retinoic acid receptor have been described, the RARs and the RXRs, each of which has three members termed alpha, beta and gamma. Within the nuclear receptor superfamily the RAR and RXR families are less closely related to one another than to other family members (Laudet et al., 1992). The genes encoding the three RARs, RAR alpha (RARA) (Giguere et al., 1987; Petkovich et al., 1987), RAR beta (RARB) and RAR gamma (RARG) have each been cloned in the mouse and human, and have a remarkably conserved genomic structure. Each of the three genes encode several different protein isoforms which have alternative A domains, and therefore presumably encode proteins with different transactivation properties. The different isoforms appear to be controlled by different prom oters, thereby allowing differential spatial or temporal regulation of the gene. The R A R A and R A R B genes, but not apparently R A R G , each have one promoter which is up-regulated by retinoic acid, creating a potential feedback loop (de The et al.> 1990; Leroy et al ., 1991b; Sucov et al.y 1990).
52

The R X R genes have been identified more recently by low stringency screening of a liver cDNA library with the RARA DNA- binding domain (Mangelsdorf et al.> 1992; Mangelsdorf et al.y1990). The main difference between the RAR family and the RXR family is their high affinity ligands; the high affinity ligand for the RARs is all-trans retinoic acid, while that for the RXRs is its isomer 9 -cis retinoic acid (Heyman et al., 1992; Levin et a/., 1992). The RA R and RXR genes are expressed in different tissues at different points of development in both the embryo and the adult, hence particular receptors exert greater effects over differentiation in given tissues. For example, RARG transcripts are only expressed in the skin.
Members of the nuclear receptor family activate (or repress) genes by binding to response elements of specific sequences in the promoters of their target genes. The literature on these response elements has recently been clarified by the realization that the hormone binding sites obey the so-called 3-4-5 rule (Kliewer et a l .y 1992a; Umesono et al.y 1988). This rule states that two direct repeats of the half-site sequence AGGTCA acts as a hormone response element, and that the spacing between the half sites (3, 4 or 5 nucleotides) determines which of the receptors will specifically bind. A spacing of 3 nucleotides creates a vitamin D response elem ent, 4 nucleotides ensures thyroid horm one responsiveness and 5 nucleotides engenders retinoic acid responsiveness. Moreover, this rule predicted that some of the unassigned spacing options (0, 1 or 2) might be filled by other nuclear receptors. This prediction was fulfilled by the discovery that the RXRs bind to a direct repeat with the two half-sites separated by single nucleotide (K liew er et al . y 1992a). Intriguingly, an orphan nuclear receptor, COUP-TF, was also shown to bind direct repeats spaced by a single nucleotide, and this receptor could antagonize activation mediated by RXR (Kliewer et al.y 1992a). This suggested that among the nuclear receptors in general the half-site spacing preferences could determine which nuclear receptors will antagonize one another, and thereby offer a simple means to decipher the cross-regulatory circuits.
53

As mentioned earlier, heterodimerization of transcription factors is a common phenomenon (Murre et al., 1989) and is also required between the nuclear receptors for binding to their response elements. Five laboratories have independently demonstrated that the RXRs appear to be common coregulators of the retinoic acid (RARs), thyroid hormone and vitamin D receptors, and can enhance the binding of these receptors to their cognate response elements (Bugge et al., 1992; Kliewer et al., 1992b; Leid et al.y 1992; Yu et al.t 1991; Zhang et al.f 1992). RXR may therefore be a commonly limiting molecule for all three types of receptor, hence over-expression of any individual receptor could affect all the pathw ays.
Occurrence of the retinoic acid response elements (RAREs) in the homeobox gene clusters helps explain the profound effects that RA exerts and how it manages to supply positional information. H ox2 genes, for instance, are activated in embryonal carcinoma cells by RA in a concentration-dependent fashion, with transcription occurring first from the 3' members of the cluster and subsequently from the 5' members (Simeone et al.y 1990).
1.6-3 Retinoids and Cancer
Indirect evidence that the retinoids can act as chemopreventive agents has accumulated but generally the field has lacked a firm molecular footing. Epidemiologists have espoused an inverse relationship between the risk of cancer in humans and vitamin A intake, but the levels of intake were often estimated indirectly from ingestion of particular foodstuffs (e.g. vegetables) and it is impossible to be sure that the effects are not due to another dietary constituent. Histologically the epithelia during vitamin A deficiency can resemble neoplastic tissue (Wolbach and Howe, 1925). .
Animal models have further suggested that retinoids can suppress the effects of carcinogens (Moon et al.y 1983). The administration of retinoids during the induction of papillomas and carcinomas in mouse skin by application of carcinogens was two-fold; fewer
54

papillomas and carcinomas developed, and some papillomas showed retarded growth or even regressed. This suggested that retinoids had both preventive and therapeutic effects although in other experiments application of retinoids potentiated the number of papillomas. More convincing evidence of the ameliorating effects of retinoids has come from studies on the induction of mammary cancer in rats by dimethylbenzanthracene (DMBA). Coadministration of DMBA and retinyl acetate caused a 52% reduction in tumour incidence compared to DMBA and placebo controls. Tumour inhibition has also been documented in the lung, stomach and bladder (Moon et al., 1983).
The striking ability of retinoic acid to cause the in vitro d iffe ren tia tion of HL60 (m yeloid , AML M2) and F9 (teratocarcinom a) neoplastic cells (Breitm an et al ., 1980;Strickland and Mahdavi, 1978) suggests that RA exerts its antineop lastic effects through the prom otion of te rm inal differentiation. Unfortunately these effects seem limited to these two cell lines, although the in vitro differentiation of fresh APL cells has been reported (Breitman et al., 1981). These results were extended by the discovery that all-trans retinoic acid can be used as a d iffe ren tia te therapy in APL (Castaigne et al., 1990; Huang et al., 1988). Retinoids have been used to treat other types of cancer but with less dramatic results. For example, 13-cis retinoic acid has been used to prevent the occurrence of second primary tumours in patients with squamous cell carcinoma of the head and neck, although it does not prevent recurrence of the original tumour (Hong et al., 1990). Likewise 13-cis RA has been used to prevent skin cancer in patients with xeroderma pigmentosum (Kraemer et al., 1988).
Another observation linking neoplasia and retinoids was made through the study of an integration site of the hepatitis B virus (HBV) in a single case of human hepatocellular carcinoma (HCC). A causal role for HBV in HCC is widely accepted and immunization programs are underway, but the molecular means by which HBV transforms liver cells is unknown although a potential mechanism is through insertional mutagenesis. A number of viral integration
55

sites have been cloned and a single tumour identified which contained the HBV integrated within the retinoic acid receptor beta locus (RARB) (Dejean et al., 1986; Dejean and de, 1990). The codons of the viral surface protein are fused in-frame with most of the RARB protein, including the DNA-binding, dimerization and ligand-binding domains, suggesting that expression of RARB was deregulated in the liver. Since there was neither RNA nor protein remaining from this tumour, the existence of the putative fusion message could not be directly confirmed. A similar rearrangement has not subsequently been identified in any further liver tumours.
In summary, although animal models have provided evidence that retinoids can help prevent cancer, retinoids have not proved a universal panacea in human cancer although they have proven efficacious in rare instances. However, the study of these exceptions could provide fresh insights as to how retinoids and their receptors are linked to malignancy.
1.7 Aims of this Thesis
This introduction has reviewed some of the data which suggests that cancer, including the leukaemias, has a genetic basis and that the genes responsible can be cloned, characterized and the knowledge put to diagnostic or therapeutic use. Moreover, some of the genetic steps which lead to malignancy are manifest as gross chromosomal abnormalities, such as reciprocal translocations or deletions, and specific oncogenic sequences can be identified through study of these rearrangments. Translocations are the best markers of oncogenic rearrangem ents since they accurately pinpoint the transforming genes among the 3 x 10⁹ nucleotides in the human genome. The t ( l 5; 17) translocation is a recurrent translocation found consistently and exclusively in acute promyelocytic leukaemia and undoubtedly represents the major causative mutation in this life-threatening disorder. None of the candidate genes had been shown to be involved at the breakpoint.
56

Thus the aims of this thesis were as follows:
1. To design and effect an efficient positional cloning strategy to identify the t(15;17) APL translocation breakpoint on chromosome 17. This strategy should also provide markers for on-going efforts to clone other disease loci on chromosome 17. The strategy consisted of three parts:
A. Construction of a Notl linking library from 17q. Linking clones are among the most versatile and efficient types of marker.
B. Assignment of the clones to subregions of 17q to locate those clones mapping closest to the APL breakpoint.
C. Identification of the APL breakpoint as a band shift onPPGE.
2. To physically isolate the genomic sequences lying at the APL breakpoint on chromosome 17, and to isolate and characterize cDNAs affected by the translocation.
3. To walk over the breakpoint to clone the breakpoint locus on chromosome 15, and determine whether leukaemogenesis arises through gene fusion or gene deregulation.
4. If fusion messages are transcribed over the t(15; 17) breakpoint, establish a specific diagnostic test based on PCR amplification of these messages.
5. Using the t(15;17) breakpoint sequences, determine if the similar rearrangements occur in all APL patients, including patients with rare variant translocations.
6. Assess the breakpoint genes for any means of therapeutic intervention in APL.
57
Chapter 2
Materials and Methods
Most of the protocols presented here have been described elsewhere (Sambrook et al., 1989), and additional references by be found therein. Standard buffers and solutions used throughout are presented in section 2.13.
2.1 DNA Preparation and Digestion
2.1-1 Genomic DNA
High molecular weight genomic DNA suitable for Southern analysis (section 2.2) or library construction (sections 2.5 and 2.6) was prepared from cells grown in tissue culture by the following method. Tissue culture cells were washed twice with PBSA, spun down at 1,000 rpm (IK ) for 5 min and resuspended in 1ml of lOmM Tris.HCl pH 8.0. 20-40ml of lysis buffer was added for every 108 cells, followed by the addition of proteinase K to 100|Xg/ml. The lysis mixture was incubated at 37°C for 4 hours, then RNAse was added to 50pg/ml and incubation continued for a further hour. The cell lysate was extracted with an equal volume of phenol for 15 min, spun at 3K for 30 min and the aqueous layer transferred to a fresh 50ml Falcon tube. This layer was re- extracted twice with a 25:24:1 phenol:chloroform:isoamylalcohol mixture (henceforward referred to as phenol:chloroform), once with 24:1 chloroform :isoam ylalcohol, then the DNA was precipitated by the addition of one tenth volume of 3M sodium acetate pH 5.2 and 2.5 volumes of cold absolute ethanol. The tube was inverted until the DNA formed a visible tangled mass and removed from the tube using a hooked pasteur pipette. If no visible precipitate appeared the tube was left at -40°C overnight. Finally, the DNA was washed in 70% ethanol and dissolved in TE pH7.5 by rolling the tube O/N at 4°C. DNA from APL bone marrow samples was prepared according to protocols designed to yield both RNA and DNA (section 2.9).
58

Lysis buffer: lOmM Tris.HCl pH8.0lOmM EDTA lOmM NaCl 0.5% SDS
2.1-2 Plasmid Preparations
M ini-Preparations
Small scale plasmid preparations were made by the alkaline lysis method. Single colonies of transformed bacteria were inoculated into 5ml of Luria (L) broth containing the appropriate antibiotic (50p.g/ml ampicillin for plasmids based on pBluescript) and grown with vigorous shaking overnight at 37°C. 1.4ml of culture was added to a 1.5ml eppendorf, centrifuged for 5 min, the supernatant discarded and resuspended by vortexing in lOOpl of solution I. Following a 5 min incubation period 200jil of solutionII was added, the tube inverted twice and stored on ice for 5 min.150|il of 5M potassium acetate pH4.8 was added, the contents mixed and stored on ice for a further 5 min prior to 5 mincentrifugation at 4°C. The supernatant was transferred to a freshtube and extracted once with a phenolichloroform mixture. After centrifugation 2 volumes of 100% ethanol was added at room temperature (R/T), mixed and left to stand for 2 min, then spun for 5 mins at room temperature. The pellet was washed in 70% ethanol, dried under vacuum and dissolved in TE. Analytical digests (section 2.1-5) were performed to check the authenticity of each plasmid.
Solution I 50mM glucose Solution II 0.2M NaOHlOmM EDTA 1%SDS25mM Tris.HCl pH 8.0 4mg/ml lysozyme
59

Maxi-Preparations
Large scale plasmid and cosmid preparations were made by a scaled-up alkaline lysis method. An overnight (O/N) starter culture was added to 400ml of L broth in a 1L conical flask and grown with vigorous aeration O/N in the presence of the selective antibiotic. The following morning the culture was spun for 20 min at 3.5K at 4°C in a J6B centrifuge, resuspended in 5ml of solution I without lysozyme and transferred to an Oakridge tube. After addition of 1ml of lOmg/ml lysozyme solution the tube was left for 10 min at R/T, then 12ml of solution II were added and the tube inverted until the solution cleared; the tube was then stood on ice for 10 min. 8ml of 5M potassium acetate pH 4.8 was mixed with this solution and the cellular DNA and bacterial debris left to precipitate on ice for 10 min. Centrifugation at 11K for 20 min at 4°C pelleted the debris so the supernatant could be transferred to a 50ml Falcon tube, and 0.6 volumes of isopropanol was used to precipitate the plasmid DNA. The DNA was pelleted at 4K for 30 min at R/T, the pellet washed in 70% ethanol, dried under vacuum and redissolved in 9.5ml TE. Exactly 9ml was transferred to a universal tube, and lOg of caesium chloride was added together with 1ml of ethidium bromide (5mg/ml). The solution was sealed into a Beckman tube (no. 342413) and ultracentrifuged in Beckman rotor 70.1 Ti for 20 hrs at 55K at 17°C. This separated the supercoiled plasmid DNA from any remaining bacterial genomic DNA or nicked plasmid DNA on the basis of density. The lower plasmid band was removed from tube through a needle and syringe, and extracted three times with equal volumes of CsCl- saturated isopropanol to remove the ethidium bromide. The purified DNA was precipitated by addition of 2.5 volumes of distilled water and 2.5 volumes of 100% ethanol, spun 20 min at 3K, washed twice in 70% ethanol and finally dissolved in 300p.l of TE.
60
2.1-3 Bacteriophage Preparations
Mini (3mD Phage Preparations
An agar plug containing a single bacteriophage plaque was picked into 3ml of L broth supplemented with lOmM MgSC>4 and incubated in a rotatory shaker O/N at 37°C. Any rem aining bacteria were lysed by the addition of 30jxl of chloroform and the bacterial lysate was centrifuged for 30 min at 3K to remove the debris; the supernatant was transferred to a fresh tube and 3pi of lOmg/ml RNAse and DNAse was added. Bacterial nucleic acid was digested for 30 mins at 37°C, followed by the addition of NaCl to 0.3M, EDTA to lOmM, Tris.HCl (pH7.6-8.0) to lOOmM and 30pl of proteinase K (stock lOmg/ml). The phage coats were digested for 30-60 mins at 50°C. Next, 0.6 volumes of isopropanol was added, the tube left on ice for lOmin, spun for 30 min at 3K and the supernatant discarded. The pellet was dissolved in 200pl of TE, extracted once with phenolxhloroform and once with water- saturated diethylether. Bacteriophage DNA was precipitated by the addition of sodium acetate to 0.3M and 0.6-0.8 volumes of isopropanol. After a 70% ethanol wash the DNA was dried and dissolved in lOOpl TE. The average yield was 0.5pg.
Midi (50mD Phage Preparations
These preparations were made using a scaled-up version of the 3ml phage preparations, starting with 50ml of lysed bacteria. Most recombinant bacteriophage of interest were grown using this m ethod.
Maxi (400ml) Phage Preparations
This method was used to product large, pure quantities of two bacteriophage vectors, NofEMBL3A and EMBL3cos, for library construction. The host bacterial strain for NofEMBL3A is NM538 (Frischauf et al., 1987), and for EMBL3cos, NM621 (Whittaker et a l ., 1988). The preparation of a plate stock is necessary to start
61

this size preparation. A fresh plaque is picked into 0.3|il of lambda diluent and left to diffuse for lhr, preincubated with host plating cells, added to top BBL agar and poured onto a plate of bottom BBL agar. After O/N incubation the plate is precooled for lhr, 5ml of lambda diluent is layered onto the plate and left for at least lhr. The supernatant (the plate stock) is then removed with a pipette, and a drop of chloroform added. Six 2 litre flasks each containing 400ml L broth supplemented with MgS0 4 to lOmM were inoculated with 4ml of an O/N host cell culture, and grown to optical density (O.D.) 0.3 (600nm). 1ml of plate stock was added and grown until lysis occurred, whereupon 2ml of chloroform wasadded and the flasks shaken for another 5 min. The lysate wasspun at 4K, 20 min, the supernatant transferred to a fresh bottle, RNAse and DNAse added to lOpg/ml and the incubated for 30 mins, R/T. At this point 20g/L NaCl and 80g/L of PEG 6000 wereadded and dissolved, and the phage particles left to precipitateO/N at 4°C. After a 30 min spin at 5K each pellet was resuspended in 20ml lambda diluent, the volume adjusted to 30ml and 0.7 lg of CsCl added per ml of preparation. Beckman 342413 tubes were loaded, topped up with lambda diluent, ultracentrifuged in a Beckman 70.1 Ti rotor, 48K, O/N and the bands of phage particles removed with a syringe. The phage were dialyzed extensively against lambda diluent, then sodium acetate was added to 0.1M and the phage were extracted twice with phenol and three times with ether, then precipitated, washed and redissolved as described in section 2.1-1.
Host plating cells were prepared by spinning a fresh O/N bacterial culture for 10 mins at 4000g and taking the cells up in lOmM M gS 0 4 to half the growth volume. These cells remained viable for several weeks at 4°C.
Lambda diluent: lOmM Tris.HCl pH 7.5lOmM MgS0 4
ImM EDTA pH8.0
62
BBL bottom agar: (1L)
lOg trypticase peptone (Baltimore Biological Laboratories 11921)5g NaCllOg agar (pH7.2)
For BBL top agar only 6.5g of agar were used per litre. Agarose was substituted for agar if filter lifts were to be taken. Top agar was supplemented with lOmM MgSC>4 .
2.1-4 Measuring DNA Concentrations
DNA concentrations for genomic, plasmid or phage DNA weredetermined by measuring the O.D. at 260nm after the DNA wasfully dissolved. A reading of 20 O.D. units on the spectrophotometer (LKB Biochrom Ultraspec II) was taken toindicate a DNA concentration of 1 mg/ml.
2.1-5 Restriction Endonuclease Digestions
The DNA prepared by the protocols above was suitable was most molecular manipulations, including restriction digests, ligations,PCR or sequencing. Restriction enzymes were purchased from Boehringer Mannheim, Northumbria Biologicals Ltd. or New England Biolabs and DNA was digested in the manufacturer's buffers at the recommended temperatures. The number of enzyme units added and the length of digestion were determined from the assumption that 1 unit of enzyme digests lp,g of DNA in 1 hour, with a margin of error to ensure complete digestion.
2.2 Southern Analysis
2.2-1 Electrophoretic Size-Separation of DNA
DNA fragments were size-separated in electrophoresis tanks (Bio- Rad DNA Sub Cells) through agarose gels containing ethidium bromide at lpg/ml using TAE buffer. For optimal separation the concentration of the agarose gel was varied according the average
63

fragment size: genomic DNA restriction digests were separated on 0.8% gels, PCR fragments on 1.0-1.5% gels and high molecular weight fragments on 0.4% gels. Markers were / / /n d l l l - c le a v e d lambda DNA or a lOObp ladder (Pharmacia Biosystems Ltd.). Fragments were visualized with UV light and photographed with Polaroid 667 film through a Wratten 22A filter. 1/10th volume of loading buffer was added to the DNA samples prior to loading into the gel slots.
2.2-2 Southern Blotting
Size-separated DNA was acid-nicked with 0.25M HC1 for 15 min to improve the transfer of DNA fragments over lOkb. The fragments were then transferred from the agarose gel to a charged nylon membrane, Hybond N+ (Amersham), by the alkaline blotting procedure. Denaturation and transfer of the DNA is mediated by a reservoir of 0.4M NaOH which is soaked up through the gel into paper towelling placed above the membrane. The membrane and towelling are separated by three pieces of 3MM paper (Whatman). Transfer occurred over 4 hrs after which the membrane filter was washed three times in 2 x SSC and stored at 4°C until required for hybridization.
Filters were pretreated with hybridization solution O/N prior to hybridization. Pretreatment was carried out in plastic bag at 65°C. For highly repetitive probes such as whole cosmids the hybridization solution was supplemented with lOOjig/ml sheared human DNA.
Hybridization solution:
(Yeast total RNA can be substituted with lOOpg/ml salmon sperm DNA)
50 x Denhardt’s solution: (500m l)
5 x SSC0.1% SDS5 x Denhardt's50% deionized formamideYeast total RNA 1 mg/ml
Ficoll 400 5g Polyvinylpyrrolidone 5g Bovine serum albumin 5g
64

2.2-3 Labelling Probes
DNA probes for hybridization were labelled to high specific activity with 32P (Amersham) by the random priming method (Feinberg and Vogelstein, 1984). DNA fragments to be labelled were excised from 1% LMP agarose gels, weighed and dH20 added to 3ml/g of gel prior to melting the agarose at 65°C. 20-50ng of DNA was transferred in a 34p.l volume to an eppendorf tube, boiled for 8 min and quenched on ice. To this was added 2|xl of lOmg/ml bovine serum albumin (BSA), 10|il of oligolabelling buffer, 3pl (30pCi) of 32P dCTP and 1 unit of Klenow polymerase, and the reaction left at R/T for 4 hours. Cosmid or total human DNA probes were partially digested with Bam HI prior to labelling.
Unincorporated nucleotides were removed on a Sephadex column, and if the probe was repetitive it was competed with lOOjig of sheared human placental DNA. Probe and competitor were boiled together for 8 mins and left at 1.5-4 hours for repetitive sequences to preferentially re-anneal. The probe was then added to 10ml of hybridization buffer, poured into the bag containing the pretreated filter and left O/N at 65°C for hybridization to occur.
Filters were washed to a final stringency of 0.1 x SSC (0.2 x SSC for less stringent washes) and 0.1 x SDS at 65°C, and exposed to Kodak film for periods between 5 min and 2 weeks between intensifying screens at -70°C. Filters were stripped for re-use with 0.5% SDS.
2.3 Pulsed Field Gel E lectrophoresis
2.3-1 Preparation of Blocks
Pulsed field blocks were prepared from cells grown in tissue culture (PCTBA1.8 (Bai et al., 1982), PJT2A1 (Sheer et a l y 1983)(, PLTI1S and GBT8). Cells were trypsinized, counted and resuspended at 2.5 x 10⁷/ml in PBS A, then mixed with an equal volume of molten 1.2% LMP agarose in PBS A at 42°C. The cell
65
suspension was aliquoted into block formers (capacity 80pl, 106 cells/block) and left to solidify on ice for 20 mins. When solid the blocks were pushed out of the formers into proteinase K digestion buffer, incubated at 50-55°C for 48 hours, rinsed three times in TE and incubated in 0.04 mg/ml phenylmethylsulfonylfluoride (PMSF) in TE for 30 mins at 50-55°C to inactivate the proteinase K. The PMSF treatment is repeated once, the blocks washed twice in TE and then stored at 4°C in 0.5M EDTA.
Proteinase K Digestion Buffer: 500mM EDTA pH 8.01% sodium lauryl sarcosine 2mg/ml proteinase K
2.3-2 Digestion and Electrophoresis
Blocks were washed twice in TE for 30 min to remove excess EDTA prior to digestion. Restriction digests on the blocks were performed in the manufacturer’s buffer for 4-6 hours.
PFGE gels were run and cast in 0.25 x TBE on a LKB 2015 Pulsaphor electrophoresis unit (Pharmacia) with a hexagonal array of electrodes. A 15cm x 15cm gel was cast with 110ml of 1.0% agarose around the blocks which were held in position on a comb; after removal of the comb from the gel the gaps were filled with agarose. The pulse times for effective separation in any given size range were as recommended by the manufacturer. For enzymes such Not! and Nru\> which produce large fragments, gels were run for 34 hours with a 90 second pulse at 170 V, 60-70mA, whereas for digests with £$.sHII, Sacll and Clal which give smaller fragments on average, the pulse and run time were reduced to 45 seconds and 30 hours respectively.
After electrophoresis the gels were stained in 0.4|xg/ml ethidium bromide, photographed, acid-nicked and transferred as for conventional gels. Size markers for gels were S a c c h a r o m y c e s cerevisiae (YP148) or lambda concatamers.
66

2.4 Tissue Culture
Cells were grown in tissue culture for DNA extraction, RNA extraction or PFGE blocks. Adherent cells lines were passaged before confluency was reached. The media was replaced with 3ml of versene for 1 min, discarded and replaced with a 1:1 versenertrypsin (0.25% trypsin) mixture for a further minute, then neutralized with media containing fetal calf serum (FCS). Disaggregated cells were centrifuged IK , 5 min, R/T and resuspended in fresh tissue culture media. Cells growing in suspension were maintained at 105 cells/ml. Sterile technique was maintained throughout. Cells were either grown in E4 media (Dulbeccos modified MEM) in 10% CO2 at 37°C or RPMI 1640 in 5% C O 2 at 37°C; both types of media were always supplemented with 10% FCS. The requirements and selection systems are shown below for each cell line.
TR1D62 is a mouse-human tribrid carrying the long arm of chromosome 17 translocated to a mouse chromosome as its only human material (Tunnacliffe et al., 1983). The dominant selectable marker E c o g p t , which encodes the xanthine phosphoribosyl transferase, has been introduced into human chromosome 17q, so the tribrid is selected in 25jig/ml m ycophenolic acid and 250|ig/ml xanthine. TRID62 was grown as a suspension in RPMI.
PCTBA1.8 is a chromosome 17-only hybrid (Bai et al., 1982). Since the selectable marker thymidine kinase maps on the telomere of 17q this hybrid is grown in RPMI supplemented with HAT (1.6pM hypoxanthine, 10|iM methotrexate, 100|iM thymidine). The APL 15q+ hybrids PJT2A1, PLTI1S and GBT8 (Sheer et a l ,1983) were also grown with HAT.
The following chromosome mediated gene transfectants (CMGTs) were selected from the described panel (Xu et a l , 1988); KLT8, PLT6B, PLT8, PLT6, PLT15, PLT20, KLT3, KLT12, KLT13, TLT8 and TLT10. All CMGTs were grown in E4 media with HAT selection with the exception of the back-selectant PLT6B which was grown without HAT.
67
The 17q- APL hybrid P12.3B6 (kindly provided by D. Ledbetter) was grown in E4 medium with no selection.
Karyptypic analyses on all of these cell lines (except the CMGTs) were performed in the ICRF Cytogenetics Laboratory by T. Jones and P. Gorman. This support is gratefully acknowledged.
2.5 L inking L ib rary C onstruction
A Notl linking library was constructed in the lambda replacement vector M?fEMBL3A as described (Frischauf, 1989). The method is shown schematically in chapter 3.
2.5-1 Vector arm preparation
A large scale preparation (section 2.1-3) of the vector N o tE M B L 3 A (Frischauf et al.y 1987) was prepared and 10|ig was digested to completion with 50 units of N o t I. After determining that the digestion had reached completion, 50 units of E coB l was added and digestion continued for another hour. EDTA was added to 15mM and the digest heated to 68°C for 15 min, then extracted with phenol:chloroform. The vector arms were differentially precipitated by adding sodium acetate pH6 to 0.45M and 0.6 volumes of isopropanol and leaving on ice for 5 min. The tube was spun, the supernatant removed and the pellet washed in 70% ethanol and dissolved in TE at 0.25pg/ml.
2.5-2 Preparation of Suppressor Plasmid
The suppressor plasmid pSD (Levinson et al ., 1984) was propagated in the bacterial host MC1061(p3). The host contains two plasmids, the 57kb p3 plasmid which contains amber mutated ampicillin and tetracycline resistance elements, and pSD which provides suppressor functions to allow selection for these genes. The suppressor plasmid was grown in L broth with ampicillin at 12.5pg/ml and tetracycline at 7.5pg/ml. Due to the poor yield of this plasmid, six 400ml cultures were prepared simultaneously.
68

Prior to ultracentrifugation the tubes were vortexed to shear the p3 plasmid. The pSD and p3 plasmids were size-separated on an 0.7% agarose gel (cast and run in 0.5% TBE), and the slice containing the supercoiled pSD was excised from the gel and the DNA electroeluted in a piece of dialysis tubing. The DNA was extracted once with phenolichloroform, precipitated, washed, dried and dissolved in TE. An excess of pSD DNA was digested with B a m U l and treated with 0.3 units of calf intestinal phosphatase/|ig for 30 min at 37°C in the restriction buffer, then the enzymes were inactivated at 68°C for 15 min by the addition of trinitriloacetic acid to lOmM and EDTA to 15mM. After a final phenol extraction and ethanol precipitation the suppressor plasmid was dissolved in TE ready for ligation to the insert DNA.
2.5-3 Preparation of Insert DNA
High molecular weight DNA was prepared from TRID62 as described (section 2.1-1), and analytical digests were performed on l |ig aliquots to establish the number of units of M b o I necessary to yield 10-20kb fragments. Using the results of the analytical digests, 10pg aliquots were digested for 5, 10, 15 and 20min with M bo I, and the digestions stopped by the addition of EDTA to 15mM and incubation at 68°C for 15min. The extent of each digestion was determined on a 0.4% agarose gel, and the appropriate time points were pooled, extracted twice with phenol, twice with ether, precipitated, washed and dissolved in TE.
2|xg of partially digested genomic TRID62 DNA and 2|Xg of linearized, phosphatased pSD were ligated in a 1ml reaction volume of 40mM Tris.HCl pH 7.6, lOmM MgCl2 , ImM DTT, 0.5mM ATP with 2,000 units of T4 ligase (New England Biolabs) for 36-48 hours at 6°C. The T4 ligase was inactivated with 15mM EDTA at 68°C for 15 mins. The ligation mixture was precipitated in the presence of 3|ig of carrier tRNA, dissolved and digested with Notl , phosphatased, inactivated and precipitated in the presence of 2p,g of prepared N0fEMBL3A arms. Since the ratio of pSD to genomic DNA is critical, parallel reactions using 1 and 4pg of pSD were carried through these and subsequent steps.
69

2.5-4 Ligation into NotEMLE3A
The addition of the vector arms prior to precipitation allowed a concentrated ligation mixture to be set up between the vector arms and the circularized M?/I-cleaved genomic DNA. The ligation was performed in a 20|il volume in the same ligation buffer as previously, but using only 400 units of ligase. After an O/N ligation period at 15°C the library was packaged with homemade packaging extract (a gift from A. M. Frischauf) and plated on three bacterial hosts, NM538, NM539 and MC1061. NM538 imposes no selection; NM539, a P2 lysogen, selects for recombinant phage and M C I061 imposes selection for phage carrying the suppressor plasmid. Having established that the library construction had been successful, further aliquots of the ligation mixture was packaged using Gigapack II Gold (Stratagene) and plated.
2.5-5 Plaque Lifts
Bacteriophage were plated in 85mm petri-dishes for test ligations or in 23 x 23cm plates for library lifts. The 23 x 23cm plates were poured with 300ml of bottom BBL agar, the packaged phage were mixed with 1.2ml of plating bacteria, incubated for 20 mins at 37°C , added to 30ml of molten top agarose and poured onto the solidified bottom agar. For the 85mm petri-dishes, only 30ml of bottom agar, 100|il of plating cells and 3ml of top agarose were used. After incubation O/N, plaque lifts were taken onto Hybond N (Amersham). Filters were placed on the top agarose for 1 min and the membrane was keyed to the plate, the filter was peeled off and placed in denaturing solution (1.5M NaCl, 0.5M NaOH) for 1 min then neutralized in 1.5M NaCl, 0.5M Tris.HCl pH 8.0 for 5 mins. The filters were rinsed in 2 x SSC, air-dried, baked at 80°C for 2 hours and hybridized as described (section 2.2-3). Duplicate sets of filter lifts were taken for the library.
Macroplaque filters were subsequently taken from human linking clones picked into 96 well dishes. 23 x 23 cm plates were prepared with top agarose containing bacteria, and a 96-needle
70

aluminium "hedgehog" was used to spot phage lysate from the wells onto the surface of the agarose. Incubation O/N results in macroplaques from which duplicate filter lifts were taken. The "hedgehog" was also used to transfer the phage to a second set of 96 well dishes containing L broth supplemented with lOmM M gS 0 4 and incubated O/N at 37°C with shaking. l/5th the volume of 5 x phage freezing buffer was added to each well and the library replicas were stored at -70°C.
5 x Phage freezing buffer: 0.5M NaCl50mM MgS0 4
0.25M Tris.HCl pH7.5 0.05% gelatin 50% glycerol
2.6 Genomic L ib rary C onstruction
Genomic libraries were constructed with DNA from three interspecies hybrids (PJT2A1, PLTI1S, and GBT8) and from an APL patient with a variant t(3;15) translocation using the lambda replacement vector EMBL3co.s (Whittaker et al., 1988) following established protocols (Frischauf, 1991). V ector arms were prepared from a bulk preparation of EMBL3coj: 10|ig of DNA was cleaved with 2? am HI, checked to confirm that digestion was complete, cut with E coR I (to "spoil" the stuffer fragment) then purified and precipitated as described for NotEM BL3A (section2.5-1). Partial digests of insert DNA were prepared with M bo I as described (section 2.5-3), phosphatased, extracted and taken up in TE. Controls to check that dephosphorylation had occurred were performed. The DNA was not size-fractionated prior to ligation to the purified vector arms. 5pg of vector arms were ligated to 2.5pg of dephosphorylated insert DNA in a 15|il reaction volume at 15°C O/N, then packaged with Gigapack II Gold packaging extract. Phage were titred and plated on NM646 for spi selection. Filter lifts were taken as described (section 2.5-5).
71

2.7 Subcloning and Bacterial Colony Lifts
2.7-1 Subcloning
DNA fragments from cosmids, bacteriophage, plasmids or from PCR reactions were subcloned into the multiple cloning site of the plasmid vector pBluescript. 2jig of pBluescript was cleaved with the desired restriction enzymes, treated with CIP at 0.3 units/pg of DNA for 30 min in the restriction enzyme buffer, then the enzymes were inactivated by addition of trinitriloacetic acid to lOmM and EDTA to 15mM and incubation at 68°C for 15 mins. Digests were extracted once with phenolichloroform and once with ether, precipitated, dried and redissolved in 30pl of TE. Insert fragments were prepared by digestion of 2pg of cosmid or phage DNA, extracted, precipitated and dissolved in TE. Insert and vector were ligated in a 3:1 molar ratio in a 20pl ligation volume (see section 2.5-3 for ligation buffer) with T4 ligase. Control ligations were performed on ///n^III-cleaved lambda DNA.
PCR fragments were purified on a Centricon 200 spin column (Amicon) to remove unincorporated oligonucleotide primers, extracted once with phenol:chloroform, once with chloroform, precipitated and redissolved in TE. PCR fragments were subcloned into ddT-tailed pBluescript (Holton and Graham, 1991). This method is based on the observation that a single non template- directed deoxyadenosine residue is added to the 3' end of PCR products by Taq polymerase.
2.7-2 Electroporation
Recombinant plasmids (ligation reactions or pCDM8 cDNA libraries) were introduced into bacterial hosts by electroporation. Ligation reactions were electroporated after O/N incubation. Four cDNA libraries were kindly provided by D. Simmons in the plasmid vector pCDM8 (Seed, 1987) ready for electroporation and screening. These libraries were constructed with RNA from HL60 cells stimulated with phorbol 12-myristate 13-acetate (PMA), U937 cells, human bone marrow and from a presentation bone
72
marrow sample from patient APL25. The construction of this latter library by D. Simmons is gratefully acknowledged.
The bacterial host for pBluescript was XLl-Blue and the host for pCDM8 was MC1061(p3). Bacterial cells were grown to an O.D. 600 of 0.6 in a volume of 400ml, chilled on ice, transferred to a precooled centrifuge bottle and spun at 4-10k, 20 min, 2°C. The pellet was resuspended in 5ml of ice-cold water, made up to 500ml in ice-cold water, mixed and spun as before. This wash was repeated a second time, the supernatant poured off, the cells resuspended in the remaining liquid, mixed with 40ml ice-cold 10% glycerol and re-spun. The pellet volume was estim ated, the cells resuspended in an equal volume of ice-cold 10% glycerol, aliquoted in 50pl volumes into eppendorf tubes, frozen on dry-ice and stored at -70°C until required for electroporation.
Plasmid DNA (lOOng) was added to thawed, prepared cells, mixed and transferred to a chilled gene pulser cuvette with a 0.2cm electrode gap (Bio-Rad). The cells were electroporated at 2.5kV, 25jiF , 200 ohms with a pulse time of 4-5 seconds. 1ml of SOC medium was added immediately, and the cells were allowed to recover for 30 mins with shaking at 37°C. Aliquots were plated on L agar plates with antibiotics.
SOC medium: 0.5% yeast extract lOmM MgCl2
2.7-3 Bacterial Colony Lifts
Small numbers of colonies were grown to 0.2 mm on 85mm petri dishes with antibiotics, the plates cooled for 1 hour at 4°C and a Hybond N filter placed on top of the colonies. The filter was keyed to the plate with a needle, peeled off and the colonies allowed to regenerate at 37°C. The colonies on the filter were lysed in a puddle of 0.5M NaOH on saran wrap for 2 mins, blotted dry, placed in fresh 0.5M NaOH for 2 mins, blotted dry and transferred
2% tryptone lOmM NaCl 2.5mM KC1
lOmM MgS0 4
20mM glucose
73
to 1M Tris.HCl pH7.4 for 5 mins. The filter was blotted once again and then returned to fresh 1M Tris.HCl for a further 5 mins. Finally, the filter was transferred to a puddle of 1.5M NaCl and 0.5M Tris.HCl pH7.4 for 5 mins, blotted, air-dried and baked for 2 hours at 80°C under vacuum. Filters were hybridized as described previously to identify colonies of interest.
For the larger numbers of bacterial colonies required for the cDNA libraries, 23 x 23 cm plates were poured and a calculated 200,000 transformants in a 1ml volume of L broth were spread over the surface of a Hybond N filter placed directly on the surface of the agar. Three to four plates were used for each library. The plates were incubated O/N at 37°C. A second 22 x 22 cm filter was taken and placed over the colony-containing master filter, the two filters sandwiched between several thicknesses of 3MM paper and stamped together using perspex boards. Keying marks were noted on the replica filter. The process was repeated with a second duplicate filter, and the two duplicate filters were placed on fresh agar plates and incubated at 37°C for a few hours. The master plates were also regenerated, then stored at 4°C.
The bacteria on the replica filters were then lysed and the liberated DNA bound to the filter by the following protocol. A tray was lined with 3MM paper soaked in 10% SDS, and the filter, colony side up, was placed in the tray for 3 mins, then transferred to a second tray containing 3MM paper saturated with denaturing solution (0.5M NaOH, 1.5M NaCl) for 5 mins. The filter was moved to a third sheet of 3MM soaked in neutralizing solution (1.5M NaCl, 0.5M Tris.HCl pH 8.0) and left for 5 min. The filters were rinsed in 2 x SSC, dried, baked and probed as before.
Positive clones were identified by aligning the key marks on the replicas with those on the master plate. Secondary screening was performed on 85mm plates. Stocks from clones of interest were frozen in 15% glycerol on dry ice and stored at -70°C.
74

2.7-4 a-Complementation
Recom binant pB luescrip t clones were iden tified by a - com plem entation. Colonies were plated with appropriate antibiotics on LB agar plates which had been spread with 40pl of X-gal (20mg/ml in dimethylformamide) and 4pl of isopropylthio- P-D-galactoside (200mg/ml). Colonies were grown O/N at 37°C, then cooled at 4°C. Recombinant colonies were white, nonrecombinant colonies were blue.
2.8 Sequencing
Sequencing reactions were perform ed on double-stranded templates using vector-derived or insert-specific primers. The plasmid templates were purified on CsCl gradients (section 2.1-2). Sequencing reactions were performed by the dideoxynucleotide chain termination method using the Sequenase Kit (United States Biochemical). 2pg of supercoiled plasmid template was taken up in 18pl of dH 20 and denatured by the addition of 4pl of a solution of 1M NaOH and ImM EDTA. The solution was mixed and left to stand for 5 mins, precipitated with sodium acetate and ethanol, spun down, washed in 70% ethanol, dried and dissolved in 6pl of dH20. 50ng of primer was added in a 2pl volume, and 2jil of the manufacturer's sequencing buffer added. The tube was capped, heated at 65°C for 2 min and left to cool slowly to R/T to permit primer annealing. Labelling and termination reactions were performed according to the m anufacturer's instructions using 35S dATP (Amersham) and Sequenase enzyme. Samples were denatured for 2 min at 75°C and loaded immediately onto an acrylamide gel.
Polyacrylamide gels (6%) were cast between glass plates using the Sequagel (National Diagnostics) concentrate, buffer and diluent. The larger of the plates was treated with Sigmacote. The catalysts, 150pl of 20% ammonium persulphate and 60pl of TEMED, were added to the acrylamide immediately before the gel was poured. The sequencing apparatus (Model S2, BRL) was pre-run in TBE buffer at 1100V, 80mA for 30 min before the samples were
75

denatured and loaded. After electrophoresis the gel was dismantled and immersed in 2L of fixative (10% glacial acetic acid, 10% methanol) for 20 min, carefully blotted with paper towels and transferred to a piece of 3MM paper. The gel was wrapped with Saran wrap and dried with a heated vacuum drier. The Saran wrap was removed and the gel exposed to Kodak film at R/T for 1-3 days.
Sequence data was entered, assembled and analysed using the Intelligenetics suite of programs (Intelligenetics Inc.) on a VAX computer. Homology searches were performed using the BIFIND program, and closer comparisons with the ALIGN program.
2.9 RNA Protocols
2.9-1 RNA Extraction
RNA was extracted from cell lines and leukaemic bone marrow samples by ultracentrifugation of a guanidinium lysate through a caesium chloride cushion (Chirgwin et a l ., 1979). Cells(approximately 107) were vortexed in 7ml of 4M GT stock, layered over 3ml of 5.7M caesium chloride in Beckman 331372 tubes and ultracentrifuged for 24 hours at 27K, 20°C in a SW 27.1 rotor. Each layer was removed with a separate plastic pipette, and the DNA (from just below the interface) was set aside. The tube wasinverted and the RNA pellet left to drain. Pellets were dissolved in 200pl diethylpyrocarbonate (DEPC)-treated w ater, extracted twice with phenol:chloroform, once with chloroform, ethanol precipitated, washed twice in 70% ethanol and redissolved in 100- 500pl of DEPC-dH20. lOOjig of yeast carrier tRNA (Sigma) was added prior to precipitation to improve the recovery rate if the RNA yield was low. RNA was stored at -40°C. If RNA was to beused for diagnostic RT-PCR, samples were matched withunaffected blood or yeast tRNA controls which were carried through the same series of ultracentrifugation and purification.
The DNA was subsequently dialyzed, then extracted andprecipitated as described (section 2.1-1).
76

4M GT stock: (200m l)
lOOg guanidine thiocyanate lg sodium N-lauryl sarcosine 5ml sodium citrate pH7.0 1.4ml 2-mercaptoethanol
Caesium Chloride 5.7M: (100m l)
95.98g caesium chloride 40ml 0.25M EDTA, pH7.0
2.9-2 PolvfAH RNA Isolation
Poly(A) RNA was isolated from total RNA samples which were required for Northern analysis using the Poly(A)Quik mRNA Purification Kit (Stratagene). RNA samples were heated to 65°C for 5 min, quenched on ice, and 10 x sample buffer (lOmM Tris.HCl pH7.5, ImM EDTA, 5.0M NaCl) added to working strength (1 x). The oligo(dT) cellulose column was flushed through twice withhigh salt buffer, and the RNA sample pushed through with a Luer-Lock syringe. Two high salt and one low salt buffer (manufacturer’s buffers) washes were given prior to elution. The concentration of the poly(A)+ RNA was determ ined on a spectrophotometer assuming that an O.D. 260 of 1.0 approximated to 40|Xg/ml single-stranded RNA solution.
2.9-3 Northern Blots
RNA was separated electrophoretically through formaldehyde gels in 1 x formaldehyde gel-running buffer at 3-4 V/cm in a 1% agarose gel. The agarose gel was cast in 1 x formaldehyde gel- running buffer and 2.2M formaldehyde. The samples were prepared in a 20jil volume containing 2pl of 5 x gel-running buffer, 3.5pl formaldehyde and 10|il formamide, heated at 65°C for 15 min and chilled on ice. 2pl of formaldehyde gel-loading buffer was added, and the samples loaded on a gel which had been prerun for 5 min. Total RNA samples containing the 18S and28S rRNAs were used as markers. The gel was stained withethidium bromide (0.5p.g/ml) to visualize the RNA. The RNA was transferred to Hybond N+ (Amersham) as described for Southern
77

blots except that 0.05M NaOH (instead of 0.4M) was used to transfer the nucleic acid.
5 x Formaldehyde gel-running buffer: 0.1M MOPS (pH7.0)40mM sodium acetate 5mM EDTA (pH8.0)
Formaldehyde gel-loading buffer: 50% glycerolImM EDTA (pH8.0)0.25% bromophenol blue 0.25% xylene cyanol FF
2.10 RT-PCR
2.10-1 Reverse Transcription
Reverse transcription was performed on lpg of total RNA (or 1/10th of the total sample volume if the yield was low). The RNA was denatured for 3 min at 65°C and quenched on ice. cDNA was synthesized using 10 units of AMV reverse transcriptase (Life Sciences) in the manufacturer's reverse transcription buffer (1 x) with 10 units of RNasin (Promega Biotech) and each dNTP at ImM in a final volume of 20|il. Initial experiments were primed with 10 pmoles of gene-specific prim er (R A R A or P M L ) , andsubsequently with 0.5pg of a 17mer oligo-dT. Samples wereincubated at 42°C for 1 hour and at 52°C for 30 min, diluted with 0.5ml of TE and 10|il aliquots were used for PCR amplification. The cDNA pools from each patient were stored at -40°C.
2.10-2 PCR Amplifications
Polymerase chain reactions (PCR) (Saiki et al.y 1985) were run on a Techne Programmable Dri-Block (PHC-1) using nested sets of primers for maximal sensitivity. Four types of PCR reaction were performed on each APL bone marrow sample: normal R A R A(RARA-RARA), normal PML (PML-PML), 15q+ (PML-RARA) and 17q- (R A R A -P M L ). The former two reactions test the integrity of the RNA while the latter two amplify the two reciprocal APL
78

fusion messages. The position and orientation of the eight 20-mer PCR primers used in these amplifications are shown subsequently (Figure 7.1), and their sequence is shown in Table 2.1. The first round of PCR amplification was performed in a 50pl reaction volume using lOjil of the cDNA pool as template. Reactions contained 5pi of 10 x Promega PCR buffer, each dNTP at 100pM, 20 pmoles of each external primer and 1 unit of Taq polymerase (Promega). Reactions were overlaid with 30|il of paraffin oil. The PCR parameters were 40 cycles of 1 min denaturation at 95° C, 1 min annealing at 55°C and 1 min extension at 72°C, followed by a final extension of 72°C for 10 mins. A lp l aliquot of the product of the first round was used as template for the second round. The second round of PCR was performed with the internal primer pairs, and only 35-40 cycles run. Care was taken to minimize false positives (Kwok and Higuchi, 1989). PCR products were analyzed on 1.5% agarose gels with a lOObp ladder as size markers. PCR products were subcloned into pBluescript as described (section2.7-1) and sequenced.
Table 2.1 Sequence of RT-PCR primers.
N um ber Gene Position Sequence 5'-3'1 PML 5’ external AGCIGCIGGAGGCIGTGGAC2 PML 5' internal TGTGCIGCAGOGCATOCGCA3 PML 3’ external CGGCATCIGAGTCTICGGAG4 PML 3’ internal CIGCIGATCACCACAACGOG5 RARA 5’ external GGCCAGCAACAGCAGCTCCT6 RARA 5’ internal GGlGCCrOCCTACGCCITCT7 RARA 3’ external TCTIUIGGATGCIGOGGOGG8 RARA 3’ internal GGCGCTCAOXCATAGTGGT
2.10-3 RACE Technique
The RACE technique (tapid amplification of &DNA finds) was performed as described (Frohman et al.t 1988) on lp g of total RNA. Hybrid dT-adaptor and adaptor primers were as described (Frohman et al.y 1988). Gene-specific primers from R A R A were chosen to match the Tm of the adaptor primer. The technique was designed to amplify the 5' ends of RARA messages in APL bone marrow, and hence detect both normal R A R A messages and the
79

fusion P M L - R A R A messages. Insufficient of the latter were produced for successful subcloning. The parameters for dT tailing and PCR amplification were as described (Frohman et al ., 1988).
All the primers for sequencing, reverse transcription, PCR and RACE techniques were synthesized by I. Goldsmith at the ICRF Clare Hall laboratories. This support is gratefully acknowledged.
2.11 APL Patien t Samples
Bone marrow and blood samples from APL patients were obtained as cryopreserved specimens from the cell banks of the following hospitals with the help of the people indicated, whose efforts were greatly appreciated: St. Bartholomew's Hospital, London (T. A. Lister, A. Rohatiner, B. Gibbons, R. Gupta); Great Ormond Street Hospital, London (T. Eden, J. Kingston, F. Katz); Hammersmith Hospital, London (D. Swirsky); Addenbrooks Hospital, Cambridge (J. K. H. Rees, R. Marcus); Royal Hallamshire Hospital, Sheffield (D. A. Winfield, T. Potter); Manchester Royal Infirmary (C. Harrison); University Hospital, Lund, Sweden (F. Mitelman, T. Fioretos); University of Toronto (I. Dube); Erasmus University, Rotterdam (A. Hagemeijer); Indianapolis (A. C. Antony, A. Srivastava). Patient samples were numbered from APL1-APL33, and details of the patient ages, karyotypes, coagulopathy, percentage BM blasts at presentation are given in chapter 7.
? »12 S ta tis tic s
Statistical comparisons of the position of the APL breakpoint within the P ML gene to a series of parameters were performed using chi-squared 2 x 2 contingency tables, while actuarial analysis were kindly performed by T. Bishop (Leeds).
2.13 Buffers and Solutions
LB Broth (1L): lOg Bacto tryptone5g Yeast extract lOg NaCl (pH 7.2)
80

Loading Buffer:
PBS A (1L)
Phenol:
Phenol buffer:
20 x SSC (1L)
TAE Electrophoresis Buffer: 1 x
TBE Electrophoresis Buffer: 0.5 x
TE:
Bromophenol blue 0.25% Xylene cyanol 0.25%30% glycerol in dH20
lOg NaCl 0.25 g KC10.25g KH2P 0 4 1.43g Na2H P04 lg MgCh
500g phenol crystals 800mg hydroxyquinoline 300ml phenol buffer
500mM Tris.HCl pH 8.0 lOmM EDTA lOmM NaCl
175.3g NaCl 88.2g sodium citrate (pH 7.0)
40mM Tris-acetate ImM EDTA
45mM Tris-borate ImM EDTA
lOmM Tris.HCl pH7.6 ImM EDTA
81

Chanter 3
Construction and Regional Localization of Clones from a 17q Specific No t l Linking Library
3.1 Properties of Linking Clones
The use of a positional cloning strategy to identify a disease- associated gene requires the saturation of the chromosomal region with random marker clones, the compilation of these clones into physical and/or genetic maps and the examination of candidate genes until a causative mutation is identified. As the Human Genome Mapping initiative proceeds and the density of marker clones increases over the entire genome, the time-consuming necessity of mapping further random markers to saturate the region of interest will be reduced. Nonetheless, at the initiation of this project the marker density on chromosome 17 was deemed insufficient to provide adequate coverage for the identification of the APL breakpoint and other disease loci on the chromosome (at HGM9.5 only 142 markers had been mapped to chromosome 17; by HGM11 this had risen to 686). Choosing an appropriate cloning strategy, i.e. the type of library and the source of DNA, is therefore critical for the success of a positional cloning project. To clone the APL breakpoint ideally a series of evenly-spaced markers was required over chromosome 17 to scan for the disruption of the physical map caused by the translocation. N ot l linking clones (Poustka and Lehrach, 1986; Smith et al.y 1987) are more effective markers for this purpose than random cosmids, phage, plasmids, or A lu -PCR products. The nature and properties of N o t l linking clones which make them so useful for positional cloning are described below.
1. Linking clones consist of the recognition sequence for a rare- cutting restriction endonuclease, such as N o t l or E a g I, together with the surrounding sequences from both sides of the rare- cutting site (Poustka and Lehrach, 1986; Smith et al.y 1987). By definition rare-cutting sites occur infrequently within the genome, and are used to define the physical map. The choice of the rare- cutting enzyme will partly determine the complexity of the
82

library; an E a g l linking library will contain approximately ten times as many clones as a N o t l linking library since E a g l sites occur more frequently in the genome. However, use of an E a g I- based library would entail additional characterization and sublocalization of the clones to identify those of interest.
2. As Notl linking clones span a Notl site, hybridization to pulsed field gel electrophoresis (PFGE) blots will detect two necessarily adjacent N o t I genomic fragments, which enables the rapid construction of physical maps. It also doubles (on average) the scanning range of each clone for the detection of any rearrangements (such as the APL breakpoint) within the adjacent Notl fragments, compared to any normal genomic phage or cosmid clone lying on a single Notl fragment. Given the clustering of rare- cutting sites within the genome (see paragraph 3 below), a N o t I linking clone will often contain sites for other PFGE enzymes such as SacII, and Narl as well as the obligatory Eagl site (Eaglrecognises the internal 6bp of the octameric N o t I recognition sequence), thereby allowing refinement of the physical map. In practice two unique fragments are isolated from each linking clone, one from each side of the N ot I site, for hybridization to PFGE filters.
3. The clustering of rare-cutting sites within CpG islands is well established (Bird, 1986; Lindsay and Bird, 1987). CpG or HTF (ILpa II liny fragm ent) islands represen t areas containing abundant and non-m ethylated CpG dinucleotides, and are associated with the 5' ends of most genes (with the exception of some highly tissue-specific genes). The occurrence of two unmethylated CpG dinucleotides within the recognition sequence of Notl (GCGGCCGC) coupled with its octameric nature means that almost 90% of Not l sites occur within islands (Lindsay and Bird, 1987), and, moreover, since the remainder may be methylated and therefore resistant to cleavage by N ot I, almost 100% N o t I linking clones will be derived from CpG islands. Construction of a N ot I linking library will therefore identify a subset of the genes from the source DNA, providing a means of identifying candidate cDNAs for further analysis. Furthermore, once a gene is fully
83

mapped, the CpG island may pinpoint where within the gene the regulatory elements and the start of transcription lie. Reflecting these properties, linking clones frequently show cross-species homology on zoo blots or rodent-human hybrids.
4. A N o t l linking library is fully representative of the genome with 100- to 1000-fold fewer clones than a conventional library based on £coR I sites. This follows directly from the scarcity of N o t l sites in the genome. Moreover, the number of N o t l linking clones is sufficiently small (there are only 103-104 Afo/I sites in the whole genome) that the clones can be individually picked into microtitre well dishes to permit mechanical replication of the library. Hybridization of clones already characterized back to filter lifts of the library will identify independent representations of the same N ot l site, and thereby prevent needless duplication of effort in the chromosomal sublocalization of clones.
5. Movement along the chromosome between adjacent linking clones is possible using a jumping library constructed with the same rare-ctting enzyme used in the construction of the linking library (Poustka et al ., 1987). The probability of isolating a jumping clone is decreased when the distance between the N ot l sites exceeds 400kb. However, the advent of YAC technology has largely obviated the need for jum ping libraries, with the additional bonus that in a YAC clone the intervening sequences will also be present.
6. In common with conventional cosmid or phage clones, highly polymorphic microsatellite di-, tri- or tetra-nucleotide repeats can be isolated from linking clones to permit an integration of physical and genetic maps. CA-repeats are the most widely used.
Taken together, these properties make N ot I linking clones the ideal clones with which to search for the APL breakpoint or other disease loci.
84
3.2 Construction of a N o t I linking Library
3.2-1 Methods of Construction
Several alternative methods for the construction of linking libraries have been described, most of which involve the circularization of fragments of DNA and their subsequent cleavage with N ot I. The method utilized here was first described for the isolation of Not I linking clones in the Huntington’s gene region on chromosome 4 (Frischauf, 1989; Pohl et al., 1988). The method is shown schematically in Figure 3.1. In brief, genomic DNA was partially digested with the frequent-cutting enzyme M b o l to give, on average, 15-20kb sized fragments, as for a normal genomic phage library. There is no requirement for especially high molecular weight DNA. The DNA was then diluted and circularized at low concentration in the presence of a selectable marker, in this case the .swpF-containing suppressor plasmid pSD (Levinson et al.,1984). The addition of pSD provides a powerful selection for recombinant phage and also marks the point of circularization. The concentration of phosphatased pSD in the circularization reaction is critical; if too much is added both ends of the circularizing genomic fragment will ligate to a phosphatased pSD plasmid and thereby prevent ring closure, whereas addition of too little will permit circularization without incorporation of the plasm id. Three independent ligations with d ifferen t pSD concentrations were performed to find the optimal efficiency. The circular molecules were then digested to completion with an excess of Not I, and ligated into the prepared arms of the lambda replacement vector NofEMBL3A (Figure 3.2) (Frischauf et al., 1987) which contains compatible Notl sites. Packaged phage were plated on the suppressor-free bacterial host M C I061 for s u p F selection (N#fEMBL3A contains two amber mutations, Aam and Bam as shown in Figure 3.1) or on NM539 for spi selection.
A similar method for construction of linking libraries has also been described (Wallace et al ., 1989) with replacement of the M bol partial digest with a complete Bglll digest. Theoretically this provides a higher cloning efficiency per microgram of input DNA,
85

cN N represents a Not\ site
j _________________________________________
jV_________ genomic DNA
(TRID62)
partial M bo\ digest
N-L
Icircularize in presence of supF plasmid
N
O 1
N ot\ diaest phospatase
NJ
ligate into A/ofEM BL3A
^Aam Bam y |SupF_______________
Figure 3.1 Scheme for the construction of Not\ linking library from TR ID 62, which contains the long arm of chromosome 17 as its only human material.

A. /
Vo(E
MBL
3A
Sca
le
IIBSI10N
IH003
"OC
IIIPuiH
IH003U°NIIBS
00co
CM*
. Ic o cn
co £CO o
-C CO
oCOCO
COCO
co
0
c075 E *22 2o **" i5C L0
CO05co05
Ek_005co
MBSIlSd
■Oc
iaoo3|OBS
lew s
0
2 O00 o cO 0 5o c
jc c
o
0
E o■O ^ 0D 88
o c2 .2^ 0 c® § c w 0 0
0 Q-C L ^0k—0 co
1 - E 05« *55® c £ o
< ~3 tsCD 2LU Co § ^ ©
0o *-C £
P4-+ *E >* W 0£ £ C L —
§L
< 1 CM — CO ”m ° £ ^ D0 5 0
iT £
0c0 <0 CO
- J0 5 CDc
c WOLj £
CD c
IIIPUjH -
UBSUON^-
CO
0
L_o
. c</>
in A
/0/E
MB
L3A
, wi
th
the
supp
ress
or
plas
mid
, pS
D,
show
n as
a st
riped
bo
x (e
nlar
ged)
.

enabling flow-sorted chromosomes to be used as the DNA source, but the final insert size is dependent on the initial size of the N ofl-containing B g l II fragment. More recently new vectors for constructing Not I linking libraries have been developed that do not require the inclusion of a selectable marker (Zabarovsky et al., 1990), but instead rely on a partial filling-in reaction to ensure the correct clone structure. A PCR-based strategy has also been devised (Kandpal et al ., 1990), as has a method which relies on pulsed-field acrylamide gel electrophoresis to physically separate the circular and linear fragments (Ito and Sakaki, 1988). Additionally, cosmids that contain Not I sites can be detected by hybridization to an eight base pair oligonucleotide that corresponds to the N o t I recognition sequence (Estivill and Williamson, 1987), or by cleavage of purified cosmids with Notl . However, the method of Frischauf et al. remains attractive (Frischauf, 1989).
3.2-2 Choice of DNA Source
The choice of starting material for construction of a linking library is dictated by the specific aims of the project. As the human genom e con tains betw een 103 and 104 N o t I sites, the identification of either of the N o t I sites flanking the APL breakpoint at 17ql2-21 from a complete human N o t I linking library would have been a formidable task. Instead, construction of the library from chromosome 17 only (approximately 3% of the genome) would enrich thirty-fold for the clones of interest, as well as providing a chromosome-specific resource for other cloning endeavours on chromosome 17. However, chromosome 17 still contains between 90 and 200 unmethylated Notl sites (Wallace et al.9 1989), the characterization and sublocalization of which would remain time-consuming. A chromosome 17-specific library could be constructed from either flow-sorted chromosomes or a somatic cell hybrid containing only human chromosome 17 on a rodent background, for exam ple PCTBA1.8 (Bai et al., 1982). Alternatively, library construction could have commenced from a chromosome-mediated gene transfectant (CMGT) containing only a small region of chromosome 17 around the APL breakpoint; for
88

example the CMGT KLT8 (Xu et al., 1988) was estimated to contain about 10% of chromosome 17 in a minimum of two discontiguous stretches of DNA, of which one was thought to span the APL breakpoint (Figure 3.3). Although this would have limited the number of different human clones to less than 20, of which two should have detected the APL breakpoint on PFGE, in practice CMGTs often prove to contain further deletions and breakpoints than those characterized initially, hence creating a risk that the sequences of interest would be deleted from the chosen CMGT. In addition, such a library would have been of diminished use for the Human Genome Mapping project. The decision not to use the CMGT KLT8 as the DNA source was perhaps justified following the subsequent demonstration that it does contain further deletions (see section 3.3-3), although the sequences spanning the APL breakpoint itself are present.
A somatic cell hybrid containing 17q as its only cytogenetically- visible human material (TRID62; Tunnacliffe et al., 1983) wastherefore chosen as a compromise between the size of the libraryand its subsequent utility. The long arm of chromosome 17 represents two thirds of the entire chromosome, thus TRID62 should contain between 60 and 140 human N o t I sites. Such a library might be useful in the identification of not only the APL breakpoint at 17q21 but also the neurofibromatosis (NF1) gene at 17ql 1.2. Although the NF1 gene has since been cloned (Cawthon et al.9 1990; Viskochil et al.f 1990; Wallace et al.y 1990), thediscovery that hereditary early-onset breast and ovarian cancer is linked to 17q (Hall et al ., 1990; Narod et al.t 1991) provides another reverse genetical goal to which a 17q N ot l linking library could be harnessed. However, the library would be inapplicable to disease loci on the short arm of chromosome 17, such as the M iller-Dieker chromosome region (Ledbetter et al ., 1990) andCharcot-Marie-Tooth neuropathy type 1A (Vance et al.t 1989).
The use of a mouse-human somatic cell hybrid as a DNA source requires that the human clones can be identified from the murine clones following construction of the library. This was accomplished by probing filters of the library with labelled total human DNA,
89

Regi
on
Map
ped
Num
ber
of
loci
linki
ng
clon
es
00+
<0
coCOCO
<CM
uo
CM
CDCD _c < UJ g
cogLL ^COo
CO
CM
r-»COr» .
in co
in
EE _
inco
XQ.2=>
<CO
o
O) CDCO
OUTL
Gild
Q911d
srw moa
9882 Ld
IVZiTd
290IH1
8'lVaiOd
Ll CL 2 <
©c COc >* ® n c o '•= *■* "oco ® 58 S 5
CO° C CDo>~ c £ .2 >c c o o ~ tj j—
— CO*= jo m ^ £ coCM © CO ^ £ C
ol ° l~ ~ a_ C <uQ- ® ir2 c ■“ t o —° ° H ■ o 5 S S '" «.
£ ’c co a -e E °-.c ST3 m -Q •C © 5C .O -C O ^ J .> 3-c c ©as S C CD .tS8 $ Y.2 co « i3 c -J E o JO Q . < W JC „ m rt ® ® © XZ ■*= ~ ~
-Q * - °
§ § g r- S .13: So *5 8 e ® Q.o x: m 8 ~ |§ * H u COr V ^o 2 10 O c am *® •* ” u o CO jg© c3 -2 s
i ? ® O LL u CO Th
e nu
mbe
r of
linkin
g clo
nes
map
ped
to ea
ch
region
is
show
n at
the
right
, to
geth
er
with
som
e pr
evio
usly
m
appe
d m
arke
rs.
The
addi
tiona
l hu
man
fra
gmen
ts fou
nd
in KL
T8
are
show
n in
grey
.

which identifies those clones which contain human repeat sequences. Ninety-nine percent of human phage contain repeat sequences and hence are detectable by this method (Kao et al.,1982). Another consideration is the state of methylation of human genes on a mouse background; if the human genes aremethylated then they will fail to cleave with Notl , leading to an under-representation of human clones in the library. However, providing that the cells do not reach confluence in tissue culture, methylation does not appear to be a problem. Care was therefore taken not to overgrow TRID62 prior to harvesting the DNA.
3.2-3 Library Efficiency
Construction of the Not I linking library required the isolation and purification of three types of DNA: genomic DNA from TRID62 (human 17q only), the suppressor plasmid pSD and the phagevector itself, NotEMBL3A. The TRID62 genomic DNA was partially digested to give 15-20kb sized fragments (no further sizeselection is required), electroeluted pSD was digested to completion with B am HI and phoshatased, while an aliquot of a bulk NofEMBL3A preparation was cut with N ot I to prepare the vector arms. Three separate ligations of TRID62 and the suppressor plasmid pSD were set up with increasing pSD concentrations in order to achieve the optimal pSD concentration. pSD should be present at the same concentration as the ends of the DNA fragment being circularized, for the reasons described above. The theoretical optim al concentrations have beencalculated through the Jacobson-Stockmayer equation (Frischauf, 1989; Poustka and Lehrach, 1986). The ligations were set up as shown in Table 3.1 to bracket this concentration.
Table 3.1 Relative amounts of pSD and TRID62 used for the circularization
step during library construction.
Ligation Number Amount of pSD Amount of TRID621 l u g 2 M- g2 2 n g 2 M- g3 4 u g 2 M- g
91

Following digestion of the ligation mixes with Notl, addition of the vector arms and ligation, test aliquots were packaged with homemade packaging extract and plated on the following bacterial hosts: NM538, which permits growth of recombinant and nonrecombinant phage; NM539 which uses spi selection to select for recombinant phage; and M CI061, a suppressor-free host which selects for recom binant clones which have incorporated a suppressor plasmid. Plaques were obtained on all three hosts, indicating that the library construction had been successful. Further aliquots were therefore re-packaged with Gigapack II Gold and plated on M CI061 to establish the efficiencies of the three different ligations. These results are presented in Table 3.2.
Table 3.2 Efficiencies of library construction with the three different concentrations of pSD.
L igation
no.A m ountlig a tio n
m ixpackaged
A m ount
lam bdad ilu e n tadded
A m ount plated on MC1061
No. of
p laq u es o b ta in ed
C alcu lat
ed total no. of
p laq u es
E ff ic ie n
cy /|xg TRID62
DNA1 4 p l
(of 20ul)300pl lO pl 305 45,750 2.3xl04
p fu /p .g
2 16|xl (of 20|xl)
l,2 0 0 |il 10|xl 359 53,850 2.7xl04p f u / p g
581 |xl 31,500 81,325 4 .0 x l0 4 p f u l\L g
•
3 4 p l
(of 20ul)
3 0 0]xl lO pl 211 31,650 1.6X10⁴p f u / j i g
♦The highest efficiency was obtained with the concentration of pSD closest to that theoretically calculated for optimal yield (ligation 2), and is shown in bold.
Ligation 2 appeared to be the most promising from the initial experiments with home-made packaging extract as was confirmed with the Gigapack II Gold packaging reactions (Table 3.2).
92
Consequently seven large 23 x 23 cm plates were plated with ligation 2 at a density of 3,000 plaques per plate (i.e. low density). Counting a representative area of one of these plates indicated that the efficiency was higher than that initially calculated, as each large plate contained approximately 4,500 phage instead of 3,000. The efficiency was thus recalculated to be 4.0x10⁴ pfu/p.g of input DNA. This compares favourably with other construction methods (Wallace et al.9 1989). The total number of linking clones available if all three ligation mixes were packaged and plated would be about 1.6xl05, although those already plated sufficed to saturate 17q (see below).
3.2-4 Characterization of Library
Before proceeding further it was necessary to check that the linking clones had the predicted structure (Figure 3.2B) and contained the suppressor plasmid as expected. Eight plaques were therefore chosen at random and DNA isolated. Digestion with Notl separated the long and short vector arms from a different-sized insert in the 15-20kb range in all eight cases, as predicted. Likewise, digestion with Sail not only cut out the insert (Sail sites flank the Not I sites), but also cut each insert into two fragments due to the presence of a Sail site in the pSD polylinker. Sail sites are otherwise rare in the genome. Subsequent double E c o R l-S a l l digests on linking clones always released a 1.5kb fragment corresponding to pSD, since these two sites flank the suppressor plasmid. Extensive further mapping of many clones has failed to yield any whose structure deviates from that shown in Figure 3.2, highlighting the power of the selection procedure.
To identify the human clones from among the majority of murine N ot I linking clones, lifts from the seven 23 x 23cm plates were probed with labelled human DNA. A pproxim ately 3.3% (150/4500) of the plaques were positive, which, assuming the mouse genome to have an equivalent number of Not I sites as the human genome, is greater than the 1% estimated for a single chromosome 17 long arm on a diploid background. This may be attributable to cross-reactive mouse clones, or to the presence of
93

small plaques with human inserts that were invisible to the eye but detectable on hybridization. The majority of clones ultimately proved to be human.
A total of 650 positive clones were individually picked into microtitre well dishes to facilitate replication of the library. Replicas were prepared using a 96-needle aluminium "hedgehog" (Coulson et al.f 1986) to transfer the phage lysate from the microtitre well dishes to plates containing plating bacteria in the top agarose. Lifts were taken from the resulting macroplaques. Each linking clone was assigned a unique number based on its position within the seven microtitre well dishes.
Hybridizations with unique fragments derived from a particular linking clone back to the gridded reference filters indicates how many times a particular Notl site is represented in the 650 clones. The results obtained with unique fragments derived from 22 different linking clones indicated that on average each Not I site is represented 3.7 times in the 650 clones. Assuming that no mouse clones were picked in error, this would indicate that there are 176 (650/3.7) unmethylated Not I sites on 17q . Given that there are some mouse clones present, the real number must be less than 176 and hence agrees well with the theoretical estimates of 60- 140 Notl sites on 17q.
3.3 Regional Assignment of Linking Clones on 17o
The purpose of constructing the N o t I linking library was to provide a series of markers along 17q to detect the APL breakpoint. In order to determine which of the linking clones should be used on PFGE to look for the breakpoint, it was necessary to sublocalize the clones on 17q and then proceed with those clones which mapped closest to the region of interest. The clones were therefore regionally localized on a somatic cell hybrid mapping panel which divides 17q into nine regions based on the breakpoints within the hybrids. Consideration was given to how many clones needed to be mapped. Since either of the two linking clones that flank the APL breakpoint would suffice to detect the
94

breakpoint on PFGE, only half of the N ot I sites on 17q should require sublocalization. However, since the localized clones would inevitably contain some independent representations of the same N ot l site, over half of the 17q linking clones (i.e. over 70 clones) would need to be mapped to ensure an adequate chance of identifying either of the flanking clones.
13-1 The Somatic Cell Hybrid Mapping Panel
The mapping panel employed was similar to that used to map cosmid clones in the investigation of the neurofibromatosis gene (Yagle et al.y 1990). The mapping panel (Figure 3.3) consists of five somatic cell hybrids with simple well-defined breakpoints on human chromosome 17 and three chromosome-mediated gene transfectants (CMGTs) which contain multiple DNA fragments. A fourth CMGT (TLT10) was later used to refine the position ofparticular clones of interest and is also shown. The four CMGTs arepart of a large series of hybrids originally developed to define the relative order of genes on chromosome 17 (Xu et a l ., 1988). From left to right on Figure 3.3, the hybrids are: PCTBA1.8 (Bai et a l .,1982), chromosome 17-only hybrid; TRID62 (Tunnacliffe et al .y
1983), which contains the whole of 17q; PJT2A1 (Sheer et a l .,1983), which contains the APL 15q+ derivative chromosome (17ql2-21 to qter); P12.3B6 (van Tuinen et a l ., 1987), the reciprocal APL 17q- hybrid (17pter to 17ql2-21); DCR1 (Fain e t a l.y 1989), an NF1 translocation hybrid t( l;1 7 )(q 2 2 ;q l 1.2) containing 17ql 1.2 to qter; and lastly four CMGTs KLT8, PLT6B, PLT 8 and TLT10 (Xu et al.y 1988).
The nine regions defined by the mapping panel are particularlyfocused to identify those clones immediately adjacent to the APL and neurofibromatosis breakpoints. Regions 2A and 2B flank the neurofibromatosis translocation breakpoint; clones mapped to these regions were considered as potential NF1 candidates prior to the cloning of the N F1 gene. Regions 3 and 4 flank the APL breakpoint and clones that mapped to these regions were investigated in greater detail. Region 3 contains three genes, CSF 3t E R B B 2 and THRA1 none of which are involved in APL, while
95

region 4 is defined by the four cosmid clones D17S166, D17S167, D17S174 and D17S175 (Yagle et al ., 1990). Figure 3.3 shows the positions of these and other genes mapped to the nine different regions (Xu et al., 1988). Regions 5 and 6 are defined, respectively, by EPB3 and R N U 2 y whilst region 7 contains three genes, H O X 2 t G AA and U M P H . Any clones mapping positive in PLT8 lie in regions 8 or 9; these are the largest and least well-characterized regions. The selectable marker thymidine kinase, used during the construction of many of the hybrids maps to region nine. The panel also included mouse (EL4) and total human (MOLT4) controls.
All the cell lines and CMGTs were grown in tissue culture to provide sufficient DNA for the mapping experiments, with the exception of DNA from DCR1 (the NF1 t(l;17) translocation hybrid) which was prepared by M. Yagle. In order to permit multiple, simultaneous mappings, a total of forty identical mapping filterswere prepared by digestion of the genomic DNA with either B am U l or EcoRl, followed by gel electrophoresis and Southern transfer.
3.3-2 Mapping Results
In order to avoid mapping those mouse clones that had been picked and gridded among the 650 "human" clones in error, labelled total human and total mouse DNA were hybridized separately to filter lifts taken from macroplaques of the gridded clones. Although the results were not as clear as hoped, they did enable the avoidance of some mouse-positive, human-negative clones. Small phage DNA preparations were then madesystematically from clones through the library. DNA from the whole phage (including the vector arms) was labelled, competed with sheared human DNA to remove the human repeat sequences, and hybridized to the mapping panel filters to sublocalize the clones on 17q. A total of 174 hybridizations with different linkingclones were performed in this way. Interpretation of the resultswas simplified by the reduced human content of the hybrids compared to total human DNA, since the signal to noise ratio is
96

improved. For 47 of these clones, medium scale (50ml) phage DNA preparations were made to provide sufficient DNA for the identification and isolation of repeat-free bands. Unique bands were identified by cutting the phage DNA with both B am H I-Sa l l and E c o R l - S a l l double digests and probing lifts of the electrophoretically size-separated fragments with labelled total human DNA. Fragments which failed to hybridize to the human DNA were cut out of low melting point agarose and used as probes on the 17q mapping panel. The combined approach of mapping with either whole phage or unique subfragments led to the unambiguous assignment of 112 N ot I linking clones to the nine different regions of 17q. Of the remaining clones, 11 lacked easily identifiable unique bands, and 51 were assumed to be either of mouse origin or mixed human and mouse phage preparations.Since no secondary screening was performed after picking the human clones the latter possibility is perhaps more likely. Noclones appeared to be derived either from other human chromosomes or from the short arm of chromosome 17 in agreement with the karyotype of TRID62. The number of linking clones mapped to each individual region is also shown in Figure 3.3.
Figure 3.4 shows the hybridization pattern on the mapping panel of nine different linking clones. These nine clones were chosen to illustrate the hybridization patterns for each of the nine regions. All the results shown were obtained with unique subfragments with the exception of the results for regions 1 and 9, which were obtained by hybridization of the whole clone. Note that the result shown for region 4 is atypical as this particular subfragment is absent from the 15q+ APL hybrid (PJT2A1) for reasons discussed later (section 4.4-2), but otherwise the pattern is correct for aclone assigned to region 4.
As mentioned previously, unique inserts from 22 of the linking clones were hybridized back to the 650 gridded clones todetermine that on average each clone was represented 3.7 times in the library. This experiment also indicated that six of the 112 linking clones (three from region 2A, and one each from regions 5,
97
Figure 3.4 Autoradiographs showing the hybridization pattern of linking clones to each of the nine different regions of 17q defined by the somatic cell hybrid mapping panel.
Hybridizations were performed with whole phage for LCN5A11 (region 1) and LCN4E1 (region 9) and with unique subfragments for the remaining seven phage. Probes were labelled to high specific activity with 32P, hybridized to filters containing EcoRl or B a m H l digested DNA from the mapping panel, then washed to high stringency and exposed for 1 to 3 days. The ten lanes contain the same DNAs in each of the individual photographs. Lane 1, PCTBA1.8 (17-only somatic cell hybrid); lane 2, TRID62 (17q); lane 3, PJT2A1 (APL 15q+ hybrid); lane 4, P12.3B6 (APL 17q- hybrid); lane 5, DCR1 (NF translocation t( l ; 17) hybrid); lane 6, KLT8; lane 7, PLT6B; lane 8, PLT8 (these latter three hybrids are all CMGTs); lane 9, EL4 (mouse); lane 10, MOLT4 (total human). The lanes are in the same order as shown in the schematic representation of the mapping panel in Figure 3.3. Note that two of the probes (LCN4G8 and LCN5F6) detect low levels of an unstable fragment of KLT8 (lane 6). LCN5F6 also detects a faint extra band in lane 5 which is presumably cross-reaction with a contaminating plasmid. Also note that the pattern for the region 4 clone illustrated by LCN4A3/C is atypical in that this particular probe is negative in the 15q+ APL hybrid whereas all other region 4 clones are positive (see section 4.4-2 for the explanation). The region 7 clone LCN5E12 detects two strong cross-reacting mouse bands in all lanes except total human, likewise LCN5A11 (region 1) shows a fainter crossreactive band (the lower of the two visible bands).

1 2 3 4 5 6 7 8 9 1 0 1 2 3 4 5 6 7 8 9 1 0
'REGION 1 LCN5A11
1 2 3 4 5 6 7 8 9 1 0
REGION 2A LCN6F2
1 2 3 4 5 6 7 8 9 1 0
*m m
REGION 3 LCN4G8
1 2 3 4 5 6 7 8 9 1 0
REGION 4 LCN4A3/C
1 2 3 4 5 6 7 8 9 1 0
REGION 5 LCN5D10 REGION 6 LCN5F6
1 2 3 4 5 6 7 8 9 1 0
REGION 7 L CN5 E1 2
Figure 3 .4
MOUSE HOMOLOGY
1 2 3 4 5 6 7 8 9 1 0 1 2 3 4 5 6 7 8 9 1 0
P IREGION 8 LCN5G11 REGION 9 LCN4E1

7, and 8) had been picked and mapped twice. These represent independent clones of the same Not I site. Accordingly only the remaining 106 linking clones were assigned D-numbers for entry into the Genome Data Base. The names and D-numbers of these 106 linking clones, together with the regions in which they lie, are shown in Table 3.3. The italicized clones in Table 3.3 are those clones whose mapping results are illustrated in Figure 3.4.
3.3-3 Fine Mapping of Candidate Breakpoint Clones
The 106 linking clones sublocalized over 17q exceeds the figure of 70 calculated earlier as the minimum number required to identify one of the two clones that flanks the APL breakpoint. Statistically, one of the APL flanking clones should have been present among the clones mapped to regions 3 and 4. However, an immediate analysis of the region 3 and region 4 linking clones on PFGE did not seem advisable for two reasons.
1. Region 3 was initially defined as the region between the NF and APL breakpoints (Figure 3.3) which is present in the CMGT KLT8 but negative in PLT6B. Two linking clones (LCN4C4 and LCN4G8) were mapped to region 3 on the basis that they lay between the two translocation breakpoints and were negative in PLT6B. However, unlike the three genes previously mapped in this region (Xu et al.9 1988), both linking clones were negative in KLT8 (or gave a weak signal indicative of an unstable fragment). This implied that KLT8 did not contain a contiguous stretch of DNA spanning both the APL and NF translocations, and more importantly, might not include the APL breakpoint itself. If this was true, linking clones mapping directly beneath the APL breakpoint would also be negative in KLT8 and hence, on consideration of the mapping panel, would have been assigned to region 7. However, the fact that the single linking clone mapped to region 2B was also negative in KLT8 suggested that the deletion in KLT8 spanned the region 2B/3 junction, and not the region 3/4 junction (i.e. the APL breakpoint). This is how the deletion is drawn in Figure 3.3. Although this latter observation provided some reassurance that the APL breakpoint would be flanked by
100

Region LCN D-no. LCN D-no. LCN D-no.1 LCN5AJJ
LCN5F12D17S263D17S266
LCN5B6 D17S264 LCN5F4 D17S265
2 A LCN4D4 D17S267 LCN5A4 D17S268 LCN6F2 D17S269
2B LCN6E5 D17270
3 LCN4C4 D17S271 LCN4G8 D17S272
4 LCN4A3 DJ7S273 LCN4E5 D17S274
5 LCN4B5 D17S275 LCN4C8 D17S276 LCN4F4 D17S277LCN4H6 D17S278 LCN5D10 DJ7S279 LCN5E10 D17S443LCN6C10 D17S280
6 LCN4F11LCN6F6
D17S281D17S284
LCN5B4 D17S282 LCN5F6 D17S283
7 LCN4B2 D17S285 LCN4F9 D17S286 LCN4H8 D17S287LCN5A12 D17S288 LCN5C10 D17S289 LCN5E12 D17S290LCN5F7 D17S291 LCN6B7 D17S292 LCN6C1 D17S293
7 (+ve LCN4B1 D17S294 LCN4G3 D17S295 LCN5E4 D17S296KLT8) LCN5G1 D17S297 LCN6E3 D17S298
LCN4B4 D17S299 LCN4B7 D17S300 LCN4C5 D17S301LCN4C9 D17S302 LCN4D9 D17S303 LCN4D10 D17S304LCN4E8 D17S305 LCN4F2 D17S306 LCN4G11 D17S307LCN5A2 D17S308 LCN5B7 D17S309 LCN5B10 D17S310LCN5C2 D17S311 LCN5C7 D17S312 LCN5D5 D17S313
8 LCN5E1 D17S314 LCN5E2 D17S315 LCN5E3 D17S316LCN5F1 D17S317 LCN5F9 D17S318 LCN5F11 D17S319LCN5G2 D17S320 LCN5G6 D17S321 LCN5G10 D17S322
LCN5G11 D17S323 LCN5H1 D17S324 LCN6B9 D17S325LCN6C6 D17S326 LCN6D6 D17S327 LCN6D7 D17S328LCN6D8 D17S329 LCN6E4 D17S330 LCN6F7 D17S331
LCN7B11 D17S332LCN4D8 D17S333 LCN4E1 D17S334 LCN4E12 D17S335LCN4G1 D17S336 LCN4G6 D17S337 LCN4H5 D17S338
9 LCN5B11 D17S339 LCN5C1 D17S340 LCN5D2 D17S341LCN5E9 D17S342 LCN6A7 D17S343 LCN6B6 D17S344
LCN6B12 D17S345 LCN6C9 D17S346 LCN6E8 D17S347LCN6E9 D17S348 LCN6F10 D17S349LCN4B3 D17S350 LCN4B8 D17S351 LCN4C3 D17S352LCN4C10 D17S353 LCN4H1 D17S354 LCN4G9 D17S355
8 or 9 LCN5C8 D17S356 LCN5D7 D17S357 LCN5E6 D17S358LCN5F5 D17S359 LCN5H2 D17S360 LCN5H7 D17S361LCN6A1 D17S362 LCN6C3 D17S363 LCN6C12 D17S364LCN6D4 D17S365 LCN6F1 D17S366 LCN6F4 D17S367
Table 3.3 Assignment of linking clones to the nine defined regions of chromosome 17q, with D-numbers. The linking clones whose mapping results are shown in Figure 3.4 are italicized.

KLT8 positive clones, the former observation still indicated that the critical region 4 clone might have been mapped to region 7 in erro r.
2. Secondly, the number of clones that had been mapped to region 4 seemed implausibly high. Although Figure 3.3 only shows 2 clones lying in region 4 (LCN4A3 and LCN4E5), the initial results obtained (prior to adjustment through the fine mapping described below), were just based on the CMGTs KLT8, PLT6B and PLT8, and this placed a total of seven linking clones in region 4. Given that region 3 was thought to be larger than region 4 (three genes had previously been mapped to region 3 and none to region 4), it was surprising that seven linking clones (all known to represent separate Not I sites) had been mapped to region 4 and only two to region 3. This suggested that there might be further DNA segments present in KLT8 that lie distal to region 4. Consideration of the breakpoints in the other CMGTs indicated that these sequences would have to lie in region 7, and consequently most of the "region 4" clones might also belong in this region (these sequences are shown in grey rather than solid black in Figure 3.3). The possibility of additional chromosomal fragments in KLT8 was also suggested by FISH (fluorescence in situ hybridization) data obtained with a series of cosmids previously localized to region 4: the cosmids appeared to cluster in three separate groups on 17q rather than the one expected (S. Rider, unpublished results).
The observations above suggested that the assignment of linking clones to regions 4 and 7 required confirmation (or rejection) through further mapping. By using an extended panel of hybrids with an increased number of breakpoints it was possible to determine if some of the "region 4" clones really belong in region 7 and vice visa. A further eight CMGTs were therefore chosen from the described panel (Xu et al.y 1988) which contained breakpoints that might separate the APL breakpoint region from region 7 sequences. The eight chosen hybrids, PLT6, PLT15, PLT20, KLT3, KLT12, KLT13, TLT8 and TLT10, were grown in tissue culture, and DNA was extracted. Eight mapping filters were prepared with BamH\ or E c <?RI-digested DNA from the hybrids,
102

with mouse (EL4) and human (MOLT4) controls. All the region 4 and region 7 clones were then hybridized to this extended panel, and the results are shown in idiogramatic form in Figure 3.5. Figure 3.5 also shows KLT8 for comparative purposes. Thehybridization of two linking clones (LCN4F2 and LCN5A12) to this CMGT mapping panel is shown in Figure 3.6. The findings are summarized below.
1. Two of the eight hybrids, KLT13 and TLT8, are unstable and have lost most of their human DNA. All the probes hybridized to these two CMGTs, with the exception of LCN5E4 to TLT8, were either negative or gave a very faint signal. In particular thecontrol hybridization of NGFR (a gene previously mapped to region7) was negative in both KLT3 and TLT8 when previously it hadbeen scored positive in both hybrids (Xu et al.y 1988). Accordingly, less weight was attached to the results obtained with these hybrids.
2. TLT10 emerged as a key hybrid for the segregation of clones immediately adjacent to the APL breakpoint from those KLT8- positive clones lying further telomeric. TLT10 is negative for all probes mapping to the genuine region 4 and to regions 5 and 6, but positive for all region 7 clones (except LCN5A12, see paragraph 4 below). For this reason TLT10 is also shown for comparison in the initial mapping panel in Figure 3.3. Using TLT10 it was possible to re-assign five of the seven linking clones initially mapped to region 4 to region 7. In Table 3.3 these are described as the KLT8-positive region 7 clones. The remaining two region 4 linking clones, LCN4A3 and LCN4E5, were negative in TLT10, and were therefore considered to lie immediately adjacent to the APL breakpoint.
The use of TLT10 as a means of distinguishing the region 4 and 7 clones was confirmed by the hybridization of a single cosmid from each of the three cosmid clusters identified by FISH. (These cosmids were also initially thought to lie in region 4, as discussed earlier). As hoped, only cosmid D14 (D17S174) was negative in TLT10 (this cosmid defines region 4, see Figure 3.3), whereas
103

Probe Region
Centromere
LCN4A3 4
D14
LCN4E5
LCN6C10
RNU2
LCN5A12
LCN5G5
E55
LCN4B1
LCN6B7
LCN5F7
LCN4B2
LCN4F2
LCN4F9
NGFR
LCN4H8
LCN6C1
E39
LCN6E3
LCN4G3
LCN5E4
Telomere
4
4
5
6
7
4 / 7
4 / 7
4 / 7
7
7
7
7
7
7
7
7
4 / 7
4 / 7
4 / 7
4 / 7
Figure 3.5 Fine mapping of the region 4 and region 7 linking clones, three cosmids (D14, E55 and E39) and two reference markers (RNU2 and NGFR) over an extended panel of CMGT somatic cell hybrids.
+ve -ve unstable no data

m o u s eh o m o l o g y
hu m an
L C N 5 A 1 2 R e g io n 7 P o s i t i v e in TLT10
- - + + + U - - - - +
m hu m a n
hum an
LCN4F2 R e g io n 7 N e g a t i v e in TLT10
+ + - + - U U + - +
Figure 3 .6 Mapping of two region 7 linking c l o n e s ov er an e x t e n d e d panel of c h r o m o s o m e m e d i a t e d g e n e t r a n s f e c t a n t s to ref ine their pos i t io n with r e s p e c t to the APL breakpoint . A unique su b f r a g m e n t from e a c h c l o n e w a s i so l ated and hybridized to E c o R I - d i g e s t e d hybrid DNA. T h e critical hybrid ( s e e text) is TLT10: L C N 5 A 1 2 is n e g a t i v e and L C N 4 F 2 is posi t ive . LC N 5A 12 therefore m a p s c lo s e r to the APL breakpoint . L C N 4 F 2 s h o w s c r o s s - s p e c i e s hybridization. Key: U = unstable , i .e. only a faint s ignal is s e e n a s m o s t of the huma n s e q u e n c e s h a v e b e e n lost from that hybrid. KLT13 and TLT8 are part icular ly u n s t a b l e .

representatives of the two distal cosmid clusters (E55 and E39) were positive.
3. Using the combined CMGT data, it was possible to derive a tentative order for the region 4 and 7 linking clones on 17q. Figure 3.5 shows the order of clones which gives the least number of breaks in the hybrids. Probes initially mapped to region 4 and subsequently moved to region 7 are designated 4/7. Four different linking clones (LCN5F7, LCN4B2, LCN4F2 and LCN4F9) have hybridization patterns almost identical to that of NGFR, and might define a PFGE contig of this region. One of these clones may represent NGFR itself, since it is known to have a GC-rich promoter, which, upon scrutiny, contains a Not I site at position - 390 (Sehgal et al., 1988). Likewise, LCN4H8 and LCN6C1 represent different N o t l sites which may be adjacent in the genome since their linking clones have identical mapping results. LCN6B7 gives an identical mapping result to the H O X 2 gene cluster (Xu et al., 1988).
4. A single linking clone, LCN5A12, originally mapped to region 7, was negative in TLT10. Given that the KLT8 deletion in region 3 could span the APL breakpoint, this clone could be directly adjacent to the APL breakpoint in region 4. Ultimately this did not prove to be the case (see Chapter 4). Instead, this clone may lie at the junction of regions 6 and 7 as shown in Figure 3.5, or alternatively at the junction of regions 7 and 8.
The extended CMGT mapping panel was therefore used to subdivide the region 4 linking clones into a pair of clones (LCN4A3 and LCN4E5) still though to lie at the APL breakpoint, and a larger group of five clones that were re-assigned to two KLT8-positive areas of region 7. In addition the region 7 clone LCN5A12 could not be excluded as a potential region 4 clone, given the possibility that the APL breakpoint sequences might be deleted from KLT8. These three clones plus the two region 3 clones (LCN4C4 and LCN4G8) therefore emerged as the best candidates for the detection of the APL breakpoint on PFGE.
106

3.4 Discussion and Summary
This chapter describes the positional cloning strategy adopted to generate probes in the APL breakpoint region at 17ql2-21, which is summarized in Figure 3.7. The aim was to saturate the entire long arm of human chromosome 17 with well-spaced markers which would provide a permanent mapping resource for the identification of disease loci on 17q. The most efficient markers for this purpose are No tl linking clones, since their unique ability to identify two adjacent N o t l fragments on PFGE facilitates the construction of physical maps and the identification of disease-associated rearrangements.
Accordingly a N o t I linking library was constructed from an interspecies hybrid containing 17q as its only human material(Borrow et al., 1991). The library was constructed in the lambda replacement vector N0/EMBL3A to high efficiency. Human clones were identified by hybridization to human repeat sequences, and 650 positive clones were picked into microtitre well dishes. This represents 3-4 equivalents of each Not I site on 17q. To identify the clones flanking the APL breakpoint, 112 clones were sublocalized to a somatic cell hybrid mapping panel defining nine different regions on 17q. As there are only 60-140 N ot I sites on 17q, these clones should include at least one of the clones that flank the APL translocation breakpoint. The positions of a subset of clones were refined on a second mapping panel consisting purely of CMGTs. Based on their proximity to the APL breakpoint, five clones were selected for further analysis. Chapter 4 will show that this strategy was successful as one of these five clones detected the APL breakpoint on PFGE.
At the time of construction of the N ot I linking library there wasan additional target to the APL breakpoint on 17q: theneurofibromatosis gene. Two independent translocations had been described in NF families providing a means of identifying the NF gene region on PFGE. The neurofibrom atosis gene was subsequently identified through a N o t I linking clone from the library constructed by Wallace et al. (Fountain et al., 1989). This
107

Choice of type of library Choice of DNA source
YAC, cosmid, phage,
link ing lib ra ry , plasmid, Alu-PCR
Whole genome, chrom osom e17, 17q (TRIP62),
CMGT
N o t I linking Library from 17q
160,000 clones
Probe with labelled total human DNA to detect
human clones Picked and gridded 650 human clones
IRegionally localize 112 linking
clones from 17q (>50% of Not\ sites) on somatic cell hybrid mapping panel
ICharacterize those clones
immediately flanking breakpoint
IVisualize APL breakpointas band shift on pulsed field
gel electrophoresis
Figure 3.7 Positional cloning strategy for detection of the APL breakpoint.
clone, 17L1, identified both NF translocations breakpoints on PFGE. The linking clone LCN6F2 from the library described here was mapped to region 2A im m ediately adjacent to the NFtranslocation. This clone represents the same Notl site as 17L1 as judged by its restriction pattern and ability also to detect the NF translocations on PFGE (Borrow et al.t 1991). This Notl site actually lies within the 5' untranslated region of the NF gene (Marchuk et al ., 1991). The other flanking NF Notl site (B35; Yagle et a/., 1990) was also present three times in the 650 gridded N o t I linking clones, but none of the three copies had been sublocalized.However, the presence of both the NF flanking N o t I sites in thelibrary confirmed that the library was highly representative for17q.
More recently the gene for familial early onset breast and ovarian cancer has been mapped to chromosome 17 (Hall et al., 1990;Narod et al., 1991). The current linkage analysis places the BRCA1 gene within regions 4, 5, 6 or 7 (Hall et al., 1992), containing a total of 26 Notl linking clones. These clones will be useful in the search for gross genomic rearrangements associated with thedisease. A dditionally, the derivation of highly inform ative dinucleotide-repeats from these linking clones may help define critical cross-over events in linkage analysis of affected families. Screening the 650 gridded clones with a CA-probe enabled thesimultaneous identification of all the linking clones which contained CA-repeats, including several in those mapped to thecritical region (D. Black, unpublished observations).
On the short arm of chromosome 17, clones from the flow sorted Notl linking library of Wallace et at. are being used in the analysis of the Miller-Dieker chromosome region at 17pl3.3 (Ledbetter et al., 1990). A total of 66 clones have been regionally assigned from this library, included four in the M iller-Dieker region. The combination of clones from both libraries (Borrow et al., 1991; Wallace et al., 1989) will be useful as efforts progress to map physically the whole of chromosome 17.
109

Chapter 4
Identification of the APL Breakpoint On Pulsed Field Gel Electrophoresis Using a N o t l Linking Clone
4.1 Pulsed Field Gel E lectrophoresis
4.1-1 PFGE: The Technique
Pulsed field gel electrophoresis (PFGE) is a technique for the size separation of macromolecular DNA fragments (Schwartz and Cantor, 1984). The technique requires the alternation of the orientation of the electric field during electrophoresis which, in combination with the correct pulse time, can separate fragments up to 7 megabases in size. At the opposite end of the size scale, PFGE can still separate fragments in the range usually resolved by conventional electrophoresis. PFGE therefore bridges the gap in resolution between conventional Southern analysis and techniques such as genetic linkage and in situ hybridization. Alternating the direction of the electric field during electrophoresis requires that the DNA fragments change direction, and the time taken for them to change direction appears to reflect their size. Beyond this the mechanisms by which PFGE achieves separation remain largely speculative. The requirement for high molecular weight DNA for PFGE analysis demands that the DNA is prepared and digested in low melting point agarose blocks to prevent shearing. The pulse time and run time are varied between experiments to achieve maximal resolution for the desired fragment size range. PFGE fragments are sized against yeast chromosomes or lambda concatam ers.
4.1-2 PFGE: Physical Mapping
Physical maps are based on the recognition sites of rare-cutting restriction enzymes - enzymes such as N o t I - which are used to cleave the high molecular weight genomic DNA prior to PFGE. One of the major uses of PFGE has therefore been the construction of long-range physical maps for loci of particular interest. For
110

example, much of the region thought to contain the Huntington's gene at 4pl6.3 has been physically mapped (Bucan et al ., 1990), and the region surrounding the gene predisposing to polycystic kidney disease has been similarly defined (Germino et al ., 1992). These maps serve to connect the flanking markers for the disease and define those sequences which must be analysed further to isolate the gene responsible. However, in neither of these cases has pulsed field mapping revealed any gross chromosomal abnormalities associated with the disease, in contrast to the examples given in section 4.1-3.
The rare-cutting enzymes used to generate the PFGE maps are the same enzymes that are used to construct linking libraries. These enzymes usually have one or more CpG dinucleotides in their recognition sites, and only cleave when their target sites are unmethylated. CpG dinucleotides are depleted in bulk DNA (they occur at only one fifth of the theoretical frequency) presumably as a consequence of methylation; 5-methylcytosine is deaminated to give thymine, which goes undetected by the DNA repair mechanisms. Much of the remaining non-methylated CpG is clustered in CpG-islands at the 5' ends of genes (Bird, 1986), where its methylation may impair the transcriptional activity of the associated gene (Keshet et al., 1985). Transcription is inhibited through at least one protein which binds to methyl-CpG (MeCP-1) and prevents transcription factors from interacting with the gene (Boynes and Bird, 1991).
The rare-cutting restriction enzymes used for physical mapping around the APL breakpoint region are listed in Table 4 A \ This table also shows the subdivision of the rare-cutting enzymes into the class a and class b enzymes (Bird, 1989). The class a enzymes recognize sites composed purely of G + C nucleotides whereas class b enzyme sites contain at least one A + T in addition. Most CpG islands have sites for class a enzymes and inter-island sites are rare, while class b enzymes were found to cut 10 times less frequently within islands than theoretically expected (Bird, 1989), and hence mainly cut at rare non-methylated inter-island sites. Class b sites are, however, more prone to methylation and the
111
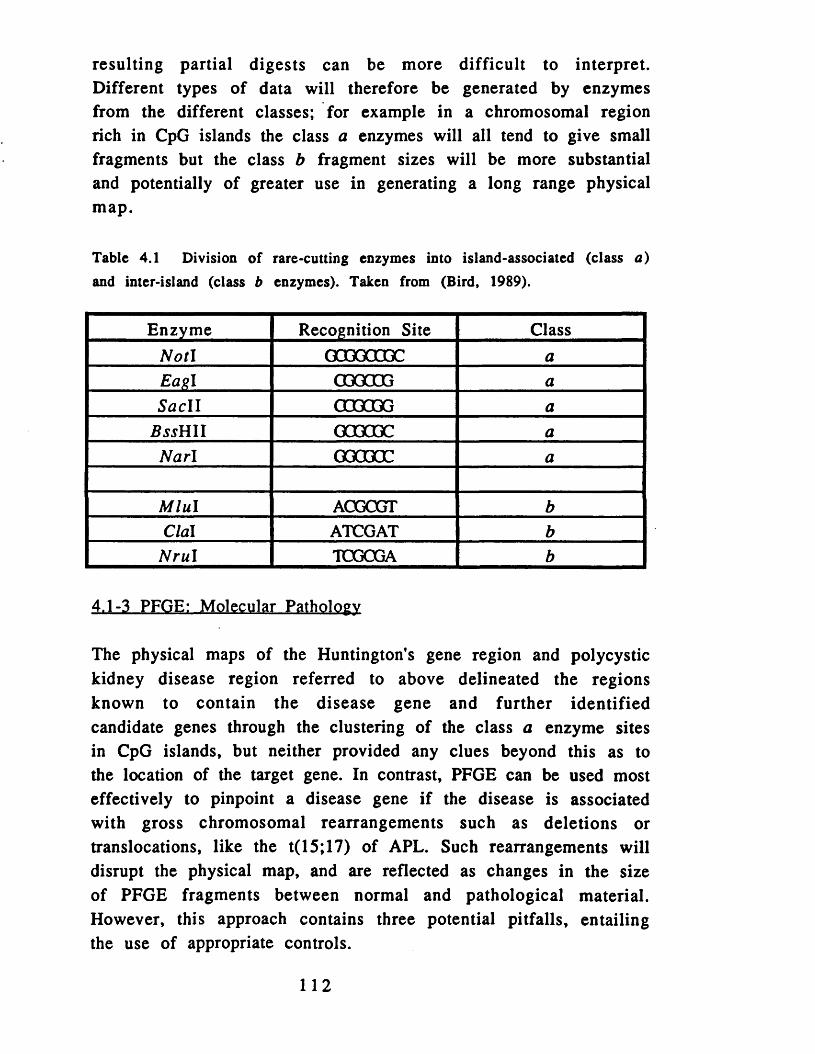
resulting partial digests can be more difficult to interpret. Different types of data will therefore be generated by enzymes from the different classes; for example in a chromosomal region rich in CpG islands the class a enzymes will all tend to give small fragments but the class b fragment sizes will be more substantial and potentially of greater use in generating a long range physical m ap.
Table 4.1 Division of rare-cutting enzymes into island-associated (class a) and inter-island (class b enzymes). Taken from (Bird, 1989).
Enzyme Recognition Site ClassNotl GOGGOCGC aEazl CGGOCG aSacll COOG3G a
BssUll GOOOX aNarl GGCDCC a
Mlul AOGOGT bClal ATCGAT b
Nrul TOGOGA b
4.1-3 PFGE: Molecular Pathology
The physical maps of the Huntington’s gene region and polycystic kidney disease region referred to above delineated the regions known to contain the disease gene and further identified candidate genes through the clustering of the class a enzyme sites in CpG islands, but neither provided any clues beyond this as to the location of the target gene. In contrast, PFGE can be used most effectively to pinpoint a disease gene if the disease is associated with gross chromosomal rearrangements such as deletions or translocations, like the t(15;17) of APL. Such rearrangements will disrupt the physical map, and are reflected as changes in the size of PFGE fragments between normal and pathological material. However, this approach contains three potential pitfalls, entailing the use of appropriate controls.
112

The factor most likely to confound this type of analysis is partial methylation - since PFGE enzymes are methylation sensitive, the result will be the presence of extra bands on the autoradiograph which could be interpreted as detection of a genomic rearrangement (Reilly et al., 1989). Analysis of more than one tissue type or cell line may help reveal any bands attributable to partial methylation. Preferential use of class a enzymes rather than those in class b may also help overcome this problem. If the band shift is real then it should also be detectable with more than one restriction enzyme. The other two potential problems apply equally to both conventional gel electrophoresis and PFGE. They include the possibility of partial digestion, which should become apparent if a series of probes all give multiple bands on the same filter, and the possibility that the band shift represents a restriction fragment length polymorphism (Julier and White, 1988). Again, analysis with multiple enzymes should clarify this issue.
Despite these caveats the detection of the APL t( 15; 17) translocation breakpoint as a band shift on PFGE seemed feasible. Shortly after this work had begun, the efficacy of this approach was confirmed by the cloning of the neurofibromatosis (NF) gene. Following the initial identification of a balanced translocation in an NF patient as a band shift on PFGE (Fountain et al., 1989), a panel 54 NF patients was scanned with the same probe for further rearrangements detectable by PFGE. Two deletions of 190kb and 40kb were identified (Viskochil et al., 1990), which helped identify the gene itself.
4.2 Detection of APL Breakpoint on PFGE
4.2-1 Cell Lines and Patient Material
The detection of the APL breakpoint required the careful comparison of pulsed field band sizes from normal and pathological material. The best source of DNA carrying the APL translocation for comparison to normal material was the somatic
113

cell hybrids which segregate either the 15q+ or 17q- APL derivative chromosomes on a mouse background in the absence of any normal human chromosomes 15 or 17. At least three 15q+APL hybrids have been constructed in the SCG laboratory fromdifferent APL patients; PJT2A1 (Sheer et al., 1983), PLTI1S and GBT8 (Moore et al.9 1989), and a single APL 17q- hybrid, P12.3B6 (van Tuinen et al.y 1987) has been reported. The use of somatic cell hybrid DNA was preferable to the direct use of bone marrow from APL patients since the quantity of hybrid DNA wasessentially unlimited, the signal from an aberrant band was not diluted by normal bone marrow cells, and the signal to noise ratio of hybridized probes was improved due to the reduced human content. For these reasons all the initial work in identifying the APL breakpoint was performed with blocks of hybrid DNA from PJT2A1 (15q+) and P12.3B6 (17q-), and only in subsequent experiments were blocks of patient material used. For comparison with the APL m aterial blocks were prepared from thechromosome 17-only hybrid PCTBA1.8 (Bai et al.y 1982) since this hybrid not only contained a normal chromosome 17 but also controlled for the mouse background of the APL hybrids. Additional normal controls employed were human lymphoblastoid cell lines.
PFGE filters were prepared with Notly BssHII, Sacl\9 Nruly Eagl and N a r l with blocks from PCTBA1.8, PJT2A1, P12.3B6 and two lymphoblastoid controls. The pulse and run times were chosen to give the widest resolution possible on a single gel (between 90kb and 1 megabase). The enzymes were chosen to include at least one from class b (the inter-island enzymes), as these enzymes are able to scan over CpG islands, thereby maximizing the genomic region scanned for rearrangements with each probe.
4.2-2 Linking Clones used as PFGE Probes
Chapter three described the regional localization of 112 N o t I linking clones over 17q using a somatic cell hybrid mapping panel, and the refinement of a subset of these on an extended panel of CMGTs. Five of these were thought to lie in the immediate vicinity
114

of the APL breakpoint, and were therefore to hybridized to PFGE filters to try to detect the APL breakpoint. These clones included LCN4C4 and LCN4G8 (region 3, directly above the APL breakpoint), LCN4A3 and LCN4E5 (region 4, directly below the APL breakpoint), and LCN5A12 (region 7, potentially adjacent to the breakpoint). Partial or complete restriction maps for these clones were obtained with EcoRI, BamHl and Hindlll to enable the isolation of two unique probes from each clone, one from each side of the Notl site (Table 4.2).
Table 4.2 Details of the subfragments of the five linking clones used to
search for the APL breakpoint on PFGE.
Probe name S u b fragm ent
Restrictionenzym es
Size bp Subclonedin to
pB luescriptLCN4C4
(D17S271)A BamHl-Notl 2,500bp YesB BamHl-Notl 3,500bp Yes
LCN4G8(D17S272)
A BamHl-Notl 1,500bp YesB BamHl-Notl 400bp Yes
LCN4A3(D17S273)
A BamHl-Notl 3,000bp YesB BamHl-Notl 4,700bp Yes
LCN4E5(D17S274)
A BamHl-BamHl 2,500bp YesB BamHl-EcoRl 560bp No
LCN5A12(D17S288)
A Hindll l -Notl 670bp YesB EcoRl-Notl 3,000bp No
For each linking clone subfragments A and B were derived from oppositesides of the N o t I site. The restriction enzymes necessary to release the
subfragment from the linking clone (or pBluescript if subcloned) aregiven together with the size of the fragment. All the fragments are unique.
Hybridizations with all of these probes except LCN4E5 A and B are shown in
Figure 4.1.
These ten probes were hybridized to the PFGE filters prepared with the six rare-cutting enzymes, and the sizes of the detected restriction fragments were calculated from comparison with the yeast chromosome size markers (Table 4.3). The average fragment size was less than 500kb with none exceeding 1 megabase,indicating that the APL breakpoint lies in a relatively gene-rich
115

area, probably derived from a negative G-band on chromosome 17 (Bickmore and Sumner, 1989). A number of fragments migrated faster than the smallest yeast chromosome marker (92kb) and are therefore outside of the range of resolution of this series of gels. These fragments are listed as <92kb unless they have been resized on a gel with a lower window of resolution.
Table 4.3 Sizes of pulsed field gel electrophoresis fragments obtained with N o tl linking clones mapped close to the APL breakpoint.
Probenam e
Notl BssUll Sacll Nrul Eaz I Narl
LCN4C4A
< 92kb 92kb 92kb lOOkb <92kb 90kb
LCN4C4B
92 k b <92kb <92kb 280kb <92kb ND
LCN4G8A
32 Okb 360kb <92kb ND 180kb ND
LCN4G8B
< 92kb 220kb <92kb 3 90kb 9 2 k b ND
LCN4A3A
1 7 Okb 23kb 3+23kb ND 3+23kb 3+23kb
LCN4A3B
25kb 2 5 k b 25kb ND 25+92kb 25kb
LCN4E5A
333+590 140+210280+520
120+220+380kb
550+930 190+530
ND
LCN4E5B
31 Okb 160kb ND ND ND ND
LCN5A12A
9 2 k b 150kb ND 92kb 9 2kb ND
LCN5A12B
380+520+670kb
<92kb+I S O k b
ND 92kb+380kb
170+300440+590
ND
Two subfragments (A and B) were derived from opposite sides of the N o tl site from each clone, labelled with 32p and hybridized to PFGE filters made with a range of rare-cutter restriction enzymes. The fragment sizes are in kb. ND = no data. The hybridizations which are illustrated in Figure 4.1 are
italicized (and bold).
The autoradiographs showing the hybridization of eight of the ten fragments to PFGE filters are shown in Figure 4.1. All the
116

hybridizations shown are made to Not I filters with the exception of LCN5A12 (probe B) which is hybridized to a BssHII digest. Both probes from LCN4C4 and LCN4G8 (region 3) are positive in the 17q- APL hybrid rather than the 15q+ hybrid as expected since they originate from above the breakpoint. However, in all four cases the fragment size in the 17q- APL hybrid is the same as in the 17-only control and in the two lymphoblastoid cell lines. This indicates that the APL breakpoint does not occur in any of the four N o t l fragments detected by these linking clones, and, furthermore the proximal APL N o t I site was not represented among the 112 sublocalized linking clones. Probe B from LCN4G8 detects a homologous mouse PFGE band in the three hybrid lanes (Figure 4.1) in addition to the human band.
The fragments surrounding the region 7 linking clone LCN5A12 also appear to remain in their germline configuration. A faint cross-hybridizing mouse band can again be seen with probe B from LCN5A12 (Figure 4.1). Here it is the 15q+ APL hybrid which gives the signal rather than the 17q- hybrid, since this probe is beneath the breakpoint. A similar result was obtained with the fragments from the region 4 clone LCN4E5 (data not shown), although interpretation of the results was complicated by multiple bands with probe A in the lymphoblastoid cell lines presumably due to partial methylation of the adjacent CpG islands.
However, probe A from LCN4A3 (region 4) gave a clear band shift in the 15q+ APL hybrid compared to both the 17-only somatic cell hybrid and both normal lymphoblastoid controls (Figure 4.1). The band was shifted in size from a germline 170kb to 31 Okb in the APL hybrid PJT2A1. There was no trace of the 170kb band in the 15q+ hybrid as would be expected if the shift was caused by partial digestion or partial methylation, although this result could be explained by a Notl polymorphism at this site (there are only 5 other chromosome 17s on this filter). However, the most likely explanation of this result was that LCN4A3 contained the Not l site immediately distal to the APL breakpoint, and that the aberrant
117

Figure 4.1 Hybridization of linking clone fragments to PFGE filters to detect the APL breakpoint as a shift in fragment size.
Hybridizations with unique subfragments derived from either side of the Not I site for four of the five linking clones mapped in the vicinity of the APL breakpoint are shown. Probes were labelled with 32P, hybridized to PFGE digests of both normal and APL material then washed to high stringency and exposed. The five lanes contain the same DNAs in each of the hybridizations: 17, the chromosome 17-only mouse-human hybrid PCTBA1.8; 15q+, the APL 15q+ somatic cell hybrid PJT2A1; 17q-, the APL 17q- somatic cell hybrid P12.3B6; N, normal lymphoblastoid cell line. All of the fragments detected by the probes remain in their germline configuration with the exception of the 1 7 Okb Notl fragment detected by probe A from LCN4A3. This fragment is rearranged to a 31 Okb N ot I fragment in the APL 15q+ hybrid, which may be interpreted as the t(15;17) junction fragment. Homologous bands from cross-reacting murine sequences are visible with the B probes from LCN4G8 and LCN5A12 in the three hybrid lanes.

+ .cr cr1 7 S £ N N
LCN 4C4 PROBE ANOTI
<92kb
+cruo LCN4G8 PROBE A
cr
+cr cr 1 7 £ £ N N
+cr cr 1 7 in r - N N
LCN4C4 PROBE B NOTI
9 2 k b
LCN4G8 PROBE B
NOT! NOTI
* • # !
3 2 0 k b
^ __ m o u s eh o m o l o g y
< 9 2 k b
+ 1 cr cr 1 7 u} ^ N N
LCN4A3 PROBE A 15
q+
17q-
z
z LCN4A3 PROBE B
# NOTI
31 Okb II NOTI
• II 1 7 0 k b1 1
4« • •• 2 5 k b
N N L C N 5 A 1 2 PROBE A NOTI
9 2 k b
FIGURE 4.1
+ i1 7 trT [\j f\| L C N 5 A 1 2
PROBE B B S S H II
1 5 0 k b
< 9 2 k b

31 Okb band represents the N ot I junction fragment derived from the fusion of chromosome 15 and chromosome 17 sequences. Probe B from LCN4A3 detected a germline N o t I fragment as predicted, since this N ot I fragment should extend towards the telomere away from the APL breakpoint.
4.3 Confirm ation of Detection of the APL B reakpoint
Obtaining a band shift in a single APL sample with a singlerestriction enzyme was suggestive but did not prove that theprobe detected the breakpoint for the reasons discussed in section4.1-3. To eliminate the possibility that the band shift arose from partial digestion, probe A from LCN4A3 (henceforth referred to as LCN4A3/A) was hybridized to a N o t I partial digestion filter provided by M. Yagle. The probe detected the 170kb normal band plus a partial digest product of about 250kb, which was distinguishable from the 310kb aberrant band observed in PJT2A1. This filter contained DNA from eleven distinct human lymphoblastoid cell lines, hence the absence of the 31 Okb band from all 22 alleles also reduces the chance that the band shift represented a Not I restriction fragment length polymorphism.
4.3-1 Band Shifts with Mlul and Clal
If the band shift seen with N ot I represents the t(15; 17) junction fragment then size shifts should be obtainable with other enzymes. Of the six enzymes originally used (Table 4.3) only Notl revealed a shift: N rul digests gave no signals in either the controls or the 15q+ APL hybrid, perhaps indicating that the N r u l fragment is greater than 1 megabase and lay in the compressionzone (CZ). Clear signals, but no band shifts, were obtained with theremaining four enzymes Sac II, E a g I and Atari. However,the B.y$HII, SacII, Eagl and Narl fragments detected by LCN4A3/A all migrated faster than the smallest (92kb) yeast chromosome, making accurate size determination difficult since this part of the gel is not well resolved. As there appeared no size differences between the controls and the 15q+ hybrid for these four enzymes, this suggested that a second CpG island containing sites for these
120
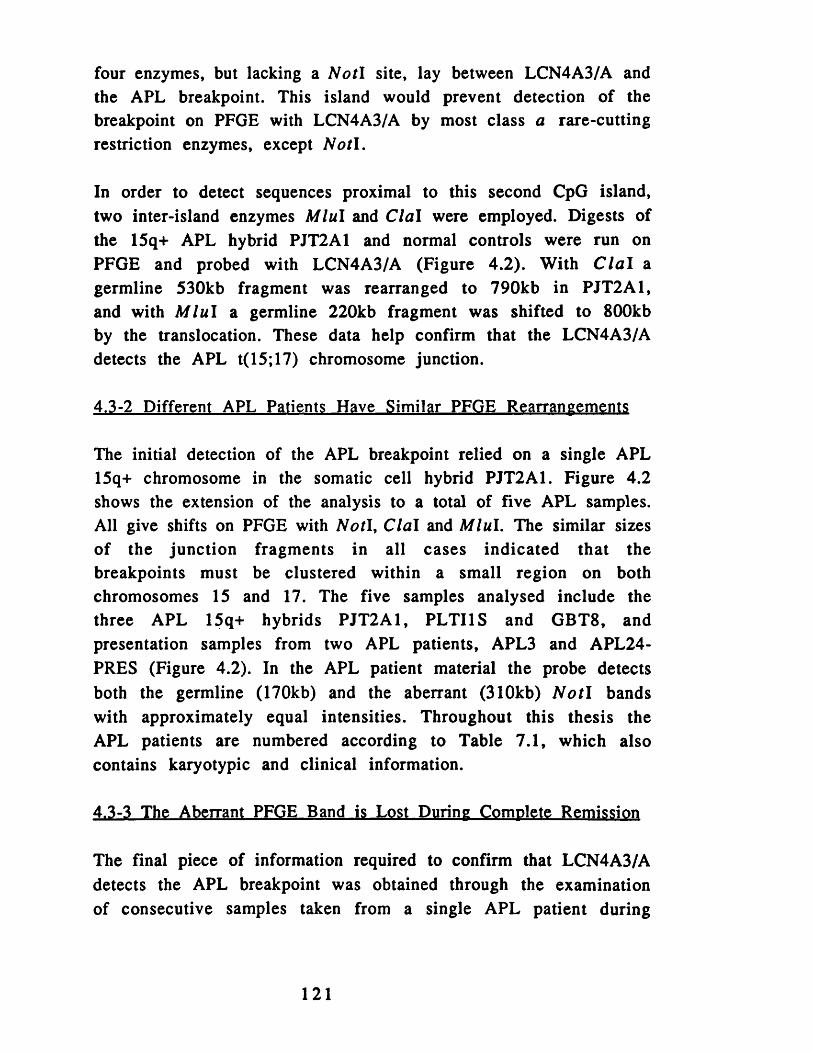
four enzymes, but lacking a Not I site, lay between LCN4A3/A and the APL breakpoint. This island would prevent detection of the breakpoint on PFGE with LCN4A3/A by most class a rare-cutting restriction enzymes, except Notl.
In order to detect sequences proximal to this second CpG island, two inter-island enzymes Mlul and Clal were employed. Digests of the 15q+ APL hybrid PJT2A1 and normal controls were run on PFGE and probed with LCN4A3/A (Figure 4.2). With C la l a germline 530kb fragment was rearranged to 790kb in PJT2A1, and with M lu l a germline 220kb fragment was shifted to 800kb by the translocation. These data help confirm that the LCN4A3/A detects the APL t(15; 17) chromosome junction.
4.3-2 Different APL Patients Have Similar PFGE Rearrangements
The initial detection of the APL breakpoint relied on a single APL 15q+ chromosome in the somatic cell hybrid PJT2A1. Figure 4.2 shows the extension of the analysis to a total of five APL samples. All give shifts on PFGE with Notl, Clal and Mlul. The similar sizes of the junction fragments in all cases indicated that the breakpoints must be clustered within a small region on both chromosomes 15 and 17. The five samples analysed include the three APL 15q+ hybrids PJT2A1, PLTI1S and GBT8, and presentation samples from two APL patients, APL3 and APL24- PRES (Figure 4.2). In the APL patient material the probe detects both the germline (170kb) and the aberrant (31 Okb) N o t l bands with approximately equal intensities. Throughout this thesis the APL patients are numbered according to Table 7.1, which also contains karyotypic and clinical information.
4.3-3 The Aberrant PFGE Band is Lost During Complete Remission
The final piece of information required to confirm that LCN4A3/A detects the APL breakpoint was obtained through the examination of consecutive samples taken from a single APL patient during
121
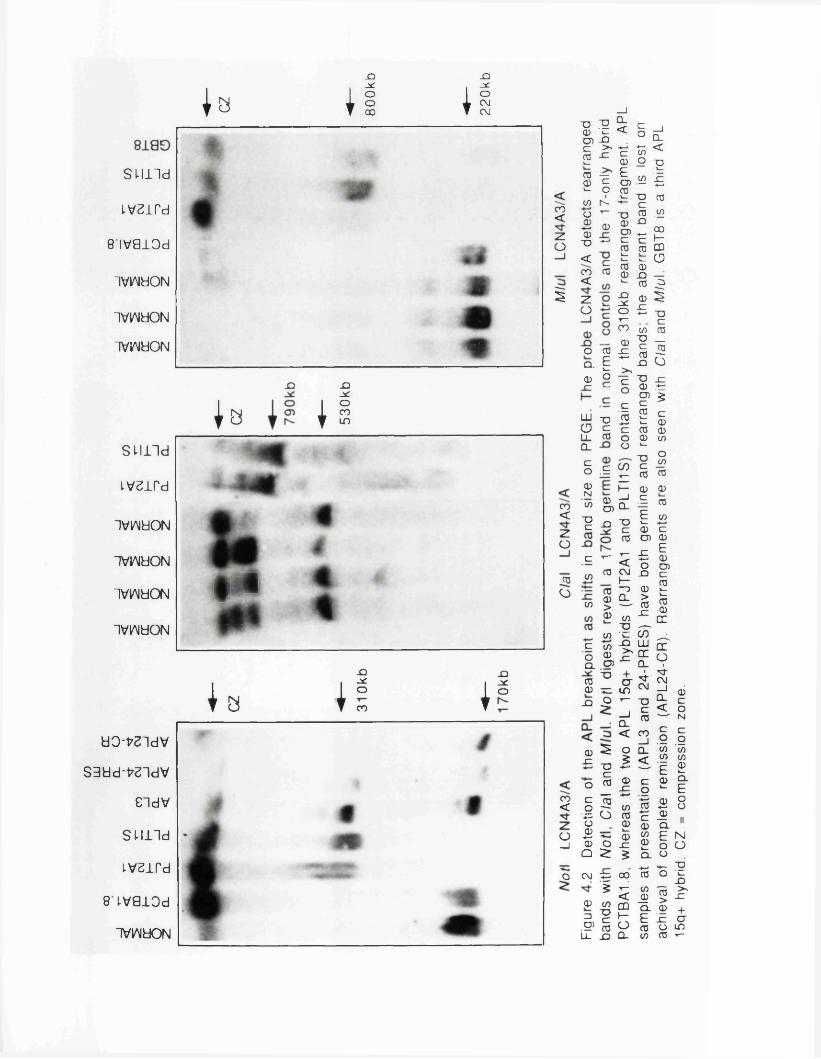
1VWLION
iviAiaoN
| a I
.ajxoo03 I
_QJ XOC\JC\J
SUlld
ivaird
8 ivaiod
IVlAldON
JO
| a |
JDXLOCOun
l a I
-Qj*:oco I
so-Xo
co<zo
§
SUlld
ivzird
i v w h o n
1VIAIUON
| 4IVIAIUON
IVIAIdON
a o -^ id v
Sddd-^ldV
eidv
SUlld
Lv^ird
8i.vaiod
1VIAIHON
-o ~gCD >- O) -Q c >* 03k_03 —05 £ >- oCO 1 -o ',_
CD0)0 u **< CCO 05<zO
CO<ZO
03o
O 03
q- £CD Of— t-
LU ~0° 511 03CL
C Co .ECDNco 0
O)
? -o
c 1_CO
CO
03
030>0
CO<
^ COc to o ®Q. O)m ^ 00 t: -Q -2
0 ^£ -o co &
£ 5J= Oo0(J X
_| 0 OQ ^o C\l ^
£0 CO
= ? .9> 0I L JD P
CT
BA
1.8,
w
here
as
the
two
APL
15q+
hy
brid
s (P
JT2A
1 an
d PL
TI1
S)
cont
ain
only
th
e 31
Okb
re
arra
nged
fr
agm
ent.
A
PL
sa
mpl
es
at pr
esen
tati
on
(APL
3 an
d 24
-PR
ES
) ha
ve
both
ge
rmlin
e an
d re
arra
nged
ba
nds;
th
e ab
erra
nt
band
is
lost
on
ac
hiev
al
of co
mpl
ete
rem
issi
on
(AP
L24
-CR
).
Rea
rran
gem
ents
ar
e al
so
seen
wi
th
C/a
l an
d M
luI.
GB
T8
is a
third
A
PL
15q+
hy
brid
. CZ
=
com
pres
sion
zo
ne.

presentation and remission. Figure 4.2 shows N o t I digested samples from APL24 taken at presentation (APL24-PRES) and during remission (APL24-REM). The presentation sample shows both germline and aberrant bands whereas the remission sample has lost all trace of the 31 Okb rearranged band. This eliminated any remaining doubts that the band shifts were due to rare polym orphism s.
4.4 Physical M apping Around the APL B reakpoint
4.4-1 LCN4A3 Contains Two CpG Islands
The starting point to derive a physical map of the DNA around a Not I linking clone such as LCN4A3 is to determine which rare- cutting enzymes other than Not I have sites within the clone itself, with the expectation being that many of the remaining class a enzymes will be represented. This necessitates the prior characterization of the clone with common-cutting enzymes. Single and double restriction enzyme digests were therefore performed on DNA from LCN4A3 with Bam HI, EcoR I and H ind l l l , and a restriction map of LCN4A3 was derived (Figure 4.3 A). The phage contains a 17kb insert divided by pSD into 11.5kb and 5kb fragments from which probes A and B were respectively derived. Figure 4.3 B shows the normal genomic rearrangement of this sequences; note that probes A and B, which are at opposite ends of the linking clone, are adjacent in the genome and flank the N ot I site.
The positions of the rare-cutting sites within LCN4A3 are difficult to determine from direct digestion of the linking clone DNA since the vector N0/EMBL3A contains multiple sites for these enzymes. Instead, human genomic DNA was cut with B am H l together with each of the rare-cutting enzymes in turn, and then hybridized consecutively to probes A and B. A similar set of hybridizations were made to ///nt/III/rare-cutter double digests. The positions of unmethylated rare-cutting enzyme sites were determined from the sizes of the bands obtained after hybridization of the probes. The calculated positions of the sites are shown (Figure 4.3 B).
123

NotlVector
B E B B E Notl4.7kb | pSD | 2kb i 5.3kb i 2.6kb i Vector
E S 0.4kb
k.vvvvww v v \ D E S 5 S S SProbe B Probe C Probe A
M ►
17kb insert
Figure 4.3 A. Restriction map of the Notl linking clone LCN4A3 in A/ofEMBL3A. The positions of the three non-repetitive subclones (Probes A-C) used in subsequent experiments are shown. Probe C is a 300bp Pstl-BamHl fragmant. B = BamHl, E = EcoRI, S « Sail.
E B , 2kb 5.3kb
B E2.6kb
B4.7kb
EaBs Eafea NS--------- S R
Centromere and R RAPL breakpoint Bs
Telomere
QProbe C Probe A Probe B
Figure 4.3 B. Genomic map of the insert from LCN4A3. The two halves of the Notl site have been rejoined, hence probes A and B are now adjacent. The positions of the rare-cutting enzymes are also shown. These cluster in two CpG islands which are separated by only 3kb of DNA. Common-cutting enzymes (above line) B = BamHl, E = EcoRI. Rare-cutting enzymes (below line) Bs = BssHII, Ea = Eagl, R = Narl, S = Sacll.

The rare-cutting sites in LCN4A3 cluster in two groups, presumably CpG islands since each cluster contains multiple unmethylated rare-cutting sites, which are separated by only 3kb (Figure 4.3 B). The island which containing the Notl site is distal to the second island and the APL breakpoints. The presence of B 5 5 HII, S a c II, E a g I and N a r I sites within this second island explains the inability of these enzymes to detect band shifts on pulsed field blots of APL material when probed with LCN4A3/A. The occurrence of two CpG islands so close together is unusual, but it is unlikely that the two islands represent a single larger island since most islands are only 500-2,OOObp in length (Bird, 1986), and furthermore the clustering of the rare-cutting sites into two groups is quite distinct.
4 .4 -2 C onstruc tion o f the Physica l M ap
The majority of PFGE fragments in the APL breakpoint region were less than 92kb, thus further PFGE gels that clearly resolved fragments between 2 and 92kb were run. Using LCN4A3/B (probe B) the distance between the Wa/I-containing CpG island and the next distal island (in the opposite direction to the APL breakpoints), was determined to be 25kb for Notl, Sacl l and Narl (Figure 4.4).
The hybridization of probe A to the same digests detected two bands of 3kb and 23kb with BssHII, Sacll, Eagl and Narl\ the 3kb band corresponds to the inter-island distance between the two CpG islands contained within LCN4A3, and the 23kb band defined another CpG island proximal to LCN4A3 which lies towards the APL breakpoint region (Figure 4.4). This island and the two within LCN4A3 are defined as Islands 1, 2 and 3 (Figure 4.4). A third probe (probe C, Figure 4.3) was then isolated from LCN4A3 which only detects the normal 23kb bands produced with the four aforementioned enzymes (in normal material).
To determine whether the APL breakpoint region lay within this 23kb region between Islands 1 and 2 or beyond Island 1 in the
125

Cen
trom
ere
Tel
omer
e coDC
CO
CO<Tj-zO
CD CO
O -oa. £ O JS v>
o c
J §m 2 cm £
CO
-o , o o ^ ^N < a
£
c0Eo>©
O
.oo
© ® £ N ’©
!■ ***“ TJ CO ©© e « ° IE 2 ©
©
©fCic *o © ©
© © ©
> HO)©©
— oo
©© B © ©
o> >C -© c3 ©r - ECM O )
■S' 2
i ss g
£ 0) .2 cJZ *£S * 3OT V © ©E * >» *- N C ©
? B s !C aR cJC o© - (5 ©J5 £CL < < CO < "M-
©oT3C©
"5§©JZ
©
©©_3Ooco•o
*0C -J 3 w2 <© m ©JD© o© £ ©£ CO © <£ o>5Q.Z« o
© . © © ©Oo© OT § “
® £ w ** O.£ ? !OT —© © - c© © O« g r o> >© 3 >
• c w _ r
? ; zCO A ^ •S © _| © *o■O C -T u. J2 O © g*£ T3 !£ ® © O~ © >© "© ® © ^ ©© i2 Id c c E o iS EQ_ OT — ■frt * ©
■Q o c j S »< £ c © •*- ©£ © | c ©C «3 ©" -g -c ^ o8 S c
v- 2
CL<
© .t= 3 ©
2 o -c w ♦-
LUOUL CL
2 = 3 ^ O) Oil £
I I © ©
©oEco
© k-© oE ~ >* © N © C C © ©
O)
©o
*5) o>_ 2 * 1 1
.2 © .2 ~O’ ©g E“ Hi © <© r - © .£
JSCc
© 3 ©i O >■C i © © ©.© © *- »- o© © ©fc i g
° ©■9 <o£ ; © © CO ? »■CM £ Q . be
rear
rang
ed
in AP
L. N
* A/
ofl,
B =
BssH
II, E
= Ea
g\,
R =
A/ad
, S
=* Sa
di.

remainder of the 170kb N o t I fragment, probe C was used to search for band shifts with £.sjHII, S a c II, E a g I and N a r l in APL samples. However, the hybridization of LCN4A3/C to PFGE digests of the 15q+ APL hybrid PJT2A1 and the 17q- APL hybrid unexpectedly failed to give any signal, aberrant or germline, in either hybrid (data not shown). Repetition of this experiment on the original somatic cell hybrid mapping panel, which contained both hybrids digested with EcoR I or 2? am HI, yielded the same result (Figure 3.4).
The most plausible explanation for this intriguing result was that the breakpoints in these two hybrids are not precisely reciprocal and that some sequences on chromosome 17 are lost from both hybrids. This interpretation suggests that the rearrangem ents occur between Islands 1 and 2 (Figure 4.4). Moreover, both these islands provide excellent markers for genes which might be involved in the leukaemogenic process in APL.
4.5 Discussion and Sum m ary
The identification of the APL breakpoint as a shift in PFGE band size with a Notl linking clone confirmed that the positional cloning strategy described in the previous chapter was valid. The results also vouch for the efficacy of the somatic cell hybrid mapping panel, although the initial reliance on only three CMGTs was unw ise given th e ir p ropensity to con tain ad d itio n a l uncharacterized deletions and insertions. The density of N o t I linking clones on 17q should therefore suffice to detect any given rearrangement on chromosome 17q. Following the detection of linkage of early-onset breast cancer to 17q (Hall et al., 1990) these clones may be of use in the examination of breast cancer tumours and cell lines for any disease-associated translocations or deletions. The use of Notl jumping libraries (Poustka and Lehrach, 1986) to jump between adjacent N o t l sites may also be useful in such studies, although jumps from LCN4C4 and LCN4A3 attempted here were unsuccessful, possibly due to the age of the library filters rather than the jump size since neither jump exceeded 200kb. These results are not discussed further.
127

The APL breakpoint was initially detected as a band shift in the 15q+ APL hybrid PJT2A1 on a N o t I digest using the probe LCN4A3/A. The possibility that this shift was due to partial digestion, partial methylation or a RFLP was ruled out by the the confirmation of the shift with C la I and M lu l digests, and by the observation that the aberrant band is lost during remission. The similar size of the band shifts in five separate APL patients suggested that the breakpoints cluster in a small region of both chromosomes 15 and 17.
The clone LCN4A3 was found to contain two separate CpG islands separated by 3kb of DNA. The use of probes from either side of these two islands identified two further CpG islands 23kb proximal and 25kb distal of LCN4A3. The discovery that a more proximal fragment of LCN4A3 (probe C) is absent from both the 15q+ hybrid PJT2A1 and the 17q- APL hybrid suggested that the APL breakpoint region may lie immediately proximal of LCN4A3 within the 23kb inter-island interval. The presence of numerous CpG islands in the region provides multiple starting points for the isolation of transcribed sequences which might be disrupted by the translocation in APL.
In addition to the physical cloning strategy described here, two other alternative routes were considered to identify the APL breakpoint; namely through the creation of a genetic map over the APL breakpoint region or through analysis of a chromosome 17- specific 18kb repeat sequence which was thought to cluster in the APL breakpoint region (Moore et al ., 1989). Data from both of these alternative strategies is presented in appendices 1 and 2 respectively .
128

Chapter 5
The Retinoic Acid Receptor Alpha Gene is Interrupted hv the 1(15:17) APL Translocation
5.1 Detection of the APL B re a k p o in t on C o n v en tio n a l S o u th ern A nalysis
The previous chapters have shown how the APL breakpoint on chromosome 17 was narrowed down on 17q to a 23kb region through the use of PFGE. The further identification of the breakpoints on conventional Southern analysis using probes from this region would both corroborate the PFGE data and determine whether the breakpoints are clustered in a genomic region of less than 23kb. In particular the proximity of the breakpoints to the three CpG islands in the region could be assessed through Southern analysis, paving the way for isolation of breakpoint cDNAs. To expand the coverage of the region two cosmids were isolated using LCN4A3 and restriction mapped by A. Goddard.
5.1-1 LCN4A3/A Detects the APL Breakpoints On Southern Analysis
DNA from a series of APL samples was prepared and digested with Bam li l or EcoRI. The first probe hybridized to these digests was LCN4A3/A, since this probe had already detected band shifts on PFGE. This probe detected aberrant bands in the majority of the APL patients (Figure 5.1 A) which, given the proven proximity of this probe to the breakpoint region, were interpreted as APL junction fragments.
Two germline E co RI fragments of 5.4kb and lOkb were detected by LCN4A3/A, although the signal from the lOkb fragment was stronger since the probe is mainly derived from this fragment. Presentation samples from six APL patients (APL3, APL24, APL25, APL27, APL28 and APL29) all contained the two normal EcoKl bands, and an additional junction fragment was observed in five of the six (Figure 5.1 A). A band shift was obtained in the
129

Figure 5.1 Southern analysis of EcoKl digested APL DNA probed with breakpoint clones.
A. LCN4A3/A detects two normal EcoRI bands of lOkb and 5.4kb and additional junction fragments in APL material. The three 15q+ somatic cell hybrids (PJT2A1, PLTI1S and GBT8) lack a normal lOkb band since this is replaced by the APL breakpoint junction fragment and they do not have a normal copy of chromosome 17. Similar rearranged fragments are seen in five of the six APL presentation samples. Junction fragments are indicated with arrows. APL remission samples and non-APL leukaemic DNA lack the rearranged bands.
B. Hybridization of the same EcoRl digests with LCN4A3/C, a probe which lies 5kb proximal to LCN4A3/A. Aberrant bands of different sizes to the ones obtained with probe A are seen in four APL DNA samples. These correspond to 17q- junction fragments, whereas probe A largely detects 15q+ breakpoints.

A00
co
CO 2 CDCD1 Q.LU 1
DCDC DCCL O Oi CM
un M- h- 00 <y>C\J CM CM CM CD CD CM CM CM_i _I _1 _1 _l _iQ_ CL 0_ CL < < CL CL CL< < < < l_L LL < < <
M ou se —
N o r m a l 1 0 k b —
N o r m a l 5 .4 k b -
b
B
N o r m a l
1 Okb
00
<CD
CO
COLU
2 CDCD CL
DC DC DCCL Oi O CM
lO rj- r- 00 CD00 CO CM CM CM CM CD
CM CM CM_j _J _J _J _l CD _J _l _l
CD CL CL CL CL CL < < CL CL CLo < < < < < LL LL < < <
* — - • —
Figure 5.1

sixth patient (APL29) using a H ind III digest hybridized with the same probe (A. Goddard, personal communication). The junction fragment in APL 27 is fainter since it is derived from the 5.4 kb £c<?RI fragment which hybridizes less strongly to the probe. In each of the three APL 15q+ somatic cell hybrids PJT2A1, PLTI1S and GBT8 the normal lOkb E coK l band is replaced by a novel junction fragment (Figure 5.1 A). Unlike the patient bone marrow samples the germline lOkb fragment is not detected since the hybrids lack a normal chromosome 17. The 15q+ hybrid GBT8 was derived from the patient APL3 in Figure 5.1, and, as would be predicted, the size of the rearranged band is the same in both the bone marrow and the hybrid. The probe also demonstrates strong cross-species homology in all the mouse-human hybrid lanes, although this homology was not observed on the pulsed field gel filters. In summary, these results showed that eight independent APL cases represented by bone marrow or somatic cell hybrid DNA all demonstrated rearrangements which were detectable with a single probe.
Loss of the rearranged band on achievem ent of com plete remission (CR) was also confirmed by Southern analysis using LCN4A3/A (Figure 5.1 A). Two remission samples were obtained from patient APL24, one from bone marrow (APL24-CR-BM) and one from peripheral blood (APL24-CR-PB). Both samples have lost the aberrant band. Samples from the same patient were used on PFGE to document the loss of the rearranged band during rem ission.
The specificity of these rearrangements to APL (FAB M3) was addressed by the hybridization of LCN4A3/A to DNA from two other types of myeloid leukaemia. Single cases of undifferentiated (FAB M l) and myeloblastic (FAB M2) myeloid leukaemias only yielded the normal germline fragments (Figure 5.1 A).
132

5.1-2 APL Breakpoints Cluster in a 12kb Region of Chromosome 12
To clarify the position of probe C (LCN4A3/C) with respect to the APL breakpoints, the filter containing the DNA samples described above was stripped and re-probed with probe C (Figure 5.1 B). This probe had previously been shown to be absent from both the 15q+ hybrid PJT2A1 and the 17q- hybrid P12.3B6 on PFGE and Southern analysis (section 4.4-2). Probe C lies 5.3kb proximal of probe A. Four of the five APL patients which demonstrated band shifts with LCN4A3/A also demonstrated shifts with LCN4A3/C, but the novel bands obtained with the two probes were of different sizes in each case (Figure 5.1 B). The only explanation for this is that probe A detects the 15q+ junction fragments whereas probe C detects junction fragm ents from 17q- translocation products. The detection of both 15q+ and 17q- breakpoints within a small region of chromosome 17 indicated that in the majority of cases the translocations are reciprocal and there is no substantial overall loss of sequences from chromosome 17.
These results have now been confirmed in a series of over 20 APL patients (combined mapping data of mine and A. Goddard). The hybridization of probes LCN4A3/A, B and C to DNA cut with either B a m E l , E co RI or H in d III detects the 15q+ rearrangement in almost every case, and frequently detects the 17q- rearrangement as well. The positions of the breakpoints and the CpG islands in the breakpoint region are shown (Figure 5.2). Although the first ten APL cases examined all lay within a 12kb region, the actual region over which breakpoints may lie is slightly larger (17kb, see section 5.3) although all the breakpoints are still detectable with the same three probes. A fourth probe LCN4A3/D, a 700bp B a m U l - E a g l fragment, was also used to help sublocalize the breakpoints within the region (Figure 5.2).
133

APL3
A
PL24
AP
L25
APL
28
PJT2
A1
PLT
I1S
A ®
I ! t l
COcdcoc\i
£ LU"1E O H o<D CD—
C0“
+e J
CD
<Q
a o
CD-CD-
CQ.I .C0-lUlC 0-
LLT"
CD-
CD_mLUX'
iu -ur00-
w
▼ ©
2 LU- ©E2 lit- c3
— z iS w cc m
co cc
co
nll3
= u3 CO CC oS 1
~ | S &
CM■DcISto
CO<zo
■oc©CO
? £C . T375 c ® iS o cO Q ©o 2 *oc co o 7=O)© © T3■9 w tr CM 3 ▼- O
_ w•C♦- O)
©c
COQ.©E
© CD W CD3Oh-
COCM
s ?E .o co szE o- o Is*O (D £-
coo©
SZ CO *” *cT £< 2, M- O)z il S c
^ ©9 *° < © ©©© © ■© !>< o ©
c *= ° c
■O © ~ Q. .EQ. Og 5 - c « © © c -Q O © Q. JZiZ « ^© ^ j5 CO-I -o< « - CM
§■8 © C| |
® -8H © ©CM “ CO O© o3 - O ) ©i l £
Q. © ©JZ .ts .ti ©
c 73 .2 £2 o8 £ ■S © © © •O *-(D ©
c "S 3© 5
! oQ. —1© £ £ I.o ^
T5ft © U. «-< ©_ O= ©©
©o 2c E •*_ © *“ o
°8 § 2 2

5.2 Isolation of R A R A cDNAs from the APL Breakpoin tR eg ion
Molecular analysis of translocations in other leukaemias suggests that transcribed sequences lie at the breakpoints and are rearranged by the translocation. The clustering of the APL breakpoints within a small region of chromosome 17 was consistent with the idea that a single gene on chromosome 17 was involved in the pathogenesis of APL, and that this gene could be identified by the isolation of cDNAs from the breakpoint region. Sequence data from this gene could be used to determine whether it had been characterized already, and if not, whether it contained any regions of apparent homology with other genes from which its function could be predicted.
A number of strategies have been used to identify transcribed sequences from genomic DNA. One method is based on the observation that functional sequences such as genes tend to be conserved between different species whereas non-functional DNA will diverge during evolution. Phylogenetically conserved sequences can be identified by hybridization to a "zoo blot" and used to probe Northern blots or screen cDNA libraries. Similarly, sequences adjacent to CpG islands can be used to probe cDNA libraries since islands frequently contain the first exons of the associated gene. However, both these approaches rely on choosing a tissue source which expresses the desired gene, a potential problem if the gene should prove to have a strict temporal or spatial pattern of expression. To overcome this problem "exon trapping" methods have been devised which locate exons through the donor and acceptor splice sites present in genomic DNA (Buckler et al., 1991; Duyk et al., 1990).
5.2-1 Choice of Probe
The presence of three CpG islands in the APL breakpoint region initially suggested that at least three different genes lay in the area, and that multiple cDNAs would have to be isolated and ch arac te rized to determ ine w hich was in v o lv ed in
135
leukaemogenesis. However, the CpG islands were subsequently interpreted as three different promoters belonging to the same gene (see section 5.5). Nonetheless, they still acted as markers to identify exonic sequences.
As breakpoints occurred on both sides of island 2 (Figure 5.2), probes from this region were chosen to screen a cDNA library. LCN4A3/A and B lie in this region, and both were already known to identify homologous murine sequences. The suitability of probe A was tested further by probing a "zoo blot" containing DNA from a variety of organisms. Homologous sequences were detected in all the mammalian DNA sources (including minke whale, rabbit and red deer) and in two avian species (turkey and chicken). DNA from D ro s o p h i la and barley failed to give a specific signal at moderate washing stringency (0.2 X SSC, 0.1% SDS, 65°C) (data not shown). Probe C showed no cross-species homology; since it lies 5kb from the nearest CpG island this result was not unexpected. Probe D, another island-derived probe, also detected conserved sequences on the "zoo blot". A mixture of probes A and B was finally used to screen the cDNA library since they were both conserved and together span 8kb.
5.2-2 Choice of cDNA Libraries
The choice of which cDNA library to screen is usually guided by the known or presumed expression profile of the gene of interest. The ideal library would be constructed from a tissue or cell line which expresses the desired gene at high levels. If APL resulted from the deregulation of a gene through its juxtaposition to a promyelocyte-specific promoter or enhancer, and if chromosome 17 were to provide that enhancer, a promyelocytic cDNA library would be required. Alternatively if the enhancer was provided by chromosome 15 then it would be more difficult to predict with accuracy which RNA source should be used since the gene on chromosome 17 might be ectopically expressed in APL. In this case an APL cDNA library would be the best library to screen. The other molecular event that could occur at the APL breakpoint is the fusion of two genes. In this eventuality at least one of the
136

fusion partners (the one providing the promoter and N-terminus) would be expected to be normally expressed within the prom yelocyte.
Since an APL cDNA library was unavailable at this time, three cDNA libraries representing different haematopoietic lineages were screened in parallel. The library closest to the promyelocytic stage of myeloid differentiation was constructed from the myeloblastic cell line HL60 (Dalton et al., 1988) after it had been induced to differentiate with PMA. Libraries from the myeloid cell line U937 and human bone marrow were also screened.
5.2-3 Results of cDNA Library Screens
The three cDNA libraries were supplied in the plasmid vector pCDM8 (Seed, 1987), an expression vector also designed for panning with an tibodies. The p lasm id lib ra rie s w ere electroporated into the bacterial host MC1061/p3, and titred. The efficiency of electroporation was higher for the HL60 library (1.4 X 10⁷ colonies/p,g plasmid DNA) than for either the U937 (2 X 1 0 6/pg) or bone marrow libraries (1 X 10⁶/pg). An mRNA representing less than 0.5% of the total mRNA is described as a low-abundance or rare message, and 30% of mRNAs fall into this category. The assumption that the APL breakpoint gene was one of these 11,000 mRNAs required that a total of 170,000 clones be screened to give a 99% probability that the desired cDNA would be present in the library. The efficiencies obtained above therefore gave sufficient clones to screen effectively for the breakpoint cDNAs.
Seven positive colonies from the HL60 library (referred to as HI to H7) and a single potential positive in the U937 library were identified after exposure of the autoradiographs for a week. Secondary screens were performed successfully for all the positive clones apart from H4 and the sole U937 clone. The remaining six clones were purified and hybridized back to LCN4A3 to check that it was derived from the breakpoint region. HI failed to hybridize, but the remaining five clones all
137
represented breakpoint cDNAs. The signals from LCN4A3 indicated that the five cDNAs had been detected by probe B rather than probe A (data not shown). The gene represented by these cDNAs was considered as a candidate for APL.
5.2-4 Sequence Identity with RARA
Sequence data was obtained directly from the plasmids using pCDM8-based primers which flanked the multiple cloning site. The vector-based primers were used to sequence an average of 300bp from the ends of all five candidate cDNAs. The sequence data was entered and assembled into three contigs of 752bp, 358bp and 287bp using the suite of program s from IntelliG enetics Incorporation. These three contigs spanned an estimated 2.2kb from a single gene. Comparison of these contigs to the EMBL DNA sequence database using the Intelligenetics Batch Ifind program revealed a 100% identity with the retinoic receptor alpha receptor (RARA) gene. This cDNA contig extended a further 238bp into the 5' untranslated region of R A R A than the sequences initially reported for RARA (Giguere et al., 1990; Petkovich et al., 1987), although a 5' full-length message has been reported subsequently (Brand et al., 1990). The position of the five R A R A cDNAs in relation to the published gene sequence is shown in Figure 5.3.
The discovery that the retinoic acid receptor alpha gene lay at the APL breakpoint was in disagreem ent with the in situ hybridization mapping data which had placed RARA at 17q21.1 (Mattei et al., 1988b). Cytogenetic analyses had concluded that the APL breakpoint lay at 1 7 q ll.2 -q l2 . However, given, the imprecision involved in both techniques the two findings could be compatible. To confirm that the gene at the breakpoint was not a homologous member of the nuclear receptor superfamily (i.e to check that probe B had not merely cross-hybridized with R A R A cDNAs), the pattern and size of the bands detected by the R A R A cDNAs in genomic DNA was compared with that obtained from LCN4A3 and cosmids isolated from the breakpoint region. The identity of these patterns proved that R A R A does lie at the APL breakpoint (data not shown).
138

coco
inino>
CMX eo I
CM
COCM
00O)CO
1^CDCMCM
O
inX co
XCOoCM
g CM A CM X CO
CMoin
oocoCl
oococo
X'It00
g
COCMCM
m
x
<x
5t © .° •- E
© P © £ § CO T3P © <X Q®■p E -© 8 ? CO q_ ©I g i rm o t : X CM 3CO « ^ X £ CDCM © £X lE O
© </> < © Z -DQ *5 o ° ©© u
« i
CO ©•o ® c £ © ©©
f ©
2 a. ^~ ffl r i rv
©© ©c E C o c .Eo o © < ©© © — u.O r* ©O^ 2
5 & ic© © ©
> ©> _
m « W © W e-6 ® o E X
©
S t t S ' ^CC ^ — s °^ c © .2§ 8> X il © _
O )o> ci= c
o © © ©
" 1 5
= 5 ^© ^ in o o oO .Q - CM© j- w
O N © h CO 2 >
• CO 5 -S £> _ ©* * JZ » c ~ o O g> 3° E c- ©< — ©2 — © o = 2o ©
g I " i
5 s £r—
n g =
« ® &©3 r- Co>*z 2
LL £ ©
_ TJ "O Oo oo __ ©
i foO —5© c © o
5 g© <o
I <
C JZ © * - © « -
o© c n o
= 1 s a° oco x:it© _ © ou ■*“' ■° T5i ©
^ © © *-f 5 566
and
19
55.

5.3 The APL Breakpoints Occur in the First R A R A Intron
The isolation of RARA cDNAs from the APL breakpoint region suggested that this gene might be involved in the genesis of the disease, but the only evidence supporting this was the proximity of the gene to the breakpoints. The ability of RARA to regulate other genes as a ligand-dependent transcription factor was not inconsistent with this idea, since transcription factors have been implicated in many types of cancer. The t(15; 17) translocation might therefore deregulate R A R A , or alternatively fuse RARA to a gene from chromosome 15. If the latter scenario was correct then the breakpoints would be expected to interrupt the coding sequences of the gene, or put another way, occur in intronic sequences between two coding exons. This possibility was investigated by the hybridization of a cDNA containing the entire coding region to the cosmid contig of the breakpoint region.
The cosmid contig extends further centromeric and telomeric than LCN4A3 (Figure 5.2) and spans the entire RARA genomic locus. At least part of R A R A was already known to lie distal to the APL breakpoints since the probe used to isolate the cDNAs was derived from this side. Hybridization of four of the five cDNAs to £ c o R I and BamlAl cosmid digests detected fragments which lay on both sides of the breakpoint region. None of the cDNAs hybridized to the lOkb E c o R l fragment which contained the majority of the breakpoints, indicating that this fragment lay within an intron.
The positions of the first and second introns within the coding sequence of R A R A have been published (Brand et al ., 1988; Ponglikitmongkol et al., 1988). The first intron was reported to lie between residues 59 and 60. A 221 bp subfragment of the H7 RARA cDNA (H7B) was produced by additional cleavage of the insert with K p n l and was hybridized to digests of the breakpoint region cosmids. This probe detected restriction fragments from both sides of the breakpoint region. Since this cDNA fragment spans the first intron but not the second the APL breakpoints must lie in the first R A R A intron (Figure 5.3). This intron must
140

therefore be at least 12kb in size. The rearrangement of R A R A within its coding sequences strongly suggested that the t(15;17) translocation fuses RARA to another gene from chromosome 15.Consideration of which of the functional domains of RARA lie oneach side of the breakpoint will be made in the discussion (section 5.6). These hybridization studies also permitted the orientation of RARA on chromosome 17; the gene lies with its 5' end towards the centrom ere.
5.4 N orthern Analysis of the R A R A gene in APL
The results presented above show that the retinoic acid receptor alpha gene is severed by the t ( l 5; 17) translocation between its59th and 60th codons. This situation is reminiscent of other leukaemic translocations which fuse two separate genomic loci, resulting in the production of a chimaeric message and protein. The two messages must be in-frame at the point of fusion to maintain the reading frame. If RARA is involved in such a fusion then aberrant-sized fusion transcripts should be visible on Northern blots of APL material.
Messenger RNA was extracted from two APL samples taken at presentation (APL1 and APL2). A sample from an M2 myeloid leukaemia was processed as a control. RNA was run on a Northern blot and probed with a RARA cDNA (H3). This probe detected the two normal R A R A messages of 3.4kb and 2.3kb in all three samples (Figure 5.4). The two normal RARA messages are thought to result from the use of different polyadenylation signals(Pandolfi et al.t 1992). In both the APL samples an additional band was seen which was larger than the 3.4kb R A R A message. These bands were not due to cross-hybridization with the 28S RNA. A second extra band may be present in both APL samples migrating slightly faster than the 3.4kb normal R A R A message, although this requires confirmation.
The H3 RARA cDNA used to probe the Northern blot lies on the telomeric side of the breakpoints, that is, between the breakpoints
141

28S rRNA 6,333bp
Figure 5.4 Northern analysis of APL material. Messenger RNA from two APL patients (APL1 and APL2) and a control M2 AML (patient 37) is shown hybridized to a RARA cDNA (H3). This cDNA detects the two normal RARA messages in all the samples and additional aberrant R AR A messages in the two APL samples (arrowed). These aberrant messages were later shown to be PML-RARA fusion messages.
no rm a l RARAmessages
3,371 bp
2.3kb
-►►

and the carboxy-terminus of RARA (the H3 cDNA actually extends five nucleotides over the breakpoint, but these nucleotides are not sufficient to hybridize to sequences on the centromeric side of the breakpoint). If the additional bands on the Northern did represent fusion messages formed from RARA and a gene from chromosome 15, then these messages would have to be transcribed from the 15q+ derivative chromosome since the H3 cDNA would not detect a 17q- transcript. A fusion message transcribed from the 15q+ derivative chromosome would contain the 5' end of a chromosome 15-derived cDNA fused to the bulk of the R A R A gene. The fact that two additional bands were seen on the Northern blot with this probe could be attributed to the two polyadenylation sites of the normal RARA message or to differential splicing in the gene from chromosome 15.
A general assumption about leukaemia-related translocations is that only one of the two chromosome derivatives will produce a leukaemogenic transcript, and that if the reciprocal derivative is retained in the cell it will be for reasons of gene dosage or chromosomal imprinting rather than for its contribution to the neoplastic process. This assumption is borne out in CML: even when both derivative chromosomes are present in the cell, only B C R -A B L fusion messages have been documented and never the reciprocal ABL-BCR messages. The demonstration of an aberrant R A R A message transcribed from the 15q+ chromosome in APL could therefore be interpreted to mean that the 15q+ chromosome is the leukaemogenic derivative.
Moreover, if the 17q- derivative were to transcribe a fusion message, then all the 17q- translocation breakpoints would be expected to cluster in the RARA breakpoint intron. The majority of 15q+ and 17q- breakpoints do indeed shown to cluster in this region (Figures 5.1 and 5.2), with the exception of the 17q- breakpoint in the hybrid P12.3B6. This was mapped approximately 20kb further proximal by A. Goddard (Figure 5.2). This particular 17q- chromosome would therefore have been unable to transcribe a functional 17q- message since the first R A R A coding exon has been deleted as a consequence of the
143

translocation. These data will be discussed again in chapters 6 and 7.
5.5 RARA Isoforms and Cp G Islands
Work on all three members of the retinoic acid receptor family (alpha, beta and gamma) in both humans and mice has indicated that each member can exist in a number of different isoforms (Giguere et al.y 1990; Kastner et al.t 1990; Leroy et al.9 1991a; Zelent et al.t 1991), although in each case one or two of the isoform s predominate. The major isoforms encode different amino-termini which are fused to the residual body of the gene (domains B-F) which remains constant in each isoform. Since the amino-terminus (domain A) is thought to encode a constitutive transactivation domain, the existence of m ultiple isoforms provides a mechanism for generating similar ligand-dependent transcrip tion factors which have d ifferen t transactivation properties. Moreover, if each of these alternative amino-terminal isoforms is provided with its own promoter then the possibility of independent spatial or temporal regulation can arise. Intriguingly the t( 15; 17) translocation interrupts R A R A at the same point in the gene at which the different isoforms diverge, and could therefore mimic the normal differential splicing patterns. A more precise understanding of the different roles of the RARA isoforms could therefore shed light on the pathogenesis of APL.
The murine retinoic acid receptor alpha gene has been shown to have seven different isoforms (Leroy et al., 1991a), and although its human equivalent has not been studied in as much detail it is likely that it has a similar organization. Of the seven murine isoforms, only two, the alpha 1 and alpha 2 isoforms, have been shown to encode distinct N-terminal A regions, but the sequences of two others encode reading frames which are open to the very 5’ end. The alpha 1 and alpha 2 isoforms have their own independent promoters which differ in their sensitivity to retinoic acid. The alpha 1 promoter does not respond to retinoic acid, whereas expression from the alpha 2 promoter is induced by retinoic acid . A similar retinoic acid response element which up-
144
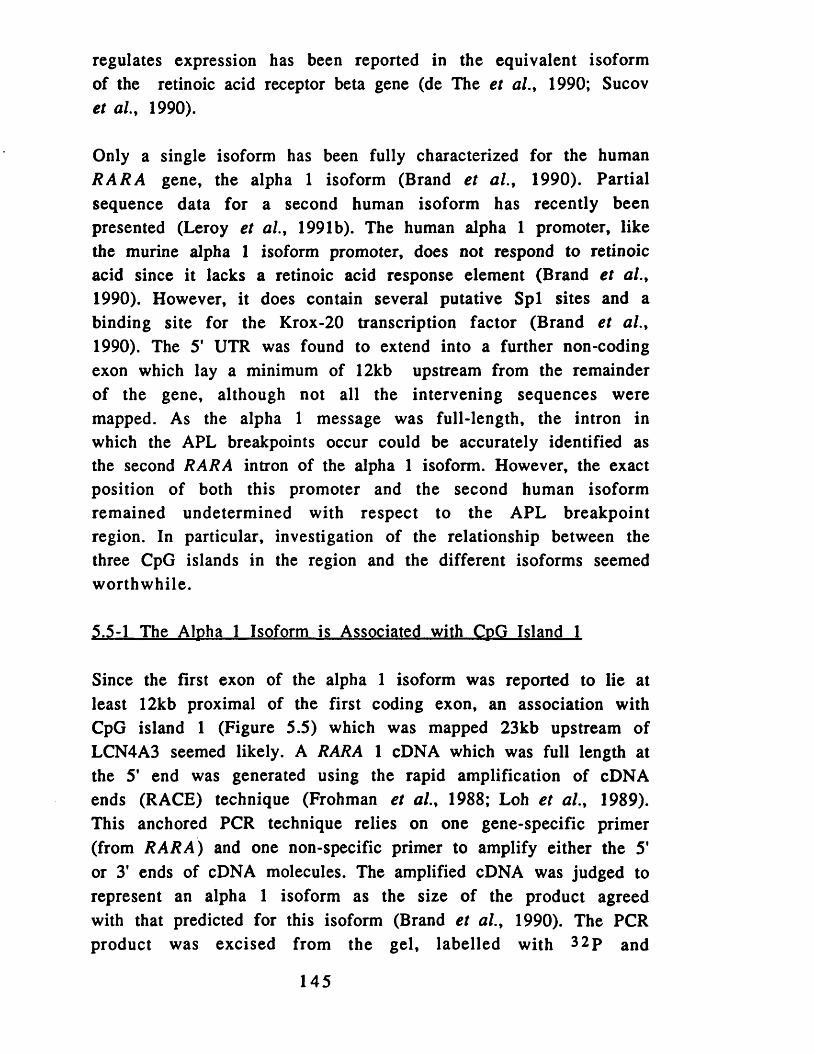
regulates expression has been reported in the equivalent isoform of the retinoic acid receptor beta gene (de The et al., 1990; Sucov et a l , 1990).
Only a single isoform has been fully characterized for the human R A R A gene, the alpha 1 isoform (Brand et a l , 1990). Partial sequence data for a second human isoform has recently been presented (Leroy et al., 1991b). The human alpha 1 promoter, like the murine alpha 1 isoform promoter, does not respond to retinoic acid since it lacks a retinoic acid response element (Brand et al., 1990). However, it does contain several putative Spl sites and a binding site for the Krox-20 transcription factor (Brand et al., 1990). The 5’ UTR was found to extend into a further non-coding exon which lay a minimum of 12kb upstream from the remainder of the gene, although not all the intervening sequences were mapped. As the alpha 1 message was full-length, the intron in which the APL breakpoints occur could be accurately identified as the second RARA intron of the alpha 1 isoform. However, the exact position of both this promoter and the second human isoform remained undetermined with respect to the APL breakpoint region. In particular, investigation of the relationship between the three CpG islands in the region and the different isoforms seemed worthw hile.
5.5-1 The Alpha 1 Isoform is Associated with CpG Island 1
Since the first exon of the alpha 1 isoform was reported to lie at least 12kb proximal of the first coding exon, an association with CpG island 1 (Figure 5.5) which was mapped 23kb upstream of LCN4A3 seemed likely. A RARA 1 cDNA which was full length at the 5' end was generated using the rapid amplification of cDNA ends (RACE) technique (Frohman et al., 1988; Loh et al., 1989). This anchored PCR technique relies on one gene-specific primer (from R A RA) and one non-specific primer to amplify either the 5' or 3’ ends of cDNA molecules. The amplified cDNA was judged to represent an alpha 1 isoform as the size of the product agreed with that predicted for this isoform (Brand et al., 1990). The PCR product was excised from the gel, labelled with 32P and
145
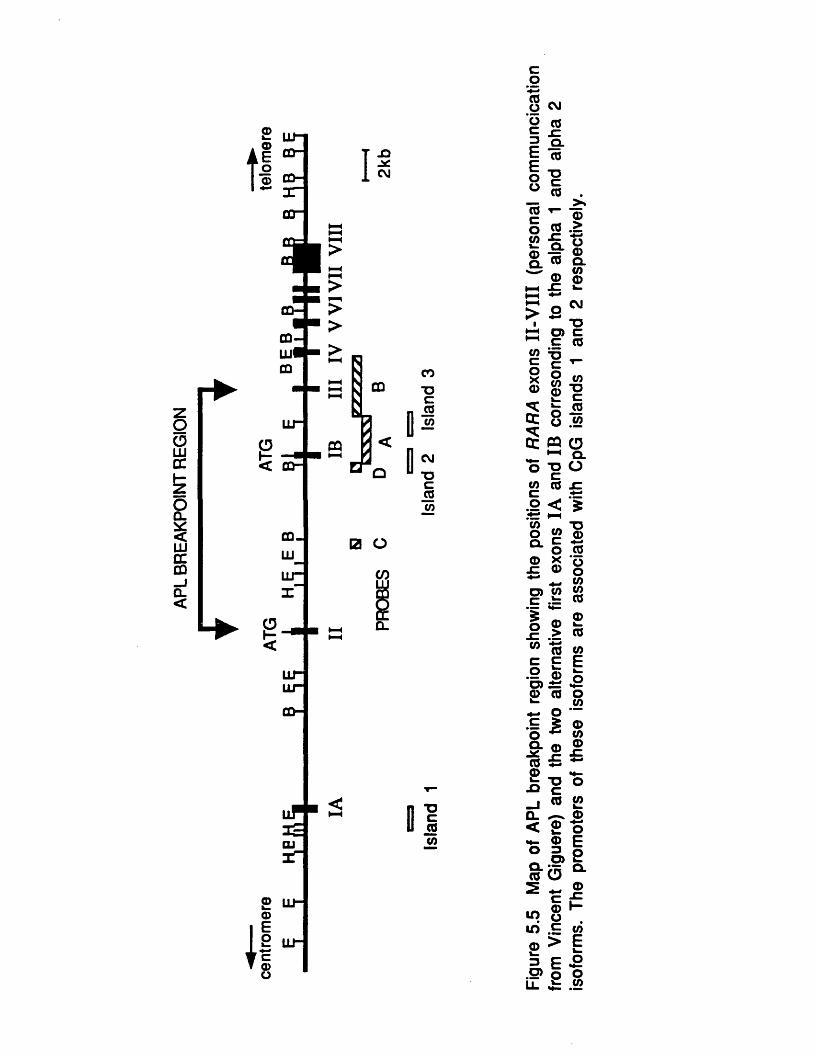
APL
BREA
KPOI
NT
REG
ION
co
fl\B
U J -£D-
CD ©E o<D CO-
ZET"
CD“
I .O
CVJ
41
C O .
inlu
x '
LLTi±r
C D -
I ▼ 0)
© ID-<DE2 LLf—
©co
0 O
co
u l TEUxn
*Dc©CO
co *.O CM0 CO
I*1 "O 1 ° § .
« - -5 o © •—e S . gQ . CO CL
^ m © © <D HH £ £^ - CM
TJ O C C ©1 - o
CO
s s |- u C** o JS °c o .©
. ^ Q.o T) O
g ® £.2 < > .■ti HH W T3 O © ©
O ©© *o £ © o
•►- © g> e {§^ ® ©
s i sw © CO
S E E •2 © © o> a *2 © © o *- co.E | © o ^ ©s - ® £ © £© •«-x 5 ? °_ l © ©0 . ©
S EO 3 w r* .2> £S -o ^ ©
c f« 8 K if) .E co © > E3 E °
.O) © oIl > - ©

hybridized to digests of the cosmids from the RARA locus where it hybridized immediately adjacent to CpG island 1 (Figure 5.5). This promoter, which controls the expression of the most abundant R A R A isoform, is always separated from domains B-F by the translocation. Figure 5.5 also shows the positions of exons II-VIII of RARA (V. Giguere, personal communication).
5.5-2 Identification of the Human Alpha 2 Isoform and its Association with CpG Island 2
The human equivalent of the murine R A R A 2 isoform had not been reported at the time that the breakpoint region was characterized. Comparison with the murine gene suggested that this isoform should positively self-regulate through a retinoic acid response element in its promoter. If the translocation were to remove this promoter an important positive feed-back loop would be broken, hence it was of interest to identify and map this promoter with respect to the APL breakpoint region. Clearly CpG islands 2 and 3 were candidates for this promoter, and both lie within the breakpoint intron.
Sequence data around both of these CpG islands was obtained and assembled into contigs of 2321 bp around island 2 and 1383bp around island 3. This sequence data was then compared with the murine alpha 2 isoform using the Intelligenetics Align program. The human equivalent of this isoform was identified within CpG island 2, and the alignment is shown in Figure 5.6. The human gene contains a deletion of two amino acids compared to the murine sequence (residues 10 and 11), but otherwise differs by only two amino acid substitutions (Figure 5.6). The retinoic acid response element identified by Brand and co-workers is present upstream of the coding sequence. The APL translocations are seen to occur on both sides of this promoter (Figure 5.4) although in the majority of APL patients this promoter is retained on the 15q+ derivative. However, since the promoter can be left on either derivative it is unlikely that it is important in the pathogenesis of APL. Partial sequence data from this promoter, including the
147

I s l a n d 2 24 GACTCTAGACGGGAGTCCCCTCGAGGTGAAGCCGCTGAGTTCCCGGGCCCCGCCAGGCI I I I I I I I I I II I I I I I I I I I I I I II I I I I I I I
m RAR-a2 1 GACTCTGCCTGGGACACC------------------GGAGCCTC-GAGTTCTTGG------CCACCGGGC
8 2 —TTCCCT--------GGGAGAGCCGACGGACCCCCCCTCCCAGCACACACAACTTCCCTGCTI I I I I I I I I I I I I I I I I I I I I I I I I I I I I I I I I I I I I I I I I
4 6 GTTCCCTGCGAGGGAGCGCCGAGGGACCTCCTCCTCCAACCTGTACAACTTCCC-GCT
1 3 5 TTTCACC-GGGACTGGCGGAGCGGCCGGCGGACTTAGACGCGGGGACTTCAGCAGGGGI I I I I I I I I I I I II I I I I I II II I I I I I I I I I I I I I I III I II
1 0 3 TTTCACCTGGGACCGGTGGAGTGACCTGCAGACTTAGGCGCGGGCAATTCTGGGCTGG
192 GCGCCCCTGCCCGGGTC-ACCAGTCGGGGCGAGGGGACGTCTCCTCTCCCCC-----------I I I I I I I III I II I I I I I I I I I I I I I I I I III I I I I I I
161 GCGCCCCGCTGAGGGGCTGCCCGTCGGGGCGAAGGGACTTGTCCCCCCCCCCCCCTGC
2 4 3 AGCTGCTCTGCTCGGATGGCGCCGCCGGCTGAGTGACGGGGGCGGCGCGCAGGAI I I I I I I I I I I I I I I I I I I I I I I I I I I I I I I I I I I I I I I I I
2 1 9 CCCTAGCCGATTTGCACGGATGGCGCCTCCAGCAGAGTGACGAGATCCCCGTGCAGGA
2 9 7 CTTCCCAGCTCGGACCTCTTGCCTTCGAGGGGAAAGATGTACGAGAGTGTAGAAGTGG I I I I I I I III III I I I I I I I I I I I II I I I I I I I I I I I I I I I I I I I I
2 7 7 CTTCCCCTCCTGGATCTCCGGCCTTCGTGGGGCGAGATGTACGAGAGTGTGGAAGTCG I s l a n d 2 1 M Y E S V E V Gm RAR-a2 1 .........................................................
35 6 GGGG------------TCCCACCCCTAATCCCTTCCTAGTGGTGGATTTTTATAACCAGAACCGI I I I III I I I I I I I I I I I I I I I I I I I I I I I I I I I I I I I I I I I I I I I I I
33 6 GGGGCCTTACCCCCGCCCCTAACCCCTTCCT AGTGGTGGACTTTT ATAACCAGAACCG 9 G - - P T P N P F L V V D F Y N Q N R 9 L T . A .............................................................................................................
407 GGCCTGTTTGCTCCCAGAGAAGGGGCTCCCCGCCCCGGGTCCGTACTCCACCCCGCTC I I I I I I I I I I I I I I I I I I I I I I I I I I I I I I I I I I I I I I I I I I I I I I I I I I III
3 9 4 GGCCTGTTTGCTCCAGGAGAAGGGGCTCCCTGCCCCGGGTCCCTACTCCACCCCACTC 2 5 A C L L P E L G L P A P G P Y S T P L 27 N ................................................................................................................
465 CGGACTCCGCTTTGGAATGGCTCAAACCACT 495I I I I I I I I I I I I I I I I I I I I I I I I I I I I I I I
451 CGGACTCCGCTTTGGAATGGCTCAAACCACT 4814 5 R T P L W N G S N H 4 7 .........................................................................
Figure 5.6 Sequence alignment of human CpG island 2 from the RARA gene locus with the murine RAR alpha 2 isoform (mRAR-a2). The CpG island sequence was determined from genomic clones in the APL breakpoint region while the m RAR-a2 sequence is taken from published sequence (Leroy et al.y 1991). The predicted protein sequences are 93% homologous. These sequences do not encompass the retinoic acid response element, which lies upstream of the point at which transcription is initiated.

retinoic acid response element, has subsequently been presented (Leroy et al., 1991b).
The sequences around CpG island 3 do not correspond to any of the other reported murine R A R A isoforms. This island probably represents a third promoter for an as yet undescribed isoform which may be specific for a particular tissue type or stage of development. Alternatively this island could be associated with a different gene. The locus of the ERBA gene, which encodes the thyroid hormone receptor (another member of the nuclear receptor family which maps to chromosome 17), has been shown to encode two different family members in opposing orientations from opposite strands of the same transcriptional unit (Lazar et al ., 1989; Miyajima et al.y 1989).
5.6 Discussion and Sum m ary
The t(15;17) APL breakpoint was identified on conventional Southern analysis using the same probes that were initially used to detect the breakpoints on PFGE. Both the 15q+ and 17q- breakpoints were shown to cluster in a 12kb region of chromosome 17, from which evolutionary-conserved probes were used to screen a number of haematopoietic cDNA libraries. Five cDNAs were identified which on sequence analysis proved to belong to the retinoic acid receptor alpha gene, a member of the nuclear receptor superfamily. Mapping the cDNAs over the breakpoint region indicated that the translocation interrupts the first intron between coding sequences, and therefore separates the A domain from the remainder of the gene (domains B-F). This work was the first of three independent reports all implicating the retinoic acid receptor alpha gene in the pathogenesis of APL (Borrow et al., 1990; de The et al.9 1990; Longo et al.9 1990b).
This chapter also describes the detection of aberrant-sized messages on northern blots with a RARA cDNA. The increased size of these messages indicates that R A R A may be fused to another gene from chromosome 15 as a consequence of the translocation.
149
These aberrant messages are transcribed from the 15q+ derivative chromosome.
In addition, the relationship of the APL breakpoint region to the positions of the promoters of the two main R A R A isoforms was examined. The breakpoints can occur on either side of the retinoic acid-sensitive alpha 2 isoform promoter.
The discovery that RARA is rearranged by the t(15;17) in APL has implications in three areas: the mechanisms of leukaemogenesis, the treatment of APL with all- / ra ns retinoic acid, and the diagnosis and monitoring of the disease.
5.6-1 Mechanisms of Leukaemogenesis
Comparison of the sequence of RARA with other members of the nuclear receptor superfamily suggests that RARA can also be divided into six functional domains (A-F) (Giguere et al ., 1987; Petkovich et al ., 1987), where domains A/B contain theconstitutive transactivation functions, domain C contains the DNA- binding zinc fingers and domain £ mediates retinoic acid-binding and dimerization. Studies on the oestrogen receptor suggest that the ligand binding domain may also be capable of ligand-inducible transactivation (Tasset et al., 1990; Tora et al., 1989). The APL translocation separates the constitutive transactivation properties encoded by the A domain from the remainder of the protein. A similar situation occurs as a result of the t(l;19) translocation in pre-B-cell leukaemia, where the two transcription factors E2A and PBX are rearranged by the translocation and swap , their transactivation domains (Kamps et al ., 1991; Nourse et al ., 1990). Therefore the simplest model to be derived from the data presented above is that a second transcription factor on chromosome 15 replaces the lost transactivation functions of RARA, changing the manner in which genes regulated by RARA are activated (not all transactivation domains are equally potent). Furthermore, the bulk of the RARA protein would be placed under the control of a promoter of a gene from chromosome 15, which may be expressed at different levels in myeloid cells and may
150

have different regulatory loops. Note that this model assumes that the fusion message responsible for leukaemogenesis is transcribed from the 15q+ chromosome, as suggested by the Northern data.
Why should only RARA, and never RARB or RARG (the retinoic acid beta and gamma receptors), be involved in the genesis of APL? Several lines of evidence suggest that RARA is specifically involved in the regulation of myeloid differentiation while the other receptors function elsewhere. For example, in 14 RNA sources including liver, breast, kidney, prostate and two haematopoietic cell lines HL60 (Dalton et al.y 1988) and K562 (Lozzio and Lozzio, 1975), only the latter two cell lines contained significant levels of R A RA message (de The et al ., 1989). This specifically implicates RARA in the regulation of differentiation of haematopoietic lineages in the adult. In contrast RARB is scarcelyexpressed in HL60 and K562 (de The et al ., 1989), nor is R A R Gexpressed in HL60 (Ishikawa et al ., 1990). Furthermore, the induced differentiation of HL60 cells (AML M2) down the granulocytic pathway by retinoic acid is mediated through R A R A rather than the beta or gamma receptors, demonstrating the central role of the RARA in myeloid differentiation (Collins et al.,1990). The rearrangement of RARA in APL therefore disrupts the receptor which is specifically responsible for controlling differentiation of the myeloid lineage.
The evidence which im plicates R A R A in the induction of differentiation in HL60 was accrued from an HL60 subclone which was resistant to RA-induced differentiation. A retinoic acid receptor with decreased affinity for RA and lower molecular weight was demonstrated in this variant, suggesting that R A R A had been m utated , and m oreover, re tro v ira l-m ed ia ted transduction of a normal R A R A gene back into this cell line restored its responsiveness to RA (Collins et al.t 1990). Similar observations have been made in a retinoic acid-resistant variantof the embryonal carcinoma line P I9, RAC65, which usually differentiates on exposure to retinoic acid. RAC65 also contains a mutated R A R A gene, but here the mutation is caused by theintegration of an ETn retrotransposon into intron 6 of the gene,
151

resulting in a RARA-ETn fusion gene which lacks the terminal 71 amino acids of RARA including part of the ligand-binding domain (Kruyt et al ., 1992; Pratt et al.y 1990). The translocated RA RA of APL and the HL60 and P19 RARA mutants show several parallels: all three mutant RARA proteins block myeloid differentiation at physiological concentrations of retinoic acid, and all three achieve this despite the presence of a second unmutated copy of RARA in the same cell. Together, these data support the notion that mutated RARA proteins act as dominant negative repressors of genes normally regulated by RARA.
The simplest dominant negative model for mutant RARA is based on that suggested for the v-ERBA oncoprotein, a virally- transduced mutant form of the thyroid hormone receptor which cooperates in the induction of erythroleukaemia. V-ERBA does not activate genes normally up-regulated by the thyroid hormone, but instead acts as a repressor (Damm et al.y 1989). Co-expression of v-ERBA and the thyroid receptor demonstrates that this inhibitory action is dominant, possibly due to the formation of nonfunctional dimers on the thyroid response element. v-ERBA is unable to bind thyroid hormone, even at high levels. Hence mutant RARA might also block the action of its normal cellular counterpart resulting in a block in myeloid differentiation.
The recent observations that the RARs dimerize with the RXRs to enhance the stability of the complex on the retinoic acid response element (Bugge et al.y 1992; Kliewer et al.y 1992b; Leid et al.y 1992; Yu et al.y 1991; Zhang et al.y 1992) adds a further twist to this tale. It suggests that the dominant negative effect is mediated through the RXRs, with the mutant RARA proteins perhaps competing more successfully for the RXRs than normal RARA. Indeed, a similar model can be evoked for v-ERBA since the thyroid hormone is also thought to dimerize with the RXR family.
The subsequent description of the gene, P M L y which is fused to RARA by the t(15;17) translocation does not contradict any of these theories, but creates further in triguing possib ilities considered in chapter 9.
152
5.6-2 Differentiation Therapy with 2\\-trans Retinoic Acid
The use of all-trans retinoic acid to achieve complete remission in APL patients has been described (Castaigne et al ., 1990; Huang et al ., 1988). Retinoids have found little use in the treatment of other types of myeloid leukaemia, suggesting that this type of therapy is unique to APL. The work described in this chapter shows that the high affinity receptor for this ligand is rearranged in APL and not in other types of leukaemia, suggesting a possible link between the therapy and the genetic abnorm ality. This is therefore a rare example of a therapy unknowingly tailored to correct a genetic defect. This example also implies that the molecular elucidation of translocations in other leukaemias may suggest novel and exciting treatm ent regim es. M odels of leukaemogensis involving RARA must also account for the ability of therapeutic doses of retinoic acid to overcome the effects of the t(15;17) translocation.
5.6-3 Diagnosis and Monitoring
The clustering of the APL breakpoints within a small region of chromosome 17 means that consistent molecular detection of the translocation is possible at the DNA level. Using the three probes LCN4A3/A, B and C it is possible to detect the translocation in most patients using a combination of B a m Hl and £ co R I digests. One caveat is that the aberrant band may co-migrate with the germline band, hence any negative result requires confirmation with additional enzymes. Molecular detection of the t(15;17) translocation may be useful for confirmation of the diagnosis of APL, particularly if the t(15;17) translocation is absent or the cytogenetics fails. The achievement of complete remission can also be confirmed by DNA analysis, although this method is less sensitive than the RT-PCR assay described in chapter 7.
153

Chapter 6
Identification of the P ML Locus on Chromosome 15
6.1 C onstruction and C haracterization of Genomic Phage L ibraries from APL Somatic Cell H ybrids
The identification of RARA at the APL translocation breakpoint provided only a partial explanation of the molecular events governing the development of the disease. In addition, the isolation of the breakpoint locus on chromosome 15 was necessary to gain a full understanding of the t( 15; 17> translocation at the molecular level. The locus at 15q22 juxtaposed to R A R A by the translocation was termed P M L for prom velocvtic leukaem ia by the DNA nomenclature committee of the Human Genome Mapping organization. To isolate this locus it was decided to construct a genomic library from APL DNA and walk across the breakpoint from RARA on chromosome 17 to the P ML locus on chromosome 15. This strategy avoided making any assumptions about whether or not a fusion message was transcribed across the breakpoint, which would be inherent in any attempt to "skip" across the breakpoint through the isolation of chimaeric messages derived from both loci.
6.1-1 Library Construction
The vectors most commonly employed for the construction of genomic libraries are cosmids and lambda bacteriophage, whichdiffer in their insert size capacity. Cosmid clones contain up to45kb of genomic DNA whereas replacement lambda vectors only have the capacity for inserts in the 15-20kb size range, hencefewer clones are required for a cosmid library to be fully representative. However, phage libraries are marginally easier to construct than cosmid libraries since they have a less stringentrequirement for high molecular weight DNA and yield higher efficiencies per \i g of DNA (Frischauf et al.y 1987). For these reasons the phage vector EMBL3 co 5 was chosen to construct the genomic libraries. This vector has modified arms to facilitate
154
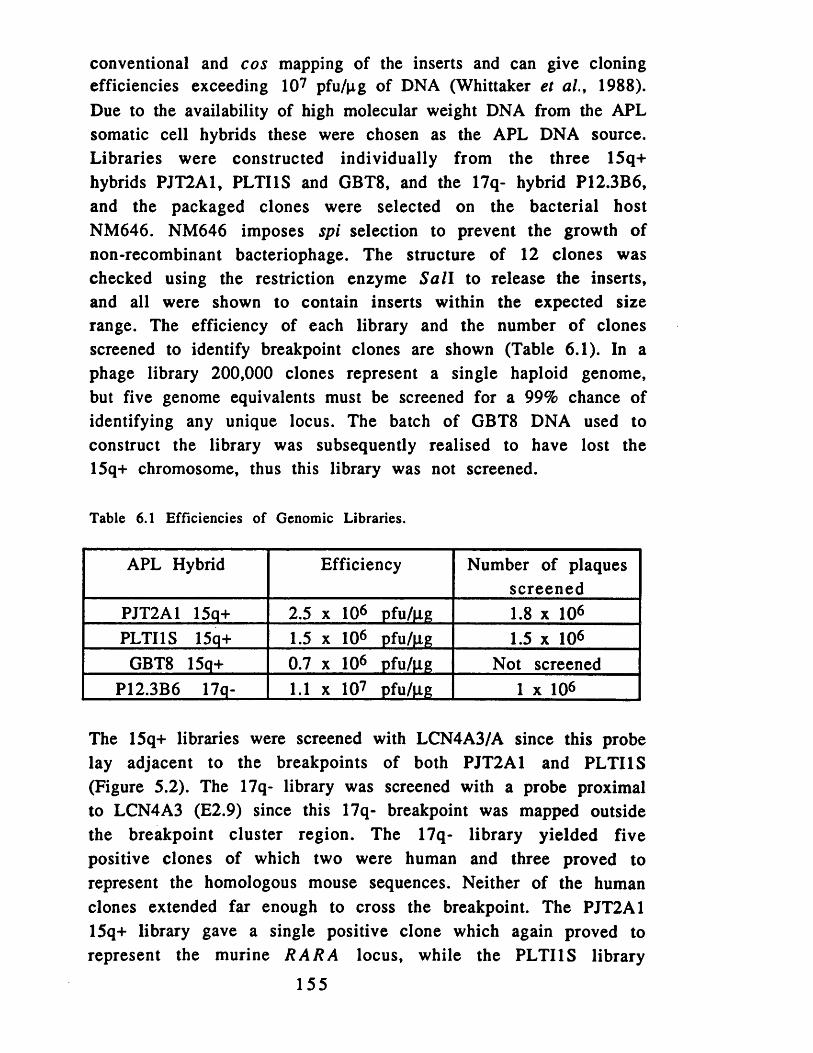
conventional and cos mapping of the inserts and can give cloning efficiencies exceeding 107 pfu/pg of DNA (Whittaker et al.y 1988). Due to the availability of high molecular weight DNA from the APL somatic cell hybrids these were chosen as the APL DNA source. Libraries were constructed individually from the three 15q+ hybrids PJT2A1, PLTI1S and GBT8 , and the 17q- hybrid P12.3B6, and the packaged clones were selected on the bacterial host NM646. NM646 imposes spi selection to prevent the growth of non-recombinant bacteriophage. The structure of 12 clones was checked using the restriction enzyme Sai l to release the inserts, and all were shown to contain inserts within the expected size range. The efficiency of each library and the number of clones screened to identify breakpoint clones are shown (Table 6.1). In a phage library 2 0 0 , 0 0 0 clones represent a single haploid genome, but five genome equivalents must be screened for a 99% chance of identifying any unique locus. The batch of GBT8 DNA used to construct the library was subsequently realised to have lost the 15q+ chromosome, thus this library was not screened.
Table 6.1 Efficiencies of Genomic Libraries.
APL Hybrid Efficiency Number of plaques screened
PJT2A1 15q+ 2.5 x 10⁶ pfu/ug 1 .8 x 1 0 6
PLTI1S 15q+ 1.5 x 10⁶ pfu/|Xg 1.5 x 1 0 6
GBT8 15q+ 0.7 x 10⁶ pfu/ug Not screenedP12.3B6 17q- 1 .1 x 1 0 7 pfu/ixg 1 x 1 0 6
The 15q+ libraries were screened with LCN4A3/A since this probe lay adjacent to the breakpoints of both PJT2A1 and PLTI1S (Figure 5.2). The 17q- library was screened with a probe proximal to LCN4A3 (E2.9) since this 17q- breakpoint was mapped outside the breakpoint cluster region. The 17q- library yielded five positive clones of which two were human and three proved to represent the homologous mouse sequences. Neither of the human clones extended far enough to cross the breakpoint. The PJT2A1 15q+ library gave a single positive clone which again proved to represent the murine R A R A locus, while the PLTI1S library
155

contained three RARA -positive clones of which two were murine and one human. This latter clone, fqpl2 (for fifteen fl.iJ.lus) was characterized in detail.
6.1-2 Isolation of the PML Locus
The human clone fqp l2 contained a 15kb insert which was restriction mapped and compared to the map of the R A R A locus. The clone encompassed CpG islands 2 and 3 and terminated on its proximal side within the 5kb Bam HI fragment which was known to contain the breakpoint in PLTI1S (Figure 5.2). It was therefore unclear whether or not this clone spanned the breakpoint, since this depended on exactly where within the 5kb B a m H l fragment the breakpoint occurred. The terminal 2.9kb from the clone were subcloned as a B a m H I -Sa 11 fragment into pBluescript and hybridized to DNA from a somatic cell hybrid HORL-I (Heisterkamp et al ., 1982) which contains chromosome 15 (plus part of the long arm of chromosome 1 1 ) as its only human material. A signal was obtained in HORL-I, indicating that this 2.9kb fragment spanned the APL breakpoint. However, the signal in HORL-I was considerably weaker than that in PCTBA1.8 (17- only) which implied that the amount of sequence derived from chromosome 15 was limited. The terminal 600bp of the 2.9kb fragment were subcloned as a B g l l \ - S a l l fragm ent into pBluescript, and the insert re-hybridized to the chromosome 15 and 17 hybrids. The intensity of the signals from PCTBA1.8 and HORLI were now comparable (Figure 6.1) which suggested that about 300bp of sequence from the P M L locus had been isolated. Two bands were detected in total human DNA (MOLT4), the,9.5kb band corresponding to chromosome 15 and the lOkb band corresponding to chromosome 17 (Figure 6.1). Only a single band corresponding to the junction fragment was detected in PLTI1S. These data indicated that the P M L locus had been successfully isolated.
Hybridization of this 600bp junction fragment to DNA from three APL patients (APL27, APL28 and APL29) detected additional junction fragments beyond those attributable to the chromosome
156

<CMCO h- 00 CT>
CM CM CM_l _J _JCL CL CL< < <
COCDCOCM
HIo oc
OX
°0
<CDI—oCL
chromosome 17 specific band 10kb chromosome 15 specific band 9.5kb
Figure 6.1 Hybridization of the t(15; 17) junction fragment from PLTI1S to EcoRI-digested DNA. This probe spans the APL breakpoint and therefore detects germline bands in both the chromosome 17 hybrid (PCTBA1.8) and the chromosome 15 hybrid (HORL-I). Both bands are detected in total human DNA (M0LT4). The probe detects additional junction fragments in three APL DNA samples APL27, APL28 and APL29 that were not detected with probes derived solely from chromosome 17. The junction fragments are marked with arrows.EL4 = mouse. P12.3B6 = 17q- hybrid. PJT2A1 a n d PLTI1S = 15q+ hybrids.

17 component of the probe. Hybridization of the equivalent chromosome 17 probe (LCN4A3/D) to these three digests detected only one aberrant band, in APL28 (data not shown). However hybridization of the junction fragment detected band shifts in APL27 and APL29, and both derivative chromosome junction fragments in APL28 (Figure 6.1). Hence in these three APL patients the breakpoints on chromosome 15 were shown to cluster within a small region, reminiscent of the clustering of the breakpoints within a single intron of R A R A .
6.1-3 PFGE Analysis of the PML Locus
To characterize the region of chromosome 15 in which the APL breakpoint occurred the t( 15; 17) junction fragm ent was hybridized to PFGE blots to determine the size of the fragments on which it lay. The probe hybridized to the chromosome 17 fragments which had already been identified and additional bands corresponding to the PM L PFGE fragments. The fragment sizes were calculated (Table 6.2), and indicate that in common with the chromosome 17 breakpoint region, the chromosome 15 breakpoint region is also gene-rich.
Table 6.2 PML PFGE fragment sizes.
PFGE Enzyme PML Fragment size
Eag I lOOkbNarl lOOkbClal 270kb
BssUll 280kbNotl 7 90kbMlul 800kb
The smallest fragments (lOOkb) detected on chromosome 15 were obtained with E a g I and N a r I, both island-associated enzymes. These two enzymes may define two CpG islands separated by
158

lOOkb, one of which could correspond to the 5' end of the putative PML gene.
The fqp l2 junction fragment was subsequently given to A. Goddard to isolate cosmids from the PML locus on chromosome 15 to expand the coverage of the region. Neither of the cosmids isolated contained the E ag I or N a r l sites identified through the PFGE analysis. However, cDNAs were isolated from the cosmids by A. Goddard which, like R A R A , spanned the breakpoints and were therefore considered as candidates for the P M L gene. These sequences were absent from DNA databases indicating that these cDNAs defined a previously uncharacterized gene. The positions of the APL breakpoints within the cosmid contig were also mapped by A. Goddard. In addition to the breakpoint cluster detected by fq p l2 , a second apparently discrete cluster was identified approximately five kilobases away. This suggested that the P M L gene was interrupted in two different introns.
6.2 Screening an APL cDNA L ibrary
Proof that the two breakpoint genes, RARA and P M L , were fused by the t ( l5; 17) translocation required the isolation of chimaeric cDNAs from an APL-specific cDNA library. An APL cDNA library was therefore constructed from a bone marrow sample from patient APL25 by D. Simmons in the pCDM8 vector specifically for this purpose. Plasmid cDNAs were electroporated into MC1061/p3 and the efficiency of the library was established at 5 x 10s colonies/|ig of electroporated cDNA. Approximately 1 x 10⁶
colonies were plated and screened with the RARA cDNA H7. Three positive clones were obtained which were purified through secondary screening although restriction digests indicated that two of the three clones were identical. Hybridization of the chromosome 15 breakpoint cDNAs to the two independent clones indicated that both contained PML sequences as well as the R A R A sequences, strongly suggesting that these clones were fusion messages. The clones were then sequenced using both vector- based and gene-specific primers.
159

6.2-1 Both PML-RARA and R A R A -P M L Fusion Messages can be E xpressed
The RARA cDNA H7 was chosen to screen the cDNA library since this probe spanned the breakpoint position within R A R A and would therefore detect fusion messages transcribed from either the 15q+ chromosome {PML-RARA fusion messages), or from the 17q- chromosome {RARA- PM L fusion messages). Although the aberrant bands observed on Northern analysis appeared to be derived from the 15q+ chromosome (section 5.4), the possibility remained that, at least in some cases, a fusion message could also be transcribed from the 17q- derivative chromosome. The sequence data obtained from the two fusion clones proved that although unprecedented among leukaem ias, in APL both derivative chromosomes can be transcriptionally active. The predicted PML-RARA fusion message from the 15q+ chromosome was represented by a clone with a 1.5kb insert containing 964 nucleotides from P M L and 568 nucleotides from RARA. T h e breakpoint within R A R A occurred at the expected position between the first coding exons as predicted from the Southern analysis of the breakpoint region. The intron interrupted by the breakpoints actually lies within the 60th codon rather than between the 59th and 60th codons as originally reported for R A R A (Brand et al.y 1988). The breakpoint occurs between the first and second nucleotides that encode the threonine residue at 60th position. The RARA sequences 5' of this position are replaced by sequences from PML which are fused in-frame to preserve the predicted P M L open reading frame. The breakpoint in patient APL25 occurred between nucleotides 1197 and 1198 of the consensus PML sequence derived by A. Goddard (Goddard et al.y1991). This would contribute 372 amino acids from PML to a predicted PML-RARA fusion protein. A comparison of the junction sequence of the PML-RARA fusion message from patient APL25 to the normal RARA message is shown (Figure 6.2).
The other fusion clone isolated from the APL cDNA library was a R A R A - P M L fusion m essage transcribed from the 17q- chromosome. This 2.7kb message was the exact reciprocal of the
160
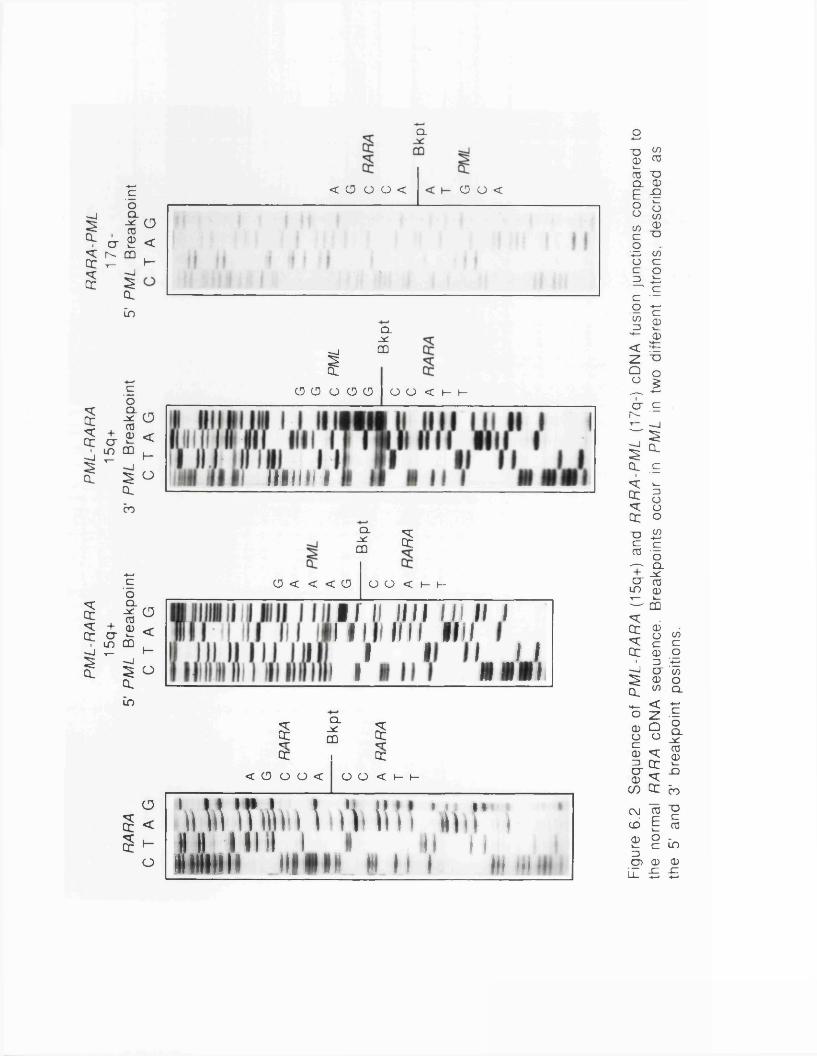
PML-
RAR
A PM
L-R
ARA
RA
RA
-PM
L15
q+
15q+
1
7q
-RA
RA
5' PM
L B
reak
poin
t 3'
PML
Bre
akpo
int
5' PM
L B
reak
poin
tCl
< CD O O < o o <
0<I-
IQ_JX.
CD
CD CD O CD CD I O O < h - l —
0<f-O IIHIH I
CO
CD < < < CD
* §
O O < h- h-
0<h-o
I I II M11 III II II I I Hi l l III!
I I _ I L JJ.i i M i l I
s 5" s? “ SDC I QC
< CD O O < O O < I - h -
0<HO
U U T i r t i h l i H m *iiir iI J * i i i *i i » m i iM i l l . Ill I I H W II I Hi •«! Fi
gure
6.2
Se
quen
ce
of P
ML-
RA
RA
(1
5q+)
an
d R
AR
A-P
ML
(17q
-)
cDNA
fu
sion
ju
nctio
ns
com
pare
d to
the
no
rmal
RA
RA
cDNA
se
quen
ce.
Brea
kpoi
nts
occu
r in
PML
in tw
o di
ffere
nt
intr
ons,
de
scrib
ed
as
the
5’ an
d 3'
brea
kpoi
nt
posi
tions
.

P M L - R A R A message with identical breakpoint positions in both genes (Figure 6.2). The reading frame was also maintained in this gene fusion, and was predicted to encode a RARA-PML fusion protein. This clone contained the entire 17q- coding regions and could therefore be used directly to express the protein. The complete sequence of the 17q- clone is shown (Figure 6.3).
6.2-2 Identification of a Second Breakpoint Position in P M L
The 15q+ and 17q- fusion messages isolated from the cDNA library confirmed the expected breakpoint position in R A R A and identified precisely where P M L was interrupted by the translocation, at least for patient APL25. Although all the APL breakpoints clustered within a single intron of R A R A , the genomic breakpoint map of PM L obtained by A, Goddard suggested that the breakpoints in the PML locus occurred in two discrete regions which could represent different introns. Breakage within different P M L introns would be reflected in different-sized P M L - R A R A fusion messages. The PML breakpoint in APL25 represented the 5’ breakpoint cluster, leaving the position of the 3' breakpoint cluster region within P M L undetermined. Rather than construct another cDNA library from a second APL patient with a breakpoint in the 3’ cluster region, it was decided to utilise the RT-PCR technique (reverse transcription coupled to PCR) to identify this second PML breakpoint position. This technique will be described in detail in the following chapter. In brief, RNA from a 3' P M L breakpoint patient was reverse transcribed and subjected to two rounds of PCR using nested sets of P M L and R ARA primers which were chosen to amplify across the junction of the P M L - R A R A fusion message. PCR products from patient APL3 were subcloned and sequenced, and the alternative P M L breakpoint position was found to lie between nucleotides 1671 and 1672 of the PML message (Figure 6.2). The two P M L breakpoint positions are therefore separated by 474 nucleotides in the cDNA, which translates to a difference of 158 amino acids between the predicted chimaeric proteins.
162

CCA
CCCA
AACC
CCAT
CTG
GG
CCCA
GG
CCCA
TGCC
CCG
AG
GAG
GG
TGG
TCTG
AAG
CCC
ACCA
GA
GC
CCC
CTG
CCA
GA
CTG
TCTG
CCT
CCC
TTCT
GAC
TGTG
GCC
GC
TTG
GC
ATG
GCC
AGCA
12
0M
etA
laS
erA
ovooo
ooo oCMr~o O o o o o o o o O O O O Oco o CM VOCO o CM VO00O CMo CMcn m VO00 Ol o H CM m VO
H H «”CH CMCMCMCMCMCMCo■ rHn9
O 9 O O
U a
O CU
U 04 U »U 04
U 04 O 04
U 9H CO
u au a o cu a
u a
o M u «
CMr-
O H H O O H O O < H < O H O O 2 O H H O Q O O O O- ^ O o o
< < oO O < H H 2 o o u< U < 8 8 8 8 SSH O < OHO O H H HO O OHO O O H
O O O O
O O O_ - 8 8 O H Q O < l ) Q H8 8 8 8 < O O H O H O O8 8 £ 8 _h ?§$ |*!^885o< O O O O H O H Q O O O H O O O O r t ! H O O H - H < H O
O O O O0 O O O O g u < < < u
H U 8 8 S§ § 8 8 8 8 8 S i:eO O O < H < ..........< O < O O " H O O H < H O O
8 ?5 h 8H O O ‘8 8 O H 2 <2 o 2 o
_ H _o o oH < H H O O _ < O < _O O H O O O H O H O H O _ _£ S 8 8 S 3 8 £
o o o
o o o
o o
o o
g o o
H O 1< < < O O O O H H 1<<5 O < 2 < 0 O H < H O O 2 2‘ ■ ‘ H o O O QO o H < OQ O O H . , O H O O
8 B 3 8 S
o o o_ O O H O O O O < < H O O O O O < < H
< O O O < H
O S $ 8 < O 5y BE 8 8 S 8
8 8 8 8 8
o o
o oO O CMo oO O H O O H H O O O
S S 8 2
S 8
o o o o o
o S S K S S S S B t : S 8 8 8 8 5 S S 8 2 8 2 3 8 8 3 8 3 2 *
8 8 8 8 8 8 8 .8 5
o o H 8 8 6h H
WOOONVWtOOCMVtff lDOCMVa o N < r) ’» i n « o o a o H C M ' » i n »hhhhhhhhcmcmcmncmn
. e
4>oco9CTOC/3
*o*-*o
*o<u&
•CH
<§o
Ja*<o
X i
£ot§ 8 8 8 <fcs
8 8 8 8 |CO’O
cr
<2Doc0M
<2Kj£a,105
058 S 8 8 8 S 8 8 8 8 8 8 S S 8 « S g 8 e 8 S 8 8 8 S 8 G8 8 g I
mvo£ 9 00 • fM
u< prote
in is
indica
ted
unde
rnea
th
using
the
th
ree-
letter
co
de.
Ii =
point
of
fusion
be
twee
n RA
RA
and
PML
sequ
ence
s. V
= po
int
of
dive
rgen
ce
of the
di
ffere
nt
PML
iso f
orm
s.

6.2-3 The P M L Gene Encodes Multiple Al ternat ive Carboxv Term ini
The RARA -P ML 17q- cDNA clone starts within the 5' UTR of the first RA RA isoform (position 458) and terminates within a P M L poly-A tract (Figure 6.3). However, comparison of the P M L terminus contained within this 17q- subclone to the concensus P M L sequence compiled by A. Goddard indicated that the two sequences diverged after nucleotide 1724 while still within the coding region of the P M L gene (codon 548). This point of divergence lies further 3' in the gene to both the breakpointpositions. Like RARA, PML therefore has different isoforms although these diverge at the C-terminus rather than the N-terminus. The original PML sequence was termed PM L I , and the isoform defined by the 17q- fusion as P M L 2 . The sequence of PML2 has been deposited with the EMBL-GenBank database with the accession number M79463.
Two additional P M L clones were isolated by screening the APL cDNA library with PML cDNAs. Two clones were isolated, one of which represented the PM L I isoform, whereas the second was similar to PML2 but lacked nucleotides 1725-2365. On the basis of this clone and a similar clone isolated by A. Goddard, a third P M L isoform was defined (P M L 3 ). This encodes a third alternative C- terminus. A total of six alternative P M L C-termini have been described to date by the different groups working on APL (Borrow and Solomon, 1992).
6.3 Discussion and Summary
The construction of a genomic phage library from the APL 15q+somatic cell hybrid PLTI1S permitted the isolation of the locus at 15q22 involved in the APL translocation (PML) by walking from RARA breakpoint sequences. Sequences from the P ML locus were used to demonstrate a breakpoint cluster region on chromosome 15 and determine the PFGE fragment sizes of the region. Coverage of the locus was expanded by A. Goddard who isolated two overlapping cosmids from the region and identified a second
164
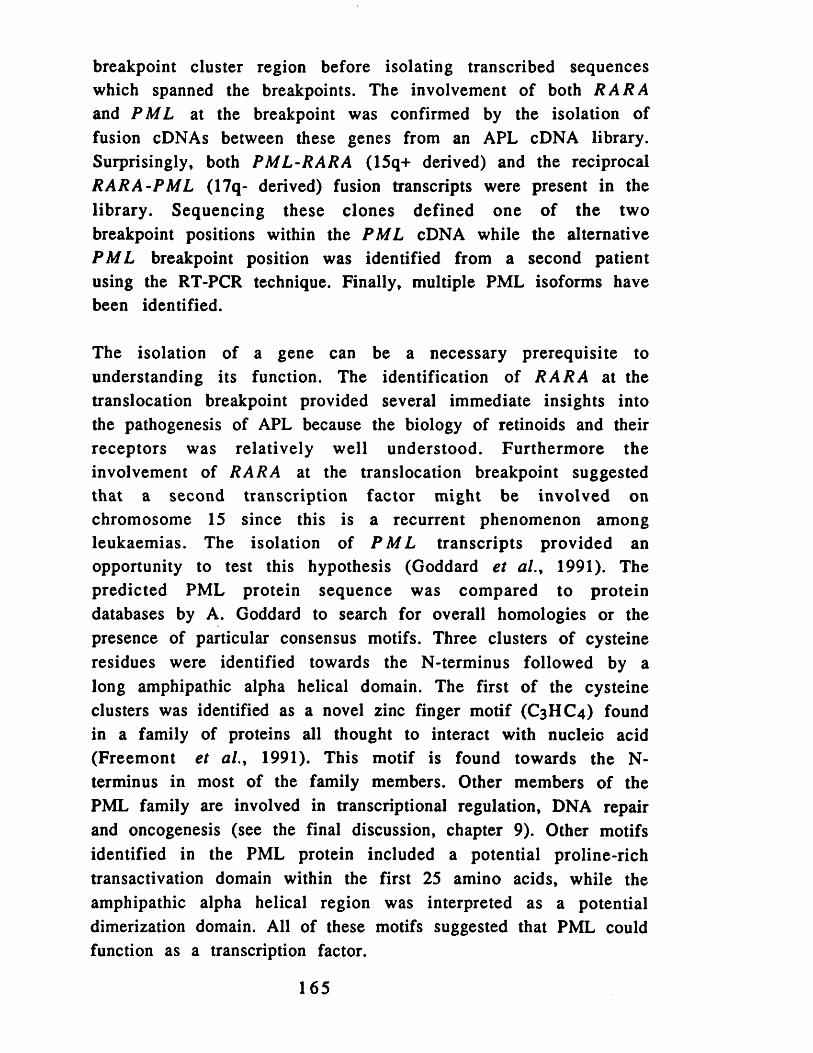
breakpoint cluster region before isolating transcribed sequences which spanned the breakpoints. The involvement of both R A R A and P M L at the breakpoint was confirmed by the isolation of fusion cDNAs between these genes from an APL cDNA library. Surprisingly, both PML -RA RA (15q+ derived) and the reciprocal R A R A - P M L (17q- derived) fusion transcripts were present in the library. Sequencing these clones defined one of the two breakpoint positions within the P M L cDNA while the alternative P M L breakpoint position was identified from a second patient using the RT-PCR technique. Finally, multiple PML isoforms have been identified.
The isolation of a gene can be a necessary prerequisite to understanding its function. The identification of R A R A at the translocation breakpoint provided several immediate insights into the pathogenesis of APL because the biology of retinoids and their receptors was relatively well understood. Furtherm ore the involvement of RARA at the translocation breakpoint suggested that a second transcription factor might be involved on chromosome 15 since this is a recurrent phenomenon among leukaemias. The isolation of P M L transcripts provided an opportunity to test this hypothesis (Goddard et al.y 1991). The predicted PML protein sequence was compared to protein databases by A. Goddard to search for overall homologies or the presence of particular consensus motifs. Three clusters of cysteine residues were identified towards the N-terminus followed by a long amphipathic alpha helical domain. The first of the cysteine clusters was identified as a novel zinc finger motif (C3 H C 4 ) found in a family of proteins all thought to interact with nucleic acid (Freem ont et al.y 1991). This motif is found towards the N- terminus in most of the family members. Other members of the PML family are involved in transcriptional regulation, DNA repair and oncogenesis (see the final discussion, chapter 9). Other motifs identified in the PML protein included a potential proline-rich transactivation domain within the first 25 amino acids, while the amphipathic alpha helical region was interpreted as a potential dimerization domain. All of these motifs suggested that PML could function as a transcription factor.
165
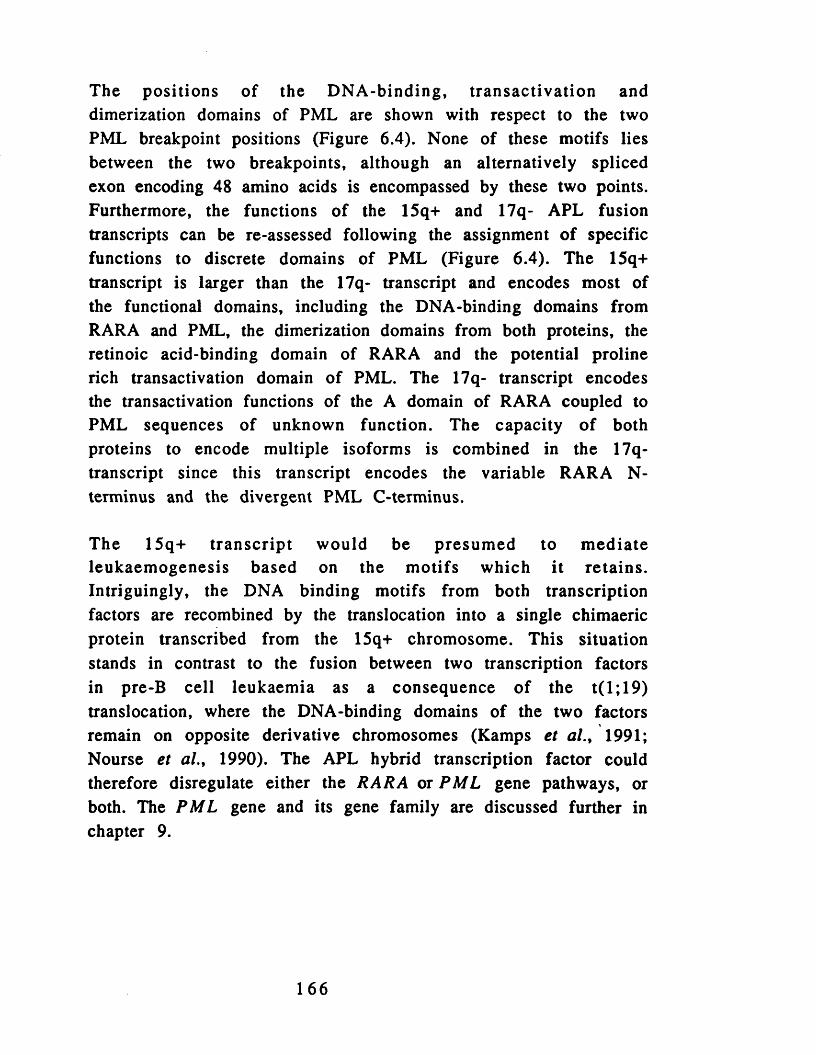
The positions of the DNA-binding, transactivation and dimerization domains of PML are shown with respect to the two PML breakpoint positions (Figure 6.4). None of these motifs lies between the two breakpoints, although an alternatively spliced exon encoding 48 amino acids is encompassed by these two points. Furthermore, the functions of the 15q+ and 17q- APL fusion transcripts can be re-assessed following the assignment of specific functions to discrete domains of PML (Figure 6.4). The 15q+ transcript is larger than the 17q- transcript and encodes most of the functional domains, including the DNA-binding domains from RARA and PML, the dimerization domains from both proteins, the retinoic acid-binding domain of RARA and the potential proline rich transactivation domain of PML. The 17q- transcript encodes the transactivation functions of the A domain of RARA coupled to PML sequences of unknown function. The capacity of both proteins to encode multiple isoforms is combined in the 17q- transcript since this transcript encodes the variable RARA N- terminus and the divergent PML C-terminus.
The 15q+ tran sc rip t would be presum ed to m ediate leukaem ogenesis based on the m otifs which it reta ins. Intriguingly, the DNA binding motifs from both transcription factors are recombined by the translocation into a single chimaeric protein transcribed from the 15q+ chromosome. This situation stands in contrast to the fusion between two transcription factors in pre-B cell leukaemia as a consequence of the t( 1; 19) translocation, where the DNA-binding domains of the two factors remain on opposite derivative chromosomes (Kamps et al.> 1991; Nourse et al ., 1990). The APL hybrid transcription factor could therefore disregulate either the RARA or P M L gene pathways, or both. The PM L gene and its gene family are discussed further in chapter 9.
166
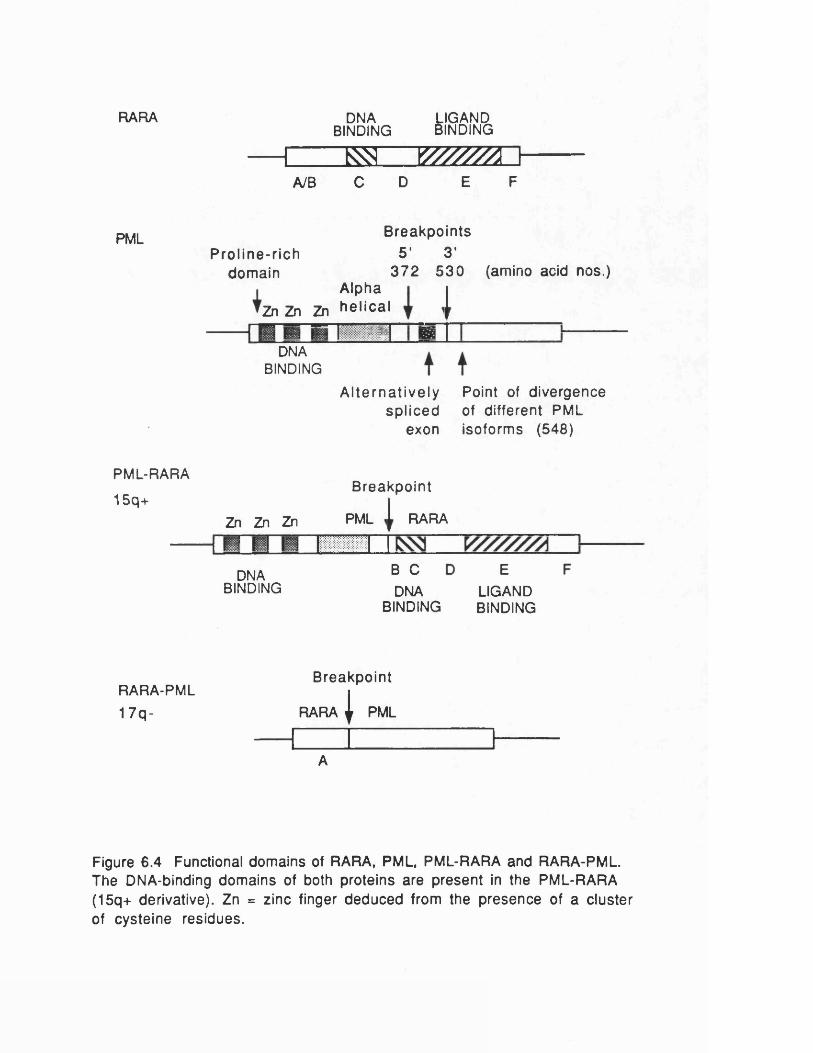
RARA DNA LIGANDBINDING BINDING
^ Z 3 Z 2 Z Z Z &A / B C D E F
PMLProl ine-r ich
domain
u
2n Zn Zn
Breakpoints 5 ' 3 ’
3 7 2 5 3 0Alpha he l ica l
(amino acid nos.)
i—DNA
BINDINGA lte rna t ive ly
sp l icedexon
Point of divergence of different PML isoforms (548)
PML-RARA
15q+Zn Zn Zn
Breakpoint
PML
cmRARA
DNABINDING
B CDNA
BINDING
ELIGANDBINDING
BreakpointRARA-PML1 7q- RARA | PML\
A
Figure 6.4 Functional domains of RARA, PML, PML-RARA and RARA-PML. The DNA-binding domains of both proteins are present in the PML-RARA (15q+ derivative). Zn = zinc finger deduced from the presence of a cluster of cysteine residues.

Chapter 7
Detection of PML- RARA and RA R A - P ML Fusion Transcripts bv RT-PCR
7.1 RT-PCR - The Technique
The polymerase chain reaction (PCR) is a powerful technique for the selective amplification of small DNA fragments (Saiki e t al.y 1985) and has found applications throughout molecular biology. Two primers which flank the target sequence are added to DNA in the presence of a thermostable DNA polymerase and repeated cycles of annealing, extension and denaturation result in exponential amplification of the intervening sequences. If the primers are chosen to flank a translocation breakpoint then amplification is contingent on the presence of the translocation in the source DNA. This provides a highly sensitive method for the diagnosis and monitoring of those cancers which demonstrate specific translocations, especially the haematological malignancies (Tables 1.1 and 1.2). The efficacy of this approach was first proven on DNA from a follicular lymphoma using primers flanking the t(14;18)(q32;q21) translocation junction, which proved both the specificity and sensitivity of the test (Lee et al.y 1987). The translocation could also be detected in remission samples by PCR amplification although no evidence of the abnormality could be detected by morphological examination or Southern blot analysis.
A potential drawback to this approach is that translocation breakpoints can occur at variable positions over genomic distances which may exceed the maximum length of DNA that is amenable to amplification by PCR. This would entail the determination of the precise breakpoint positions for every patient. This problem was particularly acute in the analysis of t(9;22) Philadelphia chromosome junction fragments since the breakpoint at 9q34 could occur anywhere within the first ABL intron which exceeds 200kb. Likewise the size of the RARA breakpoint intron in APL is 17kb, which prevents direct detection of the t(15; 17) translocation by a DNA-based PCR. To circum vent the variability of
168
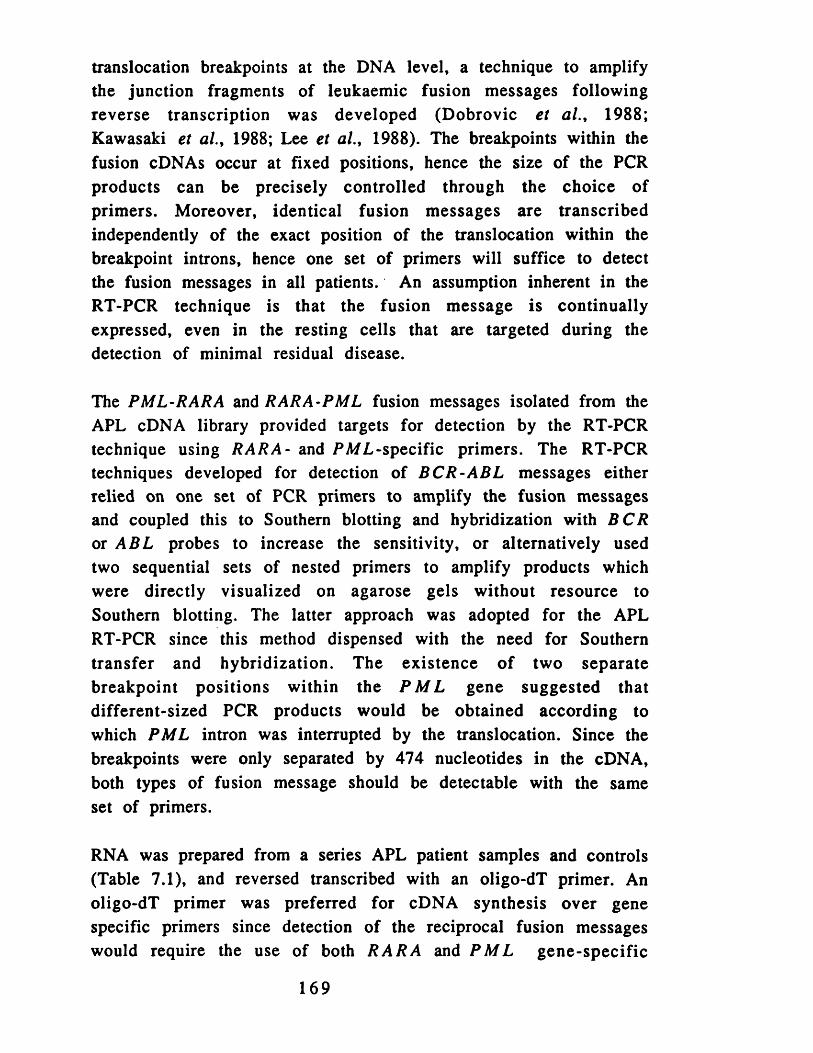
translocation breakpoints at the DNA level, a technique to amplify the junction fragments of leukaemic fusion messages following reverse transcription was developed (Dobrovic et al ., 1988; Kawasaki et al.t 1988; Lee et al., 1988). The breakpoints within the fusion cDNAs occur at fixed positions, hence the size of the PCR products can be precisely controlled through the choice of primers. Moreover, identical fusion messages are transcribed independently of the exact position of the translocation within the breakpoint introns, hence one set of primers will suffice to detect the fusion messages in all patients. An assumption inherent in the RT-PCR technique is that the fusion message is continually expressed, even in the resting cells that are targeted during the detection of minimal residual disease.
The PML-RARA and RARA-PML fusion messages isolated from the APL cDNA library provided targets for detection by the RT-PCR technique using RARA- and PA/L-specific primers. The RT-PCR techniques developed for detection of B C R - A B L messages either relied on one set of PCR primers to amplify the fusion messages and coupled this to Southern blotting and hybridization with B C R or A B L probes to increase the sensitivity, or alternatively used two sequential sets of nested primers to amplify products which were directly visualized on agarose gels without resource to Southern blotting. The latter approach was adopted for the APL RT-PCR since this method dispensed with the need for Southern transfer and hybridization. The existence of two separate breakpoint positions within the P M L gene suggested that different-sized PCR products would be obtained according to which PML intron was interrupted by the translocation. Since the breakpoints were only separated by 474 nucleotides in the cDNA, both types of fusion message should be detectable with the same set of primers.
RNA was prepared from a series APL patient samples and controls (Table 7.1), and reversed transcribed with an oligo-dT primer. An oligo-dT primer was preferred for cDNA synthesis over gene specific primers since detection of the reciprocal fusion messages would require the use of both R A R A and P M L gene-specific
169

oligonucleotides. Forty cycles of PCR were performed with the external PCR primer pair, followed by a further 40 cycles using the internal pair of primers on an aliquot of the product from the first round. The RT-PCR protocol is shown schematically with the positions of the PCR primers (Figure 7.1), which can be used in different combinations to amplify either PML -RA RA, RARA-P ML , RARA or PML messages. The amplification of normal R A R A and P M L messages was necessary to control for the integrity of the RNA and successful cDNA synthesis.
The RT-PCR technique was applied to four different areas of research on APL (Borrow et al., 1992), as described in sections7.2-7.5 below.
7.2 Analysis of P M L - R A R A Fusion Message Junctions
The use of the RT-PCR technique to establish the position of the 3' P M L breakpoint has already been described (section 6.2-2). Knowing the position of both the P M L breakpoints and the position of the PCR primers (Figure 7.1), the size of the amplified fusion messages could be predicted for both classes of PM L-R ARA fusion transcript. For 5' P M L breakpoint fusions a 355bp P M L - R A RA product should be obtained with the internal pair of PCR primers (primer nos. 2 and 8 , Figure 7.1), whereas 3' P M L breakpoint fusions should yield a 829bp product due to the additional 474 nucleotides which separate the breakpoints in the cDNA. The region of the PML gene in which the breakpoints occur contains two further introns in addition to the two breakpoint introns (Figure 7.2). The position of these two introns was surmised from the variably-spliced 144bp exon (exon C, Figure7.2) which lies between the two breakpoint positions.
This P M L - R A R A 15q+ PCR was initially applied to presentation samples from ten APL patients (Figure 7.3). In all ten APL patient samples PML-RARA junction fragments were amplified. The three cell lines HL60 (Dalton et al., 1988), U937 (Sundstrom and Nilsson, 1976) and K562 (Lozzio and Lozzio, 1975) were employed as negative controls since they lack the t(15;17) translocation.
170

PML RARA
fusion mRNA AAAAAAA
reverse transcription
TTTT
denature, add external RARA and PML primers
l ------ 7 40 cycles PCR
remove aliquot and repeat PCR with nested PCR primers
8
Visualise products by running on 1.5% agarose gel
PML-PML
RARA-RARA [
5 6 8 7
i 1
1
PML-RARA15q+
RARA-PML 17q- external internal internal external
Figure 7.1 RT-PCR protocol for detection of PML-RARA, RARA-PML, PML and RARA messages. The four messages are amplified according to the different primer combinations shown in the lower part of the figure. The sequence of primers 1-8 are given in the Materials and Methods (Table 2.1).

5' BR
EAKP
OINT
3'
BREA
KPOI
NT
RBRD
N RE
GION
COin
JD
Q.
CO
o
CO
3 3 3 2 5 2 Q- Q. Q-O O (D (O 00 CO co in n' d> '
in
coinicom
ocomlin
Tfi1o>CO
coo>COICON.CO
CM1CO
o CO5= o2 o < <
3 3 3 2 2 2 CL Q_ Q_O 0 CDO § o£ £ £ t o ?
inCM
CM Tt Is- CM CD h*
1COI
CO
CM
cnCDCM
COCOCMI
COo>
1o>
<z£ CLE n
to oc . g CD
I sorn x LU
■o£ o co *C 2CO CO
I s® rC 0) CD >
I fc lo CO Q. oCO c CD •-.O ® in ^CD ^«- O OCO £co QJ’55 T5 o c O. CO® D h co
= 1 .2 So>© cw © ^ ©IICO 4-2 •§ * & -J ■*5 sA- £CM COr-* ©
LL ©
c£ o © £D> ©
© ©> £ w■° “ -o © © cE > © c © _ o — <° 2L ©£ m C ffl O■J CO °5 8 ®0- E c
©£o
Z Vn co
© c*i. © ©2= -o
’o © © _t i s i© .c o ■*-3 « “ CODC ®
s i
©4—<coN
©* i
■© S ©8c c © o 2 ~ > £ © —
w ® © £? o© © Q. © © £
c$0x:©©k_€01
£©E
C Q .
5 ; CMrf 05t*. O)O ^© * C «£o ®
■e 2 ® 5© CL O O CL fc© me c
§ 1©■° iii © c E °
•a © c *r © ©
©x ® *o© c ©t_ © CL "O ©
c 33 <

Additional water-only controls were also negative on this assay. Six of the ten APL patient RNA samples (APL1, 2, 4, 5, 8 and 9) gave a single PCR product of 355bp after amplification, indicating that the breakpoint had occurred in the 5' intron of P M L in these patients. The remaining four patient samples (APL3, 6 , 7 and 10) yielded the 829bp product expected from the 3' P M L breakpoint. However, these four patients also dem onstrated a variable number of additional bands as well as the 829bp product (Figure7.3). To determine the nature of these additional fragments the PCR products were subcloned into pBluescript and sequenced. The sequence data dem onstrated that these sm aller fragm ents represented differentially-spliced junction fragments. A 685bp product differed from the 829bp product only by the 144bp exon (exon C). This 685bp message remains in-frame and therefore has the potential to encode a third different-sized PML-RARA fusion protein. A 426bp product was also subcloned from the 15q+ PCR mixture which represented an out-of-frame P M L - R A R A fusion, derived from splicing PML exons A and B to the common R A R A splice acceptor site without inclusion of PML exon D (Figure 7.2). A summary of the different 15q+ junction fragments is shown in Figure 7.4. A band at approximately 800bp was not subcloned and its identity remains unclear.
RNA was obtained from a total of 23 APL presentation samples (Table 7.1) of which 18 had been karyotyped and shown to contain the t( 15; 17) translocation (APL1-18). The t(15;17) was absent from APL22, while no cytogenetic analysis was performed on the remaining four patients. Of these 23 APL patients, 22 were positive for the 15q+ PCR, while the only negative patient (APL23) also failed to demonstrate any rearrangement of RARA or P M L on Southern analysis. Since this patient was classified prior to the revised FAB criteria for myeloid leukaemias, this patient may have been misdiagnosed or represent an APL phenocopy. However, 100% of patients (18/18) which had a cytogenetically visible t(15; 17) translocation were positive on this PCR assay. No evidence was obtained in any of these patients for additional breakpoint positions in either PML or RARA,
173
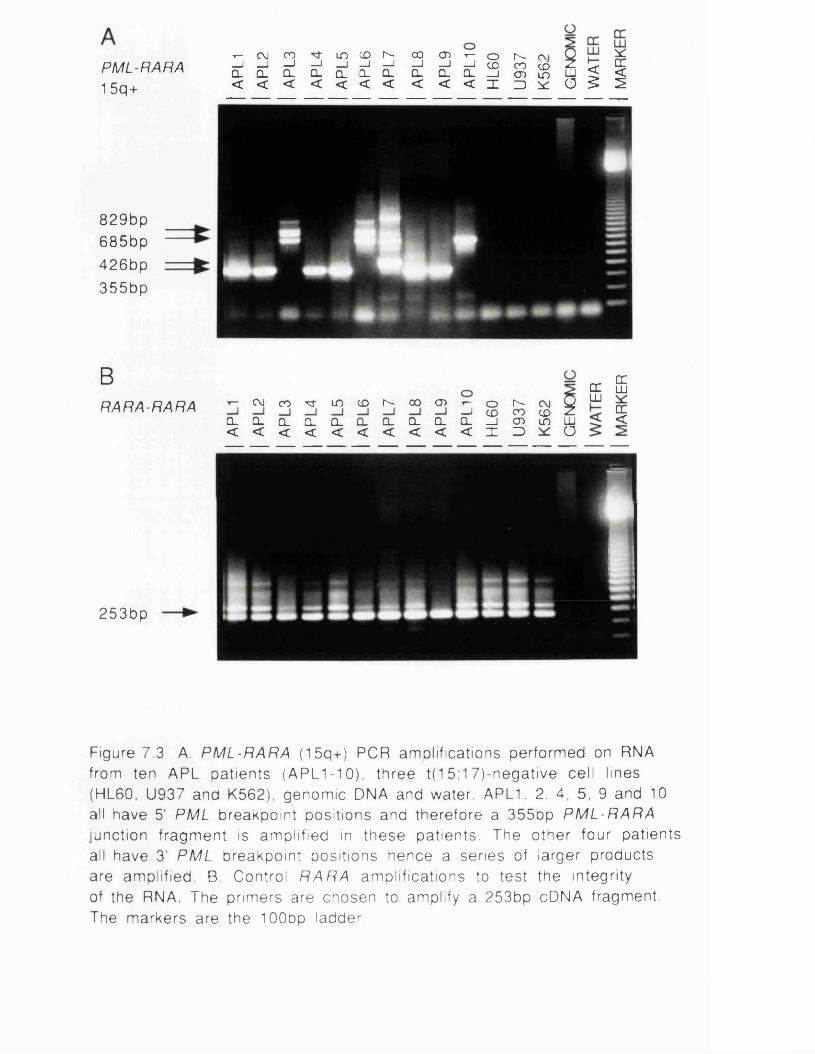
r- CM CO ifi ID N ® 0 1 ^ 0 N w Q u ^P M I . R A R A —i —I —I —I —I —I —I —l —I —J CD co cd Z X qcr M L r l HMrt Q. Q . 1 CL Q. a . 1 D _ Q _ C L _ l c r > L r ) L J < <* l 5 q + < < < < < < < < < < x z ) ^ G ^ ^
829bp685bp
426bp355bp
HL.BRARA-RARA C V J c O ^ l f i t D N O O O )
CL<
Q_< CL
<CL<
CL<
Q_<
CL<
CL<
CL<
•»- o Is-- <\j y—J CD CO CD ZQ_ I CJ> LO LU< X Z) O
„ ccQC LULU
DC<
1
253bp
Figure 7.3 A. P M L -R A R A (15q+) PCR ampli fications performed on RNA from ten APL patients (APL1-10), three t(15:17)-negat ive cell l ines (HL60, U937 and K562), genomic DNA and water. APL1, 2, 4, 5, 9 and 10 all have 5' PML breakpoint posit ions and therefore a 355bp P M L -R A R A junct ion fragment is ampl i f ied in these patients. The other four patients all have 3' PML breakpoint posit ions hence a series of larger products are ampli f ied. B. Control R A R A ampl i f icat ions to test the integri ty of the RNA. The primers are chosen to amplify a 253bp cDNA fragment. The markers are the 100bp ladder.

A. PML-RARA SUBCLONES (15q+)
1
372aa 530aaI lB ™RA 1 PML-RARA
PML
i i i 355bp in frame p872 i » I i — I 426bp out of frame3 i i I » i i 685bp in frame p984 i l l I I I 829bp in frame p103
(not subcloned)
B. RARA-PML SUBCLONES (17q-)
RARA m
PMLJ RARA-PML
J
J 144bp in frame 3 215bp out of frame 3 403bp out of frame 3 474bp in frame 3 618bp in frame
Figure 7.4 Structure of the 15q+ (A) and 17q- (B) PCR subclones from amplified APL cDNA junctions. The fusion message junctions were amplied using the RT-PCR technique, subcloned and sequenced. The different sized messages are due to differential splicing of the exons in the breakpoint region. Not all of the messages are in frame. The modular nature of the subclones is shown by comparison to the positions of the PML and RARA exons. Taken from Borrow et a!., 1992.

7.3 Which Fusion Derivative Mediates Leukaemogenesis?
The identification of both P M L - R A R A (15q+) and R A R A - P M L (17q-) fusion messages reopened the question as to which fusion message mediated leukaemogenesis in APL. The 15q+ PML -RARA message had emerged as the most likely candidate in view of the motifs which it retains (section 6.3). The RT-PCR provided a means for the detection of both P M L - R A R A messages as described (section 7.2), and also for the reciprocal R A R A - P M L messages (Figure 7.1), and hence a means of assessing whether or not all APL patients expressed both types of fusion message.
The sizes of the R A R A - P M L (17q-) PCR products could be predicted for the two different P M L breakpoint positions. Amplification of 17q- messages from cDNA from APL patients APL1-10 appeared to confirm these message sizes (Figure 7.5), although the messages were also subcloned and sequenced. For patients with 3' P M L breakpoints, which had previously demonstrated multiple 15q+ transcripts, a single band of 144bp was obtained resulting from the fusion of the R A R A sequences directly to exon E of P M L (Figure 7.4). The 5' PML breakpoint patients dem onstrated a plethora of in- and out-of-fram e messages (Figures 7.4 and 7.5) corresponding to all of the different splice combinations across the breakpoint region.
The 17q- RT-PCR system was used to analyse all 18 of the APL patients with cytogenetically confirmed translocations, APL1-18 (Table 7.1), all of which expressed 15q+ messages detectable by PCR. However, only 12 of these 18 patients expressed the reciprocal 17q- message (compare Figures 7.3 and 7.5 for APL1- 10). The mechanism responsible for silencing expression of 17q- transcripts in a third of APL patients was suggested by the position of the breakpoint in the 17q- somatic cell hybrid P12.3B6 (section 5.4 and Figure 5.2). This breakpoint lies outside the chromosome 17 breakpoint cluster region, suggesting that exonic sequences have been deleted by the translocation. Presumably a third of all APL translocations are not perfectly reciprocal and
176

RARA-PML 1 7 q -
C\J CO v I/) 0 NQ_<
CL<
CL<
CL<
CL CL CL < < <
00 ° ] ^ o cm—i —i co co co Z CCCL 0- I <J) LO LU ^< < I D * O ^
□l<
QC<
6 1 8 b p _ 4 7 4 b p “
2 1 5 b p — 14 4 b p
BPML-PML CM CO ^ in (D N 00 CD
Q_<
CL<
CL<
CL<
CL CL < <
CL<
CL<
Cl<
CL<
oCD
N (\J UCO CD 2CD LO HIz> * o
LUh-<£
DC<
7 2 0 b p5 7 6 b p
2 4 6 b p
Figure 7.5 A. R A R A - P M L (17q-) ampl ica t ions on RNA from the same ten APL pat ients and contro ls as shown in Figure 7.3. Only f ive of the ten pat ients (APL1, 3, 6, 9 and 10) express 17q- transcrip ts . Dif ferent ia l sp l ic ing is now observed in the pat ients with 5' P M L b reakpo in t pos it ions (APL1 and 9). B. Control PML amp l i f ica t ions to check the integri ty of the RNA. P M L also de m on s t ra tes a high level of a l te rna t ive spl ic ing in the ampli f ied region. The m arkers are the 100bp ladder.
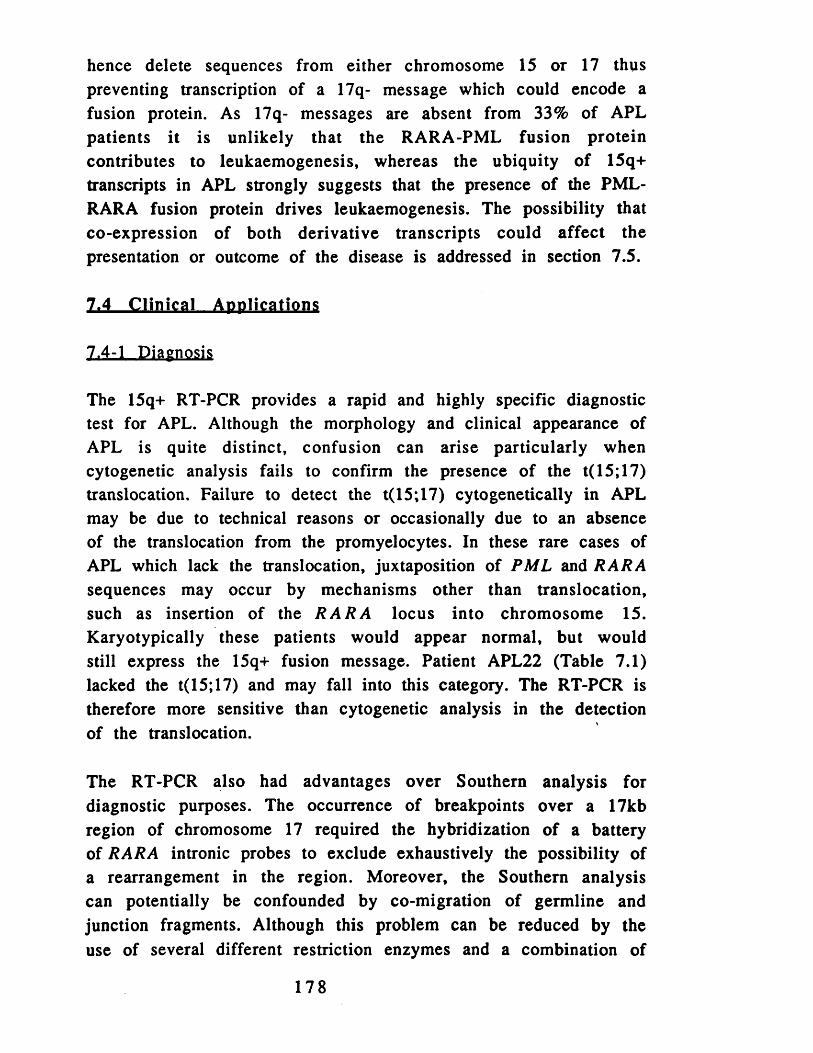
hence delete sequences from either chromosome 15 or 17 thus preventing transcription of a 17q- message which could encode a fusion protein. As 17q- messages are absent from 33% of APL patients it is unlikely that the RARA-PML fusion protein contributes to leukaemogenesis, whereas the ubiquity of 15q+ transcripts in APL strongly suggests that the presence of the PML- RARA fusion protein drives leukaemogenesis. The possibility that co-expression of both derivative transcripts could affect the presentation or outcome of the disease is addressed in section 7.5.
7.4 C linical A pplications
7.4-1 Diagnosis
The 15q+ RT-PCR provides a rapid and highly specific diagnostic test for APL. Although the morphology and clinical appearance of APL is quite distinct, confusion can arise particularly when cytogenetic analysis fails to confirm the presence of the t( 15; 17) translocation. Failure to detect the t(15;17) cytogenetically in APL may be due to technical reasons or occasionally due to an absence of the translocation from the promyelocytes. In these rare cases of APL which lack the translocation, juxtaposition of PML and R A R A sequences may occur by mechanisms other than translocation, such as insertion of the R A R A locus into chromosome 15. Karyotypically these patients would appear normal, but would still express the 15q+ fusion message. Patient APL22 (Table 7.1) lacked the t(15; 17) and may fall into this category. The RT-PCR is therefore more sensitive than cytogenetic analysis in the detection of the translocation.
The RT-PCR also had advantages over Southern analysis for diagnostic purposes. The occurrence of breakpoints over a 17kb region of chromosome 17 required the hybridization of a battery of RARA intronic probes to exclude exhaustively the possibility of a rearrangement in the region. Moreover, the Southern analysis can potentially be confounded by co-migration of germline and junction fragments. Although this problem can be reduced by the use of several different restriction enzymes and a combination of
178
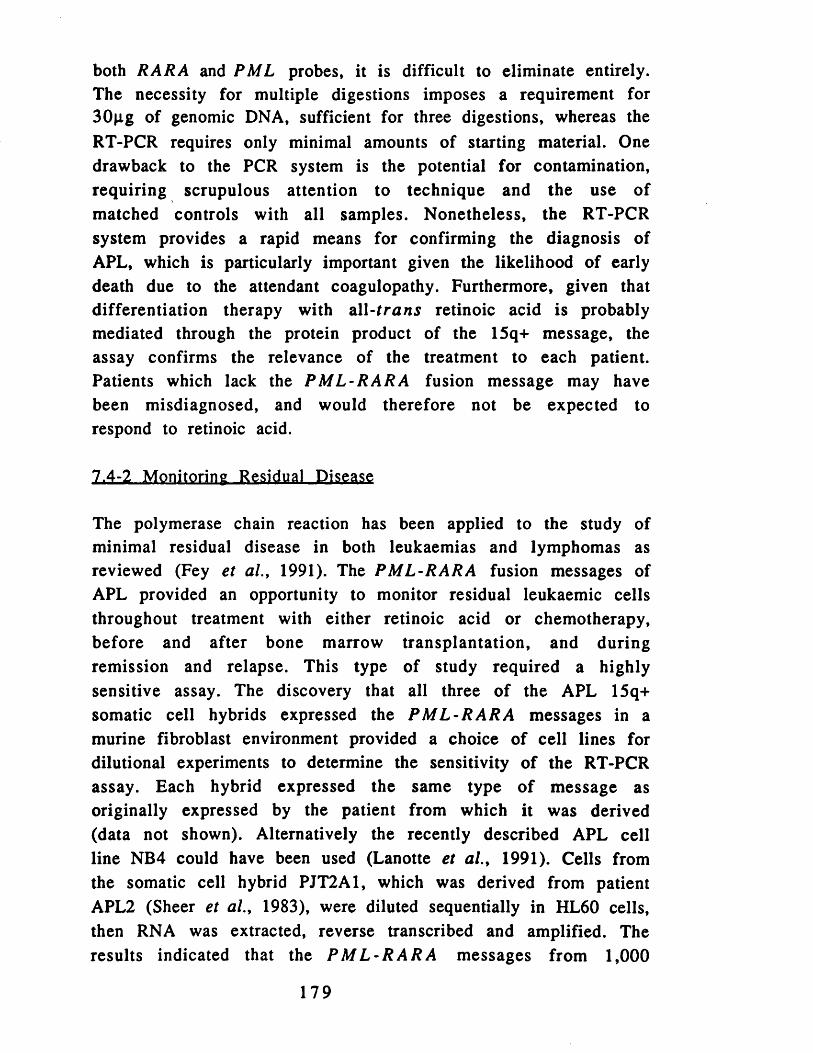
both R A R A and PML probes, it is difficult to eliminate entirely. The necessity for multiple digestions imposes a requirement for 30|ig of genomic DNA, sufficient for three digestions, whereas the RT-PCR requires only minimal amounts of starting material. One drawback to the PCR system is the potential for contamination, requiring scrupulous attention to technique and the use of matched controls with all samples. Nonetheless, the RT-PCR system provides a rapid means for confirming the diagnosis of APL, which is particularly important given the likelihood of early death due to the attendant coagulopathy. Furthermore, given that differentiation therapy with all-trans retinoic acid is probably mediated through the protein product of the 15q+ message, the assay confirms the relevance of the treatment to each patient. Patients which lack the P M L - R A R A fusion message may have been misdiagnosed, and would therefore not be expected to respond to retinoic acid.
7 .4 -2 M o n ito rin g R esid u a l D isease
The polymerase chain reaction has been applied to the study of minimal residual disease in both leukaemias and lymphomas as reviewed (Fey et al.y 1991). The P M L - R A R A fusion messages of APL provided an opportunity to monitor residual leukaemic cells throughout treatment with either retinoic acid or chemotherapy, before and after bone marrow transplantation, and during remission and relapse. This type of study required a highly sensitive assay. The discovery that all three of the APL 15q+ somatic cell hybrids expressed the P M L - R A R A messages in a murine fibroblast environment provided a choice of cell lines for dilutional experiments to determine the sensitivity of the RT-PCR assay. Each hybrid expressed the same type of message as originally expressed by the patient from which it was derived (data not shown). Alternatively the recently described APL cell line NB4 could have been used (Lanotte et al.y 1991). Cells from the somatic cell hybrid PJT2A1, which was derived from patient APL2 (Sheer et al., 1983), were diluted sequentially in HL60 cells, then RNA was extracted, reverse transcribed and amplified. The results indicated that the P M L - R A R A messages from 1,000
179
PJT2A1 cells could be detected in 107 HL60 cells whereas 100 PJT2A1 cells mixed with 107 HL60 cells gave a negative result. Since not every PJT2A1 cell retains the 15q+ chromosome the assay may be even more sensitive than it appears.
Paired samples obtained at presentation and remission were obtained from two patients, APL17 and APL18. The presentation samples were both positive, and indicated that APL17 has a 3' PML breakpoint and APL 18 has a 5' PML breakpoint (Figure 7.6). In contrast, both remission samples were negative (Figure 7.6). An additional three remission samples obtained from patients APL31, APL 32 and APL33 were also negative (Figure 7.6). Control P M L amplifications from all the remission samples were positive, hence the negative results could not be attributed to RNA degradation. Although no presentation samples were available from these la tter three patients, they all dem onstrated the t( 15; 17) translocation on cytogenetic analyses performed at presentation and it can therefore be reasonably assumed that P M L - R A R A messages were originally present. These results indicated that the RT-PCR may be of use to determine whether a patient has achieved complete remission (CR), and could be used to supplement the morphological criteria used for this purpose. In addition, the test could be used prior to bone marrow harvest. Potentially the test may be of use to predict impending relapse, but further experiments involving m ultiple time points are required to establish the kinetics of the reappearance of the disease.
7.5 C lin ico-M olecular C orre la tions
The two alternative P M L breakpoint positions lead to the transcription of different-sized fusion messages and alternative fusion proteins. Use of the 5’ PML breakpoint position results in a predicted 87kd fusion protein (p87PML"RARA) while breakpoints at the 3' position result in a 103kd protein (pl03PML-RARA). if exon C is spliced out, the predicted size of the latter fusion protein is reduced to 98kd. These fusion proteins could have different properties. In other leukaemias that express fusion proteins of
180
PML-RARA 1 5q+
8 2 9 b p
6 8 5 b p
4 2 6 b p = # :
3 5 5 b p
coLU
coLU
QC DC DC CC CC DC CC 1 0 1 0 0 0 0 CC
oo c\i co t - co co co
PML-PML
7 2 0 b p
5 7 6 b p
co coLU LU□C QC DC QC QC DC CC Q - O C L O O a O Q Ch-r^oooC'r-CNjcoyi-r-T-T-CCCCCOiu u u u u ^ u Q Cq _ c l q _ q _ c l c l c l << < < < < < < ^ >
Figure 7.6 RT-PCR analys is of APL remission samples. Paired presenta t ion (PRES) and com p le te remiss ion (CR) sam p les were obta ined from APL 17 and 18. The P M L - R A R A fusion m essages were not de tec ted dur ing remiss ion . Remiss ion samp les from APL3 1 -3 3 were also negat ive. Control P M L ampl i f ica t ions are shown below. The markers are the 100bp ladder.
Figure 7.6 RT-PCR analysis of APL remission samples
181
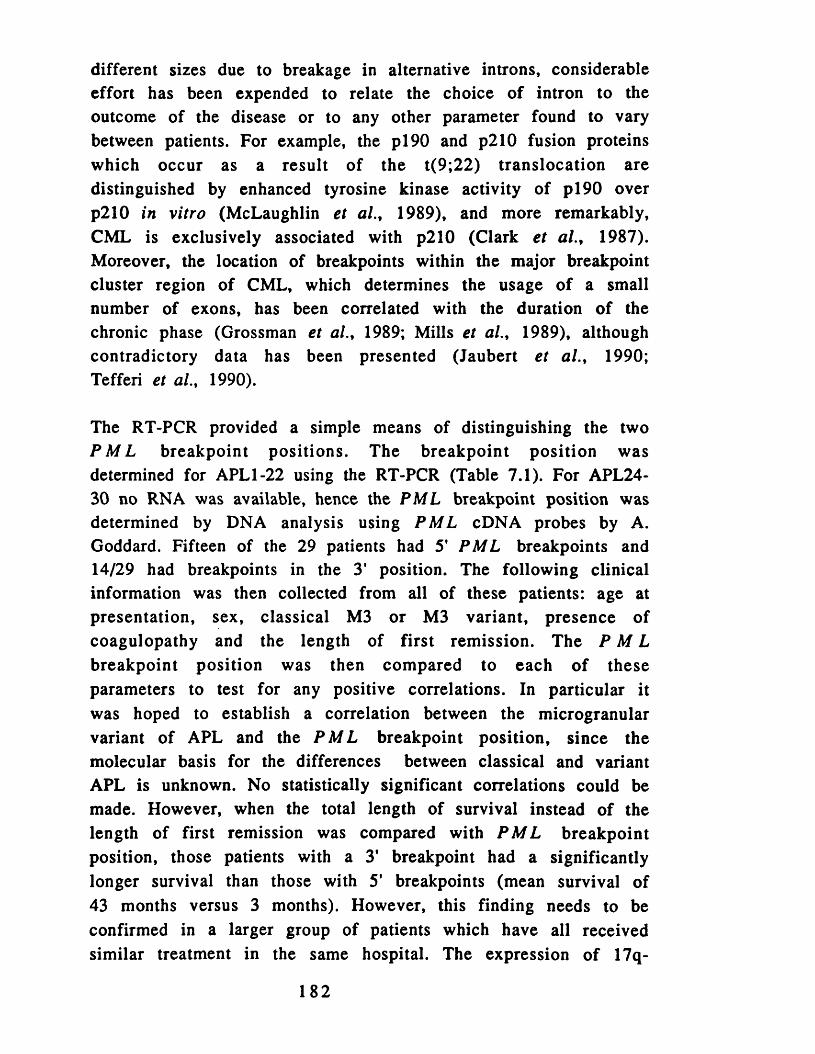
different sizes due to breakage in alternative introns, considerable effort has been expended to relate the choice of intron to the outcome of the disease or to any other parameter found to vary between patients. For example, the p i 90 and p210 fusion proteins which occur as a result of the t(9;22) translocation are distinguished by enhanced tyrosine kinase activity of p i 90 over p210 in vitro (McLaughlin et al ., 1989), and more remarkably, CML is exclusively associated with p210 (Clark et al ., 1987). Moreover, the location of breakpoints within the major breakpoint cluster region of CML, which determines the usage of a small number of exons, has been correlated with the duration of the chronic phase (Grossman et al., 1989; Mills et al., 1989), although contradictory data has been presented (Jaubert et al ., 1990; Tefferi et al.y 1990).
The RT-PCR provided a simple means of distinguishing the two P M L breakpoint positions. The breakpoint position was determined for APL1-22 using the RT-PCR (Table 7.1). For APL24- 30 no RNA was available, hence the PML breakpoint position was determined by DNA analysis using P M L cDNA probes by A. Goddard. Fifteen of the 29 patients had 5’ PM L breakpoints and 14/29 had breakpoints in the 3' position. The following clinical information was then collected from all of these patients: age at presentation, sex, classical M3 or M3 variant, presence of coagulopathy and the length of first remission. The P M L breakpoint position was then compared to each of these parameters to test for any positive correlations. In particular it was hoped to establish a correlation between the microgranular variant of APL and the P M L breakpoint position, since the molecular basis for the differences between classical and variant APL is unknown. No statistically significant correlations could be made. However, when the total length of survival instead of the length of first remission was compared with P M L breakpoint position, those patients with a 3' breakpoint had a significantly longer survival than those with 5' breakpoints (mean survival of 43 months versus 3 months). However, this finding needs to be confirmed in a larger group of patients which have all received similar treatment in the same hospital. The expression of 17q-
182

Table
7.1
:
Sum
mar
y of
Patie
nt
Info
rmat
ion
and
PCR
resu
lts.
From
Borro
w et
al.f
1992
.
ft. C i m n n n n n n i n n m i o i * ) pn «n r-> w i m »n < < < <22 22
at,K
« « « V «> « > > ► > > >+ * + 77 +
«>«>«>« > ► ► ►7 7 + +V V V V U t t V V V V t t V V . . . . . .> > > > > > > > > > > > - fr-s I- M h- h-+ + + + 7 + + + + + + + ► 2 2 2 2 2 2
««>«>«> ► > > > *>*>*>*> > > > >
OOUVOOt t VOV > > > > > > > > > > + + + + + + + + + +
0 V I I ( I 0 « < I U U I > I ) O> > > > > > > > > > > >+ + + + + + + + + + + +
<>««>«> ► > > > «> « u u > ► > >
& zt - 2
O S a S C Z O ' S 5 -S !Z ;-S 5i Es3 Oi
. f* o s < < < © -* 2 2 2 00« - - ' 0 0 0 2 2 * ~ - 2 2 2 -'«- MM
22
o o S S o S o ^ S o2 2 >n>.2 >-i2 2 >n2
00t >4 >4 >4 >4 ) 4 >0 0 t >^^0 0 0 4 ) 4 ) m m m© <> t> 4) H 2><><>.2 MM MM
22 22
«►
© © *3 fe
o►s 9 t,; o < » (
V►r ^
soo s
"' <s n
> .> .> *S 75 75
*n © M^ cs» '»
**; M so s© _ © 2 cn
M n n n nv v v w v v ^ ^ v w v v w ^ v ^ v v v v ^ t z v v v v v t z t z>< >< >* >*><>» 2 2 Jm >h ;* >. 2 >« 2 >• Jm Jn >* 2 55 >. >. >. >. >* 2 2 * » « « « © >* >* >* >■• Z MM M ,o 22 22 ;
^ i4 £ £ «* # «P £ u ** * M & M ** M £ ^ # «* £ **— inirioo'vwiir^f^io «eoi9MOOioo~^»n CO CN nyvini0s v > 0s — 0 0 # - , 0 s 0 s * _ , 0 s * - l 0 0 * - , ^ 0 s 0 s © s 0 0 s 0
» 2 §OOVOO ^ o o o n oo eo oo oo o s
** M M *lf» i y ^ A « ^ aft
a. o. a. a. a. pj a. 2 &• ft* a ft- ft* n 2 cq co m 2 2 2 n &• n &. m a « «M M M u u u S
s e e ” g g g g
MM MM22 22
n n n n n n w n n n2 2 2 2 2 2 2 2 2 2 g 2 2 2 2 2 2 2 2 2 2 2 2 2 2 g g g g
u.2 «-2 »-2 2 a*2 s- 2 *»-tt-2 2 2 * 2 2 a-*fc2 tt-2 2 » < 2
m s o ^ s o .a s o ^ M < ' * & ' — o s o » n f ^ — c s i o s ^ - s o — o m ' o r ~ « r i « n
w n w (*i «
a . c u ^ a . tz.
S gggE
s s s s
t t - g s s
_ m m w .a m a . © — c» «*» «r> s© r*. oo os © — w r> ^ «n © r*. oo os- N m » i n e N 0 6 » „ „ „ „ „ w „ „ - - N r J N N N r i N N f iN © •■< e* to«*> CO CO CO m 'C h ®n m ww

transcripts could not be correlated with any of the clinical parameters listed above.
7.5 Discussion and Sum m ary
This chapter describes a rapid and sensitive technique for the diagnosis of APL based on the amplification of PML- RARA fusion messages. A high level of differential splicing was observed across the breakpoint region, with both in- and out-of-frame fusion messages documented. The 15q+ derived messages were found in all 18 patients with cytogenetically confirm ed t(15;17) translocations. In contrast the reciprocal 17q- derived R A R A - P M L fusion messages were only detected in 12/18 of these patients, suggesting that it is the 15q+ derived message which mediates leukaemogenesis. The PM L - R A R A message may therefore be of use in the diagnosis of APL and for confirmation of achievement of remission. Finally, the choice of P M L intron could not be correlated with any of a series of parameters including the microgranular variant of APL or the length of first remission, but apparently the patients with 3' P M L breakpoint positions enjoyed a significantly longer period of total survival.
In addition to the two reciprocal RT-PCR assays described here (Borrow et al., 1992), similar PCR assays based on the fusion messages in APL have also recently been published by several other laboratories (Castaigne et al ., 1992; Alcalay et al ., 1992; Chang et al., 1992b; Chen et al.y 1992; Miller et al ., 1992; Pandolfi et al.y 1992). The conclusions drawn by the different groups are largely in agreement, although certain differences, which may reflect technique or treatment protocols, are observed.
All groups concluded that a P M L - R A R A (15q+) fusion message was expressed in all APL patients with a cytogenetically confirmed translocation at presentation. In addition to our series of 18 such patients, all of whom expressed a PML-RA RA message, a 15q+ fusion message was amplified in 6 / 6 patients (Chang et al .y
1992b), 30/30 patients (M iller et a l . y 1992), 14/14 patients (Castaigne et al.y 1992) and 31/32 patients (Chen et a l . y 1992). The
184

remaining patient in this latter series had a variant t( l 1; 17) translocation involving R A R A y but not P M L y which is described further in the next chapter in the context of other rare variant translocations. None of the groups detected the fusion in any disorder other than APL. Diagnosis of APL is therefore clearly feasible through amplification of these messages. However, the failure to detect a P M L - R A R A fusion message in a single APL patient (APL23, Table 7.1) which lacked cytogenetic analysis (Borrow et al.y 1992) was echoed by the description of four "APL" patients characterized by M iller and coworkers. These four patients were all classified as APL by morphological criteria, but lacked the t(15;17) translocation and failed to respond to retinoic acid. Northern analysis also failed to reveal any evidence of aberrant transcripts. Together these five patients define a minority of "APL" patients which are indistinguishable on morphological grounds from true APL but which lack the unique molecular basis of APL and which also fail to respond to d ifferen tia tion therapy. The RT-PCR provides the only unambiguous means of identifying these patients from the majority of t(15;17)-positive, retinoic acid-sensitive patients. Nonetheless, it is still expected that the majority of t(15;17)- negative APL patients will prove to carry cryptic P M L - R A R A rearrangements, such as patient APL22.
The question of which fusion message mediates leukaemogenesis has also been addressed by other groups. Section 7.3 described how the reciprocal RARA -P ML (17q-) message was only detected in 12/18 APL patients, and how these 17q- messages are a mixture of both in- and out-of-frame messages. These data suggested that the 17q- transcripts are by-products of the translocation rather than its raison d'etre. The in-frame 17q- messages can be translated, and the protein product(s) have been detected with an antibody specific to the RARA A domain (Kastner et al.y 1992). Kastner et al. also suggested that the small size of the 17q- protein would allow it free access to the nucleus where it could mediate its effects (if any). Others have detected the 17q- transcript in 3/3 patients using RT-PCR (Chang et al.y 1992c), but the sample size was too small to draw any firm
185

conclusions as to the true frequency of expression. However, an analysis of the expression of R A R A - P M L messages by Northern hybridization has also been presented (Alcalay et al ., 1992). Hybridization of an isoform-specific PML probe to APL Northern blots identified 17q- transcripts in 9/15 patients, but in patients with 5’ P M L breakpoints the normal P M L message appeared to comigrate with the 17q- message, making it impossible to score these patients accurately. Application of the RT-PCR technique subsequently identified a 17q- message in 7/9 (78%) patients (Alcalay et al.t 1992). This figure of 78% can be compared directly to the figure of 67% presented here, which agrees well given the relatively small sample sizes. Together these results support the notion that the 17q- messages are an epiphenomenon in APL, although Alcalay and coworkers also point out that the t(15;17) is frequently the sole detectable abnormality in the disease, and, since carcinogenesis is a multistep process, the production of a RARA-PML protein could provide the second "hit". To resolve the matter entirely the 17q- protein will have to be tested in a functional assay for myeloid transformation.
Both of the other groups who have presented data on 17q- PCRs have only documented in-frame fusion messages (Alcalay et al.y 1992; Chang et al.y 1992c). In contrast this chapter described two 17q- fusion messages which were out-of-frame, and would therefore encode truncated proteins. Since these out-of-frame messages are co-expressed alongside in-fram e fusions, it is unlikely (but unproven) that they have any role.
The results of 15q+ P M L - R A R A PCRs performed on remission samples may also be contrasted. The results presented here (5/5 remissions were all negative) contrast sharply with the detection of PML-RARA fusions in each of five remission samples (Chang et al ., 1992b). However, three of the five remission samples in our series of patients (APL31, 32 and 33) were peripheral blood samples which are not ideal for the detection of minimal residual disease, although the other two samples were bone marrow. Given the small numbers of patients involved, the results obtained from a series of 14 patients in remission are probably more meaningful
186
(Miller et al ., 1992). Miller et al. detected P M L - R A R A fusion messages in 5/6 remission samples from patients treated with retinoic acid, but in only 3/8 patients treated with conventional chemotherapy. Since only a proportion of the patients were positive this suggests that the RT-PCR technique may be of use in predicting which patients will relapse, although this can only be determined by continuous monitoring of these patients. These results also suggest that the remissions obtained by retinoic treatment may prove to be of shorter duration than those induced by chemotherapy. A large study using samples from multiple time points from each patient throughout the course of their disease is currently underway in our laboratory in collaboration with St. Bartholomew's hospital.
All of the reports are in agreement as to the number of breakpoint positions within P M L , except for one group of investigators who describe a third breakpoint region (Pandolfi et al .9 1992). This report documents a similar pattern of in- and out- of-frame fusions transcribed from the 15q+ chromosome to those described here, but assigns the breakpoints to three different regions within the differentially spliced breakpoint area. Two of the three breakpoint regions are in common, but a third breakpoint region is described in addition. This region was defined at the DNA level on the basis of four patients, which on further analysis appeared to have breakpoints which occurred within the 259bp PML exon D rather than in intronic sequences. At the RNA level there was no evidence presented to suggest that these patien ts could not transcribe a fusion m essage corresponding to that caused by a breakpoint in the 5' P M L position (intron a), although additional out-of-frame messages could also be transcribed. The designation of three different P M L breakpoint positions at the RNA level is therefore misleading.
Finally, none of the other RT-PCR papers attempted to relate P M L breakpoint position to the microgranular variant or to the length of survival, hence the possibility that 3' breakpoint patients survive for longer cannot be re-assessed using combined data.
187
C hapter 8
Molecular Analysis of Simple Variant APLTranslocations
8.1 V arian t T ranslocations
Cytogenetic analysis of patients with APL has established that the majority of patients present with a typical t(15;17) translocation (Larson et al.t 1984; Sheer et al., 1985). Patients who fail to demonstrate the standard t(15;17) translocation are rare, and are divided into three classes: A) those with complex translocations; B) those with simple variant translocations and C) those that entirely lack the t(15; 17) or any of its variants. For example, in a recent cytogenetical survey of 105 APL patients, 100 had a simplet(15;17) translocation, four patients lacked the t(15;17) and asingle patient had a complex three-way translocation involving both the usual breakpoint positions on chromosomes 15 and 17 (B erger et al .y 1991). No patients w ith sim ple varianttranslocations were reported in this series.
Complex translocations are three (or four) way translocations which in APL involve not only chromosomes fifteen and seventeen but a third (or fourth) chromosome in addition. The breakpoint positions on chromosomes 15 and 17 are broadlycompatible with rearrangement of the R A R A and P M L loci, whereas the third rearranged locus can involve the autosomalchromosomes or the X chromosome. In APL only seven complex translocations have been reported in total (Osella et al.y 1991),which involve chromosomes 1, 2, 3, 4, 5 and the X chromosome. Six of these were three way translocations while the seventh involved four chromosomes. These translocations were expectedto result in the same P M L - RA R A fusion messages as observed in patients with the standard t(15;17). To test this hypothesis a bone marrow sample from an APL patient with a previouslyunreported complex translocation, t(13;15;17), was reverse transcribed and amplified with the P M L and R A R A primers as described in the previous chapter. A 355bp P M L - R A R A fusion
188

message was amplified, indicating that the same molecular events had occurred at the breakpoint despite the involvement of a third chromosome. This patient does not appear in Table 7.1. Studies in CML have concluded that complex translocations initiate as simple translocations and evolve clonally, as suggested by the case of a mosaic t(9;22)/t(V;9;22) (see references in Huret, 1990). By analogy APL complex translocations may also be two step phenomena. From the molecular viewpoint the study of complex translocations is unlikely to provide any further insights into the pathogenesis of APL since they appear to result from the same P M L - R A R A fusions as found in the overwhelming majority of patien ts.
Reasons for the failure to detect the t(15; 17) translocation in a small proportion of APL patients have already been discussed (section 7.4-1). It is expected that the majority of the t(15;17) - negative patients will eventually prove to carry cryptic P M L andR A R A rearrangements, despite the five cases discussed to thecontrary in the preceding chapter (which may have been misclassified). Likewise, most cases of Philadelphia-negative CML have been shown to exhibit hidden BCR -AB L rearrangements, and it has been suggested that the rare cases of CML without such rearrangement should be reclassified as "CML-like disease” (Huret,1990). M olecular analysis of t(15;17)-negative patients is therefore unlikely to reveal novel mechanisms for the genesis of APL.
The third type of variant translocation found in APL is the simple variant translocation. Simple variant translocations involve one of the two well-defined breakpoint positions at 17q 12-21 or 15q22without apparent rearrangement of the other. A survey of theliterature revealed that only nine simple variant translocations have been recorded in APL. Two simple variant translocations involving chromosome 15 have been published (Table 8.1), neither of which showed any involvement of chromosome 17. The other seven cases all involve chromosome 17 (Table 8.2), with no reported abnormalities of chromosome 15.
189

Table 8.1 Simple variant translocations involving chromosome 15.
V arian ttranslocation
Sex/Age M aterialrem aining
Reference
t(3;15)(q21 ;q22) M /65 DNA (Heim et a l ., 1988)t(X ;15)(pl l;q22) F /18 DNA + RNA (Srivastava et al .y
1987)
Table 8.2 Simple variant translocations involving chromosome 17.
V arian ttranslocation
Sex/Age M aterialrem aining
Reference
t( l ;17)(p36;q21) M /57 fixed cells (Yamada et al .y 1983)t(l;17 )(p36 ;q21) F /4 none (Schwartz et a l . t
1986)t(7;17)(q36;q21) F /2 2 fixed cells (Yamada et al .y 1983)
t( 8 ; 17)(p 1 2 - p 2 1 ;q 1 2 )
M /36 none (Sonoda et al .y 1985)
t( l l ;1 7 ) (q l3 ;q l2 ) M /74 BM smears (Naifeld et al .y 1989)t( l l;17)(q22-23;
q 1 2 -q 2 1 )M /67 undeterm ined (Chen et al .y 1991a)
(Tong et al .y 1992)t(1 7 ;1 9 )(q l2 ;q l3 ) F DNA + RNA C. Harrison,
unpublished obs.
Two explanations have been invoked to explain the occurrence ofsimple variant translocations. The most likely explanation is thatthe "simple" translocation is in fact complex, and that additionalcy togenetically undetectable m aterial is p resen t at thetranslocation breakpoint. In CML, all cases of presumed simplevariant translocations have been reclassified as com plextranslocations after further analysis using a combination of highresolution banding, in situ hybridization with BCR or ABL probesor DNA analysis (see references in Huret, 1990). Prior to thecloning of the APL translocation breakpoint, in situ hybridizationand DNA analysis were unavailable for the reappraisal of APLsimple variant translocations. Another technique which can reveala masked fusion of PML and RARA sequences is the RT-PCR assay.In comparison with CML it could be expected that all nine of the
190

simple variant APL cases would prove to contain cryptic P M L - R A R A rearrangements. Using the reagents outlined in previous chapters it became possible to test this theory for the first time.
The alternative explanation to account for the varian t translocations is more intellectually intriguing, and assumes that the variant translocation accurately represents a direct fusion event between either R A R A ox P M L and a novel locus on the varian t chrom osom e. For exam ple, the varian t t(3 ; 15) translocation (Heim et a l 1988) might product a chimaeric fusion message and protein between P M L and an uncharacterized locus on chromosome 3, and the t(l;17) translocation (Schwartz et al ., 1986; Yamada et al., 1983) might fuse R A R A to a new gene at chromosome lp36. If this should prove to be correct then analysis of the nine simple variant APL translocations could provide considerable detail about alternative molecular pathways leading to the same disease phenotype. In particular, comparison of the properties of different proteins which could replace P M L (or R A R A ) at the breakpoint might reveal certain properties in common. These properties could be the key to determining why a fusion between two particular transcription factors leads to one type of leukaemia and not another.
Two lines of evidence supported the hypothesis that the simple variant translocations might identify additional oncogenic rearrangements. Analysis of the t(6;9) translocation seen in M2 and M4 types of myeloid leukaemia has identified fusion messages between two genes, D E K and C AN (von Lindem et al., 1992; von Lindem et al., 1990). However, molecular analyses revealed a different rearrangement in a single patient with acute undifferentiated leukaemia, in which C A N was fused to the S E T gene instead of to D E K (von Lindern et al., 1992). A SET-CAN fusion protein was predicted. These data confirm that translocation breakpoint genes, in this case C A N , can have multiple fusion partners. More recently a second fusion partner, the H L F gene, has been identified for the E2A gene in B-lineage leukemia (Inaba et al., 1992).
191

The second line of evidence is the recurrence of two of the chrom osom e 17 varian t translocation b reakpo in ts. The t( l;1 7 )(p 3 6 ;q 2 1 ) APL v arian t tran slo ca tio n has been independently reported twice (Schwartz et al., 1986; Yamada et al., 1983) following an earlier report of a patient classified as AML with an identical rearrangement (Rowley et al., 1977b). On the basis of these three reports and an additional four way translocation involving lp36 as well as the usual 15 and 17 breakpoints (Ohyashiki et al., 1985), the t(l;17) translocation has achieved Status II (i.e. at least three cases reported from two or more laboratories) in the catalogue of chromosomal changes in neoplasia. The repeated involvement of chromosome 1 suggests the presence of a gene at lp36 which can replace P M L at the translocation breakpoint. Similarly, the two independent case reports describing a t(l 1; 17) variant APL translocation (Najfeld et al., 1989; Chen et al., 1991a) possibly pinpoint a third fusion partner for R A R A , although it is unclear if the same band is involved on chromosome 11 in both cases. These genes could be closely related members of the same zinc finger gene family to which PML belongs.
Cloning the t( 15; 17) translocation breakpoint provided the probes to distinguish between hidden P M L - R A R A rearrangments or alternative oncogenic rearrangements. The authors of all the case reports which described the APL simple variants were therefore approached to determine if any material remained from these archival cases which was suitable for molecular analysis, with the exception of the authors of the t(l 1; 17) case report (Chen et al., 1991a) which was only recently published. The surviving material from the variants is summarized in Tables 8.1 and 8.2. No material remained from the t(l;1 7 ) translocation reported by Schwartz et al. or the t(8;17). A few fixed cells of uncertain quality remained from both the variants described by Yamada et al. while the only material left from the t(ll;1 7 ) described by Najfeld et al. was smears of bone marrow. However, cryopreserved bone marrow and leukophoresed blood samples were available from the t(3;15) and t(X; 15) variants respectively, which were kindly provided for analysis on a collaborative basis. In addition, a bone
192

marrow sample from an unpublished t(17;19) APL variant was kindly provided by C. Harrison (Manchester). This latter sample is currently being analysed in the laboratory by K. Howe. The analysis of the two chromosome 15 variants is described below.
8.2 Analysis of the t(X:15) APL V arian t
Only two chromosome 15 variants have been described, the t(3;15)(q21;q22) and the t(X ;15)(p ll;q22) (Table 8.1), and by chance these were the two variants for which material was available. Neither of these variants appeared to rearrange 17ql2- 21, suggesting the possibility that genes from 3q21 and X p ll could replace R A R A at the breakpoint. Two obvious candidates were the highly homologous beta and gamma retinoic acid receptors. However, since these map to 3p24 and chromosome 12 respectively (Ishikawa et a l ., 1990; Mattei et al.y 1991; Mattei et a l . y 1988a) it was deemed unlikely that either gene was involved at the variant translocation breakpoints. Instead, one of the chromosomally unassigned RXR genes or an unrelated gene could be involved, or R A R A itself could be cryptically rearranged. Neither patient could be distinguished clinically from t(15;17) APL patients; for example, both showed the clotting disorders characteristic of the disease.
Both RNA and DNA were extracted from the t(X;15) leukophoresed blood sample, which were analysed respectively by RT-PCR and Southern blotting. DNA was digested with BamHI and EcoKl and hybridized to a PML cDNA fragment (XH400) (Figure 8.1 B). This probe detected a rearranged band, confirming that P M L was involved in the translocation as suggested by the karyotype. The digests were then hybridized with the entire battery of R A R A probes (LCN4A3/A-D), which detected the same rearranged fragments as had the PML probe (Figure 8.1 A and Table 8.3). This proved that R A R A was involved, and a cytogenetically undetectable fragment of chromosome 17 including RARA must be present at the t(X;15) translocation breakpoint. The RT-PCR analysis confirmed that a P M L - R A R A fusion message was transcribed by the amplification of a 355bp (5’ P M L breakpoint
193
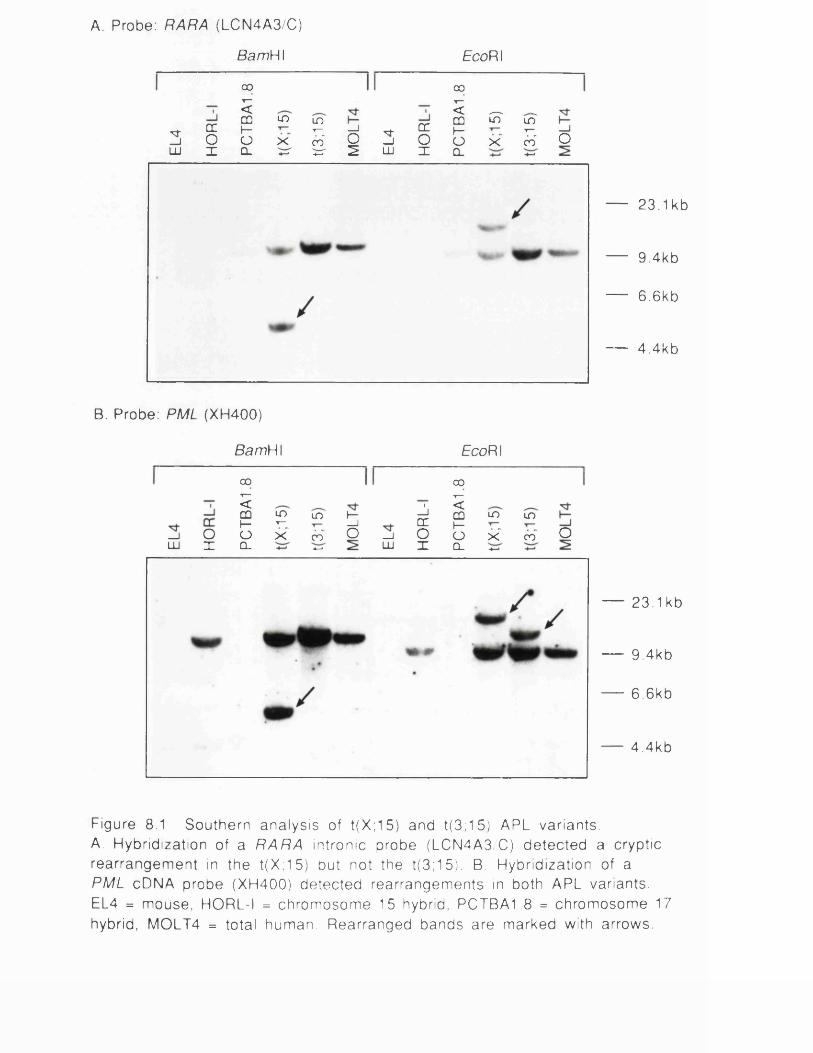
A. Probe: RARA (LCN4A3/C)
BamH I EcoRI
001—<CO LO LOh— T—o X COQ_
^ _ c c i — ^ i ^ c r .—i O o X c o - O —j O o x c o ' OL U I C L ^ ^ r ^ L U X
00T—< „____ . ^CO LO LOh - ■»—o X 00Q_ 1
23.1 kb
— 9.4kb
— 6.6kb
■— 4.4kb
B. Probe: PML (XH400)
BamH I EcoRI
_ i LU I
00 00T— T—<CO LO LO I—
1_l <
CO LO LO1—o
y—X 00
_Jo —ICCo 1—
o X COQ_ ■*—> LU X CL
m LO m I— —1 m LO i n
O O X c o Q —i O o x c o Q
— 23.1 kb
— 9.4kb
— 6.6kb
— 4.4kb
Figure 8.1 Southern analysis of t(X;15) and t(3 :15) APL variants.A. Hybridization of a RARA intronic probe (LCN4A3/C) detected a cryptic rearrangement in the t (X : 15) but not the t(3; 15). B. Hybridization of a PML cDNA probe (XH400) detected rearrangements in both APL variants. EL4 = mouse, HORL-I = chromosome 15 hybrid, PCTBA1.8 = chromosome 17 hybrid, MOLT4 = total human. Rearranged bands are marked with arrows.

position) PCR product (data not shown). The position of the chromosome 17 breakpoint within the RARA breakpoint intron is shown in Figure 8.2.
Table 8.3 Probes used for detection of the t(X;15) breakpoint on Southern an a ly sis .
Probe BamHl Digest EcoRI DigestLCN4A3/A No YesLCN4A3/B No NoLCN4A3/C Yes YesLCN4A3/D No Yes
PML XH400 Yes Yes
The ability of the breakpoint probes to detect the t(X;15) breakpoint fragments was recorded on B a m H l and EcoR I digests. The position of the breakpoint within the RARA locus was deduced from this data (Figure 8.2).
8.3 Analysis of the t(3:15) APL V arian t
High molecular weight DNA was extracted from the bone marrow sample provided from the t(3;15) APL variant, but the RNA was degraded. This prevented the use of RT-PCR to establish whether or not P M L - R A R A transcripts were present. The DNA was analysed in a similar way to the t(X;15) sample, that is, by thehybridization of PML and RARA clones. Again, PML was shown tobe rearranged (Figure 8.1 B), but no rearrangements could be detected in RARA using any of the four LCN4A3 probes on B a m H l or E co R I digests. The analysis was extended to include an additional proximal RARA probe (Cosl24 BE1.5, see Figure 8.2) and the RARA cDNA probe H5. Assuming that the rearranged band has not co-migrated with the germline band, these hybridizations eliminated the possibility that R A R A was rearranged in this patient. This implied that a locus involved in leukaemogenesis on chromosome 3 could isolated by walking from P M L over thet(3; 15) breakpoint.
195

APL
BREA
KPOI
NT
REGI
ON
tl
in
?E coH■S au
3 rccr
.oCM
§C
co L .
CQ-m-LUTX'
p<LLTLLT
CD-
IIT ©o
£ ur- ©E8 iii-
ca o.LU!uj
©cooco“J3oc3
in
co4—•
ooXX
8 ^ 2 Q o LU(A O LU O CD
8x -CD”UJ J CD
u f ■ 2I SUJx‘
co ^s ccQ. ©^ £ ca **©^ ° g go*» o0 § •CO ©c £2 *-
in o T l ©S ’0*S” TJ1 |^ ©
co ^ .* ■ « I£ * 1<0)•- ©° o) .*2
©<2 j= © £ 0 . C.2 o% £ ° o Tl coa . co j=_ ^ —* O)c © ©£ £ © ° _ o£ E (/)CO g -
© - 2 O ? T 55 o 8^ o D CC C CO
5 1 *o i l9- ® s© £ >2 - o
o §S Q- x® © X 2 e ©£ > .c 8u- l- CL
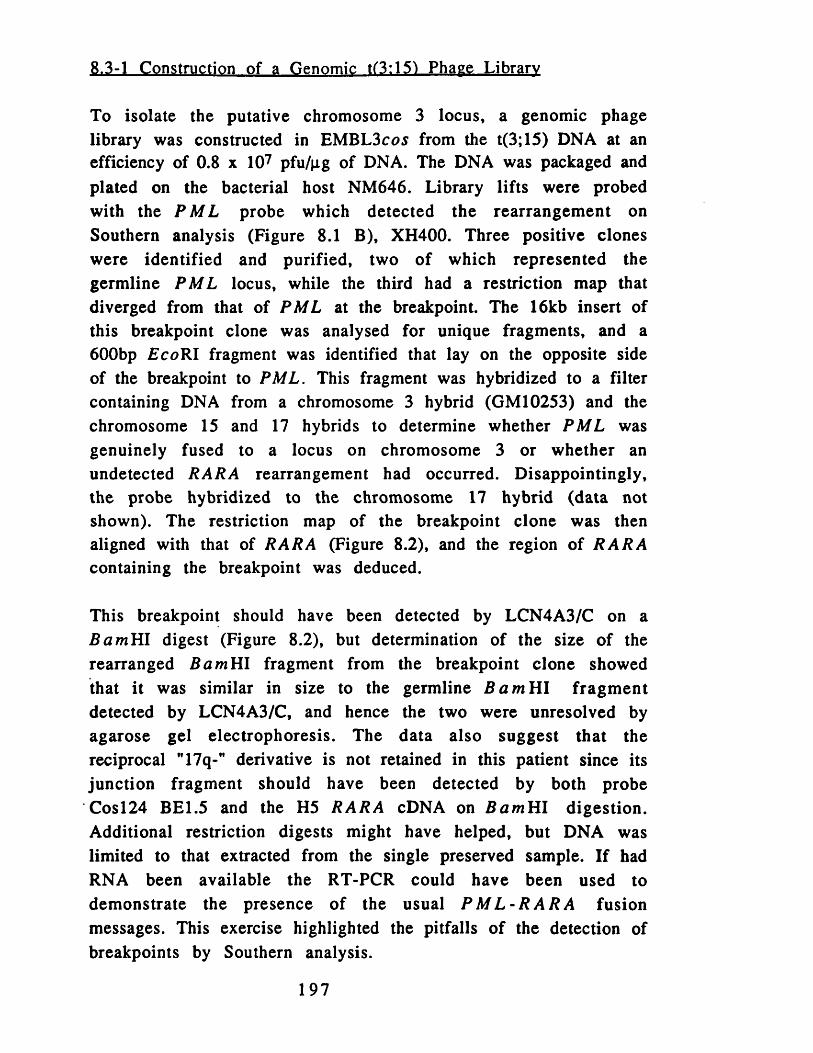
8,3-1 Construction of a Genomic t(3:15) Phage Library
To isolate the putative chromosome 3 locus, a genomic phage library was constructed in EMBL3 C0 S from the t(3;15) DNA at an efficiency of 0.8 x 10⁷ pfu/pg of DNA. The DNA was packaged and plated on the bacterial host NM646. Library lifts were probed with the P M L probe which detected the rearrangem ent on Southern analysis (Figure 8.1 B), XH400. Three positive clones were identified and purified, two of which represented the germline P M L locus, while the third had a restriction map that diverged from that of PM L at the breakpoint. The 16kb insert of this breakpoint clone was analysed for unique fragments, and a 600bp EcoRI fragment was identified that lay on the opposite side of the breakpoint to PML. This fragment was hybridized to a filter containing DNA from a chromosome 3 hybrid (GM10253) and the chromosome 15 and 17 hybrids to determine whether P M L was genuinely fused to a locus on chromosome 3 or whether an undetected R ARA rearrangement had occurred. Disappointingly, the probe hybridized to the chromosome 17 hybrid (data not shown). The restriction map of the breakpoint clone was then aligned with that of RA RA (Figure 8.2), and the region of R A R A containing the breakpoint was deduced.
This breakpoint should have been detected by LCN4A3/C on a B a m H l digest (Figure 8.2), but determination of the size of the rearranged B a m Hl fragment from the breakpoint clone showed that it was similar in size to the germline B a m H l fragm ent detected by LCN4A3/C, and hence the two were unresolved by agarose gel electrophoresis. The data also suggest that the reciprocal "17q-" derivative is not retained in this patient since its junction fragment should have been detected by both probe Cosl24 BE1.5 and the H5 R A R A cDNA on B a m H l digestion. Additional restriction digests might have helped, but DNA was limited to that extracted from the single preserved sample. If had RNA been available the RT-PCR could have been used to demonstrate the presence of the usual P M L - R A R A fusion messages. This exercise highlighted the pitfalls of the detection of breakpoints by Southern analysis.
197

8.3-2 In Situ Hybridization Analysis of the t(3:15) APL Variant
The availability of fixed cells from the t(3;15) APL variant prompted an investigation of the translocation using in situ hybridization techniques. These experiments were performed by J. Shipley (Human Cytogenetics, ICRF). PCR products from a flow sorted chromosome 17 library was biotinylated and used to paint the t(3; 15) chromosomes. This painting experiment detected two apparently normal chromosome 17s, but no signal was obtained from the junction of either of the derivative chromosomes. This indicated that the size of the fragment of chromosome 17 which is inserted at the translocation breakpoint is less than the 5-10 megabase resolution of the chromosome painting technique (Figure 8.3 A and B).
Cosmids from the PML and RARA loci were then used for in situ hybridization together with a chromosome 15 centromeric probe. The PML cosmid was labelled with digoxigenin and detected with FITC (green), and the R A R A cosmid ws biotin labelled and detected in TR (red). The chromosome 15 centromeric probe was labelled with both, and all three probes hybridized simultaneously to the variant. Signals obtained from the derivative chromosome 15 indicated that P M L and RARA sequences were juxtaposed in the breakpoint region (Figure 8.3 C and D). Unfortunately the quality of the fixed cells was insufficient to determine whether both the "normal" chromosome 17s also retained the R ARA locus, or whether the locus was lost from one of them. This would reflect whether R A RA was duplicated or excised prior to ligation to the PML locus.
8.4 Discussion and Sum m ary
Analysis of both the reported chromsome 15 APL translocation variants (Table 8.1) has proved that these apparently simple variant translocations are instead complex translocations with masked involvement of RARA. The t(X; 15) was analysed by RT- PCR and Southern blotting and the t(3;15) was investigated using
198

Figure 8.3 A and B) Chromosome 17 paint of the t ( 3 ; 15) APL variant trans locat ion using b iot iny lated PCR products from a f low sorted ch rom osom e 17 library. Two apparent ly normal ch rom osom e 17s are are detected (arrowed), but no convincing signal is obta ined on ei ther of the der ivat ive chromosomes.C) S imu l taneous in si tu hybridizat ion of a d igox igen- labe l led PML cosmid and a ch romosom e 15 centromer ic probe to the t(3;15) var iant. The signals are detected with FITC (green). The normal ch romosome 15 is not visible in this photograph but the 15q+ derivat ive is ind icated with an arrow.D) Hybridizat ion of a biot in- label led R A R A cosmid to the same chromosome spread. The signal is detected with TR (red) and co- loca l izes with PML to the 15q+ chromosome, reveal ing the crypt ic juxtaposit ion of PML and R ARA sequences.These hybridizat ions were per formed by J. Shipley.

Southern blotting, a t(3;15)-specific genomic library, chromosome painting and in situ hybridization. The results indicated that in both cases the familiar fusion of the PML and RARA genes had occurred. These results are in agreement with the analysis of CML simple variant translocations, which have been shown to disguise cryptic B C R - A B L rearrangem ents. This indicated that the rearrangement of RARA is essential for the genesis of APL, and that R ARA cannot be replaced by any other nuclear retinoic acid receptor. No other simple variant chromosome 15 translocations have been reported.
The possibility that P M L can be replaced at the translocation breakpoint cannot be excluded due to the unavailability of material from the majority of the simple chromosome 17 variants. The analysis of the t(17;19) variant is currently underway in the laboratory. However, the recurrence of both the t ( l ; 17) and t( 11; 17) variants strongly suggests that R A R A may have alternative fusion partners on chromosomes 1 and 11. Evidence to support this theory is provided by similar combined RT-PCR and Southern analyses performed on the recently reported t( l 1; 17) variant (Chen et al., 1991a). Although RARA rearrangements were demonstrated (Chen et al.y 1991a), PM L appeared to remain in its germline state (Tong et al.y 1992). More importantly, given the difficulties inherent in Southern analysis, RT-PCR failed to amplify the customary P M L - R A R A fusion messages (Chen et al.y 1992). Intriguingly this patient also failed to respond to treatment with a ll-trans retinoic acid. These data strongly suggest the existence of a second fusion partner for RARA on chromosome 11, the isolation of which will represent a major advance in the molecular understanding of APL. A lthough patien ts w ith varian t translocations are numerically insignificant, the analysis of their chromosome breakpoints may provide critical insights into the disease with broad implications for the majority of patients with the classical t(15;17).
2 0 0

C hapter 9
D i s c u s s i o n
9.1 Overview of Results
The individual discussions at the end of each chapter have shown that the objectives of the thesis (section 1.7) have been met. The APL t(15; 17) breakpoint was cloned through a positional cloning strategy which required the saturation of 17q with N ot I linking clones (chapter 3) and the detection of the breakpoint as a band shift on PFGE (chapter 4). Linking clones are one of the most efficient types of marker for saturation of a chromosomal region since duplicate clones can be avoided and each clone spans two adjacent Not l fragments.
A second property of linking clones is their association with transcription units, and a gene isolated with the linking clone that detected the PFGE bandshifts was shown to span the breakpoint suggesting the involvement of this gene in the pathogenesis of APL. This gene proved to encode the retinoic acid receptor alpha (RARA) (chapter 5), a retinoic acid-responsive transcription factor presumed to mediate leukaem ogenesis through a dom inant negative effect. Aberrant messages were detected on Northern blots with RARA. The identification of RARA at the breakpoint on chromosome 17 provided a springboard for the isolation of the P ML locus on chromosome 15 by walking over the translocation breakpoint, and enabled the identification of reciprocal fusion messages, P M L - R A R A and R A R A - P M L , between the two genes (chapter 6 ). PML is interrupted in one of two alternative positions by the translocation. The fusion messages formed the basis of a diagnostic PCR specific for APL (chapter 7) which was used in the analysis of simple variant APL translocations (chapter 8 ). Both of the variant translocations studied had cryptic rearrangments of RARA.
2 0 1

Cloning the t(15;17) breakpoint has identified the primary genetic abnormality in APL as a fusion between two genes, one encoding a proven transcription factor (RARA), and the other a putative transcription factor (PML). This discovery further justifies the attention which has been focussed on transcription factors elsewhere in neoplasia. The ultimate goal of cloning experiments is to provide a complete explanation of the disease at the molecular level and in doing so to open new areas of potential therapeutic intervention or improved diagnostics. This work has done both, since the RT-PCR assay will facilitate diagnosis and should permit monitoring of patients in relapse, while the indictment of a retinoic acid receptor at the breakpoint helps put the hitherto empirically administered differentiation therapy with ATRA on a more scientific footing. The implications of the indictment of a retinoid receptor in cancer are discussed furtherin section 9.2. Other implications of this work are discussed below.
The utility of linking clones in positional cloning strategies, particularly for the detection of deletions and translocations onPFGE, is emphasized by this work. The subsequent adoption of an almost identical strategy using linking clones from chromosome 21 to clone the t(8;21) translocation seen in other types of AML demonstrates that the worth of this approach (Miyoshi et al.,1991; Shimizu et al., 1991). Likewise, the cloning of the NF1 gene was accomplished using linking clones (Fountain et al ., 1989). It is to be hoped that the cloning of the early onset breast and ovarian cancer locus, also located on 17q (Hall et al., 1990; Narod et al.,1991), will also benefit from the work presented in this thesis. Even when the Human Gene Mapping project has achieved its goal of an overlapping series of clones for every human chromosome (scheduled for 1995), these linking clones, by then incorporated into a contiguous physical map, will remain as key markers on the chromosome. Approximately 5% of the linking clones will identify genes that have already been characterized (an estimated 5 % ofgenes had been cloned by HGM11, 1991), hence the remaining 95% of the linking clones will identify novel genes on 17q.
2 0 2

The identification of reciprocal transcription products (i.e. P M L - R A R A and R A R A - P M L fusion messages) read from both translocation derivatives is unique to APL. As discussed in chapter 6 , the inability to detect the 17q- derivative {RARA-PML) in 33% of APL patients suggested that it is the 15q+ derivative which mediates leukaemogenesis, and the 17q- product may be nothing more than a molecular by-product of the translocation. Patients expressing both fusion messages did not have a worse prognosis, nor was expression of the 17q- message correlated with the microgranular variant. Moreover, the 17q- message lacks a DNA binding motif, and would encode a protein unlikely to contain transforming potential.
However, the realization that both chromosomal derivatives can be transcriptionally active prompts an urgent review of other leukaemias with reciprocal translocations to determine if they too can express the reciprocal fusion message. The failure to detect these messages in the past may reflect the assumption that only a single chromosomal derivative would be active, and hence a second fusion message has not been sought. In contrast to APL some of these other hypothetical reciprocal fusion messages would contain motifs of significance in neoplasia. For a reciprocal message to be expressed three criteria must be met: 1 ) both translocation derivatives must be retained in the cell, 2 ) the translocation must be perfectly reciprocal such that no coding sequences are lost and 3) both promoters must be active in the cell type in which the translocation occurs. RT-PCR now provides a rapid means of testing for the presence of these messages.
CML remains one of the best-studied haematological malignancies, and it is difficult to see how the presence of ABL-BCR messages (in addition to B C R - A B L messages) could have gone undetected. Nonetheless, both translocation derivatives are retained in the majority of CML patients; for example, the original nine patients in which the t(9;22) translocation was defined contained both the 22q- and 9q+ chromosomes and could potentially transcribe fusion messages from either chromosome (Rowley, 1973). Furthermore, the A B L promoter is ubiquitously expressed in
203

haematopoietic cell lines and would therefore could be expected to mediate the expression of an ABL-BCR fusion gene (Westin et al.y1982). There is therefore no a priori reason why ABL-BCR fusion messages should not be detected in at least some CML patients. As described (section 1.3-3) BCR is a modular protein with three separate functional domains, and the C-terminus of the predicted ABL-BCR protein would therefore encode a GAP for RAC (Diekmann et al.y 1991). Further investigation is warranted.
Likewise, the t(6;9) translocation has been reported to express a DEK- CA N fusion message (von Lindem et al.y 1992), but Northern analysis with 5' CAN probes suggests that a C AN -D EK message is not expressed. However, co-migration of normal CAN and CAN-DEK messages would disguise the latter, hence RT-PCR should be applied to confirm this apparent lack of expression. The C A N promoter is active in the myeloid lineage (von Lindern et al.y1992), potentially allowing transcription of C A N - D E K fusions in myeloid leukaemias. The D E K - C A N message was consistently detected in all 10 of the patients with t(6;9) which have so far been analysed with RT-PCR (Soekarman et al.y 1992), and these patients should be re-analysed for evidence of the reciprocal m essage.
The t( 1; 19) translocation of pre-B-cell leukaemia has a reported E2A-PBX fusion message, but it is unlikely to express a reciprocal PBX-E2A message since the P B X gene is not thought to be transcriptionally active in B-cells (Kamps et al.y 1990; Nourse et al .y 1990) and the putative PBX-E2A message would be under the control of the PBX regulatory elements. However, the hypothetical PBX-E2A protein would still retain a DNA-binding domain from E2A, and hence would appear more likely to participate in oncogenesis than the RARA-PML protein of APL. Again, the reciprocal product should be sought.
In general, if both fusion derivatives do not contribute to leukaem ogenesis then the retention of both chrom osom al derivatives within leukaemic cells may reflect dosage or imprinting requirements.
204
9.2 Retinoic Acid Receptors in Neoplasia
The dem onstration that R A R A is involved at the t(15;17) breakpoint (Borrow et al.9 1990; de The et al ., 1990; Longo et al ., 1990b) has prompted a re-evaluation of the role of retinoic acid receptors in neoplasia. The only previous firm evidence which implicated the nuclear retinoic acid receptors in cancer was the report of a single case of hepatocellular carcinoma (HCC) which contained part of the hepatitis B virus (HBV) integrated within the retinoic acid receptor beta gene (Dejean et al ., 1986; Dejean and de, 1990). In parallel with APL a fusion protein was predicted, but between the viral surface protein and RARB instead of PML and RARA. Furthermore, the breakpoints within the two retinoic acid receptors are in comparable positions. However, while R A R A is normally expressed at high levels in promyelocytes, RARB is only expressed at low levels in normal hepatocytes, hence ectopic expression of RARB was mooted as the mechanism of oncogenesis. This is not the case in APL, since both R A R A and P M L are normally expressed during myeloid development. Alternatively the integration of HBV within R A R B may have been fortuitous; HBV integration sites have not generally revealed oncogenic sequences, and nor has another instance of integration within RARB been presented.
So is the rearrangement of RARA in APL an isolated example of retinoid receptor-induced neoplasia? One way to determine if the other retinoic acid receptors are involved in other types of cancer is to compare the chromosomal map positions of the other two RARs (the beta and gamma receptors) to the sites of other chromosomal aberrations in cancer. A similar comparison for the three RXRs will have to wait until the map positions of these receptors have been reported. Intriguingly, RARB maps to chromosome 3p24 (Mattei et al ., 1988a), a chromosomal region frequently deleted in lung cancer (Whang-Peng et al., 1982) which also shows high levels of allele loss (3p21-24) in lung tumours. A tumour suppressor gene is actively sought in this region, and
205

several lines of evidence suggest that RARB could be this tumour suppressor gene.
Various data suggest that RARB is a logical candidate for a lung cancer tumour suppressor gene in addition to its map position and the indictment of its sister receptor, R A R A f in neoplasia. Firstly, as mentioned in the introduction, vitamin A deficiency results in a squamous metaplasis of the columnar epithelia, including that of the airways, suggesting that retinoic acid plays a role in epithelial differentiation (Wolbach and Howe, 1925). Secondly, in situ hybridization studies in the adult mouse with RARB indicates that expression of RA RB is restricted to a small number of epithelial tissues including the bronchial epithelium (Dolle et al ., 1990), again suggesting a role for R A R B in bronchial differentiation. Thirdly, rearrangements in RARB were found in 3/33 independent lung cancer cell lines (Gebert et al ., 1991). Proof of this theory would require documentation of point mutations (and other types of mutation) in other lung cancer cell lines and in lung biopsy sam ples.
The third retinoic acid receptor, R A R G , has been mapped to chromosome 12 (Ishikawa et al ., 1990), and has recently been sublocalized to 12ql3 by in situ hybridization (Mattei et al ., 1991). This chromosomal region is consistently rearranged in a group of translocations with breakpoints at 12ql3-ql5 found in lipomas, myxoid liposarcomas, leiomyomas and pleom orphic adenomas (see references in Solomon et al.y 1991). A role for RARG has not been explored in these tumours.
Finally, a role for RA RA itself in early onset breast and ovarian cancer has not yet been ruled out, neither by genetic recombination nor a systematic search of the gene for mutations in breast tumour samples or affected individuals from breast cancer pedigrees. The gene lies within the critical region (Hall et a l . t 1992). The inhibition of mammary carcinogenesis in rats after treatment with retinoids would support this idea (Moon et al.y
1983).
206

The above discussion shows that although a number of promising leads concerning the other receptors in cancer should be followed up, at the moment APL remains the only example of the oncogenic conversion of one of these nuclear receptors. The dominant negative model of oncogenesis, whereby a PML-RARA fusion protein in APL successfully competes out the normal RARA, perhaps preventing dimerization to the RXRs, has already been mentioned (chapter 5). This model might predict a knock on effect to the thyroid hormone and vitamin D receptors which also dimerize with the RXR receptors (Bugge et al., 1992; Kliewer et al., 1992b; Leid et al., 1992; Yu et al., 1991; Zhang et al., 1992). Similar models have been proposed for the mutant RARA proteins in the HL60 and P I9 variants which suffer a block to terminal differentiation on addition of retinoic acid (Collins et al., 1990; Kruyt et al., 1992; Pratt et al., 1990).
Considering the ability of RARA to dimerize with RXR, PML-RARA would also be expected to dimerize with RXR since it retains the dimerization domain. Treatment of APL patients with all- t rans retinoic acid, the high affinity ligand of RARA, induces complete remissions in the majority of patients (Castaigne et al., 1990; Huang et al., 1988), hence the application of the high affinity ligand of the RXRs, 9-cis retinoic acid, might also prove efficacious. The action of the 9-cis isomer as a differentiating agent could be tested on the APL cell line NB4 (Lanotte et al., 1991). Relapses which are resistant to ATRA might still be responsive to the 9-cis isom er.
9.3 The P M L Gene
Following the discovery that R A R A lay at the APL breakpoint (Borrow et al., 1990; de The et al., 1990; Longo et al., 1990b), a total of six groups have independently isolated its fusion partner, PML, from chromosome 15, including our own laboratory (Chang et al., 1992c; de The et al., 1991; Goddard et al., 1991; Kakizuka et al., 1991; Pandolfi et al., 1991; Kastner et al., 1992). The majority of the conclusions reached are in agreement, but some of the reports contain additional unique observations. A summary of the
207

properties of PML will be presented here, since a full understanding of how the PML-RARA fusion protein induces APL can only be surmised from a detailed knowledge of the function of the normal PML protein as well as that of RARA.
9.3-1 The PML Gene Family
PML was widely hailed as a new member of a zinc finger family of proteins which all contain a C3 HC 4 cysteine-histidine motif, usually towards the N-terminus of the protein (Freemont et al., 1991). At least 17 family members have been identified and the number continues to rise. As mentioned in chapter 6 , these proteins are all thought to interact with nucleic acid and direct evidence for the interaction of a synthetic peptide corresponding to the C3 HC 4 motif with both DNA and zinc has recently been presented (Lovering et al ., 1992). This is consistent with the idea that most, and possibly all, of the C3 HC4 family function as transcription factors.
In addition to PML many of the other C3 HC 4 family members have been implicated in oncogenesis; for example, the BMI-1 gene was identified through proviral tagging of genes which can cooperate with a E\i-MYC transgene in B-cell lymphomagenesis (Haupt et al , 1991; van Lohuizen et al., 1991). A second family member MEL 18 (Tagawa et al., 1990) was identified from a mouse melanoma, and was later shown be to 80% homologous to the BMI-1 gene product (Goebl, 1991). Both genes could function as transcription factors. Several other family members are also thought to be involved in transcriptional regulation, including the XNF7 phosphoprotein from Zenopus laevis (Reddy et al., 1991), the human RPT1 protein which may regulate expression of the interleukin - 2 receptor (Patarca et al., 1988) and the immediate early IE110 protein of herpes simplex virus which transcriptionally activates later viral genes (Perry et al., 1986). The herpes simplex virus is not the only virus to contain a C3 HC4 zinc finger protein.
At first glance the murine RAG-1 gene (recombination activating gene-1) and the R A D 1 8 gene of yeast (required for post- replication repair of UV damaged DNA) are both members of the
208

C 3 HC 4 gene family whose functions seem to necessitate interaction with DNA, but are not transcription factors. The RAG-1 activates V(D)J recombination on its introduction into fibroblasts (Schatz et a l ., 1989) and R A D 1 8 mutants have lost the ability for postreplication repair of UV damaged DNA (Jones et al., 1988). However, there is no proof that either of these gene products directly mediates recombination or DNA-repair themselves, and it is more plausible that, in keeping with the other family members, R A G -1 and R A D 18 transactivate other genes which are then responsible for the ascribed phenotypes.
An alternative view of the function of the C3 H C 4 zinc finger proteins is provided by the RO-52kD protein identified by one of the autoantibodies found in patients with systemic lupus erythematosus and Sjogren's syndrome (Chan et al., 1991). The targets for the antibodies are a class of small ribonucleoprotein particles (RNPs) which contain four RNA molecules (hY RNAs) and two proteins, the 52kD zinc finger protein together with a second 60kD antigenic protein. These data could be interpreted to suggest that the C3 H C 4 zinc finger of the R0-52kD protein serves as an RNA-binding motif in contradiction to its presumed role as a DNA- binding motif of transcription factors. However, it is known that the 60kD protein directly binds RNA (Wolin and Steitz, 1984), and the 52kD C3 HC 4 protein could therefore be present in the complex through an ability to dimerize with this former protein. Hence the possibility that PML could also be part of an RNP complex should be borne in mind, although such a finding would not necessarily contradict its role as a transcription factor. The study of the C3 H C 4
proteins as an entity rather than disparate proteins involved in different processes may help clarify some of these issues.
Recent data presented on the subcellular localization of the P M L gene product suggest that PML may indeed be present in a RNP complex. Use of a polyclonal anti-PML antibody revealed that PML has a speckled nuclear localization (Kastner et al., 1992) directly comparable to that of the RO-52kD protein (Ben-Chetrit et al.,1988), part of a well-characterized RNP complex.
209

9.3-2 The "B Box" Defines a Subfamily of C3 HC4 proteins
PML contains a further two clusters of cysteine residues in addition to the first C3 HC 4 motif (also termed the "A box”) found in all the family members, and it is expected that these clusters also contribute to DNA-binding. The second cysteine cluster or "B box” (Reddy and Etkin, 1991) defines a subfamily of six C3 HC 4 proteins comprising PML, XNF7 (Reddy et al., 1991), Ro-52kD (Chan et al.,1991), RPT1 (Patarca et al., 1988), RFP (the RET finger protein) (Takahashi et al., 1988) and T18 (Miki et al., 1991) which presumably have more closely related functions than the family members which lack the "B box".
This assumption is perhaps borne out by the observation that two other "B box" proteins in addition to PML also acquire transforming potential by fusion to a second gene. The RET finger protein (RFP) gene is a human gene expressed at variable levels which may function in male germ cell development (Takahashi et al., 1988). Transfection of NIH3T3 fibroblasts with DNA from a human T-cell lymphoma had previously identified a transforming entity formed from the RFP gene and a second gene encoding a tyrosine kinase (Takahashi and Cooper, 1987). Like the P M L - R A R A fusion of APL, this transforming gene preserves the cysteine clusters of RFP at the N-terminus of the fusion. However, the relevance of this fusion may be questioned since it arose only during the course of transfection and was not present in the primary DNA of the lymphoma.
The provenance of a second fusion gene identified in an NIH3T3 transformation assay is more certain since this rearrangement was detected in m ultiple prim ary foci from a mouse hepatocellular carcinoma. This fusion gene (T18) contains the N- terminus of a "B box" protein fused to the C-terminus of the murine B-RAF oncogene, a serine/threonine kinase (Kastner et al., 1992; Miki et al., 1991). Again, the cysteine clusters of the wild- type T18 gene are contained in the fusion. T18 is the most closely related gene to PML since T18 and PML are the only family members to contain three cysteine clusters (Kastner et al., 1992).
2 1 0

It is more difficult to see why the fusion of a presumed transcription factor (RFP or T18) with a protein kinase should result in a transforming protein than is it to explain the transforming activities of the PML-RARA fusion of APL, where at least both partners are thought to normally function in the same organelle. One scenario is that the protein kinases, whose kinase domains remain intact after fusion, autophosphorylate key residues of their transcription factor fusion partners.
9.3-3 Future Work
RARA is known to function as a ligand-dependent transcription factor, and a number of genes have been identified which contain retinoic acid response elements in their control regions. Since RARA is known to control myeloid differentiation, one or more of these genes should represent the next layer of genes in the cascade of gene activation which resu lts in term inal differentiation. A likely candidate for such a gene is the M Z F -1 gene, a zinc finger gene (unrelated to PML) whose expression is stimulated when HL60 cells are induced to differentiate with retinoic acid, although its promoter has not been characterized to determine whether it contains a retinoic acid response element (Hromas et al., 1991). Potentially, the disregulation of genes such as MZF-1 by the PML-RARA fusion protein could block myeloid differentiation and result in APL.
This convincing scenario can be assembled from the extensive literature on the retinoid receptors, but fails to assign a role to PML in the fusion protein. If PML is indeed a transcription factor then it too must regulate genes through specific response elements, and identification of these response elements and associated genes becomes a matter of urgency if the molecular events underlying APL are to be fully understood. Future research on APL may therefore concentrate on the following areas.
1) Identification of the response elements sites of a transcription factor is now possible following the description of several PCR- based assays for this purpose (Kinzler and Vogelstein, 1989;
2 1 1

Pollock and Treisman, 1990). The protein is bound to sheared DNA or random sequence oligonucleotides (which should contain the target sites) then separated from the unbound DNA by immunoprecipitation. PCR permits the amplification of the DNA bound to the protein, and the process can be repeated until sufficient target sequences have been amplified for sequence analysis. This technique could be used to identify the PML response element (PRE). Another possible way to identify target sequences is to characterize the P M L p rom oter, since transactivating proteins often participate in their own regulation. Once established, consensus sequences can be used to search data bases for natural sites in known promoters. As with RARA, the object would be to identify genes potentially involved in myeloid d ifferentiation .
Another way to uncover those genes which are disregulated by the presence of the PML-RARA fusion gene is to subtract an APL cDNA library from a second myeloid RNA source. Such a library has already been constructed (Chang et al ., 1992a), and now requires careful analysis to determine which are the key genes.
2) The central domain of PML encodes a coiled coil motif which most workers have suggested could act as a dimerization domain. Indeed, PML can dimerize with PML-RARA through this motif (Kastner et al.y 1992). If PML is a regulatory protein then this coiled coil might be expected to mediate interactions with other transcription factors, forming regulatory networks similar to those of the nuclear receptors (section 1 .6 -2 ) and the helix-loop-helix proteins (Murre et al.y 1989). The PML-RARA protein could exert a dominant negative effect over these proteins just as it may over the RAR/RXR pathways (chapter 5). Before such possibilities can be addressed these proteins must be identified. It would not be surprising if the protein partners of PML proved to be additional members of the C3 H C 4 family, hence another way to identify such genes would be via low-stringency hybridizations with PML.
2 1 2

9.4 Properties of the PML-RARA Fusion Protein
Functional studies to assess the ability of the PML-RARA fusion protein to activate a reporter gene through a retinoic acid response element have been performed, and the results compared to that of wild-type RARA (de The et al., 1991; Kakizuka et al., 1991; Pandolfi et al., 1991). In summary it may be said that the results are conflicting, and that although the PML-RARA fusion protein can still transactivate genes through a RARA response element, the result is highly dependent on the cell type and the particular response element used. These experiments also showed that the PML-RARA protein can still bind retinoic acid, as expected if the palliative effects of ATRA are mediated through this protein.
Instead, what is required is a functional assay which directly measures the transforming ability of PML-RARA. Ideally a cell line of early myeloid or stem cell origin is required which can be transformed by the introduction of the P M L-RARA fusion gene by a block at the promyelocytic stage of differentiation. Retroviral - mediated gene transfer of the fusion gene into haematopoietic precursor cell lines may provide such an assay, which could be used to assess the individual contributions of the PM L and R A R A genes to the fusion protein. For example, mutation of either the PML or RARA zinc fingers would reveal if the fusion protein needs to interact with response elements from both pathways. Mutation of the dimerization domains would reveal if interactions with other transcription factors are necessary for transformation, and in particular if a dominant negative effect is mediated through the PML or RARA pathways. Furthermore, the transforming ability of the reciprocal PML-RARA and RARA-PML proteins could be assessed.
Anti-sense technology may also be applied to the P M L -R A R A fusion message of APL. In parallel with CML, the addition of an anti-sense fusion message or oligonucleotide to an APL cell line such as NB4 (Lanotte et al., 1991) should relieve the cell line of its transformed phenotype. This would again be proof that the PML-
213

RARA fusion mediates leukaemogenesis. Anti-sense inhibition of the R A R A -P M L message, also expressed in NB4, would not be expected to alter the line's neoplastic potential. The transforming ability of the APL fusion messages could also be assessed in transgenic mice.
9.5 Concluding Rem arks
Cloning the t(15; 17) translocation breakpoint has elucidated the pivotal molecular event in the genesis of APL, and allows us to frame the questions to determine exactly how the PML-RARA fusion protein blocks myeloid differentiation. Clearly our understanding of PML lags behind that of RARA, and the determination of the normal functions of PML is a priority. Our current interpretation of PML as a regulatory protein may need to be revised if a transactivation domain cannot be identified or if contradictory information comes to light from other family members. The possibility of identifying alternative genes at the breakpoints of simple variant APL translocations which can replace the PML gene in the oncogenic fusion protein is exciting, since a comparison of their properties may help identify the essential molecular ingredients which underlie APL.
214

Appendix 1
New RFLPs on Chromosome 17
The construction of a N ot I linking library and saturation of 17q with N ot I linking clones led to the successful identification of the APL breakpoint. Prior to the construction of the linking library an alternative mapping strategy was considered, based on the construction of a genetic map across the breakpoint region. The aim of this strategy was to identify restriction fragment length polymorphisms (RFLPs) in random cosmids mapped to the APL breakpoint region, and then to identify the pair of cosmids which mapped to opposite sides of the APL breakpoint and showed the closest linkage in CEPH families. This cosmid pair would define the APL flanking markers from which a directional cloning strategy could be mounted to identify the breakpoint itself. A series of cosmids had been already been mapped to the APL breakpoint region (regions 3 and 4 on the chromosome 17 somatic cell hybrid mapping panel) (Yagle et al., 1990), but no polymorphisms had been described in these clones. This strategy therefore required the identification of RFLPs from as many of these cosmids as possible. In total three RFLPs were identified from the cosmid series, but this genetic mapping strategy was not pursued further partly because of doubts over whether the DNA source for the cosmid library (the CMGT KLT8 ) was deleted for sequences immediately around the APL breakpoint. The data on these three RFLPs is presented in this appendix, together with data on an additional two polymorphisms which were fortuitously identified while mapping linking clones.
RFLPs were identified through the hybridization of entire cosmids to filters containing genomic DNA from ten unrelated donor individuals. The donor DNA was digested with restriction enzymes which show an above-average level of polymorphism in their recognition sites (Taq I, / / i n f i l l , M sp l and B g l II). Cosmids were competed with total human DNA to improve the signal-to-noise ratio, but pretreatment of the filters with sheared human DNA was also necessary. Seven cosmids from region 3 (above the APL
215

breakpoint) and 13 cosmids from region 4 (below the APL breakpoint) were hybridized to these filters (Tables A l . l and A1.2). One RFLP was found in region 3 and two in region 4.
Table A l . l D etection o f RFLPs by hybrid ization o f cosm ids from region 3
(A 13-E31; the nam es o f all the cosm ids should be p refixed w ith c3/) to
filte rs p repared w ith the four ind icated restric tion enzym es. ind icates
that no RFLP was detected.
A13 C29 D28 D416 E14 E21 E31Taql - - - - - -
H in d ll l - - - - - -
M spl - - - RFLP - -
B z l l l - - - - - -
Table A 1.2 D etection o f RFLPs by hybridization o f cosm ids from region 4
(A 26-E55; the nam es o f all the cosm ids should be p refixed w ith c4/) to
filte rs prepared w ith the four restric tion enzym es. ind icates no R FLP
was found, NT = not tested.
A26 A48 B 13 C22 C26 C27 C214Taql - - - - - -
H in d ll l NT NT NT NT - NT
M spl NT NT NT NT NT NT
B z l l l NT NT NT - - -
C42 D14 D26 E38 E39 E55Taql - RFLP - - -
H in d ll l - NT NT NT -
M spl NT NT NT NT NT NT
B x ll l - - NT - RFLP
Detection of the three RFLPs by hybridization of unique cosmidsubfragments to digested genomic DNA is shown (Figure A (appendix) 1). Details of the allele sizes and frequencies were calculated and are presented in Table A 1.3. Additional individuals were used to assess the allele frequencies. Details of the two polymorphisms detected by two linking clones are also presented.
216

Figure A l (Appendix 1) Detection of the new RFLPs on chromosome 17 by hybridization of 3 2 P-labelled probes to filters containing digested DNA from unrelated donor individuals. The sizes of alleles Al and A2 are given with the allele frequencies (Table A 1.3). LCN5A2 detects a VNTR based on a 37bp repeat with numerous alleles in the 2.0-2.3 kb region of a Bam R l filter. Details of the unique probes used to obtain these results are given in Table A1.4.

CM<
i - CM< <
O
00
LO
00
CM
t - CM < <
CrCOK
0-(f)Is-
QO
o
00
CD
UO
CO
CM
CM
CD
00
Is-
CD
CD
CO
^ CM CD
o00
COO'
er)LOLU
O
T-<D X
=3 "OcO ) 0
LL CLCL
<
|j
C3/
E14
(D17
S16
1)
Msp
l L
CN
5F7
(D17
S29
1)
Eco
Rl
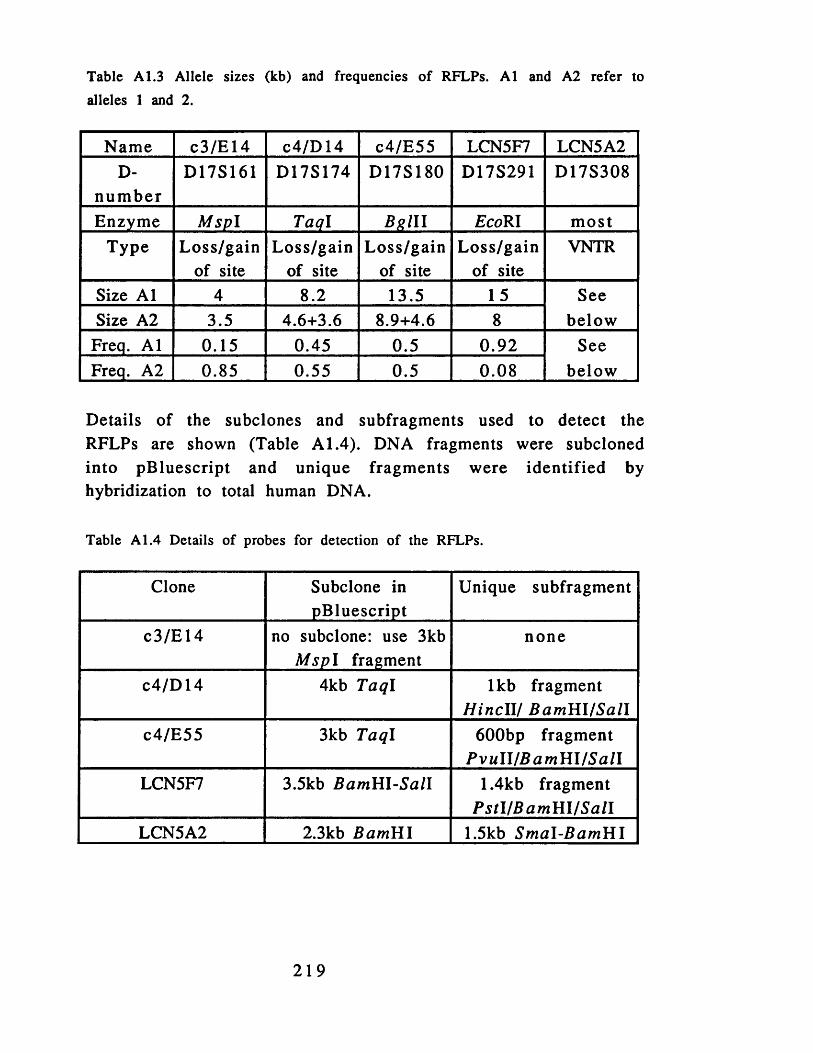
Table A 1.3 Allele sizes (kb) and frequencies of RFLPs. A l and A2 refer to alleles 1 and 2.
Name C3/E14 C4/D14 C4/E55 LCN5F7 LCN5A2D-
n u m b erD17S161 D17S174 D17S180 D17S291 D17S308
Enzyme M spl Taql Br III EcoRl m ostType Loss/gain
of siteLoss/gain
of siteL oss/gain
of siteL oss/gain
of siteVNTR
Size Al 4 8 . 2 13.5 15 SeebelowSize A2 3.5 4.6+3 . 6 8 .9+4 . 6 8
Freq. Al 0.15 0.45 0.5 0.92 SeebelowFreq. A2 0.85 0.55 0.5 0.08
Details of the subclones and subfragments used to detect the RFLPs are shown (Table A 1.4). DNA fragments were subcloned into pBluescript and unique fragments were identified by hybridization to total human DNA.
Table A 1.4 Details of probes for detection of the RFLPs.
Clone Subclone in pBluescript
Unique subfragment
C3/E14 no subclone: use 3kb M spl fragment
none
C4/D14 4kb Taql lkb fragment H incll/ B am U l/Sa ll
C4/E55 3kb Taql 600bp fragment P v u l l /B a m m /S a l l
LCN5F7 3.5kb Bam Ul-Sall 1.4kb fragment P stl/B am U l/Sa ll
LCN5A2 2.3kb Bam U l 1.5kb Sm al-B am H l
219

LCN5A2 VNTR
The hybridization pattern of the 1.5kb S m a l-B a m H l fragment from LCN5A2 (Figure A l) suggested that this clone detected a hypervariable VNTR repeat with numerous alleles in the 2-2.3 kb size range (on a BamHl filter). The total number of alleles has not been determined for this probe, but the autoradiograph shows that 9/12 individuals are heterozygous at this locus which, considering the size of the VNTR repeat (below) and the resolution of the gel, probably underestim ates the real level of heterozygosity.
To determine the nature of the VNTR repeat, the 2.3kb BamYLI fragment was sequenced. The VNTR is based on a 37bp repeat elem ent:
CTGCAGTTj IGGGGGGCAGGGAAGGAGGGGGAGGGGTG
The number of guanosine residues in the 6 bp poly-G tract (nucleotides 10-15) varied between 5 and 7 in different copies of the repeat. Attempts to derive PCR primers from the adjacent sequences and amplify the repeat by PCR were unsuccessful, possibly due to the high percentage (73%) of G+C residues within the repeat which promote slippage during amplification. A search of the sequence databases with this repeat unit indicated a homology with the pMS228B repeat sequence (D17S134) which maps to 17pl3-pter (Armour et al., 1989). LCN5A2 maps to 17q23. The repeat unit of pMS228B is 16bp, and each LCN5A2 repeat can be aligned with two pMS228B repeats with an additional 5 nucleotides used as a spacer.
2 2 0

Appendix 2
CosH17.3 - A Transposahle Element?
The SCG laboratory has previously reported a m ulti-copy, tandemly-repeated 18kb sequence which is clustered in the region of the APL breakpoint on chromosome 17 (Moore et al.,1989). This sequence, CosH17.3, was derived from a cosmid isolated from a chromosome 17-specific library and in situ hybridization was used to confirm that the majority of copies were restricted to chromosome 17. Dot blot analysis suggested that there were approximately 30 copies of this sequence on the chromosome. In situ hybridization to chromosomes from an APL patient demonstrated that the majority of the copies of this sequence lay above the APL breakpoint but some lay below. This led to the suggestion that the APL breakpoint might lie within a tandem array of CosH17.3-like sequences (Moore et al., 1989). The complete lack of homology to murine sequences raised the possibility that this repeat could represent a human-specific transposon sequence (Moore et al.y 1989). CosH17.3 is divided into seven fragments, A-G, on the basis of its BamYil restriction map.
This appendix contains data to show that CosH17.3 does not map immediately adjacent to the APL breakpoint, but further evidence that this sequence may be capable of transposition within the human genome is presented.
Hybridization of the linking clone LCN5E4 (D17S296) to the somatic cell hybrid mapping panel during the sublocalization of the linking clones over 17q indicated that it detected a repeat sequence with copies above and below the APL breakpoint, as demonstrated by its ability to hybridize to both the 15q+ and 17q- APL hybrids. This result suggested that LCN5E4 overlapped one of the copies of CosH17.3. To confirm this hypothesis the terminal fragment of CosH17.3 (a 3.3kb B a m HI fragm ent, fragment G; Moore et al., 1989) was hybridized to the same filter as LCN5E4, where it detected an identical series of bands but with different intensities (Figure A2.1).
2 2 1

Figure A2.1 (Appendix 2.1) Hybridization of two probes to Bam H l- digested DNA from the chromosome 17 mapping panel (Figure 3.3). PCTBA1.8, 17-only; TRID62, 17q; PJT2A1, APL 15q+; P12.3B6, APL 17q-; DCR1, NF1 translocation (17qll.2-qter); KLT8 , PLT6 B, PLT8 ; CMGTs; EL4, mouse; MOLT4, total human. The positions of the lambda size markers are indicated between the two panels.
A) Hybridization of probe E3 from LCN5E4. This probe detects a similar pattern of bands to that detected by fragment G of CosH17.3 (B), indicating that this linking clone overlaps one of the CosH17.3 repeats. Different copies of the repeat have diverged from one another, and three main bands (A-C) are detected on a Bam HI digest (A, 3.3kb; B, 2.8kb; C 2.4kb). See the text for a description of how these three bands allow the regional assignment of the clusters of repeats found above and below the APL breakpoint.
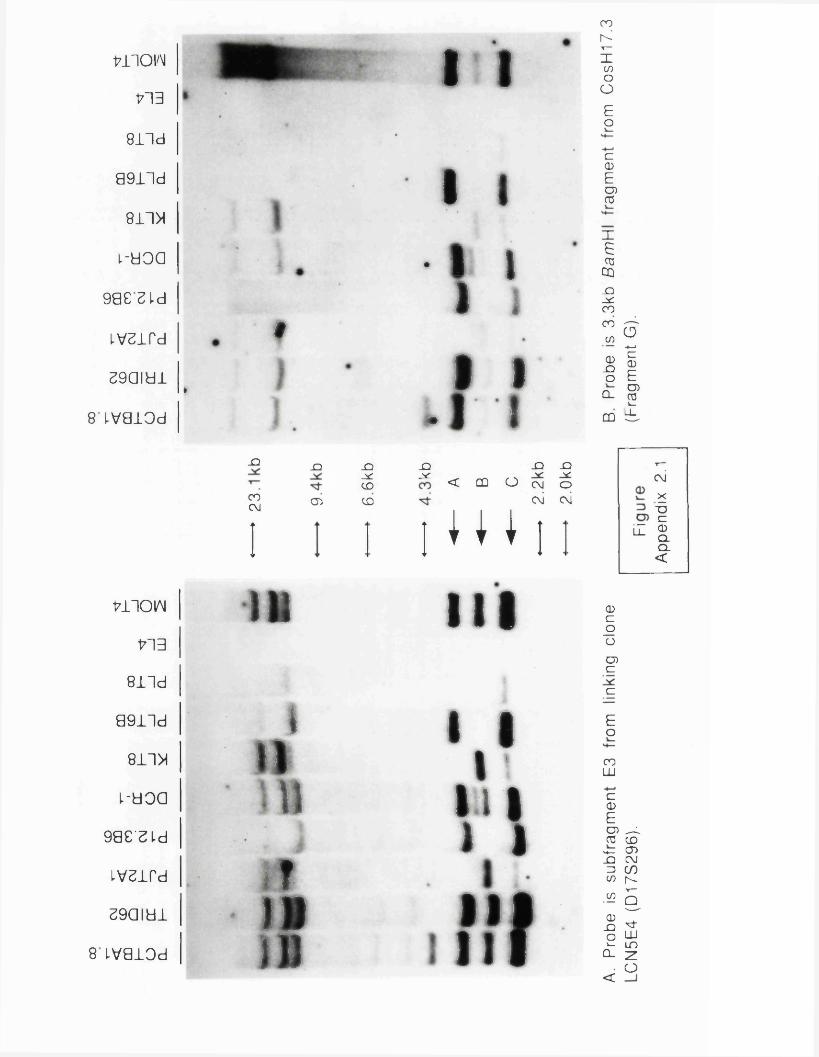
moi/M
1713
811d
a 9 iid
811*
t-aoa
mII
9 a e s i d
i v z i P d t
^ 9 a i a i*
8 t v a i o d
JD
COCXI
1
t 7 H O W
▼
l >
V13
8 1 1 d
a 9 1 1 d1
8 1 1 *1 1
t - a o au
9 8 8 ' ^ l d
LVSlPdi f
8 9 a i a ii s
8 i v a i o d) »
JD
<T>
JDJXLCDCD
I I
• 5i I I 1
I I. 1 1
JD JD JDy v v< CD O c \ j oc\i c\i
] UI | I I I
I II I
f \I I II I I
CO1
5COooEo
c0ECDaj
XE03
CQ
-Q2*:COCOCO
0JDOCL
CQ
0£Z_ooCDcc
Eo
COLUC0ECD0315ZJ000
JDOk—CL
< CN5E
4 (D
17S
296)
. R
(Fra
gmen
t G
).
App
endi
x 2.
1

Several observations can be made from careful analysis of these autoradiographs (Figure A2.1). It has previously been documented that fragment G (the terminal 3.3kb BamYil fragment of CosH17.3) detects three main bands on hybridization to 5 a m H I-d ig e s te d DNA; the expected 3.3kb band, and two additional bands at 2.8kb and 2.4kb (Moore et al., 1989). This is presumably due to heterogeneity between different copies of the repeat. These three bands (labelled A-C) are seen between the 4.3kb and 2.2kb lambda markers in Figure A2.1. Comparison of bands A-C detected by LCN5E4 in the 15q+ (PJT2A1) and the 17q- (P12.3B6) APL hybrid lanes shows that band B is restricted to those copies beneath the APL breakpoint while bands A and C correspond to the sequences above the breakpoint. The faint signal from band C in the 15q+ appears to be caused by a single copy of the repeat sequence which maps towards 17qter, since this faint band is also present in the hybrid PLT8 (refer to the somatic cell hybrid mapping panel, Figure 3.3). This enables the sequences above and below the breakpoint to be distinguished on the CMGT mapping panel.
Sublocalization of the CosH17.3 sequences on the CMGT mapping panel has not been reported previously, nor their hybridization to the NF1 translocation hybrid (DCR1) or the APL 17q- hybrid (P12.3B6). Consideration of the signals from these latter two hybrids (Figure A2.1) shows that the cluster of repeats above the APL breakpoint lies between the APL and NF1 breakpoints. This region was previously thought to be spanned by a contiguous stretch of DNA in the CMGT KLT8 , yet the repeat sequences are clearly absent from this hybrid. This gap in KLT8 appears to lie above GCSF, ERBA1 and ERBB2, which are all positive in KLT8 , suggesting these proximal CosH17.3 sequences are separated from the APL breakpoint by at least one megabase.
The cluster of CosH17.3 repeat sequences beneath the APL breakpoint are represented by band B on the mapping panel. The distal cluster of repeat sequences was also tagged by the linking clone LCN5E4 which provided additional single copy sequences for
224

confirming the sublocalization of this locus on both the standard and extended mapping panels (data not shown). On the basis of positive signals from KLT8 and TLT10 this distal cluster was assigned to region 7 rather than to region 4, indicating that this CosH17.3 cluster is also distant from the APL breakpoint region. These results are still compatible with the original in situ data since the signals from the distinct clusters above and below the breakpoint could merge into a single, larger signal apparently centred over the APL breakpoint.
The presence of CosH17.3-like sequences in the linking clone LCN5E4 could arguably have been caused by a co-ligation event during the construction of the linking library. To eliminate this possibility the gridded linking library filters were probed with fragment G, and two additional independent linking clones LCN1E5 and LCN7B9 were shown to contain CosH17.3-like sequences. These three linking clones have overlapping restriction patterns and represent three independent clones derived from the same N o t I site. It is unlikely that the function of the putative gene associated with LCN5E4 is connected with CosH17.3.
Evidence for Transposition
In order to determine whether any transcripts are read from CosH17.3, fragments A-G of CosH17.3 were individually hybridized to Northern filters containing both total and polyA+ RNA (S. Rider, unpublished observations). The results indicated that several regions of CosH17.3 could potentially be expressed, and it was decided to sequence the genomic DNA from the following CosH17.3 subclones. The sequence of fragments A and B, together with a small amount of sequence from the end of fragment C, was determined and assembled into a 4kb contig by P. Hedge. The sequence of two separate subfragments of the 4.4kb BamYLl fragment (fragment F), a l.Okb H in d ll l fragment and a 1.5kb B am U l-P stl fragment, was determined as part of this thesis. Database searches with all three of these contigs failed to identify any homologous sequences (December, 1988).
225

In 1992 further homology searches were performed to determine if any of the sequences added to the databases in the ensuing period had homology with CosH17.3. These searches identified homology between a single entry in the database and the 4kb CosH17.3 contig, with a standard deviation from the mean of 22.24. This was considerably higher than any other sequence in the EMBL database. An alignment of these two sequences is shown (Figure A2.2).
The sequence identified by CosH17.3 was derived from the junction of a deletion in the factor VIII clotting factor gene on the X chromosome. This deletion was associated with a familial case of haemophilia A (patient JH 21) (Woods-Samuels et al.y 1991; Youssoufian et al.y 1988). Deletions and other mutations in the factor VIII are known to cause haemophilia (Antonarakis and Kazazian, 1988). The deletion in patient JH 21 removes exons 2 and 3 of the factor VIII gene, but it was realized that additional material was inserted at the point of the deleted sequences (Woods-Samuels et al.y 1991). These sequences were not mapped to determine their original location in the genome. It is these sequences which are homologous to CosH17.3, although they are derived from a divergent copy of the repeat from the copy sequenced. The level of sequence variation between different copies of CosH17.3 is unknown.
These data support the hypothesis that CosH17.3 sequences are capable of transposition between different chromosomes in the human genome, and that the integration of a copy of CosH17.3 (or a part thereof) into the factor VIII locus (with concurrent deletion of the adjoining sequences) has caused haemophilia A in a single instance. Two other cases of haemophilia A are caused by integration of long interspersed repetitive elem ents (LINE sequences) into the factor VIII locus (Antonarakis and Kazazian, 1988). Similarly a single case of NF1 caused by the insertion of an Alu repeat has been reported (Wallace et al.y 1991).
If the scenario outlined above is correct then CosH17.3 may represent a novel human transposable element with mutagenic
226

Fragment A of CosH17.3
Factor VIII insertion (HSFVIII10)
10 20 30 40 50 60GGATCCT-CAAGTCTCTGACATAACATGGCCTAGTATTTACATATCAGCTATGCAACCATCCTCCCGT I I I I I I I I I I I I I I I I I I I I I I I I I I I I I I I I I I I I I I I I I I I I I I I I I II
TGGGATTGTGCAAGTCTCTGATATAAAATGGTGTAGCATTTGCATATAACGTACGCA— CATCCTCT-GT 54 0 550 560 57 0 58 0 59 0 600
70 80 90 100 11 0 12 0 130AGACATTAGACCATCTCTGGATTATTCATGATGTGTAATACAATGCAGATGCTACATAAATGGTCGTGAT I I I I I I I I I I I I I I I I I I I I I I I I I I I I I I I I I I I I I I I I I I I I I I
ATACTTTAAATCCTCTCCAGATTACTTGTAATGCCTAGTACAATGTAAGCGCTATGTAAATAGTTGTTAA 610 620 630 640 650 660 670
14 0 150 160 170 18 0 190 20 0ACTGGATTCTTTAGGGAATAATGACAAGAACAAACTCTGCACATGTTCAATAGAAACATAACCGTCCAATI I I I I I I I I I I I I I I I I I I I I I I I I I I I I II I I I I I I I I I I I I I I I I I I I I II I I
ACTGTATTGTTTAGGAAATAATGACTAGAAAAAAA-CTTTACATGTGCAATAGAGACACAACCATCTATT680 690 70 0 71 0 72 0 73 0 740
2 1 0 2 2 0 23 0 24 0 2 5 0TTATTTTCTGAATATTTTCCATCTGCTG-TTG-CTGAATCTACAGATGCI I I I I I I I I I I I I I I I I I I I I I I I I I I
TTG— TTCAGAATACCTTCCAACCCATGGTTGACTGAATTC750 76 0 77 0
Figure A2.2 Alignment of fragment A (the first B am B l fragment of the 18kb repeat sequence CosH17.3) with the sequence of unknown origin found integrated within the factor VIII clotting gene in a haemophilia A patient. The homology extends over the entire region of overlap of the two sequences (begining at the start of fragment A and extending to the end of the sequence data obtained from the factor VIII insertion). The two sequences contain a number of substitutions, but some of the frame-shifts could prove to be sequencing errors within the CosH17.3 sequence. This sequence should be confirmed prior to submission to a database.

potential. However, it is also possible that the presence of CosH17.3 sequences at this deletion breakpoint is entirely fortuitous. The size of the insertion in patient JH 21 was not reported, but it would be of interest to determine whether an entire repeat element is present. CosH17.3 transcripts should be sought, which in common with LINEs might encode proteins with reverse transcriptase or integrase activity.
228

R eferen ces
Alcalay M., Zangrilli D., Fagioli M., Pandolfi P.P., Mencarelli A., Lo CoCo F., Biondi A., Grignani F. and Pelicci P.G. (1992) Expression pattern of the R A R A -P M L fusion gene in acute promyelocyticleukemia. Proc. Natl. Acad. Sci. USA 89: 4840-4.
Antonarakis S.E. and Kazazian H.H. (1988) The molecular basis ofhemophilia A in man. Trends Genet. 4: 233-7.
Apian P.D., Lombardi D.P., Ginsberg A.M., Cossman J., Bertness V.L. and Kirsch I.R. (1990) Disruption of the human SCL locus by ’’illegitimate" V-(D)-J recombinase activity. Science 250: 1426-9.
Armour J.A.L., Wong Z., Wilson V., Royle N.J. and Jeffreys A.J.(1989) Sequences flanking the repeat arrays of minisatellites association with tandem and dispersed repeat elements. N u c le ic Acids Res. 17: 4925-35.
Askew D.S., Bartholomew C., Buchberg A.M., Valentine M.B., Jenkins N.A., Copeland N.G. and Ihle J.N. (1991) H is-1 and H is-2: identification and chromosomal mapping of two commnonly rearranged sites of viral integration in a myeloid leukemia. Oncogene 6 : 2041-7.
Bai Y., Sheer D., Hioms L., Knowles R.W. and Tunnacliffe A. (1982) A monoclonal antibody recognizing a cell surface antigen coded for by a gene on human chromosome 17. Ann. Hum. Genet. 46: 337- 47.
Baker S.J., Markowitz S., Fearon E.R., Willson J.K. and Vogelstein B.(1990) Suppression of human colorectal carcinoma cell growth by wild-type p53. Science 249: 912-5.
Bakhshi A., Jensen J.P., Goldman P., Wright J.J., McBride O.W., Epstein A.L. and Korsmeyer S.J. (1985) Cloning the chromosomal breakpoint of t(14; 18) human lymphomas: clustering around Jjj onchromosome 14 and near a transcriptional unit on 18. Cell 41: 899-906 .
229

Ballard D.W., Walker W.H., Doerre S., Sista P., Molitor J.A., DixonE.P., Peffer N.J., Hannink M. and Greene W. (1990) The v-re l oncogene encodes a kB enhancer binding protein that inhibits NF- kB function. Cell 63: 803-14.
Barbacid M. (1986) Oncogenes and human cancer: cause or consequence? Carcinogenesis 7: 1037-42.
Begley C.G., Apian P.D., Denning S.M., Haynes B.F., Waldmann T.A. and Kirsch I.R. (1989) The gene SCL is expressed during early hematopoiesis and encodes a differentiation-related DNA-binding motif. Proc. Natl. Acad. Sci. USA 8 6 : 10128-32.
Ben-Chetrit E., Chan E.K.L., Sullivan K.F. and Tan E.M. (1988) A 52- kD protein is a novel component of the SS-A/RO antigenic particle. J. Exp. Med. 167: 1560-71.
Berger R., Bernheim A., Daniel M.T., Valensi F. and Flandrin G. (1983) C ytological types of m itoses and chrom osom e abnormalities in acute leukemia. Leuk. Res. 7: 221-36.
Berger R., Le C.M., Derre J., Vecchione D. and Jonveaux P. (1991) Cytogenetic studies in acute promyelocytic leukemia: a survey of secondary chromosomal abnormalities. Genes Chromosom. Cancer 3: 332-7.
Bickmore W.A. and Sumner A.T. (1989) Mammalian chromosome banding—an expression of genome organization. Trends Genet. 5: 144-8.
Bird A.P. (1986) CpG-rich islands and the function of DNA methylation. Nature 321: 209-13.
Bird A.P. (1989) Two classes of observed frequency for rare- cutter sites in CpG islands. Nucleic Acids Res. 17: 9485.
Blackwell T.K., Kretzner L., Blackwood E.M., Eisenman R.N. and Weintraub H. (1990) Sequence-specific DNA binding by the c-Myc protein. Science 250: 1149-51.
230

Blomhoff R., Green M.H., Berg T. and Norum K.R. (1990) Transport and storage of vitamin A. Science 250: 399-404.
Boehm T., Baer R., Lavenir I., Forster A., Waters J.J., Nacheva E. and Rabbitts T.H. (1988) The mechanism of chromosomal translocation t( 11; 14) involving the T-cell receptor C delta locus on human chromosome 14q ll and a transcribed region of chromosome l lp l5 . Embo J. 7: 385-94.
Boehm T., Foroni L., Kaneko Y., Perutz M.F. and Rabbitts T.H.(1991) The rhombotin family of cysteine-rich LIM -domain oncogenes: distinct members are involved in T-cell translocations to human chromosomes l ip 15 and 1 l p l 3. Proc. Natl. Acad. Sci. USA 8 8 : 4367-71.
Boehm T., Foroni L., Kennedy M. and Rabbitts T.H. (1990a) The rhombotin gene belongs to a class of transcriptional regulators with a potential novel protein dimerisation motif. Oncogene 5: 1103-5.
Boehm T., Greenberg J.M., Buluwela L., Lavenir I., Forster A. and Rabbitts T.H. (1990b) An unusual structure of a putative T cell oncogene which allows production of similar proteins from distinct mRNAs. Embo J. 9: 857-68.
Bollag G. and McCormick F. (1991) Regulators and effectors of ras proteins. Annu. Rev. Cell Biol. 7: 601-32.
Borrow J., Black D.M., Goddard A.D., Yagle M.K., Frischauf A.M. and Solomon E. (1991) Construction and regional localization of clones from a Notl linking library from human chromosome 17q. Genomics 10: 477-80.
Borrow J., Goddard A.D., Gibbons B., Katz F., Swirsky D., Fioretos T., Dube I., Winfield D.A., Kingston J., Hagemeijer A., Rees J.K.H., Lister T.A. and Solomon E. (1992) Diagnosis of acute promyelocytic leukaemia by RT-PCR: detection of P M L-RA R A and R A R A -P M L fusion transcripts. Br. J. Haematol. In press.
231

Borrow J., Goddard A.D., Sheer D. and Solomon E. (1990) Molecular analysis of acute promyelocytic leukemia breakpoint cluster region on chromosome 17. Science 249: 1577-80.
Borrow J. and Solomon E. (1992) Molecular analysis of the t(15; 17) translocation in acute promyelocytic leukaemia. Baillieres Clin. Haematol. In press.
Boynes J. and Bird A. (1991) DNA m ethylation inhibits transcription indirectly via a methyl-CpG binding protein. Cell 64: 1123-34.
Brand N., Petkovich M., Krust A., Chambon P., de The H., Marchio A., Tiollais P. and Dejean A. (1988) Identification of a second human retinoic acid receptor. Nature 332: 850-3.
Brand N.J., Petkovich M. and Chambon P. (1990) Characterization of a functional promoter for the human retinoic acid receptor- alpha (hRAR-alpha). Nucleic Acids Res. 18: 6799-806.
Breitman T., Collins S.J. and Keene B. (1981) Terminal differentiation of human promyelocytic leukemic cells in primary culture in response to retinoic acid. Blood 57: 1000-4.
Breitman T.R., Selonick S.E. and Collins S.J. (1980) Induction of differentiation of human promyelocytic leukemia cell line (HL60) by retinoic acid. Proc. Natl. Acad. Sci. USA 77: 2936-40.
Brockes J.P. (1989) Retinoids, homeobox genes, and limb morphogenesis. Neuron 2: 1285-94.
Bucan M., Zimmer M., Whaley W.L., Poustka A., Youngman S., Allitto B.A., Ormondroyd E., Smith B., Pohl T.M., MacDonald M., Bates G.P., Richards J., Volinia S., Gilliam T.C., Sedlacek Z., Collins F.S., Wasmuth J.J., Shaw D.J., Gusella J.F., Frischauf A.-M. and Lehrach H. (1990) Physical maps of 4pl6.3, the area expected to contain the Huntington disease mutation. Genomics 6 : 1-15.
Buckler A.J., Chang D.D., Graw S.L., Brook J.D., Haber D.A., Sharp P.A. and Housman D.E. (1991) Exon amplification: a strategy to
232
isolate mammalian genes based on RNA splicing. Proc. Natl. Acad. Sci. USA 8 8 : 4005-9.
Bugge T.H., Pohl J., Lonnoy O. and Stunnenberg H.G. (1992) RXRa, a promiscuous partner of retinoic acid and thyroid hormone receptors. Embo J. 11: 1409-18.
Call K.M., Glaser T., Ito C.Y., Buckler A.J., Pelletier J., Haber D.A., Rose E.A., Krai A., Yeger H., Lewis W.H., Jones C. and Housman D.E. (1990) Isolation and characterization of a zinc finger polypeptide gene at the human chromosome 11 Wilms’ tumor locus. Cell 60: 509-20 .
Castaigne S., Balitrand N., de The H., Dejean A., Degos L. and Chomienne C. (1992) A PML/retinoic acid receptor-a fusion transcript is constantly detected by RNA-based polymerase chain reaction in acute promyelocytic leukemia. Blood 79: 3110-5.
Castaigne S., Chomienne C., Daniel M.T., Ballerini P., Berger R., Fenaux P. and Degos L. (1990) All-trans retinoic acid as a differentiation therapy for acute prom yelocytic leukemia. I. Clinical results. Blood 76: 1704-9.
Cavenee W.K., Dryja T.P., Phillips R.A., Benedict R., Gallie B.L., Murphree A.L., Strong L.C. and White R.L. (1983) Expression of recessive alleles by chromosomal mechanisms in retinoblastoma. Nature 305: 779-84.
Cawthon R.M., Weiss R., Xu G.F., Viskochil D., Culver M., Stevens J., Robertson M., Dunn D., Gesteland R., O'Connell P. and White R. (1990) A major segment of the neurofibromatosis type 1 gene: cDNA sequence, genomic structure, and point mutations [published erratum appears in Cell 1990 10; 62: following 608]. Cell 62: 193-201.
Chan E.K.L., Hamel J.C., Buyon J.P. and Tan E.M. (1991) Molecular definition and sequences motifs of the 52-kD component of the human SS-A/Ro autoantigen. J. Clin. Invest. 87: 68-76.
233

Chang K.-S., Wang G., Friereich E.J., Daly M., Naylor S.L., Trujillo J.M. and Stass S.A. (1992a) Specific expression of the annexin VIII gene in acute promyelocytic leukemia. Blood 79: 1802-10.
Chang K.S., Lu J.F., Wang G., Trujillo J.M., Estey E., Cork A., Chu D.T., Freireich E.J. and Stass S.A. (1992b) The t(15; 17) breakpoint in acute promyelocytic leukemia cluster within two different sites of the myl gene: targets for the detection of minimal residual disease by the polymerase chain reaction. Blood 79: 554-8.
Chang K.S., Stass S.A., Chu D.T., Deaven L.L., Trujillo J.M. and Freireich E.J. (1992c) Characterization of a fusion cDNA (RARA/m yl) transcribed from the t( 15; 17) translocation breakpoint in acute promyelocytic leukemia. Mol. Cell. Biol. 12: 800-10.
Chen Q., Cheng J.-T., Tsai L.-H., Schneider N., Buchanan G., Carroll A., Crist W., Ozanne B., Siciliano M.J. and Baer R. (1990) The tal gene undergoes chromosome translocation in T cell leukaemia and potentially encodes a helix-loop-helix protein. Embo J. 9: 415-24.
Chen S.-J., Chen X., Chen A., Tong J.-H., Dong S., Wang Z.-Y., Waxman S. and Zelent A. (1992) Occurrence of distinct PM L-RAR- a fusion gene isoforms in patients with acute promyelocytic leukemia detected by reverse transcriptase/polym erase chain reaction. Oncogene 7: 1223-32.
Chen S.-J., Zhu Y.-J., Tong J.-H., Dong S., Huang W., Chen Y., Xiang W.-M., Zhang L., Li X.-S., Qian G.-Q., Wang Z.-Y., Chen Z., Larsen C.-J. and Berger R. (1991a) Rearrangements in the second intron of the RARA gene are present in a large majority of patients with acute promyelocytic leukaemia and are used as molecular marker for retinoic acid-induced leukemia cell differentiation. Blood 78: 2696-2701 .
Chen Z.X., Xue Y.Q., Zhang R., Tao R.F., Xia X.M., Li C., Wang W., Zu W.Y., Yao X.Z. and Ling B.J. (1991b) A clinical and experimental study on all-trans retinoic acid-treated acute prom yelocytic leukemia patients. Blood 78: 1413-9.
234
Chirgwin J.M., Pryzbyla A.E., MacDonald R.J. and Rutter W.J. (1979) Isolation of biologically active ribonucleic acid from sources enriched in ribonuclease. Biochemistry 18: 5294-9.
Chomienne C., Ballerini P., Balitrand N., Daniel M.T., Fenaux P., Castaigne S. and Degos L. (1990) All-trans retinoic acid in acute promyelocytic leukemias. II. In vitro studies: Structure-function relationship. Blood 76: 1710-7.
Clark S.S., McLaughlin J., Crist W.M., Champlin R. and Witte O.N. (1987) Unique forms of the abl tyrosine kinase distinguish Phl- positive CML from Phi-positive ALL. Science 235: 85-8.
Clarkson B. (1991) Retinoic acid in acute promyelocytic leukemia: the promise and the paradox. Cancer Cells 3: 211-20.
Cleary M.L. and Sklar J. (1985) Nucleotide sequence of a t(14; 18) chrom osom al b reakpo in t in fo llic u la r lym phom a and dem onstration of a breakpoint c lu ster region near a transcriptionally active locus on chromosome 18. Proc. Natl. Acad. Sci. USA 82: 7439-7443.
Cole M.D. (1991) Myc meets its Max. Cell 65: 715-6.
Collins F.S. (1992) Positional cloning: let's not call it reverse anymore. Nature Genet. 1: 3-6.
Collins S.J., Robertson K.A. and Mueller L. (1990) Retinoic acid- induced granulocytic differentiation of HL-60 myeloid leukemia cells is mediated directly through the retinoic acid receptor (RAR- alpha). Mol. Cell. Biol. 10: 2154-63.
Coulson A., Sulston J., Brenner S. and Karn J. (1986) Towards a physical map of the genome of the nematode C a e n o r h a b d i t i s elegans. Proc. Natl. Acad. Sci. USA 83: 7821-5.
Daga A., Tighe J.E. and Calabi F. (1992) Leukaemia /D rosophila homology. Nature 356: 484.
235

Dalton W.J., Aheam M.J., McCredie K.B., Freireich E.J., Stass S.A. and Trujillo J.M. (1988) HL-60 cell line was derived from a patient with FAB-M2 and not FAB-M3. Blood 71: 242-7.
Damm K., Thompson C.C. and Evans R.M. (1989) Protein encoded by v-erbA functions as a thyroid homone receptor antagonist. Nature 339: 593-7.
Davey F.R., Davis R.B., MacCallum J.M., Nelson D.A., Mayer R.J., BallE.D., Griffin J.D., Schiffer C.A. and Bloomfield C.D. (1989) M orphologic and cytochem ical ch a rac te ris tic s o f acutepromyelocytic leukemia. Am. J. Hematol. 30: 221-7.
de Luca L.M. (1991) Retinoids and their receptors indifferentiation, embryogenesis, and neoplasia. FASEB J. 5: 2924- 33.
de The H., Chomienne C., Lanotte M., Degos L. and Dejean A. (1990) The t( 15; 17) translocation of acute promyelocytic leukaemia fuses the retinoic acid receptor alpha gene to a novel transcribed locus. Nature 347: 558-61.
de The H., Lavau C., Marchio A., Chomienne C., Degos L. and Dejean A. (1991) The PML-RAR alpha fusion mRNA generated by the t(15; 17) translocation in acute promyelocytic leukemia encodes a functionally altered RAR. Cell 6 6 : 675-84.
de The H., Marchio A., Tiollais P. and Dejean A. (1989) Differential expression and ligand regulation of the retinoic acid receptor alpha and beta genes. Embo J. 8 : 429-33.
de The H., Vivanco R.M., Tiollais P., Stunnenberg H. and Dejean A. (1990) Identification of a retinoic acid responsive element in theretinoic acid receptor beta gene. Nature 343: 177-80.
Dejean A., Bougueleret L., Grzeschik K.H. and Tiollais P. (1986) Hepatitis B virus DNA integration in a sequence homologous to v- erb-A and steroid receptor genes in a hepatocellular carcinoma. Nature 322: 70-2.
236

Dejean A. and de T.H. (1990) Hepatitis B virus as an insertional mutagene in a human hepatocellular carcinoma. Mol. Biol. Med. 7: 213-22 .
Diekmann D., Brill S., Garrett M.D., Totty N., Hsuan J., Monfries C., Hall C., Lim L. and Hall A. (1991) Bcr encodes a GTPase-activating protein for p21rac. Nature 351: 400-2.
Dobrovic A., Trainor K.J. and Morley A.A. (1988) Detection of the molecular abnormality in chronic myeloid leukemia by use of the polymerase chain reaction. Blood 72: 2063-5.
Dolle P., Ruberte E., Leroy P., Morriss-Kay G. and Chambon P.(1990) Retinoic acid receptors and cellular retinoid binding proteins I. A systematic study of their differential pattern of transcription during mouse organogenesis. Development 110: 1133-51.
Donehower L.A., Harvey M., Slagle B.L., McArthur M.J., Montgomery C.A., Butel J.S. and Bradley A. (1992) Mice deficient for p53 are developm entally normal but susceptible to spontaneous tumours. Nature 356: 215-21.
Donti E., Montanucci M., Longo L., Mencarelli A., Pandolfi P., Tabilio A., Nanni M., Alimena G., Avanzi G., Pegoraro L., Grignani F. and Pelicci P.G. (1989) The m yeloperoxidase gene in acute promyelocytic leukemia. Science 244: 824-5.
Dumanski J.P., Carlbom E., Collins V.P. and Nordenskjold M. (1987) Deletion mapping of a locus on human chromosome 22 involved in the oncogenesis of meningioma. Proc. Natl. Acad. Sci. USA 84: 9275-9 .
Duyk G.M., Kim S.W., Myers R.M. and Cox D.R. (1990) Exon trapping: a genetic screen to identify candidate transcribedsequences in cloned mammalian genomic DNA. Proc. Natl. Acad. Sci. USA 87: 8995-9.
Ellisen L.W., Bird J., West D.C., Soreng A.L., Reynolds T.C., Smith S.D. and Sklar J. (1991) TAN-1, the human homolog of the Drosophila
237

notch gene, is broken by chromosomal translocations in T lymphoblastic neoplasms. Cell 6 6 : 649-61.
Engel E., McKee L.C. and Bunting K.W. (1967) Chromosomes 17-18 in leukaemias. Lancet 2: 42-3.
Estivill X. and Williamson R. (1987) A rapid method to identify cosmids containing rare restriction sites. Nucleic Acids Res. 15: 1415-25.
Fain P.R., Wright E., Willard H.F., Stephens K. and Barker D.F.(1989) The order of loci in the pericentric region of chromosome 17, based on evidence from physical and genetic breakpoints. Am . J. Hum. Genet. 44: 68-72.
Fearon E.R., Cho K.R., Nigro J.M., Kern S.E., Simons J.W., Ruppert J.M., Hamilton S.R., Preisinger A.C., Thomas G., Kinzler K.W. and Vogelstein B. (1990) Identification of a chromosome 18q gene that is altered in colorectal cancers. Science 247: 49-56.
Feinberg A.P. and Vogelstein B. (1984) A technique for radiolabelling DNA restriction endonuclease fragments to high specific activity. Anal. Biochem. 137: 266-7.
Fenaux P. and Degos L. (1991) Treatment of acute promyelocytic leukemia with all-trans retinoic acid. Leuk. Res. 15: 655-7.
Fey M.F., Kulozik A.E., Hansen H.T. and Tobler A. (1991) The polymerase chain reaction: a new tool for the detection of minimal residual disease in haematological malignancies. Eur. J. Cancer 27: 89-94.
Finger L.R., Kagan J., Christopher G., Kurtzberg J., Hershfield M.S., Nowell P.C. and Croce C.M. (1989) Involvement of the TCL5 gene on human chromosome 1 in T-cell leukaemia and melanoma. Proc. Natl. Acad. Sci. USA 8 6 : 5039-43.
Fontana J.A., Rogers J.S. and Durham J.P. (1986) The role of 13 cis- retinoic acid in the remission induction of a patient with acute promyelocytic leukemia. Cancer 57: 209-17.
238
Fountain J.W., Wallace M.R., Bruce M.A., Seizinger B.R., Menon A.G., Gusella J.F., Michels V.V., Schmidt M.A., Dewald G.W. and CollinsF.S. (1989) Physical mapping of a translocation breakpoint in neurofibromatosis. Science 244: 1085-7.
Frankel A.E. and Fischinger P.J. (1976) Nucleotide sequences in mouse DNA and RNA specific for Moloney sarcoma viruses. Proc. N atl Acad. Sci. USA 73: 3705-9.
Freemont P.S., Hanson I.M. and Trowsdale J. (1991) A novel cysteine-rich sequence motif [letter]. Cell 64: 483-4.
Freyd G., Kim S.K. and Horvitz H.R. (1990) Novel cysteine-rich motif and homeodomain in the product of the Caenorhabditis elegans cell lineage gene lin-11. Nature 344: 876-9.
Friend S.H., Horowitz J.M., Gerber M.R., Wang X.F., Bogenmann E., LiF.P. and Weinberg R.A. (1987) Deletions of a DNA sequence in retinoblastomas and mesenchymal tumors: organization of the sequence and its encoded protein [published erratum appears in Proc. Natl. Acad. Sci. USA 1988; 85: 2234]. Proc. Natl. Acad. Sci. USA 84: 9059-63.
Frischauf A.-M. (1989) Construction and use of linking libraries. Technique 1: 3-10.
Frischauf A.M. (1991) Construction of genomic libraries in lambda and cosmid vectors. Essential molecular biology A p ra c t ic a l approach. New York, Oxford University Press. 15-38.
Frischauf A.M., Murray N. and Lehrach H. (1987) Lambda phage vectors-EMBL series. Methods Enzymol. 153: 103-15.
Frohman M.A., Dush M.K. and Martin G.R. (1988) Rapid production of full-length cDNAs from rare transcripts: amplification using a single gene-specific oligonucleotide primer. Proc. Natl. Acad. Sci. USA 85: 8998-9002.
Gallagher R.E., Said F., Pua I., Papenhausen P.R., Paietta E. and Wiernik P.H. (1989) Expression of retinoic acid receptor-alpha
239

mRNA in human leukemia cells with variable responsiveness to retinoic acid. Leukemia 3: 789-95.
Gebert J.F., Moghal N., Frangioni J.V., Sugarbaker D.J. and Neel B.G.(1991) High frequency of retinoic acid receptor beta abnormalities in human lung cancer. Oncogene 6: 1859-68.
Germino G.G., Weinstat-Saslow D., Himmelbauer H., Gillespie G.A.J., Somlo S., Wirth B., Barton N., Harris K.L., Frischauf A.M. and T. R.S.(1992) The gene for autosomal dominant polycystic kidney disease lies in a 750-kb CpG-rich region. Genomics 13: 144-51.
Gessler M., Poustka A., Cavenee W., Neve R.L., Orkin S.H. and BrunsG.A. (1990) Homozygous deletion in Wilms tumours of a zinc- finger gene identified by chromosome jumping. Nature 343: 774- 8 .
Giguere V., Ong E.S., Segui P. and Evans R.M. (1987) Identification of a receptor for the morphogen retinoic acid. Nature 330: 624-9.
Giguere V., Shago M., Zimgibl R., Tate P., Rossant J. and Varmuza S.(1990) Identification of a novel isoform of the retinoic acid receptor gamma expressed in the mouse embryo. Mol. Cell. Biol. 10: 2335-40.
Glorius J.B. and Houssay D. (1973) Auer bodies in acute promyelocytic leukemia. Demonstration of their fine structure and peroxidase localization. Lab. Invest. 28: 135-41.
Goddard A.D., Borrow J., Freemont P.S. and Solomon E. (1991) Characterization of a zinc finger gene disrupted by the t(15; 17) in acute promyelocytic leukemia. Science 254: 1371-4.
Goebl M.G. (1991) The bmi-1 and m e l!8 gene products define a new family of DNA-binding proteins involved in cell proliferation and tumorigenesis. Cell 66: 623.
Golomb H.M., Rowley J., Vardiman J., Baron J., Locker G. and Krasnow S. (1976) Partial deletion of long arm of chromosome 17: a specific abnormality in acute promyelocytic leukemia? A rch . Intern. Med. 136: 825-8.
240

Golomb H.M., Rowley J.D., Vardiman J.W., Testa J.R. and Butler A. (1980) "Microgranular" acute promyelocytic leukemia: a distinct clinical, ultrastructural, and cytogenetic entity. Blood 55: 253-9.
Green S. and Chambon P. (1988) Nuclear receptors enhance our understanding of transcription regulation. Trends Genet. 4: 309- 14.
Groden J., Thliveris A., Samowitz W., Carlson M., Gelbert L., Albertsen H., Joslyn G., Stevens J., Spirio L., Robertson K., Sargeant L., Krapcho K., Wolff E., Burt R., Hughes J.P., Warrington J., McPherson J., Wasmuth J., Le Pasilier D., Abderrahim H., Cohen D., L eppert M. and W hite R. (1991) Id en tifica tio n and characterization of the familial adenomatous polyposis coli gene. Cell 66: 589-600.
Groopman J.E., Molina J.-M. and Scadden D.T. (1989) Hematopoietic growth factors: biology and clinical applications. New Engl. J. Med. 321: 1449-59.
Grossman A., Silver R.T., Arlin Z., Coleman M., Camposano E., Gascon P. and Benn P.A. (1989) Fine mapping of chromosome 22 breakpoints within the breakpoint cluster region (bcr) implies a role for bcr exon 3 in determining disease duration in chronic myeloid leukemia. Am. J. Hum. Genet. 45: 729-38.
Guerts van Kessel A., de Leeuw H., Dekker E.J., Rijks L., Spurr N., Ledbetter D., Kootwijk E. and Vaessen M.J. (1991) Localization of the cellular retinoic acid binding protein (CRABP) gene relative to the acute prom yelocytic leukem ia-associated breakpoint on human chromosome 15. Hum. Genet. 87: 201-4.
Hall J.M., Friedman L., Guenther C., Lee M.K., Weber J.L., Black D.M. and King M.-C. (1992) Closing in on a breast cancer gene on chromosome 17q. Am. J. Hum. Genet. 50: 1235-42.
Hall J.M., Lee M.K., Newman B., Morrow J.E., Anderson L.A., Huey B. and King M.C. (1990) Linkage of early-onset familial breast cancer to chromosome 17q21. Science 250: 1684-9.
241
Harris H., Milller O.J., G. K., Worst P. and Tachibana T. (1969) Suppression of malignancy by cell fusion. Nature 223: 363-8.
Hart M.J., Eva A., Evans T., Aaronson S.A. and Cerione R.A. (1991) Catalysis of guanine nucleotide exchange on the CDC42Hs protein by the dbl oncogene product. Nature 354: 311-4.
Hatano M., Roberts C.W., Minden M., Crist W.M. and Korsmeyer S.J. (1991) Deregulation of a homeobox gene, HOX11, by the t(10; 14) in T cell leukemia. Science 253: 79-82.
Haupt Y., Alexander W.S., Barri G., Klinken S.P. and Adams J.M.(1991) Novel zinc finger gene implicated as m yc collaborator by retrovially accelerated lymphomagenesis in E|i-m yc transgenic mice. Cell 65: 753-63.
Heim S., Kristoffersson U., Mandahl N., Malm C. and Mitelman F.(1988) Variant translocation t(3; 15)(q21 ;q22) in a patient with acute promyelocytic leukemia. Leukemia 2: 65-7.
Heisterkamp N., Groffen J., Stephenson J.R., Spurr N.K., Goodfellow P.N., Solomon E., Carritt B. and Bodmer W.F. (1982) Chromosomallocalization of human cellular homologues of two viral oncogenes.Nature 299: 747-9.
Heyman R.A., Mangelsdorf D.J., Dyck J.A., Stein R.B., Eichele G., Evans R.M. and Thaller C. (1992) 9-cis retinoic acid is a high affinity ligand for the retinoid X receptor. Cell 68: 397-406.
Hillestad L.K. (1957) Acute promyelocytic leukemia. Acta Med.Scand. 159: 189-94.
Hockenbery D., Nunez G., Milliman C., Schreiber R.D. and Korsmeyer S. (1990) Bcl-2, an inner mitochondrial membraneprotein blocks programmed cell death. Nature 348: 334-6.
Holton T.A. and Graham M.W. (1991) A simple and efficientmethod for direct cloning of PCR products using ddT-tailed vectors. Nucleic Acids Res. 19: 1156.
242

Hong W.K., Lippman S.M., Itri L.M., Karp D.D., Lee J.S., Byers R.M., Schantz S.P., Kramer A.M., Lotan R., Peters L.J., Dimery I.W., Brown B.W. and Goepfert H. (1990) Prevention of second primary tumors with isotretinoin in squamous-cell carcinoma of the head and neck. New Engl. J. Med. 323: 795-801.
Hromas R., Collins S.J., Hickstein D., Raskind W., Deaven L.L., O'Hara P., Hagen F.S. and Kaushansky K. (1991) A retinoic acid-responsive human zinc finger gene, M Z F -1 , preferentially expressed in myeloid cells. / . Biol. Chem. 266: 14183-7.
Huang M.-E., Ye Y.-C., Chen S.-R., Chai J.-R., Lu J.-X., Zhoa L., Gu L.-J. and Wang Z.-Y. (1988) Use of all- tra n s retinoic acid in the treatment of acute promyelocytic leukemia. Blood 72: 567-72.
Huret J.L . (1990) Complex translocations, simple variant translocations and Ph-negative cases in chronic myelogenous leukaemia. Hum. Genet. 85: 565-8.
Inaba T., Roberts W.M., Shapiro L.H., Jolly K.W., Raimondi S.C., Smith S.D. and Look A.T. (1992) Fusion of the leucine zipper gene H LF to the E2A gene in human acute B-lineage leukemia. Science 257: 531-4.
Ishikawa T., Umesono K., Mangelsdorf D.J., Aburatani H., StangerB.Z., Shibasaki Y., Imawari M., Evans R.M. and Takaku F. (1990) A functional retinoic acid receptor encoded by the gene on human chromosome 12. Mol. Endocrinol. 4: 837-44.
Ito T. and Sakaki Y. (1988) A novel procedure for selective cloning of Notl linking fragments from mammalian genomes. N u c le ic Acids Res. 16: 9177-84.
Jaubert J., Martiat P., Dowding C., Ifrah N. and Goldman J.M. (1990) The position of the M-BCR breakpoint does not predict the duration of chronic phase or survival in chronic myeloid leukemia. Br. J. Haematol. 74: 30-5.
Jones J.S., Weber S. and Prakash L. (1988) The Saccharomyces cerev isiae RAD18 gene encodes a protein that contains potential
243

zinc finger domains for nucleic acid binding and a putative nucleotide binding sequence. Nucleic Acids Res. 16: 7119-31.
Jones M.E. and Saleem A. (1978) Acute promyelocytic leukemia. Am. J. Med. 65: 673-7.
Joslyn G., Carlson M., Thliveris A., Albertsen H., Gelbert L., Samowitz W., Groden J., Stevens J., Spirio L., Robertson M., Sargeant L., Krapcho K., Wolff E., Burt R., Hughes J.P., Warrington J., McPherson J., Wasmuth J., Le Pasilier D., Abderrahim H., Cohen D., Leppert M. and White R. (1991) Identification of deletion mutations and three new genes at the familial polyposis locus. C ell 66: 601-13.
Julier C. and White R. (1988) Detection of a Notl polymorphism with the pmetH probe by pulsed-field gel electrophoresis. Am. J. Hum. Genet. 42: 45-8.
Kakizuka A., Miller W.J., Umesono K., Warrell R.J., Frankel S.R., Murty V.V., Dmitrovsky E. and Evans R.M. (1991) Chromosomal translocation t ( l 5; 17) in human acute promyelocytic leukemia fuses RAR alpha with a novel putative transcription factor, PML. Cell 66: 663-74.
Kamps M.P., Look A.T. and Baltimore D. (1991) The human t ( l ; 19) translocation in pre-B ALL produces multiple nuclear E2A-Pbxl fusion proteins with differing transforming potentials. Genes Dev. 5: 358-68.
Kamps M.P., Murre C., Sun X.H. and Baltimore D. (1990) A new homeobox gene contributes the DNA binding domain of the t ( l ; 19) translocation protein in pre-B ALL. Cell 60: 547-55.
Kandpal R.P., Shukla H., Ward D.C. and Weissman S.M. (1990) A polymerase chain reaction approach for constructing jumping and linking libraries. Nucleic Acids Res. 18: 3081.
Kao F.T., Hartz J.A., Law M.L. and Davidson J.N. (1982) Isolation and chromosomal localization of unique DNA sequences from a human genomic library. Proc. Natl. Acad. Sci. USA 79: 865-9.
244

Karlsson O., Thor S., Norberg T., Ohlsson H. and Edlund T. (1990) Insulin gene enhancer binding protein Isl-1 is a member of a novel class of proteins containing both a homeo- and a Cys-His domain. Nature 344: 879-82.
Kastner P., Krust A., Mendelsohn C., Gamier J.M., Zelent A., Leroy P., Staub A. and Chambon P. (1990) Murine isoforms of retinoic acid receptor gamma with specific patterns of expression. P roc. Natl. Acad. Sci. USA 87: 2700-4.
Kastner P., Perez A., Lutz Y., Rochette-Egly C., Gaub M.-P., DurandB., Lanotte M., Berger R. and Chambon P. (1992) Structure, localization and transcriptional properties of two classes of retinoic acid receptor a fusion proteins in acute promyelocytic leukemia (APL): structural similarities with a new family of oncoproteins. Embo J. 11: 629-42.
Kawasaki E.S., Clark S.S., Coyne M.Y., Smith S.D., Champlin R., Witte O.N. and McCormick F.P. (1988) Diagnosis of chronic myeloid and acute lymphocytic leukemias by detection of leukemia-specific mRNA sequences amplified in vitro. Proc. Natl. Acad. Sci. USA 85: 5698-702 .
Kennedy M.A., Gonzalez S.R., Kees U.R., Lampert F., Dear N., Boehm T. and Rabbitts T.H. (1991) HOX11, a homeobox-containing T-cell oncogene on human chromosome 10q24. Proc. Natl. Acad. Sci. USA 88: 8900-4.
Keshet I., Yisraeli J. and Cedar H. (1985) Effect of regional DNA methylation on gene expression. Proc. Natl. Acad. Sci. USA 82: 2560-4 .
Kinzler K.W., Nilbert M.C., Su L.-K., Vogelstein B., Bryan T.M., LevyD.B., Smith K.J., Preisinger A.C., Hedge P., McKechnie D., Finniear R., Markham A., Groffen J., Boguski M.S., Altschul S.F., Horii A., AndoH., Miyoshi Y., Miki Y., Nishisho I. and Nakamura Y. (1991) Identification of FAP locus genes from chromosome 5q21. Science 253: 661-5.
245

Kinzler K.W. and Vogelstein B. (1989) Whole genome PCR: application to the identification of sequences bound by gene regulatory proteins. Nucleic Acids Res. 17: 3645-53.
Kliewer S.A., Umesono K., Heyman R.A., Mangelsdorf D.J., Dyck J.A. and Evans R.M. (1992a) Retinoid X receptor-COUP-TF interactions modulate retinoic acid signaling. Proc. Natl. Acad. Sci. USA 89: 1448-52.
Kliewer S.A., Umesono K., Mangelsdorf D.J. and Evans R.M. (1992b) Retinoid X receptor interacts with nuclear receptors in retinoic acid, thyroid hormone and vitamin D3 signalling. Nature 355: 446-9 .
Knudson A.G. (1971) Mutation and cancer: statistical study of retinoblastoma. Proc. Natl. Acad. Sci. USA 68: 820-3.
Kraemer K.H., DiGiovanna J.J., Moshell A.N., Tarone R.E. and PeckG.L. (1988) Prevention of skin cancer in xeroderma pigmentosum with the use of oral isotretinoin. New Engl. J. Med. 318: 1633-7.
Kruyt F.A.E., van der Veer L.J., Mader S., van den Brink C.E., Feijen A., Jonk L.J.C., Kruijer W. and van der Saag P.T. (1992) Retinoic acid resistance of the variant embryonal carcinoma cell line RAC65 is caused by expression of a truncated R A R a . Differentiation 49: 27-37.
Kwok S. and Higuchi R. (1989) Avoiding false positives with PCR. Nature 339: 237-8.
Lammie G.A., Fantl V., Smith R., Schuuring E., Brookes S., Michalides R., Dickson C., Arnold A. and Peters G. (1991) D11S287, a putative oncogene on chromosome l lq l 3 , is amplified and expressed in squamous cell and mammary carcinomas and linked to BCL-1. Oncogene 6: 439-44.
Land H., Parada L.F. and Weinberg R.A. (1983) Tumorigenic conversion of primary embryo fibroblasts requires at least two cooperating oncogenes. Nature 304: 596-602.
246
Lanotte M., Martin-Thouvenin V., Najman S., Balerini P., Valensi F. and Berger R. (1991) NB4, a maturation inducible cell line with t(15; 17) marker isolated from a human acute promyelocytic leukemia (M3). Blood 77: 1080-6.
Largman C., Detmer K., Corral J.C., Hack F.M. and Lawrence H.J.(1989) Expression of retinoic acid receptor alpha mRNA in human leulemia cells. Blood 74: 99-102.
Larson R.A., Kondo K., Vardiman J.W., Butler A.E., Golomb H.M. and Rowley J.D. (1984) Evidence for a 15;17 translocation in every patient with acute promyelocytic leukemia. Am. J. Med. 76: 827- 41.
Laudet V., Hanni C., Coll J., Catzeflis F. and Stehelin D. (1992) Evolution of the nuclear receptor gene superfamily. Embo J. 11: 1003-13.
Lazar M.A., Hodin R.A., Darling D.S. and Chin W.W. (1989) A novel member of the thyroid/steroid hormone receptor family is encoded by the opposite strand of the rat c-erbA alpha transcriptional unit. Mol. Cell. Biol. 9: 1128-36.
Ledbetter S.A., Wallace M.R., Collins F.S. and Ledbetter D.H. (1990) Human chromosome 17 Notl linking clones and their use in long- range restriction mapping of the Miller-Dieker chromosome region (MDCR) in 17pl3.3. Genomics 7: 264-9.
Lee M.S., Chang K.S., Cabanillas F., Freireich E.J., Trujillo J.M. and Stass S.A. (1987) Detection of minimal residual cells carrying the t(14; 18) by DNA sequence amplification. Science 237: 175-8.
Lee M.S., Chang K.S., Freireich E.J., Kantarjian H.M., Talpaz M., Trujillo J.M. and Stass S.A. (1988) Detection of minimal residual bcr/abl transcripts by a modified polymerase chain reaction. Blood 72: 893-7.
Lee W.H., Shew J.Y., Hong F.D., Sery T.W., Donoso L.A., Young L.J., Bookstein R. and Lee E.Y. (1987) The retinoblastoma susceptibility
247

gene encodes a nuclear phosphoprotein associated with DNA binding activity. Nature 329: 642-5.
Leid M., Kastner P., Lyons R., Nakshatri H., Saunders M., Zacharewski T., Chen J.Y., Staub A., Gamier J.M., Mader S. and Chambon P. (1992) Purification, cloning, and RXR identity of the HeLa cell factor with which RAR or TR heterodimerizes to bind target sequences efficiently. Cell 68: 377-95.
Leroy P., Krust A., Zelent A., Mendelsohn C., Gamier J.M., Kastner P., Dierich A. and Chambon P. (1991a) Multiple isoforms of the mouse retinoic acid receptor alpha are generated by alternative splicing and differential induction by retinoic acid. Embo J. 10: 59-69.
Leroy P., Nakshatri H. and Chambon P. (1991b) Mouse retinoic acid receptor alpha 2 isoform is transcribed from a promoter that contains a retinoic acid response element. Proc. Natl. Acad. Sci. USA 88: 10138-42.
Levin A.A., Sturzenbecker L.J., Kazmer S., Bosakowski T., HuseltonC., Allenby G., Speck J., Kratzeisen C., Rosenberger M., Lovey A. and Grippo J.F. (1992) 9-cis retinoic acid stereoisomer binds and activates the nuclear receptor RXR alpha. Nature 355: 359-61.
Levinson A., Silver D. and Seed B. (1984) Minimal size plasmids containing an M l 3 origin for production of single-strand transducing particles. J. Mol. Appl. Genet. 2: 507-17.
Lindsay S. and Bird A.P. (1987) Use of restriction enzymes to detect potential gene sequences in mammalian DNA. Nature 327: 336-8.
Loh E.Y., Elliott J.F., Cwirla S., Lanier L.L. and Davis M.M. (1989) Polymerase chain reaction with single-sided specificity: analysis of T cell receptor delta chain. Science 243: 217-20.
Longo L., Donti E., Mencarelli A., Avanzi G., Pegoraro L., Alimena G., Tabilio A., Venti G., Grignani F. and Pelicci P.G. (1990a) Mapping of chromosome 17 breakpoints in acute myeloid leukaem ias. Oncogene 5: 1557-63.
248

Longo L., Pandolfi P.P., Biondi A., Rambaldi A., Mencarelli A., CocoF.L., Diverio D., Pegoraro L., Avanzi G., Tabilio A., Zangrilli D., Alcalay M., Donti E., Grignani F. and Pelicci P.G. (1990b) Rearrangements and aberrant expression of the retinoic acid receptor alpha gene in acute promyelocytic leukemias. J. Exp. Med. 172: 1571-5.
Lovering R., Hanson I.M., Borden K.L.B., Martin S., O’Reilly N., EvanG.I., Rahman D., Pappin D.J.C., Trowsdale J. and Freemont P.S.(1992) The RING finger - a novel protein-DNA binding motif related to the zinc finger. Subm itted.
Lozzio C.B. and Lozzio B.B. (1975) Human chronic myelogenous leukemia cell-line with positive Philadelphia chromosome. B lo o d 45: 321-34.
Lu D., Thompson J.D., Gorski G.K., Rice N.R., Mayer M.G. and Yunis J.J. (1991) Alterations at the rel locus in human lymphoma. Oncogene 6: 1235-41.
MacDonald M.E., Cheng S.V., Zimmer M., Haines J.L., Poustka A., Allitto B., Smith B., Whaley W.L., Romano D.M., Jagadeesh J., Myers R.H., Lehrach H., Wasmuth J.J., Frischauf A.-M. and Gusella J.F.(1989) C lustering of m ultiallele DNA m arkers near the Huntington's disease gene. J. Clin. Invest. 84: 1013-6.
Magrath I. (1990) The pathogenesis of Burkitt’s lymphoma. A dv. Cancer Res. 55: 133-270.
Malkin D., Li F.P., Strong L.C., Fraumeni J.J., Nelson C.E., Kim D.H., Kassel J., Gryka M.A., Bischoff F.Z., Tainsky M.A. and Friend S.H.(1990) Germ line p53 mutations in a familial syndrome of breast cancer, sarcomas, and other neoplasms. Science 250: 1233-8.
Mangelsdorf D.J., Borgmeyer U., Heyman R.A., Yang Zhou J., OngE.S., Oro A.E., Kakizuka A. and Evans R.M. (1992) Characterization of the three RXR genes that mediate the action of 9-cis retinoic acid. Genes Dev. 6: 329-44.
249

Mangelsdorf D.J., Ong E.S., Dyck J.A. and Evans R.M. (1990) Nuclear receptor that identifies a novel retinoic acid response pathway. Nature 345: 224-9.
Marchuk D.A., Saulino A.M., Tavakkol R., Swaroop M., Wallace M.R., Andersen L.B., Mitchell A.L., Gutmann D.H., Boguski M. and CollinsF.S. (1991) cDNA cloning of the type 1 neurofibromatosis gene: complete sequence of the NF1 gene product. Genomics 11: 931 - 40.
Maru Y. and Witte O.N. (1991) The BCR gene encodes a novel serine/threonine kinase activity within a single exon. Cell 67: 459-68 .
Mattei M.-G., Riviere M., Krust A., Ingvarsson S., Vennstrom B., Quamrul Islam M., Levan G., Kauyner P., Zelent A., Chambon P., Szpirer J. and Szpirer C. (1991) Chromosomal assignment of retinoic acid receptor (R A R ) genes in the human, mouse and rat genomes. Genomics 10: 1061-9.
Mattei M.G., de T.H., Mattei J.F., Marchio A., Tiollais P. and Dejean A. (1988a) Assignment of the human hap retinoic acid receptor RAR beta gene to the p24 band of chromosome 3. Hum. Genet. 80: 189-90.
Mattei M.G., Petkovich M., Mattei J.F., Brand N. and Chambon P. (1988b) Mapping of the human retinoic acid receptor to the q21 band of chromosome 17. Hum. Genet. 80: 186-8.
McGuire E.A., Hockett R.D., Pollock K.M., Bartholdi M.F., O’Brien S.J. and Korsmeyer S.J. (1989) The t(l 1 ;14)(pl5;ql 1) in a T-cell acute lymphoblastic leukemia cell line activates multiple transcripts, including Ttg-1, a gene encoding a potential zinc finger protein. Mol. Cell. Biol. 9: 2124-32.
McKeithan T.W., Rowley J.D., Shows T.B. and Diaz M.O. (1987) Cloning of the chromosome translocation breakpoint junction of the t( 14; 19) in chronic lymphocytic leukemia. Proc. Natl. Acad. Sci. USA 84: 9257-60.
250

McKenna R.W., Parkin J. and Bloomfield C.P. (1982) Acute monomyelocytic leukaemia: a study of 39 cases with identification of a hyperbasophilic microgranular variant. Br. J. Haematol. 50: 201-14 .
McLaughlin J., Chianese E. and Witte O.N. (1989) Alternative forms of the BCR-ABL oncogene have quantitatively different potencies for stimulation of immature lymphoid cells. Mol. Cell. Biol. 9: 1866-74.
Meeker T.C., Hardy D., Willman C., Hogan T. and Abrams J. (1990) Activation of the interleukin-3 gene by chromosomal translocation in acute lymphocytic leukaemia with eosinophilia. Blood 76: 285- 9.
Mellentin J.D., Smith S.D. and Cleary M.L. (1989) lyl-1, a novel gene altered by chromosomal translocation in T cell leukemia, codes for a protein with a helix-loop-helix DNA binding domain. Cell 58: 77-83.
Mertelsmann R., Thaler H.T., To L., Gee T.S., McKenzie S., Schauer P., Friedman A., Arlin Z., Cirrincione C. and Clarkson B. (1980) Morphological classification, response to therapy, and survival in 263 adult patients with acute nonlymphoblastic leukemia. B lo o d 56: 773-81.
Miki T., Fleming T.P., Crescenzi M., Molloy C.J., Blam S.B., Reynolds S.H. and Aaronson S.A. (1991) Development of a highly efficient expression cDNA cloning system: application to oncogene isolation. Proc. Natl. Acad. Sci. USA 88: 5167-71.
Miller C.W., Rovera G., Venturelli D., Huebner K.F., van Tuinen P., Ledbetter D.H., Kitchingman G., Mirro J. and Koeffler H.P. (1989) The myeloperoxidase gene in acute promyelocytic leukemia. Science 244: 823-4.
Miller W.H., Kakizuka A., Frankel S.R., Warrell R.P., DeBlasio A., Levine K., Evans R.M. and Dmitrovsky E. (1992) Reverse transcription polym erase chain reaction for the rearranged retinoic receptor alpha clarifies diagnosis and detects minimal
251
residual disease in acute promyelocytic leukemia. Proc. Natl. Acad. Sci. USA 89: 2694-8.
Mills K.I., Hynds S.A., Burnett A.K., MacKenzie E.D. and Bimie G.D.(1989) Further evidence that the site of the breakpoint in the major breakpoint cluster region (M-bcr) may be a prognostic indicator. Leukemia 3: 837-40.
Mitelman F., Kaneko Y. and Trent J.M. (1990) Report of the committee on chromosome changes in neoplasia, HGM10.5. Cytogenet. Cell Genet. 55: 358-86.
Miyajima N., Horiuchi R., Shibuya Y., Fukushige S., Matsubara K., Toyoshima K. and Yamamoto T. (1989) Two erbA homologs encoding proteins with different T3 binding capacities are transcribed from opposite DNA strands of the same genetic locus. Cell 57: 31-9.
Miyoshi H., Shimizu K., Kozu T., Maseki N., Kaneko Y. and Ohki M.(1991) t(8;21) breakpoints on chromosome 21 in acute myeloid leukemia are clustered within a limited region of a single gene, AML1. Proc. Natl. Acad. Sci. USA 88: 10431-4.
Moon R.C., McCormick D.L. and Mehta R.G. (1983) Inhibition of carcinogenesis by retinoids. Cancer Res. 43: 24696-755.
Moore G., Hedge P.J., Rider S.H., Xu W., Hing S., Palmer R., Sheer D. and Solomon E. (1989) M ultiple tandem 18-kb sequences clustered in the region of the acute promyelocytic leukemia breakpoint on chromosome 17. Genomics 4: 152-61.
Motokura T., Bloom T., Kim H.G., Juppner H., Ruderman J.V., Kronenberg H.M. and Arnold A. (1991) A novel cyclin encoded by a bell-linked candidate oncogene. Nature 350: 512-5.
Muindi J., Frankel S.R., Miller W.J., Jakubowski A., Scheinberg D.A., Young C.W., Dmitrovsky E. and Warrell R.J. (1992) Continuous treatment with all-trans retinoic acid causes a progressive reduction in plasma drug concentrations: implications for relapse and retinoid "resistance" in patients with acute promyelocytic leukemia. Blood 79: 299-303.
252

Murre C., McCaw P.S., Vaessin H., Caudy M., Jan L.Y., Jan Y.N., Cabrera C.V., Buskin J.N., Hauschka S.D., Lassar A.B., Weintraub H. and Baltimore D. (1989) Interactions between heterologous helix- loop-helix proteins generate complexes that bind specifically to a common DNA sequence. Cell 58: 537-44.
Najfeld V., Scalise A. and Troy K. (1989) A new variant translocation 11; 17 in a patient with acute promyelocytic leukemia together with t(7; 12). Cancer Genet. Cytogenet. 43: 103- 8 .
Narod S.A., Feunteun J., Lynch H.T., Watson P., Conway T., Lynch J. and Lenoir G.M. (1991) Familial breast-ovarian cancer locus on chromosome 17ql2-q23. Lancet 338: 82-3.
Neri A., Chang C.-C., Lombardi L., Salina M., Corradini P., Maiolo A.T., Chaganti R.S.K. and Dalla-Favera R. (1991) B cell lymphoma- associated chromosomal translocation involves candidate oncogene lyt-10, homologous to NF-kB p50. Cell 67: 1075-87.
Nourse J., Mellentin J.D., Galili N., Wilkinson J., Stanbridge E., Smith S.D. and Cleary M.L. (1990) Chromosomal translocation t ( l ; 19) results in synthesis of a homeobox fusion mRNA that codes for a potential chimeric transcription factor. Cell 60: 535-45.
Nowell P.C. and Hungerford D.A. (1960) A minute chromosome in human chronic granulocytic leukemia. Science 132: 1497.
Ohno H., Takimoto G. and McKeithan T.W. (1990) The candidate proto-oncogene bcl-3 is related to genes implicated in cell lineage determination and cell cycle control. Cell 60: 991-7.
Ohyashiki K., Oshimura M., Uchida H., Nomoto S., Sakai N., Tonomura A. and Ito H. (1985) Cytogenetic and ultrastructural studies on ten patients with acute promyelocytic leukemia, including one case with a complex translocation. Cancer Genet. Cytogenet. 14: 247-55.
253

Osella P., Wyandt H., Vosburgh E. and Milunsky A. (1991) Report of a variant t(l;15; 17)(p36;q22;q21.1) in a patient with acute promyelocytic leukemia. Cancer Genet. Cytogenet. 57: 201-7.
Pandolfi P.P., Alcalay M., Fagioli M., Zangrilli D., Mencarelli A., Diverio D., Biondi A., Lo Coco F., Rambaldi A., Grignani F., Rochette- Egly C., Gaube M.-P., Chambon P. and Pelicci P.G. (1992) Genomic variability and alternative splicing generate multiple PML/RARA transcripts that encode aberrant PML proteins and PML/RARA isoforms in acute promyelocytic leukaemia. Embo J. 11: 1397- 407.
Pandolfi P.P., Grignani F., Alcalay M., Mencarelli A., Biondi A., LoCoco F., Grignani F. and Pelicci P.G. (1991) Structure and origin of the acute promyelocytic leukemia myl/rar alpha cdna and characterization of its retinoid-binding and transactivation properties. Oncogene 6: 1285-92.
Patarca R., Schwartz J., Singh R.P., Kong Q.-T., Murphy E., Anderson Y., Wei Sheng F.-Y., Singh P., Johnson K.A., Guamagia S.M., Durfee T., Blattner F. and Cantor H. (1988) rpt-1, an intracellular protein from helper/inducer T cells that regulates gene expression of interleukin 2 receptor and human immunodeficiency virus type 1. Proc. Natl. Acad. Sci. USA 85: 2733-7.
Pendergast A.M., Muller A.J., Havlik M.H., Maru Y. and Witte O.N.(1991) BCR sequences essential for transformation by the B C R - ABL oncogene bind to the ABL SH2 regulatory domain in a non- phosphotyrosine-dependent manner. Cell 66: 161-71.
Perry L.J., Rixon F.J., Everett R.D., Frame M.C. and McGeoch D.J.(1986) Characterization of the IE110 gene of herpes simplex virus type 1. J. Gen. Virol. 67: 2365-80.
Petkovich M., Brand N.J., Krust A. and Chambon P. (1987) A human retinoic acid receptor which belongs to the family of nuclear receptors. Nature 330: 444-50.
Pohl T.M., Zimmer M., MacDonald M.E., Smith B., Bucan M., Poustka A., Volinia S., Searle S., Zehetner G., Wasmuth J.J., Gusella J.,
254
Lehrach H. and Frischauf A.-M. (1988) Construction of a Notl linking library and isolation of new markers close to the Huntington's disease gene. Nucleic Acids Res. 16: 9185-98.
Pollock R. and Treisman R. (1990) A sensitive method for the determination of protein-DNA binding specificites. Nucleic Acids Res. 18:* 6197-204.
Ponglikitmongkol M., Green S. and Chambon P. (1988) Genomic organization of the human oestrogen receptor gene. Embo J. 7: 3385-8 .
Poustka A. and Lehrach H. (1986) Jumping libraries and linking libraries: the next generation of molecular tools in mammalian genetics. Trends Genet. 2: 174-9.
Poustka A., Pohl T.M., Barlow D.P., Frischauf A.M. and Lehrach H.(1987) Construction and use of human chromosome jumping libraries from Notl-digested DNA. Nature 325: 353-5.
Pratt M.A., Kralova J. and McBurney M.W. (1990) A dominant negative mutation of the alpha retinoic acid receptor gene in a retinoic acid-nonresponsive embryonal carcinoma cell. Mol. Cell. Biol. 10: 6445-53.
Rabbitts T.H. and Boehm T. (1991) Structural and functional chimerism results from chromosomal translocation in lymphoid tumors. Adv. Immunol. 50: 119-46.
Reddy B.A. and Etkin L.D. (1991) A unique bipartite cysteine- histidine motif defines a subfamily of potential zinc-finger proteins. Nucleic Acids Res. 19: 6330.
Reddy B.A., Kloc M. and Etkin L. (1991) The cloning and characterization of a maternally expressed novel zinc finger nuclear phosphoprotein (xnf7) in Xenopus laevis. Dev. Biol. 148: 107-16.
Reilly D.S., Sosnoski D.M. and Nussbaum R.L. (1989) Detection of translocation breakpoints by pulsed field gel analysis: practical considerations. Nucleic Acids Res. 17: 5414.
255

Rimokh R., Rouault J.P., Wahbi K., Gadoux M., Lafage M., Archimbaud E., Charrin C., Gentilhomme O., Germain D., Samarut J. and Magaud J.-P. (1991) A chromosome 12 coding region is juxtaposed to the MYC protooncogene locus in a t(8;12)(q24;q22) translocation in a case of B-cell chronic lymphocytic leukemia. Genes Chromosom. Cancer 3: 24-36.
Rosenberg C.L., Kim H.G., Shows T.B., Kronenberg H.M. and Arnold A. (1991) Rearrangement and overexpression of D11S287E, a candidate oncogene on chromosome 1 l q l 3 in benign parathyroid tumors. Oncogene 6: 449-53.
Rowley J.D. (1973) Letter: A new consistent chromosomal abnormality in chronic myelogenous leukaemia identified by quinacrine fluorescence and Giemsa staining. Nature 243: 290-3.
Rowley J.D., Golomb H.M. and Dougherty C. (1977a) 15/17 translocation, a consistent chrom osom al change in acute promyelocytic leukaemia [letter]. Lancet 1: 549-50.
Rowley J.D., Golomb H.M. and Vardiman J. (1977b) Nonrandom chromosomal abnormalities in acute nonlymphocytic leukemia in patients treated for Hodgkin d isease and non-H odgkin lymphomas. Blood 50: 759-70.
Royer-Pokora B., Loos U. and Ludwig W.-D. (1991) TTG-2, a new gene encoding a cysteine-rich protein with the L IM motif, is overexp ressed in acu te T -ce ll leu k aem ia w ith the t( 11; 14)(p 13;q 11). Oncogene 6: 1887-93.
Rustgi A.K., Dyson N. and Bernards R. (1991) Amino-terminal domains of c-myc and N-myc proteins mediate binding to the retinoblastoma gene product. Nature 352: 541-4.
Saiki R.K., Scharf S., Faloona F., Mullis K.B., Horn G.T., Erlich H.A. and Arnheim N. (1985) Enzymatic amplification of beta-globin genomic sequences and restriction site analysis for diagnosis of sickle cell anemia. Science 230: 1350-4.
256

Sambrook J., Fritsch E.F. and Maniatis T. (1989) Molecular Cloning A Laboratory Manual. Cold Spring Harbor Laboratory Press.
Sawyers C.L., Denny C.T. and Witte O.N. (1991) Leukemia and the disruption of normal hematopoiesis. Cell 64: 337-50.
Schatz D.G., Oettinger M.A. and Baltimore D. (1989) The V(D)J recombination activating gene, RAG-1. Cell 59: 1035-48.
Schwartz D.C. and Cantor C.R. (1984) Separation of yeast chrom osom e-sized DNAs by pulsed field g rad ien t gel electrophoresis. Cell 37: 67-75.
Schwartz J.G., Clare N., Hansen K., Britton H. and Manhoff L. (1986) Acute promyelocytic leukemia: report of a variant translocation, t( 1; 17). Cancer Genet. Cytogenet. 20: 89-93.
Seed B. (1987) An LFA-3 cDNA encodes a phospholipid-linked membrane protein homologous to its receptor CD2. Nature 329: 840-2.
Sehgal A., Patil N. and Chao M. (1988) A constitutive promoter directs expression of the nerve growth factor receptor gene. Mol . Cell. Biol. 8: 3160-7.
Sheer D., Hiorns L.R., Stanley K.F., Goodfellow P.N., Swallow D.M., Povey S., Heisterkamp N., Groffen J., Stephenson J.R. and SolomonE. (1983) Genetic analysis of the 15; 17 chromosome translocation associated with acute promyelocytic leukemia. Proc. Natl. Acad. Sci. USA 80: 5007-11.
Sheer D., Lister T.A., Amess J. and Solomon E. (1985) Incidence of the 15q+;17q- chromosome translocation in acute promyelocytic leukaemia (APL). Br. J. Cancer 52: 55-8.
Shih C., Shilo B., Goldfarb M.P., Dannenberg A. and Weinberg R.A. (1979) Passage of phenotypes of chemically transformed cells via transfection of DNA and chromatin. Proc. Natl. Acad. Sci. USA 76: 5714-8 .
257

Shimizu K., Ichikawa H., Miyoshi H., Ohki M., Kobayashi H., Maseki N. and Kaneko Y. (1991) Molecular assignment of a translocation breakpoint in acute myeloid leukemia with t(8;21). G e n e s Chromosom. Cancer 3: 163-7.
Simeone A., Acampora D., Arcioni L., Andrews P.W., Boncinelli E. and Mavilio F. (1990) Sequential activation of HOX2 homeobox genes by retinoic acid in human embryonal carcinoma cells. Nature 763-6.
Smith C.L., Lawrance S.K., Gillespie G.A., Cantor C.R., Weissman S.M. and Collins F.S. (1987) Strategies for mapping and cloning macroregions of mammalian genomes. Methods Enzymol. 151: 461-89.
Soekarman D., von Lindern M., Daenen S., de Jong B., Fonatsch C., Heinze B., Bartram C., Hagemeijer A. and Grosveld G. (1992) The translocation (6;9)(p23;q34) shows consistent rearrangement of two genes and defines a myeloproliferative disorder with specific clinical features. Blood 79: 2990-7.
Solomon E., Borrow J. and Goddard A.D. (1991) Chromosome aberrations and cancer. Science 254: 1153-60.
Sonoda Y., Misawa S., Maekawa T., Taniwaki M., Abe T. and Takino T. (1985) A variant 15; 17 translocation in a patient with acute promyelocytic leukemia. Cancer Genet. Cytogenet. 17: 61-7.
Srivastava A., Heerema N., Lauer R.C., Nahreini P., Boswell H.S., Hoffman R. and Antony A.C. (1987) A variant t(X;15)(pl l;q22) translocation in acute promyelocytic leukemia. Cancer Genet. Cytogenet. 29: 65-74.
Stanbridge E.J., Flandermeyer R.R., Daniels D.W. and Nelson-Rees W.A. (1981) Specific chromosome loss associated with the expression of tumorigenicity in human cell hybrids. Somatic Cell Genet. 7: 699-712.
258

Stehelin D., Varmus H.E., Bishop J.M. and Vogt P.K. (1976) DNA related to the transforming gene(s) of avian sarcoma viruses is present in normal avian DNA. Nature 260: 170-3.
Stone R.M. and Mayer R.J. (1990) The unique aspects of acute promyelocytic leukemia. 8: 1913-21.
Strickland S. and Mahdavi M. (1978) The induction of differentiation in teratocarcinoma stem cells by retinoic acid. Cel l 15: 393-403.
Sucov H.M., Murakami K.K. and Evans R.M. (1990) Characterization of an autoregulated response element in the mouse retinoic acid receptor type beta gene. Proc. Natl. Acad. Sci. USA 87: 5392-6.
Sundstrom C. and Nilsson K. (1976) Establishm ent and characterization of a human histiocytic lymphoma cell line (U- 937). Int. J. Cancer 17: 565-77.
Szczylik C., Skorski T., Nicolaides N.C., Manzella L., Malaguamera L., Venturelli D., Gewirtz A.M. and Calabretta B. (1991) Selective inhibition of leukemia cell proliferation by BCR-ABL antisense oligodeoxynucleotides. Science 253: 562-5.
Tagawa M., Sakamoto T., Shigemoto K., Matsubara H., Tanura Y., Ito T., Nakamura I., Okitsu A., Imai K. and Taniguchi M. (1990) Expression of novel DNA-binding protein with zinc finger structure in various tumor cells. J. Biol. Chem. 265: 20021-6.
Takahashi M. and Cooper G.M. (1987) ret transforming gene encodes a fusion protein homologous to tyrosine kinases. Mol. Cell. Biol. 7: 1378-85.
Takahashi M., Inaguma Y., Hiai H. and Hirose F. (1988) Developmentally regulated expression of a human "finger"- containing gene encoded by the 5’ half of the ret transform ing gene. Mol. Cell. Biol. 8: 1853-6.
Tallman M.S. and Kwaan H.C. (1992) Reassessing the hemostatic disorder associated with acute promyelocytic leukemia. Blood 79: 543-53.
259

Tanaka S., Nishigaki H., Misawa S., Taniwaki M., Nakagawa H., Yashige H., Horiike S., Kashima K., Inazawa J., Sonoda Y. and Abe T.(1990) Lack of involvement of the G-CSF gene by chromosomal translocation t( 15; 17) in acute promyelocytic leukemia. Leukemi a 4: 494-6.
Tasset D., Tora L., Fromental C., Scheer E. and Chambon P. (1990) Distinct classes of transcriptional activating domains function by different mechanisms. Cell 62: 1177-87.
Tefferi A., Bren G.D., Wagner K.V., Schaid D.J., Ash R.C. and Thibodeau S.N. (1990) The location of the Philadelphiachrom osom al breakpoint site and prognosis in chronic granulocytic leukemia. Leukemia 4: 839-42.
Thaller C. and Eichelle G. (1987) Identification and spatial distribution of the retinoids in the developing chick limb bud.Nature 327: 625-8.
Thomas X., Archimbaud E., Treille-Ritouet D. and Fiere D. (1991) P rognostic factors in acute prom yelocytic leukem ia: aretrospective study of 67 cases. Leuk. Lymphoma 4: 249-56.
Tong J.-H., Dong S., Geng J.-P., Huang W., Wang Z.-Y., Sun G.-L., Chen S.-J., Chen Z., Larsen C.-J. and Berger R. (1992) Molecular rearrangements of the M YL gene in acute promyelocytic leukemia (APL, M3) define a breakpoint cluster region as well as somemolecular variants. Oncogene 7: 311-6.
Tora L., White J., Brou C., Tasset D., Webster N., Scheer E. and Chambon P. (1989) The human estrogen receptor has two independent nonacidic transcriptional activation functions. Cel l 59: 477-87.
Tsuijimoto Y., Gorham J., Cossman J., Jaffe E. and Croce C. (1985) The t( 14; 18) chromosome translocation involved in B-cell neoplasms results from mistakes in VDJ joining. Science 229: 1390-3.
260

Tsujimoto Y., Yunis J., Onorato S.L., Erikson J., Nowell P.C. and CroceC.M. (1984) Molecular cloning of the chromosomal breakpoint of B-cell lymphomas and leukemias with the t( ll;1 4 ) chromosome translocation. Science 224: 1403-6.
Tunnacliffe A., Parkar M., Povey S., Bengtsson B.O., Stanley K., Solomon E. and Goodfellow P. (1983) Integration of Ecogpt and SV40 early region sequences into human chromosome 17: a dominant selection system in whole cell and microcell human- mouse hybrids. Embo J . 2: 1577-84.
Umesono K., Giguere V., Glass C.K., Rosenfeld M.G. and Evans R.M.(1988) Retinoic acid and thyroid hormone induce gene expression through a common responsive element. Nature 336: 262-5.
van Lohuizen M., Verbeek S., Scheijen B., Wientjens E., van der Gulden H. and Berns A. (1991) Identification of cooperating oncogenes in E|i-m yc transgenic mice by proviral tagging. Cel l 65: 737-52.
van Tuinen P., Rich D.C., Summers K.M. and Ledbetter D.H. (1987) Regional mapping panel for human chromosome 17: application to neurofibromatosis type 1. Genomics 1: 374-81.
Vance J.M., Nicholson G.A., Yamaoka L.H., Stajich J., Stewart C.S., Speer M.C., Hung W.Y., Roses A.D., Barker D. and Pericak V.M.(1989) Linkage of Charcot-Marie-Tooth neuropathy type la to chromosome 17. Exp. Neurol. 104: 186-9.
Viskochil D., Buchberg A.M., Xu G., Cawthon R.M., Stevens J., Wolff R.K., Culver M., Carey J.C., Copeland N.G., Jenkins N.A., White R. and O'Connell P. (1990) Deletions and a translocation interrupt a cloned gene at the neurofibromatosis type 1 locus. Cell 62: 187- 92.
von Lindem M., Fomerod M., van Baal S., Jaegle M., de Wit T., Buijs A. and Grosveld G. (1992) The translocation (6;9), associated with a specific subtype of acute myeloid leukaemia, results in the fusion of two genes, d e k and c a n , and the expression of a
261

chimaeric, leukaemia-specific dek-can mRNA. Mol. Cell. Biol. 12: 1687-97.
von Lindern M., Poustka A., Lerach H. and Grosveld G. (1990) The (6;9) chromosome translocation, associated with a specific subtype of acute nonlymphocytic leukemia, leads to aberrant transcription of a target gene on 9q34. Mol. Cell. Biol. 10: 4016-26.
von Lindern M., van Baal S., Wiegant J., Raap A., Hagemeijer A. and Grosveld G. (1992) can, a putative oncogene associated with myeloid leukemogenesis, may be activated by fusion of its 3' half to different genes: characterization of the set gene. Mol. Cell. Biol. 12: 3346-55.
Wallace M.R., Andersen L.B., Saulino A.M., Gregory P.E., Glover T.W. and Collins F.S. (1991) A de novo Alu insertion results in neurofibromatosis type 1. Nature 353: 864-6.
Wallace M.R., Fountain J.W., Brereton A.M. and Collins F.S. (1989) Direct construction of a chromosome-specific Notl linking library from flow-sorted chromosomes. Nucleic Acids Res. 17: 1665-77.
Wallace M.R., Marchuk D.A., Andersen L.B., Letcher R., Odeh H.M., Saulino A.M., Fountain J.W., Brereton A., Nicholson J., Mitchell A.L., Brownstein B.H. and Collins F.S. (1990) Type 1 neurofibromatosis gene: identification of a large transcript disrupted in three NF1 patients. Science 249: 181-6.
Weil S.C., Rosner G.L., Reid M.S., Chisholm R.L., Lemons R.S., Swanson M.S., Carrino J.J., Diaz M.O. and Le Beau M.M. (1988) Translocation and rearrangement of myeloperoxidase gene in acute promyelocytic leukemia. Science 240: 790-2.
Weinberg R.A. (1991) Tumour suppressor genes. Science 254: 1138-46.
Westin E.H., Wong-Staal F., Gelmann E.P., Dalla Favera R., Papas T.S., Lautenberger J.A., Eva A., Reddy E.P., Tronick S.R., Aaronson S.A. and Gallo R.C. (1982) Expression of cellular homologues of retroviral one genes in human haematopoietic cells. Proc. Natl. Acad. Sci. USA 79: 2490-2.
262

Whang-Peng J., Kao S.C., Lee E.C., Bunn P.A., Carney D.N., Gazdar A.F. and Minna J.D. (1982) Specific chromosome defect associated with human small-cell lung cancer; deletion 3p(14-23). Sc i ence 215: 181-2.
Whittaker P.A., Campbell A.J.B., Southern E.W. and Murray N.E.(1988) Enhanced recovery and restriction mapping of DNA fragments cloned in a new X vector. Nucleic Acids Res. 16: 6725- 36.
Wolbach S.B. and Howe P.R. (1925) Tissue changes followingdeprivation of fat-soluble A vitamin. J. Exp. Med. 42: 753-77.
Wolin S.L. and Steitz J.A. (1984) The Ro small cytoplasmic ribonucleoproteins: identification of the antigenic protein and its binding site on the Ro RNAs. Proc. Natl. Acad. Sci. USA 81: 1996- 2000 .
Woods-Samuels P., Kazazian H.H. and Antonarakis S.E. (1991) Nonhomologous recombination in the human genome: deletions in the human factor VIII gene. Genomics 10: 94-101.
Xu W.M., Gorman P.A., Rider S.H., Hedge P.J., Moore G., Prichard C., Sheer D. and Solomon E. (1988) Construction of a genetic map of human chromosome 17 by use of chromosome-mediated gene transfer. Proc. Natl. Acad. Sci. USA 85: 8563-7.
Yagle M.K., Parruti G., Xu W., Ponder B.A.J. and Solomon E. (1990) Genetic and physical map of the von Recklinghausenneurofibromatosis (NF1) region on chromosome 17. Proc. Natl. Acad. Sci. USA 87: 7255-9.
Yamada K., Sugimoto E., Amano M., Imamura Y., Kubota T. and Matsumoto M. (1983) Two cases of acute promyelocytic leukemia with variant translocations: the importance of chromosome No. 17 abnormality. Cancer Genet. Cytogenet. 9: 93-9.
Yano K., Morishita Y., Tanimoto M., Okumura M., Nagata S.,Morishima Y., Ohno R. and Saito H. (1990) Myeloperoxidase gene analysis in 34 patients with acute prom yelocytic leukemia:
263
evidence for no gene rearrangem ent by pulse field gel electrophoresis. Acta Haematol. Jpn. 53: 889-97.
Young B.D. (1992) Cytogenetic and m olecular analysis of chromosome llq 2 3 abnormalities in leukaemia. Baillieres Clin. Haematol. In press.
Youssoufian H., Kasper C.K., Phillips D.G., Kazazian H.H. and Antonarakis S.E. (1988) Restriction endonuclease mapping of the novel deletions of the factor VIII gene in hemophilia A. H u m . Genet. 80: 143-8.
Yu V.C., Delsert C., Andersen B., Holloway J.M., Devary O.V., Naar A.M., Kim S.Y., Boutin J.M., Glass C.K. and Rosenfeld M.G. (1991) RXR beta: a coregulator that enhances binding of retinoic acid, thyroid hormone, and vitamin D receptors to their cognate response elements. Cell 67: 1251-66.
Zabarovsky E.R., Boldog F., Thompson T., Scanlon D., Winberg G., Marcsek Z., Erlandsson R., Stanbridge E.J., Klein G. and Sumegi J.(1990) Construction of a human chromosome 3 specific Notl linking library using a novel cloning procedure. Nucleic Acids Res. 18: 6319-24.
Zelent A., Mendelsohn C., Kastner P., Krust A., Garnier J.M., Ruffenach F., Leroy P. and Chambon P. (1991) Differentially expressed isoforms of the mouse retinoic acid receptor beta generated by usage of two promoters and alternative splicing. Embo J. 10: 71-81.
Zhang X.K., Hoffmann B., Tran P.B., Graupner G. and Pfahl M.(1992) Retinoid X receptor is an auxiliary protein for thyroid hormone and retinoic acid receptors. Nature 355: 441-6.
264