Gene Expression Profiling of B Cell Chronic Lymphocytic Leukemia Reveals a Homogeneous Phenotype...
14
J. Exp. Med. The Rockefeller University Press • 0022-1007/2001/12/1625/14 $5.00 Volume 194, Number 11, December 3, 2001 1625–1638 http://www.jem.org/cgi/content/full/194/11/1625 1625 Gene Expression Profiling of B Cell Chronic Lymphocytic Leukemia Reveals a Homogeneous Phenotype Related to Memory B Cells ✪ Ulf Klein, 1 Yuhai Tu, 2 Gustavo A. Stolovitzky, 2 Michela Mattioli, 1 Giorgio Cattoretti, 1 Hervé Husson, 3 Arnold Freedman, 3 Giorgio Inghirami, 4 Lilla Cro, 5 Luca Baldini, 5 Antonino Neri, 5 Andrea Califano, 6 and Riccardo Dalla-Favera 1 1 Institute for Cancer Genetics, the Departments of Pathology and Genetics & Development, Columbia University, New York, NY 10032 2 IBM T.J.Watson Research Center,Yorktown Heights, New York, NY 10598 3 Department of Adult Oncology Dana-Farber Cancer Institute, and the Department of Medicine, Harvard Medical School, Boston, MA 02115 4 Department of Pathology, New York University Medical Center, New York, NY 10016 5 Ematologia 1, Department of Hematology, Ospedale Maggiore, I.R.C.C.S., Milan 20122, Italy 6 First Genetic Trust, Inc., Lyndhurst, NJ 07071 Abstract B cell–derived chronic lymphocytic leukemia (B-CLL) represents a common malignancy whose cell derivation and pathogenesis are unknown. Recent studies have shown that 50% of CLLs display hypermutated immunoglobulin variable region (IgV) sequences and a more fa- vorable prognosis, suggesting that they may represent a distinct subset of CLLs which have transited through germinal centers (GCs), the physiologic site of IgV hypermutation. To fur- ther investigate the phenotype of CLLs, their cellular derivation and their relationship to nor- mal B cells, we have analyzed their gene expression profiles using oligonucleotide-based DNA chip microarrays representative of 12,000 genes. The results show that CLLs display a com- mon and characteristic gene expression profile that is largely independent of their IgV geno- type. Nevertheless, a restricted number of genes ( 30) have been identified whose differential expression can distinguish IgV mutated versus unmutated cases and identify them in indepen- dent panels of cases. Comparison of CLL profiles with those of purified normal B cell subpop- ulations indicates that the common CLL profile is more related to memory B cells than to those derived from naive B cells, CD5 B cells, and GC centroblasts and centrocytes. Finally, this analysis has identified a subset of genes specifically expressed by CLL cells of potential pathoge- netic and clinical relevance. Key words: somatic hypermutation • germinal center • CD5 • DNA microarray • cluster analysis Introduction B cell chronic lymphocytic leukemia (B-CLL)* represents the most common leukemia in the Western countries with an estimated incidence of 1 per 100,000 per y (1). This disease is characterized by the monoclonal expansion of B lymphocytes in the peripheral blood, bone marrow, and lymphoid organs, and by an indolent course which ulti- mately becomes aggressive and invariably lethal (1). Cur- rent knowledge of the pathogenesis of CLL is limited be- cause no specific genetic alteration has yet been associated with this disease. In particular, CLL is not associated ✪ The online version of this article contains supplemental material. Address correspondence to Riccardo Dalla-Favera, Institute for Can- cer Genetics, Columbia University, 1150 St. Nicholas Ave., New York, NY 10032. Phone: 212-304-7381; Fax: 212-304-5537; E-mail: [email protected] *Abbreviations used in this paper: B-CLL, B cell CLL; BL, Burkitt lym- phoma; CB, centroblast; CC, centrocyte; CLL, chronic lymphocytic leu- kemia; DLCL, diffuse large cell lymphoma; FL, follicular lymphoma; GC, germinal center; IgV, Ig variable region; MB, microbeads; M-CLL, IgV- mutated CLL; UM-CLL, IgV-unmutated CLL. on February 2, 2015 jem.rupress.org Downloaded from Published December 3, 2001 http://jem.rupress.org/content/suppl/2001/12/05/194.11.1625.DC1.html Supplemental Material can be found at:
-
Upload
independent -
Category
Documents
-
view
0 -
download
0
Transcript of Gene Expression Profiling of B Cell Chronic Lymphocytic Leukemia Reveals a Homogeneous Phenotype...
J. Exp. Med.
The Rockefeller University Press • 0022-1007/2001/12/1625/14 $5.00Volume 194, Number 11, December 3, 2001 1625–1638http://www.jem.org/cgi/content/full/194/11/1625
1625
Gene Expression Profiling of B Cell Chronic Lymphocytic Leukemia Reveals a Homogeneous Phenotype Related to
Memory B Cells
✪
Ulf Klein,
1
Yuhai Tu,
2
Gustavo A. Stolovitzky,
2
Michela Mattioli,
1
Giorgio Cattoretti,
1
Hervé Husson,
3
Arnold Freedman,
3
Giorgio Inghirami,
4
Lilla Cro,
5
Luca Baldini,
5
Antonino Neri,
5
Andrea Califano,
6
and Riccardo Dalla-Favera
1
1
Institute for Cancer Genetics, the Departments of Pathology and Genetics & Development, Columbia University, New York, NY 10032
2
IBM T.J. Watson Research Center, Yorktown Heights, New York, NY 10598
3
Department of Adult Oncology Dana-Farber Cancer Institute, and the Department of Medicine, Harvard Medical School, Boston, MA 02115
4
Department of Pathology, New York University Medical Center, New York, NY 10016
5
Ematologia 1, Department of Hematology, Ospedale Maggiore, I.R.C.C.S., Milan 20122, Italy
6
First Genetic Trust, Inc., Lyndhurst, NJ 07071
Abstract
B cell–derived chronic lymphocytic leukemia (B-CLL) represents a common malignancywhose cell derivation and pathogenesis are unknown. Recent studies have shown that
�
50%of CLLs display hypermutated immunoglobulin variable region (IgV) sequences and a more fa-vorable prognosis, suggesting that they may represent a distinct subset of CLLs which havetransited through germinal centers (GCs), the physiologic site of IgV hypermutation. To fur-ther investigate the phenotype of CLLs, their cellular derivation and their relationship to nor-mal B cells, we have analyzed their gene expression profiles using oligonucleotide-based DNAchip microarrays representative of
�
12,000 genes. The results show that CLLs display a com-mon and characteristic gene expression profile that is largely independent of their IgV geno-type. Nevertheless, a restricted number of genes (
�
30) have been identified whose differentialexpression can distinguish IgV mutated versus unmutated cases and identify them in indepen-dent panels of cases. Comparison of CLL profiles with those of purified normal B cell subpop-ulations indicates that the common CLL profile is more related to memory B cells than to thosederived from naive B cells, CD5
�
B cells, and GC centroblasts and centrocytes. Finally, thisanalysis has identified a subset of genes specifically expressed by CLL cells of potential pathoge-netic and clinical relevance.
Key words: somatic hypermutation • germinal center • CD5 • DNA microarray • cluster analysis
Introduction
B cell chronic lymphocytic leukemia (B-CLL)
*
representsthe most common leukemia in the Western countries withan estimated incidence of 1 per 100,000 per y (1). Thisdisease is characterized by the monoclonal expansion of B
lymphocytes in the peripheral blood, bone marrow, andlymphoid organs, and by an indolent course which ulti-mately becomes aggressive and invariably lethal (1). Cur-rent knowledge of the pathogenesis of CLL is limited be-cause no specific genetic alteration has yet been associatedwith this disease. In particular, CLL is not associated
✪
The online version of this article contains supplemental material.
Address correspondence to Riccardo Dalla-Favera, Institute for Can-cer Genetics, Columbia University, 1150 St. Nicholas Ave., New York,NY 10032. Phone: 212-304-7381; Fax: 212-304-5537; E-mail:[email protected]
*
Abbreviations used in this paper:
B-CLL, B cell CLL; BL, Burkitt lym-phoma; CB, centroblast; CC, centrocyte; CLL, chronic lymphocytic leu-
kemia; DLCL, diffuse large cell lymphoma; FL, follicular lymphoma; GC,germinal center; IgV, Ig variable region; MB, microbeads; M-CLL, IgV-mutated CLL; UM-CLL, IgV-unmutated CLL.
on February 2, 2015
jem.rupress.org
Dow
nloaded from
Published December 3, 2001
http://jem.rupress.org/content/suppl/2001/12/05/194.11.1625.DC1.html Supplemental Material can be found at:
1626
Gene Expression Profiling of B Cell Chronic Lymphocytic Leukemia
with reciprocal balanced chromosomal translocations, butrather with specific deletions (2) suggesting the loss ofpresently unidentified tumor suppressor genes. CLL cellshave a low proliferative rate and a prolonged life span,suggesting that their primary alteration may be a defect inapoptosis (1).
The cellular origin of CLL is unknown and has been theobject of recent controversy. CLL cells are characterized bythe expression of the cell surface markers CD5, CD23,CD19, and low levels of sIgM/IgD, a pattern not shared byany known B cell subpopulation (1, 3). The expression ofthe CD5 antigen was originally taken to suggest thatB-CLL originates from CD5
�
B cells (4), which are usuallycharacterized by unmutated Ig variable region (IgV) genes(5, 6). However, recent studies have shown that 50–70% ofCLL have undergone IgV hypermutation (7–9), a phe-nomenon that characterizes normal B cells undergoing a Tcell–dependent germinal center (GC) reaction (10) andmalignant B cells derived from GC or post-GC B cells (11,12). This finding has led to the hypothesis that CLL casesdisplaying mutated IgV may derive from a cell that hadtransited through the GC, whereas those with germlineIgV may derive from GC-independent cells (8, 9, 13). Thishypothesis has both biological and clinical relevancesince the two subgroups have different prognosis, withIgV-mutated CLL (M-CLL) displaying a more benign clin-ical course (13, 14).
To further investigate the phenotype of CLL subtypes,their cellular derivation and their relationship with normalB cells, we have analyzed their gene expression profiles us-ing oligonucleotide-based DNA chip microarrays (Affyme-trix) representative of
�
12,000 genes. The gene expressionprofiles have been comparatively analyzed: (i) betweenM-CLL and IgV-unmutated CLL (UM-CLL) cases, to de-termine whether the two subgroups are different; (ii) withthose of normal B cell subpopulations, including GC-inde-pendent (CD5
�
), preGC (naive), GC (centroblasts [CBs]and centrocytes [CCs]), and post-GC (memory) B cells, toinvestigate their cellular derivation; and (iii) with those ofnormal B cell subpopulations and of other malignancies de-rived from mature B cells to identify genes that are specifi-cally expressed in CLL.
Materials and Methods
CLL Cases.
Peripheral blood from CLL patients who hadnot received treatment was taken after informed consent. CLLcells were enriched from PBMCs by magnetic cell separation us-ing the MidiMACS
®
system (Miltenyi Biotec). After Ficoll-Iso-paque™ density centrifugation, PBMCs were incubated withCD19-microbeads (MB) (Miltenyi Biotec). Magnetically labeledcells were isolated by passing the cell suspension over an LS col-umn (Miltenyi Biotec). All isolation steps were performed on iceand using ice-cold solutions. Sequences of IgV
H
genes of the 34CLL cases were determined as described previously (15).
Isolation of Normal Human B Cell Subsets and Tumor Cells.
Adetailed description of the gene expression profiles of normal Bcell subpopulations, including the methods for purification andcharacterization, will be reported elsewhere (unpublished data).
Briefly, tonsils were obtained from routine tonsillectomies per-formed at the Children’s Hospital of Columbia University. Thespecimens were kept on ice immediately after surgical removal,and all cell isolation steps were performed on ice. B cell subsetswere isolated by magnetic cell separation (see above). The isola-tion strategies were based on recent characterizations of the hu-man B cell subsets (16–19). For the isolation of naive B cells, ton-sillar mononuclear cells were first incubated with anti-CD27,anti-CD10 (both BD PharMingen), and anti-CD3 (BeckmanCoulter/Immunotech), then with anti–IgG
1
-MB and anti–CD14-MB. Magnetically labeled cells were depleted by passingthe cell suspension over a LD-column (Miltenyi Biotec). Theflow-through was incubated first with anti–IgD-FITC (BDPharMingen), then with anti–FITC-MB. IgD-positive B cellswere isolated using LS columns. CBs were isolated in a single stepby staining tonsillar mononuclear cells with anti-CD77 (BeckmanCoulter/Immunotech), followed by incubation with mouse anti–rat IgM (BD PharMingen), and finally anti–IgG
1
-MB. The cellswere passed over a LS column. CC: tonsillar MC were first incu-bated with anti-CD77, then with anti-CD39 (Beckman Coulter/Immunotech), anti-CD3, and mouse anti–rat IgM, followed byanti–IgG
1
-MB staining. The cells were passed subsequently overa LS column with G21 needle and a LD column. The resultingflow-through was first incubated with anti-CD10, then withanti–IgG
1
-MB. CD10
�
CCs were isolated using LS columns.Memory B cells: tonsillar mononuclear cells were incubated firstwith anti-CD10, anti-CD3, and anti-CD38 (BD PharMingen),the latter at a titer of 1:1,000 to facilitate a selective depletion ofCD38
high
plasma cells and GC B cells, then with anti–IgG
1
-MBand anti–CD14-MB. Labeled cells were depleted using a LD col-umn. The flow-through was first stained with anti–CD27-FITC,then with anti–FITC-MB. CD27
�
cells were isolated using a LScolumn.
Cord blood was obtained after informed consent. Cord bloodB cells almost exclusively consist of CD5
�
B cells. To enrich forCD5
�
B cells from cord blood, mononuclear cells obtained byFicoll-Isopaque™ density centrifugation were incubated withCD19-MB (Miltenyi Biotec). The stained cells were passed overa LS column.
Follicular lymphoma (FL) cells were isolated from single cellsuspensions from digested lymph nodes or spleen which were his-tologically involved with FL. These cell suspensions were de-pleted of T cells, monocytes, NK cells using anti-CD4, -CD8,-CD14, and -CD56, followed by immunomagnetic beads as de-scribed previously (20). FL cells were isolated from six individualswith relapsed FL who had not received any therapy for at least 6mo before biopsy. Diffuse large cell lymphoma (DLCL) and Bur-kitt lymphoma (BL) tumor cells were enriched by magneticallydepleting CD3-, CD4-, CD8-, CD14-, CD15-, CD16-, CD56-,and glycophorin-expressing nontumor cells. All samples were ob-tained according to appropriate Human Protection Committeevalidation and informed patient consent.
Generation of cRNA and Microarray Hybridization.
Total RNAwas isolated in two steps using Trizol (Life Technologies), fol-lowed by RNeasy (QIAGEN) purification. Double strand cDNAwas generated from 5
�
g of total RNA using a poly dT oligonu-cleotide that contains a T7 RNA polymerase initiation site andthe SuperScript Choice System kit (Life Technologies). cDNAwas phenol/chloroform extracted. Biotinylated cRNA was gen-erated by in vitro transcription using the Bio Array™ HighYield™ RNA Transcript Labeling kit (ENZO Diagnostics, Inc.).The cRNA was purified using RNeasy. cRNA was fragmentedaccording to the Affymetrix protocol, and 15
�
g of biotinylated
on February 2, 2015
jem.rupress.org
Dow
nloaded from
Published December 3, 2001
1627
Klein et al.
cRNA were hybridized to U95A microarrays (Affymetrix). Afterscanning (scanner from Affymetrix), the expression values for thegenes were determined using Affymetrix GENECHIP software,using the Global Scaling option that allows a number of experi-ments to be normalized to one target intensity, thus facilitatingcomparison between multiple experiments.
Data Processing.
The Affymetrix expression data (average dif-ferences) was processed as follows. The small and negative expres-sion levels were clipped-off to be equal to a cutoff value arbi-trarily chosen as 20. The logarithm of this clipped-off data wassubsequently used throughout analyses.
Dendrogram.
The hierarchical clustering algorithm used togenerate the dendrogram is based on the average-linkage method(21, 22). To construct the dendrogram, a subset of genes was usedout of the total of 12588 gene segments present on the microar-ray, whose expression levels vary the most among the 40 samples,and which are thus most informative. For the hierarchical cluster-ing shown in Fig. 1, only genes were chosen whose averagechange in expression level from the mean across the whole panelwas at least twofold (2,337 genes selected). Independent analyseswere performed using all genes and only gene segments whoseaverage change in expression level was at least threefold and four-fold, respectively. The expression values of each selected gene isnormalized to have 0 mean and unit SD. The distance betweentwo individual samples is calculated by Euclidean distance withthe normalized expression values.
Analysis of Gene Expression Profiles.
We used the Genes@Work software platform which is a gene expression analysis toolbased on the pattern discovery algorithm structural pattern local-ization analysis by sequential histograms (SPLASH; references 23and 24). Genes@Work is used here to perform both supervisedand unsupervised gene expression analysis.
Rather than inferring clusters by comparing the gene expres-sion values of each possible pair of experiments, as it is the casefor the average-linkage method (21, 22), Genes@Work proceedsby discovering one or more global gene expression “signatures”that are common to an entire set of at least
n
experiments (thesupport experiments), where
n
is a user-selectable parametercalled the minimum support. A Genes@Work pattern represents(a subset of) the genes that are differentially expressed in (a subsetof) the phenotype set with respect to the control set. AGenes@Work pattern can be represented as a matrix composedof columns for the experiments of the phenotype and control setand rows for the differentially expressed genes (see description ofmatrices). The number of experiments in the Genes@Work pat-tern,
n
�
�
n
, is called the pattern support. Differential expressionis determined as follows: independently for each gene, an ex-pected gene expression probability density
p(e)
is computed em-pirically from the experimental set (the method differs in the caseof supervised versus unsupervised clustering; see below). Then,given the group of
n
cells, the algorithm builds a cluster with allof the genes such that the integral of their
p(e)
over the expres-sion range of the group is less than a predefined threshold
�
. Thestatistical significance of a Genes@Work pattern is computedbased on the probability of observing a similar pattern (i.e. a pat-tern with the same number of support experiments and supportgenes) in a set of random cells whose genes are distributed ac-cording to the empirical probability density
p(e)
, the null hypoth-esis (24). Genes@Work patterns are then ranked according totheir statistical significance.
Supervised versus Unsupervised Clustering.
In supervised cluster-ing, a phenotype set and a control set is defined. The aim is toidentify a set of genes that optimally discriminate between pheno-
type and control sets. The expression probability density
p(e)
isdetermined independently for each gene as the one most likely toproduce the expression values observed in the control set, giventhe expected error in the measure. This is accomplished by con-volving the expression values in the control set with a gaussiankernel, with a SD equal to the error determined from repeatabil-ity experiments as a function of the expression level (for a review,see reference 24). The algorithm is run twice, with either set cho-sen in turn as phenotype, and the resulting gene expression pat-terns are then fused into a single one.
In unsupervised clustering, a control set is not available as thealgorithm is applied to determine the most likely subsets withoutany a-priori knowledge. In this case the expression probabilitydensity is computed differently (24) either as a uniform probabil-ity density over the expected expression range of the full set, or asa normal distribution. The latter is used with a mean equal to thegene expression over the full experimental set and a SD equal to1/4 of the experimental one.
Pattern Discovery.
Unsupervised clustering: following compu-tation of the expression probability of each gene, pattern discov-ery is performed starting with a support value
n
n
0
m
, where
n
0
is equal to the number of experiments in the set and
m
is thesize of the smallest subset which is expected to be characterizedby a discernible subphenotype (typically,
m
n
0
/4). For a givensupport
n
, the pattern
z
score
z
p
(
p
i
,
n
) of each discovered pattern,
p
i
, is computed. (The pattern
z
score
z
p
, is inversely related to thepattern
p
value; when
z
p
is sufficiently large, this relation is
�
p
1/
z
p
2
). The pattern
P
(
n
), corresponding to the maximum pattern
z
score
Z
p
(
n
), is selected.
Z
p
(
n
)
1 if no patterns are found forthe given support value. This process is repeated iteratively fordecreasing values of
n
, until a sudden increase in the pattern
z
score is detected. This corresponds to a maximum of the first de-rivative of the pattern
z
score function for a support value equalto
n
. Such extrema can be determined, as a first approximation,when the following condition is satisfied:
Z
p
(
n
– 1)/
Z
p
(
n
)
�
Z
p
(
n
)/
Z
p
(
n
�1). The pattern P(n) for the corresponding value ofn is called the interest pattern. The experiments that support theinterest pattern become a subset and the genes that support theinterest pattern become the subset-signature. For a discussion ofthe pattern z score, see reference 24.
Supervised clustering: the gene expression probability densitiesare computed and pattern discovery is performed iteratively witha decreasing value of the support, starting at N (the size of thephenotype group), until either a significant gene cluster size isobtained, or discovered patterns appear to be no longer statisti-cally significant.
For the unsupervised clustering analysis, an optimal value for� 0.1, or 10% of the total probability, is chosen. For supervisedclustering, due to the significantly higher sensitivity, a smallervalue of � 0.01, or 1% of the total probability, is used.
Graphic Representations of Gene Expression Patterns (Matrices).Columns represent individual experiments, and rows representindividual genes present on the expression microarray. To gener-ate a pseudocolor map, first a gene- and experiment-specificchange of variables, from the original measurement v into �ge, iscomputed using the formula:
(1)
where �P and P are respectively the mean and SD computedfrom the gene expression values for that gene in the phenotypegroup, and �c and c are their corresponding values computedfrom the control group (Eq. 1). The value of this function is then
ζgev µp µc+( )– 2⁄
σp σc+( ) 2⁄------------------------------------=
on February 2, 2015
jem.rupress.org
Dow
nloaded from
Published December 3, 2001
1628 Gene Expression Profiling of B Cell Chronic Lymphocytic Leukemia
plotted using a pseudocolor map that represents �ge 0 as black,�ge � 0 as progressively brighter hues of red, and �ge � 0 as pro-gressively brighter levels of green. �ge 4 and �ge 4 corre-spond to complete saturation of the red and the green, respec-tively. The resulting pseudocolor map associates the same colorsto measurements that are off by the same number of SDs fromtheir expected value.
For each gene, the statistical significance of the differential ex-pression across the phenotype and control sets (gene z score, zg),is computed using the formula (Eq. 2)
(2)
In contrast to the generally used fold-ratio (�P/�C) to describegene expression changes among cell subsets, zg represents the dif-ferential expression between phenotype and control samples rela-tive to the variability of their expression levels. Rows are dividedinto two groups. First, the genes that are overexpressed in thefirst experiment set are reported by decreasing value of the zg
score (most significant first). Then, the genes that are underex-pressed are reported, ordered by increasing value of the zg score(most significant first).
Classifier and Classification Method. The classifier is a scoringfunction based on the values of a set of genes (gene cluster)which are differentially expressed in two sets of cell types and canthus be used for cell type classification. The higher the score, themore likely it is that a cell type is related to the phenotype set.Pattern discovery methods are used here to identify gene clusters.The union of the genes of all statistically significant patterns isused to define the classifier (see above for pattern discoverymethod). Given a set of genes, the scoring function is definedquantitatively as:
(3)
where f(x) max (1, min (1, x)), nc is the number of genes inthe classifier, and i 1, 2, ...,nc is the label for each individual genein the classifier, �i is the expression level of gene i for the new cell,�i
(1) and �i(2) represent the mean expression levels of gene i for
cells in the phenotype and control set, respectively (Eq. 3).Online Supplemental Material. GenBank accession no., Af-
fymetrix entry numbers, and the normalized primary data of thegenes shown in Figs. 2, 4, and 5 are available at the journal’swebsite.
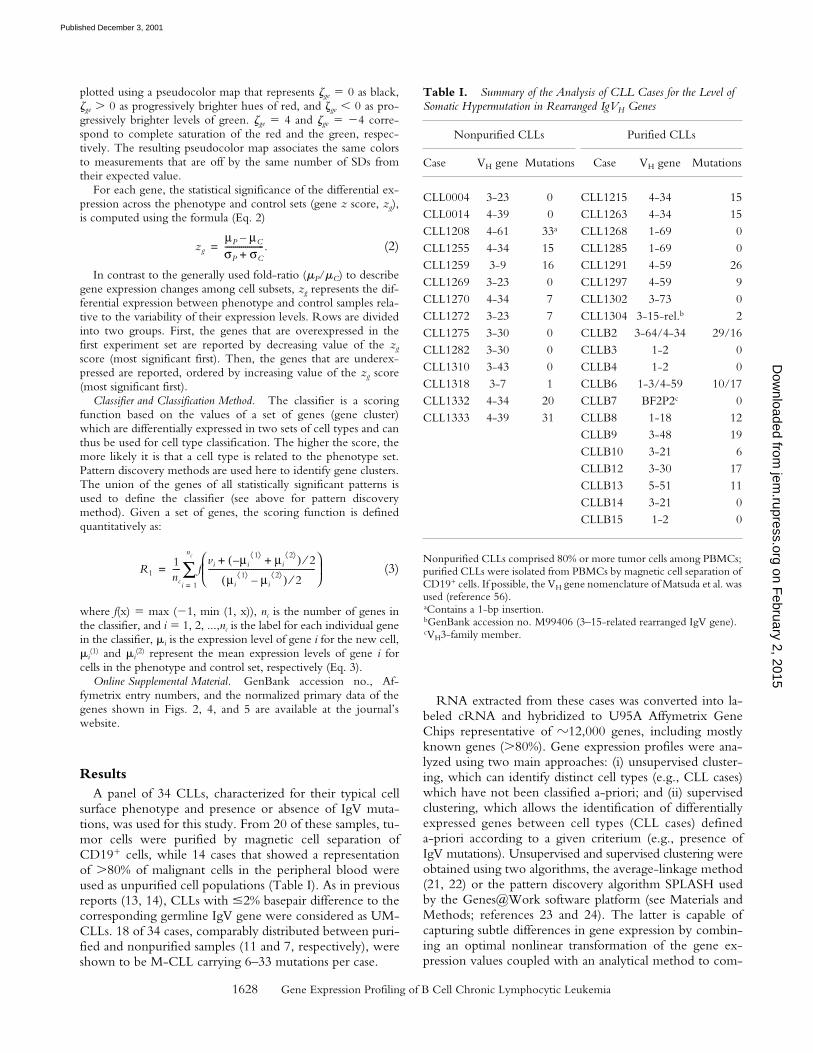
ResultsA panel of 34 CLLs, characterized for their typical cell
surface phenotype and presence or absence of IgV muta-tions, was used for this study. From 20 of these samples, tu-mor cells were purified by magnetic cell separation ofCD19� cells, while 14 cases that showed a representationof �80% of malignant cells in the peripheral blood wereused as unpurified cell populations (Table I). As in previousreports (13, 14), CLLs with �2% basepair difference to thecorresponding germline IgV gene were considered as UM-CLLs. 18 of 34 cases, comparably distributed between puri-fied and nonpurified samples (11 and 7, respectively), wereshown to be M-CLL carrying 6–33 mutations per case.
zg
µP µC–σP σC+------------------- .=
R11nc---- f
vi µi1⟨ ⟩ µi
2⟨ ⟩+–( )+ 2⁄µi
1⟨ ⟩ µi2⟨ ⟩–( ) 2⁄
----------------------------------------------------
i 1=
nc
∑=
RNA extracted from these cases was converted into la-beled cRNA and hybridized to U95A Affymetrix GeneChips representative of �12,000 genes, including mostlyknown genes (�80%). Gene expression profiles were ana-lyzed using two main approaches: (i) unsupervised cluster-ing, which can identify distinct cell types (e.g., CLL cases)which have not been classified a-priori; and (ii) supervisedclustering, which allows the identification of differentiallyexpressed genes between cell types (CLL cases) defineda-priori according to a given criterium (e.g., presence ofIgV mutations). Unsupervised and supervised clustering wereobtained using two algorithms, the average-linkage method(21, 22) or the pattern discovery algorithm SPLASH usedby the Genes@Work software platform (see Materials andMethods; references 23 and 24). The latter is capable ofcapturing subtle differences in gene expression by combin-ing an optimal nonlinear transformation of the gene ex-pression values coupled with an analytical method to com-
Table I. Summary of the Analysis of CLL Cases for the Level of Somatic Hypermutation in Rearranged IgVH Genes
Nonpurified CLLs Purified CLLs
Case VH gene Mutations Case VH gene Mutations
CLL0004 3-23 0 CLL1215 4-34 15CLL0014 4-39 0 CLL1263 4-34 15CLL1208 4-61 33a CLL1268 1-69 0CLL1255 4-34 15 CLL1285 1-69 0CLL1259 3-9 16 CLL1291 4-59 26CLL1269 3-23 0 CLL1297 4-59 9CLL1270 4-34 7 CLL1302 3-73 0CLL1272 3-23 7 CLL1304 3-15-rel.b 2CLL1275 3-30 0 CLLB2 3-64/4-34 29/16CLL1282 3-30 0 CLLB3 1-2 0CLL1310 3-43 0 CLLB4 1-2 0CLL1318 3-7 1 CLLB6 1-3/4-59 10/17CLL1332 4-34 20 CLLB7 BF2P2c 0CLL1333 4-39 31 CLLB8 1-18 12
CLLB9 3-48 19CLLB10 3-21 6CLLB12 3-30 17CLLB13 5-51 11CLLB14 3-21 0CLLB15 1-2 0
Nonpurified CLLs comprised 80% or more tumor cells among PBMCs;purified CLLs were isolated from PBMCs by magnetic cell separation ofCD19+ cells. If possible, the VH gene nomenclature of Matsuda et al. wasused (reference 56).aContains a 1-bp insertion.bGenBank accession no. M99406 (3–15-related rearranged IgV gene).cVH3-family member.
on February 2, 2015
jem.rupress.org
Dow
nloaded from
Published December 3, 2001
1629 Klein et al.
pute the statistical significance of the identified clusters (seeMaterials and Methods and below).
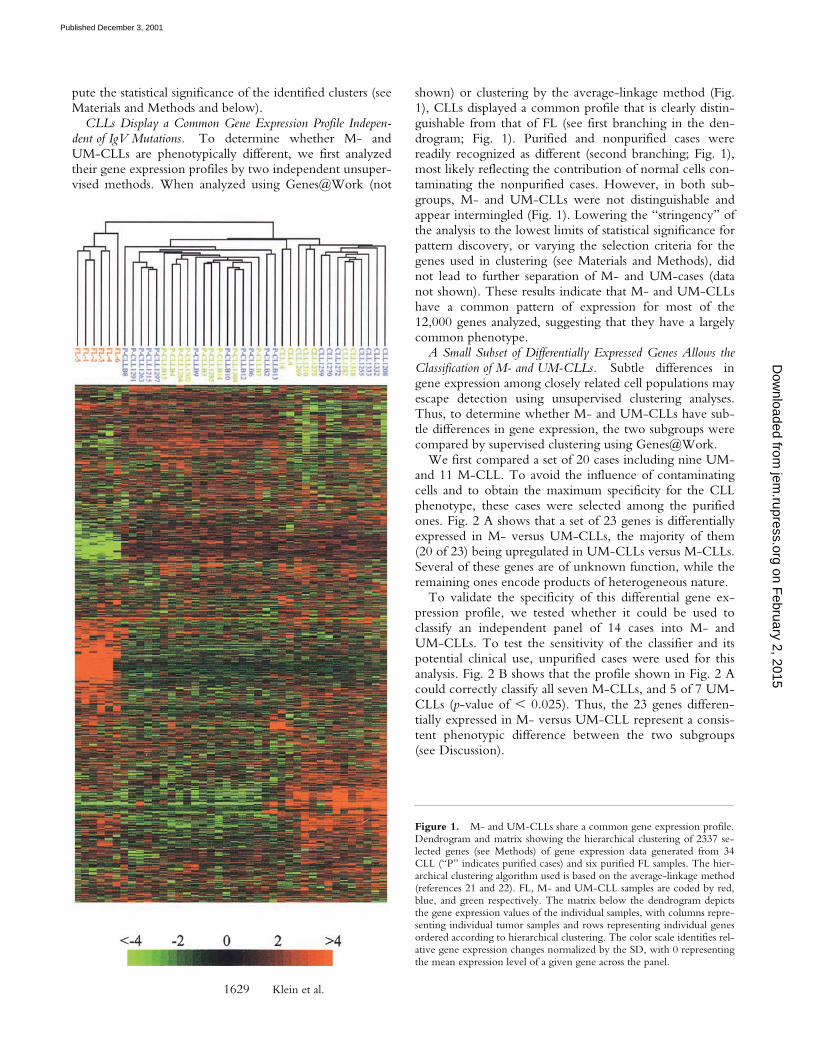
CLLs Display a Common Gene Expression Profile Indepen-dent of IgV Mutations. To determine whether M- andUM-CLLs are phenotypically different, we first analyzedtheir gene expression profiles by two independent unsuper-vised methods. When analyzed using Genes@Work (not
shown) or clustering by the average-linkage method (Fig.1), CLLs displayed a common profile that is clearly distin-guishable from that of FL (see first branching in the den-drogram; Fig. 1). Purified and nonpurified cases werereadily recognized as different (second branching; Fig. 1),most likely reflecting the contribution of normal cells con-taminating the nonpurified cases. However, in both sub-groups, M- and UM-CLLs were not distinguishable andappear intermingled (Fig. 1). Lowering the “stringency” ofthe analysis to the lowest limits of statistical significance forpattern discovery, or varying the selection criteria for thegenes used in clustering (see Materials and Methods), didnot lead to further separation of M- and UM-cases (datanot shown). These results indicate that M- and UM-CLLshave a common pattern of expression for most of the12,000 genes analyzed, suggesting that they have a largelycommon phenotype.
A Small Subset of Differentially Expressed Genes Allows theClassification of M- and UM-CLLs. Subtle differences ingene expression among closely related cell populations mayescape detection using unsupervised clustering analyses.Thus, to determine whether M- and UM-CLLs have sub-tle differences in gene expression, the two subgroups werecompared by supervised clustering using Genes@Work.
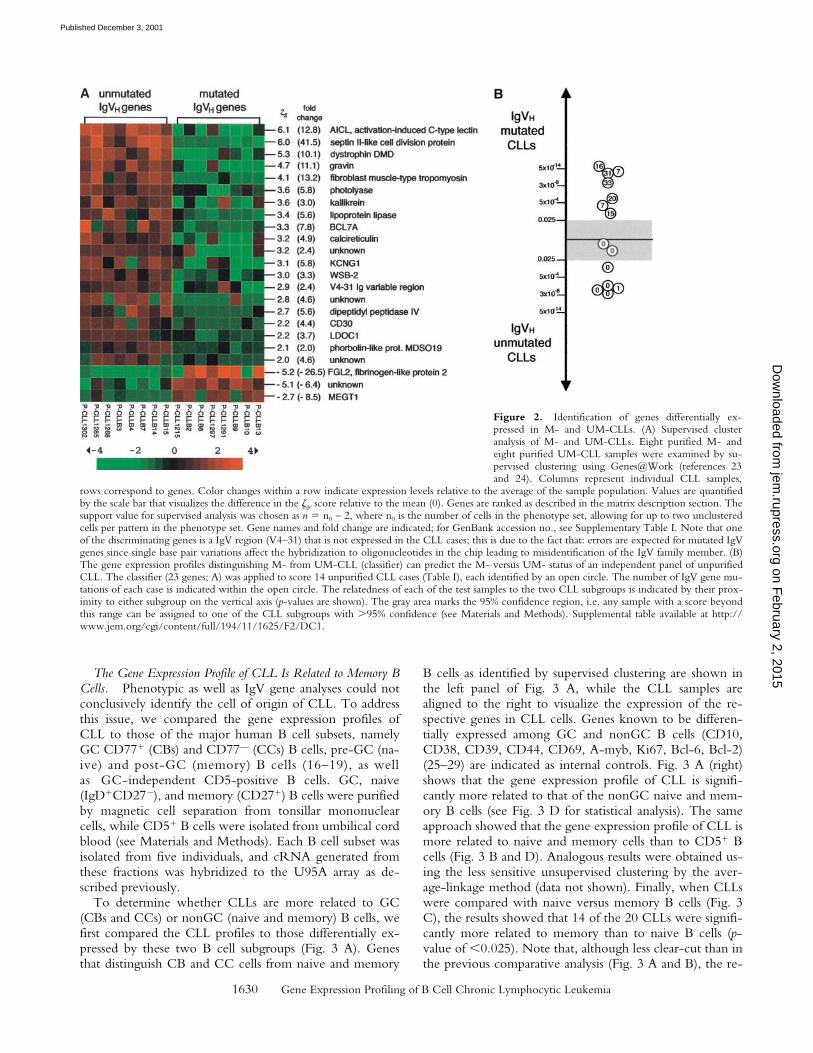
We first compared a set of 20 cases including nine UM-and 11 M-CLL. To avoid the influence of contaminatingcells and to obtain the maximum specificity for the CLLphenotype, these cases were selected among the purifiedones. Fig. 2 A shows that a set of 23 genes is differentiallyexpressed in M- versus UM-CLLs, the majority of them(20 of 23) being upregulated in UM-CLLs versus M-CLLs.Several of these genes are of unknown function, while theremaining ones encode products of heterogeneous nature.
To validate the specificity of this differential gene ex-pression profile, we tested whether it could be used toclassify an independent panel of 14 cases into M- andUM-CLLs. To test the sensitivity of the classifier and itspotential clinical use, unpurified cases were used for thisanalysis. Fig. 2 B shows that the profile shown in Fig. 2 Acould correctly classify all seven M-CLLs, and 5 of 7 UM-CLLs (p-value of � 0.025). Thus, the 23 genes differen-tially expressed in M- versus UM-CLL represent a consis-tent phenotypic difference between the two subgroups(see Discussion).
Figure 1. M- and UM-CLLs share a common gene expression profile.Dendrogram and matrix showing the hierarchical clustering of 2337 se-lected genes (see Methods) of gene expression data generated from 34CLL (“P” indicates purified cases) and six purified FL samples. The hier-archical clustering algorithm used is based on the average-linkage method(references 21 and 22). FL, M- and UM-CLL samples are coded by red,blue, and green respectively. The matrix below the dendrogram depictsthe gene expression values of the individual samples, with columns repre-senting individual tumor samples and rows representing individual genesordered according to hierarchical clustering. The color scale identifies rel-ative gene expression changes normalized by the SD, with 0 representingthe mean expression level of a given gene across the panel.
on February 2, 2015
jem.rupress.org
Dow
nloaded from
Published December 3, 2001
1630 Gene Expression Profiling of B Cell Chronic Lymphocytic Leukemia
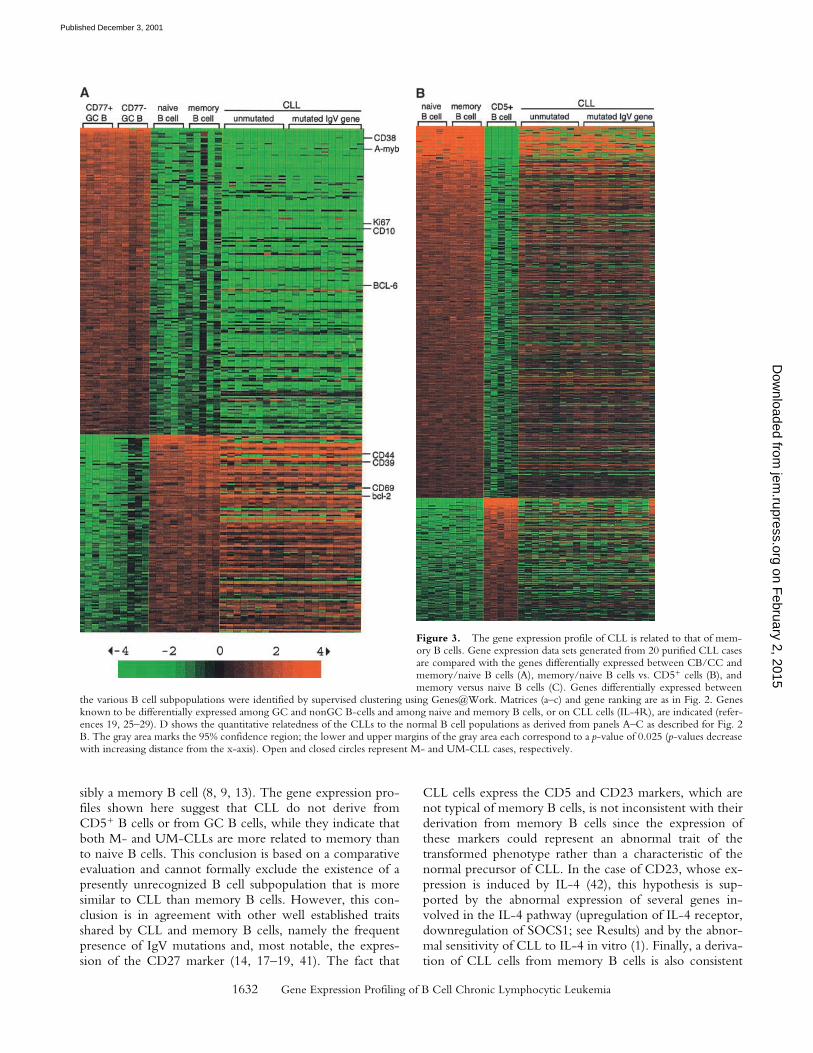
The Gene Expression Profile of CLL Is Related to Memory BCells. Phenotypic as well as IgV gene analyses could notconclusively identify the cell of origin of CLL. To addressthis issue, we compared the gene expression profiles ofCLL to those of the major human B cell subsets, namelyGC CD77� (CBs) and CD77— (CCs) B cells, pre-GC (na-ive) and post-GC (memory) B cells (16–19), as wellas GC-independent CD5-positive B cells. GC, naive(IgD�CD27), and memory (CD27�) B cells were purifiedby magnetic cell separation from tonsillar mononuclearcells, while CD5� B cells were isolated from umbilical cordblood (see Materials and Methods). Each B cell subset wasisolated from five individuals, and cRNA generated fromthese fractions was hybridized to the U95A array as de-scribed previously.
To determine whether CLLs are more related to GC(CBs and CCs) or nonGC (naive and memory) B cells, wefirst compared the CLL profiles to those differentially ex-pressed by these two B cell subgroups (Fig. 3 A). Genesthat distinguish CB and CC cells from naive and memory
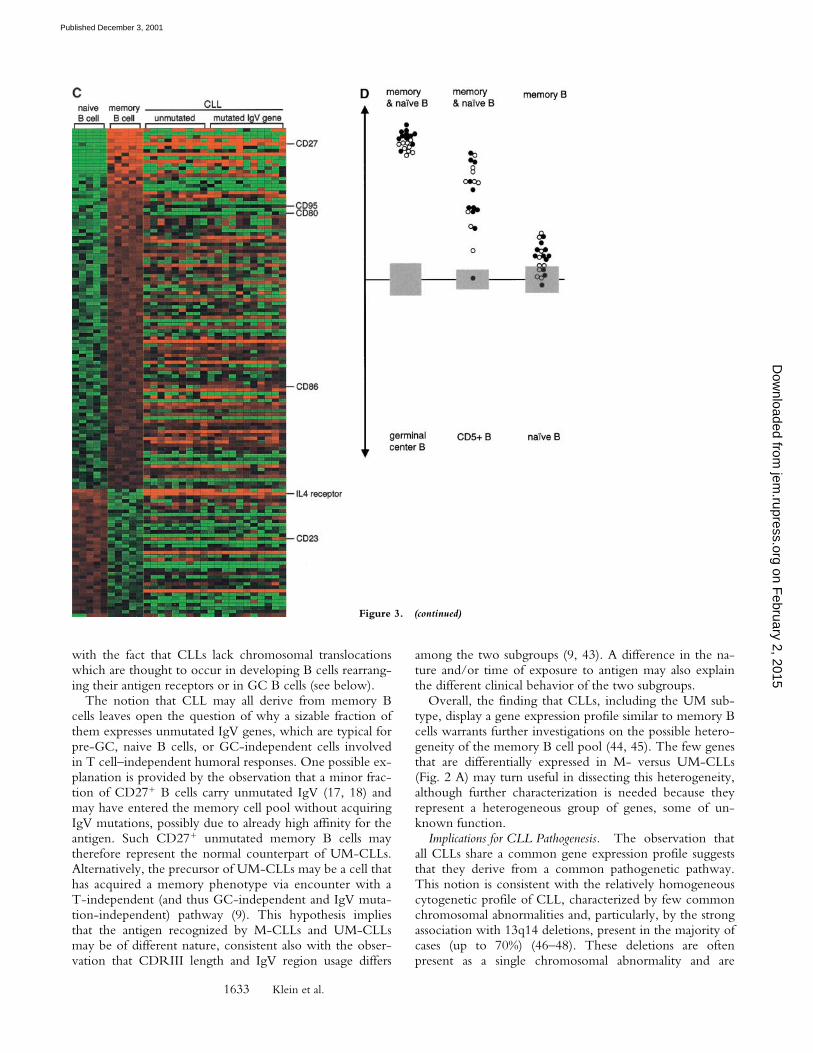
B cells as identified by supervised clustering are shown inthe left panel of Fig. 3 A, while the CLL samples arealigned to the right to visualize the expression of the re-spective genes in CLL cells. Genes known to be differen-tially expressed among GC and nonGC B cells (CD10,CD38, CD39, CD44, CD69, A-myb, Ki67, Bcl-6, Bcl-2)(25–29) are indicated as internal controls. Fig. 3 A (right)shows that the gene expression profile of CLL is signifi-cantly more related to that of the nonGC naive and mem-ory B cells (see Fig. 3 D for statistical analysis). The sameapproach showed that the gene expression profile of CLL ismore related to naive and memory cells than to CD5� Bcells (Fig. 3 B and D). Analogous results were obtained us-ing the less sensitive unsupervised clustering by the aver-age-linkage method (data not shown). Finally, when CLLswere compared with naive versus memory B cells (Fig. 3C), the results showed that 14 of the 20 CLLs were signifi-cantly more related to memory than to naive B cells (p-value of �0.025). Note that, although less clear-cut than inthe previous comparative analysis (Fig. 3 A and B), the re-
Figure 2. Identification of genes differentially ex-pressed in M- and UM-CLLs. (A) Supervised clusteranalysis of M- and UM-CLLs. Eight purified M- andeight purified UM-CLL samples were examined by su-pervised clustering using Genes@Work (references 23and 24). Columns represent individual CLL samples,
rows correspond to genes. Color changes within a row indicate expression levels relative to the average of the sample population. Values are quantifiedby the scale bar that visualizes the difference in the �ge score relative to the mean (0). Genes are ranked as described in the matrix description section. Thesupport value for supervised analysis was chosen as n n0 – 2, where n0 is the number of cells in the phenotype set, allowing for up to two unclusteredcells per pattern in the phenotype set. Gene names and fold change are indicated; for GenBank accession no., see Supplementary Table I. Note that oneof the discriminating genes is a IgV region (V4–31) that is not expressed in the CLL cases; this is due to the fact that: errors are expected for mutated IgVgenes since single base pair variations affect the hybridization to oligonucleotides in the chip leading to misidentification of the IgV family member. (B)The gene expression profiles distinguishing M- from UM-CLL (classifier) can predict the M- versus UM- status of an independent panel of unpurifiedCLL. The classifier (23 genes; A) was applied to score 14 unpurified CLL cases (Table I), each identified by an open circle. The number of IgV gene mu-tations of each case is indicated within the open circle. The relatedness of each of the test samples to the two CLL subgroups is indicated by their prox-imity to either subgroup on the vertical axis (p-values are shown). The gray area marks the 95% confidence region, i.e. any sample with a score beyondthis range can be assigned to one of the CLL subgroups with �95% confidence (see Materials and Methods). Supplemental table available at http://www.jem.org/cgi/content/full/194/11/1625/F2/DC1.
on February 2, 2015
jem.rupress.org
Dow
nloaded from
Published December 3, 2001
1631 Klein et al.
latedness to memory B cells is significant considering thatmemory and naive B cells differ in the expression of only�140 of 12,000 genes (data not shown). While the differ-ence was not statistically significant for the remaining sixcases, none of the CLL cases was more related to naive thanto memory B cells. The degree of relatedness to memory Bcells was not significantly different for M- and UM-CLLs.Taken together, these results indicate that, independentlyof their IgV mutational status, CLLs are more related tomemory cells than to naive, GC, or CD5� B cells.
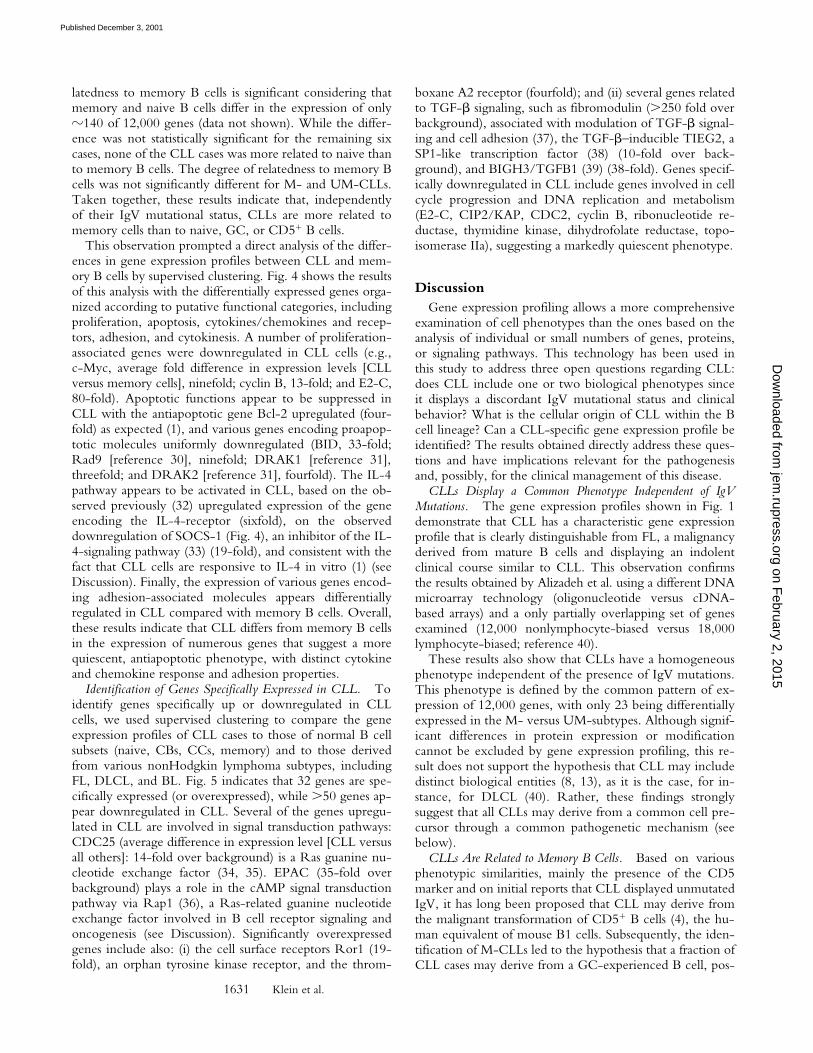
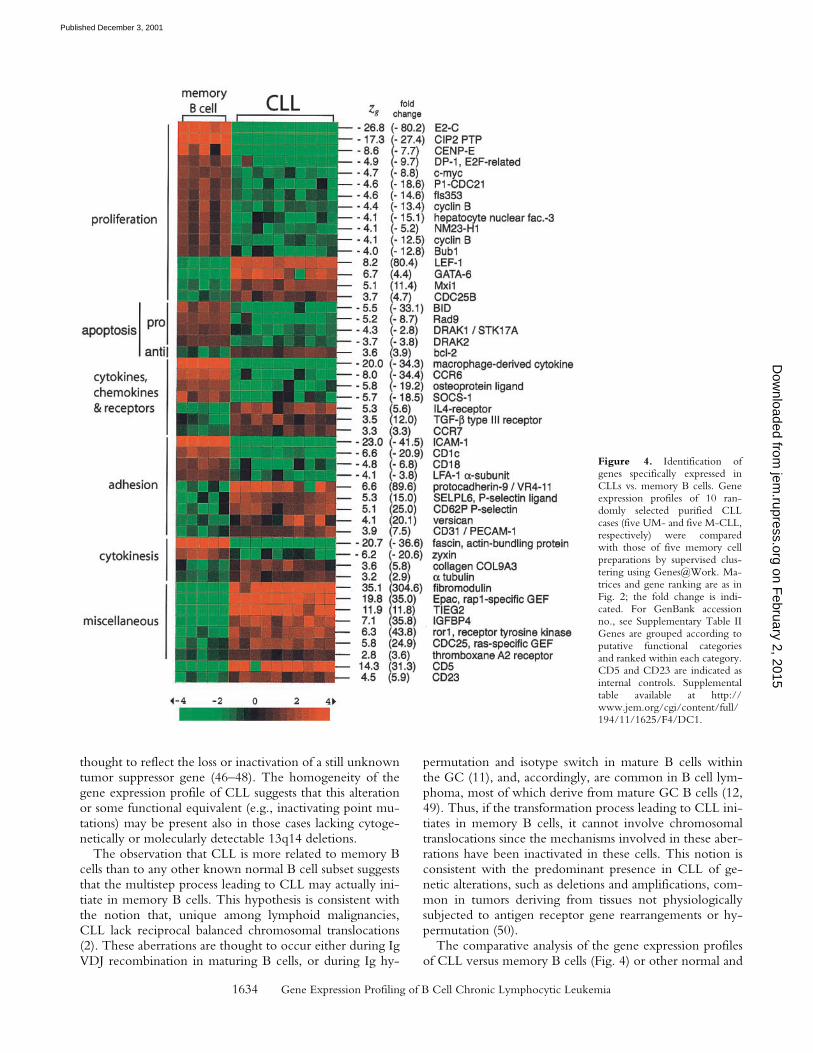
This observation prompted a direct analysis of the differ-ences in gene expression profiles between CLL and mem-ory B cells by supervised clustering. Fig. 4 shows the resultsof this analysis with the differentially expressed genes orga-nized according to putative functional categories, includingproliferation, apoptosis, cytokines/chemokines and recep-tors, adhesion, and cytokinesis. A number of proliferation-associated genes were downregulated in CLL cells (e.g.,c-Myc, average fold difference in expression levels [CLLversus memory cells], ninefold; cyclin B, 13-fold; and E2-C,80-fold). Apoptotic functions appear to be suppressed inCLL with the antiapoptotic gene Bcl-2 upregulated (four-fold) as expected (1), and various genes encoding proapop-totic molecules uniformly downregulated (BID, 33-fold;Rad9 [reference 30], ninefold; DRAK1 [reference 31],threefold; and DRAK2 [reference 31], fourfold). The IL-4pathway appears to be activated in CLL, based on the ob-served previously (32) upregulated expression of the geneencoding the IL-4-receptor (sixfold), on the observeddownregulation of SOCS-1 (Fig. 4), an inhibitor of the IL-4-signaling pathway (33) (19-fold), and consistent with thefact that CLL cells are responsive to IL-4 in vitro (1) (seeDiscussion). Finally, the expression of various genes encod-ing adhesion-associated molecules appears differentiallyregulated in CLL compared with memory B cells. Overall,these results indicate that CLL differs from memory B cellsin the expression of numerous genes that suggest a morequiescent, antiapoptotic phenotype, with distinct cytokineand chemokine response and adhesion properties.
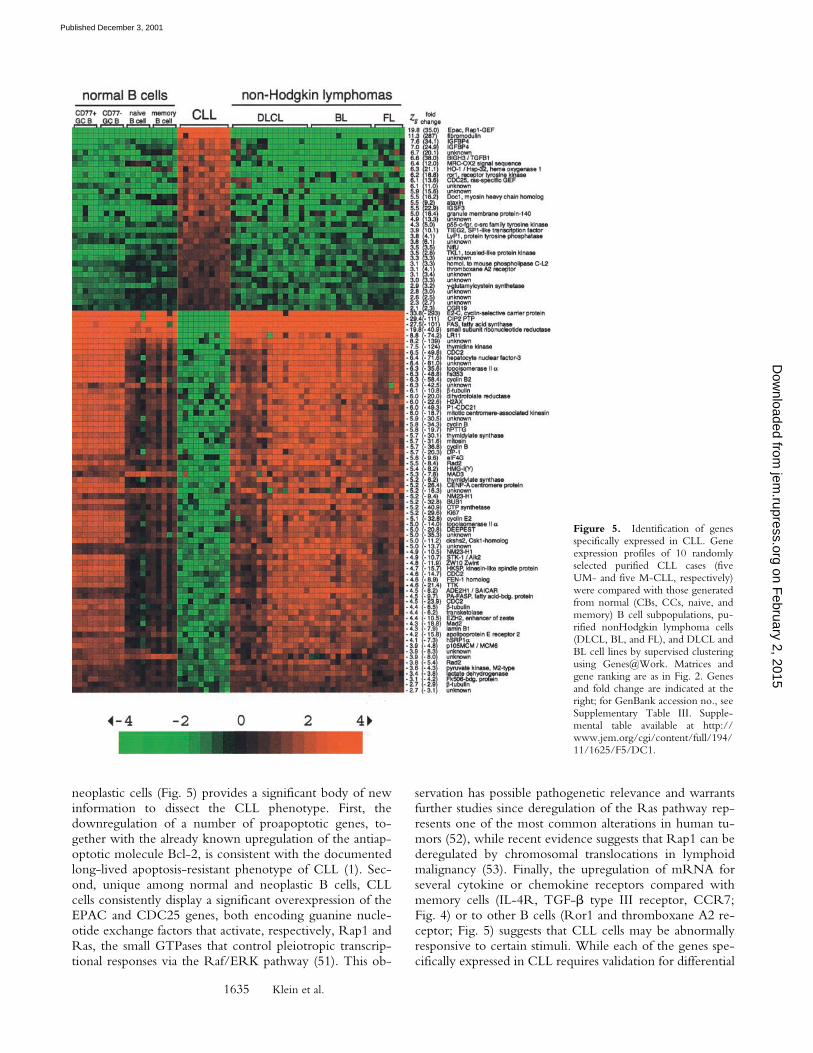
Identification of Genes Specifically Expressed in CLL. Toidentify genes specifically up or downregulated in CLLcells, we used supervised clustering to compare the geneexpression profiles of CLL cases to those of normal B cellsubsets (naive, CBs, CCs, memory) and to those derivedfrom various nonHodgkin lymphoma subtypes, includingFL, DLCL, and BL. Fig. 5 indicates that 32 genes are spe-cifically expressed (or overexpressed), while �50 genes ap-pear downregulated in CLL. Several of the genes upregu-lated in CLL are involved in signal transduction pathways:CDC25 (average difference in expression level [CLL versusall others]: 14-fold over background) is a Ras guanine nu-cleotide exchange factor (34, 35). EPAC (35-fold overbackground) plays a role in the cAMP signal transductionpathway via Rap1 (36), a Ras-related guanine nucleotideexchange factor involved in B cell receptor signaling andoncogenesis (see Discussion). Significantly overexpressedgenes include also: (i) the cell surface receptors Ror1 (19-fold), an orphan tyrosine kinase receptor, and the throm-
boxane A2 receptor (fourfold); and (ii) several genes relatedto TGF-� signaling, such as fibromodulin (�250 fold overbackground), associated with modulation of TGF-� signal-ing and cell adhesion (37), the TGF-�–inducible TIEG2, aSP1-like transcription factor (38) (10-fold over back-ground), and BIGH3/TGFB1 (39) (38-fold). Genes specif-ically downregulated in CLL include genes involved in cellcycle progression and DNA replication and metabolism(E2-C, CIP2/KAP, CDC2, cyclin B, ribonucleotide re-ductase, thymidine kinase, dihydrofolate reductase, topo-isomerase IIa), suggesting a markedly quiescent phenotype.
DiscussionGene expression profiling allows a more comprehensive
examination of cell phenotypes than the ones based on theanalysis of individual or small numbers of genes, proteins,or signaling pathways. This technology has been used inthis study to address three open questions regarding CLL:does CLL include one or two biological phenotypes sinceit displays a discordant IgV mutational status and clinicalbehavior? What is the cellular origin of CLL within the Bcell lineage? Can a CLL-specific gene expression profile beidentified? The results obtained directly address these ques-tions and have implications relevant for the pathogenesisand, possibly, for the clinical management of this disease.
CLLs Display a Common Phenotype Independent of IgVMutations. The gene expression profiles shown in Fig. 1demonstrate that CLL has a characteristic gene expressionprofile that is clearly distinguishable from FL, a malignancyderived from mature B cells and displaying an indolentclinical course similar to CLL. This observation confirmsthe results obtained by Alizadeh et al. using a different DNAmicroarray technology (oligonucleotide versus cDNA-based arrays) and a only partially overlapping set of genesexamined (12,000 nonlymphocyte-biased versus 18,000lymphocyte-biased; reference 40).
These results also show that CLLs have a homogeneousphenotype independent of the presence of IgV mutations.This phenotype is defined by the common pattern of ex-pression of 12,000 genes, with only 23 being differentiallyexpressed in the M- versus UM-subtypes. Although signif-icant differences in protein expression or modificationcannot be excluded by gene expression profiling, this re-sult does not support the hypothesis that CLL may includedistinct biological entities (8, 13), as it is the case, for in-stance, for DLCL (40). Rather, these findings stronglysuggest that all CLLs may derive from a common cell pre-cursor through a common pathogenetic mechanism (seebelow).
CLLs Are Related to Memory B Cells. Based on variousphenotypic similarities, mainly the presence of the CD5marker and on initial reports that CLL displayed unmutatedIgV, it has long been proposed that CLL may derive fromthe malignant transformation of CD5� B cells (4), the hu-man equivalent of mouse B1 cells. Subsequently, the iden-tification of M-CLLs led to the hypothesis that a fraction ofCLL cases may derive from a GC-experienced B cell, pos-
on February 2, 2015
jem.rupress.org
Dow
nloaded from
Published December 3, 2001
1632 Gene Expression Profiling of B Cell Chronic Lymphocytic Leukemia
sibly a memory B cell (8, 9, 13). The gene expression pro-files shown here suggest that CLL do not derive fromCD5� B cells or from GC B cells, while they indicate thatboth M- and UM-CLLs are more related to memory thanto naive B cells. This conclusion is based on a comparativeevaluation and cannot formally exclude the existence of apresently unrecognized B cell subpopulation that is moresimilar to CLL than memory B cells. However, this con-clusion is in agreement with other well established traitsshared by CLL and memory B cells, namely the frequentpresence of IgV mutations and, most notable, the expres-sion of the CD27 marker (14, 17–19, 41). The fact that
CLL cells express the CD5 and CD23 markers, which arenot typical of memory B cells, is not inconsistent with theirderivation from memory B cells since the expression ofthese markers could represent an abnormal trait of thetransformed phenotype rather than a characteristic of thenormal precursor of CLL. In the case of CD23, whose ex-pression is induced by IL-4 (42), this hypothesis is sup-ported by the abnormal expression of several genes in-volved in the IL-4 pathway (upregulation of IL-4 receptor,downregulation of SOCS1; see Results) and by the abnor-mal sensitivity of CLL to IL-4 in vitro (1). Finally, a deriva-tion of CLL cells from memory B cells is also consistent
Figure 3. The gene expression profile of CLL is related to that of mem-ory B cells. Gene expression data sets generated from 20 purified CLL casesare compared with the genes differentially expressed between CB/CC andmemory/naive B cells (A), memory/naive B cells vs. CD5� cells (B), andmemory versus naive B cells (C). Genes differentially expressed between
the various B cell subpopulations were identified by supervised clustering using Genes@Work. Matrices (a–c) and gene ranking are as in Fig. 2. Genesknown to be differentially expressed among GC and nonGC B-cells and among naive and memory B cells, or on CLL cells (IL-4R), are indicated (refer-ences 19, 25–29). D shows the quantitative relatedness of the CLLs to the normal B cell populations as derived from panels A–C as described for Fig. 2B. The gray area marks the 95% confidence region; the lower and upper margins of the gray area each correspond to a p-value of 0.025 (p-values decreasewith increasing distance from the x-axis). Open and closed circles represent M- and UM-CLL cases, respectively.
on February 2, 2015
jem.rupress.org
Dow
nloaded from
Published December 3, 2001
1633 Klein et al.
with the fact that CLLs lack chromosomal translocationswhich are thought to occur in developing B cells rearrang-ing their antigen receptors or in GC B cells (see below).
The notion that CLL may all derive from memory Bcells leaves open the question of why a sizable fraction ofthem expresses unmutated IgV genes, which are typical forpre-GC, naive B cells, or GC-independent cells involvedin T cell–independent humoral responses. One possible ex-planation is provided by the observation that a minor frac-tion of CD27� B cells carry unmutated IgV (17, 18) andmay have entered the memory cell pool without acquiringIgV mutations, possibly due to already high affinity for theantigen. Such CD27� unmutated memory B cells maytherefore represent the normal counterpart of UM-CLLs.Alternatively, the precursor of UM-CLLs may be a cell thathas acquired a memory phenotype via encounter with aT-independent (and thus GC-independent and IgV muta-tion-independent) pathway (9). This hypothesis impliesthat the antigen recognized by M-CLLs and UM-CLLsmay be of different nature, consistent also with the obser-vation that CDRIII length and IgV region usage differs
among the two subgroups (9, 43). A difference in the na-ture and/or time of exposure to antigen may also explainthe different clinical behavior of the two subgroups.
Overall, the finding that CLLs, including the UM sub-type, display a gene expression profile similar to memory Bcells warrants further investigations on the possible hetero-geneity of the memory B cell pool (44, 45). The few genesthat are differentially expressed in M- versus UM-CLLs(Fig. 2 A) may turn useful in dissecting this heterogeneity,although further characterization is needed because theyrepresent a heterogeneous group of genes, some of un-known function.
Implications for CLL Pathogenesis. The observation thatall CLLs share a common gene expression profile suggeststhat they derive from a common pathogenetic pathway.This notion is consistent with the relatively homogeneouscytogenetic profile of CLL, characterized by few commonchromosomal abnormalities and, particularly, by the strongassociation with 13q14 deletions, present in the majority ofcases (up to 70%) (46–48). These deletions are oftenpresent as a single chromosomal abnormality and are
Figure 3. (continued)
on February 2, 2015
jem.rupress.org
Dow
nloaded from
Published December 3, 2001
1634 Gene Expression Profiling of B Cell Chronic Lymphocytic Leukemia
thought to reflect the loss or inactivation of a still unknowntumor suppressor gene (46–48). The homogeneity of thegene expression profile of CLL suggests that this alterationor some functional equivalent (e.g., inactivating point mu-tations) may be present also in those cases lacking cytoge-netically or molecularly detectable 13q14 deletions.
The observation that CLL is more related to memory Bcells than to any other known normal B cell subset suggeststhat the multistep process leading to CLL may actually ini-tiate in memory B cells. This hypothesis is consistent withthe notion that, unique among lymphoid malignancies,CLL lack reciprocal balanced chromosomal translocations(2). These aberrations are thought to occur either during IgVDJ recombination in maturing B cells, or during Ig hy-
permutation and isotype switch in mature B cells withinthe GC (11), and, accordingly, are common in B cell lym-phoma, most of which derive from mature GC B cells (12,49). Thus, if the transformation process leading to CLL ini-tiates in memory B cells, it cannot involve chromosomaltranslocations since the mechanisms involved in these aber-rations have been inactivated in these cells. This notion isconsistent with the predominant presence in CLL of ge-netic alterations, such as deletions and amplifications, com-mon in tumors deriving from tissues not physiologicallysubjected to antigen receptor gene rearrangements or hy-permutation (50).
The comparative analysis of the gene expression profilesof CLL versus memory B cells (Fig. 4) or other normal and
Figure 4. Identification ofgenes specifically expressed inCLLs vs. memory B cells. Geneexpression profiles of 10 ran-domly selected purified CLLcases (five UM- and five M-CLL,respectively) were comparedwith those of five memory cellpreparations by supervised clus-tering using Genes@Work. Ma-trices and gene ranking are as inFig. 2; the fold change is indi-cated. For GenBank accessionno., see Supplementary Table IIGenes are grouped according toputative functional categoriesand ranked within each category.CD5 and CD23 are indicated asinternal controls. Supplementaltable available at http://www.jem.org/cgi/content/full/194/11/1625/F4/DC1.
on February 2, 2015
jem.rupress.org
Dow
nloaded from
Published December 3, 2001
1635 Klein et al.
neoplastic cells (Fig. 5) provides a significant body of newinformation to dissect the CLL phenotype. First, thedownregulation of a number of proapoptotic genes, to-gether with the already known upregulation of the antiap-optotic molecule Bcl-2, is consistent with the documentedlong-lived apoptosis-resistant phenotype of CLL (1). Sec-ond, unique among normal and neoplastic B cells, CLLcells consistently display a significant overexpression of theEPAC and CDC25 genes, both encoding guanine nucle-otide exchange factors that activate, respectively, Rap1 andRas, the small GTPases that control pleiotropic transcrip-tional responses via the Raf/ERK pathway (51). This ob-
servation has possible pathogenetic relevance and warrantsfurther studies since deregulation of the Ras pathway rep-resents one of the most common alterations in human tu-mors (52), while recent evidence suggests that Rap1 can bederegulated by chromosomal translocations in lymphoidmalignancy (53). Finally, the upregulation of mRNA forseveral cytokine or chemokine receptors compared withmemory cells (IL-4R, TGF-� type III receptor, CCR7;Fig. 4) or to other B cells (Ror1 and thromboxane A2 re-ceptor; Fig. 5) suggests that CLL cells may be abnormallyresponsive to certain stimuli. While each of the genes spe-cifically expressed in CLL requires validation for differential
Figure 5. Identification of genesspecifically expressed in CLL. Geneexpression profiles of 10 randomlyselected purified CLL cases (fiveUM- and five M-CLL, respectively)were compared with those generatedfrom normal (CBs, CCs, naive, andmemory) B cell subpopulations, pu-rified nonHodgkin lymphoma cells(DLCL, BL, and FL), and DLCL andBL cell lines by supervised clusteringusing Genes@Work. Matrices andgene ranking are as in Fig. 2. Genesand fold change are indicated at theright; for GenBank accession no., seeSupplementary Table III. Supple-mental table available at http://www.jem.org/cgi/content/full/194/11/1625/F5/DC1.
on February 2, 2015
jem.rupress.org
Dow
nloaded from
Published December 3, 2001
1636 Gene Expression Profiling of B Cell Chronic Lymphocytic Leukemia
expression at the protein level, these observations are po-tentially important for CLL pathogenesis and are amenableto experimental testing.
Clinical Implications. The results of these studies havepotential clinical application in several areas. First, the abil-ity to distinguish M- versus UM-CLLs by gene expressionprofiling (Fig. 2) represents a potential prognostic test forCLL since these two groups have a distinct clinical course.It is unlikely that this analysis will find clinical applicationusing expensive microarrays with 12,000 genes such as theones used in this study since IgV sequencing is more rapidand economical. Rather, these results should lead to thedevelopment of simple and inexpensive cytochemical assaysrecognizing the products of few of the genes differentiallyexpressed in M- versus UM-CLLs. Second, the products ofgenes specifically expressed in CLL (Fig. 5) represent po-tential markers for the diagnosis of CLL, its differential di-agnosis from related B cell malignancies, or the detection ofsmall numbers of CLL cells in minimal residual disease con-texts. Finally, the products of these same genes representpotential therapeutic targets based on their specific expres-sion in CLL cells versus normal cells. The successful use ofmAb therapy targeting the CD20 molecule in B cell lym-phoma (54) suggests that cell surface receptors that are ab-normally expressed in CLL (e.g., Ror1 and thromboxaneA2 receptors) may represent good candidates for initial test-ing of this approach. Further DNA microarray studies maybe aimed at determining the expression profiles of cytoge-netically distinct CLL cases or cases displaying differentclinical behavior (55).
We are grateful to Vladan Miljkovic for technical assistance. Wealso thank Laura Pasqualucci for discussions and Richard Baer forcomments on the manuscript.
U. Klein was a recipient of fellowships granted by the EuropeanMolecular Biology Organization and Human Frontiers ScienceProgram. G. Cattoretti is a recipient of an Aboodi Associate Profes-sor Fellowship. H. Husson was supported by the Cure for Lym-phoma Foundation, M. Mattioli by the Universita’ degli Studi diMilano, A. Neri by the Associazione Italiana Ricerca sul Cancro(AIRC). A. Freedman received support from the United States Na-tional Institute of Health (grant CA66996), the Leukemia and Lym-phoma Society, and the Norman Hirschfield Foundation.
Submitted: 14 June 2001Revised: 7 August 2001Accepted: 17 August 2001
References1. Caligaris-Cappio, F., and T.J. Hamblin. 1999. B-cell chronic
lymphocytic leukemia: a bird of a different feather. J. Clin.Oncol. 17:399–408.
2. Döhner, H., S. Stilgenbauer, K. Döhner, M. Bentz, and P.Lichter. 1999. Chromosome aberrations in B-cell chroniclymphocytic leukemia: reassessment based on molecular cy-togenetic analysis. J. Mol. Med. 77:266–281.
3. Kipps, T.J. 1998. Chronic lymphocytic leukemia. Curr. Opin.Hematol. 5:244–253.
4. Dighiero, G., T. Kipps, H.W. Schroeder, N. Chiorazzi, F.Stevenson, L.E. Silberstein, F. Caligaris-Cappio, and M. Fer-rarini. 1996. What is the CLL B-lymphocyte? Leuk. Lym-phoma. 22:13–39.
5. Brezinschek, H.P., S.J. Foster, R.I. Brezinschek, T. Dörner,R. Domiati-Saad, and P.E. Lipsky. 1997. Analysis of the hu-man VH gene repertoire. Differential effects of selection andsomatic hypermutation on human peripheral CD5�/IgM�
and CD5/IgM� B cells. J. Clin. Invest. 99:2488–2501.6. Fischer, M., U. Klein, and R. Küppers. 1997. Molecular sin-
gle-cell analysis reveals that CD5-positive peripheral blood Bcells in healthy humans are characterized by rearranged V�genes lacking somatic mutation. J. Clin. Invest. 100:1667–1676.
7. Schroeder, H.W., Jr., and G. Dighiero. 1994. The pathogen-esis of chronic lymphocytic leukemia: analysis of the antibodyrepertoire. Immunol. Today. 15:288–294.
8. Oscier, D.G., A. Thompsett, D. Zhu, and F.K. Stevenson.1997. Differential rates of somatic hypermutation in V(H)genes among subsets of chronic lymphocytic leukemia de-fined by chromosomal abnormalities. Blood. 89:4153–4160.
9. Fais, F., F. Ghiotto, S. Hashimoto, B. Sellars, A. Valetto, S.L.Allen, P. Schulman, V.P. Vinciguerra, K. Rai, L.Z. Rassenti,et al. 1998. Chronic lymphocytic leukemia B cells express re-stricted sets of mutated and unmutated antigen receptors. J.Clin. Invest. 102:1515–1525.
10. Rajewsky, K. 1996. Clonal selection and learning in the anti-body system. Nature. 381:751–758.
11. Küppers, R., U. Klein, M.L. Hansmann, and K. Rajewsky.1999. Cellular origin of human B-cell lymphomas. N. Engl.J. Med. 341:1520–1529.
12. Stevenson, F., S. Sahota, D. Zhu, C. Ottensmeier, C. Chap-man, D. Oscier, and T. Hamblin. 1998. Insight into the ori-gin and clonal history of B-cell tumors as revealed by analysisof immunoglobulin variable region genes. Immunol. Rev. 162:247–259.
13. Hamblin, T.J., Z. Davis, A. Gardiner, D.G. Oscier, and F.K.Stevenson. 1999. Unmutated Ig VH genes are associated witha more aggressive form of chronic lymphocytic leukemia.Blood. 94:1848–1854.
14. Damle, R.N., T. Wasil, F. Fais, F. Ghiotto, A. Valetto, S.L.Allen, A. Buchbinder, D. Budman, K. Dittmar, J. Kolitz, etal. 1999. Ig V gene mutation status and CD38 expression asnovel prognostic indicators in chronic lymphocytic leukemia.Blood. 94:1840–1847.
15. Pasqualucci, L., A. Neri, L. Baldini, R. Dalla-Favera, and A.Migliazza. 2000. BCL-6 mutations are associated with immu-noglobulin variable heavy chain mutations in B-cell chroniclymphocytic leukemia. Cancer Res. 60:5644–5648.
16. Pascual, V., Y.J. Liu, A. Magalski, O. de Bouteiller, J.Banchereau, and J.D. Capra. 1994. Analysis of somatic muta-tion in five B cell subsets of human tonsil. J. Exp. Med. 180:329–339.
17. Klein, U., K. Rajewsky, and R. Küppers. 1998. Human im-munoglobulin (Ig)M�IgD� peripheral blood B cells express-ing the CD27 cell surface antigen carry somatically mutatedvariable region genes: CD27 as a general marker for somati-cally mutated (memory) B cells. J. Exp. Med. 188:1679–1689.
18. Tangye, S.G., Y.J. Liu, G. Aversa, J.H. Phillips, and J.E. deVries. 1998. Identification of functional human splenic mem-ory B cells by expression of CD148 and CD27. J. Exp. Med.188:1691–1703.
19. Agematsu, K., S. Hokibara, H. Nagumo, and A. Komiyama.
on February 2, 2015
jem.rupress.org
Dow
nloaded from
Published December 3, 2001
1637 Klein et al.
2000. CD27: a memory B-cell marker. Immunol. Today. 21:204–206.
20. Ghia, P., V.A. Boussiotis, J.L. Schultze, A.A. Cardoso, D.M.Dorfman, J.G. Gribben, A.S. Freedman, and L.M. Nadler.1998. Unbalanced expression of Bcl-2 family proteins in fol-licular lymphoma: contribution of CD40 signaling in pro-moting survival. Blood. 91:244–251.
21. Hartigan, J.A. 1975. Clustering Algorithms. Wiley, NewYork. 351 pp.
22. Eisen, M.B., P.T. Spellman, P.O. Brown, and D. Botstein.1998. Cluster analysis and display of genome-wide expressionpatterns. Proc. Natl. Acad. Sci. USA. 95:14863–14868.
23. Califano, A. 2000. SPLASH: structural pattern localizationanalysis by sequential histograms. Bioinformatics. 16:341–357.
24. Califano, A., G. Stolovitzky, and Y. Tu. 2000. Analysis ofgene expression microarrays for phenotype classification. Proc.Int. Conf. Intell. Syst. Mol. Biol. 8:75–85.
25. Liu, Y.J., C. Barthelemy, O. de Bouteiller, C. Arpin, I. Du-rand, and J. Banchereau. 1995. Memory B cells from humantonsils colonize mucosal epithelium and directly present anti-gen to T cells by rapid up-regulation of B7-1 and B7-2. Im-munity. 2:239–248.
26. Golay, J., V. Broccoli, G. Lamorte, C. Bifulco, C. Parravi-cini, A. Pizzey, N.S. Thomas, D. Delia, P. Ferrauti, D. Vi-tolo, and M. Introna. 1998. The A-Myb transcription factoris a marker of centroblasts in vivo. J. Immunol. 160:2786–2793.
27. Cattoretti, G., C.C. Chang, K. Cechova, J. Zhang, B.H. Ye,B. Falini, D.C. Louie, K. Offit, R.S. Chaganti, and R. Dalla-Favera. 1995. BCL-6 protein is expressed in germinal-centerB cells. Blood. 86:45–53.
28. Onizuka, T., M. Moriyama, T. Yamochi, T. Kuroda, A. Ka-zama, N. Kanazawa, K. Sato, T. Kato, H. Ota, and S. Mori.1995. BCL-6 gene product, a 92- to 98-kD nuclear phos-phoprotein, is highly expressed in germinal center B cells andtheir neoplastic counterparts. Blood. 86:28–37.
29. van Der Vuurst De Vries, A.R., and T. Logtenberg. 1999. Aphage antibody identifying an 80-kDa membrane glycopro-tein exclusively expressed on a subpopulation of activated Bcells and hairy cell leukemia B cells. Eur. J. Immunol. 29:3898–3907.
30. Komatsu, K., T. Miyashita, H. Hang, K.M. Hopkins, W.Zheng, S. Cuddeback, M. Yamada, H.B. Lieberman, andH.G. Wang. 2000. Human homologue of S. pombe Rad9 in-teracts with BCL-2/BCL-xL and promotes apoptosis. Nat.Cell Biol. 2:1–6.
31. Sanjo, H., T. Kawai, and S. Akira. 1998. DRAKs, novelserine/threonine kinases related to death-associated proteinkinase that trigger apoptosis. J. Biol. Chem. 273:29066–29071.
32. Douglas, R.S., R.J. Capocasale, R.J. Lamb, P.C. Nowell,and J.S. Moore. 1997. Chronic lymphocytic leukemia B cellsare resistant to the apoptotic effects of transforming growthfactor-�. Blood. 89:941–947.
33. Losman, J.A., X.P. Chen, D. Hilton, and P. Rothman. 1999.Cutting edge: SOCS-1 is a potent inhibitor of IL-4 signaltransduction. J. Immunol. 162:3770–3774.
34. Martegani, E., M. Vanoni, R. Zippel, P. Coccetti, R. Bram-billa, C. Ferrari, E. Sturani, and L. Alberghina. 1992. Cloningby functional complementation of a mouse cDNA encodinga homologue of CDC25, a Saccharomyces cerevisiae RAS acti-vator. EMBO J. 11:2151–2157.
35. Wei, W., R.D. Mosteller, P. Sanyal, E. Gonzales, D.
McKinney, C. Dasgupta, P. Li, B.X. Liu, and D. Broek.1992. Identification of a mammalian gene structurally andfunctionally related to the CDC25 gene of Saccharomyces cere-visiae. Proc. Natl. Acad. Sci. USA. 89:7100–7104.
36. de Rooij, J., F.J. Zwartkruis, M.H. Verheijen, R.H. Cool,S.M. Nijman, A. Wittinghofer, and J.L. Bos. 1998. Epac is aRap1 guanine-nucleotide-exchange factor directly activatedby cyclic AMP. Nature. 396:474–477.
37. Soo, C., F.Y. Hu, X. Zhang, Y. Wang, S.R. Beanes, H.P.Lorenz, M.H. Hedrick, R.J. Mackool, A. Plaas, S.J. Kim, etal. 2000. Differential expression of fibromodulin, a trans-forming growth factor-� modulator, in fetal skin develop-ment and scarless repair. Am. J. Pathol. 157:423–433.
38. Cook, T., B. Gebelein, K. Mesa, A. Mladek, and R. Urrutia.1998. Molecular cloning and characterization of TIEG2 re-veals a new subfamily of transforming growth factor-�-inducible Sp1-like zinc finger-encoding genes involved inthe regulation of cell growth. J. Biol. Chem. 273:25929–25936.
39. Skonier, J., M. Neubauer, L. Madisen, K. Bennett, G.D.Plowman, and A.F. Purchio. 1992. cDNA cloning and se-quence analysis of � Ig-h3, a novel gene induced in a humanadenocarcinoma cell line after treatment with transforminggrowth factor-�. DNA Cell. Biol. 11:511–522.
40. Alizadeh, A.A., M.B. Eisen, R.E. Davis, C. Ma, I.S. Lossos,A. Rosenwald, J.C. Boldrick, H. Sabet, T. Tran, X. Yu, etal. 2000. Distinct types of diffuse large B-cell lymphomaidentified by gene expression profiling. Nature. 403:503-511.
41. Ranheim, E.A., M.J. Cantwell, and T.J. Kipps. 1995. Ex-pression of CD27 and its ligand, CD70, on chronic lympho-cytic leukemia B cells. Blood. 85:3556–3565.
42. Punnonen, J., G. Aversa, B.G. Cocks, and J.E. de Vries.1994. Role of interleukin-4 and interleukin-13 in synthesisof IgE and expression of CD23 by human B cells. Allergy. 49:576–586.
43. Widhopf, G.F. II, and T.J. Kipps. 2001. Normal B cells ex-press 51p1-encoded Ig heavy chains that are distinct fromthose expressed by chronic lymphocytic leukemia B cells. J.Immunol. 166:95–102.
44. Dono, M., S. Zupo, N. Leanza, G. Melioli, M. Fogli, A.Melagrana, N. Chiorazzi, and M. Ferrarini. 2000. Heteroge-neity of tonsillar subepithelial B lymphocytes, the splenicmarginal zone equivalents. J. Immunol. 164:5596–5604.
45. Weller, S., A. Faili, C. Garcia, M.C. Braun, F.F. Le Deist,G.G. de Saint Basile, O. Hermine, A. Fischer, C. Reynaud,and J. Weill. 2001. CD40-CD40L independent Ig gene hy-permutation suggests a second B cell diversification pathwayin humans. Proc. Natl. Acad. Sci. USA. 98:1166–1170.
46. Migliazza, A., F. Bosch, H. Komatsu, E. Cayanis, S. Marti-notti, E. Toniato, E. Guccione, X. Qu, M. Chien, V.V.Murty, et al. 2001. Nucleotide sequence, transcription map,and mutation analysis of the 13q14 chromosomal region de-leted in B-cell chronic lymphocytic leukemia. Blood. 97:2098–2104.
47. Mabuchi, H., H. Fujii, G. Calin, H. Alder, M. Negrini, L.Rassenti, T.J. Kipps, F. Bullrich, and C.M. Croce. 2001.Cloning and characterization of CLLD6, CLLD7, andCLLD8, novel candidate genes for leukemogenesis at chro-mosome 13q14, a region commonly deleted in B-cellchronic lymphocytic leukemia. Cancer Res. 61:2870–2877.
48. Corcoran, M.M., O. Rasool, Y. Liu, A. Iyengar, D. Grander,R.E. Ibbotson, M. Merup, X. Wu, V. Brodyansky, A.C.Gardiner, et al. 1998. Detailed molecular delineation of13q14.3 loss in B-cell chronic lymphocytic leukemia. Blood.
on February 2, 2015
jem.rupress.org
Dow
nloaded from
Published December 3, 2001
1638 Gene Expression Profiling of B Cell Chronic Lymphocytic Leukemia
91:1382–1390.49. Klein, U., T. Goossens, M. Fischer, H. Kanzler, A. Braeun-
inger, K. Rajewsky, and R. Küppers. 1998. Somatic hyper-mutation in normal and transformed human B cells. Immunol.Rev. 162:261–280.
50. Lengauer, C., K.W. Kinzler, and B. Vogelstein. 1998. Ge-netic instabilities in human cancers. Nature. 396:643–649.
51. Zwartkruis, F.J., and J.L. Bos. 1999. Ras and Rap1: twohighly related small GTPases with distinct function. Exp.Cell. Res. 253:157–165.
52. Bos, J.L. 1989. ras oncogenes in human cancer: a review.Cancer Res. 49:4682–4689.
53. Hussey, D.J., M. Nicola, S. Moore, G.B. Peters, and A. Do-brovic. 1999. The (4;11)(q21;p15) translocation fuses theNUP98 and RAP1GDS1 genes and is recurrent in T-cell
acute lymphocytic leukemia. Blood. 94:2072–2079.54. White, C.A., R.L. Weaver, and A.J. Grillo-Lopez. 2001.
Antibody-targeted immunotherapy for treatment of malig-nancy. Annu. Rev. Med. 52:125–145.
55. Stratowa, C., G. Löffler, P. Lichter, S. Stilgenbauer, P. Hab-erl, N. Schweifer, H. Döhner, and K.K. Wilgenbus. 2001.cDNA microarray gene expression analysis of B cell chroniclymphocytic leukemia proposes potential new prognosticmarkers involved in lymphocyte trafficking. Int. J. Cancer. 91:474–480.
56. Matsuda, F., E.K. Shin, H. Nagaoka, R. Matsumura, M.Haino, Y. Fukita, S. Taka-ishi, T. Imai, J.H. Riley, R.Anand, et al. 1993. Structure and physical map of 64 variablesegments in the 3�0.8-megabase region of the human immu-noglobulin heavy-chain locus. Nat. Genet. 3:88–94.
on February 2, 2015
jem.rupress.org
Dow
nloaded from
Published December 3, 2001