Gas-Exchange Properties of Salt-Stressed Olive (Olea europea L.) Leaves
9
Plant Physiol. (1989) 90, 1408-1416 0032-0889/89/90/1408/09/$01 .00/0 Received for publication October 10, 1988 and in revised form April 4, 1989 Gas-Exchange Properties of Salt-Stressed Olive (Olea europea L.) Leaves Guido Bongi and Francesco Loreto*l Consiglio Nazionale delle Ricerche C.S., Olivicoltura, Via Madonna Alta, 06100 Perugia, Italy ABSTRACT The effects of two levels of salinity on photosynthetic proper- ties of olive (Olea europea L.) leaves were observed either in low or in high H20 vapor pressure deficit (vpd). Under moderate salt stress, stomata were found to be less open and responsive both to light and vpd, but the predominant limitation of photosynthesis was due to the mesophyll capacity of CO2 fixation. We elaborate a procedure to correlate mesophyll capacity and liquid phase diffusive conductance. The estimated liquid phase diffusive con- ductance was reduced by salt and especially by high vpd; mor- phological and physiological changes could be responsible for this reduction. As a result, the chloroplast CO2 partial pressure was found to decrease both under salt and vpd stress, thus resulting in a ribulose-1,5-bisphosphate carboxylase limitation of assimilation. However, under combined salt and vpd stress, 02 sensitivity of assimilation increased, as would be expected under conditions of limiting ribulose 1,5-bisphosphate regeneration. Flu- orescence induction measurements indicated that, under these conditions, energy supply may become limiting. When Cl- con- centration exceeded 80 millimolar in tissue water, zero growth and 50% leaf drop was observed. Fluorescence induction showed irreversible damage at Clr levels higher than 200 millimolar and basal leaves reached this concentration earlier than the apical ones. Salinity affects an area three times greater than all the land presently irrigated in the world. It is involved in many struc- tural changes of plants and in variations of gas-exchange properties of leaves. Photosynthesis is generally thought to be reduced by toxic levels of sodium or chloride (1 1). In this case changes in turgor pressure act synergistically to maintain turgor against an increased vacuolar osmotic potential. There- fore, an increase in salt concentration produces effects similar to those of drought stress. Robinson et al. (18) noticed primary stomatal effects and accumulation of salt in intracellular compartments other than chloroplasts during salt-stress in spinach. Gas-exchange analy- sis of secretive halophytes (2) demonstrated a coordinate variation of A2 and g, with increasing salinity. No variation ' Current address: Department of Botany, University of Wisconsin, Madison, WI 53706. 2 Abbreviations: A, net assimilation rate; g&, stomatal conductance; WUE, water use efficiency; vpd, H20 vapor pressure difference be- tween leaf and air; gw, liquid phase diffusive conductance; Rubisco, ribulose-1 ,5-bisphosphate carboxylase; RuBP, ribulose-1 ,5-bisphos- phate; pi, substomatal CO2 partial pressure; Pc, chloroplast CO2 partial pressure; Q, ratio between oxygenation and carboxylation velocity of Rubisco; Pa, ambient CO2 partial pressure; SAR, cell surface exposed to gas exchange. in marginal water use cost was seen; however, WUE was significantly reduced. Lloyd et al. (1 1) found that in orange the primary effect of salt stress was a reduction of mesophyll capacity for CO2 assimilation, which also resulted in a low- ering of WUE. Finally, vpd, already indicated as the main cause of midday depression (16), was found to affect the response to salt in several species, as described in mangroves (2) where it causes a further reduction both in A and WUE. Olive is a plant considered to show intermediate salt toler- ance (6, 19), and its response to salt is typical of Mediterranean evergreens. Moreover, salt stress is important in olive culture since dilute seawater irrigation is normally supplied in sum- mer when temperature and drought induce very high vpd. A common feature of salt-stressed olive leaves is an increase in cell wall thickness and in total leaf thickness, as observed in other glycophytes and, to a lesser extent, in halophytes (15). Previous experience with greenhouse-grown olive plants (24) has shown a large increase in leaf thickness and a dramatic reduction of photosynthetic capacity during salt treatment, indicating irreversible leaf damage at approximately 200 mM Cl - concentration in the sap. The present study further examines salt effects in this glycophytic evergreen and attempts to establish how high vpd can aggravate these effects. To this aim we have carried out measurements of quantum yield, Chl fluorescence, CO2 and 02 responses of photosynthesis and have calculated 02 effects on photosynthesis. Changes in CO2 permeability inside the leaves were also considered since in schlerophyllous leaves the increase in leaf thickness could produce a substantial variation in the resistance to C02 diffusion (14). THEORY The total diffusive resistance to CO2 (r,) can be separated into gas diffusive resistance (rd) and liquid phase diffusive resistance (r,). Parkhurst et al. (14) reported a relationship between rd, the diffusivity of CO2 in the air (Dd), and the thickness of the leaf (td). This relationship can be reduced to rd = 2td/Dd in hypostomatous leaves. The term r, is a function of unit surface, cell surface actually exposed to gas exchange (SAR), diffusive resistance between cells (D,), and cell wall thickness (t,). Thus, the relation between leaf structure and r, is r, = 1/SAR x t,D,. Most gas-exchange models rely on the assumption of a gw (which is the inverse of r,) equal to 1 mol m-2 s-', but this value is correct only in amphistomatous leaves with high SAR. In schlerophyllous leaves, values of gw as low as 0.15 mol m-2 s-' are common and the increase in wall thickness 1408
Transcript of Gas-Exchange Properties of Salt-Stressed Olive (Olea europea L.) Leaves

Plant Physiol. (1989) 90, 1408-14160032-0889/89/90/1408/09/$01 .00/0
Received for publication October 10, 1988and in revised form April 4, 1989
Gas-Exchange Properties of Salt-Stressed Olive(Olea europea L.) Leaves
Guido Bongi and Francesco Loreto*lConsiglio Nazionale delle Ricerche C.S., Olivicoltura, Via Madonna Alta, 06100 Perugia, Italy
ABSTRACT
The effects of two levels of salinity on photosynthetic proper-ties of olive (Olea europea L.) leaves were observed either in lowor in high H20 vapor pressure deficit (vpd). Under moderate saltstress, stomata were found to be less open and responsive bothto light and vpd, but the predominant limitation of photosynthesiswas due to the mesophyll capacity of CO2 fixation. We elaboratea procedure to correlate mesophyll capacity and liquid phasediffusive conductance. The estimated liquid phase diffusive con-ductance was reduced by salt and especially by high vpd; mor-phological and physiological changes could be responsible forthis reduction. As a result, the chloroplast CO2 partial pressurewas found to decrease both under salt and vpd stress, thusresulting in a ribulose-1,5-bisphosphate carboxylase limitation ofassimilation. However, under combined salt and vpd stress, 02sensitivity of assimilation increased, as would be expected underconditions of limiting ribulose 1,5-bisphosphate regeneration. Flu-orescence induction measurements indicated that, under theseconditions, energy supply may become limiting. When Cl- con-centration exceeded 80 millimolar in tissue water, zero growthand 50% leaf drop was observed. Fluorescence induction showedirreversible damage at Clr levels higher than 200 millimolar andbasal leaves reached this concentration earlier than the apicalones.
Salinity affects an area three times greater than all the landpresently irrigated in the world. It is involved in many struc-tural changes of plants and in variations of gas-exchangeproperties of leaves. Photosynthesis is generally thought to bereduced by toxic levels ofsodium or chloride (1 1). In this casechanges in turgor pressure act synergistically to maintainturgor against an increased vacuolar osmotic potential. There-fore, an increase in salt concentration produces effects similarto those of drought stress.
Robinson et al. (18) noticed primary stomatal effects andaccumulation of salt in intracellular compartments other thanchloroplasts during salt-stress in spinach. Gas-exchange analy-sis of secretive halophytes (2) demonstrated a coordinatevariation of A2 and g, with increasing salinity. No variation
' Current address: Department of Botany, University ofWisconsin,Madison, WI 53706.
2 Abbreviations: A, net assimilation rate; g&, stomatal conductance;WUE, water use efficiency; vpd, H20 vapor pressure difference be-tween leaf and air; gw, liquid phase diffusive conductance; Rubisco,ribulose-1 ,5-bisphosphate carboxylase; RuBP, ribulose-1 ,5-bisphos-phate;pi, substomatal CO2 partial pressure; Pc, chloroplast CO2 partialpressure; Q, ratio between oxygenation and carboxylation velocity ofRubisco; Pa, ambient CO2 partial pressure; SAR, cell surface exposedto gas exchange.
in marginal water use cost was seen; however, WUE wassignificantly reduced. Lloyd et al. (1 1) found that in orangethe primary effect of salt stress was a reduction of mesophyllcapacity for CO2 assimilation, which also resulted in a low-ering of WUE. Finally, vpd, already indicated as the maincause of midday depression (16), was found to affect theresponse to salt in several species, as described in mangroves(2) where it causes a further reduction both in A and WUE.
Olive is a plant considered to show intermediate salt toler-ance (6, 19), and its response to salt is typical ofMediterraneanevergreens. Moreover, salt stress is important in olive culturesince dilute seawater irrigation is normally supplied in sum-mer when temperature and drought induce very high vpd. Acommon feature of salt-stressed olive leaves is an increase incell wall thickness and in total leaf thickness, as observed inother glycophytes and, to a lesser extent, in halophytes (15).Previous experience with greenhouse-grown olive plants (24)has shown a large increase in leaf thickness and a dramaticreduction of photosynthetic capacity during salt treatment,indicating irreversible leaf damage at approximately 200 mMCl - concentration in the sap.The present study further examines salt effects in this
glycophytic evergreen and attempts to establish how high vpdcan aggravate these effects. To this aim we have carried outmeasurements of quantum yield, Chl fluorescence, CO2 and02 responses of photosynthesis and have calculated 02 effectson photosynthesis. Changes in CO2 permeability inside theleaves were also considered since in schlerophyllous leavesthe increase in leaf thickness could produce a substantialvariation in the resistance to C02 diffusion (14).
THEORY
The total diffusive resistance to CO2 (r,) can be separatedinto gas diffusive resistance (rd) and liquid phase diffusiveresistance (r,). Parkhurst et al. (14) reported a relationshipbetween rd, the diffusivity of CO2 in the air (Dd), and thethickness of the leaf (td). This relationship can be reduced tord = 2td/Dd in hypostomatous leaves.The term r, is a function ofunit surface, cell surface actually
exposed to gas exchange (SAR), diffusive resistance betweencells (D,), and cell wall thickness (t,). Thus, the relationbetween leaf structure and r, is r, = 1/SAR x t,D,.Most gas-exchange models rely on the assumption of a gw
(which is the inverse of r,) equal to 1 mol m-2 s-', but thisvalue is correct only in amphistomatous leaves with highSAR. In schlerophyllous leaves, values of gw as low as 0.15mol m-2 s-' are common and the increase in wall thickness
1408
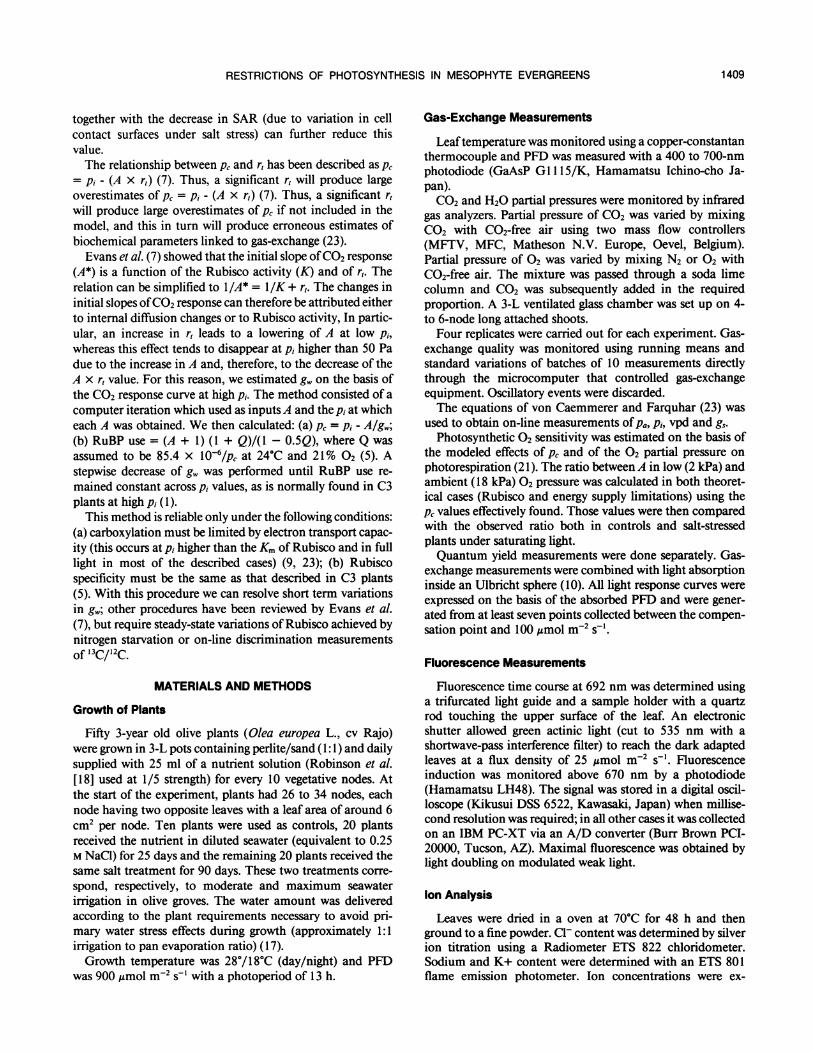
RESTRICTIONS OF PHOTOSYNTHESIS IN MESOPHYTE EVERGREENS
together with the decrease in SAR (due to variation in cellcontact surfaces under salt stress) can further reduce thisvalue.The relationship between Pc and r, has been described as Pc
= pi - (A x r,) (7). Thus, a significant r, will produce largeoverestimates of Pc = pi - (A x r,) (7). Thus, a significant r,will produce large overestimates of Pc if not included in themodel, and this in turn will produce erroneous estimates ofbiochemical parameters linked to gas-exchange (23).
Evans et al. (7) showed that the initial slope ofCO2 response(A*) is a function of the Rubisco activity (K) and of r,. Therelation can be simplified to l/A* = 1/K + r,. The changes ininitial slopes ofCO2 response can therefore be attributed eitherto internal diffusion changes or to Rubisco activity, In partic-ular, an increase in r, leads to a lowering of A at low pi,whereas this effect tends to disappear at pi higher than 50 Padue to the increase in A and, therefore, to the decrease of theA x r, value. For this reason, we estimated gw on the basis ofthe CO2 response curve at high pi. The method consisted of acomputer iteration which used as inputsA and the Pi at whicheach A was obtained. We then calculated: (a) Pc = Pi - Alg,;(b) RuBP use = (A + 1) (1 + Q)/(l -0.5Q), where Q wasassumed to be 85.4 x 10⁻⁶/p, at 24°C and 21% 02 (5). Astepwise decrease of gw was performed until RuBP use re-mained constant across pi values, as is normally found in C3plants at high pi (1).
This method is reliable only under the following conditions:(a) carboxylation must be limited by electron transport capac-ity (this occurs at pi higher than the Km of Rubisco and in fulllight in most of the described cases) (9, 23); (b) Rubiscospecificity must be the same as that described in C3 plants(5). With this procedure we can resolve short term variationsin g1,; other procedures have been reviewed by Evans et al.(7), but require steady-state variations of Rubisco achieved bynitrogen starvation or on-line discrimination measurementsof 13C/'2C.
MATERIALS AND METHODS
Growth of Plants
Fifty 3-year old olive plants (Olea europea L., cv Rajo)were grown in 3-L pots containing perlite/sand (1:1) and dailysupplied with 25 ml of a nutrient solution (Robinson et al.[18] used at 1/5 strength) for every 10 vegetative nodes. Atthe start of the experiment, plants had 26 to 34 nodes, eachnode having two opposite leaves with a leaf area of around 6cm2 per node. Ten plants were used as controls, 20 plantsreceived the nutrient in diluted seawater (equivalent to 0.25M NaCl) for 25 days and the remaining 20 plants received thesame salt treatment for 90 days. These two treatments corre-spond, respectively, to moderate and maximum seawaterirrigation in olive groves. The water amount was deliveredaccording to the plant requirements necessary to avoid pri-mary water stress effects during growth (approximately 1:1irrigation to pan evaporation ratio) ( 17).Growth temperature was 28°/18C (day/night) and PFD
was 900 ,umol m-2 S-1 with a photoperiod of 13 h.
Gas-Exchange Measurements
Leaftemperature was monitored using a copper-constantanthermocouple and PFD was measured with a 400 to 700-nmphotodiode (GaAsP GI1115/K, Hamamatsu Ichino-cho Ja-pan).CO2 and H20 partial pressures were monitored by infrared
gas analyzers. Partial pressure of CO2 was varied by mixingCO2 with C02-free air using two mass flow controllers(MFTV, MFC, Matheson N.V. Europe, Oevel, Belgium).Partial pressure of 02 was varied by mixing N2 or O2 withC02-free air. The mixture was passed through a soda limecolumn and CO2 was subsequently added in the requiredproportion. A 3-L ventilated glass chamber was set up on 4-to 6-node long attached shoots.Four replicates were carried out for each experiment. Gas-
exchange quality was monitored using running means andstandard variations of batches of 10 measurements directlythrough the microcomputer that controlled gas-exchangeequipment. Oscillatory events were discarded.The equations of von Caemmerer and Farquhar (23) was
used to obtain on-line measurements of Pa, Pi, vpd and g,.Photosynthetic 02 sensitivity was estimated on the basis of
the modeled effects of Pc and of the 02 partial pressure onphotorespiration (21). The ratio between A in low (2 kPa) andambient (18 kPa) 02 pressure was calculated in both theoret-ical cases (Rubisco and energy supply limitations) using thePc values effectively found. Those values were then comparedwith the observed ratio both in controls and salt-stressedplants under saturating light.Quantum yield measurements were done separately. Gas-
exchange measurements were combined with light absorptioninside an Ulbricht sphere (10). All light response curves wereexpressed on the basis of the absorbed PFD and were gener-ated from at least seven points collected between the compen-sation point and 100 ,umol m-2 s-.
Fluorescence Measurements
Fluorescence time course at 692 nm was determined usinga trifurcated light guide and a sample holder with a quartzrod touching the upper surface of the leaf. An electronicshutter allowed green actinic light (cut to 535 nm with ashortwave-pass interference filter) to reach the dark adaptedleaves at a flux density of 25 'mol m-2 s-'. Fluorescenceinduction was monitored above 670 nm by a photodiode(Hamamatsu LH48). The signal was stored in a digital oscil-loscope (Kikusui DSS 6522, Kawasaki, Japan) when millise-cond resolution was required; in all other cases it was collectedon an IBM PC-XT via an A/D converter (Burr Brown PCI-20000, Tucson, AZ). Maximal fluorescence was obtained bylight doubling on modulated weak light.
Ion Analysis
Leaves were dried in a oven at 70°C for 48 h and thenground to a fine powder. Cl- content was determined by silverion titration using a Radiometer ETS 822 chloridometer.Sodium and K+ content were determined with an ETS 801flame emission photometer. Ion concentrations were ex-
1 409
Plant Physiol. Vol. 90, 1989
pressed on a tissue water basis from measurements of tissuefresh and dry weights.
RESULTS
Salt Penetration and Growth Effects
Plant growth was strongly inhibited after 25 d of salt stress.Salt-stressed plants produced no new shoots during the exper-iment, while control plants produced an average of one newnode for every 1O nodes present at the start ofthe experiment.After 20 d, Cl- concentration in salt-stressed plants increased(57 ± 5 mm in tissue water compared to 26.4 ± 4 mm observedin controls). This did not cause any visible damage in leaves,but had noticeable effects on the photosynthetic capacity ofstressed leaves (see below).Sodium levels of the leaves were also analyzed after 25 d.
We found a Na+ concentration of 35 ± 3 mm in controls andincreasing concentrations in salt-stressed plants, ranging from46 ± 6 mm in the apical leaves to 90 ± 8 mm in the basalleaves.
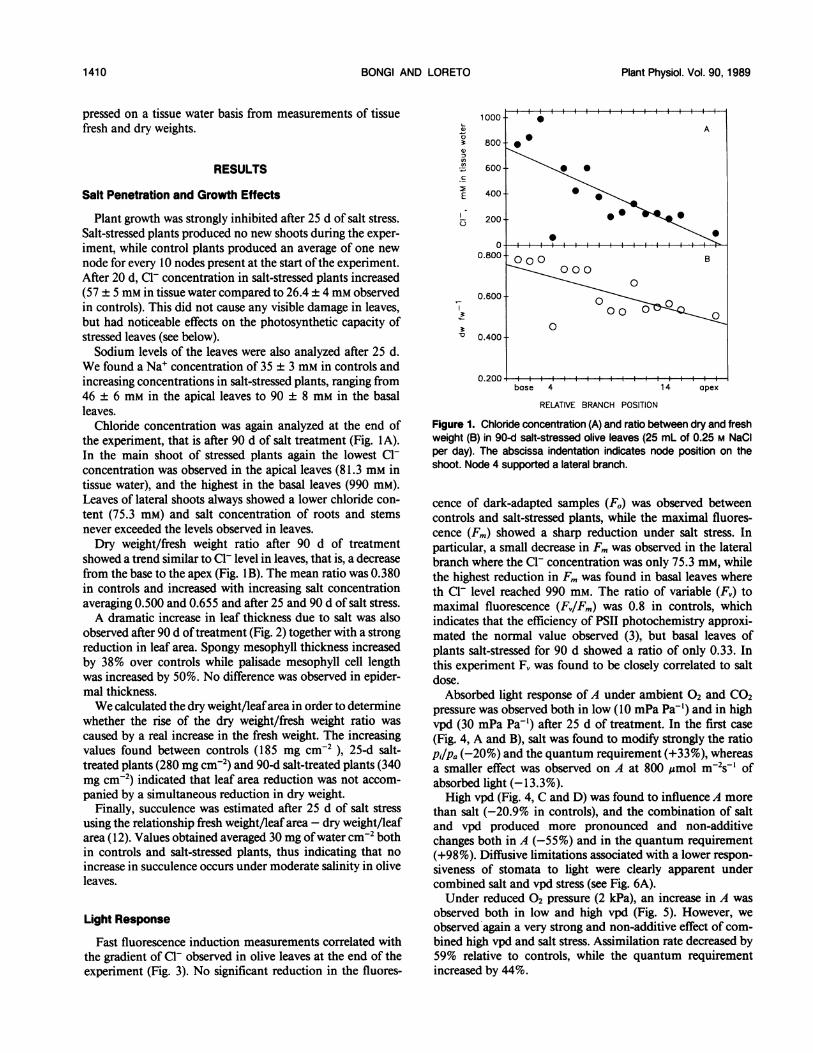
Chloride concentration was again analyzed at the end ofthe experiment, that is after 90 d of salt treatment (Fig. IA).In the main shoot of stressed plants again the lowest Cl-concentration was observed in the apical leaves (81.3 mm intissue water), and the highest in the basal leaves (990 mM).Leaves of lateral shoots always showed a lower chloride con-tent (75.3 mM) and salt concentration of roots and stemsnever exceeded the levels observed in leaves.Dry weight/fresh weight ratio after 90 d of treatment
showed a trend similar to Cl- level in leaves, that is, a decreasefrom the base to the apex (Fig. 1 B). The mean ratio was 0.380in controls and increased with increasing salt concentrationaveraging 0.500 and 0.655 and after 25 and 90 d of salt stress.A dramatic increase in leaf thickness due to salt was also
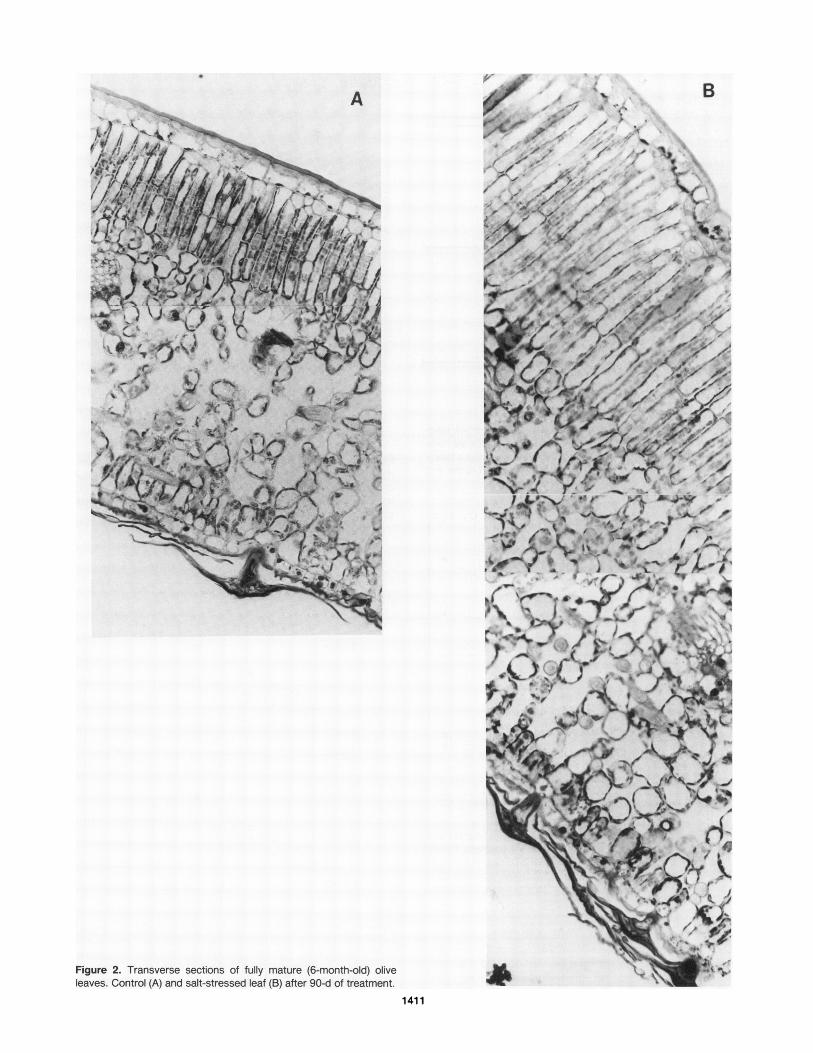
observed after 90 d oftreatment (Fig. 2) together with a strongreduction in leaf area. Spongy mesophyll thickness increasedby 38% over controls while palisade mesophyll cell lengthwas increased by 50%. No difference was observed in epider-mal thickness.We calculated the dry weight/leafarea in order to determine
whether the rise of the dry weight/fresh weight ratio wascaused by a real increase in the fresh weight. The increasingvalues found between controls (185 mg cm-2 ), 25-d salt-treated plants (280 mg cm-2) and 90-d salt-treated plants (340mg cm-2) indicated that leaf area reduction was not accom-panied by a simultaneous reduction in dry weight.
Finally, succulence was estimated after 25 d of salt stressusing the relationship fresh weight/leaf area - dry weight/leafarea (12). Values obtained averaged 30 mg ofwater cm-2 bothin controls and salt-stressed plants, thus indicating that noincrease in succulence occurs under moderate salinity in oliveleaves.
Light Response
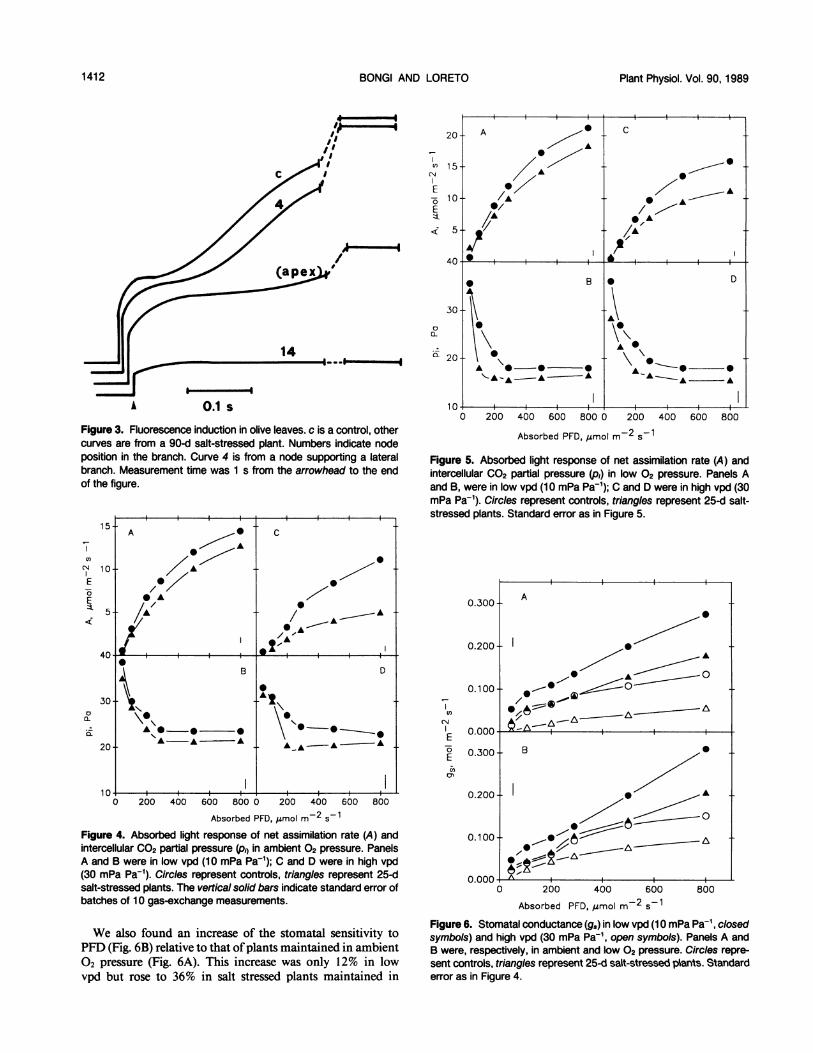
Fast fluorescence induction measurements correlated withthe gradient of Cl- observed in olive leaves at the end of theexperiment (Fig. 3). No significant reduction in the fluores-
Q) ~~~~~~~~~~~A
800
600 - \
C
E 400 4 14 a
I-200-
0.600-
00
0.400- O
0.200-
base 4 14 apex
RELATIVE BRANCH POSITION
Figure 1. Chloride concentration (A) and ratio between dry and freshweight (B) in 90-d salt-stressed olive leaves (25 mL of 0.25 M NaCIper day). The abscissa indentation indicates node position on theshoot. Node 4 supported a lateral branch.
cence of dark-adapted samples (Fo) was observed betweencontrols and salt-stressed plants, while the maximal fluores-cence (Fm) showed a sharp reduction under salt stress. Inparticular, a small decrease in Fm was observed in the lateralbranch where the Cl- concentration was only 75.3 mm, whilethe highest reduction in Fm was found in basal leaves whereth Cl- level reached 990 mm. The ratio of variable (F,) tomaximal fluorescence (Fv/Fm) was 0.8 in controls, whichindicates that the efficiency of PSII photochemistry approxi-mated the normal value observed (3), but basal leaves ofplants salt-stressed for 90 d showed a ratio of only 0.33. Inthis experiment F, was found to be closely correlated to saltdose.Absorbed light response of A under ambient 02 and CO2
pressure was observed both in low (10 mPa Pa-') and in highvpd (30 mPa Pa-') after 25 d of treatment. In the first case(Fig. 4, A and B), salt was found to modify strongly the ratioPi/Pa (-20%) and the quantum requirement (+33%), whereasa smaller effect was observed on A at 800 ,umol m-2s-' ofabsorbed light (-13.3%).High vpd (Fig. 4, C and D) was found to influence A more
than salt (-20.9% in controls), and the combination of saltand vpd produced more pronounced and non-additivechanges both in A (-55%) and in the quantum requirement(+98%). Diffusive limitations associated with a lower respon-siveness of stomata to light were clearly apparent undercombined salt and vpd stress (see Fig. 6A).Under reduced 02 pressure (2 kPa), an increase in A was
observed both in low and high vpd (Fig. 5). However, weobserved again a very strong and non-additive effect of com-bined high vpd and salt stress. Assimilation rate decreased by59% relative to controls, while the quantum requirementincreased by 44%.
1410 BONGI AND LORETO
A A sZ ;vAB
>; ;~~~~~~~~~~~~~~1 I.3;-* 4t"
;&~~~~~~~~<) t) wAvi~A
~~~~'~~xfg(o0s#~7
rAj4J41<'
~~~~~~~~~~~~~~~~~~~~~~~~4
~~~~~~V~~~~~~~~~~~~~~~~~~4Z~ ~ ~ ~ ~ ~ ~ ~ ~ 01
jof , ":P,
Ap.~ ~ ~ ~ ~ A
PTi
Ak,-~~~~~~~~~~~~~~~~~~~~~~~~~~~~~~~~'
*01
Figure 2. Transverse sections of fully mature (6-month-old) olive II J a
leaves. Control (A) and salt-stressed leaf (B) after 90-d of treatment.
1411
Plant Physiol. Vol. 90, 1989
C N
E-5E
0~a-c)
J lA 0.1 s
Figure 3. Fluorescence induction in olive leaves. c is a control, othercurves are from a 90-d salt-stressed plant. Numbers indicate nodeposition in the branch. Curve 4 is from a node supporting a lateralbranch. Measurement time was 1 s from the arrowhead to the endof the figure.
A0-* * 'C
T ~~~~~AN 10- AE
5- A
0200 /0600 8000 200A400600 800A
I A
40 II
B 0
A~~~A
20--~ A A
20-
0 200 400 600 800 0 200 400 600 800
Absorbed PFD. u.mol mn2 S-1Figure 4. Absorbed light response of net assimilation rate (A) andintercellular CO2 partial pressure (pq in ambient 02 pressure. PanelsA and B were in low vpd (10 mPa Pa-1); C and D were in high vpd(30 mPa Pa-1). Circles represent controls, triangles represent 25-dsalt-stressed plants. The vertical solid bars indicate standard error ofbatches of 10 gas-exchange measurements.
We also found an increase of the stomatal sensitivity toPFD (Fig. 6B) relative to that ofplants maintained in ambient02 pressure (Fig. 6A). This increase was only 12% in lowvpd but rose to 36% in salt stressed plants maintained in
20 A C
15 A~~~~~~
5 /
40-? I
* BC 0~~~
30
20
10U 200 400 600 800 0 200 400 600 800
Absorbed PFD, Mmol m 2 s 1
Figure 5. Absorbed light response of net assimilation rate (A) andintercellular CO2 partial pressure (p,) in low 02 pressure. Panels Aand B, were in low vpd (10 mPa Pa"'); C and D were in high vpd (30mPa Pa-1). Circles represent controls, triangles represent 25-d salt-stressed plants. Standard error as in Figure 5.
0.300 A
0.200 -A
0.100 * 0
0.000E0 0.300 BE
0.200 A
0.100 .06
0.000 _A0 200 400 600 800
Absorbed PFD, Amol m 2 s-1
Figure 6. Stomatal conductance (g,) in low vpd (10 mPa Pa-1, closedsymbols) and high vpd (30 mPa Pa-1, open symbols). Panels A andB were, respectively, in ambient and low 02 pressure. Circles repre-sent controls, triangles represent 25-d salt-stressed plants. Standarderror as in Figure 4.
1412 BONGI AND LORETO

RESTRICTIONS OF PHOTOSYNTHESIS IN MESOPHYTE EVERGREENS
high vpd.
CO2 Response
The CO2 response was also measured after 25 d of salttreatment. In low vpd, A in salt-stressed plants was only 15imol m-2 s-' at api of 60 Pa, while controls reached 19 ,molm-2 s-' (Fig. 7A). The initial slope of the curve for salt-stressed plants was higher than that for control plants (9.8 x10⁻³ and 7 x 10⁻³ ,umol m2 s-'Pa-', respectively), but this isprobably related to the observed increase in dry weight/leafarea.The effect of increasing pi from 30 to 60 Pa was greater on
controls than on salt-stressed plants. In the same range of pi,the pj/pa ratio (Fig. 7B) and g. (Fig. 7C) did not decrease, thusindicating that no feedback response of stomata occurred.However salt-stressed plants in comparison with controlsshowed an average reduction of 1% for the PuPa ratio andof 16% for g.
In high vpd, the initial slope of A did not change signifi-cantly between controls and salt-stressed plants (5.6 x 10⁻³and 5.2 x 10-' ,umol m-2 s-' Pa', respectively) but was lowerthan the slope observed in low vpd. At api of60 Pa, A reached18 ,umol m-2 s-' in controls and 14.5 gmol m-2 s-' in salt-stressed plants (Fig. 7D) with a slight reduction (5.2% forcontrols and 3.3% for salt-stressed plants) compared to valuesfound in low vpd. However, under these conditions, both Pi!Pa (Fig. 7E) and gs (Fig. 7F) decreased and the values weresignificantly lower than those observed in low vpd. At a pi of60 Pa, the reduction ofPu/Pa was 30% in controls and 27% insalt-stressed plants, whereas gs decreased by 48% and 54%,respectively.
2
N
E
A 0
A~~~~iA0/A A
oI A
//Ao ~~~~~~~iI~ I, i I
A~~~~~~~1.000+
0.800 +
0.600±I.,
E
E
U.400U0.250I *
0.200 0
0.150 vA v-
0.100t t -A--
0.050 C F -
0.000 l I I i I0 20 40 60
pi. Po
B
DISCUSSION
The light response of olive leaves was markedly changed bysalt and vpd. Chances in chlorophyll fluorescence at 692 nmcorrelated well with Cl- levels found at the end of the exper-iment, indicating that these elevated Cl- concentrations weresufficient to reduce electron flow in PSII. This finding alsodemonstrates that the increase in FV could be used as anefficient, nondestructive method for assaying salt-stress. How-ever, FV was drastically reduced only at a Cl- doses, whichcaused leaf drop 2 weeks after the end of our experiment.According to Bjorkman (3), the reduction of F, could beattributed to a decrease in the rate constant for photochem-istry of PSII and, to a greater extent, to an increase in thenonradiative dissipation rate constant. However, this hypoth-esis is based on the assumption of steady-state conditions,either in the size of PSII reaction centers or in their ratio withtotal Chl. In previous experiments, we observed under saltstress a reduction of 66% of the area between the rise curveof fluorescence induction and the Fm in presence of inhibitors(DCMU) (our unpublished results). This area shows the con-centration of active PSII reaction centers, and their observedreduction suggests a limitation due to PSII stoichiometryrather than to changes in the rate constants under salt stress.The observed photosynthetic 02 sensitivity, ranging from
25.5 to 29.5% (Table I), was consistent with values calculatedwhen the capacity ofRubisco limits photosynthesis (21). Onlyunder combined salt and vpd stress the observed value(51.3%) seems to indicate a limitation of A due to RuBPregeneration (theoretical value = 44.7%). This result couldexplain the nonadditivity of salt stress and high vpd. The
Figure 7. Intercellular C02 partial pressure (pi) re-sponse of net assimilation rate (A), ratio between inter-cellular and ambient C02 partial pressure (p,/p8) andstomatal conductance (g.). Panels A, B, and C, were inlow vpd (10 mPa Pa-1); panels D, E, and F, were in highvpd (30 mPa Pa-1). Circles represent controls, trianglesrepresent 25-d salt-stressed plants. Standard error asin Figure 4.
1413
2.0 4.0 6.0

Plant Physiol. Vol. 90, 1989
Table I. Effect of Salt and vpd on 02 Sensitivity of PhotosynthesisAll treatments were carried out at ambient C02 pressure (33 Pa)
and 280C. Salt-stressed plants were daily treated with 25 mL of NaCIsolution 0.25 M for 25 d. RI and El are the 02 sensitivity expected inRubisco and energy limited conditions, respectively. Obs is the ob-served 02 sensitivity. All values are calculated from assimilation inlow 02 pressure (2 kPa) and ambient 02 pressure (18 kPa) accordingto the relation (A2 - Al 8)/A2. LSD 5% were calculated between vpdtreatments at the same salt level (LSD vpd) or at different salt levels(LSD tot).
Treatment vpd RI El Obs
mPa Pa %Controls 10 24.7 37.2 29.5Salt-stressed plants 10 24.1 39.6 28.8
Controls 30 24.1 48.6 25.5Salt-stressed plants 30 22.0 44.7 51.3
LSD vpd 5.6 6.1 4.9LSD tot 8.9 8.2 9.7
Table II. Sensitivity of Gas-Exchange Parameters to vpdD(EV) and D(A) represent, respectively, the sensitivity of transpir-
ation rate and net assimilation rate to high (30 mPa Pa-1) and low (10mPa Pa-1) vpd. D(p,) and D(pc) are differences between pi and Pcobserved at high and low vpd. Salt treatment as in Table I. LSD 5%were calculated between salt treatment at the same 02 level (LSDsalt) or at different 02 levels (LSD tot).
Treatment 02 D(EV) D(A) D(p,) D(pc)kPa % Pa
Controls 18 +65.01 -20.9 -3.0 -6.6Salt-stressed 18 +58.76 -53.1 -3.0 -2.3
Controls 2 +49.95 -25.2 -0.5 -5.0Salt-stressed 2 +36.81 -36.1 -0.5 -2.1
LSD salt 7.2 2.1 1.0 1.9LSD tot 13.1 5.2 2.9 3.1
increased 02 sensitivity under combined stresses should indi-cate energy-limited photosynthesis. It is possible that theenergy supply from the light reactions becomes limiting even
at a pi (20 Pa) at which 02 sensitivity is usually due to bothRubisco and RuBP use limitations. Another possible cause ofthe increased 02 sensitivity could be stomatal patchiness on
the leaf surface. However, olive leaves were found to lackbundle-sheath extensions (8), do not have closed areoles, andhave limited leaf heterogeneity. In the case of such homobaricleaves, limitations due to patchiness should not be relevant(22). We have at present no definitive proof of the presenceor absence of patchiness in olive leaves. However, recentexperiments seem to demonstrate the occurrence of patchi-ness in olive leaves under stress due to high vpd (F Loreto,unpublished results). Since patches of stomata lead to over-estimation ofpi in gas-exchange measurements, we think theireffects should be included in the calculation of the term gw(see theory).
In ambient 02 pressure, the sensitivity of transpiration rateto vpd (Table II) showed only a small decrease in salt-stressedplants compared to controls, but this decrease was moreevident when the 02 pressure was lowered. In contrast, the
sensitivity ofphotosynthesis to vpd increased under salt stress,but in reduced 02 pressure the increase was only half as great.The difference ofpi values observed in low and high vpd was
greater in ambient than in low 02 pressure; no variationsbeing seen between controls and salt-stressed plants. However,the difference ofpc decreased in salt-stressed plants comparedto controls both in low (58%) and in ambient (62%) 02pressure.
Plant stomatal closure is a response to increased vpd inorder to maintain a constant evaporation rate (2, 20). In ourcase, however, salt seems to make stomata less responsive.Stomatal closure in high vpd is not sufficient to reduce or
even to maintain constant the evaporation rate (Table III),and this causes a decline in A because oftransient water stress.However, since no significant variation was found in pi, gs
and evaporation rate in all the experimental conditions, itseems likely that the evaporation rate is never great enoughto cause a strong intercellular water stress and, hence, a highstomatal response.
Steady-state WUE in controls and salt-stressed pants (7.5mmol C02/mol H20) was observed only at low vpd andambient 02 pressure. In high vpd, WUE ofsalt-stressed plantsdecreased compared to controls by 14% in low 02 pressureand by 42% in ambient 02 pressure. Thus, in agreement withBall and Farquhar (2), the marginal water cost increasedgreatly when Pa was high. In this case, g, varies in order tokeep Pi as low as possible also when A is high. However, sincepi did not change between controls and salt-stressed plants(Table II), both A and g, showed the same sensitivity to saltand vpd.
Since stomata did not seem to be directly involved in themechanism of response to salinity in olive, we investigatedthe possibility that increasing internal resistances could affectthe gas pathway. We observed that salt stress caused a reduc-tion in g1, and that higher vpd increased this change (TableIV). These effects are probably linked to the morphologicalchanges observed in salt-stressed plants. It has been previouslyreported that the great resistance to C02 diffusion in olive isdue to mesophyll cell wall thickness and to a SAR lower than
Table Ill. Salt, vpd, and 02 Pressure Effects on Gas-ExchangeParameters
Transpiration rate (EV), quantum requirement (QR) and stomatalconductance (g4), are related to changes in salt, vpd and 02 pressure.Salt treatment and LSD as in Table I.
Treatment 02 vpd EV QR g.kPa mPa Pa-' mmol m' s- quanta mo/' mol m-2 s-'
Controls 18 10 2.0 15.01 0.13Salt-stressed 18 10 1.7 20.04 0.05
Controls 18 30 3.3 26.59 0.28Salt-stressed 18 30 2.7 49.26 0.18
Controls 2 10 2.0 12.50 0.16Salt-stressed 2 10 1.9 13.88 0.10
Controls 2 30 3.0 14.70 0.32Salt-stressed 2 30 2.6 18.86 0.21
LSD vpd 0.24 2.6 0.050LSD tot 0.69 3.9 0.095
1414 BONGI AND LORETO

RESTRICTIONS OF PHOTOSYNTHESIS IN MESOPHYTE EVERGREENS
Table IV. Evaluation of Salt and vpd Effects on PhotosyntheticParameters
The Rubisco activity in saturating C02 (Vcm) and the whole chainelectron transport rate (J) are calculated from the A/pi curves. Theliquid phase diffusive conductance (g,) was calculated according tothe experimental procedure outlined under "Theory." Salt treatmentand LSD as in Table I.
Treatment vpd VJ 9w
mPa Pa-' Imo/ m-2 s-' pmol e m-2 s-' mol m-2 S-1
Controls 10 55.3 99.7 0.300Salt-stressed 10 46.0 79.8 0.288
Controls 30 58.1 97.9 0.136Salt-stressed 30 47.3 76.6 0.122
LSD vpd 4.2 4.6 0.034LSD tot 9.6 9.9 0.096
the cell-cell surface area. The latter is due to pectic ladderstermed 'scala,' typically seen in this species, which maintainpacked chlorenchyma layers (4). Salinity seems to cause a
further reduction in the SAR because ofthe increase in turgorand, hence, in cellular volume. This physiological changebalances the increased osmotic pressure inside the vacuolebut, at the same time, causes a greater contact between cells.The further reduction ofSAR under increased vpd is probablydue to the development of an intercellular liquid film thatleaves cells and causes an increase in the internal resistanceto gas diffusion. It should be stressed that in the field vpdchanges instantaneously in response to daily climatic varia-tions (16). Therefore, SAR and internal resistances alsochange suddenly. Finally, gw could also be inhibited by in-creasing cell wall lignification due to salt as suggested byNobel and Walker (13).
CONCLUSIONS
In olive a tolerance mechanism (typical of glycophytes)helps the plant to avoid direct toxic ion effects. The partiallyirreversible reduction of A can be related to the capacity toaccumulate salt in the leaf vacuole up to a level which causes
leafdrop. This mechanism allows the maintenance oflow saltlevels in the plant. In particular, olive leaves showed no
apparent negative effects on photosynthesis if Cl- concentra-tion was lower than 80 mm in tissue water. When this thresh-old Cl- level was exceeded, we observed photosynthetic im-pairments associated with morphological changes in leaves,reduction of growth, less open and responsive stomata, andwater loss. Salt stress was found to cause irreversible andvisible damage, such as complete water loss and withering, ata Cl- concentration close to 200 mm in tissue water.By using the described procedure we found high internal
diffusive resistances leading to a substantial limitation ofCO2diffusion in olive. These resistances were further increased insalt-stressed, thick leaves and in relation to increased evapo-rative demand. This further increase probably occurs beforeany biochemical regulation of stromal proteins or membraneadaptation can take place. We therefore considered it likelythat variation of cell surface exposed to gas-exchange dependson the liquid film filling the intercellular spaces. We also
considered in our model a possible contribution oftransversalheterogeneity, although this has yet to be detected in homo-baric leaves.The result of the morphological adaptations due to the
combined salt-vpd stress is a depletion ofPC that averages 60%compared to the controls (Table II). Our model (Table I)indicates that Rubisco is limiting when salt and vpd stress actseparately, but that RuBP use is the photosynthetic target ofthe combined stresses. We attribute this surprising resultmainly to the possibility that energy supply is also limiting ata rather low pi (20 Pa), as indicated by the analysis of Chlfluorescence.
ACKNOWLEDGMENTS
We are grateful to Dr. T. D. Sharkey for critical review. F. L. alsothanks J. Marshall for help in preparation of the manuscript.
LITERATURE CITED
1. Badger MR, Sharkey TD, von Caemmerer S (1984) The relation-ship between steady-state gas exchange of tree leaves and thelevels of carbon-reduction-cycle-intermediates. Planta 160:305-313
2. Ball MC, Farquhar GD (1984) Photosynthetic and stomatalresponses of two mangroves species, Aegiceras corniculatumand Avicennia marina, to long term salinity and humidityconditions. Plant Physiol 74: 1-6
3. Bjorkman 0 (1987) High-irradiances stress in higher plants andinteraction with other stress factor. In J Biggens, ed, Progressin Photosynthesis Research, Vol 4. Nijhoff, Dordrecht, pp 11-18
4. Bongi G, Soldatini GF, Hubick KT (1987) Mechanism of pho-tosynthesis in olive tree (Olea europea L.). Photosynthetica 21:572-578
5. Brooks A, Farquhar GD (1985) Effect of the temperature on theCo2/02 specificity of Ribulose 1-5-bisphosphate carboxylase/oxygenase and the rate of respiration in the light. Planta 165:397-406
6. El Gazzar AM, El Azab EM, SheataM (1979) Effect ofirrigationwith fractions of sea water and drainage water on growth andmineral composition of young grapes, guavas, oranges andolives. Alexandria J Agric Res 1: 207-219
7. Evans JR, Sharkey TD, Berry JA, Farquhar GD (1986) Carbonisotope discrimination measured concurrently with gas ex-change to investigate CO2 diffusion in leaves of higher plants.Aust J Plant Physiol 13: 281-292
8. Fahn A (1974) Plant Anatomy. Pergamon Press, Oxford, p 2569. Farquhar GD, Sharkey TD (1982) Stomatal conductance and
photosynthesis. Annu Rev Plant Physiol 33: 317-34510. Idle DB, Proctor CW (1983) An integrating sphere leafchamber.
Plant Cell Environ 6: 437-44011. Lloyd J, Kriedemann PE, Syvertsen JP (1987) Gas-exchange,
water relations and ion concentrations ofleaves on salt-stressed"Valencia" orange, Citrus sinensis (L.) Osbeck. Aust J PlantPhysiol 14: 387-396
12. Longstreth DJ, Nobel PS (1979) Salinity effects on leafanatomy;consequences for photosynthesis. Plant Physiol 63: 700-703
13. Nobel PS, Walker DB (1985) Structure of leaf photosynthetictissue. In J Barber, NR Baker, eds, Photosynthetic Mechanismsand the Environment, Vol 12. Elsevier, Amsterdam, pp 502-531
14. Parkhurst DF, Wong SC, Farquhar GD, Cowan IR (1987) Gra-dients of intercellular CO2 levels across the leaf mesophyll.Plant Physiol 86: 1032-1038
15. Poljakoff-Mayber A (1975) Morphological and anatomicalchanges in plants as a response to salinity stress. In A Poljakoff-Mayber, J Gale, eds, Plants in Saline Environments. Springer-Verlag, Berlin, pp 100-103
1415

BONGI AND LORETO
16. Raschke K, Resemann A (1986) The midday depression of CO2assimilation in leaves of Arbutus unedo L.: diurnal changes inphotosynthetic capacity related to changes in temperature andhumidity. Planta 168: 546-558
17. Robinson FE (1987) Growth potential of young olive with highchloride irrigation water. HortScience 22: 509
18. Robinson SP, Downton WJS, Millhouse JA (1983) Photosyn-thesis and ion content of leaves and isolated chloroplasts ofsalt-stressed spinach. Plant Physiol 73: 238-242
19. Russel EW, ed (1976) Soil Conditions and Plant Growth, Ed 10.
Longman, New York, p 75320. Sharkey TD (1984) Transpiration induced changes in the pho-
tosynthetic capacity of leaves. Planta 160: 143-150
Plant Physiol. Vol. 90, 1989
21. Sharkey TD (1986) Theoretical and experimental observationson 02 sensitivity of C3 photosynthesis. In R Marcelle, HClijsters, M Van Poucke, eds, Biological Control of Photosyn-thesis. Nijhoff, Dordrecht, pp 115-125
22. Terashima I, Wong SC, Osmond CB, Farquhar GD (1988) Char-acterization ofnon uniform photosynthesis induced by abscisicacid in the leaves having different mesophyll anatomies. PlantCell Physiol 29: 385-394
23. von Caemmerer S, Farquhar GD (1981) Some relationship be-tween the biochemistry of photosynthesis and the gas-exchangeof leaves. Planta 153: 376-387
24. Wallace A, Mueller RT, Hartsock T (1979) Effect of irrigatingsmall olive trees grown in a glasshouse with different percent-ages of sea water. Alexandria J Agric Res 1: 221-224
1416