Genetic differences in some haematological traits of communally reared clonal ayu, Plecoglossus...
8
Aquaculture Research, 1996. 27,787-793 Genetic differences in some haematoiogical traits of communally reared clonal ayu, Plecoglossus altivelis Temminck & Schlegel, under stressed and non- stressed conditions G del Valle Research Centre for Food and Development. Mazatlan Division for Aquaculture and Environmental Management. Mazatlan. Mexico N Xaniguchi Department of Cultural Fisheries, Faculty of Agriculture, Kochi University. Japan A Tsujimura Wakayama Prefecture Freshwater Fisheries Center. Momoyama. Wakayama. Japan Correspondence: Dra Gabriela del Valle P., Centre de Investigacion en Alimentacion y Dcsarrollo. A.C. Unidad Mazatlan en Acuicultura y Mane)o Ambiental Av. Sabalo Cerritos s/n. Apartado Postal 711. Mazallan. Sinaloa. 82010 Mexico Abstract Four clonal lines of ayu, Plecoglossus altivelis Temminck & Schlegel, were produced through gynogenesis, mixed before hatching and reared communally. After 10 months, a randomly taken sample was subjected to a standardized shallow- water stressor. Haematocrit, haemoglobin, red blood cells count (RBC) and mean corpuscular volume (MCV) were obtained from stressed and non-stressed fish. DNA fingerprinting was used to confirm the clonal nattire of the organisms and to identify the clonal line to which each fish belonged. We observed significant differences between clonal lines mostly in the haematocrit and MCV measured tmder no-stress conditions. Such differences are suggested to represent mainly genetic variance, on account of the common environment provided to all the experimental groups. The stress response ratio was lower than expected, mainly due to some tinexpectedly high non-stress values. Heritability values (h^) were medium to high for the no-stress measurements (mean 0.238) and very low or zero for the stressed groups' traits (excepting one high value of 0.484). We conclude that the use of communally reared clonal lines represents a good tool for the characterization of the physiological traits, thus allowing for their utilization as genetic selection criteria. Introduction Selective breeding has traditionally been based on the manipulation of characteristics such as growth rate and reproductive performance (Hershberger, Myers, Iwamoto, McAuley & Saxton 1990; Gjedrem 1992), while only recently, attention has become focused on the manipulation of the components of the stress response in a similar fashion (Pickering 1992, 1993; Fevolden, Refstie & Gjerde 1993). Schreck (1981) proposed that the 'fundamental' performance capacity of a fish is limited by its genotype and that the environment further restrains it, creating a 'realized' performance capacity. Therefore, grasping that 'fundamental' or genotypically determined performance capacity may constitute a short cut for the identification of the heritable physiological traits that could eventually be included in genetic stock-improvement programmes. Nevertheless, the large amounts of environmental O 1996 Blackwell Science Lid. 787
-
Upload
independent -
Category
Documents
-
view
4 -
download
0
Transcript of Genetic differences in some haematological traits of communally reared clonal ayu, Plecoglossus...
Aquaculture Research, 1996. 27,787-793
Genetic differences in some haematoiogical traits ofcommunally reared clonal ayu, Plecoglossus altivelisTemminck & Schlegel, under stressed and non-stressed conditions
G del ValleResearch Centre for Food and Development. Mazatlan Division for Aquaculture and Environmental Management.
Mazatlan. Mexico
N XaniguchiDepartment of Cultural Fisheries, Faculty of Agriculture, Kochi University. Japan
A TsujimuraWakayama Prefecture Freshwater Fisheries Center. Momoyama. Wakayama. Japan
Correspondence: Dra Gabriela del Valle P., Centre de Investigacion en Alimentacion y Dcsarrollo. A.C. Unidad Mazatlan en Acuicultura
y Mane)o Ambiental Av. Sabalo Cerritos s/n. Apartado Postal 711. Mazallan. Sinaloa. 82010 Mexico
Abstract
Four clonal lines of ayu, Plecoglossus altivelisTemminck & Schlegel, were produced throughgynogenesis, mixed before hatching and rearedcommunally. After 10 months, a randomly takensample was subjected to a standardized shallow-water stressor. Haematocrit, haemoglobin, red bloodcells count (RBC) and mean corpuscular volume(MCV) were obtained from stressed and non-stressedfish. DNA fingerprinting was used to confirm theclonal nattire of the organisms and to identify theclonal line to which each fish belonged.
We observed significant differences between clonallines mostly in the haematocrit and MCV measuredtmder no-stress conditions. Such differences aresuggested to represent mainly genetic variance, onaccount of the common environment provided toall the experimental groups.
The stress response ratio was lower than expected,mainly due to some tinexpectedly high non-stressvalues.
Heritability values (h^) were medium to high forthe no-stress measurements (mean 0.238) and verylow or zero for the stressed groups' traits (exceptingone high value of 0.484).
We conclude that the use of communally rearedclonal lines represents a good tool for thecharacterization of the physiological traits, thusallowing for their utilization as genetic selectioncriteria.
Introduction
Selective breeding has traditionally been based onthe manipulation of characteristics such as growthrate and reproductive performance (Hershberger,Myers, Iwamoto, McAuley & Saxton 1990; Gjedrem1992), while only recently, attention has becomefocused on the manipulation of the components ofthe stress response in a similar fashion (Pickering1992, 1993; Fevolden, Refstie & Gjerde 1993).
Schreck (1981) proposed that the 'fundamental'performance capacity of a fish is limited by itsgenotype and that the environment further restrainsit, creating a 'realized' performance capacity.Therefore, grasping that 'fundamental' orgenotypically determined performance capacity mayconstitute a short cut for the identification of theheritable physiological traits that could eventually beincluded in genetic stock-improvement programmes.Nevertheless, the large amounts of environmental
O 1996 Blackwell Science Lid.787
Genetic differences of ayu clones G del Valle et al. Aquaculture Research, 1996, 27, 787-793
variation usually involved seems to he one of themain ohstacles to this kind of approach,
Taniguchi, Han & Tisuiimura (1993) ohserved thatthe phenotypic variance within a clonal line consistsentirely of environmental variance {Vp = Ve) whichis composed of different elements depending on therearing and experimental conditions. In this study,the environmental variation due to tank effects waseliminated, thus minimizing the total V̂ that couldotherwise exceed and 'mask' the genetic variancethat is expected to he found hetween pure lines:
+ (1)
where Vp and Vg are the phenotypic and geneticvariances for each clonal line, respectively, V^i is theenvironmental variance 'inherent' to everyindividual and Vet is the variance due to tanks effect,Heritahility values were estimated in order to assessthe haematological traits' potential response toselection.
Thus, the present study focuses on the geneticcharacterization of the physiological traits, and thedifferentiation of the stress response hetween severallines of clones of ayu. Plecoglossus altivelis Temminck& Schlegel,
Materials and methods
Fish samples
The four clonal lines of P, altivelis used in this studywere produced hy chromosome manipulation asdescrihed hy Taniguchi, Han & 'ftujimura (1994):mitotic gynogenetic ayu were obtained hyhyperpressure-shocking eggs 80 min afterfertilization at an incubation temperature of 19°C(Taniguchi, Seki, Fukai & Kijima 1988), Eggs fromthese fish were given a cold shock (0,4-1,0°C) 5 minafter insemination, to cause the retention of thesecond polar body (Taniguchi, Kijima. Fukai & Inada1986), thus obtaining fully homozygous clones(Han, Taniguchi & 'ftujimura 1991),
Three of the lines that we used belonged to a flrstgeneration of clones that were obtained from severalunrelated mitotic gynogenetic female fish, and theother one came from a fifth generation of clonesderived from normal crosses hetween female clonesand hormonally sex-reversed fish of the same familyCftujimura, Uno & Takehiro 1991),
Fertilized eggs of each of the four lines were mixedbefore hatching and placed in a 700-1 incubationtank (water temperature between 16°C and 17°C),
Thenceforth, the larvae and juveniles were rearedin successively bigger, common tanks.
After approximately 10 months, a sample of 202fish was randomly taken and transported to thelaboratory at Kochi University. The mean bodyweight was 27,82 ± 9,88 g and the mean forklength was 13,86 ± 1,80 cm.
Acclimation period
After transportation, the fish were randomly placedin four 500-1 tanks at a density of approximately2,8 g 1^^ and treated for 24 h with 0,5% ofcotnmercial salt, Steirting 48 h later, a ration of 3%body weight day "^ was given to the fish for thefollowing 2 weeks. The water temperature fiuctuatedfrom 18°C to 19°C.
Stressor application
The experiments took place from 10 to 15 October1993, Two of the four acclimation tanks containingthe fish were randomly chosen for the stressorapplication and the other two were used as non-stressed controls. Feeding was stispended 24 h priorto the experiments.
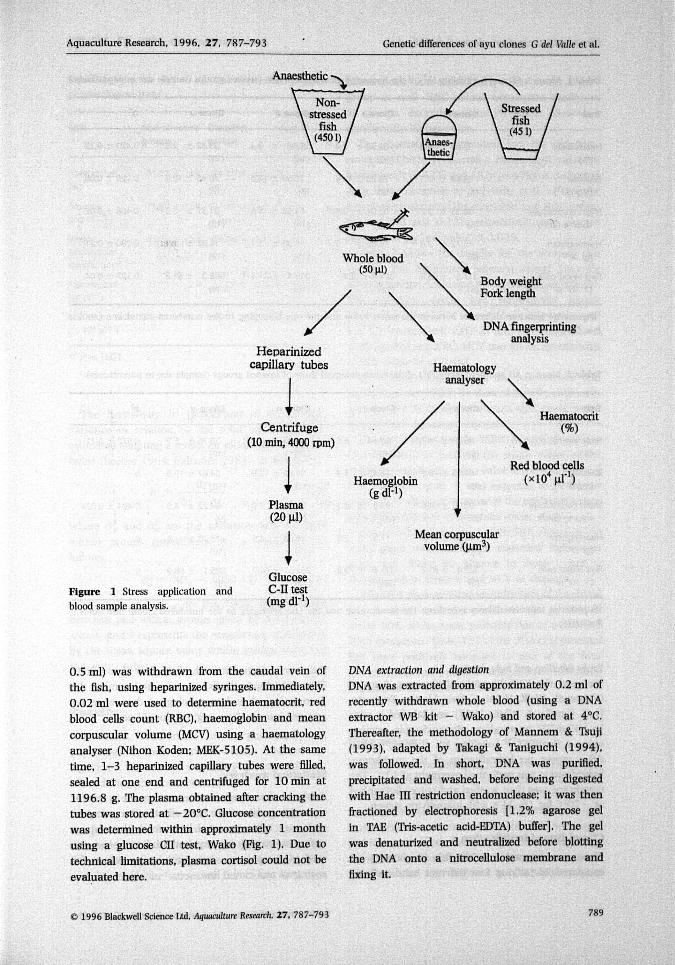
The shallow-water stressor methodology wasadapted from Fevolden, Refstie & Roed (1991) andThomas & Robertson (1991). and has beenpreviously described in Del Valle, Taniguchi &Tsujimura (1995), In short, the volume of water inthe experimental tank was dropped to 10% (from450 to 45 1) within 5 to 10 min (Fig, 1), Starting15 min later, subsamples of eight fish were nettedand placed in a bucket with abundant aeration and0,2 ml r ^ of anaesthetic (2-phenoxyethanol), priorto taking the blood sample. It usually took 12 minto bleed eight fish, therefore, the approximate timethat a fish was kept in the experimental tank variedhetween 15 and 90 min.
For the non-stressed controls, the anaestheticwas poured into the experimental tank withoutdisttirbing the fish, carefully netting them once theyhad lost equilibrium. Body weight, fork length andgonad weight of all the fish were recorded aftertaking the blood sample.
Blood samples analysis
Haematology
The maximum possible volume of blood (usually
788 © 1996 BlacitweU Science Ltd, Aquaculture Research. 27 . 787-793
Aquaculture Research, 1996, 27. 787-793 Genetic differences of ayu clones G del Valle et al.
Anaesthetic
Heparinizedcapillary tubes
1Centrifuge
(10 miti, 4000 rpm)
IPlasma(20 Hi)
IGlucose
Figure 1 Stress application and C-II testblood sample analysis. *""(mgdl-')
Body weightFork length
DNA fingerprintingandysis
Haematologyanalyser
Haemoglobin
Haematocrit
Red blood cells
Mean corpuscularvolume (Jim^)
0.5 ml) was withdrawn from the caudal vein ofthe fish, using heparinized syringes. Immediately,0,02 ml were used to determine haematocrit, redblood cells count (RBC), haemoglobin and meancorpuscular volume (MCV) using a haematologyanalyser (Nihon Koden; MEK-5105). At the sametime, 1-3 heparinized capillary tubes were filled,sealed at one end and centrifuged for 10 min at1196.8 g. The plasma obtained after cracking thetubes was stored at -20°C. Glucose concentrationwas determined within approximately 1 monthusing a glucose CII test, Wako (Fig. 1). Due totechnical limitations, plasma cortisol could not beevaluated here.
DNA extraction and digestion
DNA was extracted from approximately 0.2 ml ofrecently withdrawn whole blood (using a DNAextractor WB kit - Wako) and stored at 4°C.Thereafter, the methodology of Matmem & Tsuji(1993), adapted by Takagi & Taniguchi (1994),was followed. In short, DNA was purified,precipitated and washed, before being digestedwith Hae III restriction endonuclease; it was thenfractioned by electrophoresis [1.2% agarose gelin TAE (Tris-acetic acld-EDTA) buffer]. The gelwas denaturized and neutralized before blottingthe DNA onto a nitrocellulose membrane andfixing it.
© 1996 Blackwell Science Ltd. Aquacullure Research. 27, 787-793 789
Genetic differences of ayu clones G del Valle et al. Aquaculture Research, 1996, 27, 787-793
Table 1 Mean ±
Trait
Haematocrit
Glucose(mg dri)
Mean corpuscular
volume (\irv?)
Haemoglobin(grdl-'')
Red blood cells(X 10" nr^)
SD and heritability
Clone i''
32.95 ±(6)
69.49 ±
(7)
90.33 ±(6)
15.72 ±
(6)
317.3 ±(6)
{h^) of the haematological
4.0 III
7.1
2.7 1"
2.8 II'̂
69.9
Clone II
32.50 i
(15)
78.25 i
(18)
: 2.4 III
: 11.6
92.0 ± 3.6 '"(14)
' 18.99 ± 1.9 IV
(14)
344.8 ±(14)
32.6
traits of non-stressed
Clone III
26.98 ±
(18)
72.93 ±
(8)
84.63 ±
(16)
15.93 ±
(16)
313.4 ±
(16)
5.4
13.8
5.8
3.1 'V
61.4 IV
groups (sample
Clone IV
33.82 ±
(19)
78.46 ±
(12)
91.37 ±
(19)
18.92 ±
(19)
358.3 ±
(19)
2.8 'II
12.9
3.3 "'
2.3
38.2
size in parentheses)
0.421
0.025
1 0.408
0.290
0.127
±0.23
± 0.06
± 0.02
± 0.21
± 0.04
^Superscript indicates difference between the mean value and the one belonging to the numbered clonal line (ANOVA;
P « 0 , 0 5 ) .
2 Mean ± SD and heritability (h^) of the haematological traits of stressed groups (sample size in parentheses)
Trait
Haematocrit(%)
Glucose(mg dr ' )
Mean corpuscularvolume (nm )̂
Haemoglobin(gr dr 1)
Red blood cells(X 10" nr'')
Clone 1
35.29
(6)
84.55
(6)
93.80
(5)
16.34
(5)
323.8
(5)
± 4.7
± 8.5
± 4.6 1V
± 1.8
± 20.2
Clone II
32.54 ±
(26)
88.42 ±(13)
93.9 ±
(20)
17.0 ±(25)
331.6 ±(20)
6.5 IV
5.9
6.3 "I-IV
2.6
79.8
Clone III
31.94 ±
(13)
81.69 ±
(11)
88.33 ±(12)
16.93 ±
(13)
357.5 +(12)
5.2'V
13.9
7.9'V
1.5
84.7
Clone IV
36.75 ±
(12)
84.67 ±
(18)
104.22 ±
(9)
15.78 ±
(10)
325.1 ±
(9)
5.2
12.5
4.5
1.6
68.9
0.072 ± 0.11
0
0.484 ± 0.024
0
0
'Superscript indicates difference between the mean value and the one belonging to the numbered clonal line (ANOVA;
PS 0,05),
Probe labelling and hybridization
We used the YNZ-22 probe (Nakamura. Leppert,O'Connell, Wolff, Holm, Culver, Martin, Fujimoto,Hoff, Kumlin & White 1987) and labelled it with[a-^-P]-dCTP hy random oligonucleotide primingusing a BcaBEST™ Labelling Kit (Takara, Japan).After proper pre-hybridization of the membrane,hybridization was performed overnight at 42°C, Themembrane was then washed and autoradiographedat -70°C for 16-24 h with intensifying screen,
Clonal lines identificationThe autoradiographs of 200 fish (8 plates) werecompared, identifying four different band patterns
that were assigned to each of the four clonal lines.Thus, referring to the fish experimental numher, thehaematological and morphological data were re-grouped into the four original clonal lines.
Statistical analyses
Analyses of variance (ANOVAS) were used to test fora possible (acclimation) tank effect and to compareeach trait between clonal lines, for hoth no-stressand stress conditions; unpaired Student's t-test wasused to compare no-stress with stress values, foreach trait and clonal line.
790 C 1996 Blaclcweil Science Ltd, Aquaculturt Research. 27. 787-793
Aquaculture Research. 1996. 27. 787-793 Genetic diilerences of ayu clones G del Valle et al.
Table 3 Mean ± SD of all the clonal fish groups'haematoiogical traits
Trait Non-sttessed Stressed (-test
groups groups
Haematocrit 31.23 ± 4.9 34.17 ± 6.0 " .
Glucose 75.66+11.8 84.42 ± 10.9 "
(mg d|-')Mean 88.74 ± 5.5 94.04 ± 7.8 "corpuscularvolume (̂ m*̂ )Haemoglobin 17.71 ± 2.8 17.01 ± 2.5 P= 0.091(gr d r ' )
Red blood cells 340.5 ± 59 340.4 ±75 P = 0.99
(X 10" n l ' ' )
•• P « 0.01.
The heritability h^ (proportion of the geneticvariance in relation to the total variance), wasestimated adapting a model for monozygous humantwins (Becker 1964; Falconer 1981), as follows;
(2)
where ai and d^ are the variances between andwithin groups respectively. 6 ; is calculated asfollows;
i = (MS, - MSJ I k (3)
where MS^ and MS^ are the mean square valuesbetween and within groups given by a one-factorANOVA, and k represents the sample size. 6^ is givenby the mean square value within groups (MS^ ofthe ANOVA table.
Results
The ANOVA comparison of morphological andphysiological traits between tanks showed nosignificant differences, discarding a potential tankeffect during the acclimation period.
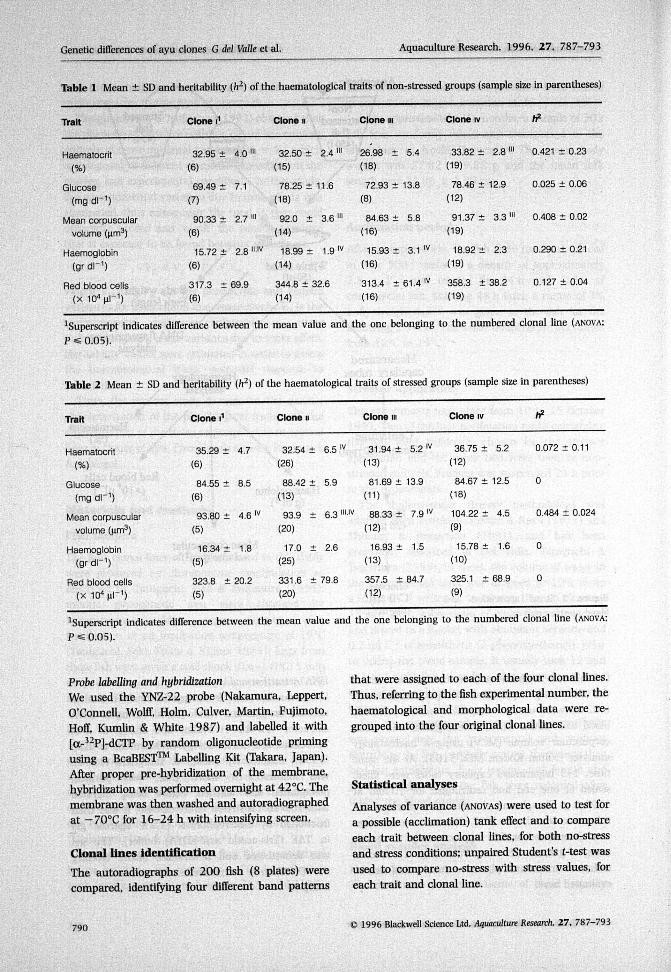
Table 1 shows the non-stress mean and standarddeviation values for each trait and group. Thecomparison between clonal lines showed significantdifferences in all the traits excepting glucose, mainlydue to the significantly lower haematocrit, MCVand haemoglobin values of the clone rii group;
haemoglobin was significantly lower in the clone rgroup as well. RBC values were quite similar inall groups, excepting clone iv, which showed asignificantly higher value.
The heritability estimates for the no-stresscondition (Table 1) showed a rather high value forhaematocrit (0.421) and MCV (0.408) as comparedwith those obtained by Del Valle etal. (1995) formorphological traits. Haemoglobin and RBC valueswere 0.290 and 0.127, respectively, and glucoseshowed a very low value of 0.025.
Table 2 shows the results for the stressed fishgroups. The differences between clonal lines forglucose, haemoglobin and RBC were non-significant.The clone iv group had significantly higherhaematocrit and MCV values. Heritability was verylow for haematocrit (0.072) and zero for glucose,haemoglobin and RBC. MCV was an exception, witha high estimate of 0.484.
An overall comparison of the non-stressed andstressed groups (Table 3) showed that haematocrit,glucose and MCV were the traits that could bettercharacterize the stress response.
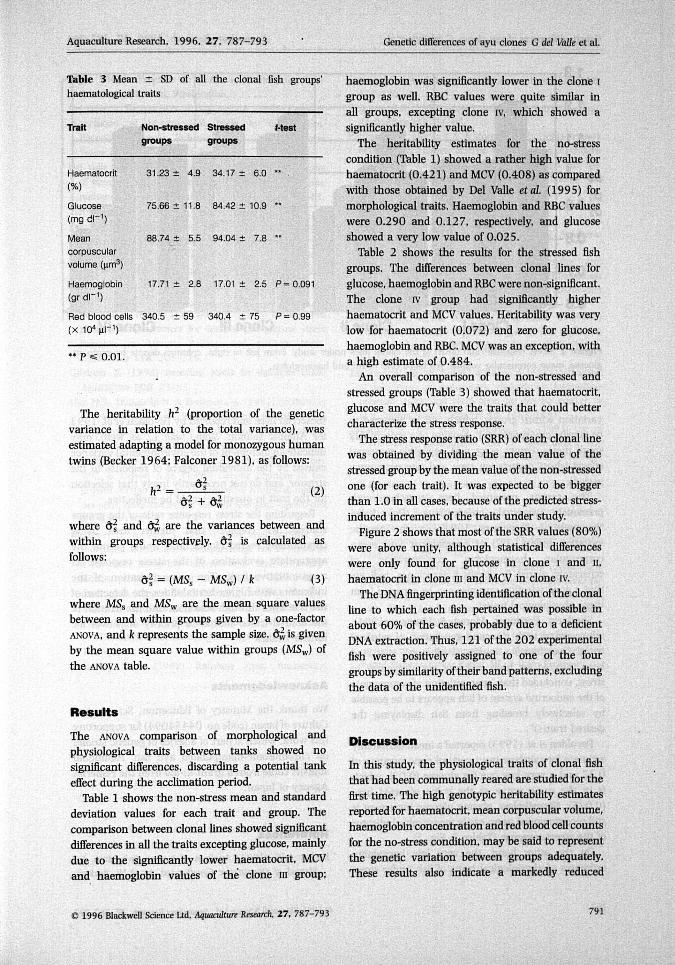
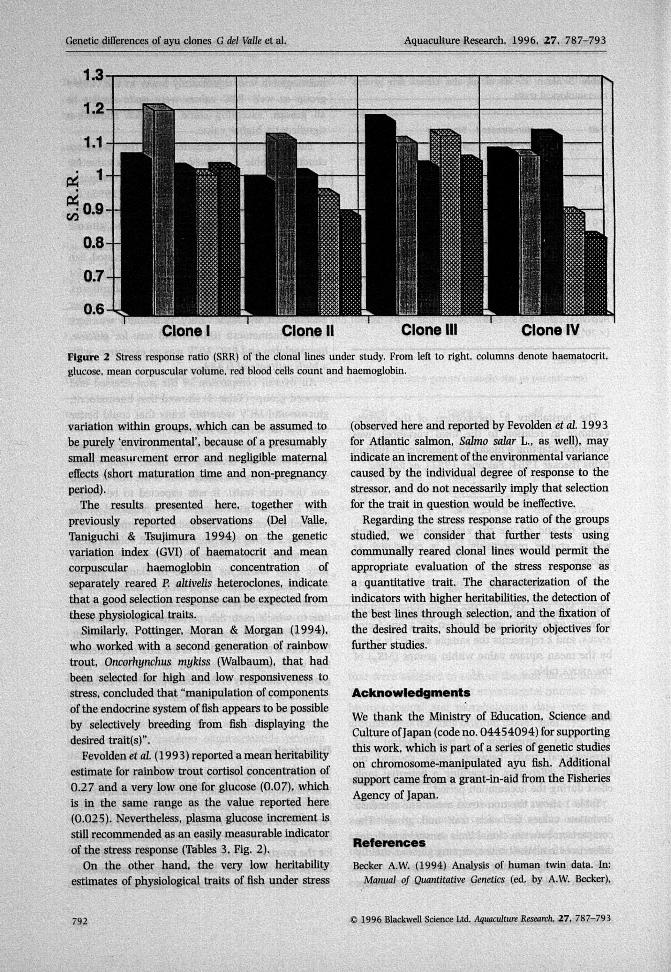
The stress response ratio (SRR) of each clonal linewas obtained by dividing the mean value of thestressed group by the mean value of the non-stressedone (for each trait). It was expected to be biggerthan 1.0 in all cases, because ofthe predicted stress-induced Increment of the traits under study.
Figure 2 shows that most ofthe SRR values (80%)were above unity, although statistical differenceswere only found for glucose in clone I and ii,haematocrit in clone ill and MCV in clone iv.
The DNA fingerprinting identification ofthe clonalline to which each fish pertained was possible inabout 60% of the cases, probably due to a deficientDNA extraction. Thus, 121 ofthe 202 experimentalfish were positively assigned to one of the fourgroup.s by similarity of their band patterns, excludingthe data of the unidentified fish.
Discussion
In this study, the physiological traits of clonal fishthat had been communally reared are studied for thefirst time. The high genotypic heritability estimatesreported for haematocrit, mean corpuscular volume,haemoglobin concentration and red blood cell countsfor the no-stress condition, may be said to representthe genetic variation between groups adequately.These results also indicate a markedly reduced
1996 Blackwell Science Ltd, Aquaculture Research, 27, 787-793 791
Genetic differences of ayu clones G del Valle et al. Aquaculture Research, 1996, 27, 787-793
Clone I Clone II Clone III Clone IV
Figure 2 Stress response ratio (SRR) of the clonal lines under study. From left to right, columns denote haematocrit,glucose, mean corpuscular volume, red blood cells count and haemoglobin.
variation within groups, which can he assumed tobe purely 'environmental', because of a presumablysmall measurement error and negligible maternaleffects (short maturation time and non-pregnancyperiod).
The results presented here, together withpreviously reported observations (Del Valle,l^niguchi & Tsujimura 1994) on the geneticveiriation index (GVI) of haematocrit and meancorpuscular haemoglobin concentration ofseparately reared P. altivelis heteroclones, indicatethat a good selection response can be expected fromthese physiological traits.
Similarly, Pottinger, Moran & Morgan (1994),who worked with a second generation of rainbowtrout, Oncorhynchus mykiss (Walbaum), that hadbeen selected for high and low responsiveness tostress, concluded that "manipulation of componentsof the endocrine system of fish appears to be possibleby selectively breeding from fish displaying thedesired trait(s)".
Fevolden et al (1993) reported a mean heritabilityestimate for rainbow trout cortisol concentration of0,27 and a very low one for glucose (0.07), whichis in the same range £is the value reported here(0.025). Nevertheless, plasma glucose increment isstill recommended as an easily measurable indicatorof the stress response (Tables 3, Fig, 2),
On the other hand, the very low heritabilityestimates of physiological traits of fish under stress
(ohserved here and reported by Fevolden et al. 1993for Atlantic salmon, Salmo salar L,, as well), mayindicate an increment of the environmental variancecaused by the individual degree of response to thestressor, and do not necessarily imply that selectionfor the trait in question would be ineffective.
Regarding the stress response ratio of the groupsstudied, we consider that further tests usingcotnmunally reared clonal lines would permit theappropriate evaluation of the stress response asa quantitative trait. The characterization of theindicators with higher heritabilities, the detection ofthe best lines through selection, and the fixation ofthe desired traits, should be priority objectives forfurther studies.
Acknowledgments
We thank the Ministry of Education, Science andCulture of Japan (code no. 04454094) for supportingthis work, which is part of a series of genetic studieson chromosome-manipulated asm fish. Additionalsupport came from a grant-in-aid from the FisheriesAgency of Japan,
References
Becker A.W. (1994) Analysis of human twin data. In:Manual of Quantitative Genetics (ed, by A.W. Becker),
792 © 1996 Blaciiwell Science Ltd, Aquaculture Research. 27, 787-793
Aquaculture Research. 1996, 27. 787-793 Genetic differences of ayu clones G del Valle et al.
pp. 15-22. Program in Genetics. Washington StateUniversity, Pullman, Washington.
Del Valle G., Taniguchi N. & Tsujimura A. (1994) Reducedvariation of physiological traits in ayu clones.Plecoglossus altivelis. Fisheries Science (formerly Nippon
Suisan Gakkaishi) 60. 523-526.Del Valle G., Taniguchi N. & Tsujimura A. (1995) Effects
of stress on some hematological traits of chromosomemanipulated ayu. Plecoglossus altivelis, Suisanzoshoku 43,89-95.
Falconer D.S. (1981) Introduction to Quantitative Genetics
(2nd edition). Longman. London and New York, 340 pp.Fevolden S.E.. Refstie T. & Roed K.H. (1991) Selection of
high and low cortisol stress response in Atlantic salmon(Salmo salar) and rainbow trout (Oncorhynchus mykiss),
Aquaculture 95 , 53-65.Fevolden S.E.. Refstie T. & Gjerde B. (1993) Genetic and
phenotypic parameters for cortisol and glucose stressresponse in Atlantic salmon and rainbow trout.Aquaculture 118. 205-216.
Gjedrem T. (1992) Breeding plans lor rainbow trout.Aquaculture 100. 73-83.
Han H.S.. Taniguchi N. & Tsujimura A. (1991) Productionof clonal ayu by chromosome manipulation andconfirmation by isozyme marker and tissue grafting.Nippon Suisan Gakkaishi 57, 825-832.
Hershberger W.K.. Myers J.M.. Iwamoto R.N.. McAuleyW.C. & Saxton A.M. (1990) Genetic changes in thegrowth of coho salmon (Oncorhynchus kisuteh) in marinenet-pens, produced by ten years of selection. Aquaculture
85. 187-197.Mannem H. & Tsuji S. (1993) DNA flngerprinting for
individual Identification and parentage test in Japaneseblack cattle using five diflerent mini- and one micro-satellite probes. Joumal of Animal Genetics 21. 62-68.
Nakamura Y. Leppert M.. O'Connell P.. Wolff L.. Holm T.,Culver M., Martin C. Fujimoto E.. Hoff M.. Kumlin E. &White R. (1987) Variable number of tandem repeat(VNTR) markers for human gene mapping. Science 235,1616-1622.
Pickering A.D. (1992) Rainbow trout husbandry:
management of the stress responose. Aquaculture 100.125-139.
Pickering A.D. (199 3) Growth and stress in fish production.Aquaculture 111. 51-63.
Pottinger T.G.. Moran T.A. & Morgan A.W. (1994) Primaryand secondary indices of stress in the progeny of rainbowtrout (Oncorhynchus mykiss) selected for high and lowresponsiveness to stress. Joumal of Fish Biology 44.149-163.
Schreck C.B. (1981) Stress and compensation in leleosteanfishes: response to social and physical factors. In: Stressand Fish (ed. by A.D. Pickering), pp. 295-321. AcademicPress, New York.
Takagi M. & T&niguchi M. (1994) Variability andgeographical divergence in Ryukyu-ayu Plecoglossusaltivelis ryukyuensis by DNA fingerprinting. Fish Geneticsand Breeding Science 20, 29-37 (in Japanese).
Taniguchi N.. Kijima A.. Fukai J. & Inada Y. (1986)Conditions to induce triploid and gynogenetic diploid inayu Plecoglossus altivelis, Nippon Suisan Gakkaishi 52.49-53.
Taniguchi N.. Seki S., Fukai J. & Kijima A. (1988) inductionof two types of gynogenetic diploids by hydrostaticpressure shock and verification by genetic marker inayu. Nippon Suisan Gakkaishi 54. 148 3-1491.
Taniguchi N.. Han H.S. & Tsujimura A. (1993) Use ofchromosome manipulated fish in aquaculture andrelated problems of conservation of wildstock. In: SelectiveBreeding of Fishes in Asia and the United States (ed. byK.L. Main & E. Reynolds), pp. 68-81. The OceanicInstitute, Hawaii.
Tiiniguchi N.. Han H.S. & Tsujimura A. (1994) Variationin some quantitative traits of clones produced bychromosome manipulation in ayu. Plecoglossus altivelis.Aquaculture 120. 53-60.
Thomas P. & Robertson L. (1991) Plasma cortisol andglucose stress response of red drum (Sdaenops ocellatus)to handling and shallow water stressors and anesthesiawith MS-222. quinaldine sulfate and metomidate.Aquaculture 96, 69-86.
•Riujimura A.. Uno E. & Takehiro M. (1991) Study on thereproduction of all female ayu. Wakayama PrefectureInland Fisheries Center Report 17, 1-6 (in Japanese).
© 1996 Blackwell Science Ltd, Aquaculture Research. 27, 787-793 793