Acoustic Emission Characteristics and Failure of Uniaxially Stressed Granitic Rocks: the Effect of...
16
Rock Mech. Rock Engng. (2003) 36 (4), 255–270 DOI 10.1007/s00603-003-0051-7 Acoustic Emission Characteristics and Failure of Uniaxially Stressed Granitic Rocks: the Effect of Rock Fabric By R. Pr ˇikryl 1 , T. Lokajı ´c ˇek 2 , C. Li 3 , and V. Rudajev 2 1 Institute of Geochemistry, Mineralogy and Mineral Resources, Faculty of Science, Charles University, Prague, Czech Republic 2 Institute of Rock Structure and Mechanics, Academy of Sciences of the Czech Republic, Prague, Czech Republic 3 Division of Rock Mechanics, Lulea ˚ University of Technology, Lulea ˚, Sweden Received October 5, 2001; accepted January 9, 2003 Published online April 29, 2003 # Springer-Verlag 2003 Summary Laboratory experiments on rock samples were carried out to understand the relationship between the acoustic emission (AE) parameters and rock fabric. AE activity was recorded during the uniaxial compression with constant stress rate of several granitic rocks showing variable micro- fabric (e.g. grain size, shape and crystallographic preferred orientation) and macrofabric (e.g. magmatic isorientation, metamorphic banding). A broad band multichannel recording system with a high dynamic recording range enabled individual acoustic emission events to be analysed in a wide frequency and energy range. The microfabric of the rocks was studied by quantitative petrographic analysis of thin sections allowing precise description of mode, grain size and shape. It has been proved that the energy-frequency distribution of AE events strongly reflects the fabric of the samples. The characteristic energy value of AE events reflects the most frequently occurring grain dimensions. The AE parameters like acoustic rate or cumulative energy are highly sensitive to fabric arrangement in rocks with pronounced fabric (e.g. foliation, lineation etc.). Keywords: Acoustic emission, energy-frequency distribution, rock fabric, grain size distribution, fracture pattern. 1. Introduction The energy-frequency distribution of the acoustic emission (AE) radiated from loaded rock structures characterises the process of elastic energy release from seismoacoustic brittle fracture regions. This distribution indicates the relation between the occurrence of weak and strong events. The results of laboratory experiments are important not only for interpreting the data from seismic active regions (Oda et al., 1989; Lockner, 1993; Rudajev et al., 1994a) but also for studying the rock fabric as will be discussed
Transcript of Acoustic Emission Characteristics and Failure of Uniaxially Stressed Granitic Rocks: the Effect of...
Rock Mech. Rock Engng. (2003) 36 (4), 255–270
DOI 10.1007/s00603-003-0051-7
Acoustic Emission Characteristics and Failure of UniaxiallyStressed Granitic Rocks: the Effect of Rock Fabric
By
R. Prikryl1, T. Lokajıcek2, C. Li3, and V. Rudajev2
1Institute of Geochemistry, Mineralogy and Mineral Resources, Faculty of Science,Charles University, Prague, Czech Republic
2Institute of Rock Structure and Mechanics, Academy of Sciences of the Czech Republic,Prague, Czech Republic
3Division of Rock Mechanics, Lulea University of Technology, Lulea, Sweden
Received October 5, 2001; accepted January 9, 2003Published online April 29, 2003 # Springer-Verlag 2003
Summary
Laboratory experiments on rock samples were carried out to understand the relationship betweenthe acoustic emission (AE) parameters and rock fabric. AE activity was recorded during theuniaxial compression with constant stress rate of several granitic rocks showing variable micro-fabric (e.g. grain size, shape and crystallographic preferred orientation) and macrofabric (e.g.magmatic isorientation, metamorphic banding). A broad band multichannel recording system witha high dynamic recording range enabled individual acoustic emission events to be analysed in awide frequency and energy range. The microfabric of the rocks was studied by quantitativepetrographic analysis of thin sections allowing precise description of mode, grain size and shape.It has been proved that the energy-frequency distribution of AE events strongly reflects the fabricof the samples. The characteristic energy value of AE events reflects the most frequently occurringgrain dimensions. The AE parameters like acoustic rate or cumulative energy are highly sensitiveto fabric arrangement in rocks with pronounced fabric (e.g. foliation, lineation etc.).
Keywords: Acoustic emission, energy-frequency distribution, rock fabric, grain size distribution,fracture pattern.
1. Introduction
The energy-frequency distribution of the acoustic emission (AE) radiated from loaded
rock structures characterises the process of elastic energy release from seismoacoustic
brittle fracture regions. This distribution indicates the relation between the occurrence
of weak and strong events. The results of laboratory experiments are important not
only for interpreting the data from seismic active regions (Oda et al., 1989; Lockner,
1993; Rudajev et al., 1994a) but also for studying the rock fabric as will be discussed
later. From the seismological point of view the distribution is of fundamental impor-
tance in classifying the seismicity of different regions, and also for seismic hazard
assessment. It has been extrapolated empirically using a negative exponential relation
(Epstein and Lomnitz, 1966):
log ðNðEÞÞ ¼ a� b � log ðEÞ; ð1Þwhere a and b are parameters of the distribution, which may vary with the time or
place of observation, and N(E) is the number of seismic events with energy E. The
loading process (prevailing components of the stress tensor and time variations of the
stress rate), the seismic zone structure and its physical properties are the main factors
controlling these changes. Further analysis of the energy-frequency distribution of AE
events radiated from uniaxially loaded samples proved their bilogarithmic distribution
(Rudajev et al., 1998):
Nðln EÞ ¼ 1
K� e�ðln E�kÞ2
2d2 ; ð2Þ
where K, k are the constants of the distribution, and d is the dispersion.
Since the first applications of AE monitoring were motivated by a desire to predict
mine failures or slope stability (Goodman and Blake, 1965; Wisecarver et al., 1969),
the later development lead to the frequent use of AE as a passive method sensitive to
the growth of defects during the laboratory deformational tests of different rocks like
sandstones (Deflandre et al., 1995; Zang et al., 1996), granitoids (Thill, 1972; Montoto
et al., 1981; Rao and Ramana, 1992; Shah and Labuz, 1995), andezites (Rao and
Kusunose, 1995) or tuffs (Shi et al., 1995). Further, the application of AE as an
indicator of prior stress conditions was based on the so called Kaiser effect (compare
Holcomb, 1993). Amplitude of AE was related to geometric properties like crack size
(Cox and Meredith, 1993).
These studies demonstrated that AE monitoring is sensitive to different stages of rock
disintegration during laboratory deformation regardless the type of rock and intensity of
its fabric. Our study, on contrary, aims to point out the influence of some fabric param-
eters of natural rocks on AE characteristics obtained during laboratory experiments.
2. Theory
The acoustic waves radiated at ultrasonic frequency are characterised by the amplitude
x of displacement, frequency f and wavelength �. All these parameters are connected
with the properties of the source and media. The following relations apply:
vP;S ¼ �P;S � fP;S; ð3Þwhere vP,S is the longitudinal or transverse wave velocity, and
E ¼ k
ð�0
xðtÞ2f ðtÞ2dt; ð4Þ
where E is the energy of the radiated signal, x(t) the displacement in time at point of
recording, � the duration of the signal, k is the constant describing the properties and
geometry of the media, such as the propagation velocity of a given wave phase, the
density and geometry of the wave front.
256 R. P�rrikryl et al.

Equation (4) can be modified for the energy determination to read:
E ¼ k1
ð�0
_xxðtÞ2dt; ð4aÞ
where _xx is the velocity vibration component at the point of recording, i.e.
_xx ¼ 2�fx ¼ 2�v
�� x: ð5Þ
It follows from the above formulas that the acoustic energy released from the stressed
rock samples under the given experimental arrangement is proportional to the size of
the source of radiation. The shape of the energy-frequency distribution (Eq. 1) also
reflects this dependence. This practically means that the above-mentioned shape of the
negative exponential distribution (Eq. 1) cannot be expected to describe the distribu-
tion of energy released in the whole energy range. The value of the maximum released
energy is limited to the sample size.
3. Rock Samples
The study was conducted on granitic rocks exhibiting different fabric features like
intensity of the fabric, grain size and microcrack density. Rock samples (sampled in
granitoid plutons and crystalline units of the Bohemian Massif, Czech Republic) for
geomechanical tests and AE monitoring were cut from the block of an intact rock in
three mutually perpendicular directions according to the orientation of rock fabric
elements (magmatic banding, joint distribution, foliation or lineation). For each rock
type, 3 samples were prepared in each direction, giving a total number of 9 samples.
The rock fabric was studied in thin sections by standard petrographic and petrostruc-
tural methods. A quantitative analysis of microstructures (grain sizes, shapes and other
geometrical characteristics of grains) and of mineral content was carried out by using
an image measurement system of thin sections employing SIGMASCAN software
(Jandel Scientific, U.S.A.). The original idea for its construction came out from the
image measurement method mentioned by Siegesmund et al. (1994). The whole
process consists of the following stages – image acquisition, image pre-processing,
digitising, measurement, and data analysis (P�rrikryl, 1998, 2001). Some of the obtained
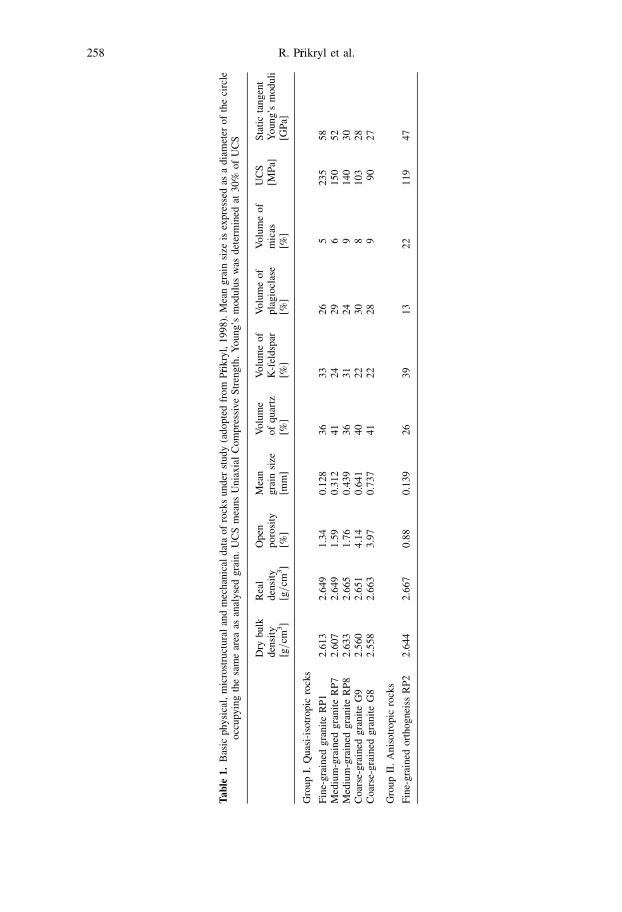
parameters are summarised in Table 1. The rocks investigated can be divided in two
groups according to their fabrics:
� quasi-isotropic rocks with different grain size of major rock-forming minerals and
diverse microcrack density but constant mineralogical composition (i.e. granites),
� anisotropic rocks with constant grain size and mineralogical composition similar to
granites but different intensity of fabric (i.e. orthogneisses).
4. Testing Method
Uniaxial compression tests were carried out under constant stress rate conditions
(0.3 kN=s) on samples showing length=diameter ratio 2:1. The axial strain was mon-
itored by coupled LVDTs. All samples were stressed to macroscopic failure.
The Study of Relationship Between AE and Rock Fabric 257
Ta
ble
1.
Bas
icphysi
cal,
mic
rost
ruct
ura
lan
dm
echan
ical
dat
aof
rock
sunder
study
(adopte
dfr
om
P� rri
kry
l,1
99
8).
Mea
ng
rain
size
isex
pre
ssed
asa
dia
met
ero
fth
eci
rcle
occ
up
yin
gth
esa
me
area
asan
alyse
dg
rain
.U
CS
mea
ns
Un
iax
ial
Co
mpre
ssiv
eS
tren
gth
.Y
ou
ng’s
mod
ulu
sw
asd
eter
min
edat
30
%o
fU
CS
Dry
bu
lkd
ensi
tyR
eal
den
sity
Op
enp
oro
sity
Mea
ng
rain
size
Vo
lum
eo
fq
uar
tzV
olu
me
of
K-f
eldsp
arV
olu
me
of
pla
gio
clas
eV
olu
me
of
mic
asU
CS
[MP
a]S
tati
cta
ngen
tY
ou
ng’s
mod
uli
[g=cm
3]
[g=cm
3]
[%]
[mm
][%
][%
][%
][%
][G
Pa]
Gro
up
I.Q
uas
i-is
otr
op
icro
cks
Fin
e-g
rain
edg
ran
ite
RP
12
.613
2.6
49
1.3
40
.12
83
63
32
65
23
55
8M
ediu
m-g
rain
edg
ran
ite
RP
72
.607
2.6
49
1.5
90
.31
24
12
42
96
15
05
2M
ediu
m-g
rain
edg
ran
ite
RP
82
.633
2.6
65
1.7
60
.43
93
63
12
49
14
03
0C
oar
se-g
rain
edgra
nit
eG
92.5
60
2.6
51
4.1
40.6
41
40
22
30
8103
28
Coar
se-g
rain
edgra
nit
eG
82.5
58
2.6
63
3.9
70.7
37
41
22
28
99
02
7
Gro
up
II.
An
iso
trop
icro
cks
Fin
e-g
rain
edo
rth
og
nei
ssR
P2
2.6
44
2.6
67
0.8
80
.13
92
63
91
32
21
19
47
258 R. P�rrikryl et al.
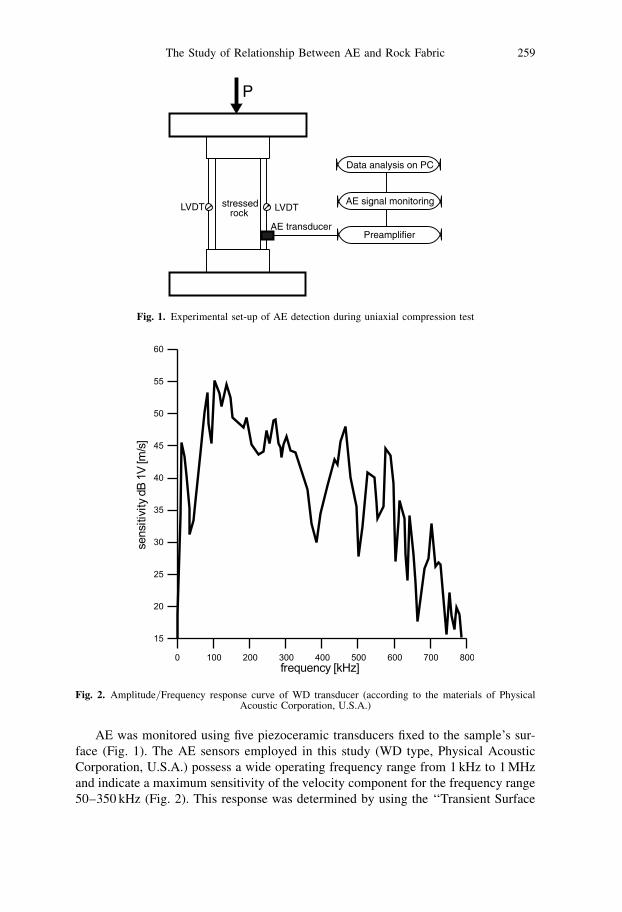
AE was monitored using five piezoceramic transducers fixed to the sample’s sur-
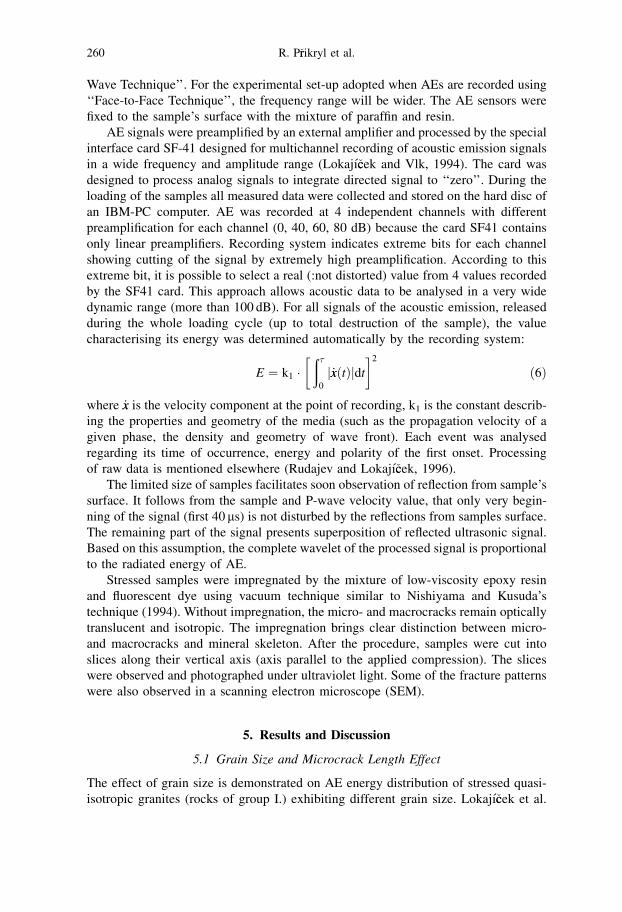
face (Fig. 1). The AE sensors employed in this study (WD type, Physical Acoustic
Corporation, U.S.A.) possess a wide operating frequency range from 1 kHz to 1 MHz
and indicate a maximum sensitivity of the velocity component for the frequency range
50–350 kHz (Fig. 2). This response was determined by using the ‘‘Transient Surface
Fig. 1. Experimental set-up of AE detection during uniaxial compression test
Fig. 2. Amplitude=Frequency response curve of WD transducer (according to the materials of PhysicalAcoustic Corporation, U.S.A.)
The Study of Relationship Between AE and Rock Fabric 259
Wave Technique’’. For the experimental set-up adopted when AEs are recorded using
‘‘Face-to-Face Technique’’, the frequency range will be wider. The AE sensors were
fixed to the sample’s surface with the mixture of paraffin and resin.
AE signals were preamplified by an external amplifier and processed by the special
interface card SF-41 designed for multichannel recording of acoustic emission signals
in a wide frequency and amplitude range (Lokajı�ccek and Vlk, 1994). The card was
designed to process analog signals to integrate directed signal to ‘‘zero’’. During the
loading of the samples all measured data were collected and stored on the hard disc of
an IBM-PC computer. AE was recorded at 4 independent channels with different
preamplification for each channel (0, 40, 60, 80 dB) because the card SF41 contains
only linear preamplifiers. Recording system indicates extreme bits for each channel
showing cutting of the signal by extremely high preamplification. According to this
extreme bit, it is possible to select a real (:not distorted) value from 4 values recorded
by the SF41 card. This approach allows acoustic data to be analysed in a very wide
dynamic range (more than 100 dB). For all signals of the acoustic emission, released
during the whole loading cycle (up to total destruction of the sample), the value
characterising its energy was determined automatically by the recording system:
E ¼ k1 �� ð�
0
j _xxðtÞjdt
�2
ð6Þ
where _xx is the velocity component at the point of recording, k1 is the constant describ-
ing the properties and geometry of the media (such as the propagation velocity of a
given phase, the density and geometry of wave front). Each event was analysed
regarding its time of occurrence, energy and polarity of the first onset. Processing
of raw data is mentioned elsewhere (Rudajev and Lokajı�ccek, 1996).
The limited size of samples facilitates soon observation of reflection from sample’s
surface. It follows from the sample and P-wave velocity value, that only very begin-
ning of the signal (first 40 ms) is not disturbed by the reflections from samples surface.
The remaining part of the signal presents superposition of reflected ultrasonic signal.
Based on this assumption, the complete wavelet of the processed signal is proportional
to the radiated energy of AE.
Stressed samples were impregnated by the mixture of low-viscosity epoxy resin
and fluorescent dye using vacuum technique similar to Nishiyama and Kusuda’s
technique (1994). Without impregnation, the micro- and macrocracks remain optically
translucent and isotropic. The impregnation brings clear distinction between micro-
and macrocracks and mineral skeleton. After the procedure, samples were cut into
slices along their vertical axis (axis parallel to the applied compression). The slices
were observed and photographed under ultraviolet light. Some of the fracture patterns
were also observed in a scanning electron microscope (SEM).
5. Results and Discussion
5.1 Grain Size and Microcrack Length Effect
The effect of grain size is demonstrated on AE energy distribution of stressed quasi-
isotropic granites (rocks of group I.) exhibiting different grain size. Lokajı�ccek et al.
260 R. P�rrikryl et al.
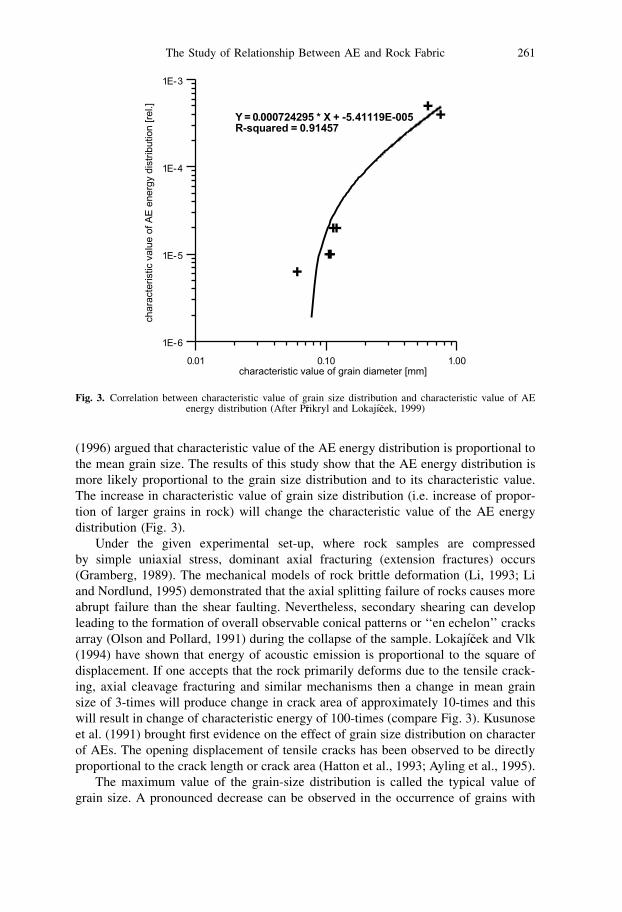
(1996) argued that characteristic value of the AE energy distribution is proportional to
the mean grain size. The results of this study show that the AE energy distribution is
more likely proportional to the grain size distribution and to its characteristic value.
The increase in characteristic value of grain size distribution (i.e. increase of propor-
tion of larger grains in rock) will change the characteristic value of the AE energy
distribution (Fig. 3).
Under the given experimental set-up, where rock samples are compressed
by simple uniaxial stress, dominant axial fracturing (extension fractures) occurs
(Gramberg, 1989). The mechanical models of rock brittle deformation (Li, 1993; Li
and Nordlund, 1995) demonstrated that the axial splitting failure of rocks causes more
abrupt failure than the shear faulting. Nevertheless, secondary shearing can develop
leading to the formation of overall observable conical patterns or ‘‘en echelon’’ cracks
array (Olson and Pollard, 1991) during the collapse of the sample. Lokajı�ccek and Vlk
(1994) have shown that energy of acoustic emission is proportional to the square of
displacement. If one accepts that the rock primarily deforms due to the tensile crack-
ing, axial cleavage fracturing and similar mechanisms then a change in mean grain
size of 3-times will produce change in crack area of approximately 10-times and this
will result in change of characteristic energy of 100-times (compare Fig. 3). Kusunose
et al. (1991) brought first evidence on the effect of grain size distribution on character
of AEs. The opening displacement of tensile cracks has been observed to be directly
proportional to the crack length or crack area (Hatton et al., 1993; Ayling et al., 1995).
The maximum value of the grain-size distribution is called the typical value of
grain size. A pronounced decrease can be observed in the occurrence of grains with
Fig. 3. Correlation between characteristic value of grain size distribution and characteristic value of AEenergy distribution (After P�rrikryl and Lokajı�ccek, 1999)
The Study of Relationship Between AE and Rock Fabric 261
sizes smaller than the typical value. This fact is similarly reflected by the AE energy-
frequency distribution, in which the decrease of the number of events with lower
energies than the characteristic energy value can also be observed. The drop in the
frequency distribution of grains larger than typical, and analogously also the drop in
the distribution of energetically strong events correspond to the expected event dis-
tribution. On the basis of the similarity between the grain-size distribution and the
distribution of the AE energy, one may assume that the sources of the acoustic emis-
sion (i.e. the points of brittle fracturing of the sample) lie either on grain boundaries or
on transgranular cracks.
Rudajev et al. (1994b) have shown that the energy-frequency distribution can be
described by a bilogarithmic curve, which almost preserves its own character (shape)
during the whole loading cycle (from a stress value equal to 50% of the strength limit
of the model sample, when AE events start to occur, up to 95% of strength limit). The
maximum value of the energy-frequency distribution can be found in the vicinity of
10� 1 relative energy units but this value seems to be dependent of the level of the
acting stress. This is caused by the fact that stronger grains break at higher stresses and
release more energy than the weak ones. It is supposed that the framework of the
largest grains disrupt just before the macroscopic failure of the specimen. The failure
of large grains at the end of loading correlates with the highest released energies
(Fig. 4). This fact corresponds with the demonstrated relationship between typical
radiated energy and typical size of contact planes between the grains. The difference
between the AE characteristic energy radiated at different stages of loading can cover
a range of two to three orders in magnitude.
The above mentioned laboratory experiments have been focused on the investiga-
tion of the energy-frequency distribution and proved the precursory character of the
stress state of the sample (mainly its total rupture). No significant changes in the shape
of this distribution before the total rupture of the sample (close to the marginal
deformational stage) were observed.
5.2 Rock Fabric Effect and Fracture Pattern
AE characteristics are also strongly dependent on the bulk rock fabric. This is well-
documented on the example of highly anisotropic orthogneiss (rocks of group II.)
(Fig. 5). The most pronounced differences were recorded in the AE energy distribution
and in the shape of AE cumulative energy curves. This is probably caused by diverse
bonding strength of various fabric elements and corresponds to the pronounced ani-
sotropic stress-strain behaviour of the rock. The model of elastic stress distribution
(Hawkes and Mellor, 1970; Patterson, 1978) suggests inhomogeneous distribution of
stressing in rock specimens. The important factor influencing the correct interpretation
of fracture pattern is the scale of observation. When examining typical cone-shaped
fragments of loaded specimens, one could mistakenly assume that the shearing is the
driving process of sample’s failure under uniaxial compression. The microscopic study
of stressed and successively impregnated samples revealed, on the other hand, the
predominance of tensile fracturing. The type of microfractures is controlled by rock
fabric and grain size. In highly anisotropic rocks, the cohesion along grain boundaries
is weaker than the strength of minerals. This leads to the development of tensile grain-
boundary microfractures. Tensile intragranular fracturing is typical for granites
262 R. P�rrikryl et al.

(Fig. 6A). Tightly closed shear fractures occur in anisotropic rocks forming bridges
between neighbouring tensile microfractures (Fig. 6B). Such interaction of tensile
fractures and favourably inclined micas which are weak in shear is common in rocks
Fig. 4. Series of time dependent energy-frequency distribution curves of orthogneiss (Sample RP2, Speci-men 4656 loaded parallel to the lineation). Each graph represents the time interval (that is indicated inseconds in the left upper corner) for which the characteristic value of AE energy was determined (adopted
from P�rrikryl, 1998)
The Study of Relationship Between AE and Rock Fabric 263

Fig. 5. Effect of sample’s rock fabric orientation on the AE characteristics. Example of highly anisotropicrock – orthogneiss. A Axial stress was oriented perpendicular to the lineation and parallel to the foliation. BAxial stress was oriented parallel to the lineation and to the foliation. C Axial stress was orientedperpendicular to the lineation and to the foliation. I Frequency of AE energy distribution. II Dependence
of AE rate on time. III Dependence of cumulative energy of AE on time
264 R. P�rrikryl et al.
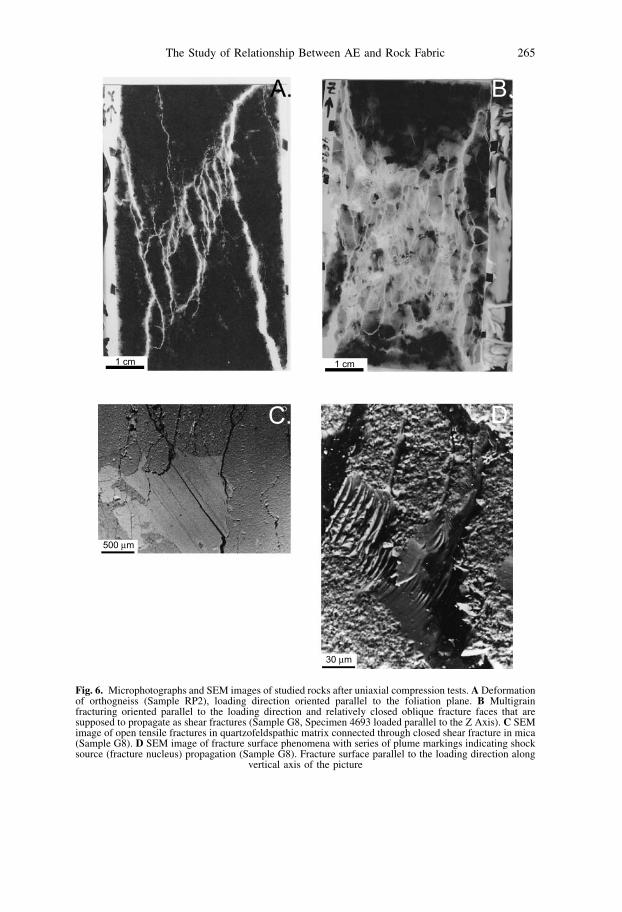
Fig. 6. Microphotographs and SEM images of studied rocks after uniaxial compression tests. A Deformationof orthogneiss (Sample RP2), loading direction oriented parallel to the foliation plane. B Multigrainfracturing oriented parallel to the loading direction and relatively closed oblique fracture faces that aresupposed to propagate as shear fractures (Sample G8, Specimen 4693 loaded parallel to the Z Axis). C SEMimage of open tensile fractures in quartzofeldspathic matrix connected through closed shear fracture in mica(Sample G8). D SEM image of fracture surface phenomena with series of plume markings indicating shocksource (fracture nucleus) propagation (Sample G8). Fracture surface parallel to the loading direction along
vertical axis of the picture
The Study of Relationship Between AE and Rock Fabric 265
dominated by quartzofeldspathic matrix (Fig. 6C; compare also Tapponier and Brace,
1976; Wong, 1982).
The deduction of fracture growth is supported by the analysis of the AE signal
polarity distribution. The polarity of each signal onset presents a sensible indicator of
the movement mechanism on the plane of propagating fracture recorded at the point of
registration. The SF41 card automatically captured the polarity of AE signal from the
channel with highest preamplification (80 dB). The processing of AEs polarities thus
presents mainly statistical task because of limited number of transducers and quasi-
random distribution of stress concentrators that are assumed to be a source of AEs.
Employed measuring system and data processing allows AEs to be distinguished
between groups of minus and plus sign (first-motion) onset. Negative first motions
(minus polarities) are from compressional motions associated with the source region
moving inwards (i.e. crack closure, pore collapse). Positive first motions (plus pola-
rities) on the waveforms are from the dilatational motions at the source being asso-
ciated with the source region moving outwards (i.e. crack opening, tensile crack
growth). Current measuring system is not capable to reconstruct acoustic events with
a more complex radiation pattern, i.e. the double-couple mechanism.
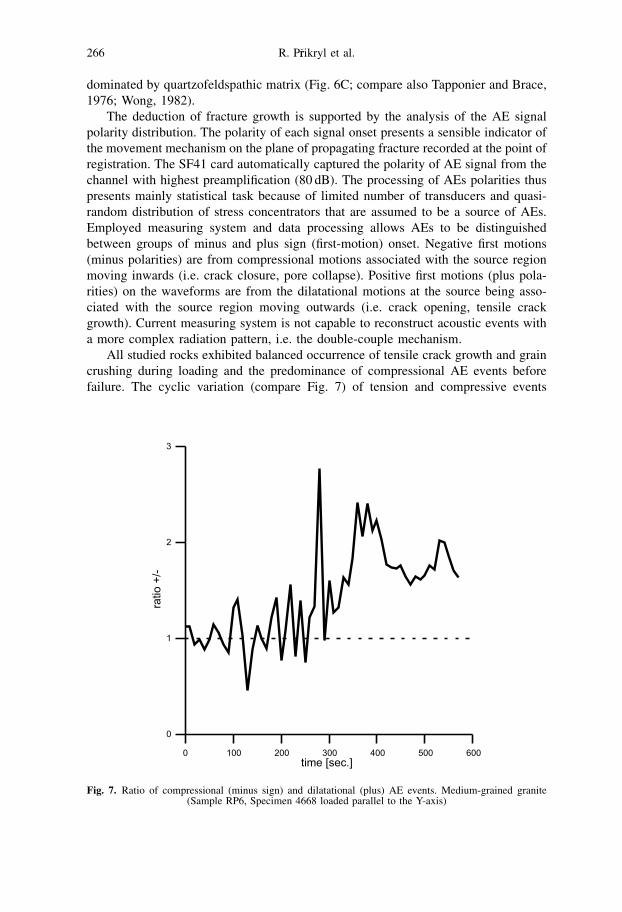
All studied rocks exhibited balanced occurrence of tensile crack growth and grain
crushing during loading and the predominance of compressional AE events before
failure. The cyclic variation (compare Fig. 7) of tension and compressive events
Fig. 7. Ratio of compressional (minus sign) and dilatational (plus) AE events. Medium-grained granite(Sample RP6, Specimen 4668 loaded parallel to the Y-axis)
266 R. P�rrikryl et al.
during uniaxial loading also supports the presence of complex mixed phenomena
during fracture growth. The coexistence of tensile crack opening and successive
frictional shearing along some fracture planes is documented by several experimental
studies (Shah and Labuz, 1995; Zang et al., 1996). The presence of tensile crack
opening was confirmed by direct observation of fracture surface by SEM (see Fig. 6D).
6. Conclusions
The study of relationship between acoustic emission and rock fabric revealed three
important characteristics:
1. dependence of AE energy on grain size distribution;
2. dependence of AE rate and AE cumulative energy on the anisotropic state of rock
fabric;
3. dependence of AE on brittle fracture pattern.
The energy of the AEs depends strongly on the dimension of the contact planes
between the grains, where acoustic energy release originates. The dependence of
AE energy on the characteristic value of grain size distribution can be described by
power series function where n< 1. The maximum value of the distribution (character-
istic energy) depends on the level of actual stress. The experiments demonstrate that
larger grains break at higher stresses and release more AE energy than finer grains
disrupted at low stresses. The AEs of loaded rock samples were released from inter-
granular contacts of grains (grain boundaries) and new formed intragranular micro-
and macrocracks (cracks within individual grains). In high anisotropic rocks, the effect
of grain size is disguised by the influence of macrofabric. The monomineralic clus-
ters showing shape-preferred orientation result in directional dependence of AE
parameters.
The high sensitivity of the AE energy-frequency distribution to grain size (for
instance the distribution of the discontinuity areas, where the radiation of acoustic waves
is generated) indicates that AE monitoring can be used as a proper non-destructive
method to assess the fabric (grain-size and fracture distribution) of the stressed material.
The rock fabric influences resulting fracture pattern. AE monitoring and direct
microscopic observation confirmed that tensile crack growth is dominant fracture
mechanism of uniaxially stressed rock. Nevertheless, secondary shearing can be found
namely in anisotropic rocks and in the form of interconnecting bridges of neighbour-
ing tensile microfractures.
Acknowledgements
This study makes a part of R.P. PhD. thesis and postdoctoral studies. The financial support fromthe Grant Agency of the Czech Republic (grant No. 205=99=P059) is highly appreciated. Mr.Zden�eek Erdinger from Institute of Rock Structure and Mechanics, Academy of Sciences of theCzech Republic kindly helped with geomechanical tests. A portion of this work was also sup-ported by Grant Agency of the Czech Republic, projects Nos. 205=00=1143 and 205=01=1430,and by the project MSM 113100005 ‘‘Material and energy flows in the upper parts of the Earth’’.
The Study of Relationship Between AE and Rock Fabric 267
References
Ayling, M. R., Meredith, P. G., Murrell, S. A. F. (1995): Microcracking during triaxialdeformation of porous rocks monitored by changes in rock physical properties. 1. Elastic-wave propagation measurements on dry rocks. Tectonophysics 245(3–4), 205–221.
Cox, S. J. D., Meredith, P. G. (1993): Microcrack formation and material softening in rockmeasured by monitoring acoustic emissions. Int. J. Rock Mech. Min. Sci. Geomech. Abstr.30(1), 11–24.
Deflandre, J.-P., Vinck�ee, O., Rebut, E. (1995): Contribution of the acoustic emission analysis tothe interpretation of the uniaxial compressive test. Proc., 35th U.S. Symposium on RockMechanics, Reno (Nevada), June 5–7, 867–872.
Epstein, B., Lomnitz, C. (1966): A model for the occurrence of large earthquakes. Nature211(5052), 954–956.
Goodman R. E., Blake, W. (1965): An investigation of rock noise in landslides and cut slopes.Rock Mech. Eng. Geol. Suppl. II, 88–93.
Gramberg, J. (1989): A non-conventional view on rock mechanics and fracture mechanism.Balkema, Rotterdam, 250 pp.
Hatton, C. G., Main, I. G., Meredith, P. G. (1993): A comparison of seismic and structuralmeasurements of scaling exponents during tensile subcritical crack growth. J. Struct. Geol.15(12), 1485–1495.
Hawkes, I., Mellor, M. (1970): Uniaxial testing in rock mechanics laboratories. Eng. Geol. 4,177–285.
Holcomb, D. J. (1993): General theory of the Kaiser effect. Int. J. Rock Mech. Min. Sci.Geomech. Abstr. 30(7), 929–935.
Kusunose, K., Lei, X., Nishizawa, O., Satoh, T. (1991): Effect of grain size on fractal structure ofacoustic emission hypocenter distribution in granitic rock. Phys. Earth Planet. Interior. 67,194–199.
Li, C. (1993): Deformation and failure of brittle rocks under compression. Doctoral thesis1993:118D, Lulea University of Technology, Lulea, Sweden.
Li, C., Nordlund, E. (1993): Deformation of brittle rocks under compression – with particularreference to microcracks. Mech. Mater. 15, 223–239.
Lockner, D. (1993): The role of acoustic emission in the study of rock. Int. J. Rock Mech. Min.Sci. Geomech. Abstr. 30(7), 883–899.
Lokajı�ccek, T., Vlk, J. (1994): Interface card for multichannel processing of acoustic emissionsignals. Progress in acoustic emission VII, Proc., 12th International Acoustic EmissionSymposium, October 17–20, 1994, Sapporo, Japan, 577–582.
Lokajı�ccek, T., Vlk, J. (1996): Complex multichannel system for continuous monitoring of AE andrelated parameters. In: Rogers, L. M., Tscheliesnig, P. (eds.), Proc., 22nd European Conferenceon Acoustic Emission Testing, The Robert Gordon University, Aberdeen, U.K., 271–275.
Lokajı�ccek, T., P�rrikryl, R., Rudajev, V. (1996): Energy-frequency distribution of acoustic emissionfrom loaded rock samples. In: Bartos, A. L., Green, R. E. Jr, Ruud, C. O. (eds.), Non-destructive characterization of materials VII, Part 2, Proc., 7th International Symposium onNondestructive Characterization of Materials, Prague, Czech Republic. Transtec Publica-tions, Switzerland, 541–547.
Montoto, M., Suarez del Rıo, L. M., Khair, A. W., Hardy, H. R. Jr. (1981): Acoustic emissionbehaviour of sound to weak granites: Petrographic interpretation. Proc., InternationalSymposium on Weak Rock, Tokyo, Japan, Vol. 1, 285–290.
268 R. P�rrikryl et al.
Nishiyama, T., Kusuda, H. (1994): Identification of pore spaces and microcracks using fluorescentresins. Int. J. Rock Mech. Min. Sci. Geomech. Abstr. 31(4), 369–375.
Oda, H., Koami, H., Seya, K. (1989): Effect of occurrence rate of acoustic emission on theirstatistical behavior. Pure Appl. Geophys. 130(1), 5–29.
Olson, J. E., Pollard, D. D. (1991): The initiation and growth of en echelon veins. J. Struct. Geol.13, 595–608.
Paterson, M. S. (1978): Experimental rock deformation – the brittle field. Springer, BerlinHeidelberg New York, 254 pp.
P�rrikryl, R. (1998): The effect of rock fabric on some mechanical properties of rocks: an exampleof granites. Doctoral thesis, Faculty of Science, Charles University, Prague, 154 pp.
P�rrikryl, R. (2001): Some microstructural aspects of strength variation in rocks. Int. J. Rock Mech.Min. Sci. Geomech. Abstr. 38(5), 671–682.
P�rrikryl, R., Lokajı�ccek, T. (1999): The effect of grain size and other fabric parameters on theacoustic emission characteristics of stressed granitic rocks. In: Lokajı�ccek T., Ji�rrı�ccek O. (eds.),Proc., 35th International Conference on Ultrasonics and Acoustic Emission, T�rre�sst’, CzechRepublic, 74–77.
Rao, M. V. M. S., Kusunose, K. (1995): Failure zone development in andesite as observed fromacoustic emission locations and velocity changes. Phys. Earth Planet. Interior. 88(2),131–143.
Rao, M. V. M. S., Ramana, Y. V. (1992): A study of progressive failure of rock under cyclicloading by ultrasonic and AE monitoring techniques. Rock Mech. Rock Engng. 25, 237–251.
Rudajev, V., Lokajı�ccek, T. (1996): Influence of rock grain size on energy of acoustic emission. In:Rogers, L. M., Tscheliesnig, P. (eds.), Proc., 22nd European Conference on Acoustic EmissionTesting, The Robert Gordon University, Aberdeen, U.K., 105–110.
Rudajev, V., Vilhelm, J., Kozak, J. (1994a): Simulation of Aftershock Series from Rock Samples.Int. J. Rock Mech. Min. Sci. Geomech. Abstr. 31(3), 253–260.
Rudajev, V., Vilhelm, J., Kozak, J., Lokajı�ccek, T. (1994b): Complex analysis of acoustic emissionfrom loaded rock samples. Progress in acoustic emission VII, Proc., 12th InternationalAcoustic Emission Symposium, Sapporo, Japan, 243–248.
Rudajev, V., Vilhelm, J., Lokajı�ccek, T. (1998): Characteristics of acoustic emission from rocksunder different loading patterns. In: Tscheliesnig, P. (ed.), Proc., 23rd European Conference onAcoustic Emission Testing, Vienna, Austria, 48–52.
Shah, K. R., Labuz, J. F. (1995): Damage mechanisms in stressed rock from acoustic emission.J. Geophys. Res. Solid Earth 100(B8), 15527–15539.
Shi, L. P., Huang, T. H., Hung, J. J. (1995): A study on the uniaxial compression behaviors andacoustic emission characteristics of rocks in Taiwan. Proc., 8th International Congress onRock Mechanics, Tokyo, Japan, Vol. I, Theme 2, 211–214.
Siegesmund, S., Helming, K., Kruse, R. (1994): Complete texture analysis of a deformedamphibolite – comparison between neutron diffraction and U-stage data. J. Struct. Geol.16(1), 131–142.
Tapponnier, P., Brace, W. F. (1976): Development of stress-induced microcracks in Westerleygranite. Int. J. Rock Mech. Min. Sci. Geomech. Abstr. 13, 103–112.
Thill, R. E. (1972): Acoustic methods for monitoring failure in rock. Proc., 14th Symposium onRock Mechanics, University Park, Pennsylvania, 649–687.
Wisecarver, D. W., Merrill, R. H., Stateham, R. M. (1969): The microseismic technique applied toslope stability. Trans. AIME 244, 378–385.
The Study of Relationship Between AE and Rock Fabric 269
Wong, T.-F. (1982): Micromechanics of faulting in Westerley granite. Int. J. Rock Mech. Min. Sci.Geomech. Abstr. 19(2), 49–64.
Zang, A., Wagner, C., Dresen, G. (1996): Acoustic emission, microstructure, and damagemodel of dry and wet sandstone stressed to failure. J. Geophys. Res. Solid Earth 101(B8),17507–17521.
Author’s address: Dr. R. P�rrikryl, Institute of Geochemistry, Mineralogy and MineralResources, Faculty of Sciences, Charles University, Albertov 6, 12843 Prague 2, Czech Republic;e-mail: [email protected]
270 R. P�rrikryl et al.: The Study of Relationship Between AE and Rock Fabric