analysis and design of simply supported pre stressed
116
ADDIS ABABA UNIVERSITY ADDIS ABABA INSTITUTE OF TECHNOLOGY SCHOOL OF CIVIL & ENVIRONMENTAL ENGINEERING ANALYSIS AND DESIGN OF SIMPLY SUPPORTED PRE STRESSED PRECAST-CAST IN-SITU CONCRETE COMPOSITE RAILWAY BRIDGES: COMPARISON OF BALLASTED AND SLAB TRACK ALTERNATIVES By Ashenafi Oycha Oyda March 12, 2015
-
Upload
khangminh22 -
Category
Documents
-
view
0 -
download
0
Transcript of analysis and design of simply supported pre stressed

ADDIS ABABA UNIVERSITY
ADDIS ABABA INSTITUTE OF TECHNOLOGY
SCHOOL OF CIVIL & ENVIRONMENTAL
ENGINEERING
ANALYSIS AND DESIGN OF SIMPLY SUPPORTED PRE STRESSED
PRECAST-CAST IN-SITU CONCRETE COMPOSITE RAILWAY BRIDGES:
COMPARISON OF BALLASTED AND SLAB TRACK ALTERNATIVES
By
Ashenafi Oycha Oyda
March 12, 2015

ADDIS ABABA UNIVERSITY
ADDIS ABABA INSTITUTE OF TECHNOLOGY
SCHOOL OF CIVIL & ENVIRONMENTAL
ENGINEERING
ANALYSIS AND DESIGN OF SIMPLY SUPPORTED PRE STRESSED
PRECAST-CAST IN-SITU CONCRETE COMPOSITE RAILWAY BRIDGES:
COMPARISON OF BALLASTED AND SLAB TRACK ALTERNATIVES
A thesis submitted to the School of Graduate Studies of the Addis Ababa
University in partial fulfillment of the requirements for the degree of
Master of Science in Civil Engineering
(Railway civil Engineering)
By
Ashenafi Oycha Oyda
Advisor: Dr. Asnake Adamu
March 12, 2015

ADDIS ABABA UNIVERSITY
ADDIS ABABA INSTITUTE OF TECHNOLOGY
SCHOOL OF GRADUATE STUDIES SCHOOL OF
CIVIL & ENVIRONMENTAL ENGINEERING
ANALYSIS AND DESIGN OF SIMPLY SUPPORTED PRE STRESSED PRECAST-CAST
IN-SITU CONCRETE COMPOSITE RAILWAY BRIDGES: COMPARISON OF
BALLASTED AND SLAB TRACK ALTERNATIVES
By
Ashenafi Oycha Oyda
Approved By Board of Examiners
Advisor
__________________
Internal Examiner
__________________
External Examiner
__________________
Chairman
__________________
March 12, 2015

Page i
DECLARATION
I hereby declare that this thesis is my original work performed under the
supervision of my thesis advisor Dr. Asnake Adamu and has not been presented as
a thesis for a degree in any other university. All sources of materials used for this
thesis have also been duly acknowledged.
______________________ __________________ Ashenafi Oycha Oyda Date
(Student)
This is certifying that the above declaration made by the candidate is correct to the best of my
knowledge.
______________________ _______________
Dr. Asnake Adamu Date
(Advisor)

Page ii
ACKNOWLEDGEMENTS
First of all, I give thanks to God for protection and ability to do work and I would
like to express my sincere gratitude to my advisor Dr. Asnake Adamu for the
continuous support of my master’s study, for his patience, motivation, enthusiasm,
and immense knowledge and excellent guidance and supervision throughout this
research; without his support, this thesis would not have been possible.
Also, my greatest gratitude goes to Abebayehu oycha due to his constant support
financially, belief and encouragement.
Furthermore, I am thankful to Adnew Ayssa, Engidayehu Labena and Tesfaye
Semma for their continuous encouragement, patience, motivation, guidance, and
even, they are played a great role in choice of this field.
I thank almighty, my family, brothers, sisters and friends for their constant
encouragement, support, and prayed for me throughout the time of my research.
God richly bless all of you.
I am also deeply thankful to my informants. Their names cannot be disclosed, but I
want to acknowledge and appreciate their help and transparency during my
research.
Lastly, I thank all who in one way or another contributed in the completion of this
thesis.
Ashenafi Oycha Oyda
March 12, 2015

Page iii
ABSTRACT
Bridge is one of the most important components of railway line for development of
transportation. It is known that Addis Ababa light rail transit project construction
started two years ago. Also the construction of national railway project started. In
these projects, the construction of bridges need highly skilled man power and highest
construction cost.
The railway bridge commonly contains two types of tracks which are ballasted and
slab track. There is a difference in construction cost of bridge between ballasted track
case and slab track case.
Thus, this study has attempted to analyze, design and compare both ballasted and slab
track type laying on the surface of bridge. This study mainly focuses on the
superstructure of bridge supporting track rails attached to the bridge to support
trains.
The intention of this thesis is therefore to compare the construction cost of railway
bridges with ballasted and slab track cases and to select the economical track type
laying on the surface of railway bridge.
Finally, from the overall analysis result of this thesis, the study conclude that slab
track is economical than ballasted track for span length greater than 15m. On the
other hand, ballasted track seems economical than slab track for span length less than
15m.

Page iv
TERMINOLOGY
Anchorage A device generally used to enable the tendon to impart and maintain pre-
stress in concrete.
Ballast Gravel or coarse stone used to form the bed of a railway track or the
substratum of a road.
Bars A tendon can be made up of a single steel bar. The diameter of a bar is
much larger than that of a wire.
Cable A group of tendons form a pre-stressing cable.
Curb A rim, especially of joined stones or concrete, along a bridge or roadway,
forming an edge for a sidewalk.
Dead load A type of load that is relatively constant over time, including the weight
of the structure itself and also known as permanent loads.
Jacking force The temporary force applied to tendons by a jacking device to produce
the tension in pre-stressing tendons.
Jacking stress The maximum stress that occurs during the stressing of a precast
concrete tendon.
Jacking plate A steel bearing plate used during jacking operations to transmit
the load of the jack to the pile.
Live load A temporary load for short duration or a moving load. Bridge live loads
are produced by vehicles traveling over the deck of the bridge.
Mild steel Steel with less than 0.15% carbon.

Page v
Post-tensioning A method of pre-stressing concrete by tensioning the tendons against
hardened concrete. In this method, the pre-stress is imparted to concrete
by bearing.
Pre-stressed concrete Is basically concrete in which internal stresses of a suitable magnitude
and distribution are introduced so that the stresses resulting from the
external loads are counteracted to a desired degree.
Pre-stressing wire A single unit made of steel.
Pre-tensioning A method of pre-stressing concrete in which the tendons are tensioned
before the concrete is placed. In this method, the concrete is introduced
by bond between steel& concrete.
Rail A bar or pair of parallel bars of rolled steel making the railway along
which railroad cars or other vehicles can roll.
Sleeper A track tie usually made of concrete or wood that is laid across a
railroad bed to support the rails.
Strands Two, three or seven wires are wound to form a pre-stressing strand.
Tendons A group of strands or wires are wound to form a pre-stressing tendon.

Page vi
SYMBOLS
Ac Area of concrete.
Acc Area of composite concrete.
Apc Area of precast concrete.
As Area of tendon.
e Eccentricity of pre-stressing force.
Es Modulus of elasticity of steel.
Ec Modulus of elasticity of concrete.
fbr Permissible range of stresses at the bottom of the cross section.
fcd The compressive design strength of concrete.
fck The characteristic cylinder compressive strength of concrete.
fcp Compressive pre-stress at the centroid of a section.
fct Allowable compressive Stresses in concrete at transfer.
fctd The tensile design strength of concrete.
fctk Tensile strength of concrete.
fcu The value of the cube strength of concrete.
fcw Allowable compressive Stresses in concrete under working.
fd The design strength for a given material.
fk The characteristic strength for all materials has the notation.
flw Stresses after all losses of pre stress and the full working load acts on the lower fiber.
fpe Effective stress in tendons after loss.
fpi Stress in tendon at transfer.

Page vii
fpk Characteristics strength of tendon.
ftr Permissible range of stresses at the top of the cross section.
ftt Allowable tensile stress in concrete at transfer.
ftw Allowable tensile stress in concrete under working.
fy Characteristic strength of reinforcing steel.
fyd The tensile or compressive design strength of reinforcing steel.
Īc Second moment of Inertia for composite structure.
Ip Second moment of Inertia for precast.
Md The bending moment at the cross-section where shear capacity is calculated.
Mg1 Bending moment caused by the self –weight.
Mg2 Bending moment caused by the superimposed load.
Mo Bending moment caused by the eccentricity and pre-stressing force.
Mq2 Bending moment caused by the live load.
ƞ Reduction factor for loss of pre-stress.
P Pre-stressing force at transfer on the cross section
Pe Pre-stressing force under working condition (after all losses) on cross section.
Vc Flexural Shear force.
Vcw Web shear force
Vd Design shear force
VRd Limiting value of shear force against diagonal compression.
Weq Equivalent uniform load.
Z Section modulus.

Page viii
Zbc Section modulus, at bottom fiber for composite structure.
Zbp Section modulus, at bottom fiber for precast structure.
Ztc Section modulus, at top fiber for composite structure.
Ztp Section modulus, at top fiber for precast structure.
Δ LL+I Deflection due to live load and impact load.
Δg Deflection due to self-weight load.
Δp Deflection due to pre-stressing force.
Δs Deflection due to superimposed load.
ӯc Centroid of composite structure.

Page ix
ABBREVIATIONS
AASHTO American Association of State Highway and Transportation Officials.
AREMA American Railway Engineering Maintenance of Way Association.
DL Dead load.
EBCS Ethiopian building code standard.
KMPH Kilo meter per hour.
LL Live load.
LRT Light rail transit.
PSC Pre-stressed concrete.
RC Reinforced concrete.
RCC Rolled compacted concrete.
SDL Superimposed dead load.
ULS Ultimate limit state.
ACI American concrete institute.

Page x
LIST OF TABLES
Table 2-1 Comparative study: pretension Vs post-tensioned member ........................................... 9
Table 2-2 Comparisons of ballasted track and ballast-less track: ................................................. 20
Table 2-3 Maximum moments, and shears of LL for one rail (one - half track load) .................. 26
Table 2-4 Grades of concrete ........................................................................................................ 30
Table 2-5 Conversion factors for strength .................................................................................... 31
Table 2-6 Grades of concrete and characteristic cylinder compressive strength fck ..................... 31
Table 2-7 Modulus of elasticity of concrete ................................................................................. 32
Table 2-8 Reinforcing steel ........................................................................................................... 33
Table 2-9 Pre-stress losses ............................................................................................................ 37
Table 4-1Dimensions of bridge .................................................................................................... 52
Table 4-2 Design parameters as follows ....................................................................................... 52
Table 4-3 Load combination ......................................................................................................... 56
Table 4-7 Pre-stressing force versus span length in both ballasted and slab railway bridge ........ 80
Table 7-1 First trial dimension of precast ....................................................................................... II
Table 7-2 Determination of centroid of precast .............................................................................. II
Table 7-3 Determination of second moment of inertia for precast ............................................... III
Table 7-4 Determination of the centroid of the composite girder ................................................ IV
Table 7-5 Determination of the second moment of inertia of the composite girder ....................... V

Page xi
LIST OF FIGURES
Figure 2-1 Pre-stressed row of books ............................................................................................. 4
Figure 2-2 Reinforced concrete ...................................................................................................... 4
Figure 2-3 Pre- tensioning of tendon .............................................................................................. 5
Figure 2-4 Stages of pre-tensioning ................................................................................................ 6
Figure 2-5 Transmission length .................................................................................................... 6
Figure 2-6 Transmission of tendon force ........................................................................................ 7
Figure 2-7 Construction sequence for pre‐tensioned concrete beam ............................................. 7
Figure 2-8 Stages of post tensioning .............................................................................................. 8
Figure 2-9 Post tensioned cable profile .......................................................................................... 8
Figure 2-10 Pre-stressing steel (wires, strands, tendons and bars) ............................................... 11
Figure 2-11 a) Tendon anchorage b) Reinforcement of end of a post-tensioned member ......... 11
Figure 2-12 Composite precast pre-stressed - in situ concrete ..................................................... 13
Figure 2-13 Depth of ballast in bridge .......................................................................................... 22
Figure 2-14 Depth of slab track on bridge .................................................................................... 23
Figure 2-15 Cooper E- 80 Live load ............................................................................................. 25
Figure 2-16 Relationship between compressive strength of concrete and water-cement ratio .... 29
Figure 2-17 Idealized stress- strain diagram ................................................................................. 32
Figure 2-18 a) Stress-strain curve for mild steel b) Stress-strain curve for high-yield steel ..... 33
Figure 2-19 Idealized the stress-strain diagram for steel with ultimate strain of 0.01 ................. 34
Figure 2-20 Stress-strain curve for typical high strength steel ..................................................... 36
Figure 2-21 Web and flexural shear crack .................................................................................... 38
Figure 4-1 Cross section of ballasted railway bridge ................................................................... 52
Figure 4-2 Girder with superimposed load ................................................................................... 54
Figure 4-3 Pre-stressing force versus span length in both slab and ballasted railway bridge ...... 81
Figure 7-1 Cross section of precast .................................................................................................. I
Figure 7-2 Relevant dimensions of the precast concrete girder ....................................................... I
Figure 7-3 Centroid of precast measured from x-axis ................................................................... II
Figure 7-4 Second moment of inertia of precast .......................................................................... III
Figure 7-5 Centroid of precast and cast in situ composite structure ............................................. IV
Figure 7-6 Second moment of inertia of composite structure ....................................................... V

Page xii
TABLE OF CONTENTS
DECLARATION ............................................................................................................................. i
ACKNOWLEDGEMENTS ............................................................................................................ ii
ABSTRACT ................................................................................................................................... iii
TERMINOLOGY .......................................................................................................................... iv
SYMBOLS ..................................................................................................................................... vi
ABBREVIATIONS ....................................................................................................................... ix
LIST OF TABLES .......................................................................................................................... x
LIST OF FIGURES ....................................................................................................................... xi
TABLE OF CONTENTS .............................................................................................................. xii
CHAPTER ONE ............................................................................................................................. 1
1 Introduction ............................................................................................................................. 1
1.1 Background ...................................................................................................................... 1
1.2 Objectives of the Study .................................................................................................... 2
1.2.1 Objectives ................................................................................................................. 2
1.2.2 Scope of the Study .................................................................................................... 2
1.3 What is in this Study ........................................................................................................ 3
CHAPTER TWO ............................................................................................................................ 4
2 Literature Review .................................................................................................................... 4
2.1 Pre-Stressed Concrete for Railway Bridges ..................................................................... 4
2.1.1 Definition .................................................................................................................. 5
2.1.2 Methods of Pre-Stressing .......................................................................................... 5
2.1.3 Materials of Pre Stressing ....................................................................................... 10
2.1.4 What is Composite Precast Pre-Stressed - in Situ Concrete ................................... 12
2.1.5 Differences of Pre-Stressed Concrete over Reinforced Concrete: .......................... 13
2.2 Rail Track on Bridges .................................................................................................... 14
2.2.1 Ballast Track ........................................................................................................... 14
2.2.2 Slab Track on Bridge .............................................................................................. 16
2.2.3 Comparison Between Ballasted and Slab Track ..................................................... 19

Page xiii
2.3 Structural Initial Dimension of Slab for Rail Tracks ..................................................... 22
2.3.1 Thickness of the Deck ............................................................................................. 22
2.3.2 Determination of Ballast Depth in the Bridge ........................................................ 22
2.3.3 Determination of Slab Depth in the Bridge ............................................................ 23
2.4 Design Standards and Methods ...................................................................................... 23
2.4.1 Design Standards .................................................................................................... 23
2.4.2 Loadings on Railway Bridges ................................................................................. 23
2.4.3 Material Properties of Pre-Stressed and Non-Pre-Stressed Concrete and Steel ..... 29
2.4.4 Design Criteria: Strengths, Deflections and Shears ................................................ 35
2.5 Advantage of Simple Span over Continuous Span Bridge ............................................ 40
2.6 Disadvantage of Simple Span over Continuous Span Bridge ........................................ 40
CHAPTER THREE ...................................................................................................................... 41
3 Analysis and Design of Pre-Stressed Concrete Bridge ......................................................... 41
3.1 Analysis of Bridge with Ballasted Track System........................................................... 41
3.1.1 Section Properties of Pre-Stressed Precast Girder .................................................. 41
3.1.2 Section Properties of Pre-Stressed Precast - in Situ Composite Deck Girder ........ 42
3.1.3 Analysis Procedure for Different Stages of Loading .............................................. 43
3.2 Analysis of Bridge with Slab Track System .................................................................. 45
3.2.1 Section Properties of Pre-Stressed Precast Girder .................................................. 45
3.2.2 Section Properties of Pre-Stressed Precast-Cast in Situ Composite Deck Girder .. 46
3.2.3 Analysis Procedure for Different Stages of Loading .............................................. 46
3.2.4 Design of Section in Ballasted Track System ......................................................... 48
3.2.5 Design of Section in Slab Track System................................................................. 49
3.3 Other Design Consideration ........................................................................................... 49
3.3.1 Design Consideration of Ballasted Track System for Shear ................................... 49
3.3.2 Design of Slab Track System in Shear ................................................................... 50
3.3.3 Bearings .................................................................................................................. 50
CHAPTER FOUR ......................................................................................................................... 51
4 Design Examples and Discussion .......................................................................................... 51

Page xiv
Example 1: 15m Span Bridge with Ballasted Track System ................................................... 51
Example 2: 15m Span Bridge with Slab Track System ............................................................ 61
Example 3: 40m Span Bridge with Ballasted Track System ................................................... 66
Example 4: 40m Span Bridge with Slab Track System ............................................................ 71
4.1 Discussion of the Results ............................................................................................... 76
4.2 Summary of Discussion ................................................................................................. 80
CHAPTER FIVE .......................................................................................................................... 82
5 Conclusions and Recommendation ....................................................................................... 82
5.1 Conclusion ...................................................................................................................... 82
5.2 Recommendation ............................................................................................................ 83
6 References ............................................................................................................................. 84
7 Appendix .................................................................................................................................. I
Appendix-A .................................................................................................................................. I
Appendix-B ............................................................................................................................... VI
Appendix-C ............................................................................................................................... IX
Appendix-D .............................................................................................................................. XII

Page 1
CHAPTER ONE
1 Introduction
1.1 Background
The development of infrastructure especially railway lines has a great share to the economic
development of a nation. But the developing countries are not well developed in railway
transportation. Therefore railway transportation is intended to solve such problem in our country.
To implement this type of transportation, Ethiopian Railways Corporation was started the
construction of railway lines in both Addis Ababa light rail transit and national railway project
which are eight corridors from Addis Ababa to investment areas throughout in the country.
But the topography of our country is difficult to construct highway as well as railway especially
northern part of our country. These ups and downs of landscape are a great challenge when
selecting routes and constructing railway lines. In addition to this, railway lines that pass through
these topographies need a number of bridges.
In Addis Ababa also a railway lines need a number of bridge to make overpass and reduce the
congestion or traffic jam. Now in Addis Ababa, the construction of railway lines is under
progress and these lines have different forms. That is at grade level, under pass and elevated. In
the case of elevated, the railway line needs bridge and therefore bridge is mandatory for
construction of the railway line.
The construction cost of railway line too high as compared with highway lines. Out of the whole
railway project, the construction cost of railway bridge takes a very large portion of the annual
budget of the project.
A bridge is a structure providing passage over an obstacle. The obstacle may be a river, valley,
road or railway. The passage may be for highway or railway traffic, pedestrian, canal or pipeline.
Bridges provide essential links in highways and railways at obstacles. Therefore bridge
construction becomes mandatory for development of railway and hence for the development of
transportation. Since, bridge is the key element in a transportation system; balance must be

Page 2
achieved between handling future traffic volume and loads and the cost of heavier and wider
bridge structure.
The intension of this thesis is to minimize significant construction cost of railway bridge since
construction and maintenance of bridge is highly expensive and it needs highly skilled man
power. In addition to this, for a wide gorge bridge the construction period also long.
Thus, this study is intended to address these problems and seeks one alternative solution by
preparing analysis and design of simply supported pre stressed precast-cast in-situ concrete
composite railway bridges, with due regard to comparison of ballasted and slab track
alternatives.
Finally, from the overall analysis result of this thesis, the study conclude that slab track is
economical than ballasted track for span length greater than 15m. On the other hand, ballasted
track seems economical than slab track for span length less than 15m.
1.2 Objectives of the Study
1.2.1 Objectives
The main objective of this thesis is to compare analysis result of ballasted and slab railway
bridges and economic analysis of both cases.
The specific objectives of the thesis are to compare slab and ballasted railway bridge in terms of
construction cost, to select economical track type for the railway bridge and to recommend better
track type for railway bridges in Ethiopia.
1.2.2 Scope of the Study
The scope of the study has been limited to the preparation of analysis and design of simply
supported pre-stressed precast-cast in-situ concrete composite railway bridges; with due regard
to comparison of ballasted and slab track alternatives. Also this study considered only single
track, not covered dynamic analysis of bridge as well as track but the dynamic effect considered
through impact factor, study based on only superstructure, the bridge is assumed to have a linear
behavior, pre-stressed concrete is assumed to have an elastic behavior and to be un-cracked and

Page 3
lateral forces, lateral accelerations or displacements are not considered, some load effects, such
as snow, water pressure, and wind and centrifugal force are not considered.
The study area conducted in view of the light rail transit at Addis Ababa. The total length of
34.25 km (north-south line 16.9 km and east-west line 17.35 km) two lines (i.e. north-south and
east-west lines) use common track of about 2.7km and standard gauge (1.435 meters).
1.3 What is in this Study
The study of this thesis mainly focuses on pre-stressed post tensioned railway bridge girder,
advantage of ballasted track over slab track and vice versa, and the advantage of post tension
over pre tension. The reference material used for this thesis are AREMA, and books reference
for pre-stress, railway bridge, ballasted track, and slab track.
The study basically focused on selection of economical track type laying on railway bridge and
developing analysis and design of simply supported pre stressed precast-cast in-situ concrete
composite railway bridges. Since the study based on comparative analysis of railway bridge, the
study has been took counter examples of both ballasted and slab railway bridge.
The study took the same values of design parameters, span of the bridge and depth of girder for
both cases. In addition to this, the depth of ballast and slab are predetermined in literature
review. Here the study took the same parameters and compare initial pre-stress force for both
cases. Finally, the study used software, Auto CAD to draw the different figures in this text.
To attain the objective of the study which is based on economical point of view, the results of
analysis of both cases have been compared and contrasted. Finally, from the above result the
study has concluded the whole idea of the study and recommended the better track type for
practice in the railway project.
This thesis contains five chapters. The first chapter deals with introductory part of the thesis,
second chapter deals with literature review of the thesis, third chapter deals with analysis and
design of pre-stressed bridges, fourth chapter deals with design examples and discussion , fifth
chapter deals with the summary, conclusion and recommendation of the study.

Page 4
CHAPTER TWO
2 Literature Review
A number of studies dealing with pre stressed concrete, railway bridges, ballasted or slab tracks
are important for this study. An important literature review has been discussed below.
2.1 Pre-Stressed Concrete for Railway Bridges
The classic everyday example of pre-stressing is this: a row of books can be lifted by squeezing
the ends together:
Figure 2-1 Pre-stressed row of books
The structural explanation is that the row of books has zero tensile capacity. Therefore the
„beam‟ of books cannot even carry its self-weight. To overcome this we provide an external
initial stress (the pre-stress) which compresses the books together. Now they can only separate if
the tensile stress induced by the self-weight of the books is greater than the compressive pre-
stress introduced.
Concrete is very strong in compression but weak in tension. In an ordinary concrete beam the
tensile stress at the bottom are taken by standard steel reinforcement: But we still get cracking,
which is due to both bending and shear:
Figure 2-2 Reinforced concrete
In pre-stressed concrete, because the pre-stressing keeps the concrete in compression, no
cracking occurs. This is often preferable where durability is a concern [10]
.
Page 5
2.1.1 Definition
Pre-stress is defined as a method of applying pre-compression to control the stresses resulting
due to external loads below the neutral axis of the beam tension developed due to external load
which is more than the permissible limits of the plain concrete. The pre-compression applied
(may be axial or eccentric) will induce the compressive stress below the neutral axis or as a
whole of the beam resulting either no tension or compression [28]
.
Pre-stressed concrete is basically concrete in which internal stresses of a suitable magnitude and
distribution are introduced so that the stresses resulting from the external loads are counteracted
to a desired degree [28]
.
2.1.2 Methods of Pre-Stressing
There are two methods of pre-stressing:
Pre-tensioning: Apply pre-stress to steel strands before casting concrete; and
Post-tensioning: Apply pre-stress to steel tendons after casting concrete.
1. Pre-Tensioning
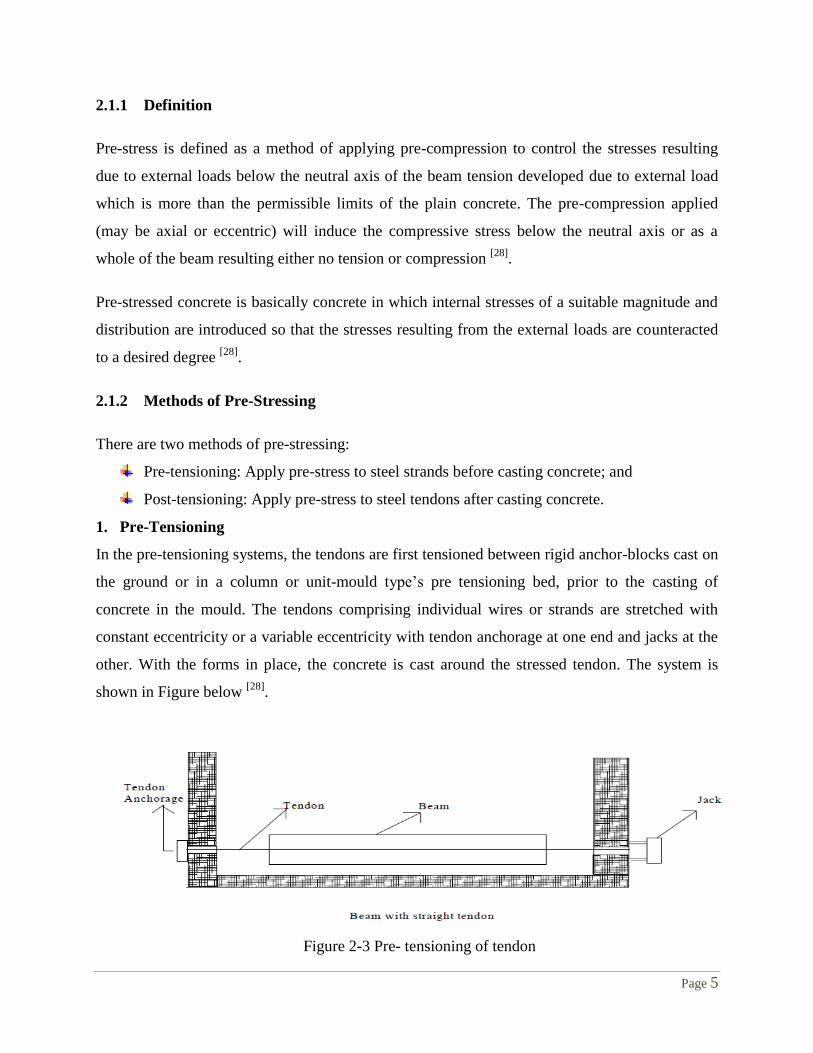
In the pre-tensioning systems, the tendons are first tensioned between rigid anchor-blocks cast on
the ground or in a column or unit-mould type‟s pre tensioning bed, prior to the casting of
concrete in the mould. The tendons comprising individual wires or strands are stretched with
constant eccentricity or a variable eccentricity with tendon anchorage at one end and jacks at the
other. With the forms in place, the concrete is cast around the stressed tendon. The system is
shown in Figure below [28]
.
Figure 2-3 Pre- tensioning of tendon

Page 6
Pre-tensioning is the most common form for precast sections. In Stage 1, the wires or strands are
stressed; in Stage 2, the concrete is cast around the stressed wires/strands; and in Stage 3, the
pre-stressed in transferred from the external anchorages to the concrete, once it has sufficient
strength [10]
.
Figure 2-4 Stages of pre-tensioning
In pre-tensioned members, the strand is directly bonded to the concrete cast around it. Therefore,
at the ends of the member, there is a transmission length where the strand force is transferred to
the concrete through the bond [10]
.
Figure 2-5 Transmission length

Page 7
Figure 2-6 Transmission of tendon force
In pre tensioned concrete components, the pre-stressing steel is tensioned before the concrete is
placed, as illustrated in figure below. The pre-stressing tendons are typically un‐sheathed so that
the concrete bonds to the tendons [23]
.
Figure 2-7 Construction sequence for pre‐tensioned concrete beam
2. Post-Tensioned
In this method, the concrete has already set but has ducts cast into it. The strands or tendons are
fed through the ducts (Stage 1) then tensioned (Stage 2) and then anchored to the concrete
(Stage3) [10]
.

Page 8
Figure 2-8 Stages of post tensioning
In post‐tensioned concrete, the concrete is pre-stressing steel is tensioned after the concrete is
placed, as illustrated in figure below. The pre-stressing tendons are sheathed or placed in ducts
so that the concrete and tendons are unbounded. Ducts can be grouted after post‐tensioning to
protect the tendons from moisture and corrosion [23]
.
Figure 2-9 Post tensioned cable profile

Page 9
In post-tensioning the concrete unit are first cast by incorporating ducts or grooves to house the
tendons. When the concrete attains sufficient strength, the high-tensile wires are tensioned by
means of jack bearing on the end of the face of the member and anchored by wedge or nuts. The
forces are transmitted to the concrete by means of end anchorage and, when the cable is curved,
through the radial pressure between the cable and the duct. The space between the tendons and
the duct is generally grouted after the tensioning operation [28]
.
Most of the commercially patented pre-stressing systems are based on the following principle of
anchoring the tendons:
1. Wedge action producing a frictional grip on the wire.
2. Direct bearing from the rivet or bolt heads formed at the end of the wire.
3. Looping the wire around the concrete.
To summarize that, pre-stressing systems are two types. Pre-tensioning and post-tensioning. The
comparisons between them have been discussed in the table below [28]
.
Table 2-1 Comparative study: pretension Vs post-tensioned member
Pretension member Post-tensioned member
1. In pre-tensioned pre-stress concrete, steel is
tensioned prior to that of concrete. It is released
once the concrete is placed and hardened. The
stresses are transferred all along the wire by
means of bond.
1. Concreting is done first then wires are
tensioned and anchored at ends. The stress
transfer is by end bearing not by bond.
2. Suitable for short span and precast products
like sleepers, electric poles on mass production.
2. Suitable for long span bridges
3. In pre-tensioning the cables are basically
straight and horizontal. Placing them in curved or
inclined position is difficult. However the wires
can be kept with eccentrically. Since cables
cannot be aligned similar to B.M.D. structural
advantages are less compare to that of post-
tensioned.
3. The post tensioning cables can be aligned in
any manner to suit the B.M.D due to external load
system. Therefore it is more economical
particularly for long span bridges. The curved or
inclined cables can have vertical component at
ends. These components will reduce the design
shear force. Hence post-tensioned beams are
superior to pre-tensioned beams both from
flexural and shear resistances point.
4. Pre-stress losses are more compare to that of
post-tensioned concrete.
4. Losses are less compare to pre-tensioned
concrete

Page 10
Advantage of Pre-Stressed Concrete [28]
The use of high strength concrete and steel in pre-stressed members results in lighter
and slender members than is possible with RC members.
In fully pre-stressed members the member is free from tensile stresses under working
loads, thus whole of the section is effective.
In pre-stressed members, dead loads may be counter-balanced by eccentric pre-
stressing.
Pre-stressed concrete member possess better resistance to shear forces due to effect of
compressive stresses presence or eccentric cable profile.
Use of high strength concrete and freedom from cracks, contribute to improve
durability under aggressive environmental conditions.
Long span structures are possible so that saving in weight is significant & thus it will
be economic.
Pre-stressed members are tested before use.
Pre-stressed concrete structure deflects appreciably before ultimate failure, thus
giving ample warning before collapse.
Disadvantages of Pre-Stressed Concrete [28]
The availability of experienced builders is scanty.
Initial equipment cost is very high.
Availability of experienced engineers is scanty.
Pre-stressed sections are brittle
Pre-stressed concrete sections are less fire resistant.
2.1.3 Materials of Pre Stressing
1. Concrete
The main factors for concrete used in PSC are:
Ordinary Portland cement-based concrete is used but strength usually greater than 50 N/mm2;
A high early strength is required to enable quicker application of pre-stress;
A larger elastic modulus is needed to reduce the shortening of the member;
A mix that reduces creep of the concrete to minimize losses of pre-stress [28]
.

Page 11
2. Steel
The steel used for pre-stressing has nominal yield strength of between 1550 to 1800N/mm2. The
different forms the steel may take are:
Wires: individually drawn wires of 7 mm diameter;
Strands: a collection of wires (usually 7) wound together and thus having a diameter that
is different to its area;
Tendon: A collection of strands encased in a duct – only used in post tensioning;
Bar: a specially formed bar of high strength steel of greater than 20 mm diameter.
Figure 2-10 Pre-stressing steel (wires, strands, tendons and bars)
3. A Typical Tendon Anchorage
The anchorages to post-tensioned members must distribute a large load to the concrete, and
must resist bursting forces as a result. A lot of ordinary reinforcement is often necessary [10]
.
Figure 2-11 a) Tendon anchorage b) Reinforcement of end of a post-tensioned member

Page 12
4. Post-Tensioning Ducts
Post-tensioning ducts for longitudinal post-tensioning tendons in precast spliced I-girders shall
be made of rigid galvanized spiral ferrous metal to maintain standard girder concrete cover
requirements. The radius of curvature of tendon ducts shall not be less than 20 feet except in
anchorage areas where 12 feet may be permitted [29]
.
2.1.4 What is Composite Precast Pre-Stressed - in Situ Concrete
Precast Concrete
Pre-casting involves the casting of concrete away from the site of final position. It can also be
produced near the site. The member of precast element produced either in a permanent plant or
temporary arrangement and eventually erected at the final position. Pre-casting permits better
control in mass production. It is also economical [14]
.
Precast concrete is a construction product produced by casting concrete in a reusable form which
is then cured in a controlled environment, transported to the construction site and lifted into
place. The precast girder supports the cast in place part of the slab and standard precast girders
may be grouped together or spread apart to accommodate heavy or light loads, respectively. This
precast is post tensioned or pre tensioned is known as precast pre-stressed concrete.
Cast in place
Concrete cast in situ is poured into site-specific forms and cured on site. Cast in place concrete
require more formwork and false work per unit of product but save the cost of transportation and
erection, and it is better used for large and heavy members. The cast in place top slab ties the
structure together and gives a uniform continuous surface.
Therefore, the combination of precast pre-stressed concrete and concrete cast in situ is called
composite precast pre-stressed - in situ concrete. As shown in following figure below; by using
composite construction, it is possible to save much form work and false work as compared to
fully cast in place construction.

Page 13
Figure 2-12 Composite precast pre-stressed - in situ concrete
2.1.5 Differences of Pre-Stressed Concrete over Reinforced Concrete:
1. In pre-stress concrete member steel plays active role. The stress in steel prevails whether
external load is there or not. But in R.C.C., steel plays a passive role. The stress in steel in
R.C.C members depends upon the external loads (i.e. no external load, no stress in steel).
2. In pre-stress concrete the stresses in steel is almost constant where as in R.C.C the stress
in steel is variable with the lever arm.
3. Pre-stress concrete has more shear resistance, whereas shear resistance of R.C.C is less.
4. In pre-stress concrete members, deflections are less because the eccentric pre-stressing
force will induce couple which will cause upward deflections, where as in R.C.C,
deflections are more.
5. In pre-stress concrete fatigue resistance is more compare to R.C.C. because in R.C.C.
stress in steel is external load dependent where as in P.S.C member it is load independent.
6. Pre-stress concrete is more durable as high grade of concrete is used which are denser in
nature. R.C.C. is less durable.
7. In pre-stress concrete, dimension is less because external stresses are counterbalance by
the internal stress induced by pre-stress. Therefore reactions on column & footing are
less as a whole the quantity of concrete is reduced by 30% and steel reduced by about 60
to 70%. R.C.C. is uneconomical for long span because in R.C.C. dimension of sections
are large requiring more concrete & steel. Moreover as self-weight increases more
reactions acted on columns & footings, which requires higher sizes [28]
.

Page 14
2.2 Rail Track on Bridges
Traditionally, railway tracks are ballasted. However, efficient and safe solutions that do not use
ballasts have been developed in the past 40 years, called slab tracks [25]
.
2.2.1 Ballast Track
Ballast is gravel or coarse stone used to form the bed of a railway track or the substratum of a
road. Ballast has many functions. The most important functions are to retain track position,
reduce the sleeper bearing pressure for the underlying materials, store fouling materials, provide
drainage for water falling onto the track, and rearrange during maintenance to restore track
geometry. Thus, ballast materials are required to be hard, durable, and angular, free from dust
and dirt, and have relatively large voids. Since ballast is a type of granular material, behavior of
such a material is well documented in granular materials literature. Past experience of ballast
field performance has shown that the progressive breakdown of ballast materials, such as that
caused by traffic load and maintenance tamping, and the intrusion of external materials, such as
wagon spillage and infiltration of underlying materials into the ballast results in major track
deterioration. The response of fouled ballast is highly dependent on the types of fouling
materials, the quantity of fouling materials and water content [28]
.
The ballasted track has relatively low construction costs comparing to slab track, it has high
elasticity and high maintainability at relatively low cost. Another important advantage of the
ballasted track is the high noise absorption [7]
. The 150 years‟ experience with ballasted tracks
makes the engineers more confident to deal with ballasted track problems and avoid the higher
risk of dealing with problems concerning a relatively new design [30]
.
Many recent advances in ballasted track construction make them even more competitive against
slab track. Few examples of these advances are the following [30]
.
Introduction of reinforced concrete or steel sleepers.
Optimization of the rail geometry improves the wheel-rail contact condition offering a
better load bearing capacity.
Optimized rail pads and fastening providing better attenuation of the wheel- rail contact
forces and of noise.

Page 15
Stone blowing and tamping machines provide more accurate corrections and faster
maintenance.
Better track resilience and resistance to settlements through the use of under sleeper mats
as well as geo grids and geo synthetics between the different layers.
The use of geotechnical retro-fitting techniques (e.g. lime cement columns), improving
the bearing capacity of the sub grade, minimizing the possibility of settlements.
The final decision for the construction is taken considering both advantages and disadvantages of
each system. The disadvantages which may lead the decision-makers to a slab track construction
are the following [7]
.
The ballasted track does not provide good lateral or longitudinal resistance with result to
have “floating” track effects.
Limited lateral resistance of the ballasted track, resulting to lower speeds in curves.
The deterioration of the ballast creates particles which are damaging the rail and the
wheels.
The wear of the ballast plus the intrusion of the fine particles from the sub grade,
contaminate the structure making it impermeable.
Ballasted track is heavier and higher structure demanding stronger structures and larger
foundations in case of viaducts and bridges.
The track elements and the way they are put together during construction will highly
influence the rate of the track deterioration.
In bridges and tunnels where continuous ballast bed is the case, extra elasticity must be
supplied by application of ballast mats, rail fastenings with increased elasticity.
Nonetheless the usual maintenance must be provided at regular basis.

Page 16
2.2.2 Slab Track on Bridge
The bridge deck supports the slab track on a bridge. Structural elements that are part of the slab
track are subject to mainly compression forces. All components of the slab track have to be
designed in such a way that the vertical and horizontal forces are transmitted and resisted in a
safe way [25].
Generally speaking the advantages of the slab track design are the significantly reduced
maintenance need in combination with its higher serviceability life, as well as its higher
structural track stability. According to bibliography [24], the reasons that may lead to the
construction of a slab track system instead a ballasted one are the following:
Lower maintenance need during its life cycle. No need for tamping, ballast cleaning and
track lining results to a reduced cost approximately 20-30% for repairs comparing to that
in ballasted track.
Lower traffic hindrance or interruption costs.
Higher life cycle, around 50-60 years compared to ballasted track (30-40 years) and
possibility of almost full replacement at the end of the service life.
More cost effective line positioning (as narrower curves at high super elevation and
super elevation deficiency can be applied)
No ballast or solid particles are whirled up on slab track.
Higher safety against lateral forces and accommodation of higher axle loads.
The eddy current brake can be applied without problems any time. (This is an advantage
against ballasted track only in certain places such as signals or at station entrances. It
cannot be seen as an advantage on plain line track.)
Emergency vehicles and fire brigade vehicles can drive on the slab track in tunnels easily.
Cost of vegetation control is either excluded or very reduced.
Near maximum availability of the line and barely causes disturbances to the residents for
maintenance during night shifts.
Optimum design for high speed trains since it does not experience any problems such as
drag forces at ballast.

Page 17
The slab track can compensate any excess in super elevation and in cant deficiency with
freight trains or passenger trains without fears for dislocation of the track.
Possible corrections up to 26 mm in vertical and up to 5 mm in horizontal position can be
applied to counterbalance minor displacements.
Reduced height and weight of the structure.
The lack of suitable aggregates for a ballasted track in a certain area can also lead to a
slab track design.
Slab track maybe also more suitable in cases where the noise emissions and the vibration
nuisance do not cause problems and are acceptable.
In places where the release of dust from the ballast bed must be prevented for
environmental reasons the slab track is a good solution.
Excellent riding comfort at high speed.
Better load distribution, hence reduced dynamic load of subsoil.
Excellent load distribution, thereby reducing the pressure on unconfined soil layers and
the sub grade.
Lower wear of vehicle running gear through good retention of track geometry.
The higher braking forces enable for shorter braking distances.
Slab tracks allow for steeper route gradients.
The rail can be laid in lower temperatures since buckling is less of a concern comparing
to ballasted track.
Lower construction costs in case track and rolling stock are adjusted to one another.
Slab track systems have various disadvantages too. In general the higher investment costs
combined with the longer manufacture and installation time needed for its construction as well as
the limited options in adjustments after construction and the higher air-borne vibration
emissions, are few of the main reasons slab track is not the dominant track type used. The
disadvantages of slab track are stated below according to the available bibliography [24]
:
The danger to have wrongly selected this design because of its lower maintenance cost
due to the influence of the operational organization which is fully responsible for the
railways maintenance after the construction. In many railways a part or the whole
construction costs of a track are usually covered by governmental financial subsidies for

Page 18
sums invested in infrastructure. The total cost must be assessed and carefully examined
in a fair way in order to select the most suitable track design.
The deterioration of the track geometry in case the operational strength of the concrete
slab track has been reached, can occur very suddenly and unforeseeably. Thus the
operational strength of the slab track might be compared to the occurrence of rail
fracture.
Small adaptability to large displacements in the embankment. Large displacements in
track can be compensated only by significant amounts of work.
Slab track has an estimated life cycle of 50-60 years. Of course this is valid only if the
presupposition that the expected acceptable settlements will occur. In case of a
derailment or any other unforeseeable events which could cause greater damage than the
expected one (damage in sensitive fastening elements) can result to long term and
expensive track closures. Unfortunately due to the short age of slab track there is not
enough information on the actual performance during its life time in order to assess and
examine this issue with high validity.
Slab track by its rigid structure it is ensured that its life time will be at least 50-60 years.
The nature of the slab track does not allow for easy adjustments and repairs after its
construction. That means that its quality during the construction must be checked and
reassured carefully because any defect on its quality would either remain for the entire
life cycle either high costly measures should be taken in order to eliminate it.
Not many possibilities to apply any innovation (improvement) or future updates after
construction.
Slab track cannot be built in soft clays, earthquake areas or embankments on soft peat
layers.
Slab track requires homogeneous sub layers which are capable to carry the imposed loads
with minor or no settlements. This means that in many cases and especially in earth
structures special attention should be given in the foundation preparations. The high costs
which are associated with the above mentioned fact is the main reason for the limited use
of the slab track.
Higher noise emissions. To handle the increased noise, extra treatment is needed which
result to higher construction costs.

Page 19
Very expensive repair concepts and long term closures due to the curing and hardening
procedures of the concrete.
The frost protective layer in earth structures must be applied in any case and it is much
thicker comparing to the ballasted one. This is a prerequisite in order to reassure a
lengthy life cycle.
The cost of the reconstruction (after it has reached the end of its life cycle) of the slab
track is not considered. One or two standardized types of slab track seem to be optimal
solutions.
Transitions between ballasted track and slab track require special attention.
In many cases new mechanisms needed for production and repair.
2.2.3 Comparison Between Ballasted and Slab Track
The slab track can ensure very good geometrical stability of the track comparing to the ballasted
track, on the other side it produces higher noise emissions. The extra protective measures need to
be taken, increase the costs of the slab track construction significantly. In tunnels though, the
slab track has been proved in many cases to be a more economical efficient solution due to its
structure (lower height and no need for special preparation of the subsoil). Slab track is more
beneficial in more favorable locations of the lines which can be adapted to the terrain and to
existing structures by applying higher super elevation and super elevation deficiency values. One
more advantage of the slab track is the easier and more economic vegetation control comparing
to conventional track. In general the ballasted track is considered as a better solution in earth
structures due to the lower costs of the construction [24]. On the other side, slab track maybe is
more expensive to construct but the lower demand for track maintenance during the years and its
high serviceability life time, suggest that in a long term perspective is economically more
efficient [24].

Page 20
The comparison of ballasted track and slab track as follows [1]
.
Table 2-2 Comparisons of ballasted track and ballast-less track:
S.N. DESCRIPTION BALLASTED TRACK SLAB TRACK
1 Maintenance Input Frequent maintenance for
geometry.
No frequent maintenance for
geometry.
2 Cost comparison Relatively low construction costs
but higher life cycle cost.
Relatively high construction cost
but lower life cycle cost.
3 Elasticity
High elasticity due to ballast. Elasticity is achieved through use
of rubber pads and other artificial
materials.
4 Riding Comfort Good riding comfort at speeds up
to 250 – 280 KMPH.
Excellent riding comfort even at
speeds greater than 250 KMPH.
5 Life expectation Poor Life expectation Good life expectation.
6 Stability Over time, the track tends to
“float”, in both longitudinal and
lateral directions, as a result of
non-linear, irreversible behavior
of the materials.
No such problem.
7 Lateral resistance Limited non compensated
Lateral acceleration in curves, due
to the limited lateral resistance
offered by the ballast.
High lateral resistance to the track
which allows future increase in
speeds in combination with tilting
coach technology.
8 Noise
Relatively High noise. Relatively low noise and vibration
nuisance.

Page 21
9 Churning up of
Ballast
Ballast can be churned up at high
speeds, causing serious damage to
rails and wheels.
No such damage to rails
and wheels.
10 Permeability Reduced permeability due to
contamination, grinding-down of
the ballast and transfer of fine
particles from the sub grade.
High impermeability
11 Construction cost of
Bridges/Tunnels/etc.
Ballast is relatively heavy,
leading to an increase in the costs
of building bridges and viaducts
if they are to carry a continuous
ballasted track.
Less cost of construction of
bridges and viaducts due to
lower dead weight of the
slab track.
12 Construction Depth Depth of Ballasted track is
relatively high, and this has direct
consequences for tunnel
diameters and for access points.
Reduced height
13 Availability of
Material.
Limited availability of suitable
ballast material.
No problem of material.
14 Accessibility to road
vehicles.
Track is not accessible to road
vehicles.
The track can be
accessible to road vehicles
15 Dust pollution
requirement.
Release of dust from the ballast
into the environment thus causing
environmental pollution.
Less environment
pollution.
16 Suitability on the
basis of requirement
of maintenance
input.
Less suitable due to limited
availability of traffic block in the
present scenario of high traffic
growth.
Highly suitable in the
present and future scenario
due to very less
maintenance

Page 22
2.3 Structural Initial Dimension of Slab for Rail Tracks
2.3.1 Thickness of the Deck
Appropriate thickness need to be provided on the basis of deflection requirement. The minimum
thickness of reinforced concrete depends on the support condition and the support spacing. This
criterion is defined for concrete flexural members so that they are provided with adequate
stiffness to resist excessive deflection. The deflection of simple or continuous slabs shall not
exceed L/800 of the span length [14]
. The thickness of the composite slab can be
t =
for simply supported slab (2.1)
t =
for continuous slab (2.2)
Where, t=thickness of deck in meter.
S=effective span in meter.
2.3.2 Determination of Ballast Depth in the Bridge
Depth of ballast in bridge is limited and numerically specified as follows;
For a railway bridge, the ballast height should be at least 0.6m. The ballast has a weight density
of 20kN/m3 [25]
.
Figure 2-13 Depth of ballast in bridge

Page 23
2.3.3 Determination of Slab Depth in the Bridge
The minimum depth of slab track is 200mm as shown in the figure below [24]
.
Figure 2-14 Depth of slab track on bridge
2.4 Design Standards and Methods
2.4.1 Design Standards
In order to form a consistent basis for design, design standards loading are applied to the design
model of structure. Now a day‟s in Ethiopia, the railway project constructed by china companies
and used their design standard. However, china design standards are not available. For the
availability as well as many country adoptions, the study used design standards: American
Railway Engineering and Maintenance of Way Association (AREMA) and American
Association of State Highway and Transportation Officials (AASHTO).
2.4.2 Loadings on Railway Bridges
Bridges must be designed to carry the specified dead loads, live loads and impact, as well as,
loads from continuous welded rail, loads from ballast, loads from curbs and load from sleeper.
The forces and stresses from each of these specified loads should be a separate part of the design
calculations. Also, because rail cars have changed in size and weight over the years and
frequently are run in unit consists; the designer should be alert to live loadings that may be more
severe than those used in some specifications.

Page 24
The following loads and forces shall be considered in the design of railway concrete structures
supporting tracks [4]
.
1) Dead load.
2) Live load.
3) Centrifugal force.
4) Lateral force due to wind load and nosing of locomotives.
5) Longitudinal force.
6) Impact load.
7) Earth quack load
Dead Load
Dead loads are those that are constant in magnitude and fixed in location throughout the lifetime
of the structure. Usually the major part of the dead load is the weight of the structure itself. This
can be calculated with good accuracy from the design configuration, dimensions of the structure,
and density of the material.
1. The dead load shall consist of the estimated weight of the structural member, plus that of the
track, ballast, fill, and other portions of the structure supported thereby.
2. The unit weight of materials comprising the dead load, except in special cases involving
unusual conditions or materials, shall be assumed as follows [4]
.
Track rails, inside guardrails and fastenings – 200 lb per linear foot of track. (3kN/m)
Ballast, including track ties – 120 lb per cubic foot. (1900 kg/m3)
Reinforced concrete – 150 lb per cubic foot. (2400 kg/m3)
Earth filling materials – 120 lb per cubic foot. (1900 kg/m3)
Waterproofing and protective covering – estimated weight.

Page 25
Live Load
Live loads consist chiefly of occupancy loads in buildings and traffic loads on bridges. They may
be either fully or partially in place or not present at all, and may also change in location. Railway
bridges have a higher live-to-dead load ratio because the mass of the railway loading is generally
large, relative to that of the bridge [4]
.
The recommended live load for each track of main line structure is Cooper E-80 loading with
axle loads and axle spacing as shown in figure below. On branch lines and in other locations
where the loading is limited to the use of light equipment, or cars only, the live load may be
reduced, as directed by the engineer.
Figure 2-15 Cooper E- 80 Live load

Page 26
To determine maximum moments, and shears force for cooper E-80 live load, refer table 2-3 and
tabulated values are used for only simple spans [4]
.
Table 2-3 Maximum moments, and shears of LL for one rail (one - half track load)
span
length
(Ft)
maximum moment
(Ft-Kips)
maximum
moment Quarter
point (Ft-Kips)
maximum shears (Kips) Maximum pier
reaction (Kips)
(2) At End At Quarter
Point At center
E-80 Alt. E-80 Alt. E-80 Alt. E-80 Alt. E-80 Alt. E-80 Alt.
5 50.00 62.50 37.50 46.88 40.00 50.00 20.00 25.00 40.00 50.00
6 60.00 75.00 45.00 56.25 46.67 58.33 30.00 37.50 20.00 25.00 53.33 58.33
7 70.00 87.50 55.00 68.75 51.43 64.29 31.43 39.29 20.00 25.00 62.86 71.43
8 80.00 100.00 70.00 87.50 55.00 68.75 35.00 43.75 20.00 25.00 70.00 81.25
9 93.89 117.36 85.00 106.25 57.58 72.22 37.78 47.23 20.00 25.00 75.76 88.89
10 112.50 140.63 100.00 125.00 60.00 75.00 40.00 50.00 20.00 25.00 80.00 95.00
11 131.36 164.20 115.00 143.75 65.45 77.27 41.82 52.28 21.82 27.28 87.28 100.00
12 160.00 188.02 130.00 162.50 70.00 83.33 43.33 54.17 23.33 29.17 93.33 108.33
13 190.00 212.83 145.00 181.25 73.84 88.46 44.61 55.76 24.61 30.76 98.46 115.39
14 220.00 250.30 165.00 200.00 77.14 92.86 47.14 57.14 25.71 32.14 104.29 121.43
16 280.00 325.27 210.00 250.00 85.00 100.00 52.50 62.50 27.50 34.38 113.74 131.25
18 340.00 400.24 255.00 318.79 93.33 111.11 56.67 68.05 28.89 36.11 121.33 138.89
20 412.50 475.00 300.00 362.50 100.00 120.00 60.00 72.50 28.70 37.50 131.10 145.00
24 570.42 668.75 420.00 500.00 110.83 133.33 70.00 83.33 31.75 41.67 147.92 154.17
28 730.98 866.07 555.00 650.00 120.86 142.86 77.14 92.86 34.29 46.43 164.58
32 910.85 1064.06 692.50 800.00 131.44 150.00 83.12 100.00 37.50 50.00 181.94
36 1097.30 1262.50 851.50 950.00 141.12 155.56 88.90 105.56 41.10 55.56 199.06
40 1311.30 1461.25 1010.50 1100.00 150.80 160.00 93.55 110.00 44.00 60.00 215.90
45 1601.20 1710.00 1233.60 1287.48 163.38 164.44 100.27 114.45 45.90 64.45 237.25
50 1901.80 1959.00 1473.00 1481.05 174.40 106.94 118.42 49.73 68.00 257.52
55 2233.10 1732.30 185.31 113.58 120.91 52.74 70.91 280.67
60 2597.80 2010.00 196.00 120.21 123.33 55.69 73.33 306.42
70 3415.00 2608.20 221.04 131.89 61.45 77.14 354.08
80 4318.90 3298.00 248.40 143.41 67.41 80.00 397.70
90 5339.10 4158.00 274.46 157.47 73.48 82.22 437.15
100 6446.30 5060.50 300.00 173.12 78.72 84.00 474.24
120 9225.40 7098.00 347.35 202.19 88.92 544.14
140 12406.00 9400.00 392.59 230.23 101.64 614.91

Page 27
In calculating the maximum live loads on a structural member due to simultaneous loading on
two or more tracks, the following proportions of the specified live load shall be used:
For two tracks – full live load,
For three tracks – full live load on two tracks and one-half on the other track,
For four tracks – full live load on two tracks, one-half on one track, and one-fourth on the
remaining track [4]
.
Centrifugal Force
a. On curves, the centrifugal force in percentage of the live load is:
0.00117S2D (2.3)
Where:
S = Speed in miles per hour
D = Degree of curve
(Because of the limited duration of the loads, centrifugal force need not be considered in
the design of stringers.)
b. The effect of centrifugal force may be reduced by the compensating effect of the actual
amount of super elevation provided [4]
.
Impact Forces
Impact forces, applied at the top of rail, shall be added to the axle loads specified. For
rolling equipment without hammer blow (diesels, electric locomotives, tenders alone,
etc.), the impact shall be equal to the following percentages of the live load:
For L ≤ 4 meters I = 60 (2.4)
For 4 meters < L ≤ 39 meters I =
√ (2.5)
For L ≥ 39 meters I = 20 (2.6)
Where L is the span length in (meters)
For continuous structures, the impact value calculated for the shortest span shall be used
throughout.
Impact may be omitted in the design for massive substructure elements which are not
rigidly connected to the superstructure.
For steam locomotives with hammer blow, the impact shall be increased by 20% [4]
.

Page 28
Longitudinal Force
The longitudinal force for E-80 loading shall be taken as the larger of:
Force due to braking, as prescribed by the following equation, acting 8 feet (2450mm)
above top of
Longitudinal braking force (kips) = 45+1.2L (2.7)
(Longitudinal braking force (kN) = 200+17.5L) (2.8)
Where L is the length in feet (meters) of the portion of the bridge under consideration
Force due to traction, as prescribed by the following equation, acting 3 feet (900mm)
above top of rail.
Longitudinal traction force (kips) = 25 √ (2.9)
(Longitudinal traction force (kN) = 200√ ) (2.10)
Where L is the length in feet (meters) of the portion of the bridge under consideration
Wind Load
A wind load of 300lb per linear foot (4.4kN/m) on the train shall be applied 8 feet (2450mm)
above the top of rail in a horizontal direction perpendicular to the centerline of the track [4]
.
Earthquake Loading
Earth quake loading is a product of natural loading which depend on geometric location of the
bridge. Seismic force primarily affects bridge substructure components. The earth quake forces
can be described as a function of the acceleration coefficient, Soil type, the fundamental period.
The effect of earthquake in Ethiopia is grouped in to four different zones. Bridge in seismic zone
1-3 need not be analyzed for seismic loads, regardless of their importance and geometry. Seismic
analysis is not required for single-span bridge, regardless of the seismic zone (10) [14]
.Since the
study area is Addis Ababa (zone-2), and no need of design of seismic load in this zone.
Load Path
The path of the load from the wheels through the rail and into the tie is either directly to the
supporting beams, or through a ballast bed to a deck and hence into the supporting beams or
girders and then load to the abutments of the bridge [4]
.

Page 29
Combination of Loads
The loads which are considered in the thesis are dead, superimposed, and live and impact loads.
These loads combination is as follows:
Loads combination = 1.25 DL + 1.75 LL [4]
(2.11)
Loads combination = 1.4(D+5/3(L+I)) [18]
(2.12)
2.4.3 Material Properties of Pre-Stressed and Non-Pre-Stressed Concrete and Steel
Concrete
Concrete is stone like material obtained artificially by hardening of the mixture of cement, inert-
aggregate materials (fine & course) and water in predetermined proportions. When these
ingredients are mixed, they form a plastic mass which can be poured in suitable moulds (forms)
and set-on standing into hard solid mass, as a result of exothermic chemical reaction between
cement and water. To produce a workable mix, more water is used over and above that needed
for this chemical reaction (water-cement ratio required for complete chemical reaction is about
0.25). The reaction between cement and water is relatively slow and requires time and favorable
temperature for its completion [21]
.
Compressive Strength of Concrete: -A wide range of strength properties can be obtained for
concrete by appropriate adjustment of the proportions of the constituent materials, using different
degree of the compaction and the conditions of temperature and moisture under which it is
placed and cured. Water cement ratio is the main factor affecting the strength of concrete, as
shown in figure below.
Figure 2-16 Relationship between compressive strength of concrete and water-cement ratio

Page 30
Standard test specimens of 150mm cube are taken at the age of 28days to determine the
compressive strength of concrete. At age of 7days, concrete may attain approximately about 2/3
of the full compressive strength of concrete. In some national standard (example ACI code),
cylinder specimens of 150mm diameter by 300mm high are taken. Although the load is applied
uni-axially, the friction between the loading plate and the contact faces of the test specimen has
more effect on cube strength than the cylinder strength. Because of this, the cube strength gives
more strength than the true compressive strength of concrete, whereas, cylinder strength gives
reasonably the true compressive strength. On average, cube strength is taken as 1.25 times
cylinder strength. If large size aggregates are used, a cube mold with side 200mm may be used to
determine compressive strength of concrete. And strength of concrete is converted to 150mm
cube compressive strength by factor of 1.05.
The strength of concrete for design purposes will be based on compressive tests made on cubes
at an age of 28 days unless there is satisfactory evidence that a particular testing regime is
capable of predicting the 28-day strength at an earlier age. These 28-day characteristic strengths
determine the grade of the concrete and it is important to select the correct grade appropriate for
use. The concrete has to provide the durability for the environmental conditions as well as
adequate strength for the loading requirements [21]
.
Table 2-4 Grades of concrete
Class Permissible Grades of concrete
I C5 C15 C20 C25 C30 C40 C50 C60
II C5 C15 C20
In accordance with Ethiopian Standards, compressive strength of concrete is determined from
tests on 150mm cubes at the age of 28 days. Cylindrical or cubical specimens of other sizes may
also be used with conversion factors determined from a comprehensive series of tests. In the
absence of such tests, the conversion factors given in Table below may be applied to obtain the
equivalent characteristic strength on the basis of 150mm cubes [21]
.

Page 31
Table 2-5 Conversion factors for strength
Size and type of Test Specimen Conversion Factor
Cube (200mm)
Cylinder (150mm diameter 300mm height)
1.05
1.25
The characteristic cylinder compressive strength fck are given for different grades of concrete in
Table below
Table 2-6 Grades of concrete and characteristic cylinder compressive strength fck
Grades of
concrete
C 15 C 20 C 25 C 30 C 40 C 50 C 60
fck 12 16 20 24 32 40 48
Characteristic Tensile Strength of Concrete: the characteristic tensile strength of concrete can
be determined statistically by the same equation given above using test results obtained from
split-cylinder test or from beam-test. It can also be determined using empirical relation obtained
from a number of tests in terms of characteristic compressive strength of concrete given by
codes. According to EBCS-2, characteristic tensile strength of concrete is obtained using
fctk = 0.21(0.8fcu)2/3
(fcu & fctk in MPa) (2.13)
Reinforced concrete has a weight density usually set, for design purposes; to 25 kN/m3
(unreinforced concrete has a weight density of 24 kN/m3)
[25].
Design Strength of Material in Limit State: The design strength for a given material and limit
state is given by:
Design Strength for Concrete [11]
.
a) In compression fcd =
or fcd =
(2.14)
b) In tension fctd =
(2.15)
Design Strength for Steel
In tension and compression fyd =
(2.16)

Page 32
Idealized Stress-Strain Diagrams: For s design purpose, most codes adopt idealized stress-
strain diagrams in predicting the ultimate strength of sections in plastic-theory. In EBCS-2, a
parabola-rectangle stress-strain diagram is given for concrete in compression as shown in figure
below.
Figure 2-17 Idealized stress- strain diagram
Modulus of Elasticity of Concrete: According to EBCS-2/95, mean value of the secant
modulus, Ec is given as shown in table below.
Table 2-7 Modulus of elasticity of concrete
fcu(MPa) C-15 C-20 C-25 C-30 C-40 C-50 C-60
Ec (GPa 26 27 29 32 35 37 39
Reinforcing Steel
Steel reinforcements are available in the form of round bars and welded wire fabric. The most
commonly used bars have projected ribs on the surface of bar. Such bars are called deformed
bars. The ribs of deformed bar improve the bond between steel and the surrounding concrete in
RC members by providing mechanical keys. A wide range of reinforcing bars is available with
nominal diameter ranging 6mm to 35mm. Most bars except 6mm diameter are deformed one.
Some of the common bar size with their application in concrete works are given in table below.
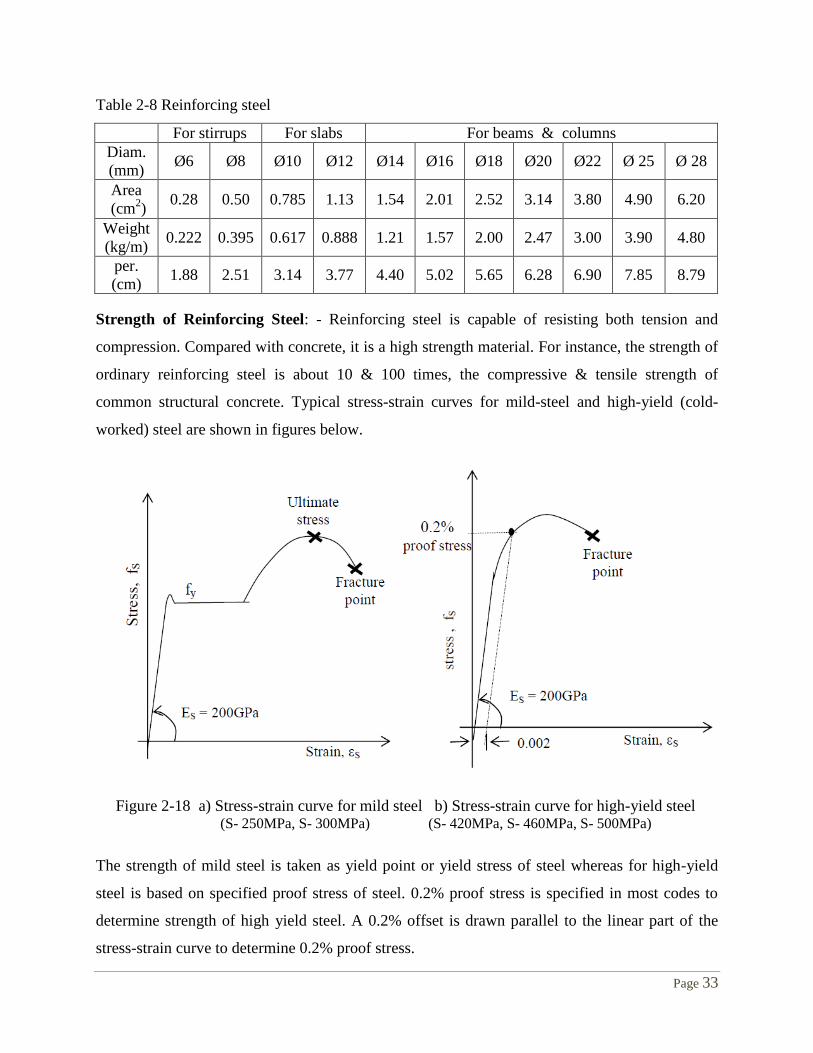
Page 33
Table 2-8 Reinforcing steel
For stirrups For slabs For beams & columns
Diam.
(mm) Ø6 Ø8 Ø10 Ø12 Ø14 Ø16 Ø18 Ø20 Ø22 Ø 25 Ø 28
Area
(cm2)
0.28 0.50 0.785 1.13 1.54 2.01 2.52 3.14 3.80 4.90 6.20
Weight
(kg/m) 0.222 0.395 0.617 0.888 1.21 1.57 2.00 2.47 3.00 3.90 4.80
per.
(cm) 1.88 2.51 3.14 3.77 4.40 5.02 5.65 6.28 6.90 7.85 8.79
Strength of Reinforcing Steel: - Reinforcing steel is capable of resisting both tension and
compression. Compared with concrete, it is a high strength material. For instance, the strength of
ordinary reinforcing steel is about 10 & 100 times, the compressive & tensile strength of
common structural concrete. Typical stress-strain curves for mild-steel and high-yield (cold-
worked) steel are shown in figures below.
Figure 2-18 a) Stress-strain curve for mild steel b) Stress-strain curve for high-yield steel (S- 250MPa, S- 300MPa) (S- 420MPa, S- 460MPa, S- 500MPa)
The strength of mild steel is taken as yield point or yield stress of steel whereas for high-yield
steel is based on specified proof stress of steel. 0.2% proof stress is specified in most codes to
determine strength of high yield steel. A 0.2% offset is drawn parallel to the linear part of the
stress-strain curve to determine 0.2% proof stress.

Page 34
The shape of the stress-strain curve is similar for all steel, and differs only in the value of
strength of steel, the modulus of elasticity, Es being for all practical purposes constant. Es is
taken as 200GPa. For a design of RC members, reinforcing steel up to grade of 550MPa can be
used. If steel with grade beyond 550MPa is used for RC member, the sections are under utilizing
the reinforcement. This is because the width of concrete crack is wide if the steel is fully
stressed.
EBCS-2, also idealized the stress-strain diagram for steel with ultimate strain of 0.01 as shown in
figure below. It is a portion of stress-strain diagram of steel. The maximum strain of steel, ,
max = 0.01 permitted by code assumed to limit width of concrete crack in tension zone to
acceptable limit.
Figure 2-19 Idealized the stress-strain diagram for steel with ultimate strain of 0.01
Reinforced Concrete
It is known that plain concrete is quite strong in compression, weak in tension. On the other
hand, steel is a high cost material which able to resist both tension & compression. The two
materials (plain concrete & reinforcing steel) are best be utilized in logical combination if steel
bars are embedded in the plain concrete in tension zone close to the surface. In this case, plain
concrete is made to resist the compressive stresses and reinforcing steel resists the tensile
stresses. Both plain concrete & reinforcing steel bar together assumed to act as one composite
unit and it is termed as reinforced concrete (RC). The tensile stresses developed in the section are
transferred to reinforcing steel by the bond between the interfaces of the two materials [21]
.
In all RC members, strength design is made on the assumption that concrete does not resist any
tensile stresses. All the tensile stresses are assumed to be resisted by the reinforcing steel
imbedded in tension zone. Sometimes if necessary, reinforcing steel is provided in compression
zone to assist the concrete resisting compression in addition to reducing creep deformation.

Page 35
Reinforcing steel & concrete may work readily in combinations due to the following reasons.
1. Bond between the bars & the surrounding concrete prevents slip of the bars relative to
the concrete. Adequate concrete cover for steel bar and embedment length of bar are
required to transfer stress between steel and concrete without slipping.
2. Proper concrete mixes provide adequate impermeability of concrete against bar
corrosion.
3. Sufficiently similar rates of thermal expansion (0.00001/0C to 0.000013/
0C for concrete
and 0.000012/0C for steel) introduce negligible stresses between steel and concrete under
temperature changes [21]
.
Advantages of Reinforced Concrete:
1. It is monolithic. This gives it more rigidity.
2. It is durable. It does not deteriorate with time.
3. While it is plastic, it can be moldable into any desired shape.
4. It is fire, weather and corrosion resistant.
5. By proper proportioning of mix, concrete can be made water-tight.
6. It maintenance cost is practically nil.
Disadvantages of Reinforced Concrete:
1. It is difficult to demolish in case of repair of modification.
2. It is too difficult to inspect after the concrete has been poured [21]
.
2.4.4 Design Criteria: Strengths, Deflections and Shears
2.4.4.1 Material Properties
To satisfy the design objective of a structural member, the design strength for ULS of both
concrete and steel are required. The instantaneous and time dependent properties of concrete and
steel at typical in-service stress level are also required [6]
.
a) Concrete
High strength concrete are used, concrete grade larger than C-30 class I works high compressive
strength at a reasonably early age, & comparatively higher tensile strength as compared with
ordinary RC member, low shrinkage, minimum creep characteristics and high young‟s modulus
are necessary [6]
.

Page 36
Concrete grade larger than
C-40, for pre tensioned,
C-30, for post tensioned members
The stress permitted in concrete at the stage of transfer and service loads are defined in terms of
the corresponding compressive strength of the concrete at each stage.
Allowable stresses in concrete [6]
.
At transfer
fct ≤ 0.6 fck(t) in compression due to bending. (2.17)
ftt ≤ 0.21 fck(t)2/3
in tension due to bending. (2.18)
Under working loads
fcw ≤ 0.50 fck in compression due to bending. (2.19)
ftw ≤ 0.00 in tension for fully pre-stressing. (2.20)
b) Pre-Stressing Steel
Three types of high strength steel termed as tendons are used with fpu ≥ 1000 MPa.
For design purpose the following idea stress – strain curve is adopted.
In design the stress in pre stressing steel at ULS limited to 0.9fpk/ϒs and strain u ≤ 0.01.
Figure 2-20 Stress-strain curve for typical high strength steel
Immediately after pre stress transfer
fpi ≤ 0.75fpk (2.21)
Stress in tendons after all losses (under working)
fpe ≤ ƞ*(0.75fpk) = 0.6 fpk (2.22)

Page 37
Where, ƞ- is loss factor which is 0.78 or 0.82 for pre tension and post tension respectively.
2.4.4.2 Pre-Stress Losses
Lump Sum Estimate of Pre Stress Losses
For average steel and concrete properties, cured under average air condition, the following
values may be taken as representative of average losses [6]
.
Table 2-9 Pre-stress losses
Loss due to % loss
Pre-tensioning Post-tensioning
Elastic shortening and bending of concrete 4 1
Creep of concrete 6 5
Shrinkage of concrete 7 6
Steel relaxation 5 6
Total loss 22 18
These values are based on the assumption that over tensioning has been applied to overcome
friction and anchorage losses.
An average of 22% loss in case of pretension and 18% in post-tension may be assumed with
condition of over tensioning has been applied to overcome friction and anchorage losses.
2.4.4.3 Deflection
Deflections can take place: upwards due to pre stressing (-) & down wards due to transverse
loads (+). The deflection can be calculated using the ordinary deflection formulas because there
are no cracks
Deflections due to loads: ordinary formula can be applied depending on
The intensity of loading
Restraint condition and span
Deflection due to Self-Weight or uniformly distributed Superimposed Load
=
(2.23)

Page 38
Deflection due to Pre Stressing Force [6]
a) Straight tendons
p =
(2.24)
b) Parabolic Tendons (Central Anchors)
=
(2.25)
2.4.4.4 Shear
Two major modes of shear cracks may be observed namely web shear and flexure shear cracks
Figure 2-21 Web and flexural shear crack
Web Shear Crack: - it is governed by limiting value of the principal tensile stress as developed
in concrete. It is more likely to occur in highly pre stressed members with thin webs.
Flexure Shear Cracks: - primarily initiated by flexural cracks and are developed when the
combined shear and flexural tensile stresses produce a principal tensile stress exceeding the design
tensile strength of concrete. When the shear force exceeds the limiting value against diagonal
compression the section must be changed.

Page 39
When Vc > Vd, only minimum shear reinforcement shall be provided which may be expressed as
Smax =
=
(2.26)
The shear force sustained by stirrups may be computed for
Vs =
(2.27)
2.4.4.5 Designs for Bearings
In the case of post-tensioned members, the pre stress is transferred to concrete by means of
external anchorage, the bearing pressure developed behind the anchorages suitably controlled to
prevent crushing failure of the end block zone. To such effect, limit bearing plates, both at initial
pre stress and after losses are provided [6]
.
At initial pre-stress
fb = 0.8 fci √
≤ 1.25 fci (2.28)
After losses
fb = 0.6 fci √
≤ fci (2.29)
Where,
fci is cube strength of concrete at the stage of stress transfer
Apun = Punching area and is generally contact area of the anchoring device
Abr = Bearing area and is the maximum area of that portion of the member, which is
geometrically similar and concentric to the effective punching area.

Page 40
2.5 Advantage of Simple Span over Continuous Span Bridge
Many railroads prefer simple span bridges to continuous structures, finding them easier install
and maintain. Since they are structurally determinate, simple span are better able to handle
problems such as support, settlement, and thermal effects than some continuous bridges. Precast
concrete elements are particularly suited to simple span construction. Additional reasons many
railroads prefer simple supported bridges to continuous span bridges include the following [18]
.
If repair or replacement of superstructure elements is necessary, less interruption
to train traffic is incurred with a simple span bridge than with a continuous span
bridge.
Installation of simple spans can be accomplished more quickly than continuous
spans.
If a bridge experiences substructure problems such as settlement, a continuous
span bridge may require immediate and more extensive work, thereby resulting in
greater interruptions to train traffic.
Simple span bridges have a proven history of performing well [18]
.
2.6 Disadvantage of Simple Span over Continuous Span Bridge
In simply supported bridges the bending moment anywhere in the span is considerably greater
than that in case of continuous supported span. Such increment of bending moment ultimately
results in the less economic section for the bridge.
In continuous bridges the stresses are reduced due to negative moments developed at pier or
supports. Thus continuous span bridges have considerable saving compared to simply supported
bridge construction. However; this study considered simple supported bridge due to the above
advantages.

Page 41
CHAPTER THREE
3 Analysis and Design of Pre-Stressed Concrete Bridge
3.1 Analysis of Bridge with Ballasted Track System
Assumptions
Concrete is homogeneous elastic material and within the range of working stresses both
materials concrete & steel behave elastically
Plane section before bending remain plane
Sign convention :- in the foregoing computation
(+) is for compression
(-) is for tensile stress
An average of 22% loss in case of pretension and 18% in post-tension may be assumed
with condition of over tensioning has been applied to overcome friction and anchorage
losses.
3.1.1 Section Properties of Pre-Stressed Precast Girder
Centroid of trapezium (form top of trapezium), Y=
(3.1)
Second moment of inertia at center of trapezium is =
(3.2)
Centroid of rectangle, ӯ =
(3.3)
Second moment of inertia at center of rectangle is =
(3.4)

Page 42
Section modulus, Z is two types which is
Zt =
and (3.5)
Zb =
(3.6)
Where, ӯ is measured from base or bottom of rectangle.
3.1.2 Section Properties of Pre-Stressed Precast - in Situ Composite Deck Girder
Centroid of composite structure is ӯ = ∑
∑ (3.7)
Where,
- Area of components of composite structure
- Centroid of components of composite structure
- Area of composite structure
When a composite area is composed of a large number of parts, it is convenient to tabulate the
results for each of parts in terms of its area A, its centroidal moment of inertia I, the distance d
from its centroidal axis to the axis about which the moment of inertia of the entire section is
being computed, and the product A×d2. For any one of the parts the moment of inertia about the
desired axis by the transfer of axis theorem is Ī + A . Thus, for the entire section the desired
moment of inertia becomes I = ∑ ∑ and the tabulation include
Part Area, A dx dy A×dx2 A×dy
2 Īx Īy
Sums ∑
∑ ∑
∑ ∑
From the sums of the four columns, then, the moment of inertia for the composite area about the
x- and y- axes become
Ix = ∑ ∑ (3.8)
Iy = ∑ ∑ (3.9)

Page 43
3.1.3 Analysis Procedure for Different Stages of Loading
1. For precast
Bending stress analysis of a PC member has two cases and calculation may be made:
a) At transfer
Self-weight &
Pre-stress force
Stresses Immediately after Pre Stressing
fut = Pi/Apc - Pi × e/Ztp + M(gp) /Ztp ≥ - ftt (3.10)
flt = Pi/Apc + Pi × e/Zbp - M(gp) /Zbp ≤ fct (3.11)
Pi = pre stressing force immediately after pre stressing
Apc = b×h, area of concrete, Ztp = section modulus top,
Zbp = section modules bottom
Mgp = bending moment caused by the own weight of precast.
fct = permissible compressive stresses in concrete at the moment of pre stressing.
ftt = permissible tensile stresses in concrete at the moment of pre stressing.
b) Under Working (at Service)
Self-weight
Cast-in situ deck &
Pre-stressing force

Page 44
Stresses after all Losses of Pre Stress
flw = Pe/Apc +Pe × e/Zbp – M(gp+gin-situ) /Zbp ≥ -ftw (3.12)
fuw = Pe/Apc - Pe × e/Ztp + M(gp+gin-situ) /Ztp ≤ fcw (3.13)
Where, Pe - is the effective pre stressing force after all losses.
M (gp+gin) = Bending moment caused by maximum total load of precast and cast-in situ.
2. For Precast-Cast-in Situ Composite Structure
In this case, only one stage has been discussed, because pre-stress force already transferred in the
stage of precast.
Under Working (at Service)
Self-weight (precast plus cast-in situ deck)
Superimposed dead load
Live load &
Pre-stressing force
Stresses after all Losses of Pre Stress and the full Working Load acts on the Member
flw = Pe/Apc +Pe × e/Zbp – M(g1+g2 +q) /Zbc ≥ -ftw (3.14)
But -ftw is zero for fully pre-stressed
fuw = Pe/Apc - Pe × e/Ztp + M(g1+g2 + q) /Ztc ≤ fcw (3.15)
Where, Pe - is the effective pre stressing force after all losses.
M (g1+ g2+q) = bending moment caused by maximum total load (self-weight, superimposed load
and live load).

Page 45
Ultimate Limit State of a Cross Section
Consider the PC member when stressed nearly to failure.
NP = AP × fpyd, (3.16)
Where, fpyd is the design strength of tendon
fpyd = 0.9×fP (3.17)
fP = fpk/ϒs, (3.18)
Where, ϒs is partial safety factor (1.15)
AP = area of tendons‟ cross section
∑ = o
Np = Nc = y×b×fcd (3.19)
y =
, Z =d-y/2 (3.20)
∑ = o
Mu = Nc × Z = Np × Z (3.21)
Design moment must be less than ultimate moment ( ≤ Mu)
3.2 Analysis of Bridge with Slab Track System
The procedure for analysis of bridge with slab track system is similar with ballasted track
system.
3.2.1 Section Properties of Pre-Stressed Precast Girder
As discussed above, section properties of pre-stressed precast girder in ballasted & slab case are
the same. Therefore the reader can refer the sub topic 3.1.1 in this thesis.

Page 46
3.2.2 Section Properties of Pre-Stressed Precast-Cast in Situ Composite Deck Girder
Also section properties of pre-stressed precast – cast in situ composite deck girder in ballasted &
slab case are the same. Therefore the reader can refer the sub topic 3.1.2 in this thesis.
3.2.3 Analysis Procedure for Different Stages of Loading
The study used same procedure for this case as discussed above and refer sub topic 3.1.3 in this
thesis.
Basic principle of pre-stressed concrete is discussed below.
Consider the basic case of a simply-supported beam subjected to a uniformly distributed load of
w kN/m:
In this case, we have the maximum mid-span moment as:
M =
(3.22)
Also, if we assume a rectangular section as shown, we have the following section properties:
Case one:
We consider the same beam, but with centroidal axial pre-stress (eccentricity equals zero) as
shown below:

Page 47
Now we have two separate sources of stress:
For failure to occur, the moment caused by the load must induce a tensile stress greater than
.
Hence, just prior to failure, we have:
=
=
(3.23)
WI =
(3.24)
Case two:
In this case we place the pre-stress force at an eccentricity:
Using an equilibrium set of forces as shown, we now have three stresses acting on the section:

Page 48
Thus the stresses are:
Hence, for failure we now have:
= (
) (3.25)
But Mc =
WII =
(
) (3.26)
If, for example, we take e =
, then:
WII =
(
) =
×
= 2×WI (3.27)
So the introduction of a small eccentricity has doubled the allowable service load.
Deflection
Deflections can take place: upwards due to pre stressing (-) & down wards due to transverse
loads (+). The deflection can be calculated using the ordinary deflection formulas shown in the
equation 2.23 and 2.25.
Deflections due to loads: ordinary formula can be applied depending on
: The intensity of loading
: Restraint condition and span
3.2.4 Design of Section in Ballasted Track System
The minimum depth of ballast on the top of bridge deck is 600mm. In the analysis, the study
considered the weight of ballast is including sleeper weight. As shown in the figure below, the
cross section of ballasted railway bridges include deck, precast girder, ballast, sleeper, fastening,

Page 49
rail and etc. The design parameters like compressive strength of concrete, tensile strength of
tendon, span length, depth of precast girder, and eccentricity of tendon are the same for both
ballasted and slab railway bridge.
3.2.5 Design of Section in Slab Track System
The minimum depth of slab on the top of bridge deck is 200mm. In the analysis, the study
considered the weight of slab is including sleeper weight. As shown in the figure below, the
cross section of slab railway bridges include deck, precast girder, slab on the surface of bridge
deck, sleeper, fastening, rail and etc.
3.3 Other Design Consideration
3.3.1 Design Consideration of Ballasted Track System for Shear
Two major modes of shear cracks may be observed namely web shear and flexure shear cracks.
Web Shear Crack: - it is governed by limiting value of the principal tensile stress as developed
in concrete. It is more likely to occur in highly pre stressed members with thin webs [6]
.
Vcw = bw × (I/Q) × √
(3.28)
However, I/Q range between 0.67h, (for rectangle) to 0.85h (for flanged section)
Thus, it is normally recommended to use
Vcw = 0.67 × bw × h × √
(3.29)
Where
fcp is compressive pre stress at the centroid of a section
bw is the breath of web, h is gross depth.
Flexure Shear Cracks: - primarily initiated by flexural cracks and are developed when the
combined shear and flexural tensile stresses produce a principal tensile stress exceeding the design
tensile strength of concrete [6]
.

Page 50
The section capacity in this case on the basis of experiments is given by
Vc = 1 × 0.05 ×b × d × fctd (3.30)
Where, 1 = 1+
≤ 2.0
Md is the bending moment at the cross section where shear capacity is calculated.
Mo = P(Z/Ac + e) , Z is section modulus where flexure shear likely to occur , P is pre-stressing
force at the cross section however, when the shear force exceed the limiting value against
diagonal compression the section must be changed.
When Vc > Vd, only minimum shear reinforcement shall be provided which may be expressed in
the equation 2.26 and 2.27.
3.3.2 Design of Slab Track System in Shear
The study took the same procedure for both ballasted and slab track system in shear. Therefore
the reader can refer sub topic 3.4.1 of this thesis.
3.3.3 Bearings
Designs for Bearings
In the case of post-tensioned members, the pre stress is transferred to concrete by means of
external anchorage, the bearing pressure developed behind the anchorages suitably controlled to
prevent crushing failure of the end block zone. To such effect, limit bearing plates, both at initial
pre stress and after losses are calculated by the equation 2.28 and2.29.

Page 51
CHAPTER FOUR
4 Design Examples and Discussion
As we know that, now a day‟s a railway project is the big project next to grand renaissance dam
in our country. This great project should be studied to make the project economical. From this
project, railway bridge shares great percent and that is one needs to study on railway bridge.
Therefore, this chapter is made to covers analysis of railway bridge as follows. Analysis is made
to make comparative study of bridges design on ballasted and slab track and compare
construction costs.
The study has been taken counter examples of both ballasted and slab railway bridge. In this
example the design parameter, span and cross sections of the bridge are the same for both cases.
Example 1: 15m Span Bridge with Ballasted Track System
A simple span precast post tensioned pre-stressed concrete girder bridge is to be designed for a
railway bridge with cast in situ deck slab, cross section of which shown in figure below. The
span length is 15m and cast in place concrete deck slab is of 300 mm thick, while the ballast is of
600 mm in thickness. The bridge is to serve for the Cooper E-80 rail load (live load)
configuration and the following design data may be used.
Material Properties
Concrete C-50
Mild steel S-500
Pre-stressing tendons fpk = 1800MPa
Unit weight of plain concrete =24kN/m3
Unit weight of reinforced concrete RC =25kN/m3
Unit weight of steel= 78.5kN/m3
Unit weight of sand, gravel and ballast =19kN/m3

Page 52
Figure 4-1 Cross section of ballasted railway bridge
Table 4-1Dimensions of bridge
Span
(mm)
Rail gauge
dist.Sg (mm)
Girder clear
spacing Z (mm)
Live load
configuration
precast web,
bw (mm) Y(mm) h'(mm) X(mm)
15000 1435 1500 E-80 570 1680.00 20 2282.5
Design parameters as follows:
Table 4-2 Design parameters as follows
C-50 (Mpa) S-500 (Mpa) fpk (Mpa) ϒc (Mpa) ϒRc (Mpa) ϒsteel (Mpa) ϒballast (Mpa)
50 500 1800 24 25 78.5 19
fck=50/1.25=0.8 50 = 40Mpa
fpi = 0.75 fpk = 0.75 1800= 1350Mpa
fpe = 0.82 1350Mpa = 1107Mpa since pre-stress is post-tension type
fcd =
=
= 22.667Mpa
fctd = fctk/ϒc, but fctk = 0.21
,
From above, fck = 40 MPa so, fctk = 0.21
= 2.46 MPa
Therefore, fctd = fctk/ϒc = 2.46/ 1.5 = 1.64Mpa
For S-500(Mpa), fyk = 500Mpa.
fyd = fyk / ϒs = 500 / 1.15 = 434.78 Mpa.

Page 53
Now find permissible stress in different stages:
i. Permissible stresses immediately at transfer
fct = 0.6 fck = 0.6 40 = 24MPa
ftt =0.21
= 0.21
= 2.46 MPa
ii. Permissible stresses under working condition (after all losses)
fcw = 0.5 fck = 0.5 40 = 20MPa
ftw=0.75
= 1.84 MPa
iii. Permissible range of stresses at the top of the cross section
ftr = (fcw + ƞ ftt) (4.1)
Where, ƞ-is pre-stress loss factor between 0.8-0.85 for post tensioned case and this study took
average of pre-stress loss factor, 0.82.
ftr = 20+0.82 2.46 = 22Mpa
iv. Permissible range of stresses at the bottom of the cross section
fbr = ƞ fct + ftw (4.2)
fbr = 0.82 24 +1.84 = 21.5 Mpa
Checking of Section Modulus in Different Stage
zt > (Mq+(1-ƞ) Mg1)/ftr or zt > (Mq+Mg2+(1-ƞ) Mg1)/ftr (4.3)
zb > (Mq+(1-ƞ) Mg1)/fbr or zb > (Mq+Mg2+(1-ƞ) Mg1)/fbr (4.4)
To check section modulus, first we should determine the value of the following variables.
1. Find maximum moment and shear force due to live load
From the table 2-3, the maximum moment due to live load (Cooper E-80) for span length 15m is
2,514.10kN-m and moment due to impact load (20% of live load). Therefore moment due to
impact load equals 20% of 2,514.10kN and equals 502.82kN.The maximum moment due to live
load (Mq) equals 2,514.10 plus 502.82kN and equals 3,016.92kN.
Similarly, from the above table 2-3, the maximum shear force due to live load for span length
15m is 767.99kN and impact load from live load is 20% of live load. Therefore impact load

Page 54
equals 20% of 767.99kN and equals 153.60kN. The maximum shear force due to live load equals
767.99kN plus 153.60kN and equals 921.59kN.
2. Find maximum moment and shear force due to self -weight.
i. precast
From the appendix A, area of precast is A = 1,380,825 mm 2
Self -weight = ϒc AP = 25kN/m3 1.38 m
2 = 34.52kN/m
Since our bridge is simple span, so
a. Maximum moment (Mg1) =
=
= 970.89kN-m
b. Maximum shear force =
=
= 258.90kN
ii. Composite structure
From the appendix A, area of composite structure is A =2,265,625mm2
Self-weight = ϒc Ac = 25 kN/m3 2.27m
2 = 56.64kN/m
Since our bridge is simple span, so
a. Maximum moment (Mg1) =
=
=1,593kN-m
b. Maximum shear force =
=
= 424.80kN.
3. Find maximum moment and shear force due to superimposed load.
Figure 4-2 Girder with superimposed load
i. Ballast
Unit weight of sand, gravel and ballast equals 19kN/m3
from [4]
.
A= 1/2(5+5.3) 0.6 =3.09m2

Page 55
Ballast distributed load equals 3.09m2
times 19kN/m3
and equals 58.71kN/m but ballast weight
is shared to two girders. Therefore, for one precast girder ballast weight is half of total ballast
weight. i.e. ballast weight equals half of 58.71 and equals 29.355kN/m
ii. Rail
Rail self-weight is assumed 1.5kN/m [4]
.
iii. Curb
From the above figure, area of curb is A= 1/2(0.3+0.5) 0.8 = 0.32m2
Self- weight = ϒc Acurb = 25 kN/m3 0.32 m
2 = 8kN/m
From above (i, ii, and iii), total superimposed load is 29.355+1.5+8 = 38.855kN/m
Since our bridge is simple span, so
a) Maximum moment (Mg2) =
=
= 1,092.80kN-m
b) Maximum shear force =
=
= 291.41kN.
A. Check section modulus at transfer
i. [Mq+ (1-ƞ) Mg1] / ftr = [3,016.92 + (1- 0.82) ) × 970.89] ×1,000,000 / 22
= 1.45 × 108 mm
3
1.45 × 108 mm
3 ≤ 1.06 10
9 mm
3 ----------------------Ok!!
ii. [Mq+ (1-ƞ) Mg1] / fbr = [3,016.92 + (1- 0.82) 970.89] × 1.000,000 / 21.5
= 1.48 108
mm3
=1.48 × 108 mm
3 ≤ 1.30 10
9 mm
3 ----------------------Ok!!
B. Check section modulus at working
i. [Mq + Mg2 + ( 1-ƞ) Mg1]/ftr = [3,016.92 + 1,092.80 + (1-0.82) × 1,593.02]×1,000,000/22
= 2.00×10⁸
mm3
= 2.00×10⁸
mm3 ≤ 1.38 × 10
9 mm
3 ---------------Ok!!
ii. [Mq + Mg2+ (1-ƞ) Mg1]/fbr = [3,016.92 + 1,092.80 + (1-0.82) × 1,593.02]×1,000,000/21.5
= 2.04 × 10⁸
mm3
= 2.04 × 108 mm
3 ≤
9.09 × 10
8 mm
3------------- Ok!!

Page 56
Load combination
Load factor group I loading =1.4(DL +5/3 (LL +I))
Table 4-3 Load combination
Self Wt
(g)
Dead Load
(SDL)
Live +impact
load ( LL +I)
Total Service
Load Total Factored Load Maximum BM
Maximum
SF
56.64 38.86 107.27 202.76 383.99 10,799.62 2,879.90
Determination of initial pre - stressing force to be applied
Minimum pre - stressing force to be applied on concrete may be expressed as equation (4.5) and
e = ӯ-concrete cover-1/2 Ø where, Ø – is diameter of tendon which may be assumed 100mm.
e =853- 50 - 0.5 100 = 753mm
flw = Pe/Acp +Pe e/Zbp –M(g1+g2 +q) /Zbc ≥ -ftw but -ftw is zero for fully pre-stressed, then
Pe/Acp +Pe e /Zbp = M (g1+g2+q) /Zbc
Pe = M (q+ g2+g1) /Zbc (Acp Zbp / (Zbp +Acp e))
Pe =
(4.5)
Pe =
Pe = 4,804.02kN
p = Pe/0.82 = 4,804.02/ 0.82 = 5,858.56kN.
Number of high strength steel wires as follows:
Area of tendon =
=
= 4,339.67mm
2
Assume wire diameter is 7mm, therefore; area of one wire is as follows:
Area of one wire =
=
= 38.47mm
2
Number of high strength steel wires required (n) =
=
= 113
n = 113 wires are necessary to pre-stress the concrete.

Page 57
Deflection
I. Deflection due to pre-stress
Since pre-stressing method used in this study is post tensioning, assuming eccentricity profile to
be parabolic and calculated by using equation 2.25 but Ec is unknown and determined by
equation 4.6.
Ec=wc 1.5 0.043 (f'c)1/2
[4]
. (4.6)
wc = Unit weight of concrete in kg/m3
is 2500kg/m3
Again, f'c = Characteristics compressive strength of concrete
fck=50/1.25=0.8 50 = 40Mpa, therefore;
Ec = 2500 1.5 0.043 GPa
Ec= 33.99 GPa and from appendix A, = 1,106,811,332,931mm4, therefore;
Δp
Δp = - 2.70mm ………………..(Upwards)
II. Deflection due to beam self-weight at transfer:
By using equation 2.23, the deflection due to self-weight at transfer is calculated as follows:
Δg
Δg = 0.60mm ………….. (Downwards)
III. Deflection due to uniformly distributed superimposed dead load:
By using equation 2.23, the deflection due to superimposed dead load is calculated as follows:
Δs
Δs =0.63mm ……………. (Downwards)
IV. Deflection due to live load:
By using equation 2.23, the deflection due to live load is calculated as follows:
Before calculating for deflection, the value of Weq is calculated from the live load moment.
From the above, we have live load moment MLL+I = 3,016.92kN-m
Now the value of distributed live load is, Weq. =
Weq. = 107.27kN/m, therefore;

Page 58
ΔLL+I =
ΔLL+I = 1.74mm ……………. (Downwards)
But, the maximum allowable deflection due to live load plus impact shall not exceed L/640 [4]
.
Therefore, L/640 = 15000/640 = 23.44mm, where L-is in mm.
Δmax = 1.74mm < 23.44mm ……………………………………………..OK!!
V. Total immediately deflection after pre stressing - parabolic tendons
Total immediate deflection is the sum of deflection due to initial pre-stressing force and
deflection due to self-weight at transfer
Δi = Δp + Δg = - 2.70mm + 0.60mm = -2.10mm…….. (Upwards)
VI. Deflection due to self-weight under working:
By using equation 2.23, the deflection due to self-weight under working is calculated as follows:
Δg
Δg = 0.92mm ………….. (Downwards)
VII. Long time deflection:
Long time deflection is the result of creep and shrinkage of concrete and relaxation of stresses in
steel. Therefore, the total long time deflection Δl may be obtained from
Δl = Δc (1+ ) – Δp [(1- ΔP/P) + (1- ΔP/P)] [6]
. (4.7)
Where
Δc = Initial deflection due to transverse loads
Δl = Long time deflection
Δp = Initial deflection due to pre stress force
= Coefficient which account creep, shrinkage etc. ( ~2.0)
ΔP = P-Pe = loss of pre stressing force due to relaxation, shrinkage & creep.
But,
Δc
Where; W- is the sum of live load, composite self-weight and superimposed dead load.
W = 107.27kN/m + 56.64kN/m + 38.84kN/m =202.76kN/m

Page 59
Δc
= 3.29mm.
ΔP = P - ƞ P = P-Pe,
Where; ƞ-is pre-stress loss factor = 0.82 for post tensioned case.
ΔP = P-Pe = 5,858.56 - 0.82×5,858.56= 0.18×5,858.56 =1054.54kN
Δl = Δc × (1+ ) – Δp [(1- ΔP/P) + (1- ΔP/P)]
Δl = 3.29× (1+2) – 2.70× [(1- 1054.54/5,858.56) + (1- 1054.54/5,858.56)]
Δl = 3.29× (3) – 2.70× [0.82+ 1.64] =3.11mm………. (Downwards)
Check web shear and design for flexural shear
Web shear and flexural shear crack are two different cracks as shown in the figure 2.21 and both
are governed by limiting value of the principal tensile stress expressed in equation 3.29 and 3.30.
I. Web shear:
In equation 3.29, fcp is unknown. To get the value of fcp, use the following formula.
fcp = Pe/Apc , but Pe= As × fpe , therefore; fcp =(As fpe)/Apc or fcp = Pe/Apc, hear already pe
calculated above and its equals Pe = 4,804,018.06N, and from appendix A, Apc = 1,380,825mm2,
fcp = 4,804,018.06N/1,380,825mm2 fcp = 3.48Mpa
From above, bw = 570mm, h = 2,180.00mm, fctd = 1.64MPa & Vd = 2,879.90kN.
Therefore; Vcw = (0.82 570×2,180 √ ) ( ) = 2,949.29kN and
Vcw = 2,949.29 > Vd = 2,879.90kN……………………………………………Ok!
II. Flexural shear:
The section capacity (Vc), on the basis of experiments is given by
Vc = β1 ×0.5×b×d×fctd where, β1 = 1+ Mo / Md and now we can calculate the value of
Mo = P (Z/Ac + e). Already, we have the values for P, Zbp, Ac and e.
P = 5,858,558.61, e = 753mm, Acp = 1,380,825mm2, Zbp = 1,297,027,973.54 mm
3
Mo = P (Zbp/Acp + e) = 5,858,558.61N × (1,297,027,973.54/1,380,825+ 753) × (10-6
)
Mo = 9,916.54kN-m but Md =10,799.62kN-m & then,
β1 = 1 +9,916.54/10,799.62 = 1.92 ≤ 2.00 …………….…………………………Ok!

Page 60
Therefore; we can take β1 = 1.92 and now calculate for Vc = β1×0.5×b×d×fctd
Where, b = 570mm, d = hc – cover- half of diameter of tendon = 2180 – 50-0.5×100= 2,080mm
& fctd = 1.64 MPa and Vc = (1.92 ×0.5×570×2080×1.64) × (10-3
) = 1,861.99kN < Vd =
2,879.90kN……………Not ok.
When Vc < Vd, Therefore; shear force sustained by stirrups may be computed for Vs = av×d×fyd /s
Assume that spacing of stirrup is S =150mm , Vs = Vd -Vc =2,879.90 - 1,861.99 =1017.91kN and
av = (Vs × S / d × fyd) = 1017.91×1000 × 150 / (2080× 434.78) = 169mm2. Assume that stirrup
diameter is Ø8. And area of one stirrup is
=
= 50.27mm
2
Number of stirrup (n) = 169/50.27 = 4
III. Limiting value against diagonal compression:
When shear force exceed the limiting value against diagonal compression, then the section must
be changed. Let us see the following.
VRd = 0.25 × fcd × bw ×d = 0.25×22.667×570×2080 × (10-3
) = 6,718.40kN > 2,879.90kN……Ok!
Therefore, the section is adequate for design load

Page 61
Example 2: 15m Span Bridge with Slab Track System
A simple span precast post tensioned pre-stressed concrete girder bridge is to be designed for a
railway bridge with cast in situ deck slab, cross section of which shown in figure below. The
span length is 15m and cast in place concrete deck slab is of 300 mm thick, while the slab track
is 200 mm in thickness. The bridge is to serve for the Cooper E-80 rail load (live load)
configuration.
Checking of Section Modulus in Different Stage
To check section modulus, first we should determine the value of the following variables.
1. Find maximum moment and shear force due to live load
From example 1, the result is as follows:
The maximum moment due to live load (Mq) = 3,016.92kN-m
The maximum shear force due to live load = 921.59kN.
2. Find maximum moment and shear force due to self -weight.
i. precast
From example 1, the result is as follows:
The maximum moment due to self-weight of pre-cast ((Mg1)) = 970.89kN-m
The maximum shear force due to self-weight of pre-cast = 258.90kN
ii. Composite structure
The maximum moment due to self-weight of composite structure ((Mg1)) = 1,593kN-m
The maximum shear force due to self-weight of composite structure = 424.80kN.
3. Find maximum moment and shear force due to superimposed load.
i. Slab instead of ballast
Unit weight of RC concrete is 25kN/m3 &
A= 1/2(5+5.1) × 0.2= 1.01m2
Slab distributed load is 1.01m2
times 25kN/m3
and equals 25.25kN/m but slab weight is shared to
two girders. Therefore, for one precast girder, slab weight is half of total slab weight. i.e. Slab
weight = ½ × (25.25) = 12.625 kN/m
ii. Rail
Rail self -weight is assumed 1.5kN/m [4]
.

Page 62
iii. Curb
From the above figure, area of curb is A= ½ × (0.3+0.5) × 0.8 = 0.32m2
Self-weight = ϒc ×Acurb = 25kN/m3
× 0.32 m2
=8kN/m
From above (i, ii, and iii), total superimposed load is 12.625+1.5+8=22.125kN/m
Since our bridge is simple span, so
a. Maximum moment (Mg2) =
=
= 622.27kN-m
b. Maximum shear force =
=
= 165.94kN.
A. Check section modulus at transfer
a) [Mq+ (1-ƞ) Mg1] / ftr = [3,016.92 + (1- 0.82) ) × 970.89] ×1,000,000 / 22
= 1.45 × 108 mm
3
1.45 × 108 mm
3 ≤ 1.06 10
9 mm
3 ----------------------Ok!!
b) [Mq+ (1-ƞ) Mg1] / fbr = [3,016.92 + (1- 0.82) 970.89] × 1.000,000 / 21.5
= 1.48 108
mm3
=1.48 × 108 mm
3 ≤ 1.30 10
9 mm
3 ----------------------Ok!!
B. Check section modulus at working
a) [Mq + Mg2 + ( 1-ƞ) Mg1]/ftr = [3,016.92 + 622.27+ (1-0.82) × 1,593.02]×1,000,000/22
= 1.78 ×10⁸
mm3
= 1.78 ×10⁸
mm3 ≤ 1.38 × 10
9 mm
3 ---------------Ok!!
b) [Mq + Mg2+ (1-ƞ) Mg1]/fbr = [3,016.92 + 622.27 + (1-0.82) × 1,593.02]×1,000,000/21.5
= 1.82 × 10⁸
mm3
= 1.82 × 108 mm
3 ≤
9.09 × 10
8 mm
3------------- Ok!!
Load combination
Load factor group I loading =1.4× (DL +5/3× (LL +I))
Table 4-4 Load combination
Self
Wt (g)
Dead Load
(SDL)
Live +impact
load ( LL +I)
Total Service
Load
Total Factored
Load
Maximum
BM
Maximum
SF
56.64 22.13 107.27 186 361 10,140.88 2,704.23
Determination of initial pre - stressing force to be applied
Minimum pre - stressing force to be applied on concrete may be expressed as equation (4.5) and

Page 63
Pe =
p = Pe/0.82 = 4,407.64/ 0.82 = 5,375.17kN.
Number of high strength steel wires as follows:
Area of tendon =
=
= 3,981.61mm
2
Assume wire diameter is 7mm, therefore; area of one wire is as follows:
Area of one wire =
=
= 38.47mm
2
Number of high strength steel wires required (n) =
=
= 104
n = 104 wires are necessary to pre-stress the concrete.
Deflection
I. Deflection due to pre-stress
Since pre-stressing method used in this study is post tensioning, assuming eccentricity profile to
be parabolic and calculated by using equation 2.25.
Δp
Δp = - 2.5mm ………………..(Upwards)
II. Deflection due to beam self-weight at transfer:
By using equation 2.23, the deflection due to self-weight at transfer is calculated as follows:
Δg
Δg = 0.60mm ………….. (Downwards)
III. Deflection due to uniformly distributed superimposed load:
By using equation 2.23, the deflection due to superimposed dead load is calculated as follows:
Δs
Δs = 0.36mm ……………. (Downwards)

Page 64
IV. Deflection due to live load:
By using equation 2.23, the deflection due to live load is calculated as follows:
ΔLL+I =
=
ΔLL+I = 1.74mm ……………. (Downwards)
But, the maximum allowable deflection due to live load plus impact shall not exceed L/640 [4]
.
Therefore, L/640 = 15000/640 = 23.44mm, where L-is in mm.
Δmax = 1.74mm < 23.44mm ……………………………………………..OK!!
V. Total immediately deflection after pre stressing - parabolic tendons
Total immediate deflection is the sum of deflection due to initial pre-stressing force and
deflection due to self-weight at transfer
Δi = Δp + Δg = - 2.5mm + 0.60mm = -1.90mm…….. (Upwards)
VI. Deflection due to self-weight under working:
By using equation 2.23, the deflection due to self-weight under working is calculated as follows:
Δg
= 0.92mm ………….. (Downwards)
VII. Long time deflection:
By using equation 4.7, the deflection due to long time is calculated as follows:
First calculate for W = 107.27kN/m + 56.64kN/m + 22.13kN/m =186.04kN/m,
Δc
= 3.02mm, and then ΔP = P-Pe
=5,375.17 - 0.82×5,375.17 = 0.18×5,375.17 =967.53kN
Therefore; Δl = 3.02× (1+2) – 2.50× [(1- 967.53/5,375.17) + (1- 967.53/5,375.17)]
= 3.02× (3) – 2.50× [0.82+ 1.64] = 2.91mm……. (Downwards)
Check web shear and design for flexural shear
Web shear and flexural shear crack are two different cracks as shown in the figure 2.21and both
are governed by limiting value of the principal tensile stress expressed in equation 3.29 and 3.30.
I. Web shear:
In equation 3.29, fcp is unknown. To get the value of fcp, use the following formula.

Page 65
fcp = Pe/Apc , but Pe= As × fpe , therefore; fcp =(As fpe)/Apc or fcp = Pe/Apc, hear already pe
calculated above and its equals Pe =4,407,639.71N, and from appendix B, Apc = 1,380,825mm2,
fcp = 4,407,639.71N /1,380,825mm2 fcp = 3.19Mpa
From above, bw = 570mm, h = 2,180.00mm, fctd = 1.64MPa & Vd = 2,704.23kN
Therefore; Vcw = (0.82 570×2,180 √ ) ( ) = 2,865.36kN and
Vcw = 2,865.36> Vd =2,704.23kN ………………………………………..……………………Ok!
Flexural shear:
The section capacity (Vc), on the basis of experiments is given by
Vc = β1 ×0.5×b×d×fctd , where, β1 = 1+ Mo / Md and now we can calculate the value of
Mo = P (Z/Ac + e). Already, we have the values for P, Zbp, Ac and e.
P = 5,375,170.37, e = 753mm, Acp = 1,380,825mm2, Zbp = 1,297,027,973.54 mm
3
Mo = P (Zbp/Acp + e) = 5,375,170.37 × (1,297,027,973.54/1,380,825+ 753) × (10-6
)
Mo =9,098.33kN-m but Md =10,140.88kN-m & then,
β1 = 1+ Mo / Md = 1 +9,098.33/10,140.88 = 1.90≤ 2.00 ……………………………………Ok!
Therefore; we can take β1 = 1.90 and now calculate for Vc = β1×0.5×b×d×fctd
Where, b = 570mm, d = hc - cover - half of diameter of tendon = 2180 – 50-0.5×100= 2,080mm
& fctd = 1.64 MPa and Vc = (1.90×0.5×570×2080×1.64) × (10-3
) = 1,841.57kN < Vd
=2,704kN…………………………………….. Not ok.
When Vc < Vd, Therefore; shear force sustained by stirrups may be computed for Vs = av×d×fyd /s
Assume that spacing of stirrup is S =150mm , Vs = Vd -Vc =2,704kN -1,841.57kN=862.67 kN
and av = (Vs × S / d × fyd) = 862.67 ×1000 × 150 / (2080× 434.78) = 143.09mm2
Assume that
stirrup diameter is Ø8. And area of one stirrup is
=
= 50.27mm
2
Number of stirrup (n) = 143.09/50.27 = 3
IV. Limiting value against diagonal compression:
When shear force exceed the limiting value against diagonal compression, then the section must
be changed. Let us see the following.
VRd = 0.25 × fcd × bw ×d = 0.25×22.667×570×2080 × (10-3
) = 6,718.40kN > 2,704kN ……Ok!
Therefore, the section is adequate for design load

Page 66
Example 3: 40m Span Bridge with Ballasted Track System
A simple span precast post tensioned pre-stressed concrete girder bridge is to be designed for a
railway bridge with cast in situ deck slab, cross section of which shown in figure below. The
span length is 40m and cast in place concrete deck slab is of 300 mm thick, while the ballast is of
600 mm in thickness. The bridge is to serve for the Cooper E-80 rail load (live load)
configuration.
Checking of Section Modulus in Different Stage
To check section modulus, first we should determine the value of the following variables.
1. Find maximum moment and shear force due to live load
From the table 2-3, the maximum moment due to live load E-80 for span length 40m is
14929.33kN-m and moment due to impact load (20% of live load). Therefore moment due to
impact load equals 20% of 14929.33 kN and equals 2985.87kN. The maximum moment due to
live load (Mq) equals 14929.33 plus 2985.87kN and equals 17915.20kN.
Similarly, from the above table 2-3, the maximum shear force due to live load for span length
40m is 1658kN and impact load from live load is 20% of live load. Therefore impact load equals
20% of 1658kN and equals 331.60kN. The maximum shear force due to live load equals 1658kN
plus 331.60kN and equals 1989.60kN.
2. Find maximum moment and shear force due to self-weight
i. For precast
From the above table, area of precast is Acp = 1,851,300 mm2
Self-weight = ϒc AP = 25kN/m3 *
1.85m2
= 46.25kN/m
Since our bridge is simple span and span length is 40m,
a) Maximum moment (Mg1) =
=
= 9,250kN-m
b) Maximum shear force =
=
= 925kN.
ii. For Composite structure
From the above table, area of composite structure is Acc = 2,733,700mm2
Self-weight = ϒc Ac = 25 kN/m3
× 2.73m2 = 68.34kN/m
Since our bridge is simple span and span length is 40m,

Page 67
a. Maximum moment (Mg1) =
=
= 13,668.50kN-m
b. Maximum shear force =
=
= 1,366.85kN.
3. Find maximum moment and shear force due to superimposed load.
From the example 1, total superimposed load is 38.855kN/m
Since our bridge is simple span and span length is 40m,
a. Maximum moment (Mg2) =
=
= 7771kN-m
b. Maximum shear force =
=
= 777kN.
A. Check section modulus at transfer
a) [Mq+ (1-ƞ) Mg1] / ftr = [1,7915.20 + (1- 0.82) × 9,250] ×1,000,000 /22
= 8.90 × 10⁸
mm3
=8.90 × 10⁸
mm3 ≤ 1.64 × 10
9 mm
3-------------------- ok!!
b) [Mq+ (1-ƞ) Mg1] / fbr = [1,7915.20+ (1- 0.82) × 9,250] × 1.000,000 / 21.5
= 9.11 108
mm3
= 9.11 108
mm3 ≤ 2.01 10
9 mm
3-------------------- Ok!!
B. Check section modulus at working
a) [Mq + Mg2 + ( 1-ƞ) Mg1]/ftr = [17915.20 + 7771+ (1-0.82) ] ×1,000,000 /22
= 1.28 109
mm3
= 1.28 109
mm3 ≤ 1.77 109mm
3--------------------------- ok!!
b) [Mq + Mg2+ (1-ƞ) Mg1]/fbr = [17915.20 + 7771 + (1- 0.82) 13,650] ×1.000,000 / 21.5
= 1.31 109
mm3
= 1.31 109
mm3 ≤ 1.32 10
9mm
3------------------------ ok!!
Load combination
Load factor group I loading =1.4(DL +5/3 (LL +I))
Table 4-5 Load combination
Self Wt
(g)
Dead Load
(SDL)
Live +impact
load ( LL +I)
Total Service
Load
Total Factored
Load
Maximum
Design BM
Maximum
Design SF
68.34 38.86 89.58 196.77 359.09 71817.43 7181.74

Page 68
Determination of initial pre - stressing force to be applied
Minimum pre - stressing force to be applied on concrete may be expressed as equation (4.5) and
Pe =
p = Pe/0.82 = 30,404.91/0.82 = 37,079.15kN.
Number of high strength steel wires as follows:
Area of tendon =
=
= 27,466.04mm
2
Assume wire diameter is 7mm, therefore; area of one wire is as follows:
Area of one wire =
=
= 38.47mm
2
Number of high strength steel wires required (n) =
=
= 714.05
n = 715 wires are necessary to pre-stress the concrete.
Deflection
I. Deflection due to pre-stress
Since pre-stressing method used in this study is post tensioning, assuming eccentricity profile to
be parabolic and calculated by using equation 2.25.
Δp
= - 81.15mm ………………..(Upwards)
II. Deflection due to beam self-weight at transfer:
By using equation 2.23, the deflection due to self-weight at transfer is calculated as follows:
Δg
= 22.81 mm ………….. (Downwards)
III. Deflection due to uniformly distributed superimposed load:
By using equation 2.23, the deflection due to superimposed dead load is calculated as follows:
Δs
Δs = 20.31 mm ……………. (Downwards)

Page 69
IV. Deflection due to live load:
By using equation 2.23, the deflection due to live load is calculated as follows:
ΔLL+I =
=
ΔLL+I = 46.82 mm ……………. (Downwards)
But, the maximum allowable deflection due to live load plus impact shall not exceed L/640 [4]
.
Therefore, L/640 = 40000/640 = 62.50mm, where L-is in mm.
Δmax = 46.82 mm < 62.50 mm ……………………………………………..OK!!
V. Total immediately deflection after pre stressing - parabolic tendons
Total immediate deflection is the sum of deflection due to initial pre-stressing force and
deflection due to self-weight at transfer
Δi = Δp + Δg = - 81.15mm + 22.81 mm = -58.34 …….. (Upwards)
VI. Deflection due to self-weight under working:
By using equation 2.23, the deflection due to self-weight under working is calculated as follows:
Δg
= 35.72 mm ………….. (Downwards)
VII. Long time deflection:
By using equation 4.7, the deflection due to long time is calculated as follows:
First calculate for W = 68.34kN/m + 38.855 kN/m + 89.58 kN/m =196.78kN/m,
Δc
= 103mm, and then ΔP = P-Pe
=37,079 – 0.82×37,079 = 0.18×37,079 = 6,675N
Therefore; Δl = 103× (1+2) - 81.15× [(1- 6675/37,079) + (1- 6675/37,079)]
= 103× (3) - 81.15× [0.82+ 1.64] =109.30mm………. (Downwards)
Check web shear and design for flexural shear
Web shear and flexural shear crack are two different cracks as shown in the figure 2.21 and both
are governed by limiting value of the principal tensile stress expressed in equation 3.29 and 3.30
I. Web shear:
In equation 3.29, fcp is unknown. To get the value of fcp, use the following formula.

Page 70
fcp = Pe/Apc , but Pe= As × fpe , therefore; fcp =(As fpe)/Apc or fcp = Pe/Apc, hear already pe
calculated above and its equals Pe = 30,404,905.85N & from appendix C, Apc = 1,851,300mm2,
fcp = 30,404,905.85/ 1,851,300 = 16.42Mpa
From above, bw = 660mm, h = 2,480 mm, fctd = 1.64MPa & Vd = 7,181.74kN
Therefore; Vcw = (0.82 660 2,480 √ ) ( ) = 7,303.42kN and
Vcw = 7,303.42 > Vd = 7,181.74kN………….……………………Ok!
II. Flexural shear:
The section capacity (Vc), on the basis of experiments is given by
Vc = β1 ×0.5×b×d×fctd , where, β1 = 1+ Mo / Md and now we can calculate the value of
Mo = P (Z/Ac + e). Already, we have the values for P, Zbp, Ac and e.
P =37,079,153.48 N, e = 888 mm, Acp = 1,851,300mm2, Zbp = 2,013,522,942.45mm
3
Mo = P (Zbp/Acp + e) =37,079,153.48 N × (2,013,522,942.45/1,851,300 + 888) × (10-6
)
Mo =73,258kN-m but Md =71,817.43kN-m & then,
β1 = 1+ Mo / Md = 1 + 73,258/71,817.43= 2.02 ≥ 2.00 ……………………………Not Ok!
Therefore; we can take β1 = 2 and now calculate for Vc = β1×0.5×b×d×fctd
Where, b = 660mm, d = hc – cover- half of diameter of tendon = 2480 – 50-0.5×100= 2,380mm
& fctd = 1.64 MPa and Vc = (2 ×0.5×660×2380×1.64) × (10-3
) = 2,597.90kN < Vd = 7,181.74
kN………….………………………Not ok.
When Vc < Vd, Therefore; shear force sustained by stirrups may be computed for Vs = av×d×fyd /s
Assume that spacing of stirrup is S =150mm , and Vs = Vd -Vc = 7,181.74-2,597.90 =4,583.85kN
and av = (Vs × S / d × fyd) = 4,583.85 ×1000 × 150 / (2380× 434.78) = 665mm2. Assume that
stirrup diameter is Ø8. And area of one stirrup is
=
= 50.27mm
2
Number of stirrup (n) = 665/50.27 = 14
III. Limiting value against diagonal compression:
When shear force exceed the limiting value against diagonal compression, then the section must
be changed. Let us see the following.
VRd = 0.25 × fcd × bw ×d = 0.25×22.667×660×2380 × (10-3
) = 8,901.20kN > 7,181.74kN……Ok!
Therefore, the section is adequate for design load

Page 71
Example 4: 40m Span Bridge with Slab Track System
A simple span precast post tensioned pre-stressed concrete girder bridge is to be designed for a
railway bridge with cast in situ deck slab, cross section of which shown in figure below. The
span length is 40m and cast in place concrete deck slab is of 300 mm thick, while the slab track
is 200 mm in thickness. The bridge is to serve for the Cooper E-80 rail load (live load)
configuration.
Check section modulus in different stage
To check section modulus, first we should determine the value of the following variables.
1. Find maximum moment and shear force due to live load
From example 3, the result is as follows:
The maximum moment due to live load (Mq) = 17,915.20kN.
The maximum shear force due to live load = 1989.60kN.
2. Find maximum moment and shear force due to self-weight.
i. For precast
From example 3, the result is as follows:
The maximum moment due to self-weight of pre-cast ((Mg1)) = 9,250kN-m
The maximum shear force due to self-weight of pre-cast = 925kN.
iii. For composite structure
From example 3, the result is as follows:
The maximum moment due to self-weight of composite structure (Mg1) = 13,668.50kN-m
The maximum shear force due to self-weight of composite structure = 1,366.85kN.
3. Find maximum moment and shear force due to superimposed load.
From above the example 2, total superimposed load is 12.625+1.5+8=22.125kN/m
Since our bridge is simple span, so
a. Maximum moment (Mg2) =
=
= 4425kN-m
b. Maximum shear force =
=
= 442.50kN.

Page 72
A. Check section modulus at transfer
a) = [1,7915.20 + (1- 0.82) × 9,250] ×1,000,000/22
= 8.90 × 10⁸
mm3
=8.90 × 10⁸
mm3 ≤ 1.64 × 10
9 mm
3-------------------- ok!!
b) [Mq+ (1-ƞ) Mg1] / fbr = [1,7915.20+ (1- 0.82) × 9,250] × 1.000,000 / 21.5
= 9.11 108
mm3
= 9.11 108
mm3 ≤ 2.01 10
9 mm
3-------------------- Ok!!
B. Check section modulus at working
a) [Mq + Mg2 + ( 1-ƞ) Mg1]/ftr = [17915.20 + 4,425+ (1-0.82) ] ×1,000,000 /22
= 1.13 109
mm3
= 1.13 109
mm3 ≤ 1.77 109mm
3--------------------------- ok!!
b) [Mq + Mg2+ (1-ƞ) Mg1]/fbr = [17915.20 + 4,425 + (1- 0.82) 13,650] ×1.000,000 / 21.5
= 1.15 109
mm3
= 1.15 109
mm3 ≤ 1.32 10
9mm
3------------------------ ok!!
Load combination
Load factor group I loading =1.4× (DL +5/3× (LL +I))
Table 4-6 Load combination
Self Wt (g)
Dead Load
(SDL)
Live +impact
load ( LL +I)
Total Service
Load
Total Factored
Load
Maximum
BM
Maximum
SF
68.34 22.13 89.58 180 336 67,133.03 6,713.30
Determination of initial pre - stressing force to be applied
Minimum pre - stressing force to be applied on concrete may be expressed as equation (4.5) and
Pe =
= 27,820kN
p = Pe/0.82 = 27,819,832/ 0.82 =33,926,624.39 N = 33,926.62kN.
Number of high strength steel wires as follows:
Area of tendon =
=
= 25,130.83mm
2
Assume wire diameter is 7mm, therefore; area of one wire is as follows:

Page 73
Area of one wire =
=
= 38.47mm
2
Number of high strength steel wires required (n) =
=
= 653.34
n = 654 wires are necessary to pre-stress the concrete.
Deflection
I. Deflection due to pre-stress
Since pre-stressing method used in this study is post tensioning, assuming eccentricity profile to
be parabolic and calculated by using equation 2.25.
Δp
Δp = - 74.20mm ………………..(Upwards)
II. Deflection due to beam self-weight at transfer:
By using equation 2.23, the deflection due to self-weight at transfer is calculated as follows:
Δg
Δg = 22.81 mm ………….. (Downwards)
III. Deflection due to uniformly distributed superimposed dead load:
By using equation 2.23, the deflection due to superimposed dead load is calculated as follows:
Δs
Δs = 11.56 mm ……………. (Downwards)
IV. Deflection due to live load:
By using equation 2.23, the deflection due to live load is calculated as follows:
ΔLL+I =
=
ΔLL+I = 46.82 mm ……………. (Downwards)
But, the maximum allowable deflection due to live load plus impact shall not exceed L/640 [4]
.
Therefore, L/640 = 40000/640 = 62.50mm, where L-is in mm.

Page 74
Δmax = 46.82 mm < 62.50 mm ……………………………………………..OK!!
V. Total immediately deflection after pre stressing - parabolic tendons
Total immediate deflection is the sum of deflection due to initial pre-stressing force and
deflection due to self-weight at transfer
Δi = Δp + Δg = - 74.20mm + 22.81 mm = -51.39 ……………….. (Upwards)
VI. Deflection due to self-weight under working:
By using equation 2.23, the deflection due to self-weight under working is calculated as follows:
Δg
Δg = 35.72 mm ………….. (Downwards)
VII. Long time deflection:
By using equation 4.7, the deflection due to long time is calculated as follows:
First calculate for W = 68.34kN/m + 22.13kN/m + 89.58kN/m =180.05kN/m,
Δc
= 94.24mm, and then ΔP = P-Pe
= 33,927 – 0.82 × 33,927= 0.18 × 33,927= 6,107 N
Therefore; Δl = 94.24× (1+2) - 74.20× [(1- 6,107/33,927) + (1-6,107/33,927)]
= 94.24× (3) – 74.25× [0.82+ 1.64] =100.07mm……. (Downwards)
Check web shear and design for flexural shear
Web shear and flexural shear crack are two different cracks as shown in the figure 2.21 and both
are governed by limiting value of the principal tensile stress expressed in equation 3.29 and 3.30
II. Web shear:
In equation 3.29, fcp is unknown. To get the value of fcp, use the following formula.
fcp = Pe/Apc , but Pe= As × fpe , therefore; fcp =(As fpe)/Apc or fcp = Pe/Apc, hear already pe
calculated above and its equals Pe = 27,819,832N and from appendix D, Apc = 1,851,300mm2,
fcp = 27,819,832/ 1,851,300 = 15.03MPa

Page 75
From above, bw = 660mm, h = 2,480 mm, fctd = 1.64MPa & Vd =6,713.30kN
Therefore; Vcw = (0.82 660 2,480 √ ) ( ) = 7,011.18kN and
Vcw = 7,011.18 > Vd = 6,713.30kN………….……………………Ok!
III. Flexural shear:
The section capacity (Vc), on the basis of experiments is given by
Vc = β1 ×0.5×b×d×fctd , where, β1 = 1+ Mo / Md and now we can calculate the value of
Mo = P (Z/Ac + e). Already, we have the values for P, Zbp, Ac and e.
P = 33,926,624.39N, e = 888 mm, Acp = 1,851,300mm2, Zbp = 2,013,522,942.45mm
3
Mo = P (Zbp/Acp + e) = 33,926,624.39 N × (2,013,522,942.45/1,851,300 + 888) × (10-6
)
Mo =67,029kN-m but Md =67,133.03kN-m & then,
β1 = 1+ Mo / Md = 1 + 67,029/67,133.03= 1.998
β1 = 1.998 ≤ 2.00 ……………………………………Ok!
Therefore; we can take β1 = 1.998 and calculate for Vc = β1×0.5×b×d×fctd
Where, b = 660mm, d = hc - cover - half of diameter of tendon = 2480 - 50 - 0.5×100 = 2,380mm
& fctd = 1.64 MPa and Vc = (1.998 ×0.5×660×2380×1.64) × (10-3
) = 2,570.12kN < Vd =
6,713.30kN………….………………………Not ok.
When Vc < Vd, Therefore; shear force sustained by stirrups may be computed for Vs=av×d×fyd /s
Assume that spacing of stirrup is S =150mm , and Vs = Vd-Vc= 6,713.30 - 2,570.12 = 4,143.19kN
and av = (Vs × S / d × fyd) = 4,143.19 ×1000 × 150 / (2380× 434.78) = 600.59mm
2. Assume that
stirrup diameter is Ø8. And area of one stirrup is
=
= 50.27mm
2
Number of stirrup (n) = 600.59/50.27 = 12
IV. Limiting value against diagonal compression:
When shear force exceed the limiting value against diagonal compression, then the section must
be changed. Let us see the following.
VRd = 0.25 × fcd × bw ×d = 0.25×22.667×660×2380 × (10-3
) = 8,901.20kN > 6,713.30kN……Ok!
Therefore, the section is adequate for design load

Page 76
4.1 Discussion of the Results
The previous chapter target is only analysis and design of superstructure in both ballasted and
slab cases. Now in this section, discussion based on the result from the different loading of both
ballasted and slab track cases are addressed. The analysis considered two different span lengths
with corresponding depth of girder. The first analysis considered 15m span length and the second
analysis considered 40m span length and the effect of span difference also discussed below.
The study considered the same result of loading of live load in simply supported bridges for both
ballasted and slab track as shown in the table 2-3, the maximum moment for span length 15m
due to live load (Cooper E-80) is 2,514.10kN-m and the maximum moment due to impact load
(impact load is 20% of live load). Therefore, the maximum moment for span length 15m due to
impact load is 502.82kN. The maximum moment for span length 40m due to live load (Cooper
E-80) is14, 929.33kN-m and the maximum moment for span length 40m due to impact load is
2985.87kN. Similarly, the maximum shear force for span length 15m due to live load is
767.99kN and the maximum shear force for span length 15m due to impact load is 153.60kN.
The maximum shear force for span length 40m due to live load is 1,658kN and the maximum
shear force for span length 40m due to impact load is 331.60kN.
Here the study considered the same depth of precast girder and deck of bridge for this study and
this assumption leads to conclude the self-weight of bridge is the same for both ballasted and
slab bridge. Since our bridge is simple supported, so the maximum moment for span length 15m
due to self-weight is 1,593kN-m and its shear force is 424.80kN.The maximum moment for span
length 40m due to self-weight is 13,668.50kN-m and its shear force is 1,366.85kN.
The basic difference between both cases is superimposed dead load. In ballasted case, the depth
of ballast on bridge surface already mentioned above is 600mm and its cross sectional area is
3.09m2. Therefore its weight is 58.71kN/m. But ballast weight is shared to two girders.
Therefore, for one precast girder, ballast weight is half of total ballast weight (i.e. ballast weight
is ½ times 58.71kN/m is 29.355kN/m). Besides, rail self-weight assumed 1.5kN/m from [4]
. In
addition to this curb of bridge weight calculated and which is 8kN/m. Therefore total
superimposed load is 38.855kN/m. So the maximum bending moment and shear force for span
length 15m due to superimposed dead load is 1,092.80kN-m and 291.41kN respectively. The

Page 77
maximum bending moment and shear force for span length 40m due to superimposed dead load
is 7,771kN-m and 777kN respectively.
For slab case, the depth of slab instead of ballast on bridge surface already mentioned above and
which is 200mm and its cross sectional area is 1.01m2. Therefore, slab weight is 25.25kN/m but
slab weight is shared to two girders. Therefore, the share of one precast girder is half of total slab
weight. i.e. half of 25.25kN/m, is equals 12.625kN/m. Besides, rail self-weight is assumed
1.5kN/m [4]
. In addition to this curb of bridge weight calculated and which is 8kN/m. Therefore
total superimposed load is 22.125kN/m. So the maximum bending moment and shear force for
span length 15m due to superimposed dead load is 622.27kN-m and 165.94kN respectively. The
maximum bending moment and shear force for span length 40m due to superimposed dead load
is 4,425kN-m and 442.50kN respectively.
To address the objective of this thesis, the result of initial pre - stressing force in both cases is
necessary. Here the initial pre - stressing force introduced in the ballasted case for 15m span
length is 5,858.56kN and the initial pre - stressing force introduced in the slab case for 15m span
length is 5,375.17kN. From this result, the slab case saved 483.39kN. Again, the initial pre -
stressing force introduced in the ballasted case for 40m span length is 37,079.15kN and the
initial pre - stressing force introduced in the slab case for span length 40m is 33,926.62kN. From
this result, the slab case saved 3,152.53kN.
As the study discussed above, in the ballasted case for span length 15m, the deflection
immediately after pre-stressing is 2.70mm upwards, deflection due to beam self-weight at
transfer is 0.60mm downwards, and deflection due to superimposed dead load is 0.63mm
downwards, deflection due to self-weight under working is 0.92mm downwards, total
immediately deflection(combination of deflection due to pre-stress and deflection due to beam
self-weight at transfer ) is 2.10mm upwards, long term deflection is 3.11mm downwards and
deflection due to live load 1.74mm downwards but, the maximum allowable deflection due to
live load plus impact shall not exceed L/640 [4]
and therefore, L/640 is 15000/640 which is
23.44mm, where L-is in mm. Since deflection due to live load is 1.74mm which is less than
23.44mm and from this result the study conclude that the cross section is adequate for this live
load (Cooper E-80).
Page 78
As the study discussed above, in the ballasted case for span length 40m, the deflection
immediately after pre-stressing is 81.15mm upwards, deflection due to beam self-weight at
transfer is 22.81mm downwards, and deflection due to superimposed dead load is 20.31mm
downwards, deflection due to self-weight under working is 35.72 mm downwards, total
immediately deflection(combination of deflection due to pre-stress and deflection due to beam
self-weight at transfer ) is 58.34mm upwards, long term deflection is 109.30mm downwards and
deflection due to live load 46.82mm downwards but, the maximum allowable deflection due to
live load plus impact shall not exceed L/640 [4]
and therefore, L/640 is 40000/640 which is
62.50mm, where L-is in mm. Since deflection due to live load is 46.82mm which is less than
62.50 mm and from this result the study conclude that the cross section is adequate for this live
load (Cooper E-80).
In the slab case for 15m span length, deflection immediately after pre-stressing is 2.5mm
upwards, deflection due to beam self -weight at transfer is 0.60mm downwards, and deflection
due to superimposed dead load is 0.36mm downwards, deflection due to self-weight under
working is 0.92mm downwards, total immediately deflection (combination of deflection due to
pre-stress and deflection due to beam self-weight at transfer) is 1.90mm upwards, long term
deflection is 2.91mm downwards and deflection due to live load 1.74mm downwards but, the
maximum allowable deflection due to live load plus impact shall not exceed L/640 [4]
and
therefore, L/640 = 15000/640 which is 23.44mm, where L-is in mm. Since deflection due to live
load is 1.74mm which is less than 23.44mm and from this result the study conclude that the cross
section is adequate for this live load (Cooper E-80).
In the slab case for 40m span length, deflection immediately after pre-stressing is 74.2mm
upwards, deflection due to beam self -weight at transfer is 22.81mm downwards, and deflection
due to superimposed dead load is 11.56mm downwards, deflection due to self-weight under
working is 35.72 mm downwards, total immediately deflection (combination of deflection due to
pre-stress and deflection due to beam self-weight at transfer) is 51.39mm upwards, long term
deflection is 100.07mm downwards and deflection due to live load 46.82 mm downwards but,
the maximum allowable deflection due to live load plus impact shall not exceed L/640 [4]
and

Page 79
therefore, L/640 = 40000/640 which is 62.50mm, where L-is in mm. Since deflection due to live
load is 46.82mm which is less than 62.50 mm and from this result the study conclude that the
cross section is adequate for this live load (Cooper E-80).
The web shear of ballasted case for 15m span length is 2,949.29kN which is greater than design
shear force which is 2,879.90kN and this satisfies pre condition of web shear. But flexural shear
for this case is 1,861.99kN which is less than design shear force which is 2,879.90kN and this is
not satisfy pre condition of flexural shear. To satisfy this condition, the study needs extra stirrups
and number of stirrup from above 4 Ø8 @ 150mm has been used.
The web shear of ballasted case for 40m span length is 7,303.42kN which is greater than design
shear force which is 7,181.74kN and this satisfies pre condition of web shear. But flexural shear
for this case is 2,597.90kN which is less than design shear force which is 7,181.74kN and this is
not satisfy pre condition of flexural shear. To satisfy this condition, the study needs extra stirrups
and number of stirrup from above 14 Ø8 @ 150mm has been used.
For 15m span length of slab case, the web shear is 2,865.36kN which is greater than design shear
force which is 2,704.23kN and this satisfies pre condition of web shear. But flexural shear for
this case is 1,841.57kN which is less than design shear force which is 2,704.23kN and this is not
satisfy pre condition of flexural shear. To satisfy this condition, the study needs extra stirrups
and number of stirrup from above 3 Ø8 @ 150mm has been used.
For 40m span length of slab case, the web shear is 7,011.18kN which is greater than design shear
force which is 6,713.30kN and this satisfies pre condition of web shear. But flexural shear for
this case is 2,570.12kN which is less than design shear force which is 6,713.30kN and this is not
satisfy pre condition of flexural shear. To satisfy this condition, the study needs extra stirrups
and number of stirrup from above 12 Ø8 @ 150mm has been used.
When shear force exceed the limiting value against diagonal compression, then the section must
be changed. From the analysis result, limiting value against diagonal compression for 15m span
length of ballasted case is 6,718.40kN which is greater than that of design shear force which is
2,879.90kN. Therefore the section provided above is safe. Again, in slab case, the result of
limiting value against diagonal compression is 6,718.40kN which is greater than that of design
shear force which is 2,704kN. Therefore the section provided above is safe also for this case.
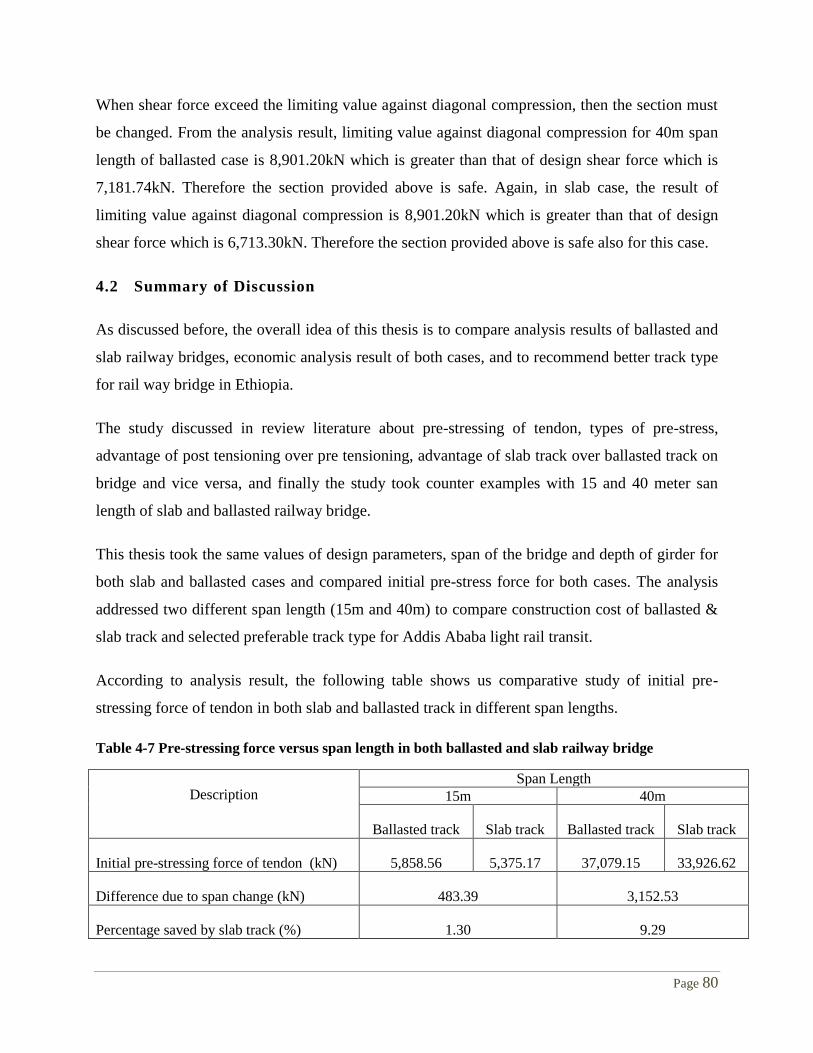
Page 80
When shear force exceed the limiting value against diagonal compression, then the section must
be changed. From the analysis result, limiting value against diagonal compression for 40m span
length of ballasted case is 8,901.20kN which is greater than that of design shear force which is
7,181.74kN. Therefore the section provided above is safe. Again, in slab case, the result of
limiting value against diagonal compression is 8,901.20kN which is greater than that of design
shear force which is 6,713.30kN. Therefore the section provided above is safe also for this case.
4.2 Summary of Discussion
As discussed before, the overall idea of this thesis is to compare analysis results of ballasted and
slab railway bridges, economic analysis result of both cases, and to recommend better track type
for rail way bridge in Ethiopia.
The study discussed in review literature about pre-stressing of tendon, types of pre-stress,
advantage of post tensioning over pre tensioning, advantage of slab track over ballasted track on
bridge and vice versa, and finally the study took counter examples with 15 and 40 meter san
length of slab and ballasted railway bridge.
This thesis took the same values of design parameters, span of the bridge and depth of girder for
both slab and ballasted cases and compared initial pre-stress force for both cases. The analysis
addressed two different span length (15m and 40m) to compare construction cost of ballasted &
slab track and selected preferable track type for Addis Ababa light rail transit.
According to analysis result, the following table shows us comparative study of initial pre-
stressing force of tendon in both slab and ballasted track in different span lengths.
Table 4-7 Pre-stressing force versus span length in both ballasted and slab railway bridge
Description Span Length
15m 40m
Ballasted track Slab track Ballasted track Slab track
Initial pre-stressing force of tendon (kN) 5,858.56 5,375.17 37,079.15 33,926.62
Difference due to span change (kN) 483.39 3,152.53
Percentage saved by slab track (%) 1.30 9.29

Page 81
The above table results presented in the following graph and show us the difference of four
points in both slab and ballasted cases. Let us consider the first point (15, 5,375.17), second point
(15, 5,858.56), third point (40, 33,926.62) and fourth point (40, 37,079.15). In the first and
second point; there is insignificant difference in value, which means the first point saved 1.30%
from second point. But in third and fourth point; there is significant difference in value which
means the third point saved 9.29% from fourth point.
Figure 4-3 Pre-stressing force versus span length in both slab and ballasted railway bridge
The graphical presentation shows us comparative analysis result in three parts. They are below
15m span length, between 15m and 40m span length, and above 40m span length. Above 40m
span length, slab track more economical than ballasted track, again in between 15m and 40m
span length, slab track economical than ballasted track but below 15m span length, ballasted
track seems economical than slab track.
0
5000
10000
15000
20000
25000
30000
35000
40000
0 10 20 30 40 50
Pre
- S
tres
sin
g F
orc
e (k
N)
Span Length (m)
Slab Track
Ballasted Track

Page 82
CHAPTER FIVE
5 Conclusions and Recommendation
5.1 Conclusion
In Addis Ababa Light Rail Transit (LRT), a number of overpasses (railway bridges) with
different span length in different area are considered to study construction cost of both slab and
ballasted cases.
The purpose of this study is to select economical track type for railway bridges. Based on the
thesis objective, the analysis considered 15 and 40meter span length railway bridge for slab and
ballasted cases.
Hear numerical value saved by slab track in 15m span length is 1.30% and in 40m span length is
9.29%. Therefore the study conclude that slab track is economical than ballasted track for span
length greater than 15m. On the other hand, ballasted track seems economical than slab track for
span length less than 15m.
Moreover; the study considered pre-stressed post tensioned concrete and this consideration leads
to use long span bridge due to the fact that pre-stressed post tensioned concrete suitable for long
span bridges than pre-stressed pre-tensioned concrete and hence the study concluded from this
consideration and analysis result, slab track is economical for long span than ballasted track.
Finally, from over all analysis result, discussion and conclusion, the study selected slab track
type than ballasted track and which is preferable & should be adopted in Ethiopian Railway
Projects (Addis Ababa Light Rail Transit).

Page 83
5.2 Recommendation
The slab track can ensure very good geometrical stability of the track comparing to the ballasted
track. This stability of geometry is necessary for railway bridge because of maintenance of
bridge takes a lot of time and this may leads to interruption of transportation. Therefore the study
recommended slab track than ballasted track for railway bridge.
Ballasted track cannot be accessible to road vehicles and slab track can be accessible to road
vehicles especially at level crossing. Therefore, around level crossing, the study recommended
slab track.
Release of dust from the ballast into the environment is causing environmental pollution but slab
track has less environment pollution as compared with ballasted track. Therefore, for Addis
Ababa Light Rail Transit project, the study recommended slab track than that of ballasted track.
The final result of this study show us the economical track type for long span bridge is slab track
and therefore the study recommended that, for long span railway bridge, slab track type should
be adopted.
Besides the objective of the study, this thesis used for national railway project to select
economical track type for simply supported railway bridges. Therefore, the one who interested in
this study area can improve this thesis by considering the limitation of this thesis.

Page 84
6 References
1. A. Mittal and K. Maurya, 2011. Ballast Specification for High Axle Load. selva_651950,
Ministry of Railways, India.
2. A. Simon 2002, The Mechanical Behavior of Ballasted Railway Tracks. Netherlands: Delft
University Press.
3. American Association of State Highway and Transportation Officials, 2010. LRFD Bridge
Design Specifications. Fifth Edition. AASHTO, Washington, D.C
4. American Railway Engineering and Maintenance-of-Way Association, 2010. Concrete
structure and foundation. AREMA, Derek wood Lane, Suite 210, Lanham, MD 20706 USA.
5. K. Amlan and D. Menon, 2012. Pre-stressed Concrete Structures. Indian Institute of
Technology Madras.
6. A. Adamu, 2012. Pre-stressed Concrete Railway Bridges. Addis Ababa, Ethiopia.
7. C. Esveld, 1997. Innovations in Railway Track. Delft University of Technology.
8. C. Esveld, 2001. Modern Railway Track, Second Edition. Delft University of Technology.
9. P. Collin, B. Johansson & H. Sundquist, 2008. Steel Concrete Composite Bridges.
Stockholm, Sweden.
10. C. Caprani, 2006/7. Civil Engineering Design (1) Pre-stressed Concrete. Rasiduzzaman
Rashid, Monash University.
11. Ministry of Work and Urban Development, (1995). Ethiopian Building Code Standard.
(EBCS-2), Addis Ababa Ethiopia
12. J. Wiley, 2002. Engineering mechanics Volume 1 Statics, Fifth edition. Von Hoffman press,
United States of America
13. C. Bonnett, 1996. Practical Railway Engineering. Imperial College Press, London.
14. Z. Kitaw, 2005. Analysis and Design of Precast - Cast in Situ Concrete Composite Bridges.
Addis Ababa, Ethiopia.
15. B. Lichtberger, 2005. Track compendium. Eurail Press, Latin American
16. Modjeski and Masters consulting Engineers, 2003. Comprehensive design example for pre-
stressed concrete girder super structure bridge with commentary. U.S. Government Printing
Office, Washington, D.C.
17. O. Nigel and Q. Franz, 2001. Innovative Track Systems Criteria for their Selection. European
Community.

Page 85
18. Pre-Stressed Concrete Institution (PCI), 2003. Bridge design manual. Sergio, USA.
19. Q. Franz. 2001. Innovative Track Systems Technical Construction. European Community.
20. R. Bastin, 2005. Development of German non-ballasted track forms. ICE, UK.
21. T. Semma, 2009. Reinforced Concrete handbook. Arbaminch Univercity, Ethiopia.
22. Ruble E, 1955. Impact in Railroad Bridges, American Society of Civil Engineers - Official
Site, ASCE Proceedings.
23. Spring, 2011. Introduction to Pre-stressed Concrete. [Online]. [02/04/2014]. Available from:
https://prestressedconcrete.wordpress.com/2011/08/18/introduction-to-prestressed-concrete/.
24. , G. Michas, 2012. Slab Track Systems for High-Speed Railways. Royal Institute of
Technology, Stockholm, Sweden
25. G. GILLET, 2010. Simply supported composite railway bridge: a comparison of ballasted
and ballast-less track alternatives. Royal Institute of Technology, Stockholm, Sweden.
26. Task Group 6.5, 2006. Pre-cast concrete railway track systems. International Federation for
Structural Concrete, Lausanne, Switzerland.
27. W.Chen and L.Duan, 2000. Bridge Engineering Handbook. CRC Press LLC, Boca Raton
London, New York, Washington, D. C.
28. Wee Loon Lim, 2004. Mechanics of Railway Ballast Behavior. The University of
Nottingham, England.
29. Washington State Department of Transportation, 2014. Bridge Design Manual. (WSDOT),
Washington, D.C
30. Y. Bezin, 2010. The dynamic response of slab track constructions and their benefit with
respect to conventional ballasted track. Taylor & Francis, Manchester, UK.

Page I
7 Appendix
Appendix-A
Arithmetic calculation of area of pre-cast, area of composite structure, centroid of precast,
centroid of composite structure, second moment of inertia of precast, second moment of inertia
of composite structure, section modulus of precast and section modulus of composite structure in
ballasted case (15m span) as follows:
First, find the relevant dimensions of the pre-cast concrete girder
Figure 7-1 Cross section of precast
After so many trial the study selected pre-cast depth d = 1,900mm
Figure 7-2 Relevant dimensions of the precast concrete girder

Page II
Section properties of precast
Precast and composite structure section properties discussed below. The following figures show
us, neutral axis, second moment of inertia and total area of precast structure. All dimensions are
expressed in terms of height of precast.
Table 7-1 First trial dimension of precast
h bt bb h1 h2 h3 h4 h5 bw
h 0.40h 0.50h 0.05h 0.05h 0.40h 0.25h 0.25h 0.30h
1900 760 950 95 95 760 475 475 570
N.B: all dimensions are in mm.
Determination of the centroid of the precast girder
Figure 7-3 Centroid of precast measured from x-axis
Ap ӯp =A1 ӯ1 +A2 ӯ2 +A3 ӯ3+A4 ӯ4 +A5 ӯ5
ӯp = ӯ ӯ ӯ ӯ ӯ
Table 7-2 Determination of centroid of precast
Area
Height
(mm)
base 1
(mm)
base 2
(mm)
Area Ai
(mm)2
Ӯi
(mm)
Ai * ӯi
(mm)3
A1 95 760 760 72,200 1,853 133,750,500
A2 95 760 570 63,175 1,760 111,172,958
A3 760 570 570 433,200 1,330 576,156,000
A4 475 570 950 361,000 693 250,067,708
A5 475 950 950 451,250 238 107,171,875
∑= 1,380,825 ∑ 1,178,319,042
ӯ 853 mm
N.B: Area of trapezium and rectangle solved by the following formulae.
AT =
(a +b) h and AR = b h

Page III
Determination of the second moment of inertia of the precast girder
Figure 7-4 Second moment of inertia of precast
Table 7-3 Determination of second moment of inertia for precast
Area
Height
(mm)
base 1
(mm)
base 2
(mm)
Īi
(mm)4
Area Ai
(mm)2
di
(mm)
di2
(mm)2
Ai * di2
(mm)4
A1 95
760
760
54,300,417
72,200
999
998,312
72,078,145,140
A2 95
760
570
47,189,648
63,175
906
821,593
51,904,138,238
A3 760
570
570
20,851,360,000
433,200
1,330
1,768,900
766,287,480,000
A4 475
570
950
6,646,144,748
361,000
161
25,804
9,315,204,362
A5 475
950
950
8,484,440,104
451,250
616
379,264
171,142,930,274
∑
36,083,434,917
1,380,825 ∑
1,070,727,898,014
ĪP
1,106,811,332,931 mm4
Īp = (Ī1+ Ī2+ Ī3+ Ī4+ Ī5) +A1 D12+ A2 D2
2+ A3 D3
2+ A4 D4
2+ A5 D5
2
Īp = ∑ ∑ i= 1, 2, 3 ……
Īp = 1,106,811,332,931 mm4
Section modulus of precast structure
Zbp =
=
= 1.30 10
9 mm
3
Ztp =
=
= 1.06 10
9 mm
3

Page IV
The following figures show us, precast and cast in situ composite structure neutral axis, second
moment of inertia and total area of composite structure.
Determination of the centroid of the composite girder
Figure 7-5 Centroid of precast and cast in situ composite structure
Ac ӯc =A1 ӯ1 +A2 ӯ2 +A3 ӯ3+A4 ӯ4 +A5 ӯ5 +A6 ӯ6 - A7 ӯ7
ӯc =
Table 7-4 Determination of the centroid of the composite girder
Area Height
(mm)
base 1
(mm)
base 2
(mm)
Area Ai
(mm2)
ӯi
(mm)3
Ai * ӯi
(mm)3
A1
95
760
760
72,200
1,853
133,750,500
A2
95
760
570
63,175
1,760
111,172,958
A3
760
570
570
433,200
1,330
576,156,000
A4
475
570
950
361,000
693
250,067,708
A5
475
950
950
451,250
238
107,171,875
A6
300
3,000
3,000
900,000
2,030
1,827,000,000
A7
20
760
760
15,200
1,890
28,728,000
∑=
2,265,625 ∑
2,976,591,042
ӯ
1,314 mm

Page V
Determination of the second moment of inertia of the composite structure
The determination of second moment of inertia of the composite structure is shown in the table
below.
Figure 7-6 Second moment of inertia of composite structure
Table 7-5 Determination of the second moment of inertia of the composite girder
Area
height
(mm)
base 1
(mm)
base 2
(mm)
Īi
(mm)4
Area Ai
(mm2)
di
(mm)
di2
(mm)2
Ai * di2
(mm)4
A1
95
760 760 54,300,417
72,200
539
290,192
20,951,829,738
A2
95
760 570 47,189,648
63,175
446
198,877
12,564,050,403
A3
760
570 570 20,851,360,000
433,200
(16)
262
113,609,003
A4
475
570 950 6,646,144,748
361,000
621
385,762
139,260,060,451
A5
475
950 950 8,484,440,104
451,250
1,076
1,158,434
522,743,325,500
A6
300
3,000 3,000 6,750,000,000
900,000
716
512,934
461,640,846,335
A7
20
760 760 506,667
15,200
576
332,000
5,046,398,024
∑ == 42,832,928,250
2,265,625 ∑
1,152,227,323,405
Īc
1,195,060,251,655 mm4
Section modulus of composite structure
zbc =
=
= 9.09 × 10
8 mm
3
Ztc =
=
= 1.38× 10
9 mm
3

Page VI
Appendix-B
Arithmetic calculation of area of pre-cast, area of composite structure, centroid of precast,
centroid of composite structure, second moment of inertia of precast, second moment of inertia
of composite structure, section modulus of precast and section modulus of composite structure in
slab case (15m span) as follows:
As discussed before in chapter 2, the depth of precast is the same for both ballasted track and
slab track and which is h = 1,900mm.
Section properties of precast
Table 7-6 Dimension of precast
h bt bb h1 h2 h3 h4 h5 bw (mm)
100%h 0.40h 0.50h 0.05h 0.05h 0.40h 0.25h 0.25h 0.30h
1900 760 950 95 95 760 475 475 570
N.B: all dimensions are in mm.
Determination of the centroid of the precast girder
Ap× ӯp =A1×ӯ1 +A2× ӯ2 +A3× ӯ3+A4× ӯ4 +A5× ӯ5
ӯp = ӯ ӯ ӯ ӯ ӯ
Determination of the centroid of the precast girder
Table 7-7 Determination of the centroid of the precast girder
Area
Height
(mm)
base 1
(mm)
base 2
(mm)
Area Ai
(mm2)
ӯi
(mm)
Ai * ӯi
(mm)2
A1 95 760 760 72,200 1,853 133,750,500
A2 95 760 570 63,175 1,760 111,172,958
A3 760 570 570 433,200 1,330 576,156,000
A4 475 570 950 361,000 693 250,067,708
A5 475 950 950 451,250 238 107,171,875
∑= 1,380,825 ∑ 1,178,319,042
ӯ 853 mm
N.B: Area of trapezium and rectangle solved by the following formulae.
AT =
× (a +b) ×h and AR = b×h

Page VII
Determination of the second moment of inertia of the precast girder
Table 7-8 Determination of the second moment of inertia of the precast girder
Area height
(mm)
base 1
(mm)
base 2
(mm)
Īi
(mm)4
Area Ai
(mm)2
di
(mm)
di2
(mm)2
Ai * di2
(mm)4
A1 95 760 760 54,300,417 72,200 999 998,312 72,078,145,140
A2 95 760 570 47,189,648 63,175 906 821,593 51,904,138,238
A3 760 570 570 20,851,360,000 433,200 1,330 1,768,900 766,287,480,000
A4 475 570 950 6,646,144,748 361,000 161 25,804 9,315,204,362
A5 475 950 950 8,484,440,104 451,250 616 379,264 171,142,930,274
∑ 36,083,434,917 1,380,825 ∑ 1,070,727,898,014
ĪP 1,106,811,332,931 mm4
Section modulus of precast structure
Zbp =
=
= 1.30 10
9 mm
3
Ztp =
=
= 1.06 10
9 mm
3
Determination of the centroid of the composite girder
Ac ӯc =A1 ӯ1 +A2 ӯ2 +A3 ӯ3+A4 ӯ4 +A5 ӯ5 +A6 ӯ6 - A7 ӯ7
ӯc =
Table 7-9 Determination of the centroid of the composite girder
Area Height
(mm)
base 1
(mm)
base 2
(mm)
Area Ai
(mm2)
ӯi
(mm)3
Ai * ӯi
(mm)3
A1 95
760 760
72,200
1,853 133,750,500
A2 95
760 570
63,175
1,760 111,172,958
A3 760
570 570
433,200
1,330 576,156,000
A4 475
570 950
361,000
693 250,067,708
A5 475
950 950
451,250
238 107,171,875
A6 300
3,000 3,000
900,000
2,030 1,827,000,000
A7 20
760 760
15,200
1,890 28,728,000
∑=
2,265,625 ∑ 2,976,591,042
ӯ
1,314 mm

Page VIII
Determination of the second moment of inertia of the composite structure
The determination of second moment of inertia of the composite structure is shown in the table
below
Table 7-10 Determination of the second moment of inertia of the composite girder
Area
height
(mm)
base 1
(mm)
base 2
(mm)
Īi
(mm)4
Area Ai
(mm2)
di
(mm)
di2
(mm)2
Ai * di2
(mm)4
A1
95
760 760 54,300,417
72,200
539
290,192
20,951,829,738
A2
95
760 570 47,189,648
63,175
446
198,877
12,564,050,403
A3
760
570 570 20,851,360,000
433,200
(16)
262
113,609,003
A4
475
570 950 6,646,144,748
361,000
621
385,762
139,260,060,451
A5
475
950 950 8,484,440,104
451,250
1,076
1,158,434
522,743,325,500
A6
300
3,000 3,000 6,750,000,000
900,000
716
512,934
461,640,846,335
A7
20
760 760 506,667
15,200
576
332,000
5,046,398,024
∑ == 42,832,928,250
2,265,625 ∑
1,152,227,323,405
Īc
1,195,060,251,655 mm4
Section modulus of composite structure
zbc =
=
= 9.09 × 10
8 mm
3
Ztc =
=
= 1.38× 10
9 mm
3

Page IX
Appendix-C
Arithmetic calculation of area of pre-cast, area of composite structure, centroid of precast,
centroid of composite structure, second moment of inertia of precast, second moment of inertia
of composite structure, section modulus of precast and section modulus of composite structure in
ballasted case (40m span) as follows:
After trial, took height of precast girder, H = 2.2m for 40m span.
Table 7-11 Second trial dimensions of precast
h bt bb h1 h2 h3 h4 h5 bw
h 0.40h 0.50h 0.05h 0.05h 0.40h 0.25h 0.25h 0.30h
2200 880 1100 110 110 880 550 550 660
N.B: all dimensions are in mm.
Determination of the centroid of the precast girder
Ap ӯp =A1 ӯ1 +A2 ӯ2 +A3 ӯ3+A4 ӯ4 +A5 ӯ5
ӯp = ӯ ӯ ӯ ӯ ӯ
Table 7-12 Second trial, determination of the centroid of precast girder
Area Height
(mm) base 1
(mm) base 2
(mm) Area Ai
(mm2)
ӯi
(mm) Ai × ӯi
(mm3)
A1 110 880 880 96,800 2,145 207,636,000
A2 110 880 660 84,700 2,038 172,586,333
A3 880 660 660 580,800 1,540 894,432,000
A4 550 660 1,100 484,000 802 388,208,333
A5 550 1,100 1,100 605,000 275 166,375,000
∑= 1,851,300 ∑ 1,829,237,667
ӯ 988mm

Page X
Determination of the second moment of inertia of the precast girder
Table 7-13 Determination of the second moment of inertia of the precast girder
Area height
(mm) base 1
(mm) base 2
(mm) Īi
(mm)4
Area Ai
(mm2)
di
(mm) di
2
(mm)2
Ai × di2
(mm)4
A1 110 880 880 97,606,667 96,800 1,157 1,338,457 129,562,679,599
A2 110 880 660 84,824,841 84,700 1,050 1,101,526 93,299,282,594
A3 880 660 660 37,480,960,000 580,800 1,540 2,371,600 1,377,425,280,000
A4 550 660 1,100 11,946,649,306 484,000 186 34,596 16,744,365,935
A5 550 1,100 1,100 15,251,041,667 605,000 713 508,487 307,634,673,417
∑ 64,861,082,480 1,851,300 ∑ 1,924,666,281,544
ĪP 1,989,527,364,025 mm4
Acp = 1,851,300 mm2
Section modulus of precast structure
Zbp =
=
= 2,013,691,664mm
3 = 2.01 10
9 mm
3
Ztp =
=
= 1,641,524,228mm
3 = 1.64 10
9 mm
3
Determination of the centroid of the composite girder
Ac ӯc =A1 ӯ1 +A2 ӯ2 +A3 ӯ3+A4 ӯ4 +A5 ӯ5 +A6 ӯ6 - A7 ӯ7
ӯc =
Table 7-14 Determination of the centroid of the composite girder
Area Height
(mm)
base 1
(mm)
base 2
(mm)
Area Ai
(mm2)
ӯi
(mm) Ai × ӯi
(mm3
)
A1 110 880 880 96800 2145.00 207636000
A2 110 880 660 84700 2037.62 172586333.3
A3 880 660 660 580800 1540.00 894432000
A4 550 660 1100 484000 802.08 388208333.3
A5 550 1100 1100 605000 275.00 166375000
A6 300 3000 3000 900000 2330.00 2097000000
A7 20 880 880 17600 2190.00 38544000
∑= 2,733,700 ∑ 3887693667
ӯ 1422.14 mm

Page XI
Determination of the second moment of inertia of the composite structure
The determination of second moment of inertia of the composite structure is shown in the table
below.
Table 7-15 Determination of the second moment of inertia of the composite girder
Determination of the second moment of inertia of the composite girder
Area
height
(mm)
base 1
(mm)
base 2
(mm) Īi
Area Ai
(mm2)
di
(mm)
di2
(mm)
Ai × di2
(mm)4
A1 110 880 880 97,606,667 96,800 723 522,532 50,581,107,939
A2 110 880 660 84,824,841 84,700 615 378,819 32,085,983,208
A3 880 660 660 37,480,960,000 580,800 118 13,892 8,068,404,372
A4 550 660 1,100 11,946,649,306 484,000 620 384,466 186,081,315,919
A5 550 1,100 1,100 15,251,041,667 605,000 1,147 1,315,921 796,132,451,990
A6 300 3,000 3,000 6,750,000,000 900,000 908 824,217 741,795,049,239
A7 20 880 880 586,667 17,600 768 589,615 10,377,221,376
∑ = 71,610,495,813 2,733,700 ∑ 1,804,367,091,292
Īc 1,875,977,587,106 mm4
Section modulus of composite structure
zbc =
=
= 1,319,252,874mm
3 = 1.32 10
9mm
3
ztc =
=
= 1,773,135,716mm
3 = 1.77 10
9mm
3

Page XII
Appendix-D
Arithmetic calculation of area of pre-cast, area of composite structure, centroid of precast,
centroid of composite structure, second moment of inertia of precast, second moment of inertia
of composite structure, section modulus of precast and section modulus of composite structure in
slab case (40m span) as follows:
As discussed before in chapter 2, the depth of precast is the same for both ballasted track and
slab track and which is h = 2,200mm.
Section properties of precast
Table 7-16 Dimension of precast
h bt bb h1 h2 h3 h4 h5 bw (mm)
100%h 0.40h 0.50h 0.05h 0.05h 0.40h 0.25h 0.25h 0.30h
2200 880 1100 110 110 880 550 550 660
N.B: all dimensions are in mm.
Determination of the centroid of the precast girder
Ap× ӯp =A1×ӯ1 +A2× ӯ2 +A3× ӯ3+A4× ӯ4 +A5× ӯ5
ӯp = ӯ ӯ ӯ ӯ ӯ
Determination of the centroid of the precast girder
Table 7-17 Determination of the centroid of the precast girder
Area Height
(mm)
base 1
(mm)
base 2
(mm)
Area Ai
(mm2)
ӯi
(mm) Ai × ӯi
(mm2
)
A1 110 880 880 96,800 2,145 207,636,000
A2 110 880 660 84,700 2,038 172,586,333
A3 880 660 660 580,800 1,540 894,432,000
A4 550 660 1,100 484,000 802 388,208,333
A5 550 1,100 1,100 605,000 275 166,375,000
∑= 1,851,300 ∑ 1,829,237,667
ӯ 988 mm
N.B: Area of trapezium and rectangle solved by the following formulae.
AT =
× (a +b) ×h and AR = b×h

Page XIII
Determination of the second moment of inertia of the precast girder
Table 7-18 Determination of the second moment of inertia of the precast girder
Area height
(mm)
base 1
(mm)
base 2
(mm) Īi
(mm)4
Area Ai
(mm2)
di
(mm)
di2
(mm)2
Ai × di2
(mm)4
A1 110 880 880 97,606,667 96,800 1,157 1,338,457 129,562,679,599
A2 110 880 660 84,824,841 84,700 1,050 1,101,526 93,299,282,594
A3 880 660 660 37,480,960,000 580,800 1,540 2,371,600 1,377,425,280,000
A4 550 660 1,100 11,946,649,306 484,000 186 34,596 16,744,365,935
A5 550 1,100 1,100 15,251,041,667 605,000 713 508,487 307,634,673,417
∑ 64,861,082,480 1,851,300 ∑ 1,924,666,281,544
ĪP 1,989,527,364,025 mm4
Acp = 1,851,300mm2
Section modulus of precast structure
zbp =
=
= 2.01 × 10
9 mm
3
ztp =
=
= 1.64 × 10
9 mm
3
Determination of the centroid of the composite girder
Ac× ӯc =A1× ӯ1 +A2× ӯ2 +A3× ӯ3+A4× ӯ4 +A5× ӯ5 +A6× ӯ6 - A7× ӯ7
ӯc = ӯ ӯ ӯ ӯ ӯ ӯ ӯ
Table 7-19 Determination of the centroid of the composite girder
Determination of the centroid of the composite girder
Area Height
(mm)
base 1
(mm)
base 2
(mm)
Area Ai
(mm2)
ӯi
(mm)
Ai × ӯi
(mm3)
A1 110 880 880 96800 2145.00 207636000
A2 110 880 660 84700 2037.62 172586333.3
A3 880 660 660 580800 1540.00 894432000
A4 550 660 1100 484000 802.08 388208333.3
A5 550 1100 1100 605000 275.00 166375000
A6 300 3000 3000 900000 2330.00 2097000000
A7 20 880 880 17600 2190.00 38544000
∑= 2,733,700 ∑ 3887693667
ӯ 1422.14 mm

Page XIV
Determination of the second moment of inertia of the composite structure
The determination of second moment of inertia of the composite structure is shown in the table
below.
Table 7-20 Determination of the second moment of inertia of the composite structure
Determination of the second moment of inertia of the composite girder
Area
height
(mm)
base 1
(mm)
base 2
(mm) Īi
Area Ai
(mm2)
di
(mm)
di2
(mm)2
Ai × di2
(mm)4
A1 110 880 880 97,606,667 96,800 723 522,532 50,581,107,939
A2 110 880 660 84,824,841 84,700 615 378,819 32,085,983,208
A3 880 660 660 37,480,960,000 580,800 118 13,892 8,068,404,372
A4 550 660 1,100 11,946,649,306 484,000 620 384,466 186,081,315,919
A5 550 1,100 1,100 15,251,041,667 605,000 1,147 1,315,921 796,132,451,990
A6 300 3,000 3,000 6,750,000,000 900,000 908 824,217 741,795,049,239
A7 20 880 880 586,667 17,600 768 589,615 10,377,221,376
∑ = 71,610,495,813 2,733,700 ∑ 1,804,367,091,292
Īc 1,875,977,587,106 mm4
Section modulus of composite structure
zbc =
=
= 1.32 × 10
9 mm
3
ztc =
=
= 1.77 ×10
9 mm
3