Fuzzy upscaling in reservoir simulation: An improved alternative to conventional techniques
10
Fuzzy upscaling in reservoir simulation: An improved alternative to conventional techniques Vida Gholami * , Shahab D. Mohaghegh West Virginia University, 347 MRB, Morgantown, WV 26506, USA article info Article history: Received 15 November 2010 Received in revised form 25 July 2011 Accepted 2 August 2011 Available online 17 October 2011 Keywords: Rock typing Reservoir simulation Upscaling Fussy logic Fuzzy rock typing abstract Rock typing is an essential part of building geological model for an asset. Millions of dollars are invested in logs, core measurements, SCAL studies and geological interpretation that result in definition of different rock types. In most cases rock types that are identified in a reservoir do not have crisp boundaries and display overlapping characteristics. During the upscaling process, multiple rock types that have been identified in a high resolution geological (geocellular) model are approximated into a dominant rock type for any grid block in a reservoir simulation flow model. This defeats the original purpose of performing detail geological and petrophysical studies as far as reservoir flow models are concerned. The objective of this study is to develop a new upscaling methodology based on fuzzy set theory. Fuzzy rock typing is a new upscaling methodology where the inherent uncertainties and vagueness associated with rock typing procedure are accounted for during the development of the geological model that is used in the dynamic modeling. In this paper a numerical simulator has been used in order to set up multiple scenarios that would demonstrate the differences between conventional approach of implementation of rock types in geological models and the new approach that is the subject of this study. Multiple rock types are implemented in a high resolution geological model and upscaling is performed using conventional technique and the Fuzzy rock typing. Results (oil production and water breakthrough time) of models with conventional and the new upscaling methods are compared with the high resolution model to demonstrate the advantages of the new method. It is demonstrated that upscaling using the new methodology leads to better simulation results when compared to high resolution model both in primary production model and in water flooding model. Ó 2011 Elsevier B.V. All rights reserved. 1. Introduction Reservoir rocks having similar texture, grain size, sorting, etc, can be classified (purely geologically) into lithofacies classifications. Each lithofacies indicates a certain depositional environment with a distribution trend and dimension. Petrophysical groups are clas- sified by porosity, permeability, capillary pressure and pore throat size distribution. A Rock Type combines both these classifications by linking petrophysical properties and lithofacies as part of the reservoir rock type definition. According to previous works done, it has been proved that a static rock type cannot be used to simulate the fluid flow behavior in the reservoir (Taghavi et al., 2007). There are a unique set of properties that define the productivity of hydrocarbon in a reservoir. These properties are discussed under the reservoir characterization concept. There is a link between the geological theory and reservoir engineering/management. Reser- voir characteristics can be put in two categories, as far as reservoir scale is considered, namely microscale and macroscale. Microscale properties include pore types, pore connectivity, and capillary and electrical properties, etc., whereas macroscale properties include lateral and vertical connectivity of reservoir layers, flow units, etc. However all these properties are controlled by three geological inputs: depositional texture, diagenesis and tectonic features. The rock type (lithotype) classification which is usually used is only based on the depositional texture and grain size, sorting, effective pore type and diagenesis. According to these criteria, the data needed to define the rock types such as pore throat size distribution can be identified using throat size distribution plot and thin section analysis for each lithotype (Varavur et al., 2005). Varavur et al. 2005 identify significant shortcomings in the current rock typing method used. Some of them are summarized as follows: * Corresponding author. E-mail address: [email protected] (V. Gholami). Contents lists available at SciVerse ScienceDirect Journal of Natural Gas Science and Engineering journal homepage: www.elsevier.com/locate/jngse 1875-5100/$ e see front matter Ó 2011 Elsevier B.V. All rights reserved. doi:10.1016/j.jngse.2011.08.001 Journal of Natural Gas Science and Engineering 3 (2011) 706e715
-
Upload
independent -
Category
Documents
-
view
2 -
download
0
Transcript of Fuzzy upscaling in reservoir simulation: An improved alternative to conventional techniques
at SciVerse ScienceDirect
Journal of Natural Gas Science and Engineering 3 (2011) 706e715
Contents lists available
Journal of Natural Gas Science and Engineering
journal homepage: www.elsevier .com/locate/ jngse
Fuzzy upscaling in reservoir simulation: An improved alternative to conventionaltechniques
Vida Gholami*, Shahab D. MohagheghWest Virginia University, 347 MRB, Morgantown, WV 26506, USA
a r t i c l e i n f o
Article history:Received 15 November 2010Received in revised form25 July 2011Accepted 2 August 2011Available online 17 October 2011
Keywords:Rock typingReservoir simulationUpscalingFussy logicFuzzy rock typing
* Corresponding author.E-mail address: [email protected] (V. G
1875-5100/$ e see front matter � 2011 Elsevier B.V.doi:10.1016/j.jngse.2011.08.001
a b s t r a c t
Rock typing is an essential part of building geological model for an asset. Millions of dollars are investedin logs, core measurements, SCAL studies and geological interpretation that result in definition ofdifferent rock types. In most cases rock types that are identified in a reservoir do not have crispboundaries and display overlapping characteristics. During the upscaling process, multiple rock typesthat have been identified in a high resolution geological (geocellular) model are approximated intoa dominant rock type for any grid block in a reservoir simulation flow model. This defeats the originalpurpose of performing detail geological and petrophysical studies as far as reservoir flow models areconcerned. The objective of this study is to develop a new upscaling methodology based on fuzzy settheory. Fuzzy rock typing is a new upscaling methodology where the inherent uncertainties andvagueness associated with rock typing procedure are accounted for during the development of thegeological model that is used in the dynamic modeling.
In this paper a numerical simulator has been used in order to set up multiple scenarios that woulddemonstrate the differences between conventional approach of implementation of rock types ingeological models and the new approach that is the subject of this study. Multiple rock types areimplemented in a high resolution geological model and upscaling is performed using conventionaltechnique and the Fuzzy rock typing. Results (oil production and water breakthrough time) of modelswith conventional and the new upscaling methods are compared with the high resolution model todemonstrate the advantages of the new method. It is demonstrated that upscaling using the newmethodology leads to better simulation results when compared to high resolution model both in primaryproduction model and in water flooding model.
� 2011 Elsevier B.V. All rights reserved.
1. Introduction
Reservoir rocks having similar texture, grain size, sorting, etc,can be classified (purely geologically) into lithofacies classifications.Each lithofacies indicates a certain depositional environment witha distribution trend and dimension. Petrophysical groups are clas-sified by porosity, permeability, capillary pressure and pore throatsize distribution. A Rock Type combines both these classificationsby linking petrophysical properties and lithofacies as part of thereservoir rock type definition. According to previous works done, ithas been proved that a static rock type cannot be used to simulatethe fluid flow behavior in the reservoir (Taghavi et al., 2007).
There are a unique set of properties that define the productivityof hydrocarbon in a reservoir. These properties are discussed under
holami).
All rights reserved.
the reservoir characterization concept. There is a link between thegeological theory and reservoir engineering/management. Reser-voir characteristics can be put in two categories, as far as reservoirscale is considered, namely microscale and macroscale. Microscaleproperties include pore types, pore connectivity, and capillary andelectrical properties, etc., whereas macroscale properties includelateral and vertical connectivity of reservoir layers, flow units, etc.However all these properties are controlled by three geologicalinputs: depositional texture, diagenesis and tectonic features.
The rock type (lithotype) classification which is usually used isonly based on the depositional texture and grain size, sorting,effective pore type and diagenesis. According to these criteria, thedata needed to define the rock types such as pore throat sizedistribution can be identified using throat size distribution plot andthin section analysis for each lithotype (Varavur et al., 2005).
Varavur et al. 2005 identify significant shortcomings in thecurrent rock typing method used. Some of them are summarized asfollows:

V. Gholami, S.D. Mohaghegh / Journal of Natural Gas Science and Engineering 3 (2011) 706e715 707
1. Significant degrees of overlap between various rock typesobserved on the Porosity/Permeability cross plots.
2. No success proof of the attempts for predicting these lithotypesusing conventional logs and a combination of high technologytools.
3. Having no input data from uncored wells for defining RockTypes and consequent definition of them for the core wells andspatially distributing them (Varavur et al., 2005).
Varavur et al. 2005 have used a new method to define thedynamic rock type in a giant reservoir that is different with the oldscheme which only honors the geological reservoir properties. Themercury injection data has been vastly used in their work. Theclassification generated by clustering of Mercury Injection data hasunique Porosity/Permeability correlation for each class. In this paperapart from the static parameters of the rock types (porosity andpermeability), their dynamic values have been considered as well.
The other issue discussed in this work with affiliation to rocktyping, is theupscaling. Buildinggeologicmodels foranasset requiresrock typing as an essential part. Information necessitated for definingrock types are obtained from logs, core measurements, SCAL studiesandgeological interpretation.Millionsofdollars are invested toattainthis information. Upondefinition of rock types for series of geologicalformation, geo-scientists are asked touse approximationand identifya dominant rock type for any given grid block in a reservoir simula-tion model. This defeats the original purpose of performing detailgeological, petrophysical and geophysical studies as far as reservoirflow models are concerned.
This approximation of multiple and overlapping rock types intoone dominant rock type becomes even more notable when real-izing that a typical grid block in a reservoir flowmodel is almost thesize of six football fields, while most of the rock typing studies areperformed at the core scale.
Each rock type is associated with a series of relative perme-ability and capillary pressure curves. Values identified in this studywill be used in a fuzzy aggregation method in order to identify theway relative permeability and capillary pressure curves should beused to generate values that are used in the reservoir flow modelfor a particular grid block.
It is important to note that the methodology and the resultspresented in this paper marks the start of a larger study that hasbeen initiated to develop a new upscaling technology for reservoirsimulation and modeling by integrating reservoir characterization,geology, petrophysics with the state of the art in artificial intelli-gence and data mining. As such the results presented here shouldbe considered preliminary and part of a work in progress.
2. Literature review
2.1. Upscaling dynamic reservoir characteristics
Avariety of approaches for upscaling high resolution geocellularmodels for flow simulation is reviewed. The number of cells whichcan be handled in a typical reservoir simulator is highly dependenton the type of simulation to be performed and is usually between105 and 106 cells. On the other hand geological models which arereferred to as geocellular models, geostatistical models or fine gridmodels contain 107e108 cells. Computing time, cost and capabil-ities all restrict our ability to use high resolution geocellular modelsfor reservoir fluid flow simulation. As a result there is a need tocluster data into smaller sets of characteristics that represent themost significant aspects of reservoir. This process is called upscaling(Durlofsky, 2005).
Depending on the situation, different upscaling proceduresmight be appropriate. The simulation question being addressed,
production mechanism and level of details which can be consid-ered in the coarse model, will define the idyllic process to use(Durlofsky, 2003).
Upscaling techniques can be categorized based on differentfactors.
One classification is based on the types of parameters upscaled.This category contains single phase upscaling used for moderatedegrees of coarsening and two phases upscaling usually used forhigher degrees of coarsening. Upscaling the relative permeabilityand capillary pressure data are usually reflected on high degrees ofcoarsening. The second classification is in accordance with theway in which the abovementioned parameters are computed.Under the third classification, the upscaling methods are dividedinto analytical and numerical categories in accordance with themethod used.
The only parameters to be upscaled in the single phase flow areporosity and absolute permeability (or transmissibility). However,in two phase flow case, relative permeability can be upscaled aswell. Nevertheless some engineers have always believed in simu-lating the low resolution two phase models only by taking intoaccount the absolute permeability (or transmissibility) andporosity. This approach is referred to as single phase upscaling. Inmodels of this type, the geocellular scale relative permeabilities areused directly on the coarse scale (Durlofsky, 2003).
Some publications have shown that this is not enough to capturethe effects of heterogeneity on two phase fluid simulation usingupscaling only permeability particularly if the correlation length ofthe heterogeneity not represented on the fluid flow simulation gridis significant compared with the well spacing (Durlofsky et al.,1994; Muggeridge, 1991). This often happens when long, thin,high-permeability channels, thin, high-permeability layers, orextensive, but thin, shale barriers are present in the reservoir(Barker and Thibeau, 1997).
With reference to pressure and saturation equations, it can besaid that in single phase upscaling only the pressure equation ismodified while in two phase upscaling parameters in both pressureand saturation equations are altered.
In the second type of classification, two different approaches ofpurely local procedure and global upscaling techniques can bedefined. In purely local procedure only the fine scale area equiva-lent to the coarse block parameters are considered for upscaling.Conversely in the global upscaling technique the coarse modelparameters are computed after simulating the high resolutionmodel.
Baker and Thibeau have summarized different dynamic pseudorelative permeability methods, their properties and limitations intheir work (Barker and Thibeau, 1997). The role of pseudo relativepermeabilities is determining the output flow rate of each phasefrom each grid block. The flow rate and pressure gradient betweeneach grid block and its neighbor is related using the pseudo relativepermeabilities. If the flow is dominated by gravity forces, verticalequilibrium pseudo can be calculated (Coats et al., 1971). On theother hand, if the capillary pressure is dominated, the pseudo maybe calculated by upscaling the permeability of each phase anddividing by the scaled up absolute permeability (Lemouzy et al.,1993).
One of the well known methods for calculating the pseudorelative permeability curve is Kyte and Berry method (Kyte andBerry, 1975). In this method the values of average pressure foreach coarse-grid block and total flow rate of each phase betweeneach pair of neighboring coarse-grid block are computed from thefine grid simulation results. These values are substituted in thecoarse-grid Darcy equations to conjecture the coarse-grid (pseudo)relative permeability values that would be required to reproducethe fine grid flows. Some problems can happen if the net flow of

Fig. 1. Winland plot for case 1.
V. Gholami, S.D. Mohaghegh / Journal of Natural Gas Science and Engineering 3 (2011) 706e715708
a phase is in the opposite direction to the average pressure gradient(Kyte and Berry, 1975).
Stone used the total mobility as away to overcome the problemswith Kyte and Berrymethod (Stone,1991). He suggested calculatingaverage mobility and net fractional flow. His method is not validwhen the effect of capillary pressure and gravity is not neglected(Barker and Thibeau, 1997).
The other method which is widely used is the weighted relativepermeability method. This method is used in the upscalingprogram of ECLIPSE reservoir simulation software, and givessmooth pseudos with values between 0 and 1. In this method, thepseudo relative permeability of a phase is simply calculated byaveraging the relative permeabilities of that phase in certain blocksof the fine grid model. There is not enough validation of repro-ducing the same results as fine scale model, using this method,despite its popularity (Barker and Thibeau, 1997).
2.2. Rock types and flow units
A need to define quasi geological/engineering units to shape thedescription of reservoir zones as storage containers and reservoirconduits for fluid flow have been recognized by petroleum geolo-gists, engineers, and hydrologists. “Flow units” are resultant ofdepositional environment and digenetic process, and differentauthors have defined them in different words (Tiab and Donaldson,2004).
Understanding complex variation in pore geometry withindifferent lithofacies rock types is the key for improving reservoirdescription and exploitation. Core data provide information onvarious depositional and diagenetic controls on pore geometry.
The Rock Type concept was introduced by Archie who classifiedcarbonate rocks on the basis of grain type and the amount of visualporosity. Rock types usually were corresponded to flow units interms of productivity. In fact Rock Types are defined as units of rockdeposited under similar conditions which experienced similardiagenetic processes resulting in a unique porosity-permeabilityrelationship, capillary pressure profile and water saturation fora given height above free water in a reservoir (Archie, 1950).
Porosity, permeability, mercury injection capillary pressure,relative permeability and mineralogical data are usually utilized toportray the reservoir pore system into rock types having similarflow capacity and storage capacity. Characterization of reservoirinto rock types in order to determine flow units incorporategeological, petrophysical and production data (Porras and Campos,2001).
Rock type distribution identification is conspicuous, since it iskey information to define layering and select the best option forproduction test interpretation (Asgari and Sobhi, 2006). Gunteret al. pioneered a graphical method for quantifying reservoir flowunits based on geological framework, petrophysical rock/porestypes, storage capacity, flow capacity, and reservoir process speed(Gunter et al., 1997).
Amaefule et al. introduced the concept of reservoir quality index(RQI), considering the pore throat, pore and grain distribution, andother macroscopic parameters (Amaefule et al., 1993).
2.3. Fuzzy set theory
One can view fuzzy sets as a generalization of classical sets, orcrisp sets as they are sometimes called. Classical sets and theiroperations are particularly useful in expressing classical logic andthey lead to Boolean logic and its applications in digital systems.Fuzzy sets and fuzzy operations, on the other hand, are useful inexpressing the ideas of fuzzy logic leading to applications such asfuzzy controllers (Harris, 2005).
In crisp logic the boundary of the sets are precise while this isnot true for fuzzy logic (FL). In FL this requirement is relaxed andtherefore the set boundaries in this case are vague. A fuzzy set isa set where degrees of membership between 1 and 0 are permitted;it allows partial membership. The fuzzy logic Venn diagram doesnot have a crisp boundary, and boundary zones appear as shading(Harris, 2005). Having the set X as the universe and set A as a fuzzysubset of the universe, the value mA (x) is called the membershipvalue or the grade of membership of x˛X. The membership valuerepresents the degree of x belonging to the fuzzy set A. The value ofthe characteristic functions for crisp sets is either 0 or 1, but themembership value of a fuzzy set can be an arbitrary value between0 and 1.
3. Methodology
This study included several stages and models. For the purposesof brevity only two of the models that had been studied are pre-sented in the article. Readers are encouraged to refer to the thesispublished at West Virginia University (Gholami, 2009) for thecomplete study.
A commercial reservoir simulator has been used (CMG-IMEX) tomodel a single well. The modeled reservoir consists of threedifferent rock types. Specific relative permeability and capillarypressure curves have been assigned to each of the rock types. Fig. 1shows the three overlapping rock types selected for this study ina permeability-porosity cross plot. The detailed explanation for theprocedure is shown below.
It is obvious from Fig. 1 and confirmed by results of somesensitivity analysis that rock type 3 has the most contribution tofluid flow throughout the reservoir. The objective is to study theimpact of overlapping rock types on flow of fluid in the reservoirand test a new upscaling technology that would minimize theinfluence of the upscaling in the outcome of the fluid flow in thereservoir and compare this new technology with the conventional

Table 1High resolution model properties.
High resolution model properties
Property Value Unit
Dx 500 ftDy 500 ftDz 15 ftnx 45ny 45nz 9Reservoir Top 2000 ftBubble point pressure 500 psiInitial reservoir pressure 4500 psiInitial oil saturation 65 percentWater saturation 35 percent
V. Gholami, S.D. Mohaghegh / Journal of Natural Gas Science and Engineering 3 (2011) 706e715 709
techniques so called as single phase upscaling currently being used(Durlofsky, 2003). To accomplish this task following steps areimplemented:
1. Build a high resolutionmodel withmultiple rock types. Run themodel and establish a flow rate profile for well in the highresolution model.
2. Upscale the model using conventional upscaling technique(identifying one rock type as the dominant rock type for eachupscaled grid block). Run the upscaled model and establisha flow rate profile for well in the low resolution (conventionallyupscaled) model.
3. Upscale the model using the Fuzzy Rock Typing (FRT) upscalingtechnique (the details to be followed). Run the FRT upscaledmodel and establish a flow rate profile for the well in the FRTlow resolution model. Compare the three flow rate profilesnamely the high resolutionmodel (representing the geocellularmodel) with the two upscaled models, the conventional andthe FRT upscaling.
Fig. 2. Relative permeability and capill
4. Modify the percent of dominant rock type in the high resolu-tion model and repeat steps 1e3.
The point is that as the percent of the dominant rock type in thehigh resolution model decreases (from 90% to 50%), the conven-tional rock type would still pick the rock type with larger share asthe dominant rock type without a distinction on the role it plays inthe overall fluid flow and the results of the upscaling will notchange. The FRT upscalingmethod, on the other hand, will take intoaccount the contribution of each rock type to the fluid flow duringthe upscaling process. The process of modifying the high resolutionmodel and changing the percentage of the dominant rock type isdescribed in the following sections.
The decisive aspiration of upscaling is to symbolize a reservoirgrid block system with fewer grid blocks without losing the actualmodel’s flow characteristics. The quality of the upscaled model isusually confirmed by doing displacement exercises. Hence, a waterflooding case has been studied as well.
3.1. Case1
3.1.1. High resolution modelFirst the high resolution model is built and run. This model is
representing the high resolution geocellular model with fine scaledata. The general properties of the high resolution model are pre-sented in Table 1.
TheWinland plot used for this study is shown in Fig. 1. As shownin this figure the grid blocks in the high resolution model consist ofthree distinct but overlapping rock types denoted as RT1, 2, 3.
“Winland Plot” is a semi-log cross plot of permeability (mD)versus porosity (%), with isopore throat lines (R35Ports). “R35Ports” correspond to the calculated pore throat radius (microns) at35%mercury saturation from amercury injection capillary pressuretest. They can be calculated directly from Winland’s equation (Eq.
ary pressures for three rock types.

Fig. 3. Winland Plot for Case 2.
Table 4The membership values used for different cases.
RT mK mV Newmembershipvalue
Normalizedmembershipvalue
90% of RT3 RT1 0.267 0.050 0.013 0.049RT2 0.456 0.040 0.018 0.066RT3 0.267 0.910 0.243 0.885
80% of RT3 RT1 0.267 0.160 0.043 0.156
Table 2Number of grid blocks for each rock type out of 75 grids.
Percentageof RT3
Number of RT3grid blocks
Number of RT2grid blocks
Number of RT1grid blocks
100% 75 0 090% 68 3 480% 60 3 1270% 53 3 1960% 45 3 2750% 38 3 34
V. Gholami, S.D. Mohaghegh / Journal of Natural Gas Science and Engineering 3 (2011) 706e715710
(1)) or other equations based on permeability and porosity(Pittman, 1992; Katz and Thompson). In this equation, permeabilityis input in milidarcies and porosity in percent.
log R35 ¼ 0:732þ 0:588� logðKÞ � 0:864� log ðfÞ (1)
R35 pore throat radii is a function of entry size and pore throatsorting, and is a goodmeasure of the largest connected pore throatsin a rock with intergranular porosity.
As explained before, each rock type is associated with certaindynamic reservoir properties (relative permeability and capillarypressure characteristics). The abovementioned curves for threerock types used in this study are demonstrated in Fig. 2.
The high resolution model will be upscaled 75 times. Thisimplies that 75 grid blocks from the high resolution model willcreate one low resolution grid block in the upscaled model. Table 2displays the degree of contribution for all rock types in terms of thenumber of grids belonging to each of the 75 high resolution blocks.
In this case the porosity value is the same for all the rock types.Using this value and the porosity-permeability relationship in eachrock type, the permeabilities are calculated to be 1.8 mD, 4.9 mDand 7.8 mD for rock types 1, 2 and 3 correspondingly (see Fig. 1).
3.1.2. Conventionally upscaled modelThe geological models, referred to as fine grid models, geo-
statistical models or simply geocellular models, represent geolog-ical variation on very fine scales vertically, though their arealresolution is still relatively coarse. For example, a typical geo-statistical model might contain layering of thickness 1 ft or less,though cell sizes in the areal direction might be about 50e100 ft.Thus, fine grid geological descriptions can be expected to growfurther, so the need for reliable upscaling techniques will continue.
In this study a high resolution model was built to symbolizea high resolution replica of the reservoir made based on fine scalegeocellular model data. The geocellular models should be upscaledin order to be run in the reservoir simulators.
The upscaling is performed by the magnitude of 75. The lowresolution model has nine grid blocks in each of X and Y direction.Every three layers in Z direction is upscaled to one layer. Therefore75 high resolution grids create one low resolution block; conse-quently the low resolution model has 243 grid blocks while thehigh resolution one was consisting of 18,225 grids.
In conventional upscaling process, the rock type that has thehigher number of grids in 75 high resolution block will compel its
Table 3Permeability values before and after fuzzy upscaling (60% of rock type 3).
Property Number of highresolution grids
Fuzzy membershipvalue
Value beforeupscaling
Value afterfuzzy upscaling
Kx (mD) RT 1: 27 RT 1: 0.36 RT 1: 1.78 FRT 1: 5.54RT 2: 3 RT 2: 0.04 RT 2: 4.9RT 3: 45 RT 3: 0.60 RT 3: 7.84
properties to the whole block. As it was explained in the lastsections, rock type 3 is the dominant among all, in all cases. Asa result, all 243 blocks will belong to rock type 3 after carrying outthe upscaling. Since it is a fact for all the cases, the upscaled modelachieved by this methodology will be indistinguishable for all ofthem regardless of different rock type distributions.
3.1.3. Fuzzy upscaled modelEach rock type is associated with a series of relative perme-
ability and capillary pressure curves. The approximation of multipleand overlapping rock types into a dominant rock type results indefeating the original purpose of performing a detailed geological,petrophysical and geophysical studies as far as reservoir flowmodels are concerned.
The approach proposed in this research is based on fuzzy settheory. Based on this method, a membership value is defined foreach rock type. This value is calculated based on the quantity of thegrids belonging to each rock type (mv). For instance if out of 75 gridblocks, 38 of them belong to rock type 3, and rock types 2 and 1have a share of 3 and 27 apiece, the membership value for rocktypes 3, 2 and 1 will be 60, 4 and 36 percent correspondingly.
RT2 0.456 0.040 0.018 0.066RT3 0.267 0.800 0.214 0.778
70% of RT3 RT1 0.267 0.250 0.067 0.243RT2 0.267 0.710 0.190 0.690RT3 0.456 0.040 0.018 0.066
60% of RT3 RT1 0.267 0.360 0.096 0.350RT2 0.267 0.600 0.160 0.583RT3 0.267 0.600 0.160 0.583
50% of RT3 RT1 0.267 0.450 0.120 0.438RT2 0.267 0.510 0.136 0.496RT3 0.267 0.510 0.136 0.496
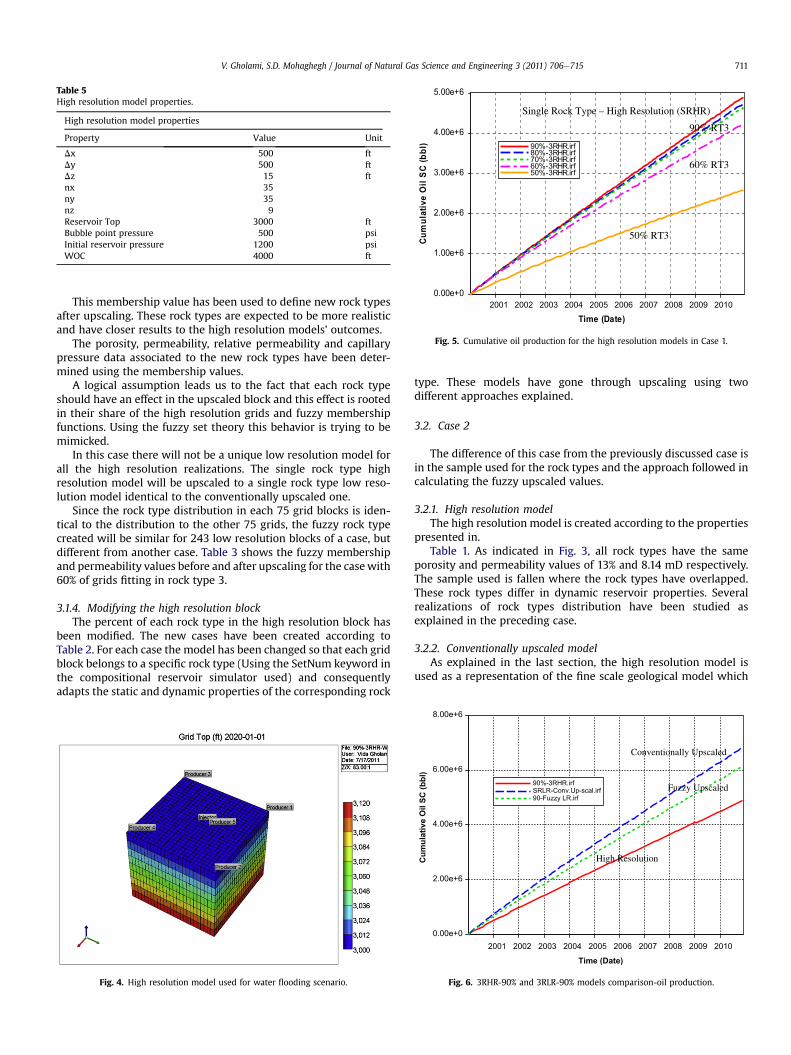
Table 5High resolution model properties.
High resolution model properties
Property Value Unit
Dx 500 ftDy 500 ftDz 15 ftnx 35ny 35nz 9Reservoir Top 3000 ftBubble point pressure 500 psiInitial reservoir pressure 1200 psiWOC 4000 ft
Time (Date)
Cu
mu
la
tiv
e O
il S
C (b
bl)
2001 2002 2003 2004 2005 2006 2007 2008 2009 20100.00e+0
1.00e+6
2.00e+6
3.00e+6
4.00e+6
5.00e+6
90%-3RHR.irf80%-3RHR.irf70%-3RHR.irf60%-3RHR.irf50%-3RHR.irf
Single Rock Type – High Resolution (SRHR)
90% RT3
50% RT3
60% RT3
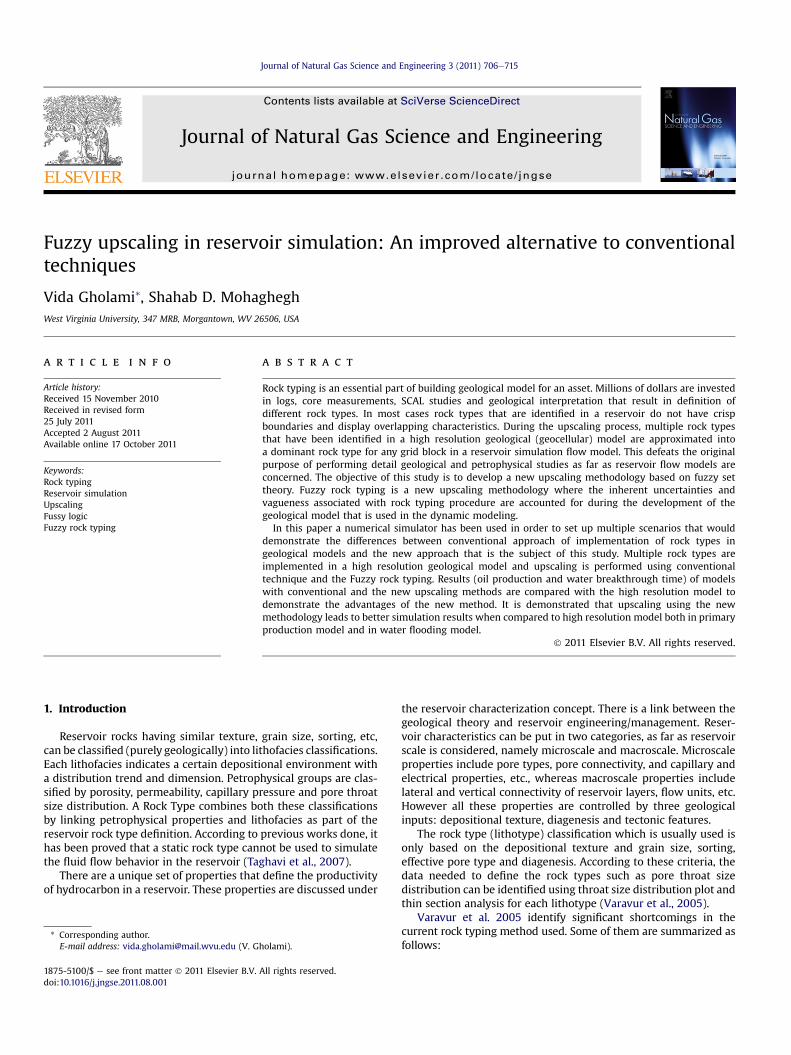
Fig. 5. Cumulative oil production for the high resolution models in Case 1.
V. Gholami, S.D. Mohaghegh / Journal of Natural Gas Science and Engineering 3 (2011) 706e715 711
This membership value has been used to define new rock typesafter upscaling. These rock types are expected to be more realisticand have closer results to the high resolution models’ outcomes.
The porosity, permeability, relative permeability and capillarypressure data associated to the new rock types have been deter-mined using the membership values.
A logical assumption leads us to the fact that each rock typeshould have an effect in the upscaled block and this effect is rootedin their share of the high resolution grids and fuzzy membershipfunctions. Using the fuzzy set theory this behavior is trying to bemimicked.
In this case there will not be a unique low resolution model forall the high resolution realizations. The single rock type highresolution model will be upscaled to a single rock type low reso-lution model identical to the conventionally upscaled one.
Since the rock type distribution in each 75 grid blocks is iden-tical to the distribution to the other 75 grids, the fuzzy rock typecreated will be similar for 243 low resolution blocks of a case, butdifferent from another case. Table 3 shows the fuzzy membershipand permeability values before and after upscaling for the casewith60% of grids fitting in rock type 3.
3.1.4. Modifying the high resolution blockThe percent of each rock type in the high resolution block has
been modified. The new cases have been created according toTable 2. For each case the model has been changed so that each gridblock belongs to a specific rock type (Using the SetNum keyword inthe compositional reservoir simulator used) and consequentlyadapts the static and dynamic properties of the corresponding rock
Fig. 4. High resolution model used for water flooding scenario.
type. These models have gone through upscaling using twodifferent approaches explained.
3.2. Case 2
The difference of this case from the previously discussed case isin the sample used for the rock types and the approach followed incalculating the fuzzy upscaled values.
3.2.1. High resolution modelThe high resolution model is created according to the properties
presented in.Table 1. As indicated in Fig. 3, all rock types have the same
porosity and permeability values of 13% and 8.14 mD respectively.The sample used is fallen where the rock types have overlapped.These rock types differ in dynamic reservoir properties. Severalrealizations of rock types distribution have been studied asexplained in the preceding case.
3.2.2. Conventionally upscaled modelAs explained in the last section, the high resolution model is
used as a representation of the fine scale geological model which
Time (Date)
Cu
mu
la
tiv
e O
il S
C (b
bl)
2001 2002 2003 2004 2005 2006 2007 2008 2009 20100.00e+0
2.00e+6
4.00e+6
6.00e+6
8.00e+6
90%-3RHR.irfSRLR-Conv.Up-scal.irf90-Fuzzy LR.irf
Conventionally Upscaled
Fuzzy Upscaled
High Resolution
Fig. 6. 3RHR-90% and 3RLR-90% models comparison-oil production.

Time (Date)
Cu
mu
la
tiv
e O
il S
C (b
bl)
2001 2002 2003 2004 2005 2006 2007 2008 2009 20100.00e+0
2.00e+6
4.00e+6
6.00e+6
8.00e+6
60%-3RHR.irfSRLR-Conv.Up-scal.irf60-Fuzzy LR.irf
Conventionally Upscaled
Fuzzy Upscaled
High Resolution
Fig. 7. 3RHR-60% and 3RLR-60% models comparison-oil production.
Time (Date)
Cu
mu
lative O
il S
C (b
bl)
2001 2002 2003 2004 2005 2006 2007 2008 2009 20100.00e+0
1.00e+6
2.00e+6
3.00e+6
4.00e+6
5.00e+6
6.00e+6
90%-3RHR.irf80%-3RHR.irf70%-3RHR.irf60%-3RHR.irf50%-3RHR.irf
SRHR
90% RT3
50% RT3
60% RT3
Fig. 9. Cumulative oil production for the high resolution models in case 2.
V. Gholami, S.D. Mohaghegh / Journal of Natural Gas Science and Engineering 3 (2011) 706e715712
should be upscaled in order to be run by the reservoir simulators.The upscaling was performed to the magnitude of 75. Given thatconventional upscaling was used for upscaling, the properties ofthe dominant rock type (rock type 3) were dispensed to all the gridblocks.
3.2.3. Fuzzy upscaled modeApart from calculating the membership values based on the
participation of each rock type in making fine scale model grids(mv), anothermembership value has been computed using the fuzzymembership functions for permeability (mk).
The triangular membership function used in this case can beexpressed as:
mðxÞ¼aðb�xÞ=ðb�cÞ; b�x�c¼aðd�xÞ=ðd�cÞ; c�x�d¼0 (2)
The membership value used at the end is the integration ofeffect of each rock type in making the high resolution model and itsinfluence in the Winland plot. The values for different cases havebeen presented in Table 4. Since the porosity and permeabilityvalues are the same for all rock types, only the dynamic reservoirproperties (relative permeability and capillary pressure) will befuzzy upscaled.
3.2.4. Modifying the high resolution blockAfter modifying the high resolution model by changing the
percent of each rock type, the steps C and D were repeated. Table 4displays the membership values calculated for each case.
Fig. 8. Upscaling error caused by two methods for case 2 at tenth year of oilproduction.
3.3. Waterflooding
Several reservoir models were built in order to investigate theeffect of fuzzy upscaling while an injection is going on in the field.To do this the same strategy used in case 1 was followed. Theproperties for the high resolution model are listed in Table 5.
The schematic of the model has been shown in Fig. 4. Waterinjection starts after 20 years but all the producers have been put toproduction from beginning.
4. Results and discussion
Two cases were discussed in this work. The results are discussedfor both cases.
4.1. Case 1
Fig. 5 compares the cumulative oil production for different highresolution models created based on the percentage of each rocktype. As explained before rock type 3 has the most contribution inthe flow, rock types 2 and 1 come after in sequence. Hence, themore percentage of rock type 3 is, the higher the oil productionwillbe. This is attested in the following figures.
In fact the reduction in number of grids belonging to the rocktype 3 is the reason of decline in amount of produced oil.
Time (Date)
Cu
mu
lative O
il S
C (b
bl)
2001 2002 2003 2004 2005 2006 2007 2008 2009 20100.00e+0
2.00e+6
4.00e+6
6.00e+6
8.00e+6
90%-3RHR.irfSRLR-Conv.Up-scal.irf90-Fuzzy LR.irf
Conventionally Upscaled
Fuzzy Upscaled
High Resolution
Fig. 10. 3RHR-90% and 3RLR-90% models comparison-oil production.

Time (Date)
Cu
mu
la
tiv
e O
il S
C (b
bl)
2001 2002 2003 2004 2005 2006 2007 2008 2009 20100.00e+0
2.00e+6
4.00e+6
6.00e+6
8.00e+6
60%-3RHR.irfSRLR-Conv.Up-scal.irf60-Fuzzy LR.irf
Conventionally Upscaled
Fuzzy Upscaled
High Resolution
Fig. 11. 3RHR-60% and 3RLR-60% models comparison-oil production.
Time (Date)
Cu
mu
la
tive W
ater S
C (b
bl)
2010 2020 2030 2040 2050 20601.00e-5
1.00e-4
1.00e-3
1.00e-2
1.00e-1
1.00e+0
1.00e+1
1.00e+2
1.00e+3
1.00e+4
1.00e+5
1.00e+6
Cumulative Water SC srhr.irfCumulative Water SC 90%.irfCumulative Water SC 80%.irfCumulative Water SC 70%.irfCumulative Water SC 60%.irfCumulative Water SC 50%.irf
Fig. 13. Comparison of water breakthrough time in high resolution models.
V. Gholami, S.D. Mohaghegh / Journal of Natural Gas Science and Engineering 3 (2011) 706e715 713
Rock type 3 was identified as the dominant rock type; therebyits properties were assigned to all coarsened blocks using theconventional upscaling technique. The upscaled model was runand the flow rate profile of the well in low resolution (conven-tionally upscaled) model was established. These results werecompared with the outcome of low resolution model upscaledusing fuzzy rock typing technique, and the high resolutionmodel.
The results for the models having 90% and 60% of the dominantrock type (rock type 3) are demonstrated in Figs. 6 and 7respectively.
The errors caused by upscaling using two explained approachesare compared in Fig. 8.
It can be observed that the error in conventional upscaledmodel goes up as the contribution of the dominant rock type inthe high resolution model reduces. This originated from the factthat the properties of the dominant rock type have been dispensedthrough all coarsened blocks in the conventional upscalingapproach.
The error in fuzzy upscaled model decreases to almost 1% in thecase having 70% of rock type 3. This number increases for after thatwhich can be explained as a function of the rock type allocation inthe high resolution model and direct contact of them with well-bore. Nevertheless, in all cases the percent of error caused by fuzzyupscaled model is astonishingly less than the error generated byconventional upscaling technique.
Fig. 12. Upscaling error caused by two methods for case 1 at tenth year of oilproduction.
4.2. Case 2
The same analysis explained in the preceding section has beencarried out for this case as well. As it can be observed in Fig. 9,decrease in the number of grids associated with rock type 3, causesreduction in oil production. Referring to the role of each rock typein hydrocarbon production, this behavior can be easily explained.
The high resolution and upscaled models results have beencompared. The results for the cases having 90 and 60 percents ofrock type 3 have been demonstrated here as an example (Figs. 10and 11).
Fig. 12 is the graphical representation of the amount of differ-ence between the high resolution model result and both lowresolution models’ outcomes, after ten years of oil production.
As it is demonstrated in Fig. 12 the error caused by conventionalupscaling is significantly more than fuzzy upscaling. As the percentof rock type 3 in high resolutionmodel decreases, the error increasedrastically in conventionally upscaled model. However the errorfollows a descending trend for fuzzy upscaling models except forthe case having 50% of rock type three grid blocks in high resolutionmodel. This might be rooted in the geometry of rock type distri-bution in the reservoir. The blocks that the well is drilled in, and therock types they belong to play an important role in generating thisdifference.
In accordance with the results shown in Figs. 8 and 12, whenoverlap of the rock types is higher, the results obtained by fuzzy
Time (Date)
Cu
mu
lative O
il S
C (b
bl)
2020 2040 2060 2080 2100 2120 2140 2160 2180 22000.00e+0
5.00e+6
1.00e+7
1.50e+7
2.00e+7
Conventionally Upscaled
Fuzzy Upscaled
High Resolution
Fig. 14. 3RHR-80% and 3RLR-80% models comparison-oil production from producer 5.

Time (Date)
Cu
mu
lative W
ater S
C (b
bl)
2020 2040 2060 2080 2100 2120 2140 2160 2180 22001.00e-4
1.00e-3
1.00e-2
1.00e-1
1.00e+0
1.00e+1
1.00e+2
1.00e+3
1.00e+4
1.00e+5
1.00e+6
1.00e+7
Conventionally Upscaled
Fuzzy Upscaled
Conventionally Upscaled
Fig. 15. Comparison of water breakthrough time in producer 5 in high resolution andlow resolution models having 80% of RT3.
V. Gholami, S.D. Mohaghegh / Journal of Natural Gas Science and Engineering 3 (2011) 706e715714
upscaling model are better in comparison with the conventionalupscaling method.
4.3. Waterflooding
It takes a long time for the injected water to make an influenceon the oil production from producers 1 to 4. So only the effect ofinjection on producer 5 which is closer to the injection well hasbeen illustrated here.
As demonstrated in Fig. 13 the water breakthrough occursearlier when contribution of rock type 3 is less. That is because rocktype 3 results in higher oil flow and lower water flow while therelative permeability curves of other rock types 1 and 2 make themmore conductive to water flow rather than oil.
The high resolution and upscaled models results have beencompared. The result for the case having 80 percents of rock type 3has been graphically shown in Fig. 14 as an example.
As it is shown in Fig.14, fuzzy upscaling leads to a closer result tothe high resolution model in terms of oil production from the wellwhich is adjacent to the injection well.
The fuzzy upscaled model is more precise than the conven-tionally upscaled model in predicting the breakthrough time aswell. This can be seen in Fig. 15. The significant difference inbreakthrough time between the high resolution and low resolutionmodels comes from the order of upscaling. If the upscaling orderdecreases, the breakthrough time in low resolution model will getcloser to the high resolution one.
The results after 200 years of production have been compared indifferent cases. The amount of error caused by upscaling by two
Fig. 16. Upscaling error caused by two techniques for water flooding case after200 years of production.
different techniques has been demonstrated in Fig. 16. In all casesthe error from the conventionally upscaled model is more than thefuzzy upscaled ones.
The resolution change itself can cause an error even in the casethat all grid blocks belong to a single rock type. This has beendemonstrated in Fig. 16 as the error corresponding to 100% of rocktype 3.
5. Conclusion
Different realizations have been generated using a commercialreservoir simulator to mimic the behavior of a hypothetic reservoir.
Using multiple studies, the differences between employingconventional approach of implementation of geologic models inthe reservoir flow simulation studies and a new approach havebeen demonstrated. The new methodology used in this study isbased on fuzzy set theory.
The intention of this investigation was to establish a newtechnique for impersonating the reservoir behavior, while theuncertainties have been tried to be taken into account.
According to the outcomes in all cases the fuzzy upscaled modelresults are by far closer to the high resolution model. The differencebetween the conventionally and fuzzy upscaled models becomesmore conspicuous when the percentage of the grids belonged toeach rock types gets close. In this case the share of the grids for thedominant rock type is not significantly higher than the other’s. Thistechnique has been studied for the water flooding case as well andaccording to the results it is more reliable than the conventionalupscaling technique.
According to the analysis performed, the higher the overlap, thebetter is the result.
In reference to the results, this methodology seems to befeasible. It can be studied under other reservoir circumstances tofind more about its applicability.
Acknowledgement
Authors would like to express their gratitude to ComputerModeling Group, for making the CMG reservoir simulator availableto us to perform the reservoir simulations in this paper. They alsowould like to thankmembers of PEARL (Petroleum Engineering andAnalytics Research Laboratory) at WVU for their technical supportduring this work.
References
Amaefule, J.O., Altunbay, M.H., Tiab, D., Kersey, D.G., and Keelan, D.K., 1993.Enhanced Reservoir Description Using Core and Log Data to Identify Hydraulic(Flow) Units and Predict Permeability in Uncored Intervals/Wells. SPE 26436.
Archie, G.E., 1950. Introduction to Petrophysics of Reservoir Rocks, vol. 34. AAPGBulletin, pp. 943e961.
Asgari, A., Sobhi, G.A., 2006. A fully integrated approach for the development ofrock type characterization, in a middle east giant carbonate reservoir. Journal ofGeophysics and Engineering 3, 260e270.
Barker, J.W., Thibeau, S., 1997. A critical review of the use of pseudo-relativepermeabilities for upscaling. SPE Reservoir Engineering 12, 138e143.
CMG-IMEX. [Online] Computer Modeling Group LTD. http://www.cmgroup.com/.Coats, K.H., Dempsey, J.R., Henderson, J.H., March 1971. The use of vertical equi-
librium in two-Dimensional simulation of three-Dimensional reservoir perfor-mance. SPEJ, 63.
Durlofsky, L.J., June 23e27 2003. Upscaling of Geocellular Models for Reservoir FlowSimulation: A Review of Recent Progress. Paper presented at 7th InternationalForum on Reservoir Simulation. B€uhl/Baden-Baden, Germany.
Durlofsky, L.J., June, 2005. Upscaling and Gridding of Fine Scale Geological Modelsfor Flow Simulation. In: 8th International Forum on Reservoir Simulation. IlesBorromees, Stresa, Italy s.n.
Durlofsky, L.J., Jones, R.C.,Miliken,W.J., 7e10 June 1994. ANewMethod for the ScaleUpof Displacement Processes in Heterogeneous Reservoirs. Paper presented at the1994 European Conference on the Mathematics of Oil Recovery. Roros, Norway.

V. Gholami, S.D. Mohaghegh / Journal of Natural Gas Science and Engineering 3 (2011) 706e715 715
Gholami, Vida. 2009. Fuzzy Rock Typing; Enhancing reservoir Simulation andModeling by Honoring High resolution Geological Models. Petroleum andNatural Gas Eng. Dept. Morgantown, WV: thesis Submitted to College ofEngineering and Mineral Resources ate West Virginia University.
Gunter, G.W., Finneran, J.M., Hartman, D.J. and Miller, J.D., October 1997. EarlyDetermination of Reservoir Flow Units Using an Integrated PetrophysicalMethod. Annual Technical Conference and Exhibition. San Antonio, TX: s.n.,SSPE. pp. 5e8.
Harris, J., November 28, 2005. Fuzzy Logic Applications in Engineering Science.Katz, A.J. and Thompson, A.H., Quantitative Prediction of permeability in Pours rock:
Physical Review. vol. 34, pp. 8179e8188.Kyte, J.R., Berry, D.W., August 1975. New pseudofunctions to control numerical
dispersion. SPEJ, 269.Lemouzy, P., Kruel Romeu, R., Morelon, I., 3e6 October 1993. A New Scaling-Up
Method To Compute Relative Permeability and Capillary Pressure for Simula-tion of Heterogeneous Reservoirs. Presented at the 1993 SPE Annual TechnicalConference and Exhibition. Houston: s.n. SPE 26660.
Muggeridge, A.H., 1991. Generation of effective relative permeabilities from detailedsimulation of flow in Heterogeneous Porous Media [book auth.]. In:
Carroll, H.B., Wesson, T.C., Lake, L.W. (Eds.), Reservoir Characterization II.Academic Press, San Diego, California, pp. 197e225.
Pittman, E.D., 1992. Relationship of porosity and permeability to various parametersDerived from mercury InjectionCapillary pressure curves for Sandstones. AAPGBulletin 76 (2), 191e198.
Porras, J.C., Campos, O., March 2001. Rock Typing: A Key Approach for PetrophysicalCharacterization and Definition of Flow Units, Santa Barbara Field, EasternVenezuela Basin. Buenos Aires, Argentina: s.n.,pp. 25e28. SPE 69458.
Stone, H.L., February 1991. Rigorous Black-Oil Pseudofunctions. Presented at the1991 SPE Symposium on Reservoir Simulation. Anaheim, California: s.n. pp.17e20. SPE 21207.
Taghavi, A.A., Mørk, A., Kazemzadeh, E., March 21, 2007. Flow unit classification forgeological modeling of a hetergeneous carbonate reservoir: cretaceous sarvakformation, dehloranfield, SW Iran. Journal of PetroleumGeology 30 (2),129e146.
Tiab, Djebbar, Donaldson, Erle C., 2004. Petrophysics: Theory and Practice ofMeasuring Reservoir Rock and Fluid Transport Properties. s.l.. Gulf ProfessionalPublishing.
Varavur, S., Shebl, H., Salman, S.M., Shibasaki, T., Dabbouk, C., March 2005. ReservoirRock Typing in a Giant Carbonate. Bahrain: s.n., pp. 12e15. SPE 93477.