Functional Analysis of the Genes of Yeast Chromosome V by Genetic Footprinting
6
tagenesis was used to create two “kinetic bottlenecks” in the reaction pathway of isocitrate dehydrogenase, greatly extending the lifetime of each of two transient inter- mediates, enabling their observation. In the present context, it is possible that the lat- tice contacts themselves have created such a kinetic bottleneck, enabling us to freeze- trap a conformational intermediate prior to RNA catalytic cleavage. Kinetic bottleneck mutants of the hammerhead RNA should allow capture of additional cleavage reac- tion intermediates. REFERENCES AND NOTES ___________________________ 1. C. Guerrier-Takada, K. Gardiner, T. Marsh, N. Pace, S. Altman, Cell 35, 849 (1983); A. J. Zaug, T. R. Cech, Science 231, 470 (1986). 2. H. W. Pley, K. M. Flaherty, D. B. McKay, Nature 372, 111 (1994). 3. W. G. Scott, J. T. Finch, A. Klug, Cell 81, 991 (1995). 4. O. C. Uhlenbeck, Nature 328, 596 (1987); D. E. Ruffner, G. D. Stormo, O. C. Uhlenbeck, Biochemis- try 29, 10695 (1990). 5. D. B. McKay, RNA 2, 395 (1996). 6. K. Moffat and R.Henderson, Curr. Opin. Struct. Biol. 5, 656 (1995). 7. W. Scott and A. Klug, Trends Biochem. Sci. 21, 220 (1996). 8. S. Dahm and O. C. Uhlenbeck, Biochemistry 30, 9464 (1991); S. Dahm, W. Derrick, C. Uhlenbeck, ibid. 32, 13040 (1993). 9. J. B. Murray, A. K. Collier, J. R. P. Arnold, Anal. Biochem. 218, 177 (1994); W. G. Scott et al., J. Mol. Biol. 250, 327 (1995). 10. T. Tushl et al., Science 266, 785 (1994); S. T. Sig- urdsson, T. Tushl, F. Eckstein, RNA 1, 575 (1995); K. M. A. Amiri and P. J. Hagerman, J. Mol. Biol. 261, 125 (1996). 11. K. J. Hertel and O. C. Uhlenbeck, Biochemistry 34, 1744 (1995). 12. J.-H. Yang et al., ibid. 29, 11156 (1990). 13. H. van Tol et al., Nucleic Acids Res. 18, 1971 (1990); G. Slim and M. J. Gait, ibid. 19, 1183 (1991); M. Koizumi and E. Ohtsuka, Biochemistry 30, 145 (1991). 14. G. S. Bassi et al., Nature Struct. Biol. 2, 45 (1995). 15. J. B. Murray, C. J. Adams, J. R. P. Arnold, P. G. Stockley, Biochem. J. 311, 487 (1995). 16. J. M. Bolduc et al., Science 268, 1312 (1995). 17. Diffraction data were processed with DENZO [Z. Otwinowski, in Proceedings of the CCP4 Study Weekend, L. Sawyer, N. Isaacs, S. Bailey, Eds. [Daresbury, U.K., and SERC, 1993), pp. 56 – 62]. Further details are described in Table 1. 18. Molecular replacement was done with the AMoRe (au- tomated molecular replacement) software distributed with CCP4 (19) and, as a probe, the dimer structure determined from the previous crystal form. The top translation function solution had an R factor of 53% and a correlation coefficient of 28. However, 10 cycles of rigid-body refinement in AMoRe reduced the R factor to 31%, and the correlation coefficient simultaneously in- creased to 86. Further rigid-body refinement followed by conventional positional refinement (Powell minimiza- tion) in X-PLOR 3.1 [A. T. Bru ¨ nger, X-PLOR 3.1: A Sys- tem for Crystallography and NMR (Yale Univ. Press, New Haven, CT, 1993)] further reduced the R factor to 26%. The initial model of one hammerhead ri- bozyme molecule in the crystal asymmetric unit was further refined with a standard simulated annealing slow-cooling molecular dynamics protocol followed by conventional positional and restrained tempera- ture factor refinement in X-PLOR 3.1 with data from 8.0 to 3.0 Å resolution and a modified RNA geometry parameter library [G. Parkinson, J. Vojtechovsky, L. Clowney, A. T. Bru ¨ nger, H. M. Berman, Acta Crystal- logr. D52, 57 (1996)]. Finally, the low resolution data were incorporated, a solvent mask was determined, and partial calculated structure factors were gener- ated to model the bulk solvent contribution to the x-ray scattering amplitudes for further refinement within X-PLOR 3.1. The metal-bound crystal struc- tures were refined identically ( Table 1). 19. Collaborative Computational Project, Number 4 [CCP4], Acta Crystallogr. D50, 760 (1994). 20. We thank P. Stockley, J. Finch, G. Varani, S. Price, K. Nagai, O. Uhlenbeck, and members of their research groups for advice; R. Sweet for help with data collec- tion at Brookhaven synchrotron beamline X12C, and the Daresbury Laboratory for additional data collec- tion; D. McKay and K. Flaherty for discussions and for providing us with an improved set of stereochemical parameters (18) for RNA refinement. Supported by the Medical Research Council of the United Kingdom and the American Cancer Society ( W.G.S., PF-3970), and the NIH (B.L.S., GM-49857). 21 May 1996; accepted 26 October 1996 Functional Analysis of the Genes of Yeast Chromosome V by Genetic Footprinting Victoria Smith, Karen N. Chou, Deval Lashkari, David Botstein, Patrick O. Brown* Genetic footprinting was used to assess the phenotypic effects of Ty1 transposon insertions in 268 predicted genes of chromosome V of Saccharomyces cerevisiae. When seven selection protocols were used, Ty1 insertions in more than half the genes tested (157 of 268) were found to result in a detectable reduction in fitness. Results could not be obtained for fewer than 3 percent of the genes tested (7 of 268). Previously known mutant phenotypes were confirmed, and, for about 30 percent of the genes, new mutant phenotypes were identified. The completion of the sequences of the genomes of several microorganisms is a wa- tershed for the new science of genomics. The next important challenge is to deter- mine, in an efficient and reliable way, something about the function of each gene in these genomes. The 12,057-kb nonre- petitive portion of the S. cerevisiae ge- nome—the first completely sequenced eu- karyotic genome— contains 6000 to 6500 predicted genes, of which fewer than half had previously been known. A still smaller fraction of the genes of yeast have been characterized experimentally with respect to biological function; indeed, previous work suggested that disruption of yeast genes resulted in a readily discernible phe- notype only about 30% of the time (1). Here, we describe the results of genetic footprinting (2) as applied to 268 predicted protein-coding genes on chromosome V of S. cerevisiae (3). We subjected a large population of hap- loid yeast cells (;10 11 cells) to mutagenesis by transiently inducing transposition of a marked Ty1 transposable element. DNA was extracted from a portion of this culture (the “time-zero” DNA). Other representa- tive samples of this population were sub- jected to one of several selections (Table 1). DNA was extracted from the cells recov- ered after each selection. The presence and relative abundance of cells carrying Ty1 insertions within a gene of interest was assessed for each of these samples by means of a polymerase chain reaction (PCR) (2). In general, for each gene, we surveyed a minimum of 500 to 900 base pairs (bp) of coding sequence, along with 400 to 600 bp of upstream sequence. Smaller genes (,700 bp) were analyzed in their entirety, along with several hundred base pairs of sequence flanking the start and stop codons. A growth disadvantage to cells carrying inser- tions in a gene, under a particular selection, was reflected by the loss or depletion of the PCR products representing those insertions (the “genetic footprint”) when DNA sam- ples from the selected population were com- pared with the time-zero DNA samples. The method not only detects severe growth disadvantages, but also sensitively measures moderate reductions in fitness. For each predicted protein-coding se- quence on chromosome V, a color was as- signed on the basis of whether a particular selection protocol resulted in a perceptible depletion of the PCR products representing insertions in that coding sequence (Fig. 1). Overall, we were able to obtain satisfactory genetic footprinting data for 261 (97%) of the predicted protein-coding genes (4, 5). This total includes six putative genes con- tained in repeated telomeric sequences (boxed in Fig. 1): cells with mutations in any of these six genes appeared wild type for V. Smith and K. N. Chou, Department of Biochemistry, Stanford University School of Medicine, Stanford, CA 94305, USA. D. Lashkari and D. Botstein, Department of Genetics, Stanford University School of Medicine, Stanford, CA 94305, USA. P. O. Brown, Howard Hughes Medical Institute and De- partment of Biochemistry, Stanford University School of Medicine, Stanford, CA 94305, USA. * To whom correspondence should be addressed. E-mail: [email protected] REPORTS SCIENCE z VOL. 274 z 20 DECEMBER 1996 2069
-
Upload
independent -
Category
Documents
-
view
4 -
download
0
Transcript of Functional Analysis of the Genes of Yeast Chromosome V by Genetic Footprinting
tagenesis was used to create two “kineticbottlenecks” in the reaction pathway ofisocitrate dehydrogenase, greatly extendingthe lifetime of each of two transient inter-mediates, enabling their observation. In thepresent context, it is possible that the lat-tice contacts themselves have created sucha kinetic bottleneck, enabling us to freeze-trap a conformational intermediate prior toRNA catalytic cleavage. Kinetic bottleneckmutants of the hammerhead RNA shouldallow capture of additional cleavage reac-tion intermediates.
REFERENCES AND NOTES___________________________
1. C. Guerrier-Takada, K. Gardiner, T. Marsh, N. Pace,S. Altman, Cell 35, 849 (1983); A. J. Zaug, T. R.Cech, Science 231, 470 (1986).
2. H. W. Pley, K. M. Flaherty, D. B. McKay, Nature 372,111 (1994).
3. W. G. Scott, J. T. Finch, A. Klug, Cell 81, 991 (1995).4. O. C. Uhlenbeck, Nature 328, 596 (1987); D. E.
Ruffner, G. D. Stormo, O. C. Uhlenbeck, Biochemis-try 29, 10695 (1990).
5. D. B. McKay, RNA 2, 395 (1996).6. K. Moffat and R.Henderson, Curr. Opin. Struct. Biol.
5, 656 (1995).7. W. Scott and A. Klug, Trends Biochem. Sci. 21, 220
(1996).8. S. Dahm and O. C. Uhlenbeck, Biochemistry 30,
9464 (1991); S. Dahm, W. Derrick, C. Uhlenbeck,ibid. 32, 13040 (1993).
9. J. B. Murray, A. K. Collier, J. R. P. Arnold, Anal.Biochem. 218, 177 (1994); W. G. Scott et al., J. Mol.Biol. 250, 327 (1995).
10. T. Tushl et al., Science 266, 785 (1994); S. T. Sig-urdsson, T. Tushl, F. Eckstein, RNA 1, 575 (1995); K.M. A. Amiri and P. J. Hagerman, J. Mol. Biol. 261,125 (1996).
11. K. J. Hertel and O. C. Uhlenbeck, Biochemistry 34,1744 (1995).
12. J.-H. Yang et al., ibid. 29, 11156 (1990).13. H. van Tol et al., Nucleic Acids Res. 18, 1971 (1990);
G. Slim and M. J. Gait, ibid. 19, 1183 (1991); M.Koizumi and E. Ohtsuka, Biochemistry 30, 145(1991).
14. G. S. Bassi et al., Nature Struct. Biol. 2, 45 (1995).15. J. B. Murray, C. J. Adams, J. R. P. Arnold, P. G.
Stockley, Biochem. J. 311, 487 (1995).16. J. M. Bolduc et al., Science 268, 1312 (1995).17. Diffraction data were processed with DENZO [Z.
Otwinowski, in Proceedings of the CCP4 StudyWeekend, L. Sawyer, N. Isaacs, S. Bailey, Eds.[Daresbury, U.K., and SERC, 1993), pp. 56–62].Further details are described in Table 1.
18. Molecular replacement was done with the AMoRe (au-tomated molecular replacement) software distributedwith CCP4 (19) and, as a probe, the dimer structuredetermined from the previous crystal form. The toptranslation function solution had an R factor of 53% anda correlation coefficient of 28. However, 10 cycles ofrigid-body refinement in AMoRe reduced the R factor to31%, and the correlation coefficient simultaneously in-creased to 86. Further rigid-body refinement followedby conventional positional refinement (Powell minimiza-tion) in X-PLOR 3.1 [A. T. Brunger, X-PLOR 3.1: A Sys-tem for Crystallography and NMR (Yale Univ. Press,New Haven, CT, 1993)] further reduced the R factorto 26%. The initial model of one hammerhead ri-bozyme molecule in the crystal asymmetric unit wasfurther refined with a standard simulated annealingslow-cooling molecular dynamics protocol followedby conventional positional and restrained tempera-ture factor refinement in X-PLOR 3.1 with data from8.0 to 3.0 Å resolution and a modified RNA geometryparameter library [G. Parkinson, J. Vojtechovsky, L.Clowney, A. T. Brunger, H. M. Berman, Acta Crystal-logr. D52, 57 (1996)]. Finally, the low resolution datawere incorporated, a solvent mask was determined,
and partial calculated structure factors were gener-ated to model the bulk solvent contribution to thex-ray scattering amplitudes for further refinementwithin X-PLOR 3.1. The metal-bound crystal struc-tures were refined identically ( Table 1).
19. Collaborative Computational Project, Number 4[CCP4], Acta Crystallogr. D50, 760 (1994).
20. We thank P. Stockley, J. Finch, G. Varani, S. Price, K.Nagai, O. Uhlenbeck, and members of their researchgroups for advice; R. Sweet for help with data collec-
tion at Brookhaven synchrotron beamline X12C, andthe Daresbury Laboratory for additional data collec-tion; D. McKay and K. Flaherty for discussions and forproviding us with an improved set of stereochemicalparameters (18) for RNA refinement. Supported bythe Medical Research Council of the United Kingdomand the AmericanCancer Society (W.G.S., PF-3970),and the NIH (B.L.S., GM-49857).
21 May 1996; accepted 26 October 1996
Functional Analysis of the Genes of YeastChromosome V by Genetic Footprinting
Victoria Smith, Karen N. Chou, Deval Lashkari,David Botstein, Patrick O. Brown*
Genetic footprinting was used to assess the phenotypic effects of Ty1 transposoninsertions in 268 predicted genes of chromosome V of Saccharomyces cerevisiae.Whenseven selection protocols were used, Ty1 insertions in more than half the genes tested(157 of 268) were found to result in a detectable reduction in fitness. Results could notbe obtained for fewer than 3 percent of the genes tested (7 of 268). Previously knownmutant phenotypes were confirmed, and, for about 30 percent of the genes, newmutantphenotypes were identified.
The completion of the sequences of thegenomes of several microorganisms is a wa-tershed for the new science of genomics.The next important challenge is to deter-mine, in an efficient and reliable way,something about the function of each genein these genomes. The 12,057-kb nonre-petitive portion of the S. cerevisiae ge-nome—the first completely sequenced eu-karyotic genome—contains 6000 to 6500predicted genes, of which fewer than halfhad previously been known. A still smallerfraction of the genes of yeast have beencharacterized experimentally with respectto biological function; indeed, previouswork suggested that disruption of yeastgenes resulted in a readily discernible phe-notype only about 30% of the time (1).Here, we describe the results of geneticfootprinting (2) as applied to 268 predictedprotein-coding genes on chromosome V ofS. cerevisiae (3).
We subjected a large population of hap-loid yeast cells (;1011 cells) to mutagenesisby transiently inducing transposition of amarked Ty1 transposable element. DNAwas extracted from a portion of this culture(the “time-zero” DNA). Other representa-
tive samples of this population were sub-jected to one of several selections (Table 1).DNA was extracted from the cells recov-ered after each selection. The presence andrelative abundance of cells carrying Ty1insertions within a gene of interest wasassessed for each of these samples by meansof a polymerase chain reaction (PCR) (2).In general, for each gene, we surveyed aminimum of 500 to 900 base pairs (bp) ofcoding sequence, along with 400 to 600 bpof upstream sequence. Smaller genes (,700bp) were analyzed in their entirety, alongwith several hundred base pairs of sequenceflanking the start and stop codons. Agrowth disadvantage to cells carrying inser-tions in a gene, under a particular selection,was reflected by the loss or depletion of thePCR products representing those insertions(the “genetic footprint”) when DNA sam-ples from the selected population were com-pared with the time-zero DNA samples.The method not only detects severe growthdisadvantages, but also sensitively measuresmoderate reductions in fitness.
For each predicted protein-coding se-quence on chromosome V, a color was as-signed on the basis of whether a particularselection protocol resulted in a perceptibledepletion of the PCR products representinginsertions in that coding sequence (Fig. 1).Overall, we were able to obtain satisfactorygenetic footprinting data for 261 (97%) ofthe predicted protein-coding genes (4, 5).This total includes six putative genes con-tained in repeated telomeric sequences(boxed in Fig. 1): cells with mutations inany of these six genes appeared wild type for
V. Smith and K. N. Chou, Department of Biochemistry,Stanford University School of Medicine, Stanford, CA94305, USA.D. Lashkari and D. Botstein, Department of Genetics,Stanford University School of Medicine, Stanford, CA94305, USA.P. O. Brown, Howard Hughes Medical Institute and De-partment of Biochemistry, Stanford University School ofMedicine, Stanford, CA 94305, USA.
*To whom correspondence should be addressed. E-mail:[email protected]
REPORTS
SCIENCE z VOL. 274 z 20 DECEMBER 1996 2069
growth in all selections. However, because aunique priming site was found for only oneof these genes, they are excluded from thefollowing discussion. Of the remaining 255genes, we could detect a phenotype thatdistinguished the corresponding mutantsfrom wild-type cells for 157 genes (61.6%).For 98 genes (38.4%), Ty1 insertions result-ed in a reduction in growth of less than 5 to10%, or a decrease in mating proficiency (as
an a) of less than ;50%; that is, the mu-tants were indistinguishable from the wildtype for growth or mating, within the sen-sitivity of our assays.
The most common mutant phenotypewe found among all the genes analyzed wasa general growth disadvantage for mutantcells under all selections. By analyzing mul-tiple time points using the least stringentselection for growth—growth in rich-glu-
cose medium at 25°C (Table 1)—we couldestimate the growth rates of each mutant.We divided the results into three categories:Q1, Q2, and Q3. Q1 indicates that mutantcells grew at no more than 75% of thegrowth rate of the overall population (forexample, after 15 population doublings themutants had doubled no more than 12times, and thus were represented at no morethan 1/23 5 1/8 of their abundance in the
0
100
200
300
400
500 Q1
Q2
C
M S
CAN1
NPR2
CIN8 PRB1
PCM1
MAK10
AFG1
GLY1
GDA1
CYC7RAD23
ANP1
MCM3TIF51A
CUP5
RIP1URA3
MMS21PMP2
UBC8GLC3
WBP1
MNN1
PMI40
PAC2
SEC3
SRP1PRE1
PRP22FAA2
AFG3
GPA2SRB4
PRO3
GCD11
CHO1GAL83
YPT8
GLN3
MEI4CAJ1
HOM3 HIS1FCY2
PET117
CEM1ICL1
MOT2ARG5,6
L X
WT
Q3
ILV1 TRP2
MET6
RAD51
PRS1
UBC6
AST2
SSA4
SWI4 BEB1SPR6
GLO3
RSP5PAK1
PAB1BCK2
CCA1
ADK2RAD3
GLC7GDI1
BMH1PDA1
DMC1
ISC10
UBP5MAG1
SPT15
UBP3PET122
OXA1
BEM2SPT2
RAD4
GCN4
H
NR
RNR1
10
18ca20
3040
5060
70
107ca
20
30 40
44ca 50
60
56ca
70
80 90
93ca
10097 98
110
120
130
140
138
150
160161
170
180
188
132
136 154
158
123
164 182
73
76
96
6658
48
24
8
1
1
1321
25
27
3646
49
18 17 11 7
45 65
93
134 151
44 34 28
9
49
56
75
131
137 139
157
159
181
HXT13
VMA8PAU2
NTF2
NUP157
HOR2
SHO1
SCS2USS1
SUN2
SAH1GIP2
RP50A
RPL15B
PUP3
SHC1UBP9 RPS8B
FLO8
RPL17B
CLK3COX15
BRR2
RPS26B
NA
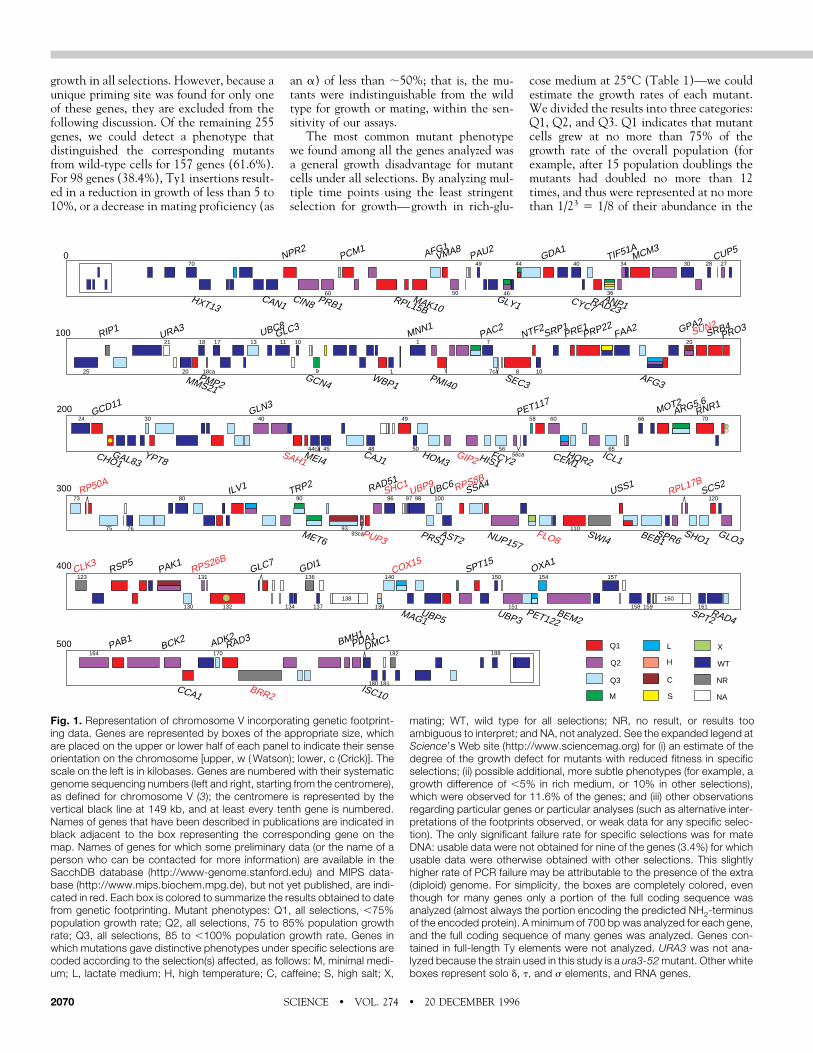
Fig. 1. Representation of chromosome V incorporating genetic footprint-ing data. Genes are represented by boxes of the appropriate size, whichare placed on the upper or lower half of each panel to indicate their senseorientation on the chromosome [upper, w (Watson); lower, c (Crick)]. Thescale on the left is in kilobases. Genes are numbered with their systematicgenome sequencing numbers (left and right, starting from the centromere),as defined for chromosome V (3); the centromere is represented by thevertical black line at 149 kb, and at least every tenth gene is numbered.Names of genes that have been described in publications are indicated inblack adjacent to the box representing the corresponding gene on themap. Names of genes for which some preliminary data (or the name of aperson who can be contacted for more information) are available in theSacchDB database (http://www-genome.stanford.edu) and MIPS data-base (http://www.mips.biochem.mpg.de), but not yet published, are indi-cated in red. Each box is colored to summarize the results obtained to datefrom genetic footprinting. Mutant phenotypes: Q1, all selections, ,75%population growth rate; Q2, all selections, 75 to 85% population growthrate; Q3, all selections, 85 to ,100% population growth rate. Genes inwhich mutations gave distinctive phenotypes under specific selections arecoded according to the selection(s) affected, as follows: M, minimal medi-um; L, lactate medium; H, high temperature; C, caffeine; S, high salt; X,
mating; WT, wild type for all selections; NR, no result, or results tooambiguous to interpret; and NA, not analyzed. See the expanded legend atScience’s Web site (http://www.sciencemag.org) for (i) an estimate of thedegree of the growth defect for mutants with reduced fitness in specificselections; (ii) possible additional, more subtle phenotypes (for example, agrowth difference of ,5% in rich medium, or 10% in other selections),which were observed for 11.6% of the genes; and (iii) other observationsregarding particular genes or particular analyses (such as alternative inter-pretations of the footprints observed, or weak data for any specific selec-tion). The only significant failure rate for specific selections was for mateDNA: usable data were not obtained for nine of the genes (3.4%) for whichusable data were otherwise obtained with other selections. This slightlyhigher rate of PCR failure may be attributable to the presence of the extra(diploid) genome. For simplicity, the boxes are completely colored, eventhough for many genes only a portion of the full coding sequence wasanalyzed (almost always the portion encoding the predicted NH2-terminusof the encoded protein). A minimum of 700 bp was analyzed for each gene,and the full coding sequence of many genes was analyzed. Genes con-tained in full-length Ty elements were not analyzed. URA3 was not ana-lyzed because the strain used in this study is a ura3-52mutant. Other whiteboxes represent solo d, t, and s elements, and RNA genes.
SCIENCE z VOL. 274 z 20 DECEMBER 19962070

time-zero population). This category in-cludes genes whose product is absolutelyrequired for vegetative cell growth (“essen-tial” genes). The Q2 and Q3 categoriesinclude genes for which mutant cells wereat more subtle growth disadvantages, grow-ing at apparent rates of 75 to 85% and 85 to,100% of the population growth rate, re-spectively (Fig. 1 and Table 2). None of thephenotypes in these classes was a conse-quence of the freezing of cells in glycerolafter mutagenesis, or of their subsequentresuscitation (6). These data were con-firmed by analysis of DNA isolated fromthree independent rich-medium selections.In addition, the data obtained from theother selections corroborated the generalgrowth defects observed in rich-glucose me-dium. For .90% of the genes in the Q2 andQ3 categories, growth deficits were repro-ducibly detected to within 65% variabilityin independent samples.
Fifty-one genes (20%) fell into the Q1category; 14 of these were previously unde-scribed (Table 2 and Figs. 1 and 2). Inaddition to several known essential genes,this category included ILV1 and PRO3, mu-tations of which are known to result inauxotrophy. As described previously forade2 insertions (2), genetic footprinting re-vealed considerable growth defects for ilv1and pro3 mutant cells even in rich mediumthought to contain adequate quantities ofthe relevant nutrients [the inability of pro3mutants to grow in rich medium was report-ed previously (7)].MOT2, which encodes atranscriptional repressor, also fell in thisclass; although null mutants were viable at25°C, their growth defect was clearly ex-posed by genetic footprinting analysis (8).Other genes previously reported to be non-essential, such as VMA8 (encoding the vac-uolar H-adenosine triphosphatase subunit),GDA1 (encoding guanosine diphosphatase
of the Golgi membrane), and MMS21 (en-coding a DNA repair protein) (9), werefound to fall in the Q1 category, whichindicated a substantial growth disadvantageof the corresponding mutant strains.
Some selection against cells with muta-tions in essential genes may occur duringthe 4-day Ty1 mutagenesis. It is possiblethat this factor accounted for some cases inwhich we failed to obtain an interpretableresult (3% of the genes analyzed) (10).Most essential genes were not excludedfrom analysis in this way, as we were reliablyable to obtain PCR products representingTy1 insertions in almost all of the previous-ly identified essential genes on chromosomeV with the use of DNA from the time-zerocells.
Insertion mutations in 99 genes (38.8%)resulted in more subtle quantitative growthdefects in all selections. These genes weredivided into two classes (Q2 and Q3, Fig. 1and Table 2) on the basis of the estimatedgrowth rate disadvantage of mutants. Mostof the genes in these groups (58%) had notbeen previously characterized. Moreover,for many of the previously characterizedgenes in these categories, the growth disad-vantage we observed had not previouslybeen reported. An example of such a gene isSSA4, for which we found a Q3 mutantgrowth defect. This gene is a member of alarge family of genes that encode apparentlyinterchangeable cytoplasmic heat shockproteins (11). We also observed a Q2growth disadvantage for mutants of RAD51(encoding a RecA-like DNA repair pro-tein), PRB1 (encoding vacuolar proteaseB), and GLN3 (encoding a positive nitro-gen-regulatory protein) (12).
Spurious PCR products (those unrelatedto real Ty1 insertions in the gene of inter-est) would not be expected to be depletedunder a selection that requires the gene’s
Table 1. Selections used in genetic footprintinganalysis. The time points at which DNA sampleswere isolated correspond to the given numbersof population doublings in each selection afterTy1 mutagenesis. Each gene was analyzed us-ing DNA (1 mg) isolated at a primary time point foreach selection; the pattern of PCR products wascompared with that obtained with the time-zeroDNA sample. Secondary time points were usedto confirm potential growth defects or to resolveambiguities identified by the primary analysis.Analysis of both primary and secondary timepoints was useful for confirmation of generalquantitative growth defects as well as for identi-fication of growth defects in specific selections.As a control to identify any nonspecific PCRproducts, each gene-specific primer was alsoused with the Ty1-specific primer for a PCR thatused DNA isolated from cells in which Ty1 trans-position had not been induced. Ty1 transposi-tion mutagenesis was performed as described(2). At least 4 3 108 cells were transferred to theappropriate medium for each selection, and celldensity was maintained at 1 3 105 to 3 3 107cells per milliliter (or less) over the course of eachselection. In some cases, cell density was al-lowed to reach 5 3 107 to 1 3 108 cells permilliliter for harvesting at the final time point. Allselections were performed at 25°C, except high-temperature growth (36.5°C) and mating (30°C).The media for all selections contained 2% glu-cose, except rich-lactate medium (2% lactate).The pH of the media was ;5.5. Standard richmedium, with supplements for auxotrophies ofthe host strain, was used for the rich-medium,lactate, high-temperature, caffeine, and high-saltselections (1% yeast extract, 2% bactopeptone,0.008% tryptophan, 0.0026% adenine, 0.0022%uracil, and 0.0046% histidine). The medium forthe caffeine selection contained, in addition, 6mM caffeine, and the high-salt selection mediumincluded 0.9 M NaCl. The minimal medium usedfor selection lacked amino acids and nucleo-tides, except as required by the auxotrophy ofthe strain (0.67% yeast nitrogen base, 0.0022%uracil, and 0.0046% histidine). For the matingselection, mutagenized cells (his3 HIS4) weregrown in rich-glucose medium for 4 hours, thenmixed with a threefold excess of cells of oppositemating type (HIS3 his4), collected on a filter, andincubated on rich-glucose medium at 30°C for 7hours. Cells were then washed into SC-histidineliquid medium and incubated at 30°C for 16hours (;10 population doublings) to select theHIS1 diploid products of successful mating. Tocompensate for the presence of the extra hap-loid genome, we used 2 mg of DNA from theselected diploids for each PCR.
Selection
Primarytime point(populationdoublings)
Secondarytime points(populationdoublings)
Rich medium 18 5, 12, 15, 23Rich medium 51 56, 60
Minimal medium 18 10, 15
Rich-lactatemedium
18 11
Caffeine 18 12
High temperature 18 10
High salt 10
Mating 15
Fig. 2. YER083c, an example ofa novel gene identified as impor-tant for growth under all selec-tions (Q1), including rich-glu-cose medium. These data weregenerated by analyzing 10 ml ofeach PCR reaction by denatur-ing polyacrylamide gel electro-phoresis, as described (2). Inthis and subsequent figures, themost intense peaks (at the rightof each trace) are shown off-scale to allow clearer visualiza-tion of the lower-intensity peaks;the shaded box under eachtrace represents the coding se-quence of the gene (CDS), and peaks to the right of this box correspond to insertions upstreamof the startATG codon. For most genes on chromosome V, these peaks tended to be more intense than peakscorresponding to insertions in the coding sequence, reflecting a preference for Ty1 insertion into non-coding regions. In this example, all peaks corresponding to insertions in the coding sequence of YER083cwere depleted after 15 population doublings in rich medium (Rich 15).
REPORTS
SCIENCE z VOL. 274 z 20 DECEMBER 1996 2071
activity, leading to underestimation of theselective disadvantage of the mutants. Asimilar behavior would be expected for PCRproducts that represent actual insertionswithin a gene that do not impair its func-tion. PCR products corresponding to toler-ated Ty1 insertions were frequently ob-served immediately adjacent to the 59 and39 boundaries of coding sequences and wereeven observed within coding sequences(13). Because we analyzed multiple timepoints, we were usually able to determinewhether these anomalous products wereconsistently present and omitted them fromthe quantitative analysis. The 50- to 60-generation time points were particularlyuseful for this purpose (14).
When a gene is important for cell growth,the dilution of the corresponding mutant cellsas the general cell population expands leavesprogressively fewer targets for PCR amplifica-tion. Reduced competition for PCR reagentscould then lead to more efficient amplifica-tion of these remaining DNA targets. Forexample, PCR products representing inser-tions upstream of an important coding regionwere often more abundant among the prod-ucts amplified with the use of DNA samplesfrom the corresponding selection than amongthe products of the time-zero PCR. We triedto take this effect into account by normalizingthe signal produced in different PCRs relative
to insertions upstream of the coding regions,under the assumption that these upstreaminsertions had no effect on fitness. To providea more robust normalization, we developed anindependent internal standard for the PCRreactions. A library of Sau 3A restriction frag-ments of yeast genomic DNA was cloned intoa vector carrying the marked Ty1 primer se-quence, such that PCR amplification of thislibrary with the Ty1-specific primer and anylabeled gene-specific primer resulted in a pre-dictable pattern of products (15). DNA fromthe library was mixed at a fixed concentra-tion with DNA samples from selected cellsand time-zero cells, respectively. The mix-tures were subjected to a second set of PCRreactions for each of 63 genes that werequantitatively important for growth (16).The intensities of the PCR products from thedifferent selected DNAs were then normal-ized using the library-specific peaks (Fig. 3).The growth rate defect of the mutant cellswas estimated by comparing the normalizedsignals from the different time points. Thesedata facilitated the grouping of genes into theQ classifications and were also useful in re-solving ambiguous results concerning generalor specific growth defects.
Ty1 insertion mutations in a few genesresulted in growth defects that were discern-ible only in one of the selection protocols.Mutations in several other genes resulted ingeneral growth defects as well as more severespecific ones. Genes required for growth inminimal medium include four previouslycharacterized genes involved in amino acid
biosynthesis [GLY1, TRP2, MET6, andARG5,6 (17)] and two novel genes,YER006w and YEL044w (18). (Novel genesare genes that have not been previouslycharacterized and have not had a putativefunction assigned on the basis of compellinghomology to a characterized gene.) Muta-tions in GLY1, ARG5,6, MET6, TRP2, andYER006w also produced more subtle growthdefects in rich medium (Q2 forGLY1, Q3 forthe others). GCN4, which encodes a tran-scriptional activator of amino acid biosyn-thetic genes, displayed a Q2 phenotype onlyin minimal medium (19). Mutations inYER146w produced a Q3 growth defect onlyin minimal medium. Mutations in ANP1,which encodes a protein involved in reten-tion of glycosyltransferases in the Golgi ap-paratus (20), produced numerous pheno-types: Q1 (possibly Q2) in minimal medium,in high-salt medium, and at high tempera-ture, and Q3 in all other selections.
Genes known to be required for respiration(PET117, PET122, CEM1, OXA1, andAFG3) behaved as expected, showing atleast a Q1 defect in rich-lactate medium(21, 22). YER141w was also important forgrowth on lactate, consistent with itsidentification as COX15 (23). Mutationsin most of these genes resulted in lesssevere general growth defects in all otherselections as well. One novel gene,YER087w, was important for growth inlactate medium (Q1 in lactate) and wasquantitatively important for growth inrich medium (Q2). Mutants of YEL066w
Table 2. Numbers of genes giving mutant pheno-types in each selection. The percentage of genesassociated with each phenotype was calculatedwith respect to the 255 nontelomeric genes onchromosome V for which reliable data were ob-tained. Some genes were associated with morethan one phenotype. For 98 genes (38.4%), Ty1insertion mutants were indistinguishable fromwild-type cells in any of the selections we used. Rrefers to genes for which mutants with generalsevere growth defects (Q1 or Q2) were able togrow at notably improved rates under particularselections. Many of the phenotypes we detectedfor previously characterized genes are, in fact,novel phenotypes (not listed). These new pheno-types were typically Q2 or Q3 (sometimes Q1)growth disadvantages for mutants of genes pre-viously described as wild type for vegetativegrowth.
SelectionNumberof genes(%)
Numberof novelgenes
Rich: Q1 (,75%) 51 (20.0) 14Rich: Q2 (75 to 85%) 44 (17.3) 22Rich: Q3 (85 to 100%) 55 (21.6) 35Minimal 9 (3.5) 3Lactate 8 (3.1) 1Caffeine 3 (1.2) 1High temperature 2 (0.8) 1High temperature R 1 (0.4) 1High salt 3 (1.2) 2High salt R 1 (0.4) 0Mating 1 (0.4) 1Mating R 2 (0.8) 2
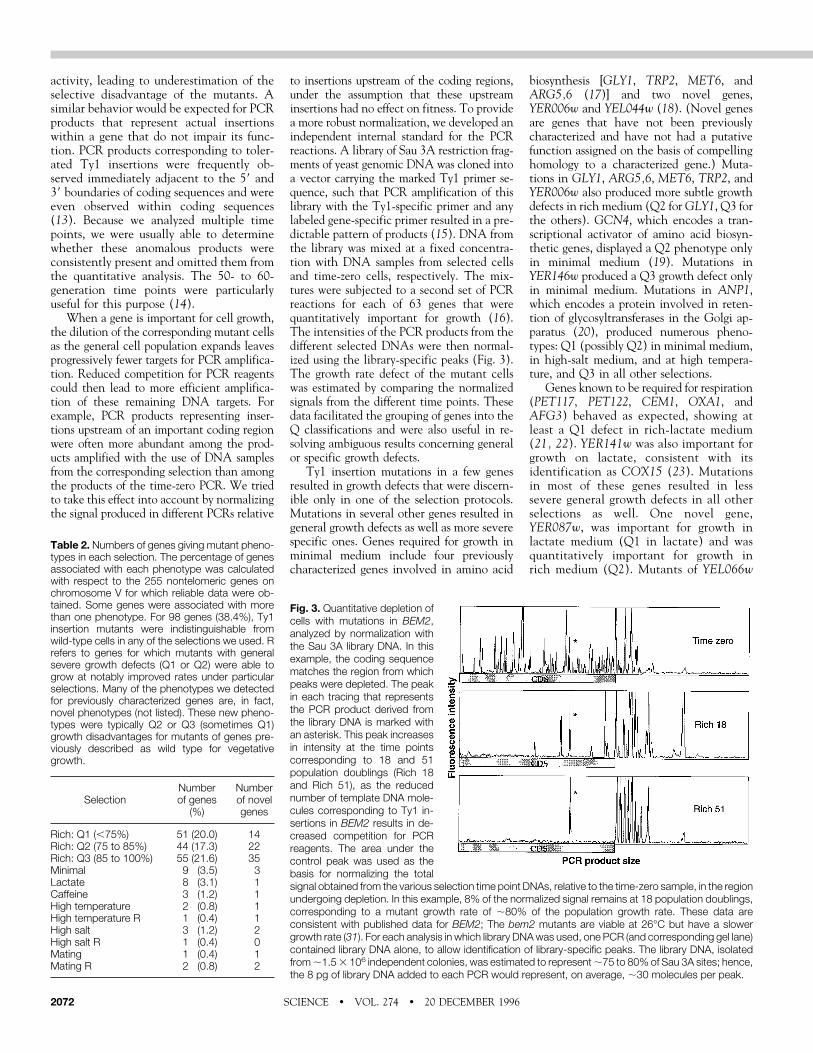
Fig. 3. Quantitative depletion ofcells with mutations in BEM2,analyzed by normalization withthe Sau 3A library DNA. In thisexample, the coding sequencematches the region from whichpeaks were depleted. The peakin each tracing that representsthe PCR product derived fromthe library DNA is marked withan asterisk. This peak increasesin intensity at the time pointscorresponding to 18 and 51population doublings (Rich 18and Rich 51), as the reducednumber of template DNA mole-cules corresponding to Ty1 in-sertions in BEM2 results in de-creased competition for PCRreagents. The area under thecontrol peak was used as thebasis for normalizing the totalsignal obtained from the various selection time point DNAs, relative to the time-zero sample, in the regionundergoing depletion. In this example, 8% of the normalized signal remains at 18 population doublings,corresponding to a mutant growth rate of ;80% of the population growth rate. These data areconsistent with published data for BEM2; The bem2 mutants are viable at 26°C but have a slowergrowth rate (31). For each analysis in which library DNAwas used, one PCR (and corresponding gel lane)contained library DNA alone, to allow identification of library-specific peaks. The library DNA, isolatedfrom;1.53 106 independent colonies, was estimated to represent;75 to 80% of Sau 3A sites; hence,the 8 pg of library DNA added to each PCR would represent, on average, ;30 molecules per peak.
SCIENCE z VOL. 274 z 20 DECEMBER 19962072
had a moderate growth defect (Q2) onlyin lactate medium.
Mutants of three genes were found tohave growth defects (Q1) in medium con-taining 6 mM caffeine. Two of these, PAK1andGPA2 (24), encode a protein kinase anda guanosine triphosphate–binding regulatoryprotein, respectively; the third, YER093c,was a novel gene (Fig. 4). Mutations in allthree of these genes also resulted in a lesssevere general growth disadvantage (Q2 orQ3) (Fig. 4). One novel gene, YER139c, wasidentified as important for growth at hightemperature. Two novel genes, YEL008wand YER014w, were found to be importantfor growth in high-salt medium.
There were some examples of unexpectedsurvival in particular selections. CHO1,which encodes a phosphatidylserine syn-thetase, is important for phosphatidylcholinesynthesis (25). By genetic footprinting anal-ysis, cho1 mutants were at a severe growthdisadvantage in rich medium (Q1) and allother selections, except rich medium con-taining high salt (0.9 M NaCl). Cells con-taining insertions in the CHO1 coding se-quence were abundantly represented afterselection in the high-salt medium, indicatingthat the cho1 mutants were not only viable,but grew at least as well as the general pop-ulation of cells in this medium. This unex-pected result has no obvious explanation(26), but it highlights the value of applying
genetic footprinting analysis to all genes,even the apparently well-characterized ones.Similarly, mutants in the novel genesYER093ca (Q2) and YER072w (Q1) showedgeneral growth defects at 25°C but grew atimproved rates at 36.5°C (Fig. 1).
The ability to mate was also used as aselection protocol. Selection for diploids wasdone after Ty1-mutagenized MATa cellswere mated with excess MATa partners.One novel gene on chromosome V,YER107c, was required for mating. Muta-tions in this gene also resulted in a Q3growth defect in all selections. Conservativeinterpretation of mating data was necessaryin cases of mutants with more severe generalgrowth defects (Q1 and Q2), as these mu-tants were more susceptible to inadvertentselection during the mating procedure (27).PCR products representing detrimental in-sertions in mutants with the most severegrowth defects (Q1) were frequently (butnot always) absent upon analysis of theDNA from the selected diploid products of asuccessful mating. There were two notableexceptions. Peaks corresponding to inser-tions in the analyzed coding sequence ofYER132c were barely detectable after PCRanalysis of the time-zero DNA and weredepleted in all other selections. However,these peaks were detected upon PCR analy-sis of DNA isolated from the diploid prod-ucts of mating, which suggested that these
severely growth-impaired mutants werenonetheless able to mate. Similarly, peakscorresponding to insertions in the codingsequence of YER072w (Q1) were detectedupon PCR analysis of the successful maters.Mutants with less severe growth defects (Q2and Q3) were generally able to mate (28).
Genetic footprinting has allowed us to de-termine that an unexpectedly large fraction ofthe genes of S. cerevisiaemake detectable con-tributions to fitness under standard laboratoryconditions. This finding may be attributablein part to the essentially quantitative natureof the data obtained with this method. Unlikestandard gene disruption methods, geneticfootprinting provides an estimate of the fit-ness of mutants relative to the population as awhole. The estimates obtained for the fractionof genes that are “essential” is governed bythis feature: the Q1 category includes not onlyessential genes but genes for which mutantshave severe growth defects but might stillmanage a visible colony. The number ob-served here (20%) is indeed higher than thatreported in other studies estimating the pro-portion of “essential” genes (2). Mutations inanother 39% of the nontelomeric genes onchromosome V resulted in general growthdefects. These results suggest that despite theapparent redundancy in the yeast genome,more than half of all yeast genes contributedetectably to competitive fitness. Even redun-dant genes can be important for vegetativegrowth. For example, on chromosome V,YER074w (RP50A) and YER131w (RPS26b),which encode predicted ribosomal proteins,have nearly perfect homologs on other chro-mosomes. Mutants of YER074w andYER131w were nonetheless at substantialgrowth disadvantages (Q1 and Q2) in richmedium (29).
We anticipate that simply extendingthe methods described above to the wholegenome will enable us to assign mutantphenotypes to more than half of the genes.In our work to date, the more specializedselections yielded fewer mutant pheno-types, but the number obtained is of con-sequence nonetheless. Mutants of 11 nov-el genes were found to have specificgrowth defects or growth advantages inspecialized selections. Extrapolating thisresult to the rest of the genome predictsthat these specialized selections alonewould identify specific mutant phenotypesfor another 250 to 300 novel genes, inaddition to any new discoveries for previ-ously characterized genes. Incorporationof additional selection protocols shouldincrease the fraction of genes for which aspecific role can be inferred. However,even when mutations in a gene producedno discernible phenotype under any of theselections we used, the result was stillinformative: we learned that the gene un-
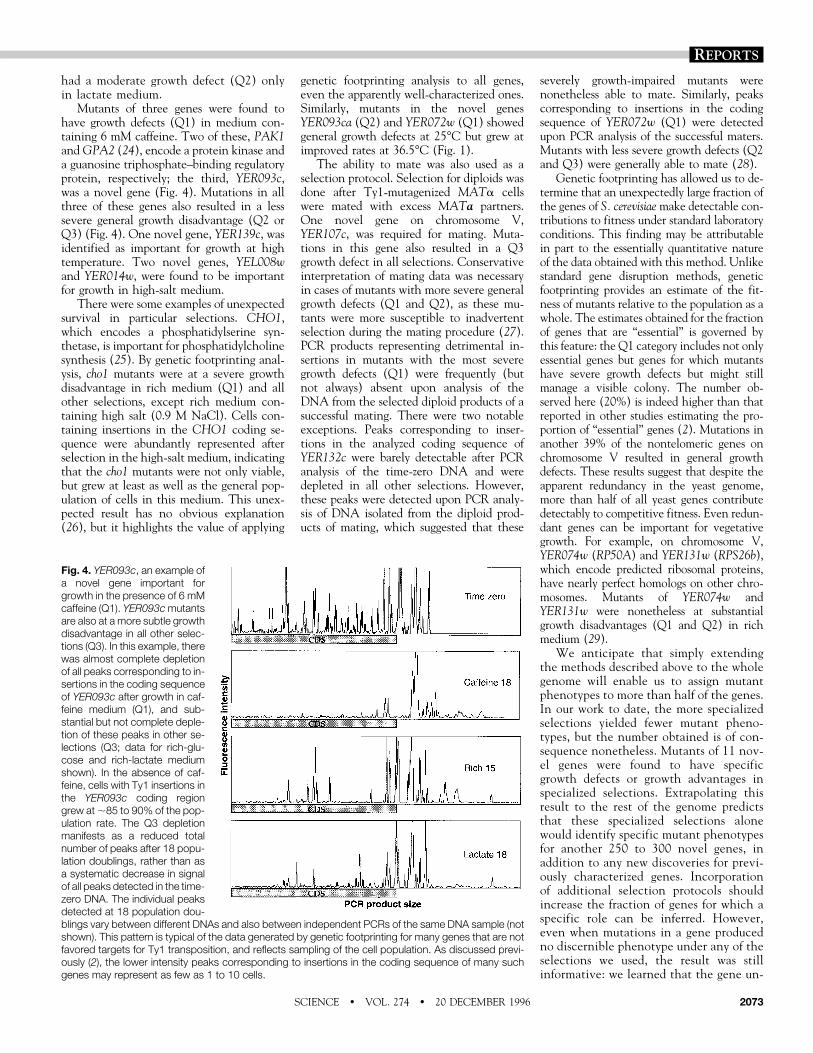
Fig. 4. YER093c, an example ofa novel gene important forgrowth in the presence of 6 mMcaffeine (Q1). YER093cmutantsare also at a more subtle growthdisadvantage in all other selec-tions (Q3). In this example, therewas almost complete depletionof all peaks corresponding to in-sertions in the coding sequenceof YER093c after growth in caf-feine medium (Q1), and sub-stantial but not complete deple-tion of these peaks in other se-lections (Q3; data for rich-glu-cose and rich-lactate mediumshown). In the absence of caf-feine, cells with Ty1 insertions inthe YER093c coding regiongrew at;85 to 90% of the pop-ulation rate. The Q3 depletionmanifests as a reduced totalnumber of peaks after 18 popu-lation doublings, rather than asa systematic decrease in signalof all peaks detected in the time-zero DNA. The individual peaksdetected at 18 population dou-blings vary between different DNAs and also between independent PCRs of the same DNA sample (notshown). This pattern is typical of the data generated by genetic footprinting for many genes that are notfavored targets for Ty1 transposition, and reflects sampling of the cell population. As discussed previ-ously (2), the lower intensity peaks corresponding to insertions in the coding sequence of many suchgenes may represent as few as 1 to 10 cells.
REPORTS
SCIENCE z VOL. 274 z 20 DECEMBER 1996 2073
der study was dispensable for growth ineach of the media tested, to a resolution of5 to 10% of the population growth rate(30).
Genetic footprinting provides an effi-cient and economical way to take advan-tage of the genomic sequences of micro-organisms so as to learn about the functionsof the newly identified genes. Thanks to thehigh degree of functional conservationamong eukaryotic proteins, we can expectthat the information gathered in this waywill also, in many cases, provide importantclues to the functions of the cognate humangenes.
REFERENCES AND NOTES___________________________
1. M. G. Goebl and T. D. Petes, Cell 46, 983 (1986); S.G. Oliver et al., Nature 357, 38 (1992).
2. V. Smith, D. Botstein, P. O. Brown, Proc. Natl. Acad.Sci. U.S.A. 92, 6479 (1995).
3. F. Dietrich et al., Nature, in press. In subsequentreleases, additional telomeric sequences were add-ed, making the full length of chromosome V 574,860bp [updated in the Martinsried Institute for ProteinSequences (MIPS) Yeast Genome Database]. Thenumber of predicted genes is derived fromDietrich etal. and from theMIPS database. Most of the possibleadditional and alternative open reading frames notedin the MIPS database were also covered by the prim-ers used in this study. One to three independentgene-specific primers were used to analyze eachgene. Primers were designed with the use of theprogram PRIMER (Whitehead Institute for Biomedi-cal Research, Cambridge, MA) with a specified melt-ing temperature of 69° to 73°C. Primers were syn-thesized by means of a 96-well array synthesizer [D.A. Lashkari, S. P. Hunicke-Smith, R. Norgren, R. W.Davis, T. Brennan, Proc. Natl. Acad. Sci. U.S.A. 92,7912 (1995)] and labeled at their 59 end with 5-car-boxyfluorescein (Applied Biosystems or Pharmacia).Approximately 85% of primers produced usabledata. Alternative primers were synthesized for anygene for which the first primer failed to produce us-able data. Each labeled gene-specific primer wasused in a PCRwith an unlabeled Ty1-specific primer,as described (2).
4. Although genetic footprinting analysis of chromo-some V had a high success rate, there were somefailures. For seven genes (RIP1, PMP2, SWI4,CLK3, GDI1, BRR2, and YER182w), PCR reactionsthat used two different gene-specific primers failedto produce enough amplified products to allowmeaningful data interpretation. In some cases,products corresponding to insertions upstream ofthe start ATG codon were readily detected, butproducts representing insertions in the coding se-quence were not reproducibly detected. This mayreflect a low frequency of Ty1 insertion in the cod-ing sequences of these genes. It is also possiblethat Ty1 insertions in essential genes may not bedetected, even in the time-zero sample, because ofselection during the mutagenesis (10). However, atleast some of the genes for which no insertionscould be detected are known from previous worknot to be essential for vegetative growth, so thelatter hypothetical explanation cannot account forall failures resulting from insufficient signal. In al-most all cases, when two independent primers forany particular gene both produced Ty1-dependentsignal upon PCR analysis, a very similar distributionof PCR products was obtained. In three cases,however, two independent primers for the samegene produced apparently credible data yet gavedifferent results by genetic footprinting analysis(YEL044w, AFG3, and RSP5; Fig. 1). On the basisof the relative frequency of these cases of discor-dant data produced by two gene-specific primersrelative to the frequency of concordant result, we
estimate that each analysis using a single primerhas a 2 to 3% chance of producing unreliable data.
5. Caution was necessary in interpreting data forgenes that had very strong local preferences forTy1 insertion upstream of the start ATG codon. Onchromosome V, these genes were generally locat-ed in the immediate vicinity of tRNA genes. Pre-ferred upstream sites for Ty1 transposition fre-quently generated a cluster of PCR products with100 to 1000 times the signal typically observed.This raises the possibility of exhaustion of PCRreagents at a stage earlier than 30 cycles, becauseof the increased number of initial template mole-cules. It is thus possible that some of the less abun-dant, smaller DNA products observed in these cas-es, which would ordinarily be assumed to representinsertions in the coding sequence of the gene,could be artifactual. In cases of this kind, PCR wasrepeated with only 23 cycles in an attempt to min-imize this possible artifact. In addition, new primersthat did not encompass the preferred site were alsoused; typically, these primers were located in thefirst 100 bp of the gene and were directed down-stream, toward the stop codon. These “reverse”primers typically allowed a more reliable survey ofproducts corresponding to insertions in coding se-quences of genes with very strong upstream sitepreferences for Ty1 insertion.
6. Typically, after mutagenesis, aliquots of 23 108 cellswere stored in 25% glycerol at –80°C. After onemutagenesis, cells were immediately transferred torich medium for growth, without intervening storage.The DNA isolated from these cells was analyzed withprimers specific to every gene for which a quantita-tive growth defect was detected. No cases werefound in which storage in glycerol, freezing and re-suscitation, or both accounted for the apparentgrowth defect, although possible contributions ofthese procedures to some phenotypes are noted inFig. 1.
7. M. C. Brandriss, J. Bacteriol. 138, 816 (1979).8. K. Irie, K. Yamaguchi, K. Kawase, K. Matsumoto,
Mol. Cell. Biol. 14, 3150 (1994).9. L. A. Graham, K. J. Hill, T. H. Stevens, J. Biol. Chem.
270, 15037 (1995); C. Abeijon et al., J. Cell Biol. 122,307 (1993); S. Prakash and L. Prakash,Genetics 87,229 (1977).
10. Selection against the mutants during the mutagene-sis procedure itself may account for our failure todetect insertions in most of the coding sequence ofGDI1, an essential gene [M. D. Garrett, J. E. Zahner,C. M. Cheney, P. L. Novick, EMBO J. 13, 1718(1994)]. Factors that may affect the degree to whichmutants are lost during the period of mutagenesis,and thus our ability to detect insertions in an essentialgene, include the integrity of the mutant cell (rapidcell lysis would limit recovery of the cell’s DNA) andthe stability and turnover of residual RNA and proteinproduced before Ty1 insertion.
11. M. Werner-Washburne, D. E. Stone, E. A. Craig,Mol. Cell. Biol. 7, 2568 (1987).
12. A. Shinohara, H. Ogawa, T. Ogawa, Cell 69, 457(1992); C. M. Moehle, M. W. Aynardi, M. R. Kolodny,F. J. Park, E. W. Jones,Genetics 115, 255 (1987); A.P. Mitchell and B. Magasanik,Mol. Cell. Biol. 4, 2758(1984).
13. These observations presumably reflect the fact thatthe Ty1 element could supply promoter or terminatorfunctions and could even provide an ATG startcodon [J. D. Boeke, D. J. Garfinkel, C. A. Styles, G.R. Fink, Cell 40, 491 (1985)].
14. For example, for a gene in which mutations reducethe growth rate to 90% of the population rate, 29%of the signal corresponding to insertions affectinggene function would remain after 18 populationdoublings, but only 3% would remain after 50 pop-ulation doublings.
15. There are 1628 Sau 3A sites in the 569,202-bp se-quence of chromosome V investigated in this analy-sis. Thus, a Sau 3A site occurs, on average, every350 bp. In this analysis, for 600 to 900 bp of codingsequence, two or three peaks resulting from Sau 3Asites are expected, assuming a random distribution.
16. We analyzed 63 genes for which quantitative mutantgrowth deficits were detected in rich medium (42%)
independently by library DNA normalization and nor-malization to upstream peaks; the remainder wereanalyzed only by normalization to upstream peaks.Variations in intensities of library peaks were ob-served. In some cases, library peaks could not beidentified because of the density of Ty1-specificpeaks. The library DNAwasmost useful as a normal-ization standard for genes that contained Sau 3Asites within the region undergoing depletion. Most ofthe genes analyzed (94%) satisfied this criterion.
17. J. B. McNeil et al., J. Biol. Chem. 269, 9155 (1994);G. Nass and K. Poralla, Mol. Gen. Genet. 147, 39(1976); M. Masselot and H. de Robichon-Szulmaj-ster, ibid. 139, 121 (1975); C. Boonchird, F. Messen-guy, E. Dubois, ibid. 226, 154 (1991).
18. YEL044w may be important for growth under all se-lections (Q1). The two primers used to analyze thisgene gave conflicting data.
19. A. P. Mitchell and B. Magasanik, Mol. Cell. Biol. 4,2767 (1984).
20. R. E. Chapman and S. Munro, EMBO J. 13, 4896(1994).
21. J. E. McEwen, K. H. Hong, S. Park, G. T. Preciado,Curr. Genet. 23, 9 (1993); J. D. Ohmen, B. Kloeck-ener-Gruissem, J. E. McEwen, Nucleic Acids Res.16, 10783 (1988); A. Harrington, C. J. Herbert, B.Tung, G. S. Getz, P. P. Slonimski, Mol. Microbiol. 9,545 (1993); N. Bonnefoy, F. Chalvet, P. Hamel, P. P.Slonimski, G. Dujardin, J. Mol. Biol. 239, 201 (1994).
22. E. Guelin, M. Rep, L. A. Grivell, Yeast 10, 1389(1994).
23. GenBank accession numbers YSCCOX15A andL38643.
24. S. Thiagalingam, K. W. Kinzler, B. Vogelstein, Proc.Natl. Acad. Sci. U.S.A. 92, 6062 (1995); M. Naka-fuku et al., ibid. 85, 1374 (1988).
25. K. D. Atkinson et al., J. Bacteriol. 141, 558 (1980).26. Perhaps an alternative synthesis or salvage pathway
is activated when cells are exposed to 0.9 M NaCl,possibly as part of a general process in which cellwall structure is altered to enhance viability in thehigh-osmolarity medium.
27. Approximately four to five population doublingselapsed during themixing and plating of cells to allowmating before selection for diploid (mated) cells.
28. Depending on the severity of the growth defect, thenumber of peaks corresponding to detrimental inser-tions detected in the PCR analysis of DNA from suc-cessful maters typically ranged between the numberobserved in the time-zero analysis and the numberobserved at 18 population doublings.
29. Explanations for this type of phenomenon have beenreported previously. For example, RNR1 and RNR3are closely related in sequence, and both encodelarge subunits of ribonucleotide reductase. Howev-er, RNR1 is constitutively expressed and is essentialfor vegetative growth, whereas RNR3 is induced inresponse to exposure to DNA-damaging agents [S.J. Elledge and R. W. Davis, Genes Dev. 4, 4740(1990)].
30. After 60 population doublings, mutants with a 5%growth rate disadvantage will have doubled only 57times, and thus will be underrepresented by a fac-tor of 23 5 8. Thus, by examining cells grown for 60population doublings in rich-glucose medium, wecould readily detect a 5% deficit in growth rate inthis medium. Because selections for growth in oth-er media involved fewer population doublings (typ-ically 15 to 18), we may only have been able torecognize growth deficits of $10% in those selec-tions (15).
31. Y-J. Kim, L. Francisco, G.-C. Chen, E. Marcotte, C.S. M. Chan, J. Cell Biol. 127, 1381 (1994).
32. We thank R. Norgren for assistance with data anal-ysis and the generation of Fig. 1, and L. McAllisterand K. Davis for discussions. Supported by NIHgrant 1PO1 HG00205-05 (to R. Davis, P.O.B., andD.B.) and by the Howard Hughes Medical Institute(P.O.B.). Supported in part by grant LT-141/93 fromthe Human Frontier Science Program Organizationto V.S. P.O.B. is an assistant investigator of theHoward Hughes Medical Institute.
31 July 1996; accepted 7 November 1996
SCIENCE z VOL. 274 z 20 DECEMBER 19962074