Face Recognition with Liveness detection using eye and Mouth Movement
Upload
unishivajiCategory
view
0download
0
Probing the Outer Mouth Structure of the hERG Channel with PeptideToxin Footprinting and Molecular Modeling
Gea-Ny Tseng,* Kailas D. Sonawane,y Yuliya V. Korolkova,z Mei Zhang,* Jie Liu,* Eugene V. Grishin,z
and H. Robert Guyy
*Department of Physiology, Virginia Commonwealth University, Richmond, Virginia; yLaboratory of Cell Biology, National Cancer Institute,National Institutes of Health, Bethesda, Maryland; and zShemyakin-Ovchinnikov Institute of Bioorganic Chemistry, Russian Academy ofSciences, Moscow, Russia
ABSTRACT Previous studies have shown that the unusually long S5-P linker lining human ether a-go-go related gene’s(hERG’s) outer vestibule is critical for its channel function: point mutations at high-impact positions here can interfere with theinactivation process and, in many cases, also reduce the pore’s K1 selectivity. Because no data are available on the equivalentregion in the available K channel crystal structures to allow for homology modeling, we used alternative approaches to model itsthree-dimensional structure. The first part of this article describes mutant cycle analysis used to identify residues on hERG’souter vestibule that interact with specific residues on the interaction surface of BeKm-1, a peptide toxin with known NMRstructure and a high binding affinity to hERG. The second part describes molecular modeling of hERG’s pore domain. Thetransmembrane region was modeled after the crystal structure of KvAP pore domain. The S5-P linker was docked to thetransmembrane region based on data from previous NMR and mutagenesis experiments, as well as a set of modeling criteria.The models were further restrained by contact points between hERG’s outer vestibule and the bound BeKm-1 toxin moleculededuced from the mutant cycle analysis. Based on these analyses, we propose a working model for the open conformationof the outer vestibule of the hERG channel, in which the S5-P linkers interact with the pore loops to influence ion flux throughthe pore.
INTRODUCTION
The human ether a-go-go related gene (hERG) encodes the
pore-forming subunit of the rapid delayed rectifier K chan-
nels (IKr) expressed in cardiac myocytes, certain neurons,
gastrointestinal smooth muscle cells, and pancreatic insulin-
secreting cells (1–8). Furthermore, hERG is upregulated in a
number of cancer cell lines (9,10), prompting the suggestion
that an increase in hERG channel activity may be antiapoptotic
in these cells. Therefore, hERG is involved in diverse cel-
lular activities under physiological and pathological condi-
tions. Much has been learned about the structure-function
relationship of the hERG channel (11). Our focus here is the
S5-P linker and P-S6 linker that line the outer vestibule of
this channel. The S5-P linker in hERG is two to three times
the length of its counterparts in most other K channels.
Previous data have suggested that the conformation of the
long S5-P linker in the hERG channel is very dynamic, and is
crucial for the channel’s inactivation process and K1 selec-
tivity (12–15). Furthermore, NMR studies of peptides corre-
sponding to hERG’s S5-P linker sequence showed that the
middle portion of the peptides could adopt an amphipathic
helical structure when placed in detergent micelles (15,16).
Information about the three-dimensional (3-D) structure of
the S5-P linker and its relationship to other channel domains
is needed to understand how conformational changes here
can affect the inactivation process and K1 selectivity.
Crystal structures of five different K channels are available
(17–21). Of these, the sequence of KvAP is the most similar
to that of hERG for the pore-forming domain. Unfortunately,
the ‘‘S5-P linker equivalents’’ (or turrets) of all five crystal
structures are much shorter and bear no sequence similarity
to that of hERG. We thus sought alternative approaches to
model the 3-D structure of hERG’s outer mouth region.
Peptide toxin ‘‘footprinting’’ had been used to probe the
structures of outer vestibules of Kv channels before any K
channel crystal structures were available (22–25). Peptide
toxins purified from scorpions and several other species can
bind to Kv channels with high affinities. These peptide
toxins have disulfide bond-stabilized compact structures that
can be determined using NMR spectroscopy (26,27). They
likely retain their rigid structures upon binding to target
channels’ receptor sites. Spatial information about some
channels’ residues have been obtained by using ‘‘mutant
cycle analysis’’ to identify channel residues that interact with
specific toxin residues in a toxin/channel complex (22–25).
Therefore, we used the mutant cycle analysis to study which
residues on hERG’s outer mouth region can interact with
specific residues on BeKm-1, a scorpion peptide toxin with a
high binding affinity to the hERG channel (under appropriate
conditions, dissociation constant, Kd, in low nM) (28–30)
and known NMR structure (Protein Data Bank code, 1J5J)
Submitted September 13, 2006, and accepted for publication January 12,
2007.
Address reprint requests to Gea-Ny Tseng, PhD, Dept. of Physiology,
Virginia Commonwealth University, 1101 E. Marshall St., Richmond, VA
23298. Tel.: 804-827-0811; Fax: 804-828-7382; E-mail: [email protected].
Kailas D. Sonawane’s present address is Dept. of Biochemistry, Shivaji
University, Kolhapur, India.
� 2007 by the Biophysical Society
0006-3495/07/05/3524/17 $2.00 doi: 10.1529/biophysj.106.097360
3524 Biophysical Journal Volume 92 May 2007 3524–3540
(31). The second approach was molecular modeling. The
transmembrane region of hERG’s pore domain was modeled
using the available KvAP crystal structure as the template.
The extracellular S5-P linker was modeled based on sec-
ondary structure information from the NMR experiments,
previous experimental observations, and a series of modeling
criteria. These structures were docked to the transmembrane
region of the pore domain in different orientations. The
models were further restrained based on mutant cycle anal-
ysis of BeKm-1/hERG interactions. These models were then
subjected to molecular dynamics (MD) simulations to test
their stability. We present the most favorable structure here
and discuss its implications for the outer mouth structure of
the hERG channel.
MATERIALS AND METHODS
Toxin preparation
The expression and purification of BeKm-1 and its alanine mutants was
performed as described previously (31). Briefly, toxins were expressed in the
periplasm of Escherchia coli (HB101) as a fusion protein with two IgG-
binding domains (ZZ) of staphylococcal protein A. The HB101 cells were
harvested and lysed by ultrasonication. After ultracentrifugation, BeKm-1
fusion proteins in the supernatant were purified by an IgG-Sepharose 6FF
column (Amersham Pharmacia Biotech, Uppsala, Sweden). Wild-type (WT)
and mutant BeKm-1 toxins were cleaved from the fusion protein by entero-
kinase. The recombinant toxins were purified from the cleavage mixture by
chromatography on a reverse phase high-performance liquid chromatogra-
phy column (Delta Pak C18 300-A pore, 3.9 3 300 mm; Waters, Milford,
MA). Mass spectrometry verified the composition of the purified material.
The toxin peptide content was determined using the bicincholinic acid
method with bovine serum albumin as the standard.
Cysteine scanning mutagenesis
Wild-type hERG in a vector, pAlterMax, was used to produce cysteine-
substituted mutants using the oligonucleotide-directed method and a com-
mercial kit (Altered Site Mammalian Mutagenesis System, Promega, Madison,
WI) as described previously (14). Mutants are designated by the WT residue
(one-letter code), followed by the position number and ‘‘C’’ for cysteine.
cRNA and oocyte preparations
cRNA transcription and oocyte injection were as described previously (32).
cRNA concentrations were quantified by densitometry (ChemiImager model
4000; a-Innotech, San Leandro, CA). Oocytes were isolated from Xenopus
laevis (Xenopus One, Dexter, MI) and freed from follicular cell layers after
mild collagenase treatment. Each oocyte was microinjected with 40 nl of
cRNA solution (total cRNA 10–18 ng). After incubating the oocytes for 2–4
days at 16�C in an ND96 medium supplemented with horse serum (4%) and
antibiotics (penicillin 50 units/ml and streptomycin 50 units/ml), channels
were studied in electrophysiological experiments.
Electrophysiological experiments
Before experiments, oocytes expressing cysteine-substituted mutants were
incubated in DTT (reducing agent, 10 mM)-containing medium at room
temperature to break disulfide bonds that might be spontaneously formed
involving introduced cysteine (Cys) side chains (14). Oocytes were then
thoroughly rinsed in DTT-free medium (5 ml for 1–2 min, three washes)
before being placed in the tissue bath that contained 0.8 ml of low-[Cl] bath
solution (to avoid interference from endogenous Cl currents). The grounding
electrodes were filled with 3 M KCl (in contact with Ag/AgCl pellets) and
connected to the bath solution with salt bridges made of 1% agar in bath
solution ([K]¼ 2 or 98 mM, see below, to avoid changing [K] in bath, which
could markedly affect hERG current amplitude). The oocyte was impaled
with two microelectrodes, and membrane currents were recorded using an
oocyte clamp amplifier (model 725B or 725C; Warner Instruments, Hamden,
CT). Voltage clamp protocol generation and data acquisition were controlled
by pClamp 5.5 via computer and a 12-bit D/A and A/D converter (Axon
Instruments, Union City, CA).
The membrane voltage was held at �80 mV (Vh), and currents were
activated by a 1-s step to 120 mV applied once per 30 or 60 s. Previous data
indicated that 1-s depolarization to 120 mV was sufficient to fully activate
WT and mutant hERG channels (14). After control currents (IC) were
recorded, 5–10 ml of BeKm-1 stock solution (2, 20, or 200 mM in 0.1%
bovine serum albumin (BSA), depending on the desired initial toxin
concentration; see below) was diluted with 0.2 ml of bath solution and added
to the bath. We targeted the degree of current suppression by 30–70%. To
reach this goal, we set the initial [BeKm-1] at an estimated Kd value
assuming no interaction between the mutated toxin and channel residues.
This was calculated based on the published Kd values for WTTx:WTCh and
WTTx:MutCh (28) and the Kd values for MutTx:WTCh (33):
Predicted Kd for MutTx:MutCh if no interaction ¼ ðKWT-Tx:Mut-Chd 3
KMut-Tx:WT-Chd Þ=KWT-Tx:WT-Ch
d :
After adding the toxin stock solution, the bath solution was gently
pipetted up and down repetitively to facilitate equilibration of toxin
concentration in the bath. The remaining current in the presence of BeKm-
1 (ITX) was recorded when the degree of current suppression reached a
steady state. If the initial [BeKm-1] induced too little suppression, the toxin
concentration was elevated in 5- or 10-fold steps until the desired degree of
suppression was obtained or until the toxin concentration reached 5000 nM.
Solutions
The standard low-[Cl] solution contained (in mM): NaOH 96, KOH 2, CaCl21.8, MgSO4 1, HEPES 5, Na-pyruvate 2.5. The solution was titrated to pH
7.5 with methanesulfonic acid. In some cases when the hERG mutant
channels manifested very small currents, we raised [K]o to 98 mM to
increase the current amplitude. This was made by replacing NaOH with
equimolar KOH and Na-pyruvate was omitted. The oocyte culture medium
was made using high-[Cl] ND96 (similar to the low-[Cl] standard bath
solution except that NaOH and KOH were replaced by NaCl and KCl,
respectively), supplemented with 4% horse serum and antibiotics.
Lyophilized BeKm-1 toxins were dissolved in 0.1% BSA in bath
solution, aliquoted, and kept at�30�C. After thawing, each aliquot was kept
on ice or at 4�C and used in ,2 days.
Data analysis
Data analysis was performed using the following programs: Clampfit of
pClamp 6 or 8 (Axon Instruments), Excel (Microsoft, Redmond, WA),
PeakFit, and SigmaPlot (Jandel Scientific, San Rafael, CA).
The amounts of charge transferred through the channels under the control
conditions and at the steady state of toxin effect (QC and QTx, respectively)
were estimated by integrating tail currents recorded at �80 mV over time.
We chose to analyze tail currents at�80 mV because: a), the holding current
at �80 mV could be used as a baseline, b), this voltage provided sufficient
driving force for either outward tail currents recorded in 2 mM [K]o or
inward tail currents recorded in 98 mM [K]o, and c), the rate of tail decay
at �80 mV could be conveniently quantified during a 1-s step. These
values were used to calculate the apparent dissociation constant (Kd).
Previous data showed that the maximum degree of hERG current sup-
pression by BeKm-1 was 90 6 1% (28). Therefore, Kd was calculated as:
3-D Structure of hERG Open Outer Mouth 3525
Biophysical Journal 92(10) 3524–3540
QTx/QC ¼ 0.9/(1 1 [Tx]/Kd) 1 0.1. The Hill coefficient is 1, consistent with
our model of toxin binding to the channel (28). Perturbation of toxin:channel
interaction induced by mutation of either toxin or channel (DDG) was
calculated by: DDG ¼ RT ln½KMutd =KWT
d �; where KMutd and KWT
d refer to Kd
values for mutant toxin or channel and for WT toxin or channel, and RT ¼0.59 kcal/mol. For double (toxin and channel) mutations, the coupling
coefficient (V) was calculated as:
V ¼ðKWT-Tx:WT-Ch
d 3KMut-Tx:Mut-Ch
d Þ= KWT-Tx:Mut-Ch
d 3KMut-Tx:WT-Ch
d Þ:�
For clarity of data presentation, the degree of coupling was quantified
using the absolute value of coupling coefficient (jVj). The mean 6 SE of V
(SEV) was calculated by:
SEV ¼½ððWWM 3 MMSÞ2 1 ðMMM 3WWSÞ2Þ0:5=ðWWM 3MMMÞ�2
1½ððWMM3MWSÞ21ðMWM3WMSÞ2Þ0:5=ðWMM3MWMÞ�2;where WW, MM, WM, and MW refer to WTTx:WTCh, MutTx:MutCh,
WTTx:MutCh, and MutTx:WTCh pairs, with subscripts ‘‘M’’ and ‘‘S’’ denot-
ing mean and SE, respectively.
Kinetic model simulations of hERG gating and state-dependent toxin
binding/unbinding was performed using ModelMaker version 4 (Family-
Genetix, Berkshire, UK).
Sequence alignment and analysis
Sequences were obtained from NCBI’s nonredundant database and were
aligned using ClustalW (34) followed by some manual adjustments to reduce
the number of insertions and deletions within families and subfamilies using
the Seqlab editor of the GCG program (Wisconsin Package Version 10.2;
Accelrys, San Diego, CA). The degree of mutability, m, for the EAG family of
sequences was calculated as described in Shrivastava et al. (35).
Molecular modeling and simulations
Modeling and simulation procedures and criteria used to develop and
evaluate models were similar to those described previously (35,36). Initial
models of the S5, P, and S6 segments were modeled from the KvAP crystal
structure (20) using the Modeler software (37). Initial models of the S5-P
linkers were developed using an in-house program to generate idealized
a-helices with side chains in the conformation most frequently observed in
helical segments of known proteins. The PSSHOW program (38) was used
to position the helical segments and to manually model the nonhelical
segments. Tetrameric models were minimized with fourfold symmetry about
the axis of the pore using CHARMM (39). The molecular dynamics
simulations of the pore-forming domain of the hERG channel embedded in a
phosphatidylethanolamine (POPE) lipid bilayer were run using the program
Gromacs (http://www.gromacs.org) (see Shrivastava et al. (35) for details).
RESULTS
Using mutant cycle analysis to probe hERGresidues that interact with specificBeKm-1 residues
In these experiments, we used BeKm-1 toxin mutants in
which surface residues were replaced by alanine (Ala) (33),
and hERG channel mutants in which residues lining the outer
vestibule were replaced by Cys (14). A prerequisite for the
mutant cycle analysis is that the mutations should not perturb
the native conformation of either the toxin or the channel.
Ala and Cys have small hydrophobic side chains that are
generally well tolerated in mutagenesis experiments. We
have analyzed the effects of Cys substitution in the outer
vestibule region of hERG (amino acids 571–613 and 631–
638; Fig. 1 A) on the channel function (14). Cys substitution
per se (not in disulfide bonded state) at 19 positions
markedly perturbed the hERG channel function. These are
‘‘high-impact:’’ positions (Fig. 1 A, residues highlighted in
red), and these Cys mutants were not included in the
experiments. For the remaining 32 positions, Cys substitu-
tion per se had little impact on the channel function. These
WT-like Cys mutants were included in the mutant cycle
analysis reported here. It was shown previously that, with the
exception of F21A, all Ala-substituted toxin mutants
retained the native conformation of the WT toxin (33). Our
preliminary experiments showed that out of the 15 Ala-
substituted BeKm-1 mutants tested, only K18A, R20A,
F14A, and Y11A showed coupling to hERG Cys mutants.
Therefore, we focused on these four BeKm-1 mutants (see
Supplemental Fig. S1 for results from the other BeKm-
1 mutants). These four residues are highlighted in Fig. 1 B.
To test our ability to differentiate between coupled and un-
coupled toxin-channel residue pairs, we also included E9A
mutant toxin in our mutant cycle analysis.
The binding affinity of channel-blocking toxins is tradi-
tionally evaluated by the degree of suppression of current
amplitude. In the case of toxin binding to the hERG channel,
suppression of peak amplitudes of tail currents has been used
as an estimator (28,31,40). This is because test pulse currents
through the hERG channel at positive membrane voltages
are small due to the fast inactivation process, whereas the
peak amplitudes of tail currents are much larger due to a fast
recovery from inactivation upon membrane repolarization
(41). During the course of our experiments, we noticed that
for some toxin:channel pairs, the peak amplitudes of tail
currents were only modestly or little suppressed although the
tail current decay became significantly faster. This occurred
when mutation(s) introduced into toxin and/or channel
weakened the binding affinity (e.g., K18A or R20A mutant
toxin (33), and Q592 or S631 mutant channel (28)), so that
high toxin concentrations (typically 1000–5000 nM) were
needed to evaluate binding affinity. Fig. 2 A depicts three
toxin:channel pairs. The left panel shows that WT toxin
binding to the I583C mutant channel was strong, and 10 nM
toxin suppressed both the test pulse current (time-dependent
component, excluding the instantaneous current component
that might arise from oocyte endogenous or leak currents)
and the peak amplitude of tail current to ;50%. The middle
panels shows that WT toxin binding to the Q592C mutant
channel was weaker, and in the presence of 1000 nM toxin
the peak amplitude of tail current was modestly suppressed
although the tail decay became much faster. Furthermore, in
the presence of toxin test pulse current activation became
slower, reaching the same level as control current at the end
of the pulse. The right panel shows that R20A mutant toxin
3526 Tseng et al.
Biophysical Journal 92(10) 3524–3540

binding to the S631C mutant channel was very weak, so that
5000 nM toxin was needed to evaluate toxin effects. In the
presence of toxin, the test pulse current and peak amplitude
of tail current superimposed with the control current trace.
However, the tail decay was markedly accelerated.
We suspect that the toxin effects on hERG gating kinetics
may reflect state-dependent toxin:channel interactions. It has
been shown that Bekm-1 binding to the hERG channel
occurs preferentially in the closed states. Channel opening
weakens toxin binding, and channel inactivation causes
toxin unbinding (29). According to this scenario, BeKm-1
tends to unbind from the hERG channels upon membrane
depolarization when the channels make transitions from
closed to open and then to inactivated states. This can lead to
an apparent slowing of hERG activation. BeKm-1 rebinds
during membrane repolarization when the hERG channels
recover from inactivation and begin to deactivate; that can
create an apparent acceleration of hERG deactivation. To test
this possibility, we set up a kinetic model of hERG gating
based on a published model (42), and incorporate state-
dependent BeKm-1 binding/unbinding reactions into the
model. The state diagram is shown in the left panel of Fig. 2
B, whereas the model parameters are listed in the right panel.
In this model, BeKm-1 binding and unbinding is voltage in-
dependent but state dependent, defined by a coupling coef-
ficient ( f ) of 2. As the channel moves forward in the
activation pathway from C0 to C1, C2, O, and then I states,
the ratio of binding to unbinding rate constants decreases to
1:4, 1:16, 1:64, and 1:256 of that in the C0 state. Therefore,
toxin binding mainly occurs in C0 and C1 states. Transition
into O and I states favors toxin unbinding. Fig. 2 C, left
panel, depicts model simulations of current traces elicited by
the same voltage clamp protocol as used in our experiments
under the control conditions and in the presence of 10 or
1000 nM toxin. In the presence of toxin, the test pulse current
begins at a level lower than control, and the activation is
slowed in a dose-dependent manner. These reflect toxin
binding in the closed state and unbinding upon channel
activation/inactivation. The peak amplitude of tail current is
suppressed in a dose-dependent manner. However, although
the rate of tail current decay is not altered by 10 nM toxin, the
decay is markedly accelerated by 1000 nM toxin. In the
presence of 1000 nM toxin, upon membrane repolarization
the channels are quickly sequestered into toxin-bound closed
(C0Tx and C1Tx) states, and this shift in channel state
distribution accelerates channel transitions from the open (O)
to closed (C2) states. In the presence of 10 nM toxin, the
rebinding is too slow to manifest the change in gating ki-
netics. These simulations are consistent with experimental
findings. The right panel of Fig. 2 C shows an example: 1000
nM BeKm-1 slowed activation and accelerated deactivation
of the WT hERG channel. It is important to point out that
although such a strong state dependence of BeKm-1/hERG
interactions appears similar to that of ‘‘gating-modifying
toxins’’ that bind to the S3-S4 linkers of target channels
(43,44), the BeKm-1 binding site is in the outer vestibule
region of the hERG channel. This is based on data from
previous experiments showing that mutations in the outer
vestibule region could markedly impact on BeKm-1 binding
whereas mutations in the S3-S4 linker could not, and that
BeKm-1 binding potency was weakened by an outer mouth
blocker, tetraethylammonium (28).
Based on the above, we could choose between two
methods to evaluate toxin potency: 1), suppression of peak
amplitude of tail current, or 2), decrease in the amount of
charges transferred through the channels during tail current
(tail current integration, taking into account toxin-induced
acceleration of tail decay). The examples shown in Fig. 2 Aindicate that although these two methods gave the same
qualitative conclusion (i.e., toxin binding was strong in
WTTx:I583CCh, weaker in WTTX:Q592CCh, and weakest in
R20ATx:S631CCh), quantitatively the tail integration method
was more reliable than the peak amplitude method as an
estimator of toxin potency. Supplemental Fig. S2 of the
Supplementary Material shows a more extensive comparison
of the apparent dissociation constant (Kd) values for R20A
toxin binding to WT and mutant hERG channels estimated
by the two methods. This comparison leads to the same
conclusion. Thus, for the experiments reported here, we
integrated the tail currents over time at �80 mV to estimate
the amount of charge transferred under the control conditions
and at the steady state of toxin effects, QC and QTx,
FIGURE 1 (A) Amino acid sequence lining the outer vestibule of hERG: residues 573–611 (S5-P linker), and residues 631–636 (P-S6 linker). Segment
585–594 corresponds to a helical region determined by previous NMR studies (15,16). Red lettering highlights high-impact positions based on a previous
cysteine scanning mutagenesis study (14). (B) Three-dimensional structure of BeKm-1 in ribbon format, with positions color coded for effects of alanine
substitution on toxin binding to hERG: high (brown), substantial (yellow), moderate (green), and negligible (blue). BeKm-1 positions not tested are color coded
light gray. Side chains for the first three classes of position are shown in ball-and-stick format. Side chains of Y11, F14, K18, and R20 are labeled.
3-D Structure of hERG Open Outer Mouth 3527
Biophysical Journal 92(10) 3524–3540
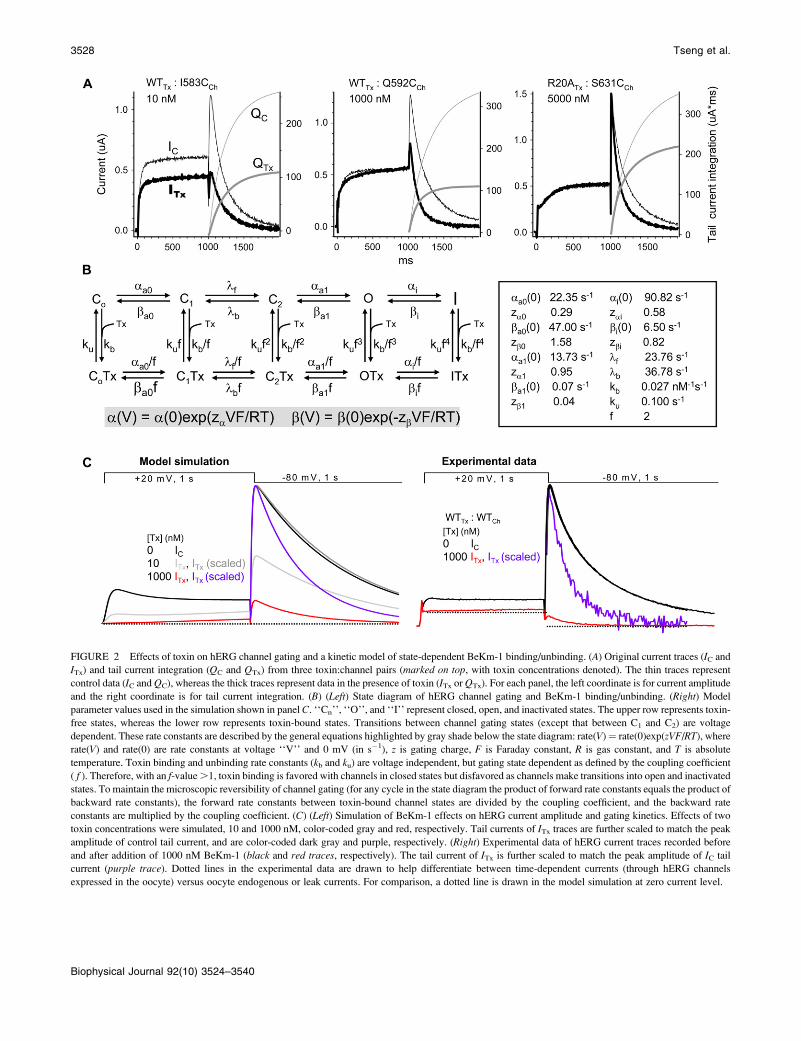
FIGURE 2 Effects of toxin on hERG channel gating and a kinetic model of state-dependent BeKm-1 binding/unbinding. (A) Original current traces (IC and
ITx) and tail current integration (QC and QTx) from three toxin:channel pairs (marked on top, with toxin concentrations denoted). The thin traces represent
control data (IC and QC), whereas the thick traces represent data in the presence of toxin (ITx or QTx). For each panel, the left coordinate is for current amplitude
and the right coordinate is for tail current integration. (B) (Left) State diagram of hERG channel gating and BeKm-1 binding/unbinding. (Right) Model
parameter values used in the simulation shown in panel C. ‘‘Cn’’, ‘‘O’’, and ‘‘I’’ represent closed, open, and inactivated states. The upper row represents toxin-
free states, whereas the lower row represents toxin-bound states. Transitions between channel gating states (except that between C1 and C2) are voltage
dependent. These rate constants are described by the general equations highlighted by gray shade below the state diagram: rate(V)¼ rate(0)exp(zVF/RT), where
rate(V) and rate(0) are rate constants at voltage ‘‘V’’ and 0 mV (in s�1), z is gating charge, F is Faraday constant, R is gas constant, and T is absolute
temperature. Toxin binding and unbinding rate constants (kb and ku) are voltage independent, but gating state dependent as defined by the coupling coefficient
( f ). Therefore, with an f-value .1, toxin binding is favored with channels in closed states but disfavored as channels make transitions into open and inactivated
states. To maintain the microscopic reversibility of channel gating (for any cycle in the state diagram the product of forward rate constants equals the product of
backward rate constants), the forward rate constants between toxin-bound channel states are divided by the coupling coefficient, and the backward rate
constants are multiplied by the coupling coefficient. (C) (Left) Simulation of BeKm-1 effects on hERG current amplitude and gating kinetics. Effects of two
toxin concentrations were simulated, 10 and 1000 nM, color-coded gray and red, respectively. Tail currents of ITx traces are further scaled to match the peak
amplitude of control tail current, and are color-coded dark gray and purple, respectively. (Right) Experimental data of hERG current traces recorded before
and after addition of 1000 nM BeKm-1 (black and red traces, respectively). The tail current of ITx is further scaled to match the peak amplitude of IC tail
current (purple trace). Dotted lines in the experimental data are drawn to help differentiate between time-dependent currents (through hERG channels
expressed in the oocyte) versus oocyte endogenous or leak currents. For comparison, a dotted line is drawn in the model simulation at zero current level.
3528 Tseng et al.
Biophysical Journal 92(10) 3524–3540

respectively. The ratio of QTx/QC was used to calculate the
apparent Kd value. In the majority of the experiments, we
used a single toxin concentration to estimate Kd (see
Materials and Methods), and assumed that the maximal
toxin effect was a 90% suppression of charge transfer (28).
For WT BeKm-1 binding to the WT hERG channel, we have
shown that the maximal degree of BeKm-1 suppression of
WT hERG was ;90%, and the Kd value estimated based on
a single toxin concentration (10 nM) was not different from
that determined by a complete dose-response relationship
(from 1 to 1000 nM) (28). The site and mechanism of BeKm-
1 action are likely maintained in the interactions between
mutant toxins and mutant channels, because the mutant
toxins maintained the native BeKm-1 conformation (33), and
we chose to use mutant channels that retained WT-like
function (14). Indeed, Fig. S3 in the Supplementary Material
shows that the maximal degree of current suppression
induced by WT toxin in two mutant channels that exhibited
markedly different toxin sensitivity than WT hERG (Q592C
and S631C) was ;90%, similar to that seen in the WT
channel. Furthermore, the Kd values for toxin binding to
these two mutant channels determined by dose-response
relationships were similar to those estimated based on single
toxin concentrations (see below, Table 1).
Fig. 3 A compares the effects of S631C channel mutation
on toxin binding when the toxin is WT, Y11A, or K18A.
Representative current traces are shown in the top panels of
Fig. 3 A. The two mutant cycles, one for Y11A/S631C and
the other for K18A/S631C, are shown in the lower panels of
Fig. 3 A. The apparent Kd values are listed below the
toxin:channel pairs. S631C reduced WT BeKm-1 toxin
binding affinity (increasing the mean Kd value from 8.1 to
TABLE 1 Summary of apparent dissociation constants (Kd) for WT or alanine-substituted BeKm-1 toxins (E9A, Y11A, F14A, K18A,
and R20A, listed on top) binding to WT or cysteine-substituted hERG channels (listed on the left)
WT E9A Y11A F14A K18A R20A
Toxin Channel Mean SE n Mean SE n Mean SE n Mean SE n Mean SE n Mean SE n
WT 8.1 0.5 14 6.2 0.9 3 2441 29 4 53.8 8.4 3 1031 155 3 2358 419 4
M574C 16.7 5.5 4 9.4 4.2 3 186 61 5 177.7 56.9 3 854 256 4 2746 506 4
E575C 4.7 1.1 4 3.3 1.3 4 413 151 3 44.8 15.9 3 1348 701 4 788 67 3
Q576C 16.6 4.7 6 11.4 3.2 3 300 53 3 140.2 52.6 4 1614 503 4 2578 534 3
P577C 8.4 0.1 3 5.1 2.2 4 173 59 3 80.9 12.7 3 1495 613 4 4860 2036 4
H578C 4.6 1.1 4 1.5 0.1 3 100 14 3 62.2 16.6 3 772 23 3 3236 458 4
M579C 8.3 4.2 4 12.0 6.3 3 134 33 3 121.8 49.7 4 1652 238 3 1669 283 5
D580C 29.5 8.3 4 7.1 1.9 3 477 64 3 458.9 190.1 3 2225 423 3 5700 653 4
S581C 7.5 1.4 4 10.8 6.9 3 194 49 3 89.2 33.8 3 580 161 3 1579 437 3
R582C 22.3 6.7 5 30.7 14.6 4 728 256 5 1946.7 529.8 5 2353 958 3 11346 2231 7
I583C 5.6 1.5 5 3.4 0.8 3 1462 301 4 87.5 35.5 3 1823 429 4 2539 534 3
G584C 1.6 0.3 5 1.0 0.1 3 133 45 3 20.2 7.8 4 111 12 3 87 28 6
H587C 4.7 0.8 6 2.9 1.0 4 251 84 4 64.0 22.8 3 644 131 4 764 195 4
Q592C 438.0 84.8 3 153.2 61.0 5 4174 2290 3 3241.3 586.8 3 1.8x10⁵ 3 5662 631 4
G594C 6.4 2.1 4 3.3 0.8 3 84 25 3 82.9 24.2 3 527 151 3 2295 503 4
P596C 28.1 12.6 4 14.9 3.4 3 995 202 3 268.9 36.6 3 1783 767 4 2335 156 4
Y597C 6.9 1.0 4 4.5 0.6 3 2036 198 6 1370.4 603.1 5 1792 536 4 1782 1100 3
N598C 7.5 1.0 4 3.4 0.5 3 155 19 3 41.1 9.5 3 615. 137 3 703 81 3
S599C 5.6 1.6 4 2.6 0.6 4 91 10 3 36.0 3.7 3 517 33 3 504 73 3
S600C 8.1 1.7 4 3.8 1.2 4 275 55 3 49.3 11.6 3 767 224 4 2212 815 4
G601 C 2.8 0.3 4 3.4 0.3 3 342 93 5 57.5 9.5 4 1468 277 4 2995 473 3
L602C 9.3 3.4 6 4.4 1.4 4 366 88 3 135.9 81.5 3 1002 86 3 937 214 3
G603C 7.1 0.9 3 4.3 1.2 4 481 111 3 64.9 14.5 3 867 148 3 1841 841 3
S606C 5.7 0.9 4 6.0 2.8 3 543 91 3 61.3 16.2 3 1398 243 4 1184 503 3
I607C 5.3 1.0 3 6.7 0.8 3 262 45 5 126.8 75.2 4 1137 212 4 3022 1079 3
K608C 9.1 2.1 3 4.6 1.4 3 286 52 4 109.6 23.0 3 1609 339 3 2400 721 3
D609C 14.6 1.7 6 16.6 6.3 3 2023 501 4 1562.7 363.2 4 1363 201 3 1838 597 7
K610C 8.2 1.6 4 5.5 0.4 3 175 46 3 53.5 14.9 3 1081 326 3 832 59 3
V612C 4.5 0.4 5 4.9 2.1 3 177 42 4 33.9 14.1 3 448 73 3 438 161 3
T613C 50.4 23.4 3 64.6 16.9 3 2215 640 3 1403.7 198.0 3 4192 1440 6 16091 8887 5
S631C 119.8 23.1 6 91.0 37.5 3 1855 248 6 2017.9 389.7 5 774 114 5 4079 1485 4
N635C 15.8 6.1 5 11.2 1.9 3 800 201 4 483.7 176.8 4 1526 329 3 2692 595 4
S636C 7.0 2.3 4 2.3 0.9 3 128 11 3 96.8 34.0 3 414 61 3 598 107 4
In all experiments, channels were activated by 1-s depolarization pulses from Vh �80 mV to 120 mV (plateau level of activation) and tail currents were
recorded at �80 mV. To evaluate the toxin effects, the amount of charge transferred through the channels was calculated by integrating the tail current over
time at �80 mV. This was done under the control conditions (QC) and at the steady state of toxin effects (QTx). The ratio of QTx/QC was used to estimate the
apparent Kd value. Our previous data showed that WT BeKm-1 could not suppress WT hERG currents. At 100-fold of IC50 (1000 nM), the remaining hERG
current amounted to 10 6 1% of control (28). Therefore, Kd was calculated as QTx/QC ¼ 0.9/(1 1 [Tx]/Kd) 1 0.1. n ¼ number of observations.
3-D Structure of hERG Open Outer Mouth 3529
Biophysical Journal 92(10) 3524–3540
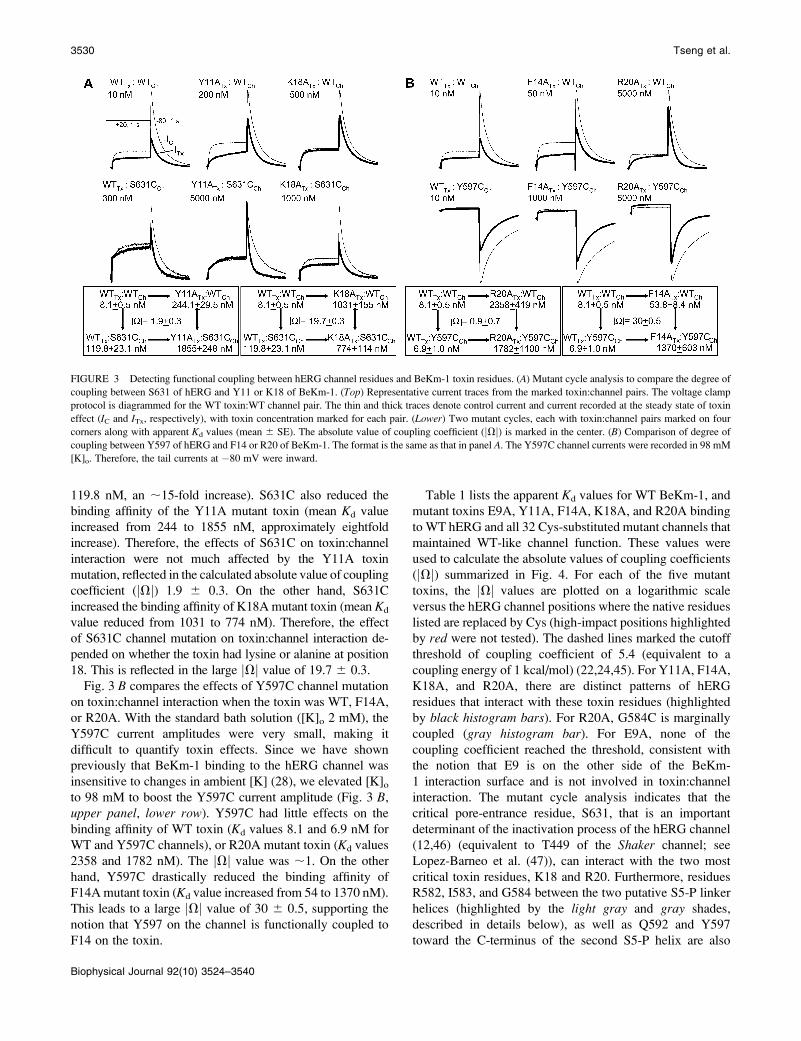
119.8 nM, an ;15-fold increase). S631C also reduced the
binding affinity of the Y11A mutant toxin (mean Kd value
increased from 244 to 1855 nM, approximately eightfold
increase). Therefore, the effects of S631C on toxin:channel
interaction were not much affected by the Y11A toxin
mutation, reflected in the calculated absolute value of coupling
coefficient (jVj) 1.9 6 0.3. On the other hand, S631C
increased the binding affinity of K18A mutant toxin (mean Kd
value reduced from 1031 to 774 nM). Therefore, the effect
of S631C channel mutation on toxin:channel interaction de-
pended on whether the toxin had lysine or alanine at position
18. This is reflected in the large jVj value of 19.7 6 0.3.
Fig. 3 B compares the effects of Y597C channel mutation
on toxin:channel interaction when the toxin was WT, F14A,
or R20A. With the standard bath solution ([K]o 2 mM), the
Y597C current amplitudes were very small, making it
difficult to quantify toxin effects. Since we have shown
previously that BeKm-1 binding to the hERG channel was
insensitive to changes in ambient [K] (28), we elevated [K]o
to 98 mM to boost the Y597C current amplitude (Fig. 3 B,
upper panel, lower row). Y597C had little effects on the
binding affinity of WT toxin (Kd values 8.1 and 6.9 nM for
WT and Y597C channels), or R20A mutant toxin (Kd values
2358 and 1782 nM). The jVj value was ;1. On the other
hand, Y597C drastically reduced the binding affinity of
F14A mutant toxin (Kd value increased from 54 to 1370 nM).
This leads to a large jVj value of 30 6 0.5, supporting the
notion that Y597 on the channel is functionally coupled to
F14 on the toxin.
Table 1 lists the apparent Kd values for WT BeKm-1, and
mutant toxins E9A, Y11A, F14A, K18A, and R20A binding
to WT hERG and all 32 Cys-substituted mutant channels that
maintained WT-like channel function. These values were
used to calculate the absolute values of coupling coefficients
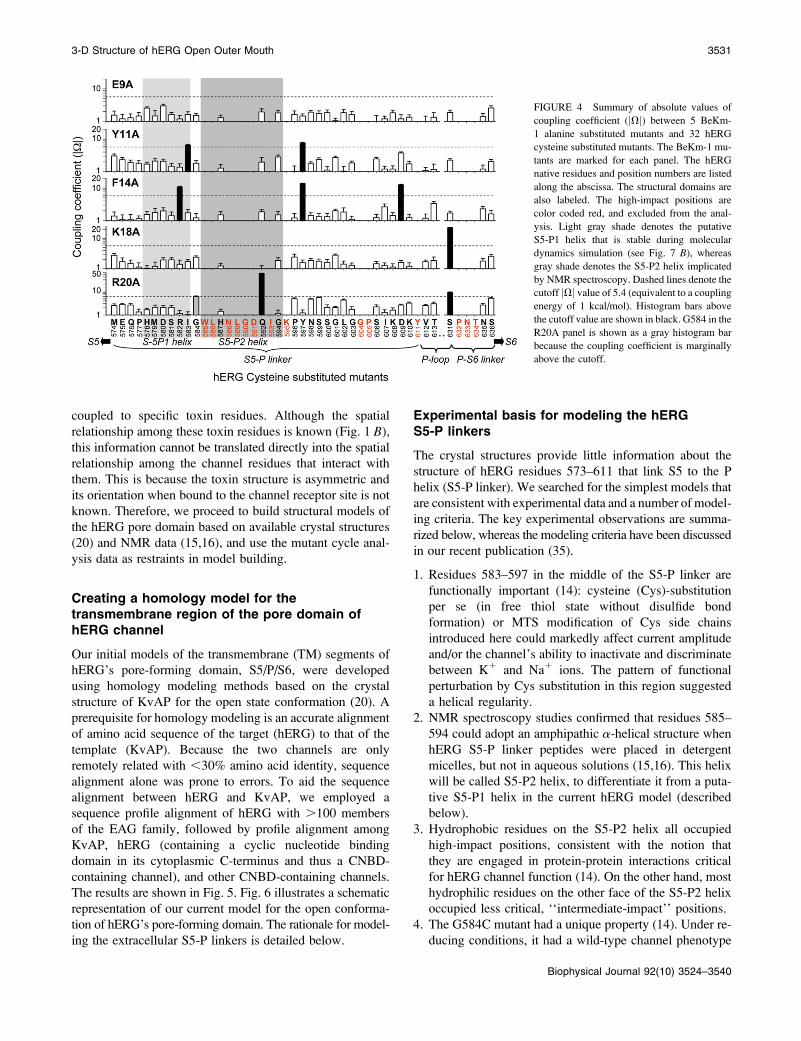
(jVj) summarized in Fig. 4. For each of the five mutant
toxins, the jVj values are plotted on a logarithmic scale
versus the hERG channel positions where the native residues
listed are replaced by Cys (high-impact positions highlighted
by red were not tested). The dashed lines marked the cutoff
threshold of coupling coefficient of 5.4 (equivalent to a
coupling energy of 1 kcal/mol) (22,24,45). For Y11A, F14A,
K18A, and R20A, there are distinct patterns of hERG
residues that interact with these toxin residues (highlighted
by black histogram bars). For R20A, G584C is marginally
coupled (gray histogram bar). For E9A, none of the
coupling coefficient reached the threshold, consistent with
the notion that E9 is on the other side of the BeKm-
1 interaction surface and is not involved in toxin:channel
interaction. The mutant cycle analysis indicates that the
critical pore-entrance residue, S631, that is an important
determinant of the inactivation process of the hERG channel
(12,46) (equivalent to T449 of the Shaker channel; see
Lopez-Barneo et al. (47)), can interact with the two most
critical toxin residues, K18 and R20. Furthermore, residues
R582, I583, and G584 between the two putative S5-P linker
helices (highlighted by the light gray and gray shades,
described in details below), as well as Q592 and Y597
toward the C-terminus of the second S5-P helix are also
FIGURE 3 Detecting functional coupling between hERG channel residues and BeKm-1 toxin residues. (A) Mutant cycle analysis to compare the degree of
coupling between S631 of hERG and Y11 or K18 of BeKm-1. (Top) Representative current traces from the marked toxin:channel pairs. The voltage clamp
protocol is diagrammed for the WT toxin:WT channel pair. The thin and thick traces denote control current and current recorded at the steady state of toxin
effect (IC and ITx, respectively), with toxin concentration marked for each pair. (Lower) Two mutant cycles, each with toxin:channel pairs marked on four
corners along with apparent Kd values (mean 6 SE). The absolute value of coupling coefficient (jVj) is marked in the center. (B) Comparison of degree of
coupling between Y597 of hERG and F14 or R20 of BeKm-1. The format is the same as that in panel A. The Y597C channel currents were recorded in 98 mM
[K]o. Therefore, the tail currents at �80 mV were inward.
3530 Tseng et al.
Biophysical Journal 92(10) 3524–3540
coupled to specific toxin residues. Although the spatial
relationship among these toxin residues is known (Fig. 1 B),
this information cannot be translated directly into the spatial
relationship among the channel residues that interact with
them. This is because the toxin structure is asymmetric and
its orientation when bound to the channel receptor site is not
known. Therefore, we proceed to build structural models of
the hERG pore domain based on available crystal structures
(20) and NMR data (15,16), and use the mutant cycle anal-
ysis data as restraints in model building.
Creating a homology model for thetransmembrane region of the pore domain ofhERG channel
Our initial models of the transmembrane (TM) segments of
hERG’s pore-forming domain, S5/P/S6, were developed
using homology modeling methods based on the crystal
structure of KvAP for the open state conformation (20). A
prerequisite for homology modeling is an accurate alignment
of amino acid sequence of the target (hERG) to that of the
template (KvAP). Because the two channels are only
remotely related with ,30% amino acid identity, sequence
alignment alone was prone to errors. To aid the sequence
alignment between hERG and KvAP, we employed a
sequence profile alignment of hERG with .100 members
of the EAG family, followed by profile alignment among
KvAP, hERG (containing a cyclic nucleotide binding
domain in its cytoplasmic C-terminus and thus a CNBD-
containing channel), and other CNBD-containing channels.
The results are shown in Fig. 5. Fig. 6 illustrates a schematic
representation of our current model for the open conforma-
tion of hERG’s pore-forming domain. The rationale for model-
ing the extracellular S5-P linkers is detailed below.
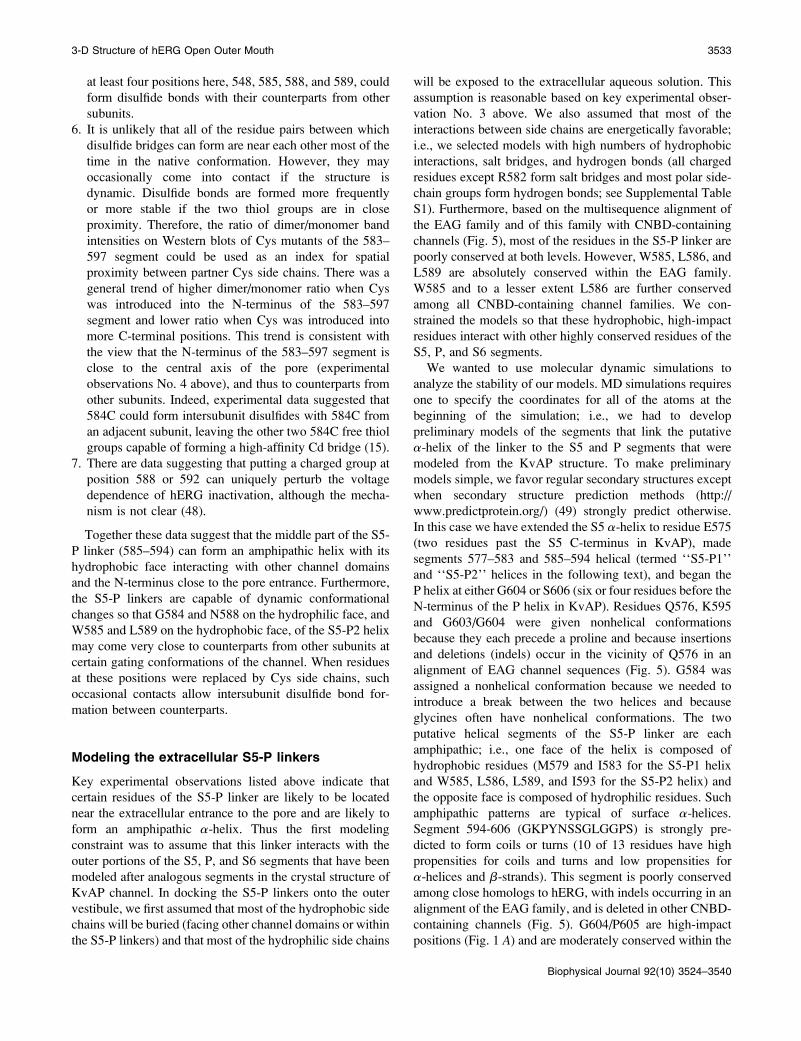
Experimental basis for modeling the hERGS5-P linkers
The crystal structures provide little information about the
structure of hERG residues 573–611 that link S5 to the P
helix (S5-P linker). We searched for the simplest models that
are consistent with experimental data and a number of model-
ing criteria. The key experimental observations are summa-
rized below, whereas the modeling criteria have been discussed
in our recent publication (35).
1. Residues 583–597 in the middle of the S5-P linker are
functionally important (14): cysteine (Cys)-substitution
per se (in free thiol state without disulfide bond
formation) or MTS modification of Cys side chains
introduced here could markedly affect current amplitude
and/or the channel’s ability to inactivate and discriminate
between K1 and Na1 ions. The pattern of functional
perturbation by Cys substitution in this region suggested
a helical regularity.
2. NMR spectroscopy studies confirmed that residues 585–
594 could adopt an amphipathic a-helical structure when
hERG S5-P linker peptides were placed in detergent
micelles, but not in aqueous solutions (15,16). This helix
will be called S5-P2 helix, to differentiate it from a puta-
tive S5-P1 helix in the current hERG model (described
below).
3. Hydrophobic residues on the S5-P2 helix all occupied
high-impact positions, consistent with the notion that
they are engaged in protein-protein interactions critical
for hERG channel function (14). On the other hand, most
hydrophilic residues on the other face of the S5-P2 helix
occupied less critical, ‘‘intermediate-impact’’ positions.
4. The G584C mutant had a unique property (14). Under re-
ducing conditions, it had a wild-type channel phenotype
FIGURE 4 Summary of absolute values of
coupling coefficient (jVj) between 5 BeKm-
1 alanine substituted mutants and 32 hERG
cysteine substituted mutants. The BeKm-1 mu-
tants are marked for each panel. The hERG
native residues and position numbers are listed
along the abscissa. The structural domains are
also labeled. The high-impact positions are
color coded red, and excluded from the anal-
ysis. Light gray shade denotes the putative
S5-P1 helix that is stable during molecular
dynamics simulation (see Fig. 7 B), whereas
gray shade denotes the S5-P2 helix implicated
by NMR spectroscopy. Dashed lines denote the
cutoff jVj value of 5.4 (equivalent to a coupling
energy of 1 kcal/mol). Histogram bars above
the cutoff value are shown in black. G584 in the
R20A panel is shown as a gray histogram bar
because the coupling coefficient is marginally
above the cutoff.
3-D Structure of hERG Open Outer Mouth 3531
Biophysical Journal 92(10) 3524–3540

(fast inactivation and high K1 selectivity). However,
when G584C was exposed to either positively charged
MTSET or negatively charged MTSES, it adopted a
mutant behavior in which both inactivation and K1
selectivity were drastically altered. The only other
cysteine mutants with this property were T613C (in the
P helix) and S631C (at the pore entrance) (14). This
similarity suggests a spatial proximity of G584, T613,
and S631 near the entrance of the selectivity filter.
5. Cys introduced into positions 583–597 could form inter-
subunit disulfide bonds, producing dimer bands on Western
blots (15). Furthermore, Cys side chains introduced into
FIGURE 5 Multisequence alignment of pore-form-
ing domain of KvAP with hERG (ERG1, accession
No. Q12809) and CNBD-containing channel homo-
logs in plants (AKT1, accession No. NP_180233), in
paramecium (PaK1, No. U19907), in Trichodesmium
erythraeum bacteria ((T. er) No. YP_724331), cation
nonselective HCN (No. NP_034538), and CNG (No.
NP_776703) channels. The following regions are
labeled on top: S5, S5-P linker, P helix, (selectivity)
filter, and S6. Black background indicates residues that
are identical to those of hERG, and gray background
indicates residues identical to those of KvAP but not
hERG. Residues of hERG are color coded according to
their mutability (35) calculated from an alignment of
more than 100 members of the EAG family: red m , 1,
orange m ¼ 1–3, yellow m ¼ 3–6, green m ¼ 6–10,
cyan m . 10 for residues predicted to be aqueous
(water) exposed, blue m . 10 for residues that occur
frequently in lipid headgroup region (K, R, W, Y), gray
m . 10 for hydrophobic and ambivalent residues
predicted to be exposed to lipid alkyl chains. Lower
case letters in hERG S5-P linker sequence indicate
positions deleted in some members of the EAG family.
FIGURE 6 Schematic representation of our model for
hERG’s pore-forming domain. Cylinders represent
a-helices. Color code, S5 ¼ cyan, S5-P linker ¼ purple,
P segment ¼ yellow, S6 ¼ pink. (A) View from the
extracellular side through the pore. (B) Side view with
two subunits colored by segment. The subunit at the back
is colored light gray, and the subunit nearest the viewer
has been removed. Highly conserved residues of the S5-
P linker (W585, L586, and L589) are shown and colored
red. Each S5-P linker is postulated to possess two helices
(S5-P1 helix, H578-I583; and S5-P2 helix, W585-G594)
that are connected by a hinge G584.
3532 Tseng et al.
Biophysical Journal 92(10) 3524–3540
at least four positions here, 548, 585, 588, and 589, could
form disulfide bonds with their counterparts from other
subunits.
6. It is unlikely that all of the residue pairs between which
disulfide bridges can form are near each other most of the
time in the native conformation. However, they may
occasionally come into contact if the structure is
dynamic. Disulfide bonds are formed more frequently
or more stable if the two thiol groups are in close
proximity. Therefore, the ratio of dimer/monomer band
intensities on Western blots of Cys mutants of the 583–
597 segment could be used as an index for spatial
proximity between partner Cys side chains. There was a
general trend of higher dimer/monomer ratio when Cys
was introduced into the N-terminus of the 583–597
segment and lower ratio when Cys was introduced into
more C-terminal positions. This trend is consistent with
the view that the N-terminus of the 583–597 segment is
close to the central axis of the pore (experimental
observations No. 4 above), and thus to counterparts from
other subunits. Indeed, experimental data suggested that
584C could form intersubunit disulfides with 584C from
an adjacent subunit, leaving the other two 584C free thiol
groups capable of forming a high-affinity Cd bridge (15).
7. There are data suggesting that putting a charged group at
position 588 or 592 can uniquely perturb the voltage
dependence of hERG inactivation, although the mecha-
nism is not clear (48).
Together these data suggest that the middle part of the S5-
P linker (585–594) can form an amphipathic helix with its
hydrophobic face interacting with other channel domains
and the N-terminus close to the pore entrance. Furthermore,
the S5-P linkers are capable of dynamic conformational
changes so that G584 and N588 on the hydrophilic face, and
W585 and L589 on the hydrophobic face, of the S5-P2 helix
may come very close to counterparts from other subunits at
certain gating conformations of the channel. When residues
at these positions were replaced by Cys side chains, such
occasional contacts allow intersubunit disulfide bond for-
mation between counterparts.
Modeling the extracellular S5-P linkers
Key experimental observations listed above indicate that
certain residues of the S5-P linker are likely to be located
near the extracellular entrance to the pore and are likely to
form an amphipathic a-helix. Thus the first modeling
constraint was to assume that this linker interacts with the
outer portions of the S5, P, and S6 segments that have been
modeled after analogous segments in the crystal structure of
KvAP channel. In docking the S5-P linkers onto the outer
vestibule, we first assumed that most of the hydrophobic side
chains will be buried (facing other channel domains or within
the S5-P linkers) and that most of the hydrophilic side chains
will be exposed to the extracellular aqueous solution. This
assumption is reasonable based on key experimental obser-
vation No. 3 above. We also assumed that most of the
interactions between side chains are energetically favorable;
i.e., we selected models with high numbers of hydrophobic
interactions, salt bridges, and hydrogen bonds (all charged
residues except R582 form salt bridges and most polar side-
chain groups form hydrogen bonds; see Supplemental Table
S1). Furthermore, based on the multisequence alignment of
the EAG family and of this family with CNBD-containing
channels (Fig. 5), most of the residues in the S5-P linker are
poorly conserved at both levels. However, W585, L586, and
L589 are absolutely conserved within the EAG family.
W585 and to a lesser extent L586 are further conserved
among all CNBD-containing channel families. We con-
strained the models so that these hydrophobic, high-impact
residues interact with other highly conserved residues of the
S5, P, and S6 segments.
We wanted to use molecular dynamic simulations to
analyze the stability of our models. MD simulations requires
one to specify the coordinates for all of the atoms at the
beginning of the simulation; i.e., we had to develop
preliminary models of the segments that link the putative
a-helix of the linker to the S5 and P segments that were
modeled from the KvAP structure. To make preliminary
models simple, we favor regular secondary structures except
when secondary structure prediction methods (http://
www.predictprotein.org/) (49) strongly predict otherwise.
In this case we have extended the S5 a-helix to residue E575
(two residues past the S5 C-terminus in KvAP), made
segments 577–583 and 585–594 helical (termed ‘‘S5-P1’’
and ‘‘S5-P2’’ helices in the following text), and began the
P helix at either G604 or S606 (six or four residues before the
N-terminus of the P helix in KvAP). Residues Q576, K595
and G603/G604 were given nonhelical conformations
because they each precede a proline and because insertions
and deletions (indels) occur in the vicinity of Q576 in an
alignment of EAG channel sequences (Fig. 5). G584 was
assigned a nonhelical conformation because we needed to
introduce a break between the two helices and because
glycines often have nonhelical conformations. The two
putative helical segments of the S5-P linker are each
amphipathic; i.e., one face of the helix is composed of
hydrophobic residues (M579 and I583 for the S5-P1 helix
and W585, L586, L589, and I593 for the S5-P2 helix) and
the opposite face is composed of hydrophilic residues. Such
amphipathic patterns are typical of surface a-helices.
Segment 594-606 (GKPYNSSGLGGPS) is strongly pre-
dicted to form coils or turns (10 of 13 residues have high
propensities for coils and turns and low propensities for
a-helices and b-strands). This segment is poorly conserved
among close homologs to hERG, with indels occurring in an
alignment of the EAG family, and is deleted in other CNBD-
containing channels (Fig. 5). G604/P605 are high-impact
positions (Fig. 1 A) and are moderately conserved within the
3-D Structure of hERG Open Outer Mouth 3533
Biophysical Journal 92(10) 3524–3540

EAG family (Fig. 5), suggesting that they are functionally
important.
Initial models of the transmembrane and extracellular por-
tion of hERG were minimized with fourfold symmetry about
the axis of the pore. These models included the voltage-
sensing domain. Models of the voltage-sensing domain and
activation gating mechanism will be presented elsewhere.
However, the models of the outer vestibule region described
here were not affected substantially by different models of
the voltage-sensing domain, consistent with the observation
that the crystal structures of the outer vestibule and selec-
tivity filter regions of Kv1.2 (21), KvAP (20), and KcsA (17)
were quite similar even though the structures of the voltage-
sensing domains were very different in the Kv1.2 and KvAP,
and is absent in KcsA. These models were constructed with
backbone torsion angles and side-chain conformations fre-
quently observed in known protein structures. Some initial
atomic overlaps were eliminated by manual adjustments and
invacu minimization. Next MD simulations were performed
with the protein embedded in a lipid bilayer, with water on
each side of the membrane and in the pore, and with K1 ions
in the selectivity filter. The backbone atoms of the S5, P, and
S6 segments were restrained during the first nanosecond of
simulation. This allowed the more speculative portions of the
model (the S5-P linker and voltage-sensing domain) to relax
in a manner that did not substantially perturb the portion of
the pore that was modeled from the KvAP crystal structure.
The restraint was removed for the second nanosecond of
simulation. The average structure during the unrestrained
portion of the simulation was examined visually and the
root-mean-square deviation (RMSD) was calculated for
different portions of the model to determine how well the
structure of the initial model was maintained. This procedure
was performed using numerous starting models that all had
fourfold symmetry. When positions and/or conformations of
a given residue changed in the same manner in most of the
subunits, new models with fourfold symmetry were con-
structed that preserved these changes while also preserving
energetically favorable interactions among the residues, and
the simulation was repeated. This process of simulation fol-
lowed by remodeling was repeated until consistent changes
were no longer observed during the simulations.
The S5-P linker was relatively dynamic during all of these
MD simulations (typical RMSD of ;3–4 A). Some of this
dynamic nature may be due to modeling errors, because this
region was not modeled after any known crystal structure.
However, mutagenesis experiments suggest that the S5-P
linker is inherently dynamic (key experimental observations
No. 5 and No. 6 above). As mentioned above, the most con-
served S5-P linker residues within the EAG family are W585,
L586, and L589 (Fig. 5). Coincidentally, the region con-
taining L586 and L589 was the most stable portion of the
linker in MD simulations of our models. The helical sec-
ondary structure of residues 585–589 was well maintained in
the simulations. However, the helix sometimes bent or broke
at residues G590 and D591. In most simulations the helical
structure of the S5-P1 segment (amino acids 577–583) was
maintained, although in some cases portions of it adopted a
310 helical conformation. The additional helical structures at
the end of S5 and beginning of the P helix that were not
present in the KvAP template structure were also well
maintained in most simulations; however, residues 606–611
adopted a nonhelical conformation in a few simulations. As
anticipated, the most dynamic portion of the models was the
putative coiled segment that links the S5-P2 helix to the P
segment; i.e., segment 594–606. Its conformation always
changed substantially, and differently, in each of the four
subunits during the MD simulations. The presence of this long
flexible segment, which is absent in other CNBD-containing
channel families (Fig. 5), likely increases the dynamic nature
of the entire S5-P linker. We have little confidence that our
models of residues 594–606 are correct, but this segment has
been included to illustrate its general location and make this
portion of the model complete for the MD simulations.
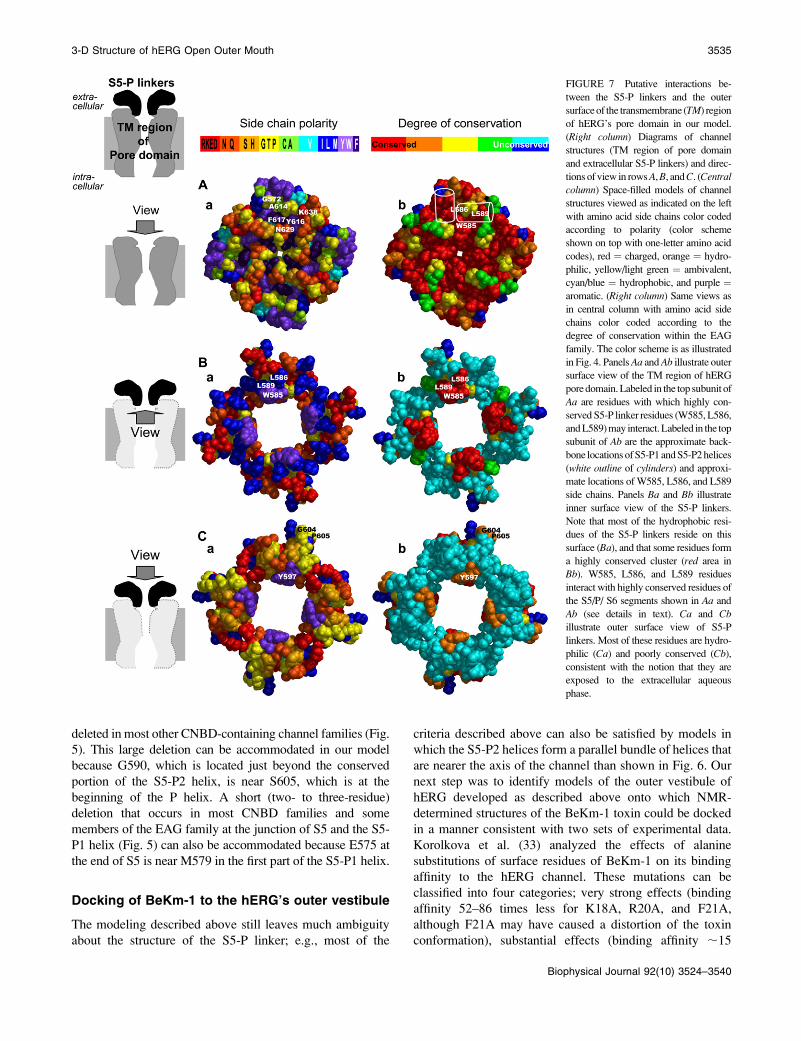
The outer surface of S5, P, and S6 segment modeled
directly from the KvAP crystal structure is illustrated in Fig. 7
A. With few exceptions, most of the residues in the central
core are highly conserved within the EAG family (Figs. 5 and
7 Ab), and that most of the residues on the outer surface are
either hydrophobic (cyan, blue, and purple, tend to be buried
in proteins) or ambivalent (green and yellow, can be either
buried or exposed) (Fig. 7 Aa). Fig. 7 B illustrates the inner
surface of the four S5-P linkers, which interacts with the outer
surface of the pore-forming domain shown in Fig. 7 A.
Although most of this segment is poorly conserved among
EAG channels, the conserved W585, L586, and L589 side
chains reside on this inner surface (Fig. 7 Bb). These residues
interact in our models with highly conserved residues of the
pore-forming domain: W585 interacts with the aromatic cuff
residues Y616 and F617, and the selectivity filter residue
N629. L586 interacts with G572, A614, and F617. L589
interacts with K638. The poorly conserved hydrophobic
M574 and I583 residues of the putative S5-P1 helix are buried
in our models and interact primarily with other poorly con-
served residues of the S5-P and P-S6 linkers. In our models
the upper, water-exposed, surface of the S5-P linkers are
poorly conserved (Fig. 7 Cb) and relatively hydrophilic (Fig. 7
Ca). The major exception is Y597, which was modeled at the
entrance of the outer vestibule to be consistent with the
observation that cysteine side chains introduced here could
form weak intersubunit disulfide bonds (experimental findings
No. 6 above), and to better fit the BeKm-1 results as described
below.
We favor models in which the backbone portions of
segments that can be aligned unambiguously would be valid
for all members of the family or superfamily. Deletions can
be accommodated without altering the surrounding structure
substantially if the residues at the beginning and end of
the deleted segment are near each other. The long poorly
conserved segment that links the S5-P2 helix to the P helix is
3534 Tseng et al.
Biophysical Journal 92(10) 3524–3540
deleted in most other CNBD-containing channel families (Fig.
5). This large deletion can be accommodated in our model
because G590, which is located just beyond the conserved
portion of the S5-P2 helix, is near S605, which is at the
beginning of the P helix. A short (two- to three-residue)
deletion that occurs in most CNBD families and some
members of the EAG family at the junction of S5 and the S5-
P1 helix (Fig. 5) can also be accommodated because E575 at
the end of S5 is near M579 in the first part of the S5-P1 helix.
Docking of BeKm-1 to the hERG’s outer vestibule
The modeling described above still leaves much ambiguity
about the structure of the S5-P linker; e.g., most of the
criteria described above can also be satisfied by models in
which the S5-P2 helices form a parallel bundle of helices that
are nearer the axis of the channel than shown in Fig. 6. Our
next step was to identify models of the outer vestibule of
hERG developed as described above onto which NMR-
determined structures of the BeKm-1 toxin could be docked
in a manner consistent with two sets of experimental data.
Korolkova et al. (33) analyzed the effects of alanine
substitutions of surface residues of BeKm-1 on its binding
affinity to the hERG channel. These mutations can be
classified into four categories; very strong effects (binding
affinity 52–86 times less for K18A, R20A, and F21A,
although F21A may have caused a distortion of the toxin
conformation), substantial effects (binding affinity ;15
FIGURE 7 Putative interactions be-
tween the S5-P linkers and the outer
surface of the transmembrane (TM) region
of hERG’s pore domain in our model.
(Right column) Diagrams of channel
structures (TM region of pore domain
and extracellular S5-P linkers) and direc-
tions of view in rows A, B, and C. (Centralcolumn) Space-filled models of channel
structures viewed as indicated on the left
with amino acid side chains color coded
according to polarity (color scheme
shown on top with one-letter amino acid
codes), red ¼ charged, orange ¼ hydro-
philic, yellow/light green ¼ ambivalent,
cyan/blue ¼ hydrophobic, and purple ¼aromatic. (Right column) Same views as
in central column with amino acid side
chains color coded according to the
degree of conservation within the EAG
family. The color scheme is as illustrated
in Fig. 4. Panels Aa and Ab illustrate outer
surface view of the TM region of hERG
pore domain. Labeled in the top subunit of
Aa are residues with which highly con-
served S5-P linker residues (W585, L586,
and L589) may interact. Labeled in the top
subunit of Ab are the approximate back-
bone locations of S5-P1 and S5-P2 helices
(white outline of cylinders) and approxi-
mate locations of W585, L586, and L589
side chains. Panels Ba and Bb illustrate
inner surface view of the S5-P linkers.
Note that most of the hydrophobic resi-
dues of the S5-P linkers reside on this
surface (Ba), and that some residues form
a highly conserved cluster (red area in
Bb). W585, L586, and L589 residues
interact with highly conserved residues of
the S5/P/ S6 segments shown in Aa and
Ab (see details in text). Ca and Cbillustrate outer surface view of S5-P
linkers. Most of these residues are hydro-
philic (Ca) and poorly conserved (Cb),
consistent with the notion that they are
exposed to the extracellular aqueous
phase.
3-D Structure of hERG Open Outer Mouth 3535
Biophysical Journal 92(10) 3524–3540
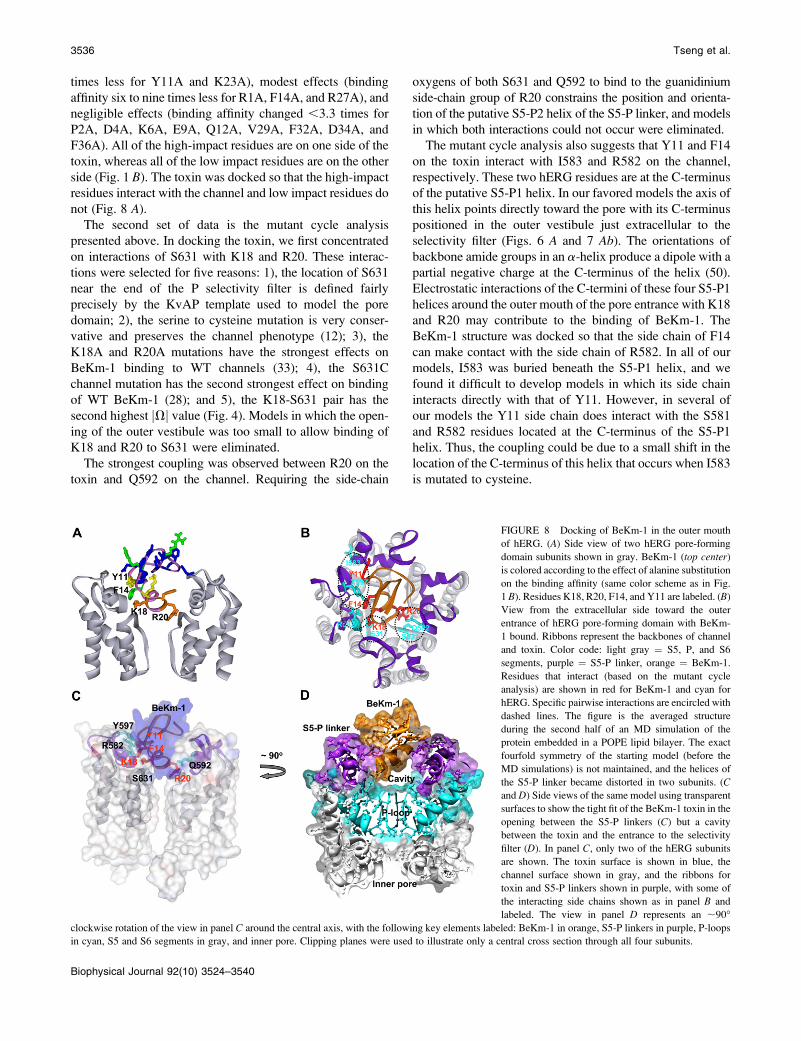
times less for Y11A and K23A), modest effects (binding
affinity six to nine times less for R1A, F14A, and R27A), and
negligible effects (binding affinity changed ,3.3 times for
P2A, D4A, K6A, E9A, Q12A, V29A, F32A, D34A, and
F36A). All of the high-impact residues are on one side of the
toxin, whereas all of the low impact residues are on the other
side (Fig. 1 B). The toxin was docked so that the high-impact
residues interact with the channel and low impact residues do
not (Fig. 8 A).
The second set of data is the mutant cycle analysis
presented above. In docking the toxin, we first concentrated
on interactions of S631 with K18 and R20. These interac-
tions were selected for five reasons: 1), the location of S631
near the end of the P selectivity filter is defined fairly
precisely by the KvAP template used to model the pore
domain; 2), the serine to cysteine mutation is very conser-
vative and preserves the channel phenotype (12); 3), the
K18A and R20A mutations have the strongest effects on
BeKm-1 binding to WT channels (33); 4), the S631C
channel mutation has the second strongest effect on binding
of WT BeKm-1 (28); and 5), the K18-S631 pair has the
second highest jVj value (Fig. 4). Models in which the open-
ing of the outer vestibule was too small to allow binding of
K18 and R20 to S631 were eliminated.
The strongest coupling was observed between R20 on the
toxin and Q592 on the channel. Requiring the side-chain
oxygens of both S631 and Q592 to bind to the guanidinium
side-chain group of R20 constrains the position and orienta-
tion of the putative S5-P2 helix of the S5-P linker, and models
in which both interactions could not occur were eliminated.
The mutant cycle analysis also suggests that Y11 and F14
on the toxin interact with I583 and R582 on the channel,
respectively. These two hERG residues are at the C-terminus
of the putative S5-P1 helix. In our favored models the axis of
this helix points directly toward the pore with its C-terminus
positioned in the outer vestibule just extracellular to the
selectivity filter (Figs. 6 A and 7 Ab). The orientations of
backbone amide groups in an a-helix produce a dipole with a
partial negative charge at the C-terminus of the helix (50).
Electrostatic interactions of the C-termini of these four S5-P1
helices around the outer mouth of the pore entrance with K18
and R20 may contribute to the binding of BeKm-1. The
BeKm-1 structure was docked so that the side chain of F14
can make contact with the side chain of R582. In all of our
models, I583 was buried beneath the S5-P1 helix, and we
found it difficult to develop models in which its side chain
interacts directly with that of Y11. However, in several of
our models the Y11 side chain does interact with the S581
and R582 residues located at the C-terminus of the S5-P1
helix. Thus, the coupling could be due to a small shift in the
location of the C-terminus of this helix that occurs when I583
is mutated to cysteine.
FIGURE 8 Docking of BeKm-1 in the outer mouth
of hERG. (A) Side view of two hERG pore-forming
domain subunits shown in gray. BeKm-1 (top center)
is colored according to the effect of alanine substitution
on the binding affinity (same color scheme as in Fig.
1 B). Residues K18, R20, F14, and Y11 are labeled. (B)
View from the extracellular side toward the outer
entrance of hERG pore-forming domain with BeKm-
1 bound. Ribbons represent the backbones of channel
and toxin. Color code: light gray ¼ S5, P, and S6
segments, purple ¼ S5-P linker, orange ¼ BeKm-1.
Residues that interact (based on the mutant cycle
analysis) are shown in red for BeKm-1 and cyan for
hERG. Specific pairwise interactions are encircled with
dashed lines. The figure is the averaged structure
during the second half of an MD simulation of the
protein embedded in a POPE lipid bilayer. The exact
fourfold symmetry of the starting model (before the
MD simulations) is not maintained, and the helices of
the S5-P linker became distorted in two subunits. (Cand D) Side views of the same model using transparent
surfaces to show the tight fit of the BeKm-1 toxin in the
opening between the S5-P linkers (C) but a cavity
between the toxin and the entrance to the selectivity
filter (D). In panel C, only two of the hERG subunits
are shown. The toxin surface is shown in blue, the
channel surface shown in gray, and the ribbons for
toxin and S5-P linkers shown in purple, with some of
the interacting side chains shown as in panel B and
labeled. The view in panel D represents an ;90�clockwise rotation of the view in panel C around the central axis, with the following key elements labeled: BeKm-1 in orange, S5-P linkers in purple, P-loops
in cyan, S5 and S6 segments in gray, and inner pore. Clipping planes were used to illustrate only a central cross section through all four subunits.
3536 Tseng et al.
Biophysical Journal 92(10) 3524–3540

Weak coupling between R20A and G584C was also
observed in the mutant cycle analysis. G584 links the two
putative S5-P helices and was near S631, and thus R20, in
most of our models, consistent with the observed functional
coupling between the two.
The mutant cycle analysis also suggests that the two
aromatic toxin residues, Y11 and F14, interact with an
aromatic hERG residue, Y597, which lies within the latter
portion of the S5-P linker that we suspect has little regular
secondary structure. We developed models of this segment
to allow the interaction between Y11/F14 and Y597 only for
models in which the putative helical portions and their
interactions with BeKm-1 had been modeled. In these
models, the S5-P2 helix terminates at K595 and the P596 and
Y597 residues extend back over the axis of this helix so that
the Y597 side chain resides between the Y11 and F14 side
chains.
The only apparent coupling interaction indicated by the
mutant cycle analysis that is inconsistent with all of our
models occurs between F14 and D609. In our models, D609
resides on the face of the P helix that is oriented toward the
pore. However, it lies beneath the S5-P2 helix and was
relatively far from F14 in our models. Because D609 interacts
directly with the S5-P2 helix in the vicinity of G590 in our
model, and the S5-P2 helix can adopt dynamic conforma-
tions, it is possible that the D609C mutation alters the posi-
tion of some of the S5-P linker residues that interact directly
with F14. Such anomalies are not unprecedented; e.g., cou-
pling was observed between an aspartate on the P helix of
Shaker (D431) and S11 of Agitoxin 2 (25); however, mod-
eling based on crystal structures and NMR studies of the toxin-
channel complex indicate that these residues do not interact
directly.
Five similar models for the outer vestibule interactions
with BeKm-1 were identified in which most of the interac-
tions described above were maintained during an invacu
minimization procedure. Next MD simulations of these
models of the channel-toxin complex were performed. The
pore domain was embedded in a POPE lipid bilayer with
water on each side. During the first nanosecond of the MD
simulations, restraints were imposed to 1), maintain interac-
tions between the K18 amine group and a S631 hydroxyl
group; 2), maintain interactions between the R20 guanidi-
nium group and a Q592 amide group and a S631 hydroxyl
group; and 3), maintain the backbone atoms of the inner
portions of the S5 and S6 helices to within an angstrom of
their starting position. These restraints allowed the position
of the toxin and conformation of the channel outer vestibule
to relax without dramatically altering the conformation of the
pore or losing the strongest interactions between the toxin
and channel. These restraints were removed during the sec-
ond nanosecond of the simulations. The average structures of
the complex during the last nanosecond were then examined
visually to determine how well the interactions suggested by
the experiments were maintained, and how the position and
conformation of the toxin and the S5-P linker were altered.
In most of the simulations, some of the experimentally
determined pairwise interactions present in the initial models
were not maintained. However, in one simulation, they all
were, as illustrated in Fig. 8 (the pairwise interactions are
marked in Fig. 8 B). Supplemental Fig. S4 illustrates the
other models for which the interactions were not maintained
as well. In the model presented in Fig. 8, which we consider
our best, some of the initial fourfold symmetry of the outer
vestibule was lost during the simulation. In two subunits,
residues 577–583 of the S5-P1 helix and 585–594 of the
S5-P2 helix maintained their secondary structure; however,
the helical conformation was lost in a third subunit for
residues 577, 578, 585, and 594, and in a fourth subunit for
residues 585 and 590–594. The S5-P helices also shifted
slightly relative to the transmembrane helices, but the direc-
tion of the shift differed among the four subunits. Some of
this loss of symmetry could be due to interactions with the
asymmetric BeKm-1 toxin; e.g., the two subunits in which
the helical structure of the S5-P linker was completely main-
tained had the least contact with the toxin. However, some of
the symmetry was also lost in most simulations in which
the toxin was not present. This result is consistent with our
hypothesis that the structure of the S5-P linker is highly
dynamic, and can be easily perturbed by mutations, toxin
binding, or conformational changes in other parts of the
protein.
DISCUSSION
The structural model matches the functionaldata well
The structural model presented here not only matches seven
out of eight pairs of interacting residues identified in the
mutant cycle analysis, but also provides mechanistic insights
into the unique features of BeKm-1/hERG interaction. The
model showed that BeKm-1 is stuck above the pore en-
trance by the S5-P1 and S5-P2 helices that crowd the outer
vestibule of the channel. The S5-P helices make contacts
with Y11 and F14 on one end of the toxin’s a-helix. The
other end of the toxin a-helix is pointing downward, toward
the pore entrance, with K18 and R20 making contacts with
S631 side chains on two adjacent subunits. The observation
in the model that BeKm-1 is bound above the pore entrance
and none of its side chains penetrate deep into the pore
explains why BeKm-1 is not sensitive to [K1] inside the pore
(28). This is distinctly different from charybdotoxin (ChTx)
or agitoxin2 (AgTx2) binding to the Shaker channel. In the
latter case, ChTx or AgTx2 uses a critical lysine residue on
their interaction surfaces to protrude into the pore and bind in
the vicinity of the selectivity filter (25). Therefore, increasing
K1 ion occupancy inside the pore or elevating K1 ion
concentration around the outer mouth can destabilize ChTx
or AgTx2 binding to the Shaker channel (25). The positive
3-D Structure of hERG Open Outer Mouth 3537
Biophysical Journal 92(10) 3524–3540

charges of the K18 and R20 side chains around outer en-
trance likely hinder K1 ion flux through the pore. Although
electrostatic forces do not play as a major role in directing
BeKm-1 (net 12.73 charges at neutral pH) binding to the
hERG outer vestibule, as is the case for ChTx or AgTx2
binding to the Shaker channel (14.89 and 15.89 at neutral
pH), increasing the amount of positive charges on BeKm-1
(changing the bath solution pHo in the range of 8.5–6.5)
could modestly increase its potency (28).
BeKm-1 does not totally suppress hERG currents: even in
the presence of 1000 nM BeKm-1 (100-fold its IC50) there
remained some residual hERG current amounting to ;10%
of the control amplitude (28). This residual conductance
could indicate that BeKm1 never completely blocks the
entrance to the pore. The fit of BeKm-1 in the opening
between the S5-P linkers is relatively tight in this model, as
illustrated in Fig. 8 C; however, there is a cavity between the
toxin and entrance to the selectivity filter (Fig. 8 D). Our
models are not sufficiently precise and stable to exclude the
possibility that ions can pass into this cavity through gaps
between the toxins and the linkers or between the linkers and
the P segments at a rate sufficient to cause the residual cur-
rent. It is also possible that the dynamic nature of the binding
region allows flickering between blocked and unblocked
states. This possibility is supported by our kinetic model
simulations (Fig. 2): membrane depolarization that enhances
hERG inactivation induces BeKm-1 dissociation, and toxin
rebinds upon membrane repolarization. This is also consis-
tent with experimental findings: elevating temperature mark-
edly reduces BeKm-1 binding potency (IC50 increased from
9 nM at room temperature to 63 nM at 37�C), as if more
vigorous motions of the S5-P linkers around the outer mouth
at the higher temperature dislodge BeKm-1 more easily (29).
Therefore, at positive voltages we used to monitor the cur-
rents, dynamic conformational changes of the S5-P linkers
could temporarily dislodge BeKm-1 from the pore entrance,
allowing K1 currents.
A recent report suggests that, as has been described for the
P-type inactivation in the Shaker (51), Kv1.5 (52) and Kv2.1
(53) channels, the inactivation process in the hERG channel
is accompanied by a transient increase in Na1 permeability
through the pore (54). In our model, residues at high-impact
positions on the S5-P linker interact with residues of the pore
loop. For example, W585 interacts with the aromatic cuff
residues Y616 and F617, as well as the selectivity filter
residue N629, and L586 interacts with A614 and F617 (Fig.
7). These intimate interactions may explain why many
mutations in the S5-P linker disrupt not only the inactivation
process but also the ability of the hERG pore to select for
K1 ions (12–14).
Limitations
The Guy laboratory at National Institutes of Health uses a
long-term iterative approach to modeling. Initial models that
are not highly restrained by experimental data, such as those
we proposed shortly after the first voltage-gated channel se-
quences were determined (55), are often relatively imprecise
and highly speculative. Even so, these models were valuable
in designing and interpreting experiments that confirmed
most of our major predictions. As more data were obtained
and as methods of modeling improved, we developed suc-
cessive generations of models that are less speculative and
are probably more correct. Although the models presented
here are less speculative and more constrained than were our
early models of Na1 and K1 channels, they deal with a very
difficult problem of modeling dynamic loops for which no
homologous template structure has been determined. Thus
these models should still be considered as tentative approx-
imations of the loop structure of the open conformation. The
most speculative aspects of the models concern segments
where indels occur in alignments of closely related se-
quences, that are predicted not to have regular secondary
structures, and for which there are no experimental data that
support the proposed models. The rationale for modeling
these regions is that they are required for MD simulations.
Here these regions correspond to the first and last part of the
S5-P linker. Thus, the proposed extension of the S5 helix and
the S5-P1 helix are speculative and are supported only by the
observation that they remain intact during MD simulations
and allow hydrophobic residues to be buried while hydro-
philic residues are exposed. However, the observation that
the S5-P1 segment is poorly conserved and that some of its
residues are deleted or replaced by helix breaking residues
such as proline in some homologs makes it unlikely that this
segment is helical in all CNBD channel families, and raises
questions about the validity of this aspect of the model for
hERG. The proposed structure of the last part of the loop that
connects the S5-P2 helix to the P helix is even more spe-
culative. It is even less well conserved with rather large
indels in alignments of even closely related channels of the
EAG family, is predicted to have a coiled structure, and is
very dynamic in the simulations. The most firmly based as-
pect of the model is the central region that contains the high-
impact residues. NMR studies support the helical nature of
this segment, its hydrophobic residues are highly conserved,
these interact with highly conserved residues of the P
segment, and mutations of these residues alter the selectivity
and gating properties of the channel. W585 is the only loop
residue that is completely conserved among all CNBD fami-
lies. It is also the residue that interacts with some of the most
highly conserved residues of the P segment; i.e., with the two
aromatic residues of the P helices that form the aromatic cuff
that surrounds the selectivity filter in most K1 channels and
with residues at the outer entrance to the selectivity filter.
Thus, whereas some precise details of our models are likely
to be incorrect, we believe that the general location of these
highly conserved S5-P linker residues at the outer entrance of
the selectivity filter is valid. Fortunately, this is likely to be
the most important part of the linker, and errors in modeling
3538 Tseng et al.
Biophysical Journal 92(10) 3524–3540

the more peripheral parts of the linker are probably not as
important.
SUPPLEMENTARY MATERIAL
An online supplement to this article can be found by visiting
BJ Online at http://www.biophysj.org.
This work was supported in part by HL 67840 and HL 46451 from National
Institutes of Health/National Heart, Lung, and Blood Institute (to G.N.T.),
by the Intramural Research Program of the NIH, National Cancer Institute,
Center for Cancer Research (to H.R.G.), by a grant from the Russian
Foundation of Basic Research (to Y.V.K.), by Ministry of Education and
Science of Russian Federation and the Program of Cellular Biology,
Russian Academy of Sciences (to E.V.G.), and by A. D. Williams Trust
Funds (to G.N.T. and Y.V.K.).
REFERENCES
1. Sanguinetti, M. C., C. Jiang, M. E. Curran, and M. T. Keating. 1995. Amechanistic link between an inherited and an acquired cardiacarrhythmia: HERG encodes the IKr potassium channel. Cell. 81:299–307.
2. Emmi, A., H. J. Wenzel, P. A. Schwartzkroin, M. Taglialatela, P.Castaldo, L. Bianchi, J. M. Nerbonne, G. A. Robertson, and D. Janigro.2000. Do glia have heart? Expression and functional role for ether-a-go-go currents in hippocampal astrocytes. J. Neurosci. 20:3915–3925.
3. Zhou, W., F. S. Cayabyab, P. S. Pennefather, L. C. Schlichter, andT. E. DeCoursey. 1998. HERG-like K1 channels in microglia. J. Gen.Physiol. 111:781–794.
4. Bauer, C. K., I. Wulfsen, R. Schafer, G. Glassmeier, S. Wimmers, J.Flitsch, D. K. Ludecke, and J. R. Schwarz. 2003. HERG K1 currents inhuman prolactin-secreting adenoma cells. Pflugers Arch. 445:589–600.
5. Faravelli, L., A. Arcangeli, M. Olivotto, and E. Wanke. 1996. AHERG-like K1 channel in rat F-11 DRG cell line: pharmacologicalidentification and biophysical characterization. J. Physiol. 496:13–23.
6. Wang, X., E. R. Reynolds, P. Deak, and L. M. Hall. 1997. The seizurelocus encodes the Drosophila homolog of the HERG potassiumchannel. J. Neurosci. 17:882–890.
7. Overholt, J. L., E. Ficker, T. Yang, H. Shams, G. R. Bright, and N. R.Prabhakar. 2000. HERG-like potassium current regulates the restingmembrane potential in glomus cells of the rabbit carotid body.J. Neurophysiol. 83:1150–1157.
8. Rosati, B., P. Marchetti, O. Crociani, M. Lecchi, R. Lupi, A. Arcangeli,M. Olivotto, and E. Wanke. 2000. Glucose- and arginine-inducedinsulin secretion by human pancreatic b-cells: the role of HERG K1
channels in firing and release. FASEB J. 14:2601–2610.
9. Wang, H., Y. Zhang, L. Cao, H. Han, J. Wang, B. Yang, S. Nattel, andZ. Wang. 2002. HERG K1 channel, a regulator of tumor cell apoptosisand proliferation. Can Res. 62:4843–4848.
10. Crociani, O., L. Guasti, M. Balzi, A. Becchetti, E. Wanke, M. Olivotto,R. S. Wymore, and A. Arcangeli. 2003. Cell cycle-dependent expres-sion of HERG1 and HERG1B isoforms in tumor cells. J. Biol. Chem.278:2947–2955.
11. Chadwick, D. J., and J. Goode. 2005. The hERG Cardiac PotassiumChannel: Structure, Function and Long QT Syndrome. NovartisFoundation Symposium 266. John Wiley & Sons, Chichester, UK.
12. Fan, J.-S., M. Jiang, W. Dun, T. V. McDonald, and G.-N. Tseng. 1999.Effects of outer mouth mutations on hERG channel function: acomparison with similar mutations in Shaker. Biophys. J. 76:3128–3140.
13. Dun, W., M. Jiang, and G.-N. Tseng. 1999. Allosteric effects ofmutations in the extracellular S5-P loop on the gating and ionpermeation properties of hERG. Pflugers Arch. 439:141–149.
14. Liu, J., M. Zhang, M. Jiang, and G.-N. Tseng. 2002. Structural andfunctional role of the extracellular S5-P linker in the HERG potassiumchannel. J. Gen. Physiol. 120:723–737.
15. Jiang, M., M. Zhang, I. V. Maslennikov, J. Liu, D. M. Wu, Y. V.Korolkova, A. S. Arseniev, E. V. Grishin, and G.-N. Tseng. 2005.Dynamic conformational changes of extracellular S5-P linkers in thehERG channel. J. Physiol. 569:75–89.
16. Torres, A. M., P. Bansal, M. Sunde, C. E. Clarke, J. A. Bursill, D. J.Smith, A. Bauskin, S. N. Breit, T. J. Campbell, P. F. Alewood, P. W.Kuchel, and J. I. Vandenberg. 2003. Structure of the HERG K1
channel S5P extracellular linker: role of an amphipathic a-helix inC-type inactivation. J. Biol. Chem. 278:42136–42148.
17. Doyle, D. A., J. M. Cabral, R. A. Pfuetzner, A. Kuo, J. M. Gulbis, S. L.Cohen, B. T. Chait, and R. MacKinnon. 1998. The structure of thepotassium channel: molecular basis of K1 conduction and selectivity.Science. 280:69–77.
18. Jiang, Y., A. Lee, J. Chen, M. Cadene, B. T. Chait, and R. MacKinnon.2002. The open pore conformation of potassium channels. Nature.417:523–526.
19. Kuo, A., J. M. Gulbis, J. F. Antcliff, T. Rahman, E. D. Lowe, J.Zimmer, J. Cuthbertson, F. M. Ashcroft, T. Ezaki, and D. A. Doyle.2003. Crystal structure of the potassium channel KirBac1.1 in theclosed state. Science. 300:1922–1926.
20. Jiang, Y., A. Lee, J. Chen, V. Ruta, M. Cadene, B. T. Chait, and R.MacKinnon. 2003. X-ray structure of a voltage-dependent K1 channel.Nature. 423:33–41.
21. Long, S. B., E. B. Campbell, and R. MacKinnon. 2005. Crystalstructure of a mammalian voltage-dependent Shaker family K1
channel. Science. 309:897–903.
22. Hidalgo, P., and R. MacKinnon. 1995. Revealing the architecture ofa K1 channel pore through mutant cycles with a peptide inhibitor.Science. 268:307–310.
23. Gross, A., and R. MacKinnon. 1996. Agitoxin footprinting the Shakerpotassium channel pore. Neuron. 16:399–406.
24. Imredy, J. P., and R. MacKinnon. 2000. Energetic and structuralinteractions between d-dendrotoxin and a voltage-gated potassiumchannel. J. Mol. Biol. 296:1283–1294.
25. Ranganathan, R., J. H. Lewis, and R. MacKinnon. 1996. Spatiallocalization of the K1 channel selectivity filter by mutant cycle-basedstructure analysis. Neuron. 16:131–139.
26. Miller, C. 1995. The charybdotoxin family of K1 channel-blockingpeptides. Neuron. 15:5–10.
27. Tytgat, J., K. G. Chandy, M. L. Garcia, G. A. Gutman, M.-F. Martin-Eauclaire, J. J. van der Walt, and L. D. Possani. 1999. A unifiednomenclature for short-chain peptides isolated from scorpion venoms:a-KTx molecular subfamilies. Trends Pharmacol. Sci. 20:444–447.
28. Zhang, M., Y. V. Korolkova, J. Liu, M. Jiang, E. V. Grishin, and G.-N.Tseng. 2003. BeKm-1, an HERG-blocking scorpion toxin, shares theglobal structure with charybdotoxin but the mechanism of action withErgTx. Biophys. J. 84:3022–3036.
29. Milnes, J. T., C. E. Dempsey, J. M. Ridley, O. Crociani, A. Arcangeli,J. C. Hancox, and H. J. Witchel. 2003. Preferential closed channelblockade of HERG potassium currents by chemically synthesizedBeKm-1 scorpion toxin. FEBS Lett. 547:20–26.
30. Yao, J.-A., X. Du, D. Lu, R. L. Baker, E. Daharsh, and P. Atterson.2006. Estimation of potency of HERG channel blockers: impact ofvoltage protocol and temperature. J. Pharmacol. Toxicol. Methods.52:146–153.
31. Korolkova, Y. V., S. A. Kozlov, A. V. Lipkin, K. A. Pluzhnikov, J. K.Hadley, A. K. Filippov, D. A. Brown, K. Angelo, D. Strobaek, T.Jespersen, S.-P. Olesen, B. S. Jensen, and E. V. Grishin. 2001. An ERGchannel inhibitor from the Scorpion Buthus eupeus. J. Biol. Chem.276:9868–9876.
32. Tseng-Crank, J. C. L., G.-N. Tseng, A. Schwartz, and M. A. Tanouye.1990. Molecular cloning and functional expression of a potassiumchannel cDNA isolated from a rat cardiac library. FEBS Lett. 268:63–68.
3-D Structure of hERG Open Outer Mouth 3539
Biophysical Journal 92(10) 3524–3540

33. Korolkova, Y. V., E. V. Bocharov, K. Angelo, I. V. Maslennikov,O. V. Grinenko, A. V. Lipkin, E. D. Nosireva, K. A. Pluzhnikov, S.-P.Olesen, A. S. Arseniev, and E. V. Grishin. 2002. New binding site onthe old molecular scaffold provides selectivity of HERG-specificscorpion toxin BeKm-1. J. Biol. Chem. 277:43104–43109.
34. Thompson, J. D., D. G. Higgins, and T. J. Gibson. 1994. CLUSTALW: improving the sensitivity of progressive multiple sequence align-ment through sequence weighting, position-specific gap penalties andweight matrix choice. Nucleic Acids Res. 22:4673–4680.
35. Shrivastava, I. H., S. R. Durell, and H. R. Guy. 2004. A model ofvoltage gating developed using the KvAP channel crystal structure.Biophys. J. 87:2255–2270.
36. Durell, S. R., I. H. Shrivastava, and H. R. Guy. 2004. Models of thestructure and voltage-gating mechanism of the Shaker K1 channel.Biophys. J. 87:2116–2130.
37. Sali, A., and T. L. Blundell. 1993. Comparative protein modeling bysatisfaction of spatial restraints. J. Mol. Biol. 234:779–815.
38. Swanson, E. 1995. PSSHOW version 1.9. University of Washington.Seattle, WA.
39. Brooks, B. R., R. E. Bruccoleri, B. D. Olafson, D. J. States, S.Swaminathan, and M. Karplus. 1983. CHARMM: a program for macro-molecular energy minimization and dynamic calculations. J. Comput.Chem. 4:187–217.
40. Pardo-Lopez, L., M. Zhang, J. Liu, M. Jiang, L. D. Possani, and G.-N.Tseng. 2002. Mapping the binding site of a HERG-specific peptidetoxin (ErgTx) to the channel’s outer vestibule. J. Biol. Chem. 277:16403–16411.
41. Tseng, G.-N. 2001. IKr: the hERG channel. J. Mol. Cell. Cardiol. 33:835–849.
42. Wang, S., S. Liu, M. J. Morales, H. C. Strauss, and R. L. Rasmusson.1997. A quantitative analysis of the activation and inactivation kineticsof HERG expressed in Xenopus oocytes. J. Physiol. 502:45–60.
43. Swartz, K. J., and R. MacKinnon. 1997. Mapping the receptor site forHanatoxin, a gating modifier of voltage-dependent K1 channels. Neuron.18:675–682.
44. Winterfield, J. R., and K. J. Swartz. 2000. A hot spot for the interactionof gating modifier toxins with voltage-dependent ion channels. J. Gen.Physiol. 116:637–644.
45. Schreiber, G., and A. R. Fersht. 1995. Energetics of protein-proteininteractions: analysis of the barnase-barstar interface by singlemutations and double mutant cycles. J. Mol. Biol. 248:478–486.
46. Smith, P. L., T. Baukrowitz, and G. Yellen. 1996. The inward rectifi-cation mechanism of the HERG cardiac potassium channel. Nature. 379:833–836.
47. Lopez-Barneo, J., T. Hoshi, S. H. Heinemann, and R. W. Aldrich.1993. Effects of external cations and mutations in the pore region onC-type inactivation of Shaker potassium channels. Receptors Channels.1:61–71.
48. Clarke, C. E., A. P. Hill, J. Zhao, M. Kondo, R. N. Subbiah, T. J.Campbell, and J. I. Vandenberg. 2006. Effect of S5P a-helix chargemutants on inactivation of hERG K1 channels. J. Physiol. 573:291–304.
49. Rost, B., G. Yachdav, and J. Liu. 2003. The PredictProtein server.Nucleic Acids Res. 32:W321–W326.
50. Hol, W. G. 1985. Effects of the alpha-helix dipole upon the functioningand structure of proteins and peptides. Adv. Biophys. 19:133–165.
51. Starkus, J. G., L. Kuschel, M. D. Rayner, and S. H. Heinemann. 1997.Ion conduction through C-type inactivated Shaker channels. J. Gen.Physiol. 110:539–550.
52. Wang, Z., J. C. Hesketh, and D. Fedida. 2000. A high Na1 conductionstate during recovery from inactivation in the K1 channel Kv1.5.Biophys. J. 79:2416–2433.
53. Kiss, L., J. LoTurco, and S. J. Korn. 1999. Contribution of the selec-tivity filter to inactivation in potassium channels. Biophys. J. 76:253–263.
54. Gang, H., and S. Zhang. 2006. Na1 permeation and block of hERGpotassium channels. J. Gen. Physiol. 128:55–71.
55. Guy, H. R., and P. Seetharamulu. 1986. Molecular model of the actionpotential sodium channel. Proc. Natl. Acad. Sci. USA. 83:508–512.
3540 Tseng et al.
Biophysical Journal 92(10) 3524–3540
Copyright © 2022 FDOKUMEN