Fluorescent tagged analysis of neural gene function using mosaics in zebrafish and Xenopus laevis
10
Research Report Fluorescent tagged analysis of neural gene function using mosaics in zebrafish and Xenopus laevis Greg Conway a, ⁎ , Marcela Torrejón a , Shuo Lin b , Sigrid Reinsch a a NASA Ames Research Center, Moffett Field, CA 94035, USA b University of California, Los Angeles, CA 90095, USA ARTICLE INFO ABSTRACT Article history: Accepted 25 November 2005 Available online 23 January 2006 An important question in the neurosciences is the role of specific gene expression in the control of neural morphology and connectivity. To address this question, methods are needed for expression of exogenous genes in a subset of neurons. This limited and mosaic expression allows the assessment of gene expression in a cell autonomous fashion without environmental contributions from neighboring expressing cells. These methods must also label neurons so that detailed morphology and neural connections can be evaluated. The labeling method should label only a subset of neurons so that neuronal morphology can be viewed upon a non-stained background, in a Golgi staining fashion. Here, we report methods using plasmids called pTAGUM (tagged analysis of genes using mosaics) that accomplish these goals. These methods should prove useful for the analysis of neural gene function in two important model organisms, the zebrafish and Xenopus laevis. © 2005 Elsevier B.V. All rights reserved. Keywords: Mosaic expression Transgenic Neuron EGFP TAGUM 1. Type of research Over a century ago, Camillo Golgi developed the silver bichromate “black reaction” that revealed the fine morphology of individual neural processes (Golgi, 1898). Ramón y Cajal used this technique to confirm the cellular nature of the nervous system and thus founded the field of neurobiology (Ramon Y Cajal, 1892, 1911, [1908] 1954). The utility of this technique lies in its inefficiency. Only a few neurons stain allowing the detailed visualization of all processes of an individual neuron upon a clear background. If the Golgi method stained all neurons, the dense interweaving of neuronal processes would prevent the visualization of indi- vidual neuronal morphology. A molecular equivalent of Golgi stain is the mosaic expression of fluorescent protein in neurons and has been achieved in different organisms by a variety of approaches including electroporation, transfection, microinjection, and FLT/FLP recombination (Teh et al., 2003; Downes et al., 2002; Lee and Luo, 1999; Koster and Fraser, 2001). Curiously, expression of fluorescent proteins under the control of neurospecific promoters in transgenic mice often leads to mosaic expression in a subset of neurons (Feng et al., 2000). This mosaic expression is inherited, characteristic of the transgenic line, and likely a consequence of differing integra- tion sites and the chromatin context in which they reside. This “Golgi-like” staining has been exploited to study neuron pro- jections and axon behavior in the mouse (Bishop et al., 2004). Many of these mosaic expression approaches allow the co- expression of mutant or exogenous proteins in these neurons to assess the cell autonomous consequences of gene expres- sion during neural differentiation and pathfinding. Therefore, BRAIN RESEARCH 1070 (2006) 150 – 159 ⁎ Corresponding author. Fax: +1 650 604 3954. E-mail address: [email protected] (G. Conway). 0006-8993/$ – see front matter © 2005 Elsevier B.V. All rights reserved. doi:10.1016/j.brainres.2005.11.079 available at www.sciencedirect.com www.elsevier.com/locate/brainres
Transcript of Fluorescent tagged analysis of neural gene function using mosaics in zebrafish and Xenopus laevis

B R A I N R E S E A R C H 1 0 7 0 ( 2 0 0 6 ) 1 5 0 – 1 5 9
ava i l ab l e a t www.sc i enced i rec t . com
www.e l sev i e r. com/ loca te /b ra in res
Research Report
Fluorescent tagged analysis of neural gene function usingmosaics in zebrafish and Xenopus laevis
Greg Conwaya,⁎, Marcela Torrejóna, Shuo Linb, Sigrid Reinscha
aNASA Ames Research Center, Moffett Field, CA 94035, USAbUniversity of California, Los Angeles, CA 90095, USA
A R T I C L E I N F O
⁎ Corresponding author. Fax: +1 650 604 3954.E-mail address: [email protected]
0006-8993/$ – see front matter © 2005 Elsevidoi:10.1016/j.brainres.2005.11.079
A B S T R A C T
Article history:Accepted 25 November 2005Available online 23 January 2006
An important question in the neurosciences is the role of specific gene expression in thecontrol of neural morphology and connectivity. To address this question, methods areneeded for expression of exogenous genes in a subset of neurons. This limited and mosaicexpression allows the assessment of gene expression in a cell autonomous fashion withoutenvironmental contributions from neighboring expressing cells. These methods must alsolabel neurons so that detailed morphology and neural connections can be evaluated. Thelabeling method should label only a subset of neurons so that neuronal morphology can beviewed upon a non-stained background, in a Golgi staining fashion. Here, we reportmethods using plasmids called pTAGUM (tagged analysis of genes using mosaics) thataccomplish these goals. These methods should prove useful for the analysis of neural genefunction in two important model organisms, the zebrafish and Xenopus laevis.
© 2005 Elsevier B.V. All rights reserved.
Keywords:Mosaic expressionTransgenicNeuronEGFPTAGUM
1. Type of research
Over a century ago, Camillo Golgi developed the silverbichromate “black reaction” that revealed the finemorphologyof individual neural processes (Golgi, 1898). Ramón y Cajalused this technique to confirm the cellular nature of thenervous system and thus founded the field of neurobiology(Ramon Y Cajal, 1892, 1911, [1908] 1954). The utility of thistechnique lies in its inefficiency. Only a few neurons stainallowing the detailed visualization of all processes of anindividual neuron upon a clear background. If the Golgimethod stained all neurons, the dense interweaving ofneuronal processes would prevent the visualization of indi-vidual neuronal morphology.
A molecular equivalent of Golgi stain is the mosaicexpression of fluorescent protein in neurons and has been
ov (G. Conway).
er B.V. All rights reserved
achieved in different organisms by a variety of approachesincluding electroporation, transfection, microinjection, andFLT/FLP recombination (Teh et al., 2003; Downes et al., 2002;Lee and Luo, 1999; Koster and Fraser, 2001). Curiously,expression of fluorescent proteins under the control ofneurospecific promoters in transgenic mice often leads tomosaic expression in a subset of neurons (Feng et al., 2000).This mosaic expression is inherited, characteristic of thetransgenic line, and likely a consequence of differing integra-tion sites and the chromatin context in which they reside. This“Golgi-like” staining has been exploited to study neuron pro-jections and axon behavior in the mouse (Bishop et al., 2004).
Many of these mosaic expression approaches allow the co-expression of mutant or exogenous proteins in these neuronsto assess the cell autonomous consequences of gene expres-sion during neural differentiation and pathfinding. Therefore,
.
151B R A I N R E S E A R C H 1 0 7 0 ( 2 0 0 6 ) 1 5 0 – 1 5 9
mosaic expression allows the detection ofmutant cells ormis-expressing cells within a wild-type background. Expressingneurons can be easily identified from neighboring non-expressing neurons and surrounding cells. One can obtainboth qualitative and quantitative data about the effects ofexogenous gene expression on neural morphology, differen-tiation, and function. Fluorescent protein expression alsoallows the visualization of neurons and their processes inliving embryos (Zito et al., 1999; Van Den Pol and Ghosh, 1998;Murray et al., 1998; Knobel et al., 1999; Dynes and Ngai, 1998;Chalfie et al., 1994).
Microinjection of plasmids into early fish and frogembryos provides a simple method to achieve mosaicexpression. Plasmids are replicated episomally and persistthroughout embryo development. Expression in thesefounder individuals is mosaic, and, in one model organism,the zebrafish, expression from tissue-specific promotersoften gives faithful expression. In a previous study analyz-ing the zebrafish GATA2 promoter, wide neural-specificexpression of EGFP was conferred by a construct, nsP5-GM2,containing the GATA2 minimal promoter plus a fragmentcontaining a neural-specific enhancer (Meng et al., 1997).This study did not analyze the specific neural typesexpressing this transgene in depth nor was transientexpression optimized. The neural expression conferred bythe GATA2 enhancer suggested that this promoter might beexcellent for the tagged analysis of genes in neurons usingmosaics.
Here, we report a refinement of the zebrafish mosaictechnique for neural expression of EGFP. Our DNA construct,called pTAGUMGATA2 (tagged analysis of genes usingmosaics), uses the GATA2 minimal promoter and neuralenhancer regions to drive strong mosaic enhanced greenfluorescent protein (EGFP) expression to a large variety ofneuronal types during early zebrafish development. Thisconstruct allows the expression of in frame EGFP fusionproteins such that the effects of exogenous gene expressioncan be rapidly detected.
We have also tested the utility of this construct inanother model organism, Xenopus laevis. We reasoned thatthe zebrafish GATA2 promoter and neural enhancer mightalso function in Xenopus since Xenopus promoters oftenfunction with similar tissue specificity in zebrafish (Amster-dam et al., 1995; Lin et al., 1994). Unfortunately, thepTAGUMGATA2 construct does not give neural-specificexpression in X. laevis, but expression is restricted to onlyneurons, muscle, and skin. To overcome this somewhatpromiscuous expression in Xenopus, we specifically targetedpTAGUMGATA2, as well as a variant of this constructcontaining the CMV promoter (pTAGUMCMV), to dorsalblastomeres that are fated to become neural tissue. Wefind that this targeting strategy now restricts expression inmuscle and skin to regions of the body axis that in manycases do not overlap with neural expression.
For Xenopus studies, targeted blastomeric injection yieldsembryos that should be useful for many neuroscienceapplications. For zebrafish studies, the pTAGUMGATA2 con-struct is neurospecific and simple; one-cell embryo injectionsyield embryos useful for exploring gene function in aneurospecific and cell autonomous context.
2. Time required
2.1. Plasmid construction
The plasmids pTAGUMGATA2 and pTAGUMCMV can beobtained from the corresponding author. Gene insertion intothe backbone of these plasmids takes 3 days includingscreening for the insertion and preparing a DNA miniprepara-tion of the plasmid.
2.2. Zebrafish
Injection of zebrafish embryos: injection requires 1 to 3 h.Growth of embryos: embryos are allowed to develop to 2 daysp.f. when EGFP expression is maximal and constant. Immu-nohistochemical amplification of EGFP: to boost EGFP signals,fixed embryos are stained with an anti-GFP antibody. Immu-nohistochemical staining requires 2 days.
2.3. X. laevis
X. laevis females must be primed 1–2 weeks prior to theinjection day and induced to ovulate the night beforemicroinjection. Preparation of buffers used for Xenopusincubations and microinjection takes 2–4 h. Ovulation occurs8–12 h post-injection of HCG. Isolating testes frommales takes30–45 min. From fertilization to the beginning of injectiontakes 30–45 min during which eggs must be dejellied. EGFPexpression can be initially detected several hours after theonset of transcription at the mid-blastula transition (∼8 h p.f.)but is optimally viewed after 48 h.
3. Detailed procedure
3.1. Plasmid constructs
The pTAGUMGATA2 plasmid was constructed by cloningEGFP sequences into the EcoRI/NotI sites of pSP64T (Melton etal., 1984). The resulting plasmid is called pEGFPT-N3. TheGATA2 promoter sequence of nsP5-GM2 (Meng et al., 1997)was amplified by PCR using primers containing HindIII sitesand inserted into the HindIII site of pEGFPT-N3 to create theplasmid pEGFPTns-N3. The SV40 early polyA signal frompEGFP-N1 (Clonetech Inc., Palo Alto, CA, USA) was amplifiedby PCR with NotI and XbaI sites in the primers. Thisfragment was used to replace the NotI/XbaI fragment ofpEGFPTns-N3 containing the polyA and polyC stretches. Theresulting plasmid is called pTAGUMGATA2 (Fig. 1A). pTA-GUMCMV was constructed by removing GATA2 promoterand enhancer sequences from pTAGUMGATA2 and replacingthem with CMV promoter sequences from pEGFP-N1. CMVpromoter sequences were amplified by PCR using primerswith HindIII sites.
3.2. Zebrafish embryo injections
Linear DNA for injections was generated by PCR using primersto vector sequences flanking the GATA2 promoter and SV40
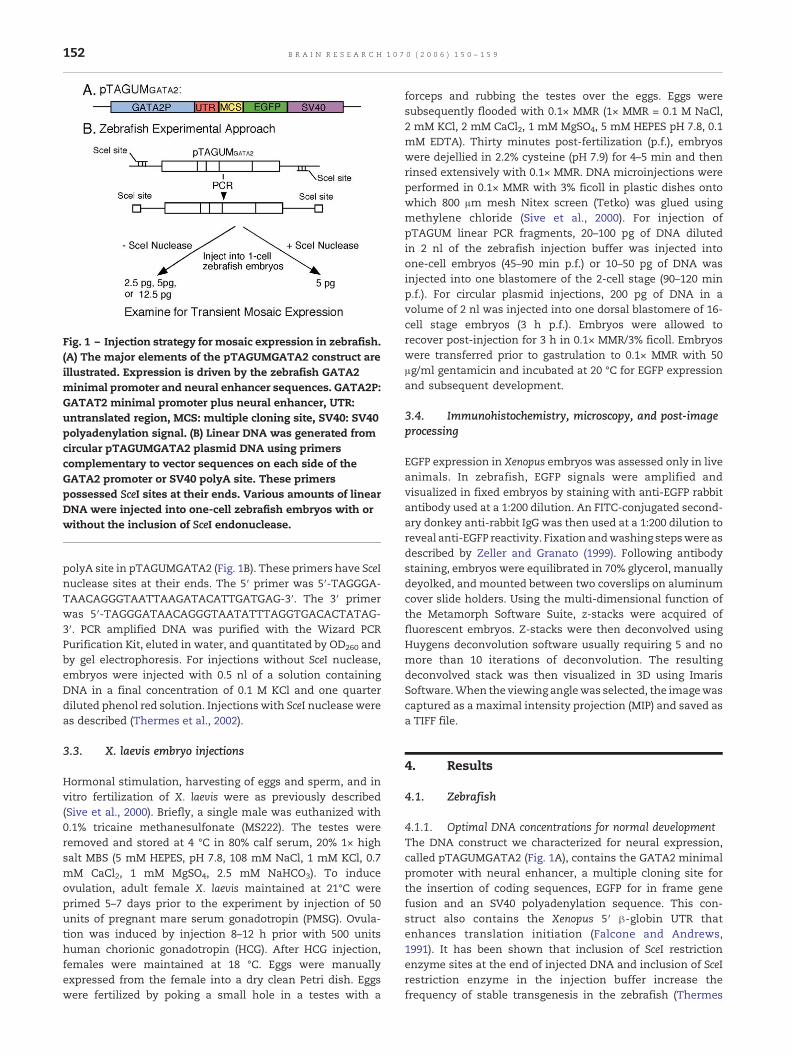
Fig. 1 – Injection strategy for mosaic expression in zebrafish.(A) The major elements of the pTAGUMGATA2 construct areillustrated. Expression is driven by the zebrafish GATA2minimal promoter and neural enhancer sequences. GATA2P:GATAT2 minimal promoter plus neural enhancer, UTR:untranslated region, MCS: multiple cloning site, SV40: SV40polyadenylation signal. (B) Linear DNA was generated fromcircular pTAGUMGATA2 plasmid DNA using primerscomplementary to vector sequences on each side of theGATA2 promoter or SV40 polyA site. These primerspossessed SceI sites at their ends. Various amounts of linearDNA were injected into one-cell zebrafish embryos with orwithout the inclusion of SceI endonuclease.
152 B R A I N R E S E A R C H 1 0 7 0 ( 2 0 0 6 ) 1 5 0 – 1 5 9
polyA site in pTAGUMGATA2 (Fig. 1B). These primers have SceInuclease sites at their ends. The 5′ primer was 5′-TAGGGA-TAACAGGGTAATTAAGATACATTGATGAG-3′. The 3′ primerwas 5′-TAGGGATAACAGGGTAATATTTAGGTGACACTATAG-3′. PCR amplified DNA was purified with the Wizard PCRPurification Kit, eluted in water, and quantitated by OD260 andby gel electrophoresis. For injections without SceI nuclease,embryos were injected with 0.5 nl of a solution containingDNA in a final concentration of 0.1 M KCl and one quarterdiluted phenol red solution. Injections with SceI nuclease wereas described (Thermes et al., 2002).
3.3. X. laevis embryo injections
Hormonal stimulation, harvesting of eggs and sperm, and invitro fertilization of X. laevis were as previously described(Sive et al., 2000). Briefly, a single male was euthanized with0.1% tricaine methanesulfonate (MS222). The testes wereremoved and stored at 4 °C in 80% calf serum, 20% 1× highsalt MBS (5 mM HEPES, pH 7.8, 108 mM NaCl, 1 mM KCl, 0.7mM CaCl2, 1 mM MgSO4, 2.5 mM NaHCO3). To induceovulation, adult female X. laevis maintained at 21°C wereprimed 5–7 days prior to the experiment by injection of 50units of pregnant mare serum gonadotropin (PMSG). Ovula-tion was induced by injection 8–12 h prior with 500 unitshuman chorionic gonadotropin (HCG). After HCG injection,females were maintained at 18 °C. Eggs were manuallyexpressed from the female into a dry clean Petri dish. Eggswere fertilized by poking a small hole in a testes with a
forceps and rubbing the testes over the eggs. Eggs weresubsequently flooded with 0.1× MMR (1× MMR = 0.1 M NaCl,2 mM KCl, 2 mM CaCl2, 1 mM MgSO4, 5 mM HEPES pH 7.8, 0.1mM EDTA). Thirty minutes post-fertilization (p.f.), embryoswere dejellied in 2.2% cysteine (pH 7.9) for 4–5 min and thenrinsed extensively with 0.1× MMR. DNA microinjections wereperformed in 0.1× MMR with 3% ficoll in plastic dishes ontowhich 800 μm mesh Nitex screen (Tetko) was glued usingmethylene chloride (Sive et al., 2000). For injection ofpTAGUM linear PCR fragments, 20–100 pg of DNA dilutedin 2 nl of the zebrafish injection buffer was injected intoone-cell embryos (45–90 min p.f.) or 10–50 pg of DNA wasinjected into one blastomere of the 2-cell stage (90–120 minp.f.). For circular plasmid injections, 200 pg of DNA in avolume of 2 nl was injected into one dorsal blastomere of 16-cell stage embryos (3 h p.f.). Embryos were allowed torecover post-injection for 3 h in 0.1× MMR/3% ficoll. Embryoswere transferred prior to gastrulation to 0.1× MMR with 50μg/ml gentamicin and incubated at 20 °C for EGFP expressionand subsequent development.
3.4. Immunohistochemistry, microscopy, and post-imageprocessing
EGFP expression in Xenopus embryos was assessed only in liveanimals. In zebrafish, EGFP signals were amplified andvisualized in fixed embryos by staining with anti-EGFP rabbitantibody used at a 1:200 dilution. An FITC-conjugated second-ary donkey anti-rabbit IgG was then used at a 1:200 dilution toreveal anti-EGFP reactivity. Fixation andwashing stepswere asdescribed by Zeller and Granato (1999). Following antibodystaining, embryos were equilibrated in 70% glycerol, manuallydeyolked, and mounted between two coverslips on aluminumcover slide holders. Using the multi-dimensional function ofthe Metamorph Software Suite, z-stacks were acquired offluorescent embryos. Z-stacks were then deconvolved usingHuygens deconvolution software usually requiring 5 and nomore than 10 iterations of deconvolution. The resultingdeconvolved stack was then visualized in 3D using ImarisSoftware.When the viewing anglewas selected, the imagewascaptured as a maximal intensity projection (MIP) and saved asa TIFF file.
4. Results
4.1. Zebrafish
4.1.1. Optimal DNA concentrations for normal developmentThe DNA construct we characterized for neural expression,called pTAGUMGATA2 (Fig. 1A), contains the GATA2 minimalpromoter with neural enhancer, a multiple cloning site forthe insertion of coding sequences, EGFP for in frame genefusion and an SV40 polyadenylation sequence. This con-struct also contains the Xenopus 5′ β-globin UTR thatenhances translation initiation (Falcone and Andrews,1991). It has been shown that inclusion of SceI restrictionenzyme sites at the end of injected DNA and inclusion of SceIrestriction enzyme in the injection buffer increase thefrequency of stable transgenesis in the zebrafish (Thermes
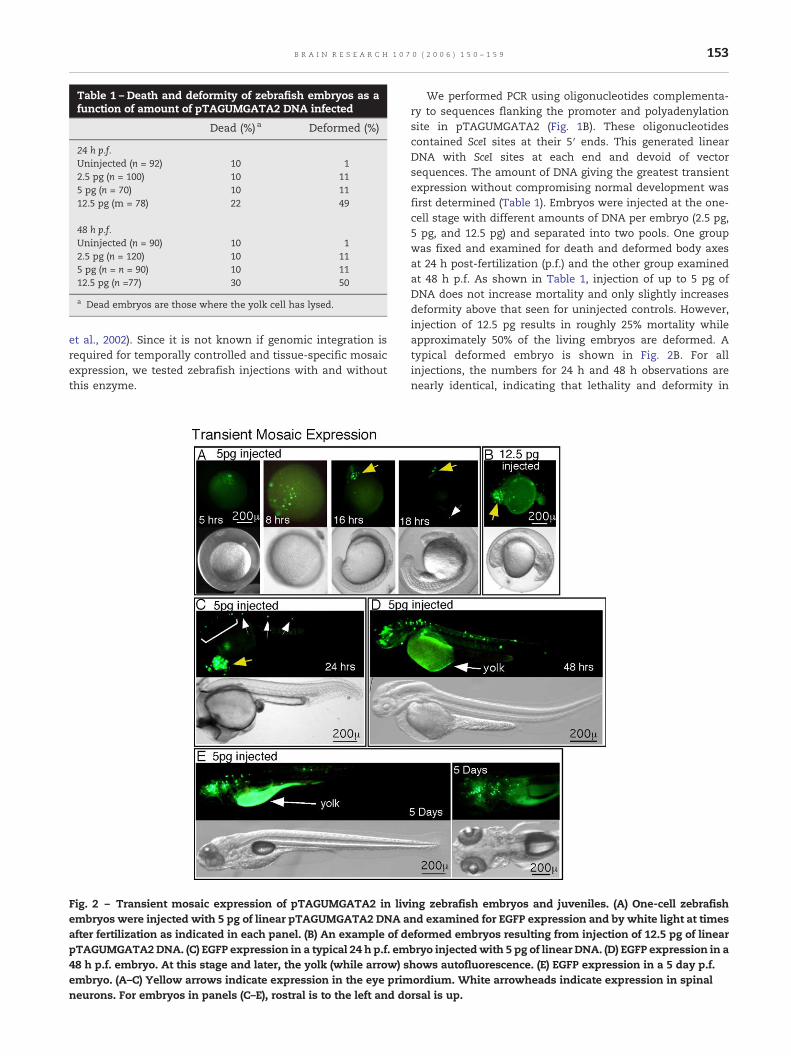
Table 1 – Death and deformity of zebrafish embryos as afunction of amount of pTAGUMGATA2 DNA infected
Dead (%) a Deformed (%)
24 h p.f.Uninjected (n = 92) 10 12.5 pg (n = 100) 10 115 pg (n = 70) 10 1112.5 pg (m = 78) 22 49
48 h p.f.Uninjected (n = 90) 10 12.5 pg (n = 120) 10 115 pg (n = n = 90) 10 1112.5 pg (n =77) 30 50
a Dead embryos are those where the yolk cell has lysed.
153B R A I N R E S E A R C H 1 0 7 0 ( 2 0 0 6 ) 1 5 0 – 1 5 9
et al., 2002). Since it is not known if genomic integration isrequired for temporally controlled and tissue-specific mosaicexpression, we tested zebrafish injections with and withoutthis enzyme.
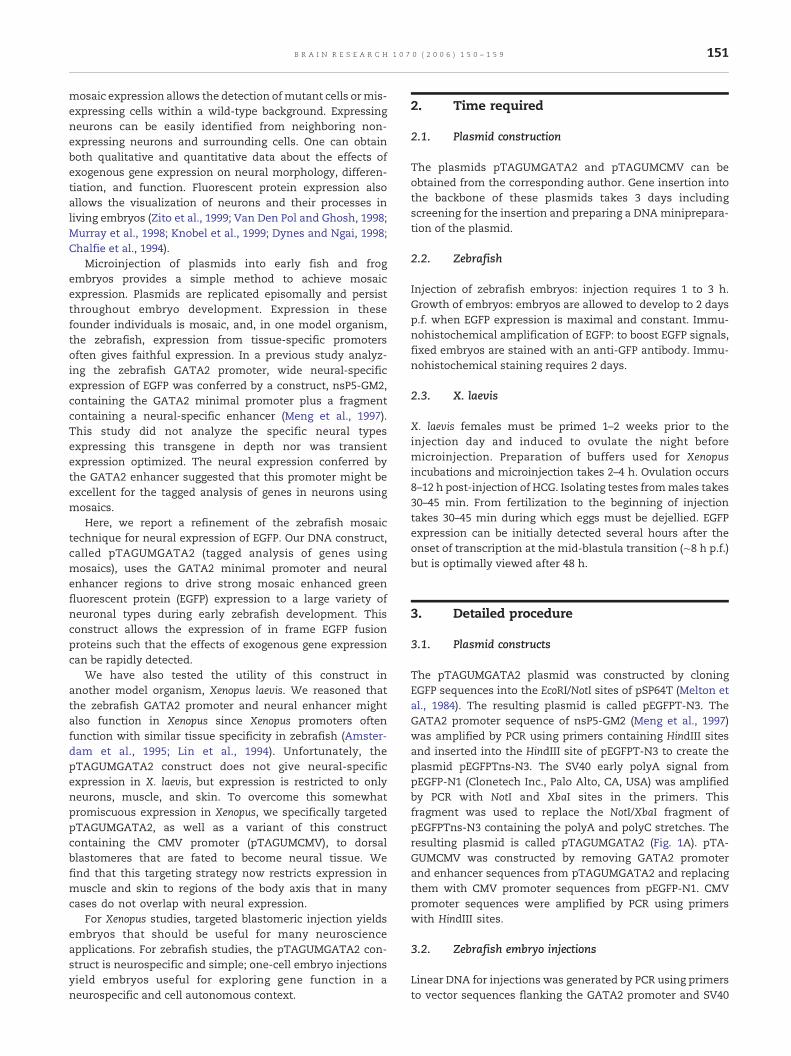
Fig. 2 – Transient mosaic expression of pTAGUMGATA2 in livembryos were injected with 5 pg of linear pTAGUMGATA2 DNA aafter fertilization as indicated in each panel. (B) An example of dpTAGUMGATA2DNA. (C) EGFP expression in a typical 24 h p.f. em48 h p.f. embryo. At this stage and later, the yolk (while arrow) sembryo. (A–C) Yellow arrows indicate expression in the eye primneurons. For embryos in panels (C–E), rostral is to the left and do
We performed PCR using oligonucleotides complementa-ry to sequences flanking the promoter and polyadenylationsite in pTAGUMGATA2 (Fig. 1B). These oligonucleotidescontained SceI sites at their 5′ ends. This generated linearDNA with SceI sites at each end and devoid of vectorsequences. The amount of DNA giving the greatest transientexpression without compromising normal development wasfirst determined (Table 1). Embryos were injected at the one-cell stage with different amounts of DNA per embryo (2.5 pg,5 pg, and 12.5 pg) and separated into two pools. One groupwas fixed and examined for death and deformed body axesat 24 h post-fertilization (p.f.) and the other group examinedat 48 h p.f. As shown in Table 1, injection of up to 5 pg ofDNA does not increase mortality and only slightly increasesdeformity above that seen for uninjected controls. However,injection of 12.5 pg results in roughly 25% mortality whileapproximately 50% of the living embryos are deformed. Atypical deformed embryo is shown in Fig. 2B. For allinjections, the numbers for 24 h and 48 h observations arenearly identical, indicating that lethality and deformity in
ing zebrafish embryos and juveniles. (A) One-cell zebrafishnd examined for EGFP expression and by white light at timeseformed embryos resulting from injection of 12.5 pg of linearbryo injectedwith 5 pg of linear DNA. (D) EGFP expression in ahows autofluorescence. (E) EGFP expression in a 5 day p.f.ordium. White arrowheads indicate expression in spinalrsal is up.
154 B R A I N R E S E A R C H 1 0 7 0 ( 2 0 0 6 ) 1 5 0 – 1 5 9
these injections are an early event that does not increasewith time.
4.1.2. Optimal DNA concentrations for transient neuralexpressionWe next examined the number and type of neurons labeled inembryos injected with the different DNA concentrations(Table 2). Only embryos that developed normally wereexamined. We readily determined that the number of labeledneurons increases significantly after 24 h p.f. regardless ofhow much DNA is injected. Therefore, we counted neurons in48 h p.f. embryos. Initially, we counted RoP (rostral primary),MiP (middle primary), and CaP (caudal primary) motoneuronssince these are easy to identify and visualize. This quantita-tion revealed that the number of neurons expressing EGFPincreases with the amount of DNA injected (2.5 pg comparedto 5 pg, Table 2). However, injection of 12.5 pg of DNA did notincrease the number of neurons labeled compared toinjection of 5 pg. Therefore, 5 pg of DNA is the optimalamount to inject to maximize transient neural expression.This amount of DNA also does not induce lethality orsignificantly increase body axis deformity above levels seenwith uninjected embryos.
4.1.3. SceI nuclease decreases transient expressionNext, we determined if inclusion of SceI nuclease wouldincrease the number of labeled neurons in embryos injectedwith 5 pg of DNA. SceI nuclease decreases the number of EGFPexpressing motoneurons by at least one-half compared toidentical control injections without nuclease inclusion (Table2). Therefore, SceI nuclease should not be used when transientexpression is desired.
4.1.4. Temporal expression pattern from the pTAGUMGATA2constructEGFP expression is easily detected in living embryos, and atime course of expression shows EGFP in isolated envelopinglayer (EVL) cells beginning at 5 h p.f. (Fig. 2A). EVL cells form askin that covers early zebrafish embryos and juveniles that islater sloughed-off. This EVL expression continues through
Table 2 – EGFP expression from pTAGUMGATA2 in 48 h zebrafisDNA, and SceI endonuclease
SceIinject
Number of neurons expressing EGFP
Pg injected RoP MiP CaP VeLD RB DoLA
− 2.5 4 1 4 ND− 5 7 7 22 12 6 7− 12.5 8 8 18 ND+ 5 5 0 4 ND
Only embryos that developed normally were examined. RoP (rostral priprimary motoneuron), VeLD (ventral longitudinal descending interneurointerneuron), CoBL (commissural bifucating longitudinal interneuro(circumferential descending interneuron), Retic. (reticulospinal neuron),none of the embryos did CoPA (commissural primary ascending) or UCnumber of embryos examinedwas: n = 96 for 2.5 pg injected, n = 71 for 5 pgrestriction endonuclease. ND corresponds to not determined.a For these neural types, numerous neurons were labeled and exact numand 2° motoneurons labeled, see Figs. 3A, C.
gastrulation (see 8hp.f. embryo, Fig. 2A), but thenumberof EVLcells expressing EGFP rapidly decreases and by 16 h ofdevelopment few EVL cells express EGFP from this promoter.At 16 h p.f., EGFP is seen in the eye primordium (Fig. 2, yellowarrows). Expression in the eye continues throughout develop-ment and for up to 5 days p.f., the oldest embryos we haveexamined. At 18 h p.f., expression begins in spinal cordneurons (Fig. 2, white arrows). The number of spinal cordneurons expressing EGFP increases and by 24 h neurons in thehindbrain also express EGFP (Fig. 2C, bracket). By 48 h, thenumber of neurons and the intensity of expression havepeaked (Fig. 2D), and this expression remains constant for up to5 days p.f. (Fig. 2E).
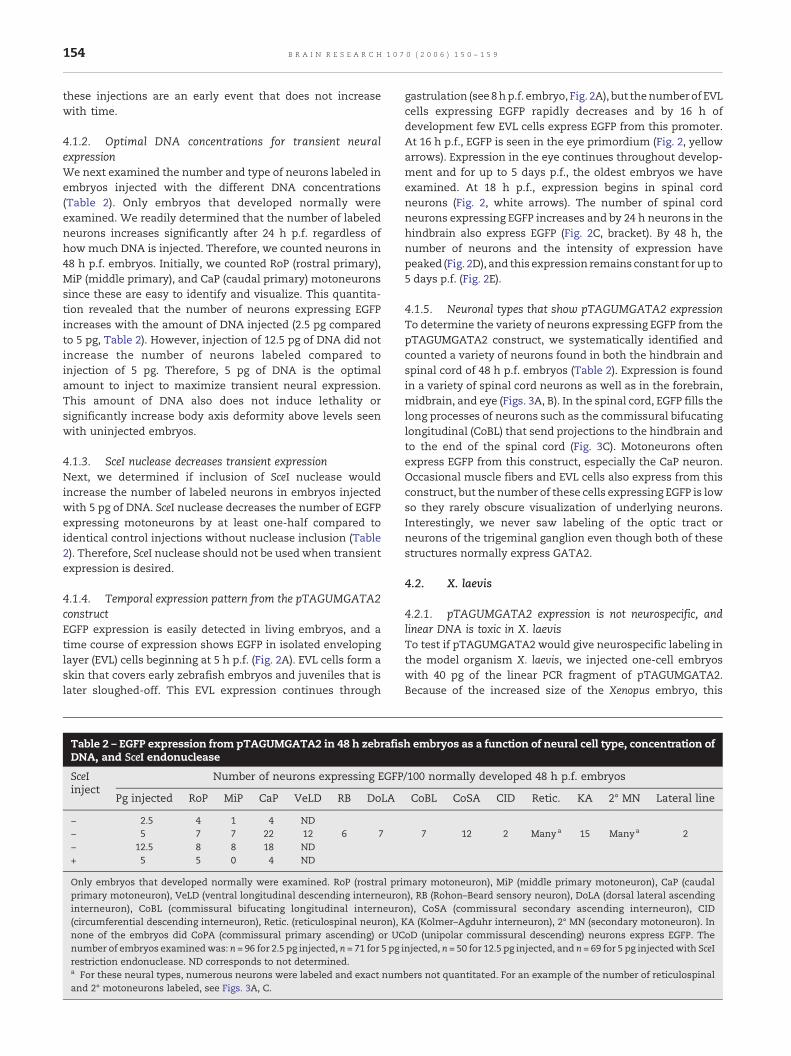
4.1.5. Neuronal types that show pTAGUMGATA2 expressionTo determine the variety of neurons expressing EGFP from thepTAGUMGATA2 construct, we systematically identified andcounted a variety of neurons found in both the hindbrain andspinal cord of 48 h p.f. embryos (Table 2). Expression is foundin a variety of spinal cord neurons as well as in the forebrain,midbrain, and eye (Figs. 3A, B). In the spinal cord, EGFP fills thelong processes of neurons such as the commissural bifucatinglongitudinal (CoBL) that send projections to the hindbrain andto the end of the spinal cord (Fig. 3C). Motoneurons oftenexpress EGFP from this construct, especially the CaP neuron.Occasional muscle fibers and EVL cells also express from thisconstruct, but the number of these cells expressing EGFP is lowso they rarely obscure visualization of underlying neurons.Interestingly, we never saw labeling of the optic tract orneurons of the trigeminal ganglion even though both of thesestructures normally express GATA2.
4.2. X. laevis
4.2.1. pTAGUMGATA2 expression is not neurospecific, andlinear DNA is toxic in X. laevisTo test if pTAGUMGATA2 would give neurospecific labeling inthe model organism X. laevis, we injected one-cell embryoswith 40 pg of the linear PCR fragment of pTAGUMGATA2.Because of the increased size of the Xenopus embryo, this
h embryos as a function of neural cell type, concentration of
/100 normally developed 48 h p.f. embryos
CoBL CoSA CID Retic. KA 2° MN Lateral line
7 12 2 Manya 15 Manya 2
mary motoneuron), MiP (middle primary motoneuron), CaP (caudaln), RB (Rohon–Beard sensory neuron), DoLA (dorsal lateral ascendingn), CoSA (commissural secondary ascending interneuron), CIDKA (Kolmer–Agduhr interneuron), 2° MN (secondary motoneuron). InoD (unipolar commissural descending) neurons express EGFP. Theinjected, n = 50 for 12.5 pg injected, and n = 69 for 5 pg injectedwith SceI
bers not quantitated. For an example of the number of reticulospinal
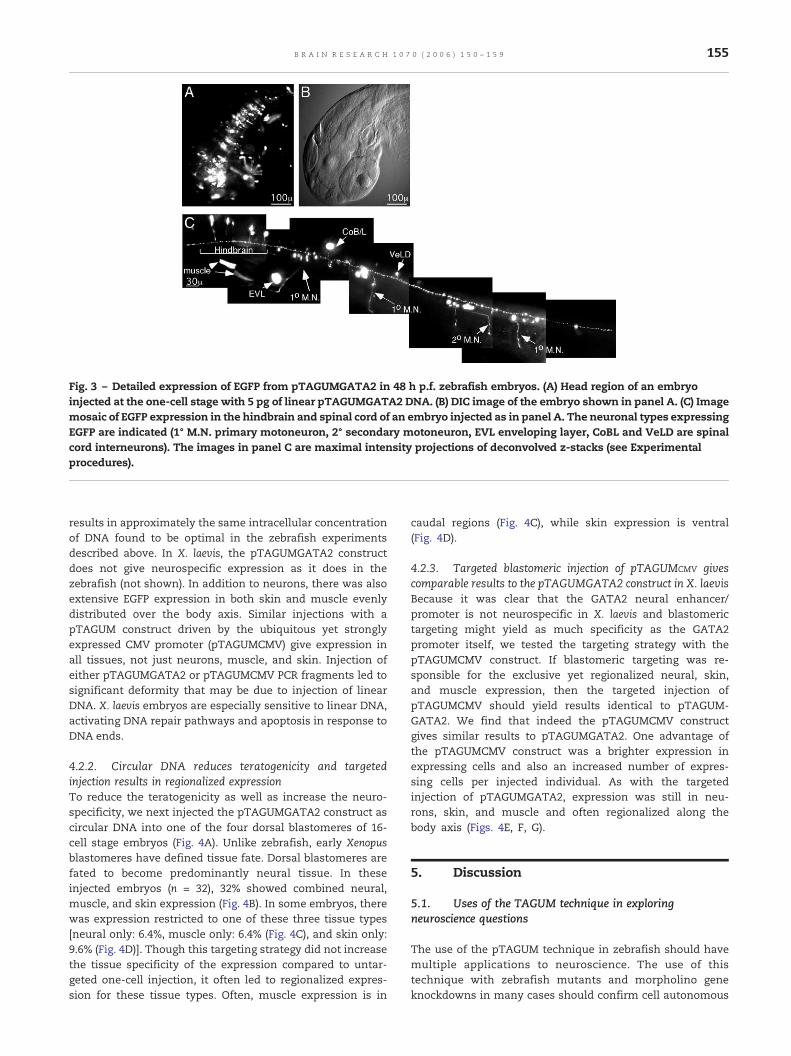
Fig. 3 – Detailed expression of EGFP from pTAGUMGATA2 in 48 h p.f. zebrafish embryos. (A) Head region of an embryoinjected at the one-cell stage with 5 pg of linear pTAGUMGATA2 DNA. (B) DIC image of the embryo shown in panel A. (C) Imagemosaic of EGFP expression in the hindbrain and spinal cord of an embryo injected as in panel A. The neuronal types expressingEGFP are indicated (1° M.N. primary motoneuron, 2° secondary motoneuron, EVL enveloping layer, CoBL and VeLD are spinalcord interneurons). The images in panel C are maximal intensity projections of deconvolved z-stacks (see Experimentalprocedures).
155B R A I N R E S E A R C H 1 0 7 0 ( 2 0 0 6 ) 1 5 0 – 1 5 9
results in approximately the same intracellular concentrationof DNA found to be optimal in the zebrafish experimentsdescribed above. In X. laevis, the pTAGUMGATA2 constructdoes not give neurospecific expression as it does in thezebrafish (not shown). In addition to neurons, there was alsoextensive EGFP expression in both skin and muscle evenlydistributed over the body axis. Similar injections with apTAGUM construct driven by the ubiquitous yet stronglyexpressed CMV promoter (pTAGUMCMV) give expression inall tissues, not just neurons, muscle, and skin. Injection ofeither pTAGUMGATA2 or pTAGUMCMV PCR fragments led tosignificant deformity that may be due to injection of linearDNA. X. laevis embryos are especially sensitive to linear DNA,activating DNA repair pathways and apoptosis in response toDNA ends.
4.2.2. Circular DNA reduces teratogenicity and targetedinjection results in regionalized expressionTo reduce the teratogenicity as well as increase the neuro-specificity, we next injected the pTAGUMGATA2 construct ascircular DNA into one of the four dorsal blastomeres of 16-cell stage embryos (Fig. 4A). Unlike zebrafish, early Xenopusblastomeres have defined tissue fate. Dorsal blastomeres arefated to become predominantly neural tissue. In theseinjected embryos (n = 32), 32% showed combined neural,muscle, and skin expression (Fig. 4B). In some embryos, therewas expression restricted to one of these three tissue types[neural only: 6.4%, muscle only: 6.4% (Fig. 4C), and skin only:9.6% (Fig. 4D)]. Though this targeting strategy did not increasethe tissue specificity of the expression compared to untar-geted one-cell injection, it often led to regionalized expres-sion for these tissue types. Often, muscle expression is in
caudal regions (Fig. 4C), while skin expression is ventral(Fig. 4D).
4.2.3. Targeted blastomeric injection of pTAGUMCMV givescomparable results to the pTAGUMGATA2 construct in X. laevisBecause it was clear that the GATA2 neural enhancer/promoter is not neurospecific in X. laevis and blastomerictargeting might yield as much specificity as the GATA2promoter itself, we tested the targeting strategy with thepTAGUMCMV construct. If blastomeric targeting was re-sponsible for the exclusive yet regionalized neural, skin,and muscle expression, then the targeted injection ofpTAGUMCMV should yield results identical to pTAGUM-GATA2. We find that indeed the pTAGUMCMV constructgives similar results to pTAGUMGATA2. One advantage ofthe pTAGUMCMV construct was a brighter expression inexpressing cells and also an increased number of expres-sing cells per injected individual. As with the targetedinjection of pTAGUMGATA2, expression was still in neu-rons, skin, and muscle and often regionalized along thebody axis (Figs. 4E, F, G).
5. Discussion
5.1. Uses of the TAGUM technique in exploringneuroscience questions
The use of the pTAGUM technique in zebrafish should havemultiple applications to neuroscience. The use of thistechnique with zebrafish mutants and morpholino geneknockdowns in many cases should confirm cell autonomous
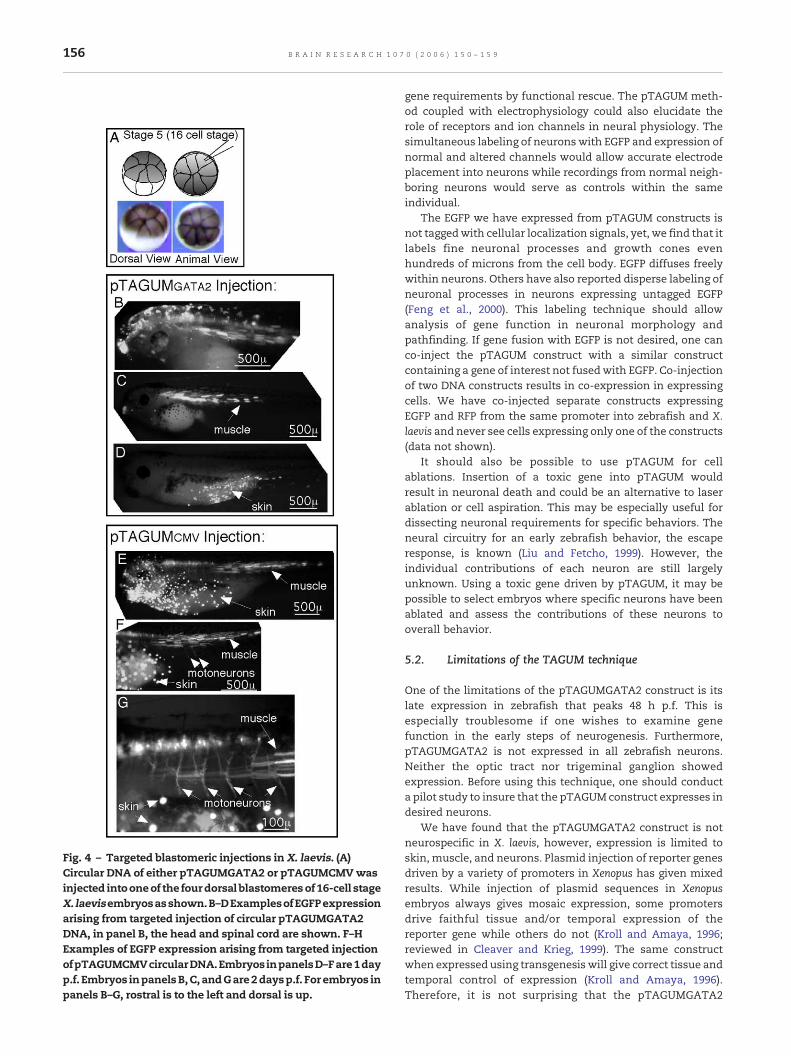
Fig. 4 – Targeted blastomeric injections in X. laevis. (A)Circular DNA of either pTAGUMGATA2 or pTAGUMCMVwasinjected intooneof the fourdorsal blastomeresof16-cell stageX. laevisembryosasshown.B–DExamplesofEGFPexpressionarising from targeted injection of circular pTAGUMGATA2DNA, in panel B, the head and spinal cord are shown. F–HExamples of EGFP expression arising from targeted injectionofpTAGUMCMVcircularDNA.EmbryosinpanelsD–Fare1dayp.f. Embryos inpanelsB,C, andGare2daysp.f. For embryos inpanels B–G, rostral is to the left and dorsal is up.
156 B R A I N R E S E A R C H 1 0 7 0 ( 2 0 0 6 ) 1 5 0 – 1 5 9
gene requirements by functional rescue. The pTAGUM meth-od coupled with electrophysiology could also elucidate therole of receptors and ion channels in neural physiology. Thesimultaneous labeling of neuronswith EGFP and expression ofnormal and altered channels would allow accurate electrodeplacement into neurons while recordings from normal neigh-boring neurons would serve as controls within the sameindividual.
The EGFP we have expressed from pTAGUM constructs isnot taggedwith cellular localization signals, yet, we find that itlabels fine neuronal processes and growth cones evenhundreds of microns from the cell body. EGFP diffuses freelywithin neurons. Others have also reported disperse labeling ofneuronal processes in neurons expressing untagged EGFP(Feng et al., 2000). This labeling technique should allowanalysis of gene function in neuronal morphology andpathfinding. If gene fusion with EGFP is not desired, one canco-inject the pTAGUM construct with a similar constructcontaining a gene of interest not fusedwith EGFP. Co-injectionof two DNA constructs results in co-expression in expressingcells. We have co-injected separate constructs expressingEGFP and RFP from the same promoter into zebrafish and X.laevis and never see cells expressing only one of the constructs(data not shown).
It should also be possible to use pTAGUM for cellablations. Insertion of a toxic gene into pTAGUM wouldresult in neuronal death and could be an alternative to laserablation or cell aspiration. This may be especially useful fordissecting neuronal requirements for specific behaviors. Theneural circuitry for an early zebrafish behavior, the escaperesponse, is known (Liu and Fetcho, 1999). However, theindividual contributions of each neuron are still largelyunknown. Using a toxic gene driven by pTAGUM, it may bepossible to select embryos where specific neurons have beenablated and assess the contributions of these neurons tooverall behavior.
5.2. Limitations of the TAGUM technique
One of the limitations of the pTAGUMGATA2 construct is itslate expression in zebrafish that peaks 48 h p.f. This isespecially troublesome if one wishes to examine genefunction in the early steps of neurogenesis. Furthermore,pTAGUMGATA2 is not expressed in all zebrafish neurons.Neither the optic tract nor trigeminal ganglion showedexpression. Before using this technique, one should conducta pilot study to insure that the pTAGUMconstruct expresses indesired neurons.
We have found that the pTAGUMGATA2 construct is notneurospecific in X. laevis, however, expression is limited toskin, muscle, and neurons. Plasmid injection of reporter genesdriven by a variety of promoters in Xenopus has given mixedresults. While injection of plasmid sequences in Xenopusembryos always gives mosaic expression, some promotersdrive faithful tissue and/or temporal expression of thereporter gene while others do not (Kroll and Amaya, 1996;reviewed in Cleaver and Krieg, 1999). The same constructwhen expressed using transgenesis will give correct tissue andtemporal control of expression (Kroll and Amaya, 1996).Therefore, it is not surprising that the pTAGUMGATA2
157B R A I N R E S E A R C H 1 0 7 0 ( 2 0 0 6 ) 1 5 0 – 1 5 9
construct does not give faithful tissue-specific expression inXenopus embryos. However, since the capacity for tissuespecificity varies from promoter to promoter and cannot bepredicted, the only way to determine expression character-istics is to perform injections and examine the expressiondynamics directly.
5.3. pTAGUMCMV: an alternate protocol for geneexpression and neural labeling in X. laevis
Because of disappointing results with pTAGUMGATA2 in X.laevis, we sought to increase the neural specificity of thisconstruct by injecting only dorsal blastomeres that arepredominately fated to become neural tissue. Though thistargeting strategy does not increase the tissue specificity, itdoes lead to regionalized expression domains for the threeexpressing tissues. Neural expression is predominantly ante-rior, while muscle expression is in caudal regions and skinexpression is ventral. Since targeted blastomeric injectionsappeared to be the determinant in establishing neuralexpression and not the specificity of the pTAGUMGATA2promoter, we tested similar targeted injections with the sameconstruct driven by the more robust CMV promoter. We findthe CMV viral promoter to give brighter expression of EGFPthan the pTAGUMGATA2 promoter and also to labelmore cellsthan pTAGUMGATA2. Muscle expression is usually limited tocaudal regions of theXenopus embryo, while neural expressioncomprises the anterior regions (forebrain, midbrain, hind-brain, and anterior spinal cord). This expression domain is inagreement with the fate map of the dorsal blastomeres thatwere injected.
For the analysis of X. laevis brain neurons, the targetedinjection method we describe should be useful since muscleexpression is largely absent from this region. However, for theanalysis of neurons in the spinal cord, muscle expressionmayobscure underlying neural expression. Frequently, there is aregion of the spinal cord just caudal to the hindbrain that isdevoid of muscle expression (Fig. 4H). If analysis is restrictedto this region, it may be possible to analyze spinal cordneurons.
5.4. Extended uses of the TAGUM method
It should be possible to substitute other tissue-specificpromoters in pTAGUM, allowing use of this technique foranalysis in other cell types. Furthermore, substitution ofanother neural promoter, one that is expressed at earlierdevelopmental stages, should allow the tagged analysis ofgene function during zebrafish neurogenesis. Any promoterused for TAGUM analysis should be tissue-specific androbustly transcribed during transient expression and willhave to be empirically tested.
5.5. Advantages over other labeling and expressionmethods
Recently, Downes et al. published a method similar to the onewe report (Downes et al., 2002). They also labeled zebrafishneurons by mosaic expression, however, they used the rat α1-tubulin promoter. A construct driven by the α1-tubulin
promoter is robustly expressed and neural-specific in the rat(Wang et al., 1998), yet it functions inefficiently in thezebrafish (Downes et al., 2002). For example, using themethodof Downes to label one motoneuron, 230 embryos must beinjected. In the method reported here to visualize one EGFPexpressing motoneuron, only 4 embryos must be injected onaverage. The method reported here is much more efficientthan the method of Downes et al.
5.6. Summary
In summary, the methods we report should be useful to theneuroscience community using the zebrafish and X. laevis asmodel organisms. Certainly for zebrafish studies, the pTA-GUMGATA2 construct and injection protocols we describe willyield neurospecific expression, allowing the analysis of geneexpression in a neurospecific and cell autonomous fashion.For studies utilizingX. laevis, the targeted injection strategywedescribe, though not neurospecific, should yield embryoswhere neuronal expression is not coincident with muscle orskin expression.
6. Quick procedure
1. Isolate plasmid DNA (for zebrafish injections generatelinear DNA by PCR).
2. Dilute DNA into injection buffer and load injection needles.3. Inject embryos.4. Rear embryos for one to several days.5. View EGFP expression in live embryos or fix embryos for
immunohistochemical amplification of EGFP signal.6. Mount embryos and image.7. Perform post-image processing deconvolution/3D image
reconstruction.
7. Essential literature references
7.1. Zebrafish
A similar mosaic expression protocol for use in zebrafish wasreported by Downes et al. (2002). Theirmethod, like the onewereport, also gives neurospecific expression. However, theefficiency of neural labeling is much less with their methodcompared to the TAGUM method that we report.
7.2. X. laevis
An excellent general review of transgene expression frominjected DNA in X. laevis is presented by Cleaver and Krieg(1999).
8. Experimental procedures
8.1. Animals
Adult zebrafish of the AB strain and embryos are from our in-house laboratory colony. Starter animals for establishing a colonycan be obtained from the Zebrafish Resource Center (http://zfin.
158 B R A I N R E S E A R C H 1 0 7 0 ( 2 0 0 6 ) 1 5 0 – 1 5 9
org/zirc/). Adult X. laevis were obtained from NASCO Inc. (FortAtkinson, WI) and maintained at 21 °C. All animal experimentswere carried out in accordance with institutional animal careguidelines. The experimental protocol was approved by the NASAAmes institutional animal care and use committee.
8.2. Embryo injections
Embryo injections were performed with an Eppendorf Transjector(Brinkmann Instruments product 5246). Glass capillary pipettes(Precision Instruments product M1B120F-4) were pulled intoneedles with a Sutter P-97 Flaming/Brown Micropipette Puller(Sutter Instruments product P-97). During injection, embryos wereviewed with a Leica MZFLIII dissecting microscope (Leica Micro-systems). The Wizard PCR Purification Kit was from Promega Inc.(Madison, WI). SceI nuclease is from New England Biolabs (Beverly,MA). Phenol red solution is from Sigma Inc. (St. Louis, MO; productP-0290). PMSG and HCG were from Sigma. Tricane methanesulfo-nate (MS222) was from Argent.
8.3. Immunohistochemistry and microscopy
The anti-EGFP rabbit antibody was from Molecular Probes Inc.(Eugene, OR product A-6455). FITC-conjugated secondary donkeyanti-rabbit IgG was obtained from Jackson Immunoresearch(product 711-095-152, Philadelphia, PA). Aluminum cover slideholders were obtained from the Harvard University BiologicalLaboratories Machine Shop (http://www.mcb.harvard.edu/Bio-Shop/). Embryos were imaged at low magnification with a LeicaMZFLIII dissecting microscope. Embryos were imaged at highmagnification with an inverted Leica DMIRB and z-stacks takenwith Metamorph Software (Universal Imaging Inc.) and a Hama-matsu Orca II camera. Z-stacks were deconvolved using Huygensdeconvolution software (Scientific Volume Imaging Inc., Hilver-sum Netherlands) and viewed as maximal intensity projectionswith Imaris Software (Bitplane AG, Zurich Switzerland).
Acknowledgments
We thank members of the Reinsch and Conway laboratoriesfor helpful suggestions and comments on the manuscript. M.T. is a National Research Council (NRC) postdoctoral fellow.This study was supported by funds from the NASA Funda-mental Biology program to S.R. and G.C.
R E F E R E N C E S
Amsterdam, A., Lin, S., Hopkins, N., 1995. The Aequorea victoriagreen fluorescent protein can be used as a reporter in livezebrafish embryos. Dev. Biol. 171, 123–129.
Bishop, D.L., Misgeld, T., Walsh, M.K., Gan, W.B., Lichtman, J.W.,2004. Axon branch removal at developing synapses byaxosome shedding. Neuron 44, 651–661.
Chalfie, M., Tu, Y., Euskirchen, G., Ward, W.W., Prasher, D.C., 1994.Green fluorescent protein as a marker for gene expression.Science 263, 802–805.
Cleaver, O., Krieg, P.A., 1999. Expression from DNA injectedinto Xenopus embryos. In: Guille, M. (Ed.), Methods inMolecular Biology, vol. 127. Humana Press Inc., Totowa, NJ,pp. 133–153.
Downes, G.B., Waterbury, J.A., Granato, M., 2002. Rapid in vivolabeling of identified zebrafish neurons. Genesis 34,196–202.
Dynes, J.L., Ngai, J., 1998. Pathfinding of olfactory neuron axons to
stereotyped glomerular targets revealed by dynamic imagingin living zebrafish embryos. Neuron 20, 1081–1091.
Falcone, D., Andrews, D.W., 1991. Both the 5′ untranslated regionand the sequences surrounding the start site contribute toefficient initiation of translation in vitro. Mol. Cell. Biol. 11,2656–2664.
Feng, G., Mellor, R.H., Bernstein, M., Keller-Peck, C., Nguyen, Q.T.,Wallace, M., Nerbonne, J.M., Lichtman, J.W., Sanes, J.R., 2000.Imaging neuronal subsets in transgenic mice expressingmultiple spectral variants of GFP. Neuron 28, 41–51.
Golgi, C., 1898. Intorno all struttura della cellula nervosa. Boll. Soc.Med.-Chir. Pavia 13, 3–6.
Knobel, K.M., Jorgensen, E.M., Bastiani, M.J., 1999. Growth conesstall and collapse during axon outgrowth in Caenorhabditiselegans. Development 126, 4489–4498.
Koster, R.W., Fraser, S.E., 2001. Tracing transgene expression inliving zebrafish embryos. Dev. Biol. 233, 329–346.
Kroll, K.L., Amaya, E., 1996. Transgenic Xenopus embryos fromsperm nuclear transplantations reveal FGF signalingrequirements during gastrulation. Development 122,3173–3183.
Lee, T., Luo, L., 1999. Mosaic analysis with a repressible cell markerfor studies of gene function in neuronal morphogenesis.Neuron 22, 451–461.
Lin, S., Yang, S., Hopkins, N., 1994. lacZ expression in germlinetransgenic zebrafish can be detected in living embryos. Dev.Biol. 161, 77–83.
Liu, K.S., Fetcho, J.R., 1999. Laser ablations reveal functionalrelationships of segmental hindbrain neurons in zebrafish.Neuron 23, 325–335.
Melton, D.A., Krieg, P.A., Rebagliati, M.R., Maniatis, T., Zinn, K.,Green, M.R., 1984. Efficient in vitro synthesis of biologicallyactive RNA and RNA hybridization probes from plasmidscontaining a bacteriophage SP6 promoter. Nucleic Acids Res.12, 7035–7056.
Meng, A., Tang, H., Ong, B.A., Farrell, M.J., Lin, S., 1997. Promoteranalysis in living zebrafish embryos identifies a cis-actingmotif required for neuronal expression of GATA-2. Proc. Natl.Acad. Sci. U. S. A. 94, 6267–6272.
Murray, M.J., Merritt, D.J., Brand, A.H., Whitington, P.M., 1998. Invivo dynamics of axon pathfinding in the Drosophila CNS: atime-lapse study of an identifiedmotorneuron. J. Neurobiol. 37,607–621.
Ramon Y Cajal, S., 1892. A new concept of the histology of thecentral nervous system. In: Rottenberg, D.A., Hochberg, F.H.(Eds.), Neurological Classics in Modern Translation. Hafner,New York, pp. 7–29.
Ramon Y Cajal, S., 1911. Histology of the Nervous System of Manand Vertebrates. Oxford Univ. Press Inc., Oxford. 1995Translation.
Ramon Y Cajal, S., [1908] 1954. In: Purkiss, M.U., Rox, C.A.(Eds.), Neuron Theory or Reticular Theory? ObjectiveEvidence of the Anatomical Unity of Nerve Cells. ConsejoSuperior de Investigaciones Cientificas Instituto Ramon yCajal, Madrid.
Sive, H.L., Grainger, R.M., Harland, R.M., 2000. Early Developmentof Xenopus laevis—A Laboratory Manual. Cold Spring HarborPress, Cold Spring Harbor, NY.
Teh, C., Chong, S.W., Korzh, V., 2003. DNA delivery into anteriorneural tube of zebrafish embryos by electroporation.BioTechniques 35, 950–954.
Thermes, V., Grabher, C., Ristoratore, F., Bourrat, F., Choulika,A., Wittbrodt, J., Joly, J.S., 2002. I-SceI meganucleasemediates highly efficient transgenesis in fish. Mech. Dev.118, 91–98.
Van Den Pol, A.N., Ghosh, P.K., 1998. Selective neuronal expressionof green fluorescent protein with cytomegalovirus promoterreveals entire neuronal arbor in transgenic mice. J. Neurosci.18, 10640–10651.

159B R A I N R E S E A R C H 1 0 7 0 ( 2 0 0 6 ) 1 5 0 – 1 5 9
Wang, S., Wu, H., Jiang, J., Delohery, T.M., Isdell, F., Goldman, S.A.,1998. Isolation of neuronal precursors by sorting embryonicforebrain transfected with GFP regulated by the T alpha 1tubulin promoter. Nat. Biotechnol. 16, 196–201.
Zeller, J., Granato, M., 1999. The zebrafish diwanka gene controls
an early step of motor growth cone migration. Development126, 3461–3472.
Zito, K., Parnas, D., Fetter, R.D., Isacoff, E.Y., Goodman, C.S., 1999.Watching a synapse grow: noninvasive confocal imaging ofsynaptic growth in Drosophila. Neuron 22, 719–729.