Genome-Tagged Amplification (GTA): a PCR-based method to prepare sample-tagged amplicons from...
12
Genome-Tagged Amplification (GTA): a PCR-based method to prepare sample-tagged amplicons from hundreds of individuals for next generation sequencing Thien Ho • Linda Cardle • Xin Xu • Micha Bayer • K. Silvas Jebakumar Prince • Raymond N. Mutava • David F. Marshall • Naeem Syed Received: 3 February 2014 / Accepted: 2 April 2014 Ó Springer Science+Business Media Dordrecht 2014 Abstract Sampling the sequence of a relatively small fraction of the genome in large numbers of individuals is an important objective for population genetics and association genetics approaches. How- ever, currently available ‘sequence capture’ methods either require expensive instrumentation or have problems dealing with high sample numbers and relatively small target sizes. We have developed Genome-Tagged Amplification (GTA) as a flexible PCR-based method for preparing pools of hundreds of amplicons from hundreds of samples for next gener- ation sequencing. The method involves tagging of genomic DNA with barcode adapters at restriction sites, followed by PCR amplification from flanking DNA. It is freely scalable for both sample number and amplicon number and has no specialized equipment requirement. An optimized protocol is presented which provides a matrix of 96 9 192 combinations of samples x amplicons, corresponding to a complete 454 Titanium run. Initially, we used 454 sequencing; however, GTA could easily be adapted to Illumina sequencing platforms as read lengths have signifi- cantly increased in this system. Keywords Next generation sequencing Barley PCR Pooling Introduction Next generation sequencing (NGS) technologies (Bent- ley 2006; Choi et al. 2009; Margulies et al. 2005) have transformed sequence-based genetic and genomic ana- lysis of human, animal and plant species. The capacity Electronic supplementary material The online version of this article (doi:10.1007/s11032-014-0090-7) contains supple- mentary material, which is available to authorized users. T. Ho X. Xu Division of Plant Sciences, University of Dundee at The James Hutton Institute, Invergowrie, Dundee DD2 5DA, Scotland, UK Present Address: T. Ho Department of Plant Pathology, University of Arkansas, 495N Campus Dr, Fayetteville, AR 72701, USA L. Cardle M. Bayer D. F. Marshall Information and Computational Sciences Group, The James Hutton Institute, Invergowrie, Dundee DD2 5DA, Scotland, UK K. S. J. Prince R. N. Mutava National Centre for Soybean Biotechnology, Division of Plant Sciences, University of Missouri, Columbia, MO 65211, USA N. Syed (&) Department of Geographical and Life Sciences, Canterbury Christ Church University, Canterbury CT1 1QU, UK e-mail: [email protected] 123 Mol Breeding DOI 10.1007/s11032-014-0090-7
-
Upload
independent -
Category
Documents
-
view
0 -
download
0
Transcript of Genome-Tagged Amplification (GTA): a PCR-based method to prepare sample-tagged amplicons from...

Genome-Tagged Amplification (GTA): a PCR-based methodto prepare sample-tagged amplicons from hundredsof individuals for next generation sequencing
Thien Ho • Linda Cardle • Xin Xu • Micha Bayer • K. Silvas Jebakumar Prince •
Raymond N. Mutava • David F. Marshall • Naeem Syed
Received: 3 February 2014 / Accepted: 2 April 2014
� Springer Science+Business Media Dordrecht 2014
Abstract Sampling the sequence of a relatively
small fraction of the genome in large numbers of
individuals is an important objective for population
genetics and association genetics approaches. How-
ever, currently available ‘sequence capture’ methods
either require expensive instrumentation or have
problems dealing with high sample numbers and
relatively small target sizes. We have developed
Genome-Tagged Amplification (GTA) as a flexible
PCR-based method for preparing pools of hundreds of
amplicons from hundreds of samples for next gener-
ation sequencing. The method involves tagging of
genomic DNA with barcode adapters at restriction
sites, followed by PCR amplification from flanking
DNA. It is freely scalable for both sample number and
amplicon number and has no specialized equipment
requirement. An optimized protocol is presented
which provides a matrix of 96 9 192 combinations
of samples x amplicons, corresponding to a complete
454 Titanium run. Initially, we used 454 sequencing;
however, GTA could easily be adapted to Illumina
sequencing platforms as read lengths have signifi-
cantly increased in this system.
Keywords Next generation sequencing �Barley � PCR � Pooling
Introduction
Next generation sequencing (NGS) technologies (Bent-
ley 2006; Choi et al. 2009; Margulies et al. 2005) have
transformed sequence-based genetic and genomic ana-
lysis of human, animal and plant species. The capacity
Electronic supplementary material The online version ofthis article (doi:10.1007/s11032-014-0090-7) contains supple-mentary material, which is available to authorized users.
T. Ho � X. Xu
Division of Plant Sciences, University of Dundee at The
James Hutton Institute, Invergowrie, Dundee DD2 5DA,
Scotland, UK
Present Address:
T. Ho
Department of Plant Pathology, University of Arkansas,
495N Campus Dr, Fayetteville, AR 72701, USA
L. Cardle � M. Bayer � D. F. Marshall
Information and Computational Sciences Group, The
James Hutton Institute, Invergowrie, Dundee DD2 5DA,
Scotland, UK
K. S. J. Prince � R. N. Mutava
National Centre for Soybean Biotechnology, Division
of Plant Sciences, University of Missouri, Columbia,
MO 65211, USA
N. Syed (&)
Department of Geographical and Life Sciences,
Canterbury Christ Church University,
Canterbury CT1 1QU, UK
e-mail: [email protected]
123
Mol Breeding
DOI 10.1007/s11032-014-0090-7

of these enabling technology platforms to generate
sequences at the gigabase level per experiment allows
mutation detection, gene discovery and comparative
genomic analysis at a level which was impossible
previously (Mardis 2008). In genomes carrying high
levels of nucleotide diversity, direct sequencing is now
a viable alternative and arguably a replacement for
molecular markers. The goal for diversity analysis by
sequencing is a matrix of multiple sequenced loci
(typically genes or segments thereof) in multiple
samples. This raises important technical questions.
First, how is the genomic subset isolated? Recently,
several methods for this have been described. The first
uses molecular inversion probes (derived from padlock
probes), based upon hybridization, gap filling and
ligation to provide thousands of PCR amplicons (Dahl
et al. 2007; Porreca et al. 2007; Turner et al. 2009).
Another, more widely used approach involves ‘capture’
of genomic target DNA by hybridization (Bainbridge
et al. 2010; Bodi et al. 2013; Gnirke et al. 2009;
Mamanova et al. 2010; Okou et al. 2007). Potential
problems with this approach include paralog capture
(most genes are members of multiple gene families) and
the need to block hybridization of repetitious DNAs
(particularly transposable elements and their pseudo-
genes) (Okou et al. 2007). Capture methods work best
in genomes, such as Homo sapiens (Hopp et al. 2011;
Tan et al. 2011) with relatively simple sets of repetitious
DNA, and when the capture target is greater than 2 Mb,
giving capture specificities around 85 % (Lee et al.
2009). For the larger maize genome with a more
complex repetitious DNA populations, preparation of
blocking DNA to prevent non-specific hybridization of
DNA to the capture probe has been troublesome
(Bashiardes et al. 2005) and capture specificities have
been lower (between 22 and 36 %) though larger
capture targets may improve this (Fu et al. 2010).
The second technical issue with generating large
numbers of (sample 9 locus) combinations is how to
track multiple samples per locus during NGS of
pooled templates. The manufacturers have addressed
this issue firstly by providing multiple-lane gaskets
(typically 2, 4, 8 or 16 lanes) and secondly by
implementing short sequence ‘barcode’ tag capability
(typically up to 12 bp) (Binladen et al. 2007). Decon-
volution of sample ID is performed later in the
bioinformatics processing steps. Barcoding was first
developed in the context of NGS by Binladen et al.
(2007), who used 2-bp barcodes at the 50 ends of their
PCR primers to sample identity. Barcodes were
originally used by Qiu et al. (2003) to differentiate
maize cDNA libraries from different samples (Ash-
lock et al. 2002) and have been widely employed
(Craig et al. 2008; Smith et al. 2010). A problem with
barcoding is significant unevenness in sample cover-
age associated with particular barcodes (Binladen
et al. 2007; Mamanova et al. 2010; Qiu et al. 2003).
Can conventional PCR be used for production of
complex multi (sample 9 locus) NGS templates? PCR
is cheap, simple and has inherently high specificity for
targeting genome sub-fractions. This was the original
method used for array re-sequencing in humans (Albert
et al. 2007), but the approach was aimed at very large
stretches of very few individual genomes and involved
thousands of difficult long range PCRs. For surveys of
hundreds of samples, the complexity of amplified
genomic DNA is far less challenging; for example, a
capture experiment involving *200 9 0.4 Kb loci in
100 sample genotypes (80 Kb complexity, 8 Mbp
capture) corresponds to a complete 454 sequencer run
(800,000 sequence reads) at 40-fold sequencing depth.
However, a new problem arises. Preparation of the
above amplicons requires 20,000 PCRs (Fig. 1),
divided by the multiplex ratio per PCR. In practice,
multiplexing is only realistic for amplicon sets which
will be used repeatedly as it requires much optimiza-
tion. In addition, the PCR primers must be tagged to
keep track of sample origin in the NGS step. This
necessitates at least 40,000 primers for the above
experiment (Fig. 1), costing at least as much as the
direct sequencing costs, and this expense would rise
linearly with increase in sample size and target loci.
Conventional tagged PCRs are therefore unrealistic
options for NGS template preparation in large-scale
diversity studies. Recently, microfluidic approaches to
conventional PCR setup have been developed (Tewhey
et al. 2009). These are a useful option but they have the
disadvantages of requiring somewhat expensive dedi-
cated equipment for reaction setup and PCR, and also
are tied to particular combinations of sample 9 locus
numbers (see ‘Discussion’ section).
The purpose of this study was to address the
problems of tagged PCRs for targeted amplification of
multiple loci for multiple samples and to develop a
simple flexible method capable of amplifying tagged
gene segments from hundreds of loci in hundreds of
samples, corresponding to a complete NGS run
capacity.
Mol Breeding
123

Materials and methods
Plant samples and DNAs
Barley lines used in this study are listed in Supple-
mentary Material 1. Genomic DNAs were isolated
from plant leaves using Qiagen DNeasy 96 kit
following the manufacturer’s instructions. DNA sam-
ples were quantified using either NanoDrop 2000
spectrophotometer (Thermo Scientific), combined
with agarose gel visualization in parallel or picogreen
(Molecular Probes) (Ahn et al. 1996), which we
A B
C
Fig. 1 Tagging amplicons from multiple samples: The GTA
approach. a Conventional tagging of PCR amplicons, where
each genotype sample has a corresponding tag (color coded)
incorporated into the PCR primer. For X amplicons and Y
samples, this requires Y(X ? 1) primers and XY PCRs, or
2XHY primers if both ends are tagged (and this raises potential
problems because sequence fidelity is often low at one end of an
NGS sequence run). b The Genome-Tagging principle. Each
genotype sample is tagged (horizontally in the figure—indicated
by colored stars), all genotypes are pooled (vertically) then
aliquots of the pools are amplified at gene loci (3 are shown in
the figure). Each amplicon in the sequence pool carries a tag
indicating its sample origin, so the mixture can be sequenced by
NGS. In principle, for X amplicons and Y samples, Y tagging
reactions plus X amplifications are needed. c The Genome-
Tagged Approach (GTA). (1) Each DNA sample is digested
with a frequent cutter restriction enzyme. A single gene is shown
here. (2) Adapters containing sample-specific tags (color-coded
red, dark blue and purple in the figure) and a generic primer
sequence (brown) are ligated to all fragments. (3) Nested PCR is
carried out with the generic primer and two successive locus-
specific primers (brown and blue arrows; nested PCR improves
locus specificity). Finally, the amplification products are pooled
and subjected to 454 sequencing. (Color figure online)
Mol Breeding
123

recommend. In all cases, parallel standard DNA
dilution series controls were used.
Tagged (barcoded) adapter design and
gene-specific primers used
The structure of GTA adapters and corresponding
adapter PCR primers are shown in Supplementary
Material 2. Adapters carry a 30-AT overhang to ligate
to DNA restricted with MseI (50 T/TAA 30), BfaI
(C/TAG) or Csp6I (G/TAC). Gene-specific primer
sequences are listed in Supplementary Material 3,
barcode tag sequences are listed in Supplementary
Material 4 and numbers of sequences obtained relative
to loci, samples and tags in all 3 GTA experiments are
in the Supplementary Spreadsheet. Genomic barley
gene sequence data (Rostoks et al. 2005) and EST
sequence data (http://www.harvest-web.org/) were
mined, and nested primer pairs were matched to the
generic PCR adapter primer using Primer3 (http://
frodo.wi.mit.edu/primer3/).
GTA protocol
The optimized GTA protocol is described in detail in
Supplementary Material 5. Briefly, exactly equal
amounts of barley genomic DNAs (0.6 lg each) were
restriction digested separately with each of the following
enzymes producing a 50 TA overhang: MseI (T/TAA),
BfaI (C/TAG) and Csp6I (G/TAC). After checking
digestion completion by agarose gel electrophoresis and
heat-inactivating of the restriction enzymes, each
digested DNA sample was ligated with a corresponding
sample-specific adapter carrying an 8-bp barcode tag,
followed by heat inactivation of the DNA ligase.
Adapter-ligated DNA samples were then tested
separately for their quality as templates for the GTA
reaction by amplifying a single locus (AF052665)
previously shown to produce a single predicted
product from a reference DNA sample. For these
tests, high PCR cycle numbers were used for the two
consecutive nested GTA PCRs to ensure strong
amplification bands. The first test PCR used 12
‘touchdown’ cycles at decreasing annealing tempera-
tures from 65 to 56 �C, followed by 27 cycles of 56 �C
and the second (nested) test PCR (25 ll, 25 cycles)
used 0.04 ll of the first round PCRs. Five microliters
of the PCR products were visualized on a 2 % agarose-
TBE-ethidium bromide gel under UV light (examples
are shown in Fig. 2). Any sample failing to produce
the predicted band was replaced by another fresh
aliquot of the same or an alternative sample.
GTA amplifications for downstream NGS were
performed as follows: First, equal volumes of adapted
samples from above were pooled into GTA template
mixes which were cleaned up using Qiaquick PCR
cleanup kits (Qiagen). Different sample pooling
depths between 12 and 96 were explored for these
template mixes in the study (see ‘Results’ section),
with 48 sample pooling selected for the final validated
protocol. Aliquots of this mix were GTA amplified
separately for each amplicon for 28 cycles (55 �C
annealing temperature). PCR products were checked
by gel electrophoresis as above. Typically, PCR
products obtained using these conditions were very
faint and hardly visible on the gels (e.g., Supplemen-
tary Material 6B iii, top lane). The second (nested)
GTA PCRs used exactly the same cycling conditions
as the first round PCR but with 20 cycles and an
annealing temperature of 58 �C, with 0.01 ll DNA
input from the first round PCR, together with nested
gene-specific primer and the same generic adapter
primer used in the first round PCR. Nested PCRs were
checked by gel electrophoresis. Amplified samples
were normalized for DNA content (Invitrogen Sequal-
PrepTM) then pooled for NGS.
454 Sequence data processing
A complete annotated processing pipeline containing
Linux shell and Perl scripts for GTA sequence data is
obtainable from the authors on request. Briefly, reads
and quality scores were extracted from the sequence
providers’ SFF files. The sequence reads were com-
pared to the nucleotide tags representing each corre-
sponding genotype source using BLAST (Altschul
et al. 1997). A read was only accepted for further
A
B
Fig. 2 Examples of locus-specific nested GTA test amplifica-
tions (GTA Experiment 1). First round PCRs (a) and nested
PCRs (b) are shown for gene-specific primers 97–144 on pooled
samples 1–96. See Supplementary Material 1 and 3 for samples,
loci and primer sequences
Mol Breeding
123
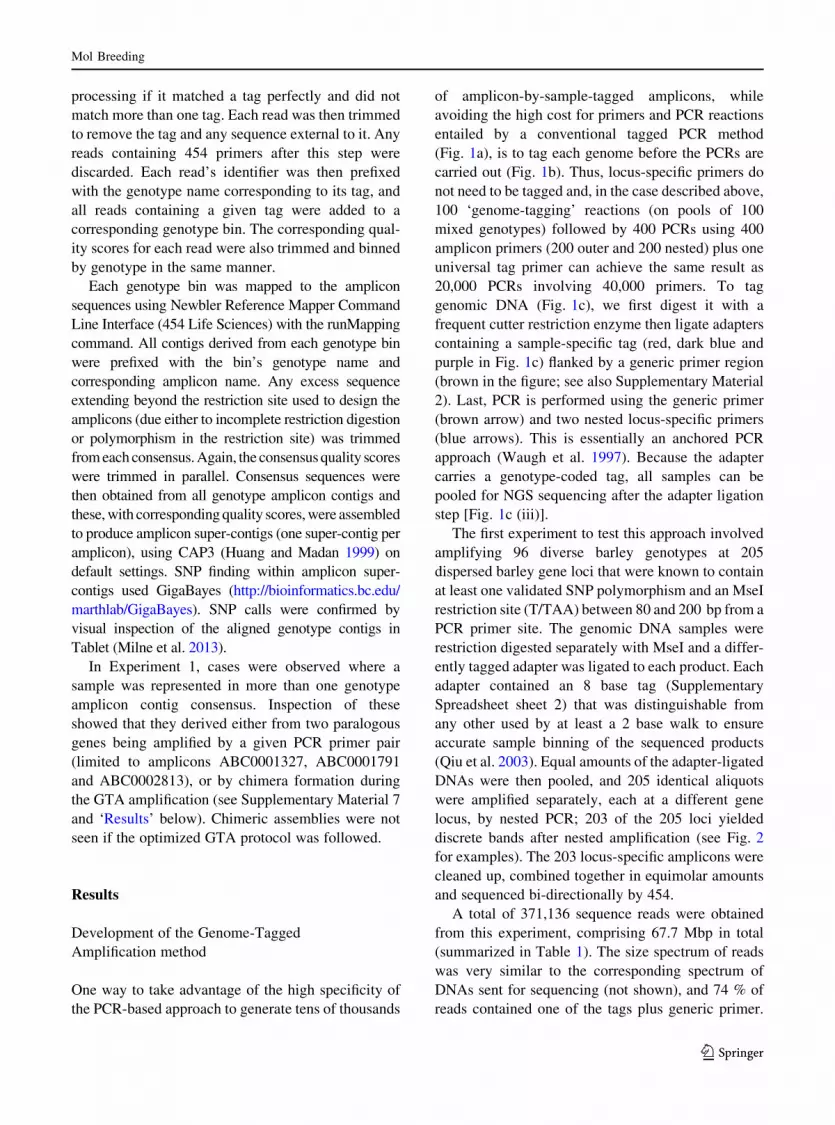
processing if it matched a tag perfectly and did not
match more than one tag. Each read was then trimmed
to remove the tag and any sequence external to it. Any
reads containing 454 primers after this step were
discarded. Each read’s identifier was then prefixed
with the genotype name corresponding to its tag, and
all reads containing a given tag were added to a
corresponding genotype bin. The corresponding qual-
ity scores for each read were also trimmed and binned
by genotype in the same manner.
Each genotype bin was mapped to the amplicon
sequences using Newbler Reference Mapper Command
Line Interface (454 Life Sciences) with the runMapping
command. All contigs derived from each genotype bin
were prefixed with the bin’s genotype name and
corresponding amplicon name. Any excess sequence
extending beyond the restriction site used to design the
amplicons (due either to incomplete restriction digestion
or polymorphism in the restriction site) was trimmed
from each consensus. Again, the consensus quality scores
were trimmed in parallel. Consensus sequences were
then obtained from all genotype amplicon contigs and
these, with corresponding quality scores, were assembled
to produce amplicon super-contigs (one super-contig per
amplicon), using CAP3 (Huang and Madan 1999) on
default settings. SNP finding within amplicon super-
contigs used GigaBayes (http://bioinformatics.bc.edu/
marthlab/GigaBayes). SNP calls were confirmed by
visual inspection of the aligned genotype contigs in
Tablet (Milne et al. 2013).
In Experiment 1, cases were observed where a
sample was represented in more than one genotype
amplicon contig consensus. Inspection of these
showed that they derived either from two paralogous
genes being amplified by a given PCR primer pair
(limited to amplicons ABC0001327, ABC0001791
and ABC0002813), or by chimera formation during
the GTA amplification (see Supplementary Material 7
and ‘Results’ below). Chimeric assemblies were not
seen if the optimized GTA protocol was followed.
Results
Development of the Genome-Tagged
Amplification method
One way to take advantage of the high specificity of
the PCR-based approach to generate tens of thousands
of amplicon-by-sample-tagged amplicons, while
avoiding the high cost for primers and PCR reactions
entailed by a conventional tagged PCR method
(Fig. 1a), is to tag each genome before the PCRs are
carried out (Fig. 1b). Thus, locus-specific primers do
not need to be tagged and, in the case described above,
100 ‘genome-tagging’ reactions (on pools of 100
mixed genotypes) followed by 400 PCRs using 400
amplicon primers (200 outer and 200 nested) plus one
universal tag primer can achieve the same result as
20,000 PCRs involving 40,000 primers. To tag
genomic DNA (Fig. 1c), we first digest it with a
frequent cutter restriction enzyme then ligate adapters
containing a sample-specific tag (red, dark blue and
purple in Fig. 1c) flanked by a generic primer region
(brown in the figure; see also Supplementary Material
2). Last, PCR is performed using the generic primer
(brown arrow) and two nested locus-specific primers
(blue arrows). This is essentially an anchored PCR
approach (Waugh et al. 1997). Because the adapter
carries a genotype-coded tag, all samples can be
pooled for NGS sequencing after the adapter ligation
step [Fig. 1c (iii)].
The first experiment to test this approach involved
amplifying 96 diverse barley genotypes at 205
dispersed barley gene loci that were known to contain
at least one validated SNP polymorphism and an MseI
restriction site (T/TAA) between 80 and 200 bp from a
PCR primer site. The genomic DNA samples were
restriction digested separately with MseI and a differ-
ently tagged adapter was ligated to each product. Each
adapter contained an 8 base tag (Supplementary
Spreadsheet sheet 2) that was distinguishable from
any other used by at least a 2 base walk to ensure
accurate sample binning of the sequenced products
(Qiu et al. 2003). Equal amounts of the adapter-ligated
DNAs were then pooled, and 205 identical aliquots
were amplified separately, each at a different gene
locus, by nested PCR; 203 of the 205 loci yielded
discrete bands after nested amplification (see Fig. 2
for examples). The 203 locus-specific amplicons were
cleaned up, combined together in equimolar amounts
and sequenced bi-directionally by 454.
A total of 371,136 sequence reads were obtained
from this experiment, comprising 67.7 Mbp in total
(summarized in Table 1). The size spectrum of reads
was very similar to the corresponding spectrum of
DNAs sent for sequencing (not shown), and 74 % of
reads contained one of the tags plus generic primer.
Mol Breeding
123

The drop-out fraction mainly comprised short
sequence reads from the locus-specific primer end
that failed to reach the tag. Tag-containing reads were
binned by tag to their 96 samples of origin using
BLAST, and contigs were obtained for each bin. The
results showed excellent amplification specificity,
with greater than 99 % of contigs deriving from the
203 amplicon set (data not shown).
However, two problems were apparent with the first
GTA protocol. First, we observed an unacceptably
high proportion of presumed chimeric sequences
(mixed haplotypes) for some samples at some loci
(Supplementary Material 7). PCR assays confirmed
that the original genotypes lack these chimeric mole-
cules (data not shown), proving they were experimen-
tal artefacts introduced during the GTA procedure. We
hypothesized that PCR overcycling (continued PCR
cycling after the exponential growth phase has ended)
(Klock and Lesley 2009) was responsible for this
problem and confirmed this using a recombination
assay involving two amplicons polymorphic for a
22-bp indel sequence (Supplementary Material 6B, C).
This assay showed that lowered PCR cycle numbers in
both the first and nested PCRs greatly reduces chimera
formation (Supplementary Material 6C iii). These
improved conditions were validated in GTA experi-
ment 2, which tested three differential pooling regimes
for 48 DNA samples amplified at 46 loci, each carried
through to separate 454 sequencing (Table 1). Tagged
samples were GTA-amplified in sample pools of 12, 24
or 48, with the last being the most stringent test for the
new reaction conditions, and the first being the least
demanding but the most complicated to set up.
Chimera occurrence was not observed in the processed
(sample 9 locus) contigs for any of the three super-
pools, showing that at least 48 samples can be
successfully pooled in the optimized GTA protocol.
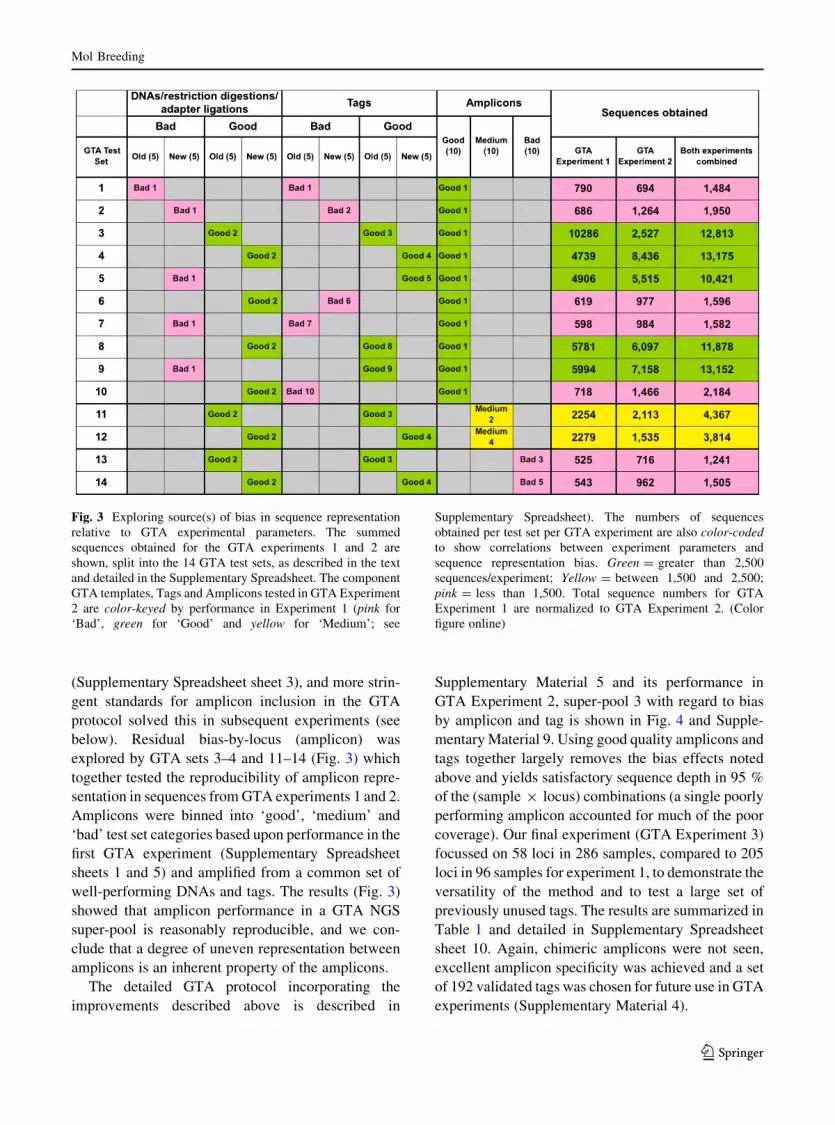
The second problem we encountered was biased
representation of sequences in the data set, with
respect to both sample and locus. To explore the
source(s) of bias by sample, we designed a new set of
GTA control experiments (GTA test sets 1–10;
Fig. 3), to test the parameters DNA sample (‘good/
bad’ and ‘old/new’), digestion/ligation (‘old/new’)
and tag adapter (‘good/bad’; ‘old/new’), where
‘good’/‘bad’ refers to numbers of sequences obtained
from the first GTA experiment and ‘old’/‘new’ refers
to GTA experiments 1 and 2, respectively. For each
parameter, a set of five similarly-performing variants
(tag or DNA sample) was selected based on perfor-
mance in the first GTA, and a shared set of 10 well-
performing loci were amplified for all 10 GTA pools
(thus, all variants were tested against each other for
each of 10 pools). The results are summarized in Fig. 3
and detailed in Supplementary Spreadsheet sheets
4–8. A clear correlation was seen between tag adapter
quality (‘good/bad’ tags) and proportion of sequences
obtained in both GTA experiments 1 and 2. For the 10
pooled GTA test sets, the combined Pearson product-
moment correlation coefficient r in tag performance
between the two experiments is 0.702 and for each tag
adapter treated separately r is 0.586. The only
pronounced difference between the two experiments
was the performance of GTA Set 3 (‘old good’ DNA
sample), which over-performed in GTA experiment 1
and under-performed somewhat in GTA experiment 2,
perhaps due to decay in quality during prolonged
storage between the two experiments. We conclude
that tag sequences show reproducible variation in
amplification performance during the GTA procedure,
allowing us to discard tags with strong positive or
negative bias in GTA reactions (see ‘Discussion’
section). None of the other three experimental param-
eters (‘good’/‘bad’ adapter ligation, ‘old’/‘new’ tag
adapter and ‘old’/‘new’ DNA) showed an obvious
correlation with the number of sequences obtained.
Much of the locus-specific bias in sequence repre-
sentation was traced back to the use of poor quality
GTA-amplified products in the first experiment
Table 1 Summary of sequence data obtained from GTA
experiments
Before quality
control
After quality
control
Sequence
reads
Mb Sequence
reads
Mb
GTA experiment 1 371,136 67.7 275,216 41.7
GTA experiment 2 469,953 74.1 282,435 43.2
Super-pool 1
(12-sample pooling)
89,104 15.8 65,504 10.6
Super-pool 2
(24-sample pooling)
105,056 17.8 72,888 11.4
Super-pool 3
(48-sample pooling)
142,658 25.0 103,517 16.6
Super-pool 4 133,135 15.5 40,526 4.8
GTA experiment 3 1,471,936 314.9 834,455 161.5
Mol Breeding
123
(Supplementary Spreadsheet sheet 3), and more strin-
gent standards for amplicon inclusion in the GTA
protocol solved this in subsequent experiments (see
below). Residual bias-by-locus (amplicon) was
explored by GTA sets 3–4 and 11–14 (Fig. 3) which
together tested the reproducibility of amplicon repre-
sentation in sequences from GTA experiments 1 and 2.
Amplicons were binned into ‘good’, ‘medium’ and
‘bad’ test set categories based upon performance in the
first GTA experiment (Supplementary Spreadsheet
sheets 1 and 5) and amplified from a common set of
well-performing DNAs and tags. The results (Fig. 3)
showed that amplicon performance in a GTA NGS
super-pool is reasonably reproducible, and we con-
clude that a degree of uneven representation between
amplicons is an inherent property of the amplicons.
The detailed GTA protocol incorporating the
improvements described above is described in
Supplementary Material 5 and its performance in
GTA Experiment 2, super-pool 3 with regard to bias
by amplicon and tag is shown in Fig. 4 and Supple-
mentary Material 9. Using good quality amplicons and
tags together largely removes the bias effects noted
above and yields satisfactory sequence depth in 95 %
of the (sample 9 locus) combinations (a single poorly
performing amplicon accounted for much of the poor
coverage). Our final experiment (GTA Experiment 3)
focussed on 58 loci in 286 samples, compared to 205
loci in 96 samples for experiment 1, to demonstrate the
versatility of the method and to test a large set of
previously unused tags. The results are summarized in
Table 1 and detailed in Supplementary Spreadsheet
sheet 10. Again, chimeric amplicons were not seen,
excellent amplicon specificity was achieved and a set
of 192 validated tags was chosen for future use in GTA
experiments (Supplementary Material 4).
Fig. 3 Exploring source(s) of bias in sequence representation
relative to GTA experimental parameters. The summed
sequences obtained for the GTA experiments 1 and 2 are
shown, split into the 14 GTA test sets, as described in the text
and detailed in the Supplementary Spreadsheet. The component
GTA templates, Tags and Amplicons tested in GTA Experiment
2 are color-keyed by performance in Experiment 1 (pink for
‘Bad’, green for ‘Good’ and yellow for ‘Medium’; see
Supplementary Spreadsheet). The numbers of sequences
obtained per test set per GTA experiment are also color-coded
to show correlations between experiment parameters and
sequence representation bias. Green = greater than 2,500
sequences/experiment; Yellow = between 1,500 and 2,500;
pink = less than 1,500. Total sequence numbers for GTA
Experiment 1 are normalized to GTA Experiment 2. (Color
figure online)
Mol Breeding
123

Discussion
Advantages of the GTA approach compared
to hybridization capture
The GTA method developed and described here offers
an alternative to hybridization-based capture methods
and emerging microfluidic approaches (Tewhey et al.
2009). Its advantages relative to other current
approaches are as follows:
1. It is very low-tech and inexpensive. All the
reactions are simple incubations (restriction
digestions, ligation PCRs) in plate format, so the
experiment can be carried out in any molecular
biology lab with no extra equipment expenditure.
There is no need for a pre-NGS library preparation
step per sample, which for high sample numbers
becomes time-consuming and very expensive
(currently *£30,000 for 100 samples), or expen-
sive equipment associated with hybridization
capture and microfluidics.
2. The GTA procedure has no requirement for
blocking of hybridization between repeats, which
is an essential part of all hybridization-based
capture methods and requires a new blocker
preparation for each genome under investigation.
3. It does not require detailed knowledge of the
genome under study. The only information
needed is small DNA segments (less than 1 Kb)
which could be very easily obtained by a single
NGS sequencing run on cDNA. Currently, hybrid-
ization capture arrays are only available for a
limited number of species. Furthermore, design of
capture arrays for a new species demands the
availability of a large body of genome sequence to
exclude repetitive sequences from the capture
oligonucleotides. This problem is much greater
for crop plants with large genomes, because their
dispersed repeat retrotransposon populations are
highly complex (Gribbon et al. 1999; SanMiguel
et al. 1996).
4. It is easily scalable in both dimensions (sample
and locus). We have tested 309 different tags
(Supplementary Material 4) and recommend 192
that should be combined in groups of up to 48.
One problem with using tags in hybridization
capture is blocking cross-hybridization between
tags to form ‘daisy chains’. In fact, the recently
announced Agilent SureSelect barcoding (Gnirke
et al. 2009) specifies that barcoded DNAs should
be hybridized separately then pooled for sequenc-
ing. This makes the analysis of hundreds of
samples very difficult and expensive.
5. It can deal perfectly well with indel polymor-
phism. Hybridization capture is adversely affected
by indels because the capture probes have pro-
gressively lower homology with increasing indel
size. GTA PCRs simply generate an amplicon of a
different size, unless the deleted region knocks out
one of the primer-binding sites (see below).
Limitations of the GTA approach
Disadvantages of the GTA approach include the
following:
6. It is dependent upon restriction enzyme cleavage
sites, making it less suitable than a hybridization-
based approach for capturing large genome regions,
because the experimental design is rather time-
consuming and particular sites may be missing
from some regions. We have reduced this problem
Samples
Loci
Fig. 4 Representation (read depth) bias by sample and locus in the
optimized GTA protocol. A matrix of 48 samples (X axis) by 46
loci (Y axis) is shown. Samples and loci are ordered by total read
number per column or row, in descending order from top to bottom
(loci) and left to right (samples). Each cell is coded according to
read depth as follows (all reads are full length). Black greater than 5
reads; Gray 3–5 reads; White 0–2 reads. The 9 sporadic white
squares in well-represented (amplicon 9 sample) combinations
represent possible examples of allelic dropout (see text)
Mol Breeding
123

by using multiple enzymes with identical sticky
ends, (MseI, T/TAA; BfaI, C/TAA; and Csp6I,
G/TAC) in GTA experiment 3. However, several
digestions are needed per sample, leading to an
approximate 25 % loss in coverage due to overlaps
between amplicons. There is also a failure rate of
roughly 15 % in candidate GTA primers, necessi-
tating a planning stage for primer validation on a
reference sample. It is important to note that
restriction site polymorphism is not a big problem
to the GTA approach because the amplified
sequence is extended to the next site, and as
sequencing is from both ends, a 454 template longer
than the *450 bp read length will retain its tag for
half of the sequence runs in such circumstances.
7. GTA is only well suited to NGS applications that
generate long (at least 200 bp) sequencing reads.
GTA amplicons carry tagged PCR adapters
(Waugh et al. 1997) at one end and only sequences
that contain the tag will retain the barcoding. At
present, this limits the application of GTA to
Roche-454 sequencing (Margulies et al. 2005).
However, with the latest increase in read lengths
on Illumina platforms, it could now readily be
used in place of 454-sequencing in the future.
8. Sample pooling depth and PCR cycling are both
limited by chimera formation and representation
bias. Each halving in GTA sample pool size
almost doubles the number of reactions needed
but halves the competition between amplicons.
Our validated protocol uses 48 sample pooling,
but we suggest that 96 sample pooling will give
acceptable results, provided bioinformatics-based
exclusion of chimeras is carried out and at least
40-fold sequencing depth is used. Provided that a
minor allele (say 1/48 of the input in a 48 GTA
pool) results in a corresponding tagged-amplified
sequence with less that 50 % chimera contami-
nation then the bioinformatics filtering can elim-
inate it effectively.
9. PCR-based target enrichment is potentially sus-
ceptible to allelic dropout (loss of particular
sequences because they amplify poorly). For
example, mutation to a PCR priming site might
reduce or remove a particular amplicon in a subset
of samples. This would be detected as sporadic
low representation in well-represented amplicons
and possible examples of this (0.5 % of the cells)
are visible in Fig. 4.
10. Bias by barcode and amplicon during the GTA
amplifications limits the total coverage obtained.
This can be reduced by avoiding tags and
amplicons showing strong bias but the latter limits
target options. However, our studies here show
that at least 95 % coverage can easily be obtained
at acceptable read depth (409) and in crucial
situations, a ‘catch-up’ GTA experiment focussed
on the missing samples and/or sequences could be
performed. In such cases, the poorly performing
sets (sample or amplicon) would be amplified
separately to reduce bias (all poorly performing
pool members would be competing against
equally poor members) and for poor samples,
new DNA preps and adapter ligations, together
with high performance tags would be the best
approach. For poorly performing amplicons, high
performance tags would be used.
Comparison of the GTA approach with other
capture technologies
In Table 2, we compare the GTA method with other
sequence capture approaches, to show the most
appropriate use for it. The GTA and Fluidigm
approaches are best suited for high sample numbers
(hundreds) and low capture complexity (below
100 Kb), whereas hybridization capture, MIPs and
Raindance technologies are better suited to a few
samples and high capture complexity ([0.4 Mb)
captures. GTA is a low-tech option for medium-sized
projects, whereas Fluidigm requires capital invest-
ment in equipment, but GTA involves more lab work
(ligations, PCRs, gels) (30) than Fluidigm. GTA is
very flexible in terms of sample number versus
amplicon number, but Fluidigm is tied to 48 samples
by 48 amplicons. Lastly, 192 validated tag options are
available for GTA (Supplementary Material 4),
whereas Fluidigm has 48, which necessitates either
the use of sequencing plate gaskets or much deeper
NGS sequence pooling and lower coverage.
In passing, it is worth noting that the occurrence of
chimeric PCR products during our early GTA exper-
iments has worrying implications for both hybridiza-
tion capture and conventional PCR amplification of
multi-gene families, such as histocompatibility or
plant resistance genes, because both involve PCR of
mixed template loci. Under such conditions,
Mol Breeding
123

Ta
ble
2C
om
par
iso
no
fca
ptu
rete
chn
olo
gie
s
Tec
hn
olo
gy
Bas
isT
yp
ical
cap
ture
targ
et
Cap
ture
com
ple
xit
y
(Mb
)
Ty
pic
al
sam
ple
size
To
tal
seq
uen
ce
cap
ture
(bp
)
%o
fta
rget
cap
ture
d
Ap
pli
cab
le
seq
uen
cin
g
pla
tfo
rm(s
)
Cap
ital
equ
ipm
ent
cost
Ap
pro
xim
ate
cost
per
run
c
Gen
om
e-T
agg
ed
Am
pli
fica
tio
n
(GT
A)
An
cho
red
PC
R
48
PC
Ram
pli
con
s0
.02
96
4,6
08
(2M
b)
[9
5R
och
e-4
54
on
lyL
ow
bL
ow
c
Flu
idig
mM
icro
flu
idic
PC
R
48
PC
Ram
pli
con
s0
.01
48
2,3
04
(1M
b)
[9
0R
och
e-4
54
on
ly£
70
,00
0L
ow
c
Rai
nd
ance
Mic
rofl
uid
ic
PC
R
20
,00
0P
CR
amp
lico
ns
81
20
,00
0(8
Mb
)9
8R
och
e-4
54
or
Illu
min
a
£2
00
,00
0£
1,0
00
Mo
lecu
lar
inv
ersi
on
pro
bes
(MIP
)
Gap
fill
lig
atio
n
55
,00
05
6b
p
amp
lim
ers
0.4
15
5,0
00
(0.4
Mb
)
90
Illu
min
ao
nly
Lo
wb
Lo
wc
Arr
ayca
ptu
re
(Nim
ble
gen
)
Hy
bri
diz
atio
n3
85
,00
0o
r2
.1M
bai
ts(t
wo
fold
dep
th)
0.4
or
21
–1
2(5
or
30
Mb
)5
0–
90
aR
och
e-4
54
or
Illu
min
a
£1
5,0
00
£8
00
Liq
uid
cap
ture
(Ag
ilen
t)
Hy
bri
diz
atio
n2
0,0
00
bai
ts2
.51
[1
5,0
00
(2.5
Mb
)
40
–8
0Il
lum
ina
on
lyL
ow
b£
90
0
aD
epen
ds
up
on
targ
etsi
ze—
see
tex
tb
No
spec
iali
zed
lab
equ
ipm
ent
nee
ded
cM
ain
cap
ital
ou
tlay
iso
lig
on
ucl
eoti
des
,w
hic
hca
nb
eu
sed
for
mu
ltip
leru
ns
Mol Breeding
123

recombination between multiplex barcoded samples
or among multi-gene family members will occur if
overcycling conditions are used in a single sample.
Conclusions
In this study, we have described a new PCR-based
approach for sequence capture. We particularly recom-
mend the GTA approach for studies of hundreds of gene
segments in hundreds of samples. Typical applications
include population genetics, evolutionary studies and
association genetics screens in genome subsets. We are
currently using it to scan across association peaks in
barley but it could readily be used, for example, to
screen the members of a dispersed gene family in
hundreds of samples for association with traits of
interest. We used 454 sequencing during development
of GTA method, however, this could easily be adapted
to Illumina sequencing platforms as read lengths have
significantly increased recently. Furthermore, GTA
could virtually be used for any organism with available
genome/sequence information.
Acknowledgments The authors thank Patrick Schnable for
suggestions on barcoding, Dan Ashlock for generating and
providing barcodes for this study and Jeffrey Jeddeloh for
communicating unpublished observations on hybridization
capture technologies. We also thank Margaret Hughes, Garry
Cusack and the Roche-454 Delaware sequencing facility for
much help and advice with 454 sequencing. This work was
supported by Biotechnology and Biological Sciences Research
Council grant BB/E003184/1.
References
Ahn SJ, Costa J, Emanuel JR (1996) PicoGreen quantitation of
DNA: effective evaluation of samples pre- or post-PCR.
Nucleic Acids Res 24:2623–2625
Albert TJ, Molla MN, Muzny DM, Nazareth L, Wheeler D,
Song XZ, Richmond TA, Middle CM, Rodesch MJ,
Packard CJ, Weinstock GM, Gibbs RA (2007) Direct
selection of human genomic loci by microarray hybrid-
ization. Nat Methods 4:903–905
Altschul SF, Madden TL, Schaffer AA, Zhang J, Zhang Z,
Miller W, Lipman DJ (1997) Gapped BLAST and PSI-
BLAST: a new generation of protein database search pro-
grams. Nucleic Acids Res 25:3389–3402
Ashlock D, Guo L, Qiu F (2002) Greedy closure evolutionary
algorithms. In: Proceedings of the 2002 congress on evo-
lutionary computation, pp 1296–1301
Bainbridge MN, Wang M, Burgess DL, Kovar C, Rodesch MJ,
D’Ascenzo M, Kitzman J, Wu YQ, Newsham I, Richmond
TA, Jeddeloh JA, Muzny D, Albert TJ, Gibbs RA (2010)
Whole exome capture in solution with 3 Gbp of data.
Genome Biol 11:R62
Bashiardes S, Veile R, Helms C, Mardis ER, Bowcock AM,
Lovett M (2005) Direct genomic selection. Nat Methods
2:63–69
Bentley DR (2006) Whole-genome re-sequencing. Curr Opin
Genet Dev 16:545–552
Binladen J, Gilbert MTP, Bollback JP, Panitz F, Bendixen C,
Nielsen R, Willerslev E (2007) The use of coded PCR
primers enables high-throughput sequencing of multiple
homolog amplification products by 454 parallel sequenc-
ing. PLoS ONE 2:e197. doi:10.1371/journal.pone.0000197
Bodi K, Perera AG, Adams PS, Bintzler D, Dewar K, Grove DS,
Kieleczawa J, Lyons RH, Neubert TA, Noll AC, Singh S,
Steen R, Zianni M (2013) Comparison of commercially
available target enrichment methods for next-generation
sequencing. J Biomol Tech 24:73–86
Choi M, Scholl UI, Ji W, Liu T, Tikhonova IR, Zumbo P, Nayir
A, Bakkaloglu A, Ozen S, Sanjad S, Nelson-Williams C,
Farhi A, Mane S, Lifton RP (2009) Genetic diagnosis by
whole exome capture and massively parallel DNA
sequencing. Proc Natl Acad Sci USA 106:19096–19101
Craig DW, Pearson JV, Szelinger S, Sekar A, Redman M,
Corneveaux JJ, Pawlowski TL, Laub T, Nunn G, Stephan
DA, Homer N, Huentelman MJ (2008) Identification of
genetic variants using bar-coded multiplexed sequencing.
Nat Methods 5:887–893
Dahl F, Stenberg J, Fredriksson S, Welch K, Zhang M, Nilsson
M, Bicknell D, Bodmer WF, Davis RW, Ji HL (2007)
Multigene amplification and massively parallel sequencing
for cancer mutation discovery. Proc Natl Acad Sci USA
104:9387–9392
Fu Y, Springer NM, Gerhardt DJ, Ying K, Yeh CT, Wu W,
Swanson-Wagner R, D’Ascenzo M, Millard T, Freeberg L,
Aoyama N, Kitzman J, Burgess D, Richmond T, Albert TJ,
Barbazuk WB, Jeddeloh JA, Schnable PS (2010) Repeat
subtraction-mediated sequence capture from a complex
genome. Plant J Cell Mol Biol 62:898–909
Gnirke A, Melnikov A, Maguire J, Rogov P, LeProust EM,
Brockman W, Fennell T, Giannoukos G, Fisher S, Russ C,
Gabriel S, Jaffe DB, Lander ES, Nusbaum C (2009)
Solution hybrid selection with ultra-long oligonucleotides
for massively parallel targeted sequencing. Nat Biotechnol
27:182–189
Gribbon BM, Pearce SR, Kalendar R, Schulman AH, Paulin L,
Jack P, Kumar A, Flavell AJ (1999) Phylogeny and trans-
positional activity of Ty1-copia group retrotransposons in
cereal genomes. Mol Gen Genetics 261:883–891
Hopp K, Heyer CM, Hommerding CJ, Henke SA, Sundsbak JL,
Patel S, Patel P, Consugar MB, Czarnecki PG, Gliem TJ,
Torres VE, Rossetti S, Harris PC (2011) B9D1 is revealed
as a novel Meckel syndrome (MKS) gene by targeted exon-
enriched next-generation sequencing and deletion analysis.
Hum Mol Genet 20:2524–2534
Huang X, Madan A (1999) CAP3: a DNA sequence assembly
program. Genome Res 9:868–877
Klock HE, Lesley SA (2009) The Polymerase Incomplete Pri-
mer Extension (PIPE) method applied to high-throughput
cloning and site-directed mutagenesis. Methods Mol Biol
498:91–103
Mol Breeding
123

Lee H, O’Connor BD, Merriman B, Funari VA, Homer N, Chen
Z, Cohn DH, Nelson SF (2009) Improving the efficiency of
genomic loci capture using oligonucleotide arrays for high
throughput resequencing. BMC Genom 10:646
Mamanova L, Coffey AJ, Scott CE, Kozarewa I, Turner EH,
Kumar A, Howard E, Shendure J, Turner DJ (2010) Target-
enrichment strategies for next-generation sequencing. Nat
Methods 7:111–118
Mardis ER (2008) Next-generation DNA sequencing methods.
Annu Rev Genom Hum G 9:387–402
Margulies M, Egholm M, Altman WE, Attiya S, Bader JS,
Bemben LA, Berka J, Braverman MS, Chen YJ, Chen Z,
Dewell SB, Du L, Fierro JM, Gomes XV, Godwin BC, He
W, Helgesen S, Ho CH, Irzyk GP, Jando SC, Alenquer ML,
Jarvie TP, Jirage KB, Kim JB, Knight JR, Lanza JR, Le-
amon JH, Lefkowitz SM, Lei M, Li J, Lohman KL, Lu H,
Makhijani VB, McDade KE, McKenna MP, Myers EW,
Nickerson E, Nobile JR, Plant R, Puc BP, Ronan MT, Roth
GT, Sarkis GJ, Simons JF, Simpson JW, Srinivasan M,
Tartaro KR, Tomasz A, Vogt KA, Volkmer GA, Wang SH,
Wang Y, Weiner MP, Yu P, Begley RF, Rothberg JM
(2005) Genome sequencing in microfabricated high-den-
sity picolitre reactors. Nature 437:376–380
Milne I, Stephen G, Bayer M, Cock PJA, Pritchard L, Cardle L,
Shaw PD, Marshall D (2013) Using Tablet for visual
exploration of second-generation sequencing data. Brief
Bioinform 14:193–202
Okou DT, Steinberg KM, Middle C, Cutler DJ, Albert TJ, Zwick
ME (2007) Microarray-based genomic selection for high-
throughput resequencing. Nat Methods 4:907–909
Porreca GJ, Zhang K, Li JB, Xie B, Austin D, Vassallo SL,
LeProust EM, Peck BJ, Emig CJ, Dahl F, Gao Y, Church
GM, Shendure J (2007) Multiplex amplification of large
sets of human exons. Nat Methods 4:931–936
Qiu F, Guo L, Wen TJ, Liu F, Ashlock DA, Schnable PS (2003)
DNA sequence-based ‘‘bar codes’’ for tracking the origins
of expressed sequence tags from a maize cDNA library
constructed using multiple mRNA sources. Plant Physiol
133:475–481
Rostoks N, Mudie S, Cardle L, Russell J, Ramsay L, Booth A,
Svensson JT, Wanamaker SI, Walia H, Rodriguez EM,
Hedley PE, Liu H, Morris J, Close TJ, Marshall DF, Waugh
R (2005) Genome-wide SNP discovery and linkage ana-
lysis in barley based on genes responsive to abiotic stress.
Mol Genetics Genomics 274:515–527
SanMiguel P, Tikhonov A, Jin YK, Motchoulskaia N, Zakharov
D, Melake-Berhan A, Springer PS, Edwards KJ, Lee M,
Avramova Z, Bennetzen JL (1996) Nested retrotranspo-
sons in the intergenic regions of the maize genome. Science
274:765–768
Smith AM, Heisler LE, St Onge RP, Farias-Hesson E, Wallace
IM, Bodeau J, Harris AN, Perry KM, Giaever G, Pourmand
N, Nislow C (2010) Highly-multiplexed barcode
sequencing: an efficient method for parallel analysis of
pooled samples. Nucleic Acids Res 38:e142. doi:10.1093/
nar/gkq368
Tan IB, Cutcutache I, Zang ZJ, Iqbal J, Yap SF, Hwang W, Lim
WT, Teh BT, Rozen S, Tan EH, Tan P (2011) Fanconi’s
anemia in adulthood: chemoradiation-induced bone mar-
row failure and a novel FANCA mutation identified by
targeted deep sequencing. J Clin Oncol Off J Am Soc Clin
Oncol 29:e591–e594
Tewhey R, Warner JB, Nakano M, Libby B, Medkova M, David PH,
Kotsopoulos SK, Samuels ML, Hutchison JB, Larson JW,
Topol EJ, Weiner MP, Harismendy O, Olson J, Link DR, Frazer
KA (2009) Microdroplet-based PCR enrichment for large-scale
targeted sequencing. Nat Biotechnol 27:U1025–U1094
Turner EH, Lee CL, Ng SB, Nickerson DA, Shendure J (2009)
Massively parallel exon capture and library-free rese-
quencing across 16 genomes. Nat Methods 6:315–316
Waugh R, McLean K, Flavell AJ, Pearce SR, Kumar A, Thomas
BB, Powell W (1997) Genetic distribution of Bare-1-like
retrotransposable elements in the barley genome revealed
by sequence-specific amplification polymorphisms (S-
SAP). Mol Gen Genetics 253:687–694
Mol Breeding
123