
Road-based travel recommendation using geo-tagged images
13
Road-based travel recommendation using geo-tagged images Yeran Sun ⇑ , Hongchao Fan, Mohamed Bakillah, Alexander Zipf GIScience Research Group, Institute of Geography, University of Heidelberg, Berliner Straße 48, Heidelberg 69120, Germany article info Article history: Available online xxxx Keywords: Volunteered geographic information Travel recommendation Routing planning Spatial data mining Semantic routing abstract Geotagged photos on social media like Flickr explicitly indicate the trajectories of tourists. They can be employed to reveal the tourists’ preference on landmarks and routings of tourism. Most of existing works on routing searches are based on the trajectories of GPS-enabled devices’ users. From a distinct point of view, we attempt to propose a novel approach in which the basic unit of routing is separate road segment instead of GPS trajectory segment. In this paper, we build a recommendation system that provides users with the most popular landmarks as well as the best travel routings between the landmarks. By using Flickr geotaggged photos, the top ranking travel destinations in a city can be identified and then the best travel routes between the popular travel destinations are recommended. We apply a spatial clustering method to identify the main travel landmarks and subsequently rank these landmarks. Using machine learning method, we calculate the tourism popularity of the road in terms of relevant parameters, e.g., the number of users and the number of Point-of-Interests. These popularity assessments are integrated into the routing recommendation system. The routing recommendation system takes into consideration both the popularity assessment and the length of the road. The best route recommended to the user min- imizes the distance while including maximal tourism popularity. Experiments were conducted in two dif- ferent scenarios. The empirical results show that the recommendation system is able to provide the user good travel planning including both top ranking landmarks and suitable routings in a city. Besides, the system offers user-generated semantic information for the recommended routes. Ó 2013 Elsevier Ltd. All rights reserved. 1. Introduction Web 2.0 technologies enable users of social media to make con- tributions or to communicate with each other. Among the various types of information contributed and shared by users on social media, the geographic one is called Volunteered Geographic Infor- mation (VGI, Goodchild, 2007). The most common providers of VGI are Flickr, OpenStreetMap, Twitter, Facebook, YouTube, Wikima- pia, Foursquare, etc. VGI has been used in research on tourism, disaster and crisis management, transportation, etc. As a typical photo-sharing provider, Flickr provides a platform where users can share their photos with metadata (e.g., size, time when photo was taken, location, camera type, etc.) and add textual information on the photos. Such textual information includes title, tag, etc. Georeferenced photos in Flickr are associated with locational, tem- poral and textual information, which reflect the behaviours and activities of users, particularly tourists. For instance, spatial distri- bution of Flickr images can reveal the underlying process of tour- ists’ footprints. With a combination of spatial and the temporal dimensions, Flickr images can be used to uncover the trajectories and movements of tourists. From this point of view, Flickr can be employed to provide users with travel recommendations based on the identification of tourists’ spatial and temporal patterns from images. In addition to the georeferenced photos, georeferenced posts in Twitter, geolocated check-ins in Foursquare, user-gener- ated GPS trajectories, etc., have potentials of being leveraged for travel recommendations (Zheng, 2012). From an insight into location-based social network (LBSN), Zheng and Zhou (2011) classify travel recommendations into two types: generic and personalized. Basically, a generic travel recom- mendation system should provide users the top ranked landmarks, travel sequences, and travel experts in a specified region (e.g., a city). In the contrast, a personalized system is able to provide an individual user with a distinctive recommendation based on the travel preferences and histories of the users (e.g., Cheng, Chen, Huang, Hsu, & Liao, 2011; Majid et al., 2012). Apart from the tour- ism attraction or landmark, routing is another important aspect of travel recommendation. GPS history data is often used to track the footprint of the user, which becomes an indicator of the user’s tra- jectory and movement (e.g., Zheng, Zheng, Xie, & Yang, 2010). Rep- resentative or typical routings of tourists can be mined from huge amounts of tourists’ trajectories and thus are recommended to the user (e.g., Lu, Wang, Yang, Pang, & Zhang, 2010). Some researchers take advantage of the trajectory similarity calculation to offer the 0198-9715/$ - see front matter Ó 2013 Elsevier Ltd. All rights reserved. http://dx.doi.org/10.1016/j.compenvurbsys.2013.07.006 ⇑ Corresponding author. Address: Room 101, Berliner Straße 48, D-69120 Heidelberg, Germany. Tel.: +49 6221 54 5528; fax: +49 6221 54 4529. E-mail address: [email protected] (Y. Sun). Computers, Environment and Urban Systems xxx (2013) xxx–xxx Contents lists available at ScienceDirect Computers, Environment and Urban Systems journal homepage: www.elsevier.com/locate/compenvurbsys Please cite this article in press as: Sun, Y., et al. Road-based travel recommendation using geo-tagged images. Computers, Environment and Urban Systems (2013), http://dx.doi.org/10.1016/j.compenvurbsys.2013.07.006
-
Upload
uni-heidelberg -
Category
Documents
-
view
0 -
download
0
Transcript of Road-based travel recommendation using geo-tagged images

Computers, Environment and Urban Systems xxx (2013) xxx–xxx
Contents lists available at ScienceDirect
Computers, Environment and Urban Systems
journal homepage: www.elsevier .com/locate /compenvurbsys
Road-based travel recommendation using geo-tagged images
0198-9715/$ - see front matter � 2013 Elsevier Ltd. All rights reserved.http://dx.doi.org/10.1016/j.compenvurbsys.2013.07.006
⇑ Corresponding author. Address: Room 101, Berliner Straße 48, D-69120Heidelberg, Germany. Tel.: +49 6221 54 5528; fax: +49 6221 54 4529.
E-mail address: [email protected] (Y. Sun).
Please cite this article in press as: Sun, Y., et al. Road-based travel recommendation using geo-tagged images. Computers, Environment and Urban S(2013), http://dx.doi.org/10.1016/j.compenvurbsys.2013.07.006
Yeran Sun ⇑, Hongchao Fan, Mohamed Bakillah, Alexander ZipfGIScience Research Group, Institute of Geography, University of Heidelberg, Berliner Straße 48, Heidelberg 69120, Germany
a r t i c l e i n f o
Article history:Available online xxxx
Keywords:Volunteered geographic informationTravel recommendationRouting planningSpatial data miningSemantic routing
a b s t r a c t
Geotagged photos on social media like Flickr explicitly indicate the trajectories of tourists. They can beemployed to reveal the tourists’ preference on landmarks and routings of tourism. Most of existing workson routing searches are based on the trajectories of GPS-enabled devices’ users. From a distinct point ofview, we attempt to propose a novel approach in which the basic unit of routing is separate road segmentinstead of GPS trajectory segment. In this paper, we build a recommendation system that provides userswith the most popular landmarks as well as the best travel routings between the landmarks. By usingFlickr geotaggged photos, the top ranking travel destinations in a city can be identified and then the besttravel routes between the popular travel destinations are recommended. We apply a spatial clusteringmethod to identify the main travel landmarks and subsequently rank these landmarks. Using machinelearning method, we calculate the tourism popularity of the road in terms of relevant parameters, e.g.,the number of users and the number of Point-of-Interests. These popularity assessments are integratedinto the routing recommendation system. The routing recommendation system takes into considerationboth the popularity assessment and the length of the road. The best route recommended to the user min-imizes the distance while including maximal tourism popularity. Experiments were conducted in two dif-ferent scenarios. The empirical results show that the recommendation system is able to provide the usergood travel planning including both top ranking landmarks and suitable routings in a city. Besides, thesystem offers user-generated semantic information for the recommended routes.
� 2013 Elsevier Ltd. All rights reserved.
1. Introduction
Web 2.0 technologies enable users of social media to make con-tributions or to communicate with each other. Among the varioustypes of information contributed and shared by users on socialmedia, the geographic one is called Volunteered Geographic Infor-mation (VGI, Goodchild, 2007). The most common providers of VGIare Flickr, OpenStreetMap, Twitter, Facebook, YouTube, Wikima-pia, Foursquare, etc. VGI has been used in research on tourism,disaster and crisis management, transportation, etc. As a typicalphoto-sharing provider, Flickr provides a platform where userscan share their photos with metadata (e.g., size, time when photowas taken, location, camera type, etc.) and add textual informationon the photos. Such textual information includes title, tag, etc.Georeferenced photos in Flickr are associated with locational, tem-poral and textual information, which reflect the behaviours andactivities of users, particularly tourists. For instance, spatial distri-bution of Flickr images can reveal the underlying process of tour-ists’ footprints. With a combination of spatial and the temporaldimensions, Flickr images can be used to uncover the trajectories
and movements of tourists. From this point of view, Flickr can beemployed to provide users with travel recommendations basedon the identification of tourists’ spatial and temporal patterns fromimages. In addition to the georeferenced photos, georeferencedposts in Twitter, geolocated check-ins in Foursquare, user-gener-ated GPS trajectories, etc., have potentials of being leveraged fortravel recommendations (Zheng, 2012).
From an insight into location-based social network (LBSN),Zheng and Zhou (2011) classify travel recommendations into twotypes: generic and personalized. Basically, a generic travel recom-mendation system should provide users the top ranked landmarks,travel sequences, and travel experts in a specified region (e.g., acity). In the contrast, a personalized system is able to provide anindividual user with a distinctive recommendation based on thetravel preferences and histories of the users (e.g., Cheng, Chen,Huang, Hsu, & Liao, 2011; Majid et al., 2012). Apart from the tour-ism attraction or landmark, routing is another important aspect oftravel recommendation. GPS history data is often used to track thefootprint of the user, which becomes an indicator of the user’s tra-jectory and movement (e.g., Zheng, Zheng, Xie, & Yang, 2010). Rep-resentative or typical routings of tourists can be mined from hugeamounts of tourists’ trajectories and thus are recommended to theuser (e.g., Lu, Wang, Yang, Pang, & Zhang, 2010). Some researcherstake advantage of the trajectory similarity calculation to offer the
ystems

2 Y. Sun et al. / Computers, Environment and Urban Systems xxx (2013) xxx–xxx
individual user the most ‘‘similar’’ routing, which is acquired fromthe tracking histories of the other users, as the personalized rout-ing (e.g., Cheng et al., 2011). To enhance the real-time usabilityof the travel recommendation application, time constraint is alsotaken into account in some research works (e.g., Lu et al., 2010).
In general, a good travel recommendation system should pro-vide the user with the most interesting (popular) landmarksincluding routing paths as the most people recommended. Addi-tionally, for tourists, an optimal routing should take into accountnot only the distance but also the tourism popularity. The researchresult of Popescu and Grefenstette (2009) shows that tourists nor-mally do not take the shortest path between landmarks. Touristsusually like popular streets where they can glimpse more touristicattractions (e.g., churches, squares, statues, memorials, etc.) or sat-isfy some personalized needs (e.g., eating, shopping, mailing postcard, etc.) before reaching their destinations. Thus, to measurethe popularity of a road, not only the images taken of the road it-self, but also the images taken of the Points-of-Interest (POIs) onor near the road should be taken into consideration. Moreover, inaddition to the popularity of the road itself, POIs on or near theroad should be taken into account to recommend the best routing.However, the previous research works generate recommendedroutings from the historic trajectories (or trajectory segments) ofusers directly. Unlike these previous research works, we have analternative perspective on the routing generation, according towhich a recommended routing is composed by a set of separateroads (or road segments) which are connected in road network.Therefore, the advantage of our approach is that we are able toconsider the tourism popularity of road as a new feature of road’spopularity in a routing planning problem, and based on the valuesof features including road popularity as well as other attributes(e.g., POIs), we are able to find out the best road set constitutingthe best overall routing.
In this paper, we propose a road-based travel recommendationparadigm combining the landmarks and the routing. The travellandmark can be identified by the georeferenced images with aspatial clustering method. The best routings between the travellandmarks are recommended to users in terms of calculating thetotal value of the defined recommendation index. This defined rec-ommendation index is constituted by the popularity and distanceof the road as well as number of the POIs. Section 2 reviews relatedwork on travel recommendation using georeferenced photos. Sec-tion 3 introduces the proposed approach to recommending travel.Section 4 presents the experimental results and analysis. At last,the paper makes a conclusion and presents future work.
2. Related works
In tourism research, the leverage of geotagged images and GPShistory data mostly focuses on hotspot and landmark identifica-tion, trajectory and movement mining as well as trip recommenda-tion. The related research works on these aspects are introduced inthe following sub-sections.
2.1. Hotspot and landmark identification
Through geotagged images, Kennedy, Naaman, Ahern, Nair, andRattenbury (2007) firstly used spatial clustering method to recog-nize the landmarks, and then employed a location-driven approachto generate representative tags for these landmarks. Rattenbury,Good, and Maaman (2007) proposed an approach to extract placesemantics from Flickr tags automatically. Comparative resultsshowed that the proposed scale-structure identification (SCI) out-performs the baseline methods. Following this, Rattenbury andNaaman (2009) developed a new approach called TagMaps to ex-
Please cite this article in press as: Sun, Y., et al. Road-based travel recommend(2013), http://dx.doi.org/10.1016/j.compenvurbsys.2013.07.006
tract semantic information of place, and compared it with the pre-vious methods. The results showed that TagMaps methodoutperformed the existing ones. Using Flickr, Girardin, Dal Fiore,Ratti, and Blat (2007) identified local regions of tourist concentra-tion in terms of the point density of tourists. Subsequently, basedon the most active regions obtained by spatial data clustering,Girardin, Calabrese, Dal Fiore, Ratti, and Blat (2008) presentedthe spatial and temporal distribution of tourists during their tripsto Rome. In addition, Girardin, Vaccari, Gerber, and Ratti (2009)measured the attractiveness of POI in terms of the presence of pho-tographer. Crandall, Backstrom, Huttenlocher, and Kleinberg(2009) employed a non-parametric clustering method namedmean shift to discover the significant landmarks at a global leveland evaluated their method within several specific cities.
To mine interesting locations and classical travel sequences in ageospatial region, Zheng, Xie, and Ma (2009) proposed a HITS(Hypertext Induced Topic Search)-based model to infer a user’s tra-vel experiences and the interest of a location considering the rela-tionship between user and location. The results showed that thereexisted a mutual reinforcement relationship between locationinterest and user travel experiences. Meanwhile, employing bothusers’ travel experiences and location interests, they achieved thebest performance of detecting the classical travel sequences Jan-kowski, Andrienko, Andrienko, and Kisilevich (2010) presented ageovisual analytic approach to discover people’s preferencesonlandmarks from Flickr photos. Their results could help to distin-guish between sites that are occasionally popular among the tour-ists and sites already known as city landmarks. Moreover, Ji, Gao,Zhong, Yao, and Tian (2011) applied a spectral clustering methodto identify landmark region and mined representative photos.
In this work, we employ DBSCAN method to identify the land-marks. It is a classic and popular density-based clustering method,which has several generalized forms, e.g. GDBSCAN and ST-GDB-SCAN. Compared to the most of clustering methods we mentionedabove, DBSCAN can identify the clusters of arbitrary shape withoutthe specification of cluster count a priori. However, two parametersare required in DBSCAN procedure which might influence the clus-tering result. Unfortunately, there is not yet perfectly generalmethod to search the optimal parameters which is adaptive to dif-ferent applications. Therefore, we firstly generate different resultsof clustering at different values of the parameters. We subse-quently compare these results and finally find out an appropriatepair of parameters. Among the clusters generated with this pairof parameters, we have three steps to distinguish the clusters re-sulted from landmarks with the ones resulted from some eventsor other things which are unrelated to tourism. Consequently,the identification of landmark will be enhanced.
2.2. Trajectory and movement mining
For pedestrian navigation based on mobile devices, Hile et al.(2008) proposed a system for the automatic generation of naviga-tional instructions from collections of geotagged photos. Theinstructions consist of a sequence of landmark images augmentedwith directional instructions. Using geotagged photos, Andrienko,Andrienko, Bak, Kisilevich, and Keim (2009) built a flow map show-ing aggregated moves of photographers between different places.Defining some criteria to calculate the duration of the tourist’s visitfrom Flickr photos, Popescu and Grefenstette (2009) exploitedtemporal information associated with touristic sites. Also, to ex-tract trip-related information, Popescu, Grefenstette, and Moëllic(2009) characterized the discovered trips and computed the visittimes of the sites. Aiming at solving the problem of automatic tra-vel route planning, Lu et al. (2010) provided a customized trip planenabling tourists to specify personal preference such as visitinglocation, visiting time/season, time duration of travel, and destina-
ation using geo-tagged images. Computers, Environment and Urban Systems

Y. Sun et al. / Computers, Environment and Urban Systems xxx (2013) xxx–xxx 3
tion style in an interactive manner to guide the system. Similarly,Arase, Xie, Hara, and Nishio (2010) detected people’s frequent trippatterns, i.e., typical sequences of visited cities and stay durationsas well as descriptive tags that characterize the trip patterns. Withrespect to the trip theme, the trips were categorized using tags andtitles of photos as well as visited cites as features. The proposedmethod mined frequent trip patterns for each trip theme category.Jankowski et al. (2010) presented a geovisual analytics approach todiscovering people’s movement patterns from Flickr photos. Theresults show that most of the tourists’ itineraries are short andhighly local. Choudhury et al. (2010) extracted photo streams ofindividual users on Flickr and aggregated them into a POI graph.Subject to the constraints of user’s time and destination, travel itin-eraries were then automatically constructed from the graph basedon the popularity of the POI. To explore the representative trajec-tory patterns, Yin, Cao, Han, Luo, and Huang (2011) generatedmany trajectories and ranked the trajectory patterns by quantita-tively utilizing an exemplar-based algorithm. To discover movingflock patterns among pedestrians, Wachowicz, Ong, Renso, andNanni (2011) proposed an extraction algorithm based on the no-tion of collective coherence. Consequently, the base trajectoriesof the moving flock patterns were mined from GPS history data.Using GPS traces, Zheng and Xie (2011) performed a travel recom-mendation devoted to offering a user with top interesting locationsand travel routines in a given geospatial region in consideration ofboth the number of users and their knowledge. Aiming at low-sampling-rate GPS data, Lou et al. (2009) proposed a novel globalmap-matching algorithm called ST-Matching to match the GPS tra-jectories of users with the digital map. Using Markov chain model,Zheng, Zha, and Chua (2012) investigated the tourist movementpatterns in relation to the regions of attractions from geotaggedphotos. Subsequently, the topological characteristics of travelroutes made by different tourists were analyzed. Wei, Zheng, andPeng (2012) proposed a Route Inference framework based on Col-lective Knowledge (RICK) to construct the popular routes fromuncertain historic trajectories. Foursquare check-ins and taxi tra-jectories were chosen as two experiment cases.
2.3. Travel recommendation
Based on user’s location history from GPS, Takeuchi and Sugim-oto (2006) proposed a shop recommendation system for real-worldshopping. Considering a ‘‘convenience’’ metric in making recom-mendation, Horozov, Narasimhan, and Vasudevan (2006) proposedan enhanced collaborative filtering method to recommend restau-rants to mobile users. To provide personalized travel recommenda-tions for users owning a preference for a specific type of landmarkin a city, Clements, Serdyukov, Vries, and Reinders (2010) proposeda method to predict a user’s favorite locations from Flickr photos.They reranked the popular locations for individual user in termsof calculating the similarities between the geotagged image distri-butions of different users. Using a probabilistic Bayesian learningmethod, Cheng et al. (2011) proposed a personalized recommenda-tion considering specific user profiles or attributes (e.g. gender,age, race). Zheng et al. (2010) integrated the users’ comments intothe travel recommendation system based on the GPS history data.The system can discover interesting locations together with possi-ble activities that can be performed there. Considering the locationcorrelation, Zheng and Xie (2010) performed a personalized loca-tion recommendation system based on the user-generated GPS tra-jectories, by taking into account a user’s travel experiences andknowledge. Majid et al. (2012) presented a context-aware person-alized travel recommendation system considering the temporaland weather context of tourist. The system acquired users’ specifictravel preferences by building the travel similarities between usersfrom their travel histories. Subsequently, it recommended tourist
Please cite this article in press as: Sun, Y., et al. Road-based travel recommend(2013), http://dx.doi.org/10.1016/j.compenvurbsys.2013.07.006
the personalized travel locations in unvisited regions. To enhancetravel planning in unfamiliar regions, Yoon, Zheng, Xie, and Woo(2012) proposed a social itinerary recommendation system bylearning from multiple user-generated GPS trails.
The above works on travel recommendation can offer users theprominent travel landmarks and further the ordering of landmarks,which compose travel routings. Besides, personalized preference isconsidered in the recommendation. Moreover, some works presenta trip routing based on user trajectory from GPS history data. Eachhistoric trajectory of the user can be considered as a historic indi-vidual routing. The recommended routing is always represented asthe average of the historic routings (trajectories) or the one withthe highest ranking. Nevertheless, such recommended trip rout-ings sometimes lack convenience and effectiveness for users to po-sition and navigate on the digital map, since they are based on GPStrajectory instead of separate road in the road network. Specifi-cally, users might conduct their travelling by walking, biking, car,bus, or hybrid way. It might be inconvenient and ineffective to rec-ommend a user, who wants to walk in a city, a routing based onhistoric trajectories of users driving cars. Moreover, road-based ap-proach can consider more the hidden spatial associations of roadsin different directions than trajectory-based approach. Comparedto common tourists, tourists of GPS trajectories, especially the oneswho are driving or bicycling, tend to choose a straightforward line.On the other hand, few tourists tend to use GPS device to recordtheir trajectories when travelling. Thus, coverage and representa-tiveness of GPS trajectory data is relatively low compared to Flickrimages which are generated by a larger variety of tourists. Besides,the routing recommenders in state-of-the-art neglect the tourismattractions and POIs on the road, to which tourists always paymore attention than the road itself.
Contrary to the previous research works, through leveragingFlickr geotagged images, this paper aims to generate recom-mended routing from separate roads instead of historic trajectoriesof users. In other words, the atomic unit of the routing is road seg-ment rather than trajectory segment. Moreover, to recommend thesuitable routing, in addition to the popularity of the road, POIs onthe road as well as the length of the road are considered in the pro-posed recommendation system.
3. Approach
3.1. Framework of travel recommendation system
We define the travel recommendation for a user u as {L(1),Rou(1, 2), L(2), . . . , L(n � 1), Rou(n � 1, n), L(n)}. L(i) is the recom-mended landmark for the user in a city. Rou(i � 1, i) is the recom-mended travel routing between starting landmark L(i � 1) andending landmark L(i). Rou(i � 1, i) is constituted by a sequence ofseparate roads represented as (r1, r2, . . . , rk).
As shown in Fig. 1, the outputs of the travel recommendationsystem are landmarks and routings. For this purpose, we need toidentify and rank the landmarks using geotagged images of Flickrfirstly. Then, we calculate the tourism popularity of the road byassigning geotagged images to the appropriate roads.
3.2. Noise elimination
Some of images related to residents’ activities (e.g. wedding,birthday party, house decoration, etc.) or some temporal eventsunrelated to tourism (weather change, accident, etc.) do not haveany positive contribution to travel recommendation. In otherwords, such images are noise and thus should be pruned for travelrecommendation. Fortunately, the vast majority of such images arecontributed by residents and thus can be removed by our following
ation using geo-tagged images. Computers, Environment and Urban Systems
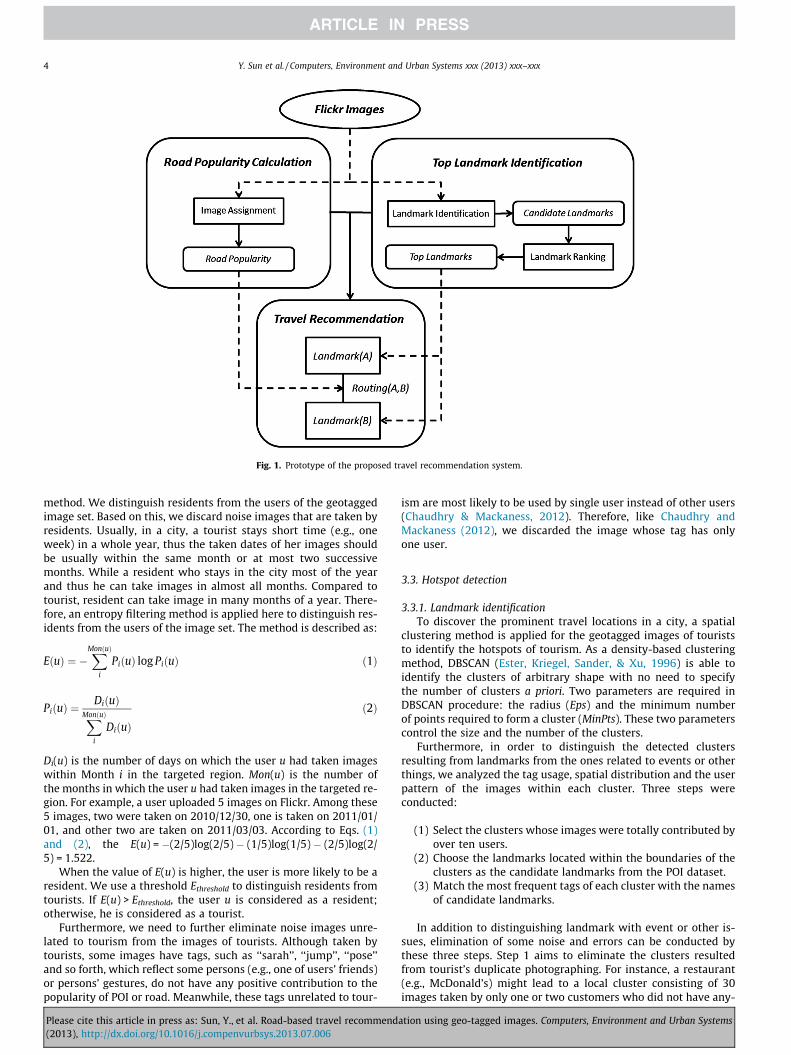
Fig. 1. Prototype of the proposed travel recommendation system.
4 Y. Sun et al. / Computers, Environment and Urban Systems xxx (2013) xxx–xxx
method. We distinguish residents from the users of the geotaggedimage set. Based on this, we discard noise images that are taken byresidents. Usually, in a city, a tourist stays short time (e.g., oneweek) in a whole year, thus the taken dates of her images shouldbe usually within the same month or at most two successivemonths. While a resident who stays in the city most of the yearand thus he can take images in almost all months. Compared totourist, resident can take image in many months of a year. There-fore, an entropy filtering method is applied here to distinguish res-idents from the users of the image set. The method is described as:
EðuÞ ¼ �XMonðuÞ
i
PiðuÞ log PiðuÞ ð1Þ
PiðuÞ ¼DiðuÞXMonðuÞ
i
DiðuÞð2Þ
Di(u) is the number of days on which the user u had taken imageswithin Month i in the targeted region. Mon(u) is the number ofthe months in which the user u had taken images in the targeted re-gion. For example, a user uploaded 5 images on Flickr. Among these5 images, two were taken on 2010/12/30, one is taken on 2011/01/01, and other two are taken on 2011/03/03. According to Eqs. (1)and (2), the E(u) = �(2/5)log(2/5) � (1/5)log(1/5) � (2/5)log(2/5) = 1.522.
When the value of E(u) is higher, the user is more likely to be aresident. We use a threshold Ethreshold to distinguish residents fromtourists. If E(u) > Ethreshold, the user u is considered as a resident;otherwise, he is considered as a tourist.
Furthermore, we need to further eliminate noise images unre-lated to tourism from the images of tourists. Although taken bytourists, some images have tags, such as ‘‘sarah’’, ‘‘jump’’, ‘‘pose’’and so forth, which reflect some persons (e.g., one of users’ friends)or persons’ gestures, do not have any positive contribution to thepopularity of POI or road. Meanwhile, these tags unrelated to tour-
Please cite this article in press as: Sun, Y., et al. Road-based travel recommend(2013), http://dx.doi.org/10.1016/j.compenvurbsys.2013.07.006
ism are most likely to be used by single user instead of other users(Chaudhry & Mackaness, 2012). Therefore, like Chaudhry andMackaness (2012), we discarded the image whose tag has onlyone user.
3.3. Hotspot detection
3.3.1. Landmark identificationTo discover the prominent travel locations in a city, a spatial
clustering method is applied for the geotagged images of touriststo identify the hotspots of tourism. As a density-based clusteringmethod, DBSCAN (Ester, Kriegel, Sander, & Xu, 1996) is able toidentify the clusters of arbitrary shape with no need to specifythe number of clusters a priori. Two parameters are required inDBSCAN procedure: the radius (Eps) and the minimum numberof points required to form a cluster (MinPts). These two parameterscontrol the size and the number of the clusters.
Furthermore, in order to distinguish the detected clustersresulting from landmarks from the ones related to events or otherthings, we analyzed the tag usage, spatial distribution and the userpattern of the images within each cluster. Three steps wereconducted:
(1) Select the clusters whose images were totally contributed byover ten users.
(2) Choose the landmarks located within the boundaries of theclusters as the candidate landmarks from the POI dataset.
(3) Match the most frequent tags of each cluster with the namesof candidate landmarks.
In addition to distinguishing landmark with event or other is-sues, elimination of some noise and errors can be conducted bythese three steps. Step 1 aims to eliminate the clusters resultedfrom tourist’s duplicate photographing. For instance, a restaurant(e.g., McDonald’s) might lead to a local cluster consisting of 30images taken by only one or two customers who did not have any-
ation using geo-tagged images. Computers, Environment and Urban Systems

Y. Sun et al. / Computers, Environment and Urban Systems xxx (2013) xxx–xxx 5
thing else to do apart from taking picture casually during the din-ner. In another example, there is a square reflected by totally 30images as well, which are contributed by 15 persons. Comparedto the square, the restaurant cannot be considered as landmark be-cause landmark should have relatively large numbers of imagesand users simultaneously. Here we choose ten as the minimumthreshold of user count. Step 2 aims to eliminate noise and errorof user’s tagging. Tourists sometimes take images of a high land-mark (e.g. a tower) from a long distance and still use the nameof this landmark as the tag of the images. These images could beconsidered as indicators of the landmarks. However, with theDBSCAN method based on distance these images are actually con-tained by a local cluster which represents another landmark duo toshorter distance. Thus, we only take into account the landmarkswithin the spatial region of the cluster as the candidate ones.Otherwise, there would be some errors occurring in case that themajority of the images composing a detected local cluster repre-senting a nearby landmark belong to such kind of images actuallyindicating a landmark far away. Besides, some users might make amistake when tagging images recording same types of objects. Forinstance, a tourist who does not have knowledge of church’ archi-tectural style, might confuse Catholic churches with Protestantchurches and thus tag them with wrong names. Therefore step 2reduces the occurrence of such mistakes as well through therestriction of spatial distance. Step 3 is dedicated to finding outpopular landmarks.
After the three steps above, the top landmarks must beidentified.
3.3.2. Landmark rankingTo rank the landmarks detected using the method in Sec-
tion 3.3.1, we need to quantify the tourism popularity of the land-mark based on the geotagged images. To measure the popularity ofa place (e.g., landmark, POI, street, etc.) using user-generateimages, in general the difference of contribution among imagesshould be considered. For user-generated images, there are basi-cally two kinds of differences. One is the difference among touristswith different levels of travel knowledge and experiences. For in-stance, based on Zheng et al. (2009), tourists of rich knowledgeand travel experiences would provide more reliable and valuabledata for travel recommendation than novel tourists. An experi-enced tourist might be more interested in the highly ranked land-marks than a novel tourist. The experienced tourist thus is morelikely to upload the images reflecting the landmark of more popu-larities since such images are more worthy of attention. Moreover,she can tag the image with more accurate information to indicatethe name of the landmark which the image reflects. For instance, totag an image recording the Old Pinakothek, a user of rich knowledgewould like to use ‘‘oldpinakothek’’ while a novel tourist might use‘‘pinakothek’’. In this case, the user of rich knowledge provides datawith more accurate textual information than the novel tourist be-cause ‘‘pinakothek’’ is ambiguous in consideration of the existenceof another Pinakothek nearby called New Pinakothek in Munich.Therefore, the contributions of experienced tourists should be ofmore importance and values than novel tourists.
The other is the difference among images taken by the sametourist. As Schlieder and Matyas (2009) substantiated already,the landmark popularity contributed by user-generated image fol-lows a power law distribution. Specifically, the first image of a userincreases the popularity of the landmark, while subsequent imagesof that same user add less and less popularity. For instance, whenarriving at the Avenue des Champs-Elysee, a tourist takes a couple ofimages. When uploading these images, she is most likely to tag thefirst one with ‘‘Champselysee’’ since this image is recording theAvenue des Champs-Elysee itself instead of other POIs at this famousavenue. Then she, in turn, tags the other images with e.g., ‘‘louis-
Please cite this article in press as: Sun, Y., et al. Road-based travel recommend(2013), http://dx.doi.org/10.1016/j.compenvurbsys.2013.07.006
vuitton’’, ‘‘hôteldelapaïva’’, etc., which record some popular POIsat this avenue. In this case, the first image should contribute moreto the popularity of the Avenue des Champs-Elysee than the otherimages.
Here we name the first and the second kind of difference as theinter- and intra-tourist difference of image contribution respec-tively. It is difficult to measure the inter-tourist difference of con-tribution currently duo to the limitation of obtaining user’ travelexperiences and knowledge from Flickr images. Because the major-ity of Flickr users’ profiles are incomplete, the level of user’ knowl-edge and experiences is always unavailable. At the same time,there exists a potential of measuring the intra-tourist differencethrough exploring spatial-temporal patterns of user’ footprintsgenerated by Flickr images (e.g., Zheng et al., 2009). However, inregard of obtaining the experiences and knowledge of the user,the data quality or fitness-for-use of Flickr image is not so goodas that of the GPS data and the user-generated Check-in data(e.g. Foursquare).For example, the data quality of Flickr data, suchas positional, temporal and textual accuracies, is not that good. Be-sides, the spatial and temporal distribution of Flickr image is con-siderably heterogeneous. For a landmark, s tourist only takes oneimage although she visits it four times totally in a year; while an-other tourist takes more than ten images during the first visit butnever takes any more for the later visiting. More details about thedisadvantages of Flickr data will be presented in Section 3.4.2.Thus, we need to propose an innovative approach in the future,or at least modify some existing methods (e.g., HITS-based modelproposed by Zheng et al. (2009)) originally applied to GPS dataand consequently make them adaptive to user-generated geotag-ged images.
Therefore, in this research we currently only take into accountintra-tourist difference of contribution based on an assumptionthat there is no inter-tourist difference of contribution; in otherwords, the contribution to the popularity of landmark is the sameamong tourists.
To measure the popularity of landmark, we take advantage of ameasurement method proposed by Schlieder and Matyas (2009)based on a fact that tag frequency of social media follows thepower law distribution (Guy & Tonkin, 2006). Consider the imagesassigned to landmark L were contributed by m different users.UL = {u1, . . . , um} is the user set of the images assigned to landmarkL. The number of images taken by user u in the region of landmarkL is nL(u). The popularity of the landmark is computed as follows:
PopðLÞ ¼X
u2UL
ð1þ log nLðuÞÞ ¼ mþX
u2UL
log nLðuÞ ð3Þ
With this measure, the first image of a user increases the pop-ularity of the landmark by 1, while subsequent images of that sameuser add less and less popularity: the second image raises popular-ity by log 2 and the n-th image by log (n/n � 1).
3.4. Road popularity calculation
3.4.1. Indicator of road popularityUsers take images on street or inside the buildings representing
POIs (e.g., restaurants) located on the street. Images owning thetags which contain road names act as the indicators of road popu-larity. Unfortunately, the vast majority of the images are not ableto indicate the street or the road where they were taken directly,because the tags do not contain names of streets explicitly. Itwould lead to data sparsity if we only consider the geotaggedimages which explicitly indicate road names. Actually, imageswhose tags do not contain road names explicitly still have somecontributions to road popularity since they record the POIs onroads. When standing on a street, a tourist might take photos ofsome buildings along the street. Then she uploads the image with
ation using geo-tagged images. Computers, Environment and Urban Systems
6 Y. Sun et al. / Computers, Environment and Urban Systems xxx (2013) xxx–xxx
a tag indicating a building name rather than the street name sinceshe is more interested in the building representing a POI than thestreet itself. For instance, there are a large number of images aboutthe Old Pinakothek in Munich, they are normally tagged with thename of ‘‘old pinakothek’’ or ‘‘pinakothek’’. Although the OldPinakothekis located on the Arcis Street, these photos are rarelytagged with ‘‘arcisstreet’’ or ‘‘arcisstr.’’. But such images can indi-cate that some tourists had been on this street before, becausethe POIs which they reflect are geo-located on this street.
Despite in the absence of tag indicating road name, such imagesstill have the potential of being the indicators of road popularity byrecording the POIs on these streets. Therefore, to address the datasparsity issue, we also consider these images as popularityindicators.
3.4.2. Image assignmentBased on above discussion, in a densely populated urban area
we can take into account almost all the tourism-related geotaggedimages as the indicators of the road popularity, since these images,more or less, record or reflect roads themselves or POIs located onthe roads. The problem is thus to determine, for an image, of whichstreet (road) it should act as a popularity indicator. Essentially, thisproblem is how to assign these images to the correct roads.
Some researchers used map-matching algorithms to assign thepoints of GPS trajectories to the appropriate roads (e.g., Lou et al.,2009). Map-matching is the process of aligning a sequence of ob-served user positions with the road network on a digital map. It isapplied to many trajectory-based applications, e.g., moving objectmanagement, traffic flow analysis and driving directions (Louet al., 2009). While some map-matching methods were already pro-posed (e.g., Lou et al., 2009) to deal with low-sampling rate GPS tra-jectories (e.g., one point every 2 min), they are not applicable toFlickr images, since a large amount of these geotagged images arenot useful to generate a trajectory. More specifically, if we considera series of images taken by the same user on the same day, if all ofthem were taken at the same place, they cannot constitute a trajec-tory in the absence of neighbouring locations and directional infor-mation. Particularly, the majority of the images in our case studyare such ones; this will be explained with more details and sup-ported by statistical data in Section 4.3. Thus, the existing map-matching algorithms cannot perform well on Flickr geotaggedimages. At the same time, map-matching algorithms are proposedinitially to assign GPS points of a trajectory to the right road. How-ever, those approaches are mostly useful only for vehicles. For
Fig. 2. The problem of assigning im
Please cite this article in press as: Sun, Y., et al. Road-based travel recommend(2013), http://dx.doi.org/10.1016/j.compenvurbsys.2013.07.006
example, Lou et al. (2009) suggested that the speed of the vehiclecan be used to determine if a part of a trajectory that falls betweena highway and a nearby parallel road should be assigned to thehighway or the road. In our context, we cannot make these typesof assumptions, as we have no information on the transportationmeans of people taking pictures. This means that map-matchingalgorithms probably are not that applicable to Flickr images evenin the case that the majority of the images could constitute trajec-tories. Map-matching algorithms take into consideration the posi-tional context of the vehicle and the network’s topologicalinformation. Although their approach does not apply to our casesince, like in the previous example, the assumptions are only suit-able for the vehicles, we adopt a similar approach here by takinginto consideration the spatial and topological characteristics ofthe environment where the pictures are taken.
Therefore, in this research, we have developed another imageassignment method, explained below.
Before that, we clarify the idea behind our proposed assignmentmethod. Firstly, we introduce two types of images in two scenariosrespectively.
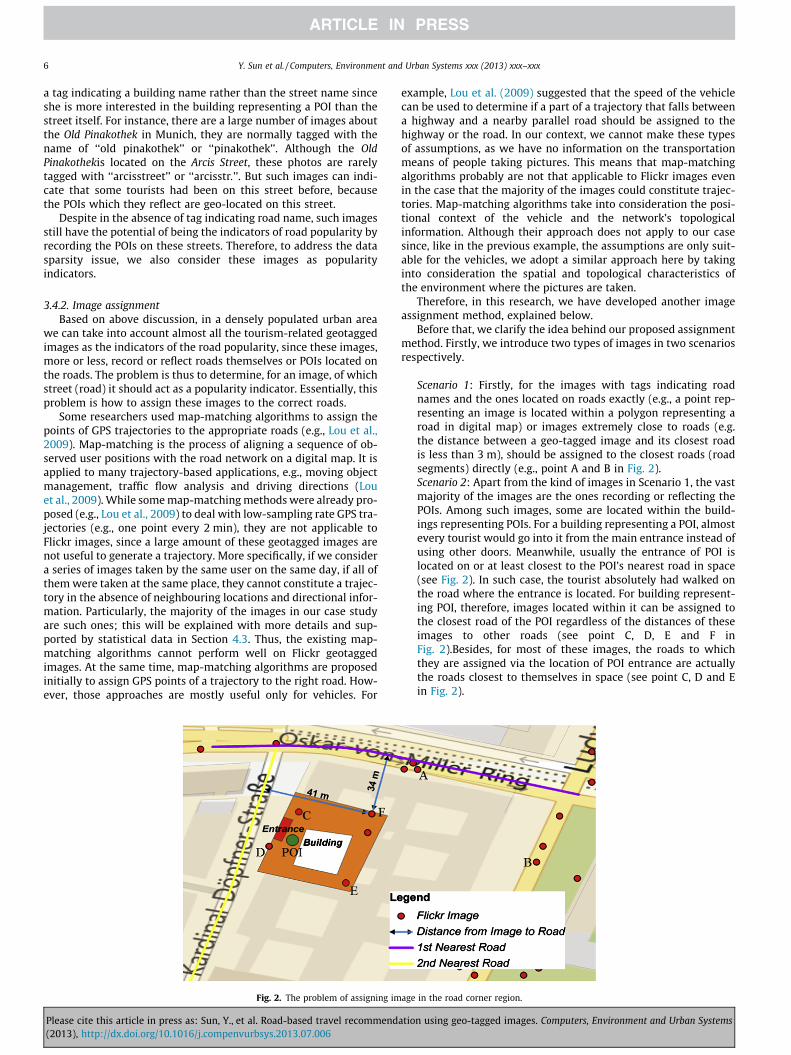
Scenario 1: Firstly, for the images with tags indicating roadnames and the ones located on roads exactly (e.g., a point rep-resenting an image is located within a polygon representing aroad in digital map) or images extremely close to roads (e.g.the distance between a geo-tagged image and its closest roadis less than 3 m), should be assigned to the closest roads (roadsegments) directly (e.g., point A and B in Fig. 2).Scenario 2: Apart from the kind of images in Scenario 1, the vastmajority of the images are the ones recording or reflecting thePOIs. Among such images, some are located within the build-ings representing POIs. For a building representing a POI, almostevery tourist would go into it from the main entrance instead ofusing other doors. Meanwhile, usually the entrance of POI islocated on or at least closest to the POI’s nearest road in space(see Fig. 2). In such case, the tourist absolutely had walked onthe road where the entrance is located. For building represent-ing POI, therefore, images located within it can be assigned tothe closest road of the POI regardless of the distances of theseimages to other roads (see point C, D, E and F inFig. 2).Besides, for most of these images, the roads to whichthey are assigned via the location of POI entrance are actuallythe roads closest to themselves in space (see point C, D and Ein Fig. 2).
age in the road corner region.
ation using geo-tagged images. Computers, Environment and Urban Systems

Y. Sun et al. / Computers, Environment and Urban Systems xxx (2013) xxx–xxx 7
Here we call the types of images described in Scenario 1 andScenario 2 Type 1 and Type 2 respectively. For images of Type 1and Type 2, the roads to which they are most likely assigned aretheir 1st closest roads in space. Meanwhile in densely populatedurban area where the road is densely distributed, like Munich inthis research, images of Type 1 and Type 2 are able to representthe vast majority of images used for travel recommendation.Therefore, we can assume in general that almost all the imagesused for travel recommendation could be most likely assigned tothe 1st closest roads. In this case, however, there would be poten-tial false assignments when we deal with images taken on the cor-ner region. For instance, for an image displayed as Point F in Fig. 2,if the POI entrance is considered, it should be assigned to the 2ndnearest road (yellow colour); otherwise, it should be assigned tothe first 1st road (violet colour). Although the possibilities ofthe images assigned to other closest roads instead of the 1st road-sare relatively low, we still need to consider them in imageassignment.
For this kind of problem, we built a model by which images canbe assigned to not only1st, but also 2nd, . . . , or kth nearest roads.In order to reduce the complexity of modelling, for each image cur-rently we only take into account the 1st nearest road or 2nd near-est road as the candidate roads of assignment. In other words, weassume that all of the tourists’ images should belong to their 1stnearest roads or 2nd nearest roads. Although only two nearestroads are considered, the model would still be rather reasonable.For an image of Type 1, two candidate roads are definitely enoughfor it to be assigned to (e.g., Point A and B in Fig. 2). For an image ofType 2, taking advantage of two candidate roads is rather reliableas well, considering the entrances of the buildings representingPOIs as we discuss above. Specifically, for almost all buildings rep-resenting POIs, the entrances of them are exclusively located ontheir two nearest roads which are always the two nearest roadsof the images recording or reflecting the POIs simultaneously. InFig. 2, it is clear that for the images represented as Point C, D, Eand F separately, the two nearest roads are the same with that ofthe corresponding POI entrances.
Finally, for the images of Type 1and Type 2, this assignment be-comes a binary classification problem. The classification categoryset is {1,0}, where 1 means that the image is assigned to 1st near-est road, and 0 means that it is assigned to 2nd nearest road.Through the noise elimination of Section 3.2, we can acquire theimage set among which the image belongs to either Type 1or Type2 as the experimental data. Therefore, we propose a classification-based approach to assign these images to the roads in this research.The classification features as well as the detailed classificationalgorithms are presented as follows.
3.4.3. Classification featuresWe can expect that the distances of image to the 1st and 2nd
nearest roads have powerful influences on the classification(assignment) result. Basically, we select these two distances asthe classification features. In addition to the distances, the numberof POIs is also regarded as the classification feature, since touristsare sometimes attracted by one road duo to its POIs offering a vari-ety of services. We need to assign the POIs to the correct roads aswell. If a POI has address information, we assign it to the appropri-ate roads by matching the street name extracted from its addresswith the name of the road; otherwise, we assign it to its closestroad. Concerning in general the different importance of variousPOIs from the perspective of a tourist, here we use three categoriesof POIs, which are visiting attractions, eating, and other tourismactivities (e.g., lodging). According to the statistical result of theFoursquare POIs in Munich, the number of users who checked-inat these three categories of POIs are 13%, 14% and 34% of the total
Please cite this article in press as: Sun, Y., et al. Road-based travel recommend(2013), http://dx.doi.org/10.1016/j.compenvurbsys.2013.07.006
number of users who checked-in at all POIs respectively. Thus,these three categories of POIs are considered as important POIsto tourist. Among these 3 categories of POIs tourism attractions rankfirst, followed by eating & drinking sites, and others (e.g. hotel, bank,etc.) rank last. This ranking is supported by a statistical result ofthe Foursquare POIs as well. The average number of users whocheck-in at tourism attraction, eating & drinking sites and others is105, 82 and 67 respectively, which represents 1.4, 1.1 and 0.9 timesthe average number of users who checked-in at all POIs respec-tively. If one category of POI has a higher average number of userswho checked-in at, we consider that it is more attractive fortourists.
The subcategories of these three categories of POIs are pre-sented as following
Tourism Attraction (Category 1): museum, palace, church, gal-lery, memorial, monument, square, university, etc.Eating & Drinking (Category 2): restaurant, cafe, canteen, vend-ing machine, etc.Others (Category3): hotel, post office, bank, ATM, Info centre,toilet, etc.
In addition, according to the problem shown in Fig. 2, the loca-tion of POI entrance could be integrated into classification model.In this case, we could generate some new feature variables, e.g.the distance between image and its 1st and 2nd nearest POI en-trances, which would be very likely to enhance the assignment ofimage. However, in this research we are not able to leverage thelocation of POI entrance due to the limitation of data availability.
Here, therefore the classification feature set is represented as
ðDis1;Dis2;Num11;Num1
2;Num21;Num2
2;Num31;Num3
2Þ ð4Þ
where Dis1 is the distance of the image to the 1st nearest road; Dis2
is the distance of the image to the 2nd nearest road; Num11 is the
number of POIs of Category1 on the 1st nearest road; Num12 is the
number of POIs of Category1 on the 2nd nearest road; Num21 is
the number of POIs of Category2 on the 1st nearest road; Num22 is
the number of POIs of Category2 on the 2nd nearest road; Num31
is the number of POIs of Category3 on the 1st nearest road; Num32
is the number of POIs of Category3 on the 2nd nearest road.
3.4.4. Classification methodsIn this paper, we applied machine learning methods for the
classification. For the purpose of classification, machine learningis always superior to other classification methods (e.g., statisticalmethods), particularly when the relationships between aims andfactors are unclear or insignificant. In our classification task, therelationships (associations) between classification category andfeature variables are not clearly correlated. Thus, two classic ma-chine learning methods, namely Binary Logistic Regression andSupport Vector Machines, which are widely used in remote sens-ing, land use, data mining, etc., are chosen for the classificationin this research. These two methods are deployed for the same se-lected training and test data set separately. The results of these twomethods are then compared in terms of validation, and at last themethod with a higher overall accuracy is chosen to assign all therest images. The two methods are introduced as following:
3.4.4.1. Binary Logistic Regression. Binary Logistic Regression (BLR)is able to measure the relationship between the binary dependentvariable and one or several independent variable(s), by computingthe probabilities of the outputs for the different category. BLR al-lows assessing the contribution of individual variables to the clas-sification and subsequently choosing the important variables to
ation using geo-tagged images. Computers, Environment and Urban Systems

Table 1Filtering accuracy of user type with different threshold.
Month count (k) 3 4 5 6 7
E(u) 3 � (�1/3)log2(1/3) 4 � (�1/4)log2(1/4) 5 � (�1/5)log2(1/5) 6 � (�1/6)log2(1/6) 7 � (�1/7)log2(1/7)Threshold value 1.6 2.0 2.3 2.6 2.8Filtering accuracy 87.5% 88.2% 89.0% 87.5% 87.1%
Fig. 3. The number of clusters detected with different value of parameters.
8 Y. Sun et al. / Computers, Environment and Urban Systems xxx (2013) xxx–xxx
build a new model, leading to an enhancement of the classification.The BLR model is represented as
PðyÞ ¼ 11þ e�ða0þa1x1þa2x2þa3x3þa4x4þa5x5þa6x6þa7x7þa8x8Þ
ð5Þ
where y e {1, 0} is the dependent variable, and (x1, x2, x3, x4, x5, x6,x7, x8) are the independent variables a0 is the intercept, and a1, a2,a3, a4, a5, a6, a7, a8 are the coefficients of the independent variables(x1, x2, x3, x4, x5, x6, x7, x8). In this classification problem, the targetedclassification category (1 or 0) and the eight classification featuresin Eq. (4) correspond to the dependent variable Y and eight inde-pendent variables in Eq. (5) respectively.
3.4.4.2. Support Vector Machines. Support Vector Machines (SVM) isfirstly proposed by Vapnik (1995) to solve the classification prob-lem. Particularly, it can avoid the over-fitting problem in datatraining. Using kernel function, SVM can efficiently perform non-linear classification. It is widely used to address classification, pre-diction and regression problem in many fields (e.g. image process-ing, remote sensing, etc.).
The formula can be briefly presented as follows:
Table 2The top-10 ranked landmarks identified by analysing geotagged images.
Ranking Landmark Popularity
1 Marienplatz 535.82 English Garden 184.83 BMW World & BMW Museum 162.84 Hofbräuhaus 151.65 Church of Our Lady 120.16 New & Old Pinakothek 86.27 Olympic Park 56.28 Deutsches Museum 52.39 Nymphenburg Palace 47.3
10 TierparkHellabrunn 10.3
Please cite this article in press as: Sun, Y., et al. Road-based travel recommend(2013), http://dx.doi.org/10.1016/j.compenvurbsys.2013.07.006
mina
12
Xl
i¼1
Xl
j¼1
yiyjaiajkðxi; xjÞ �Xl
j¼1
aj
s:t:Xl
i¼1
yiai ¼ 0
0 6 ai 6 C; i ¼ 1; � � � l
where y e {1, �1} is the classification variable, and x is the featurevariable. Similarly, the eight features defined in classification fea-ture set are all chosen as the feature variables, which correspondto independent variables x1, x2, x3, x4, x5, x6, x7, x8 in BLR model sep-arately. K (xi, xj) is the kernel function which maps the input fea-tures into high-dimensional feature space.
3.4.5. Popularity of roadLike the popularity of landmark, the popularity of road should
also take into account the inter- and intra-tourist difference of con-tribution. Duo to the availability of data as well as limitation ofalgorithm that we discuss in Section 3.3.2, here we consider onlythe intra-tourist difference of contribution with an assumptionthat the contribution of image to the popularity of road is the sameamong tourists. In order to calculate the popularity of individual
Reviews in TripAdvisor Related tags
2013 Marienplatz, square1449 English garden, garden1040 Auto, bmw, car, museum, welt
557 Hofbräuhaus, brewery,beer94 Frauenkirche, church, lady
551 Pinakothek, art, museum511 Olympiapark, olympic707 Deutsches museum553 Nymphenburg, palace, schloss247 Tierpark,zoo, hellabrunn
ation using geo-tagged images. Computers, Environment and Urban Systems

Table 3Classification accuracy of BLR and SVM methods.
Prediction
BLR SVM
ObservationClass 1 0 Accuracy Class 1 0 Accuracy1 81 0 100% 1 81 0 100%0 23 3 11.5% 0 21 5 19.2%Total 78.5% Total 80.4%
Table 4Selected variables in the BLR model.
Variables B S.E. Wald df Sig. Exp (B)
x1 3.235 1.740 3.456 1 0.063 25.400x3 20.125 54382.509 0.000 1 1.000 5.495x4 .234 36633.066 0.000 1 1.000 1.264x5 �.274 49222.006 0.000 1 1.000 0.760x6 �22.577 23143.635 0.000 1 0.999 0.000x7 �2.380 1.178 4.083 1 0.043 0.093Intercept (a0) 2.464 18323.206 0.000 1 1.000 11.755
Y. Sun et al. / Computers, Environment and Urban Systems xxx (2013) xxx–xxx 9
road, we applied the method used in landmark ranking as well.Similarly, consider the images assigned to road r were contributedby m different users. Ur = {u1, . . . , um} is the user set of the imagesassigned to road r. The number of images taken on road r by user uis nr (u). The popularity of the road can be represented as follows:
PopðrÞ ¼ mþX
u2Ur
log nrðuÞ ð7Þ
3.5. Routing recommendation
3.5.1. Recommendation indexIn addition to the number of the images, the number of POIs and
the length of road are considered in the routing recommendation.Here we define a recommendation index named Rec_Index(r) toquantify the overall popularity of the road r. The Rec_Index(r) of
Fig. 4. The tourism popularit
Please cite this article in press as: Sun, Y., et al. Road-based travel recommend(2013), http://dx.doi.org/10.1016/j.compenvurbsys.2013.07.006
the road mainly consists of two parts: tourism popularity andPOI usability.
Regarding the different categories of POI mentioned in Sec-tion 3.5, POI usability of the road r is described as
PoiðrÞ ¼ w1Num1POIðrÞ þw2Num2
POIðrÞ þw3Num3POIðrÞ ð8Þ
Num1POI (r), Num2
POI (r) and Num3POI (r) are number of POIs of Category
1, 2 and 3 separately. w1, w2 and w3 are the weights of N1POI (r), N2
POI
(r) and N3POI (r), and w1 + w2 + w3 = 1.
Therefore, Rec_Index(r) is computed as follow
Rec IndexðrÞ ¼ a1PopðrÞ þ a2PoiðrÞ � b LengðrÞ ð9Þ
Pop(r) is the popularity of road r in Eq. (7). Leng(r) is the length ofthe road r, which is used as a penalty to avoid generating unpracti-cal routing whose length is too long for user. a1, a2 and b are theweights of Pop(r), Poi(r) and Leng(r) separately.
3.5.2. Best routing generationConsidering two landmarks Lp and Lq, in terms of the Rec_In-
dex(r) in Eq. (9) the best routing can be generated by
Rou�ðLp; LqÞ ¼ argmaxRouðLp ;LqÞ
X
r2RouðLp ;LqÞRec IndexðrÞ ð10Þ
Rou(Lp, Lq) is a routing between Lp and Lq, and r is a separate road inRou(Lp, Lq). Rou * (Lp, Lq) is the one which is of the maximum value oftotal Rec_Index(r).
4. Experimental results
4.1. Preprocessing data
The proposed algorithm is implemented and tested with Flickrphotos in Munich, Germany. All the images were taken duringthe year 2010 and 2011. Totally, 45,950 images were acquiredvia Flickr API (http://www.flickr.com/services/api/). From theseimages, we need to extract the images taken by tourists usingthe entropy filtering method described in Section 3.3. Firstly, wehave selected a sample of images whose user location is available
y of the road in Munich.
ation using geo-tagged images. Computers, Environment and Urban Systems
10 Y. Sun et al. / Computers, Environment and Urban Systems xxx (2013) xxx–xxx
in terms of the user profile to acquire an appropriate threshold fordistinguishing tourists from residents among image contributors.Simply, we suppose that the images of the user in one year areequally distributed among k months. According to Eq. (1), we inturn calculated the E(u) at different k. For instance, there is a userwho took 12 pictures in one year. If these pictures are equally dis-tributed among three months, in other words, 3 pictures permonth, the E(u) is 3 � (�1/3)log2(1/3) which equals to 1.6. If thesepictures are equally distributed among four months, the E(u) is4 � (�1/4)log2(1/4) which equals to 2. We attempted to select theappropriate one as the best threshold among these values of E(u)in terms of taking them as the threshold value for the samplingdata set separately. Table 1 shows the filtering accuracy of the usertype of the same sampling images with different E(u) as the thresh-old value. Thus, 2.3 is the best threshold with a filtering accuracy of89% and it was chosen as the filtering threshold. With this filteringthreshold, a total of 32,558 images taken by tourists were distin-guished from the 45,950 images. Subsequently, among these32,558 images, we discarded 1223 images whose tags are not indi-cating the popularity of any POI or road but reflecting some per-sons, persons’ gestures and other contents unrelated to tourism.Each one among these discarded images is the one whose tag hasonly one user and thus was easily selected. Consequently, 31,335
(a) connecting Central Railway Statio
(b) between Central Railway S
Fig. 5. The recommended routi
Please cite this article in press as: Sun, Y., et al. Road-based travel recommend(2013), http://dx.doi.org/10.1016/j.compenvurbsys.2013.07.006
geotagged images taken by 2422 users were finally chosen as thestudy data in this paper. In addition, the road network and POI datawere downloaded from OpenStreetMap (http://www.openstreet-map.org/).
4.2. Detecting top landmarks
The DBSCAN method needs two parameters. We generated dif-ferent results of clustering at different values of the parameters.Fig. 3 demonstrates the distribution of cluster numbers with differ-ent Eps and MinPts separately. Apart from the curve with a MinPtsof 60, the other curves are similarly changing. When the value ofEps is between 40 m and 50 m, the cluster count reaches a maxi-mum value. The number of detected clusters is always decreasingwith the increase of MinPts. The decreasing becomes slow whenMinPts is up 50. Here we made Eps = 50 m and MinPts = 100, andconsequently found out 37 clusters.
The dictionary of landmarks in this paper was from TripAdvisor(http://www.tripadvisor.com/) which recommends the importantlandmarks in terms of tourists’ reviews and comments. With thethree steps in 3.3.1, we identified 15 landmarks. Table 2 showsthe top-10 ones. Except Frauenkirche and Deutsches Museum,landmarks of higher popularity always own more reviews in
n, Marienplatz and English Garden
tation and Marienplatz
ngs with a1 = 1 and a2 = 5.
ation using geo-tagged images. Computers, Environment and Urban Systems

Y. Sun et al. / Computers, Environment and Urban Systems xxx (2013) xxx–xxx 11
TripAdvisor. Moreover, the top three landmarks with a popularity ofup 100 had been reviewed over 1000 times in TripAdvisor.
4.3. Calculating tourism popularity of road
Firstly, we analyzed the data. We assume that a Flickr user’s tra-jectory should consist of images (1) taken by this user on the sameday; and (2) associated with more than one geo-location. Amongthe 31,335 images part of our experimental data, only 40% meetthese requirements. Therefore, for the task of image assignment,we did not apply the existing map-matching method (which isbased on trajectory), since the majority of images are not usefulto generate trajectories. Instead, we used our classification-basedmethod that exploits spatial attributes of images, as stated inSection 3.4.
Before applying the BLR and SVM methods for the classification,building model from the training data is necessary. At the sametime, we need to evaluate the two methods by using a test dataset, and subsequently choose the one with better performance toclassify the rest data.
In the data set, there are 452 images bearing the tags able toindicate road name. From these 452 images, 320 images (nearly1% of the total data set) are randomly selected to build and evalu-ate the classification model. Among them, 213 images are chosenas the training data and the other 107 ones as test data. Table 3shows the validation results of classification using the two meth-ods. Among the test data, 81 images belong to class 1 and 26 onesto class 0. Class 1 means image is actually assigned to its 1st nearestroad and Class 0 means image is assigned to its 2nd nearest road.The total validation accuracies of BLR and SVM are 78.5% and80.4% respectively. These two methods perform almost same forour purpose. Both accuracies approximately 80% demonstrate thatour proposed methods are fine in this study case. For both meth-ods, the false predictions are almost resulted from that someimages actually belonging to 2nd nearest roads (Class 0) are as-
(c) between Marienplatz and English Garden
Fig. 5 (continued)
Please cite this article in press as: Sun, Y., et al. Road-based travel recommend(2013), http://dx.doi.org/10.1016/j.compenvurbsys.2013.07.006
signed to 1st nearest roads (Class 1) (see Table 3). In the presentedwork, we use SVM which is slightly higher as the classificationmodel to predict the assignment categories of the rest 32,238images.
Besides, to observe the influences of the variables on the classi-fication result, the selected variables as well as their coefficients inthe last stage of the stepwise BLR are listed in Table 3. It indicatesthat x1 and x7 are the most influential variables with the signifi-cance value (Sig.) <0.1. It means the distance to 1st nearest roadas well as the number of POIs of Category 1 on 1st nearest roadhave significant effects on the prediction. However, the effects ofthe other variables on the result are not significant. Contrary tothe BLR, SVM model are not allowed to see the coefficients orweights of variables because the variables were together trans-formed into a high-dimension space during the classification.
Moreover, although the total accuracy is fine, based on the clas-sification result of the Class 0 and the coefficients of the variables,the two methods somewhat do not perform pretty well. The mainreason is probably the selection of the features (variables) insteadof the methods themselves. In other words, some of the features(e.g. x3 and x4) are not that correlated with assignment result(dependence variable) according to significance values (Sig.) inTable 4.
In general, SVM and BLR can be considered as effective methodsto deal with the task of image assignment in this research. Firstly,considering disadvantages of Flickr images over GPS data as well asthe unclear relationships between classification categories and fea-ture variables, machine learning is probably more applicable tothis task than both map-matching algorithms and other classifica-tion methods (e.g., statistical methods). Secondly, the total testaccuracies of these two methods are rather good (approximately80%).
On the basis of the abovementioned classification model usingSVM method, we computed the tourism popularity of road. Herewe mapped the popularity of road in Fig. 4. We can see that forFlickr user the road of East–West direction is more popular thanthe one of North–South direction in Munich.
4.4. Generating travel routing
Selecting two landmarks, we need to find out the recommendedrouting between them. Simply, we applied the classic Dijkstra’salgorithm (Dijkstra, 1959) to generate the best routing betweentwo landmarks by using the proposed Recommendation Index inEq. (9) instead of the road length. Although we in general introduceour proposed approach at a road level, this algorithm aiming atrouting generation is actually applied at a level of road segmentin this research, since road segment can be considered as ‘‘smaller’’road in space.
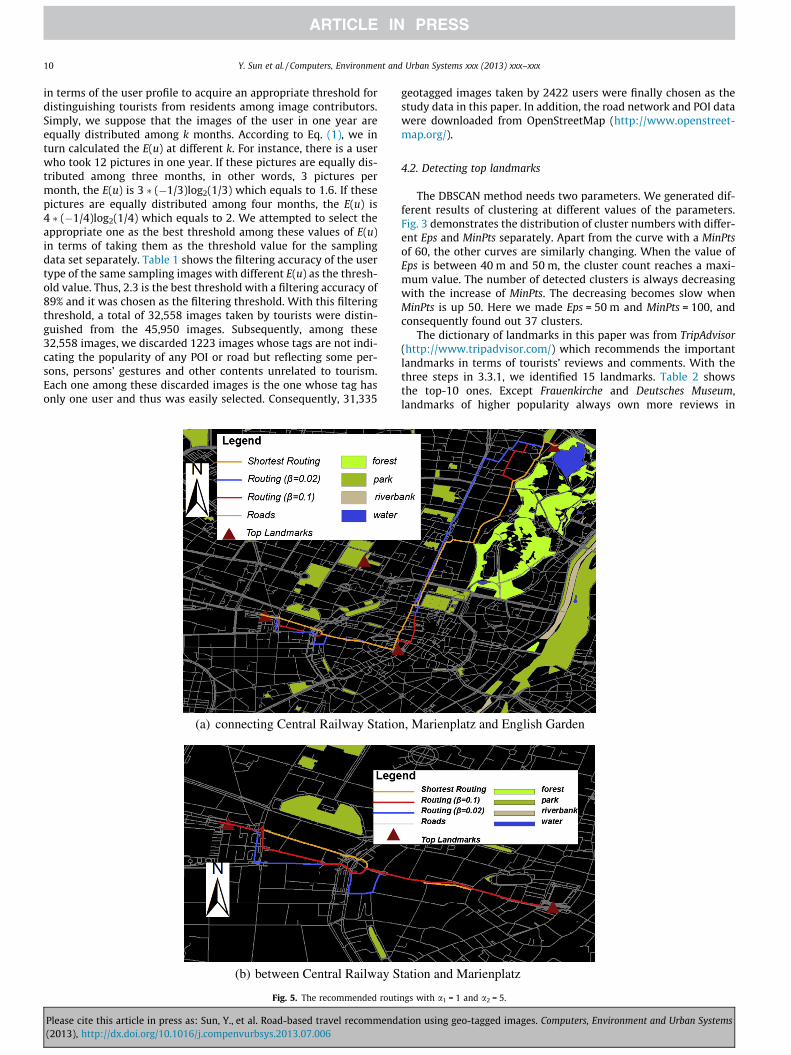
We assume that a novice user uses our travel recommendationsystem when she is on the central railway station after arrivingMunich. She selects two ones from the 10 top ranked landmarksgenerated by our proposed system. Concerning the weights in Eq.(9), we generated routing at different values of the weights. Be-cause the influence of a2 (the weight of POI number) is relativelyweak on the final result, in Fig. 5 we showed only the generatedroutings with different value of b while value of a1 and a2 is
Table 5Top tags of semantic routings.
Start and end locations Routings Top-three POI-related tags
Marienplatz–EnglishGarden
Baseline Theatiner church, odenosplatz, churchof st.louis
b = 0.02 Town hall, theatiner church, theaterb = 0.1 Leopoldstrasse, opera, church of st.louis
ation using geo-tagged images. Computers, Environment and Urban Systems

Table 6Comparison of the routings generated by proposed and baseline methods.
Routes Start landmark End landmark Baseline method Proposed method
Image Num POI Num Check-in Num Image Num POI Num Check-in Num
1 Railway Station Marienplatz 2005 55 333 2167 87 3312 Marienplatz Square English Garden 2029 35 228 2298 98 4133 Marienplatz Square Olympic Park 1336 45 162 1715 57 1224 Marienplatz Square Nymphenburg Palace 2109 88 440 2408 90 4935 Marienplatz Square BMW World 1869 95 397 3824 109 5166 English Garden Deutsches Museum 2785 74 361 2226 119 5427 Nymphenburg Palace Hofbräuhaus Beer garden 4739 122 893 4753 124 9488 Pinakothek Art Gallery BMW World 385 74 100 533 38 199 Olympic Park Deutsches Museum 873 96 298 4515 140 629
10 Marienplatz Square TierparkHellabrunn Zoo 388 36 80 4083 92 577
12 Y. Sun et al. / Computers, Environment and Urban Systems xxx (2013) xxx–xxx
constant. These routings are connecting Central Railway Station,and two top landmarks (Marienplatz and English Garden). To makecomparison, we also demonstrate the shortest routing as the base-line routing exclusively considering road length. The comparisonindicates that the generated routing is more similar to the baselinerouting when b (the weight of road length) is higher. In addition,the total lengths of the recommended routings are all less than 2times of that of the corresponding shortest routings. It shows thefeasibility of the routing recommended to the user.
In addition, we display a simple semantic routing example.Table 5 shows the most frequent POI-related tags of imagesassigned to the roads composing the generated routings in Fig. 5.With such tags, the system can offer some user-generated seman-tic information for the routing.
4.5. Routing quality
The quality of the generated routings cannot be evaluated di-rectly, since we do not have access to user-generated GPS trajec-tory data or tourist survey data. But here, we still evaluate thegenerated routings by comparing them with the shortest routingsgenerated by the baseline method. We used Flickr image, OSM POI,as well as Gowalla Check-in located on or close to (with a distance<50 m) the roads of routing. Like Foursquare, Gowalla is a LBSNservice and the information of its user-generated georeferencedcheck-in, such as user ID, longitude, latitude and time, is available(Cho, Myers, & Leskovec, 2011). The Flickr images are the ones thatwere already preprocessed in Section 4.1. Similarly, we applied theentropy filtering method (see Section 3.2) to check-in data to elim-inate the ones generated by local residents with the same filteringthreshold (i.e., 2.3) that we used for Flickr images.
Ten routings generated by our proposed method with a1 = 1,a2 = 5and b = 0.1 are compared with 10corresponding routings gen-erated by baseline method. Table 6 displays the start and end land-marks of the routings as well as comparison measurements. WithWilcoxon test, the image count, POI count and check-in count ofthe routings generated by proposed method are all statisticallyhigher than that generated by baseline method. The p-values are0.032, 0.044 and 0.049 respectively, all of which are <0.05. It indi-cated that the routings generated by proposed method are signifi-cantly of more user activities than that by baseline method.Compared to the shortest routing, the generated routing by ourmethod should be somehow good, at least with more user activities.
5. Conclusions and future work
This paper presented a new travel recommendation approachintegrating landmark and routing. The routing is based on road in-stead of the GPS trajectory used in the researches of the state-of-the-art. Using spatial clustering method, we generated some clus-ters of images. Subsequently, we identified important landmarks
Please cite this article in press as: Sun, Y., et al. Road-based travel recommend(2013), http://dx.doi.org/10.1016/j.compenvurbsys.2013.07.006
from these clusters and ranked these landmarks in terms of tour-ism popularity. To recommend the routings between landmarks,we calculated the tourism popularity of road. Before that, we as-signed geotagged image to the correct road in terms of employingdata mining method. Finally, appropriate routing between twolandmarks was generated using a recommendation index proposedin the paper. An empirical evaluation of our proposed approachwas conducted on the Flickr image set. The experimental resultsdemonstrate that the approach is able to recommend the user suit-able routings considering image, POI and road length.
Duo to the data quality (e.g., incompleteness, tagging error, etc.)of the Flick data, to enhance the travel recommendation, there aresome aspects should be taken into account in the future research.Firstly, other data sources (e.g. highly accurate GPS data and otherVGI) should be considered to be integrated into our system to en-hance the recommendation. The identification and ranking of land-marks should take into consideration the experiences andknowledge of tourist who have visited these landmarks. The chal-lenge here mainly relies on how to gather information that canhelp to accurately assess the experiences and knowledge of tourist.More importantly, to enhance the assignment of images to appro-priate roads, we in addition will attempt to integrate the locationof POI entrance into the image assignment. In that case, it wouldgenerate new feature variables (e.g. the spatial distance betweenimage and POI entrance) which could probably enhance the perfor-mance of our proposed method. We also could employ the spatialdistribution of POI entrance to improve the image assignment bymining some spatial association rules between POI and road inthe road network. To obtain the location of POI entrance, we willseek to acquire the official data of urban buildings or extract suchinformation from some existing map services (e.g., OSM, GoogleMap, etc.) using some methods (e.g., geocoding). In addition tothe location of POI entrance, the boundary of the building repre-senting POI is probably helpful to the image assignment and thusshould be integrated into the recommendation system, consideringthe topological relationship between image (point) and building(polygon) representing POI. On the other hand, we will attemptto take advantage of more advanced methods to assign the imagesto the correct road. For instance, instead of only two candidateroads, more roads should be taken into consideration as the candi-date roads for the image to be assigned to, and thus a more com-plicated model is probably needed to be built. We also plan touse other classification methods (e.g., other machine learningmethods, statistical methods, etc.) to improve the assignmentaccuracy. At the same time, the recommendation system shouldpay more attentions to the personalized need of user. Moreover,a context-aware recommendation would be more helpful to usersby integrating context information (e.g., weather, user task, userpreference, time, season, etc.) into the image assignment as wellas the popularity calculation. Apart from the visit of landmark,other activities (e.g. eating & drinking, shopping, etc.) that might
ation using geo-tagged images. Computers, Environment and Urban Systems

Y. Sun et al. / Computers, Environment and Urban Systems xxx (2013) xxx–xxx 13
influence the final travel decision of the user should be integratedinto the personalized recommendation system. Subsequently, theresult of routing recommendation should be validated in termsof the test conducted by volunteers or tourists. At last, a real-timerecommendation is vital to users, particularly the smart phoneowners. Thus the time needed to spend on landmarks as well asthe routings become important constraints and thus should beconsidered in a time-constrained travel recommendationapplication.
Acknowledgements
This research is supported by CSC (China Scholarship Council).We would like to express our gratitude to the three anonymousreferees for their comments and thank Christian Sengstock(Database Systems Research Group, Institute of Computer Science,University of Heidelberg) for sharing the research data.
References
Andrienko, G., Andrienko, N., Bak, P., Kisilevich, S. & Keim, D. (2009). Analysis ofcommunity-contributed space-and time-referenced data (example of flickr andPanoramiophotos). In IEEE symposium on visual analytics sciences and technology,October 12–13, 2009, New Jersey, USA (pp. 213–214).
Arase, Y., Xie, X., Hara, T. & Nishio, S. (2010). Mining people’s trips from large scalegeo-tagged photos. In Proceedings of the international conference on Multimedia,October 25–29, 2010. Firenze, Italy (pp. 133–142). New York: ACM.
Chaudhry, O. & Mackaness, W. (2012). Automated extraction and geographicalstructuring of Flickr Tags. In Proceedings of the 4th international conference onadvanced geographic information systems, applications, and services, January 30 –February 04, 2012, Valencia, Spain (pp. 134–139).
Cheng, A., Chen, Y., Huang, Y., Hsu, W. H. & Liao, H. M. (2011). Personalized travelrecommendation by mining people attributes from community-contributedphotos. In Proceedings of the 19th ACM international conference on Multimedia,November 28–December 01, 2011, Scottsdale, Arizona, USA (pp. 83–92). NewYork: ACM.
Cho, E., Myers, S. A., & Leskovec, J. (2011). Friendship and mobility: user movementin location-based social networks. In Proceedings of the 17th ACM SIGKDDinternational conference on Knowledge discovery and data mining (pp. 1082–1090). New York, NY, USA: ACM.
Choudhury, M.D., Feldman, M., Amer-Yahia, S., Golbandi, N., Lempel, R. & Yu, C.(2010). Automatic construction of travel itineraries using social breadcrumbs.In Proceedings of the 21st ACM conference on Hypertext and hypermedia, June 13–16, 2010, Toronto, Ontario, Canada (pp. 35–44). New York: ACM.
Clements, M., Serdyukov, P., Vries, A. & Reinders, M. (2010). Using flickrgeotags topredict user travel behaviour. In F. Crestani, S. Marchand-Maillet, H. H. Chen, E.N. Efthimiadis and J. Savoy (Eds.), Proceedings of the 33rd international ACM SIGIRconference on Research and development in information retrieval, 19–23 July 2010,SIGIR ‘10, Geneva (pp. 851–852). New York: ACM.
Crandall, D., Backstrom, L., Huttenlocher, D. & Kleinberg, J. (2009). Mapping theWorld’s Photos. In Proceedings of the 18th international conference on World wideweb. April 20–24, 2009, Madrid, Spain (pp. 761–770). New York: ACM.
Dijkstra, E. W. (1959). A note on two problems in connexion with graphs.Numerische Mathematik, 1, 269–271.
Ester, M., Kriegel, H. P., Sander, J. & Xu, X. (1996). A density based algorithm fordiscovering clusters in large spatial databases with noise. In Simoudis, E., Han, J.W., & Fayyad, U. M. (Eds.) Proceedings of the 2nd international conference onknowledge discovery and data mining. August 02–04, 1996, Portland, Oregon,USA (pp. 226–231). Menlo Park, California: AAAI Press.
Girardin, F., Calabrese, F., Dal Fiore, F., Ratti, C., & Blat, J. (2008). Digital footprinting:Uncovering tourists with user-generated content. IEEE Pervasive Computing,7(4), 36–43.
Girardin, F., Dal Fiore, F., Ratti, C., & Blat, J. (2007). Leveraging explicitly disclosedlocation information to understand tourist dynamics: a case study. Journal ofLocation Based Services, 2(1), 41–56.
Girardin, F., Vaccari, A., Gerber, A., & Ratti, C. (2009). Quantifying urbanattractiveness from the distribution and density of digital footprints. Journalof Spatial Data Infrastructure Research, 4, 175–200.
Goodchild, M. F. (2007). Citizens as sensors: The world of volunteered geography.GeoJournal, 69(4), 211–221.
Guy, M., & Tonkin, E. (2006). Folksonomies: Tidying up Tags? In: D-Lib Magazine,12(1).
Hile, H., Vedantham, R., Cuellar, G., Liu, A., Gelfand, N., Grzeszczuk, R. & Borriello G.(2008). Landmark-based pedestrian navigation from collections of geotaggedphotos. In Proceedings of the 7th international conference on mobile and ubiquitousmultimedia, December 03–05, 2008, Umeå, Sweden (pp. 145–152). New York:ACM.
Horozov, T., Narasimhan, N. & Vasudevan, V. (2006). Using location for personalizedPOI recommendations in mobile environments. In Proceedings of theinternational symposium onapplications on Internet applications and the Internet,
Please cite this article in press as: Sun, Y., et al. Road-based travel recommend(2013), http://dx.doi.org/10.1016/j.compenvurbsys.2013.07.006
23–27 January 2006. Phoenix, AZ, USA (pp. 124–129). Washington, DC: IEEEComputer Society.
Jankowski, P., Andrienko, N., Andrienko, G., & Kisilevich, S. (2010). Discoveringlandmark preferences and movement patterns from photo Postings.Transactions in GIS, 14(6), 833–852.
Ji, R., Gao, Y., Zhong, B., Yao, H., & Tian, Q. (2011). Mining flickr landmarks bymodeling reconstruction sparsity. ACM Transactions on Multimedia Computing,Communications, and Applications, 7(Supplement), 31.
Kennedy, L., Naaman, M., Ahern, S., Nair, R., & Rattenbury, T. (2007). How flickr helpsus make sense of the world: Context and content in community-contributedmedia collections. In R. Lienhart, A. R. Prasad, A. Hanjalic, S. Choi, B. P. Bailey andN. Sebe (Eds.), Proceedings of the 15th international conference on Multimedia, 24–27 September 2007, MULTIMEDIA ‘07, Augsburg (pp. 631–640). New York:ACM.
Lou, Y., Zhang, C., Zheng, Y., Xie, X., Wang, W. & Huang, Y. (2009). Map-matching forLow-sampling-rate GPS Trajectories. In Proceedings of the 17th ACM SIGSPATIALinternational conference on advances in geographic information systems, 04–06November, 2009, Seattle, Washington, USA (pp. 352–361). New York: ACM.
Lu, X., Wang, C., Yang, J., Pang, Y. & Zhang, L. (2010). Photo2Trip: generating travelroutes from geo-tagged photos for trip planning. In A. D. Bimbo, S. F. Chang andA. W. M. Smeulders (Eds.), Proceedings of the internationalconference onMultimedia, 25–29 October 2010, MM ‘10, Firenze (pp. 143–152). New York:ACM.
Majid, A., Chen, L., Chen, G., Mirza, H. T., Hussain, I., & Woodward, J. (2012). Acontext-aware personalized travel recommendation system based ongeotagged social media data mining. International Journal of GeographicalInformation Science, 27(4), 662–684.
Popescu, A. & Grefenstette, G. (2009). Deducing trip related information from Flickr.In J. Quemada, G. León, Y. S. Maarek and W. Nejdl (Eds.), Proceedings of the 18thinternationalconference on World Wide Web, 20–24 April 2009, WWW ‘09,Madrid (pp. 1183–1184). New York: ACM.
Popescu, A., Grefenstette, G. & Moëllic, P. A. (2009). Mining tourist information fromuser-supplied collections. In Proceeding of the 18th ACM conference onInformation and knowledge management, November 02–06, 2009, Hong Kong,China (pp. 1713–1716). New York: ACM.
Rattenbury, T., Good, N. & Maaman, M. (2007). Towards automatic extraction ofevent and place semantics from flickr tags. In Proceedings of the 30th annualinternational ACM SIGIR conference on Research and development in informationretrieval. July 23–27, 2007, Amsterdam, The Netherlands (pp. 103–110). NewYork: ACM.
Rattenbury, T., & Naaman, M. (2009). Methods for extracting place semantics fromFlickr tags. ACM Transactions on the Web, 3(1), 1–30.
Schlieder, C., & Matyas, C. (2009). Photographing a city: An analysis of placeconcepts based on spatial choices. Spatial Cognition and Computation, 9(3),212–228.
Takeuchi, Y. & Sugimoto, M. (2006). CityVoyager: An outdoor recommendationsystem based on user location history. In: J. Ma, H. Jin, L. Yang, & J. Tsai (Eds.),Ubiquitous intelligence and computing, Vol. 4159 of Lecture Notes in ComputerScience (pp. 625–636). Berlin: Springer.
Vapnik, V. (1995). The nature of statistical learning theory. New York: Springer-Verlag.
Wachowicz, M., Ong, R., Renso, C., & Nanni, M. (2011). Finding moving flock patternsamong pedestrians through collective coherence. International Journal ofGeographical Information Science, 25(11), 1849–1864.
Wei, L., Zheng, Y. & Peng, W. (2012). Constructing popular routes from uncertaintrajectories. In Proceedings of the 18th ACM SIGKDD international conference onKnowledge discovery and data mining, August 12–16, 2012, Beijing, China (pp.195–203). New York: ACM.
Yin, Z., Cao, L., Han, J., Luo, J. & Huang, T. (2011). Diversified trajectory patternranking in geo-tagged social media. In Proceedings of the eleventh SIAMinternational conference on data mining, SDM 2011 (pp. 980-991), April 28–30,2011, Mesa, Arizona, USA.
Yoon, H., Zheng, Y., Xie, X., & Woo, W. (2012). Social itinerary recommendation fromuser-generated digital trails. Personal and Ubiquitous Computing, 16(5), 469–484.
Zheng, Y. & Xie, X. (2010). Learning location correlation from GPS trajectories. InProceedings of 11th international conference on mobile data management. 23–26May, 2010, Kanas City, Missouri, USA (pp. 27–32). Washington, DC: IEEEComputer Society.
Zheng, Y. (2012) Tutorial on location-based social networks. In Proceedings of the21st international conference on world wide web. April 16–20, 2012, Lyon, France.
Zheng, Y., Xie, X., & Ma, W. Y. (2009). Mining interesting locations and travelsequences from GPS trajectories. In Proceedings of the 18th internationalconference on world wide web. April 20–24, 2009, Madrid, Spain (pp. 791–780). New York: ACM.
Zheng, V. W., Zheng, Y., Xie, X. & Yang, Q. (2010). Collaborative location and activityrecommendations with GPS history data. In J. Quemada, G. Leon, Y. S. Maarekand W. Nejdl (Eds.), Proceedings of the 19th international conference on WorldWide Web, 20–24 April 2009, WWW ‘10, Raleigh, NC (pp. 1029–1038). NewYork: ACM.
Zheng, Y., & Xie, X. (2011). Learning travel recommendations from user-generatedGPS traces. ACM Transactions on Intelligent Systems and Technology, 2(1), 1–29.Article 2.
Zheng, Y., Zha, Z., & Chua, T. (2012). Mining travel patterns from geotagged photos.ACM Transactions on Intelligent Systems and Technology, 3(3), 1–18.
Zheng, Y., & Zhou, X. (2011). Computing with spatial trajectories. Springer.
ation using geo-tagged images. Computers, Environment and Urban Systems