Product Recommendation System - IHU Repository
108
-i- Product Recommendation System Paraskevopoulos Athanasios SID: 3306160004 SCHOOL OF SCIENCE & TECHNOLOGY A thesis submitted for the degree of Master of Science (MSc) in Mobile and Web Computing DECEMBER 2017 THESSALONIKI – GREECE
-
Upload
khangminh22 -
Category
Documents
-
view
0 -
download
0
Transcript of Product Recommendation System - IHU Repository

-i-
Product Recommendation System
Paraskevopoulos Athanasios
SID: 3306160004
SCHOOL OF SCIENCE & TECHNOLOGY
A thesis submitted for the degree of
Master of Science (MSc) in Mobile and Web Computing
DECEMBER 2017
THESSALONIKI – GREECE

-ii-
Product Recommendation System
Paraskevopoulos Athanasios
SID: 3306160004
Supervisor: Assistant Professor Dr. Christos Tjortjis
Supervising Committee Members:
Faculty Member Dr. Christos Berberidis
Academic Associate Dr. Marios Gatzianas
Assistant Professor Dr. Christos Tjortjis
SCHOOL OF SCIENCE & TECHNOLOGY
A thesis submitted for the degree of
Master of Science (MSc) in Mobile and Web Computing
DECEMBER 2017
THESSALONIKI – GREECE

-iii-
Abstract
This dissertation was written as a part of the MSc in Mobile and Web Computing at
the International Hellenic University. The aim of this work is to investigate if user’s de-
mographics data and ratings entropy0 scores can have an impact on addressing the cold
start problem in collaborative filtering. We propose four collaborative movie recom-
mender systems that use ask-to-rate techniques by displaying movies to users for rating.
The implementation of the aforementioned systems was done in Python 3.6 program-
ming language, developing four independent scripts that display movies for rating using
different ask-to-rate techniques: random choice of movies, demographic based, entropy0
based , mix of demographic and entropy0 based.
In the evaluation we have taken into consideration both the accuracy of the predictions
but also the user effort. The results have shown that there is (almost) a tie for the first
place between demographic-based and entropy0-based systems both in terms of user pref-
erence score but also in terms of user’s effort (entropy0 based system is only marginally
better). Furthermore, we can also see that the system with the combination of de-
mographics and entropy0, is slightly better (in terms of user preference score) than the
basic (random selection), even if the user effort is much higher. Finally, for a future work
we can use a movie-set with newer movies or a completely different dataset with another
type of products like electronic devices, books etc. Moreover, a mobile implementation
can make recommender systems even more useful and also valuable.
Last but not least, I would like to thank my supervisor Dr. Christos Tjortjis for all his
valuable support and guidance that he has given me the past six months.
Student Name: Athanasios Paraskevopoulos
Date: 29/12/2017


-v-
Contents
ABSTRACT ................................................................................................................. III
CONTENTS ................................................................................................................... V
1 INTRODUCTION ...................................................................................................... 1
1.1 DEFINITION OF RECOMMENDER SYSTEMS ........................................................ 1
1.2 PROBLEM ........................................................................................................... 3
1.3 PURPOSE ........................................................................................................... 3
1.4 SCOPE ................................................................................................................ 3
1.5 STRUCTURE OF DISSERTATION ......................................................................... 4
2 CORE CONCEPTS OF RECOMMENDER SYSTEMS ..................................... 5
2.1 RECOMMENDER SYSTEMS ................................................................................. 5
2.1.1 Basic concepts for ratings .................................................................. 7
2.2 CONTENT-BASED FILTERING ............................................................................. 9
2.3 COLLABORATIVE FILTERING ............................................................................. 11
2.3.1 Item – Based Collaborative Filtering (IBCF) ................................. 11
2.3.2 User – Based Collaborative Filtering (UBCF) ............................... 15
2.3.3 kNN Algorithm .................................................................................... 16
2.4 MATRIX FACTORIZATION .................................................................................. 18
2.5 HYBRID ALGORITHM ......................................................................................... 19
3 CHALLENGES AND RELATED WORK ........................................................... 21
3.1 COLD START PROBLEM ................................................................................... 21
3.1.1 New user ............................................................................................. 22
3.1.2 New product ....................................................................................... 22
3.2 DOCUMENTS ADDRESSING THE COLD START PROBLEM .................................. 22
3.2.1 Using Demographic Information to Reduce the New User
Problem in Recommender Systems........................................................... 22
3.2.2 Collaborative Filtering Enhanced By Demographic Correlation 24

-vi-
3.2.3 Cold-start Problem in Collaborative Recommender Systems:
Efficient Methods Based on Ask-to-rate Technique ................................ 25
3.2.4 Learning Preferences of New Users in Recommender Systems:
An Information Theoretic Approach ........................................................... 29
4 REQUIREMENTS AND DESIGN ....................................................................... 33
4.1 REQUIREMENTS ............................................................................................... 34
4.1.1 Functional requirements .................................................................. 34
4.1.2 Non-Functional requirements ......................................................... 35
4.2 SYSTEM ARCHITECTURE .................................................................................. 37
4.2.1 Recommendation engine ................................................................ 38
4.3 USED DATASET ................................................................................................ 38
4.4 ASSUMPTIONS ................................................................................................. 43
4.5 FLOWCHART DIAGRAMS ................................................................................... 43
4.5.1 Basic algorithm flowchart diagram ................................................. 44
4.5.2 User Demographics based algorithm flowchart diagram ........... 45
4.5.3 Movies Entropy0 based algorithm flowchart diagram ................. 47
4.5.4 User Demographics and movies entropy0 based algorithm
flowchart diagram ......................................................................................... 48
4.5.5 Movies rating function flowchart diagram ..................................... 49
4.5.6 Inserting target user demographics ............................................... 51
5 IMPLEMENTATION .............................................................................................. 53
5.1 BASIC PARTS OF OUR IMPLEMENTATION ......................................................... 53
5.1.1 Functions of the Basic script ........................................................... 53
5.1.2 Functions of the Demographic-based script ................................. 54
5.1.3 Functions of the Entropy0-based script ........................................ 56
5.1.4 Functions of the Demographic & Entropy0-based script ............ 57
5.2 BASIC FLOW OF EACH SCRIPT ......................................................................... 58
5.2.1 Basic script ........................................................................................ 58
5.2.2 Demographic-based script .............................................................. 58
5.2.3 Entropy0-based script ...................................................................... 59
5.2.4 Demographic & Entropy0-based script ......................................... 59
6 EVALUATION AND FUTURE WORK ............................................................... 61

-vii-
6.1 RESULTS AND EVALUATION .............................................................................. 61
6.2 CONCLUSIONS .................................................................................................. 63
6.3 FUTURE WORK ................................................................................................. 64
BIBLIOGRAPHY .......................................................................................................... 65
APPENDIX .................................................................................................................... 67


-1-
1 Introduction
Over the last decade, the rapid growth of technology has led to an enormous amount
of information enabling even an average internet user to have a wide variety of options.
Electronic shops like Amazon or E-bay are offering plentitude of products, online news-
papers are publishing numerous articles every day while other websites like Netflix are
offering thousands of movies to their subscribers. Statistics have also shown that the num-
ber of internet users is growing more and more. More specifically we can see that from
2000 to 2017 there is a growth of 976 % in the global internet usage [1].
Although technology evolution is making a huge progress, there are several disad-
vantages that should be taken into consideration. Using the search engines in order to find
something that I would like seem very generic and often has not the desired results. In-
ternet users are facing the problem of information overloading in which it is seems very
challenging to find and process the most suitable information in order to extract mean-
ingful information and knowledge [2]. It is obvious that utilizing and manipulating useful
information is proven a very demanding and time-consuming procedure.
In order to address this problem, we can use recommender systems which seem an
effective solution in many cases. In other words, recommender systems are capable of
processing huge amounts of information in order to help users identify meaningful data
and knowledge from a wide range of choices. As a result the main goal of these systems
is to do all the “hard” work which in other conditions would be executed by human be-
ings.
1.1 Definition of Recommender Systems
Recommender systems suggest items based on users past behavior, preferences and
personal data. Because of the diversity of data, the variety of the information and the wide
range of products, recommender systems are very essential in order to provide recom-
mendations for products and other items [3]. In other words, a recommender system is a
software that process large amounts of data in order to produce useful information. Mov-
ies, news or books which are considered by a user as “interesting” can now be presented
by these systems that can be very helpful especially in cases with a wide range of items.

-2-
We can define a recommender systems as a system that is capable of gathering, processing
and suggesting products that might be interesting for a given user. According to [2] a
recommender system is every system that outputs personalized recommendations or has
the ability to navigate users in order to find interesting and useful products.
Many companies are currently using these systems for commercial reasons. They pro-
vide different types of products such as movies, songs or books which means that recom-
mender systems do not focus on specific type of items but they can be generalized in
order to operate on a wide range of products. Below we introduce some of the most fa-
mous recommendation engines:
Netflix which is a service for video rental and streaming, is considered as one of
the most well-known paradigms because it helps its viewers to find shows that
might have not initially chosen.
Amazon which is a very popular e-commerce website, suggests items that other
users have bought based on the item that you have just purchased.
LinkedIn which is a social networking website designed for business community,
makes recommendations for people that you might know, jobs you may like or
companies and groups that are interested in.
Also Hulu which is a streaming video website uses recommender systems is order
to suggest content that many users may find interesting.
Recommendations can be optimized if the system can use two different types of input
data: explicit (raw user input) and implicit (user’s behavior) [5]. For example, when a
user is rating some movies on Netflix, this means that he offers explicit input to the sys-
tem. Various online communities like MovieFinder or MovieLens for movies and Pan-
dora or Last.fm for music, are trying to collect user opinions, in order to recommend items
based on this knowledge. However, there are many cases where this type of information
is not available for the system. Moreover, user experience will become worse in case the
system will keep using long and demanding questionnaires in order to extract useful in-
formation from user.
In order to provide accurate recommendations, systems should be aware of users past
ratings and tastes. By this way, system should be able to suggest products based on what
users like in the past or products that other similar (based on ratings) users like. However,
there are many situations where this kind of knowledge is not available for the new users.

-3-
In this case systems have to face the cold start problem which is considered a very critical
problem. In order to overcome this problem, many different approaches have been
adopted: for example systems are capable of exploiting user’s demographic data in order
to make recommendations for new users based only on this kind of information [6].
1.2 Problem
The main problem of collaborative recommender systems is to make suggestions for
new users who have just started to make use of the system. In this problem, which is
known as cold start problem, the system has to collect new user information in order to
be ready for use by the recently entered user. In case the system does not have sufficient
information about new users, it will be very hard to provide accurate predictions.
1.3 Purpose
The main goal of this thesis is to address the cold start problem of collaborative rec-
ommender systems in the context of suggesting movies to new users. First of all, we will
examine how user’s demographic data affects their movies preferences and then we are
going to study efficient methods such as the entropy of ratings based on ask-to-rate tech-
nique. These approaches will be evaluated for their efficiency and accuracy in the Mov-
ieLens 100K dataset.
1.4 Scope
The goal of this study is not to improve the accuracy of collaborative or content based
filtering as this is not within the scope of this dissertation. In this study, we are going to
investigate if demographic data or/and entropy of information can effectively address the
cold start problem. Although there is a wide variety of MovieLens datasets with a lot of
movies ratings, the majority of them does not include information about demographic
data. In our study, we will use the demographic data of MovieLens 100K dataset com-
bined with small research conducted by us.

-4-
1.5 Structure of Dissertation
In the first (Introduction) chapter, we give a brief description of the main features of
the recommendation systems and the challenges that they have to face right now. Then,
we present the purpose and the scope of this dissertation, and finally we provide a brief
summary of the next chapters.
In the second chapter, we present the core concepts of our Thesis. In other words we
are trying to describe recommender systems and explain how they work. Furthermore we
introduce the main categories of recommender systems and also give a description of their
characteristics and their functionality.
In the third chapter, we provide a literature review of the main published work re-
garding the recommendation systems and how they address the cold start problem. In this
point, the main goal is to critique the respective literature and to identify the main prob-
lematic areas that can be improved. Moreover, we are trying to define the problem we are
working on and also to connect our study with previous knowledge and suggest any fur-
ther research. More specifically, we are trying to focus on the cold start problem which is
a big issue for new users in recommender systems. Also we concentrate on the possibility
of addressing it by using user metadata such as demographic data and proving that this
kind of information can affect personalized recommendations. Furthermore, we try to
focus on how ratings entropy and entropy0 can affect the cold start problem.
In the fourth chapter, we provide a section with the most important functional and
non-functional requirements of our proposed system. Moreover, we give a description of
the design of our proposed recommender system by providing all the related details and
components. In addition, we present some diagrams and also the logic behind our pro-
posed system.
In the fifth chapter, we introduce the implementation of our system by presenting the
tools and the programming languages that we have used. For the needs of this thesis the
programming language we have used is Python 3.6, and the development environment is
PyCharm. Additionally, we present the datasets and all the related knowledge that we
have extracted from them. In this case, we have used the MovieLens datasets that include
user’s demographic data thousands of movie ratings.
In the final chapter, we evaluate our proposed system, compare it with other systems
and present the final conclusions of this study. Furthermore, we are also trying to suggest
future work related to our system.

-5-
2 Core concepts of Recom-mender Systems
In this chapter, we introduce the basic idea and some of the most important charac-
teristics that are related with recommender systems. Also, we are trying to explain some
of core concepts that are adopted in our dissertation.
2.1 Recommender Systems
In previous chapters we introduced the problem of information overload in which
users find it difficult to locate the most suitable information at the right time. The set of
solutions that have been proposed can be presented in the following figure:
Picture 2.1: The hierarchy of solutions proposed for the information overload problem
As we can see in the above figure, the solutions are located between information fil-
tering and information retrieval. Information retrieval systems ask the users to specify the
type of information that is needed. On the other hand, information filtering systems aim
to learn the user’s main interests and then filter information taking into consideration
users’ profiles.

-6-
As we mentioned in the previous chapters, recommender systems are used to suggest
what products to buy, what movies to watch or even who should be your friends on the
social media. In 1992 Goldberg created the first recommender system in order to address
the problem of the problem of the numerous emails which were presented in user’s mail-
box. In simple words, this system is a type of collaborative filtering algorithm in which
users make reviews for the emails they read [7]. Over the last decade the need for precise
and accurate recommender systems is growing more and more, because there are large
amounts of data and the demand of personalized recommendations. Universities and com-
panies have developed many techniques because it is proven that recommender systems
can be very profitable.
Recommender systems include two main ingredients: the database and the filtering
algorithm [8]. All the datasets and the information about users is placed in database. On
the other hand, the filtering algorithm is divided into two steps: Firstly, the algorithm
calculates the most similar users or items while in the second step the system is trying to
make recommendations for the users. All the above can also be seen in the following
figure:
Picture 2.2: Information filtering in recommender systems
Below we present the different recommendation techniques that have been developed
over the past years:
Collaborative filtering: The recommendations are based on the similarity be-
tween users and their ratings.
Content-based filtering: The recommendations are based on the similarity be-
tween items.
Demographic filtering: In this case, recommendations are based on the user per-
sonal information such as gender, age, occupation, location etc.
Social filtering: Recommender systems are based on user’s social networks
Hybrid filtering: Combination of the above approaches

-7-
It is also worth mentioning that our implementation is based on collaborative filtering.
In the next sections, we will give a brief description of some of the above techniques
focusing on the methods that are used in our proposed system.
2.1.1 Basic concepts for ratings
The rating system has a big impact on the design of the recommender algorithms. The
ratings are usually indicate how much a user likes or dislikes a specific item. There are
rare cases, where ratings can take continuous values, for example in the Jester recommen-
dation engine the rating values range between -10 and 10. On the other hand, in most
cases the rating values are in intervals, which means that there is a collection of distinct
ordered numbers used to indicate whether the user likes or dislikes the item on hand. For
instance, a 5-star rating system can use the set {-2, -1, 0, 1, 2} where a rating of -2 repre-
sents extreme dislike while a rating of 2 an extreme like. For other implementations we
may have other distinct values such as {0, 1, 2, 3, 4}, having the same logic as above.
The number of the rating values depends on the recommendation system. The most
common scenarios is to use a 5-star, a 7-star or even a 10-star system rating. In figure 2.3
we can see an implementation of a 5 star rating system.
Picture 2.3: The picture shows a 5-star ratings system that is also referred as interval ratings sys-
tem

-8-
Apart from the ratings, the above picture can also show the semantic meaning of the user’s
interests. This meaning can be different depending on the system: For example, Netflix
uses a 5-star rating system where 4-stars mean that the user “really liked” the movie,
while the “middle” 3-star rating means that the user simply “liked” the movie. For that
reason, Netfilx has two ratings expressing the “dislike”, and three ratings expressing the
“like”, which is also referred to as unbalanced rating scale. There are other implementa-
tions where the number of ratings is even and the neutral rating is absent, which leads to
a forced choice rating system.
In case of our implementation, we have the Movielens Dataset where there are users
that give their ratings for different items. Users are people who rate items, while items
are the movies. Ratings can be explicit which means that users inserted the ratings by
himself or they can be implicit which means that the ratings were estimated based up on
the users behavior. In our implementation, we use a five point rating scale with ratings
ranging from 1 to 5 (1 is the extreme dislike, while 5 is the extreme like).
In table below we can see an example of the rating matrix that will be used in our
implementation:
Toy Story Men in Black
User1 1 4
User2 5 Nan
User3 Nan 3
Table 2.1: Example of rating matrix
The above rating matrix includes the ratings which three users gave for 2 movies. As we
have mentioned before the ratings are ranging between 1 and 5. Also, the Nan value
means that either the user have not rated the movie because either he has not seen it or he
he has seen it, he has not managed to rate it.

-9-
2.2 Content-Based filtering
Over the past years, a lot of research has been carried out in order to address the
problem of information overload, as we have mentioned above. Several items are com-
pared with items that have already rated by users in order to recommend the most suitable
items.
The difference between information filtering and information retrieval can be located
in this point: The user is not trying to make a query for information, but the filtering
system is building a model based on user’s past choices and behavior and then tries to
recommend the most suitable information to the user. Although there is a difference be-
tween these two concepts, information filtering has adopted several approaches from in-
formation retrieval, as it can be seen in content-based filtering and in collaborative filter-
ing.
In content-based filtering, the recommendation is constructed based up on user’s be-
havior. In this technique which is also known as cognitive filtering [10], all the available
information is used in order to predict its relevance taking into consideration the user’s
profile. Content-based filtering has many similarities with the relevance feedback of in-
formation retrieval literature [11] in which the query vector is constructed by using the
relevance of user’s opinions on new documents. In Information Filtering (IF), this modi-
fied query vector can be considered as a profile model that includes keywords and their
relative importance. Based on this profile, the relevance of new items is calculated by
measuring the similarity between the query vector and the item feature vector.
In their simplest form, these profiles are user defined keywords or rules that represent
users interests and traits. Usually, users would prefer the system to learn their profiles
rather than providing it to system by themselves. For that reason, systems have to use
machine learning techniques where the main idea is to learn to create rules and classify
newly entered items based up on previous knowledge that has been provided by users.
Thus, machine learning techniques can be used in order to construct a model that will be
capable of predicting whether newly introduced products or items are probably going to
be of interest. The ML techniques used in this case are based on text categorization be-
cause the IF is mainly focused on textual domains [19].
The process of allocating a Boolean value to each pair (dj,ci )∈DxC, where D is a set
of documents and C is a set of categories. If true is allocated to the pair (dj,ci) there is a

-10-
tendency to assign the category ci to the document dj. On the other hand, if false is as-
signed to this pair then there is an aversion to assign the category ci to the document dj.
The aim of this process is to estimate the function F∶DxC →{True,False} which deter-
mines the way that documents should be classified, by defining a new function F':DxC
→{True,False}. The F' function which is called model, should be similar to F as much as
possible.
One of the most well-known approaches from the Information Retrieval and Text
Categorization domains is the Rocchio Algorithm which describes documents using the
vector space representation having as the most important ingredient the TF-IDF weight
(Term Frequency/Inverse Document Frequency). TF-IDF can be formulated by the fol-
lowing equation:
𝑡𝑓𝑖𝑑𝑓(𝑡𝑘, 𝑑𝑖) = 𝑡𝑓(𝑡𝑘, 𝑑𝑖)𝑥𝑙𝑜𝑔𝑁
𝑛𝑘 (1)
where N represents how many documents there are in the collection, and nk defines the
number of documents that involve the token tk. Moreover, tf(tk,di) can be considered as
the scheme which calculates how many times the token tk appears in document di.
Rocchio algorithm calculates 𝑐𝑖 = (𝜔1𝜄, … . , 𝜔|𝛵|𝜄) (where T is the number of the
unique tokens in the training set), for the 𝑐𝑖 category using the following equation:
𝜔𝑘𝑖 = 𝛽 ∙ ∑𝜔𝑘𝑗
𝑃𝑂𝑆𝑖− 𝛾 ∙ ∑
𝜔𝑘𝑗
𝑁𝐸𝐺𝑖 (2)
𝑑𝑗 𝜖 𝑁𝐸𝐺𝑖𝑑𝑗 𝜖 𝑃𝑂𝑆𝑖
where ωkj represents the tfidf factor of the token tk in the dj document, 〖POS〗i is the
positive example in the training set for a category ci and 〖NEG〗i is the negative example
respectively.
Moreover β and γ are the factors that set the relative weight of the positive and nega-
tive examples. The vector model enables us to estimate how similar two vectors are taking
into consideration the correlation. In order to calculate this correlation we can simply
measure the cosine of the angle between these vectors. The class 𝑐 is assigned to a docu-
ment 𝑑𝑗, by computing the similarity between each vector 𝑐𝑖 and the document 𝑑𝑗 . The 𝑐
will eventually be defined by the 𝑐𝑖 that has the highest similarity score.

-11-
2.3 Collaborative filtering
In Collaborative filtering (CF), user similarity is calculated based on user’s ratings
[9]. The majority of the studies uses this technique because it is easy to implement and
also it provides satisfactory results. Most of the research is mainly focused on two points:
The first is how to determine the similarity metric and the second is how to make predic-
tions for items that have no ratings.
Collaborative filtering is mainly based on a model that exploits user’s behavior. This
model can be created by using a single user’s behavior or by using the behavior of a group
of users that have similar preferences. In other words, this technique makes recommen-
dations based up on the collaboration of many users and focuses on users that have similar
traits and behavior.
There are two main groups of Collaborative filtering algorithms: Memory-based Col-
laborative Filtering and Model-Based collaborative Filtering [12]. In Memory-Based Col-
laborative Filtering, recommendations are made by using the whole or a large part of the
user dataset. One of the most famous and effective algorithms of this category is User-
Based Collaborative Filtering. One of the most important disadvantages of this algorithm
is that in order to create recommendations, the system has to process the whole dataset
which can be proved a very demanding and slow task. On the other hand, model-based
algorithms utilize datasets in order to create a more concrete model that will be used in
order to make recommendations. The most famous algorithm in this case is Item-Based
Collaborative Filtering. Below we are going to introduce the core concepts of the most
famous memory and model based collaborative filtering algorithms. Furthermore, we will
introduce kNN algorithm, a well-known data science algorithm that will be used in com-
bination with Collaborative Filtering in our implementation.
2.3.1 Item – Based Collaborative Filtering (IBCF)
Item Based collaborative filtering [13, 14] is a model-based technique which recom-
mends items taking into consideration the relationship of items from the rating matrix.
The main idea of this technique is that users would choose items which have similarities
with other items they had already liked in the past.
This approach involves the calculation of similarity matrix which has item to item
similarities based on a similarity measure. Some of the most well-known similarity
measures are: Cosine Similarity, Pearson Similarity and Adjusted Cosine Similarity.

-12-
These similarities are located in a matrix S with n rows and n columns. In order to the
size of the matrix to n * k where k <<n, we only save the k most similar items and their
corresponding similarity values. The neighborhood of the item i with size k, can be de-
fined by the set S(i) which is translated as the k items that are most similar with the item
i. Keeping the k most common neighbors simplifies the problem, however it is obvious
that the quality of recommendation is decreasing.
One of the most important parts in item-based recommender systems is to calculate
item similarities and then to choose only the most similar items. The main idea behind
the calculation of the similarity between two items i and j is to choose only the users who
have rated both of these items and then to calculate the similarity sij based on a similarity
measure technique. The above procedure can be visualized in the following Picture 2.4,
where there is a matrix with m rows which represent users and n columns that represent
items.
Picture 2.4: Elicitation of the co-rated items and similarity computation.
There three main methods that are used in order to calculate the similarity between
items. These methods which are described below are: cosine based similarity, correlation
based similarity, and adjusted cosine similarity.

-13-
2.3.1.a. Cosine-based similarity
In this approach, two items are represented as two vectors in the m dimensional user
space. We calculate the similarity between these items by measuring the cosine angle of
their corresponding vectors. Looking at the matrix of Picture 2.3 we calculate the simi-
larity between two items i,j ( sim(i,j) ):
𝑠𝑖𝑚(𝑖, 𝑗) = cos(𝑖, 𝑗) =𝑖 ∙ 𝑗
|𝑖| ∗ |𝑗| (3)
where “.” is the dot product
2.3.1.b. Correlation-based similarity
In this technique, we calculate similarity between two items i,j by computing the Pear-
son correlation corrij. In order to improve accuracy we have to single out the cases where
users have rated both items i and j as we have mentioned in Picture 2.3. Defining as U the
set of users that have rated both items i and j, correlation-based similarity is calculated by
the following equation:
𝑠𝑖𝑚(𝑖, 𝑗) =∑ (𝑅𝑢,𝑖 − 𝑅��
)(𝑅𝑢,𝑗 − 𝑅��)𝑢∈𝑈
√∑ (𝑅𝑢,𝑖 − 𝑅��)2𝑢∈𝑈 √∑ (𝑅𝑢,𝑗 − 𝑅��)2
𝑢∈𝑈
(4)
where 𝑅𝑢,𝑖 corresponds to the rating of the user u for the item i, and 𝑅�� represents the
average rating for the i-th item.
2.3.1.c. Adjusted cosine similarity
The calculation of similarity between user-based collaborative filtering and item-
based collaborative filtering has some differences. One of the main differences is that in
user based collaborative filtering, we calculate the similarity between the rows of the rat-
ing matrix while in item based collaborative filtering we calculate the similarity between
columns of the matrix (each pair of the co-rated items represents a different user). In case
of item based collaborative filtering, the computation of similarity by the cosine similarity
technique has one main disadvantage: The variation of the rating scale for different users
is not taken into consideration. This problem can be addressed by using the adjusted co-
sine similarity where the user average is subtracted by each co rated pair.
By using this approach, the similarity between two items i and j is calculated by the
equation:

-14-
𝑠𝑖𝑚(𝑖, 𝑗) =∑ (𝑅𝑢,𝑖 − 𝑅𝑢
)(𝑅𝑢,𝑗 − 𝑅𝑢 )𝑢∈𝑈
√∑ (𝑅𝑢,𝑖 − 𝑅𝑢 )2
𝑢∈𝑈 √∑ (𝑅𝑢,𝑗 − 𝑅𝑢 )2
𝑢∈𝑈
(5)
where Ru denotes the average rating for user u.
2.3.1.d. Prediction computation
The most crucial part of a collaborative filtering system is to generate the desired
predictions. First of all we try to single out the most similar items taking into considera-
tion the aforementioned similarity measures and then we try to focus on the users’ ratings
and generate predictions based on the weighted sum approach.
In this approach we calculate the prediction for an item i targeting a user u by calcu-
lating the sum of all the ratings the user u has given for items that are similar to the item
j. The similarity sim(i,j) between items I and j “weights” each one of the ratings. Taking
into consideration the idea that is depicted in Figure 2.5 we can define the prediction
P(u,i) using the following equation:
𝑃𝑢,𝑖 =∑ (𝑠𝑖,𝑁 ∗ 𝑅𝑢,𝑁)𝑎𝑙𝑙 𝑠𝑖𝑚𝑖𝑙𝑙𝑎𝑟 𝑖𝑡𝑒𝑚𝑠,𝑁
∑ (|𝑠𝑖,𝑁|)𝑎𝑙𝑙 𝑠𝑖𝑚𝑖𝑙𝑙𝑎𝑟 𝑖𝑡𝑒𝑚𝑠,𝑁
(6)
The main idea of this technique is that it tries to describe how a user rates similar items.
Moreover we can see that the sum of similar items scales the weighted sum in order to
guarantee that the prediction falls within a specified range.
Picture 2.5: Item-based collaborative filtering algorithm. Prediction is done by considering 5
neighbors

-15-
2.3.2 User – Based Collaborative Filtering (UBCF)
User based collaborative filtering is memory based approach that uses and process
rating data from a wide range of users. The main idea behind this technique is that users
with the same or almost the same preferences will also give similar ratings in the items.
For that reason, a user’s missing ratings can be estimated by finding the k-most common
neighbors and then process their ratings in order to create the final recommendations.
Picture 2.6: User-based collaborative filtering approach. In (a) there is the matrix with all users
ratings and also the predicted ratings for the target user ua,, where in (b) there is the neighbor-
hood with the most similar users for the target user ua.
The neighborhood with the k most common users is calculated by the similarity of
users, choosing the k most similar users or choosing all users that have a defined similarity
threshold. For User-based collaborative filtering the most well-known similarity
measures are person correlation and cosine similarity (both of them where presented in
the previous paragraph 2.3.1). As we have mentioned before, a user’s N(a) ⊂ U neigh-
borhood can be estimated either by choosing a number of the most similar neighbors or
by defining a threshold on the similarity. After finding the common neighbors, we aggre-
gate their ratings in order to predict the missing ratings for the target user ua. A simple
approach is to take the average of the ratings in the neighborhood by using the below
equation:
��𝑎𝑗 =1
𝑁(𝑎)∑ 𝑟𝑖𝑗 (7)
𝑖∈𝑁(𝑎)
In order to exploit the case the fact that some neighbors are more similar to the target
user than other neighbors, we adopt another approach in which we add weights in equa-
tion (7). As a result we now have:

-16-
��𝑎𝑗 =1
∑ 𝑠𝑎𝑖𝑖∈𝑁(𝑎)∑ 𝑠𝑎𝑖𝑟𝑖𝑗
𝑖∈𝑁(𝑎)
(8)
where 𝑠𝑎𝑖 defines the similarity between a neighbor ui and the target user ua.
An even better approach is to measure ��𝑎𝑗 with distinct ratings. In this case, we have
the classic user-based collaborative filtering algorithm, in which there is an aggregation
of the target user’s average rating, considering all the items that the target user has rated.
This approach can be defined by the following equation:
��𝑎𝑗 = ��𝑎 +∑ (𝑟𝑢,𝑗 − ��𝑢)𝑃𝑎,𝑢
𝑘𝑢=1
∑ 𝑃𝑎,𝑢𝑘𝑢=1
(9)
where: k is the number of the k most similar neighbors for the target user a, 𝑃𝑎,𝑢 denotes
the similarity between the target user and the other users u, ��𝑎 is the average rating for the
target user a, ��𝑢 is the average rating of the neighborhood users for the item j, and 𝑟𝑢,𝑗 is
the rating that user u gave to item j.
2.3.3 kNN Algorithm
In this point, we will give a short description of the kNN algorithm which is used in
our implementation. K Nearest Algorithm (known as kNN) is very simple and easy to
understand and also has an incredibly well performance. Moreover, it is versatile and
robust classifier and has a wide range of applications. The aim of this algorithm is to
utilize a dataset where the data points divided into classes, in order to predict in which
class belongs a new data point.
Each of the features of the dataset is considered as a different dimension in space and
the value of an observation for each of these features is considered as a coordinate, which
means that we have a collection of points in the dimensional space. Eventually, the simi-
larity of two points can be regarded as the distance between them.
In order to make predictions for a new observation the algorithm picks the k most
similar (closest distance) points to this observation and then chooses the most similar
class between them. For that reason the algorithm is referred to as k-Nearest Neighbors
Algorithm. [23]
kNN is considered as a non-parametric and lazy algorithm. It is characterized as non-
parametric because it does not make any assumptions regarding the underlying data dis-

-17-
tribution. This is a big advantage because the majority of the practical data does not usu-
ally follow the typical theoretical assumptions. As a result, non-parametric algorithms
such as kNN are here to offer the desired solutions.
Moreover kNN is a lazy algorithm. In other words, it does not utilize the training data
sets in order to make generalizations. This means that the explicit training phase is absent
or is extremely small, which denotes that the training phase is very fast. The absence of
generalization indicates that kNN maintains all training data which is needed for the test-
ing phase. Contrary to other methods in which you can remove a portion of the dataset,
lazy algorithms such as kNN utilizes the whole dataset in order to make predictions.
In case of kNN, two opposing parts can also be observed: Although the training is
absent or almost absent, the testing phase is much more expensive regarding memory and
time. Time is demanded because there are cases in which all data had to participate in
generating a prediction, while memory is needed when all data must be saved.
The algorithm can be briefly described in four steps:
1. We define a positive integer k, and also a new sample
2. We choose the k points from our dataset, which are mist similar to the new sam-
ple
3. We make the classification based up on these points
4. The aforementioned class is given to our new sample
As we have mentioned before, data points are located in a feature space and can be
considered as scalars or multidimensional vectors. As a result, there is the concept of
distance between these points, which can be calculated by many ways for example the
Pearson correlation or simply the Euclidean distance. Furthermore, we take into consid-
eration the integer number k which determines the number of neighbors that defines the
classification.
To conclude, considering that the points are m-dimensional the procedure of finding
the k-Nearest Neighbors can take O(m) time. Moreover, choosing the value of number k
is a challenging task: If the value of number k is small the noise will have a big impact
on the final result. On the other hand, if the value of number k is large, then the algorithm
becomes more resource demanding. As a result, a compromised solution for this issue is
to choose the number k based up on the function 𝑘 = 𝑠𝑞𝑟𝑡(𝑛), where n is the number of
data that are included in the dataset.

-18-
2.4 Matrix Factorization
Until now we have introduced neighborhood methods which are focused on measur-
ing the relationships between items or users. In contrast to these methods, there are also
the latent factor models where both items and users are characterized on factors which
are derived from the rating patterns.
The implementation of latent factor models is mainly based on matrix factorization
[22]. The basic functionality of the Matrix Factorization is that it characterizes items and
users using vectors of factors which are derived from item rating patterns. Recommenda-
tions are generated in case there is high similarity between items and users. These ap-
proaches are becoming more and more popular in recent years because they combine
scalability and precise recommendations. Furthermore, they are also more flexible be-
cause they are capable of modeling real life scenarios.
As we have mentioned in the previous section, recommender systems are based on
various types of input data. This data is usually located in matrices which have one di-
mension as the items and the other dimension as the users. One of the most suitable type
of data is the explicit feedback, which includes users’ ratings for products in interest. For
instance, Netflix gives users the opportunity to rate their preferred movies by giving star
ratings, while TiVo collects ratings by enabling users to press thumbs up or thumbs down
buttons if they like or not the movies respectively. The explicit feedback can also be called
as ratings. It is also worth noting that these ratings are often placed in sparse matrices
because users have only rated only a small number of the existing movies of the whole
dataset.
One of the main advantages of matrix factorization is that it is capable of enabling the
integration of additional information. In case explicit feedback is not available, recom-
mender systems can predict user tastes by using implicit feedback. Implicit feedback rep-
resents opinions by taking into consideration users’ behaviors and habits such as: past
purchases, search history and in some cases the movement of mouse. Furthermore, im-
plicit feedback can be depicted by a dense matrix because it often indicates if there is an
event or not.
-19-
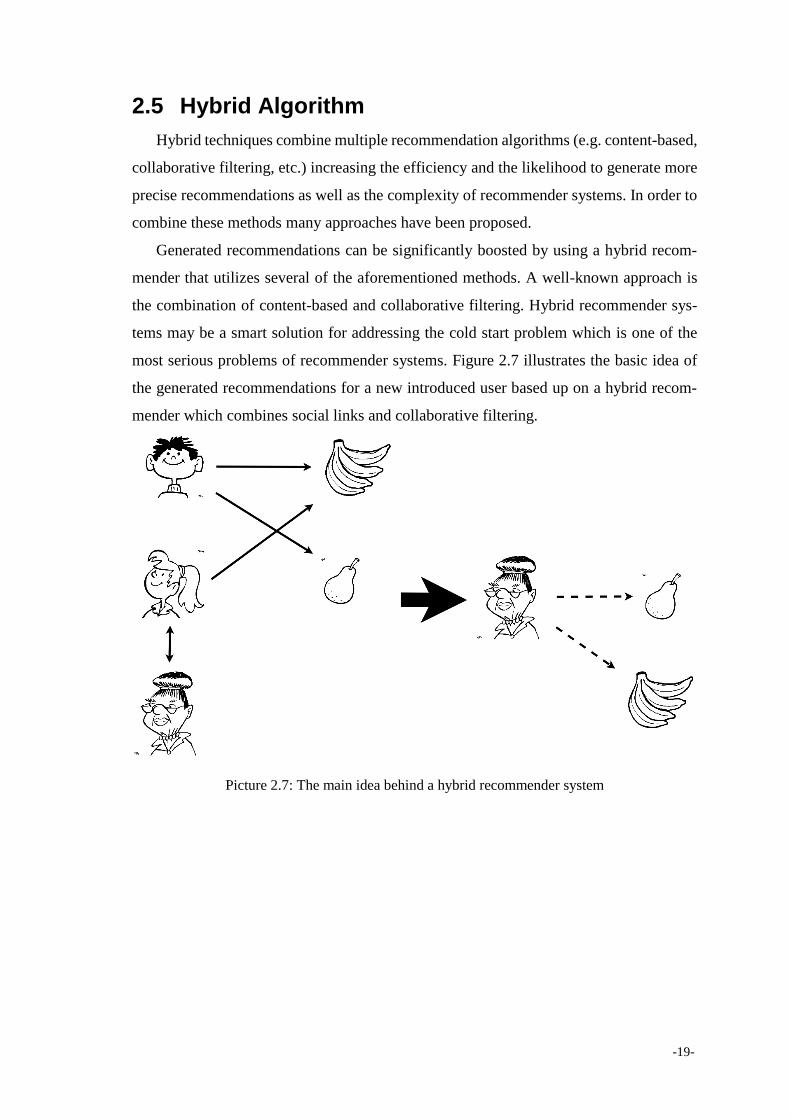
2.5 Hybrid Algorithm
Hybrid techniques combine multiple recommendation algorithms (e.g. content-based,
collaborative filtering, etc.) increasing the efficiency and the likelihood to generate more
precise recommendations as well as the complexity of recommender systems. In order to
combine these methods many approaches have been proposed.
Generated recommendations can be significantly boosted by using a hybrid recom-
mender that utilizes several of the aforementioned methods. A well-known approach is
the combination of content-based and collaborative filtering. Hybrid recommender sys-
tems may be a smart solution for addressing the cold start problem which is one of the
most serious problems of recommender systems. Figure 2.7 illustrates the basic idea of
the generated recommendations for a new introduced user based up on a hybrid recom-
mender which combines social links and collaborative filtering.
Picture 2.7: The main idea behind a hybrid recommender system


-21-
3 Challenges and related work
Recommender systems have been a subject of a vast number of research studies and
discoveries in order to find new approaches capable of enhancing and improving recom-
mendations. In this chapter we are going to present some of the most important research
topics over the last years. This analysis is mainly based on papers [15, 16, 17, 18]. More-
over, the majority of the presented work is tightly related with the development and the
problems that we have faced in our work. To sum up, we will present the cold start prob-
lem, followed by some works that are trying to solve it using various techniques and
approaches.
3.1 Cold Start Problem
One of the most challenging problems which recommenders systems have to face is
undoubtedly the limited number of the initially available user data. Under these circum-
stances, it is not easy to apply the aforementioned recommendations techniques and es-
pecially the collaborative filtering method. Although knowledge based or content based
models proved to be more resistant to cold start problems than collaborative filtering, it
is not easy to have this knowledge or content always available. Small numbers of data
has negative effect on the performance of recommender systems by downgrading their
prediction accuracy to a large extent. For that reason, there is a great interest of research-
ing and studying all the drawbacks of limited data, and also what has to be done in order
to address this problem.
Cold start problem affects recommender systems in terms of new users and new prod-
ucts [20]. Many studies have shown that cold start problem affects all types of recom-
mender systems, but it is also proved that collaborative filtering methods have to face
bigger problems than content based methods. [5] Below we present the two different cat-
egories of the cold start problem which are related with the new user and the new product
respectively.

-22-
3.1.1 New user
The cold start problem is related with the issue of the new user when a new user has
just been introduced himself to the system or when an already existing user has not given
enough data to the system and as a result the system is not performing with the normal
way. Having this limitation in user’s data, the system generates inaccurate predictions
which do not fit with the users preferences. In order to address this problem, many sys-
tems use the ask-to-rate technique where they ask from users to rate some products. For
example MovieLens asks users to rate movies when they sign up [21].
3.1.2 New product
The second instance of the cold start problem is related with the issue of the new
product. This problem arises when a new product is introduced to the system because is
not related with any user or any of the already existing products. This limitation in data
is very challenging especially in case of collaborative filtering systems which usually use
information that describe connections between products and users. On the other hand,
content based filtering methods are more robust because they classify the items based up
on its characteristics. [21]
3.2 Documents addressing the cold start problem
Below we present some solutions that have been proposed in the past, by giving a
description of some of the documents which helped us to create our recommender system.
3.2.1 Using Demographic Information to Reduce the New User Problem in Recommender Systems
In [15], the author attempts to build a recommender system based up on the de-
mographics data included in the MovieLens 100K dataset. This dataset which will also
be used in our work, has various information including 100,000 movies ratings made by
963 users for 1682 movies. Moreover, the ratings range from 1 –the lowest rating- to 5 –
the highest rating. Additionally, the dataset is created by users’ personal information
which are were provided when users visited the MovieLens website for the first time. The
structure of the demographic information is given below:
user id | age | gender | occupation | zipcode

-23-
Furthermore, the user ratings in the dataset is given as follows:
user id | item id | rating | timestamp
Dividing the above users into training and testing set, we create a model that has K
distinct clusters, and we train it, by taking into consideration the users of the training set.
This model can be considered as a classifier that defines which of the users of the training
set matches a new introduced user (a user from testing set). Also, this model makes the
classifications based on the user’s demographic data. The ratings of the new introduced
user are generated by taking into consideration the rating information which is calculated
from users who belong to the same cluster.
Some indicative rating predictions for users in the testing set are plotted along with
the actual ratings of the users of training set on some specific movies. These plots are
shown in picture 3.1:
Picture 3.1: This plot depicts the predicted ratings r* along with the actual ratings r, for five
movies for a male user that is 24 years old, he is technician and his zip code is 85711
The figure shows that the predicted ratings r* are very close with the actual predictions r.
However, regarding the final results it was observed that most of the predicted ratings are
located around 3-4.
To sum up, the prediction of ratings for new users assuming that there are not any
past rating data, cannot guarantee that there is any significant relevance between the
number of clusters and the precision of the prediction regarding the MovieLens 100K

-24-
dataset. Moreover, it seems that there is a connection between demographic data and
movie ratings, but in order to generate more concrete results there is a need for a greater
range of demographic data.
3.2.2 Collaborative Filtering Enhanced By Demographic Correla-tion
In [16], there is an attempt to introduce a specific technique which includes a lot of
approaches of existing algorithms combing them with demographic data using Mov-
ieLens 100k dataset. The introduced hybrid algorithms called U-Demog and I-Demog,
are mainly influenced by the User-based and Item-based collaborative filtering respec-
tively. Additionally, the aforementioned algorithms are also enhanced by the user’s de-
mographic data: age, gender, a choice of 21 occupations, and also the zip code for each
user that gave his ratings. The aforementioned data is used for the calculation of demo-
graphic correlations by taking into consideration the user vector similarities. In other
words, each user in MovieLens 100k dataset corresponds to a user demographic vector
that is defined as a vector with 27 features and can be seen in detail in the following table:
feature # feature contents comments
1 age <= 18 each user belongs to a
single age group,
the corresponding slot
takes value 1 (true)
the rest of the features re-
main 0 (false)
2 18 < age <= 29
3 29 < age <= 49
4 age > 49
5 male the slot describing the
user gender is 1
the other slot takes a
value of 0
6 female
7-27 occupation
a single slot describing
the user occupation is 1
the rest of the slots re-
main 0
Table 3.2: Description of the user demographic vector

-25-
In this point, it is worth mentioning that we will follow the same logic in our imple-
mentation where we are also exploiting user’s demographic data. This procedure is de-
scribed in chapter 4 (requirements and design).
The experiments have shown that the performance of the proposed algorithms can be
much better than the base algorithms, but on the other hand it can also be worse than
them. This deviation is mainly based on the role of the demographic correlations in the
process of the prediction generation.
As it has also mentioned in the previous section, it was noticed that the demographic
data from the MovieLens 100K dataset, does not have the adequate information in order
to generate precise and reliable predictions. However, in case this data is combined with
other types of filtering, like collaborative filtering, the recommendation procedure can be
boosted and the final predictions can be more precise and reliable.
3.2.3 Cold-start Problem in Collaborative Recommender Systems: Efficient Methods Based on Ask-to-rate Technique
In this document [17], the author is trying to address the cold start problem of a Col-
laborative filtering recommendation method by proposing some variations of the “ask-to-
rate” technique.
In order to generate recommendations, the author uses memory based Collaborative
filtering algorithm which was described in the previous Chapter (Chapter 2). In this point
we can figure out that this algorithm is mainly based on kNN (k –Nearest Neighbors)
algorithm. The whole recommendation procedure can be described as follows:
First of all, we calculate the similarity between the active user and the other users
who have rated the item by measuring the Pearson’s correlation. Defining as U
the set of users that have rated both items i and j, correlation-based similarity is
calculated by the following equation:
𝑠𝑖𝑚(𝑖, 𝑗) =∑ (𝑅𝑢,𝑖−𝑅𝑖 )(𝑅𝑢,𝑗−𝑅𝑗 )𝑢∈𝑈
√∑ (𝑅𝑢,𝑖−𝑅𝑖 )2𝑢∈𝑈 √∑ (𝑅𝑢,𝑗−𝑅𝑗 )2
𝑢∈𝑈
(10)
where 𝑅𝑢,𝑖 corresponds to the rating of the user u for the item i, and 𝑅�� represents
the average rating for the i-th item.
Then, the prediction for a target item regarding an active user can be measured by
the following equation:

-26-
��𝑎𝑗 = ��𝑎 +∑ (𝑟𝑢,𝑗 − ��𝑢)𝑃𝑎,𝑢
𝑘𝑢=1
∑ 𝑃𝑎,𝑢𝑘𝑢=1
(11)
where: k is the number of the k most similar neighbors for the target user a, 𝑃𝑎,𝑢
denotes the similarity between the target user and the other users u, ��𝑎 is the aver-
age rating for the target user a, ��𝑢 is the average rating of the neighborhood users
for the item j, and 𝑟𝑢,𝑗 is the rating that user u gave to item j.
Some of the advantages of Collaborative filtering algorithms are that they are simple
to implement and relatively easy to understand, and also that new data can be added with-
out any problem. However, the main drawback of these systems is the cold start problem
when there is a new user to the system.
In order to find a solution for the cold start problem, the author proposes the “ask-to-
rate” technique .The main idea of this technique is to present some items to the new user
and ask for explicit ratings. Then, in the user item matrix, the row with the ratings of the
new user is not empty anymore and the system is capable of using these ratings in order
to make recommendations. The above process can also be depicted below:
Picture 3.2: The main idea behind ask-to-rate technique
It is also worth noting that the system must be capable of presenting the most informa-
tive items in order to collect the right information for the new user. If the ratings of the
new user are originated from a well-designed selection method rather than a “random
selection”, then there is a great chance of generating much more improved and accurate
predictions. Normally, these techniques should not be difficult but instead they should be
understandable and user friendly. An indicative evaluation of the proposed selection tech-
niques on the user effort and the recommendation accuracy can be seen in Table 3.2.

-27-
Methods User Effort Recommendation
Accuracy
IGCN
(Log pop)×Ent
Entropy0
HELF
Popularity
Item-Item
Entropy
Random
Table 3.2: The evaluation of the proposed selection methods on user effort and on prediction ac-
curacy (5star: Best, 1star: Worst).
For our recommender system we have initially taken into consideration the pure en-
tropy method, which is also referred as non-adaptive method. Non-adaptive methods are
able to present similar items to all new users ignoring the existence of changes in
knowledge of the user being asked. Pure entropy H( ta ) which is usually characterized by
low complexity, represents the scattering of the item ratings in the rating matrix. The
basic structure of entropy’s algorithm can be seen in the following figure 3.3.
In this point it is worth mentioning that this method is capable of providing a lot of
information for each rating. However, this kind of information is not always really useful
as the system can present some items that are totally unknown to the majority of the users.

-28-
Function Entropy ( ta )
{
entropy ( ta ) = 0
for each item ta in dataset
{
for i as each of the possible rating values //in case of MovieLens, i = 1…5
{
if (rating( ta ) == i):
{
value[i] += 1 //rating frequencies
}
}
proportion[i] = value[i]/(total number of users who rate ta )
entropy( ta ) += proportion[i]*Math.log(proportion[i],2)
}
entropy( ta ) = - entropy( ta )
}
Picture 3.3: Algorithm of pure entropy method
The author also examines the Entropy0 method which is the Entropy considering
missing values. In the previous method (Pure Entropy), missing ratings were nor taken
into consideration. In order to address the problem of an item without evaluation, the
method of Entopy0 zero is introduced: All missing ratings belong to a new category re-
ferred as “0” while “1-5” continues to be the normal rating scale as it was before. The
following equation shows the Entropy0 formulation using a weighted approach:
𝐸𝑛𝑡𝑟𝑜𝑝𝑦0(𝑎𝑡) = −1
∑ 𝑤𝑖𝑖∑ 𝑝𝑖𝑤𝑖 log(𝑝𝑖) (12)
5
𝑖=0
where w0 = 0.5 represents the weight for the missing ratings, and wi = 1 (for i = 1,…5)
represents the original ratings of the dataset. It is also worth noting that if we change w0
to 0, the Entropy0 is altered to the Pure Entropy. Entropy0 manages to address some of
the drawbacks of Pure Entropy, and make a distinction between the unknown items (items
that have a small number of ratings) and frequently rated items. It is also observed that
Entropy0 generates better results than Popularity method.

-29-
3.2.4 Learning Preferences of New Users in Recommender Sys-tems: An Information Theoretic Approach
This paper [18], is trying to address the cold start problem by examining the effec-
tiveness of several item selection methods based on information theory. The basic concept
of this procedure is to use each of these methods in order to find a set of items, and then
to evaluate how effective these items are in constructing new users profiles. We also have
to note that the author is mainly focused on developing methods based on information
theory, aiming to extract information about new users’ habits and tastes. Similar to the
previous section, the author also notices that pure entropy has many limitations and as a
result he proposes some variations: Entropy0 and HELF. The methods used by the author
are: Popularity, Entropy0 (Entropy Considering Missing Values), HELF (Harmonic mean
of Entropy and Logarithm of Frequency) and IGCN (Information Gain through Clustered
Neighbors).
Entropy and Entropy0 were presented in the previous section. Regarding the other 3
methods we have:
Popularity shows how frequently the users rate the items, and it is considered a
very easy and inexpensive technique.
HELF which is the Harmonic mean of Entropy and Logarithm of rating Frequency
can be formulated with the above equation:
𝐻𝐸𝐿𝐹𝑎𝑖=
2 ∗ 𝐿𝐹𝑎𝑖
′ ∗ 𝐻′(𝑎𝑖)
𝐿𝐹𝑎𝑖′ + 𝐻′(𝑎𝑖)
(13)
where 𝐿𝐹𝑎𝑖
′ is the normalized algorithm of the rating frequency of 𝑎𝑖:
lg( ) / lg( )ia U and 𝐻′(𝑎𝑖) is the normalized entropy of 𝑎𝑖: 𝐻(𝑎𝑖)/lg (5).
Finally, ICGN which is the Information Gain through Clustered Neighbors, cal-
culates information gain of items. Additionally, the ratings data is selected accord-
ing to the users that match best with the active’s user profile until now. The infor-
mation gain of an item ta can be calculated by the below function:
𝐼𝐺(𝑎𝑡) = 𝐻(𝐶) − ∑|𝐶𝑎𝑟
𝑟 |
|𝐶|𝑟
𝐻(𝐶𝑎𝑟𝑟 ) (14)
where H(X) represents the entropy of a distinct variable X, while C indicates the
distribution of users into clusters defining the number of users that belong to each
cluster. 𝐶𝑎𝑟𝑟 indicates the distribution into classes of those users that have rated the

-30-
item 𝑎𝑡 with value r. ∑|𝐶𝑎𝑟
𝑟 |
|𝐶|𝑟 𝐻(𝐶𝑎𝑟𝑟 ) represents the weighted average of entropies
of the partitions of the class distribution (C) caused by the ratings of the item 𝑎𝑡.
The following figure shows the results of the above methods from the offline simula-
tion:
Picture 3.3: The figure shows how familiar the presented movies are to the users, for each of the
aforementioned selection methods.
It is obvious that popularity method selects the most familiar items to users while
HELF generates the worst results. Moreover, we can see that Entropy0 is also capable of
producing some satisfactory results.
Then, in figure 3.4 we can see the results regarding the accuracy of recommendations.
From these results we can see that both IGCN and Entropy0 have a good performance for
both of the metrics. However, HELF produces some confusing results because regarding
MAE is one of the worst, while regarding Expected Utility is one of the best.

-31-
Picture 3.4: The plots show the effectiveness of the generated user’s profiles. (a),(b) present the
recommendation accuracy of User-based kNN CF algorithm, while (c),(d) present the accuracy
of Item-based kNN CF algorithm. Mean absolute error (MAE) is better for lower values, and
Expected Utility is better for higher values


-33-
4 Requirements and Design
In this chapter, we present the functional and non-functional requirements of our im-
plementation, taking into consideration the cold start problem and the overview of the
system model that is described briefly below: The system asks the new user for explicit
ratings and then, based on the already existing dataset which has the other users’ ratings,
generates recommendations for the new user.
Furthermore, we are going to introduce the design of our proposed system and how is
it possible to satisfy the aforementioned requirements. We will give a brief description
about the architecture of the system, the data that we used, the assumptions we made, and
finally the basic execution flow.

-34-
4.1 Requirements
4.1.1 Functional requirements
In this section, there will be a brief explanation of the non-functional requirements of
the user interaction with the software
FR ID Title Description
1 Display movies for rating
The system should provide an in-
terface that presents movies to
users
2 Request users demographic
data
The system should provide an in-
terface which asks users to give
their demographic information
3 Display movies for rating
based on their entropy
The system should be able to cal-
culate movies entropy, and pre-
sent (for rating) the movies with
the highest scores of entropy
4
Display movies for rating
based on users’ demo-
graphic data
The system should be able to
find the k most common neigh-
bors (based on demographics)
for the target user, and present
(for rating) their corresponding
movies.
5 Ask user for explicit ratings
The system should provide an in-
terface that asks users for ex-
plicit ratings
6 Generate recommendations
using collaborative filtering
The system should be able to
generate recommendations by
processing the ratings given by
the target user and other similar
user from the existing dataset.
Table 4.1: Functional requirements of our proposed system
-35-
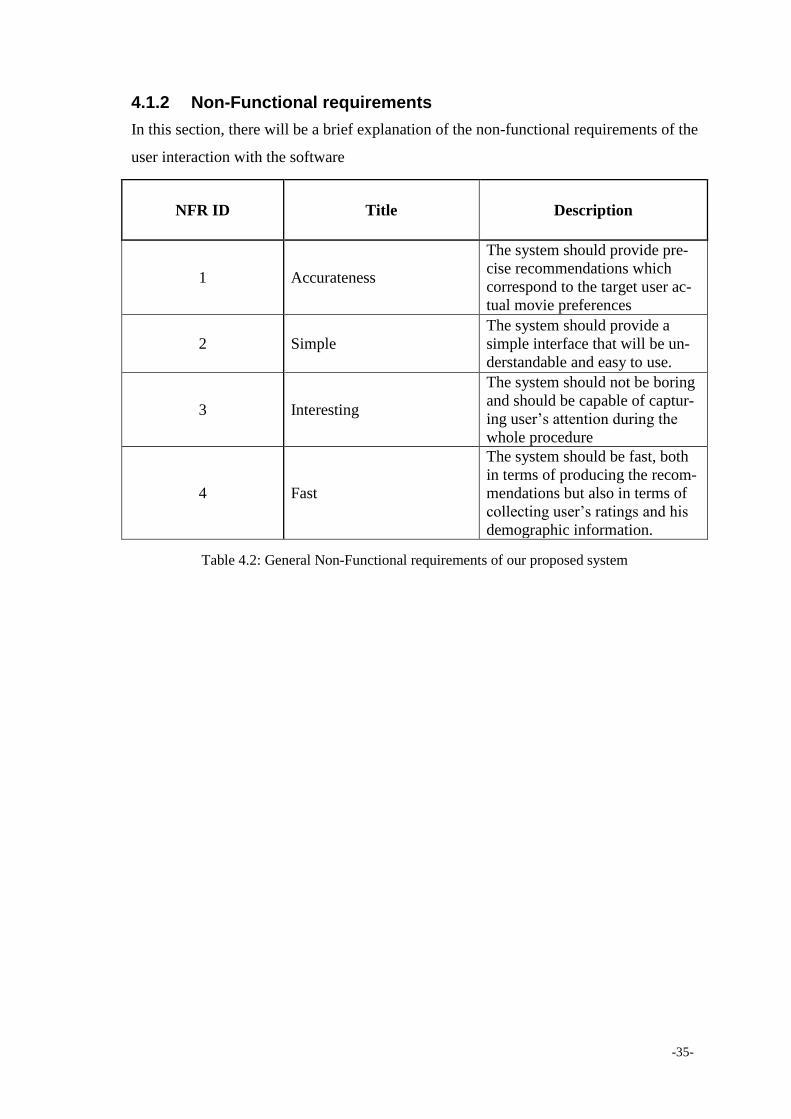
4.1.2 Non-Functional requirements
In this section, there will be a brief explanation of the non-functional requirements of the
user interaction with the software
NFR ID Title Description
1 Accurateness
The system should provide pre-
cise recommendations which
correspond to the target user ac-
tual movie preferences
2 Simple
The system should provide a
simple interface that will be un-
derstandable and easy to use.
3 Interesting
The system should not be boring
and should be capable of captur-
ing user’s attention during the
whole procedure
4 Fast
The system should be fast, both
in terms of producing the recom-
mendations but also in terms of
collecting user’s ratings and his
demographic information.
Table 4.2: General Non-Functional requirements of our proposed system

-36-
The software must also be compliant with ISO 9126 quality characteristics
(http://www.sqa.net/iso9126.html).
Category Subcategory Description Functionality Compliance
The system should minimize in-trusiveness and be compliant with privacy laws
Reliability Maturity The software should face very rarely failures
Fault tolerance Software should be able to withstand and recover from failures
Recoverability Ability to bring back a failed system to full operation, includ-ing data
Usability Understandability Ease of which the software’s functions can be understood
Learnability It should be easy to learn for every kind of user (i.e. no tech savvy)
Operability Ability of the software to be easily operated by a given user in a given environment.
Efficiency Time Behavior Response time < 5 sec
Resource behavior Use a little amount of memory
Portability Adaptability Characterizes the ability of the system to change to new speci-fications or operating environ-ments.
Table 4.3: ISO 9126 quality characteristics

-37-
4.2 System architecture
The user interacts with the system through an interface that we have developed. The
interface is capable of displaying movies to user, and also asking for explicit ratings. It is
also asks for users demographic data and store all this information on the disk. Finally the
system is capable of generating recommendations based on user’s ratings and his demo-
graphic information. This can be implemented by finding the top k most common neigh-
bors and then using collaborative filtering bias subtracted technique.
In order to provide an optimal service to users, the system must be able to generate
fast and precise recommendations. Furthermore, the ask-to-rate method should be simple
and not boring, but instead should capture user’s attention throughout the duration of the
whole procedure of information gathering.
The aforementioned functional and non-functional requirements should be satisfied
by designing a recommender system with various components and operations. Below, we
provide the key points of its operation:
Input: MovieLens 100k Dataset, new user movies ratings and his demographic
data
Output: Generated recommendations based on: 1) select movies for rating ran-
domly, 2) select movies for rating, considering users demographic data, 3) select
movies for rating, considering their entropy0 score, 4) combination of 2, 3 meth-
ods.
Basic steps of the systems functionality:
1. User starts the system
2. System loads the MovieLens 100k dataset
3. Target user gives his demographic data – optional (only in case the algo-
rithm requests user’s demographic data)
4. System calculates movies entropy – optional (only in case the algorithm
take into consideration movies entropy)
5. System displays movies for rating
6. User rates movies
7. System generates and displays recommendations
8. User exits the system

-38-
In this point it is worth mentioning that our proposed system consists of four inde-
pendent and different algorithms (scripts):
1. The first algorithm (basic algorithm) displays movies for rating randomly, and
then generates recommendations based on collaborative filtering.
2. The second algorithm (demographic based algorithm) displays movies for rating
based on users demographic data, and then generates recommendations like the
basic script.
3. The third algorithm (entropy0 based algorithm) displays movies for rating based
their entropy0 scores (movies with the highest entropy0 scores are presented first),
and then generates recommendations like the basic script.
4. The fourth algorithm (demographic and entropy0 based algorithm) which is a
combination of the third and the fourth script, displays movies for rating based on
users demographics and movies entropy0 scores, and then generates recommen-
dations like the basic script.
4.2.1 Recommendation engine
As we have mentioned above, the recommendation engine is implemented by using
the kNN algorithm and bias subtracted user based collaborative filtering, and the users
similarities are calculated by the Pearson correlation scheme. In other words, we will have
the user-similarity matrix that includes the similarities (Pearson correlation) between us-
ers. Also the recommendations are calculated by taking into account only the top-k most
similar users (kNN algorithm). Finally, in the collaborative filtering technique we have
managed to prevent biases related with the users by subtracting each user’s average rating
from each user’s rating, and then add that average at the end (bias subtracted collaborative
filtering).
4.3 Used dataset
For this project we have used the MovieLens 100k dataset as we have already men-
tioned in previous chapters. This dataset, was developed by GroupLens Research Project
and contains 1682 movies with 100.000 ratings on the rating scale 1-5 provided by 943
users. Moreover, it is based on explicit information given by users during their sign-up on
MovieLens website. It is also worth mentioning that every user included in the dataset
has rated at least 20 movies.

-39-
The MovieLens dataset contains a lot of files, however for our implementation we
have singled out and used the following files:
u.user: This file contains demographic data about users. This information has the
following format:
user id | age | gender | occupation | zipcode.
From the above structure, the zipcode feature was removed because it is not
needed for our project. Below we present the first 3 users of the u.user file:
user id age gender occupation
1 24 M Technician
2 53 F Other
3 23 M Writer
Table 4.4: A sample containing the first 3 rows of the u.user file
The users are classified based on their demographic data by converting the above features
(age, gender and occupation) to numeric scales in order to estimate their similarity. As a
result we have:
a) Age is represented within the ranges: 0-18, 19-24, 25-30, 31-40, 41-50,
51-60, 61-70, 71-100. So for a 24 year old user, we have value 1 for the
19-24 age range and 0s for the other ranges.
b) Gender is specified by 0 and 1
c) Occupation is also specified by 0s and 1
Combining the above features we develop the below model:
age = ['18', '24', '30', '40', '50', '61', '70', '100']
gender = ['M', 'F']
occupation = ['administrator', 'artist', 'doctor', 'educator', 'engineer', 'enter-
tainer', 'executive', 'healthcare', 'homemaker', 'lawyer', 'librarian', 'market-
ing', 'none', 'other', 'programmer', 'retired', 'salesman', 'scientist', 'student',
'technician', 'writer']
combined_features = ['18|0', '24|1', '30|2', '40|3', '50|4', '60|5', '70|6', '100|7',
'm|8', 'f|9', 'administrator|10', 'artist|11', 'doctor|12', 'educator|13', 'engi-
neer|14', 'entertainer|15', 'executive|16', 'healthcare|17', 'homemaker|18',

-40-
'lawyer|19', 'librarian|20', 'marketing|21', 'none|22', 'other|23', 'program-
mer|24', 'retired|25', 'salesman|26', 'scientist|27', 'student|28', 'techni-
cian|29', 'writer|30']
Applying the same logic as the author of 3.2.2 in chapter 3, the above data is used for the
calculation of demographic correlations by taking into consideration the user vector sim-
ilarities. The user demographic vector is defined as a vector with 31 features and can be
seen in detail in the following table:
feature # feature contents comments
0 age <= 18
each user belongs to a single
age group,
the corresponding slot takes
value 1 (true)
the rest of the features re-
main 0 (false)
1 18 < age <= 24
2 24 < age <= 30
3 30 < age <= 40
4 40 < age <= 50
5 50 < age <= 60
6 60 < age <= 70
7 70 < age <= 100
8 Male the slot describing the user
gender is 1
the other slot takes a value
of 0 9 Female
10-30 occupation
a single slot describing the
user occupation is 1
the rest of the slots remain 0
Table 4.5: Description of the user demographic vector
For example, considering the first user of the table 4.4 (24 year old, Male technician)
we can see that the corresponding combined_features list contains the below values:
[0, 1, 0, 0, 0, 0, 0, 0, 1, 0, 0, 0, 0, 0, 0, 0, 0, 0, 0, 0, 0, 0, 0, 0, 0, 0, 0, 0, 0, 1, 0]

-41-
u.data: This is our main dataset that includes 100000 ratings for 1682 movies
given by 943 users. Information is formatted on a table with four columns (user
id, movie id, rating, timestamp). Users are numbered consecutively from 1 to 943
and every use rid is unique for each user. Moreover the same logic applies for
movies (movie id ranges from 1 to 1682). Also as we have mentioned before,
ratings range from 1 to 5. Finally the timestamps are unix seconds since 1/1/1970
UTC, but in our implementation we will not take them into consideration. Below
we give a small sample of the first 5 rows of this dataset where we have omitted
the timestamp column as we mentioned before:
user id movie id rating value
196 242 3
186 302 3
22 377 1
244 51 2
166 346 1
Table 4.6: A sample containing the first 5 rows of the u.data file
u.item: Finally, this file includes the metadata for our movies. More specifically it
is formatted as a table with rows where each row corresponds to a movie. Also the
table has 23 columns where: the 1st column is the movie id, the 2nd is the movie
title, the 3rd is the release date of the movie, the 4th is the imdb link for this movie,
and the remaining columns corresponds to the movie genres. All the possible gen-
res can be: | unknown | Action | Adventure | Animation |Children's | Comedy |
Crime | Documentary | Drama | Fantasy |Film-Noir | Horror | Musical | Mystery |
Romance | Sci-Fi |Thriller | War | Western |. A 1 indicates the movie is of that
genre, while a 0 indicates it is not. Also movies can be in several genres at once.
It is also worth noting that the movie ids are the ones that are used in the u.data
dataset. For our implementation we care only about the titles, as a result we keep
only the first two columns (movie id and movie title). Below we give a small
sample of the first 5 rows of this dataset:

-42-
movie id movie title
1 Toy Story (1995)
2 GoldenEye (1995)
3 Four Rooms (1995)
4 Get Shorty (1995)
5 Copycat (1995)
Table 4.7: A sample containing the first 5 rows of the u.item file

-43-
4.4 Assumptions
For the sake of simplicity, and in order to overcome various problems, we are going
to make some assumptions that are applied within the constraints of our project. The as-
sumptions are described as follows:
The u.item dataset which contains metadata about movies, remains stable and does
not change from the start till the end of our implementation. In other words, there
are not new movies that are added, or there are not movies characteristics that are
altered.
The u.users dataset that contains user’s demographic information does not change.
This means that neither new users are added nor existing users demographic data
changes throughout the whole procedure of our implementation. Even if a new
user is introduced to the system, his demographic data is saved only temporarily.
The same logic is also applied for the u.data dataset, as all the including infor-
mation (users’ movies ratings) does not change. Similarly, in case a new user en-
ters the system, his movies ratings are only saved temporarily and are discarded
when the user exits the system.
There is always a fixed number of movies displayed to target user for rating.
The number of recommended movies is also fixed.
Each algorithm (script) provides recommendations when user has rated 10 mov-
ies.
4.5 Flowchart diagrams
The following sections provide a brief description of the functions of the four algo-
rithms that were discussed in 4.2: Basic algorithm, Demographics based algorithm, En-
tropy0 based algorithm and Demographics-Entropy0 based algorithm. Moreover we in-
troduce the procedure of inserting user’s demographics and providing ratings for movies.

-44-
4.5.1 Basic algorithm flowchart diagram
In this section we introduce the flowchart of the basic algorithm which only uses col-
laborative filtering. Movies are displayed for rating randomly without using a specific
approach.
Picture 4.1 Basic algorithm

-45-
4.5.2 User Demographics based algorithm flowchart diagram
In this section we introduce the flowchart of the user demographics based algorithm
which displays movies for rating based on users’ demographic data and uses collaborative
filtering for recommendations.
Picture 4.2: User Demographics based algorithm

-46-
Below we present a screenshot of how the system asks user to insert his demographic
data:
Picture 4.3: System asks target user to insert his age, gender and occupation

-47-
4.5.3 Movies Entropy0 based algorithm flowchart diagram
In this section we introduce the flowchart of the movies entropy0 based algorithm
which displays movies for rating based on their entropy0 scores and uses collaborative
filtering for recommendations.
Picture 4.4: Movies Entropy0 based algorithm

-48-
4.5.4 User Demographics and movies entropy0 based algorithm flowchart diagram
In this section we introduce the flowchart of the user demographics and movies en-
tropy0 based algorithm which displays movies for rating based on users’ demographics
and movies entropy0 scores and uses collaborative filtering for recommendations.
Picture 4.5: Users demographics and Movies Entropy0 based algorithm

-49-
4.5.5 Movies rating function flowchart diagram
In this point we provide the flowchart diagram for the movie rating procedure. User
starts the system and the system displays movies for rating. User either choses a movie
for rating or presses -1 to load a new movielist. If he has rated 10 movies, the system
provides recommendations by using collaborative filtering. On the other hand, if he has
rated less than 10 movies the user either changes the movielist or keeps the already exist-
ing movielist.
Picture 4.6: Movies rating function

-50-
Below we present an example of how movies are displayed by the system to the target
user for rating:
Picture 4.7: Movies displayed to user for rating

-51-
4.5.6 Inserting target user demographics
In the following flowchart we describe how user inserts his demographic data. First
of all he inserts his age, then he inserts his gender and finally he enters his occupation.
Finally the system uses the kNN algorithm to find user’s top k most common neighbors
based on demographics
Picture 4.8: Insert users demographics function


-53-
5 Implementation
5.1 Basic parts of our implementation
As we have already mentioned in the previous chapter, we developed four different
scripts: basic, demographic-based, entropy0-based and demographic & entropy0-based.
The aforementioned scripts were developed in Python (version 3.6) language using the
PyCharm development environment. Furthermore in order to manage some important Py-
thon packages we have used the Anaconda package manager. Below we are going to give
a brief description of the main functions of the four scripts:
5.1.1 Functions of the Basic script
readFullDataset(dataSetFilePath): This function reads the full dataset (u.data)
which contains the 100000 ratings. It takes one argument (dataSetFilePath) of type
string, which is the path of the u.data file and finally returns the full dataset as
Pandas dataframe with the following names as columns: 'user_id', 'item_id', 'rat-
ing', 'timestamp'
readMovieSet(movieSetFilePath): This function reads the movie dataset (u.item)
which contains information about movies. It takes one argument (movieSet-
FilePath) of type string, which is the path of the u.item file and finally returns the
movie dataset as Pandas dataframe with the following names as columns:
'item_id', 'title'
insertNewUserRatings(ids_titles, fullDataSet, newUserID, timestamp,
known_positives, mySelMovies): This function displays movies to the new user
and asks for explicit ratings. It takes 6 arguments: ids_titles from the
readMovieSet(movieSetFilePath) function, fullDataSet from the readFullDa-
taset(dataSetFilePath) function, the newUserID, a random timestamp, and
known_positives, mySelMovies are both Python lists. Finally returns the full da-
taset that includes the new user with his ratings.

-54-
numberOfUsers(fullDataSet): This function returns the number of users in the da-
taset. It takes the full dataset as an argument.
numberOfMovies(fullDataSet): This function returns the number of movies in the
dataset. It takes the full dataset as an argument.
getUserItemMatrix(n_users, n_items, fullDataSet): This function returns the user-
item matrix. It takes the number of users, the number of movies and also the full
dataset as arguments.
calculateUsersPearsonCorrelation(user_item_matrixTrain): This function re-
turns a matrix with the users Pearson correlation based on their ratings. It takes
the user-item matrix as an argument.
predict_Top_K_no_Bias(ratings, similarity, k=40): This function returns a
numpy array with the predictions for each user (kNN Collaborative filtering-bias
subtracted). It takes the user-item matrix, the matrix with Users Pearson Correla-
tion and a number for the kNN algorithm (default is 40) as arguments.
printPredictedMoviesUserBased(user, n): This function prints the top–n recom-
mended movies for a given user id. It takes the user id and the number of recom-
mended movies as arguments.
5.1.2 Functions of the Demographic-based script
_read_raw_data(path): This function reads the demographic data of the existing
users. It takes one argument (path) of type string, which is the path of the zip file
that contains all the datasets and finally returns the demographic data.
createUserMetaDataList (users_raw, users_age, users_occup, user_meta_raw):
This function asks the new user for his demographic data (age, gender and occu-
pation) and then append this data to the previous dataset with the users de-
mographics. It takes 4 lists as arguments: the first 3 lists are from the demograhic
model that we have created, and the 4th list is demographics of the dataset.

-55-
_parse_user_metadata (num_users, user_meta_raw, users_combined_features):
This function transforms users demographics list (with the new user) into a list
with zeros and ones and return this list. It takes as arguments the number of users,
the demographics of all users (including the new user), and the user’s combined
features from the demographic model.
euclideanDistance(instance1, instance2, length): This function calculates and re-
turns the Euclidean distance of two instances (instance 1 and instance 2).
getNeighbors(trainingSet, testInstance, k): This function calculates and returns
the k most common neighbors of a specified testInstance from a given dataset.
readFullDataset(dataSetFilePath): The same as Basic script.
readMovieSet(movieSetFilePath): The same as Basic script.
insertNewUserRatings(ids_titles, fullDataSet, newUserID, timestamp,
known_positives, mySelMovies, neighborsmovies): The same as Basic script, tak-
ing into consideration the most common neighbors movies.
numberOfUsers(fullDataSet): The same as Basic script
numberOfMovies(fullDataSet): The same as Basic script
getUserItemMatrixDemographicsBased(n_users, n_items, fullDataSet, neigh-
bors) The same as the getUserItemMatrix of the Basic script, taking into consid-
eration only the common neighbors.
getUserItemMatrix(n_users, n_items, fullDataSet): The same as Basic script
calculateUsersPearsonCorrelation(user_item_matrixTrain): The same as Basic
script
predict_Top_K_no_Bias(ratings, similarity, k=40): The same as Basic script
printPredictedMoviesUserBased(user, n): The same as Basic script

-56-
5.1.3 Functions of the Entropy0-based script
readFullDataset(dataSetFilePath): The same as Basic script.
readMovieSet(movieSetFilePath): The same as Basic script.
insertNewUserRatings(ids_titles, fullDataSet, newUserID, timestamp,
known_positives, mySelMovies, entropy_indexes): The same as Basic script tak-
ing into consideration movies entropy (entropy_indexes).
numberOfUsers(fullDataSet): The same as Basic script
numberOfMovies(fullDataSet): The same as Basic script
calcMoviesEntropy0(fullDataSet, n_users, n_items, neighbors): This function
calculates and returns the entropy0 values of the full dataset. It takes as arguments
the full dataset and the number of users and movies.
getUserItemMatrix(n_users, n_items, fullDataSet): The same as Basic script
calculateUsersPearsonCorrelation(user_item_matrixTrain): The same as Basic
script
predict_Top_K_no_Bias(ratings, similarity, k=40): The same as Basic script
printPredictedMoviesUserBased(user, n): The same as Basic script

-57-
5.1.4 Functions of the Demographic & Entropy0-based script
_read_raw_data(path): The same as Demographic based script.
createUserMetaDataList (users_raw, users_age, users_occup, user_meta_raw):
The same as Demographic based script.
_parse_user_metadata(num_users, user_meta_raw, users_combined_features): The same as Demographic based script.
euclideanDistance(instance1, instance2, length): This function calculates and re-
turns the Euclidean distance of two instances (instance 1 and instance 2).
getNeighbors(trainingSet, testInstance, k): This function calculates and returns
the k most common neighbors of a specified testInstance from a given dataset.
readFullDataset(dataSetFilePath): The same as Basic script.
readMovieSet(movieSetFilePath): The same as Basic script.
insertNewUserRatings(ids_titles, fullDataSet, newUserID, timestamp,
known_positives, mySelMovies, entropy_indexes): The same as Basic script
numberOfUsers(fullDataSet): The same as Basic script
numberOfMovies(fullDataSet): The same as Basic script
calcMoviesEntropy0(fullDataSet, n_users, n_items, neighbors): The same as En-
tropy0 based script.
getUserItemMatrix(n_users, n_items, fullDataSet): The same as Basic script
calculateUsersPearsonCorrelation(user_item_matrixTrain): The same as Basic
script
predict_Top_K_no_Bias(ratings, similarity, k=40): The same as Basic script
printPredictedMoviesUserBased(user, n): The same as Basic script

-58-
5.2 Basic flow of each script
Below we are going to present and highlight the most important points of the basic
flow of each script. The corresponding scripts can be seen in detail in the Appendix
(source code section).
5.2.1 Basic script
Lines 198-201: The system initializes the new user and also some lists.
Lines 203-206: The system reads the full dataset and the full movieset,
Lines 209-213: The system displays movies and asks for explicit ratings., then it
calculates the number of users and movies
Line 216: The system creates the user item matrix taking into consideration the
new user.
Line 219: The system calculates users similarity by Pearson correlation
Line 222: The system generates predictions for users
Line 238: The system prints the top 10 recommended movies for the new user
5.2.2 Demographic-based script
Lines 369-372: The system initializes the new user and also some lists.
Line 375: The system fetch the users demographic data
Lines 378-392: The system creates the model for the demographic based system
by creating some lists
Line 395: The system asks for the demographic data of new user and appends it
to the list with the demographics of existing users.
Lines 397-400: The system reads the full dataset and the full movieset
Line 404: The system creates a list with zeros and ones that corresponds to users
demographic data including the new user
Line 406: The system creates a list with zeros and ones that corresponds to users
demographic data without the new user
Line 408: The system creates a list with zeros and ones that corresponds only to
new user demographic data.
Line 411: The system finds the 20 most common neighbors of the new user, tak-
ing into consideration users demographics.
Lines 413-415: The system calculates the number of users and movies

-59-
Line 417: The system returns all the rated movies of the 20 most common users
based on demographics
Lines 421: The system displays movies and asks for explicit ratings, taking into
consideration only the movies of the 20 most common users.
Lines 424-425: The system calculates again the number of users and movies
Line 428: The system creates the user item matrix taking into consideration the
new user.
Line 431: The system calculates users similarity by Pearson correlation
Line 434: The system generates predictions for users
Line 450: The system prints the top 10 recommended movies for the new user
5.2.3 Entropy0-based script
Lines 253-256: The system initializes the new user and also some lists.
Lines 258-261: The system reads the full dataset and the full movieset.
Line 263-265: The system calculates the number of users and movies
Line 267: The system calculate movies ratings entropy0 values and return mov-
ies indexes starting from the highest entropy0 values to the lowest
Lines 271: The system displays movies and asks for explicit ratings, considering
movies entropy0 values.
Line 273-275: The system re-calculates the number of users and movies.
Line 278: The system creates the user item matrix taking into consideration the
new user.
Line 281: The system calculates users similarity by Pearson correlation
Line 284: The system generates predictions for users
Line 300: The system prints the top 10 recommended movies for the new user
5.2.4 Demographic & Entropy0-based script
Lines 408-411: The system initializes the new user and also some lists.
Line 414: The system fetch the users demographic data
Lines 417-431: The system creates the model for the demographic based system
by creating some lists
Line 433: The system asks for the demographic data of new user and appends it
to the list with the demographics of existing users.

-60-
Line 437: The system creates a list with zeros and ones that corresponds to users
demographic data including the new user
Line 439: The system creates a list with zeros and ones that corresponds to users
demographic data without the new user
Line 441: The system creates a list with zeros and ones that corresponds only to
new user demographic data.
Line 444: The system finds the 20 most common neighbors of the new user, tak-
ing into consideration users demographics.
Lines 446-449: The system reads the full dataset and the full movieset.
Lines 451-453: The system calculates the number of users and movies
Line 457: The system calculates movies ratings entropy0 values taking into con-
sideration the ratings of the 20 most common neighbors, and returns the corre-
sponding movies indexes from the highest to the lowest.
Lines 460: The system displays movies and asks for explicit ratings, taking into
consideration the movies indexes of the previous line
Line 462-464: The system calculates the number of users and movies
Line 467: The system creates the user item matrix taking into consideration the
new user.
Line 470: The system calculates users similarity by Pearson correlation
Line 473: The system generates predictions for users
Line 489: The system prints the top 10 recommended movies for the new user

-61-
6 Evaluation and future work
6.1 Results and evaluation
In this part, we proceed in the evaluation of our system: We have tested each of the
four scripts on 25 different users. 10 of them were female and 15 were male with their
age ranging from 20-60.
In order to remove bias from the evaluation, we do not disclose in which of the four
scripts each predicted movieset corresponds to. For that reason, we modified the printPre-
dictedMoviesUserBased(), function of each script by commenting out the last line and
adding another line that saves the predicted movieset in excel format. As a result, the
modified function will be:
Picture 6.1: Modified version of the printPredictedMoviesUserBased() function
As we can see from the above figure, the blue arrow indicates the added line of code that
writes the predicted movieset into an excel file, while the red arrow indicates the com-
mented code. By this way, the program hides the predicted movieset and the user is com-
pletely unaware of which predicted movieset corresponds to each of the 4 scripts.
The evaluation process is presented as follows: First of all, every user have to execute
each of the four scripts (systems). Then, the four predicted moviesets are shown to the
user: The A set corresponds to the demographic-based script, the B set corresponds to the
entropy0-based script, the C set corresponds to the basic script and finally the D set cor-
responds to the demographic & entropy0 based script, however the user is not aware of
that matching in order to remove bias as we have mentioned before. Finally, the users
have to rank their most preferred to least preferred movieset by declaring his preferences.

-62-
For example: Firstly I choose movieset B, secondly I choose movieset A, then I choose
movieset D and finally I choose movieset C. The first preference is awarded with four
points, the second with 3, the third with 2 and the final with 1 point. By this way we can
get the required preference scores for each of the 4 scripts in order to complete the eval-
uation.
In order to calculate the final scores of the evaluation for each script, we created an
excel file with all the required information. This can be seen below:
User info User preference scores for each system User effort time (min.)
Age Gender Occupation A B C D A B C D
27 F Student 4 3 2 1 6 4 9 15
55 F Technician 2 4 1 3 3 3 9 16
54 M Technician 4 2 3 1 3 4 9 15
30 M Scientist 3 4 1 2 4 3 7 10
20 F Artist 4 3 2 1 5 4 8 12
22 M Student 1 3 4 2 4 4 9 13
25 F Programmer 4 2 3 1 4 5 8 11
30 M Engineer 3 4 1 2 5 6 7 16
31 M Doctor 1 4 2 3 3 3 9 17
18 M Student 4 3 1 2 4 6 7 13
62 F Retired 4 1 2 3 6 4 7 12
65 M Retired 1 4 3 2 6 3 8 15
38 M Programmer 3 4 2 1 5 5 6 15
31 F Lawyer 2 1 3 4 3 4 8 14
27 M Salesman 3 4 2 1 4 3 7 14
26 M Healthcare 3 4 1 2 7 4 9 16
28 F Educator 3 4 1 2 5 6 9 17
27 M Marketing 2 4 3 1 6 5 7 11
25 M Salesman 4 2 1 3 7 3 8 18
24 F Educator 3 2 1 4 3 3 9 12
29 M Engineer 1 4 2 3 7 4 8 14
33 M Programmer 4 2 3 1 3 5 6 12
35 F Homemaker 2 4 3 1 3 6 6 13
25 M Technician 3 4 1 2 4 3 7 17
21 F Artist 4 1 2 3 6 4 9 17
SUM 72 77 50 51 116 104 196 355
AVG 3,13 3,34 2,17 2,21 5,04 4,52 8,52 15,43
Table 6.1: Evaluation table containing user demographics, the preference scores for every script
and also the effort time to complete each script

-63-
As we can see, demographic-based and entropy0 based systems are topping the list of
most preferred systems. Entropy0 based is in the first position with average preference
score 3,34, while demographic based comes second with 3,13. Surprisingly, the demo-
graphic and entropy0 based system is in the third position with 2,21 average preference
score, while the basic system (random selection) is the last with 2,17.
In terms of user effort time, entropy0 based system is again the first with 4,52 minutes
average user effort time, demographic based is second with 5,04 minutes, basic system is
third with 8,52 minutes while demographics and entropy0 based system is the last with
15,43 minutes (double than that of basic).
Finally, excluding the system that combines demographics and entropy0, we compare
and contrast entropy0 based and demographic based systems with the basic system. As a
result we have the following table:
Demographics based Entropy0 based Basic
SUM 72 77 50
Percentage 36,18% 38,69% 25,12%
Table 6.2: Comparing the best two systems with the basic in terms of user preference score
6.2 Conclusions
Taking into consideration the above evaluations, we conclude that ratings entropy0
values as well as users demographics can play an important role in addressing cold start
problem on collaborative filtering systems. Users tend to prefer entropy0 based systems,
while demographics based systems rank second with small difference from the first. Sur-
prisingly, the system that combines both demographics and entropy0 is in the third place
with almost the same user preference score as the basic system that offers random selec-
tion.
More specifically, the entropy0 based system not only is first in terms of user prefer-
ence scores, but also requires less user effort than the other three systems. The average
user effort for entropy0 based system is 4,5 minutes while demographics based system
requires 5 minutes on average. Users seemed happy as both of the aforementioned sys-
tems and especially entropy0 based displayed movies that were known to them. Moreo-
ver, they were a little concerned about the demographic based system because it displayed
for rating only a small portion of the total available movies of the dataset. Furthermore,
the system that combines both demographics and entropy0 values, is in the last position

-64-
because it mostly displays unknown movies, so the users have to make a great effort in
order to complete this test.
To sum up, we can see that entropy0 based system is in the first place both in terms
of users preference scores and also in terms of effort time. This can also be depicted better
if we see the tables 6.1 and 6.2 where entropy0 based system is better than the basic by
13% while it requires much less user effort (the average user effort for entropy0 based is
4,5 minutes while for the basic is 8,5 minutes). By this way, we have significantly im-
proved the collaborative movie recommender system both in terms of user preference
scores and also in user effort time.
6.3 Future work
As we have seen from the evaluation part, the majority of users were complaining that
many movies were old and completely unknown to them. As a result, in a future work
there a need to use newer dataset with more known movies. Furthermore, except from the
release year, the movie-set should be enhanced with more demographic features such as
income level, marital status, number of children, religion etc. By this way we can better
understand how much demographics affect recommender systems.
Another idea for future research is to use completely different datasets that include
other kind of products such as music, books, electronic devices and more (this can be
achieved by using Amazon datasets).
Finally, another addition that will surely attract a lot of attention is to develop recom-
mender systems for mobile devices. As we can see, in the past 10 years there is a rapid
growth of mobile devices and more and more people are using smartphones and tablets.
As a result, there is a need to develop recommender systems that fit in these mobile de-
vices. The main idea is that the user will send all the required data from his mobile device
using an easy and friendly graphical user interface. Then the recommendation engine run-
ning on a powerful server will receive and process the user input, generate recommenda-
tion and send it back to user’s device. By this way the user will be able to see the predic-
tions through a simple and friendly interface of his mobile device.

-65-
Bibliography
1. Internet usage statistics - The big picture of world Internet users and population
stats. http://www.internetworldstats.com/stats.htm.
2. P. Resnick, N. Iacovou, M. Suchak, P. Bergstorm, and J. Riedl. GroupLens: An
Open Architecture for Collaborative Filtering of Netnews. Proceedings of ACM
Conference on Computer Supported Cooperative Work, citeseer.ist.psu.edu/res-
nick94grouplens.html, 1994.
3. Leskovec,J.,Rajaraman,A.,&Ullman,J.D.(2014). Mining of massive datasets.
Cambridge University Press.
4. Burke,R.(2002). Hybrid recommender systems: Survey and experiments. User
modeling and user-adapted interaction, 12(4), 331-370.
5. Hu,Y.,Koren,Y.,&Volinsky,C.(2008).Collaborative filtering for implicit feed-
back datasets. Data Mining,2008. ICDM’08.Eighth IEEE International Confer-
ence (pp. 263-272).IEEE.
6. Ricci,F.,Rokach,L.,& Shapira,B.(2011). Introduction to recommender systems
handbook (pp. 1-35).Springer US.
7. D. Goldberg, D. Nichols, B. M. Oki, and D. Terry, “Using collaborative filtering
to weave an information tapestry,” Commun. ACM, vol. 35, pp. 61–70, Dec.
1992.
8. G. Adomavicius and A. Tuzhilin, “Toward the next generation of recommender
systems a survey of the state-of-the-art and possible extensions
9. J. Bobadilla, F. Serradilla, and J. Bernal, “A new collaborative filtering metric that
improves the behavior of recommender systems,” Knowledge-Based Systems
10. Hanani U., Shapira B., Shoval P., (2001). “Information Filtering: Overview of
Issues, Research and Systems”, User Modeling and User-Adapted Interaction, 11
(3), 203–259.
11. Salton G., McGill M.J., Introduction to Modern Information Retrieval, McGraw-
Hill, 1983.

-66-
12. Breese J. S., Heckerman D., Kadie C., (1998). “Empirical Analysis of Predictive
Algorithms for Collaborative Filtering.” In Uncertainty in Artificial Intelligence.
Proceedings of the Fourteenth Conference, pp. 43–52.
13. Deshpande M., Karypis G., (2004). “Item-based top-N recommendation algo-
rithms.” ACM Transations on Information Systems, 22(1), 143–177. ISSN 1046-
8188.
14. Linden G., Smith B., York J., (2003). “Amazon.com Recommendations: Item-to-
Item Collaborative Filtering.” IEEE Internet Computing, 7(1), 76–80.
15. Callvik, Johan, Liu, Alva, (2017) “Using Demographic Information to Reduce
the New User Problem in Recommender Systems.” Kth Royal Institute of Tech-
nology School Of Computer Science And Communication
16. Manolis Vozalis, Konstantinos G Margaritis, (2004). “Collaborative Filtering En-
hanced By Demographic Correlation.” AIAI symposium on professional practice
in AI, of the 18th world computer congress.
17. MH Nadimi-Shahraki, M Bahadorpour, (2014). “Cold-start Problem in Collabo-
rative Recommender Systems: Efficient Methods Based on Ask-to-rate Tech-
nique”. CIT. Journal of Computing and Information Technology 22 (2), 105-113
18. Rashid, A.M., Karypis, G., Riedl, J. (2002) “Learning preferences of new users in
recommender systems: an information theoretic approach” 127–134. ACM Press
19. Sebastiani F., (2002) “Machine Learning in Automated Text Categorization”,
ACM Computing Surveys, 34 (1), 1–47.
20. Shani,G., & Gunawardana,A. (2011). Evaluating recommendation systems. Rec-
ommender systems handbook (pp. 257-297). Springer US.
21. Burke,R.(2007).Hybrid web recommender systems. The adaptive web (pp. 377-
408).Springer Berlin Heidelberg.
22. Koren, Yehuda; Bell, Robert; Volinsky, Chris. Matrix factorization techniques for
recommender systems. Published by the IEEE Computer Society, 0018 9162/09,
2009.
23. Oliver Sutton, (2012). Introduction to k Nearest Neighbor Classification and Con-
desed Nearest Neighbor Data Reduction
24. Konstantinos Chatzisavvas, George Sarigiannidis, Machine Learning Algorithms
for Recommendation System and a Social Recommender System.

-67-
Appendix
Source Code
basic.py
1 import numpy as np
2 import pandas as pd
3 from sklearn.metrics.pairwise import pairwise_distances
4 from random import randint
5
6
7
######################################################################
##################################################
8 #We read in the u.data file, which contains the full dataset.
9 def readFullDataset(dataSetFilePath):
10 header = ['user_id', 'item_id', 'rating', 'timestamp']
11 return pd.read_csv(dataSetFilePath, sep='\t', names=header)
12 #----------------------------------------------------------------
------------------------------------------------------#
13
14
15
######################################################################
##################################################
16 #we read the the movies titles from the movie dataset
17 def readMovieSet(movieSetFilePath):
18 df_ids_titles = pd.read_csv(movieSetFilePath, sep="|",
header=None, encoding='latin-1', names=['itemId', 'title'],usecols=[0,
1])
19 ids_titles = np.empty(1682, dtype=np.object)
20 for line in df_ids_titles.itertuples():
21 ids_titles[line[0]] = line[2]
22 return ids_titles
23 #----------------------------------------------------------------
------------------------------------------------------#
24
25
26
######################################################################
##################################################
27 #insert new user by creating gui in python console
28 def insertNewUserRatings(ids_titles, fullDataSet, newUserID,
timestamp, known_positives, mySelMovies):
29 i=0
30 j=20
31 f=0
32 while(f < 10):
33 userList = []
34 for x in range(i,j):
35 userList.append({x%20+1: ids_titles[randint(0,
1681)]})

-68-
36 print('\n')
37 for p in userList:
38 print(p)
39 print('\n')
40 while(True):
41 try:
42 var = int(input("Choose a movie, or press -1 to
change movieset: "))
43 except ValueError:
44 print("Wrong input, please insert an integer")
45 continue
46 if((var<-1 or var>20) and var ==0):
47 print("Value must be -1 OR between 1 and 20.
Please insert a valid integer")
48 continue
49 if(1<=var and 20>=var):
50 selMovie = str(ids_titles.tolist().index(us-
erList[var - 1][var]) + 1)
51 if selMovie in mySelMovies:
52 print("You have already selected that movie,
please choose another movie")
53 continue
54 mySelMovies.append(str(ids_titles.tolist().in-
dex(userList[var-1][var])+1))
55 break
56 if (var == -1):
57 if ((1681 - j) >= 20):
58 i = j
59 j += 20
60 elif ((1681 - j) > 0):
61 i = j
62 j = 1682
63 else:
64 i = 0
65 j = 20
66 continue
67 else:
68 print('\n')
69 print("You selected the movie: " + userList[var-
1][var] + " with ID: " + str(ids_titles.tolist().index(userList[var-
1][var])+1))
70 print('\n')
71 while (True):
72 try:
73 rating = int(input("Rate the movie: "))
74 except ValueError:
75 print("Wrong input, please insert an inte-
ger")
76 continue
77 if (rating < 1 or rating > 5):
78 print("Value must be between 1 and 5. Please
insert a valid integer")
79 continue
80 break
81 known_positives.append(ids_titles.tolist().index(us-
erList[var - 1][var]) + 1)
82 fullDataSet.loc[len(fullDataSet)] = [newUserID,
ids_titles.tolist().index(userList[var - 1][var]) + 1, rating,
timestamp]
83 f = f + 1
84 while(f < 10):

-69-
85 while (True):
86 try:
87 ch = int(input("To change the movieset
press -1, to keep press 1: "))
88 except ValueError:
89 print("Wrong input, please insert an in-
teger")
90 continue
91 if (ch != 1 and ch != -1):
92 print("Value must be 1 or -1. Please in-
sert a valid integer")
93 continue
94 break
95 if(int(ch) == -1):
96 break
97 else:
98 print('\n')
99 for p in userList:
100 print(p)
101 print('\n')
102 while (True):
103 try:
104 var = int(input("Choose a movie: "))
105 except ValueError:
106 print("Wrong input, please insert an
integer")
107 continue
108 if ((var < -1 or var > 20)):
109 print("Value must be between 1 and
20. Please insert a valid integer")
110 continue
111 selMovie = str(ids_titles.tolist().in-
dex(userList[var - 1][var]) + 1)
112 if selMovie in mySelMovies:
113 print("You have already selected that
movie, please choose another movie")
114 continue
115 mySelMovies.append(str(ids_ti-
tles.tolist().index(userList[var - 1][var]) + 1))
116 break
117 print('\n')
118 print("You selected the movie: " + us-
erList[var - 1][var] + " with ID: " + str(
119 ids_titles.tolist().index(userList[var -
1][var]) + 1))
120 print('\n')
121 while (True):
122 try:
123 rating = int(input("Rate the movie:
"))
124 except ValueError:
125 print("Wrong input, please insert an
integer")
126 continue
127 if (rating < 1 or rating > 5):
128 print("Value must be between 1 and 5.
Please insert a valid integer")
129 continue
130 break
131 known_positives.append(ids_ti-
tles.tolist().index(userList[var - 1][var]) + 1)

-70-
132 fullDataSet.loc[len(fullDataSet)] = [newUse-
rID, ids_titles.tolist().index(userList[var - 1][var]) + 1, rating,
timestamp]
133 f = f + 1
134 if((1681-j) >= 20):
135 i = j
136 j += 20
137 elif((1681-j) > 0):
138 i = j
139 j = 1682
140 else:
141 i = 0
142 j = 20
143 print('\n')
144 return fullDataSet
145 #----------------------------------------------------------------
------------------------------------------------------#
146
147
148
######################################################################
##################################################
149 #we count the number of unique users and movies.
150 def numberOfUsers(fullDataSet):
151 n_users = fullDataSet.user_id.unique().shape[0]
152 return n_users
153
154 def numberOfMovies(fullDataSet):
155 n_items = fullDataSet.item_id.unique().shape[0]
156 return n_items
157 #----------------------------------------------------------------
------------------------------------------------------#
158
159
160
######################################################################
##################################################
161 #we create user-item matrix
162 def getUserItemMatrix(n_users, n_items, fullDataSet):
163 user_item_matrix = np.zeros((n_users, n_items))
164 for line in fullDataSet.itertuples():
165 user_item_matrix[line[1] - 1, line[2] - 1] = line[3]
166 return user_item_matrix
167 #----------------------------------------------------------------
------------------------------------------------------#
168
169
170
######################################################################
##################################################
171 #we use the pairwise_distances function from sklearn to calculate
the pearson correlation
172 def calculateUsersPearsonCorrelation(user_item_matrixTrain):
173 user_similarityPearson = 1 - pairwise_distances(user_item_ma-
trixTrain, metric='correlation') #943*943
174 user_similarityPearson[np.isnan(user_similarityPearson)] = 0
175 return user_similarityPearson
176 #----------------------------------------------------------------
------------------------------------------------------#
177
178

-71-
179
######################################################################
##################################################
180 #make predictions combining Top-K neigbors and Bias-subtracted
collaborative filtering
181 def predict_Top_K_no_Bias(ratings, similarity, k=40):
182 pred = np.zeros(ratings.shape)
183 user_bias = ratings.mean(axis=1)
184 ratings = (ratings - user_bias[:, np.newaxis]).copy()
185 for i in range(ratings.shape[0]):
186 top_K_users = [np.argsort(similarity[:,i])[:-k-1:-1]]
187 for j in range(ratings.shape[1]):
188 pred[i,j] = similarity[i, :][top_K_users].dot(rat-
ings[:, j][top_K_users])
189 pred[i,j] /= np.sum(np.abs(similarity[i, :][top_K_us-
ers]))
190 pred += user_bias[:, np.newaxis]
191 return pred
192 #----------------------------------------------------------------
------------------------------------------------------#
193
194
195
######################################################################
##################################################
196 ##############################################BASIC
SCRIPT##############################################################
197
198 newUserID = 944 # new user's id
199 timestamp = '883446543' # random timestamp, we dont care about
that
200 known_positives = []
201 mySelMovies = []
202
203 #read the movieset
204 ids_titles = readMovieSet('u.item')
205 #read the full dataset
206 fullDataSet = readFullDataset('u.data')
207
208 #insert new user
209 fullDataSetNewUser = insertNewUserRatings(ids_titles, fullDa-
taSet, newUserID, timestamp, known_positives, mySelMovies)
210
211 #calculate number of users and items
212 n_users = numberOfUsers(fullDataSetNewUser)
213 n_items = numberOfMovies(fullDataSetNewUser)
214
215 #calculate user item matrix
216 user_item_matrix = getUserItemMatrix(n_users, n_items, fullDa-
taSetNewUser)
217
218 #calculate user similarity(Pearson correlation)
219 user_similarityPearson = calculateUsersPearsonCorrela-
tion(user_item_matrix)
220
221 #apply bias subtracted user-based collaborative filtering with
Top-40 most common neigbors algorithm
222 user_prediction_User = predict_Top_K_no_Bias(user_item_matrix,
user_similarityPearson, k=40)
223

-72-
224 #function for printing the top n recommended movies for a given
user id -
225 def printPredictedMoviesUserBased(user, n):
226 user = user - 1
227 n = n - 1
228 pred_indexes = [i + 1 for i in np.argsort(-user_predic-
tion_User[user])]
229 pred_indexes = [item for item in pred_indexes if item not in
known_positives]
230 movies_ids_titles = pd.read_csv('u.item', sep="|",
header=None, encoding='latin-1', names=['itemId', 'title'],
usecols=[0, 1])
231 pd_pred_indexes = pd.DataFrame(pred_indexes, columns=['item-
Id'])
232 pred_movies = pd.merge(pd_pred_indexes, movies_ids_titles,
on='itemId')
233 print('\n')
234 print("*******************user-based collaborative filtering
(Top-K neigbors and Bias-subtracted)*******************************")
235 print(pred_movies.loc[:n])
236
237 #print the top 10 recommended movies for the new User (id = 944)
238 printPredictedMoviesUserBased(944, 10)

-73-
demographic-based.py
1 import zipfile
2 from numpy import array
3 import numpy as np
4 import pandas as pd
5 from sklearn.metrics.pairwise import pairwise_distances
6 import math
7
8
9
10
######################################################################
##################################################
11 #fetch demographic data
12 def _read_raw_data(path):
13 with zipfile.ZipFile(path) as datafile:
14 return datafile.read('ml-100k/u.user').decode(errors='ig-
nore').split('\n')
15 #----------------------------------------------------------------
------------------------------------------------------#
16
17
18
######################################################################
##################################################
19 # create the user_meta-data list
20 def createUserMetaDataList(users_raw, users_age, users_occup,
user_meta_raw):
21 # first create the user_meta-data list by the existing da-
taset
22 for line in users_raw:
23 if not line:
24 continue
25 #print(line)
26 splt = line.split('|')
27 # Zero-based indexing
28 userid = int(splt[0])
29 age = int(splt[1])
30 gender = splt[2]
31 occup = splt[3]
32 i = 0
33 for m in users_age:
34 if(age <= int(m)):
35 #print(i)
36 break
37 else:
38 i = i + 1
39
40 if(gender == 'M'):
41 j = 8
42 else:
43 j = 9
44 k = 10
45 for n in users_occup:
46 if(occup == n):
47 #print(k)
48 break
49 else:
50 k = k + 1
51 s = str(userid) + "|"
52 for l in range(0,31):

-74-
53 if(l == i or l == j or l == k):
54 s = s + "1|"
55 else:
56 s = s + "0|"
57 s = s[:-1]
58 user_meta_raw.append(s)
59 #then, append the new user to the above user_meta_data list
60 while (True):
61 try:
62 print('Select your age range:\n', '1. <=18\n', '2.
19-24\n', '3. 25-30\n', '4. 31-40\n', '5. 41-50\n',
63 '6. 51-60\n', '7. 61-70\n', '8. 71-100\n')
64 newage = int(input("Choose the corresponding number:
"))
65 except ValueError:
66 print("Wrong input, please insert an integer")
67 continue
68 if (newage < 1 or newage > 8):
69 print("Value must be between 1 and 8. Please insert a
valid integer")
70 continue
71 if (1 <= newage and 8 >= newage):
72 newage = (newage) - 1
73 break
74
75 while (True):
76 try:
77 print('Select your gender:\n', '1. Male\n', '2. Fe-
male\n')
78 newgend = int(input("Choose the corresponding number:
"))
79 except ValueError:
80 print("Wrong input, please insert an integer")
81 continue
82 if (newgend < 1 or newgend > 2):
83 print("Value must be 1 or 2. Please insert a valid
integer")
84 continue
85 if (1 == newgend or 2 == newgend):
86 newgend = (newgend) - 1 + 8
87 break
88
89 while (True):
90 try:
91 print('Select your occupation:\n', '1. administra-
tor\n', '2. artist\n', '3. doctor\n', '4. educator\n',
92 '5. engineer\n', '6. entertainer\n',
93 '7. executive\n', '8. healthcare\n', '9. home-
maker\n', '10. lawyer\n', '11. librarian\n',
94 '12. marketing\n', '13. none\n', '14. other\n',
95 '15. programmer\n', '16. retired\n', '17.
salesman\n', '18. scientist\n', '19. student\n',
96 '20. technician\n', '21. writer\n')
97 newoccup = int(input("Choose the corresponding num-
ber: "))
98 except ValueError:
99 print("Wrong input, please insert an integer")
100 continue
101 if (newoccup < 1 or newoccup > 21):
102 print("Value must be between 1 and 21. Please insert
a valid integer")

-75-
103 continue
104 if (1 <= newoccup and 21 >= newoccup):
105 newoccup = (newoccup) - 1 + 10
106 break
107
108 s = str(944) + "|"
109 for l in range(0, 31):
110 if (l == newage or l == newgend or l == newoccup):
111 s = s + "1|"
112 else:
113 s = s + "0|"
114 s = s[:-1]
115 user_meta_raw.append(s)
116 return user_meta_raw
117 #----------------------------------------------------------------
------------------------------------------------------#
118
119
120
######################################################################
##################################################
121 #transform users metadata to a list with zeros and ones
122 def _parse_user_metadata(num_users, user_meta_raw, users_com-
bined_features):
123 user_features = np.zeros((num_users, len(users_combined_fea-
tures)))
124 for meta in user_meta_raw:
125 if not meta:
126 continue
127 splt = meta.split('|')
128 # Zero-based indexing
129 iid = int(splt[0]) - 1
130 item_meta = [idx for idx, val in
131 enumerate(splt[1:])
132 if int(val) > 0]
133 for gid in item_meta:
134 user_features[iid, gid] = 1.0
135 return user_features
136 #----------------------------------------------------------------
------------------------------------------------------#
137
138
139
######################################################################
##################################################
140 #calculate the euclidean distance of users and then find the
k(k=20) most common neigbors based on demographics
141 def euclideanDistance(instance1, instance2, length):
142 distance = 0
143 for x in range(length):
144 distance += pow((instance1[x] - instance2[x]), 2)
145 return math.sqrt(distance)
146
147 def getNeighbors(trainingSet, testInstance, k):
148 distances = []
149 length = len(testInstance)
150 for x in range(len(trainingSet)):
151 dist = euclideanDistance(testInstance, trainingSet[x],
length)
152 distances.append(dist)
153 a = array(distances)

-76-
154 sorted_indexes = np.argsort(a)
155 index_neighbors = sorted_indexes[:k]
156 return index_neighbors
157 #----------------------------------------------------------------
------------------------------------------------------#
158
159
160
######################################################################
##################################################
161 #We read in the u.data file, which contains the full dataset.
162 def readFullDataset(dataSetFilePath):
163 header = ['user_id', 'item_id', 'rating', 'timestamp']
164 return pd.read_csv(dataSetFilePath, sep='\t', names=header)
165 #----------------------------------------------------------------
------------------------------------------------------#
166
167
168
######################################################################
##################################################
169 #we read the the movies titles from the movie dataset
170 def readMovieSet(movieSetFilePath):
171 df_ids_titles = pd.read_csv(movieSetFilePath, sep="|",
header=None, encoding='latin-1', names=['itemId', 'title'],usecols=[0,
1])
172 ids_titles = np.empty(1682, dtype=np.object)
173 for line in df_ids_titles.itertuples():
174 ids_titles[line[0]] = line[2]
175 return ids_titles
176 #----------------------------------------------------------------
------------------------------------------------------#
177
178
179
######################################################################
##################################################
180 #we count the number of unique users and movies.
181 def numberOfUsers(fullDataSet):
182 n_users = fullDataSet.user_id.unique().shape[0]
183 return n_users
184
185 def numberOfMovies(fullDataSet):
186 n_items = fullDataSet.item_id.unique().shape[0]
187 return n_items
188 #----------------------------------------------------------------
------------------------------------------------------#
189
190
191
######################################################################
##################################################
192 #we create user-item matrix with the k most common users based on
demographics
193 def getUserItemMatrixDemographicsBased(n_users, n_items, fullDa-
taSet, neighbors):
194 user_item_matrixTrain = np.zeros((n_users, n_items))
195 for line in fullDataSet.itertuples():
196 if line[1] - 1 in neighbors:
197 user_item_matrixTrain[line[1] - 1, line[2] - 1] =
line[3]

-77-
198 neighborsmovies = []
199 for i in range(0, n_items):
200 for u in neighbors:
201 if ((user_item_matrixTrain[u, i] == 5) and (i not in
neighborsmovies)):
202 neighborsmovies.append(i)
203 return neighborsmovies
204
205 #----------------------------------------------------------------
------------------------------------------------------#
206
207
208
######################################################################
##################################################
209 #insert new user by creating gui in python console
210 def insertNewUserRatings(ids_titles, fullDataSet, newUserID,
timestamp, known_positives, mySelMovies, neighborsmovies):
211 i=0
212 j=20
213 f=0
214 while(f < 10):
215 userList = []
216 for x in range(i,j):
217 userList.append({x%20+1: ids_titles[neighborsmov-
ies[x]]})
218 print('\n')
219 for p in userList:
220 print(p)
221 print('\n')
222 while(True):
223 try:
224 var = int(input("Choose a movie, or press -1 to
change movieset: "))
225 except ValueError:
226 print("Wrong input, please insert an integer")
227 continue
228 if((var<-1 or var>20) and var ==0):
229 print("Value must be -1 OR between 1 and 20.
Please insert a valid integer")
230 continue
231 if(1<=var and 20>=var):
232 selMovie = str(ids_titles.tolist().index(us-
erList[var - 1][var]) + 1)
233 if selMovie in mySelMovies:
234 print("You have already selected that movie,
please choose another movie")
235 continue
236 mySelMovies.append(str(ids_titles.tolist().in-
dex(userList[var-1][var])+1))
237 break
238 if (var == -1):
239 if ((len(neighborsmovies)-1 - j) >= 20):
240 i = j
241 j += 20
242 elif ((len(neighborsmovies)-1 - j) > 0):
243 i = j
244 j = len(neighborsmovies)-1
245 else:
246 i = 0
247 j = 20

-78-
248 continue
249 else:
250 print('\n')
251 print("You selected the movie: " + userList[var-
1][var] + " with ID: " + str(ids_titles.tolist().index(userList[var-
1][var])+1))
252 print('\n')
253 while (True):
254 try:
255 rating = int(input("Rate the movie: "))
256 except ValueError:
257 print("Wrong input, please insert an inte-
ger")
258 continue
259 if (rating < 1 or rating > 5):
260 print("Value must be between 1 and 5. Please
insert a valid integer")
261 continue
262 break
263 known_positives.append(ids_titles.tolist().index(us-
erList[var - 1][var]) + 1)
264 fullDataSet.loc[len(fullDataSet)] = [newUserID,
ids_titles.tolist().index(userList[var - 1][var]) + 1, rating,
timestamp]
265 f = f + 1
266 while(f < 10):
267 while (True):
268 try:
269 ch = int(input("To change the movieset
press -1, to keep press 1: "))
270 except ValueError:
271 print("Wrong input, please insert an in-
teger")
272 continue
273 if (ch != 1 and ch != -1):
274 print("Value must be 1 or -1. Please in-
sert a valid integer")
275 continue
276 break
277 if(int(ch) == -1):
278 break
279 else:
280 print('\n')
281 for p in userList:
282 print(p)
283 print('\n')
284 while (True):
285 try:
286 var = int(input("Choose a movie: "))
287 except ValueError:
288 print("Wrong input, please insert an
integer")
289 continue
290 if ((var < -1 or var > 20)):
291 print("Value must be between 1 and
20. Please insert a valid integer")
292 continue
293 selMovie = str(ids_titles.tolist().in-
dex(userList[var - 1][var]) + 1)
294 if selMovie in mySelMovies:

-79-
295 print("You have already selected that
movie, please choose another movie")
296 continue
297 mySelMovies.append(str(ids_ti-
tles.tolist().index(userList[var - 1][var]) + 1))
298 break
299 print('\n')
300 print("You selected the movie: " + us-
erList[var - 1][var] + " with ID: " + str(
301 ids_titles.tolist().index(userList[var -
1][var]) + 1))
302 print('\n')
303 while (True):
304 try:
305 rating = int(input("Rate the movie:
"))
306 except ValueError:
307 print("Wrong input, please insert an
integer")
308 continue
309 if (rating < 1 or rating > 5):
310 print("Value must be between 1 and 5.
Please insert a valid integer")
311 continue
312 break
313 known_positives.append(ids_ti-
tles.tolist().index(userList[var - 1][var]) + 1)
314 fullDataSet.loc[len(fullDataSet)] = [newUse-
rID, ids_titles.tolist().index(userList[var - 1][var]) + 1, rating,
timestamp]
315 f = f + 1
316 if((len(neighborsmovies)-1-j) >= 20):
317 i = j
318 j += 20
319 elif((len(neighborsmovies)-1-j) > 0):
320 i = j
321 j = len(neighborsmovies)-1
322 else:
323 i = 0
324 j = 20
325 print('\n')
326 return fullDataSet
327 #----------------------------------------------------------------
------------------------------------------------------#
328
329
330
######################################################################
##################################################
331 #we create user-item matrix
332 def getUserItemMatrix(n_users, n_items, fullDataSet):
333 user_item_matrix = np.zeros((n_users, n_items))
334 for line in fullDataSet.itertuples():
335 user_item_matrix[line[1] - 1, line[2] - 1] = line[3]
336 return user_item_matrix
337 #----------------------------------------------------------------
------------------------------------------------------#
338
339

-80-
340
######################################################################
##################################################
341 #we use the pairwise_distances function from sklearn to calculate
the pearson correlation
342 def calculateUsersPearsonCorrelation(user_item_matrixTrain):
343 user_similarityPearson = 1 - pairwise_distances(user_item_ma-
trixTrain, metric='correlation') #943*943
344 user_similarityPearson[np.isnan(user_similarityPearson)] = 0
345 return user_similarityPearson
346 #----------------------------------------------------------------
------------------------------------------------------#
347
348
349
######################################################################
##################################################
350 #make predictions combining Top-K neigbors and Bias-subtracted
collaborative filtering
351 def predict_Top_K_no_Bias(ratings, similarity, k=40):
352 pred = np.zeros(ratings.shape)
353 user_bias = ratings.mean(axis=1)
354 ratings = (ratings - user_bias[:, np.newaxis]).copy()
355 for i in range(ratings.shape[0]):
356 top_K_users = [np.argsort(similarity[:,i])[:-k-1:-1]]
357 for j in range(ratings.shape[1]):
358 pred[i,j] = similarity[i, :][top_K_users].dot(rat-
ings[:, j][top_K_users])
359 pred[i,j] /= np.sum(np.abs(similarity[i, :][top_K_us-
ers]))
360 pred += user_bias[:, np.newaxis]
361 return pred
362 #----------------------------------------------------------------
------------------------------------------------------#
363
364
365
366
######################################################################
##################################################
367 ##############################################BASIC
SCRIPT##############################################################
368
369 newUserID = 944 # new user's id
370 timestamp = '883446543' # random timestamp, we dont care about
that
371 known_positives = []
372 mySelMovies = []
373
374
375 #fetch dempgraphic data
376 users_raw = _read_raw_data("C:/Users/Sak/lightfm_data/mov-
ielens100k/movielens.zip")
377
378 #create models
379 users_age = ['18', '24', '30', '40', '50', '61', '70', '100']
380 users_occup = ['administrator', 'artist', 'doctor', 'educator',
381 'engineer', 'entertainer', 'ex-
ecutive', 'healthcare', 'homemaker',
382 'lawyer', 'librarian', 'market-
ing', 'none', 'other', 'programmer',

-81-
383 'retired', 'salesman', 'scien-
tist', 'student', 'technician',
384 'writer']
385
386 users_combined_features = ['18|0', '24|1', '30|2', '40|3',
'50|4', '61|5', '70|6',
387 '100|7', 'm|8', 'f|9', 'admin-
istrator|10', 'artist|11', 'doctor|12', 'educator|13',
388 'engineer|14', 'enter-
tainer|15', 'executive|16', 'healthcare|17', 'homemaker|18',
389 'lawyer|19', 'librarian|20',
'marketing|21', 'none|22', 'other|23', 'programmer|24',
390 'retired|25', 'salesman|26',
'scientist|27', 'student|28', 'technician|29',
391 'writer|30']
392
393 user_meta_raw = []
394
395 user_meta_raw = createUserMetaDataList(users_raw, users_age, us-
ers_occup, user_meta_raw)
396
397 #read the movieset
398 ids_titles = readMovieSet('u.item')
399 #read the full dataset
400 fullDataSet = readFullDataset('u.data')
401
402
403 #users demographic data with new user
404 usr_feat = _parse_user_metadata(944, user_meta_raw, users_com-
bined_features)
405 #users demographic data without the new user
406 usr_feat_no_newUser = np.delete(usr_feat, (943), axis=0)
407 #new user demographic data
408 new_usr_feat = usr_feat[-1]
409
410 ##The 20 most common neighbors for the new user based on de-
mographics are:
411 neighbors = getNeighbors(usr_feat_no_newUser, new_usr_feat, 10)
412
413 #calculate number of users and items
414 n_users = numberOfUsers(fullDataSet)
415 n_items = numberOfMovies(fullDataSet)
416
417 #neigbors movies the k most common users based on demographics
418 neighborsMovies = getUserItemMatrixDemographicsBased(n_users,
n_items, fullDataSet, neighbors)
419
420 #full dataset with new users ratings
421 fullDataSetNewUser = insertNewUserRatings(ids_titles, fullDa-
taSet, newUserID, timestamp, known_positives, mySelMovies, neigh-
borsMovies)
422
423 #calculate number of users and items
424 n_users = numberOfUsers(fullDataSetNewUser)
425 n_items = numberOfMovies(fullDataSetNewUser)
426
427 #calculate user item matrix with new dataset
428 user_item_matrix = getUserItemMatrix(n_users, n_items, fullDa-
taSetNewUser)
429
430 #calculate user similarity(Pearson correlation)

-82-
431 user_similarityPearson = calculateUsersPearsonCorrela-
tion(user_item_matrix)
432
433 #apply bias subtracted user-based collaborative filtering with
Top-40 most common neigbors algorithm
434 user_prediction_User = predict_Top_K_no_Bias(user_item_matrix,
user_similarityPearson, k=40)
435
436 #function for printing the top n recommended movies for a given
user id -
437 def printPredictedMoviesUserBased(user, n):
438 user = user - 1
439 n = n - 1
440 pred_indexes = [i + 1 for i in np.argsort(-user_predic-
tion_User[user])]
441 pred_indexes = [item for item in pred_indexes if item not in
known_positives]
442 movies_ids_titles = pd.read_csv('u.item', sep="|",
header=None, encoding='latin-1', names=['itemId', 'title'],
usecols=[0, 1])
443 pd_pred_indexes = pd.DataFrame(pred_indexes, columns=['item-
Id'])
444 pred_movies = pd.merge(pd_pred_indexes, movies_ids_titles,
on='itemId')
445 print('\n')
446 print("*******************user-based collaborative filtering
(Top-K neigbors and Bias-subtracted)*******************************")
447 print(pred_movies.loc[:n])
448
449 #print the top 10 recommended movies for the new User (id = 944)
450 printPredictedMoviesUserBased(944, 10)

-83-
entropy0-based.py
1 import numpy as np
2 import pandas as pd
3 from sklearn.metrics.pairwise import pairwise_distances
4 import math
5
6
7
8
######################################################################
##################################################
9 #We read in the u.data file, which contains the full dataset.
10 def readFullDataset(dataSetFilePath):
11 header = ['user_id', 'item_id', 'rating', 'timestamp']
12 return pd.read_csv(dataSetFilePath, sep='\t', names=header)
13 #----------------------------------------------------------------
------------------------------------------------------#
14
15
16
######################################################################
##################################################
17 #we read the the movies titles from the movie dataset
18 def readMovieSet(movieSetFilePath):
19 df_ids_titles = pd.read_csv(movieSetFilePath, sep="|",
header=None, encoding='latin-1', names=['itemId', 'title'],usecols=[0,
1])
20 ids_titles = np.empty(1682, dtype=np.object)
21 for line in df_ids_titles.itertuples():
22 ids_titles[line[0]] = line[2]
23 return ids_titles
24 #----------------------------------------------------------------
------------------------------------------------------#
25
26
27
######################################################################
##################################################
28 #we count the number of unique users and movies.
29 def numberOfUsers(fullDataSet):
30 n_users = fullDataSet.user_id.unique().shape[0]
31 return n_users
32
33 def numberOfMovies(fullDataSet):
34 n_items = fullDataSet.item_id.unique().shape[0]
35 return n_items
36 #----------------------------------------------------------------
------------------------------------------------------#
37
38
39
######################################################################
##################################################
40 #calculate existing movies entropy0 values
41 def calcMoviesEntropy0(fullDataSet, n_users, n_items):
42
43 user_item_matrixTrain = np.zeros((n_users, n_items))
44
45 for line in fullDataSet.itertuples():
46 user_item_matrixTrain[line[1] - 1, line[2] - 1] = line[3]
47

-84-
48 values = np.zeros((n_items, 6))
49
50 for i in range(0,n_items):
51 for u in range(0,n_users):
52 for j in range(0,6):
53 if user_item_matrixTrain[u, i] == j:
54 values[i, j] += 1
55
56 voters = np.zeros((n_items))
57
58 for i in range(0,n_items):
59 voters[i] = values[i,1] + values[i,2] + values[i,3] +
values[i,4] + values[i,5]
60
61 prop = np.zeros((n_items, 6))
62
63 w = np.zeros(6)
64 for i in range(0,6):
65 if i == 0:
66 w[i] = 0.5
67 else:
68 w[i] = 1
69
70 for i in range(0,n_items):
71 prop[i, 0] = values[i, 0]/voters[i]
72 prop[i, 1] = values[i, 1]/voters[i]
73 prop[i, 2] = values[i, 2]/voters[i]
74 prop[i, 3] = values[i, 3]/voters[i]
75 prop[i, 4] = values[i, 4]/voters[i]
76 prop[i, 5] = values[i, 5]/voters[i]
77
78 entropy = np.zeros((n_items))
79 for i in range(0,n_items):
80 entropy[i] = 0
81 for rat in range(0,6):
82 if prop[i,rat] != 0:
83 entropy[i] = entropy[i] +
prop[i,rat]*w[rat]*math.log(prop[i,rat],2)
84 entropy[i] = entropy[i]/5.5
85
86 entropy = -entropy
87 entropy_indexes = [i for i in np.argsort(-entropy)]
88 return entropy_indexes
89 #----------------------------------------------------------------
------------------------------------------------------#
90
91
92
######################################################################
##################################################
93 #insert new user by creating gui in python console
94 def insertNewUserRatings(ids_titles, fullDataSet, newUserID,
timestamp, known_positives, mySelMovies, entropy_indexes):
95 i=0
96 j=20
97 f=0
98 while(f < 10):
99 userList = []
100 for x in range(i,j):
101 userList.append({x%20+1: ids_titles[entropy_in-
dexes[x]]})

-85-
102 print('\n')
103 for p in userList:
104 print(p)
105 print('\n')
106 while(True):
107 try:
108 var = int(input("Choose a movie, or press -1 to
change movieset: "))
109 except ValueError:
110 print("Wrong input, please insert an integer")
111 continue
112 if((var<-1 or var>20) and var ==0):
113 print("Value must be -1 OR between 1 and 20.
Please insert a valid integer")
114 continue
115 if(1<=var and 20>=var):
116 selMovie = str(ids_titles.tolist().index(us-
erList[var - 1][var]) + 1)
117 if selMovie in mySelMovies:
118 print("You have already selected that movie,
please choose another movie")
119 continue
120 mySelMovies.append(str(ids_titles.tolist().in-
dex(userList[var-1][var])+1))
121 break
122 if (var == -1):
123 if ((1681 - j) >= 20):
124 i = j
125 j += 20
126 elif ((1681 - j) > 0):
127 i = j
128 j = 1682
129 else:
130 i = 0
131 j = 20
132 continue
133 else:
134 print('\n')
135 print("You selected the movie: " + userList[var-
1][var] + " with ID: " + str(ids_titles.tolist().index(userList[var-
1][var])+1))
136 print('\n')
137 while (True):
138 try:
139 rating = int(input("Rate the movie: "))
140 except ValueError:
141 print("Wrong input, please insert an inte-
ger")
142 continue
143 if (rating < 1 or rating > 5):
144 print("Value must be between 1 and 5. Please
insert a valid integer")
145 continue
146 break
147 known_positives.append(ids_titles.tolist().index(us-
erList[var - 1][var]) + 1)
148 fullDataSet.loc[len(fullDataSet)] = [newUserID,
ids_titles.tolist().index(userList[var - 1][var]) + 1, rating,
timestamp]
149 f = f + 1
150 while(f < 10):

-86-
151 while (True):
152 try:
153 ch = int(input("To change the movieset
press -1, to keep press 1: "))
154 except ValueError:
155 print("Wrong input, please insert an in-
teger")
156 continue
157 if (ch != 1 and ch != -1):
158 print("Value must be 1 or -1. Please in-
sert a valid integer")
159 continue
160 break
161 if(int(ch) == -1):
162 break
163 else:
164 print('\n')
165 for p in userList:
166 print(p)
167 print('\n')
168 while (True):
169 try:
170 var = int(input("Choose a movie: "))
171 except ValueError:
172 print("Wrong input, please insert an
integer")
173 continue
174 if ((var < -1 or var > 20)):
175 print("Value must be between 1 and
20. Please insert a valid integer")
176 continue
177 selMovie = str(ids_titles.tolist().in-
dex(userList[var - 1][var]) + 1)
178 if selMovie in mySelMovies:
179 print("You have already selected that
movie, please choose another movie")
180 continue
181 mySelMovies.append(str(ids_ti-
tles.tolist().index(userList[var - 1][var]) + 1))
182 break
183 print('\n')
184 print("You selected the movie: " + us-
erList[var - 1][var] + " with ID: " + str(
185 ids_titles.tolist().index(userList[var -
1][var]) + 1))
186 print('\n')
187 while (True):
188 try:
189 rating = int(input("Rate the movie:
"))
190 except ValueError:
191 print("Wrong input, please insert an
integer")
192 continue
193 if (rating < 1 or rating > 5):
194 print("Value must be between 1 and 5.
Please insert a valid integer")
195 continue
196 break
197 known_positives.append(ids_ti-
tles.tolist().index(userList[var - 1][var]) + 1)

-87-
198 fullDataSet.loc[len(fullDataSet)] = [newUse-
rID, ids_titles.tolist().index(userList[var - 1][var]) + 1, rating,
timestamp]
199 f = f + 1
200 if((1681-j) >= 20):
201 i = j
202 j += 20
203 elif((1681-j) > 0):
204 i = j
205 j = 1682
206 else:
207 i = 0
208 j = 20
209 print('\n')
210 return fullDataSet
211 #----------------------------------------------------------------
------------------------------------------------------#
212
213
214
######################################################################
##################################################
215 #we create user-item matrix
216 def getUserItemMatrix(n_users, n_items, fullDataSet):
217 user_item_matrix = np.zeros((n_users, n_items))
218 for line in fullDataSet.itertuples():
219 user_item_matrix[line[1] - 1, line[2] - 1] = line[3]
220 return user_item_matrix
221 #----------------------------------------------------------------
------------------------------------------------------#
222
223
224
######################################################################
##################################################
225 #we use the pairwise_distances function from sklearn to calculate
the pearson correlation
226 def calculateUsersPearsonCorrelation(user_item_matrixTrain):
227 user_similarityPearson = 1 - pairwise_distances(user_item_ma-
trixTrain, metric='correlation') #943*943
228 user_similarityPearson[np.isnan(user_similarityPearson)] = 0
229 return user_similarityPearson
230 #----------------------------------------------------------------
------------------------------------------------------#
231
232
233
######################################################################
##################################################
234 #make predictions combining Top-K neigbors and Bias-subtracted
collaborative filtering
235 def predict_Top_K_no_Bias(ratings, similarity, k=40):
236 pred = np.zeros(ratings.shape)
237 user_bias = ratings.mean(axis=1)
238 ratings = (ratings - user_bias[:, np.newaxis]).copy()
239 for i in range(ratings.shape[0]):
240 top_K_users = [np.argsort(similarity[:,i])[:-k-1:-1]]
241 for j in range(ratings.shape[1]):
242 pred[i,j] = similarity[i, :][top_K_users].dot(rat-
ings[:, j][top_K_users])

-88-
243 pred[i,j] /= np.sum(np.abs(similarity[i, :][top_K_us-
ers]))
244 pred += user_bias[:, np.newaxis]
245 return pred
246 #----------------------------------------------------------------
------------------------------------------------------#
247
248
249
250
######################################################################
##################################################
251 ##############################################BASIC
SCRIPT##############################################################
252
253 newUserID = 944 # new user's id
254 timestamp = '883446543' # random timestamp, we dont care about
that
255 known_positives = []
256 mySelMovies = []
257
258 #read the movieset
259 ids_titles = readMovieSet('u.item')
260 #read the full dataset
261 fullDataSet = readFullDataset('u.data')
262
263 #calculate number of users and items
264 n_users = numberOfUsers(fullDataSet)
265 n_items = numberOfMovies(fullDataSet)
266
267 #calculate movies ratings entropy0 values and return movies in-
dexes with the highest entropy0 values to the lowest
268 entropy_indexes = calcMoviesEntropy0(fullDataSet, n_users,
n_items)
269
270 #insert new user
271 fullDataSetNewUser = insertNewUserRatings(ids_titles, fullDa-
taSet, newUserID, timestamp, known_positives, mySelMovies, entropy_in-
dexes)
272
273 #calculate number of users and items with new user
274 n_users = numberOfUsers(fullDataSetNewUser)
275 n_items = numberOfMovies(fullDataSetNewUser)
276
277 #calculate user item matrix
278 user_item_matrix = getUserItemMatrix(n_users, n_items, fullDa-
taSetNewUser)
279
280 #calculate user similarity(Pearson correlation)
281 user_similarityPearson = calculateUsersPearsonCorrela-
tion(user_item_matrix)
282
283 #apply bias subtracted user-based collaborative filtering with
Top-40 most common neigbors algorithm
284 user_prediction_User = predict_Top_K_no_Bias(user_item_matrix,
user_similarityPearson, k=40)
285
286 #function for printing the top n recommended movies for a given
user id -
287 def printPredictedMoviesUserBased(user, n):
288 user = user - 1

-89-
289 n = n - 1
290 pred_indexes = [i + 1 for i in np.argsort(-user_predic-
tion_User[user])]
291 pred_indexes = [item for item in pred_indexes if item not in
known_positives]
292 movies_ids_titles = pd.read_csv('u.item', sep="|",
header=None, encoding='latin-1', names=['itemId', 'title'],
usecols=[0, 1])
293 pd_pred_indexes = pd.DataFrame(pred_indexes, columns=['item-
Id'])
294 pred_movies = pd.merge(pd_pred_indexes, movies_ids_titles,
on='itemId')
295 print('\n')
296 print("*******************user-based collaborative filtering
(Top-K neigbors and Bias-subtracted)*******************************")
297 print(pred_movies.loc[:n])
298
299 #print the top 10 recommended movies for the new User (id = 944)
300 printPredictedMoviesUserBased(944, 10)

-90-
demographic_entropy0-based.py
1 import zipfile
2 from numpy import array
3 import numpy as np
4 import pandas as pd
5 from sklearn.metrics.pairwise import pairwise_distances
6 import math
7
8
9
10
######################################################################
##################################################
11 #fetch demographic data
12 def _read_raw_data(path):
13 with zipfile.ZipFile(path) as datafile:
14 return datafile.read('ml-100k/u.user').decode(errors='ig-
nore').split('\n')
15 #----------------------------------------------------------------
------------------------------------------------------#
16
17
18
######################################################################
##################################################
19 # create the user_meta-data list
20 def createUserMetaDataList(users_raw, users_age, users_occup,
user_meta_raw):
21 # first create the user_meta-data list by the existing da-
taset
22 for line in users_raw:
23 if not line:
24 continue
25 #print(line)
26 splt = line.split('|')
27 # Zero-based indexing
28 userid = int(splt[0])
29 age = int(splt[1])
30 gender = splt[2]
31 occup = splt[3]
32 i = 0
33 for m in users_age:
34 if(age <= int(m)):
35 #print(i)
36 break
37 else:
38 i = i + 1
39
40 if(gender == 'M'):
41 j = 8
42 else:
43 j = 9
44 k = 10
45 for n in users_occup:
46 if(occup == n):
47 #print(k)
48 break
49 else:
50 k = k + 1
51 s = str(userid) + "|"
52 for l in range(0,31):

-91-
53 if(l == i or l == j or l == k):
54 s = s + "1|"
55 else:
56 s = s + "0|"
57 s = s[:-1]
58 user_meta_raw.append(s)
59 #then, append the new user to the above user_meta_data list
60 while (True):
61 try:
62 print('Select your age range:\n', '1. <=18\n', '2.
19-24\n', '3. 25-30\n', '4. 31-40\n', '5. 41-50\n',
63 '6. 51-60\n', '7. 61-70\n', '8. 71-100\n')
64 newage = int(input("Choose the corresponding number:
"))
65 except ValueError:
66 print("Wrong input, please insert an integer")
67 continue
68 if (newage < 1 or newage > 8):
69 print("Value must be between 1 and 8. Please insert a
valid integer")
70 continue
71 if (1 <= newage and 8 >= newage):
72 newage = (newage) - 1
73 break
74
75 while (True):
76 try:
77 print('Select your gender:\n', '1. Male\n', '2. Fe-
male\n')
78 newgend = int(input("Choose the corresponding number:
"))
79 except ValueError:
80 print("Wrong input, please insert an integer")
81 continue
82 if (newgend < 1 or newgend > 2):
83 print("Value must be 1 or 2. Please insert a valid
integer")
84 continue
85 if (1 == newgend or 2 == newgend):
86 newgend = (newgend) - 1 + 8
87 break
88
89 while (True):
90 try:
91 print('Select your occupation:\n', '1. administra-
tor\n', '2. artist\n', '3. doctor\n', '4. educator\n',
92 '5. engineer\n', '6. entertainer\n',
93 '7. executive\n', '8. healthcare\n', '9. home-
maker\n', '10. lawyer\n', '11. librarian\n',
94 '12. marketing\n', '13. none\n', '14. other\n',
95 '15. programmer\n', '16. retired\n', '17.
salesman\n', '18. scientist\n', '19. student\n',
96 '20. technician\n', '21. writer\n')
97 newoccup = int(input("Choose the corresponding num-
ber: "))
98 except ValueError:
99 print("Wrong input, please insert an integer")
100 continue
101 if (newoccup < 1 or newoccup > 21):
102 print("Value must be between 1 and 21. Please insert
a valid integer")

-92-
103 continue
104 if (1 <= newoccup and 21 >= newoccup):
105 newoccup = (newoccup) - 1 + 10
106 break
107
108 s = str(944) + "|"
109 for l in range(0, 31):
110 if (l == newage or l == newgend or l == newoccup):
111 s = s + "1|"
112 else:
113 s = s + "0|"
114 s = s[:-1]
115 user_meta_raw.append(s)
116 return user_meta_raw
117 #----------------------------------------------------------------
------------------------------------------------------#
118
119
120
######################################################################
##################################################
121 #transform users metadata to a list with zeros and ones
122 def _parse_user_metadata(num_users, user_meta_raw, users_com-
bined_features):
123 user_features = np.zeros((num_users, len(users_combined_fea-
tures)))
124 for meta in user_meta_raw:
125 if not meta:
126 continue
127 splt = meta.split('|')
128 # Zero-based indexing
129 iid = int(splt[0]) - 1
130 item_meta = [idx for idx, val in
131 enumerate(splt[1:])
132 if int(val) > 0]
133 for gid in item_meta:
134 user_features[iid, gid] = 1.0
135 return user_features
136 #----------------------------------------------------------------
------------------------------------------------------#
137
138
139
######################################################################
##################################################
140 #calculate the euclidean distance of users and then find the
k(k=20) most common neigbors based on demographics
141 def euclideanDistance(instance1, instance2, length):
142 distance = 0
143 for x in range(length):
144 distance += pow((instance1[x] - instance2[x]), 2)
145 return math.sqrt(distance)
146
147 def getNeighbors(trainingSet, testInstance, k):
148 distances = []
149 length = len(testInstance)
150 for x in range(len(trainingSet)):
151 dist = euclideanDistance(testInstance, trainingSet[x],
length)
152 distances.append(dist)
153 a = array(distances)

-93-
154 sorted_indexes = np.argsort(a)
155 index_neighbors = sorted_indexes[:k]
156 return index_neighbors
157 #----------------------------------------------------------------
------------------------------------------------------#
158
159
160
######################################################################
##################################################
161 #We read in the u.data file, which contains the full dataset.
162 def readFullDataset(dataSetFilePath):
163 header = ['user_id', 'item_id', 'rating', 'timestamp']
164 return pd.read_csv(dataSetFilePath, sep='\t', names=header)
165 #----------------------------------------------------------------
------------------------------------------------------#
166
167
168
######################################################################
##################################################
169 #we read the the movies titles from the movie dataset
170 def readMovieSet(movieSetFilePath):
171 df_ids_titles = pd.read_csv(movieSetFilePath, sep="|",
header=None, encoding='latin-1', names=['itemId', 'title'],usecols=[0,
1])
172 ids_titles = np.empty(1682, dtype=np.object)
173 for line in df_ids_titles.itertuples():
174 ids_titles[line[0]] = line[2]
175 return ids_titles
176 #----------------------------------------------------------------
------------------------------------------------------#
177
178
179
######################################################################
##################################################
180 #we count the number of unique users and movies.
181 def numberOfUsers(fullDataSet):
182 n_users = fullDataSet.user_id.unique().shape[0]
183 return n_users
184
185 def numberOfMovies(fullDataSet):
186 n_items = fullDataSet.item_id.unique().shape[0]
187 return n_items
188 #----------------------------------------------------------------
------------------------------------------------------#
189
190
191
192
######################################################################
##################################################
193 #calculate existing movies entropy0 values
194 def calcMoviesEntropy0(fullDataSet, n_users, n_items, neighbors):
195
196 user_item_matrixTrain = np.zeros((n_users, n_items))
197
198 for line in fullDataSet.itertuples():
199 if line[1] - 1 in neighbors:

-94-
200 user_item_matrixTrain[line[1] - 1, line[2] - 1] =
line[3]
201
202 values = np.zeros((n_items, 6))
203
204 for i in range(0,n_items):
205 for u in range(0,n_users):
206 for j in range(0,6):
207 if user_item_matrixTrain[u, i] == j:
208 values[i, j] += 1
209
210 voters = np.zeros((n_items))
211
212 for i in range(0,n_items):
213 voters[i] = values[i,1] + values[i,2] + values[i,3] +
values[i,4] + values[i,5]
214
215 prop = np.zeros((n_items, 6))
216
217 w = np.zeros(6)
218 for i in range(0,6):
219 if i == 0:
220 w[i] = 0.5
221 else:
222 w[i] = 1
223
224 for i in range(0,n_items):
225 if voters[i] !=0:
226 prop[i, 0] = values[i, 0]/voters[i]
227 prop[i, 1] = values[i, 1]/voters[i]
228 prop[i, 2] = values[i, 2]/voters[i]
229 prop[i, 3] = values[i, 3]/voters[i]
230 prop[i, 4] = values[i, 4]/voters[i]
231 prop[i, 5] = values[i, 5]/voters[i]
232
233 entropy = np.zeros((n_items))
234 for i in range(0,n_items):
235 entropy[i] = 0
236 for rat in range(0,6):
237 if prop[i,rat] != 0:
238 entropy[i] = entropy[i] +
prop[i,rat]*w[rat]*math.log(prop[i,rat],2)
239 entropy[i] = entropy[i]/5.5
240
241 entropy = -entropy
242 entropy_indexes = [i for i in np.argsort(-entropy)]
243 return entropy_indexes
244 #----------------------------------------------------------------
------------------------------------------------------#
245
246
247
######################################################################
##################################################
248 #insert new user by creating gui in python console
249 def insertNewUserRatings(ids_titles, fullDataSet, newUserID,
timestamp, known_positives, mySelMovies, entropy_indexes):
250 i=0
251 j=20
252 f=0
253 while(f < 10):

-95-
254 userList = []
255 for x in range(i,j):
256 userList.append({x%20+1: ids_titles[entropy_in-
dexes[x]]})
257 print('\n')
258 for p in userList:
259 print(p)
260 print('\n')
261 while(True):
262 try:
263 var = int(input("Choose a movie, or press -1 to
change movieset: "))
264 except ValueError:
265 print("Wrong input, please insert an integer")
266 continue
267 if((var<-1 or var>20) and var ==0):
268 print("Value must be -1 OR between 1 and 20.
Please insert a valid integer")
269 continue
270 if(1<=var and 20>=var):
271 selMovie = str(ids_titles.tolist().index(us-
erList[var - 1][var]) + 1)
272 if selMovie in mySelMovies:
273 print("You have already selected that movie,
please choose another movie")
274 continue
275 mySelMovies.append(str(ids_titles.tolist().in-
dex(userList[var-1][var])+1))
276 break
277 if (var == -1):
278 if ((1681 - j) >= 20):
279 i = j
280 j += 20
281 elif ((1681 - j) > 0):
282 i = j
283 j = 1682
284 else:
285 i = 0
286 j = 20
287 continue
288 else:
289 print('\n')
290 print("You selected the movie: " + userList[var-
1][var] + " with ID: " + str(ids_titles.tolist().index(userList[var-
1][var])+1))
291 print('\n')
292 while (True):
293 try:
294 rating = int(input("Rate the movie: "))
295 except ValueError:
296 print("Wrong input, please insert an inte-
ger")
297 continue
298 if (rating < 1 or rating > 5):
299 print("Value must be between 1 and 5. Please
insert a valid integer")
300 continue
301 break
302 known_positives.append(ids_titles.tolist().index(us-
erList[var - 1][var]) + 1)

-96-
303 fullDataSet.loc[len(fullDataSet)] = [newUserID,
ids_titles.tolist().index(userList[var - 1][var]) + 1, rating,
timestamp]
304 f = f + 1
305 while(f < 10):
306 while (True):
307 try:
308 ch = int(input("To change the movieset
press -1, to keep press 1: "))
309 except ValueError:
310 print("Wrong input, please insert an in-
teger")
311 continue
312 if (ch != 1 and ch != -1):
313 print("Value must be 1 or -1. Please in-
sert a valid integer")
314 continue
315 break
316 if(int(ch) == -1):
317 break
318 else:
319 print('\n')
320 for p in userList:
321 print(p)
322 print('\n')
323 while (True):
324 try:
325 var = int(input("Choose a movie: "))
326 except ValueError:
327 print("Wrong input, please insert an
integer")
328 continue
329 if ((var < -1 or var > 20)):
330 print("Value must be between 1 and
20. Please insert a valid integer")
331 continue
332 selMovie = str(ids_titles.tolist().in-
dex(userList[var - 1][var]) + 1)
333 if selMovie in mySelMovies:
334 print("You have already selected that
movie, please choose another movie")
335 continue
336 mySelMovies.append(str(ids_ti-
tles.tolist().index(userList[var - 1][var]) + 1))
337 break
338 print('\n')
339 print("You selected the movie: " + us-
erList[var - 1][var] + " with ID: " + str(
340 ids_titles.tolist().index(userList[var -
1][var]) + 1))
341 print('\n')
342 while (True):
343 try:
344 rating = int(input("Rate the movie:
"))
345 except ValueError:
346 print("Wrong input, please insert an
integer")
347 continue
348 if (rating < 1 or rating > 5):

-97-
349 print("Value must be between 1 and 5.
Please insert a valid integer")
350 continue
351 break
352 known_positives.append(ids_ti-
tles.tolist().index(userList[var - 1][var]) + 1)
353 fullDataSet.loc[len(fullDataSet)] = [newUse-
rID, ids_titles.tolist().index(userList[var - 1][var]) + 1, rating,
timestamp]
354 f = f + 1
355 if((1681-j) >= 20):
356 i = j
357 j += 20
358 elif((1681-j) > 0):
359 i = j
360 j = 1682
361 else:
362 i = 0
363 j = 20
364 print('\n')
365 return fullDataSet
366 #----------------------------------------------------------------
------------------------------------------------------#
367
368
369
######################################################################
##################################################
370 #we create user-item matrix
371 def getUserItemMatrix(n_users, n_items, fullDataSet):
372 user_item_matrix = np.zeros((n_users, n_items))
373 for line in fullDataSet.itertuples():
374 user_item_matrix[line[1] - 1, line[2] - 1] = line[3]
375 return user_item_matrix
376 #----------------------------------------------------------------
------------------------------------------------------#
377
378
379
######################################################################
##################################################
380 #we use the pairwise_distances function from sklearn to calculate
the pearson correlation
381 def calculateUsersPearsonCorrelation(user_item_matrixTrain):
382 user_similarityPearson = 1 - pairwise_distances(user_item_ma-
trixTrain, metric='correlation') #943*943
383 user_similarityPearson[np.isnan(user_similarityPearson)] = 0
384 return user_similarityPearson
385 #----------------------------------------------------------------
------------------------------------------------------#
386
387
388
######################################################################
##################################################
389 #make predictions combining Top-K neigbors and Bias-subtracted
collaborative filtering
390 def predict_Top_K_no_Bias(ratings, similarity, k=40):
391 pred = np.zeros(ratings.shape)
392 user_bias = ratings.mean(axis=1)
393 ratings = (ratings - user_bias[:, np.newaxis]).copy()

-98-
394 for i in range(ratings.shape[0]):
395 top_K_users = [np.argsort(similarity[:,i])[:-k-1:-1]]
396 for j in range(ratings.shape[1]):
397 pred[i,j] = similarity[i, :][top_K_users].dot(rat-
ings[:, j][top_K_users])
398 pred[i,j] /= np.sum(np.abs(similarity[i, :][top_K_us-
ers]))
399 pred += user_bias[:, np.newaxis]
400 return pred
401 #----------------------------------------------------------------
------------------------------------------------------#
402
403
404
405
######################################################################
##################################################
406 ##############################################BASIC
SCRIPT##############################################################
407
408 newUserID = 944 # new user's id
409 timestamp = '883446543' # random timestamp, we dont care about
that
410 known_positives = []
411 mySelMovies = []
412
413 #fetch dempgraphic data
414 users_raw = _read_raw_data("C:/Users/Sak/lightfm_data/mov-
ielens100k/movielens.zip")
415
416 #create models
417 users_age = ['18', '24', '30', '40', '50', '61', '70', '100']
418 users_occup = ['administrator', 'artist', 'doctor', 'educator',
419 'engineer', 'entertainer', 'ex-
ecutive', 'healthcare', 'homemaker',
420 'lawyer', 'librarian', 'market-
ing', 'none', 'other', 'programmer',
421 'retired', 'salesman', 'scien-
tist', 'student', 'technician',
422 'writer']
423
424 users_combined_features = ['18|0', '24|1', '30|2', '40|3',
'50|4', '61|5', '70|6',
425 '100|7', 'm|8', 'f|9', 'admin-
istrator|10', 'artist|11', 'doctor|12', 'educator|13',
426 'engineer|14', 'enter-
tainer|15', 'executive|16', 'healthcare|17', 'homemaker|18',
427 'lawyer|19', 'librarian|20',
'marketing|21', 'none|22', 'other|23', 'programmer|24',
428 'retired|25', 'salesman|26',
'scientist|27', 'student|28', 'technician|29',
429 'writer|30']
430
431 user_meta_raw = []
432
433 user_meta_raw = createUserMetaDataList(users_raw, users_age, us-
ers_occup, user_meta_raw)
434
435
436 #users demographic data with new user

-99-
437 usr_feat = _parse_user_metadata(944, user_meta_raw, users_com-
bined_features)
438 #users demographic data without the new user
439 usr_feat_no_newUser = np.delete(usr_feat, (943), axis=0)
440 #new user demographic data
441 new_usr_feat = usr_feat[-1]
442
443 ##The 20 most common neighbors for the new user based on de-
mographics are:
444 neighbors = getNeighbors(usr_feat_no_newUser, new_usr_feat, 10)
445
446 #read the movieset
447 ids_titles = readMovieSet('u.item')
448 #read the full dataset
449 fullDataSet = readFullDataset('u.data')
450
451 #calculate number of users and items
452 n_users = numberOfUsers(fullDataSet)
453 n_items = numberOfMovies(fullDataSet)
454
455
456 #calculate only neigbors movies ratings entropy0 values and re-
turn movies indexes with the highest entropy0 values to the lowest
457 entropy_indexes = calcMoviesEntropy0(fullDataSet, n_users,
n_items, neighbors)
458
459 #insert new user
460 fullDataSetNewUser = insertNewUserRatings(ids_titles, fullDa-
taSet, newUserID, timestamp, known_positives, mySelMovies, entropy_in-
dexes)
461
462 #calculate number of users and items with new user
463 n_users = numberOfUsers(fullDataSetNewUser)
464 n_items = numberOfMovies(fullDataSetNewUser)
465
466 #calculate user item matrix
467 user_item_matrix = getUserItemMatrix(n_users, n_items, fullDa-
taSetNewUser)
468
469 #calculate user similarity(Pearson correlation)
470 user_similarityPearson = calculateUsersPearsonCorrela-
tion(user_item_matrix)
471
472 #apply bias subtracted user-based collaborative filtering with
Top-40 most common neigbors algorithm
473 user_prediction_User = predict_Top_K_no_Bias(user_item_matrix,
user_similarityPearson, k=40)
474
475 #function for printing the top n recommended movies for a given
user id -
476 def printPredictedMoviesUserBased(user, n):
477 user = user - 1
478 n = n - 1
479 pred_indexes = [i + 1 for i in np.argsort(-user_predic-
tion_User[user])]
480 pred_indexes = [item for item in pred_indexes if item not in
known_positives]
481 movies_ids_titles = pd.read_csv('u.item', sep="|",
header=None, encoding='latin-1', names=['itemId', 'title'],
usecols=[0, 1])

-100-
482 pd_pred_indexes = pd.DataFrame(pred_indexes, columns=['item-
Id'])
483 pred_movies = pd.merge(pd_pred_indexes, movies_ids_titles,
on='itemId')
484 print('\n')
485 print("*******************user-based collaborative filtering
(Top-K neigbors and Bias-subtracted)*******************************")
486 print(pred_movies.loc[:n])
487
488 #print the top 10 recommended movies for the new User (id = 944)
489 printPredictedMoviesUserBased(944, 10)