Microbiome Profiling by Illumina Sequencing of Combinatorial Sequence-Tagged PCR Products
28
arXiv:1007.5075v1 [q-bio.GN] 28 Jul 2010 Microbiome profiling by Illumina sequencing of combinatorial sequence-tagged PCR products Gregory B. Gloor 1,∗ , Ruben Hummelen 2,3 , Jean M. Macklaim 1,2 , Russell J. Dickson 1 Andrew D. Fernandes 1,4 , Roderick MacPhee 2,5 , Gregor Reid 1,2,5,6 1 Department of Biochemistry, University of Western Ontario, London, ON, Canada 2 Canadian Research & Development Centre for Probiotics, Lawson Health Research Institute, London, Canada 3 Department of Public Health, Erasmus MC, University Medical Centre Rotterdam, The Netherlands 4 Department Applied Mathematics 5 Department of Microbiology & Immunology, University of Western Ontario, London, ON, Canada 6 Department of Surgery, University of Western Ontario, London, ON, Canada * E-mail: [email protected] Abstract We developed a low-cost, high-throughput microbiome profiling method that uses combinatorial sequence tags attached to PCR primers that amplify the rRNA V6 region. Amplified PCR products are sequenced using an Illumina paired-end protocol to generate millions of overlapping reads. Combinatorial sequence tagging can be used to examine hundreds of samples with far fewer primers than is required when sequence tags are incorporated at only a single end. The number of reads generated permitted saturating or near-saturating analysis of samples of the vaginal microbiome. The large number of reads al- lowed an in-depth analysis of errors, and we found that PCR-induced errors composed the vast majority of non-organism derived species variants, an ob- servation that has significant implications for sequence clustering of similar high-throughput data. We show that the short reads are sufficient to assign organisms to the genus or species level in most cases. We suggest that this method will be useful for the deep sequencing of any short nucleotide region that is taxonomically informative; these include the V3, V5 regions of the bac- terial 16S rRNA genes and the eukaryotic V9 region that is gaining popularity for sampling protist diversity. Introduction Microbiome profiling is used to identify and enumerate the organisms in samples from diverse sources such as soil, clinical samples and oceanic environments [4, 22, 29]. This profiling is an important first step in determining the important bacterial and protist organisms in a biome and how they interact with and influence their environment. 1
Transcript of Microbiome Profiling by Illumina Sequencing of Combinatorial Sequence-Tagged PCR Products

arX
iv:1
007.
5075
v1 [
q-bi
o.G
N]
28
Jul 2
010
Microbiome profiling by Illumina sequencing ofcombinatorial sequence-tagged PCR productsGregory B. Gloor 1,∗, Ruben Hummelen 2,3, Jean M. Macklaim 1,2, Russell J.Dickson 1 Andrew D. Fernandes 1,4, Roderick MacPhee 2,5, Gregor Reid 1,2,5,6
1 Department of Biochemistry, University of Western Ontario,London, ON, Canada2 Canadian Research & Development Centre for Probiotics, LawsonHealth Research Institute, London, Canada3 Department of Public Health, Erasmus MC, University MedicalCentre Rotterdam, The Netherlands4 Department Applied Mathematics5 Department of Microbiology & Immunology, University ofWestern Ontario, London, ON, Canada6 Department of Surgery, University of Western Ontario, London,ON, Canada∗ E-mail: [email protected]
Abstract
We developed a low-cost, high-throughput microbiome profiling method thatuses combinatorial sequence tags attached to PCR primers that amplify therRNA V6 region. Amplified PCR products are sequenced using an Illuminapaired-end protocol to generate millions of overlapping reads. Combinatorialsequence tagging can be used to examine hundreds of samples with far fewerprimers than is required when sequence tags are incorporated at only a singleend. The number of reads generated permitted saturating or near-saturatinganalysis of samples of the vaginal microbiome. The large number of reads al-lowed an in-depth analysis of errors, and we found that PCR-induced errorscomposed the vast majority of non-organism derived species variants, an ob-servation that has significant implications for sequence clustering of similarhigh-throughput data. We show that the short reads are sufficient to assignorganisms to the genus or species level in most cases. We suggest that thismethod will be useful for the deep sequencing of any short nucleotide regionthat is taxonomically informative; these include the V3, V5 regions of the bac-terial 16S rRNA genes and the eukaryotic V9 region that is gaining popularityfor sampling protist diversity.
Introduction
Microbiome profiling is used to identify and enumerate the organisms in samplesfrom diverse sources such as soil, clinical samples and oceanic environments[4, 22, 29]. This profiling is an important first step in determining the importantbacterial and protist organisms in a biome and how they interact with andinfluence their environment.
1

Microbiome profiling is usually achieved by sequencing PCR-amplified vari-able regions of the bacterial 16S and of the protistan small subunit ribosomalRNA genes [17, 3]. Other sequences, such as the GroEL genes may also betargeted for independent validation [33]. The microbial profile of a sample maybe determined by traditional Sanger sequencing, by terminal restriction lengthpolymorphism analysis or by denaturing gradient gel electrophoresis (reviewedin [25]. The recent introduction of massively parallel 454 pyrosequencing hasresulted in a radical increase in the popularity of microbiome profiling becausea large number of PCR amplicons can be sequenced at for a few cents per read[28, 17]. However, while constituting a tremendous improvement over previousmethods, pyrosequencing is constrained by cost limitations and a relatively highper-read error rate. The high error rate has led to some discussion in the lit-erature about the existence and importance of the ‘rare microbiome’ [32]. Newmethods for analyzing pyrosequencing output suggest that much of the raremicrobiome is composed of errors introduced by the sequencing method [30].
Until recently, the Illumimna sequencing-by-synthesis method of parallelDNA sequencing was thought to be unsuitable for microbiome profiling becausethe sequencing reads were too short to traverse any of the 16S rRNA variable re-gions. This can be partially circumvented by identifying maximally informativesites for specific groups of organisms (eg. [27]). A recent report demonstratedthat short sequences derived from Illumina sequences could be used for robustreconstruction of bacterial communities. This group used Illumina sequencingto determine the partial paired-end sequence of the V4 16S rRNA region in avariety of samples using single-end sequence tagged PCR primers [8].
Here we report the methods used to perform microbiome analysis of the V6region of 272 clinical samples using the Illumina sequencing technology. We usedpaired-end sequencing in combination with unique sequence tags at the 3‘ end ofeach primer. The overlapping paired-end reads gave us complete coverage of theV6 region. The combination of sequence tags at each end of the overlapped readsallowed us to use a small number of primers to uniquely tag a large number ofsamples. The Illumina sequencing method generated ∼ 12 million useable readsat a cost of ∼ 0.03 cents per read, an approximate order of magnitude cheaperthan the per-read cost of pyrosequencing. The cheaper per-read costs allowseconomical experiments on large numbers of samples at very large sequencingdepths. Since Illumina sequencing is now capable of ∼ 100 nt long reads fromeach end of a DNA fragment, the methods described here can be easily adaptedfor paired-end sequencing of the microbial V3, V5, V6 and the eukaryotic V9rRNA regions. Similarly to others [8], we found that methods used to analyzepyrosequencing microbiome data were often unsuitable for reads generated byIllumina sequencing and we present a workflow that can be used for rapid androbust generation of the relative abundance of organisms in each sample.
Importantly, we found that the Illumina sequencing method has an exceed-ingly low error rate and that the majority of errors arise during the PCR am-plification step. We argue that the error profile has profound implications forchoosing the appropriate seed sequence for clustering using the data generatedby Illumina sequencing.
2

Results
Description of the data
The DNA samples analyzed by this method were derived from a study designedto examine the vaginal microbiota in HIV+ women in an African population.A separate manuscript details the clinical findings of the study [18]. In all weanalyzed 272 clinical samples by a single Illumina paired-end sequencing run.
The Illumina sequencing platform is currently restricted to read lengths of∼ 100 nucleotides from each end of a DNA fragment, and was limited to ∼75nt at the time of experimental design. Thus, a paired-end sequencing run couldonly traverse the short 16S variable regions: V3, V5 and V6. The expecteddistribution of amplified fragment sizes, including the primer, for each variableregion is shown in Figure 1. We decided to use the V6 region for two mainreasons. First, the V6 region was expected to produce amplified fragmentsbetween 110 and 130 bp, ensuring that the majority of paired-end reads wouldoverlap. Secondly, the V6 region provided resolution for a number of organismsof interest in our samples down to the species and in some cases the strain level[20]. The Illumina platform currently provides reads long enough to overlap ineither the bacterial V3 [20, 4] or V5 regions or in the eukaryotic V9 region [3].We suggest the region(s) chosen for sequencing should be characterized for theresolution of taxa of interest, and several studies have examined this in detail[27, 25].
PCR Primer characterization
The primers were located within two conserved 16S rRNA segments that flankedthe V6 region. The left and right primer sequences mapped to the 967-985(CAACGCGARGAACCTTACC) and 1078-1061 (ACAACACGAGCTGACGAC)using the coordinates on the Escherichia coli 16S rRNA segment, and werechosen to amplify the majority of species expected to be found in the vagi-nal environment. The potential ability to amplify the regions flanking the V6region was tested computationally by two methods. First, the primers wereassessed using the probematch service from the Ribosomal Database Project[12]. The forward and reverse primers were found to match 96.8% and 99.3%of the good quality, long 16S rRNA sequences with 2 or fewer mismatches. Theforward primer was strongly biased against amplification of sequences in theTenericutes and Thermotogae phyla, amplifying 201/1438 and 8/82 in thesegroups. The reverse primer was unbiased. Secondly, we used a method similarto Wang and Qian [38]. Unaligned 16S rRNA sequences were downloaded fromthe Ribosomal RNA Database Project [12] and the 187260 sequences longerthan 1400 nt were extracted. Sequences of this length are nearly-full length andare expected to contain the V6 region. These sequences were filtered to removeentries where the only entry on the annotation line was ‘unidentified bacterium’or ‘uncultured bacterium’, leaving 97987 entries. Approximate string matching(agrep) with the TRE regular expression library [23] was used to determine that
3

Figure 1: Expected amplified product size using constant regions flank-ing eubacterial variable regions.
the left and right primers matched 94101 and 96432 of 97987 sequences withthe requirements of perfect matching at the 5 nucleotides at the 3‘ end and upto 2 mismatches in the remainder of the primer. Using this measure, the leftprimer matched over 96% and the right primer over 98% of the sequences inthe dataset. However, as shown in Table 1, either the left or right the primersdid not match the majority of sequences annotated as Sneathia, Leptotrichia,Ureaplasma or Mycoplasma. We found that relaxing the parameters somewhatresulted in matching to the majority of species in these groups (Table 1). Wesuggest that these primers would allow amplification of the majority of speciesin each of these groups, but that amplification may occur at lower efficienciesin some groups.
The primers were tested for their ability to amplify the 16S rRNA V6 re-gion of Lactobacillus iners, Lactobacillus rhamnosus, Gardnerella vaginalis andAtopobium vaginae. All were amplified equivalently using the following PCRparameters: denaturation 94◦, annealing 51◦, extension 72◦ all for 45 secondsover 25 amplification cycles.
4

Table 1: Number of species matching each primer in a filtered RDPdatasetTaxon Total species Left1 Righta
Escherichia 322 320 318Citrobacter 113 111 110Bacteroides 275 265 270Streptococcus 1249 1243 1244Staphylococcus 704 696 694Lactobacillus 1922 1908 1910Lachnospiraceae 82 82 82Peptostreptococcus 28 28 28Anaerococcus 29 29 29Megasphaera 38 38 38Dialister 21 21 21Candidatus 579 377 566Mobiluncus 25 25 25Propionibacteriaceae 12 12 12Bifidobacterium 146 145 143Porphyromonas 111 109 111Prevotella 269 264 264Fusobacterium 103 102 103Sneathia 4 4 0(4)b
Leptotrichia 60 60 1(58)b
Gardnerella 3 3 3Ureaplasma 36 0(34)c 36Mycoplasma 414 95(331)d 336
a number of hits with identity at the 3’ 5 nucleotides and up to 2 mismatches in the rest of
the primer:b number of hits requiring identity at the 3’ 4 nucleotides:c number of hits allowing 3 mismatches and identity at the 3’ 5 nucleotides:d number of hits allowing 4 mismatches and identity at the 3’ 5 nucleotides.
Sequence tag choice
The Illumina sequencing platform uses dye-terminated primer extension to se-quence DNA [6] and the base-calling algorithm uses the intensities from the firstseveral nucleotides incorporated to normalize the fluorescent signal from sub-sequent nucleotide incorporation events [35, 39]. Thus, we chose sequence tagsto ensure all 4 nucleotides were represented in each of the first four positionsof the primers using parameters similar to those in the barcrawl program [16].This was achieved, in part, by varying the length of the tags between 3 and 6nucleotides long. The tag length variation was expected to reduce the likeli-hood that adjacent spots on the Illumina solid support would be scored as oneduring the sequencing of the amplification primers [35, 39]. All sequence tags
5

were checked with a primer design program to ensure that they would not in-duce primer-dimer formation [15]. The sequence tags are given in Table 2. Theright-side sequence tags can be uniquely identified if they are full-length, or ifthey are truncated by 1 nucleotide, as commonly occurs during oligonucleotidesynthesis. Three of the left-side sequence tags (GTA, CTA, TGA) could derivedfrom three longer left-side sequence tags (AGTA, GCTA, ATGA) by N-1 trun-cation. Only reads with full-length sequence tag sequences were used in thisanalysis. The three nucleotide-long sequence tags have been redesigned for sub-sequent experiments to remove any ambiguities that arise from N-1 truncation.The sequence tags were incorporated at the 3‘ end of the PCR primers.
Table 2: sequence tag and primer sequencesL-tag Name R-tag Namecatgcg 0-v6L cgcatg 0-v6Rgcagt 1-v6L actgc 1-v6Rtagct 2-v6L agcta 2-v6R
gactgt 3-v6L acagtc 3-v6Rcgtcga 4-v6L tcgacg 4-v6Rgtcgc 5-v6L gcgac 5-v6Racgta 6-v6L tacgt 6-v6Rcactac 7-v6L gtagtg 7-v6Rtgac 8-v6L gtca 8-v6Ragta 9-v6L tact 9-v6Ratga 10-v6L tcat 10-v6Rtgca 11-v6L tgca 11-v6Ract 12-v6L agt 12-v6Rtcg 13-v6L cga 13-v6Rgta 14-v6L tac 14-v6Rcta 15-v6L tag 15-v6Rtga 16-v6Lgcta 17-v6L
Extracting sequence reads and sample assignment
As stated by others [8] the large number of sequences and the short sequencereads present a challenge. The number of and the short length of the readsprevented the application of many commmon pyrosequencing data analysispipelines. We therefore developed the data analysis pipeline shown schemat-ically in Figure 2. A full description of each step is given below. All programsto extract the sequence reads and to index them into individual sequence units(ISUs) were developed in-house. A Bash shell script referencing C, Perl and Rprograms and scripts that are able to recapitulate this analyses on OS X areavailable from the authors.
We received 18047860 reads that were 76 nt long from each end of the PCR
6
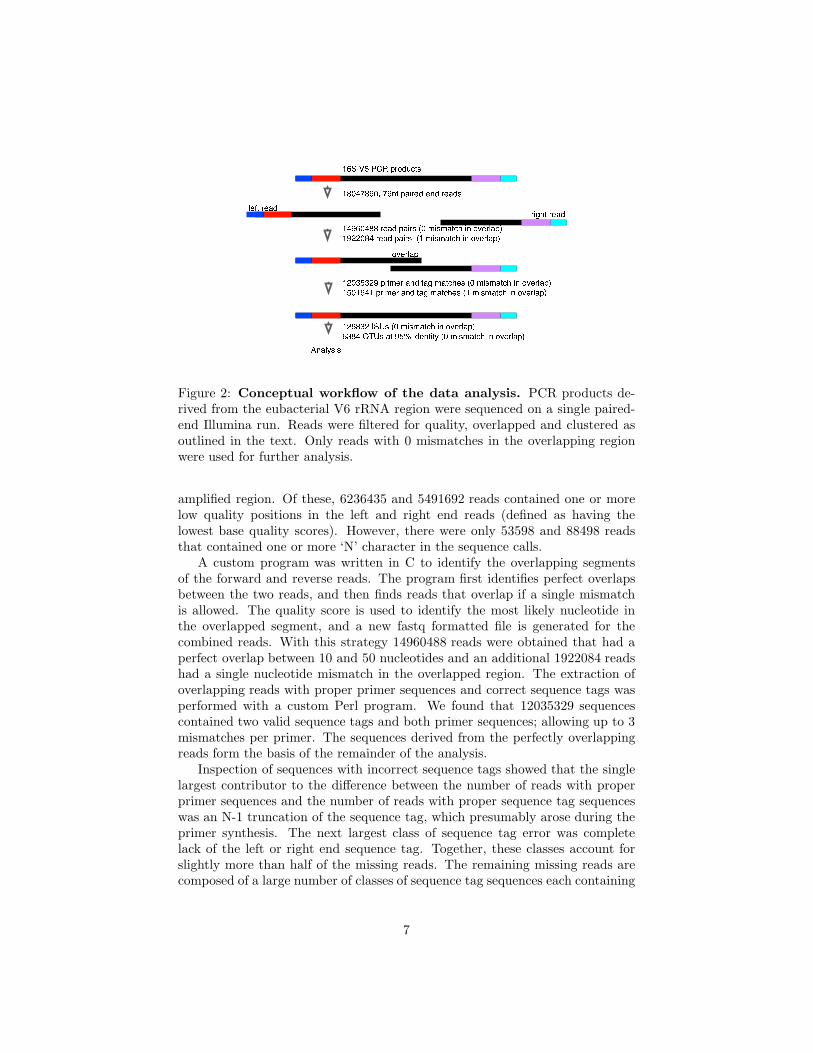
Figure 2: Conceptual workflow of the data analysis. PCR products de-rived from the eubacterial V6 rRNA region were sequenced on a single paired-end Illumina run. Reads were filtered for quality, overlapped and clustered asoutlined in the text. Only reads with 0 mismatches in the overlapping regionwere used for further analysis.
amplified region. Of these, 6236435 and 5491692 reads contained one or morelow quality positions in the left and right end reads (defined as having thelowest base quality scores). However, there were only 53598 and 88498 readsthat contained one or more ‘N’ character in the sequence calls.
A custom program was written in C to identify the overlapping segmentsof the forward and reverse reads. The program first identifies perfect overlapsbetween the two reads, and then finds reads that overlap if a single mismatchis allowed. The quality score is used to identify the most likely nucleotide inthe overlapped segment, and a new fastq formatted file is generated for thecombined reads. With this strategy 14960488 reads were obtained that had aperfect overlap between 10 and 50 nucleotides and an additional 1922084 readshad a single nucleotide mismatch in the overlapped region. The extraction ofoverlapping reads with proper primer sequences and correct sequence tags wasperformed with a custom Perl program. We found that 12035329 sequencescontained two valid sequence tags and both primer sequences; allowing up to 3mismatches per primer. The sequences derived from the perfectly overlappingreads form the basis of the remainder of the analysis.
Inspection of sequences with incorrect sequence tags showed that the singlelargest contributor to the difference between the number of reads with properprimer sequences and the number of reads with proper sequence tag sequenceswas an N-1 truncation of the sequence tag, which presumably arose during theprimer synthesis. The next largest class of sequence tag error was completelack of the left or right end sequence tag. Together, these classes account forslightly more than half of the missing reads. The remaining missing reads arecomposed of a large number of classes of sequence tag sequences each containing
7

small numbers of errors including additional 5’ bases, misincorporated bases ordifficult to classify errors that presumably arose during the PCR amplification.
Sequence clustering
Clustering was used to group identical sequences into ISUs, and these ISUs were-further clustered into operational taxonomic units (OTUs). The variation in anOTU can come from sequence differences between closely related taxa in theunderlying population, through errors introduced into the amplified fragmentfrom the PCR amplification, or from DNA sequencing errors.
ISUs were produced by collecting and collapsing identical sequences locatedbetween the primers and collapsing. A custom Perl program was written thatassociated each ISU with the number of identical sequences in it, that indexedeach read to the appropriate ISU and, later the OTU. The 12035329 reads werecollapsed into 126832 ISU sequences, with the most abundant ISU containing4321348 identical reads.
The occurrence of chimeric sequences was examined using UCHIME, a partof the UCLUST package (REF, http://www.drive5.com/uclust/). Chimericsequences can arise during PCR [21] or because of overlapping spots on thesolid support when imaged during DNA sequencing [6]. The default settings ofUCHIME identified 5211 putative chimeric ISUs, containing 18614 reads. Thus,5.6% of the ISUs were putative chimeric sequences, but these composed only0.15% of the total reads. There were 21 abundant putative chimeric ISUs thatcontained > 100 reads; the most abundant contained contained 1271 reads.
Each of the abundant putative chimeric ISUs were tested for chimerism withBLAST using the ISU sequence as the query and using the bacterial subset ofnucleotide sequences at NCBI as the database. We found only two putativechimeric sequences had sequence derived from two different species and had aUCHIME chimera score > 10, the other 19 putative chimeric ISU sequencesmatched multiple independent sequences in the dataset with ≥ 98% identity fortheir entire length. Thus, the occurrence of chimeric sequences was re-evaluatedusing a chimera score cutoff of 10 and only 497 ISUs containing 1834 total reads(0.015% of the dataset) were above this threshold. We concluded that chimericsequences composed a very small subset of the total number of ISUs, probablybecause the primers amplified across a variable region only. The dataset wasused without further regard to chimeric sequences because putative chimericsequences composed a miniscule fraction of reads.
The ordered ISU sequences were clustered into OTUs, operational taxonomicunits, by UCLUST which clusters each ISU to a seed sequence at a fixed sequenceidentity threshold using sequences as seeds in the order they are encountered inthe file. We ordered the ISU sequences from the most to the least abundant,under the assumption that read abundance correlated with the abundance ofthe sequences in the underlying population. Several lines of analysis were usedto decide on appropriate clustering values.
It is expected that the abundance of sequence variants per OTU will decreaseaccording to a power law if the variants are generated stochastically. However,
8

if a variant represents a distinct taxon in the underlying microbial population,the frequency of the variant is expected to reflect the proportion of the bacterialDNA in the sample.
Figure 3: The proportion of reads in the 25 most abundant OTUsclustered at 92% identity as a function of the number of differenceswith the seed ISU. The red line shows the plot for the concatenated primersequences, and the blue line shows the plot for the OTU containing the mostabundant ISU.
Figure 3 shows a plot of the number of reads in an OTU having nmismatchescompared to the most frequent read in the OTU at a cluster percentage of 92%.For an OTU with a length between 72-80 bp this corresponds to ∼ 5 mismatcheswith the seed sequence. The red line in Figure 3 shows the plot for the 37bp concatenated left and right primer sequences, which are expected to havehalf the per-nucleotide PCR-dependent error rate as the sequence between theprimers, because 50% of the sequence is not derived de novo but is contributedby the primer sequence. Because the concatenated sequence is about one-halfthe length of the sequence between the primers, the overall slope of the primerline should approximate the slope of a single-species OTU that includes errorsarising only from the PCR and sequencing. Note that the line for the primersequence is nearly linear and, in line with our expectations, the number ofreads having additional differences with the seed sequence for the OTU is farless abundant than the reads with one fewer difference. Also plotted are theresults for the 25 most abundant OTUs, with OTU 0, the most abundant OTUcomprising 51% of the total reads, shown in blue. The line for OTU 0, and
9

several other OTUs closely follow the line for the concatenated primers until 4or 5 differences with the seed sequence are included. The simplest interpretationis that one or more additional rare taxa having 4 or more mismatches with theseed sequence for OTU 0 are now being included at this level of clustering. Thelines for 11 of the 25 OTUs show a similar pattern with a sharp increase at 4 ormore mismatches. Only 3 of the OTUs show a continuous decline for all numberof mismatches with the seed member of the OTU suggesting that clustering at92% identity was including sequences not derived from PCR or sequencing error.
Figure 4: Neighbour-joining tree derived from Levenshtein distancebetween the 108 most abundant ISU sequences. ISUs clustered intoOTUs at 95% identity are connected with red branches and ISU sequencesclustered at 92% identity are connected with green branches. The seed sequencefor each 95% identity OTU cluster is identified by a red dot.
We next calculated the Levenshtein distance — the minimal number of sub-stitutions, insertions or deletions needed to convert one sequence into another— for all pairs of the 108 ISU sequences that occurred with a frequency of≥ 1% in any of the 272 samples. Examination of the neighbour-joining treedrawn from these distances showed that there was a continuum of distancesbetween ISU sequences, but that there seemed to be a natural distance cutoffof three substitutions in this dataset. This is illustrated in Figure 4 where thebranches sharing red nodes connect ISU sequences that clustered together at95% identity, and branches sharing green nodes connect ISU sequences clus-
10

tered at 92% identity. Several of these are instructive. The clade at 2 o’clock isanchored around ISU 0. The other ISU sequences in this clade differ from ISU0 by one or two substitutions, and, as we show below, represent substitutionsbecause of PCR error. All the members of this clade are well-separated fromall other clades. The other extreme can be illustrated by the clades at 4 and6 o’clock. Here, as shown below, the grouping at 95% identity includes differ-ences derived from PCR errors and from underlying sequence diversity in themicrobial sample. However, grouping at 92% identity (Levenshtein distance of5) clearly groups outlier clades with the main group. It is standard to assumethat clustering at 97% identity represents species units [8]. However, takingthe two extremes as examples, clustering at greater than 95% identity wouldresult in splitting clades that contain differences derived only from PCR error(i.e. ISU 0 and associated ISUs) and clustering at less than 95% identity wouldgroup sequences that should be distinct.
Based on these analyses a cluster percentage of 95% was used for the anal-ysis given below because it allowed up to 3 nucleotide differences with the seedsequence per OTU. At the 95% clustering threshold, 15 of the OTUs showedISU mismatch frequency decay characteristics similar to that expected for er-rors introduced only via PCR or sequencing error; i.e., their abundance profilesdecayed at a rate similar to that seen for errors in the primer sequences. Thisindicates that these 15 OTU sequences may be well differentiated from theirneighbours at this level of clustering and may represent distinct sequence speciesin the underlying population. On the other hand, the most abundant ISU inseveral OTUs was outnumbered by clustered ISU sequences. In the most ex-treme cases, OTUs 46, 97 and 119, ISU species with 2 and 3 differences from theseed ISU outnumbered the seed ISU by 2-3 orders of magnitude. An example ofthis characteristic profile is labeled with an arrow in Figure 3. As shown below,these OTUs represent clusters of errors derived from very abundant organismsin the underlying population.
Assignment of OTUs to taxonomic groups
The tools used for taxonomic assignment are not designed to work with theshort sequences derived from this type of analysis [12]. Therefore, similar toothers we designed a simple classification scheme based on sequence comparisonwith BLAST [7, 8] vs. eubacterial sequences (taxid 2), excluding unculturedand environmental samples, in the GenBank database [5]. In essence, sequenceswere identified at the species level if a fully-sequenced or classified type-speciessequence matched the OTU with 100% identity and 100% coverage and no othersequence matched with > 97%identity. Sequences that matched with less than100% identity were classified at the genus level if another genus matched with alower percent identity. Sequences with less than 95% identity were matched tothe taxonomic level supported by the groups of reads. With these rules we wereable to assign the 63 OTU sequences that were at an abundance of ≥ 1% inany of the 272 samples unambiguously. As discussed below, three of the OTUswere derived from PCR errors from the G. vaginalis strains and were classified
11

accordingly. The classifications of these OTUs, and the supporting evidence foreach is shown in Supplementary Table 1.
Systematic sources of error
Recently, Quince et al [30] examined the effect of pyrosequencing errors onthe classification of organisms in high-throughput microbiome analyses. Theyconcluded that a large fraction of the ‘rare microbiota’ was composed of py-rosequencing errors and introduced a method to accurately cluster the readsbased on their expected errors. Since the Illumina sequencing platform has asubstantially lower error rate than does the 454 pyrosequencing platform, andthe read length is deterministic rather than random [35] we were thus interestedin identifying the sources of error in the ∼ 13 million overlapping reads in ourdataset. Most notably the Illumina platform is not susceptible to miscalling thenumber of nucleotides in homopolymeric regions; this type of base-call error ismore pronounced in pyrosequencing reads when sequence coverage is relativelylow [35].
If the major source of error in the data came from DNA sequencing, wewould expect that errors should increase as a function of distance from thesequencing primer until the region of overlap and that the errors should bemuch less frequent in the overlapped region. This hypothesis can be assessedby comparing the Q, or quality, score assigned by the Illumina base-callingalgorithm in the overlapped 16S sequences with the error frequency per position.
Figure 5 shows a boxplot of the Q scores for the reads of length 120 nt,which composed 24% of the ∼ 12000000 overlapping reads. Similar results wereobtained for reads between 113 and 126 nt, which together compose > 99%of the overlapping reads. Two important conclusions can be drawn. First, asexpected, the median Q score decreases and the range of scores increase as thedistance from the sequencing primer becomes greater. Second, the Q scores,and the variability in these scores for the region of overlap are greater than forthe region of single coverage.
Initally, the concept of stochastic error contributing to sequence variationwas examined by measuring the frequency of occurrence of each nucleotide inthe left and right primers. Figure 6 shows a plot of the number of times thateach nucleotide occurred at each position in the left and right V6 primers. Thisfigure illustrates several points. First, the most frequent variant at each positionis usually a transition rather than a transversion, although several positions didnot follow this pattern. Secondly, the frequency of the residues differing fromthe primer sequence are found in a relatively consistent range. Thirdly, po-sition 9 in the left primer, which was synthesized as a mixture of G and A,shows a strong deviation from the background frequency. Thus the underlyingnucleotide frequency in the population of molecules being amplified stronglyaffects the nucleotide frequency at the polymorphic position. Finally, the varia-tion is constant across the entire length of the primers except for position 9 andis not dependent on the distance from the sequencing primer. These observa-tions support the hypothesis that stochastic errors may contribute significantly
12

Figure 5: Quality scores for all overlapped 120 bp composite reads.The Q scores a log-odds score of the likelihood of error in the base call, higherQ scores represent lower likelihoods of error [11]. They are expected to decreasewith distance from the left or right sequencing primer, and to be highest in theregion of perfect overlap because Q scores are additive.
to sequence variation in our dataset.The relationship between the Q scores and the abundance of sequence vari-
ants for each OTU was examined by mapping the variants onto seed ISUs aswas done for the primer sequences. All ISU sequences in each OTU were used tomake a BLAST database for that OTU and the OTU seed sequence was used asthe query sequence. An additional 6 nucleotides were added onto both ends ofboth the OTU sequence and the ISU sequences because of the edge effects in theBLAST algorithm [1]. These nucleotides were later trimmed for the analysis.The number of sequence variants at each position, weighted by the number ofreads that the variant occurred in was tabulated and converted into graphicalrepresentations of nucleotide counts at each position in the OTU.
Two representative examples for the rRNA V6 region are given in Figure7, and a summary of the distributions is given in Figure 8. Figure 7 showsthe number of reads that contain an individual residue at each position plottedin color. The entropy of each position is plotted as open or filled diamonds;higher entropy values correspond to greater variability at the position. Bothof these OTUs contain several million reads, and the predominant nucleotidecorresponds to the OTU seed sequence. However, there are many variants thatwere clustered together in these OTUs.
Figure 8 shows a summary plot of the distribution of differences in thefrequency across each OTU between the most commonly occurring residue andthe other 3 residues at each position. The OTUs are arranged approximatelyfrom those with the most to the least number of reads. Several interestingobservations can be made from these barplots. First, the frequency differentialvaries between 10−2 and 10−5 for the vast majority of sequence variants fromthe seed ISU sequence. Second, about half of the OTUs contain one or morestrongly outlying values. These correspond directly to the common variantresidues seen in Figure 7. Compare, for example, the uniform distribution of
13
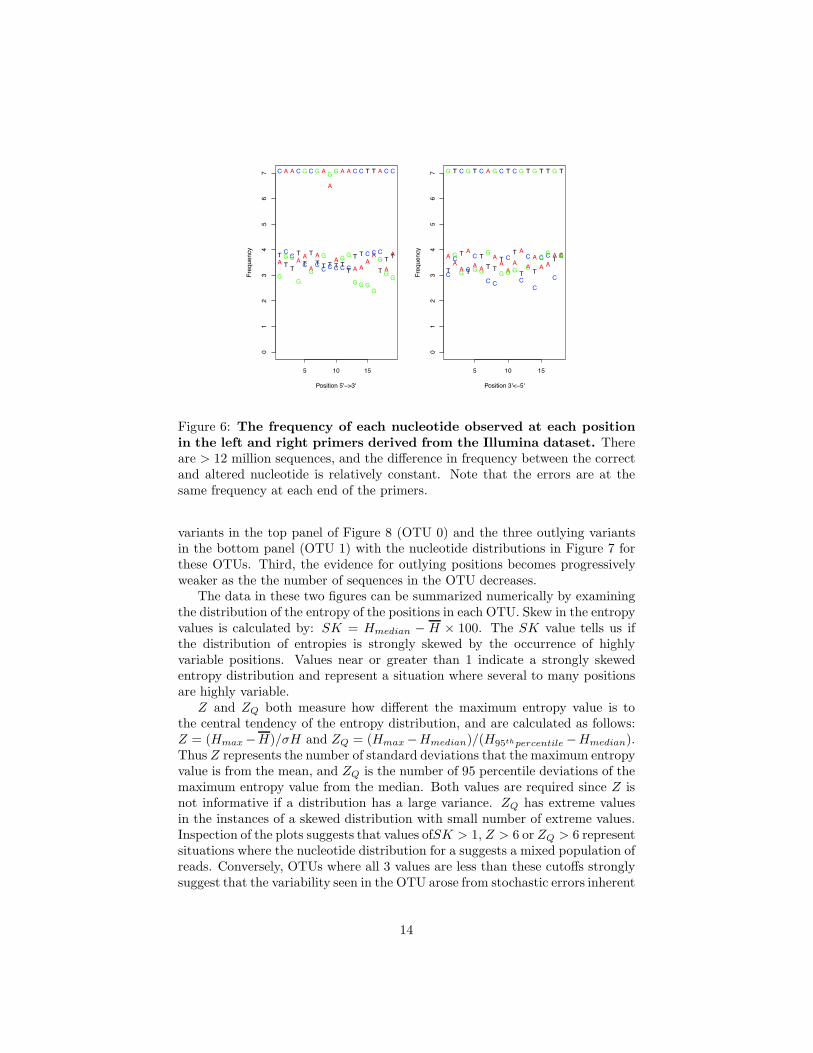
Figure 6: The frequency of each nucleotide observed at each positionin the left and right primers derived from the Illumina dataset. Thereare > 12 million sequences, and the difference in frequency between the correctand altered nucleotide is relatively constant. Note that the errors are at thesame frequency at each end of the primers.
variants in the top panel of Figure 8 (OTU 0) and the three outlying variantsin the bottom panel (OTU 1) with the nucleotide distributions in Figure 7 forthese OTUs. Third, the evidence for outlying positions becomes progressivelyweaker as the the number of sequences in the OTU decreases.
The data in these two figures can be summarized numerically by examiningthe distribution of the entropy of the positions in each OTU. Skew in the entropyvalues is calculated by: SK = Hmedian − H × 100. The SK value tells us ifthe distribution of entropies is strongly skewed by the occurrence of highlyvariable positions. Values near or greater than 1 indicate a strongly skewedentropy distribution and represent a situation where several to many positionsare highly variable.
Z and ZQ both measure how different the maximum entropy value is tothe central tendency of the entropy distribution, and are calculated as follows:Z = (Hmax−H)/σH and ZQ = (Hmax−Hmedian)/(H95thpercentile −Hmedian).Thus Z represents the number of standard deviations that the maximum entropyvalue is from the mean, and ZQ is the number of 95 percentile deviations of themaximum entropy value from the median. Both values are required since Z isnot informative if a distribution has a large variance. ZQ has extreme valuesin the instances of a skewed distribution with small number of extreme values.Inspection of the plots suggests that values ofSK > 1, Z > 6 or ZQ > 6 representsituations where the nucleotide distribution for a suggests a mixed population ofreads. Conversely, OTUs where all 3 values are less than these cutoffs stronglysuggest that the variability seen in the OTU arose from stochastic errors inherent
14
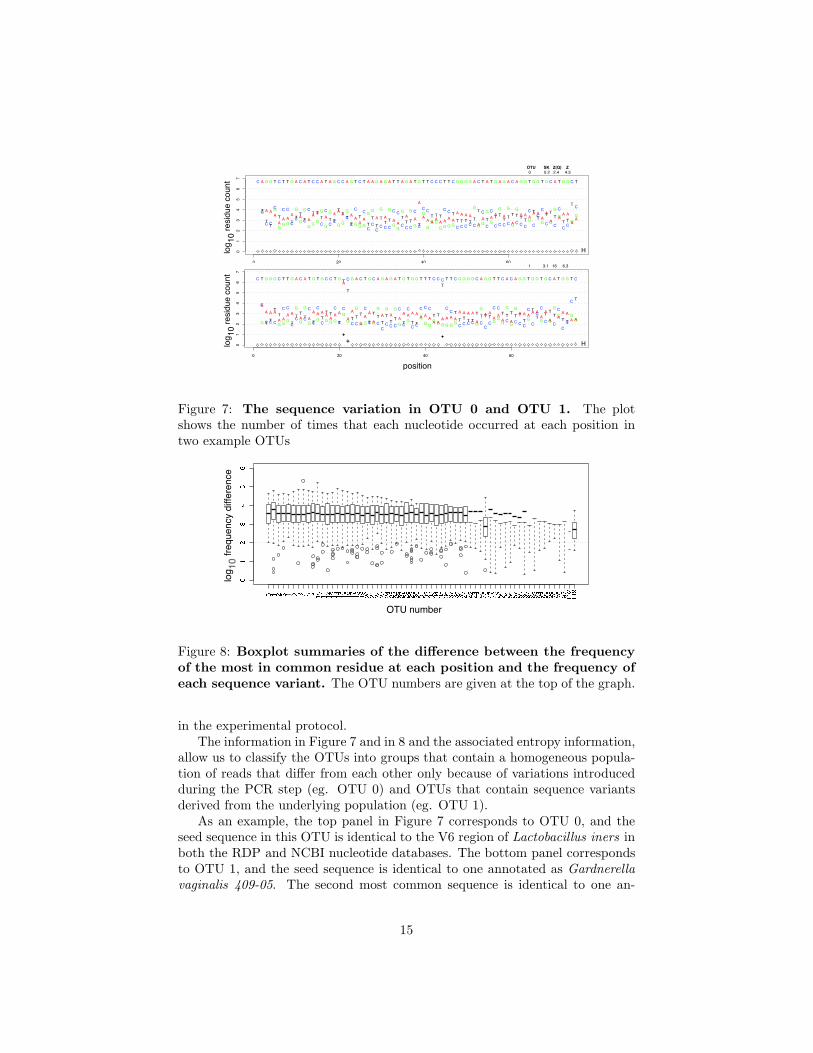
Figure 7: The sequence variation in OTU 0 and OTU 1. The plotshows the number of times that each nucleotide occurred at each position intwo example OTUs
Figure 8: Boxplot summaries of the difference between the frequencyof the most in common residue at each position and the frequency ofeach sequence variant. The OTU numbers are given at the top of the graph.
in the experimental protocol.The information in Figure 7 and in 8 and the associated entropy information,
allow us to classify the OTUs into groups that contain a homogeneous popula-tion of reads that differ from each other only because of variations introducedduring the PCR step (eg. OTU 0) and OTUs that contain sequence variantsderived from the underlying population (eg. OTU 1).
As an example, the top panel in Figure 7 corresponds to OTU 0, and theseed sequence in this OTU is identical to the V6 region of Lactobacillus iners inboth the RDP and NCBI nucleotide databases. The bottom panel correspondsto OTU 1, and the seed sequence is identical to one annotated as Gardnerella
vaginalis 409-05. The second most common sequence is identical to one an-
15

notated as G. vaginalis NML060420, and the third and fourth most commonsequences are identical to sequences annotated as uncultured G. vaginalis se-quences. All four of these sequences differ from each other by a single diagnosticnucleotide, and the variant counts match the counts of the 4 major ISUs. These4 ISUs make up the 88.9% of the reads in OTU 1. Based on the analysis of thesetwo OTUs and the similar analyses of the remaining OTUs, we conclude thatOTUs that exhibit the pattern of variation seen in OTU 0 represent distinctsequence entities in the underlying dataset and that those exhibiting a patternof variation similar to OTU 1 represent the grouping of sequence entities in theunderlying dataset based on sequence similarity. In the case of OTU 0, no se-quence in the RDP database [12] could be clustered with it without including atleast 5 nucleotide substitutions, leading us to conclude that OTU 0 representsa distinct taxonomic group at the sequence level. In the case of OTU 1 thereare several sequences, all annotated as different strains of the same species thatare grouped together, and like OTU 0, all are well-separated from other V6sequences. Thus, we conclude that OTU 1 is a cluster of distinct G. vaginalis
strains.OTUs 46, 97 and 119 in the dataset, had distinct distributions when plotted
as in Figures 7 and 8. The nucleotide frequency difference between the seedsequence and the nucleotide variants in these three OTUs was much smallerthan in the other 61 OTUs. Inspection of the sequences making up these OTUsshowed that they were most similar to one or more of the G. vaginalis strains.We propose that these OTUs are composed of ISU sequences derived solelyfrom PCR errors that failed to cluster with the seed sequence in OTU 1. Weare currently working on a clustering procedure that explicitly accounts both foredit distance and read abundance to more accurately cluster sequences derivedby very high throughput sequencing.
Organism diversity and data reproducibility
We found that one right-end tag, GCGAG, was composed of a mixture with theratio 69.5/30.5 of the full-length and the unique N-1 truncation-derived GCGAtag. This oligonucleotide synthesis error was exploited to determine the effect ofthe number of reads on within-sample variability; in essence the N-1 truncatedtag allowed an examination of the technical replication of the experiment. TheGCGAC tag was used in 17 samples. The black-filled circles in Figure 9 showthe number of reads from the full length GCGAC tag compared to the truncatedGCGA tag in these samples. The red open circles in Figure 9 show an exampleof the read replication observed from independent samples. The replication ofthe read numbers in the full length and N-1 samples is extremely high for readsoccurring at least 30 times in the full-length tag set, and at least 10 reads inthe N-1 tag set. As expected the read replication for independent samples ismuch poorer. The correlation coefficients for the 17 full-length and N-1 samplesranged from 0.97 to 0.99 when the N-1 sample contained at least 10 reads. Thus,we conclude that the number of reads in a sample is reproducible, if at least10 reads are observed. Similar conclusions about the minimum read abundance
16

Figure 9: Plot of the reproducibility between and within samples.Theblack-filled circles plot within-sample variation, and the red circles plot thebetween-sample variation for the GTCGC tag. The count of sequences com-posing OTUs clustered at 95% identity for samples containing the GTCGC tagand the GTCG N-1 tag are in black. This shows the technical replication ofthe data when amplified from the same sample in the same tube. The open redcircles plot the correspondence for between-sample OTU counts.
have been drawn from RNA-seq experiments [24].
Rarefaction curves
A second way to examine reproducibility is to generate rarefaction curves wherethe number of species sampled per unit of effort is estimated by resampling thedataset [19, 36]. Rarefaction curves for the dataset from each sample weregenerated by performing 10000 random samples with replacement [14] on thecomplete set of OTUs or ISUs or by including only those OTUs and ISUs thatoccurred in a sample more than twice. The values for resampling without re-placement will approach the observed value (i.e. will saturate) only if the sampleis of sufficient size to encapsulate all possible diversity [14]. Thus, if the valuesdo approach saturation when resampling with replacement, we can be confidentthat we have sampled most, if not all, of the available sequence species [14, 13].
Figure 10 shows rarefaction curves generated for ISUs and OTUs in sample1 using different protocols for a representative sample in our dataset; it is worth
17

Figure 10: An example rarefaction curve. The top panel shows rarefactioncurves generated for sample 1 by resampling with replacement either all OTUsor ISUs, or OTUs and ISUs where at least 3 reads were observed. The bottompanel shows the rarefaction curve and the 95% and 99% confidence interval forall OTUs in sample 1.
pointing out that this rarefaction curve is one of the few curves that does notreach saturation. The white-filled symbols show curves generated for unclus-tered ISUs in this sample, and the black-filled symbols are for OTUs generatedat 95% sequence clustering. Here, the effect of removing rare sequence speciesis clear. The curve saturates when sampling only 50% of the reads if either rareISU or rare OTU sequences are removed, but does not saturate for either the
18
ISUs or OTUs even with the full set of reads. Inspection of the full set of rar-efaction curves shows that this failure to reach the limit is commonly observedwhen the sample is dominated by one or a few species, which is the case inmany of the microbiota samples in our complete dataset. Samples containing abroader range of species show rarefaction curves that generally reach the limitnear 20000 reads, suggesting that this is an appropriate number of reads tosample the microbiome in the vaginal environment.
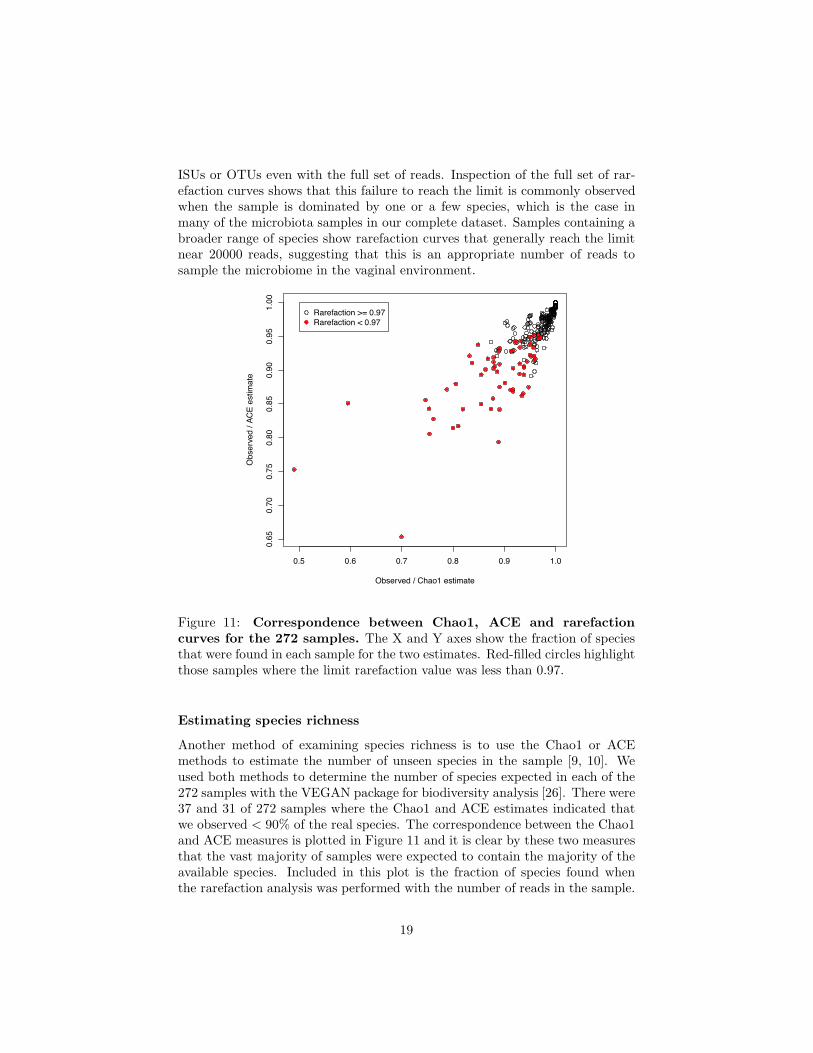
Figure 11: Correspondence between Chao1, ACE and rarefactioncurves for the 272 samples. The X and Y axes show the fraction of speciesthat were found in each sample for the two estimates. Red-filled circles highlightthose samples where the limit rarefaction value was less than 0.97.
Estimating species richness
Another method of examining species richness is to use the Chao1 or ACEmethods to estimate the number of unseen species in the sample [9, 10]. Weused both methods to determine the number of species expected in each of the272 samples with the VEGAN package for biodiversity analysis [26]. There were37 and 31 of 272 samples where the Chao1 and ACE estimates indicated thatwe observed < 90% of the real species. The correspondence between the Chao1and ACE measures is plotted in Figure 11 and it is clear by these two measuresthat the vast majority of samples were expected to contain the majority of theavailable species. Included in this plot is the fraction of species found whenthe rarefaction analysis was performed with the number of reads in the sample.
19

Figure 12: Plot of the number of distinct ISU or OTU classes in eachsample as a function of the number of reads. The number of ISU classesincreases with the number of reads, but the number of OTU classes becomesconstant above 20000 - 30000 reads.
Rarefaction with a saturating number of reads again showed that the 206 of 272samples identified all or almost all of the available species.
Diversity vs. number of reads
Finally, species richness can be examined as a function of the number of readsacross all 272 samples. This is plotted in Figure
12 for ISU and OTU sequences. In this case the white-filled symbols repre-sent populations derived from samples classified as ‘normal’, and are expectedto be dominated by one or a few species, and the red or blue-filled symbolsrepresent populations classified as bacterial vaginosis (BV), where there is ex-pected to be a more even distribution of species [37, 34]. There are stronglydiminishing returns when more than 20000-25000 reads are obtained regardlessof the diversity of the population; sampling more than 50000 reads was suffi-cient to sample all the available OTU diversity in the samples. Interestingly, thenumber of distinct ISU sequences increases linearly with the number of reads,providing further evidence that increasing the number of reads increases thebackground number of ISUs that contain PCR-derived errors. Taken togetherwith the rarefaction, Chao1, ACE data, we conclude that the number of readsobtained by this Illumina sequencing is adequate to sample nearly saturating
20

numbers of species in this environment.
!"!"!"
#$#$#$
%&
'( )(
Prevotella melaninogenicaStreptococcus anginosus/milleriS. phocae/difficilis/porcinus
S. pneumoniae/ oralis/ parasanguinis/ infantis/mitis/
sanguinis/merionis/
oligofermentans Peptostreptococcus anaerobius
Gemella sp. WALAggregatibacter aphrophilus/ segnis
H aemophilus segnis/ quentini/ influenzae/paraphrophilus
Gemella sanguinis/ haemolysans/ morbillorum
Shewanella harveyiVibrio harveyiVibrio owensii/
rumoiensis/hepatarius/parahaemolyticus/natriegens
Nitrincola lacisaponensis
Citrobacter freundiiSerratia plymuthica/ marcescens/ entomophilaPhotobacterium rosenbergiiEnterobacter cloacae
H aemophilus parainfluenzaeL. crispatus
L. iners
G . vaginalis
Streptococcus anginosus
Streptococcus agalactiae
H aemophilus haemolyticus
Leptotrichia amnioniiPrevotella amniotica
!""#
$%%&'()*
Sneathia sanguinegens
Leptotrichia sanguinegens
Atopobium vaginae
Prevotella timonensis
D ialister propionicifaciens
Lactobacillacea: G ranulicatella/Aerococcus/
Atopobacter/AbiotrophiaVeillonella montpellierensis
Atopobium rimae
!"#####!$#####$%
& '
Figure 13: DGGE analysis of selected samples. Panel A shows repre-sentative PCR amplicons from 3 of 20 clinical samples (Subjects 40, 48 and89) were electrophoresed on a denaturing gradient gel. Bands were excised,sequenced and identified as in the Materials and Methods. Bands are labeledas follows: le=Leptotrichia amnionii ; in=Lactobacillus iners ; ga=Gardnerella
vaginalis ; cr=Lactobacillus crispatus ; pr=Prevotella amniotica. Panel B showsa Venn diagram of the organisms identified by Illumina sequencing of the V6rRNA region and by sequencing DGGE bands amplified from the V3 rRNAregion.
Comparison with DGGE
Results from Illumina sequencing were compared to those from dideoxy chaintermination sequencing of bands isolated from following denaturing gradient gelelectrophoresis (DGGE) analysis of amplified PCR products; a method tradi-tionally used for the separation of bacterial species. A total of 20 samples wereselected that were expected to have a diverse population of organisms by ex-trapolation from the 272 samples sequenced by Illumina. DNA fragments fromthe bands were sequenced and each OTU sequence and each sequence from theDGGE bands were assigned to taxonomic groups by BLAST using the Gen-Bank nucleotide database as described above. OTU sequences were assigned tospecies if they matched 100% of their length at 100% identity, and to genus orother groups as outlined in Supplementary Table 1. DGGE was found to detectonly those bacterial species of greatest abundance in the sample, with a minimalIllumina read abundance of 11%. In two cases, one shown in Figure 13A-lane
21

89, a distict band was excised and sequenced that had an Illumina abundanceof between 2-3%. Figure 13B shows that a total of 8 organisms were detectedthrough DGGE analysis, compared to 59 organisms detected through Illuminaanalysis in the same 20 samples, and that the organisms identified by DGGEanalysis were a strict subset of those identified by Illumina sequencing.
Discussion
We present and characterize a low-cost, high throughput method for microbiomeprofiling. The method uses combinatorial sequence tags attached to the 3‘ endof PCR primers that amplify the rRNA V6 region, but may be easily adapted foruse in other bacterial and eukaryotic sequences. Illumina paired-end sequencingof the amplimers generates millions of overlapping reads. The combinatorialsequence tags allows the investigator to examine hundreds of samples with farfewer primers than is required for single-end bar-code sequencing. We proposethat this method will be useful for the deep sequencing of any short sequencethat is informative; these include the V3 and V5 regions of the bacterial 16SrRNA genes and the eukaryotic V9 region that is gaining popularity for samplingprotist diversity. The use of the V3 and V5 regions is currently being attemptedby our group.
A recent report used a small number of sequence tags on one end of oneprimer to examine microbial diversity using Illumina sequencing [8]. However,this method required three Illumina sequencing to fully identify the sequencetags, and the tags were much longer. In our study, we used a simple set of rulesto choose sequence tags that balanced the nucleotide composition in the first4 positions of the reads, that maximizee the stagger in the primer sequenceswhen attached to the solid surface and that minimized the possibility of primer-dimer formation. Using these simple principles and avoiding the N-1 generationof non-unique sequences, short sequence tags should be easily derived that aresuitable for primers specific to any small region of interest. Sequence tags canbe chosen automatically using the barcrawl program [16] or can be chosen byhand.
We observed very few chimeric sequences in our dataset. There are severalreasons. First, we used a relatively small amount of input DNA and used asmall number of PCR cycles for amplification [21]. Secondly, many chimericsequences may have been removed because of the strict requirement for propersequence tag and primer sequences on the left and right ends, and because ofa requirement for long overlapping segments of a defined length. In this case,the deterministic read lengths of the Illumina protocol combined with our nar-row window for overlapping segments would have resulted in many chimericsequences being filtered out. Indeed, inspection of a fraction of the read pairsthat failed to overlap, or that failed to pass the sequence tag and primer require-ments showed that many of these were chimeric or deleted at one or both ends(data not shown). Thus, while the Illumina sequencing protocol is limited toshort segments these can be combined into longer segments using the paired-end
22
approach as long as there is a significantly overlapping segment.The utility of the method is further demonstrated by the near-saturating
number of ISU and OTU sequences obtained from a large number of clinicalsamples. We used several lines of evidence to show that 20000 reads are sufficientto capture all or virtually all of the sequence diversity in the vaginal microbiome,and that obtaining over 50000 reads results in no new sequence species. Thus,assuming a requirement for 50000 reads, up to 200 samples can be combined intoa single Illumina lane, while up to 500 samples are possible if only 20000 readsare required. This is much greater depth at a much lower cost than is possiblewith current pyrosequencing technology. Strikingly, we observed that none ofour samples contained the full range of species in the microbiome as a whole, andthat we found fewer species than in a recent report that used pyrosequencingin the same niche [31], despite averaging 20-fold greater sequence coverage. Wesuggest that the higher fidelity Illumina sequencing may have resulted in fewertaxa because of a lower error rate contributing to fewer ‘rare microbiome’ taxa.
Finally, we showed that the spectrum of errors could be examined for eachOTU to help determine if the OTU was derived from a single underlying se-quence in the sample population. The large number of reads presented a chal-lenge for sequence-based clustering because sequencing millions of reads ensuredthat much of the read variation was derived from PCR-amplification. We showthat sequence clustering of the large number of reads derived from Illumina se-quencing would be more accurate if it took both the sequence variation and theunderlying error rates into account. We are currently working on developingmethods to cluster that use both sequence similarity and read abundance.
Materials and Methods
Ethics Statement
The medical ethical review committee of Erasmus University Medical Centre,The Netherlands, and the medical research coordinating committee of the Na-tional Institute for Medical Research, Tanzania, approved the study design andprotocol. Subjects were informed of the purpose of the study and gave theirsigned informed consent before participation. The study was registered at clin-ical trials.gov NCT00536848.
Sample preparation and amplification
DNA was prepared from clincal swabs as part of a clinical study [18]. Amplifi-cation was initiated with a 61◦ annealing temperature that dropped to 51◦ in 1◦
increments followed by 15 cycles of: denaturation 94◦, annealing 51◦, extension72◦ all for 45 seconds with a final elongation for 2 minutes. A constant volumealiquot of each amplification was run on a 1.4% agarose gel for to determinethe approximate amount of product. The amount of product was scored on a 4point scale and, based on this scale, between 2 and 40 µl of the PCR productswere mixed together to give the final sample sent for Illumina sequencing at
23
The Next-Generation Sequencing Facility in The Centre for Applied Genomicsat the Hospital for Sick Children in Toronto. The library was prepared withoutfurther size selection.
Denaturing gradient gel electrophoresis analysis
Clinical samples were amplified using eubacterial primers flanking the V3 re-gion of the 16S rRNA gene: HDA-1 (5-ACTCCTACGGGAGGCAGCAGT-3)at position 339-357 (with a GC clamp located at the 5 end), and HDA-2 (5-GTATTACCGCGGCTGCTGGCA-3) at position 518-539, with an annealingtemperature of 56◦C. PCR reactions were carried out in 50 µl reactions for 30cycles using the profile: 94◦C, a gradient of annealing temperatures 71− 51◦Cat 45sec each, elongation 72◦C all for 45sec.
Preparation of the 8% polyacrylamide denaturing gradient and gel elec-trophoresis was done according to the manufacturers instructions for the D-CodeUniversal Detection System (Bio-Rad) with a 30-50% gradient of urea and for-mamide. The gel was run in Tris-acetate buffer and pre-heated to 59◦C. Thegel was run at 130V for 2 hours or until the xylene cyanol dye front reached thelower end of the gel. DNA was visualized by UV irradiation following stain withethidium bromide. Bands were excised and reamplified, using the same primersand profile but without the GC clamp. This second PCR product was purifiedand sequenced with the HDA forward primer via dideoxy chain termination.Analysis of results was carried out using the GenBank nucleotide database andBLAST algorithm [2].
Acknowledgments
We thank Dr. Sergio Pereira (The Center for Applied Genomics, University ofToronto), and Layla Katiree from Illumina for insights into the inner workingsof the Illumina platform. The design and analysis was done to analyze themicrobiome of a large cohort of HIV+ women in Tanzania. Partial fundingof this project from the National Sciences and Engineering Research Councilof Canada (NSERC) to Gregor Reid and Greg Gloor is acknowledged. AFis supported an NSERC post-doctoral fellowship and RD is supported by anNSERC CGS-D scholarship. The funders had no role in study design, datacollection and analysis, decision to publish, or preparation of the manuscript.
References
[1] Altschul, S. F. and Gish, W. (1996). Local alignment statistics. Methods
Enzymol , 266, 460–80.
[2] Altschul, S. F., Madden, T. L., Schaffer, A. A., Zhang, J., Zhang, Z., Miller,W., and Lipman, D. J. (1997). Gapped blast and psi-blast: a new generationof protein database search programs. Nucleic Acids Res , 25(17), 3389–3402.
24

[3] Amaral-Zettler, L. A., McCliment, E. A., Ducklow, H. W., and Huse, S. M.(2009). A method for studying protistan diversity using massively parallelsequencing of v9 hypervariable regions of small-subunit ribosomal rna genes.PLoS One, 4(7), e6372.
[4] Andersson, A. F., Lindberg, M., Jakobsson, H., Backhed, F., Nyren, P.,and Engstrand, L. (2008). Comparative analysis of human gut microbiota bybarcoded pyrosequencing. PLoS One, 3(7), e2836.
[5] Benson, D. A., Karsch-Mizrachi, I., Lipman, D. J., Ostell, J., and Sayers,E. W. (2010). Genbank. Nucleic Acids Res , 38(Database issue), D46–51.
[6] Bentley, D. R., Balasubramanian, S., Swerdlow, H. P., Smith, G. P., Milton,J., Brown, C. G., Hall, K. P., Evers, D. J., Barnes, C. L., Bignell, H. R.,Boutell, J. M., Bryant, J., Carter, R. J., Keira Cheetham, R., Cox, A. J.,Ellis, D. J., Flatbush, M. R., Gormley, N. A., Humphray, S. J., Irving, L. J.,Karbelashvili, M. S., Kirk, S. M., Li, H., Liu, X., Maisinger, K. S., Murray,L. J., Obradovic, B., Ost, T., Parkinson, M. L., Pratt, M. R., Rasolonjatovo,I. M. J., Reed, M. T., Rigatti, R., Rodighiero, C., Ross, M. T., Sabot, A.,Sankar, S. V., Scally, A., Schroth, G. P., Smith, M. E., Smith, V. P., Spiridou,A., Torrance, P. E., Tzonev, S. S., Vermaas, E. H., Walter, K., Wu, X., Zhang,L., Alam, M. D., Anastasi, C., Aniebo, I. C., Bailey, D. M. D., Bancarz,I. R., Banerjee, S., Barbour, S. G., Baybayan, P. A., Benoit, V. A., Benson,K. F., Bevis, C., Black, P. J., Boodhun, A., Brennan, J. S., Bridgham, J. A.,Brown, R. C., Brown, A. A., Buermann, D. H., Bundu, A. A., Burrows, J. C.,Carter, N. P., Castillo, N., Chiara E Catenazzi, M., Chang, S., Neil Cooley,R., Crake, N. R., Dada, O. O., Diakoumakos, K. D., Dominguez-Fernandez,B., Earnshaw, D. J., Egbujor, U. C., Elmore, D. W., Etchin, S. S., Ewan,M. R., Fedurco, M., Fraser, L. J., Fuentes Fajardo, K. V., Scott Furey, W.,George, D., Gietzen, K. J., Goddard, C. P., Golda, G. S., Granieri, P. A.,Green, D. E., Gustafson, D. L., Hansen, N. F., Harnish, K., Haudenschild,C. D., Heyer, N. I., Hims, M. M., Ho, J. T., Horgan, A. M., Hoschler, K.,Hurwitz, S., Ivanov, D. V., Johnson, M. Q., James, T., Huw Jones, T. A.,Kang, G.-D., Kerelska, T. H., Kersey, A. D., Khrebtukova, I., Kindwall,A. P., Kingsbury, Z., Kokko-Gonzales, P. I., Kumar, A., Laurent, M. A.,Lawley, C. T., Lee, S. E., Lee, X., Liao, A. K., Loch, J. A., Lok, M., Luo,S., Mammen, R. M., Martin, J. W., McCauley, P. G., McNitt, P., Mehta, P.,Moon, K. W., Mullens, J. W., Newington, T., Ning, Z., Ling Ng, B., Novo,S. M., O’Neill, M. J., Osborne, M. A., Osnowski, A., Ostadan, O., Paraschos,L. L., Pickering, L., Pike, A. C., Pike, A. C., Chris Pinkard, D., Pliskin,D. P., Podhasky, J., Quijano, V. J., Raczy, C., Rae, V. H., Rawlings, S. R.,Chiva Rodriguez, A., Roe, P. M., Rogers, J., Rogert Bacigalupo, M. C.,Romanov, N., Romieu, A., Roth, R. K., Rourke, N. J., Ruediger, S. T.,Rusman, E., Sanches-Kuiper, R. M., Schenker, M. R., Seoane, J. M., Shaw,R. J., Shiver, M. K., Short, S. W., Sizto, N. L., Sluis, J. P., Smith, M. A.,Ernest Sohna Sohna, J., Spence, E. J., Stevens, K., Sutton, N., Szajkowski,L., Tregidgo, C. L., Turcatti, G., Vandevondele, S., Verhovsky, Y., Virk,
25

S. M., Wakelin, S., Walcott, G. C., Wang, J., Worsley, G. J., Yan, J., Yau, L.,Zuerlein, M., Rogers, J., Mullikin, J. C., Hurles, M. E., McCooke, N. J., West,J. S., Oaks, F. L., Lundberg, P. L., Klenerman, D., Durbin, R., and Smith,A. J. (2008). Accurate whole human genome sequencing using reversibleterminator chemistry. Nature, 456(7218), 53–9.
[7] Camacho, C., Coulouris, G., Avagyan, V., Ma, N., Papadopoulos, J., Bealer,K., and Madden, T. L. (2009). Blast+: architecture and applications. BMC
Bioinformatics , 10, 421.
[8] Caporaso, J. G., Lauber, C. L., Walters, W. A., Berg-Lyons, D., Lozupone,C. A., Turnbaugh, P. J., Fierer, N., and Knight, R. (2010). Global patternsof 16s rrna diversity at a depth of millions of sequences per sample. Proc Natl
Acad Sci U S A.
[9] Chao, A. (1984). Nonparametric estimation of the number of classes in apopulation. Scandinavian Journal of Statistics , 11, 265–270.
[10] Chao, A. and Lee, S. M. (1992). Estimating the number of classes viasample coverage. J. American Stat. Soc., 87, 210–217.
[11] Cock, P. J. A., Fields, C. J., Goto, N., Heuer, M. L., and Rice, P. M.(2010). The sanger fastq file format for sequences with quality scores, andthe solexa/illumina fastq variants. Nucleic Acids Res , 38(6), 1767–71.
[12] Cole, J. R., Wang, Q., Cardenas, E., Fish, J., Chai, B., Farris, R. J., Kulam-Syed-Mohideen, A. S., McGarrell, D. M., Marsh, T., Garrity, G. M., andTiedje, J. M. (2009). The ribosomal database project: improved alignmentsand new tools for rrna analysis. Nucleic Acids Res , 37(Database issue),D141–5.
[13] Colwell, R. (2009). Estimates: Statistical estimation of species richnessand shared species from samples.
[14] Efron, B. (1981). Nonparametric estimates of standard error: The jack-knife, the bootstrap and other methods. Biometrika, 68(3), 589.
[15] Engels, W. R. (1993). Contributing software to the internet: the amplifyprogram. Trends Biochem Sci , 18(11), 448–50.
[16] Frank, D. N. (2009). Barcrawl and bartab: software tools for the design andimplementation of barcoded primers for highly multiplexed dna sequencing.BMC Bioinformatics , 10, 362.
[17] Hamady, M. and Knight, R. (2009). Microbial community profiling forhuman microbiome projects: Tools, techniques, and challenges. Genome Res ,19(7), 1141–52.
[18] Hummelen, R., Fernandes, A. D., Macklaim, J. M., Dickson, R. J.,Changalucha, J., Gloor, G. B., and Reid, G. (2010). Deep sequencing of thevaginal microbiota of women with hiv. PLoS ONE , Accepted 2010-07-08.
26
[19] Hurlbert, S. (1971). The nonconcept of species diversity: a critique andalternative parameters. Ecology, 52(4), 577–586.
[20] Huse, S. M., Dethlefsen, L., Huber, J. A., Mark Welch, D., Welch, D. M.,Relman, D. A., and Sogin, M. L. (2008). Exploring microbial diversity andtaxonomy using ssu rrna hypervariable tag sequencing. PLoS Genet , 4(11),e1000255.
[21] Lahr, D. J. G. and Katz, L. A. (2009). Reducing the impact of pcr-mediatedrecombination in molecular evolution and environmental studies using a new-generation high-fidelity dna polymerase. Biotechniques , 47(4), 857–66.
[22] Lauber, C. L., Hamady, M., Knight, R., and Fierer, N. (2009).Pyrosequencing-based assessment of soil ph as a predictor of soil bacte-rial community structure at the continental scale. Appl Environ Microbiol ,75(15), 5111–20.
[23] LAURIKARI, V. (2010). Tre the free and portable approximate regexmatching library.
[24] Mortazavi, A., Williams, B. A., McCue, K., Schaeffer, L., and Wold, B.(2008). Mapping and quantifying mammalian transcriptomes by rna-seq. NatMethods , 5(7), 621–8.
[25] Nocker, A., Burr, M., and Camper, A. K. (2007). Genotypic microbialcommunity profiling: a critical technical review. Microb Ecol , 54(2), 276–89.
[26] Oksanen, J., Kindt, R., Legendre, P., and B., O. (2010). vegan: Communityecology package version 18-3. r package.
[27] Pawlowski, J. and Lecroq, B. (2010). Short rdna barcodes for species iden-tification in foraminifera. J Eukaryot Microbiol , 57(2), 197–205.
[28] Petrosino, J. F., Highlander, S., Luna, R. A., Gibbs, R. A., and Versalovic,J. (2009). Metagenomic pyrosequencing and microbial identification. Clin
Chem, 55(5), 856–66.
[29] Polymenakou, P. N., Lampadariou, N., Mandalakis, M., and Tselepides,A. (2009 Feb). Phylogenetic diversity of sediment bacteria from the southerncretan margin, eastern mediterranean sea. Syst Appl Microbiol , 32(1), 17–26.
[30] Quince, C., Lanzen, A., Curtis, T. P., Davenport, R. J., Hall, N., Head,I. M., Read, L. F., and Sloan, W. T. (2009). Accurate determination ofmicrobial diversity from 454 pyrosequencing data. Nat Methods , 6(9), 639–41.
[31] Ravel, J., Gajer, P., Abdo, Z., Schneider, G. M., Koenig, S. S. K., Mc-Culle, S. L., Karlebach, S., Gorle, R., Russell, J., Tacket, C. O., Brotman,R. M., Davis, C. C., Ault, K., Peralta, L., and Forney, L. J. (2010). Vagi-nal microbiome of reproductive-age women. Proc Natl Acad Sci U S A,doi/10.1073/pnas.100611107.
27

[32] Reeder, J. and Knight, R. (2009). The ’rare biosphere’: a reality check.Nat Methods , 6(9), 636–7.
[33] Schellenberg, J., Links, M. G., Hill, J. E., Dumonceaux, T. J., Peters,G. A., Tyler, S., Ball, T. B., Severini, A., and Plummer, F. A. (2009). Py-rosequencing of the chaperonin-60 universal target as a tool for determiningmicrobial community composition. Appl Environ Microbiol , 75(9), 2889–98.
[34] Shi, Y., Chen, L., Tong, J., and Xu, C. (2009). Preliminary characterizationof vaginal microbiota in healthy chinese women using cultivation-independentmethods. J Obstet Gynaecol Res , 35(3), 525–32.
[35] Smith, D. R., Quinlan, A. R., Peckham, H. E., Makowsky, K., Tao, W.,Woolf, B., Shen, L., Donahue, W. F., Tusneem, N., Stromberg, M. P., Stew-art, D. A., Zhang, L., Ranade, S. S., Warner, J. B., Lee, C. C., Coleman,B. E., Zhang, Z., McLaughlin, S. F., Malek, J. A., Sorenson, J. M., Blanchard,A. P., Chapman, J., Hillman, D., Chen, F., Rokhsar, D. S., McKernan, K. J.,Jeffries, T. W., Marth, G. T., and Richardson, P. M. (2008). Rapid whole-genome mutational profiling using next-generation sequencing technologies.Genome Res , 18(10), 1638–42.
[36] Smith, E. P. and Van Belle, G. (1984). Nonparametric estimation of speciesrichness. Biometrics , 40, 119–129.
[37] Srinivasan, S. and Fredricks, D. N. (2008). The human vaginal bacterialbiota and bacterial vaginosis. Interdisciplinary perspectives on infectious dis-
eases , 2008, 750479.
[38] Wang, Y. and Qian, P.-Y. (2009). Conservative fragments in bacterial 16srrna genes and primer design for 16s ribosomal dna amplicons in metagenomicstudies. PLoS One, 4(10), e7401.
[39] Whiteford, N., Skelly, T., Curtis, C., Ritchie, M. E., Lohr, A., Zaranek,A. W., Abnizova, I., and Brown, C. (2009). Swift: primary data analysis forthe illumina solexa sequencing platform. Bioinformatics , 25(17), 2194–9.
28