Fine-Scale Mapping of the Nasonia Genome to Chromosomes Using a High-Density Genotyping Microarray
11
INVESTIGATION Fine-Scale Mapping of the Nasonia Genome to Chromosomes Using a High-Density Genotyping Microarray Christopher A. Desjardins,* ,†,1 Jürgen Gadau, ‡ Jacqueline A. Lopez, §,2 Oliver Niehuis, ‡, ** Amanda R. Avery,* David W. Loehlin,* ,3 Stephen Richards, †† John K. Colbourne, §,4 and John H. Werren* *Department of Biology, University of Rochester, Rochester, New York 14627, † Broad Institute, Cambridge, Massachusetts 02141, ‡ School of Life Sciences, Arizona State University, Tempe, Arizona 85287, § The Center for Genomics and Bioinformatics, Indiana University, Bloomington, Indiana 47405, **Center for Molecular Biodiversity Research, Zoological Research Museum Alexander Koenig, 53113 Bonn, Germany, and †† Human Genome Sequencing Center, Baylor College of Medicine, Houston, Texas 77030 ABSTRACT Nasonia, a genus of four closely related parasitoid insect species, is a model system for genetic research. Their haplodiploid genetics (haploid males and diploid females) and interfertile species are advantageous for the genetic analysis of complex traits and the genetic basis of species differences. A fine- scale genomic map is an important tool for advancing genetic studies in this system. We developed and used a hybrid genotyping microarray to generate a high-resolution genetic map that covers 79% of the sequenced genome of Nasonia vitripennis. The microarray is based on differential hybridization of species- specific oligos between N. vitripennis and Nasonia giraulti at more than 20,000 markers spanning the Nasonia genome. The map places 729 scaffolds onto the five linkage groups of Nasonia, including locating many smaller scaffolds that would be difficult to map by other means. The microarray was used to charac- terize 26 segmental introgression lines containing chromosomal regions from one species in the genetic background of another. These segmental introgression lines have been used for rapid screening and mapping of quantitative trait loci involved in species differences. Finally, the microarray is extended to bulk-segregant analysis and genotyping of other Nasonia species combinations. These resources should further expand the usefulness of Nasonia for studies of the genetic basis and architecture of complex traits and speciation. The parasitic wasp genus Nasonia (Insecta: Hymenoptera) is a model system in genetics, particularly evolutionary genetics, the genetics of complex traits, developmental genetics, and host2parasite interactions (Beukeboom and Desplan 2003; Werren and Loehlin 2009). Nasonia consists of four closely related species, Nasonia vitripennis, Nasonia giraulti, Nasonia longicornis, and the recently discovered Nasonia oneida, which are all cross-fertile once cured of their endosymbiotic Wolbachia (Breeuwer and Werren 1995; Raychoudhury et al. 2010). The pres- ence of interfertile species is advantageous for evolutionary genetic research because it allows movement of genetic regions between species for the identification, mapping, and cloning of quantitative trait loci (QTL) involved in species differences. Several additional features make Nasonia an excellent genetic model, including short (2-wk) generation time, ease of laboratory rearing, systemic RNA interference, and haplodiploid sex determination (females are dip- loid, whereas males are haploid and derived from unfertilized eggs, Copyright © 2013 Desjardins et al. doi: 10.1534/g3.112.004739 Manuscript received May 10, 2012; accepted for publication November 30, 2012 This is an open-access article distributed under the terms of the Creative Commons Attribution Unported License (http://creativecommons.org/licenses/ by/3.0/), which permits unrestricted use, distribution, and reproduction in any medium, provided the original work is properly cited. Supporting information is available online at http://www.g3journal.org/lookup/ suppl/doi:10.1534/g3.112.004739/-/DC1 1 Corresponding author: Broad Institute, 320 Charles Street, Cambridge, MA 02141. E-mail: [email protected] 2 Present address: Department of Biological Sciences, University of Notre Dame, Notre Dame, IN 46556. 3 Present address: Howard Hughes Medical Institute and Laboratory of Molecular Biology, University of Wisconsin, Madison, WI 53706. 4 Present address: School of Biosciences, The University of Birmingham, Birmingham, B15 2TT, United Kingdom. Volume 3 | February 2013 | 205
-
Upload
independent -
Category
Documents
-
view
1 -
download
0
Transcript of Fine-Scale Mapping of the Nasonia Genome to Chromosomes Using a High-Density Genotyping Microarray

INVESTIGATION
Fine-Scale Mapping of the Nasonia Genometo Chromosomes Using a High-DensityGenotyping MicroarrayChristopher A. Desjardins,*,†,1 Jürgen Gadau,‡ Jacqueline A. Lopez,§,2 Oliver Niehuis,‡,**Amanda R. Avery,* David W. Loehlin,*,3 Stephen Richards,†† John K. Colbourne,§,4 and John H. Werren**Department of Biology, University of Rochester, Rochester, New York 14627, †Broad Institute, Cambridge,Massachusetts 02141, ‡School of Life Sciences, Arizona State University, Tempe, Arizona 85287, §The Center forGenomics and Bioinformatics, Indiana University, Bloomington, Indiana 47405, **Center for Molecular BiodiversityResearch, Zoological Research Museum Alexander Koenig, 53113 Bonn, Germany, and ††Human Genome SequencingCenter, Baylor College of Medicine, Houston, Texas 77030
ABSTRACT Nasonia, a genus of four closely related parasitoid insect species, is a model system for geneticresearch. Their haplodiploid genetics (haploid males and diploid females) and interfertile species areadvantageous for the genetic analysis of complex traits and the genetic basis of species differences. A fine-scale genomic map is an important tool for advancing genetic studies in this system. We developed andused a hybrid genotyping microarray to generate a high-resolution genetic map that covers 79% of thesequenced genome of Nasonia vitripennis. The microarray is based on differential hybridization of species-specific oligos between N. vitripennis and Nasonia giraulti at more than 20,000 markers spanning theNasonia genome. The map places 729 scaffolds onto the five linkage groups of Nasonia, including locatingmany smaller scaffolds that would be difficult to map by other means. The microarray was used to charac-terize 26 segmental introgression lines containing chromosomal regions from one species in the geneticbackground of another. These segmental introgression lines have been used for rapid screening andmapping of quantitative trait loci involved in species differences. Finally, the microarray is extended tobulk-segregant analysis and genotyping of other Nasonia species combinations. These resources shouldfurther expand the usefulness of Nasonia for studies of the genetic basis and architecture of complex traitsand speciation.
The parasitic wasp genus Nasonia (Insecta: Hymenoptera) is a modelsystem in genetics, particularly evolutionary genetics, the genetics ofcomplex traits, developmental genetics, and host2parasite interactions(Beukeboom and Desplan 2003; Werren and Loehlin 2009). Nasoniaconsists of four closely related species, Nasonia vitripennis, Nasoniagiraulti, Nasonia longicornis, and the recently discovered Nasonia oneida,which are all cross-fertile once cured of their endosymbiotic Wolbachia(Breeuwer and Werren 1995; Raychoudhury et al. 2010). The pres-ence of interfertile species is advantageous for evolutionary geneticresearch because it allows movement of genetic regions betweenspecies for the identification, mapping, and cloning of quantitativetrait loci (QTL) involved in species differences. Several additionalfeatures make Nasonia an excellent genetic model, including short(2-wk) generation time, ease of laboratory rearing, systemic RNAinterference, and haplodiploid sex determination (females are dip-loid, whereas males are haploid and derived from unfertilized eggs,
Copyright © 2013 Desjardins et al.doi: 10.1534/g3.112.004739Manuscript received May 10, 2012; accepted for publication November 30, 2012This is an open-access article distributed under the terms of the CreativeCommons Attribution Unported License (http://creativecommons.org/licenses/by/3.0/), which permits unrestricted use, distribution, and reproduction in anymedium, provided the original work is properly cited.Supporting information is available online at http://www.g3journal.org/lookup/suppl/doi:10.1534/g3.112.004739/-/DC11Corresponding author: Broad Institute, 320 Charles Street, Cambridge, MA 02141.E-mail: [email protected]
2Present address: Department of Biological Sciences, University of Notre Dame,Notre Dame, IN 46556.
3Present address: Howard Hughes Medical Institute and Laboratory of MolecularBiology, University of Wisconsin, Madison, WI 53706.
4Present address: School of Biosciences, The University of Birmingham,Birmingham, B15 2TT, United Kingdom.
Volume 3 | February 2013 | 205

facilitating mutation screening) (Lynch and Desplan 2006; Werrenand Loehlin 2009; Werren et al. 2009). The N. vitripennis2N. giraultispecies pair has been used widely to identify QTL involved in a diversearray of phenotypes, including wing size (Gadau et al. 2002; Loehlinet al. 2010a,b; Loehlin and Werren 2012), cuticular hydrocarbons(Niehuis et al. 2011), hybrid incompatibilities (Breeuwer and Werren1995; Gadau et al. 1999; Gibson et al. 2010; Koevoets et al. 2012;Niehuis et al. 2008; Werren et al. 2010), and host preference (Desjardinset al. 2010).
The recent sequencing of the genomes of three Nasonia species(Werren et al. 2010) provides a key resource for advancing this newmodel system. Using the genome sequence data in conjunction withhaploid males from hybrid crosses between N. vitripennis and N.giraulti, a genetic map of the Nasonia genome was generated (Niehuiset al. 2010; Werren et al. 2010). This approach was facilitated by thehigh level of single-nucleotide polymorphisms (SNPs) between species(average coding sequence difference between N. vitripennis and N.giraulti is 1%). The mapping population consisted of haploid maleembryos from F1 hybrid females. The advantage of hybrid haploidmales is that for any locus, a hybrid male carries only the allele for oneof the parental species. With the use of this strategy, 265 scaffolds(covering 64% of the assembled genome) were mapped onto the fivechromosomes of Nasonia (Niehuis et al. 2010). The combination ofa genome sequence and genetic map has allowed investigators study-ing Nasonia to do forward genetics efficiently, i.e., quickly proceedfrom detection of QTL to positional cloning of QTL and identifi-cation of the genetic architecture that underlie phenotypes of in-terest (Loehlin et al. 2010b; Loehlin and Werren 2012).
To further advance Nasonia as a genetic system, a high-resolutiongenetic map is needed that places more scaffolds onto the linkage mapand has a finer scale of resolution. In addition, the availability ofa cost-effective tool for high-throughput genotyping and bulk-segregant analysis could help advance studies geared toward in-vestigating the genetic basis of complex adaptive phenotypes, geneticincompatibilities, and species differences. Here, we developed a com-parative hybridization genotyping (CGH) microarray that usesclusters of SNPs and insertion-deletions (indels) in a high-densitygenotyping microarray to differentiate N. vitripennis from N. giraultisequence at a large number of markers spanning the Nasonia genome.
Additional resources being developed for Nasonia include a set ofsegmental introgression lines (SILs), which contain specific genomicregions from one species (typically N. giraulti) in the genetic back-ground of another (typically N. vitripennis) (Werren and Loehlin2009). These are produced by performing an interspecific cross fol-lowed by repeated backcrossing of hybrid females to males of onespecies. To “hold onto” the introgressed genetic region during thebackcrossing process, either visible mutant markers, phenotypic spe-cies-differences (such as wing size), or molecular markers are used.Eventually (usually greater than eight generations depending on thesize of the introgressed region) the introgression lines are made ho-mozygous for the “foreign” target region within the other species’genetic background. SILs already have been used for efficient mappingof genes affecting phenotypic differences between Nasonia species(Loehlin et al. 2010b; Loehlin and Werren 2012). To further developNasonia SIL resources for QTL mapping, here we used the microarrayto genotype 26 SILs.
We also tested the applicability of the microarray to bulk segregantanalysis, another useful tool for efficiently identifying genomic regionsassociated with phenotypes of interest (Michelmore et al. 1991). Inbulk segregant analysis, a population is divided into two subsamplesbased on phenotype, and then allele proportions are estimated for
each subsample. It is an alternative to genotyping a large populationat the level of individuals, and is an economical way to quickly andefficiently identify genomic regions associated with traits of interest.For example, this approach was used in combination with genotypingto identify regions associated with nuclear-cytoplasmic incompatibilityin hybrids of N. vitripennis and N. giraulti (Werren et al. 2010). Herewe broadly applied the methodology to mapping phenotypes in Naso-nia by using the CGH microarray.
The CGH array will be of even greater utility if it can be applied tohybrid crosses involving other Nasonia species, such as N. longicornisand N. oneida, as a number of research groups are currently investi-gating these species (L. Beukeboom, personal communication; Koevoets2012). Although the array was not designed for this purpose, the closephylogenetic relationship of both N. longicornis and N. oneida to N.giraulti suggest that their DNA would be more likely to hybridize to theN. giraulti oligo than the N. vitripennis oligo (Raychoudhury et al.2010). We therefore tested how many markers on the microarray canaccurately distinguish between N. vitripennis2N. longicornis and N.vitripennis2N. oneida sequences.
METHODS AND MATERIALS
Strains usedCrosses to generate the F2 mapping population were between the N.vitripennis (ASymCX) and N. giraulti (RV2Xu) strains used in thegenome sequencing project (Werren et al. 2010). SILs were generatedby sequential backcrossing for variable numbers of generations (usu-ally more than eight) and then typically made homozygous. Somelines were subsequently subjected to additional backcrosses to furtherreduce the size of the introgressed segment. Some SILs have beendescribed in previous studies, whereas others are first reported hereand were generated in the Werren laboratory (University of Roches-ter) as a resource for QTL mapping and cloning (Table 1). Typicalnomenclature refers to the marker (visible or molecular) used in theintrogression with subscript for the species of the allele, followed bycapital letters for the genetic background it was introgressed into (e.g.,rdh5gV for the rdh5 eye color marker wild-type allele from N. giraultiin a N. vitripennis genetic background), with V representing N.vitripennis and G representing N. giraulti. The introgression lineswill contain the marker used plus introgressed flanking DNA andin some cases unlinked regions that also were retained during theintrogression.
Microarray designTo identify polymorphisms (SNPs and small indels of 1–50 bp), weused N. giraulti genomic sequence (1X Sanger) aligned to the N.vitripennis genome sequence (Werren et al. 2010). Based on thesealignments, we identified 80-bp segments with clusters of fixed differ-ences between the two genomes. Sequence segments were filtered toidentify those with a SNP at the 39 end of the sequence, at least fivepolymorphisms in the 39 most 20 bp, and at most 15 polymorphismsin the entire 80 bp length. A preponderance of SNPs at the 39 regionwas preferred because the oligos are attached to the array substrate atthe 59 end, and solution-end polymorphisms have been shown to bemore important to differential hybridization than polymorphismsnear the substrate end (Hughes et al. 2001). Individual bases withina single insertion or deletion were each counted as polymorphisms (e.g., a three-base insertion was counted as three polymorphisms). Toincrease confidence in polymorphism calls, at least 2· coverage of theN. giraulti sequence was required along the entire 80-bp segment. AllSNPs were required to have PHRED quality values $50, and no
206 | C. A. Desjardins et al.

nTa
ble
1Des
criptions
ofSILs
Figure
Cod
eIntrog
ression
Nam
eIntrog
ressed
Locu
s
Introg
ressed
/Backg
roun
dSp
ecies
Startin
gCluster
Startin
gMarke
rEn
ding
Cluster
EndMarke
rIntrog
ression
Size,bp
Locu
sCita
tion
aSIL0
2_an
t_gV
antenn
aped
iamutan
tg/V
1.00
4SC
AFF
OLD
_16_
6950
42_6
9512
11.02
6SC
AFF
OLD
_16_
3632
344_
3632
423
3006
600
(Werrenan
dPe
rrot-M
inno
t19
99)
bSIL0
3_rdh5
_gV
rdh5
eyeco
lor
g/V
1.06
1SC
AFF
OLD
_33_
6658
68_6
6594
71.06
3SC
AFF
OLD
_1_6
3190
6_63
1985
1928
226.5
(Sau
l199
0)c
SIL0
4_b3u
_gV
wdw
wingQTL
g/V
1.09
6SC
AFF
OLD
_1_4
5949
63_4
5950
421.10
7SC
AFF
OLD
_7_7
419_
7498
1651
579
(Loe
hlin
and
Werren20
12)
dSIL0
5_d1_
gV
wdw
wingQTL
g/V
1.09
1SC
AFF
OLD
_1_3
6136
37_3
6137
161.10
6SC
AFF
OLD
_7_2
4252
_243
3126
1021
7(Loe
hlin
and
Werren20
12)
eSIL0
6_hsb3u
_gV
wdw
wingQTL
g/V
1.09
6SC
AFF
OLD
_1_4
5949
63_4
5950
421.10
7SC
AFF
OLD
_7_7
419_
7498
1651
579
(Loe
hlin
and
Werren20
12)
fSIL0
7_wdw_vG
wdw
wingQTL
v/G
1.07
2SC
AFF
OLD
_1_1
8495
34_1
8496
131.10
2SC
AFF
OLD
_1_5
6603
92_5
6604
7138
2329
8.5
(Loe
hlin
and
Werren20
12)
gSIL0
8_st31
8_gV
st-318
eyeco
lor
g/V
3.04
3SC
AFF
OLD
_89_
6019
54_6
0203
33.07
7SC
AFF
OLD
_17_
1447
204_
1447
283
2431
6119
.5(Sau
l199
0)h
SIL0
9_stmm_g
Vst-318
,mm
head
shap
eg/V
3.05
6SC
AFF
OLD
_22_
1563
155_
1563
234
3.08
7SC
AFF
OLD
_17_
2553
865_
2553
944
3239
862.5
(Sau
l199
0)
iSIL1
0_bk4
24_g
Vbk4
24ey
eco
lor
g/V
4.00
0SC
AFF
OLD
_4_5
2065
96_5
2066
754.00
7SC
AFF
OLD
_4_3
6923
82_3
6924
6115
8513
4.5
(Sau
l199
0)j
SIL1
1_mrp90
1_gV
mito
chon
dria
lrib
oprotein
901
molec
ular
marke
r
g/V
4.01
6SC
AFF
OLD
_4_3
0196
64_3
0197
434.02
8SC
AFF
OLD
_4_1
5059
72_1
5060
5115
1992
2.5
J.H.Werren,
unpub
lishe
ddata
kSIL1
2_wbr055
_gV
ws1
wingQTL
g/V
4.03
6SC
AFF
OLD
_4_3
2561
2_32
5691
4.05
1SC
AFF
OLD
_23_
1362
01_1
3628
026
3140
2(Loe
hlin
etal.
2010
b)
lSIL1
3_w1.1_
gV
ws1
wingQTL
g/V
4.03
7SC
AFF
OLD
_4_2
9047
8_29
0557
4.05
1SC
AFF
OLD
_29_
1609
60_1
6103
928
9838
0.5
(Loe
hlin
etal.
2010
b)
mSIL1
4_bkb
w_g
Vws1
wingQTL
g/V
4.04
7SC
AFF
OLD
_23_
1874
450_
1874
529
4.05
1SC
AFF
OLD
_29_
1609
60_1
6103
920
6945
6(Desjardins
etal.2
010)
4.05
6SC
AFF
OLD
_17_
4319
85_4
3206
44.06
9SC
AFF
OLD
_40_
1771
694_
1771
773
2185
0167
.5n
SIL1
5_ws1_8
44_g
Vws1
wingQTL
g/V
4.04
7SC
AFF
OLD
_23_
1874
450_
1874
529
4.05
1SC
AFF
OLD
_29_
1609
60_1
6103
920
6945
6(Loe
hlin
etal.
2010
b)
4.05
6SC
AFF
OLD
_17_
4319
85_4
3206
44.06
2SC
AFF
OLD
_66_
5703
09_5
7038
853
4144
0.5
oSIL1
6_ws1_vG
ws1
wingQTL
g/V
4.05
6SC
AFF
OLD
_23_
1661
132_
1661
211
4.05
5SC
AFF
OLD
_35_
1537
323_
1537
402
8091
567
(Loe
hlin
etal.
2010
b)
pSIL1
7_ws1_lV
ws1
wingQTL
g/V
4.05
1SC
AFF
OLD
_23_
5625
42_5
6262
14.06
3SC
AFF
OLD
_66_
5703
09_5
7038
812
3584
88(Loe
hlin
etal.
2010
b)
qSIL1
8_s6k_gV
s6kina
semolec
ular
marke
rg/V
4.05
7SC
AFF
OLD
_17_
3179
04_3
1798
34.06
1SC
AFF
OLD
_51_
6865
10_6
8658
943
2893
2J.
H.Werren,
unpub
lishe
ddata
rSIL1
9_sw
w84
5_gV
shorterwider
wingQTL
g/V
4.06
4SC
AFF
OLD
_66_
3641
14_3
6419
34.06
8SC
AFF
OLD
_40_
1838
710_
1838
789
1631
0977
J.H.Werren,
unpub
lishe
ddata
sSIL2
0_sw
w_g
Vshorterwider
wingQTL
g/V
4.06
5SC
AFF
OLD
_43_
1004
11_1
0049
04.07
1SC
AFF
OLD
_40_
1699
997_
1700
076
1596
9580
.5J.
H.Werren,
unpub
lishe
ddata
(con
tinue
d)
Volume 3 February 2013 | Fine-Scale Mapping of the Nasonia Genome | 207

intraspecific polymorphism was allowed. Finally, the 70 bp down-stream of the selected sequence was allowed to contain a maximumof four SNPs to ensure proper alignment of the entire region. Down-stream sequences with no SNPs were retained as potential controlsequences for the array. In addition to polymorphism clusters, weidentified moderately sized indels (30–50 bp) in the alignments andselected 80 bp of total sequence for each species including the in-sertion when present and flanking sequence centered on the middleof the indel.
From the resulting sequence files, we selected 70-bp subsequencesto be potential oligos by using Oligopicker 2.3.2 (Wang and Seed2003). Oligo sequences were then trimmed from the 59 end so thatthey would require no more than 180 synthesis cycles according to theRoche NimbleGen protocol. We then removed all oligos with multiplematches to the genome or any number of matches to Nasonia mito-chondrial DNA as determined by WU-BLAST (Lopez et al. 2003) (e =1 · 1025, hspsepsmax = 500). From the remaining set, only pairs withboth an N. vitripennis and N. giraulti oligo were retained.
The microarray was manufactured by Roche NimbleGen’s customdesign service and consists of all probes on each of four subarrays,which can altogether genotype up to eight samples simultaneouslyusing two-color labeling and hybridization. The same microarraywas reused three times by stripping the labeled targets after eachhybridization and scanning. Data for custom assembly of the CGHmicroarray and SNP calling of oligos from the array are available atrequest from the authors.
DNA preparationFor mapping, F2 hybrid haploid male embryos were used to minimizemapping artifacts due to postembryonic mortality of certain species-hybrid genotypes (Breeuwer and Werren 1995; Niehuis et al. 2008).The method to isolate and amplify DNA from embryos has beendescribed in detail elsewhere (Niehuis et al. 2008, 2010). For micro-array hybridization of DNA from individual adult Nasonia, includingSILs, DNA was extracted using the QIAGEN Puregene Gentra pro-tocol for single Drosophila (http://www.qiagen.com/literature). Formicroarray hybridization of DNA for bulk sample studies, Nasoniawere pooled into a single tube and DNA was then extracted using theQIAGEN Puregene Gentra protocol for 1–30 Drosophila, with twoNasonia equaling one Drosophila. All resulting DNA from both in-dividual and bulk samples was subsequently amplified using theGenomiPhi DNA amplification kit (Amersham Biosciences, Piscat-away, NJ). DNA was quantified using a Qubit Fluorometer (LifeTechnologies).
DNA labeling and hybridizationDNA was labeled and hybridized following Roche NimbleGen’s User’sGuide: CGH Analysis v.3.0 methods with minor modifications. Atleast 1.0 mg of dsDNA was fragmented to 1000–2000 bp in length(as determined by gel electrophoresis) by either hydrodynamic shear-ing (HydroShear, GeneMachines) or sonication (Sonicator 4000,Misonix). Genomic DNA with lengths primarily between 2000 and10,000 bp based on gel electrophoresis analysis was subject to hydro-dynamic shearing (which offers greater fragmentation sensitivity andcontrol), whereas DNA with lengths .10,000 bp was fragmented bymeans of sonication. Fragmented DNA was labeled by random primerlabeling. First, 1.0 mg of fragmented DNA was primed with 1 O.D. Cy-labeled random monomer primer (Trilink Biotechnology) at 98� for10 min and subsequently chilled at 0�–2� for 15 min. Next, 100 UKlenow Fragment (39 . 59 exo-) and 10 mM dNTP mix (to finalconcentration of 1 mM dNTPs) was added to the primed DNA. Then
Table
1,co
ntinue
d
Figure
Cod
eIntrog
ression
Nam
eIntrog
ressed
Locu
s
Introg
ressed
/Backg
roun
dSp
ecies
Startin
gCluster
Startin
gMarke
rEn
ding
Cluster
EndMarke
rIntrog
ression
Size,bp
Locu
sCita
tion
tSIL2
1_ws2_g
Vws2
wingQTL
g/V
4.08
7SC
AFF
OLD
_9_3
4814
49_3
4815
284.10
3SC
AFF
OLD
_9_4
2054
_421
3334
9856
2J.
H.Werren,
unpub
lishe
ddata
uSIL2
2_na
dhR
NADH-ubiquitin
molec
ular
marke
rg/V
5.00
0SC
AFF
OLD
_14_
2350
9_23
588
5.00
1SC
AFF
OLD
_14_
6271
30_6
2720
963
7381
.5J.
H.Werren,
unpub
lishe
ddata
vSIL2
3_atpd4_
gV
Atpase-6molec
ular
marke
rg/V
5.00
3SC
AFF
OLD
_14_
1325
752_
1325
831
5.01
5SC
AFF
OLD
_38_
1386
740_
1386
819
2548
446.5
J.H.Werren,
unpub
lishe
ddata
wSIL2
4_Pe
Pu_G
DgV
pea
chey
e,purple
bod
y,groun
ded
(tiny
wing)
g/V
5.00
8SC
AFF
OLD
_14_
2690
831_
2690
910
5.01
7SC
AFF
OLD
_7_3
0618
99_3
0619
7835
4269
1.5
(Sau
l199
0;Werren
etal.2
010)
xSIL2
5_peg
pug
Vgd
pea
chey
e,purple
bod
yg/V
5.02
8SC
AFF
OLD
_7_1
2863
68_1
2864
475.04
4SC
AFF
OLD
_208
5_97
62_9
841
1289
4737
.5(Sau
l199
0;Werren
etal.2
010)
ySIL2
6_stdr109
_gV
st-D
Rey
eco
lor
g/V
5.04
1SC
AFF
OLD
_1_9
3907
01_9
3907
805.05
5SC
AFF
OLD
_10_
2982
477_
2982
556
1240
0393
(Sau
l199
0)z
SIL2
7_stdr_gV
st-D
Rey
eco
lor
g/V
5.04
1SC
AFF
OLD
_1_9
3907
01_9
3907
805.07
1SC
AFF
OLD
_2_4
5514
81_4
5515
6016
6973
18(Sau
l199
0)
SILs,seg
men
talintrogressionlin
es.S
hownisthereferenc
eco
deforF
igure3(a
graphicald
epictio
nof
SILgen
otyp
es),na
meof
theintrog
ression,
locu
sused
intheintrog
ression,
introg
ressed
andbackg
roun
dsp
ecies(V
forN.v
itripen
nisor
GforN.g
iraulti),loc
ationof
theintrog
ression,
introg
ressionsize,a
ndrelevant
citatio
nfortheloci
used
intheintrog
ression.
Notethat
theintrog
ressionna
mes
show
thesp
eciesgen
otyp
eof
the
introg
ressed
regionas
asm
allletter(v,gor
lfor
N.long
icornis)
andthebackg
roun
dsp
eciesas
alargeletter
(Vor
G).
208 | C. A. Desjardins et al.

mixture was incubated at 37� in a thermocycler (heated-lid) for 2 hrand then stopped with 0.05 M EDTA (final concentration). Cy-labeledDNA was purified by isopropanol precipitation in the presence ofsodium chloride (0.5 M NaCl final concentration). Dual-color hybrid-ization, posthybridization washing, and scanning were performedaccording to manufacturer’s instructions (Roche NimbleGen’s User’sGuide: CGH Analysis v.3.0). Images were acquired using a GenePixProfessional 4200A scanner with the GenePix 6.0 software. The datafrom these arrays were saved and exported using the softwareNimbleScan 2.4 (Roche NimbleGen Inc.).
Calculation of differential hybridization andgenotype callingTo calculate a normalized difference in hybridization of a DNAsample to paired species-specific oligos, a modified version of M andA values from two-color cDNA microarray analyses was used. Wecalculated this normalized difference in hybridization (“hybridizationvalue”) as (intensity to N. vitripennis oligo minus the intensity to N.giraulti oligo) divided by (intensity to N. vitripennis oligo plus theintensity to N. giraulti oligo), resulting in numbers ranging from 21to 1. Positive numbers indicate better hybridization to the N. vitri-pennis oligo than to the N. giraulti oligo, whereas negative numbersindicate the opposite. We then tested the array by hybridizing DNAfrom seven N. vitripennis (strain ASymCX) and seven N. giraulti(strain RV2Xu) single whole adult females. Both strains were usedfor the Nasonia genome sequencing project (Werren et al. 2010).We then calculated mean, median, and SD of the hybridization valuesfor each studied marker (the genomic region represented by an oligopair) as a quality control measure.
To genotype a marker of a test individual, we calculated thecumulative probability that the marker belonged to each genotype, N.vitripennis and N. giraulti, based on the pure species hybridizationvalue, assuming the distribution of hybridization values for a singlemarker within a species is normally distributed. Markers were thencalled as N. vitripennis (V), N. giraulti (G), or ambiguous (U) based onthree parameters (supporting information, File S1). We optimized allparameters relative to precision (the probability that a called genotypeis correct) and recall (the probability that an unambiguous genotype iscalled for a given locus, also referred to as sensitivity), resulting in99.5% precision at a level of 90.8% recall (File S1, Figure S1, Table S6).
In an attempt to further increase precision, we developed a smoothingalgorithm based on genotypes of neighboring markers. If the two closestneighbors of a marker both have at least one opposite genotype call andhave no similar genotype calls, that marker is converted to ambiguous. Ifa marker has only one neighbor, and the two markers are called oppositegenotypes, both are considered ambiguous. If a marker has no neighbors(e.g., scaffolds with only one marker), no correction can be made. Op-timization of parameters using this algorithm resulted in an increasedprecision of 99.9% and recall of 97.7% (File S1, Figure S1, Table S6).
To determine whether the array could successfully distinguish otherspecies pairs, DNA from four N. longicornis and five N. oneida femaleswas individually extracted and hybridized to the array as describedpreviously. Hybridization value statistics were then recalculated foreach marker for each comparison, and precision and recall was calcu-lated using the N.vitripennis2N. longicornis SIL (SIL17_ws1_lV; Table1) in the same manner as the initial parameter optimization.
Mapping analysisTo estimate recombination frequencies and generate a linkage map,we genotyped the same 110 F2 hybrid male embryos previously used
to generate a linkage map with fewer markers (Niehuis et al. 2010),plus an additional 27 newly generated F2 hybrid male embryos. Allembryos were derived from virgin F1 hybrid females generated by aninitial hybrid cross between N. vitripennis (ASymCX) females and N.giraulti (RV2Xu) males. The two parental strains also were used forgenome sequencing and should therefore provide the best sequence fitto the oligos used on the array (Werren et al. 2010). F2 hybrid maleembryos were extracted from the fly host as described previously(Niehuis et al. 2008).
As the construction of a linkage map requires extremely accurategenotype profiles, we opted to use a set of 19,681 markers andparameters with a precision of 99.98%. To avoid an inflation ofrecombination estimates due to genotyping errors not correctable bysmoothing, we excluded all scaffolds represented by only one marker.We genotyped each hybrid for all remaining markers, and thencollapsed these loci into a set of marker clusters with unique genotypeprofiles. Markers that could not be unambiguously placed into a singlecluster were subsequently excluded from map construction. Thisresulted in 498 clusters composed of 15,546 markers. Using theclusters, we generated a preliminary linkage map using the programMultiPoint (www.multiqtl.com) (Mester et al. 2003). Clusters used forlinkage mapping showed no significant segregation distortion, andnone of the genotype profiles used for creating the map was missinga genotype. The initial two-point mapping was performed with the-minimum recombination frequency setting of 0.18, which resulted infive linkage groups containing all clusters. The initial marker clusterorder within a linkage group was verified using a jackknifing pro-cedure (Mester et al. 2003).
We further refined the linkage map by removing genotypes thatrequired double recombinants between physically close markerclusters by using the “graphical genotypes” feature in Multipoint, asthe probability of a double recombinant over a short physical distancein an individual is extremely low or impossible due to genetic in-terference (Berchowitz and Copenhaver 2010; Muller 1916; Sturtevant1915). Once these genotypes were removed, Multipoint was rerun toproduce an improved linkage map. In a last step to improve the markercluster order of the linkage map, we examined the linkage map forpotential mis-assembled contigs and scaffolds in the N. vitripennisassembly version 1.0. In cases where a potential assembly error wasonly supported by a single genotyped sample and by two or fewerconsecutive genotypes, we corrected the linkage map to agree withthe assembly. In all other cases, the inferred linkage map was consid-ered correct, indicating that the corresponding contig or scaffold is verylikely mis-assembled. Finally, we used recombination events in SILs tosubdivide clusters and orient some scaffolds within those clusters.
Once the linkage map was complete, we estimated the positions of4136 previously excluded markers on the linkage map. These includedmarkers on scaffolds represented by a single marker, and markerswith genotyping profiles that could not be unambiguously assigned tosingle cluster. We identified all marker clusters that had the bestmatches to genotype profiles of the excluded markers, allowinga maximum of three mismatches.
Bulk segregant analysisWe tested the applicability of bulk segregant analysis using themicroarray on a sample composed of individuals with knowngenotypes. Using two linked N. vitripennis mutations, st-318 (scarleteyes) and mm (“mickeymouse,” bulging eyes), we backcrossed wild-type N. giraulti (st-318+g,mm+g) in a st-318, mm mutant N. vitripennisbackground for eight generations. The resulting heterozygous femaleswere set as virgins to produce haploid male offspring segregating for
Volume 3 February 2013 | Fine-Scale Mapping of the Nasonia Genome | 209
the mutant phenotypes. This created a population of individualswhose N. giraulti allele frequency across the region should be cor-related with the distance from the visible markers. From these off-spring, 24 recombinant males were selected from each recombinantclass (st-318+g,mm and st-318,mm+g).
We separated the heads and bodies of each individual, and thebodies of each of the two recombinant classes were pooled. DNA wasextracted from each pool and subsequently amplified using a Genomi-Phi amplification kit (described previously). The two pools were thenindependently hybridized to the array and genotype frequencies of thesamples were calculated based on the relative hybridization to alternateoligos. Assuming the proportion of alleles in a pooled sample ofN. vitripennis2N. giraulti hybrids follows a uniform distributionbetween the median hybridization values of pure N. vitripennisand N. giraulti samples, the proportion of the DNA hybridizing tothe allele from each respective species can be estimated for everymarker. To test the accuracy of the bulk segregation results, DNAwas extracted from individual heads and genotyped at four markersknown to be linked to the mutations using polymerase chainreaction (PCR), as described in Werren et al. (2010).
RESULTS AND DISCUSSION
A high-density genotyping microarrayThe designed microarray includes polymorphism-cluster oligo pairsrepresenting 19,708 markers on a total of 933 scaffolds, which cover255 of the 295 Mb (86%) of the assembled genome. This includes100% of scaffolds greater than 400 Kb (139/139) and 87% of scaffoldsgreater than 100 Kb (404/467). Of these 19,708 markers, 1696 alsohave a control oligo from sequence located immediately downstreamof the marker. Additionally, the array includes large-indel oligo pairsrepresenting 843 markers within those same scaffolds, for a total of20,551 markers. Both scaffold coverage and marker density aresignificant improvements over the previous single-SNP-based micro-array, which covered only 265 scaffolds (64%) of the genome and had1,255 single-SNP-based probes.
The distribution of markers between coding and non-coding DNAis shown in Table 2. The majority of markers (88%) fall entirely withineither non-coding DNA or introns, although 1096 markers fall en-tirely within exons. Nevertheless, most annotated genes in N. vitri-pennis are in close proximity to a mapped marker; of the 10,734 genesin the N. vitripennis RefSeq gene set in Genbank, 94% are on a scaffoldrepresented on the microarray, and those genes are on average 7.4 kbfrom the nearest marker. This means that mapped markers (andassociated SNPs) can be used for microdissection of QTL to regionscontaining one or a few genes.
Analysis of hybridization values for markers from control DNA ofN. vitripennis and N. giraulti showed largely nonoverlapping distribu-tions (Figure 1)—DNA from N. vitripennis hybridized more stronglyto the N. vitripennis-specific oligo 97.9% of the time, whereas DNA ofN. giraulti hybridized more strongly to the N. giraulti-specific oligo98.4% of the time. Furthermore, 19,681 of the 20,551 markers had
median hybridization values for each species separated by at least 1 SDof each distribution, and 16,511 markers were separated by at least 2SD. These largely nonoverlapping distributions of N. vitripennis andN. giraulti control DNA predict that we can call genotypes of un-known samples for most markers with high confidence.
A new genetic map for NasoniaThe genetic map constructed here contains 510 marker clustersmapped to five linkage groups (Figure 2), representing the five pre-viously identified chromosomes of Nasonia (Rutten et al. 2004). Clus-ter- and marker-level details of the map are shown in Table S1 andTable S2, respectively. With respect to the Niehuis et al. (2010) map,the current map presented here expands the number of mapped scaf-folds, increases the percentage of assembled genome that is mapped,and decreases average distance between clusters (see Table 3 for com-parisons between the new and previous map). The 510 marker clustersin the new map almost doubles the 264 marker clusters of the Niehuiset al. (2010) genetic map. Despite the increase in mapped scaffoldsand marker clusters, the recombination size of the new map totals435.9 cM, similar to the 446.9 cM of the Niehuis et al. (2010) map.This finding suggests that we are converging on the recombinationmap size for Nasonia based on the hybrid mapping population.
Markers used to construct the genetic map represent 476 scaffolds(211 more than in the Niehuis et al. map), covering 74% of theassembled genome. Of these 476 scaffolds, 53 are oriented, whilethe others are placed within a cluster but not oriented because ofabsence of a recombination event within the scaffold that would alloworientation. We found evidence for 34 scaffolds being mis-assembledin the Nasonia genome assembly version 1.0 (Werren et al. 2010), anddue to the high density of markers on the microarray, we are able toresolve breakpoints in scaffold assemblies to an average size of 52 Kb(Table S3).
Apparent in the genetic map (Table S1) is that typically one clusterper chromosome contains a large number of scaffolds and that manyof these scaffolds are relatively short. These clusters likely correspond
n Table 2 Distribution of oligo pairs between coding and non-coding DNA
Location Number of Oligos
Within an exon 1096Within an intron 7377Crosses intron-exon boundary 982Crosses gene-intergene boundary 214Intergenic 10,039
Figure 1 Frequency histograms of hybridization values when hybrid-ized with N. vitripennis (Nv; gray) or N. giraulti (Ng; white) controlDNA. The Y-axis shows the number of markers which produced therelevant hybridization values of the 20,551 total markers. Hybridizationvalues . 0 indicate greater hybridization to the N. vitripennis oligo,whereas values , 0 indicate greater hybridization to the N. giraultioligo. Only a small fraction of markers produce greater hybridizationto the alternate species oligo when hybridized with control DNA.
210 | C. A. Desjardins et al.

to regions containing the centromere and flanking heterochromaticDNA. The many small scaffolds can result from intervening repetitiveDNA (e.g., transposons or tandem repeats), typical of low recombina-tion regions. Such features fail to assemble well in automated genomeassemblies. Based on the criterion of a large number of scaffolds map-ping to a single cluster, the clusters corresponding to the centromericregions (and number of scaffolds within each one) for the five chromo-somes are 1.056 (116), 2.046 (91), 3.045 (81), 4.065 (64), and 5.044 (43).
Because the total genetic length of the map did not changesubstantially between the new and previous maps (435.9 cM and446.9 cM, respectively), the genome-wide recombination rate estimate
of 1.4–1.5 cM/Mb made previously (Niehuis et al. 2010) is still accu-rate. Local recombination rates (see Table S1) were negatively corre-lated with both the number of scaffolds per cluster (Spearman’s rankorder coefficient, r = 20.37, P , 0.001) and the number of markersper cluster (Spearman’s rank order coefficient, r = 20.58, P , 0.001).This finding likely reflects the accumulation of repetitive DNA inregions of low recombination as noted previously. Recombination rateson chromosome arms remained similar between the new and the pre-vious map, which is expected as little sequence was added to chromo-some arms in the new map. However, local recombination rates ofcentromeric clusters decreased dramatically, ranging from a 1.5-fold
Figure 2 Genetic map of Nasonia.Marker cluster IDs are listed above theline to the right of each cluster, andcorresponding map distances (in cM) arelisted below the line. Recombination ratesfor each cluster are given in Table S1.
n Table 3 Comparison of new genetic map (2012) with the previous map (Niehuis et al. 2010)
Chromosome
Total 1 2 3 4 5
Map version 2010 2012 2010 2012 2010 2012 2010 2012 2010 2012 2010 2012
Genetic length, cM 446.9 435.9 94.5 95.6 89.8 86.9 98.9 89.8 87.6 90.6 76.1 73No. observed recombinations 499 597 106 131 100 119 110 123 99 124 84 100Marker clusters 264 510 61 108 58 102 53 104 41 104 51 92Avg distance between marker clusters, cM 1.7 0.9 1.6 0.9 1.6 0.9 1.9 0.9 2.2 0.9 1.5 0.8No. markers 1255 15546 372 4259 207 3435 188 3084 224 1930 264 2838Mapped scaffolds 265 476 91 154 48 105 46 91 61 97 31 53Mapped scaffolds (oriented) 42 53 11 15 10 10 9 9 5 11 7 8Physical length, Mb 187.6 217.7 48.3 56.5 39.5 47.3 34 38 35.8 42.3 30 33.6Associated markers 0 3702 0 657 0 478 0 411 0 1818 0 338Associated additional scaffolds 0 253 0 63 0 39 0 51 0 82 0 23Associated physical length, Mb 0 15.9 0 4.0 0 2.6 0 2.4 0 5.4 0 1.5Total scaffolds 265 729 91 217 48 144 46 142 61 179 31 76Total physical length, Mb 187.6 232.4 48.3 60.5 39.5 49.9 34 40.4 35.8 47.7 30 35.1
Results for the complete map are shown, as well as results for individual chromosomes. Key improvements in the new map include a dramatically increased markerdensity and the placement of a large number of small scaffolds.
Volume 3 February 2013 | Fine-Scale Mapping of the Nasonia Genome | 211

decrease at the chromosome 3 centromere to a 2.4-fold decrease at thechromosome 5 centromere due to the mapping of many smaller pre-viously unmapped scaffolds to the centromeric region. Overall, thelocal recombination rates at the centromeres on the new map rangedfrom 0.044 to 0.173 cM/Mb, or 8.1- to 34.1-fold lower than the averagerecombination rate. Given that most of the remaining sequence thathas still not been placed in the new map is repetitive and likely con-centrated in the centromeres, the true recombination rate for centro-meric regions is probably even lower than these new estimates.
To increase accuracy of the inferred map, certain markers wereexcluded during map reconstruction (see Materials and Methods).However, we were able to map many of these markers a posteriori toclusters on the linkage map. Table S4 shows the results for markers onscaffolds that are not represented on the genetic map, whereas Table S5shows the corresponding information for markers on scaffolds repre-sented on the genetic map. Of the 4135 unmapped markers, the geno-type profile of 3702 matched that of at least one marker cluster withinour mismatch threshold. This allows up to map an additional 253scaffolds representing 4% of the assembled genome, bringing the com-plete map coverage to 729 scaffolds covering 79% of the assembledgenome. Many of the previously unplaced scaffolds added here are short(median length 20.2 kb) and fall within low recombination regions.
SILs for QTL mappingTo further develop resources for QTL mapping in Nasonia, wegenotyped 26 SILs (summaries of the regions covered by SILs aredescribed in Table 1 and depicted graphically in Figure 3). In total, theSILs cover 101 Mb (46%) of the mapped genome sequences. TheseSILs have proven useful in mapping QTL involved in species differ-ences, and for mapping visible mutants generated in N. vitripennis byintrogression of the wild-type N. giraulti allele into N. vitripennis.Examples of mapped QTL and visible mutants are shown in Figure 3.
These SILs have been used as starting points for cloning the widerwinglocus [wdw, which affects male wing size differences between N. vit-ripennis and N. giraulti and has been shown to be the growth regu-lator unpaired-like (Loehlin and Werren 2012)], cloning the malewing locus wing-size-1 [ws1, shown to be the sex determining genedoublesex (Loehlin et al. 2010b)], in implicating cinnabar as the eyecolor mutant st-318 (see the section Bulk segregant analysis of a red eyemutant), and in mapping the R-locus [(Saul 1990) a major nonre-combining locus containing genes affecting eye color and other phe-notypes], to a region flanking the centromere on chromosome 5.These SILs and their extensive genotypic characterization can be usedas an important resource for mapping additional QTL and identifyingthe underlying genes.
Some of these SILs are particularly helpful in resolving scaffoldpositions in regions of low recombination. Although recombinationevents in these regions are rare in the F2 mapping population, someSILs have been specifically generated in centromeric and flankingregions (e.g., Desjardins et al. 2010; Loehlin et al. 2010b). Data fromthe SILs were used to more finely map scaffolds that had previouslybeen assigned to a single cluster due to absence of F2 hybrids that arerecombinant for these scaffolds (seeMaterials and Methods). From thisanalysis, we identified 12 additional clusters and were able to refinepositions of 82 scaffolds between these clusters, thereby increasinglinkage map resolution and accuracy. In three instances, we were alsoable to orient scaffolds because they crossed the recombination junc-tion of the newly created clusters. Because recombination distances areestimated from the frequency of recombinant F2 hybrids, these clustersshow no recombination between them in the linkage map.
Bulk segregant analysis of a red eye mutantBulk segregant analysis is a method in which individuals ina population with segregating phenotypes are sorted into pools and
Figure 3 Genotype profiles of 26 SILs along the fivechromosomes of Nasonia. Each cluster in the linkagemap is depicted by a horizontal tick in black (N.giraulti), dark gray (ambiguous), or light gray (N. vit-ripennis). Clusters were assigned to a species whenat least 60% of markers at that cluster were geno-typed as that species; in cases in which neither spe-cies had at least 60% of markers, the cluster waslabeled as ambiguous. Names and background in-formation on the different SILs (a through z) are pro-vided in Table 1.
212 | C. A. Desjardins et al.
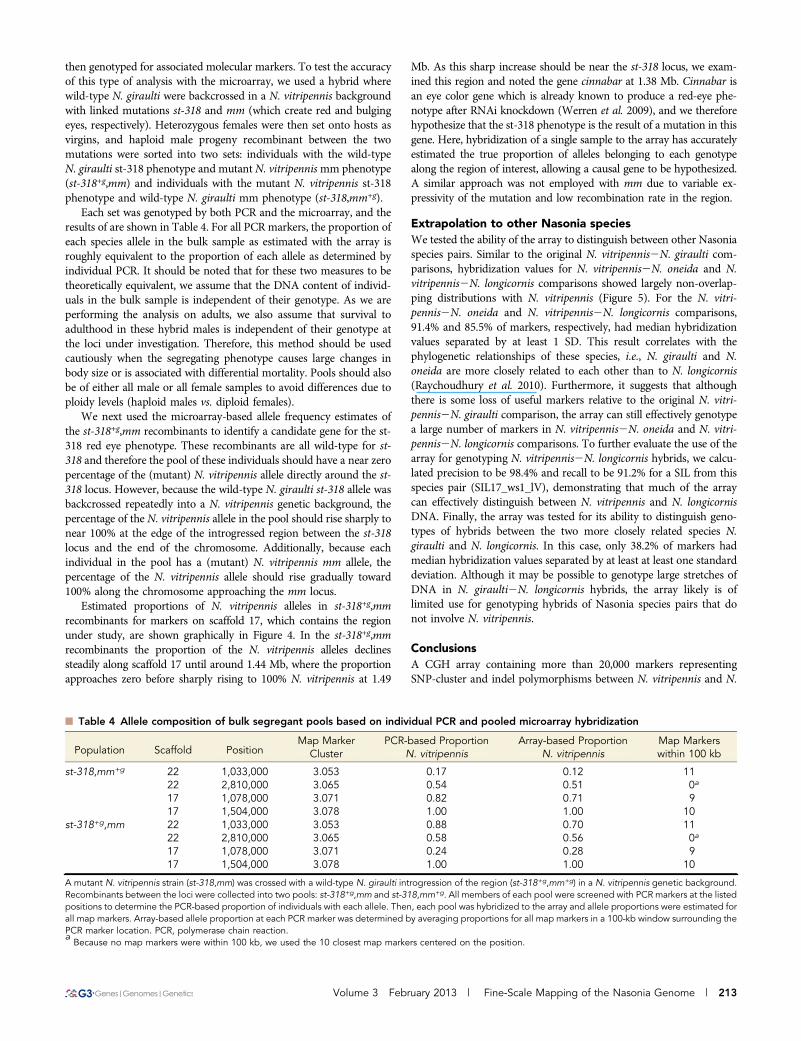
then genotyped for associated molecular markers. To test the accuracyof this type of analysis with the microarray, we used a hybrid wherewild-type N. giraulti were backcrossed in a N. vitripennis backgroundwith linked mutations st-318 and mm (which create red and bulgingeyes, respectively). Heterozygous females were then set onto hosts asvirgins, and haploid male progeny recombinant between the twomutations were sorted into two sets: individuals with the wild-typeN. giraulti st-318 phenotype and mutant N. vitripennismm phenotype(st-318+g,mm) and individuals with the mutant N. vitripennis st-318phenotype and wild-type N. giraulti mm phenotype (st-318,mm+g).
Each set was genotyped by both PCR and the microarray, and theresults of are shown in Table 4. For all PCR markers, the proportion ofeach species allele in the bulk sample as estimated with the array isroughly equivalent to the proportion of each allele as determined byindividual PCR. It should be noted that for these two measures to betheoretically equivalent, we assume that the DNA content of individ-uals in the bulk sample is independent of their genotype. As we areperforming the analysis on adults, we also assume that survival toadulthood in these hybrid males is independent of their genotype atthe loci under investigation. Therefore, this method should be usedcautiously when the segregating phenotype causes large changes inbody size or is associated with differential mortality. Pools should alsobe of either all male or all female samples to avoid differences due toploidy levels (haploid males vs. diploid females).
We next used the microarray-based allele frequency estimates ofthe st-318+g,mm recombinants to identify a candidate gene for the st-318 red eye phenotype. These recombinants are all wild-type for st-318 and therefore the pool of these individuals should have a near zeropercentage of the (mutant) N. vitripennis allele directly around the st-318 locus. However, because the wild-type N. giraulti st-318 allele wasbackcrossed repeatedly into a N. vitripennis genetic background, thepercentage of the N. vitripennis allele in the pool should rise sharply tonear 100% at the edge of the introgressed region between the st-318locus and the end of the chromosome. Additionally, because eachindividual in the pool has a (mutant) N. vitripennis mm allele, thepercentage of the N. vitripennis allele should rise gradually toward100% along the chromosome approaching the mm locus.
Estimated proportions of N. vitripennis alleles in st-318+g,mmrecombinants for markers on scaffold 17, which contains the regionunder study, are shown graphically in Figure 4. In the st-318+g,mmrecombinants the proportion of the N. vitripennis alleles declinessteadily along scaffold 17 until around 1.44 Mb, where the proportionapproaches zero before sharply rising to 100% N. vitripennis at 1.49
Mb. As this sharp increase should be near the st-318 locus, we exam-ined this region and noted the gene cinnabar at 1.38 Mb. Cinnabar isan eye color gene which is already known to produce a red-eye phe-notype after RNAi knockdown (Werren et al. 2009), and we thereforehypothesize that the st-318 phenotype is the result of a mutation in thisgene. Here, hybridization of a single sample to the array has accuratelyestimated the true proportion of alleles belonging to each genotypealong the region of interest, allowing a causal gene to be hypothesized.A similar approach was not employed with mm due to variable ex-pressivity of the mutation and low recombination rate in the region.
Extrapolation to other Nasonia speciesWe tested the ability of the array to distinguish between other Nasoniaspecies pairs. Similar to the original N. vitripennis2N. giraulti com-parisons, hybridization values for N. vitripennis2N. oneida and N.vitripennis2N. longicornis comparisons showed largely non-overlap-ping distributions with N. vitripennis (Figure 5). For the N. vitri-pennis2N. oneida and N. vitripennis2N. longicornis comparisons,91.4% and 85.5% of markers, respectively, had median hybridizationvalues separated by at least 1 SD. This result correlates with thephylogenetic relationships of these species, i.e., N. giraulti and N.oneida are more closely related to each other than to N. longicornis(Raychoudhury et al. 2010). Furthermore, it suggests that althoughthere is some loss of useful markers relative to the original N. vitri-pennis2N. giraulti comparison, the array can still effectively genotypea large number of markers in N. vitripennis2N. oneida and N. vitri-pennis2N. longicornis comparisons. To further evaluate the use of thearray for genotyping N. vitripennis2N. longicornis hybrids, we calcu-lated precision to be 98.4% and recall to be 91.2% for a SIL from thisspecies pair (SIL17_ws1_lV), demonstrating that much of the arraycan effectively distinguish between N. vitripennis and N. longicornisDNA. Finally, the array was tested for its ability to distinguish geno-types of hybrids between the two more closely related species N.giraulti and N. longicornis. In this case, only 38.2% of markers hadmedian hybridization values separated by at least at least one standarddeviation. Although it may be possible to genotype large stretches ofDNA in N. giraulti2N. longicornis hybrids, the array likely is oflimited use for genotyping hybrids of Nasonia species pairs that donot involve N. vitripennis.
ConclusionsA CGH array containing more than 20,000 markers representingSNP-cluster and indel polymorphisms between N. vitripennis and N.
n Table 4 Allele composition of bulk segregant pools based on individual PCR and pooled microarray hybridization
Population Scaffold PositionMap Marker
ClusterPCR-based Proportion
N. vitripennisArray-based Proportion
N. vitripennisMap Markerswithin 100 kb
st-318,mm+g 22 1,033,000 3.053 0.17 0.12 1122 2,810,000 3.065 0.54 0.51 0a
17 1,078,000 3.071 0.82 0.71 917 1,504,000 3.078 1.00 1.00 10
st-318+g,mm 22 1,033,000 3.053 0.88 0.70 1122 2,810,000 3.065 0.58 0.56 0a
17 1,078,000 3.071 0.24 0.28 917 1,504,000 3.078 1.00 1.00 10
A mutant N. vitripennis strain (st-318,mm) was crossed with a wild-type N. giraulti introgression of the region (st-318+g,mm+g) in a N. vitripennis genetic background.Recombinants between the loci were collected into two pools: st-318+g,mm and st-318,mm+g. All members of each pool were screened with PCR markers at the listedpositions to determine the PCR-based proportion of individuals with each allele. Then, each pool was hybridized to the array and allele proportions were estimated forall map markers. Array-based allele proportion at each PCR marker was determined by averaging proportions for all map markers in a 100-kb window surrounding thePCR marker location. PCR, polymerase chain reaction.aBecause no map markers were within 100 kb, we used the 10 closest map markers centered on the position.
Volume 3 February 2013 | Fine-Scale Mapping of the Nasonia Genome | 213

giraulti has been successfully used to create a high-resolution linkagemap of Nasonia, covering 79% of the assembled genome of N. vitri-pennis. Errors in the original N. vitripennis assembly have been iden-tified through mapping, and this information can be used to improvethe next assembly. The CGH array also provides an inexpensivemeans of mapping QTL involved in species differences and visiblemutants onto the linkage map. The array can be used for bulk-segregant analysis, as was demonstrated by identifying the gene
cinnabar as a potential cause of the red eye mutant st-318. Hybrids ofN. vitripennis2N. oneida and N. vitripennis2N. longicornis speciespairs also can be genotyped using the microarray due to shared fixedmarker differences between N. longicornis, N. oneida, and N. giraulti.The genetic map and 26 SILs presented here will further promoteNasonia as a model for studying the genetics of complex traits.
The microarray design, including oligo sequences and SNP in-formation is available by request from the authors. Perl scripts for
Figure 4 Bulk segregant analysis suggesting that thest-318 red-eye phenotype is caused by the gene cin-nabar. A mutant N. vitripennis strain (st-318,mm) wascrossed with a wild-type N. giraulti introgression ofthe region (st-318+g,mm+g) in a N. vitripennis geneticbackground. Twenty-four recombinants with thewild-type N. giraulti st-318 phenotype and mutantN. vitripennis mm phenotype (st-318+g,mm) were col-lected, pooled, and genotyped. Shown here is theproportion of sample with N. vitripennis genotypefor markers across scaffold 17, 502200 Kb in the st-318+g,mm pool. Because all recombinants show thewild-type N. giraulti st-318 phenotype, the proportionof individuals with an N. vitripennis genotype shouldapproach zero at the site of st-318 locus. Gene pres-ence along the same region is shown in black barsbelow. Cinnabar, a gene known to cause a red-eyephenotype, is indicated in red and is located in thenoted region.
Figure 5 Frequency histograms of hybridization values when hybridized with (A) N. oneida (No; white) vs. N. vitripennis (Nv; gray), and (B) N.longicornis (Nl; white) vs. N. vitripennis (Nv; gray). The Y-axis shows the number of markers that produced the relevant hybridization values of the20,551 total markers. Hybridization values . 0 indicate greater hybridization to the N. vitripennis oligo, while hybridization values , 0 indicategreater hybridization to the N. giraulti oligo. A large fraction of markers successfully discriminate between the two species pairs, as most markersproduced greater hybridization to the correct oligo when hybridized with control DNA.
214 | C. A. Desjardins et al.

processing data are available as File S2, and additional scripts for dataanalysis are available by request from the authors. Segmental introgres-sion lines reported here can be obtained by contacting J. H. Werren([email protected]).
ACKNOWLEDGMENTSWe thank Rachel Edwards for maintenance of SILs, and BartPannebakker and Tosca Koevoets for feedback on the output of themicroarray analysis Perl scripts. The research was supported by NIHgrant to J.H.W., 1R24GM084917 “Genetic and Genomic Tools for theEmerging Model Organism, Nasonia” with subawards to J.K.C. and J.G. This work was also supported in part by the METACyt Initiative ofIndiana University, funded in part through a major grant from theLilly Endowment, Inc. and Indiana 21st Century Research and Tech-nology Fund. O.N. acknowledges the Alexander von HumboldtFoundation for a Feodor Lynen research stipend for postdoctoralresearchers.
LITERATURE CITEDBerchowitz, L. E., and G. P. Copenhaver, 2010 Genetic interference: don’t
stand so close to me. Curr. Genomics 11: 91–102.Beukeboom, L., and C. Desplan, 2003 Nasonia. Curr. Biol. 13: R860.Breeuwer, J., and J. Werren, 1995 Hybrid breakdown between two haplo-
diploid species-the role of nuclear and cytoplasmic genes. Evolution 49:705–717.
Desjardins, C. A., F. Perfectti, J. D. Bartos, L. S. Enders, and J. H. Werren,2010 The genetic basis of interspecies host preference differences in themodel parasitoid Nasonia. Heredity 104: 270–277.
Gadau, J., R. E. Page, and J. H. Werren, 1999 Mapping of hybrid incom-patibility loci in Nasonia. Genetics 153: 1731–1741.
Gadau, J., R. E. Page, and J. H. Werren, 2002 The genetic basis of the in-terspecific differences in wing size in Nasonia (Hymenoptera; Pteromalidae):Major quantitative trait loci and epistasis. Genetics 161: 673–684.
Gibson, J. D., O. Niehuis, B. C. Verrelli, and J. Gadau, 2010 Contrastingpatterns of selective constraints in nuclear-encoded genes of the oxidativephosphorylation pathway in holometabolous insects and their possiblerole in hybrid breakdown in Nasonia. Heredity 104: 310–317.
Hughes, T. R., M. Mao, A. R. Jones, J. Burchard, M. J. Marton et al.,2001 Expression profiling using microarrays fabricated by an ink-jetoligonucleotide synthesizer. Nat. Biotechnol. 19: 342–347.
Koevoets, T., 2012 Deadly Combinations: Hybrid incompatibilities in theParasitic Wasp Genus Nasonia. Ph.D. Thesis, University of Groningen.
Koevoets, T., O. Niehuis, L. van de Zande, and L. W. Beukeboom,2012 Hybrid incompatibilities in the parasitic wasp genus Nasonia:negative effects of hemizygosity and the identification of transmissionratio distortion loci. Heredity 108: 302–311.
Loehlin, D. W., L. S. Enders, and J. H. Werren, 2010a Evolution of sex-specific wing shape at the widerwing locus in four species of Nasonia.Heredity 104: 260–269.
Loehlin, D. W., D. C. Oliveira, R. Edwards, J. D. Giebel, M. E. Clark et al.,2010b Non-coding changes cause sex-specific wing size differences be-tween closely related species of Nasonia. PLoS Genet. 6: e1000821.
Loehlin, D. W., and J. H. Werren, 2012 Evolution of shape by multipleregulatory changes to a growth gene. Science 335: 943–947.
Lopez, R., V. Silventoinen, S. Robinson, A. Kibria, and W. Gish, 2003 WU-Blast2 server at the European Bioinformatics Institute. Nucleic Acids Res.31: 3795–3798.
Lynch, J. A., and C. Desplan, 2006 A method for parental RNA interferencein the wasp Nasonia vitripennis. Nat. Protoc. 1: 486–494.
Mester, D. I., Y. I. Ronin, Y. Hu, J. Peng, E. Nevo et al., 2003 Efficientmultipoint mapping: making use of dominant repulsion-phase markers.Theor. Appl. Genet. 107: 1102–1112.
Michelmore, R. W., I. Paran, and R. V. Kesseli, 1991 Identification ofmarkers linked to disease-resistance genes by bulked segregant analysis:a rapid method to detect markers in specific genomic regions by usingsegregating populations. Proc. Natl. Acad. Sci. USA 88: 9828–9832.
Muller, H. O., 1916 The mechanism of crossing-over. Am. Nat. 50: 193–221.
Niehuis, O., A. K. Judson, and J. Gadau, 2008 Cytonuclear genic incom-patibilities cause increased mortality in male F2 hybrids of Nasonia gir-aulti and N. vitripennis. Genetics 178: 413–426.
Niehuis, O., J. D. Gibson, M. S. Rosenberg, B. A. Pannebakker, T. Koevoetset al., 2010 Recombination and its impact on the genome of the hap-lodiploid parasitoid wasp Nasonia. PLoS ONE 5: e8597.
Niehuis, O., J. Büllesbach, A. K. Judson, T. Schmitt, and J. Gadau,2011 Genetics of cuticular hydrocarbon differences between males ofthe parasitoid wasps Nasonia giraulti and Nasonia vitripennis. Heredity107: 61–70.
Raychoudhury, R., C. A. Desjardins, J. Buellesbach, D. W. Loehlin, B. K.Grillenberger et al., 2010 Behavioral and genetic characteristics of a newspecies of Nasonia. Heredity 104: 278–288.
Rutten, K. B., C. Pietsch, K. Olek, M. Neusser, L. W. Beukeboom et al.,2004 Chromosomal anchoring of linkage groups and identification ofwing size QTL using markers and FISH probes derived from microdis-sected chromosomes in Nasonia(Pteromalidae: Hymenoptera). Cytoge-net. Genome Res. 105: 126–133.
Saul, G. B., 1990 Gene map of the parasitic wasp Nasonia vitripennis(=Mormoniella vitripennis), pp. 3.198–193.201 in Genetic Maps: LocusMaps of Complex Genomes, edited by S. J. O’Brien. Cold Spring HarborLaboratory Press, Cold Spring Harbor, NY.
Sturtevant, A. H., 1915 The behavior of chromosomes as studied throughlinkage. Z fur induk. Abst. Vererb. 13: 234–297.
Wang, X., and B. Seed, 2003 Selection of oligonucleotide probes for proteincoding sequences. Bioinformatics 19: 796–802.
Werren, J. H., and D. W. Loehlin, 2009 The parasitoid wasp Nasonia: anemerging model system with haploid male genetics. Cold Spring Harb.Protoc. 2009: pdb.emo134.
Werren, J. H., D. W. Loehlin, and J. D. Giebel, 2009 Larval RNAi in Na-sonia (parasitoid wasp). Cold Spring Harb. Protoc. 2009: pdb.prot5311.
Werren, J. H., and M. J. Perrot-Minnot, 1999 An antennapedia mutant inNasonia vitripennis. Heredity 90: 319–320.
Werren, J. H., S. Richards, C. A. Desjardins, O. Niehuis, J. Gadau et al.,2010 Functional and evolutionary insights from the genomes of threeparasitoid Nasonia species. Science 327: 343–348.
Communicating editor: S. Celniker
Volume 3 February 2013 | Fine-Scale Mapping of the Nasonia Genome | 215