Differential divergence in autosomes and sex chromosomes is ...
40
HAL Id: hal-03000811 https://hal.archives-ouvertes.fr/hal-03000811 Submitted on 12 Nov 2020 HAL is a multi-disciplinary open access archive for the deposit and dissemination of sci- entific research documents, whether they are pub- lished or not. The documents may come from teaching and research institutions in France or abroad, or from public or private research centers. L’archive ouverte pluridisciplinaire HAL, est destinée au dépôt et à la diffusion de documents scientifiques de niveau recherche, publiés ou non, émanant des établissements d’enseignement et de recherche français ou étrangers, des laboratoires publics ou privés. Differential divergence in autosomes and sex chromosomes is associated with intra-island diversification at a very small spatial scale in a songbird lineage Yann Bourgeois, Joris Bertrand, Boris Delahaie, Hélène Holota, Christophe Thébaud, Borja Milá To cite this version: Yann Bourgeois, Joris Bertrand, Boris Delahaie, Hélène Holota, Christophe Thébaud, et al.. Differen- tial divergence in autosomes and sex chromosomes is associated with intra-island diversification at a very small spatial scale in a songbird lineage. Molecular Ecology, Wiley, 2020, 29 (6), pp.1137-1153. 10.1111/mec.15396. hal-03000811
-
Upload
khangminh22 -
Category
Documents
-
view
1 -
download
0
Transcript of Differential divergence in autosomes and sex chromosomes is ...

HAL Id: hal-03000811https://hal.archives-ouvertes.fr/hal-03000811
Submitted on 12 Nov 2020
HAL is a multi-disciplinary open accessarchive for the deposit and dissemination of sci-entific research documents, whether they are pub-lished or not. The documents may come fromteaching and research institutions in France orabroad, or from public or private research centers.
L’archive ouverte pluridisciplinaire HAL, estdestinée au dépôt et à la diffusion de documentsscientifiques de niveau recherche, publiés ou non,émanant des établissements d’enseignement et derecherche français ou étrangers, des laboratoirespublics ou privés.
Differential divergence in autosomes and sexchromosomes is associated with intra-island
diversification at a very small spatial scale in a songbirdlineage
Yann Bourgeois, Joris Bertrand, Boris Delahaie, Hélène Holota, ChristopheThébaud, Borja Milá
To cite this version:Yann Bourgeois, Joris Bertrand, Boris Delahaie, Hélène Holota, Christophe Thébaud, et al.. Differen-tial divergence in autosomes and sex chromosomes is associated with intra-island diversification at avery small spatial scale in a songbird lineage. Molecular Ecology, Wiley, 2020, 29 (6), pp.1137-1153.�10.1111/mec.15396�. �hal-03000811�
1
Differential divergence in autosomes and sex chromosomes is associated with 1
intra-island diversification at a very small spatial scale in a songbird lineage 2
Running title: Genomic divergence in an island songbird 3
4
Yann XC Bourgeois1,2, Joris AM Bertrand2,3, Boris Delahaie2,4, Hélène Holota2, Christophe 5
Thébaud2*, Borja Milá5* 6
7
8
1 School of Biological Sciences, University of Portsmouth, Portsmouth PO1 2DY, UK 9
2Laboratoire Évolution et Diversité Biologique (EDB), UMR 5174 Centre National de la 10
Recherche Scientifique (CNRS) - Université Paul Sabatier - Institut de Recherche pour le 11
Développement (IRD), 118 Route de Narbonne, F-31062 Toulouse Cédex 9, France. 12
3Université de Perpignan Via Domitia, Laboratoire Génome & Développement des Plantes, 13
UMR 5096, 58 14
av. Paul Alduy, Bât. T, F-66860 Perpignan Cédex 9, France. 15
4Department of Plant Sciences, University of Cambridge, Downing Street, Cambridge CB2 16
3EA, United Kingdom. 17
5National Museum of Natural Sciences, Spanish National Research Council (CSIC), Madrid 18
28006, Spain. 19
Corresponding author: Yann Bourgeois, E-mail: [email protected] 20
*These authors contributed equally. 21
22
23
24
25

2
Abstract 26
27
Recently diverged taxa showing marked phenotypic and ecological diversity are optimal systems 28
to understand the genetic processes underlying speciation. We used genome-wide markers to 29
investigate the diversification of the Reunion grey white eye (Zosterops borbonicus) on the small 30
volcanic island of Reunion (Mascarene archipelago), where this species complex exhibits four 31
geographic forms that are parapatrically distributed across the island and differ strikingly in 32
plumage colour. One form restricted to the highlands is separated by a steep ecological gradient 33
from three distinct lowland forms which meet at narrow hybrid zones that are not associated with 34
environmental variables. Analyses of genomic variation based on SNP data from genotyping-by-35
sequencing and pooled RADseq approaches, reveal that signatures of selection associated with 36
elevation can be found at multiple regions across the genome, whereas most loci associated with 37
the lowland forms are located on the Z sex chromosome. We identified TYRP1, a Z-linked colour 38
gene, as a likely candidate locus underlying colour variation among lowland forms. Tests of 39
demographic models revealed that highland and lowland forms diverged in the presence of gene 40
flow, and divergence has progressed as gene flow was restricted by selection at loci across the 41
genome. This system is promising to investigate how adaptation and reproductive isolation shape 42
the genomic landscape of divergence at multiple stages of the speciation process. 43
44
Keywords: Speciation, Sex chromosome, Natural selection, Genomics, Population 45
Differentiation, Plumage colour evolution, Zosterops. 46
47
48
49
50
51
52
53
3
Introduction 54
55
As populations and lineages diverge from each other, a progressive loss of shared 56
polymorphisms and accumulation of fixed alleles is expected. This is influenced by neutral 57
processes (e.g. genetic drift), but also natural and sexual selection, and the interaction between 58
these processes may vary between different parts of the genome, creating a mosaic pattern of 59
regions displaying different rates of divergence (Wu, 2001; Nosil et al., 2009). However, 60
genomic regions directly involved in local adaptation and reproductive isolation may experience 61
reduced effective gene flow compared to the genomic background (Ravinet et al., 2017). In 62
addition, the effects of selection at linked sites can also locally increase divergence and magnify 63
the effects of non-equilibrium demography over large genomic regions (Cruickshank and Hahn, 64
2014; Burri et al., 2015; Burri, 2017; Van Belleghem et al., 2018). Thus, establishing how 65
different processes such as drift, selection and also gene flow, shape the rates of divergence at 66
the genomic scale is critical to understand the links between speciation processes and their 67
genetic and genomic consequences (Gavrilets, 2014). 68
Identifying the main drivers of genome-wide differentiation (i.e. isolation by environment vs. 69
reproductive isolation driven by non-adaptive factors) remains a complex question (Cruickshank 70
and Hahn, 2014; Wolf and Ellegren, 2016; Ravinet et al., 2017). Recent studies have displayed 71
varied results, and those focusing on the early stages of speciation have often emphasised 72
ecological divergence over sexual selection and intrinsic incompatibilities (Bierne et al., 2011; 73
Seehausen et al., 2014). In this context, studies of closely related taxa or populations that show 74
phenotypic and ecological diversity, and are at different stages of divergence, hold promise to 75
help clarify the chronology and relative importance of these underlying evolutionary 76
mechanisms (Sætre and Sæether, 2010; Pryke, 2010; Safran et al., 2013; Seehausen et al., 2014; 77
Delmore et al., 2015; Mořkovský et al., 2018). 78
We used the Reunion grey white-eye (Zosterops borbonicus; taxonomy following Gill and 79
Donsker 2019), a songbird endemic to the small (2512 km2) volcanic ocean island of Reunion 80
(Mascarene archipelago, southwestern Indian Ocean), to quantify genome-wide patterns of 81
divergence across its range and better understand underlying evolutionary factors. This species is 82
characterized by complex patterns of plumage colour and size variation with five distinct 83

4
variants recognised across the island (Gill 1973). These variants can be grouped into four 84
parapatrically distributed geographical forms with abutting ranges that came into secondary 85
contact after diverging in allopatry (Cornuault et al., 2015; Bertrand et al., 2016; Delahaie et al., 86
2017). Three lowland forms differ primarily in plumage colour (Gill, 1973; Cornuault et al., 87
2015) and show a unique distribution pattern, with each form being separated from the other two 88
by narrow physical barriers such as rivers or lava fields (Gill, 1973). These forms differ 89
strikingly in head coloration and include a light brown form (lowland brown-headed brown 90
form; hereafter LBHB), a grey-headed brown form (GHB) with a brown back and a grey head, 91
and a brown-naped brown form (BNB) with a brown back and nape, and a grey crown (Figure 1 92
and Figure S1; see Cornuault et al., 2015 for a detailed description). A fourth form, restricted to 93
the highlands (between 1,400 m and 3,000 m), is relatively larger than the lowland forms and 94
comprises two very distinct colour morphs, with birds showing predominantly grey (GRY) or 95
brown (highland brown-headed brown form, HBHB) plumage, respectively (Gill, 1973; Milá et 96
al., 2010; Cornuault et al., 2015; Bertrand et al., 2016). Both morphs occur in sympatry and 97
represent a clear case of plumage colour polymorphism (Bourgeois et al. 2017). This highland 98
form is separated from all three lowland forms by relatively narrow contact zones located along 99
the elevational gradient (Gill, 1973). One such contact zone was recently studied and was found 100
to correspond to an ecotone between native habitat (> 1400 m above sea level; a.s.l.) and 101
anthropogenic landscapes (< 1400 m a.s.l.), suggesting a possible role of environmental 102
differences in influencing the location of these zones (Bertrand et al. 2016). While plumage 103
colour differences between the two apparently similar all-brown variants (LBHB and HBHB) 104
may appear subtle, they are in fact significant when considering bird vision and using a visual 105
model to project these colours in an avian appropriate, tetrachromatic colour space (Cornuault et 106
al. 2015). Patterns of colouration among forms and morphs are stable over time, with no apparent 107
sex effect (see Gill 1973, Milá et al. 2010). 108
Recent studies have revealed that dispersal and gene flow must be limited in the Reunion grey 109
white-eye, with low levels of historical and/or contemporary gene flow among populations, 110
unless very close geographically (< 10 km) (Bertrand et al., 2014), and that more variation exists 111
among the different geographical forms than would be expected under drift for both 112
morphological and plumage colour traits (Cornuault et al. 2015). Thus, it is the combination of 113
reduced dispersal and divergent selection that seems to explain why white-eyes were able to 114

5
differentiate into multiple geographical forms within Reunion, as originally proposed by Frank 115
Gill (Gill, 1973). The island exhibits a dramatic topography (maximum elevation : 3070 m) and a 116
steep elevational gradient was found to be associated with strong divergent selection on 117
phenotypes and marked genetic structure for autosomal microsatellites, a pattern that is 118
consistent with isolation by ecology between lowland and highland forms (Bertrand et al., 2016). 119
In contrast, lowland forms show no association with neutral genetic (microsatellite) structure or 120
major changes in vegetation characteristics and associated climatic variables and are separated 121
by very narrow hybrid zones centered on physical barriers to gene flow (Delahaie et al., 2017). 122
Although the autosomal markers used could not provide information on sex-linked loci, these 123
patterns of genetic differentiation suggest that while a sharp ecological transition between 124
lowlands and highlands could drive differentiation at many autosomal loci through local 125
adaptation, phenotypic divergence between lowland forms involves either fewer loci, or loci 126
concentrated in a narrower genomic region not covered by microsatellites (Delahaie et al. 2017). 127
In this work, we aim at (i) identifying the genomic variation associated with phenotypic 128
differentiation between forms in relation to ecological variation (low vs. high elevation) and 129
divergence in signaling traits (conspicuous variation in plumage colour between lowland forms 130
in the absence of abrupt ecological transitions), (ii) determining whether divergence peaks are 131
found on autosomes or sex chromosomes, respectively, and (iii) identifying potential candidate 132
genes associated with divergent genomic regions. We used individual genotyping by sequencing 133
(GBS) (Elshire et al., 2011) to characterise the amount of divergence between forms. We further 134
used a pooled RAD-sequencing (Baird et al., 2008) approach that produced a high density of 135
markers to characterise with greater precision the genomic landscape of divergence and assess 136
the extent of differentiation between the different colour forms. Finally, in order to test whether 137
incomplete lineage sorting or gene flow explained shared genetic variation among forms, we use 138
coalescent models to test alternative demographic scenarios of divergence, including models 139
with different temporal patterns of gene flow and effective population size changes over time. 140
141
142
143
6
Material and Methods 144
145
Field sampling 146
We sampled a total of 259 Reunion grey white-eyes between 2007 and 2012 from nine locations 147
that were chosen to extensively cover the species' range and the different geographic forms. We 148
also sampled 25 Mauritius grey white-eyes (Zosterops mauritianus) from a single location on 149
Mauritius to be used as an outgroup in some of our analyses since this species and the Reunion 150
grey white-eye are sister taxa (Warren et al. 2006). Birds were captured using mistnets, marked 151
with a uniquely numbered aluminum ring, and approximately 50 µL of blood were collected 152
from each individual and preserved in Queen's lysis buffer (Seutin et al., 1991). All 153
manipulations were conducted under a research permit issued by the Centre de Recherches sur la 154
Biologie des Populations d’Oiseaux (CRBPO) – Muséum National d’Histoire Naturelle (Paris). 155
Individuals were sexed using PCR (Griffiths et al., 1998) in order to infer the number of distinct 156
Z chromosomes included in each genetic pool. We included 152 females and 132 males in this 157
study, among which 47 females and 48 males were included in the genotyping-by-sequencing 158
experiment (see below). 159
160
Genotyping by sequencing (GBS) using individual DNA samples 161
We performed genotyping by sequencing (GBS hereafter; (Elshire et al., 2011) on 95 162
individuals, including 90 Reunion and five Mauritius grey white-eyes (Figure 1). We included 7-163
14 individuals from each Reunion location and two locations per geographic form; such a 164
sampling scheme should be sufficient to retrieve patterns of differentiation and diversity at the 165
scale of forms, as highlighted by both theoretical (Willing et al., 2012) and empirical studies 166
(Jeffries et al., 2016; Nazareno et al., 2017). GBS is similar to RAD-sequencing, but involves 167
fewer preparation steps (Elshire et al., 2011) and samples loci at a lower resolution across the 168
genome. Approximately one microgram of DNA was extracted with a QIAGEN DNeasy Blood 169
& Tissue kit following manufacturer’s instructions and sent to the BRC Genomic Diversity 170
Facility at Cornell University (see Elshire et al., 2011) for single-end sequencing on a single lane 171
of an Illumina HiSeq2000 after digestion with PstI. Read length was 100 bp. Three individuals 172
7
had to be removed from subsequent analyses due to the extremely low number of reads obtained 173
(Supplementary Table 1). Raw reads were trimmed with Trimmomatic (v 0.33, (Bolger et al., 174
2014)) with a minimum base quality of 20. We used the recently assembled Z. lateralis genome 175
(Cornetti et al., 2015) to map reads back onto this reference with BWA MEM (v. 0.7.12, (Li and 176
Durbin, 2009)) and SAMTOOLS (v 1.3.1, (Li et al., 2009)), instead of creating consensuses 177
directly from data as in Bourgeois et al. (2013). Reads with a mapping score below 20 were 178
excluded (samtools view -q 20). We then aligned contigs and scaffolds from a congeneric white-179
eye species Zosterops lateralis on the Zebra Finch (Taeniopygia guttata) passerine reference 180
genome (version July 2008, assembly WUGSC v.3.2.4) using LASTZ (v 1.03.54, (Schwartz et 181
al., 2003; Harris, 2007)). We used the following options and thresholds:--masking=254 --182
hspthresh=4500 --gappedthresh=3000. The first option means that any locus found mapping 183
more than 254 times is automatically masked and does not appear in the final pairwise 184
alignment. The –hspthresh parameter is an option that excludes any alignment with a score lower 185
than 4500 during the gap-free extension stage. The --gappedthresh option controls the maximum 186
size of the gaps allowed to join best local alignments; the higher the score, the fewer gaps are 187
allowed. We used the same set of options previously used in comparisons between other related 188
bird genomes, such as chicken and grouse (e.g. (Kozma et al., 2016)). Scaffolds were then 189
assigned to chromosomal regions based on their alignment scores. We note that synteny is well 190
conserved in birds (Derjusheva et al., 2004), and that misalignment is therefore unlikely to 191
constitute a major source of errors. 192
SNPs were called using freebayes (v 0.9.15-1, (Garrison and Marth, 2012)) and filtered with 193
VCFTOOLS (v 0.1.12b) using the following criteria for autosomal markers: (i) a sequencing 194
depth between 8 and 100X for each individual genotype; (ii) a minimal genotype quality of 20; 195
and (iii) no more than 9 missing genotypes. Missing data per individual before filtering and after 196
removing individuals with low read count was at most 50% (average 30%, s.d.=5%, see Suppl. 197
Table 1). Average sequencing depth was 9.75X (s.d.=3.05). The range of sequencing depth for 198
filtering was chosen based on visual examination of histograms produced by SAMTOOLS 199
(option depth), to remove loci with a clear excess of mapping reads that may indicate repetitive 200
sequences and those loci with very low depth for which genotypes may not be called confidently, 201
while retaining enough information for inference. For Z-linked markers, we first listed scaffolds 202
mapping on the Zebra finch’s Z chromosome based on LASTZ alignments. We then used 203
8
VCFTOOLs to extract genotypes found on Z scaffolds (providing a list of these scaffolds with 204
the option –bed). SNPs were filtered in male individuals only, using the same criteria as for 205
autosomes, except that no more than 5 missing genotypes were allowed. We then extracted these 206
sites in females only, using VCFTOOLS (option --positions), and removed markers displaying 207
more than three heterozygous females, allowing for some tolerance since freebayes attempts to 208
balance the count of heterozygotes in a diploid population.. This led to the removal of 171 sites 209
out of 1,136. We then recalled SNPs with freebayes in females only, assuming haploidy (option 210
–ploidy 1). The constraint on sequencing depth and genotype quality was removed in females to 211
consider the fact that a single Z copy is found in these individuals, therefore reducing depth of 212
coverage at Z-linked markers. Since we excluded reads with a mapping quality below 20 when 213
creating BAM files, we considered that a single read was enough to call a site in females for the 214
Z scaffold. This decision was taken to maximize the number of markers available for this 215
chromosome. The final dataset consisted of 34,951 autosomal markers and 965 Z-linked 216
markers. Recent studies have suggested the existence of a neo sex chromosome in Sylvioidea, 217
consisting of a fusion between ancestral Z and W chromosomes with the first 10 Mb of the Zebra 218
Finch’s chromosome 4A (Pala et al., 2012). We therefore excluded this region from our analyses 219
and studied it separately, focusing on males only. In males, 917 and 730 SNPs called by 220
freebayes were found polymorphic on the Z and the 4A sex-linked fragment, respectively. 221
Pooled RAD-seq 222
To identify loci and genomic regions associated with ecological variation (low vs. high 223
elevation) and divergence plumage colour between lowland forms, we used a paired-end RAD-224
sequencing protocol, using a dataset partially described elsewhere (Bourgeois et al., 2013) in 225
which six pools of 20-25 individuals from the same three locations as those sampled for the high-226
elevation form in the GBS experiment were sequenced. We added seven more pools of 16-25 227
individuals from the lowland forms to cover the same localities than the GBS dataset (Figure 1, 228
Suppl. Table 2). This protocol was used since it produced a higher density of markers along the 229
genome relative to the GBS approach described above, thus increasing the ability to detect 230
outlier genomic regions. This approach resulted in approximately 600,000 contigs with an 231
average size of 400 bp, covering about 20% of the genome (Bourgeois et al., 2013). The larger 232
number of individuals included in each pool should also increase the ability to detect shifts in 233
allele frequencies between populations. We modified the bioinformatics protocol used in 234

9
Bourgeois et al. (2013) by mapping the reads on the Z. lateralis genome using BWA MEM 235
instead of creating contigs from the RAD-seq reads. PCR duplicates were removed using 236
SAMTOOLS (Li et al., 2009). SNPs were called using Popoolation2 (v 1.201, (Kofler et al., 237
2011)), using a minimal allele count of two across all pools, and a depth between 10X and 300X 238
for each pool to remove loci that were clear outliers for sequencing depth while keeping a high 239
density of markers along the genome. We used BEDTOOLS (v 2.25.0, (Quinlan and Hall, 2010)) 240
to estimate the proportion of sites covered at a depth between 10X and 300X in each pool (option 241
genomecov). Overall, more than 1,104,000 SNPs for autosomes and 42,607 SNPs for the Z 242
chromosome were obtained, covering between 12 and 18% of the genome (Sup. Table 2). We 243
accounted for the unequal number of alleles between autosomal markers and Z-linked markers in 244
all subsequent analyses. 245
246
Genetic structure 247
To assess population genetic structure within and between geographic forms, we first performed 248
a principal components analysis (PCA (Patterson et al., 2006)) on all GBS autosomal markers, 249
using the Bioconductor package SeqVarTools (v 1.24.0, (Huber et al., 2015)), excluding markers 250
with a minimal allele frequency below 0.05. We then evaluated population structure for both 251
autosomal and Z-linked markers using the software ADMIXTURE (v 1.3.0, (Alexander and 252
Novembre, 2009)). This software is a fast and efficient tool for estimating individual ancestry 253
coefficients. It does not require any a-priori grouping of individuals by locality but requires 254
defining the expected number (K) of clusters to which individuals can be assigned. Importantly, 255
ADMIXTURE allows specifying which scaffolds belong to sex chromosomes, and corrects for 256
heterogamy between males and females. “Best” values for K were assessed using a cross-257
validation (CV) procedure using 10 CV replicates. In this context, cross-validation consists in 258
masking alternatively one fifth of the dataset, then using the remaining dataset to predict the 259
masked genotypes. Predictions are then compared with actual observations to infer prediction 260
errors. This procedure is therefore sensitive to heterogeneity in structure across markers induced 261
by, e.g., selection. Therefore, we present results for all values of K as they may reveal subtle 262
structure supported by only a subset of markers under selection. Based on patterns of LD-decay, 263
we thinned the dataset to limit the effects of linkage, with a minimal distance between two 264

10
adjacent markers of 1,000 bp (Figure S2). Pairwise LD (measured as r2, which does not require 265
phasing) between all pairs of markers was computed in VCFTOOLS (v 0.1.12b). 266
To further explore whether changes in SNP caller and the number of markers could affect the 267
ADMIXTURE analysis and observed differences between autosomes and Z-linked markers, we 268
called Z-linked SNPs using ANGSD (v 0.923, (Korneliussen et al., 2014)), following an 269
approach similar to the one used with freebayes. We first called SNPs in all individuals assuming 270
diploidy, using a uniform prior based on allele frequencies but not assuming Hardy-Weinberg 271
equilibrium in samples (option -doPost 2). SNP likelihoods were computed following the model 272
implemented in SAMTOOLS (-GL=1). We then called SNPs in females only, assuming haploid 273
markers and calling the consensus base (option -doHaploCall 2). We filtered reads so they 274
mapped to a single site in the genome (-uniqueOnly 1 -remove_bads 1), had a mapping quality of 275
at least 20 (-minMapQ 20), a minimum read quality of 20 (-minQ 20), and were covered in at 276
least two thirds of individuals with a minimum individual depth of 6X in males (-277
geno_minDepth 6). We corrected for excessive mismatch with the reference and excess of SNPs 278
with indels (-C 50 -baq 1). This resulted in 2,282 Z-linked SNPs. 279
To assess the relative proportion of genetic variance contributing to the differentiation of 280
geographic forms (estimated by FCT) while taking into account population substructure (FSC and 281
FST), we conducted an analysis of molecular variance (AMOVA) in Arlequin v3.5 (Excoffier and 282
Lischer, 2010) using as groups either islands (Reunion vs. Mauritius), lowlands and highlands, or 283
the forms themselves. F-statistics for the whole dataset are weighted averages. Significance was 284
assessed with 1000 permutations. 285
We assessed relationships between populations from pooled data using POPTREE2 (Takezaki et 286
al., 2010) to compute FST matrices across populations using allele frequencies. A Neighbor-287
Joining tree was then estimated from these matrices. We included 20,000 random SNPs with a 288
minimum minor allele count of 2. Branch support was estimated through 1,000 bootstraps. As a 289
supplementary control, we also report the correlation matrix estimated from the variance-290
covariance matrix obtained by the software BAYPASS (v2.1) (Gautier, 2015) for both GBS and 291
pooled data. The variance-covariance matrix reflects covariation of allele frequencies within and 292
between populations. The correlation matrix describing pairwise relatedness between populations 293
was then derived using the R function cov2cor() provided with BAYPASS. The function 294
11
hierclust() was used to perform hierarchical clustering based on matrix coefficients. For 295
POPTREE2 analysis and AMOVAs, we took care of accounting for the different number of 296
alleles between males and females for Z-linked markers, including one allele for females and two 297
for males. 298
299
Demography 300
To help distinguish between the presence of extensive gene flow between forms and incomplete 301
lineage sorting as an explanation for the generally low differentiation, we performed model 302
comparison under the likelihood framework developed in fastsimcoal2.6 (Excoffier et al., 2013) 303
using frequency spectra inferred by ANGSD from autosomal and Z-linked GBS data. We 304
focused on the split between populations from high and low elevations. This split was the 305
clearest across all analyses, with very little genetic differentiation between lowland forms for 306
these markers (see Results). Given the weak genetic substructure for autosomal markers, and 307
since a large number of individuals within groups is required to infer very recent demographic 308
events (Robinson et al., 2014), we pooled individuals into three groups: highlands, lowlands and 309
Mauritius. We acknowledge that models incorporating substructure could be built, but this would 310
come at the cost of adding more parameters. We preferred to limit this study to simple models 311
that can serve as a basis for future, more detailed work using more markers and individuals (Otto 312
and Day, 2007). 313
We used GBS autosomal and Z-linked markers as they could be filtered with higher stringency 314
than pooled markers and were more likely to follow neutral expectations, with only 1.6% of 315
genetic variance explained by GBS loci harboring significant differentiation between highland 316
and lowland forms (see AMOVAs in Results). SNPs mapping on scaffolds corresponding to the 317
neo sex chromosome region on 4A were discarded from the analysis (see Results). We extracted 318
the joint derived site frequency spectrum (SFS) using ANGSD, which takes into account 319
genotypic uncertainties to directly output the most likely SFS. We used the reference genome as 320
an outgroup to assign alleles to ancestral or derived states. Using ANGSD should correct for 321
biases that may happen when calling genotypes from low and medium-depth sequencing. We 322
filtered markers using the same criteria used for the ADMIXTURE analysis on Z-linked loci (-323
uniqueOnly 1 -remove_bads 1 -minMapQ 20 -minQ 20 -doPost 2 -geno_minDepth 6 -C 50 -baq 324

12
1), but excluded two individuals with very low average sequencing depth (993 and 11_0990), 325
and removed sites that were not covered in all remaining individuals. For Z-linked markers, we 326
extracted the SFS from male individuals only, given that ANGSD cannot simultaneously extract 327
the spectrum from samples with mixed ploidy. Entries in the joint site frequency spectrum were 328
examined to exclude potential paralogs displaying strong heterozygosity.. We did not filter on 329
minimal allele frequency since singletons are important to properly estimate parameters and 330
likelihoods. We compared four distinct demographic models (Figure 3), one in which all forms 331
were essentially treated as a single population (by forcing a very recent split 10 generations ago) 332
that went through a change in effective population sizes after the split from Mauritius, one with 333
no gene flow between highland and lowland forms, one allowing constant and asymmetric gene 334
flow between lowland and highland forms, and a last model where gene flow could vary at some 335
time in the past between present time and the split between lowland and highland forms. 336
Population sizes could vary at each splitting time and each group was assigned a specific 337
effective population size. Parameters were estimated from the joint SFS using the likelihood 338
approach implemented in fastsimcoal2.6 (Excoffier et al., 2013). Parameters with the highest 339
likelihood were obtained after 20 cycles of the algorithm, starting with 50,000 coalescent 340
simulations per cycle, and ending with 100,000 simulations. This procedure was replicated 50 341
times and the set of parameters with the highest final likelihood was retained as the best point 342
estimate. The likelihood estimated by fastsimcoal2.6 is a composite likelihood, which can be 343
biased by covariance between close markers (Excoffier et al., 2013). To properly compare 344
likelihoods and keep the effects of linkage to a minimum, we first used a thinned dataset with 345
SNPs separated by at least 10,000 bp (see LD decay, Figure S2). We then used the complete 346
dataset for parameter estimation. We used a fixed divergence time of 430,000 years between 347
Reunion and Mauritius grey white-eyes (Warren et al., 2006) and assumed a generation time of 348
one year to calibrate parameters and obtain an estimate in demographic units for the timing of 349
diversification in the Reunion grey white eye. We used python scripts implemented in ∂a∂i 350
(Gutenkunst et al., 2009) to visualise and compare predicted and observed SFS. To assess 351
deviation from neutrality and stable demography, we estimated Tajima’s D (Tajima, 1989) from 352
the spectra with ∂a∂i. 353
We estimated 95% confidence intervals (CIs) using a non-parametric bootstrap procedure, 354
bootstrapping the observed SFS 100 times using ANGSD and repeating the parameter estimation 355
13
procedure on these datasets, using 10 replicates per bootstrap run to reduce computation time. To 356
visualise whether the model fitted the observed data, we compared the observed SFS with 100 357
SFS simulated using the set of parameters obtained from the model with the highest likelihood. 358
Coalescent simulations were carried out in fastsimcoal2.6, simulating DNA fragments of the size 359
of GBS loci (91bp) and using a mutation rate of 3.6x10⁻⁹ mutations/generation (Axelsson et al., 360
2004) until the number of SNPs matched the number of segregating sites in the observed dataset. 361
Parameters for each simulation were uniformly drawn from the CIs of the best model. We 362
summarized SFS by PCA using the gfitpca() function of the abc package (Csilléry et al., 2012), 363
including only entries with at least 0.1% of the total number of segregating sites to reduce 364
variance. 365
366
Selection and environmental association 367
To detect loci displaying a significant association with geographic forms and environment, we 368
performed an association analysis on the pooled RAD-seq data. We used the approach 369
implemented in BAYPASS (v 2.1.)) to detect SNPs displaying high differentiation (Gautier, 2015). 370
This approach is designed to robustly handle uncertainties in allele frequencies due to pooling and 371
uneven depth of coverage, by directly using read count data. It performs well in estimating 372
differentiation and population structure (Hivert et al., 2018). Briefly, BAYPASS estimates a 373
variance-covariance matrix reflecting correlations between allele frequencies across populations. 374
Divergence at each locus is quantified through a Bayesian framework using the XTX statistic, which 375
can be seen as a SNP-specific FST corrected by this matrix. BAYPASS also offers the option to 376
estimate an empirical Bayesian P-value (eBPis) which can be seen as the support for a non-random 377
association between alleles and any population-specific covariable. We also computed eBPis to 378
determine the level of association of each SNP with geographic form and elevation. Specifically, 379
we tested associations between allele frequencies and a binary covariable stating whether pools 380
belonged or not to Mauritius grey white-eye, GHB, BNB and LBHB forms. We also tested 381
association with elevation, coded as a continuous variable. BAYPASS was run using default 382
parameters under the core model with 25 pilot runs and a final run with 100,000 iterations thinned 383
every 100 iterations. Because estimates of the variance-covariance matrix are robust to minor 384
allele count thresholds (Gautier, 2015), we only included SNPs with a minor allele count of 10 385
14
over the entire dataset to reduce computation time and ran separate analyses on Z chromosome 386
and autosomes to account for their distinct patterns of differentiation and allele counts. 387
388
GO enrichment analysis 389
To gain insight into the putative selective pressures acting on Reunion grey white-eye 390
populations, we performed a Gene Ontology (GO) enrichment analysis, selecting for each 391
association test SNPs in the top 1% for both eBPis and XTX, considering separately the Z 392
chromosome and autosomes. Gene annotations within 100 kb windows flanking selected SNPs 393
were extracted using the zebra finch reference and the intersect function in bedtools v2.25.0 394
(Quinlan and Hall, 2010). We chose 100kb based on the average territory size of protein-coding 395
genes in the zebra finch (87.8kb, see Table 1 in Warren et al., 2010). We adjusted the gene 396
universe by removing zebra finch genes not mapping onto the Z. lateralis genome. GO 397
enrichment analysis was performed using the package topGO in R (Alexa and Rahnenfuhrer, 398
2016), testing for significant enrichment using a Fisher’s test for overrepresentation. We present 399
raw P-values instead of P-values corrected for multiple testing, following recommendations from 400
the topGO manual, and because we wanted to detect any interesting trend in the dataset that 401
could then be further explored. We present the top 50 GO terms associated with biological 402
processes, ranked by their raw P-values. 403
404
Results 405
406
Genetic structure and relationships among geographic forms 407
We first assessed whether geographic forms could be distinguished based on the genomic data 408
available for individuals (GBS). A principal components analysis on autosomal allele 409
frequencies revealed a clear distinction between Mauritius and Reunion grey white-eyes on the 410
first axis, as well as a distinction between localities from lowlands and highlands on the second 411
axis (Figure 1B). When excluding Mauritius white-eyes, the main distinction remained between 412
localities from high and low elevation, reflecting differentiation between highland and lowland 413

15
forms. Further principal components did not reveal any strong clustering of the different forms 414
from the lowlands (Figure 1B). This pattern was further confirmed by the ADMIXTURE 415
analysis, where low and high clustered separately for both autosomal and Z-linked markers 416
(Figure 2). The cross-validation procedure gave K=2 and K=7 as best models for autosomal and 417
Z-linked markers respectively (Figure S3). Cross-validation scores were however low for all K 418
values ranging from 5 to 7 for Z-linked markers, making it difficult to clearly identify an optimal 419
value. Given the subtle genetic structure, we present results for values of K ranging from 2 to 7. 420
Clustering was consistent with the PCA, with a distinction between localities from high and low 421
elevations at K=2 and 3, for Z-linked and autosomal markers respectively (Figure 2A). For 422
autosomal markers, higher values of K highlighted a structure consistent with sampling sites, but 423
structure according to geographic forms was more elusive. For Z-markers, clustering tended to 424
be more consistent with forms at low elevation. At K=7, one cluster corresponded to localities at 425
high elevation, three others grouped lowland localities by forms, while a fifth cluster included 426
Mauritian individuals (Figure 2A). Two localities (LF and TC) displayed stronger signals of 427
mixed ancestry, probably due to gene flow between those two localities which are close to a zone 428
of contact between the GHB and BNB forms. The same pattern was observed using the set of Z-429
linked SNPs called with ANGSD, the distinction between GHB and BNB forms being even 430
clearer, likely due to the larger number of markers (Figure S4). We note that using this set of 431
markers improved the discrimination between colour forms, probably because of the higher 432
number of SNPs remaining after filtering with ANGSD (2,282 loci) instead of freebayes (965 433
loci). 434
Recent studies revealed the existence of neo sex chromosomes in Sylvioidea, to which 435
Zosteropidae belong (Pala et al., 2012), and their existence was recently confirmed in the 436
Reunion grey white-eye (Leroy et al. 2019). These neo-sex chromosomes emerged from the 437
fusion of Z and W chromosomes with the first 10 Mb of chromosome 4A. We extracted GBS 438
markers mapping to this region and confirmed that they were sex-linked, as shown by a PCA on 439
allele frequencies (Figure S5). Visual examination of genotypes revealed that females (ZW) 440
displayed a strong excess of heterozygous markers, contrary to males (ZZ), due to divergence 441
between neo-Z and neo-W chromosomes. We further investigated population structure in males 442
only, using a set of combined Z and 4A markers, and an ADMIXTURE analysis tended to better 443
discriminate geographic forms at K=6 with this set of markers (Figure S6). 444

16
The same pattern was observed with the POPTREE2 analysis on the pooled dataset. The 445
autosomal topology supported a grouping of localities from high elevation together and 446
supported a grouping of localities belonging to BNB and LBHB forms, yet there was no support 447
for grouping together localities from the GHB form. In contrast, topology based on Z markers 448
provided good support for a grouping of localities by geographic form (Figure 2B). 449
We further investigated population structure by estimating the variance-covariance matrix 450
obtained from allele frequencies for both pooled and GBS data using BAYPASS (Gautier, 2015). 451
Localities from high elevation were systematically found clustering together, a pattern consistent 452
with previous analyses (Figure S7). Again, both analyses on Z-linked markers for GBS and 453
pooled data revealed a closer relationship between populations from the same geographic form 454
when compared to autosomal markers. LBHB and BNB forms clustered together, with the GHB 455
form branching off first within the lowland group. 456
To estimate quantitatively the proportion of the genome discriminating among geographic forms 457
while accounting for population structure within forms, we performed a molecular analysis of 458
variance (AMOVA) on GBS data. This analysis confirmed the previous patterns, with a 459
proportion of variance explained by forms or elevation not higher than 1.6% for autosomal 460
markers (Table 1). The strongest differentiation was observed between localities from low and 461
high elevations and between Mauritius and Reunion populations. For Z-linked markers however, 462
the proportion of variance explained by forms and elevation was more substantial, ranging from 463
3.4 to 12.6% (Table 1). This higher differentiation could not be explained by differences in 464
sample size between autosomal and Z-linked data. For autosomal markers, AMOVAs performed 465
only on males did not show substantial deviations from the results obtained with the full dataset 466
(Table 1). 467
468
Demographic history 469
We compared four nested models (Figure 3), allowing for no or constant gene flow after the split 470
between populations. The highest likelihoods were found for the model allowing change in gene 471
flow at some time (Tchange)after the initial split at Tsplit between lowlands and highlands (model D, 472
Figure 3), while the other models were clearly rejected (Table 2). Such a pattern of higher gene 473
flow in recent times is consistent with a scenario of introgression through secondary contact. 474
17
Assuming a conservative divergence time between Z. borbonicus and Z. mauritianus of 430,000 475
years, parameter estimates suggested a split between high and low elevation populations 400,000 476
years ago and an increase in gene flow 80,000 years ago (Table 3). Overall, point estimates of 477
effective migration rates (2Nm, with N the diploid population size) were high (2NHigh mLow→High 478
=0.1 gene copies/generation, 2NLow mHigh→Low =9.2 before Tchange, then reaching 2NHigh mLow→High 479
= 9.9 and 2NLow mHigh→Low = 6.0 80,000 years ago), consistent with homogenisation of genomes 480
through migration. This model was able to explain our observed dataset, as indicated by visual 481
comparisons of the observed and predicted SFS (Figure S8A). Coalescent simulations using 482
parameters drawn from CIs of the best model produced SFS similar to the observed one (Figure 483
S8B). 484
Genes that are involved in reproductive isolation between populations are expected to resist gene 485
flow due to counterselection of maladapted or incompatible alleles. This should result in an 486
increased divergence at these loci when compared to the genomic background (Cruickshank and 487
Hahn, 2014). We tested whether reduced gene flow explained increased divergence in the Z by 488
estimating parameters from the four models but using this time all Z-linked markers, because 489
they explained most of the differentiation between forms. We used the same filtering criteria that 490
we used for autosomes but focused our analysis on diploid males only. The highest likelihood 491
was also found for the model allowing gene flow to change after Tsplit (Table 2), again providing 492
support for a scenario of introgression trhough secondary contact. As expected, given 493
hemizygosity, effective population size estimates were lower for this set of markers than for 494
autosomes (Table 3). Estimates of gene flow were also historically lower than for autosomes, 495
while time since the split between highland and lowland groups was similar. This combination of 496
lower population sizes and lower gene flow is expected to lead to increased divergence at Z-497
linked loci, in accordance with the stronger differentiation observed at these markers in 498
AMOVAs and other tests. 499
To further explore whether differences in demographic inferences may be due to stronger effects 500
of linked selection on the Z chromosome, we computed Tajima’s D for each group (Tajima, 501
1989). This statistic should be negative (<2) in the case of recent population expansion, or if 502
positive/purifying selection is acting. It should be positive (>2) in the case of a recent bottleneck 503
or balancing selection. Tajima’s D values for the autosomal spectra obtained by ANGSD were -504
0.29, -0.73 and -1.18 for Mauritius, highlands and lowlands respectively. Tajima’s D values were 505

18
higher for Z-linked markers, at 0.12, 0.09 and -0.76, but followed the same trend, being lower in 506
lowlands than in highlands and Mauritius. This suggests that widespread effects of linked 507
selection on the Z chromosome are unlikely to explain its higher differentiation. 508
509
Genome scan for association and selection analysis 510
We used BAYPASS (Gautier, 2015) on pooled data to retrieve markers displaying high levels of 511
differentiation (XTX) and association (empirical Bayesian P-values; eBPis) with 5 different 512
features (elevation, being GHB, being BNB, being LBHB, being Mauritian). Overall, this pooled 513
dataset included a total of 284 individuals sequenced at an average depth of ~250X over all 514
pools. We examined Z and autosomal markers separately due to their distinct demographic 515
histories. Results revealed a strong association of Z-linked markers with geographic forms and 516
their associated colour phenotypes and elevation (Figure 4). SNPs discriminating Mauritius from 517
other populations were found distributed uniformly along the genome. Most of the peaks 518
displaying a large XTX were also found associated with elevation. Strikingly, the clearest peaks 519
on chromosomes 2, 3 and 5 covered large genomic regions, spanning several hundreds of 520
kilobases. The sex-linked region on chromosome 4A was the clearest outlier. Since the neo-W 521
chromosome is highly divergent and found in all females, an excess of variants with frequencies 522
correlated to the proportion of females in the pool is expected. This may lead to high 523
differentiation between pools with different sex ratios. Despite this, the strong association with 524
elevation and geographic form on chromosome 4A is genuine since the expected proportion of 525
divergent W-linked alleles in each pool was not correlated with those variables in our experiment 526
(Figure S9), making confounding effects unlikely. 527
To assess the possible role of these genomic regions in adaptation, we performed a Gene 528
Ontology (GO) enrichment analysis using the zebra finch (Taeniopygia guttata) annotation 529
(Supplementary tables 3 to 6). Genes found in regions associated with elevation displayed 530
enrichment for GO terms linked to development, body growth, gene expression, RNA 531
metabolism, DNA organization, immune-system development, hematopoiesis and hemoglobin 532
synthesis (GO:0005833: hemoglobin complex, 3 genes found over 4 in total, P=0.0031). For 533
genes associated with each one of the parapatric lowland forms, we mostly found associations 534
19
with immune response, metabolic process, hematopoiesis, reproduction, morphogenesis, and 535
development (Supplementary Tables 4 to 6). 536
To identify candidates for plumage colour variation between forms, we screened the genes found 537
in outlier regions for GO terms linked to melanin synthesis and metabolism (GO:0042438, 538
GO:0046150, GO:0006582). TYRP1 (tyrosinase-related protein 1), located on the Z 539
chromosome, was the only gene that was systematically found associated with BNB, GHB and 540
LBHB forms. Another gene, WNT5A, was found associated only with the GHB form. 541
542
Discussion 543
544
Genetic structure and genomic islands of differentiation 545
Our results quantify the relative importance of autosomal and sex-linked genetic variation 546
underlying a potential case of incipient speciation in the Reunion grey white-eye. We confirm 547
previous findings based on microsatellite data about the existence of a fine-grained population 548
structure, with low but significant FST between localities (Bertrand et al., 2014), and a clear 549
divergence between populations from low and high elevations (Cornuault et al., 2015; Bertrand 550
et al., 2016). These events of divergence have likely occurred in the last 430,000 years (Warren 551
et al. 2006), and perhaps even more recently since this divergence time estimate was based on 552
mitochondrial data that tend to yield overestimates of population splitting times (Moore, 1995) 553
(Moore 1995). A striking result is the clear contrast between patterns of variation in autosomes 554
and the Z chromosome, the latter discriminating more clearly the different geographic forms and 555
systematically displaying markers associated with plumage colour phenotypes and elevational 556
ranges. Similar results were found independently for both pooled and individual datasets, and 557
with two different SNP callers. These observations combined with demographic analyses suggest 558
that while extensive gene flow has occurred between populations from high and low elevations, 559
the Z chromosome acts as a barrier to it. 560
561
562
20
Reproductive isolation between forms may explain divergence at the Z chromosome 563
Reproductive isolation between nascent species can arise as incompatibilities between interacting 564
loci accumulate in the genome, as described by the Bateson-Dobzhansky-Muller model 565
(Dobzhansky 1934; Muller 1940, 1942; Orr 1996). Sex chromosomes are particularly likely to 566
accumulate such incompatibilities, since the genes they harbor are not transmitted by the same 567
rules between males and females (Seehausen et al., 2014) and are therefore prone to genetic 568
conflicts. Indeed, sex chromosomes often harbor many genes causing disruption of fertility or 569
lower viability in hybrids (Storchová et al., 2004, 2010; Masly and Presgraves, 2007; Good et al., 570
2008), which may lead to increased divergence (Carling and Brumfield, 2008; Macholán et al., 571
2011; Ellegren et al., 2012), and faster emergence of postzygotic isolation (Lima, 2014). 572
Hemizygosity of sex-chromosomes may also lead to the exposure of recessive incompatibilities 573
in heterogametic individuals (Qvarnström and Bailey, 2009). This large effect of sex 574
chromosomes has been a common explanation of Haldane’s rule (Haldane 1922; Orr 1997; 575
Coyne and Orr 2004), which states that in hybrids, the heterogametic sex often displays a 576
stronger reduction in fitness, and may explain why an excess of highly differentiated regions on 577
sex chromosomes is often observed during the early stages of speciation (e.g. Backström et al. 578
2010). An excess of highly differentiated regions on sex chromosomes at the early stages of 579
speciation therefore suggests a role for intrinsic barriers to gene flow in promoting divergence 580
(Backström et al., 2010). 581
In addition, premating and prezygotic isolation affect sexually dimorphic traits that are under the 582
control of sex-linked genes (Pryke, 2010). While this type of isolation would lead to divergence 583
across the entire genome due to the isolation of gene pools, divergence is expected to be 584
accelerated at loci controlling traits under sexual selection, especially if hybrids and backcrosses 585
have lower mating success (Svedin et al., 2008). Finally, effective recombination rates are lower 586
in sex chromosomes since they recombine in only one sex (males in birds), which facilitates 587
linkage of genes involved in pre- and post-zygotic barriers. This linkage would ultimately 588
promote reinforcement of isolation between species or populations (Pryke, 2010). Because of 589
these processes, gene flow at isolating sex-linked loci is expected to be impeded between 590
diverging populations, leaving a stronger signature of differentiation than in the rest of the 591
genome (e.g. Mořkovský et al., 2018). 592

21
Our findings are in line with these theoretical expectations, and show an excess of highly 593
differentiated markers on the Z chromosome that display evidence for resisting gene flow, a 594
pattern that is also consistent with Haldane’s rule (e.g. Carling and Brumfield, 2008). 595
Importantly, highly differentiated autosomal markers were mostly associated with differences in 596
elevation ranges but Z chromosome variation was found to be associated with both elevation and 597
plumage colour differences between lowland forms. This suggests that the divergence between 598
lowland and highland forms is due to both polygenic adaptation to different elevational ranges 599
and behavioural differentiation, e.g. mating preferences (Sæther et al., 2007). 600
We acknowledge that we have no direct evidence yet of assortative mating, character 601
displacement, or lower hybrid fitness in contact zones between the different geographic forms of 602
our study species, but (i) a previous study showed that Reunion grey white-eyes can perceive 603
colour differences between forms, and that both within- and between-form differences in 604
plumage colour can be discriminated (Cornuault et al. 2015); (ii) hybrid zones are narrow among 605
lowland forms (Delahaie et al., 2017) and quite likely also between lowland and highland forms 606
(Bertrand et al 2016), suggesting that hybrid phenotypes must have a lower fitness; and (iii) high 607
gene flow within forms can erase signatures of character displacement if alleles responsible for 608
pre-mating isolation are nearly neutral in populations that are distant from contact zones 609
(Servedio and Noor, 2003). 610
Role of drift and recent selective sweeps in Z chromosome divergence 611
The higher differentiation observed on the Z chromosome may also be due to its reduced 612
effective population size, which leads to faster drift and lineage sorting between forms. Such a 613
mechanism may explain the generally higher rate of divergence observed on Z chromosomes 614
(fast-Z effect). This effect can become even stronger in the presence of a recent bottleneck and 615
population size change (Pool and Nielsen, 2007; Van Belleghem et al., 2018). However, we did 616
not find any evidence for strong bottlenecks or abrupt changes in population sizes, making faster 617
accumulation of divergent alleles in recently established populations unlikely. Moreover, another 618
recent study on Z. borbonicus has also shown that there is weak support for a fast-Z effect in the 619
clade to which this species belongs (Leroy et al., 2019). Another mechanism that might lead to 620
stronger differentiation at Z-linked loci is female-biased dispersal, which is frequent in passerine 621
birds (Greenwood, 1980). However, dispersal in Z. borbonicus is extremely reduced for both 622

22
sexes (Bertrand et al. 2014), which should attenuate the contrast between autosomal and Z-linked 623
markers. In addition, although it could lead to stronger differentiation between localities, such a 624
mechanism alone is unlikely to explain why such a high proportion of variance is associated with 625
forms on the Z chromosome. At last, we do not observe higher differentiation on Z markers or 626
autosomes in males as compared to all individuals (Table 1). 627
Lower effective recombination rates on the sex chromosome may enhance the effects of 628
selection at sites linked to loci involved in ecological adaptation, further reducing diversity on 629
the Z. In addition, a possible explanation of fast-Z effect in birds may result from positive 630
selection on recessive beneficial alleles in heterogametic females (Dean et al. 2015). At last 631
faster drift on the Z chromosome may lead to a faster accumulation of incompatibilities 632
(Janoušek et al., 2019), which will further increase divergence. Ultimately, drift and selection are 633
interconnected processes that are difficult to disentangle. Unfortunately, we cannot provide with 634
our dataset alone a detailed understanding of how processes such as linked selection, 635
chromosomal rearrangements and barriers to gene flow can interact (Bierne et al., 2011; Ravinet 636
et al., 2017). Future studies using whole-genome resequencing data should provide a clearer 637
picture, by providing information on genealogies and age of both autosomal and sex-linked 638
haplotypes. 639
We note however that the allele frequency spectra of lowland and highland forms do not display 640
the expected signature of pervasive linked selection, with Tajima’s D actually higher for Z 641
markers than for autosomes. Our demographic analyses also show that the effective population 642
sizes estimated from Z markers are reduced by a factor of 0.38-0.89 when compared to 643
autosomes, the neutral expectation being 0.75. We acknowledge that polygenic adaptation to 644
divergent environmental pressures is likely partly responsible for the observed genomic 645
landscape of differentiation, possibly leading to localised divergence at autosomal and Z loci (see 646
below). However, reproductive isolation seems to be at play in this system, either through 647
premating isolation based on plumage characters, and/or post-zygotic isolation. More research 648
about the ecology of the Reunion grey white-eye would also be useful to quantify the extent of 649
sex-biased dispersal, assortative mating, parental imprinting, intrinsic incompatibilities, and how 650
these factors may interact in this system (Pryke, 2010; Seehausen et al., 2014). 651
652
Autosomal divergence is mostly associated with elevation 653
23
Adaptation to local environmental conditions or natural selection against hybrids is more likely 654
to be driven by genes scattered across the genome, assuming polygenic selection (Qvarnström 655
and Bailey, 2009; Seehausen et al., 2014). In addition to Z-linked loci, we found many 656
differentiated loci on autosomes, mostly in association with elevation. Genomic regions 657
associated with elevation displayed an enrichment of genes involved in development and body 658
growth, and included the cluster of hemoglobin subunits A, B, and Z on chromosome 14. The 659
function of these genes is consistent with biological expectations, given the wide elevational 660
range (from 0 to 3,000 m) occupied by white-eyes on Reunion. 661
Large chromosomal rearrangements are powerful drivers of differentiation, since they prevent 662
recombination between several consecutive genes, facilitating the maintenance of divergent 663
allele combinations between populations. A famous example of adaptive inversions facilitating 664
the maintenance of colour (geographic) forms and species has been reported in Heliconius 665
butterflies (Joron et al., 2011) or the white-throated sparrow (Tuttle et al., 2016), and these 666
rearrangements have been predicted to take place in isolation followed by secondary contact 667
(Feder et al., 2011). In this study, autosomal regions associated with geographic forms and 668
elevation sometimes spanned more than 1 Mb. This suggests a possible role for large scale 669
rearrangements and linked selection in regions of low recombination as a substrate for 670
divergence in Reunion grey white-eyes. Our results remind at a much smaller spatial scale what 671
has been previously observed in Ficedula flycatchers, with high differentiation on the Z 672
chromosome, linked selection, and chromosomal rearrangements (Ellegren et al., 2012; Burri et 673
al., 2015). 674
The low number of Z-linked markers found in this study and their higher level of population 675
differentiation may limit the interpretation of results when comparing patterns of divergence with 676
autosomes. Whole-genome resequencing data and refined demographic models building on the 677
ones used in this study will be critical to precisely quantify the evolutionary dynamics of the Z 678
chromosome compared to autosomes, and identify at a higher resolution the loci displaying 679
strong divergence. Future studies should also focus on the variation in allele frequencies along 680
hybrid zones and test whether loci that are more likely to be involved in local adaptation (such as 681
immune genes or hemoglobin subunits) display changes in frequencies that are as sharp as Z-682
linked loci, since the latter are more likely involved in both pre- and post-zygotic isolation. 683
Overall, our results suggest an extreme case of divergence with gene flow that can bring valuable 684
24
insights into the relative order at which pre- and post- zygotic isolation mechanisms occur during 685
speciation. 686
687
Genetics of colour 688
TYRP1, a well-characterized colour gene in both model species and natural populations (Nadeau 689
et al., 2007; Backström et al., 2010; Delmore et al., 2016; Abolins-Abols et al., 2018), was the 690
only known colour gene found in the regions associated with each of the three lowland forms. 691
This gene had been previously studied using a candidate gene approach in Z. borbonicus, but no 692
clear association with plumage colour phenotypes was found, probably owing to the low levels 693
of polymorphism displayed among lowland forms (Bourgeois et al., 2016). The WNT5A gene 694
was found associated with the GHB form, with a brown back and a grey head. This gene is 695
known to regulate TYRP1 expression (Zhang et al., 2013) and is differentially expressed between 696
black carrion and grey-coated hooded crows (Poelstra et al., 2015). However, this gene is not 697
only involved in melanogenesis but also in cell migration and differentiation, making it a less 698
straightforward candidate in this system. 699
Our pool-seq approach only covered about 10-20% of the genome, and may therefore have 700
missed some colour loci. The likelihood is high, however, that recent selective sweeps would 701
have been detected if such genes had been targeted by selection. For example, the locus 702
underlying color polymorphism in the high-elevation form shows clear signs of a selective sweep 703
reducing diversity over 500kb (see Figure 3 in Bourgeois et al. 2017), a region which is large 704
enough to be covered by tens of RAD-seq loci. Cases of long-term balancing selection may 705
however be harder to detect because of the short haplotypes typically found in this case due to 706
extensive recombination. Together with previous findings (Bourgeois et al., 2012, 2017), this 707
suggests that a large part of plumage colour variation between the geographic forms of the 708
Reunion grey white-eye may be controlled by a set of a few loci of major effect. More detailed 709
studies of hybrid zones between the different lowland forms may help characterize the exact 710
association of alleles that produce a given plumage colour phenotype. 711
712
713
25
Acknowledgments 714
715
We thank Joseph Manthey, Stéphane Boissinot, Maëva Gabrielli and Thibault Leroy for 716
insightful comments that improved the manuscript. We also thank the Reunion National Park for 717
granting us permission to conduct fieldwork and to collect blood samples. Thomas Duval, 718
Guillaume Gélinaud, Josselin Cornuault, Philipp Heeb, Dominique Strasberg, Ben Warren, and 719
Juli Broggi assisted with fieldwork. Emeline Lhuillier and Olivier Bouchez assisted with the 720
development of pooled RAD-seq. This research was carried out on the High-Performance 721
Computing resources at New York University Abu Dhabi and the Genotoul HPC cluster. This 722
work was supported by Fondation pour la Recherche sur la Biodiversité (FRB), Agence 723
Française pour le Développement (AFD), Agence Nationale de la Recherche (ANR-2006-724
BDIV002), Centre National de la Recherche Scientifique (CNRS) through a PEPS grant, The 725
National Geographic Society, and the “Laboratoire d’Excellence” TULIP (ANR-10-LABX-41). 726
The first author was supported by a MESR (Ministère de l’Enseignement Supérieur et de la 727
Recherche) PhD scholarship during this study. 728
729
Author contributions 730
731
BM and CT initiated, coordinated and supervised the project; YB, BM and CT conceived the 732
study and designed the experiments; BM, CT, YB, JAB and BD conducted the fieldwork; 733
molecular data were generated by YB and HH; YB analyzed the data; and YB, BM, and CT 734
wrote the paper with input from the other authors. All authors gave final approval for 735
publication. 736
737
Data Accessibility 738
739
All data associated with this manuscript are published on DRYAD (VCF files,allele counts for 740
pooled data and position of Z. lateralis scaffolds on zebra finch chromosomes; 741
26
https://doi.org/10.5061/dryad.z34tmpg8z) and European Nucleotide Archive (BAM files for 742
pools and fastq files for individual GBS data; accession number PRJEB36701). 743
744
References 745
746
Abolins-Abols M, Kornobis E, Ribeca P, Wakamatsu K, Peterson MP, Ketterson ED, et al. 747
(2018) Differential gene regulation underlies variation in melanic plumage coloration in the 748
dark-eyed junco (Junco hyemalis). Mol Ecol, 27, 4501–4515. 749
Alexander DH, Novembre J (2009) Fast Model-Based Estimation of Ancestry in Unrelated 750
Individuals. Genome Res, 19, 1655–1664. 751
Axelsson E, Smith NGC, Sundström H, Berlin S, Ellegren H (2004) Male-biased mutation rate 752
and divergence in autosomal, z-linked and w-linked introns of chicken and Turkey. Mol 753
Biol Evol, 21, 1538–47. 754
Backström N, Lindell J, Zhang Y, Palkopoulou E, Qvarnström A, Saetre G-P, et al. (2010) A 755
high-density scan of the Z chromosome in Ficedula flycatchers reveals candidate loci for 756
diversifying selection. Evolution, 64, 3461–75. 757
Baird NA, Etter PD, Atwood TS, Currey MC, Shiver AL, Lewis ZA, et al. (2008) Rapid SNP 758
discovery and genetic mapping using sequenced RAD markers. PLoS One, 3, e3376. 759
Van Belleghem SM, Baquero M, Papa R, Salazar C, McMillan WO, Counterman BA, et al. 760
(2018) Patterns of Z chromosome divergence among Heliconius species highlight the 761
importance of historical demography. Mol Ecol, 27, 3852–3872. 762
Bertrand JAM, Bourgeois YXC, Delahaie B, Duval T, García-Jiménez R, Cornuault J, et al. 763
(2014) Extremely reduced dispersal and gene flow in an island bird. Heredity, 112, 190–6. 764
Bertrand JAM, Delahaie B, Bourgeois YXC, Duval T, García-Jiménez R, Cornuault J, et al. 765
(2016) The role of selection and historical factors in driving population differentiation along 766
an elevational gradient in an island bird. J Evol Biol, 29, 824–836. 767
Bierne N, Welch J, Loire E, Bonhomme F, David P (2011) The coupling hypothesis, why 768
27
genome scans may fail to map local adaptation genes. Mol Ecol, 20, 2044–72. 769
Bolger AM, Lohse M, Usadel B (2014) Trimmomatic, A flexible trimmer for Illumina sequence 770
data. Bioinformatics, 30, 2114–2120. 771
Bourgeois YXC, Bertrand JAM, Delahaie B, Cornuault J, Duval T, Milá B, et al. (2016) 772
Candidate Gene Analysis Suggests Untapped Genetic Complexity in Melanin-Based 773
Pigmentation in Birds. J Hered, 107, 327–335. 774
Bourgeois YXC, Bertrand JAM, Thébaud C, Milá B (2012) Investigating the role of the 775
melanocortin-1 receptor gene in an extreme case of microgeographical variation in the 776
pattern of melanin-based plumage pigmentation. PLoS One, 7, e50906. 777
Bourgeois YXC, Delahaie B, Gautier M, Lhuillier E, Malé P-JG, Bertrand JAM, et al. (2017) A 778
novel locus on chromosome 1 underlies the evolution of a melanic plumage polymorphism 779
in a wild songbird. R Soc Open Sci, 160805. 780
Bourgeois YXC, Lhuillier E, Cézard T, Bertrand J a M, Delahaie B, Cornuault J, et al. (2013) 781
Mass production of SNP markers in a nonmodel passerine bird through RAD sequencing 782
and contig mapping to the zebra finch genome. Mol Ecol Resour, 13, 899–907. 783
Burri R (2017) Interpreting differentiation landscapes in the light of long-term linked selection. 784
Evol Lett, 1, 118–131. 785
Burri R, Nater A, Kawakami T, Mugal CF, Olason PI, Smeds L, et al. (2015) Linked selection 786
and recombination rate variation drive the evolution of the genomic landscape of 787
differentiation across the speciation continuum of Ficedula flycatchers. Genome Res, 25, 788
1656–1665. 789
Carling MD, Brumfield RT (2008) Haldane’s rule in an avian system, using cline theory and 790
divergence population genetics to test for differential introgression of mitochondrial, 791
autosomal, and sex-linked loci across the Passerina bunting hybrid zone. Evolution, 62, 792
2600–15. 793
Cornetti L, Valente LM, Dunning LT, Quan X, Black RA, Hébert OH, et al. (2015) The genome 794
of the ‘great speciator’ provides insights into bird diversification. Genome Biol Evol, 7, 795
2680–2691. 796

28
Cornuault J, Delahaie B, Bertrand JAM, Bourgeois YXC, Mila B, Heeb P, et al. (2015) 797
Morphological and plumage colour variation in the Réunion grey white-eye (Aves, 798
Zosterops borbonicus), Assessing the role of selection. Biol J Linn Soc, 114, 459–473. 799
Cruickshank TE, Hahn MW (2014) Reanalysis suggests that genomic islands of speciation are 800
due to reduced diversity, not reduced gene flow. Mol Ecol, 23, 3133–3157. 801
Csilléry K, François O, Blum MGB (2012) abc, an R package for approximate Bayesian 802
computation (ABC). Methods Ecol Evol, 3, 475–479. 803
Dean, R., Harrison, P. W., Wright, A. E., Zimmer, F., & Mank, J. E. (2015). Positive Selection 804
Underlies Faster-Z Evolution of Gene Expression in Birds. Molecular biology and 805
evolution, 32, 2646–2656. 806
Delahaie B, Cornuault J, Masson C, Bertrand JAM, Bourgeois YXC, Milá B, et al. (2017) 807
Narrow hybrid zones in spite of very low population differentiation in neutral markers in an 808
island bird species complex. J Evol Biol, 30, 2132–2145. 809
Delmore KE, Hübner S, Kane NC, Schuster R, Andrew RL, Câmara F, et al. (2015) Genomic 810
analysis of a migratory divide reveals candidate genes for migration and implicates selective 811
sweeps in generating islands of differentiation. Mol Ecol, 24, 1873–1888. 812
Delmore KE, Toews DPL, Germain RR, Owens GL, Irwin DE (2016) The Genetics of Seasonal 813
Migration and Plumage Color. Curr Biol, 26, 2167–2173. 814
Derjusheva S, Kurganova A, Habermann F, Gaginskaya E (2004) High chromosome 815
conservation detected by comparative chromosome painting in chicken, pigeon and 816
passerine birds. Chromosome Res, 12, 715–23. 817
Ellegren H, Smeds L, Burri R, Olason PI, Backström N, Kawakami T, et al. (2012) The genomic 818
landscape of species divergence in Ficedula flycatchers. Nature, 491, 756–60. 819
Elshire RJ, Glaubitz JC, Sun Q, Poland JA, Kawamoto K, Buckler ES, et al. (2011) A Robust, 820
Simple Genotyping-by-Sequencing (GBS) Approach for High Diversity Species. PLoS One, 821
6, e19379. 822
Excoffier L, Dupanloup I, Huerta-Sanchez E, Sousa VC, Foll M (2013) Robust Demographic 823
Inference from Genomic and SNP Data. PLoS Genet, 9. 824
29
Excoffier L, Lischer HEL (2010) Arlequin suite ver 3.5, a new series of programs to perform 825
population genetics analyses under Linux and Windows. Mol Ecol Resour, 10, 564–7. 826
Feder JL, Gejji R, Powell THQ, Nosil P (2011) Adaptive chromosomal divergence driven by 827
mixed geographic mode of evolution. Evolution, 65, 2157–2170. 828
Garrison E, Marth G (2012) Haplotype-based variant detection from short-read sequencing. 829
arXiv Prepr arXiv12073907, 9. 830
Gautier M (2015) Genome-Wide Scan for Adaptive Divergence and Association with 831
Population-Specific Covariates. Genetics, 201, 1555–1579. 832
Gavrilets S (2014) Models of speciation, Where are we now? J Hered, 105, 743–755. 833
Gill FB (1973) Intra-island variation in the Mascarene White-eye Zosterops borbonica. Ornithol 834
Monogr 12. 835
Gill F, Donsker D (2015) IOC World Bird List v5.1. Int Ornithol Union Comm Nomencl. 836
Good JM, Dean MD, Nachman MW (2008) A complex genetic basis to X-linked hybrid male 837
sterility between two species of house mice. Genetics, 179, 2213–2228. 838
Greenwood PJ (1980) Mating systems, philopatry and dispersal in birds and mammals. Anim 839
Behav, 28, 1140–1162. 840
Griffiths R, Double M, Orr K, Dawson RJG (1998) A DNA test to sex most birds. Mol Ecol, 7, 841
1071–1075. 842
Gutenkunst RN, Hernandez RD, Williamson SH, Bustamante CD (2009) Inferring the joint 843
demographic history of multiple populations from multidimensional SNP frequency data. 844
PLoS Genet, 5. 845
Harris RS (2007) Improved pairwise alignment of genomic DNA. 846
Hivert V, Leblois R, Petit EJ, Gautier M, Vitalis R (2018) Measuring genetic differentiation from 847
pool-seq data. Genetics, 210, 315–330. 848
Huber W, Carey VJ, Gentleman R, Anders S, Carlson M, Carvalho BS, et al. (2015) 849
Orchestrating high-throughput genomic analysis with Bioconductor. Nat Methods, 12, 115–850
121. 851

30
Janoušek V, Fischerová J, Mořkovský L, Reif J, Antczak M, Albrecht T, Reifová R.. (2019). 852
Postcopulatory sexual selection reduces Z-linked genetic variation and might contribute to 853
the large Z effect in passerine birds. Heredit,y 122,622-635. 854
Jeffries DL, Copp GH, Handley LL, Håkan Olsén K, Sayer CD, Hänfling B (2016) Comparing 855
RADseq and microsatellites to infer complex phylogeographic patterns, an empirical 856
perspective in the Crucian carp, Carassius carassius, L. Mol Ecol, 25, 2997–3018. 857
Joron M, Frezal L, Jones RT, Chamberlain NL, Lee SF, Haag CR, et al. (2011) Chromosomal 858
rearrangements maintain a polymorphic supergene controlling butterfly mimicry. Nature, 859
477, 203–6. 860
Kofler R, Pandey RV, Schlötterer C (2011) PoPoolation2, identifying differentiation between 861
populations using sequencing of pooled DNA samples (Pool-Seq). Bioinformatics, 27, 862
3435–6. 863
Korneliussen TS, Albrechtsen A, Nielsen R (2014) ANGSD, Analysis of Next Generation 864
Sequencing Data. BMC Bioinformatics, 15, 356. 865
Kozma R, Melsted P, Magnússon KP, Höglund J (2016) Looking into the past - The reaction of 866
three grouse species to climate change over the last million years using whole genome 867
sequences. Mol Ecol, 25, 570–580. 868
Leroy T, Anselmetti Y, Tilak M-K, Berard S, Csukonyi L, Gabrielli M, et al. (2019) A bird’s 869
white-eye view on avian sex chromosome evolution. bioRxiv, 505610. 870
Li H, Durbin R (2009) Fast and accurate short read alignment with Burrows-Wheeler transform. 871
Bioinformatics, 25, 1754–60. 872
Li H, Handsaker B, Wysoker A, Fennell T, Ruan J, Homer N, et al. (2009) The Sequence 873
Alignment/Map format and SAMtools. Bioinformatics, 25, 2078–9. 874
Lima TG (2014) Higher levels of sex chromosome heteromorphism are associated with markedly 875
stronger reproductive isolation. Nat Commun, 5, 4743. 876
Macholán M, Baird SJE, Dufková P, Munclinger P, Bímová BV, Piálek J (2011) Assessing 877
multilocus introgression patterns, A case study on the mouse x chromosome in central 878
europe. Evolution, 65, 1428–1446. 879

31
Masly JP, Presgraves DC (2007) High-resolution genome-wide dissection of the two rules of 880
speciation in Drosophila. PLoS Biol, 5, 1890–1898. 881
Milá B, Warren BH, Heeb P, Thébaud C (2010) The geographic scale of diversification on 882
islands, genetic and morphological divergence at a very small spatial scale in the Mascarene 883
grey white-eye (Aves, Zosterops borbonicus). BMC Evol Biol, 10, 158. 884
Moore WS (1995) Inferring Phylogenies from mtDNA Variation, Mitochondrial-Gene Trees 885
Versus Nuclear-Gene Trees. Evolution 49, 718–726. 886
Mořkovský L, Janoušek V, Reif J, Rídl J, Pačes J, Choleva L, et al. (2018) Genomic islands of 887
differentiation in two songbird species reveal candidate genes for hybrid female sterility. 888
Mol Ecol, 27, 949–958. 889
Nadeau NJ, Mundy NI, Gourichon D, Minvielle F (2007) Association of a single-nucleotide 890
substitution in TYRP1 with roux in Japanese quail (Coturnix japonica). Anim Genet, 38, 891
609–13. 892
Nazareno AG, Bemmels JB, Dick CW, Lohmann LG (2017) Minimum sample sizes for 893
population genomics, an empirical study from an Amazonian plant species. Mol Ecol 894
Resour, 17, 1136–1147. 895
Nosil P, Harmon LJ, Seehausen O (2009) Ecological explanations for (incomplete) speciation. 896
Trends Ecol Evol, 24, 145–56. 897
Otto SP, Day T (2007) A biologist’s guide to mathematical modeling in ecology and evolution, 898
volume 13. Princeton University Press. 899
Pala I, Naurin S, Stervander M, Hasselquist D, Bensch S, Hansson B (2012) Evidence of a neo-900
sex chromosome in birds. Heredity, 108, 264–272. 901
Patterson N, Price AL, Reich D (2006) Population structure and eigenanalysis. PLoS Genet, 2, 902
2074–2093. 903
Poelstra JW, Vijay N, Hoeppner MP, Wolf JBW (2015) Transcriptomics of colour patterning and 904
coloration shifts in crows. Mol Ecol, 24, 4617–4628. 905
Pool JE, Nielsen R (2007) Population size changes reshape genomic patterns of diversity. 906
Evolution, 61, 3001–3006. 907
32
Pryke SR (2010) Sex chromosome linkage of mate preference and color signal maintains 908
assortative mating between interbreeding finch morphs. Evolution, 64, 1301–10. 909
Quinlan AR, Hall IM (2010) BEDTools, a flexible suite of utilities for comparing genomic 910
features. Bioinformatics, 26, 841–842. 911
Qvarnström A, Bailey RI (2009) Speciation through evolution of sex-linked genes. Heredity, 912
102, 4–15. 913
Ravinet M, Faria R, Butlin RK, Galindo J, Bierne N, Rafajlović M, et al. (2017) Interpreting the 914
genomic landscape of speciation, finding barriers to gene flow. J Evol Biol, 30, 1450–1477. 915
Robinson JD, Coffman AJ, Hickerson MJ, Gutenkunst RN (2014) Sampling strategies for 916
frequency spectrum-based population genomic inference. BMC Evol Biol, 14, 1–16. 917
Sæther SA, Sætre GP, Borge T, Wiley C, Svedin N, Andersson G, et al. (2007) Sex 918
chromosome-linked species recognition and evolution of reproductive isolation in 919
flycatchers. Science, 318, 95–97. 920
Sætre GP, Sæether SA (2010) Ecology and genetics of speciation in Ficedula flycatchers. Mol 921
Ecol, 19, 1091–1106. 922
Safran RJ, Scordato ESC, Symes LB, Rodríguez RL, Mendelson TC (2013) Contributions of 923
natural and sexual selection to the evolution of premating reproductive isolation, A research 924
agenda. Trends Ecol Evol, 28, 643–650. 925
Schwartz S, Kent W, Smit A (2003) Human–mouse alignments with BLASTZ. Genome Res, 13, 926
103–107. 927
Seehausen O, Butlin RK, Keller I, Wagner CE, Boughman JW, Hohenlohe PA, et al. (2014) 928
Genomics and the origin of species. Nat Rev Genet, 15, 176–192. 929
Servedio MR, Noor MAF (2003). The Role of Reinforcement in Speciation, Theory and Data. 930
Annu Rev Ecol Evol Syst, 34, 339–364. 931
Seutin G, White BN, Boag PT (1991) Preservation of avian blood and tissue samples for DNA 932
analyses. Can J Zool, 69, 82–90. 933
Storchová R, Gregorová S, Buckiová D, Kyselová V, Divina P, Forejt J (2004) Genetic analysis 934
of X-linked hybrid sterility in the house mouse. Mamm Genome, 15, 515–524. 935
33
Storchová R, Reif J, Nachman MW (2010) Female heterogamety and speciation, Reduced 936
introgression of the z chromosome between two species of nightingales. Evolution, 64, 456–937
471. 938
Svedin N, Wiley C, Veen T, Gustafsson L, Qvarnstrom A (2008) Natural and sexual selection 939
against hybrid flycatchers. Proc R Soc B Biol Sci, 275, 735–744. 940
Tajima F (1989) Statistical method for testing the neutral mutation hypothesis by DNA 941
polymorphism. Genetics, 123, 585–95. 942
Takezaki N, Nei M, Tamura K (2010) POPTREE2, Software for constructing population trees 943
from allele frequency data and computing other population statistics with windows 944
interface. Mol Biol Evol, 27, 747–752. 945
Tuttle EM, Bergland AO, Korody ML, Brewer MS, Newhouse DJ, Minx P, et al. (2016) 946
Divergence and functional degradation of a sex chromosome-like supergene. Curr Biol, 26, 947
344–350. 948
Warren BH, Bermingham E, Prys-Jones RP, Thébaud C (2006) Immigration, species radiation 949
and extinction in a highly diverse songbird lineage, white-eyes on Indian Ocean islands. 950
Mol Ecol, 15, 3769–86. 951
Warren WC, Clayton DF, Ellegren H, Arnold AP, Hillier LW, Künstner A, et al. (2010) The 952
genome of a songbird. Nature, 464, 757–62. 953
Willing EM, Dreyer C, van Oosterhout C (2012) Estimates of genetic differentiation measured 954
by fst do not necessarily require large sample sizes when using many snp markers. PLoS 955
One, 7, 1–7. 956
Wolf JBW, Ellegren H (2016) Making sense of genomic islands of differentiation in light of 957
speciation. Nat Rev Genet, 18, 87–100. 958
Wu CI (2001) The genic view of the process of speciation. J Evol Biol, 14, 851–865. 959
Zhang J, Li Y, Wu Y, Yang T, Yang K, Wang R, et al. (2013) Wnt5a inhibits the proliferation 960
and melanogenesis of melanocytes. Int J Med Sci, 10, 699–706. 961
962
963
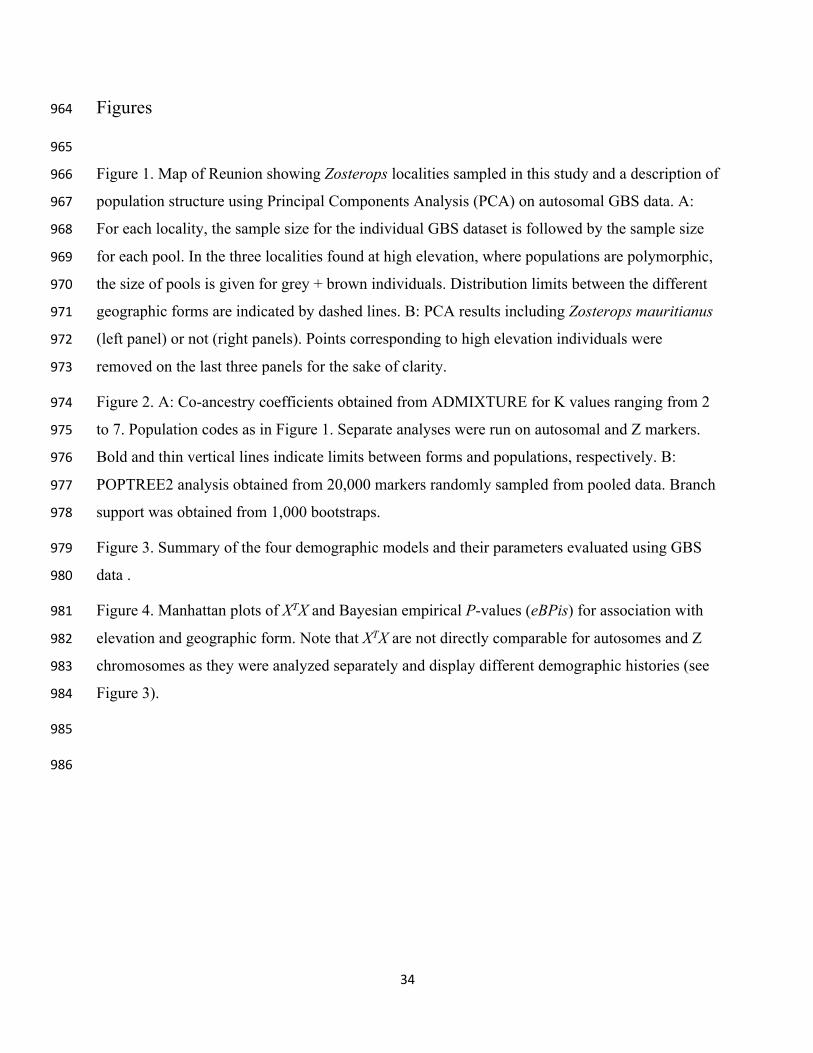
34
Figures 964
965
Figure 1. Map of Reunion showing Zosterops localities sampled in this study and a description of 966
population structure using Principal Components Analysis (PCA) on autosomal GBS data. A: 967
For each locality, the sample size for the individual GBS dataset is followed by the sample size 968
for each pool. In the three localities found at high elevation, where populations are polymorphic, 969
the size of pools is given for grey + brown individuals. Distribution limits between the different 970
geographic forms are indicated by dashed lines. B: PCA results including Zosterops mauritianus 971
(left panel) or not (right panels). Points corresponding to high elevation individuals were 972
removed on the last three panels for the sake of clarity. 973
Figure 2. A: Co-ancestry coefficients obtained from ADMIXTURE for K values ranging from 2 974
to 7. Population codes as in Figure 1. Separate analyses were run on autosomal and Z markers. 975
Bold and thin vertical lines indicate limits between forms and populations, respectively. B: 976
POPTREE2 analysis obtained from 20,000 markers randomly sampled from pooled data. Branch 977
support was obtained from 1,000 bootstraps. 978
Figure 3. Summary of the four demographic models and their parameters evaluated using GBS 979
data . 980
Figure 4. Manhattan plots of XTX and Bayesian empirical P-values (eBPis) for association with 981
elevation and geographic form. Note that XTX are not directly comparable for autosomes and Z 982
chromosomes as they were analyzed separately and display different demographic histories (see 983
Figure 3). 984
985
986

35
Tables 987
988
Table 1: Pairwise AMOVAs comparing geographic forms within Reunion grey white-eye and between Reunion and Mauritius grey 989
white-eyes. All values are significant (1000 permutations). To properly compare patterns observed on sex-linked and autosomal 990
markers, results for autosomal markers using only males are also shown. 991
Comparison LBHB v. BNB GHB v. LBHB GHB v. BNB High v. Low Reunion v. Mauritius
Autosomes (wo 4A sex-linked markers) F-statistics
% of variance explained
F-statistics
% of variance explained
F-statistics
% of variance explained
F-statistics
% of variance explained
F-statistics
% of variance explained
Among groups (Fct) 0.005 0.48 0.010 1.03 0.006 0.59 0.016 1.57 0.173 17.31
Among populations within groups (Fsc) 0.033 3.31 0.042 4.11 0.035 3.49 0.040 3.97 0.049 4.09
Within populations (Fst) 0.038 96.21 0.051 94.86 0.041 95.92 0.052 94.46 0.214 78.61
Z-linked markers F-statistics
% of variance explained
F-statistics
% of variance explained
F-statistics
% of variance explained
F-statistics
% of variance explained
F-statistics
% of variance explained
Among groups (Fct) 0.068 6.82 0.108 10.84 0.034 3.45 0.126 12.59 0.206 20.61
Among populations within groups (Fsc) 0.038 3.56 0.093 8.28 0.095 9.13 0.123 10.78 0.191 15.17
Within populations (Fst) 0.104 89.62 0.191 80.88 0.095 87.42 0.234 76.63 0.358 64.21
Autosomes (wo 4A sex-linked markers, Males only)
F-statistics
% of variance explained
F-statistics
% of variance explained
F-statistics
% of variance explained
F-statistics
% of variance explained
F-statistics
% of variance explained
Among groups (Fct) 0.007 0.69 0.009 0.93 0.005 0.53 0.019 1.86 0.166 16.6
Among populations within groups (Fsc) 0.013 1.32 0.029 2.87 0.027 2.72 0.040 3.92 0.051 4.25
Within populations (Fst) 0.02 97.98 0.038 96.2 0.032 96.75 0.058 94.22 0.209 79.15
4A-1-10Mb (Males only) F-statistics
% of variance explained
F-statistics
% of variance explained
F-statistics
% of variance explained
F-statistics
% of variance explained
F-statistics
% of variance explained
Among groups (Fct) 0.044 4.44 0.069 6.92 0.048 4.81 0.080 7.95 0.370 28.58
Among populations within groups (Fsc) 0.050 4.80 0.059 5.47 0.039 3.68 0.075 6.89 0.118 8.44
Within populations (Fst) 0.044 90.76 0.124 87.61 0.085 91.51 0.148 85.16 0.286 62.98
992
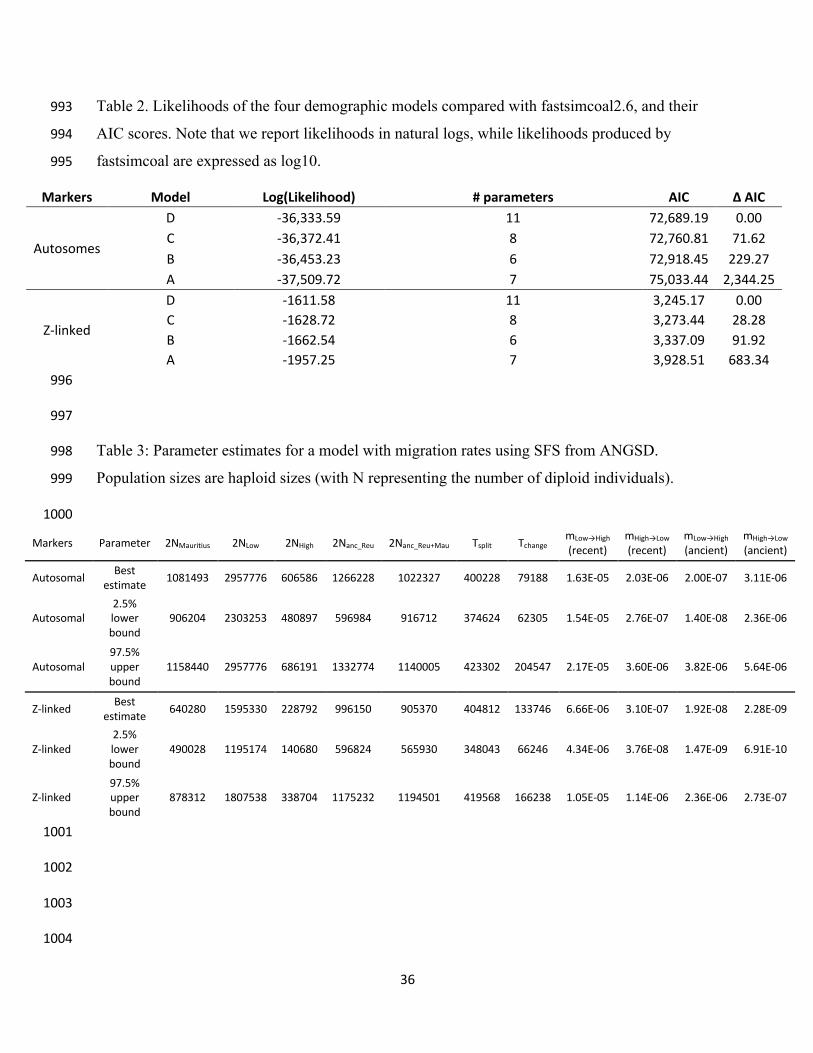
36
Table 2. Likelihoods of the four demographic models compared with fastsimcoal2.6, and their 993
AIC scores. Note that we report likelihoods in natural logs, while likelihoods produced by 994
fastsimcoal are expressed as log10. 995
Markers Model Log(Likelihood) # parameters AIC Δ AIC
Autosomes
D -36,333.59 11 72,689.19 0.00 C -36,372.41 8 72,760.81 71.62 B -36,453.23 6 72,918.45 229.27 A -37,509.72 7 75,033.44 2,344.25
Z-linked
D -1611.58 11 3,245.17 0.00 C -1628.72 8 3,273.44 28.28 B -1662.54 6 3,337.09 91.92 A -1957.25 7 3,928.51 683.34
996
997
Table 3: Parameter estimates for a model with migration rates using SFS from ANGSD. 998
Population sizes are haploid sizes (with N representing the number of diploid individuals). 999
1000
1001
1002
1003
1004
Markers Parameter 2NMauritius 2NLow 2NHigh 2Nanc_Reu 2Nanc_Reu+Mau Tsplit Tchange mLow→High
(recent) mHigh→Low
(recent) mLow→High
(ancient) mHigh→Low
(ancient)
Autosomal Best estimate 1081493 2957776 606586 1266228 1022327 400228 79188 1.63E-05 2.03E-06 2.00E-07 3.11E-06
Autosomal 2.5% lower bound
906204 2303253 480897 596984 916712 374624 62305 1.54E-05 2.76E-07 1.40E-08 2.36E-06
Autosomal 97.5% upper bound
1158440 2957776 686191 1332774 1140005 423302 204547 2.17E-05 3.60E-06 3.82E-06 5.64E-06
Z-linked Best estimate 640280 1595330 228792 996150 905370 404812 133746 6.66E-06 3.10E-07 1.92E-08 2.28E-09
Z-linked 2.5% lower bound
490028 1195174 140680 596824 565930 348043 66246 4.34E-06 3.76E-08 1.47E-09 6.91E-10
Z-linked 97.5% upper bound
878312 1807538 338704 1175232 1194501 419568 166238 1.05E-05 1.14E-06 2.36E-06 2.73E-07
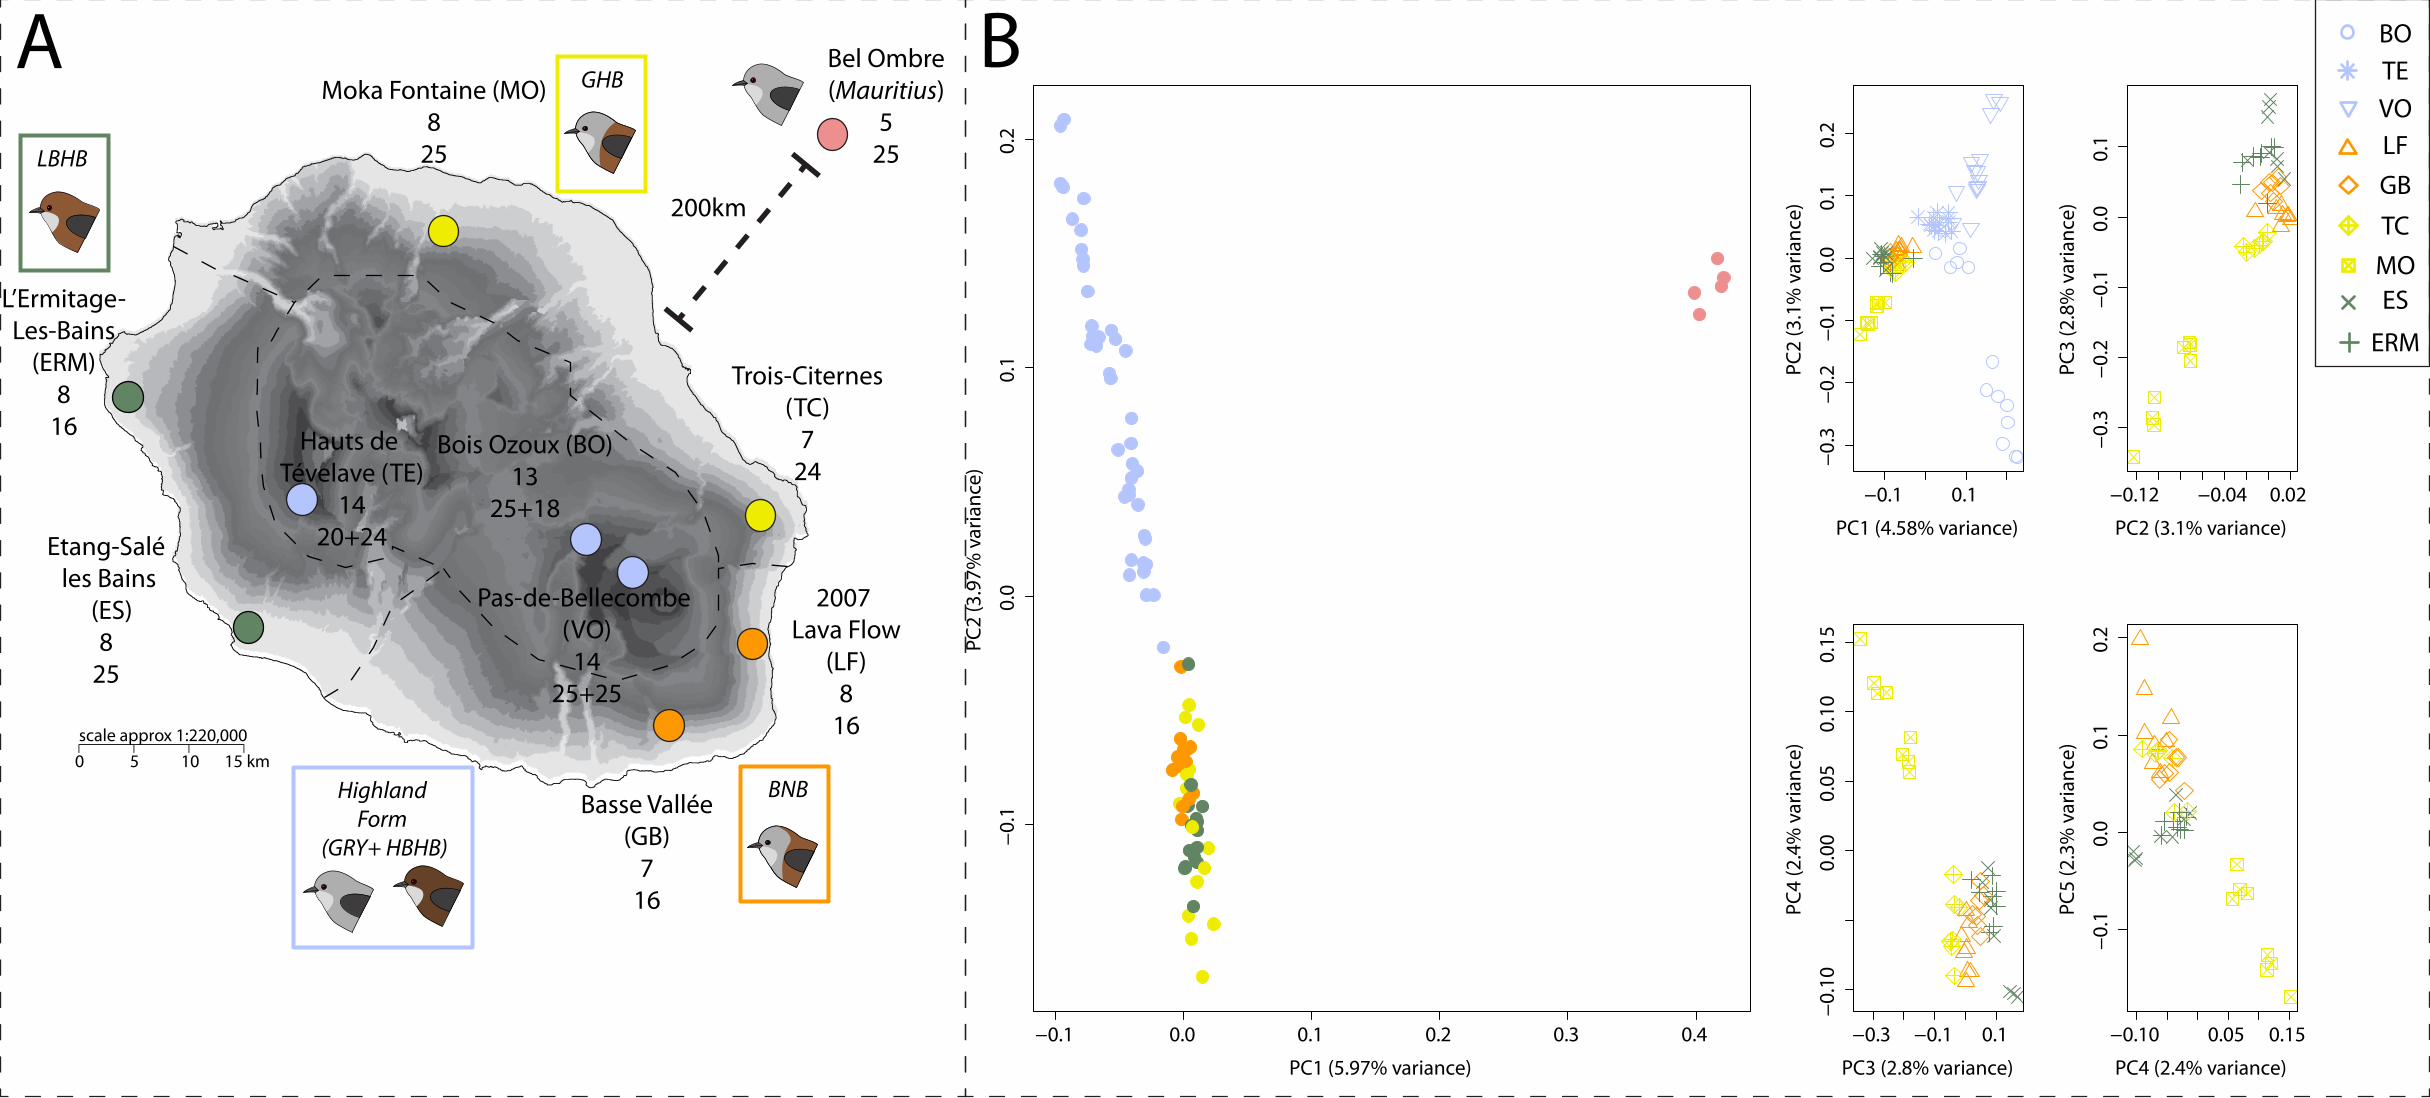
Bel Ombre(Mauritius)
525
L’Ermitage-Les-Bains
(ERM)8
16
Etang-Salé les Bains
(ES)8
25
Hauts de Tévelave (TE)
1420+24
Bois Ozoux (BO)13
25+18
Pas-de-Bellecombe (VO)14
25+25
Moka Fontaine (MO)8
25
Trois-Citernes(TC)
724
2007 Lava Flow
(LF)8
16
Basse Vallée(GB)
716
Highland Form
(GRY+ HBHB)
200km
LBHB
GHB
BNB
A B
−0.1 0.0 0.1 0.2 0.3 0.4−0
.10.
00.
10.
2
PC1 (5.97% variance)
PC2
(3.9
7% v
aria
nce)
−0.1 0.1
−0.3
−0.2
−0.1
0.0
0.1
0.2
PC1 (4.58% variance)
PC2
(3.1
% v
aria
nce)
−0.12 −0.04 0.02
−0.3
−0.2
−0.1
0.0
0.1
PC2 (3.1% variance)
PC3
(2.8
% v
aria
nce)
−0.3 −0.1 0.1
−0.1
00.
000.
050.
100.
15
PC3 (2.8% variance)
PC4
(2.4
% v
aria
nce)
−0.10 0.05 0.15
−0.1
0.0
0.1
0.2
PC4 (2.4% variance)
PC5
(2.3
% v
aria
nce)
VOTEBO
LFGBTC
MOES
ERM

0.0
0.4
0.8
Adm
ixtu
re c
oeffi
cien
ts
0.0
0.4
0.8
0.0
0.4
0.8
Adm
ixtu
re c
oeffi
cien
ts
0.0
0.4
0.8
0.0
0.4
0.8
Adm
ixtu
re c
oeffi
cien
ts
0.0
0.4
0.8
0.0
0.4
0.8
Adm
ixtu
re c
oeffi
cien
ts
0.0
0.4
0.8
0.0
0.4
0.8
Adm
ixtu
re c
oeffi
cien
ts
0.0
0.4
0.8
0.0
0.4
0.8
Adm
ixtu
re c
oeffi
cien
ts
0.0
0.4
0.8
BO VO TE LF GB MO TC ERM ES MAU
Autosomal markers Z markers
BO VO TE LF GB MO TC ERM ES MAU
Coan
cest
ry c
oeffi
cien
ts
0.04
BO-HBHB
GB
LF
MAU
ES
ERM
MO
TC
TE-HBHB
VO-HBHB
BO-GRY
VO-GRY
TE-GRY
1
1
1
1
0.98
1
1
0.521
1
0.03
BO-GRY
TE-HBHB
ES
VO-GRY
MO
TC
VO-HBHB
GB
MAU
LF
ERM
TE-GRY
BO-HBHB
1
1
0.987
0.801
1
10.57
0.764
0.632
1
Autosomal markers (Pools)
Z markers (Pools)
A B
K=2
K=3
K=4
K=5
K=6
K=7
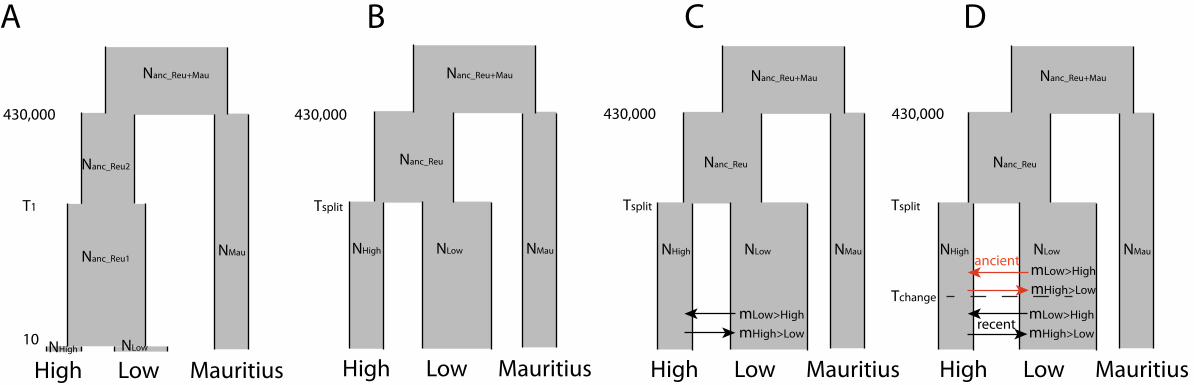
High Low Mauritius
NMauNLowNHigh
High Low Mauritius
NMauNLowNHigh
High Low Mauritius
NMauNLowNHigh
High Low Mauritius
NMau
NLowNHigh
Nanc_Reu1
Nanc_Reu2 Nanc_Reu
Nanc_Reu+Mau Nanc_Reu+Mau
10
T1
430,000
Nanc_Reu
Nanc_Reu+Mau
Nanc_Reu
Nanc_Reu+Mau
Tsplit
430,000
Tsplit
430,000
Tsplit
Tchange
430,000
mHigh>Low
mLow>High
mHigh>Low
mLow>High
mHigh>Low
mLow>High
recent
ancient
A B C D