OCCUPATIONAL SEX SEGREGATION
299
OCCUPATIONAL SEX SEGREGATION : A COMPARATIVE STUDY BETWEEN BRITAIN AND JAPAN Thesis submitted for the degree of D.Phil, in Sociology at the University of Oxford Makiko Nishikawa Nuffield College Hilary Term 1997 ABSTRACT Occupational sex segregation is often regarded as the central component of gender inequality in the labour market in contemporary industrial societies. Through comparing the situation between Britain and Japan, which have contrasting features in their patterns of occupational sex segregation and in the position of women in the labour market, this thesis examines the mechanism of occupational sex segregation - how it is constructed and maintained - in the two societies with different social and economic backgrounds. Particular focus is on the impact of occupational sex segregation on individual workers' experiences, and systematic analysis is applied to investigate the impact by using a range of national-level large-scale data sets. The findings suggest that the implications of occupational sex segregation differ for Britain and Japan; for the former, occupational sex segregation contributes to gender inequality in the labour market, but this is not the case for the latter. It is suggested that occupational sex segregation could be one of the components of gender inequality in the labour market, but not necessarily the principal one. This thesis argues that the implications of occupational sex segregation in a society very much depend on the given social and economic institutions in the society that differ across countries, and thus occupational sex segregation should not be treated a priori as the central component of gender inequality.
-
Upload
khangminh22 -
Category
Documents
-
view
0 -
download
0
Transcript of OCCUPATIONAL SEX SEGREGATION

OCCUPATIONAL SEX SEGREGATION :
A COMPARATIVE STUDY BETWEEN BRITAIN AND JAPAN
Thesis submitted for the degree of D.Phil,
in Sociology at the University of Oxford
Makiko Nishikawa
Nuffield College
Hilary Term 1997
ABSTRACT
Occupational sex segregation is often regarded as the central component of gender inequality in the labour market in contemporary industrial societies. Through comparing the situation between Britain and Japan, which have contrasting features in their patterns of occupational sex segregation and in the position of women in the labour market, this thesis examines the mechanism of occupational sex segregation - how it is constructed and maintained - in the two societies with different social and economic backgrounds. Particular focus is on the impact of occupational sex segregation on individual workers' experiences, and systematic analysis is applied to investigate the impact by using a range of national-level large-scale data sets. The findings suggest that the implications of occupational sex segregation differ for Britain and Japan; for the former, occupational sex segregation contributes to gender inequality in the labour market, but this is not the case for the latter. It is suggested that occupational sex segregation could be one of the components of gender inequality in the labour market, but not necessarily the principal one. This thesis argues that the implications of occupational sex segregation in a society very much depend on the given social and economic institutions in the society that differ across countries, and thus occupational sex segregation should not be treated a priori as the central component of gender inequality.

OCCUPATIONAL SEX SEGREGATION :A COMPARATIVE STUDY BETWEEN BRITAIN AND JAPAN
Makiko Nishikawa
Nuffield College
Hilary Term 1997
Thesis submitted for the degree of D.Phil.
in Sociology in the Faculty of Social Studies
at the University of Oxford.
ACKNOWLEDGEMENTS
First and foremost, I would like to thank my university supervisor Professor Duncan
Gallic for his constructive advice, intellectual stimulation, and encouragement
throughout the various stages of my research for this thesis.
I am indebted, also, to my college supervisor, Dr.Gordon Marshall, who not only
provided me with access to various data sets, but also gave generously of his time and
ideas.
My thanks also go to Dr. David Firth for his help on the application of statistics, Clive
Payne and Mark Tomlinson for their advice on statistical modelling, Jane Roberts for
preparing various British data sets, and Sachiko Imada and Shuichi Hirata for offering
me the access to and advice on the Japanese data set. I am also grateful to Dr.Diego
Gambetta, Professor Anthony Heath, Professor Takeshi Inagami, Professor Kazuo
Sugeno, Dr.Tak-Wing Chan, Dr.Sheila Jacobs, and Dr.Mark Rebick for their help and
comments in the course of my work. Although I cannot list them all, I benefited
greatly from many friends in Britain and Japan to make my life in Oxford fruitful.
Finally, I would like to thank Nuffied College for offering me a full funded
studentship for the three years of my research at Oxford, the British government and
the University of Oxford for awarding me the Overseas Research Studentship, and thei
Matsushita International Foundation for providing financial support for the research
project.

CONTENTS
Acknowledgements
List of Tables
Chapter 1 Introduction 1
Chapter 2 The Extent and Form of Women's Integration 28 into the Labour Market in Britain and Japan
Chapter 3 The Extent and Trends of Occupational Sex Segregation 51 in Britain and Japan
Chapter 4 Occupational Sex Segregation at the Level of Individuals 76
Chapter 5 Occupational Sex Segregation and Employment Conditions 1: 125 Analysis of Britain
Chapter 6 Occupational Sex Segregation and Employment Conditions 2: 150 Comparison of Britain and Japan
Chapter 7 Job Preferences, Job Satisfaction and 185 Occupational Sex Segregation
Chapter 8 Social and Economic Conditions and 218 Occupational Sex Segregation
Chapter 9 Conclusion 254
Appendix A British and Japanese Occupational Classifications 265
Appendix B Variables Used in the Thesis 269
References 275

LIST OF TABLES
2.1 Labour force participation rates in Britain and Japan, 1970-1993
2.2 Part-time employment in Britain and Japan, 1973-1994
2.3 Employment status of workers in Britain and Japan, 1970-1990
2.4 Distribution of workers by industrial sectors in Britain and Japan, 1970-1990
2.5 Male/female share in occupational groups in Britain and Japan, 1970-1993
2.6 Extremely male/female occupations in Britain
2.7 Extremely male/female occupations in Japan
2.8 10 most populous occupations for men and women in Britain
2.9 10 most populous occupations for men and women in Japan
2.10 Median age for workers in different occupational groups in Britain and Japan
2.11 Female share in top-ranked occupations in Britain and Japan, 1970-1990
3.1 Indices of segregation in Britain and Japan using ISCO68 major occupational groups, 1970-1993
3.2 Indices of segregation in Britain and Japan using census occupational classification, 1970-1991
3.3 Distribution of men and women across sex-typed occupations in Britain and Japan, 1970-1991
4.1 Job shifts across sex-typed occupations for British men, 1965-1992
4.2 Job shifts across sex-typed occupations for British women, 1965-1992
4.3 Log-linear models for net job movement, British men and women
4.4 Log-linear models for sex difference of job movement, British men and women
4.5 Fitted odds ratios under the sex difference model in Britain
4.6 Job shifts across sex-typed occupations for Japanese women, 1965-1983

4.7 Log-linear models for net job movement, Japanese women
4.8 Log-linear models for country differences of job movement, British women and Japanese women
4.9 Fitted odds ratios under the country difference model, British women and Japanese women
4.10 Job shifts across sex-typed occupations by periods, British men
4.11 Job shifts across sex-typed occupations by periods, British women
4.12 Log-linear models for period differences of job movement, British men and women
4.13 Fitted odds ratios under the period difference model, British women
4.14 Job shifts across sex-typed occupations by periods, Japanese women
4.15 Log-linear models for period differences of job movement, Japanese women
4.16 Movement between sex-typed occupations and out-of-employment activities: "inflow" matrix, British men 1965-1992
4.17 Movement between sex-typed occupations and out-of-employment activities: "inflow" matrix, British women 1965-1992
4.18 Relative chances to enter sex-typed occupations from out-of-employment activities, British men and women
4.19 Movement between sex-typed occupations and out-of-employment activities: "outflow" matrix, British men 1965-1992
4.20 Movement between sex-typed occupations and out-of-employment activities: "outflow" matrix, British women 1965-1992
4.21 Relative chances to move to out-of-employment activities from sex-typed occupations, British men and women
4.22 Movement between sex-typed occupations and out-of-employment activities: "inflow" matrix, Japanese women 1965-1983
4.23 Relative chances to enter sex-typed occupations from out-of-employment activities, Japanese women
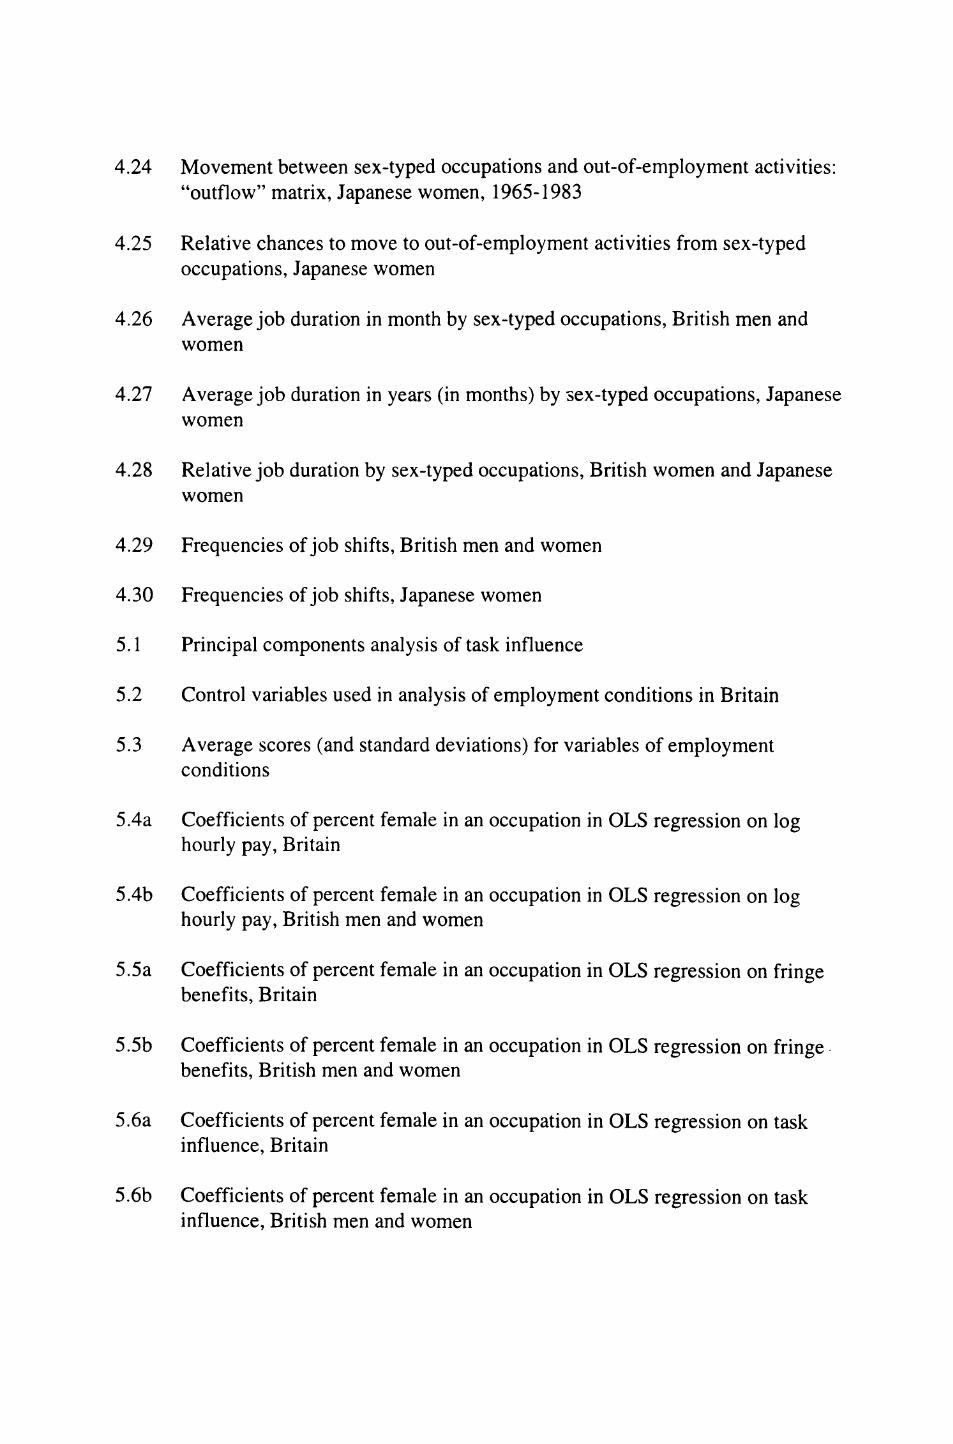
4.24 Movement between sex-typed occupations and out-of-employment activities: "outflow" matrix, Japanese women, 1965-1983
4.25 Relative chances to move to out-of-employment activities from sex-typed occupations, Japanese women
4.26 Average job duration in month by sex-typed occupations, British men and women
4.27 Average job duration in years (in months) by sex-typed occupations, Japanese women
4.28 Relative job duration by sex-typed occupations, British women and Japanese women
4.29 Frequencies of job shifts, British men and women
4.30 Frequencies of job shifts, Japanese women
5.1 Principal components analysis of task influence
5.2 Control variables used in analysis of employment conditions in Britain
5.3 Average scores (and standard deviations) for variables of employment conditions
5.4a Coefficients of percent female in an occupation in OLS regression on log hourly pay, Britain
5.4b Coefficients of percent female in an occupation in OLS regression on log hourly pay, British men and women
5.5a Coefficients of percent female in an occupation in OLS regression on fringe benefits, Britain
5.5b Coefficients of percent female in an occupation in OLS regression on fringe benefits, British men and women
5.6a Coefficients of percent female in an occupation in OLS regression on task influence, Britain
5.6b Coefficients of percent female in an occupation in OLS regression on task influence, British men and women

5.la Coefficients of percent female in an occupation in logistic regression on promotion chances, Britain
5.7b Coefficients of percent female in an occupation in logistic regression on promotion chances, British men and women
5.8a Coefficients of percent female in an occupation in logistic regression on training chances, Britain
5.8b Coefficients of percent female in an occupation in logistic regression on training chances, British men and women
5.9a Coefficients of percent female in an occupation in logistic regression on job tenure, Britain
5.9b Coefficients of percent female in an occupation in logistic regression on job tenure, British men and women
6.la Average gross annual income by sex by full-time/part-time work, Britain and Japan
6. Ib Average gross annual income by sex-typed occupations, Britain and Japan
6.2a Percentage of workers who supervise others by sex by full-time/part-time work, Britain and Japan
6.2b Percentage of men and women who supervise others by sex-typed occupations, Britain and Japan
6.3a Percentage of workers who design important aspects of their work by sex by full-time/part-time work, Britain and Japan
6.3b Percentage of men and women who design important aspects of their work by sex-typed occupations, Britain and Japan
6.4a Percentage of workers with more than 50% chances of promotion by sex by full-time/part-time work, Britain and Japan
6.4b Percentage of men and women with more than 50% chances of promotion by sex-typed occupations, Britain and Japan
6.5 Factors which actually influence pay, Britain and Japan

6.6 Factors which should have influenced pay, Britain and Japan
6.7 Variables used in analysis of income
6.8 Coefficients of sex dummy in OLS regression on log gross annual income, Britain and Japan
6.9 OLS regression on log gross annual income, Britain and Japan
6.10 OLS regression on log gross annual income for men and women in Britain and Japan
7.1 Intensity of job preferences by sex by full-time/part-time work, Britain
7.2 Factor loadings for four dimensions of job preferences, Britain
7.3 Job preferences by sex by full-time/part-time work, Britain
7.4 Job preferences by sex-typed occupations, British men
7.5 Job preferences by sex-typed occupations, British women
7.6 Job preferences by sex-typed occupations, British female full-timers
7.7 Job preferences by sex-typed occupations, British female part-timers
7.8 OLS regression on overall job satisfaction, British men and women
7.9 OLS regression on overall job satisfaction with the categorical variable of occupational sex segregation, British men and women
7.10 OLS regression on overall job satisfaction with the level of choice, British women
7.11 Coefficients of percent female in an occupation in OLS regression on specific job satisfaction, British men and women
7.12 Intensity of job preferences by full-time/part-time work, Japanese womerf
7.13 Principal components analysis of job preferences, Japanese women
7.14 Job preferences by full-time/part-time work, Japanese women
7.15 Job preferences by sex-typed occupations, Japanese women

7.16 Job preferences by sex-typed occupations, Japanese female full-timers
7.17 Job preferences by sex-typed occupations, Japanese female part-timers
7.18 OLS regression on overall job satisfaction, Japanese women
7.19 OLS regression on overall job satisfaction with the categorical variable of occupational sex segregation, Japanese women
8.1 Percentage of women who agreed to statements of gendered attitudes, Britain and Japan
8.2 Wives' responsibilities for household chores, Britain and Japan
8.3 Decision making in the household, Britain and Japan
8.4 Recruitment by size of enterprise, Japan
8.5 Training chances by size of enterprise, Japan
A.I Standard Occupational Classification in the 1991 Census of Population in Great Britain
A.2 Standard Occupational Classification in the 1990 Population Census of Japan
LIST OF FIGURE
2.1 Female labour force participation rates in Britain and Japan
CHAPTER 1
INTRODUCTION
Introduction
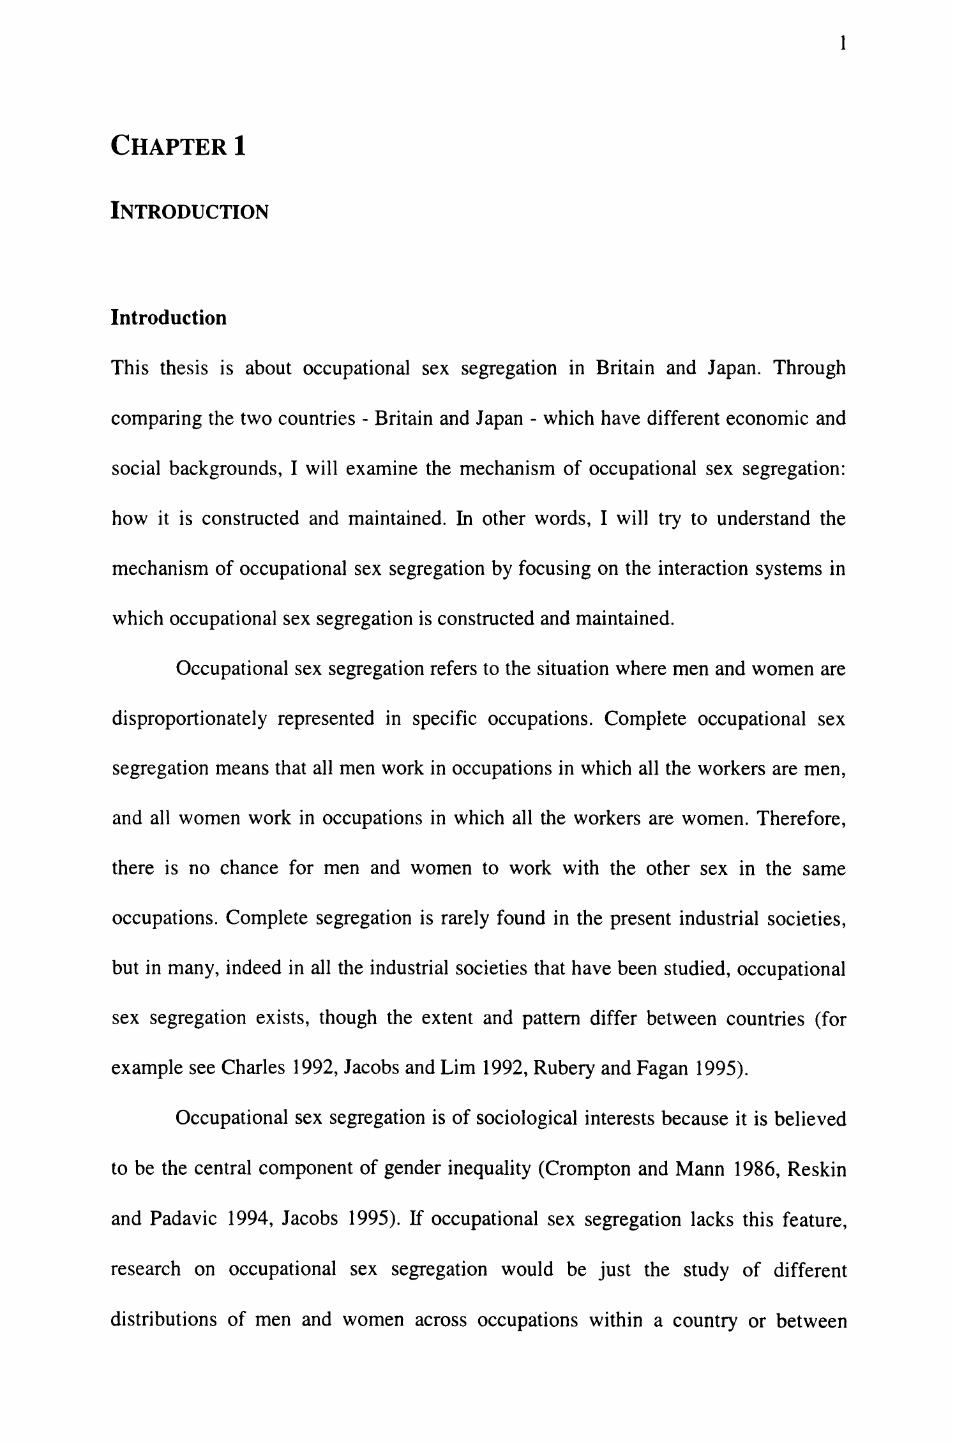
This thesis is about occupational sex segregation in Britain and Japan. Through
comparing the two countries - Britain and Japan - which have different economic and
social backgrounds, I will examine the mechanism of occupational sex segregation:
how it is constructed and maintained. In other words, I will try to understand the
mechanism of occupational sex segregation by focusing on the interaction systems in
which occupational sex segregation is constructed and maintained.
Occupational sex segregation refers to the situation where men and women are
disproportionately represented in specific occupations. Complete occupational sex
segregation means that all men work in occupations in which all the workers are men,
and all women work in occupations in which all the workers are women. Therefore,
there is no chance for men and women to work with the other sex in the same
occupations. Complete segregation is rarely found in the present industrial societies,
but in many, indeed in all the industrial societies that have been studied, occupational
sex segregation exists, though the extent and pattern differ between countries (for
example see Charles 1992, Jacobs and Lim 1992, Rubery and Pagan 1995).
Occupational sex segregation is of sociological interests because it is believed
to be the central component of gender inequality (Crompton and Mann 1986, Reskin
and Padavic 1994, Jacobs 1995). If occupational sex segregation lacks this feature,
research on occupational sex segregation would be just the study of different
distributions of men and women across occupations within a country or between

countries. However, there are many empirical studies which show that occupational
sex segregation does generate gender inequality in the labour market. The most
notable is the impact on pay inequality between men and women; workers in female-
dominated occupations are found to be paid less than those in male-dominated
occupations. This is reported in the US (England and McLaughlim 1979, Roos 1981,
Hadson and England 1986, Tomaskovic-Devey 1995) and in Britain (Millward and
Woodland 1995). Other influences of occupational sex segregation are reported in
various employment spheres, such as occupational prestige, authority, and promotion
chances; female-dominated occupations are often regarded as of low prestige, provide
low authority and low promotion chances (Jacobs and Powell 1985, Reskin and Roos
1990, Tomaskovic-Devey 1993b 1995, Reskin and Padavic 1994). Also, various case
studies suggest inferior employment conditions in female-dominated occupations
compared to male-dominated occupations, arguing that the deterioration of
employment conditions leads employers to hire women as men lose interest in such
jobs, or that the fear of deterioration of employment conditions leads male workers to
resist women's entry to their occupations (Cohn 1985, Reskin and Roos 1990,
Siltanen 1994).
As Reskin and Roos (1990) point out, "sex segregation has a history as old as
the labour force itself. However, it is only in the last two decades that research on
occupational sex segregation has become a major concern in the study of the labour
market or social stratification. There are basically two types of research on
occupational sex segregation. One examines the trend and extent of occupational sex
segregation, and the other examines the cause and consequence of occupational sex
segregation.

Examining the trends and extent of occupational sex segregation has been of
research interest in itself as an indicator of gender inequality and the way it has
changed over time. Also the methodological complexities of the issue - the results
depend on what kind of occupational data is used and how occupational sex
segregation is measured - have been of central interest to researchers (Blackburn et al
1993, Watt 1994, Siltanen et al 1995). Some studies on the extent of occupational sex
segregation focus on a single country and the long-term trends of occupational sex
segregation. For example, we can trace the change of the extent of occupational sex
segregation in this century from Jacobs' study for the US (Jacobs 1989a) and Hakim's
study for Britain (Hakim 1981, 1994). Both of these studies show the enduring nature
of occupational sex segregation throughout this century, though a little decline can be
found after the 1970s for both countries. Other studies compare the extent and trends
of occupational sex segregation among various countries (OECD 1985, Charles 1992,
Jacobs and Lim 1992, Shirahase and Ishida 1994, Rubery and Pagan 1995, Charles
and Grusky 1995). Though these studies on the trend and extent of occupational sex
segregation examine different countries, using different data sets and different
measurements, they all show that it is a universal phenomenon that men and women
work in occupations predominantly done by their own sex.
Though occupational sex segregation is rather stable at the aggregate level, at
the level of individuals it is more dynamic. Jacobs (1989b), for instance, examines
individual mobility across gendered occupations in the US labour market. In spite of
the stability of occupational sex segregation at the aggregate level, what Jacobs found
is frequent movement of men and women across gendered occupations, thus his
metaphor of "revolving doors". In Britain, Scott and Burchell (1994) also found that

many men and women have sex-mixed careers while at the aggregate level the extent
of occupational sex segregation is stable.
The second type of research on occupational sex segregation examines the
cause or the consequence of occupational sex segregation. These studies can also be
divided into two types. One examines the cause and consequences in a single country
or a few occupations, and the other investigates the cause and consequences in a
comparative perspective. The major difference between these two is whether or not
the influences of institutional differences are taken into account. As a study focusing
on a single country, Reskin and Roos (1990) demonstrated how occupations were
feminised in the US by pointing to various factors that led employers to hire or not
hire women, as well as factors that led male workers to leave their occupations to
women, or to prevent women from entering into their occupations. Also in Britain,
Cohn (1985) explains how and why clerical occupations were feminised, and Siltanen
(1994) examines how men and women were distributed into different occupations
with different rewards. These studies give deep insight into the dynamic of
occupational sex segregation by focusing on particular occupations, and carefully
examine the behaviour of the agents involved in the process. There are also some
quantitative studies which examine the consequences of occupational sex segregation
in a single country in a more systematic way, by using large scale sample data, which
makes it possible to control for the other relevant factors. These studies show that
female-dominated occupations provide less favourable conditions compared to male-
dominated occupations, such as low pay, less authority and promotion chances
(Hadson and England 1986, Tomaskovic-Devey 1993a 1995).

The other research which focuses on the cause and consequences of
occupational sex segregation investigates why the pattern of occupational sex
segregation differs between countries from the point of view of different social and
economic structures across countries. Charles (1992), in a comparison of the OECD
countries, suggests that fertility rates, gender ideology, and economic structure all
affect the extent of occupational sex segregation in these countries. Rubery and Pagan
(1995), in their comparison of countries in the European Community, point to the
importance of the factors such as women's labour market participation patterns,
industrial organisation, labour market conditions, social attitudes, training systems and
career paths, working-time arrangement and systems of pay determination, for the
pattern of occupational sex segregation.
Thus, there are various empirical studies on occupational sex segregation.
Some focus on the trends of occupational sex segregation, some compare the extent of
occupational sex segregation across countries, some examine the cause or the
consequences of occupational sex segregation. What can be understood from these
studies are that, firstly, occupational sex segregation is a universal phenomenon.
Secondly, for at least Britain and the US, it has been quite stable throughout this
century. Thirdly, it is relevant to gender inequality in the labour market. Finally, from
a comparative perspective, its pattern is influenced by social and economic structures
which differ across countries.

Different Explanatory approaches to occupational sex segregation
There are various theoretical approaches to explain why occupational sex segregation
is constructed and maintained in the labour market. The fundamental debate of
occupational sex segregation is divided between those who see it as a result of the
choice of women themselves, where supply-side factors are emphasised, and those
who see occupational sex segregation as a result of structural constraints on women,
where demand-side factors are emphasised. However, recent theoretical development
is more likely to see occupational sex segregation as the result of the interaction
between the supply-side and the demand-side, or of individual choice under various
structural constraints. In this section, we will review the basic theoretical approaches
to occupational sex segregation, and their critiques.
Human capital theory1
Human capital theory states that people are forward-looking and invest in their human
capital, such as skills, qualifications and labour market experiences, to maximise
long-term economic benefits. Becker (1981, 1985) argues that women's poorer
earning prospects relative to their husbands would lead them to specialise in domestic
work while their husbands specialise in market work, and thus maximise economic
benefits within the family unit. On the other hand, Polachek (1976,1981) suggests that
by choosing female occupations women can gain higher initial starting salaried and
less penalties for their intermittent employment, as those occupations are believed to
require skills that do not depreciate rapidly and they are believed to require less
investment in training. Thus, women choose female occupations which can maximise

their life-time earnings with regard to their present or future domestic responsibilities
which may require intermittent careers.
Many of the assumptions and predictions of human capital theories are not
supported empirically. Firstly, the starting wage of female occupations is not generally
higher than male occupations (England 1982, 1984). Secondly there is no clear
evidence that female occupations penalise intermittence less than male occupations
(England 1984). Thirdly, sex differences in human capital variables explain only a
portion of occupational segregation (England 1982, England and Farkas 1986). And
finally, women often change their goals and educational choices and they move
between female occupations and male occupations in their occupational careers
(1989b).
Gender socialisation theory
While human capital theories emphasise the rationality of women as decision makers,
trying to maximise their economic benefits, the theory of gender socialisation
emphasises social factors which shape women's preference for particular occupations.
There are various ways by which gender socialisation influences women's
occupational choices. Firstly, sex-specific socialisation may lead women to prefer
occupations that are generally viewed as appropriate for them. Secondly, women's
pre-market education and training may restrict the jobs for which they qualify. Third,
women's beliefs that certain jobs are unavailable may deter them from trying to
pursue them. Fourth, women's choices may reflect their ignorance of available
options. And finally, women's anticipated family obligations may affect their choices
of occupations (Reskin and Hartmann 1986). Thus, gender socialisation can generate
8
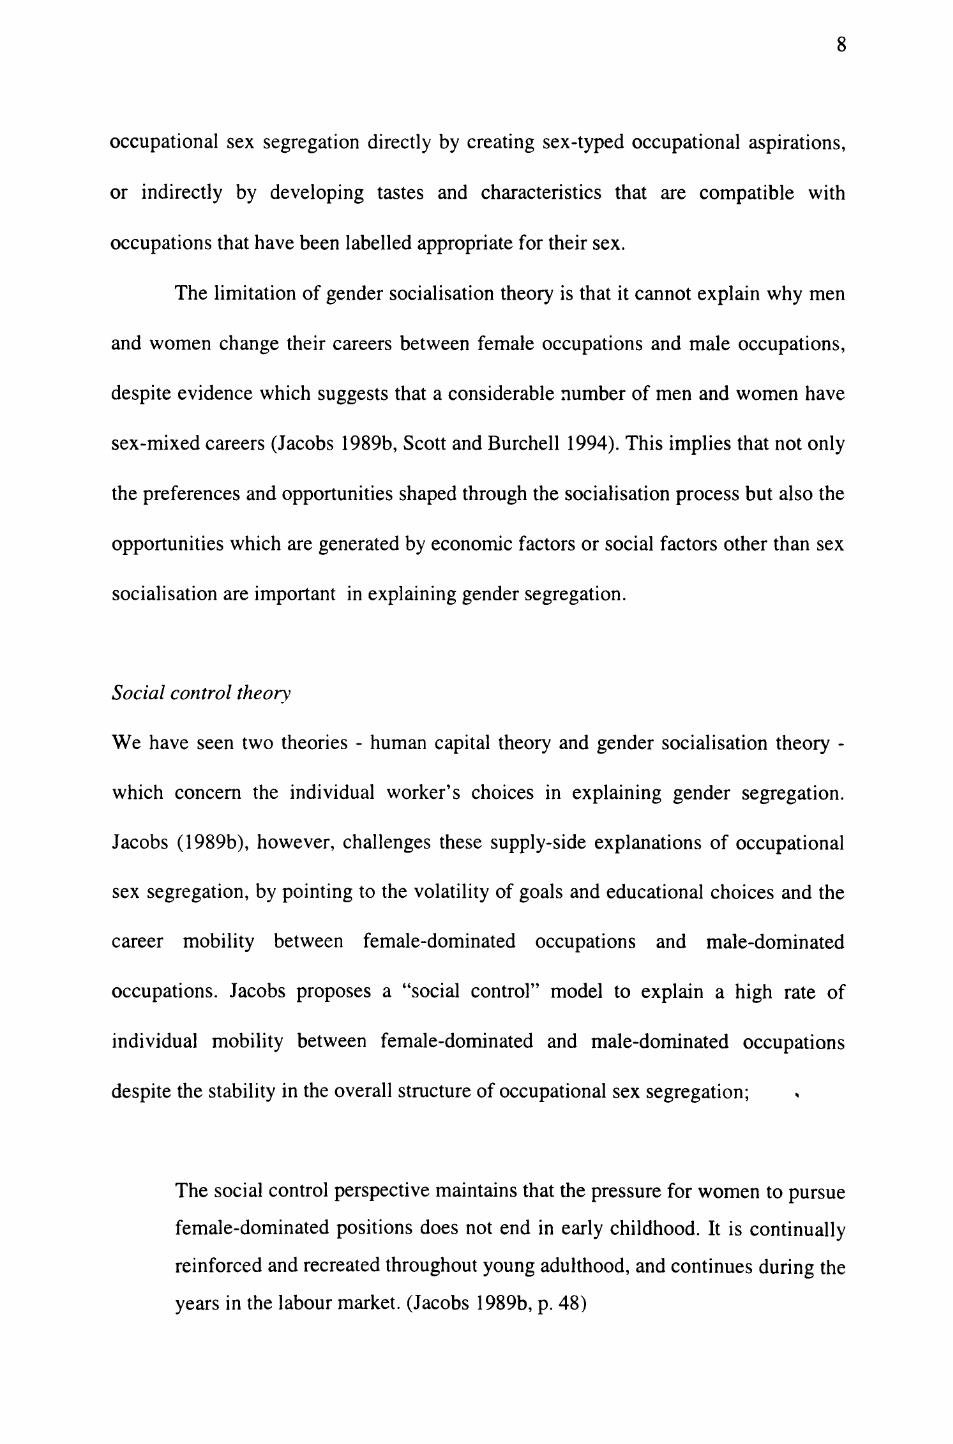
occupational sex segregation directly by creating sex-typed occupational aspirations,
or indirectly by developing tastes and characteristics that are compatible with
occupations that have been labelled appropriate for their sex.
The limitation of gender socialisation theory is that it cannot explain why men
and women change their careers between female occupations and male occupations,
despite evidence which suggests that a considerable number of men and women have
sex-mixed careers (Jacobs 1989b, Scott and Burchell 1994). This implies that not only
the preferences and opportunities shaped through the socialisation process but also the
opportunities which are generated by economic factors or social factors other than sex
socialisation are important in explaining gender segregation.
Social control theory
We have seen two theories - human capital theory and gender socialisation theory -
which concern the individual worker's choices in explaining gender segregation.
Jacobs (1989b), however, challenges these supply-side explanations of occupational
sex segregation, by pointing to the volatility of goals and educational choices and the
career mobility between female-dominated occupations and male-dominated
occupations. Jacobs proposes a "social control" model to explain a high rate of
individual mobility between female-dominated and male-dominated occupations
despite the stability in the overall structure of occupational sex segregation;
The social control perspective maintains that the pressure for women to pursue
female-dominated positions does not end in early childhood. It is continually
reinforced and recreated throughout young adulthood, and continues during the
years in the labour market. (Jacobs 1989b, p. 48)

The social control is "an enduring and imperfect set of influences" (Jacobs 1989b,
pi04), so that women's preferences change throughout their life-courses according to
their circumstances. However, the overall stability of occupational sex segregation is
maintained, since despite many women moving from female-dominated occupations
to male-dominated occupations according to their circumstances, the exit from male-
dominated occupations is also high. As Beilby (1992) put it, "the imagery is of a self-
regulating system".
Social control theory greatly helps us to understand the individual worker's
behaviour under the macro institutional settings. However, Jacobs only focuses on the
supply-side of the labour market, and therefore, is not successful in specifying the
agents of social control. His findings of the volatility of occupational goals and the
frequent movement of men and women between female-dominated and male-
dominated occupations nevertheless suggest the importance of the pressures deriving
from the process of social control, or the importance of an institutional perspective.
We now turn to theories which focus on macro-level economic and social structures
which affect occupational sex segregation; they are labour market segmentation
theory, dual systems theory, and queuing theory.
Segmentation theories
Segmentation theories contribute to the understanding of occupational sex segregation
from a demand-side perspective. These theories argue that the labour market is mainly
divided into two groups; one is the primary sector which has an advantageous position

10
in the market, involving stable employment with considerable job security, relatively
high pay, and career progression, and the other is the secondary sector which has
disadvantageous features, such as casual employment with little job security, low pay,
and little career progression. They argue that the differentiation between a core
workforce in the primary sector and a peripheral workforce in the secondary sector is
in employers' interests, since it enables them to retain core workers as well as to gain
flexibility with respect to uncertain economic factors by making use of peripheral
workers (Berger and Piore 1981), or to achieve greater control over workers by
dividing them (Edwards 1979).
Barron and Norris (1976) argue that gender division in the labour market
corresponds to the division between the primary and the secondary sectors, suggesting
that women have the five main attributes that make a particular social group a likely
source of workers in the secondary sector; dispensability, clearly visible social
difference, little interest in acquiring training, low economism, and the lack of
solidarity. They emphasise that women are likely to possess all of these features, by
pointing to the fact that women's voluntary or involuntary turnover rate is higher than
men's, their conventional social differences make them believe that they are inferior
to men and that training does not accord with their place in the family life after
marriage. In turn the fact that many women are secondary earners gives less incentive
for them to seek monetary rewards, and makes them less successful in organising
themselves industrially.
There are some evident difficulties with these theories of occupational sex
segregation. Firstly while women are more likely to be concentrated in the periphery
sector, there is nearly as much occupational segregation by sex within each sector

11
(Jacobs 1989b). Secondly, the gender dichotomy applied by Barren and Morris seems
to be too simple; within each sex, there are considerable variations in attitudes to work
and employment prospects (Burchell and Rubery 1989, Siltanen 1994). And lastly
they only focus on employers' strategies in terms of the organisation of the labour
process, but ignore the other factors, such as power relations between men and
women, which could impose constraints for employers in pursuing their strategies;
evidence suggests that men actively organised against women in the labour market,
and this prevented employers from hiring women, and women from entering better
rewarding, high-status jobs (Hartmann 1979, Cockburn 1983, Cohn 1985, Walby
1986, Reskin and Padavic 1994).
Dual systems theory
While segmentation theories emphasise power relations between capitalists and
workers, dual systems theory also concerns power relations between men and women
(Hartmann 1976, 1979, Walby 1986, 1990). Dual systems theory argues that women
are suppressed by capitalists and by men for both of them seek control over women.
Male workers prevent women from having access to the desirable, higher paying
occupations. Thus, they retain a privileged position in the labour market, and this
privileged position assures the economic dependence of women, hence women have a
greater share of domestic unpaid work (Hartmann 1976, 1979). Capitalists also benefit
from occupational sex segregation, as it enables them to pay women low wages since
there is an over-supply of women for the remaining occupations (Walby 1986).
The critical issue of dual systems theory is that it cannot separate between
capitalism and patriarchy; the motives of men as patriarchs and as capitalists do not

12
always coincide. However, this theory does not predict which is more fundamental
than the other (Walby 1988). It is often suggested that patriarchy is often in
contradiction to the needs of both individual and collective capital (Cohn 1985,
Siltanen 1994).
Queuing theory
Like segmentation theory and dual systems theory, queuing theory mainly point to the
importance of demand-side factors in explaining the patterns of occupational sex
segregation. However queuing theory also discusses the preferences and choices of
workers. According to Reskin and Roos (1990),
The queuing perspective views the labour market as comprising labour queues
(employers' ranking of possible workers) and job queues (workers' ranking of
jobs); it sees occupational composition as the result of a matching process in
which the top-ranked workers get the most attractive jobs and so forth, so that
the lowest workers end up in jobs that others have rejected.
(Reskin and Roos, 1990, p. 307)
Reskin and Roos argue that employers often rank men higher than women, because of
their emphasis on custom, stereotypes about sex differences in productivity, and anti-
female pro-male biases. However, feminisation of occupations occurs, when
occupational growth heightens the demand for women, when men revise the ranking
of occupations, when employers re-rank the sexes, and when the intensity of
employers' preference for men declines. However, queuing theory suggests that even
if an occupation is desegregated, "gettoization" occurs as women and men work in
different specialities in the occupation.

13
While queuing theory discusses the preferences and choices of employers,
male employees, and female employees, its main concern is the structural properties
of the labour market, which are shaped by the preferences of employers and of male
workers. Although queuing theory recognises the existence of women's "job queues",
it states that women will take virtually any occupation once it becomes available to
them. Women's preferences are not fully discussed, and women are rather treated as
passive agents. The only explanation provided from women's point of view for
women's inroads into male occupations is that these occupations are preferable to or
better than most female occupations even though they are rejected by men. However,
some researchers suggest that there are women whose preferences about work and
commitment to work are different from men, and these women positively choose
women's jobs (Hakim 1991 1996, Crompton & Le Feuvre 1996).
We have seen various theories of occupational sex segregation, which differ in terms
of the perspective through which they try to capture occupational sex segregation.
They vary in terms of the emphasis on the point of view of employers or of workers,
and in terms of whether they focus primarily on the labour market or on a wider set of
social structures. Although we have seen some critiques for these theories, there is no
a priori reason to justify one theory at the cost of others. Rather, it is more plausible
that the final outcome is the result of more than just one mechanism.
Having said that, however, from a comparative perspective, which we take in
this thesis, it is helpful to discuss some limitations in the above theories. Human
capital theory and gender socialisation theory assume that individuals make choices,
but they do not discuss individual decisions as the reflection of macro-level social and
14
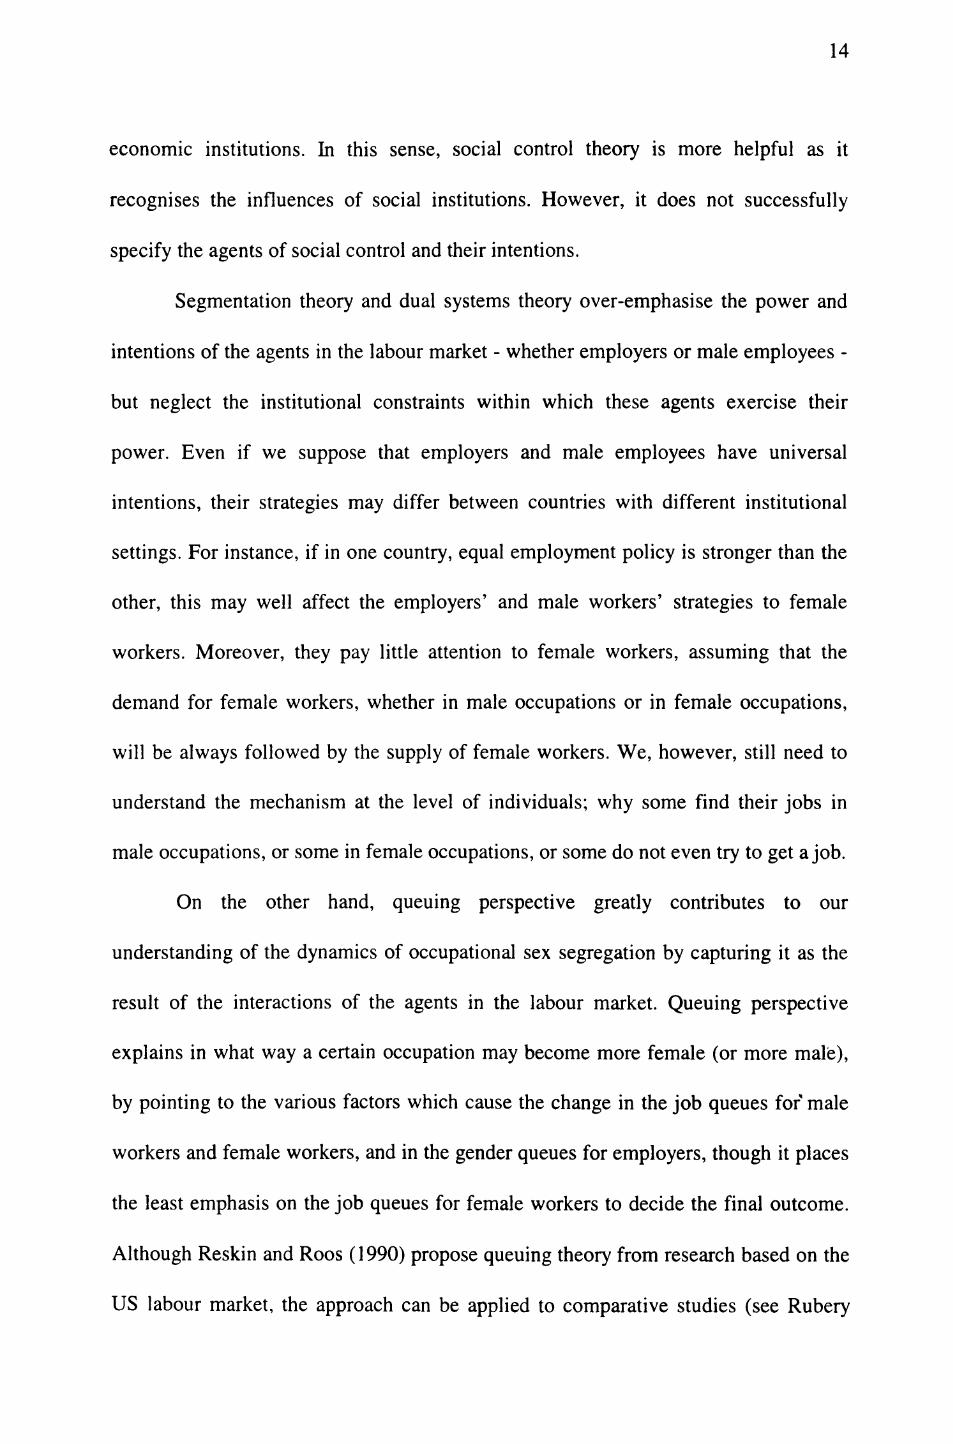
economic institutions. In this sense, social control theory is more helpful as it
recognises the influences of social institutions. However, it does not successfully
specify the agents of social control and their intentions.
Segmentation theory and dual systems theory over-emphasise the power and
intentions of the agents in the labour market - whether employers or male employees -
but neglect the institutional constraints within which these agents exercise their
power. Even if we suppose that employers and male employees have universal
intentions, their strategies may differ between countries with different institutional
settings. For instance, if in one country, equal employment policy is stronger than the
other, this may well affect the employers' and male workers' strategies to female
workers. Moreover, they pay little attention to female workers, assuming that the
demand for female workers, whether in male occupations or in female occupations,
will be always followed by the supply of female workers. We, however, still need to
understand the mechanism at the level of individuals; why some find their jobs in
male occupations, or some in female occupations, or some do not even try to get a job.
On the other hand, queuing perspective greatly contributes to our
understanding of the dynamics of occupational sex segregation by capturing it as the
result of the interactions of the agents in the labour market. Queuing perspective
explains in what way a certain occupation may become more female (or more male),
by pointing to the various factors which cause the change in the job queues for male
workers and female workers, and in the gender queues for employers, though it places
the least emphasis on the job queues for female workers to decide the final outcome.
Although Reskin and Roos (1990) propose queuing theory from research based on the
US labour market, the approach can be applied to comparative studies (see Rubery

15
and Pagan 1995). For instance, it could take account of the influences of social
institutions which often differ between countries, such as gender ideologies and labour
laws, by reflecting them in the job queues for male workers and female workers, and
in the gender queues for employers.
Why compare between Britain and Japan?
As mentioned in the first part of this chapter, the purpose of this thesis is to
understand the mechanism of occupational sex segregation by focusing on the
interaction systems in which occupational sex segregation is constructed and
maintained. Although we compare the patterns of occupational sex segregation
between Britain and Japan in this thesis, this is by no means our ultimate purpose.
Without defining the implication of occupational sex segregation in each society, the
comparison itself has little sociological meaning. We, however, compare the patterns
of occupational sex segregation between Britain and Japan, because this in itself gives
an idea of the implication of occupational sex segregation in the two societies. As
Brinton (1988, p302) writes, "a research tradition that concentrates almost exclusively
on the explanation of differences in economic outcomes between individual men and
women in one culture makes it difficult to develop a theory of gender stratification
that confronts issues of micro-level interaction within the macro-level institutional
setting".
As we noted before, occupational sex segregation is often regarded as the
central component of gender inequality, restricting women's opportunities in the
labour market and lowering their status, and rewards (Crompton and Mann 1986,
Reskin and Padavic 1994, Jacobs 1995). It is because of this mechanism that the
16
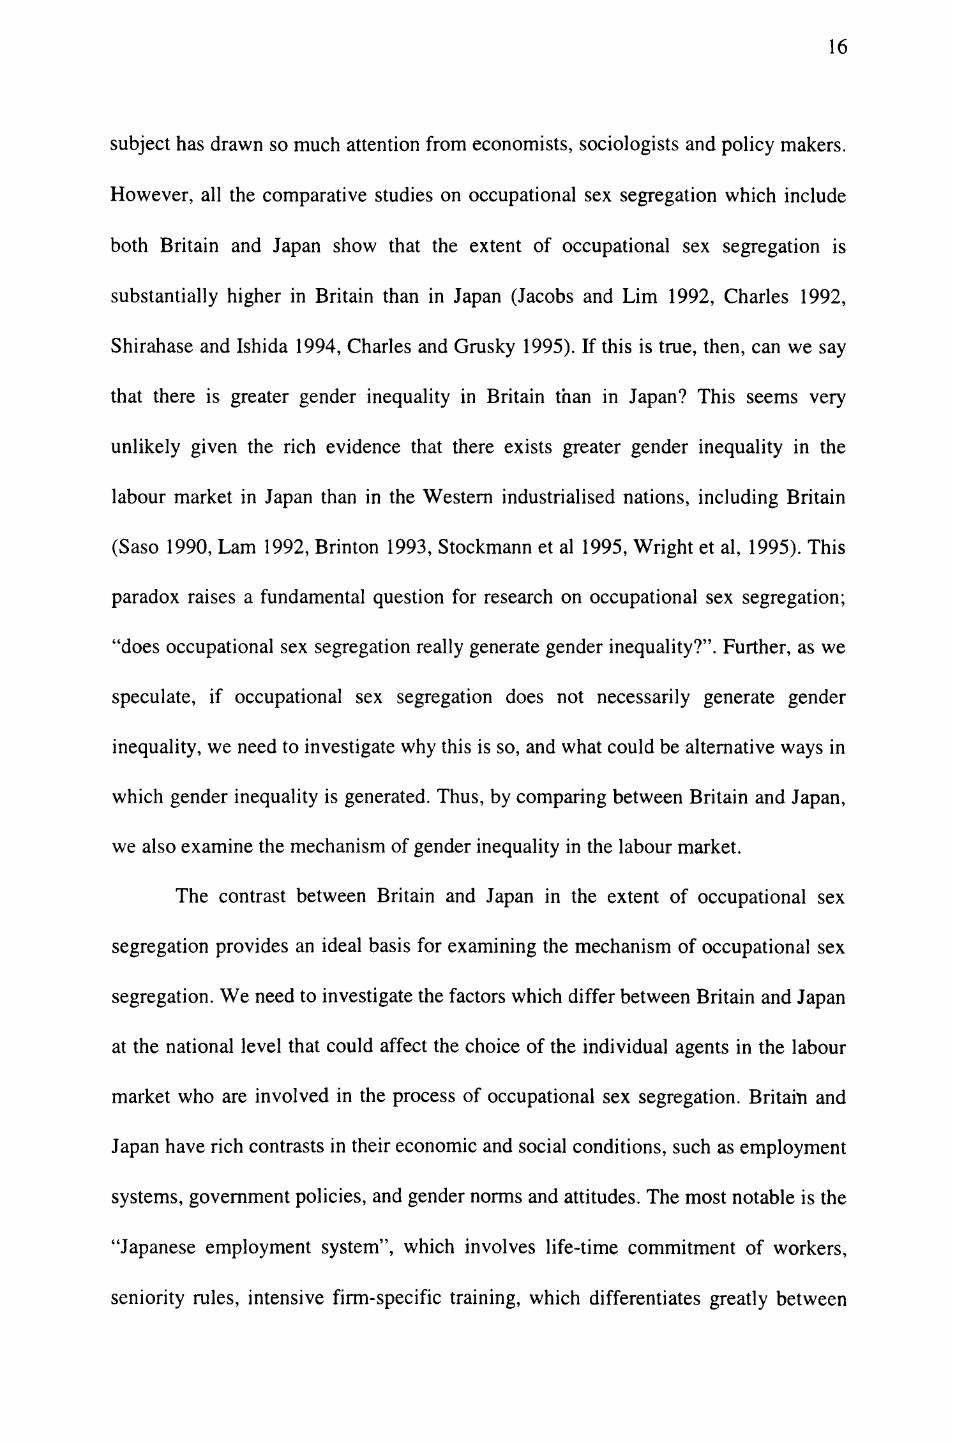
subject has drawn so much attention from economists, sociologists and policy makers.
However, all the comparative studies on occupational sex segregation which include
both Britain and Japan show that the extent of occupational sex segregation is
substantially higher in Britain than in Japan (Jacobs and Lim 1992, Charles 1992,
Shirahase and Ishida 1994, Charles and Grusky 1995). If this is true, then, can we say
that there is greater gender inequality in Britain than in Japan? This seems very
unlikely given the rich evidence that there exists greater gender inequality in the
labour market in Japan than in the Western industrialised nations, including Britain
(Saso 1990, Lam 1992, Brinton 1993, Stockmann et al 1995, Wright et al, 1995). This
paradox raises a fundamental question for research on occupational sex segregation;
"does occupational sex segregation really generate gender inequality?". Further, as we
speculate, if occupational sex segregation does not necessarily generate gender
inequality, we need to investigate why this is so, and what could be alternative ways in
which gender inequality is generated. Thus, by comparing between Britain and Japan,
we also examine the mechanism of gender inequality in the labour market.
The contrast between Britain and Japan in the extent of occupational sex
segregation provides an ideal basis for examining the mechanism of occupational sex
segregation. We need to investigate the factors which differ between Britain and Japan
at the national level that could affect the choice of the individual agents in the labour
market who are involved in the process of occupational sex segregation. Britain and
Japan have rich contrasts in their economic and social conditions, such as employment
systems, government policies, and gender norms and attitudes. The most notable is the
"Japanese employment system", which involves life-time commitment of workers,
seniority rules, intensive firm-specific training, which differentiates greatly between

17
men's and women's careers (Osawa, Mari 1993, Sugeno 1996). This system differs
considerably from the British system (Dore 1973, 1986, Saso 1990). Also the
provisions of the equal employment law significantly differ between these two
countries. These institutional differences may well generate the different outcomes in
the labour market between the two countries by giving different weights to the options
of each individual agent who is involved in the construction and maintenance of
occupational sex segregation.
As we have seen, there are already some attempts made to explain the different
patterns of occupational sex segregation across countries (Charles 1992, Rubery and
Pagan 1995). For instances, Charles's study (1992), which uses the log-linear
technique, explains how different national institutional settings, such as economic
structure, fertility rate and gender ideology, influence the extent of occupational sex
segregation. However, she relies entirely on aggregate data and only looks at the
relations between macro phenomena (i.e., occupational sex segregation, economic
structure, gender ideology, etc.). In her explanation, no active agent who is involved in
the process of occupational sex segregation is to be found. Rubery and Pagan (1995),
on the other hand, go further into the micro level. Their research not only examines
the relations between macro phenomena (e.g. occupational sex segregation and labour
market systems), but also takes a qualitative method by focusing on six occupational
areas, and tries to link the influences of social/economic institutions with the
behaviour of individual agents (i.e., male workers and female workers). However, the
institutional explanation they provide in their latter approach is occupation-specific,
and it is inadequate to explain the difference in the overall extent of occupational sex
segregation between countries.

18
In this thesis, our focus is not on the relations between macro structures nor on
specific occupations, but on individual workers: individual workers who are employed
in gendered occupations, whose experiences are influenced by occupational sex
segregation, and who are the agents actually constructing and maintaining
occupational sex segregation under the constraints imposed by macro institutions. We
will examine the mechanism of occupational sex segregation at the level of
individuals, by focusing on the implications of occupational sex segregation for
individual workers' experiences. Does occupational sex segregation really generate
gender inequality in the labour market? What are the implications or the consequences
of occupational sex segregation for employers and employees; does it benefit or
motivate them to construct and maintain occupational sex segregation? Do the
implications of occupational sex segregation differ between Britain and Japan? If so,
do the institutional differences between the two countries help to understand the
difference? And finally, do the differences in the implications of occupational sex
segregation in these countries in turn help to account for the different extent of
occupational sex segregation between these countries? These are the questions to be
asked in this thesis.
Data Sources
We examine data from a range of sources. There are three principal data requirements.
Firstly, we need national representative data which has detailed information of
individual workers' occupations and their experiences in the labour market. Secondly,
we need data which makes it possible to examine the "net" occupational-sex-
segregation effect on workers' experiences. By "net" effect, I mean the effect which

19
is independent of other relevant factors that influence workers' experiences, such as
age, educational qualifications and the length of service, the effects of which are
supposed to be culturally specific. Finally, it is necessary to have comparable data and
variables for Britain and Japan.
I have re-analysed four different surveys to investigate and compare individual
workers' experiences in the labour market - the Employment in Britain Survey, the
Occupational Mobility and Career Research Survey in Japan, the International Social
Justice Project, and the Comparative Project of Class Consciousness Survey. The
description of the four data sets are as follows.
The Employment in Britain Survey
The Employment in Britain Survey (EIB) was carried out between May and
September 1992. It is a national representative sample of those currently in work, aged
between 20 and 60 in Britain. The achieved sample size is 3855 (2038 men and 1817
women) of whom 3458 (1751 men 1707 women) were employees. The response rate
was 72% (see Gallie and White 1993). The EIB has both cross sectional and work
history data. The cross sectional data is a rich source of information about individual
workers' experiences and their attitudes to work. It also makes it possible to control
for relevant factors to workers' experiences in the labour market from personal
characteristics to organisational characteristics. It is analysed extensively to
investigate the influences of occupational sex segregation on various employment
conditions, as well as to examine the association between occupational sex
segregation and job preferences and satisfaction for men and women in Britain. The
work history data contains job histories which began with the first job after leaving

20
school, and cover all jobs thereafter to the time of the survey. The work history data is
analysed to examine individual workers' job movement across gendered occupations.
The 1983 Occupational Mobility and Career Research Survey (1983 Shokugyo-ido to
Keireki Chosa)
The 1983 Occupational Mobility and Career Research Survey (OMC) was conducted
in Japan in February 1983. The OMC is one of the series of surveys on occupational
mobility and careers by the Japan Institute of Labour. 1 The sample of the OMC is
randomly selected women in Japan aged between 25 and 69. The valid sample size is
2490, of whom 1320 were in work and 1170 not. Of those in work, 664 were
employees. The response rate was 83%. The OMC has both cross sectional data and
work history data. The cross sectional data contains information of women's job
preferences and job satisfaction, which can be compared with Britain. It also allows us
to take account of the effects of personal characteristics and organisational
characteristics. The work history data contains the events which began with the first
job after leaving school, and covers all jobs thereafter to the time of the survey. We
will use the work history data to analyse individual workers' job movement across
gendered occupations and compare it with Britain.
1 The first survey was carried out in 1973 on men aged 20-69. Since then, there were four surveys conducted in 1975, 1981, 1983 and 1991. Only the last survey contains both men and women data. The relevant materials can be found in the working paper No. 77 of the Koyo Shokugyo Kenkyusho (1988), and the working paper No. 74, of the Japan Institute of Labour (1995).

21
The International Social Justice Project
The International Social Justice Project (ISJP) is a collaborative research project on
the perception of justice, conducted in 12 different countries including Britain and
Japan. The participant countries used identical questionnaires with questions in
identical order, so that we can compare between Britain and Japan directly. The
British survey was carried out between May 3 and July 17, 1991. It is a national
representative sample of the population in Britain aged 18 years old and over. The
sample size is 1319 of whom 577 were men and 742 were women. The response rate
was 71.1% (Kluegel et al, 1995). The Japanese survey was conducted between July 17
and September 17, 1991. The Japanese sample size is 777 of whom 362 were men and
415 were women, with a relatively low completion rate of 51.8%. 2 The ISJP is used to
analyse income. It provides not only the data for the actual level of individual income,
but also the data for people's perception of the determinants of income. Information of
relevant factors determining income, such as workers' personal characteristics and job
characteristics, are available in the ISJP.
The Comparative Project on Class Consciousness Survey
The Comparative Project on Class Consciousness Survey (CPCC) is an international
project of 15 different countries including Britain and Japan. Each country basically
followed the core US survey, but may have country-specific questions. Thus, the data
consists of common, equivalent, and country-specific parts (see Wright 1990). The
British survey was carried out from 1 March 1984 to 3 July 1984. It is a random
2 In spite of the low response rate, the distributions of sex and age in the Japanese sample are not substantially different from the sample population, though the data slightly over-represents younger persons.

22
selection of persons of working age (men aged 16-64, women 16-59), who were not in
full-time education and resident in Great Britain. The sample size is 1770 of whom
899 were men and 871 were women. The response rate was 62.5% (see Marshall et al,
1989). The Japanese survey was conducted between 21 February and 4 March 1987. A
random sample was selected from men and women aged 20 and over who were living
in the Tokyo metropolitan area (within 30km regions from the Tokyo station),
excluding students. The achieved sample size is 823 of whom 360 were men and 463
were women. The response rate was 41.1%.3 The CPCC provides data for various
working conditions, such as job autonomy, supervisory responsibilities and promotion
chances.
We will also use published data from two different surveys to examine the
institutional differences between Britain and Japan - the Public Opinion Survey
Regarding Equality of the Sexes (Joseimondai-ni-kansuru Kokusai-hikaku-chosa,
Tokyo-to seikatu-bunka-kyoku 1993) and the Women's Employment Survey (Joshi-
koyokanri-kihon-chosa, Ministry of Labour 1990, 1992).
3 As the Japanese sample was drawn from the Tokyo metropolitan area, it has the tendency to over-represent persons in the labour force, older persons, and women, compared to the Japanese Labour Force Survey or the Census, but this is mainly because of the exclusion of students from the sample(Harada et al 1988, Ushijima 1995). Also, compared to the census, the men's sample over-represents professional, technical, managerial and clerical workers, and significantly under-represents skilled, semi-skilled and unskilled workers. The women's sample significantly over-represents clerical, sales and service workers, slightly under-represents professional and technical workers, and significantly under-represents skilled, semi-skilled and unskilled workers (Ushijima 1995), and this might well distort the results of our analysis. In analysing the Japanese CPCC data to compare the situation between Britain and Japan, we take this into consideration, applying extra analysis, such as controlling for occupational distribution or enterprise size, to see whether we can confirm the results.

23
In comparing Britain and Japan using different data sets, it is important to
obtain basic comparability for the variables and measurements used in the analysis.
Effort is made to obtain as much comparability as possible, but we also use country-
specific variables if this is necessary. Given the diversity of the data sources used and
the specificity of some of the methodological issues to the particular data sets, detailed
methodological discussion is introduced in the relevant chapters rather in an overview
chapter on methodology. The description of variables, explanations of measurements
and of methods of data analysis are provided the first time they are introduced. For the
variables which need special attention for purposes of comparison - occupation, part-
time/full-time status, educational qualifications, and work experiences - detailed
explanation is given in Appendices A and B.
The plan of this thesis
The plan of this thesis is as follows;
Chapter 2 gives a basic description of the extent and form of women's integration into
the labour market in Britain and Japan. We look at basic statistics, such as the labour
force participation rates, the life-cycle pattern of the participation, the proportion of
part-timers, the employment status, the distribution of workers across industrial
sectors, and the distribution of workers across different occupations. We examine
whether or not any converging trends can be found in the form of women's labour
force participation for Britain and Japan.
Chapter 3 examines the difference in the extent and trends of occupational sex
segregation between Britain and Japan. Firstly, various data and measurements are
investigated. Secondly, using both the aggregate level and detailed level data, we

24
measure and compare the extent and trends of occupational sex segregation for Britain
and Japan after 1970.
In Chapter 4, we examine what micro movements are producing the aggregate
patterns found in Chapter 3, by using the work history data from the Employment in
Britain Survey and the Occupational Mobility and Career Research Survey in Japan.
The pattern of occupational sex segregation found in Chapter 3 is rather static,
showing the structural differences between Britain and Japan. The purpose of Chapter
4 is to capture occupational sex segregation in a dynamic way by focusing on the
behaviour of the individual workers who actually construct and maintain the macro
patterns. Even if one country has greater occupational sex segregation at the aggregate
level than the other, this does not necessarily mean that moving across gendered
occupations is more difficult for the former country than the latter. Also, even if the
extent of occupational sex segregation declined at the aggregate level, this does not
necessarily mean that individual movement across gendered occupations became more
fluid.
Examining individual movement across gendered occupations not only helps
us to understand the aggregate pattern, but also allows us to understand the
implications of occupational sex segregation for individual workers' experiences. If,
for example, we found greater inflows into sex-typical occupations as compared to
into sex-atypical occupations, this would suggest that workers' experiences in sex-
typical occupations and in sex-atypical occupations are different. Or if we found
random movements across gendered occupations, this would imply that there is little
difference between these occupations from the points of view of workers. Also, in this
chapter, we compare job movements between men and women in Britain as well as

25
between British women and Japanese women. We will try to interpret the patterns of
job movements across gendered occupations found in this chapter through evidence
examined in the following chapters.
Chapters 5, 6 and 7 examine the influences of occupational sex segregation on
workers' experiences. Firstly, in Chapter 5, we investigate the impact of occupational
sex segregation on men's and women's employment conditions in the British labour
market. Although the negative impact of occupational sex segregation on workers'
wage is reported in Britain (Millward and Woodland 1995), there is little research on
the impact of occupational sex segregation on other aspects of employment
conditions. Sex pay differential is no doubt an essential element of gender inequality,
but gender inequality can be formed in other spheres of employment, and occupational
sex segregation could well contribute to the inequality in these spheres. The
Employment in Britain survey data allows us to examine the impact of occupational
sex segregation on various aspects of employment conditions. Also it allows us to take
account of various factors which influence employment conditions, such as human
capital and organisational characteristics. We analyse hourly pay, fringe benefits,
promotion chances, training chances, task influence, and job security. We ask the
following questions. How does occupational sex segregation affect employees'
working conditions? Does it affect men and women differently? We then consider the
possible implications of the patterns that emerge for the nature of emp!6yers'
strategies and of individual job movements across gendered occupations.
Chapter 6 investigates whether the impact of occupational sex segregation on
employees' experiences differs between Britain and Japan, using the International
Social Justice Project data and the Comparative Project on Class Consciousness

26
survey data which have the same or equivalent questions for Britain and Japan. We
will adopt a simpler method to analyse the impact of occupational sex segregation
than the method of analysis in Chapter 5, due to the small sample sizes of the two data
sets and the more limited number of relevant explanatory variables. Little research on
occupational sex segregation can be found in Japan, and its impact on Japanese
workers' experiences is yet unknown. Is occupational sex segregation a source of
gender inequality in Japan as it is reported in the US and Britain? We investigate the
factors emphasised in the employment systems in Britain and Japan, and examine the
implication of the different employment system for the impact of occupational sex
segregation on employment conditions.
Chapter 7 examines the involvement of workers in the construction and
maintenance of occupational sex segregation by analysing job preferences and job
satisfaction. We firstly examine men's and women's job preferences. Then we
investigate the impact of occupational sex segregation on individual workers' job
satisfaction. We use the Employment in Britain survey, and the Occupational Mobility
and Career Research Survey in Japan.
Chapter 8 examines the social and economic institutions in Britain and Japan.
They are gendered attitudes, household responsibilities, social security systems,
employment systems, and labour laws. We examine how these institutional
differences between Britain and Japan encourage (or discourage) employers and
employees to construct and maintain occupational sex segregation, and how this in
turn affects the patterns of occupational sex segregation in these countries.
Finally, Chapter 9 brings together the findings, trying to establish the link
between individual-level explanation and institutional-level explanation. We discuss

27
what is the mechanism of occupational sex segregation in Britain and Japan, in what
ways the different social and economic institutions in the two countries affect
employers' and employees' behaviour, and how the differences in the institutional
settings in turn affect the patterns of occupational sex segregation in these countries.

28
CHAPTER 2
THE EXTENT AND FORM OF WOMEN'S INTEGRATION
INTO THE LABOUR MARKET IN BRITAIN AND JAPAN
Before examining occupational sex segregation in Britain and Japan in detail, this
chapter overviews the extent and form of women's integration into the labour market
in Britain and Japan, by exploring some descriptive data. We study the labour force
participation rate, the share of part-time work, employment status, industrial
distributions, and occupational distributions. One possibility is that the difference in
the extent of occupational sex segregation reflects different stages of economic
development in the two societies. Given that Japan is one of the late industrialised
countries, one might suppose that the economic structure in Japan has not yet
developed fully to absorb the potential female labour and to differentiate between
men's work and women's work. Through investigating the change in the pattern of
women's labour force participation and the change of the economic structure after the
1970s, we examine whether or not any converging trends can be found for the form of
women's integration into the labour market in Britain and Japan.
Women's labour force participation in Britain and Japan
We will firstly look at the change in the labour market participation rates after 1970.
Table 2.1 shows the labour force participation rates for men and women in Britain and
Japan between 1970 and 1993.

29
Table 2.1 Labour force participation rates in Britain and Japan, 1970-1993
1970
1980
1990
1993
70-93
British men
94.4
90.5
86.4
84.0
-10.4
British women
50.7
58.3
65.5
65.3
+14.6
men-women
+43.7
+32.2
+20.9
+18.7
-25.0
Japanese men
89.4
89.0
87.8
90.2
+0.8
Japanese women
55.4
54.9
60.4
61.8
+6.4
men-women
+34.0
+34.1
+27.4
+28.4
-5.6
Source: OECD Labour Force Statistics 1992, 1995
From Table 2.1, we can see that British women steadily increased their participation
rate after 1970. On the other hand Japanese women showed little change in the 1970s,
but after the 1980s, the participation rate started to increase. In 1993, British women
were slightly more likely to participate in the labour market than Japanese women.
Many studies suggest that the change in the participation rate for Japanese
women is distinct as compared to the Western Industrialised nations. Although not
shown in Table 2.1, the labour force participation rate of Japanese women reached its
peak in the 1960s, but since then it started to decline, mainly because the number of
family workers in the agricultural sector decreased rapidly (see Roos 1985, Osawa,
Machiko 1993, Takenaka and Kuba 1994). This cancelled out the effect of the trend
towards an increase in the number of employees in the 1970s on overall participation.
There is an interesting contrast between these two countries when we look at
the sex difference in the participation rates. For Japan, men's participation rate«
showed little change after 1970, while women's gradually increased after 1980.
However for Britain, men's participation rate steadily dropped after 1970, while

30
women's participation rates substantially increased. 1 As a result, the sex difference in
the participation rate decreased more rapidly in Britain than in Japan.
As women advanced into the labour market, their pattern of labour force participation
changed. Figure 2.1 shows the age profile of the labour force participation rate for
British women and Japanese women (the black lines indicate Britain and the white
lines indicate Japan).
Figure 2.1. Female labour force participation rates
1970 Britain
1970 Japan
1993 Britain
1994 Japan
15-19 20-24 25-34 35-44 45-54
Source: OECD Labour Force Statistics 1992,1995
55-59 6O64
In terms of Britain, there is a marked difference in the age profile between
1970 and 1993. Compared to the profile in 1970, the 1993 profile shows that
substantially larger proportion of women in their 20s, 30s, 40s and early 50s
participated in the labour force, and the curve is no longer in the M-shape. In terms of*
Japan, compared to the profile in 1970, the 1994 profile shows that firstly, the
1 Hakim (1996) suggests that British men lost jobs mainly because of the structural change in the manufacturing industry, and that British women gained jobs in part-time jobs rather than in full-time jobs.
31
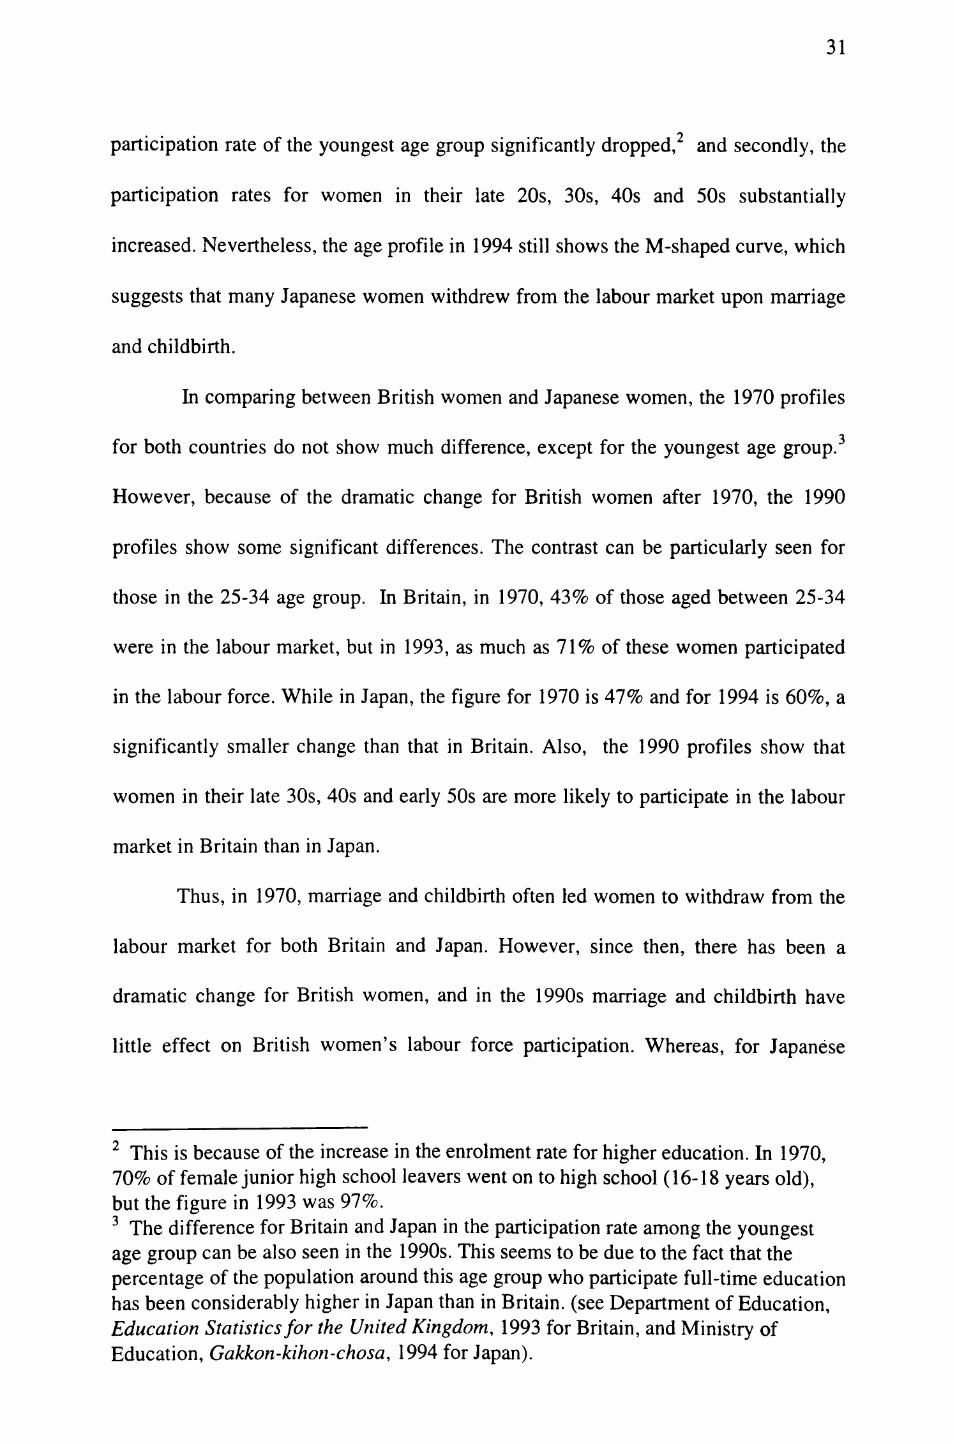
0participation rate of the youngest age group significantly dropped, and secondly, the
participation rates for women in their late 20s, 30s, 40s and 50s substantially
increased. Nevertheless, the age profile in 1994 still shows the M-shaped curve, which
suggests that many Japanese women withdrew from the labour market upon marriage
and childbirth.
In comparing between British women and Japanese women, the 1970 profiles
for both countries do not show much difference, except for the youngest age group. 3
However, because of the dramatic change for British women after 1970, the 1990
profiles show some significant differences. The contrast can be particularly seen for
those in the 25-34 age group. In Britain, in 1970, 43% of those aged between 25-34
were in the labour market, but in 1993, as much as 71% of these women participated
in the labour force. While in Japan, the figure for 1970 is 47% and for 1994 is 60%, a
significantly smaller change than that in Britain. Also, the 1990 profiles show that
women in their late 30s, 40s and early 50s are more likely to participate in the labour
market in Britain than in Japan.
Thus, in 1970, marriage and childbirth often led women to withdraw from the
labour market for both Britain and Japan. However, since then, there has been a
dramatic change for British women, and in the 1990s marriage and childbirth have
little effect on British women's labour force participation. Whereas, for Japanese
2 This is because of the increase in the enrolment rate for higher education. In 1970, 70% of female junior high school leavers went on to high school (16-18 years old), but the figure in 1993 was 97%.3 The difference for Britain and Japan in the participation rate among the youngest age group can be also seen in the 1990s. This seems to be due to the fact that the percentage of the population around this age group who participate full-time education has been considerably higher in Japan than in Britain, (see Department of Education, Education Statistics for the United Kingdom, 1993 for Britain, and Ministry of Education, Gakkon-kihon-chosa, 1994 for Japan).

32
women, though a change can be seen after the 1970s, many women still leave the
labour market upon marriage or childbirth, and after a break, they gradually return to
the labour market.
The proportion of part-timers in Britain and Japan
Although women's labour force participation increased substantially, we cannot take
this simply as the sign of increasing equality between men and women in the labour
market. In fact, Hakim (1993b) suggests that the growth of female labour force which
occurred in Britain in the post war period was brought about by the rise of part-time
workers rather than full-time workers. Also in Japan, it is reported that the increase in
women's participation rate was mainly brought about by the increase of part-time jobs
(Takenaka and Kuba 1994, Tanaka 1996).
Table 2.2 Part-time employment in Britain and Japan, 1973-1994
Britain Japan
% PT in total % women in % PT among % PT in total % women in % PT among
employment total PT women employment total PT women
1973
1983
1994
73-94
16.0
19.4
23.8
+7.8
90.9
89.8
83.6
-7.3
39.1
42.4
44.3
+5.2
13.9
16.2
21.4
+7.5
70.0
72.9
67.5
-2.5
25.1
29.8
35.2
+ 10.J
Source: OECD Employment Outlook 1995Note: for Britain, the part-time/full-time delineation is based on the respondent's own classification. ForJapan, part-timers are defined as those who work less than 35 hours a week.
Table 2.2 shows the size of part-time employment in Britain and Japan and the
change over time. In general, we can see that part-time employment has been growing
for both Britain and Japan. It has developed particularly as women's work, but this is

33
more likely so for Britain than for Japan. Part-time employment had been developed
among women earlier in Britain than in Japan, but the share of part-timers among
Japanese women has been growing rapidly, so that the difference between British
women and Japanese women has been decreasing.
The rise of part-time employment seems to contribute to the increase in the
female labour force participation after marriage and childbirth which occurred in both
countries. However, the fact that British women have developed the form of part-time
employment earlier and more intensively than Japanese women seems to be reflected
in the dramatic change in British women's labour force participation rates after 1970.
Nevertheless, the share of part-time employment among Japanese women is
expanding at a rapid rate, so that the M-shaped curve of their participation pattern
could be further modified in the future.
Employment Status in Britain and Japan
When we looked at the change in the labour force participation rate for Japanese
women, we briefly noted that the change was brought about by the two opposing
trends - one is the decline of family workers and the other is the increase of employed
workers. In fact, our data shows that in 1970, as many as three out of ten Japanese
women worked as family workers. The form of family work which enables women to
combine market work and domestic work has been popular among Japanese women.
However, the share of family workers decreased rapidly after 1970 and it became 17%
in 1990 (see Table 2.3). On the other hand, more than nine out of ten British women
were employees in 1970, so that the rise in the participation rate after 1970 for British
women was generated by the increase of employees.

34
Table 2.3 Employment status of workers in Britain and Japan, 1970-1990
1970 total
men
women
1980 total
men
women
1990 total
men
women
Britain
Employees
92.2%
89.3%
95.8%
91.9%
89.1%
96.1%
86.0%
81.3%
92.0%
Self-
employed
7.8%
10.7%
4.2%
8.1%
10.9%
3.9%
12.4%
17.0%
6.6%
Japan
not Employees
specified*
65.0%
71.6%
54.8%
71.9%
77.3%
63.3%
1.6% 77.6%
1.7% 81.1%
1.4% 72.5%
Self-
employed
19.2%
22.4%
14.3%
17.2%
19.4%
13.7%
14.1%
16.4%
10.7%
Unpaid
family
workers
15.8%
6.0%
30.9%
10.9%
3.3%
23.0%
8.3%
2.5%
16.8%
Source: Labour Force Statistics, OECD, 1995Note: * Trainees on work related government programmes are included.
It is notable that in 1990, men's employment status looked quite similar
between Britain and Japan. This is because there was a shift from self-employed
persons and unpaid family workers to employees among Japanese men. However
women's employment status differed significantly. Although the proportion of
employees for Japanese women rapidly increased after 1970, compared to British
women, a large number of women in Japan still worked as unpaid family workers in
1990. It seems that the integration of women into the formal economy has not yet fully
developed in Japan.
Industrial structures of Britain and Japan
As the economy develops, there generally occurs a shift from the primary sector to the
secondary sector, and then from the secondary sector to the tertiary sector. While the
secondary sector tends to provide job opportunities for men, the tertiary sector tends to
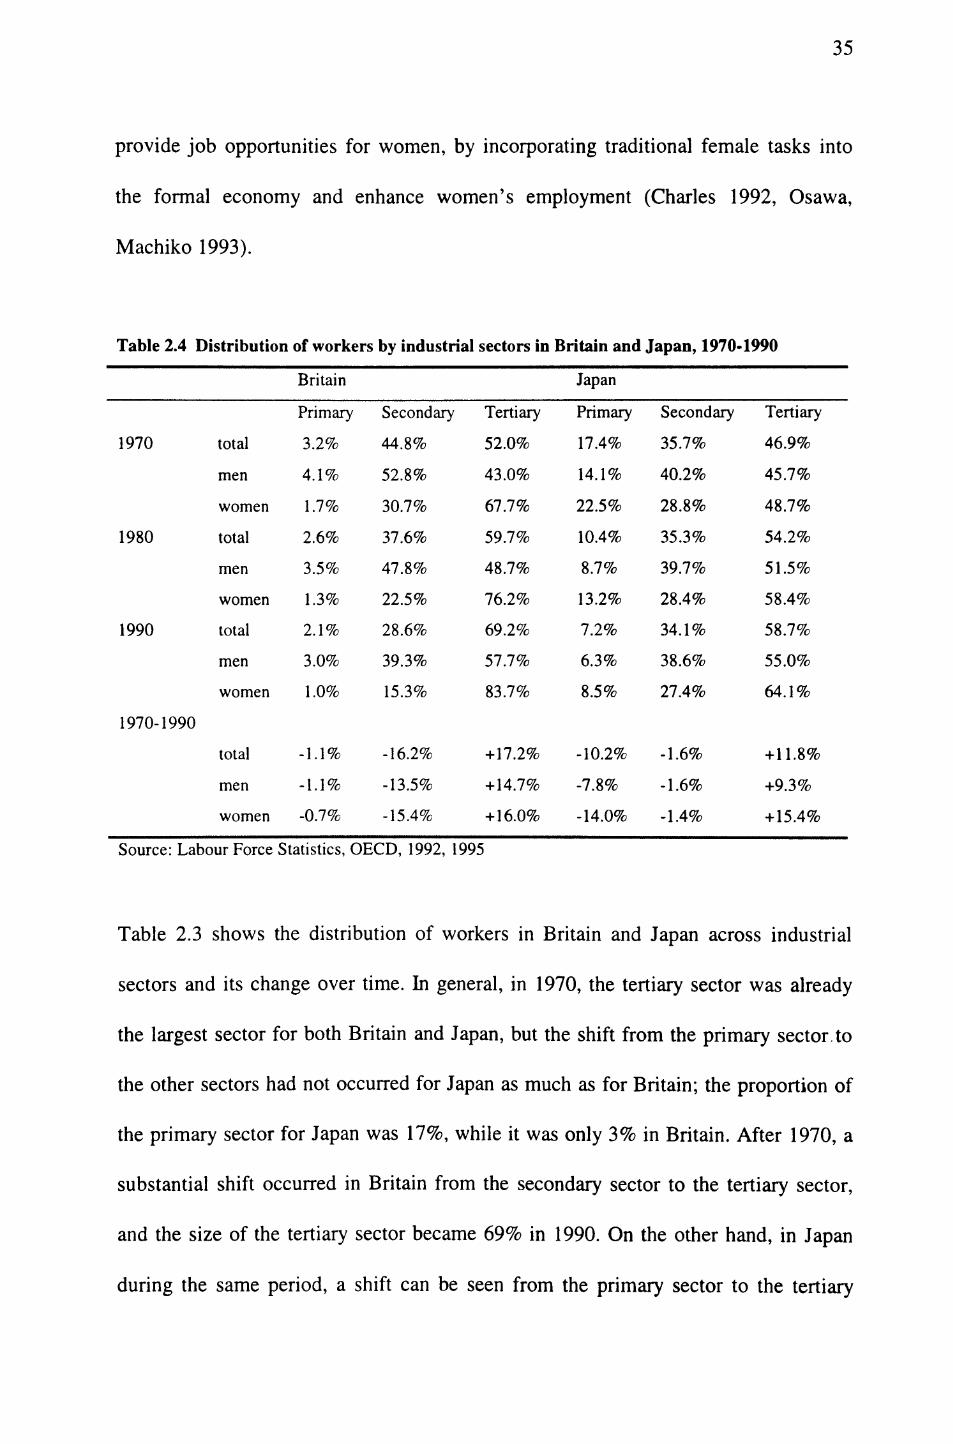
35
provide job opportunities for women, by incorporating traditional female tasks into
the formal economy and enhance women's employment (Charles 1992, Osawa,
Machiko 1993).
Table 2.4 Distribution of workers by industrial sectors in Britain and Japan, 1970-1990
1970
1980
1990
1970-1990
total
men
women
total
men
women
total
men
women
total
men
women
Britain
Primary
3.2%
4.1%
1.7%
2.6%
3.5%
1.3%
2.1%
3.0%
1.0%
-1.1%
-1.1%
-0.7%
Secondary
44.8%
52.8%
30.7%
37.6%
47.8%
22.5%
28.6%
39.3%
15.3%
-16.2%
-13.5%
-15.4%
Tertiary
52.0%
43.0%
67.7%
59.7%
48.7%
76.2%
69.2%
57.7%
83.7%
+17.2%
+ 14.7%
+ 16.0%
Japan
Primary
17.4%
14.1%
22.5%
10.4%
8.7%
13.2%
7.2%
6.3%
8.5%
-10.2%
-7.8%
-14.0%
Secondary
35.7%
40.2%
28.8%
35.3%
39.7%
28.4%
34.1%
38.6%
27.4%
-1.6%
-1.6%
-1.4%
Tertiary
46.9%
45.7%
48.7%
54.2%
51.5%
58.4%
58.7%
55.0%
64.1%
+11.8%
+9.3%
+15.4%
Source: Labour Force Statistics, OECD, 1992, 1995
Table 2.3 shows the distribution of workers in Britain and Japan across industrial
sectors and its change over time. In general, in 1970, the tertiary sector was already
the largest sector for both Britain and Japan, but the shift from the primary sector.to
the other sectors had not occurred for Japan as much as for Britain; the proportion of
the primary sector for Japan was 17%, while it was only 3% in Britain. After 1970, a
substantial shift occurred in Britain from the secondary sector to the tertiary sector,
and the size of the tertiary sector became 69% in 1990. On the other hand, in Japan
during the same period, a shift can be seen from the primary sector to the tertiary

36
sector, but the size of the secondary sector showed little change (less than 2%). As a
result, compared to Britain, the size of the tertiary sector in Japan was relatively small,
and that of the secondary sector was relatively large in 1990.
When we compare between Britain and Japan, men's distributions across
industrial sectors became quite similar in 1990, though for British men this was the
result of a shift from the secondary sector to the tertiary sector, while for Japanese
men it was brought about by a shift from the primary sector to the tertiary sector.
However, in terms of women, we can see considerable differences. For British
women, there was a considerable shift to the tertiary sector from the secondary sector
after 1970, and a high level of concentration in the tertiary sector (84%) can be found
in 1990. On the other hand, for Japanese women, although a shift occurred to the
tertiary sector, it was from the primary sector, but little shift was found from the
secondary sector. In 1990, the extent of concentration into the tertiary sector for
Japanese women was lower compared to British women (64%), but 9% of Japanese
women still worked in the primary sector, and 28% of them worked in the secondary
sector.
Summary
British women showed a dramatic change during the last two decades in their pattern
of labour force participation, and at present their age-profile is no longer in the M-
shape. However, the increase in the participation rate for British women were mainly
brought about by the rise in part-time employment. Also, as noted, British women are
highly concentrated into the tertiary sector. This suggests that although British women
have increasingly participated in the formal economy, their form of integration is

37
quite segregated from men's. In other words, paid work may be a normal activity for
British women, but still many seek their jobs which enable them to combine paid
work with domestic work.
In terms of Japanese women, the number of family workers dramatically
declined and the number of employees increased after 1970. Although part-time
employment among women has been growing, the pattern of labour force participation
still shows the M-shape curve, which suggests that after marriage and childbirth, many
stop working, and then after a break, return to the labour market.
It is notable that although in 1970, we can see considerable differences
between British men and Japanese men in their form of labour force participation (the
share of the primary sector was substantially larger and the share of employed persons
was considerably smaller for Japanese men than for British men), after then the
patterns have converged. Their distributions across the three industrial sectors as well
as employment status became quite similar in 1990. However, the real difference can
be found for women's form of participation. For Japanese women, the share of the
primary sector or family workers are still relatively large, though these are decreasing.
Also the size of the secondary sector has remained large. While the proportion of
employees and the size of the tertiary sector are very large for British women, these
are relatively smaller and still developing for Japanese women.
Occupational Distribution
We have seen in the previous section that both British women and Japanese women
have been increasingly integrated into the labour market. How is this reflected in the
occupational distributions for men and women in the two countries? In this section,

38
we examine the change in occupational distributions since 1970. Also, we provide
descriptive data to show which occupations are female occupations and male
occupations in Britain and Japan. We look at both the horizontal aspect of
occupational sex segregation (i.e., sex segregation across occupations) and the vertical
aspect of occupational sex segregation (i.e., sex segregation in different grades of
occupations) at the descriptive level.
Table 2.5 Male/female share in occupational groups in Britain and Japan, 1970-1993
Britain Japan
1971 1981 1993 77-95
Professional, technical and related
workers
Administrative and managerial
workers
Clerical and related workers
Sales workers
Service workers
Production and related workers, transport
equipment, operators and labourers
Total
%male
%female
%male
%female
%male
%female
%male
%female
%male
%female
%male
%female
%male
%female
62
38
92
8
40
60
53
47
30
70
83
17
64
36
60
40
77
23
26
74
41
59
33
67
85
15
60
40
56
44 +6
67
33 +25
24
76 +76
36
64 +77
34
66 -4
85
15 -2
55
45 +9
1970 1980 1993 77-93
64
36
95
5
50
50
58
42
44
56
73
27
61
39
56
44
93
7
46
54
61
39
45
55
74
26
62
38
58
42
91
9
39
61
61
39
46
54
71
29
60
40
+6
+4
+77
-3
-2
+2
+ /
Source: ILO Year Book of Labour Statistics, various years
Table 2.5 shows the female/male share in different occupational groups and
the change after 1970. From Table 2.5 we can see that in 1970, a few differences can
be found between Britain and Japan. Firstly, clerical occupations were more feminised
in Britain than in Japan. Secondly, service occupations were also more feminised in
Britain than in Japan. And thirdly, production occupations were more masculinised in

39
Britain than in Japan. However, since the 1970s, the differences between the two
countries have become larger rather than smaller. Firstly, women's share in
administrative and managerial occupations substantially increased in Britain after
1971, while these remained highly male-dominated in Japan. Secondly, sales
occupations changed from male-dominated to female-dominated in the 1970s, and
continued to be feminised in Britain thereafter, while they remained male-dominated
in Japan. And thirdly, clerical occupations were further feminised in Britain, while the
rate of feminisation of clerical occupations was relatively slow in Japan.
Thus, since 1970, British women have advanced into administrative/
managerial occupations, feminised sales occupations, and further feminised clerical
occupations. On the other hand, Japanese women have not fully feminised clerical
occupations, hardly increased their shares of administrative/managerial occupations
and of sales occupations. Also the share of Japanese women in production
occupations has remained relatively high.
Men's occupations and women's occupations in Britain and Japan
We have seen the difference in the distribution of men and women in highly
aggregated occupational groups. In this section, we will use the detailed occupational
classification in each country to see what are men's occupations and women's
occupations in Britain and Japan. Firstly, we look at the occupations which are
extremely male or extremely female in Britain and Japan. Jacobs (1989b) suggests
that the work performed by men and women reflects the cultural definition of sex
roles, but does the definition differ between Britain and Japan?

40
Table 2.6 Extremely male/female occupations in Britain
Extremely Male occupations % male
Clerks of workers
Face trained coal mining workers, shotfirers and deputies
Slingers
Paviors, kerb layers
Vehicle body repairers, panel beaters
Washers, screeners and crushers in mines and quarries
Plasterers
Scaffolders, stagers, steeplejacks, riggers
Auto electricians
Centre, capstan, turret and other lathe setters and setter-operators
100.00%
99.81%
99.72%
99.64%
99.60%
99.59%
99.56%
99.46%
99.46%
99.44%
Extremely female occupations % female
Midwives 99.52%
Medical secretaries 98.98%
Legal secretaries 98.90%
Other childcare and related occupations, nee. 98.83%
Typists and word processor operators 98.78%
Receptionist/telephonists 98.69%
Nursery nurses 98.53%
Beauticians and related occupations 97.38%
Other secretaries, personal assistance, typists, word processor operators, nee. 97.18%
Receptionists 97.00%
Source: British Census 1991, Economic Activity, Table 4 Note: The classification is based on the 371 unit groups.
We can see from Table 2.6 that basically, the distinction between extremely
male occupations and extremely female occupations is based on "male tasks" and
"female tasks". Typical "male tasks" in Britain mean those that require the knowledge
of machine mechanics, physical strength, or tasks which involve some danger. On the
other hand, typical "female tasks" mean those that involve caring for people,
communicating with people, or manual dexterity. This is basically the same for Japan

41
as shown in Table 2.7. However, we can see that "male tasks" in Japan are particularly
relevant to transport operations.
Table 2.7 Extremely male/female occupations in Japan
Extremely Male occupations % male
Skippers, chief engineers and engineers of fishing boat
Electric, diesel and steam locomotive engineers
Train drivers
Ship captains and navigators (except fishing boats) and pilots
Pilots, aircraft navigators and engineers
Marshallers, signallers, shunters and couplers
Coal diggers
Prop setters
Mining underground carriers
Ship carpenters
Boiler engineers
Electric power station and substation operators
Line workers
Track workers
100.00%
100.00%
100.00%
100.00%
100.00%
100.00%
100.00%
100.00%
100.00%
100.00%
100.00%
100.00%
100.00%
100.00%
Extremely female occupations % female
Public health nurses
Midwives
Clinical and sanitary experts
Domestic maids
Housekeepers
Geisha and dancing partners
Kindergarteners
Telephone operators
Nurses
Dental technicians
100.00%
100.00%
100.00%
100.00%
100.00%
100.00%
99.21%
97.11%
96.74%
94.79%
Source: Japanese Census 1990Note: The occupational classification is based on the 293 unit groups.

42
We now turn to the occupations in which a large number of men and women are
employed in Britain and Japan.
Table 2.8 10 most populous occupations for men and women in Britain
Men
Total labour force
Drivers of road goods vehicles
Managers and proprietors in service industries nee.
Metal working production and maintenance fitters
Production, works and maintenance managers
Carpenters and joiners
Storekeepers and warehousemen
Marketing and sales managers
Electricians, electrical maintenance fitters
Technical and wholesale sales representatives
Other building and civil engineering labourers nee
14,824,290
488,060
481,470
416,050
408,420
306,880
269,520
245,250
244,900
210,460
206,460
100%
3.3%
3.2%
2.8%
2.8%
2.1%
1.8%
1.7%
1.7%
1.4%
1.4%
Women
Total labour force
Sales assistants
Cleaners, domestics
Other secretaries, personal assistants, typists, word processor operators etc.
Clerks (not elsewhere specified)
Accounts and wage clerks, book-keepers, other financial clerks
Nurses
Counter clerks and cashiers
Managers and proprietors in service industries nee.
Care assistants and attendants
Primary (and middle school deemed primary) and nursery education teaching
professionals
11,090,680
830,770
660,760
619,400
523,220
444,480
435,580
297,460
270,140
265,710
224,090
100%
7.5%
6.0%
5.6%
4.7%
4.0%
3.9%
2.7%
2.4%
2.4%
, 2.0%
Source: British Census 1991, Economic Activity Table 4 Note: The classification is based on the 371 unit groups.
Of the men in the 1991 British Census, more than one-fifth worked in the 10 most
populous occupations classified by the 371 unit groups (see Table 2.8). The largest

43
occupation for British men is drivers of road goods vehicles. The 10 most populous
occupations include managerial occupations, skilled and unskilled occupations.
As much as two-fifths of the British women in the 1991 census worked in the
10 most populous occupations. The largest occupation is sales assistants. Women are
likely to be concentrated into clerical occupations, lower professional occupations,
and unskilled occupations.
Table 2.9 10 most populous occupations for men and women in Japan
Men
Total labour force
General clerical workers
Travelling commodity sale persons
Automobile drivers
Farmers and sericulturists
Directors of companies
Shop sales persons and sales clerks
Cooks
Retail dealers
Construction labourers
Travelling sales persons (except commodity, insurance and real estate)
37,332,100
3,755,400
1,973,000
1,886,100
1,771,500
1,395,500
1,065,600
783,400
777,200
760,900
747,000
100%
10.1%
5.3%
5.1%
4.7%
3.7%
2.9%
2.1%
2.1%
2.0%
2.0%
Women
Total labour force
General clerical workers
Accounting clerks
Shop salespersons and sales clerks
Farmers and sericulturists
Cooks
Nurses
Servants, waiters and waitresses
Sewing machinists
Electric machine assemblers
Labourers not elsewhere classified
24,401,700
4,771,800
2,090,000
1,951,200
1,700,200
861,000
745,100
722,300
593,900
500,300
479,900
100%
19.6%
8.6%
8.0%
7.0%
3.5%
3.1%
3.0%
2.4%
2.1%
2.0%
Source: Japanese census 1990Note: The occupational classification is based on the 293 unit groups

44
In terms of Japan, about two fifths of the men in the 1990 Japanese census
worked in the 10 most populous occupations classified by the 293 unit groups (see
Table 2.9). The occupation which employed the largest number of men is general
clerical workers. The other occupations include sales occupations, managerial
occupations, skilled and unskilled occupations, and service occupations.
As much as three-fifths of the Japanese women in the 1990 census worked in
the 10 most populous occupations (Table 2.9). The largest occupation for Japanese
women is general clerical workers. The other occupations include sales occupations,
service occupations, lower professional occupations, and semi/unskilled occupations.
It is notable that the 10 most populous occupations for Japanese women include
manual occupations, though this is not the case for British women. This seems to
reflect the economic structure in Japan that many women still work in the secondary
sector.
Japanese women are more likely than British women to share the same
occupations with men in the 10 most populous occupations. General clerical workers
occupy the top position for both men and women in Japan. Also, within the 10
occupations, women and men in Japan share shop sales persons and sales clerks,
cooks, and farmers and sericulturists. While in Britain, they share only one out of the
10 occupations; managers and proprietors in service industries not elsewhere
classified.
However, this does not necessarily mean women's equal position to men's in
these occupations in Japan, as it seems to be partly due to the difference in the
occupational classification schemes between these countries. As we will see in the

45
next chapter (see Chapter 3, p61), the British occupational classification is based on
the hierarchical features in work, while the Japanese occupational classification lacks
this feature, but occupations are grouped according to the kind of work an employed
person does. Also, it seems that the meaning of "manager" differs between these two
countries; it takes much longer experience to reach managerial positions in Japan than
in Britain. As can be seen from Table 2.10 which shows the median age for workers in
different occupational groups, administrative/managerial workers in Japan are
considerably older than the other workers, as compared to Britain. Even if men and
women work in the same occupations in Japan, it is possible that their hierarchical
positions within these occupations differ. For instance, in Japan, male clerical
workers are in general those of potential candidates for administrative/managerial
occupations, but among female clerical workers, it is more common to stop working
upon marriage or childbirth. This is reflected in the fact that female clerical workers
are substantially younger than male clerical workers in Japan as can be seen in Table
2.10.
Table 2.10 Median age for workers in different occupational groups in Britain and Japan
Professional/ technical
Admi ni strati ve/man ageri al
Clerical
Sales
Service
Production/transport
Total
Britain
Total
38.6
41.0
35.2
35.7
36.6
38.1
38.4
Men
39.3
42.1
33.3
34.4
34.4
38.4
38.8
Women
37.8
38.4
35.8
36.4
38.0
38.0
38.0
men-
women
+ 1.5
+3.7
-2.5
-2.0
-3.6
+0.4
+0.8
Japan
Total
39.5
52.3
37.9
41.6
41.9
43.1
42.3
Men
38.4
52.1
40.8
40.4
38.9
42.0
42.5
Women
33.7
53.9
35.4
43.4
44.1
45.4
42.0
men-
women
+4.7
-1.8
+5.4
-3.0
-5.2
-3.4
+0.5
Sources: British Census 1991, Japanese Census 1990Note: Agricultural/forestry/fisheries workers are excluded, though in Britain, these workers inmanagerial occupations are included.

46
Table 2.10 also shows that median age varies by occupations more in Japan
than in Britain. This is particularly so for Japanese women. For British women, the
difference in the median age between the youngest occupations and oldest occupations
is just 2.6 years, but for Japanese women it is as many as 20.2 years. Also, the age
differences by sex in different occupations are larger for Japan than for Britain. This
seems to indicate that recruitment and promotion systems in Japan are considerably
biased by sex. For Japanese women, the average workers in professional/technical
occupations and that in clerical occupations are substantially younger than their male
counterparts, which may suggest that for these occupations, women occupy lower
grade jobs, compared to men.
Vertical aspects of occupational sex segregation
We have discussed in the previous section that although men and women in Japan are
likely to work in the same occupations, they might be hierarchically segregated within
these occupations. In this section, we examine selected specified professional and
executive occupations to examine the segregation pattern which differs in grades of
occupations. Though we cannot obtain exactly the same title of occupational groups,
we can find some correspondence between Britain and Japan.
Table 2.11 shows percent female in these occupations. We can see that in the
1970s, vertical sex segregation was considerably high for both Britain and Japan, but
this is particularly so for Japan. Only 4% of judges, barristers, advocates and solicitors
and just 1% of engineers in Britain were women in 1971, while at the same time 20%
of local government officers, 21% of managers in large and small establishments were
women. In Japan, only 2% of judges, prosecutors and lawyers, 1% of government

47
officials, less than 1% of engineers, and 2% of the managers of companies and
corporations were women in 1970.
Table 2.11 Female share in top-ranked occupations in Britain and Japan, 1970-1990
Britain
Judges, barristers, advocates,solicitors
General administrators: nationalgovernmentLocal government officers:administrative and executivefunctionsAccountant, valuers, financespecialists, underwriters, brokersPersonnel and industrial relationsmanagers, O&M, work studyofficersManagers; marketing, sales,advertising, public relations,purchasingOther professional and supportingmanagementTeachers in higher education:university, further, and highereducationMedical and dental practitioners
Biologist, chemist, physicist,mathematicians, other scientistsEngineers; civil municipal,structural, mining, quarryingEngineers; mechanical,aeronauticalEngineers; electrical, electronic
Architects, town planners,quantity, building, and landsurveyorsManagers; large and smallestablishment
Average whole work-force
1971
4%
12%
20%
4%
12%
11%
34%
25%
18%
7%
*
1%
1%
1%
21%
36%
1981 a14%
19%
31%
10%
29%
16%
43%
27%
23%
20%
*
1%
2%
4%
23%
39%
1981 b15%
19%
32%
10%
29%
16%
43%
26%
23%
20%
1%
1%
2%
4%
23%
40%
1991
28%
28%
52%
22%
55%
31%
53%
44%
30%
29%
2%
2%
8%
7%
31%
44%
Japan
Judges, prosecutors andlawyers
Other judicial workersGovernment officials
Registered accountants andlicensed tax accountantsDirectors of companies
Directors of other corporations
Professors; college anduniversity
PhysiciansDentistsNatural science researchers
Civil and surveying engineers
Mechanical, aircraft andshipbuilding engineersElectrical and electronicengineersArchitects
Managers of companies andcorporations
Average whole work-force
1970
2%
7%1%
3%
8%
3%
15%
9%11%5%
*
*
1%
1%
2%
39%
1980
3%
10%1%
3%
12%
5%
16%
11%13%6%
*
*
2%
2%
2%
38%
1990
3%
12%2%
7%
13%
5%
19%
11%13%11%
1%
2%
3%
3%
4%
40%Sources: British Census for 1971 1% sample England & Wales, for 1981a 10% sample England & Wales, for 1981b, 1991, 10% sample Great Britain. Japanese Census 20% sample for 1970 and 1980, 1% sample for 1990
However, for Britain, we can see a substantial increase in the share of women in the
top ranked occupations after 1970, except for engineering occupations. For example,
in 1991, 28% of judges, barristers, advocates and solicitors, more than half of local
government officers and of personal and industrial relations managers, and nearly half
of teachers in higher education were women in Britain. However, in Japan women's

48
shares of the top ranked occupations hardly increased. In 1991, only 3% of judges,
prosecutors and lawyers, 2% of government officials, 4% of managers of companies
and corporations, and 19% of professors in college and university were women in
Japan. Thus, if we examine occupations at the top level, we can see greater
segregation in Japan than in Britain, and the change for Japan is much slower than
Britain.
Summary and Conclusion
During these two decades, British women have increasingly integrated into the labour
market, particularly as part-time workers. At present the age-profile of the labour
force participation is no longer in the M-shape, and many women continue working
after marriage and childbirth. Their advancement into the economy, however, took a
different form from men's. Nearly half of them work as part-timers, and they are
concentrated into the tertiary sector. The feminisation of clerical occupations has
further developed, sales occupations have been feminised, while production
occupations have remained highly male-dominated. However, at the same time, as
they have more advanced into the economy, women's shares of higher-grade
occupations, such as professional occupations and administrative/managerial
occupations have increased, and thus de-segregation has been occurring in terms of
vertical occupational segregation.
On the other hand, the form of the labour market participation for Japanese
women has shifted from unpaid family workers to employed workers during the last
two decades. Like British women, as they have been more integrated into the formal
economy, the share of part-time workers has increased. However, many Japanese

49
women at present still leave the labour market upon marriage or childbirth. During
these two decades, little change has occurred in their occupational distributions,
except that they have increased their share of clerical occupations. Women and men in
Japan are likely to share the same occupations, but it seems that within these
occupations, they are hierarchically segregated. The differences of median age for
different occupational groups seem to suggest that women are concentrated into lower
grade jobs. Top ranked occupations, such as administrative/managerial occupations
and professional occupations are still highly male-dominated in Japan.
Thus, we can hardly say that the forms of the labour force participation for
Japanese women and British women are converging. Rather, in terms of occupational
distributions, the differences between them have been expanding with the former
developing their share in clerical, sales, administrative/managerial occupations, while
the latter showing much slower change.
Then, can we say that Japanese economy has not yet developed fully to absorb
potential female labour to differentiate men's work and women's work? It is the case
that the number of employed women in the tertiary sector in the economy, of which
increase seems to have contributed to the feminisation of clerical occupations and
sales occupations, and to the increasing share of women in administrative/managerial
occupations in Britain, is still expanding in Japan. However, although Japanese
women have actually expanded the number of employees and the size of the tertiary
sector during these two decades, the responding change has only occurred in clerical
occupations, but for other occupations, little change has appeared. Our results rather
suggest that sex segregation within occupations might be the form which has absorbed

50
the increasing number of female workers in the Japanese labour market. Above all,
vertical occupational sex segregation has remained very high in Japan.
We will investigate the extent of occupational sex segregation and the change
over time in Britain and Japan in a more systematic way in the next chapter.

51
CHAPTER 3
THE EXTENT AND TRENDS OF OCCUPATIONAL SEX SEGREGATION
IN BRITAIN AND JAPAN
Introduction
In the previous chapter, we briefly examined what are female occupations and what
are male occupations in Britain and Japan by looking at descriptive data. In this
chapter, we will provide more systematic analyses of the extent of occupational sex
segregation and its change after the 1970s in Britain and Japan. From this chapter,
occupations are not defined by their title, but they are distinguished by the extent of
concentration of women (or men) within them.
In the previous chapter, we hypothesised that the extent of women's
integration into the labour market would affect the pattern of occupational sex
segregation. We actually found that the rapid increase of employed women in the
service sector and in part-time work in Britain was associated with the feminisation of
clerical and sales occupations, as well as the de-segregation of administrative/
managerial occupations. Also in Japan, women's advancement into the economy was
related to the feminisation of clerical occupations, though the change was not so
dramatic as for British women. Then, what change has occurred to the extent of*
occupational sex segregation at the level of entire population, as women increasingly
integrated into the labour market?
In this chapter, we will firstly examine the measurements of occupational sex
segregation. Secondly, using these measurements, we will systematically investigate

52
the extent and trends of occupational sex segregation in Britain and Japan after the
1970s.
Measuring the Extent and Trends of Occupational Sex Segregation
There are various studies that examine the extent and trends of occupational sex
segregation. Some examine the trends in a single country (Jacobs 1989a, Hakim
1981), some compare the extent between countries (OECD 1980, 1985, Charles 1992,
Shirahase & Ishida 1994, Rubery and Pagan 1995), or compare the trends between
countries (Jacobs and Lim 1992). According to their research purposes, these studies
use different methods to measure the extent and trends of occupational sex
segregation. However, no clear consensus has been achieved among researchers on the
methods to examine and compare the extent of occupational sex segregation
(Blackburn et al 1993, Watt 1994, Charles and Grusky 1995, Siltanen et al 1995). This
is because there are various methodological problems in measuring occupational sex
segregation.
The fundamental problem is inconsistency in occupational data. It is reported
that the more detailed the occupational classification is, the clearer, and therefore, the
greater the extent of occupational sex segregation that can be found (Siltanen et al,
1995). However, the occupational classification scheme differs over time; some
occupations disappear or emerge, some converge into broader categories, and'some
diverge to more detailed categories. This prevents us from seeing the pattern of
occupational sex segregation systematically. Also, even if the same classification
scheme is used, there is a possibility that the world described by the classification
itself has changed (OPCS 1990b).

53
In comparing the pattern of occupational sex segregation between countries,
the lack of consistency in the occupational classifications between countries prevents
us from seeing the differences clearly. The International Standard of Classification of
Occupations (ISCO) provided by the ILO is supposed to solve this problem by
providing international consensus in the classification schemes. However the
correspondence can only be found at the highly aggregate level rather than the detailed
level, since some countries, including Britain, retain their own classification schemes,
which have been developed with their particular national need in mind (OPCS 1990b).
This is the reason why most of the comparative studies of occupational sex
segregation use highly aggregate data (see for example, Jacobs and Lim 1992, Charles
1992).
Thus, it is preferable to use a common and detailed occupational classification
to examine the trends of occupational sex segregation in a single country or to
compare the extent between countries. However, because of the inconsistency of
classification schemes in time and space, we often need to aggregate the original data,
which may well result in losing substantial information.
Apart from the problem of occupational classification, there are problems of choosing
between types of measurement. There are basically three methods to measure the
extent of occupational segregation. The simplest method is to see the representation of
one sex within occupations. 1 For instance, if 70 men and 30 women are employed in
an occupation, this occupation is 70% male (or 30% female). We actually used this
1 Siltanen (1995) calls this as concentration, and conceptually separates it from segregation, arguing that segregation should refer to the separation of the two sexes across occupations.

54
method in the previous chapter, where we examined the shares of men and women in
the ISCO broad occupational groups, or the shares of men and women in the
occupations that are disproportionately represented by men and women. However, this
method is inconvenient to obtain a summary picture of occupational sex segregation.
This is particularly so, if there are many categories of occupations.
The best method to see the overall pattern of occupational sex segregation is to
use a segregation index. A segregation index represents the overall degree of
occupational sex segregation. By comparing the values indicated by the index, we can
analyse the overall trends of occupational sex segregation and the differences in the
extent of occupational sex segregation between countries. For example, we can
examine whether the occupational structure of the British labour market has become
more sex segregated or less sex segregated over time, or we can compare whether the
British labour market is more sex segregated than the Japanese labour market.
There are various segregation indices. The most widely used is the Index of
Dissimilarity (= ID, see for example, England 1981, OECD 1985 1988, Reskin and
Hartmann 1986, Jacobs 1989a, Rubery and Pagan 1995). ID measures the degree to
which two groups are unevenly distributed over a set of categories. The value of ID is
easy to interpret; it indicates the proportion of women (or men) who would have to
change occupations in order to be distributed in the same manner as men (see for
example Jacobs 1989a, Charles and Grusky 1995). The formula of ID is;
ID = 1/211 (Fi/F)-(Mi/M)l*100
where
I: total number of occupations
FJ : number of women in the ith occupation
MJ : number of men in the ith occupation

55
F : number of women in the total labour force
M : number of men in the total labour force
When trends are examined or the extent is compared across countries, the
index of dissimilarity is often supplemented with a size standardised index of
dissimilarity (= IDs), because the index of dissimilarity is sensitive to the relative size
of occupational groups. In comparing between Britain and Japan, this property of ID
would be a problem. For instance, the relative size of production related occupations
is considerably larger in Japan than in Britain, while the relative sizes of professional
•^
occupations, administrative/managerial occupations are larger in Britain and Japan.
The standardised index of dissimilarity indicates what the degree of segregation would
be if all occupations were of equal size. In other words, in examining trends over time,
IDs indicates what changes over time would have occurred if there had been no
change in the relative sizes of the occupations. In comparing between countries, it
indicates what differences in the extent of occupational sex segregation would have
been if there had been no difference in the sizes of occupations across countries. The
formula for LDS can be written as,
IDs = 1/211 ((Fj/Ti)/ KF/TiHMi/Ti)/1( M/Ti))l* 100
where Ti: total number of men and women in the ith occupation, and other terms are
defined as in ID.
2 In 1993, the size of production related occupations in Japan was 35%, while it was 23% in Britain. On the other hand, the size of professional/technical related occupations, and of administrative/managerial occupations for Britain were 19% and 16% respectively, but the corresponding figures for Japan were 12% and 4% respectively (ILO Year book of labour statistics 1995).

56
The standardised index of dissimilarity, however, has the property that it depends on
the rate of female labour force participation (Charles and Grusky 1995). Charles and
Grusky suggest that if the number of females in each occupation is multiplied by an
arbitrary constant, the value of IDs will typically change.
As an alternative measurement, which is not influenced by the differences in
the occupational structure and female labour force participation, Charles and Grusky
(1992, 1995) propose the Ratio Index (IR). The value of IR gives the sum of
occupation-specific deviation from proportional representation of the sexes. The
factor by which women in a given country are disproportionately represented in the
average occupation is given by exp(IR). In a perfectly integrated market, IR=0 and
exp(IR)=l . The formula of IR is;
IR=
where
Fi : number of women in the ith occupation
Mi : number of men in the ith occupations
The Ratio Index is not, however, cost free; the value is undefined in a perfectly
segregated labour market, or when Fj and/or Mj=0, because of the property of the
formula (i.e., ln(Fi/Mi) is undefined if F4 and/or Mi=0). This is not a serious problem if
we use aggregated data where this situation seldom happens. However when we use«
detailed data, it happens that some occupations are 100% female and some are 100%
male. This is what we actually found in the previous chapter; some of the occupations
in Japan are 100% male or 100% female. The inability to define the value seems to be
problematic as these occupations, in particular, should be reflected in a segregation
index.

57
The Marginal Matching Method (= MM), which is proposed by Siltanen et al
(1995) is also neither affected by female labour force participation nor occupational
structure. However, the occupational structure in this method refers to a "gender-
grouped" occupational structure, rather than the occupational structure in a
conventional sense. In MM, the occupations are grouped into either "male" or
"female". The division between male and female occupations is chosen so that the
marginal totals for gendered occupations are identical to marginal totals for the sex of
workers (i.e., male occupations matched with men and female occupations matched
with women). The relationship of segregation is the association between the two
variables of the matched marginals table. This association is the relationship between
the sex of workers and the gender of occupations. The formula for MM is;
MM = (FfMm-FmMf)/FM
where,
Ff : number of women in female occupations
Mm : number of men in male occupations
Fm : number of women in male occupations
Mf : number of men in female occupations
F : number of workers in female occupations = number of female workers
M: number of workers in male occupations = number of male workers
There are controversies on MM (Lampard 1994, Watt 1994). For instance, in MM, all
"male" and "female" occupations are assumed to have the same sex composition, and
therefore, it does not take account of different degree of "male" occupations and
"female" occupations (Lampard 1994).

58
There are various other measures used by segregation research, such as the
index of the probability of intergroup contact (see Jacobs 1989a, Jacobs and Lim
1992), the Gini-coefficient (see Siltanen et al. 1995), and Karmel and Mclachlan's
index (see Watts 1993). Choosing one appropriate measure thus seems to be difficult.
The best way is to choose between them according to the research purpose, and if
necessary supplement one measure with another. Many researchers on the
comparative study of occupational sex segregation, for example, use ID (Roos 1985,
Jacobs 1989a, Jacobs and Lim 1992, Shirahase and Ishida 1994, Rubery and Pagan
1995), and supplement it with IDS or other indices (Jacobs and Lim 1992, Rubery and
Pagan 1995).
There is another method to measure the occupational sex segregation which
focuses on the distribution of men and women across occupations classified by the
degree of concentration (Hakim 1993a, 1996, Siltanen et al 1995). This measurement
uses the same technique as the first method, e.g., calculating the sex composition
within occupations. However, it groups occupations by the degree of concentration, so
that we can obtain the information about large numbers of occupations in a more
concise manner. For example, the measurement is used by Hakim's study (1993a),
where she aggregated occupations and classified them into three groups, "female",
"male" and "integrated". Hakim argues that the classification should be theoretically<
guided or policy oriented. She, for example, used 40%, which was the female share in
the labour force as the mid-point and place "integrated" occupations within 15%
width from the point. Therefore, female occupations are defined as those with more
than 55% female workers and male occupations are defined as those with less than
25% female workers. Then, Hakim investigated the distribution of men, women, and

59
total workers across these three sex-typed occupations. However, Hakim's method
may lead to different classifications of occupations, as it depends on the female share
in the labour force, which differs over time and across countries.
We need to use the measurements which fit our purpose, i.e., examining the extent
and trends of occupational sex segregation and compare them between Britain and
Japan, as well as between men and women in each country.
The first measurement, i.e., the representation of one sex within occupations,
seems not to be useful, as it is only helpful if we are interested in particular
occupations, or occupational groups, as we saw in the previous chapter.
The second measurement, the segregation index, is the best to see the overall
extent and trends of occupational sex segregation. However, it is only effective when
we can obtain consistency in the occupational classification. For instance, in order to
compare between Britain and Japan precisely, we need the same occupational
classification between these two countries. Also, when we examine the trends of
segregation accurately, it is necessary to have a consistent occupational classification
over time. This is because the index value based on the aggregated data tends to
provide a lower estimate of the extent of segregation than that based on the detailed
data, as was mentioned earlier. Although the segregation index is able to capture the*
overall extent and trends of occupational sex segregation, it is not helpful for
examining the difference between men and women, or at least, we need to decompose
the index, in order to see the sex difference.
The third method, i.e., to examine the distributions of men and women across
sex-typed occupations, is the most effective method to investigate men and women

60
separately, though in investigating overall trends, it is not as effective as the
segregation index, since the interpretation of the results is not as simple as for the
segregation index. Another advantage of this method is that we can obtain consistency
in the occupational classification without losing information from the detailed data.
Many studies on cross-country comparison of occupational sex segregation use highly
aggregated data, such as the ISCO broad occupational groups. The basis of this
aggregation is the detailed occupational data of each country, but the occupations in
the original data are simply grouped to the broad occupational groups to which they
belong to, so that the sex segregated nature of the original data might be lost. On the
other hand, although the occupational classification in our third method takes the
same basis, i.e., the individual country's detailed occupational data, the occupations
are classified into broader groups according to percent female within them. Therefore,
compared to the method which simply groups occupations to broad occupational
groups, this method is more likely to reflect the segregated nature of original
(detailed) data. Thus, without losing the original information, this method enables us
to compare the situation between Britain and Japan.
In this thesis, we will use two kind of measurements, i.e., a segregation index
and the distribution of men and women across occupations classified by percent
female in them, to see the extent and trends of occupational sex segregation and
compare them between Britain and Japan, as well as between men and women in each
country.

61
Comparison between Britain and Japan
It is reported that the occupational classification scheme used in Britain has been
based on the distinctions in the hierarchical features in work, and has been changing in
order to retain its validity in this respect (OPCS 1990a). In the current British census,
there are three levels of aggregation of occupations; 9 major groups, 77 minor groups,
and 371 unit groups (see Appendix A, Table A.I). At the major group level, the most
relevant criteria of the classification are "type of skill" and "level of skill", and at the
minor group level, the criterion is "type of skill" rather than "level of skill" (OPCS
1990b). On the other hand, the current Japanese occupational classification used by
the Japanese census does not have such a hierarchical feature. It consists of 10 major
groups, 61 medium groups, and 293 minor groups (see Appendix A, Table A.2).
These are grouped according to "the kind of work" an employed person does, which is
rather a vague criterion, compared to Britain. 3
It is difficult to find correspondence between the two countries at the major
group level. For instance, in Japan, all the agricultural workers belong to a major
group "agricultural, forestry and fisheries workers", while in Britain, they are
hierarchically divided into two major groups, "managers and administrators" and
"other occupations". Also, in Japan, physicians and nurses are in the same major
group, "professional and technical workers", while in Britain, medical practitioners
belong to "professional occupations" and nurses belong to "associate professions and
technical occupations". Having seen these examples, it seems that "the kind of work"
criterion for the Japanese classification is more similar to the "type of skill" criterion
3 This, however, seems to reflect the different notions of occupation and skill for Britain and Japan . We will discuss this issue in Chapter 8.

62
rather than "level of skill" criterion. Therefore, it is better to look at occupations at the
minor group level.
There are two methods to find occupational correspondence between these
countries. One is to match each country's occupations to the ISCO classification, and
the other is to match each country's occupations directly. The former method is
difficult at a detailed level, as international consensus is made at the highly aggregated
level, rather than at the detailed level. For instance, we can find correspondence
between the ISCO68 classification and the Japanese census classification after 1970 at
the most aggregated level.
Matching each country's occupations directly is also difficult because different
occupations are found between the two countries. The classification of occupations
depends on the economic or cultural structure of each country. For instance, this might
be a very particular case, but in Japan, we can find "Tatami (Japanese mat) installers",
but cannot find any equivalence in Britain. Even if we can obtain some
correspondence, we lose substantial information as far as matching occupations
between countries requires aggregation of occupations. Moreover, even if the same
occupational title can be found, the world described by the title might differ between
Britain and Japan.
In considering the choices of the agents involved in the construction and
maintenance of occupational sex segregation that will be discussed later in our
analytical chapters, the occupations classified by each country's own scheme seem to
be the most basic representative units. However, using different occupational
classifications between Britain and Japan might well distort our results. How shall we
cope with this dilemma?

63
We need to compare the extent and trends of occupational sex segregation
between Britain and Japan, as well as between men and women. In order to compare
the extent of occupational sex segregation between Britain and Japan, it is necessary
to aggregate occupations even if this means that we lose information. We use two
kinds of aggregated data. One is by the ISCO68 Major groups. They are,
0/1. Professional, technical and related workers
2. Administrative and managerial workers
3. Clerical and related workers
4. Sales workers
5. Service workers
6. Agriculture, animal husbandry and forestry workers, fishermen and
hunters
7/8/9. Production and related workers, transport equipment operators and
labourers
x Workers not classified by occupation
This data comes from the ILO Labour Force Statistics Table 2B, which is based on the
census or the labour force survey of the two countries. We will exclude category "x"
(workers not classified by occupations) to avoid the potential differences in the
definition between Britain and Japan.4 Although we might lose information by
aggregating original data classified by each national scheme into these broad<
categories, using the ISCO68 major groups allows us to exclude the bias caused by the
different occupational classification schemes between Britain and Japan.
4 For instance, a greater proportion of workers in Britain belong to the category "x" compared to Japan.

64
The second aggregation is made by percent female (or percent male) in
occupations classified by each national census scheme. We will classify occupations
into three groups "female", "male" and "mixed". Female occupations are defined as
those where more than 70% of the workers are female, male occupations are defined
as those where more than 70% of the workers are male, and mixed occupations are
those in the middle. We could have used different groupings, but this classification is
easy to understand as it has only three categories, it is not country-specific, and it is
gender symmetrical. The same classification is used to analyse occupational sex
segregation by American studies (Jacobs 1989b, Hakim 1993a, Rosenfeld and
Spenner 1995). As have discussed, this aggregation does not lose the information
from the original data, as it takes account of the sex composition in the detailed
occupational data. However, it is not entirely free from the different classification
schemes of Britain and Japan, as the information of sex segregation comes from the
original data.
Our detailed-level data came from the census in each country. This gives
further information of the extent and the trends of occupational sex segregation.
However, it is not recommended to use this data to compare between Britain and
Japan directly, since the classification differs between Britain and Japan. Therefore,
the detailed data is only directly used to examine the trends of segregation within
countries.
For the British census, the number of the minor occupational units changed
considerably between 1971 and 1991 from 223 to 371. In examining the trends within
Britain, this might well distort our results. As mentioned, it is preferable to use a
common classification scheme to obtain reliable results. Though basically, in each

65
British census, occupations were classified by its own classification, the 1981 census
has a table which re-classifies 1971 occupational data by the 161 unit groups of the
OPCS 1980 classification. The OPCS 1980 classification is the one used in the 1981
census. Also, the 1991 census has a table which re-classifies the 1991 occupational
data by the same 161 unit groups. Therefore, we will use the 161 unit groups of the
OPCS 1980 classification as the detailed data to investigate the trends of segregation
in Britain. In terms of Japan, the occupational classification between 1970 and 1990
has showed little change, and the numbers of the minor units show little variation.5
Therefore, we will use each census's classification.
Then, how should we measure the extent and trends of occupational sex
segregation? For the comparison of the extent of occupational sex segregation
between Britain and Japan, we firstly use a segregation index. As mentioned, there are
various segregation indices. They all indicate the degree of segregation but in different
manners. For comparing the extent of occupational sex segregation between Britain
and Japan and their trends over time, we use the ISCO68 major groups, and examine
the values of the index of dissimilarity, the standardised index of dissimilarity, the
ratio index, and the marginal matching method.
Also in investigating trends within the two countries, we use more detailed
data classified by each national scheme. For Britain, we use the 1980 OPCS 161 unit
occupational groups, and for Japan, each census occupational classifications. We
apply the index of dissimilarity, the standard index of dissimilarity, and the marginal
matching method to the detailed data. We avoid using the ratio index, as some
5 The number of occupational group was 284 in the 1970 census, and 296 in the 1990 census.

66
occupations are 100% female or 100% male in the Japanese data, so that the value of
the ratio index is undefined.
Secondly, we will examine the distribution of men and women across "male",
"mixed" and "female" occupations, using the aggregated data by percent female in
occupations. This method supplements the segregation indices, as it is suitable to
examine to what extent men and women are concentrated into these three types of
occupations, and how it changed over time. Also, as mentioned, though we aggregate
data, it has not lost the information of sex segregated nature of occupations from the
original data, so that we can compare the situation between Britain and Japan in more
detail than using the ISCO broad occupational groups.
For both aggregated and detailed data, we examine the data which include
agricultural workers as well as the data which exclude them. As have seen in the
previous chapter, the size of the agricultural sector considerably differs between
Britain and Japan, although it has shown substantial change in Japan since 1970.
Given the size and sex-neutral nature of this sector in Japan that was found in the
previous chapter, the extent and trends of occupational sex segregation based on these
two kinds of data might well differ.
Extent and trends of occupational sex segregation since 1970
Occupational sex segregation measured by the summary index
In this section, firstly, we will use the occupational data classified by the ISCO68
major groups to see the extent and trends of occupational sex segregation. Table 3.1
summarises the results. The results based on non-agricultural workers are shown in
parentheses. From Table 3.1, we can firstly see that all the segregation indices show
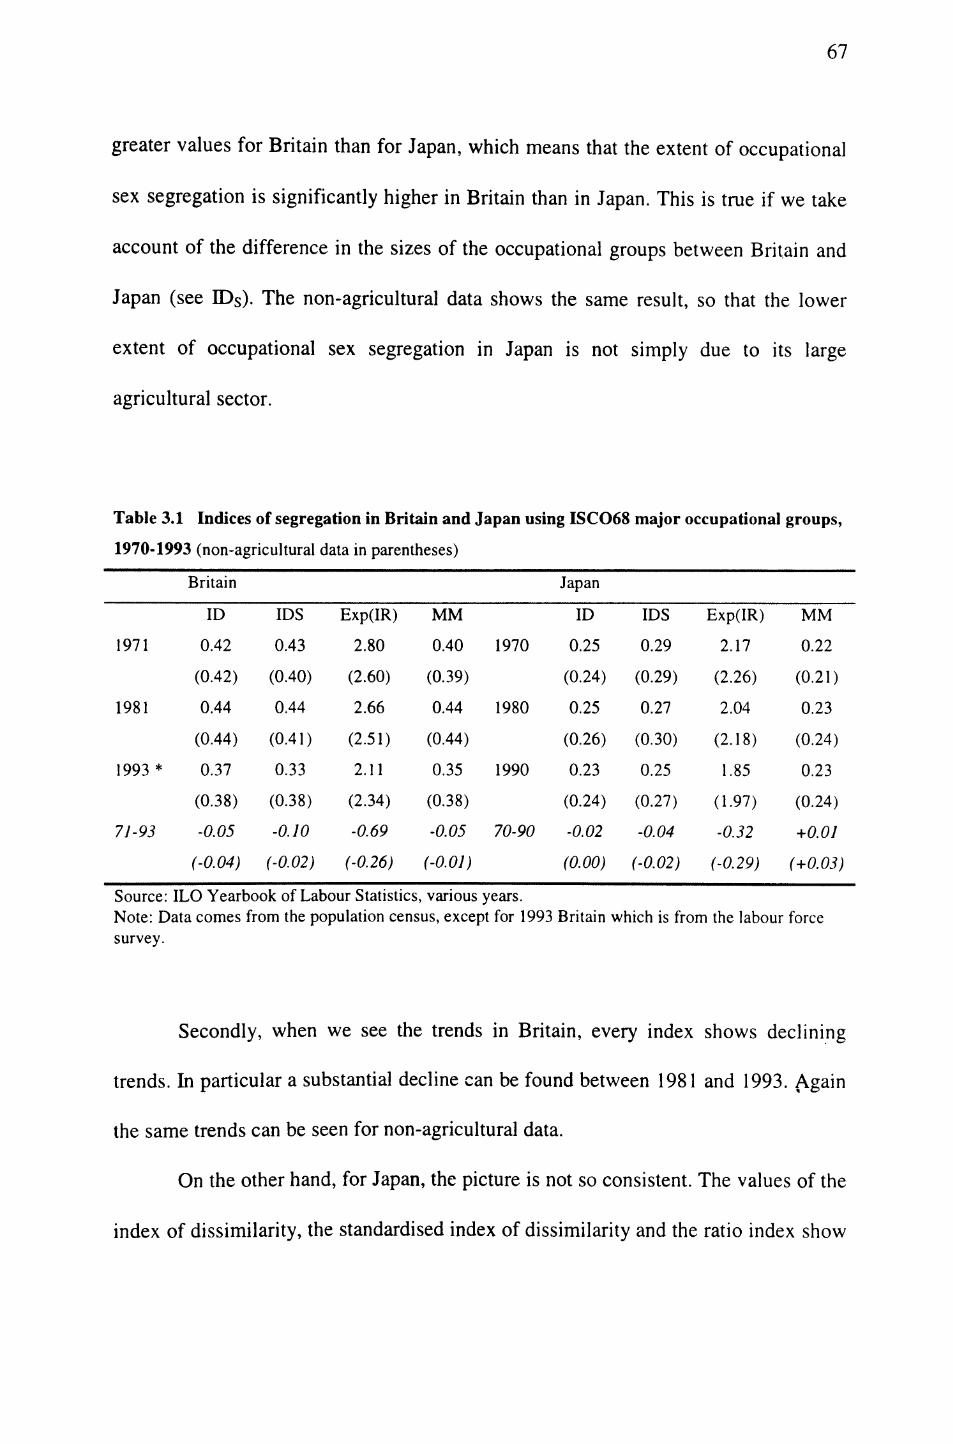
67
greater values for Britain than for Japan, which means that the extent of occupational
sex segregation is significantly higher in Britain than in Japan. This is true if we take
account of the difference in the sizes of the occupational groups between Britain and
Japan (see IDs). The non-agricultural data shows the same result, so that the lower
extent of occupational sex segregation in Japan is not simply due to its large
agricultural sector.
Table 3.1 Indices of segregation in Britain and Japan using ISCO68 major occupational groups,
1970-1993 (non-agricultural data in parentheses)
1971
1981
1993*
71-93
Britain
ID
0.42
(0.42)
0.44
(0.44)
0.37
(0.38)
-0.05
(-0.04)
IDS
0.43
(0.40)
0.44
(0.41)
0.33
(0.38)
-0.10
(-0.02)
Exp(IR)
2.80
(2.60)
2.66
(2.51)
2.11
(2.34)
-0.69
(-0.26)
MM
0.40 1970
(0.39)
0.44 1980
(0.44)
0.35 1990
(0.38)
-0.05 70-90
(-0.01)
Japan
ID
0.25
(0.24)
0.25
(0.26)
0.23
(0.24)
-0.02
(0.00)
IDS
0.29
(0.29)
0.27
(0.30)
0.25
(0.27)
-0.04
(-0.02)
Exp(IR)
2.17
(2.26)
2.04
(2.18)
1.85
(1-97)
-0.32
(-0.29)
MM
0.22
(0.21)
0.23
(0.24)
0.23
(0.24)
+0.01
(+0.03)
Source: ILO Yearbook of Labour Statistics, various years.Note: Data comes from the population census, except for 1993 Britain which is from the labour forcesurvey.
Secondly, when we see the trends in Britain, every index shows declining
trends. In particular a substantial decline can be found between 1981 and 1993. Again
the same trends can be seen for non-agricultural data.
On the other hand, for Japan, the picture is not so consistent. The values of the
index of dissimilarity, the standardised index of dissimilarity and the ratio index show

68
decreasing trends, while the marginal matching method shows increasing trends
between 1970 and 1990. This is also the case for non-agricultural data.
We now turn to the detailed data (see Table 3.2). The detailed data for Britain
and Japan came from census of population. For British data, we use the OPCS 1980
161 unit-group classification, and for Japanese data we use the 3-digit occupational
classification of each census. First of all, it is noticeable that the values of all the
indices are much higher than the values based on the ISCO68 broad categories. As we
mentioned, this reflects the tendency that the more detailed data is used, the greater
the extent of occupational sex segregation is to be found. As have discussed, we
cannot compare the extent of occupational sex segregation between Britain and Japan
using the detailed data, as we use different occupational classifications between the
two countries. However, we can examine the trends within countries as the
classification is consistent within countries.
Table 3.2 Indices of segregation in Britain and Japan using census occupational classification,
1970-1991 (non-agricultural data in parentheses)
Britain Japan
ID IDS MM ID IDS MM
1971 0.66 0.64 0.62 1970 0.48 0.59 0.42
(0.66) (0.64) (0.62) (0.53) (0.59) (0.48)
1981a 0.65 0.60 0.63 1980 0.50 0.56 0.43
(0.65) (0.60) (0.63) (0.54) (0.57) (0.46)
1981b 0.65 0.60 0.64 1990 0.52 0.55 0.46
(0.65) (0.60) (0.63) (0.55) (0.56) (0.48)
1991 0.60 0.58 0.59
(0.60) (0.57) (0.59)
77-97 -0.06 -0.06 -0.03 70-90 +0.04 -0.04 +0.04
(-0.06) (-0.07) (-0.03) (+0.02) (-0.03) (0.00)
Source: British census, England and Wales for 1971 and 1981a, Great Britain for 1981b and 1991. Japanese census 1970, 1980, and 1990.

69
In terms of Britain, again, we can see consistent trends from the three indices
that the extent of occupational sex segregation decreased between 1971 and 1991.6 In
particular, the change can be found between 1981 and 1991. This is the same for non-
agricultural data. In terms of Japan, again we cannot see any consistent trends
between the segregation indices. The index of dissimilarity and the marginal matching
method show increasing trends between 1970 and 1990, but the standardised index of
dissimilarity show decreasing trends. This is basically the same for non-agricultural
data.
Also for Japan, the trends indicated by the index of dissimilarity and the
marginal matching method using the data based on the ISCO68 major groups and
those using the 3-digit census occupational data sometimes show different directions.
For instance, the value of the index of dissimilarity based on the 3-digit census data
steadily increased, but that based on the ISCO68 data declined after 1980. This also
happens for non-agricultural data. This result challenges Jacobs and Lim's "parallel
lines" argument, where they suggest that the trends obtained from aggregate data
correspond to the trends obtained from detailed data (Jacobs and Lim 1992).
In summary, the examination of the segregation indices showed that firstly the extent
of occupational sex segregation is greater in Britain than in Japan. This result was
supported by various segregation indices. Secondly, in Britain between 1971 and
1993, there had been decreasing trends of occupational sex segregation. In particular,
6 For Britain, we need to compare between 1971 and 198la, and between 1981b and 1991, as the former data based on England and Wales, and the latter data based on Great Britain.

70
the change can be found after the 1980s. These trends can be seen for both the
aggregated data and the detailed data. However, in Japan, no consensus can be found
for the trends of occupational sex segregation among various indices as well as
between the data based on the ISCO68 major groups and that on the 3-digit census
classification.
Distribution of men and women across sex-typed occupations
We will now examine to what extent men and women are employed in occupations
predominantly done by their own sex, how the extent has changed over time, and how
much the extent differs between Britain and Japan. In so doing, we will look at the
distribution of men and women across three sex-typed occupations, which are
classified according to percent female (or percent male) in the original occupations in
each national census (see Table 3.3).
Firstly, we will look at the British data which includes agricultural workers.
We need some caution in examining the results for Britain, since for the 1971 census,
the OPCS80 classification is only available for England & Wales7 , and for the 1991
census it is only available for Great Britain. However, the 1980 census has the data
based on both England & Wales(1980a) and Great Britain(1980b), so that we can
examine the trends by comparing between 1970 and 1980a, and between 1980b and
1990. In terms of the distribution of workers, we can see that there was a gradual shift
from male occupations to mixed occupations and to female occupations after 1971. 8
For British men, between 1970 and 1980a, the proportion of workers in male
7 This information is available in the 1981 British Census, Table A.8 In the British labour market after the 1970s, the sizes of the service sector and of part-time employment expanded, and this seems to have contributed to the feminisation of occupations.

71
occupations slightly decreased, but that of mixed occupations slightly increased.
Between 1980a and 1990, there was a further shift from male occupations to mixed
occupations for British men. For British women, little change can be found in the
1970s, but in the 1980s, there was a slight shift from female occupations to mixed
occupations. In comparing men and women in Britain, in 1971, men were much more
segregated than women. However, the difference had become smaller over time, as
men shifted from male occupations to mixed occupations. Basically, the same result
can be found for non-agricultural data in Britain.
Table 3.3 Distribution of men and women across sex-typed occupations in Britain and Japan,
1970-1991 (non-agricultural data in parentheses)
Britain
1971 workers
male
female
198 la workers
male
female
1981b workers
male
female
1991 workers
male
female
male occupati on
54%(52%) 77%
(77%) 12%
(11%) 49%
(47%) 74%
(73%) 11%
(10%) 49%
(48%) 74%
(73%) 11%
(10%) 42%
(41%) 67%
(65%) 10%
(10%)
mixed occupati on
26%(27%) 19%
(19%) 40%
(40%) 30%
(31%) 22%
(23%) 42%
(43%) 20%
(20%) 17%
(17%) 24%
(25%) 25%
(25%)23%
(24%) 27%
(27%)
female occupati on
20%(21%)
4%(4%) 48%
(49%) 21%
(22%) 4%
(4%) 47%
(47%) 31%
(32%) 9%
(10%) 65%
(65%) 33%
(34%) 10%
(11%) 63%
(63%)
Japan
1970 workers
male
female
1980 workers
male
female
1990 workers
male
female
male occupati on
39%(47%) 57%
(65%) 9%
(12%) 41%
(45%) 60%
(65%) 10%
(11%) 42%
(45%) 62%
(66%) 11%
(12%)
mixed occupati on
53%(43%) 41%
(33%) 72%
(62%) 51%
(46%) 39%
(34%) 72%
(68%) 45%
(41%) 34%
(30%) 61%
(57%)
female occupati on
8%(10%)
2%(2%) 19%
(26%) 8%
(9%) 1%
(1%) 18%
(21%) 13%
(14%) 4%
(4%) .28%(31%)
Sources: British Census for 1971 1% sample England & Wales, for 1981a 10% sample England & Wales, for 1981b, 1991, 10% sample Great Britain. Japanese Census 20% sample for 1970 and 1980, 1% sample for 1990

72
We now turn to the Japanese data including agriculture. It is notable that the
proportion of workers in mixed occupations is substantially larger in Japan. Over half
of the workers in 1970 were in mixed occupations. Although the proportion gradually
declined, 45% of the workers in 1990 still worked in mixed occupations in Japan.
After the 1980s, the proportion of workers in female occupations slightly increased.9
In comparing between 1970 and 1980, for Japanese men, we can see a slight increase
in the proportion of workers in male occupations. After the 1980s, for Japanese men,
we can again see a small increase in the proportion of workers in male occupations,
and a slight decline in the proportion of workers in mixed occupations. Also, the
proportion of workers in female occupations for Japanese men slightly increased in
the 1980s. For Japanese women, between 1970 and 1980, little change can be found.
However, in the 1980s, a substantial shift occurred from mixed occupations to female
occupations. In comparing men and women, Japanese men are much more
concentrated into male occupations than Japanese women are into female occupations;
in 1990, 63% of men were in male occupations, but only 28% of women were in
female occupations.
Unlike Britain, the Japanese non-agricultural data shows different patterns
from the data including agriculture. This difference seems to reflect the sex-neutral
nature of agricultural work. Firstly, the data shows that the proportion of workers in
mixed occupations is substantially smaller, but the proportion of workers in« male
occupations is larger than when agricultural workers were included. Secondly, the
extent of segregation for both men and women is greater for non-agricultural data;
men are more likely to be found in male occupations, so are women in female
9 This seems to be relevant to the fact that the sizes of employees and of service sector for Japanese women expanded, during the period.

73
occupations. Third, for men, little change can be found in their proportion in male
occupations between 1970 and 1990, but in the 1980s, their proportion in female
occupations slightly increased. For women, between 1970 and 1980, there was a shift
from female occupations to mixed occupations, but after 1980, the reverse shift
occurred.
Finally, we will compare Britain and Japan. Firstly, we can see that in Britain,
both men and women are concentrated into sex-typical occupations, but in Japan, this
can only be seen for men but not for women. Women in Japan are likely to be found
in mixed occupations rather than in female occupations. Secondly, when we compare
between British men and Japanese men, the difference in their distributions across
sex-typed occupations have become similar over time with the former shifting to
mixed occupations. However, this is not the case for women; British women have
kept highly concentrated into female occupations, but the size of female occupations
for Japanese women has remained small. It seems that Japanese women are
concentrated into mixed occupations, but given the range of mixed occupations (31-
69%) which is wider than female occupations (70-100%), the proportion of Japanese
women in mixed occupations is not particularly large. We can at least say that
Japanese women are not concentrated into female occupations. Thirdly, Britain has
decreased the extent of occupational segregation since 1971, and this has been
generated mainly by men shifting from male occupations to mixed occupations. On
the other hand, it seems that Japan has started to increase the extent of occupational
segregation after the 1980s, with a considerable proportion of Japanese women
shifting from mixed occupations to female occupations, although there has been a
slight shift from mixed occupations to female occupations for Japanese men.

74
Summary
We have examined various data and measurements to obtain the picture of the extent
and trends of occupational sex segregation in Britain and Japan. We used two levels
of data - one based on the ISCO68 major groups, and the other on each census 3-digit
classifications - and examined various summary indices, as well as examining the
distribution of men and women across sex-typed occupations. As a result, we found
that the extent of occupational sex segregation is lower in Japan than in Britain. We
further investigated why it is lower in Japan than in Britain, and found that this is
because of the difference in the distributions of women across sex-typed occupations.
British women are concentrated into female occupations, while this is not the case for
Japanese women. In Britain, 63% of women were employed in female occupations in
1991, but in Japan, the corresponding figure is 28% in 1990. However, men's
distribution across sex-typed occupations has become similar over time between
Britain and Japan, though British men are slightly more likely to work in female
occupations than Japanese men.
In terms of the trends of occupational sex segregation, the segregation indices
showed decreasing trends for Britain after the 1970s. The examination of the
distributions of workers across sex-typed occupations showed that this was mainly
generated by British men shifting from male occupations to mixed occupations.
British women also slightly shifted from female occupations to mixed occupations in
the 1980s. Thus, for both men and women, neutralising trends can be found for
Britain. On the other hand, for Japan, the segregation indices did not show any
consistent trends. However, the distribution across sex-typed occupations showed that

75
after 1980, for Japanese women, a considerable shift from mixed occupations to
female occupations can be found. While for Japanese men, there occurred a slight
shift to female occupations in the 1980s.
As we found in the previous chapter which examined the pattern of women's
integration into the labour market, women, but not men, again showed different
patterns of labour market participation. Men's distributions across sex-typed
occupations were different in the 1970s, but the patterns for British men and for
Japanese men started to converge after then and became quite similar in 1990.
Although British women gradually increased the share of mixed occupations after the
1970s, and Japanese women increased the share of female occupations after the
1980s, their distributions across sex-typed occupations differ substantially. As we
noted in the previous chapter, it might be argued that Japanese women will further
increase the share of female occupations, as there is more room for employees to
increase relative to other types of workers and for the service sector to develop.
However, the large size of mixed occupations for Japanese women seem to imply that
they have been integrated into the labour market through occupying the lower grades
of the same occupations as men, rather than through occupying different occupations
from men. We will further investigate this issue in Chapter 6 and Chapter 8.
76
CHAPTER 4
OCCUPATIONAL SEX SEGREGATION AT THE LEVEL OF INDIVIDUALS
Introduction
In the previous chapter, we examined the difference in the extent and trends of
occupational sex segregation between Britain and Japan, as well as between men and
women in each country at the aggregate level. The findings are, firstly, that the extent of
occupational sex segregation is substantially greater in Britain than in Japan. Secondly,
both British men and British women are concentrated into sex-typical occupations,
although in Japan, it is only the case for men but not for women. Thirdly, since the
1970s, Britain has been decreasing its extent of occupational sex segregation, while no
consistent change in the extent of occupational sex segregation can be found for Japan.
In this chapter, we will examine occupational sex segregation at the individual
level. Does the greater extent of occupational sex segregation in Britain than in Japan at
the aggregate level mean that it is more difficult for British workers than for Japanese
workers to enter and stay in sex-atypical occupations? Do the decreasing trends of
occupational sex segregation in Britain at the aggregate level mean that it has become
easier for individual workers in Britain to enter and remain in sex-atypical occupations?
The results found in the previous chapter do not tell the micro or individual actions that
underlie the macro stability or change. The picture at the aggregate level might be static,
but it may be more dynamic at the individual level. Jacobs (1989b), for instance,
suggests that in the US, though occupational sex segregation is stable at the aggregate
level, it is much more fluid at the micro or individual level. Also, even if there is a
decline in the extent of occupational sex segregation at the aggregate level, this does not

77
necessarily mean that entering sex-atypical occupations has become easier for individual
workers. For instance, the decline might be simply generated by the structural influence
which changed the distribution of sex-typed occupations, or by cohort-replacement that
younger workers enter less segregated occupations than older workers, but within
cohorts there may be no change in their tendency to work in sex-typical occupations or
in sex-atypical occupations.
As far as social change occurs as the aggregate of individual actions, it is
necessary to see individual movements across gendered occupations. This is particularly
so with regard to the implication of occupational segregation for the experiences of men
and women in the labour market. For instance, if individual men and women randomly
change jobs between sex-typical occupations and sex-atypical occupations, we cannot
apply supply-side explanations successfully, since these assume systematic patterns of
movements. We would rather need to focus on demand-side or structural explanations,
given the stability of occupational sex segregation at the aggregate level. However, if
there are any systematic movements for individual workers between sex-typical and sex-
atypical occupations, this would imply that the experience in sex-typical occupations
and in sex-atypical occupations differs. The difference would induce individual workers
to enter, stay or leave these occupations.
Since we try to explain the mechanism of occupational sex segregation in the
following chapters at the individual level by focusing on the implication of occupational
sex segregation for individual workers' experiences, we need to find out whether men
and women randomly change their jobs between sex-typical occupations and sex-
atypical occupations, or systematically move between them. If the movements are not
random, we will investigate further whether the patterns of movements between sex-

78
typical occupations and sex-atypical occupations differ between Britain and Japan, as
well as between men and women.
Approaches to individual job mobility
In order to see the individual movements across gendered occupations, longitudinal data
analysis is necessary. Jacobs (1989b), for instance, found in the US labour market that
though occupational sex segregation is very stable at the aggregate level, it is much more
fluid at the micro or individual level. In Britain, Scott and Burchell (1994) also found
that there is less occupational sex segregation at the individual level than the aggregate
level. According to their study, a considerable proportion of women spent their career
life in both sex-typical and sex-atypical occupations.
Individual mobility (or immobility) across sex-typed occupations is often
captured by comparing two time points or two career stages of individual workers
(Jacobs 1989b). However, by doing this, the movements that have taken place between
the two points of time are ignored; there is a possibility that even if an individual worker
shows immobility at time B compared to at time A, he/she might have moved across
sex-typed occupations between A and B. This might be a problem, if our interests lie in
examining the systematic nature of the movements between sex-typical occupations and
sex-atypical occupations. Also, taking two points of time might cause a sampling error,
since those who do not have jobs at both A and B are excluded from the analysis. '
Another approach to individual mobility is to examine the types of careers of
individual workers. For instance, Scott and Burchell (1994) distinguished several career
types, such as "only male", "male and mixed", or "male and female" etc. This method
has an advantage over the previous one in that every individual worker can be taken into

79
consideration. However, in Scott and Burchell's study, a person who had a short
experience in the labour market can be categorised in the same way as a person who had
a longer or continuous employment. Moreover, even if having the same length of
employment, a person who worked in both sex-typical and sex-atypical occupations, but
only a small part of whose career was spent in sex-atypical occupations, is categorised as
the same as a person who worked half of his/her career in the former and half in the
latter. In order to understand occupational sex segregation at the individual level, this is
problematic. For instance, for the latter case, the career of the former person should be
regarded as more segregated than the career of the latter. At the least, we need a more
detailed classification of gendered careers to distinguish between them.
An alternative approach to individual mobility is to examine the patterns of job
movements across sex-typed occupations, using job shift data (Rosenfeld & Spenner,
1995). Rosenfeld and Spenner (1995) restructured work history data into records based
on jobs, so that the pattern of job shifts across sex-typed occupations could be examined.
This method does not require that women be employed on two specific time points or
have continuous employment. However, as it is based on a job rather than an individual
worker, it reflects all job shift patterns across individual career trajectories.
It depends on the purpose of research which method should be taken. In this
chapter, we are interested in examining whether individual workers show systematic
movements between sex-typical occupations and sex-atypical occupations, and whether
the patterns of the movements between sex-typical occupations and sex-atypical
occupations are different between Britain and Japan, as well as between men and
women. In so doing, the best way is to take account of every job movement in the
individual job histories. We count the occurrence of every job shift, and look at the

80
patterns of the movements. Therefore, a job is the unit of analysis, rather than an
individual worker or an individual career pattern. However, we will also consider the
impact of the patterns of job movement on individual workers' careers in the last part of
this chapter, by looking at job duration in sex-typed occupations and the frequency of
job shifts.
Comparison between Britain and Japan
Individual job mobility can be influenced by both structural factors and individual
factors. For instance, if male occupations are more available, there might be more
movements into male occupations. In comparing between men and women, and Britain
and Japan, excluding structural factors is necessary, since the distributions of
male/mixed/female occupations differ between men and women as well as between
Britain and Japan, as we have seen in the previous chapter. We have to distinguish
between "gross" movements and "net" movements. "Gross" movements are the
movements which include the influence of both structural factors and individual factors.
On the other hand "net" movements are those where structural factors are controlled.
Distinguishing between "gross" movements and "net" movements is important when we
compare two countries where different labour market structures exist. Also, if we find
no systematic movement across sex-typed occupations (or find random movements
across them) after controlling for the structural factors, this would imply the
ineffectiveness of the supply-side explanation, since the individual workers here are just
responding to their circumstances. In this case, the aggregate change would be simply
generated by structural factors, or demand-side factors, or the factors external

81
to individual workers. Thus, distinguishing between "gross" movements and "net"
movements are particularly important for our following analytical chapters.
We have some limitations in comparing between Britain and Japan. The first
limitation comes from data. The data used for Britain comes from the Employment in
Britain Survey (EIB) which was conducted in 1992, and for Japan, it is drawn from the
Women's Occupational Mobility and Career Survey (OMC), carried out in 1983, both of
which have retrospective work history data. For both data sets, the coding scheme is
basically the same; job histories begin with the first job after leaving school, and cover
all jobs thereafter to the time of the survey. Even if the respondent did not change their
organisations or establishments, if the job title or job content was changed, this was
counted as one event. However, the British data and Japanese data have different
samples. Though the Japanese data includes both economically active and non-active
samples, the British data lacks a sample of economically non-active. Excluding the non-
active sample might cause an estimation error about the job movements between sex-
typical and sex-atypical occupations. However, given the absence of a non-active sample
in the British data, the only way to make the two data sets comparable is to exclude non-
actives from the Japanese data. Therefore, we need some caution in interpreting the
results.
Secondly, the British data permits a comparison between men and women. On
the other hand, the Japanese data only includes women, and therefore, it is only women
that can be compared between Britain and Japan. However, Chapter 2 and Chapter 3
have shown that it is between British women and Japanese women that we found the
substantial difference in labour market behaviour, not between British men and Japanese
men. In this sense, it is not so crucial that we lack the data for Japanese men.

82
The third limitation is that the Japanese survey was conducted nine years before
the British survey, and these nine years seem to be crucial with regard to women's
employment, so that direct comparison seems to be difficult. Nevertheless, unlike cross-
sectional data, work history data provides information from the beginning of the first
job. Therefore, it is possible to compare the two countries, if we focus on a particular
time period.
The fourth limitation comes from sample representation of our job shift data.
Since we take a job as the unit of analysis rather than an individual worker, those who
experienced more job shifts are counted more than those with less movements.
However, as our interests lie in examining the patterns of job movements across sex-
typed occupations in the actual labour market, there is no reason that a person who
experienced more movements should be given equal weight to a person who
experienced less movements. If the original sample is the representative sample, the
patterns found in the job shifts are also supposed to represent the patterns of job shifts in
the labour market.
The last limitation concerns data reliability, as the work history data is
retrospective. It is not certain that people remember the past event as well as the present
event. Also, people tend to remember the longer events rather than the shorter events.
However, as the coding scheme for the British data and Japanese data is the same for the
work history data, we cannot find any plausible reasons for the differences in'these
tendencies between British men and British women, as well as between British women
and Japanese women.
Apart from problems about data, we have a measurement problem. How shall
we classify each job event in the job histories into sex-typed occupations? As in the
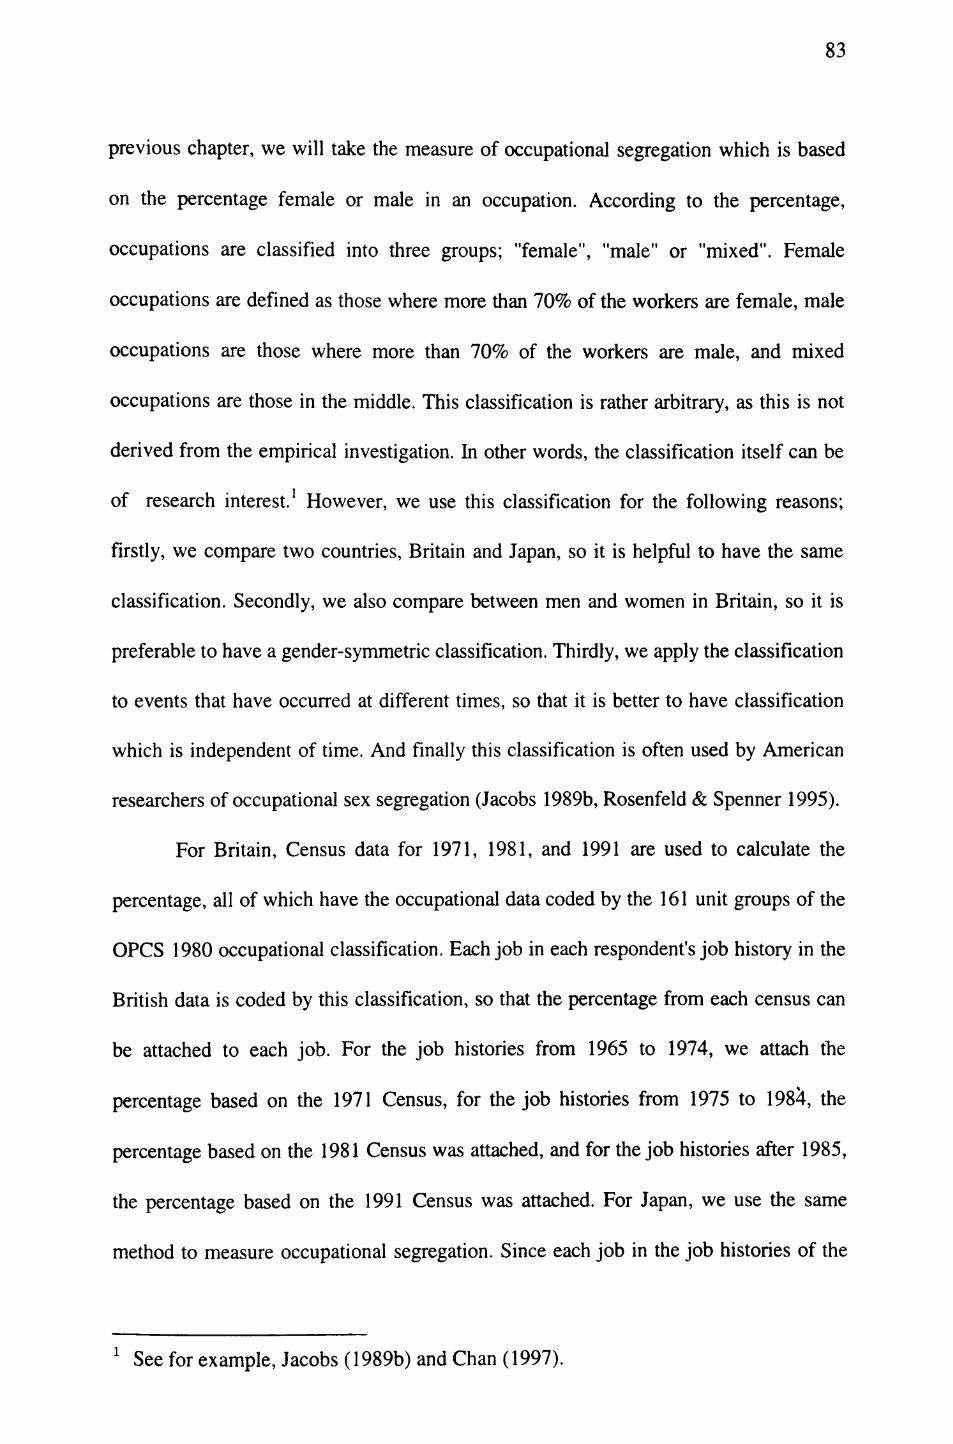
83
previous chapter, we will take the measure of occupational segregation which is based
on the percentage female or male in an occupation. According to the percentage,
occupations are classified into three groups; "female", "male" or "mixed". Female
occupations are defined as those where more than 70% of the workers are female, male
occupations are those where more than 70% of the workers are male, and mixed
occupations are those in the middle. This classification is rather arbitrary, as this is not
derived from the empirical investigation. In other words, the classification itself can be
of research interest. 1 However, we use this classification for the following reasons;
firstly, we compare two countries, Britain and Japan, so it is helpful to have the same
classification. Secondly, we also compare between men and women in Britain, so it is
preferable to have a gender-symmetric classification. Thirdly, we apply the classification
to events that have occurred at different times, so that it is better to have classification
which is independent of time. And finally this classification is often used by American
researchers of occupational sex segregation (Jacobs 1989b, Rosenfeld & Spenner 1995).
For Britain, Census data for 1971, 1981, and 1991 are used to calculate the
percentage, all of which have the occupational data coded by the 161 unit groups of the
OPCS 1980 occupational classification. Each job in each respondent's job history in the
British data is coded by this classification, so that the percentage from each census can
be attached to each job. For the job histories from 1965 to 1974, we attach the
percentage based on the 1971 Census, for the job histories from 1975 to 198^, the
percentage based on the 1981 Census was attached, and for the job histories after 1985,
the percentage based on the 1991 Census was attached. For Japan, we use the same
method to measure occupational segregation. Since each job in the job histories of the
1 See for example, Jacobs (1989b) and Chan (1997).

84
Japanese data is coded by the 1980 Census occupational classification which has 285
categories, we reclassified the 1970 Census occupations according to the 1980 Census
classification, and then calculated the percentage female or male from each census. For
the job histories from 1965 to 1974, we attached the percentage from the 1970 Census,
and for the job histories after 1975, the percentage from the 1980 Census was attached.
In this chapter, we will firstly examine whether there are any systematic movements
between sex-typical occupations and sex-atypical occupations. As mentioned, if we find
systematic movements, this would imply that the experience in sex-typical occupations
and that in sex-atypical occupations for individual workers are different. Then, the
movements will be compared between British men and British women, as well as
between British women and Japanese women. Secondly, we will examine the change in
the patterns of the job movements after 1965. Are there any parallel changes between
the aggregate-level occupational sex segregation and the individual-level occupational
sex segregation? For instance, in the 1980s, a substantial decline in the extent of
occupational sex segregation occurred in Britain, but did a decline occur at the
individual level as well? Thirdly, we will investigate the relation between occupational
sex segregation and out-of-employment activities. This is to further explore the possible
differences in the experiences of workers in sex-typical occupations and in sex-atypical
occupations. Finally, we will investigate the influence of the patterns of job movements
on individual workers' careers. In so doing, we will examine job duration in sex-typed
occupations as well as the frequencies of job changes.

85
Job mobility across sex-typed occupations
Job mobility in Britain: 1965-1992
We firstly examine the British case. Our interest here is in investigating whether there
are any systematic movements across sex-typed occupations for British men and British
women. Also, we will examine whether there are any differences in the patterns of job
movements between British men and British women. We firstly look at the pattern for
British men.
Table 4.1 Job shifts across sex-typed occupations for British men, 1965-1992
Reference jobs Next jobs
Male occupations Mixed occupations Female occupations No. of job shirts
Male occupations 86.4% 10.3% 3.3% 7036
Mixed occupations 34.9% 60.1% 5.0% 1996
Female occupations 32.7% 16.5% 50.8% 953
Total 9985
N=2713
Source: The Employment in Britain survey
Table 4.1 shows men's gross movements across sex-typed occupations which
occurred between 1965 and 1992. In this table, the row categories show the sex-type of
the reference job and the column categories show the sex-type of the next job. From the
table, firstly, we can see a tendency to change jobs within the same sex-typed
occupations, but the tendency depends on whether the jobs are in sex-typical*
occupations or in sex-atypical occupations; as much as 86% of the changes from male
occupations were to male occupations, but the figure for the changes from female
occupations to female occupations is 51%. Thus, there is greater attrition of female
occupations than of male occupations. Related to this point, secondly, when we see the
movements between sex-typical and sex-atypical occupations, we can see that the

86
movements from female occupations to male occupations are much more frequent than
the opposite movements; as much as one-third of the movements from female
occupations were to male occupations, but only 3% of the movements from male
occupations went to female occupations. Thus, although we can find a considerable
number of job movements to and from female occupations for men, the attrition of
female occupations is considerably higher, and this fact seems to be reflected in the
aggregate pattern that a large proportion of men are employed in male occupations.
Table 4.2 Job shifts across sex-typed occupations for British women, 1965-1992
Reference jobs
Male occupations
Mixed occupations
Female occupations
Total
N=2142
Next jobs
Male occupations
57.5%
9.0%
5.6%
Mixed occupations
22.6%
67.4%
19.2%
Female occupations
19.9%
23.6%
75.2%
No. of job shifts
629
2182
3591
6402
Source: The Employment in Britain survey
Table 4.2 shows women's job movement from 1965 to 1992. Like men's data,
we can see a tendency to change jobs within the same sex-typed occupations, though
women's tendency to move within sex-typed occupations is somewhat lower than
men's, while their tendency to move within sex-atypical occupations is somewhat
higher. Also, though the movements from sex-typical occupations to sex-atypical<
occupations for women are less frequent than the movements from sex-atypical
occupations to sex-typical occupations, the difference is relatively small, compared to
men. Thus, compared to men, the attrition of sex-atypical occupations for British
women is relatively low and the attrition of sex-typical occupations is relatively high,

87
and this fact seems to be reflected in the aggregate difference between men and women
in Britain that men are more concentrated into sex-typical occupations than women are.
In summary, individual job movements are often found within the same sex-
typed occupations. However, this tendency differs by the sex-type of occupations and by
sex. In general, we have found that movements within sex-typical occupations are more
frequent than those within sex-atypical occupations, but this tendency is greater for men
than for women. In terms of the movements between sex-typical occupations and sex-
atypical occupations, it is found that movements out of sex-typical occupations to sex-
atypical occupations are less frequent than the opposite movements. This tendency again
differs by sex; the movements out of sex-typical occupations to sex-atypical occupations
are more frequent for women than for men. Thus, compared to men, the movements
across sex-typed occupations are relatively fluid for women.
These results, however, might be influenced by the structural factors that for men, male
occupations are more available and for women female occupations are more available.
For instance, we have found stronger inflows into sex-typical occupations rather than
into sex-atypical occupations, but this might be simply because sex-typical occupations
are more available for men and women. In other words, after controlling for the
structural differences, the movements across sex-typed occupations might be random
after all. Therefore, we will examine the movements after controlling for the structural
influence.
In order to test whether the movements across sex-typed occupations are random
or not after allowing for the structural influences, we will use log-linear models. Log-
linear models allow us to see whether or not the cell values in our 3 by 3 table are

88
determined solely by the marginal distributions of the reference job and the next job. In
other words, by using log-linear models, we can test whether there are any associations
between the reference job and the next job independently of the marginal effects. The
data on our 2-way table can be expressed as;
fij i = 1,..., I 3 sex-typed occupations for Reference jobs(R)
j = 1,..., J 3 sex-typed occupations for Next jobs(N)
where fjj is observed frequencies.
Firstly, we will make the model which hypothesises that there is no association between
the reference job and the next job after controlling for the marginal distributions of sex-
typed occupations (Independence model).
Independence ModelF TU RT N r,j I L! lj
where, Fy is fitted frequencies, T is a constant, T,R , TjN are terms which represent,
respectively, the one-way effects of reference jobs, and next jobs.
Model formula: Reference + Next
If this model does not show a good fit, this suggests that there are associations between
the reference job and the next job. We would expect, then, from the results of the gross
mobility table that greater movements can be found within the same sex-typed*
occupations, but the other movements might be simply due to the different distributions
of sex-typical occupations and sex-atypical occupations. To test this, we will construct
the quasi-independence model. The quasi-independence model assumes that there are
associations between the reference job and the next job, but conditional on changing
jobs across different sex-typed occupations, the sex-type of the reference job is

89
independent of the sex-type of the next job. Model formula for the quasi-independence
model is;
Quasi-independence model
Ref+Next + Diag
where, Diag is the diagonal effects to allow for the perfect fit for the cells on the
diagonal on our 3 by 3 table.
Table 4.3 shows the results of the log-linear models for British men and women.
For men, the independence model does not fit the data very well, which means that there
are associations between the reference job and the next job. The quasi-independence
model significantly improves the fit from the independence model, and under this
model, we can obtain a good fit with the p-value .48, and only 0.1% of the cases
misclassified. Therefore, men's data shows that men tend to change jobs within the
same sex-typed occupations, but when they change jobs across different sex-typed
occupations, the sex-type of the reference job and that of the next job are independent.
Therefore, there is no greater job movements into male occupations from other sex-
typed occupations or no greater job movements out of female occupations to other
occupations once marginal effects are taken into account.
Table 4.3 Log-linear models for net job movement, British men and women
L2 df p %misclassified
Men N=2713
Independence Model 3608 4 0. 22.77
Quasi-independence model 0.49 1 0.48 0.13
Women N=2142
Independence model 2501 4 0. 28.13
Quasi-independence model 0.73 1 0.39 0.24
Source: The Employment in Britain survey

90
From the results of the log-linear models for women in Table 4.3, we can see the
same result as that for men, i.e., the independence model does not show a good fit, but
the quasi-independence model does. The quasi-independence model for women shows a
good fit with the p-value of .39, which means that women tend to change jobs within the
same sex-typed occupations, but when they change jobs across different sex-typed
occupations, their destination is independent of their origin. Thus, we cannot find any
greater job movements into female occupations nor greater job movements out of male
occupations to other occupations once marginal effects are taken into account.
Then, how about the difference between men and women? We have found from our
"gross" tables that compared to women, men are more likely to change jobs within sex-
typical occupations rather than within sex-atypical occupations, and they are less likely
to change jobs from sex-typical occupations to sex-atypical occupations. Can these
differences hold after the different distributions of sex-typical/sex-neutral/sex-atypical
occupations between men and women are taken into account?
To test this, we will make a three-way table of observed counts for the reference
job by the next job by sex. The observed frequencies are expressed as,
i = 1,..., I 3 sex-typed occupations for Reference jobs(R)
fjjk j = 1,..., J 3 sex-typed occupations for Next jobs(N)
k=l,..., K 2 sexes for Sex(S)
Firstly we will construct a basic reference model where we allow for the different
distribution of sex-typical/sex-neutral/sex-atypical occupations between men and

91
women, but this model assumes that there is no association between the reference job
and the next job for both men and women.
Basic reference model
where, Fyk is fitted frequencies.
Model formula: Reference + Next + Sex + Reference.Sex + Next. Sex
Where T is a constant, TjR , Tj N , TkS are terms which represent, respectively, the one-way
effects of reference jobs, next jobs, and sex; TucRS , TjkNS represent the two-way effects
between sex and reference jobs and between sex and next jobs. As would be expected, it
fits badly with L2= 6109 on 8 df, 24.9 % of the cases misclassified.
Table 4.4 Log-linear models for sex difference of job movement, British men and women
Model L df p %misclassified
Reference model 6109 8 O 24.86
No sex difference model 20.39 5 0.001 1.156
Sex difference model 1.223 2 0.543 0.171
Source: The Employment in Britain survey
Then, we would expect that the quasi-independence model would fit our three-
way table. Firstly, we will assume that there is no difference between men and women in
the density level of the cells on the diagonal, or on the cells which represent the job
changes between the same sex-typed occupations. In other words, under this model, we
assume that greater movements within sex-typical occupations for men than for women
which are found in the gross mobility tables are the results of the different distribution of
sex-typical/sex-neutral/sex-atypical occupations between men and women. We will call

92
this model no sex difference model. The model formula for this model can be expressed
as;
No sex difference model
Reference + Next + Sex + Reference.Sex + Next. Sex + Diag,
where, Diag is the diagonal effects.
^This model significantly improved the fit from our basic reference model with L =20.39
on 5 df, 1.2% the cases misclassified, but the assumption of the same density for the
cells on the diagonal between men and women is not supported by its poor fit (p=.001).
Therefore, we would assume that the density for the cells on the diagonal varies
by sex. So we will add a diag.sex term to the model formula. This model fits very well
(p=.54) with L2=1.22 on 2df, with 0.17% misclassified. The fitted odds ratio under this
model (Table 4.5) shows that the chances for men in sex-typical occupations to find the
next job in sex-typical occupations rather than sex-atypical occupations are 41 times
higher, compared to the chance for men in sex-atypical occupations to find the next job
in sex-typical occupations rather than sex-atypical occupations, but the corresponding
figure for women is 40. Therefore, little difference can be found between men and
women about the job movements between sex-typical occupations and sex-atypical
occupations; for both men and women, job changes between sex-typical occupations and
sex-atypical occupations are very unlikely. For the other types of job movement, the
model shows that the chances for men in sex-typical occupations to find next jobs in
sex-typical occupations rather than sex-neutral occupations, compared to the same
chances for men in sex-neutral occupations, are 14 times higher, but for women the
corresponding figure is 11. Also, the chances for men in sex-neutral occupations to find

93
next jobs in sex-neutral occupations rather than sex-atypical occupations, compared to
the same chances for men in sex-atypical occupations are as much as 36 times higher,
but for women the figure is 19. Therefore, according to this model, it is less likely for
men than for women to change jobs between sex-typical occupations and sex-neutral
occupations, and it is much less likely for men than for women to change jobs between
sex-neutral occupations and sex-atypical occupations.
Table 4.5 Fitted odds ratios under the sex difference model in Britain
Men Women
Ref: sex-typical vs. sex-neutral 14.41 11.15
Next: sex-typical vs. sex-neutral
Ref: sex-typical vs. sex-atypical 40.84 39.76
Next: sex-typical vs. sex-neutral
Ref: sex-neutral vs. sex-atypical 36.44 18.99
Next: sex-neutral vs. sex-atypical
Source: The Employment in Britain survey
In summary, though we have found in the analysis of "gross" movements that the
inflows into sex-typical occupations are greater than those into sex-atypical occupations,
this is no longer supported after allowing for the structural influences. Also we found
that it is equally unlikely for both men and women to move between sex-typical
occupations and sex-atypical occupations, but it is more unlikely for men than for«
women to move between sex-typical occupations and sex-neutral occupations, as well as
between sex-atypical occupations and sex-neutral occupations. Thus, the results based
on both "gross" and "net" movements show more segregated nature of job mobility for
men than for women.

94
Job Mobility for Japanese women: 1965-1983
We will now examine job mobility for Japanese women and compare the patterns
between British women and Japanese women. Firstly, we will look at the "gross" job
movements for Japanese women which occurred between 1965 and 1983. From Table
4.6, we can see that the tendency for Japanese women to change jobs within the same
sex-typed occupations is relatively low; only 35% of the changes from male occupations
were to male occupations, and 45% of the changes from female occupations were to
female occupations. Rather we find considerable movements into mixed occupations; as
much as 44% of the changes from male occupations went to mixed occupations, and as
much as 47% of changes from female occupations were to mixed occupations.
Table 4.6 Job shifts across sex-typed occupations for Japanese women, 1965-1983
Reference jobs Next jobs
Male occupations Mixed occupations Female occupations No. of job shifts
Male occupations 35.2% 44.4% 20.4% 54
Mixed occupations 9.1% 76.5% 14.4% 485
Female occupations 8.4% 46.9% 44.7% 179
Total 718
N=1393
Source: The Occupational Mobility and Career survey
This might be because of the structural factor that mixed occupations are widely
available for Japanese women, as we saw in the previous chapter. To test this, we will
again use log-linear models.
Table 4.7 Log-linear models for net job movement, Japanese women
L2 df p %misclassified
Independence Model 9O54 O 13.99
Quasi-independence model 0.9133 1 0.34 0.79
Source: The Occupational Mobility and Career survey
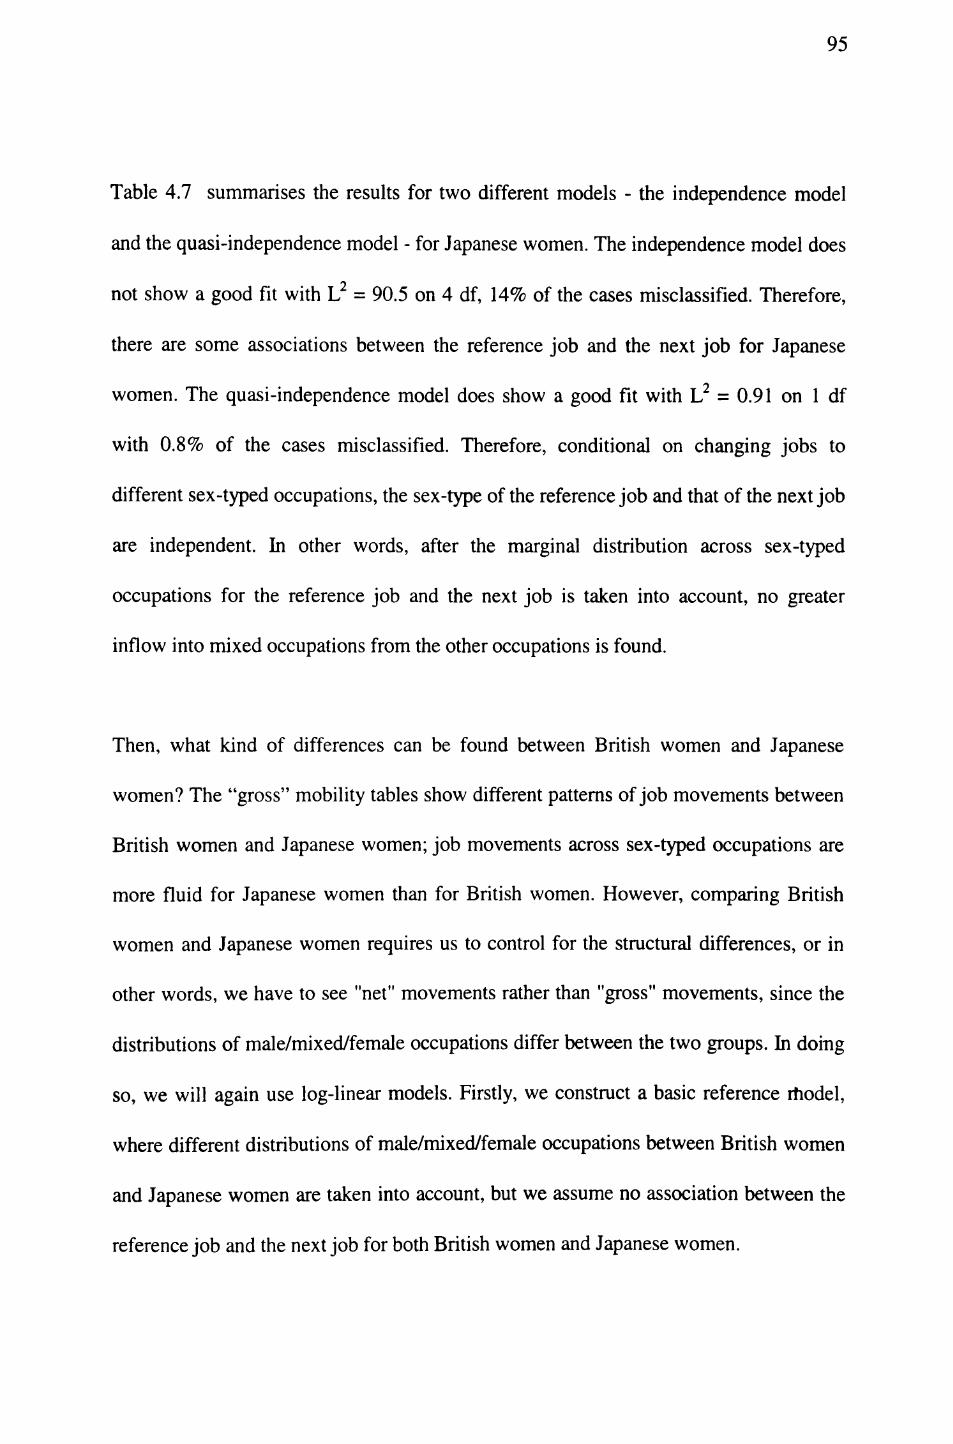
95
Table 4.7 summarises the results for two different models - the independence model
and the quasi-independence model - for Japanese women. The independence model does
not show a good fit with L2 = 90.5 on 4 df, 14% of the cases misclassifled. Therefore,
there are some associations between the reference job and the next job for Japanese
A
women. The quasi-independence model does show a good fit with L = 0.91 on 1 df
with 0.8% of the cases misclassifled. Therefore, conditional on changing jobs to
different sex-typed occupations, the sex-type of the reference job and that of the next job
are independent. In other words, after the marginal distribution across sex-typed
occupations for the reference job and the next job is taken into account, no greater
inflow into mixed occupations from the other occupations is found.
Then, what kind of differences can be found between British women and Japanese
women? The "gross" mobility tables show different patterns of job movements between
British women and Japanese women; job movements across sex-typed occupations are
more fluid for Japanese women than for British women. However, comparing British
women and Japanese women requires us to control for the structural differences, or in
other words, we have to see "net" movements rather than "gross" movements, since the
distributions of male/mixed/female occupations differ between the two groups. In doing
so, we will again use log-linear models. Firstly, we construct a basic reference rhodel,
where different distributions of male/mixed/female occupations between British women
and Japanese women are taken into account, but we assume no association between the
reference job and the next job for both British women and Japanese women.

96
Basic reference model
where Fijk is fitted frequencies.
Model formula: Reference + Next + Country + Reference. Country + Next.
Country
Where T is a constant, TjR , TjN , Tk° are terms which represent, respectively, the one-way
effects of reference jobs, next jobs, and country; TucRC, TjkNC represent the two-way
effects between country and reference jobs and between country and next jobs. As
would be expected, this model does not fit the data very well with L2 = 2591 on 8 df,
26.7% of the cases misclassified.
Table 4.8 Log-linear models for country differences of job movement,
British women and Japanese women
L2 df p %misclassifled
Reference model 2591 8 O 26.70
no country-difference model 25.97 5 0.0001 1.46
country-difference model 1.65 2 0.44 0.29
Source: The Employment in Britain survey for Britain, and the Occupational Mobility and Career survey
for Japan
Then, we expect that the quasi-independence model would fit the data. In other
words, we will assume that conditional on changing jobs to different sex-typed
occupations, the reference job and the next job are independent for British women as»
well as for Japanese women. As we did before, we will firstly assume that the density
level of the cells representing the movements within the same sex-typed occupations
does not differ between British women and Japanese women (no country-difference
model). This model substantially improves the fit from the independence model, but
because of the poor fit (p=.0001), we cannot reject the hypothesis that the association

97
between the reference job and the next job does not differ between British women and
Japanese women.
The model which adds a country.diag term, or which allows for the different
diagonal effects, or different density of the cells representing the movements within the
same sex-typed occupations, between British women and Japanese women, shows the
best fit with L2 = 1.65 on 2 df, only 0.3% of the cases misclassified. Thus, the results
show that the patterns of the movements differ between British women and Japanese
women. Table 4.9 shows the fitted odds ratio under this model.
Table 4.9 Fitted odds ratios under the country difference model,
British women and Japanese women
British women Japanese women
Ref: male occ vs. mixed occ 19.0 6.5
Next: male occ vs. mixed occ
Ref: male occ vs. female occ 39.8 9.9
Next: male occ vs. female occ
Ref: mixed occ vs. female occ 11.2 5.0
Next: mixed occ vs. female occ
Source: The Employment in Britain survey for Britain, and the Occupational Mobility and Career survey
for Japan
We can see from Table 4.9 that it is much less likely for British women than for
Japanese women to change jobs between male occupations and female occupations; the
chances for British women in male occupations to find next jobs in male occupations
rather than in female occupations are 40 times higher, compared to the same chances for
those in female occupations, but the corresponding figure for the Japanese women is
only 10. Also, it is less likely for British women than for Japanese women to change
jobs between male occupations and mixed occupations, and between mixed occupations

98
and female occupations. The chances for British women in male occupations to find
next jobs in male occupations rather than in mixed occupations are 19 times higher,
compared to the same chance for those in mixed occupations, and the chances for those
in mixed occupations to find jobs in mixed occupations rather than in female
occupations are 11 times higher, compared to the same chances for those in female
occupations. Whereas, corresponding figures for Japanese women are 6 times and 5
times respectively. Therefore, though we can find for Japanese women the tendency to
change jobs within the same sex-typed occupations, given the much smaller values of
the odd ratios of Japanese women, they are more likely than British women to change
jobs across sex-typed occupations. Thus, the results based on both "gross" and "net"
movements show a more segregated nature of job mobility for British women than for
Japanese women.
In summary, we have found that the movements across sex-typed occupations are not
random for British men, British women, and Japanese women. They all show the
tendency to change jobs within the same sex-typed occupations, though when they do
change their jobs across sex-typed occupations, their destinations are rather random.
When men and women are compared in Britain, we have found that it is more likely for
women than for men to move between sex-typical and sex-neutral occupations as well
as between sex-neutral occupations and sex-atypical occupations. When women are
compared between Britain and Japan, we have found that it is more likely for Japanese
women than for British women to change jobs across sex-typed occupations.

99
Trends in job mobility
Trends in job mobility in Britain: 1965-1992
In the previous chapter, we found declining trends in the extent of occupational
segregation for Britain after the 1970s. We saw that this is mainly generated by men and
women shifting to mixed occupations. But, did this imply changes in the pattern of job
mobility of British men and women at the level of individuals? In order to examine the
trend of individual movements, we will now divide the period 1965-1992 into three sub
periods: a. 1965-1974, b. 1975-1984, and c. 1985-1992, and examine the movements in
each of three sub periods.2
Table 4.10 Job shifts across sex-typed occupations by periods, British men
Reference Job
male occ
mixed occ
female occ
N=2713
Next Job
male occ mixed occ female occ
65-74 75-84 85-92 65-74 75-84 85-92 65-74 75-84 85-92
88.8% 87.1% 83.8% 8.7% 10.5% 11.4% 2.5% 2.4% 4.8%
43.1% 38.1% 27.8% 53.7% 57.4% 65.8% 3.2% 4.5% 6.4%
47.8% 40.1% 27.1% 15.4% 18.8% 16.0% 36.8% 41.1% 56.9%
Source: The Employment in Britain survey
2 Dividing 1965-1992 into three time periods might cause a sample bias in examining the trends of individual movements. This is because the sample included for the job movements in the last period 1985-1992 is larger than that in the first/second period. Only relatively older workers have information for the first/second periods, and the job movements in the first/second periods include those taken place when they were relatively young but lack the information of older workers at that time (who would have left the workforce before the time of the survey), and therefore, over-represent relatively young workers. This causes problems if the tendency of job mobility differs by age. One of the ways to avoid this problem is to select young workers at each time period and examine the trend. By doing this analysis (not shown here), it is found that the results discussed below are basically supported.

100
Table 4.10 shows men's gross movements across sex-typed occupations by the
three time periods. From this table we can see that the proportion of the job changes
from male occupations to male occupations slightly declined from 89% for 1965-1974
to 84% for 1985-1992. While the proportion of the job changes from mixed occupations
to mixed occupations increased from 54% for 1965-1974 to 66% for 1985-1992. And
the proportion of the job changes from female occupations to female occupations
considerably increased from 37% for 1965-1974 to 57% for 1985-1992. When we see
the movements between sex-typical and sex-atypical occupations, we can see that the
proportion of the movements out of female occupations to male occupations decreased
considerably from 48% for 1965-1974 to 27% for 1985-1992, while the proportion of
the movements out of male occupations to female occupations slightly increased from
3% for 1965-1974 to 5% for 1985-1992. Thus, the attrition of female occupations, as
well as of mixed occupations, have decreased over time for British men, while the
attrition of male occupations slightly increased. This seems to contribute to the
aggregate decline in occupational sex segregation after the 1970.
Table 4.11 shows the gross job movements for women's data. We can see that
the proportion of the movements from female occupations to female occupations
increased from 66% for 1965-1974 to 80% for 1985-1992. Also, the proportion of the
movements from mixed occupations to mixed occupations increased from 54% for
1965-1974 to 69% for 1985-1992. However, we cannot see any clear trends in terms of
the movements between male occupations and male occupations. With regard to the
movements between sex-typical occupations and sex-atypical occupations, we can see
that the proportion of the movements from male occupations to female occupations
increased from 14% for 1965-1974 to 23% for 1985-1992. While the proportion of the

101
movements from female occupations to male occupations slightly declined from 7% for
1965-1974 to 5% for 1985 - 1992. Thus, we can see a decline in the attrition of female
occupations as well as of mixed occupations over time for British women. The results,
however, show the opposite trends to the aggregate-level trends that the extent of
occupational sex segregation declined during the period.
Table 4.11 Job shifts across sex-typed occupations by periods, British women
Reference Job Next Job
male occ
male occ
mixed occ
female occ
N=2713
65-74
58.3%
9.9%
7.0%
75-84
56.3%
9.5%
5.7%
55-92
58.3%
7.4%
5.0%
mixed occ
65-74
27.3%
53.7%
27.2%
75-84
24.2%
67.7%
22.9%
85-92
18.5%
69.3%
14.6%
female occ
65-74
14.4%
24.9%
65.8%
75-84
19.5%
22.8%
71.4%
55-92
23.2%
23.3%
80.4%
Source: The Employment in Britain survey
These trends include the structural influences, or in other words, they include the
influences of the marginal distributions of the reference job and the next job across sex-
typed occupations which differ by periods. For example, the increasing inflows into
female occupations among women might be simply due to the structural change that had
occurred during the period. Therefore, in order to see "net" movements, or the
movements after allowing for the structural influences, we will again use log-linear
models.*
Firstly, we will make a basic reference model in which the different distributions
of male/mixed/female occupations by periods are taken into account, but we assume no
association between the reference job and the next job for all the three periods. The
model formula can be expressed as;

102
Basic reference model
Reference + Next + Period + Reference. Period + Next. Period
As would be expected, this model does not show a good fit for both men and women. L2
for men's data is 3432 on 12 df, with 22.2% of the cases misclassified. For women, L2 =
2370 on 12 df with 26.4% of the cases misclassified.
Table 4.12 Log-linear models for period differences of job movement, British men and women
Men
Reference model
no period-difference model
period-difference model
Women
Reference model
no period-difference model
period-difference model
L2
3432
9.27
0.51
2370
37.70
1.77
df
12
9
3
12
9
3
P
0.
0.41
0.92
0.
0.
0.62
%misclassified
22.19
1.02
0.11
26.40
2.83
0.35
Source: The Employment in Britain survey
Then, we would expect that the quasi-independence model would fit the data. As
mentioned before, this model assumes that there are associations between the reference
job and the next job, but conditional on changing jobs between different sex-typed
occupations, the sex-type of the reference job and that of the next job are independent.
We will firstly assume that the level of density on the cells on the diagonal, which
represent the job changes within the same sex-typed occupations, does not differ by
period. The model formula can be expressed as:
No period-difference model
Reference + Next + Period + Reference.Period + Next. Period + Diag
where Diag is the diagonal effects.

103
This model significantly improved the fit from the basic reference model for
both men and women (see Table 4.12). Men's model shows L2 = 9.27 on 9 df, with
1.0% of the cases misclassifled, and for women's model, L2 = 37.7 on 9 df with 2.8% of
the cases misclassifled.
From these results, for men, we cannot reject the hypothesis that the level of
association between the reference job and the next job does not differ by periods.
Actually, the model which allows for different association by period does not improve
this model significantly. But for women, we reject the same hypothesis as a result of the
poor fit.
Therefore we add a diag.period term to the model for women (period-difference
model). This model in fact shows the best fit with L2 = 1.77 on 3 df with 0.35% of the
cases misclassified. According to this final model, it had become more unlikely for
British women to change jobs between male occupations and female occupations,
between male occupations and mixed occupations, and between mixed occupations and
female occupations over time (see Table 4.13). For instance, the chances for women in
male occupations to find next jobs in male occupations rather than in mixed
occupations, compared to the same chances for those in mixed occupations were 14
times higher for 1965-1974, but for 1985-1992, the chance doubled to 29 times. The
chances for women in male occupations to find next jobs in male occupations father
than female occupations compared to those in female occupations were 36 times higher
for 1965-1974, but the corresponding figure for 1985-1992 was 41. Also, the chances
for women in mixed occupations to find next jobs in mixed occupations rather than
female occupations compared to those in female occupations were 6 times higher for

104
1965-1974, but the figure for 1985-1992 was 16. Therefore, at the level of individuals,
women's mobility patterns have become more segregated over time.
Table 4.13 Fitted odds ratios under the period difference model, British women
1965-19741975-19841985-1992
Ref: male occ vs. mixed occ 14.4 16.2 29.3
Next: male occ vs. mixed occ
Ref: male occ vs. female occ 36.1 36.7 41.3
Next: male occ vs. female occ
Ref: mixed occ vs. female occ 6.4 9.2 16.2
Next: mixed occ vs. female occ
Source: The Employment in Britain survey
In summary, we found a trend towards de-segregation for British men in their
gross job movements, but after controlling for the structural change, no significant trend
can be found. However, for British women, the trend is toward greater segregation both
before and after controlling for structural change. Given the finding in the previous
chapter that at the aggregate level, both men and women in Britain showed de
segregation, our results suggest that there is no parallel trend in occupational sex
segregation at the aggregate level and at the level of the career trajectories of individuals.
Trends in job mobility for Japanese women: 1965-1983
We will now turn to the trends of the job mobility for Japanese women. In order to%
examine the trends, we will divide 1965-1983 into two sub periods: a. 1965-1974, and b.
1974-1983. In the previous chapter, we could not find any systematic trend of
occupational sex segregation for Japanese women at the aggregate level, but can we find
any trends at the individual level?

105
We will firstly see "gross" movements (Table 4.14). In terms of the movements
within the same sex-typed occupations, the proportion of the movements between male
occupations and male occupations decreased from 42% for 1965-1974 to 30% for 1975-
1983, and that between female occupations and female occupations slightly decreased
from 46% for 1965-1974 to 44% for 1975-1983. While the proportion of the movements
between mixed occupations and mixed occupations slightly increased from 75% for
1965-1974 to 78% for 1975-1983. In terms of the movements between sex-typical
occupations and sex-atypical occupations, the proportion of the movements from male
occupations to female occupations increased from 13% for 1965-1974 to 27% for 1975-
1983. The proportion of the movements from female occupations to male occupations
also show a slight increase from 7% for 1965-1974 to 10% for 1974-1983. Therefore, it
seems that the movements across sex-typed occupations became more fluid for Japanese
women over time.
Table 4.14 Job shifts across sex-typed occupations by periods, Japanese women
Reference Job Next Job
male occ mixed occ female occ
65-74 75-83 65-74 75-83 65-74 75-83
male occ 41.7% 30.0% 45.8% 43.3% 12.5% 26.7%
mixed occ 8.4% 9.9% 75.2% 78.0% 16.4% 12.1%
female occ 7.0% 10.0% 47.5% 46.3% 45.5% 43.7%
N=1393
Source: The Occupational Mobility and Career survey
However, this result is not independent of the change in the distributions of sex-
typed occupations over time. Therefore, we will again examine "net" movements using
log-linear models. Firstly, we will construct a model which allows for different
distributions of male/mixed/female occupations by period, but the model assumes no

106
association between the reference job and the next job (basic reference model). As
would be expected, this model shows a poor fit with L2 = 93.9 on 8 df, 14.2% of the
cases misclassified.
Then, we make a model, which assumes that there are associations between the
reference job and the next job only when they change jobs within the same sex-typed
occupations, but the level of association does not differ by period (no period-difference
model). This model fits the data very well with L2 = 4.7 on 5 df, 2.0% of the cases
misclassified. In fact, the model which allows for the different level of association by
period (period-difference model) does not show any significant improvement from the
no period difference model.
Table 4.15 Log-linear models for period differences of job movement, Japanese women
L df p %misclassified
Reference model 93.89 8 0. 14.21
no period-difference model 4.70 5 0.45 2.05
period-difference model 1.63 2 0.44 0.84
Source: The Occupational Mobility and Career survey
Thus, the data shows that there is no trend for the movements across sex-typed
occupations for Japanese women after controlling for structural change. The differences
between British women and Japanese women with respect to their job movements
across sex-typed occupations at the individual level seem to be widening as the^ trend
towards segregation increases for British women both before and after controlling for
structural change, while Japanese women show a trend towards de-segregation before
controlling for structural change, and no trend after controlling for structural change.
However, to confirm this, we need job history data for Japanese women after the 1980s
(which was not available for this study).

107
Sex-typed occupations and out-of-employment activities
Our mobility analysis so far focuses on job movements, therefore, ignores experiences
out of employment. However, in this section, we develop our analysis to include these
experiences. "Out of employment" activities mean unemployed, retired, in full-time
education, housekeeping and on maternity leave. The purpose of this is to examine the
possible differences in the experiences of men and women in female occupations as
compared with male occupations.
We examine both movement into sex-typed occupations from out-of-
employment activities, and movement from sex-typed occupations to out-of-
employment activities. If we follow human capital theory or socialisation theory, it is
expected that women's domestic leave is associated with female occupations, so that
female occupations tend to accept women from domestic leave, as well as women tend
to move to domestic leave from female occupations.
Movements between employment and out-of-employment for British men and women
We will firstly examine movements into sex-typed occupations from out-of-employment
activities. Table 4.16 presents an "inflow" job mobility matrix for men. From this table
we can see that female occupations are more likely to accept those re-entering the labour
market than male occupations; 26% of the inflows into female occupations were from
out-of-employment activities, but the corresponding figure for male occupations is 17%.
This is the same for women. From Table 4.17, we can see that 25% of the
inflows into male occupations were from out-of-employment activities, whereas as

108
much as 35% of the inflows into female occupations were from out-of-employment
activities.
Table 4.16 Movement between sex-typed occupations and out-of-employment activities: 'Inflow"
matrix, British men 1965-1992
Reference Jobs Next Jobs
Male occupations
Mixed occupations
Female occupations
Out-of-emplovment activities
n
N
Male occupations
71.4%
8.2%
3.6%
16.8%
8517
2713
Mixed occupations
28.8%
47.5%
6.2%
17.5%
2525
Female occupations
21.0%
9.0%
43.8%
26.2%
1105
Source: The Employment in Britain survey
Table 4.17 Movement between sex-typed occupations and out-of-employment activities: "inflow*
matrix, British women 1965-1992
Reference Jobs
Male occupations
Mixed occupations
Female occupations
Out-of-emplovment activities
(Domestic leave)
n
N
Next Jobs
Male occupations
35.8%
19.4%
19.8%
25.0%
(15.5%)
1011
2142
Mixed occupations
4.4%
45.6%
21.4%
28.5%
(16.8%)
3223
Female occupations
2.4%
10.0%
52.3%
35.3%
(23.2%)
5165
Source: The Employment in Britain survey
As we expected, women's out-of-employment experiences were often related to
domestic reasons, and this seems to be reflected in the relatively large percentages of
out-of-employment activities in the table for women, compared to men. The percentages
in parenthesis in Table 4.17 show the percentage of the inflows into each sex-typed
occupations from out-of-employment activities due to domestic reasons. We can see

109
from the table that 16% of the inflows into male occupations were from domestic leave,
but the figure for female occupations is 23%. Thus, both men and women are more
likely to re-enter the labour market through female occupations than other occupations.
Women are also more likely to re-enter the labour market from domestic-leave through
female occupations than other occupations.
The results from "gross" movements might again reflect structural factors. The best
method to see the relations between each sex-typed occupations and out-of-employment
activities that are independent of the structural influences is to see the disparity ratios. In
a 2 by 2 mobility table, the disparity ratios are calculated as,
(fn/f.i)/(fi2/f. 2) and (f22/f. 2)/(f2 i/f.i) for the inflow matrix
(fi,/f,.)/(f2i/f2.) and (f22/f2 .)/(fi2/fi.) for the outflow matrix
where fn is the frequency in the 1-1 cell, f.i the corresponding row marginal, fj. the
corresponding column marginal, etc.(see Goldthorpe 1987:75). Using disparity ratios,
we can examine relative chances for different sex-typed occupations to accept people
from out-of-employment activities, or the relative chances for people in different sex-
typed occupations to move to out-of-employment activities. Table 4.18 shows the
disparity ratios for men and women, derived from the inflow matrix for men and
women.
From Table 4.18 we can see that for men, the chances for female occupations to
accept those from out-of-employment activities are 1.6 times as high as the chances for
male occupations. For women, the corresponding figure is 1.4 times. Also for women,
the chances for female occupations to accept those from domestic leave are 1.5 times as

110
high as the chances for male occupations. Therefore, for both men and women, even
after allowing for the structural influences, female occupations are more likely to accept
those from out-of-employment activities than male occupations. This might suggest that
female occupations are utilised to meet labour market fluctuation.
Table 4.18 Relative chances to enter sex-typed occupations from out-of-employment activities,
British men and women
Reference Jobs Next Jobs
Men Male occupations Mixed occupations Female occupations
Out-of-employment activities set at 1 1.04 1.56
Women
Out-of-emplovment activities set at 1 1.14 1.41
Domestic leave set at 1 1.08 1.50
Source: The Employment in Britain survey
If we follow the explanations of human capital theory or socialisation theory, women in
female occupations should be also likely to leave the labour market more frequently,
because they have more traditional values and they are more family oriented. Or if
female occupations are utilised to meet labour market fluctuation, they are also likely to
be followed by out-of-employment activities. Table 4.19 presents men's outflow matrix.
From this table, we find that there are slightly greater outflows from female occupations
to out-of-employment activities than in the case for other occupations. However, for*
women, the opposite is the case; the outflows from male occupations to out-of-
employment activities are greater than from other occupations (Table 4.20). This is also
true for domestic leave; the outflows from male occupations to domestic leave are
greater than those from female occupations. These results from "gross" movements,
however, might reflect structural factors.

Ill
Table 4.19 Movement between sex-typed occupations and out-of-employment activities:
"outflow" matrix, British men 1965-1992
Reference Jobs
Male occ.
Mixed occ.
Female occ.
N
Next Jobs
Male occ.
72.0%
29.2%
26.7%
2713
Mixed occ.
8.6%
50.2%
13.5%
Female occ.
2.8%
4.2%
41.5%
Source: The Employment in Britain survey
Table 4.20 Movement between sex-typed occupations and
"outflow" matrix, British women 1965-1992
Reference Jobs
Male occ.
Mixed occ.
Female occ.
N
Next Jobs
Male occ.
39.3%
6.2%
4.1%
2142
Mixed occ.
15.4%
46.6%
13.9%
Female occ.
13.6%
16.3%
54.5%
Out-of-emplovment
16.6%
16.4%
18.3%
n
8440
2387
1167
out-of-employment activities:
Out-of-emplovment
31.7%
30.9%
27.5%
(Pom)
(20.9%)
(19.9%)
(18.3%)
n
921
3159
4954
Source: The Employment in Britain survey
Table 4.21 shows the disparity ratios for men and women based on the "outflow"
matrix. In terms of men, the disparity ratios show that those in female occupations are
slightly more likely to move to out-of-employment activities. However for women, we
can see the opposite tendency; those in male occupations are slightly more likely to
move to out-of-employment activities. This is the same for domestic leave; those in
male occupations are more likely to move to domestic leave. Thus, the results for
women do not support our hypotheses. However, the result might suggest that women's
experiences in male occupations are less favourable than other occupations. 3
3 We will examine workers' experiences in gendered occupations in Chapters 5, 6 and 7.

112
Table 4.21 Relative chances to move to out-of-employment activities from sex-typed occupations,
British men and women
Reference Jobs
Male occupations
Mixed occupations
Female occupations
Next Jobs
Men
Out-of-emplovment activities
set at 1
0.98
1.10
Women
Out-of-emplovment activities
set at 1
0.98
0.87
Domestic leave
set at 1
0.95
0.87
Source: The Employment in Britain survey
In summary, we have found that female occupations provide more opportunities for
those who re-enter the labour market than the other occupations. This is not only the
case for women but also for men. However, we cannot find that women in female
occupations are likely to leave the labour market. Rather, we have found for both men
and women that those in sex-atypical occupations are more likely to leave the labour
market.
Movements between employment and out-of-employment activities for Japanese women
We have seen for British women that female occupations are more likely than the other
occupations to accept those from out-of-employment activities, particularly from
domestic leave, while male occupations are more likely to be followed by out-of-
employment activities. Is this also the case for Japanese women?
Table 4.22 presents the "inflow" job mobility matrix for Japanese women. From
this table, we can see that each of these sex-typed occupations accepts relatively large
number of women re-entering the labour market, but the differences between sex-typed
occupations are not large; 49% of the inflows to male occupations were from out-of-

113
employment activities but the corresponding figures for mixed occupations and female
occupations were 46% and 47% respectively. However, if we see the proportion of those
re-entering the labour market after domestic leave, we can see that male occupations
provide more opportunities than the other occupations; 42% of the inflows into male
occupations were from domestic leave, but 36% of the inflows into mixed or female
occupations were from domestic leave.
Table 4.22 Movement between sex-typed occupations and out-of-employment activities:
"inflow" matrix, Japanese women, 1965-1983
Reference Jobs
Male occupations
Mixed occupations
Female occupations
Out-of-employment activities
(Domestic leave)
n
N
Next Jobs
Male occupations
12.5%
28.9%
9.9%
48.7%
(41.5%)
152
1393
Mixed occupations
2.7%
41.4%
9.4%
46.5%
(36.3%)
895
Female occupations
3.6%
22.9%
26.1%
47.4%
(36.3%)
306
Source: The Occupational Mobility and Career survey
Table 4.23 Relative chances to enter sex-typed occupations from out-of-employment activities,
Japanese women
Reference Jobs Next Jobs
Male occupations Mixed occupations Female occupations
Out-of-employment activities set at 1 0.95 0.97
Domestic leave set at 1 0.88 0.88
Source: The Occupational Mobility and Career survey
These results might be again influenced by structural factors which reflect
different distribution of male/mixed/female occupations. Therefore, we will look at the
disparity ratios again. Table 4.23 shows the disparity ratios based on the inflow matrix.
We cannot see much differences between sex-typed occupations in accepting women

114
from out-of-employment activities. However, male occupations provide slightly more
opportunities for women to re-enter the labour market after domestic leave; the chances
for female occupations and for mixed occupations to accept those from domestic leave
are .88 times as high as the chances for male occupations. Thus, the result for Japanese
women is different from that for British women which showed that female occupations
accept more women from domestic leave (see Table 4.18). 4
Table 4.24 Movement between sex-typed occupations and out-of-employment activities:
"outflow" matrix, Japanese women, 1965-1983
Reference Jobs Next Jobs
Male occ. Mixed occ. Female occ. Out-of-employment (Pom) n
Male occ. 21.6% 27.3% 12.5% 38.6% (28.4%) 88
Mixed occ. 5.2% 43.7% 8.2% 42.9% (32.2%) 850
Female occ. 5.1% 28.9% 27.5% 38.5% (29.2%) 291
N 1393
Source: The Occupational Mobility and Career survey
We will now look at the "outflow" matrix. From Table 4.24 we can again see
that the proportion of outflows from each sex-typed occupations to out-of-employment
activities is relatively large. The proportion is slightly higher for mixed occupations than
the other occupations; 43% of the outflows from mixed occupations were to out-of-
employment activities, but the corresponding figures for male occupations is 39% and
for female occupations is 39%. Also the outflows from mixed occupations to domestic
4 This may reflect the fact that part-time workers are likely to be found in female occupations in Britain, while this is not the case for Japan. In the EIB, the proportion of women in female occupations who are part-timers is 48%, but the corresponding figures for mixed and male occupations are 30% and 17% respectively. In the OMC, on the other hand, the proportions of women in female occupations, mixed occupations, and male occupations who are part-timers are 40%, 43% and 46% respectively; male occupations have slightly higher proportion of part-time workers than other occupations. The OMC has higher proportion of part-timers than the EIB in general, because the sample for the former included those aged between 25 and 69, while for the latter aged between 20 and 60.

115
leave are slightly greater than those from other occupations; 32% of the outflows from
mixed occupations were to domestic leave, but the corresponding figures for male
occupations and female occupations were 28% and 29% respectively.
Table 4.25 Relative chances to move to out-of-employment activities from sex-typed
occupations, Japanese women
Reference Jobs Next Jobs
Reference Jobs Out-of-employment activities Domestic leave
Male occupations set at 1 set at 1
Mixed occupations 1.11 1.13
Female occupations 1.00 1.03
Source: The Occupational Mobility and Career survey
The disparity ratios based on the outflow matrix confirm this result. Little
difference can be found between male occupations and female occupations, but mixed
occupations are slightly more likely to be followed by out-of-employment activities as
well as by domestic leave (Table 4.25). Again, we cannot see any similarities between
British women and Japanese women in the relations between sex-typed occupations and
out-of-employment activities (see Table 4.21).
In summary, these results suggest that the market position of "female" occupations differ
between Britain and Japan with regard to the relation with out-of-employment activities;
in Japan, female occupations do not provide greater opportunities for those re-entering
the labour market, nor are male occupations likely to be followed by out-of-employment
activities. What is striking about our Japanese data is the much closer relation between
employment and out-of-employment activities regardless of the sex-type of occupations.
Compared to the British counterparts, both the "inflow" and "outflow" matrices for the
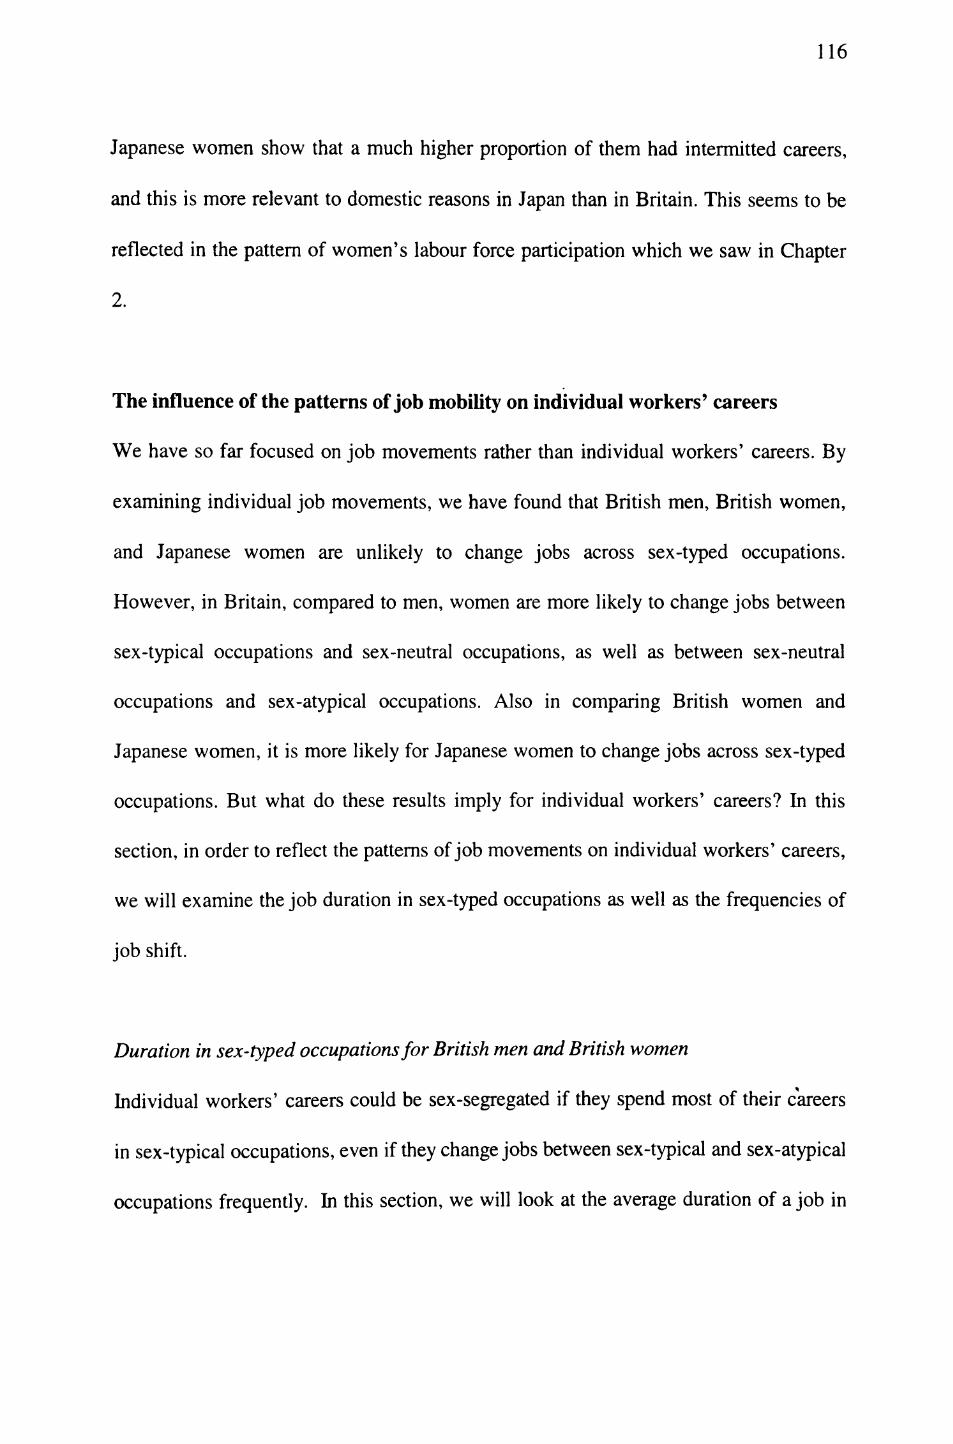
116
Japanese women show that a much higher proportion of them had intermitted careers,
and this is more relevant to domestic reasons in Japan than in Britain. This seems to be
reflected in the pattern of women's labour force participation which we saw in Chapter
2.
The influence of the patterns of job mobility on individual workers' careers
We have so far focused on job movements rather than individual workers' careers. By
examining individual job movements, we have found that British men, British women,
and Japanese women are unlikely to change jobs across sex-typed occupations.
However, in Britain, compared to men, women are more likely to change jobs between
sex-typical occupations and sex-neutral occupations, as well as between sex-neutral
occupations and sex-atypical occupations. Also in comparing British women and
Japanese women, it is more likely for Japanese women to change jobs across sex-typed
occupations. But what do these results imply for individual workers' careers? In this
section, in order to reflect the patterns of job movements on individual workers' careers,
we will examine the job duration in sex-typed occupations as well as the frequencies of
job shift.
Duration in sex-typed occupations for British men and British women
Individual workers' careers could be sex-segregated if they spend most of their careers
in sex-typical occupations, even if they change jobs between sex-typical and sex-atypical
occupations frequently. In this section, we will look at the average duration of a job in

117
each sex-typed occupations. In so doing, we will focus on the jobs which started after
1965 and were completed before the time of the survey. 5
Table 4.26 Average job duration in month by sex-typed occupations,
British men and women
Men Women
Male occupations 32.2 28.8
Mixed occupations 30.4 30.4
Female occupations 21.6 25.1
N 2686 2121
Source: The Employment in Britain survey
Table 4.26 shows the average duration of the jobs taken after 1965 and
completed before 1992 for both men and women. We can see that for men, the average
duration of the jobs in male occupations is 32 months, and in female occupations is 22
months, and therefore, men on average spent a longer time in sex-typical occupations
than in sex-atypical occupations. For women, however, this is not the case. The average
duration of the jobs in female occupations is 25 months, and that in male occupations is
29 months, but women on average spent the longest time in mixed occupations.
This seems to imply that the experience in sex-typical occupations and sex-
atypical occupations differ between men and women. For example, some studies suggest
that female occupations provide unfavourable employment conditions, such as a lower
salary than male occupations (Reskin and Roos 1990, Tomaskovic-Devey 1995, Sloane
5 This may cause an estimation bias, since we exclude the jobs which were still undertaken at the time of the survey. The duration of these jobs might be longer than the jobs already completed, so that the estimated average duration of a job in each sex-typed occupation might be under-estimated. There is a method to take account of the uncompleted job events, by calculating job retention rates and predict the likely additional time a worker spend in his/her current job (Hall 1982). But in this section, we are interested in actual job duration which constitutes the past occupational sex segregation at the aggregate level, rather than predicted job duration, which are more relevant to the future occupational sex segregation.

118
1994). If so, shorter duration in female occupations as compared with male occupations
for both men and women is understandable. However other research suggest that there
exists a pressure for men and women to leave sex-atypical occupation (Jacobs 1989b,
1993, Williams 1993). This might also explain why women's average duration of male
occupations is shorter than that of mixed occupations, as in the former, women may
have more pressure to leave than the latter. Since for men, female occupations are their
sex-atypical occupations, the substantially shorter job duration in these occupations for
them is understandable.
In sum, our findings suggest that for British men, in general, female occupations
seem to occupy a minor part of their careers. This is because men's attrition from female
occupations is relatively high and they on average spend substantially shorter time in
these occupations than other occupations. However, it seems that British women in
general have less segregated careers than British men, as their attrition from male
occupations is lower than men's attrition from female occupations, and they on average
spend a relatively long time in sex-atypical occupations compared to men.
Duration in sex-typical/sex-atypical occupations for Japanese women
Table 4.27 shows the average duration for Japanese women in the jobs taken after 1965
and completed before 1983 in male, mixed, and female occupations in years (and in
months). First of all, we can see that the average job duration for Japanese woinen is
considerably longer as compared to British women. Secondly, the job duration for
Japanese women in male occupations is slightly longer than the other occupations.

119
Table 4.27 Average job duration in years (in months) by sex-typed occupations,
Japanese women
years (months)
Male occupations 3.8 45.7
Mixed occupations 3.5 41.7
Female occupations 3.5 42.1
N 1391
Source: The Occupational Mobility and Career survey
Table 4.28 Relative job duration by sex-typed occupations,
British women and Japanese women (female occupations = 1)
British Women Japanese Women
Male occupations 1.1 1.1
Mixed occupations 1.2 1.0
Female occupations 1 1
Source: The Employment in Britain survey for Britain, and the Occupational Mobility and Career survey
for Japan.
Table 4.28 shows the relative job duration of each sex-typed occupations for
British women and Japanese women (the job duration of female occupations is set as 1).
As can be seen, there is not much difference found between British women and Japanese
women. Thus, the absolute job duration of sex-typed occupations is longer for Japanese
women than for British women, but the relative job duration of sex-typed occupations
does not differ so much between them.
The longer job duration in every sex-typed occupation for Japanese women than
for British women would help to confine them into the same sex-typed occupations.
However, given that Japanese women are likely to be found in mixed occupations rather
than female occupations, this seem to contribute to the sex-neutral careers of Japanese
women, rather than sex-segregated careers.

120
Frequencies of job changes
In comparing the average duration in a job between women in Britain and in Japan, we
have found that Japanese women in general spent much longer time in every sex-typed
occupation than the British women. Also, what we have found from the analysis of the
movements between employment and out-of-employment activities is that relatively
large number of Japanese women have intermitted careers. These findings suggest that
throughout their careers, Japanese women experience less job shifts compared to British
women.
Table 4.29 Frequencies of job shifts, British men and women
No. of Job Shifts Men Women _ ___ ___
1 14.6% 18.0%
2 17.0% 17.8%
3+ 59.1% 50.9%
N 2713 2142
Source: The Employment in Britain survey
Table 4.30 Frequencies of job shifts, Japanese women
No. of Job Shifts
0 65.8%
1 22.5%
2 7.9%
3+ 3.8%
N 1393
Source: The Occupational Mobility and Career survey
Table 4.29 shows the distribution of British men and British women by the
number of job shifts which occurred between 1965 and 1992.6 From this table, we can
6 Job movements which include no employment sphere in between are excluded, as we are interested in how the boundaries between sex-typed occupations affect individual workers' careers.

121
see that only 9.3% of men and 13.3% of women had no job shift between 1965 and
1992, or remained in the same job or leave the labour market after taking a job, but as
much as 59.1 % of men and 50.9% of women had more than three job shifts. British men
are slightly more likely to change their jobs than British women. On the other hand,
between 1965 and 1983, as much as 65.8% of Japanese women had no job shift, and
only 3.8% of them had more than three job shifts (Table 4.30). Since the distributions of
the number of job shifts in the Japanese data and in the British data are based on
different time periods - for Britain it is for 27 years and for Japan for 18 years, individual
workers in Britain might have more job shifts than those in Japan. However, if we see
the last 17 years in the British data, as much as 44.8% of men and 37.6% of women still
had more than three job shifts.
Therefore, even though we found that it is unlikely for them to move between
sex-typical occupations and sex-atypical occupations, Japanese women are less likely to
confront the situation where they actually change jobs between sex-typed occupations.
Even if they change their jobs, they move across sex-typed occupations relatively easily,
compared to British women. On the other hand, in Britain, people change their jobs
more frequently, so there are greater chances for them to confront the situation of
moving between sex-typed occupations. Moreover, when they change their jobs, it is
more difficult for them to move across sex-typed occupations. Thus, Japanese women's
careers seem to be much less sex-segregated than British men's and women's careers.

122
Summary and Conclusion
We have found that individual job movements are not random across sex-typed
occupations. What we have found instead is that for men and women in Britain, there
are relatively strong inflows into sex-typical occupations. On the other hand, for
Japanese women, we have found strong inflows into mixed occupations. However, these
results are very much influenced by the structural factors that male occupations are more
available for British men, female occupations are more available for British women, and
mixed occupations are more available for Japanese women. After controlling for the
structural differences, the only systematic movements that are found for British men and
British women, as well as for Japanese women, are to change jobs within the same sex-
typed occupations. Both the British data and Japanese data show that people are unlikely
to change jobs between sex-typical occupations and sex-atypical occupations. This is
particularly so for British men and women, but not so much for Japanese women.
In examining the job movements over time, we found a trend towards de
segregation before controlling for structural change, and no trends after controlling for
structural change for British men. However, for British women, the trend is towards
greater segregation both before and after controlling for structural change. This might
imply that British women's experiences in sex-typed occupations have been more
differentiated over time, and this would prevent them from moving across the
boundaries between sex-typed occupations. The job movements for British women both
before and after controlling for structural change did not show any parallel trends to the
aggregate change that are found in the previous chapter. Therefore, the aggregate change
seems to be generated by cohort replacement, that is to say, younger workers enter less
segregated occupations than older workers. With respect to Japanese women's job

123
movement, the trend is towards de-segregation before controlling for structural change,
but no trend can be found after controlling for structural change.
The examination of the relations between sex-typed occupations and out-of-
employment activities suggests that the implications of female occupations and of male
occupations differ between British men and British women, as well as between British
women and Japanese women. In Britain, both men and women are likely to re-enter the
labour market through female occupations, but this is not the case for Japanese women.
Also, both British men and British women are likely to exit the labour market through
sex-atypical occupations, but Japanese women are likely to exit the labour market
through mixed occupations.
About the implications of the patterns of job movements on individual workers'
careers, firstly, we found that for British men, the average job duration in sex-atypical
occupations is considerably shorter than that in sex-typical occupations, while British
women spent a relatively long time in sex-atypical occupations, compared to men. This,
together with the job mobility pattern for men that compared to women, the attrition of
sex-typical occupations is lower but that of sex-atypical occupations is higher, implies
that British men in general have more sex-segregated careers than British women.
Secondly, we discussed that the boundary between sex-typed occupations would affect
the individual workers' careers more in Britain than in Japan. This is not only because it
is less likely for British women than for Japanese women to change jobs between sex-
typical occupations and sex-atypical occupations, but also because people in Britain on
average have shorter job duration, and are more likely to experience job shifts in their
work life, and therefore, they have more chances to confront the situation of moving
between sex-typed occupations. In contrast, Japanese women's job duration is relatively

124
long and they seldom change their jobs, so that they have less chance to confront the
situation of changing jobs between sex-typed occupations. This, together with the fact
that Japanese women are likely to be found in mixed occupations rather than in female
occupations, suggests that women's careers are less sex segregated in Japan than in
Britain.

125
CHAPTER 5
OCCUPATIONAL SEX SEGREGATION AND EMPLOYMENT CONDITIONS 1:
ANALYSIS OF BRITAIN
Introduction
In the previous chapter, we found that there are systematic job movements across sex-
typed occupations in Britain. For both men and women, the attrition of sex-typical
occupations is relatively low, but the attrition of sex-atypical occupations is relatively
high. This would imply that individual workers' experiences differ by whether they
work in sex-typical occupations or in sex-atypical occupations. However, the analysis
of job duration in sex-typed occupations showed that for both men and women, the
average duration in female occupations is the shortest among the three sex-typed
occupations. In addition, the analysis of the relation between sex-typed occupations
and out-of-employment activities revealed that for both men and women, female
occupations are more likely to accept those re-entering the labour market. These
results seem to suggest that the differences are found between female occupations and
male occupations rather than between sex-typical occupations and sex-atypical
occupations. Thus, it seems that there are two dimensions of differentiation of
individual workers' experiences in Britain; one is between sex-typical occupations
and sex-atypical occupations, and the other is between female occupations and male
occupations.
In this chapter, together with Chapters 6 and 7, we will investigate why men
and women show the above systematic movements across sex-typed occupations. This

126
chapter and Chapter 6 will focus on employment conditions to examine the
implications of occupational sex segregation on individual workers' experiences in the
labour market. This chapter will firstly focus on the British labour market, and then
Chapter 6 will make a comparison of Britain and Japan.
The nature of employment conditions is one of the factors (but not the sole
factor) which influence individual workers' behaviour in the labour market; whether
to enter, stay or leave a job. The main characteristics of employment conditions on
which we focus in this chapter are pay, fringe benefits, task influence, promotion
chances, training chances, and job tenure. By examining these, we will investigate the
implications of occupational sex segregation for experiences of men and women in
Britain.
Occupational sex segregation and employment conditions
The impact of occupational sex segregation on employment conditions is well
documented in the US. The most notable finding is the impact of occupational sex
segregation on the level of pay. It is reported that the more female-dominated an
occupation is, the lower the level of pay that is provided in the occupation, after
controlling for other relevant factors (Hadson and England 1986, Tomaskovic-Devey
1995, England and Werbert 1995). Also, other studies suggest the negative impacts of
occupational sex segregation on supervisory responsibilities, promotion chances', task
complexity, occupational prestige, and job security (Jacobs and Prowell 1985, Reskin
and Roos 1990, Tomaskovic-Devey 1993b, 1995). Basically, female occupations
provide disadvantageous conditions to workers as compared to male occupations.
Research on the impact of occupational sex segregation on the experiences of

127
workers is less extensive in Britain. There are some studies of the effect of sex
segregation on pay (Sloane 1994, Mill ward and Woodland 1995), but research on
employment conditions other than pay is scarce.
There are basically two approaches to explain the different employment
conditions between female occupations and male occupations. One emphasises the
demand-side factors that attract different groups of workers (e.g., men and women,
whites and blacks, etc.). Based on the case studies in the US market, Reskin and Roos
(1990) argue that most of the occupations they studied were feminised because their
earnings, benefits, prestige, job security, autonomy, or chances for advancement failed
to keep pace with those in other occupations, and therefore men became less
interested in them. This made it necessary for employers to hire women in these
occupations. Here, the argument is that the deterioration of employment conditions led
employers to hire women. Women entered these occupations as they were better than
other occupations available to them. Cohn (1985), in his case study on the Great
Western Railway and the General Post Office in Britain, also suggests that it was the
need for inexpensive labour which increased the use of female clerks in them. The
recruitment of women fitted into employers' strategies to reduce labour costs. They
represented one of the few sources of highly educated skilled labour, but their
relatively high turnover rate made them inexpensive under the tenure-based salary
system.
The other approach focuses on the incumbents of the occupations to explain
different employment conditions. Tomaskovic-Devey (1993b), for instance, suggests
two explanations - status closure and status composition processes - to explain the
different employment conditions between female occupations and male occupations.

128
Status closure refers to the social processes by which status characteristics,
such as sex and race, determine who has access to valuable employment
positions. ... social pressures for race- and sex-based status-exclusion rise as
the quality of the job increases. Status composition refers to the process by
which the typical sex or race of a class of jobs in concrete workplaces becomes
a fundamental aspect of that job, influencing the work done as well as the
organisational evaluation of the worth of the work. ... the better the job, the
more black men, white women, and black women are excluded, and the more a
job is filled by black women, white women, or black men, the more it is
devalued and deskilled by employers.
(Tomaskovic-Devey 1993b pp218-219)
Another example, which emphasises the sex of incumbents, can be seen in Siltanen's
study on the postal workers in Britain (Siltanen 1994). Siltanen shows that men tried
to prevent women from entering their jobs, being afraid of the deterioration of work
conditions. The idea behind this is that women do not need "full-wage" jobs which
enable workers to fully support their household, but they only need "component-
wage" jobs which bring supplemental income to their household.
Although these two approaches differ in emphasising the factors that generate
the differences in employment conditions between female occupations and male
occupations, they both agree that male occupations provide better employment
conditions than female occupations.
In the following section, we will examine whether or not occupational sex
segregation differentiates various aspects of employment conditions in Britain, and in
what way it affects men and women.

129
Analysing the effects of occupational sex segregation on employment conditions
In analysing the impact of occupational sex segregation on employment conditions,
we use the data of the Employment in Britain survey (EIB) which was conducted in
summer 1992. The Effi is a national representative sample of men and women in work
aged between 20 and 60. Although the survey includes self-employed workers and
employees, we selected employees, since our principal interests are in examining the
possible differences in employment conditions which are imposed by employers. The
Effi contains rich information on employment conditions. We select pay, fringe
benefits, task influence, promotion chances, training chances, and job tenure as the
main characteristics of employment conditions.
Pay is one of the most fundamental aspects of work. In the Effi, the
respondents were asked, "what was your gross wage or salary the last time you were
paid, that is before deduction for tax, national insurance or superannuation?", "what
period did this cover?", and "how many hours a week did you work in that job during
this period, excluding meal intervals and unpaid overtime, but including paid
overtime?" From the responses to these questions, the variable of gross hourly pay
was constructed. In order to compensate for the skewness of the distribution, we take
the natural logarithm to analyse gross hourly pay.
Fringe benefits are selected as they, together with pay, represent economic
rewards. The Effi asked the respondents, "which, if any, of these benefits, or any
others like them, does your employer provide to people like you even if you yourself
have not taken up the benefits?" The list of fringe benefits includes, occupational
pension scheme beyond the basic state scheme, sick pay beyond the basic government
scheme, time off work for domestic problems on part or full pay etc., time off work

130
for domestic problems unpaid, use of a company car or van, free transport or other
help with travel costs, good or services at a discount or a preferential rate, subsidised
or free meals, finance or loans such as for house purchase, accommodation or
housing, life assurance cover, private health scheme, recreation or sports facilities,
maternity pay beyond the basic government scheme, child care assistance, career
break schemes, and any other benefits. We constructed a summary score for access to
fringe benefits, by assigning one point for each item that the employer provided across
the range of these.
Task influence is also an important aspect of work, as it indicates people's
capacity to exercise control over their jobs in the organisation, which in turn generates
job satisfaction (Reskin and Padavic 1994). The EIB has two relevant questions with
respect to task influence. Firstly, the respondents were asked, "how true would you
say each of the following statements is about your job? (Q25)" Among the four
statements, we selected the following two; "I have a lot of say over what happens in
my job (Q25b)", and "my job allows me to take part in making decisions that affect
my work (Q25c)". The answers were coded into very true, true, somewhat true and not
at all true. The second question is, "how much influence do you personally have on
each of the following? (Q49)" The list includes "deciding what tasks you are to do
(Q49b)" and "deciding how you are to do the task (Q49c)". The answers were coded
*
into a great deal, a fair amount, not much, and none at all. The four items scaled well,
with a Cronbach's Alpha of .78. Using the responses to the above four questions, a
variable of task influence was constructed by a principal components factor analysis.
Principal components analysis is a statistical technique to construct a single
representative variable from a set of variables (Kirn and Mueller 1978). As can be

131
seen from Table 5.1, the factor extracted has a variance of 2.4, which is 61.2 % of the
total variance of the four variables. Thus, the factor is adequate to represent the data.
Table 5.1 Principal components analysis of task influence
Variable
Q25b
Q25c
Q49b
Q49c
Communality
.65475
.65545
.58713
.54990
* Factor Eigenvalue Pet of Var Cum Pet
* 1 2.44723 61.2 61.2
*
*
*
Source: The Employment in Britain survey Note: Cronbach's alpha for the factor is .78.
Promotion chances and training chances are selected as they indicate the
chances of economic advancement. The more promotion and training chances people
have, the more likely it is that they reach higher positions in the organisation which
will provide greater economic rewards as well as greater power to exercise authority
and autonomy, which in turn will generate greater job satisfaction. In terms of
promotion chances, the EIB asked the respondents, "how high do you think your
chances are of being given a significant promotion with your present organisation?".
The answer was coded into five categories; 100%/definite, 75%/high chance,
50%/fifty/fifty, 25%/low chance, and 0%/no chance at all. The answer was recoded
into a binary variable of promotion chances; 50% or more chances of promotion, and
less than 50% chances of promotion.
In terms of training chances, the EIB asked the respondents, "how likely are
you to get training in the future with your present employer?" The answers were coded
into four categories; very likely, fairly likely, fairly unlikely and not at all likely. We

132
receded this variable into two categories; likely or unlikely.
Finally, job tenure indicates job security. The EIB asked the respondents, "do
you think your job is considered by your employer to be (a) a temporary job lasting
less than 12 months, (b) a fixed term job lasting between 1 and 3 years, or (c) a
permanent job with no fixed time of ending?". We receded this variable into two
categories; permanent job(=(c)) or non-permanent job(=(a) or (b)).
As the measurement of occupational sex segregation, we use percent female in
an occupation. We calculate percent female by using the 3-digit occupational
classification of the Labour Force Survey 1992 Summer, and attach it to the EIB survey
data. Both data sets are national random samples, and were conducted approximately at
the same time, so that the method of creating a variable from the LFS and attaching it to
the EIB is not statistically problematic. We are interested in the effect of this variable on
various employment conditions described above. We will examine the linear effect of
occupational sex segregation, that is, the possible change in the response variables by an
increase in percent female in an occupation.
In order to see whether there is a significant impact of an increase in female percent in
an occupation on employment conditions for both men and women in Britain, and
whether the impact differs between men and women, we will firstly construct a model,
which includes sex, percent female in an occupation, and the interaction term between
sex and percent female as the predictor variables. The model formula for the ith person
can be written as,
ECi = a + alSi + a2Fi + a3Si.Fi + ui

133
where,
EC: employment conditions (e.g., hourly pay, benefits, etc.)
S: sex dummy. 1 if the ith person is female
F: percent female in the occupation of ith person
S.F : interaction between sex dummy and percent female
u: random error
What we are interested to see in this model is the coefficients of percent female in an
occupation, and of the interaction term with sex. As we include the interaction term
between sex and percent female in an occupation, the coefficient for percent female
(=a2) is interpreted as the effect of an increase in percent female in an occupation for
men, and the coefficient for the interaction term (=a3) estimates the difference in the
effect of an increase in percent female in an occupation for men and women. 1 In other
words, if the effect of the interaction term is significant, this indicates that an increase in
percent female in an occupation generates different effects on the particular employment
condition for men and women.
By examining the value of a2, which is the effect of percent female in an
occupation for men, and the value of a2+a3, which is the effect of percent female in an
occupation for women, we can see in which direction, negative or positive, an increase
in percent female in an occupation affects men and women, as well as examine which
sexes, men or women, are affected more by an increase in percent female in an
occupation.
The results obtained from this model, however, simply represent the uneven
distribution of men and women across the variables which influence employment
conditions. Therefore, we need to add the variables which could possibly affect
For regression with dummy variables, see Hardy (1993).

134
employment conditions as control variables in our models to see the net effect of
occupational sex segregation. As these variables, we include human capital variables,
variables of organisational characteristics, variables of job characteristics, and a dummy
variable for part-time work (see Table 5.2).
Table 5.2 Control variables used in analysis of employment conditions in Britain
Control variables Definitions
Human capital variables 4 educational dummies; (1) a low level dummy, (2)an ordinary leveldummy, (3)an advanced level dummy, and (4)a degree level dummy.2 Years in the labour market Years out of the labour market
Organisational variables 5 dummies for the size of the organisation; (l)less than 10 workers, (2)10to 24, (3)25 to 99, (4)100 to 499, and (5)500 or more workers Public sector dummy Union presence dummy18 dummies for industry; (l)agriculture, forestry and fishing, (2)energy and water supply, (3) extraction of minerals and ores other than fuels, (4) mechanical engineering and manufacture of vehicles, (5)electrical and electronic engineering, (6)other manufacturing, (7)construction, (8)retail, (9)hotels and catering, (lO)transport and communication, (ll)postal services and telecommunications, (12)banking, finance and insurance, (13)national and local government services, (14)education, research and development, (15)medical and other health services, (16)welfare, (17)leisure services, and (18) personal services
Job characteristics variables 6 job qualification dummies; (l)no qualification, (2)CSE equivalent, (3)O-level equivalent, (4)A-level equivalent, (5)post A-level, and (6)degree level6 former training dummies; (l)none, (2)less than 1 month, (3)1-3 months, (4)4-6 months, (5)7-12 months, and (6)over one year
Part-time dummy = 1 if working up to 30 hours a week
Source: The Employment in Britain SurveyNote: Unless otherwise stated, the first category of each variable is set as the reference category.
*
Economists suppose that those with greater human capital are more productive
than those with lesser human capital. The more productive a worker is, the better
bargaining position the worker is in, and therefore, the better employment conditions the
worker should have. As the variables of human capital, we include educational
For details of the variable of educational qualifications, see Appendix B.

135
qualifications, years in the labour market, and years out of the labour market. It is
reported that women on average acquire less human capital than men; their educational
attainment is relatively low, and they have shorter experience in the labour market, but
longer experience out of the labour market. The supply-side explanation for
occupational sex segregation suggests that because of this, women are concentrated into
female occupations where their lesser human capital is least likely to be penalised.
Thus, the results found in the previous model may be influenced by the effects of human
capital.
Organisational characteristics also affect employment conditions, as they
represent the capacity to provide different rewards to workers. As the variables of
organisational characteristics, we include 4 dummies for the size of the organisation, a
union presence dummy, a public sector dummy, and 17 industry dummies. For instance,
large organisations may provide more favourable employment conditions, such as higher
pay, higher chances of promotion and training, than smaller ones. Union presence may
help to enhance better employment conditions. Also employment conditions might
differ between public and private sectors, as well as by industry. Again, men and women
are unevenly distributed across these variables. Women are more likely than men to be
concentrated into small organisations, they are less likely to work in organisations
without unions, they are more likely to work in the public sector, and they are more
^
likely to be concentrated into the service industries. Thus, the results in the previous
model might well reflect these uneven distributions between the sexes. 3
3 We also report the results based on the models that exclude industry. Controlling for industry is based on the assumption that industries with unfavourable conditions do not have these conditions because of the sex composition of occupations in the industry. However, it seems more plausible that industry's overall employment conditions are affected by the concentration of female-dominated occupations or male-dominated occupations within the industry.

136
We also control for job characteristic variables. They are qualifications required
for the job and former training periods for the job. These variables are supposed to
influence employment conditions, as they indicate skill requirements for the job. The
more skilled the job, the better the employment conditions the worker should have.
These variables are different from human capital variables, as it does not necessarily
happen that worker's human capital matches with their job requirements. It is reported
that men occupy more skilled jobs than women (Horrell et al, 1990, Reskin and Roos
1990), so that this might well be reflected in the results of the previous model.
Finally, we add a part-time work dummy, as the division of part-time work and
full-time work is reported to be relevant to the differentiation of employment conditions
(Rubery et al, 1994, Tam 1995). Part-time jobs are predominantly done by women, and
again the result in the previous model may reflect this.
The model formula which includes these controls variables can be written as,
ECi = a + alSi + a2Fi + aSSi.Fi + a4HCi + a5ORi + a6JCi + a7PTi + ui
where,
HC: human capital variables
OR: organisational variables
JC: job characteristics variable
PT: part-time work dummy
other terms are the same as the previous model.
The interpretations of the coefficients of percent female in an occupation, and of the
interaction term between sex and percent female in an occupation are the same as the
previous model, but they represent the effects net of the other predictor variables in

137
the equation.
This model assumes that the effects of control variables on the response
variable are the same for men and women. However, these control variables might
have sex-specific effects. If women had less training in their jobs than men, this would
generate different effect of years in the labour market for men and women. Also, it is
reported that women are lower-paid than men after adjusting for job skills (Horrell et.
al., 1994). In order to control for the potential sex difference in the effect of our
control variables, we need to add the interaction terms between sex and each of the
control variables in the above equation, as the following formula shows.
ECi = a + alSi + a2Fi + aSSi.Fi + a4HCi + aSSi.HCi + a6ORi + aTSi.ORi
+ aSJCi + a9Si.JCi + alOPTi + al ISi.PTi + ui
where,
S.HC: interaction term between sex and human capital variables
S.OR: interaction term between sex and organisational variables
S.JC: interaction term between sex and job characteristics variable
S.PT: interaction term between sex and part-time work dummy
Alternatively, we can make sex-specific functions. Constructing sex-specific functions
makes it easier to interpret the results. By examining the coefficient of percent female
in men's model (or women' model), we can see whether an increase in percent female
in an occupation has a significant impact for men (or for women) after controlling for
the effects of human capital variables, organisational characteristic variables, job
characteristics variables, and a dummy variable for part-time work. Also, it enables us
to avoid the potential problem of multicollinearity between sex and the other predictor

138
variables. Thus, in order to control for the sex-specific effects of our control
variables, we will construct separate models for men and women. The model formula
for the ith male (or ith female) can be written as,
ECi= a + alFi + a2HCi + a3ORi + a4JCi + a5PTi + ui
Our response variables, log gross hourly pay, fringe benefits and task influence are or
approximate to continuous variables, so that we use the OLS regression for modelling
these variables. Promotion chances, training chances, and job security are binary
variables, so that we use logistic regression for the modelling.
As can be seen in Table 5.3, there are significant sex differences for hourly
pay, fringe benefits, task influence, promotion chances, and training chances, but not
for job tenure.
Table 5.3 Average scores (and standard deviations) for variables of employment conditions
Dependent variables All Men Women Significance of Sex Gap
N=3469 N=1803 N=1667
Ln Hourly Pay 1.74(0.45) 1.87(0.42) 1.60(0.44) ***
Fringe Benefits 4.33(3.11) 4.82(3.15) 3.81(2.97) ***
Task Influence 0.0001(1.0001) 0.0517(0.9988) -0.0558(0.9988) **
Promotion Chances 0.40(0.49) 0.44(0.50) 0.35(0.48) ***
Training Chances 0.54(0.50) 0.57(0.50) 0.52(0.50) **
Job tenure 0.88(0.33) 0.88(0.32) 0.88(0.32) n.s.
Source: The Employment in Britain survey Note:***p<.001,**p<.01
4 For instance, the correlation between sex and percent female in an occupation is quite high (r=.68).

139
Modelling the impact of occupational sex segregation
Log Hourly Pay
We firstly examine log gross hourly pay. We can see from Table 5.4a that the model
which includes both men and women without control variables, but just sex, percent
female in an occupation, and the interaction term between them, shows that an
increase in percent female in an occupation for men is significant and negative, which
means that moving to more female occupations decreases men's hourly wage. This
negative effect is significantly larger for women (-0.0011-0.0023 = -0.0034), so that
women's hourly pay would decrease more than men's by an increase in percent female
in an occupation (we tested separately for the significance of the female percent
coefficient by running a model in which men were coded "1" so that coefficient of the
non-interactive independent term reveals the effect for women). However, once we
include our control variables (= human capital, organisational characteristics, job
requirements, and a dummy for part-time work) in our model, the difference of the
effect of occupational sex segregation for men and women is no longer significant.
The results of the model with control variables, however, still show that both men and
women lose their hourly pay by an increase in percent female in an occupation.
Table 5.4a Coefficients of percent female in an occupation in OLS regression on log hourly pay,
Britain (N=2305)
Without Controls With controls
Coefficients Standard errors Coefficients Standard errors
Fempctformen -0.0011* (0.0004) -0.0013***/*** (0.0004)
Sex.Fempct -0.0023*** (0.0007) 0.0004 (0.0006)
Fempct for women -0.0034*** (0.0005) -0.0009*/** (0.0005)
AdjR2 0.1018 0.4719
Source: The Employment in Britain surveyNote: *** p<.001, ** p<.01, * p<.05. Asterisk after slash denotes significance if industry is excluded fromthe model.

140
Table 5.4b shows the coefficients of percent female in an occupation for separate
models for men and women. The results show that even after controlling for the sex-
specific effects of control variables, occupational sex segregation negatively affects
both men's and women's pay in Britain.
Table 5.4b Coefficients of percent female in an occupation in OLS regression on log hourly pay
with controls, British men and women
Men Women
Fempct -0.0011**/** -0.0009*/*
s.e. (0.0004) (0.0005)
Adj R2 0.4236 0.4385
N 1176 1129
Source: The Employment in Britain surveyNote: *** p<.001, ** p<.01, * p<.05 Asterisk after slash denotes significance if industry is excluded fromthe model.
Fringe Benefits
We now turn to fringe benefits. Firstly the model including both men and women
without control variables shows that an increase in percent female in an occupation
increases, rather than decreases, men's fringe benefits (Table 5.5a). The effect of
percent female in an occupation is significantly lower for women than for men, and it
negatively affects women's fringe benefits, thus women's access to fringe benefits
decreases as percent female in an occupation increases. The effect of percent female
in an occupation net of human capital, organisational characteristics, job requirement,
and full-time/part-time work, is still significant and positive for men, indicating that
they gain more access to fringe benefits as they move to more female occupations.
The coefficient for the interaction term shows that the effect is significantly lower for
women than for men. However, for women, the effect is no longer significant after

141
controlling for other variables. Nevertheless, if we exclude industry dummies from
the model, the effect of percent female is significant and negative for women. This
seems to suggest that the effect of occupational sex segregation is cancelled out by
including the industry dummies because of the concentration of female occupations
into particular industries, such as education, research and development, medical and
other health services, welfare, and personal services, which provide lesser access to
fringe benefits.
Table 5.5a Coefficients of percent female in an occupation in OLS regression on fringe benefits,
Britain (N=2825)
Without Controls With controls
Coefficients Standard errors Coefficients Standard errors
Fempctformen 0.0077** (0.0030) 0.0069**/** (0.0027)
Sex.Fempct -0.0325*** (0.0046) -0.0119**/*** (0.0040)
Fempct for women -0.0247*** (0.0035) -0.0049ns /*** (0.0032)
Adj R2 0.0465 0.3563
Source: The Employment in Britain survey p<.001, ** rx.Ol, * p<.05Note: *** p<.001, ** p<.01, * p<.05. n.s = not significant. Asterisk after slash denotes significance ifindustry is excluded from the model.
Table 5.5b Coefficients of percent female in an occupation in OLS regression on fringe benefits
with controls, British men and women
Men Women
Fempct 0.0070*/** -0.0088***/***
s.e. (0.0031) (0.0031)
AdjR2 0.3172 0.3778
N 1454 1371
Source: The Employment in Britain surveyNote: *** p<.001, ** p<.01, * p<.05. Asterisk after slash denotes significance if industry is excluded from
the model.
Separate models for men and women show that after controlling for the other
variables, an increase of percent female in an occupation significantly decreases
women's access to fringe benefits (see Table 5.5b). For men, as in the previous

142
model, an increase in percent female in an occupation significantly increases their
access to fringe benefits.
Task Influence
Table 5.6a shows the result for the models for task influence for men and women. The
model without controls shows that the effect of percent female in an occupation is not
significant for men. However, it is significantly lower for women, indicating that
women lose task influence as they work in more female occupations. Nevertheless,
after controlling for other variables relevant to employment conditions, occupational
sex segregation no longer has a significant effect on either men or women.
Table 5.6a Coefficients of percent female in an occupation in OLS regression on task influence,
Britain (N=2768)
Without Controls With controls
Coefficients Standard errors Coefficients Standard errors
Fempct for men 0.0012 ns/ns (0.0009) 0.0005" s/ns (0.0010)
Sex.Fempct -0.0036** (0.0015) -0.0023 ns/ns (0.0015)
Fempct for women -0.0024* (0.0012) -0.0019ns/ns (0.0012)
AdjR2 0.0053 0.1431
Source: The Employment in Britain survey.Note: *** p<.001, ** p<.01, * p<.05. n.s.= not significant. Asterisk after slash denotes significance ifindustry is excluded from the model.
Table 5.6b Coefficients of percent female in an occupation in OLS regression on task influence
with controls, British men and women
Men Womenn.s./n.s.Fempct -0.0003 ns/ns -0.0017
s.e. (0.0010) (0.0012)
AdjR2 0.1685 0.1223
N 1428 1340
Source: The Employment in Britain survey.Note: *** p<.001, ** p<.01, * p<.05. n.s. = not significant. Asterisk after slash denotes significance ifindustry is excluded from the model.

143
This result is supported even after controlling for sex-specific effects of control
variables (see Table 5.6b). Therefore, the level of task influence seems to be relevant
to other factors, such as human capital, organisational characteristics, job
requirements, and part-time/full-time status, rather than occupational sex segregation
per se.
Promotion Chance
We now turn to promotion chances. The model without control variables shows that
the effect of percent female in an occupation for men is significant and positive; men
increase their chances of promotion as they work in more female occupations. The
effect is significantly lower for women, and it is significant and negative for women;
women lower their chances of promotion as they work in more female occupations.
Table 5.7a Coefficients of percent female in an occupation in logistic regression on
promotion chances, Britain (N=2753)
Without Controls With controls
Coefficients Standard errors Coefficients Standard errors
Fempctformen 0.0048** (0.0019) 0.0031"''7* (0.0023)
Sex.Fempct -0.0130*** (0.0031) -0.0055 ns/ns (0.0036)
Fempct for women -0.0082*** (0.0024) -0.0024 n 'sj ns (0.0029)
Chisqr 52.155*** df=3 471.578*** df=42
Source: The Employment in Britain survey.Note: *** p<.001, ** p<.01, * p<.05 n.s. = not significant. Asterisk after slash denotes significance if
industry is excluded from the model.
However, the model with control variables shows that the effect of an increase of
percent female in an occupation net of human capital, organisational characteristics,
job requirements, and full-time/part-time status, is not significant for either men or
women. If we exclude industry from the model, however, the effect for men appears

144
significant and positive. This seems to be because men particularly have advantages in
their promotion chances in industries which have a large share of female-dominated
occupations, such as retail, welfare, and personal services.
Table 5.7b Coefficients of percent female in an occupation in logistic regression on promotion
chances with controls, British men and women
Men WomenFempct 0.0027 ns/ns -0.0036 ns/*
s.e. (0.0026) (0.0030)
Chisqr 288.133 200.877
df 40 40
N 1429 1324
Source: The Employment in Britain survey.Note: *** p<.001, ** p<.01, * p<.05. Asterisk after slash denotes significance if industry is excluded fromthe model.
After controlling for sex-specific effects of control variables, the result for men shows
that occupational sex segregation does not significantly affect men's promotion chances.
Neither does it affect women (see Table 5.7b). However, if we exclude industry from the
model, the effect of percent female in an occupation is significant for women, and the
coefficient is negative. Again, this seems to suggest that in industries which have large
share of female-dominated occupations, such as education, research and development,
medical and other health services, and personal services, women have less chances of
promotion.
Training Chances
Table 5.8a shows the coefficients for percent female in an occupation for the models
of training chances. The result for the model without control variables shows that the
effect of percent female in an occupation is significant and positive for men; men's
training chances increase as they work in more female occupations. The effect is
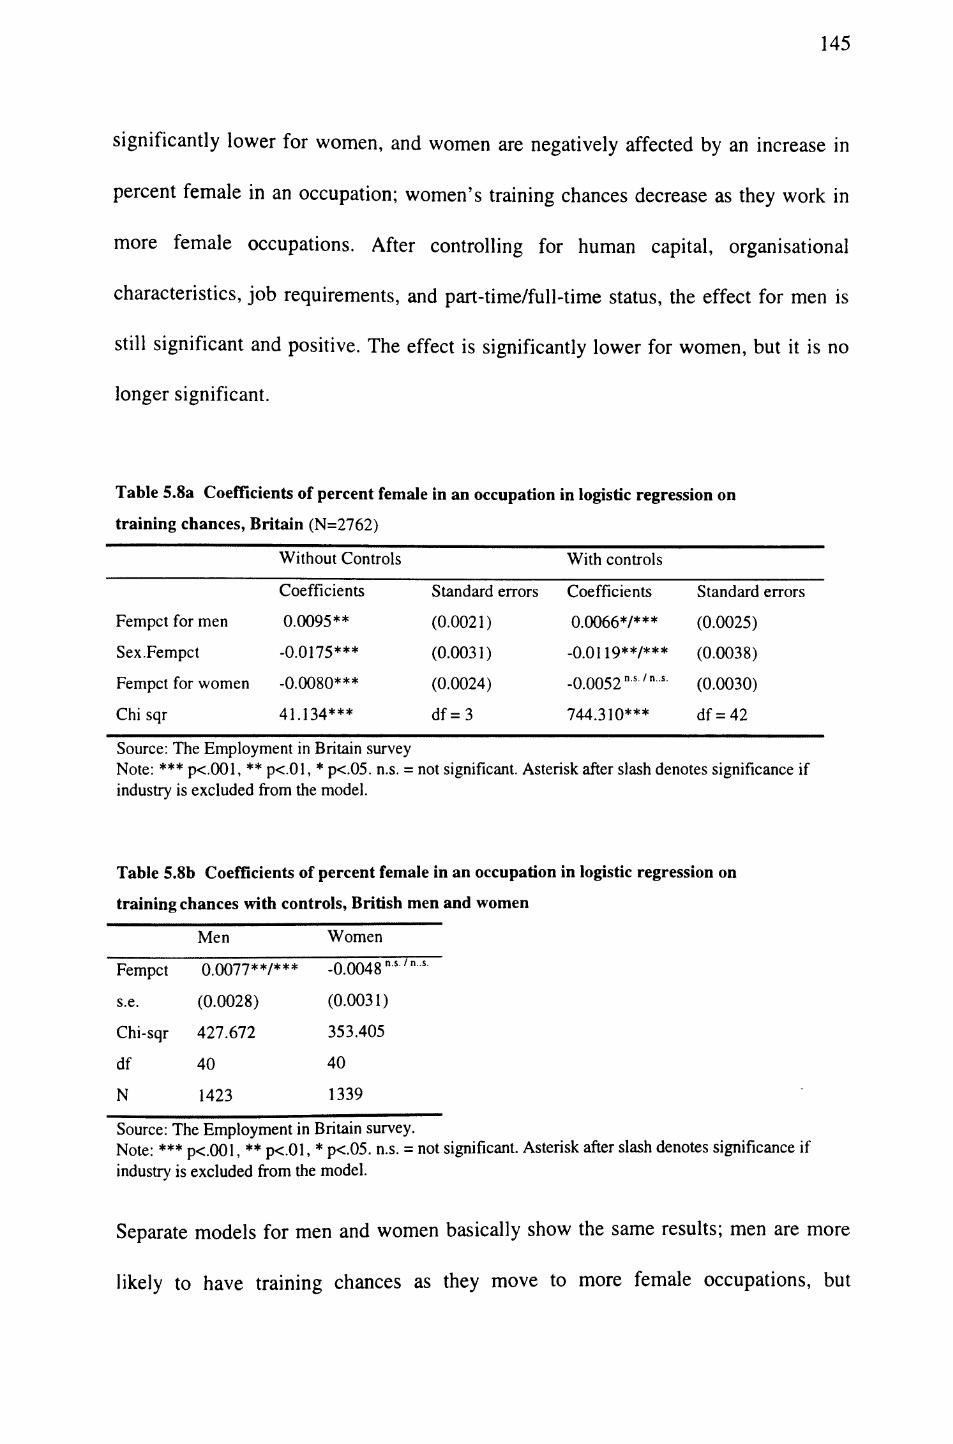
145
significantly lower for women, and women are negatively affected by an increase in
percent female in an occupation; women's training chances decrease as they work in
more female occupations. After controlling for human capital, organisational
characteristics, job requirements, and part-time/full-time status, the effect for men is
still significant and positive. The effect is significantly lower for women, but it is no
longer significant.
Table 5.8a Coefficients of percent female in an occupation in logistic regression on
training chances, Britain (N=2762)
Without Controls
Fempct for men
Sex.Fempct
Fempct for women
Chi sqr
Coefficients
0.0095**
-0.0175***
-0.0080***
41.134***
Standard errors
(0.0021)
(0.0031)
(0.0024)
df=3
With controls
Coefficients
0.0066*/***
-0.01 19**/***
-0.0052 ns/ns
744.310***
Standard errors
(0.0025)
(0.0038)
(0.0030)
df=42
Source: The Employment in Britain surveyNote: *** p<.001, ** p<.01, * p<.05. n.s. = not significant. Asterisk after slash denotes significance ifindustry is excluded from the model.
Table 5.8b Coefficients of percent female in an occupation in logistic regression on
training chances with controls, British men and women
Fempct
s.e.
Chi-sqr
df
N
Men
0.0077**/***
(0.0028)
427.672
40
1423
Women-0.0048 ns/ns
(0.0031)
353.405
40
1339
Source: The Employment in Britain survey.Note: *** p<.Q01, ** p<.01, * p<.05. n.s. = not significant. Asterisk after slash denotes significance ifindustry is excluded from the model.
Separate models for men and women basically show the same results; men are more
likely to have training chances as they move to more female occupations, but

146
women's training chances are not significantly affected by occupational sex
segregation (see Table 5.8b).
Job tenure
Finally, we examine job tenure. The model without control variables shows that the
effect of percent female in an occupation is significantly greater for women than for
men, and it positively affects women's job tenure (see Table 5.9a). Therefore,
women's chance to get a permanent job increases as they work in more female
occupations. However, the effect for men is insignificant so that occupational sex
segregation does not significantly affect men's job tenure. The same result can be
found if we include human capital, organisational characteristics, job requirements
and part-time/full-time work as controls.
Table 5.9a Coefficients of percent female in an occupation in logistic regression on
job tenure, Britain (N=2760)
Without Controls With controls
Coefficients Standard errors Coefficients Standard errors
Fempctformen -0.0059 (0.0030) -0.0006 ns/ns (0.0034)
Sex.Fempct 0.0131** (0.0044) 0.0136**/** (0.0049)
Fempct for women 0.0072* (0.0033) 0.0130**/* (0.0038)
Chisqr 9.500* df=3 147.539* df=42
Source: The Employment in Britain survey.Note: *** p<.001, ** p<.01, * p<.05. n.s. = not significant. Asterisk after slash denotes significance ifindustry is excluded from the model.
This is the same even if we further control for sex-specific effects of control variables
(see Table 5.9b). Thus, job tenure is the only dependent variable in which we found a
positive impact of occupational sex segregation for women.

147
Table 5.9b Coefficients of percent female in an occupation in logistic regression on job tenure
with controls, British men and women
Men Women
Fempct -0.0005 s ' 0.0090*7*
s.e. (0.0037) (0.0043)
Chisqr 70.802 141.468
df 40 40
N 1415 1345
Source: Employment in Britain survey.Note:*** p<.001, ** p<.01, * p<.05. n.s. = not significant. Asterisk after slash denotes significance ifindustry is excluded from the model.
Summary and Conclusion
In summary, our findings show that after controlling for human capital, organisational
characteristics, job requirements and full-time/part-time work, both men and women
receive lower pay as they work in more female occupations. However, men gain more
access to fringe benefits and more training chances as they work in more female
occupations. On the other hand, women lower their access to fringe benefits, though
they gain more secure jobs as they work in more female occupations. What do these
findings imply for the aggregate stability of occupational sex segregation, or the
patterns of individual job mobility across sex-typed occupations that are found in the
previous chapters?
Firstly, from employer's point of view, it seems in their interests to employ
women in female occupations. By doing this, they could cut labour costs by providing
women with less economic rewards (i.e., pay and fringe benefits) relative to their
human capital or job skills. The advantage in job tenure for women in more female
occupations might suggest that this cost effectiveness leads British employers to
utilise women seriously in these occupations. Thus, British employers have incentives

148
to maintain occupational sex segregation by hiring and retaining women in female
occupations, and this seems to be reflected in the aggregate stability of occupational
sex segregation in the British labour market.
Secondly, for men, they lower their pay as they work in more female
occupations. However, our results also suggest that men have greater access to fringe
benefits and training chances as they work in more female occupations. Therefore,
even if men lose their income as they move to more female occupations, they could
get some compensations. Thus, female occupations do not necessarily disadvantage
men. Men's low attrition of male occupations, their greater inflows into male
occupations from other occupations, and their relatively long job duration in male
occupations, that are found in the previous chapter, however, seem to suggest that
there are incentives for men to move to and stay in male occupations. Although it is
difficult to compare the loss of pay to the gain of fringe benefits and training chances
by an increase in percent female in an occupation, greater pay in more male
occupations could well be one of the factors which induce men's movements into
male occupations and make them stay in these occupations.
Finally, for women, occupational sex segregation negatively affects their pay
and fringe benefits; women lower their pay and lose access to fringe benefits as they
work in more female occupations. This might be reflected in their relatively higher
attrition from sex-typical occupations as well as their relatively shorter job duration in
sex-typical occupations compared to men, as we found in the previous chapter.
Having said that, however, the question of why women enter and stay in
female occupations still remains. Even if it is cost effective for employers to hire and
5 This might help to avoid the potential conflicts between employers and male workers in these occupations, as suggested elsewhere (see Williams 1993).

149
retain women in female occupations, and this helps to generate more job opportunities
for women in female occupations, women still seem to have alternative options in the
labour market. In fact, some women, if not many, do enter and remain in male
occupations as we saw in the previous chapter.
Thus, we were not very successful in explaining the patterns of women's
movement between sex-typed occupations in this chapter. We will, therefore,
investigate further why women move to and remain in female occupations by focusing
on job preferences and job satisfaction in Chapter 7. But firstly in the next chapter, we
will compare the impact of occupational sex segregation on employment conditions
between Britain and Japan, to examine the issue of why the extent of occupational sex
segregation is greater in Britain than in Japan.

150
CHAPTER 6
OCCUPATIONAL SEX SEGREGATION AND EMPLOYMENT CONDITIONS 2:
COMPARISON OF BRITAIN AND JAPAN
Introduction
As we found in Chapter 3, at the aggregate level, the extent of occupational sex
segregation is substantially greater in Britain than in Japan. This is because both men
and women in Britain are concentrated into sex-typical occupations, while in Japan,
this is only the case for men, but not for women. In the previous chapter, we found
that women receive lower pay and lose access to fringe benefits as they work in more
female occupations. We have argued that this can be one of the factors contributing to
the maintenance of occupational sex segregation, since British employers can cut
labour costs relative to human capital and skills by hiring women in more female
occupations. If this mechanism of occupational sex segregation is valid, then
occupational segregation should generate greater benefits for British employers than
for Japanese employers, so that the former have more incentives to provide more job
opportunities for women in female occupations, while the latter have little incentive to
do so.
In this chapter, we will examine the impact of occupational sex segregation on
employment conditions in Britain and Japan, using two sources of data - the
International Social Justice Project survey data and the Comparative Project on Class
Consciousness survey data - both of which have the same or equivalent questions for
both countries. We will examine income, supervisory responsibilities, job autonomy

151
and promotion chances as the characteristics of employment conditions. We will
firstly examine to what extent sex differentiates these variables, and how much
occupational sex segregation accounts for the sex differences in Britain and Japan. In
the second half of this chapter, we will focus on the payment systems of Britain and
Japan, trying to understand why the implications of occupational sex segregation
differ between Britain and Japan. Also we will discuss how this could affect the
aggregate patterns of occupational sex segregation.
Sex differences in employment conditions and occupational sex segregation
Although there are some statistics which make it possible to compare sex pay
differential across countries (see for example, ILO 1995), it is difficult to find data
which permits us to compare sex difference in other aspects of employment
conditions. The International Social Justice Project survey data and the Comparative
Project on Class Consciousness survey data, however, allow us to compare the sex
gap in various employment conditions, such as income, supervisory responsibilities,
job autonomy, and promotion chances, between Britain and Japan. However, since
these two data sets have smaller sample sizes as compared to the Employment in
Britain survey data, and lack the equivalent variables to those found in the EIB, we
will apply simpler analyses in this chapter than the one we did in the previous chapter.
Income data comes from the International Social Justice Project survey (ISJP,
for details of the sample, see Chapter 1, p21). In the ISJP, the respondents were asked
their annual income from their jobs before tax. For Britain, it was the income of the
respondent in the last 12 months before tax and for Japan it was the income of the
respondent in 1990 before tax.

152
Data on supervisory responsibilities, job autonomy and promotion chances
comes from the Comparative Project on Class Consciousness survey (CPCC, for
details of the sample, see Chapter 1, pp21-22). As we noted in Chapter 1, the
Japanese survey is not a national representative sample but a representative sample of
persons living in Tokyo metropolitan area, so that we need some caution in comparing
the results between Britain and Japan. 1
The variable for supervisory responsibility is binary - whether or not to
supervise others. The wording of the question for Britain is "as part of your job do
you supervise or manage the work of other employees?", and for Japan is "as an
official part of your job, are you in a position in which you supervise the work of other
employees or give instructions to other employees?". The job autonomy variable is
also binary. The wording for Britain is "is yours a job which allows you to design and
plan important aspects of your own work or is your work largely defined for you?",
and for Japan is "is your job the one in which you are required to design important
aspects of your own work and put your idea into practice? Or is yours a job in which
most of your work is routinized?". The variable of promotion chances is binary as
well. The British survey asked the respondents "how high you think your chances are
1 As we already noted in Chapter 1, compared to the Japanese Census, the men's sample over-represents professional, technical, managerial and clerical workers, and significantly under-represents skilled, semi-skilled and unskilled workers.* The women's sample significantly over-represents clerical, sales and service workers, slightly under-represents professional and technical workers, and significantly under- represents skilled, semi-skilled and unskilled workers (Ushijima 1995). In analysing the Japanese CPCC data to compare the situation between Britain and Japan, we took this into consideration, applying extra analyses, such as the one after controlling for occupational distribution or enterprise size, and see whether we can confirm the results. By doing this, we found that the analyses after controlling for the size of enterprises (4 categories) as well as occupational class (higher non-manual/lower non- manual/manual) basically supported the arguments made in this chapter (results not shown here).

153
of being given a significant promotion within your present organisation?", and the
respondents answered on a 5 point-scale, 1) 100% definite, 2) 75% high chance, 3)
50% fifty/fifty, 4) 25% low chance, and 5) 0% no chance. We recoded the variable
into two categories, 1) 50% or more chances and 2) less than 50% chances, so that we
can find a comparability with the Japanese variable, which is based on the response to
the question, "at your place of work, are more than half the people in a position like
yours likely to get significant promotions?".
In this section, we will divide the data by sex and groups of occupational sex
segregation, and examine whether each group has different employment conditions
from the others. We constructed a variable of occupational sex segregation which has
three categories, according to percent female in an occupation, 1. male (0-30 percent
female in an occupation), 2. mixed (31-69 percent female in an occupation), and 3.
female (70-100 percent female in an occupation). This classification corresponds to
the one used in Chapters 3 and 4, so that examining men's and women's employment
conditions by using this variable helps us to understand why men and women are
distributed differently into these three groups of occupations (Chapter 3), and why
men and women show systematic movements between the three groups of occupations
(Chapter 4). As mentioned, the advantage of this classification is that it is not country-
specific, and it is gender-symmetrical (see Chapter 3). Also it is often used by research
on occupational sex segregation (Jacobs 1989b, Rosenberg and Spenner 1995). The
percentage is calculated using the 3-digit occupational classification of the labour
force survey or the census of each country. For the British ISJP, the percentage based
on the 1991 labour force survey was attached, and for the British CPCC, the one based
on the 1984 labour force survey was attached. For Japan, since the detailed

154
occupational classification is only available in the censuses in every five years, but not
in the labour force survey, we attached the information from the census which was
conducted at the nearest point in time. For both the Japanese ISJP and CPCC, we used
the 1990 census. For the Japanese CPCC, we could use the 1985 census, but we used
the 1990 census for the following reasons. Firstly, the occupational classification in
the CPCC corresponds to the 1990 census classification, rather than the 1985 census
classification, so that it is easier to attach the 1990 census data rather than the 1985
census data. Secondly, the Equal Employment Opportunity Law came into force in
1986, so this might have changed the distribution of men and women across
occupations. As the Japanese CPCC was conducted in 1987, it is preferable to use the
1990 census.
We will firstly compare between male employees and female employees.
Women are divided between full-timers and part-timers. Only full-timers are included
for men, due to the small number of part-timers among them. The definition of part-
time work is controversial in both countries. There are basically two definitions: one
is by the status defined by the employment contract or reported by the respondent, and
the other is based on working hours. For the latter, 30 hours a week is conventionally
used as the dividing point between full-time work and part-time work in Britain, while
35 hours a week is used in Japan. However, these two definitions do not necessarily
coincide.2 This is particularly so for Japan: a survey on part-time workers in 1989
reported that nearly one-fifth of so-called part-timers worked as long hours as full-
timers with the average worker working 43 hours as week (Rododaijin-kanbo-seisaku-
2 The Employment in Britain survey data, however, shows that two definition in Britain often coincide. 95% of self-reported full-time employees worked 30 hours or more a week, and 93% of self-reported part-time employees worked less than 30 hours a week.
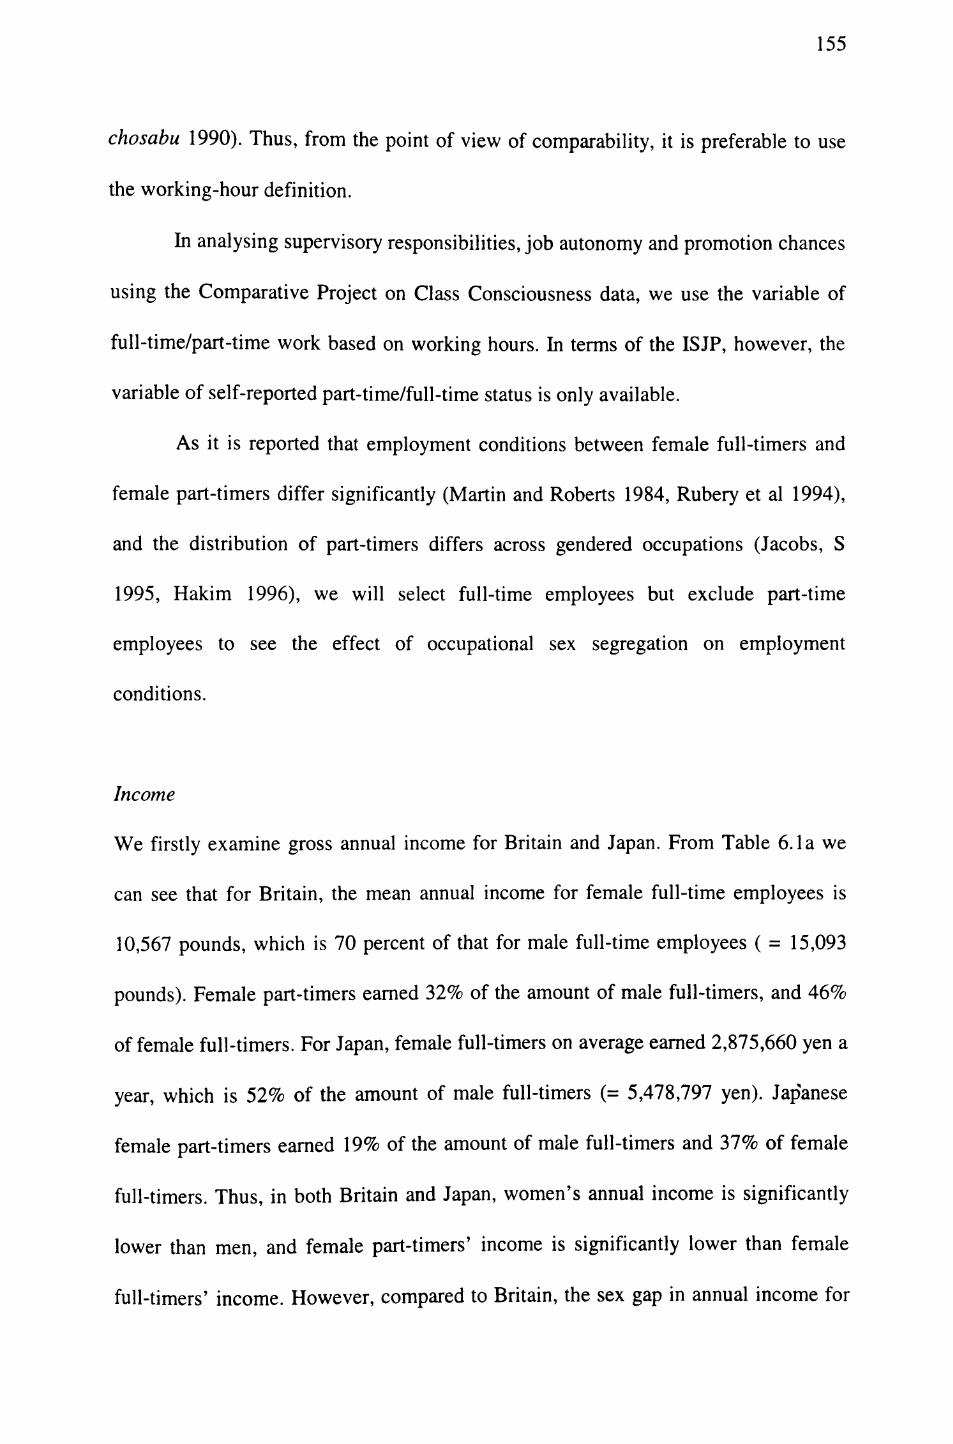
155
chosabu 1990). Thus, from the point of view of comparability, it is preferable to use
the working-hour definition.
In analysing supervisory responsibilities, job autonomy and promotion chances
using the Comparative Project on Class Consciousness data, we use the variable of
full-time/part-time work based on working hours. In terms of the ISJP, however, the
variable of self-reported part-time/full-time status is only available.
As it is reported that employment conditions between female full-timers and
female part-timers differ significantly (Martin and Roberts 1984, Rubery et al 1994),
and the distribution of part-timers differs across gendered occupations (Jacobs, S
1995, Hakim 1996), we will select full-time employees but exclude part-time
employees to see the effect of occupational sex segregation on employment
conditions.
Income
We firstly examine gross annual income for Britain and Japan. From Table 6.la we
can see that for Britain, the mean annual income for female full-time employees is
10,567 pounds, which is 70 percent of that for male full-time employees ( = 15,093
pounds). Female part-timers earned 32% of the amount of male full-timers, and 46%
of female full-timers. For Japan, female full-timers on average earned 2,875,660 yen a
year, which is 52% of the amount of male full-timers (= 5,478,797 yen). Japanese
female part-timers earned 19% of the amount of male full-timers and 37% of female
full-timers. Thus, in both Britain and Japan, women's annual income is significantly
lower than men, and female part-timers' income is significantly lower than female
full-timers' income. However, compared to Britain, the sex gap in annual income for

156
Japan is substantially greater, so is the gap between female full-time employees and
female part-time employees. 3
Table 6.1a Average gross annual income by sex by full-time/part-time work, Britain and Japan
Full-time
%
N
Part-time
%
N
Britain
Men
15,093
100%
275
(pounds)
Women
10,567
70%(100%)
160
4,876
32%(46%)
135
Sig.
men vs.
women
***
fft vs. fpt
***
Japan
Men
5,478,797
100%
133
(yen)
Women
2,875,660
52%(100%)
53
1,061,515
19%(37%)
33
Sig.
men vs. women
***
fft vs. fpt
***
Source : The International Social Justice Project surveyNote: *** p < .001, fft = female full-time employees, fpt = female part-time employees
We now examine the effects of occupational sex segregation on men's and
women's income (see Table 6.1b). As mentioned, only full-time employees are
included in this analysis. For Britain, there are marked differences for both men and
women between those in male or mixed occupations and those in female occupations.
The differences are statistically significant at the 5% level. For British men, those in
female occupations on average earned only 63% of the amount of those in male
occupations, and 56% of the amount of those in mixed occupations.4 For British
3 Similar figures can be found in the ILO Year book of Labour Statistics 1995. According to the ILO statistics, for non-agricultural workers, in 1991, Japanese women earned 51% of the amount of men, and British women earned 70% of the amount of men, though the figure for the former is based on earnings per month andthe latter per hour.4 The effect of occupational sex segregation on employment conditions is not linear, but mixed occupations often show the best conditions in our analysis. This seems to be because people with degree-level qualifications are most likely to be found in mixed occupations, and these occupations are most likely to include professional/managerial occupations. However, the difference in employment conditions between male occupations and mixed occupations is not statistically

157
women, the mean income for those in female occupations is 80% of the amount for
those in male occupations, and 75% of the amount for those in mixed occupations.
Thus, female occupations provide substantially lower income than the other
occupations for both men and women in Britain, but this is particularly so for men.
The sex gap in income in Britain is lower than the average in every
occupational segregation group, showing that it is partly accounted for by
occupational sex segregation. The largest decrease can be found for female
occupations, where women's income is as much as 97% of men's. This is not because
women earned a good amount of income in these occupations, but because men's
income is substantially lower in these occupations than the other occupations. If male
occupations and mixed occupations are compared, the sex gap becomes lower in the
former than the latter. Women in male occupations earned 77% of the amount of men
in these occupations, while women in mixed occupations earned 73% of the amount
of men in these occupations.
For Japan, we do not find that female occupations particularly disadvantage
men's and women's income. For men, it is those in mixed occupations who had the
lowest income, though the average income for those in mixed occupations is not
significantly lower compared to those in male occupations (the difference is not
significant at the 10% level). For women, on the contrary to men, mixed occupations
provided the highest income, and female occupations did not provide the lowest
significant at the 5% level for both men and women for all the variables of
employment conditions, except for men's job autonomy. In the last half of this
chapter, however, we will examine the effect of occupational sex segregation after
controlling for educational qualifications, occupational class, and other factors
relevant to employment conditions.

158
income, though the difference in women's income by the groups of occupational sex
segregation is not statistically significant at the 10% level.
Table 6.1b Average gross annual income by sex-typed occupations, Britain and Japan
Male occupations
%
N
Mixed occupations
%
N
Female occupations
%
N
Britain
Men
15,209
100%
189
17,236
100%
64
9,631
100%
29
(pounds)
Women
11,691
77%
17
12,459
73%
48
9,368
97%
94
Japan
Men
5,411,363
100%
88
4,823,529
100%
34
5,163,333
100%
6
(yen)
Women
2,500,000
46%
2
2,997,187
62%
32
2,794,444
54%
18
Source : The International Social Justice Project survey
When the sex gap is examined across gendered occupations for Japan, it is
mixed occupations where the largest decrease in the sex gap can be found for Japan,
though the gap is still very large ( = 62%). This is because men's income in these
occupations is relatively low, while women's income in these occupations is relatively
high. However, there is no evidence that the sex gap decreases in male occupations,
though the case number for women might be too small to confirm this. Also, the sex
gap shows little change in female occupations where women earned only 54% of the%
amount of men.
In sum, the sex gap in annual income is substantially larger in Japan than in
Britain. The sex gap decreases for Britain after controlling for occupational sex
segregation, but this is not true in all cases for Japan. The sex gap does decrease for
mixed occupations in Japan, but even so, women earned only 62% of the amount of

159
men, a substantially smaller proportion compared to their British counterparts. It is
possible that Japan has a higher degree of vertical sex segregation within occupations,
which cannot be captured by our measurement of occupational sex segregation as it
primarily captures horizontal segregation. This may help to explain the greater sex gap
in income in Japan. Next, we will look at supervisory responsibilities which reflect the
vertical aspects of work. If the sex gap in supervisory responsibilities is still large and
hardly affected after controlling for occupational sex segregation, this helps to account
for the greater sex gap in income in Japan than in Britain.
Supervisory responsibilities
Table 6.2a shows the sex gap in supervisory responsibilities in Britain and Japan. In
Britain, 40% of male full-time employees supervised others while the figure for
female full-time employees is 31%, and for female part-time employees is 20%. In
Britain, women are significantly less likely to have supervisory responsibilities than
men. On the other hand in Japan, 54% of male full-timers replied that they had
supervisory responsibilities, while only 12% of female full-timers and 10% of female
part-timers replied so. 5 Thus, compared to their British counterparts, Japanese women,
whether in full-time work or in part-time work, are much less likely to have
supervisory responsibilities than men.
5 If we apply the British definition of full-time/part-time work, the figure are slightly changed; they are 53.4% for male full-timers, 14.2% for female full-timers, and 2.2% for female part-timers.6 The difference in supervisory responsibilities between Japanese female full-timers and Japanese female part-timers is not statistically significant at the 10% significance level.

160
Table 6.2a Percentage of workers who supervise others by sex by full-time/part-time work,
Britain and Japan
Britain
Men
Full-time 39.7%
N 248/376
Part-time
N
Women
31.4%
103/225
20.0%
20/154
Japan
Men Women
53.6% 12.0%
135/117 16/117
9.8%
6/55
Source : The Comparative Project on Class Consciousness surveyNote: The number before slash denoted the number of workers who supervise others, and after slash the number of workers who do not. 30 hours a week is used to divide between full-time work and part-time work in Britain, but 35 hours a week is used for Japan.
We now turn to the effect of occupational sex segregation on men's and
women's supervisory responsibilities, and on the sex gap (see Table 6.2b). For both
men and women in Britain, those in female occupations are least likely to say that they
had supervisory responsibilities, but this is more likely so for men.7 In female
occupations, women are more likely than men to report that they had supervisory
responsibilities. For both men and women, those in mixed occupations are most likely
to reply that they had supervisory responsibilities, and in this group, the sex gap is just
2%. 8 In male occupations, men are more likely to report that they had supervisory
responsibilities than women, but the difference is only 5%. Thus, the sex gap is lower
than the average for every occupational sex segregation group for Britain.
On the other hand in Japan, in every occupational sex segregation group, the
sex gap in supervisory responsibilities remains large. No women in male occupations*
had supervisory responsibilities9 , while more than half of men in these occupations
7 The differences for men between male/mixed occupations and female occupations, and for women between mixed occupations and female occupations are statisticallysignificant at the 5% level.8 For both men and women, however, the differences between male occupations and mixed occupations are not statistically significant at the 5% level.9 The Japanese Social Justice Project Survey data also shows that no women out of 5 in male occupations had supervisory responsibilities.

161
had supervisory responsibilities. However, in mixed occupations, the sex gap
becomes smaller, since relatively many women (19%) reported that they supervised
others. Having said this, the sex gap in mixed occupations is still large with a
difference of nearly 20%. In female occupations, the sex gap is very large as women
hardly had supervisory responsibilities in these occupations, though men on average
had the lowest supervisory responsibilities in these occupations."
Table 6.2b Percentage of men and women who supervise others by sex-typed occupations,
Britain and Japan
Male occupations
N
Mixed occupations
N
Female occupations
N
Britain
Men
39.7%
192/293
50.0%
45/45
20.8%
10/38
Women
35.1%
13/24
48.0%
36/39
24.7%
53/162
Japan
Men
53.2%
66/58
46.7%
42/48
30.8%
4/9
Women
0%
0/8
18.9%
14/60
4.3%
2/44
Source : The Comparative Project on Class Consciousness survey dataNote: The number before slash denoted the number of workers who supervise others, and after slash thenumber of workers who do not.
Thus, after controlling for occupational sex segregation, the sex gap in
supervisory responsibilities becomes very small in Britain, while in Japan, there still
remains a great sex gap. This seems to be reflected in the greater sex gap in income
within occupational sex segregation groups in Japan than in Britain.
10 The difference between women in mixed occupations and women in female occupations is statistically significant at the 5% level.11 However, we cannot find any statistical evidence that the supervisory responsibilities for men in female occupations is significantly lower compared to men in other occupations.

162
Job Autonomy
We now turn to job autonomy. For Britain, the difference between male full-timers
and female full-timers is not significantly large; 27% of male full-timers replied that
their jobs required them to design important aspects of their work, and the figure for
female full-timers is 21%. 12 Whereas, a significant difference can be found between
female full-timers and female part-timers in Britain; the proportion of female part-
timers whose jobs required them to design important aspects of their work is just
10%. On the other hand, a substantially greater sex gap can be found for Japan. As
much as 61% of male full-timers replied that their jobs required them to design
important aspects of their work, while the proportion for female full-timers is 31%,
and for female part-timers is 20%. 14
Table 6.3a Percentage of workers who design important aspects of their work
by sex by full-time/part-time work, Britain and Japan
Britain
Men
Full-time 26.9%
N 166/451
Part-time
N
Women
21.1%
69/258
10.4%
18/155
Japan
Men Women
60.7% 30.8%
153/99 41/92
19.7%
12/49
Source : The Comparative Project on Class Consciousness survey dataNote: The number before slash denoted the number of workers who design important aspects of their work, and after slash the number of workers who do not. 30 hours a week is used to divide between full-time work and part-time work in Britain, but 35 hours a week is used for Japan.
12 The difference is not statistically significant at the 5% level.13 The difference between female full-timers and female part-timers is statistically significant at the 5% level.14 The difference for Japanese women between full-timers and part-timers is not statistically significant at the 10% level. If we use the British definition of full- time/part-time work, the figures for Japan are very similar: 60.5% for male full-timers, 30.4% for female full-timers, and 17.4% for female part-timers.

163
After controlling for occupational sex segregation, the sex gap in Britain
further decreases, and the figures for men and women in each occupational sex
segregation group become quite similar with the difference within 2%. Again, for both
men and women in Britain, those in female occupations are least likely to say that
their jobs required them to design important aspects of their work compared to other
occupations, while those in mixed occupations are most likely to reply so. 15
Table 6.3b Percentage of men and women who design important aspects of their work
by sex-typed occupations, Britain and Japan
Male occupations
N
Mixed occupations
N
Female occupations
N
Britain
Men
25.7%
123/356
38.9%
35/55
16.7%
8/40
Women
27.0%
10/27
36.0%
27/48
14.5%
31/183
Japan
Men
61.3%
76/48
65.6%
59/31
38.5%
5/8
Women
25.0%
2/6
29.7%
22/52
32.6%
15/31
Source : The Comparative Project on Class Consciousness survey dataNote: The number before slash denoted the number of workers who design important aspects of their work,and after slash the number of workers who do not.
With respect to Japan, the sex gap in job autonomy remains large for male and
mixed occupations. On the other hand, it decreases substantially in female
occupations, where the proportion of men who replied that their jobs required them to
design important aspects of their work is considerably smaller than in other
occupations. 16 For women, however, those in female occupations are more likely to
15 The differences for both men and women between female occupations and male/mixed occupations are statistically significant at the 5% level. For men, the difference between mixed occupations and male occupations is significant at the 5% level, but this is not the case for women.16 We cannot, however, find any statistical evidence that men in female occupations had lower job autonomy than other men.

164
say than other women that their jobs required them to design important aspects of
work. 17 This is contrary to the result for British women.
Thus, after controlling for occupational sex segregation, the sex gap in job
autonomy almost disappears for Britain. However, this is not the case for Japan where
a large sex gap remains in male occupations, as well as in mixed occupations. It is
notable that although for British men and women, as well as for Japanese men, female
occupations are associated with lower job autonomy, this is not the case for Japanese
women.
Promotion Chances
We now turn to promotion chances. From Table 6.4a we can see that not much
difference can be found between male full-time employees and female full-time
employees in Britain; 41% of male full-timers replied that they had a better than 50/50
i ochance of promotion, while the figure for female full-timers is 37%. However, a
significant difference can be found between female full-timers and female part-timers
with only 17% of the latter replying that they had a better than 50/50 chance of
promotion. On the other hand, for Japan, the sex gap is considerably larger; 52% of
male full-timers replied that more than half the people in positions like them would
have promotions, but the corresponding figure for female full-timers is 24%, and for
female part-timers is just 5%.
17 However, the difference between female occupations and other occupations is not statistically significant at the 10% level.18 The difference is not statistically significant at the 5% level.19 The difference is significant between male full-timers and female full-timers, as well as between female full-timers and female part-timers. If we use the British definition of part-time/full-time work, the figures are 51.9%, 21.7%, and 6.8% respectively, so the results do not change very much.

165
Table 6.4a Percentage of workers with more than 50% chances of promotion
by sex by full-time/part-time work, Britain and Japan
Britain
Men
Full-time 40.7%
N 227/331
Part-time
N
Women
36.8%
106/182
16.8%
26/129
Japan
Men Women
52.1% 24.2%
123/113 31/97
5.1%
3/56
Source : The Comparative Project on Class Consciousness surveyNote: The number before slash denoted the number of workers who have 50% more promotion chances, and after slash the number of workers who do not. 30 hours a week is used to divide between full-time work and part-time work in Britain, but 35 hours a week is used for Japan.
Table 6.4b Percentage of men and women with more than 50% chances of promotion
by sex-typed occupations, Britain and Japan
Male occupations
N
Mixed occupations
N
Female occupations
N
Britain
Men
39.3%
170/263
44.0%
37/47
48.8%
20/21
Women
50.0%
16/16
35.5%
22/40
35.2%
68/125
Japan
Men
55.5%
66/53
46.3%
38/44
72.7%
8/3
Women
25.0%
2/6
23.9%
17/54
27.3%
3/12
Source : The Comparative Project on Class Consciousness surveyNote: The number before slash denoted the number of workers who have 50% more promotion chances,
and after slash the number of workers who do not.
After controlling for occupational sex segregation (see Table 6.4b), for Britain, the sex
gap reversed for male occupations, but increased for female occupations, This is
because men in female occupation are most likely to say that they have a better than
50/50 chance of promotion, while women in male occupations are most likely to say
so. 20 For Japan, however, the sex gap remains large in every occupational sex
segregation group, though it slightly decreases for mixed occupations.
20 However, we cannot find any statistical evidence that sex-type of occupations
differentiate men's and women's promotion chances in Britain.

166
Summary
In summary, we found a considerably larger sex gap in income, supervisory
responsibilities, job autonomy, and promotion chances for Japan than for Britain.
Also, the gap between female full-timers and female part-timers is substantially larger
in Japan than in Britain, except for job autonomy. It seems that employment
conditions are differentiated by sex to a greater extent in Japan than in Britain.
Occupational sex segregation affects British employees. For men, those in
female occupations have substantially lower income, less supervisory responsibilities
and less job autonomy than other men, though this is not the case for their promotion
chances. For women, as well, those in female occupations have considerably lower
income, less supervisory responsibilities, and less job autonomy. Thus, for both men
and women in Britain, those in female occupations are in disadvantageous positions.
This helps to understand why the number of British men in female occupations is
small (Chapter 3), why the attrition of female occupations for British men is high, and
why the average duration of a job in female occupations for British men is shorter
than in other occupations (Chapter 4). Though for British women, we still need to
investigate the reason why they enter and remain in female occupations.
For Japan, occupational sex segregation did not show any systematic effect.
However, workers' sex seems to be much more important than the sex-type of
occupations in differentiating employment conditions; in every occupational sex
segregation group, there remains a great sex gap. Nevertheless, the division between
full-time work and part-time work greatly differentiates Japanese women's
employment conditions. Thus, the concentration of Japanese women into part-time

167
work helps to account for the sex gap in employment conditions at the aggregate level,
but occupational sex segregation seems to have little impact on it.
On the other hand in Britain, sex itself becomes less important after
controlling for full-time/part-time work and occupational sex segregation. Rather, we
have found that full-time/part-time work and the sex-type of occupations contribute to
differentiate employment conditions. The differentiations by full-time/part-time work
and by occupational sex segregation help to account for the sex gap in employment
conditions at the aggregate level, given that women are concentrated into part-time
work and into female occupations in Britain.
In the next section, we will examine why occupational sex segregation has less
impact on employment conditions in Japan than in Britain by focusing on the payment
systems in Britain and Japan.

168
Payment systems in Britain and Japan
Our results in the first half of this chapter suggest that occupational sex segregation is
utilised to differentiate workers' employment conditions more in Britain than in
Japan. In this section, we will focus on the payment systems in Britain and Japan, and
examine why the function of occupational sex segregation differs for Britain and
Japan.
There are various systems of pay, such as those based on job grading, seniority, or
performance and merit. In Japan, it is often maintained that pay is mainly determined
by the individual worker's characteristics, such as educational qualification, age, and
the length of service, rather than by job characteristics (Kalleberg and Lincoln 1988,
Tachibanaki 1996). In particular, seniority is said to be one of the important factors for
the Japanese payment system, both directly affecting basic pay and indirectly through
influencing the qualification grade system (Tachibanaki 1996, Sako 1997, also see
Chapter 8 for details). On the other hand, in Western industrialised countries,
including Britain, pay is more likely to be determined by job content and skills, rather
than by individual workers' characteristics (Dore 1973, 1986, Kalleberg and Lincoln
1988, Rubery and Pagan 1994). This might be relevant to the differences in the
function of occupational sex segregation in Britain and Japan, as occupational sex
segregation exists at the job-level, rather than at the individual-level.
Also, if Japan greatly emphasises seniority, or life-time commitment to work,
to determine the pay level, this would disadvantage women greatly, as women in

169
Japan are likely to have interrupted careers (see Chapter 2 and Chapter 4), and they
have strong gender and family norms, and hence have heavy domestic burdens
(Brinton 1993, Stockman et al 1995, and also see Chapter 8 for details). Therefore, it
is difficult for Japanese employers to expect the same level of life-time commitment
to work for women as for men. Thus, the combination of the emphasis on seniority
pay, and women's intermittent work life or gendered family life seems to bring a
double disadvantage to Japanese women for being women. While on the other hand,
in the countries which emphasise job content and skills to determine the pay level, the
disadvantage of being a woman would not be so great. However, the sex differences
may appear in these countries as a result of differentiating job content or skills
between the two sexes.
The International Social Justice Project survey (ISJP) allows us to examine how the
systems of payment differ between Britain and Japan. We will firstly examine how
people perceive the factors which determine their level of pay. Then, we will analyse
income data with various explanatory variables, which could potentially affect the pay
level.
In the International Social Justice Project, respondents were asked about the
factors which they think actually influence the level of pay, as well as the factors
which they think should have influenced the level of pay. These were (l)the
employee's level of education, (2) unpleasant working conditions, such as dirty, noisy
or strenuous work, (3)the employee's individual effort, (4)the size of the family the
employee supports, (5)the responsibility held by the employee on the job, (6)the
length of service with employer, and (7)being a man and not a woman. These factors

170
can be ordered according to the extent to which they belong to individuals or to their
jobs. The order is presented in Table 6.5 and Table 6.6, where the top factor, i.e., sex,
means the most personal-level characteristics, and the bottom factor, work conditions,
means the most job-level characteristics. We place sex at the top, and family size as
the second, as they are external to their job content. Educational level and the length
of service also belong to individuals, but as they also indicate the ability of workers to
carry out their work, they are relevant to their jobs. On the other hand, employees'
effort and their responsibilities are more relevant to their jobs, as they are regarded as
the aspects of job demand. Finally, work conditions are external to individuals, but
job-specific. The answers for each factor were originally nominal, coded into four
categories from 'a great deal' to 'none', but we receded it into a 4-point scale score,
where 4 means 'great deal' and 1 means 'none'. Table 6.5 shows the average scores
for the factors which the respondents think actually influence the level of pay, and
Table 6.6 shows the average scores for the factors which the respondents think should
have influenced the level of pay.
Table 6.5 Factors which actually influence pay, Britain and Japan
Britain Japan Sig. Britain vs.
____________(N=1297) (N=730) Japan______
~Sex I5 316***
Family size 1.5 2.5 ***
Education 3.0 3.5 ***
Length of service 2.7 3.2 ***
Effort 2.9 2.7 **
Responsibilities 3.1 3.0 *
Work conditions 2.6 2.6_____n.s.________
Source : International Social Justice Project surveyNote: *** p < .001, ** p < .01, * p < .05, n.s.= not significant.

171
From Table 6.5 we can see that British people tend to think that job
characteristics are actually more likely to be reflected in pay than personal
characteristics; they tend to emphasise job related characteristics, such as
responsibilities and effort, as well as individual ability and experience, more than
personal characteristics, such as the size of the family to support and worker's sex. On
the other hand in Japan, people are most likely to emphasise individual abilities to
carry out work, such as educational level and the length of service. What is notable for
Japan is that people put equal emphasis on worker's sex and job responsibilities.
Moreover, worker's sex is more likely to be emphasised than job effort. If we compare
between Britain and Japan, Japanese people are more likely to emphasise personal
characteristics, i.e., worker's sex and the size of the family to support, as well as
education and the length of service, than British people. While British people are more
likely to emphasise the job characteristics, i.e., effort and responsibility, than Japanese
people.
Table 6.6 Factors which should have influenced pay, Britain and Japan
Britain Japan Sig. Britain
____________(N=1297) (N=730) vs. Japan __ _ _ __
Family size 1.9 2.8 ***
Education 2.9 2.5 ***
Length of service 3.0 3.0 n.s.
Effort 3.6 3.6 n.s.
Responsibility 3.6 3.4 ***
Job condition____3A_____3.3____**_____
Source : International Social Justice Project surveyNote: *** p < .001, ** p < .01, * p < .05, n.s.= not significant.
Table 6.6 presents respondents' opinions about what should have influenced
the level of pay. In Britain, we can see that people emphasise job-related
characteristics more than personal characteristics, and this is the same for Japan.

172
However, if Britain and Japan are compared, Japanese people are more likely to
emphasise personal characteristics, i.e., worker's sex and the size of the family to
support, than British people, while British people are more likely to emphasise
educational qualifications, job responsibilities and unpleasant working conditions.
Also, compared to Table 6.5, people in both Britain and Japan feel that job
characteristics should have influenced pay more than they actually do, and that
personal characteristics should have influenced pay less than they actually do.
Thus, the results imply that the systems of payment are different for Britain
and Japan. In Britain, not only human capital variables, but also job demand and
content seem to be the main determinants of pay, but in Japan, personal
characteristics, such as worker's sex, and the size of the family to support, as well as
human capital, are likely to be emphasised.
These results have an important implication for the impact of occupational sex
segregation on employment conditions. If the British payment system emphasises the
characteristics of the "job" more than the characteristics of the "individual worker",
occupational sex segregation, as a job characteristic, might become an alternative way
to differentiate employment conditions for men and women in Britain other than sex
per se. However, if the Japanese payment system emphasises the characteristics of the
"individual worker" more than of the characteristics of the "job", workers' sex might
have a greater impact on pay determination and other employment conditions. In the
next section, we will analyse the income data and examine how the income level is
determined in Britain and Japan, taking these different systems of payment, and
different systems of sex differentiation into consideration.

173
Pay differentials between sexes and occupational sex segregation in Britain and
Japan
So far, we have examined people's perception of the determinants of pay, but in this
section, we will analyse income data using the International Social Justice Project
survey data. The purpose here is to link the findings of the first part of this chapter (a
greater sex gap remains for Japan than for Britain even after controlling for full-
time/part-time work and sex-type of occupations) to the findings of the previous
section (people in Britain and Japan put different emphasis between the personal
characteristics and job characteristics as the potential determinants of pay).
We will construct a model which makes it possible to examine the factors that
influence income for Britain and Japan. We select employees, as we assume that the
decision about their employment conditions is external to them. The dependent
variable in the model is the natural logarithm of gross annual income. The
independent variables are sex, age, marital status, educational qualifications, the
length of service in the present job, occupational class, supervisory responsibilities,
occupational sex segregation, full-time/part-time work, size of organisations and
industries. Sex, age, and marital status are personal characteristics of workers which
are external to their jobs. Educational qualifications and the length of service in the
present job belong to individual workers, but they also represent their abilities to carry
out their work. Occupational class and supervisory responsibilities are used as the
indicators of job content and skills. If it is right that job characteristics are more
important for Britain than for Japan, these variables should affect the level of income
for British employees more than for Japanese employees. Occupational sex
segregation is also a job characteristic. Full-time/part-time work is included as a

174
control variable, as our dependent variable is gross annual income. Finally size of
organisations and industries are also added as controls since they are structural
variables that influence the income level.
Table 6.7 Variables used in analysis of income
Variables Britain JapanSexAge
Marital Status Educational Qualification
Length of Service
Occupational Class
Supervisory responsibilities Occupational Segregation
Part-time/Full-time Size of the organisation
Industries
Dummy variable, if female=l 5 categories, (l)-24, (2)25-34, (3)35-44, (4)45-54 and (5)55+ Dummy variable, if married=l 4 CASMIN levels21 , (l)low,(2)ordinary,(3)advanced & (4) degreelength of service with current employer in months Goldthorpe 8 categories, (1) salariat, (2)routine clerical, (3)petite bourgeois, (4)farmers (5)supervisors,(6)skilled workers, (7)semi and unskilled workers, (S)agricultural workers Dummy variable, if supervise others =1.%female in an occupation from the LFS91 self report(1) up to 9, (2) 10-24, (3)25-99, (4) 100-499, and (5)500 or more (1) construction (2)durable manufacturing (3) non-durable manufacturing, (4)communications and utility, (5)wholesale/retail, (6)business service, (7)personal service, (8)public services/non profit service
Dummy variable, if female=l 5 categories, (l)-24, (2)25-34, (3)35-44, (4)45-54 and (5)55+ Dummy variable, if married=l 4 CASMIN levels (l)low,(2)ordinary,(3)advanced & (4) degreelength of service with current employer in months SSM 8 categories22 , (1 professional, (2)managerial, (3)clerical, (4)sales (5)skilled workers,(6)semi-skilled workers, (7)unskilled workers, (S)agricultural workers Dummy variable, if supervise others =1.%female in an occupation from the Census90 self report1) up to 9, (2) 10-24, (3)25-99, (4) 100-499, and (5)500 or more (1) construction (2)durable manufacturing (3) non-durable manufacturing, (4)communications and utility, (5)wholesale/retail, (6)business service, (7)personal service, (8)public services/non profit service
Source: The International Social Justice Project surveyNote: Unless otherwise stated, the first category of each categorical variable is set as the base category
to create dummy variables.
21 See Appendix B for the detailed classification and receding system for the CASMIN educational levels.22 See Appendix B for the SSM occupational groups.

175
We firstly test whether the sex gap is simply due to the different distribution of
men and women across the factors relevant to pay determination. In so doing, we
construct a model which has only sex as the predictor variable ( = simple model), and
then make a model which includes all the independent variables mentioned above ( =
full model). By comparing the sex coefficients in these two models, we can see to
what extent the variables added in the equation explain the sex-differentials in
income. If we see a large reduction in the coefficient, this would imply that sex itself
becomes less important to predict income; it is rather the different distributions of
men and women across the other independent variables, such as longer length of
service for men than for women, or men's greater supervisory responsibilities than
women, that explains the sex gap. However, if we see little reduction in the sex gap,
after controlling for all the other predictor variables, this implies that sex is the
primary determinant of income.
Table 6.8 shows the coefficients of the dummy variable for sex (female is set
as "1", so that the coefficient can be interpreted as the difference between men and
women) for the two models for Britain and Japan. When we compare the results of
the simple models between Britain and Japan, we can see that the predictive power of
sex is much larger in Japan (adj R2 = 0.44) than in Britain (adj R2 = 0.20), which
means that knowing workers' sex, we can predict the income level for Japan more
than for Britain. After controlling for all the other predictor variables, the sex gap in
Britain was reduced to one quarter, so that three quarters of the initial sex gap was
explained by the different distribution of men and women across the other predictor
variables. On the other hand, in Japan, the sex gap did decrease, but still half the

176
initial gap remained. Therefore, compared to Britain, the reduction is smaller in Japan,
which suggests that sex is more fundamental in Japan than in Britain in determining
the income level.
Table 6.8 Coefficients of sex dummy in OLS regression on log gross annual income,
Britain and Japan
Sex coefficient(S.E.)adjR2FN
Britain
Simple model-0.68***
(0.06)0.20144.30***
584
Full model-0.17**
(0.05)0.6436.67***
564
Japan
Simple model-1.08***
(0.08)0.44169.76***
217
Full model-0.52***
(0.09)0.7118.61***
211
Source: The International Social Justice Project survey Note: *** p >.001, ** p > .01, * p > .05
We now look at the results for the full models in both countries and examine
which variables are influential in determining the level of income. From Table 6.9 we
can see that for Britain, both the personal characteristics and job characteristics have
significant impacts in determining income, while in Japan, the job characteristics have
little impact after controlling for other variables. Although there is a possibility that
smaller sample size in Japan makes some of the effects of our predictor variables
insignificant, even if we allow for a 10% significance level for Japan, or even if we
reduced the British sample randomly by half (so we can have approximately the same
sample as in the Japanese data), the results are basically the same (see the asterisks
after slash which denotes the significance using the half sample for Britain).

177
Table 6.9 OLS regression on log gross annual income, Britain and Japan
Britain JapanFemaleAge:25-34Age:35-44Age:45-54Age:55+MarriedEducation: ordinaryEducation: advancedEducation: degreeLength of ServiceRoutine ClericalSupervisorsSkilled workersSemi/un-skilled workersAgricultural workers
SuperviseFempctPart-timeSize: 25-99Size: 100-499Size: 500+Durable manufacturingNon-durable manufacturingCommunications and utilityWholesale/RetailBusiness servicePersonal servicePublic services/Non-profit serviceConstantadjR2FN
-.173**/** Female.1237* Age:25-34.195**/* Age:35-44.046 Age:45-54.089 Age:55+.056 Married.041/* Education: ordinary.103 Education: advanced.297***/*** Education: degree.006* Length of Service
-.081 Managers and administrators-.652***/*** Clerical workers-.378***/*** Sales workers-.295***/*** Skilled workers-.095 Semi-skilled workers
Unskilled workersAgricultural workers
.258***/*** Supervise-.003**/* Fempct-.809* **/*** Part-time.071 Size: 25-99.105+ Size: 100-499.196**/* Size: 500+
-.040 Durable manufacturing-.116 Non-durable manufacturing-.070 Communications and utility-.126/*** Wholesale/Retail-.027"'' Business service-.171*/* Personal service-.071 /* Public services/Non-profit service9.354***/*** Constant0.639 adj R236.669*** F554 N ____
-.519***
.037
.309*
.298
.436*-.008 .148 .246 .404* .015***
-.202-.155 .197
-.060-.220*
.145-.308 .028
-.003* .880***
-.054 .189*
-.029-.032-.049 .504
-.008 .507** .059
-.02414.873***0.71518.607***
211Source: International Social Justice Project survey dataNote: Asterisks after slash denote the significance of the coefficient when the British sample israndomly reduced to half. *** p<0.001, ** p<0.01, * p<0.05, + p<0.10
For both Britain and Japan, sex, age and educational qualifications have
significant effects on income. However, the differences between Britain and Japan are
that firstly, the effect of the length of service in the present job is significant in Japan,
but not in Britain at the 5% significance level. Thus, seniority has a greater effect for
income determination in Japan than in Britain, net of other variables. Secondly, job-
related variables, such as occupational class, supervisory responsibilities and percent
female in an occupation have significant impacts on the income level for Britain,
while this is not the case for Japan. If we permit the 10% significance level, however,

178
the effect of semi-skilled workers (compared to professional workers) and the effect of
percent female in an occupation are significant for Japan. The value of the coefficient
of percent female in an occupation for Japan shows that an increase in percent female
in an occupation decreases Japanese employees' income. However, the size of the
coefficient of occupational sex segregation relative to the size of the coefficient of sex
is substantially smaller in Japan than in Britain, which suggests that after controlling
for other variables, the effect of occupational sex segregation relative to the effect of
sex is considerably smaller in Japan than in Britain.
Thus, the results show that individual workers' characteristics, in particular
seniority, are important determinants of the income level in Japan, but that job
characteristics are not so important. Perhaps because of this, sex is more influential,
but occupational sex segregation is less important in Japan for the income
determination, compared to Britain.
Our analysis so far has examined the general impact of our explanatory
variables on the level of income, assuming that the effect of each variable does not
differ for men and women. However, it is expected that these variables have sex-
specific effects. For instance it has been suggested that the wage for women does not
increase by age as much as for men, because of their intermittent work life (OECD
1985, Takenaka 1991). Therefore, we construct different models for men and women.
Making sex-specific functions also helps us to understand why the extent of
occupational sex segregation is greater in Britain than in Japan. We discussed in the
previous chapter that employing women in more female occupations is in British
employers' interests because they could pay less to women relative to their human
capital and job skills. If this mechanism can be applied to explain the greater extent of

179
occupational sex segregation for Britain than for Japan, then the negative effect of
occupational sex segregation for women should be greater for Britain than for Japan.
Table 6.10 OLS regression on log gross annual income for men and women
in Britain and Japan
Britain
Age:25-34Age:35-44Age:45-54Age:55+MarriedEducation: ordinaryEducation: advancedEducation: degreeLength of ServiceRoutine Clerical
Men.185*r.25i**r.001
-.169.161*
-.029-.001.191*.013***/*
-.362**/**
Women.075.184.109.29 1*
-.077.076.246*.360**/*
-.001.003
Age: 25-34Age:35-44Age:45-54Age:55+MarriedEducation: ordinaryEducation: advancedEducation: degreeLength of ServiceManagers and
Men.068.376**
.350*
.110.150+.174.111.161.014***
-.075
Women.320.540+.649+1.211**
-.500*.352.5971.122*.010
n.a.
Supervisors Skilled workers Semi/un-skilled workers Agricultural workers
Supervise Fempct Part-time Size: 25-99 Size: 100-499 Size: 500+ Durable manufacturing Non-durable manufacturing Communications and utilityWholesale/Retail Business service Personal service Public services/Non profit service Constant adjR2
F N
592***/*** ..467***/** ..357***/**
.691 ***
.124+-.002+-.670***/***
.068 .120+ .228**
-.029
-.027
-.046
.055.013
-.008-.006
9.310***
0.601 16.664***
281
772***/*.221 /* .209W+
.202
.307***/*-.004*/*- 782***/***
.024
.095
.110-.011
-.198
-.050
-.165/*
.017-.276*r-.065
9.274***
0.547 13.622***
282
administrators Clerical workers Sales workers Skilled workers
Semi-skilled workersUnskilled workersAgricultural workersSuperviseFempctPart-timeSize: 25-99Size: 100-499Size: 500+Durable manufacturing
Non-durablemanufacturingCommunications andutilityWholesale/RetailBusiness servicePersonal servicePublic services/Non-profitserviceConstantadjR2FN
-.118-.026-.116
-.137-.086 n.a. .070
-.001-.193 .140* .247**
-.008-.062
-.105
.591*
.369*
.012.164
-.154-.567 .217
.519-.410-.037-.089-.0004-.796***
.106 .222
-.015 .044
-.055
n.a.
.216
.616*-.066 .025
14.764*** 13.947***
0.585 0.5687.458*** 5.005128 82
Source: International Social Justice Project *** p<0.001, ** p<0.01, * p<0.05 Note: n.a., not applicable because of missing correlation. Asterisks after slash of the coefficient when the British sample is randomly reduced to half.
, + p<.010denote the significance
Table 6. 10 shows the summaries of the results for income models for men and
women in Britain and Japan. There are several points to be made. Firstly, age affects

180
the level of income of our sub-samples in different ways. For British men, their
income level reaches its highest level in their late 30s and early 40s. For Japanese men
and women, the peak comes somewhat later; for Japanese men, it reaches its highest
level in their late 40s and early 50s, and for Japanese women, even later in their late
50s. We cannot find any clear age effect for British women. This again seems to
suggest that seniority is more important in Japan than in Britain. Secondly, marital
status positively affects men's income level in Britain and Japan, but it negatively
affects women's income in both countries, though the effect is significant only for
British men and Japanese women after controlling for the other variables. Thirdly,
getting higher educational qualifications increases the level of income in general, but
the effect is larger for women than for men in both countries. Fourth, the effect of the
length of service in the present job is significant only for men but not for women for
both countries. This, together with the result that the effects of size of organisation are
only significant for men but not for women in both countries, seems to suggest that
women are unlikely to be in the internal labour market. In other words, men in large
organisations and with longer length of service have an advantage in pay over other
men, but this is not the case for women. Fifth, occupational class has a greater impact
in Britain than in Japan. It significantly affects British men's and British women's
income after controlling for other variables, but the effect is not statistically
significant at the 10% level for Japanese men and Japanese women. Having
supervisory responsibilities significantly increases British women's income (and
British men's income if we allows for the 10% significance level), but it has little
impact for both men and women in Japan after controlling for the other variables.
Thus, the finding of the previous analysis that job content and skills are important

181
determinants of income in Britain but not in Japan is basically supported.
Occupational sex segregation has a significant impact for British women (and British
men, if we permit the 10% significance level). However, the coefficient for Japanese
women shows that it hardly affects their income.
In summary, the results of sex-specific functions show similarities and
differences between countries, as well as between men and women. In comparing the
two countries, the results confirmed that seniority is more important in Japan than in
Britain, while job characteristics are more influential in Britain than in Japan. If men
and women are compared, the length of service in the present job and the size of
organisation only significantly affect men in both countries, but they are not so
relevant to women's income in either countries. As discussed, this seems to suggest
that women in both countries are likely to be excluded from the internal labour
market.
About the effect of occupational sex segregation for women, and its
implication for the mechanism of occupational sex segregation, we confirmed that for
British women, an increase in percent female in an occupation significantly decreases
their income, net of other predictor variables. Therefore, British employers could cut
labour costs by employing women in more female occupations. However, we cannot
find any significant impact of percent female in an occupation for Japanese women,
net of other predictor variables. Thus, Japanese employers seem to have little
incentive to employ women in female occupations.

182
Summary and Conclusion
In the first half of this chapter, we found that occupational sex segregation affects
Britain and Japan differently. In Britain, both men and women in female occupations
are paid less, have less supervisory responsibilities and job autonomy. However, given
the concentration of women into female occupations, the aggregate effect is more
negative for women than for men. On the other hand in Japan, we could not find that
female occupations disadvantage women. Neither did these occupations disadvantage
men's income. However, in Japan, the large sex gap remains even after controlling for
full-time/part-time work and occupational sex segregation.
We suggested that differences between Britain and Japan in the nature of
payment systems would explain the different function of occupational sex segregation.
Our findings showed that in Japan, individual worker's characteristics, particularly
worker's sex, are more likely to be reflected in their income level, while in Britain,
job content and skills have a substantial impact on the income level independently of
individual characteristics. Perhaps because of this, occupational sex segregation, as
one of the job characteristics, has a significant impact on British employees' income
level. Thus, in the British labour market, there are two gender lines differentiating the
level of income - worker's sex and the sex-type of occupations. In Japan, however,
sex has a much greater impact than in Britain, and little differentiation can be found
by the sex-type of occupations.
It seems that in a society like Britain where the characteristics of the "job" are
emphasised independently of the characteristics of the "individual worker" in
determining the level of income, employers have the incentives to generate sex
differentials through allocating different occupations to men and women. By doing so,

183
they can avoid the costs arising from overt discrimination by "worker's sex", but they
can benefit from covert discrimination by the "sex-type of occupations". However, in
a society like Japan where the characteristics of the "individual worker" are more
important than the characteristics of the "job", employers seem to have little incentive
to allocate different occupations between men and women, as this does not benefit
them so much as in the job-oriented society. Rather, they may have more incentives to
differentiate employment conditions by individual workers' characteristics. If
"worker's sex" is cost-effective, they would use it, and if it costs them, as it is overt
discrimination, they would find another way to differentiate between men and women
(see Chapter 8 for Japanese employer's policies towards women).
Therefore, these differences in the payment systems of Britain and Japan seem
to provide different conditions for occupational sex segregation to emerge and
maintain itself. Our analysis of income actually showed that the effect of percent
female in an occupation is significant and negative for British women (the consistent
result with the previous chapter), but it is not significant for Japanese women, after
controlling for other predictor variables. Thus, British employers can cut labour costs
as they employ women in more female occupations, but this is not the case for
Japanese employers. This in turn seems to be reflected in the fact that the extent of
occupational sex segregation is greater for Britain than for Japan at the aggregate
level.
The differences in the impact of occupational sex segregation between Britain
and Japan also help us to understand individual workers' mobility patterns in the two
countries. The more systematic impact of occupational sex segregation on
employment conditions for British employees compared to Japanese employees seems

184
to provide British employees with a greater basis to judge whether to enter, exit from,
and remain in female occupations or in male occupations. This may explain the more
clear and rigid mobility patterns across sex-typed occupations for British men and
women, compared to Japanese women that were found in Chapter 4.
185
CHAPTER 7
JOB PREFERENCES, JOB SATISFACTION
AND OCCUPATIONAL SEX SEGREGATION
Introduction
As we discussed in Chapter 4, the systematic patterns of job mobility across gendered
occupations for men and women in Britain seem to imply the involvement of men and
women, as the suppliers of the labour, in the construction and maintenance of
occupational sex segregation. The purpose of this chapter is to examine why men and
women move to and stay in male occupations and in female occupations from the
supply-side of the labour market. In so doing, we firstly examine job preferences. If
women's job preferences differ from those of men, this would affect their
occupational choices between female occupations and male occupations. We also
investigate whether the job preferences of men and women who are employed in
female occupations differ from those employed in male occupations. If there are any
distinct job preferences for men and women in female occupations or in male
occupations, this would help to account for why they enter and remain in the same
sex-typed occupations. Secondly, we will examine job satisfaction. If men and women
tend to be satisfied with sex-typical occupations, this would help to account for why
they stay in these occupations. Also, in the last part of this chapter, we will make a
comparison between British women and Japanese women, in order to investigate the
implication of the supply-side involvement for the differences in the aggregate pattern
of occupational sex segregation.

186
Job preferences and occupational sex segregation
It is difficult to tell how much individual workers' attitudes are reflected in their
actual behaviour in the labour market, as the relation between attitudes and behaviour
is not straightforward (see Dex 1988). Moreover, the outcome in the labour market
should be regarded as the result of the interaction between employers and employees,
but not solely of individual workers' preferences. It has also been suggested that the
importance of job preferences for job structure depends on the sex of the employee.
For instance, Reskin and Roos (1990), in their study of the US labour market, suggest
the minor role of women's job preferences in their occupational outcomes. They argue
that it is employers' and male workers' preferences that are important in constructing
occupational sex segregation, but not women's job preferences. Moreover, they
suggest that basically women's job preferences do not differ from men's, but women
are queuing up to male occupations, taking them if these occupations become
available.
Opposite views are suggested by studies carried out in Europe (Hakim 1991,
Crompton and Le Feuvre 1996). For example, Hakim (1991), in her study on British
women, argues that the persistence of job segregation should be regarded as a
reflection of women's own preferences and choices. She suggests that the distinction
between primary/secondary earners or between full-time/part-time workers are
important in considering women's preferences and choices. Crompton and Le Feuvre
(1996), in their comparative study of British women and French women, also suggest
that women's job preferences and life plans are important in determining the outcome
in the labour market, although they suggest that these are not the sole important
factors, as some women in their study had "unintentional" careers, just responding to

187
the situation around them. Crompton and Le Feuvre, like Hakim, also recognise
"qualitatively different types" of working women with some emphasising work roles
and others emphasising family roles.
Thus, there are two opposing views about women's job preferences and their
importance for the outcomes in the labour market - occupational sex segregation. As
has seen, the first view suggests that women's job preferences do not basically differ
from those of men, but the second view suggests that they do differ from men's, or - at
least - that this is true for a category of women. In the following section, we will
firstly examine whether women's job preferences are different from men's. We will
distinguish two groups of women; full-time workers and part-time workers, following
the argument that full-time/part-time work can be used as the proxy to distinguish
women with different work values (Martin and Robert 1980, Hakim 1991). We use
self-reported status to define full-timers and part-timers rather than the definition
based on working hours. 1
Men's and Women's job preferences
In analysing job preferences in Britain, we use the Employment in Britain survey data,
which has various items of job preferences. In the EIB the respondents are asked their
opinion about the things they look for in a job. They are (1) friendly people to work
with, (2) good promotion prospects, (3) good pay, (4) good relations with their
supervisor or manager, (5) a secure job, (6) a job where they can use their own
initiative, (7) work they like doing, (8) convenient hours of work, (9) choice in hours
1 This is to obtain greater comparability between the British data and Japanese data, as the information of working hours in the Japanese data is based on a day, rather than a week (see Appendix B).

188
of work, (10) the opportunities to use abilities, (11) good fringe benefits, (12) an easy
work load, (13) good training provision, (14) good physical working conditions, and
(15) a lot of variety in the type of work. The answer was coded in a four-point scale
from essential to not very important.
Firstly, we will examine whether women, particularly female part-timers, are
less concerned than men about job characteristics in looking for their jobs. If so, it
could be said that they are more likely to adapt to the market situation than men, thus
becoming more vulnerable to the impact of demand-side factors. In so doing, we
simply add the scores for each item of job preferences and construct the variable of
"intensity" of job preferences. It should be noted that our sample is restricted to
employees; if we include non-working women, the results might change significantly
(see Hakim 1991). Table 7.1 summarises the average score for our three groups of
employees; male full-timers, female full-timers and female part-timers.
Table 7.1 Intensity of job preferences by sex by full-time/part-time work, Britain
Male Female Female Sig. male full- Sig. female full-
full-timers full-timers part-timers timers vs. female timers vs. female
(N=1694) (N=974) (N=670) full-timers part-timers
39.72 40.84 39.54 ******
(5.96) (5.70) (6.00)
Source: The Employment in Britain survey. *** p < .001
From Table 7.1 we can see that female full-timers' score is the highest, male
full-timers' score is in the middle, and female part-timers' score is the lowest. The
difference between male full-timers and female full-timers is significant, which means
that in terms of overall score, female full-timers are more likely to be concerned about
job characteristics than male full-timers in looking for their jobs. However, female

189
part-timers are less likely to be concerned than female full-timers about job
characteristics in looking for their jobs. Thus, it seems that women are not necessarily
more vulnerable to the impact of demand-side factors, just adapting to the market
situation. However, female part-timers are the group which is least likely to be
concerned about job characteristics in looking for their jobs.
So far, we have examined the overall score, putting the same weights on each
item of job preferences. However, people may place different weights on different job
characteristics in looking for their jobs. For instance, a person who is a breadwinner
may emphasise economic rewards, or a person with small children might emphasise
convenient working hours. In order to find out possible differences in the dimensions
of job preferences, the inter-correlation among the items of job preferences were
factor analysed. As a result, four dimensions of job preferences emerged from the
analysis.
As can be seen from Table 7.2, the items which have high loadings for the first
factor are good pay, a secure job, good fringe benefits, good training provision, good
promotion prospects, and good physical working conditions. Thus, they seem to
represent the preference for the extrinsic aspects of work. The items which have high
loadings for the second factor are a job where you can use own initiative, the
opportunity to use abilities, work you like doing, and a lot of variety in the type of
work. Thus, they seem to represent the preference for the intrinsic aspects of work.
The items which have high loadings for the third factor are choice in hours of work,
convenient hours of work, and an easy work load, so that they seem to represent the
preference for convenient work arrangements. Finally, the items which show high
loadings for the last factor are friendly people to work with and good relations with

190
supervisor or manager, so that they seem to represent the preference for a friendly
workplace atmosphere.
Table 7.2 Factor loadings for four dimensions of job preferences, Britain
Preference for extrinsic aspects of work
1 . good pay
2. a secure job
3. good fringe benefits
4. good training provision
5. good promotion prospects
6. good physical working conditions
Preferences for intrinsic aspects of work
1. use own initiative
2. use abilities
3. work you like doing
4. variety in the type of work
Preferences for convenient work arrangement
1 . choice in hours of work
2. convenient hours of work
3. an easy work load
Preferences for friendly workplace atmosphere
1 . friendly people to work with
2. good relations with supervisor/manager
1
.67
.63
.57
.57
.57
.54
.10
.17
-.08
.12
-.01
.03
.34
.04
.16
2
-.02
-.08
.08
.28
.33
.13
.77
.77
.66
.58
.09
.04
-.10
.05
.18
3
.19
.00
.36
-.09
-.10
.16
-.04
.00
.06
.08
.83
.81
.57
.14
.05
4
-.10
.26
-.01
.15
-.06
.29
-.03
-.03
.28
.15
.05
.17
.03
.77
.71
communality
.50
.48
.47
.44
.45
.41
.61
.63
.53
.38
.70
.68
.45
.62
.56
Source: The Employment in Britain surveyNote: Varimax rotated factor loadings. The eigenvalues for the four factors are 3.4, 2.0, 1.5 and 1.1respectively. Reliabilities (Cronbach's alpha) for the four factors are .68, .69, .65, and .47 respectively.
We will now examine whether male full-timers, female full-timers, and female
part-timers differ in these factors of job preferences. 2 Table 7.3 shows the average
scores for four dimensions of job preferences for male full-timers, female full-timers,
and female part-timers. In terms of the preference for the extrinsic aspects of work,
2 We excluded male part-timers as their proportion is small (=3% of the male sample).

191
male full-timers' score is the highest, female full-timers' score is in the middle, and
female part-timers' score is the lowest. The difference between male full-timers and
female full-timers, as well as the difference between female full-timers and female
part-timers are statistically significant.
Table 7.3 Job preferences by sex by full-time/part-time work, Britain
Extrinsic work
Intrinsic work
Convenientwork Friendly workplace
Male full-timers (N=1607)
.177(.9341) .042(1.009)-.247(.959) -.224 (1.049)
Female full-timers (N=932)
.000(.976) .153(.955) .007(.972) .197 (.886)
Female Sig. male full- Sig. female part-timers timers vs. full-timers vs. (N=626) female full- female part-
timers timers_ 4g9 *** ***(1.034)
312 ** ***(.966)^49 *** ***
(.855) .276 *** not significant (.889)
Source: The Employment in Britain survey. *** p < .001, ** p <.01
For the preference for the intrinsic aspects of work, female full-timers' score is
the highest, male full-timers' score is in the middle, and female part-timers' score is
the lowest. The difference between male full-timers and female full-timers is
statistically significant, and the difference between female full-timers and female part-
timers is statistically significant.
For the preference for convenient work arrangements, female part-timers are
the group which is most likely to emphasise this aspect of work, and male full-timers
are the group which is least likely to emphasise it. There is a significant difference
between male full-timers and female full-timers in emphasising this factor, as well as
between female full-timers and female part-timers.
Finally, for the preference for a friendly workplace atmosphere, female part-
timers are most likely to emphasise this factor, and male full-timers are least likely to

192
emphasise this factor. The difference between male full-timers and female full-timers
is significant, but the difference between female full-timers and female part-timers is
not significant.
Thus, the emphasis placed on the four dimensions of job preferences differs
between the three groups of employees. Compared to the other groups, male full-
timers are most likely to emphasise the extrinsic aspects of work, but least likely to
emphasise convenient work arrangements, and a friendly workplace atmosphere.
Compared to the other groups, female full-timers are most likely to emphasise the
intrinsic aspects of work, but they are also likely to emphasise a friendly workplace
atmosphere. Compared to the other groups, female part-timers are most likely to
emphasise convenient work arrangements and a friendly workplace atmosphere, but
least likely to emphasise the extrinsic aspects of work and the intrinsic aspects of
work.
We now examine whether workers' job preferences differ by occupational sex
segregation, in order to understand the systematic patterns of job mobility across sex-
typed occupations for men and women in Britain. We again use the variable of
occupational sex segregation which is based on percent female in an occupation: 1.
male (0-30 percent female in an occupation), 2. mixed (31-69 percent female in an
occupation), and 3. female (70-100 percent female in an occupation). In Chapter 5, we
found that working in more female occupations brings lower pay and less access to
fringe benefits for women, and thus failed to account for the pattern of job mobility
for women from the point of view of economic interests. Then, do job preferences
help to account for the patterns of job mobility for men and women in Britain? For
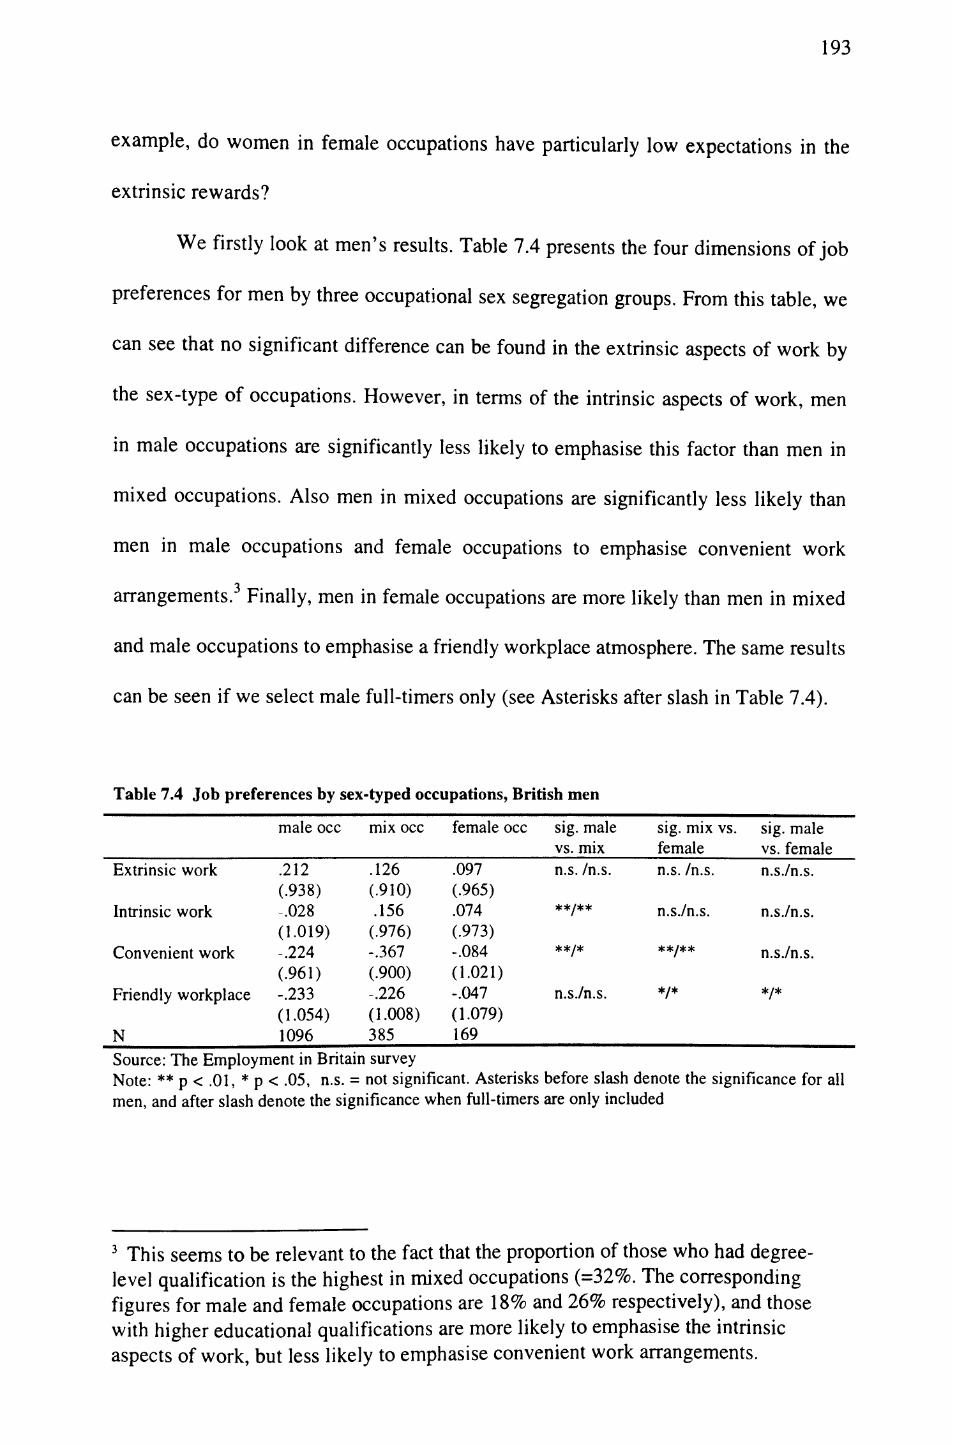
193
example, do women in female occupations have particularly low expectations in the
extrinsic rewards?
We firstly look at men's results. Table 7.4 presents the four dimensions of job
preferences for men by three occupational sex segregation groups. From this table, we
can see that no significant difference can be found in the extrinsic aspects of work by
the sex-type of occupations. However, in terms of the intrinsic aspects of work, men
in male occupations are significantly less likely to emphasise this factor than men in
mixed occupations. Also men in mixed occupations are significantly less likely than
men in male occupations and female occupations to emphasise convenient work
arrangements. 3 Finally, men in female occupations are more likely than men in mixed
and male occupations to emphasise a friendly workplace atmosphere. The same results
can be seen if we select male full-timers only (see Asterisks after slash in Table 7.4).
Table 7.4 Job preferences by sex-typed occupations, British men
Extrinsic work
Intrinsic work
Convenient work
Friendly workplace
N
male occ
.212(.938).028
(1.019)-.224(.961)-.233(1.054)1096
mix occ
.126(.910).156
(.976)-.367(.900)-.226(1.008)385
female occ
.097(.965).074(.973)-.084(1.021)-.047(1.079)169
sig. male vs. mixn.s. /n.s.
**/**
**/*
n.s./n.s.
sig. mix vs. femalen.s. /n.s.
n.s./n.s.
**/**
*/*
sig. male vs. femalen.s./n.s.
n.s./n.s.
n.s./n.s.
*/*
Source: The Employment in Britain surveyNote: ** p < .01, * p < .05, n.s. = not significant. Asterisks before slash denote the significance for allmen, and after slash denote the significance when full-timers are only included
3 This seems to be relevant to the fact that the proportion of those who had degree- level qualification is the highest in mixed occupations (=32%. The corresponding figures for male and female occupations are 18% and 26% respectively), and those with higher educational qualifications are more likely to emphasise the intrinsic aspects of work, but less likely to emphasise convenient work arrangements.

194
We now turn to women. Like men, there is no significant difference in the
preference for the extrinsic aspects of work by the sex-type of occupations. However,
women in female occupations show significantly lower preference for the intrinsic
aspects of work than women in mixed occupations and male occupations. Women in
female occupations also show significantly higher preferences for convenient work
arrangements and for a friendly workplace atmosphere than women in mixed
occupations and male occupations.
Table 7.5 Job preferences by sex-typed occupations, British women
Extrinsic work
Intrinsic work
Convenient work
Friendly workplace
N
male occ
-.161(.992).169
(1.011)-.046(1.067).033
(.955)144
mix occ
-.112(1.049).034
(.980).203
(.965).147
(.894)368
female occ sig. male sig. mix vs. mix vs. fem
-.230 n.s. n.s.(1.024)-.086 n.s. *(.981)
329 * *
(.963).284 n.s. *
(.871)1045
sig. male vs. femn.s.
**
***
**
Source: The Employment in Britain survey Note: ** p < .01, * p < .05, n.s. = not significant
These results for women, however, may be influenced by the fact that part-
time employees are concentrated into female occupations. In fact, in the Employment
in Britain survey data, 48% of the female employees in female occupations were part-
timers, while the corresponding figures for mixed occupations and male occupations
are 30% and 17% respectively. Therefore, we will divide the sample by full-time/part-
time work.
Table 7.6 shows the results for female full-timers. In fact, we can see less
difference in their job preferences by the sex-type of occupations than when we
included all women. However, female full-timers in male occupations are significantly

195
less likely to emphasise convenient work arrangements than others. Also female full-
timers in female occupations are significantly more likely to emphasise a friendly
workplace atmosphere than those in male occupations.
Table 7.6 Job preferences by sex-typed occupations, British female full-timers
Extrinsic work
Intrinsic work
Convenient work
Friendly workplace
N
male occ
-.066(.954).250(1.009)-.278(.928).018(.937)119
mix occ
.082(.995).156(.932).033(.940).168(.895)257
female occ sig. male sig. mix vs. sig. male vs. mix fern vs. fem
-.021 n.s. n.s. n.s.(.972).131 n.s. n.s. n.s.(.955).055 * n.s. **(.988).249 n.s. n.s. *(.868)555
Source: The Employment in Britain survey Note: ** p < .01, * p < .05, n.s. = not significant
Table 7.7 Job preferences by sex-typed occupations, British female part-timers
Extrinsic work
Intrinsic work
Convenient work
Friendly workplace
N
male occ
-.621(1.064).222
(.950)1.078(.987).101(1.058)25
mix occ
-.560(1.037)-.247(1.032).596(.911).099(.896)111
female occ sig. male sig. mix vs. sig. male vs. mix fem vs. fem
-.467 n.s. n.s. n.s.(1.033)-.331 n.s. n.s. n.s.(.952).640 * n.s. *(.831).325 n.s. * n.s.(.874)490
Source: The Employment in Britain survey Note: ** p < .01, * p < .05, n.s. = not significant
The results for female part-timers do not show much difference either (see
Table 7.7). Female part-timers in male occupations are significantly more likely to
emphasise convenient work arrangements. This is opposite to the result for female
full-timers. Also female part-timers in female occupations are more likely to
emphasise a friendly workplace atmosphere than those in mixed occupations.

196
Thus, the results shown in Table 7.5 which are based on all women sample are
very much influenced by the fact that the share of part-timers is considerably larger in
female occupations. However, once full-time/part-time work is controlled, little
differentiation can be found by the sex-type of occupation per se. The only common
difference that is found for both female full-timers and part-timers is that those in
female occupations are more likely to emphasise a friendly workplace atmosphere.
The differences in job preferences between men and women, as well as
between female full-timers and part-timers, however, suggest the active involvement
of men and women in the construction and maintenance of occupational sex
segregation. For instance, since men emphasise the extrinsic aspects of work, they
seem to move to and remain in male occupations where they can realise their values
most. On the other hand, compared to men, women are less likely to emphasise the
extrinsic aspects of work, so that even if they are paid less or they get less fringe
benefits, they may move to and remain in female occupations. This is particularly so
for female part-timers who are least likely to emphasise the extrinsic aspects of work.
Then, why do they show different job preferences? There are mainly two
approaches to explain the differences in job preferences among the groups of workers.
One emphasises the family role which is seen to produce distinctive constraints,
values and priorities, which in turn are reflected in distinctive work orientations
(Feldberg and Glenn 1979, Hakim 1991, 1996). The other emphasises objective work
conditions which shape work values, as workers try to resolve the dissonance between
work values and reality (see Kalleberg and Griffin 1978, Hanson et al 1987, de Vaus
& McAllister 1991, Marsden et al 1993, Rowe and Snizek 1995). Both these
approaches are consistent with our results. The clear contrast in job preferences

197
between male full-timers and female part-timers (the former emphasising the extrinsic
aspects of work, but the latter emphasising convenient work arrangements), could be
interpreted as the result of the fact that the former are supposed to be the primary
earners, while the latter are supposed to be the secondary earners and have more
domestic responsibilities. The difference between male full-timers and female full-
timers (the former emphasising the extrinsic aspects of work but the latter
emphasising the intrinsic aspects of work), might be due to the fact that the extrinsic
job rewards are greater for men than for women (see Chapter 5), so that women try to
value the intrinsic rewards more than the extrinsic rewards to resolve the dissonance
between their values and reality. Also, the commonality between men and women
(both full-timers and part-timers) in female occupations, that they all tend to
emphasise a friendly workplace atmosphere, might reflect the reality that female
occupations do provide such an atmosphere.
Job satisfaction and occupational sex segregation
We now examine the relation between job satisfaction and occupational sex
segregation. Job satisfaction is relevant to the worker's decision to leave or remain in
their jobs. If they are satisfied with their jobs, they are more likely to remain there, and
if they are dissatisfied, they are more likely to leave. We have found in Chapter 4 that
men tend to move to and remain in male occupations, as women do with respect to
female occupations. Then, does this mean that men in male occupations are more
likely to be satisfied with their work than men in female occupations, and that women
in female occupations are more likely to be satisfied with their work than women in

198
male occupations? If so, why are they likely to be satisfied with their sex-typical
occupations?
It is widely accepted that job satisfaction is a function of work values and work
rewards (Kalleberg 1977, Kalleberg and Loscocco 1983, Mottaz 1987). The prime
cause of workers' dissatisfaction is said to be the failure to achieve their values with
respect to the content of the work itself (Kalleberg 1977). Therefore, the workers who
experience the highest congruity between work values and work rewards are most
likely to be satisfied with their jobs. Although we have found in Chapter 5 that, in
Britain, female occupations are associated with low economic rewards, this does not
necessarily mean that those in female occupations are dissatisfied with their jobs more
than those in male occupations, since people have different work values, and their
work experiences are rather subjective, being influenced by their work values. In fact,
the previous section showed that women, particularly part-timers, are less likely than
men to emphasise the extrinsic aspects of work. Instead, we found that workers in
female occupations place more importance on a friendly workplace atmosphere, so
that if these occupations provide this feature, then this would enhance their job
satisfaction.
Job satisfaction is said to be a unitary concept (see Kalleberg 1977), and often
measured as a composite scale from several related items. In the Employment in
Britain data, there are three questions which are relevant to job satisfaction. Firstly,
the respondents were asked "all in all, how satisfied would you say you are with your
job?", and the answer was coded on a 7 point-scale from completely satisfied to
completely dissatisfied. The second question is "if you were free to go into any type of
job you wanted, what would your choice be?", and the respondents chose from 1. they

199
want the job they have now, 2. they want to retire and not work at all, and 3. they
would prefer some other job to the one they have now. The third question is "knowing
what you know now, if you had to decide all over again to take the job you now have,
what would you decide?". The respondents chose from 1. they would decide without
any hesitation to take the same job, 2. they would have some second thoughts, and 3.
they would decide definitely not to take the same job. We produce a measure of
overall job satisfaction which is scaled as the composite of the responses to these three
items. These items are often used in job satisfaction studies (Janson & Martin 1982,
Mottaz 1987, Hanson et al 1987, Wharton and Baron 1991). The reliability
(Cronbach's alpha) for the three items is 0.64. We recode each item on a 7-point scale,
and then sum the scores for the three items. The result is then averaged, producing a
scale of overall job satisfaction that ranges from 1.0 to 7.0.
Although, job satisfaction is a unitary concept, and would affect the decision
to leave or remain in a job by itself, the cause of overall job satisfaction is
multidimensional. Overall job satisfaction is a function of the range of specific
satisfactions and dissatisfactions (Kalleberg 1977). Therefore, it is helpful to examine
various aspects of job satisfaction to understand where the overall job satisfaction (or
dissatisfaction) comes from. The EIB also has information about various aspects of
job satisfaction with a 7-point scale. They are satisfaction with 1. promotion
prospects, 2. pay, 3. relation with supervisor or manager, 4. job security, 5. the
opportunities to use abilities, 6. being able to use own initiative, 7. the ability and
efficiency of the management, 8. working hours, 9. fringe benefits, 10. the work itself,
11. the amount of work, 12. the variety in the work, 13. the training provided, and 14.

200
friendliness of the people to work with. Examining these specific job satisfaction
items will help us to understand the causes of overall job satisfaction.
In order to investigate the relation between occupational sex segregation and
job satisfaction, it is necessarily to control for the factors which are said to be relevant
to job satisfaction. Firstly, we will control for age. Age influences job satisfaction,
because older workers have better jobs, or different cohorts have different work
values, or age indicates different life-cycle stages (e.g. marital status, number of
dependent children) that affect work values (Janson and Martin 1982, Kalleberg and
Loscocco 1983, Mottaz 1987). Secondly we will control for structural or job-related
characteristics. Various studies on job satisfaction suggest that structure-based (or job-
based) explanations help to account for job satisfaction as well as work values
(Kalleberg and Loscocco 1983, Hanson et al 1987, de Vaus and McAllister 1991). As
structural variables, we will control for occupational class and full-time/part-time
work. Occupational class can be regarded as an approximate indicator of job
characteristics in both the intrinsic and extrinsic senses. Full-time/part-time work is an
important structural variable particularly for women, as it not only differentiates
women's employment conditions but also their attitudes to work (Martin and Roberts
1984, Dex 1988, Hakim 1991, Curtice 1993). Controlling for these variables enables
us to see the independent effect of occupational sex segregation.
The variable of occupational sex segregation used in the analysis is the
continuous one - percent female in an occupation. Thus, we will examine what would
happen to workers' level of satisfaction if they moved to more female occupations.
We, however, run the same models using the categorical variable; 1. male (0-30%

201
female in an occupation), 2. mixed (31-69% female in an occupation), and 3. female
(70-100% female in an occupations).
Table 7.8 OLS regression on overall job satisfaction, British men and women
Men (N=1661)
Women (N=1567)
fempctage -24age 35-44age 45-54age 55+lower serviceroutine non-manualtechnicians and supervisorsskilled manualsemi/unskilled manualpart-timeconstant
adjusted R2 F
.001 (.002)
.289 (.121)*
.069 (.106)
.256 (.111)*
.302 (.166)-.135 (.128)-.552 (.173)** .231 (.171)
-.405 (.129)**-.431 (.117)** .043 (.222) 4.860(.112)*** .020
3.796***
.006 (.002)**
.008 (.133)
.048 (.104) .076 (.113) .565 (.176)** .387 (.161)*
-.036 (.163) .004 (.306)
-.063 (.266)-.224 (.173) .123 (.087) 4.444 (.160)***
.0264.477***
Source: The Employment in Britain survey Note: *p<.05, ** p<.01, *** p<.001
The results in Table 7.8 show that for men, the effect of percent female in an
occupation is not significant after controlling for the other independent variables.
Therefore, for men, we cannot find any evidence that an increase in percent female in
an occupation affects men's overall job satisfaction. However, for women, the effect
is significant and positive after controlling for the other independent variables. In
other words, as women work in more female occupations, they become more likely to
be satisfied with their jobs.
The model with the categorical variable of occupational sex segregation for
men also shows that there is no significant effect of occupational sex segregation on
men's overall job satisfaction. However, for women, the effect is significant, and
those in female occupations are more likely to be satisfied with their jobs than other
women (see Table 7.9). Unlike many studies which argue that part-timers are more

202
likely to be satisfied with their work than full-timers (Martin and Roberts 1984, Dex
1988, Hakim 1991, Curtice 1993), after controlling for the other variables, we cannot
find any statistical evidence to support this argument.
Table 7.9 OLS regression on overall job satisfaction with the categorical variable of
occupational sex segregation, British men and women
Men (N=1659)
Women (N=1563)
female occupationsmale occupationsage -24age 35-44age 45-54age 55+lower serviceroutine non-manualtechnicians and supervisorsskilled manualsemi/unskilled manualpart-timeconstant
adjusted R2 F
.037 (.155)
.012 (.102)
.289 (.121)*
.067 (.106)
.254 (.111)*
.302 (.166)-.120 (.129)-.520 (.172)** .667 (.473)
-.419 (.128)**-.434 (.118)** .054 (.222) 4.875(.127)*** .019
3.481***
.497 (.105)***
.275 (.158)
.011 (.132)
.044 (.104)-.061 (.112) .565 (.176)** .415 (.160)**
-.040 (.162) .005 (.305) .006 (.266)
-.242 (.171) .121 (.086) 4.539 (.154)***
.033 5.148***
Source: The Employment in Britain survey Note: *p<.05, ** p <.01, *** p <.001.
Our results help us to understand why women, despite the relatively poor
economic rewards, stay in female occupations; these women stay in female
occupations as they are satisfied with their jobs. However, this may be simply due to
the fact that female occupations are more available to women; women in female
occupations may find the jobs more easily than women in male occupations that
realise their work values, because they have greater choice in these occupations. To
examine this, we chose a question from the EIB, which asked the respondents "when
you were looking for your current job how much choice would you say you had over
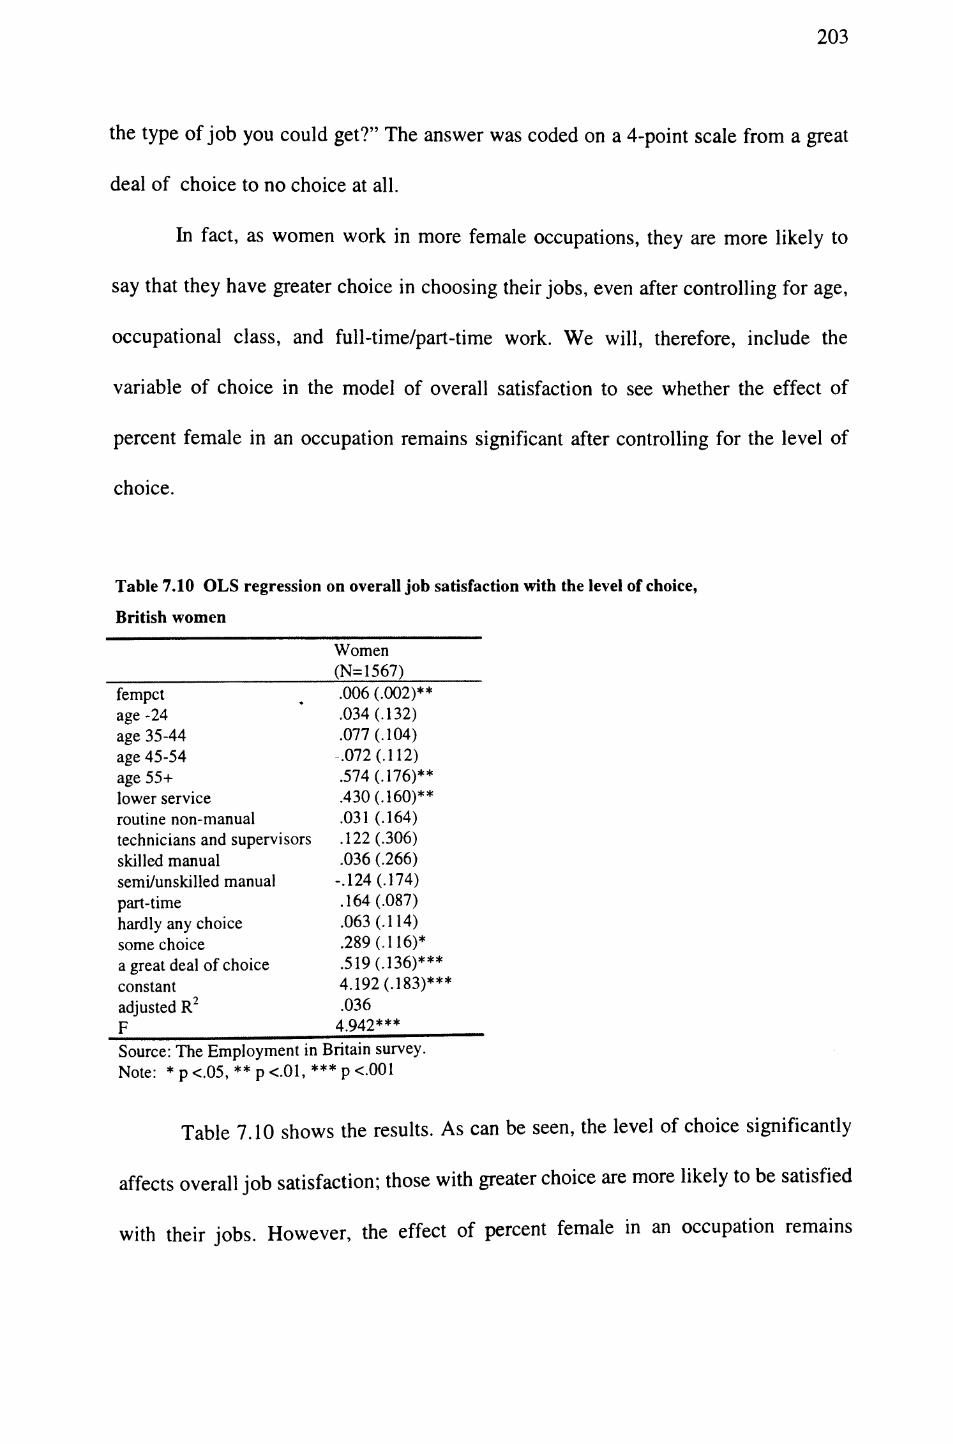
203
the type of job you could get?" The answer was coded on a 4-point scale from a great
deal of choice to no choice at all.
In fact, as women work in more female occupations, they are more likely to
say that they have greater choice in choosing their jobs, even after controlling for age,
occupational class, and full-time/part-time work. We will, therefore, include the
variable of choice in the model of overall satisfaction to see whether the effect of
percent female in an occupation remains significant after controlling for the level of
choice.
Table 7.10 OLS regression on overall job satisfaction with the level of choice,
British women
Women (N=1567)
fempct .006 (.002)** age-24 * .034 (.132) age 35-44 .077 (.104) age 45-54 .072 (.112) age 55+ .574 (.176)** lower service .430 (.160)** routine non-manual .031 (.164) technicians and supervisors .122 (.306) skilled manual .036 (.266) semi/unskilled manual -.124 (.174) part-time .164 (.087) hardly any choice .063 (.114) some choice .289 (.116)* a great deal of choice .519 (.136)*** constant 4.192 (.183)*** adjusted R2 .036 _F________________4.942***______ Source: The Employment in Britain survey. Note: *p<.05,**p<.01,***p<.001
Table 7.10 shows the results. As can be seen, the level of choice significantly
affects overall job satisfaction; those with greater choice are more likely to be satisfied
with their jobs. However, the effect of percent female in an occupation remains

204
significant even after controlling for the level of choice.4 Thus, as women work in
more female occupations, they do have greater choice in their jobs, and this seems to
enhance their job satisfaction, but an increase in percent female in an occupation itself
contributes to women's job satisfaction, independently from the level of choice.
Now, we will examine specific items of job satisfaction to see with which aspects of
their jobs women and men are satisfied or dissatisfied. As has been mentioned, overall
job satisfaction is a function of the range of specific satisfactions and dissatisfactions.
By examining specific items of job satisfaction, therefore, we can explain why women
in female occupations are satisfied with their jobs.
Table 7.11 Coefficients of percent female in an occupation in OLS regression on specific job
satisfaction, British men and women (s.e. in parentheses)
Promotion prospectsPayRelation with supervisor or managerJob securityOpportunity to use abilitiesUse own initiativeAbility and efficiency of the managementWorking hoursFringe benefitsWork itselfAmount of workVariety in workTraining providedFriendliness of people to work with
Men.003 (.002).000 (.002).002 (.001).000 (.002)
-.002 (.001)-.001 (.001).001 (.002).001 (.001)
-.001 (.002).000 (.001)
-.001 (.001)-.001 (.001).002 (.002).001 (.001)
Women.000 (.002).002 (.002).004 (.002)**.002 (.002).006 (.001)***.003 (.001)*.003 (.002).003 (.001).000 (.002).005 (.001)***.004 (.001)**.004 (.001)**.004 (.002)*.004 (.001)**
Source: The Employment in Britain survey. * p <.05, ** p <.01, *** p <.001
Table 7.11 shows the coefficients of percent female in an occupation and its
significance in the models of specific items of job satisfaction for men and women
4 The model using the categorical variable of occupational sex segregation also showed that women in female occupations have greater overall job satisfaction after controlling for the level of choice.

205
after controlling for age, occupational class, and full-time/part-time work. As can be
seen, for men, the effect of percent female in an occupation is not statistically
significant for any single specific item of job satisfaction after controlling for age,
occupational class, and full-time/part-time work. However, for women, it is
significant for several items; women in female occupations are more likely than other
women to be satisfied with the intrinsic aspects of work, such as the opportunity to
use their own abilities, being able to use their own initiative, the work itself, the
amount of work, the variety in the work, and the training provided, as well as with the
workplace atmosphere, such as relations with their supervisor or manager, the ability
an efficiency of the management, and the friendliness of the people to work with.
However, the result shows that the effect of percent female in an occupation is not
significant to explain satisfaction with the extrinsic aspects of work for women, such
as pay, promotion prospects, job security, working hours, and fringe benefits.
Therefore, it seems that as they work in more female occupations, women become
more satisfied with their jobs, because they become more satisfied with the intrinsic
aspects of their jobs and with their workplace atmosphere.
Then, why are women in female occupations more likely to be satisfied with
these aspects of work, or their jobs in general? One plausible explanation is that
women in female occupations feel less pressure and stress than women in male
occupations, as they are in their sex-typical occupations. Women in male occupations
are reported to experience hostility or harassment from male co-workers (see Kanter
1977, Jacobs 1989b, Stockdale 1996). This explanation is consistent with our findings
that women in female occupations are more likely to be satisfied with their workplace
atmosphere, such as relations with their supervisor or manager, and the friendliness of

206
the people to work with. As has been seen in our analysis of job preferences, women
(both full-timers and part-timers) in female occupations are more likely to emphasise
a friendly workplace atmosphere in looking for their jobs than other women.
Therefore, the greater overall job satisfaction for women in female occupations may
be also because women in female occupations are more likely than other women to
realise their work values.
Another explanation comes from the nature of their work. Although we found
in Chapters 5 and 6 that female occupations are associated with lower economic
rewards, women may be satisfied with these occupations, as these occupations might
provide other rewards that compensate for lower economic rewards (Ross and
Mirowsky 1996). Gallic and White (1993) suggest that satisfying jobs are often those
which are concerned primarily with people, such as dealing with clients and
customers, organising people, and above all caring for other people. The Employment
in Britain survey data shows that more than nine out of ten women who replied that
caring for people took up at least half their work time were employed in female
occupations. Therefore, the high correlation between occupational sex segregation and
caring for people might well be reflected in the effect of occupational sex segregation
in our models of job satisfaction. If we add the dummy variable of caring for people
(which coded people who said that at least half of whose work time was spent in
caring for people as "1") to our model of overall job satisfaction, as well as to our
models of the specific items of the intrinsic job satisfaction, the effects of percent
female in an occupation in all these models are reduced, and they all become
insignificant. This suggests that the high intrinsic satisfaction among women in female

207
occupations, or the high overall job satisfaction of these women in general, is in part
due to the fact that these women often work in "caring" jobs.
The greater job satisfaction of women in more female occupations seems to
account for their low attrition from female occupations as compared to male
occupations that was found in Chapter 4; women seem to remain in female
occupations as they are satisfied with the intrinsic aspects of work and with the
workplace atmosphere.
Job preferences and job satisfaction for Japanese women
In Chapter 3, we found that unlike British women, Japanese women are not
concentrated into female occupations. Also, in Chapter 4, we found that compared to
British women, the movement across sex-typed occupations are much more fluid for
Japanese women. Then does this mean that Japanese women are less likely to be
involved in the construction and maintenance of occupational sex segregation than
British women? In this section, we will examine job preferences and job satisfaction
for Japanese women, and compare them with British women, in order to see whether
there are any differences which help to account for the aggregate differences in the
patterns of occupational sex segregation. In analysing job preferences and job
satisfaction for Japanese women, we use the Occupational Mobility and Career
Research survey data (OMC) which was conducted in 1983. The sample for the OMC
only included women so that we cannot compare between men and women for Japan.
However, it is for women in the two countries that we did find substantial differences
in the pattern of occupational sex segregation (see Chapter 3), so that the lack of
men's sample seems not to be very crucial.

208
Job preferences and occupational sex segregation for Japanese women
In the OMC, the respondents were asked "how much did you emphasise the
following conditions when you chose your current job?". The list includes pay,
working hours, holidays, commuting time, job content, no fear of unemployment,
equality between the sexes, promotion prospects, and the availability of social
insurance. The answers were coded in a four-point scale from very important to not
important. We will firstly construct the variable of intensity of job preferences by
adding the responses to each item of job preferences. By the same method, we found
in Britain that female part-timers are less concerned about job characteristics than
female full-timers, and therefore, seem to be more vulnerable to demand side factors.
But can we find the same result for Japanese women?
Table 7.12 Intensity of job preferences by full-time/part-time work, Japanese women
Female full-timers Female part-timers Sig. female full-timers vs.
(N=365) (N=256) female part-timers
23.57 22.83 *
(5.01) (4.36)
Source: the Occupational Mobility and Career Research survey .
Note: * p < .05%. Self-reported full-time/part-time work is used.
The result in Table 7.12 shows that female part-timers' score is significantly lower
than that for female full-timers. Therefore, as in Britain, female part-timers in Japan
are less likely than female full-timers to be concerned about job characteristics in
choosing their jobs, and thus seem to be more vulnerable to demand-side factors.
Now, we will look at different dimensions of job preferences and compare
them between full-timers and part-timers. The items of job preferences in the Japanese

209
data are different from those in the British data. In order to find some correspondence
between these two data sets, we selected a group of items which seem to be relevant to
each dimension of job preferences extracted from the British data, and constructed an
indicator by using a principal components factor analysis. We include pay, job
security, promotion prospects and the availability of social insurance to construct an
equivalent factor to the preference for the extrinsic aspects of work. In terms of the
preference for the intrinsic aspects of work, we put job content and sex equality. For
the preference for convenient work arrangements, working hours, holidays, and
commuting time were included. The Reliabilities (= Cronbach's Alpha) for the
preference for the extrinsic aspects work, the intrinsic aspects of work, and convenient
work arrangements are .64, .57, and .74 respectively. We cannot find any equivalent
items for the preference to a friendly workplace atmosphere in the Japanese data. We
obtained good results from the factor analysis as shown in Table 7.13.
Table 7.13 Principal components analysis of job preferences, Japanese women
Variable
Preference for extrinsic aspects of work1. pay2. job security3. promotion prospects4. social insurance
Preferences for intrinsic rewards1 . job content2. sex equality
Preferences for convenient work arrangement1 . working hours2. holidays3. commuting time
Communality * Factor
.37 * 1
.69 *
.31 *
.57 *
.70 * 1
.70 *
.72 * 1
.67 *
.59 *
Eigenval Pet of ue Var
1.93 48.2
1.40 70.1
1.98 66.2
Source: the Occupational Mobility and Career Research surveyNote: Reliabilities (Cronbach's alpha) for the three factors are .64, .57, and .74 respectively.

210
Table 7.14 shows the average scores of the three factors of job preferences for
female full-timers and female part-timers in Japan. As can be seen, female full-timers
in Japan are more likely than female part-timers to emphasise both the extrinsic and
intrinsic aspects of work in choosing their jobs. However, female part-timers are more
likely than female full-timers to emphasise convenient work arrangements. Thus,
basically, in terms of job preferences for full-timers and part-timers, we can find
similarities between British women and Japanese women.
Table 7.14 Job preferences by full-time/part-time work, Japanese women (s.e in parentheses)
Female full-timers Female part-timers Sig. female full-timers vs.
__________________(N=371)_______(N=268)_______female part-timers______
Preference for extrinsic .183 .260 ***
work (1.002) (.939)
Preference for intrinsic .126 -.177 ***
work (1.033) (.926)
Preference for convenient -.167 .236 ***
work______________(1.024)________(.916)_________________________
Source: The Occupational Mobility and Career Research survey *** p < .001
We now examine whether Japanese women's job preferences differ by the sex-
type of occupations. As can be seen from Table 7.15, we cannot find any statistical
evidence that women's job preferences differ by the sex-type of occupations. This is
the same if we select female full-timers (Table 7.16) or female part-timers (Table
7.17). In Britain, we also found that the sex-type of occupations had little impact on
women, once full-time/part-time work was controlled. However, the sex-type of
occupations showed a significant impact on the job preferences for British women as a
whole, because of the uneven distributions of part-timers across sex-typed
occupations. However, the distributions of part-timers across sex-typed occupations in
the Japanese data is not so skewed as in the Britain data. In fact, the shares of part-

211
timers in gendered occupations are quite similar in our Japanese data: 46% of women
in male occupations, 43% in mixed occupations, and 40% in female occupations are
part-timers. As we have seen, the corresponding figures for the British data are 17%,
30%, and 48% respectively.5 Therefore, the differences in job preferences between
full-timers and part-timers do not significantly affect the relation between Japanese
women's job preferences and sex-typed occupations.
Table 7.15 Job preferences by sex-typed occupations, Japanese women
Extrinsic work
Intrinsic work
Convenient work
N
male occ
-.076(1.080).093
(1.048)-.035(1.062)93
mix occ
.004(.991)-.057(.986).018
(.986)394
female occ sig. male sig. mix vs. sig. male vs. mix female vs. female
.048 n.s. n.s. n.s.(.984).093 n.s. n.s. n.s.
(1.005)-.026 n.s. n.s. n.s.(1.001)165
Source: The Occupational Mobility and Career Research survey Note: ** p < .01, * p < .05, n.s. = not significant at the 10% level.
Table 7.16 Job preferences by sex-typed occupations, Japanese female full-timers
Extrinsic work
Intrinsic work
Convenient work
N
male occ
.147(1.142).215
(1.102)-.337(1.092)50
mix occ
.163(.996).082
(1.028)-.093(1.022)225
female occ
.237(.964).192
(1.014)-.238(.994)105
sig. male vs. mixn.s.
n.s.
n.s.
sig. mix vs. femalen.s.
n.s.
n.s.
sig. male vs. femalen.s.
n.s.
n.s.
Source: The Occupational Mobility and Career Research survey Note: ** p < .01, * p < .05, n.s. = not significant at the 10% level
5 The share of part-time workers in the Japanese data is considerably larger compared to the British data, because Japanese sample included those aged 25 and over. We cannot, however, compare the Japanese figures to the official statistics, such as the census or the labour force survey, as they lack the information of detail-classified occupation by full-time/part-time work or by working hours.

212
Table 7.17 Job preferences by sex-typed occupations, Japanese female part-timers
Extrinsic work
Intrinsic work
Convenient work
N
male occ
-.321(.961)-.049(.973).333
(.908)43
mix occ
-.233(.939)-.244(.895).165
(-917)169
female occ sig. male sig. mix vs. sig. male vs. mix female vs. female
-.288 n.s. n.s. n.s.(..935)-.080 n.s. n.s. n.s.(.972).345 n.s. n.s. n.s.
(.904)60
Source: The Occupational Mobility and Career Research survey Note: ** p < .01, * p < .05, n.s. = not significant at the 10% level
In sum, we have found that job preferences for Japanese female full-timers and
part-timers differ significantly; the former tend to emphasise both the extrinsic and
intrinsic aspects of work and the latter convenient work arrangements. However, we
cannot see any difference in job preferences by the sex-type of occupations for either
female full-timers or female part-timers in Japan.
Job satisfaction and occupational sex segregation for Japanese women
Now we will examine job satisfaction for Japanese women. It is supposed that if they
are satisfied with their jobs in a particular sex-typed occupations, they are likely to
stay in these occupations. However, as Chapter 4 shows, Japanese women are more
likely than British women to move across sex-typed occupations, when they change
their jobs. Then, is Japanese women's level of job satisfaction not so much affected by
the sex-type of occupations as in the case for their British counterparts?
In the Japanese data, there are two questions which are relevant to overall job
satisfaction, and they are equivalent to two of the three British questions that are used
to construct the overall job satisfaction score. The first question is "are you satisfied
with your job or dissatisfied? Considering your job as a whole, please choose from the

213
followings the one which is closest to your opinion". The answer is coded on a 5 point
scale from satisfied to dissatisfied. The second question is "would you like to continue
your current job? If possible, would you like to change it, or would you like to retire
and not work at all?". The respondent chose from 1. they would like to continue, 2.
they would prefer to change, and 3. they would like to retire. To find a correspondence
with the British analysis, we produce a measurement of overall job satisfaction which
is scaled as the composite of responses to these two items which ranges from 1.0 to
7.0. Unlike the British data, the Japanese data lacks the information about specific job
satisfaction.
Table 7.18 OLS regression on overall job satisfaction, Japanese women
Women (N=653)fempctage 35-44age 45-54age 55+managerial/administrativeclericalsalesskilledsemi-skilledunskilledagriculturalpart-timeconstantadjusted R2F
-.002 (.002).352 (.143)*.556 (.150)***.583 (.225) **
-.478(1.392)-.631 (.192)**-.856 (.223)***-.642 (.242)**-.733 (.200)***-.817 (.282)**-.632 (.600)-.298 (.115)**6.129 (.250)***.045
3.551***
Source: the Occupational Mobility and Career Research survey *p<.05, **p<.01,***p<.001
Table 7.18 shows the result. As expected, the effect of percent female in an
occupation is not statistically significant after controlling for the other predictor
variables. Moreover, unlike British women, the value of the coefficient is negative,
rather than positive. However, this result may change, if we use the categorical
variable of occupational sex segregation. As has been seen in Chapter 4, the attrition

214
of mixed occupation is relatively low for Japanese women, then women in these
occupations might show greater overall job satisfaction than other women.
Table 7.19 OLS regression on overall job satisfaction with the categorical variable of
occupational sex segregation, Japanese women
Women (N=653)female occupations -.214 (.145)male occupations -.108 (.169)age 35-44 .343 (.143)*age 45-54 .540 (.151)***age 55+ .568 (.225) * managerial/administrative .371 (1.389)clerical -.707 (.200)***sales -.837 (.218)***skilled -.661 (.239)**semi-skilled -.723 (.198)***unskilled -.829 (.279)***agricultural -.591 (.600)part-time -.309 (.115)**constant 6.136 (.195)***adjusted R2 .046 F 3.415***
Source: the Occupational Mobility and Career Research survey *p<.05, **p<.01,***p<.001
As can be seen from Table 7.19, even if we use the categorical variable of
occupational sex segregation, we cannot find any statistical evidence that women in
mixed occupations are more satisfied with their jobs than those in female occupations
and male occupations, though the coefficients of female occupations and of male
occupations show that those in female occupations and male occupations are less
satisfied with their jobs than those in mixed occupations.6
Thus, occupational sex segregation have little effect on Japanese women's job
satisfaction. However, age and job-structure variables, i.e., occupational class, and
full-time/part-time work, significantly affect Japanese women's job satisfaction. In
6 Even if we allows for the 10% significance level because the sample size is relatively smaller in the Japanese data compared to the British data, the effect of occupational sex segregation, either in categorical variable or continuous variable, is not
significant.

215
particular, the result shows that female part-timers are less likely to be satisfied with
their jobs than female full-timers despite their relatively low expectations.
In the Japanese data, the respondents were asked their opinion about the
working conditions of part-timers. The statement is "compared to full-time work, part-
time work is insecure and the working conditions are poor". The average overall
satisfaction score for part-timers who strongly agreed to the statement is 5.25.
However, the corresponding figure for the part-timers who did not agree to the
statement at all is 6.17. The difference between the two groups is statistically
significant at the 5% level. Therefore, the lower satisfaction among Japanese part-
timers could be related to their particularly poor job security and work conditions.
In summary, we cannot find any significant evidence that occupational sex segregation
is related to Japanese women's job preferences or it affects their level of overall job
satisfaction. This seems to be reflected in the job mobility patterns for Japanese
women; they move across sex-typed occupations relatively easily compared to British
women. It also seems to be reflected in the aggregate difference in the pattern of
occupational sex segregation; while British women are concentrated into female
occupations, this is not the case for Japanese women.
Summary and Conclusion
In summary, we firstly examined in this chapter whether job preferences differ
between male full-timers, female full-timers and female part-timers in Britain. Four
dimensions of job preferences emerged from the British data; they are preference for
the extrinsic aspects of work, preference for the intrinsic aspects of work, preference

216
for convenient work arrangements, and preference for a friendly workplace
atmosphere. Male full-timers are more likely than others to emphasise the extrinsic
aspects of work but less likely to emphasise convenient work arrangements and a
friendly workplace atmosphere. Female full-timers are more likely than others to
emphasise the intrinsic aspects of work. And female part-timers are more likely than
others to emphasise convenient work arrangements and a friendly workplace
atmosphere. We suggested that the greater emphasis of men on the extrinsic aspects of
work as compared with women helps to explain why men move to and stay in male
occupations, as these occupations in fact provide better pay than female occupations
(see Chapter 5), and therefore match with their work values.
Secondly, we examined job satisfaction for men and women in Britain.
Although we did not find any statistical evidence that men in male occupations are
more likely than other men to be satisfied with their jobs, we did find that women in
female occupations are more likely than other women to be satisfied with their jobs.
The greater satisfaction for women in female occupations is derived from their greater
satisfaction with the intrinsic aspects of work, as well as from their greater satisfaction
with a friendly workplace atmosphere. Given that women in female occupations have
higher preferences than other women for a friendly workplace atmosphere, the greater
satisfaction with a friendly workplace atmosphere of these women seems to suggest
that female occupations in fact provide such a work atmosphere. In terms of the
intrinsic job satisfaction, we suggested that the fact that women in female occupations
are more likely than other women to work in a job which requires them to care for
people seems to contribute to their greater satisfaction.

217
Thus, even if employers paid less to women in female occupations, their
experiences in female occupations - the friendly workplace atmosphere and the feeling
of achieving high intrinsic rewards - make these women feel satisfied with their jobs.
Occupational sex segregation, therefore, seems to be maintained in the British labour
market by benefiting employers on the one hand, and by providing women with the
work conditions which make them feel satisfied with their jobs on the other hand.
In contrast in Japan, we did not find any evidence that women's job
preferences and job satisfaction differ by occupational sex segregation, though they do
differ between full-timers and part-timers. Female full-timers are more likely than
female part-timers to emphasise both the extrinsic and intrinsic aspects of work, while
female part-timers are more likely than female full-timers to emphasise convenient
work arrangements. Also, female part-timers are less likely than female full-timers to
be satisfied with their jobs in Japan, and we suggested that this seems to be because of
their particularly poor job security and work conditions.
The greater differences made by occupational sex segregation for women's job
preferences, as well as for their job satisfaction in Britain than in Japan seem to
suggest the greater involvement of British women in the construction and maintenance
of occupational sex segregation. This in turn seems to be reflected in the differences in
the individual job mobility between the two countries (i.e., it is less likely for British
women than for Japanese women to move across sex-typed occupations), as well as in
the difference in the distributions across sex-typed occupations (i.e., British women
are concentrated into female occupations but this is not the case for Japanese women).

218
CHAPTER 8
SOCIAL AND ECONOMIC CONDITIONS
AND OCCUPATIONAL SEX SEGREGATION
Introduction
From Chapter 5 to Chapter 7, we examined the experiences of men and women in the
labour market, trying to understand how occupational sex segregation is constructed
and maintained at the individual level, and why the extent differs between Britain and
Japan at the aggregate level. In this chapter, we will further examine the mechanism of
occupational sex segregation in a wider context. Occupational sex segregation can be
captured as the results of the interaction of employers, employees and the government.
Although there is little doubt that employers and employees are the main agents who
construct and maintain occupational sex segregation, state intervention, through law
and regulation, or through the systems of social security, may influence the decision of
the two agents by giving positive weights on some options and negative weights on
the others.
Also, in a wider context than the labour market, gender norms and women's
expected roles in the society based on these norms influence the behaviour of
employers and employees. For employers, gender norms and women's expected
family roles would influence their beliefs and judgement about the nature of
employees. For employees, these factors would influence their labour market
behaviour directly through affecting feasible options, or indirectly through affecting

219
their beliefs about feasible options. Therefore, there exists a potentially complex
mechanism behind occupational segregation.
To understand this complex mechanism, firstly we will examine gendered
attitudes and women's family roles for Britain and Japan. Gendered attitudes and
family roles would affect women's behaviour in the labour market by giving different
weights between the options of sex-typical careers and sex-atypical careers. Secondly,
we will examine social security systems - the tax and pension schemes - in Britain and
Japan. We will consider whether they influence women's decisions about work,
particularly between the "non-work" option and "work" option, or between the "full-
time work" option and "part-time work" option. Thirdly, we will turn to demand-side
factors and investigate employer's policies in Britain and Japan. In particular we will
investigate how Japanese employers utilise female labour, and what implication this
has for the impact of occupational sex segregation. Then, we will investigate how
effective the labour laws in Britain and Japan are to restrict employers' discriminative
policies towards women.
Gendered attitudes and women's family roles in Britain and Japan
The beliefs and assumptions based on gender, i.e., what is appropriate for men to do
and what is appropriate for women to do, influence not only women's decisions about
work, but also employers' decisions about the appropriate candidate for a job. In this
section, we will look at some empirical evidence on gendered attitudes and behaviour
using a survey containing both British women and Japanese women. The 1992 Public
Opinion Survey regarding Equality of the Sexes (POSES) was conducted in eight
different countries by the Office of the Prime Minister in Japan, including Britain and

220
Japan (Tokyo-to Seikatsubunka-kyoku 1994). The British survey was conducted in
March 1993. It is a national representative sample of women aged 20 years and over.
The Japanese survey (Joseimondai-ni-kansuru Kokusai-hikaku-chosa) was conducted
in November 1992, and it is a national representative sample of people aged 20 and
over. The POSES asked a number of questions about gender roles, attitudes, and
household responsibilities. We will summarise the results of this survey to see how
Japanese women are different from British women.
We firstly pick up four questions which are in Table 8.1 to see gendered
attitudes in Britain and in Japan. These four questions about gendered attitudes reflect
how women internalise norms and values about gender roles, marriage, women's
reproductive role, and children's socialisation. We can see from Table 8.1 that, in
every question, Japanese women show much stronger gendered attitudes than British
women. For the bread-winner question, more than half the Japanese women agreed
that the husband should be the breadwinner and the wife should stay at home, but only
20% of the British women agreed to it. Marriage means more to Japanese women
than British women; nearly 80% of the Japanese women agreed that women's
happiness lies in marriage, so it is better for women to marry, but only 37% of the
British women agreed to this view. Also, for Japanese women, marriage often means
becoming a mother; less than one-third of the Japanese women agreed that marriage
does not mean that one should have children, while nearly nine out of ten British
women agreed to the statement. Finally, Japan is also much more traditional in child
socialisation than Britain; nearly half of the Japanese women agreed to gender-specific
socialisation, but the figure for the British women is only 16%.

221
These attitudes, however, vary by age. For both Britain and Japan, the younger
generation show less traditional attitudes than the older generation. When we focus on
the differences between Britain and Japan by generation, we can see that in terms of
the attitudes to the bread-winner role and marriage, the country difference is larger
among the younger generation than among the older generation. This suggests that the
generation change in attitudes to the bread-winner'role and marriage is greater for
British women than for Japanese women. On the other hand in terms of the attitudes
to women's reproductive role and child socialisation, the difference between Britain
and Japan is larger for the older generation than for the younger generation (except for
attitudes to child socialisation for those in their 60s), which suggests that Japanese
women's attitudes to their reproductive role and child socialisation are becoming
similar to those of British women. Having said that, however, even the youngest
generation in Japan show much more traditional attitudes than their British
counterparts.
Also, gendered attitudes differ in both countries by whether women are in
employment or not, and if they are in employment, the attitudes differ by whether they
work as full-time employees or part-time employees. In general, the results show that
those in employment have less traditional attitudes than those not in employment, and
if those in employment are compared, those who are full-time employees have less
traditional attitudes than those who are part-time employees. The biggest variation can
be seen in the bread-winner question for both countries; for British women, only one
out of ten in employment (and 8% of full-timers) agreed that men should be the bread
winner but women should stay at home, while three out of ten who were not in
employment agreed to it. In Japan, 47% of women in employment (and 37% of full-

222
timers) agreed to this statement, but as much as two-thirds of those who were not in
employment agreed to it. However, when employed women are compared between
Britain and Japan, those in Britain have much less traditional attitudes than those in
Japan in every question. Thus, even if in employment, Japanese women still have
very traditional attitudes.
Table 8.1 Percentage of women who agreed to statements of gendered attitudes,
Britain (N=1064) and Japan (N=1971)
All all in Not in
employ employees employ
ment full-time part-time ment
Age
20s
a. The husband should be the bread winner and the wife should stay at
Britain
Japan
20.3
55.6
10.3
47.2
b. All things considered,
Britain
Japan
37.0
78.2
c. Marriage does
Britain
Japan
d. It is the
Britain
Japan
88.3
32.2
best to
15.8
45.6
29.2
77.3
7.8
36.9
women 's
25.0
73.2
12.7
47.1
happiness lies
32.8
77.4
not mean that one should have
92.0
33.4
94.3
38.6
89.1
38.3
29
65
.6
.9
8.3
47.9
30s
home
8.5
46.7
40s
14.0
53.9
in marriage, so it is better for women to
44
79
children
84
30
.3
.2
.9
.8
teach a boy to behave like a boy and a girl to
10.1
41.8
10.1
32.2
10.0
47.0
21
50
.1
.4
17.2
72.9
90.7
47.5
behave
6.3
31.3
23.1
71.8
90.3
41.9
like a girl
8.1
31.2
31.1
74.4
89.6
34.7
10.4
48.7
50s
21.8
54.3
marry
50.4
81.1
89.4
28.0
14.6
49.6
60s
43.9
68.7
61.4
86.8
83.2
18.9
34.6
54.2
Source: 1992 Public Opinion Survey regarding Equality of the Sexes
In summary, firstly, we can see that Japanese women are much more
traditional than British women towards gender roles, marriage, reproduction role, and
children's socialisation. Secondly, for both British women and Japanese women, the
younger generation show less traditional gendered attitudes than the older generation.
However, in Japan, even the youngest generation show much stronger traditional
attitudes than women in Britain. Thirdly, for both countries, gendered attitudes depend

223
on whether women are in employment or not; those in employment show less
traditional attitudes than those not in employment. This is particularly so if they are
full-time employees. However, if employed women are compared between Britain and
Japan, those in Japan have much stronger gendered attitudes than the British
counterparts.
We now turn to the actual family roles of women in Britain and Japan. In so doing, we
will look at wives' responsibilities for the various household chores, and the decision
making in the household. The POSES asked the respondents who were married or
who were not married but living with a partner about who mainly takes care of various
household chores. The result is shown in Table 8.2, where the figures show the
percentage of the respondents who replied that it was the wife who mainly took care
of the household core.
Table 8.2 Wives' responsibilities for household chores, Britain and Japan
Household chores Japan Britain Difference
Cleaning the house 86.0% 77.6% 8.4%
Doing the laundry 91.3% 89.9% 2.4%
Grocery shopping 84.9% 64.2% 20.7%
Cooking 91.5% 75.4% 76.7%
Washing the dishes 84.7% 45.6% 39.7%
Helping child(ren) with homework and study3 52.5% 36.6% 75.9%
Child careb 68.6% 61.2% 7.4%
Taking care of parents' 72.5% 51.1% 27.4%
a. Only for families which have child(ren) under 16b. Only for families which have infant(s) and/or baby(babies)c. Only for families that provide daily care to or nurse parents everydaySource: 1992 Public Opinion Survey regarding Equality of the Sexes

224
From Table 8.2, we can see that Japanese women in general are more responsible for
household chores than British women. The difference can be particularly found in
washing the dishes, where less than half of the British women replied they were
mainly responsible for it, but 24% of them said that husband mainly took care of it.
On the other hand, as much as 85% of the Japanese women replied that they mainly
took care of it, while very few said that this was the chore for the husband (2% of the
respondents said that their husband were mainly responsible for it). Also, grocery
shopping is more likely to be shared among the family in Britain but it is the wife's
job in Japan; less than two-thirds of the British women replied that they mainly took
care of it but a quarter of them said that the entire family was responsible, while the
corresponding figures for the Japanese women are 85% and 8% respectively. Caring
for members of the family is also more likely to be in hands of the wife in Japan than
in Britain, though in terms of caring for infants or babies, the difference between them
is relatively small. More than half of the Japanese women replied that they mainly
help children's study, and 73% of them mainly take care of parents, though in Britain
the corresponding figures are 37% and 51% respectively.
We will now turn to the decision making at home. The POSES asked the
respondents who makes the final decision in their household with respect to purchase
of house/residence, purchase of furniture and major household appliances, and
handling of the household budget, and finally, it asked who has the real power in the
household in making major decisions. Table 8.3 shows the proportion of the
respondents who said that the husband, or the couple together, or the wife was the
final decision maker.

225
Table 8.3 Decision making in the household, Britain and Japan
Husband Couple Wife Family Others Don't know
a. Purchase of house/residence
Britain 9.7% 75.9% 10.0% 3.4% 0.0% 1.0%
Japan 56.7% 29.0% 2.1% 7.2% 3.1% 1.9%
b. Purchase of furniture and major household appliances
Britain 3.7% 72.5% 22.4% 1.4% 0.0% 0.0%
Japan 26.3% 42.2% 19.8% 9.7% 1.6% 0.4%
c. Handling of the household budget
Britain 18.2% 34.2% 46.9% 0.4% 0.0% 0.3%
Japan 10.4% 14.5% 70.5% 1.8% 2.4% 0.3%
d. Overall, who in the household has the real power in making major decisions?
Britain 21.5% 51.3% 26.3% 0.8% 0.0% 0.1%
Japan 62.4% 19.1% 12.4% 2.4% 3.2% 0.5%
Source: 1992 Public Opinion Survey regarding Equality of the Sexes
From Table 8.3, we can see that in Japan, husbands have much greater power than
wives in household decisions except for the handling of the household budget, and
this is particularly so if the decision is for more valuable things. Handling the
household budget is more likely to involve routine tasks than the other types of
decisions. On the other hand, in Britain, the couple together tend to make the final
decision. Unlike Japan, we cannot see any tendency in Britain that husbands are more
powerful decision makers than wives at home.
In summary, we can see much a clearer division of labour at home in Japan
than in Britain. Japanese women are more responsible for taking care of household
chores than British women. However, this does not necessarily mean that Japanese
women have more say in household decisions. In fact, the result shows that compared
to women in Britain, they have less power in making important decisions in the
household.

226
How could these differences in attitudes and family roles of women between
Britain and Japan affect the choices of women in the labour market? Firstly, attitudes
are the reflection of norms and values which are acquired in the process of
socialisation. Stronger gender attitudes in Japan, therefore, mean that Japanese women
are more likely to internalise gender norms and values than British women. Norms
and values shape preferences as well as the perception of the set of feasible
alternatives. Although the final decision in the labour market is very much influenced
by demand-side factors, these internalised norms and values "push" women to choose
sex-typical careers when they make the decision between non-work and work, or
between sex-typical jobs/careers and sex-atypical jobs/careers. Secondly, domestic
responsibilities not only make it difficult for women to pursue their careers, but also
shape the preferences and the perception of feasible alternatives, through the
mechanism of "sour grapes" (Elster 1983b). In other words, once married and having
experienced their household responsibilities, the preference order may be based on
"convenience" in work rather than "intrinsic or extrinsic rewards" in work. The
household responsibilities, or just the fact that they are married or have children, may
make them believe that certain jobs or careers are not for them. Thus, given the
stronger gendered attitudes and greater domestic responsibilities for Japanese women
than for British women, the "pushing" forces to choose gender typical careers seem to
be stronger for the former than the latter.
From the point of view of employers, more traditional attitudes and greater
domestic responsibilities for women in Japan than in Britain seem to encourage
Japanese employers to differentiate employment conditions by sex more than British
employers, because these attitudes and behaviour could well affect women's

227
commitment to work and their productivity. At the same time, these women's
attitudes and behaviour in turn make it easier for Japanese employers than for British
employers to pursue discriminative policies against women.
Social security system in Britain and Japan
Social security systems influence employment independently from market forces
(Esping-Andersen 1990). In this section, we will examine some aspects of the social
security systems in Britain and Japan which could possibly influence women's
decisions about work. They are the taxation and the pension schemes. These two
system can affect women's occupational choice, by differentiating not only their (or
their family's) current income, but also their life-time income.
Taxation
In Britain, taxation is based on an individual. Every man and woman, single or
married, is entitled to the personal allowance. A married man, whose wife is living
with him can claim the married couple's allowance. However, a wife can elect to
receive one-half of the married couple's allowance, and she does not need her
husband's consent to make this election. Or the allowance can be deduced wholly
from the wife's total income, instead of the husband's income, if the election is made
jointly by husband and wife (Genders 1996).
In terms of the taxation system in Japan, the base is an individual and no
difference in personal allowance is made by sex. For married couples, there are two
kinds of spouse allowance - the basic spouse allowance and the special spouse
allowance. Both of these spouse allowances are based on the income of the spouse,

228
rather than the simple fact that they are married. A person can claim the basic spouse
allowance if the spouse earns not more than ¥350,000, and the special spouse
allowance can be claimed if a person's income is not more than 10 million yen, and
the spouse earns more than ¥350,000 but less than ¥700,000 (Hobara 1993).
For Britain, if we compare the individuals who earn the same amount of
money, the net income of those who are single becomes lower than those who are
married, because of the married-couple's allowance. This can also apply to Japan, if
the spouse earns not more than the allowance limit. In this respect, a married person
benefits more than a single person. The difference between Britain and Japan in the
taxation system with regard to women's paid work is that the spouse's allowance in
Japan is based on the amount of income of the spouse, while in Britain, every married
couple if living together, irrespective of the income level of the spouse, is entitled to
the married couple's allowance. Though the Japanese system looks sex-neutral, as
"spouse" can be both sexes, given the fact that husbands often earn much more than
wives, the system may well give disincentives for wives to earn more than the
allowance level, and could affect the decision between work/non-work, or between
full-time/part-time work. This is what is actually happening in Japan, as we will see
later. In this sense, the Japanese system seems to be more gender-biased than the
British system.
Pension Scheme
In Britain, there are basically three types of contributors to the national insurance,
which includes state retirement pension, together with sickness and unemployment.
Firstly, employees are liable for Class 1 contributions unless their weekly earnings are

229
below a specified limit (£58 in 1996). Secondly, self-employed persons must pay
either Class 2 or Class 4 contributions. Class 2 is a weekly flat rate, and if their
earnings are below a specified annual limit, they can be exempted from the
contributions. Class 4 contributions are based on a percentage of their taxable
business profits. Finally, an individual who is neither employed nor in self-
employment can pay Class 3 contributions, which is, however, a voluntary option.
For a married couple, even if the wife is not a contributor, the husband is entitled to an
increase in his pension (European Commission 1993, Genders 1996).
In terms of Japan, it is more convenient to categorise people according to the
type of insured person, rather than of contribution, since the standard pension scheme
which came into force in 1986 has enabled all individuals to have their own retirement
pension. There are three categories of insured persons. The first category consists
mainly of those who are in self-employment, but also students of 20 years old or over
and wives of those self-employed belong to this category. They contribute a fixed
sum. The second category is employees, and their contributions are relative to their
income level. Finally, the third category is the wives of employees who are not in
employment, or even if they are in employment, if they work less than 3/4 hours a
day/week or 3/4 days a month of full-time ordinary workers and earn not more than
¥1,300,000 (Fujii 1993, Hobara 1993).
There are mainly two differences in the pension schemes between Britain and
Japan from the point of view of gender. The first difference is about who contributes
to the benefit. In Britain, regardless of their sex, all the persons whose income is less
than £58 a week are exempted from the contribution, or if a person is neither
employed nor in self-employment, the person can choose not to contribute regardless

230
of their sex. In Japan, only the wives of employees can be exempted from the
contribution. Therefore, the Japanese system is more gender biased. The second is
about who gets the benefits. In Britain, all married women, unless they earn more than
£58 a week, can indirectly (but not independently) get the benefits through an increase
in her husband's pension. So the unit of the benefits is the family rather than the
individual. While in Japan, the wives of employed husbands, but not of self-employed
husbands, can get their "individual" pension without any contribution. The difference
in entitlement between the wives of employed husbands and the wives of self-
employed husbands in Japan may encourage women's dependency more for the
former than the latter.
In fact, many Japanese researchers suggest that the exemption of the wives of
employed husbands from pension contributions, together with the spouse allowance in
taxation, gives them advantages if they stay at home or their earning is the minimum
taxable level (Yashiro 1993, Fujii 1993, Maruyama 1994). Also, a survey on part-time
workers conducted by the Ministry of Labour in 1990 shows that more than half the
part-timers were concerned not to earn more than minimum taxable level (Rododaijin-
kanbo-seisaku-chosabu 1990).
In summary, we have found that the taxation and pension schemes in both Britain and
Japan are gender-biased; basically, they encourage that "the husband should be the
bread-winner and the wife should stay at home". However, the extent of the
encouragement for women to be dependent on their husbands (either as housewives or
part-timers) seems to be stronger in Japan than in Britain, in particular if their
husbands are employees. This could well affect women's occupational choice, through

231
making an "exit" option for married women, or for women who are expected to marry
soon, cheaper. Or when women try to re-enter the labour market after marriage, the
tax and pension schemes influence women's preferences and feasible sets; they tend to
choose part-time jobs, which provide "low enough" income but with less working
hours. As we saw in Chapter 7, female part-timers are the group who are least likely to
be concerned about the extrinsic and intrinsic aspects of work in looking for their
jobs. Thus, they seem to be vulnerable to demand-side factors.
Employer's policy and occupational sex segregation
In this section, we will examine how employer's policy influences occupational sex
segregation. The interests of employers - to reduce labour costs - seem to be clear,
though some researchers argue that this employer's interest interacts with
"patriarchal" interests (Reskin & Hartmann 1986, Walby 1990). If an occupation can
be an effective unit for employers to utilise female labour at a relatively cheap rate,
this will encourage occupational gender segregation. This is actually what we have
found in the British labour market in the previous chapters. However, if occupation
cannot be used in this way or there is another method through which they could realise
their interests in a more effective way, there should be no incentive for employers to
allocate different occupations to different sexes. This difference in the function of an
occupation may help to explain the difference in the extent of occupational sex
segregation between Britain and Japan. However, we need to explain why the function
of occupation differs between Britain and Japan from the point of view of employer's
policies. In so doing, we will examine employment practices in Japan in comparison
with these in Britain. Also, if an occupation is not an effective unit for the Japanese

232
employers to utilise female labour, how do they utilise the female labour? Given the
strong gendered attitudes and behaviour in Japan, there must be great incentives for
Japanese employers to differentiate the employment conditions by sex. We will try to
answer this question by examining how Japanese employers utilise female labour
using the result from a survey carried out by the Ministry of Labour (Ministry of
Labour 1990, 1992).
Employment practices in Japan
Firstly, it is necessary to introduce the employment practices in Japan in order to
understand what "occupation" means in Japan and how the notion of occupation
differs from Britain.
It is often said that Japanese economic success is greatly due to its special
employment practices. Life-time employment, seniority wages, and enterprise unions
are said to be the three main factors which make of the Japanese employment system
(Dore 1973, 1993, Koike 1988, Ito & Kagono 1993), though the application of these
systems differs by the size of enterprises (Ishikawa 1993, Tachibanaki 1993).The
cultural origin of the Japanese employment system is said to be found as far back as in
the Edo and Meiji era (Dore 1993), but it was after the war when it became widely
accepted by the Japanese enterprises (Ito & Kagono 1993). Life-time employment is
defined as,
After being hired, workers receive education and training within the enterprise
and thus get to experience various kinds of jobs through job rotations and
transfers, in the course of which they obtain promotion. As a general rule, they
complete their career in the same enterprise. Their employment is, in principle,
233
guaranteed until a certain age (this age varies in each enterprise, most
enterprises setting this age between 55 and 60).
(The Japan Institute of Labour 1993a, p31)
This practice, however, becomes less common as the size of the enterprises becomes
smaller (Inagami 1988, Sato 1997a). Different recruitment systems exist between
large enterprises and smaller ones; while large enterprises tend to hire fresh school
leavers, smaller enterprises tend to fill the vacancies by mid-career workers (The
Japan Institute of Labour 1993a, Kita 1995). Also women are often excluded from the
life-time employment because a large number of them stop working when they get
married or have children (The Japan Institute of Labour 1993a).
The life-time employment system and the nenko (seniority-plus-merit) 1 wage
system go hand in hand. In Japan, fresh school leavers are recruited at the same time
in a year, and their starting salaries are determined according to their educational
qualifications (The Japan Institute of Labour 1993a). In the nenko wage system, the
wage curve increases by each year of service. For the first 10 to 20 years, the workers
are given lower wages relative to their contributions, but after then, their wage
becomes higher than their actual contributions. This is reported to give workers the
incentives to work longer in the organisations (Ito & Kagono 1993). Koike (1988,
1993a) found that the nenko wage system is not distinctive to Japan but in the large
enterprises in Britain and in the US, similar systems can be found for the white-collar
workers. What is peculiar for Japan, he argues, is that the nenko wage system is
applied to the blue-collar workers in the large enterprises (see also Higuchi 1997), and
1 Nenko is made up of two words - nen and ko. Nen means seniority and ko refers to performance and ability (Kumazawa 1996).

234
that they stay with their companies for long periods. Women are also covered by the
nenko wage system, but their wage curves by each year of service are lower than
men's (The Japan Institute of Labour 1993a). The wage gap by sex is relatively low
for young workers, but as they get older, it becomes larger because of the different
wage curve. This can be found not only for the white-collar workers but also for the
blue-collar workers in Japan, because of the "white-collarisation" of the male blue-
collar workers (Koike 1988).
There are two explanations for what makes the nenko wage system possible in
Japan. The first is the "white-collarisation" hypothesis, which is suggested by Koike
(1988). He argues that not only the white-collar workers but also the blue-collar
workers in Japan have a wider range of skills than the Western counterparts, and their
skills increase by the length of service. These skills are mainly acquired by on-the-job
training, and enable them to cope not only with usual operations but also with unusual
operations (Koike 1993a 1993b). Another explanation is the "life-assurance-wage"
hypothesis, suggested by Nomura (1992). He argues that the wage curve is decided in
a way which enables male workers to support their family, so that the companies
provide them with considerable training to increase their skills to recover the costs.
These hypotheses, however, cannot be applied to women, either because 1. women
have not accumulated such a wide range of skills because of their intermittent work
life, or 2. women are not expected to support their family, so that their wage curve is
stagnant (Osawa, Mari 1993).

235
Differences between the Japanese employment system and the British employment
system
So far, we have seen some features of what is called "Japanese employment system",
but how does this differ from British system?
Dore (1986) suggests a number of interesting contrasts between a "market-
oriented" system, which is the dominant practice of the typical British firm, and an
"organisation-oriented" system, which is mainly found in the typical large Japanese
firm.
According to Dore, in the market-oriented system, workers move from firm to
firm frequently, always watching the market. However, in the organisation-oriented
system, the mobility rate is low, and workers are assured 'life-time careers' and expect
to fill all but junior jobs (including board directorships) by internal promotion. In
terms of pay, in the market-oriented system, the wage rate is decided on the basis of
'the rate for the job', or 'the going rate' in the labour market, whereas, in the
organisation-oriented system, pay is on incremental scales which are differentiated by
qualification level. Incremental progression depends on seniority and assessed 'merit'.
For the former system, fairness resides in 'equal pay for equal work' or 'work of equal
value to employer', but for the latter it means 'equal pay for equal levels of
qualification, service, willingness, cooperativeness, etc.'. With regard to collective
bargaining, in the market-oriented system, trade unions combine all those with the
same skill to sell in the market in a co-operative effort to raise the going rate for their
skills. While in the organisation-oriented system, unions are organised at the
enterprise level, combining all the lower ranks in a co-operative effort to ensure that
they get a fair share of the proceeds of the firm's collective endeavour. They are taken

236
as seriously as the shareholders by the enterprise managers. In terms of skills, in the
market-oriented system, once acquired, skills are individual property, and they can
take them into the market, looking for a new employment contract at any time it seems
to their advantage. Hence the possibility of mobility is a fairly salient thought in the
minds of both employers and employees. An employee who acquires a new skill and
remains in the same employment can expect a new job at a new rate, because of the
salience of the consciousness of "market price' of skill. Training is seen by employers
as an alternative to buying in skills. While in the organisation-oriented system, it is
difficult to leave a major firm and expect to get a job with a competitor firm of equal
standing. The likely market values of a skill they might acquire are of little concern to
employees as they do not foresee any great likelihood of their being in the market. The
employee's wage does not immediately depend on their job-function, and it is not
necessarily altered by acquiring a new skill, because of the lack of consciousness of
the 'market price' of skill. The employers see training as a means of getting their
employees to do a better job, and the purchase of necessary skills in the market is not
normally considered as a possible substitute (Dore 1986, pp29-31).
These contrasts might have been influenced by the historical development of
industrial organisations, in particular, trade unions, in the two countries. British trade
unions originated as local societies of skilled workers, and these local societies began
to form national amalgamations from the middle of the nineteenth century. After the
turn of the century, unions of cognate trades began to merge, and subsequently, these
craft unions came to include non-craft occupations (Felling 1992, Hyman 1995).
Thus, British trade unions have a tradition of organising along occupational lines. In
terms of collective bargaining, multi-employer (or industry-wide) bargaining had been

237
the major form of negotiation up to the 1960s, although single-employer bargaining
has become dominant after the 1970s (Millward et al, 1992, Brown et al, 1995). On
the other hand in Japan, trade unions have been developed at the level of individual
enterprises since World War n, including both the blue- and white-collar workers, and
collective bargaining has been carried out within the enterprise between the union and
the employer (The Japan Institute of Labour 1993, Hisamoto 1994).
The multi-employer bargaining of Britain helped to establish the notion of the
'rate for the job', and encouraged the identification of their members with their wider
occupational and labour market collective interests (Brown et al, 1995), which
resulted in differentiating wage and work conditions within enterprises by separating
bargaining units(Keep and Rainbird 1995). In contrast, Japanese enterprise unions
worked to protect workers against the ravages of severe inflation after the war by
pressing for guaranteed minimum wages based on age and length of service, and they
sought employment stability by strenuously opposing retrenchments aimed at
rationalising company operations. They also set the objective of reducing hierarchical
differences in company management and operation, and they played a significant role
in narrowing the status and wage gap between office staff and factory and field
workers (Utada 1987, Kumazawa 1996).
Thus, what can be seen from these contrasts, are; 1. skill belongs to the
individual in Britain, but in Japan, it belongs to the individual and the firm where the
individual gets company-specific training, and 2. the wage rate is based on the market
price of a particular skill or job function in Britain, while in Japan, it is an attribute of
a person rather than a job, as companies take on workers not for specific duties or
work but for their life-time's work.

238
However, it is necessary to note that "duality" exists between large enterprises
and smaller enterprises in Japan, and the features listed above cannot be applied to
small enterprises. Firstly, workers in small enterprises are not immobile. Actually, a
survey on small enterprises in Japan done by Kokumin Kinyu Kinko in 19942 shows
that among workers recruited during the nine years before the survey, more than 80%
were mid-career workers (Kita 1995). Secondly, the wage of workers in small
enterprises does not increase by age so much as those in large enterprises. Ishikawa
(1993) suggests the duality in the wage structure between large enterprises and smaller
ones, and explains this wage gap from the point of view of dual labour market theory
(Doeringer & Piore 1971) and firm-specific training. Large enterprises in Japan
contain a larger proportion of workers in an internal labour market than smaller
enterprises. This is particularly so for manufacturing industry, in which small
enterprises have a large proportion of workers drawn from the external labour market.
If workers in the internal labour market are compared between large enterprises and
smaller ones, the intensity of firm-specific training is greater in the former than the
latter. These two factors, Ishikawa suggests, produce the dual wage structure between
large enterprises and smaller ones. Thirdly, unionisation rates differ between large and
small enterprises in Japan.3 Although it is common for large enterprises to have their
own trade unions, this is much less likely for small enterprises (Sato 1994, 1997b).
According to Sato (1994), about 90% of the enterprises with more than 1000
employees had trade unions in 1989, but the corresponding figure for enterprises with
2 The sample was drawn from the enterprises with more than 10 employees in 12 prefectures near Tokyo (only 1% of the enterprises employed more than 100 workers).3 Although the same tendency can be found for Britain(see Mill ward et al, 1992), the rate of unionisation at the level of individual workers (employees belong to unions divided by the number of employees) in small enterprises (less than 100) as compared to larger enterprises is particularly smaller in Japan (see Sato 1994).

239
50 to 99 employees was 24%. However, it is reported that about one-third of the small
enterprises (50 to 299 employees) without trade unions have the labour-management
consultation system, which has some similar, but more limited, functions to trade
unions (Sato 1994, 1997b).
Summary: What is the meaning of "occupation" ?
We have seen that the notion of skill and the price of it differ between Britain and
Japan. In the British firm, individual workers move between jobs in the market with
their skill. In general, there exists a direct match between worker's wage and skill. On
the other hand, in the Japanese firm, no market price exists for a particular skill, but
workers are paid for their long-term work, or their capability to acquire the wide range
of firm-specific skills, although this may not be applicable for smaller firms in Japan.
So far as occupations are distinguished by skill (by the type and/or the level), and
people get and move between occupations with their skills, the direct match between
skill and wage in Britain also means that more or less, there exists a match between
occupation and wage. This seems particularly so, given that trade unions in Britain
have been organised and have negotiated wages along occupational lines. However,
the lack of a direct match between skill and wage in the Japanese firm means the lack
of a direct match between occupation and wage. Therefore, in Japan, "occupation" is
not so effective a unit to differentiate workers and their wage as in Britain. Given
this, there seem less incentives for Japanese employers to differentiate the sexes and
their wage by occupation.

240
Gendered employment policies in Japan
Having seen the differences between Britain and Japan in the way occupation
differentiates workers and their wage, we will now examine how the Japanese
employers utilise female labour and differentiate women from men. As discussed
before, given the strong gendered attitudes and traditional family roles for Japanese
women, Japanese employers seem to have greater incentives to differentiate men's
and women's employment conditions. In fact, we have seen in Chapter 6 that the sex
gap in income and other employment conditions is larger in Japan than in Britain.
Then, how is the sex gap generated in Japan? In order to examine how Japanese
employers differentiate between the sexes, we will investigate the recruitment system,
the training system, the promotion system, and the retirement convention in Japanese
enterprises.
Recruitment
After the enactment of the Equal Employment Opportunity law in 1986, which made
overt discrimination by sex difficult, Japanese employers became more likely to adopt
the career-track system to utilise female labour. Basically, there are two tracks; one is
the career track and the other is the non-career track. Those in the career track could
reach managerial positions through job rotations and company-wide transfers, while
the career prospect of those in the non-career track is limited and they often do
auxiliary, fixed work without transfer. Some employers introduce more than two
tracks, such as a career track without transfer, or with transfer in a limited area.
Introduction of the career-track system differs by the size of enterprise.
According to the 1992 Women's Employment Survey (WES) conducted by the

241
Ministry of Labour, about half of the enterprises with more than 5000 workers
introduced the system, but less than 2% of the companies with 30-99 workers did so.
According to the 1992 WES, large enterprises are more likely to recruit both
men and women for available occupations or career tracks, but smaller enterprises are
more likely to recruit men-only or women-only for available occupations or career
tracks. Table 8.4 shows the percentage of enterprises which had occupations and
career tracks in which they recruited both men and women, women only, or men only.
Table 8.4 Recruitment by size of enterprise, Japan
University High School Mid-
career
Clerical/ Sales Skilled Clerical/Sales Skilled All occupations
Size 5000+ 30-99 5000+ 30-99 5000+ 30-99 5000+ 30-99 5000+ 30-99
Men & 84.7% 57.7% 88.1% 45.4% 61.4% 55.3% 67.2% 43.6% 78.7% 55.6%
Women
Women 13.9% 4.6% 6.2% 0.7% 38.2% 36.9% 7.8% 6.4% 16.4% 26.5%
only
Men 4.2% 39.4% 6.7% 54.1% 4.1% 12.7% 29.4% 51.8% 9.8% 31.2%
only
Source : The 1992 Women's Employment survey
From Table 8.4, we can see that for the recruitment of university graduates for
clerical/sales occupations, 85% of the large enterprises (more than 5000 workers)
replied that they recruited both men and women for the occupations and career tracks
available, but the corresponding figure for the small enterprises (30-99 workers) is
58%, and as much as 40% of them replied that they had occupations and career tracks
in which they recruited only men. For the recruitment of university graduates for
skilled occupations, 88% of the large enterprises (5000+) replied that they recruited
both men and women for the occupations and career tracks available, but the

242
corresponding figure for the small enterprises (30-99) is 45%, and as much as 54% of
them recruited only men for the occupations and career tracks available. Therefore, for
university graduates, large enterprises are more likely to offer sex-neutral recruitment
than small enterprises, but smaller enterprises are more likely to offer men-only
recruitment for the occupations and career tracks available.
The difference by size becomes somewhat smaller for the recruitment of high
school leavers because large enterprises are more likely to offer sex-separate
recruitment for high school leavers than for university graduates. For both large and
small enterprises, as compared to the recruitment for university graduates, the
proportions of women-only recruitment for clerical/sales occupations for high school
leavers are larger. Also, compared to the recruitment for university graduates, the
proportion of men-only recruitment for skilled occupations for high school leavers is
larger in large enterprises. Thus, the employers in large enterprises offer more sex-
discriminative recruitment for high school leavers than for university graduates.
In terms of the recruitment of mid-career workers, employers in smaller
enterprises are more likely than large enterprises to recruit men and women for
different occupations, or career tracks, if any.
Although compared to small enterprises, large enterprises are less likely to
recruit men only or women only for available occupations or career tracks, the actual
employment offer (rather than recruitment) in large enterprises is differentiated by
sexes, because of the career-track systems that are widely available in these
enterprises. According to the 1992 Women's Employment Survey, among the
enterprises which had different career-track systems, 35% of them employed both men
and women in the career-track, but as much as 41% employed only men for the career-

243
track. Even if they employed both men and women in the career-track, the proportion
of women in the career-track is very small; a survey showed that it was only 8%
(Wakisaka 1996). As the reason for not employing women in the career-track, 45% of
the enterprises which employed men only replied that they did so because there was
no female candidate, and 41% of them said they could not find suitable female
candidates. However, it seems that the requirements of the career track, in particular,
company-wide transfer, discourage women to apply for it. In fact, a survey on women
in the career-track shows that even after successfully being employed in the career
track, one-third of them said that transfer would be only possible before getting
married, and 10% of them said it would be only possible before having children, but
only 8% replied it would be possible anytime (Nijuisseiki Shokugyo Zaidan 1994).
For the non-career track, 21% of the enterprises which had different career track
systems employed both men and women, but as much as 61% of them employed only
women.
Therefore, even if women are employed in large enterprises, they are likely to
be channelled into the non-career track, rather than into the career-track. Thus, it is
possible that women in large enterprises are employed in the same occupations as
men, but channelled into different career-tracks from men where employers provide
different employment conditions. Although some companies have exchange programs
between the tracks, as far as the experiences of workers considerably differ between
the tracks, it is not easy to change from the non-career track to the career-track
(Wakisaka 1996). Thus, the career-track system in large Japanese enterprises actually
limits women's career opportunities at the time of entrance. In the next sections, we

244
will examine how women's experiences in large companies are differentiated from
men's, as compared to small enterprises.
Training
As discussed before, training chances differ between large enterprises and smaller
ones in Japan. This can apply to women as well; women in large enterprises have
more training chances than women in smaller enterprises.
Table 8.5 Training chances by size of enterprise, Japan
all companies 30-99
5000+% of which provide the
training for both men and women: all size
30-995000+
% of which provide the training for only men:
all size30-99
5000+% of which provide the
training for only women: all size
30-995000+
Training for new employees
58.3% 47.1%100%
86.0%83.7%87.2%
8.9%10.9%4.5%
7.0%7.4%
13.9%
Training for necessary skills for the daily task
53.9% 47.6%96.5%
76.9%74.8%89.9%
18.7%21.5%
3.6%
6.6%5.1%9.4%
Training for managers
35.3% 27.5%97.2%
63.5%65.1%87.9%
35.4%33.4%12.1%
1.5%1.7%0.7%
Source: The 1992 Women's Employment Survey
Table 8.5 shows training chances by size of enterprise. We can see that large
enterprises in general provide greater training chances for their employees than small
enterprises, and they are more likely to provide training for both men and women.
Although, a fairly large proportion of both large and small enterprises provide training
for both sexes, the chances for men only training increases as the level of training
becomes higher for both large and small enterprises, particularly for small enterprises.

245
On the other hand, the chances for women only training decreases as the level of
training becomes higher for both sizes of enterprises, but this is particularly so for
large enterprises. The main reason for providing men only training is that employers
cannot find any women candidate. These results suggest that at the lower level of jobs,
women are likely to get sex-typical training, while at the higher level of jobs, men are
likely to get sex-typical training. The fact that large-enterprises are more likely than
small enterprises to provide women only training at the lower level of jobs seems to
suggest stronger gendered policies in large enterprises than small ones, and reflects
the existence of the career-track systems in these enterprises. Although the
information is not available, if we include on-the-job training, which is the crucial
factor for the Japanese employment system, the differentiation between men and
women in the chances of training in large enterprises is likely to become larger.
Promotion
It is often said that women are not so interested in promotion as men. In fact the 1990
Women's Employment Survey by the Ministry of Labour shows that 70% of the
female workers replied that they did not want to be promoted. However, women in
large enterprises (more than 500 workers) are more likely to say that they want to be
promoted (36%) than women in small enterprises (30-99 workers; 26%). If those who
wanted to be promoted are compared between large enterprises and small ones, the
former has a higher proportion saying that they have few chances of promotion
because they are not trained to be promoted (48% for large enterprises and 31% for
small enterprises), or because their companies are reluctant to promote women (52%
for large enterprises and 41% for small enterprises). This again suggests that women

246
in large enterprises are more disadvantaged than those in small enterprises, probably
reflecting the effect of the career-track systems in these enterprises.
Convention of retirement upon marriage and child-birth
According to the 1990 Women's Employment Survey, about half of the female
workers said that they had a retirement convention in their companies, in spite of the
fact that retirement and dismissal based on sex are prohibited under the Equal
Employment Law. They said that they were expected to leave when they get married,
or have children. This convention is more likely to exist in large enterprises than in
small enterprises; 53% of women working in the enterprises with more than 500
employees replied that they had a retirement convention, while corresponding figure
for women working in the enterprises with 30-99 employees is 45%. This seems to be
reflected in the younger mean age for women working in large companies than that for
those in small companies, which Brinton (1993) suggests is peculiar to Japan.
Summary
As have discussed, there seem to exist great incentives for Japanese employers to
differentiate between men and women, given the strong gender norms and attitudes. In
large Japanese enterprises, the wage level is determined by the attribute of a person
rather than a particular skill required for a job, so that occupation is not the effective
unit to differentiate between men and women. Instead of differentiating them by
occupation, the employers in large enterprises employ men and women in different
career tracks; men for the career track which assures life-time careers with intensive
training, and women for the non-career track with restricted career progression. The

247
transfer requirement for the career track often conflicts with women's family life, and
therefore, it deters women from the career-track. After men and women are channelled
into different tracks, they have different training chances, promotion chances, and
different expectations of retirement, and hence they have different career prospects.
Thus, large Japanese enterprises differentiate the wage level between men and women
through the career-track systems rather than through occupation.
Whereas for smaller enterprises, where workers are relatively mobile and
therefore employers are likely to buy their skills for a job, employers are more likely
to differentiate men and women by occupation by recruiting men and women in
different occupations. In this way, they seem to differentiate men's and women's wage
level. They could, for example, recruit women for low paid jobs and men for well paid
jobs.
Labour law
We have seen how Japanese employers utilise female labour, by examining gender-
biased employment practices. But how are these gender-biased practices possible in
Japan? Further, we have suggested that for British employers occupational segregation
can be effective to utilise female labour at a relatively cheap rate. Then, again how is
this possible in Britain? In order to answer these questions, we will examine labour
laws in Britain and Japan, as they give restrictions on (or opportunities for)
employer's policies to utilise female labour. In so doing, firstly, we will contrast the
labour laws which deal with sex discrimination in Britain and Japan.

248
In Japan, there are two pieces of legislation which deal with equal treatment
of men and women in employment; one is the Equal Employment Opportunity Law
(EEOL) which came into force in 1986, and the other is the Labour Standard Law
(LSL) in 1970. For Britain, also, there are two pieces of legislation; the Sex
Discrimination Act (SDA) in 1975, and the Equal Pay Act (EPA) in 1970.
In general, the restriction imposed by labour laws on employers substantially
differs between Britain and Japan. In Britain, discrimination in selection procedure,
employment offer and refusal or omission to offer employment, and discrimination in
promotion, transfer, training, benefits, facilities and services, as well as discrimination
in dismissal are all unlawful (SDA s6(l) & (2)). On the other hand in Japan, there are
two different provisions in EEOL about the areas of discriminatory treatments - a
"duty to endeavour" and "prohibitory provisions". Japanese employers have a "duty
to endeavour" to treat female workers equally with male workers in terms of
recruitment, hiring, job assignment and promotion (EEOL art 7 &8). On the other
hand, discrimination in education and training, fringe benefits, mandatory retirement
age, retirement, and dismissal is prohibited (EEOL art 9, 10 & 11). Since the violation
of the provisions dealing with the "duty to endeavour" causes no effects under private
law in Japan (Sugeno 1996), there are still many job offers only for men, as we saw in
the previous section. Also, women-only recruitment for the non-career track or part-
time jobs is not unlawful as this is regarded as encouraging women's employment.
This gender-biased recruitment actually gives Japanese employers the opportunity to
discriminate against women in other fields, such as training, promotion and
retirement, as we saw in the previous section. Also, in Japan, the training for which
discriminative treatment is prohibited is off-the-job training, but the ordinances

249
exclude on-the-job training (Sugeno 1996). This seems to have a significant impact on
women's careers, given that on-the-job training is the crucial element of the Japanese
employment system. In terms of retirement, although Japanese employers cannot
stipulate marriage, pregnancy or childbirth as the reason for retirement or dismissal of
female workers, retirement by mutual agreement or at the suggestion of the company
are not prohibited. This seems to be reflected in the persistence of the convention for
women to leave upon marriage or childbirth, as we saw in the previous section.
With regard to equal pay, under the Japanese employment system, the wage
level is based not only on the demands of the job, but also on the individual worker's
characteristics, such as age, educational qualifications, and years in the company, or
the wage level is decided in a way in which workers can support their family, as we
discussed previously. There is no direct match between wage and job demand, and
therefore, it is difficult to find objective criteria to judge equal pay for work of equal
value in Japan. This is particularly so, since under the Japanese employment system,
the job assignment to workers is rather broad and vague (see Sugeno 1996), and they
are involved in a wide range of work, so that the job content of occupations is not
clear, except for particular occupations, such as professional occupations (Nakajima
1994).
On the other hand in Britain, finding objective criteria seems to be relatively
easy, as the definition of occupation is much clearer than that in Japan. In Britain,
EPA allows a woman the right to equal treatment, (l)when employed on work of the
same or a broadly similar nature to that of a man in the same employment, or (2) if her
job and his have been of equal value under a job evaluation study, or she can claim
equal treatment (3) with a man doing work of equal value in the same employment

250
(Upex & Shrubsall 1995). The guideline of "equal value" is often based on the
demands made on the employee (Hepple & Fredman 1992). However, EPA has a
serious limitation, as it always requires a comparison with a specific member of the
opposite sex in the same employment. Given many British women work in
predominantly female occupations or grades, it is difficult to find a suitable
comparator (Hepple & Fredman 1992). Even if a suitable comparator can be found, it
is reported that women's skill is often devalued (Craig et al 1985, Horrell et al 1990),
and this disadvantages women.
Positive discrimination is lawful in Japan, and as we have seen, many Japanese
employers provide women only recruitment and women only training. Positive
discrimination can be used by Japanese employers to treat women differently from
men rather than treating them equally to men. While in Britain, discriminatory training
is only possible if there have been disproportionately few persons of the sex (whether
men or women) in question doing the particular work at any time during the past 12
months. In this sense, it encourages "equal treatment" rather than "different treatment"
(Hepple & Fredman 1992).
Finally, indirect discrimination is still prevalent for Japanese employers. The
definition of indirect discrimination is that, if (1) the employer imposes a requirement
or condition which is such that (2) the proportion of women who can comply is
considerably smaller than the proportion of men who can comply, (3) the person
suffers detriment because she cannot comply, and (4) the condition is not justifiable
irrespective of the sex of the applicant (Hepple and Fredman 1992). For example, the
career-track system which emerged after the enactment of EEOL in large Japanese
enterprises could be regarded as indirect discrimination; even though the requirement

251
of transfer is a crucial element of the Japanese employment system, it is difficult for
women to choose and remain in the career track, as this contradicts their family role
after marriage (Nijuisseiki Shokugyo Zaidan 1994). The problem of the career track
system resides in that it makes women choose their career- or life-course at the time of
recruitment, though it is not certain that their attitudes to work are stable throughout
their lives (Wakisaka 1996). Also, the lower wage level of part-timers as compared to
full-timers that can be seen in both Britain and Japan is considered as indirect
discrimination, but the situation is more serious in the latter (Nakajima 1994). In
Japan, compared to Britain, female part-timers work much longer, but are paid much
less than the full-timers, so it is necessary to implement the right for them to claim
equal hourly pay to full-timers (Nakajima 1994).
In summary, Japanese labour laws do not impose effective restrictions on
employer's discriminative policies toward women. After the enactment of EEOL,
Japanese enterprises have adopted the career-track system, which covertly enables
them to provide different treatment between men and women. Also, women-only
measures which are allowed under EEOL actually enable employers to provide
"different treatment" between men and women rather than "equal treatment". On the
other hand, the British labour laws seem to be more effective in encouraging equal
treatment between men and women, since as we have seen, the restriction on
employers imposed by the law is more strict, and gender-neutral. However, given the
fact that women in Britain are concentrated into female occupations, it is difficult to
find the suitable comparator, and this restricts the effectiveness of the laws in Britain.

252
Summary and Conclusion
Compared to British women, Japanese women have more traditional gendered
attitudes and greater domestic responsibilities. Social security systems, such as the tax
and pension schemes, also encourage gendered work and family life more for Japan
than for Britain. In this sense, the forces which encourage women to choose sex-
typical careers are stronger in Japan than in Britain. The strong gender norms and
attitudes of Japanese women also seem to encourage Japanese employers to
differentiate employment conditions by sex more than for British employers, because
these attitude and behaviour could well affect women's commitment to work and their
productivity, or because they make it easier for Japanese employers to pursue sex
discriminative policies against women.
However, this does not necessarily lead to greater occupational sex segregation
in Japan than in Britain. The employment practices differ between Britain and Japan,
so do the notion of skill and occupation. In Britain, workers are paid for their skills,
and they move between or remain in occupations with their skills. There exists the
balance between what they do and how much they are paid in Britain. On the other
hand, in Japan, particularly in large enterprises, workers acquire a wider range of
skills, and experience a wider range of job tasks through periodic job rotation (Lam
1996, Sugeno 1995). No short-term balance exists between what they do and how
much they are paid, but they are balanced in the long-run. Therefore, occupation is not
so effective a unit to differentiate workers or differentiate between men and women in
Japan as in Britain.
Given these characteristics of occupations in Japan, the career track system is
an alternative way for Japanese employers to differentiate men and women. Many

253
women are deterred from the career track, due to the strong gender norms, or heavy
domestic responsibilities which do not accord with the requirements of the career
track, such as the company-wide transfer. Therefore, they are channelled into the non-
career track whereby they get different training chances, promotion chances, and
expectations of retirement from the career-track where most of men are employed.
Because of this difference in career prospects, these women are paid less than men.
This differentiation of men and women by career tracks is not unlawful under the
Japanese labour laws which allow employers to recruit and train women in a women-
specific way.
On the other hand, in Britain, it is in employers interests to allocate different
occupations between men and women, since an "occupation" and the skill required for
the occupation is the basis of the wage determination. It is possible for them to
devalue "female" type of skills, and pay less to women in female occupations, or to
make it difficult for women to find a suitable "comparator". These different
employment systems, different methods of utilising female labour, and different
opportunities (restrictions) imposed by the labour laws for Japanese employers and
British employers are likely to be conducive to greater occupational segregation in
Britain than in Japan.

254
CHAPTER 9
CONCLUSION
Occupational sex segregation is often treated by sociologists as the principal source of
gender inequality. In this thesis, however, we demonstrated that this is not necessarily
the case. Our findings showed that it could be one of the sources of gender inequality,
but the function of occupational sex segregation in a society very much depends on
social and economic institutions which differ across countries. In fact, this thesis
revealed that despite the greater extent of occupational sex segregation in Britain than
in Japan, gender inequality in the labour market is substantially larger in Japan than in
Britain. Thus, our comparative study suggested that occupational sex segregation
cannot be taken a priori as the principal source of gender inequality. Rather, this
thesis revealed how important it is to investigate the actual influence of occupational
sex segregation on individual workers' experiences, to understand the implication of
occupational sex segregation in the society.
In Chapter 3, we examined and compared the extent and trends of occupational
sex segregation for Britain and Japan. Our findings showed that the extent of
occupational sex segregation is greater in Britain than in Japan; although men and
women in Britain are concentrated into sex-typical occupations, this is only the case
for men in Japan, but not for women. We suggested that sex segregation within
occupations, rather than sex segregation across occupations, might be the form which
has absorbed the increased number of female workers in the labour market. We also

255
found in this chapter that the aggregate trend of occupational sex segregation is
towards de-segregation for Britain, but we cannot find any systematic trend for Japan.
Chapter 4 examined occupational sex segregation at the level of individual.
We found systematic patterns of job movement for British men, British women, and
Japanese women; they are all unlikely to change jobs across gendered occupations, but
it is more difficult for British men and British women than for Japanese women to
move across the boundary between sex-typical occupations and sex-atypical
occupations. Although at the aggregate level, British women show a trend towards de
segregation, the trend at the individual level is towards greater segregation both before
and after controlling for structural change. This suggests that the de-segregation at the
aggregate level was mainly generated by cohort-replacement, rather than by the de
segregation of individual workers' careers. We also suggested that the nature of
female occupations might differ between Britain and Japan. In Britain, women are
likely to re-enter the labour market after domestic break through female occupations,
while in Japan, women are likely to re-enter the labour market after domestic break
through male occupations. We suggested in this chapter that the systematic job
movement of British men, British women, and Japanese women seems to imply that
experiences in gendered occupations might differ for them and affect their job
mobility.
In investigating the influence of occupational sex segregation on individual
workers' experiences, we have found in Chapter 5 that in the British labour market,
occupational sex segregation contributes to differentiate employment conditions
between men and women. The findings showed that occupational sex segregation
affects women's employment conditions negatively; women receive lower pay and

256
have less access to fringe benefits when they work in more female occupations. For
men, occupational sex segregation also affects their pay negatively, though they gain
more training chances and more access to fringe benefits as they move to more female
occupations. Given the fact that women are concentrated into female occupations, the
aggregate effect of occupational sex segregation is more negative for women than for
men.
The implications of occupational sex segregation on workers' experiences
differ between Britain and Japan. Chapter 6 demonstrated that there is little impact of
occupational sex segregation on Japanese women's employment conditions. However,
the impact of sex is substantially larger in Japan than in Britain. We suggested that
this is related to the different employment systems between the two countries; in the
Japanese employment system, personal characteristics are emphasised, while in the
British employment system, job characteristics are emphasised, so that for the former,
being a woman gives a greater disadvantage, while for the latter, working in female
occupations gives the disadvantage. Thus, occupational sex segregation is not
necessarily the central component of gender inequality, or at least the function of
occupational sex segregation as a vehicle to generate gender inequality differs
between Britain and Japan.
Also in Chapter 7, we have found that occupational sex segregation influences
work experiences for British women. In Britain, women in female occupations are
more likely to be satisfied with their jobs, because they are content with their
workplace atmosphere, and they feel that they achieve sufficient intrinsic rewards. We
suggested that greater intrinsic job satisfaction, or greater overall job satisfaction in
general, among women in female occupations is related to the fact that these women

257
are likely to work in "caring" jobs. Also we suggested that female occupations seem
to provide a friendly workplace atmosphere, and this seems to enhance satisfaction
with the work environment for women in female occupations. Whereas for Japanese
women, we cannot see any significant difference in their job satisfaction by
occupational sex segregation.
Chapter 8 examined various institutional differences between the two
countries. The differences help us to understand the employers' policies in each
country. For British employers, it seems difficult to differentiate job conditions by sex
per se, because of less traditional gender norms and less traditional attitudes of British
women as compared to Japanese women. Given that job skill is the fundamental
determinant of pay under the British employment system, occupation could be the
alternative way for British employers to differentiate between men and women. Even
if they paid less to women in female occupations, these women are likely to be
satisfied with their jobs, as their jobs provide a friendly workplace atmosphere and
women feel content with the intrinsic aspects of their jobs. The British labour laws
cannot effectively regulate this type of pay discrimination, as it is necessary to find a
suitable comparator to claim the discrimination.
Whereas for Japan, women have traditional gendered attitudes and heavy
domestic burdens, so that there exist great incentives for Japanese employers to
differentiate men and women. This is particularly so, given the Japanese employment
system which emphasises life-time work commitment. Also, Japanese women's
traditional attitudes make it easy for Japanese employers to impose sex as a
discriminative criterion. Nevertheless, there has been a growing pressure after the
enactment of the Equal Employment Opportunity Law for Japanese employers not to

258
use sex as the discriminative criterion. As a result, mainly in the large enterprises,
there emerged the multiple track system. By using this system, Japanese employers
seem to differentiate various aspects of job prospects between men and women, which
result in different economic rewards between men and women. The "duty to
endeavour" clause in the EEOL still allows Japanese employers to recruit and hire
women-only, and many women are channelled into the non-career track.
We now turn to the mechanism of occupational sex segregation at the level of
individual workers. With respect to Britain, men have higher preferences for the
extrinsic aspects of work which are least likely to be provided in female occupations.
Therefore, they enter and remain in male occupations because they can realise their
interests best in these occupations in an economic sense (and perhaps in a cultural
sense, though we have not been able to examine this in this thesis). Even if men enter
female occupations, it seems to be a minor part of their careers, since they on average
stay in female occupations for a relatively short period. Men are likely to find their
jobs in female occupations when they re-enter the labour market from out-of-
employment activities, but these men are unlikely to stay in female occupations, as the
attrition of female occupations is high.
British women seem to have more job opportunities in female occupations
(remember that British employers have incentives to employ women in female
occupations). Although female occupations provide lower economic rewards, women,
particularly female part-timers, do not expect so much from this aspect of work
compared to men. Rather female full-timers are more likely than other workers to
emphasise the intrinsic aspects of work and a friendly workplace atmosphere, or in the
case of female part-timers, they are more likely than other workers to emphasise

259
convenient work arrangements as well as a friendly workplace atmosphere. Once in
female occupations, they remain there as these occupations match with their
preference for a friendly atmosphere, and they feel that they have sufficient intrinsic
rewards (as female occupations are more likely than other occupations to be
associated with work that involves caring for people). Even if they are to leave the
labour market due to domestic responsibilities, they might be able to come back to
similar occupations, as female occupations give relatively easy access to the labour
market after domestic leave.
For Japanese women, as there is little differentiation made by occupational sex
segregation in their work experiences, the choice between male occupations and
female occupations seems to be less crucial, compared to British women. This seems
particularly so for those who are married; given the heavy domestic responsibilities or
the gender-biased provision of the social security systems, the choice between work
and non-work, or between part-time work and full-time work seems to be more
important than the choice between male occupations and female occupations. In terms
of fresh school leavers, however, the choice could be between the career-track and the
non-career track, if they are well qualified to apply for a job in large enterprises.
However, given the emphasis on the long-term commitment and provision of
company-wide transfer in the career track, the career-track is not actually a feasible
option for many women who expect to have "normal" family life.
Thus, compared to British women, there is less meaning for Japanese women
in whether to work in female occupations or in male occupations. This can be seen in
their employment conditions, and in their level of job satisfaction. This seems to be
reflected in the fact that women in Japan are not concentrated into female occupations,

260
and they move across gendered occupations more easily as compared to British
women.
It seems to be helpful to introduce the idea of a "gender system" to understand
women's behaviour in the two different labour markets. By "gender system", I mean
a set of institutions in a society that interact with each other and define the notion of
gender. It is not my intention to go further to discuss whether the basis of the gender
system is "capitalism" or "patriarchy". Rather it seems to me that both mechanisms
operate to constitute the gender system. However, we need the idea of a "gender
system" to understand why occupational sex segregation is prevalent in one society
but not in the other.
If one element of the gender system is to be modified, it should change the
whole structure of the interacting system. Although in this thesis, our focus is on the
labour market, particularly occupational sex segregation, women's behaviour in the
labour market can be regarded as the reflection of their positions in the other elements
of the gender system, such as in family. Therefore, if a change occurs in the labour
market, changes in the other institutions should follow. If this adjustment system fails,
the whole system would go back to the previous state. For example, even if Japanese
women successfully get into the career track, if the other elements of the gender
system, such as gender norms and family responsibilities, do not adjust to the
situation properly (remember that the career track requires company-wide transfer),
they may be forced to leave the track, and go back to "typical" female careers.
We have seen that there have been considerable changes in the key elements of
the gender system in Britain. Chapter 2 showed that in Britain, there has been a rapid
change in the pattern of women's labour force participation over the last two decades.

261
We found a substantial change in gender norms by generation in Chapter 8. Also
Chapter 8 showed that the tax system or pension scheme, as well as the labour laws
are relatively sex-neutral in Britain. While for Japan, women's pattern of labour force
participation still shows the bimodal curve, there are still strong gender norms, and
women have heavy domestic responsibilities. Also, the tax and pension schemes
encourage Japanese women's housewife roles, and the labour laws are not very
effective in tackling discrimination based on sex. Therefore, in a number of important
respects, the modification of the gender system has been slower for Japan than for
Britain.
Having said so, however, the fact that British women are concentrated into
part-time work, or into female occupations suggests that the modification of the
gender system is not so radical. Although overt sex discrimination has decreased as
more women have been integrated into the labour market and become more conscious
about sex discrimination, there is still substantial gender inequality with part-time
work or female occupations being used as the ways to preserve this inequality. For this
situation to be changed, further modification of other elements which prevent
women's access to equal positions to men's, such as the provision of the labour law,
would be necessary.
In terms of Japan, given the stability of the other elements, it seems difficult to
see a drastic change in the gender system in the near future. However, this is by no
means to say that any positive actions to achieve gender equality are useless. Rather,
any single action could generate change, but the change will occur in accordance with
the change in other elements of the gender system. At the moment, for example, the
pro-housewife social security system, or the "duty to endeavour" clause in the EEOL

262
could be amended. This would modify the overall gender system gradually, if not
quickly, and hence, enhance greater sex equality in the labour market.
To conclude, we return to occupational sex segregation, and discuss some
necessary conditions for occupational sex segregation to emerge and be maintained in
a society. First of all, there should be a pressure - whether be it economic or cultural -
in the society to preserve the existing inequalities in the gender system. The change in
the pressure would occur through the change in individuals' attitudes and behaviour
which as aggregates modify the elements of the gender system. The extent of pressure
depends on societies. For example, more egalitarian countries have less pressure than
less egalitarian countries. Secondly, in the labour market, it should be difficult to use
sex per se as the criterion to differentiate individual workers, so that employers should
need to find an alternative way to differentiate men and women to the extent that they
feel some pressure - whether economic or cultural - to preserve sex differentials.
Thirdly, occupation should be an effective alternative to differentiate between men
and women in the labour market, given the other economic and social institutions in
the society. And finally, there should be no better alternative than occupation, or at
least occupation should be as effective as other options, to differentiate between men
and women in the labour market.
To give an example, in Britain, the pressure to preserve the existing
inequalities in the gender system is relatively low compared to Japan, but it may not
low enough to achieve complete equality between men and women in the society. So
employers still try to differentiate men's and women's employment conditions.
However, the cost of using "sex" is substantially high given other social and economic
institutions. Thus, occupation emerges as the way to differentiate between men and

263
women, since other institutions, such as the system of pay determination or labour
laws provide the opportunity for employers to use occupations as an effective tool to
differentiate between men and women.
Although we focus on occupational sex segregation, the conditions for
occupational sex segregation to emerge and be maintained in a society that were
mentioned above are applicable for the other areas of sex segregation, such as
industrial sex segregation, workplace sex segregation, or the career-course
segregation. For instance, in Japan, the pressure to modify the inequalities in the
gender system is relatively low, so that Japanese employers try to differentiate men's
and women's employment conditions. After the EEOL, however, it has become more
difficult for them to use "sex" directly as the discriminative criterion. Under the life
time employment system which is mainly found in large enterprises in Japan,
occupation is not an effective tool to differentiate between the sexes, so that the
multiple track system emerged, as it is more effective than occupation to differentiate
between men and women.
Thus, the function of occupational sex segregation as a vehicle to generate
gender inequality is conditional on other institutions in a society. We cannot simply
say that gender inequality in the labour market has declined as the extent of
occupational sex segregation has declined. Unless the gender system in the society
changes, alternative methods to differentiate men and women would emerge in the
labour market, so that there might be a situation where the extent of occupational sex
segregation has declined but the extent of gender inequality in the labour market has
remained the same. In what way the alternative methods emerge very much depends
on the given institutions in the society, as we saw in the case of the emergence of the

264
multiple-track system in Japan. At present, some scholars of segregation studies have
shifted their interests from occupational segregation to job segregation, arguing that
job segregation is the fundamental source of gender inequality (Beilby and Baron
1986, Tomoskovic-Devey 1995), but this again seems to depend on how effective a
"job" is to differentiate men's and women's employment conditions. It is more
plausible that the function of the "job" as a tool to differentiate workers' employment
conditions differs across countries with different economic and social institutions.
Again, the Japanese case is a good example.

265
APPENDIX ABritish and Japanese Occupational Classifications
Table A.I Standard Occupational Classification in the 1991 Census of Population in Great
Britain
Major Groups JMinor Groups Unit Groups1. Managers and Administrators
2. Professional Occupations
3. Associate Professionals and Technical Occupations
4. Clerical and Secretarial Occupations
10. General managers and administrators in national and local government11. Production managers in manufacturing, construction, mining and energy industries12. Specialist managers13. Financial institution and office managers, civil service executive officers14. Managers in transport and storing15. Protective service officers16. Managers in farming, horticulture, forestry and fishing17. Managers and proprietors in service industries19. Managers and administrators nee.20. Natural scientists21. Engineers and technologists22. Health professionals23. Teaching professionals24. Legal professionals25. Business and Financial professionals26. Architects, town planners and surveyors27. Librarians and related professionals29. Professional occupations nee.30. Scientific technicians
31. Draughtspersons, quantity and other surveyors32. Computer analyst/ programmers33. Ship and Aircraft officers, air traffic planners and controllers34. Health associate professionals35. Legal associate professionals36. Business and financial associate professionals37. Social welfare associate professionals38. Literary, artistic and sport professionals39. Associate professionals and technical occupations nee.40. Administrative/ clerical officers and assistants in civil service and local government41. Numerical clerks and cashiers42. Filing and records clerks43. Clerks (not otherwise specified)44. Stores and despatch clerks, storekeepers45. Secretaries, personal assistants, typists, work processor operators46. Receptionists, telephonists and related occupations
100- 103
110- 113
120- 127 130- 132, 139
140- 142 150- 155 160, 169
170- 179
190, 191, 199 201 202,209 210-219 220 - 224 230 235,239 240 - 242 250 - 253 260 - 262 270, 271 290 - 293 300 - 304, 309
310-313
320 330-332
340 349 350 360 - 364
370,371 380 - 387 390 - 396, 399
400, 401
410-412 420, 421 430 440,441
450 - 452
460 - 463

266
5. Craft and Related Occupations
6. Personal and Protective Service Occupations
7. Sales Occupations
8. Plant and Machine Operatives
9. Other occupations
49. Clerical and secretarial occupations nee.50. Construction trades51. Metal machining, fitting and instrument making trades52. Electrical / electronic trades53. Metal forming, welding and related trades54. Vehicle trades55. Textiles, garments and related trades56. Printing and related trades57. Woodworking trades58. Food preparation trades59. Other craft and related occupations nee.60. NCOs and other ranks, armed forces
61. Security and protective service occupations62. Catering occupations63. Travel attendants and related occupations64. Health and related occupations65. Childcare and related occupations66. Hairdressers, beauticians and related occupations67. Domestic staff and related occupations69. Personal and protective service occupations nee70. Buyers, brokers and related agents71. Sales representatives72. Sales assistants and check-out operatives73. Mobile, market and door-to-door sales person79. Sales occupations nee80. Food, drink and tobacco process operatives81. Textile and tannery process operatives82. Chemicals, paper, plastic and related process operatives83. Metal making and treating process operatives84. Metal working process operatives85. Assemblers / line workers86. Other routine process operatives87. Road transport operatives88. Other transport and machinery operatives89. Plant and machine operatives nee90. Other occupations in agriculture, forestry and fishing91. Other occupations in mining and manufacturing92. Other occupations in construction93. Other occupations in transport94. Other occupations in communication95. Other occupations in sales and services 99. Other occupations nee_________
490-491
500 - 507, 509 510-519
520 - 526, 529 530-537
540 - 544 550-557,559 560 - 563, 569 570 - 573, 579 580-582 590 - 599 600, 601
610-615,619
620 - 622 630,631
640-644 650 660, 661
670 - 63 690,691,699
700 - 703 710,719 720 - 722
730 - 733
790 - 792 800 - 802, 809
810-814 820 - 826, 829
830-834,839
840 - 844 850-851,859 860 - 864, 869 870 - 875 880-887,889
890 - 899 900 - 904
910-913,919
920 - 924 930 - 934 940,941 950 - 959 990, 999
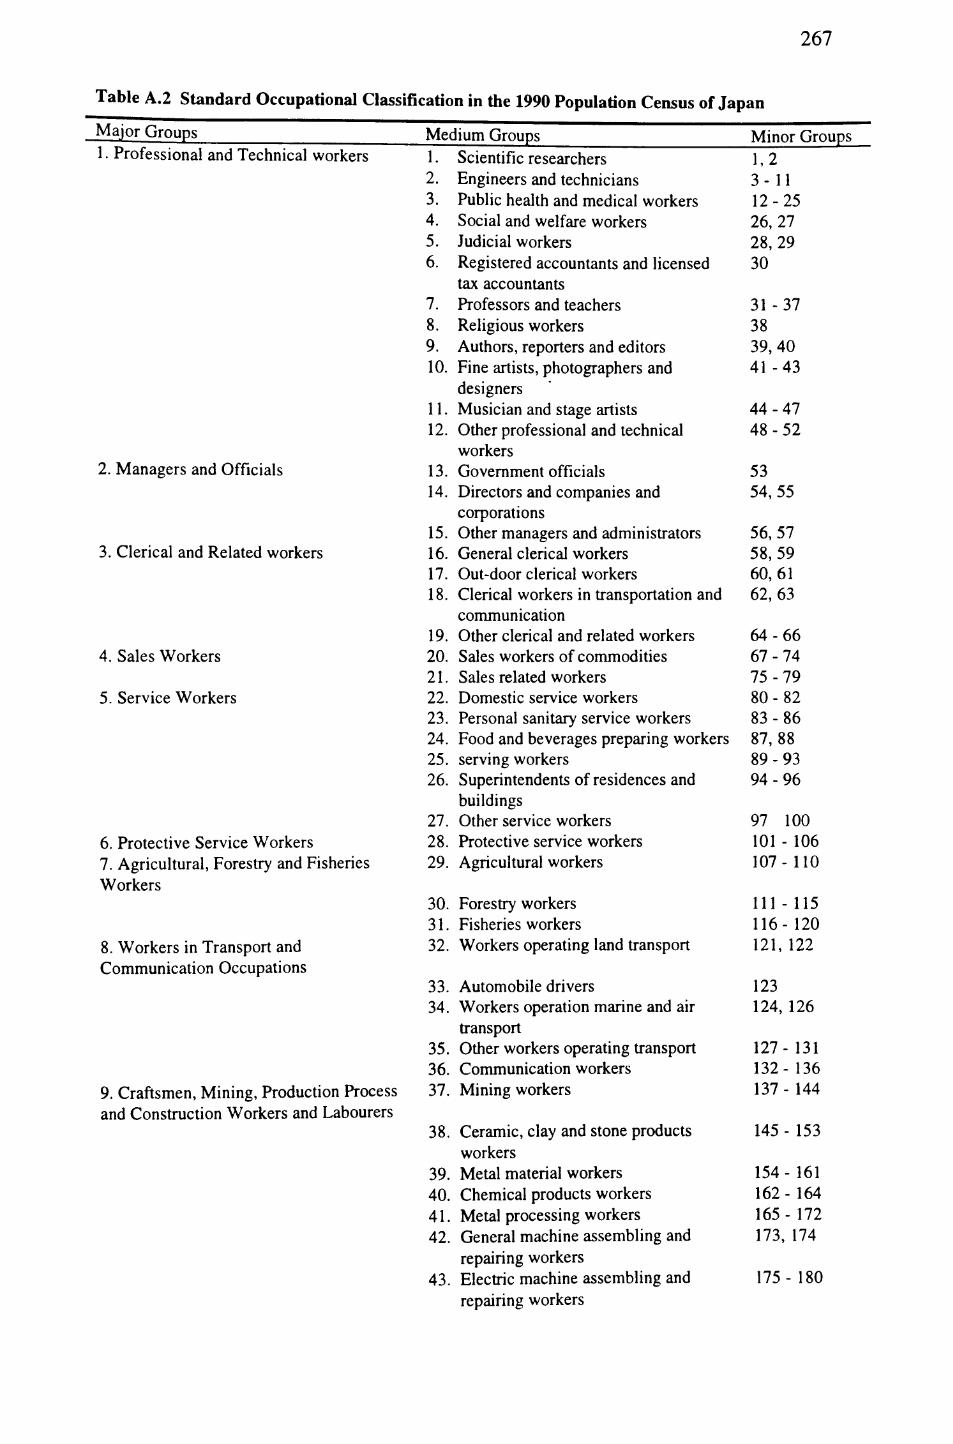
267
Table A.2 Standard Occupational Classification in the 1990 Population Census of Japan
Major Groups Medium Groups Minor Groups1. Professional and Technical workers
2. Managers and Officials
3. Clerical and Related workers
4. Sales Workers
5. Service Workers
6. Protective Service Workers7. Agricultural, Forestry and Fisheries Workers
8. Workers in Transport and Communication Occupations
9. Craftsmen, Mining, Production Process and Construction Workers and Labourers
1. Scientific researchers 1, 22. Engineers and technicians 3-113. Public health and medical workers 12-254. Social and welfare workers 26, 275. Judicial workers 28, 296. Registered accountants and licensed 30
tax accountants7. Professors and teachers 31-378. Religious workers 389. Authors, reporters and editors 39, 4010. Fine artists, photographers and 41-43
designers11. Musician and stage artists 44 - 4712. Other professional and technical 48 - 52
workers13. Government officials 5314. Directors and companies and 54, 55
corporations15. Other managers and administrators 56, 5716. General clerical workers 58,5917. Out-door clerical workers 60, 6118. Clerical workers in transportation and 62,63
communication19. Other clerical and related workers 64-6620. Sales workers of commodities 67 - 7421. Sales related workers 75 - 7922. Domestic service workers 80 - 8223. Personal sanitary service workers 83 - 8624. Food and beverages preparing workers 87, 8825. serving workers 89 - 9326. Superintendents of residences and 94 - 96
buildings27. Other service workers 97 10028. Protective service workers 101-10629. Agricultural workers 107 - 110
30. Forestry workers 111-11531. Fisheries workers 116 - 12032. Workers operating land transport 121,122
33. Automobile drivers 12334. Workers operation marine and air 124,126
transport35. Other workers operating transport 127-13136. Communication workers 132-13637. Mining workers 137 - 144
38. Ceramic, clay and stone products 145 - 153 workers
39. Metal material workers 154-16140. Chemical products workers 162-16441. Metal processing workers 165-17242. General machine assembling and 173,174
repairing workers43. Electric machine assembling and 175 - 180
repairing workers

268
44. Transportation equipment assembling 181-187 and repairing workers
45. Watch, meter, optical instrument 188-192 assembling and repairing workers
46. Food manufacturing workers 193 - 20347. Beverage and tobacco manufacturing 203 - 208
workers48. Silk reel and textile workers 209-21949. Clothing and textile products workers 220 - 22650. Wood, bamboo, grass and vine 227 - 235
products workers51. Pulp, paper, and paper products 236 - 240
workers52. printing and book-binding workers 241-24553. Rubber and plastic products workers 246 - 24954. Leather and leather products workers 250-25255. Other craftsmen and production 253 - 267
process workers56. Stationary engine, machinery and 268 - 271
construction machinery operators57. Electrical workers 272 - 27658. Construction workers 277 - 28659. Carrying labourers 287-29160. Other labourers 292,293
10. Workers not classified by occupation 61. Workers not classified by occupation 294___

269
APPENDIX B
Variables used in this thesis
It is helpful here to describe the basic variables used in this thesis. The question and
coding scheme for each variable differ by data set and by country. For example, the
title of occupations and educational qualifications differ between Britain and Japan, as
they reflect the different social institutions of each country. Having a perfect match is
impossible even if in a single survey. Effort was made to obtain basic comparability
between the data sets and between countries, particularly in doing comparative data
analyses, but we also used country specific variables if this was necessary.
Occupations
In the Employment in Britain survey data, the occupational data is coded by
the CASOC, a computer-assisted occupational coding system developed by the
University of Warwick. The CASOC codes enable to translate the basic codes into a
variety of social classifications, including the classifications used in this thesis; the
OPCS 1980 classification, the OPCS 1990 classification, and the Goldthorpe
occupational class schema (see Goldthorpe 1987). As the variable of occupational
class, we used the seven category version of the Goldthorpe class schema; (1) higher
grade service class, (2) lower grade service class, (3) routine non-manual and personal
service, (4) petty bourgeoisie, (5) technicians and supervisors, (6) skilled manual, and
(7) semi-skilled/unskilled manual.
The occupational data in the Occupational Mobility and Career Research
survey in Japan is based on the 1980 Census occupational classification. We
constructed the SSM major occupational groups based on this occupational data. The

270
SSM occupational groups are widely used in class and stratification research in Japan.
The classification is mainly based on the kind of skills required for the occupational
activities, and have been developed by the 1975 SSM committee (relevant materials
can be fond in Naoi 1978, Yesuda and Hara 1982, Naoi and Suzuki 1986, Seiyama et
al, 1990). The SSM occupational groups have eight categories; (1) professional and
technical workers, (2) managers and administrators, (3) clerical workers, (4) sales
workers, (5) skilled workers, (6) semi-skilled workers, (7) unskilled workers, and (8)
farmers.
The International Social Justice Project has both the national and international
classification of occupations. The occupational data in Britain was coded into three
kinds. The first is the OPCS 1980 classification. The second is the International
Standard Classification of Occupations (both in the ISCO68 and ISCO88
classifications). The third is the Berufsstellungen Codes (Alwin et al, 1993). The
Japanese data also has three kinds of occupational information; the 1985 Census
classification, the 1968 ISCO classification, and the Berufsstellungen codes. The
Goldthorpe occupational class was constructed by receding the information from the
ISCO classification and the Berufsstellungen codes. The Goldthorpe class has eight
categories; (1) salariat, (2) routine clerical, (3) petite bourgeois, (4) farmers, (5)
supervisors, (6) skilled workers, (7) semi and unskilled workers, and (8) agricultural
workers. We also constructed the SSM eight occupational groups for the Japanese
data from the Japanese occupational classification.
In the Comparative Project on Class Consciousness survey, occupations are
classified by the national scheme. The British data is classified by the OPCS 1980

271
occupational classification, and the Japanese data is classified by the 1986 Japanese
Standard Occupational Classification.
Full-time/Part-time work and Working hours
The distinction between full-time work and part-time work is important in examining
women's employment experiences, but the definition varies by countries. There are
basically two definitions; one is by the status defined by the employment contract or
reported by the respondent, and the other is that based on working hours.
Official statistics use different definitions of full-time/part-time work. For
instance, the British census and labour force survey have both the variable based on
full-time/part-time work as a status and the variable based on working hours. 30 hours
a week is conventionally used as the dividing point between full-time work and part-
time work in the British research. On the other hand, in Japan, the census has neither
the information of working hours not the full-time/part-time status. The labour force
survey in Japan has a variable of working hours, and the cutting point is 35 hours a
week rather than 30 hours a week. 35 hours a week is conventionally used by
researchers to distinguish between full-timers and part-timers in Japan.
In the Employment in Britain Survey, both the information of the self-
reported full-timer/part-timer as the status, and the information of working hours are
available.
In the Occupational Mobility and Career Research Survey, both the
information of self-reported full-time/part-time status and the information of working-
hour are available. The working-hour data in the OMC, however, is the average hours
a day rather than a week. It is possible to calculate per-week working hours, as the

272
information of working days per week is also available. However, given that part-
timers often work fewer days than full-timers with a rather flexible working-time
arrangement, and the respondents themselves answered the average working hours per
day, simply multiplying working hours by working days seems not to be very reliable
to construct a variable of working hours per week.
In the International Social Justice Project Survey, the self-reported full-
timer/part-timer status is available for both Britain and Japan, but not working hours.
In the Comparative Social Class Consciousness Survey, both the information
of self-reported full-timer/part-timer status and the information of working hours are
available for Britain and Japan.
Education
The educational systems and educational qualifications significantly differ between
Britain and Japan. In Britain, there are two dimensions of educational qualification;
academic qualifications and vocational/professional qualifications. There is some
correspondence in the academic qualifications between Britain and Japan, but no
equivalence to the vocational qualifications in Britain can be found in Japan.
The educational qualifications in the Employment in Britain survey, the
Occupational Mobility and Career Research survey in Japan, and the Comparative
Project on Class Consciousness survey were all coded by each national
educational/vocational qualifications. However, in the International Social Justice
Project, the educational qualifications in Britain and Japan were coded into the same
categories, which were developed by the CASMIN Project (for detail, see Konig et al.,
1988). The CASMIN classification consists of the following categories:

273
la. Inadequately completed general elementary education
Ib. General elementary education
Ic. General elementary education and basic vocational qualification
2a. Intermediate vocational qualification
2b. Intermediate general qualification
3a. Higher education-maturity level
3b. Higher education-lower-level tertiary certificate
3c. Higher education upper-level tertiary certificate
These categories have been developed so as to obtain the international comparability
of educational attainment. Each national academic and vocational qualification is
mapped to the above categories.
Four educational dummies were constructed from this variable. They are a low
level dummy, an ordinary level dummy, an advanced level dummy, and a degree level
dummy. For the low level dummy, the respondents from la to Ic CASMIN
classification were assigned 1 and others 0. For the ordinary level dummy, those in 2a
and 2b were assigned 1 and others 0. For the advanced level dummy, those in 3a and
3b were assigned 1 and others 0. And for the degree level dummy, those in 3c were
assigned 1 and others 0 (see Kluegel et al, 1995).
We created the same dummy variables for the Employment in Britain survey
data, the Occupational Mobility and Career Research survey data, and the
Comparative Project on Class Consciousness survey data.

274
Work Experience
In the Employment in Britain data, we constructed two variables of work experience
from the work history data: years in employment and years out of employment. In
constructing the variable of years in employment, we simply added the duration of the
events where the respondents were in employment, and for the variable of years out of
employment, we added the duration of the events where the respondents were out of
employment. By "in employment", we mean self-employed, full-time/part-time
employees, and working on the government scheme, and "out of employment" means
unemployed, retired, full-time students, housekeeping, and on maternity leave.
For both the International Social Justice Project and the Comparative Project
on Class Consciousness, we use the length of service with the current employer as the
indicator of experience. The ISJP asked the respondents in what month and year they
joined the organisation. We constructed the variable of the length of service with the
current employer for the British data and Japanese data from this information together
with the information of the date of interview.
In the CPCC, the British survey asked the respondents, "how long have you
worked for your present organisation?" The answers were rounded to the nearest year.
The Japanese survey asked, "how many years have you worked on this job?" The
answers were coded in years. We use these variables as the variable of the length of
service.

275
REFERENCES
Acker J, 1990, "Hierarchies, Jobs and Bodies", Gender & Society. 4
Agassi J, 1982, Comparing the Work Attitudes of Women and Men, Lexington: Massachusetts
Alwin D, Klingel D & Dielman M, 1993, International Social Justice Project: documentation and codebook, Institute for Social Research, University of Michigan
Amaya T, 1990, Recent Trends in Human Resource Development, the Japan Institute of Labour, Japanese Industrial Relations Series 17
Bagguley P, 1991, "The Patriarchal Restructuring of Gender Segregation", Sociology, Vol.25 No.4
Barren R & Norris G, 1976, "Sexual Divisions and the Dual Labour Market" in Barker D (eds), Dependence and Exploitation in Work and Marriage, Longman: London
Batstone E, 1988, "Frontier of Control", in Gallie D (ed) Employment in Britain
Becker G, 1981, A Treatise on the Family, Harvard University Press: Cambridge
Becker G, 1985 "Human Capital, Effort, and the Sexual Division of Labour", Journal of Labour Economics 3
Berger S & Piore M, 1981, Dualism and Discontinuity in Industrial Societies, Cambridge University Press: Cambridge
Bielby W, 1992, Book Review, Revolving Doors, Social Forces 70
Bielby W & Barren J, 1986, "Men and women at work: sex segregation and statistical discrimination", American Journal of Sociology, 91
Bielby D & Bielby W, 1988, "She works hard for the money: household responsibilities and the allocation of effort", American Journal of Sociology 93
Blackburn R, Jarman, J & Siltanen J, 1993, "The analysis of occupational gender segregation over time and place: concentration of measurement and some new evidence", Work, Employment & Society, Vol.7, No.3
Boudon R & Bourricaud F, 1982, A Critical Dictionary of Sociology, Routledge: London
Brinton M, 1988, "The Social-Institutional Bases of Gender Stratification: Japan as an Illustrative Case", American Journal of Sociology, Vol.94, No.2

276
Brinton M, 1993, Women and the Economic Miracle, Univ. of California Press:
London
Brown W, Marginson P & Walsh J, 1995, " Management: Pay Determination and
Collective Bargaining", in Edwards P (ed), Industrial Relations
Burchell B & Rubery J, 1990, "An Empirical Investigation into the Segmentation of
the Labour Supply", Work, Employment & Society, Vol.4, No.4
Chan T W, 1997, "Revolving doors re-examined: occupational sex segregation over the
life course", forthcoming
Charles M, 1992, "Cross-National Variation in Occupational Sex Segregation",
American Journal of Sociology, Vol.57
Charles M & Grusky D, 1995, "Models for Describing the Underlying Structure of
Sex Segregation", American Journal of Sociology
Cockburn S, 1983, Brothers-Male Dominance and Technological Change, Pluto
Press: London
Cohn S, 1985, The Process of Occupational Sex-Typing, Temple University Press:
Philadelphia
Coleman J, 1990, Foundations of Social Theory, Harvard University Press:
Cambridge
Cotter D, DeFiore J, Hermsen J, Kowalewski B & Vennerman R, "Occupational
Gender Desegregation in the 1980s", Work and Occupations, Vol.22 No.l
Craig C, Garnsey E & Rubery J, 1985, Payment Structure and Smaller Firms,
Department of Employment, Research Paper No.48
Crompton R, 1993, Class and Stratification, Polity : London
Crompton R & Mann M, 1986, Gender and Stratification, Polity: London
Crompton R & Sanderson K, 1990, Gendered Jobs and Social Change, Unwin
Hyman: London
Crompton R & Le Fevre N, 1996, "Paid employment and the changing systems of
gender relations: a cross-national comparison", Sociology Vol. 30 No.3
Crompton R, Gallic D & Purcell K, 1996, Changing Form of Employment,
Routledge: London
Crosby F, 1982, Relative Deprivation and Working Women, Oxford University Press:
Oxford

277
Curtice J, 1993, "Satisfying work - if you can get it", in Jowell R (ed), International Social Attitudes: the 10th BSA Report, Gower: Aldershot, Hants
Department of Education, Education Statistics for the United Kingdom 1993, HMSO : London
de Vaus D & McAIlister I, 1991, "Gender and work orientation: values and satisfaction in Western Europe", Work and Occupations, Vol. 18 No.l
Dex S, Women's Attitudes towards Work, 1988, Macmillan: London
Doeringer P & Piore M, 197'1, Internal Labour Market and Man-power Analysis, D. C. Heath: Lexington, Mass
Dore R, 1973, British Factory, Japanese Factory, University of California Press: London
Dore R, 1986, Taking Japan Seriously, Athlone: London
Dore R, 1993, "Nihonteki Koyosisutemu-no Shogensen"(trans. Origins of the Japanese employment System" in Itami et al, (eds), Nihon-no Kigyo Sisutemu
Edwards P, 1995, Industrial Relations, Blackwell: Oxford
Edwards R, 1979, Contested Terrain, Heinemann: London
Elster J, 1983a, Explaining Technical Change, Cambridge University Press: Cambridge
Elster J, 1983b, Sour Grapes: studies in the subversion of rationality, Cambridge University Press
England P & McLaughlin S, 1979, "Sex Segregation and Male-Female Income Differentials" in Alvavez R (eds), Discrimination in Organisations, San Francisco, CA: Jossey-Bass
England P, 1981, "Assessing trends in occupational sex segregation, 1900-1976" in Berg I (ed), Sociological perspectives on labour market, Academic Press: London
England P, 1982, "The Failure of Human Capital Theory to Explain Occupational Sex Segregation", Journal of Human Resources 17
England P, 1984, "Wage Appreciation and Depreciation", Social Forces 62
England P & Farkas G, 1986, Households, Employment and Gender, Aldine: New York

278
England P, Farkas G, Kilbourne B & Dou T, 1988, "Explaining Occupational Sex Segregation and Wages", American Journal of Sociology, 53
Esping-Andersen G, 1990, The Three Worlds of Welfare Capitalism, Polity Press: London
European Commission, 1994, MISSOC
European Commission, 1994, Social Europe: Wage determination and Sex Segregation in Employment in the European Community, Supplement 4
Eyraud F, 1993, Equal Pay Protection in Industrialised Market Economies, ILO : Geneva
Feldberg L & Glenn E, 1979, "Male and female: job versus gender models in the sociology of work", Social Problems, 26
Flanders A, 1964, The Fawley Productivity Agreements, Faber and Faber: London
Fujii Y, 1993, "Nenkin-to Josei-no Jiritsu"(trans. Pension and Women's independence), in Shakaihosho Kenkyusho (ed) Josei-to Shakaihosho (Women and Social Security)
Gallic D & White M, 1993, Employee Commitment and the Skills Revolution: Findings from the Employment in Britain Survey, PSI: London
Gallic D & Penn R, 1996, Trade Unionism in Recession, OUP: Oxford
Gambetta D, 1987, Were They Pushed or Did they Jump? : Individual decision mechanisms in education, Cambridge University Press: Cambridge
Genders D, 1996, Tax Guide 1996, Harper Collins: Glasgow
Goldthorpe J, 1987, Social Mobility and Class Structure in Modern Britain, Clarendon: Oxford
Goldthorpe J & Payne C, 1986, "On the Class Mobility of Women: results from different approaches to the analysis of recent British data", Sociology, Vol.20, No.4
Gornick J & Jacobs J, 1996, "A Cross-National Analysis of the Wages of Part-Time Workers", Work, Employment & Society, Vol.10 No.l
Hakim C, 1981, "Job segregation: trends in the 1970s", Employment Gazette, December
Hakim C, 1991, "Grateful slaves and self-made women: fact and fantasy in women's work orientations", European Sociological Review, 1

279
Hakim C, 1992, "Explaining trends in occupational segregation: the measurement, causes, and consequences of the sexual division of labour", European Sociological Review, Vol.8, No.2
Hakim C, 1993a, "Segregated and integrated occupations: a new approach to analysing social change", European Sociological Review, Vol.9 No.3
Hakim C, 1993b, "The myth of rising female employment", Work Employment and Society 1
Hakim C, 1994, "A century of change in occupational segregation 1891-1991", Journal of Historical Sociology, 1
Hakim C, 1996, Key Issues in Women's Work, Athlone: London
Hall R, 1982, "The importance of lifetime jobs in the US economy", The American Economic Review, Vol. 72, No. 4
Hanson S, Martin J & Tuch S, 1987, "Economic sector and job satisfaction", Work and Occupations, Vol. 14 No. 2
Harada K, 1988, Shakaihendo-to Kaisokozo-no Dotai-ni-kansuru Kokusai- hikakukenkyu (trans. Comparative research on social mobility and social structure}, Meijigakuin Univ.
Hardy M, 1993, Regression with Dummy Variables, Sage: London
Hartmann H, 1976, "Capitalism, Patriarchy and Job Segregation by Sex" in Women and the Workplace, Blaxall M & Reagan B (eds),University of Chicago: Chicago
Hartmann H, 1979, "The Unhappy Marriage of Marxism and Feminism" Capital and Class, 8
Hayashi H, 1995, "Danjo-koyokikai-kintoho Junen to Kongo-no Kadai"(trans. 10 years after the EEO law and future prospects), Jurist, No. 1079
Hepple B & Fredmann S, 1992, Labour Law and Industrial Relations in Great Britain, London
Higuchi Y, 1997, "Trends in Japanese labour markets" in Sako M & Sato H (eds), Japanese Labour and Management in Transition
Hiroishi T, "Kigyo-niokeru Joseikoyokanri-no Jittai"(trans. Employment practices for women in Enterprises), Jurist, No. 1979
Hisamoto N, 1994, "Enterprise Union", The Monthly Journal of the Japan Institute of Labour, Vol.36, No. 1.

280
Hobara K, 1993, "Pato Rodosha-no Shakaihoken-tono Tekiyo-wo-meguru Mondai"(trans. Problems on the application of social insurance for part-time workers), Kikan Shakai Hosho, No. 1755
Hodson R & England P, 1986, "Industrial Structure and Sex Differences in Earnings", Industrial Relations, Vol.25 No.l
Horrell S, Rubery J & Burchell B, 1990, "Gender and Skills" Work Employment & Society, Vol.4 No.2
Hunter J (ed), 1993, Japanese Women Working, Routledge: London
Hyman R, 1995, "The Historical Evolution of British Industrial Relations", in Edward P (ed), Industrial Relations
ILO, 1974, Yearbook of Labour Statistics, ILO: Geneva
ILO, 1983, Yearbook of Labour Statistics, ILO: Geneva
ILO, 1986, Yearbook of Labour Statistics, ILO: Geneva
ILO, 1993, Yearbook of Labour Statistics, ILO: Geneva
ILO, 1994, Yearbook of Labour Statistics, ELO: Geneva
ILO, 1995, Yearbook of Labour Statistics, ILO: Geneva
Imada S, 1988, Josei-no Shokugyo Keireki (trans. Women's occupational careers), the Japan Labour Institute, working paper No.77
Inagami T, 1988, Japanese Workplace Industrial Relations, the Japan Institute of Labour: Tokyo
Inagami T & Kawakita T (eds), 1985, Sangyo. Rodo (trans. Industry and Labour), The University of Tokyo: Tokyo
Ishikawa T, 1993, "Nihon-no Rodoshijo-no Kozo"(trans. Japanese Labour Market Structure), in Itami et al, (eds) Nihon-no Kigyo Sisutemu
Itami H, Kagono T & Itoh M, 1993, Nihon-no Kigyo System (trans. Japanese enterprise system), Yuhikaku: Tokyo
Itoh M & Kagono T, 1993, "Nihon-kigyo to Jinteki-shigen"(trans. Japanese enterprises and Human resources), in Itami et al, Nihon-no Kigyo System
Izumi T, 1993, "Human Resources Development of Blue-Collar Workers", Monthly Journal of Japan Institute of Labour, No. 401

281
Jacobs J, 1989a, "Long-term trends in occupational segregation by sex", American Journal of Sociology, 95(1)
Jacobs J, 1989b, Revolving Doors, Stanford Univ. Press: Stanford
Jacobs J, 1993, "Men in female-dominated fields: trends and turnover" in Williams C (ed), Doing "Women's Work": Men in Non-traditional Occupations, Sage : London
Jacobs J, 1995, Gender Inequality at Work, Sage: London
Jacobs J & Powell B, 1985, "Occupational Prestige: A sex neutral concept?" Sex Roles 12
Jacobs J& Lim S, 1992, "Trends in occupational and industrial sex segregation in 56 countries, 1960-1980", Work and Occupations, Vol.19, No.4
Jacobs S, 1995, "Changing Patterns of sex segregated occupations throughout the life- course", European Sociological Review, Vol.11 No.2
Janson P & Martin J, 1982, "Job satisfaction and age: a test of two views", Social Forces Vol. 60:4
Kalleberg A, 1977, "Work values and job rewards: a theory of job satisfaction", American Sociological Review, Vol. 42
Kalleberg A & Griffin L, 1978, "Positional sources of inequality in job satisfaction" Sociology of Work and Occupations 5
Kalleberg A & Lincoln J, 1988, "The structure of earnings inequality in the United States and Japan", American Journal of Sociology 94
Kalleberg A & Loscocco K, 1983, "Ageing, values, and rewards: explaining age differences in job satisfaction", American Sociological Review, Vol. 48
Kanter R, 1977, Men and Women of the Corporation, Basic Books: New York
Keep E & Rainbird H, 1995, "Training", in Edwards P (ed), Industrial Relations
Kim J-O & Mueller C, 1978, Introduction to Factor Analysis, Sage: London
Kita S, 1995, "Human Resource Development in Small and Medium-sized Enterprises", Monthly Journal of the Japan Institute of Labour No.425
Kluegel J, Mason D, Wegener B (eds), 1995, Social Justice and Political Change,
de Gruyter: New York
Koike K, 1988, Understanding Industrial Relations in Modern Japan, Macmillan:
London

282
Koike K, 1993a, "Nihonkigyo to Chiteki Jukuren"(trans. Japanese enterprises and
wide range of skills), in Itami et al (eds) Nihon-no Kigyo Sisutemu
Koike K, 1993b, "A Re-explication of "intellectual Skills"", Monthly Journal of Japan Institute of Labour, No. 402
Konig W, Luttinger P & Muller W, 1988, A Comparative Analysis of the
Development and Structure of Educational Systems: methodological foundations and
the construction of a comparative educational scale, CASMEN-Working Paper No. 12
Koyo Shokugyo Kenkyusho, 1988, Josei-no Shokugyo-keireki (trans. Women's Occupational Careers), Working paper No. 77
Kumazavva M, 1996, Portraits of the Japanese Workplace, Westview Press: Oxford
Lam A, 1992, Women and Japanese Management, Routledge: London
Lam A, 1996, "Work organisation, skills development and utilisation of engineers" in
Crompton R, et al (eds), Changing Form of Employment, Routledge: London
Lampard R, 1994, "Comment on Blackburn, Jarman and Siltanen", Work, Employment
& Society, Vol. 8, No. 3
Marsden P, Kalleberg A & Cook C, 1993, "Gender difference in Organisational
Commitment", Work and Occupations, Vol. 20 No. 3
Marshall G, Newby H, Rose D & Vogler C, 1989, Social Class in Modern Britain,
Hutchinson: London
Martin J & Roberts C, 1984, Women and Employment, HMSO: London
Martin J & Hanson S, 1985, "Sex, family earning status, and satisfaction with work",
Work and Occupations, Vol. 12 No. 1
Maruyama K, 1994, "Josei-no Shogai-shotoku-kara-mita Zeisei Nenkin seido"(trans.
Tax and Pension System from the perspective women's life-time income), Kikan
Shakaihosho, Vol.30 No.3
Millward N, 1994, The New Industrial Relations?, PSI: London
Millward N, Stevens M, Smart D & Hawes W. 1992, Workplace Industrial
Relations in Transition, Dartmouth: Hants
Millward S & Woodland S, 1995, Gender Segregation and Male/Female Wage
Differences, Centre for Economic Performance, Discussion Paper No. 220
Ministry of Education, 1994, Gakko-kihon-chosa (trans. Basic Survey on Schools)
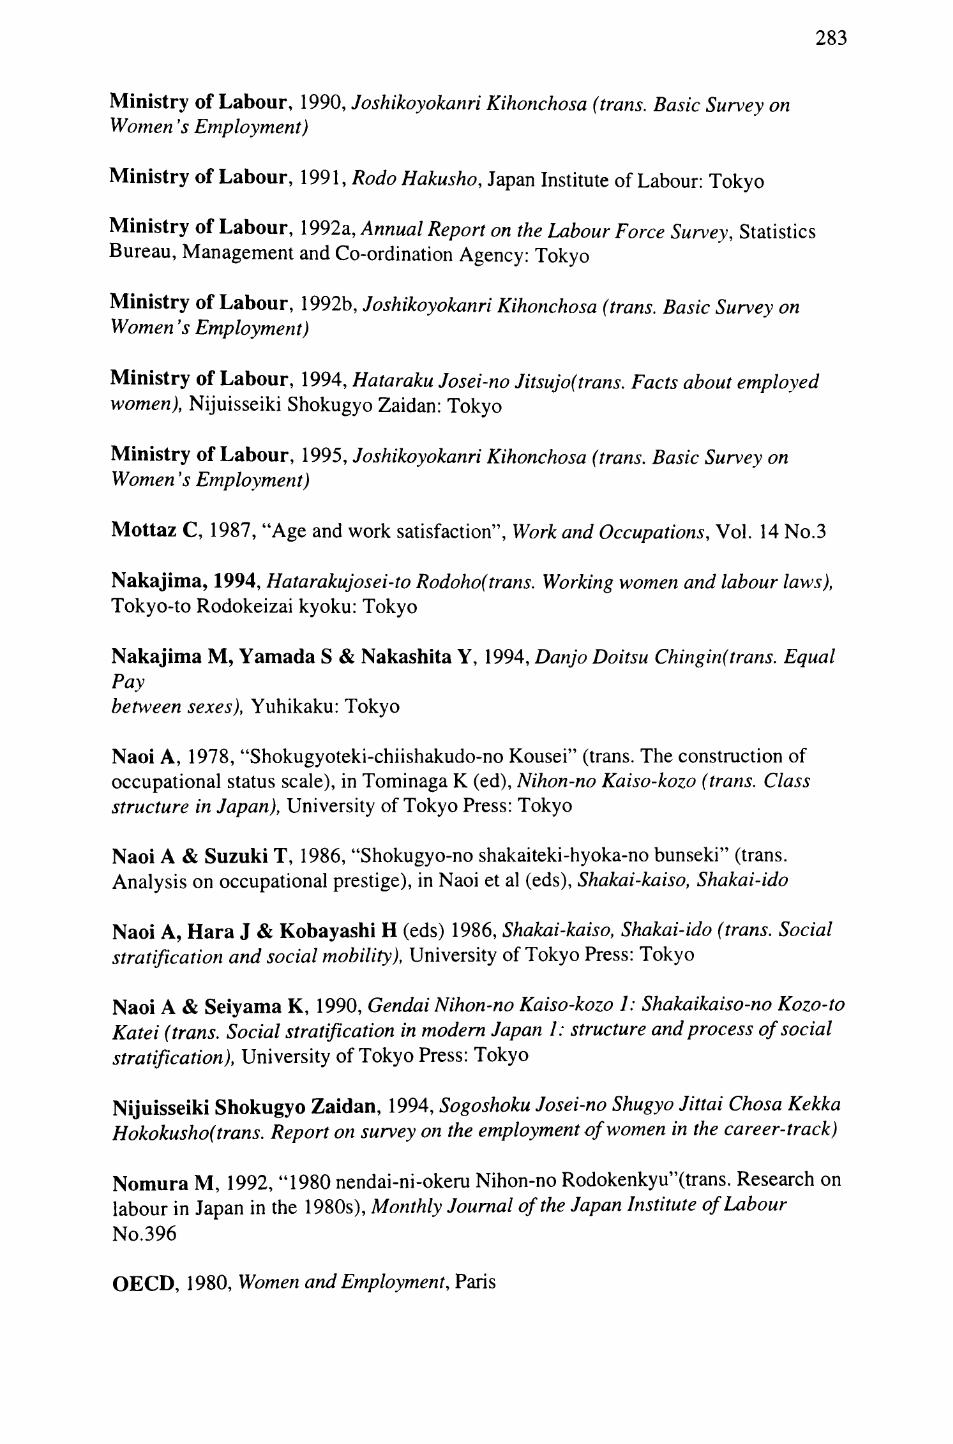
283
Ministry of Labour, 1990, Joshikoyokanri Kihonchosa (trans. Basic Survey on Women's Employment)
Ministry of Labour, 1991, Rodo Hakusho, Japan Institute of Labour: Tokyo
Ministry of Labour, 1992a, Annual Report on the Labour Force Survey, Statistics Bureau, Management and Co-ordination Agency: Tokyo
Ministry of Labour, 1992b, Joshikoyokanri Kihonchosa (trans. Basic Survey on Women's Employment)
Ministry of Labour, 1994, Hataraku Josei-no Jitsujo(trans. Facts about employed women), Nijuisseiki Shokugyo Zaidan: Tokyo
Ministry of Labour, 1995, Joshikoyokanri Kihonchosa (trans. Basic Survey on Women's Employment)
Mottaz C, 1987, "Age and work satisfaction", Work and Occupations, Vol. 14 No.3
Nakajima, 1994, Hatarakujosei-to Rodoho(trans. Working women and labour laws), Tokyo-to Rodokeizai kyoku: Tokyo
Nakajima M, Yamada S & Nakashita Y, 1994, Danjo Doitsu Chingin(trans. EqualPaybetween sexes), Yuhikaku: Tokyo
Naoi A, 1978, "Shokugyoteki-chiishakudo-no Kousei" (trans. The construction of occupational status scale), in Tominaga K (ed), Nihon-no Kaiso-kozo (trans. Class structure in Japan), University of Tokyo Press: Tokyo
Naoi A & Suzuki T, 1986, "Shokugyo-no shakaiteki-hyoka-no bunseki" (trans. Analysis on occupational prestige), in Naoi et al (eds), Shakai-kaiso, Shakai-ido
Naoi A, Hara J & Kobayashi H (eds) 1986, Shakai-kaiso, Shakai-ido (trans. Social stratification and social mobility), University of Tokyo Press: Tokyo
Naoi A & Seiyama K, 1990, Gendai Nihon-no Kaiso-kozo 1: Shakaikaiso-no Kozo-to Katei (trans. Social stratification in modern Japan I: structure and process of social stratification), University of Tokyo Press: Tokyo
Nijuisseiki Shokugyo Zaidan, 1994, Sogoshoku Josei-no Shugyo Jittai Chosa Kekka Hokokusho(trans. Report on survey on the employment of women in the career-track)
Nomura M, 1992, "1980 nendai-ni-okeru Nihon-no Rodokenkyu"(trans. Research on labour in Japan in the 1980s), Monthly Journal of the Japan Institute of Labour No.396
OECD, 1980, Women and Employment, Paris

284
OECD, 1985, The integration of women into the economy, Paris
OECD, 1988, Employment Outlook, Paris
OECD, 1989, Labour Market Flexibility
OECD, 1992, Labour Force Statistics, Paris
OECD, 1995, Labour Force Statistics, Paris
Okamoto H, 1985, "Roshi-kankei" (trans. Industrial Relations), in Inagami T & Kawakita T (eds), Sangyo Rodo (trans. Industry and Labour)
Okuyama A, 1996, "Japan's Equal Employment Opportunity Law", Monthly Journal of Japan Institute of Labour, No.433
OPCS, 1990a, Standard Occupational Classification, Vol.1, HMSO: London
OPCS, 1990b, Standard Occupational Classification, Vol.3, HMSO: London
OPCS, 1994, 7997 Census Economic Activity Great Britain
Osawa Machiko, 1993, Keizai-henka to Joshi-rodo(trans. Economic change and female labour), Nihonkeizaihyoronsha: Tokyo
Osawa Machiko, 1995, "Nihonteki Keiei-to Danjo-koyo-kintoho"(trans. Japanese employment system and Equal Employment Opportunity Law), Jurist, No. 1979
Osawa Mari, 1993, Kigyo Chushin Shakai-wo Koete(tans. Beyond the Enterprise- centred Society), Jijitsushin: Tokyo
Pelling H, 1992, A History of British Trade Unionism, Macmillan: London
Polachek S, 1976, "Occupational Segregation: an alternative hypothesis", Journal of Contemporary Business 5
Polachek S, 1981, "Occupational Self-Selection: a human capital approach to sex difference-occupational structure", Review of Economics and Statistics 63
Reskin B & Hartmann H (eds) 1986, Women's work, men's work, National Academy Press: Washington
Reskin B & Padavic I, 1994, Women and Men at Work, Pine Forge Press: California
Reskin B & Roos P, 1990, Job Queues, Gender Queues, Temple Univ. Press:
Philadelphia
Rhoads S, 1993, Incomparable Worth, CUP: Cambridge

285
Rododaijin-kanbo-seisaku-chosabu, 1990, Patotaima-no Jittai(trans. Facts about Part-timers)
Roos P, 1981, "Sex Stratification in the Workplace: Male-Female Differences in Economic Returns to Occupation", Social Science Research 10
Roos P, 1985, Gender and Work: A Comparative Analysis of Industrial Societies, State University of New York Press: New York.
Rosenfeld R & Spenner K, 1995, "Occupational sex segregation and women's early career job shifts" in Jacobs J, Gender Inequality at Work, Sage: London
Ross C & Mirowsky J, 1996, "Economic and interpersonal work rewards: subjective utilities of men's and women's compensation", Social Forces, 75: 1
Rowe R & Snizek W, 1995, "Gender differences in work values", Work and Occupations, Vol.22, No.2
Rubery J & Fagan C, 1994, Social Europe: Wage Determination and Sex Segregation in Employment in the European Community, European Commission, Supplement 4
Rubery J & Fagan C, 1995, "Gender Segregation in Social Context", Work Employment and Society
Rubery J, Horrell S & Burchell B, 1994, "Part-Time Work and Gender Inequality in the Labour Market", in Scott A (ed), Gender Segregation and Social Change, Oxford University Press: Oxford
Sainsbury D, 1994, Gendering Welfare States, Sage: London
Saso M, 1990, Women in the Japanese Workplace, Hilary Shipman: London
Sako M, 1997, "Introduction: forces for homogeneity and diversity in the Japanese industrial relations system" in Sako M & Sato H (eds), 1997, Japanese Labour and Management in Transition
Sako M & Sato H (eds), 1997, Japanese Labour and Management in Transition, Routledge: London
Sato H, 1994, "Industrial Relations in Non-Union Enterprises", The Monthly Journal of the Japan Institute of Labour, Vol. 36, No. 10
Sato H, 1997a, "Human resource management systems in large firms: the case of white-collar graduate employee" in Sako M & Sato H (eds), 1997, Japanese Labour and Management in Transition

286
Sato H, 1997b, "Labour-management relations in small and medium-sized enterprises: collective voice mechanisms for workers in non-unionised companies" in Sako M & Sato H (eds), 1997, Japanese Labour and Management in Transition
Schroeder L, Stoquist D & Stephen P, 1986, Understanding Regression Analysis, Sage: London
Scott A (ed), 1994, Gender Segregation and Social Change, OUP: Oxford
Scott A and Burchell B, 1994, "And never the twin shall meet?: gender segregation and work histories", in Scott, A (ed) Gender Segregation and Social Change, OUP: Oxford
Seiyama K, Naoi A, Sato Y, Tsuzuki K & Kojima H, "Gendai Nihon-no kaiso-kozo to sono Susei" (trans. Social stratification of modern Japan and its trends), in Naoi A & Seiyama K, 1990, Gendai Nihon-no Kaiso-kozo 1: Shakaikaiso-no Kozo-to Katei (trans. Social stratification in modern Japan 1: structure and process of social stratification)
Shakaihosho Kenkyusho (ed), 1993, Josei-to Shakai-hosho (trans. Women and Social Security), Tokyo Univ. Press: Tokyo
Shirahase S & Ishida H, 1994,"Gender Inequality in the Japanese Occupational Structure", International Journal of Comparative Sociology, Vol.XXXV No.3-4
Siltanen J, 1990, "Social change and the measurement of occupational segregation by sex: an assessment of the sex ratio index", Work, Employment & Society, Vol.4 No. 1
Siltanen J, 1994, Locating Gender, UCL Press: London
Siltanen J, Jarmen J & Blackburn R, 1995, Gender Inequality in the labour market, ILO: Geneva
Sloane P, 1994, "The Gender Wage Differential and Discrimination in the Six SCELI Local Labour Markets", in Scott A (ed), Gender Segregation and Social Change, OUP: Oxford
Statistics Bureau Management and Coordination Agency (Somu-cho Tokei-kyoku), 1990 Population Census of Japan, Prompt Report
Stockdale M, 1996, " What we know and what we need to learn about sexual harassment", in Stockdale M (ed), Sexual Harassment in the Workplace, Sage: London
Stockman N, Bonney N & Xuewen S, 1995, Women's Work in East and West, UCL: London
Sugeno K, 1992, Japanese Labour Law, University of Tokyo Press: Tokyo

287
Sugeno K, 1995, The International Labour Market and Its Legal Adjustment, JIL Forum Paper No.4, the Japan Institute of Labour: Tokyo
Sugeno K, 1996, Koyo Shakai-no Ho(trans. Laws in Employment Society), Yuhikaku: Tokyo
Tachibanaki T, 1993, "Nihon-no Rodokumiai Sankaritsu" (trans. Union participation rates in Japan), in Itami et al (eds) Nihon-no Kigyo Sisutemu (trans. Japanese enterprise system), Yuhikaku: Tokyo
Tachibanaki T, 1996, Wage Determination and Distribution in Japan, Clarendon Press: Oxford
Takenaka E (ed), 1991, Shin Joshi-rodo-ron (trans. New theory of female labour), Yuhikaku: Tokyo
Takenaka E & Kuba Y (eds), 1994, Rodoryoku-no Joseika (trans. Feminisation of the labour force), Yuhikaku: Tokyo
Tam Y, 1995, Part-time employment in the 80s Britain, D.Phil, thesis, Oxford
Tanaka S, 1996, Sengo Nihon-niokeru Seibetsu-bungyo-no Jittai (trans. Sex segregation in the post world war in Japan), Kazoku-shakaigaku-kenkyu No.8
The Japan Institute of Labour, 1993a, Labour Management Relations in Japan
The Japan Institute of Labour, 1993b, Joshi-saishushoku-no Jittai-nikansuru Kenkyu (trans. Research on women's re-employment)
The Japan Institute of Labour, 1995, Shokugyo-to Katei-seikatsu-ni-kansuru Zenkoku-chosa (trans. National Survey on Work and Family Life), Working Paper,No. 74
The Life-Cultural Bureau of Tokyo, 1994, Joseimondai ni kansuru Kokusai Hikaku Chosa (trans. International Comparison of women's issues)
The Prime Minister's Office of Japan, 1982, Hujinmondai ni kansuru Kokusai Hikaku Chosa (trans. International Comparison of women's issues)
Tokyo-to Seikatsubunka-kyoku, 1994, Joseimondai-nikansuru Kokusai-hikaku Chosa(trans. International Comparative Study on Women's Issues)
Tomaskovic-Devey D, 1993a, "The Gender and Race Composition of Jobs and the Male/Female, White/Black Pay Gaps", Social Forces, 72
Tomaskovic-Devey D, 1993b, "Labour-Process Inequality and the Gender and Race Composition of Jobs", Research in Social Stratification and Mobility, Vol.12

288
Tomaskovic-Devey D, 1995, "Sex Composition and Gendered Earnings Inequality", in Jacobs J (ed), Gender Inequality at Work, Sage: London
Tominaga K, 1978, Nihon-no Kaiso-kozo (trans. Class structure in Japan), University of Tokyo Press: Tokyo
Upex R & Shrubsall V, 1995, Discrimination in Employment, Law and Tax: London
Ushijima C, 1995, Jenda-to Shakai-kaikyu (trans. Gender and Social Class), Koseisha-Koseikaku: Tokyo
Utada T, 1987, Labour Unions and Labour-Management Relations, The Japan Institute of Labour: Tokyo
Wharton A & Baron J, 1991, "Satisfaction? The psychological impact of gender segregation on women at work", The Sociological Quarterly, Vol. 32 No.3
Wakisaka A, 1993, Shokuba-ruikei-to Josei-no Kyaria-kensei (trans. The types of workplaces and women's career formation), Ochanomizu-shobo: Tokyo
Wakisaka A, 1996, "On "Diversified Personnel Management" System", Monthly Journal of Japan Institute of Labour, No.433
Walby S, 1986, Patriarchy at Work: Patriarchal and Capitalist Relations in Employment, Polity: Cambridge
Walby S (ed.), 1988, Gender Segregation at Work, Open University Press: London
Walby S, 1990, Theorising Patriarchy, Blackwell: Oxford
Watts M, 1993, "How Occupational Sex Segregation be Measured?", Work, Employment & Society, Vol.6, No.3
Watts M, 1993, "Occupational Sex Segregation in Britain, 1979-1989", Cambridge Journal of Economics, 17
Watts M, 1994, "A Critique of Marginal Matching", Work, Employment & Society, Vol.8, No.3
Williams C (ed), 1993, Doing "Women's Work": Men in Non-traditional Occupations, Sage: London
Williams C & Villemez W, 1993, "Seekers and finders: male entry and exit in female- dominated jobs" in Williams C, Doing "Women's Work": Men in Non-traditional Occupations, Sage: London
Wright E O, 1990, Comparative Project on Class Structure and Class Consciousness, Inter-University Consortium for Political and Social Research: Michigan

289
Wright E O, Baxter J & Birkelund G E, 1995, "The Gender Gap in Workplace Authority: A Cross-National Study", American Sociological Review Vol. 60
Yashiro N, 1993, "Josei-no Nenkinken-to Sono Shugyo Yokuseikoka"(trans. Women's pension right and its negative effect on women's work), Kikan Shakai Hosho,No. 1757
Yasuda S & Kara J, 1982, Shakai-chosa Hando Bukku (trans. Handbook of Social Research), Yuhikaku: Tokyo