Financial Management as a Determinant of Profitability: a Study of Selected Pharmaceutical Firms in...
10
European Journal of Business and Management www.iiste.org ISSN 2222-1905 (Paper) ISSN 2222-2839 (Online) Vol 4, No.20, 2012 28 Financial Management as a Determinant of Profitability: a Study of Selected Pharmaceutical Firms in Nigeria. Okwo, Ifeoma Mary Ph.D 1 , Enekwe, Chinedu Innocent 2 Ugwunta David Okelue 3* 1. Department of Accountancy, Faculty of Management Sciences, Enugu State University of Science and Technology, Enugu State, Nigeria. 2. Department of Accountancy, Caritas University Amorji-Nike, Enugu State, Nigeria. 3. Department of Banking and Finance, Renaissance University Ugbawka, Enugu State, Nigeria. * E-mail of the corresponding author: [email protected]; [email protected] Abstract This study examined the relationship between firm financial management techniques and profitability. Six variables including Long-term-debt to Equity ratio (LTDER), Inventory turnover ratio (ITR), Debtors’ turnover ratio (DTR), Creditors’ velocity (CRSV), Total assets turnover ratio (TATR) and Net profit margin (NPM). Profitability as a dependent variable is represented by Net profit margin (NPM) while LTDER, ITR, DTR, CRSV and TATR were used. Descriptive statistics and multiple regressions were applied to data obtained from the annual financial statements of sampled pharmaceutical companies quoted on the Nigerian Stock Exchange. The results of the analysis showed that there is a positive relationship between LTDER, DTR, TATR and profitability while ITR and CRSV have negative relationships with profitability. Given the findings, the study recommends that the inventories of the company should be monitored more frequently to prevent stock-out or over stocking conditions of their products, that creditors’ velocity should be at a point where the creditors and purchases are equal in order to take the advantage of credit facility and any discount associated with prompt payment for goods to increase the profitability of the company. Keywords: Profitability, Determinants, Pharmaceutical industry, Descriptive research, Multiple regressions, Long-term-debt to Equity ratio, Inventory turnover ratio, Debtors’ turnover ratio, Creditors’ velocity, Total assets turnover ratio and Net profit margin. 1. Introduction Over the years, the determination of profitability in pharmaceutical industries has been a problem faced by scholars. The use of financial management as a determinant of profitability in companies is a very important aspect that cannot be overemphasized. According to Emekekwue (2002), financial management is an amalgam of planning, organizing and control of the resources available to an organization in order to meet the demands of the various claimants of the company such as human and material resources. Dave (2012) defines financial management as an integral part of overall management rather than as a staff specialty concerned with fund raising operations. He adds that the central issue of financial policy is a rational matching of advantages of potential uses against the cost of alternative potential sources, so as to achieve the broad financial goals. Management of finance has evinced keen interest both amongst the academicians and practicing managers primarily due to its immense potential to influence the profitability of an enterprise. This potential is engrossed in both the aspects of management of funds, be it mobilization of funds or deployment of funds. Pandey (2002) argue that financial management is that managerial activity which is concerned with the planning and controlling of the firm’s financial resources. The subject of financial management is of immense interest to both academicians and practicing managers. It is of great interest to academicians because the subject is still developing, and there are still certain areas where controversies exist for which no unanimous solutions have been reached as yet. Therefore, financial management is concerned with raising the funds needed to finance the enterprise’s assets and activities, the allocation of theses scare funds between competing uses and ensuring that the funds are used effectively and efficiently in achieving the enterprise’s goal. In Nigeria, the development of a better tool for profitability determinant for manufacturing industries is yet to be established. Therefore, the following research questions guided this study: Does Long- term- debt Equity Ratio (LTDER) have positive effect on Net Profit Margin (NPM)? To what extent does Inventory turnover Ratio (ITR)
Transcript of Financial Management as a Determinant of Profitability: a Study of Selected Pharmaceutical Firms in...
European Journal of Business and Management www.iiste.org ISSN 2222-1905 (Paper) ISSN 2222-2839 (Online) Vol 4, No.20, 2012
28
Financial Management as a Determinant of Profitability: a Study of Selected Pharmaceutical Firms in Nigeria.
Okwo, Ifeoma Mary Ph.D1, Enekwe, Chinedu Innocent2 Ugwunta David Okelue3*
1. Department of Accountancy, Faculty of Management Sciences, Enugu State University of Science and Technology, Enugu State, Nigeria.
2. Department of Accountancy, Caritas University Amorji-Nike, Enugu State, Nigeria.
3. Department of Banking and Finance, Renaissance University Ugbawka, Enugu State, Nigeria.
* E-mail of the corresponding author: [email protected]; [email protected]
Abstract
This study examined the relationship between firm financial management techniques and profitability. Six variables including Long-term-debt to Equity ratio (LTDER), Inventory turnover ratio (ITR), Debtors’ turnover ratio (DTR), Creditors’ velocity (CRSV), Total assets turnover ratio (TATR) and Net profit margin (NPM). Profitability as a dependent variable is represented by Net profit margin (NPM) while LTDER, ITR, DTR, CRSV and TATR were used. Descriptive statistics and multiple regressions were applied to data obtained from the annual financial statements of sampled pharmaceutical companies quoted on the Nigerian Stock Exchange. The results of the analysis showed that there is a positive relationship between LTDER, DTR, TATR and profitability while ITR and CRSV have negative relationships with profitability. Given the findings, the study recommends that the inventories of the company should be monitored more frequently to prevent stock-out or over stocking conditions of their products, that creditors’ velocity should be at a point where the creditors and purchases are equal in order to take the advantage of credit facility and any discount associated with prompt payment for goods to increase the profitability of the company.
Keywords: Profitability, Determinants, Pharmaceutical industry, Descriptive research, Multiple regressions, Long-term-debt to Equity ratio, Inventory turnover ratio, Debtors’ turnover ratio, Creditors’ velocity, Total assets turnover ratio and Net profit margin.
1. Introduction
Over the years, the determination of profitability in pharmaceutical industries has been a problem faced by scholars. The use of financial management as a determinant of profitability in companies is a very important aspect that cannot be overemphasized. According to Emekekwue (2002), financial management is an amalgam of planning, organizing and control of the resources available to an organization in order to meet the demands of the various claimants of the company such as human and material resources. Dave (2012) defines financial management as an integral part of overall management rather than as a staff specialty concerned with fund raising operations. He adds that the central issue of financial policy is a rational matching of advantages of potential uses against the cost of alternative potential sources, so as to achieve the broad financial goals. Management of finance has evinced keen interest both amongst the academicians and practicing managers primarily due to its immense potential to influence the profitability of an enterprise. This potential is engrossed in both the aspects of management of funds, be it mobilization of funds or deployment of funds. Pandey (2002) argue that financial management is that managerial activity which is concerned with the planning and controlling of the firm’s financial resources. The subject of financial management is of immense interest to both academicians and practicing managers. It is of great interest to academicians because the subject is still developing, and there are still certain areas where controversies exist for which no unanimous solutions have been reached as yet. Therefore, financial management is concerned with raising the funds needed to finance the enterprise’s assets and activities, the allocation of theses scare funds between competing uses and ensuring that the funds are used effectively and efficiently in achieving the enterprise’s goal.
In Nigeria, the development of a better tool for profitability determinant for manufacturing industries is yet to be established. Therefore, the following research questions guided this study: Does Long- term- debt Equity Ratio (LTDER) have positive effect on Net Profit Margin (NPM)? To what extent does Inventory turnover Ratio (ITR)
European Journal of Business and Management www.iiste.org ISSN 2222-1905 (Paper) ISSN 2222-2839 (Online) Vol 4, No.20, 2012
29
affect Net Profit Margin (NPM)? Does Debtors’ turnover ratio (DTR) have effect over Net Profit Margin (NPM)? To what extent does Creditors Velocity (CRSV) affect Net Profit Margin (NPM)? Is there any effect of Total Assets turnover ratio (TATR) on Net Profit Margin (NPM)?
The work is aimed at achieving the followings: To examine the effect of Long-term debt to Equity ratio (LTDER) on Net Profit Margin (NPM) of pharmaceutical companies in Nigeria. To determine the effect of Inventory turnover ratio (ITR) on Net Profit Margin (NPM) of pharmaceutical firms in Nigeria. To ascertain the extent to which debtors’ turnover ratio (DTR) affects Net Profit Margin (NPM) of pharmaceutical firms in Nigeria. To find out the effect that Creditors’ Velocity (CRSV) has on Net Profit Margin (NPM) of pharmaceutical firms in Nigeria. To determine whether Total Assets turnover ratio (TATR) have any effect on Net Profit Margin (NPM) of pharmaceutical firms in Nigeria.
Based on the research questions, the following null hypotheses were developed:
H1: Long-term debt to Equity ratio (LTDER) has no significant effect on Net Profit Margin (NPM) of pharmaceutical firm.
H2: Inventory turnover ratio (ITR) has no significant effect on Net Profit Margin (NPM) of pharmaceutical firm.
H3: Debtors’ turnover ratio (DTR) has no significant effect on Net Profit Margin (NPM) of pharmaceutical firm.
H4: Creditors’ Velocity (CRSV) has no significant effect on Net Profit Margin (NPM) of pharmaceutical firm.
H5: Total Assets turnover ratio (TATR) has no significant effect on Net Profit Margin (NPM) of pharmaceutical firm.
The rest of the paper is divided into four sections. Section two is concerned with the theoretical framework and review of related literature. Section three elucidates the methodological framework while section four discusses the findings and section five concludes the paper.
2. Review of Related Literature.
Every firm is most concerned with its profitability. One of the most frequently used tools of financial ratio analysis is profitability ratio which is used to determine the company’s bottom line. Profitability measures are important to company managers and owners alike. If a small business has outside investors who have put their own money into the company, the primary owner certainly has to show profitability to those equity investors. Profitability ratios show a company’s overall efficiency and performance. Many researchers have studied the determinant of profitability in many ways. But none of them had studied on the determinant of profitability using financial management techniques. Because of this, the researchers chose this research work to show how the financial management can be used in the determination of profitability in pharmaceutical industry. Financial management means planning, organizing, directing and controlling the financial activities such as procurement and utilization of funds of the enterprise. It means applying general management principles to financial resources of the enterprises.
Profitability means ability to make profit from all the business activities of an organization, company, firm or an enterprise. It shows how efficiently the management can make profit by using all the resources available in the market. Profitability is also the ability of a given investment to earn a return from its use. However, the term profitability is not synonymous with the term efficiency. Profitability is an index of efficiency and is regarded as a measure of efficiency and management guide to greater efficiency. Though, profitability is an important yard stick for measuring efficiency, the extent of profitability cannot be taken as a final proof of efficiency. Sometimes satisfactory profits can mark inefficiency and conversely a proper degree of efficiency can be accompanied by an absence of profit. The net profit figure simply reveals a satisfactory balance between the values received and value given. The change in operational efficiency is merely one of the factors on which profitability of an enterprise largely depend. Moreover there are many other factors besides efficiency which affect profitability. Sometimes, the terms “Profit” and “Profitability” are used interchangeably but in real sense there is a difference between the two. Profit is an absolute term, whereas, profitability is a relative concept. However, they are closely related and mutually interdependent and have distinct roles in business. Profit refers to the total income earned by the enterprise during a specified period of time while profitability refers to the operating efficiency of the enterprise. It is the ability of an enterprise to get sufficient return on the capital and employees used in the business operation.
European Journal of Business and Management www.iiste.org ISSN 2222-1905 (Paper) ISSN 2222-2839 (Online) Vol 4, No.20, 2012
30
The debt-to-equity ratio is a financial ratio indicating the relative proportion of equity and debt used to finance a company’s assets which is an indicator of the financial leverage. It is equal to total debt divided by shareholders’ equity. The two components are often taken from the firm’s balance sheet. When used to calculate a company’s financial leverage, the debt usually includes only the long-term debt (LTD). This is a useful measure as it helps the investor see the way management has financed operations. A high debt/equity ratio generally means that a company has been aggressive in financing its growth with debt. This can result in volatile earnings as a result of the additional interest expenses as well as volatile cash flow as principal payments on debt come due. If a lot of debt is used to finance increased operations (high debt to equity), the company could potentially generate more earnings per share than it would have without this outside financing. If this were to increase earnings by a greater amount than the interest on debt, then the shareholders benefit as more earnings are being spread among the same amount of stock. However, as stated, increased interest and the need to repay the principal on borrowed fund can far outweigh the benefit. It is used to measure the net worth of the organization. Long-term-debt to Equity ratio is Long-term-debt (Loan)/Stockholder Equity. This is one of the most important metrics to measure and manage as you create strategic plans.
Nweze (2011) opine that inventory turnover is computed by dividing the cost of goods sold by the average inventory. An average inventory is determined by adding the beginning and ending inventories and dividing by two. The decline in the inventory turnover indicates the stocking of more goods. An attempt should be made to determine whether specific inventory categories are not selling well and the reason for this. Emekekwue (2002) argues that stock turnover ratio seeks to identify the length of time that stock is held as inventory before it is converted to cash. In organizations where stocks are perishable, holding of large stock is very costly to the business. However, if stock is not the perishable type, delays in disposing stock might be profitable during inflationary periods. It must be appreciated that sales will be valued at cost. This is because the stock will be valued at cost. If the sales were not valued at cost, then we shall be over stating the ratio. Moreover, one will be comparing two incomparables i.e. the sales figures and the cost of stock. Furthermore, the inventory turnover ratio measures the average number of days for which stock is held. It helps to assess the efficiency of stock utilization. Various factors affect the stock level help by the organization such as product, production-seasonal or otherwise, demand pattern, competition, funds availability etc.
Nweze (2011) is of the view that debtor’s ratio consist of debtors turnover and the collection period. The debtor’s turnover gives the number of times debts are collected during the years. The turnover is found by dividing net credit sales (if not available, then total sales) by the average debtors. Average debtors are found by adding the beginning debtors to the ending debtors and dividing by two. The higher the debtor’s turnover, the better, since this means that the company is collecting debts quickly from customers. These funds can then be invested for a return. The drop in the debtor’s turnover ratio is significant, indicating a serious problem in collecting from customers. Therefore, a careful analysis of the company’s credit policy is required. The average collection period, or the number of days sales remain with debtors is found by dividing the debtor’s turnover into 365 days. A higher collection period indicates a danger that customers’ balances may become uncollectible - perhaps the company selling to highly marginal customers - a customer whose credit worthiness is very much in doubt.
Okwuosa (2005) says that creditors’ velocity means creditors’ turnover. This indicates the average number of times creditors’ turnover is paid within a year. High creditors’ turnover ratio indicates that the company is not taking advantage of credit facility and this may result in loss of profit as a result of interest on borrowed funds or bank overdraft needed to meet up. On the other hand, low creditors’ turnover ratio indicates that the company is not taking advantage of any discount associated with prompt payment and this may lead to increase in their cost of sales and consequently decrease in their profit. Therefore, a company should ensure that its creditors’ turnover ratio is neither too high nor too low. The creditors’ turnover is calculated by dividing Credit purchases by Average creditors.
Ezeamama(2010) defines total assets turnover as ratio that expresses the number of times the value of assets utilized by the firm has been generated into sales. According to Pandey (2002) total assets’ turnover ratio shows the firm’s ability in generating sales from all financial resources committed to total assets. Nweze (2011) says total assets turnover measures the level of capital investment relative to sales volume. It tells the firm how well it manages its overall assets.
Pandey (2002) notes net profit is obtained when operating expenses, interest and taxes are subtracted from the gross

European Journal of Business and Management www.iiste.org ISSN 2222-1905 (Paper) ISSN 2222-2839 (Online) Vol 4, No.20, 2012
31
profit. The net profit margin ratio is measured by dividing profit after tax by sales. Net Profit margin ratio establishes a relationship between net profit and sales and indicates management’s efficiency in manufacturing, administering and selling their products. This ratio is the overall measure of the firm’s ability to turn each rupee sales into net profit. If the net margin is inadequate, the firm will fail to achieve satisfactory return on shareholder’s funds. This ratio also indicates the firm’s capacity to withstand adverse economic conditions. A firm with a high net margin ratio would be in an advantageous position to survive in the face of falling selling prices, rising costs of production or declining demand for the product. It would really be difficult for a low net margin firm to withstand these adversities. Similarly, a firm with high net profit margin can make better use of favourable conditions such as rising selling prices, falling cost of production or increasing demand for the product. Such a firm will be able to accelerate its profits at a faster rate than a firm with a low net profit margin.
Nweze (2011) adds that ratio of net income to net sales is termed the profit margin. It indicates the profitability generated from revenue and hence is an important operating performance measure.
Dave (2012) studies capital structure and profitability of the firms listed on Nigerian Stock Exchange. He observed negative association between long term debt and profitability and suggested that top management should take interest in capital structure to improve profitability. He adds that the relationship between working capital management and profitability of 131 companies listed on the Athens Stock Exchange for the period shows that account receivables, inventories and account payables had negative relationship with profitability. However, the relationship of accounts receivables and account payables with profitability was highly significant, while the relationship of inventory with profitability was not statistically significant suggesting that account receivable and account payables are the areas to be focused on to improve the profitability of the firm. Chin (1997) adds that the relationship between the profitability of a company with various capital structure variables i.e. cash and marketable securities, receivables, working capital, long term investment, debt and equity capital etc. Kieu (2001) focuses on working capital management and tools of financial management such as ratio analysis, profitability measures and break-even analysis. Niresh (2012) says that capital structure decision of a bank is similar to that of a non-financial firm. Although there are considerable inter industry differences in the capital structure of firms due to the unique nature of each industry business, the intra-firm variations are attributed to the business and financial risk of individual firms. Most studies found a negative relationship between profitability and leverage. Chary, Kasturi and Kumar (2011) argue that the relationship between working capital and profitability has been an interesting debate in financial management. Working capital decision affects both liquidity and profitability. Excess of investment in working capital may result in poor liquidity. He adds that management need to trade-off between liquidity and profitability to maximize shareholders wealth. To understand the impact of working capital on profitability, one needs to establish the relationship between these two statistical measures such that correlation and regression models can be used to understand such relationship. Because of this literature review, the researchers conclude that there are significant effects between the independent variables and dependent variable of this study. Financial management also involves planning, acquisition, allocation and control of financial resources of an organization in order to achieve the goal(s) of the organization with minimum financial discomfort, and maximum benefit which is profit maximization. Moreover, if the management manage their finance very well, it will increase the profit made by the organization while if not, the profit of the organization will be affected or decreased. In other words, inventory turnover ratio and debtors’ turnover ratio are to be maintained at higher levels for better profitability. Creditors may be kept at higher levels for shortening the length of net trade cycle. Furthermore, this inverse relationship between net trade cycle and return on assets was found different across industries depending on the type of industry. Finally, the relationship between variables such as those between working capital management and profitability i.e. if efficient working capital management increases profitability, one should expect a negative relationship between the measure of working capital management and profitability variable. There is a negative relationship between gross profitability on one hand and the measure of working capital management on the other hand. This is consistent with the view that the time lag between expenditure for purchases of raw materials and the collection of sales of finished goods can be too long, and that decreasing this time lag increases profitability.
3. Methodology.
Since the purpose of this research is to determine the effect of financial management on profitability of
European Journal of Business and Management www.iiste.org ISSN 2222-1905 (Paper) ISSN 2222-2839 (Online) Vol 4, No.20, 2012
32
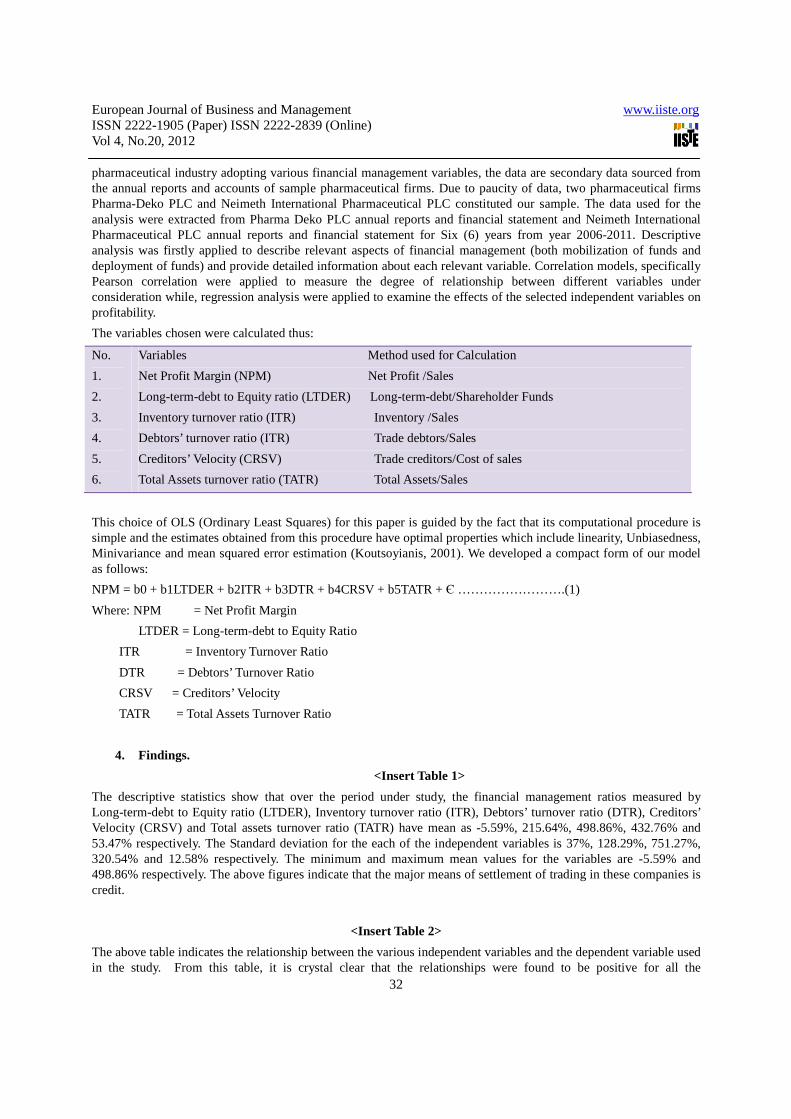
pharmaceutical industry adopting various financial management variables, the data are secondary data sourced from the annual reports and accounts of sample pharmaceutical firms. Due to paucity of data, two pharmaceutical firms Pharma-Deko PLC and Neimeth International Pharmaceutical PLC constituted our sample. The data used for the analysis were extracted from Pharma Deko PLC annual reports and financial statement and Neimeth International Pharmaceutical PLC annual reports and financial statement for Six (6) years from year 2006-2011. Descriptive analysis was firstly applied to describe relevant aspects of financial management (both mobilization of funds and deployment of funds) and provide detailed information about each relevant variable. Correlation models, specifically Pearson correlation were applied to measure the degree of relationship between different variables under consideration while, regression analysis were applied to examine the effects of the selected independent variables on profitability.
The variables chosen were calculated thus:
No.
1.
2.
3.
4.
5.
6.
Variables Method used for Calculation
Net Profit Margin (NPM) Net Profit /Sales
Long-term-debt to Equity ratio (LTDER) Long-term-debt/Shareholder Funds
Inventory turnover ratio (ITR) Inventory /Sales
Debtors’ turnover ratio (ITR) Trade debtors/Sales
Creditors’ Velocity (CRSV) Trade creditors/Cost of sales
Total Assets turnover ratio (TATR) Total Assets/Sales
This choice of OLS (Ordinary Least Squares) for this paper is guided by the fact that its computational procedure is simple and the estimates obtained from this procedure have optimal properties which include linearity, Unbiasedness, Minivariance and mean squared error estimation (Koutsoyianis, 2001). We developed a compact form of our model as follows:
NPM = b0 + b1LTDER + b2ITR + b3DTR + b4CRSV + b5TATR + Є …………………….(1)
Where: NPM = Net Profit Margin
LTDER = Long-term-debt to Equity Ratio
ITR = Inventory Turnover Ratio
DTR = Debtors’ Turnover Ratio
CRSV = Creditors’ Velocity
TATR = Total Assets Turnover Ratio
4. Findings.
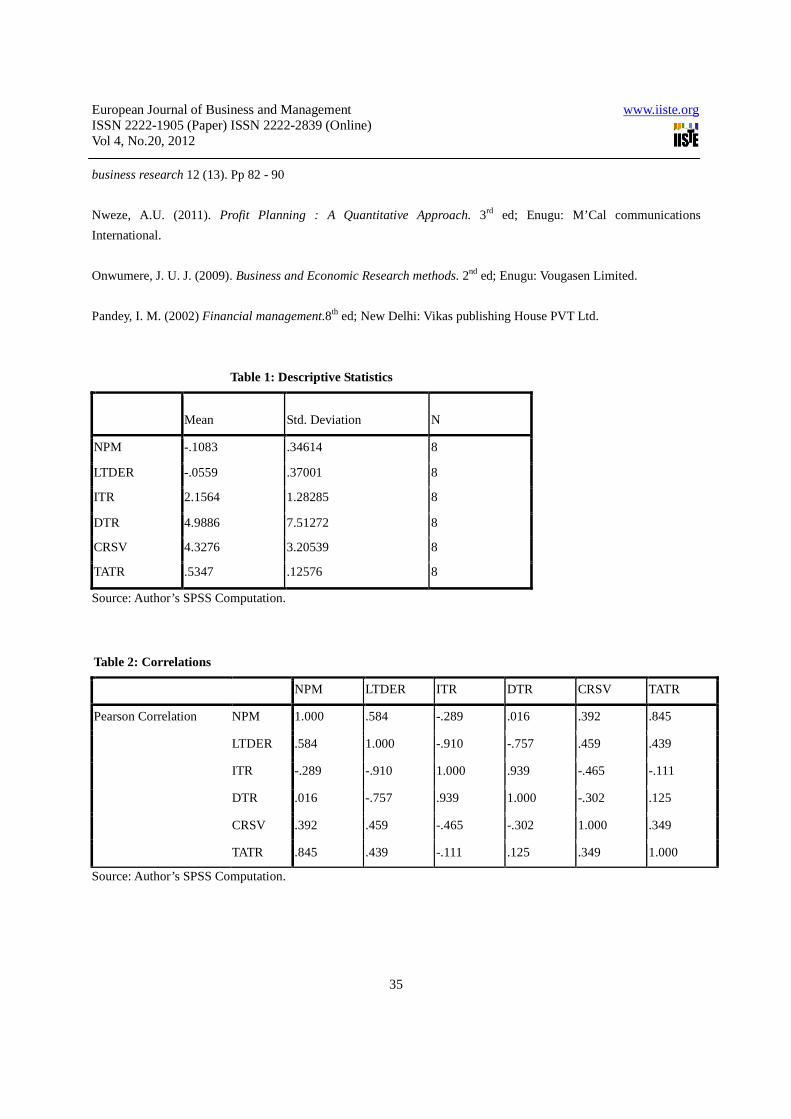
<Insert Table 1>
The descriptive statistics show that over the period under study, the financial management ratios measured by Long-term-debt to Equity ratio (LTDER), Inventory turnover ratio (ITR), Debtors’ turnover ratio (DTR), Creditors’ Velocity (CRSV) and Total assets turnover ratio (TATR) have mean as -5.59%, 215.64%, 498.86%, 432.76% and 53.47% respectively. The Standard deviation for the each of the independent variables is 37%, 128.29%, 751.27%, 320.54% and 12.58% respectively. The minimum and maximum mean values for the variables are -5.59% and 498.86% respectively. The above figures indicate that the major means of settlement of trading in these companies is credit.
<Insert Table 2>
The above table indicates the relationship between the various independent variables and the dependent variable used in the study. From this table, it is crystal clear that the relationships were found to be positive for all the
European Journal of Business and Management www.iiste.org ISSN 2222-1905 (Paper) ISSN 2222-2839 (Online) Vol 4, No.20, 2012
33
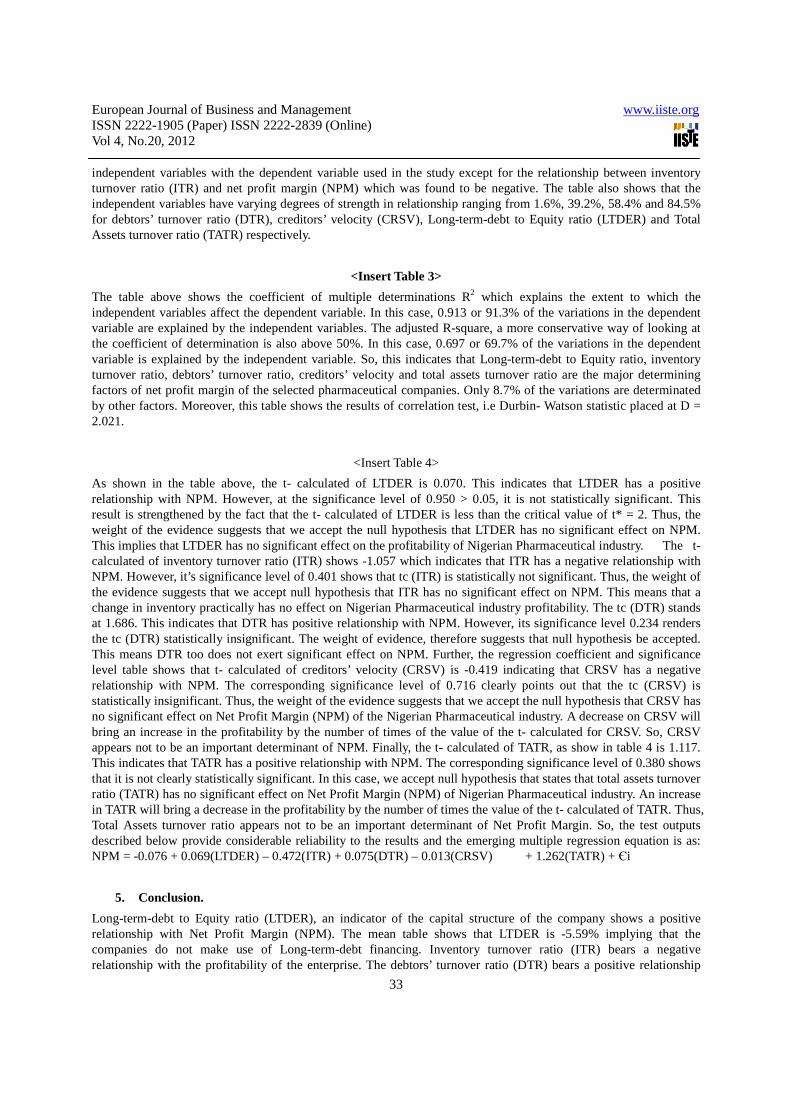
independent variables with the dependent variable used in the study except for the relationship between inventory turnover ratio (ITR) and net profit margin (NPM) which was found to be negative. The table also shows that the independent variables have varying degrees of strength in relationship ranging from 1.6%, 39.2%, 58.4% and 84.5% for debtors’ turnover ratio (DTR), creditors’ velocity (CRSV), Long-term-debt to Equity ratio (LTDER) and Total Assets turnover ratio (TATR) respectively.
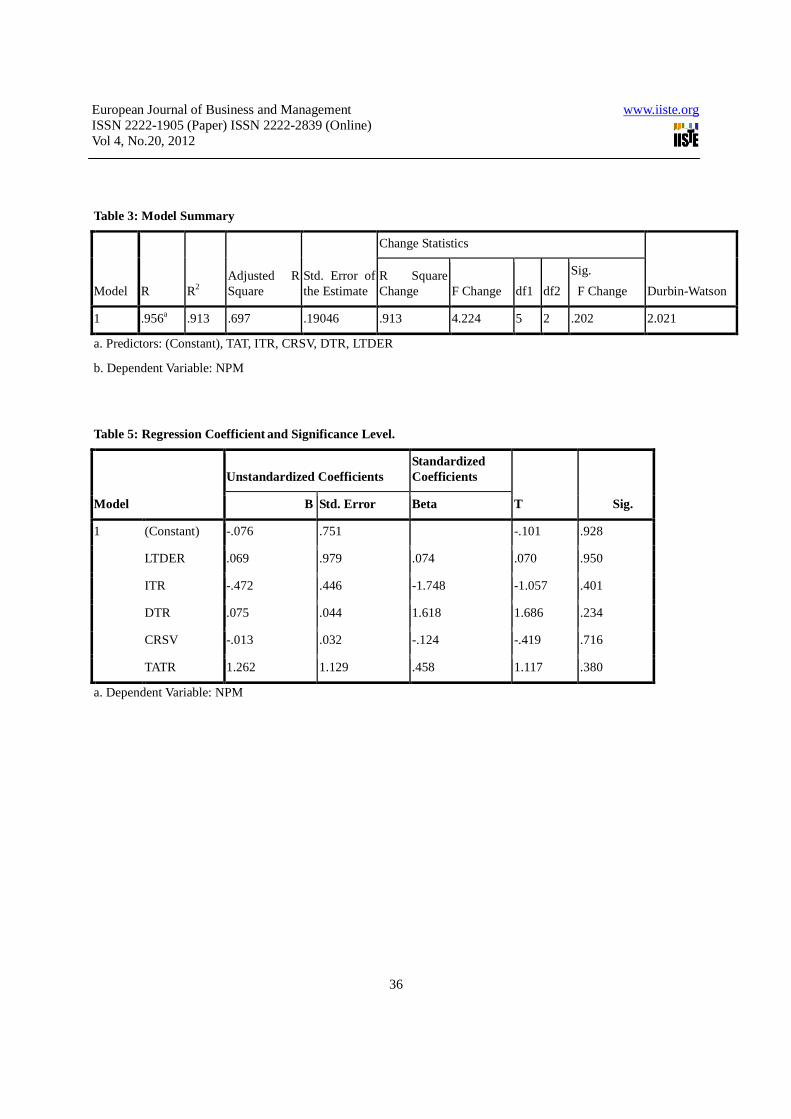
<Insert Table 3>
The table above shows the coefficient of multiple determinations R2 which explains the extent to which the independent variables affect the dependent variable. In this case, 0.913 or 91.3% of the variations in the dependent variable are explained by the independent variables. The adjusted R-square, a more conservative way of looking at the coefficient of determination is also above 50%. In this case, 0.697 or 69.7% of the variations in the dependent variable is explained by the independent variable. So, this indicates that Long-term-debt to Equity ratio, inventory turnover ratio, debtors’ turnover ratio, creditors’ velocity and total assets turnover ratio are the major determining factors of net profit margin of the selected pharmaceutical companies. Only 8.7% of the variations are determinated by other factors. Moreover, this table shows the results of correlation test, i.e Durbin- Watson statistic placed at D = 2.021.
<Insert Table 4>
As shown in the table above, the t- calculated of LTDER is 0.070. This indicates that LTDER has a positive relationship with NPM. However, at the significance level of 0.950 > 0.05, it is not statistically significant. This result is strengthened by the fact that the t- calculated of LTDER is less than the critical value of t* = 2. Thus, the weight of the evidence suggests that we accept the null hypothesis that LTDER has no significant effect on NPM. This implies that LTDER has no significant effect on the profitability of Nigerian Pharmaceutical industry. The t- calculated of inventory turnover ratio (ITR) shows -1.057 which indicates that ITR has a negative relationship with NPM. However, it’s significance level of 0.401 shows that tc (ITR) is statistically not significant. Thus, the weight of the evidence suggests that we accept null hypothesis that ITR has no significant effect on NPM. This means that a change in inventory practically has no effect on Nigerian Pharmaceutical industry profitability. The tc (DTR) stands at 1.686. This indicates that DTR has positive relationship with NPM. However, its significance level 0.234 renders the tc (DTR) statistically insignificant. The weight of evidence, therefore suggests that null hypothesis be accepted. This means DTR too does not exert significant effect on NPM. Further, the regression coefficient and significance level table shows that t- calculated of creditors’ velocity (CRSV) is -0.419 indicating that CRSV has a negative relationship with NPM. The corresponding significance level of 0.716 clearly points out that the tc (CRSV) is statistically insignificant. Thus, the weight of the evidence suggests that we accept the null hypothesis that CRSV has no significant effect on Net Profit Margin (NPM) of the Nigerian Pharmaceutical industry. A decrease on CRSV will bring an increase in the profitability by the number of times of the value of the t- calculated for CRSV. So, CRSV appears not to be an important determinant of NPM. Finally, the t- calculated of TATR, as show in table 4 is 1.117. This indicates that TATR has a positive relationship with NPM. The corresponding significance level of 0.380 shows that it is not clearly statistically significant. In this case, we accept null hypothesis that states that total assets turnover ratio (TATR) has no significant effect on Net Profit Margin (NPM) of Nigerian Pharmaceutical industry. An increase in TATR will bring a decrease in the profitability by the number of times the value of the t- calculated of TATR. Thus, Total Assets turnover ratio appears not to be an important determinant of Net Profit Margin. So, the test outputs described below provide considerable reliability to the results and the emerging multiple regression equation is as: NPM = -0.076 + 0.069(LTDER) – 0.472(ITR) + 0.075(DTR) – 0.013(CRSV) + 1.262(TATR) + Єi
5. Conclusion.
Long-term-debt to Equity ratio (LTDER), an indicator of the capital structure of the company shows a positive relationship with Net Profit Margin (NPM). The mean table shows that LTDER is -5.59% implying that the companies do not make use of Long-term-debt financing. Inventory turnover ratio (ITR) bears a negative relationship with the profitability of the enterprise. The debtors’ turnover ratio (DTR) bears a positive relationship
European Journal of Business and Management www.iiste.org ISSN 2222-1905 (Paper) ISSN 2222-2839 (Online) Vol 4, No.20, 2012
34
with the profitability of the enterprise. The creditors’ velocity (CRSV) shows that management of creditors bears a negative relationship with Net Profit Margin (NPM) with significance level standing at 0.716 showing statistically insignificant. So the CRSV has no significant effect on NPM. Because of this finding on creditors’ velocity, the company is not taking advantage of any discount associated with prompt payment and this may lead to increase in their cost of sales and consequently decrease in their profit. Total Assets turnover ratio (TATR) indicates a positive relationship with Net Profit Margin (NPM). The (model summary) indicates that coefficient of multiple determinations (R2) is 91.3% of the variations in the dependent variable and are explained by the independent variables of our model. It also shows that the independent variables are the major determinants factor of net profit margin of the Nigerian Pharmaceutical industry while only 8.7% of the variations are determined by other factors. Given the findings, the study recommends that the inventories of the company should be monitored more frequently to prevent stock-out or over stocking conditions of their products, that creditors’ velocity should be at a point where the creditors and purchases are equal in order to take the advantage of credit facility and any discount associated with prompt payment for goods to increase the profitability of the company.
References
Boris, B., Donald, R.C. & Pamela, S. S. (2008). Business Research methods. 2nd ed: UK: McGraw-Hill Education.
Chary, T. S., Kaskuri, R. and kumar, S. K (2011). “Relationship between working capital and profitability: A
statistical Approach” International Journal of Research in Finance and Marketing 1(7) pp 1 - 16
http://wwwmairec.org
Chin, A. F. (1997). “Relationship between capital structure and profitability”. Unpublished M.Sc Thesis Graduate
School of management. University of Malaysia
Dave, A. R. (2002). “Financial Management as a determinant of profitability” South Asian Journal of management
19 (1). Pp 124 - 137
Emekekwue, P. E. (2002). Corporate Financial management. 4th Revised ed. Kinshasha: African Bureau of
Educational sciences.
Ezeamama, M. C. (2010). Fundamentals of Financial management: A practical guide. Enugu: Ema Press Ltd.
Hasan, A. K., Halil; E. A., Arzu, O. C. and Salih, D. (2011). “The Relationship between working capital and
profitability: Evidence from an emerging market” International Research Journal of Finance and Economic (62). Pp
61 - 67
Kieu, M. N., (2001). “Financial management and profitability of small amd medium enterprises”. Unpublished Ph.D
Thesis Graduate College of Management Southern Cross University, N.S.W Australia.
Malik, H. (2011). “Determinants of insurance companies’ profitability: An analysis of insurance sector of Pakistan”
Academic Research International 1(3). Pp 315 – 321.
Niresh, J. A. ((2012). “Capital structure and profitability in Sirilankan Banks” Global Journal of management and
European Journal of Business and Management www.iiste.org ISSN 2222-1905 (Paper) ISSN 2222-2839 (Online) Vol 4, No.20, 2012
35
business research 12 (13). Pp 82 - 90
Nweze, A.U. (2011). Profit Planning : A Quantitative Approach. 3rd ed; Enugu: M’Cal communications
International.
Onwumere, J. U. J. (2009). Business and Economic Research methods. 2nd ed; Enugu: Vougasen Limited.
Pandey, I. M. (2002) Financial management.8th ed; New Delhi: Vikas publishing House PVT Ltd.
Table 1: Descriptive Statistics
Mean Std. Deviation
N
NPM -.1083 .34614 8
LTDER -.0559 .37001 8
ITR 2.1564 1.28285 8
DTR 4.9886 7.51272 8
CRSV 4.3276 3.20539 8
TATR .5347 .12576 8
Source: Author’s SPSS Computation.
Table 2: Correlations
NPM LTDER ITR DTR CRSV TATR
Pearson Correlation NPM 1.000 .584 -.289 .016 .392 .845
LTDER .584 1.000 -.910 -.757 .459 .439
ITR -.289 -.910 1.000 .939 -.465 -.111
DTR .016 -.757 .939 1.000 -.302 .125
CRSV .392 .459 -.465 -.302 1.000 .349
TATR .845 .439 -.111 .125 .349 1.000
Source: Author’s SPSS Computation.
European Journal of Business and Management www.iiste.org ISSN 2222-1905 (Paper) ISSN 2222-2839 (Online) Vol 4, No.20, 2012
36
Table 3: Model Summary
Model R R2 Adjusted R Square
Std. Error of the Estimate
Change Statistics
Durbin-Watson R Square Change F Change df1 df2
Sig.
F Change
1 .956a .913 .697 .19046 .913 4.224 5 2 .202 2.021
a. Predictors: (Constant), TAT, ITR, CRSV, DTR, LTDER
b. Dependent Variable: NPM
Table 5: Regression Coefficient and Significance Level.
Model
Unstandardized Coefficients Standardized Coefficients
T Sig. B Std. Error Beta
1 (Constant) -.076 .751 -.101 .928
LTDER .069 .979 .074 .070 .950
ITR -.472 .446 -1.748 -1.057 .401
DTR .075 .044 1.618 1.686 .234
CRSV -.013 .032 -.124 -.419 .716
TATR 1.262 1.129 .458 1.117 .380
a. Dependent Variable: NPM
This academic article was published by The International Institute for Science,
Technology and Education (IISTE). The IISTE is a pioneer in the Open Access
Publishing service based in the U.S. and Europe. The aim of the institute is
Accelerating Global Knowledge Sharing.
More information about the publisher can be found in the IISTE’s homepage:
http://www.iiste.org
CALL FOR PAPERS
The IISTE is currently hosting more than 30 peer-reviewed academic journals and
collaborating with academic institutions around the world. There’s no deadline for
submission. Prospective authors of IISTE journals can find the submission
instruction on the following page: http://www.iiste.org/Journals/
The IISTE editorial team promises to the review and publish all the qualified
submissions in a fast manner. All the journals articles are available online to the
readers all over the world without financial, legal, or technical barriers other than
those inseparable from gaining access to the internet itself. Printed version of the
journals is also available upon request from readers and authors.
IISTE Knowledge Sharing Partners
EBSCO, Index Copernicus, Ulrich's Periodicals Directory, JournalTOCS, PKP Open
Archives Harvester, Bielefeld Academic Search Engine, Elektronische
Zeitschriftenbibliothek EZB, Open J-Gate, OCLC WorldCat, Universe Digtial
Library , NewJour, Google Scholar