pharmaceutical dosage forms
515
-
Upload
khangminh22 -
Category
Documents
-
view
0 -
download
0
Transcript of pharmaceutical dosage forms
PHARMACEUTICALDOSAGE FORMS
PHARMACEUTICALDOSAGE FORMS
Tablets
SECOND EDITION, REVISED AND EXPANDED
In Three Volumes
VOLUME 3
EDITED BY
Herbert A. LiebermanH. H. Lieberman Associates, Inc.
Consultant ServicesLivingston, New Jersey
Leon LachmanLachman Consultant Services
Westbury, New York
Joseph B. SchwartzPhiladelphia College of Pharmacy and Science
Philadelphia, Pennsylvania
MARCELn MARCEL DEKKER, INC.
DEKKER
NEW YORK· BASEL· HONG KONG
ISBN: 0-8247-8300-X
This book is printed on acid- free paper.
Copyright 0 1990 by MARCEL DEKKER. INC. All Rights Reserved
Neither this book nor any part may be reproduced or transmitted inany form or by any means. electronic or mechanical, including photocopying, microfilming, and recording. or by any information storageand retrieval system, without permission in writing from the pubttsher ,
MARCEL DEKKER. INC.270 Madison Avenue. New York. New York 10016
Current printing (last digit):10 9 8 7 6 5
PRINTED IN THE UNITED STATES OF AMERICA
Preface
Tablets are the most commonly prescribed dosage form. The reason forthis popularity is that tablets offer a convenient form of drug administration, provide dosage uniformity from tablet to tablet. are stable over extended and diverse storage conditions, and can be produced on high-speedcompression, labeling, and packaging equipment. As a result, tablet production technology is constantly undergoing improvements that enhancetheir ability to deliver, with precision. a desired drug in a dosage formintended for immediate or extended therapeutic effect. In addition. thegrowth of the generic industry as well as increased competition from bothforeign and domestic markets require that a tablet manufacturer havegreater concern regarding the economics of tablet production by introducingless labor-intensive, higher-productivity manufacturing methods for makingthe increasing number of tablet products available today. The changes inthe science and technology of tablet formulation, production, and qualityassurance to accomplish the above are reflected in the second edition ofthe three-volume series Pharmaceutical Dosage Forms: Tablets.
The first volume in this series describes the many types of tabletproducts, giving specific updated examples of typical formulations andmethods of manufacture. These include single- and multilayered tablets,buccal and sublingual tablets, effervescent tablets. and diverse meth-ods for manufaeturtng them by wet and dry granulations and by directcompression. In addition, medicated candy products are a form of drugdelivery that has appeared in the marketplace; no complete chapter onthis technology has been printed in any pharmacy text other than botheditions of this series on tablets.
To manufacture tablets a number of unit processes are required, suchas mixing, drying, size reduction, and compression. The economics oftablet production today require an update of the technologies for each ofthese pharmaceutical operations. The granulations and tablets produced
iii
iv Preface
have particular characteristics that must be analyzed and understood inorder to produce superior tablets, particularly when new and sometimesfaster methods of manufacture are introduced. No drug dosage formwould be meaningful to the patient without the drug being bioavailable.The chapter on bioavailability in tablet technology is updated in the second edition of Volume 2. Finally, many advances in the specifications andcare of tablet tooling and problem solving caused by faulty compressiontools are expertly covered in the second volume.
Volume 3 in the series on tablets updates the special characteristicsthat should be considered for optimizing tablet production. Particularemphasis is given to design methods that should be considered when formuIattng a tablet product. Discussions of specialized granule and tablet-coating equipment are presented. discussing improvements or presenting newequipment developed since the publication of the first edition. Aqueous filmcoating is now firmly established in pharmaceutical coating processes, andthus, a shift in emphasis on coating procedures has been made in the revised chapter on coating. New coating pans and automation of aqueousfilm- and sugar-coating methods are covered. Fluid-bed processes andparticle-coating methods, including theoretical considerations, are updatedto reflect current practices.
No text on tablet technology eould be considered complete without afull theoretical and practical updated description of current methods forformulating, manufacturing, and controlling the release of drug from sustained-release tablet and particle dosage forms. A chapter on sustaineddrug release through coating provides an updated and authoritative discussion of this popular form of drug delivery. There is an enhanced emphasis on the various polymers and their combinations used to attain sustaineddrug activity. Pilot operations must reflect production methods in orderto minimize difficulties in transferring a product from preproduction toproduction. Granules prepared by precompression, wet and dry granulation, fluidized-bed granulation, and spray drying are compared. A newmethod for preparing a granulation, namely the moisture-activated drygranulation (MADG), is also suggested for more widespread pilot evaluation.
With the increasing emphasis on product uniformity from one tablet toanother. or from one batch to another, whether the product is made sequentially or with long lag periods between batches, or whether the rawmaterial source is from several different manufacturers, the concept ofprocess validation is essential. An extensive chapter descrfbing the essential considerations that should be evaluated in process validation has beenadded to the revised edition of this volume. Although the chapter presents a complete detailed description of many validation methods, it alsoshows how less detailed approaches, some of which are commonly used inthe industry, are useful. Current tablet production methods are describedwith sample control charts to help the readers improve their tablet production methods. The importance of the several different functions of production departments, their particular skills, and the need for coordinatedand cooperative work relationships are stressed in the chapter "TabletProduction" so that the combined, partnership efforts of all productionpersonnel can lead to superior tablet production. Automation of tabletcompression and coating is also part of the chapter concerned with theproduction of tablets.
In the discussion of stability, updated stability protocols to complywith recent FDA guidelines are presented. A new covariance analysis and
Preface v
statistical method for expiration date prediction are described. The chapter "Quality Assurance" upgrades tablet testing for uniformity. dissolution,assay limit, test methods, and compendia! requirements for tablets to comply with current USP/NF requirements. Included are instructive figuresfor new schematic sampling plans. an update of the restrictions on the useof colors, and a recommended sampling method for raw materials. Thus,with this third volume on tablets. all the parameters currently concernedwith the production of superior tablets are made current and discussedextensively.
An updated and full coverage of the many topics concerned with tabletsrequires highly knowledgeable authors for each of the many areas that mustbe covered. To compile and update the pertinent information needed forthe various chapters in this book required a multiauthored text of technologists with specific expertise and experience in their chosen subject matter.Each of the authors was charged with teaching their subject in such afashion that the novice as well as the experienced reader will profit.They were to offer basic scientific facts and practical information so thatall readers can learn theory and apply it toward the knowledge that eachneeds to formulate, produce, and control tablet operations in a scientificrather than an empirical manner.
With this third volume. the editors have finished their task of updatingthe second edition on tablets. The editors are grateful to the authors fortheir fine contributions and. particularly. their patient response to theeditors' suggestions for changes. The choice of the chapter topics, theauthors. and the format are the responsibilities of the editors. It is hopedthat these choices will prove fruitful to our readers by helping them solvetheir tablet technology problems and thereby advance industrial pharmacy'scontribution toward improving both quality and efficiency in the manufactureof tablets.
Herbert A. LiebermanLeon Lachman
Joseph B. Schwartz
Contents
Preface iiiContributors xiContents of Pharmaceutical Dosage Forms: Tablets, Second Edition xiii
Volumes 1 and 2Contents of Pharmaceutical Dosage Forms: Parenteral Medications. xv
Volumes 1 and 2Contents of Pharmaceutical Dosage Forms: Disperse Systems. xvii
Volumes 1 and 2
Chapter 1. Principles of Improved Tablet Production System Design 1
Garnet E. Peck. Neil R. Anderson. andGilbert S. Banker
I. Introduction 111. Benefits of Improved Tablet Production Systems 3
III. Production Process Design Considerations 3IV. Validation 64
Appendix: List of Manufacturers 73References 74
Chapter 2. Coating of Pharmaceutical Solid -Dosage Forms
Stuart C. Porter and Charles H. Bruno
I. IntroductionII. Sugar Coating
III. Film Coating
77
777893
vii
viii
IV. Coating EquipmentV. Automated Coating Procedures
References
Chapter 3. Particle-Coating Methods
Dale E. WUr'ster
Contents
125155158
161
I.II.
III.IV.V.
VI.VII.
IntroductionWurster ProcessCentrifugationSpray DryingAqueous-Phase Separation. CoacervationNonaqueous-Phase SeparationIn terfacial PolymerizationReferences
161162184187189193194195
Chapter 4. Sustained Drug Release from Tablets and ParticlesThrough Coating
Hong-Run Chang and Joseph R. Robinson
I. IntroductionII. Requirements for Sustained Drug Release
III. Fabrication of Sustained-Release ProductsIV. Sustained-Release Products Through CoatingV. Coating Materials
VI. SummaryReferences
199
199201208241282287287
303Chapter 5. The Pharmaceutical Pilot Plant
Charles I. Jarowski
I. Introduction 303II. Selected Factors to Be Considered During
Development 304III. Types of Organizational Structures Responsible
for Pilot Operations 305IV. Educational Backgrounds of Pilot Plant
Personnel 310V. Pilot Plant Design for Tablet Development 311
VI. Paper Flow Between Research. Quality Control,and Production 315
VII. Use of the Pilot Plant Scale-Up to Select theOptimal Procedure for the Preparation ofDexamethasone Tablets 320
VIII. Problem Caused by a Change in ExcipientSupplier 344
IX. Friability Related to Particle Size Distribution 345X. Effect of Disintegrant Viscosity on
Disintegration Rate 346
Contents
XI.
XII.XIII.
XIV.
XV.XVI.
XVII.XVJII.
XIX.
Influence of Ingredient Moisture Content onFriabilityDrug and Dye Migration in Wet GranulationEffect of Aged Simple Syrup on Smoothingand Rounding Steps in the Sugar Coatingof TabletsEffect of Film-Former Viscosity on DisintegrationRateTablet BindingPicking and StickingSelected Tablet Problems; Suggested SolutionsSelected Process Development Projects ofCurrent InterestAdditional Pilot Plant ResponsibilitiesReferences
347347
350
351352352353
354355365
Chapter 6 Tablet Production
Robert J. Connolly, Frank A. Berstler ,and David Cofnn-Beach
369
I.II.
III.IV.V.
VI.VII.
VIII.IX.
IntroductionFour Basic Requirements for Successful TabletProductionOverview of the ProcessDesign of the ProductDesign of the FacilityEquipment SelectionPersonnelRole of ManufacturingIndustry OutlookAppendix: List of SuppliersSuggested ReadingsReferences
369
369370390392403410411413414415415
Chapter 7. The Essentials of Process Validation
Robert A. Nash
417
I.II.
III.IV.V.
VI.VII.
VIII.IX.X.
XI.XII.
XIII.
IntroductionTotal Approach to Pharmaceutical ProcessValidationOrganizing for ValidationProcess Validation -Order of PriorityPilot - Scale- Up and Process ValidationProcess Capability Design and TestingCause-and-Effect or "Fishbone" DiagramConstraint AnalysisQualification Trial OptionsProcess ValidationProspective Process ValidationStrategy for Process ValidationConcurrent Validation
417
418421423423426431431433442443444445
XIV.XV.
XVI.
Retrospective ValidationControl ChartingConclusionsGlossary of TermsReferences
Contents
447448450451453
Chapter 8 Stability Kinetics
Samir A. Hanna
457
I.II.
III.IV.V.
VI.VII.
VIII.IX.X.
XI.XII.
IntroductionCurrent Good Manufacturing PracticesRequirementsCompendia! RequirementsU •S. Food and Drug Administration RequirementsReaction Kinetics in Solid-Dosage FormsKinetic StudiesSolid-Drug DegradationSolid -Solid DegradationSolid-Dosage Form DegradationMechanisms that Affect Tablet StabilityContainer-Closure SystemExpiration DatingReferences
457
457457458458464477477478478482485495
Chapter 9 Quality Assurance
Samir A. Hanna
497
Index
I.II.
III.IV.V.
VI.VII.
VIII.IX.X.
XI.XII.
XIII.
IntroductionQuality Assurance SystemGood Manufacturing Practices RequirementsCompendia! RequirementsRaw MaterialsActive or Therapeutic MaterialsInactive or Inert MaterialsContainerIn-Process Quality AssuranceQuality Assurance Before Start CheckingAfter Start CheckingQualification/ValidationFinished Product
497497499499507511515518522522537548548
555
Contributors
Neil R. Anderson Department Head. Pharmacy Research Department.Merrell Dow Pharmaceuticals. Inc .• Indianapolis, Indiana
Gilbert S. Banker Dean, College of Pharmacy, University of MinnesotaHealth Sciences Center. Minneapolis, Minnesota
Frank A. Berstler Manager, Technical Service, Superpharm Corporation,Central Islip, New York
Charles H. Bruno Director, Pharmaceutical Technical Services, Colorcon,West Point, Pennsylvania
Rong-Kun Chang Principle Scientist, Formulation Development. ScheringResearch, Miami, Florida
David Coffin-Beach Manager, Process Development, Schering-Plough,Inc., Kenilworth, New Jersey
Robert J. Connolly Vice President, Manufacturing, 8uperpharm Corporation, Central Islip, New York
Samir A. Hanna Vice President, Quality Assurance, Industrial Division,Bristol-Myers Squibb Company, Syracuse. New York
Charles I. Jarowski Professor, Department of Pharmacy, St. John'sUniversity, Jamaica, New York
Robert A. Nash Associate Professor. College of Pharmacy and AlliedHealth Professions, 8t. JOhn's University, Jamaica, New York
xi
xii Contributors
Garnet E. Peck Professor, Department of Industrial and PhysicalPharmacy, Purdue University, West Lafayette, Indiana
Stua rt C. Porter Vice President, Scientific Services, Colorcon, WestPoint, Pennsylvania
Joseph R. Robinson Professor of Pharmacy, Madison Center for HealthSciences, University of Wisconsin-Madison, Madison, Wisconsin
DaleE. Wu rster Professor and Dean Emeritus, College of Pharmacy,University of Iowa, Iowa City, Iowa
Contents of Pharmaceutical DosageForms: Tablets, Second Edition, Revisedand Expanded, Volumes 1 and 2
edited by Herbert A. Lieberman, Leon Lachman, and Joseph B. Schwartz
VOLUME 1
1. Preformulation Testing, Deodatt A. Wadke, Abu T. M. Serajuddin,and Harold Jacobson
2. Tablet Formulation and Design. Garnet E. Peck, George J. Bailey,Vincent E. McCurdy, and Gilbert S. Banker
3. Compressed Tablets by Wet Granulation, Fred J. Bandelin
4. Compressed Tablets by Direct Compression, Ralph F. Shangraw
5. Compression-Coated and Layer Tablets, William C. Gunsel andRobert G. Dusel
6. Effervescent Tablets, Raymond Mohrle
7. Special Tablets, James W. Conine and Michael J. Pikal
8. Chewable Tablets, Robert W. Mendes, Aloysius O. Anaebonam, andJohan B. Daruwala
9. Medicated Lozenges, David Peters
xiii
xiv
VOLUME 2
Contents of Other Volumes
1. Mixing, Russell J. Lantz, Jr., and Joseph B. Schwartz
2. Drying, Kurt G. Van Scoik, Michael Zoglio, and Jens T. Carstensen
3. Size Reduction. Russell J. Lantz. Jr.
4. Compression. Eugene L. Parrott
5. Granulation Technology and Tablet Characterization, Roger E. Gordon,Thomas W. Rosanaske, Dale E. Fonner. Neil R. Anderson. and GilbertS. Banker
6. Bioavailability in Tablet Technology. Solomon A. Stavchansky andJames W. McGinity
7. Pharmaceutical Tablet Compression Tooling, George F. Loeffler andGlen C. Ebey

Contents of Pharmaceutical DosageForms: Parenteral Medications,Volumes 1 and 2
edited by Kenneth E. Avis, Leon lachman,and Herbert A. Lieberman
VOLUME
1. The Dosage Form and Its Historical Development, Kenneth E. Avisand Beth G. Morris
2. Parenteral Drug Administration: Routes, Precautions, Problems,and Complications, Richard J. Duma and Michael J. Akers
:3. Biopharmaceutics of Injectable Medication, Sol Motola
4. Preformulation of Parenteral Medications, Sol Motola andShreeram A gharkar
5. Formulation of Small Volume Parenterals , Patrick P. DeLuca andJames C. Boylan
6. The Processing of Small Volume Parenterals and Related SterileProducts, Joel Benton Portnoff. Richard J. Harwood, and EdwardWilliam Sunbery
7. Manufacturing of Large Volume Parenterals, Nicholas J. KarUnos andMichale J. Groves
8. Records and Reports. David C. Fry
9. Environmental Factors in the Design of a Parenteral ProductionFacility, A. Michael Keller
10. Personnel: The Key Factor in Clean Room Operations, Cecelia J. Luna
xv
xvi
VOLUME 2
Contents of Other Volumes
1. Industrial Sterilization: A Review of Current Principles andPractices, Frank J. Marino and Floyd Beniamin.
2. Formulation for Large Volume Parenterals, Levit J. Demorest
3. Glass Containers for Parenterals, Frank R. Bacon
4. Plastic Containers for Parenterals, Donald D. Solomon, RaymondW. Jurgens, Jr., and K. Lim Wong
5. Elastomeric Closures for Parenterals, Edward J. Smith and Robert A.Nash
6. Particulate Matter, Patrick P. DeLuca and Julius Z. Knapp
7. Environmental Control in Parenteral Drug Manufacturing, FrancoDeVecchi
8. Quality Assurance, Samir A. Hanna
9. Federal Regulation of Parenterals, Jonas L. Bassen and BernardT. Loftus
10. Medical Devices: Design, Manufacture, and Quality Control,David H. Way!
11. Quality Assurance for Parenteral Devices, Carl W. Bruch
12. Regulatory and GMP Considerations for Medical Devices,Larry R. Pilot
13. Parenteral Products in Hospital Practice, John W. Levchuk:
Contents of Pharmaceutical Dosage Forms:Disperse Systems, Volumes 1 and 2
edited by Herbert A. lieberman, Martin M. Rieger, and Gilbert S. Banker
VOLUME 1
1. Introduction, Norman Weiner
2. Theory of Suspensions. Michael J. Falkowicz
3. Theory of Emulsions, Stig E. Friberg, Lisa B. Goldsmith, andMartha L. Hilton
4. Theory of Colloids, John Vanderhoff and Mohamed S. EI-Aasser
5. Pharmaceutical Suspensions, Robert A. Nash
6. Pharmaceutical Emulsions, Bernard Jdson
'I. Specialized Pharmaceu tical Emulsions, Morton Rosoff
8. Surfactants, Martin M. Rieger
9. Rheology of Dispersed Systems, Donald E. Deem
10. Experimental Design, Modeling. and Optimization Strategies for Productand Process Development, Robert M. Franz, Jeffrey E. Browne, andAllen R. Lewis
xvii
xviii
VOLUME 2
Contents of Other Volumes
1. A Practical Guide to Equipment Selection and Operating Techniques,Roy Scott
2. Preservation of Dispersed Systems, Harun Takruri and Claude B.Anger
3. Bioavailability of Disperse Dosage Forms, R. D. Schoenwald andDouglas R. Flanagan
4. Viscosity-Imparting Agents in Disperse Systems, Joel Zatz, Joseph J.Berry, and Daniel A. Alderman
5. Antacids and Clay Products I Richard Harwood, Joseph R. LUber, andEdward W. Sunbery
6. Oral Aqueous Suspensions, Clyde M. Orner III, Roger L. Schnaare,and Joseph B. Schwartz
7. Topical Suspensions, Hridaya N. Bhargava and Daniel W. Nicolai
8. Reconstitutable Suspensions, Clyde M. Ofner 111, Roger L. Schnaare,and Joseph B. Schwartz
9. Emulsions and Microemulsions I Lawrence H. Block
10. Injectable Emulsions and Suspensions, Joe Bruce Boyett andCraig W. Davis
11. Aerosol suspensions and Emulsions, John J. Sciarra and Anthony J.Cutie
12. Ophthalmic Ointment Suspensions, Krishna M. Bapatla and GeraldHecht
13. Gels, Joel L. Zatz and Gregory P. Kushla
14. Toothpastes, David Garlen
15. Suppositories, Marion F. Gold
16. Liposomes I Mohammad Riaz, Norman Weiner, and Frank Martin
17. Regulatory Affairs, John P. Tomaszewski
18. Quality Assurance I Samir A. Hanna
1Principles of Improved TabletProduction System DesignCarnet E. Peck
Purdue University, West Lafayette, Indiana
Neil R. Anderson
Merrell Dow Pharmaceuticals, Inc., Indianapolis, Indiana
Gilbert S. Banker
University of Minnesota Health Sciences Center, Minneapolis,Minnesota
I. INTRODUCTION
The old saying that all progress is change but not all change is progressis considered a truism by product manufacturers. Changes that are madein the production process of an established product are thoroughly evaluated from every point of view before implementation is allowed. Thevery existence of the company depends on its ability to produce productsfor sale. Therefore, any suggested change in the manufacture of an existing product must be viewed with suspicion until it can be shown thatthe change will indeed be advantageous to the company and not simplyrepresent change for the sake of change. A company's prestige, profitability, and compliance with legal requirements are at stake when production changes are considered. Therefore, changes in the pharmaceuticalindustry must clearly be warranted before they are implemented. Theobject of this chapter is to introduce to the pharmaceutical scientist howchanges can be accomplished in a pharmaceutical tablet production facilitythat wID constitute progress for the company.
A. Unit Operations and Pharmaceutical Processing
A unit operation can be defined as a process designed to achieve one ormore changes in the physical and/or chemical properties of the raw material ( s) being processed.
Two or more unit operations that are designed to convert the basicraw materials into the final product or at least to have significantly
1
2 Peck, Anderson, and Banker
improved the quality or value of the original raw material(s) describes amanufacturing system. In a tablet-manufacturing system, some of the unitoperations may include (l) particle size reduction, (2) sieving or classification, (3) mixing, (4) particle size enlargement, (5) drying, (6) compression, (7) sorting, and (8) packaging.
The literature is well documented with various unit operations involvedin the manufacture of tableted products which may impact on a number offinal dosage-form quality features. The features include, but are notlimited to, such items as content uniformity, hardness, friability drug dissolution properties, and bioavailability. The traditional responsibility ofthe development pharmacist has been to identify and control such impacts.This includes the establishment of specific operating limits for each unitoperation to ensure that the production system is under sufficient controlfor the production of safe, effective, and reliable tablets. The scope andpurpose of this chapter is to examine system design considerations, and asa result, the individual unit operations and their potential impact on product quality will not be covered. The authors assume that each unit operation has been thoroughly investigated and is under sufficient control todo what it is purported to do. Specific effects of processing variables onproduct quality are dealt with in the pertinent chapters in this book series.
B. Batch Versus Continuous Processing
Most pharmaceutical production operations are batch operations, whereby aseries of manufacturing steps are used to prepare a single batch or lot ofa particular product. The same quantity or batch of material, if processeden mass through the various production steps to produce the final product,will then typically be treated by the manufacturer and the U. S. Food andDrug Administration (FDA) as one lot. A relatively few pharmaceuticalproducts are prepared by true continuous-processing procedures wherebyraw materials are continuously fed into and through the production sequence, and the finished product is continuously discharged from the finalprocessing step(s). In continuous processing, one day's production, theproduction from one work shift, the quantity of a critical raw material froma given lot, or a combination thereof may define a single lot of manufacturedproduct. Development of continuous-processing procedures requires specially designed and interfaced equipment, special plant layouts, and dedicated plant space, which reduces plant flexibility. The equipment, specialplant design requirements, and dedicated space are all factors leading tothe high costs of setting up and maintaining a continuous-manufacturingoperation for a product. Unless the volume of product being produced isvery high, the cost of setting up a product-dedicated, continuous-production operation will not usually be justified. Since pharmaceutical products,even within a dosage-form class such as compressed tablets, differ materially in many important aspects , such as drug dosage, excipients used, critical factors, affecting product quality, manufacturing problems, and thelike, it is usually not feasible or possible to set up a continuous-processingoperation for one product and then apply it to several others. Thus truecontinuous-processing operations are largely limited in the drug industryto large-volume products, which often also have large doses (or highweights per tablet), such as Tums, Gelusil, Aldomet, or Alka Seltzer, forWhich tons of material must be processed each day, on an ongoing basis.
Improved Table Production System Design
II. BENEFITS OF IMPROVED TABLETPRODUCTION SYSTEMS
In either the batch or the continuous mode of operation, the objective ofthe production function is to produce pharmaceutical tablets for sale.Consequently, a production process should always be viewed as a candidate for progressive change in an effort to maintain the company's products in the marketplace. When looking at a process for possible changes,one must be aware of the potential benefits for the company. The majorbenefits that can be obtained, and which constitute the major valid reasons for changing or redesigning a pharmaceutical tablet manufacturingprocess, are the following [1- 5] :
Regulatory complianceCurrent good manufacturing practices (CGMPs)Occupational Safety and Health Administration (OSHA)Environmental Protection Agency (EPA)
Increased production capacity and flexibilityDecreased product throughput timeReduced labor costsIncreased energy savingsBroadened process control or automation for control, operator inter
face, and reportingEnhanced product qualityEnhanced process reliability
The benefits that can be derived from the redesign of a process aredependent to a large extent on how "good" or "bad" the old process is.With perhaps the exception of some CGMP, OSHA, or even EPA requirements, the expected benefits to be derived from proposed process designchanges are generally reduced to a dollar figure in order to compare thecost of implementing the change with the expected savings to be generatedby the change. Proposed changes on a good facility may not be costjustifiable, whereas the same proposal on a bad facility can easily be costjustified. What can be justified and what cannot is a function of what canbe referred to as the corporate policy or corporate personality at the timethe proposal is made. A pharmaceutical company, like any company, is apart of the community in which it resides and as such has responsibilitiesto many other societal groups. These include governments, stockholders,employees, the community, the competition, and customers. The interaction of all these groups with the company results in a corporate personality. Therefore, companies have different standards for evaluating different financial situations, different production philosophies, varying timeconstraints for design and implementation, and varying technical supportavailable for design changes. All of these items will be given consideration and will influence the decision-making process when a redesign proposal is made.
III. PRODUCTION PROCESS DESIGN CONSIDERATIONS
A fact that should be well understood is that the production unit is not anindependent organization within the company. Any changes made in the
3
4 Peck, Anderson, and Banker
production unit impact on many other units that come in contact with theproduction unit. However, with the rising costs of materials, labor, inflation, and regulations being constantly added to the manufacture ofpharmaceuticals, the pharmaceutical industry cannot afford to neglectchange or the modification of existing processes simply because there areestablished standards that may be difficult to change. Increased productivity matched with a reduction in direct labor cost will probably bethe way of the future. This can only be accomplished by a conscious effort on the part of those in process development. The development pharmacist should therefore be familiar with ways in which the manufacture ofpharmaceutical products can be increased and labor reduced. Even thoughthe development pharmacist will not be thoroughly knowledgeable in allareas of process design considerations, he or she should at least be awarethat those considerations exist and be able to interact with experts inthose fields to accomplish cost savings.
Major advances in efficiency have been made in tablet production overthe last 20-30 years. These advances have come about by the developmentof methods; pieces of equipment, and instrumentation with which tablet production systems have been able to (1) improve materials handling. (2) improve specific unit operations, (3) eliminate or combine processing steps,and (4) incorporate automated process control of unit operations andprocesses.
A. Materials Handling
Materials-Handling Risks
Possibly the single largest contribution to the effectiveness of a manufacturing facility is made by the facility's materials-handling capabilities.In addition to a lack of efficiency, there are certain risks involved withimproper or inefficient materials handling. These riaks include increasedproduct costs, customer dissatisfaction, and employee safety liabilities.Materials that are not handled efficiently can increase the cost of raw materials. For example, penalty charges are assessed (demurrage) whenrailroad cars are not loaded or unloaded according to schedule. If rawmaterials are not moved as required by production schedules, delays areincurred which can lead to situations in which machine time is wasted,personnel time is wasted. in-process inventories are increased, and the entire manufacturing process is slowed down. In addition, the improperhandling and storage of materials can lead to damaged, outdated, and lostmaterials. Improper materials handling can place employees in physicaldanger. An increase in employee frustration generated by constant production delays due to poor materials handling can result in reduced morale.
Materials-Handling Objectives
A well-designed and efficiently operated materials-handling system shouldimpart to the manufacturing facility reduced handling costs, increased manufacturing capacity. improved working conditions. and improved raw material distribution to the appropriate manufacturing areas. To achieve anefficient materials-handling system. as many of the basic general principlesof efficient materials handling need to be implemented as practical.

Improved Tablet Production System Design 5
Basic Principles of Materials Handling
SHORT DISTANCES. Raw materials used in the production processshould only be moved over the shortest possible distances. Moving materials over excessive distances increases production time. wastes energy,creates inefficiency, increases the possibilities of delays. and adds to thelabor costs if the material is moved by hand.
SHORT TERMINAL TIMES. When material is being transported, themeans of transportation should not have to spend time waiting On the material to be picked up. Material should always be ready when the transportation is available.
TWO-WAY PAYLOADS. The transportation mechanism for raw materialsshould never be moved empty. For example. if tablet-packaging materialsare being transported from a warehouse to a packaging line by means of afork-lift truck. the return trip could be used, for example, for the removal of accumulated scrap material or finished product from the production line.
AVOID PARTIAL LOADS. The movement of quantities of raw materialsthat require only a partial use of the total capacity of the transportationsystem is a waste of time and energy. If the movement of such materialscannot be avoided, then the partial loads should be doubled up to makeefficient use of the transportation system.
AVOID MANUAL HANDLING. The manual handling of raw materials isthe most expensive way of moving them. A great deal of direct costs canbe eliminated by mechanically moving material rather than having it movedby the production personnel.
MOVE SCRAP CHEAPLY. The movement of scrap material is a nonproductive function and scrap material should not be a primary work objectivefor a transportation system. Therefore, scrap material should be moved asinexpensiVely as possible. One way of achieving this is to handle the removal of scrap on return loads after delivering needed materials.
GRAVITY IS THE CHEAPEST POWER. The movement of material fromtop to bottom through multileveled facilities. if available. is the most efficient way of moving material.
MOVE IN STRAIGHT LINES. A basic theorem of geometry states thatthe shortest distance between two points is a straight line. Therefore,the most efficient movement of material is along the straightest and mostdirect path to its destination.
UNIT LOADS. Raw materials should be delivered to their ultimatedestination in loads that will be completely consumed by the manufacturingprocess. This will eliminate the need for the excess raw materials to behandled at the point of use and to be returned to the storage place.
LABEL THOROUGHLY. Thoroughly labeled raW materials will eliminateor help to eliminate having the improper raw material delivered to a production site. Much time and effort is wasted in correcting raw materialserrors.
6 Peck, Anderson, and Banker
Factors Affecting Matertals-Handling Decisions
Of course. not all of the basic materials-handling principles can be appliedor applied to the same extent in every situation. How a company designsits materials-handling facility and its production process is based on several different considerations. The type of process that is being designed,batch or continuous; will have a great influence on the type of materialshandling system used. The materials-handling system in a batch-ortented ,multiproduct facility is significantly different from a single-product, continuous-process. materials-handling system. The type and quantity ofproduct as well as the physical characteristics of the raw materials involvedwill also affect the materials-handling system. For example, fluids forgranulating will have to be pumped, whereas solids will have to be handledin another manner, such as with vacuum devices of conveyors. The typeof building that is available for the manufacturing process may exert thesingle greatest influence on the materials-handling system. The lack of amultistoried building will preclude the use of gravity for material flow.Like all company decisions. the costs of purchase. installation. operation.and maintenance as well as the useful life and the scrap value of the materials-handling system must be weighed against its advantages.
Greene 16] quotes an old cliche which best summarizes materialshandling:
The best solution to a materials-handling problem is not to movethe material. If this is possible. then move it by gravity. And ifthis is not possible, usually the next best way is to move it bypower. If people must move the material, it should be moved bythe cheapest labor possible.
Examples of Materials-Handling Improvement
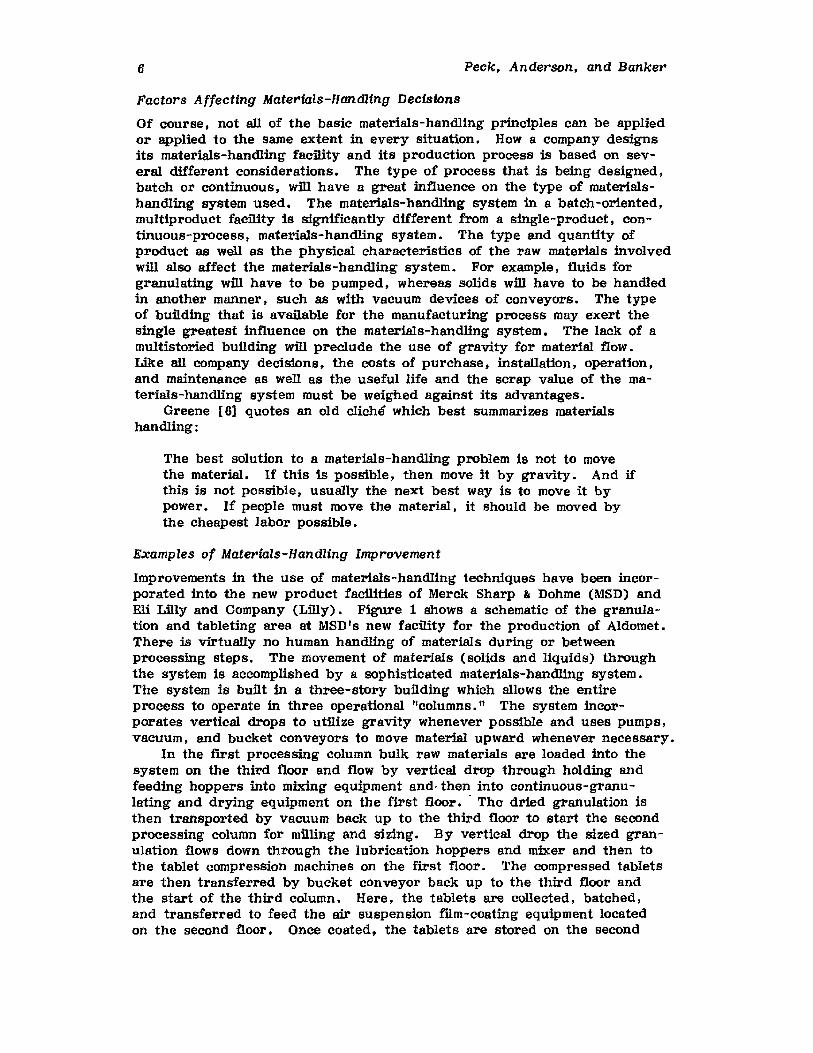
Improvements in the use of materials-handling techniques have been incorporated into the new product facilities of Merck Sharp & Dohme (MSD) andEli Lilly and Company (Lilly). Figure 1 shows a schematic of the granulation and tableting area at MSD's new facility for the production of Aldomet.There is virtually no human handling of materials during or betweenprocessing steps. The movement of materials (solids and liquids) throughthe system is accomplished by a sophisticated materials-handling system.The system is built in a three-story building Which allows the entireprocess to operate in three operational "eolumns , II The system incorporates vertical drops to utilize gravity whenever possible and uses pumps,vacuum, and bucket conveyors to move material upward whenever necessary.
In the fir-st processing column bulk raw materials are loaded into thesystem on the third floor and flow by vertical drop through holding andfeeding hoppers into mixing equipment and- then into continuous-granulating and drying equipment on the first floor. - The dried granulation isthen transported by vacuum back up to the third floor to start the secondprocessing column for milling and sizing. By vertical drop the sized granulatton flows down through the lubrication hoppers and mixer and then tothe tablet compression machines on the first floor. The compressed tabletsare then transferred by bucket conveyor back up to the third floor andthe start of the third column. Here. the tablets are collected. batohed ,and transferred to feed the air suspension film-coating equipment locatedon the second floor. Once coated. the tablets are stored on the second
Tl'Qllapol'tlll\llubricoted Orolllllotion
o
Feedlll\lAlcohol
""l
Figure 1 Granulation and tableting sections of the computer-controlled tablet-manufacturing procesa, Merck Sharp &
Dohme Pharmaceutical Laboratories. (From Innovation in Pharmaceutical Manufacturing: Compounding a PrescriptionMedicine by Computer Control brochure. 1977. by permission of Merck & Oo, , Inc •• proprietor.)

8 Peck. Anderson. and Banker
floor until required for packaging. During packaging operations the tablets now by vertical drop from the second floor to the packaging lineson the first floor.
The Aldomet facility was built to meet the need for increased manufacturing capacity of Aldomet. The new Aldomet facility requires fewerproduction people, thus keeping direct-labor costs low. Since the facUityis continuously monitored by computer throughout each phase of theprocess, Aldomet has a high degree of uniformity and reproducibility.The continuous monitoring also bring about a conservation of energy. Asa result of the numerous and rigid in-process controls in the Aldometprocess. quality control and the quality assurance costs have been reduced.Through the creation of a new building, MSD's compliance with the GoodManufacturing Practices regulations was greatly facilitated [71.
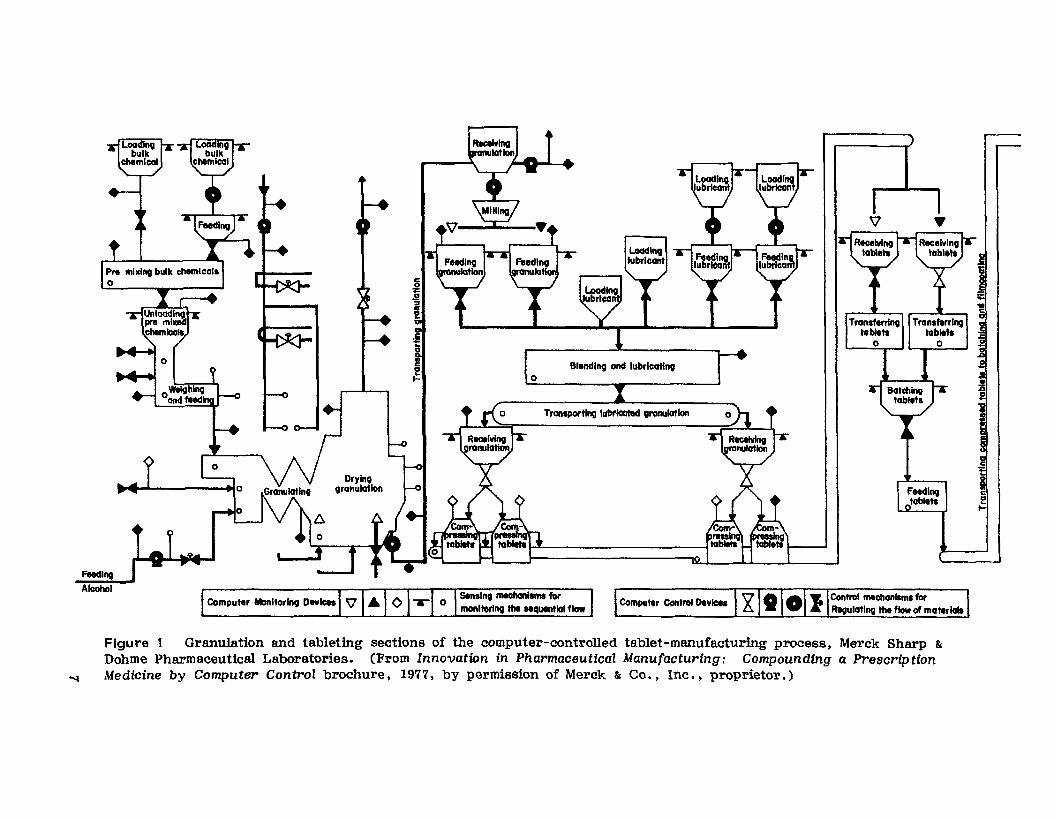
A study of Figure 2. schematically representing Warner-Chilcott's redesigned Ge1usil manufacturing system, shows that the dedicated singleprocess system makes use of gravity, belts, and pneumatic devices to efficiently move material through the process. The old manufacturing operation was a semiautomated batch operation with a capacity limit of threeshifts employing 14 persons. The capacity of the redesigned system formanufactur-ing' Ge1usil tablets is three times greater than that of the oldprocess. and the unit throughput time for Gelusil manufacture was reducedto a third of the old process time. The output of the new extrusionprocess, in one shift with two persons, equals the total daily output fromthe old process. Obviously. another one of the benefits of the new processwas a reduction in required manpower, Which reduced the direct-laborcosts involved in producing Gelusil [5.8].
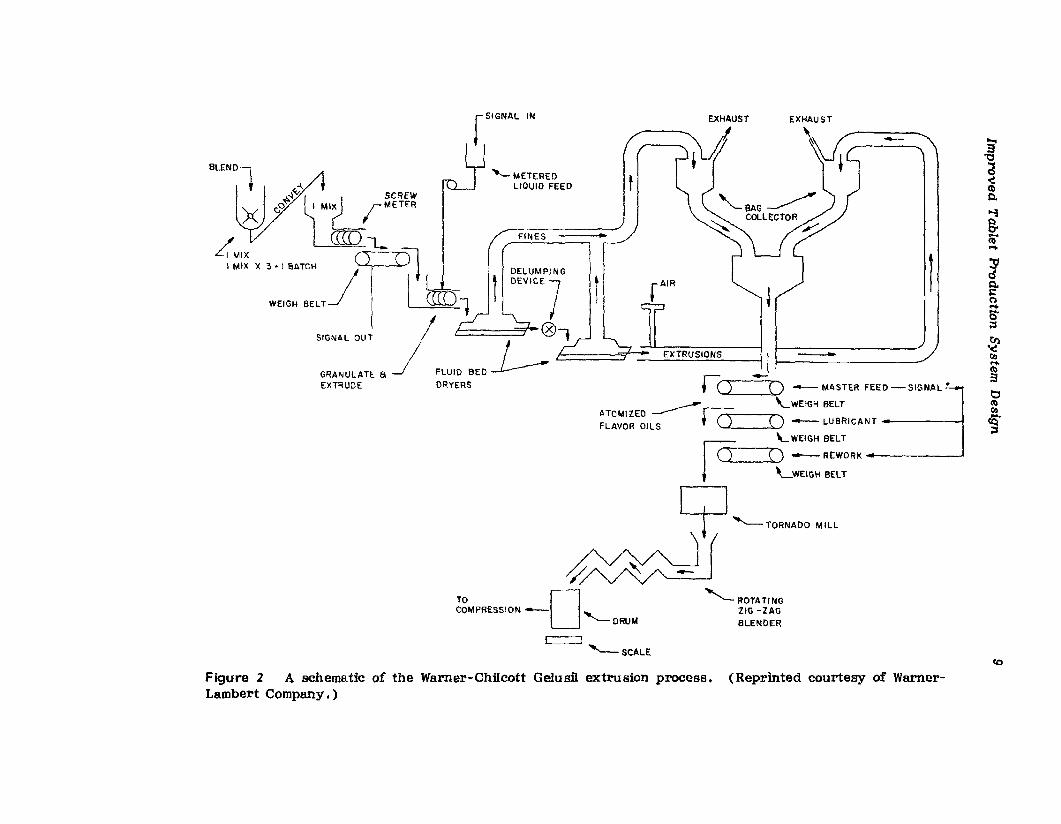
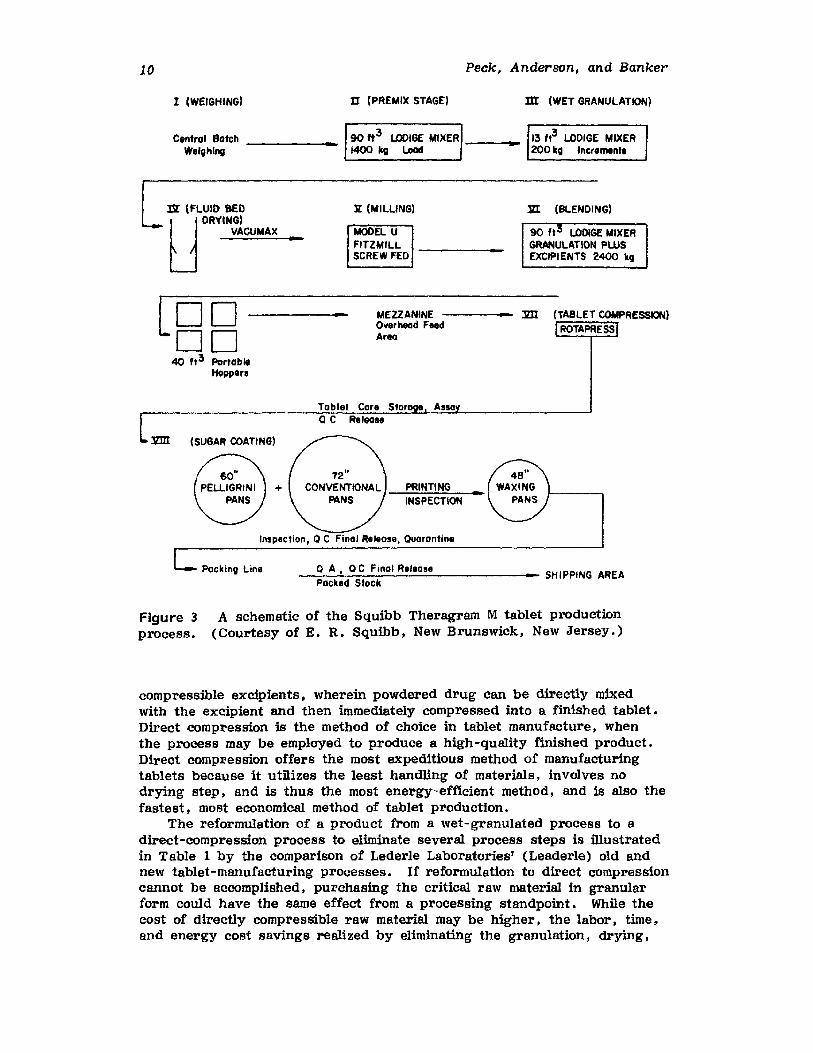
While the previous examples involved very large volumes of productproduced on a continuous basis. batch-oriented production systems havealso been made more efficient by materials-handling improvements. Figure 3 shows a schematic of E. R. Squibb IlL Sons Inc.'s (Squibb) production process for Theragran M tablets. The vacuum transfer of the granulation to the tablet compression machines has been accomplished by avertical drop from storage devices on a mezzanine above the tabletmachines.
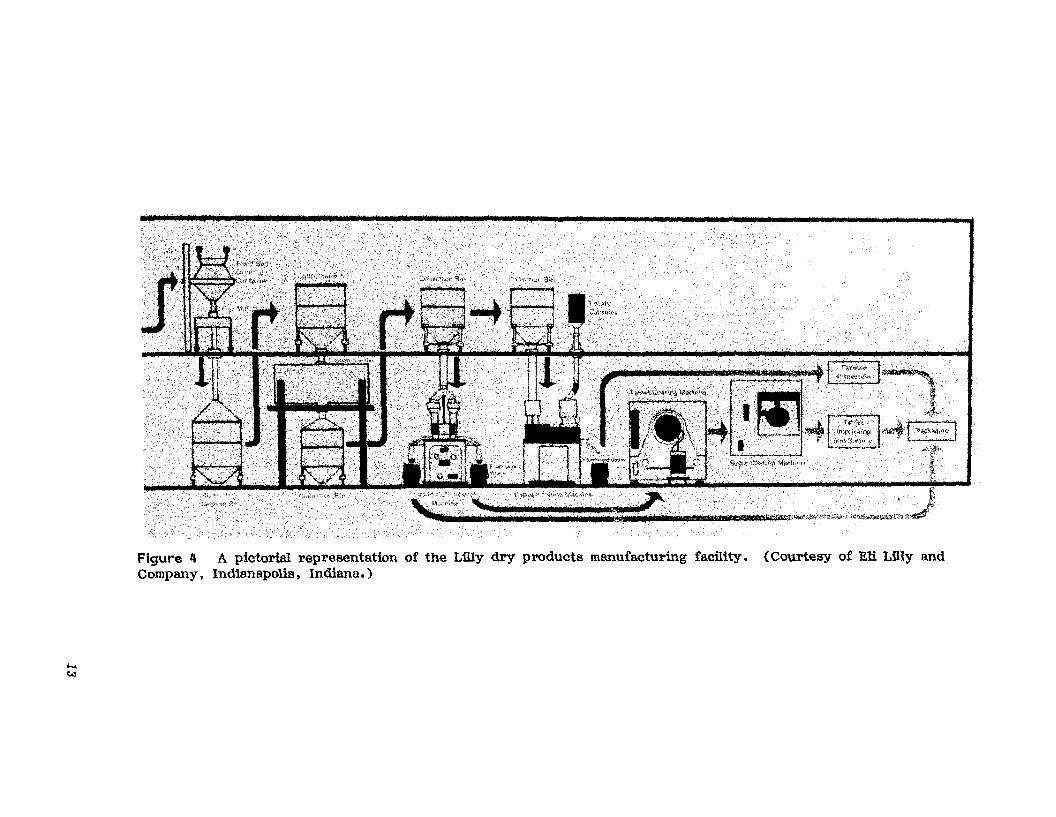
Lilly's new dry products manufacturing facility (Fig. 4) has increasedtheir materials-handling efficiency by the use of (1) a driverless trainwhich transports bulk raw materials from the receiving dock to the stagingarea, (2) vacuum powder transfer mechanisms, (3) direct transfer of inprocess materials, and (4) the liberal use of vertical drops in the twostory operation [9J.
B. Processing Step Combination or Elimination
The design of 9. new production facility should attempt to improve the oldprocess by eliminating or combining certain processing unit operations.This could take the form of simply eliminating tasks that are no longernecessary or by the utilization of new pieces of equipment that can perform more than one of the unit operations required under the oldprocessing system.
Direct Compression
Many processing steps have been eliminated in the manufacture of somepharmaceutical tablets as a result of the development of directly
co
1Q.I:(')
~;:s
~CI.l....~tl~CI.l
~.
a\:l
~~Q.
'"'3g.li)'....
1
-
fAIR
t
t
FINES
'-METEREDL1eUIO FEEDBLEND~,~,~ ~) ~~%~
O~ I MiX ;-
)( " '- II ""U.""L." ,,'amH 111-1 tLl t DEVICE7'." x .-J LJ1ID: /
WEIGH BELT / 1 <8>, '7 ~, EXTAU"O", -It I ~ _ ",."".1-- r =r- -Cl ••m. FEEO~ r: ()_SIGNAL OUT ~ t () -'-WEIGH BELT f
ANT ...
'cum BED ___) _ CUB'"'"""'AT< .. o.,..S ATO."" I C2 (\....,,," B<LT ,EXTRUDE FLAVOR OILS REWORK ..
ro= ()---l (1 ,"-WEIGH BELT
9 '--TORN'".'''
~~ "-ROTATING
ZIG -ZAGO BLENDERTO ~SSION - '-DRUMCOMPRc,
c:=:::J '-- SCALE
Figure 2 A schematic of the Warner-Chilcott Gelusil extrusion process. (Reprinted courtesy of WarnerLambert Company.)
10
I (WEIGHING) II (PAEMIX STAGE)
Peck, Anderson, and Banker
m (WET GRANULATION)
Centrol Botch _ 90 ft3 LOOIGE MIXER ~Welgll'lllI ------ 1400 kg Load
13 ft3 LODIGE MIXER200 kg Inc"""nt.
IS[ (FLUID BED
UDRYINGI
VACUMAX -1r (MILLING)
MODEL UFITZMILLSCREW FED -
JZt (BLENDING)
90 ft3 LODIGE MIXERGRANULATION PLUSEXCIPIENTS 2400 kg
[DODO
40 fl 3 PortablllHoppers
- MEZZANINE ------- JlIIOverhead FledArea
llJII (SUGAR COATING)
+
Toblet Core Stora I
Q C RIleo.,
PRINTINGINSPECTION -
Inspection, Q C Final R.'lose, Quarantine
Pockinv Une Q A • Q C Final Releas,Packld Stock
Figure 3process.
A schematic of the Squibb Theragram M tablet production(Courtesy of E. R. Squibb, New Brunswick, New Jersey.)
compressible excipients, wherein powdered drug can be directly mixedwith the excipient and then immediately compressed into a finiShed tablet.Direct compression is the method of choice in tablet manufacture, whenthe process may be employed to produce a high-quality finished product.Direct compression offers the most expeditious method of manufacturingtablets because it utilizes the least handling of materials, involves nodrying step, and is thus the most energy-efficient method, and is also thefastest, most economical method of tablet production.
The reformulation of a product from a wet-granulated process to adirect-compression process to eliminate several process steps is illustratedin Table 1 by the comparison of Lederle Laboratories' (Leaderle) old andnew tablet-manufacturing processes. If reformulation to direct compressioncannot be accomplished, purchasing the critical raw material in granularform could have the same effect from a processing standpoint. While thecost of directly compressible raw material may be higher, the labor, time,and energy cost savings realized by eliminating the granulation, drying,
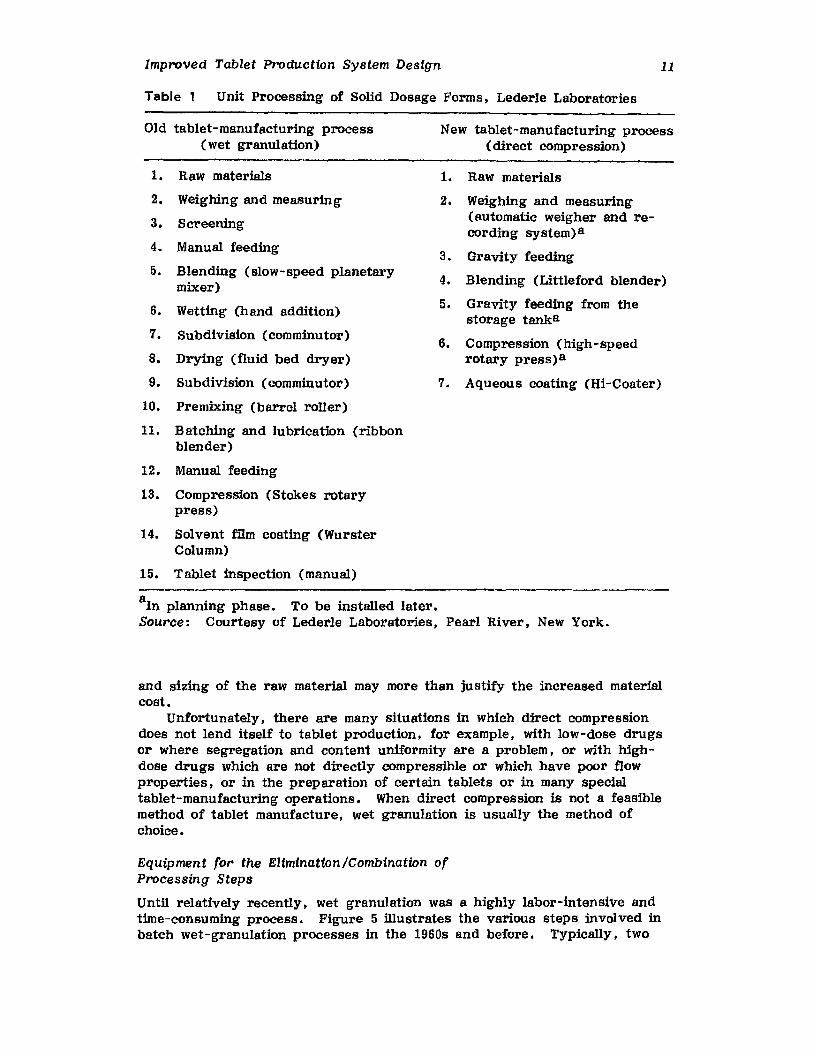
Improved Tablet Production System Design
Table 1 Unit Processing of Solid Dosage Forms, Lederle Laboratories
11
Old tablet-manufacturing process(wet granulation)
1. Raw materials
2. Weighing and measuring
3. Screening
4. Manual feeding
5. Blending (slow-speed planetarymixer)
6. Wetting (hand addition)
7. Subdivision (comminutor)
8. Drying (fluid bed dryer)
9. SUbdivision (comminutor)
10. Premixing (barrel roller)
11. Batching and lubrication (ribbonblender)
12. Manual feeding
13. Compression (Stokes rotarypress)
14. Solvent film coating (WursterColumn)
15. Tablet inspection (manual)
New tablet-manufacturing process(direct compression)
1. Raw materials
2. Weighing and measuring{automatic weigher and recording system)a
3. Gravity feeding
4. Blending (Littleford blender)
5. Gravity feeding from thestorage tanka
6. Compression (high-speedrotary press)a
7. Aqueous coating (Hi-Coater)
aIn planning phase. To be installed later.Source: Courtesy of Lederle Laboratories, Pearl River, New York.
and sizing of the raw material may more than justify the increased materialcost.
Unfortunately, there are many situations in which direct compressiondoes not lend itself to tablet production, for example, with low-dose drugsor where segregation and content uniformity are a problem, or with highdose drugs which are not directly compressible or which have poor flowproperties, or in the preparation of certain tablets or in many specialtablet-manufacturing operations. When direct compression is not a feasiblemethod of tablet manufacture, wet granulation is usually the method ofchoice.
Equipment for the Elimination/Combination ofProcessing Steps
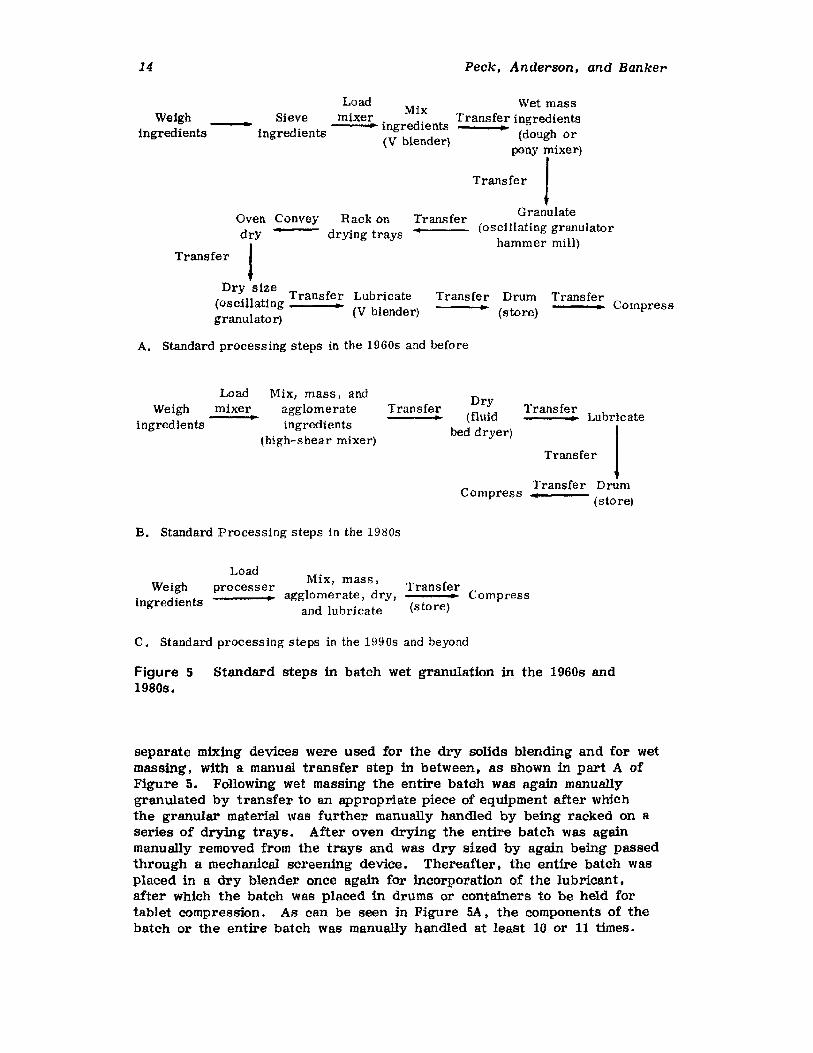
Until relatively recently, wet granulation was a highly labor-intensive andtime-consuming process. Figure 5 illustrates the various steps involved inbatch wet-granulation processes in the 1960s and before. Typically, two
12
...~
Figure 1I A pictorial representation of the Lilly dry products manufacturing facfiity. (Courtesy of Eli Lilly andCompany, Indi8napolis, Indiana.)
14 Peck, Anderson, and Banker
Transfer--_..~ Compress
Drum(store)
Transfer..Lubricate(V blender)
Load Mix Wet massSieve mixer Transfer ingredients
---- ingredients ..ingredients (dough or(V blender)
Trans:·Yrr)GranulateRack on Transfer
drying trays • (oscillating granulatorhammer mill)
..
Oven Conveydry ..
Transfer !Dry size
( '11 t" TransferOSCI a mg ..granulator)
Weighingredients
A. Standard processing steps in the 19605 and before
Dry(fluid
bed dryer)
Weighingredients
Loadmixer..
Mix, mass, andagglomerateingredients
(high-shear mixer)
Transfer.. Transfer b---...~ Lu ricate
Transfer- ITransfer Drum
Compress -4.--- (store)
B. Standard Processing steps in the 19~Os
LoadWeigh
ingredients
Mix, mass, Transferprocesser____..~ agglomerate, dry, .. Compressand lubricate (store)
C. Standard processing steps in the 1990s and beyond
Figure 5 Standard steps in batch wet granulation in the 1960s and1980s.
separate mixing devices were used for the dry solids blending and for wetmassing, with a manual transfer step in between. as shown in part A ofFigure 5. Following wet massing the entire batch was again manuallygranulated by transfer to an appropriate piece of equipment after whichthe granular material was further manually handled by being racked on aseries of drying trays. After oven drying the entire batch was againmanually removed from the trays and was dry sized by again being passedthrough a mechanical screening device. Thereafter. the entire batch wasplaced in a dry blender once again for incorporation of the lubricant.after which the batch was placed in drums or containers to be held fortablet compression. As can be seen in Figure SA. the components of thebatch or the entire batch was manually handled at least 10 or 11 times.
15
Fluid Bed Dryer. (FBD)55..
GronulatlonDischorllG toFluid BedDrYGrProduct ContolnQr.(FBDPC)
O DrumDumper
STAGING Of Hi9h-SpeedRAW MATERIALS Mb.er/Gronulotor
Row Motorial 0Storoll8 ForWeighed Miller --- ----.-ChangGl
Improved Tablet Production System Design
oFBDPCDumper
Granulation Milledinto Drulllt
DrumHoist 8 Dumptt
V bl$nder_1-----o
DlIChorgeto HoppenlFor OYllrheodToblet MachIn,Feed
-
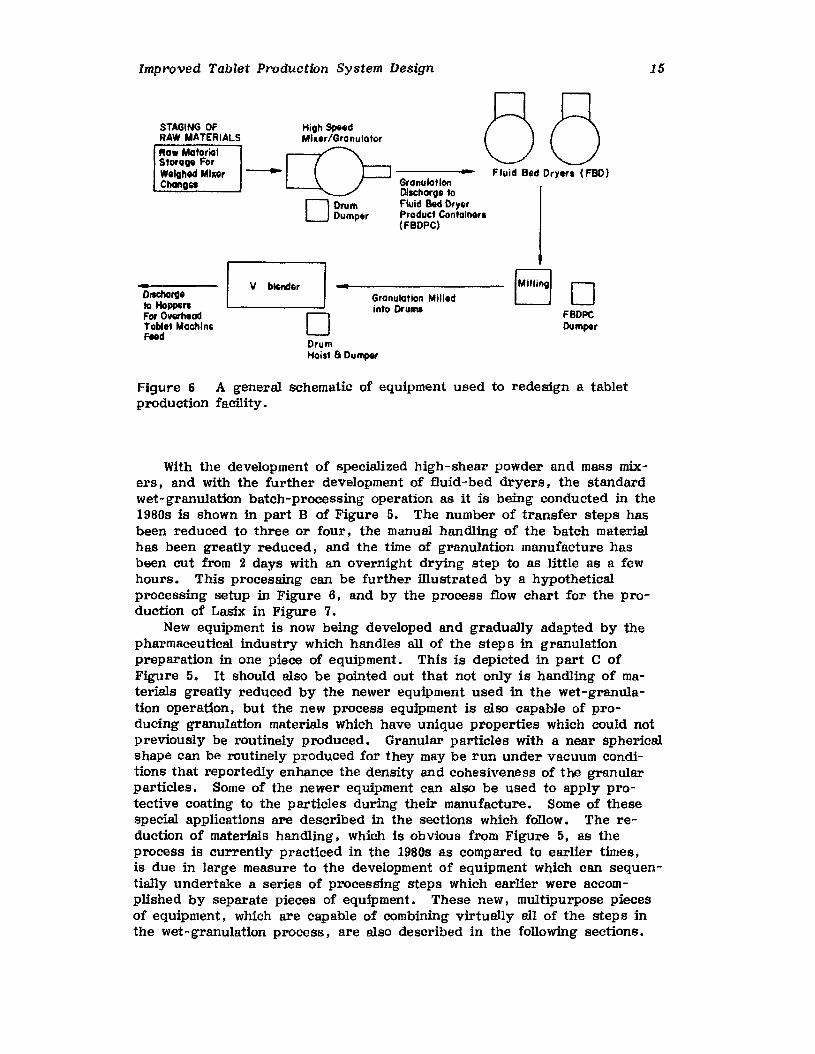
Figure 6 A general schematic of equipment used to redesign a tabletproduction facility.
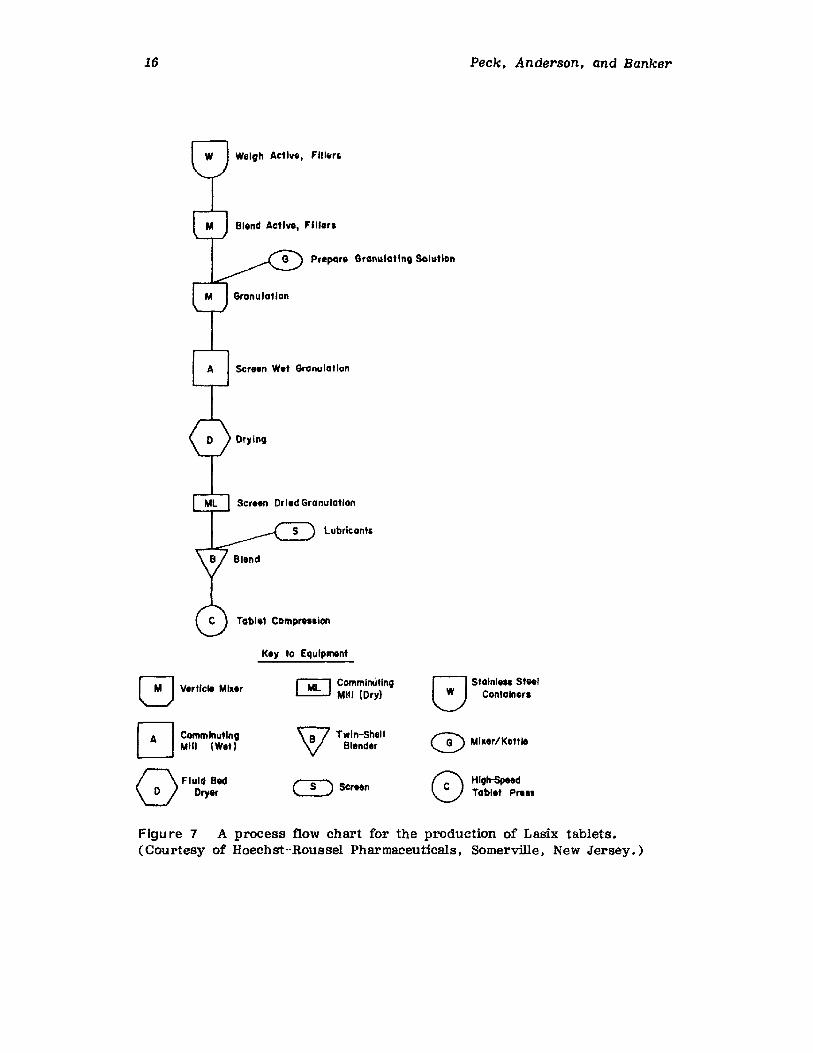
With the development of specialized high-shear powder and mass mixers , and with the further development of fluid-bed dryers, the standardwet-granulation batch-processing operation as it is being conducted in the1980s is shown in part B of Figure 5. The number of transfer steps hasbeen reduced to three or four ~ the manual handling of the batch materialhas been greatly reduced ~ and the time of granulation manufacture hasbeen cut from 2 days with an overnight drying step to as little as a fewhours. This procesaing can be further illustrated by a hypotheticalprocessing setup in Figure 6~ and by the process flow chart for the production of Lasix in Figure 7.
New equipment is now being developed and gradually adapted by thepharmaceutical industry which handles all of the step s in granulationpreparation in one piece of equipment. This is depicted in part C ofFigure 5. It should also be pointed out that not only is handling of materials greatly reduced by the newer equipment used in the wet-granulation operation, but the new process equipment is also capable of producing granulation materials which have unique properties which could notpreviously be routinely produced. Granular particles with a near sphericalshape can be routinely produced for they may be run under vacuum Conditions that reportedly enhance the density and cohesiveness of the granularparticles. Some of the newer equipment can also be used to apply protective coating to the particles during their manufacture. Some of thesespecial applications are described in the sections which follow. The reduction of materials handling, Which is obvious from Figure 5, as theprocess is currently practiced in the 1980s as compared to earlier times,is due in large measure to the development of equipment Which can sequentially undertake a series of processing steps which earlier were accomplished by separate pieces of equipment. These new, multipurpose piecesof equipment, which are capable of combining virtually all of the steps inthe wet-granulation process, are also described in the following sections.
16 Peck, Anderson, and Banker
Weigh Active, FIII"r,
Blend Active, Fillars
Granulating Solution
Screen Wet Gronulotion
Dried Gronulotlon
l.ubricant,
Tablet Comprenion
Key to Equipment
~ ComminutingLJ Mill (Wet)
r'\FIUldBId'\!:.../ Dry.,
r;;tL1 ComminUting~ Mill (Dry)
W Twin-Sheil'V Blender
CQ SCreen
r:l Stolnle.. StGeIU Contalnors
CD Mhltr/Kottl.
f:\ High-Speed~ Toblet Press
Figu re 7 A process flow chart for the production of Lasix tablets.(Courtesy of Hoechst-Roussel Pharmaceuticals, Somerville, New Jersey.)
Improved Tablet Production System Design 1'1
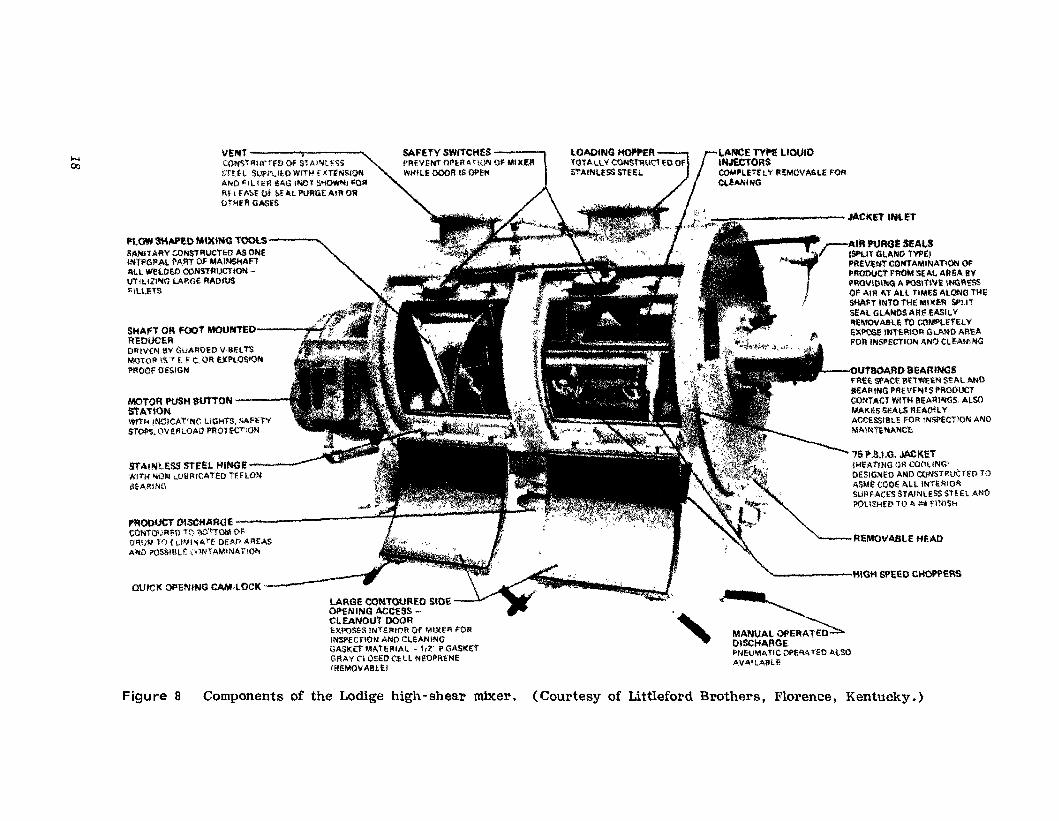
CONTINUOUS-BATCH POWDER MIXING AND MASSING EQUIPMENT.The Littleford Lodige mixer (see Appendix) was one of the first highshear powder blenders capable of rapidly blending pharmaceutical powdersand wet massing within the same equipment. With some formulations theequipment may also be capable of producing agglomerated granular particles which are ready for fluid-bed or other drying methods without further processing. Figure 8 illustrates a conventional Lodige mixer anddescribes the various assemblies of the unit. The unit consists of thehorizontal cylindrical shell equipped with a series of plow-shaped mixingtools and one or more high-speed blending chopper assemblies mounted atthe rear of the mixer. For the addition of liquids, an injection tube terminating in one or more spray nozzles is provided. The nozzle(s) is located immediately above the chopper assembly.
In operation, the plow-shaped mixing tools revolve at variable speedsfrom about 100 to 240 rpm and maintain the contents of the mixer in anessentially fluidized condition. The plow device also provides a highvolume rate of transfer of material back and forth across the blender.When liquid granulating agents are added to dry powders the liquid entersthe mixer under pressure through the liquid nozzle immediately above thechopper assembly or assemblies. Each chopper assembly consists of bladesmounted in a tulip shape configuration rotating at 3600 rpm. As the liquidimpinges on the powder in the area of the chopper it is immediately dispersed. By controlling the duration of the mixing cycle, the particle sizeof the granulation may be controlled. The choppers perform a secondaryfunction in this type of high-shear powder blender. It will be noted onexamination of part B of Figure 5 that the new processes involved in wetgranulation may not include a sieving operation. When the chopper bladesare operated during dry mixing dry lumps of powder are effectively dispersed. Consequently, it will often be found that sieving is no longer anessential prerequisite of powder blending when this type of equipment isemployed.
Using this type of high-shear powder mixing equipment, complete mixing may be obtained in as little as 30-60 s, A temperature rise of 10-15°may be expected if dry blending is continued over a period of 5-10 min.When the Littleford Lodige blender is used for wet granulation the workwhich must be done by the mixer will increase as the powder mass becomes increasingly wet. This is often reflected in the readings on theammeter of the equipment because the increased work will result in anamperage increase. Such readings may be very useful in helping toidentify the proper end point for the wet-granulation process.
The equipment illustrated in Figure 8 employs air purge seals. One ofthe major difficulties in the operation of a high-shear powder mixer ispowder making its way behind the seals and even contaminating the bearing assembly. This can lead to two difficulties: contamination of the nextproduct with materials previously run in the blender and early failure ofbearings and seals. A number of pharmaceutical manufacturers have foundthe air purge seal to be a useful device and an effective mechanism forovercoming this difficulty with this type of blender.
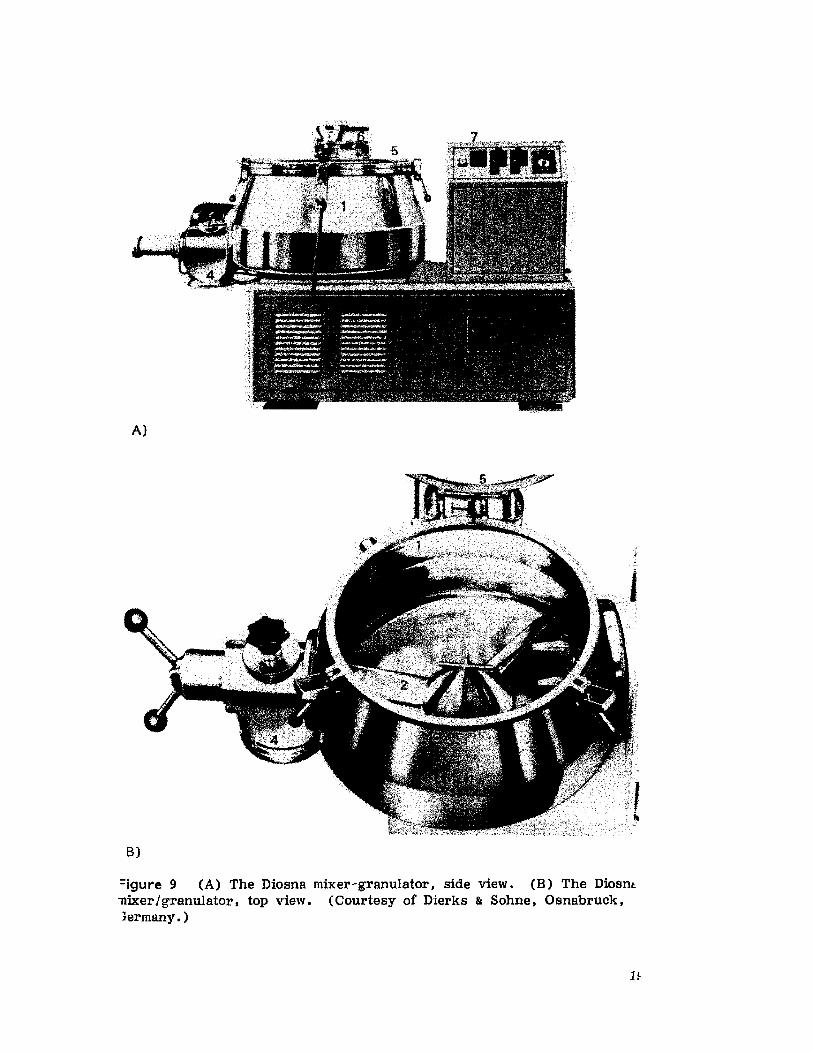
The Diosna mixer/granulator is another type of high-shear powdermixer and processor (Fig. 9). The mixer utilizes a bowl (1) mounted inthe vertical position. The bowl is available in seven sizes between 25 and100 L. The mixing bowl can be jacketed for temperature control. A highspeed mixer blade (2) revolves around the bottom of the bowl. The blade
REMOVABLE H£AD
'5 ".8.1.0. JACKET'HEATING011COOLING'OESIGN£OAND CONSTRUCTED TOASMECOoE AoU IN"fEf.llORSUfi FACES STAINless STEEt ANDPOUSH£D 'TO" ll'4 fl'NJ$H
OUTBOARD BEARINGS1'1';££S\'ACE 8E"rWEEN SEAll\tfOBEARING J>R£VI'NfSPRODUCTCONTACTWfTH BEARINGS, ALSOjlAAKESSCA\.S IlEAr;HlvACCESSl8LE FOR lNSl'eCT10N AIIIOMAlNUNANCI;,
•.....-A.R PURGE SEA"'S
,
" I l$l'llT GlANO rvl'EIPREVlHT CONTAMlNAT1ON 01'PJIOolJCf FROIllSEALARr;A BYI'lmVI"I~ A l'OSITl'JE INGR'i!SS
! OF 1111'1 ATAll TIMES ALONG THE, SHAn UII'tO THEMIXER SPlf't
SEALGLANDSARE £ASH.VFU,MOVAllU10 COMPlE'l'f::!.VEXl'OSI:lMTEIUOR aLAND AREAFOR INSPECTION ANt) CLIOANING
..... "'IOH SPl;EO CHOPPERS
__-----JACI(U INLET
~DISCHARGEI>NEUI\lIATIC OPERATEOAl.50AV,",tLABU,
I.ANCE TYPE LIQUIDINJECTORSCOMPLETELY REMOVA6L£ FORCLEANING
,, c~, ,:
SAFETYSwrtcH£S IPREVliJtTOPr,Rt, 'l{)N 01' M1XE~WHILE OOOR IS OPEN
QUICKOPENINGCAM·LOCK ---------"
MOTOR PUSH autraN • • ,STAllONWI,.", INOICATiN(~ L1GHfS.SAFEtVstOP'S. OVEf'lLOAO PROrEcnON
LARGE CONTOUR£O SIDEOPENING ACCESS CI.EANOUT DOOReXPOSES INTERIOROf ~I)(F'" FORINSI'ECnON ANOCUANiNGGASKETMATERiAl. • t,Z' l' GASl<!tTGRAY n OSEO C:~Ll NEOl'flENEIREMO'lA8\.EI
PftOOOCT OISCtlARGE 11'"CON"1)\)l'l!"l) T\'j 1'\O't'tOM Nl',)"llJ'I TryCUMIN'"rE DEAf/ARrASAND ~SStllLE ,"1NTAM1NATlON
VEI'ff<-«--.CONSrltlll'fFf>OF S1M'<U<;SSTUL StJl"PU~OWfTlH ':Tf~'>lON
ANQ I'll lEA lAG INOr S'~j "Oil"H FAl>E 0" I.EAl NftGE AIR OROTfiER GASES
StAINLESS STEEL l·flNG! ~WI1'H >tON ..UURICATEO TEFtONIif:AR1Nll
SHAFT OR FOOt MOUN'Tt:O oj&;R"OI)CEROl'llVtN BY G\iAl:lOEO V<IlElTSMOiO~ IS" E F C,OR EXPLOSIONPROOFO€SIGN
PLOW $HAP!O MtXlMQ TOOLS ....SANITARY CONSTRUCTE{) ASONEINT€GRAlPART OF MAIHSHAFTAll WELDED CONSTfruC1"IONUTlllZI'IIG !.Al'\(lE RADIUS~llUTS
~
00
Figure 8 Components of the Lodige high-shear mixer. (Courtesy of Littleford Brothers, Florence, Kentucky.)
A)
B)
=igure 9 (A) The Diosna mixer-granulator, side view. (B) The Diosns-nixer/granulator. top view. (Courtesy of Dierks & Sohne , Oanabruek ,}ermany.)
H
20 Peck, Anderson. and Banker
fits over the pin bar at the bottom of the mixing bowl which powers theblade. The blade is specially constructed to discourage material fromgetting under it. The speeds of the mixing blades vary with the size ofthe mixer. The tip speed, however, is kept at 3-4/10 m s-1 on low and6-8/10 m s-1 on high. The mixer also contains a chopper blade (3) ateither 1750 or 3500 rpm. The chopper functions as a lump and agglomerate reducer. A pneumatic discharge port (4) may be specially orderedfor the unit to provide automatic discharge. The unit is provided with alid (5) and the larger units employ a counterweight (6) to assist in raisingand lowering the lid. The lid has three openings: one to accommodate aspray nozzle, a second larger opening for an air exhaust sleeve, and athird opening for a viewing port. The units are also equipped with anammeter (7) which may be employed to determine the endpoint of granulation operations. Typical time sequences for the use of a Diosna mixer areas follows: mixing 2 min or less; granulating, 8 min or less; discharge,1 min, with discharge capable of being preset when the pneumatic discharge system is in place.
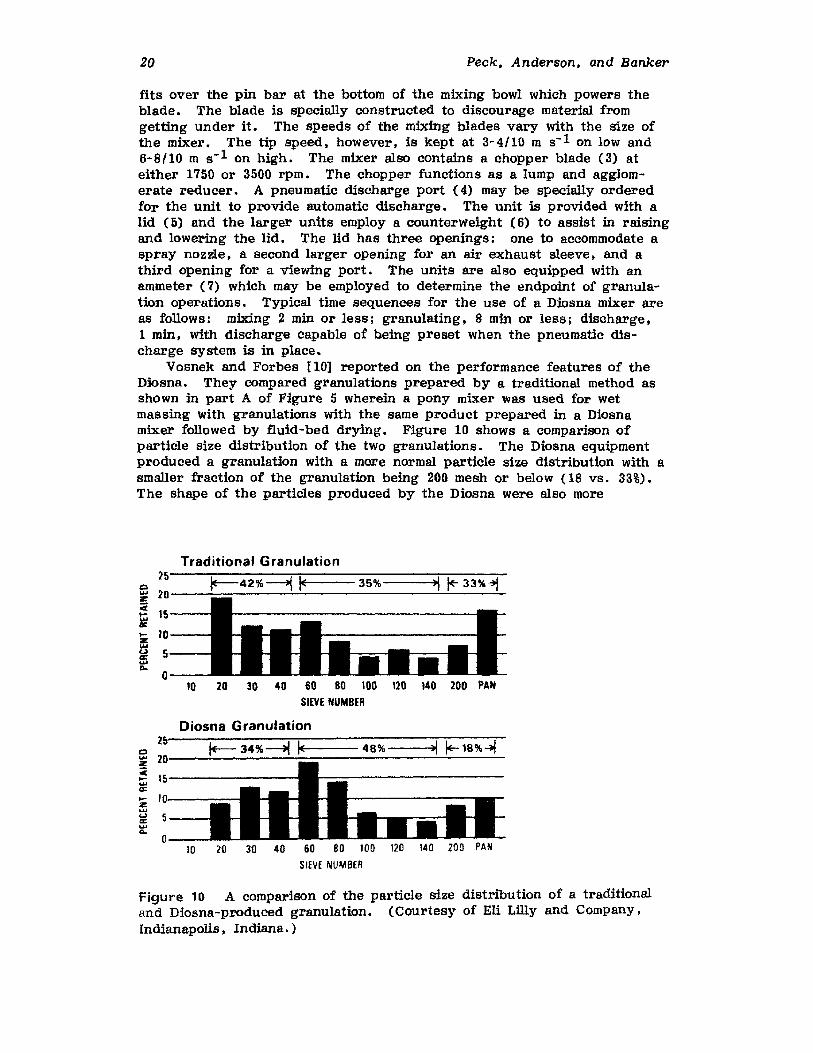
Vosnek and Forbes [10] reported on the performance features of theDiosna. They compared granulations prepared by a traditional method asshown in part A of Figure 5 Wherein a pony mixer was used for wetmassing with granulations with the same product prepared in a Diosnamixer followed by fluid-bed drying. Figure 10 shows a comparison ofparticle size distribution of the two granulations. The Diosna equipmentproduced a granulation with a more normal particle size distribution with asmaller fraction of the granulation being 200 mesh or below (18 vs. 33%).The shape of the particles produced by the Diosna were also more
Traditional Granulation25
0.... 20~
"" ISlo-....a:
~ ID....u 5II:...D-
O
jt--42%~ ~ 35% ~ ~ 33%~
10 20 30 40 80 80 100 120 140 20D PAN
SIEVE NUMBER
Diosna Granutation2~ l+--34%~ IE 48% ~ ~18%~0.... 20z
itiIIiIdi;(
15~...a:~ 10z.....,
5<I:...A-
D10 20 30 40 80 80 100 120 140 200 PAN
SIEVE NUMBER
Figure 10 A comparison of the particle size distribution of a traditionaland Diosna-produced granulation. (Courtesy of Eli Lilly and Company.Indianapolis, Indiana.)
Improved Tablet Production System Design
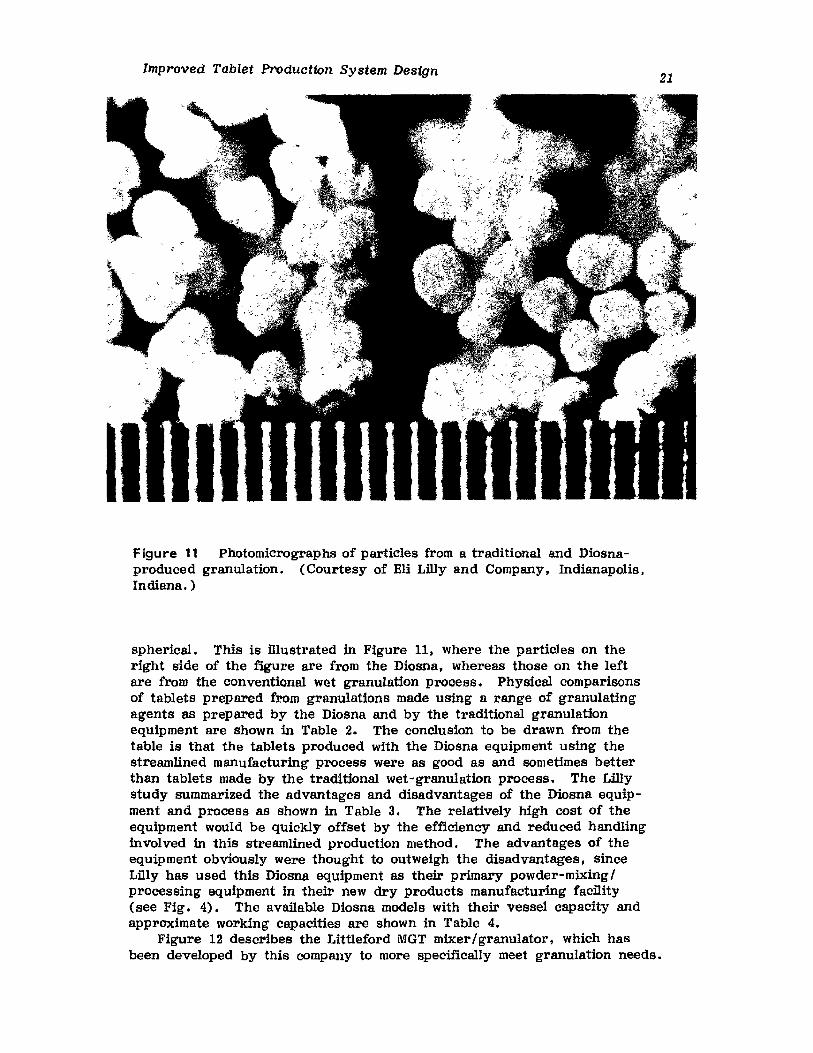
II IFigure 11 Photomicrographs of particles from a traditional and Diosnaproduced granulation. (Courtesy of Eli Lilly and Company, Indianapolis,Indiana. )
21
spherical. This is filustrated in Figure 11, where the particles on theright side of the figure are from the Diosna, whereas those on the leftare from the conventional wet granulation process. Physical comparisonsof tablets prepared from granulations made using a range of granulatingagents as prepared by the Diosna and by the traditional granulationequipment are shown in Table 2. The conclusion to be drawn from thetable is that the tablets produced with the Diosna equipment using thestreamlined manufacturing process were as good as and sometimes betterthan tablets made by the traditional wet-granulation process. The Lillystudy summarized the advantages and disadvantages of the Diosna equipment and process as shown in Table 3. The relatively high cost of theequipment would be quickly offset by the efficiency and reduced handlinginvolved in this streamlined production method. The advantages of theequipment obviously were thought to outweigh the disadvantages, sinceLfily has used this Diosna equipment as their primary powder-mixing Iprocessing equipment in their new dry products manufacturing facility(see Fig. 4). The available Diosna models with their vessel capacity andapproximate working capacities are shown in Table 4.
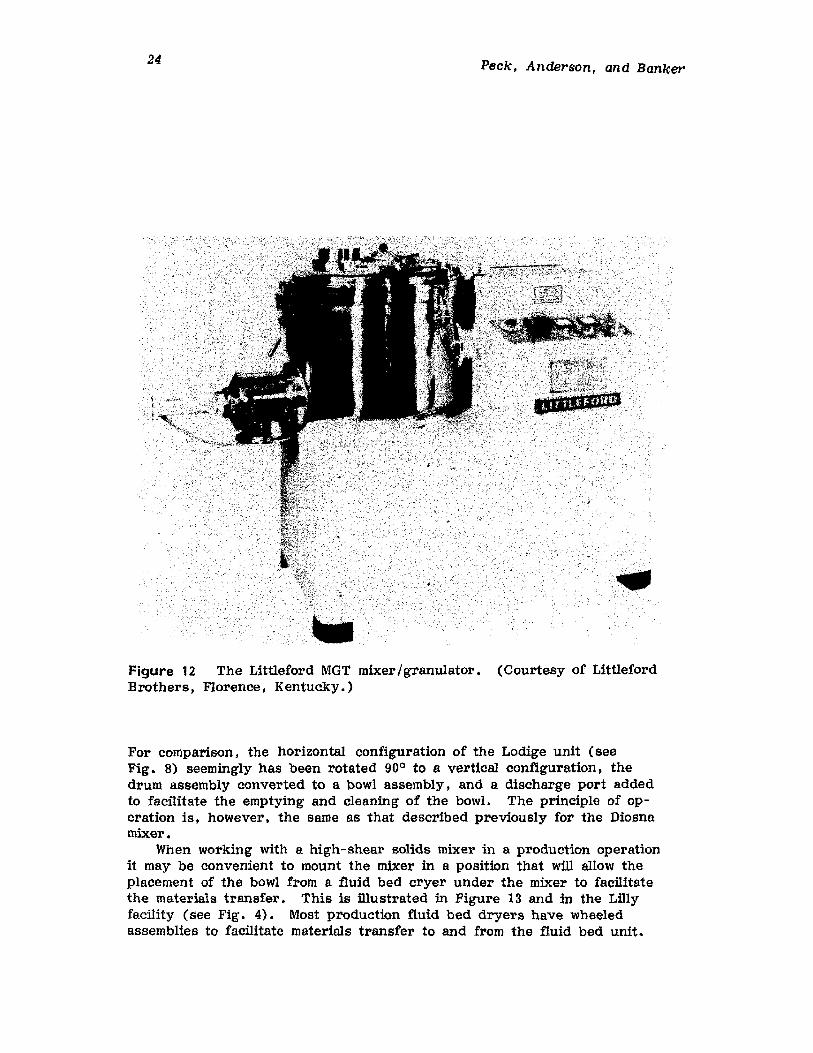
Figure 12 describes the Littleford MGT mixerI granulator, which hasbeen developed by this company to more specifically meet granulation needs.
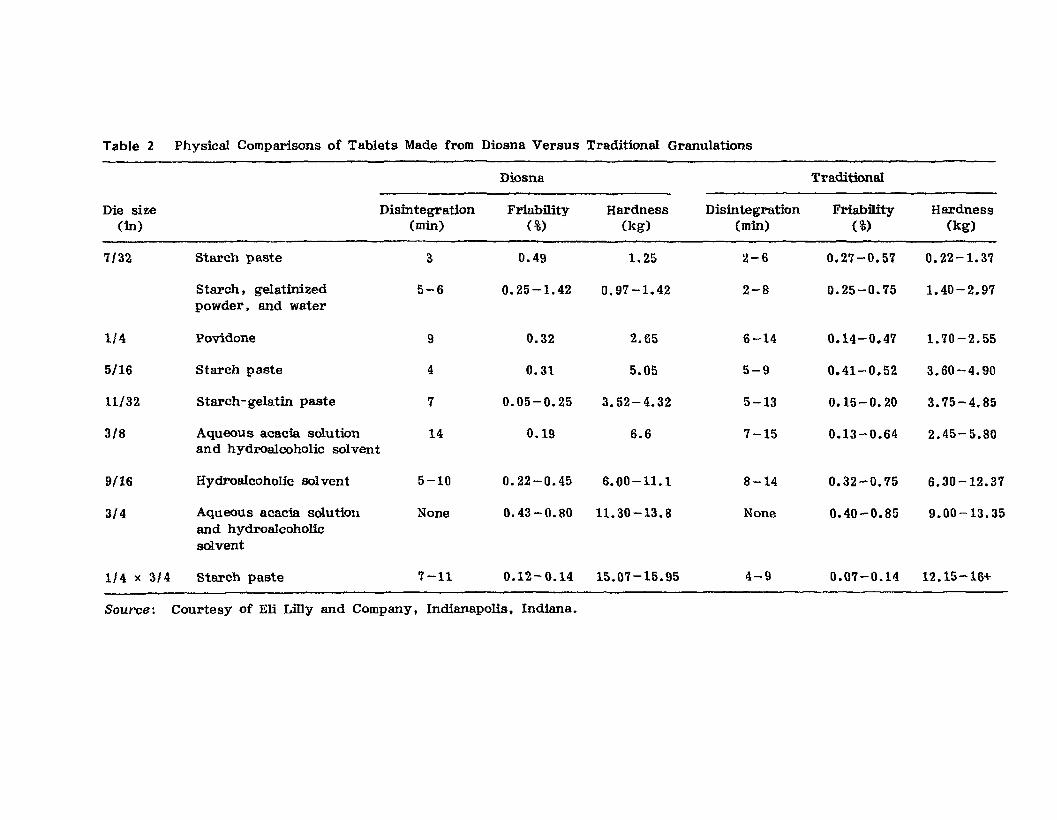
Table 2 Physical Comparisons of Tablets Made from Diosna Versus Traditional Granulations
Diosna Traditional
Die size Disintegration Friability Hardness Disintegration Friability Hardness(in) (min) (%) (kg) (min) (%) (kg)
7/32. Starch paste 3 0.49 1.25 2-6 0.27-0.57 0.22-1.37
Starch. gelatinized 5-6 0.25-1.42 0.97-1.42 2-8 0.25-0.75 1.40- 2.97powder. and water
114 Povidone 9 0.32 2.65 6-14 0.14-0.47 1.70-2.55
5/16 Starch paste 4 0.31 5.05 5-9 0.41-0.52 3.60-4.90
11/32 Starch-gelatin paste 7 0.05-0.25 3.52-4.32 5-13 0.15-0.20 3.75-4.85
3/8 Aqueous acacia solution 14 0.19 6.6 7-15 0.13-0.64 2.45-5.80and hydroalcoholic solvent
9/16 Hydl'oalcoholic sol vent 5-10 0.22-0.45 6.00-11.1 8-14 0.32-0.75 6.30-12.37
3/4 Aqueous acacia solution None 0.43-0.80 11.30-13.8 None 0.40 -0.85 9.00-13.35and hydroalcoholicsolvent
1/4 x 3/4 Starch paste 7-11 0.12-0.14 15.07-15.95 4-9 0.07-0.14 12.15-16+
Source: Courtesy of Eli Lilly and Company. Indianapolis. Indiana.
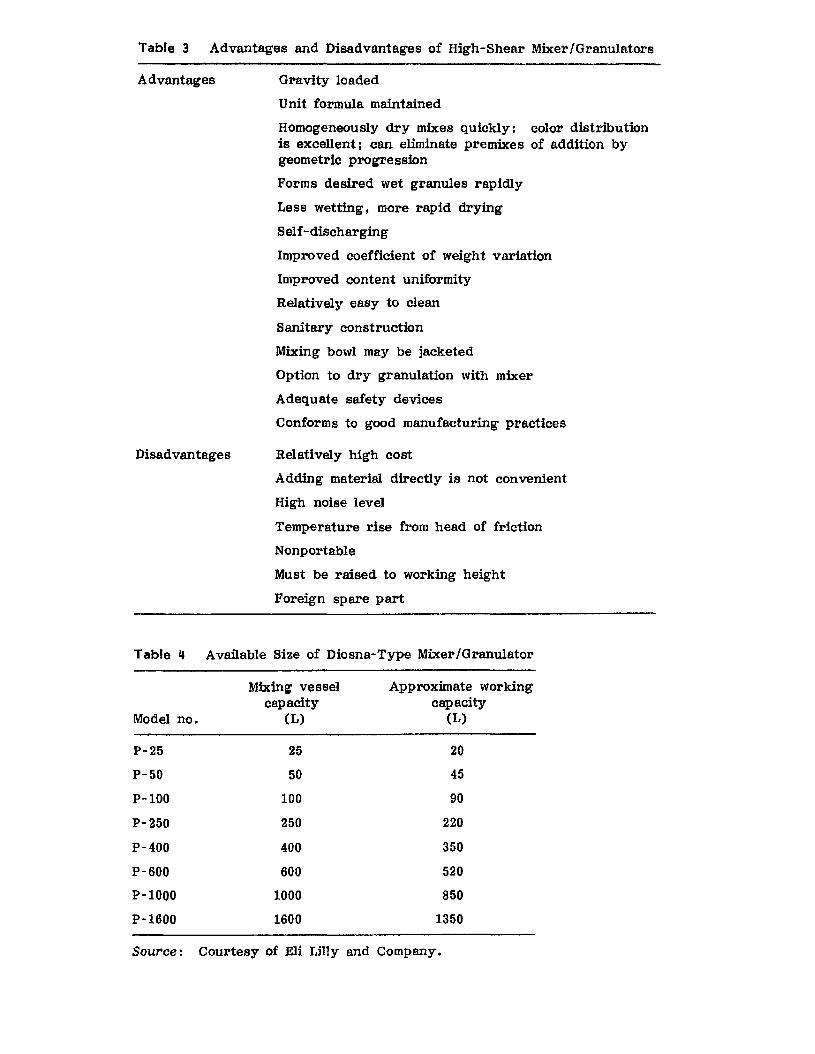
Table 3 Advantages and Disadvantages of High-Shear Mixer/Granulators
Advantages
Disadvantages
Gravity loaded
Unit formula maintained
Homogeneously dry mixes quickly: color distributionis excellent i can eliminate premixes of addition bygeometric progression
Forms desired wet granules rapidly
Less wetting, more rapid drying
Self-discharging
Improved coefficient of weight variation
Improved content uniformity
Relatively easy to clean
Sanitary construction
Mixing bowl may be jacketed
Option to dry granulation with mixer
Adequate safety devices
Conforms to good manufacturing practices
Relatively high cost
Adding material directly is not convenient
High noise level
Temperature rise from head of friction
Nonportable
Must be raised to working height
Foreign spare part
Table 4 Available Size of Diosna-Type Mixer/Granulator
Mixing vessel Approximate workingcapacity capacity
Model no. (L) (L)
P-25 25 20
P-50 50 45
P-100 100 90
P-250 250 220
P-400 400 350
P-600 600 520
P-1000 1000 850
P-1600 1600 1350
Source: Courtesy of Eli Lilly and Company.
24 Peck. Anderson. and Banker
Figure 12 The Littleford MGT mixer/granulator.Brothers. Florence. Kentucky.)
(Courtesy of Littleford
For comparison. the horizontal configuration of the Lodige unit (seeFig. 8) seemingly has been rotated 90 0 to a vertical configuration. thedrum assembly converted to a bowl assembly, and a discharge port addedto facilitate the emptying and cleaning of the bowl. The principle of operation is. however. the same as that described previously for the Diosnamixer.
When working with a high-shear solids mixer in a production operationit may be convenient to mount the mixer in a position that will allow theplacement of the bowl from a fluid bed cryer under the mixer to facilitatethe materials transfer. This is illustrated in Figure 13 and in the tIDyfacility (see Fig. 4). Most production fluid bed dryers have wheeledassemblies to facilitate materials transfer to and from the fluid bed unit.
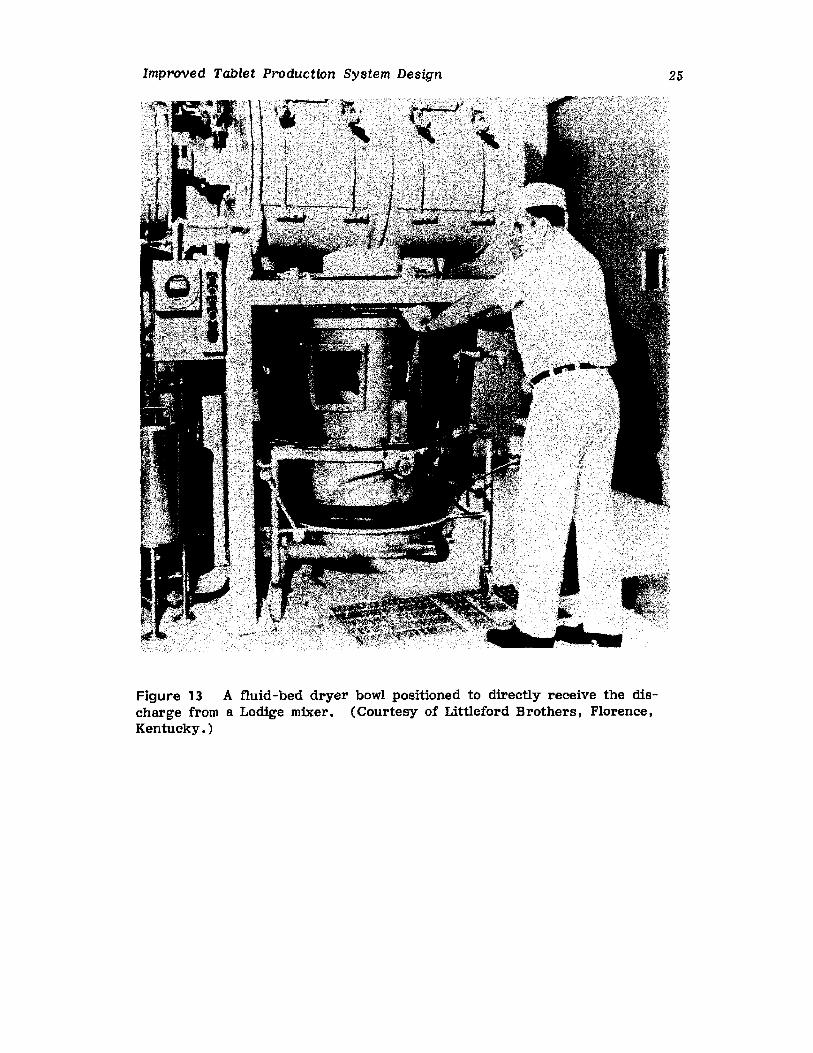
Improved Tablet Production System Design 25
Figure 13 A fluid-bed dryer bowl positioned to directly receive the discharge from a Lodige mixer. (Courtesy of Littleford Brothers, Florence.Kentucky.)
26
4......
Peck, Anderson. and Banker
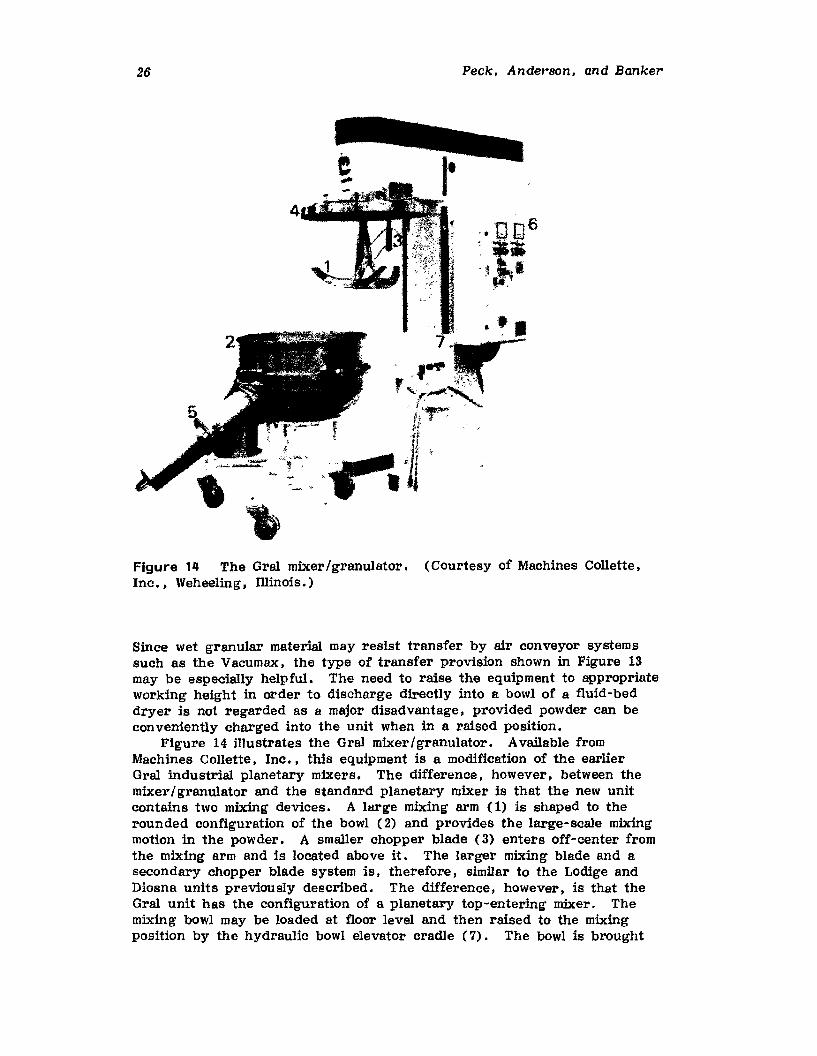
Figure 14 The Oral mixer/granulator. (Courtesy of Machines Collette,Inc•• Weheeling. illinois.)
Since wet granular material may resist transfer by air conveyor systemssuch as the Vacumax, the type of transfer provision shown in Figure 13may be especially helpful. The need to raise the equipment to appropriateworking height in order to discharge directly into a bowl of a fluid-beddryer is not regarded as a major disadvantage, provided powder can beconveniently charged into the unit when in a raised position.
Figure 14 illustrates the Oral mixer/granulator. Available fromMachines Collette, Inc., this equipment is a modification of the earlierOral industrial planetary mixers. The difference, however. between themixerI granulator and the standard planetary mixer is that the new unitcontains two mixing devices. A ll:lI'ge mixing arm (1) is shaped to therounded configuration of the bowl (2) and provides the large-scale mixingmotion in the powder , A smaller chopper blade (3) enters off-center fromthe mixing arm and is located above it. The larger mixing blade and asecondary chopper blade system is, therefore. similar to the Lodige andDiosna units previously described. The difference, however, is that theGral unit has the configuration of a planetary top-entering mixer. Themixing bowl may be loaded at floor level and then raised to the mixingposition by the hydraulic bowl elevator cradle (7). The bowl is brought
Improved Tablet Production System Design 27
into contact with a cover (4) providing a tight seal. An advantage of theunit is that it may be discharged by its hydraulic port (5), whereas inthe raised position, offering sufficient space for a container to be placedbeneath the discharged port. The entire mixer unit does not have to beelevated to provide this vertical discharge distance as is the case with thepreviously two mentioned high-shear mixers. As with the other high-shearmixers, all parts in contact with the product may be ordered in stainlesssteel. Fluid may be injected into the mixer bowl. The equipment isavailable with timer control (6). The Oral machines can also be suppliedwith explosion-proof as well as standard electrics. The equipment isavailable in five sizes ranging from 10 to 1200 L.
CONTINUOUS-BATCH MIXING, MASSING, GRANULATION, AND DRYING EQUIPMENT. The ideal equipment for the preparation of granulationsby the wet- granulation process would be one unit which is capable of sequentially dry mixing, wet massing. agglomerating. drying, and sizing thematerial being processed. with no materials handling between steps. Theonly interruption 1n such a continuous-batch process might be to stop theunit in order to add the lubricant prior to discharging a final productready for compression. This type of approach is indicated in part C ofFigure 5. A number of equipment manufacturers and pharmaceutical scientists have been working toward this goal over the last several decades.However. it is only within the last several years that commercial equipment has become available for continuous-batch wet granulation in oneunit.
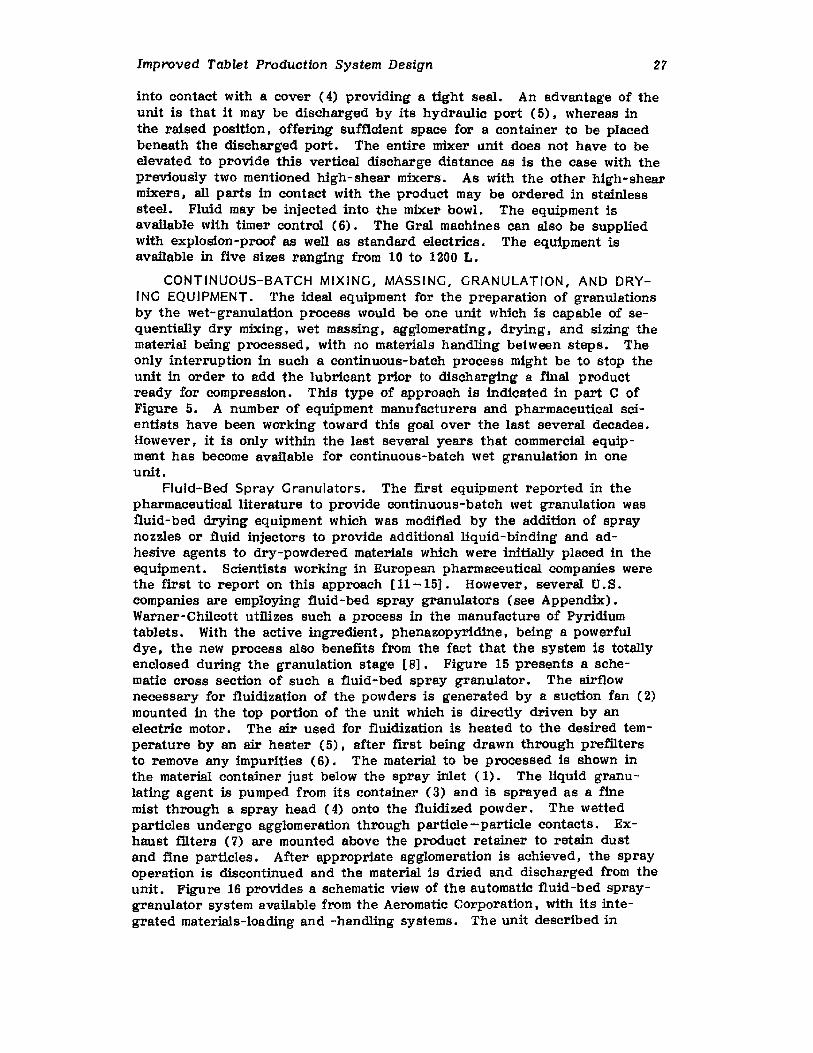
Fluid-Bed Spray Granulators. The f'll'st equipment reported in thepharmaceutical literature to provide continuous-batch wet granulation wasfluid-bed drying equipment which was modified by the addition of spraynozzles or fluid injectors to provide additional liquid-binding and adhesive agents to dry-powdered materials which were initially placed in theequipment. Scientists working in European pharmaceutical companies werethe first to report on this approach [11-15]. However. several U. S.companies are employing fluid-bed spray granulators (see Appendix).Warner-Chilcott utilizes such a process in the manufacture of Pyridiumtablets. With the active ingredient, phenazopyridine, being a powerfuldye. the neW process also benefits from the fact that the system is totallyenclosed during the granulation stage [8]. Figure 15 presents a schematic cross section of such a fluid-bed spray granulator. The airflownecessary for fluidization of the powders is generated by a suction fan (2)mounted in the top portion of the unit which is directly driven by anelectric motor. The air used for fluidization is heated to the desired temperature by an air heater (5). after first being drawn through prefiltersto remove any impurities (6). The material to be processed is shown inthe material container just below the spray inlet (1). The liquid granuIating agent is pumped from its container (3) and is sprayed as a finemist through a spray head (4) onto the fluidized powder. The wettedparticles undergo agglomeration through particle-particle contacts. Exhaust filters (7) are mounted above the product retainer to retain dustand fine particles. After appropriate agglomeration is achieved. the sprayoperation is discontinued and the material is dried and discharged from theunit. Figure 16 provides a schematic view of the automatic fluid-bed spraygranulator system available from the Aeromatic Corporation, with its integrated materials-loading and -handling systems. The unit described in
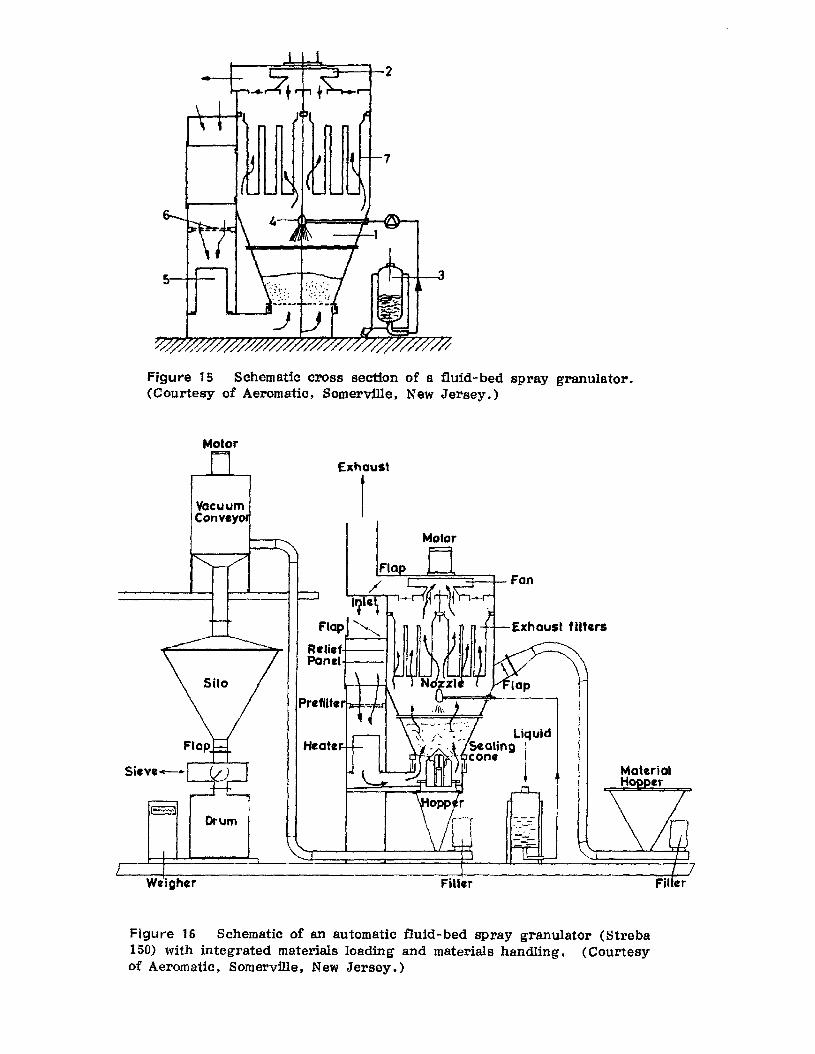
Figure 15 Schematic cross section of a fluid-bed spray granulator.(Courtesy of Aeromatic, Somerville, New Jersey.)
Motor
VacuumConvey
Exhaust
1
Filter
Motor
I~'t\
Flap ~
Rclid'+---IPanel+---I
Heate
Drum
Figure 16 Schematic of an automatic fluid-bed spray granulator (Streba150) with integrated materials loading and materials handling. (Courtesyof Aeromatic, Somerville, New Jersey.)
Improved Tablet Production System Design 29
Figure 16 is reportedly capable of processing approximately 200 kg perbatch. The advantages of such rapid wet massing, agglomeration, and drying within one unit are obviously attractive. Exclusive of equipment clean-up,the process may readily be sequentially completed within 60-90 min or less.
A number of pharmaceutical companies, both in Europe and in theUnited States, are utilizing fluid-bed processing as a rapid continuousbatch approach to wet granulation. However, there are a number of difficulties that exist for the process which may account for the fact thatfluid-bed granulation processing has not been more widely accepted.Fluid-bed systems as currently available may not provide adequate mixingof powder components. Where potent drugs are employed in a fine stateof particle size reduction, there will be a tendency of these materials tobe separated from the powdered bed and collected on the filter of the unit.Thus, even if a separate powder-mixing operation is undertaken to produce adequate uniformity of drug distribution within the mix, thus demixing action must be considered in any attempt to process potent drugsin a fluid-bed spray granulator or when there is a considerable disparityin the particle size or density of the materials being processed. Unlikeextrusion, wet screening, and the use of other more conventional mixingequipment. the forces of agglomeration which cause the particles to bebrought together producing the agglomerates are relatively low in thefluid-bed spray granulator. Accordingly, not all materials may lend themselves to agglomeration in this continuous batch-processing equipment.Low-density and hydrophobic materials can be particularly troublesome.Another limitation of this type of equipment may be related to particlescontaining granulattng agent on their surfaces which adhere to the filtersof the equipment. This creates two problems: a reduction in the effective area of the filters, which may produce filter failure and a build upof pressure within the unit and other difficulties during the granulationoperation, and problems connected with cleaning the unit following thegranulation process.
All production-size fluid-bed dryer equipment should contain explosionrelief panels. However, special attention should be given to safety precautions if organic solvents are used in the fluid-bed spray granulationprocess. A number of fatal accidents have occurred worldwide with theuse of fluid-bed dryers, as have a number of less serious explosions inwhich only the installation was damaged or destroyed. Dust explosionscan also occur in a fluid-bed dryer with dry materials. However, whenworking with solvents. especially those with flammable vapors. it might bewise to Ill'st check with the supplier of the equipment to review whetheror not the operation is safe or advisable.
Other manufacturers of fluidized-bed drying equipment, such as GlattAir Techniques, have developed specialized equipment to provide continuousbatch processing fluid-bed granulator capabilities. The number of scientific papers which have appeared in this field in recent years attests tothe interest of the pharmaceutical industry in this continuous-batchprocessing approach. For example, investigators have studied the mixingof pharmaceutical raw materials in heterogeneous fluidized beds [11]. thephysical properties of granulations produced in a fluidized bed [12], theeffect of fluidization conditions and the amount of liquid binder on properties of the granules formed [13], and the various process variablesinfluencing the properties of the final granulation [14,15].
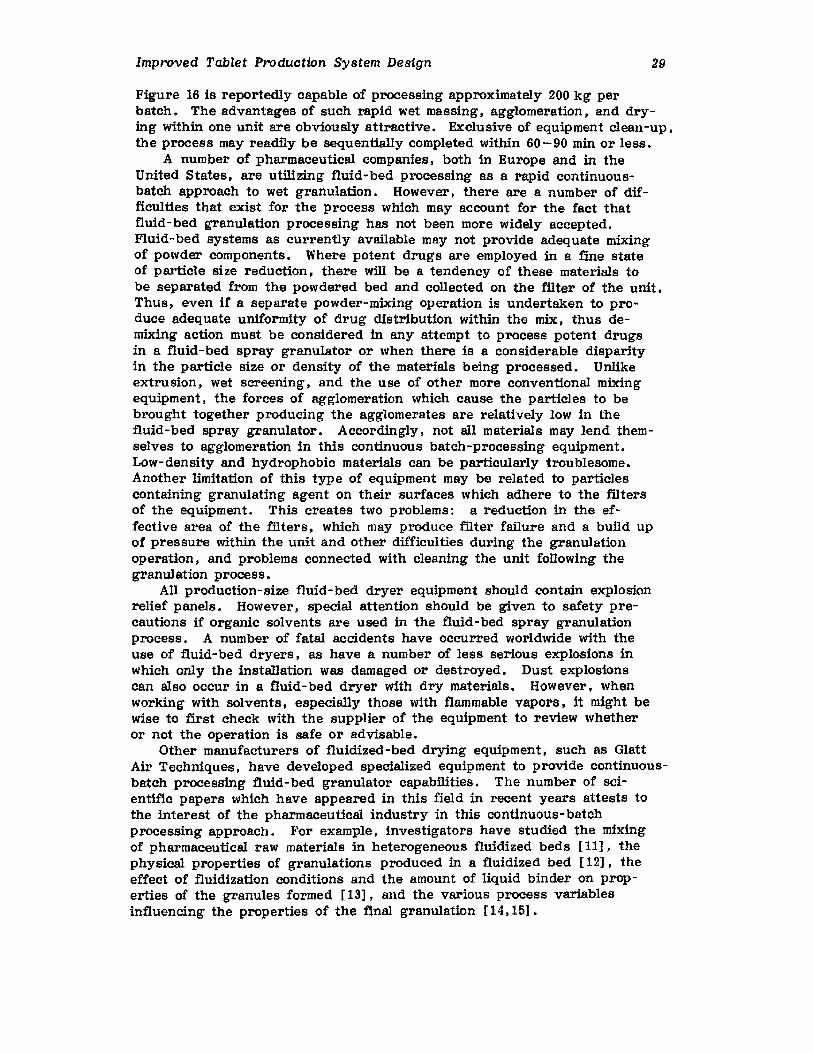
Figure 17 A cutaway view of a double-cone mixer/dryer processor. (Courtesy of PaulO. Abbe, Ine , , Little Falls,New Jersey.)
Fle~ible coltriecti(;Jn$ forf:irt:ulat/ng heating mfJi:!ium
Agtf'iJttng.(i,eI'f'AenfS,Th"edesigil.snd
numberb! the$ffc##be chllltgedltJ
suitspeeificrequi/'8rnent$
J:leJtible connections foralrcuf'ating besting medium
Flej:lblliCOnttilct16rtfQrvltcuum lihs
~,.:;:.."., "x,... Ple1ll.b..•..,leClJnnect/onl!orJ;quid spray
: 1
~
~(')
~-~;:sQ.<II
~;:s-Q;:sQ.
b:lQ;:s7';'(II"'S
Improved Tablet Production System Design 31
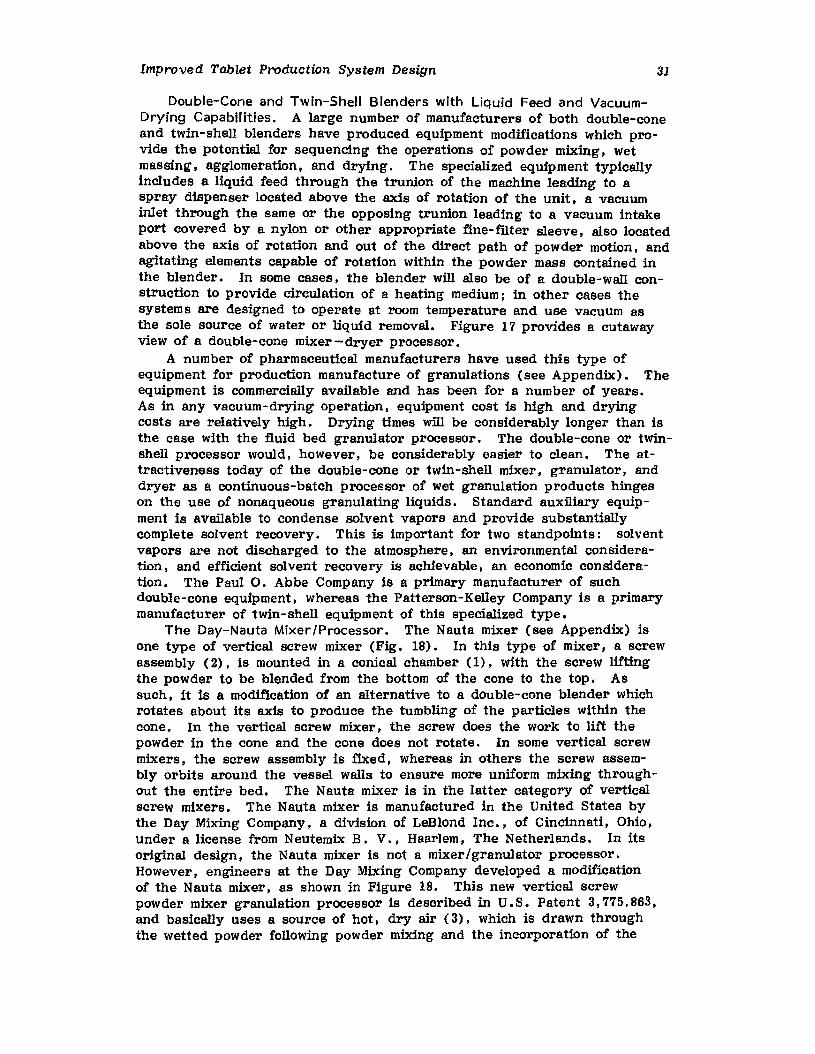
Double-Cone and Twin-Shell Blenders with Liquid Feed and VacuumDrying Capabilities. A large number of manufacturers of both double-coneand twin-shell blenders have produced equipment modifications which provide the potential for sequencing the operations of powder mixing, wetmassing, agglomeration, and drying. The specialized equipment typicallyincludes a liquid feed through the trunion of the machine leading to aspray dispenser located above the axis of rotation of the unit, a vacuuminlet through the same or the opposing trunion leading to a vacuum intakeport covered by a nylon or other appropriate fine-f'Jlter sleeve, also locatedabove the axis of rotation and out of the direct path of powder motion, andagitating elements capable of rotation within the powder mass contained inthe blender. In some cases, the blender will also be of a double-wall construction to provide circulation of a heating medium; in other eases thesystems are designed to operate at room temperature and use vacuum asthe sole source of water or liquid removal. Figure 17 provides a cutawayview of a double-cone mixer - dryer processor.
A number of pharmaceutical manufacturers have used this type ofequipment for production manufacture of granulations (see Appendix). Theequipment is commercially available and has been for a number of years.As in any vacuum-drying operation. equipment cost is high and dryingcosts are relatively high. Drying times will be considerably longer than isthe case with the fluid bed granulator processor. The double-cone or twinshell processor would, however, be considerably easier to clean. The attractiveness today of the double-cone or twin-shell mixer. granulator, anddryer as a continuous-batch processor of wet granulation products hingeson the use of nonaqueous granulating liquids. Standard auxiliary equipment is available to condense solvent vapors and provide substantiallycomplete solvent recovery. This is important for two standpoints: solventvapors are not discharged to the atmosphere. an environmental consideration, and efficient solvent recovery is achievable. an economic consideration. The Paul O. Abbe Company is a primary manufacturer of suchdouble-eone equipment, whereas the Patterson-Kelley Company is a primarymanufacturer of twin-shell equipment of this specialized type.
The Day-Nauta Mixer/Processor. The Nauta mixer (see Appendix) isone type of vertical screw mixer (Fig. 18). In this type of mixer. a screwassembly (2), is mounted in a conical chamber (1), with the screw liftingthe powder to be blended from the bottom of the cone to the top. Assuch. it is a modification of an alternative to a double-cone blender whichrotates about its axis to produce the tumbling of the particles within thecone. In the vertical screw mixer. the screw does the work to lift thepowder in the cone and the cone does not rotate. In some vertical screwmixers. the screw assembly is fixed, Whereas in others the screw assembly orbits around the vessel walls to ensure more uniform mixing throughout the entire bed. The Nauta mixer is in the latter category of verticalscrew mixers. The Nauta mixer is manufactured in the United States bythe Day Mixing Company. a division of LeBlond Inc., of Cincinnati. Ohio.under a license from Neutemix B. V., Haarlem , The Netherlands. In itsoriginal design. the Nauta mixer is not a mixer/granulator processor.However, engineers at the Day Mixing Company developed a modificationof the Nauta mixer, as shown in Figure 18. This new vertical screwpowder mixer granulation processor is described in U.S. Patent 3,775,863,and basically uses a source of hot. dry air (3), which is drawn throughthe wetted powder following powder mixing and the incorporation of the
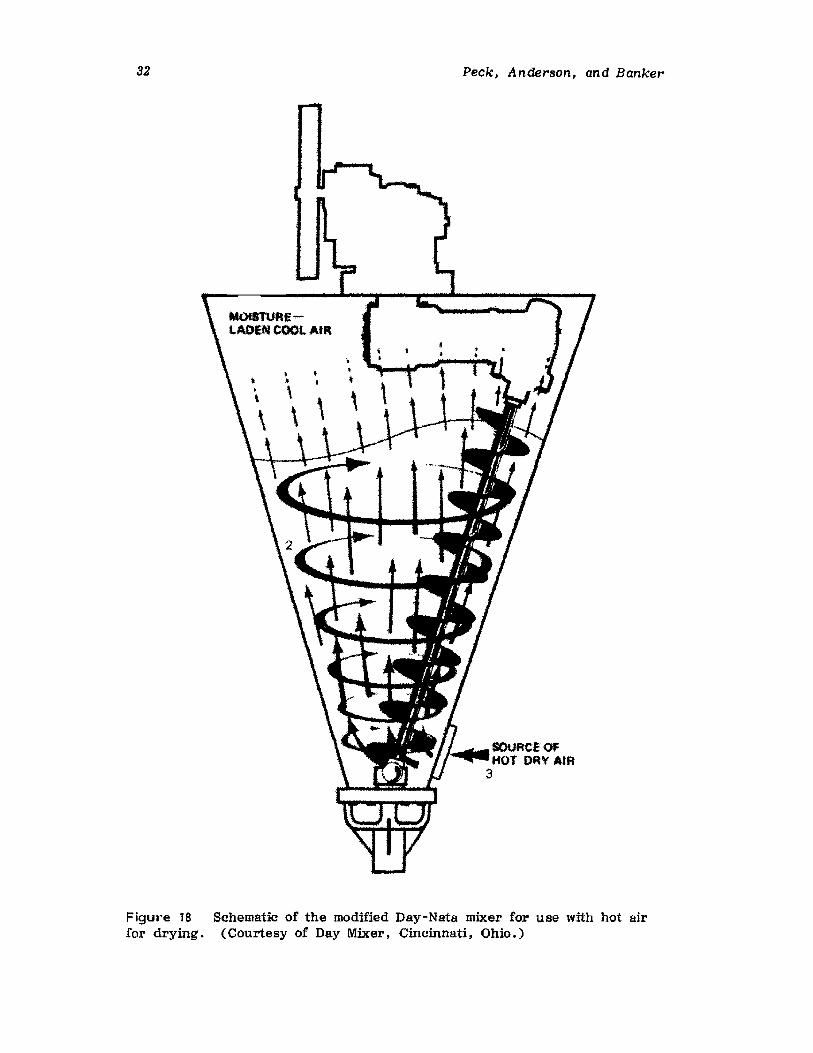
32
Figure 18for drying.
Peck, Anderson, and Banker
MOfSTURElADEtll COOl AtR
t
" •• •,I t
• ,\
Schematic of the modified Day-Nata mixer for use with hot air(Courtesy of Day Mixer. Cincinnati. Ohio.)
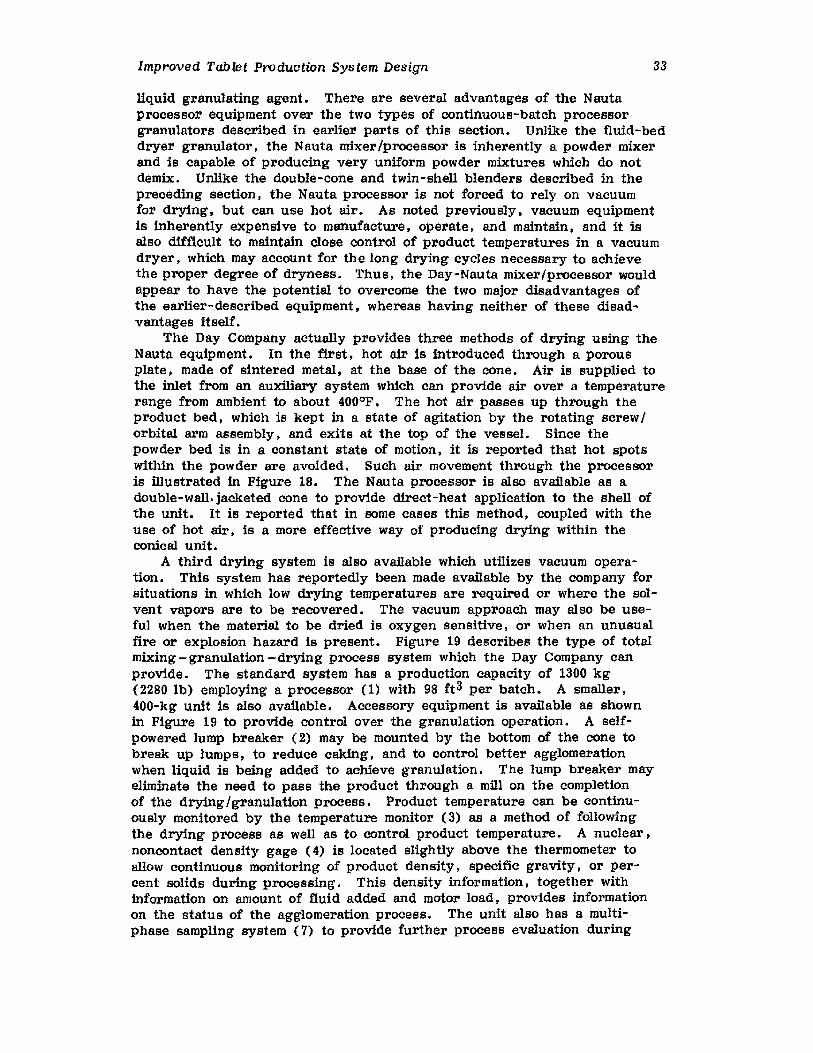
Improved Tablet Production System Design 33
liquid granulating agent. There are several advantages of the Nautaprocessor equipment over the two types of continuous-batch processorgranulators described in earlier parts of this section. Unlike the fluid-beddryer granulator , the Nauta mixer/processor is inherently a powder mixerand is capable of producing very uniform powder mixtures which do notdemix. Unlike the double-cone and twin-shell blenders described in thepreceding section, the Nauta processor is not forced to rely on vacuumfor drying, but can use hot air. As noted previously, vacuum equipmentis inherently expensive to manufacture, operate, and maintain, and it isalso difficult to maintain close control of product temperatures in a vacuumdryer, which may account for the long drying cycles necessary to achievethe proper degree of dryness. Thus, the Day-Nauta mixer/processor wouldappear to have the potential to overcome the two major disadvantages ofthe earlier-described equipment, whereas having neither of these disadvantages itself.
The Day Company actually provides three methods of drying using theNauta equipment. In the first, hot air is introduced through a porousplate. made of sintered metal ~ at the base of the cone. Air is supplied tothe inlet from an auxiliary system which can provide air over a temperaturerange from ambient to about 400°F. The hot air passes up through theproduct bed, which is kept in a state of agitation by the rotating screw/orbital arm assembly. and exits at the top of the vessel. Since thepowder bed is in a constant state of motion, it is reported that hot spotswithin the powder are avoided. Such air movement through the processoris illustrated in Figure 18. The Nauta processor is also available as adouble-wall. jacketed cone to provide direct-heat application to the shell ofthe unit. It is reported that in some cases this method, coupled with theuse of hot air ~ is a more effective way of producing drying within theconical unit.
A third drying system is also available which utilizes vacuum operation. This system has reportedly been made available by the company forsituations in which low drying temperatures are required or where the solvent vapors are to be recovered. The vacuum approach may also be useful when the material to be dried is oxygen sensitive, or when an unusualfire or explosion hazard is present. Figure 19 describes the type of totalmixing-granulation -drying process system which the Day Company canprovide. The standard system has a production capacity of 1300 kg(2280 lb) employing a processor (1) with 98 ft 3 per batch. A smaller,400-kg unit is also available. Accessory equipment is available as shownin Figure 19 to provide control over the granulation operation. A selfpowered lump breaker (2) may be mounted by the bottom of the cone tobreak up lumps, to reduce caking, and to control better agglomerationwhen liquid is being added to achieve granulation. The lump breaker mayeliminate the need to pass the product through a mill on the completionof the drying/granulation process. Product temperature can be continuously monitored by the temperature monitor (3) as a method of followingthe drying process as well as to control product temperature. A nuclear,noncontact density gage (4) is located slightly above the thermometer toallow continuous monitoring of product density, specific gravity, or percent solids during processing. This density information. together withinformation on amount of fluid added and motor load, provides informationon the status of the agglomeration process. The unit also has a multiphase sampling system (7) to provide further process evaluation during
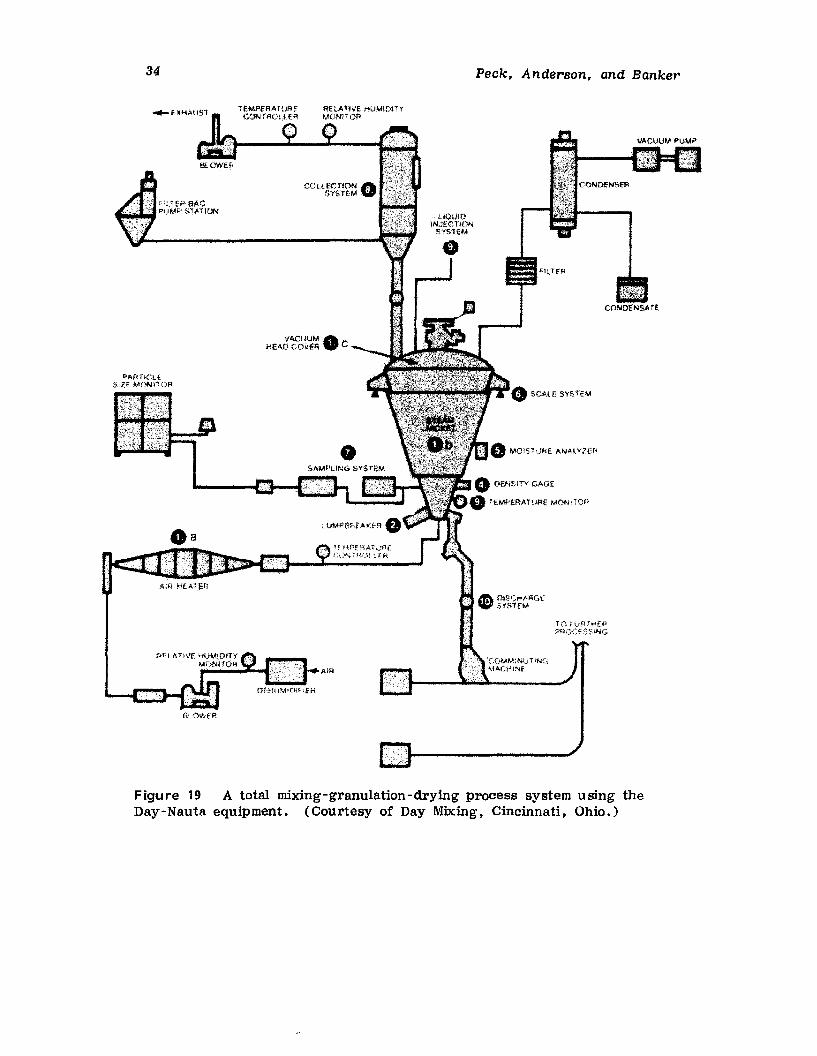
34
"AfH'CLES,lf ~ON;-rOP
6LOv.EA
VACUUM.HEAO COVER C
1"[l,uTRAl' .JflEGCiN';H,Ql:' [P,
Peck. Anderson, and Banker
CONDENSM£
o SCA,lE SV&rEM
o OENSHY GAGE
8' TEMPf.RAT\lRE MON,TOIl
TO F'URrjooltJ~
.PR0Cf:SS~"4G
'C',')MM 'NUT ,"',.'~;AC!41NE .,
Figure 19 A total mixing-granulation-drying process system using theDay-Nauta equipment. (Courtesy of Day Mixing. Cincinnati, Ohio.)
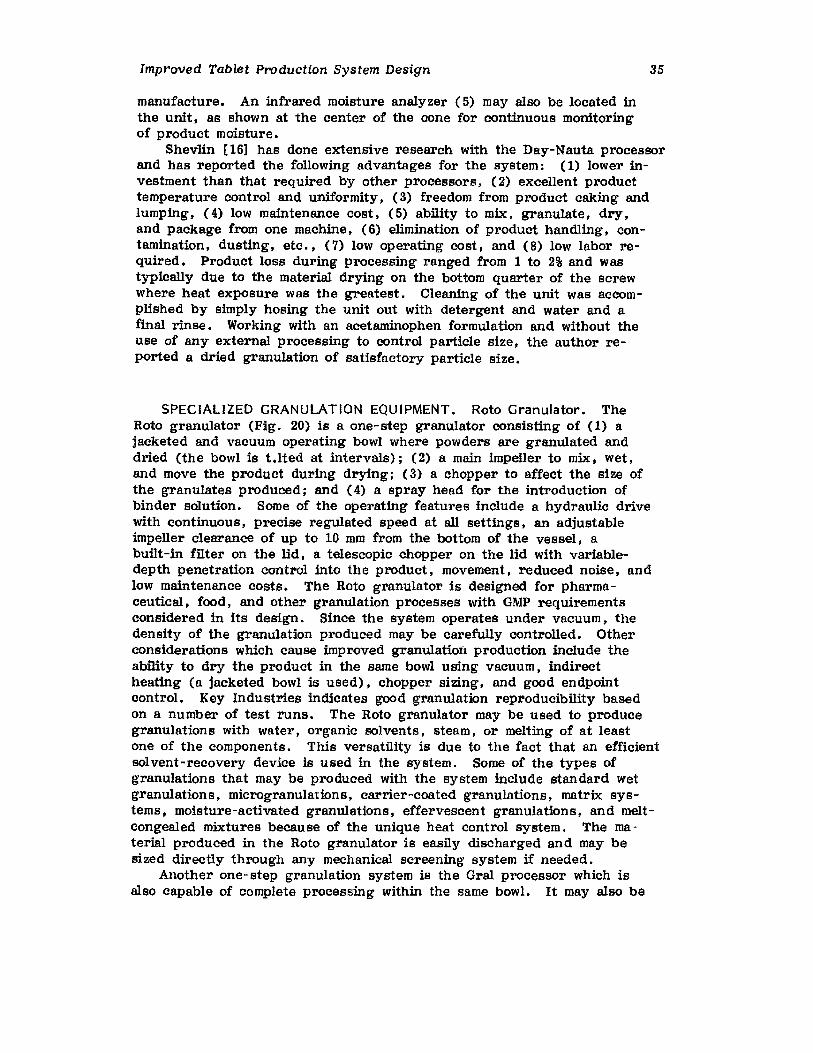
Improved Tablet Production System Design 35
manufacture. An infrared moisture analyzer (5) may also be located inthe unit. as shown at the center of the cone for continuous monitoringof product moisture.
Shevlin [16] has done extensive research with the Day-Nauta processorand has reported the following advantages for the system: (1) lower investment than that required by other processors. (2) excellent producttemperature control and uniformity, (3) freedom from product caking andlumping, (4) low maintenance cost. (5) ability to mix, granulate, dry,and package from one machine. (6) elimination of product handling, contamination, dusting. etc., (7) low operating cost, and (8) low labor required. Product loss during processing ranged from 1 to 2% and wastypically due to the material drying on the bottom quarter of the screwwhere heat exposure was the greatest. Cleaning of the unit was accomplished by simply hosing the unit out with detergent and water and aflnal rinse. Working with an acetaminophen formulation and without theuse of any external processing to control particle size, the author reported a dried granulation of satisfactory particle size.
SPECIALIZED GRANULATION EQUIPMENT. Roto Granulator. TheRoto granulator (Fig. 20) is a one-step granulator consisting of (1) ajacketed and vacuum operating bowl where powders are granulated anddried (the bowl is t.tted at intervals); (2) a main impeller to mix, wet,and move the product during drying; (3) a chopper to affect the size ofthe granulates produced; and (4) a spray head for the introduction ofbinder solution. Some of the operating features include a hydraulic drivewith continuous, precise regulated speed at all settings, an adjustableimpeller clearance of up to 10 mm from the bottom of the vessel, abuilt-dn fUter on the lid, a telescopic chopper on the lid with variabledepth penetration control into the product, movement. reduced noise, andlow maintenance costs. The Roto granUlator is designed for pharmaceutical' food, and other granulation processes with GMP requirementsconsidered in its design. Since the system operates under vacuum, thedensity of the granulation produced may be carefully controlled. Otherconsiderations which cause improved granulation production include theability to dry the product in the same bowl using vacuum. indirectheating (a jacketed bowl is used), chopper sizing, and good endpointcontrol. Key Industries indicates good granulation reproducibility basedon a number of test runs. The Roto granulator may be used to producegranulations with water, organic solvents, steam, or melting of at leastone of the components. This versatility is due to the fact that an efficientsolvent-recovery device is used in the system. Some of the types ofgranulations that may be produced with the system include standard wetgranulations, microgranulations, carrier-coated granulations, matrix systems, moisture-activated granulations, effervescent granulations. and meltcongealed mixtures because of the unique heat control system. The material produced in the Roto granulator is easily discharged and may besized directly through any mechanical screening system if needed.
Another one-step granulation system is the Gral processor which isalso capable of complete processing within the same bowl. It may also be
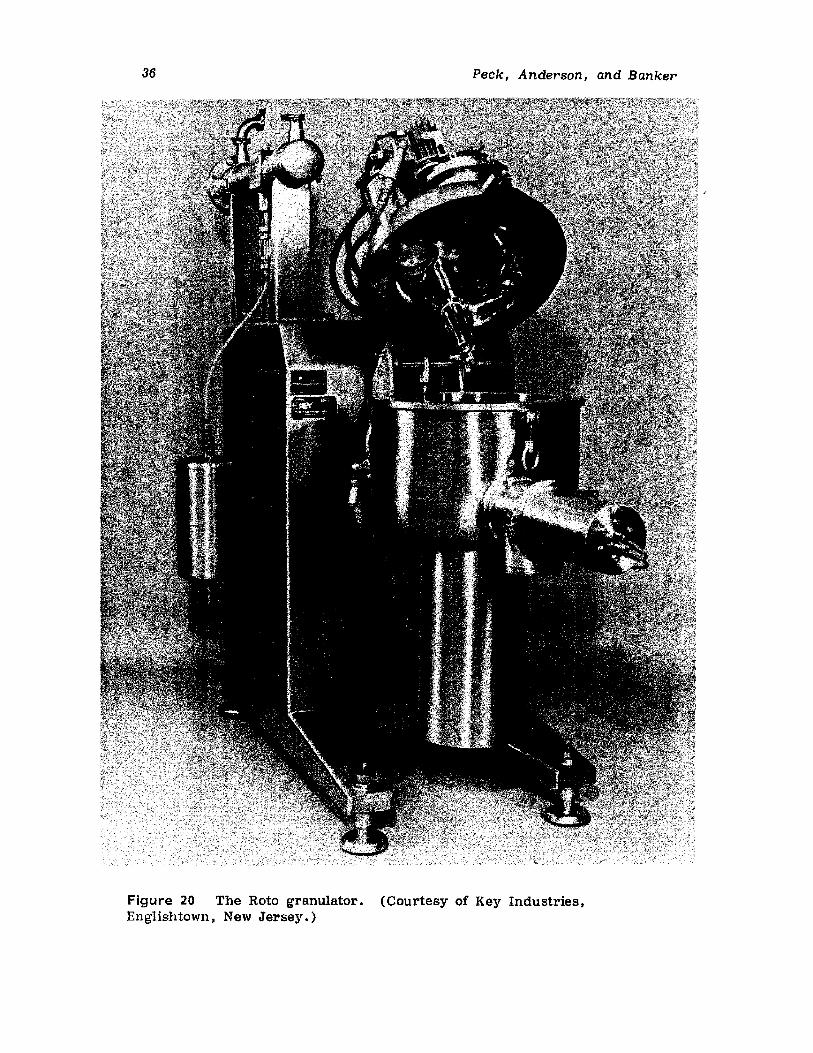
36 Peck, Anderson, and Banker
Figure 20 The Rotc granulator. (Courtesy of Key Industries,Englishtown. New Jersey.)
Improved Tablet Production System Design 37
used for aqueous and nonaqueous solvent systems because of its solventrecovery systems. Both processors have the possibility of reducing theamount of floor space needed for granulation preparation which couldreduce total capitol costs.
By imploding coating materials on existing granulations, coating withinthe unit reportedly is possible. In addition. by alternately implodingvarious drug and excipient materials, the equipment reportedly is capableof effectively separating incompatible drugs or of producing effervescentproducts of improved stability to moisture. Unfortunately. little scientificor technical information is available regarding products produced by thistechnique.
The Marumizer. The Marumerizer (Fig. 21) (see Appendix) is a specialpiece of granulation equipment originally developed in Japan and is distributed by the Luwa Corporation. It must be utilized in combination withan appropriate extruder such as the Xtruder (Fig. 22). Single or twintransport screws convey a damp, kneaded formulation from the feed hopperto the extrusion zone. A tapered rotor with longitudinal blades expelsthe material through a radial screen. The rod-shaped cylindrical segmentsare then transported to the Marumerizer. The Marumerizer incorporatesthree principal , precisely constructed components: a vertical cylinder withdischarge port. a circular friction plate. and a variable- speed drive trainwhich turns the plate. As the plate revolves the cylindrical segments ofthe product are fragmental and rolled into cylindrical or spherical shapes.The product is then dried and screened. The resulting product may thenbe tableted, coated. or otherwise processed. The diameter of the spheresthat are formed will basically be the same as the diameter of the rodshaped segments which are fed to the machine. Four models of the equipment are available. ranging in capacity from 1 L (10-30 L/h) to 50 L(500 -1500 L/h). The process is not recommended for routine preparationof granulations for tableting , but is mentioned here as a specialized typeof granulation equipment in which spherical particles may be required forthe preparation of material for coating. Current research studies shouldexpand the use of the equipment. especially in controlled-release systemsor other applications.
c. Unit Operation Improvements
Wet Granulation Monitoring
The wet granulation of powders is a fundamental pharmaceutical technological process. Wet-granulation techniques are widely used in the pharmaceutical industry on the starting materials that are used to make tablets toachieve anyone or all of a number of objectives. These objectives include improved flow; increased particle size; densification; uniform distribution of the active ingredient(s); production of uniform. spherical particles;production of hydrophilic surfaces; and increased compressibility [1- 2] •The granulation that is formed during this process affects the characteristics of the finished tablets, including hardness. friability. capping tendency, disintegration. and dissolution. The process of granulation. however, is not well understood because of the many variables involved inthe process. Attempts to obtain reproducible granulations and minimizelot-to-lot product variability have traditionally sought to control the
38Peck. An rlp.rRnn _ nnIf R nn z,.<>r
Figure 21 The Marumerizer, Model QJ-400.tion , Process Division.)
(Courtesy of Luwa Corpora-
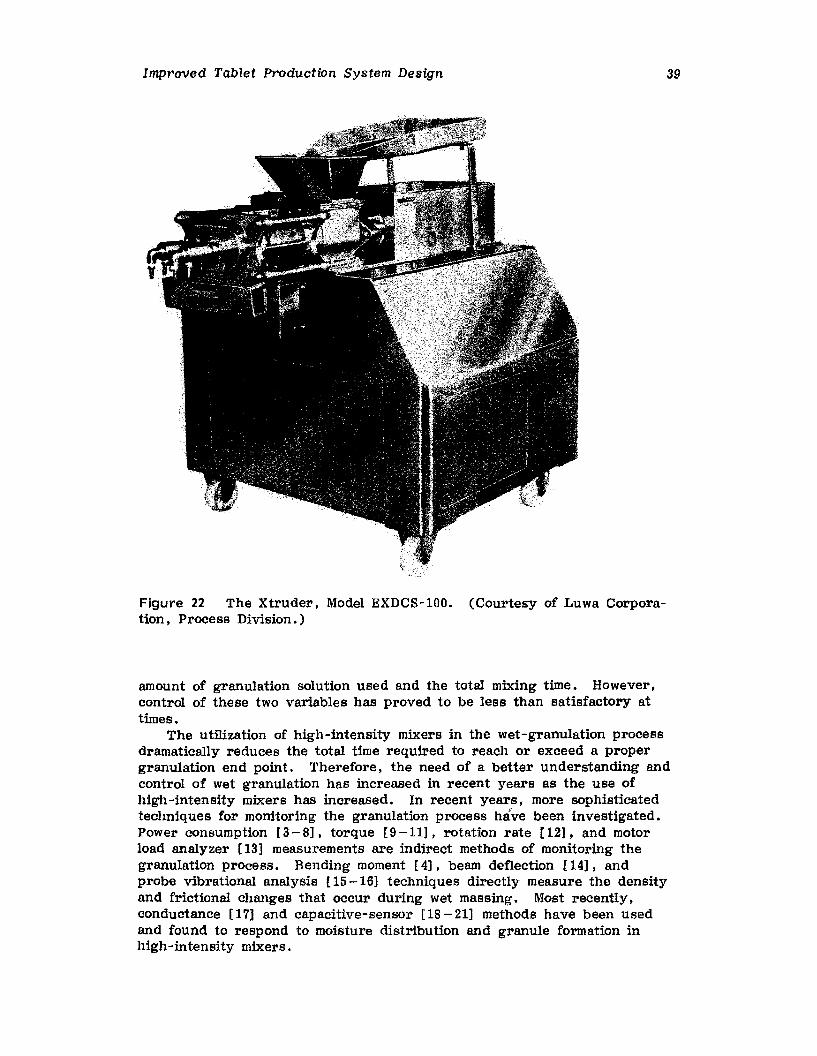
Improved Tablet Production System Design 39
Figure 22 The Xtruder , Model EXDCS-I00. (Courtesy of Luwa Corporation, Process Division.)
amount of granulation solution used and the total mixing time. However,control of these two variables has proved to be less than satisfactory attimes.
The utilization of high-intensity mixers in the wet-granulation processdramatically reduces the total time required to reach or exceed a propergranulation end point. Therefore. the need of a better understanding andcontrol of wet granulation has increased in recent years as the use ofhigh-intensity mixers has increased. In recent years. more sophisticatedtechniques for monitoring the granulation process have been investigated.Power consumption [3 - 8], torque [9 -l1J. rotation rate [12]. and motorload analyzer [13] measurements are indirect methods of monitoring thegranulation process. Bending moment [4J. beam deflection [14]. andprobe vibrational analysis [15 -16] techniques directly measure the densityand frictional changes that occur during wet massing. Most recently.conductance [17] and capacitive-sensor [18 - 21] methods have been usedand found to respond to moisture distribution and granule formation inhigh-intensity mixers.
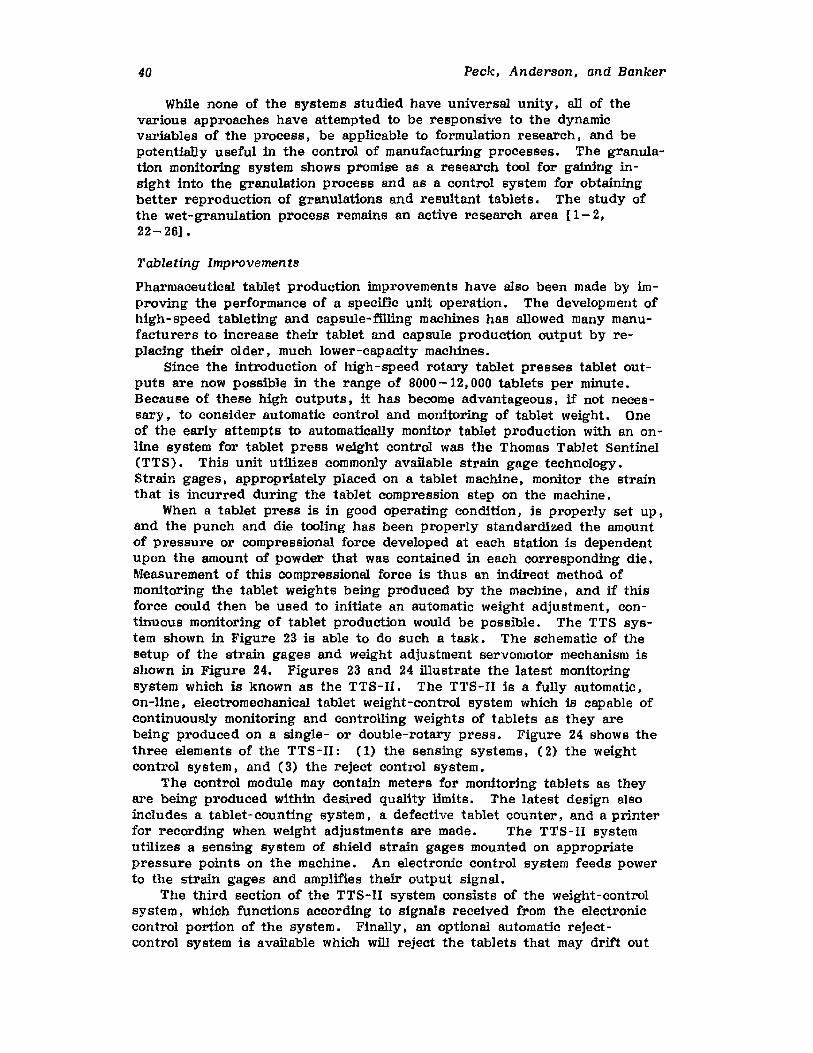
40 Peck, Anderson, and Banker
While none of the systems studied have universal unity, all of thevarious approaches have attempted to be responsive to the dynamicvariables of the process. be applicable to formulation research. and bepotentially useful in the control of manufacturing processes. The granulation monitoring system shows promise as a research tool for gaining insight into the granulation process and as a control system for obtainingbetter reproduction of granulations and resultant tablets. The study ofthe wet-granulation process remains an active research area [1- 2,22-26].
Tableting Improvements
Pharmaceutical tablet production improvements have also been made by improving the performance of a specific unit operation. The development ofhigh-speed tableting and capsule-filling machines has allowed many manufacturers to increase their tablet and capsule production output by replacing their older, much lower-capacity machines.
Since the introduction of high-speed rotary tablet presses tablet outputs are now possible in the range of 8000 -12,000 tablets per minute.Because of these high outputs, it has become advantageous. if not necessary, to consider automatic control and monitoring of tablet weight. Oneof the early attempts to automatically monitor tablet production with an online system for tablet press weight control was the Thomas Tablet Sentinel(TTS). This unit utilizes commonly available strain gage technology.Strain gages, appropriately placed on a tablet machine, monitor the strainthat is incurred during the tablet compression step on the machine.
When a tablet press is in good operating condition, is properly set up,and the punch and die tooling has been properly standardized the amountof pressure or compressional force developed at each station is dependentupon the amount of powder that was contained in each corresponding die.Measurement of this compressional force is thus an indirect method ofmonitoring the tablet weights being produced by the machine, and if thisforce could then be used to initiate an automatic weight adjustment, continuous monitoring of tablet production would be possible. The TTS system shown in Figure 23 is able to do such a task. The schematic of thesetup of the strain gages and weight adjustment servomotor mechanism isshown in Figure 24. Figures 23 and 24 illustrate the latest monitoringsystem which is known as the TTS-II. The TTS-II is a fully automatic,on-line. electromechanical tablet weight-control system which is capable ofcontinuously monitoring and controlling weights of tablets as they arebeing produced on a single- or double-r-otary press. Figure 24 shows thethree elements of the TTS - II: (1) the sensing systems, (2) the weightcontrol system. and (3) the reject control system.
The control module may contain meters for monitoring tablets as theyare being produced within desired quality limits. The latest design alsoincludes a tablet-counting system, a defective tablet counter, and a printerfor recording when weight adjustments are made. The TTS-ll systemutilizes a sensing system of shield strain gages mounted on appropriatepressure points on the machine. An electronic control system feeds powerto the strain gages and amplifies their output signal.
The third section of the TT S-II system consists of the weight -controlsystem, which functions according to signals received from the electroniccontrol portion of the system. Finally. an optional automatic rejectcontrol system is available which will reject the tablets that may drift out
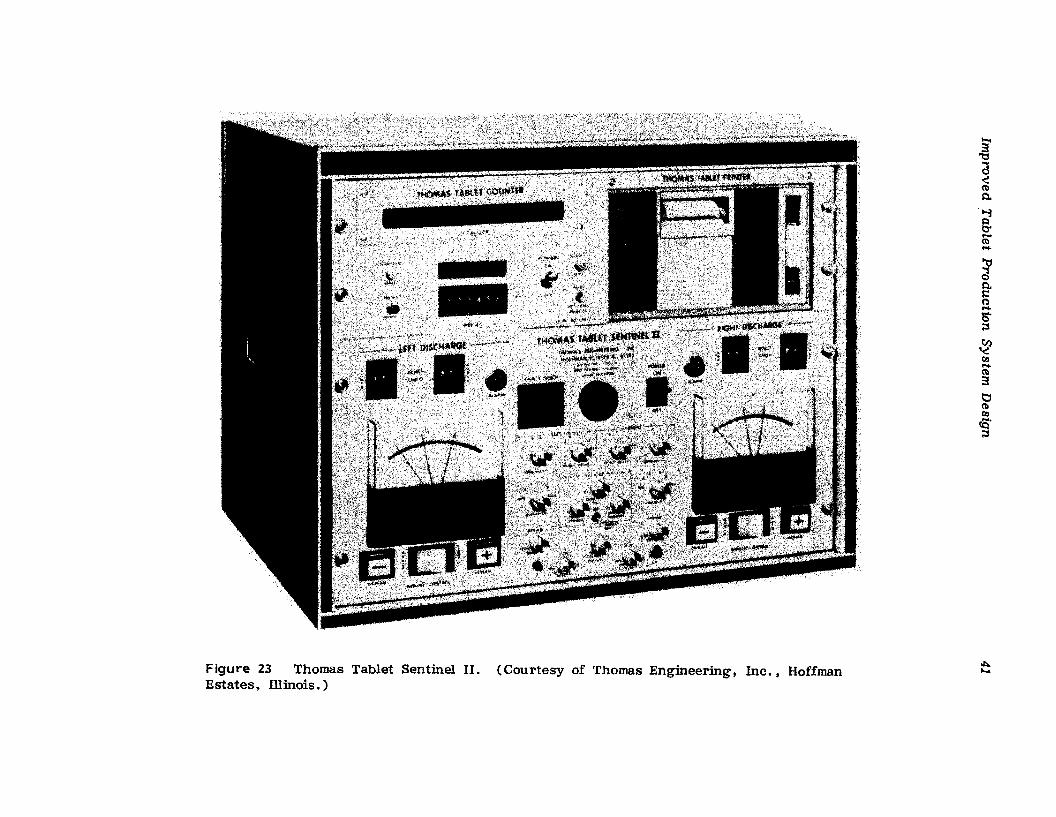
Figure 23 Thomas Tablet Sentinel II. (Courtesy of Thomas Bngfneermg , Ine , , HoffmanEstates, illinois.)
3''1:l
cs~(l)
~
.>-i
s(l)....
~~l:c....5';:s
~to....(l)
3t:l(l)to~.
;:s
II::l.....
42
TABLETTHlCI<NESS
ADJUSTMENT
STRAINGAGES
Peck, Anderson, and Banker
COMPRESSIONROLLS
- --- -- --,IJIIIIIIIIIIII
II
IIjI
l( i) SERVO-+---+, I MOTOR
I
, 2 IL ..J
Figure 211 Schematic of the Thomas Tablet Sentinel force-monitoring systern. (Courtesv of Thomas Engineering, Hoffman Estates J lllinois.)
of specifications. The weight-control system is equipped with an audiblesignal to alert the operator when a machine drifts out of present limitsas well as an automatic press shutdown after a chosen number of rejectedtablets have been observed by the system.
The TTS-II unit can be used on a machine that is compressing up to12. 000 tablets per minute. If the rejection system is used, the maximumrate of tablet preparation is 8000 tablets per minute.
The printing unit records time and tablet count. and if tablets arerejected J the rejections appear in red print rather than the normal blackprint. Since there are no on-line weighing systems that are currentlyfast enough to monitor a high· speed tablet machine. this system is themost positive automatic controlling procedure for continuously monitoringthe output of high-speed presses.
In order to meet further demands for maximum tablet press control,the TTS-III has been developed (Fig. 25). It was developed using proventablet press monitoring concepts associated with advanced sampling andmicroprocessor technology. This system provides a flexible means to control tablet weight While monitoring tablet performance. Some of the function features of this new system include (1) maintaining compressionforces within preset limits. (2) automated adjustment, (3) reading andsetting fill depth. (4) activating reject dates. (5) stopping the press,(6) displaying compression force for each station in real time. (7) displaying press performance bar graph. (8) printing all CRT displays. and
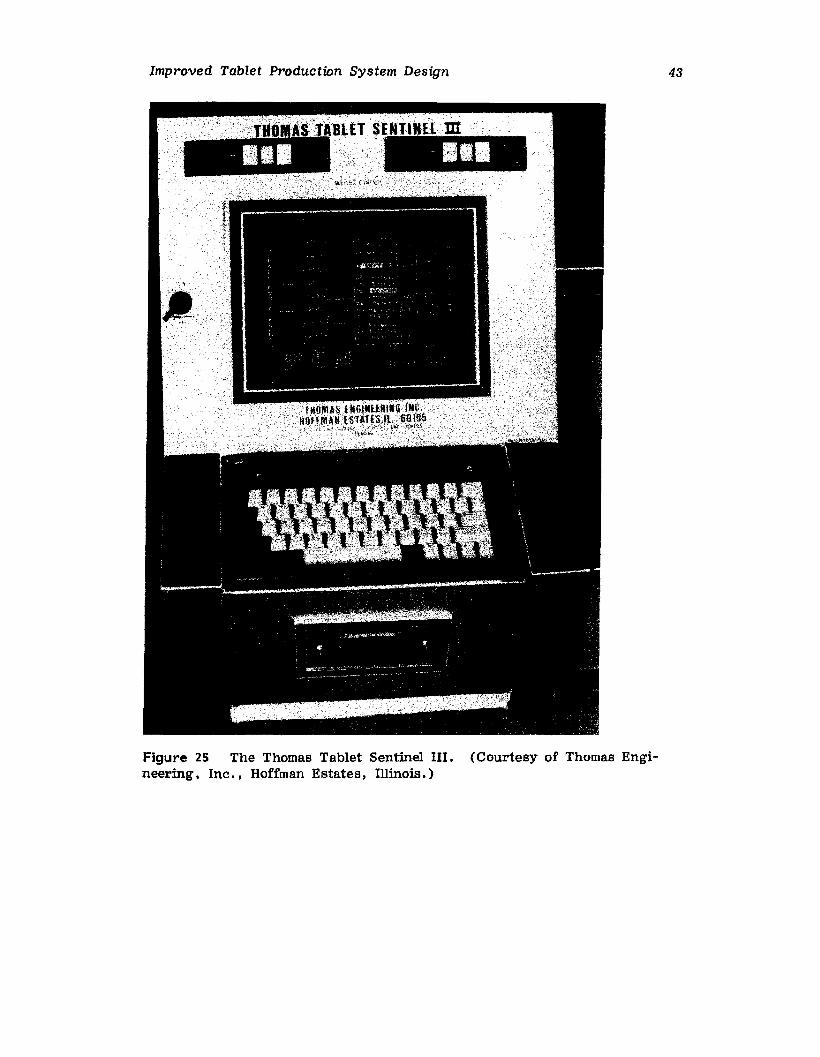
Improved Tablet Production System Design
, .. - ,
;J BLETSEMTlHEl m~II.
Figure 25 The Thomas Tablet Sentinel III. (Courtesy of Thomas Engineering. Inc, , Hoffman Estates, Illinois.)
43
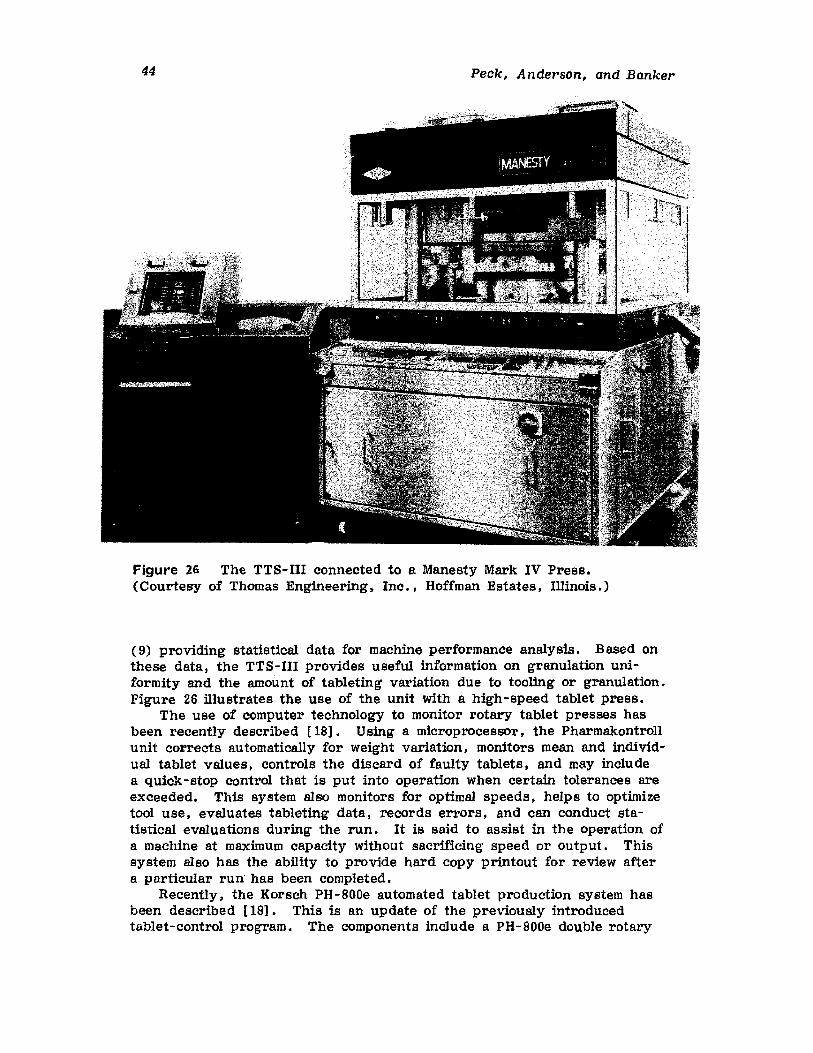
44 Peck, Anderson, and Banker
Figure 26 The TTS-III connected to a Manesty Mark IV Press.(Courtesy of Thomas Engineering. Inc., Hoffman Estates, Illinois.)
(9) providing statistical data for machine performance analysis. Based onthese data, the TTS-III provides useful information on granulation uniformity and the amount of tableting variation due to tooling or granulation.Figure 26 illustrates the use of the unit with a high-speed tablet press.
The use of computer technology to monitor rotary tablet presses hasbeen recently described [18]. Using a microprocessor, the Pharmakontrollunit corrects automatically for weight variation, monitors mean and individ·ual tablet values, controls the discard of faulty tablets, and may includea quick-stop control that is put into operation when certain tolerances areexceeded. This system also monitors for optimal speeds, helps to optimizetool use, evaluates tableting data, records errors, and can conduct statistical evaluations during the run. It is said to assist in the operation ofa machine at maximum capacity without sacrificing speed or output. Thissystem also has the ability to provide hard copy printout for review aftera particular run has been completed.
Recently, the Korsch PH-BODe automated tablet production system hasbeen described [18]. This is an update of the previously introducedtablet-control program. The components include a PH-800e double rotary
Improved Tablet Production System Design 45
tablet press ~ a Pharmakontroll 3 unit ~ a Pharmacheck unit J a weight/thickness/hardness unit, and a tablet-transfer system. Some of the operational features include continuous tablet weight verification, continuoustablet sorting, periodic quality control sampling, and fault diagnostics. Itis anticipated that the total system will provide product optimizationthrough real time adjustment.
Other improvements in tableting equipment might also include a recently introduced tablet press system (Fette Perfecta 2000 Cooltex) which enables the compression of systems at low temperature by connecting an appropriately constructed tablet press to a cooling unit. This cooling unitallows for the preparation by compression of suppositories, enzyme preparations, or other materials with thermosensitive active ingredients. Thecooling unit, connected to a relatively high-speed press, can supply coolant so that - 6°C is attainable on the press. The press is enclosed tomaintain the temperature on the die table. The cooling unit has been designed for continuous operation and remains fully effective throughout thetablet run. The liquid coolant is delivered to the areas of the tabletmachines which would be in immediate contact with the sensitive materialbeing compressed. The material is fed through a double-walled insulatedfeed hopper. This cool press should allow the production of many substances that are thermosensitive and provide the way for numerous newpossible product entries.
It is anticipated that further innovations will be developed which willbe directed to continuous monitoring of high-speed tablet presses as wellas the introduction of new tablet machines for more efficient preparationof materials by compression.
Coating Process Improvement
For years the coating of tablets and pills was conducted in standard 42-incoating pans by coaters who would ladle a given volume of sugar syrup ~
or a mixture of syrup plus insoluble additives. onto the tumbling tabletbed at selected intervals. The tablets were then allowed to roll while warmair was applied for a period of time just necessary to dry the particularapplication of coating. This procedure was entirely operator dependent.In 1963. Lachman and Cooper [18] reported a programmed, automated,film-coating process which was frankly designed to remove the humanfactor in coating and to improve the uniformity of application of an entericcoating. Figure 27 illustrates the entire system. The important componentsfor the improved technique include an airless spray system (1) J a tapetransmitter and programmer (2), suitable air controller valves (3), and aconventional exhaust air system (4). From this configuration it was possible to
1. Produce uniformly coated tablets as judged by their distintegrationrates
2. Better produce reproducible tablets from batch-to-batch3. Apply more coating to tablets per unit time4. Decrease coating build up on the pan5. Cut coating time by as much as one-half6. Be able to train coaters faster because of the automated spray
units7. Adapt the method to water-soluble films and sugar coating
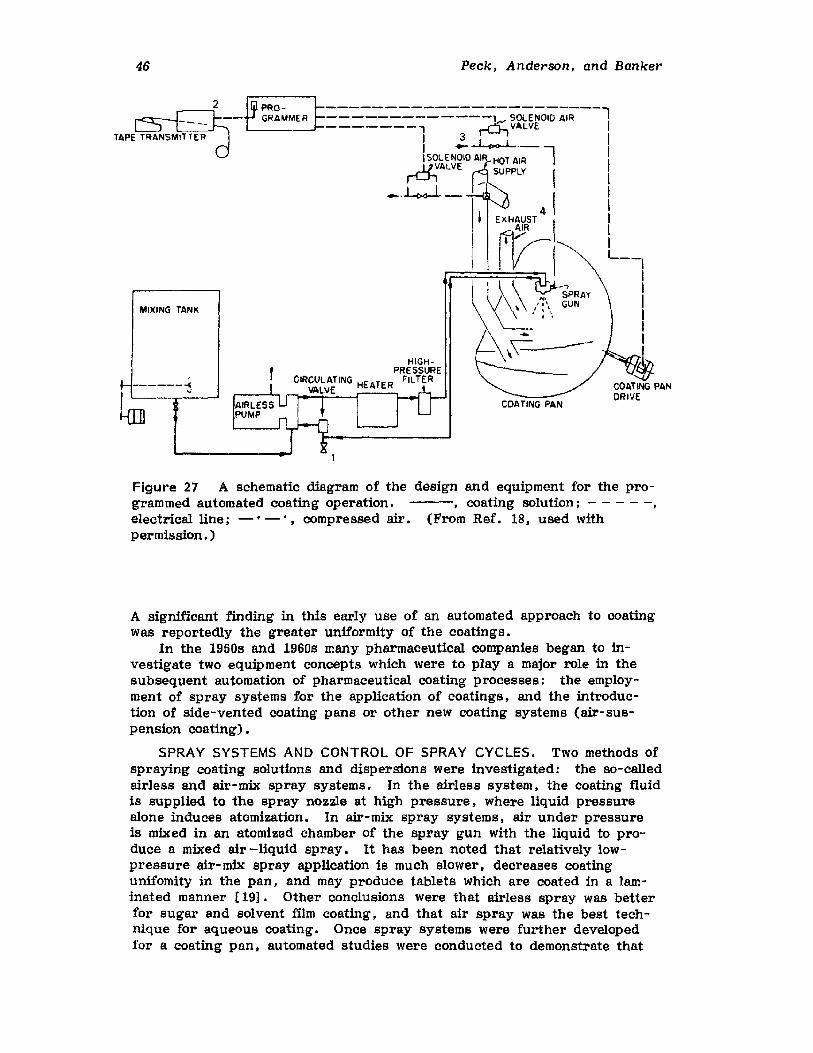
46
MIXING TANK
-------t.I ~
~
2
Peck, Anderson, and Banker
COATING PAN
Figure 27 A schematic diagram of the design and equipment for the programmed automated coating operation. , coating solution; - - - - -,electrical line; _. -', compressed air. (From Ref. 18, used withpermission. )
A significant finding in this early use of an automated approach to coatingwas reportedly the greater uniformity of the coatings.
In the 1950s and 1960s many pharmaceutical companies began to investigate two equipment concepts which were to play a major role in thesubsequent automation of pharmaceutical coating processes: the employment of spray systems for the application of coatings, and the introduction of side-vented coating pans or other new coating systems (air-suspension coating).
SPRAY SYSTEMS AND CONTROL OF SPRAY CYCLES. Two methods ofspraying coating solutions and dispersions were investigated: the so-calledairless and air-mix spray systems. In the airless system, the coating fluidis supplied to the spray nozzle at high pressure, where liquid pressurealone induces atomization. In air-mix spray systems, air under pressureis mixed in an atomized chamber of the spray gun with the liquid to produce a mixed air -liquid spray. It has been noted that relatively lowpressure air-mix spray application is much slower, decreases coatingunifomity in the pan, and may produce tablets which are coated in a laminated manner {19]. Other conclusions were that airless spray was betterfor sugar and solvent film coating, and that air spray was the best tech-nique for aqueous coating. Once spray systems were further developedfor a coating pan, automated studies were conducted to demonstrate that
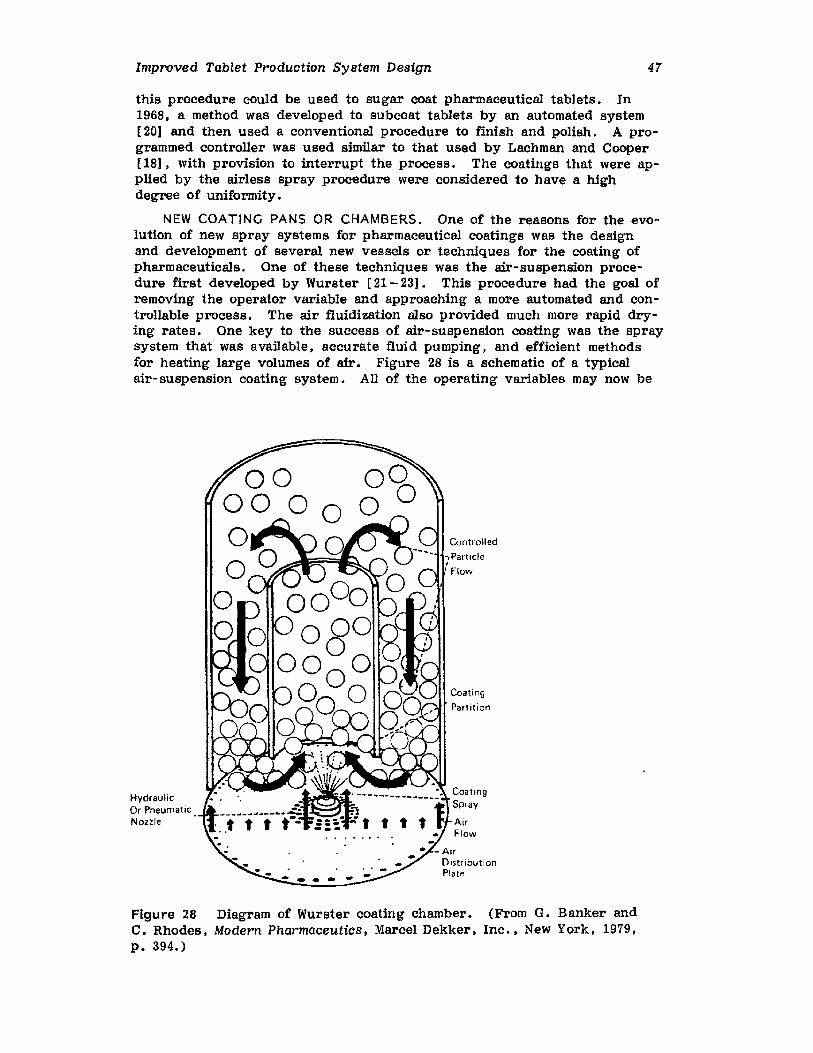
Improved Tablet Production System Design 47
this procedure could be used to sugar coat pharmaceutical tablets. In1968, a method was developed to subeoat tablets by an automated system[20] and then used a conventional procedure to finish and polish. A programmed controller was used similar to that used by Lachman and Cooper[18], with provision to interrupt the process. The coatings that were applied by the airless spray procedure were considered to have a highdegree of uniformity.
NEW COATING PANS OR CHAMBERS. One of the reasons for the evolution of new spray systems for pharmaceutical coatings was the designand development of several new vessels or techniques for the coating ofpharmaceuticals. One of these techniques was the air-suspension procedure first developed by Wurster [21- 23] • This procedure had the goal ofremoving the operator variable and approaching a more automated and controllable process. The air fluidization also provided much more rapid drying rates. One key to the success of air-suspension coating was the spraysystem that was available, accurate fluid pumping, and efficient methodsfor heating large volumes of air. Figure 28 is a schematic of a typicalair-suspension coating system. All of the operating variables may now be
HydraulicOr PneumaticNonie
Coating
Partition
CoannqSpray
AirFlow
Figure 28 Diagram of Wurster coating chamber. (From G. Banker andC. Rhodes, Modern Pharmaceutics, Marcel Dekker, Inc , , New York. 1979,p. 394.)
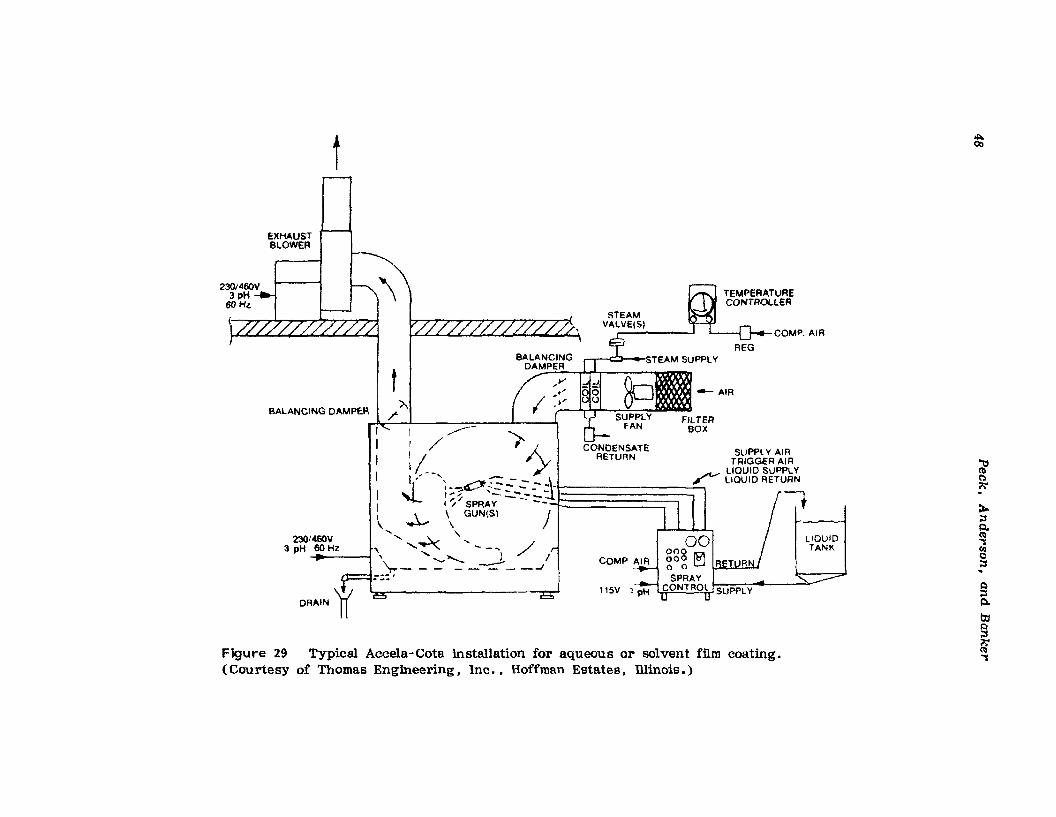
tlI:lI.00
Figure 29 Typical Accela-Cota installation for aqueous or solvent film coating.(Courtesy of Thomas Engineering t Inc., Hoffman Estates t illinois.)
Q;sQ.
b:1Q;s
ri"1
~(':l
"'")..;sQ.(1)"1toQ;s.
LlQUJDTANK
~
COMPo AIR
REG
TEMPERATURECONTROLLER
«,'1.....- .... P-1, I SUPPLV
CQMP AIR
- I. I CONDENSATE.'1. RETURN
t'"/'"
BALANCINGDAMPER-,V1 <:
• 19 ' v
I ..... I ->: :.-.l _..__.'"I I / ;- ,
I II\ ' yI 1"--' , ~ '"'""<"","• ;__ ~..::: _ .. ~ LIQUID SUPPLYI ~ ,:::~,.:::::......--:..:r ~ L1QUlDRETURN
l ~ v~0~~;1 - --J-~: I i I..... \
...... ~'-.- ",~ ........... -- ..... /-"'- ) /- - - _--=::-- -...,/
230J460V3 pH 60 Hz.....-
BALANCING DAMPER
Improved Tablet Production System Design 49
programmed, so that the operator may load the coater, set the temperature, start the warm airflow, and then start the spray system. Based onthe requirements of the dosage form being coated (tablets, beads, orsmall particles), the unit is set to coat for an appropriate preselectedperiod of time. This technique thus lends itself to the integration with aminiprocessor, since all coating procedures are capable of being mechanically or electronically controlled. The air-suspension approach may beeffectively employed with either nonaqueous or aqueous film coating.
About the same time that air-suspension coating was being perfected,another device was being investigated. This was a side-vented or perforated coating pan originally developed by Lilly and then sold as theAcce1a-Cota by Thomas Engineering (Fig. 29). One of the major advantages of this equipment is the one-way flow of air through the tablet bedand out the perforations of the pans. This greatly reduces or eliminatesthe "bounce-back" of atomized spray and particle spray drying of thespray droplets that occurs, especially with solvent-based coating, with theconventional pans. It also benefits coating because the greater air flowthrough the bed facilitates drying. Again, the key to the advance of thisnew coating pan was the availability of suitable spray systems which wouldprovide the new spray requirements while allowing for automation and thusprogrammable coating sequences within the coating unit. The side-ventedcoating pan has been successfully used for continuous coating of films andsugar systems [24]. It has been reported that by the selection of properviscosity sugar Slurries, a complete sugar coat may be applied over an8-h period. This must include such sequencing as spray, pause, and drycycles to allow for adequate sugar slurry spreading prior to drying. Itshould be noted that the Pellegrini pan, which is not side vented, butdoes have the capability of moving large amounts of air through the pan,has been adapted to continuous sugar coating, and has also been usedwith programmed control systems.
Automation and Coating
For the coating of tablets with sugar systems, it was recognized that it ispossible to spray, roll out the syrup, and dry. It is also known that thissequence can be repeated to produce a suitable coating as long as anadequate air supply is available and suitable spray systems can be used.With these two elements in place, it is then possible to install timers,mechanical or computer controllers, along with suitable solenoid valves, tohave a completely programmed system. In so doing an operation is developed that is capable of being readily validated, since all importantparameters must first be defined and then precisely controlled by theautomated system without the variability of human error. Once underautomated control, a validated process is easy to confirm with appro-priate printout recording. cf
Associated with the concept of automation may be the desire to firstoptimize a process, which would then ensure that the controlled processis operating at its maximum efficiency. A side-vented. 48-in coating panhas been used at Purdue University in the Industrial Pharmacy Laboratory(Fig. 30) to study a number of coating variables. This pan is equippedwith the usual temperature-indicating dials and coating pan pressure differential readout. However, it also includes the following features whichaid in the study of the coating process:
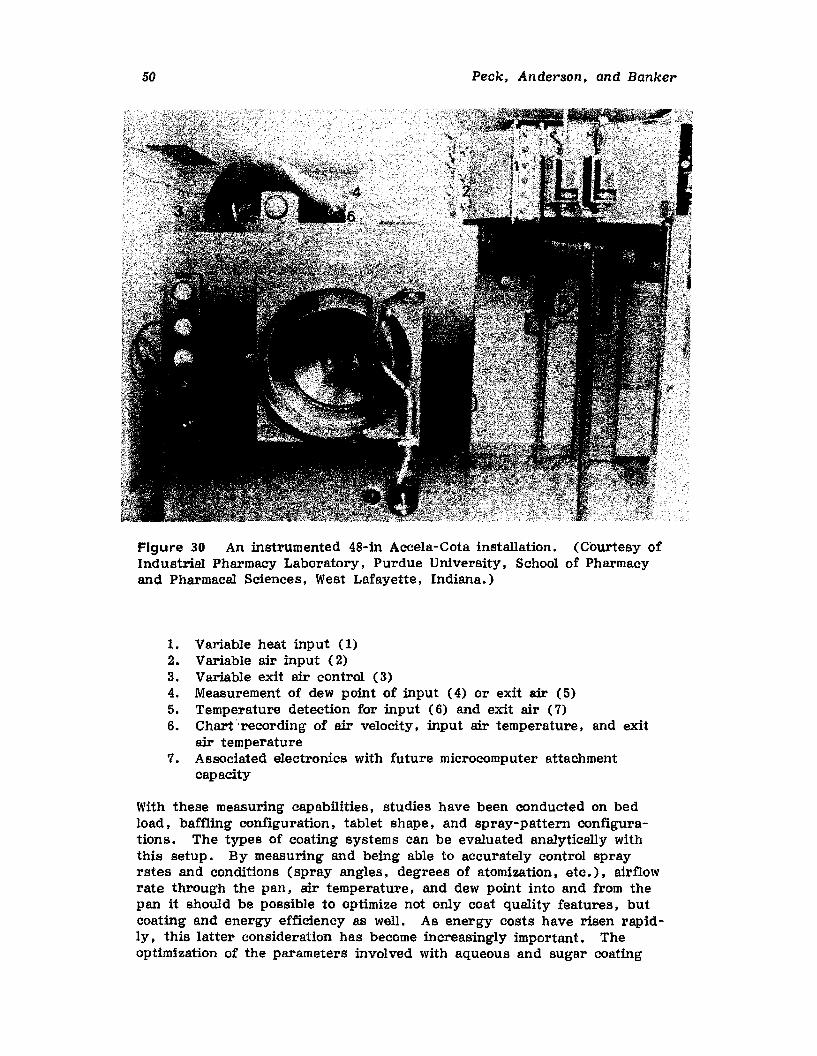
50 Peck, Anderson. and Banker
Figure 30 An instrumented 48-in Accela-Cota installation. (Courtesy ofIndustrial Pharmacy Laboratory, Purdue University, School of Pharmacyand Pharmacal Sciences, West Lafayette, Indiana.)
1. Variable heat input (1)2. Variable air input (2)3. Variable exit air control (3)4. Measurement of dew point of input (4) or exit air (5)5. Temperature detection for input (6) and exit air (7)6. Chart 'recording of air velocity, input air temperature, and exit
air temperature7. Associated electronics with future microcomputer attachment
capacity
With these measuring capabilities, studies have been conducted on bedload, baffling configuration, tablet shape, and spray-pattern configurations. The types of coating systems can be evaluated analytically withthis setup. By measuring and being able to accurately control sprayrstes and conditions (spray angles, degrees of atomization, etc.), airflowrate through the pan, air temperature, and dew point into and from thepan it should be possible to optimize not only coat quality features, butcoating and energy efficiency as well. As energy costs have risen rapidly, this latter consideration has become increasingly important. Theoptimization of the parameters involved with aqueous and sugar coating
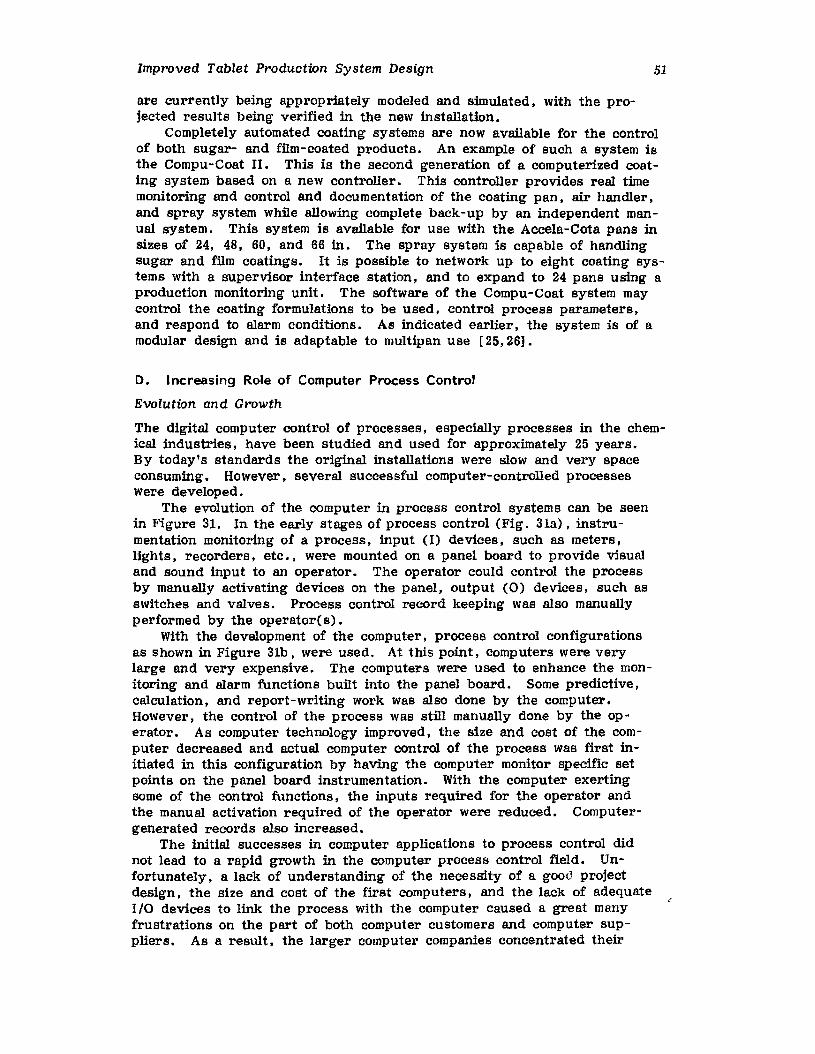
Improved Tablet Production System Design 51
are currently being appropriately modeled and simulated, with the projected results being verified in the new installation.
Completely automated coating systems are now available for the controlof both sugar- and film-coated products. An example of such a system isthe Compu-Coat II. This is the second generation of a computerized coating system based on a new controller. This controller provides real timemonitoring and control and documentation of the coating pan, air handler,and spray system while allowing complete back-up by an independent manual system. This system is available for use with the Accela-Cota pans insizes of 24, 48, 60, and 66 in. The spray system is capable of handlingsugar and film coatings. It is possible to network up to eight coating systems with a supervisor interface station, and to expand to 24 pans using aproduction monitoring unit. The software of the Compu-Coat system maycontrol the coating formulations to be used, control process parameters,and respond to alarm conditions. As indicated earlier, the system is of amodular design and is adaptable to multipan use [25,26].
D. Increasing Role of Computer Process Control
Evolution and Growth
The digital computer control of processes, especially processes in the chemical industries, have been studied and used for approximately 25 years.By today's standards the original installations were slow and very spaceconsuming. However, several successful computer-controlled processeswere developed.
The evolution of the computer in process control systems can be seenin Figure 31. In the early stages of process control (Fig. 31a) , instrumentation monitoring of a process, input (I) devices, such as meters,lights, recorders, etc., were mounted on a panel board to provide visualand sound input to an operator. The operator could control the processby manually activating devices on the panel, output (0) devices, such asswitches and valves. Process control record keeping was also manuallyperformed by the operator(s).
With the development of the computer. process control configurationsas shown in Figure 3lb. were used. At this point, computers were verylarge and very expensive. The computers were used to enhance the monitoring and alarm functions built into the panel board. Some predictive,calculation, and report-writing work was also done by the computer.However, the control of the process was still manually done by the operator. As computer technology improved, the size and cost of the computer decreased and actual computer control of the process was first initiated in this configuration by having the computer monitor specific setpoints on the panel board instrumentation. With the computer exertingsome of the control functions, the inputs required for the operator andthe manual activation required of the operator were reduced. Computergenerated records also increased.
The initial successes in computer applications to process control didnot lead to a rapid growth in the computer process control field. Unfortunately, a lack of understanding of the necessity of a good projectdesign. the size and cost of the first computers. and the lack of adequateI/O devices to link the process with the computer caused a great manyfrustrations on the part of both computer customers and computer suppliers. As a result, the larger computer companies concentrated their
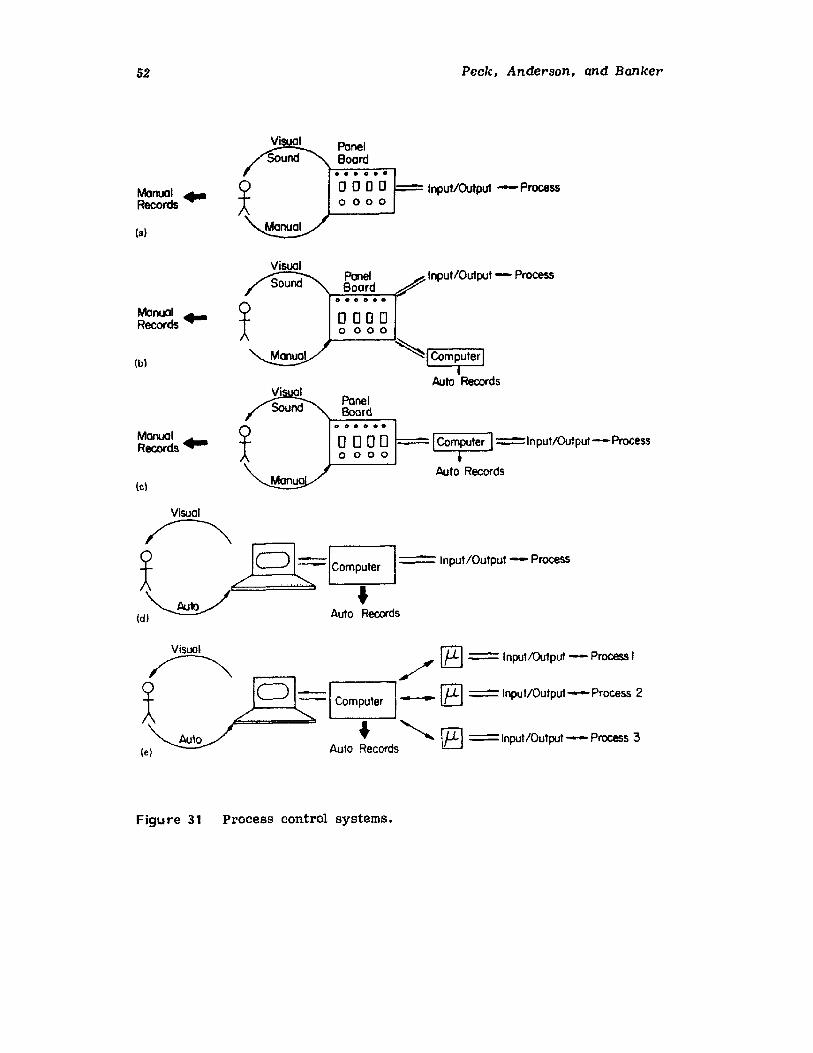
52
Manual ..Records
(al
Peck. Anderson, and Banker
PonelBoord
000 0 -lnput/Outpu1 -Process0000
Manuel ..Records
[b]
ManualRecords ..
Ie)
Ponel Input/Output- ProcessBoord
000000
0000o 000
~IComputerlt
Auto Records
PanelBoard
o000 ---Ieomruter 1=lnpuf/Oufput-Process0000
Auto Records
Visual
->.X J ?~Icom~w 1='"PUt/Output-Process
~ .[d] Auto Records
VislJOl
<>:X
Au'olei
/ [E] == InputlOufpuf - Process I
~_.......... ICompu'er 1--- [E] == Input/Output-Process 2
A .R ~ rp:t = Input/Output - Process :3uto ecords lCJ
Figu re 31 Process control systems.
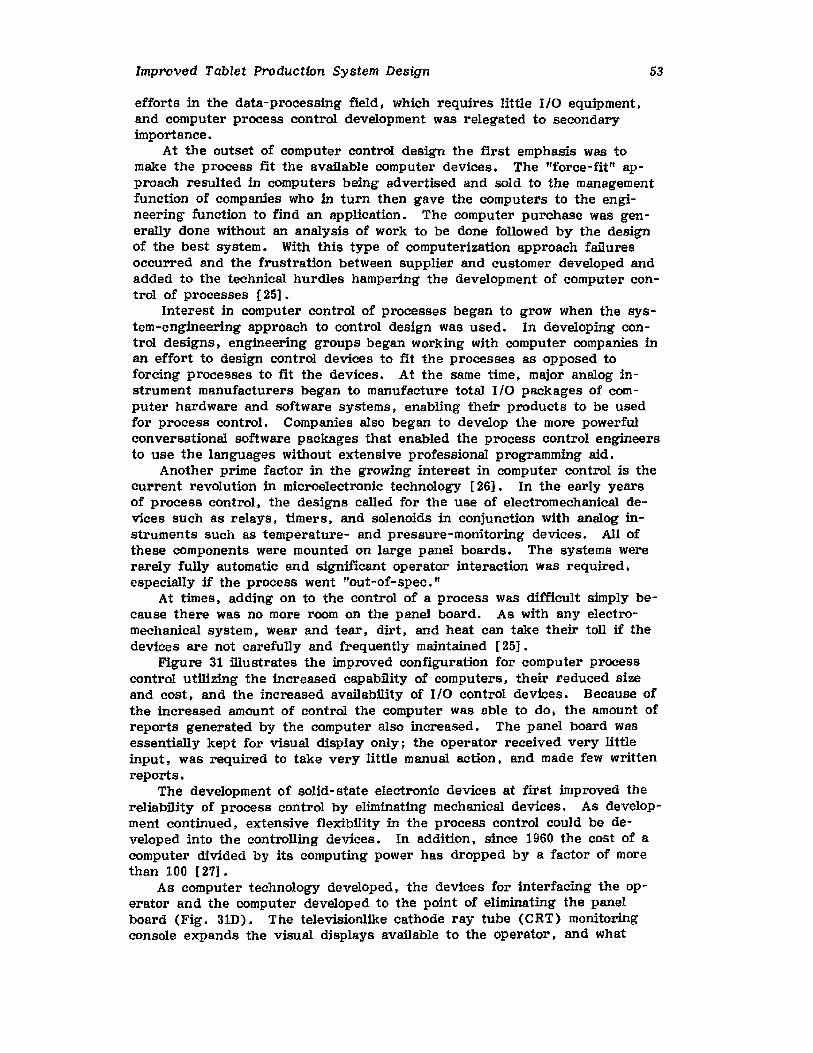
Improved Tablet Production System Design 53
efforts in the data-processing field, which requires little I/O equipment.and computer process control development was relegated to secondaryimportance.
At the outset of computer control design the first emphasis was tomake the process fit the available computer devices. The "force-fit" approach resulted in computers being advertised and sold to the managementfunction of companies who in turn then gave the computers to the engineering function to find an application. The computer purchase was generally done without an analysis of work to be done followed by the designof the best system. With this type of computerization approach failuresoccurred and the frustration between supplier and customer developed andadded to the technical hurdles hampering the development of computer control of processes [25).
Interest in computer control of processes began to grow when the system-engineering approach to control design was used. In developing control designs, engineering groups began working with computer companies inan effort to design control devices to fit the processes as opposed toforcing processes to fit the devices. At the same time, major analog instrument manufacturers began to manufacture total I/O packages of computer hardware and software systems, enabling their products to be usedfor process control. Companies also began to develop the more powerfulconversational software packages that enabled the process control engineersto use the languages without extensive professional programming aid.
Another prime factor in the growing interest in computer control is thecurrent revolution in microelectronic technology [26]. In the early yearsof process control, the designs called for the use of electromechanical devices such as relays, timers, and solenoids in conjunction with analog instruments such as temperature- and pressure-monitoring devices. All ofthese components were mounted on large panel boards. The systems wererarely fUlly automatic and significant operator interaction was required.especially if the process went "out-of-spec."
At times, adding on to the control of a process was difficult simply because there was no more room on the panel board. As with any electromechanical system, wear and tear, dirt, and heat can take their toll if thedevices are not carefully and frequently maintained [25).
Figure 31 illustrates the improved configuration for computer processcontrol utilizing the increased capability of computers, their reduced sizeand cost, and the increased availability of I/O control devices. Because ofthe increased amount of control the computer was able to do. the amount ofreports generated by the computer also increased. The panel board wasessentially kept for visual display only; the operator received very littleinput, was required to take very little manual action, and made few writtenreports.
The development of solid-state electronic devices at first improved thereliabUity of process control by eliminating mechanical devices. As development continued, extensive flexibility in the process control could be developed into the controlling devices. In addition, since 1960 the cost of acomputer divided by its computing power has dropped by a factor of morethan 100 [27].
As computer technology developed, the devices for interfacing the operator and the computer developed to the point of eliminating the panelboard (Fig. 3lD). The televisionlike cathode ray tube (CRT) monitoringconsole expands the visual displays available to the operator, and what
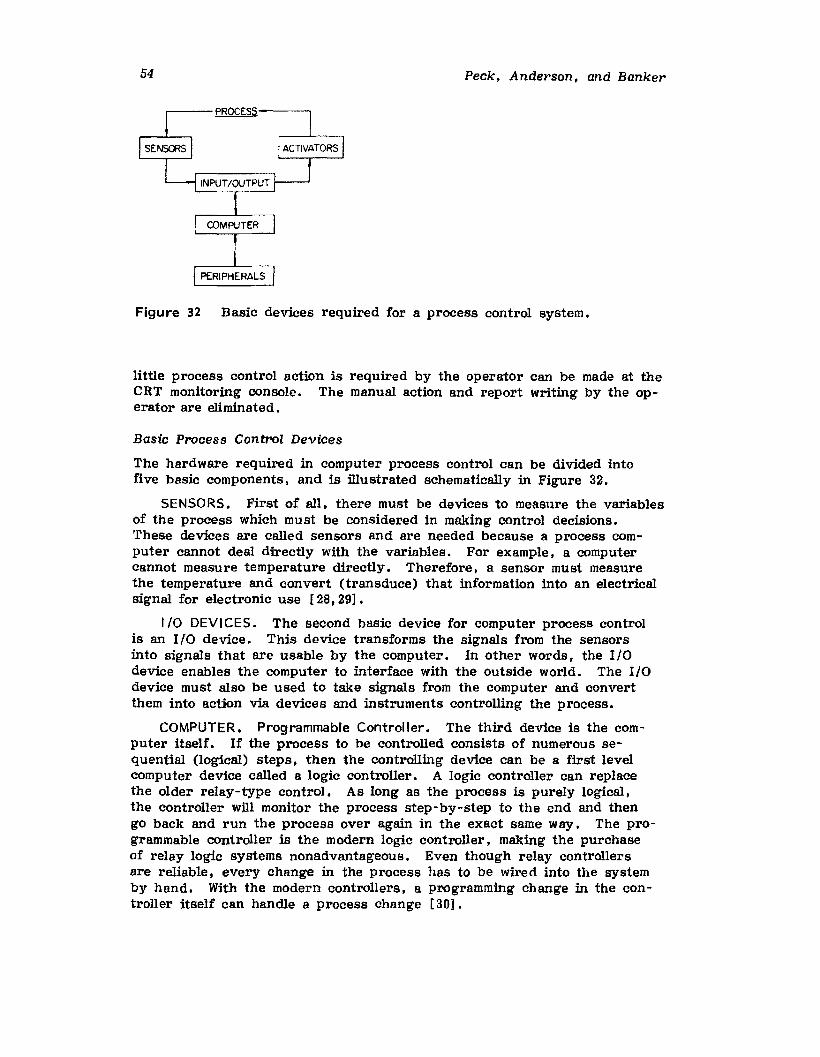
54 Peck, Anderson, and Banker
Figure 32 Basic devices required for a process control system.
little process control action is required by the operator can be made at theCRT monitoring console. The manual action and report writing by the operator are eliminated.
Basic Process Control Devices
The hardware required in computer process control can be divided intofive basic components, and is illustrated schematically in Figure 32.
SENSORS, First of all. there must be devices to measure the variablesof the process which must be considered in making control decisions.These devices are called sensors and are needed because a process computer cannot deal directly with the variables. For example. a computercannot measure temperature directly. Therefore. a sensor must measurethe temperature and convert (transduce) that information into an electricalsignal for electronic use [28, 29] •
I/O DEVICES. The second basic device for computer process controlis an I/O device. This device transforms the signals from the sensorsinto signals that are usable by the computer. In other words, the I/Odevice enables the computer to interface with the outside world. The I/Odevice must also be used to take signals from the computer and convertthem into action via devices and instruments controlling the process.
COMPUTER. Programmable Controller, The third device is the computer itself. If the process to be controlled consists of numerous sequential (logical) steps, then the controlling device can be a first levelcomputer device called a logic controller. A logic controller can replacethe older relay-type control. As long as the process is purely logical J
the controller will monitor the process step-by-step to the end and thengo back and run the process over again in the exact same way. The programmable controller is the modern logic controller, making the purchaseof relay logic systems nonadvantageous. Even though relay controllersare reliable, every change in the process has to be wired into the systemby hand. With the modern controllers. a programming change in the controller itself can handle a process change [30].
Improved Tablet Production System Design 55
Microcomputer. Unlike the logic control. which is a simple onloff typeof control, the next level of control requires that measurements be takenduring the process, such as pressures and temperatures, that an algorithm take those measurements and make some sort of decision, and thatcorrective action be implemented. This type of control is referred to asfeedback control and is normally the system used in computer control systems. The computer device that can first be used in this type of situation is the microcomputer. The capacity of a microcomputer is such that adevice can handle six to 12 feedback loops per process cycle.
Microcomputer systems are not very flexible unless the design engineers learn the particular machine language. Very few microcomputersoperate in the higher level languages, such as FORTRAN, and microcomputers generally do not operate with a universal computer language.The basic language of each machine must be learned.
The flexibility of microcomputers is limited. If 10 processes requirecontrol, then 10 microcomputers in the plant could control them. However,the reality is that with time there could be four or five different microcomputer systems controlling the 10 processes, and therefore four or fivedifferent computer languages in use. The different languages add to theconfusion When a process change takes place because consideration mustnow also be given to the compatibility of the languages in use.
The cost of the actual programmable controller and microcomputer devices is similar, but the microcomputer will cost more in terms of time toprogram.
Minicomputer. The number of feedback loops and the speed of the response times required in the loops determine the size of the computingmachine needed. These factors determine when a control system designwill require the minicomputer. Short response times and numerous loopsrequire a minicomputer.
The distinction between microcomputers and minicomputers is very difficult. There are microcomputers that can outperform a minicomputer.
ACTIVATORS. The fourth basic component of a computer process control system is a set of process activators. Activator devices, such as electric solenoids. electric motors, and hydraulic valves, take the commandsignals from the computer via the I/O device and turn them into action inthe process [28].
PERIPHERALS. The last basic set of process control components allowsreports to be printed and information stored, information to be added tothe control process or the process changed, and the system to be visuallymonitored. These devices are called peripherals, and the term comprisessuch items as disk storage devices, typewriters, printers, card readers,keyboards. and CRT screens.
Distributed Process Control Systems
DEVELOPMENT. The development of the microcomputer has made itpossible to place the 110 monitoring and controlling device close to thepoint of use, which has allowed for a basic redesign of process controlsystems (see Fig. 3lE). The control system can now be more sophisticated.Plant optimization and management information can be handled by a "host"
56 Peck, Anderson, and Banker
microcomputer while simultaneously monitoring the process-controlling microcomputers distributed throughout the entire process. This type of designof computer process control is called distributed control.
Distributed control systems reduce installation costs by reducing theamount of field wiring that must be done in the panel systems. The shorter cable runs of the distributed systems also help eliminate the electricalinterferences that often distort low-voltage electrical signals. The distributed system replaces the large panel board in favor of the much smallerCRT display. Because of the low cost of microcomputers, each remote unitcan have an on-line backup unit which will continue the control functionshould the first microcomputer fail, thus increasing the reliability of thedistributed system over the older systems. The repair of a distributedmicrocomputer is relatively easy. In many cases, a device can be repairedby the simple replacement of a printed circuit board [25,31].
To change to distributed systems has not come without criticism. Manypeople feel that the distributed systems reduce the number of personnelneeded to monitor a control system below a safe limit and that in a situation of plant upset, several operators working simultaneously on a panelboard are better able to correct the situation than one person on a singleCRT • In addition, many people feel that it is a necessity that a panelboard showing the schematic of the process be used in the monitoring ofthat process [31].
CONFIGURATIONS. There are two basic approaches to designing adistributed control system: (1) the loop approach, and (2) the unit operation approach. In the loop approach, the individual computer is programmed to control a specific number of selected functions within theprocess. Similarly. a single computer could be placed in control of asingle function in several process loops. With the unit operation approach,the computer is in control of a single unit operation. The unit operationapproach has the advantage of being inherently modular and the control ofa process can be instituted in a stepwise manner. In other words, themost critical operation of a process could possibly be controlled by computer first and the rest of the process added to the control system astime and money allow.
The host minicomputer and the microcomputers it is monitoring can bearranged in anyone of a number of operational configurations. Figure 33illustrates some of the configurations used in distributed process control.In each configuration. if the host computer fails, the microcomputers cancontinue their control functions. If any of the microcomputers fail, theothers can continue to communicate to the host computer and continuetheir control functions [31].
The major obstacles to computer process control today are
1. The continued need for smaller computer devices with highcapabilities
2. Better I/O interfacing devices3. Better operator Imachine interfacing devices
Process Control Organizations
Along with the development of computer process control design. hardware,and software has come the development of several important related organizations that have enhanced. and can continue to enhance, its development:
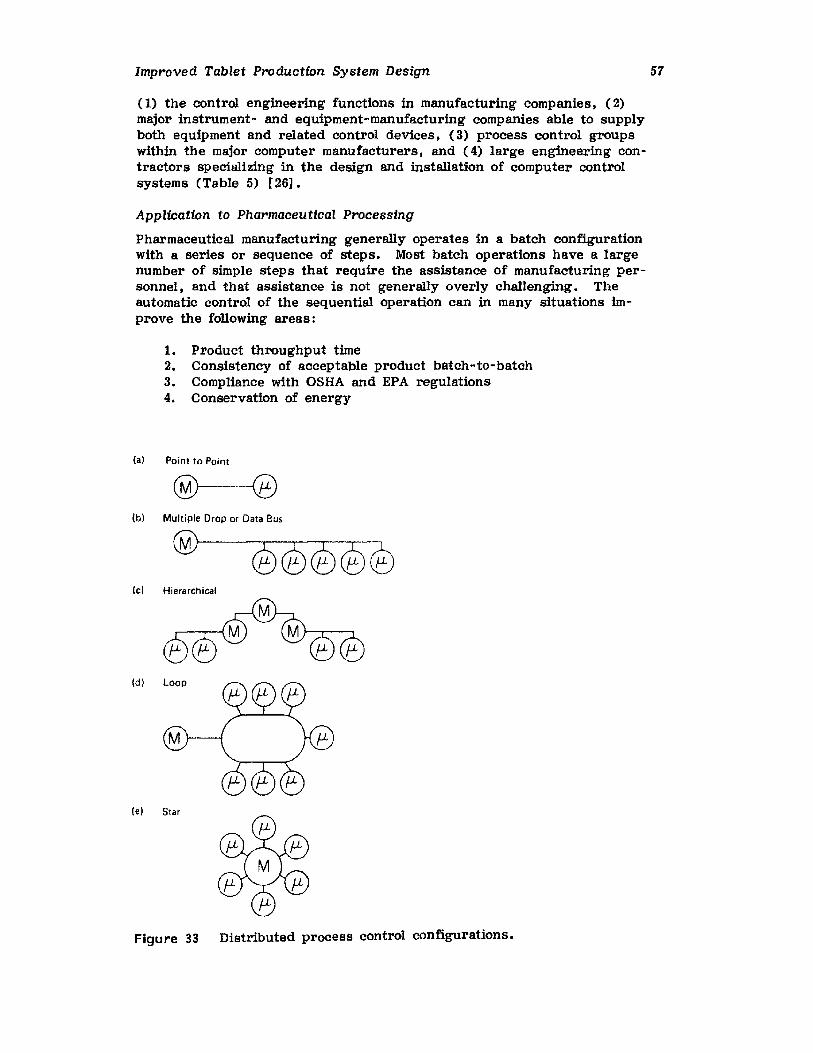
Improved Tablet Production System Design
(1) the control engineering functions in manufacturing companies, (2)major instrument- and equipment-manufacturing companies able to supplyboth equipment and related control devices, (3) process control groupswithin the major computer manufacturers, and (4) large engineering contractors specializing in the design and installation of computer controlsystems (Table 5) [26].
Application to Pharmaceutical Processing
Pharmaceutical manufacturing generally operates in a batch configurationwith a series or sequence of steps. Most batch operations have a largenumber of simple steps that require the assistance of manufacturing personnel, and that assistance is not generally overly challenging. Theautomatic control of the sequential operation can in many situations improve the following areas:
1. Product throughput time2. Consistency of acceptable product batch-to-batch3. Compliance with OSHA and EPA regulations4. Conservation of energy
(a] Point to Point
(bl Multiple Drop or Data Bus
Ie) Hierarchical
57
(dl
[e] Star
Figure 33 Distributed process control configurations.
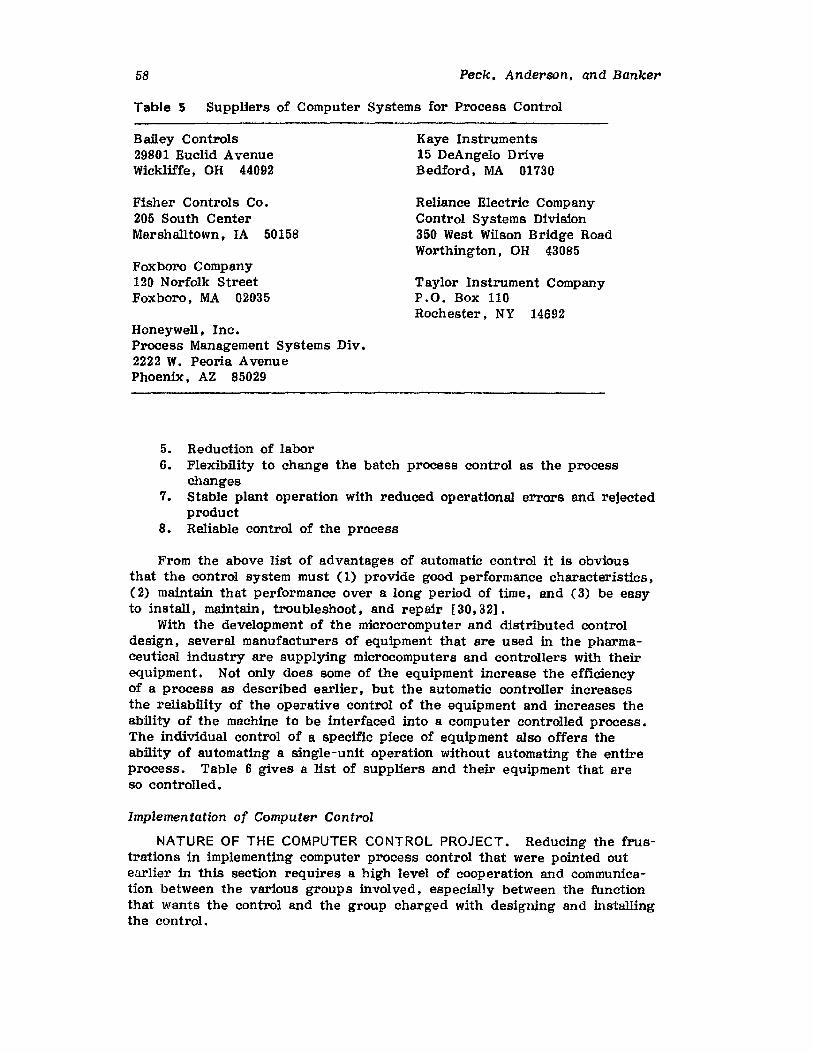
58 Peck. Anderson, and Banker
Table 5 Suppliers of Computer Systems for Process Control
Bailey Controls29801 Euclid AvenueWickliffe; OH 44092
Fisher Controls Co.205 South CenterMarshalltown, IA 50158
Foxboro Company120 Norfolk StreetFoxboro, MA 02035
Honeywell, Inc.Process Management Systems Div.2222 W. Peoria AvenuePhoenix, AZ 85029
Kaye Instruments15 DeAngelo DriveBedford; MA 01730
Reliance Electric CompanyControl Systems Division350 West Wilson Bridge RoadWorthington, OH 43085
Taylor Instrument CompanyP.O. Box 110Rochester. NY 14692
5. Reduction of labor6. Flexibility to change the batch process control as the process
changes7. Stable plant operation with reduced operational errors and rejected
product8. Reliable control of the process
From the above list of advantages of automatic control it is obviousthat the control system must (1) provide good performance characteristics,(2) maintain that performance over a long period of time. and (3) be easyto install, maintain, troublashoot , and repair [30,32].
With the development of the microcromputer and distributed controldesign, several manufacturers of equipment that are used in the pharmaceutical industry are supplying microcomputers and controllers with theirequipment. Not only does some of the equipment increase the efficiencyof a process as described earlier, but the automatic controller increasesthe reliability of the operative control of the equipment and increases theability of the machine to be interfaced into a computer controlled process.The individual control of a specific piece of equipment also offers theability of automating a single-unit operation without automating the entireprocess. Table 6 gives a list of suppliers and their equipment that areso controlled.
Implementation of Computer Control
NATURE OF THE COMPUTER CONTROL PROJECT. Reducing the frustrations in implementing computer process control that were pointed outearlier in this section requires a high level of cooperation and communication between the various groups involved, especially between the functionthat wants the control and the group charged with designing and installingthe control.
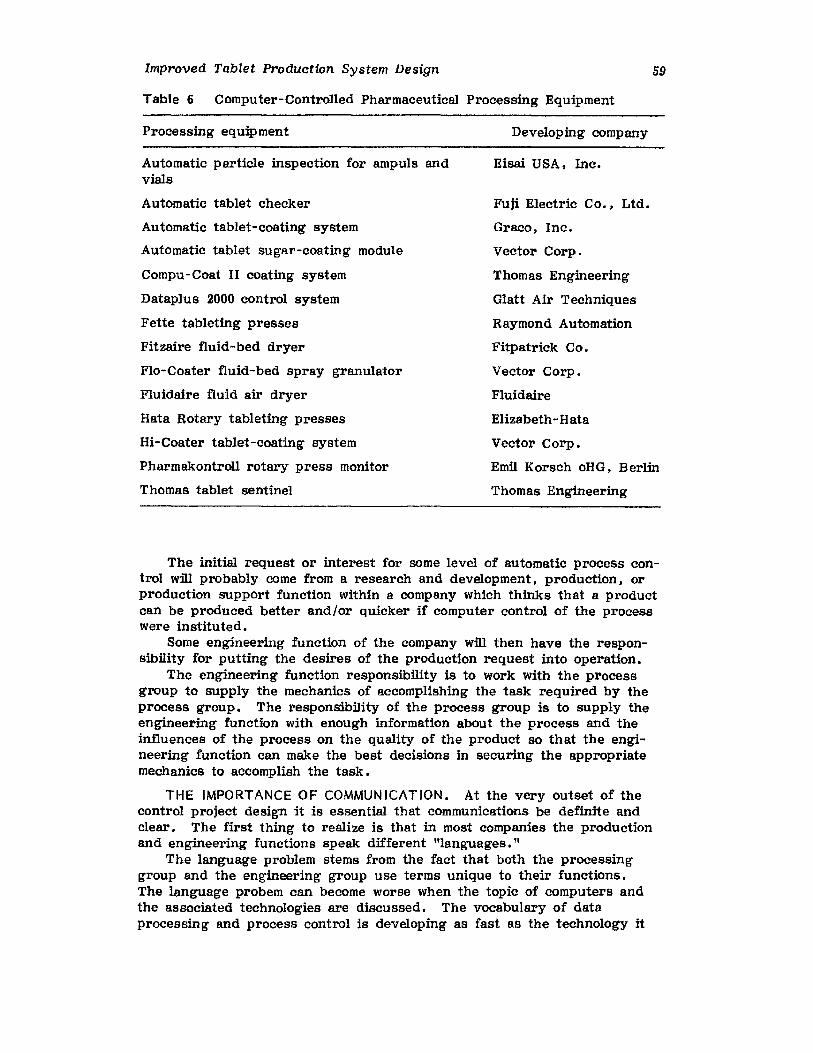
Improved Tablet Production System Design
Table 6 Computer-Controlled Pharmaceutical Processing Equipment
59
Processing equipment
Automatic particle inspection for ampuls andvials
Automatic tablet checker
Automatic tablet-coating system
Automatic tablet sugar-coating module
Compu - Coat II coating system
Dataplus 2000 control system
Fette tableting presses
Fitzaire fluid-bed dryer
Flo-Coater fluid-bed spray granulator
Fluidaire fluid air dryer
Hata Rotary tableting presses
Hi-Coater tablet-coating system
Pharmakontroll rotary press monitor
Thomas tablet sentinel
Developing company
Eisai USA, Inc.
Fuji Electric Co., Ltd.
Graco, Inc.
Vector Corp.
Thomas Engineering
Glatt Air Techniques
Raymond Automation
Fitpatrick Co.
Vector Corp.
Fluidaire
Elizabeth-Hata
Vector Corp.
Emil Korsch oHG. Berlin
Thomas Engineering
The initial request or interest for some level of automatic process control will probably come from a research and development, production, orproduction support function within a company which thinks that a productcan be produced better and/or quicker if computer control of the processwere instituted.
Some engineering function of the company will then have the responsibility for putting the desires of the production request into operation.
The engineering function responsibility is to work with the processgroup to supply the mechanics of accomplishing the task required by theprocess group. The responsibility of the process group is to supply theengineering function with enough information about the process and theinfluences of the process on the quality of the product so that the engineering function can make the best decisions in securing the appropriatemechanics to accomplish the task.
THE IMPORTANCE OF COMMUNICATION. At the very outset of thecontrol project design it is essential that communications be definite andclear. The first thing to realize is that in most companies the productionand engineering functions speak different "languages ;"
The language problem stems from the fact that both the processinggroup and the engineering group use terms unique to their functions.The language probem can become worse when the topic of computers andthe associated technologies are discussed. The vocabulary of dataprocessing and process control is developing as fast as the technology it
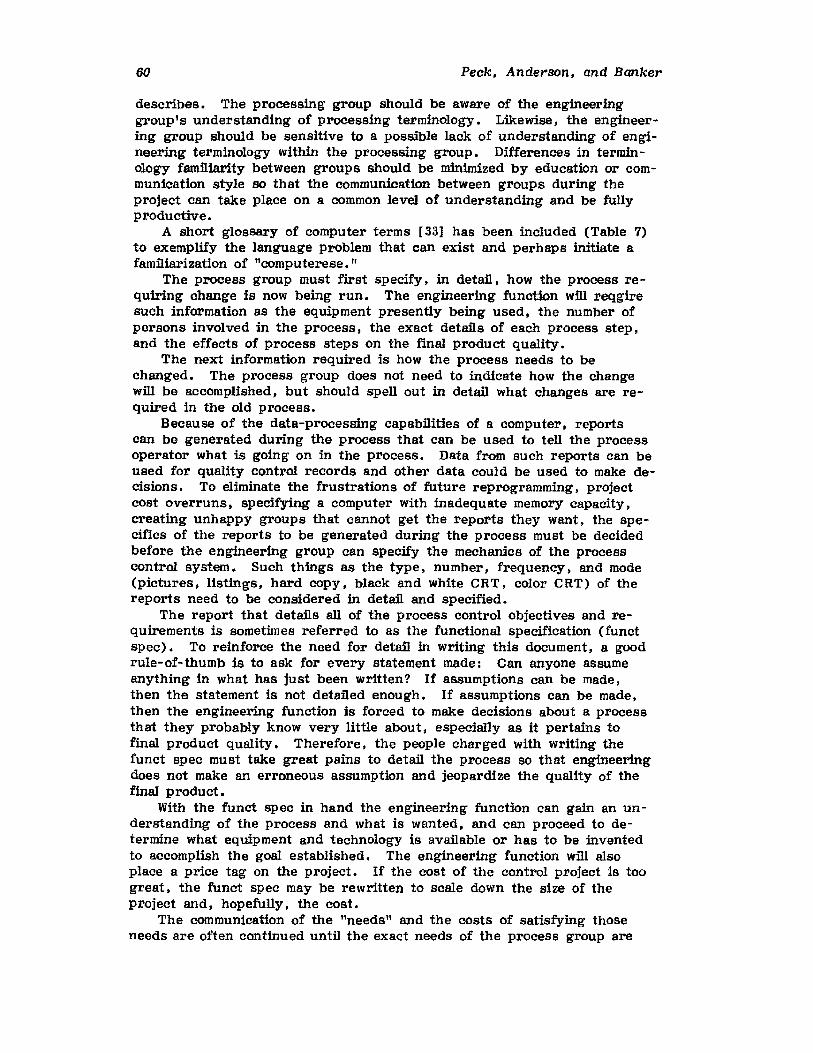
60 Peck, Anderson. and Banker
describes. The processing group should be aware of the engineeringgroup1s understanding of processing terminology. Likewise, the engineering group should be sensitive to a possible lack of understanding of engineering terminology within the processing group. Differences in termin010gy familiarity between groups should be minimized by education or communication style so that the communication between groups during theproject can take place on a common level of understanding and be fullyproductive.
A short glossary of computer terms [33] has been included (Table 7)to exemplify the language problem that can exist and perhaps initiate afamiliarization of "computerese. If
The process group must first specify. in detail, how the process requiring change is now being run. The engineering function wID reqgiresuch information as the equipment presently being used, the number ofpersons involved in the process, the exact details of each process step.and the effects of process steps on the final product quality.
The next information required is how the process needs to bechanged. The process group does not need to indicate how the changewID be accomplished, but should spell out in detail what changes are required in the old process.
Because of the data-processing capabilities of a computer, reportscan be generated during the process that can be used to tell the processoperator what is going on in the process. Data from such reports can beused for quality control records and other data could be used to make decisions. To eliminate the frustrations of future reprogramming, projectcost overruns, specifying a computer with inadequate memory capacity,creating unhappy groups that cannot get the reports they want, the specifics of the reports to be generated during the process must be decidedbefore the engineering group can specify the mechanics of the processcontrol system. Such things as the type, number. frequency, and mode(pictures, listings, hard copy, black and white CRT. color CRT) of thereports need to be considered in deta:il and specified.
The report that deta:ils all of the process control objectives and requirements is sometimes referred to as the functional specification (funetspec). To reinforce the need for detail in writing this document. a goodrule-of-thumb is to ask for every statement made: Can anyone assumeanything in what has just been written? If assumptions can be made,then the statement is not detailed enough. If assumptions can be made,then the engineering function is forced to make decisions about a processthat they probably know very little about, especially as it pertains tofinal product quality. Therefore, the people charged with writing thefunct spec must take great pains to detail the process so that engineeringdoes not make an erroneous assumption and jeopardize the quality of thefinal product.
With the funct spec in hand the engineering function can gain an understanding of the process and what is wanted, and can proceed to determine what equipment and technology is available or has to be inventedto accomplish the goal established. The engineering function will alsoplace a price tag on the project. If the cost of the control project is toogreat, the funct spec may be rewritten to scale down the size of theproject and, hopefully, the cost.
The communication of the "needs" and the costs of satisfying thoseneeds are often continued until the exact needs of the process group are
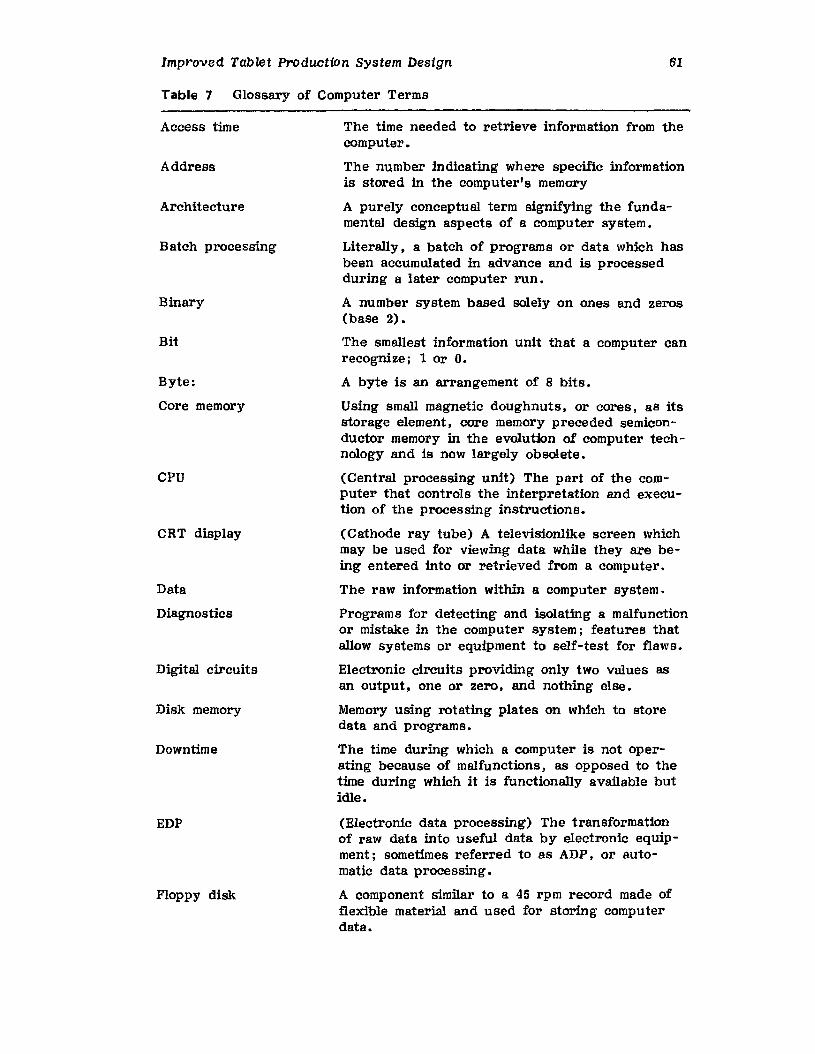
Improved Tablet Production System Design
Table 7 Glossary of Computer Terms
61
Access time
Address
Architecture
Batch processing
Binary
Bit
Byte:
Core memory
CPU
CRT display
Data
Diagnostics
Digital circuits
Disk memory
Downtime
EDP
Floppy disk
The time needed to retrieve information from thecomputer.
The number indicating where specific informationis stored in the computer's memory
A purely conceptual term signifying the fundamental design aspects of a computer system.
Literally, a batch of programs or data which hasbeen accumulated in advance and is processedduring a later computer run.
A number system based solely on ones and zeros(base 2).
The smallest information unit that a computer canrecognize; 1 or O.
A byte is an arrangement of 8 bits.
Using small magnetic doughnuts, or cores, as itsstorage element, core memory preceded semiconductor memory in the evolution of computer technology and is now largely obsolete.
(Central processing unit) The part of the computer that controls the interpretation and execution of the processing instructions.
(Cathode ray tube) A televisionlike screen whichmay be used for viewing data while they are being entered into or retrieved from a computer.
The raw information within a computer system.
Programs for detecting and isolating a malfunctionor mistake in the computer system; features thatallow systems or equipment to self-test for flaws.
Electronic circuits providing only two values asan output, one or zero, and nothing else.
Memory using rotating plates on which to storedata and programs.
The time during which a computer is not operating because of malfunctions, as opposed to thetime during which it is functionally available butidle.
(Electronic data processing) The transformationof raw data into useful data by electronic equipment; sometimes referred to as ADP, or automatic data processing.
A component similar to a 45 rpm record made offlexible material and used for storing computerdata.

Table 7 (Continued)
GIGO (Garbage in, garbage out) A shorthand expression meaning that if you put in incorrect orsloppy data, you will get incorrect or sloppyanswers; originally contrived to establish thaterrors are always the user's fault, never thecomputer's.
Hard copy Computer output recorded in permanent form,such as the paper copy produced by a printer.
Hardware The physical components of the computerprocessing system, for example, mechanical,magnetic, electrical, or electronic devices.
Ie (Integrated circuit) A digital electronic circuitor combination of circuits deposited on Semiconductor material; the physical basis of a computer's intelligence and the key to the microelectronic revolution in computers.
Input The data that is entered into the computer; theact of entering data.
Instruction A group of bits that designates a specific computer operation.
Intelligent terminal
Interface
K
Language
Language, BASIC
Language, COBOL
Language, FORTRAN
Language, Machine
Mainframe
Memory
A typewriter with a television screen attached toit that can remember things, do calculations. typeletters, communicate with other intelligent terminals. draw pictures. and even make decisions.
The juncture at which two computer entities meetand interact with each other; the process ofcausing two computer entities to intersect.
Equals 1024 bytes.
A set of words and the rules for their use thatis understood by the computer and operator alikefor programming use.
An easy-to-use high-level programming languagethat is popular with the personal computer systems (Beginners All-Purpose Symbolic InstructionCode) •
A high-level programming language widely usedin business applications (Common BusinessOriented Language).
A high -level programming language designed tofacnitate scientific and engineering problemsolving (Formula Translation).
The language. patterns of ones and zeros. directly intelligible to a computer.
A large computer. as compared to minicomputersand microcomputers.
The selection of the computer Where instructionsand data are stored; synonymous with storage.
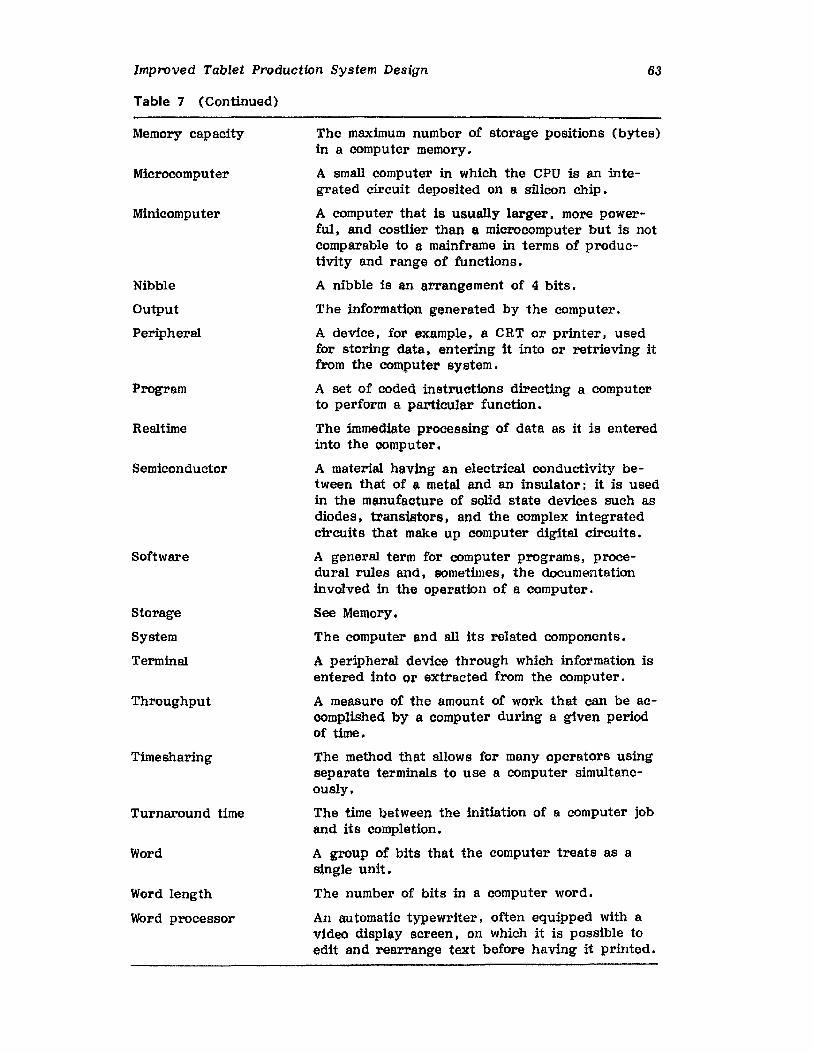
Improved Tablet Production System Design
Table 7 (Continued)
63
Memory cap acity
Microcomputer
Minicomputer
Nibble
Output
Peripheral
Program
Realtime
Semiconductor
Software
Storage
System
Terminal
Throughput
Timesharing
Turnaround time
Word
Word length
Word processor
The maximum number of storage positions (bytes)in a computer memory.
A small computer in which the CPU is an integrated circuit deposited on a silicon chip.
A computer that is usually larger, more powerful, and costlier than a microcomputer but is notcomparable to a mainframe in terms of productivity and range of functions.
A nibble is an arrangement of 4 bits.
The information generated by the computer.
A device, for example, a CRT or printer, usedfor storing data. entering it into or retrieving itfrom the computer system.
A set of coded instructions directing a computerto perform a particular function.
The fmmedlate processing of data as it is enteredinto the oomputer-,
A material having an electrical conductivity between that of a metal and an insulator; it is usedin the manufacture of solid state devices such asdiodes. transistors, and the complex integratedcircuits that make up computer digital circuits.
A general term for computer programs, procedural rules and, sometimes, the documentationinvolved in the operation of a computer.
See Memory.
The computer and all its related components.
A peripheral device through which information isentered into or extracted from the computer.
A measure of the amount of work that can be accomplished by a computer during a given periodof time.
The method that allows for many operators usingseparate terminals to use a computer simultaneously.
The time between the initiation of a computer joband its completion.
A group of bits that the computer treats as asingle unit.
The number of bits in a computer word.
An automatic typewriter, often equipped with avideo display screen. on which it is possible toedit and rearrange text before having it printed.
64 Peck, Anderson. and Banker
refined to within budget constraints. The costs of the new control system must be justified by the improvements brought about by the newprocess.
At this point in the project, the hardest and the most time-consumingpart has been completed. The remainder of the project, including specifying and ordering the actual control devices, writing and checking thecomputer control programs, and installing and checking the system, becomes, in comparison. a minor part of the project providing the initialbackground work has been done properly [31,32].
ROLE OF THE INDUSTRIAL PHARMACIST. In the introduction to thischapter reference was made to the industrial pharmacist/scientist beingaware of certain areas from which process efficiencies could be developedand, with such an awareness, being able to function with the engineeringgroup within a pharmaceutical firm to help improve the manufacturingprocesses. As the development of computer process control grows and isapplied to pharmaceutical processes. the role of the pharmacist grows evenlarger. The unique awareness of the impact and influence of a manufacturing process on the safety and efficacy of a final drug dosage form isthe sole reponsibility of the industrial pharmacist. In the age of computercontrol the industrial pharmacist will have to know in detail how each unitoperation in the manufacture of a drug product can influence the finaldrug product and what parameters within a unit operation are importantand should be monitored and controlled to produce reliable drugs. Theindu strial pharmacist will play an important role in helping to develop theincreasing role of computer process control in the pharmaceutical industry.
IV. VALIDATiON
Validation as a concept and a system of procedures came into being in thepharmaceutical industry to ensure the sternity of parenteral and otheratezile products. Basically, the system involved placing sensors andmeasuring devices in all the critical locations or recording sites withinsterilizers to accurately record temperature (or other conditions impactingon the attainment of sterility) so that following a sterilization cycle with aparticular product. in a particular container, under full production conditions, examination of the records of the sterilization conditions would provide absolute assurance that sternization was achieved in every productunit so processed. Validation requires previously establishing, in suchsterilization applications. the permutations and combinations of conditions(time, temperature, steam pressure, cycle conditions. ete .) which willproduce sternity with a very high degree of certainty. Thereafter. recorded data from each production sternization run provide the documentation that all units within all regions of the sterilizer were exposed to conditions that have clearly been established and documented by careful previous experimentation to produce sterility.
Currently. validation concepts are being recognized for their value inhelping to assure the quality features of classes of drug products otherthan sterile products. Validation procedures are being applied to solidoral dosage forms and especially to compressed tablets. Validation ismost important in tablet products in which manufacturing process conditions are known to have the potential to affect important product quality
Improved Tablet ProducUon System Design 65
features, such as bioavailability. Thus, in the design of a new tabletproduct and its method of manufacture, or as the design of process forthe manufacture of tablets is improved and evaluated, it will be necessaryto consider the concept of validation. It is increasingly recognized thatan adequate process for the pharmaceutical product is a validated process.
A definition currently in use by the Food and Drug Administration is:"A validated manufacturing process is one which has been proved to dowhat it is purported or represented to do. The proof of validation is obtained through the collection or evaluation of data preferably from theprocess and the developmental phase and continuing through into the production phase" [34]. While the FDA definition is for a validated manufacturing process, it suggests by reference to a developmental phase thatvalidation involves more than the actual production process. Indeed thiswould be so for most tablet products.
Inherent in any discussion of validation is the assumption that theproduct involved is well understood and that the essential design parameters are under control. Validation, therefore, is not indep endent of product formulation. It is not enough to start thinking about validation whena formulation is turned over to a pilot plant or production group. It isessential that the development pharmacist or pharmaceutical scientist beknowledgeable not only in formulation and physical pharmacy, but also inpharmaceutical processing and manufacturing operations. Otherwise anexperimental formula may be developed whereby the qualrty features of theproduct are very sensitive to the manufacturing conditions and variablesroutinely and normally encountered in practice, or involves such a largenumber of variables impacting on assorted quality features that validationbecomes difficult or impossible.
There are pharmaceutical products currently being marketed that cannot be Validated based on their design. Included in this group are somesustained-release products, which involve a sequence of steps wherebypowdered drug is dusted on sugar beads with other mixed hydrophilic andhydrophobic powders, employing a "binder" of polymers, fats, waxes, andpossibly shellac in a mixed solvent (sometimes including water plus organicsolvents), followed by addition of a retard coating, again using fats,waxes, and polymers in varying stages of solution and dispersion. Insuch systems, simply controlling rates of powder addition, Iiquid binder,addition, spray-gun conditions, and geometry in the coating pan, orother processing conditions will not lead to validation. When the binderand retard dispersions vary as to extent of polymer, fat, wax hydration!solvation in each batch, and are not and cannot be controlled (a formulation factor), no degree of process manufacturing control can produce acontrolled product. Furthermore, as the number of variables which caninfluence product quality increase (both process and formulation variables),the number of interaction effects capable of producing further (and oftenless predictable) effects increase in an exponential manner. Validation ofsuch systems becomes a true nightmare.
Another design parameter that must be studied in development is theestablishment of raw materials specifications. If raw materials specifications are inadequate, no amount of process validation can ensure a satisfactory product. Thus, an important responsibility of the developmentgroup is to determine that the physical and chemical specifications for allactive and excipient materials have been adequately set. For example,where polymers are employed, have molecular weight, degree of SUbstitution
66 Peck, Anderson, and Banker
of chemical groups, and polymer grade, including purity, been adequatelydefined? Does the nature of the product or method of manufacture require special specifications for the drug or excipients (such as a particular particle size or particle size distribution for drugs Which are to bedirectly compressed or which have dissolution or bioavailability problems)?Are special precautions required for a drug having chemical instability orreactivity potential (such as lower moisture content limits for excipients tobe combined with a hydrolyzable drug)? Unless such formulation or drugrelated variables, which can by themselves influence product quality features or do so by interacting with processing variables, are identified andappropriate specification limits set in place, no level of subsequent processcontrol and validation can lead to a reproducible product.
Two approaches may be taken to determine the specifications that areadequate for raw materials after the need for such critical specificationshas been identified. The first approach is to set the most rigid specification far that property that could reasonably be achieved. The advantageof this approach is that it is direct, reasonably simple. and requires minimal experimentation. The disadvantage is that this approach may represent overkill, and unnecessary costs or undue limitation of suppliers. Thesecond approach involves conducting well-designed experiments to determine where the critical specification(s) should be set. Vary the specification in question for the raw material, employing the most rigid value thatcould reasonably be achieved as one specification, relax that specificationfor another sample of the material to a value that might be expected to beborderline. and use an intermediate specification for perhaps a thirdsample of the material. Make product of each raw material, employingmanufacturing conditions in each case that would be expected to impactleast favorably with the critical product quality features being examined.Review the data from the experiments and determine whether the mostrigid specification is actually necessary, or whether the intermediate specification will suffice, or whether the least rigid specification is adequate.This approach is most useful when the development pharmacist has an accurate understanding of the product system in question and its ultimate,exact method of manufacture, and can project the range of processingvariables the product may be subjected to and the effect of the directionof such process variations on the quality feature in question. Ideally,raw materials specifications will be appropriately set before a product isplaced in production for process validation. When appropriate standardshave not been established for raw materials specifications, and where suchvariation in raw materials is significantly impacting on product quality features, attempts to achieve process validation through control of the manufacturing operation can become an exercise in futility.
Experienced development and production personnel of most companiescan recite case studies in which a new product could be made on a smallscale in the laboratory but could not be reliably reproduced in production.A different type of frustration is expressed, depending on whether the account is told by the development person or by the production person.Production personnel have a powerful argument at their disposal againstaccepting any product and/or manufacturing procedure that defies or doesnot reasonably lend itself to Validation. It is imperative that R&D andproduction groups work together to see that validation can be and isachieved.
Improved Tablet Production System Design 67
As the validation concept is applied to pharmaceutical products of increasing complexity of design and manufacture. it is very clear that validation must be initiated at a very early stage in the design of any product.not only from the traditional "process" orientation, but also from a "product" orientation. Based on this philosophy. validation may be defined as asystematic approach to ensuring product quality, by identifying processvariables that influence product qualtty features. in order to establishprocessing methods and the necessary control of these methods, whichwhen followed will assure meeting all product quality specifications after assuming that the formulation is reasonable and that the raw material specifications are adequate.
A. Validation Priorities
Perhaps the initial step in validation is to consider which product most requires a full validation treatment and which least. Validation efforts couldbe centered on processes that involve a company's largest selling and mostcommercially important products. Products containing drug(s) with a verylow dose. chemical instability. low solubility or poor wetting properties.which can lead to content uniformity, stability. or bioavailability problems;products with a history of production problems. often bordering on beingunacceptable. or which unaccountably produce occasional lots that are unacceptable or borderline; sustained or controlled release products whoseprocesses are not under control should have a high validation priority. Inother words, the initial validation effort could be focused to provide thegreatest beneficial effect.
Another approach to validation priority setting is to review the documentation and data currently available on present products and start validating those products which can be done the quickest and easiest. Forexample. a product that has a moderate dose (perhaps 25 to 150 or 200mg) of a very soluble. stable drug. which is readily compressible and hasno bioavailability or other problems. and which has been made for yearsby direct compression. with no history of a defective batch. while readilymeeting all product specifications. might be easily validated with historicdata. This approach can be advantageous in that validation concepts arelearned with the easier projects before more complex validations areundertaken.
B. Steps in Validation
Step 1
Identify all the quality features and specifications which will or do defineproduct quanty and acceptability. final product as well as in-processspecifications (see Table 8 for examples of in-process product specifications as well as process control parameters).
The first step in validation is thus to be certain that specificationshave been appropriately set to define the primary product quality featuresand to establish their limitS of acceptability. Specifications may be set onintermediate materials as well as on the finished product. For example. avariety of specifications may be placed on the powder mixture or granulation. in addition to the specifications which are placed on the final tablet

68 Peck. Anderson. and Banker
Table 8 Unit Operations and Possible Control Tests Associated with theManufacture of a Wet-Granulated Compressed Tablet
Process variable
Screening
Mixing
Granulating
Drying (oven)
Size reduction
Compression
Purpose
Ensure a set particlesize of raw material
Homogeneous mixture
Convert powders togranules havingsuitable flow andcompressive properties
Reduce moisture contentto proper level for compression
Size reduction
Manufacture ofcompressed tablet
Test parameters
1- Mesh analysis2. Bulk volume
1. Mesh analysis2. Chemical content
uniformity analysis3. Yield reconciliations
1- Weight per subpart2. Amount of granulating
agent per subpart3. Endpoint of batch4. Mixing time5. Granule size (wet)
1- Weight per tray2. Thickness per tray3. Relative humidity of
air4. Velocity of air5. Time6. Loss on drying7. Yield reconciliation
1. Bulk volume2. Flow3. Mesh analysis4. Yield reconciliation5. Loss on drying
1- Weight/10 tablets2. Hardness3. Thickness4. Appearance5. Disintegration6. Dissolution7. Weight variation8. Content uniformity9. Friability
10. Compressional forceII. Tablets per minute12. Yield reconciliation13. I\arl Fischer/loss on
dr-ying
Improved Tablet Production System Design 69
product. It is important that the list of specifications be sufficiently fulland complete to assure full eompendial , new drug application (NDA), orcompany standards. Not all product specifications come under validationtreatment. Some product specifications bear on purity and generally arenot influenced by processing; they bear on raw material quality andspecifications. Other quality features may not be sensitive to processingcondition variations and thus may not be included in the validation treatment or are of minor concern in such treatment. An example might be atablet which is formulated such that compressional force. under any projected range of compressive loads, has no significant influence on tabletdisintegration or drug dissolution rate.
Quality features for tablets have been addressed throughout the chapters in this series of books and will not be repeated here, other than tonote that they should usually include, as a minimum for an oral uncoatedtablet, weight variation, content uniformity. hardness, friability, disintegration-dissolution specifications, and size uniformity.
Identification of critical product quality features for tablet productsmust be treated as a separate undertaking for each and every product.No standard or master approach exists. For example, not all tablet products have fr.ability problems. In fact. the great majority do not, andfriability may then be discounted as a feature in the Validation program.Rate of drug dissolution. as it relates to the rate and completeness of bioavailability, and assurance of consistency of bioavailability from lot to lotmay be of great concern for some tablet products and of little or minorconcern for others.
Dissolution might reasonably be expected to be of great concern in situations of potential bioavailability. such as with a very slightly solubleacidic drug moiety which has an intermediate to large dose and is only wellabsorbed in the upper gastrointestinal tract. In such a case, great attention must be paid to such factors as methods of wet massing. how bindersare incorporated in the product, wet massing times. or the granulationmethod employed. rate of compression, consistency of feeding granulationto the dies, compressive force, particle size and particle size control,methods of incorporating disintegrants, and other factors depending on themethod of tablet manufacture. On the other hand. the assured achievement of content uniformity in such a large-dose product, through an extensive validation program. might be totally unnecessary or of minimalconcern.
The concerns of product qualtty might be just the reverse with a lowdose of a highly soluble amine drug which is well absorbed along thegastrointestinal tract. Bioavailability assurance through validation mightbe completely unnecessary and pointless. but in comparison to the acidichigh-dose drug previously described, content uniformity may now becomethe primary concern and focus of the validation efforts. In other situations. validation of both bioavailability and content uniformity goals mightbe warranted and in some situations neither of these quality features isof major concern because they are readily achieved under all conceivablepermutations and combinations of processing conditions that could be imagined for the product.
The situations given above are intended to point out that the criticalquality features are matters to be identified for each and every product.These critical quality features may depend on the pharmacokinetic properties of the drug (including but not limited to where and how the drug
70 Peck, Anderson, and Banker
is absorbed). physical chemical properties of the drug, drug dose, andchemical stability of the drug.
Step 2
Review product performance against the proposed specifications. After describing the quality features which must be achieved in the product andthe minimum acceptable values for each such feature, the specificationsdeveloped for that product should be reviewed and agreed upon as beingappropriate and reasonable by knowledgeable people in research and development. production. and quality assurance.
Another point that might be reviewed in this step is whether or notthe product in question has sets of specifications which constitute possiblycritical ncompeting objectives. n NelU'ly all tablet products do have competing objectives. For example, if during the manufacture of a hard, nonfriable, nondusting uncoated tablet these quality features arc enhanced.then the rapid tablet disintegration and drug dissolution release rate qualityfeatures would be expected to degrade and even become unacceptable.
Another type of competing objectives circumstance is encountered withinsoluble antacids. Most insoluble antacids exist as very fine powderswhich have very poor compressibility. Their effectiveness is related totheir fine particle size and large surface. which is directly related to theirability to neutralize gastric acid. Any steps which are taken to facilitatecompression by enhancing particle consolidation may be expected to reducethe activity of such antacids.
Thus, processing procedures such as precompression, increased punchdwell time, increased pressure, or procedures used to increase granulebonding cannot benefit both sets of quality features simultaneously becausethese processing effects will produce competing effects on the two sets ofquality features, no matter how the processing effects are controlled.Fortunately. through proper formulation such competing objectives are notdifficult to handle for most drugs. However. when the occasional drugcomes along with such traits as a large dose, low solubility, poor wetting,borderline bioavailability, and poor compression properties, the fact thatone is dealing with competing objectives cannot be ignored, and should becarefully considered in the design of the validation protocol.
Step 3
Identify the methodology, processes. and pieces of equipment that are orwill be used in the manufacture of the product(s).
Once the product quality and acceptability standards have been established in steps 1 and 2, the process that manufactures the product mustbe thoroughly identified. If a tablet is made by direct compression, theprocess wUl differ significantly in the unit operations involved as comparedwith wet granulation. Not only must the processes that impact directly onthe manufacture of the product be identified but those systems that support the process and thereby have an indirect impact on the process mustbe identified. Table 9 lists some of the associated systems that supporttablet production and could have an impact on tablet validation considerations.
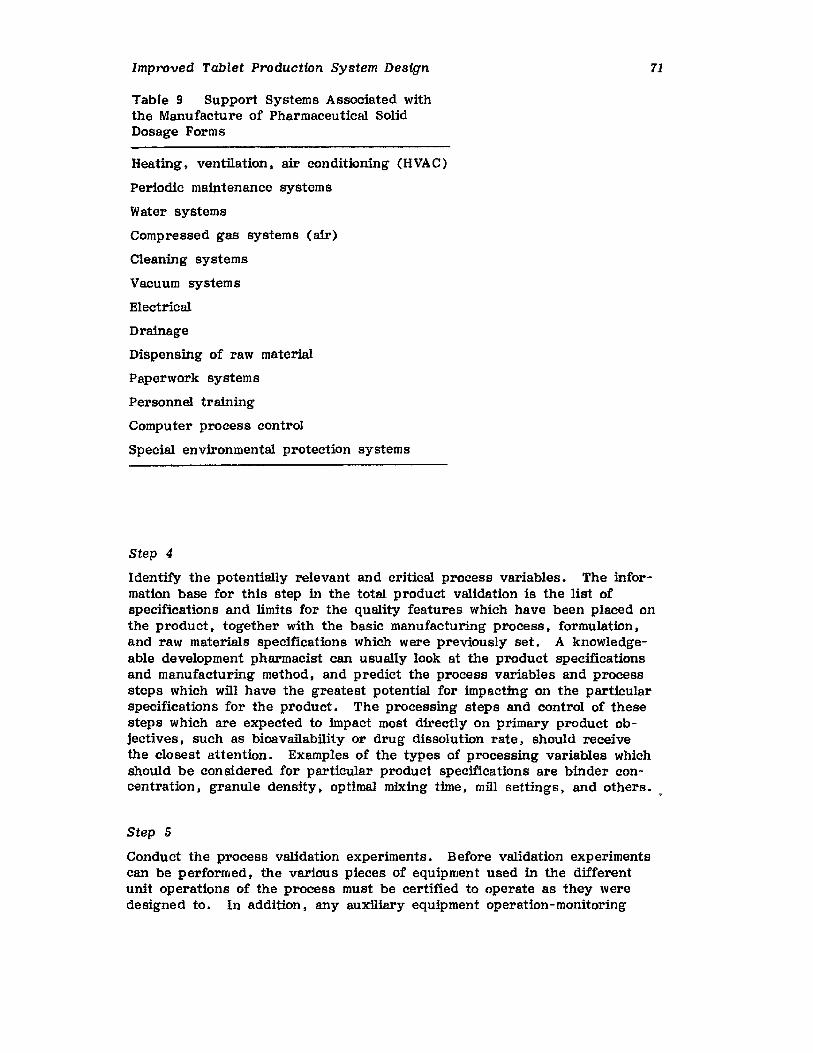
Improved Tablet Production System Design
Table 9 Support Systems Associated withthe Manufacture of Pharmaceutical SolidDosage Forms
Heating, ventilation, air conditioning (HVA C)
Periodic maintenance system s
Water systems
Compressed gas systems (air)
Cleaning systems
Vacuum systems
Electrical
Drainage
Dispensing of raw material
Paperwork systems
Personnel training
Computer process control
Special environmental protection systems
71
Step 4
Identify the potentially relevant and critical process variables. The information base for this step in the total product validation is the list ofspecifications and limits for the quality features which have been placed onthe product. together with the basic manufacturing process. formulation,and raw materials specifications which were previously set. A knowledgeable development pharmacist can usually look at the product specificationsand manufacturing method, and predict the process variables and processsteps which will have the greatest potential for impacting on the particularspecifications for the product. The processing steps and control of thesesteps which are expected to impact most directly on primary product objectives. such as bioavailability or drug dissolution rate, should receivethe closest attention. Examples of the types of processing variables whichshould be considered for particular product specifications are binder concentration, granule density, optimal mixing time, mill settings, and others. .
Step 5
Conduct the process validation experiments. Before validation experimentscan be performed. the various pieces of equipment used in the differentunit operations of the process must be certified to operate as they weredesigned to. In addition, any auxiliary equipment operation-monitoring
72 Peck, Anderson, and Banker
instruments such as ammeters, wattmeters, rpm indicators, chart recorders,and temperature indicators must be in working condition and calibrated.While equipment certification should be a responsibility of a company's engineering function, those involved in the validation project must be surethat the certification is performed to ensure that the equipment used in thevalidation studies will function reliably.
The next step is to undertake well-designed and controlled experimentsto establish the influence of the processing variables and combinations ofvariables on the quality features of the product. A variety of approachescan be taken, from full mathematical/statistical optimization, with the system actually being modeled, to a relatively few determinations for a drughaving no bioavailability or manufacturing problems. Validation in thelatter case may simply involve the documentation of current process controls and a historic review of the product's acceptance test records.
When the validation project becomes more complex. such as where competing objectives exist, or where cause and effect relationships are notobvious. the following general approach is suggested in order to develop avalidation protocol.
1. Establish preliminary limits on each processing procedure, aboveand below which you never expect to go in practice. In some cases it willbe possible to set an exact single specification for a processing procedure.such as a given mixing time. In other cases a range will be required andit should be set as noted above. A range should be used when an exactcondition cannot be achieved, as in the volumes of granulating agent used.wet-massing times, tablet machine and coating pan speeds, coating weights.temperatures. or airflow rates. When such processing conditions are expected to impact on quality features. and where exact control is not feasible.project or determine the maximum range that might be reasonably expectedto be encountered in practice (remember, future production runs must beinside these ranges or the product will be "outside validation II) •
2. Examine the listing of limits from the preceding step in light of themost critical product quality features you are to achieve. Select theprocessing variables and combination of variables along with their respectivelimits which you would expect to impact least favorably on these qualityfeatures and make the product under those conditions. Examine to see ifany extremes of the above processing conditions or combination of extremesof processing conditions place the product outside the acceptance specifications for any parameter.
Step 6
Review. monitor, and revalidate as needed. Once a process has been validated it is necessary to continuously monitor the parameters controlling theprocess. If instruments are used they must be calibrated on a routinebasis. Equipment must receive periodic maintenance so that performancedoes not change. Care must also be taken that no part of the process ischanged. A process change. improvement or otherwise, must be revalidated. Constant review of all specifications, product and process, is alsonecessary to enable the specifications to be "tightened1I or "broadened" toenhance the total validated system.
Improved Tablet Production System Design
ACKNOWLEDCMENT
Special acknowledgment to Mr. Ken Main t P. E . t Division Electrical Bngineer, Aluminum Company of America, Alcoa, Tennessee, for his help andinsight in the development of the computer process control section.
APPENDIX: LIST OF MANUFACTURERS
73
Mixer /G ranulator
DrydispenserJaygo, Inc.199 Seventh AvenueHawthorne, NJ 07506
DiosnaDierks and Sohne45 OsnabruckSandbachstrasse 1West Germany
Lodige Mixer/GranulatorMGT Vertical Mixer/Granulator
Littleford Brothers, Inc.15 Empire DriveFlorence, Kentucky 41042
Fielder Mixer/GranulatorRaymond Automation Co.508 Westport AvenueNorwalk, Connecticut 06856
Gral Mixer /GranulatorMaines Collette, Inc.P.O. Box 818Wheeling, IL 60090
Fluid-Bed Cranulator/Dryer
Aeromatic198 Route 206 SouthSomerville, NJ 08876
GlattGlatt Air Techniques, Inc.260 West BroadwayNew York. NY 10013
FreundVector Corp.675 44th StreetMarion, Iowa 52302
DOUble-Cone and Twin-Shell
Blenders with liquid feed andvacuum drying capabilities
Double Cone Rota-ConePaul D, Abbe146 Center AvenueLittle Falls, NJ 07424
Twin Shell ProcessorThe Patterson-Kelley ce., Inc.Process Equipment DivisionEast Stroudsburg, PA 18301
Nauta MixerDay Mixing Co.Cincinnati, Ohio 45212
L/D Series BlenderGemco, Inc.301 Smalley AvenueMiddlesex t NJ 08846
Specialized Granulation Equipment
Roto GranulatorKey International , Inc.480 Route 9Englishtown, NJ 07726
MarumerizerLuwa Corporation4433 Chesapeake DriveP.O. Box 16348Charlotte, NC 28216
74
REFERENCES
Peck, Anderson, and Banker
1. Sigman, D. A., Drug Cos. lrui, , 125( 5) : 84 (1979).2. Beckley, J. N. and Bathgate, T. A., Drug Cos. Ind., 125( 4) : 54
(1979) .3. Schuesaler, O. P., Pharmaceutical Plant Design in Today's Regulatory
Climate. Paper presented before the Pharmaceutical Processing Symposium, American Institute of Chemical Engineers, 88th National Meeting. Philadelphia, June 10, 1980.
4. Morrissey. J. T., Renovation of a Pharmaceutical Facility. Paper presented before the Pharmaceutical Processing Symposium, AmericanInstitute of Chemical Engineers, 88th National Meeting, Philadelphia,June 10, 1980.
5. Snyder, H., Automated Productfon Procedures in Drug Manufacturing.Paper presented before the First Annual Conference on QUality Programs and Government Regulations, Arlington, Virginia, April 12,1976, Automated Process Controls and GMPs Workshop.
6. Greene, J. H., Productfon Control Systems and Decisions. Irwin,Homewood. Illinois, 1965, p. 257.
7. Dickinson, J., Pharm. Technol., 2(2):41 (1978).8. Snyder, H. T., Battista, J. V., and Michelson, J., Development and
Technology of a Semi-Automated Continuous Extrusion Process for thePreparatfon of a Tablet Granulation. Paper presented before the Industrial Pharmacy Section, 113th Annual Meeting, American Pharmaceutical Association, Dallas, April 15 - 29, 1966.
9. Kamman. J. P., Pharmaceutical Plant Design for GMP and ProcessEfficiency. Paper presented before the Pharmaceutical ProcessingSymposium, Annual Meeting, American Institute of Chemical Engineers,New York, November 17, 1977.
10. Vosnek, K. J. and Forbes, R. A., Diosna-Granulating with WetParticle Size Control. Paper presented before the 69th Annual Meeting of the American Institute of Chemical Engineers, Chicago,December 2, 1976.
11. Thurn, U., Soliva, M., and Speiser, P., Drugs Made in Germany, 14:12 (1971).
12. Ormos, Z. and Hung, J., Ind. Chern., 1:207 (1972).13. Ormos, Z., Patald , K., Osukas, B., and Hung, J., Ind. Chern.. 1:
307 (1973).14. Davies, W. L. and Gloor, Vi. T., J. Pharm• sa., 80: 1869 (1971).15. Roufller , M., Gurny, R •• and Doelker, E., Pharm. Acta Technol.,
21(2) (1975).16. Shevlin. E. J., Pharm. Technol., 2( 3) : 56 - 59 (1978).17. Schwartz, J. B., Drug Dev. Ind. Phar•• 14(14): 2071- 2090 (1988).18. Korsch PH-BODe Automated Tablet Production System Bulletin, Korsch
Tableting, Ine , , Somerville, New Jersey, 1989.19. Kristensen, H. G. and Schaefer. T., Drug Dev; Ind. Phar., 13(4,5):
803 -872 (1987).20. Hunter, B. M. and Ganderton, D .• J. Pharm. Pharmacol., 25(Suppl.):
71P - 78P (1983).21. Lindberg, N. 0., Leander. L., Wenngren. L., Heigesen, H•• and
Reenstierna, B., Acta Pharm. Suecica, 11:603-620 (1974).

Improved Tablet Production System Design 75
22. Leuenberger, H., Bier, H. P., and Sucker, H. B., Pharm. Technol.,3( 6) :61- 68 (1979).
23. Leuenberger, Hot Pnarm, Acta Helv., 57:72-82 (1982).24. Ritala, M., Jungensen, 0., Holm. P., Schaefer, T., and Kristensen,
H. Go; Drug Dev. Ind. Phar., 12(11-13) :1685-1700 (1986).25. Compu-Coat II Bulletin, Thomas Engineering, Inc•• Hoffman Estates,
Illinois, 1986.26. Jean Y. LeFloc'h, A utomation and Networling of Coating Systems,
Thomas Engineering, Inc; , Hoffman Estates, Illinois, April 1987.27. Ritala , M., Holm. P., Schaefer, T., and Kristensen, H. G., Drug
Dev, Ind. Phar., 14(8): 1041-1060 (1988).28. Travers, D. N., Rogerson, A. G•• and Jones, T. M., J. Pharm.
Pharmacol" 27(Suppl.): 3P (1975).29. Lindberg, N. 0., Leander, L., and Reenstierna, B., Drug Dev; Ind.
Pharm., 8: 775 -782 (1982).30. Gharrta , S. R., Srinivas, R., and Rhodes, C. T., Drug Dev, Ind.
Pharm" 10:305-311 (1984).31. Lindberg, N. O. and Jonsson, C., Drug uev, Ind. Pharm., 9:
959 - 970 (1983).32. Timko, R. J., Barrett, J. S., McHugh, P. A., Chen, S. T., and
Rosenberg, X. X., Drug Dev, Ind. Pharm., 13(3):405-435 (1987).33. Kay, D. and Record, P. C., Mfg. Chemist, 48(9):45-46 (1978).34. Staniforth, J. N. and Quincey, S. M., Int. J. Pharm.• 32:
177 -185 (1986).35. Staniforth, J. N q Walker, S., and Flanders, P q Int. J. Pharm.,
32: 277 - 280 (1986).36. Spring, M. S., Drug oe«. Ind. Pharm., 9:1507-1512 (1983).37. Fry, W. C., Stagner, W. C., and Wichman, K. C., J. Pharm. sci.,
73: 420 - 421 (1984).38. Fry, W. C., Stanger, W. C., Wu, P. P., and Wichman, K. C.,
Computer-Interfaced Capacitive Sensor for Monitoring the GranulationProcess. I: Granulation Monitor Design and Application (C. E.Capes, ed.), Proceedings of the 4th International Symposium onAgglomeration, June 2 - 5, Toronto. Ontario, Canada, Book Crafters,Chelsea, Michigan, 1985, pp , 497 - 501.
39. Fry, W. C., Wu, P. P., Wichman, K. C., and Stanger, W. C.,Granulation Monitoring. In Proceedings of Pharm , Tech. Conference'85. Aster Publishing Corp., Springfield, Oregon, 1985, pp.358-367.
40. Fry, W. C., Wu, P. P., Stanger, W. C., Wichman, K. C., andAnderson, N. R., Pharm. Technol., 11(10): 30 (1987).
41. Alleva, D. S. and Schwartz, J. B., Drug Dev. Ind. Phar., 12(4)~
471- 487 (1986).42. Holm, P., Drug Dev; Ind. Phar., 13(9-11):1675-1701 (1987).43. Pemon, J. P. and Schwartz, J. B., Drug Dev, Ind. Phar., 13(1):
1-14 (1987).44. Chowhan, Z. T., Ptiarm, Technol., 12(2):26-44 (1988).45. El-Gindy, N. A., Samaha, M. W., and EI-Maradny, H. A., Drug Dev,
Ind. Phar., 14( 7): 977 -1005 (1988).46. Korsch, W., Pharm. Technol., 5( 4) : 62 (1981).47. Lachman, L. and Cooper, J., J. Pharm. Sci. I 52: 490 (1963).
76 Peck, Anderson, and Banker
48. Berfield, D., Pharm. Technol., 1(40):53 (1977).49. Krause, G. and Iorio. T., J. Pharm. sa., 57:1223 (1968).50. Wurster. D., U.S. Patent 2,648,609.1953.51. Wurster, D., U. S. Patent 2,799,241, 1957.52. Wurster, D., J. Am. Pharm. Assoc., Sci. ea., 48:451 (1959).53. Bulletin 303-873, Graco, Inc., 1977.54. Skrokov, M. R. (ed.). In Mini- and Microcomputer Control in
Industrial Processes. Van Nostrand Reinhold. New York, 1980,pp. 1-58.
55. Noyce. R. N•• Sci. Am•• 237(3):63 (1977).56. Terman, L. H., Sci. Am., 237(3):163 (1977).57. Hunter, R. P. Automated Process Control Systems Concepts and
Hardware. Prentice-Hall, Englewood Cliffs, New Jersey. 1978.pp. 15-110. 305-335.
58. Foster. D. Automation in Practice. McGraw-Hill, London, 1968,pp. 48-54.
59. Leitner, M. and Cocheo, M. S. In Mini- and Microcomputer Controlin Industrial Processes (M. R. Skrokov, ed.). Van NostrandReinhold, New York, 1980, pp. 128-163.
60. Thor. M. G. In Mini- and Microcomputer Control tn IndustrialProcesses (M. R. Skrokov, edv) , Van Nostrand Reinhold, New York,1980, pp. 212- 219.
61. Copeland, J. R. Microcomputers and Programmable Controllers forProcess Control. Center for Professional Advancement, EastBrunswick, New Jersey. 1979.
62. Renner, K. M., Pharm. Technol •• 9(12):24 (1985).63. Gopal, C., Pharm. Technol •• 13(4):20 (1989).64. Grosswirth, M., Output. I( 1) : 33 (1980).65. Byers. T. E., Manufacturing Process Validation: A Systematic Ap
proach to Quality Assurance. Paper presented at the ManagementConference for the Pharmaceutical Industry, Purdue University, WestLafayette, Indiana, September 13-15. 1978.
2Coating of PharmaceuticalSolid-Dosage FormsStuart C. Porter and Charles H. Bruno
Coloreon, West Point, Pennsylvania
I. INTRODUCTION
The application of coatings to the surface of pharmaceutical solid-dosageforms. especially tablets. has been practiced for over 150 years.
Although such a process is often applied to a dosage form that isfunctionally complete I and thus may cause US to reflect on the need forincurring the additional expense. it is evident that the continued use ofcoating processes in pharmaceutical production remains very popular.Such popularity relates to the many benefits obtained when a dosage formis coated, which include:
Improved esthetic qualities of the productMasking of unpleasant taste and odorEnabling the product to be more easily swallowed by the patientFacilitating handling. particularly in high-speed filling Ipackaging
linesImproving product stabilityModifying drug-release characteristics
Over the course of time. coating processes have developed from theart of earlier years to those that are more technologically advanced andcontrolled such that compliance with good manufacturing practices (GMPs)is facilitated. The design of new equipment, the development of newcoating materials. and the recognition of the impact of applied coatingson subsequent release of drug from the dosage form have all contributedto improved products.
77
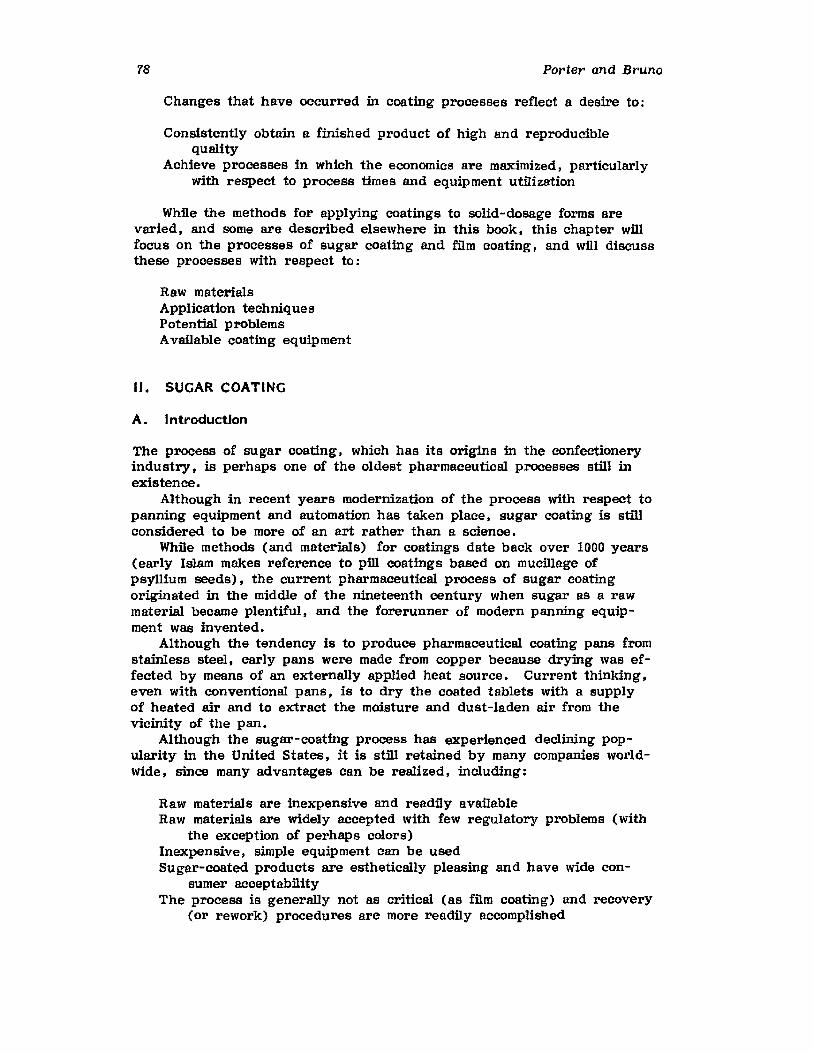
78 Porter and Bruno
Changes that have occurred in coating processes reflect a desire to;
Consistently obtain a finished product of high and reproduciblequality
Achieve processes in which the economics are maximized, particularlywith respect to process times and equipment utilization
While the methods for applying coatings to solid-dosage forms arevaried. and some are described elsewhere in this book, this chapter willfocus on the processes of sugar coating and film coating. and will discussthese processes with respect to;
Raw materialsApplication techniquesPotential problemsAvailable coating equipment
II. SUCAR COATINC
A. Introduction
The process of sugar coating, which has its origms in the confectioneryindustry. is perhaps one of the oldest pharmaceutical processes still inexistence.
Although in recent years modernization of the process with respect topanning equipment and automation has taken place, sugar coating is stillconsidered to be more of an art rather than a science.
While methods (and materials) for coatings date back over 1000 years(early Islam makes reference to pill coatings based on mucillage ofpsyllium seeds), the current pharmaceutical process of sugar coatingoriginated in the middle of the nineteenth century when sugar as a rawmaterial became plentiful, and the forerunner of modern panning equipment was invented.
Although the tendency is to produce pharmaceutical coating pans fromstainless steel, early pans were made from copper because drying was effected by means of an externally applied heat source. Current thinking,even with conventional pans, is to dry the coated tablets with a supplyof heated air and to extract the moisture and dust-laden air from thevicinity of the pan.
Although the sugar-coating process has experienced declining popUlarity in the United States, it is still retained by many companies worldwide, since many advantages can be realized, including:
Raw materials are inexpensive and readily availableRaw materials are widely accepted with few regulatory problems (with
the exception of perhaps colors)Inexpensive, simple equipment can be usedSugar-coated products are esthetically pleasing and have wide con
sumer acceptabilityThe process is generally not as critical (as film coating) and recovery
(or rework) procedures are more readily accomplished
Coating of Pharmaceutical Solid-Dosage Forms
However, in spite of the relative simplicity of the sugar-coatingprocess, it does have some potential shortcomings, for example:
79
The size and weight of the finished product results in increased packaging and shipping costs
The brittleness of the coatings renders the coated tablets susceptibleto potential damage if mishandled
The achievement of high esthetic quality often requires the services ofhighly skilled coating operators
The final gloss is achieved by a polishing step which can make imprinting difficult
The inherent complexity (from the standpoint of the variety of procedures and formulations used) of the process makes automationmore difficult
In spite of these difficulties, many companies have made excellent useof modern process technology (including automation), so that the requirements of current GMPs, including documentation, are readily achieved witha high degree of reproducibility in the quality and performance of thefinished product.
B. Raw Materials Used in Sugar Coating
As expected, the major ingredient used is sugar (sucrose), although thismay be substituted by other materials (such as sorbitol) for low calorieldiabetic products (typically in the candy industry). Sugar-coating formulations are for the most part aqueous.
The sugar-coating process consists of various steps, each designed toachieve a particular function. Consequently, a variety of additives maybe incorporated into each type of formulation. Examples of such additivesare:
Fillers (calcium carbonate, talc, titanium dioxide)Colorants (dyes, aluminum lakes, iron oxides, titanium dioxide)Film formers (acacia, gelatin, cellulose derivatives)Antiadhesives (talc)FlavorsSurfactants (as wetting agents and dispersion aids)
Although most of the coating formulations used in the sugar-coatingprocess are applied as liquids, some (e.g., dusting powders) are applieddry.
A typical sugar-coating process encompasses five stages:
1. Sealing2. Subeoatdng3. Grossing4. Color coating5. Polishing
While each of these stages is varied, the common feature throughoutis that the process requires repeated applications of coating liquid, each
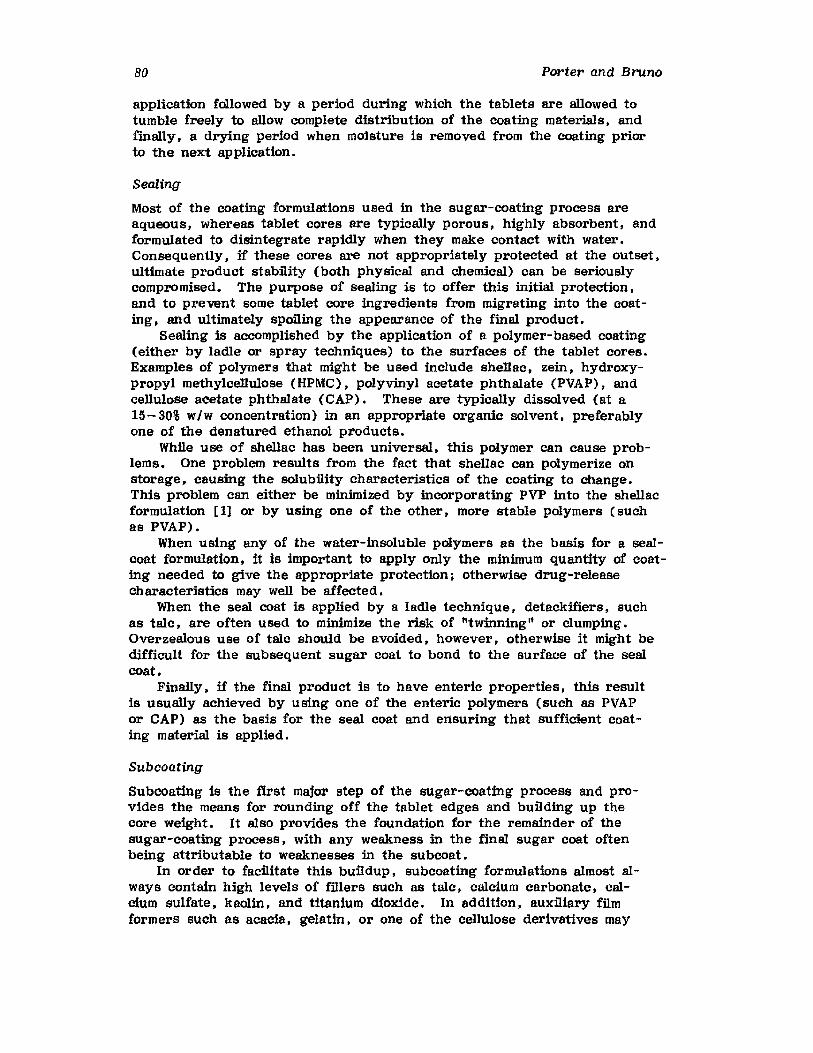
80 Porter and Bruno
application followed by a period during which the tablets are allowed totumble freely to allow complete distribution of the coating materials. andfinally. a drying period when moisture is removed from the coating priorto the next application.
Sealing
Most of the coating formulations used in the sugar-coating process areaqueous. whereas tablet cores are typically porous. highly absorbent. andformulated to disintegrate rapidly when they make contact with water.Consequently. if these cores are not appropriately protected at the outset.ultimate product stability (both physical and chemical) can be seriouslycompromised. The purpose of sealing is to offer this initial protection.and to prevent some tablet core ingredients from migrating into the coating. and ultimately spoiling the appearance of the final product.
Sealing is accomplished by the application of a polymer-based coating(either by ladle or spray techniques) to the surfaces of the tablet cores.Examples of polymers that might be used include shellac, zein. hydroxypropyl methylcellulose (HPMC), polyvinyl acetate phthalate (PVAP), andcellulose acetate phthalate (CAP). These are typically dissolved (at a15-30% w/w concentration) in an appropriate organic solvent, preferablyone of the denatured ethanol products.
While use of shellac has been universal, this polymer can cause problems. One problem results from the fact that shellac can polymerize onstorage. causing the solUbility characteristics of the coating to change.This problem can either be minimized by incorporating PVP into the shellacformulation [1] or by using one of the other. more stable polymers (suchas PVAP).
When using any of the water-insolUble polymers as the basis for a sealcoat formulation. it is important to apply only the minimum quantity of coating needed to give the appropriate protection; otherwise drug-releasecharacteristics may well be affected.
When the seal coat is applied by a ladle technique, detackifiers, suchas talc, are often used to minimize the risk of "twinning" or clumping.Overzealous use of talc should be avoided. however, otherwise it might bedifficult for the subsequent sugar coat to bond to the surface of the sealcoat.
Finally. if the final product is to have enteric properties, this resultis usually achieved by using one of the enteric polymers (such as PVAPor CAP) as the basis for the seal coat and ensuring that sufficient coating material is applied.
Subcoating
SUbcoating is the first major step of the sugar-coating process and provides the means for rounding off the tablet edges and building up thecore weight. It also provides the foundation for the remainder of thesugar-coating process. with any weakness in the final sugar coat oftenbeing attributable to weaknesses in the subcoat.
In order to facilitate this buildup. subcoating formulations almost always contain high levels of fillers such as talc. calcium carbonate. calcium sulfate, kaolin, and titanium dioxide. In addition, auxiliary filmformers such as acacia, gelatin, or one of the cellulose derivatives may
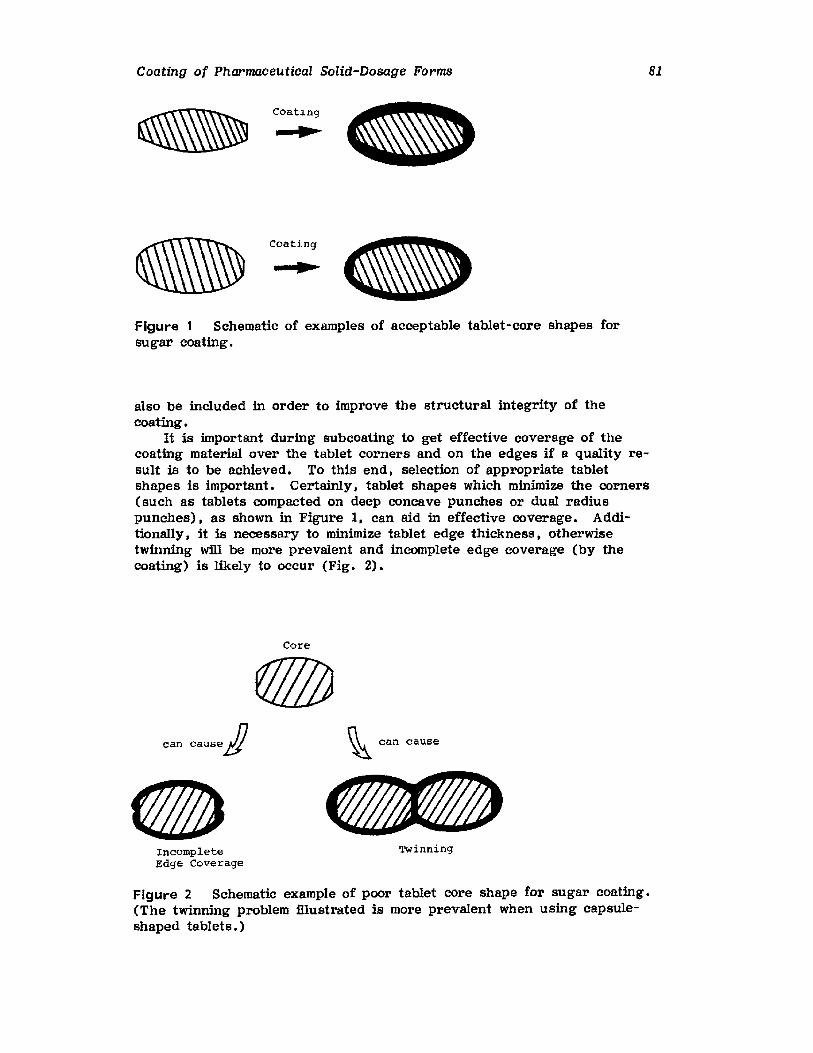
Coating of Pharmaceutical Solid-Dosage Forms 81
-
Coat~ng
Coating
II'
Figure 1 Schematic of examples of acceptable tablet-core shapes forsugar coating.
also be included in order to improve the structural integrity of thecoating.
It is important during subcoattng to get effective coverage of thecoating material over the tablet corners and on the edges if a quality result is to be achieved. To this end. selection of appropriate tabletshapes is important. Certainly. tablet shapes which minimize the corners(such as tablets compacted on deep concave punches or dual radiuspunches). as shown in Figure 1, can aid in effective coverage. Additionally, it is necessary to minimize tablet edge thickness. otherwisetwinning will be more prevalent and incomplete edge coverage (by thecoating) is likely to occur (Fig. 2).
Core
can causeJ!}
IncompleteEdge Coverage
~ can cause
Twinning
Figure 2 Schematic example of poor tablet core shape for sugar coating.(The twinning problem illustrated is more prevalent when using capsuleshaped tablets .)
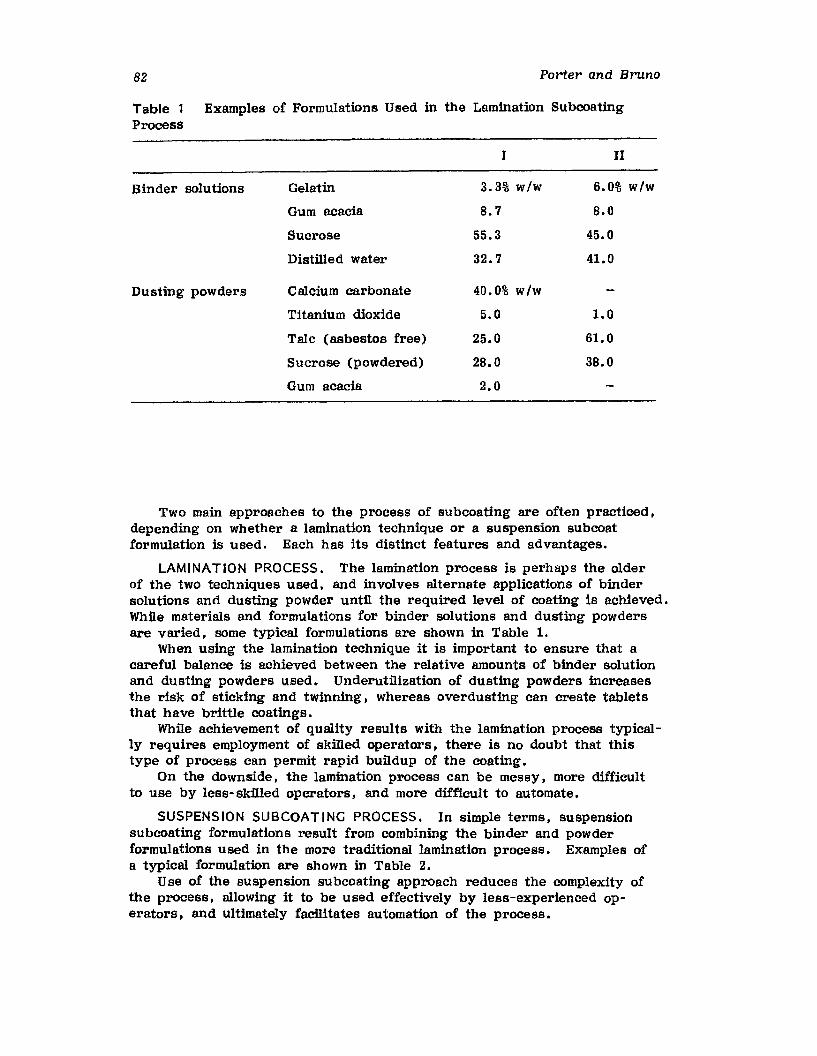
82 Porter and Bruno
Table 1 Examples of Formulations Used in the Lamination SubeoatingProcess
Binder solutions
Dusting powders
Gelatin
Gum acacia
Sucrose
Distilled water
Calcium carbonate
Titanium dioxide
Talc (asbestos free)
Sucrose (powdered)
Gum acacia
I
3.3% w/w
8.7
55.3
32.7
40.0% w/w
5.0
25.0
28.0
2.0
II
6.0% w/w
8.0
45.0
41.0
1.0
61.0
38.0
Two main approaches to the process of subcoating are often practiced,depending on whether a lamination technique or a suspension subcoatformulation is used. Each has its distinct features and advantages.
LAMINATION PROCESS. The lamination process is perhaps the olderof the two techniques used, and involves alternate applications of bindersolutions and dusting powder until the required level of coating is achieved.While materials and formulations for binder solutions and dusting powdersare varied. some typical formulations are shown in Table 1.
When using the lamination technique it is important to ensure that acareful balance is achieved between the relative amounts of binder solutionand dusting powders used. Underutilization of dusting powders increasesthe risk of sticking and twinning, whereas overdusting can create tabletsthat have brittle coatings.
While achievement of quality results with the lamination process typically requires employment of skilled operators. there is no doubt that thistype of process can permit rapid buildup of the coating.
On the downside, the lamination process can be messy, more difficultto use by less-skilled operators, and more difficult to automate.
SUSPENSION SUBCOAT INC PROCESS. In simple terms, suspensionsubcoating formulations result from combining the binder and powderformulations used in the more traditional lamination process. Examples ofa typical formulation are shown in Table 2.
Use of the suspension subcoatfng approach reduces the complexity ofthe process, allowing it to be used effectively by less-experienced operators. and ultimately facilitates automation of the process.
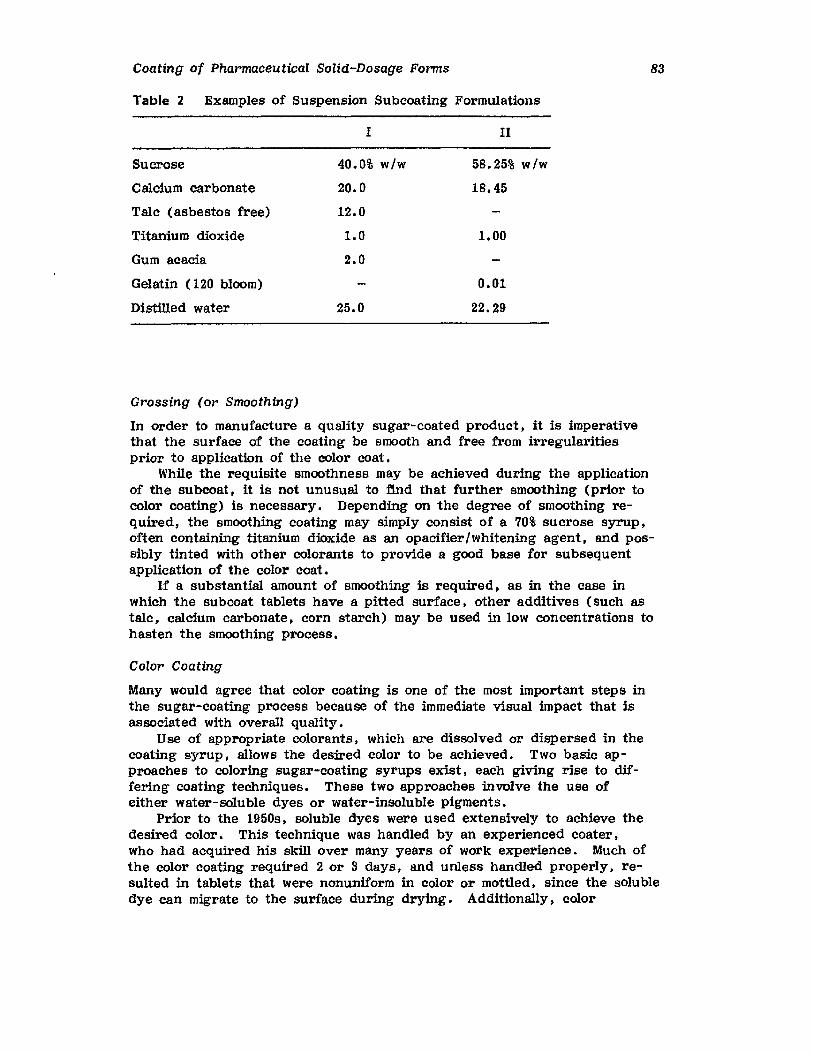
Coating of Pharmaceutical Solid-Dosage Forms
Table 2 Examples of Suspension Subcoating Formulations
I II
Sucrose 40.0% w/w 58.25% w/w
Calcium carbonate 20.0 18.45
Talc (asbestos free) 12.0
Titanium dioxide 1.0 1.00
Gum acacia 2.0
Gelatin (120 bloom) 0.01
Distilled water 25.0 22.29
83
Grossing (or Smoothing)
In order to manufacture a quality sugar-coated product, it is imperativethat the surface of the coating be smooth and free from irregularitiesprior to application of the color coat.
While the requisite smoothness may be achieved during the applicationof the subeoat , it is not unusual to find that further smoothing (prior tocolor coating) is necessary. Depending on the degree of smoothing required, the smoothing coating may simply consist of a 70% sucrose syrup,often containing titanium dioxide as an opacifier/whitening agent, and possibly tinted with other colorants to provide a good base for subsequentapplication of the color coat.
If a substantial amount of smoothing is required, as in the case inwhich the subcoat tablets have a pitted surface, other additives (such astalc, calcium carbonate, corn starch) may be used in low concentrations tohasten the smoothing process.
Color Coating
Many would agree that color coating is one of the most important steps inthe sugar-coating process because of the immediate visual impact that isassociated with overall quantv ,
Use of appropriate colorants, which are dissolved or dispersed in thecoating syrup, allows the desired color to be achieved. Two basic approaches to coloring sugar-coating syrups exist, each giving rise to differing coating techniques. These two approaches involve the use ofeither water-soluble dyes or water-insoluble pigments.
Prior to the 1950s, soluble dyes were used extensively to achieve thedesired color. This technique was handled by an experienced eoater ,Who had acquired his skill over many years of work experience. Much ofthe color coating required 2 or 3 days, and unless handled properly. resulted in tablets that were nonuniform in color or mottled, since the solubledye can migrate to the surface during drying. Additionally, color
84 Porter and Bruno
reproducibility from batch-to-batch was not predictable. and light sensitivity with subsequent fading was also a problem when using dyes.
The use of insoluble, certified lakes has virtually replaced the solubledye in pharmaceutical tablet coating. Lakes have several advantages;namely. color migration on drying is eliminated. since lakes are insoluble.light stability is improved, mottled tablets are a rare occurrence. and coating time is SUbstantially shortened. While lakes are insoluble. they arenot totally opaque. Consequently, coloring properties can be optimized bycombining lakes with opacifiers such as titanium dioxide. The most efficient process for color coating involves the use of predtspersed , opacifiedlake suspensions. By varying the ratios of lake and opacifier , variousshades can be produced.
DYE-COATING PROCESS. The features of a typical sugar-coatingprocess that utilizes water-soluble dyes as colorants include:
Sequential application of coating syrups containing specific dye concentrations (typically, as coating progresses, dye concentrations inthe syrup may be increased until the target color is achieved)
Addition of a quantity of colored syrup (at each stage) that is sufficient to just wet the total tablet surface, followed by gentle drying to achieve requisite smoothness and prevent color migration
Employment of relatively low concentrations of colorant (necessary toachieve final color uniformity). resulting in a requirement to makeanywhere up to 50 separate color syrup applications (particularlyfor dark colors)
There is no doubt that in the hands of a skilled operator the qualityof sugar-coated tablets that employ the dye-coating method are difficult tomatch (this is particularly true from the standpoint of "cleanliness." depth.and "brflltance" of the final color).
However. such a process is not without its difficulties, namely:
Color migration problems (resulting from either underdrying or toorapid a drying) are commonplace.
Color variability. across the surface of individual tablets, Which occursas the result of unevenness of the subeoat layer and transparencyof the color coat.
Tablet-to-tablet color variability which may result because the transparent coloring system has not been uniformly distributed.
Batch-to-batch color variation which is likely to occur because ofvariability in the total quantity of color applications made, or as aresult of small differences in amount of colorant weighed out foreach batch (water-soluble dyes produce very intense colors and alittle goes a long way).
The process is time consuming (because of the slow drying requiredand the need to make so many individual color applications).
PIGMENT-COATING PROCESS. Pigments have demonstrable advantagesover water-soluble dyes. two important ones being:
1. Lack of solubility in aqueous media (which eliminates color migration on drying)
2. Superior light stability
Coating of Pharmaceutical Solid-Dosage Forms 85
However, because pigments are discrete, insoluble particles, carefulattention must be paid to the pigment-dispersion process. Hence, the popularity of commercially available pigment-dispersion concentrates.
Some of the major characteristics of sugar-coating formulations andprocesses when pigment colorant systems are used include:
Use of a single-color concentration throughout the color-coatingprocess, thus making it easier to achieve the target end color (inorder to obtain a different color, it is necessary to vary the ratiosof the lake pigments with respect to the opacifier, titaniumdioxide)
Achievement of batch color uniformity after only a few applications ofcolored syrup (often color development is complete after eight to10 applications, and the remaining five to seven applications aresimply used to smooth off the tablet surface)
Reduced drying times resulting from the fact that the insoluble colorants do not migrate on drying, and thus can be dried morerapidly
Overall shortened color-coating process as a result of reduced numberof color applications and shortened drying times
One should, however, be aware of what some might construe to be disadvantages with pigment coloring systems and the associated coatingprocess:
Colorants derived from pigments (especially when lakes are used incombination with titanium dioxide) are generally not as bright orclean-looking as those obtained with soluble colorants.
If the pigment color-coating process is rushed, it is relatively easy toproduce rough tablets that are difficult to polish.
There is a need to ensure that pigments are effectively dispersed inthe coating syrup (certainly, pigm ent color concentrates eliminatethis problem), otherwise color "specking" might be a problem.
Since most pigment coloring systems contain lakes (which are typicallyacidic), it is inadvisable to keep coating systems hot for anylength of time once the color has been added; otherwise excessiveamounts of invert sugar will be formed.
With the exception of the first of these problems, all the others caneasily be avoided, and thus advantages of the pigment coating processtend to prevail, making it the process of choice.
Summarizing these advantages I they are:
Greater ability to get a uniform color on the surface of each tabletGreater batch-to-batch color uniformitySignificant reduction in thickness of the color coatSignificant reduction in processing time
Polishing (Glossing)
Since freshly color-coated tablets are typically dull (i.e. I they have amatte surface finish). it is necessary to polish them in some way toachieve the gloss that is typical of finished sugar-coated tablets.
86 Porter and Bruno
While methods to achieve a desirable gloss tend to vary considerably.it is generally recommended that tablets should be trayed overnight (priorto polishing) to ensure that they are sufficiently dry. Excessively highmoisture levels in tablets submitted for polishing will:
Make achievement of a good gloss difficultIncrease the risk of "blooming" and "sweating" over longer periods of
time
Glossing or polishing can be carried out in various types of equipment(e. g.. canvas- or wax-lined pans), including that used for applying thesugar coating itself (which is more typical in automated processes).
Polishing systems that may be used include:
Organic-solvent-based solutions of waxes (beeswax, carnauba wax,candelilla wax)
Aleoholic slurries of waxesFinely powdered mixtures of dry waxesPharmaceutical glazes (typically alcohol solutions of various forms of
shellac, often containing additional waxes)
Printing
If sugar-coated tablets are to be further identified with a product name,dosage strength, or company name or logo, this has to be accomplished bymeans of a printing process.
Typically, such printing involves the application of a pharmaceuticalbranding ink to the coated tablet surface by means of a printing processknown as offset rotogravure.
Sugar-coated tablets may be printed either before or after polishing.with each approach having its advantages and disadvantages. Printingprior to polishing enables the ink to adhere more strongly to the tabletsurface, but any legend may subsequently be removed by either friction oras a result of contact with organic solvents during the polishing process.Printing after polishing avoids the problem of print rub-off during polishing, but branding inks do not always adhere well to the waxed tablet surface. Adhesion of printing inks can be enhanced by application (prior toprinting) of a modified shellac, preprint base solution.
c. Application Techniques
Application of sugar coatings to pharmaceutical tablets has long been considered one that requires a significant amount of skill on the part of theoperator. While this philosophy has a lot of truth in it, and While it iscertainly difficult for untrained operators to achieve qUality results, theemployment of special techniques (such as the use of suspension subcoatformulations and coatings colored with proprietary pigment dispersions)makes quality results achievable even for less-skilled operators.
While many different types of coating formulation (Sec. II.B) will beapplied during the coating process, similarities in application exist for eachof them.
The basic application procedure in each case involves three steps insequence:
Coating of Pharmaceutical Solid-Dosage Forms
1. Application of an appropriate volume (sufficient to completelycover the surface of every tablet in the batch) of coating liquidto a cascading bed of tablets
2. Distribution of the coating liquid uniformly across the surface ofeach tablet in the batch
3. Drying of the coating liquid once uniform distribution is achieved
87
Specific details of actual procedures adopted may vary from companyto-company. However, the ultimate goal in each case is to ensure thatthe coating is uniformly distributed throughout the batch. Although thisgoal may be facilitated by the manner in which the coating liquid is applied, and by manual stirring of the wet tablets to help eliminate "deadspots" (regions in the tablet bed that are difficult to reach with the coating liquid), the main mechanism for distribution of the coating liquid relates to the shearing action that occurs as tablets cascade over oneanother.
For the greatest period of time, sugar-coating liquids were appliedmanually by allowing premeasured quantities of coating liquid to be pouredacross the moving tablet bed. In recent times, there has been a greaterreliance on mechanical dosing techniques, involving the use of spray gunsor dosing "spaeges" (Fig. 3).
One of the major misconceptions concerning the use of mechanicaldosing techniques, particularly spray guns, is that they can exert amajor influence on uniformity of distribution of the sugar-coating liquid.Again, it is important to emphasize that the main factor controlling distribution of the coating liquid relates to contact between the cascading tablets,and transfer of liquid from one tablet to another as the result of this contact. ThUS, particularly When using spray guns, it is not necessary tofinely atomize the coating liquid in order to ensure effective distributionof that liquid. Indeed, excessive atomization can cause "fogging!! wheremuch of the coating liquid can end up on the walls of the pan rather thanon the tablets. Consequently, many advocates for the use of spray gunssimply allow the liquid to stream from the nozzle. For this reason, useof a device similar to that shown in Figure 3 can be equally effective andless expensive than using spray guns.
Summarizing, since coating uniformity is achieved as the result oftablet-to-tablet transfer of liquid coating material, it is not necessary foreach tablet to pass through the zone of application (which is a necessityin the film-coating process). Factors which influence coating uniformity inthe sugar-coating process are that:
The coating material remains fluid until it is spread across the surfaceof every tablet in the batch.
Sufficient volume of coating liquid is applied to ensure that everytablet in the batch is capable of being wetted (thus liquid volumesmay have to be changed as the process progresses in order toreflect changes in tablet size and drying conditions).
The coating pan exhibits good mixing characteristics, particularly sothat dead spots are avoided (many coating pans of conventionaldesign, i.e., the traditional pear-shaped design, may have to bemodified by inclusion of mixing baffles, otherwise mixing may haveto be augmented by manual stirring of the tablets by the operator).
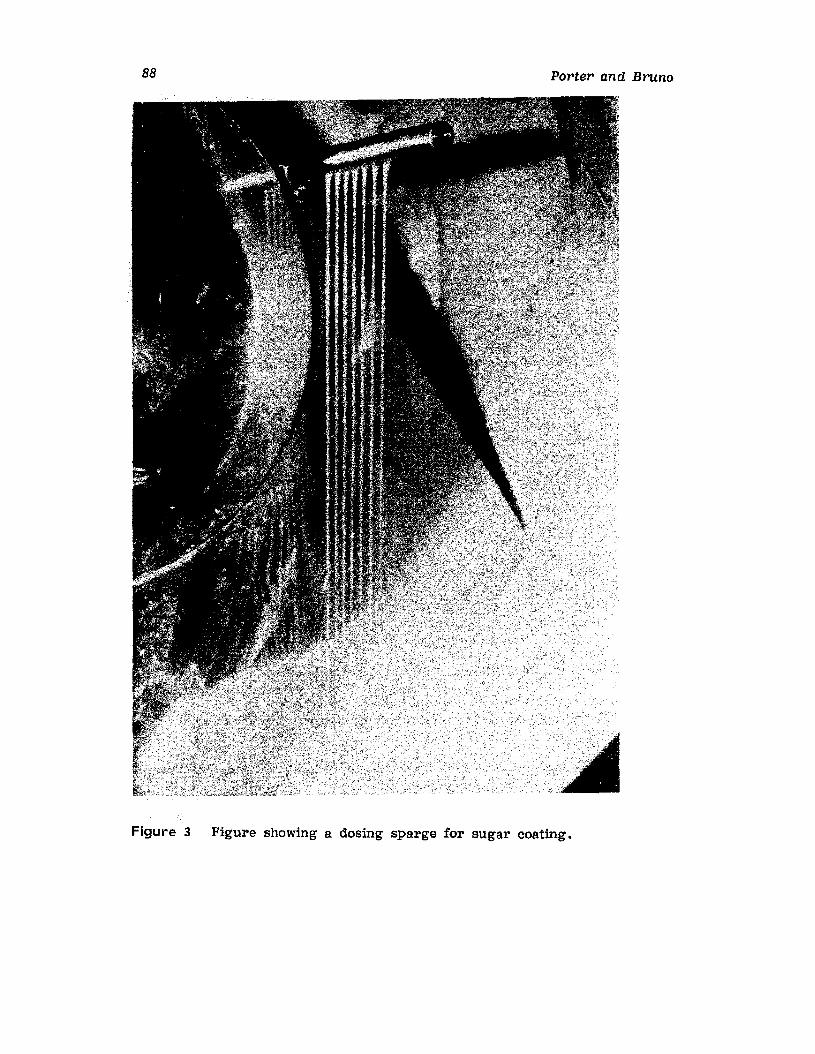
88 Porter and Bruno
Figure 3 Figure showing a dosing sparge for sugar coating.
Coating of Pharmaceutical Solid-Dosage Forms
D. Problems in Sugar Coating
89
In any coating process, a variety of problems may arise. Often such problems may be related to formulation issues that have been compounded bythose associated with processing.
Problems with Tablet Core Robustness
The attritional effects of any coating process on tablet cores is wellunderstood. Consequently. tablet cores must be sufficiently robust toresist the stress to which they will be exposed during coating.
With this in mind; particular attention must be paid to important tabletphysical properties such as hardness (diametral crushing strength), friability, and lamination tendency. Failure to address these issues is likelyto result in a situation in which tablet fragmentation occurs during thecoating process.
Tablet fragmentation is not only a problem from the standpoint thatthe broken tablets will obviously not be saleable (and thus would have tobe inspected out). but additionally. the broken fragments may typically become "glued" (because of the adhesive nature of the coating fluids) to thesurface of undamaged tablets (Fig. 4); thus spoiling a significant portionof the batch.
Quality Problems with Finished Tablets
CHIPPING OF COATINGS. Sugar coatings are inherently brittle andthus prone to chipping if mishandled. Addition of small quantities ofpolymers (such as cellulosics, polyvinyl pyrrolidone, acacia, or gelatin) toone or more of the various coating formulations often helps to improvestructural integrity. and thus reduces chipping problems.
Excessive use of insoluble f'lllers and pigments tends to increase thebrittleness of sugar coatings, and thus should be avoided where possible.
CRACKING OF THE COATING. Tablet cores that expand, either during or after coating, are likely to cause the coating to crack (Fig. 5).Such expansion may result from moisture absorption by the tablet core.or may be caused by stress-relaxation of the core after compaction (aphenomenon Which is known to occur, for example, with ibuprofen).Moisture sorption can be minimized by appropriate use of a seal coat,whereas expansion due to postcompaction stress relaxation can be resolvedby extending the time between the compaction event and commencement ofsugar coating.
NONDRYING COATINGS. Inability to dry sugar coatings properly,especially those based on sucrose, is often an indicator that excessivelevels (greater than 5%) of invert sugar is present. Inversion of sucroseis exacerbated by keeping sucrose syrups at elevated temperatures underacidic conditions for extended periods of time. Such conditions occurwhen sugar-coating solutions containing aluminum lakes are kept hot fortoo long; or such sugar-coating formulations are constantly being reheated to redissolve sugar that is beginning to crystallize out.
TWINNING (OR BUILDUP OF MULTIPLES). By their very nature,sugar-coating formulations are very sticky, particularly as they begin to
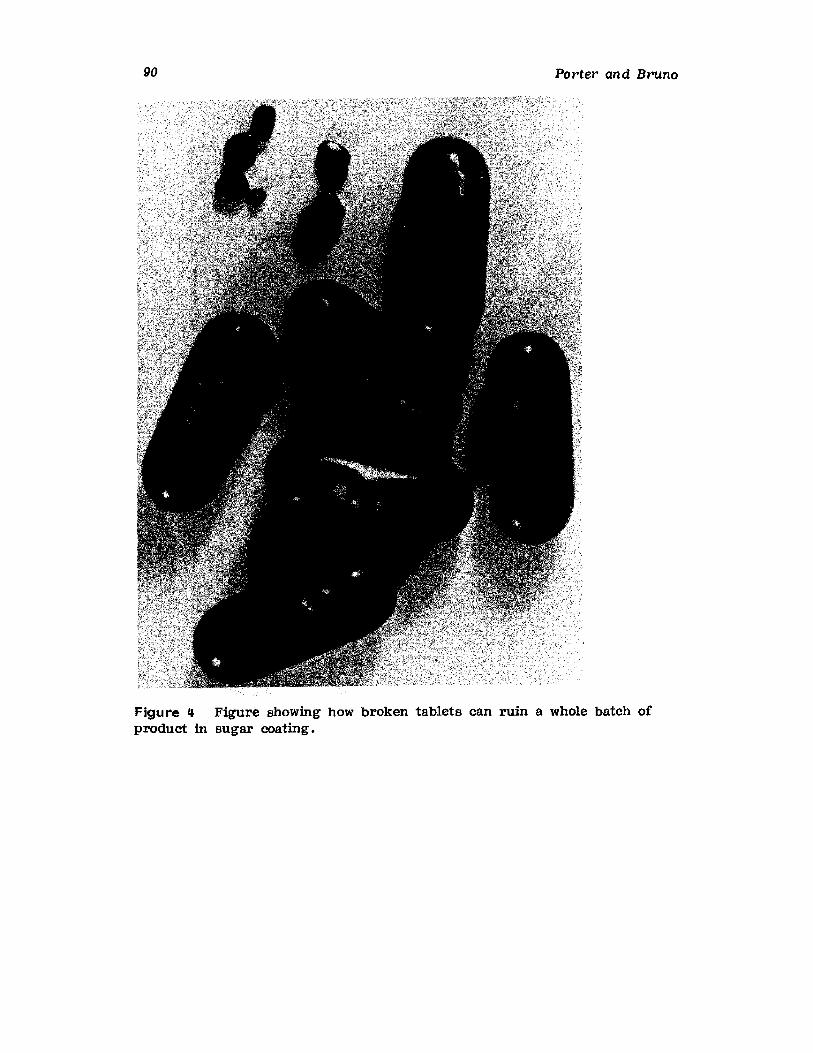
90 Porter and Bruno
Figure 4 Figure showing how broken tablets can ruin a whole batch ofproduct in sugar coating.
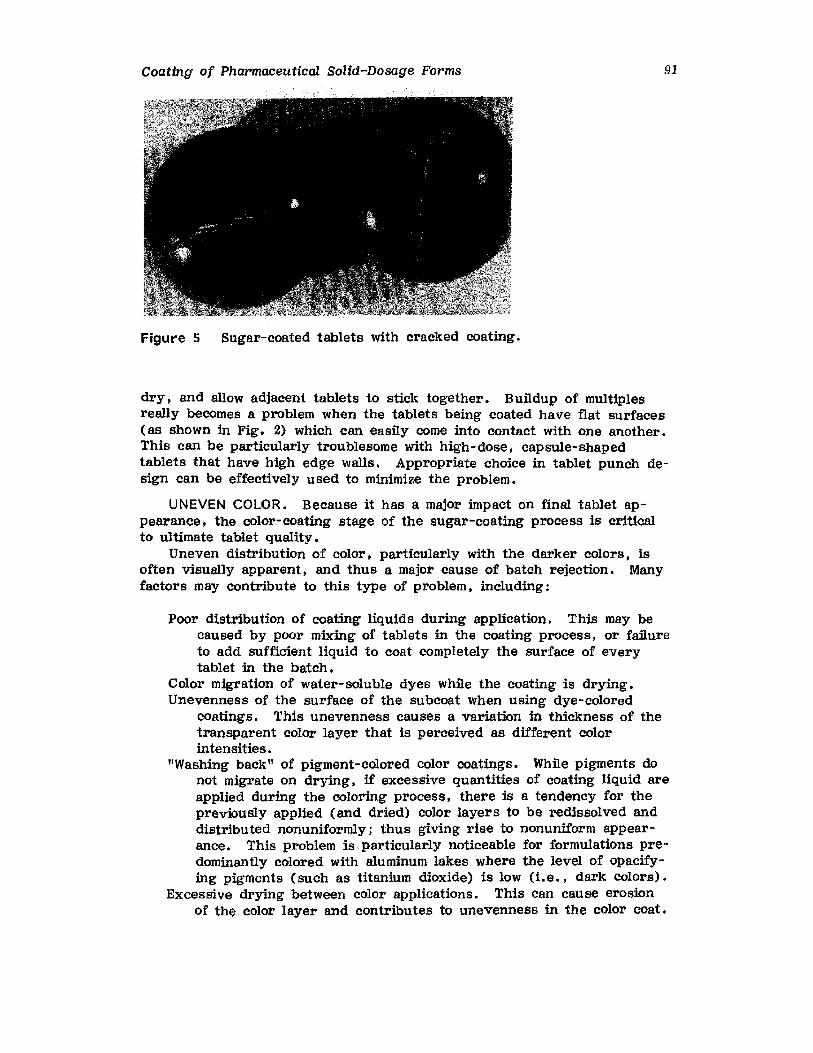
Coating of Pharmaceutical Solid-Dosage Forms
Figure 5 Sugar-coated tablets with cracked coating.
91
dry, and allow adjacent tablets to stick together. Buildup of multiplesreally becomes a problem when the tablets being coated have flat surfaces(as shown in Fig. 2) which can easily come into contact with one another.This can be particularly troublesome with high-dose, capsule-shapedtablets that have high edge walls. Appropriate choice in tablet punch design can be effectively used to minimize the problem.
UNEVEN COLOR. Because it has a major impact on final tablet appearance, the color-coating stage of the sugar-coating process is criticalto ultimate tablet quality.
Uneven distribution of color. particularly with the darker colors, isoften viaually apparent. and thus a major cause of batch rejection. Manyfactors may contribute to this type of problem, including:
Poor distribution of coating liquids during application. This may becaused by poor mixing of tablets in the coating process, or failureto add sufficient liquid to coat completely the surface of everytablet in the batch.
Color migration of water-soluble dyes while the coating is drying.Unevenness of the surface of the subcoat when using dye-colored
coatings. This unevenness causes a variation in thickness of thetransparent color layer that is perceived as different colorintensities.
"Washing back" of pigment-colored color coatings. While pigments donot migrate on drying, if excessive quantities of coating liquid areapplied during the coloring process, there is a tendency for thepreviously applied (and dried) color layers to be redissolved anddistributed nonuniformly; thus giving rise to nonuniform appearance. This problem is. particularly noticeable for formulations predominantly colored with aluminum lakes where the level of opacifying pigments (such as titanium dioxide) is low (La .• dark colors).
Excessive drying between color applications. This can cause erosionof the color layer and contributes to unevenness in the color coat.
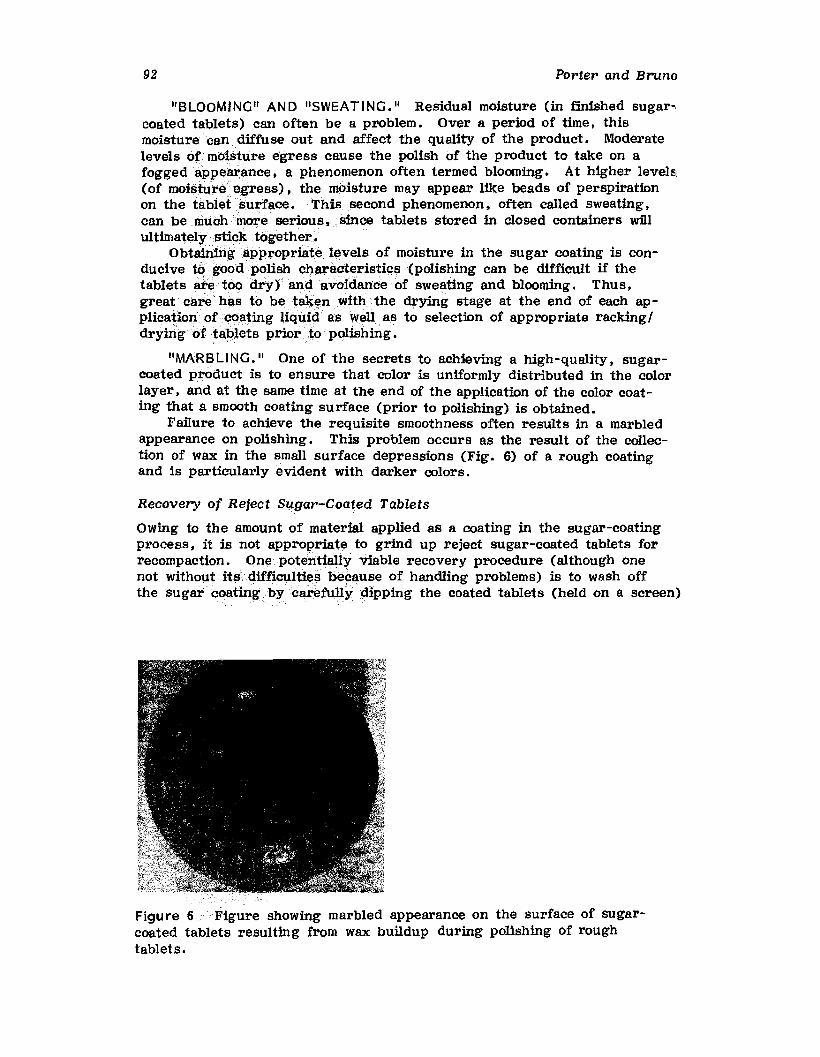
92 Porter and Bruno
"BLOOMING" AND llSWEATING." Residual moisture (in f"mished sugar-.coated tablets) can often be a problem. Over a period of time ~ thismoisture can diffuse out and affect the qUality of the product. Moderatelevels of<moisture egress cause the polish of the product to take on afogged appearance~ a phenomenon often termed blooming. At higher levels:(of moistUreagr~ss), the. moisture may appear like beads of perspirationon the tl1bletsurface • This second phenomenon, often called sweating,can be .•muChmor~ serious •..•. since tablets stored in closed containers willultimat~ysticktogethe1"'
Obtainingappropriatel.e-yelS of .. moisture in the sugar coating is conduciye ~<good PQliEili cl}8l.'act~ristigs(polishing can be difficult if thetabletsal'E!tO()dry)an~.a,yoidanceof sweating and blooming. ThUS,great care has to betakE!n. with the drying stage at the end of each application Qfcoating .iqt1id as well.as to selection of appropriate rackingldrying of tablets prior to pqlishing.
IIMA~BLlNG.1J One of the secrets to achieving a high-quality. sugarcoated product is to ensure that color is uniformly distributed in the colorlayer. and at the same time at the end of the application of the color coating that a smooth coating surface (prior to polishing) is obtained.
Failure to achieve the requisite smoothness often results in a marbledappearance on polishing. This problem occurs as the result of the collection of wax in the small surface depressions (Fig. 6) of a rough coatingand is particularly evident with darker colors.
Recovery of Reject Sugar-Coated Tablets
Owing to the amount of material applied as a coating in the sugar-coatingprocess, it is not appropriate to grind up reject sugar-coated tablets forrecompaction. ". Qne.potendally viable recovery procedure (although onenot without itsdifficultie$ because of handling problems) is to wash offthe sugar coatingbycl:ltefullydipping the coated tablets (held on a screen)
Figure 6 Figure showing marbled appearance on the surface of sugarcoated tablets resulting from wax buildup during polishing of roughtablets.
Coating of Pharmaceutical Solid-Dosage Forms 93
into a water bath until sufficient coating is removed such that on subsequent refinishing, the desired quality is achievable. Once the requisitequantity of coating is removed, the tablets can be dried by tumbling in acoating pan under a warm air stream (50°C). Such a procedure mustobviously be validated to ensure that overall product quality is not compromised for the sake of improving visual quality.
III. FILM COATING
A. Introduction
Film coating is quite a complex process that draws on technologies associated with polymer chemistry, industrial adhesives and paints, and chemical engineering. The process of film coating can be simplified to represent one that involves the application of thin (in the range of 20- 200 um) ,polymer-based coatings to an appropriate substrate (tablets, beads, granules, capsules, drug powders, and crystals) under conditions that permit:
Balance between, and control of, the coating liquid addition rate anddrying process
Uniformity of distribution of the coating liquid across the surface ofproduct being coated
Optimization of the quality (both visual and functional) of the finalcoated product
While film coatings can be applied by manual ladling techniques, theynow almost always utilize a spray-atomization technique.
In the spray-application process, bulk coating liquids are finelyatomized and delivered in such a state that droplets (of coating liquid)retain sufficient fluidity to wet the surface of the product being coated,spread out, and coalesce to form a film. Because of the highly adhesive(or "tacky") nature of partially dried droplets, it is imperative that thedroplets of coating liquid dry almost instantaneously the moment they contact the surface of the substrate; otherwise sticking and picking willoccur. Hence, there is a need to strike an appropriate balance betweenliquid application rate and the drying process. A simplified schematic ofthe film-coating process is shown in Figure 7.
Because of the rapid drying that typically takes place during the application of film coatings, uniformity of distribution of the coating is controlled both by uniformity of application of the coating liquid (Le , , thenumber of spray guns used, types of spray patterns used, and finenessof atomization of coating liquid) and the uniformity of mixing (controlledby pan speed, baffle design, tablet size and shape) of the product beingcoated. Unlike sugar coating, it is not desirable in film coating to havepartially dry coating material being transferred from one tablet to another,since this would create imperfections in the coating that would be readilyevident at the end of the coating process. However, this does not meanthat the tumbling action (of tablets, etc.) in a coating process has noeffect on ultimate coating structure. On the contrary, Rowe {2] has described how the high shear developed at the tablet surface (as the resultof the mutual rubbing together of adjacent tablets) can promote sufficientflow of the coating (which induces a leveling effect) to achieve bettercohesion within the film.
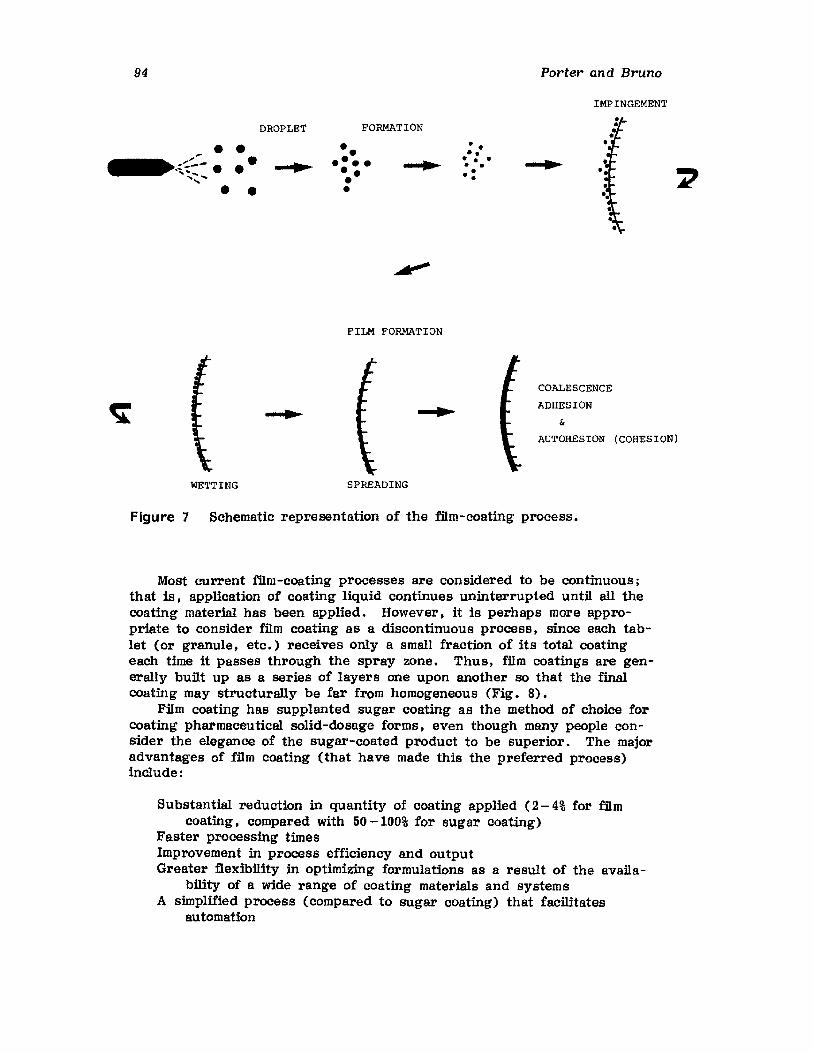
94
DROPLET.-~.(;:-..-~
"','" • •
WETTING
FORMATION
••••••• •••
FILM FORMATION
SPREADING
••••• ••• ••• •
Porter and Bruno
IMPINGEMENT
COALESCENCE
ADHESION
&
AUTOHESION (COHESION)
Figure 7 Schematic representation of the film-coating process.
Most current film-coating processes are considered to be continuous;that is, application of coating liquid continues uninterrupted until all thecoating material has been applied. However, it is perhaps more appropriate to consider film coating as a discontinuous process, since each tablet (or granule, etc.) receives only a small fraction of its total coatingeach time it passes through the spray zone. Thus, film coatings are generally built up as a series of layers one upon another so that the finalcoating may structurally be far from homogeneous (Fig. 8).
Film coating has supplanted sugar coating as the method of choice forcoating pharmaceutical solid-dosage forms, even though many people consider the elegance of the sugar-coated product to be superior. The majoradvantages of film coating (that have made this the preferred process)include:
SUbstantial reduction in quantity of coating applied (2 - 4% for filmcoating. compared with 50 -100% for sugar coating)
Faster processing timesImprovement in process efficiency and outputGreater flexibility in optimizing formulations as a result of the availa
bility of a wide range of coating materials and systemsA simplified process (compared to sugar coating) that facilitates
automation
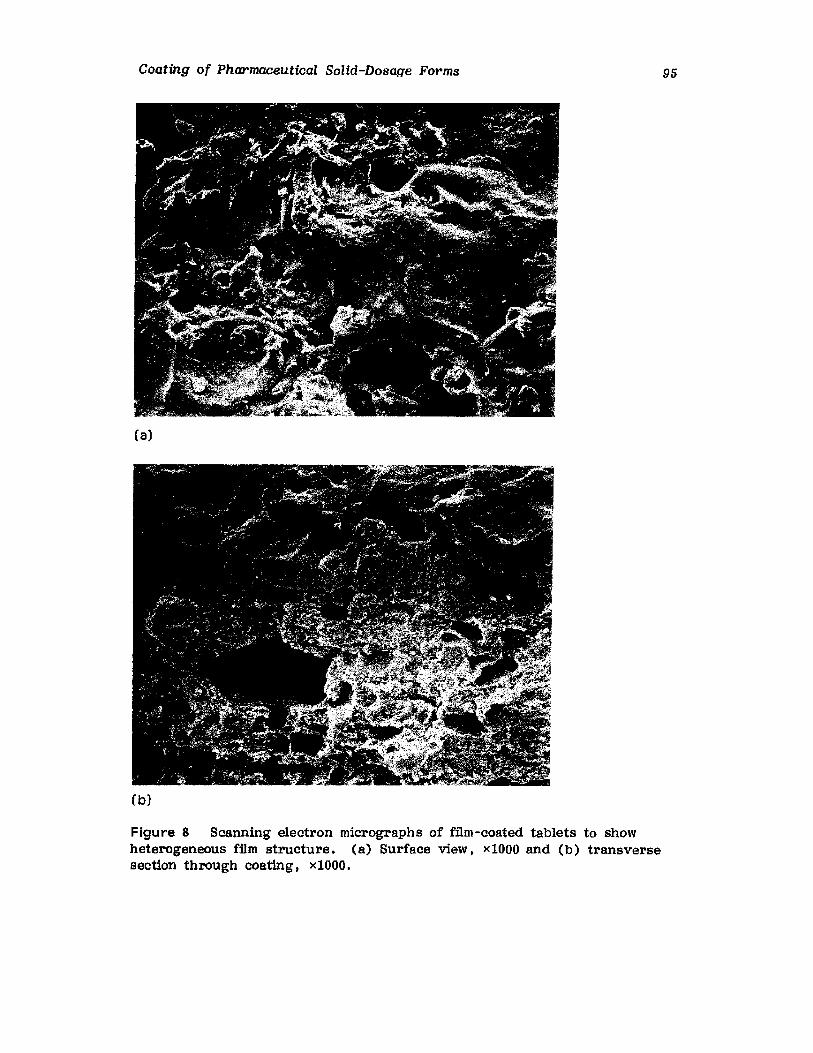
Coating of Pharmaceutical Solid-Dosage Forms
(a)
(b)
Figure 8 Scanning electron micrographs of film-coated tablets to showheterogeneous film structure. (a) Surface view, x1000 and (b) transversesection through coating, x1000.
95
96 Porter and Bruno
Ability to be applied to a wide range of pharmaceutical products (e.g.,tablets, capsules, granules, nonpareils, powders, drug crystals)
It is important to note, however, that in the early days of film coating. processing relied heavily on converting existing sugar-coating pans(which were conventional in design) by appropriate addition of air-handlingand spraying equipment. Such conversions were relatively unsophisticated,and created processes where drying efficiencies were adequate at best.Consequently. to ensure that the conversion from sugar coating to filmcoating was successful, volatile organic solvents had to be used to helpoffset the deficiencies in drying capacity that the conventional processingpans exhibited.
Over the years, as film coating has grown in popularity, use of organic solvents (with their associated flammability, toxicity, and environmental pollution hazards) has proven somewhat limiting. Fortunately, significant improvements in processing equipment have facilitated the introduction of aqueous-based coating formulations. The result is that aqueousfilm-coating processes are used preferentially by a majority of manufacturers (of film-coated products). A useful review of aqueous coating systemshas been given by McGinity [3].
Types of Film Coatings Used
The applications for use of film coatings are quite diverse. While suchapplications require some functionality of the coating formulation, it is notuncommon to see film coatings described as either functional or nonfunctional. Functionality in this context relates specifically to an ability tomodify drug-release characteristics. Nonfunctional (or conventional) filmcoatings are typically reserved for situations in which it is necessary toimprove product appearance, ease of swallowing, and product stability,and for taste masking. Functional film coatings are used when drugrelease characteristics need to be modified, and are represented byenteric coatings and sustained- (or controlled-) release coatings.
Factors Affecting the Quality of Film Coatings
Film coating is a process in which the results obtained are attributable tothe complex interaction of numerous factors. Application of a statisticaldesign approach [4 - 6] (in both formulation and process development) canplay a significant role in the optimization of the whole process. Additionaloptimization of process conditions can be achieved by employment of anappropriate thermodynamic model (such as that proposed by Ebey) [7].Such an approach may be necessary when designing an automated coatingprocess. These thermodynamic models can also be used to identify criticalprocessing variables in the aqueous process where the margin for errormay be low.
In order to better understand those factors that influence the quality(both visual and functional) of the finished coated product, it is necessary to examine the factors that have an effect on:
Interaction between the core material (substrate) and the appliedcoating
Coating of Pharmaceutical Solid-Dosage Forms
The drying processThe uniformity of distribution of the coating
Some of these important factors are highlighted in Tables 3 -5.
97
Mechanisms of Film Formation for Film-Coating Systems
In the early days, pharmaceutical film-coating formulations consisted ofsolutions of polymers (and other additives) in organic solvents or organicsolvent mixtures. As utilization of the film-coating process became morecommon, and as regulatory pressures relating to health, safety, and protection of the environment have grown, a transition to using aqueous solutions of polymers has occurred. More recently, availability of aqueouspolymeric dispersions (commonly called latices or pseudolatices) has attracted interest, particularly for situations in which the final dried coatingneeds to be water insoluble (as with modified-release products).
Clearly, modern film-coating practices require that coatings be formedfrom either polymeric solutions or polymeric dispersions. Since these coating systems are initially liquids, the coating process involves the conversion of a liquid into a "dry solid." However, polymers used in film coatingare, for the most part, amorphous, and thus the term dry solid can bemisleading. In order to clarify this situation, one can consider that:
A solid film is one which will not flow significantly under those forcesto which it is subjected at the time of observation [18].
A practical definition [19] of a dry film is one that will resist blockingwhen two coated surfaces (e.g., two coated tablets) are broughtinto contact, for 2 seconds, under a pressure of 14 kPa (20 psi).
Such block resistance occurs when the viscosity of the coating exceeds 107 Pa.s (10 8 Pl.
A viscosity conducive to such blocking occurs when, according to therelationship proposed by Williams et al , {20], a coating is exposedto temperature conditions approximately 20°C above its glasstransition temperature (T ).
g
Since pharmaceutical film-coating processes may now employ polymericsolutions (organic-solvent based or aqueous) or aqueous polymeric dispersions, the formulator and process engineer must be very much aware ofhow such coatings form 111ms in order to be sure that appropriate formulation additives and process conditions are employed to achieve consistent,quality results.
FORMULATION OF FILMS FROM POLYMERIC SOLUTIONS. The filmforming process, and internal structure of the final dried coating, willvery much depend upon the rate of solvent evaporation. Rate of solventevaporation will in turn be controlled by the latent heat of vaporization ofthat solvent and the drying conditions provided in the process.
Film formation generally comprises:
Initial rapid evaporation of solvent from the atomized droplets of coatingliquid, causing an increase in polymer concentration (and, hence,viscosity) and contraction in volume of the droplets
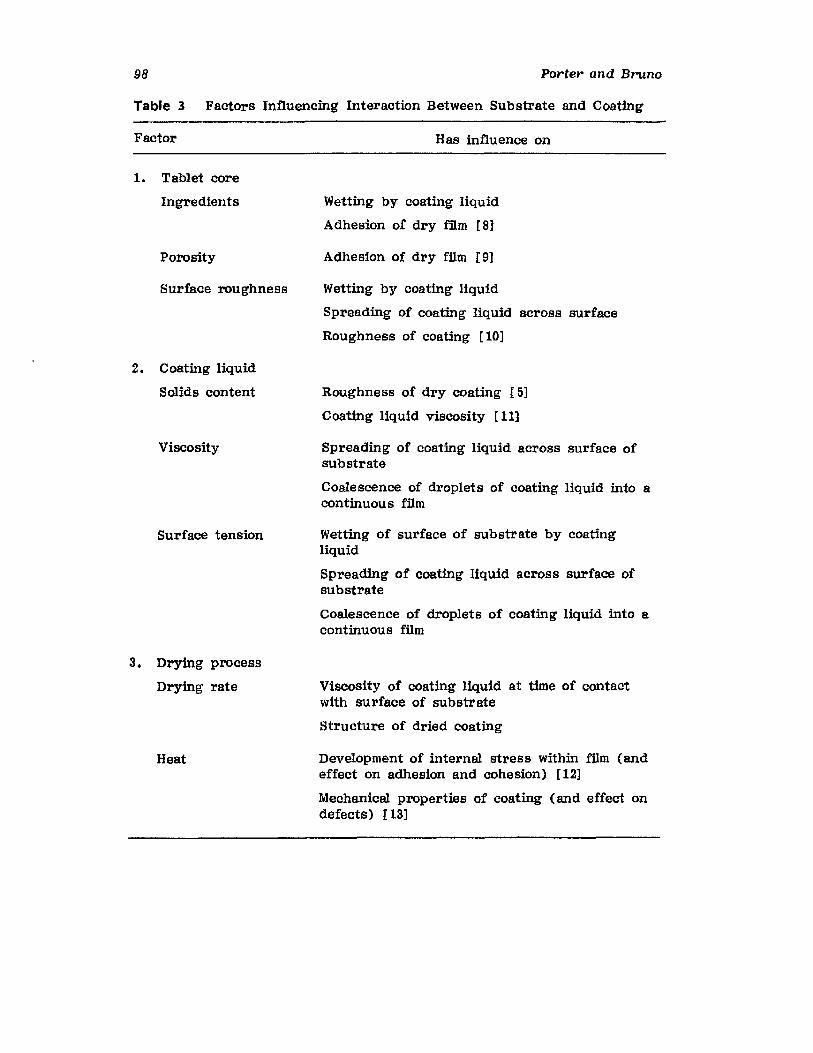
98 Porter and Bruno
Table 3 Factors Influencing Interaction Between Substrate and Coating
Factor Has influence on
1. Tablet core
Ingredients
Porosity
Surface roughness
2. Coating liquid
Solids content
Viscosity
Surface tension
3. Drying process
Drying rate
Heat
Wetting by coating liquid
Adhesion of dry film [8]
Adhesion of dry film [9]
Wetting by coating liquid
Spreading of coating liquid across surface
Roughness of coating [10]
Roughness of dry coating [5]
Coating liquid viscosity [11]
Spreading of coating liquid across surface ofsubstrate
Coalescence of droplets of coating liquid into acontinuous film
Wetting of surface of substrate by coatingliquid
Spreading of coating liquid across surface ofsubstrate
Coalescence of droplets of coating liquid into acontinuous film
Viscosity of coating liquid at time of contactwith surface of substrate
Structure of dried coating
Development of internal stress within film (andeffect on adhesion and cohesion) [12]
Mechanical properties of coating (and effect ondefects) [13]

Coating of Pharmaceutical Solid-Dosage Forms
Table 4 Factors Influencing the Drying Process
Factor Has influence on
99
1. Spray equipment
Nozzle design
Atomizing air (for air-spraynozzles)
Number of spray guns used
2. Drying conditions
Air flow
}TemperatureHumidity
3. Spray rate
Nozzle design
}Number of spray gunsPumping system
4. Solids content of coating liquid
Fineness of atomization of coatingliquid [5,11] (and thus evaporation rate of solvent/vehicle)
Fineness of atomization of coatingliquid [5, 11} (and thus evaporation rate of solvent/vehicle)
Uniform distribution of coatingliquid
Avoidance of localized overwetting
Rate at which solvent/vehicle canbe removed from the coatingliquid
Product temperature
Rate at which solvent/vehicleneeds to be removed from coatingliquid
Product temperature
Quantity of solvent/vehicle thatmust be removed from coatingliquid
Further loss of solvent from the fUm (that is, coalescing on the surfaceof the dosage form) at a slower rate which is now controlled bythe rate of diffusion of solvent through the polymer matrix
Immobllizatfon of the polymer molecules at the "solidification point"Further gradual solvent loss from the film at a very much reduced
rate
Solvent loss from the film coating will be continuous but at an everdecreasing rate. Solvent loss from the polymer matrix is governed bythe amount of space between the polymer molecules (usually termed thefree volume). As solvent loss progresses. the glass-transition temperatureof the polymer film increases and free volume decreases. Ultimately, freevolume becomes so small that further solvent loss is so restricted that totalremoval of solvent from the coating becomes almost impossible. Indeed.total solvent removal requires heating the film to a temperature significantly above the glass-transition temperature of the solvent-free polymer
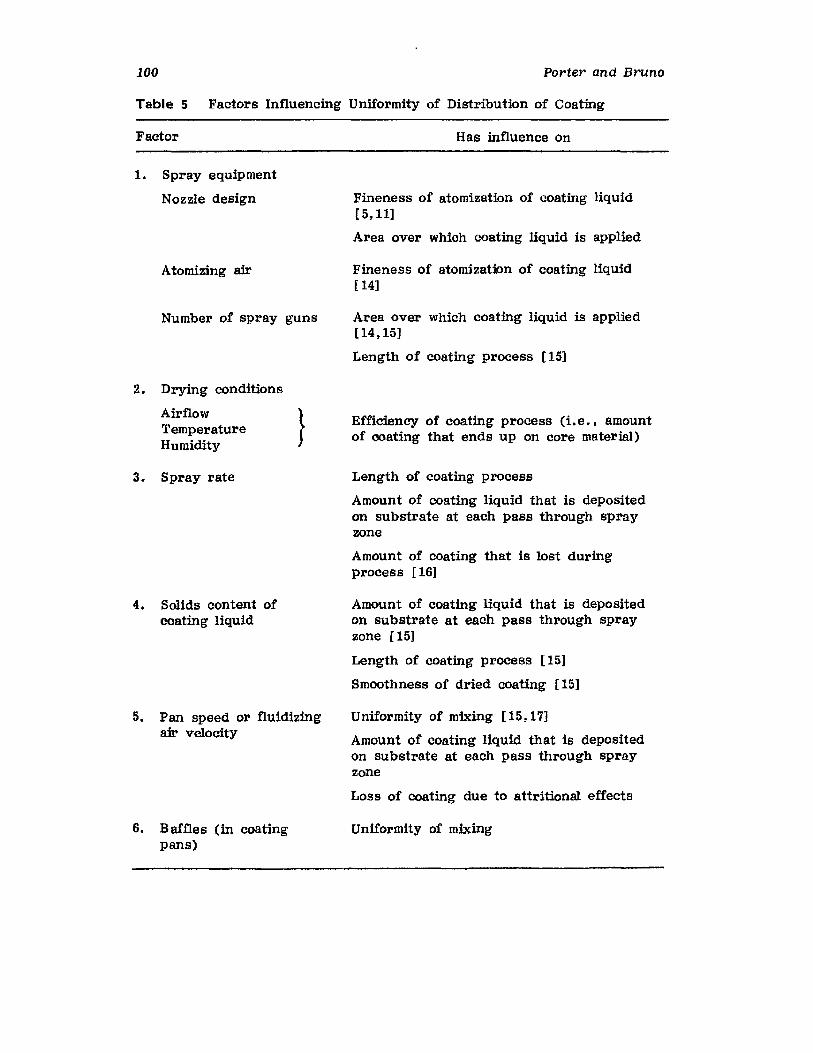
100 Porter and Bruno
Table 5 Factors Influencing Uniformity of Distribution of Coating
Factor Has influence On
1. Spray equipment
Nozzle design
Atomizing air
Number of spray guns
2. Drying conditions
Airflow }TemperatureHumidity
3. Spray rate
4. Solids content ofcoating liquid
5. Pan speed or fluidizingair velocity
6. Baffles (in coatingpans)
Fineness of atomization of coating liquid[5,11]
Area over which coating liquid is applied
Fineness of atomization of coating liquid[ 14]
Area over which coating liquid is applied[14,15]
Length of coating process [15]
Efficiency of coating process (Le •• amountof coating that ends up on core material)
Length of coating process
Amount of coating liquid that is depositedon substrate at each pass through sprayzone
Amount of coating that is lost duringprocess [16]
Amount of coating liquid that is depositedon substrate at each pass through sprayzone [15]
Length of coating process [15]
Smoothness of dried coating [151
Uniformity of mixing [15, 17]
Amount of coating liquid that is depositedon substrate at each pass through sprayzone
Loss of coating due to attritional effects
Uniformity of mixing

Coating of Pharmaceutical Solid-Dosage Forms 101
[21]. Since the glass-transition temperature of hydroxypropyl methylcellulose has been reported to be in the range of 170-180°C [22J, it is easy tounderstand how impractical it would be to try and produce solvent-freefilm coatings with this commonly used polymer.
One final note concerning film formation from polymeric solutions, solvent loss (from the coating) that occurs beyond the solidification pointcreates shrinkage stresses that contribute to the internal stress within thecoating, a factor which is related to some of the mechanical problems thatare observed with film coatings applied to pharmaceutical solid-dosageforms [23].
FORMATION OF FILMS FROM AQUEOUS POLYMERIC DISPERSIONS.Film formation from aqueous polymeric dispersions requires the coalescenceof polymer particles into a continuous film. Drying of such a system(i.e., the removal of water) is often quite rapid, whereas coalescence canbe a much slower process, extending into weeks and months if appropriateformulation and processing parameters are not used.
The actual mechanism of film formation from an aqueous polymeric dispersion is quite complex, and many competing theories exist to explain theprocess. A review of this process has been given by Bindshaedler et ale[24] •
In simplified terms, this process involves:
Rapid evaporation of water, causing the particles of dispersed polymerto be brought into close contact with one another
Development of pressures (associated with capillary forces within thestructure) that overcome repulsive forces between particles andcause deformation of the polymer particles
Gradual coalescence of the polymer particles as a result of viscous flowand movement of polymer molecules across the interfaces betweenparticles
This process of film formation is very sensitive to process conditionsused during film coating. The coalescence of the latex particles will bevery much dependent on free volume (Which influences the movement ofpolymer molecules between individual latex particles). Consequently,aqueous polymeric dispersions must be processed at temperatures in excessof the glass-transition temperature of the polymer (or plasticized polymerin the case of, e.g., ethylcellulose). However, referring back to earlierdiscussion on what constitutes a dry film, it is apparent that "blocking"of coated product becomes a problem at temperatures in excess of 20°Cabove the glass-transition temperature. ThUS, the optimum processingconditions for aqueous polymeric dispersions occur over a narrow range oftemperatures. This explains why tackiness is a common problem cited whenfilm coating with such aqueous dispersions.
The SUbject of morphological changes that occur in latex films has beendiscussed by Bradford and Vanderhoff [25].
Ingredients Used in FUm Coating
The first film-coated product was introduced to the market in late 1953[ 26] • At that time, film-coating formulations consisted of an extensivelist of ingredients, including film formers, plasticizers, colorants, surfactants , flavors, glossing agents, and solvents. Since that time such
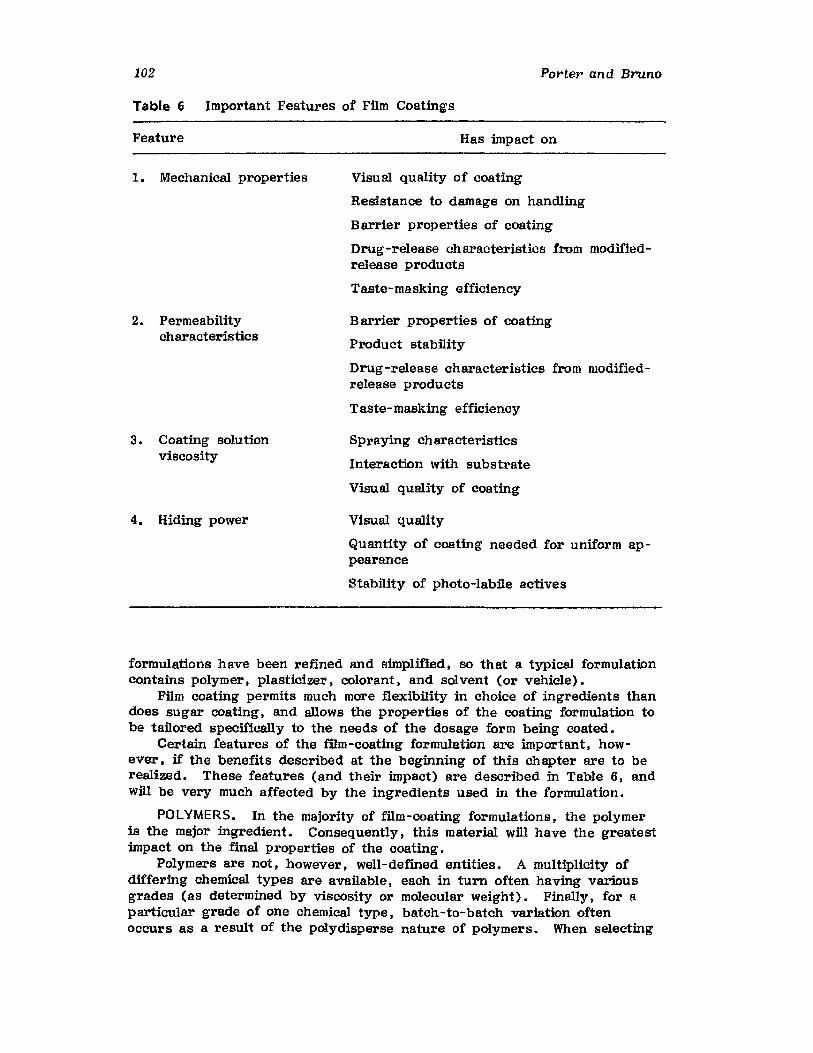
102 Porter and Bruno
Table 6 Important Features of Film Coatings
Feature Has impact on
1. Mechanical properties
2. Permeabilitycharacteristics
3. Coating solutionviscosity
4. Hiding power
Visual quality of coating
Resistance to damage on handling
Barrier properties of coating
Drug-release characteristics from modifiedrelease products
Taste-masking efficiency
Barrier properties of coating
Product stability
Drug-release characteristics from modifiedrelease products
Taste-masking efficiency
Spraying characteristics
Interaction with substrate
Visual quality of coating
Visual qUality
Quantity of coating needed for uniform appearance
Stability of photo-labile actives
formulations have been refined and simplified, so that a typical formulationcontains polymer. plasticizer. colorant, and solvent (or vehicle).
Film coating permits much more flexibility in choice of ingredients thandoes sugar coating, and allows the properties of the coating formulation tobe tailored specifically to the needs of the dosage form being coated.
Certain features of the film-coating formulation are important, however. if the benefits described at the beginning of this chapter are to berealized. These features (and their impact) are described in Table 6, andwID be very much affected by the ingredients used in the formulation.
POLYMERS. In the majority of film-coating formulations, the polymeris the major ingredient. Consequently, this material wID have the greatestimpact on the final properties of the coating.
Polymers are not, however, well-defined entities. A multiplicity ofdiffering chemical types are available, each in turn often having variousgrades (as determined by viscosity or molecular weight). Finally, for aparticular grade of one chemical type, batch-to-batch variation oftenoccurs as a result of the po1ydisperse nature of polymers. When selecting
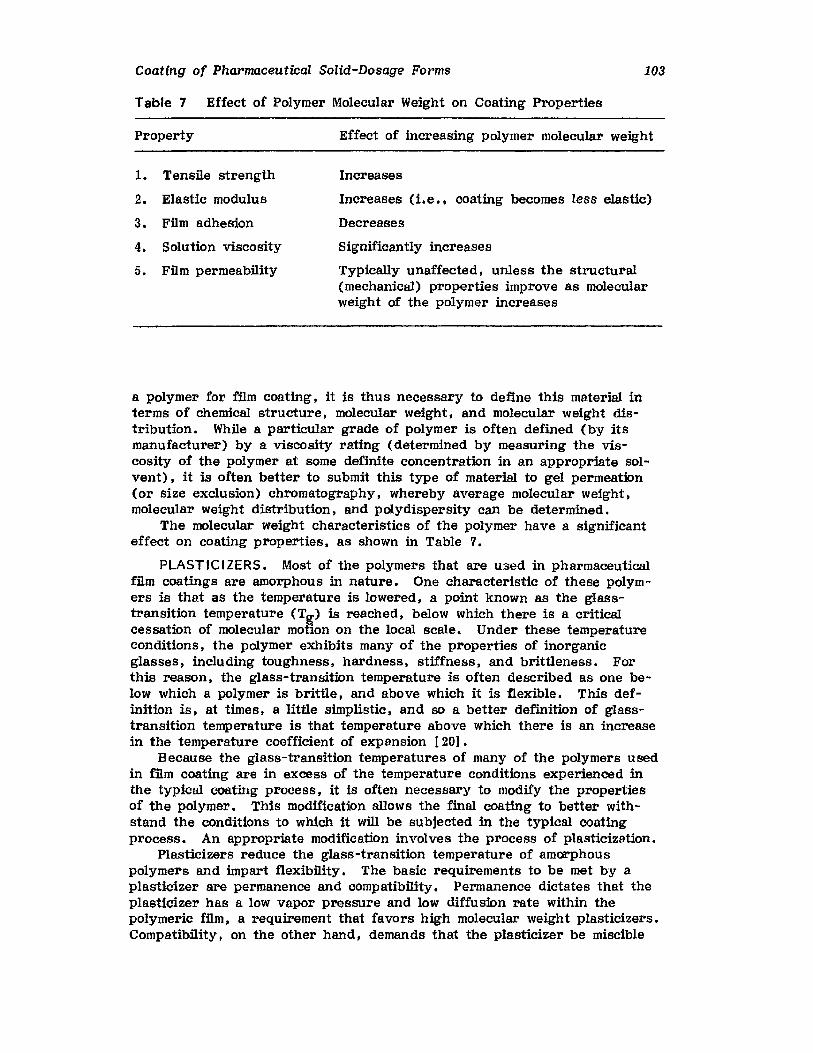
Coating of Pharmaceutical Solid-Dosage Forms 103
Table 7 Effect of Polymer Molecular Weight on Coating Properties
Property Effect of increasing polymer molecular weight
Increases
Increases (i.e., coating becomes less elastic)
Decreases
1. Tensile strength
2. Elastic modulus
3. Film adhesion
4. Solution viscosity
5. Film permeability
Significantly increases
Typically unaffected, unless the structural(mechanical) properties improve as molecularweight of the polymer increases
a polymer for film coating, it is thus necessary to define this material interms of chemical structure, molecular weight, and molecular weight distribution. While a particular grade of polymer is often defined (by itsmanufacturer) by a viscosity rating (determined by measuring the viscosity of the polymer at some definite concentration in an appropriate solvent), it is often better to submit this type of material to gel permeation(or size exclusion) chromatography, whereby average molecular weight,molecular weight distribution, and poIydispersity can be determined.
The molecular weight characteristics of the polymer have a significanteffect on coating properties, as shown in Table 7.
PLASTICIZERS. Most of the polymers that are used in pharmaceuticalfilm coatings are amorphous in nature. One characteristic of these polymers is that as the temperature is lowered, a point known as the glasstransition temperature (Tg> is reached, below which there is a criticalcessation of molecular motion on the local scale. Under these temperatureconditions, the polymer exhibits many of the properties of inorganicglasses, including toughness, hardness, stiffness, and brittleness. Forthis reason, the glass-transition temperature is often described as one below which a polymer is brittle, and above which it is flexible. This definition is, at times, a little simplistic, and so a better definition of glasstransition temperature is that temperature above which there is an increasein the temperature coefficient of expansion [201.
Because the glass-transition temperatures of many of the polymers usedin film coating are in excess of the temperature conditions experienced inthe typical coating process, it is often necessary to modify the propertiesof the polymer. This modification allows the final coating to better withstand the conditions to which it will be subjected in the typical coatingprocess. An appropriate modification involves the process of plasticization.
Plasticizers reduce the glass-transition temperature of amorphouspolymers and impart flexibility. The basic requirements to be met by aplasticizer are permanence and compatibility. Permanence dictates that theplasticizer has a low vapor pressure and low diffusion rate within thepolymeric film, a requirement that favors high molecular weight plasticizers.Compatibility, on the other hand, demands that the plasticizer be miscible
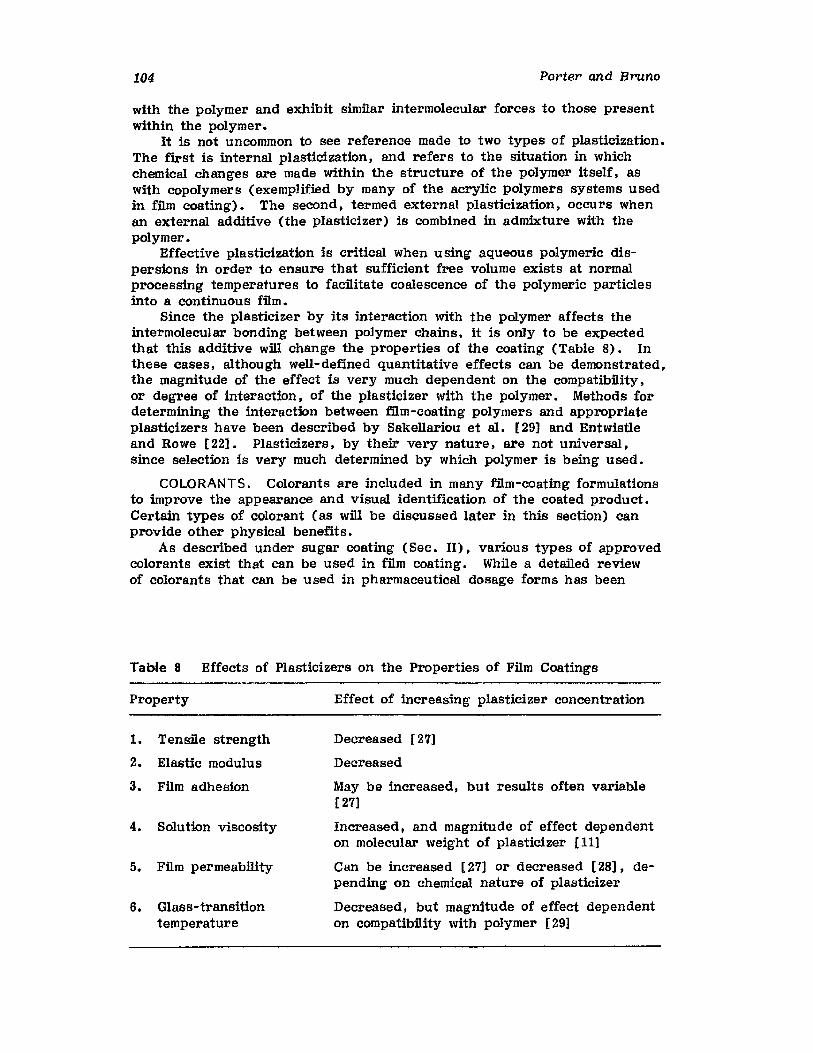
104 Porter and Bruno
with the polymer and exhibit similar intermolecular forces to those presentwithin the polymer.
It is not uncommon to see reference made to two types of plasticization.The first is internal plasticization, and refers to the situation in whichchemical changes are made within the structure of the polymer itself, aswith copolymers (exemplified by many of the acrylic polymers systems usedin film coating). The second, termed external plasticization, occurs whenan external additive (the plasticizer) is combined in admixture with thepolymer.
Effective plasticization is critical when using aqueous polymeric dispersions in order to ensure that sufficient free volume exists at normalprocessing temperatures to facilitate coalescence of the polymeric particlesinto a continuous film.
Since the plasticizer by its interaction with the polymer affects theintermolecular bonding between polymer chains, it is only to be expectedthat this additive will change the properties of the coating (Table 8). Inthese cases, although well-defined quantitative effects can be demonstrated,the magnitude of the effect is very much dependent on the compatibility,or degree of interaction, of the plasticizer with the polymer. Methods fordetermining the interaction between film-coating polymers and appropriateplasticizers have been described by Sakellariou et ale [29] and Entwistleand Rowe [22]. Plasticizers. by their very nature. are not universal,since selection is very much determined by which polymer is being used.
COLORANTS. Colorants are included in many film-coating formulationsto improve the appearance and visual identification of the coated product.Certain types of colorant (as will be discussed later in this section) canprovide other physical benefits.
As described under sugar coating (Sec. II). various types of approvedcolorants exist that can be used in film coating. While a detailed reviewof colorants that can be used in pharmaceutical dosage forms has been
Table 8 Effects of Plasticizers on the Properties of Film Coatings
Property Effect of increasing plasticizer concentration
l. Tensile strength
2. Elastic modulu s
3. Film adhesion
4. Solution viscosity
5. Film permeability
6. Glass-transitiontemperature
Decreased [27]
Decreased
May be increased, but results often variable[ 27]
Increased. and magnitude of effect dependenton molecular weight of plasticizer [11]
Can be increased [27] or decreased [28], depending on chemical nature of plasticizer
Decreased. but magnitude of effect dependenton compatibility with polymer [29]
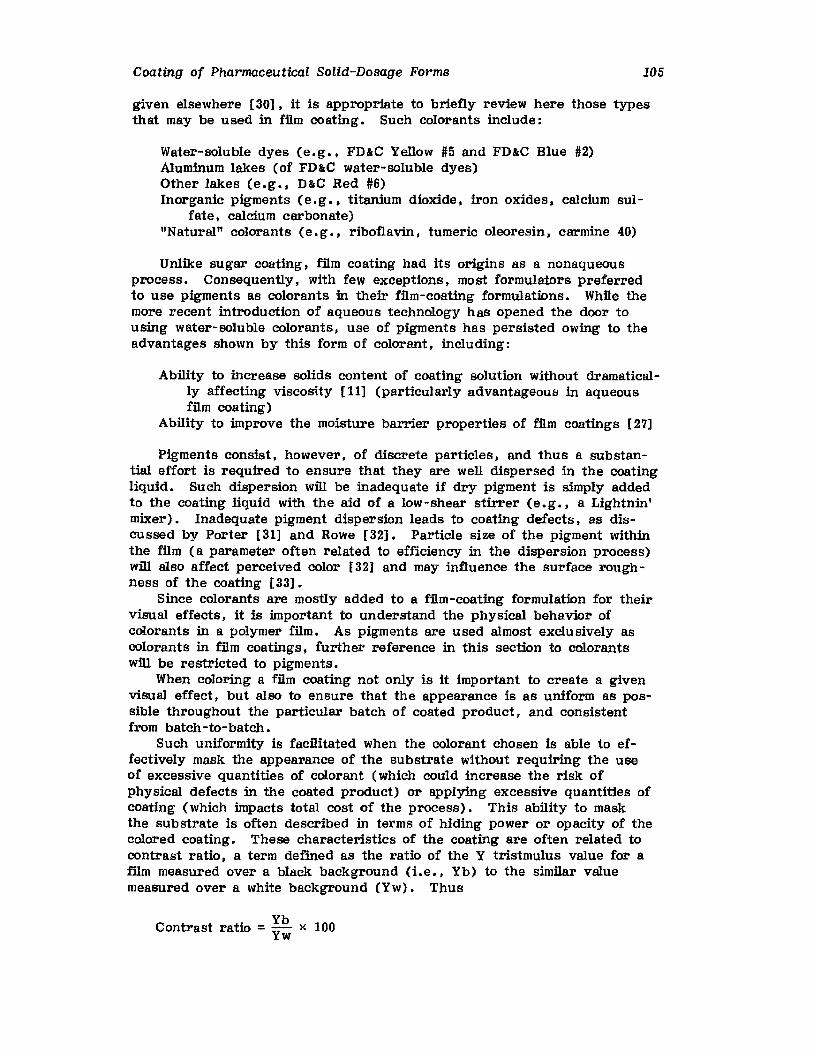
Coating of Pharmaceutical Solid-Dosage Forms 105
given elsewhere [30]. it is appropriate to briefly review here those typesthat may be used in film coating. Such colorants include:
Water-soluble dyes (e.g•• FD&C Yellow #5 and FD&C Blue #2)Aluminum lakes (of FD&C water-soluble dyes)Other lakes (e.g•• D&C Red #6)Inorganic pigments (e.g •• titanium dioxide, iron oxides. calcium sul
fate, calcium carbonate)"Natural" colorants (e. g •• riboflavin, tumeric oleoresin. carmine 40)
Unlike sugar coating. film coating had its origins as a nonaqueousprocess. Consequently, with few exceptions. most formulators preferredto use pigments as colorants in their film-coating formulations. While themore recent introduction of aqueous technology has opened the door tousing water-soluble colorants, use of pigments has persisted owing to theadvantages shown by this form of colorant. including:
Ability to increase solids content of coating solution without dramatically affecting viscosity [11] (particularly advantageous in aqueousfilm coating)
Ability to improve the moisture barrier properties of film coatings [27]
Pigments consist. however. of discrete particles, and thus a substantial effort is required to ensure that they are well dispersed in the coatingliquid. Such dispersion will be inadequate if dry pigment is simply addedto the coating liquid with the aid of a low-shear stirrer (e. g •• a Lightnin'mixer). Inadequate pigment dispersion leads to coating defects. as discussed by Porter [31] and Rowe [32J. Particle size of the pigment withinthe film (a parameter often related to efficiency in the dispersion process)will also affect perceived color [32] and may influence the surface roughness of the coating [33].
Since colorants are mostly added to a film-coating formulation for theirvisual effects. it is important to understand the physical behavior ofcolorants in a polymer film. As pigments are used almost exclusively ascolorants in film coatings. further reference in this section to colorantswill be restricted to pigments.
When coloring a film coating not only is it important to create a givenvisual effect. but also to ensure that the appearance is as uniform as possible throughout the particular batch of coated product. and consistentfrom batch-to-batch.
Such uniformity is facilitated when the colorant chosen is able to effectively mask the appearance of the substrate without requiring the useof excessive quantities of colorant (which could increase the risk ofphysical defects in the coated product) or applying excessive quantities ofcoating (which impacts total cost of the process). This ability to maskthe substrate is often described in terms of hiding power or opacity of thecolored coating. These characteristics of the coating are often related tocontrast ratio. a term defined as the ratio of the Y tristmulus value for a111m measured over a black background (i.e •• Yb) to the similar valuemeasured over a white background (Yw). Thus
YbContrast ratio = Yw x 100
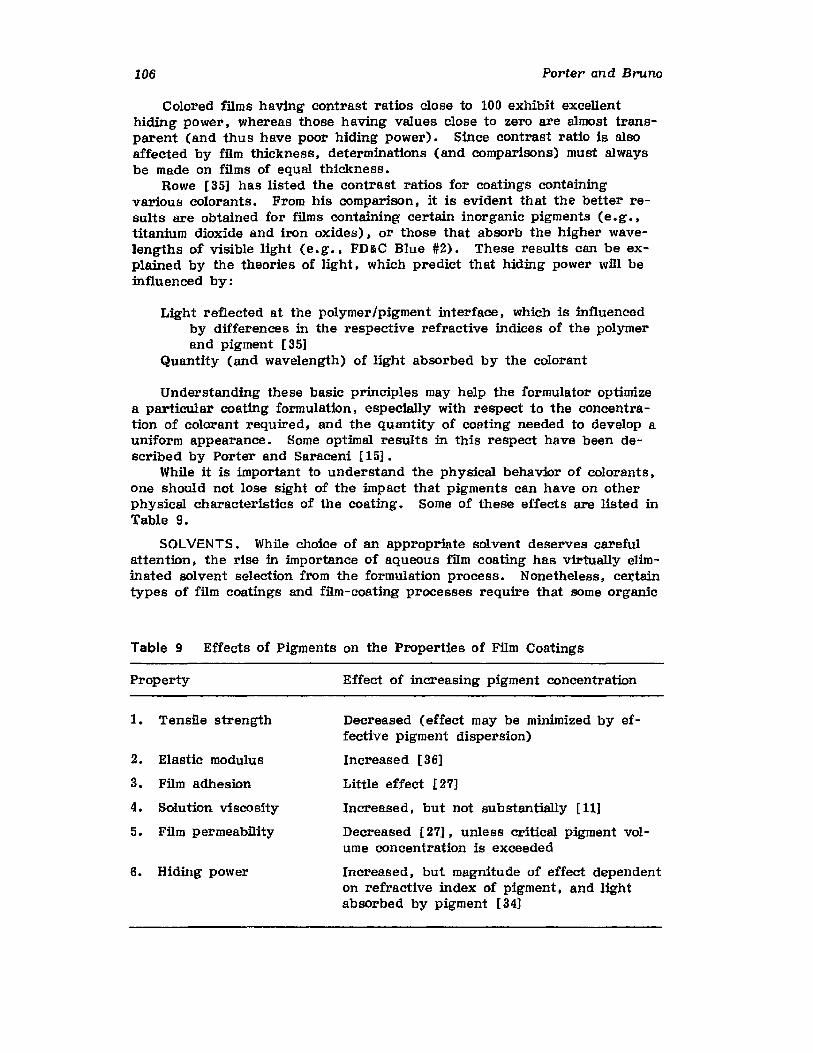
106 Porter and Bruno
Colored films having contrast ratios close to 100 exhibit excellenthiding power, whereas those having values close to zero are almost transparent (and thus have poor hiding power). Since contrast ratio is alsoaffected by film thickness, determinations (and comparisons) must alwaysbe made on films of equal thickness.
Rowe [35] has listed the contrast ratios for coatings containingvarious colorants. From his comparison, it is evident that the better results are obtained for films containing certain inorganic pigments (e. g. ,titanium dioxide and iron oxides). or those that absorb the higher wavelengths of visible light (e. g., FD IC Blue #2). These results can be explained by the theories of light, which predict that hiding power will beinfluenced by:
Light reflected at the polymer/pigment interface, which is influencedby differences in the respective refractive indices of the polymerand pigment [35]
Quantity (and wavelength) of light absorbed by the colorant
Understanding these basic principles may help the formulator optimizea particular coating formulation, especially with respect to the concentration of colorant required, and the quantity of coating needed to develop auniform appearance. Some optimal results in this respect have been described by Porter and Saraceni [15].
While it is important to understand the physical behavior of colorants,one should not lose sight of the impact that pigments can have on otherphysical characteristics of the coating. Some of these effects are listed inTable 9.
SOLVENTS. While choice of an appropriate solvent deserves carefulattention, the rise in importance of aqueous film coating has virtually eliminated solvent selection from the formulation process. Nonetheless, certaintypes of film coatings and film-coating processes require that SOme organic
Table 9 Effects of Pigments on the Properties of Film Coatings
Property Effect of increasing pigment concentration
Decreased (effect may be minimized by effective pigment dispersion)
Increased [36]
Little effect [27]
Increased I but not substantially [11]
Decreased [27], unless critical pigment volume concentration is exceeded
Increased, but magnitude of effect dependenton refractive index of pigment, and Ugh tabsorbed by pigment [34]
1. Tensile strength
2. Elastic modulus
3. Film adhesion
4. Solution viscosity
5. Film permeability
6. Hiding power
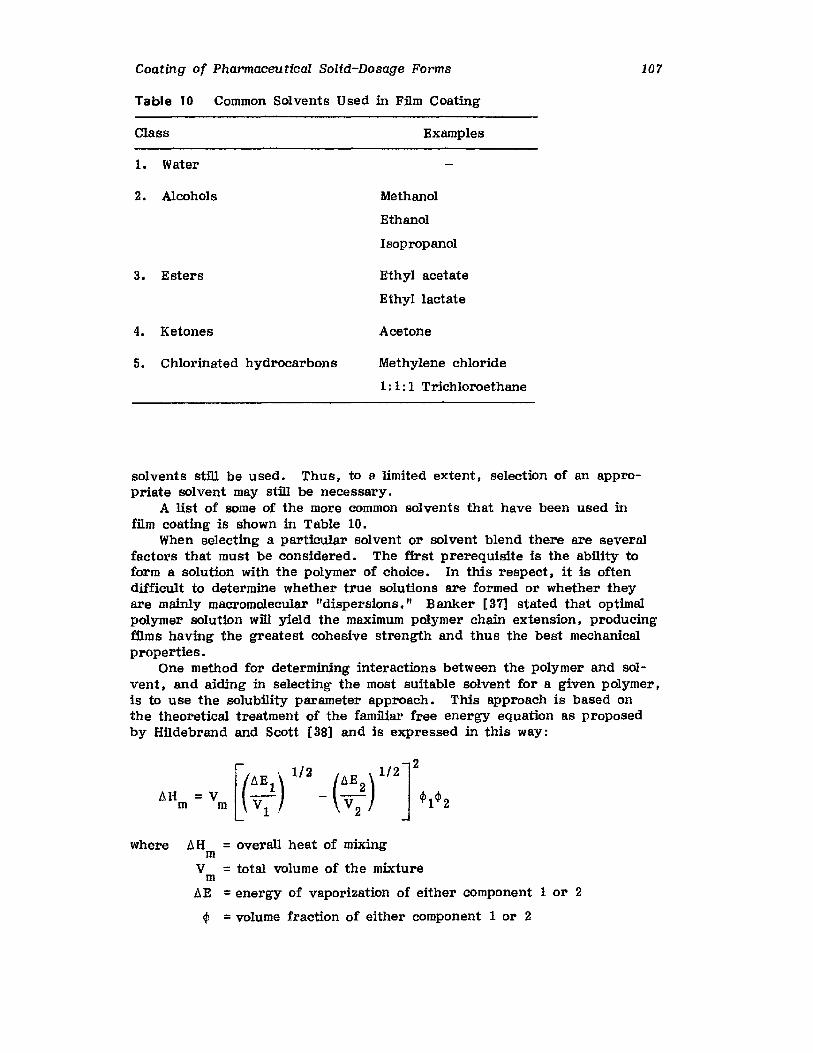
Coating of Pharmaceutical Solid-Dosage Forms 107
Table 10 Common Solvents Used in Film Coating
Class Examples
1. Water
2. Alcohols Methanol
Ethanol
Isopropanol
3. Esters Ethyl acetate
Ethyl lactate
4. Ketones Acetone
5. Chlorinated hydrocarbons Methylene chloride
1: 1: 1 Trichloroethane
solvents still be used. Thus, to a limited extent, selection of an appropriate solvent may still be necessary.
A list of some of the more common solvents that have been used infilm coating is shown in Table 10.
When selecting a particular solvent or solvent blend there are severalfactors that must be considered. The first prerequisite is the ability toform a solution with the polymer of choice. In this respect, it is oftendifficult to determine whether true solutions are formed or whether theyare mainly macromolecular "dispersions." Banker [37] stated that optimalpolymer solution will yield the maximum polymer chain extension, producingfilms having the greatest cohesive strength and thus the best mechanicalproperties.
One method for determining interactions between the polymer and solvent. and aiding in selecting the most suitable solvent for a given polymer,is to use the solubility parameter approach. This approach is based onthe theoretical treatment of the familiar free energy equation as proposedby Hildebrand and Scott [38] and is expressed in this way:
L\H = Vm m
= overall heat of mixing
=total volume of the mixture
= energy of vaporization of either component 1 or 2
ep = volume fraction of either component 1 or 2
L\Hm
Vm
L\E
where
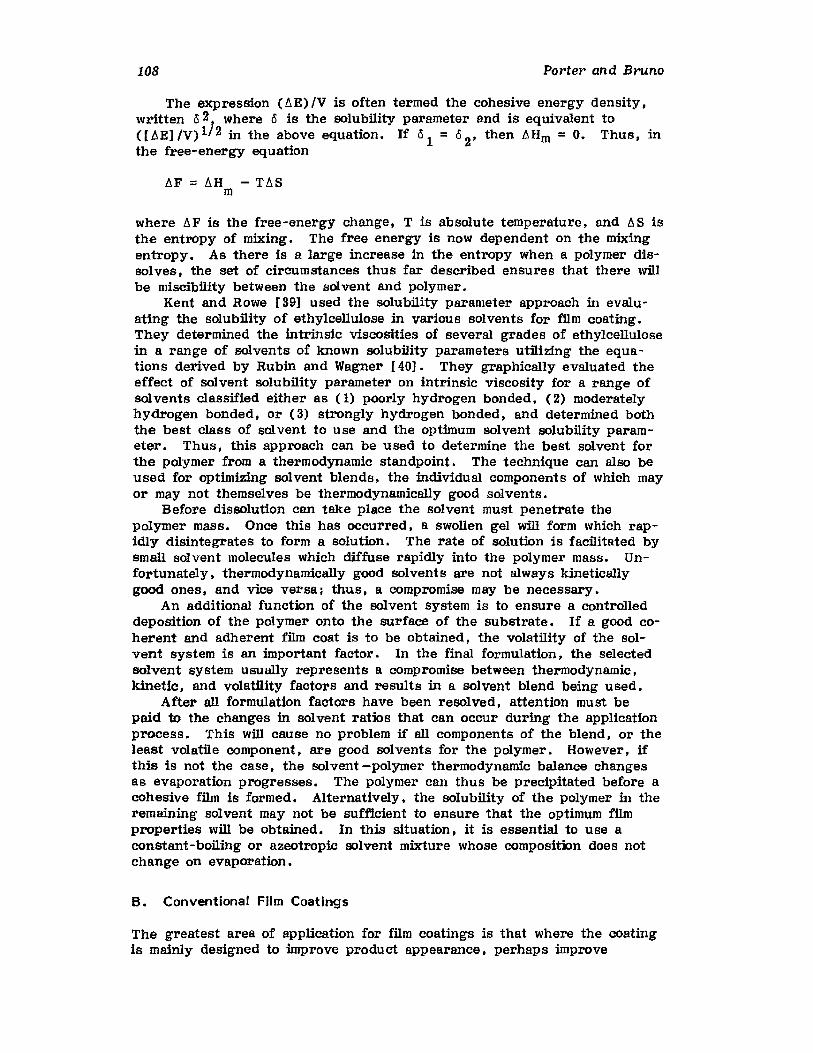
108 Porter and Bruno
The expression (~E) IV is often termed the cohesive energy density,written 02} where 0 is the solubility parameter and is equivalent to([flE]/V)1 2 in the above equation. If 0 1 = O2, then flHm = O. Thus, inthe free-energy equation
flF = ~H - T~Sm
where ~F is the free-energy change, T is absolute temperature, and ~S isthe entropy of mixing. The free energy is now dependent on the mixingentropy. As there is a large increase in the entropy when a polymer dissolves, the set of circumstances thus far described ensures that there willbe miscibility between the solvent and polymer.
Kent and Rowe [39} used the solubility parameter approach in evaluating the solubility of ethylcellulose in various solvents for film coating.They determined the intrinsic viscosities of several grades of ethylcellulosein a range of solvents of known solubility parameters utilizing the equations derived by Rubin and Wagner [40}. They graphically evaluated theeffect of solvent solubility parameter on intrinsic viscosity for a range ofsol vents classified either as (1) poorly hydrogen bonded. (2) moderatelyhydrogen bonded, or (3) strongly hydrogen bonded, and determined boththe best class of solvent to use and the optimum solvent solubility parameter. ThUS, this approach can be used to determine the best solvent forthe polymer from a thermodynamic standpoint. The technique can also beused for optimizing solvent blends, the individual components of which mayor may not themselves be thermodynamically good solvents.
Before dtssolution can take place the solvent must penetrate thepolymer mass. Once this has occurred, a swollen gel will form which rapidly disintegrates to form a solution. The rate of solution is facilitated bysmall solvent molecules which diffuse rapidly into the polymer mass. Unfortunately. thermodynamically good solvents are not always kineticallygood. ones. and vice versa; thus, a compromise may be necessary.
An additional function of the solvent system is to ensure a controlleddeposition of the polymer onto the surface of the substrate. If a good coherent and adherent film coat is to be obtained, the volatility of the solvent system is an important factor. In the final formulation, the selectedsolvent system usually represents a compromise between thermodynamic,kinetic, and volatility factors and results in a solvent blend being used.
After all formulation factors have been resolved, attention must bepaid to the changes in solvent ratios that can occur during the applicationprocess. This will cause no problem if all components of the blend, or theleast volatile component, are good solvents for the polymer. However, ifthis is not the case, the solvent -polymer thermodynamic balance changesas evaporation progresses. The polymer can thus be precipitated before acohesive film is formed. Alternatively, the solubility of the polymer in theremaining solvent may not be sufficient to ensure that the optimum filmproperties will be obtained. In this situation, it is essential to use aconstant-boiling or azeotropic solvent mixture whose composition does notchange on evaporation.
B. Conventional Film Coatings
The greatest area of application for film coatings is that where the coatingis mainly designed to improve product appearance, perhaps improve

Coating of Pharmaceutical Solid-Dosage Forms 109
stability and ease of ingestion of the dosage form, but not alter drugrelease characteristics from that dosage form.
From this description, it is apparent that esthetics are of paramountimportance, and consequently are likely to influence selection of the rawmaterials to be used in the formulation. This selection is often based onfactors that affect the mechanical properties (such as tensile strength,elasticity, and adhesion) of the coating, allow the smoothest, glossiestcoatings to be obtained, and produce coatings that readily dissolve in thehuman gastrointestinal tract.
Conventional film coating is also the area where aqueous technologyhas gained the highest acceptance. Thus, with few exceptions, most ingredients are selected for their solubility in water (this is especially truefor polymers).
Polymers
Common polymers used in conventional film coating are listed in Table 11.The most popular class of polymers used in conventional film coating
are cellulosics, many of which have good organic-solvent and aqueoussolubility, thus facilitating the transition to aqueous film coating. Ofthese cellulosics, ethylcellulose is not water soluble, and was originallyused as a film modifier in admixtures with hydroxypropyl methylcellulose(HPMC) in organic-solvent-based formulations. To a limited extent, thisblending process has continued in aqueous film coating. In this case,aqueous solutions of HPMC are mixed with aqueous dispersions of ethyIcellulose. However, except when one needs to produce special barrier
Table 11 Polymers Used in Conventional Film-CoatingFormulations
Class
1. Cellulosics
2. Vinyls
3. Glycols
4. Acrylics
Examples
Hydroxypropyl methylcellulose
Hydroxypropylcellulose
Hydroxyethylcellulose
Methylhydroxyethylcellulose
Methylcellulose
Ethylcellulose
Sodium carboxymethylcellulose
Polyvinyl pyrrolidone
Polyethylene glycols
Dimethylaminoethyl methacrylatemethylacrylate acid ester copolymer
Ethylacrylate-methylmethacrylatecopolymer
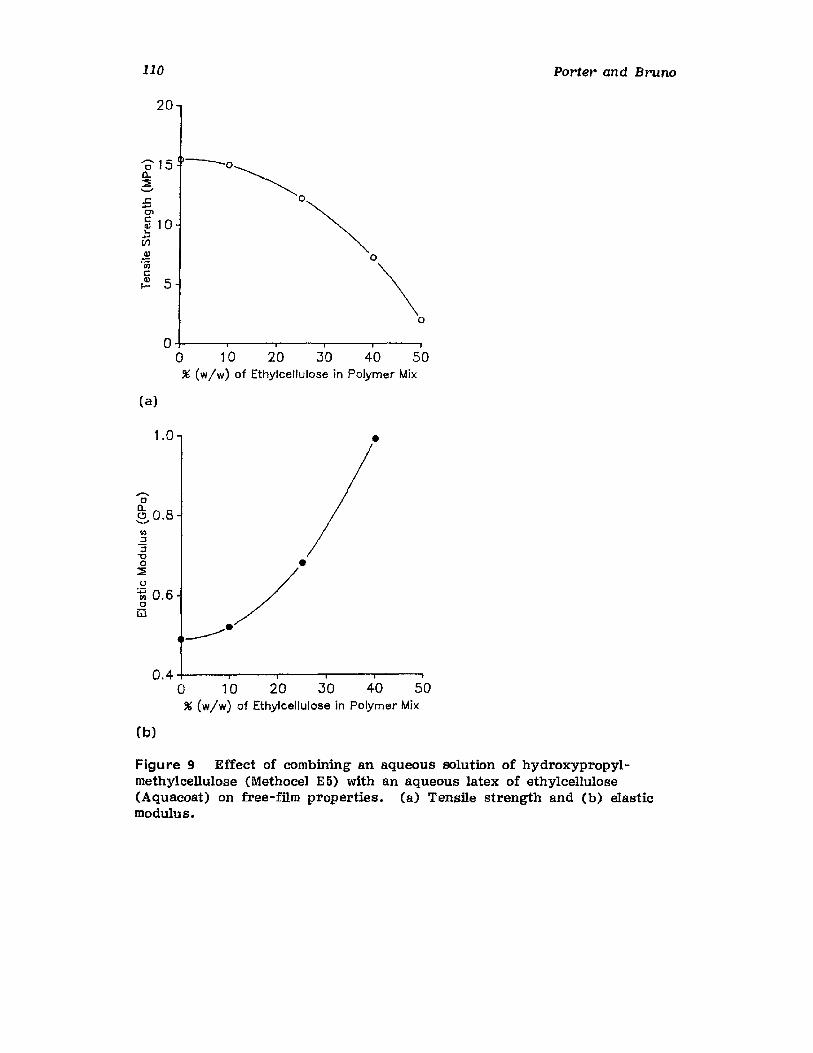
110
20
Porter and Bruno
O+-----.---,---,.----r----,o 10 20 30 40 50
% (w/w) of EthylcelluJose in Polymer Mix
(a)
1.0
,,-..oa.o 0.8........<I):J
"'5"0o
::!;oii 0.6ow
•
..-----
•
0.4 +----.---r---,----,..----,o 10 20 30 40 50
% (w/w) of Ethylcellulose in Polymer Mix
(b)
Figure 9 Effect of combining an aqueous solution of hydroxypropylmethylcellulose (Methocel E5) with an aqueous latex of ethylcellulose(Aquaeoat) on free-film properties. (a) Tensile strength and (b) elasticmodulus.
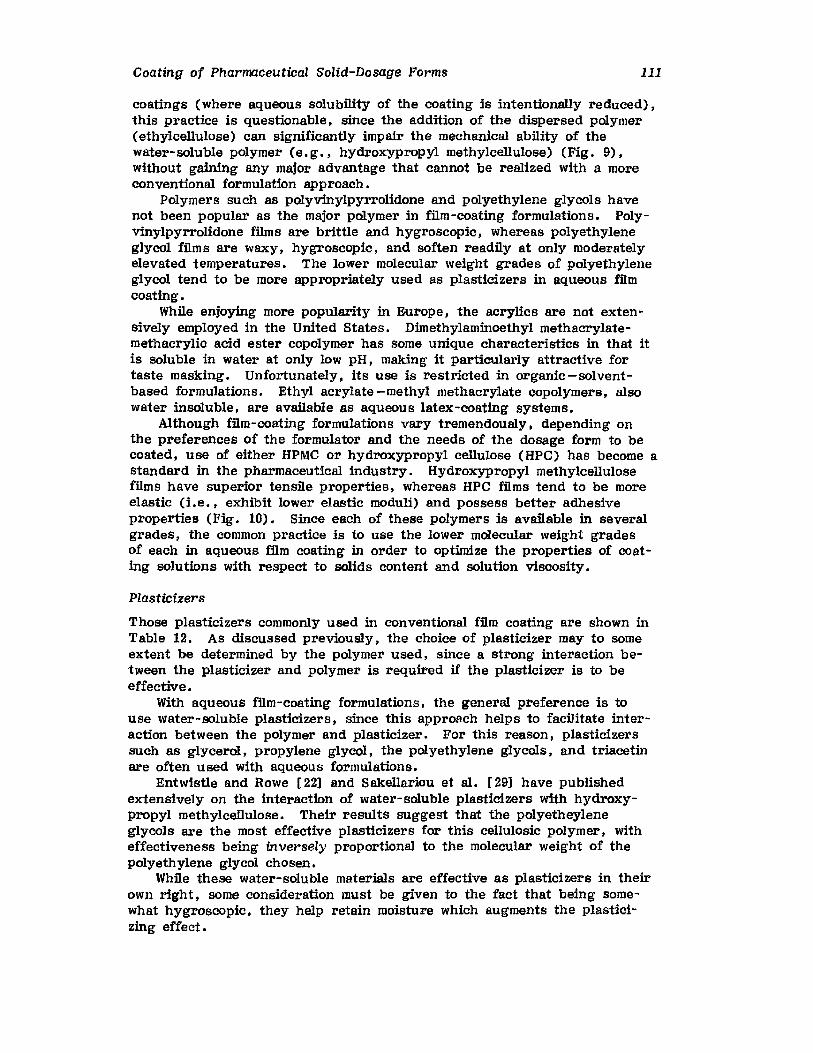
Coating of Pharmaceutical Solid-Dosage Forms 111
coatings (where aqueous solubility of the coating is intentionslly reduced),this practice is questionable, since the addition of the dispersed polymer(ethylcellulose) can significantly impair the mechanical ability of thewater-soluble polymer (e.g., hydroxypropyl methylcellulose) (Fig. 9),without gaining any major advantage that cannot be realized with a moreconventional formulation approach.
Polymers such as polyvinylpyrrolidone and polyethylene glycols havenot been popular as the major polymer in film-coating formulations. Polyvinylpyrrolidone films are brittle and hygroscopic, whereas polyethyleneglycol films are waxy, hygroscopic, and soften readily at only moderatelyeleva.ted temperatures. The lower molecular weight grades of polyethyleneglycol tend to be more appropriately used as plasticizers in aqueous filmcoating.
While enjoying more popularity in Europe, the acrylics are not exten M
sively employed in the United States. Dimethylaminoethyl methacrylatemethacrylio acid ester copolymer has some unique characteristics in that itis soluble in water at only low pH, making it particularly attractive fortaste masking. Unfortunately, its use is restricted in organic - solventbased formulations. Ethyl acrylate-methyl methacrylate copolymers, alsowater insoluble, are available as aqueous latex-coating systems.
Although film-coating formulations vary tremendously, depending onthe preferences of the formulator and the needs of the dosage form to becoated, use of either HPMC or hydroxypropyl cellulose (HPC) has become astandard in the pharmaceutical industry. Hydroxypropyl methylcellulosefilms have superior tensile properties, whereas HPC films tend to be moreelastic (i.e., exhibit lower elastic moduli) and possess better adhesiveproperties (Fig. 10). Since each of these polymers is available in severalgrades, the common practice is to use the lower molecular weight gradesof each in aqueous film coating in order to optimize the properties of coating solutions with respect to solids content and solution viscosity.
Plasticizers
Those plasticizers commonly used in conventional film coating are shown inTable 12. As discussed previously, the choice of plasticizer may to someextent be determined by the polymer used, since a strong interaction between the plasticizer and polymer is required if the plasticizer is to beeffective.
With aqueous film-coating formulations, the general preference is touse water-soluble plasticizers, since this approach helps to facilitate interaction between the polymer and plasticizer. For this reason, plasticizerssuch as glycerol, propylene glycol, the polyethylene glycols. and triacetinare often used with aqueous formulations.
Entwistle and Rowe [22] and Sakellariou et al , [29J have publishedextensively on the interaction of water-soluble plasticizers with hydroxypropyl methylcellulose. Their results suggest that the polyetheyleneglycols are the most effective plasticizers for this cellulosic polymer. witheffectiveness being inversely proportional to the molecular weight of thepolyethylene glycol chosen.
While these water-soluble materials are effective as plasticizers in theirown right, some consideration must be given to the fact that being somewhat hygroscopic, they help retain moisture which augments the plasticizing effect.
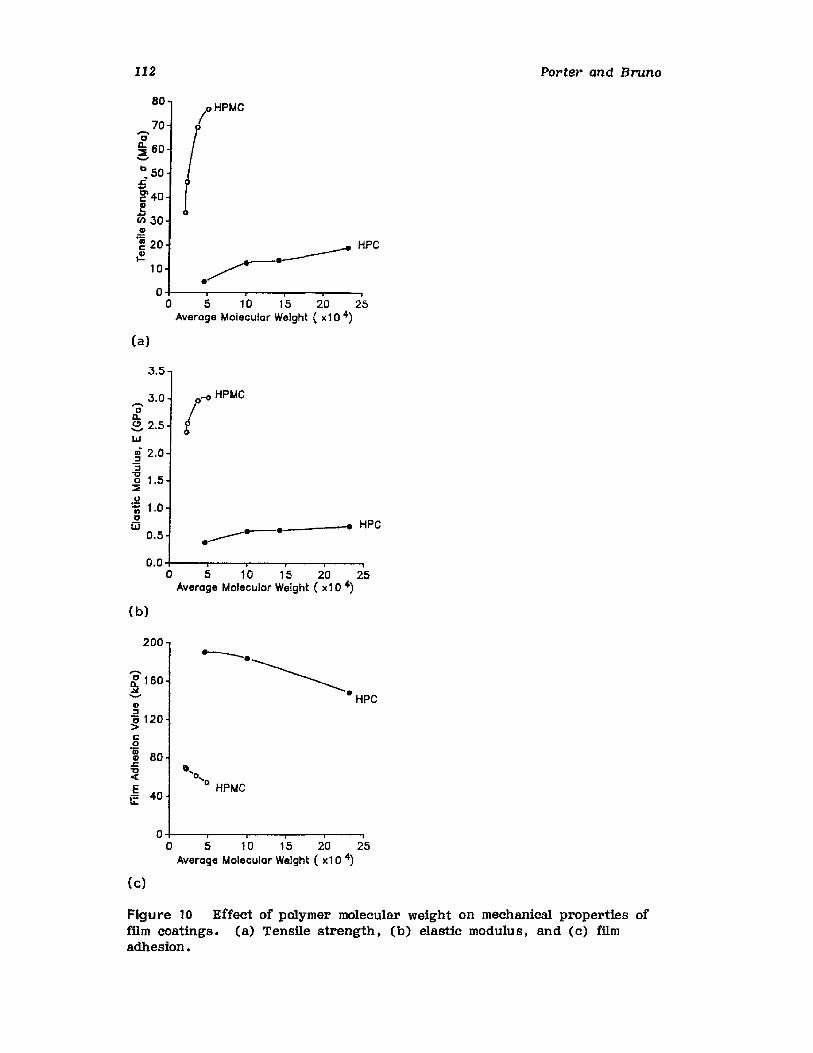
112
80
70......c~60.....b 50£i-g'40~iii .30~
.~ 20
~10
_____ HPC
~.-
Porter and Bruno
0+--.....,..--,..--......---.---,o 5 10 15 20 25
Average Molecular Weight ( x10 4)
(a)
3.5
.3.0......o
ll..e 2.541
~ 2.0'"5-g 1.5::t
~01 1.0o
W0.5
I~HP"C
__--..... HPC...---------•0.0+--~----.--~--.-----.
o 5 10 15 20 25Average Molecular Weight ( x10 4)
(b)
200
0 ..0,
o HPMC
o+--~---r----,r----r--....,o 5 10 15 20 25
Average Molecular Weight ( xl 0 4)
(e)
Figure 10 Effect of polymer molecular weight on mechanical properties offilm coatings. (a) Tensile strength. (b) elastic modulus. and (c) filmadhesion.
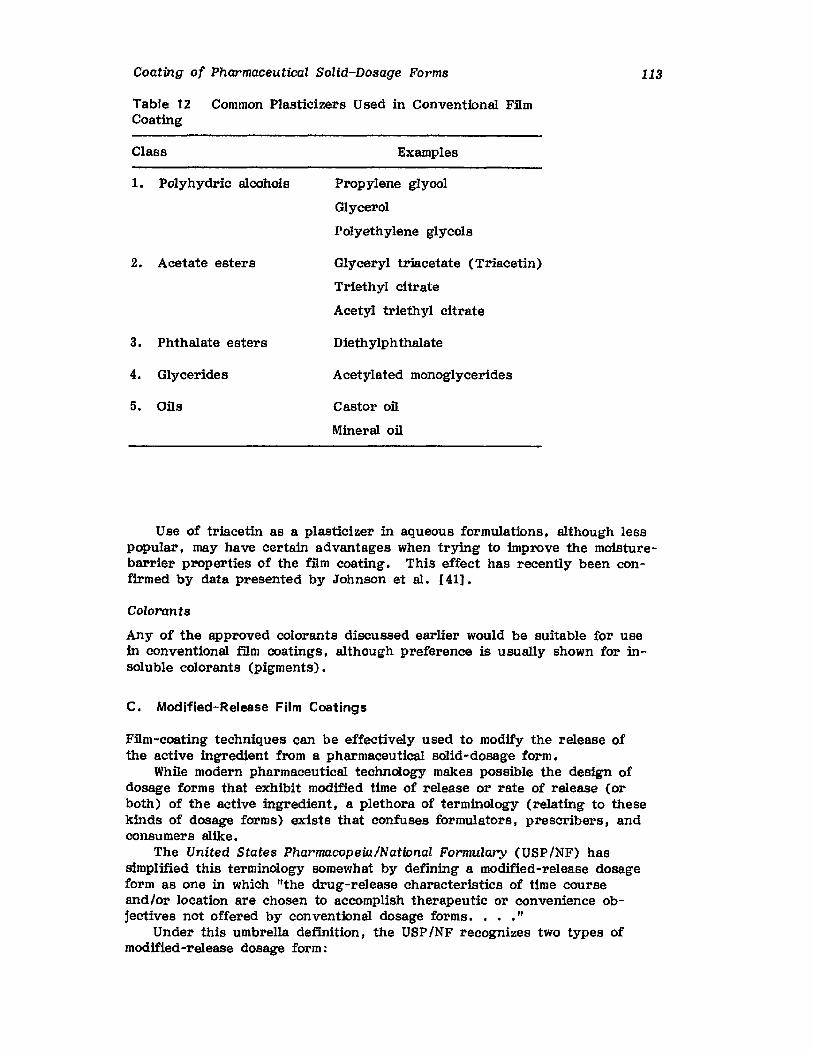
Coating of Pharmaceutical Solid-Dosage Forms
Table 12 Common Plasticizers Used in Conventional FilmCoating
Class Examples
113
1. Polyhydric alcohols
2. Acetate esters
3. Phthalate esters
4. Glycerides
5. Oils
Propylene glycol
Glycerol
Polyethylene glycols
Glyceryl triacetate (Triacetin)
Triethyl citrate
Acetyl triethyl citrate
Diethylphthalate
Acetylated monoglycerides
Castor oil
Mineral oil
Use of triacetin as a plasticizer in aqueous formulations, although lesspopular, may have certain advantages when trying to improve the moisturebarrier properties of the film coating. This effect has recently been confirmed by data presented by Johnson et al , [41].
Colorants
Any of the approved colorants discussed earlier would be suitable for usein conventional film coatings, although preference is usually shown for insoluble colorants (pigments).
C. Modified-Release Film Coatings
Film-coating techniques can be effectively used to modify the release ofthe active ingredient from a pharmaceutical solid-dosage form.
While modern pharmaceutical technology makes possible the design ofdosage forms that exhibit modified time of release or rate of release (orboth) of the active ingredient, a plethora of terminology (relating to thesekinds of dosage forms) exists that confuses formulators, prescribers, andconsumers alike.
The United States Pharmacopeia/National Formulary (USP/NF) hassimplified this terminology somewhat by defining a modified-release dosageform as one in which lithe drug-release characteristics of time courseand/or location are chosen to accomplish therapeutic or convenience objectives not offered by conventional dosage forms. • • ."
Under this umbrella definition, the USP/NF recognizes two types ofmodified-release dosage form:
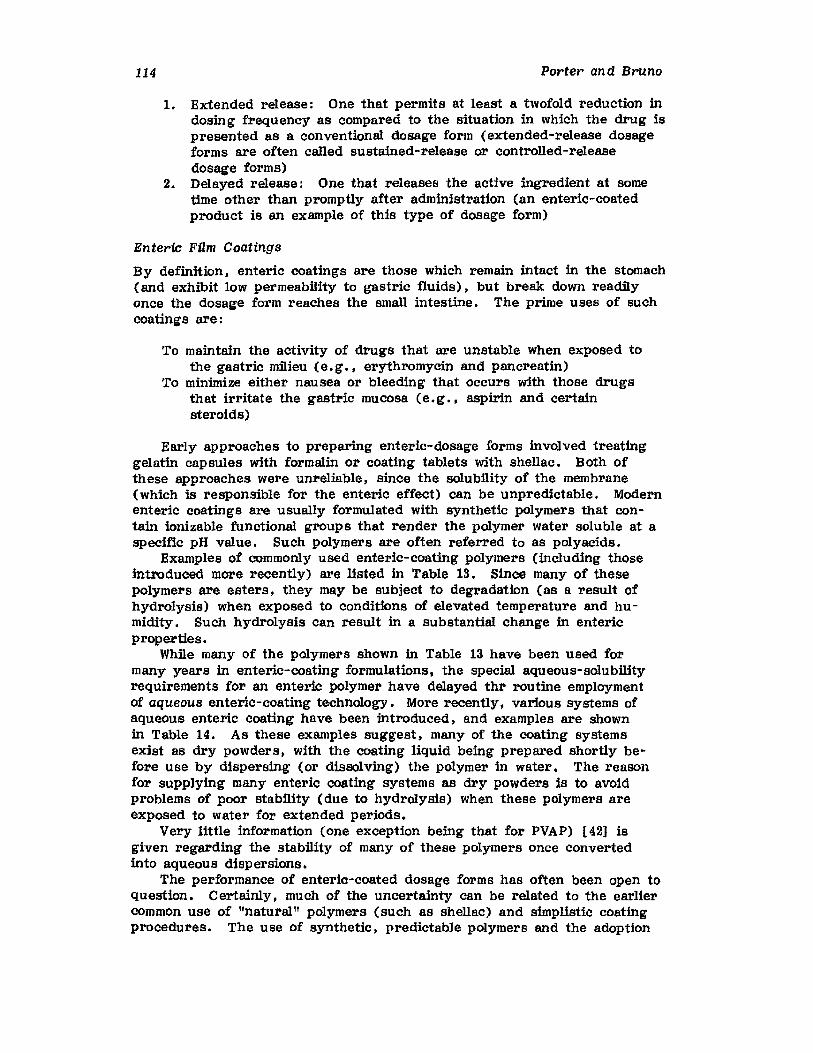
114 Porter and Bruno
1. Extended release: One that permits at least a twofold reduction indosing frequency as compared to the situation in which the drug ispresented as a conventional dosage form (extended-release dosageforms are often called sustained-release or controlled-releasedosage forms)
2. Delayed release: One that releases the active ingredient at sometime other than promptly after administration (an enteric-coatedproduct is an example of this type of dosage form)
Enteric Film Coatings
By definition, enteric coatings are those which remain intact in the stomach(and exhibit low permeabllity to gastric fluids). but break down readilyonce the dosage form reaches the small intestine. The prime uses of suchcoatings are:
To maintain the activity of drugs that are unstable when exposed tothe gastric milieu (e. g., erythromycin and pancreatin)
To minimize either nausea or bleeding that occurs with those drugsthat irritate the gastric mucosa (e.g •• aspirin and certainsteroids)
Early approaches to preparing enteric-dosage forms involved treatinggelatin capsules with formalin or coating tablets with shellac. Both ofthese approaches were unreliable, since the solubility of the membrane(which is responsible for the enteric effect) can be unpredictable. Modernenteric coatings are USUally formulated with synthetic polymers that contain ionizable functional groups that render the polymer water soluble at aspecific pH value. Such polymers are often referred to as polyacids.
Examples of commonly used enteric-coating polymers (including thoseintroduced more recently) are listed in Table 13. Since many of thesepolymers are esters, they may be subject to degradation (as a result ofhydrolysis) when exposed to conditions of elevated temperature and humidity. Such hydrolysis can result in a substantial change in entericproperties.
While many of the polymers shown in Table 13 have been used formany years in enteric-coating formulations, the special aqueous-solubilityrequirements for an enteric polymer have delayed thr routine employmentof aqueous enteric-coating technology. More recently, various systems ofaqueous enteric coating have been introduced, and examples are shownin Table 14. As these examples suggest, many of the coating systemsexist as dry powders, with the coating liquid being prepared shortly before use by dispersing (or dissolving) the polymer in water. The reasonfor supplying many enteric coating systems as dry powders is to avoidproblems of poor stability (due to hydrolysis) when these polymers areexposed to water for extended periods.
Very little information (one exception being that for PVAP) [42] isgiven regarding the stability of many of these polymers once convertedinto aqueous dispersions.
The performance of enteric-coated dosage forms has often been open toquestion. Certainly. much of the uncertainty can be related to the earliercommon use of "natural" polymers (such as shellac) and simplistic coatingprocedures. The use of synthetic, predictable polymers and the adoption
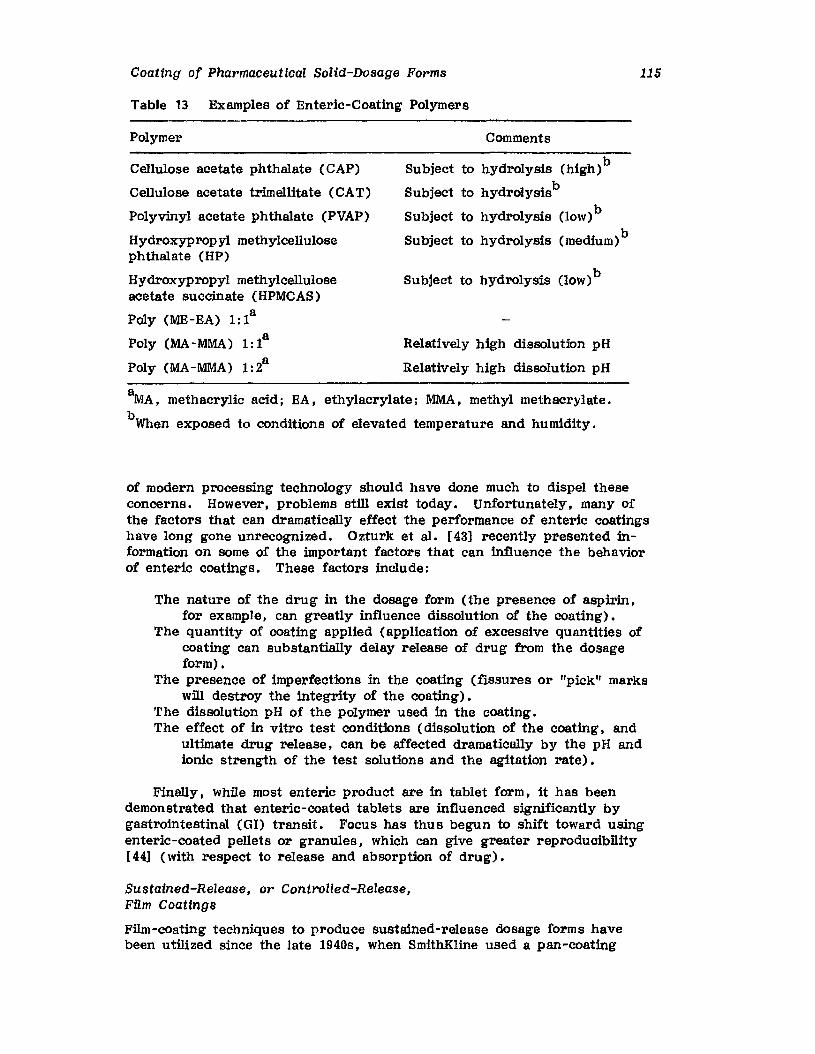
Coating of Pharmaceutical Solid-Dosage Forms
Table 13 Examples of Enteric-Coating Polymers
Polymer Comments
115
Cellulose acetate phthalate (CAP)
Cellulose acetate trimellitate (CA T)
Polyvinyl acetate phthalate (PVAP)
Hydroxypropyl methylcellulosephthalate (HP)
Hydroxypropyl methylcelluloseacetate succinate (HPMCAS)
Poly (ME-EA) 1: la
Poly (MA-MMA) 1:la
Poly (MA-MMA) 1: 2a
Subject to hydrolysis (high)b
Subject to hydrolysisb
Subject to hydrolysis (low) b
SUbject to hydrolysis (medium)b
Subject to hydrolysis (low) b
Relatively high dissolution pH
Relatively high dissolution pH
~A, methacrylic acid; EA, ethylacrylate; MMA, methyl methacrylate.
bWhen exposed to conditions of elevated temperature and humidity.
of modern processing technology should have done much to dispel theseconcerns. However, problems still exist today. Unfortunately, many ofthe factors that can dramatically effect the performance of enteric coatingshave long gone unrecognized. Ozturk et al , [43] recently presented information on some of the important factors that can influence the behaviorof enteric coatings. These factors include:
The nature of the drug in the dosage form (the presence of aspirin,for example, can greatly influence dissolution of the coating).
The quantity of coating applied (application of excessive quantities ofcoating can substantially delay release of drug from the dosageform) •
The presence of imperfections in the coating (fissures or "pick" markswill destroy the integrity of the coating).
The dissolution pH of the polymer used in the coating.The effect of in vitro test conditions (dissolution of the coating, and
ultimate drug release, can be affected dramatically by the pH andionic strength of the test solutions and the agitation rate).
Finally, While most enteric product are in tablet form, it has beendemonstrated that enteric-coated tablets are influenced significantly bygastrointestinal (GI) transit. Focus has thus begun to shift toward usingenteric-coated pellets or granules. which can give greater reproducibility(44] (with respect to release and absorption of drug).
Sustained-Release, or Controlled-Release,Film Coatings
Film-coating techniques to produce sustained-release dosage forms havebeen utilized since the late 1940s, when SmithKline used a pan-coating
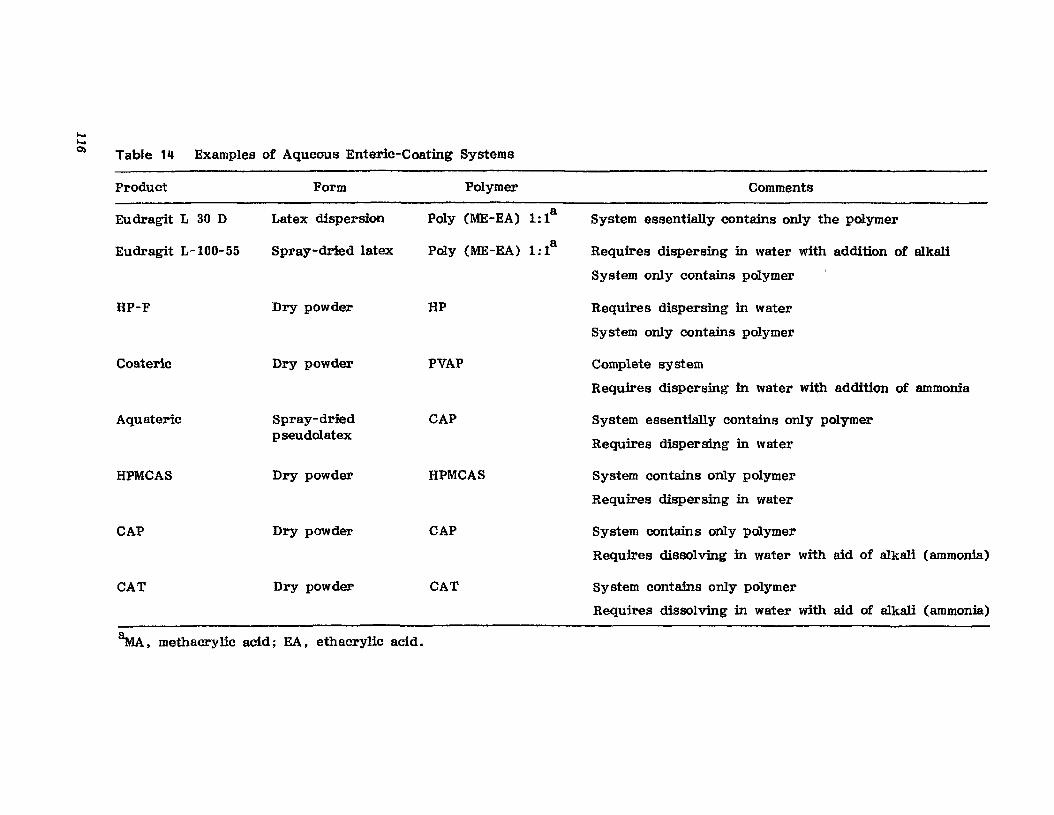
........0) Table 111 Examples of Aqueous Enteric-Coating Systems
Product
Eu dragit L 30 D
Eudragit L-100- 55
HP-F
Coatezic
Aquateric
HPMCAS
CAP
CAT
Form
Latex dispersion
Spray-dried latex
Dry powder
Dry powder
Spray-driedpseudolatex
Dry powder
Dry powder
Dry powder
Polymer
Poly (ME-EA) 1: la
Poly (ME-EA) 1: 1a
HP
PVAP
CAP
HPMCAS
CAP
CAT
Comments
System essentially contains only the polymer
Requires dispersing in water with addition of alkali
System only contains polymer
Requires dispersing in water
System only contains polymer
Complete system
Requires dispersing in water with addition of ammonia
System essentially contains only polymer
Requires dispersing in water
System contains only polymer
Requires dispersing in water
System contains only polymer
Requires dissolving in water with aid of alkali (ammonia)
System contains only polymer
Requires dissolving in water with aid of alkali (ammonia)
~. methacrylic acid; EA, ethacrylic acid.
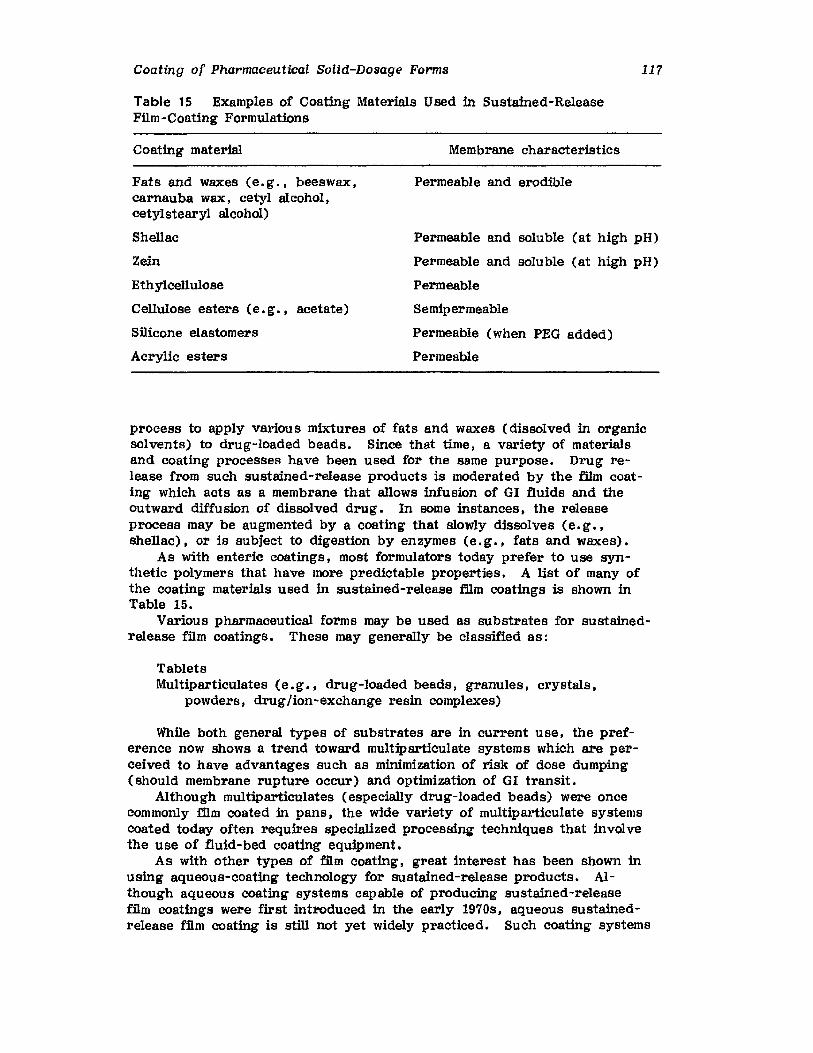
Coating of Pharmaceutical Solid-Dosage Forms
Table 15 Examples of Coating Materials Used in Sustained-ReleaseFilm-Coating Formulations
117
Coating material
Fats and waxes (e. g., beeswax,carnauba wax, cetyl alcohol,cetylstearyl alcohol)
Shellac
Zein
Ethylcellulose
Cellulose esters (e. g., acetate)
Silicone elastomers
Acrylic esters
Membrane characteristics
Permeable and erodible
Permeable and soluble (at high pH)
Permeable and soluble (at high pH)
Permeable
Semipermeable
Permeable (when PEG added)
Permeable
process to apply various mixtures of fats and waxes (dissolved in organicsolvents) to drug-loaded beads. Since that time, a variety of materialsand coating processes have been used for the same purpose. Drug release from such sustained-release products is moderated by the film coating Which acts as a membrane that allows infusion of GI fluids and theoutward diffusion of dissolved drug. In some instances, the releaseprocess may be augmented by a coating that slowly dissolves (e.g ••shellac), or is subject to digestion by enzymes (e.g., fats and waxes).
As with enteric coatings, most formulators today prefer to use synthetic polymers that have more predictable properties. A list of many ofthe coating materials used in sustained-release film coatings is shown inTable 15.
Various pharmaceutical forms may be used as substrates for sustainedrelease film coatings. These may generally be classified as:
TabletsMultiparticuIates (e.g., drug-loaded beads, granules, crystals,
powders, drug/ion-exchange resin complexes)
While both general types of substrates are in current use, the preference now shows a trend toward multiparticulate systems which are perceived to have advantages such as minimization of risk of dose dumping(should membrane rupture occur) and optimization of GI transit.
Although multiparticulates (especially drug-loaded beads) were oncecommonly film coated in pans, the wide variety of multiparticulate systemscoated today often requires specialized processing techniques that involvethe use of fluid-bed coating equipment.
As with other types of film coating. great interest has been shown inusing aqueous-coating technology for sustained-release products. Although aqueous coating systems capable of producing sustained-releasefilm coatings were first introduced in the early 1970s, aqueous sustainedrelease film coating is still not yet widely practiced. Such coating systems
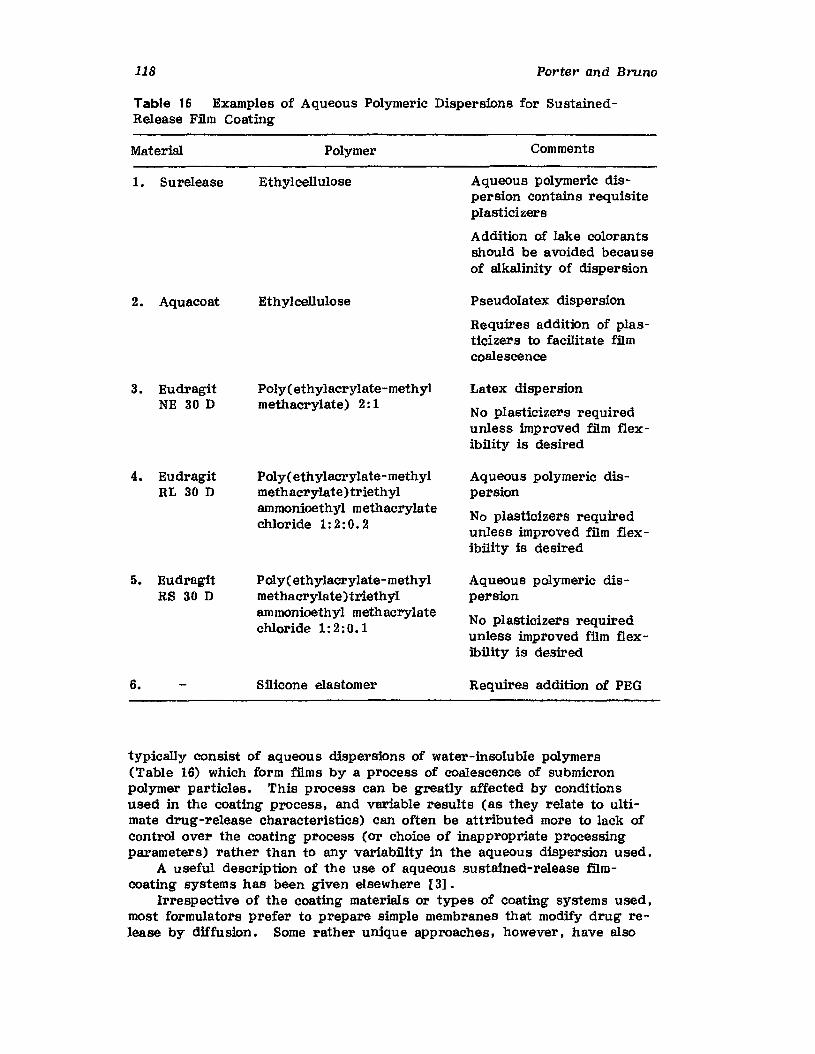
118 Porter and Bruno
Table 16 Examples of Aqueous Polymeric Dispersions for SustainedRelease Film Coating
Material
1. Surelease
2. Aquaeoat
3. EudragitNE 30 D
4. EudragitRL 30 D
5. EUdragitRS 30 D
6.
Polymer
Ethylcellulose
Ethylcellulose
Poly(ethylacrylate-methylmethacrylate) 2: 1
Poly(ethylacrylate-methylmethacrylate)triethylammonioethyl methacrylatechloride 1: 2: 0.2
Poly(ethylacrylate-methylmethaeryIate)triethylammonioethyl methacrylatechloride 1: 2: o. 1
Silicone elastomer
Comments
Aqueous polymeric dispersion contains requisiteplasticizers
Addition of lake colorantsshould be avoided becauseof alkalinity of dispersion
Pseudolatex dispersion
Requires addition of plasticizers to facilitate filmcoalescence
Latex dispersion
No plasticizers requiredunless improved film flexibility is desired
Aqueous polymeric dispersion
No plasticizers requiredunless improved film flexibility is desired
Aqueous polymeric dispersion
No plasticizers requiredunless improved film flexibility is desired
Requires addition of PEG
typically consist of aqueous dispersions of water-insoluble polymers(Table 16) which form films by a process of coalescence of submicronpolymer particles. This process can be greatly affected by conditionsused in the coating process. and variable results (as they relate to ultimate drug-release characteristics) can often be attributed more to lack ofcontrol over the coating process (or choice of inappropriate processingparameters) rather than to any variability in the aqueous dispersion used.
A useful description of the use of aqueous sustained-release filmcoating systems has been given elsewhere [3J.
Irrespective of the coating materials or types of coating systems used.most formulators prefer to prepare simple membranes that modify drug release by diffusion. Some rather unique approaches, however. have also

Coating of Pharmaceutical Solid-Dosage Forms
Table 17 Factors Influencing Drug Release from a Sustained-ReleaseFilm-Coated Dosage Form
119
Parameter
1. Surface area
2. Diffusion coefficient
3. Drug-concentrationgradient acrossmembrane
4. Membrane thickness
Influenced by
Size, size distribution, and surface topography of material being coated
Formulation of film coating
Structure of coating
Nature of drug
Initial drug loading
Drug content inside the membrane at anyintermediate time
Agitation rate (which influences drug concentration on outside of membrane)
Size. size distribution, and surface topography of material being coated
Quantity of coating material applied (related to theoretical quantity of coating tobe applied, and coating efficiency)
been used that result in the creation of incomplete film coatings. Onesuch approach is exemplified by the simple osmotic pump in which a delivery orifice is formed in the otherwise intact film coating by means oflaser drilling [45]. Alternatively, a microporous membrane may be formedby the inclusion within the film structure of various water-soluble, powderedingredients that may subsequently be leached out so as to enhance drugrelease. This approach has been described by, among others, Lindholmand Juslin [46].
Sustained-release dosage forms from which drug release is moderatedby an applied film coating are often called reservoir systems. Drug release from such systems can often be described by application of Fick'sfirst law of diffusion [47].
The rate of drug release through the membrane is directly proportionalto surface area. diffusion coefficient, drug solubility in and drug concentration gradient across the membrane, and inversely proportional to membrane thickness. Factors which have an impact on these parameters arelisted in Table 17.
With respect to drug-release characteristics, variable results may ensuethrough inability to effectively control many of these influencing factors.For example:
Variations (from batch-to-batch) in size and shape of the core material(to be coated) would certainly cause variations in surface area andcoating thickness.
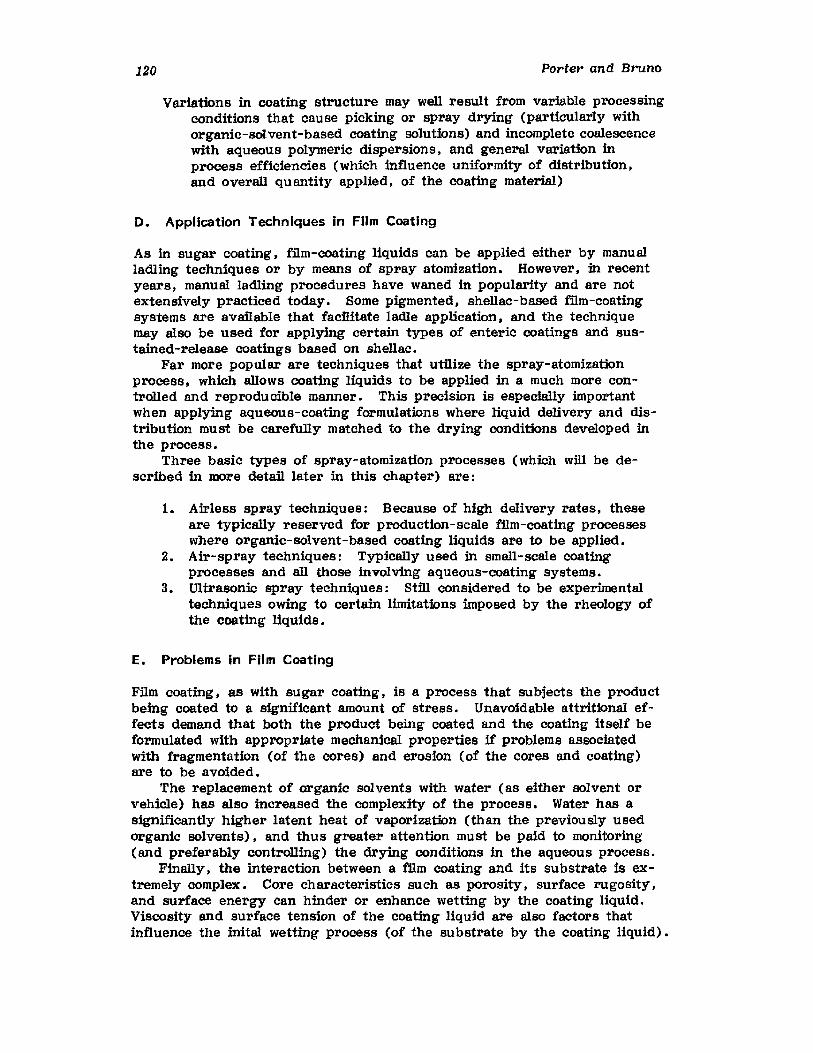
120 Porter and Bruno
Variations in coating structure may well result from variable processingconditions that cause picking or spray drying (particularly withorganic-solvent-based coating solutions) and incomplete coalescencewith aqueous polymeric dispersions. and general variation inprocess efficiencies (which influence uniformity of distribution.and overall quantity applied, of the coating material)
D. Application Techniques in Film Coating
As in sugar coating. film-coating liquids can be applied either by manualladling techniques or by means of spray atomization. However, in recentyears. manual ladling procedures have waned in popularity and are notextensively practiced today. Some pigmented, shellac-based film-coatingsystems are available that facilitate ladle application, and the techniquemay also be used for applying certain types of enteric coatings and sustained-release coatings based on shellac.
Far more popular are techniques that utilize the spray-atomizationprocess, which allows coating liquids to be applied in a much more controlled and reproducible manner. This precision is especially importantwhen applying aqueous-coating formulations where liquid delivery and distribution must be carefully matched to the drying conditions developed inthe process.
Three basic types of spray-atomization processes (which will be described in more detail later in this chapter) are:
1. Airless spray techniques: Because of high delivery rates, theseare typically reserved for production-scale film-coating processeswhere organic-solvent-based coating liquids are to be applied.
2. Air-spray techniques: Typically used in small-scale coatingprocesses and all those involving aqueous-coating systems.
3. Ultrasonic spray techniques: Still considered to be experimentaltechniques owing to certain limitations imposed by the rheology ofthe coating liquids.
E. Problems in Film Coating
Film coating. as with sugar coating. is a process that subjects the productbeing coated to a significant amount of stress. Unavoidable attritional effects demand that both the product being coated and the coating itself beformulated with appropriate mechanical properties if problems associatedwith fragmentation (of the cores) and erosion (of the cores and coating)are to be avoided.
The replacement of organic solvents with water (as either solvent orvehicle) has also increased the complexity of the process. Water has asignificantly higher latent heat of vaporization (than the previously usedorganic solvents). and thus greater attention must be paid to monitoring(and preferably controlling) the drying conditions in the aqueous process.
Finally. the interaction between a film coating and its substrate is extremely complex. Core characteristics such as porosity. surface rugosity,and surface energy can hinder or enhance wetting by the coating liquid.Viscosity and surface tension of the coating liquid are also factors thatinfluence the inital wetting process (of the substrate by the coating liquid).
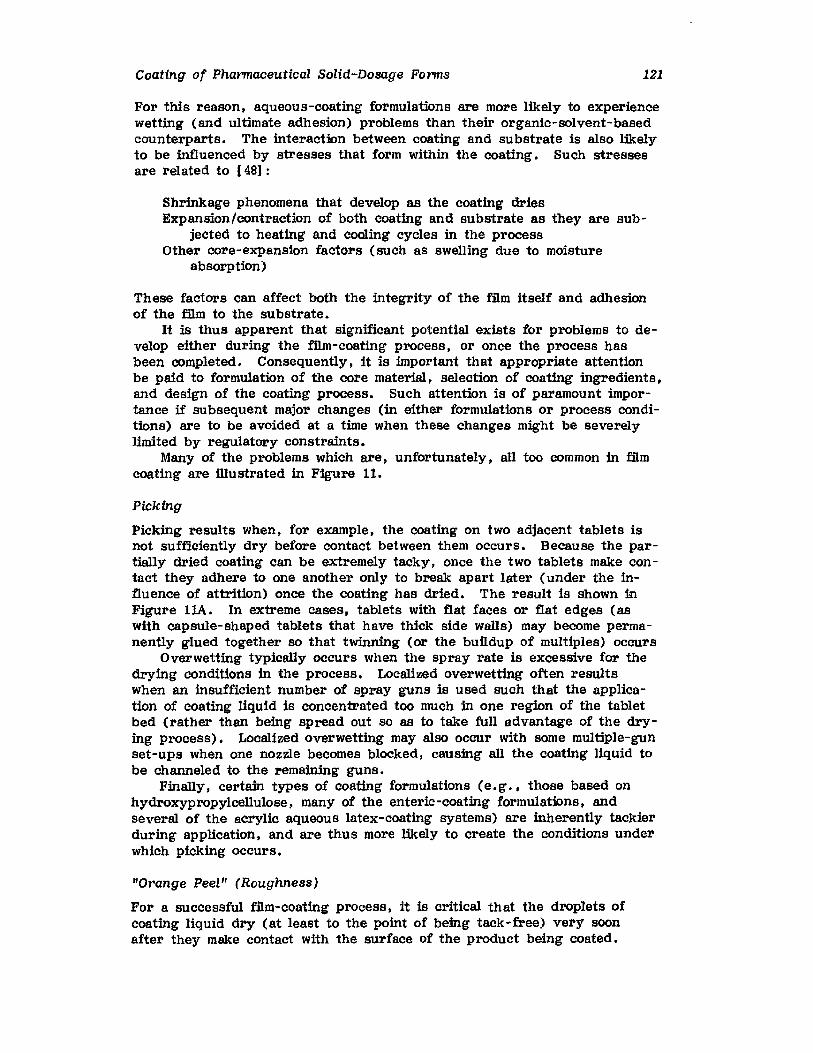
Coating of Pharmaceutical Solid-Dosage Forms 121
For this reason, aqueous-coating formulations are more likely to experiencewetting (and ultimate adhesion) problems than their organic-solvent-basedcounterparts. The interaction between coating and substrate is also likelyto be influenced by stresses that form within the coating. Such stressesare related to [48] =
Shrinkage phenomena that develop as the coating driesExpansion/contraction of both coating and substrate as they are sub
jected to heating and cooling cycles in the processOther core-expansion factors (such as sWelling due to moisture
absorption)
These factors can affect both the integrity of the film itself and adhesionof the film to the substrate.
It is thus apparent that significant potential exists for problems to develop either during the film-coating process, or once the process hasbeen completed. Consequently J it is important that appropriate attentionbe paid to formulation of the core material, selection of coating ingredients,and design of the coating process. Such attention is of paramount importance if subsequent major changes (in either formulations or process conditions) are to be avoided at a time when these changes might be severelylimited by regulatory constraints.
Many of the problems which are, unfortunately J all too common in filmcoating are illustrated in Figure 11.
Picking
Picking results when, for example, the coating on two adjacent tablets isnot sufficiently dry before contact between them occurs. Because the partially dried coating can be extremely tacky, once the two tablets make contact they adhere to one another only to break apart later (under the influence of attrition) once the coating has dried. The result is shown inFigure llA. In extreme cases, tablets with flat faces or flat edges (aswith capsule-shaped tablets that have thick side walls) may become permanently glued together so that twinning (or the buildup of multiples) occurs
Overwetting typically occurs when the spray rate is excessive for thedrying conditions in the process. Localized overwetting often resultswhen an insufficient number of spray guns is used such that the application of coating liquid is concentrated too much in one region of the tabletbed (rather than being spread out so as to take full advantage of the drying process). Localized overwetting may also occur with some multiple-gunset-ups when one nozzle becomes blocked, causing all the coating liquid tobe channeled to the remaining guns.
Finally, certain types of coating formulations (e. g ., those based onhydroxypropylcellulose, many of the enteric-coating formulations, andseveral of the acrylic aqueous latex-coating systems) are inherently tackierduring application, and are thus more likely to create the conditions underwhich picking occurs.
"Orange Peel" (Roughness)
For a successful film-coating process, it is errtical that the droplets ofcoating liquid dry (at least to the point of being tack-free) very soonafter they make contact with the surface of the product being coated.
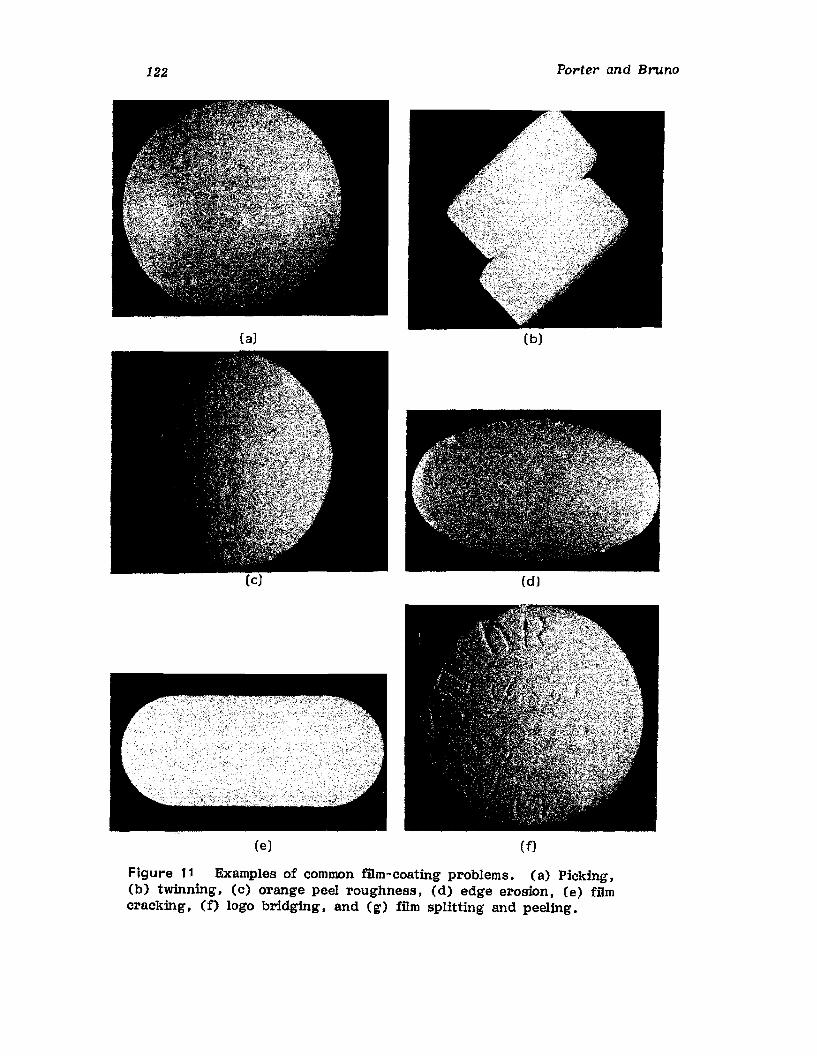
122
(a)
(e)
Porter and Bruno
(b)
(d)
(fl
Figure 11 Examples of common film-coating problems. (a) Picking,(b) twinning. (c) orange peel roughness, (d) edge erosion, (e) filmcracking, (f) logo bridging, and (g) film splitting and peeling.
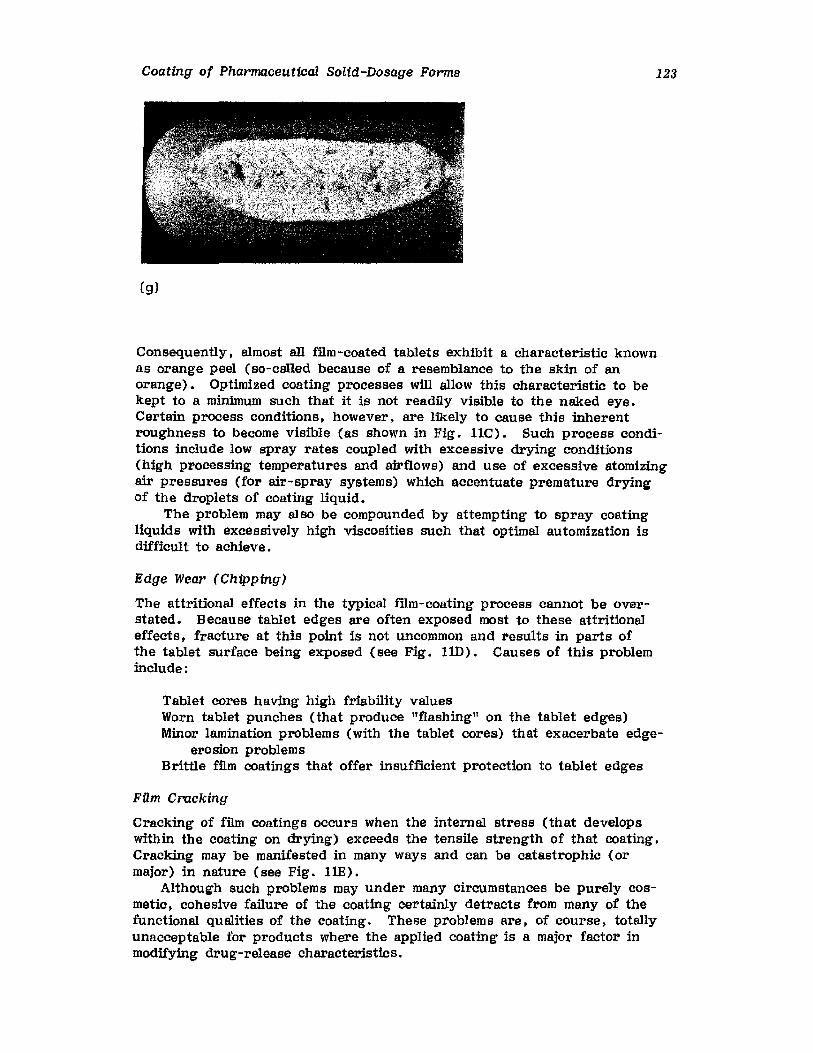
Coating of Pharmaceutical Solid-Dosage Forms
(9)
123
Consequently, almost all film-coated tablets exhibit a characteristic knownas orange peel (so-cslled because of a resemblance to the skin of anorange) • Optimized coating processes will allow this characteristic to bekept to a minimum such that it is not readily visible to the naked eye.Certain process conditions, however. are likely to cause this inherentroughness to become visible (as shown in Fig. lIC). Such process conditions include low spray rates coupled with excessive drying conditions(high processing temperatures and aJrflows) and use of excessive atomizingair pressures (for air-spray systems) which accentuate premature dryingof the droplets of coating liquid.
The problem may also be compounded by attempting to spray coatingliquids with excessively high viscosities such that optimal automization isdifficult to achieve.
Edge Wear (Chipping)
The attritional effects in the typical film-coating process cannot be overstated. Because tablet edges are often exposed most to these attritionaleffects, fracture at this point is not uncommon and results in parts ofthe tablet surface being exposed (see Fig. lID). Causes of this probleminclude:
Tablet cores having high friability valuesWorn tablet punches (that produce "flashing" on the tablet edges)Minor lamination problems (with the tablet cores) that exacerbate edge-
erosion problemsBrittle film coatings that offer insufficient protection to tablet edges
Film Cracking
Cracking of film coatings occurs when the internal stress (that developswithin the coating on drying) exceeds the tensile strength of that coating.Cracking may be manifested in many ways and can be catastrophic (ormajor) in nature (see Fig. HE).
Although such problems may under many circumstances be purely cosmetic, cohesive failure of the coating certainly detracts from many of thefunctional qualities of the coating. These problems are, of course, totallyunacceptable for products where the applied coating is a major factor inmodifying drug-release Characteristics.
124 Porter and Bruno
While cohesive failure is often associated with brittleness of the coating, the problem is certainly exacerbated by thermal expansion effects.particularly when significant differences exist between the thermal -expansion coefficients for the core and coating, respectively [49, 50] .
Bridging of Logos (IntagliatiDns)
Internal stress is also a major causative factor in logo bridging (see Fig'.llF) • This phenomenon occurs when a component of the internal stressbecomes sufficiently high so as to cause partial or complete detachment ofthe coating (from the substrate) in the region of the logo. As a result ofsuch detachment, the film is able to "shorten." and thus partially relievethe stress within the film, In doing so, legibility of the logo can be significantly reduced. Typically. this type of problem becomes progressivelyworse as more coating is gradually applied during the process.
Solutions to bridging involve improving film adhesion and/or reducingstress within the film, and usually require some reformation of eitherthe tablet core or the coating. In addition, appropriate design of tabletpunches (especially with respect to the logo) may help to alleviate theproblem, Whereas adjustment of process conditions may also prove beneficial [51,52].
Film Peeling
On occasion (particularly during application of aqueous-coating formulations). if cohesive failure (cracking) of the coating occurs, that coatingmay subsequently peel back f1'Om the surface of the substrate (see Fig.llG). While both cohesive and adhesive failure are implicated here (bothphenomena being linked to internal stress). appropriate solutions typicallyinvolve addressing the initial cracking problem by increasing the mechanicalstrength of the coating.
In -Filling of Logos
While visually similar to bridging. in -filling of logos typically occurs [53]during the spray application of aerated aqueous film-coating solutions.When a foamy coating solution impinges on a regular part of the tabletsurface it will, under the shear forces generated, form a film with "normal"characteristics. However, those droplets of coating liquid that reside inthe logo, being protected from the shear forces at the surface, graduallydry to form a solid foam that eventually obliterates the legend.
While some degree of aeration is not uncommon with many aqueouscoating solutions, when the viscosity of these solutions is too high, dissipation of the foam (on standing) does not occur. Thus, the coatingliquid that is sprayed on during the coating process will still be extremelyaerated.
Recovery of Film-Coated Tablets
Unlike with sugar-coated tablets, film-coated tablets cannot be readily recovered (should a batch be rejected) by simply washing off the coating.
Recovery of film-coated tablets thus typically involves milling of thetablets to produce "granules" that can be introduced (at a predeterminedlevel) into other batches of compression mix (of the same product). Depending on the fracture characteristics of the tablets. and to some extent
Coating of Pharmaceutical Solid-Dosage Forms 125
the adhesion of the coating to the tablet surface, the milling process maycause the coating to flake off so that it can be removed from the tabletcore material by sieving.
Usually. however, a portion of the coating will remain in the compression mix. Thus, any rework procedure must be suitably validated so asto ensure that recompressed tablets perform within the specifications ofthe original product.
A recent publication [54] discussed the use of the Crackulator for recovery of film-coated tablets. Using such equipment. a better separationof tablet and coating fragments was achieved.
IV. COATING EQUIPMENT
An extensive array of equipment is used in modern pharmaceutical coatingoperations. and includes:
Coating pansFluid -bed coating columnsAir-handling equipment (including heat exchangers)Coating liquid holding tanks (including mixers)Metering/delivery equipment (e.g •• pumps)Liquid application systems (e. g.. spray guns)Control systemsMonitoring systemsEffluent treatment systems (e.g •• dust collectors. solvent recovery
equipment)
This discussion will focus. for the main part. on coating pans, fluidbed coating columns. spray equipment. and metering systems.
A. Coating Pans
Coating pans form the basis of any coating process except those that relyon fluid-bed processing equipment. The pan serves as a container for thebatch of product being coated, and provides the means for keeping theproduct (to be coated) in continual motion throughout the process. thusfacilitating the uniform distribution of coating fluids.
Over the last 30 years, design of coating pans has undergone somemajor changes as coating technology has advanced and demands for compliance with GMPs have increased.
Conventional Coating Pans
Originally. pharmaceutical coating pans evolved from designs used for confectionery pan coating. The term conventional coating pan was used todescribe spherical, hexagonal. or pear-shaped pans. an example of whichis shown in Figure 12.
The simplicity in design made use of such equipment very popular.Drying of the product being coated was typically accomplished by ductingheated air into the opening. An adjacent duct allowed moisture- orsolvent-laden air to be exhausted from the pan. Later designs in airhandling equipment involved Ilfishtailinglf of the inlet air duct (to better
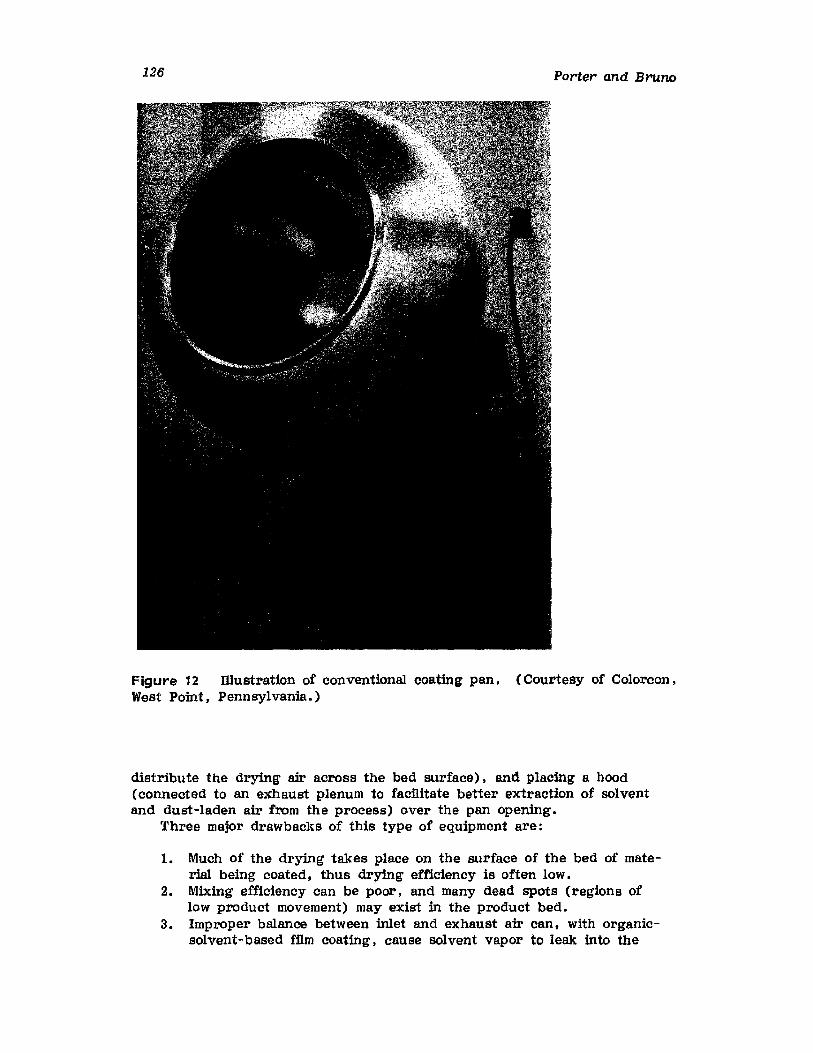
126 Porter and Bruno
Figure 12 Dlustration of conventional coating pan. (Courtesy of Colorcon,West Point, Pennsylvania.)
distribute the drying air across the bed surface), and placing a hood(connected to an exhaust plenum to facilitate better extraction of solventand dust-laden air from the process) over the pan opening.
Three major drawbacks of this type of equipment are:
1. Much of the drying takes place on the surface of the bed of material being coated, thus drying efficiency is often low.
2. Mixing efficiency can be poor, and many dead spots (regions oflow product movement) may exist in the product bed.
3. Improper balance between inlet and exhaust air can, with organicsolvent-based film coating, cause solvent vapor to leak into the
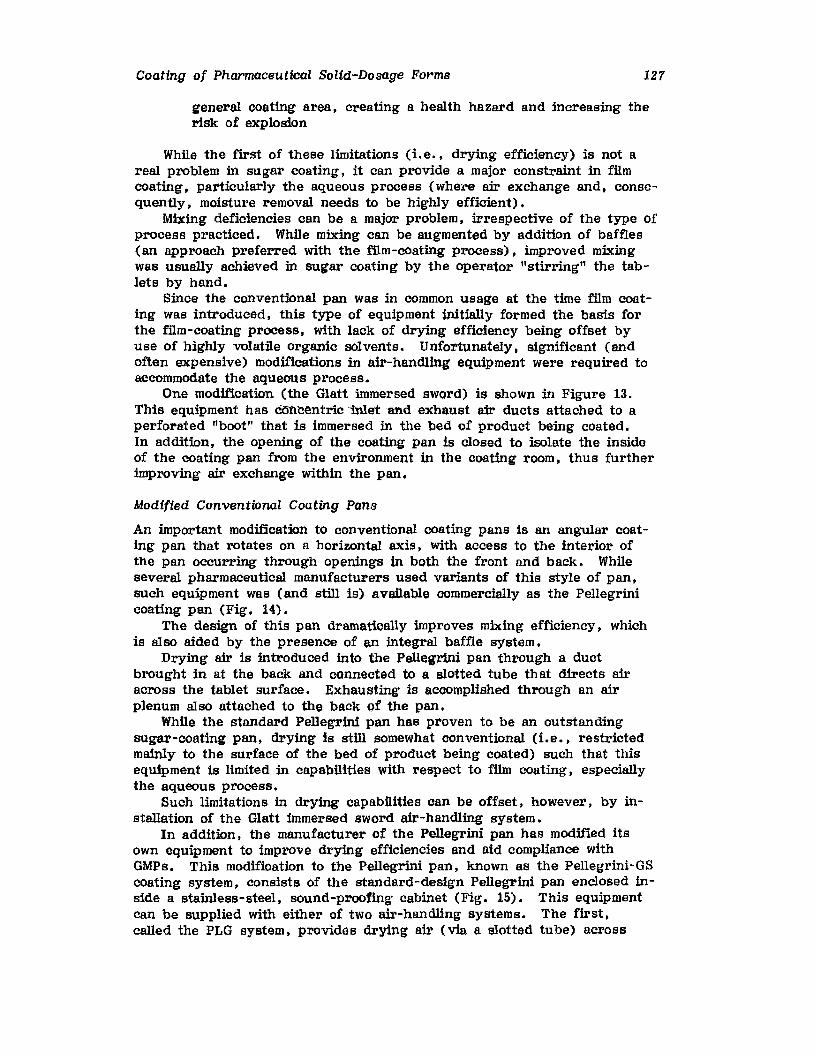
Coating of Pharmaceutical Solid-Dosage Forms 127
general coating area, creating a health hazard and increasing therisk of explosion
While the first of these limitations (Le; , drying efficiency) is not areal problem in sugar coating, it can provide a major constraint in filmcoating, particularly the aqueous process (where air exchange and, consequently, moisture removal needs to be highly efficient).
Mixing deficiencies can be a major problem, irrespective of the type ofprocess practiced. While mixing can be augmented by addition of baffles(an approach preferred with the film-coating process), improved mixingwas usually achieved in sugar coating by the operator "stirring" the tablets by hand.
Since the conventional pan was in common usage at the time film coating was introduced, this type of equipment initially formed the basis forthe film-coating process, with lack of drying efficiency being offset byuse of highly volatile organic solvents. Unfortunately, significant (andoften expensive) modifications in air-handling equipment were required toaccommodate the aqueous process.
One modification (the Glatt immersed sword) is shown in Figure 13.This equipment has clm~~ntric~in1et 'Snd exhaust air ducts attached to aperforated "boot" that is immersed in the bed of product being coated.In addition, the opening of the coating pan is closed to isolate the insideof the coating pan from the environment in the coating room, thus furtherimproving air exchange within the pan.
Modified Conventional Coating Pans
An important modification to conventional coating pans is an angular coating pan that rotates on a horizontal axis, with access to the interior ofthe pan occurring through openings in both the front and back. Whileseveral pharmaceutical manufaoturers used variants of this style of pan,such equipment was (and still is) avrdlable commercially as the Pellegrinicoating pan (Fig. 14).
The design of this pan dramatioally improves mixing efficiency, whichis also aided by the presence of an integral baffle system.
Drying air is introduced into the Pellegrini pan through a ductbrought in at the back and connected to a slotted tube that directs airacross the tablet surface. EXhausting is accomplished through an airplenum also attached to the back of the pan.
While the standard Pellegrini pan has proven to be an outstandingsugar-coating pan, drying is still somewhat conventional (Le , , restrictedmainly to the surface of the bed of product being coated) such that thisequipment is limited in capabilities with respect to film coating, especiallythe aqueous process.
Such limitations in drying capabilities can be offset, however. by installation of the Glatt immersed sword air-hendltng system.
In addition, the manufacturer of the Pellegrini pan has modified itsown equipment to improve drying efficiencies and aid compliance withGMPs. This modifioation to the Pellegrini pan, known as the Pellegrini-GScoating system, consists of the standard-design Pellegrini pan enclosed inside a stainless-steel, sound-proofing cabinet (Fig. 15). This equipmentcan be supplied with either of two air-handling systems. The first,called the PLG system, provides drying air (via a slotted tube) across
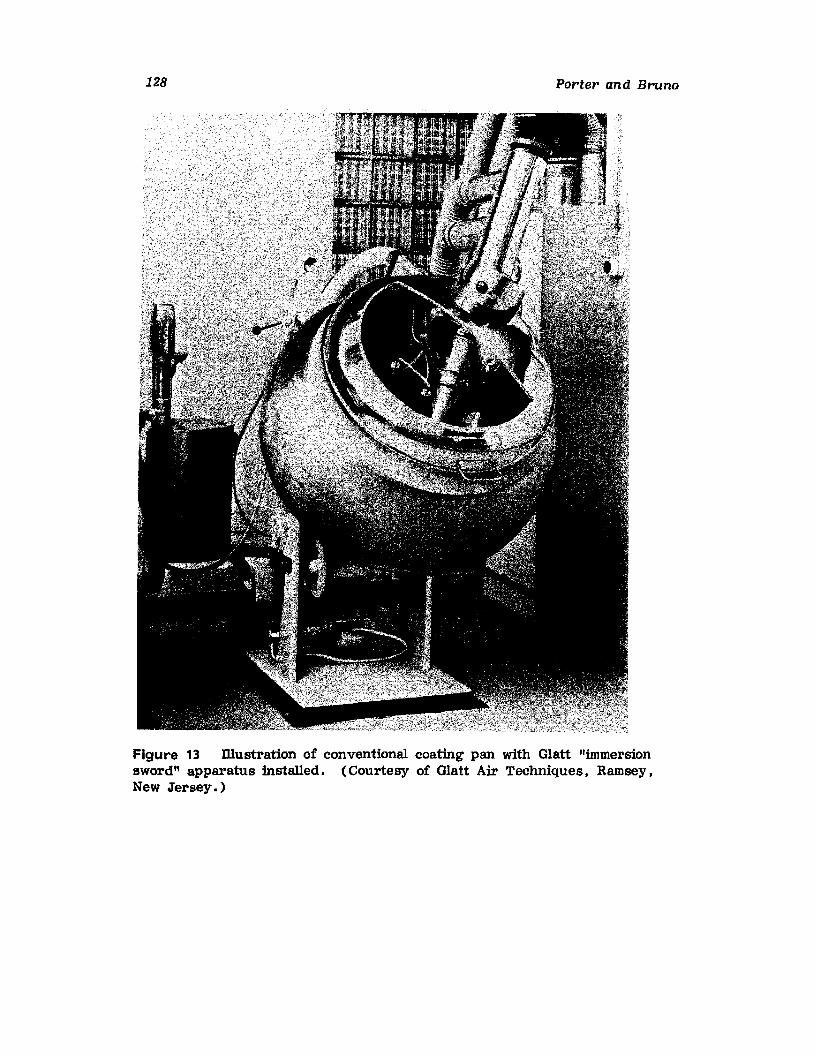
128 Porter an d Bruno
Figure 13 IDustration of conventional coating pan with Glatt "immersionsword" apparatus installed. (Courtesy of Glatt Air Techniques. Ramsey.New Jersey.)
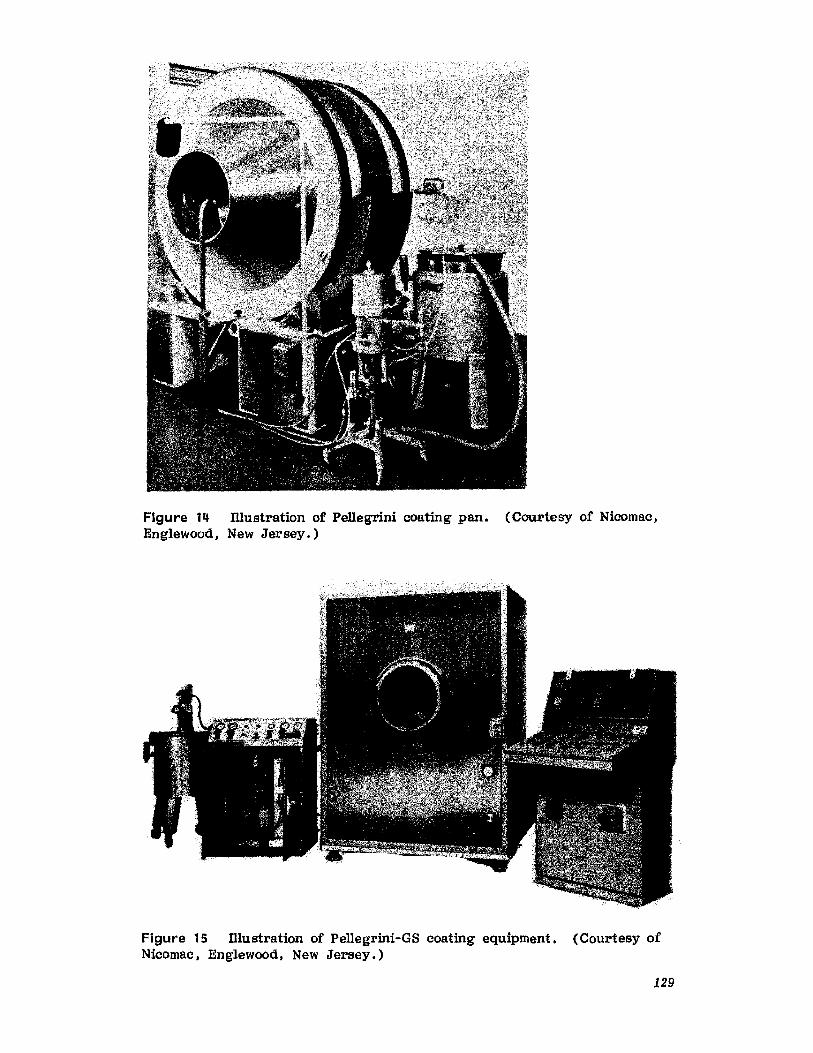
Figure 14 mustration of Pellegrini coating pan. (Courtesy of Nieomac ,Englewood, New Jersey.)
Figure 15 Illustration of Pellegrini-OS coating equipment. (Courtesy ofNicomac. Englewood, New Jersey.)
129
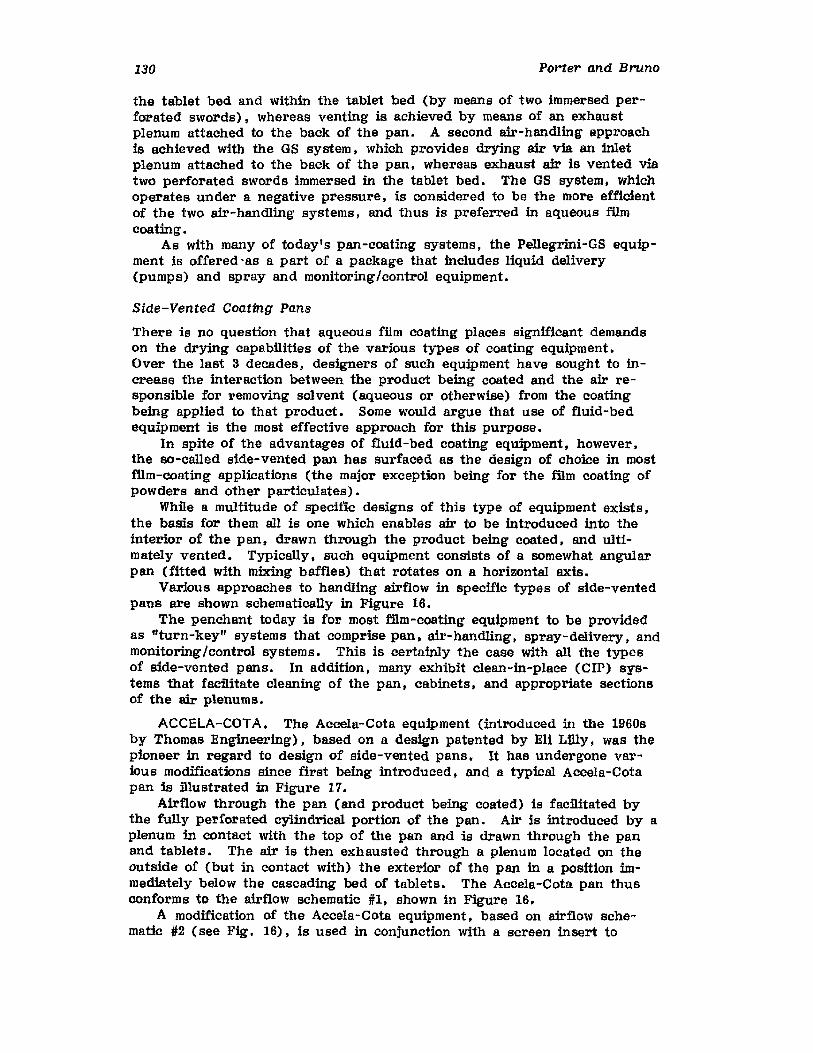
130 Porter and Bruno
the tablet bed and within the tablet bed (by means of two immersed perforated swords), whereas venting is achieved by means of an exhaustplenum attached to the back of the pan. A second air-handling approachis achieved with the GS system, which provides drying air via an inletplenum attached to the back of the pan, whereas exhaust air is vented viatwo perforated swords immersed in the tablet bed. The GS system, whichoperates under a negative pressure, is considered to be the more efficientof the two air-handling systems, and thus is preferred in aqueous rumcoating.
As with many of today's pan-coating systems, the Pellegrini-GS equipment is offered -as a part of a package that includes liquid delivery(pumps) and spray and monitoring/control equipment.
Side-Vented Coating Pans
There is no question that aqueous film coating places significant demandsOn the drying capabilities of the various types of coating equipment.Over the last 3 decades, designers of such equipment have sought to increase the interaction between the product being coated and the air responsible for removing solvent (aqueous or otherwise) from the coatingbeing applied to that product. Some would argue that use of fluid-bedequipment is the most effective approach for this purpose.
In spite of the advantages of fluid-bed coating equipment, however,the so-called side-vented pan has surfaced as the design of choice in mostIllm-coating applications (the major exception being for the film coating ofpowders and other particulates).
While a multitude of specific designs of this type of equipment exists,the basis for them all is one which enables air to be introduced into theinterior of the pan, drawn through the product being coated, and ultimately vented. Typically, such equipment consists of a somewhat angularpan (fitted with mixing baffles) that rotates on a horizontal axis.
Various approaches to handling airflow in specific types of side-ventedpans are shown schematically in Figure 16.
The penchant today is for most film-coating equipment to be providedas "turn-key" systems that comprise pan, air-handling, spray-delivery, andmonitoring/control systems. This is certainly the case with all the typesof side-vented pans. In addition, many exhibit clean-in-place (CIP) systems that facilitate cleaning of the pan, cabinets, and appropriate sectionsof the air plenums.
ACCELA-COTA. The Accela-Cota equipment (introduced in the 1960sby Thomas Engineering), based on a design patented by Eli Lilly, was thepioneer in regard to design of side-vented pans. It has undergone various modifications since first being introduced, and a typical Accela-Cotapan is Dlustrated in Figure 17.
Airflow through the pan (and product being coated) is facilitated bythe fully perforated cylindrical portion of the pan. Air is introduced by aplenum in contact with the top of the pan and is drawn through the panand tablets. The air is then exhausted through a plenum located on theoutside of (but in contact with) the exterior of the pan in a position immediately below the cascading bed of tablets. The Accela-Cota pan thusconforms to the airflow schematic #1, shown in Figure 16.
A modification of the Accela-Cota equipment, based on airflow schematic #2 (see Fig. 16), is used in conjunction with a screen insert to
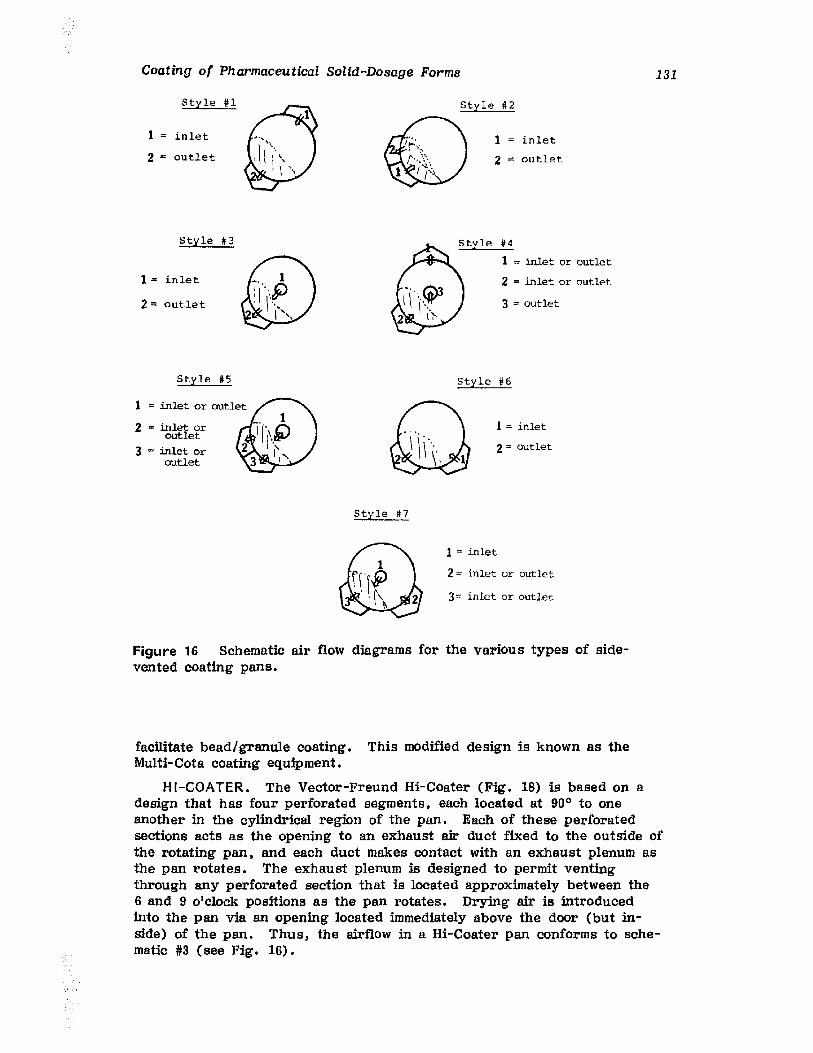
Coating of Pharmaceutical Solid-Dosage Forms 131
Style 112Style U
1 = inlet
2 '" outlet
1 '" inlet
2 '" outlet
3 '" outlet
1 '" inlet or outlet
2 '" inlet or outlet
Style #3
1 '" inlet
2 = outlet
Style 115 Style fI6
1
2 = inlet oroutlet
3 = inlet oroutlet
Style 117
1'" inlet
2 '" outlet
1 '" inlet
2 '" inlet or outlet
3= inlet or outlet
Figure 16 Schematic air flow diagrams for the various types of sidevented coating pans.
facilitate bead/granule coating. This modified design is known as theMulti-Cota coating equipment.
HI-COATER. The Vector-Freund Hi-Coater (Fig. 18) is based on adesign that has four perforated segments. each located at 90° to oneanother in the cylindrical region of the pan. Each of these perforatedsections acts as the opening to an exhaust air duct fixed to the outside ofthe rotating pan. and each duct makes contact with an exhaust plenum asthe pan rotates. The exhaust plenum is designed to permit ventingthrough any perforated section that is located approximately between the6 and 9 o'clock positions as the pan rotates. Drying air is introducedinto the pan vis. an opening located immediately above the door (but inside) of the pan. Thus, the airflow in a Hi-Coater pan conforms to schematic #3 (see Fig. 16).
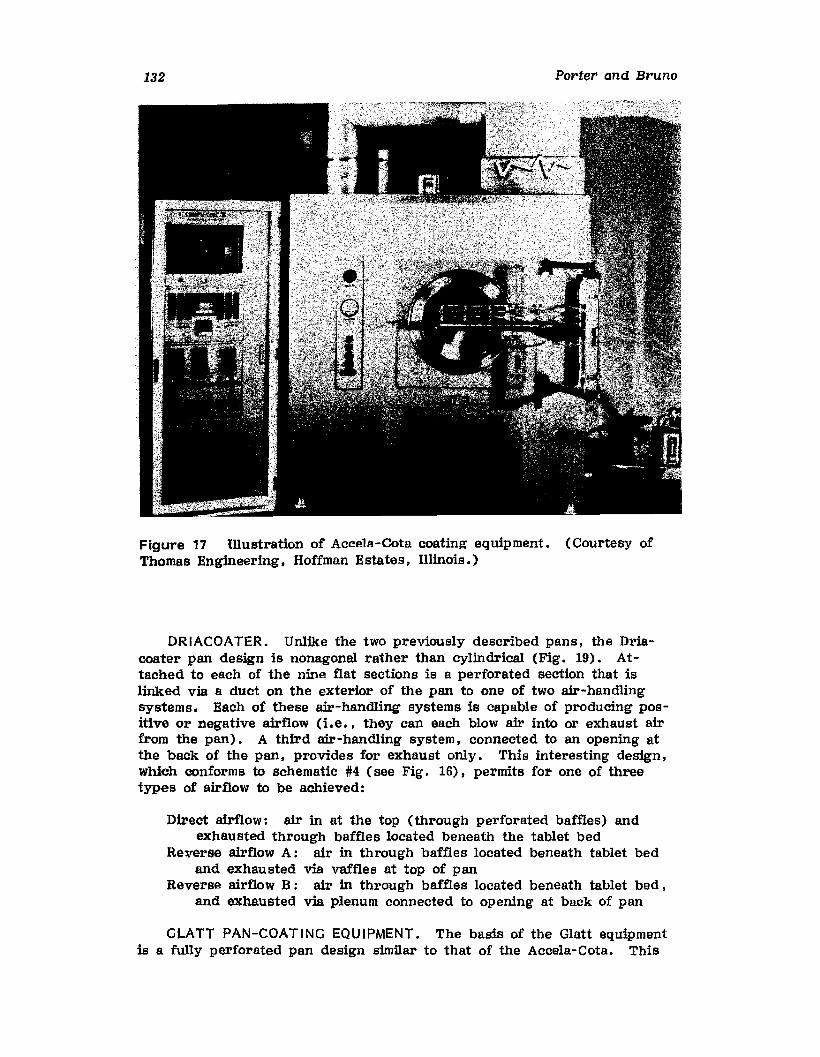
132 Porter and Bruno
Figure 17 Ulustration of Acce1a-Cota coating equipment. (Courtesy ofThomas Engineering, Hoffman Estates, Illinois.)
DRIACOATER. Unlike the two previously described pans, the Driaeoater pan design is nonagonal rather than cylindrical (Fig. 19). Attached to each of the nine flat sections is a perforated section that islinked via a duct on the exterior of the pan to one of two air-handlingsystems. Each of these air-handling systems is capable of producing positive or negative airflow (r.e •• they can each blow air into or exhaust airfrom the pan). A third air-handling system, connected to an opening atthe back of the pan, provides for exhaust only. This interesting design,which conforms to schematic #4 (see Fig. 16), permits fol" one of threetypes of airflow to be achieved:
Direct airflow: air in at the top (through perforated baffles) andexhausted through baffles located beneath the tablet bed
Reverse airflow A: air in through baffles located beneath tablet bedand exhausted via vaffles at top of pan
Reverse airflow B: air in through baffles located beneath tablet bed,and exhausted via plenum connected to opening at back of pan
GLATT PAN-COATING EQUIPMENT. The basis of the Glatt equipmentis a fully perforated pan design similar to that of the Aceela-Cota, This
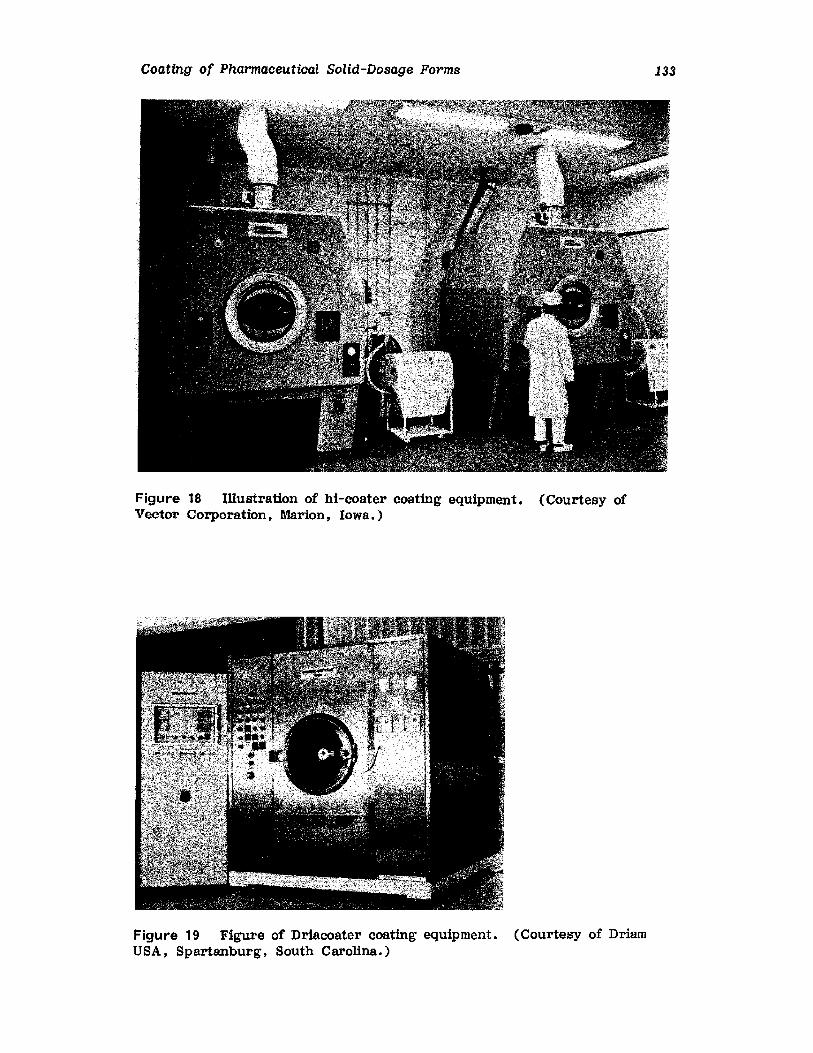
Coating of Pharmaceutical Solid-Dosage Forms 133
Figure 18 Illustration of hi-coater coating equipment. (Courtesy ofVector Corporation, Marion, Iowa.)
Figure 19 Figure of Driacoater coating equipment. (Courtesy of DriamUSA, Spartanburg, South Carolina.)
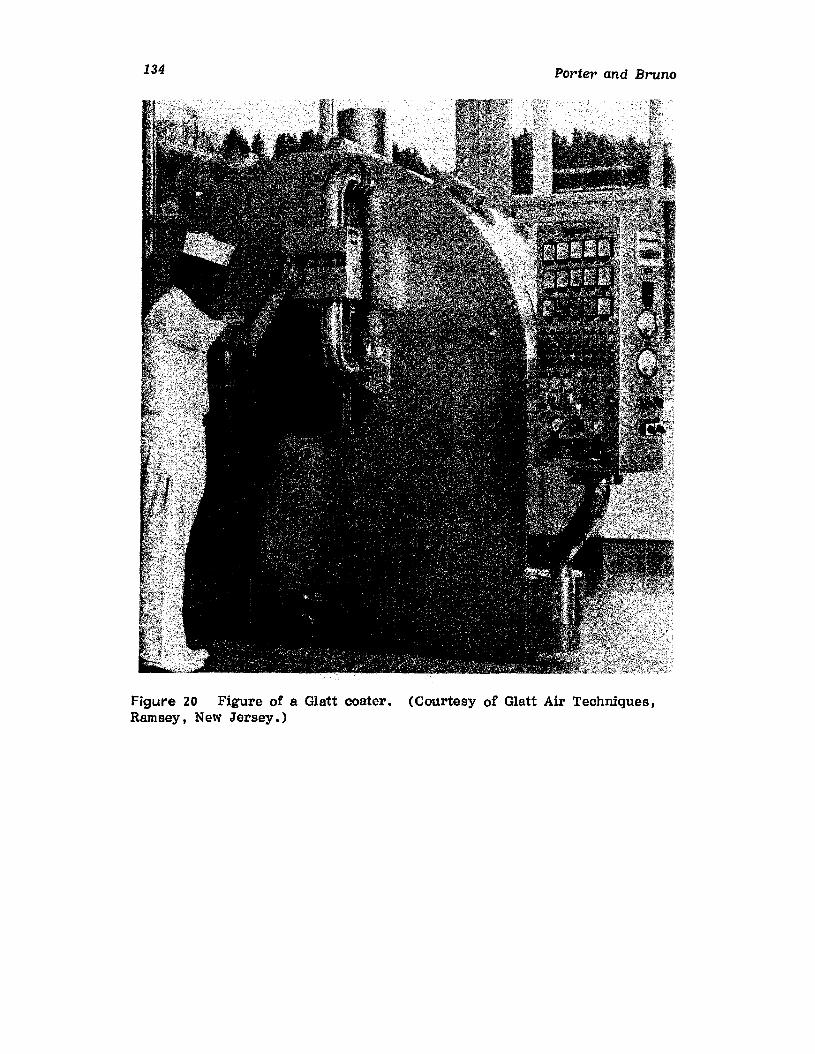
134 Porter and Bruno
Figure 20 Figure of a Glatt coater. (Courtesy of Glatt Air Techniques,Ramsey t New Jersey.)
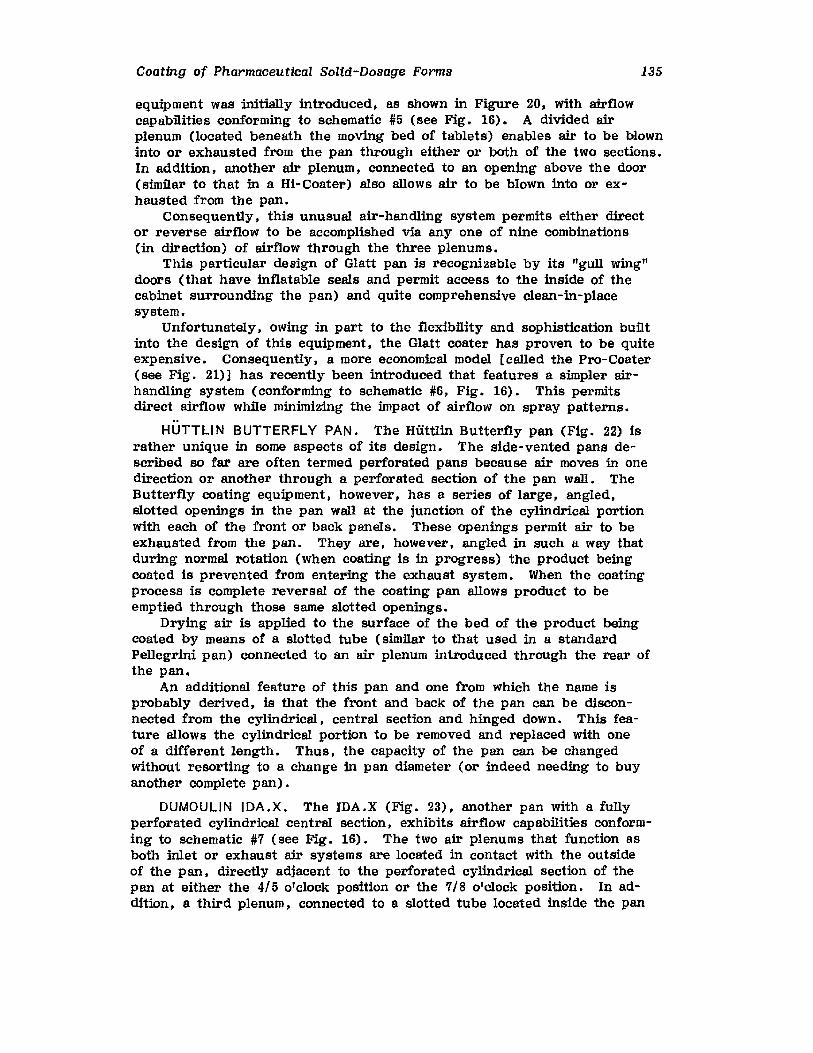
Coating of Pharmaceutical Solid-Dosage Forms 135
equipment was initially introduced, as shown in Figure 20, with airflowcapabilities conforming to schematic #5 (see Fig. 16). A divided airplenum (located beneath the moving bed of tablets) enables air to be blowninto or exhausted from the pan through either or both of the two sections.In addition, another air plenum, connected to an opening above the door(similar to that in a Hi-Coater) also allows air to be blown into or exhausted from the pan.
Consequently, this unusual air-handling system permits either director reverse airflow to be accomplished via anyone of nine combinations(in direction) of airflow through the three plenums.
This particular design of Glatt pan is recognizable by its "gull wing ll
doors (that have inflatable seals and permit access to the inside of thecabinet surrounding the pan) and quite comprehensive clean-in-placesystem.
Unfortunately. owing in part to the flexibility and sophistication builtinto the design of this equipment, the Glatt coater has proven to be quiteexpensive. Consequently, a more economical model [called the Pro- Coater(see Fig. 21)] has recently been introduced that features a simpler airhandling system (conforming to schematic #6, Fig. 16). This permitsdirect airflow while minimizing the impact of airflow on spray patterns.
HUTTLIN BUTTERFLY PAN. The Hiittltn Butterfly pan (Fig. 22) israther unique in some aspects of its design. The side-vented pans described so far are often termed perforated pans because air moves in onedirection or another through a perforated section of the pan wall. TheButterfly coating equipment, however, has a series of large, angled,slotted openings in the pan wall at the junction of the cylindrical portionwith each of the front or back panels. These openings permit air to beexhausted from the pan. They are, however, angled in such a way thatduring normal rotation (when coating is in progress) the product beingcoated is prevented from entering the exhaust system. When the coatingprocess is complete reversal of the coating pan allows product to beemptied through those same slotted openings.
Drying air is applied to the surface of the bed of the product beingcoated by means of a slotted tube (similar to that used in a standardPellegrini pan) connected to an air plenum introduced through the rear ofthe pan.
An additional feature of this pan and one from which the name isprobably derived, is that the front and back of the pan can be disconnected from the cylindrical, central section and hinged down. This feature allows the cylindrical portion to be removed and replaced with oneof a different length. Thus, the capacity of the pan can be changedwithout resorting to a change in pan diameter (or indeed needing to buyanother complete pan).
DUMOULIN IDA.X. The IDA.X (Fig. 23), another pan with a fullyperforated cylindrical central section, exhibits airflow capabilities conforming to schematic #7 (see Fig. 16). The two air plenums that function asboth inlet or exhaust air systems are located in contact with the outsideof the pan, directly adjacent to the perforated cylindrical section of thepan at either the 4/5 o'clock position or the 7/8 o'clock position. In addition, a third plenum, connected to a slotted tube located inside the pan
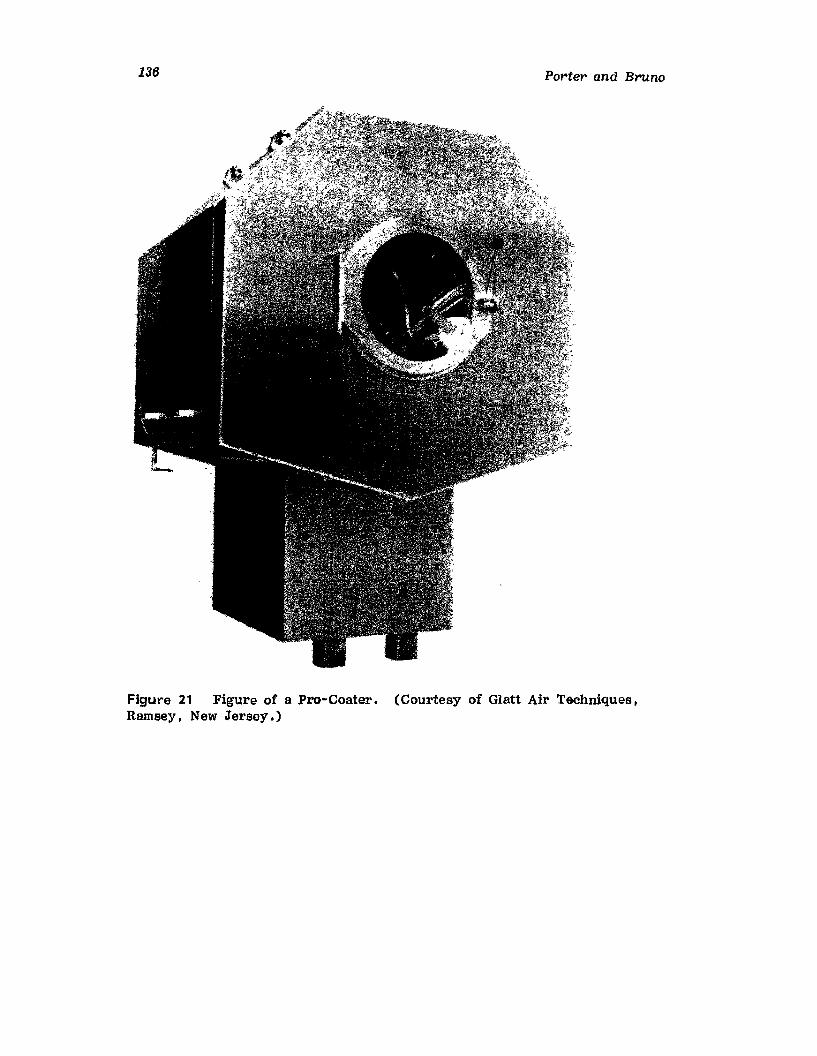
136 Porter and Bruno
Figure 21 Figure of a Pro-Coater. (Courtesy of Glatt Air Techniques,Ramsey, New Jersey.)
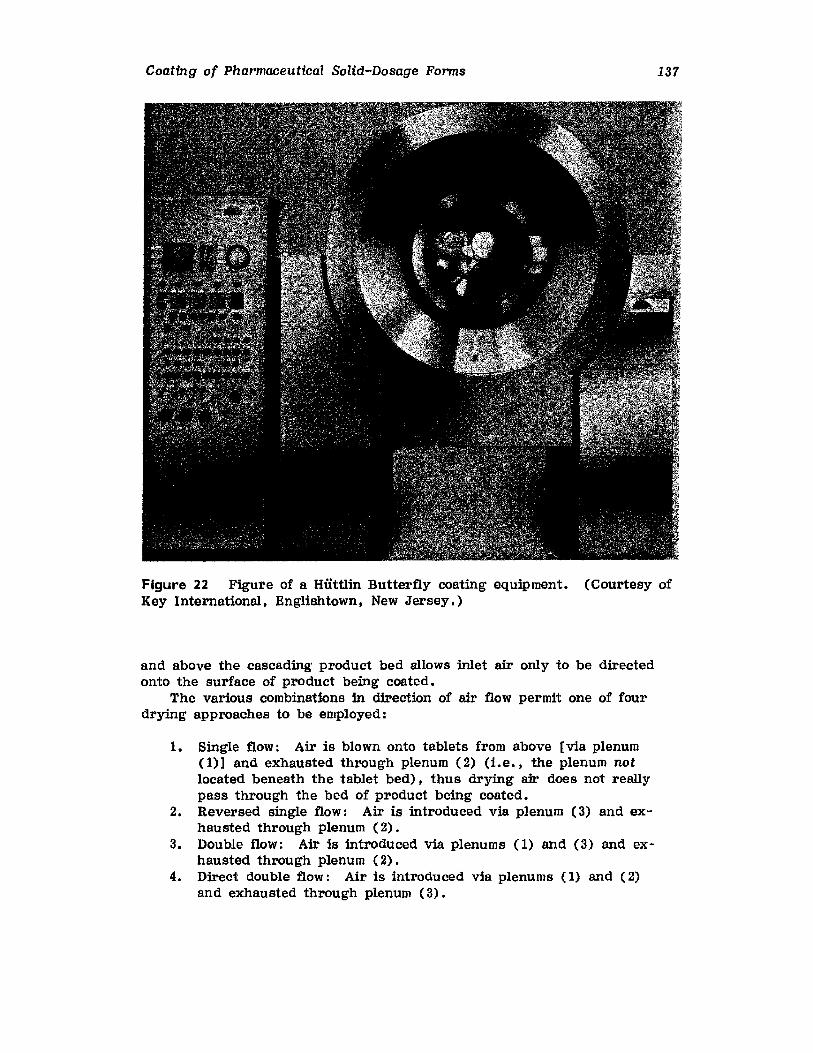
Coating of Pharmaceutical Solid-Dosage Forms 137
Figure 22 Figure of a Hiittlin Butterfly coating equipment. (Courtesy ofKey International, Englishtown, New Jersey.)
and above the cascading' product bed allows inlet air only to be directedonto the surface of product being coated.
The various combinations in direction of air flow permit one of fourdrying approaches to be employed:
1. Single flow: Air is blown onto tablets from above [via plenum(1)] and exhausted through plenum (2) (i.e., the plenum notlocated beneath the tablet bed), thus drying air does not reallypass through the bed of product being coated.
2. Reversed single flow: Air is introduced via plenum (3) and exhausted through plenum (2).
3. Double flow: Air is introduced via plenums (1) and (3) and exhausted through plenum (2).
4. Direct double flow: Air is introduced via plenums (1) and (2)and exhausted through plenum (3).
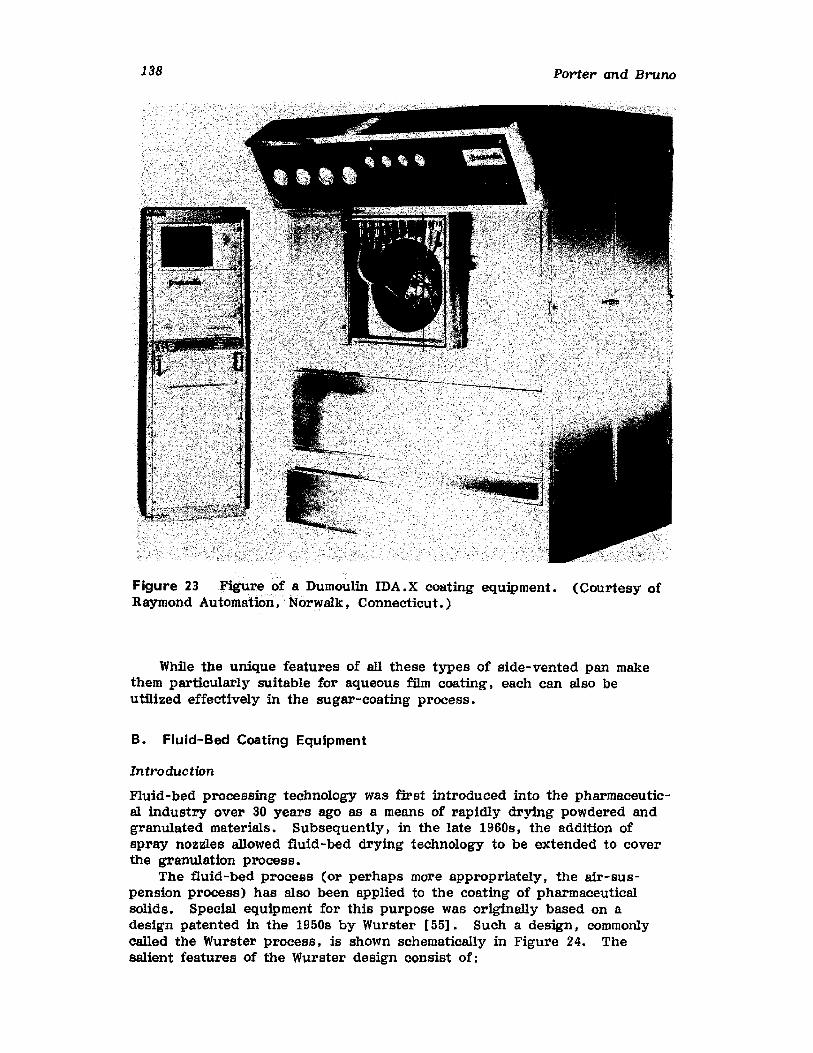
138 Porter and Bruno
Figure 23 Figur'!.ofa Dumoulin IDA. X coating equipment. (Courtesy ofRaymond Automation, Norwalk. Connecticut.)
While the unique features of all these types of side-vented pan makethem particularly suitable for aqueous film coating. each can also beutilized effectively in the sugar-coating process.
B. Fluid-Bed Coating Equipment
Introduction
Fluid-bed processing technology was first introduced into the pharmaceutical industry over 30 years ago as a means of rapidly drying powdered andgranulated materials. Subsequently, in the late 1960s, the addition ofspray nozzles allowed fluid-bed drying technology to be extended to coverthe granulation process.
The fluid-bed process (or perhaps more appropriately, the air-suspension process) has also been applied to the coating of pharmaceuticalsolids. Special equipment for this purpose was originally based on adesign patented in the 1950s by Wurster [55]. Such a design, commonlycalled the Wurster process, is shown schematically in Figure 24. TheSalient features of the Wurster design consist of:
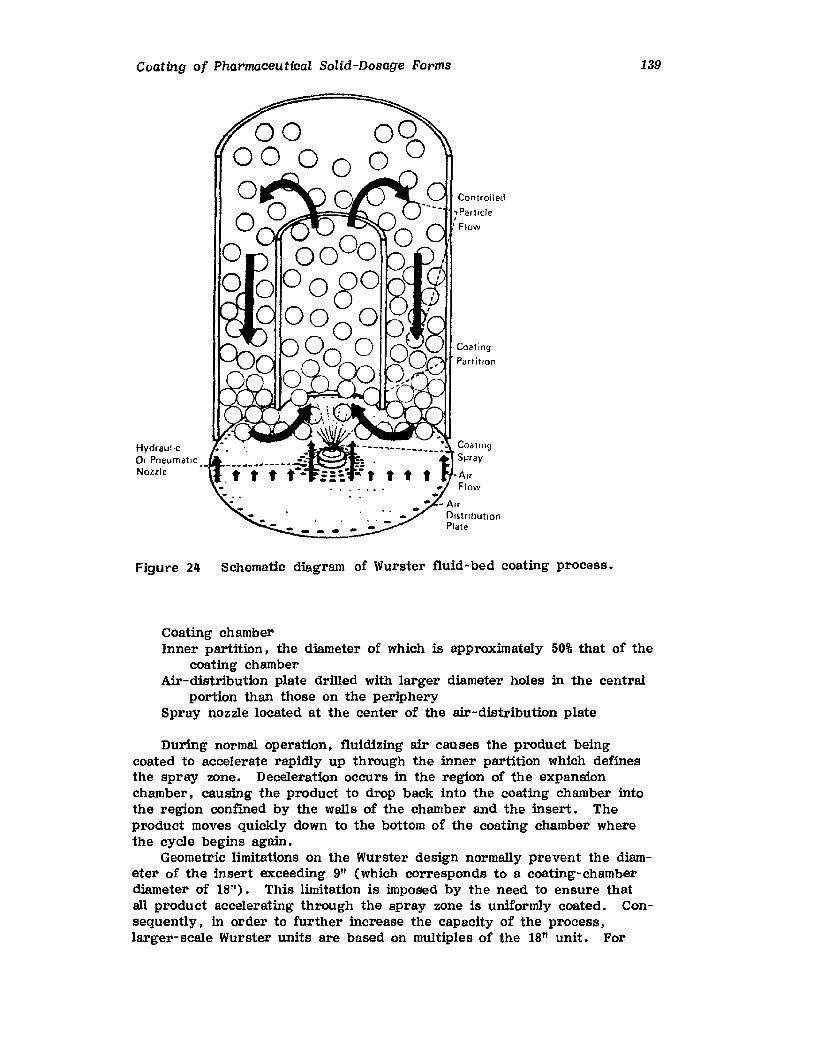
Coating of Pharmaceutical Solid-Dosage Forms
Controlled
Coating
Part itror,
Hvdrauuc CoatingOr Pneurnatrc Spray
Nozzle A"Flow
Figure 24 Schematic diagram of Wurster fluid-bed coating process.
139
coating chamberInner partition, the diameter of which is approximately 50% that of the
coating chamberAir-distribution plate drllied with larger diameter holes in the central
portion than those on the peripherySpray nozzle located at the center of the air-distribution plate
During normal operation, fluidizing air causes the product beingcoated to accelerate rapidly up through the inner partition which definesthe spray zone. Deceleration occurs in the region of the expansionchamber, causing the product to drop back into the coating chamber intothe region confined by the walls of the chamber and the insert. Theproduct moves quickly down to the bottom of the coating chamber wherethe cycle begins again.
Geometric limitations on the Wurster design normally prevent the diameter of the insert exceeding gil (Which corresponds to a ooating-chamberdiameter of 18"). This limitation is imposed by the need to ensure thatall product accelerating through the spray zone is uniformly coated. Consequently, in order to further increase the capacity of the process,larger-scale Wurster units are based on multiples of the 18n unit. For
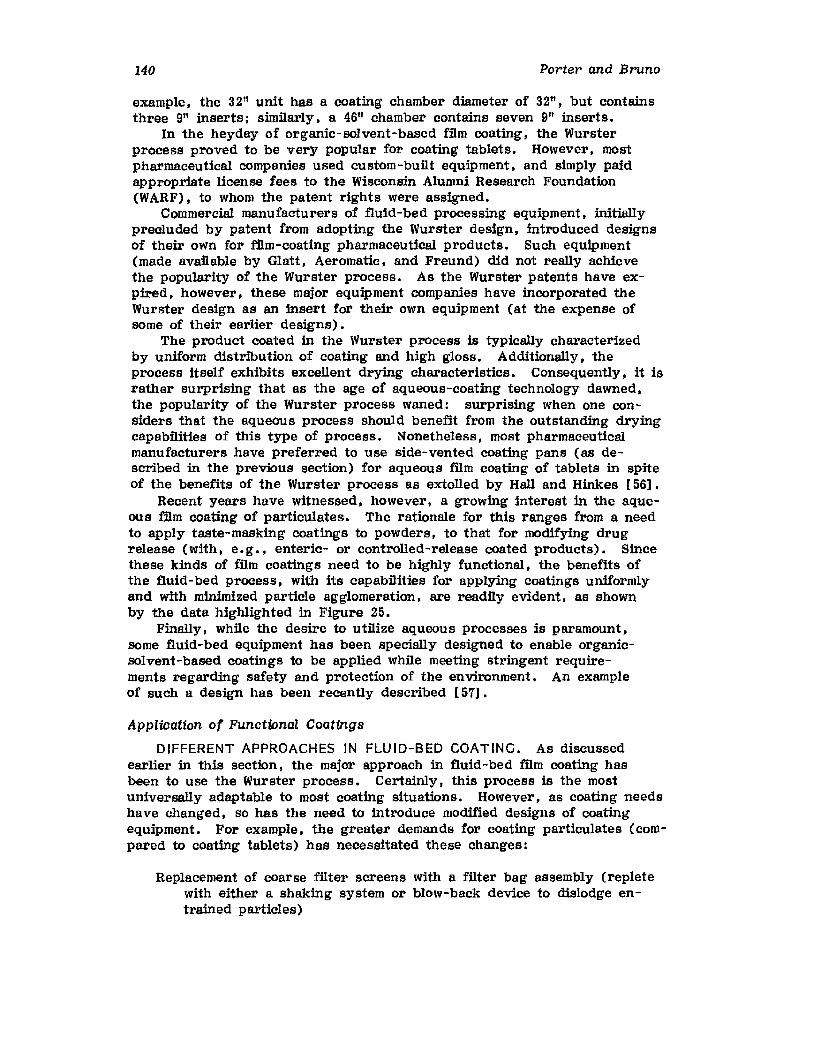
140 Porter and Bruno
example, the 32tl unit has a coating chamber diameter of 32" t but containsthree 9" inserts; similarly, a 4611 chamber contains seven 9" inserts.
In the heyday of organic-solvent-based film coating, the Wursterprocess proved to be very popular for coating tablets. However, mostpharmaceutical companies used custom-built equipment, and simply paidappropriate license fees to the Wisconsin Alumni Research Foundation(WARF), to whom the patent rights were assigned.
Commercial manufacturers of fluid-bed processing equipment, initiallyprecluded by patent from adopting the Wurster design, introduced designsof their own for film-coating pharmaceutical products. Such equipment(made available by Glatt, Aeromatic , and Freund) did not really achievethe popularity of the Wurster process. As the Wurster patents have expired, however, these major equipment companies have incorporated theWurster design as an insert for their own equipment (at the expense ofSOme of their earlier designs).
The product coated in the Wurster process is typically characterizedby uniform distribution of coating and high gloss. Additionally, theprocess itself exhibits excellent drying characteristics. Consequently, it israther surprising that as the age of aqueous-coating technology dawned,the popularity of the Wurster process waned: surprising when one considers that the aqueous process should benefit from the outstanding dryingcapabilities of this type of process. Nonetheless, most pharmaceuticalmanufacturers have preferred to use side-vented coating pans (as described in the previous section) for aqueous film coating of tablets in spiteof the benefits of the Wurster process as extolled by Hall and Hinkes [56].
Recent years have witnessed. however, a growing interest in the aqueous film coating of particulates. The rationale for this ranges from a needto apply taste-masking coatings to powders, to that for modifying drugrelease (with, e.g., enteric- or controlled-release coated products). Sincethese kinds of :film coatings need to be highly functional, the benefits ofthe fluid-bed process, with its capabilities for applying coatings uniformlyand with minimized particle agglomeration, are readily evident, as shownby the data highlighted in Figure 25.
Finally, while the desire to utilize aqueous processes is paramount,some fluid-bed equipment has been specially designed to enable organicsolvent-based coatings to be applied while meeting stringent requirements regarding safety and protection of the environment. An exampleof such a design has been recently described [57).
Application of Functional Coatings
DIFFERENT APPROACHES IN FLUID-BED COATING. As discussedearlier in this section, the major approach in fluid-bed film coating hasbeen to use the Wurster process. Certainly, this process is the mostuniversally adaptable to most coating situations. However, as coating needshave changed, so has the need to introduce modified designs of coatingequipment. For example, the greater demands for coating particulates (compared to coating tablets) has necessitated these changes:
Replacement of coarse filter screens with a filter bag assembly (repletewith either a shaking system or blow-back device to dislodge entrained particles)
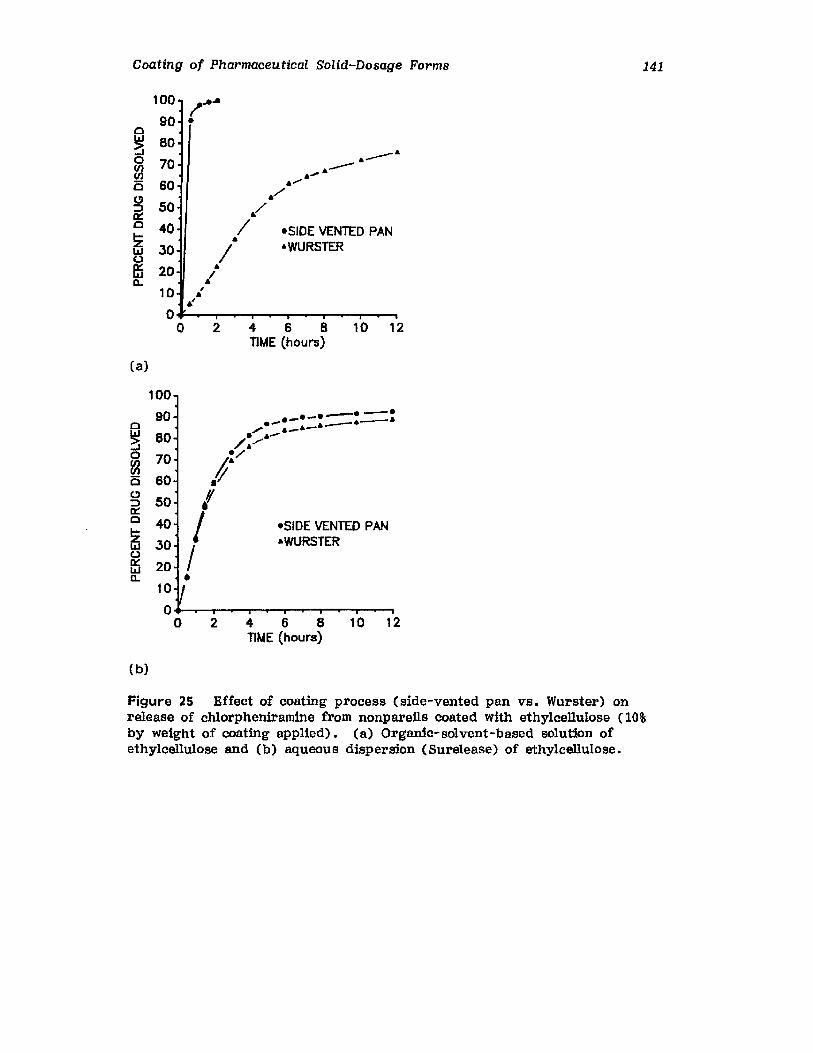
Coating of Pharmaceutical Solid-Dosage Forms 141
100 ? ....90 -
~ 800 70
6 __6
en 6--(f) 6-
B 60 6 .....
o /=:J 50 /0:::0 40 / -SIDE VENTED PAN!z 6
W 30 / 6 WURSTERoffi 20 6
c.. ~10
,•If
00 2 4 6 8 10 12
TIME (hours)
(a)
100
90 ._e------:0 • ..-. . ____6--
~ 80./ A_A-_ 6-
/6/
0 70 -/en IfenB 60 //C)
50 1/=:J •D::
/0 40 -SIDE VENTED PAN!z 30 6 WURSTERw
/oD:: 20wa, •10
00 2 4 6 8 10 12
TIME (hours)
(b)
Figure 2S Effect of coating process (side-vented pan vs, Wurster) onrelease of chlorphenirarnine from nonpareils coated with ethylcellulose (10%by weight of coating applied). (a) Organic-solvent-based solution ofethylcellulose and (b) aqueous dispersion (Surelease) of ethylcellulose.
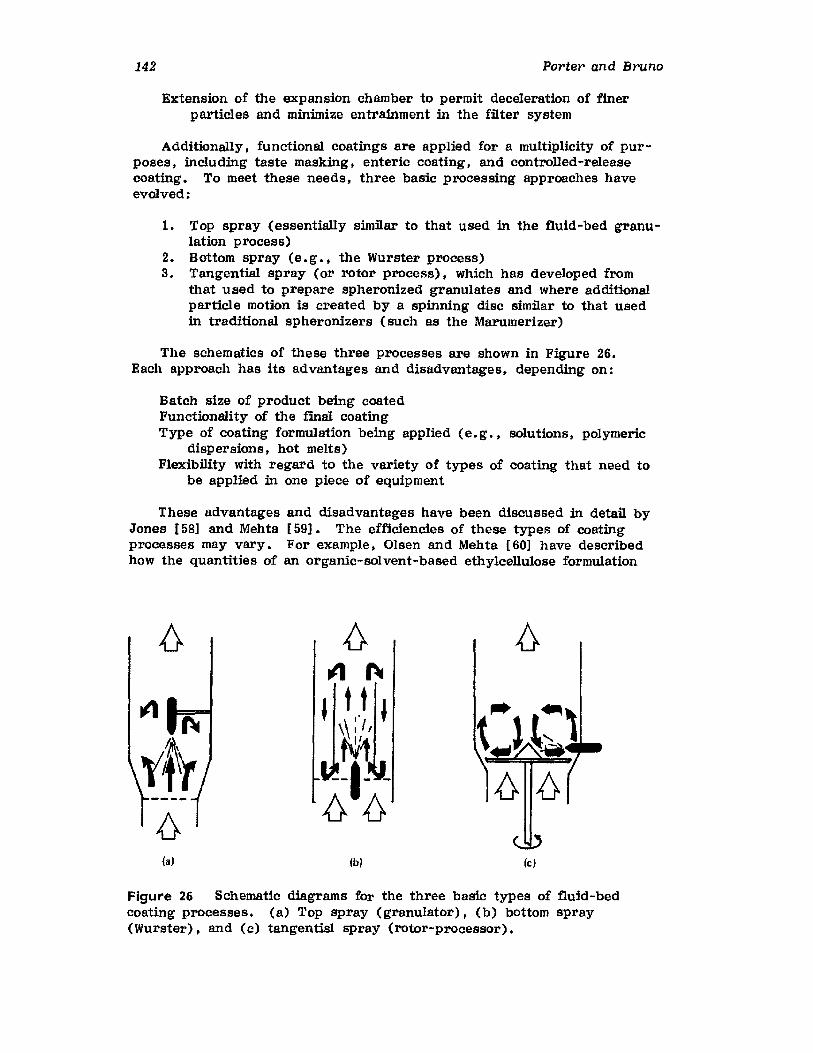
142 Porter and Bruno
Extension of the expansion chamber to permit deceleration of finerparticles and minimize entrainment in the filter system
Additionally. functional coatings are applied for a multiplicity of purposes t inclu ding taste masking I enteric coating. and controlled-releasecoating. To meet these needs. three basic processing approaches haveevolved:
1. Top spray (essentially similar to that used in the ftutd-bed granulation process)
2. Bottom spray (e. g., the Wurster process)3. Tangential spray (or rotor process) t which has developed from
that used to prepare spheronized granulates and where additionalparticle motion is created by a spinning disc similar to that usedin traditional spheronizers (such as the Marumerizer)
The schematics of these three processes are shown in Figure 26.Each approach has its advantages and disadvantages, depending on:
Batch size of product being coatedFunctionality of the final coatingType of coating formulation being applied (e. g • t solutions t polymeric
dispersions, hot melts)Flexibility with regard to the variety of types of coating that need to
be applied in one piece of equipment
These advantages and disadvantages have been discussed in detail byJones [58] and Mehta [59]. The efficiencies of these types of coatingprocesses may vary. For example, Olsen and Mehta [60] have describedhow the quantities of an organic-solvent-based ethylcellulose formulation
{}ttl ~
~ l t t~ ,", J\ I I
N/1--1- -{}6
(a) (b] (e)
Figure 26 Schematic diagrams for the three basic types of fluid-bedcoating processes. (a) Top spray (granulator). (b) bottom spray(Wurster). and (c) tangentisl spray (rotor-processor).
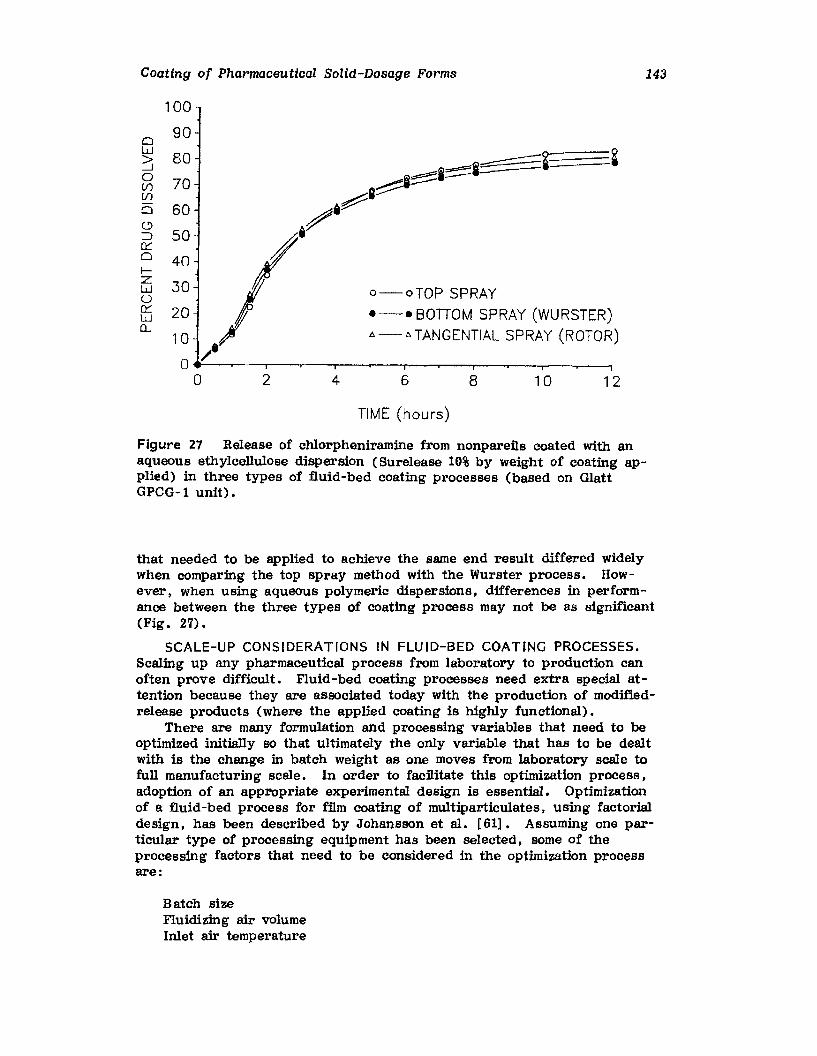
Coating of Pharmaceutical Solid-Dosage Forms 143
121086
o-oTOP SPRAY
.-.BOnOM SPRAY (WURSTER)
'" - '" TANGENTIAL SPRAY (ROTOR)
42
100
90
80
70
60
50
40
30
20
10
O....--......-------,---..---r--....---y------.--,---r--...---.....--.o
aw~oU1U1
oC)
~(t:o~zwu(t:W0...
TIME (hours)
Figure 27 Release of chlorpheniramine from nonpareils coated with anaqueous ethylcellulose dispersion (Surelease 10% by weight of coating applied) in three types of fluid-bed coating processes (based on GlattGPCG-1 unit).
that needed to be applied to achieve the same end result differed widelywhen comparing the top spray method with the Wurster process. However t when using aqueous polymeric dispersions, differences in performance between the three types of coating process may not be as significant(Fig. 2'1).
SCALE-UP CONSIDERATIONS IN FLUID-BED COATING PROCESSES.Scaling up any pharmaceutical process from laboratory to production canoften prove difficult. Fluid-bed coating processes need extra special attention because they are associated today with the production of modifiedrelease products (where the applied coating is highly functional).
There are many formulation and processing variables that need to beoptimized initially so that ultimately the only variable that has to be dealtwith is the change in batch weight as one moves from laboratory scale tofull manufacturing scale. In order to facilitate this optimization process.adoption of an appropriate experimental design is essential. Optimizationof a fluid-bed process for film coating of multipartioulates, using factorialdesign. has been described by Johansson et al , [61]. Assuming one particular type of processing equipment has been selected, some of theprocessing factors that need to be considered in the optimization processare:
Batch sizeFluidizing air volumeInlet air temperature
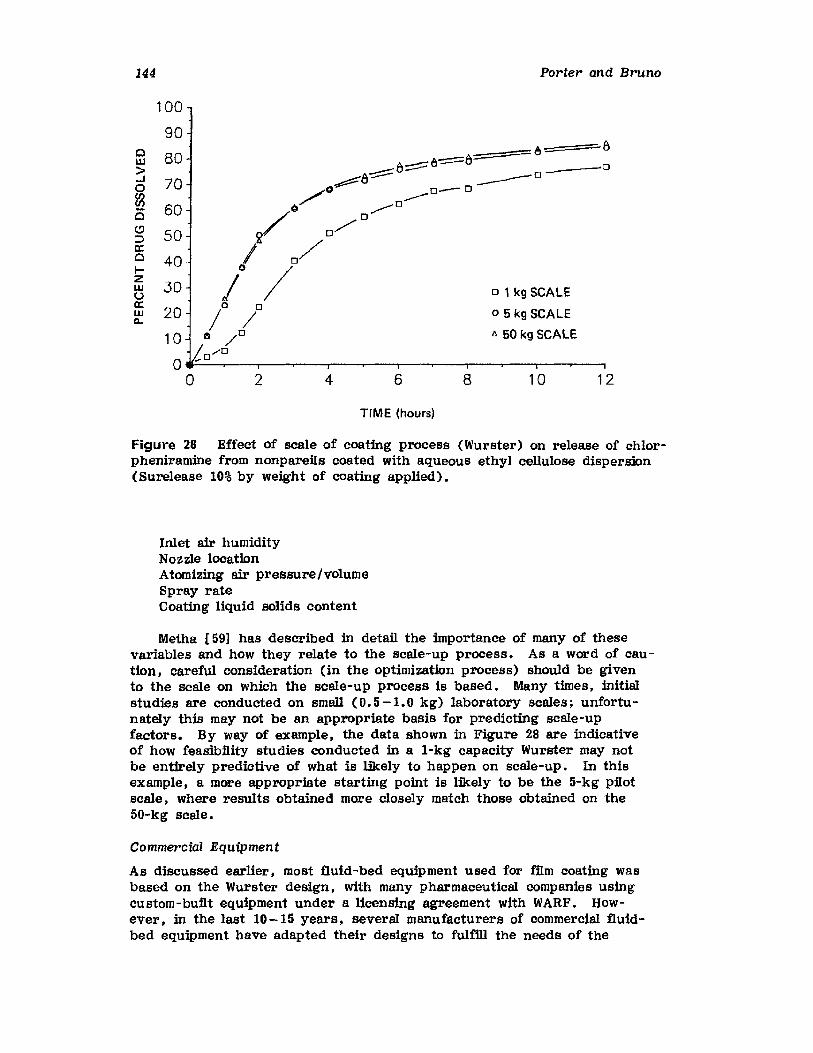
144 Porter and Bruno
12
-0
10
01 kg SCALE
05 kg SCALE
IJ. 50 kg SCALE
8642
100
90
80
70
60
50
40
30
20
10
O----.---~--.---....--~-..--...,.--..,--..........--.......-~............,o
cw>..Jo~cc:J::>a:ClIzwoa:wc,
TIME (hours)
Figure 28 Effect of scale of coating process (Wurster) on release of chlorpheniramine from nonpareils coated with aqueous ethyl cellulose dispersion(Burelease 10% by weight of coating applied).
Inlet air humidityNozzle locationAtomizing air pressure/volumeSpray rateCoating liquid solids content
Metha [59] has described in detail the importance of many of thesevariables and how they relate to the scale-up process. As a word of caution. careful consideration (in the optimization process) should be givento the scale on Which the scale-up process is based. Many times, initialstudies are conducted on small (0.5-1.0 kg) laboratory scales; unfortunately this may not be an appropriate basis for predicting scale-upfactors. By way of example, the data shown in Figure 28 are indicativeof how feasibRity studies conducted in a 1-kg capacity Wurster may notbe entirely predictive of what is likely to happen on scale-up. In thisexample, a more appropriate starting point is likely to be the 5-kg pilotscale. where results obtained more closely match those obtained on the50-kg scale.
Commercial Equipment
As discussed earlier, most fluid-bed equipment used for fHm coating wasbased on the Wurster design, with many pharmaceutical companies usingcustom-built equipment under a licensing agreement with WARF. However, in the last 10 - 15 years, several manu facturers of commercial fluidbed equipment have adapted their designs to fuliill the needs of the
Coating of Pharmaceutical Solid-Dosage Forms 145
film-coating process. The trend has been to provide equipment designedon the modular concept, where a basic processing unit is intended toaccommodate a variety of processing inserts. These inserts can facilitatethe use of fluid-bed processes for drying, granulating, spheronizing, andcoating.
While many similarities exist for equipment supplied by the variousvendors, opportunities for differentiation exists with:
Clamping systems (i.e., the mechanism for clamping the various removable sections together). which are typically either compressedair or hydraulic
Explosion protection, where some manufacturers use 2-bar constructionplus explosion-relief venting, whereas others rely on 10-barconstruction
Filter-bag assemblies, which can be based on either a split-filtershaking or pulsed-air blow-back systems
Heating units, Where typically either conventional steam or electriccan be provided. but where there is a growing preference for"face and by-pass" systems that permit more precise control overprocessing temperatures while facilitating rapid changes (in temperature) to be made When required
The trend is to provide standard equipment with appropriate optionsso that designs can be more easily customized to meet end-user requirements. Specialized designs, with taller expansion chambers that facilitateappropriate deceleration when coating small particles, are becoming common.As with other types of coating equipment, opportunities for providing completely automated processes now exist.
GLATT FLUID-BED COATING EQUIPMENT. Originally, the Glatt AirTechniques' designs were based on the WSG processing unit. which iscapable of accepting a variety of inserts. More recently. however, inorder to better address the situation in which the material to be coatedis of small particle size (ranging from approximately 100 um- 2 mm), theemphasis has shifted toward the GPCG processing unit. Inserts can beprovided to permit drying. granulating (or top-spray coating), Wurstercoating (bottom spray). and rotor granulationllayering/coating (tangentialspray).
An example of a 5- to lO-kg pilot GPCG unit is shown in Figure 29.Other common features of the Glatt equipment are:
Filter systems based on the split filter. shaking principle2-Bar construction with explosion relief (although 10-bar construction,
at an added cost. may be available)Microprocessor-based control panels when non-explosion-proof oper
ating environments are permissibleHydraulic clamping systems
AEROMATIC FLUID-BED COATING EQUIPMENT. Aeromatic fluid-bedcoating equipment is again designed to accommodate a variety of modularinserts. A typical laboratory scale unit, capable of processing up to3- 5 kg of material. is shown in Figure 30.
Inserts that can be utilized with this manufacturer's equipmentinclude:
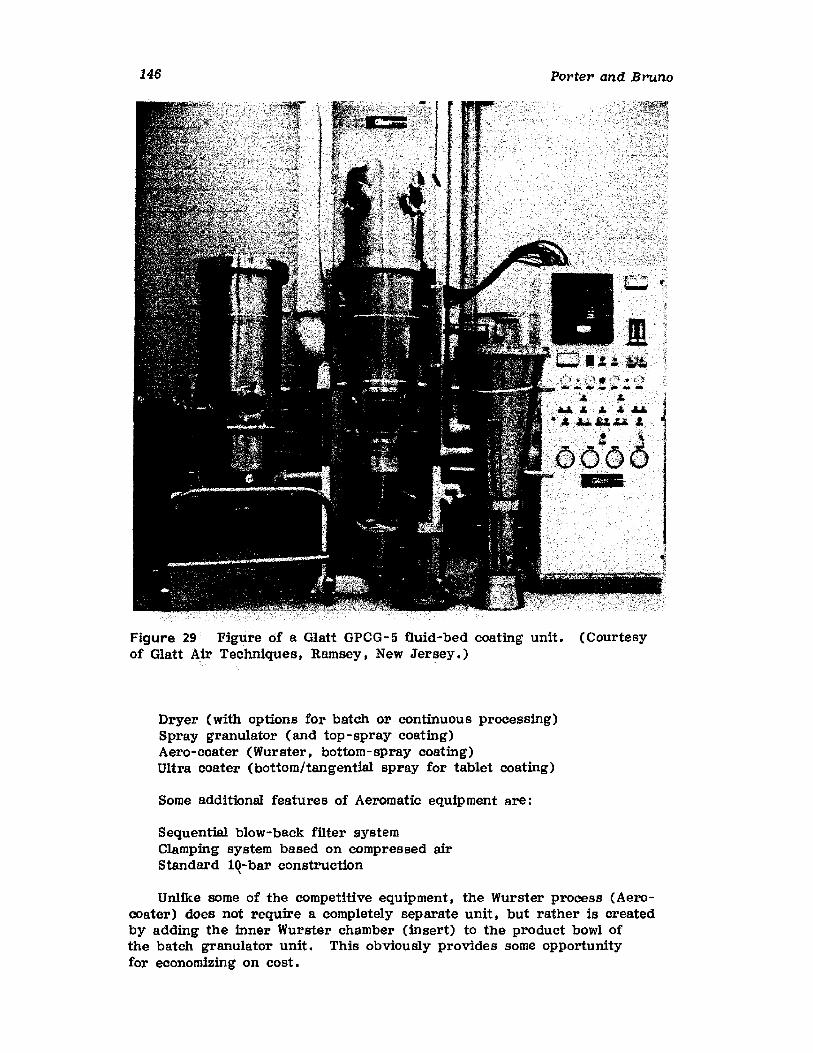
146 Porter and Bruno
Figure 29 Figure of a Glatt GPCG-5 fluid-bed coating unit. (Courtesyof Glatt Air Techniques t Ramsey, New Jersey.)
Dryer (with options for batch or continuous processing)Spray granulator (and top-spray coating)Aero-coater (Wurster, bottom-spray coating)Ultra coater (bottom/tangential spray for tablet coating)
Some additional features of Aeromatic equipment are:
Sequential blow-back filter systemClamping system based on compressed airStandard 10-bar construction,
Unlike some of the competitive equipment , the Wurster process (Aerocoater) does not require a completely separate unit, but rather is createdby adding the inner Wurster chamber (insert) to the product bowl ofthe batch granulator unit. This obviously provides some opportunityfor economizing on cost.
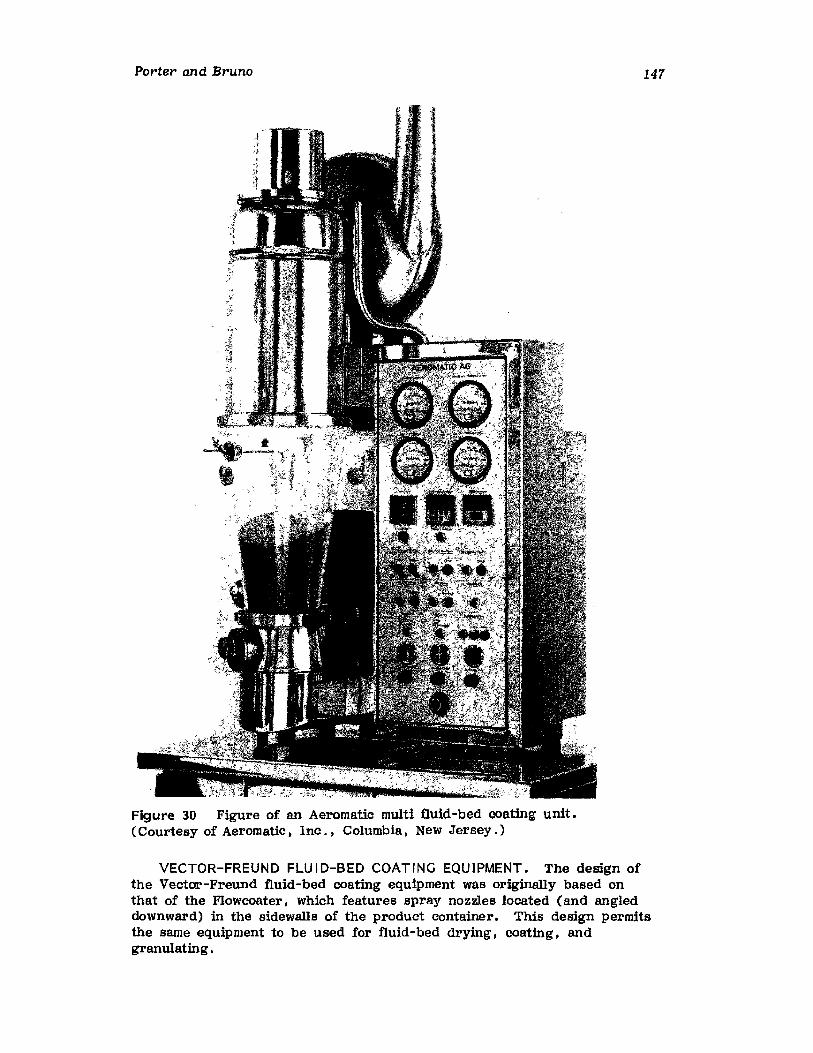
Porter and Bruno
Figure 30 Figure of an Aeromatic multi fluid-bed coating unit.eCourtesy of Aeromatic. Inc., Columbia, New Jersey.)
147
VECTOR-FREUND FLU ID-BED COATING EQUIPMENT. The design ofthe Vector-Freund fluid-bed coating equipment was originally based onthat of the Floweoater , which features spray nozzles located (and angleddownward) in the sidewalls of the product container. This design permitsthe same equipment to be used for fluid-bed drying, coating, andgranulating.
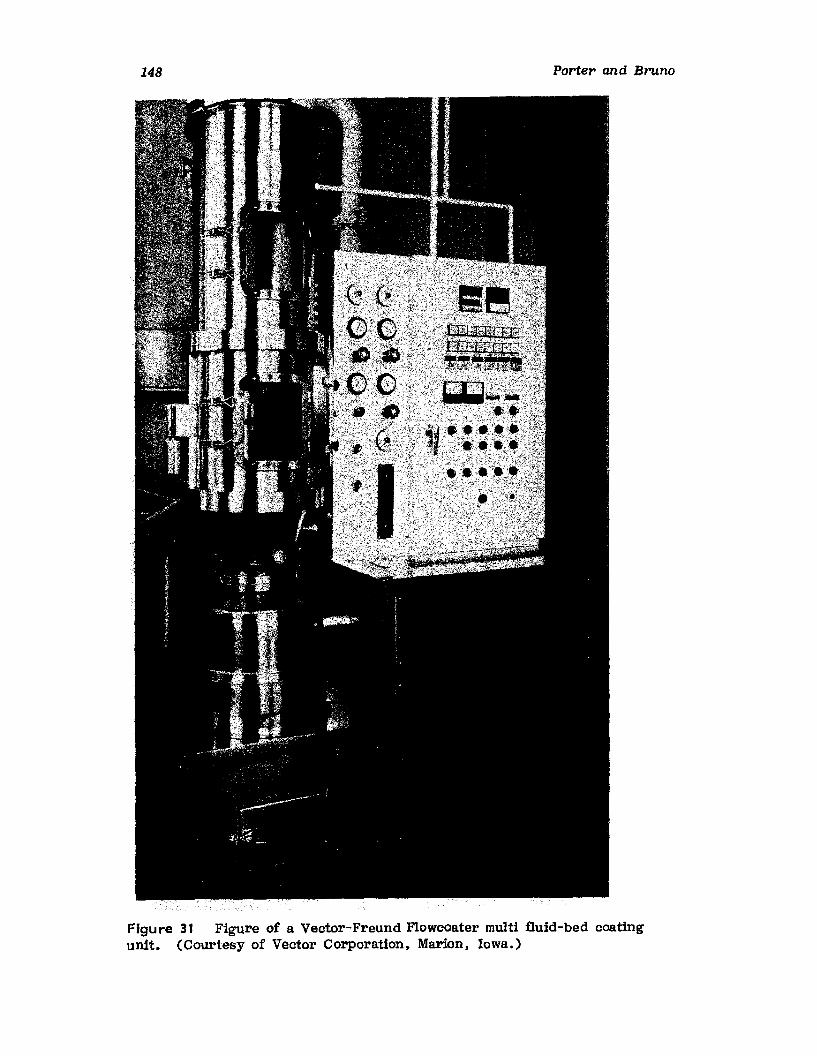
148 Porter and Bruno
Figure 31 Figure of a Vector-Freund Flowcoater multi fluid-bed coatingunit. (Courtesy of Vector Corporation. Marion. Iowa.)
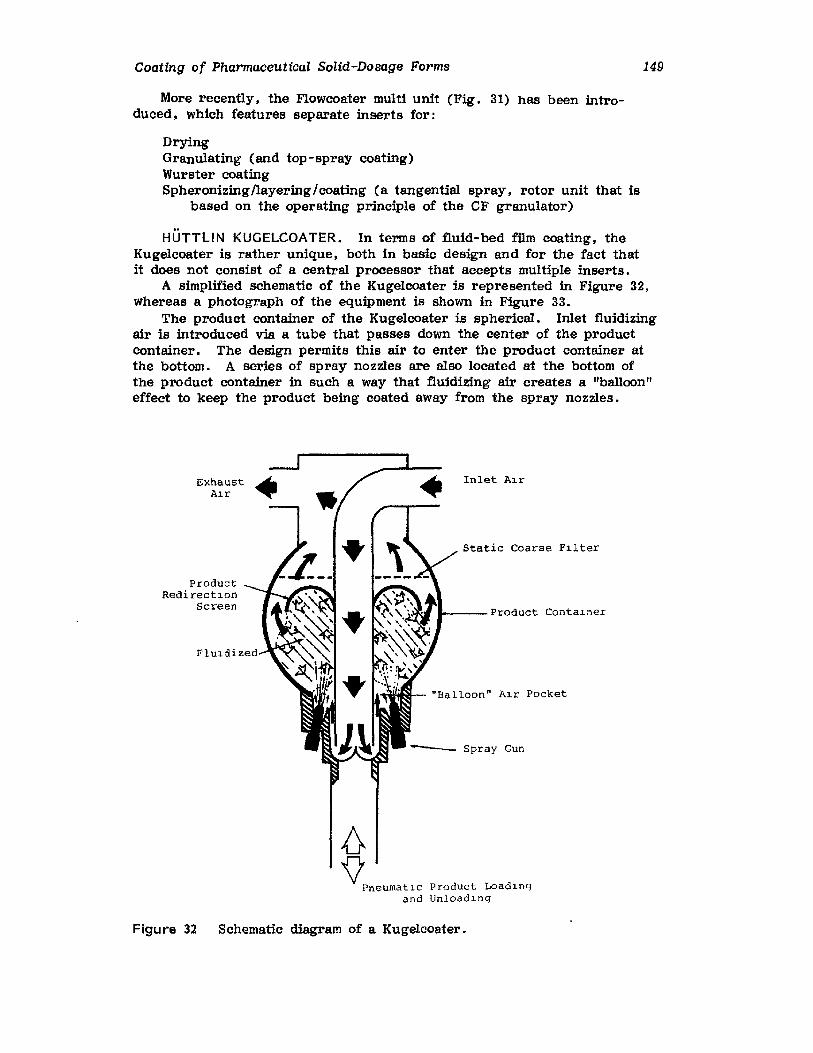
Coating of Pharmaceutical Solid-Dosage Forms
More recently, the Flowcoater multi unit (Fig. 31) has been introduced, which features separate inserts for:
DryingGranulating (and top-spray coating)Wurster coatingSpheronizing/layering/coating (a tangential spray, rotor unit that is
based on the operating principle of the CF granulator)
149
HUTTLIN KUGELCOATER. In terms of fluid-bed fllm coating, theKugelcoater is rather unique, both in basic design and for the fact thatit does not consist of a central processor that accepts multiple inserts.
A simplified schematic of the Kugelcoater is represented in Figure 32,whereas a photograph of the equipment is shown in Figure 33.
The product container of the Kugelcoater is spherical. Inlet fluidizingair is introduced via a tube that passes down the center of the productcontainer. The design permits this air to enter the product container atthe bottom. A series of spray nozzles are also located at the bottom ofthe product container in such a way that fluidizing air creates a "balloon"effect to keep the product being coated away from the spray nozzles.
ExhaustAl.r
ProductRedirectl.on
Screen
Inlet Al.r
Static Coarse Fl.lter
.---__ Product Contal.ner
"Balloon" Al.r Pocket
Spray Gun
;{}\lPneumatlc Product Loadl.nq
and Unloadl.nq
Figure 32 Schematic diagram of a Kugelcoater.

150 Porter and Bruno
Figure 33 Fig'Ure of a Hiittlin Kugeleoater ,national, Englishtown, New Jersey.)
(Courtesy of Key Inter-
The product fluidization pattern is constrained by a product redirectionscreen that restricts product entry into the filter system.
This unique design. encompassing the inclusion of multiple spray nozzles intended to maximize uniformity of distribution of the coating, alsopermits pneumatic loading and unloading of product.
Various sizes of the Kugelcoater are available, ranging from lab modelswith product container capacities of 2 L to those having capacities of700 L.
c. Application Equipment
In most modern pan-coating operations, one major emphasis is to provide ameans of mechanically applying coating liquids, and thus avoid manualtechniques such as ladling.
While there are similarities in requirements (for mechanical applicationof coating liquids) between the sugar-coating and film-coating processes,
Coating of Pharmaceutical Solid-Dosage Forms 151
certain differences exist that almost certainly influence selection of appropriate equipment.
Sugar-coating liquids typically have solids contents in excess of 70%(w/w), and consequently can be extremely viscous. Contrast this withthe fact that film-coating liquids rarely contain greater than 20% nonvolatile materials (Which typically fall in the range of 5 -15%).
Uniform distribution of sugar-coating liquids is achieved by the cascading action (of the product being coated) that takes place within the panand causes transfer of liquid from one piece to another. This transfershould occur before any substantial drying occurs. Thus, the applicationequipment needs only to be very simple in design and allow the coatingliquid to stream onto the surface of the cascading product.
Conversely, film-coating liquids (almost without exception) need to beapplied in a finely atomized state and uniformly distributed across the surface of the product being coated.
In the context of this chapter. mechanical application refers to anymethod of introducing a coating liquid across the surface in an appropriatemanner other than hand ladling.
Application Sparges
Application sparges were discussed earlier in this chapter (and illustratedin Fig. 3) and refer to simple equipment that allow the coating liquid tostream across and onto the surface of the cascading bed of the productbeing coated.
The simplicity of this type of equipment makes it extremely suitablefor use in the sugar-coating process.
Airless Spray Equipment
Airless spray equipment generally consists of a particular design of spraygun that contains a nozzle with an extremely small orifice (typically200-400 um or 0.009-0.015"). The coating liquid is delivered under significant pressure (often in the range of 3.5 - 20.0 MPa or 500 - 3000 psi)and velocity, and literally explodes into tiny droplets as it emerges fromthe nozzle. Because of the high shear generated at the nozzle, a nozzleinsert or tip made of tungsten carbide is used. Nozzle tips are availablein a wide range of configurations that permit cone spray or flat (or ovalized) spray patterns to be generated.
Liquid flow rates through airless spray equipment are typically high.Stearn [62] described how such liquid flow rates. based on examination offundamental flow theories, are:
Directly proportional to the cross-sectional area of the nozzle orificeDirectly proportional to the square root of hydraulic pressure (of
coating liquid)Inversely proportional to density of the coating liquid
Since a minimum hydraulic pressure is required for optimal atomizationof the coating liquid. and there is a practical lower limit on orifice size(before clogging becomes a serious problem), airless spray equipment ismainly restricted to applications where high-volume delivery of coatingliquids is required. Such applications include production scale. organicsol vent -based film coating or similar scale sugar coating.
152 Porter and Bruno
Air-Spray Equipment
Air-spray application equipment is generally less expensive than the corresponding airless equipment, and is capable of delivering coating liquids atlow to relatively high application rates. The functional components of anair-spray gun are the fluid cap (through which the liquid emerges) andthe air cap (through which compressed air is delivered to create thedriving force for atomization). Typically, the air cap fits over the fluidcap (or nozzle) and forms an annulus that allows compressed air to impingeon the stream of coating liquid emerging from the fluid nozzle. This impingement causes the coating liquid to be broken up into tiny droplets.
Droplet size and size distribution are typically controlled by atomizingair pressure and volume. In most pan-coating operations, in order toallow the coating liquid to be spread out, the air cap also has "wing tips"that permit compressed air to be directed laterally onto the atomized sprayso that the spray pattern is ovalfzed, In order to avoid increased risk ofspray drying and turbulence. care should be taken not to try and ovalizeexcessively the spray patterns. For this reason, air-spray guns typicallyare unable to cover as much of the surface of the product bed as airlessguns, and thus more air-spray guns must be used for a particular application (e.g., in a typical 48" Accela-Cota setup, whereas two airless gunsmay provide adequate coverage, three or more air-spray guns may berequired to provide equivalent coverage).
Air-spray equipment is typically suited to small-scale coating operations and all those involving the use of aqueous formulations (where theatomizing air effectively augments the drying capabilities of the airhandling system). Air-spray equipment should be used with great carefor organic-solvent-based film coating processes, since the atomizing aircan cause excessive spray drying.
Ultrasonic-Spray Equipment
Recently, attempts have been made to utilize ultrasonic nozzles as a meansof effectively atomizing and applying coating liquids. Such nozzles arecommonly used in oil burners and as part of the lithophotographic processused in the semiconductor industry. and to apply specialized coatings ontothe surfaces of medical devices.
The major advantages of such nozzles are that they are economical tooperate (although initial capital cost can be high). produce atomizedliquids with uniform size distributions and low velocities, and eliminatemany of the problems associated with overspray and fogging.
While various designs of ultrasonic nozzles are available, those usedfor coatings typically have relatively large orifices and conical tips. Theoperating principle of an ultrasonic nozzle is similar to that of a speakerin audio equipment. In this case, ceramic piezoelectric transducers convert electrical energy into mechanical energy, which is transmitted to atitanium horn that forms the atomizing tip. Coating liquid that is introduced onto the atomizing surface absorbs some of the vibrational energy.causing a wave motion to be set up in the liquid. If the vibrationalamplitude is carefully controlled, the liquid wID break free from the surface of the nozzle as a fine mist (with median droplet sizes in the rangeof 20-50 um) .
So far, the use of ultrasonic nozzles with pharmaceutical coatingliquids has met with t¥ery limited success. Most polymeric-coating
Coatin.g of Pharmaceutical Solid-Dosage Forms 153
solutions appear to present a problem with respect to achieving effectiveand-controllable atomization. This limitation seems to reflect the complexrheological and cohesive properties of these solutions. Such nozzles mightbe used more effectively where the coating liquid is a dispersion (e. g. ,many of the formulations used in sugar coating or the aqueous latex systems used in film coating).
Berger [63] has given a more complete description of ultrasonic nozzles, their applications, and limitations.
D. Metering/Delivery Equipment
This discussion of metering/delivery equipment refers to that equipmentWhich enables coating liquid to be delivered from a bulk holding tank tothe application equipment described in the previous section (Sec. IV.C).
Pressurized Con.tainers
Pressurized containers (or pressure pots, as they are commonly called)were once commonly used with many organic-solvent-based film-coatingsystems and have recently been reintroduced as components of somespecialized automated delivery systems.
Basically, such a system consists of a special liquid holding tank thatcan be pressurized by compressed air. Once pressurized, the liquid isforced from the tank through feed lines to the spray nozzle. Fluid delivery rates with such equipment will be dependent on air pressure.liquid viscosity and density, length and internal diameter of the feed lines,and design of the spray nozzles used.
All other things being equal (for a given system and coating liquid),flow rate is controlled via a pressure regulator that determines pressurewithin the tank.
Precision with such a system may be inadequate when attempting todeliver low-viscosity aqueous-coating liquids (such as latex dispersions).
Peristaltic Pumps
Peristaltic pumps (or "tubing" pumps) are commonly used in many coatingoperations. The operating principle of these pumps is based on the abilityto create liquid flow in a tube by squeezing and stretching that tube.Most common peristaltic pumps have a pump head that allows a piece oftubing to be clamped in a U - shaped fashion against a rotating mechanicaldevice (such as "fingers" or rollers) that squeezes the tube and createsmotion of the liquid within the tube. To function effectively, the materialfrom which the tubing is made should have sufficient resiliency that itquickly recovers its original shape after squeezing. For this reason. preferred tubing is made from silicone rubber.
Peristaltic pumps have two major advantages:
1. They are simple and inexpensive (to purchase and operate).2. They are sanitary (since the liquid being transferred does not
come in direct contact with the mechanical pump head). and cleanup is easUy accomplished by passing a cleaning liquid through thetubing, and tubing that is difficult to clean can be replaced atlittle cost.
154 Porter and Bruno
There are some major drawbacks with such equipment, including:
They are not positive displacement pumps.Linearity, and often accuracy, decreases as the pump speed is in
creased (particularly at the high end of the speed range).Accuracy decreases as the tubing wears and fatigues.Their effectiveness is limited by liquid viscosity.
Gear Pumps
Gear pumps are becoming extremely popular in aqueous film coating. Theyare positive displacement pumps that rely on two counterrotating gears todraw liquid into and through the pump housing. Because the gears comeinto contact with the coating liquid, they must be made of noncorrodiblematerials. Gear pumps can transfer liquids with a wide range of viscosities,but rely on the inherent "lubrdctty" of the coating liquid to minimize wearin the gear mechanism.
Some limitations of gear pumps are:
CostRequirement for more complicated clean-up proceduresLikelihood of excessive wear of mechanism when pumping highly pig
mented. low-viscosity coating liquidsLikelihood of inducing coagulation of latex-coating systems as a result
of shear developed as liquid passes through pump head
While many gear pump s rely on a direct mechanical drive. some recentmodels have an indirect magnetic drive.
Piston Pumps
Piston pumps. which are also positive displacement pumps, rely on a reciprocating piston (typically powered by a compressed air motor) to transfer the coating liquid. Such a pump can easily handle very viscous liquidsand so is well suited to sugar-coating and most film-coating operations.
Those piston pumps driven by air motors usually have a particularpressure ratio rating (such as 30; 1, 10; 1, or 5: 1). This rating refers toamount by Which pressure supplied by the air operating the pumps is increased when transferred to the liquid being pumped. For example J 10psi air pressure applied to a 30:1 ratio pump will generate 300 psi of liquidline pressure. For this reason, such pumps are commonly used as the delivery mechanism in airless spray systems.
More recently, electrically driven piston pumps, which have variablespeeds and stroke lengths and generate very little line pressure, havebeen introduced as components of air-spray systems used in aqueous filmcoating. An example of such a pumping system is the VOlumetric pumpPD 1000/S supplied with the Pellegrini-OS coating system.
Piston pumps, like gear pumps, are relatively expensive and not aseasy to clean as tubing pumps. In addition, the shearing action as thepump reciprocates may induce coagulation of latex-coating systems. Thisis particularly true when any significant line pressure is generated.
Coating of Pharmaceutical Solid-Dosage Forms
V. AUTOMATED COATING PROCEDURES
A. Jntroduction
155
In the early days of tablet coating, the addition of coating liquids, determination of distribution/mixing times. and application of drying andexhaust air were all manual operations. Decisions as to when heated airshould be applied, coating liquid should be added, and how long to allowfor uniform distribution of the coating liquid were all judgmental factors onthe part of the operator.
In order to achieve a high level of reproducibility in the process andsimplify the documentation process, it is apparent that the above situationhas many limitations.
To effectively automate a process, it is necessary to remove the requirements for direct (and repeated) involvement by the operator. Theprocess must be well developed and precisely defined (when a poorly defined process is automated it will simply produce consistently unacceptableresults time after time). In particular, it is imperative to avoid using anycritical steps that can only be achieved on such a limited basis as torender the whole process impractical.
The benefits to be derived from a well-automated process are;
Independence from operator judgmentAchievement of consistent product qualityAchievement of a fully optimized process with greater potential for
minimizing processing timesProduction of hard-copy documentation
It is critical, however, that an automated process possesses a fail-safemechanism so that process shutdown takes place in the event of processfailure. Such a procedure will reduce the liklihood that a batch of product is ruined.
The automation of a coating process typically involves two basicactivities:
1. Timing and sequencing (more appropriate for sugar coating wherea sequence of events must occur at specific time intervals)
2. Measuring and controlling appropriate processing parameters
The second of these two activities can be the more difficult, particularly since appropriate precision in measuring devices may be difficult toachieve. Measuring and control devices may be classified as;
ElectromechanicalPneumaticElectronic
There is no doubt that electronic devices are preferred in order todeal with the complexities of today's coating processes. Electronic devices, however, are subject to drift, and thus must constantly be zecalibrated to ensure accuracy and precision.
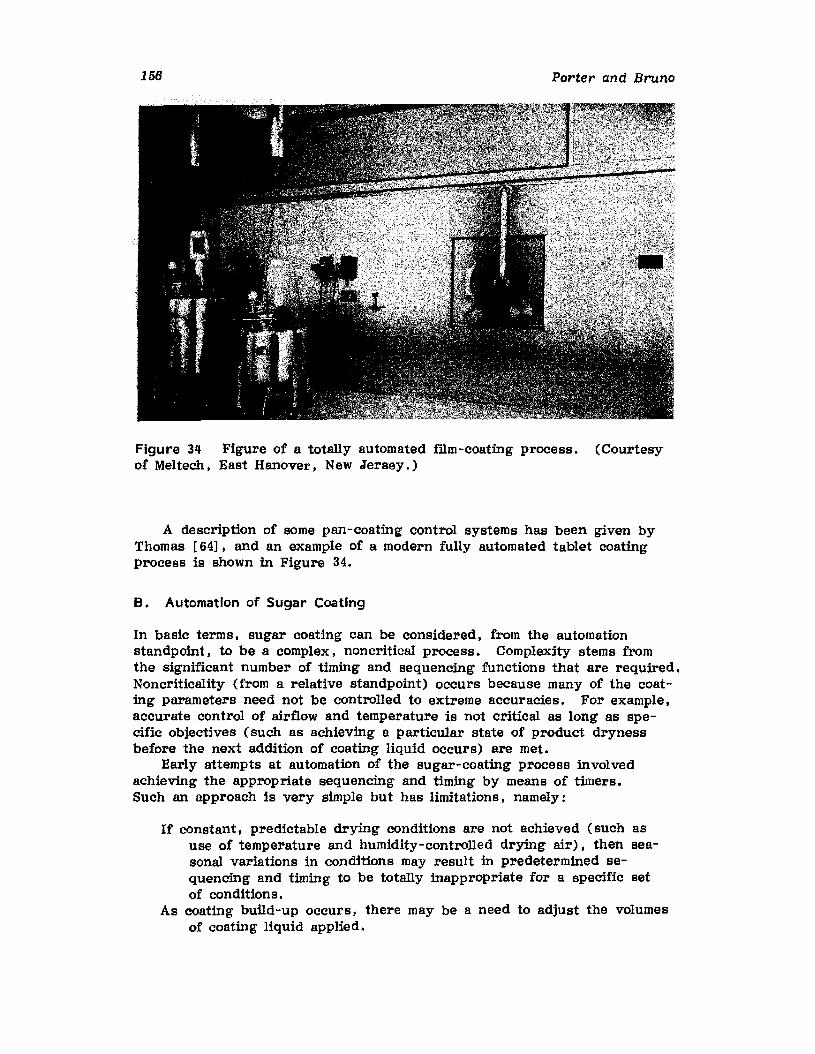
156 Porter and Bruno
Figure 3lJ. Figure of a totally automated film-coating process. (Courtesyof Meltech. East Hanover. New Jersey.)
A description of some pan-coating control systems has been given byThomas [64], and an example of a modern fully automated tablet coatingprocess is shown in Figure 34.
B. Automation of Sugar Coating
In basic terms, sugar coating can be considered. from the automationstandpoint. to be a complex. noncritical process. Complexity stems fromthe significant number of timing and sequencing functions that are required.Noncriticality (from a relative standpoint) occurs because many of the coating parameters need not be controlled to extreme accuracies. For example,accurate control of airflow and temperature is not critical as long as specific objectives (such as achieving a particular state of product drynessbefore the next addition of coating liquid occurs) are met.
Early attempts at automation of the sugar-coating process involvedachieving the appropriate sequencing and timing by means of timers.Such an approach is very simple but has limitations. namely:
If constant, predictable drying conditions are not achieved (such asuse of temperature and humidity-controlled drying air). then seasonal variations in conditions may result in predetermined sequencing and timing to be totally inappropriate for a specific setof conditions.
As coating build-up occurs, there may be a need to adjust the volumesof coating liquid applied.
Coating of Pharmaceutical Solid-Dosage Forms 157
Over the last 25 years, various descriptions of automated procedureshave appeared in the pharmaceutical literature [65 - 67] •
An early commercially available system, the Drdamat , has been described by Rose [68].
A more recently introduced commercial, fully-automated, sugar-coatingprocess is the Sandomatic system, which was first described by Melligerand Goss [69].
The important independent process variables that need to be monitoredand controlled in a typical sugar-coating process are:
Drying air volume (or flow)Drying air temperatureDrying air humidityPan speedQuantity of coating liquid applied (at each step)
C. Automation of Film Coating
In comparison to sugar coating, film coating is a simpler, but more criticalprocess to automate. Little sequencing is required, but important processconditions must be monitored and controlled to a high degree of accuracy.
Important independent variables that need to be measured and controlled in a film -coating process inc1u de:
Drying air volumeDrying air temperatureDrying air humidityPan speedSpray rate (more precisely, the delivery rate from each spray gun in
a multiple-gun setup)Atomizing air pressure/volumePattern air pressure/volume
In addition, it may be necessary to control various dependent variables,particularly in the aqueous process where the margin for error can bemuch less than in other types of coating process. Some of the importantdependent variables that need to be monitored are:
Tablet bed temperatureExhaust air temperatureExhaust air humidityTablet bed moisture
Since these variables cannot be controlled directly, it will be necessaryto control the interaction between those independent variables that influencea particular dependent variable. For example, exhaust air temperaturemay be kept under control by maintaining an appropriate balance between:
Inlet air volum eInlet air temperatureInlet air humiditySpray rate
158 Porter and Bruno
In the aqueous film-coating process, the importance of taking into account the moisture content of the inlet drying air cannot be overemphasized. The simplest way of dealing with this issue is to keep inlet airhumidity constant by use of a dehumidificat .on process. Such an approachcan, however. prove to be extremely expensive, since the volumes of airthat need to be conditioned are typically very large (in an aqueous filmcoating process, e.g •• a typical 48" Accela-Cota coating a batch of tabletsin 90 min wID require approximately 5000 m3 of conditioned air).
An alternative is to compensate for variation in humidity of inlet airby adju sting one or more of:
Air volumeInlet air temperatureSpray rate
Lachman and Cooper [70] have described an early attempt to automatethe film-coating process. More recently, the automation principles of theSandomatlc process have been applied to film coating. Also, virtuallyevery supplier of pan-coating equipment can provide automated equipment,and selection may well depend on the preferences, and individual needs,of the pharmaceutical manufacturer.
REFERENCES
1. Signorino, C. A., U.S. Patent 3,738,952 (1973).2. Rowe. R. C .• Int. J. Pharm., 43:155 (1988).3. McGinlty, J. W., Aqueous Polymeric Coatings for Pharmaceutical
Dosage Forms. Marcel Dekker, New York, 1988.4. Skultety, P. F., Rivera, D., Dunleavy, J., and Lin, C. T. Drug
Dev. Ind. Pharm., 14(5):617 (1988).5. Reiland, T. L. and Eber, A. C •• Drug Dev ; Ind. Pharm., 13(3):
231 (1986).6. Thoennes, C. J. and McCurdy, V. E., contributed paper at PT
Section of 3rd Annual Meeting of AAPS, Orlando, Florida, Oct. 1988.7. Ebey, G. C.. Pharm. Tech.. 11( 4) : 40 (1987).8. Rowe, R. C., J. Pharm. Pharmacal., 29: 723 (1977).9. Fisher, D. G. and Rowe, R. C., J. Pharm, Pharmacol., 28:886
(1976) •10. Rowe, R. C., J. Pharm. Pharmacal., 30:669 (1978).11. Aulton, M. E., Twitchell, A. M., and Hogan, J. E.. Proceedings of
AGPI Conference, Paris (1986).12. Rowe, R. C., J. Pharm. Pharmacal., 32:851 (1980).13. Rowe, R. C. and Forse, S. F., Acta Pharm. Tech., 28( 3) : 207
(1982) •14. Twitchel, A. M•• Hogan, J. E., and Aulton, M. E., J. Pharm.
Pharmacal., 398: 128P (1987).15. Porter, S. C. and Saraceni, K., Pharm. Tech., 12(9):78 (1988).16. Kara, M. A. K., Leaver, T. M•• and Rowe, R. C., J. Pharm.
Pharmacal., 34:469 (1982).17. Rowe, R. C., Pharm, Int., 6(9):225 (1985).
Coating of Pharmaceutical Solid-Dosage Forms 159
18. Wicks, Z. W., Jr., FUm Formation. Series on Coatings Technology,Federation of Societies for Coating Technology, Philadelphia (1986).
19. Burrett , H., Offic. Dig., 34(445):131 (1962).20. Williams, M. L., Landel, R. F., and Ferry, J. D., J. Am. Chem.
Soc., 77:3701 (1955).21. Wicks, Z. W., Jr., J. Coatings Technol., 58(743):23 (1986).22. Entwistle, C. A. and Rowe, R. C., J. Pharm • Pharmacol., 31: 269
(1979) •23. Rowe, R. C., J. Pharm. Pharmacal., 33: 423 (1981).24. Bindschaedler, C., Gurney, R., and Doelker, E., Labo-Pharma
Probl. Tech., 31(331):389 (1983).25. Bradford, E. B. and Vanderhoff, J. W., J. Macromol. Chem., 1(2):
335 (1966).26. Gross, H. M. and Endicott, C. J., D&CI, 86( 2) : 170 (1960).27. Porter, S. C., Pharm • Tech., 4( 3) : 66 (1980).28. Crawford, R. R. and Esmerian, O. K., J. Pharm. set., 60(2):312
(1971) .29. Sakellariou, P., Rowe, R. C., and White, E. F. To, Int. J. Pharm.,
31: 55 (1986).30. Woznicki, E. J. and Schoneker, D. R., Coloring agents, In Encyclopedia
of Pharmaceutical Technology. Marcel Dekker, New York, in press.31. Porter, S. C., Int. J. Pharm, Tech. Prod. Mfr., 3( 1) : 21 (1982).32. Rowe, R. C., Pharm. Acta. Helv .• 60(5/6):157 (1985).33. Rowe, R. C., J. Pharm. Pharmacol., 33;51 (1980).34. Rowe, R. C., J. Pharm. Pharmacol., 36: 569 (1983).35. Rowe, R. C. and Forse, S. F., J. Piuirm, Pharmacal., 35:205
(1983) •36. Rowe, R. C., Int. J. Pharm., 14:355 (1983).37. Banker, G. S., J. Pharm, Sci., 55;81 (1966).38. HUdebrand, J. and Scott, R., The Solubility of Non-Electrolytes,
3rd Ed. Reinhold, New York, 1949.39. Kent, D. J. and Rowe, R. C., J. Pharm. Pharmacal., 31(5):269
(1979) •40. Rudin, A. and Wagner, R. A., J. Appl. Polym. Sc •• , 19:3361
(1975) •41. Johnson, K., Hathaway, R. D., and Franz, R. M., Presented at the
Contributed Paper Session of the 3rd Annual Meeting of AAPS,Orlando, Florida, 1988.
42. Porter, S. C., In Aqueous Polymeric Coatings for PharmaceuticalDosage Forms (J. W. McGinity, ed.), Marcel Dekker, New York,1988, p , 317.
43. Ozturk, S. S., Palsson, B. 0., Donohoe, B., and Dressman, J. B.,Pharm. se«, 5( 9) : 550 (1988).
44. Edgar, B., Bogentaft, C., and Lagerstrom, P. 0., Biopharm DrugDisp., 5:251 (1984).
45. Theeuwes, F., J. Pharm. sa., 64(12):1987 (1975).46. Lindholm, T. and JuIsin, M., Pharm. tna., 44(9):937 (1982).47. Jarnbhekar, S. S., Breen, P. J., and Rojanasakul , Y., Drug Dev.
Ind. Pharm., 13( 15) : 2789 (1987).48. Rowe, R. C., J. Pharm. Pharmacal., 35:112 (1983).49. Rowe, R. C., J. Pharm. Pharmacol., 32: 851 (1980).
160 Porter and Bruno
50. Breech. J. A., Lucisano, L. J., and Franz, R. M., J. Pharm.Pharmacol.. 40: 282 (1988).
51. Rowe. R. C. and Forse, S. F., Acta. Pharm. Technol.. 28(3):207(1982).
52. Kim. S., Mankad. A •• and Sheen, P. Drug Dev. Ind. Pharm., 12(6):801 (1986).
53. Down. G. R. B., J. Pharm. Pharmacal., 34(4):281 (1982).54. Shah, B. B., Contractor, A. M.. and Auslander. D. E., Pharm.
Res., 5(10):S-253 (1988).55. Wurster. D. E., U.S. Patent 2.648,609 (1953).56. Hall. H. S. and Hinkes, T. M., Presented at the Symposium on
Microencapsulation: Processes and Applications. American ChemicalSociety. Chicago, Aug. 27-31, 1973.
57. Glatt Technically Speaking, 2( 1) : 1 (1989).58. Jones. D. M., Pharm. Technol., 9(4):50 (1985).59. Mehta, A. M., Pharm. Technol., 12( 2) : 46 (1988).60. Olsen. K. W. and Mehta. A. M., Int. J. Pharm. Tech. Prod. Mfr••
6( 4) : 18 (1985).61. Johansson, M. E., Ringberg, A., and Nicklasson, M., J. Micro-
encapsul •• 4(3):217 (1987).62. Stern. P. W., J. Pharm; Sci•• 63(7):1171 (1974).63. Berger, H. L., Machine Design, July 1988.64. Thomas. R., Pharmaceut. Eng., 16:Aug. -Oct. (1981).65. Rieckmann, P., Drugs Made in Germany, 6:162 (1963).66. Heyd, A. and Kanig, J. L., J. Pharm. sa., 59(8):1171 (1970).67. Fox, D. C., Buckpitt, A. E., Laramie, M. V., and Miserany, M. E.,
Presented at A.I.Ch.E. Meeting, New York, Nov. 17, 1977.68. Rose, F., D&C.I•• 44:Nov. (1971).69. Melliger, G. and Goss, L•• Presented at A.Ph.A. Annual Meeting,
New York. April 1977.70. Lachman. L. and Cooper. J., J. Pharm. Sci; , 52( 5) : 490 (1963).
3Particle-Coating Methods
Dale E. Wurster
University of Iowa. Iowa City, Iowa
I. INTRODUCTiON
There are many important pharmaceutical reasons for applying coatings toboth pure chemicals used as medicinal agents and to physical -chemicalsystems employed as dosage forms [l-4J. Similar coatings are also widelyused in other industries to coat particulate solids. One of the most widespread pharmaceutical uses today is for the control of drug release fromvarious types of oral or parenteral dosage forms designed to have eitheran enteric, a timed, or a sustained-release effect. Thus, particle coatings can be formulated so that the escape of the drug from the dosageform occurs primarily via a diffusional process. The various physicalparameters influencing diffusion can then be modified in order to controlthe rate of drug release. In other systems, the dissolution kinetics ofthe applied coat serve to control the availability of the contained drug.In still other cases, drug release can be controlled by chemical reactionsinvolving the coating material or by simple attritional effects on the coat.No matter what mechanism of controlled drug release one wishes to use, itis apparent that this can usually be achieved by the proper formulation ofcoating materials and the manner in which they are applied.
A second type of effect achieved by coating procedures is the enhancement of the chemical stability of drugs. It is possible to formulatecoating materials to guard against the penetration of substances which willcause specific degradation reactions. Thus, coatings can be designed toresist the penetration of water vapor when the product contains drugswhich are susceptible to hydrolytic decomposition. For those drugs whichdegrade by oxidative reactions, coatings can be used which inhibit thetransport of oxygen to the lab:ile compound. In cases where detrimental
161
162 Wurster
interactions result from materials contained within the physical system rather than from external influences, the incompatible materials can be separated by suitable coatings.
Of course, coating procedures have long been used to occlude drugswith an unpleasant taste from the taste receptors, or to impart pleasingcolors to a product to make it more attractive visually. Certain otherphysical parameters, such as particle density, surface characteristics, orgeometry, can also be altered by the use of coatings to obtain processingadvantages. For example, coatings can sufficiently change the geometryand surface of small particles so that the flow properties of a powder areenhanced.
It is the primary intent of this chapter to present a discussion ofthose processes which are useful in particle coating to meet the aboveneeds. While the theoretical mechanisms involved in controlling such factors as drug release and chemical stability are of great interest to all whowork with these systems, a discussion of these mechanisms is not withinthe scope of this chapter. Primary emphasis is, therefore, directed towardthe processes which are useful for the coating of solid particles. However,methods which are mainly useful for the microencapsulation of liquids arealso briefly discussed. This is because these processes can usually bemodified so that, in some manner, particulate solids can also be coated.
II. WURSTER PROCESS
A. Introduction
The commonly called air-suspension particle-coating method, also known asthe Wurster process,* has been utilized for many years by the pharmaceutical, chemical, food, agricultural, and other industries. The rapidityof the operation, the ability to control variables, the uniformity of the coatproduced, and the fact that it can be used to coat particles varying greatly in size. shape, and density are some of the main advantages of theprocess. Further, the process does not restrict either the kind of coatingmaterials used or the solvents employed in the coating fluids. Even chemical reactions designed to produce polymer coatings from applied monomersolutions can be easily conducted in the column.
Because it is possible to control the variables of the process the method is sufficiently flexible to make it extremely versatile. Thus, theprocess can be utilized to coat medicinal tablets [5 -13] or other large particles, to microencapsulate fine particles [14], to control drug release fromcoated particles [15,16], and to prepare compressed tablet granulations[17,18] or the like. By the proper adjustment of process conditions, it ispossible to either coat solid particles Or to cause particles to aggregate.It is also possible to control the density, geometry, friability, and otherphysical parameters. of the treated particles.
There is little doubt that the Wurster process provides the most rapid,efficient, and cost-effective method of producing film-coated compressed
"'Wisconsin Alumni Research Foundation, Madison. Wisconsin.
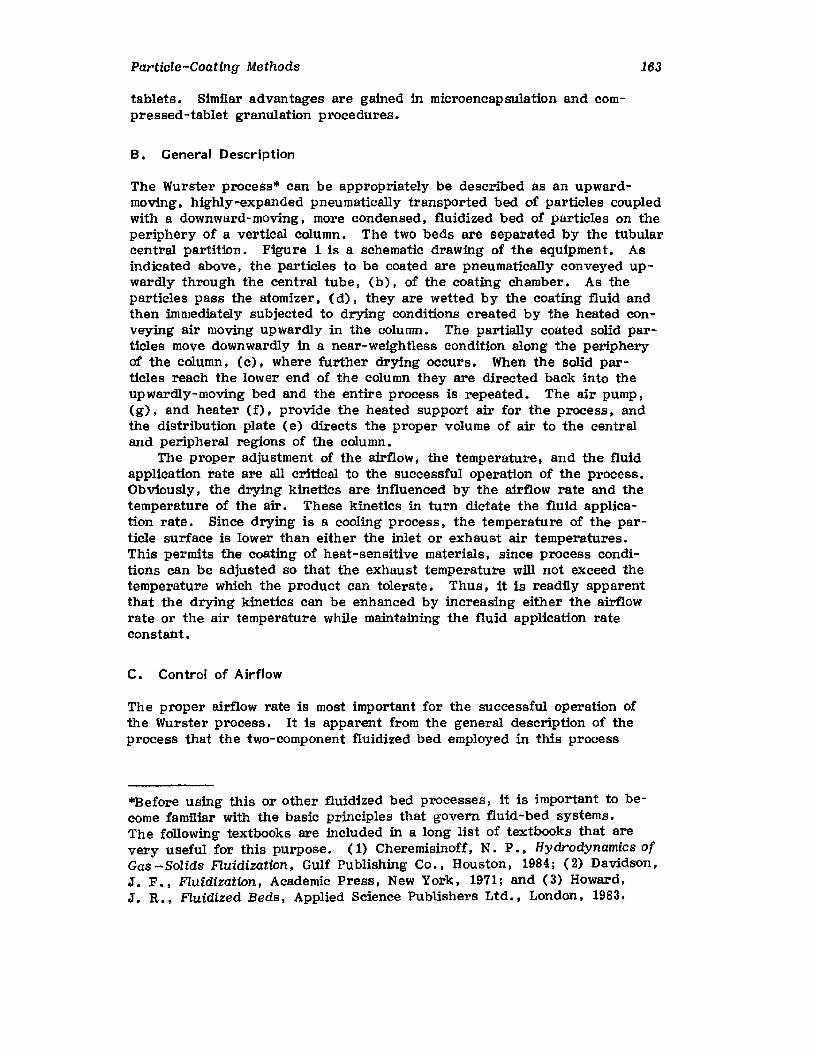
Particle-Coating Methods
tablets. Similar advantages are gained in microencapsulation and compressed-tablet granulation procedures.
B. General Description
163
The Wurster process* can be appropriately be described as an upwardmoving, highly-expanded pneumatically transported bed of particles coupledwith a downward-moving, more condensed, fluidized bed of particles on theperiphery of a vertical column. The two beds are separated by the tubularcentral partition. Figure 1 is a schematic drawing of the equipment. Asindicated above. the particles to be coated are pneumatically conveyed upwardly through the central tube, (b). of the coating chamber. As theparticles pass the atomizer, (d). they are wetted by the coating fluid andthen Immediately subjected to drying conditions created by the heated COnveying air moving upwardly in the column. The partially coated solid particles move downwardly in a near-weightless condition along the peripheryof the column. (c). where further drying occurs. When the solid particles reach the lower end of the column they are directed back into theupwardly-moving bed and the entire process is repeated. The air pump,(g). and heater (f), provide the heated support air for the process, andthe distribution plate (e) directs the proper volume of air to the centraland peripheral regions of the column.
The proper adjustment of the airflow, the temperature, and the fluidapplication rate are all critical to the successful operation of the process.Obviously. the drying kinetics are influenced by the airflow rate and thetemperature of the air. These kinetics in turn dictate the fluid application rate. Since drying is a cooling process. the temperature of the particle surface is lower than either the inlet or exhaust air temperatures.This permits the coating of heat-sensitive materials, since process conditions can be adjusted so that the exhaust temperature will not exceed thetemperature which the product can tolerate. Thus, it is readily apparentthat the drying kinetics can be enhanced by increasing either the airflowrate or the air temperature while maintaining the fluid application rateconstant.
C. Control of Airflow
The proper airflow rate is most important for the successful operation ofthe Wurster process. It is apparent from the general description of theprocess that the two-component fluidized bed employed in this process
*Before using this or other fluidized bed processes. it is important to become familiar with the basic principles that govern fluid-bed systems.The following textbooks are included in a long list of textbooks that arevery useful for this purpose. (1) Cheremisinoff, N. P., Hydrodynamics ofGas -Solids Fluidization. Gulf Publishing Co •• Houston, 1984; (2) Davidson,J. F., Fluidization, Academic Press, New York, 1971; and (3) Howard,J. R., Fluidized Beds, Applied Science Publishers Ltd., London, 1983.
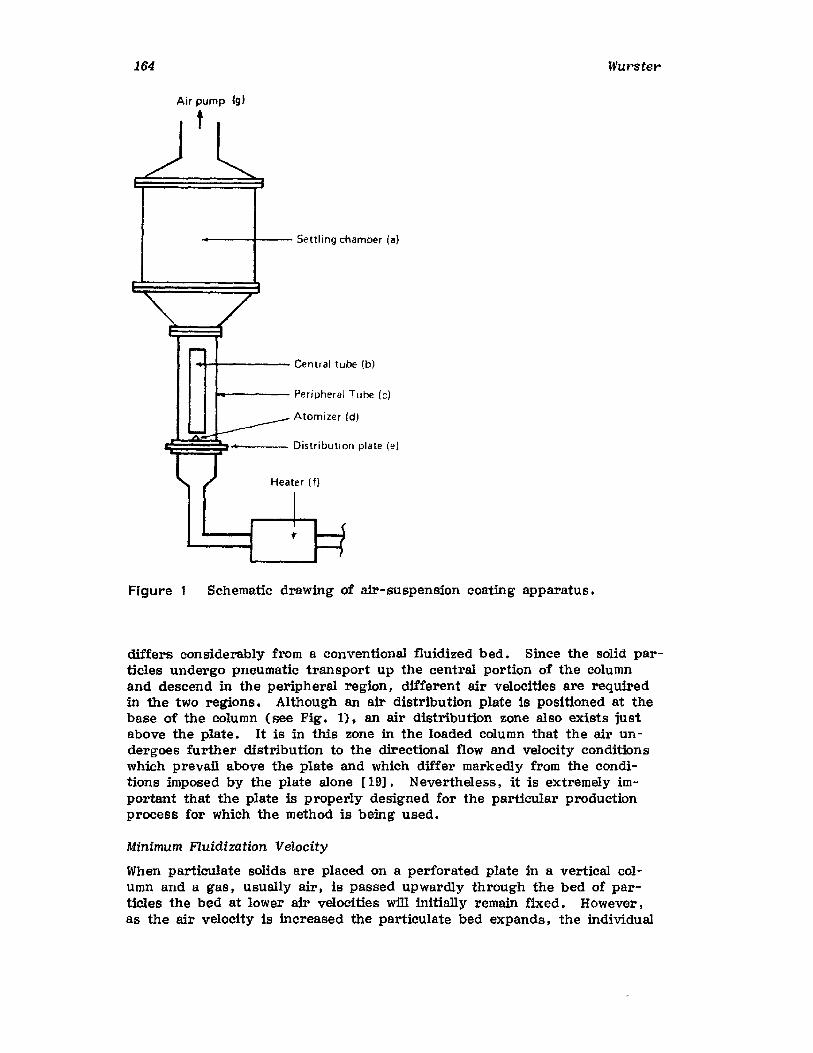
164
---+--- Settling chamber (a)
.....+----- Central tube (b)
....---- Peripheral Tube (c)
Atomizer (d)
~§E~~"""--- Distribution plate (e)
Heater (1)
Figure 1 Schematic drawing of air-suspension coating apparatus.
Wurster
differs considerably from a conventional fluidized bed. Since the solid particles undergo pneumatic transport up the central portion of the columnand descend in the peripheral region, different air velocities are requiredin the two regions. Although an air distribution plate is positioned at thebase of the column (see Fig. 1). an air distribution zone also exists justabove the plate. It is in this zone in the loaded column that the air undergoes further distribution to the directional flow and velocity conditionswhich prevail above the plate and which differ markedly from the conditions imposed by the plate alone [19]. Nevertheless, it is extremely important that the plate is properly designed for the particular productionprocess for Which the method is being used.
Minimum Fluidization Velocity
When particulate solids are placed on a perforated plate in a vertical column and a gas, usually air, is passed upwardly through the bed of particles the bed at lower air velocities will initially remain fixed. However,as the air velocity is increased the particulate bed expands, the individual
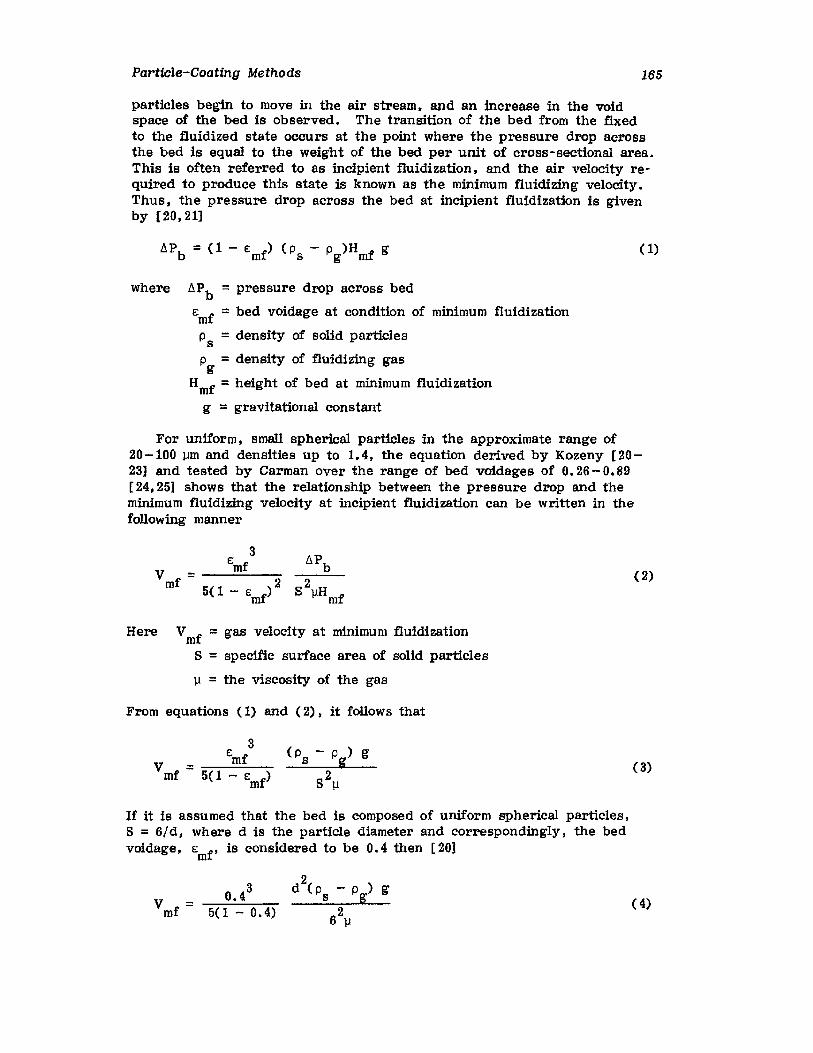
Particle-Coating Methods 165
particles begin to move in the air stream. and an increase in the voidspace of the bed is observed. The transition of the bed from the fixedto the fluidized state occurs at the point where the pressure drop acrossthe bed is equal to the weight of the bed per unit of cross-sectional area.This is often referred to as incipient fluidization, and the air velocity required to produce this state is known as the minimum fluidizing velocity.Thus. the pressure drop across the bed at incipient fluidization is givenby [20.21]
(1)
Where &Pb := pressure drop across bed
Emf =bed voidage at condition of minimum fluidization
p =density of solid particlesso =density of fluidizing gasg
Hmf = height of bed at minimum fluidization
g =gravitational constant
For uniform. small spherical particles in the approximate range of20-100 um and densities up to 1.4. the equation derived by Kozeny [2023] and tested by Carman over the range of bed voidages of O. 26 - 0.89[24.25] shows that the relationship between the pressure drop and theminimum fluidizing velocity at incipient fluidization can be written in thefollowing manner
3E
V:= mfmf 5(1 _ E )2
mf
(2)
Here Vmf = gas velocity at minimum fluidization
S = specific surface area of solid particles
J.l =the viscosity of the gas
From equations (1) and (2). it follows that
3e
V = mfmf 5(1 - Emf)
(3)
If it is assumed that the bed is composed of uniform spherical particles.S = 6/d, where d is the particle diameter and correspondingly. the bedvoidage, Emf' is considered to be 0.4 then [20)
0.43
V :=mf 5(1 - 0.4)
( 4)
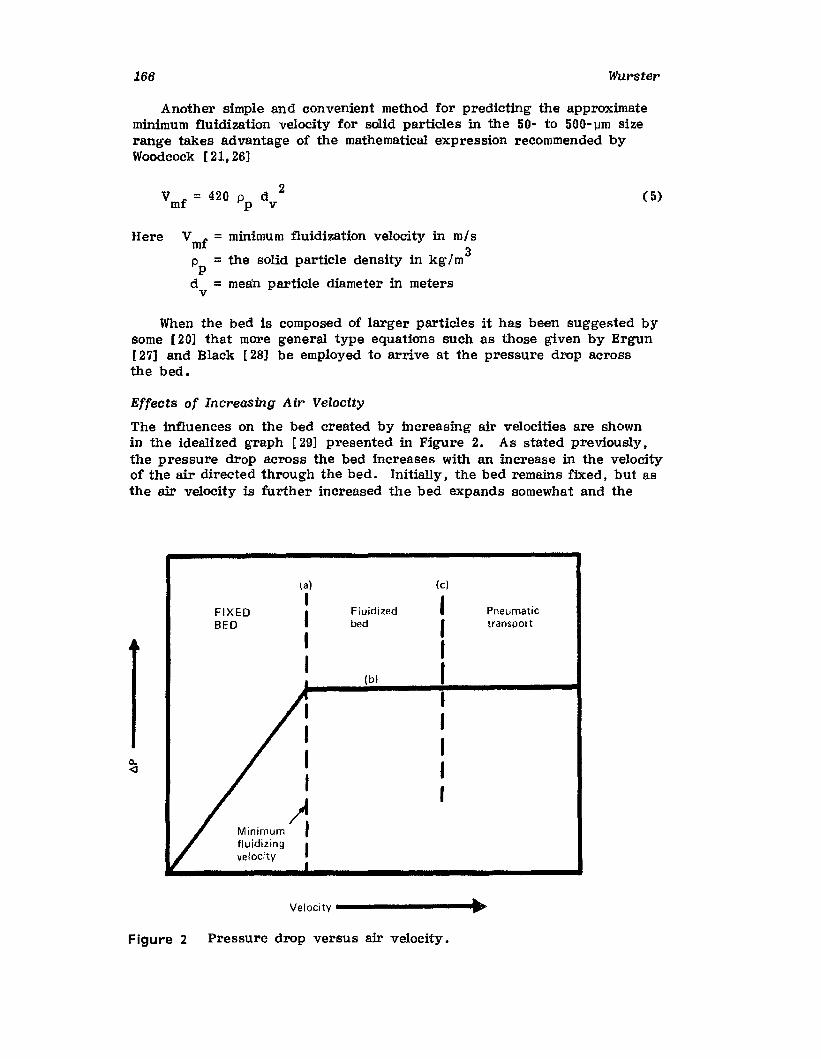
166 Wurster
Another simple and convenient method for predicting the approximateminimum fluidization velocity for solid particles in the 50- to 500-jJm sizerange takes advantage of the mathematical expression recommended byWoodcock [21,26)
( 5)
Here Vmf = minimum fluidization velocity in mls
p =the solid particle density in kg/ m3p
d =mean particle diameter in metersv
When the bed is composed of larger particles it has been suggested bysome [20] that more general type equations such as those given by Ergun[27] and Black [28] be employed to arrive at the pressure drop acrossthe bed.
Effects of Increasing Air Velocity
The influences on the bed created by increasing air velocities are shownin the idealized graph [29] presented in Figure 2. As stated previously,the pressure drop across the bed increases with an increase in the velocityof the air directed through the bed. Initially. the bed remains fixed, but asthe air velocity is further increased the bed expands somewhat and the
0..<J
(al
IFIXED I FluidizedBED bed
II
(bl
)Minimum Ifluidizing Ivelocity
[c]
IIIIIIIII
Pneumatictransport
Figure 2 Pressure drop versus air velocity.

Particle-Coating Methods 167
point of incipient particle fluidization and the mimmum fluidizing air velocity is reached at point (a). A further increase in the air velocity topoint (b) does not yield a concomitant increase in the pressure drop; however, the bed does further expand, bed voidage changes. and the natureof the bed changes drastically as it passes from smooth fluidization throughbubbling fluidization. slugging, and fast fluidization phases. Ultimately,as the air velocity is further increased pneumatic transport of the solidparticles begins at point (c).
A graph of the type shown in Figure 2 can also be readily preparedfrom the experimental data obtained on a particular type of bed. Ofcourse, in this case, the particle size, shape, and density will remain constant. This type of experimental graph is particularly useful to show thepressure drop across the bed and the air velocity required to produce thevarious phases of bed fluidization. Since the Wurster process employs atwo-component fluidized bed, it is most important to know the minimumfluidization and pneumatic transport velocities. Other types of experimentally derived graphs will also be found to be most useful for a coatingcolumn of a given diameter. For example, the manner in which a changein the size of the solid particles in the bed, but which have the same shapeand density, influence the required velocities can be shown by plotting theair velocity in cubic feet per minute (cfm) or the pitot tube reading ininches of water versus the particle size of the mesh size [30].
When there is a tendency for the solid particles in the bed to interlock with one another the pressure drop across the bed actually increasesand departs from theoretical, as is shown in curve (a) of Figure 3. If thebed is composed of large and unevenly sized particles, the departure fromthe theoretical pressure drop is manifested by a pressure decrease owingto uneven support of parts of the bed and uneven bed fluidization, as isshown in curve (b) of Figure 3.
log velocity
Figure 3 Pressure drop versus air velocity. A = Interlocking particles,B =large particles.
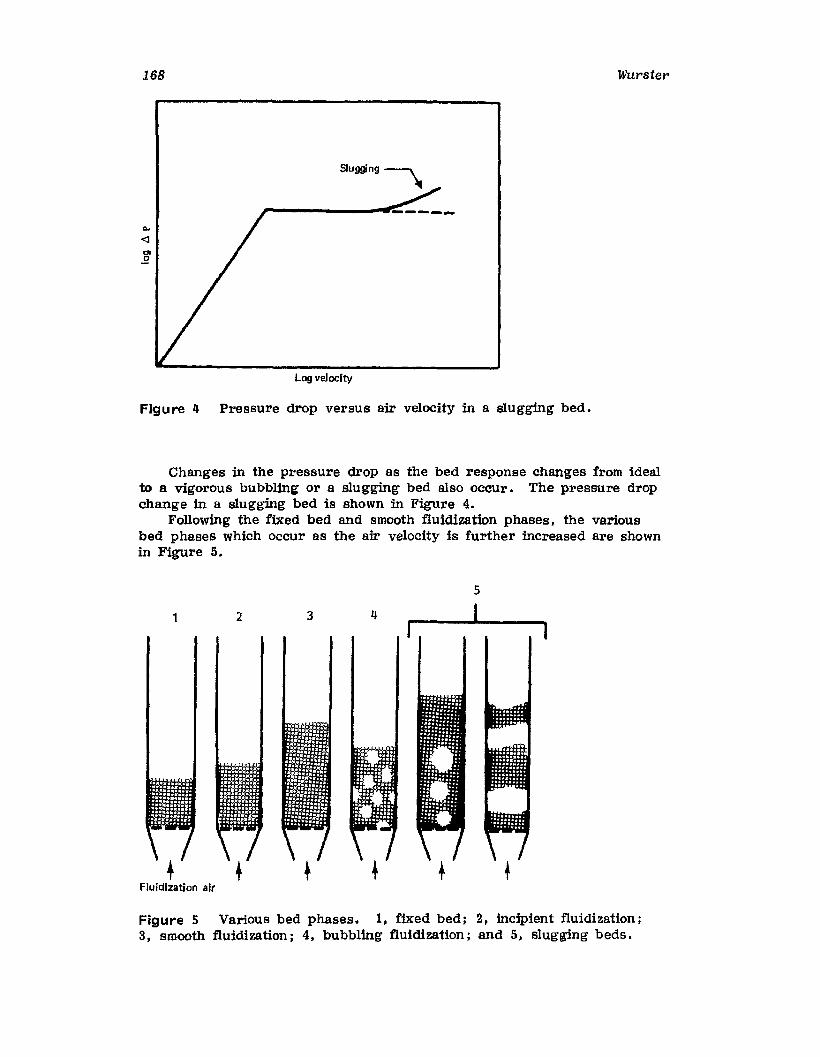
168
Log velocity
Figure 1I Pressure drop versus air velocity in a slugging bed.
Wurster
Changes in the pressure drop as the bed response changes from idealto a vigorous bubbling or a slugging bed also OCCUr. The pressure dropchange in a slugging bed is shown in Figure 4.
Following the fixed bed and smooth fluidization phases. the variousbed phases which occur as the air velocity is further increased are shownin Figure 5.
5
2 3r
Figure 5 Various bed phases. 1, fixed bed; 2, incipient fluidization;3, smooth fluidization; 4, bubbling fluidization; and 5, slugging beds.
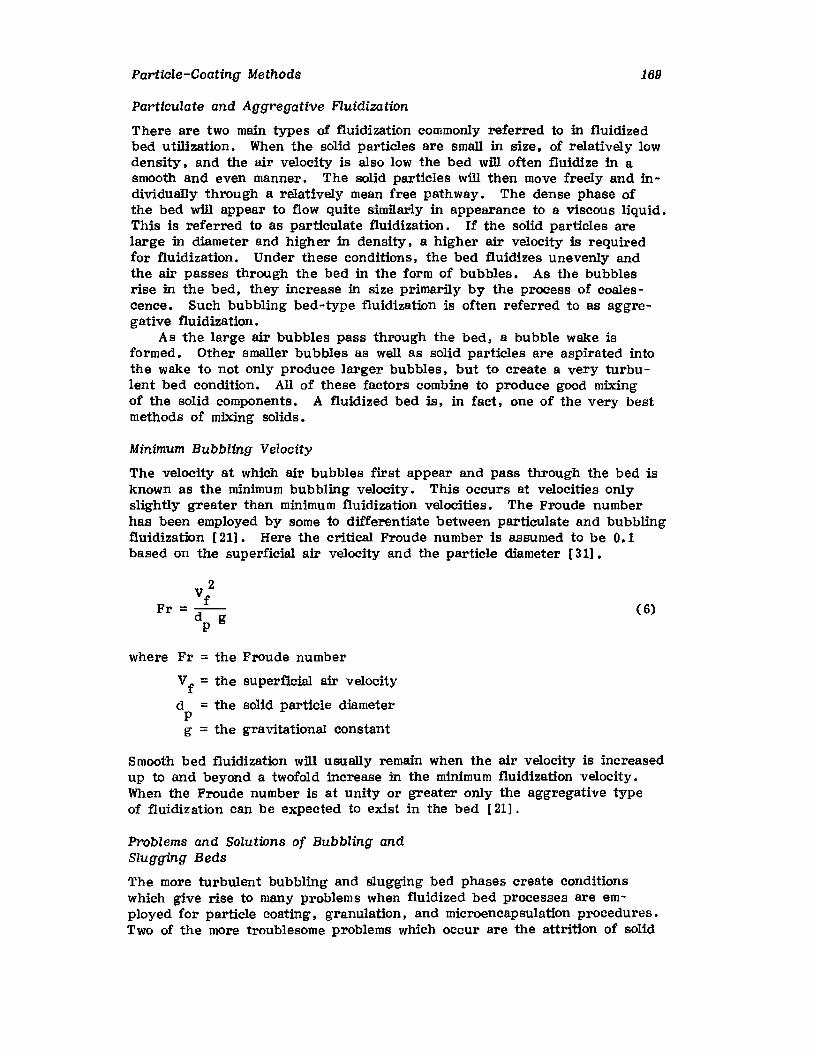
Parti.cle-Coating Methods 169
Particulate and Aggregative Fluidization
There are two main types of fluidization commonly referred to in fluidizedbed utilization. When the solid particles are small in size, of relatively lowdensity, and the air velocity is also low the bed will often fluidize in asmooth and even manner. The solid particles will then move freely and individuaIly through a relatively mean free pathway. The dense phase ofthe bed will appear to flow quite similarly in appearance to a viscous liquid.This is referred to as particulate fluidization. If the solid particles arelarge in diameter and higher in density, a higher air velocity is requiredfor fluidization. Under these conditions, the bed fluidizes unevenly andthe air passes through the bed in the form of bubbles. As the bubblesrise in the bed, they increase in size primarily by the process of coalescence. Such bubbling bed-type fluidization is often referred to as aggregative fluidization.
As the large air bubbles pass through the bed, a bubble wake isformed. Other smaller bubbles as well as solid particles are aspirated intothe wake to not only produce larger bubbles, but to create a very turbulent bed condition. All of these factors combine to produce good mixingof the solid components. A fluidized bed is, in fact, one of the very bestmethods of mixing solids.
Minimum Bubbling Velocity
The velocity at which air bubbles first appear and pass through the bed isknown as the minimum bubbling velocity. This occurs at velocities onlyslightly greater than minimum fluidization velocities. The Froude numberhas been employed by some to differentiate between particulate and bubblingfluidization [21]. Here the critical Froude number is assumed to be 0.1based on the superficial air velocity and the particle diameter [31].
v 2fFr =-
d gP
where Fr = the Froude number
Vf = the superficial air velocity
d =the solid particle diameterpg = the gravitational constant
(6)
Smooth bed fluidization wlll usually remain when the air velocity is increasedup to and beyond a twofold increase in the minimum fluidization velocity.When the Froude number is at unity or greater only the aggregative typeof fluidization can be expected to exist in the bed [21].
Problems and Solutions of Bubbling andSlugging Beds
The more turbulent bubbling and slugging bed phases create conditionswhich give rise to many problems when fluidized bed processes are employed for particle coating. granulation. and microencapsulation procedures.Two of the more troublesome problems which occur are the attrition of solid
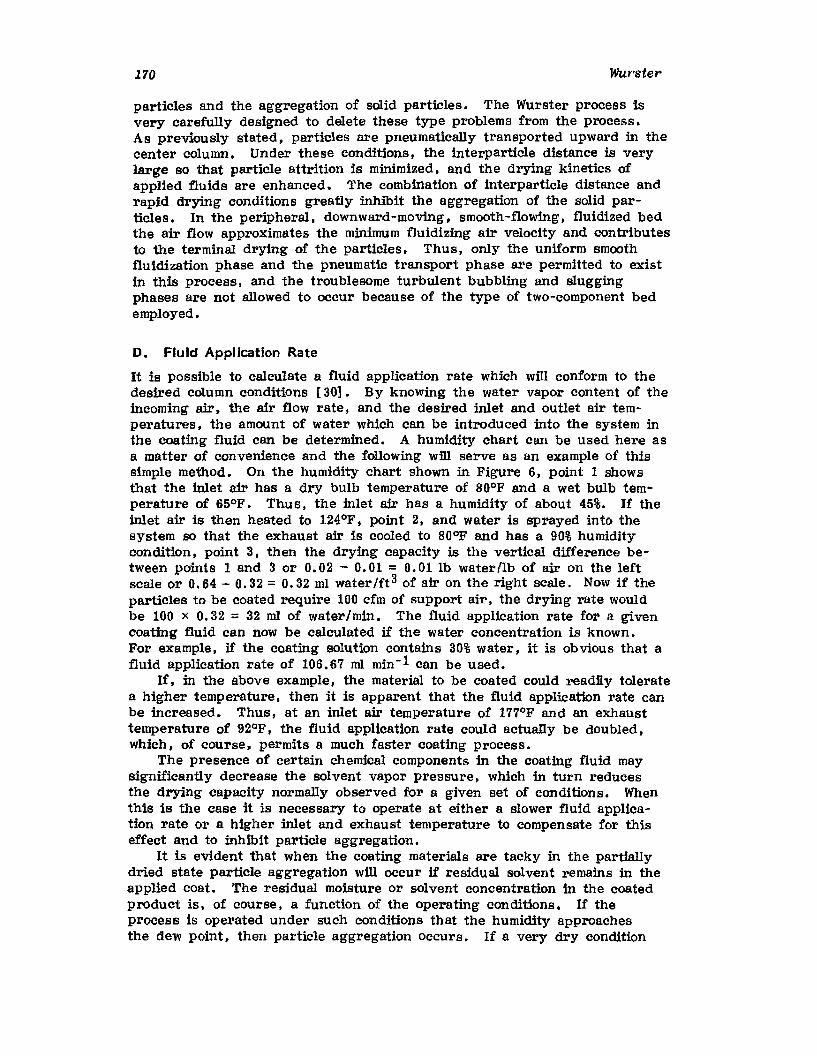
170 Wurster
particles and the aggregation of solid particles. The Wurster process isvery carefully designed to delete these type problems from the process.As previously stated, particles are pneumatically transported upward in thecenter column. Under these conditions, the interparticle distance is verylarge so that particle attrition is minimized, and the drying kinetics ofapplied fluids are enhanced. The combination of interparticle distance andrapid drying conditions greatly inhibit the aggregation of the solid particles. In the peripheral, downward-moving, smooth-flowing , fluidized bedthe air flow approximates the minimum fluidizing air velocity and contributesto the terminal drying of the particles. Thus, only the uniform smoothfluidization phase and the pneumatic transport phase are permitted to existin this process, and the troublesome turbulent bubbling and sluggingphases are not allowed to occur because of the type of two-component bedemployed.
D. Fluid Application Rate
It is possible to calculate a fluid application rate which will conform to thedesired column conditions [30]. By knowing the water vapor content of theincoming air, the air flow rate, and the desired inlet and outlet air temperatures. the amount of water which can be introduced into the system inthe coating fluid can be determined. A humidity chart can be used here asa matter of convenience and the following will serve as an example of thissimple method. On the humidity chart shown in Figure 6. point 1 showsthat the inlet air has a dry bulb temperature of 80°F and a wet bulb temperature of 65°F. Thus, the inlet air has a humidity of about 45%. If theinlet air is then heated to 124°F, point 2, and water is sprayed into thesystem so that the exhaust air is cooled to 80°F and has a 90% humiditycondition. point 3, then the drying capacity is the vertical difference between points 1 and 3 or 0.02 - 0.01 = 0.01 lb water/lb of air on the leftscale or 0.64 - 0.32 = 0.32 ml water/ft 3 of air on the right scale. Now if theparticles to be coated require 100 cfm of support air, the drying rate wouldbe 100 x 0.32 == 32 ml of water/min. The fluid application rate for a givencoating fluid can now be calculated if the water concentration is known.For example. if the coating solution contains 30% water. it is obvious that afluid application rate of 106.67 ml min- 1 can be used.
If, in the above example. the material to be coated could readily toleratea higher temperature, then it is apparent that the fluid application rate canbe increased. Thus, at an inlet air temperature of 177°F and an exhausttemperature of 92°F. the fluid application rate could actually be doubled,Which, of course, permits a much faster coating process.
The presence of certain chemical components in the coating fluid maysignificantly decrease the solvent vapor pressure, which in turn reducesthe drying capacity normally observed for a given set of conditions. Whenthis is the case it is necessary to operate at either a slower fluid application rate or a higher inlet and exhaust temperature to compensate for thiseffect and to inhibit particle aggregation.
It is evident that when the coating materials are tacky in the partiallydried state particle aggregation will occur if residual solvent remains in theapplied coat. The residual moisture or solvent concentration in the coatedproduct is, of course, a function of the operating conditions. If theprocess is operated under such conditions that the humidity approachesthe dew point, then particle aggregation occurs. If a very dry condition

0.03 ....-------
130120110
"tlc":$....5'
0.9 (iiI
C')QC
10.8....Percent humidity ....;:slQ
it:<t>
0.7 ....;:r0~CI.l
0.6 1-:§,
0.5 .~
"0?:u
0.4 '"c,
'"OJ
III
~0.3
'0::E
0.2
0.1
100908070
Wet bulbtemperature
of0.021 ,
?::c'E"J:
"-I'" ~
!~
TEMPERATURE (Degree F)
Figure 6. Humidity chart.~
~
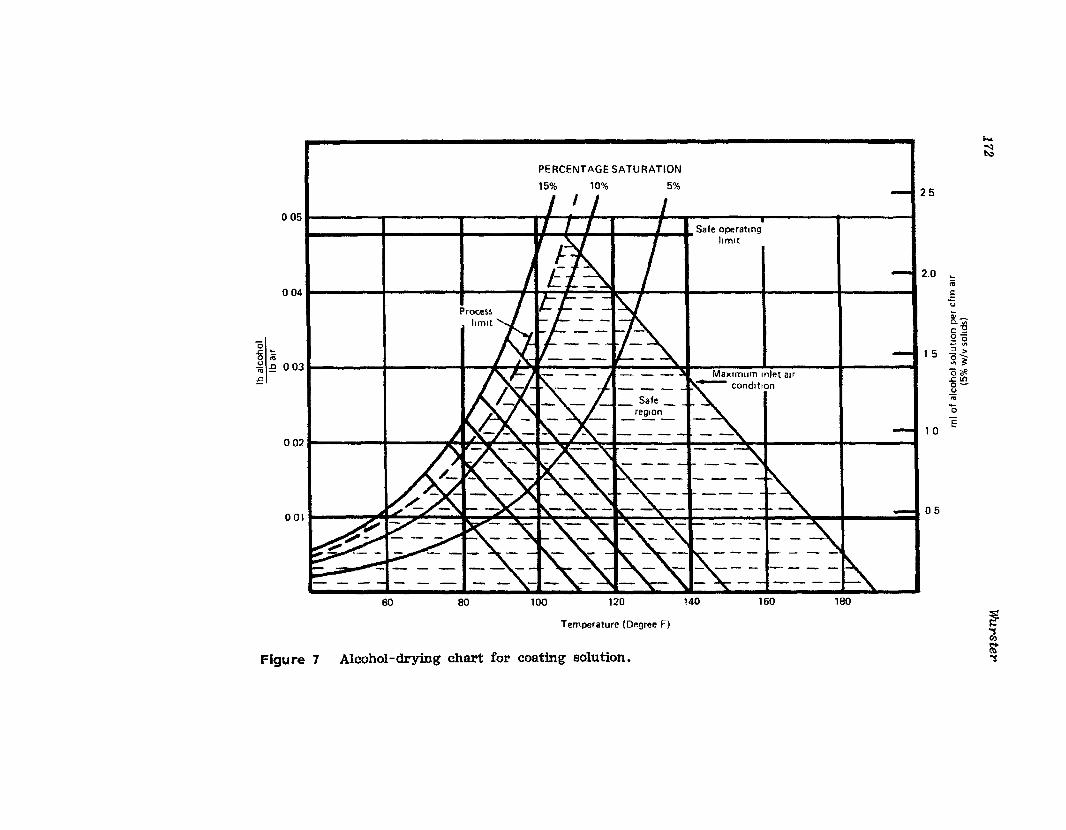
~a~~
180160140120
Temperature IDegree F)
1008060
Alcohol-drying chart for coating solution.Figure 7
....~
PERCENTAGE SATURATION I
15% 10% 5%
005I I i ./ / / • I. 12
5Safe operating
limit
I I I2.0 ~
0041 I I . I - { --,., 1 I I I '"if ... ... E't
~~
o I I Im--¥:-='\l: ~~.r:. '- - «I)o ;;; ~ >~.c 003 - - - - I 15 0--~-=--~~ ~'~~'.".'~I"'" I =1 i~u;;;
'0
DOlt I ~~'* -=---t==:= - - - -10 E
001 - - - - - - - - - - - - ~ - t~, J 05
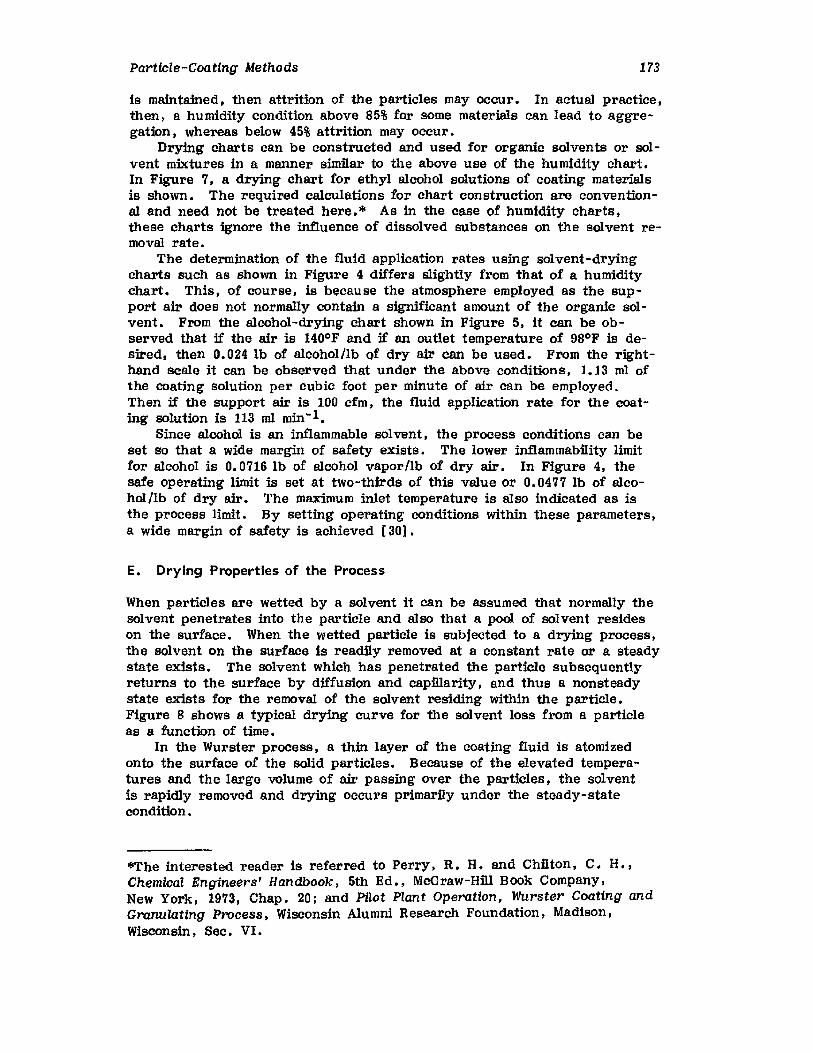
Particle -Coa ting Metho ds 173
is maintained, then attrition of the particles may occur. In actual practice,then, a humidity condition above 85% for some materials can lead to aggregation, whereas below 45% attrition may occur.
Drying charts can be constructed and used for organic solvents or solvent mixtures in a manner similar to the above use of the humidity chart.In Figure 7, a drying chart for ethyl alcohol solutions of coating materialsis shown. The required calculations for chart construction are conventional and need not be treated here.* As in the case of humidity charts,these charts ignore the influence of dissolved substances on the solvent removal rate.
The determination of the fluid application rates using solvent-dryingcharts such as shown in Figure 4 differs slightly from that of a humiditychart. This, of course, is because the atmosphere employed as the support air does not normally contain a significant amount of the organic solvent. From the alcohol-drying chart shown in Figure 5, it can be observed that if the air is 140°F and if an outlet temperature of 98°F is desired, then 0.024 lb of alcohol/1b Qf dry air can be used. From the righthand scale it can be observed that under the above conditions, 1.13 ml ofthe coating solution per cubic foot per minute of air can be employed.Then if the support air is 100 efm , the fluid application rate for the coating solution is 113 ml min-1•
Since alcohol is an inflammable solvent, the process conditions can beset so that a wide margin of safety exists. The lower inflammability limitfor alcohol is O. 0716 1b of alcohol vapor /lb of dry air. In Figure 4, thesafe operating limit is set at two-thirds of this value or 0.0477 lb of alcohol/1b of dry air. The maximum inlet temperature is also indicated as isthe process limit. By setting operating conditions within these parameters,a wide margin of safety is achieved [30].
E. Drying Properties of the Process
When particles are wetted by a solvent it can be assumed that normally thesolvent penetrates into the particle and also that a pool of solvent resideson the surface. When the wetted particle is subjected to a drying process,the solvent on the surface is readily removed at a constant rate or a steadystate exists. The solvent which has penetrated the particle subsequentlyreturns to the surface by diffusion and capillarity, and thus a nonsteadystate exists for the removal of the solvent residing within the particle.Figure 8 shows a typical drying curve for the solvent loss from a particleas a function of time.
In the Wurster process, a thin layer of the coating fluid is atomizedonto the surface of the solid particles. Because of the elevated temperatures and the large volume of air passing over the particles, the solventis rapidly removed and drying occurs primarily under the steady-statecondition.
*The interested reader is referred to Perry, R. H. and Chilton, C. H.,Chemical Engineers' Handbook, 5th Ed., McGraw-Hill Book Company,New York, 1973, Chap. 20; and Pilot Plant Operation, Wurster Coating andGranulating Process, Wisconsin Alumni Research Foundation, Madison,Wisconsin, Sec. VI.
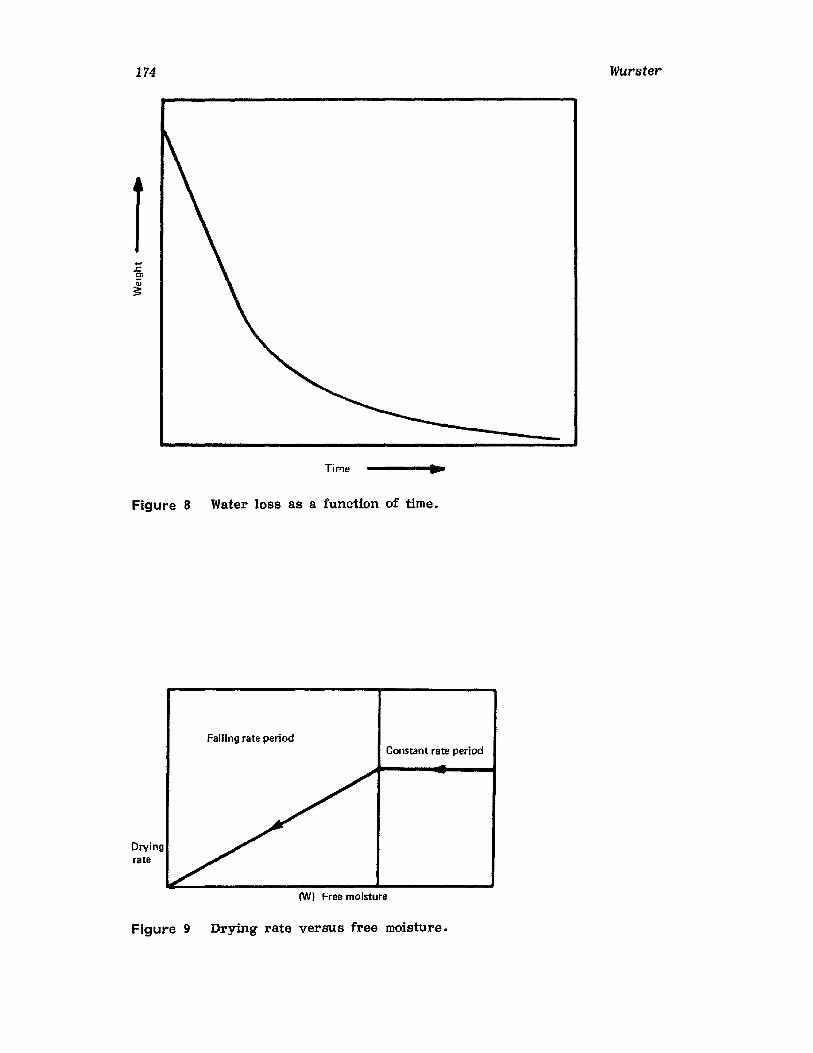
174 Wurster
Time
Figure 8 Water loss as a function of time.
Falling rate periodConstant rate period
Drvingrate
(W) Free moisture
Figure 9 Drying rate versus free moisture.
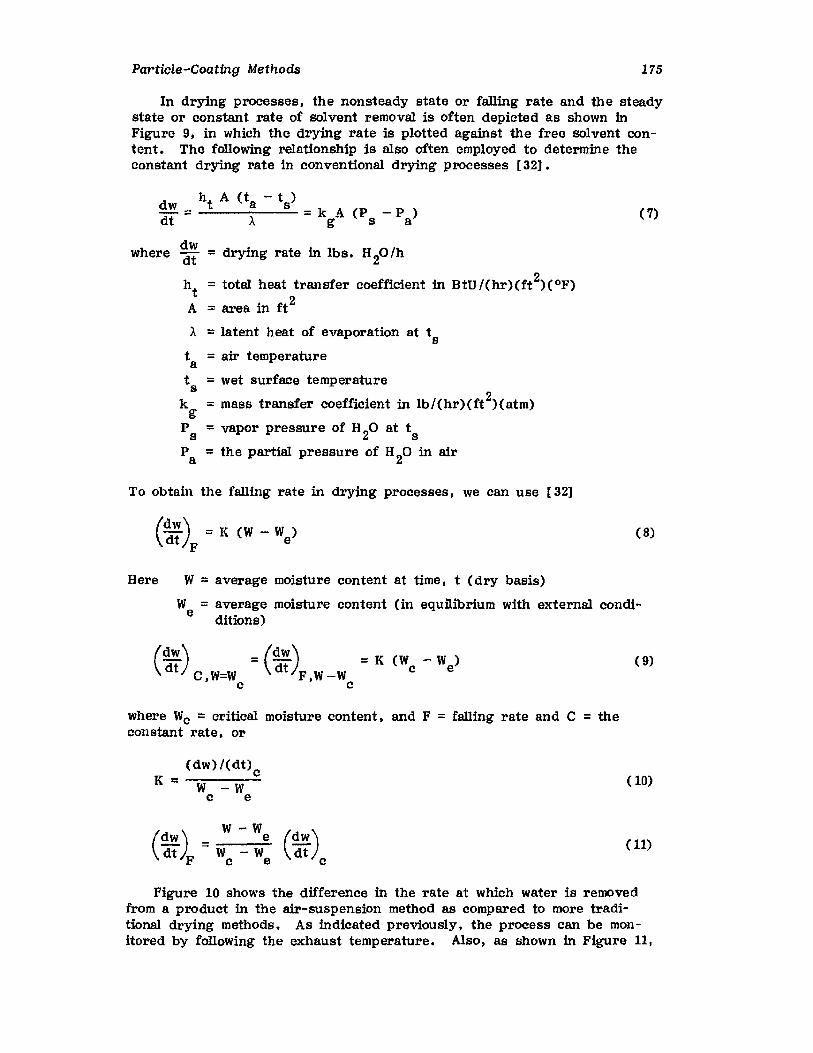
Particle-Coating Methods 175
In drying processes, the nonsteady state or falling rate and the steadystate or constant rate of solvent removal is often depicted as shown inFigure 9, in which the drying rate is plotted against the free solvent content. The following relationship is also often employed to determine theconstant drying rate in conventional drying processes [32J.
dwCit =
h A (t - t )t a s =k A (P _ P )
A. gsa (7)
= wet surface temperature
= mass transfer coefficient in Ib/(hr)(ft2)(atm)
= vapor pressure of H20 at t s
= the partial pressure of H20 in air
where dwdt =drying rate in Ibs , H 20 /h
ht
= total heat transfer coefficient in Btu /(hr)(ft2)(OF)
A = area in ft 2
A =latent heat of evaporation at t st =air temperatureat s
k gPsPa
To obtain the falling rate in drying processes, we can use [32]
( d w) = K (W - W )dt F e
(8)
Here W = average moisture content at time, t (dry basis)
W = average moisture content (in equilibrium with external eondieditions)
(dW) =(dW) =K(W - W )dt C W=W dt F W-W c e
'c J C
where Wc = critical moisture content, and F = falling rate and C =theconstant rate, or
(9)
K =(dw)/(dt)C
W - wc e(10)
( 11)
Figure 10 shows the difference in the rate at which water is removedfrom a product in the air-suspension method as compared to more traditional drying methods. As indicated previously. the process can he monitored by folloWing the exhaust temperature. Also J as shown in Figure 11,
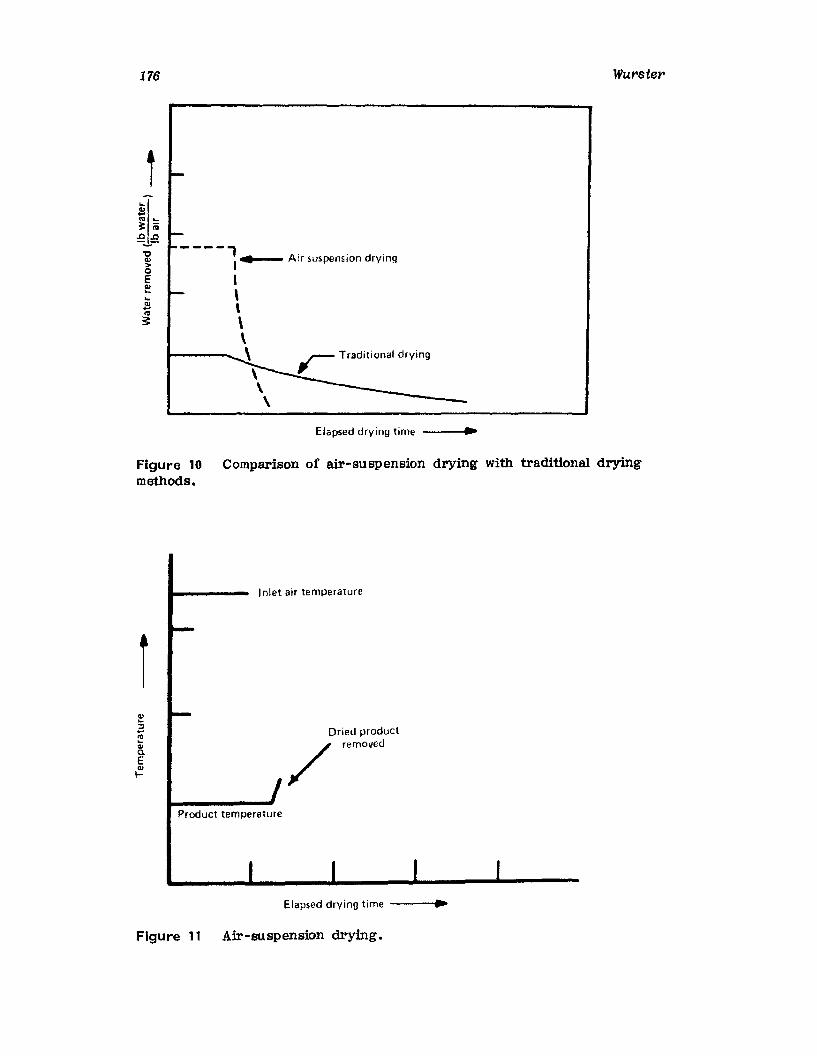
176
...s'" ...~ iii~~
"0G>>oEe...J!ls
----,I • Air suspension drying
I\,\\
1----- \
\\\
Elapsed drying time ....
Wurster
Figure 10 Comparison of air-suspension drying with traditional dryingmethods.
Inlet air temperature
rDried product
/ removed
Product temperature
Elapsed drying time ....
Figure 11 Air-su spension drying.
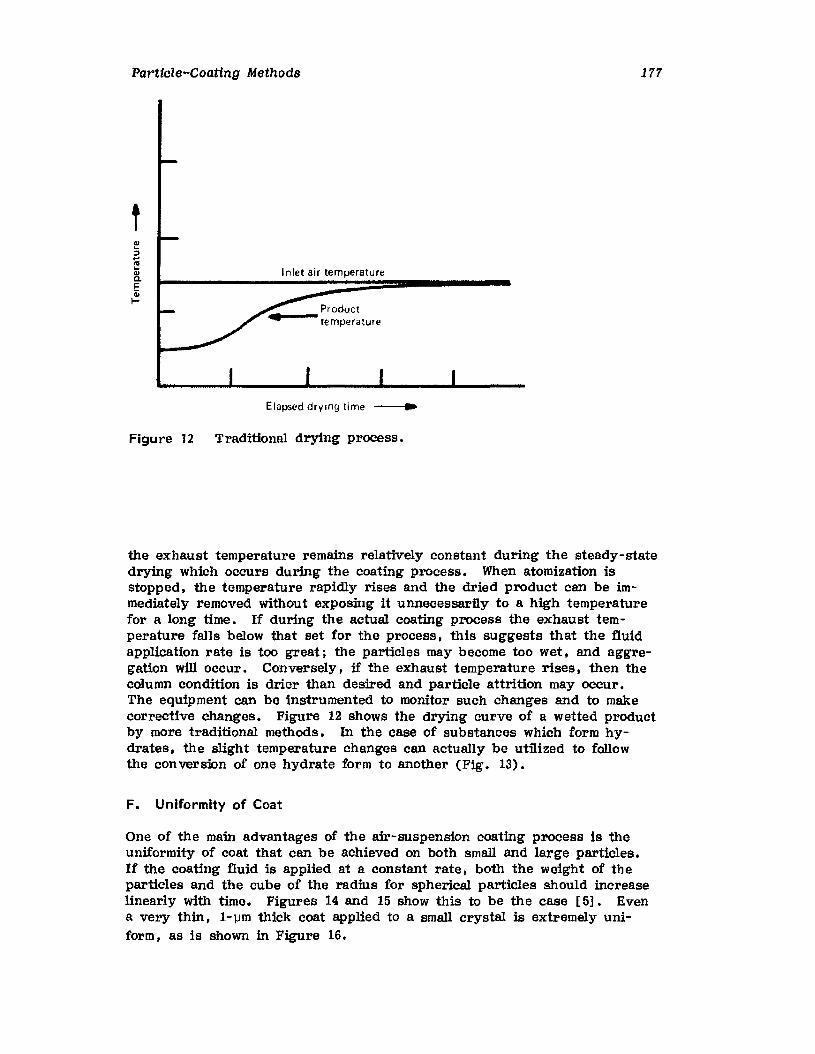
Particle-Coating Methods 177
.,:;...~.,Q.
E.,I-
Inlet air temperatu re
Product..-- temperature
Elapsed drying time ..
Figure 12 Traditional drying process.
the exhaust temperature remains relatively constant during the steady-statedrying which occurs during the coating process. When atomization isstopped. the temperature rapidly rises and the dried product can be immediately removed without exposing it unnecessarily to a high temperaturefor a long time. If during the actual coating process the exhaust temperature falls below that set for the process. this suggests that the fluidapplication rate is too great; the particles may become too wet. and aggregation will occur. Conversely. if the exhaust temperature rises, then thecolumn condition is drier than desired and particle attrition may occur.The equipment can be instrumented to monitor such changes and to makecorrective changes. Figure 12 shows the drying curve of a wetted productby more traditional methods. In the case of substances which form hydrates. the slight temperature changes can actually be utilized to followthe conversion of one hydrate form to another (Fig. 13).
F. Uniformity of Coat
One of the main advantages of the air-suspension coating process is theuniformity of coat that can be achieved on both small and large particles.If the coating fluid is applied at a constant rate, both the weight of theparticles and the cube of the radius for spherical particles should increaselinearly with time. Figures 14 and 15 show this to be the case [5]. Evena very thin. 1-lJm thick coat applied to a small crystal is extremely uniform. as is shown in Figure 16.
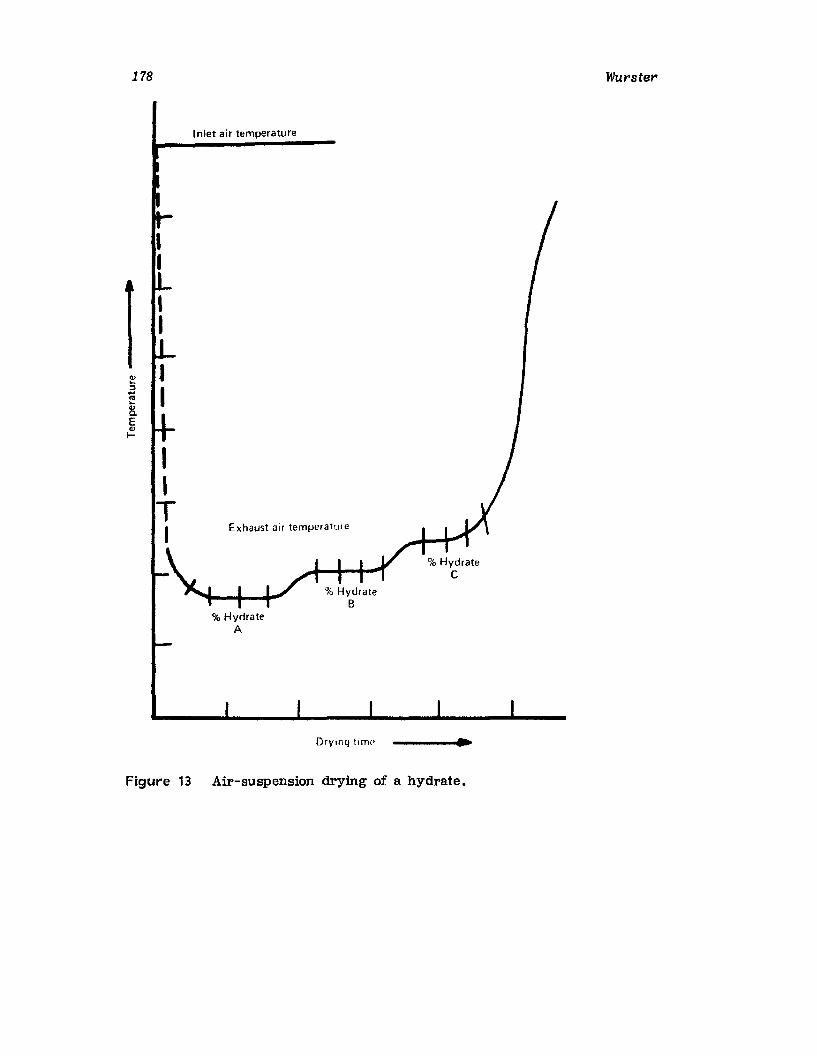
178
Inlet air temperature
Wurster
Exhaust air temperature
Drying tirn«
Figure 13 Air-suspension drying of a hydrate.
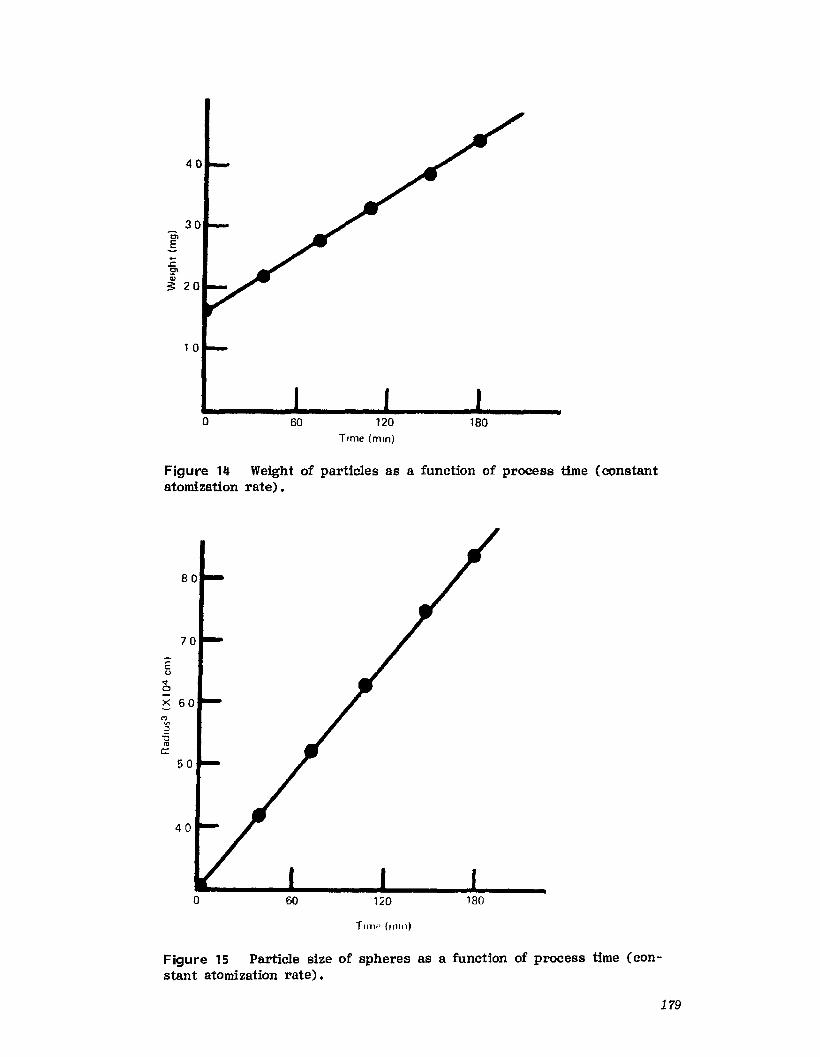
o 60 120Time (min)
180
Figure 14 Weight of particles as a function of process time (constantatomization rate).
o 60 120
Tmu- {Ill Ill)
180
Figure 15 Particle size of spheres as a function of process time (constant atomization rate).
179
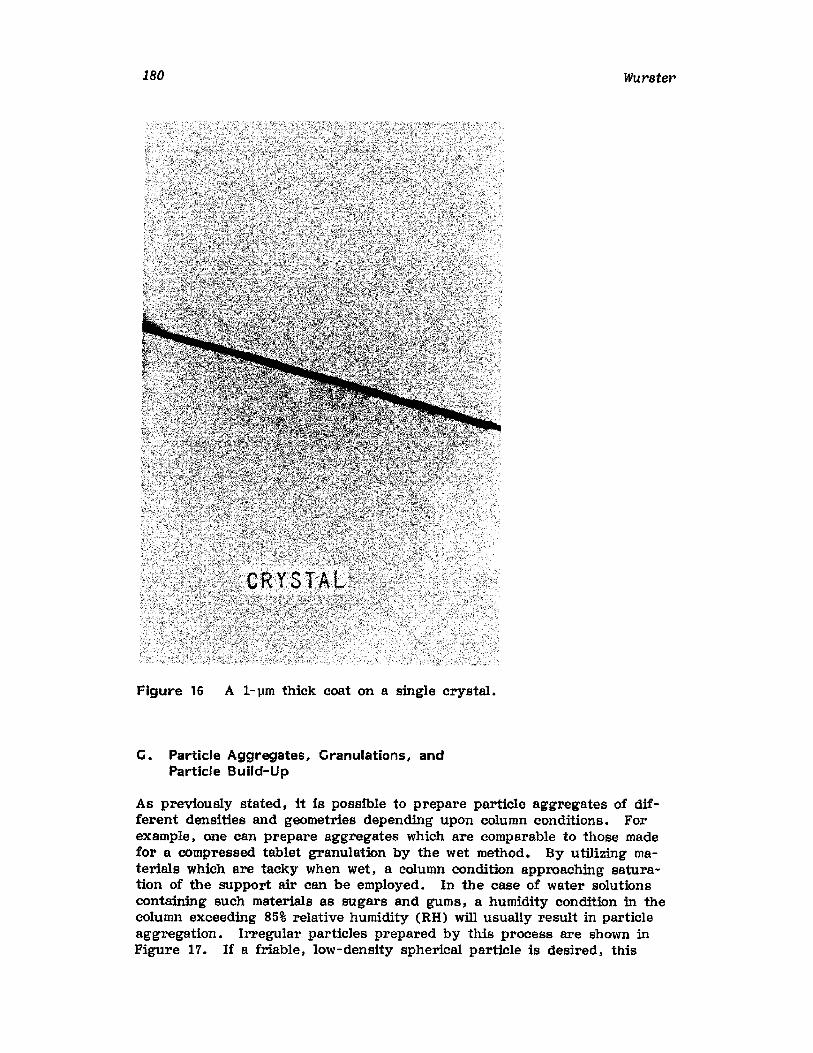
180 Wurster
Figure 16 A t-um thick coat on a single crystal.
G. Particle Aggregates, Granulations, andParticle Build-Up
As previously stated, it is possible to prepare particle aggregates of different densities and geometries depending upon column conditions. Forexample, one can prepare aggregates which are comparable to those madefor a compressed tablet granulation by the wet method. By utilizing materials which are tacky when wet, a column condition approaching saturation of the support air can be employed. In the case of water solutionscontaining such materials as sugars and gums, a humidity condition in thecolumn exceeding 85% relative humidity (RH) will usually result in particleaggregation. Irregular particles prepared by this process are shown inFigure 17. If a friable, low-density spherical particle is desired. this
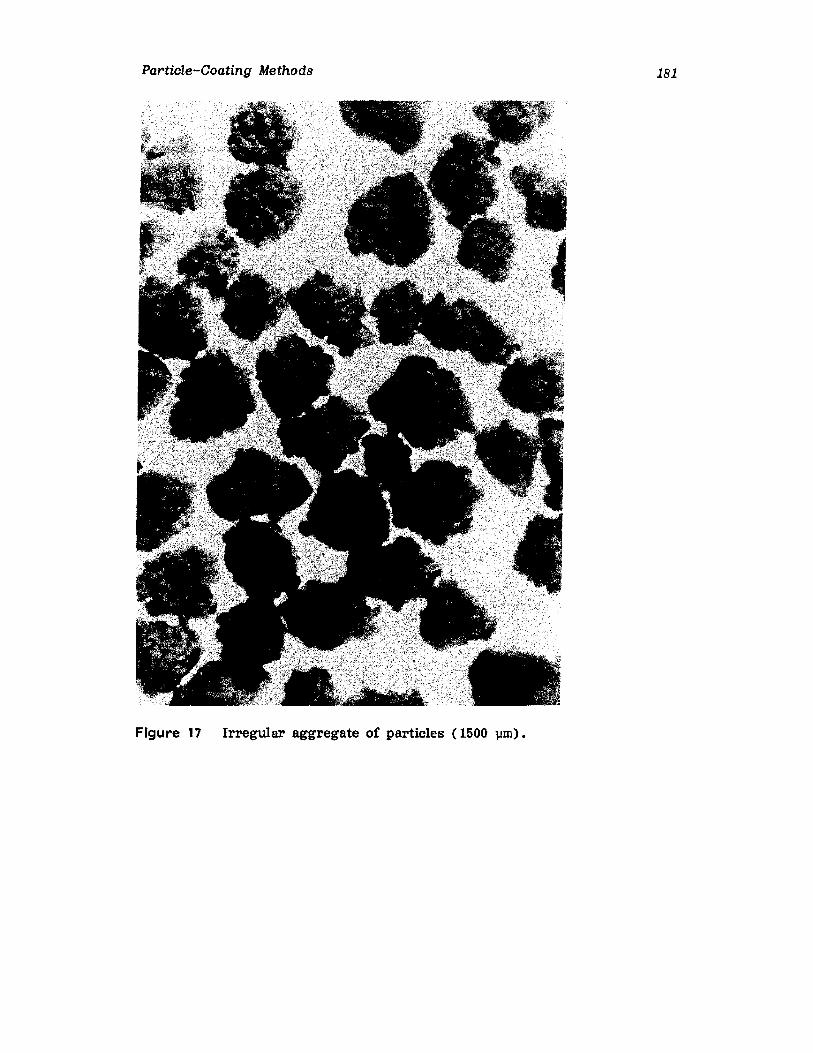
Particle-Coating Methods
Figure 17 Irregular aggregate of particles (1500 um) ,
181
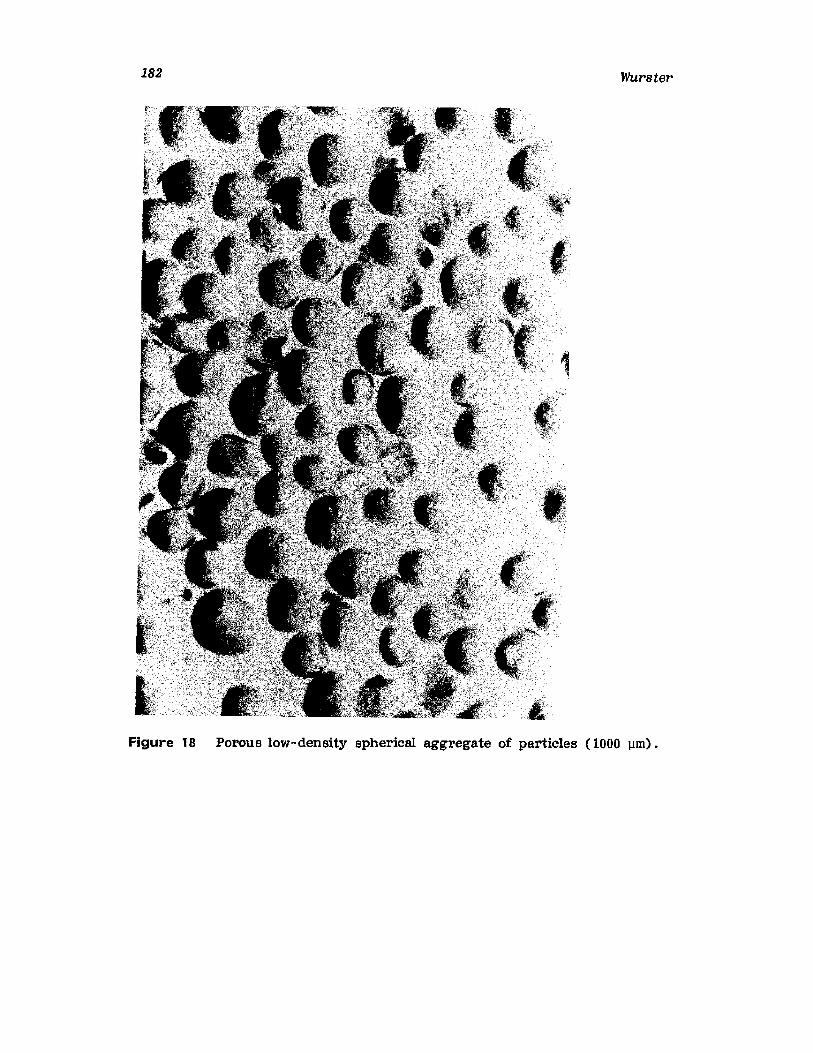
182 Wurster
Figure 18 Porous low-density spherical aggregate of particles (1000 um) ,
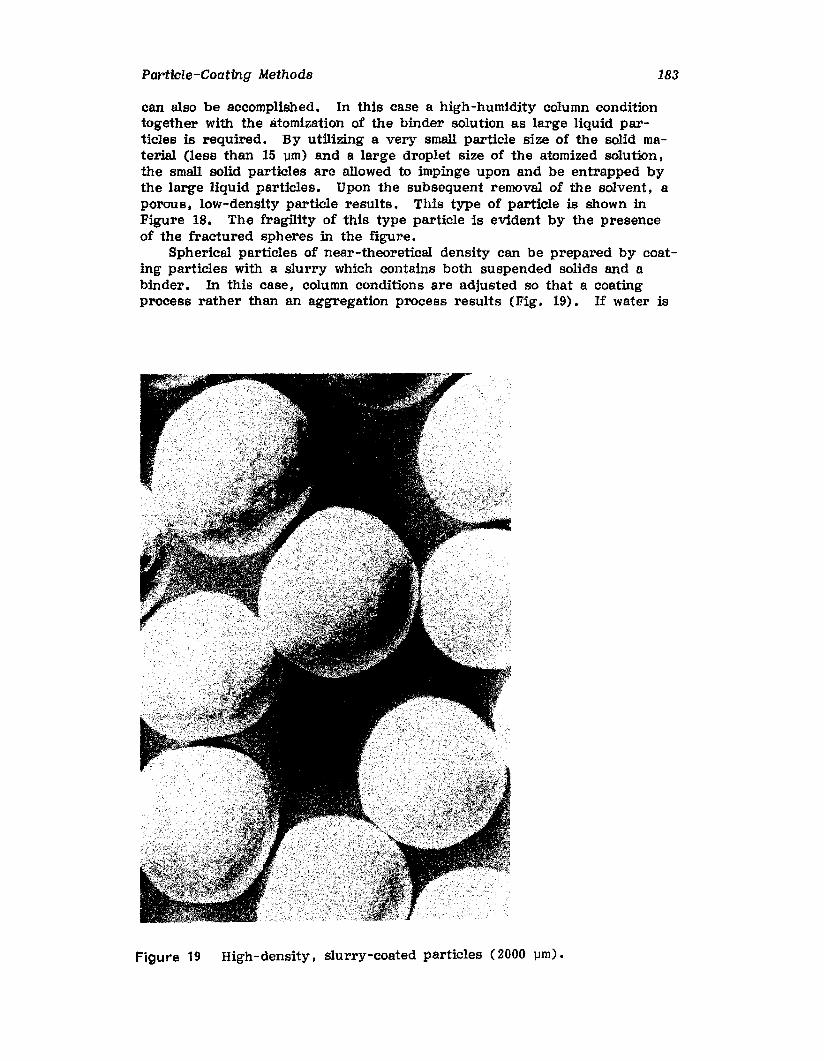
Particle-Coating Methods 183
can also be accomplished. In this case a high-humidity column conditiontogether with the atomization of the binder solution as large liquid particles is required. By utilizing a very small particle size of the solid material (less than 15 um) and a large droplet size of the atomized solution.the small solid particles are allowed to impinge upon and be entrapped bythe large liquid particles. Upon the subsequent removal of the solvent. aporous. low-density particle results. This type of particle is shown inFigure 18. The fragility of this type particle is evident by the presenceof the fractured spheres in the figure.
Spherical particles of near-theoretical density can be prepared by coating particles with a slurry which contains both suspended solids and abinder. In this case, column conditions are adjusted so that a coatingprocess rather than an aggregation process results (Fig. 19). If water is
Figure 19 High-density, slurry-coated particles (2000 um) .
184 Wurster
the solvent, a 65% humidity condition in the column can be used as astarting point.
Granulations of effervescent materials are normally quite difficult toprepare by conventional methods because of the close control which is required over the reaction rate, the drying rate, and the residual water.The air-suspension process is well suited for the preparation of thesegranulations [33] because of the ease with which the process conditionscan be controlled and monitored.
In air-suspension coating procedures. the lower particle size limit isapproximately 50 um , but smaller particles have been coated. There is nopractical upper limit for larger particles. In fact, very large particlesare efficiently coated with great ease. When particle aggregates (tabletgranulations, etc.) are prepared. very fine particles of only a few micrometers can be aggregated into larger particles without difficulty. Of course,the particle aggregates can subsequently be coated, if desired, without removing them from the column.
Lastly. because the air-suspension process operates as a closed systemwith respect to the working area, people are protected from exposure todangerous chemicals and solvents. Similarly, the loss of solids can be prevented and solvents can be reclaimed from the exhaust so that contamination of the environment does not occur.
III. CENTRIFUGATION
The centrifugation method" is a unique modification of the simple extrusiontechnique of producing microcapsules [34-40]. As shown in Figure 20.the simple extrusion method utnizes a device consisting of two concentrictubes containing aligned fluid nozzles. The liquid material to be coated isextruded through the nozzle of the inner tube into the coating fluid contained in the outer tube. Initially. the fluid extrudes as a rod surroundedby the coating fluid, but the rod ultimately breaks up into droplets whichare then immersed in the coating fluid. As the extruded droplets passthrough the nozzle orifice of the outer tube. the coating fluid forms a surface coat which encases the extruded particle. Spherically shaped particles are formed by the surface tension of the liquid. By suitable meansthe formed coat is converted to a more rigid structure. Hardening bathsare usually employed for this purpose. These baths are designed according to the coating material used. Thus, in some cases the bath contains achemical agent which will react with the coating material to yield an insoluble compound. A common example of this is the use of calcium chloridein the bath to convert sodium alginate in the coat to the insoluble calciumalginate [39]. In other cases, the bath may simply be a nonsolvent forthe coating material, whereas in still other cases only a decrease in temperature is needed to harden the coat.
This process is primarily employed to prepare microcapsules of liquids.Thus, the coating fluid is immiscible with the liquid to be encapsulated.As previously stated. however, the main concern of this chapter is a discussion of methods by which discrete solids can be coated. When this
"'Southwest Research Institute, San Antonio. Texas.
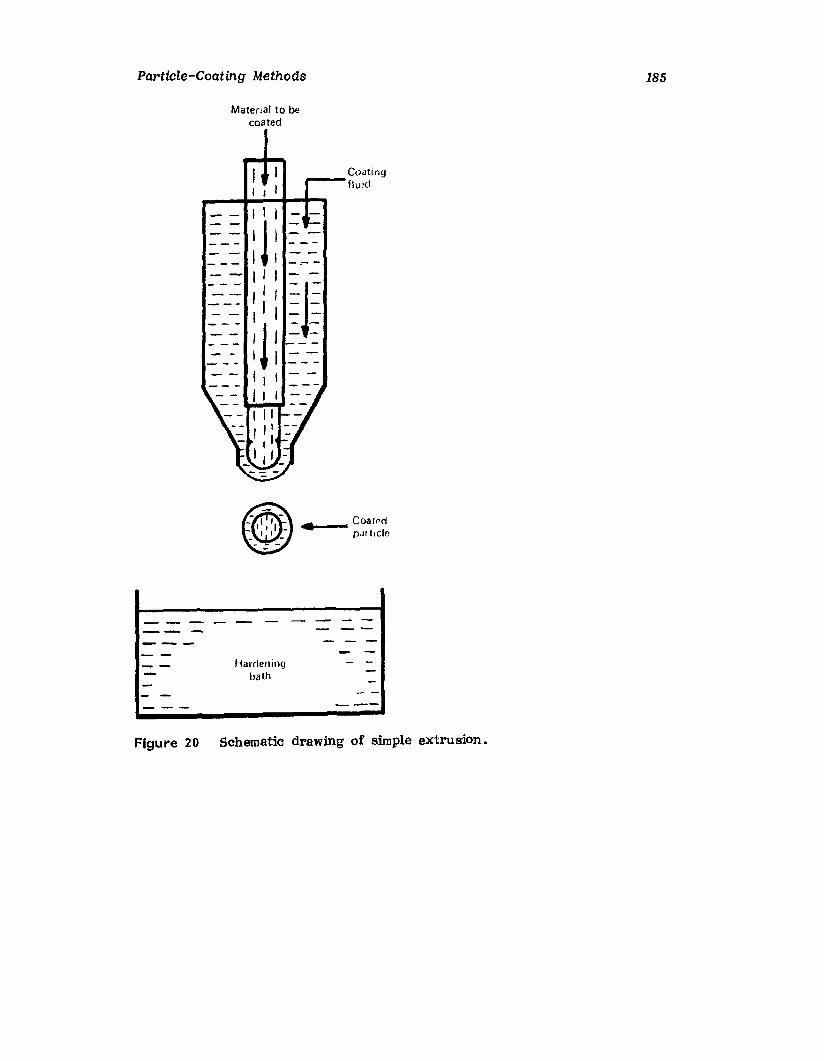
Particle-Coating Methods
Material to becoated
185
II ,
Coating"'--fluid
-j-- -
----------
Hardeningbath
Figure 20 Schematic drawing of simple extrusion.
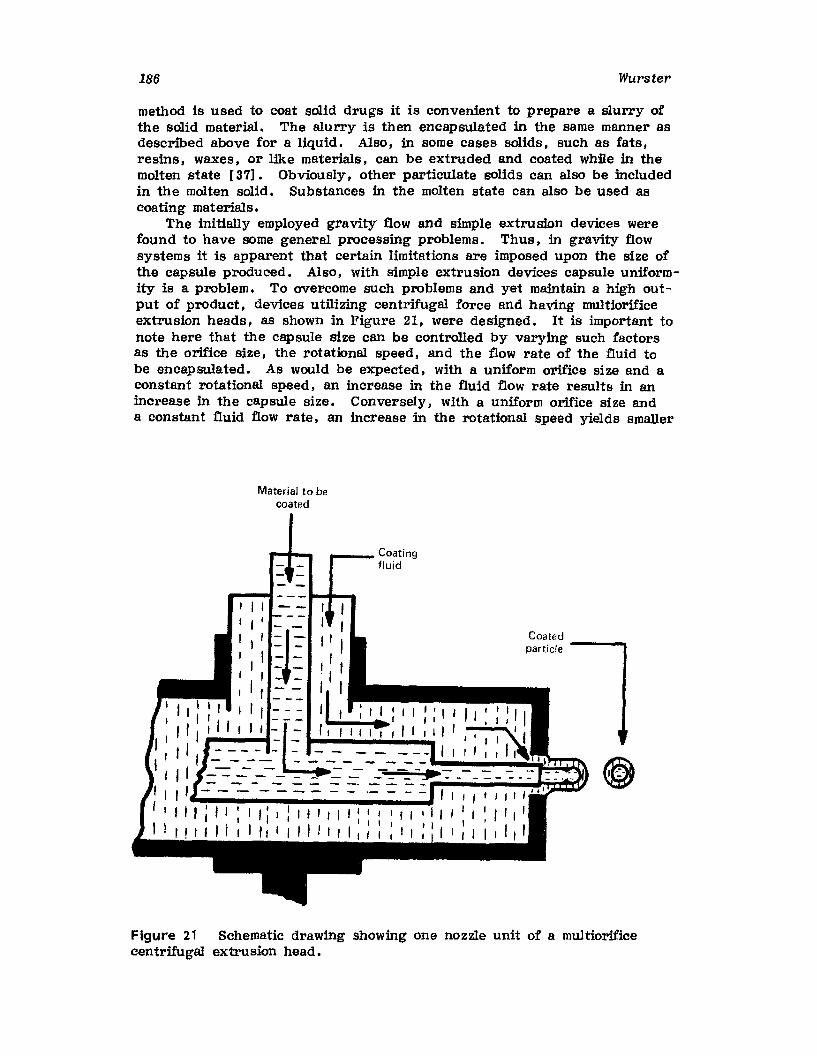
186 Wurster
method is used to coat solid drugs it is convenient to prepare a slurry ofthe solid material. The alurry is then encapsulated in the same manner asdescribed above for a liquid. Also, in some cases solids, such as fats,resins, waxes, or like materials, can be extruded and coated while in themolten state [37]. Obviously, other particulate solids can also be includedin the molten solid. Substances in the molten state can also be used ascoating materials.
The initially employed gravity flow and simple extrusion devices werefound to have some general processing problems. Thus, in gravity flowsystems it is apparent that certain limitations are imposed upon the size ofthe capsule produced. Also, with simple extrusion devices capsule uniformity is a problem. To overcome such problems and yet maintain a high output of product, devices utilizing centrifugal force and having multiorificeextrusion heads, as shown in Figure 21, were designed. It is important tonote here that the capsule size can be controlled by varying such factorsas the orifice size, the rotational speed J and the flow rate of the fluid tobe encapsulated. As would be expected, with a uniform orifice size and aconstant rotational speed, an increase in the fluid flow rate results in anincrease in the capsule size. Conversely, with a uniform orifice size anda constant fluid flow rate, an increase in the rotational speed yields smaller
Material to becoated
II f
=J-=-I --
- -
.....__ Coatingfluid
Coatedparticle ----.
Figure 21 Schematic drawing showing one nozzle unit of a multiorificecentrifugal extrusion head.
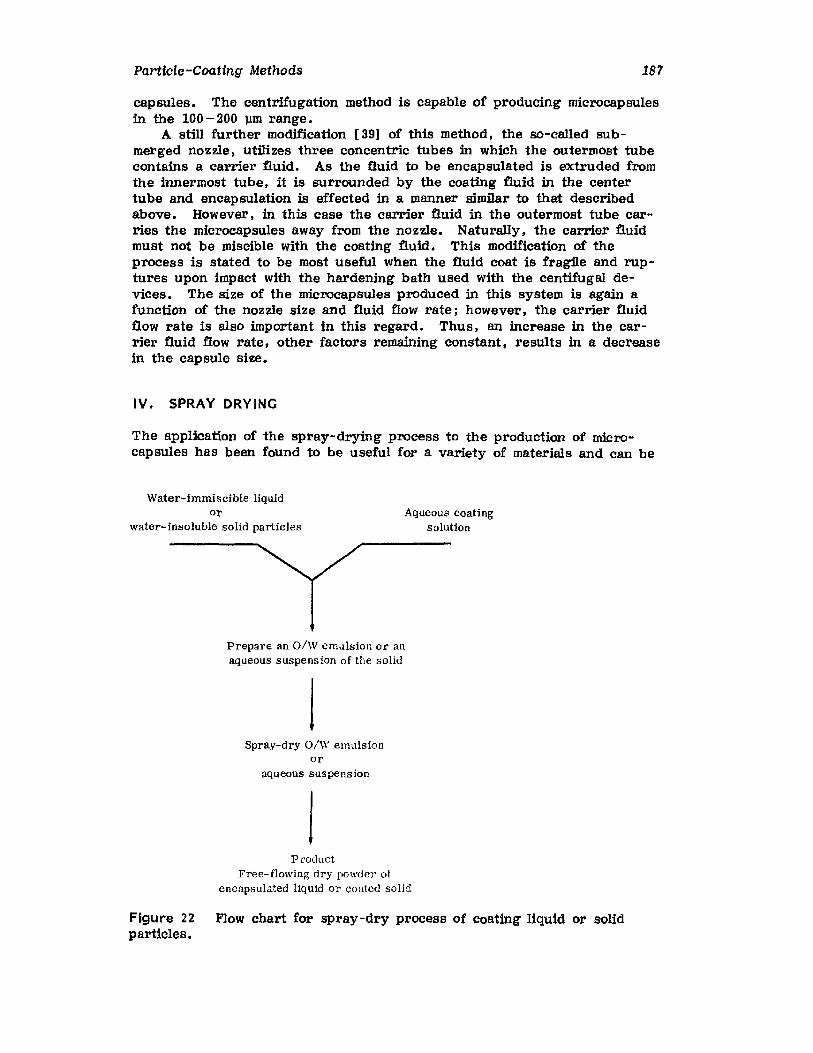
Particle-Coating Methods 187
capsules. The centrifugation method is capable of producing microcapsulesin the 100- 200 um range.
A still further modification [39) of this method, the so-called submerged nozzle, utilizes three concentric tubes in which the outermost tubecontains a carrier fluid. As the fluid to be encapsulated is extruded fromthe innermost tube. it is surrounded by the coating fluid in the centertube and encapsulation is effected in a manner similar to that describedabove. However, in this case the carrier fluid in the outermost tube carries the microcapsules away from the nozzle. Naturally. the carrier fluidmust not be miscible with the coating fluid. This modification of theprocess is stated to be most useful when the fluid coat is fragile and ruptures upon impact with the hardening bath used with the centifugal devices. The size of the microcapsules produced in this system is again afunction of the nozzle size and fluid flow rate; however, the carrier fluidflow rate is also important in this regard. Thus, an increase in the carrier fluid flow rate, other factors remaining constant, results in a decreasein the capsule size.
IV. SPRAY DRYINC
The application of the spray-drying process to the production of microcapsules has been found to be useful for a variety of materials and can be
Water-immiscible liquidOl'
water- insoluble solid particlesAqueous coating
solution
Prepare an O/W emulsion or anaqueous suspension of the solid
ISpray-dry o/»: emulsion
oraqueous suspension
JProduct
Frae-flowtng dry powder ofencapsulated Iiquid or coated solid
Figure 22 Flow chart for spray-dry process of coating liquid or solidparticles.
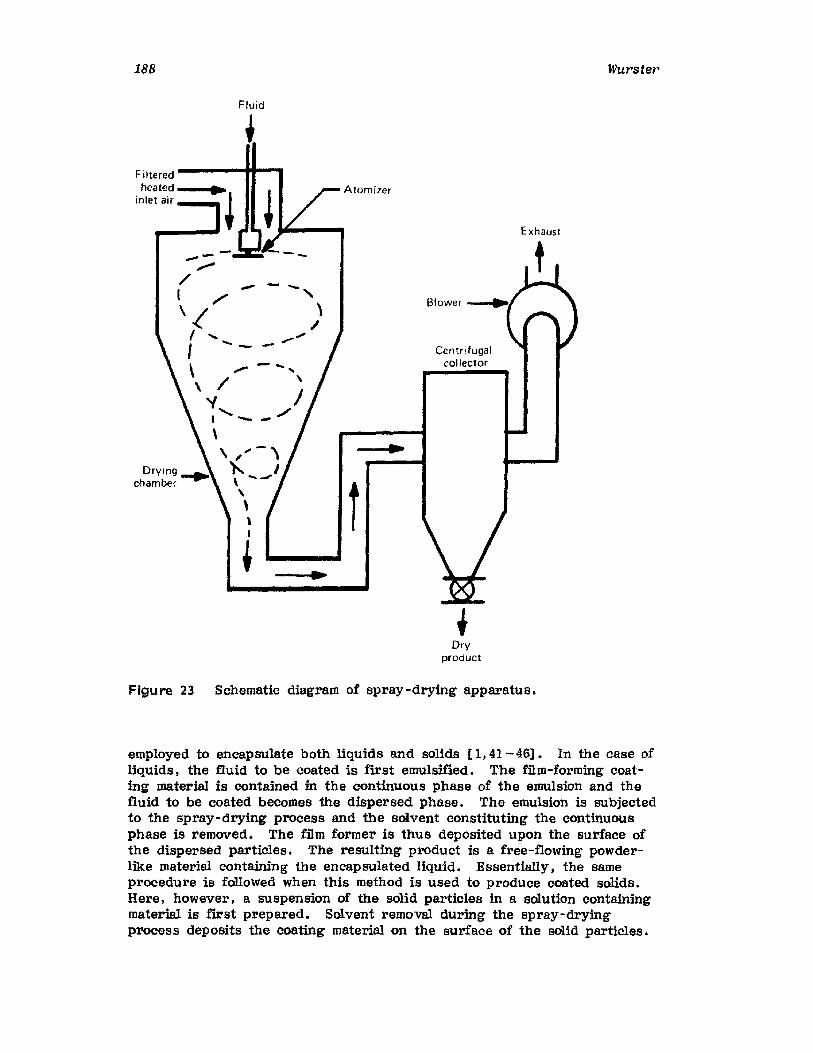
188 Wurster
Fluid
Exhaust
Centrifugalcollector
Blower - .....,
t
Atomizer
...
--,..,../ I /''.(
I ", -\ /' - ......,
".......I --\
\ ....... -,)... J\ -.-\\,I
+
Filtered ----...- ...heated __•
inlet air __II
DrVproduct
Figure 23 Schematic diagram of spray-drying apparatus.
employed to encapsulate both liquids and solids [1,41- 46]. In the case ofliquids. the fluid to be coated is first emulsified. The film-forming coating material is contained in the continuous phase of the emulsion and thefluid to be coated becomes the dispersed phase. The emulsion is subjectedto the spray-drying process and the solvent constituting the continuousphase is removed. The film former is thus deposited upon the surface ofthe dispersed particles. The resulting product is a free-flowing powderlike material containing the encapsulated liquid. Essentially, the sameprocedure is followed when this method is used to produce coated solids.Here, however, a suspension of the solid particles in a solution containingmaterial is first prepared. Solvent removal during the spray-dryingprocess deposits the coating material on the surface of the solid particles.
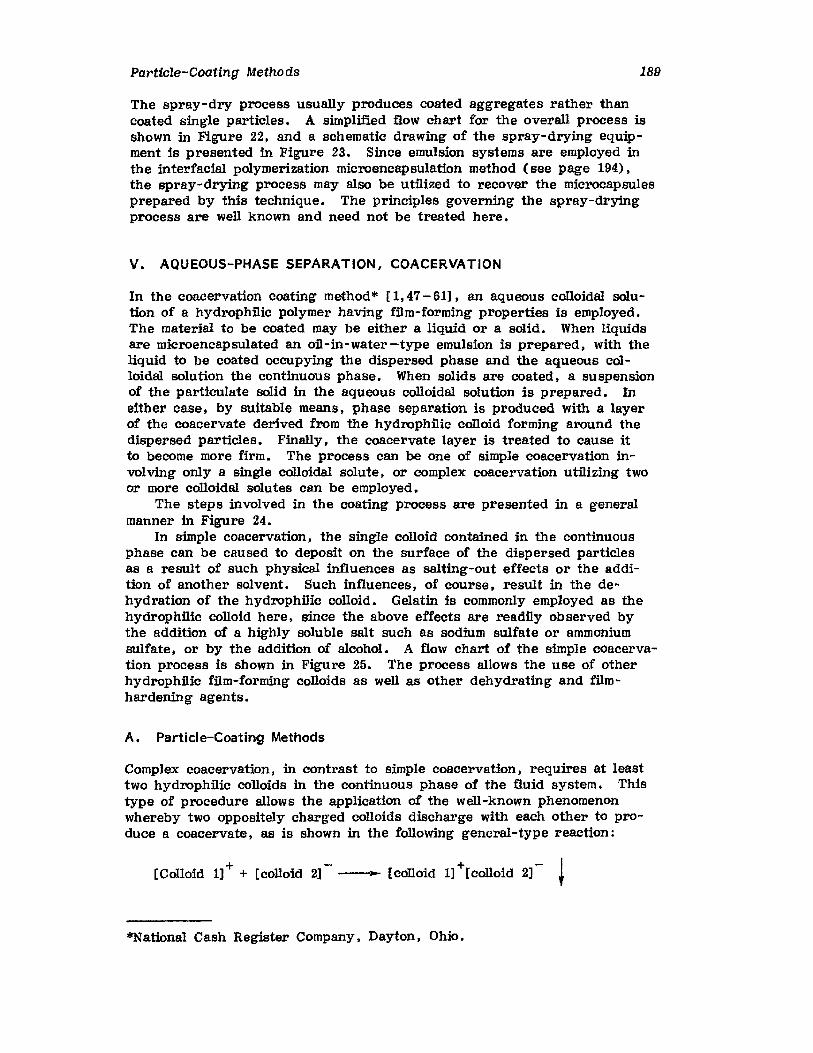
Particle-Coating Methods 189
The spray-dry process usually produces coated aggregates rather thancoated single particles. A simplified flow chart for the overall process isshown in Figure 22, and a schematic drawing of the spray-drying equipment is presented in Figure 23. Since emulsion systems are employed inthe interfacial polymerization microencapsulation method (see page 194),the spray-drying process may also be utilized to recover the microcapsulesprepared by this technique. The principles governing the spray-dryingprocess are well known and need not be treated here.
V. AQUEOUS-PHASE SEPARATION, COACERVATION
In the coacervation coating method* [1,47 - 61], an aqueous colloidal solution of a hydrophilic polymer having film-forming properties is employed.The material to be coated may be either a liquid or a solid. When liquidsare microencapsulated an oil-in-water-type emulsion is prepared, with theliquid to be coated occupying the dispersed phase and the aqueous colloidal solution the continuous phase. When solids are coated, a suspensionof the particulate solid in the aqueous colloidal solution is prepared. Ineither case, by suitable means, phase separation is produced with a layerof the coacervate derived from the hydrophflic colloid forming around thedispersed particles. Finally, the coacervate layer is treated to cause itto become more firm. The process can be one of simple coacervation involving only a single colloidal solute, or complex coacervation utnizing twoor more colloidal solutes can be employed.
The steps involved in the coating process are presented in a generalmanner in Figure 24.
In simple coacervation, the single colloid contained in the continuousphase can be caused to deposit on the surface of the dispersed particlesas a result of such physical influences as salting-out effects or the addition of another solvent. Such influences, of course, result in the dehydration of the hydrophfiic colloid. Gelatin is commonly employed as thehydrophilic colloid here, since the above effects are readily observed bythe addition of a highly soluble salt such as sodium sulfate or ammoniumsulfate, or by the addition of alcohol. A flow chart of the simple coacervation process is shown in Figure 25. The process allows the use of otherhydrophfiic film-forming colloids as well as other dehydrating and filmhardening agents.
A. Particle-Coating Methods
Complex coacervation, in contrast to simple coacervation, requires at leasttwo hydrophilic colloids in the continuous phase of the fluid system. Thistype of procedure allows the application of the well-known phenomenonwhereby two oppositely charged colloids discharge with each other to produce a coacervate, as is shown in the following general-type reaction:
[Colloid 1]+ + [colloid 2]- ---- [colloid 1]+[colloid 2]- ~
*National Cash Register Company, Dayton, Ohio.
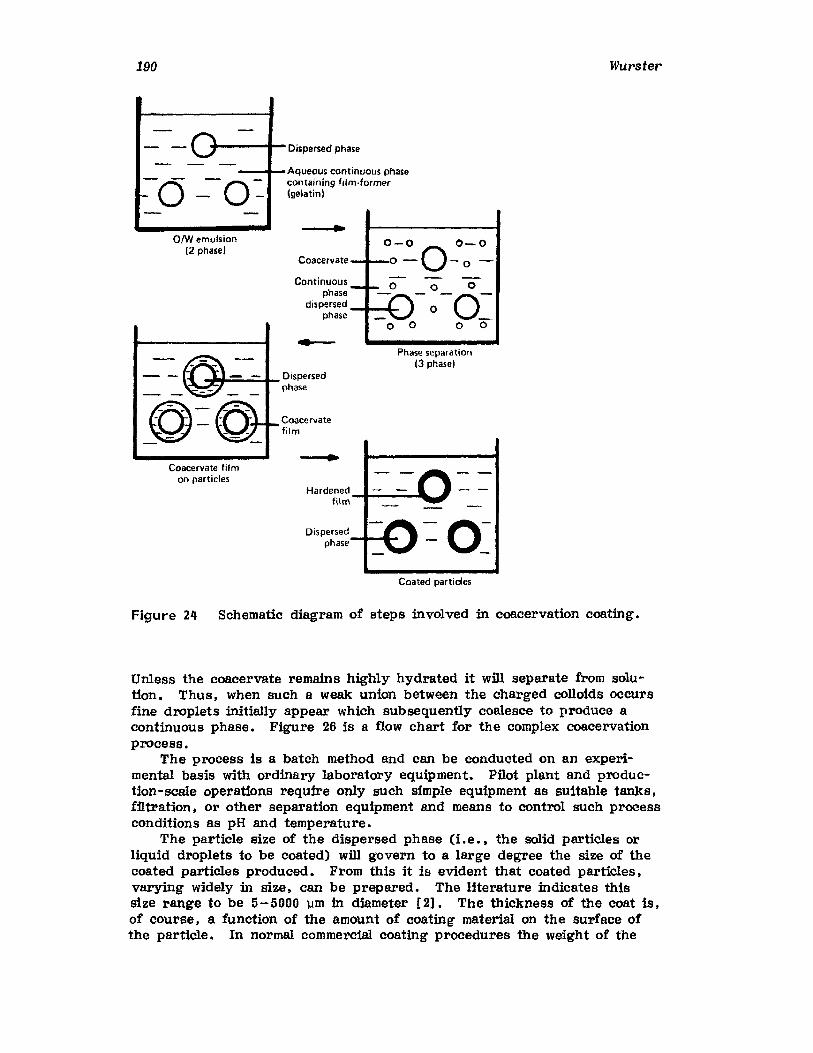
190 Wurster
+---......1- Dispersed phase
-oooo1l-Aqueous continuous phase-0 - 0 - containing fllm·former_ _ (gelatin)
Phase separation(3 phasel
Coacervate _ ..._0.0-~0 ~:: ~
o 0 °-0-0o ° 0 0
Hardened -II---~Io....o'film
Continuousphase
dispersed ----It-,,,,,,,"phase
Coacervatefilm
\1~~-=_,._Dispersedphase
OIWemulsion(2 phase)
Coacervate filmon particles
Dispersedphase-lt-....
Coated particles
Figure 24 Schematic diagram of steps involved in coacervation coating.
Unless the coacervate remains highly hydrated it will separate from solution. Thus, when such a weak union between the charged colloids occursfine droplets initially appear which subsequently coalesce to produce acontinuous phase. Figure 26 is a flow chart for the complex coacervationprocess.
The process is a batch method and can be conducted on an experimental basis with ordinary laboratory equipment. Pilot plant and production-scale operations require only such simple equipment as suitable tanks,ffitration, or other separation equipment and means to control such processconditions as pH and temperature.
The particle size of the dispersed phase (i.e •• the solid particles orliquid droplets to be coated) will govern to a large degree the size of thecoated particles produced. From this it is evident that coated particles,varying widely in size, can be prepared. The literature indicates thissize range to be 5- 5000 '11m in diameter [2]. The thickness of the coat is,of course, a function of the amount of coating material on the surface ofthe particle. In normal commercial coating procedures the weight of the
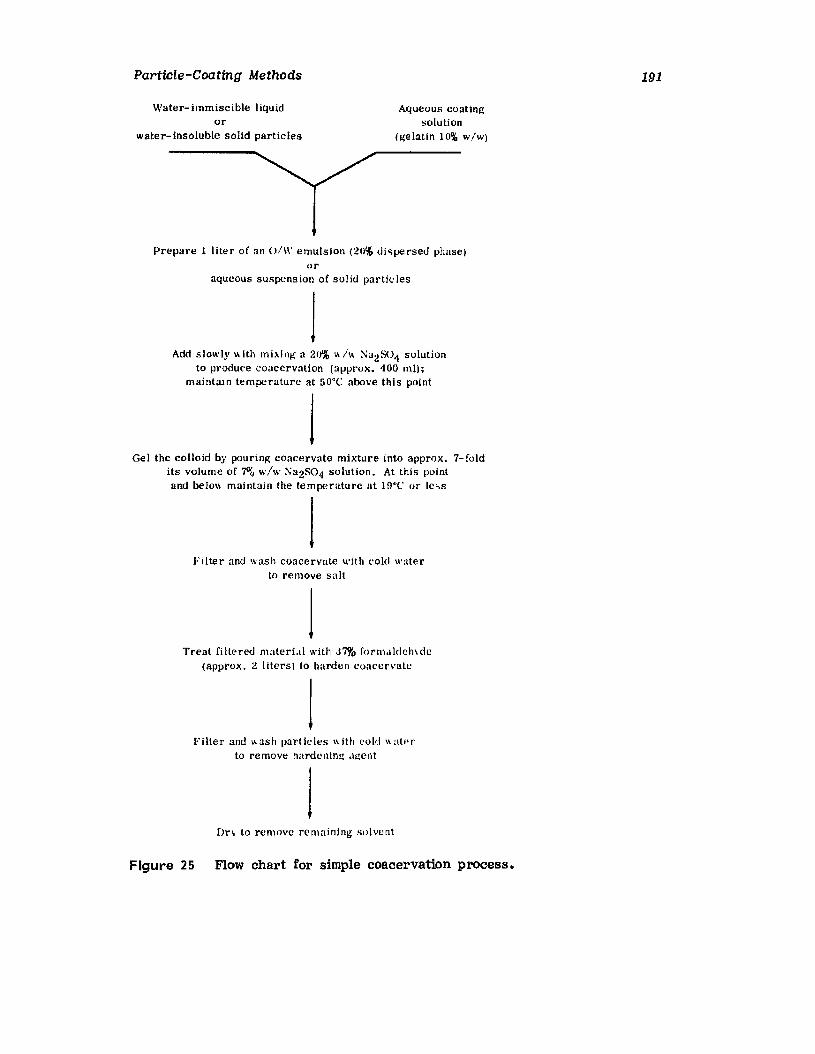
Particle-Coating Methods
Water-immiscible liquidor
water-insoluble solid particles
Aqueous coat in/;solution
(gelatin 10% w/wj
191
Prepare 1 liter of an o/w emulsion (20% dispe rsed phase)or
aqueous suspension of solid particles
jAdd slowly" ith mixing a 20% "Iw ~a2S04 solution
to produce coacervation (approx, 400 mil;maintam temperature at 50'C above this point
jGel the colloid by pouring coacervate mixture into approx, 7-fold
its volume of 7a;, wlw :\a2S04 solution. At this pointand below maintain the temperature at 19°C or le-,s
jFilter and wash coacervate with cold water
to remove salt
jTreat Ii lte red mater-ial wtth J7% Ior rnaldehvde
(approx , 2 liters) to harden coacervate
jF iller and" as h part ic les \\ ith cold \\ atl' r
to remove hardentna .urent
jDn to remove remaining solvent
Figure 25 Flow chart for simple coacervation process.
192
Water-immiscible liquidor
water-insoluble soUd particles
Aqueous coating solution(acacia 10% w/w) adjust to
pH 6.5 with 10% NaOH
Wurster
Prepare 1 liter of O/W type emulsion(30% dispersed phase) or aqueous suspension of
the solid particles
IAdd 700 ml of 10% gelatin (isoelectric point pH 8.0)
solution with mixing
IAdd warm water until a coacervate is produced. The collotd
concentration is reduced to approximately 3% (the less water thefiner the particles). Adjust pH to 4.0 to 4.5 by gradual addition of
10% acetic acid. Maintam temperature at 50·C for above steps
IPour coacervate mixture into 2 times its volume of cold
water. Maintain temperature at S·C or below in thisand subsequent step
ITreat coacervate with 37% formaldehyde solution. Adjust
pH to 9.0 with 10% NaOH (a macromolecular electrolyte suchas CMC has been used in this step in place of NaOH
to inhibit aggregation
IRemove aggregate of encapsulated material and wash with water
IDry and comminute aggregated material
Figure 26 Flow chart for complex coacervation process.
Particle-Coating Methods 193
coat varies between 3 and 30% of the particle weight. but coatings of1-70% have been applied.
The flexibility of this coating process is further emphasized by thewide variety of coating materials that can be utilized. A partial list ofsuitable coating materials which can be employed. depending on whether theaqueous-phase separation or nonaqueous-phase separation method is used,follows:
GelatinGelatin /acaciaGelatin/acacia/vinylmethylether maleic anhydrideGelatin IacaciaI ethylenemaleic anhydrideCarboxymethylce1lulosePropylhydroxycellulosePolyvinylalcoholCellulose acetate phthalateBthylcelluloseEthylenevinyIacetateNitrocelluloseShellacWax
While the coacervation method is capable of coating a large number ofmaterials. it is readily apparent that the material to be coated must bestable to the process conditions. Particular consideration must thereforebe given to the influence of temperature, pH, solvent system, etc., onproduct stability.
VI. NONAQUEOUS-PHASE SEPARATION
Phase separation [2.62,63] can be induced in organic solvent systems aswell as aqueous systems. Again, the suspended particle may be either asolid or an immiscible liquid. Thus, for dispersed liquids, emulsions ofthe W10 type are employed in contrast to the more conventional coacervation method in which 0 IW-type emulsions are used. Obviously. watersoluble solids can also be included either by suspending them in the organic solvent or by dissolving them in the internal phase of the W10-typeemulsion.
The polymeric coating material is dissolved in the continuous organicsolvent phase. Phase separation and the coating of the solid or liquiddispersed particles is accomplished by adding a solvent which is misciblewith the continuous organic solvent phase but which is a nonsolvent forthe polymeric coating material. Triangular phase diagrams are a most useful tool when dealing with phase separation in either nonaqueous [62] oraqueous [64] systems.
Hardening of the polymer coat on the particles is usually accomplishedeither by the addition of more of the nonsolvent or by separating thecoated particles from the system. washing them with a nonsolvent liquid,and drying.

194 Wurster
VII. INTERFACIAL POLYMERIZATION
The interfacial polycondensation or polymerization technique [63 - 65] hasbeen applied to the microencapsulation of various liquids. However. aswith the other processes discussed in this chapter. particulate solids canbe suspended in the liquid SO that the microencapsulated particle containsboth the solid and the liquid.
The process consists of bringing two reactants together at the interface of the dispersed and continuous phases in emulsion systems [66].This is usually accomplished by emulsifying the liquid containing the firstreactant (dispersed phase) into the continuous phase, which is initially devoid of the second reactant. Additional continuous phase containing thesecond reactant is then added. This interfacial polymerization reactionproduces a continuous fnm of the formed polymer around the dispersedphase. A diagram of the interfacial process is shown in Figure 27. Therecovery of the microcapsules from the continuous phase can be accomplished by spray drying, flash evaporation, filtration, Or other separationtechniques [67]. A flow chart of the process is shown in Figure 28.
The various polymer-coating materials which have been utilized to prepare microcapsules by the described process include polyamides (nylon).polyurethanes. polysulfonamides, polyesters, polycarbonates, and polysulfonates. The particle size of the product created by this method variesin accordance with the particle diameter of the dispersed phase. Therefore, particles varying greatly in size. from approximately 3 to 2000 um indiameter, can be prepared.
Water-soluble monomer
.1IllI....-- Interfacialreaction
Oil soluble 0 <lmonomer __.....1-
dispersed phase(oil)
Continuousphase
(water)
Figure 27 Schematic diagram of interfacial polymerization coating processin an O/W emulsion system.
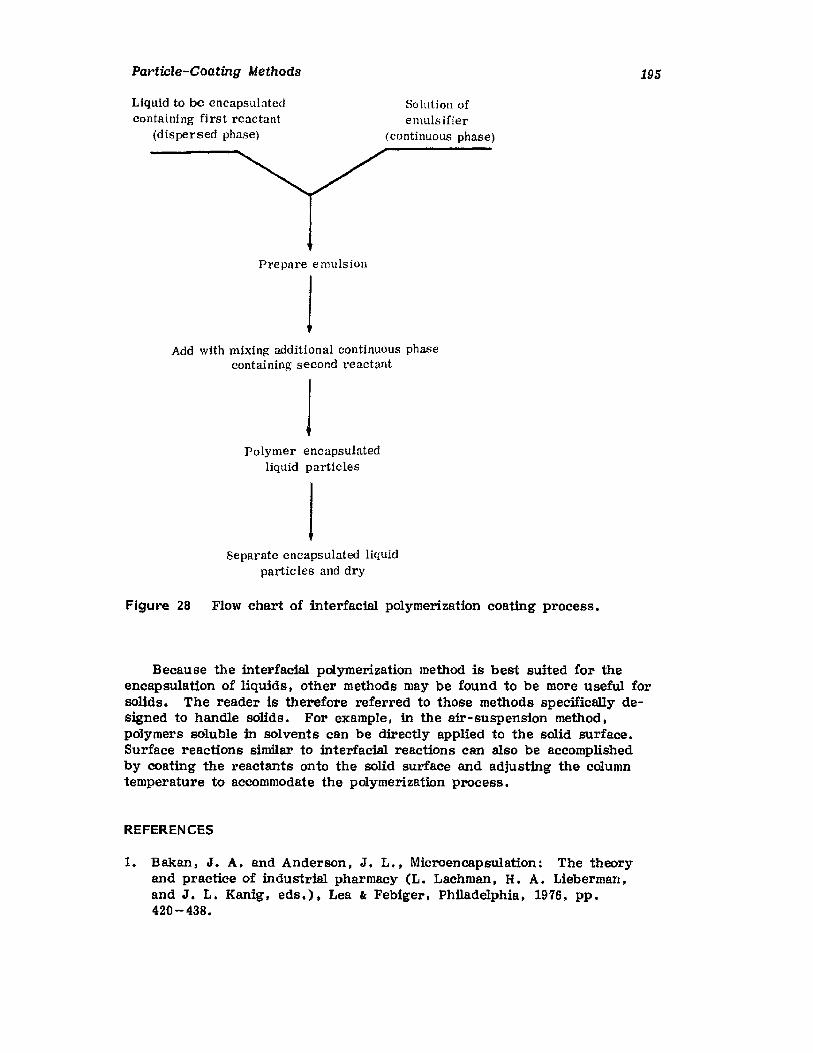
Particle-Coating Methods
Liquid to be encapsulatedcontaining first reactant
(dispersed phase)
Prepare emulsion
J
Solution ofemulsifier
(continuous phase)
195
Add with mixing- additional continuous phasecontaining second reactant
JPolymer encapsulated
Iiqutd particles
JSeparate encapsulated liquid
partie Ies and dry
Figure 28 Flow chart of interfacial polymerization coating process.
Because the interfacial polymerization method is best suited for theencapsulation of liquids, other methods may be found to be more useful forsolids. The reader is therefore referred to those methods specifically designed to handle solids. For example. in the air-suspension method,polymers soluble in solvents can be directly applied to the solid surface.Surface reactions similar to interfacial reactions can also be accomplishedby coating the reactants onto the solid surface and adjusting the columntemperature to accommodate the polymerization process.
REFERENCES
1. Bakan , J. A. and Anderson, J. L., Microencapsulation: The theoryand practice of industrial pharmacy (L. Lachman, H. A. Lieberman,and J. L. Kanig. eds , L Lea It Febiger. Philadelphia. 1976, pp.420-438.
196 Wurster
2. Microencapsulation of Pharmaceuticals, Capsular Products Division.The National Cash Register Company, Dayton, Ohio, 1971.
3. Luzzi, L. A., Encapsulation techniques for pharmaceuticals: Considerations for the microencapsulation of drugs. In Microencapsulation(J. R. Nixon, ed.), Marcel Dekker, New York, 1976, pp. 193-206.
4. Bakan, J. A. and Sloan, F. D., Drug Cosmet. Ind.. 110: 34 (1972).5. Wurster, D. E., J. Am. Pharm. Assoc. (Sci. sa.i, 48:451 (1959).6. Brudney, N. and Toupin, P. Y., Can. Pharm. J. (July 1961).7. Chilson, F., Drug Cosmer, Irui; , 84: 217 (1959).8. Wurster, D. E., U. S. Patent 2,648,609 (1953).9. Wurster, D. E., U.S. Patent 2,799,241 (1957).
10. Wurster, D. E., U.S. Patent 3,196,827 (1965).11. Wurster, D. E., U.S. Patent 3,207,834 (1965).12. Wurster, D. E., U.S. Patent 2,253,944 (1966).13. Wurster, D. E., U.S. Patent 3,241,520 (1966).14. Lindolf, J. A. and Wurster, D.E., U.S. Patent 3,117,027 (1964).15. Coletta, V. and Rubin, H., J. Pharm. sa., 53:953 (1964).16. Wood, J. and Syarto, J., J. Pharm. sa., 53: 877 (1964).17. Wurster, D. E., J. Am. Pharm. Assoc. (Sci. sa.i, 49:82 (1960).18. Wurster, D. E., U. S. Patent 3,089,824 (1959).19. Royce, F., Momentum Transfer in Wurster Air-Suspension Coating
Equipment. Wisconsin Alumni Research Foundation, Madison,Wisconsin, 1963.
20. Richardson, J. F., Incident fluidization and particulate systems:Fluidization (J. F • Davidson and D. Harrison, eds.), Academic Press,New York, 1971, pp. 25-64.
21. Cheremisinoff, N. P. and Cheremisinoff, P. N., Hydrodynamics ofGas -Solids Fluidization, Gulf Publishing Company, Houston, 1984,pp. 137-206.
22. Botterill, J. S. M., Fluidization bed beh avior : Fluidized beds(J. R. Howard, ed.) , Applied Science Publishers, London and NewYork, 1983, pp. 1-36.
23. Kozeny, J., Sitzber, Akad. Wiss. Wien, Math-naturw. kl (Abt. l1a),136:271 (1927).
24. Carman, P. C., Trans. Insi, Chem. Engrs. (Land), 15:150 (1937).25. Carman, P. C., J. Soc. Chern. Ind. (Lond), 57:225 (1938).26. Woodcock, C. R., Economical Transport of Bulk Particulate in Air
Assisted Gravity Conveyors and an Approach to Their Design,International Conference on Pneumatic Conveying, Cafe Royal,London, January 1979.
28. Blake, C. F., Trans. Amer. Inst. Chem, Engrs., 14:415 (1922).29. Kunii, D. and Levenspiel, 0., Fluidization Engineering. Wiley, New
York, 1959, Chap. 3.30. Pilot Plant Operation, Wurster Coating and Granulating Process,
Wisconsin Alumni Research Foundation, Madison, Wisconsin.31. Wilhelm, R. H. and Kwauk, M., Chern. Eng. Prog., 44:201 (1948).32. Perry, R. H., Chilton, C. H., and Kirkpatrick, S. D., Chemical
Engineers' Handbook, 4th Ed., McGraw-Hill, New York, 1963,Chap. 15, pp. 38-40.
33. Coletta, V. and Kennon, L., J. Pharm. Sci .. 53: 1524 (1964).34. Raley, C. F., Jr., Burkett, W. J., and Searingen, J. S., U.S.
Patent 2,766,478 (1956).

Particle-Coating Methods 197
35. Somerville, G. Rot U.8. Patent 3,015,128 (1962).36. Somerville, G. R., U.8. Patent 3,310.612 (1967).37. Somerville, G. R., U. 8. Patent 3,389,194 (1968).38. Schultz, E., U. S. Patent 2,857,281 (1958).39. Goodwin, J. T. and Somerville, G. R.. Physical methods for pre
paring microcapsules. In Microencapsulation: Process and Application (J. E. Vandegaer, ed.), Plenum, New York. 1974. pp. 155-163.
40. Luzzi, L. A., J. Pharm. Sci •• 59: 1367 (1970).41. Miles, J. M•• Mitzer, B., Brenner, J •• and Polak, E., J. Soc.
Cosmet; Chern., 22:655 (1971).42. Wurzburg, O. and Herbst, W., U.S. Patent 3,091,567 (1961).43. Evans. R. and Herbst, W•• U.S. Patent 3,159,585 (1961).44. Macaulay, N., U.S. Patent 3,016.308 (1962).45. Grevenstuk, A. B. and Hougesteger, F., U.S. Patent 3,202,731
(1965) •46. Marotta, N. G., Boettger, R. M., Nappen, B. H., and Szymanski,
C. D., U.S. Patent 3,455,838 (1969).47. Microencapsulation the Process and Its Capabilities. Capsular Prod-
ucts Divison, National Cash Register Company, Dayton, Ohio, 1971.48. Green, B. B., U.S. Patent 2,712,507 (1955).49. Green, B. K. and Schleicher, L., U.S. Patent 2,730,456 (1956).50. Green, B. K. and Schleicher, L., U.S. Patent 2,730,457 (1956).51. Green, B. K. and Schleicher, L., U.S. Patent 2,800,457 (1957).52. Green, B. K., U.8. Patent 2,800,458 (1957).53. Luzzi, L. A. and Cerraughty, R. J., J. Pnarm, sa., 53:429 (1964).54. Phares, R. E., Jr. and Sperandio, G. J., J. Pharm. sa., 53:515
(1964) •55. Luzzi, L. A. and Gerraughty, R. J., J. Pharm, Sci., 56:364 (1967).56. Luzzi. L. A. and Gerraughty, R. J., J. Pharm. set., 56:1174
(1967) •57. Paradissis, G. N. and Parrott, E. L., J. Clin. Pharmacol., 8: 54
(1968) •58. Madan, P. L., Luzzi, L. A., and Price, J. C., J. Pharm. sei., 61:
1586 (1972).59. Brynko, C. and Scarpelli, J. A., U.S. Patent 3,190,837 (1965).60. Brynko, C., Bakan , J. A., Miller, R. E., and Scarpelli, J. A.
U.S. Patent 3,341,466 (1967).61. Bakan , J. A., U.S. Patent 3,436,355 (1969).62. Dobry. A. and Boyer-Kawenoki, F., J. Poly. Sci •• 2:90 (1947).63. Powell. T. C., Steinle, M. E., and Yoncoskie, R. A., U.S. Patent
3,415,758 (1965).64. Phares, R. E., Jr. and 8perandio, G. J., J. Pnarm: Sci., 53:518
(1964) •65. Nack, H., J. Soc. Cosmet, Chern•• 21:85 (1970).66. Watanabe. A. and Hayashi, T •• Microencapsulation techniques of
Fuji Photo Film Co. Ltd., and their applications. In Microencapsulation (J. R. Nixon, ed.), Marcel Dekker, New York, 1976, pp. 13-38).
67. Baxter, G., Microencapsulation processes in modern business forms.In Microencapsulation: Processes and Applications (J. E. Vandegaer,ed.) , Plenum, New York, 1974, pp. 127-143.
4Sustained Drug Release from Tabletsand Particles Through Coating
Rong-Kun Chang
Schering Research, Miami, Florida
Joseph R. Robinson
University of Wisconsin, Madison, Wisconsin
I. INTRODUCTION
Probably the earliest work in the area of sustained drug delivery dosageforms can be traced to the 1938 patent of Israel Lipowski [lJ. This workinvolved coated pellets for prolonged release of a drug, and was presumably the forerunner to the development of the coated-particle approach tosustained drug delivery that was introduced in the early 1950s. There hasbeen 40 years of research and development experience in the sustaineddrug release area since that patent, and a number of strategies have beendeveloped to prolong drug levels in the body. These range from the verysimple slowly dissolving pellets or tablets to the more technologically sophisticated controlled drug-release systems which have recently started toappear on the market and in the pharmaceutical literature [2 -13] • Theendpoint in all of these systems is the same in that extended durations ofdrug levels are BOught, but the method of achieving this endpoint and theclinical performance of these products can vary considerably. Successfulfabrication of sustained-release products is usually difficult and involvesconsideration of the physical-chemical properties of the drug, pharmacokinetic behavior of the drug, route of administration, disease state to betreated and, most importantly, placement of the drug in a dosage form thatwill provide the desired temporal and spatial delivery pattern for the drug.This chapter is devoted to an examination of one method of sustainedrelease drug delivery; namely. coating.
The approach in this chapter is to present the requirements for asustained-release product in terms of the appropriate release rate of drugfrom the dosage form, a brief review of those factors influencing the design and performance of a sustained-release product, such as the physical-
199
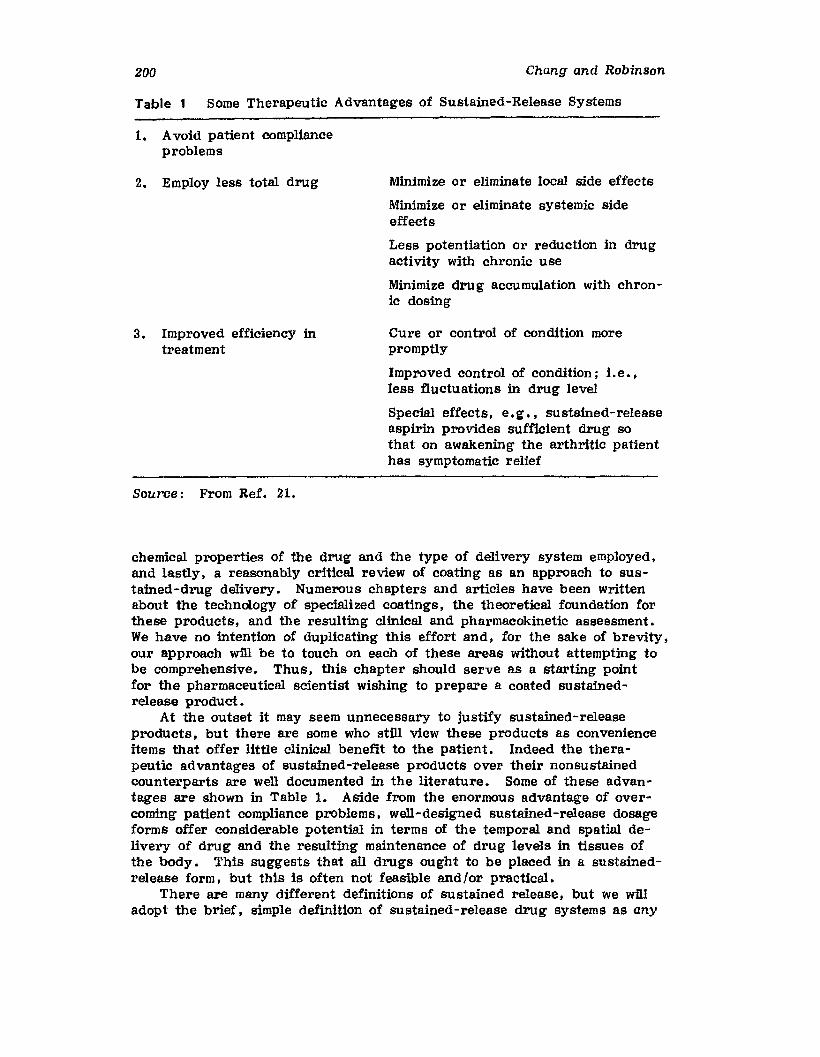
200 Chang and Robinson
Table 1 Some Therapeutic Advantages of Sustained-Release Systems
1. Avoid patient complianceproblems
2. Employ less total drug
3. Improved efficiency intreatment
Source: From Ref. 21.
Minimize or eliminate local side effects
Minimize Or eliminate systemic sideeffects
Less potentiation or reduction in drugactivity with chronic use
Minimize drug accumulation with chronic dosing
Cure or control of condition morepromptly
Improved control of condition; 1.e ••less fluctuations in drug level
Special effects, e.g. I sustained-releaseaspirin provides sufficient drug sothat on awakening the arthritic patienthas symptomatic relief
chemical properties of the drug and the type of delivery system employed,and lastly. a reasonably critical review of coating as an approach to sustained-drug delivery. Numerous chapters and articles have been writtenabout the technology of specialized coatings, the theoretical foundation forthese products, and the resulting clinical and pharmacokinetio assessment.We have no intention of duplicating this effort and. for the sake of brevity,our approach will be to touch on each of these areas without attempting tobe comprehensive. Thus, this chapter should serve as a starting pointfor the pharmaceutical scientist wishing to prepare a coated sustainedrelease product.
At the outset it may seem unnecessary to justify sustained-releaseproducts. but there are some who still view these products as convenienceitems that offer little clinical benefit to the patient. Indeed the therapeutic advantages of sustained-release products over their nonsustainedcounterparts are well documented in the literature. Some of these advantages are shown in Table 1. Aside from the enormous advantage of overcoming patient compliance problems. well-designed sustained-release dosageforms offer considerable potential in terms of the temporal and spatial delivery of drug and the resulting maintenance of drug levels in tissues ofthe body. This suggests that all drugs ought to be placed in a sustainedrelease form. but this is often not feasible and/or practical.
There are many different definitions of sustained release, but we willadopt the brief. simple definition of sustained-release drug systems as any
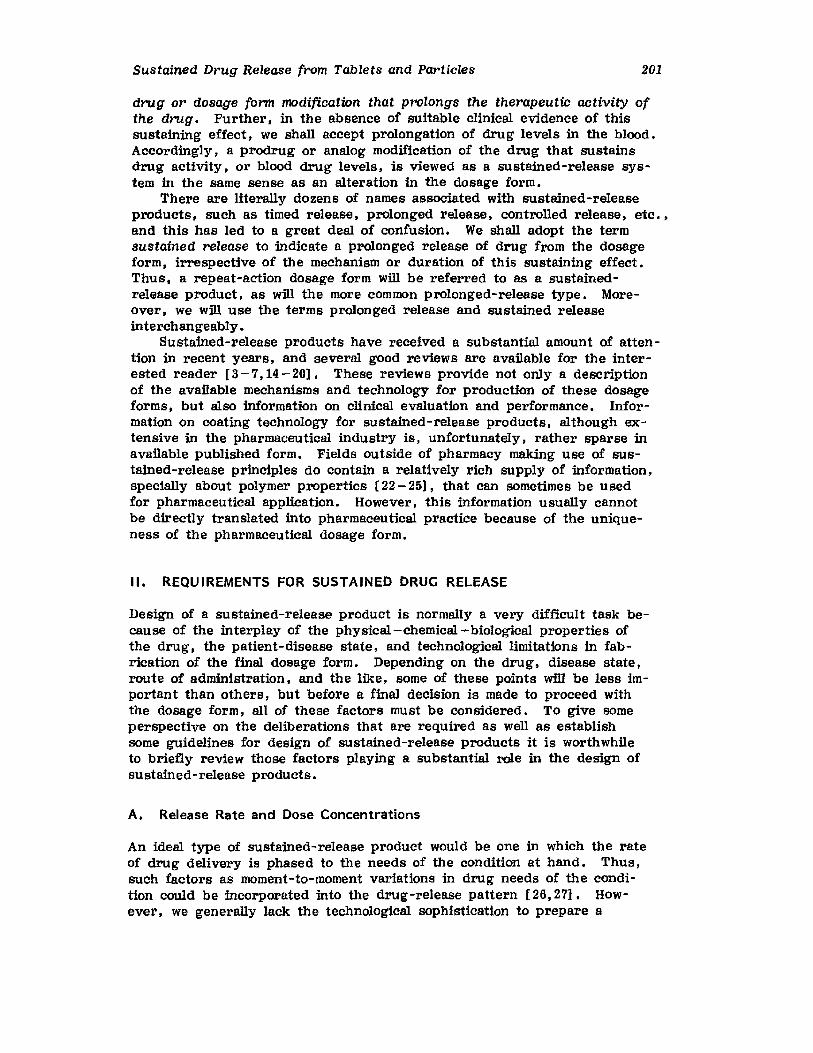
Sustained Drug Release from Tablets and Particles 201
drug or dosage form modification that prolongs the therapeutic activity ofthe drug. Further, in the absence of suitable clinical evidence of thissustaining effect, we shall accept prolongation of drug levels in the blood.Accordingly, a prodrug or analog modification of the drug that sustainsdrug activity, or blood drug levels, is viewed as a sustained-release system in the same sense as an alteration in the dosage form.
There are literally dozens of names associated with sustained-releaseproducts, such as timed release, prolonged release, controlled release, ete , ,and this has led to a great deal of confusion. We shall adopt the termsustained release to indicate a prolonged release of drug from the dosageform, irrespective of the mechanism or duration of this sustaining effect.Thus, a repeat-action dosage form will be referred to as a sustainedrelease product, as will the more common prolonged-release type. Moreover, we will use the terms prolonged release and sustained releaseinterchangeably.
Sustained-release products have received a substantial amount of attention in recent years, and several good reviews are available for the interested reader [3 -7, 14- 20]. These reviews provide not only a descriptionof the available mechanisms and technology for production of these dosageforms, but also information on clinical evaluation and performance. Information on coating technology for sustained-release products, although extensive in the pharmaceutical industry is, unfortunately, rather sparse inavailable published form. Fields outside of pharmacy making use of sustained-release principles do contain a relatively rich supply of information,specially about polymer properties [22 - 25], that can sometimes be usedfor pharmaceutical application. However, this information usually cannotbe directly translated into pharmaceutical practice because of the uniqueness of the pharmaceutical dosage form.
II. REQUIREMENTS FOR SUSTAINED DRUG RELEASE
Design of a sustained-release product is normally a very difficult task because of the interplay of the physical-chemical-biological properties ofthe drug, the patient-disease state, and technological limitations in fabrication of the final dosage form. Depending on the drug, disease state,route of administration, and the like, some of these points will be less important than others, but before a final decision is made to proceed withthe dosage form, all of these factors must be considered. To give someperspective on the deliberations that are required as well as establishsome guidelines for design of sustained-release products it is worthwhileto briefly review those factors playing a substantial role in the design ofsustained-release products.
A. Release Rate and Dose Concentrations
An ideal type of sustained-release product would be one in which the rateof drug delivery is phased to the needs of the condition at hand. Thus,such factors as moment-to-moment variations in drug needs of the condition could be incorporated into the drug-release pattern [26,27]. However, we generally lack the technological sophistication to prepare a
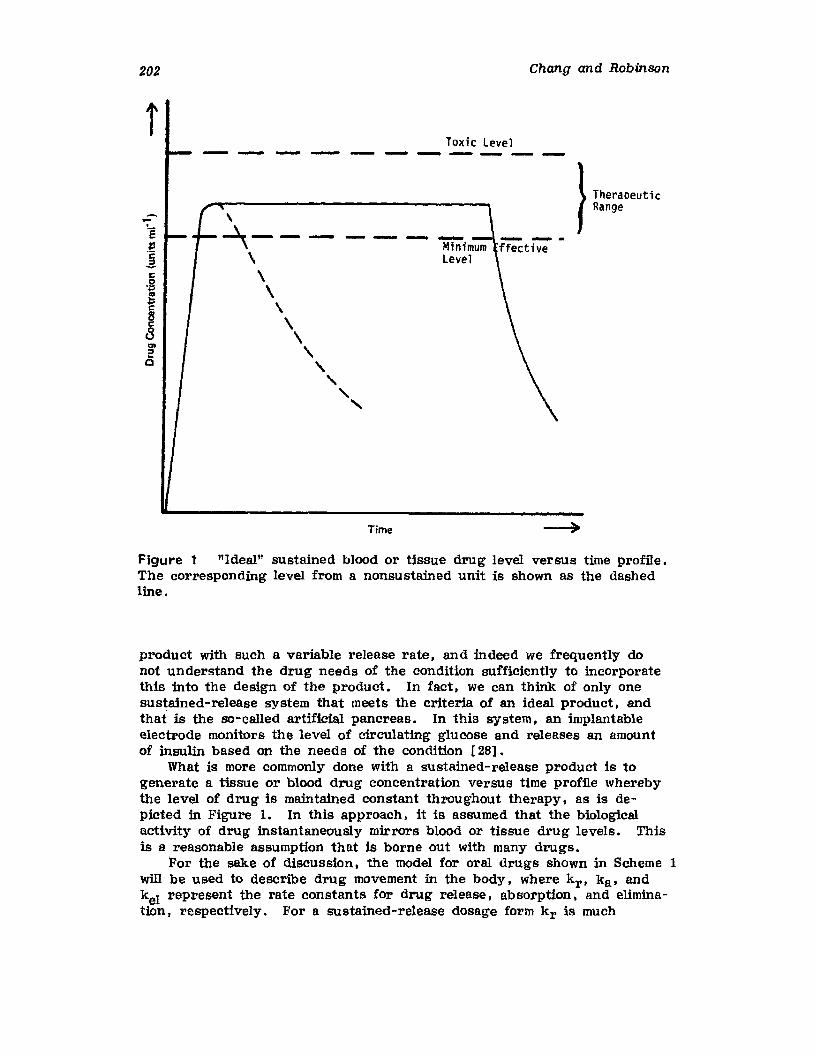
202
iChang and Robinson
Toxic Level--------_.-._-
\
~------\
\\
\\
\ ,",,
......
Time
}
TherapeuticRange
Figure 1 "Ideal" sustained blood or tissue drug level versus time profile.The corresponding level from a nonsustained unit is shown as the dashedline.
product with such a variable release rate, and indeed we frequently donot understand the drug needs of the condition sufficiently to incorporatethis into the design of the product. In fact. we can think of only onesustained-release system that meets the criteria of an ideal product, andthat is the so-called artificial pancreas. In this system, an implantableelectrode monitors the level of circulating glucose and releases an amountof insulin based on the needs of the condition [28].
What is more commonly done with a sustained-release product is togenerate a tissue or blood drug concentration versus time profile wherebythe level of drug is maintained constant throughout therapy, as is depicted in Figure 1. In this approach, it is assumed that the biologicala.ctivity of drug instantaneously mirrors blood or tissue drug levels. Thisis a reasonable assumption that is borne out with many drugs.
:For the sake of discussion, the model for oral drugs shown in Scheme 1will be used to describe drug movement in the body, where kr, ka, andke1 represent the rate constants for drug release, absorption, and elimination, respectively. For a sustained-release dosage form k r is much
Sustained Drug Release from Tablets and Particles 203
k k kr IGI tractI a
6e a-7 -7 -..
Scheme 1
k
Bk
EJr e..... .....
Scheme 2
smaller than ka, thus becoming rate limiting in the above catenary schemeand reducing the model to that shown in Scheme 2.
If indeed we wish to maintain a constant level of drug in some desiredtarget tissue, the next logical question is what release pattern from thedosage form (drug input) is needed to produce such a profile. It caneasily be shown that a zero-order release of drug from the dosage form or,conversely, availability to the body is the most appropriate release pattern[ 3,29] • The following discussion is pertinent to the question of the desired release rate. For a drug whose disposition in the body can bedescribed by a simple, one-compartment open model, the rate of drug lossat any point in time can be described as
(1)
where Ct is the concentration of drug in the blood (or tissue) at a particular point in time, kel is the total elimination rate constant, and Vd isincorporated into the equation to convert from concentration to an amountbasis and is the apparent volume of distribution for the drug. For illustration purposes refer to Figure 1; the desired concentration of a drug isshown as the plateau concentration or maximum in the nonsu stained blooddrug level profile, which presumably would be the midpoint of the therapeutic range. If we wish to maintain this drug level indefinitely, it isonly necessary to put the drug back in at the same rate it is being removed, or
rate in ( 2)
Note that the units resulting from equation 2 are weight (dose) per unittime or that to maintain a constant level of drug it is necessary to provide drug at a constant rate to replace that which is lost. One can envision the simplest sustained drug product as an intravenous drip wherebythe rate of drug supply matches that which is lost and is constant (zeroorder). For oral and other routes of drug administration, we thereforewish to provide drug via a zero-order pattern whose rate constant describing delivery is determined by the terms shown in equations 1 and 2. For
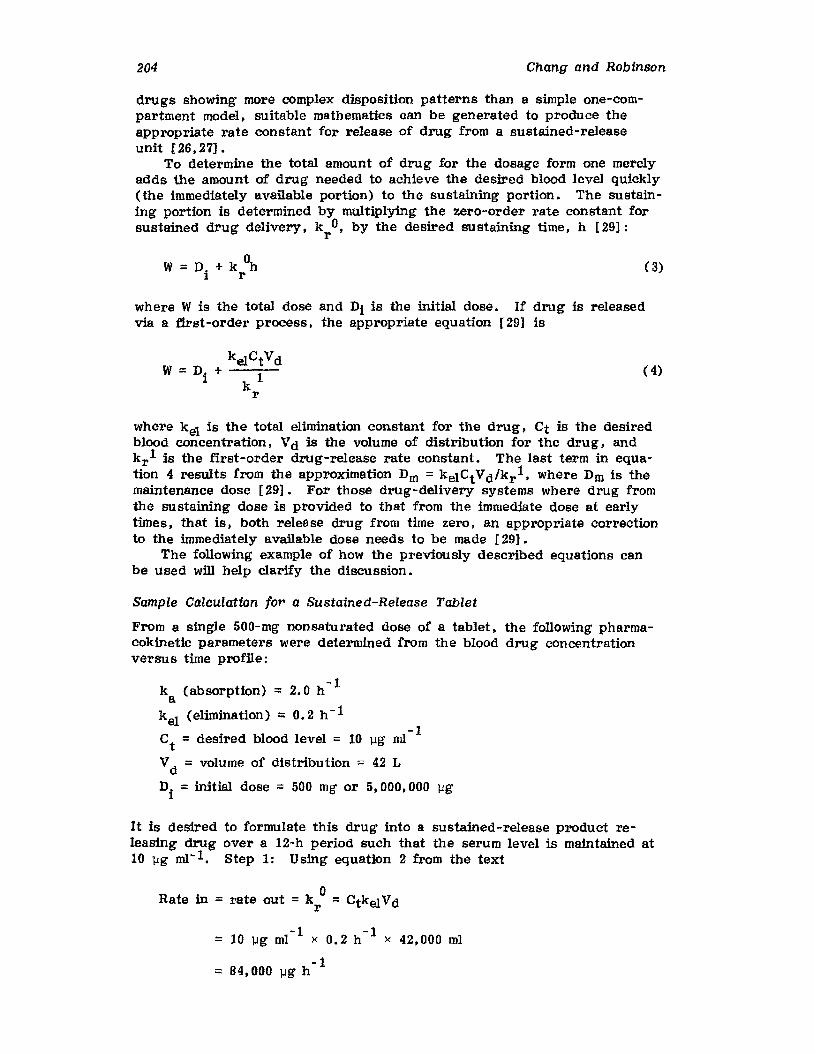
204 Chang and Robinson
drugs showing more complex disposition patterns than a simple one-compartment model, suitable mathematics can be generated to produce theappropriate rate constant for release of drug from a sustained-releaseunit [26,27].
To determine the total amount of drug for the dosage form one merelyadds the amount of drug needed to achieve the desired blood level quickly(the immediately available portion) to the sustaining portion. The sustaining portion is determined by multiplying the zero-order rate constant forsustained drug delivery, k 0, by the desired sustaining time, h [29]:r
( 3)
where W is the total dose and Di is the initial dose. If drug is releasedvia a first-order process. the appropriate equation [29] is
( 4)
where kel is the total elimination constant for the drug, Ct is the desiredblood concentration. Vd is the volume of distribution for the drug, andkr
1 is the first-order drug-release rate constant. The last term in equation 4 results from the approximation Dm =kelCt Vd Ikr 1, where Dm is themaintenance dose [29]. For those drug-delivery systems where drug fromthe sustaining dose is provided to that from the immediate dose at earlytimes, that is, both release drug from time zero, an appropriate correctionto the immediately available dose needs to be made [29].
The following example of how the previously described equations canbe used will help clarify the discussion.
Sample Calculation for a Sustained-Release Tablet
From a single 500-mg nonsaturated dose of a tablet. the following pharmacokinetic parameters were determined from the blood drug concentrationversus time profile:
k (absorption) = 2.0 h -1a
k el (elimination) =0.2 h- 1-1
Ct = desired blood level = 10 ug mI
Vd = volume of dtstribution > 42 L
Di = initial dose = 500 mg or 5,000.000 J.lg
It is desired to formulate this drug into a sustained-release product releasing drug over a 12-h period such that the serum level is maintained at10 llg mI- l • Step 1: Using equation 2 from the text
Rate in = rate out = k 0 = CtkelVdr
-1 -1= 10 ].lg ml x 0.2 h x 42,000 ml
-1=84,000 ].lg h
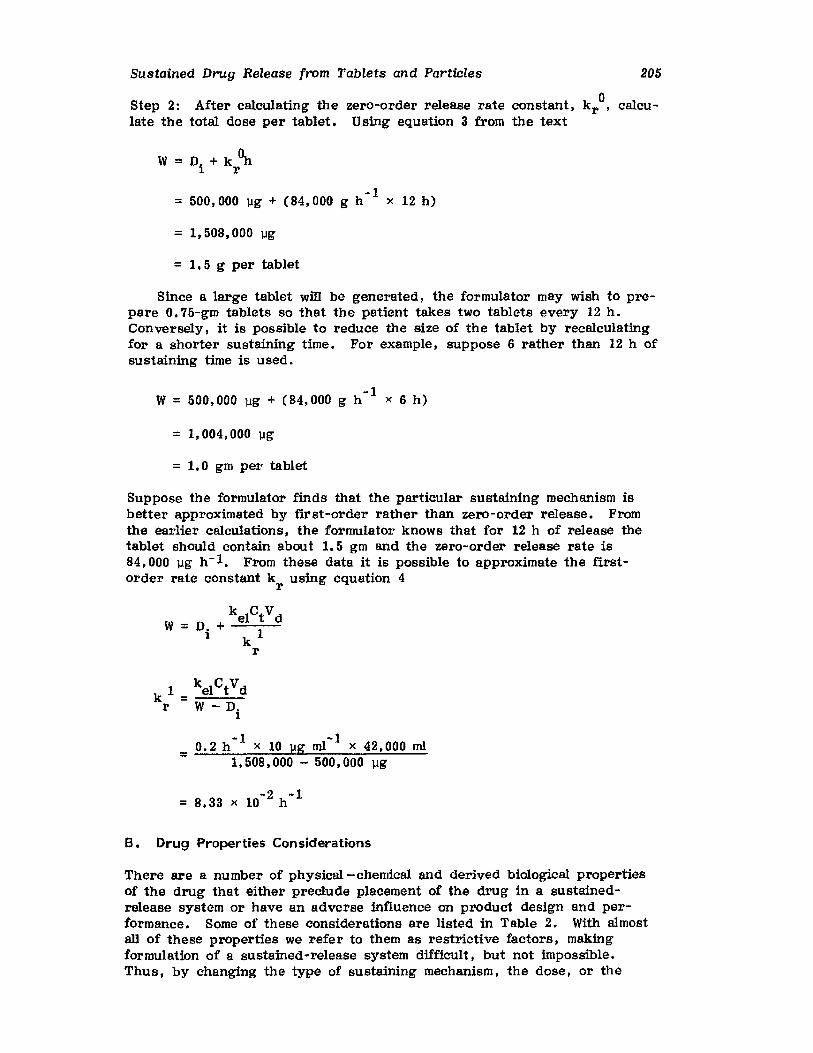
Sustained Drug Release from Tablets and Particles 205
oStep 2: After calculating the zero-order release rate constant. k r • calcu-late the total dose per tablet. Using equation 3 from the text
W = D. + k ~1 r
-1= 500,000 llg + (84,000 g h x 12 h)
= 1.508.000 ug'
=1.5 g per tablet
Since a large tablet will be generated. the formulator may wish to prepare O.75-gm tablets so that the patient takes two tablets every 12 h.Conversely, it is possible to reduce the size of the tablet by recalculatingfor a shorter sustaining time. For example. suppose 6 rather than 12 h ofsustaining time is used.
-1W = 500,000].lg + (84,000 g h x 6 h)
= 1.004,000 ug
= 1.0 gm per tablet
Suppose the formulator finds that the particular sustaining mechanism isbetter approximated by first-order rather than zero-order release. Fromthe earlier calculations. the formulator knows that for 12 h of release thetablet should contain about 1.5 gm and the zero-order release rate is84.000 1Jg h -1. From these data it is possible to approximate the firstorder rate constant k using equation 4
r
1 kelCtVdk = ::-::"-~
r W - Di
-1 -1= 0.2 h x 10 llg ml x 42.000 ml1,508,000 - 500,000 llg
B. Drug Properties Considerations
There are a number of physical-chemical and derived biological propertiesof the drug that either preclude placement of the drug in a sustainedrelease system or have an adverse influence on product design and performance. Some of these considerations are listed in Table 2. With almostall of these properties we refer to them as restrictive factors. makingformulation of a sustained-release system difficult, but not impossible.Thus, by changing the type of sustaining mechanism, the dose. or the
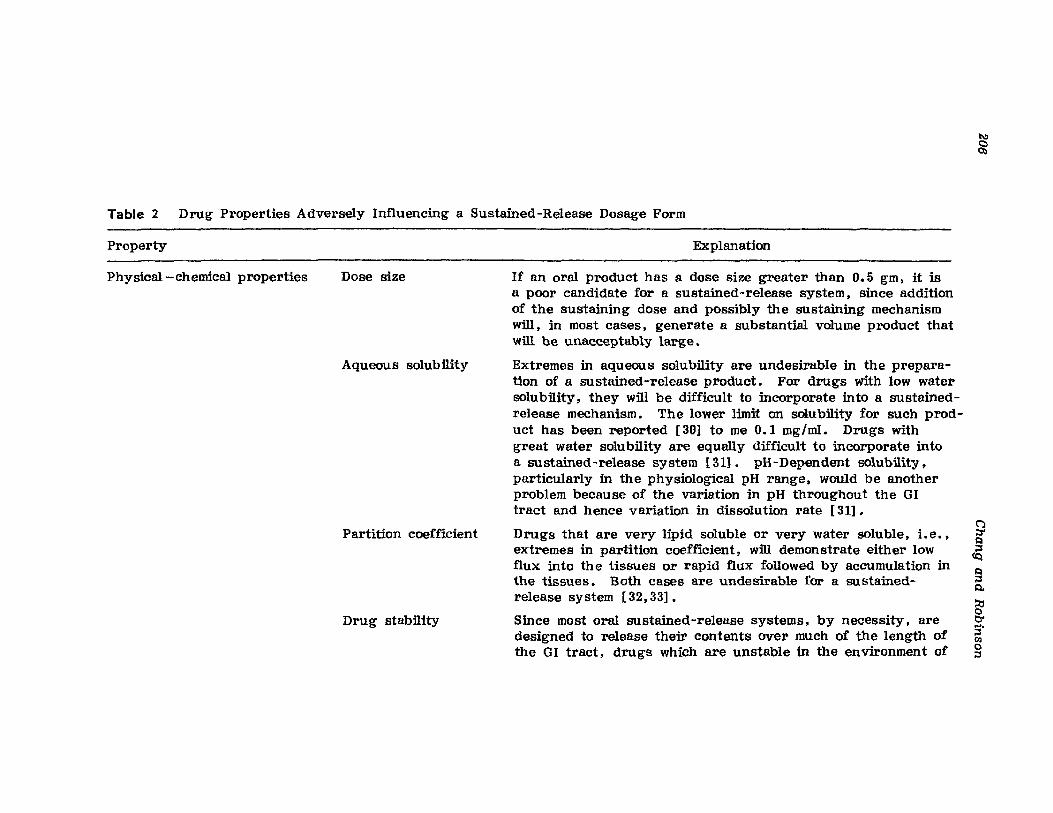
Table 2 Drug Properties Adversely Influencing a Sustained-Release Dosage Form
Property Explanation
~
~
Physical-chemical properties Dose size
Aqueous solubility
Partition coefficient
Drug stability
If an oral product has a dose size greater than 0.5 gm, it isa poor candidate for a sustamed-release system, since additionof the sustaining dose and possibly the sustaining mechanismWill, in most cases, generate a substantial volume product thatwill be unacceptably large.
Extremes in aqueous solubility are undesirable in the preparation of a sustained-release product. For drugs with low watersolubility, they will be difficult to incorporate into a sustainedrelease mechanism. The lower limit on solubility for such product has been reported [30] to me 0.1 mg/ml. Drugs withgreat water solubility are equally difficult to incorporate intoa sustained-release system [311. pH-Dependent solubiltty ,particularly in the physiological pH range, would be anotherproblem because of the variation in pH throughout the GItract and hence variation in dissolution rate [31].
Drugs that are very lipid soluble or very water soluble, i.e.,extremes in partition coefficient, will demonstrate either lowflux into the tissues or rapid flux followed by accumulation inthe tissues. Both cases are undesirable for a sustainedrelease system [32, 33] •
Since most oral sustained-release systems, by necessity faredesigned to release their contents over much of the length ofthe GI tract, drugs which are unstable in the environment of
();::T'I:l
~I:l;::lQ.
~....;::lCf.lC;::l
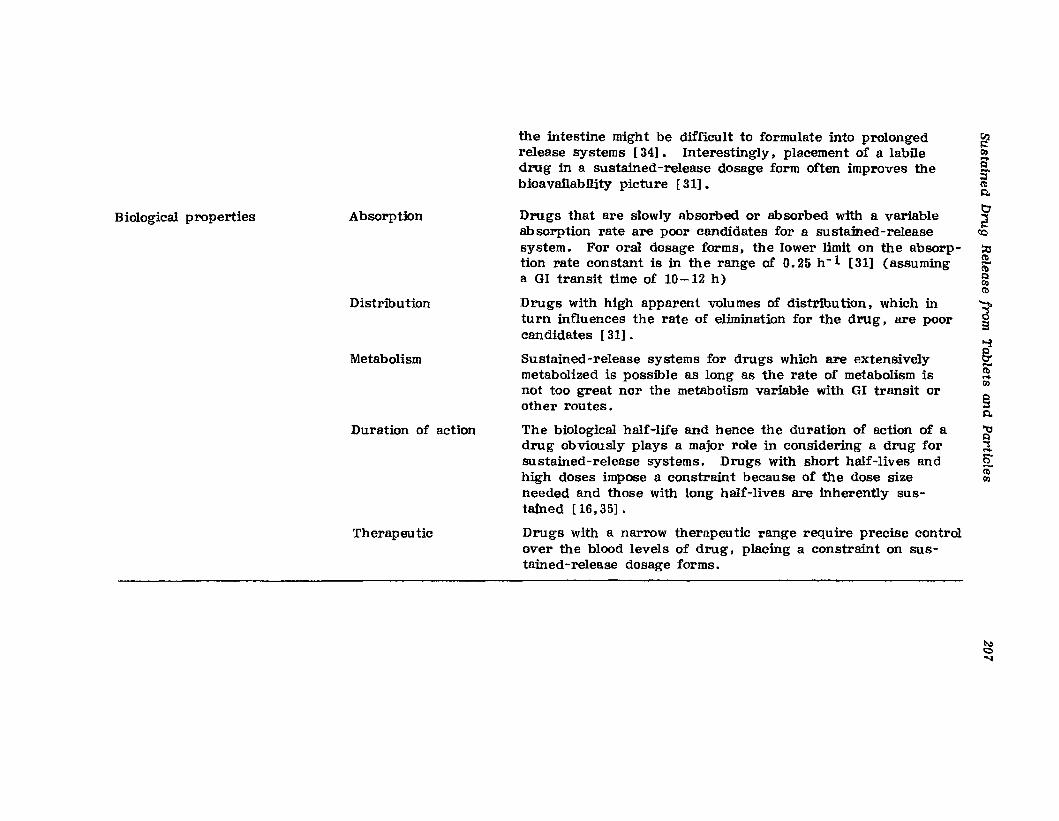
Biological properties Absorption
Distribution
Metabolism
Duration of action
Therapeutic
the intestine might be difficult to formulate into prolongedrelease systems [34]. Interestingly, placement of a labiledrug in a sustained-release dosage form often improves thebioavailability picture [31].
Drugs that are slowly absorbed or absorbed with a variableabsorption rate are poor candidates for a sustained-releasesystem. For oral dosage forms, the lower limit on the absorption rate constant is in the range of 0.25 h- 1 [31] (assuminga GI transit time of 10-12 h)
Drugs with high apparent volumes of distribution, which inturn influences the rate of elimination for the drug. are poorcandidates [31].
Sustained-release systems for drugs which are extensivelymetabolized is possible as long as the rate of metabolism isnot too great nor the metabolism variable with GI transit orother routes.
The biological half-life and hence the duration of action of adrug obviously plays a major role in considering a drug forsustained-release systems. Drugs with short half-lives andhigh doses impose a constraint because of the dose sizeneeded and those with long half-lives are inherently sustained [16,35].
Drugs with a narrow therapeu tic range require precise controlover the blood levels of drug, placing a constraint on sustained-release dosage forms.
~OJE'-::l(Il
1:4
o2~
~(Il
(i)~OJ(Il
~::I
§:(i)....OJ
s1:4
;§''"'$....0"(i)OJ
~C"'1
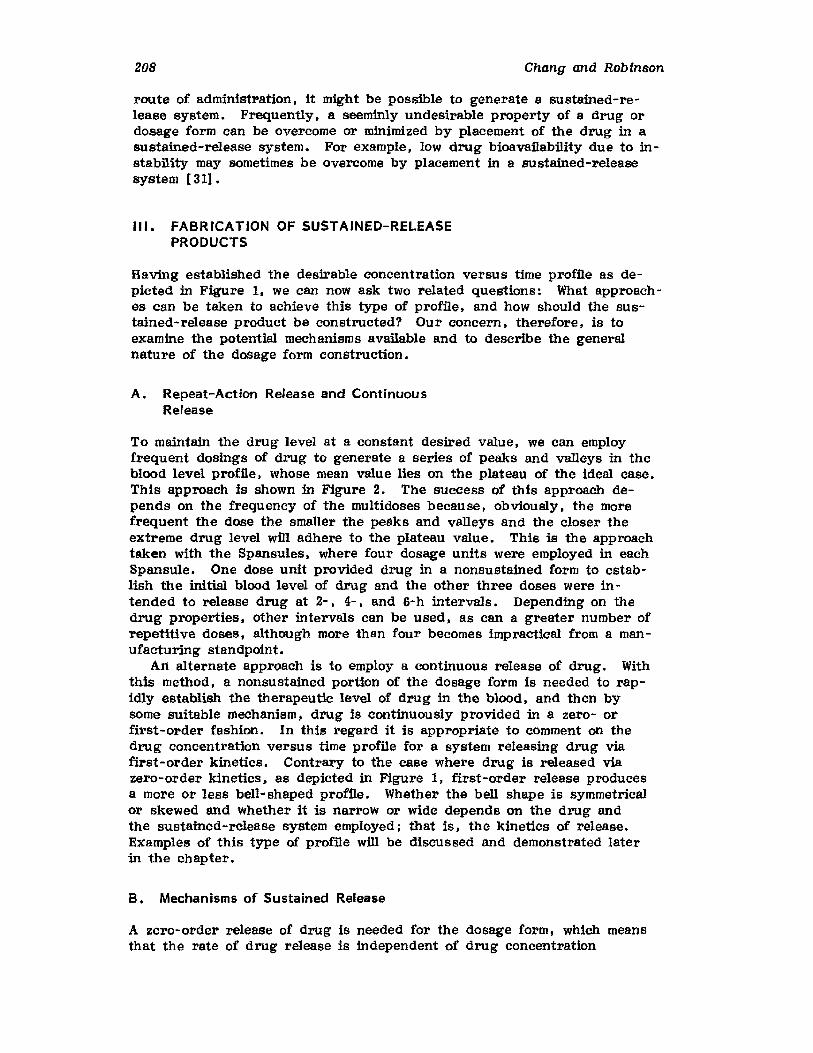
208 Chang and Robinson
route of administration, it might be possible to generate a sustained-release system. Frequently, a seeminly undesirable property of a drug ordosage form can be overcome or minimized by placement of the drug in asustained-release system. For example, low drug bioavanability due to instability may sometimes be overcome by placement in a sustained-releasesystem [311.
III. FABRICATION OF SUSTAINED-RELEASEPRODUCTS
Having established the desirable concentration versus time proflle as depicted in Figure 1, we can now ask two related questions: What approaches can be taken to achieve this type of profile, and how should the sustained-release product be constructed? Our concern, therefore, is toexamine the potential mechanisms available and to describe the generalnature of the dosage form construction.
A. Repeat-Action Release and ContinuousRelease
To maintain the drug level at a constant desired value, we can employfrequent dosings of drug to generate a series of peaks and valleys in theblood level proflle, whose mean value lies on the plateau of the ideal case.This approach is shown in Figure 2. The success of this approach depends on the frequency of the multidoses because. obviously, the morefrequent the dose the smaller the peaks and valleys and the closer theextreme drug level will adhere to the plateau value. This is the approachtaken with the Spansules, where four dosage units were employed in eachSpansule. One dose unit provided drug in a nonsustained form to establish the initial blood level of drug and the other three doses were intended to release drug at 2-, 4-, and 6-h intervals. Depending on thedrug properties, other intervals can be used, as can a greater number ofrepetitive doses, although more than four becomes impractical from a manufacturing standpoint.
An alternate approach is to employ a continuous release of drug. Withthis method, a nonsustained portion of the dosage form is needed to rapidly establish the therapeutic level of drug in the blood, and then bysome suitable mechanism, drug is continuously provided in a zero- orfirst-order fashion. In this regard it is appropriate to comment on thedrug concentration versus time profile for a system releasing drug viafirst-order kinetics. Contrary to the case where drug is released viazero-order kinetics, as depicted in Figure 1, first-order release producesa more or less bell-shaped proflle. Whether the bell shape is symmetricalor skewed and whether it is narrow or wide depends on the drug andthe sustained-release system employed; that is, the kinetics of release.Examples of this type of profile will be discussed and demonstrated laterin the chapter.
B. Mechanisms of Sustained Release
A zero-order release of drug is needed for the dosage form, which meansthat the rate of drug release is independent of drug concentration
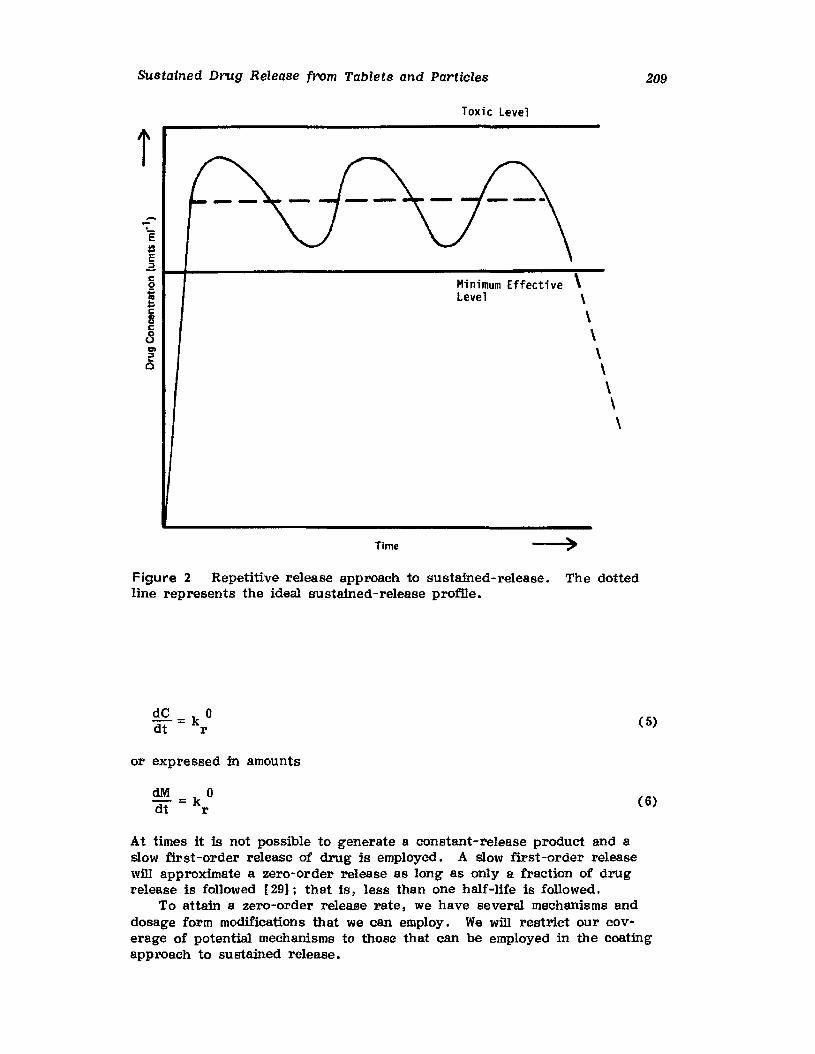
Sustained Drug Release from Tablets and Particles 209
Toxic level
Minimum Effective \level \
\\\\\\\
....\...E:lC
.a1--4-----------------------"'""':~-s~88C>
2o
Time )
Figure 2 Repetitive release approach to sustained-release. The dottedline represents the ideal sustained-release profile.
de = k 0 (5)dt r
or expressed in amounts
(6)
At times it is not possible to generate a constant-release product and aslow first-order release of drug is employed. A slow first-order releasewill approximate a zero-order release as long as only a fraction of drugrelease is followed [291; that is. less than one half-life is followed.
To attain a zero-order release rate, we have several mechanisms anddosage form modifications that we can employ. We will restrict our coverage of potential mechanisms to those that can be employed in the coatingapproach to sustained release.
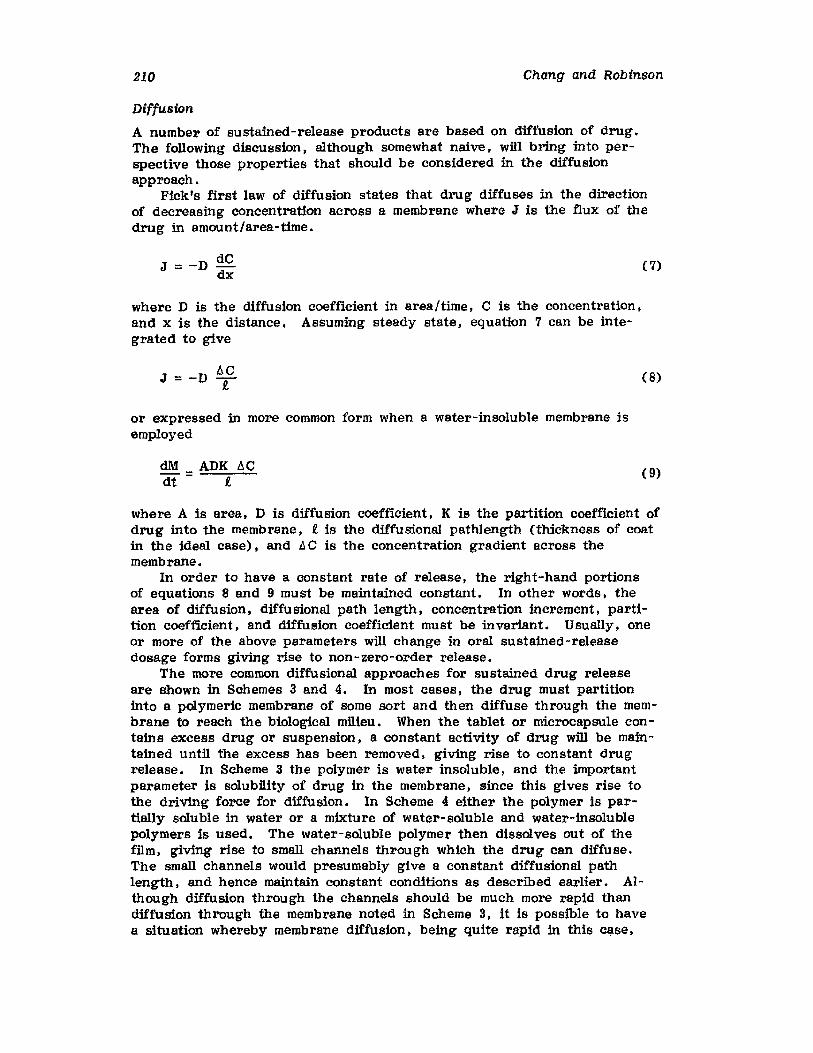
210 Chang and Robinson
Diffusion
A number of sustained-release products are based on diffusion of drug.The follOWing discussion. although somewhat naive, will bring into perspective those properties that should be considered in the diffusionapproach.
Fick's first law of diffusion states that drug diffuses in the directionof decreasing concentration across a membrane where J is the flux of thedrug in amount/area-time.
dCJ =-Ddx
where D is the diffusion coefficient in area/time, C is the concentration,and x is the distance. Assuming steady state, equation 7 can be integrated to give
6CJ = -D T
or expressed in more common form when a water-insoluble membrane isemployed
elM ADK 6Cdt = i
( 7)
(8)
( 9)
where A is area. D is diffusion coefficient, K is the partition coefficient ofdrug into the membrane, i is the diffusional pathlength (thickness of coatin the ideal case), and !l C is the concentration gradient across themembrane.
In order to have a constant rate of release, the right-hand portionsof equations 8 and 9 must be maintained constant. In other words, thearea of diffusion, diffusional path length, concentration increment, partition coefficient. and diffusion coefficient must be invariant. Usually, oneor more of the above parameters will change in oral sustained-releasedosage forms giving rise to non-zero-order release.
The more common diffusional approaches for sustained drug releaseare shown in Schemes 3 and 4. In most cases, the drug must partitioninto a polymeric membrane of some sort and then diffuse through the membrane to reach the biological milieu. When the tablet or microcapsule contains excess drug or suspension. a constant activity of drug will be maintained until the excess has been removed, giving rise to constant drugrelease. In Scheme 3 the polymer is water insoluble. and the importantparameter is solubility of drug in the membrane. since this gives rise tothe driving force for diffusion. In Scheme 4 either the polymer is partially soluble in water or a mixture of water-soluble and water-insolublepolymers is used. The water-soluble polymer then dissolves out of thefilm. giving rise to small channels through which the drug can diffuse.The small channels would presumably give a constant diffusional pathlength. and hence maintain constant conditions as described earlier. Although diffusion through the channels should be much more rapid thandiffusion through the membrane noted in Scheme 3, it is possible to havea situation whereby membrane diffusion, being quite rapid in this ease,
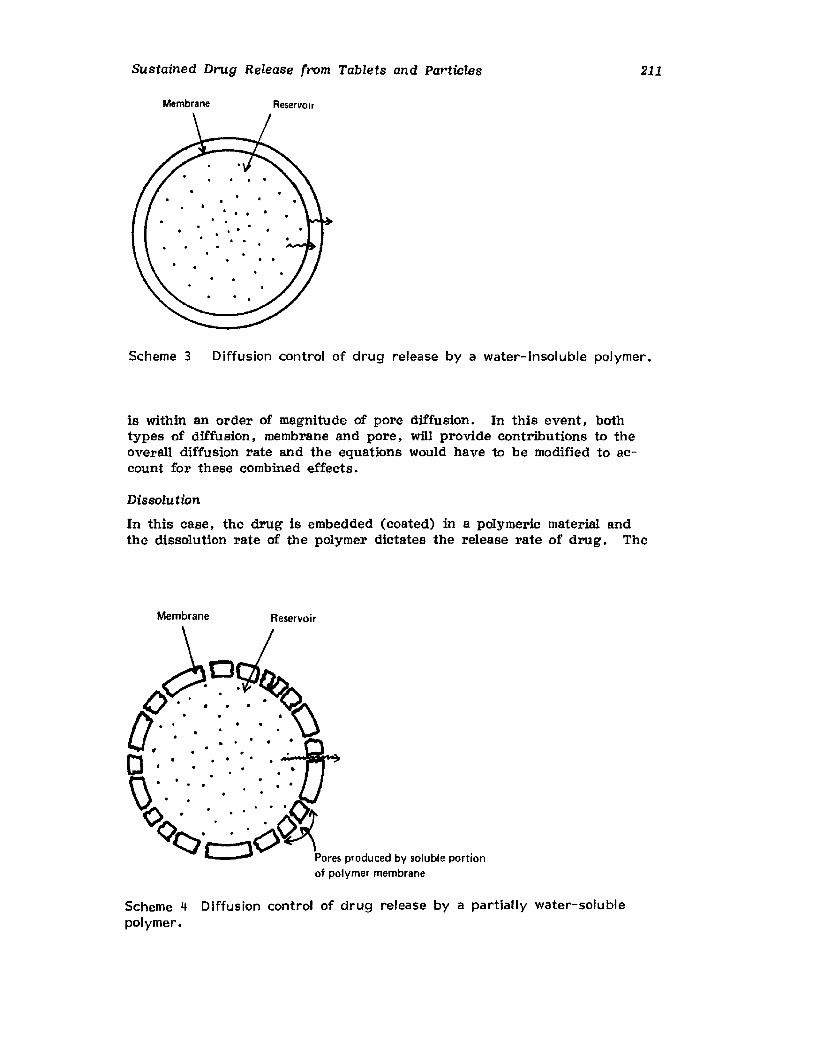
Sustained Drug Release from Tablets and Particles
Membrane Reservoir
211
Scheme 3 Diffusion control of drug release by a water-Insoluble polymer.
is within an order of magnitude of pore diffusion. In this event, bothtypes of diffusion, membrane and pore, will provide contributions to theoverall diffusion rate and the equations would have to be modified to account for these combined effects.
Dissolution
In this case, the drug is embedded (coated) in a polymeric material andthe dissolution rate of the polymer dictates the release rate of drug. The
Membrane Reservoir
b~~J.~a ::. :.\)D ' .
\)~ . ' .... : .~. "O~c:::J Pores produced by soluble portion
of polymer membrane
Scheme 4 Diffusion control of drug release by a partially water-solublepolymer.
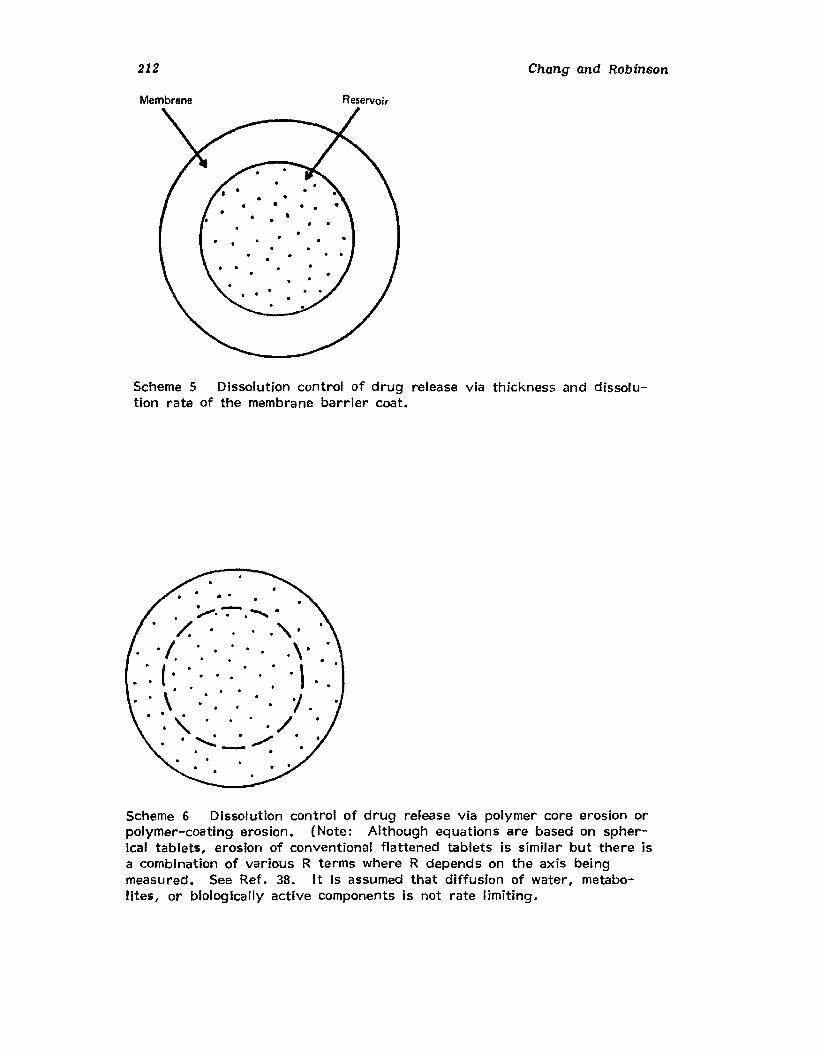
212
Membrane Reservoir
Chang and Robinson
Scheme 5 Dissolution control of drug release via thickness and dissolution rate of the membrane barrier coat.
Scheme 6 Dissolution control of drug release via polymer core erosion orpolymer-coating erosion. (Note: Although equations are based on spherical tablets, erosion of conventional flattened tablets is similar but there isa combination of various R terms where R depends on the axis beingmeasured. See Ref. 38. It is assumed that diffusion of water, metabolites, or biologically active components is not rate limiting.
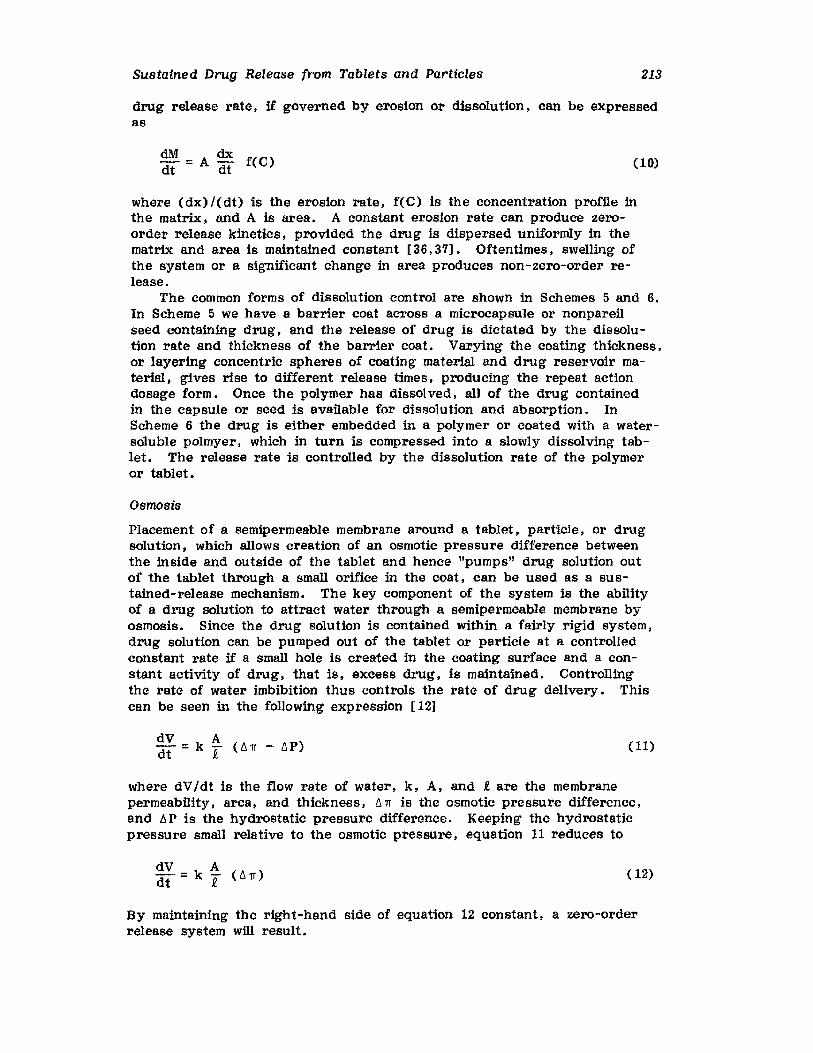
Sustained Drug Release from Tablets and Particles 213
drug release rate, if governed by erosion or dissolution, can be expressedas
dM = A dx fCC)dt dt (10)
where (dx)/(dt) is the erosion rate, fCC) is the concentration profile inthe matrix, and A is area. A constant erosion rate can produce zeroorder release kinetics, provided the drug is dispersed uniformly in thematrix and area is maintained constant [36,37). Oftentimes, swelling ofthe system or a significant change in area produces non-zero-order release.
The common forms of dissolution control are shown in Schemes 5 and 6.In Scheme 5 we have a barrier coat across a microcapsule or nonpareilseed containing drug, and the release of drug is dictated by the dissolution rate and thickness of the barrier coat. Varying the coating thickness,or layering concentric spheres of coating material and drug reservoir material, gives rise to different release times, producing the repeat actiondosage form. Once the polymer has dissolved, all of the drug containedin the capsule or seed is available for dissolution and absorption. InScheme 6 the drug is either embedded in a polymer or coated with a watersoluble polmyer, which in turn is compressed into a slowly dissolving tablet. The release rate is controlled by the dissolution rate of the polymeror tablet.
Osmosis
Placement of a semipermeable membrane around a tablet, particle, or drugsolution, which allows creation of an osmotic pressure difference betweenthe inside and outside of the tablet and hence "pumps" drug solution outof the tablet through a small orifice in the coat, can be used as a sustained-release mechanism. The key component of the system is the abilityof a drug solution to attract water through a semipermeable membrane byosmosis. Since the drug solution is contained within a fairly rigid system,drug solution can be pumped out of the tablet or particle at a controlledconstant rate if a small hole is created in the coating surface and a constant activity of drug, that is, excess drug, is maintained. Controllingthe rate of water imbibition thus controls the rate of drug delivery. Thiscan be seen in the following expression (12)
dV = k A (6 1l' - 6P)dt t
(11)
where dVI dt is the flow rate of water, k , A, and t are the membranepermeability, area, and thickness, 6 11" is the osmotic pressure difference,and liP is the hydrostatic pressure difference. Keeping the hydrostaticpressure small relative to the osmotic pressure, equation 11 reduces to
dV A-= k - (61l')dt £-
(12)
By maintaining the right-hand side of equation 12 constant, a zero-orderrelease system will result.
214 Chang and Robinson
COATING METHODS. Coating is a versatile process which impartsvarious useful properties to the product. Modifications of drug-releasepatterns such as enteric release, repeat-action release, and sustainedrelease are the most important pharmaceutical applications of coating. Although many coating techniques, for various purposes, have been detailedin previous chapters, we have elected to discuss the coating methods forthe purpose of modified release.
Pharmaceutical coatings have been classified into four basic categories:sugar coating, microencapsulation, film coating, and compression coating.Sugar coating of compressed tablets and granules is regarded as the oldestprocess, involving the multistage build up of sugar layers through deposition from an aqueous-coating solution and coating powder. Sugar coatingfalls outside the scope of this chapter owing to the inability to controldrug release through a highly water-soluble sugar barrier.
A. Microencapsulation
Microencapsulation is a process in which tiny particles or droplets are surrounded by a uniform coating (so-called microcapsule) or held in a matrixof polymer (so-called microsphere). A number of microencapsulation techniques, including aqueous phase separation, three-phase dispersion, organic phase separation, and interfacial polymerization, have been used toencapsulate pharmaceu ticals and to retard the liberation of drug frommicrocapsules.
Aqueous phase separation methods to prepare microcapsules Include thesimple coacervation of hydrophilic colloids with ethanol or sodium sulfate asdehydrating agents. In addition, one can employ a complex coacervationof two dispersed hydrophilic colloids of opposite electric charges with subsequent pH change. Aqueous phase separation was patented as an encapsulation process by Green in 1955 [39]. and has been used commerciallysince that time for numerous applications.
The three-phase dispersion method involves dispersion of the materialsto be coated in a nonsolvent liquid phase containing colloidal or filmforming materials such as gelatin. This two-phase system is then dispersed in a third phase by emulsification. through spraying or othermeans. and the coating material is gelled, usually by cooling. The resulting gelled droplets are then either separated and dried or partially dehydrated with an aliphatic alcohol and then separated and dried. Variations on this process have been used commercially to encapsulate oilsoluble vitamins such as vitamin A. One of the earliest applications ofthis method was reported in a British patent in 1938 [40].
Generally, aqueous phase separation and three-phase dispersion methods are used to encapsulate water-insoluble or poorly water-soluble materials which are usually poor drug candidates to incorporate into a sustained-release system. Gelatin is the most commonly used microencapsulating agent for the two processes described above. Even for poorlywater-soluble drugs, gelatin is usually not able to achieve the desireddissolution profile owing to the hydrophilic properties of gelatin. The useof formalin in treatment to cross-link the gelatin and/or dual coating ofgelatin microcapsules may be necessary to improve the dissolution profile.In addition, these encapsulation processes would be precluded for heatsensitive materials and substances with a stability and/or solubility problemat the pH of coacervation.
SUstained Drug Release from Tablets and Particles 215
Nonaqueous phase separation involves dispersion of core material inan organic continuous phase in which the wall-forming polymer has beendissolved. Phase separation is induced by the addition of a nonsolvent,incompatible polymer, inorganic salt, or by altering temperature of thesystem. The organic phase separation method can be employed in themanufacture of microcapsules using various water-insoluble polymers ascoating materials to enclose water-soluble drugs and to slow the drugrelease rate.
Encapsulation via interfacial polymerization was pioneered by Chang[ 41, 42] in work designed to produce artificial cells. This method involves the reaction of various monomers, such as hexamethylene diamineand sebacoyl chloride. at an interface between two immiscible liquidphases to form a film of polymer that encapsulates the dispersed phase.Capsules formed by interfacial polymerization usually have relatively thinsemipermeable membranes highly suited for artificial cell studies or applications requiring permeable walls. This method may give rise to questions about toxicity of the unreacted monomer, the polymer fragments,and other constituents in the process, instability of the drug in the reaction medium during the polymerization period, fragility of the microcapsules, and high permeability of the coating to low molecular weightspecies [43]. Various other polymerization procedures, tneluding bulk,suspension, emulsion, and micellar polymerization, have received considerable academic interest to entrap active materials in polymer matrices.However, inherent problems of polymerization procedures such as impurities in the system, limited drug solubility in the monomer, excessivedrug degradation caused by reaction with the monomer or initiator. andpossible entrapment of drug in polymers may prevent the pharmaceuticalindustry from actively engaging in this approach to control drug release.
In general, microencapsulation techniques using liquid as a processmedium are rather complicated and difficult to control. Several processdifficulties such as hardening of the capsule shell, isolating the microcapsules from the manufacturing vehicle, and drying the microcapsules toform free-flowing powder should be solved in order to ascertain batch tobatch uniformity. Equipment required for microencapsulation by thesemethods is relatively simple: It consists mainly of jacketed tanks withvariable speed agitation. The process can be carried out on a productionscale with good reliability. reproducibility. and control. However,process control, product quality control, and scale-up problems appear tobe the limiting factors influencing general acceptance by the pharmaceutical industry.
The most common mechanical microencapsulation process is the spraydrying technique, which consists of rapid evaporation of the solvent fromthe droplets. Spray-drying techniques may produce monodispersed freeflOWing particles which can be directly compressed into tablets, filled intocapsules, and suspended in water. However, the microcapsules obtainedby spray drying tend to be very porous because of rapid volatilizationof the solvent. Spray-congealing techniques accomplish coating solidification by thermal congealing of the molten coating materials such as hydrogenated castor oil, cetyl alcohol, monoglyceride and diglyceride , etc.Spray-congealed coatings are less porous but require coating materialsthat melt at moderate temperature.
Successful attempts using spray-drying and congealing techniques tocontrol the release of sulfa drugs have been reported [44 - 47] .
216 Chang and Robinson
B. Film Coating
Film coating involves the deposition of a uniform film onto the surface ofthe substrate, such as compressed tablets, granules, nonpareil pellets,and capsules. Intermittent manual application or continuous spraying ofcoating solution onto a mechanically tumbled or fluidized bed of substratesallow the coating to be built up to the desired thickness. Because of thecapability of depositing a variety of coating materials onto solid cores,this process has been widely used to make modified-release beads andtablets in the pharmaceutical industry.
Properly designed film coating can be applied to pharmaceutical products to achieve performance requirements such as rapidly dissolving coatings, sustained- or controlled-release coatings, and enteric coatings. Thepolymer(s) used in coating formulations is the predominant factor for theproperties of the film coat. Water-soluble fflm formers such as methyl cellulose, hydroxypropyl methylcellulose, hydroxypropylcellulose, polyethyleneglycol, polyvinyl pyrrolidone, etc , , form a rapidly dissolving barrier.Enteric materials such as cellulose acetate phthlate, polyvinyl acetatephthalate, methacrylic acid ester copolymers, etc., form acid-resistantfilms. The hydrophobic water-insoluble polymers such as ethyl cellulose,cellulose acetate. cellulose triacetate, cellulose acetate butyrate, and methacrylic acid ester copolymers are used to extend the release of drug over along period of time. Depending upon the physicochemical properties of thedrug and the substrate formulation, several coating approaches have beenemployed to regUlate drug release.
Partitioning Membrane
Partitioning membranes, continuous hydrophobic polymeric films which remain intact throughout the gastrointestinal tract, can be applied onto thecoating substrate by using a single polymer or a combination of waterinsoluble polymers. Since drug molecules cross the membrane by both apartition and a diffusion process, solubility of the drug in the polymericmaterial is a prerequisite to permeation. The polymeric material should becarefully selected to have the desired permeability to the drug and waterin order to achieve the desired release profile, In addition to thicknessof membranes, the permeability of the film can also be adjusted by mixingtwo water-insoluble polymers in any desired proportion.
Dialysis Membrane
Frequently, the partitioning membrane is too effective to regulate drug release. In other words, the drug within the coating would be releasedvery slowly or be released not at all for a long period of time. The inclusion of hydrophilic additives within the coating along with hydrophobicpolymer(s) creates pores when the additives are dissolved by water, whichguarantees the penetration of water and elimination of drug entrapment.When the drug molecule leaves the membrane by diffusing through poresfilled with dissolution media (dialysis mechanism) the size of the drug molecules and solubility of the drug in a dissolution medium are importantfactors in transport. Some water-soluble additives such as sodium chloride, lactose and sucrose have poor sohrbilfty in organic solvents and maybe micronized and suspended in a solvent-based coating system. Watersoluble polymers such as methyl cellulose. polyvinyl pyrrolidone, and
Sustained Drug Release from Tablets and Particles 217
polyethylene glycol are commonly mixed with hydrophobic polymers to regulate drug release owing to their excellent film-forming properties andsolubility in organic solvents. In addition to film thickness, the ratio ofsoluble components to insoluble polymer in the coating influences the release rate. Porous membranes may also be prepared by incomplete coatingof hydrophobic polymers. However, strict process control is necessary toascertain the reprodUcibility owing to sensitivity to the coating weight.
Fat Wax Barrier
Mixtures of waxes (bees wax, carnauba wax, etc.) with glycerol monopalmitate, cetyl alcohol, and myristyl alcohol can be applied onto the substrate to form a barrier by hot-melt coating. Hot-melt coating is the mosteconomical process owing to elimination of solvent cost and the inexpensiveness of the coating materials. However, a higher level of coating, compared to polymeric film coating. is normally required to retard the liberation of the drug.
Incorporation of Enteric Materials intothe Formulation
In general, pH-independent dissolution is the ideal attribute of a controlledrelease dosage form. However, most drugs are either weak acids or weakbases; their release from delivery systems is pH dependent. If the drughas a higher solubility in acidic than in basic media. enteric material maybe incorporated into the rate-controlling barrier or core matrix to minimizethe effect of pH -dependent solubility. In another approach. physiologicalacceptable buffering agents can be added to the core formulation to maintain the fluid inside the rate-controlling membrane to a suitable constantpH. thereby rendering a pH-independent drug release [48]. Enteric material also can be incorporated into rate-controlling membranes or corematrices to create pH-dependent release of the drug. The dosage formwith pH-dependent dissolution characteristics may be beneficial in somecases to improve the extent of absorption by dumping the dose in timeand preventing the unabsorbed dose being entrapped in the stool. Sustained-release preparations overcoated with enteric material can be utilizedas an intestinal delivery system with sustained-release properties. Entericcoated dosage forms can be overcoated with a drug layer to form a repeataction preparation.
CORE PREPARAT ION. Very few drug particles possess adequatephysicochemical properties for the usual coating process. These propertiesinclude (1) suitable tensile, compaction, shear, impaction, and attritionstrengths to avoid destruction during the coating process; (2) approximately spherical shape to obtain good flow and rolling properties in thecoating equipment; (3) suitable size and size distribution; and (4) suitabledensity to avoid escape of the drug particles during the coating process.Certainly. different types of coating equipment have their own capabilitiesto handle the cores. leading to different requirements of the cores forvarious equipment. For the pan coating process, a relatively large particle size (larger than 500 urn) and a spherical shape are generally considered necessary to provide excellent rolling in the coating pan and to avoidthe agglomeration and/or aggregation owing to inefficiency of drying andlong contact time among the cores. Although fluidized -bed coating
218 Chang and Robinson
systems expanded coating capabilities dramatically. suitable strengths andweight of the cores are needed to avoid excessive attrition of drug particles and suction of drug particles into the filter during the coatingprocess. The major advantages of using pure drug particles as coatingsubstrates are elimination of the core-making process and a less bulky finalproduct. Potassium chloride and acetyl salicylic acid crystals are typicalexamples which have been satisfactorily coated in a coating pan or afluidized-bed coating system.
1. Compaction process. Apparently. tablets are the most common andeasiest dosage form to coat. Tablets with excellent friability. hardness,and edge thickness are preferred for coating. However, sustained-releasefilm-coated tablets may prematurely dose dump due to accidental ruptureof the coating film. The use of a multiple-unit instead of a single-unitdosage form is a pharmaceutical trend because of the presumed reductionof the inherently large inter- and intrasubject variation linked to gastrointestinal transit time. Tablets of small dimensions have been successfullyprepared from polyvinyl alcohol and subsequently cross-linked at the surface to form a quasimembrane-controlled system for a multiple-unit dosageform [49]. In order to achieve high output in large-scale manufacturing,this approach to the preparation of cores may face formulation difficultiesand tablet tooling problems; i.e •• multitipped punches. The limited sizeflexibility of the tableting method to manufacture cores for a multiple-unitdevice is another disadvantage.
Other methods with production capacity. such as slugging, ehllsonator ,and Hutt Compactor, can be used to produce granules in the compactionmode. However, irregular-shaped granules are commonly observed andextensive sieving is necessary to remove the fines and oversized granules.
2. Surface-layering process. Another common approach to core production involves the use of substrates and enlargement of the substratesby a surface-layering technique. Thus, nonpareil seeds of various sizesor sugar crystals are used as the substrate. Application of an activesubstance onto an inert substrate can be carried out by uniform coatingin a rotating coating pan in the presence of a suitable adhesive. In detail. the substrate is uniformly wetted by manual spreading of a bindingsolution. followed by attachment of the active substance to the surface ofthe substrate. Commonly used adhesives include solutions of polyvinylpyrrolidone polyethylene glycols, cellulose ethers, natural gums, shellac,zein, gelatin, and sugar syrup. Suitable binder(s) and solvent systemsfor the binder( s) must be found in order to have smooth production ofcores without excessive agglomeration of the cores or separation of thedrug particles. Enteric binders. such as cellulose acetate phthalate andshellac, may impart pH-dependent dissolution properties to the final product. Separating agents, such as talcum and magnesium stearate, may beused to eliminate or reduce tackiness of the adhesives. Trituration technique, to blend the potent drug with the auxiliary agents, is usually required to obtain a uniform distribution of the drug onto the substratesurface.
The powder layering process requires a great deal of repetition, andis thus time consuming. Moreover. undesired agglomeration or aggregation and adhesion to the wall of coating equipment can occur. To avoidthe labor-intensive powder layering process in a coating pan. a centrifugal-type fluidized bed with a powder feed device (CF-Granulator) has
Sustained Drug Release from Tablets and Particles 219
been used to produce high-quality pellets. The stirring chamber of theCF-Granulator consists of a fixed specially curved wall stator and a directed rotating plate rotor. Fluidization air, through a gap slit betweenthe stator and rotor, prevents the substrates from falling. The substrates are whirled up along the wall of the stator owing to centrifugalforce of the rotor and to the upper part of the wall due to the fluidizationair. SUbsequently, they drop due to gravitational force. During thespiral stirring operation, layering powder is metered to the fluidized bedfrom a powder feed unit. A binder solution is sprayed from a sprayinggun to cause binding of the powder to the substrate surface.
It is also possible to dissolve or to suspend the drug in the bindersolution and to apply this liquid uniformly to the surface of the substrateusing a coating pan or fluidized-bed system. However, there are severaldifficulties with this approach, including the tendency to clog the nozzlewith the slurry. A large quantity of solvent may be needed to dissolveor suspend the active substance. In addition, drug loss to the air streamand possible adverse aggregation of the cores can occur. Another inherent disadvantage of the layering process is the possible formation ofunduly large pellets owing to the use of nonpareil seeds as a substrate.Small-sized substrates, such as sugar crystals, can be used to eliminatebulkiness of the pellets. The finer the substrate, the finer the drug particle should be and the more difficult the process.
3. Agglomeration process. Alternatively, the drug particles in thepowder bed can grow by wet agglomeration. The extent of granule growthdepends on the amount of granulating solution, the type of binder, theforce of agitation, and heat applied. The conventional wet granulationmethod to prepare the substrate for coating can give rise to problemssuch as irregular- shaped particles with a coarse and porous surface, softand pliable particles, and a broad granular size distribution. Applicationof relatively large amounts of coating material may be required owing tocapillary suction of the coating fluid to pores. The porous structure andirregular shape of the granules may lead to an unpredictable sustainedrelease coating. Additional powder layering to round off the granulesinto a sphere or to smooth surfaces or perhaps to increase the strengthof the pellets may be important. However, Kohnle et al , [50] have successfully produced microspherules which are suitable for enterlc- andsustained-release coating through agglomeration of fine drug particles byusing a Twin Shell Blender with an intensifier bar assembly.
The inclined dish granulator or disc pelletizer is well known and high1y utilized in the fertilizer, iron ore, and detergent industries. It alsohas been adopted throughout the pharmaceutical, chemical, food, andallied industries. The equipment, known as the nodulizer and pelletizer,are available for continuous production of spherical pellets. The unitnormally consists of a shallow cylindrical dish, motor drive, adjustablescrapers, spraying system, and powder feed device. As the pan rotatesabout an inclined axis, the raw material bed is rolled by centrifugal forceand maintained as a uniform deposit of material onto the base of the panby a plow. Scrapers also prevent buildup of materials on the dish surface. Powdered ingredients must be milled, premixed, and deaerated inorder to have a uniform chute fed to the unit. Powder materials arecontinuously metered to the pan at a specific location, normally at a pointthree-fourths of a radius unit from the top of the dish. The spray angledepends to a large extent on positioning of the sprays and their distance
220 Chang and Robinson
from the bed powders; commonly, a 60 spray angle is used. The spraydroplet size should be adjusted according to feed size and desired granulesize. In other words, if small granules are desired, a fine droplet sprayshould be used and vice versa. Also, the finer the feed material. thefiner the spray droplet.
There are several theoretical equations that can be used to calculatethe rotational speed of the pan. However, appreciable discrepancy existsin theory and practice. Usually 20-30 rpm seems a reasonable rotationspeed. Following agglomeration, the finished granules are raked over bythe dish rim, and the rim height can be adjusted to control granule size.Pronounced size segregation is the principal feature of dish granulation.This ensures almost perfectly spherical pellets with a narrow particle sizedistribution. Important parameters in the dish pelletizer include powderfeet rate, position of powder feed chute, spraying rate, position of thespraying gun, spray nozzle size, angle of inclination, rotational speed, rimheight, powder bed depth, and pan size. These variables interact tosome extent to produce the final granules.
However, the noncontinuous granulation process in which spraying anddrying stages are alternately repeated has been employed to maintain constant moisture levels and to produce high-density granules. A high levelof perfection in shape and size of the granules cannot be obtained byagglomeration mechanism using a conventional fluidized-bed granulator.Recently, modified fluidized-bed units. such as the Roto-Processor, theSpir-A-Flow, and the Glatt Rotor Granulator/Coater, ell utilize a rotatingdisc at the bottom of a fluidized-bed, replacing the air-distribution plate.This modification supposedly combines the advantages of the dish granulator and the fluidized-bed granulator. It has been demonstrated that therotary fluidizer-bed granulator can be used to produce spherical granuleswith high density by an agglomeration mechanism [51]. In general, thelayering mechanism using nonpareil seeds or sugar crystals as a substrateto build spherical-shaped pellets is relatively easy compared to the agglomeration mechanism.
4. Bxtrusion-eptierontzatton process. Spherical pellets can also beproduced using an extrusion-spheronization process. The main processingsteps include (1) dry blending, (2) wet granulation, (3) kneading, (4)extrusion, (5) spheronization, (6) drying, and (7) screening. A thoroughly wet granulation containing the drug, diluent. and binder is forcedthrough a radial or axial extruder with a suitable die design, such as aperforated die or multiple-hole die, by means of a screw feeder to produceroughly cylindrical extrudates. The extrudate size and final pellet sizeare determined by the size of the die used on the extruder. The pelletmill, a radial extruder, was initially developed for the agricultural industry to densify and upgrade the particle size of poultry and animalfeeds. In operation, the preconditioned material is fed continuously in acontrolled fashion to the pelleting chamber. The motor-driven outer perforated die ring causes the roller( s), Which is mounted inside the die ring,to turn. The feed, carried by the rotation of the die ring, is compressedand forced through the holes in the die ring. As pellets are extz-uded , aknife, or knives, mounted at the exterior of the die ring. cuts the pelletsto length. Application of the pellet mill to pharmaceutical products hasbeen extremely limited. However, it deserves special mention owing to itsability to produce pellets with high density and low friability at a highoutput.
Sustained Drug Release from Tablets and Particles 221
The extruded granules can be converted into consistently sizedspheres by use of a Japanese device called a marumerizer or an Englishversion of the device called a spheronizer. This device consists of a stationary cylinder with a smooth wall and a grooved rotating disc. Thecentrifugal and frictional forces, generated by the rough rotating baseplate, spheronize and densify the extruded granule. A typical time forthe spheronization process would be approximately 5 min per batch, depending upon the nature of the material. Recently, a unique device calledthe Roto-Coil has been designed 8S a continuous spheronizer with no moving parts. This device consists of a spiral-shaped pipe. The extrudateis spheronized by passing through the pipe in a rotation movement withthe aid of negative pressure generated by a fluidized-bed system. Theadvantages of the extrusion-spheronization process include: (1) production of the spherical pellets without using seeds, leading to reduction ofthe bulk of final product; (2) the ability to regulate size of the pelletswithin a narrow particle size distribution; (3) the ability to produce highdensity, low-friability, spherical pellets; and (4) the ability to achieveexcellent surface characteristics for subsequent coating, leading to anhomogeneous distribution of coating material( s) onto the spherical pellets.
It is also possible to agglomerate the finely divided solids into sphericalmatrices from a liquid suspension [52]. In the spherical agglomerationprocess, fine pow del'S are dispersed in the liquid. With controlled agitation, a small amount of a second liquid, which is immiscible with the firstliquid and preferentially wets the solids, is added to induce formation ofdense, highly spherical agglomerates. Another approach to preparespherical matrices in the liquid state is the instantaneous crosa-Iinking ofdrug-containing droplets of aqueous solution of sodium alginate in a suitable hardening bath, such as calcium chloride solution. This entrapmenttechnique in recent years has become the most Widely used method forimmobilizing living cells and enzymes. It enjoys several advantages, suchas a simple production process, a wide size range of beads, and a narrowsize distribution [53]. The spray-drying process has been used to produce a spherical matrix. However, the spray-dried cores may be porousand fluffy because of rapid volatilization of the solvent. The spraycongealing process, also called the prilling process, is well known in thefertilizer industry for production of urea pellets and ammonium nitratepellets. This process can be defined as the process by Which a productis formed into particles, usually of spherical shape, by spraying a melt ofthe product into a chamber of suitable configuration through which cool-ing air is passed. The process is fairly restricted to matrix materialshaving suitable properties; namely, a high melting point and low heats ofcrystallization [54]. These several techniques may have potential applicability to produce spherical cores containing drug for SUbsequent sustainedrelease coating, and thus deserve further investigation. The physicalproperties of the product, such as pellet size and size distribution, pelletdensity, strengths, globocity, pore and pore distribution I ate , , are different for various methods and may be important for subsequent coatingas well as in product performance. Table 3 summarizes the various possiblemethods to core production and some selected pharmaceutical examples.
LATEX/PSEUDOLATEX COATING. The strict air-quality controlsinstituted by different federal agencies, spiraling solvent costs. the highprice of solvent recovery system, and potential toxicity as well as to some
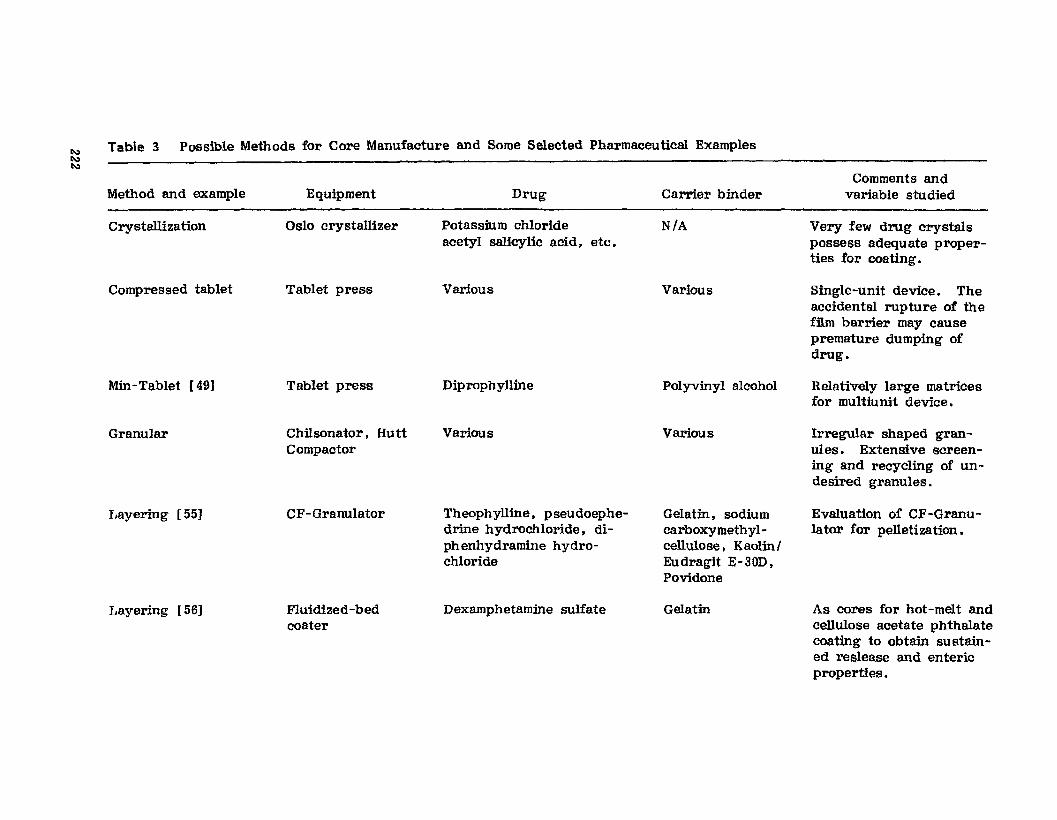
Table 3 Possible Methods for Core Manufacture and Some Selected Pharmaceutical Examplest\,)t\,)t\,)
Method and example
Crystallization
Compressed tablet
Min-Tablet [49J
Granular
Layering [55J
Layering [56]
Equipment
Oslo crystallizer
Tablet press
Tablet press
Chilsonator, HuttCompactor
CF-Granulator
Fluidized-bedcoater
Drug
Potassium chlorideacetyl salicylic acid. etc.
Various
Diprophylline
Various
Theophylline, pseUdoephedrine hydrochloride. diphenhydramine hydrochloride
Dexamphetamine sulfate
Carrier binder
N/A
Various
Polyvinyl alcohol
Various
Gelatin, sodiumcarboxymethylcellulose. KaolinlEudragit E-30D.Povidone
Gelatin
Comments andvariable studied
Very few drug crystalspossess adequate properties for coating.
Single-unit device. Theaccidental rupture of thefilm barrier may causepremature dumping ofdrug.
Relatively large matricesfor multiunit device.
Irregular shaped granules. Extensive screening and recycling of undesired granules ,
Evaluation of CF-Granulator for pelletization.
As cores for hot-melt andcellulose acetate phthalatecoating to obtain sustained reslease and entericproperties.
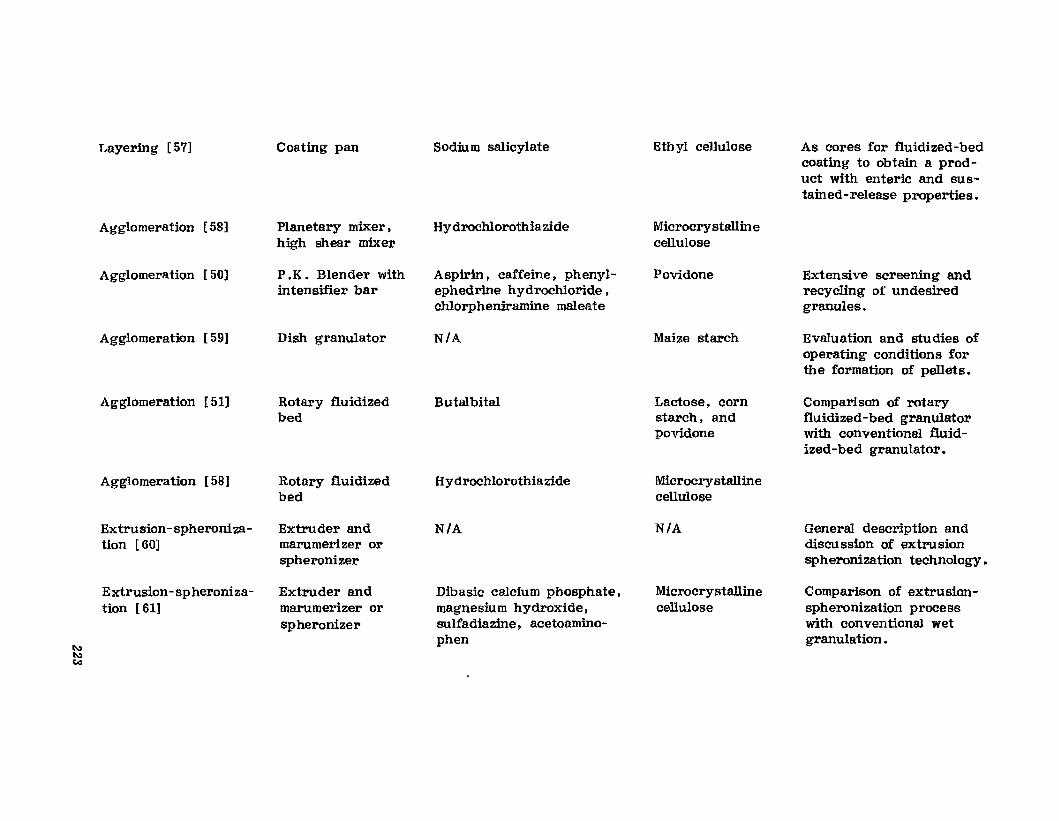
Layering [57] Coating pan Sodfum salicylate Ethyl cellulose As cores for fluidized-bedcoating to obtain a prod-uct with enteric and sus-tained- release properties.
Agglomeration [58] Planetary mixer. Hydrochlorothiazide Microcrystallinehigh shear mixer cellulose
Agglomeration [50] P.K. Blender with Aspirin, caffeine, phenyl- Povidone Extensive screening andintensifier bar ephedrine hydrochloride. recycling of undesired
chlorpheniramine maleate granules.
Agglomeration [59] Dish granulator N/A Maize starch Evaluation and studies ofoperating conditions forthe formation of pellets.
Agglomeration [51] Rotary fluidized Butalbital Lactose, corn Comparison of rotarybed starch. and fluidized-bed granulator
povidone with conventional fluid-ized-bed granulator.
Agglomeration [58] Rotary fluidized Hydrochlorothiazide Microcrystallinebed cellulose
Extrusion-spheroniza- Extruder and N/A N/A General description andtion [60] marumerizer or discu ssion of extru sion
spheronizer spheronization technology.
Extrusion-spheroniza- Extruder and Dibasic calcium phosphate. Microcrystalline Comparison of extrusion-tion [61] marumerizer or magnesium hydroxide, cellulose spheronization process
spheronizer sulfadiazine. aeatoamlno- with conventional wet
wphen granulation.
w~
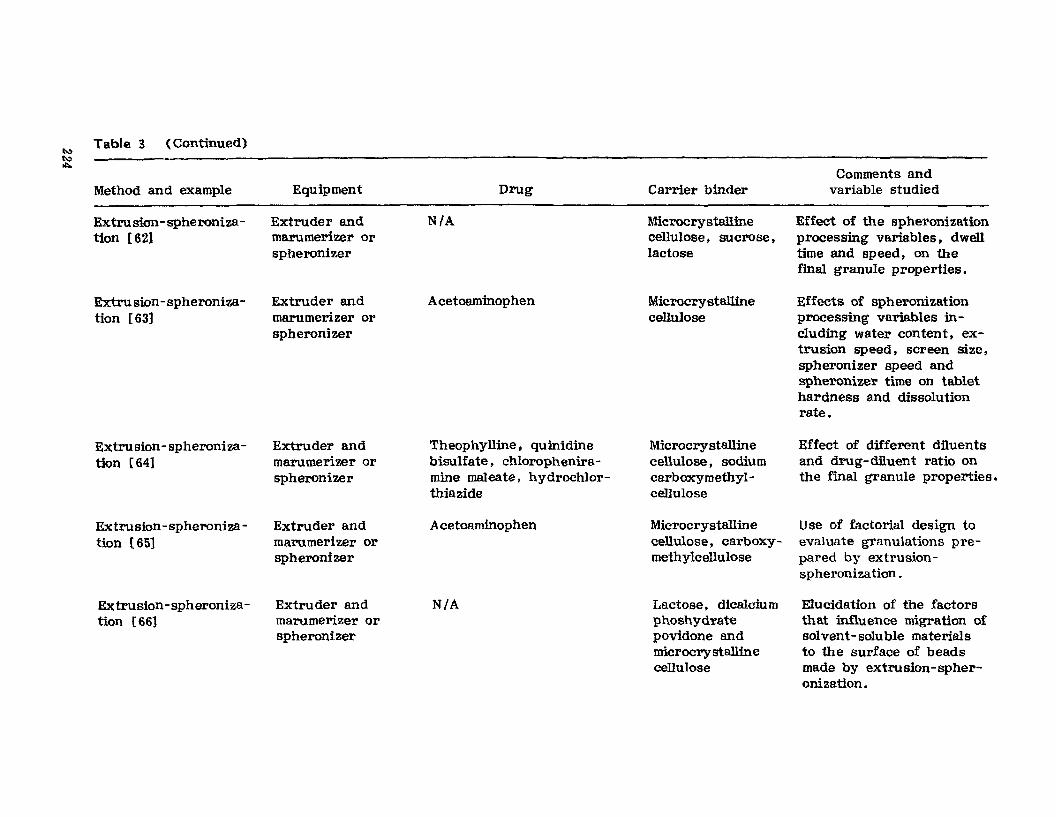
Method and example
~
~
Table 3 ( Continued)
Equipment Drug Carrier binderComments and
variable studied
Extrusian-spheronization (62]
Extru sian-spheronization [63]
Extrusion- spheronization [64]
Extrusion-spheronization [651
Extrusion- spheronization [66J
Extruder andmarumerizer orspheronizer
Extruder andmarumerizer orspheronizer
Extruder andmarumerizer orspheronizer
Extruder andmarumerizer orspheronizer
Extruder andmarumerizer orspheronizer
N/A
Acetoaminophen
Theophylline. quinidinebisulfate, chloropheniramine maleate, hydrochlorthiazide
Acetoaminophen
N/A
Microcrystallinecellulose. sucrose,lactose
Microcrystallinecellulose
Microcrystallinecellulose, sodiumcarboxymethylcellulose
Microcrystallinecellulose, carboxymethylcellulose
Lactose, dicalciu mphoshydratepovidone andmicrocrystallinecellulose
Effect of the spheronizationprocessing variables, dwelltime and speed, on thefinal granule properties.
Effects of spheronizationprocessing variables including water content, extrusion speed. screen size,spheronizer speed andspheronizer time on tablethardness and dissolutionrate.
Effect of different diluentsand drug-diluent ratio onthe final granule properties.
Use of factorial design toevaluate granulations prepared by extrusionspheronizatton .
Elucidation of the factorsthat influence migration ofsolvent-soluble materialsto the surface of beadsmade by extrusion-spheronization.
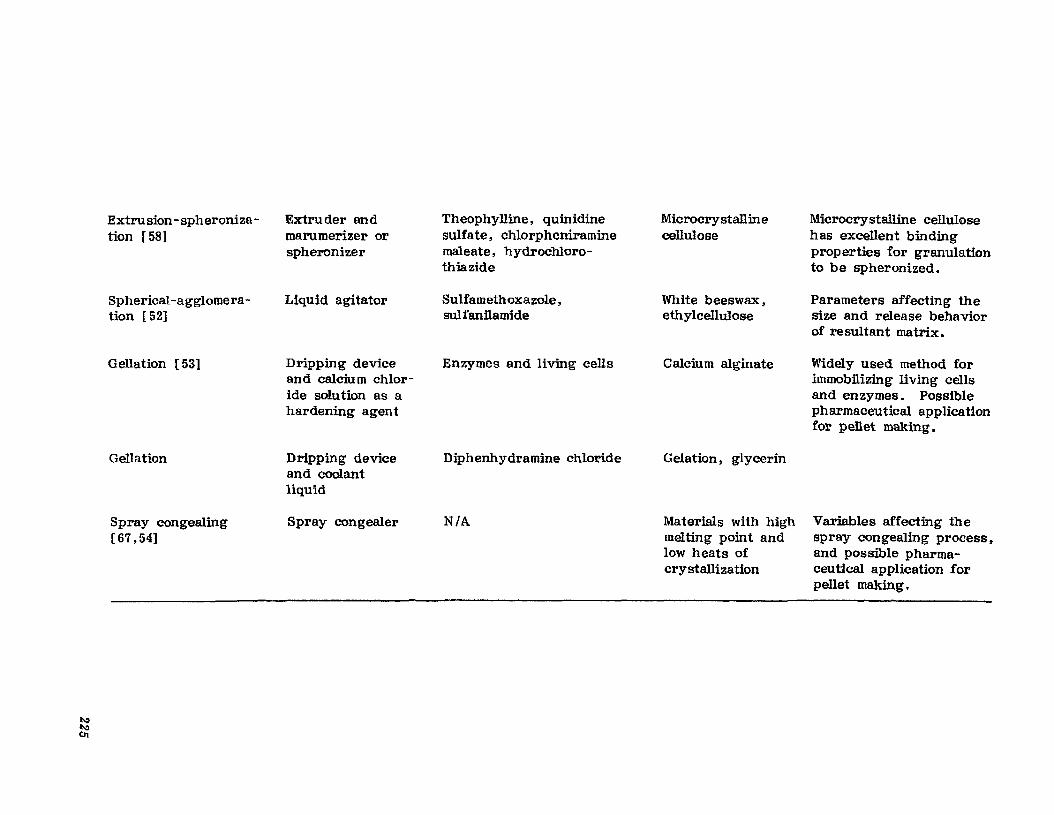
~~
til
Extrusion -spheroniza- Extruder and Theophylline, quinidine Microcrystalline Microcrystalline cellulosetion [58] marumerizer or sulfate, chlorpheniramine cellulose has excellent binding
spheronizer maleate, hydrochloro- properties for granulationthiazide to be spheronized.
Spherical-agglomera- Liquid agitator Sulfamethoxazole, White beeswax, Parameters affecting thetion [52] sulfanilamide ethylcellulose size and release behavior
of resultant matrix.
Gellation [53] Dripping device Enzymes and living cells Calcium alginate Widely used method forand calcium chlor- immobilizing living cellside solution as a and enzymes. Possiblehardening agent pharmaceutical application
for pellet making.
Gellation Dripping device Diphenhydramine chloride Gelation, glycerinand coolantliquid
Spray congealing Spray congealer N/A Materials with high Variables affecting the[67,54] melting point and spray congealing process,
low heats of and possible pharma-crystallization ceutical application for
pellet making.
226 Chang and Robinson
extent explosiveness and danger of these solvents have given pharmaceutical and food supplement processors considerable incentive to removeorganic solvents from the coating process. The most commonly used methods to eliminate organic solvents are presented in Table 4. At presentand in the foreseeable future, latex or pseudolatex coatings appear to bethe best choice to eliminate solvent-based coatings for controlled drug release. Several techniques. including emulsion polymerization. emulsionsolvent evaporation. phase inversion, and solvent change. can be employedto prepare suitable latex{pseudolatex dispersion systems. Each methodhas advantages and disadvantages based upon ease of preparation. latexstability. convenience of use, film properties, and economics.
METHODS TO PREPARE LATEX DISPERSIONS
1. Emulsion polymerization. Polymerization in an emulsion state canbe applied to a wide variety of vinyl, acrylic, and diene monomers withwater solubility in the proper range, usually 0.001-1. 000% [89 - 911. Thebasic formula used in emulsion polymerization consists of water, monomer,surfactant, and initiator. The system contains three phases: Water containing small amounts of dissolved surfactant and monomer. monomer droplets stabilized by surfactant, and much smaller surfactant micelles saturated with monomer. The initiator decomposes into free radicals whichreact with monomer units at three possible sites for polymerization. Theradicals can react with dissolved monomer in the aqueous phase. or candiffuse into the monomer droplets or the micelles. Obviously. there isvery little initiation in the aqueous phase owing to low monomer concentration in the water phase. The diffusion rate of the radicals, which isdirectly proportionsl to surface area, is far greater into the micelles, andthus there is virtually no initiation in the monomer droplets. Free radicals,from initiator decomposition, begin polymerization in the monomer solubilizedin the micelles. The micelles transform into growing particles. As thesemonomer-polymer particles grow, they are stabilized by more surfactant atthe expense of uninitiated micelles, which eventually disappear. Thegrowing latex particles are continually supplied with monomer by diffusionthrough the aqueous phase from monomer droplets. The latter graduallydecreases in quantity as polymerization proceeds, until at a conversion ofabout 60%, they disappear completely. All free monomer has then dif-fused into the latex particles. The polymerization rate decreases as themonomer in the particles is depleted by further polymerization. The schematic process for emulsion polymerization is shown in Scheme 7.
2. Emulsion -solvent evaporation technique. The emulsion -solventevaporation technique [92 - 97] also called emulsion hardening, has beenwidely used to prepare microspheres for controlled drug release [98 -100] •The technique involves dispersion of drug in an organic polymer solution,followed by emulsification of the polymer solution in water. After continuous stirring, the solvent evaporates and drug-containing rigid polymermicrospheres are formed. The procedure for preparing pseudolatex isessentially the same as that described above (Scheme 8). The polymeremulsion, with droplets so small they are below the resolution limit of theoptical microscope. can be accomplished by subjecting the crude emulsionto a source of energy such as ultrasonic irradiation or by passing thecrude emulsion through a homogenizer or submicron dispenser. Thepolymer solvent is normally stripped from the emulsion at elevated temperatures and pressures to leave a stable pseudolatex. If foaming is not aproblem. the solvent may be removed under reduced pressure.
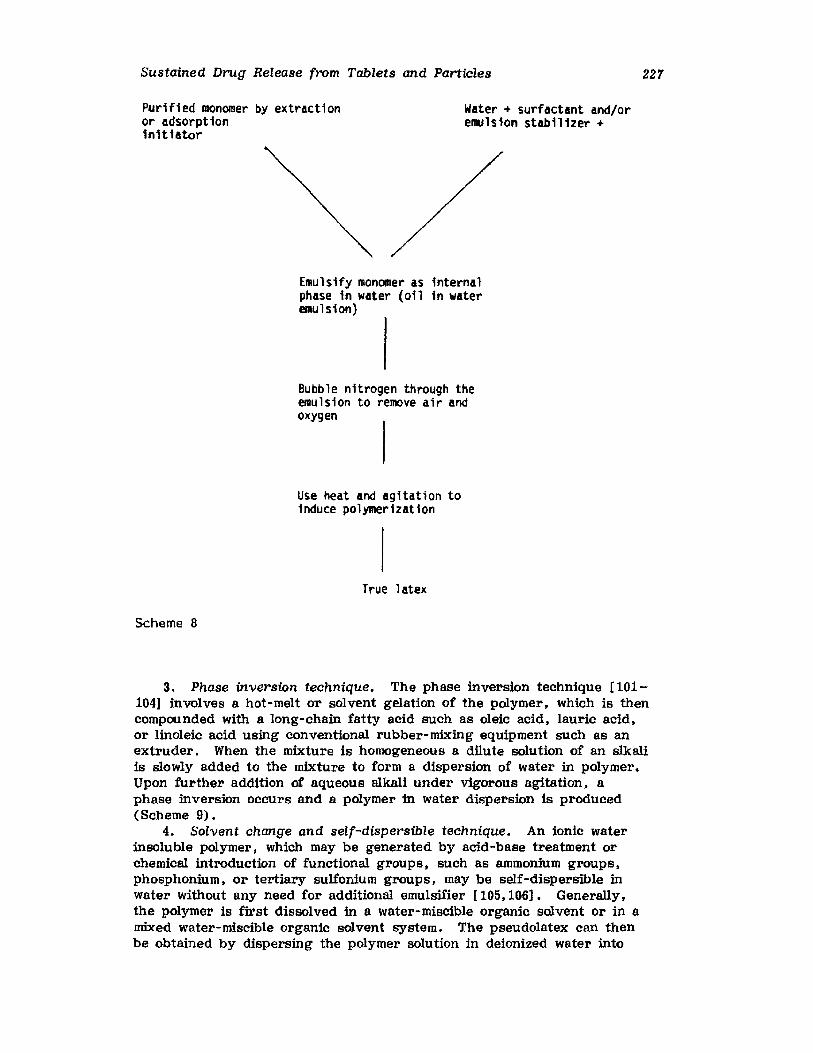
Sustained Drug Release from Tablets and Particles 227
Purified monomer by extractionor adsorptioninitiator
Water + surfactant and/oremulsion stabilizer +
Emulsify monomer as internalphase in water (oil in wateremulsion)
Bubble nitrogen through theemulsion to remove air andoxygen
Use heat and agitation toinduce polymerization
True latex
Scheme 8
3. Phase inversion technique. The phase inversion technique [101104] involves a hot-melt or solvent gelation of the polymer, which is thencompounded with a long-chain fatty acid such as oleic acid, lauric acid,or linoleic acid using conventional rubber-mixing equipment such as anextruder. When the mixture is homogeneous a dilute solution of an slkaliis slowly added to the mixture to form a dispersion of water in polymer.Upon further addition of aqueous alkali under vigorous agitation, aphase inversion occurs and a polymer in water dispersion is produced(Scheme 9).
4. Solvent change and self-dispersible technique. An ionic waterinsoluble polymer, which may be generated by acid-base treatment orchemical introduction of functional groups, such as ammonium groups,phosphonium, Or tertiary sulfonium groups, may be self-dispersible inwater without any need for additional emulsifier [105,106]. Generally,the polymer is first dissolved in a water-miscible organic solvent or in amixed water-miscible organic solvent system. The pseudolatex can thenbe obtained by dispersing the polymer solution in deionized water into
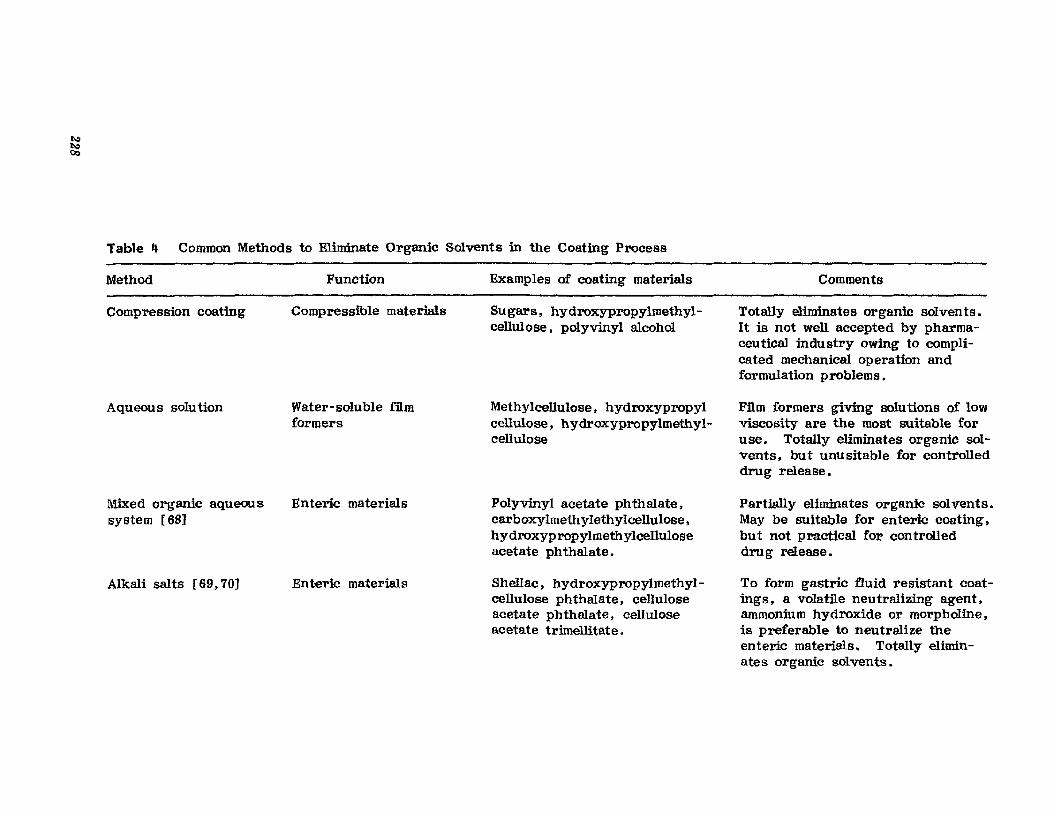
~~Oc)
Table" Common Methods to Eliminate Organic Solvents in the Coating Process
Method
Compression coating
Aqueous solution
Mixed organic aqueoussystem [68]
Alkali salts [69. 70J
Function
Compressible materials
Water-soluble filmformers
Enteric materials
Ent-eric materials
Examples of coating materials
Su gars, hydroxypropylmethylcellulose, polyvinyl alcohol
Methylcellulose. hydroxypropylcellulose, hydroxypropylmethyl N
cellulose
Polyvinyl acetate phthalate,carboxylmethylethylcellulose.hydroxypropyimethylcelluloseacetate phthalate.
Shellac. hydroxypropylmethylcellulose phthalate. celluloseacetate phthalate, celluloseacetate trimellitate.
Comments
Totally eliminates organic solvents.It is not well accepted by pharmaceutical industry owing to complicated mechanical operation andformulation problems.
Film formers giving solutions of lowviscosity are the most suitable foruse. Totally eliminates organic solvents. but unusitable for controlleddrug release.
Parti8lly eliminates organic solvents.May be suitable for enteric coating,but not practical for controlleddrug release.
To form gastric fluid resistant coatings, a volatile neutralizing agent,ammonium hydroxide or morpholine,is preferable to neutralize theenteric materials. Totally eliminates organic solvents.
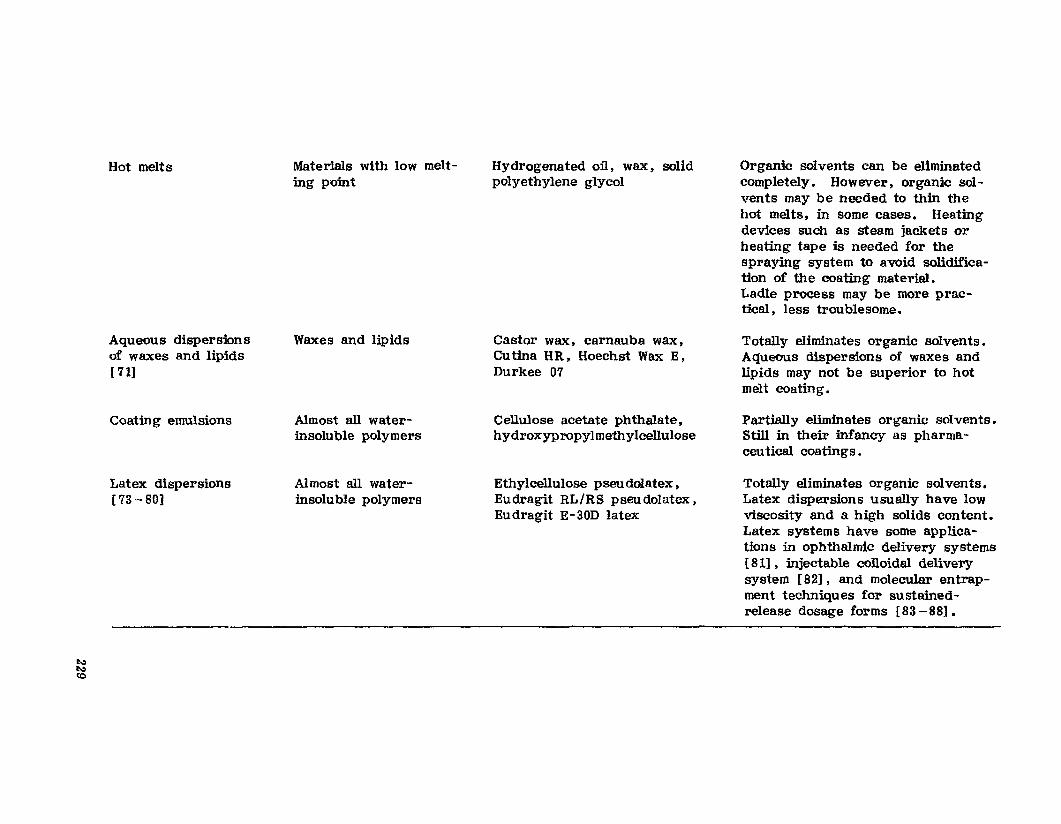
t"t"to
Hot melts
Aqueous dispersionsof waxes and lipids[ 71]
Coating emulsions
Latex: dispersions[73 -80]
Materials with low melting point
Waxes and lipids
Almost all waterinsoluble polymers
AImost all waterinsoluble polymers
Hydrogenated oil. wax, solidpolyethylene glycol
Castor wax. carnauba wax.Cu tina HR. Hoechst Wax E.Durkee 07
Cellulose acetate phthalate.hydroxypropylmethylceI1ulose
Ethylcellulose pseudolatex ,Eudragit RL/RS pseu dolatex ,Eudragit E-30D latex
Organic solvents can be eliminatedcompletely. However. organic solvents may be needed to thin thehot melts, in some cases. Heatingdevices such as steam jackets orheating tape is needed for thespraying system to avoid solidification of the coating material.Ladle process may be more practical, less troublesome.
Totally eliminates organic solvents.Aqueous dispersions of waxes andlipids may not be superior to hotmelt coating.
Partially eliminates organic solvents.Still in their infancy as pharma-ceutical coatings.
Totally eliminates organic solvents.Latex dispersions usually have lowviscosity and a high solids content.Latex systems have some applications in ophthalmic delivery systems[81]. injectable colloidal deliverysystem [82]. and molecular entrapment techniques for sustainedrelease dosage forms {83-88].
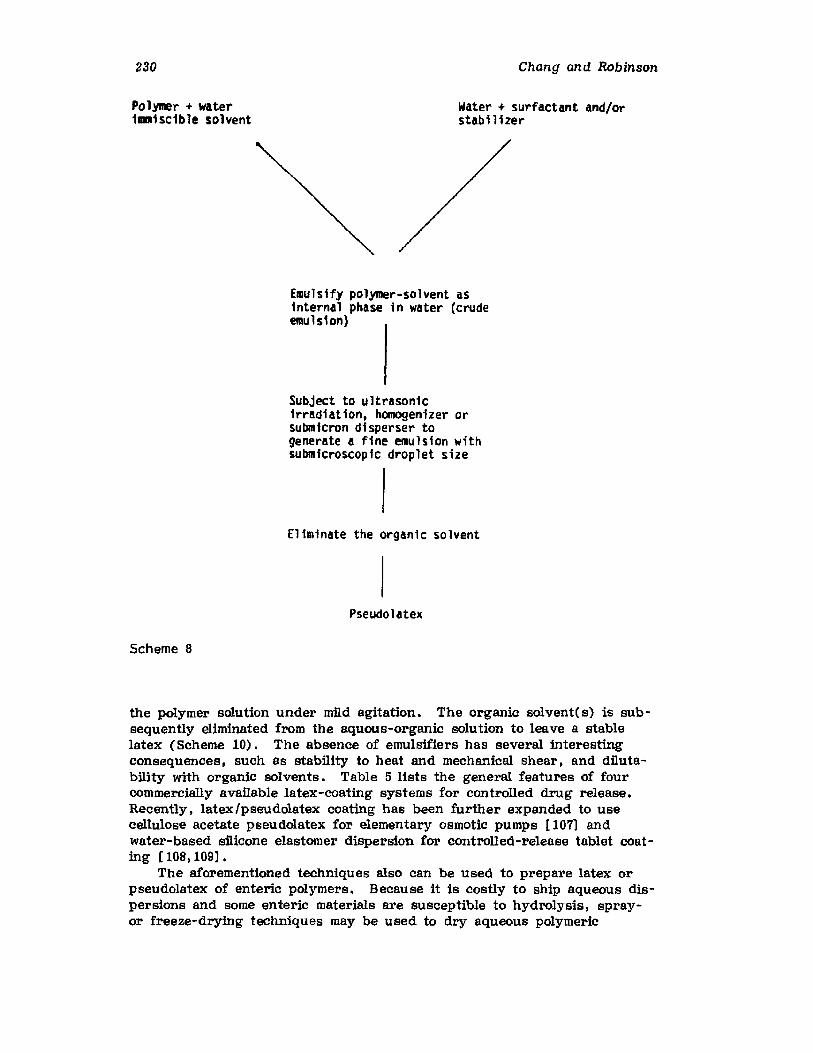
230
Polymer + waterimmiscible solvent
Chang and Robinson
Water + surfactant and/orstabilizer
Scheme 8
Emulsify polymer-solvent asinternal phase in water (crudeemulsion)
Subject to ultrasonicirradiation, homogenizer orsubm1cron disperser togenerate a fine emulsion withsUbmicroscopic droplet size
Eliminate the organic solvent
Pseudolatex
the polymer solution under mild agitation. The organic solvent(s) is subsequently eliminated from the aquous-organic solution to leave a stablelatex (Scheme 10). The absence of emulsifiers has several interestingconsequences, such as stability to heat and mechanical shear, and dilutability with organic solvents. Table 5 lists the general features of fourcommercially available latex-coating systems for controlled drug release.Recently, latex/pseudolatex coating has been further expanded to usecellulose acetate pseudolatex for elementary osmotic pumps [107] andwater-based silicone elastomer dispersion for controlled-release tablet coating [108,109].
The aforementioned techniques also can be used to prepare latex orpseudolatex of enteric polymers. Because it is costly to ship aqueous dispersions and some enteric materials are susceptible to hydrolysis, sprayor freeze-drying techniques may be used to dry aqueous polymeric
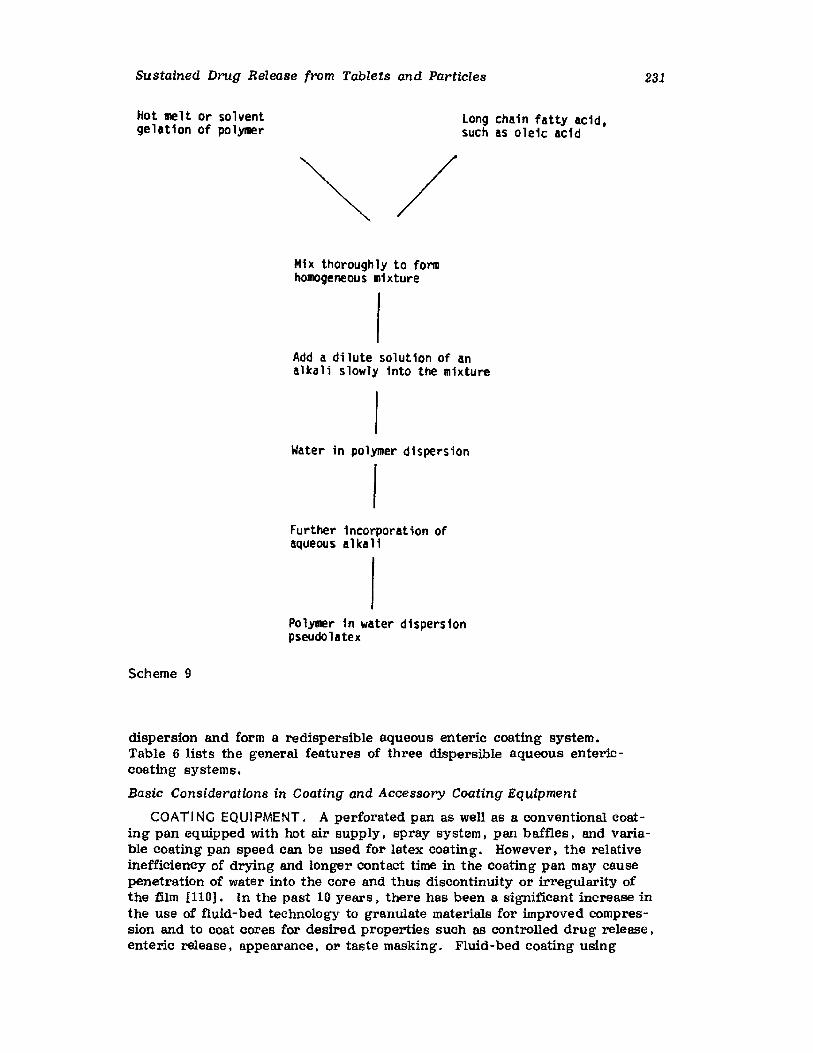
Sustained Drug Release from Tablets and Particles 231
Hot melt or solventgelation of polymer
Scheme 9
long chatn fatty acid.such as oleic acid
Mix thoroughly to formhomogeneous mixture
Add a dilute solution of analkali slowly into the mixture
Water in polymer dispersion
fFurther incorporation ofaqueousal ka 11
Polymer 1n water dispersionpseudolatex
dispersion and form a redispersible aqueous enteric coating system.Table 6 lists the general features of three dispersible aqueous enter1ccoating systems.
Basic Considerations in Coating and Accessory Coating Equipment
COATI NG EQUIPMENT. A perforated pan as well as a conventional coating pan equipped with hot air supply, spray system, pan baffles, and variable coating pan speed can be used for latex coating. However, the relativeinefficiency of drying and longer contact time in the coating pan may causepenetration of water into the core and thus discontinuity or irregularity ofthe film {1l0]. In the past 10 years, there has been a significant increase inthe use of fluid-bed technology to granulate materials for improved compression and to coat cores for desired properties such as controlled drug release,enteric release, appearance, or taste masking. Fluid-bed coating using
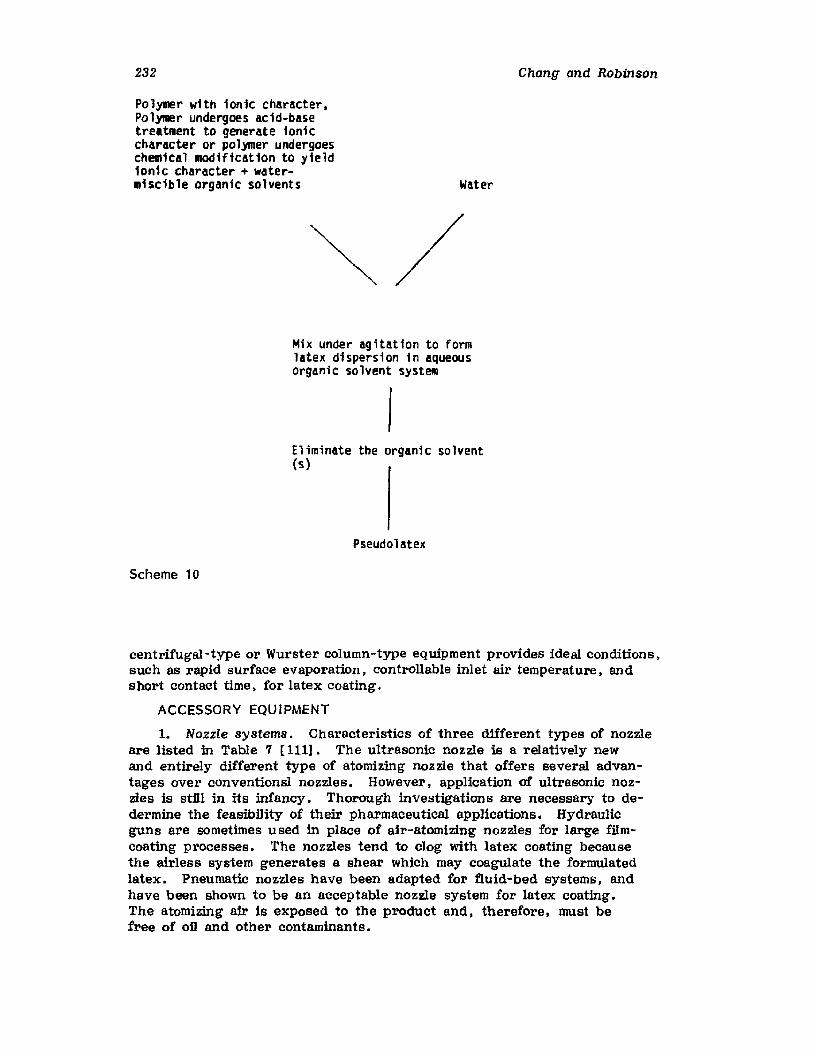
232
Polymer with ionic character.Polymer undergoes acid-basetreatment to generate ioniccharacter or polymer undergoeschemical modification to yieldionic character + watermiscible organic solvents Water
Chang and RObinson
Mix under agitation to formlatex dispersion in aqueousorganic solvent system
IEliminate the organic solvent(s)
Pseudolatex
Scheme 10
centrifugal-type or Wurster column-type equipment provides ideal conditions.such as rapid surface evaporation. controllable inlet air temperature. andshort contact time, for latex coating.
ACCESSORY EQUIPMENT
1. Nozzle systems. Characteristics of three different types of nozzleare listed in Table 7 [111]. The ultrasonic nozzle is a relatively newand entirely different type of atomizing nozzle that offers several advantages over conventionsl nozzles. However, application of ultrasonic nozzles is still in its infancy. Thorough investigations are necessary to dedermine the feasibility of their pharmaceutical applications. Hydraulicguns are sometimes used in place of air-atomizing nozzles for large filmcoating processes. The nozzles tend to clog with latex coating becausethe airless system generates a shear which may coagulate the formulatedlatex. Pneumatic nozzles have been adapted for fluid-bed systems, andhave been shown to be an acceptable nozzle system for latex coating.The atomizing air is exposed to the product and, therefore, must befree of oil and other contaminants.
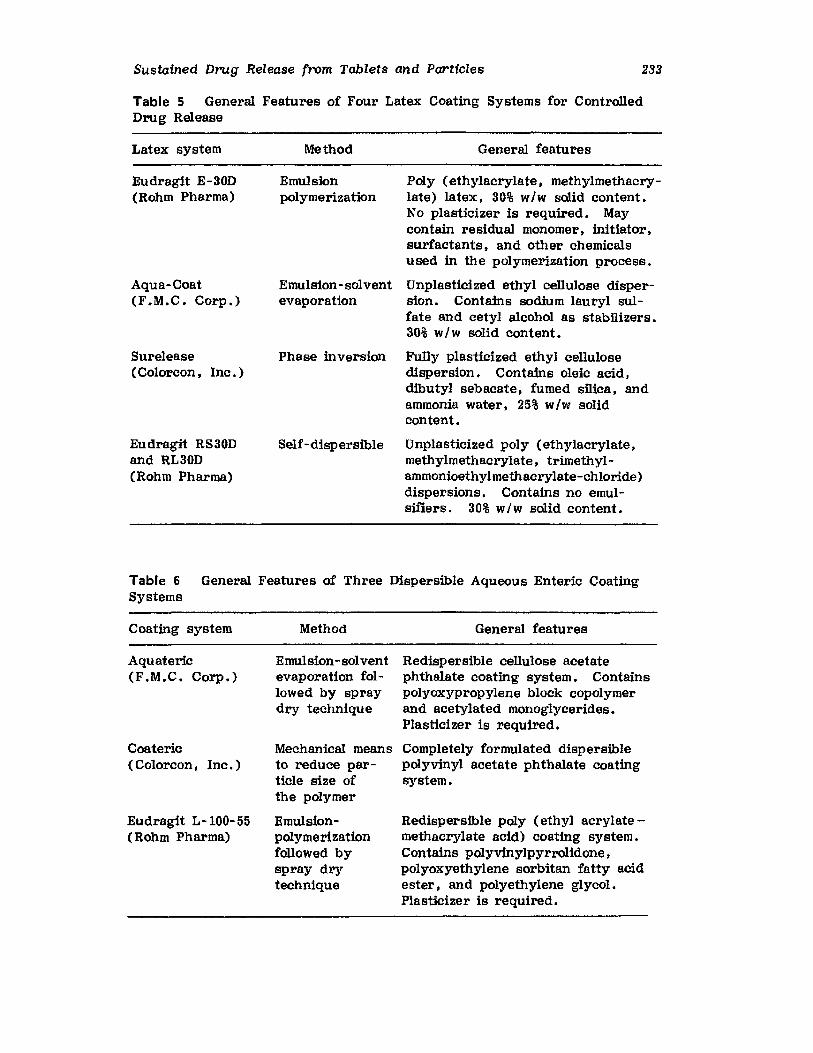
Sustained Drug Release from Tablets and Particles 233
Table 5 General Features of Four Latex Coating Systems for ControlledDrug Release
Latex system
Eudraglt E-30D(Rohm Pharma)
Aqua-Coat(F .M.C. Corp.)
Surelease(Colorcon, Ine .)
Budz-agft RS30Dand RL30D(Rohm Pharma)
Method
Emulsionpolymerization
Emulsion-solventevaporation
Phase inversion
Self-dispersible
General features
Poly (ethylacrylate, methylmethacrylate) latex, 30% w/w solid content.No plasticizer is required. Maycontain residual monomer, initiator.surfactants , and other chemicalsused in the polymerization process.
Unplasticized ethyl cellulose dispersion. Contains sodium lauryl sulfate and cetyl alcohol as stabilizers.30% w/w solid content.
Fully plasticized ethyl cellulosedispersion. Contains oleic acid,dibutyl sebacate, fumed silica, andammonia water. 25% w/w solidcontent.
Unplasticized poly (ethylaerylate ,methylmethacrylate. trimethylammonioethylmethacrylate-chloride)dispersions. Contains no emulsifiers. 30% w/w solid content.
Table 6 General Features of Three Dispersible Aqueous Enteric CoatingSystems
Coating system
Aquateric(F .M.C. Corp.)
Coateric( Colorcon, Inc.)
Budragft L - 100-55(Rohm Pharma)
Method
Emulsion-solventevaporation followed by spraydry technique
Mechanical meansto reduce particle size ofthe polymer
Emulsionpolymerizationfollowed byspray drytechnique
General features
Redispersible cellulose acetatephthalate coating system. Containspolyoxypropylene block copolymerand acetylated monoglycerides.Plasticizer is required.
Completely formulated dispersiblepolyvinyl acetate phthalate coatingsystem.
Redispersible poly (ethyl acrylatemethacrylate acid) coating system.Contains polyvinylpyrrolidone,polyoxyethylene sorbitan fatty acidester, and polyethylene glycol.Plasticizer is required.
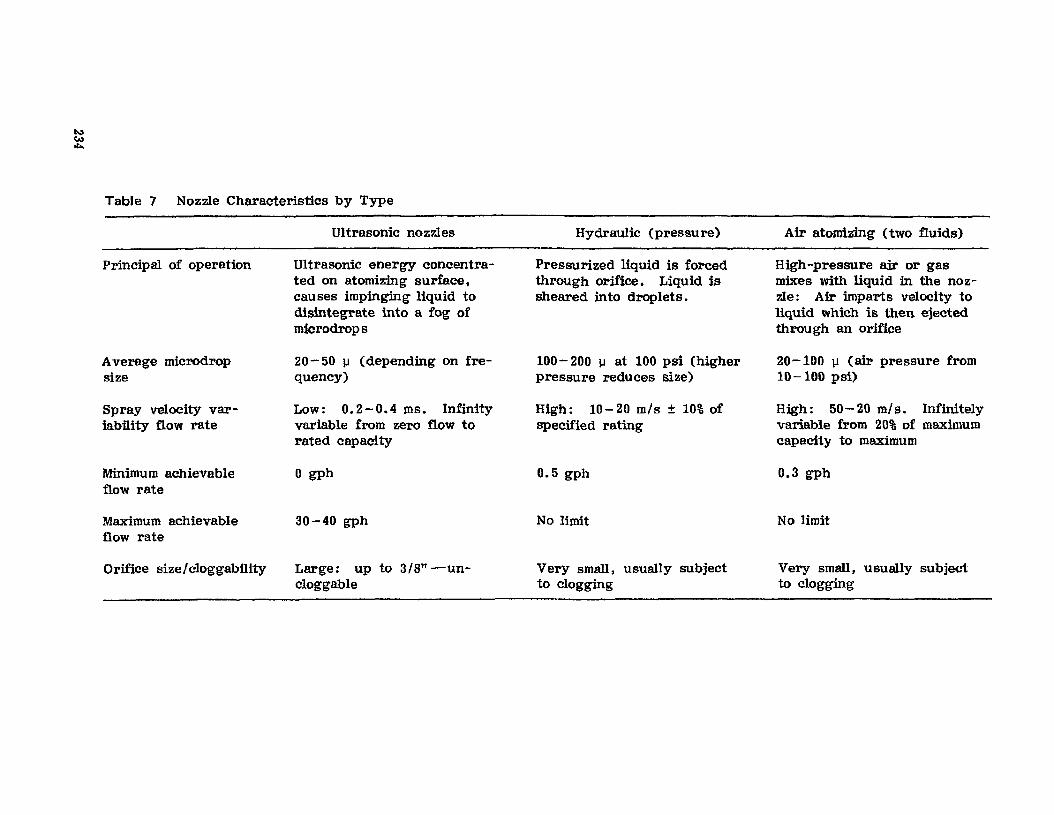
~(,,)
"'"
Table 7 Nozzle Characteristics by Type
Ultrasonic nozzles Hydraulic (pressure) Air atomfzing (two fluids)
Principal of operation
Average microdropsize
Spray velocity variability flow rate
Minimum achievableflow rate
Maximum achievableflow rate
Ornice &ze/cloggabllity
Ultrasonic energy concentrated on atomizing surface.causes impinging liquid todisintegrate into a fog ofmicrodrops
20-50 Il (depending on frequency)
Low: 0.2-0.4 ms, Infinityvariable from zero flow torated capacity
o gph
30-40 gph
Large: up to 3/8" -uneloggable
Pressurized liquid is forcedthrough orifice. Liquid issheared into droplets.
100 - 200 u at 100 psi (higherpressure reduces size)
High: 10-20 mls ± 10% ofspecified rating
0.5 gph
No limit
Very small, usually subjectto clogging
High-pressure air or gasmixes with liquid in the nozzle: Air imparts velocity toliquid which is then ejectedthrough an orifice
20-100 1.1 (air pressure from10-100 psi)
High: 50- 20 ml s , Infinitelyvariable from 20% of maximumcapacity to maximum
0.3 gph
No limit
Very small, usually subjectto clogging
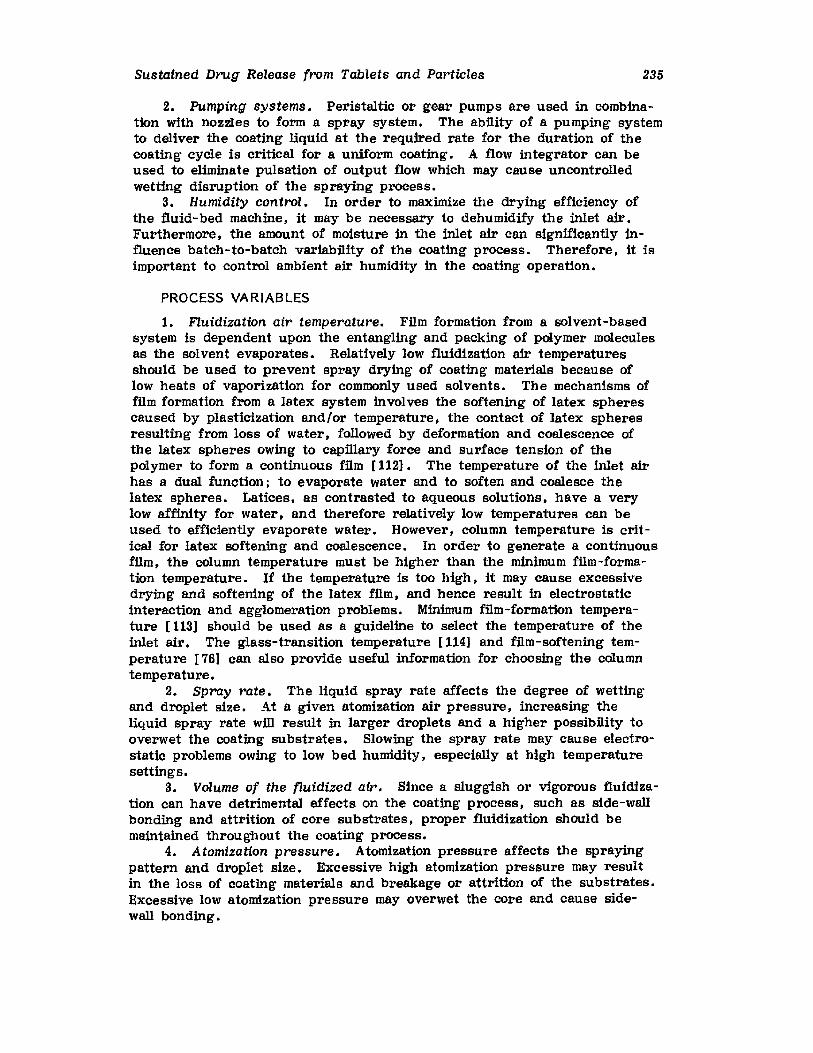
Sustained Drug Release from Tablets and Particles 235
2. Pumping systems. Peristaltic or gear pumps are used in combination with nozzles to form a spray system. The ab'fiity of a pumping systemto deliver the coating liquid at the required rate for the duration of thecoating cycle is critical for a uniform coating. A flow integrator can beused to eliminate pulsation of output flow which may cause uncontrolledwetting disruption of the spraying process.
3. Humidity control. In order to maximize the drying efficiency ofthe fluid-bed machine, it may be necessary to dehumidify the inlet air.Furthermore, the amount of moisture in the inlet air can significantly influence batch-to-batch variabfiity of the coating process. Therefore, it isimportant to control ambient air humidity in the coating operation.
PROCESS VARIABLES
1. Fluidization air temperature. Film formation from a solvent-basedsystem is dependent upon the entangling and packing of polymer moleculesas the solvent evaporates. Relatively low fluidization air temperaturesshould be used to prevent spray drying of coating materials because oflow heats of vaporization for commonly used solvents. The mechanisms offilm formation from a latex system involves the softening of latex spherescaused by plasticization and/or temperature, the contact of latex spheresresulting from loss of water, followed by deformation and coalescence ofthe latex spheres owing to capillary force and surface tension of thepolymer to form a continuous film [1121. The temperature of the inlet airhas a dual function; to evaporate water and to soften and coalesce thelatex spheres. Latices, as contrasted to aqueous solutions, have a verylow affinity for water, and therefore relatively low temperatures can beused to efficiently evaporate water. However, column temperature is critical for latex softening and coalescence. In order to generate a continuousfilm, the column temperature must be higher than the minimum film-formation temperature. If the temperature is too high, it may cause excessivedrying and softening of the latex film, and hence result in electrostaticinteraction and agglomeration problems. Minimum film-formation temperature [1131 should be used as a guideline to select the temperature of theinlet air. The glass-transition temperature [1141 and ffim-softening temperature [761 can also provide useful information for choosing the columntemperature.
2. Spray rate. The liquid spray rate affects the degree of wettingand droplet size. At a given atomization air pressure, increasing theliquid spray rate will result in larger droplets and a higher possibfiity tooverwet the coating substrates. Slowing the spray rate may cause electrostatic problems owing to low bed humidity, especially at high temperaturesettings.
3. Volume of the fluidized air. Since a sluggish or vigorous fluidization can have detrimental effects on the coating process, such as side-wallbonding and attrition of core substrates, proper fluidization should bemaintained throughout the coating process.
4. Atomization pressure. Atomization pressure affects the sprayingpattern and droplet size. Excessive high atomization pressure may resultin the loss of coating materials and breakage or attrition of the substrates.Excessive low atomization pressure may overwet the core and cause sidewall bonding.
236 Chang and Robinson
FORMULATION VARIABLES
1. The nature of the plasticizer. There are many plasticizers thatare compatible with ethyl cellulose and polymethyl methacrylate and can beused for plasticization [115]. For the polymer with a relatively high glasstransition temperature, a plasticizer with a strong affinity to the polymermust be found in order to form a resistant film. Plasticizers with lowwater soIubfiity are generally recommended for controlled drug release.Dibutyl sebacate, diethyl phthalate, triacetin, triethyl citrate, and acetylated monoglyceride often give satisfactory results.
2. The amount of the plasticizer. Experiments should be performedto determine the most favorable proportion of plasticizer. Low levels ofplasticizer may not overcome the latex sphere's resistance to deformationand result in incomplete or a discontinuous film. On the other hand, ahigh proportion of plasticizer may result in seed agglomeration, sticking,and poor fluidization problems caused by excessive softening of the polymerfilm. The best result generally is obtained with plasticizer concentrationin the range of 15- 30% based upon the polymer.
3. Incorporation of plasticizer. Plasticizer can be incorporated intothe latex system during the preparation process which provides more consistent plasticization, more effective use of plasticizer, and a relativelynonseparable plasticized latex system. Plasticizer also can be added to thelatex system under mild agitation. Agitation speed, mixing time. and separation of plasticizer during the coating process should be considered inthe preparation of the plasticized latex system.
4. The solids content of the latex system. Generally. 8-20% solidscontent give the best results [112]. However, higher or lower solids content can be used to achieve a rapid buildup of film thickness or coatinguniformity, respectively.
5. Additive. Water-soluble chemicals can be incorporated into thelatex film to enhance its dissolution rate. On the other hand, the additionof hydrophobic powder such as talc. magnesium, stearate, or silica in alatex-coating system not only alters drug release, but also facilitatesprocessing by reducing tackiness of the polymer film.
6. Dual Latex Ipseudolatex coating. Most latice or pseudolatices arestabilized by high surface potential of deflocculated particles arising fromionic functional groups on the polymer or ionic surfactant or stabilizer.For example, the positive charge on Eudragit RS30D and RL30D pseudolatex particles arising from quaternary groups on the polymers and thenegative charge on Aquacoat and Surelease pseudolatex particles originatedfrom the anionic surfactants such as sodium lauryl sulfate and oleic acidare the major stabilizing factor. Also, the size of the latex sphere and sizedistribution are important factors which affect stability, rheological properties, and film properties. Small, monodispersed latex particles arerequired to have complete coalescence of the latex sphere. Generally. itis not recommended to use dual latex/pseudolatex coating systems becauseof the possible incompatibfiity of two latex/pseudolates systems, the different glass-transition temperatures of the polymers. and the different sizesof latex spheres. However, in a British patent, Eudragit E-30D was mixedwith Aquacoat to prevent the coated granules sticking together and to
Sustained Drug Release from Tablets and Particles 237
improve the dissolution-retarding effect [116]. It has been demonstratedthat Eudragit RS pseudolatex can be mixed in any proportion with EudragitRL pseudolatex. A wide range of release rates for theophylline could beobtained by changing the ratios of Eudragit RS pseudolatex and EudragitRL pseudolatex , The enhancement of theophylline release caused by increasing the amount of Eudragit RL pseudolatex is due to its high permeability to water and theophylline [80].
7. Overcoating. During the curing or storage stage, the pelletscoated with latex or pseudolatex may adhere to one another because of thesoftening and tackiness of the film. This could have a detrimental effecton the dissolution properties of film-coated products. Nevertheless, anovercoat that is water soluble can solve the problem of tackiness of latexfilm without changing the dissolution profile. Immediate mixing of latexcoated pellets with some separating agents such as talcum. magnesiumstearate. and other dfiuents also can prevent the formation of clumps ofpellets during storage.
C. Compression Coating and Embedment
Specially constructed tablet presses such as Drycota and Prescota areavailable for compressing a polymeric or sugar composition onto a drugcontaining core. This technique has been utilized to create a polyvinylalcohol diffusion barrier surrounding a core tablet containing various activeingredients as described by Conte et al , [117]. In vitro dissolution testsshow that zero-order release kinetics of drug from compression-coated tablets can be achieved as long as the thermodynamic activity of the drugwithin the closure and the barrier characteristics are maintained constant.Salomon et al, [118] coated potassium chloride tablets with a thin layer ofhydroxypropyl methylcel1ulose by a compression technique for delayedrelease purposes. Such compression-coated tablets release potassium chloride at a constant rate. Enteric coating by a double-compression techniquehas been reported [119] using a mixture of triethanolamine cellulose acetateand lactose as coating materials.
Other variations of compression coatings such as inlaid tablets andlayer tablets may have application in preparing a sustained-release tabletwith an immediate-release and a separate slow-release portion. In general,the release rate from compression-coated tablets may be modified by corecomposition and characteristics. thickness of membrane layer, compositionof membrane layer, and geometry of core tablet and final tablet. However,the expense of compression coating and layer tablet production. complicatedmechanical operation, production problems such as multiple granulations,improper centration, capping, and limited compressible and permeable barrier materials limits its adoption as a popular technique to control drugrelease. The compression-embedding technique has received increasingattention to prepare controlled-release matrix tablets, and intensive research in this area is being conducted by pharmaceutical scientists. Thereare three different types of matrix tablets; I,e., hydrophilic matrices.plastic matrices, and fat-wax matrices. which can be differentiated by thematrix-bufiding materials.
238 Chang and Robinson
Hydrophaic Matrix Tablet
Utilization of a hydrophilic matrix as a means to control drug release wasdisclosed in U. S. Patent 3,065,143. Sodium carboxymethyl cellulose,methyl cellulose, hydroxypropyl cellulose, hydroxyethyl cellulose, polyethylene oxide. polyvinyl pyrrolidone, polyvinyl acetate. carboxy polymethylene. alginic acid, gelatin, and natural gums can be used as matrixmaterials. The matrix may be tableted by direct compression of the blendof active ingredient(s) and certain hydrophilic carriers, or from a wetgranulation containing the drug and hydrophilic matrix material( s) • Several commercial patented hydrophilic matrix systems are currently in use,such as the Synchron Technology I 120J and hydrodynamically balancedsystem [121J. The hydrophilic matrix requires water to activate the release mechanism and enjoys several advantages, including ease of manufacture and excellent uniformity of matrix tablets. Upon immersion inwater, the hydrophilic matrix quickly forms a gel layer around the tablet.Drug release is controlled by a gel diffusional barrier that is formed and/ortablet erosion. The effect of formulation and processing variables ondrug-release behavior from compressed hydrophilic matrices has beenstudied by a number of investigators [122-134] and can be summarized asfollows:
1. The matrix building material with fast polymer hydration capability is the best choice to use in a hydrophilic matrix tablet formulation.An inadequate polymer hydration rate may cause premature diffusion ofthe drug and disintegration of the tablet owing to fast penetration of water.It is particularly true for formulation of water-soluble drugs and excipients.
2. The amount of hydrophilic polymer in tablet formulations was reported to have a marked influence on the disintegration time and dissolution of the tablet. The disintegration time was extended as polymer content increased. The release rate of drug was decreased when the proportion of polymer was increased but differed quantitatively with differentdrugs and different matrix-building materials. Slower hydration polymerscan be used at higher concentration level to accelerate gel formation orreserved for water-insoluble drug( s) .
3. Generally, reduced particle size of the hydrophilic polymer ensures rapid hydration and gel formation, leading to a good controlled release. The impact of polymer particle size on the release rate is formulation dependent, but may be obscured in some cases. The particle size ofa drug. within a normal size range, may not significantly influence thedrug release from the matrix tablet. Extremes of drug particle size mayaffect release rate of the drug.
4. Viscosity characteristics of the polymers are of great importancein determining the final release properties of the matrix tablet. Generally,the drug-release rate is slower for a higher viscosity - grade polymer.
5. Commonly, water-soluble excipients in the matrix tablet can increase drug release. However, addition of water-soluble materials mayachieve a slower rate by increasing viscosity of the gel through interaction with hydrophilic polymers or by competition with matrix material forwater. When water-insoluble nonswellable excipient(s) or drug(s) is usedin the matrix system stress cracks can occur upon immersion in water because of the combination of SWelling and nonswelling components on thetablet surface.
Sustained Drug Release from Tablets and Particles 239
6. For some hydrophfiic matrix building materials, pH may affect theviscosity of the gel which forms on the tablet surface and its subsequentrate of hydration. Under acidic conditions. carboxypolymethylene andsodium carboxymethyl cellulose have little or no retarding effect on thedrug-release rate. Gelatin forms gels of higher viscosity in acidic mediaand is more effective in retarding drug release as compared to a basicmedia.
7. No conclusions could be drawn as to the effect of compressionforce on drug-release behavior owing to the different properties of thevarious hydrophilic matrix materials. However. tablet size and shape cansignificantly influence drug-release kinetics.
Fat-Wax Matrix Tablet
The drug can be incorporated into fat-wax granulations by spray congealing in air [135 -13S}. blend congealing in an aqueous media with or without the aid of surfactants I 139 -142}. and spray-drying techniques [44].In the bulk congealing method. a suspension of drug and melted fat-waxis allowed to solidify and is then comminuted for sustained-release granulations [143]. The mixture of active ingredients. waxy mat erial( s). andfiller( s) also can be converted into granules by compacting with a rollercompactor. heating in a suitable mixer such as a fluidized-bed and steamjacketed blender, or granulating with a solution of waxy material or otherbinders. Fat-wax granulations containing drug obtained from all of theabove processes may be compressed to form tablet cores or directly compressed into a final tablet form with sustained-release properties.
The drug embedded into a melt of fats and waxes is released byleaching and/or hydrolysis as well as dissolution of fats under the influence of enzymes and pH change in the gastrointestinal tract. Entericmaterials such as cellulose acetate phthalate. polyvinyl acetate phthalate,methacrylate copolymer, zein. and shellac may be used to prepare matrixtablets with somewhat a similar drug-release mechanism. In general, theprimary constituents of a fat-wax matrix are fatty acids and/or fattyesters. Fatty acids are more soluble in an alkaline rather than an acidicmedium. Fatty esters are more suscepitble to alkaline catalyzed hydrolysisthan to acid catalyzed hydrolysis. The surface erosion of a fat-wax matrix depends upon the nature and percent of fat-wax and extenders in thematrix [136]. Other factors such as drug particle size and drug concentration affects release of the drug from the matrix system [141]. The addition of surfactants to the formulation can also influence both the drugrelease rate and the proportion of total drug that can be incorporated intoa matrix [137 • 142}• Polyethylene. ethylcellulose, and glyceryl esters ofhydrogenated resins have been added to modify the drug-release pattern[135] •
Plastic Matrix Tablets
Sustained-release tablets based upon an Inert compressed plastic matrixwere first introduced in 1960 and have been used extensively clinically[144]. Release is usually delayed because the dissolved drug has to diffuse through a capillary network between the compacted polymer particles.Commonly used plastic matrix materials are polyvinyl chloride. polyethylene.vinyl acetate/vinyl chloride copolymer, vinylidene chloride/acrylonitrylecopolymer. acrylate/methyl methacrylate copolymer, ethyl cellulose.
240 Chang and RObinson
cellulose acetate, and polystyrene [145]. Plastic matrix tablets, in whichthe active ingredient is embedded in a tablet with coherent and porousskeletal structure, can be easily prepared by direct compression of drugwith plastic material( s) provided the plastic material can be comminuted orgranulated to desired particle size to facilitate mixing with drug particle.In order to granulate for compression into tablets the embedding processmay be accomplished by:
1. The solid drug and the plastic powder can be mixed and kneadedwith a solution of the same plastic material or other binding agentsin an organic solvent and then granulated.
2. The drug can be dissolved in the plastic by using an organic solvent and granulated upon evaporation of the sol vent.
3. Using latex or pseudolatex as granulating fluid to granulate thedrug and plastic masses.
Drug release from the inert plastic matrices was affected by varyingformulation factors such as the matrix material, amount of drug incorporated in the matrix, drug solUbility in the dissolution media and in thematrix, matrix additives, and the release media. Since the mechanism ofcontrolling drug release in the plastic matrix is the pore structure of thematrix:, any formulation factors affecting the release of a drug from thematrix may be a consequence of their primary effect on apparent porositiesand tortuosities of the matrices. These release factors can be summarizedas follows:
1. The release rate increases as the solubility of the drug increases,but there seems to be no direct relationship between the two variables.
2. The release rate increases as the drug concentration increases.An increase in release rate cannot be explained on the basis of increasingmatrix porosity [146]. Rather it has been attributed to changes in matrixtortuosity with drug concentration [147] and to decreased diffusional resistance by shortening the length of the capillary joining any two drugparticles [148].
3. It is possible to modify the release rate by inclusion of hydrophilicor hydrophobic additives to the matrix. The release of a sparingly solublesubstance can be increased by the addition of physiologically inert butreadily soluble material such as polyethylene glycol, sugars, electrolytes,and urea [146,149]. The decrease in the release rate on the addition ofhydrophobic substance may be due to decreased wettability of the matrix[150] •
4. The release rate from plastic matrix tablets could be decreased byexposure to acetone vapor without changing the release mechanism. Theextent of the reduction was found to be dependent on the amount ofacetone absorbed [147,151]. The tensile strength of the tablets increasesby heating the polymer matrix above the glass-transition temperature.However, porosity also increases with a marked increase in the releaserate [152,153].
5. The release rate increased as the particle size of the matrix material increased and as the particle size of the drug decreased.
6. Increasing compaction pressure up to the full consolidation pointtends to decrease the pore formed among the polymer particles, resultingin a slower drug-release rate [154].
Sustained Drug Release from Tablets and Particles 241
Microcapsules. microspheres, or coated pellets also can be compressed intotablets or embedded in a drug-containing matrix. Sustained-release tabletsmade from individual coated particles may have very different release characteristics than the original coated particles depending upon whether or not thetablets disintegrate to expose the majority of the coated particles to the dissolution environment and whether the coated particles are damaged by the compression process [155]. Generally. nondisintegrating tablets made from ethylcellulose microcapsules followed matrix -release kinetics are much slower thanthe uncompressed microcapsules. When compression force was sufficient to prevent breakup of the tablets, greater compression force had little effect onrate of dissolution I 156 - 160] • Apparently. nondisintegrating tablets madefrom individual coated particles did not provide any advantages over matrixtablets but a more complicated manufacturing process. A dispersible tabletcontaining individual coated particles distributes the drug-containing coatedparticles in the gastric content to minimize the high local concentration ofdrug and to reduce the inter- and intrasubject variation linked to gastrointestinal transit time.
However. the sustained-release properties of the coated particles maybe lost due to cracking of the membranes and rupture of the characteristicmicrocapsule tails. The amount of damage was found to be related to thecompressibility and particle size of excipients in the tablet formula as wellas to the compression pressure. Large particles led to greater damageas noted by increased dissolution rates of the disintegrating tablets [161].It also has been found that a combination of microcrystalline cellulose andpolyethylene glycol provides maximum protection from the damage of potassium chloride microcapsules by reducing interparticle friction [162].Matrix: particles have the advantage of being very rugged, less subject todose dumping, and more resistant to compression damage than membranesystems. Little change in the dissolution rate of cellulose acetate butyratemicrospheres containing succinyl sulfathiazole has been reported when tableting with microcrystalline cellulose and carboxymethyl starch under compression force between 35 and 350 MPa [163].
IV. SUSTAINED-RELEASE PRODUCTS THROUGHCOATING
The preceding discussion has provided the framework for the design ofsustained-release products. Application of these principles in the pharmaceutical industry has resulted in varying degrees of success in achievingconsistent, nonvarying blood levels of drug from sustained-release dosageforms. It is instructive to examine some of these dosage forms more closely, and to analyze where and why they fail to provide sustained releaseand whether the failure can be detected in vivo or in vitro. Of course,the reader should keep in mind that these are "failures" only in a relativesense; some forms are very much superior to others, but all do providesome sort of sustained therapy beyond their nonsustained counterparts.Whether this sustained blood or tissue level results in a measurable improvement clinically is often debatable.
It would appear from the earlier sections of this chapter that one canemploy the theoretical calculations on release-rate and dosage-form designwith great precision to formulate a prolonged-action dosage form. Inpoint of fact, although this has been done in a few studies, the vast
242 Chang and Robinson
majority of published work has employed these principles and calculationsas a working guideline. The formulator obtains the desired release-rateconstant and size of tablet by suitable calculation and attempts to generate this release pattern by some sustained-release mechanism. such ascoating. If the release rate of drug is dissimilar to the calculated value.the dosage form is appropriately modified. Since the ideal release pattern,resulting in a tissue drug concentration -time profile similar to that shownin Figure 1. is seldom obtained, the formulator will usually be satisfiedwith either a bell-shaped profile that has a broad. relatively flat plateau,or an extension of biological activity. This qualitative approach. which attimes is very empirical, is clearly evident when one reads the literaturedealing with prolonged-action dosage forms. Thus. unless the formulatorhas good control over the release mechanism, which is rarely the case. heor she wfil be working empirically or semiempirically in preparing thedosage form. Moreover. because of this lack of control over the releasemechanism, a blood drug profile will usually result that shows simple prolongation rather than the invariant drug level of the sustained type.
In the following discussion, we have arbitrarily classified the approaches used in coating sustained-release products into various SUbdivisions. Agood argument could be constructed that all of the following subdivisionsare artificial. since all coated sustained-release dosage forms utilize dissolution and diffusion to varying degrees. However. the dosage forms mentioned in each section usually appear to have one major mode of providingsustained action. These modes can derive from the way the material isproduced. as in the case of microcapsules and bead polymerization, or fromthe way the body handles the dosage form, as in the case of soluble coatedgranules or impermeable films coated in a tablet. The division has beencreated solely for the purpose of organizing the literature in the area andshould not be viewed as being rigid or exclusive.
At the end of some of the SUbdivisions, the reader will find a sectionentitled case study. These sections are intended to provide sufficient experimental detail to allow the novice formulator to initiate preparation of aprolonged-action dosage form. We will thus examine selected published reports in more detail, providing as much of the experimental methods employed as is practical. In addition. when available, the appropriate equations to describe the release of drug from the dosage form and the typeof in vitro and in vivo profile generated will be noted.
A. Sustained Release Utilizing Dissolution
Dissolution methods in sustained release generally refer to coating the individual particles, or granules, of the drug with varying thicknesses ofcoating material so that dissolution of the coat, resulting in release of thedrug contained within, occurs over a long time span owing to the thicknessdifferences of the coats. These coated particles are then either compresseddirectly into tablets (e.g .• Spacetabs), or they can be placed in capsules(e.g•• the Spansule or Plateau Cap dosage forms), as shown in Scheme 11.Alternatively. the dissolution may be that of an exterior tablet coatingWhere a portion of the drug is placed in the tablet coat and dissolves rapidly to provide enough drug to quickly reach therapeutic levels. whereasthe sustained-release interior of the tablet utilizes some other method, tobe discussed subsequently. to provide controlled, long-term release of
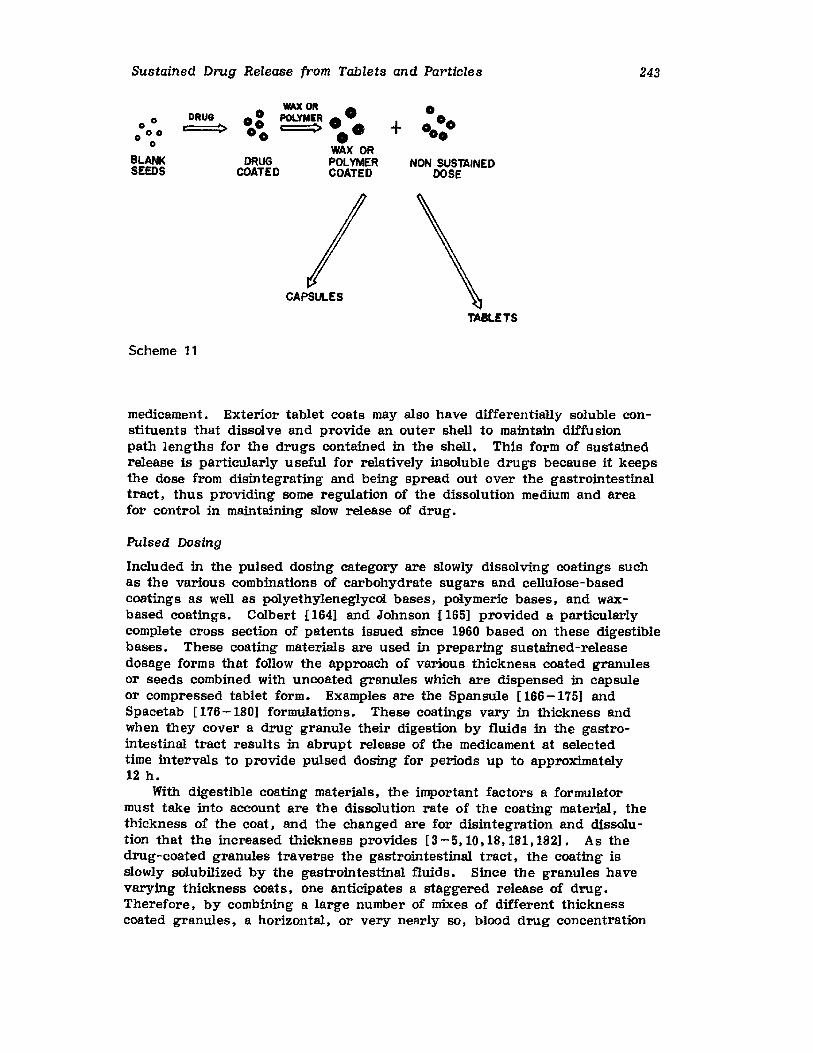
Sustained Drug Release from Tablets and Particles 243
WAX OR 000
DRUG 0° POLYMER •• + 00:0> 00 c::::=o ••000 00 WAX OR
BLANK DRUG POLYMER NON SUSTAINEDSEEDS COATED COATED DOSE
CAPSULES
TABLETS
Scheme 11
medicament. Exterior tablet coats may also have differentially soluble constituents that dissolve and provide an outer shell to maintain diffusionpath lengths for the drugs contained in the shell. This form of sustainedrelease is particularly useful for relatively insoluble drugs because it keepsthe dose from disintegrating and being spread out over the gastrointestinaltract, thus providing some regulation of the dissolution medium and areafor control in maintaining slow release of drug.
Pulsed Dosing
Included in the pulsed dosing category are slowly dissolving coatings suchas the various combinations of carbohydrate sugars and cellulose-basedcoatings as well as polyethyleneglycol bases, polymeric bases, and waxbased coatings. Colbert [1641 and Johnson [165] provided a particularlycomplete cross section of patents issued since 1960 based on these digestiblebases. These coating materials are used in preparing sustained-releasedosage forms that follow the approach of various thickness coated granulesor seeds combined with uncoated granules which are dispensed in capsuleor compressed tablet form. Examples are the Spansule [166-175] andSpacetab [176 -180] formulations. These coatings vary in thickness andwhen they COver a drug granule their digestion by fluids in the gastrointestinal tract results in abrupt release of the medicament at selectedtime intervals to provide pulsed dosing for periods up to approximately12 h.
With digestible coating materials, the important factors a formulatormust take into account are the dissolution rate of the coating material, thethickness of the coat, and the changed are for disintegration and dissolution that the increased thickness provides [3 - 5. 10, 18, 181 , 182]. As thedrug-coated granules traverse the gastrointestinal tract, the coating isslOWly solubilized by the gastrointestinal fluids. Since the granules havevarying thickness coats, one anticipates a staggered release of drug.Therefore, by combining a large number of mixes of different thicknesscoated granules, a horizontal, or very nearly so, blood drug concentration
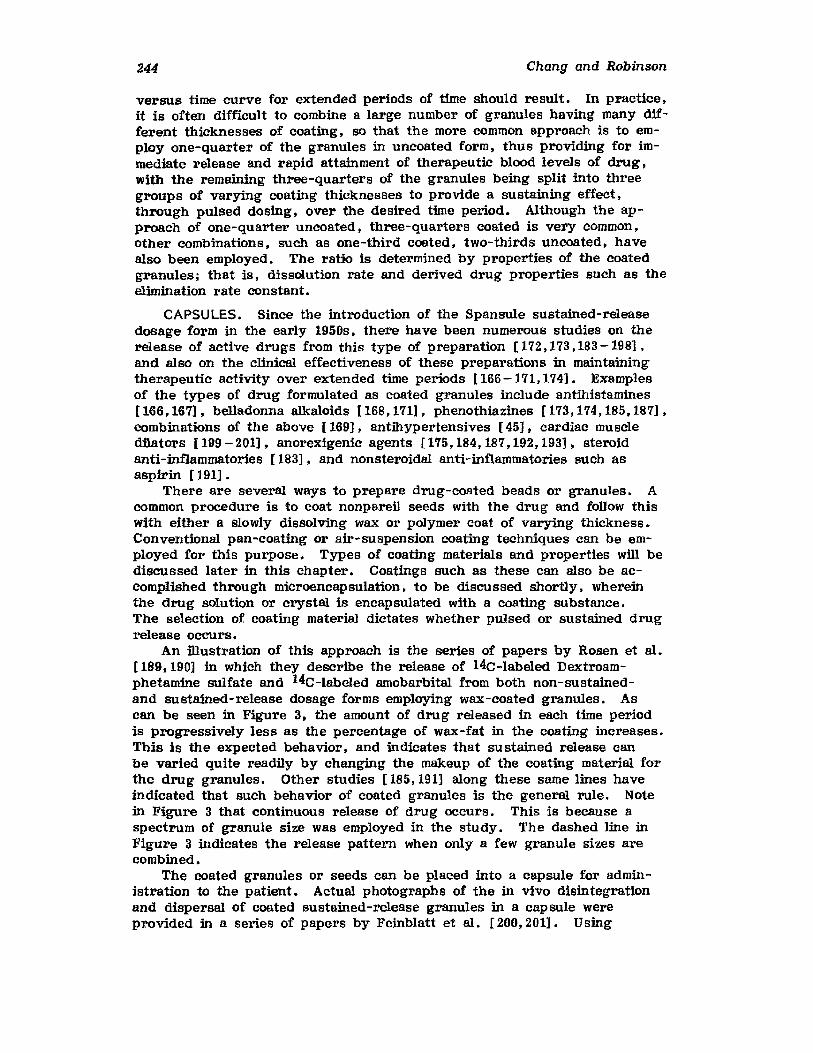
244 Chang and Robinson
versus time curve for extended periods of time should result. In practice.it is often difficult to combine a large number of granules having many different thicknesses of coating. so that the more common approach is to employ one-quarter of the granules in uncoated form, thus providing for immediate release and rapid attainment of therapeutic blood levels of drug.with the remaining three-quarters of the granules being split into threegroups of varying coating thicknesses to provide a sustaining effect,through pulsed dosing, over the desired time period. Although the approach of one-quarter uncoated, three-quarters coated is very common.other combinations, such as one-third coated, two-thirds uncoated. havealso been employed. The ratio is determined by properties of the coatedgranules; that is, dissolution rate and derived drug properties such as theelimination rate constant.
CAPSULES. Since the introduction of the Spansule sustained-releasedosage form in the early 1950s. there have been numerous studies on therelease of active drugs from this type of preparation [172,173,183 -1981 ,and also on the clinical effectiveness of these preparations in maintainingtherapeutic activity over extended time periods [166 -171,174]. Examplesof the types of drug formulated as coated granules include antihistamines[166,167], belladonna alkaloids U68,171}, phenothiazines [173,174,185,1871.combinations of the above [169], antihypertensives [45], cardiac muscledilators [199 - 201], anorexigenic agents [175, 184, 187,192, 193], steroidanti-inflammatories [183], and nonsteroidal anti-inflammatories such asaspirin [191].
There are several ways to prepare drug-coated beads or granules. Acommon procedure is to coat nonpareil seeds with the drug and follow thiswith either a slowly dissolving wax or polymer coat of varying thickness.Conventional pan-coating or air-suspension coating techniques can be employed for this purpose. Types of coating materials and properties will bediscussed later in this chapter. Coatings such as these can also be accomplished through microencapsulation, to be discussed shortly, whereinthe drug solution or crystal is encapsulated with a coating substance.The selection of coating material dictates whether pulsed or sustained drugrelease occurs.
An illustration of this approach is the series of papers by Rosen et aleI 189. 190] in which they describe the release of 14C-labeled Dextroamphetamine sulfate and 14C-labeled amobarbital from both non-sustained-and sustained-release dosage forms employing wax-coated granules. Ascan be seen in Figure 3. the amount of drug released in each time periodis progressively less as the percentage of wax-fat in the coating increases.This is the expected behavior, and indicates that sustained release canbe varied quite readily by changing the makeup of the coating material forthe drug granules. Other studies [185,191] along these same lines haveindicated that such behavior of coated granules is the general rule. Notein Figure 3 that continuous release of drug occurs. This is because aspectrum of granule size was employed in the study, The dashed line inFigure 3 indicates the release pattern when only a few granule sizes arecombined.
The coated granules or seeds can be placed into a capsule for administration to the patient. Actual photographs of the in vivo disintegrationand dispersal of coated sustained-release granules in a capsule wereprovided in a series of papers by Feinblatt et al , [200,201]. Using
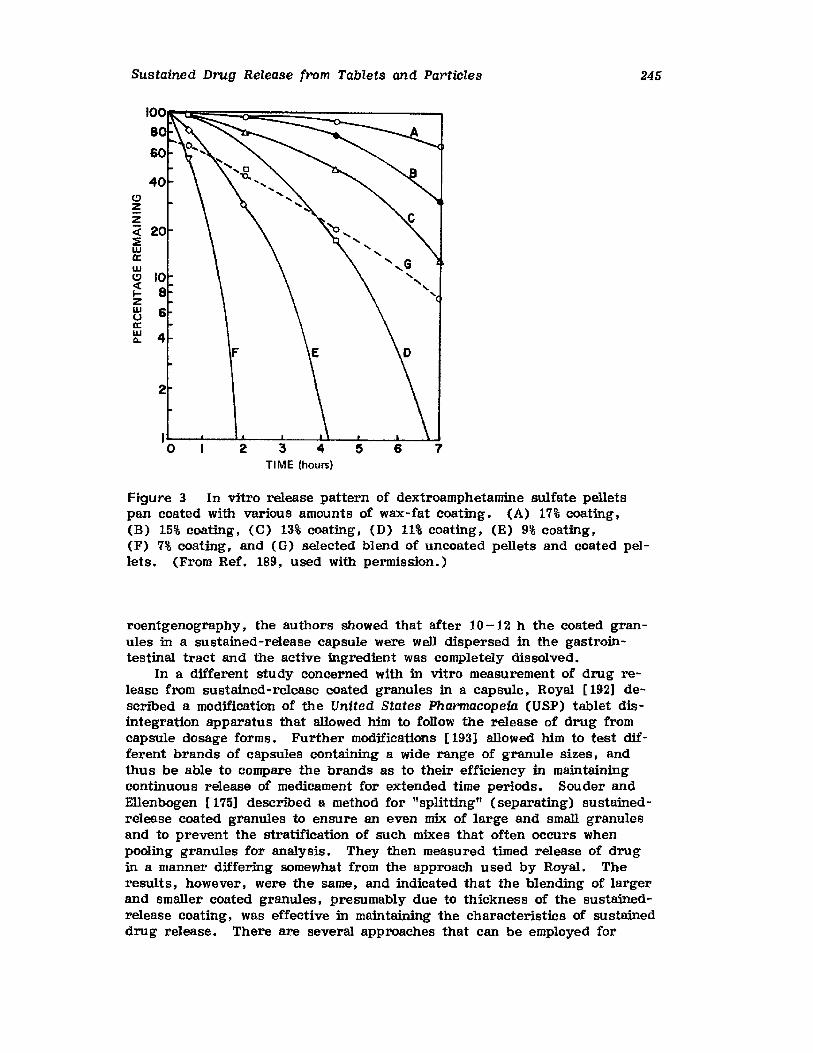
Sustained Drug Release from Tablets and Particles
C)zz;;: 20::ii:wa::wC) 10ct:
8~zw 6oII:W 40...
F
2
I0 2
245
Figure 3 In vitro release pattern of dextroamphetamine sulfate pelletspan coated with various amounts of wax-fat coating. (A) 17% coating,(B) 15% coating, (C) 13% coating, (D) 11% coating, (E) 9% coating,(F) 7% coating, and (G) selected blend of uncoated pellets and coated pellets. (From Ref. 189, used with permission.)
roentgenography, the authors showed that after 10-12 h the coated granules in a sustained-release capsule were well dispersed in the gastrointestinal tract and the active ingredient was completely dissolved.
In a different study concerned with in vitro measurement of drug release from sustained-release coated granules in a capsule, Royal [192] described a modification of the United States Pharmacopeia CUSP) tablet disintegration apparatus that allowed him to follow the release of drug fromcapsule dosage forms. Further modifications [193] allowed him to test different brands of capsules containing a wide range of granule sizes, andthus be able to compare the brands as to their efficiency in maintainingcontinuous release of medicament for extended time periods. Souder andEllenbogen [175] described a method for "splitting" (separating) sustainedrelease coated granules to ensure an even mix of large and small granulesand to prevent the stratification of such mixes that often occurs whenpooling granules for analysis. They then measured timed release of drugin a manner differing somewhat from the approach used by Royal. Theresults, however, were the same, and indicated that the blending of largerand smaller coated granules, presumably due to thickness of the sustainedrelease coating, was effective in maintaining the characteristics of sustaineddrug release. There are several approaches that can be employed for
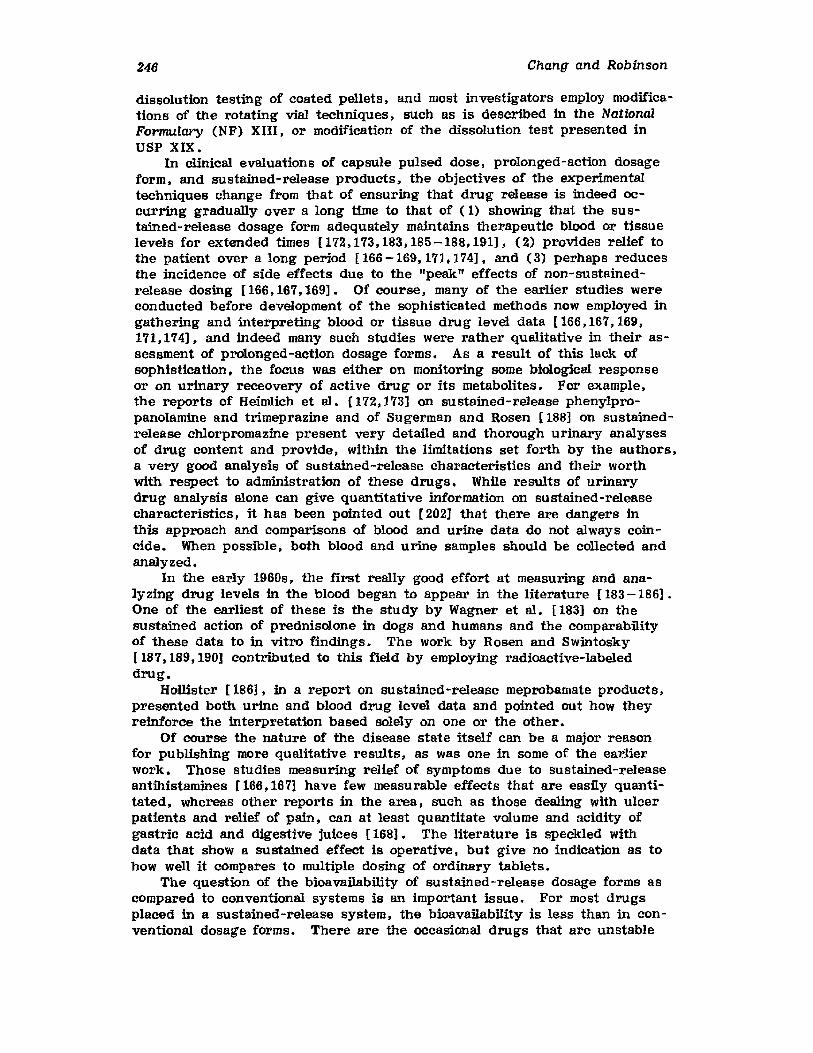
246 Chang and Robinson
dissolution testing of coated pellets. and most investigators employ modifications of the rotating vial techniques. such as is described in the NationalFormulary (NF) XIII. or modification of the dissolution test presented inuss XIX.
In clinical evaluations of capsule pulsed dose, prolonged-action dosageform, and sustained-release products. the objectives of the experimentaltechniques change from that of ensuring that drug release is indeed occurring gradually over a long time to that of (1) showing that the sustained-release dosage form adequately maintains therapeutic blood or tissuelevels for extended times (l72.173,183,185-188,191I, (2) provides relief tothe patient over a long period [166 -169, 171,174], and (3) perhaps reducesthe incidence of side effects due to the "peak" effects of non-sustainedrelease dosing [166,167,169]. Of course, many of the earlier studies wereconducted before development of the sophisticated methods now employed ingathering and interpreting blood or tissue drug level data. [166.167, 169,171,174], and indeed many such studies were rather qualitative in their assessment of prolonged-action dosage forms. As a result of this lack ofsophistication. the focus was either on monitoring some biological responseor on urinary receovery of active drug or its metabolites. For example,the reports of Heimlich et al , [172,173] on sustained-release phenylpropanolamine and trimeprazine and of Sugerman and Rosen [188] on sustainedrelease chlorpromazine present very detailed and thorough urinary analysesof drug content and provide, within the limitations set forth by the authors.a very good analysis of sustained-release characteristics and their worthwith respect to administration of these drugs. While results of urinarydrug analysis alone can give quantitative information on sustained-releasecharacteristics, it has been pointed out [202] that there are dangers inthis approach and comparisons of blood and urine data do not always coincide. When possible. both blood and urine samples should be collected andanalyzed.
In the early 1960s, the first really good effort at measuring and ana1yzing drug levels in the blood began to appear in the literature [183 -186] .One of the earliest of these is the study by Wagner et al , [183] on thesustained action of prednisolone in dogs and humans and the comparabilityof these data to in vitro findings. The work by Rosen and Swintosky[187,189,190] contributed to this field by employing radioactive-labeleddrug.
Hollister [1861. in a report on sustained-release meprobamate products,presented both urine and blood drug level data and pointed out how theyreinforce the interpretation based solely on one or the other.
Of course the nature of the disease state itself can be a major reasonfor publtshlng more qualitative results, as was one in some of the earlierwork. Those studies measuring relief of symptoms due to sustained-releaseantihistamines [166.167] have few measurable effects that are easily quantitated, whereas other reports in the area, such as those dealing with ulcerpatients and relief of pain, can at least quantitate volume and acidity ofgastric acid and digestive juices [168]. The literature is speckled withdata that show a sustained effect is operative, but give no indication as tohow well it compares to multiple dosing of ordinary tablets.
The question of the bioavailabUity of sustained-release dosage forms ascompared to conventional systems is an important issue. For most drugsplaced in a sustained-release system, the bioavailabUity is less than in conventional dosage forms. There are the occasional drugs that are unstable
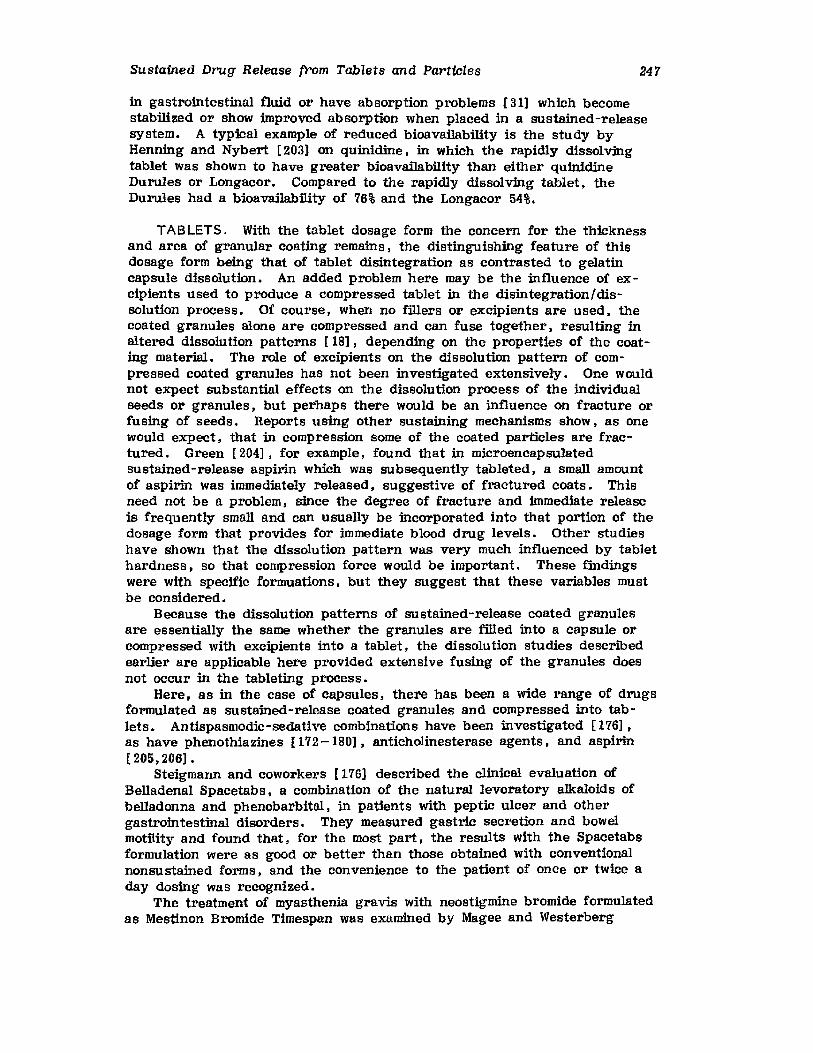
Sustained Drug Release from Tablets and Particles 24'1
in gastrointestinal fluid or have absorption problems [31] which becomestabilized or show improved absorption when placed in a sustained-releasesystem. A typical example of reduced bioavailability is the study byHenning and Nybert [203] on quinidine, in which the rapidly dissolvingtablet was shown to have greater bioavailabUity than either quinidineDurules or Longacor. Compared to the rapidly dissolving tablet, theDurules had a bioavailability of 76% and the Longacor 54%.
TABLETS. With the tablet dosage form the concern for the thicknessand area of granular coating remains, the distinguishing feature of thisdosage form being that of tablet disintegration as contrasted to gelatincapsule dissolution. An added problem here may be the influence of excipients used to produce a compressed tablet in the disintegration/dissolution process. Of course, When no fillers or excipients are used. thecoated granules alone are compressed and can fuse together, resulting inaltered dissolution patterns [18], depending on the properties of the coating material. The role of excipients on the dissolution pattern of compressed coated granules has not been investigated extensively. One wouldnot expect substantial effects on the dissolution process of the individualseeds or granules, but perhaps there would be an influence on fracture orfusing of seeds. Reports using other sustaining mechanisms show, as onewould expect, that in compression some of the coated particles are fractured. Green [204]. for example, found that in microencapsulatedsustained-release aspirin Which was subsequently tableted, a small amountof aspirin was immediately released, suggestive of fractured coats. Thisneed not be a problem, since the degree of fracture and immediate releaseis frequently small and can usually be incorporated into that portion of thedosage form that provides for immediate blood drug levels. Other studieshave shown that the dissolution pattern was very much influenced by tablethardness, so that compression force would be important. These findingswere with specific formuations , but they suggest that these variables mustbe considered.
Because the dissolution patterns of sustained-release coated granulesare essentially the same whether the granules are filled into a capsule orcompressed with excipients into a tablet, the dissolution studies describedearlier are applicable here provided extensive fusing of the granules doesnot occur in the tableting process.
Here, as in the case of capsules, there has been a wide range of drugsformulated as sustained-release coated granules and compressed into tablets. Antispasmodic-sedative combinations have been investigated [176],as have phenothiazines [172 -180], anticholinesterase agents, and aspirin[205,206].
Steigmann and coworkers [176] described the clinical evaluation ofBelladenal Spacatabs , a combination of the natural levoratory alkaloids ofbelladonna and phenobarbital, in patients with peptic ulcer and othergastrointestinal disorders. They measured gastric secretion and bowelmotility and found that. for the most part, the results with the Spacetabsformulation were as good or better than those obtained with conventionalnonsustained forms, and the convenience to the patient of once or twice aday dosing was recognized.
The treatment of myasthenia gravis with neostigmine bromide formulatedas Mestinon Bromide Timespan was examined by Magee and Westerberg
248 Chang and Robinson
[2051. The need for sustained release is particularly acute here. sincewith treatment via non-sustained-release dosage forms, the patient generally is very weak upon arising in the morning and remains in this stateuntil the morning tablet dose can be absorbed. A means of maintainingpatient strength and comfort throughout the hours of sleep was needed.The results of their study show that the value of this sustained-releasedosage form is greatest when taken at bedtime. at times even allowing thepatient to arise with sufficient strength to dress before taking morningmedication. Results of daytime use were variable, and absorption appeared to be less than optimal in comparison with non-sustained-releasetablets.
Probably the largest body of clinical data has been compiled for thephenothiazine tranquilizer thioridazine. Mellinger [177], in an earlyevaluation of thioridazine formulated as Me1laril Spacetabs, examinedserum concentrations following administration of the drug as a liquid concentrate. as tablets crushed in a mortar, as intact tablets, and as theSpacetab sustained-release tablet. He found that the drug persists inthe blood for long periods from all the dosage forms studied, and attributed its slow excretion to possible slow metabolism. There were nostriking advantages to the sustained-release formulation over that of conventional tablets. This last finding has been reiterated by other workers {178] , and as of this time, the Spacetab formulation of thioridazineis not being marketed.
The clinical evaluation and comparison of sustained-release and nonsustained-release aspirin tablets was reported by Cass and Frederik [206.207] • They measured the duration of analgesic relief obtained via aseries of different dosage regimens in patients suffering from a varietyof eoronie illnesses. In all cases, the sustained release form providedlonger and more predictable analgesic relief than any of the other nonsustained-release tablets tested.
Case Study of Slowly Soluble Wax Coating on Nonpareil Seeds [189].Prolonged action mechanism. Pulsed dosing in repeat action fashion.Drug-containing nonpareil seeds were coated with various thicknesses ofdigestible waxes which were intended to release drug at various times afterdosing.
Type and method of coating. A kilogram of medicated non-sustainedrelease pellets was prepared in a 12-in coating pan. The pellets werecomposed of 31.2 gm of dextroamphetamine sulfate; 58.8 gm of a 1:1 mixture of starch, USP, and pOWdered sucrose, USPj and 90 gm of U.S.No. 16 to 20-mesh sugar pellets. The nonpareil seeds were placed in aconventional coating pan and wetted with a water I alcohol!gelatin mixtureconsisting of gelatin 10% wlv, hydrochloric acid 0.5% vlv, and water 30%v lv , and alcohol 70% v I v (90% ethanol, 10% methanol). When the mixturebecame tacky the drug diluent was added to the rotating seeds. After ashort period of drying. one-fourth of the seeds were removed (theserepresented the uncoated portion). The remaining seeds Were then coatedto varying thicknesses with a wax formula consisting of glyceryl monostearate 11% wlw, glyceryl distearate, 16% wlw, white wax 3% wlw, incarbon tetrachloride 70% wIw. Six different groups of pellets with approximately 7. 9, 11, 13, 15, and 17% of wax coating were initially prepared and, through trial and error, a final blend consisting of 25% noncoated pellets, 55% of the 11% wax-coated seeds, and 20% of the 9% waxcoated seeds gave a satisfactory in vitro release pattern. Each group of
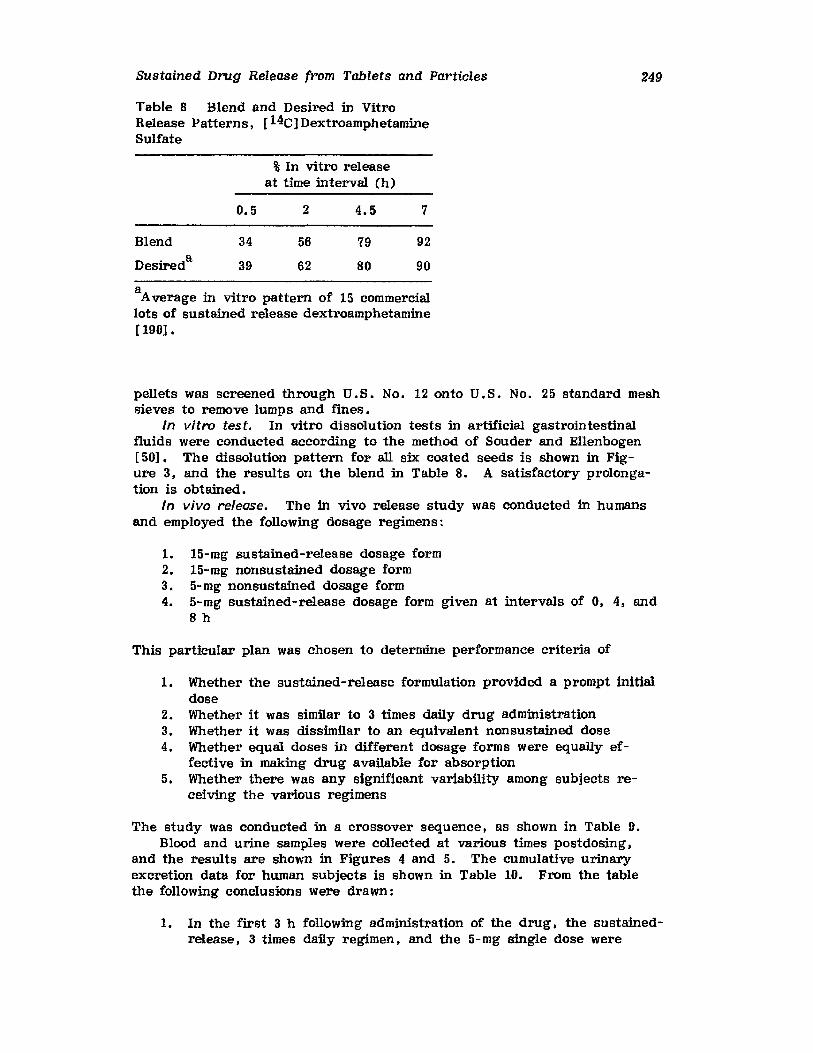
Sustained Drug Release from Tablets and Particles
Table 8 Blend and Desired in VitroRelease Patterns, [14C] DextroamphetamineSulfate
%In vitro releaseat time interval (h)
249
Blend
Desireda
0.5
34
39
2
56
62
4.5
79
80
7
92
90
aAverage in vitro pattern of 15 commerciallots of sustained release dextroamphetamine[ 190].
pellets was screened through U.S. No. 12 onto U.S. No. 25 standard meshsieves to remove lumps and ffnes ,
In vitro test. In vitro dissolution tests in artificial gastrointestinalfluids were conducted according to the method of Souder and Ellenbogen[50] • The dissolution pattern for all six coated seeds is shown in Figure 3, and the results on the blend in Table 8. A satisfactory prolongation is obtained.
In vivo release. The in vivo release study was conducted in humansand employed the following dosage regimens:
1. I5-mg sustained-release dosage form2. 15-mg nonsustained dosage form3. 5-mg nonsustained dosage form4. 5-mg sustained-release dosage form given at intervals of 0, 4, and
8 h
This particular plan was chosen to determine performance criteria of
1. Whether the sustained-release formulation provided a prompt initialdose
2. Whether it was similar to 3 times daily drug administration3. Whether it was dissimilar to an equivalent nonsustained dose4. Whether equal doses in different dosage forms were equally ef
fective in making drug available for absorption5. Whether there was any significant variability among subjects re
ceiving the various regimens
The study was conducted in a crossover sequence, as shown in Table 9.Blood and urine samples were collected at various times postdosing,
and the results are shown in Figures 4 and 5. The cumulative urinaryexcretion data for human subjects is shown in Table 10. From the tablethe following conclusions were drawn:
1. In the first 3 h following administration of the drug, the sustainedrelease, 3 times daily regimen, and the 5-mg single dose were
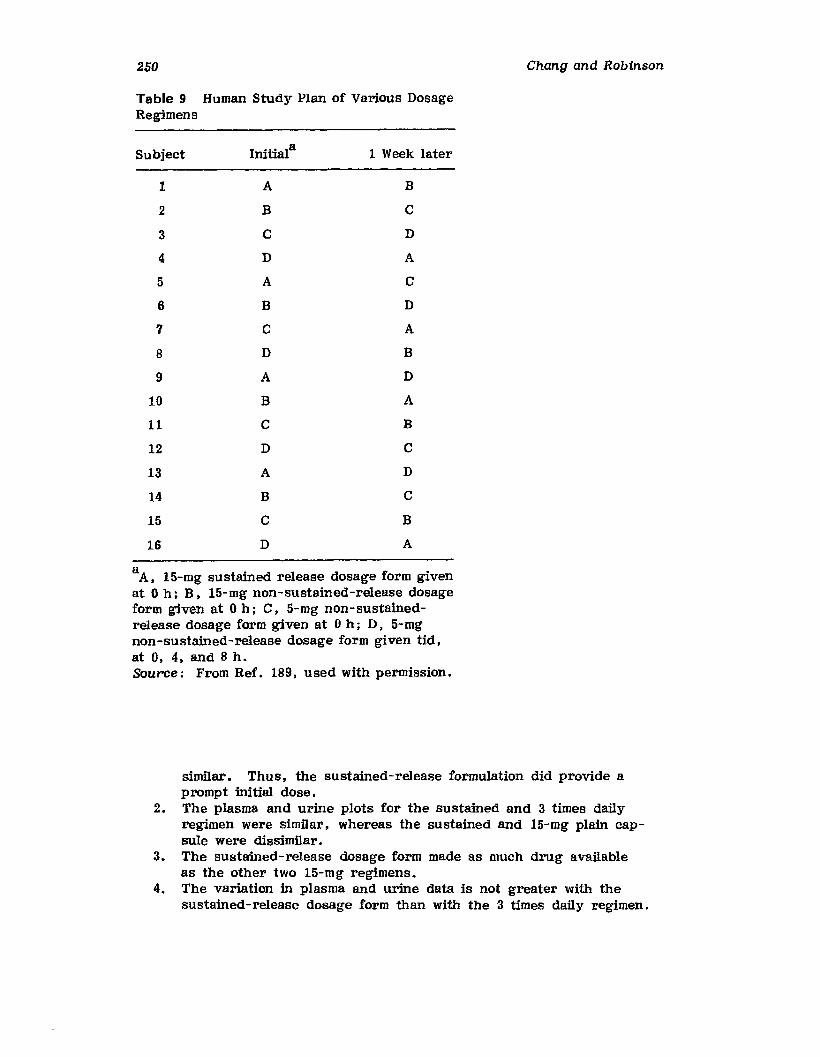
250
Table 9 Human Study Plan of Various DosageRegimens
Subject Initiala 1 Week later
1 A B
2 B C
3 C D
4 D A
5 A C
6 B D
7 C A
8 D B
9 A D
10 B A
11 C B
12 D C
13 A D
14 B C
15 C B
16 D A
aA, 15-mg sustained release dosage form givenat 0 h; B, I5-mg non-sustained-release dosageform given at 0 h; C. 5-mg non-sustainedrelease dosage form given at 0 h; D, 5-mgnon-sustained-release dosage form given tid,at 0, 4, and 8 h.Source: From Ref. 189, used with permission.
Chang and Robinson
similar. Thus, the sustained-release formulation did provide aprompt initial dose.
2. The plasma and urine plots for the sustained and 3 times dailyregimen were similar, whereas the sustained and I5-mg plain capsule were dissimilar.
3. The sustained-release dosage form made as much drug availableas the other two I5-mg regimens.
4. The variation in plasma and urine data is not greater with thesustained-release dosage form than with the 3 times daily regimen.
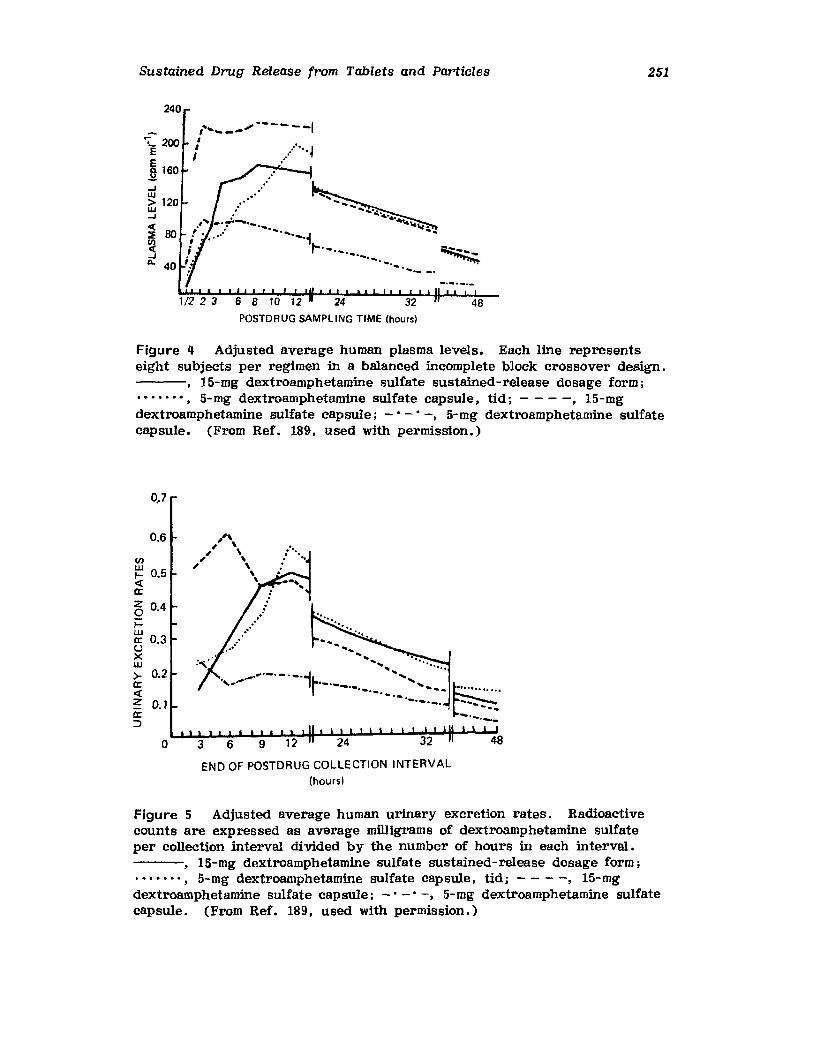
Sustained Drug Release from Tablets and Particles 251
240
•••• I........ 0.,
.. '_..-
6 8 10 12 24 32 48POSTDRUG SAMPLING TIME (hours)
.~, _.~.......-.-,. -..f ".,,0- • ... • ...·i .., ~ -·-1. ~~_; .............-~
......- _.
..JUJ> 120w..J
~80
~Q. 40
,....-._,,,,,.------1~ 200 'E 'I~ 160
Figure 4 Adjusted average human plasma levels. Each line representseight subjects per regimen in a balanced incomplete block crossover design.---, lS-mg dextroamphetamine sulfate sustained-release dosage form;.•.•••• , S-mg dextroamphetamine sulfate capsule, tid; - - - -, 15-mgdextroamphetamine sulfate capsule; -' - • -, 5-mg dextroamphetamine sulfatecapsule. (From Ref. 189, used with permission.)
0.6
Vl
~ 0.5<a:~ 0.4;::~ 0.3oxw>- 0.2a:<z 0.'a:::>
o 3 6 9 12 24 32
END OF POSTDRUG COLLECTION INTERVAL(hoursl
Figure 5 Adjusted average human urinary excretion rates. Radioactivecounts are expressed as average milligrams of dextroamphetamine sulfateper collection interval divided by the number of hours in each interval.---, lS-mg dextroamphetamine SUlfate sustained-release dosage form;.•••••• , 5-mg dextroamphetamine sulfate capsule, tid; - - - -, lS-mgdextroamphetamine sulfate capsule; -' -' -, 5-mg dextroamphetamine sulfatecapsule. (From Ref. 189, used with permission.)
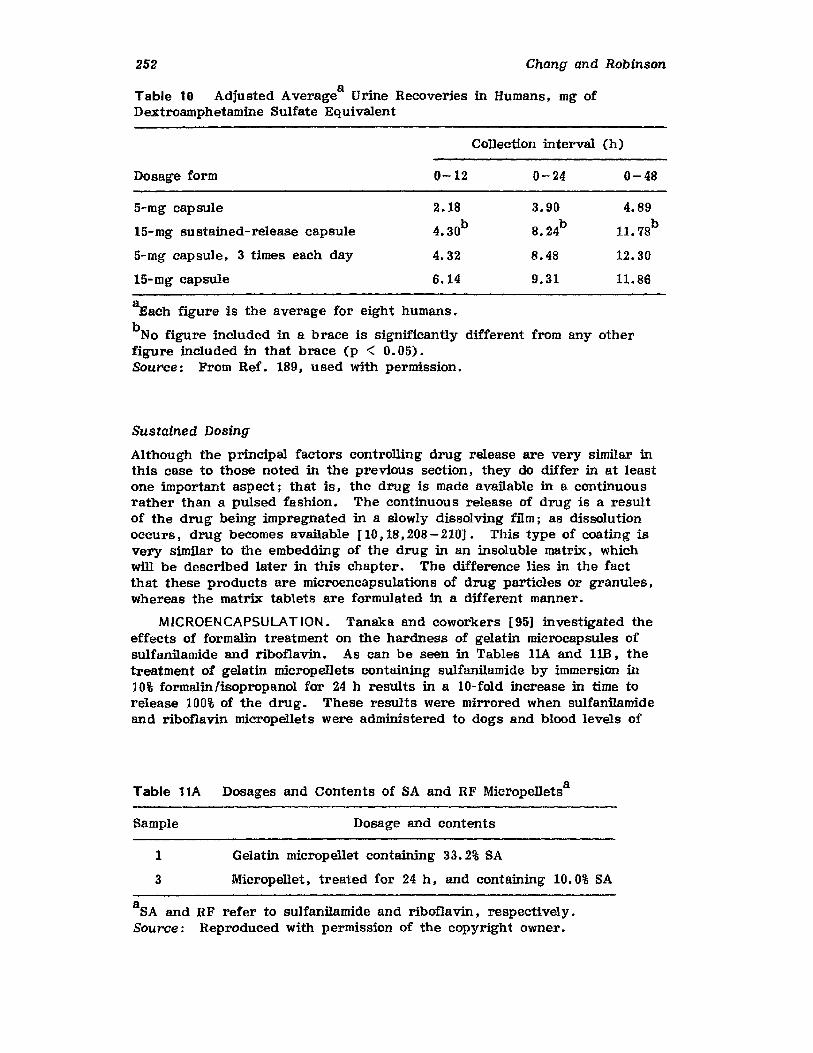
252 Chang and Robinson
Table 10 Adjusted Averagea
Urine Recoveries in Humans, mg ofDextroamphetamine Sulfate Equivalent
Collection interval (h)
Dosage form 0-12 0-24 0-48
5-mg capsule 2.18 3.90 4.89
15-mg sustained-release capsule 4.30b 8.24b11.78
b
5-mg capsule, 3 times each day 4.32 8.48 12.30
15-mg capsule 6.14 9.31 11.86
~ach figure is the average for eight humans.
b No figure included in a brace is significantly different from any otherfigure included in that brace (p < 0.05).Source: From Ref. 189, used with permission.
Sustained Dosing
Although the principal factors controlling drug release are very similar inthis case to those noted in the previous section, they do differ in at leastone important aspect; that is, the drug is made available in a continuousrather than a pulsed fashion. The continuous release of drug is a resultof the drug being impregnated in a slowly dissolving film; as dissolutionoccurs, drug becomes available [10,18,208 - 210]. This type of coating isvery similar to the embedding of the drug in an insoluble matrix, whichwill be described later in this chapter. The difference lies in the factthat these products are microencapsulations of drug particles or granules,whereas the matrix tablets are formulated in a different manner.
MICROENCAPSULATION. Tanaka and coworkers [95] investigated theeffects of formalin treatment on the hardness of gelatin microcapsules ofsulfanilamide and riboflavin. As can be seen in Tables 11A and 1ill, thetreatment of gelatin micropellets containing sulfanilamide by immersion in10% formalin/isopropanol for 24 h results in a lO-fold increase in time torelease 100% of the drug. These results were mirrored when sulfanilamideand riboflavin micropellets were administered to dogs and blood levels of
Table l1A Dosages and Contents of SA and RF Micropelletsa
Sample Dosage and contents
1 Gelatin micropellet containing 33.2% SA
3 Micropellet, treated for 24 h, and containing 10.0% SA
aSA and RF refer to sulfanilamide and riboflavin, respectively.Source: Reproduced with permission of the copyright owner.
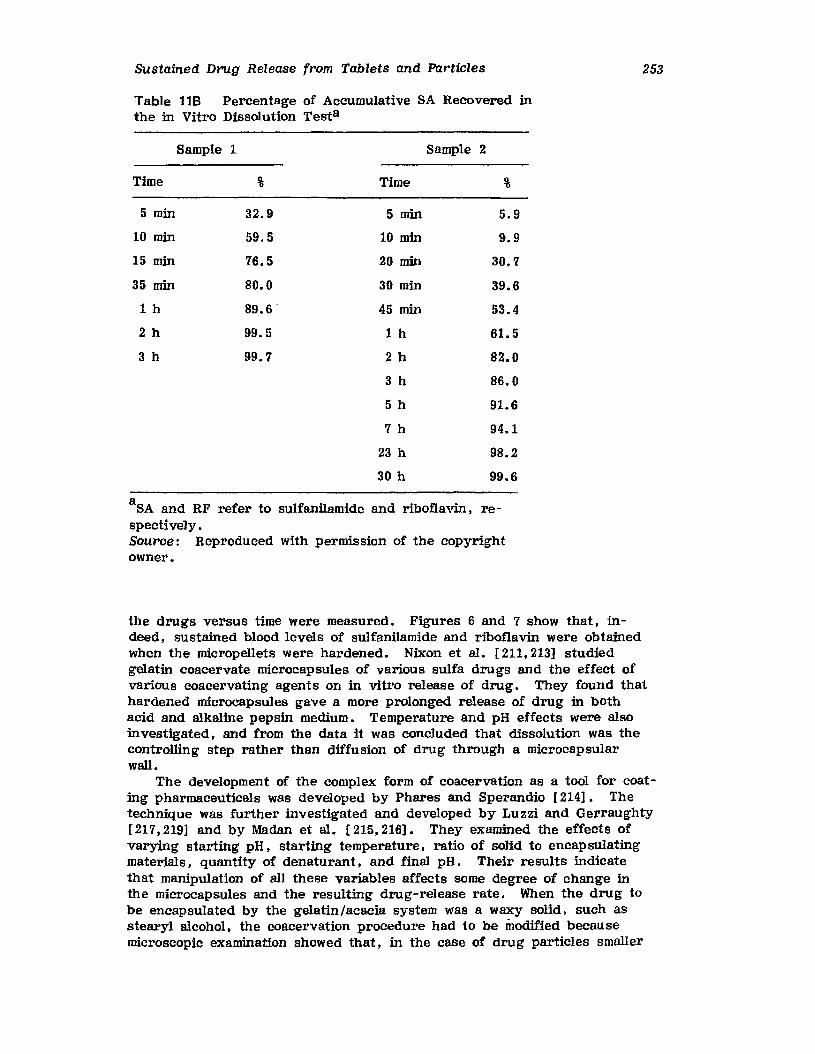
Sustained Drug Release from Tablets and Particles
Table 118 Percentage of Accumulative SA Recovered inthe in Vitro Dissolution Testa
Sample 1 Sample 2
Time % Time %
5 min 32.9 5 min 5.9
10 min 59.5 10 min 9.9
15 min 76.5 20 min 30.7
35 min 80.0 30 min 39.6
1 h 89.6· 45 min 53.4
2h 99.5 1 h 61.5
3 h 99.7 2h 82.0
3 h 86.0
5 h 91.6
7 h 94.1
23 h 98.2
30 h 99.6
aSA and RF refer to sulfanilamide and riboflavin. respectively.Source: Reproduced with permission of the copyrightowner.
253
the drugs versus time were measured. Figures 6 and 7 show that, indeed, sustained blood levels of sulfanilamide and riboflavin were obtainedwhen the micropellets were hardened. Nixon et al , [211,213] studiedgelatin coacervate microcapsules of various sulfa drugs and the effect ofvarious coacervating agents on in vitro release of drug. They found thathardened microcapsules gave a more prolonged release of drug in bothacid and alkaline pepsin medium. Temperature and pH effects were alsoinvestigated. and from the data it was concluded that dissolution was thecontrolling step rather than diffusion of drug through a microcapsularwall.
The development of the complex form of coacervation as a tool for coating pharmaceuticals was developed by Phares and Sperandio [214]. Thetechnique was further investigated and developed by Luzzi and Gerraughty[217,219] and by Madan et al, [215,216]. They examined the effects ofvarying starting pH. starting temperature, ratio of solid to encapsulatingmaterials, quantity of denaturant, and final pH. Their results indicatethat manipulation of all these variables affects some degree of change inthe microcapsules and the resulting drug-release rate. When the drug tobe encapsulated by the gelatin/acacia system was a waxy solid, such asstearyl alcohol. the coacervation procedure had to be modified becausemicroscopic examination showed that, in the case of drug particles smaller
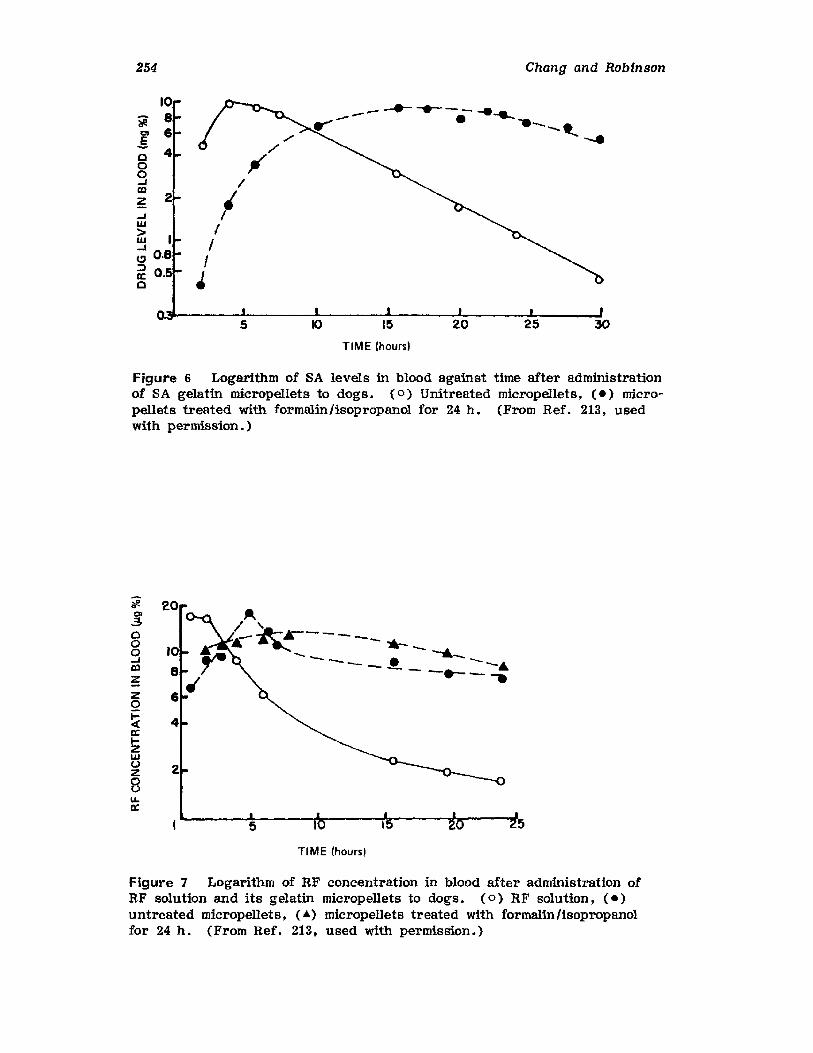
254 Chang and Robinson
--~-.--- ...........-- . ..-- .... -..~co.Eoaa-JClJ:Z
o.~---"":":----~---~---~---~--~
TIME (hours)
Figure 6 Logarithm of SA levels in blood against time after administrationof SA gelatin micropellets to dogs. (0) Unitreated micropellets, (.) micropellets treated with formalin/isopropanol for 24 h. (From Ref. 213, usedwith permission.)
"ij.
.5oo9al
~Zoi=-cex:Izwoz8
TIME (hours)
Figure 7 Logarithm of RF concentration in blood after administration ofRF solution and its gelatin micropellets to dogs. ( 0) RF solution, (.)untreated micropellets, ( ...) micropellets treated with formalin /isopropanolfor 24 h. (From Ref. 213, used with permission.)
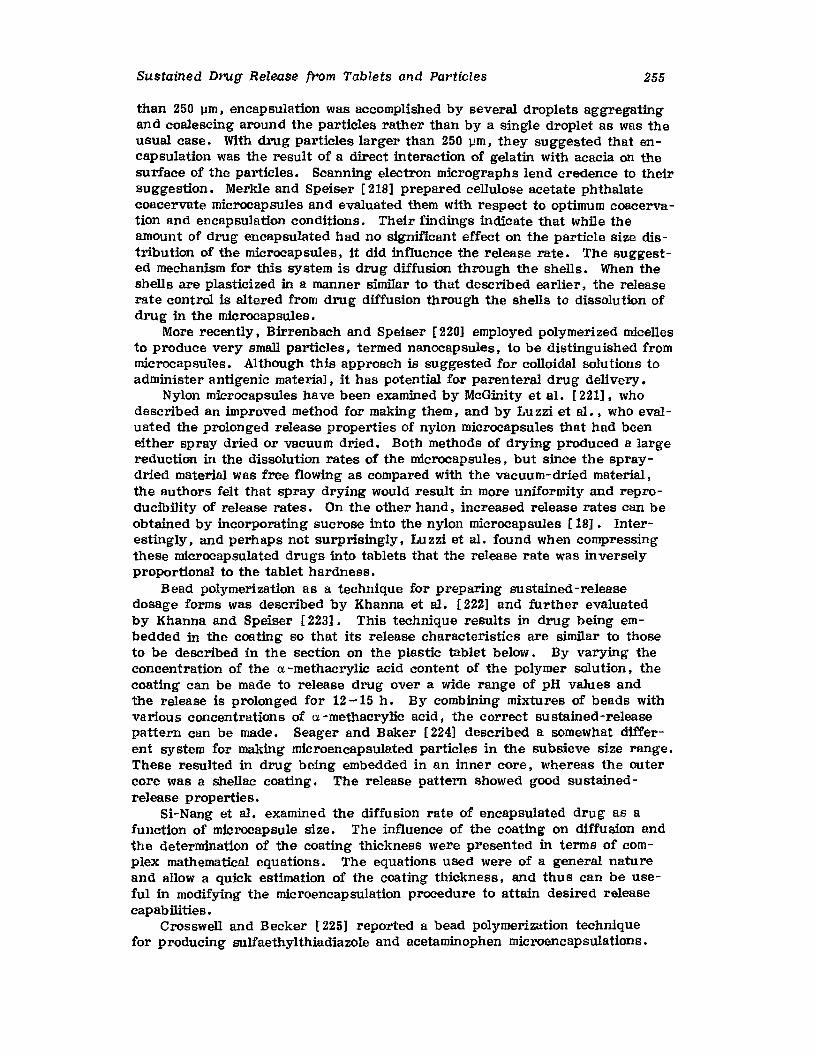
Sustained Drug Release from Tablets and Particles 255
than 250 urn, encapsulation was accomplished by several droplets aggregatingand coalescing around the particles rather than by a single droplet as was theusual case. With drug particles larger than 250 um, they suggested that encapsulation was the result of a direct interaction of gelatin with acacia on thesurface of the particles. Scanning electron micrographs lend credence to theirsuggestion. Merkle and Speiser [218] prepared cellulose acetate phthalatecoacervate microcapsules and evaluated them with respect to optimum coacervation and encapsulation conditions. Their findings indicate that while theamount of drug encapsulated had no significant effect on the particle size distribution of the microcapsules, it did influence the release rate. The suggested mechanism for this system is drug diffusion through the shells. When theshells are plasticized in a manner similar to that described earlier. the releaserate control is altered from drug diffusion through the shells to dissolution ofdrug in the microcapsules.
More recently, Birrenbach and Speiser [220] employed polymerized micellesto produce very small particles. termed nanocapsutes , to be distinguished frommicrocapsules. Although this approach is suggested for colloidal solutions toadminister antigenic material, it has potential for parenteral drug delivery.
Nylon microcapsules have been examined by McGinity et al , [221], whodescribed an improved method for making them. and by Lu zzi et al .• who evaluated the prolonged release properties of nylon microcapsules that had beeneither spray dried or vacuum dried. Both methods of drying produced a largereduction in the dissolution rates of the microcapsules, but since the spraydried material was free flowing as compared with the vacuum-dried material,the authors felt that spray drying would result in more uniformity and reproducibility of release rates. On the other hand. increased release rates can beobtained by incorporating sucrose into the nylon microcapsules [18]. Interestingly. and perhaps not surprisingly, Luzzi et al , found when compressingthesa microcapsulated drugs into tablets that the release rate was inverselyproportional to the tablet hardness.
Bead polymerization as a technique for preparing sustained -releasedosage forms was described by Khanna et al , [222] and further evaluatedby Khanna and Speiser [223]. This technique results in drug being embedded in the coating so that its release characteristics are similar to thoseto be described in the section on the plastic tablet below. By varying theconcentration of the a -methacrylic acid content of the polymer solution, thecoating can be made to release drug over a wide range of pH values andthe release is prolonged for 12-15 h. By combining mixtures of beads withvarious concentrations of a -methacrylic acid, the correct sustained-releasepattern can be made. Seager and Baker [224] described a somewhat different system for making microencapsulated particles in the subsieve size range.These resulted in drug being embedded in an inner core, whereas the outercore was a shellac coating. The release pattern showed good sustainedrelease properties.
Si-Nang et al, examined the diffusion rate of encapsulated drug as afunction of microcapsule size. The influence of the coating on diffusion andthe determination of the coating thickness were presented in terms of complex mathematical equations. The equations used were of a general natureand allow a quick estimation of the coating thickness, and thus can be useful in modifying the microencapsulation procedure to attain desired releasecapabilities.
Crosswell and Becker [225) reported a bead polymerization techniquefor producing sulfaethylthiadiazole and acetaminophen microencapsulationa.
256 Chang and Robinson
When polystyrene beads were produced in the presence of drug solution,no sustained release was evident; whereas if the beads were producedwithout drug present and allowed to expand via exposure to n-pentaneand subsequent boiling in water, and then the drug solution was allowedto seep into the deep channels produced in the expanded polystyrenebeads, the release pattern exhibited good sustaining properties.
The extensive use of polymer-drug interactions to produce sustainedrelease dosage forms was promoted by Willis and Banker [226]. The drugwas made to interact with a cross-linked copolymer such as 1, 12-dihydroxyoctadecone hemiester of poly(methylvinylether/maleic anhydride) and thesalt that was formed as a result of this exhibited good sustained-releaseproperties upon dialysis testing in artificial gastric and intestinal fluids oftablets and granules fashioned from the polymer-drug salt entities.
Banker and various coworkers [227 - 231] further studied molecularscale drug entrapment as a means of producing sustained-release dosageforms. Although the technique employed appears to be similar to beadpolymerization, it is not clear whether each drug particle was coated (entrapped) within the polymer or whether the drug was actually chemicallybonded to the polymer. For purposes of this discussion. the results aresimilar to those obtained via bead polymerization processes, so they areIncluded here. The authors prepared and tested cationic drugs such asmethapyrilene hydrochloride. chlorpromazine hydrochloride, atropine sulfate, etc; , for their amenability to the entrapment procedures. The subsequent increases in sustained-release properties Were tested andreported.
Further exploration revealed that additives SUch as organic acidscould greatly facilitate drug entrapment by increasing the degree of interaction between the drug and the polymer, and could provide more controlover the sustained-release characteristics. Other variables, such asflocculation pH, rate of agitation, use of different polymers , etc., canexert significant effects on sustained-release properties. Some of the important variables and their influences are described in Table 12.
Anionic drugs, such as sodium phenobarbital, sodium salicylate,chloral hydrate, etc; , were also entrapped via coagulated (gelled) polymeremulsion systems. These polymer-drug products were tested in a mannersimilar to that employed for the cationic drugs and the increase in andreproducibility of the sustained-release products was noted. The authorsmake special mention of the fact that their procedures result in a highlyuniform distribution of drug throughout the polymeric system and no drugsegregation, with resultant variability in blood levels of drug after dosing,was evident upon scale-up processing and blending for incorporation intosustained-release dosage forms.
All the procedures mentioned thus far in this section are at leastloosely related via their production of microencapsulated drug particlesthat employ slowly soluble films or coatings as the encapsulating material.A good portion of the literature in this area is experimental, usually resulting in statements that reflect how well these methods might be foractually producing commercial sustained-release products. As was mentioned earlier. very few products. aside from aspirin, have been actuallyformulated from these microencapsulated particles. and thus there is ascarcity of clinical evaluations in the literature. In in vitro evaluation ofsustained-release systems, one would like to have linearity in drug release versus time up to 60 -70% or more of drug content. However. it is
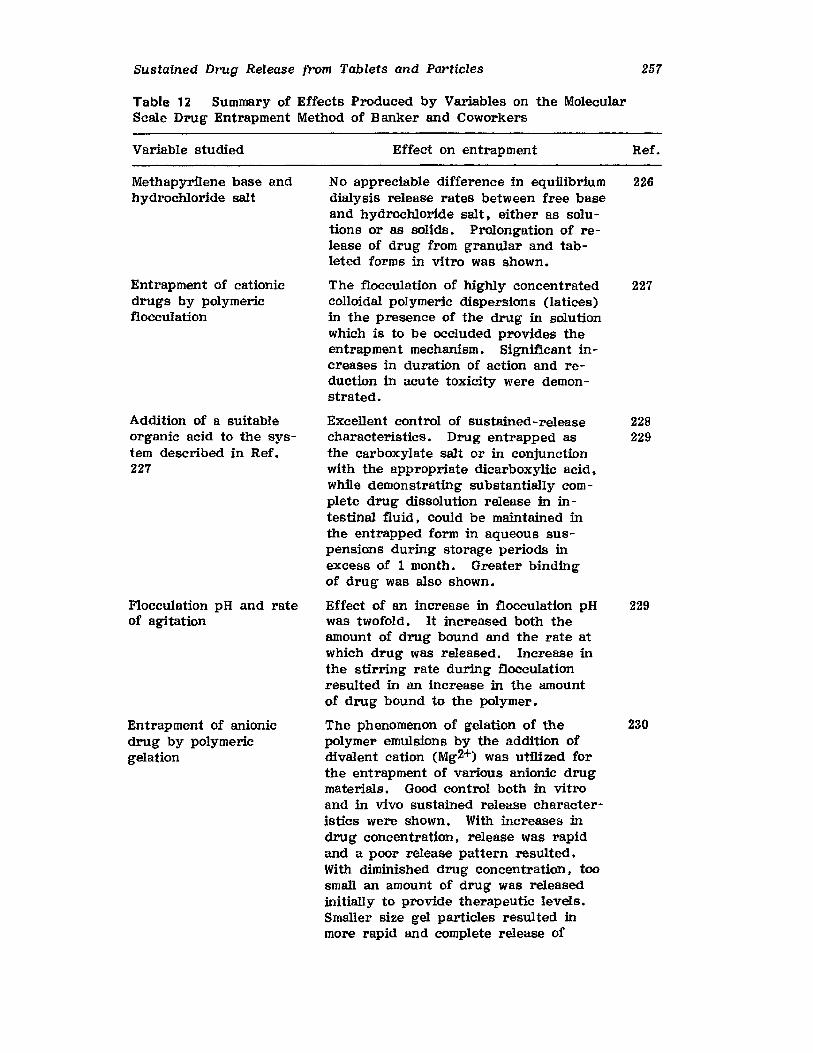
Sustained Drug Release {rom Tablets and Particles
Table 12 Summary of Effects Produced by Variables on the MolecularScale Drug Entrapment Method of Banker and Coworkers
257
Variable studied
Methapyrilene base andhydrochloride salt
Entrapment of cationicdrugs by polymericflocculation
Addition of a suitableorganic acid to the system described in Ref.227
Flocculation pH and rateof agitation
Entrapment of anionicdrug by polymericgelation
Effect on entrapment
No appreciable difference in equilibriumdialysis release rates between free baseand hydrochloride salt. either as solutions or as solids. Prolongation of release of drug from granular and tableted forms in vitro was shown.
The flocculation of highly concentratedcolloidal polymeric dispersions (latices)in the presence of the drug in solutionwhich is to be occluded provides theentrapment mechanism. Significant increases in duration of action and reduction in acute toxicity were demonstrated.
Excellent control of sustained-releasecharacteristics. Drug entrapped asthe carboxylate salt or in conjunctionwith the appropriate dicarboxylic acid.while demonstrating SUbstantially complete drug dissolution release in intestinal fluid. could be maintained inthe entrapped form in aqueous suspensions during storage periods inexcess of 1 month. Greater bindingof drug was also shown.
Effect of an increase in flocculation pHwas twofold. It increased both theamount of drug bound and the rate atwhich drug was released. Increase inthe stirring rate during flocculationresulted in an increase in the amountof drug bound to the polymer.
The phenomenon of gelation of thepolymer emulsions by the addition ofdivalent cation (Mg2+) was utilized forthe entrapment of various anionic drugmaterials. Good control both in vitroand in vivo sustained release characteristics were shown. With increases indrug concentration. release was rapidand a poor release pattern resulted.With diminished drug concentration. toosmall an amount of drug was releasedinitially to provide therapeutic levels.Smaller size gel particles resulted inmore rapid and complete release of
Ref.
226
227
228229
229
230
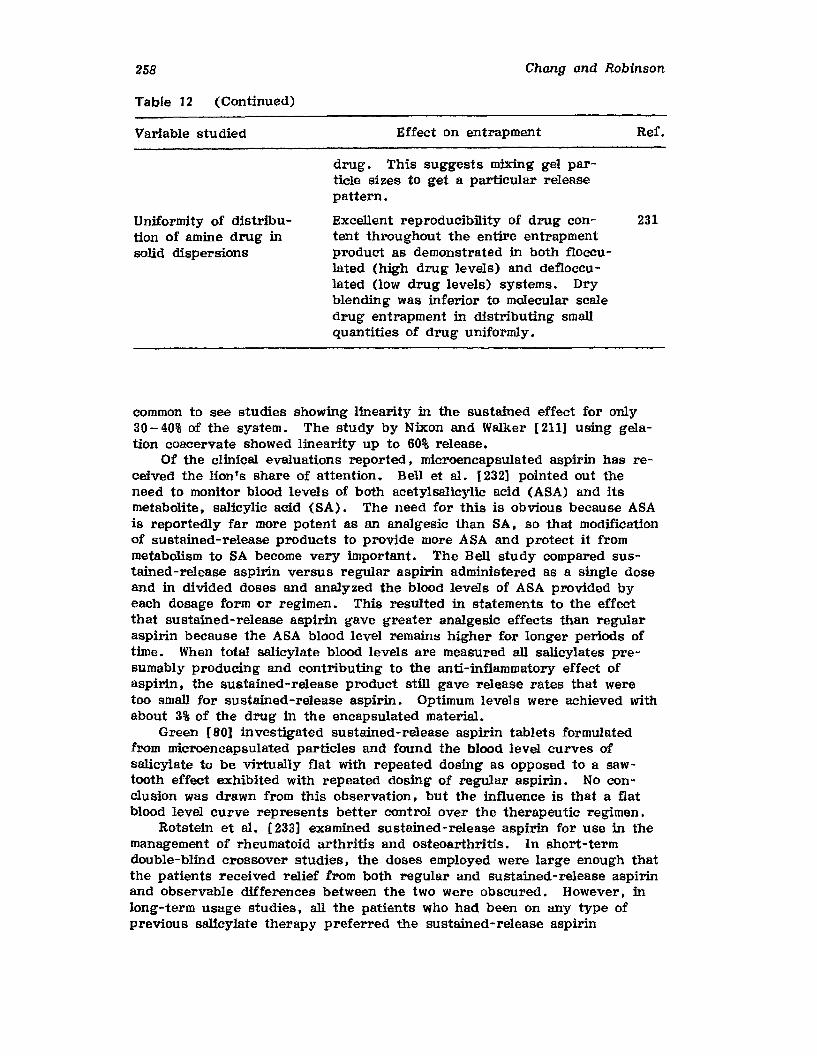
258
Table 12 (Continued)
Chang and Robinson
Variable studied
Uniformity of dlstrdbution of amine drug insolid dispersions
Effect on entrapment
drug. This suggests mixing gel particle sizes to get a particular releasepattern.
Excellent reproducibility of drug content throughout the entire entrapmentproduct as demonstrated in both flocculated (high drug levels) and deflocculated (low drug levels) systems. Dryblending was inferior to molecular scaledrug entrapment in distributing smallquantities of drug uniformly.
Ref.
231
common to see studies showing linearity in the sustained effect for only30-40% of the system. The study by Nixon and Walker [211] using gelation coacervate showed linearity up to 60% release.
Of the clinical evaluations reported, microencapsulated aspirin has received the lion's share of attention. Bell et al , [232] pointed out theneed to monitor blood levels of both acetylsalicylic acid (ASA) and itsmetabolite. salicylic acid (SA). The need for this is obvious because ASAis reportedly far more potent as an analgesic than SA, so that modificationof sustained-release products to provide more ASA and protect it frommetabolism to SA become very important. The Bell study compared sustained -release aspirin versus regular aspirin administered as a single doseand in divided doses and analyzed the blood levels of ASA provided byeach dosage form or regimen. This resulted in statements to the effectthat sustained-release aspirin gave greater analgesic effects than regularaspirin because the ASA blood level remains higher for longer periods oftime. When total salicylate blood levels are measured all salicylates presumably producing and contributing to the anti-inflammatory effect ofaspirin, the sustained-release product still gave release rates that weretoo small for sustained-release aspirin. Optimum levels were achieved withabout 3% of the drug in the encapsulated material.
Green [80] investigated sustained-release aspirin tablets formulatedfrom microencapsulated particles and found the blood level curves ofsalicylate to be virtually flat with repeated dosing as opposed to a sawtooth effect exhibited with repeated dosing of regular aspirin. No conclusion was drawn from this observation, but the influence is that a flatblood level curve represents better control over the therapeutic regimen.
Rotstein et al, [233] examined sustained-release aspirin for use in themanagement of rheumatoid arthritis and osteoarthritis. In short-termdouble-blind crossover studies, the doses employed were large enough thatthe patients received relief from both regular and sustained-release aspirinand observable differences between the two were obscured. However, inlong-term usage studies, all the patients who had been on any type ofprevious salicylate therapy preferred the sustained-release aspirin
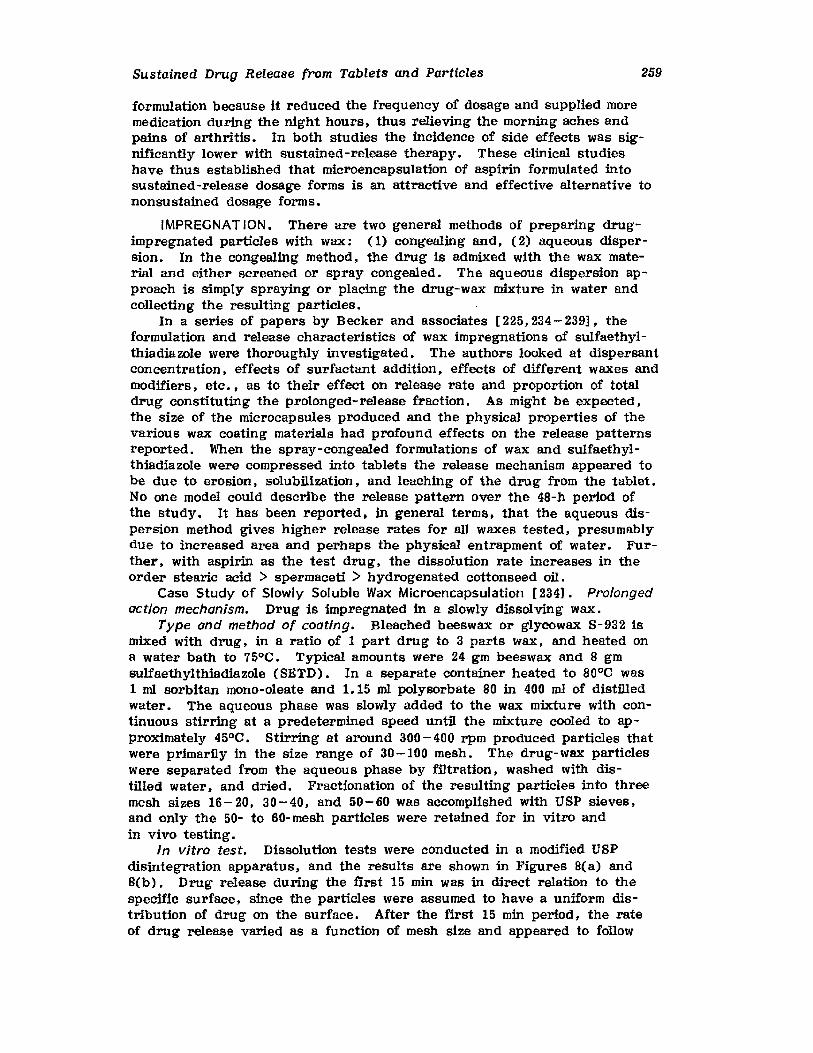
Sustained Drug Release from Tablets and Particles 259
formulation because it reduced the frequency of dosage and supplied moremedication during the night hours, thus relieving the morning aches andpains of arthritis. In both studies the incidence of side effects was significantly lower with sustained-release therapy. These clinical studieshave thus established that microencapsulation of aspirin formulated intosustained-release dosage forms is an attractive and effective alternative tononsustained dosage forms.
IMPREGNATION. There are two general methods of preparing drugimpregnated particles with wax: (1) congealing and, (2) aqueous dispersion. In the congealing method, the drug is admixed with the wax material and either screened or spray congealed. The aqueous dispersion approach is simply spraying or placing the drug-wax mixture in water andcollecting the resulting particles.
In a series of papers by Becker and associates [225,234 - 239], theformulation and release characteristics of wax impregnations of sulfaethylthiadiazole were thoroughly investigated. The authors looked at dispersantconcentration, effects of surfactant addition, effects of different waxes andmodifiers, etc., as to their effect on release rate and proportion of totaldrug constituting the prolonged-release fraction. As might be expected.the size of the microcapsules produced and the physical properties of thevarious wax coating materials had profound effects on the release patternsreported. When the spray-congealed formulations of wax and sulfaethylthiadiazole were compressed into tablets the release mechanism appeared tobe due to erosion, solubilization, and leaching of the drug from the tablet.Noone model could describe the release pattern over the 48-h period ofthe study. It has been reported, in general terms, that the aqueous dispersion method gives higher release rates for all waxes tested, presumablydue to increased area and perhaps the physical entrapment of water. Further, with aspirin as the test drug, the dissolution rate increases in theorder stearic acid > spermaceti > hydrogenated cottonseed oil.
Case Study of Slowly Soluble Wax Microencapsulation [234]. Prolongedaction mechanism. Drug is impregnated in a slowly dissolving wax.
Type and method of coating. Bleached beeswax or glycowax S-932 ismixed with drug, in a ratio of 1 part drug to 3 parts wax. and heated ona water bath to 75QC. Typical amounts were 24 gm beeswax and 8 gmsulfaethylthiadiazole (SETD). In a separate container heated to 80°C was1 ml sorbitan mono-oleate and 1. 15 ml polysorbate 80 in 400 ml of distilledwater. The aqueous phase was slowly added to the wax mixture with continuous stirring at a predetermined speed until the mixture cooled to approximately 45QC. Stirring at around 300 - 400 rpm produced particles thatwere primarily in the size range of 30-100 mesh. The drug-wax particleswere separated from the aqueous phase by filtration, washed with distilled water, and dried. Fractionation of the resulting particles into threemesh sizes 16-20, 30-40, and 50-60 was accomplished with USP sieves,and only the 50- to 60-mesh particles were retained for in vitro andin vivo testing.
In vitro test. Dissolution tests were conducted in a modified USPdisintegration apparatus, and the results are shown in Figures 8(a) and8(b). Drug release during the first 15 min was in direct relation to thespecific surface, since the particles were assumed to have a uniform distribution of drug on the surface. After the first 15 min period, the rateof drug release varied as a function of mesh size and appeared to follow
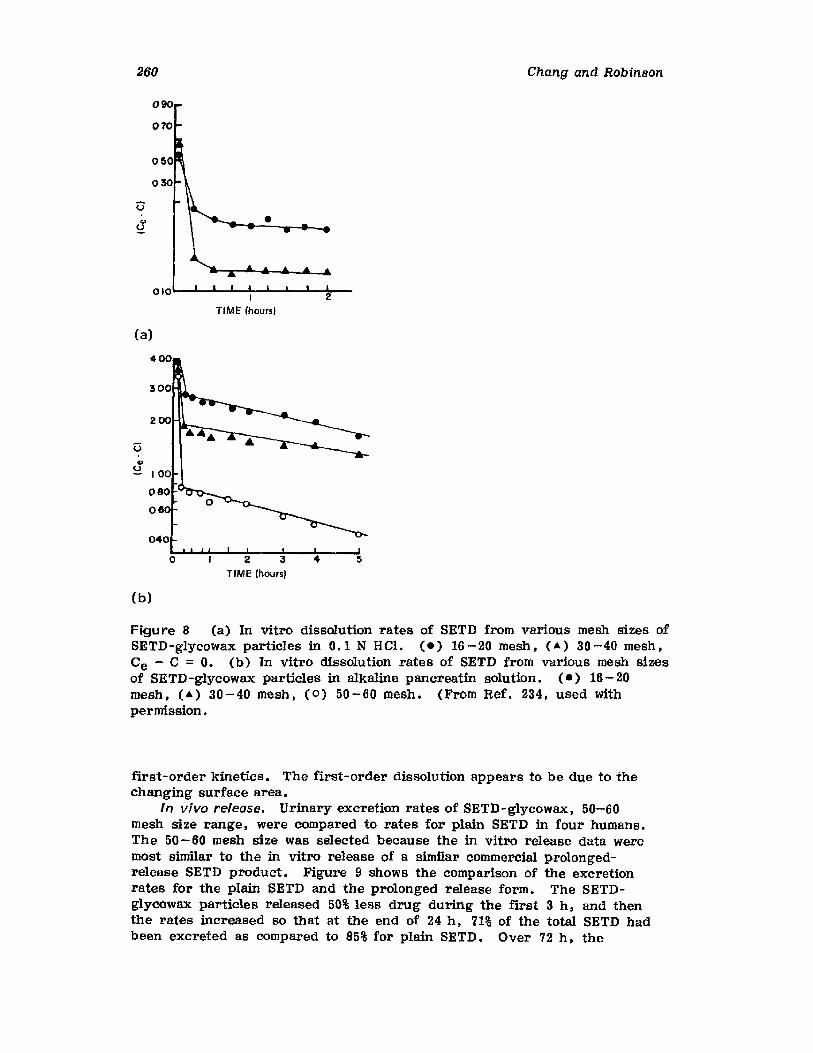
260
e
Chang and Robinson
(a)
400
I
TIME (hours)2
o
(b)
2 3TIME (hours)
4
Figure 8 (a) In vitro dissolution rates of SETD from various mesh sizes ofSETD-glycowax particles in 0.1 N HCI. (e) 16-20 mesh, (A) 30-40 mesh,Ce - C = O. (b) In vitro dissolution rates of SETD from various mesh sizesof SETD-glycowax particles in alkaline pancreatin solution. (.) 16- 20mesh, (A) 30-40 mesh, (0) 50-60 mesh. (From Ref. 234, used withpermission.
first-order kinetics. The first-order dissolution appears to be due to thechanging surface area.
In vivo release. Urinary excretion rates of SETD-glycowax, 50-60mesh size range, were compared to rates for plain SETD in four humans.The 50-60 mesh size was selected because the in vitro release data weremost similar to the in vitro release of a similar commercial prolongedrelease SETD product. Figure 9 shows the comparison of the excretionrates for the plain SETD and the prolonged release form. The SETDglycowax particles released 50% less drug during the first 3 h , and thenthe rates increased so that at the end of 24 h , 71% of the total SETD hadbeen excreted as compared to 85% for plain SETD. Over 72 h, the
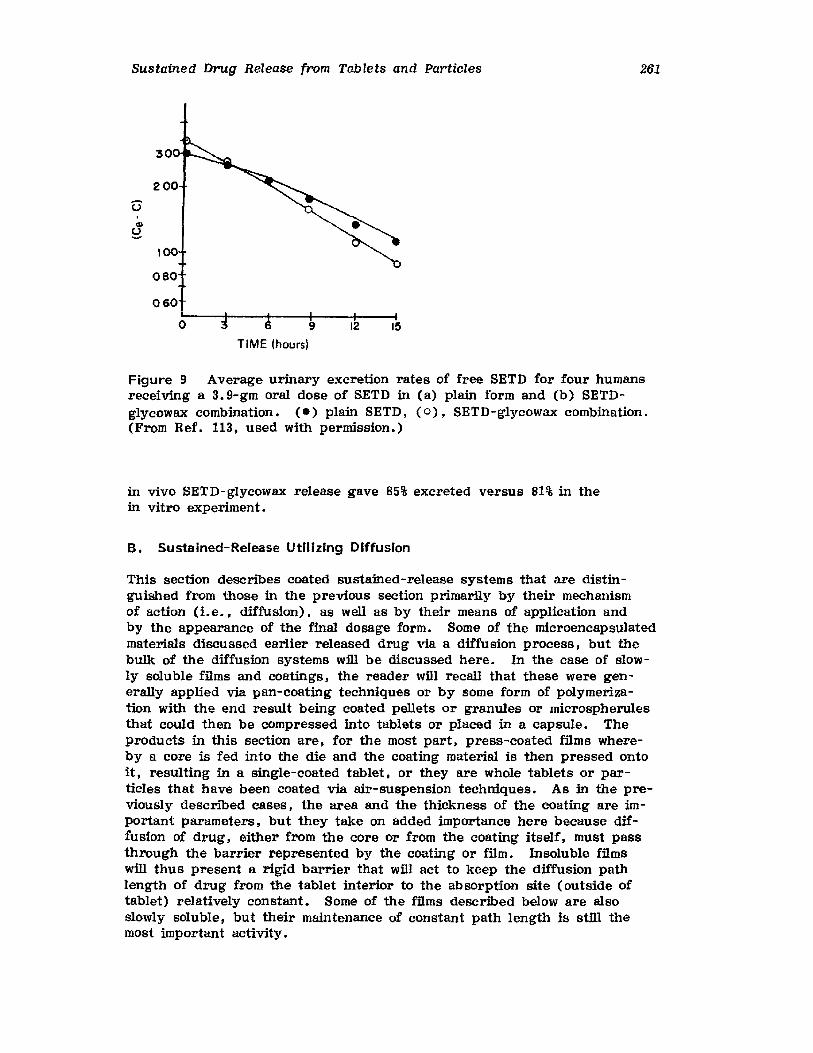
Sustained Drug Release from Tablets and Particles
080
060
261
oTIME (hours)
12 15
Figure 9 Average urinary excretion rates of free SETD for four humansreceiving a 3.9-gm oral dose of SETD in (a) plain form and (b) SETDglycowax combination. (e) plain SETD, (0), SETD-glycowax combination.(From Ref. 113, used with permission.)
in vivo SETD-glycowax release gave 85% excreted versus 81% in thein vitro experiment.
B. Sustained-Release Utilizing Diffusion
This section describes coated sustained-release systems that are distinguished from those in the previous section primarily by their mechanismof action (i.e., diffusion). as well as by their means of application andby the appearance of the final dosage form. Some of the microencapsulatedmaterials discussed earlier released drug via a diffusion process, but thebulk of the diffusion systems will be discussed here. In the case of slowly soluble films and coatings, the reader will recall that these were generally applied via pan-coating techniques or by some form of polymerization with the end result being coated pellets or granules or microspherulesthat could then be compressed into tablets or placed in a capsule. Theproducts in this section are, for the most part, press-coated films whereby a core is fed into the die and the coating material is then pressed ontoit. resulting in a single-coated tablet. or they are whole tablets or particles that have been coated via air-suspension techniques. As in the previously described cases, the area and the thickness of the coating are important parameters. but they take on added importance here because diffusion of drug, either from the core or from the coating itself, must passthrough the barrier represented by the coating Or film. Insoluble ffimswill thus present a rigid barrier that will act to keep the diffusion pathlength of drug from the tablet interior to the absorption site (outside oftablet) relatively constant. Some of the ffims deserdbed below are alsoslowly soluble, but their maintenance of constant path length is still themost important activity.
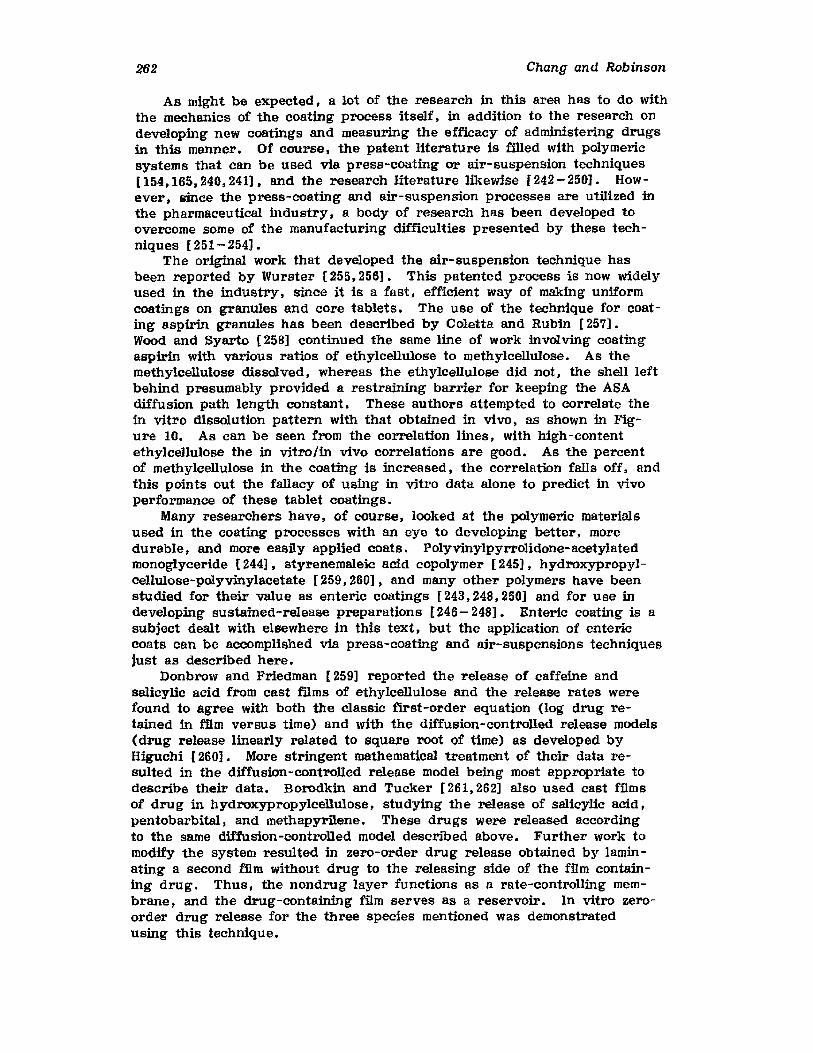
262 Chang and Robinson
As might be expected, a lot of the research in this area has to do withthe mechanics of the coating process itself, in addition to the research ondeveloping new coatings and measuring the efficacy of administering drugsin this manner. Of course, the patent literature is filled with polymericsystems that can be used via press-coating or air-suspension techniques[ 154,165, 240, 241]. and the research literature likewise [242 - 250] • However, since the press-coating and air-suspension processes are utilized inthe pharmaceutical industry, a body of research has been developed toovercome some of the manufacturing difficulties presented by these techniques [251- 254] •
The original work that developed the air-suspension technique hasbeen reported by Wurster [255,256]. This patented process is now widelyused in the industry, since it is a fast. efficient way of making uniformcoatings on granules and core tablets. The use of the technique for coating aspirin granules has been described by Coletta and Rubin [257].Wood and Syarto [258] continued the same line of work involving coatingaspirin with various ratios of ethylcellulose to methylcellulose. As themethylcellulose dissolved, whereas the ethylcellulose did not, the shell leftbehind presumably provided a restraining barrier for keeping the ASAdiffusion path length constant. These authors attempted to correlate thein vitro dissolution pattern with that obtained in vivo, as shown in Figure 10. As can be seen from the correlation lines, with high-contentethylcellulose the in vitro/in vivo correlations are good. As the percentof methylcellulose in the coating is increased, the correlation falls off, andthis points out the fallacy of using in vitro data alone to predict in vivoperformance of these tablet coatings.
Many researchers have, of course, looked at the polymeric materialsused in the coating processes with an eye to developing better, moredurable, and more easily applied coats. Polyvinylpyrrolidone-acetylatedmonoglyceride [244], styrenemaleic acid copolymer [245], hydroxypropylcellulose-polyvinylacetate [259, 260], and many other polymers have beenstudied for their value as enteric coatings [243, 248, 250] and for use indeveloping sustained-release preparations [246 - 248] • Enteric coating is aSUbject dealt with elsewhere in this text, but the application of entericcoats can be accomplished via press-coating and air-suspensions techniquesjust as described here.
Donbrow and Friedman [259] reported the release of caffeine andsalicylic acid from cast films of ethylcellulose and the release rates werefound to agree with both the classic first-order equation (log drug retained in ffim versus time) and with the diffusion-controlled release models(drug release linearly related to square root of time) as developed byHiguchi [260]. More stringent mathematical treatment of their data resulted in the diffusion-controlled release model being most appropriate todescribe their data. Borodkin and Tucker [261,262] also used cast fflmsof drug in hydroxypropylcellu!ose, studying the release of salicylic acid,pentobarbital. and methapyrfiene. These drugs were released accordingto the same diffusion-controlled model described above. Further work tomodify the system resulted in zero-order drug release obtained by laminating a second mm without drug to the releasing side of the film containing drug. Thus, the nondrug layer functions as a rate-controlling membrane, and the drug-containing film serves as a reservoir. In vitro zeroorder drug release for the three species mentioned was demonstratedusing this technique.
Sustained Drug Release from Tablets and Particles
3.0
2.5
/
263
Ii;wI-oa:!::>~
>toW:Et=
/,/
TIME IN VIVO [hours)
8 10 12
Composition and Characteristics of Test Delayed-Release Aspirin ProductsUsed in This Study
Code
1348 134C 152 138
Ratio ethyl to methylcellulose 75/25 25/75 82.5/17.5 10010
Aspirin mesh size -20 -40 -20+40 -20+40
Amount of coating (wt %) 2.7% 4.8% 6% 6%
Tablet disintegration time (sec) 40-60 25-35 3 3
Aspirin content 5 gr 5 gr 5 gr 5 gr
Cornstarch 0.87 gr 0.90 gr 0.96 gr 0.96 gr
Talc 0.13 gr 0.13 gr
Figure 10 Correlation between in vivo absorption and in vitro releaserates for corresponding fractions of total salicylate considered. (.) 152.(.) 138, ( ... ) 134C. (0) 134B. (From Ref. 258. used with permission.)
264 Chang and Robinson
Since the technique described in this section can be used to coat coretablets or granules, it is conceivable that many of the clinical studies described earlier could be applicable in this case. However, a very goodclinical study of the Sinusule sustained-release dosage form has been descrfbed [263]. This product is somewhat different from the others examined thus far in that the film applied to the granules actually functionsas a microdialysis membrane. Thus, one need not worry about the acidityof the gut, the digestive process, nor the contents of the gut. The onlyrequirement is that there be fluid in the gut. The fluid, primarily water,passes through the dialysis membrane into the sphere and dissolves thegranule of drug. This drug then diffuses through the intact membrane ata rate proportional to the permeability of the membrane, the mobility ofthe drug molecule, and the concentration of the drug within the hydratedmicrodialysis cell. When this product was tested in patients having hayfever. upper respiratory infection, and miscellaneous respiratory allergies.good to excellent results with a' minimum of side effects were reported fora large majority of the test population, This novel sustained-releasedosage form is not marketed anymore.
Case Study of DuffusiDn-Controlled Coating [261]
PROLONGED ACTION MECHANISM. Drugs are dispersed in a watersoluble polymeric coating which. when SUbjected to an aqueous environment,allows slow diffusion of drug into the leaching fluid.
TYPE AND METHOD OF FILM FORMATION. Hydroxypropylcellulose,average molecular weight of 100,000, having viscosity 75-150 cps as a 5%water solution, and polyvinylacetate, average molecular weight 500,000,having viscosity 90 -110 cps as an 8.6% benzene solution. were used.Drugs were pentobarbital, salicylic acid, and methapyrilene. The films werecast from a solution containing 10% solids (drug plus polymer), usingmethylene chloride/methanol mixture (9:1) as the solvent. The polymerswere added as dry powders, as was salicylic acid, While the pentobarbitaland methapyrilene were added from stock methylene chloride solutions.Films were cast from the solutions at various wet thicknesses (0.64- 2. 54mm) using a knife on Teflon-coated plate glass. The films were allowed toair dry at least 48 h before evaluation. The percent drug in the dry filmwas calculated from the ratio of drug and polymer weights used.
MECHANISM OF DRUG RELEASE. Release of drug from a matrix canbe either via a first-order process or via a diffusion-controlled process.Which release is operative can be ascertained by appropriate data treatment. First-order release would be a linear plot follOWing the normalfirst-order equations, whereas a diffusion-controlled process should resultin an S-shaped curve following the equation
Q =In£. (2A - E C ) C tT S S
where Q =amount of drug released per unit area of tablet exposed tosolvent
D = diffusion coefficient of drug in the permeating fluid
E =porosity of the matrix
(13)
Sustained Drug Release from Tablets and Particles
T :::: tortuosity of the matrix
A :::: concentration of solid drug in the matrix
C :::: solubility of drug in the dissolution mediumst =time
The above equation is more commonly expressed as
265
(14)Q = k t 1/ 2H
where kH:::: ED[(2A - Cs)C s]1/2 for plotting purposes.
IN VITRO TEST. Rectangular films measuring 2.2 x 4.0 em (8.8 cm2)
were cut using a razor blade with a microscope cover glass as a template.The film was weighed and its thickness was measured at all four cornersand the center with a micrometer. A thin coating of high-vacuum siliconelubricant was applied to a 2.54 x 7.62 crn microscope slide and the filmwas pressed into the slide, making sure that all edges adhered and nolubricant touched the exposed surface. The slide was placed at an angleinto a 250-ml beaker in a 37°C-water bath containing 200 m1 of pH 7 buffer preheated to 37°C. A nonagitated system was used to eliminate turbulence effect on release rate and to maintain film integrity. Periodicassay samples (:tl0 min-I) were obtained by removing the slide, stirringthe solution, and pipetting a 5-ml sample, and then reimmersing the slidewith film into the buffer solution. Beakers were covered throughout thelength of the runs (7 h at least and 31 h in the extreme for slow-releasingfilms) to prevent evaporation. The samples were assayed by ultraviolet(UV) spectrophotometry at 240 nm for pentobarbitsl in 0.1 N NH40H, at312 nm for methapyrilene in 0.1 N Hel, and at 297 nm for salicylic acid inO.1NNaOH.
Table 13 shows the results of comparing the drug release to firstorder and square root of time equations. When these data were evaluatedto determine which equation gave best fit, the correlation coefficients forthe best statisticsl lines and the lag times (time intercept extrapolated toQ = 0) were used as the principal criteria. Although the corrslation coefficients looked good for either mechanism, when these types of data areplotted out, as is shown in Figure 11, the curvature in the first-ordermechanism was evident. This indicated that the Q versus t 1/ 2 relationmore readily described the mechanism. Correlation coefficients were generally greater than 0.995 for this type of plotting and deviations, whenthey occurred, were random rather than the result of curvature. Linearityin release held through 75-80% of drug release when a constant concentration gradient was operative.
The effect of film thickness on the rate of dru g release for pentobarbital is shown in Table 14. These results indicate that the releaserate constant, kH, is independent of film thickness. However, filmthickness wID affect the duration of drug release, as is shown in the lastcolumn where t1/2 represents the time, in minutes, for 50% of the drug ineach particular film to be released.
Tables 15-17 show the effects of varying polymer ratio on the releaserate, kH, for the drugs methapyrilene, salicylic acid, and pentobarbital,respectively. In general, an acceleration of release rate can be obtained
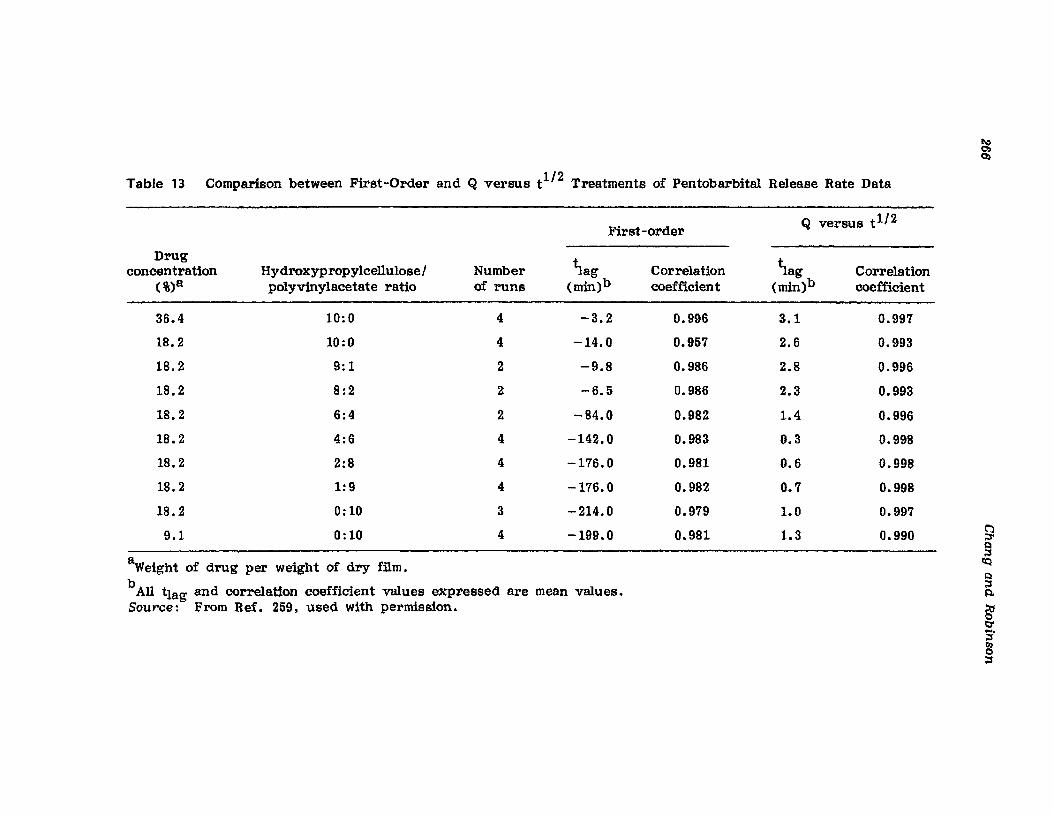
Table 13 Comparison between First-Order and Q Versus t 1/ 2 Treatments of Pentobarbital Release Rate Data
First-orderQ versus t 1/2
Drug1ag 1agconcentration Hydroxypropylcel1ulosel Number Correlation Correlation
(%)8 polyvinylacetate ratio of runs (min)b coefficient {min)b coefficient
36.4 10:0 4 -3.2 0.996 3.1 0.997
18.2 10:0 4 -14.0 0.957 2.6 0.993
18.2 9:1 2 -9.8 0.986 2.8 0.996
18.2 8:2 2 -6.5 0.986 2.3 0.993
18.2 6:4 2 -84.0 0.982 1.4 0.996
18.2 4:6 4 -142.0 0.983 0.3 0.998
18.2 2:8 4 -176.0 0.981 0.6 0.998
18.2 1:9 4 -176.0 0.982 0.7 0.998
18.2 0:10 3 -214.0 0.979 1.0 0.997
9.1 0:10 4 -199.0 0.981 1.3 0.990
aWeight of drug per weight of dry film.b
All tIag and correlation coefficient values expressed are mean values.Source: From Ref. 259, used with permission.
~OJ
9Q;::J
tQ
Q;::J~
~S'~;::J
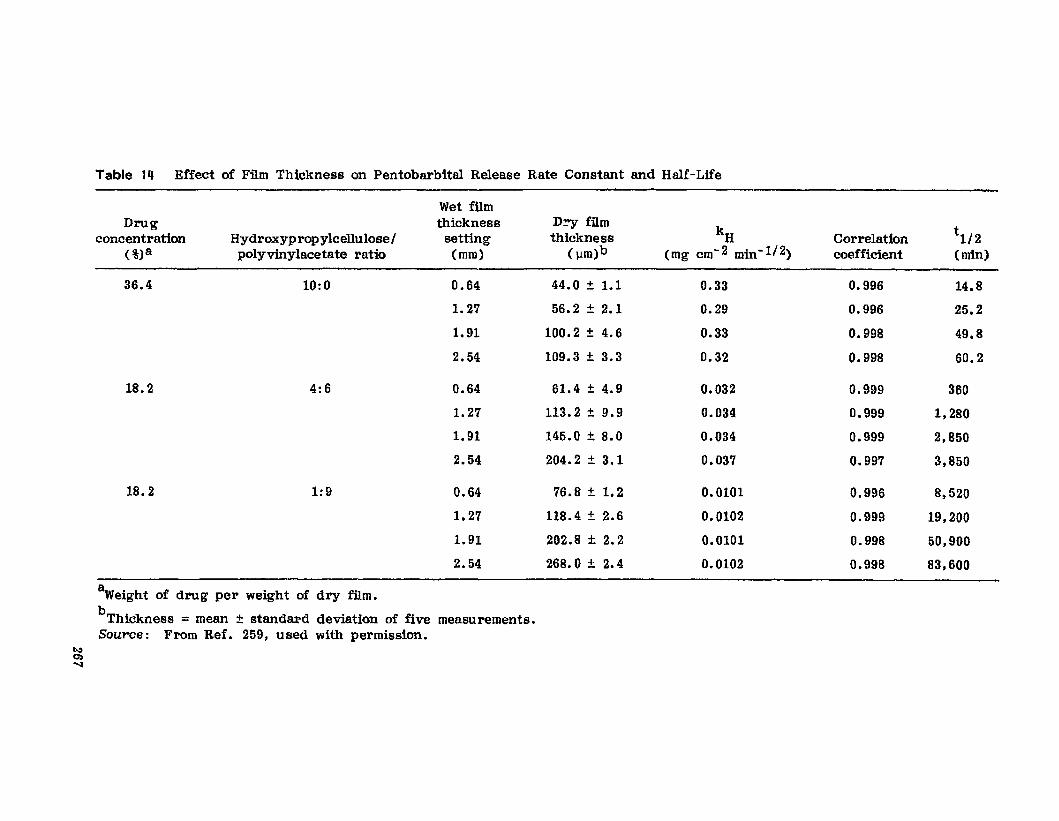
Table 111 Effect of Film Thickness on Pentobarbital Release Rate Constant and Half-Life
Wet fUmDrug thickness Dry film
k H t 1/ 2concentration Hydroxypropylcel1ulose/ setting thickness Correlation(%)a polyvinylacetate ratio (mm) (J..lm)b (mg cm- 2 min- 1/ 2) coefficient (min)
36.4 10:0 0.64 44.0 ± 1.1 0.33 0.996 14.8
1.27 56.2 ± 2.1 0.29 0.996 25.2
1. 91 100.2 ± 4.6 0.33 0.998 49.8
2.54 109.3 ± 3.3 0.32 0.998 60.2
18.2 4~6 0.64 61.4 ± 4.9 0.032 0.999 360
1. 27 113.2 ± 9.9 0.034 0.999 1,280
1.91 145.0 ± 8.0 0.034 0.999 2,850
2.54 204.2 ± 3.1 0.037 0.997 3,850
18.2 1:9 0.64 76.8 ± 1. 2 0.0101 0.996 8,520
1.27 118.4 ± 2.6 0.0102 0.999 19.200
1.91 202.8 ± 2.2 0.0101 0.998 50.900
2.54 268.0 ± 2.4 0.0102 0.998 83,600
~eight of drug per weight of dry film.
bThickness = mean :t standard deviation of five measurements.Source: From Ref. 259, used with permission.
t\)0)~
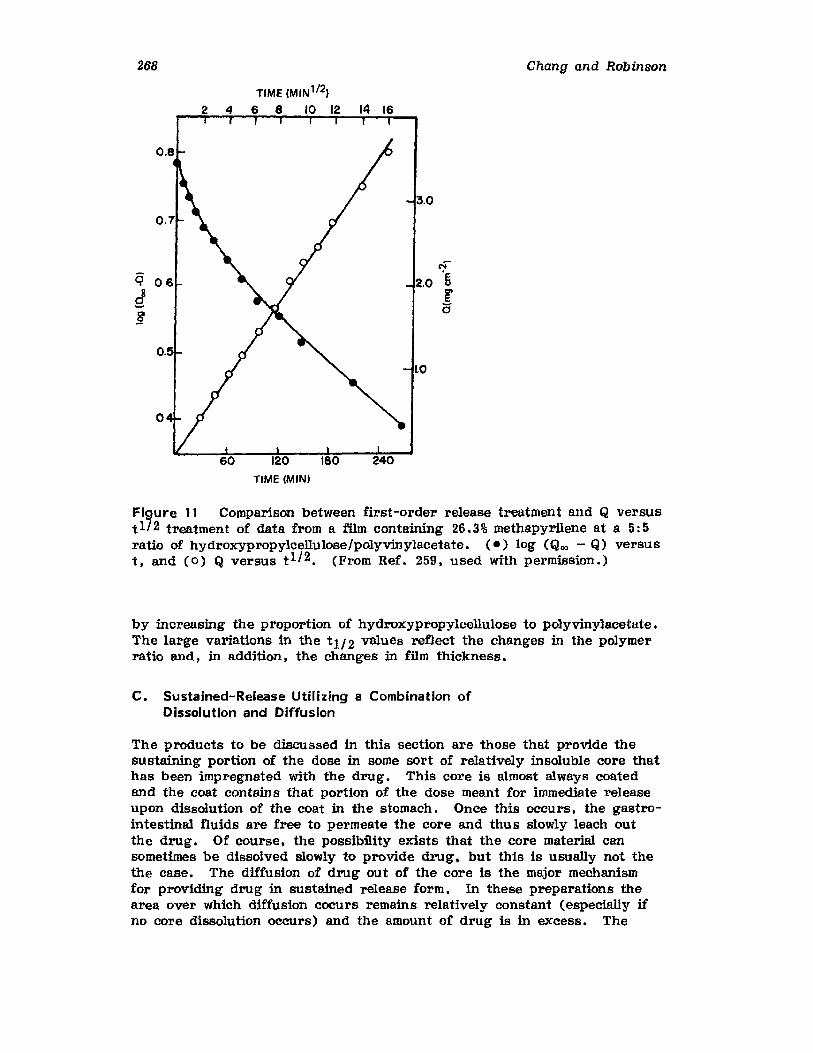
268 Chang and Robinson
Figure 11 Comparison between first-order release treatment and Q versust1/2 treatment of data from a film containing 26.3% methapyrilene at a 5:5ratio of hydroxypropylcellulose/polyvinylacetate. (e) log (QCQ - Q) versust , and (0) Q versus t 1/ 2. (From Ref. 259, used with permission.)
by increasing the proportion of hydroxypropylcellulose to polyvinylacetate.The large variations in the t 1/ 2 values reflect the changes in the polymerratio and, in addition, the changes in film thickness.
c. Sustained-Release Utilizing a Combination ofDissolution and Diffusion
The products to be discussed in this section are those that provide thesustaining portion of the dose in some sort of relatively insoluble core thathas been impregnated with the drug. This core is almost always coatedand the coat contains that portion of the dose meant for immediate releaseupon dissolution of the coat in the stomach. Once this occurs, the gastrointestinal fluids are free to permeate the core and thus slowly leach outthe drug. Of course, the possibility exists that the core material cansometimes be dissolved slowly to provide drug, but this is usually not thethe case. The diffusion of drug out of the core is the major mechanismfor providing drug in sustained release form. In these preparations thearea over which diffusion cocurs remains relatively constant (especially ifno core dissolution occurs) and the amount of drug is in excess. The
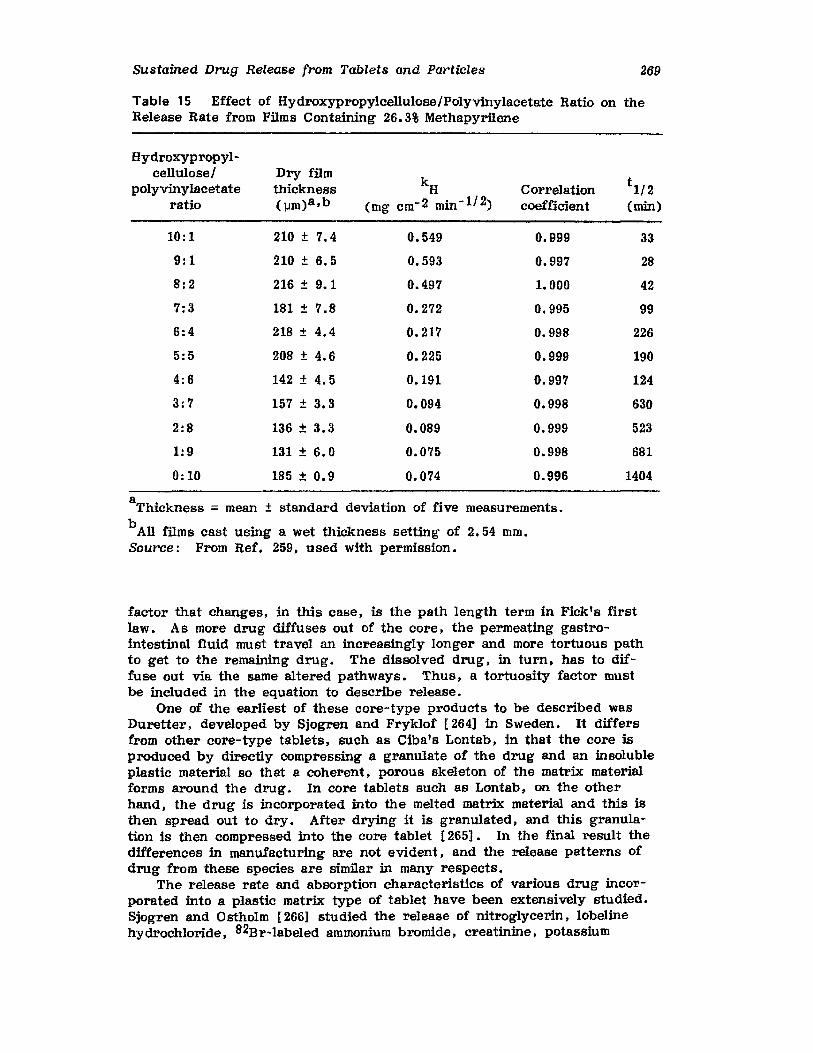
Sustained Drug Release from Tablets and Particles 269
Table lS Effect of Hydroxypropylcellulose/Polyvinylacetate Ratio on theRelease Rate from Films Containing 26.3% Methapyrilene
Hydroxypropyl-celluloseI Dry film
kH t 1/ 2polyvinylacetate thickness Correlation
ratio (llm)a, b (mg cm- 2 min- 1/ 2) coefficient (min)
10:1 210 ± 7.4 0.549 0.999 33
9:1 210 ± 6.5 0.593 0.997 28
8:2 216 ± 9.1 0.497 1.000 42
7:3 181 ± 7.8 0.272 0.995 99
6:4 218 ± 4.4 0.217 0.998 226
5:5 208 ± 4.6 0.225 0.999 190
4:6 142 ± 4.5 0.191 0.997 124
3:7 157 ± 3.3 0.094 0.998 630
2:8 136 ± 3.3 0.089 0.999 523
1:9 131 ± 6.0 0.075 0.998 681
0:10 185 ± 0.9 0.074 0.996 1404
aThickness :;: mean ± standard deviation of five measurements.
b All films cast using a wet thickness setting of 2.54 mm,Source: From Ref. 259. used with permission.
factor that changes, in this case, is the path length term in Fick's firstlaw. As more drug diffuses out of the core, the permeating gastrointestinal fluid must travel an increasingly longer and more tortuous pathto get to the remaining drug. The dissolved drug, in turn, has to diffuse out via the same altered pathways. Thus, a tortuosity factor mustbe included in the equation to describe release.
One of the earliest of these core-type products to be described wasDuretter , developed by Sjogren and Fryklof [264] in Sweden. It differsfrom other core-type tablets, such as Ciba's Lontab, in that the core isproduced by directly compressing a granulate of the drug and an insolubleplastic material so that a coherent, porous skeleton of the matrix materialforms around the drug. In core tablets such as Lontab, on the otherhand, the drug is incorporated into the melted matrix material and this isthen spread out to dry. After drying it is granulated, and this granulation is then compressed into the core tablet [265]. In the final result thedifferences in manufacturing are not evident, and the release patterns ofdrug from these species are similar in many respects.
The release rate and absorption characteristics of various drug incorporated into a plastic matrix type of tablet have been extensively studied.Sjogren and Ostholm [266] studied the release of nitroglycerin, lobelinehydrochloride, 82Br-Iabeled ammonium bromide, creatinine, potassium
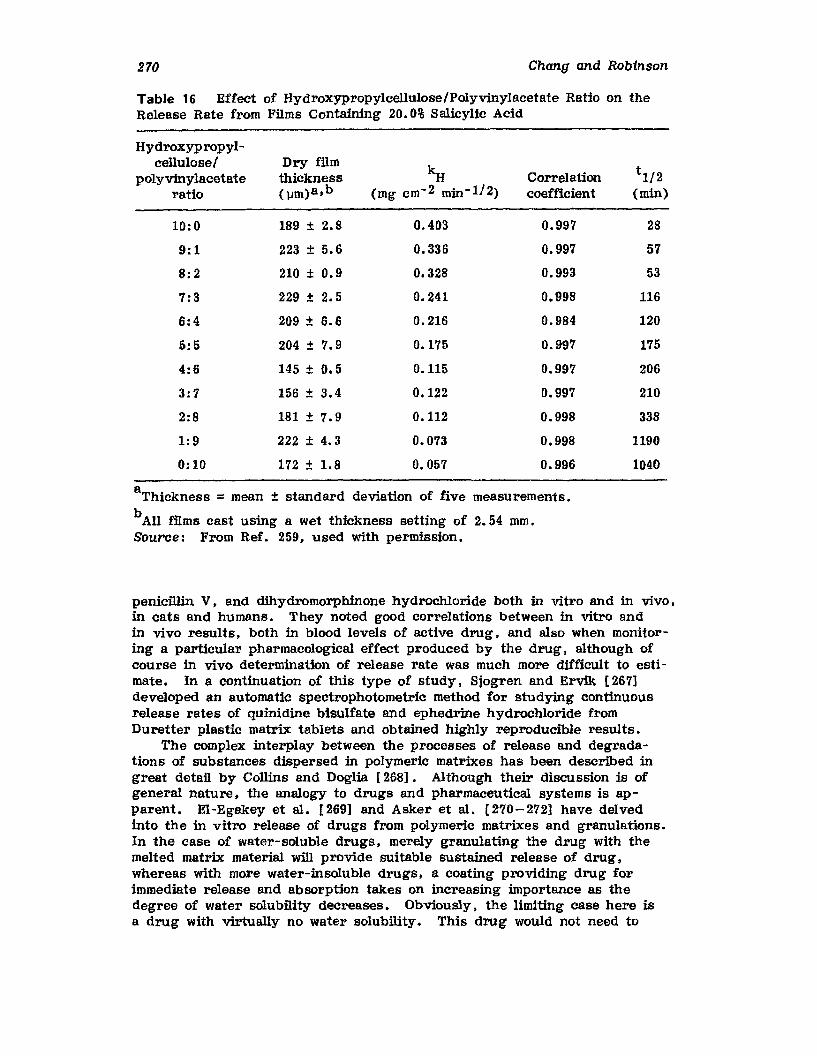
270 Chang and Robinson
Table 16 Effect of HydroxypropylcelIulose/Polyvinylacetate Ratio on theRelease Rate from Films containing 20.0% Salicylic Acid
Hydroxypropyl-celluloseI Dry film kH t1/2polyvinylacetate thickness Correlation
ratio (llm)a,b (mg cm- 2 min- 1/2) coefficient (min)
10:0 189 ± 2.8 0.403 0.997 28
9:1 223 ± 5.6 0.336 0.997 57
8:2 210 ± 0.9 0.328 0.993 53
7:3 229 ± 2.5 0.241 0.998 116
6:4 209 ± 6.6 0.216 0.984 120
5:5 204 ± 7.9 0.175 0.997 175
4:6 145 ± 0.5 0.115 0.997 206
3:7 156 ± 3.4 0.122 0.997 210
2:8 181 ± 7.9 0.112 0.998 338
1:9 222 ± 4.3 0.073 0.998 1190
0:10 172 ± 1.8 0.057 0.996 1040
s..rhickness = mean ± standard deviation of five measurements.
bAll films cast using a wet thickness setting of 2.54 mm,Source: From Ref. 259. used with permission.
penicillin V. and dihydromorphinone hydrochloride both in vitro and in vivo.in cats and humans. They noted good correlations between in vitro andin vivo results. both in blood levels of active drug. and also when monitoring a particular pharmacological effect produced by the drug, although ofcourse in vivo determination of release rate was much more difficult to estimate. In a continuation of this type of study. Sjogren and Ervik [267]developed an automatic spectrophotometric method for studying continuousrelease rates of quinidine bisulfate and ephedrine hydrochloride fromDuretter plastic matrix tablets and obtained highly reproducible results.
The complex interplay between the processes of release and degradations of substances dispersed in polymeric matrixes has been described ingreat detail by Collins and Doglia [268J. Although their discussion is ofgeneral nature, the analogy to drugs and pharmaceutical systems is apparent. EI-Egakey et al , [269] and Asker et al , [270- 272] have delvedinto the in vitro release of drugs from polymeric matrixes and granulations.In the case of water-soluble drugs, merely granulating the drug with themelted matrix material will provide suitable sustained release of drug.whereas with more water-insoluble drugs, a coating providing drug forimmediate release and absorption takes on increasing importance as thedegree of water solubility decreases. Obviously, the limiting case here isa drug with virtually no water solubility. This drug would not need to
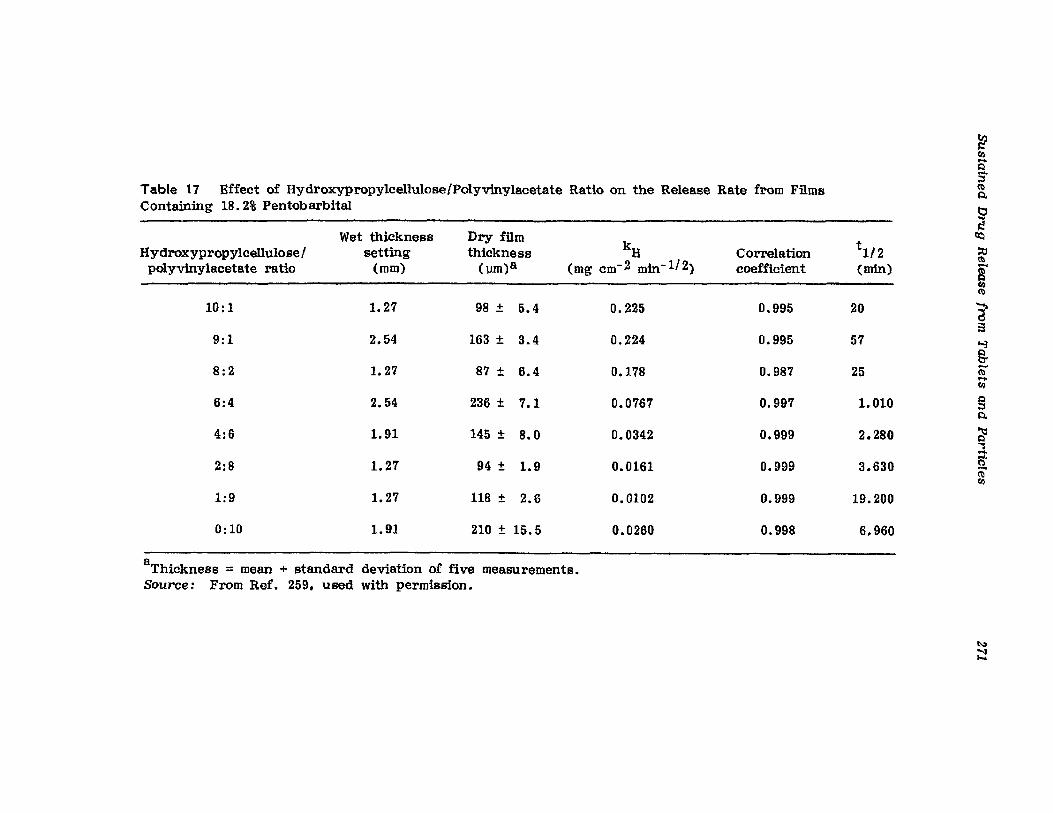
tilr::0....Q
S·Table 17 Effect of HydroxypropylcelluloselPolyvinylacetate Ratio on the Release Rate from Films ~
~
Containing 18.2% Pentobarbital t::l2
Wet thickness Dry film cq
Hydroxypropylcellulose! setting thickness kH Correlation t 1/ 2 ::tI
(mg cm- 2 min- 1!2) ~
polyvinylacetate ratio (mm) ( llm)a coefficient (min) irn~
10:1 1. 27 98 ± 5.4 0.225 0.995 20 a-:1
9:1 2.54 163 ± 3.4 0.224 0.995 57 hiQe-
8:2 1. 27 87 ± 6.4 0.178 0.987 25 -~....rn
6:4 2.54 236 ± 7.1 0.0767 0.997 1.010 Q;:!~
4:6 1.91 145 ± 8.0 0.0342 0.999 2.280 'tlQ""$........
2:8 1. 27 94 ± 1.9 0.0161 0.999 3.630 So~0
1:9 1. 27 118 ± 2.6 0.0102 0.999 19.200
0:10 1.91 210 ± 15.5 0.0260 0.998 6.960
aThickness = mean + standard deviation of five measurements.Source: From Ref. 259. used with permission.
~
~
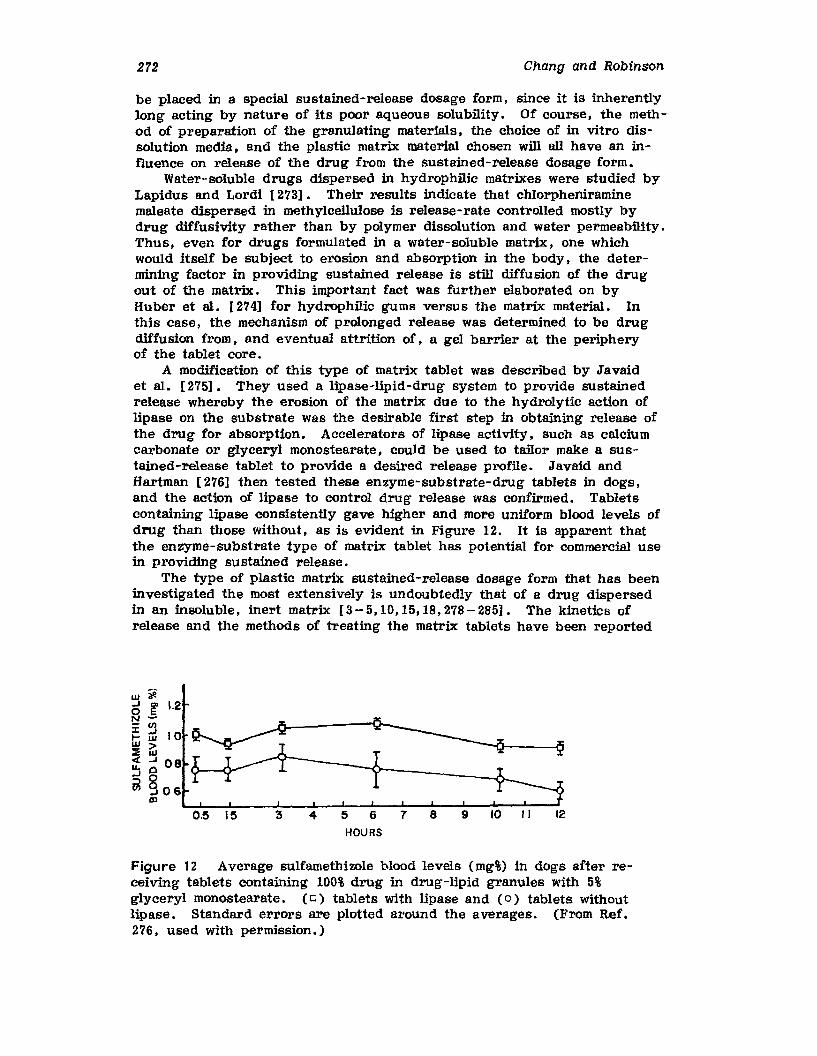
272 Chang and Robinson
be placed in a special sustained-release dosage form. since it is inherentlylong acting by nature of its poor aqueous solubility. Of course, the method of preparation of the granulating materials, the choice of in vitro dissolution media. and the plastic matrix material chosen will all have an influence on release of the drug from the sustained-release dosage form.
Water-soluble drugs dispersed in hydrophilic matrixes were studied byLapidus and Lordi [273]. Their results indicate that chIorpheniraminemaleate dispersed in methylcellulose is release-rate controlled mostly bydrug diffusivity rather than by polymer dissolution and water permeability.Thus, even for drugs formulated in a water-soluble matrix, one whichwould itself be subject to erosion and absorption in the body. the determining factor in providing sustained release is still diffusion of the drugout of the matrix. This important fact was further elaborated on byHuber et al , [274] for hydrophilic gums versus the matrix material. Inthis case. the mechanism of prolonged release was determined to be drugdiffusion from, and eventual attrition of. a gel barrier at the peripheryof the tablet core.
A modification of this type of matrix tablet was described by Javaidet 81. [275]. They used a lipase-lipid-drug system to provide sustainedrelease whereby the erosion of the matrix due to the hydrolytic action oflipase on the substrate was the desirable first step in obtaining release ofthe drug for absorption. Accelerators of lipase activity, such as calciumcarbonate or glyceryl monostearate , could be used to tailor make a sustained-release tablet to provide a desired release profile. Javaid andHartman [276] then tested these enzyme-substrata-drug tablets in dogs,and the action of lipase to control drug release was confirmed. Tabletscontaining lipase consistently gave higher and more uniform blood levels ofdrug than those without. as is evident in Figure 12. It is apparent thatthe enzyme-substrate type of matrix tablet has potential for commercial usein providing sustained release.
The type of plastic matrix sustained-release dosage form that has beeninvestigated the most extensively is undoubtedly that of a drug dispersedin an insoluble. inert matrix [3-5,10,15,18,278-285]. The kinetics ofrelease and the methods of treating the matrix tablets have been reported
~UJ 10i;joJ 08oo906OJ
0.5 ie "3 4 5 6 7 8
HOURS
9
Figure 12 Average sulfamethizole blood levels (mg%) in dogs after receiving tablets containing 100% drug in drug-lipid granules with 5%glyceryl monostearate. (D) tablets with lipase and (0) tablets withoutlipase. Standard errors are plotted around the averages. (From Ref.276, used with permission.)
Sustained Drug Release from Tablets and Particles 273
by Farhadieh and coworkers [277,279] for drugs dispersed in a methylacrylate-methyl methacrylate matrix. As seen in Table 18, treatment ofthe tablets by exposure to acetone vapor results in a significant decreasein the release rate of drug from the matrix. This, coupled with controlof the treatment temperature, allowed production of sustained release tablets with highly reproducible release rates. An investigation of the problems that could result from chewing an insoluble matrix was the subject ofa paper by Ritschel [280]. If the drug is incorporated in the pores andchannels of a matrix tablet, potential toxicity could occur if the tablet wasinadvertently chewed by the patient, since this would result in the release of large quantities of the drug. For drugs with a narrow therapeutic range, such as nitroglycerin, this could be a problem. When thedrug was dissolved directly into the plastic matrix material. the problem isalleviated since even with mastication the drug is not free to be absorbed.
Sjuib et al , [281,282] continued the work of Higuchi on the study ofdrug release from inert matrixes. The original physical model describedby Higuchi and coworkers [286 - 294] was tested for binary mixtures ofacidic drugs and also for binary mixtures of amphoteric drugs. Analysisshowed that the physical model could describe the experimental data quitewell and also pointed out that the precipitation of the drug in the matrixduring release into alkaline media, such as might be encountered in theintestinal fluids, has to be considered more important than theories involving supersaturation of the drug in the .matrix. The mathematics ofboth matrix-controlled and partition-controlled drug release mechanismswere elucidated by Chien et al , [285]. They pointed out that the transition that occurs between the two processes is dependent on the magnitudeof the solution solubility of the drug and, via a series of equations, indicated that this term dictates the mechanism and rate of drug release fromthe polymer matrix.
Other research in the area of drug release from insoluble matrix tablets has found that the square root of time relation originally proposed byHiguchf [260] described the advance of the solvent front into the tablet[ 283] • Compression force was not a major factor and drug release was,of course, proportional to the total surface area.
As can be seen from the above cited work, a tremendous amount oftime and effort has been expended to elucidate and quantify the factorsthat are important in obtaining controlled-release from plastic matrix-typetablets. The perturbations introduced by varying diluents, matrix material, and so on are all important in describing the in vitro release of drugfrom these tablets, and presumably are equally important in describing thein vivo release rates. However, we would be remiss if the clinical evaluation of these types of dosage forms are not included here, since the literature is full of examples in which systems showing good in vitro possibilities were unsuccessful in an actual clinical trial.
The effects of gastric emptying time and intestinal peristaltic activityon the absorption of aspirin from a sustained-release tablet containingcoated particles in a hydrophilic gel type matrix and conventional aspirintablets were described by Levy and Hollister [295]. The lag times in theabsorption profiles reported were undoubtedly due to the time requiredfor transfer of the dosage form from the stomach to the intestine. Theauthors point out the pitfalls of plotting averaged individual absorptiondata versus time and how this could lead to erroneous assumptions aboutwhether a dosage form is a good candidate for sustained release or not.
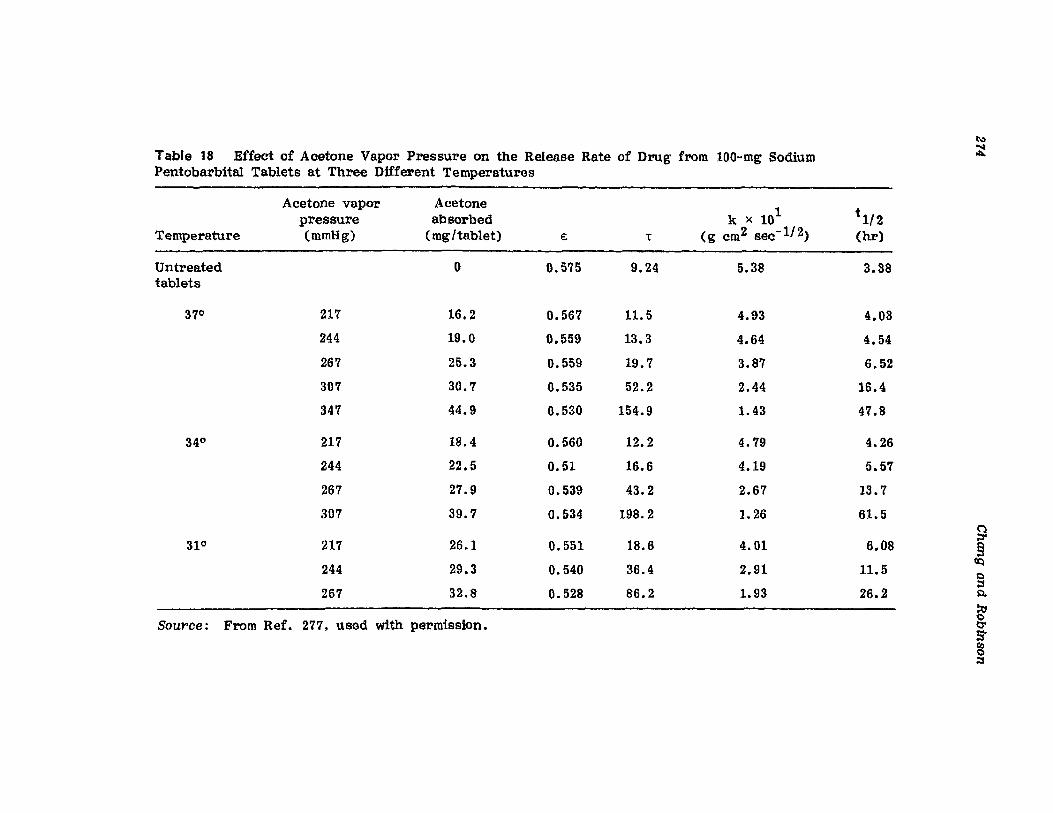
t\)
Table 18 Effect of Acetone Vapor Pressure on the Release Rate of Drug from 100~mg Sodium ~
Pentobarbital Tablets at Three Different Temperatures
Acetone vapor Acetonek x 101 t 1/ 2pressure absorbed
Temperature (mmHg) (mg/tablet) e: L (g cm2 sec- 1/ 2) (hr)
Untreated 0 0.575 9.24 5.38 3.38tablets
37° 217 16.2 0.567 11.5 4.93 4.03
244 19.0 0.559 13.3 4.64 4.54
267 25.3 0.559 19.7 3.87 6.52
307 30.7 0.535 52.2 2.44 16.4
347 44.9 0.530 154.9 1.43 47.8
34° 217 18.4 0.560 12.2 4.79 4.26
244 22.5 0.51 16.6 4.19 5.57
267 27.9 0.539 43.2 2.67 13.7
307 39.7 0.534 198.2 1. 26 61.5(")
4.01 6.08;:3"
31° 217 26.1 0.551 18.6 Q;:::l
244 29.3 0.540 36.4 2.91 11.5 tQQ;:::l
267 32.8 0.528 86.2 1.93 26.2 Q,
::tl0
Source: From Ref. 277, used with permission. t:rS·~;::I
Sustained Drug Release from Tablets and Particles 275
Individual absorption data that results in a first-order plot can often appear to be zero-order, indicating good sustained release, when such dataare averaged. Thus, it is necessary to look at the data for each individual in the test population when assessing sustained-release characteristics.
Nicholson et al. [296] desertbed the blood and urine levels obtained inhumans following ingestion of sustained-release tablets. It was noted thatthe sustained-release tablets gave less variation between maximum and minimum blood level concentrations and more uniform urinary excretion ratesthan conventional release tablets. Theophylline aminoisobutanol, administered in a tablet containing a sustained-release core having a matrix ofhydrophilic gums, a delayed barrier coat on the core, and an outer coatcontaining the drug for immediate release was investigated by Kaplan [297].Both in vitro and in vivo results were obtained and the blood level datacorrelated well. Although differences were noted in the urinary data, noexplanation was tendered other than noting that these differences havebeen reported previously. The in vivo absorption and excretion of radioactively tagged [l0-14Clpentylenetetrazol was studied by Ebert et al.r278) • Human volunteers were given either a single dose of sustainedrelease insoluble matrix tablets or three divided doses of conventional tablets. It was shown that the sustained-release form gave absorption andexcretion patterns similar to those obtained in the divided dose case.
As noted earlier in the section on coated granules, the earliest commercially available sustained-release preparations available for clinical trialsseem to be those providing antihistamines [166,167,298,299]. Such research has led to clinical trials of sustained-release triethanolamine trinitrate [300] for use in angina pectoris. The drug was provided in aplastic matrix that leached out drug over a 7- to B-h span. Patients reported no undesirable side effects and the frequency and severity of attacks were diminished in 80% of those tested.
De Ritter [301] used urinary excretion rates to evaluate nicotinic alcohol tartrate administered to humans via Roche's Roniacol Timespan matrix tablets. This dosage form uses a coating containing drug to providethe immediate release portion of the dose and the sustaining portion isprovided by erosion and/or leaching of the insoluble matrix in the gastrointestinal tract. The results indicate good correlation of in vitro andin vivo release rates, and the drug is as completely available in this formas in conventional tablets. In addition, the intense flushing caused bynon-sustained-release tablets is absent with the sustained release form.
The tension-relieving and sedative properties of pentobarbital sodium,administered via conventional capsules and Abbott's Gradumet plasticmatrix sustained-release form, were clinically evaluated by Cass andFrederik [302]. Although the grading system employed was qualitative innature, the results indicated that the Gradumet form was useful in providing daytime tranquiJization and it was virtually free of untoward sideeffects.
The Gradumet matrix dosage form has also been evaluated for treatment of iron deficiency anemia via the sustained release of ferrous sulfate[303,304]. In all cases, the hematocrit and hemoglobin responses werevirtually identical whether the non-sustained-release form or the matrixtablet was administered. However, the incidence of reported gastrointestinal upset due to ferrous sulfate, an important problem because moreiron is absorbed by fasting patients while at the same time causing moregastrointestinal distress, was greatly diminished when the dose was given
276 Chang and Robinson
as a sustained-release tablet. Crosland-Taylor and Keeling [305] formulated their own sustained-release ferrous sulfate tablets in an inertpolymer matrix and they added [59pe] SO4 as a marker to aid in evaluation.They point out that the previoualy mentioned hematocrit and hemoglobinresponses are relatively insensitive means for comparing conventional andsustained-release tablets, and their results indicate variable absorptionfrom sustained-release forms. They found no real advantage, even in thearea of management of side effects, to the use of sustained-release formsof ferrous sulfate. It is not clear, then, whether there is any significantadvantage to providing oral hematinics in sustained-release form.
Owing to the many unpleasant side effects of oral potassium supplementation, such as extremely salty taste and severe gastrointestinal upset,the past few years have seen a need for a slow-release potassium-providingproduct. Slow-K, marketed by Ciba, is the best example of this type ofproduct. The sugar-coated wax matrix contains 600 mg of potassium chloride that leaches out gradually over a 4- to 6-h period. Tarpley [306)studied the patient acceptability of this product as well as its ability tomsintain normal serum potassium levels in clinical trials comparing it to oralpotassium liquid preparations. His findings indicate that both types ofproducts maintain serum K+ levels, but the sustained-release tablet givesmuch less incidence of nausea, abdominal pain. cramps, diarrhea, etc.,and, of course, since it has little or no taste before being swallowed, itwas much more palatable and acceptable to all the patients involved.
As was noted earlier, aspirin has been tested for delivery via everynew dosage form developed for the past 20-25 years. Here, as in thecase of oral antihistaminics, the simple arithmetic of profit and loss statements has compelled pharmaceutical firms to develop sustained-releaseaspirin preparations [307]. The market is largely due to the vast numbersof arthritics who need a preparation that will provide aspirin throughoutthe night and eliminate morning stiffness, the most common plight ofarthritis sufferers. Many products have been extensively tested in clinicaltrials as well.
Wiseman and Federici [308] have developed a sustained-release aspirintablet utilizing the matrix principle. By carefully monitoring both in vitroand in vivo data, the authors were able to fashion a product that gaveconstant plasma salicylate concentrations on chronic administration. Wiseman[309] then extended the tests to the clinic where highly reproducible,stable plasma salicylate concentrations were attained that overcame thefluctuations due to multiple dosing of conventional tablets. The stablelevels do not exhibit the peaks in serum salicylate levels shown by conventional tablets; therefore the incidence of gastrointestinal upset was reducedand the valleys, or low points, were eliminated, thus providing therapeuticlevels of salicylate throughout the night. Harris and Regalado [310], however, compared conventional and sustained-release aspirin for their abilityto provide relief to patients in order that the latter might perform simpletasks requiring phalangeal dexterity. They reported no difference betweenthe two types of tablets, but a majority of the patients preferred the sustained-release form. The -inference here is that the sustained-releaseproduct gave relief throughout the night and did not cause the unpleasantgastrointestinal side effects, thus contributing to the patient's preference.Also, the convenience of eliminating frequent daytime doses was significantin the preference for sustained-release aspirin.
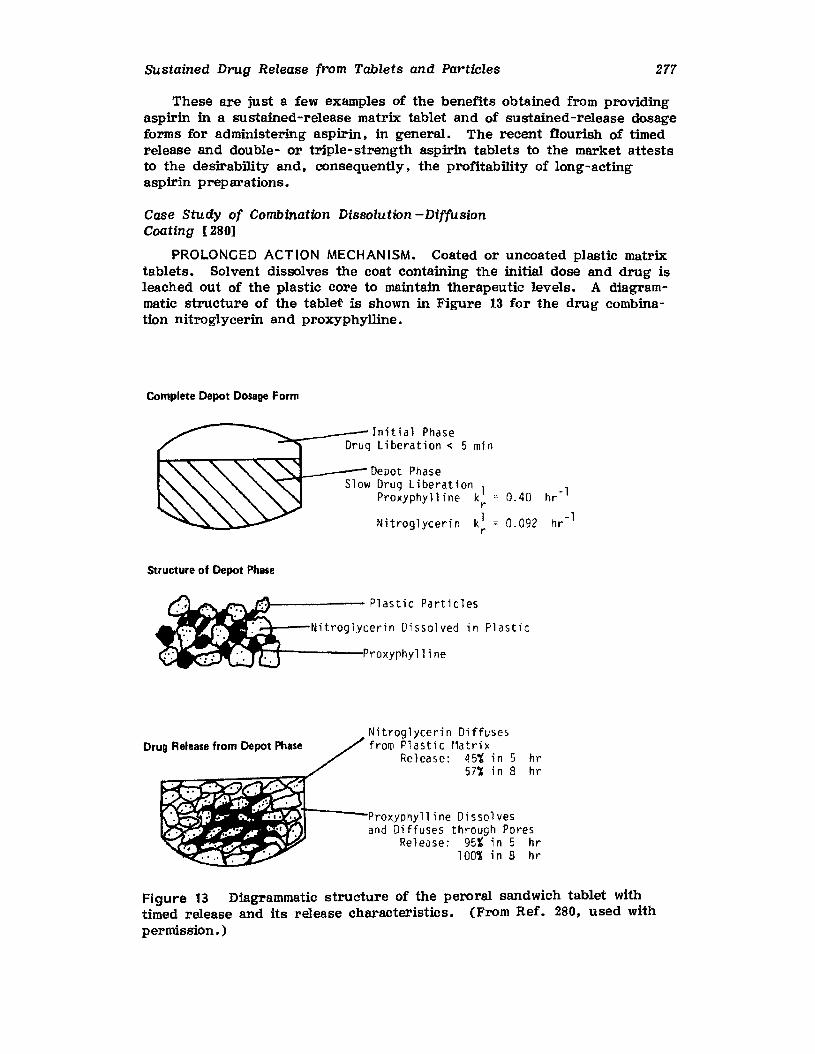
Sustained Drug Release from Tablets and Particles 277
These are just a few examples of the benefits obtained from providingaspirin in a sustained-release matrix tablet and of sustained-release dosageforms for administering aspirin. in general. The recent flourish of timedrelease and double- or triple-strength aspirin tablets to the market atteststo the desirability and. consequently. the profitability of long-actingaspirin preparations.
Case Study of Combination Dissolution -DiffusionCoating [280]
PROLONGED ACTION MECHAN ISM. Coated or uncoated plastic matrixtablets. Solvent dissolves the coat containing the initial dose and drug isleached out of the plastic core to maintain therapeutic levels. A diagrammatic structure of the tablet is shown in Figure 13 for the drug combination nitroglycerin and proxyphylllne.
Complete Depot Dosage Form
Structure of Depot Phase
Initial PhaseDrug Liberation < 5 min
Depot PhaseSlow Drug Liberation 1
Proxyphylline kr
Nitroglycerin klr
0.40 hr- l
0.092 hr- l
~ Pla'ti, Pa,ti,l".:..: "..... .: :.. Nit,091y,,"n Df s so l ved in Pl as t ic
-: ,;: :', " Proxyphylline
Drug Release from Depot PhaseNitroglycerin Diffusesf rom P1astic tlat r i x
Release: q5~ in 5 hr57'X in 8 hr
Proxyphylline Dissolvesand Diffuses through Pores
Release: 95t in 5 hr100'1 in B hr
Figure 13 Diagrammatic structure of the peroral sandwich tablet withtimed release and its release Characteristics. (From Ref. 280. used withpermission. )
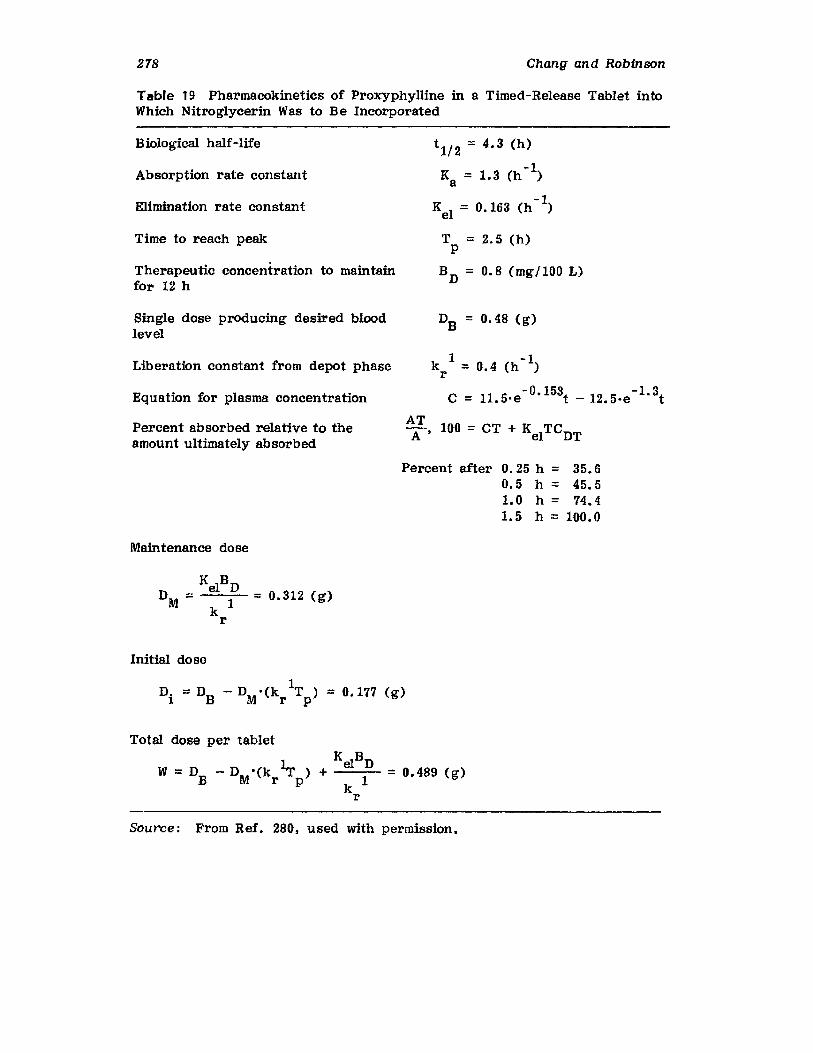
278 Chang and Robinson
Table 19 Pharmacokinetics of Proxyphylline in a Timed-Release Tablet intoWhich Nitroglycerin Was to Be Incorporated
Biological half-life
Absorption rate constant
Elimination rate constant
Time to reach peak
Therapeutic concentration to maintainfor 12 h
Single dose producing desired bloodlevel
Liberation constant from depot phase
Equation for plasma concentration
Percent absorbed relative to theamount ultimately absorbed
Maintenance dose
Initial do se
t 1/ 2 == 4.3 (h)
-1Ka = 1.3 (h )
Kel
= 0.163 (h -1)
T ::= 2.5 (h)P
BD
::= 0.8 (mg/100 L)
DB ::= 0.48 (g)
k 1 = 0.4 (h-1)r
C ::: 11.5·e- 0• I 53t -12.5.e-1. 3t
ATA' 100 == CT + Kel TCDT
Percent after 0.25 h == 35.60.5 h::: 45.51. 0 h::: 74.41.5 h == 100.0
1D
1, ::= DB - D •(k T) = O. 177 (g)
M r p
Total dose per tablet
KelB DW ::: D - D '(k IT ) + =: 0.489 (g)
B M r p k 1r
Source: From Ref. 280, used with permission.
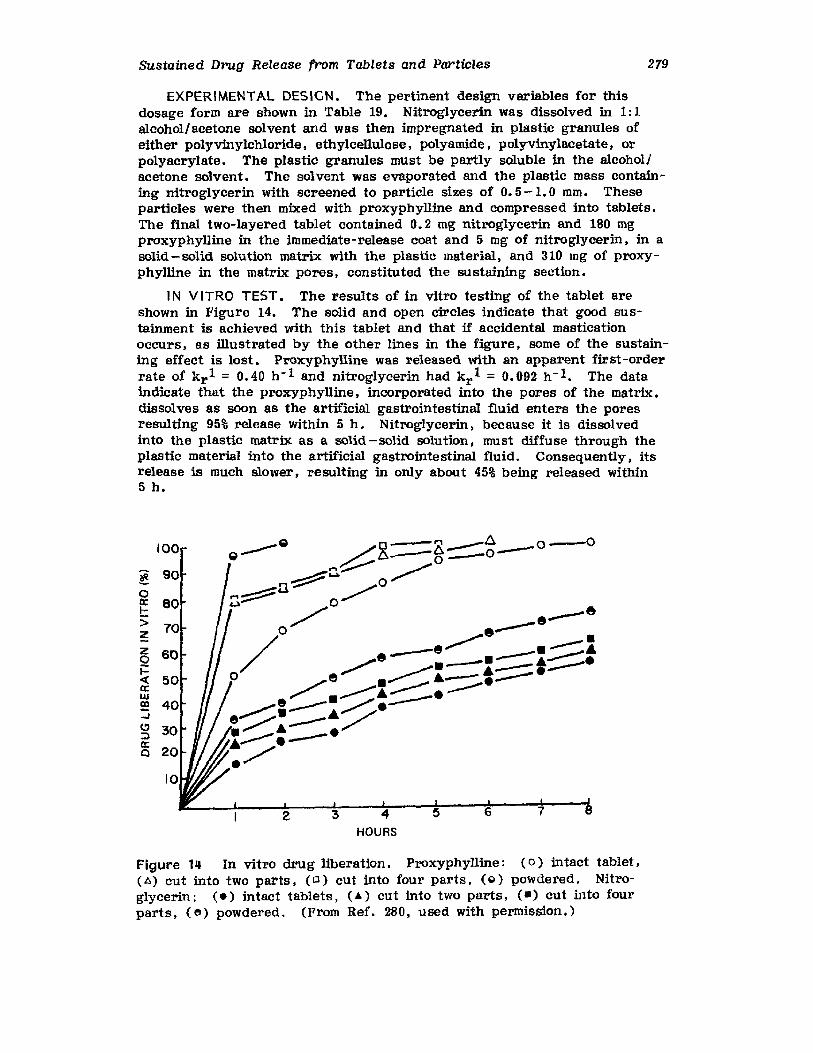
Sustained Drug Release from Tablets and Particles 279
EXPERIMENTAL DESIGN. The pertinent design variables for thisdosage form are shown in Table 19. Nitroglycerin was dissolved in 1: 1alcohol I acetone solvent and was then impregnated in plastic granules ofeither polyvinylchloride. ethylcellulose, polyamide, polyvinylacetate. orpolyacrylate. The plastic granules must be partly soluble in the alcohol/acetone solvent. The solvent was evaporated and the plastic mass containing nitroglycerin with screened to particle sizes of 0.5 -1.0 mm, Theseparticles were then mixed with proxyphylline and compressed into tablets.The final two-layered tablet contained 0.2 mg nitroglycerin and 180 mgproxyphylline in the immediate-release coat and 5 mg of nitroglycerin, in asolid-solid solution matrix with the plastic material, and 310 mg of proxyphylline in the matrix: pores, constituted the sustaining section.
I N V ITRO TEST. The results of in vitro testing of the tablet areshown in Figure 14. The solid and open circles indicate that good sustainment is achieved with this tablet and that if accidental masticationoccurs. as illustrated by the other lines in the figure, some of the sustaining effect is lost. Proxyphylline was released with an apparent first-orderrate of k r 1 = 0.40 h-! and nitroglycerin had k r
1 = 0.092 h- 1. The dataindicate that the proxyphylline, incorporated into the pores of the matrix,dissolves as soon as the artificial gastrointestinal fluid enters the poresresulting 95% release within 5 h. Nitroglycerin, because it is dissolvedinto the plastic matrix as a solid -solid solution, must diffuse through theplastic material into the artificial gastrointestinal fluid. Consequently, itsrelease is much slower, resulting in only about 45% being released within5 h.
8765:3 4HOURS
2
____ Q /0- a 6 0_0., ,......., 1).--0 _0---
~C~~~n~ ~OM~ o~u/ ___e
____ 8
/
0 ~8.8 __8 • ::;::::;"
o /" ---%---t--e/'e .:::::.- .:::::::-.__
8/' .~£---...........-:.---£~.8/. ./.---.---.../
100
~ 900a: 80t:> 70zz 600j::«a:w2:...J
e;:)a:0
Figure 14 In vitro drug liberation. Proxyphylline: (0) intact tablet,(A) cut into two parts, (lJ) cut into four parts, (Q) powdered. Nitroglycerin: (.) intact tablets, (~) cut into two parts, (.) cut into fourparts, (e) powdered, (From Ref. 280, used with permission.)
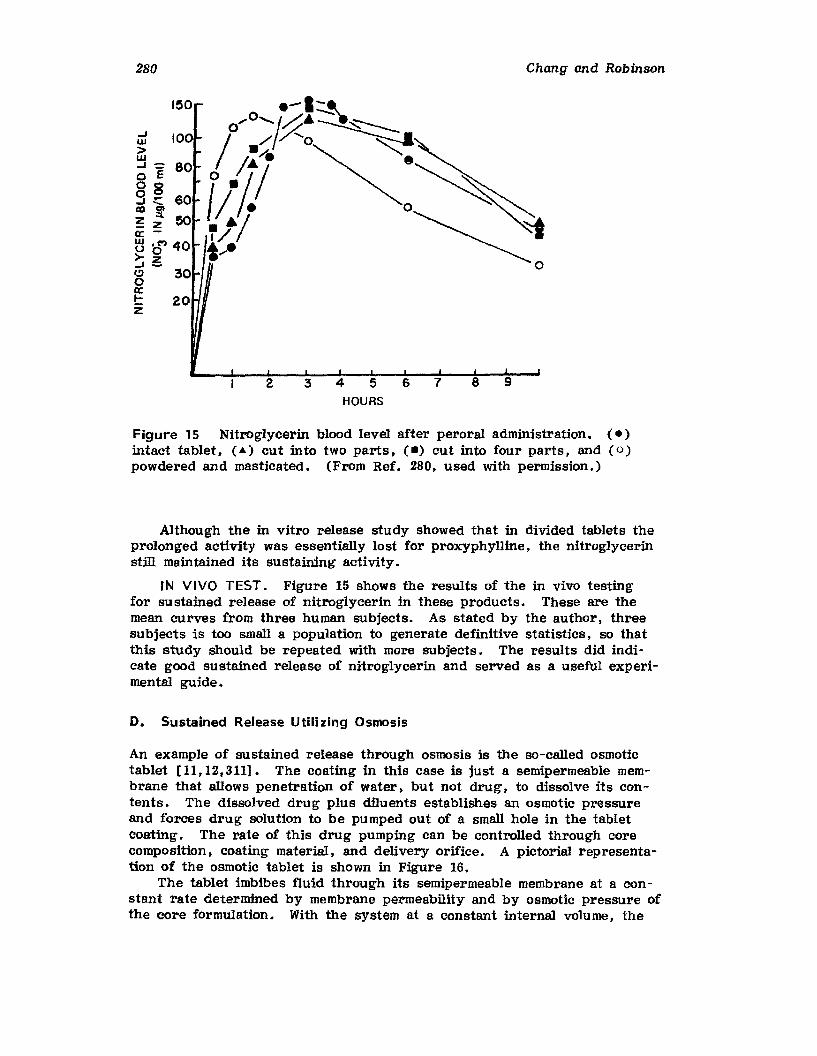
280 Chang and RObinson
2 3 456HOURS
7 8 9
Figure 15 Nitroglycerin blood level after peroral administration. ( • )intact tablet, ( ... ) cut into two parts, (.) cut into four parts. and (0)powdered and masticated. (From Ref. 280. used with permission.)
Although the in vitro release study showed that in divided tablets theprolonged activity was essentially lost for proxyphylline. the nitroglycerinstill maintained its sustaining activity.
IN VIVO TEST. Figure 15 shows the results of the in vivo testingfor sustained release of nitroglycerin in these products. These are themean curves from three human subjects. As stated by the author, threeSUbjects is too small a population to generate definitive statistics, so thatthis study should be repeated with more subjects. The results did indicate good sustained release of nitroglycerin and served as a useful experimental guide.
D. Sustained Release Utilizing Osmosis
An example of sustained release through osmosis is tbe so-called osmotictablet [11,12.311]. The coating in this case is just a semipermeable membrane that allows penetration of water. but not drug, to dissolve its contents. The dissolved drug plus diIuents establishes an osmotic pressureand forces drug solution to be pumped out of a small hole in the tabletcoating. The rate of this drug pumping can be controlled through corecomposition, coating material. and delivery orifice. A pictorial representation of the osmotic tablet is shown in Figure 16.
The tablet imbibes fluid through its semipermeable membrane at a constant rate determined by membrane permeability and by osmotic pressure ofthe core formulation. With the system at a constant internal volume, the
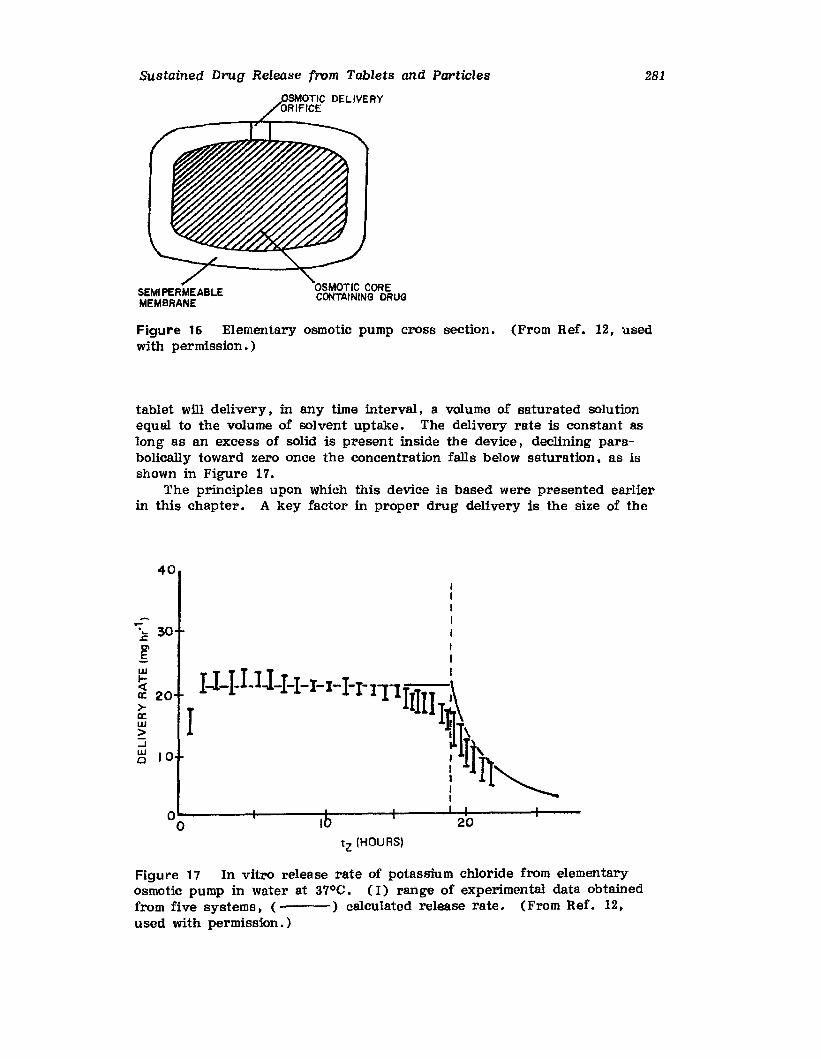
SUstained Drug Release from Tablets and Particles
SEMI PERMEABLEMEMBRANE
281
Figure 16 Elementary osmotic pump cross section. (From Ref. 12, usedwith permission.)
tablet wID delivery, in any time interval, a volume of saturated solutionequal to the volume of solvent uptake. The delivery rate is constant aslong as an excess of solid is present inside the device, declining parabolically toward zero once the concentration falls below saturation, as isshown in Figure 17.
The principles upon which this device is based were presented earlierin this chapter. A key factor in proper drug delivery is the size of the
40
...:c 30
EL1I
~cr: 20>-cr:L1I>:J~ 10
20
'z (HOURS)
Figure 17 In vitro release rate of potassium chloride from elementaryosmotic pump in water at 37°C. (I) range of experimental data obtainedfrom five systems, ( ) calculated release rate. (From Ref. 12,used with permission.)

282
30-...:cg'~ 20
~a:>-~ 10>:Jwa
Chang and Robinson
5
HOURS
10
Figu re 18 In vitro and in vivo release rate of potassium chloride fromelementary osmotic pumps. ( ) average in vitro rate from systemsof the same batch; and (6). (0). (e) average release rate in one system jn the GI tract of dogs 1, 2, and 3, plotted at the total time periodeach system resided in the dog. (From Ref. 12, used with permission.)
delivery orifice. Two conditions must be met. relative to the size of thedelivery orifice, in order for it to be successful.
1. It must be smaller than a maximum size, Amax, to minimize thecontribution to the delivery rate made by solute diffusion throughthe orifice.
2. It must be sufficiently large, above a minimum size, Amin. to minimize hydrostatic pressure inside the system that would affect thezero-order release rate.
Too small a hole will depress the delivery rate below that of the desiredconstant delivery.
In vivo tests in three dogs are shown in Figure 18. That zero-orderrelease is maintained for long periods is evident.
It should be quite obvious from the mechanistic description of thisapparatus that drug delivery would be independent of stirring rate andindependent of pH. These are sizable advantages to a sustained releasesystem and have indeed been shown operable both in vitro and in vivo.
v, COATING MATERIALS
Other sections of this text have dealt with coating substances insofar asdescribing their properties, coating technology, quality control, etc.Some of these coating materials. for conventional coating purposes, can beemployed to produce sustained-release products depending on the thickness of coat employed as well as addition of fillers to the coating substance. Table 20 lists some of the more common coating substances andtheir properties. This listing is not intended to be comprehensive, but
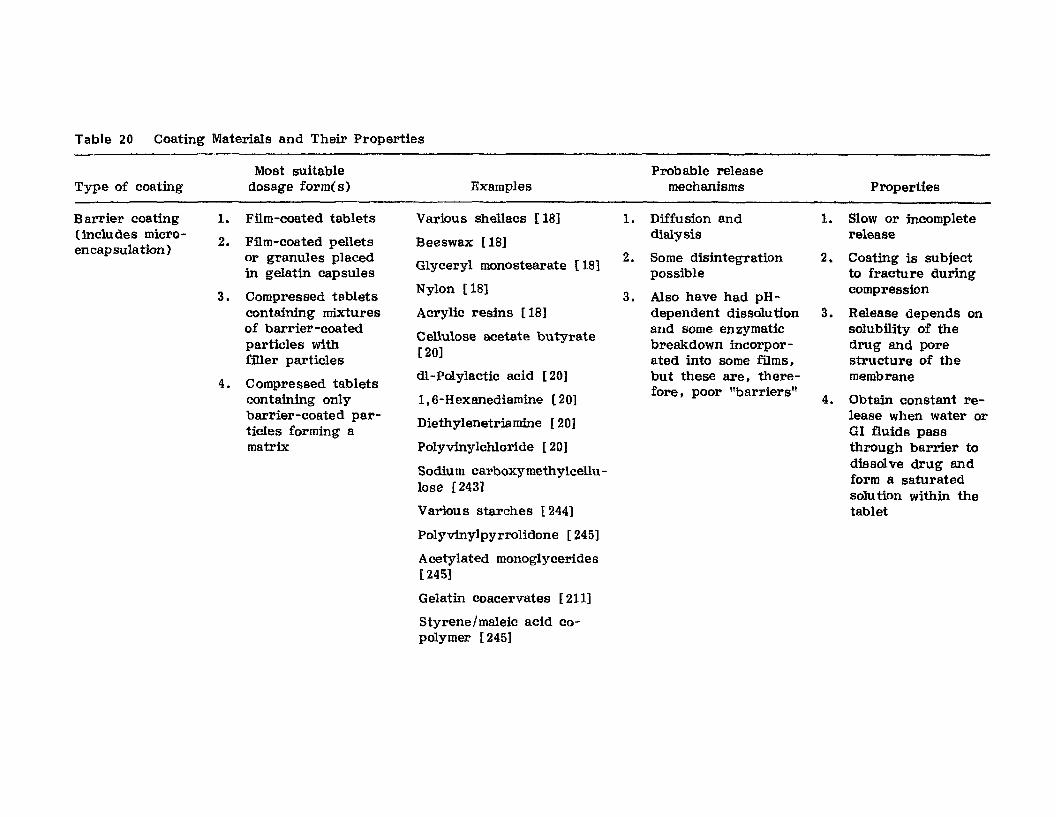
Table 20 Coating Materials and Their Properties
Type of coating
Barrier coating(includes microencapsulation)
Most suitabledosage forme s)
1. Film-coated tablets
2. Film-coated pelletsor granules placedin gelatin capsules
3. Compressed tabletscontaining mixturesof barrier-coatedparticles withfiller particles
4. Compressed tabletscontaining onlybarrier-coated particles forming amatrix
Examples
Various shellacs [18]
Beeswax [18]
Glyceryl monostearate [18]
Nylon [18]
Acrylic resins [18]
Cellulose acetate butyrate[ 20]
dl-Polylactic acid [20]
1,6-Hexanediamine (20]
Diethylenetriamine [20)
Polyvinylchloride [20]
Sodium carboxymethylcellulose {2431
Various starches 1244]
Polyvinylpyrrolidone [245]
Acetylated monoglycerides[245J
Gelatin coacervates [211]
Styrene/maleic acid copolymer [245]
1.
2.
3.
Probable releasemechanisms
Diffusion anddialysis
Some disintegrationpossible
Also have had pHdependent dissolutionand some enzymaticbreakdown incorporated into some films,but these are, therefore, poor "barriers"
1.
2.
3.
4.
Properties
Slow or incompleterelease
Coating is subjectto fracture duringcompression
Release depends onsolubility of thedrug and porestructure of themembrane
Obtain constant release when water orGI fluids passthrough barrier todissolve drug andform a saturatedsolu tion within thetablet
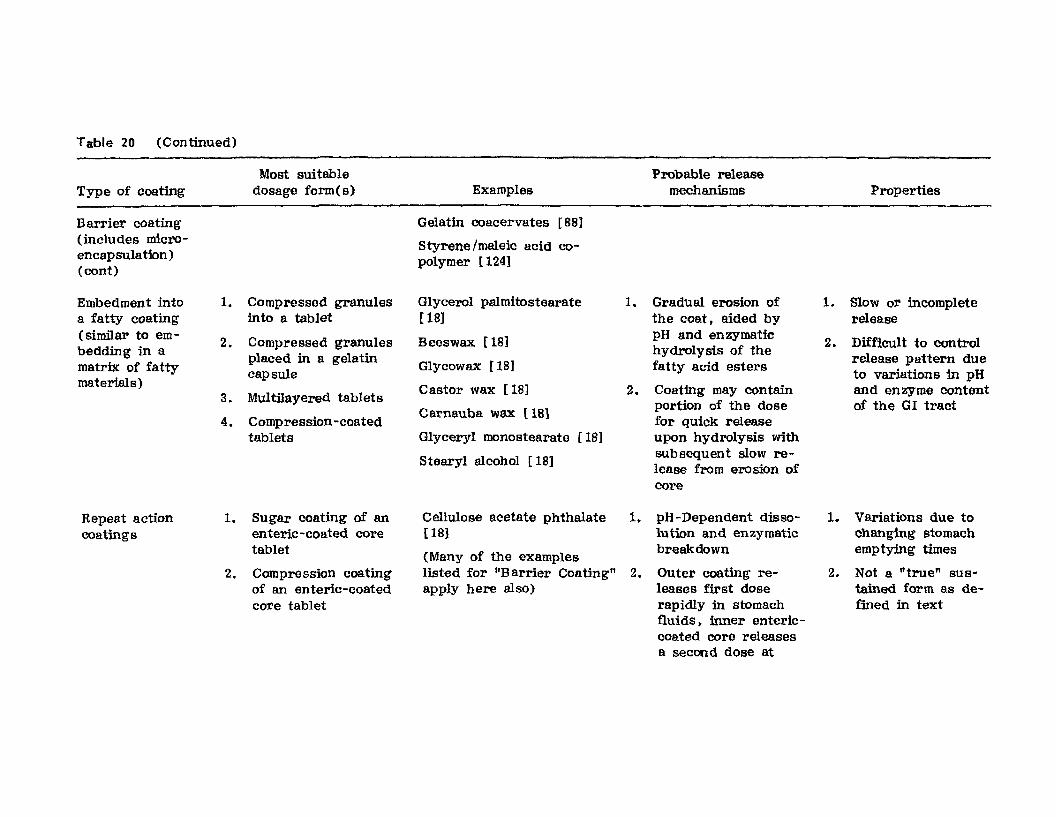
Table 20 (Continued)
Most suitable Probable releaseType of coating dosage formes) Examples mechanisms Properties
Barrier coating Gelatin coacervates [881(includes micro- Styrene/maleic acid 00-encapsulation) polymer [124](cont)
Embedment into 1- Compressed granules Glycerol palmitostearate 1. Gradual erosion of 1. Slow or incompletea fatty coating into a tablet [18J the coat. aided by release(similar to em- 2. Compressed granules Beeswax [18] pH and en zymatic 2. Difficult to controlbedding in a placed in a gelatin
hydrolysis of therelease pattern due
matrix: of fatty capsuleGlycowax [181 fatty acid esters to variations in pH
materials) Castor wax [18] 2. Coating may contain and enzyme content3. Multilayered tablets
portion of the dose of the GI tract4. Compression -eoated
Carnauba wax {18]for quick release
tablets Glyceryl monostearate [18] upon hydrolysis with
Stearyl alcohol [18] subsequent slow re-lease from erosion ofcore
Repeat action 1- Sugar coating of an Cellulose acetate phthalate 1. pH-Dependent disso- 1. Variations due tocoatings enteric-coated core [l8] lution and enzymatic changing stomach
tablet (Many of the examples breakdown emptying times
2. Compression coating listed for "Barrier Coating" 2. Outel' coating re- 2. Not a "true" sus-of an enteric-coated apply here also) leases first dose tamed form as de-core tablet rapidly in stomach fined in text
fluids. inner enteric-coated core releasesa second dose at
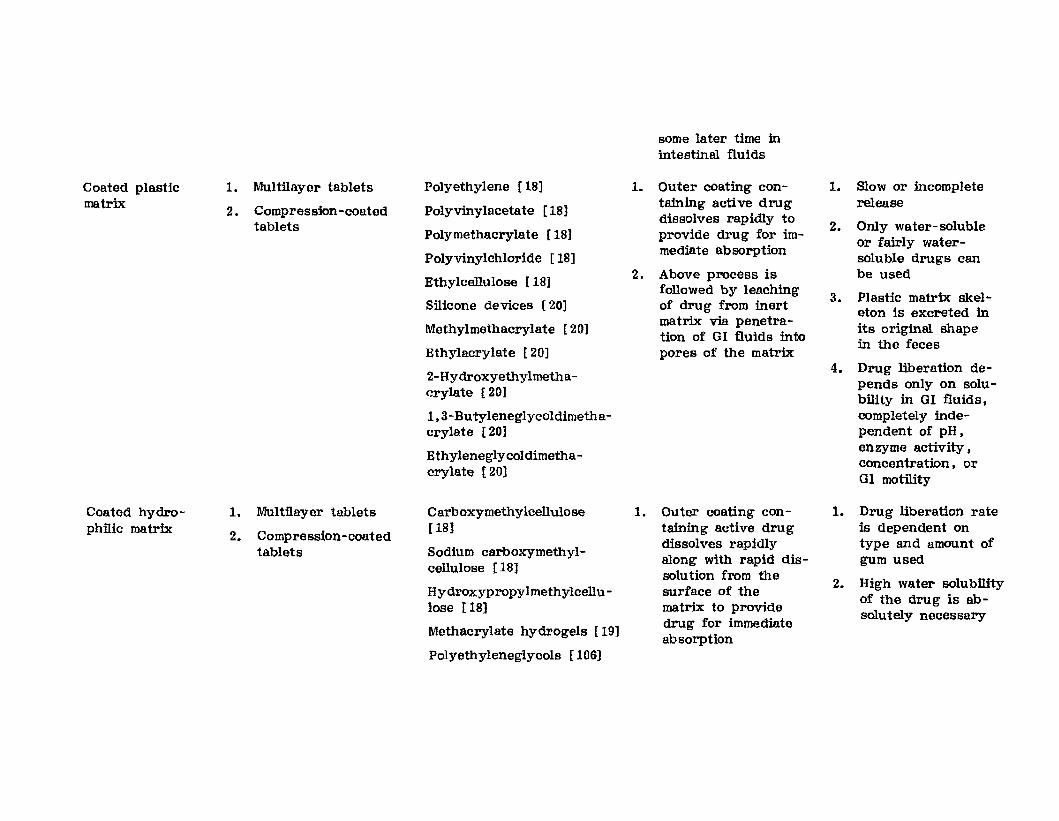
some later time inintestinal fluids
Coated plastic 1- Multilayer tablets Polyethylene [18] 1. Outer coating con- I. Slow or incompletematrix 2. Compression -coated Polyvinylacetate [18] taining active drug release
tabletsdissolves rapidly to
2. Only water-solublePolymethacrylate [18] provide drug for im- or fairly water-Polyvinylchloride [18]
mediate absorption soluble drugs can
Ethylcellulose [18] 2. Above process is be usedfollowed by leaching
3. Plastic matrix skel-Silicone devices [20] of drug from inert eton is excreted inMethylmethacrylate [20]
matrix via penetra-its original. shape
tion of 01 fluids intoEthylacrylate [20] pores of the matrix
in the feces
2-Hydroxyethylmetha-4. Drug liberation de-
pends only on solu-crylate [20] bility in 01 fluids,1.3-Butyleneglycoldimetha- completely inde-crylate [20] pendent of pH,
Ethyleneglycoldimetha-enzyme activity,concentration. or
crylate I 20]01 motility
Coated hydro- 1. Multilayer tablets Carboxymethylcellulose 1. Outer coating con- 1. Drug liberation ratephilic matrix
2. Compression-coated U8l taining active drug is dependent ondissolves rapidly type and amount of
tablets Sodium carboxymethyl- along with rapid dis- gum usedcellulose [18]
solution from theHydroxypropylmethylcellu - surface of the 2. High water solubflfty
lose [18] matrix to provide of the drug is ab-
drug for immediatesolutely necessary
Methacrylate hydrogels [19]absorption
Polyethyleneglycols [106]
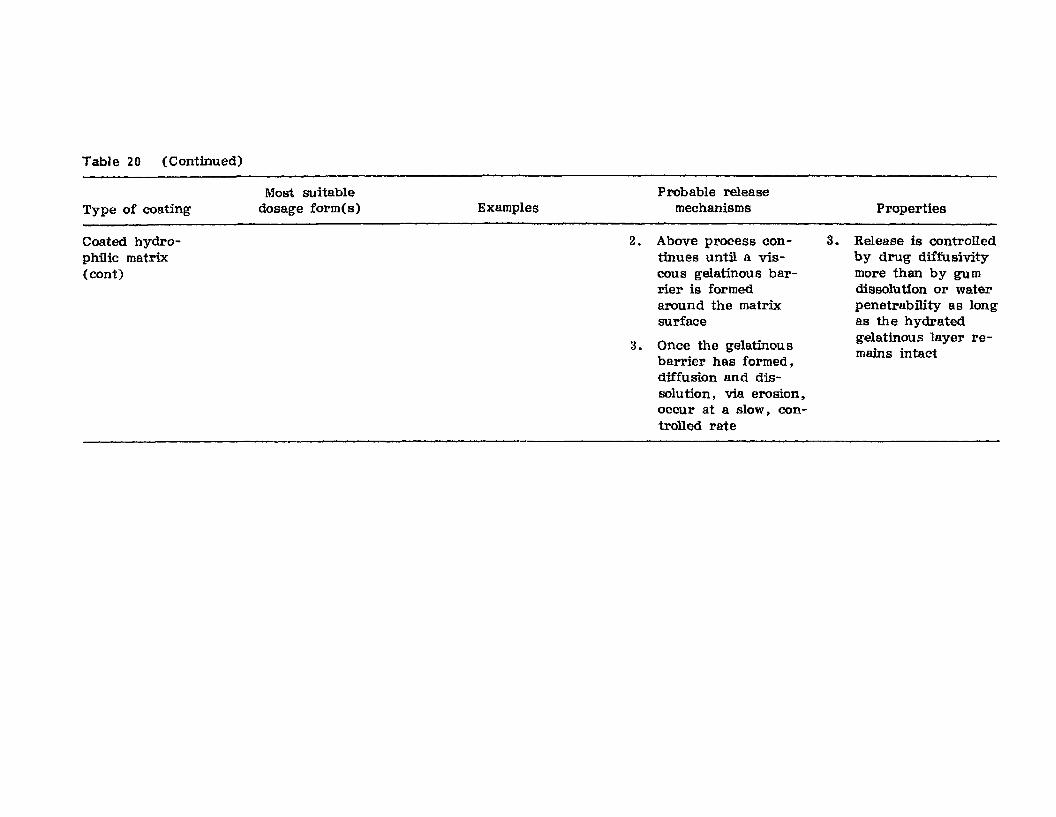
Table 20 (Continued)
Type of coating
Coated hydrophilic matrix(cont)
Most suitabledosage form(s) Examples
Probable releasemechanisms
2. Above process continues until a viscous gelatinous barrier is formedaround the matrixsurface
3. Once the gelatinousbarrier has formed.diffusion and dissolution, via erosion.occur at a slow. controlled rate
Properties
3. Release is controlledby drug diffusivitymore than by gu mdissolution or waterpenetrability as longas the hydratedgelatinous layer remains intact
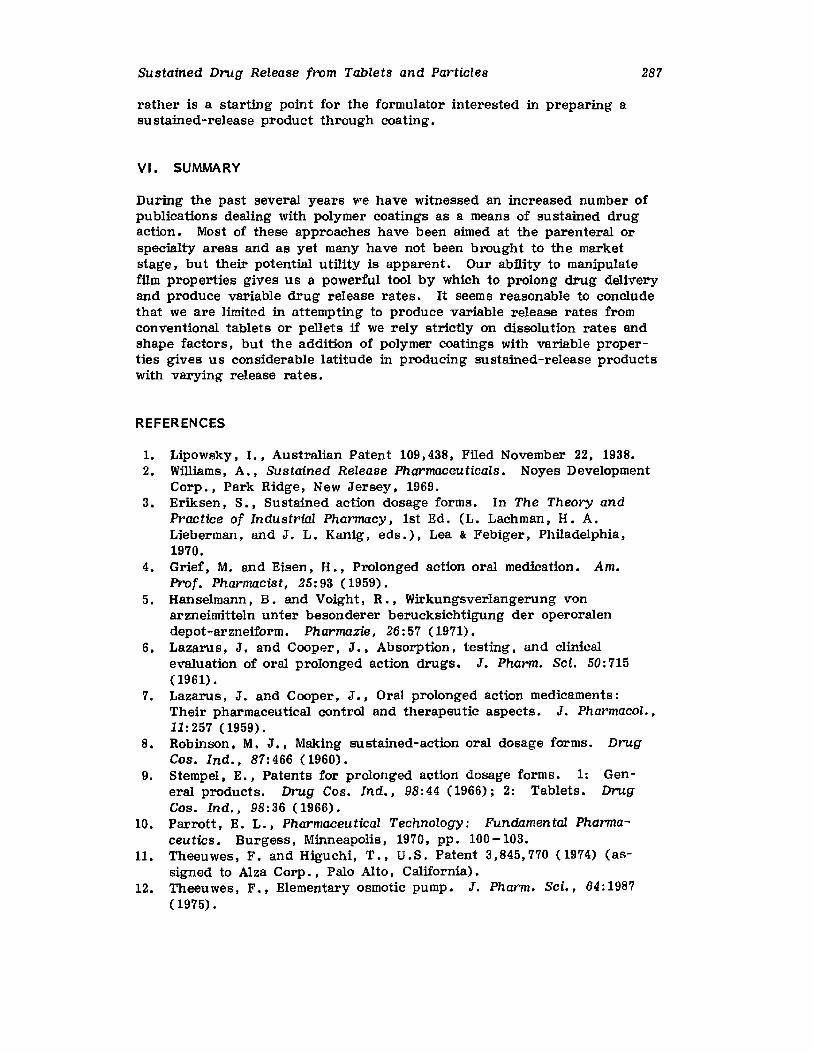
Sustained Drug Release from Tablets and Particles
rather is a starting point for the formulator interested in preparing asu stained-release product through coating.
VI. SUMMARY
287
During the past several years we have witnessed an increased number ofpubltcatlons dealing with polymer coatings as a means of sustained drugaction. Most of these approaches have been aimed at the parenteral Orspecialty areas and as yet many have not been brought to the marketstage, but their potential utility is apparent. Our ability to manipulatefilm properties gives us a powerful tool by which to prolong drug deliveryand produce variable drug release rates. It seems reasonable to concludethat we are limited in attempting to produce variable release rates fromconventional tablets or pellets if we rely strictly on dissolution rates andshape factors, but the addition of polymer coatings with variable properties gives us considerable latitude in producing sustained-release productswith varying release rates.
REFERENCES
1. Lipowsky, I., Australian Patent 109,438, Filed November 22, 1938.2. Williams, A•• Sustained Release Pharmaceuticals. Noyes Development
Corp., Park Ridge, New Jersey, 1969.3. Eriksen. S., Sustained action dosage forms. In The Theory and
Practice of Industrial Pharmacy, 1st Ed. (L. Lach man, H. A.Lieberman, and J. L. Kanig, eds.), Lea & Febiger, Philadelphia,1970.
4. Grief. M. and Eisen. H •• Prolonged action oral medication. Am.Prof. Pharmacist, 25: 93 (1959).
5. Hanselmann, B. and Voight, R .• Wirkungsverlangerung vonarzneimitteln unter besonderer berucksichtigung der operoralendepot-arzneiform. Piiarmazie , 26:57 (1971).
6. Lazarus. J. and Cooper. J.. Absorption, testing. and clinicalevaluation of oral prolonged action drugs. J. Pharm. Set. 50: 715(1961) •
7. Lazarus. J. and Cooper, J., Oral prolonged action medicaments:Their pharmaceutical control and therapeutic aspects. J. Pharmacol.,11: 257 (1959).
8. Robinson. M. J •• Making sustained-action oral dosage forms. DrugCos. Ind .• 87: 466 (1960).
9. Stempel. E.• Patents for prolonged action dosage forms. 1: General products. Drug Cos. Ind•• 98:44 (1966); 2: Tablets. DrugCos. Ind., 98:36 (1966).
10. Parrott. E. L.• Pharmaceutical Technology: Fundamental Pharmaceutics. Burgess. Minneapolis, 1970. pp , 100-103.
11. Theeuwes, F. and Higuchi. T., U.S. Patent 3,845.770 (1974) (assigned to Alza Corp., Palo Alto. California).
12. Theeuwes, F.. Elementary osmotic pump. J. Piuirm, sci., 64: 1987(1975) •
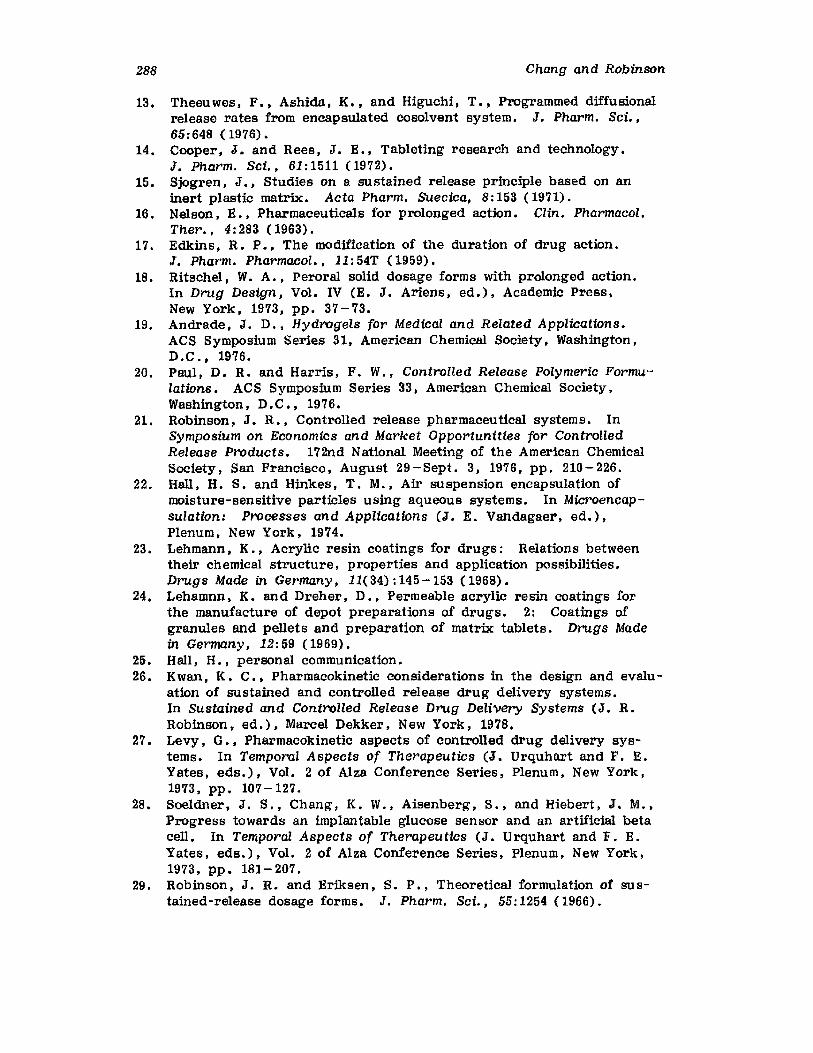
288 Chang and Robinson
13. Theeuwes J F., Ashida, K., and Higuchi, T., Programmed diffu sionalrelease rates from encapsulated cosolvent system. J. Pharm. Sci.,65: 648 (1976).
14. Cooper, J. and Rees, J. E., Tableting research and technology.J. Pharm. Sci., 61: 1511 (1972).
15. Sjogren, J., Studies on a sustained release principle based on aninert plastic matrix. Acta Pharm. suecica, 8: 153 (1971).
16. Nelson, E. J Pharmaceuticals for prolonged action. CUn. Pharmacal.Ther., 4:283 (1963).
17. Edkins, R. P., The modification of the duration of drug action.J. Pharm. Pharmacol., 11: 54T (1959).
18. Ritschel, W. A., Peroral solid dosage forms with prolonged action.In Drug Design, Vol. IV (E. J. Ariens, ed.), Academic Press,New York, 1973, pp. 37-73.
19. Andrade, J. D., Hydrogels for Medical and Related Applications.ACS Symposium Series 31, American Chemical Society, Washington,D.C .. 1976.
20. Paul, D. R. and Harris, F. W., Controlled Release Polymeric Formulations. ACS Symposium Series 33, American Chemical Society.Washington, D.C., 1976.
21. Robinson, J. R., Controlled release pharmaceutical systems. InSymposium on Economics and Market Opportunities for ControlledRelease Products. 172nd National Meeting of the American ChemicalSociety, San Francisco, August 29-Sept. 3, 1976, pp. 210-226.
22. Hall, H. S. and Hinkes, T. M., Air suspension encapsulation ofmoisture-sensitive particles using aqueous systems. In Microencapsulation: Processes and Applications (J. E. Vandagaer, ed.),Plenum, New York, 1974.
23. Lehmann, K., Acrylic resin coatings for drugs: Relations betweentheir chemical structure, properties and application possibilities.Drugs Made in Germany, 11( 34) : 145 -153 (1968).
24. Lehamnn , K. and Dreher, D., Permeable acrylic resin coatings forthe manufacture of depot preparations of drugs. 2: Coatings ofgranules and pellets and preparation of matrix tablets. Drugs Madein Germany, 12:59 (1969).
25. Hall, H., personal communication.26. Kwan, K. C., Pharmacokinetic considerations in the design and evalu
ation of sustained and controlled release drug delivery systems.In Sustained and Controlled Release Drug Delivery Systems (J. R.Robinson, ed.), Marcel Dekker, New York, 1978.
27. Levy, G., Pharmacokinetic aspects of controlled drug delivery systems. In Temporal Aspects of Therapeutics (J. Urquhart and F. E.Yates, eds.), Vol. 2 of Alza Conference Series, Plenum, New York,1973, pp. 107-127.
28. Soeldner, J. S., Chang, K. W., Aisenberg, S., and Hiebert, J. M.,Progress towards an implantable glucose sensor and an artificial betacell. In Temporal Aspects of Therapeutics (J. Urquhart and F. E.Yates, eda.}, Vol. 2 of Alza Conference Series, Plenum, New York,1973, pp , 181-207.
29. Robinson. J. R. and Eriksen, S. P., Theoretical formulation of sustained-release dosage forms. J. Pharm. Sci., 55: 1254 (1966).
Sustained Drug Release from Tablets and Particles 289
30. Fincher, J. B., Particle size of drugs and its relationship to absorption and activity. J. Pharm. Sci., 57: 1825 (1968).
31. Lee, V. B. and Robinson, J. R., Drug properties influencing thedesign of sustained Or controlled release drug delivery systems.In Sustained and Controlled Release Drug Delivery Systems (J. R.Robinson, ed.), Marcel Dekker, New York, 1978.
32. Hansch, C. and Dunn, W. J., Linear relationships between lipophiliccharacter and biological activity of drugs. J. Pharm. Sci •• 61: 1(1972) •
33. Fujita, T., Iwasa, J., and Hansch, C., A new substituent constant,derived from partition coefficients. J. Am. Chem. Soc.. 86: 5175(1964) •
34. Beerman, B., Hellstrom. K., and Rosen, A., Metabolism of propantheline in man. Clin, Pharmacol. Ther., 13: 212 (1972).
35. Niebergall, P. J., Sugita, E. T., and Schnaare, R. L., Potentialdangers of common drug dosing regimen. Am. J. Hasp. Pharm•• 31:53 (1974).
36. Brooke, D. and Washkuhn, R. J •• Zero-order drug delivery system:Theory and preliminary testing. J. Pharm. Sci.. 66: 159 (1977).
37. Lipper, R. A. and Higuchi, W. I., Analysis of theoretical behaviorof a proposed zero-order drug delivery system. J. Pharm. Sci.,66: 163 (1977).
38. Cobby, J., Mayersohn, M•• and Walker, G. C., Influence of shapefactors on kinetics of drug release from matrix tablets. I: Theoretical. J. Pharm. sa., 63: 725 (1974).
39. Green. B. K., U.S. Patent 2,712,507 (1955), Chem. Abstr. 50:12479a(1956) •
40. British Patent 490,001 (1938) through Chem. Abstr•• 33:814 (1939).41. Chang, T. M. S., Science. 146: 524 (1964).42. Chang. T. M. S., Science J., 3:63 (1967).43. Deasy, P. B., Microencapsulation and Related Drug Processes,
Marcel Dekker, New York. 1984, p , 120.44. Asker, A. F. and Becker, C. H., J. Pharm. Sci •• 55:90-94 (1966).45. Takenaka, H., Kawashima. Y., and Lin, S. Y., J. Pharm. sci., 69:
1388 - 1392 (1980).46. Cusimano, A. G. and Becker. C. H., J. Ptuirm, Sci., 5:1104-1112
(1968).47. Hamid, I. S. and Becker. C. H., J. Pharm. Sci., 59:511-514 (1970).48. Pederson, A. M. et al., U. S. Patent 4,572,833, Feb. 25 (1986).49. Colombo. P •• Conte, U., Caramella, C., Gaz zaniga , A., and
LaManna, A •• J. Controlled Release, 1: 283 - 289 (1985).50. U.S. Patent 3,400.185 (Sept. 3, 1968).51. Jager, K. F. and Bauer, K. H., Drugs Made in Germany. 15:61-65
(1982) •52. Kawashima, Y., Ohno , H., and Takenaka, H., J. Pharm. Sci•• 70:
913 -916 (1981).53. U.S. Patent 4,401,456 (Aug. 30, 1983).54. Roberts, A. G. and Shah, K. D., cnem. Eng., 12:748-750 (1975).55. Ghebre-Sellassie, I., Gordon, R. H., Fawzi, M. B., and Nesbitt,
R. U., Drug Dev, Ind. Pnarm.; 11: 1523-1541 (1985).56. Caldwell, H. C. and Rosen, E., J. Pharm. Set, 53:1387-1391 (1964).
290 Chang and Robinson
57. U.S. Patent 4,083,949 (1978).58. Handbook of Avicel Spheres, FMC Corp , , Philadelphia, (1982).59. Wan, L. S. L. and Jeyabalan, T., Chern. Ptuirtn, suu., 33:5449
5457 (1985).60. Conine, J. W. and Hadley, H. R., Drug Cosmet, Ind., 106:38-44
(1970) •61. Jalal, 1. M., Malinowski, H. J., and Smith, W. E., J. Pharm, Sci.,
6: 1466 (1972).62. Woodruff, C. W. and Nuessle, N. 0., J. Pharm. sct., 61: 787 -790
(1972) •63. Malinowski, H. J. and Smith, W. E., J. Ph arm • sct., 63: 285 - 288
(1974).64. O'Connor, R. E. and Schwartz, J. B., Drug Dev ; Ind. Pharm., 11:
1837 -1857 (1985).65. Chien, T. Y. and Nuessle, N. 0., Pharm, Tech., 9(4):42-48
(1985).66. Malinowski. H. J. and Smith, W. E., J. Pharm. Sci.. 64: 1688 -1692
(1975) •67. Scott. M. W., Robinson, M. J •• Pauls, J. F •• and Loritz, R. J.,
J. Pharm. Sci., 53:670 (1964).68. Osterwald, H. P •• Pharmaceut. Res., 2: 14 -18 (1985).69. Pharmaceu tical Glazes Product Information Bulletin, Somerset, New
Jersey, William Zinsser & Company.70. Stafford, J. W., Drug Dev; Ind. Pnarm, , 8:513-530 (1982).71. Bagar-ia , S. C. and Lordi, N. G.• Aqueous Dispersions of Waxes and
Lipids for Pharmaceutical Coating, Paper presented at the AAPSSecond National Meeting, Boston, Massachusetts, (1987).
72. Bauer, K. H. and Osterwald, H., Pnarm, Ind., 41: 1203 -1209(1979) .
73. Pondell, R. E., Drug Dev, Ind. Pharm., 10:191-202 (1984).74. Banker, G. S. and Peck, G. E., Pharm. Technol., 5(4):55-61
(1981) •75. Ghebre-Sellassie, I., Banker, G. S., and Peck, G. E., Water
Based Controlled-Release Drug Delivery Systems, Pharm. Tech.Conference 1982 Proceedings (Aster PUblishing Corp , , Springfield,Oregon, 1982), pp. 234-241.
76. Goodhart, F. W., Harris, M. R., and Nesbitt, R. W., Pharm.Technol. 8( 4) : 64 -71 (1984).
77. Lehman, K., Acta Pnarm, Fenn., 81( 2) : 55 -74 (1984).78. Lehman, K., Acta Pharm. Fenn, , 91( 4) : 225 - 238 (1982).79. Lehman, K. and Dreher, D., Int. J. Piuirm, Tech. Prod. Mfr., 2( 4):
31- 43 (1984).80. Chang, R. K., Hsiao, C. H., and Robinson, J. R., Pharm. Technol.,
11(3) :56-68 (1987).81. Gurny, R., Pharm. Acta Helv., 56(4-5):130-132 (1981).82. Gurny, R., Peppas , N. A., Harrington, D. D •• and Banker, G. S.,
Drug Dev, Ind. Pharm., 7(1): 1-25 (1981).83. Willis, C. R. and Banker, G. S., J. Ptuirtn, Sci., 57:1598-1603
(1968) .84. Goodman, H. and Banker. G. S., J. Pharm. sa., 59:1131-1137
(1970) •
Sustained Drug Release from Tablets and Particles 291
85. Rhodes, C. T., Wai, K., and Banker, G. S., J. Pharm. sa., 59:1578 -1581 (1970).
86. Rhodes, C. T., Wai, K., and Banker. G. S., J. Pharm. Sci., 59:1581-1584 (1970).
87. Boylan, J. C. and Banker, G. S., J. Pharm. sci., 62:1177-1183(1973) •
88. Larson, A. B. and Banker, G. S., J. Pharm. Sci, , 65:838-843(1976) •
89. Garden, J. L., High Polymers, 29:143-197 (1977).90. Woods, M. E., Dodge, J. S., Krieger, 1. M., and Pierce, P. Eo;
J. Paint. Technol., 40( 527) : 541- 548 (1968).91. Hansmann, J., Adhaesian, 20( 10): 272- 275 (1976).92. Vanderhoff, J. W. et al., U.S. Patent 4,177,177 (Dec. 4, 1979).93. Sanders, F. L. et aI., U.S. Patent 3,652,676 (Feb. 15, 1972).94. Burke, O. W., Jr., U.S. Patent 3,652,482 (1972).95. Miller, A. L. et al., U.S. Patent 3,022,260 (1962).96. Aelony, D. et al., U.S. Patent 2,899,397 (1959).97. Burton, G. W. and O'Farrell, C. P., Rubber Chem. Technol., 49(2):
394 (1976).98. Chang, R. K., Price, J. C., and Whitworth, C. W., Ph arm.
Technol., 10( 10) : 24 - 33 (1986).99. Chang, R. K., Price, J. C., and Whitworth, C. W., Drug Dev ; Ind.
Pharm., 13:1119-1135 (1987).100. Chang, R. K•• Price, J. C., and Whitworth, C. W., Drug Dev; Ind.
Pharm., 12: 2335, 2380 (1986).101. Cooper, W.• U.S. Patent 3,009,891 (1961).102. Date, M. et al , , Jpn. Patent 7306,619 (1973).103. Warner, G. L. et al., U.S. Patent 4,123,403 (Oct. 31, 1978).104. Leng, D. E. et al., U.S. Patent 4,502,888 (Mar. 5, 1985).105. Judd, P., Brit. Patent 1,142,375 (1969).106. Dieterich, Do; Keberle , W., and Wuest, R., J. Oil Col. Chern.
Assoc., 53(5):363-379 (1969).107. Gurny, R., Bindschaedler, C., and Doelker, E., Recent Advances
in Latex Technology, Proceedings Intern. Symp. Control. ReI.Bioact. Mater. 13, 1986 (Controlled Release Society, Ino , , Lincolnshire, Illinois), pp , 130 -131.
108. Li , L. C. and Peck, G. E., Water Based Silicone Elastomer Dispersions as Controlled Release Tablet Coating (1) -PreliminaryEvaluation of the SHicone Elastomer Dispersions, ProceedingsIntern. Symp. Control. ReI. Bioact. Mater., 14, 1987 (ControlledRelease Society, Ine , , Lincolnshire, illinois), pp , 148 -149.
109. Li, L. C. and Peck, G. E., Water Based Silfcone Elastomer Dispersions as Controlled Release Tablet Coating (II) -FormulationConsiderations, Proceedings Intern. Symp. Control. Rel. Bioact.Mater., 14, 1987 (Controlled Release Society, Ine , , Lincolnshire,illinois), pp. 150-151.
110. Mehta, A. M. and Jones, D. M., Pharm. Technol., 9(6) :52-60(1985) .
111. Sono-Tek Ultrasonic Nozzles, Technical Information Bulletin,Poughkeepsi, New York, Sono-Tek Corporation, 1984.
112. Bindsschaedler , C., Gurny, R., and Doelker, E., Lobo-Ptiarma-:Probl. Tech., 31/311:389-394 (1983).
292 Chang and Robinson
113. Standard Test Method for Minimum Film Formation Temperature ofEmulsion, American Society for Testing and Materials, DesignationD2354-81, pp. 407 -409 (l981).
114. Standard Test Method for Transition Temperature of Polymer byThermal Analysis, American Society for Testing and Materials,Designation D3418-75, pp. 840 -843 (1976).
115. Modern Plastics Encyclopedia, McGraw-Hill, New York, 1984-1985,pp , 635-644.
116. D.K. patent Application GB 086725A.117. Conte, D., Colombo, P., Caramella, C., and LaManna, A., Farmaco
Ed. Pract., 39:67 (1984).118. Salomon, J. L., Doelker, E., and Buri, P., Pharm. Irui, , 41:799
(1979) •119. Bludbaugh, F., Zapapas, J., and Sparks, M., J. Am. Piuirm,
Assoc. (Sci. ea.i, 47, 12:857-870 (1958).120. Decoursin, J. W., Conference Proceedings of the Latest Developments
in Drug Delivery Systems, Aster PUblishing Corp., 1985, pp.29-32.
121. Sheth, P. R. and Tossounian, J., Drug Dev; Ind. Pharm., 10:313 - 339 (1984).
122. Huber, H. F., Dale, L. B., and Christensen, G. L., J. Pharm.sct., 55: 974 (1966).
123. Kaplan, L. L., J. Pharm. sa., 54: 457 (1965).124. Kornblum, S. S., J. Pnarm, Sci.. 58:125 (1969).125. Lapidus, H. and Lordi, N. G., J. Pharm. Sci•• 55:840 (1966).126. Huber, H. F. and Christensen, G. L., J. Pharm. Sci., 57:164
(1968) .127. Baun , D. C. and Walker. G. C .• Pharm. Acta Helv., 46:94 (1971).128. Choalis, N. H. and Papadopoulos, H., J. Pharm. Sci., 64: 1033
(1975) .129. Lapidus, H. and Lordi, N. G., J. Pharm. sct., 57:1272 (1968).130. Nystrom, C., Mazur, J., and Sjorgren, J., Int. J. Pharm •• 10:
209- 218 (1982).131. Touiton, E. and Donbrow, M., Int. J. Pharm., 11:131-148 (1982).132. Daly, P. B .• Davis, S. S •• and Kennerley, J. W., Int. J. Pharm.,
18:201-205 (1984).133. Burl, B. and Doelker, E., Pharm. Acta Hetv ; , 55(7-8):189-197
(1980) •134. Handbook on Methocel Cellulose Ester Products, Dow Chemical
Company, Midland, Michigan, 1984.135. Raghunathan, Y. and Becker, C. H., J. Pharm. sei., 57:1748
(1968) •136. Cusimano, A. G. and Becker, C. H., J. Pharm. Sci., 57:1104
(1968) •137. John, P. H. and Becker, C. H., J. Pharm. Sci" 57:584 (1968).138. Robinson, M. J., Bondi, A., and Swintosky, J. V., J. Am. Pharm,
Assoc. Sci. sa., 47:874 (1958).139. Kowarski, C. R., Volberger, B., Versanno, J., and Kowanski, A.,
Am. J. Hosp. Pharm., 21: 409 (1964).140. Yamamoto. R. and Baba , M., Jpn. Patent 1849.1960, through
Chern. Abstr. 54.20100d, 1960.
Sustained Drug Release from Tablets and ParUcles 293
141. Draper, E. B. and Becker, C. H., J. Pharm. Sci, , 55:376 (1966).142. Robinson, I. C. and Becker, C. H., J. Pharm. Sci., 57:49 (1968).143. Lazarus, J., Pagliery, M., and Lachman, L., J. Pharm. Sci., 53:
798 (1964).144. Sjogren, J. and Fryklof, L. E., Pharm, Rev., 59:171 (1960).145. Rowe, R. C., Manuf. Chem, Aerosol News, 46(3):23 (1975).146. Desai, S. J., Simonelli, A. P., and Higuchi, W. I., J. Pharm. se«,
54: 1459 (1965).147. Farhadien, B., Borodkin, S., and BUddenhagen, J. D., J. Pharm.
Sic., 60:209 (1971).148. Rowe, R. C., Elworthy, P. H., and Ganderton, D., J. Pharm.
Pharmacal., 24(Suppl.): 137P (1972).149. Endicott, C. J., U.S. Patent 3,087,860 (1963).150. Singh, P., Desai, S. J., Simonelli, A. P., and Higuchi, W. 1.,
J. Pharm. Sci., 56:1542 (1967).151. Farhadien, B., Borodkin, S., and BUddenhagen, J. P., J. Pharm.
Sci., 60: 212 (1971).152. Rowe, R. C., Elworthy, P. H., and Ganderton, D., J. Pharm.
Pharmacal •• 25(Suppl.): 112P (1973).153. Rowe, R. C., Elworthy, P. H., and Ganderton, D., J. Pharm.
Pharmacal., 25(SuppL): 12P (1973).154. Desai, S. J.. Singh, P., Simonelli, A. P., and Higuchi, W. I.,
J. Pnarm, sa., 55: 1235 (1966).155. Chang, R. C. and Price, J. C., J. Biomater, Appl., 3( 1) :80
(1988) •156. Jalsenjak, I., Nixon, J. R., Senjkovic, R., and Stivic, 1.,
J. Pharm. Pharmacal., 32:678 (1984).157. Jalsenjak, I., Nicolaidon, C. F., and Nixon, J. R., J. Pharm.
Pharmacol., 29: 169 (1977).158. Nixon, J. R., Jalsenjak, I., Nicolaidon, C. F., and Harris, M.,
Drug Dev. Ind. Pharm., 4: 117 (1978).159. Nixon, J. R. and Agyilirah, G. A., J. Pharm, Sci., 73:52 (1984).160. Chemtob, C., Chaumeil, J. C., and N'Dongo , M., Int. J. Pharm.,
29:83 (1986).161. Hasagawa, A., Nakagawa, H., and Sugimoto, 1.. Yakugaku Zasshi,
104:889 (1984).162. Walker, S. E., Ganley, J., and Eaves, T., Tableting Properties
of Potassium Chloride Microcapsules. In F.I.P, Abstracts, 37thInternational Congress of Pharmaceutical Congress of Pharmaceutical Sciences, The Hague, Sept. 1977, p. 31.
163. Abdel Monem Sayed, H. and Price, J. C., Drug Dev. Ind. Pharm.,12: 577 (1986).
164. Colbert, J. C., Controlled action drug forms. In Chemtcal Technology Review, No. 24. Noyes Data Corp , , Park Ridge, NewJersey. 1974.
165. Johnson, J. C •• Tablet manufacture. In Chemical TechnologyReview, No. 30, Noyes Data Corp., Park Ridge, New Jersey,1974.
166. Green, M. A., One year's experience with sustained release antihistamine medication. Ann. Allergy, 12: 273 (1954).
167. Rogers, H. L., Treatment of allergic conditions with sustained release chlorpropenypyridamine maleate. Ann. Allergy, 12:266 (1954).

294 Chang and Robinson
168. Berkowitz. D.. The effect of a long-acting preparation (Spansule)of belladonna alkaloids on gastric secretion of patients with peptideulcer. Gastroenterology. 80: 608 (1956).
169. Morrison, S., The use of a sustained release tranquilizer-anticholinergic combination in patients with disturbed digestive function.Am. J. Gastroenterol., 29:518 (1958).
170. Grahn. H. V., Antihypertensive effects of reserpine in sustainedrelease form: A comparative study. J. Am. certatr. Soc., 6:671(1958).
171. Burness, S. H., Clinical evaluation of a sustained release belladonna preparation. Am. J. Dig. ou., 22:111 (1955).
172. Heimlich, K. R., MacDonnell, D. R., Flanagan, T. L., and O'Brien,P. D.. Evaluation of a sustained release form of phenylpropanolamine hydrochloride by urinary excretion studies. J. Pharm. Sci.,50:232 (1961).
173. Heimlich, K. R., MacDonnell, D. R., Polk, A., and Flanagan.T. L., Evaluation of an oral sustained release dosage form oftrimeprazine as measured by urinary excretion. J. Pharm. Sci•• 50:213 (1961).
174. Vasconcellos, J. and Kurland, A. A., Use of sustained-releasechlorpromazine in the management of hospitalized chronic psychoticpatients. Dis. Nerv ; Sys., 19:173 (1958).
175. Souder. J. C. and Ellenbogen, W. C., Laboratory control of dextroamphetamine sulfate sustained release capsulea, Drug Stand., 26:77 (1958).
176. Steigmann, F., Kaminski, L •• and Nasatir, S., Clinical-experimentalevaluation of a prolonged-acting antispasmodic-sedative. Am. J.Dig. Dis., 4:534 (1959).
177. Mellinger. T. J., Serum concentrations of thioridazine after different oral medication forms. Am. J. Psychiatry. 121: 1119 (1965).
178. Hollister, L. E., Studies of prolonged-aetion medication. II: Twophenothiazine tranquilizers (thioridazine and chlorpromazine) administered as coated tablets and prolonged action preparations.Curro Ther. Res•• 4:471 (1962).
179. Mellinger. T. J.. Mellinger, E. M., and Smith, W. T.. Thioridazineblood levels in patients receiving different oral forms. CUn.Pharmacol. Ther., 6:486 (1965).
180. vestee, N. D. and Schiele, B. C •• An evaluation of slow-releaseand regular thioridazine and two medication schedules. Curro Ther.Res., 8:585 (1966).
181. Swintosky, J. V., Design of oral sustained-action dosage forms.Drug Cosmet. Ind., 87: 464 (1960).
182. Blythe, R. H., The formulation and evaluation of sustained releaseproducts. Drug Stand., 26: 1 (1958).
183. Wagner. J. G., Carpenter. O. S •• and Collins. E. J.. Sustainedaction oral medication. I: A quantitative study of prednisolone inman, in the dog and in vitro. J. Pharmacal. Exp. Ther•• 129:101(1960) •
184. Nash, J. F. and Crabtree, R. E., Absorption of tritiated d -desoxyephedrine in sustained-release dosage forms. J. Pharm. Sci•• 50:134 (1961).
SUstained Drug Release from Tablets and Particles 295
185. Rosen, E. and Swintosky, J. V., Preparation of a 35s labeled trimeprazine tartrate sustained action product for its evaluation inman. I. Pharm. Pharmacal •• 12: 237T (1960).
186. Hollister, L. E., Studies of delayed-action medication. I: Meprobamate administered as compressed tablets and as two delayed-actioncapsules. N. Engl. I. uea., 266: 281 (1962).
187. Rosen, E., Tannenbaum, P., Ellison, T., Free, S. M., and Crosley,A. P., Absorption and excretion of radioactively tagged dextroamphetamine sulfate from a sustained-release preparation. I.A.M.A.,194: 145 (1965).
188. Sugerman, A. A. and Rosen, E., Absorption efficiency and excretion profile of a prolonged-action form of chlorpromazine. ClintPharmacal. Ther., 5: 561 (1964).
189. Rosen, E., Ellison, T., Tannenbaum, P.. Free, S. M., and Crosley,A. P., Comparative study in man and dog of the absorption and excretion of dextroamphetamine- 14C sulfate in sustained-release andnonsustained-release dosage forms. I. Pharm. sci., 56: 365 (1967).
190. Rosen, E., Polk, A., Free, S. M., Tannenbaum, P. J., and Crosley,A. P., Comparative study in man of the absorption and excretionof amobarbital- 14C from sustained-release and nonsustained-releasedosage forms. I. Pharma. Sci•• 56: 1285 (1967).
191. Khali, S. A. H. and Elgamal, S. S., In vitro release of aspirinfrom various wax-coated formulations. I. Pharm. Pharmacal., 23:72(1971) .
192. Royal, J., In vitro method for the determination of the rate of release of amphetamine sulfate from sustained release medication.Drug Stand•• 26:41 (1958).
193. Royal, J., A comparison of in vitro rates of release of severalbrands of dextroamphetamine sulfate sustained release capsules.Drug stana«, 27: 1 (1959).
194. Campbell, J. A., Nelson, E., and Chapman, D. G., Criteria fororal sustained release medication with particular reference toamphetamine. Can. Med. Assoc. I., 81:15 (1959).
195. Nash, R. A. and Marcus, A. D., An in vitro method for the evaluation of sustained release products. Drug Stand., 28: 1 (1960).
196. Vliet, E. B., A suggested in vitro procedure for measuring the rateof drug release from timed release tablets and capsules. DrugStand., 27: 97 (1959).
197. Beckett, A. H. and Tucker, G. T., A method for the evaluation ofsome oral prolonged-release forms of dextroamphetamine in man,using urinary excretion data. I. Pharm. Pharmacal. I 18: 72S(1966) •
198. Campbell, J. A., Evaluation of sustained-action release rates. DrogCosmet. Ind., 87: 620 (1960).
199. Ipsen, J., Mathematical relationship of in vitro release rates andbiological availability of controlled-release nitroglycerin (Nitrong).Curr. Ther. Res., 13:193 (1971).
200. Feinblatt, T. M. and Ferguson, E. A., Timed-disintegration capsules.An in vivo roentgenographic study. N. Engl. I. Med., 254:940(1956) •
201. Feinblatt, T. M. and Ferguson, E. A., Timed-disintegration capsules(Tympcaps): A further study. An in vivo roentgenographic study,
296 Chang and Robinson
blood level study and relief of anginal pain with pentaerythritoltetranitrate. N. Engl. J. Med., 256:331 (1957).
202. Aming, Y. M. and Nagwekar, J. B., Rationale for apparent differ·ences in pharmacokinetic aspects of model compounds determinedfrom blood level data and urinary excretion data in rats. J. Pharm,sa., 65: 1341 (1976).
203. Henning, R. and Nyberg, G•• Serum quinidine levels after administration of three different quinidine preparations. Bur, J. Clin.Pharmacol., 6: 239 (1973).
204. Green, D. M., Tablets of coated aspirin microspherules: A newdosage form. J. New Drugs, 6: 294 (1966).
205. Magee, K. R. and Westerberg, M. R., Treatment of myastheniagravis with prolonged-action mestinon. Neurology, 9: 348 (1959).
206. Cass, L. J. and Frederik, W. S., CliniCal comparison of a sustainedand a regular-release aspirin. Curro Ther. Res., 7:673 (1965).
207. cass, L. J. and Frederik, W. S., A clinical evaluation of a sustained-release aspirin. Curl". Ther. Res., 7:683 (1965).
208. Sirine, G., Microencapsulation. Drug Cosmet. Ind., 101:56(Sept. 1967).
209. Luzzi, L., Microencapsulation. J. Pharm, Sci•• 59: 1367 (1970).210. Bakan, J. A. and Sloan. F. D., Microencapsulation of drugs. Drug
Cosmet. Ind., 110: 34 (March 1972).211. Nixon, J. R. and Walker, S. E •• The in vitro evaluation of gelatin
coacervate microcapsules. J. Pharm. Pharmacol., 23:1478 (1971).212. Matthews, B. R. and Nixon, J. R., Surface characteristics of
gelatin microcapsules by scanning electron microscopy. J. Pharm.Pharmacal., 26:383 (1974).
213. Tanaka, N., Takino, S., and Utsumi, I., A new oral gelatinizedsustained-release dosage form. J. Piuirm, Sci., 52:664 (1963).
214. Phares. R. E. and Sperandio , G. J., Coating pharmaceu ticals bycoacervation. J. Pnarm, sct., 53: 515 (1964).
215. Madan, P. L., Luzzi, L. A., and Price, J. C., Microencapsulationof a waxy solid: Wall thickness and surface appearance studies.J. Ph arm. sa., 63: 280 (1974).
216. Madan, P. L., Luzzi, L. A., and Price, J. C., Factors influencingmicroencapsulation of a waxy solid by complex coacervation.J. Pharm. sa., 61:1586 (1972).
217. Luzzi, L. A. and Gerraughty, R. J., Effects of selected variableson the mtcroencapsulation of solids. J. Pharm • Sci., 56: 634 (1967).
218. Merkle, H. P. and Speiser. P •• Preparation and in vitro evaluationof cellulose acetate phthalate coacervate microcapsules. J. Pharm.sa., 62: 1444 (1973).
219. LUZzi, L. A. and Gerraughty, R. J •• Effect of additives and formulation techniques on controlled release of drugs from microcapsules.J. Pharm. sct., 56: 1174 (1967).
220. Birrenbach, G. and Speiser. P. P.. Polymerized micelles and theiruse as adjuvants in immunology. J. Ptuu-m, set., 65:1763 (1976).
221. McGinity. J. W.. Cobs. A. B.. and Martin, A. N., Improved methodfor microencapsulation of soluble pharmaceuticals. J. Pharm. Set.,64:889 (1975).
Sustained Drug Release from Tablets and Particles 297
222. Khanna, S. C., Jecklin, T., and Speiser, P., Bead polymerizationtechnique for sustained-release dosage form. J. Pharm. Sci•• 59:614 (1970).
223. Khanna, S. C. and Speiser, P., In vitro release of chloramphenicolfrom polymer beads of a -methacrylic acid and methylmethacrylate.J. Ptuirm, sct., 59: 1398 (1970).
224. Seager, H. and Baker, P., The preparation of controlled releaseparticles in the subsieve size range. J. Pharm. Pharmacal., 24:123P (1972).
225. Croswell, R. W. and Becker, C. H., Suspension polymerization forpreparation of timed-release dosage forms. J. Pharm. sct., 63:440(1974) •
226. Willis, C. R. and Banker , G. S., Polymer-drug interacted systemsin the physicochemical design of pharmaceutical dosage forms.I: Drug salts with PVM/MA and with a PVM/MA hemi-ester.J. Pharm. Sci•• 57: 1598 (1968).
227. Goodman, H. and Banker, G. S., Molecular- scale drug entrapmentas a precise method of controlled drug release. I: Entrapment ofcationic drugs by polymeric flocculation. J. Pharm. Sci•• 59: 1131(1970) •
228. Rhodes, C. T., Wai, K•• and Banker. G. S., Molecular scale drugentrapment as a precise method of controlled drug release.II: Facilitated drug entrapment to polymeric colloidal dispersion.J. Pharm, sa., 59: 1578 (1970).
229. Rhodes, C. T •• Wait K•• and Banker, G. S., Molecular scale drugentrapment as a precise method of controlled drug release.III: In vitro and in vivo studies of drug release. J. Pharm. Set,59: 1581 (1970).
230. Boyland. J. C. and Banker, G. S., Molecular-scale drug entrapmentas a precise method of controlled drug release. IV: Entrapment ofanionic drugs by polymeric gelation. J. Pharm. Sci•• 62: 1177(1973) •
231. Larson. A. B. and Banker, G. S.. Attainment of highly uniformdrug dispersions employing molecular scale drug entrapment inpolymeric latices. J. Pharm. sct.; 65: 838 (1976).
232. Bell, S. A•• Berdick, M.• and Holliday, W. M•• Drug blood levelsas indices in evaluation of a sustained-release aspirin. J. NewDrugs, 6: 284 (1966).
233. Rotatein , J., Estrin,!., Cunningham, C., Gilbert, M•• Jordan. A.,Lamstein • J.. Safrin, M., Wimer, E., and Silson, J., The use of asustained-release aspirin preparation in the management of rheumatoid arthritis and osteoarthritis. J. GUn. Pharmacal.. 7: 97 (1967).
234. Draper. E. B. and Becker. C. H.. Some wax formulations ofsulfaethylthiadiazole produced by aqueous dispersion for prolongedrelease medication. J. Pharm. ss«, 55: 376 (1966).
235. Robinson,!. C. and Becker, C. H., Sulfaethylthiadiazole (SETD)release from synthetic wax prolonged-release particles. I: Effectof dispersant concentration. J. Pharm. Sci •• 57:49 (1968).
236. John, P. M. and Becker, C. H., Surfactant effects on spraycongealed formulations of sulfaethylthiadiazole-wax. J. Pharm. Sci••57:584 (1968).
298 Chang and Robinson
237. Cusimano. A. G. and Becker, C. H., Spray-congealed formulationsof sulfaethylthiadiazole (SEl'D) and waxes for prolonged-releasemedication. Effect of wax. J. Pharm. sct., 57: 1104 (1968).
238. Raghuathan, Y. and Becker. C. H•• Spray-congealed formulations ofsuIfaethylthiadiazole (SETD) and waxes for prolonged-release medication. Effect of modifiers. J. Pharm. sa., 57: 1748 (1968).
239. Hamid, I. S. and Becker, C. H., Release study of sulfaethylthiadiasole (SETD) from a tablet dosage form prepared from spraycongealed formulations of SETD and wax. J. Phorm, Sci., 59: 511(1970) •
240. Wurster, D. E., U.S. Patent 2,648,609 (August 11, 1953).241. Wurster, D. E., U.S. Patent 2,799,241 (July 16, 1957).242. Doerr, D. W., Series, E. Rot and Deardorff, D. L., Tablet coat
ings: Cellulosic high polymers. J. Am. Pharm. Assoc., Sci. Ed.,43: 433 (1954).
243. Gagnon, L. P., DeKay. H. G.. and Lee, C. 0 •• Coating of granules.Drug Stand., 23:47 (1955).
244. Ahsan , S. S. and Blaug, S. M., A study of tablet coating usingpolyvinylpyrrolidone and acetylated monoglyceride. Drug Stand., 26:29 (1958).
245. Wagner, J. G., Veldkamp, W., and Long, S., Enteric coatings.IV: In vivo testing of granules and tablets coated with styrenemaleic acid copolymer. J. Am. Pharm. Assoc., Sci. Ed., 49:128(1960) •
246. Kleber, J. W., Nash, J. F OJ and Lee. C. C., Synthetic polymers aspotential sustained-release coatings. J. Pharm. Sci., 53: 1519(1964) .
247. Asker, A. F. and Becker. C. H., Some spray-dried formulations ofsulfaethylthiadiaoole for prolonged-release medication. J. Pharm.sa., 55: 90 (966).
248. Lappas, L. C. and McKeehan, W•• Polymeric pharmaceutical coatingmaterials. II: In vivo evaluation as enteric coatings. J. Pharm.sa., 56: 1257 (1967).
249. Seidler, W. M. K. and Rowe, E. J., Influence of certain factors onthe coating of a medicinal agent on core tablets. J, Pharm. Sci., 51:1007 (1968).
250. Powell, D. R. and Banker, G. S., Chemical modifications of polymericfllm systems in the solid state. I: Anhydride acid conversion.J. Pharm. Sci•• 58: 1335 (1969).
251. Tsevdos, T. J., Press-coated and multi-layer tablets. Drug Cosmet.Ind.. 78: 38 (1956).
252. Windheuser. J. and Cooper, J., The pharmaceutics of coating tabletsby compression. J. Am. Pharm. Assoc., Set. Ed., 45:542 (1956).
253. Cooper, J. and Pasquale, D., ThE' present status of compressioncoating. Pharm. J., 181: 397 (1958).
254. Lachman. L •• Speiser, P. P., and Sylwestrowicz. H. D., Compressed coated tablets. I: Measurement and factors influencingcore concentration. J. Pharm. Sci., 52:379 (1963).
255. Wurster, D. E., Air-suspension technique of coating drug particles.A preliminary report. J. Am. Pharm. Assoc., Sci. Ed •• 48: 451(1959) •

Sustained Drug Release from Tablets and Particles 299
256. Wurster. D. E., Preparation of compressed tablet granulations bythe air-suspension technique. II. J. Am. Pharm. Assoc., Sci.sa., 49: 82 (1960).
257. Coletta. V. and Rubin, H., Wurster coated aspirin. I: FUm-coatingtechniques. J. Pharm. Sci., 53:953 (1964).
258. Wood, J. H. and Syarto, J., Wurster coated aspirin. II: An:In vitro and :In vivo correlation of rate from sustained-releasepreparations. J. Pharm. sa., 53:877 (1964).
259. Donbrow, M. and Friedman, M., Timed release from polymeric filmscontaining drugs and kinetics of drug release. J. Pharm. sct., 64:76 (1975).
260. Higuchi, T., Mechanism of sustained-action medication. Theoreticalanalysis of rate of rel~se of solid drugs dispersed in solid matrices.J. Pharm. sa., 52: 1145 (1963).
261. Borodkin, S. and Tucker, F. E., Drug release from hydroxypropylcellulose-polyvinyl acetate fflms , J. Pharm. sct., 63: 1359 (1974).
262. Borodkin, S. and Tucker, F. E., Linear drug release from laminatedhydroxypropyl cellulose-polyvinyl acetate films. J. Pharm. Sci., 64:1289 (1975).
263. Bercher, P. R., Bevans, D. W., Gormley, J. D., Hubbard, R. E.,Sullivan, D. D.. Stevenson, C. R .• Thomas, J. B .• Goldman. R.,and Silson, J. E.. Sinusule: Timed-release therapy in allergicrhinitis. with human in vivo release rates and clinical statistics.Curro Ther. Res., 9:379 (1967).
264. Sjogren, J. and Fryklof. L. W., Duretter: A new type of oralsustained action preparation. Farm. Rev. (Stockh.), 59:171 (1960).
265. Cooper, J •• Lontab repeat action tablets. Drug Cosmet. Ind., 81:312 (1957).
266. Sjogren, J. and Ostholm, I., Absorption studies with a sustainedrelease tablet. J. Piiarm, Pharmacol., 13:496 (1961).
267. Sjogren, J. and Ervik. M., A method for release rate determinationfrom sustained-release tablets. Acta Piuirm, Suecica, 1: 219 (1964).
268. Collins. R. L. and Doglia, S., Theory of controlled release ofbiologically active substances. Arch. Environ. Contam. Toxicol., 1:325 (1973).
269. EI-Egakey, M. A., EI-Khawas, F., EI-Gindy, N. A., andAbdel-Khalik, M•• Release study of some drugs from polymericmatrices. Pharmazie, 29: 286 (1974).
270. Asker, A. F., Motawi, A. M., and Abdel-Khalek, M. M., A studyof some factors affecting the in vitro release of drug from prolonged release granulations . I: Effect of method of preparations.Piuirmazie, 26: 170 (1971).
271. Asker, A. F., Motawi, A. M., and Abdel-Khalek, M. M., A studyof SOme factors affecting the in vitro release of drug from prolonged release granulations. 2: Effect of dissolution retardent.Pharmazie, 26: 213 (1971).
272. Asker, A. F., Motawi, A, M., and Abdel-Khalek, M. M., A studyof some factors affecting the in vitro release of drug from prolonged release granulations. 3: Effects of particle size, enzymaticcontents of pepsin and pancreatin, bUe and ionic concentration.Pharmazie, 26: 215 (1971).
300 Chang and Robinson
273. Lapidus, H. and Lordi IN. G.. Some factors affecting the release ofa water-soluble drug from a compressed hydrophilic matrix.J. Ph arm. Sci., 55:840 (1966).
274. Huber, H. E., Dale, L. B •• and Christenson, G. L•• Utilization ofhydrophilic gums for the control of drug release from tablet formulations. 1: Disintegration and dissolution behavior. J. Pharm. Sci.,55:974 (1966).
275. Javoid, K. A., Fincher, J. H.• and Hartman, C. W., Timed-releasetablets employing lipase-lipid-sulfamethiazole systems prepared byspray-congealing. J. Pharm. sa., 60: 1709 (1971).
276. Javaid, K. A. and Hartman, C. W., Blood levels of sulfamethizole indogs following administration of timed-release tablets employinglipase-lipid-drug systems. J. Pharm. Sci•• 61:900 (1972).
277. Farhadieh , B" Borodkin, S., and Buddenhagen, J. D•• Drug release from methyl acrylate-methyl methacrylate copolymer matrix.II: Control of release rate by exposure to acetone vapor. J. Pnarm,sa., 60:212 (1971).
278. Elbert. W. R., Morris, R. W., Rowles, S. G., Russell, H. T ••Born. G. S., and Christian I J. E.. In vivo evaluation of absorptionand excretion of pentylenetetrazol-10- 14C from sustained-release andnonsu stained -release tablets. J. Pharm. Sci., 59: 1409 (1970).
279. Farhadieh. B., Borodkin , S., and Buddenhagen, J. D•• Drug release from methyl acrylate-methyl methacrylate copolymer matrix.1: Kinetics of release. J. Pharm. sct., 60:209 (1971).
280. Ritschel. W. A. I Influence of formulating factors on drug safety oftimed-release nitroglycerin tablets. J. Pharm. sct., 60: 1683 (1971).
281. Sjuib, F., Simonelli, A. P., and Higuchi, W. I., Release rates ofsolid drug mixtures dispersed in inert matrices. Ill: Binarymixture of acid drugs released into alkaline media. J. Pharm. Sci.,61: 1374 (1973).
282. Sjuib, F., Simonelli, A. P., and Higuchi, W. 1.. Release rates ofsolid drug mixtures dispersed in inert matrices. IV: Binarymixture of amphoteric drugs released into reactive media. J. Pharm.Sci., 61:1381 (1972).
283. Goodhart, F. W., McCoy. R. H., and Ninger, F. C., Release of awater-soluble drug from a wax matrix timed-release tablet. J.Pharm. sei., 63: 1748 (1974).
284. Choulis, N. H. and Papadopoulos I H., Timed-release tablets containing quinine sulfate. J. Pharm. sct., 64: 1033 (1975).
285. Chien, Y. W., Lambert, H. J., and Lin, T. K., Solution-solubilitydependency of controlled release of drug from polymer matrix:Mathematical analysis. J. Pharm. sct., 64: 1643 (1975).
286. Desai, S. J., Simonelli, A. P., and Higuchi, W. I •• Investigation offactors influencing release of solid drug dispersed in inert matrices.J. Pharm. set», 54: 1459 (1965).
287. Desai, S. J •• Singh, P., Simonelli. A. P., and Higuchi, W. 1.,Investigation of factors influencing release of solid drug dispersedin inert matrices. II: Quantitation of procedures. J. Pharm. Sci.,55; 1224 (1966).
288. Desai, S. J., Singh, P., Simonelli. A. P., and Higuchi, W. 1.,Investigation of factors influencing release of solid drug dispersed
Sustained Drug Release from Tablets and Particles 301
in inert matrices. III. Quantitative studies involving the polyethylene plastic matrix. J. Pharm. sct., 55: 1230 (1966).
289. Desai, S. J., Singh, P., Simonelli, A. P., and Higuchi, W. 1.,Investigation of factors influencing release of solid drug dispersedin inert matrices. IV: Some studies involving the polyvinylchloride matrix. J. Pharm. Sci.. 55: 1235 (1966).
290. Singh. P., Desai. S. J •• Simonelli, A. P •• and Higuchi, W. I.,Release rates of solid drug mixtures dispersed in inert matrices.I: Noninteracting drug mixtures. J. Pharm, sct., 56:1542 (1967).
291. Singh, P., Desai, S. J., Simonelli, A. P., and Higuchi, W. I.,Release rates of solid drug mixtures dispersed in inert matrices.II: Mutually interacting drug mixtures. J. Piuirm; set., 56: 1548(1967).
292. Singh, P., Desai, S. J., Simonelli, A. P .• and Higuchi, W. I.,Role of wetting on the rate of drug release from inert matrices.J. Pharm, Sci., 57: 217 (1968).
293. Schwartz, J. B., Simonelli, A. P., and Higuchi, W. I.. Drug release from wax matrices. I: Analysis of data with first-orderkinetics and with the diffusion-controlled model. J. Pharm. Sci.,57:274 (1968).
294. Schwartz, J. B., Simonelli, A. P., and Higuchi, W. I., Drugrelease from wax matrices. II: Application of a mixture theory tothe sulfanilamide-wax system. J. Pharm. sct., 57: 278 (1968).
295. Levy, G. and Hollister, L. E., Dissolution rate limited absorption inman. Factors influencing drug absorption from prolonged-releasedosage form. J. Pharm. Sci., 54: 1121 (1965).
296. Nicholson, A. E., Tucker, S. J., and Swintosky, J. V., Sulfaethylthiadiazole. VI: Blood and urine concentrations from sustainedand immediate release tablets. J. Am. Pharm. Aasoc; , Sci. Ed., 49:40 (1960).
297. Kaplan, L. L.. Determination of in vivo and in vitro release oftheophylline aminoisobutanol in a prolonged-action system. J. Pharm.Sci•• 54:457 (1965).
298. Laekenbaeher , R. S., Chlortrimeton maleate repeat action tablets inthe treatment of pruritic dermatoses. Ann. Allergy. 10:765 (1952).
299. Bancroft, C. M., Tripelenamine hydrochloride and chlorprophenpyridamine maleate. A comparison of their efficacies in the treatmentof hay fever. Ann. Allergy, 15: 297 (1957).
300. Fuller, H. L. and Kassel, L. E., Sustained-release triethanolaminetrinitrate biphosphate (Metamine) in angina pectoris. Antibiot. Med.,3: 322 (1956).
301. DeRitter, E., Evaluation of nicotinic alcohol Timespan tablets inhumans by urinary excretion tests. Drug Stand., 28: 33 (1960).
302. Caas , L. J. and Fredertk , W. S., Clinical evaluation of long-releaseand capsule forms of pentobarbital sodium. Curro Ther. Res., 4:263 (1962).
303. Webster, J. J., Treatment of iron deficiency anemia in patients withiron intolerance: Clinical evaluation of a controlled-release form offerrous sulfate. CUr'r. Ther, Res•• 4: 130 (1962).
304. Morrison, B. 0 •• Tolerance to oral hematinic therapy: Controlledrelease versus conventional ferrous sulfate. J. Am. Geriatr, Soc., 14:757 (1966).
302 Chang and RObinson
305. Crosland-Taylor, P. and Keeling. D. H•• A trial of slow-release tablets of ferrous sulphate. Curro Ther, Res •• 7:244 (1965).
306. Tarpley. E. L•• Controlled-release potassium supplementation. CurroTher. Res., 16:734 (1974).
307. 0 'Reagan. T.. Prolonged release aspirin. Drug. Cosmet. Ind., 98:35 (April 1966).
308. Wiseman, E. H. and Federici, N. J., Development of a sustainedrelease aspirin tablet. J. Pharm. Sci.. 57: 1535 (1968).
309. Wiseman. E. H.• Plasma salicylate concentrations following chronicadministration of aspirin as conventional and sustained-release tablets. Curro TheY'. Res •• 11:681 (1969).
310. Harris, R. and Regalado, R. G., A clinical trial of a sustainedrelease aspirin in rheumatoid arthritis. Ann. Ph)!s. Med •• 9:8(1967) •
311. Chandraesekaran. S. K•• Benson, H., and Urquhart. J., Methodsto achieve controlled drug delivery: The biomedical engineeringapproach, pp, 557-593. In Sustained and Controlled Release DrugDelivery Systems (J. R. Robinson, ed.), Marcel Dekker, New York,1978.
5The PharmaceuticalPilot Plant
Charles I. Jarowski
St. John's University, Jamaica, New York
I. INTRODUCTION
A. Primary Functions of the PharmaceuticalPilot Plant
The primary responsibility of the pilot plant staff is to ensure that thenewly formulated tablets developed by product development personnel willprove to be efficiently, economically, and consistently reproducible on aproduction scale. Attention must be given to the cost of manufacture,since low production costs provide a competitive advantage. This isespecially for tablets containing generic drugs. As a consequence, welldesigned tablet formulas must be processed intelligently to insure thateach unit operation is optimized. Thus, final compression conducted at arapid rate is economically advantageous. However, some of this advantagewill be lost if excessive production times are required and undesirableyield losses accrue during the blending, granulating, drying, and compression steps. Furthermore, excessive strain On the tablet presses canlead to the need for both more frequent press repair and resurfacing ofthe tablet punch faces.
The manufacturing instructions transferred to the production department should be clearly written, readily understood, and unambiguous.The widespread use of word processors makes standardization of such procedures desirable. Attention should be given to the use of in-house production equipment, unless sufficient data has been accumulated to supportthe economic advantage of purchasing new equipment. Alternate manufacturing equipment and procedures may also be required for internationalcompanies intending to manufacture pharmaceutical products at several sites.
303
304 Jarowski
The physical properties and specifications for the manufactured tabletformulation should match those established earlier by the product formulator, the pilot plant staff. and the quality control department. Therefore, the tablets manufactured on a production scale should possess theproper weight. thickness. and content uniformity. Tablet hardness. disintegration, and dissolution rates in simulated gastrointestinal media mustbe consistently attainable to ensure optimal bioavafiability.
Additional responsibilities for pilot plant personnel include the evaluation of new processing equipment and aiding in finding causes and providing solutions for problems that occasionally arise during routine tabletmanufacture. The manufacturer of quality tablets at a rate of 10, 000 perminute attests to the competence of tablet technologists. Such achievements have been made possible by the interaction of Skilled research,process development, and production personnel, Manufacturers of processing equipment have also played key roles by supplying excellent apparatusfor improving unit operations. such as particle size reduction. mixing.drying. granulating, compressing. and coating.
II. SELECTED FACTORS TO BE CONSIDEREDDURING DEVELOPMENT
The establishment of ideal formulations and procedures for plant manufacture must take into account a variety of factors.
A. Efficient Flow of Granules
The high speed of tablet manufacture currently attainable requires thatthe granule flow from hopper to die cavity be unimpeded. To accomplishsuch desired free flow, several parameters need study. First of all, theparticle size distribution of the granules must be accurately defined. Theaddition of glidants such as talc, starch. and magnesium stearate may beindicated for the large-scale manufacture of the tablet formulas developedin the laboratory.
The efficiency of granule flow can be checked in the pilot plant byconducting experiments under extended running conditions at high speed.Tablets produced for at least 3 to 4 h will possess uniform weight andhardness if granule flow has been efficient. Granule flow may be judgedto be satisfactory and stfll tablet weight and hardness may be unsatisfactory. Such deficiencies in many instances can be corrected by increasing the concentration of fines.
B. Ease of Compression, Speed of Manufacture,Yield of Finished Tablets
Tableting equipment, punches, and dies wID require less maintenance iftablets are routinely easily compressed. Excessive compressional forcesapplied in the manufacture of tablets wID lead to an increased frequencyof maintenance and repair. Tablets that are produced under such conditions are apt to possess excessive hardness. and are apt to exhibit reduced dissolution rates and erratic bioavailability.
The Pharmaceutical Pilot Plant 305
A high yield of finished tablets and the speed of their manufactureare obvious economic advantages that an ideal formulation should ensure.
C. Content Uniformity
The use of finely milled ingredients in tablet manufacture is advantageous.The oral absorption efficiency of poorly soluble neutral drugs is improvedas their surface area in the intestinal tract is increased. Granulationsprepared with such finely milled material and excipients possessing coarserparticle size may lead to classification problems under high-speed, largescale tablet manufacture. Particle size distribution and blending time mustbe well defined during the product development stage to avoid unacceptablevariation in drug concentration between individual tablets.
D. Advantage of Accurately Defined Variables
Process development pharmacists must conduct well-controlled scale-up experiments on the tablet formulations developed in the laboratory. Suchvariables as drying time, residual moisture, granule particle size distribution, percentage of fines, and compressional force should be accuratelydefined within specified limits. Deleterious effects encountered outsidethese specified limits should also be recorded. Such detailed data developed during the pilot stage will become valuable as tableting problemsarise in future production runs.
Reworking a production batch of tablets not meeting quality controlstandards has peen complicated by recent rulings by the U. S. Food andDrug Administration (FDA). The reason for the poor content uniformity,the poor dissolution rate, or some discoloration, for example, must be discovered and explained before reworking of such batches can be considered.The value of a well-equipped p:ilot plant manned with a skilled staff will.become increasingly apparent to managers of a pharmaceutical companywhose volume and variety of tablets produced is increasing.
III. TYPES OF ORGANIZATIONAL STRUCTURESRESPONSIBLE FOR PILOT OPERATIONS
The types of organizational structures found in the drug-manufacturingindustry depends upon a number of factors. In a small company. theremay not be space allocated for pilot development of tablet formulations.The tablet formulator in the product development department may be responsible for the ill'st few production batches of tablets. Most l:ikaly heor she would also be called upon to aid in the solution of problems encountered in future batches.
In a large organization, a pharmaceutical development team may be responsible for the transfer of new tablet formulations to production. Awell-equipped space for conducting scale-up runs of new tablets will alsobe provided in such an organization. Such a developmental team may report administratively to the head of pharmaceutical research and development. In other instances. such a group will be a part of the productiondivision.
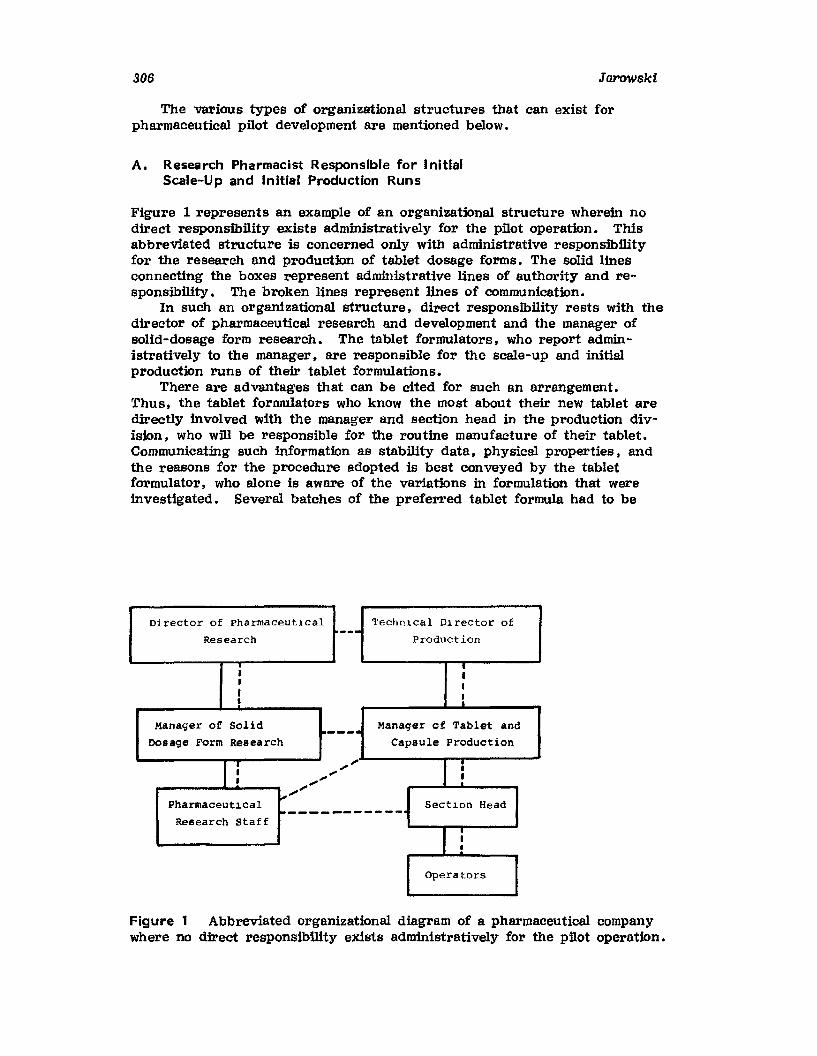
306 Jarowski
The various types of organizational structures that can exist forpharmaceutical pilot development are mentioned below.
A. Research Pharmacist Responsible for InitialScale-Up and Initial Production Runs
Figure 1 represents an example of an organizational structure wherein nodirect responsibility exists administratively for the pilot operation. Thisabbreviated structure is concerned only with administrative responsibilityfor the research and production of tablet dosage forms. The solid linesconnecting the boxes represent administrative lines of authority and responsibility. The broken lines represent lines of communication.
In such an organizational structure, direct responsibility rests with thedirector of pharmaceutical research and development and the manager ofsolid-dosage form research. The tablet formulators, who report administratively to the manager. are responsible for the scale-up and initialproduction runs of their tablet formulations.
There are advantages that can be cited for such an arrangement.Thus, the tablet formulators who know the most about their new tablet aredirectly involved with the manager and section head in the production division. who will be responsible for the routine manufacture of their tablet.Communicating such information as stability data, physical properties. andthe reasons for the procedure adopted is best conveyed by the tabletformulator, who alone is aware of the variations in formulation that wereinvestigated. Several batches of the preferred tablet formula had to be
Director of pharmaceut1cal
Research
IIII
Manager of Solid100-
Dosage Form Research
I : '".... '"....'"Pharmaceutlcal
".'
-----Research Staff
Technlcal Dlrector of- Production
•III
". Manager of Tablet andCapsule Production
j
~
Sectlon Head-----i•
Operators
Figure 1 Abbreviated organizational diagram of a pharmaceutical companywhere no direct responsibility exists administratively for the pilot operation.
The Pnarmaceutical Pilot Plant 307
prepared for accelerated and long-term stability testing. In addition.many clinical batches may also have been prepared by the tablet formuIator-,
The advantage that accrues to the production division is that individuals with the most technical information concerning the new tablet are directly involved in the initial production runs of the new formula. Thetablet formulators from the research division will also gain from such anarrangement. They in turn gain valuable experience concerning the typesof problems that can arise during the large-scale manufacture of theirtablets. Such experience wD1 serve to improve their competence in developing future tablet products.
There are disadvantages that can be cited for such a working relationship. Assigning the research division the responsibility for the first threeto five production batches means a significant commitment of research time.The research pharmacist may strive to develop formulations and procedures which are preferred by the production division in order to avoidcomplaints. Thus. for example, resistance to a direct-compression ordouble-compresskm procedure might be encountered. The heavy investmentin equipment suitable for wet granulation methodology by the productiondivision will naturally result in their continuing support for such procedures.
A person not thoroughly familiar with the production division's equipment, materials, ete , , could cause unnecessary expense in urging theacquisition of new manufacturing equipment. Furthermore, a product development pharmacist is not as familiar with the plant operations as a pilotplant person whose job responsibility necessitates knowing the productiondivision's personnel and facilities.
In a small company -where equipment and personnel are limited -thetablet formulator can more readily introduce a formula due to the limitations of facilities and personnel. In a big company. the pilot laboratory iscalled upon to bridge the gap between the production and research divisions. Manufacturing problems can arise with different lots of bulk materials. Efficient problem solving will be favored if the troubleshooter isfamiliar with the production division's facilities and has a good working relationship with research and production personnel.
The objective of the research pharmacist is to develop practical tabletformulas that cause minimal manufacturing problems. However. he or shemust not become complacent. A less practical. more expensive proceduremay produce a tablet exhibiting superior bioavaBabnity. Such a formulamodification may be difficult to promote within an organization while patentprotection exists for the drug in the less-efficient tablet. The alert andcapable tablet formulator will not wait for generic competition to initiatesuch an improvement in oral absorption through the use of a new manufacturing procedure.
Formulations that are manufactured very efficiently can still be improved by using less-expensive excipients. Automated procedures cansignificantly reduce manufacturing costs. Such improvements can only bemade after an investment of time and effort. Frequent interruptions inresearch effort result when the research pharmacist is called upon tosearch for the solution to a problem that has arisen during the manufactureof a tablet formulation developed by him or her. Such interruptions areunfortunate because they are distracting and disruptive to long-termresearch.
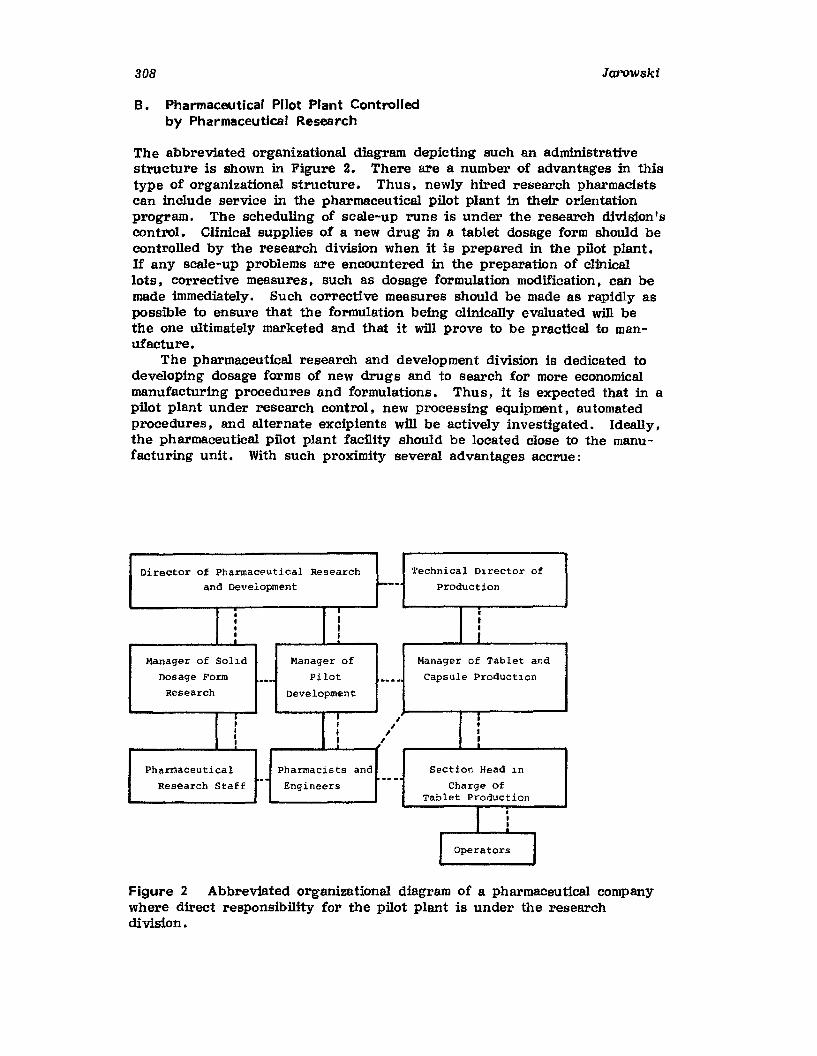
308 Jarowski
B. Pharmaceutical Pilot Plant Controlledby Pharmaceutical Research
The abbreviated organizational diagram depicting such an administrativestructure is shown in Figure 2. There are a number of advantages in thistype of organizational structure. Thus, newly hired research pharmacistscan include service in the pharmaceutical pilot plant in their orientationprogram. The scheduling of scale-up runs is under the research division'scontrol. Clinical supplies of a new drug in a tablet dosage form should becontrolled by the research division when it is prepared in the pilot plant.If any scale-up problems are encountered in the preparation of clinicallots, corrective measures, such as dosage formulation modification, can bemade immediately. Such corrective measures should be made as rapidly aspossible to ensure that the formulation being clinically evaluated will bethe one ultimately marketed and that it will prove to be practical to manufacture.
The pharmaceutical research and development division is dedicated todeveloping dosage forms of new drugs and to search for more economicalmanufacturing procedures and formulations. Thus, it is expected that in apilot plant under research control, new processing equipment, automatedprocedures, and alternate excipients will be actively investigated. Ideally,the pharmaceutical pilot plant facility should be located close to the manufacturing unit. With such proximity several advantages accrue:
Technical D1rector ofProduction
•III
Manager of Tablet and
Capsule Product1on
,,II
Section Head 1n
Charge ofTablet Production
I •I!
I Operators I
,I
II
Director of Pharmaceutical Researchand Development ..
• j,I I: I
Manager of So11d Manager of
Dosage Form ..~ PilotResearch Development
: :I II !I
Pharmaceutical Pharmacists and
Research Staff.
Engineers
Figure 2 Abbreviated organizational diagram of a pharmaceutical companywhere direct responsibility for the pilot plant is under the researchdivision.
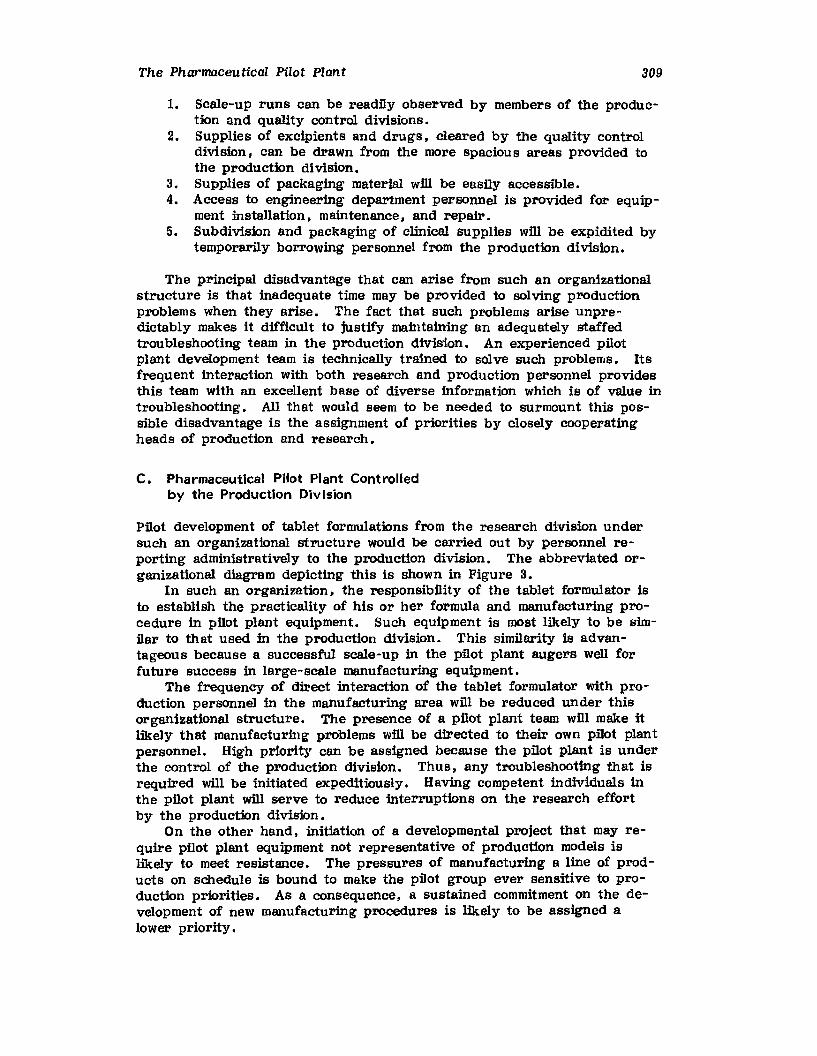
The Pharmaceutical Pilot Plant 309
1. Scale-up runs can be readily observed by members of the production and quality control divisions.
2. Supplies of excipients and drugs. cleared by the quality controldivision. can be drawn from the more spacious areas provided tothe production division.
S. Supplies of packaging material will be easily accessible.4. Access to engineering department personnel is provided for equip
ment installation. maintenance, and repair.5. Subdivision and packaging of clinical supplies will be expidited by
temporarily borrowing personnel from the production division.
The principal disadvantage that can arise from such an organizationalstructure is that inadequate time may be provided to solving productionproblems when they arise. The fact that such problems arise unpredictably makes it difficult to justify maintaining an adequately staffedtroubleshooting team in the production division. An experienced pilotplant development team is technically trained to solve such problems. Itsfrequent interaction with both research and production personnel providesthis team with an excellent base of diverse information which is of value introubleshooting. All that would seem to be needed to surmount this possible disadvantage is the assignment of priorities by closely cooperatingheads of production and research.
C. Pharmaceutical Pilot Plant Controlledby the Production Division
Pilot development of tablet formulations from the research division undersuch an organizational structure would be carried out by personnel reporting administratively to the production division. The abbreviated organizational diagram depicting this is shown in Figure 3.
In such an organization, the responsibility of the tablet formulator isto establish the practicality of his or her formula and manufacturing procedure in pilot plant equipment. Such equipment is most likely to be similar to that used in the production division. This similarity is advantageous because a successful scale-up in the pilot plant augers well forfuture success in large-scale manufacturing equipment.
The frequency of direct interaction of the tablet formulator with production personnel in the manufacturing area will be reduced under thisorganizational structure. The presence of a pilot plant team will make itlikely that manufacturing problems will be directed to their own pilot plantpersonnel. High priority can be assigned because the pilot plant is underthe control of the production division. Thus, any troubleshooting that isrequired will be initiated expeditiously. Having competent individuals inthe pilot plant will serve to reduce interruptions on the research effortby the production division.
On the other hand, initiation of a developmental project that may require pilot plant equipment not representative of production models islikely to meet resistance. The pressures of manufacturing a line of products on schedule is bound to make the pilot group ever sensitive to production priorities. As a consequence, a sustained commitment on the development of new manufacturing procedures is likely to be assigned alower priority.
310 Jarowski
Section Head in
Charge ofTablet Production
Technical Director of
Production
Manager of Tablet and
Capsule production
Section Head of
Pilot Development
Director of Pharmaceutical .Research
IIII•·
Manager of Solid Dosage l--Fot1\l Research
r•I: -'
Pharmaceuti ca 1
Research Staff1----
Figure 3 Abbreviated organizational diagram of a pharmaceutical companywhere direct responsibility for the pilot operation is under the productiondivision.
IV. EDUCATIONAL BACKGROUNDS OFPILOT PLANT PERSONNEL
Pilot plant staff members concerned with the development of tablets shouldunderstand the functions of the ingredients used, the various unit operations involved, and the general methods of preparing tablets. Theyshould possess knowledge of the physicochemical factors which could adversely affect the bioavailabfiity of the drug component from a tabletdosage form. In addition, good communication skills, both oral andwritten, are essential because these individuals must frequently interactwith members of the pharmaceutical research and production divisions.
An individual with graduate training in industrial pharmacy is wellqualified for such a responsibility. Industrial pharmacy core curriculaand electives usually include the following courses: product formulation(lecture and laboratory), manufacturing pharmacy (lecture and laboratory),industrial pharmacy. biopharmaceutics. homogeneous systems, pharmaceutical engineering. evaluation of pharmaceutical dosage forms, pharmaceutical materials, regulatory aspects of drug production and distribution,principles of quality assurance, reaction kinetics, and physical chemistryof macromolecules.
Tablet production operations are by no means static. The followingtechnological trends attest to anticipated production complexity: (1) preparing tablets by continuous processing, (2) aqueous film coating, (3)direct compression of tablets, and (4) use of fluid-bed technology ingranulating powder blends and in coating tablets. The addition of mechanical and chemical engineers would be advantageous in the selection of new
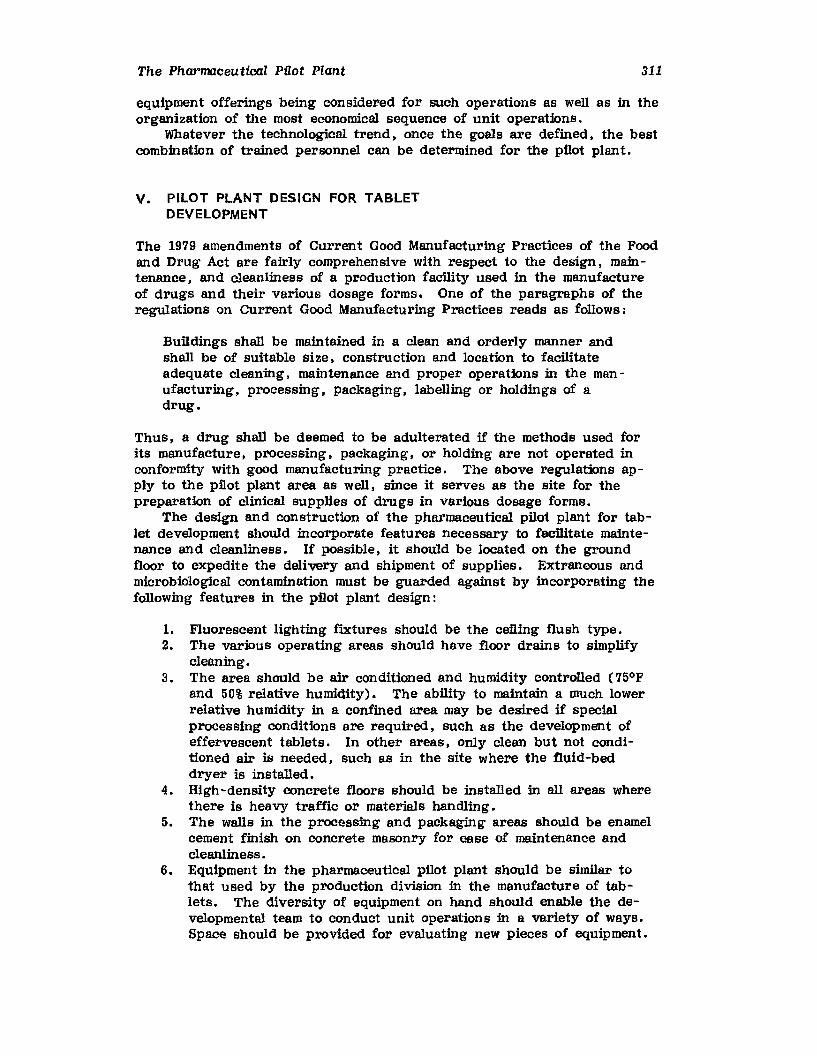
The Pharmaceutical Pilot Plant 311
equipment offerings being considered for such operations as well as in theorganization of the most economical sequence of unit operations.
Whatever the technological trend ~ once the goals are defined. the bestcombination of trained personnel can be determined for the pilot plant.
V. PILOT PLANT DESIGN FOR TABLETDEVELOPMENT
The 1979 amendments of Current Good Manufacturing Practices of the Foodand Drug Act are fairly comprehensive with respect to the design, maintenance, and cleanliness of a production facility used in the manufactureof drugs and their various dosage forms. One of the paragraphs of theregulations on Current Good Manufacturing Practices reads as follows:
Buildings shall be maintained in a clean and orderly manner andshall be of suitable size. construction and location to facilitateadequate cleaning, maintenance and proper operations in the manufacturing, processing, packaging, labelling or holdings of adrug.
Thus, a drug shall be deemed to be adulterated if the methods used forits manufacture, processing. packaging, or holding are not operated inconformity with good manufacturing practice. The above regulations apply to the pilot plant area as well, since it serves as the site for thepreparation of clinical supplies of drugs in various dosage forms.
The design and construction of the pharmaceutical pilot plant for tablet development should incorporate features necessary to facilitate mamtenance and cleanliness. If possible, it should be located on the groundfloor to expedite the delivery and shipment of supplies. Extraneous andmicrobiological contamination must be guarded against by incorporating thefollowing features in the pilot plant design:
1. Fluorescent lighting fixtures should be the ceiling flush type.2. The various operating areas should have floor drains to simplify
cleaning.3. The area should be air conditioned and humidity controlled (75°F
and 50% relative humidity). The ability to maintain a much lowerrelative humidity in a confined area may be desired if specialprocessing conditions are required, such as the development ofeffervescent tablets. In other areas, only clean but not conditioned air is needed, such as in the site where the fluid-beddryer is installed.
4. High -density concrete floors should be installed in all areas wherethere is heavy traffic or materials handling.
5. The walls in the processing and packaging areas should be enamelcement finish on concrete masonry for ease of maintenance andcleanliness.
6. Equipment in the pharmaceutical pilot plant should be similar tothat used by the production division in the manufacture of tablets. The diversity of equipment on hand should enable the developmental team to conduct unit operations in a variety of ways.Space should be provided for evaluating new pieces of equipment.

....Qo
312Jarowski
1.1 7.1 7.5 13.1 13.2
7.0 13 .01.0 i , Drying Area
Granulating
7.9
1.9Blending
2.88.0
8.3 8.5
Coating Cleaning AreaArea 9.0
[l;J I 9.3 ]2.7
Packaging Area
I 3.1 13.0
I 3.1 I3.2
4.0
Conference Room andLibrary
5.0 6.0
Manager's Office sec'tyOffice
r-
U10.1 10.2
weigh~10.0 -Area I 10.3
Storage Area for Drugsand Excipients
i i ,o
Quarantine Area
~12.0
JI
-It--------------- 60'I,-I
Figure 4 Floor plan for tablet development.
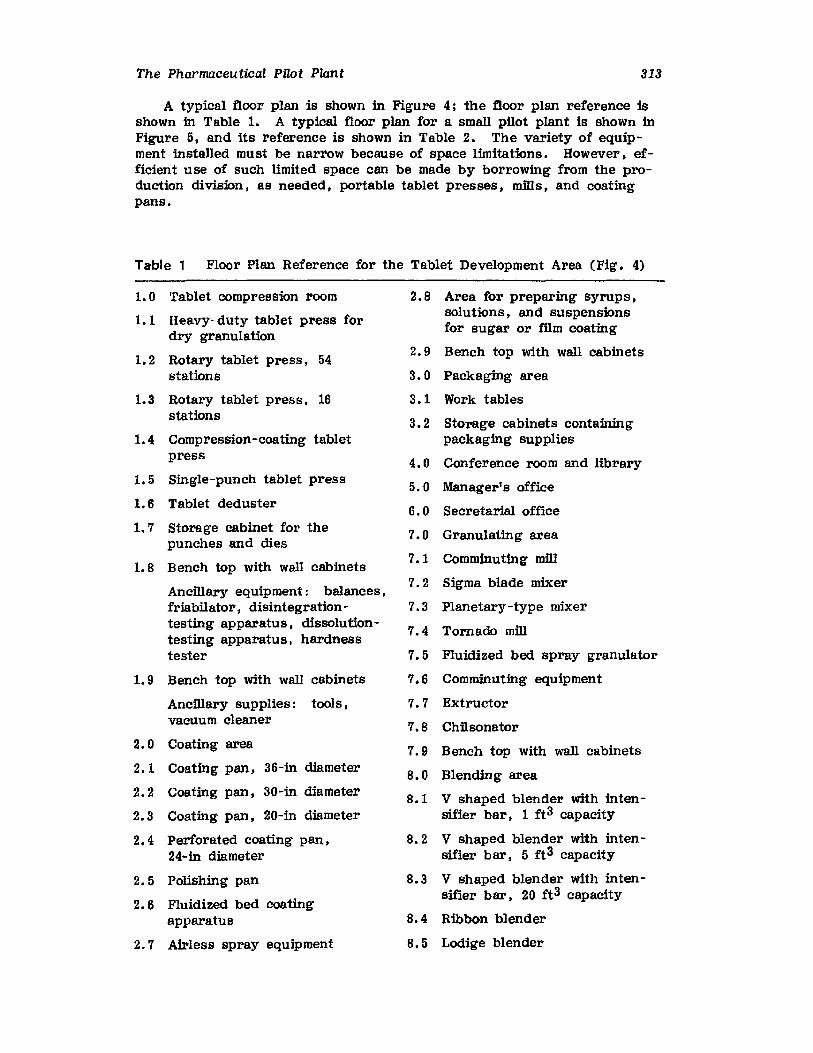
The Pharmaceutical Pilot Plant 313
A typical floor plan is shown in Figure 4; the floor plan reference isshown in Table 1. A typical floor plan for a small pilot plant is shown inFigure 5, and its reference is shown in Table 2. The variety of equipment installed must be narrow because of space limitations. However, efficient use of such limited space can be made by borrowing from the production division, as needed, portable tablet presses, mills, and coatingpans.
Table 1 Floor Plan Reference for the Tablet Development Area (Fig. 4)
1. 0 Tablet compression room
1.1 Heavy-duty tablet press fordry granulation
1.2 Rotary tablet press, 54stations
1. 3 Rotary tablet press, 16stations
1. 4 Compression-coating tabletpress
1.5 Single-punch tablet press
1. 6 Tablet deduster
1. 7 Storage cabinet for thepunches and dies
1.8 Bench top with wall cabinets
Ancillary equipment; balances,friabilator, disintegrationtesting apparatus, dissolutiontesting apparatus. hardnesstester
1. 9 Bench top with wall cabinets
Ancillary supplies: tools,vacuum cleaner
2. 0 Coating area
2.1 Coating pan. 36-in diameter
2.2 Coating pan, 30-in diameter
2.3 Coating pan, 20-in diameter
2. 4 Perforated coating pan.24-in diameter
2. 5 Polishing pan
2. 6 Fluidized bed coatingapparatus
2. 7 Airless spray equipment
2. 8 Area for preparing syrups •solutions, and suspensionsfor sugar or f"11m coating
2.9 Bench top with wall cabinets
3. 0 Packaging area
3. 1 Work tables
3.2 Storage cabinets containingpackaging supplies
4.0 Conference room and library
5.0 Manager's office
6.0 Secretarial office
7.0 Granulating area
7.1 Comminuting mill
7. 2 Sigma blade mixer
7.3 Planetary-type mixer
7.4 Tornado mill
7.5 Fluidized bed spray granulator
7.6 Comminuting equipment
7. 7 Extructor
7.8 Chilsonator
7.9 Bench top with wall cabinets
8.0 Blending area
8. 1 V shaped blender with intensifier bar, 1 ft 3 capacity
8.2 V shaped blender with intensifier bar, 5 ft3 capacity
8. 3 V shaped blender with intensifier bar, 20 ft3 capacity
8. 4 Ribbon blender
8. 5 Lodige blender
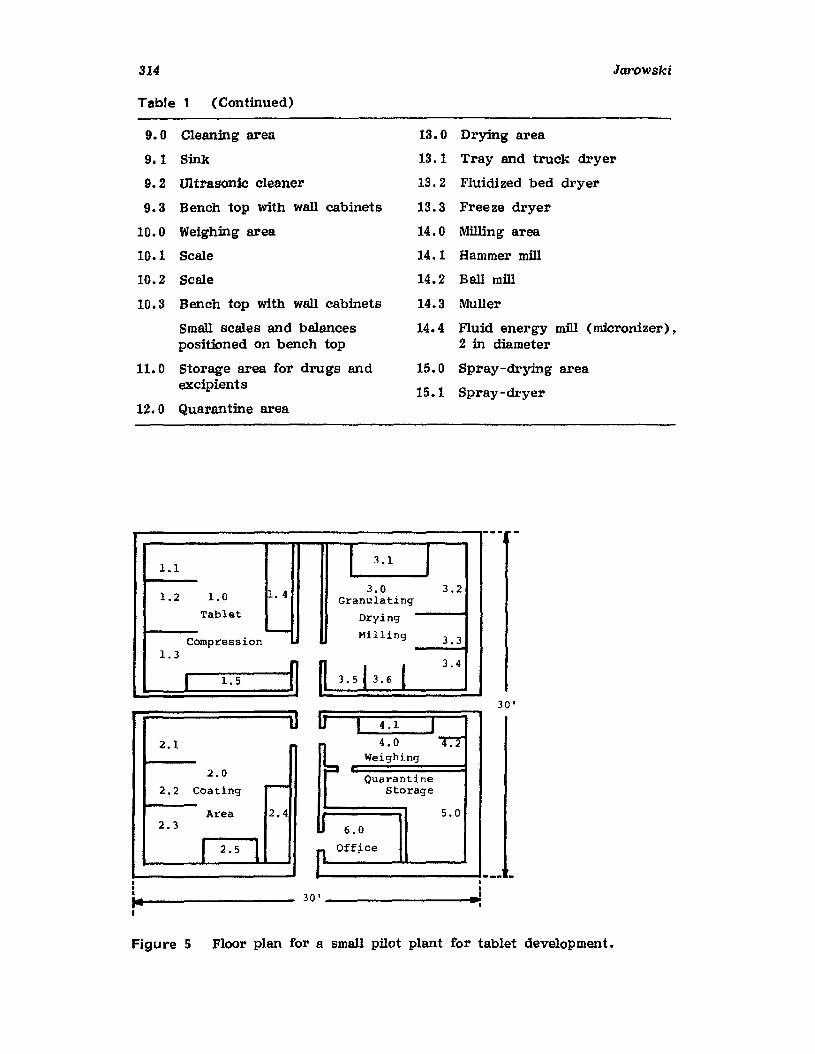
314 Jarowski
Table 1 (Continued)
9.0 Cleaning area
9.1 Sink
9. 2 Ultrasonic cleaner
9. 3 Bench top with wall cabinets
10.0 Weighing area
10.1 Scale
10.2 Scale
10.3 Bench top with wall cabinets
Small scales and balancespositioned on bench top
11.0 Storage area for drugs andexcipients
12. 0 Quarantine area
13. 0 Drying area
13. 1 Tray and truck dryer
13. 2 Fluidized bed dryer
13.3 Freeze dryer
14. 0 Milling area
14. 1 Hammer mID
14.2 Ball mID
14.3 Muller
14.4 Fluid energy mID (micronizer).2 in diameter
15.0 Spray-drying area
15.1 Spray-dryer
1.1 I 3.1 I1.2 1.4 3.0 3.2
1.0 GranulatingTablet Drying-Compression Milling 3.3
1.3n 03.513.6(
3.4
I 1.5 I3D'
--- •I-'•
u I 4.1 I4.0 T:2
~Weighing
Quarantinestorage
j5.0
6.0
flOff~ce
30 I ~
U2.1
2.0
2.2 Coating r--
Area 2.42.3
I 2.5 I•••...Figure 5 Floor plan for a small pilot plant for tablet development.
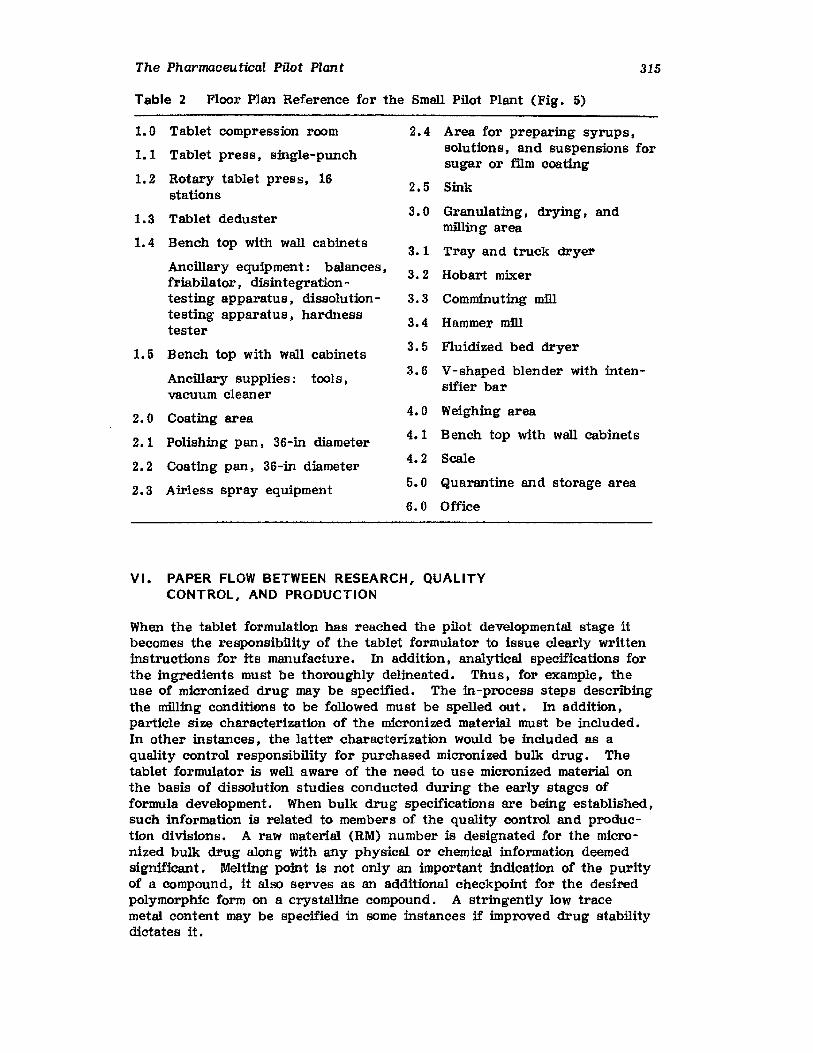
The Pharmaceutical Pilot Plant
Table 2 Floor Plan Reference for the Small Pilot Plant (Fig. 5)
315
1. 0 Tablet compression room
1. 1 Tablet press, single-punch
1.2 Rotary tablet press, 16stations
1.3 Tablet deduster
1.4 Bench top with wall cabinets
Ancillary equipment: balances ,friabilator, disintegrationtesting apparatus, dissolutiontesting apparatus, hardnesstester
1. 5 Bench top with wall cabinets
Ancillary supplies: tools,vacuum cleaner
2.0 Coating area
2.1 Polishing pan, 36-in diameter
2.2 Coating pan, 36-in diameter
2.3 Airless spray equipment
2.4 Area for preparing syrups,SOlutions, and suspensions forsugar or film coating
2.5 Sink
3.0 Granulating, drying, andmilling area
3.1 Tray and truck dryer
3. 2 Hobart mixer
3. 3 Comminuting mill
3.4 Hammer mill
3. 5 Fluidized bed dryer
3. 6 V-shaped blender with inten-sifier bar
4.0 Weighing area
4.1 Bench top with wall cabinets
4.2 Scale
5.0 Quarantine and storage area
6.0 Office
VI. PAPER FLOW BETWEEN RESEARCH, QUALITYCONTROL, AND PRODUCTION
When the tablet formulation has reached the pilot developmentsl stage itbecomes the responsibility of the tablet formulator to issue clearly writteninstructions for its manufacture. In addition, analytical specifications forthe ingredients must be thoroughly delineated. Thus, for example, theuse of micronized drug may be specified. The in-process steps describingthe milling conditions to be followed must be spelled out. In addition,particle size characterization of the micronized material must be included.In other instances, the latter characterization would be included as aquality control responsibility for purchased micronized bulk drug. Thetablet formulator is well aware of the need to use micronized material onthe basis of dissolution studies conducted during the early stages offormula development. When bulk drug specifications are being established,such information is related to members of the quality control and production divisions. A raw material (RM) number is designated for the micronized bulk drug along with any physical or chemical information deemedsignificant. Melting point is not only an important indication of the purityof a compound, it also serves as an additional checkpoint for the desiredpolymorphic form on a crystslline compound. A stringently low tracemetal content may be specified in some instances if improved drug stabilitydictates it.
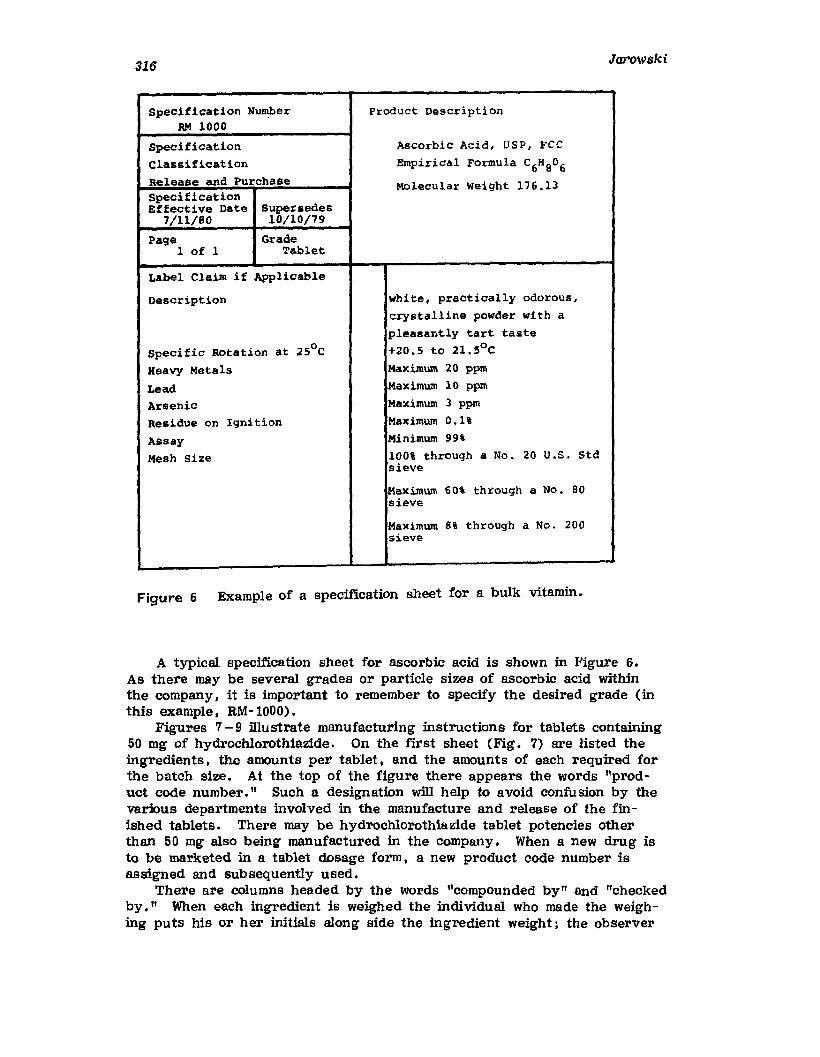
316
Specification NumberRM 1000
SpecificationClassificationRelease and PurchaseSpecificationEffective Date Super8edes
7/11/80 10/10/79
Product Description
ASCorbic Acid, DSP, FCCEmpirical Formula C6Hg0 6
Molecular Weight 176.13
Jarowski
Page1 of 1
Grade'l'~let
Label Claim if Applicable
Description
Specific Rotation at 250 C
Heavy Metals
LeadArsenicResidue on Ignition
AssayMesh size
white, practically odorous,crystalline powder with apleasantly tart taste+20.5 to 21.SoC
Maximum 20 ppmMaximum 10 ppmMaximum 3 ppmMaximum 0.1%
Minimum 99%
100% through a No. 20 u.s. Stdsieve
Maximum 60\ through a No. 80sieve
Maximum 8% through a No. 200sieve
Figure 6 Example of a specification sheet for a bulk vitamin.
A typical specification sheet for ascorbic acid is shown in Figure 6.As there may be several grades or particle sizes of ascorbic acid withinthe company. it is important to remember to specify the desired grade (inthis example. RM-1000).
Figures 7 -9 illustrate manufacturing instructions for tablets containing50 mg of hydrochlorothiazide. On the first sheet (Fig. 7) are listed theingredients, the amounts per tablet, and the amounts of each required forthe batch size. At the top of the figure there appears the words "product code number." Such a designation will help to avoid confusion by thevarious departments involved in the manufacture and release of the finished tablets. There may be hydrochlorothiazide tablet potencies otherthan 50 mg also being manufactured in the company. When a new drug isto be marketed in a tablet dosage form. a new product code number isassigned and subsequently used.
There are columns headed by the words "compounded by" and "checkedby. II When each ingredient is weighed the individual who made the weighing puts his or her initials along side the ingredient weight; the observer

Product and Potency Product Code Number 1 Lot Number PageHydrochlorthiazide Tablets, 50 mg 1 of 3
Batch Size Date Started Date Completed5,000,000
Prepared By Production Approval Quality ControlApproval
Numbel Ingredient Grade Grams/Tablet Grarns/Batct !comReunded Checked RM LotBv II 11
1 Hydrochlorthiazide ~.S.P. 0.050 250,000
2 MicrocrystallineCellulose (PH 101) N.F. 0.050 250,000
3 Dicalcium phosphate, dihydratE N.F. 0.099 495,000
4 Magnesium Stearate N.F. 0.001 5,000
Total 0.200 1,000,000
Figure 7 List of ingredients used in manufacturing hydrochlorothiazide tablets (50 mg) asthey would appear in a set of manufacturing instructions.
"'3;:l"tl)
~;(')
~.....5'a"tl1=:1Q...:gs.....
Co)....""I
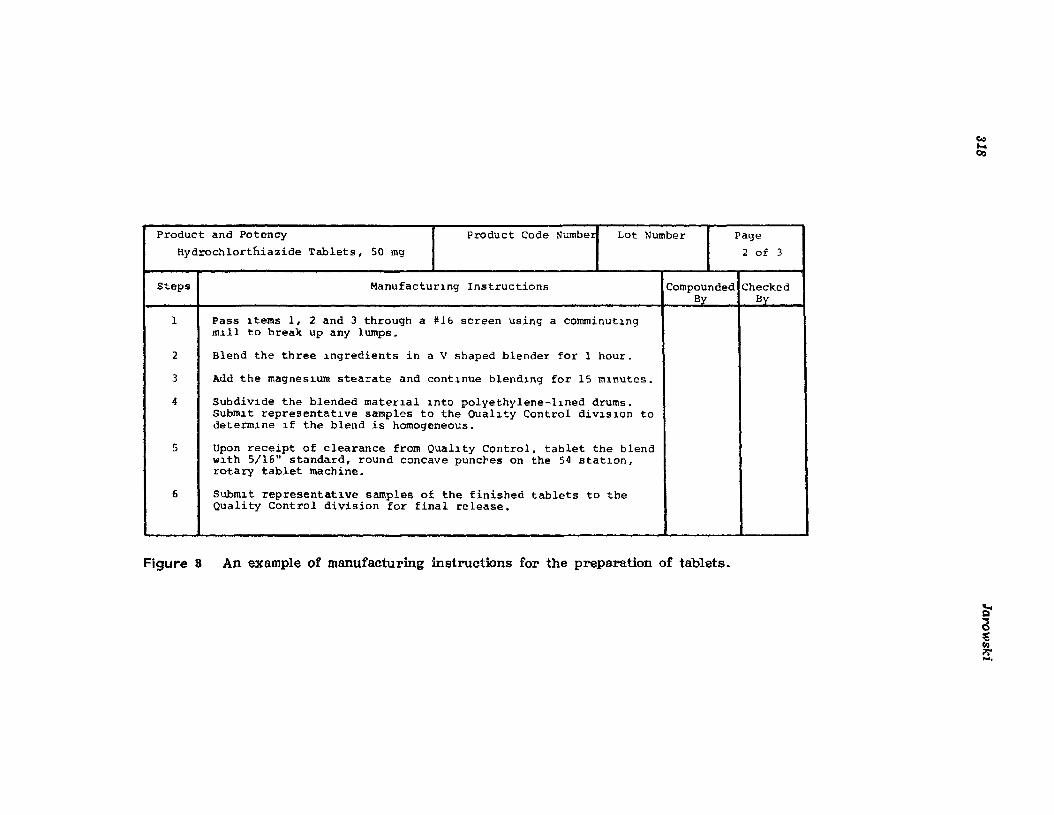
Product and Potency Product Code Numbe~ Lot Number PageHydrochlortniazide Tablets, 50 mg 2 of 3
Steps Manufacturlng Instructions Compounded CheckedBy By
1 Pass ltems I, 2 and 3 through a #16 screen using a comminutlngmlll to break up any lumps.
2 Blend the three lngredients in a V shaped blender for 1 hour.
3 Add the magneslum stearate and contlnue blend~ng for 15 mlnutes.
4 Subdivlde the blended materlal lnto polyethylene-llned drums.SUbmlt representatlve samples to the Quallty Control divlslon todetermlne lf the blend is homogeneous.
5 Upon receipt of clearance from Quallty Control, tablet the blendwlth 5/16" standard, round concave puncres on the 54 statlon,rotary tablet machine.
6 Submlt representatlve samples of the finished tablets to theQuality Control division for final release.
ee....OJ
Figure 8 An example of manufacturing instructions for the prepa.ration of tablets.
~
~I;QfI>'....
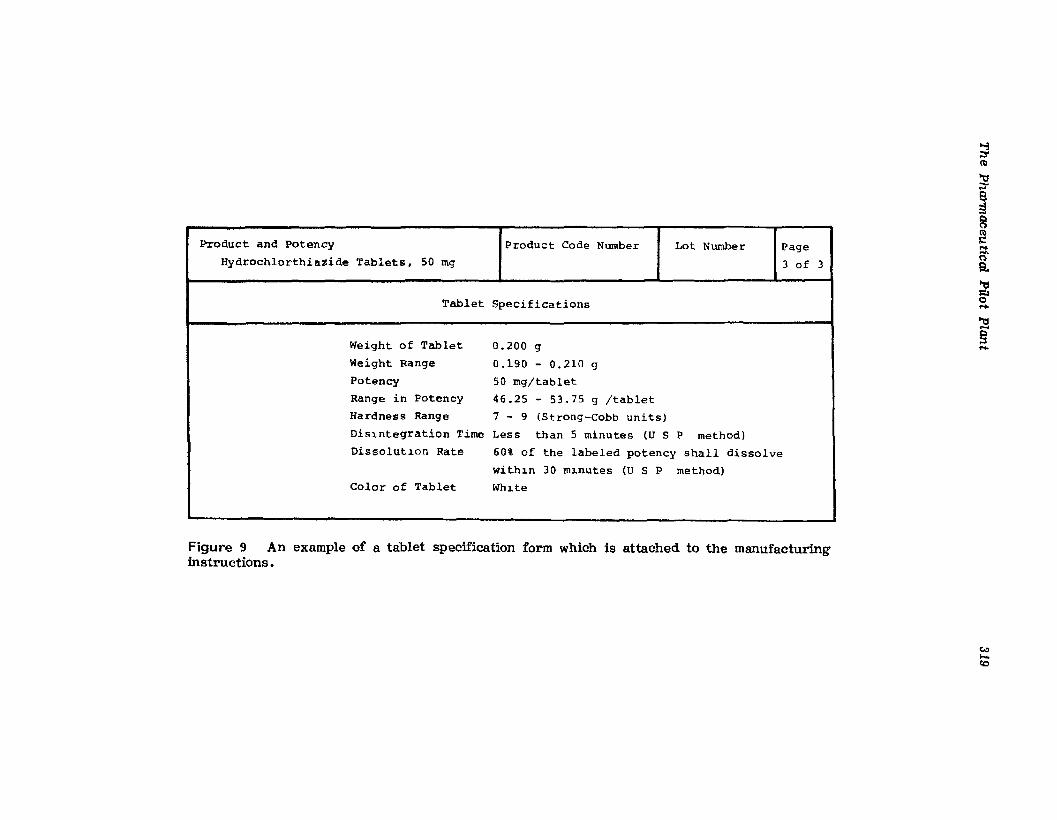
Product and Potency Product Code Number Lot Number PageHydrochlorthia~ideTablets, 50 mg 3 of 3
Tablet Specifications
Weight of Tablet 0.200 g
Weight Range 0.190 - 0.210 g
Potency 50 mg!tablet
Range in Potency 46.25 - 53.75 g !tablet
Hardness Range 7 - 9 (Strong-Cobb units)
Dis~ntegration Time Less than 5 minutes (U S P method)
Disso1utl.on Rate 60% of the labeled potency shall dissolve
withl.n 30 ml.nutes (U S P method)
Color of Tablet Whl.te
Figure 9 An example of a tablet specification form which is attached to the manufacturinginstructions.
~;:,'~
~
~R~........oa'l:l~o....~Q;::s....
C.:l.....to
320 Jarowski
of the operation also places his or her initials as a double check on theaccuracy of the weighing operation. A similar procedure should be followed for each step in the compounding operation. Such double checkingis required by the Food and Drug Administration for all new drug application-type products. However, even if it were not required. such adouble-checking procedure should be followed to ensure that there are noweighing or compounding errors.
The lot number of each ingredient used must be recorded. Such recordings become of special importance when one is attempting to trace thehistory of a particular batch of tablets. Troubleshooting will be simplifiedin some instances by tracing the source of a raw material. A typical problem that may arise can be due to a particular lot number of a substandardexcipient that could have been inadvertently used.
On the second sheet of the proposed manufacturing instructions (seeFig. 7) the stepwise procedure to be followed is described. The wordschosen should be readily understood by the variety of individuals who willbe reading these instructions. Thus, quality control personnel considering the establishment of in-process controls and pilot and production operators who will be following the procedure for the first time should not beconfused by cryptic phrases containing technical words not easily understood. The tablet formulator should keep in mind that his or her manufacturing procedure may also be circulated to foreign manufacturing plants.Manufacturing instructions that are clearly written are advantageous because they avoid confusion which may lead to errors.
Figure 9 illustrates a list of specifications for the finished tablets. Ascan be seen in Figures 7-9, spaces for the product code and lot numberare provided at the top of the form. The three forms become a part ofthe file for the lot number of the batch of tablets prepared. These threesheets serve as a historical record. Attachments that are included, forexample, would be the clearance data from the quality control division anda record of the physicians receiving the material for clinical study.
VII. USE OF THE PILOT PLANT SCALE-UP TO SELECTTHE OPTIMAL PROCEDURE FOR THE PREPARATIONOF DEXAMETHASONE TABLETS
A company was planning to expand its tablet-manufacturing facility. Thecompany's tablet products in greatest demand were potent corticoids andcardiovascular drugs. These water-insoluble, neutral drugs were to beused in concentrations ranging from 0.1 to 5.0 mg per tablet.
The presence of 0.1 mg of drug in a tablet weighing 200 mg representsa drug dilution with tablet excipients of 1: 2000. Maintaining content uniformity could be a problem in the routine manufacture of such tablets. Inaddition to content uniformity, the dissolution rates of such water-insolubledrugs can be a problem. Such drugs as the corticoids and the cardiacglycosides, on occasion, have been recalled by the Food and Drug Administration because of a lack of bioequivalency.
The company's top management requested the pharmaceutical researchand development department to determine which tablet-manufacturing procedure should be adopted for this line of tablet products. Their 0.25-mgdexamethasone tablets were considered to be representative of the severaldrugs whose production volume were to be expanded.
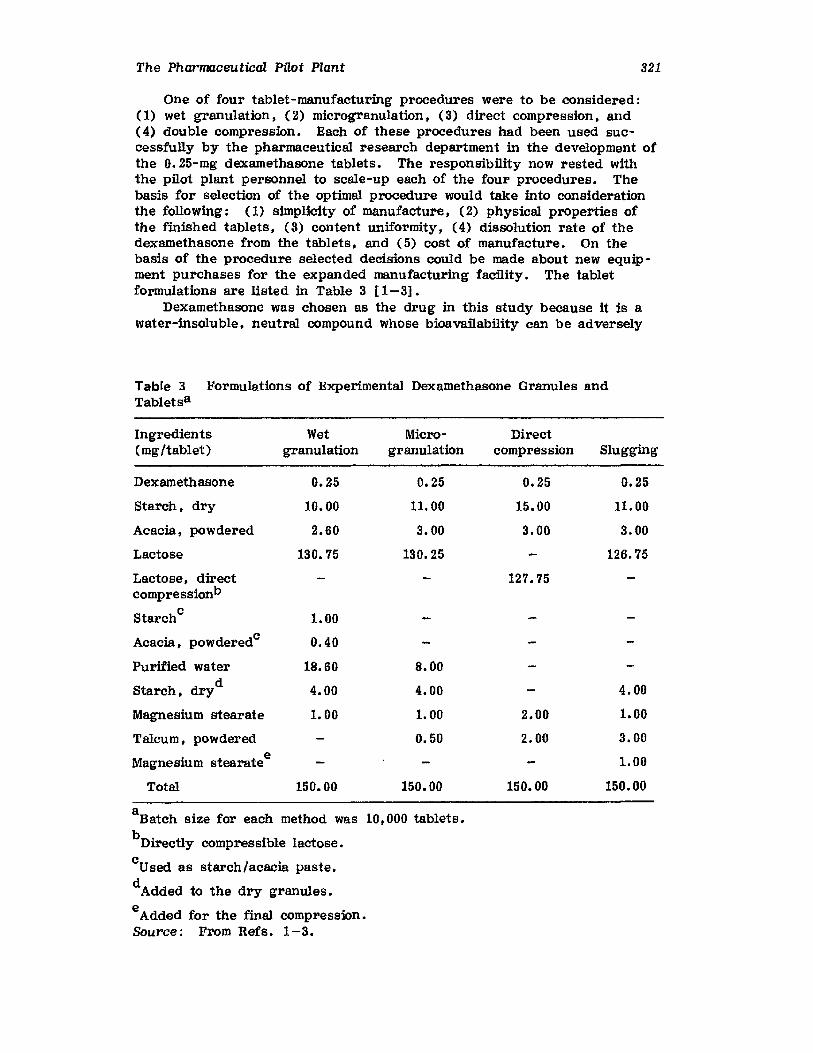
The Pharmaceutical PIlot Plant 321
One of four tablet-manufacturing procedures were to be considered:(1) wet granulation; (2) microgranulation , (3) direct compression; and(4) double compression. Each of these procedures had been used successfully by the pharmaceutical research department in the development ofthe 0.25-mg dexamethasone tablets. The responsibility now rested withthe pilot plant personnel to scale-up each of the four procedures. Thebasis for selection of the optimal procedure would take into considerationthe following: (1) simplicity of manufacture; (2) physical properties ofthe finished tablets. (3) content uniformity; (4) dissolution rate of thedexamethasone from the tablets; and (5) cost of manufacture. On thebasis of the procedure selected decisions could be made about new equipment purchases for the expanded manufacturing facility. The tabletformulations are listed in Table 3 [1-3].
Dexamethasone was chosen as the drug in this study because it is awater-insoluble. neutral compound whose bioavailability can be adversely
Table 3 Formulations of Experimental Dexamethasone Granules andTabletsa
Ingredients Wet Micro- Direct(mg/tablet) granulation granulation compression Slugging
Dexamethasone 0.25 0.25 0.25 0.25
Starch. dry 10.00 11.00 15.00 11.00
Acacia. powdered 2.60 3.00 3.00 3.00
Lactose 130.75 130.25 126.75
Lactose. direct 127.75compresaionv
Starchc1.00
Acacia. powderedc 0.40
Purified water 18.60 8.00
Starch, dryd4.00 4.00 4.00
Magnesium stearate 1. 00 1. 00 2.00 1.00
Talcum, powdered 0.50 2.00 3.00
Magnesiume 1.00stearate
Total 150.00 150.00 150.00 150.00
aBatch size for each method was 10; 000 tablets.
bDirectly compressible lactose.
"used as starch Iacacia paste.d
Added to the dry granules.
eAdded for the final. compression.Source: From Refs. 1-3.
322 Jarowski
affected by a poor tablet formulation. In each procedure the micronizeddexamethasone was mixed with the excipients by using a geometric dilutionprocedure in a V-shaped blender of 3 kg capacity. The four proceduresfollowed are summarized below.
A. Wet Granulation
Homogeneous blends of the dexamethasone and excipients were granulatedwith starch/acacia in a planetary mixer. The wet mass was passed throughan oscillating granulator equipped with a No. 8 screen and oven driedovernight at 45°C. After dry screening through a No. 16 screen, thegranulations were blended with the remaining dry starch, lubricated,and compressed.
B. Microgranulation
Microgranulates were prepared by a procedure first described by de Jong[4) • An advantage cited for this procedure is that a blend of finely powdered drug and excipients can be converted into compressible granuleswith only minor changes in particle size. Thus, microgranulation is differentiated from conventional wet granulation by the absence of large agglomerates. A relatively small quantity of granulating liquid is used in theprocess of forming microgranulates. As a consequence, the blended powder particles become coated by a thin fUm of binder which reduces interparticular attraction and yields a free-flowing powder which can be compressed to form a tablet. Hydrophobic powders coated in such a mannerare rendered less hydrophobic, and thus more readily dispersible in water.Since such microgranulations are devoid of large agglomerates, powderblends granulated in this manner exhibit excellent content uniformity.rapid dissolution. and excellent bioavailability.
In the preparation of dexamethasone microgranulates a homogeneousblend of micronized drug, powdered acacia, starch, and lactose was placedin a planetary mixer and uniformly moistened with a minimal quantity ofpurified water. The uniform distribution of water is a critical step. Failure to distribute the water uniformly will mean that portions of the blendwill have been inadequately granulated. As a result excessive cappingwill result during the compression stage. The addition of excessive waterduring the granulating step will result in the formation of macrogranules.
The uniformly moistened granules were passed through a No. 16 sieveand tray dried at 45°C overnight. The dried granules were passed througha No. 16 sieve. Additional starch and magnesium stearate were added tothe sieved microgranules and the blend was compressed into tablets.
C • Double Compression
Slugs were made using a heavy-duty press with t-In diameter punches.The slugs were granulated through an oscillating granulator fitted with aNo. 16 sieve. Additional lubricant was added to the granules and, afteradditional blending, the granules were compressed into tablets.
The Pharmaceutical Pilot Plant
D. Direct Compression
323
The dexamethasone, binder, disintegrant, and anhydrous lactose wereblended by geometric dilution. The homogeneous blend was lubricated andcompressed.
The granules prepared by the three granulation procedures and thedirectly compressible blend were compressed on a 16-station tablet machinein which only 4 stations were used. Flat punches measuring 5/16 in indiameter were employed. Particle size analyses were performed on samplesof the powder blend before granulation, after granulation, and after compaction and disintegration by using a nest of sieves and an electromagnetic sieving machine. The particle size distribution of the granules aftercompaction and disintegration was determined by the method of Khan andRhodes [5].
These authors prepared compacts by means of a hydraulic press. Toeffect disintegration of the compacts without agitation, which might causegranule fracture, a particularly effective disintegrant was included in thecompacts. In the case of compacts prepared from insoluble materials, suchas dicslcium phosphate, distilled water was used as the disintegrationvehicle; for other systems appropriately saturated solutions were used.Particle size determinations of the disintegrated compacts were made usinga particle size counter or an air-jet sieve.
The dexamethasone tablets were allowed to disintegrate into particlesand granules by soaking them in absolute ethanol saturated with the drug.Aqueous media were avoided because of the presence of water-solublelactose. The particles and granules were separated by filtration and driedat 40°C for 16 h. The dried particles and granules were then gentlybrushed through a 16-mesh screen. The screened particles and granuleswere then subjected to a particle size analysis using a nest of sieves andan electromagnetic sieving machine.
Representation of Particle Size Distribution Data
In Table 4 are shown the weight percentages and cumulative weight percentages of particles on each of the sieves for the following: (1) thedexamethasone powder blend, (2) dried granules prepared by wet granulation before compaction, and (3) dried granules after compaction anddisintegration.
Inspection of the data in Table 4 reveals that 100% of the particles inthe dexamethasone powder blend have a particle size of less than 251 um,since all the particles passed through the GO-mesh sieve. Approximately50% of the material should have diameters of less than 152 um and greaterthan 75 um, This follows, since 13% of the material was collected on the120-mesh sieve and 43% was collected on the 200-mesh sieve. The aperture for the 100-mesh sieve is 152 um and the aperture for the 200-meshsieve is 75 urn,
A method of representing the particle size data to obtain a rough estimate of the average diameter is to plot the cumulative percentage over orunder a particular size versus particle size. This is shown in Figure 10,using the cumulative percentage oversize for the data in Table 4.
As an example, the points on the dexamethasone powder blend curvewere generated as follows. All of the particles of the dexamethasone

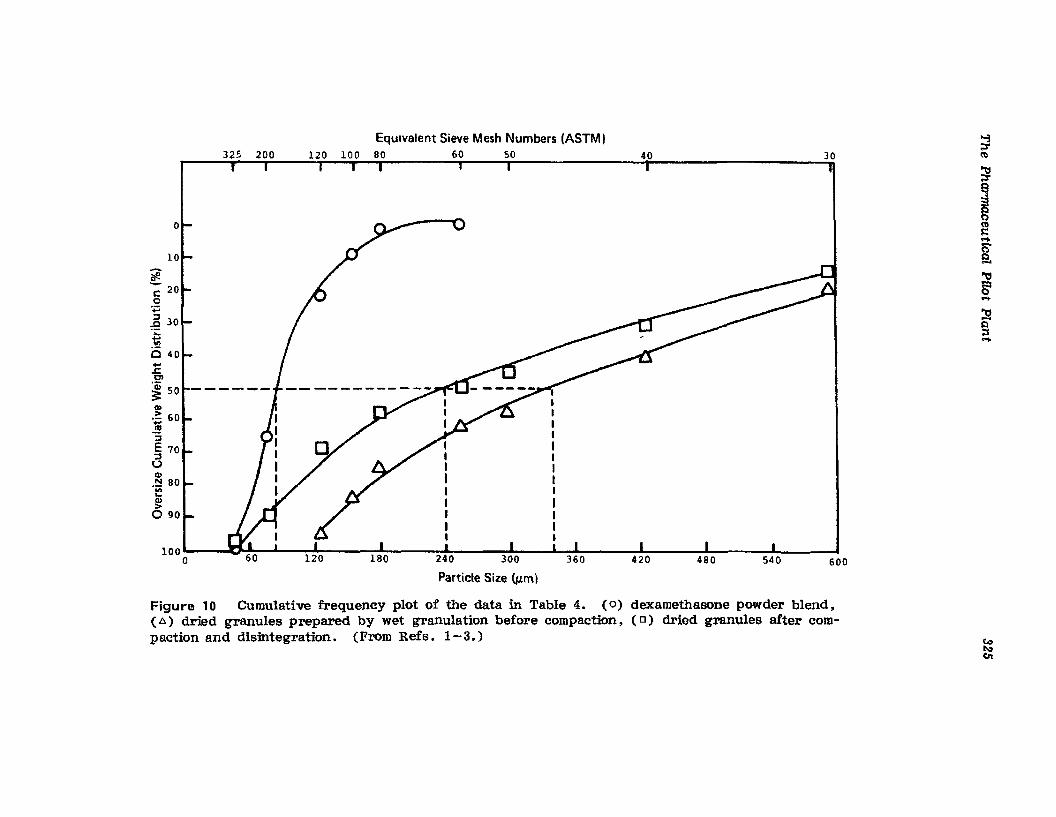
600
>;::r(ll30
~~~(')(\)
l::....["tl~0....::gs....
Equivalent Sieve Mesh Numbers (ASTM)80 60 50 40
I I J' I I I I ,~ ~!_ I I I100 l:J ~I"i 'II"'''' .,~.... ........ _~o
....J::en~ 50Q)
.e 60...
..!!!:JE 70
8Q)
N 80.~
~090
Figure 10 Cumulative frequency plot of the data in Table 4. (0) dexamethasone powder blend,(11) dried granules prepared by wet granulation before compaction, (D) dried granules after compaction and disintegration. (From Refs. 1-3.)
~
~
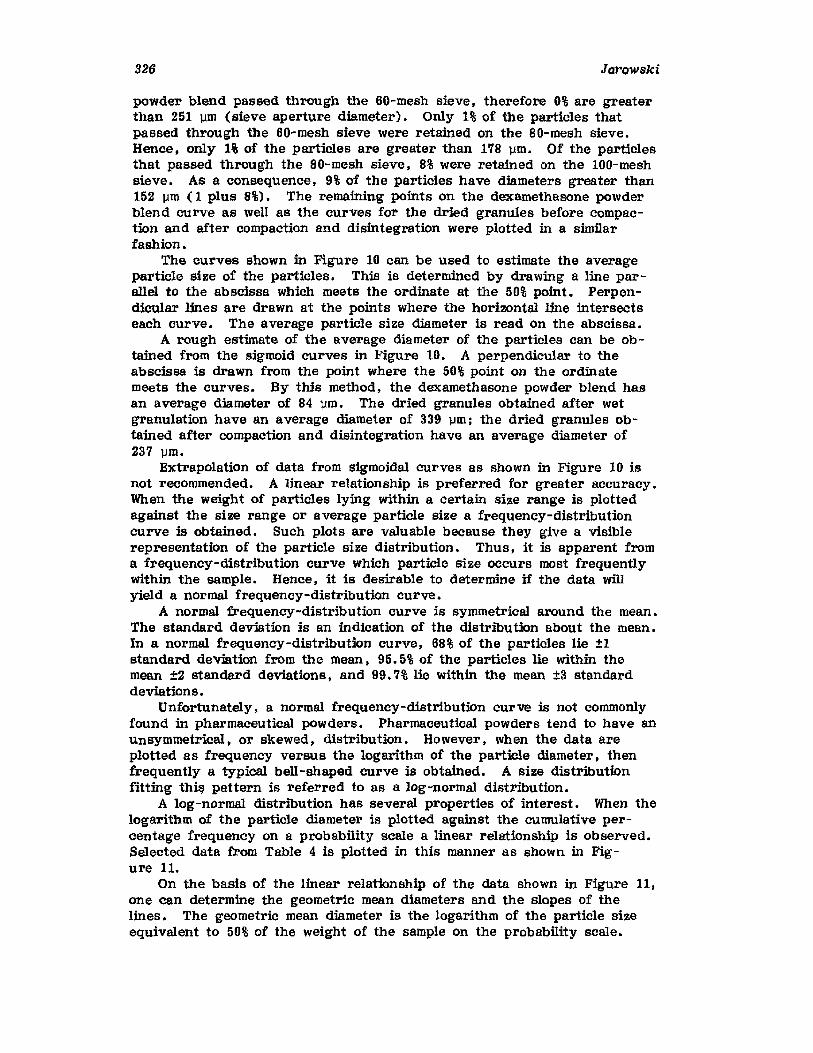
326 Jarowski
powder blend passed through the 60-mesh sieve, therefore 0% are greaterthan 251 um (sieve aperture diameter). Only 1% of the particles thatpassed through the 60-mesh sieve were retained on the SO-mesh sieve.Hence, only 1% of the particles are greater than 1'18 um, Of the particlesthat passed through the SO-mesh sieve, 8% were retained on the 100-meshsieve. As a consequence, 9% of the particles have diameters greater than152 um (1 plus 8%). The remaining points on the dexamethasone powderblend curve as well as the curves for the dried granules before compaction and after compaction and disintegration were plotted in a similarfashion.
The curves shown in Figure 10 can be used to estimate the averageparticle size of the particles. This is determined by drawing a line parallel to the abscissa which meets the ordinate at the 50% point. Perpendicular lines are drawn at the points where the horizontal line intersectseach curve. The average particle size diameter is read on the abscissa.
A rough estimate of the average diameter of the particles can be obtained from the sigmoid curves in Figure 10. A perpendicular to theabscissa is drawn from the point where the 50% point on the ordinatemeets the curves. By this method, the dexamethasone powder blend hasan average diameter of 84 urn, The dried granules obtained after wetgranulation have an average diameter of 339 um, the dried granules obtained after compaction and disintegration have an average diameter of237 um,
Extrapolation of data from sigmoidal curves as shown in Figure 10 isnot recommended. A linear relationship is preferred for greater accuracy.When the weight of particles lying within a certain size range is plottedagainst the size range or average particle size a frequency-distributioncurve is obtained. Such plots are valuable because they give a visiblerepresentation of the particle size distribution. Thus, it is apparent froma frequency-distribution curve which particle size occurs most frequentlywithin the sample. Hence, it is desirable to determine if the data willyield a normal frequency-distribution curve.
A normal frequency-distribution curve is symmetrical around the mean.The standard deviation is an indication of the distribution about the mean.In a normal frequency-distribution curve, 68% of the particles lie ±1standard deviation from the mean, 95.5% of the particles lie within themean ±2 standard deviations, and 99. 7% lie within the mean ±3 standarddeviations.
Unfortunately, a normal frequency-distribution curve is not commonlyfound in pharmaceutical powders. Pharmaceutical powders tend to have anunsymmetrical, or skewed. distribution. However, when the data areplotted as frequency versus the logarithm of the particle diameter, thenfrequently a typical bell-shaped curve is obtained. A size distributionfitting thu? pattern is referred to as a log-normal distribution.
A log-normal distribution has several properties of interest. When thelogarithm of the particle diameter is plotted against the cumulative percentage frequency on a probability scale a linear relationship is observed.Selected data from Table 4 is plotted in this manner as shown in Fig-ure 1l.
On the basis of the linear relationship of the data shown in Figure 11,one can determine the geometric mean diameters and the slopes of thelines. The geometric mean diameter is the logarithm of the particle sizeequivalent to 50% of the weight of the sample on the probability scale.
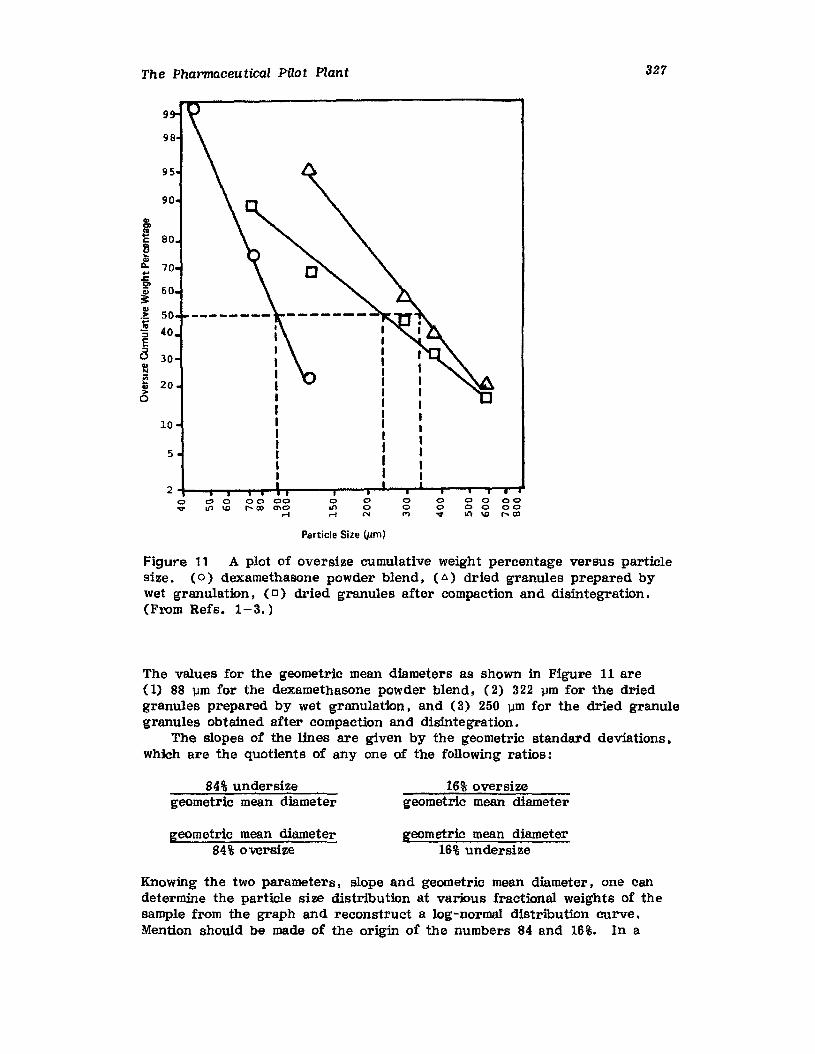
The Pharmaceutical Pilot Plant 327
9
o <:) 0 00 00"'" LJ'1 \D r- ee "'0
..-l
ooM
Particle Size CJ,tm)
oo.., o 0 0 00
o 0 0 00." Ifl \ll r-. CXI
Figure 11 A plot of oversize cumulative weight percentage versus particlesize. (0) dexamethasone powder blend. (6.) dried granules prepared bywet granulation. (0) dried granules after compaction and disintegration.(From Refs. 1-3.)
The values for the geometric mean diameters as shown in Figure 11 are(1) 88 um for the dexamethasone powder blend. (2) 322 um for the driedgranules prepared by wet granulation. and (3) 250 um for the dried granulegranules obtained after compaction and disintegration.
The slopes of the lines are given by the geometric standard deviations.which are the quotients of anyone of the following ratios:
84% undersizegeometric mean diameter
geometric mean diameter84% oversize
16% oversizegeometric mean diameter
geometric mean diameter16% undersize
Knowing the two parameters. slope and geometric mean diameter. one candetermine the particle size distribution at various fractional weights of thesample from the graph and reconstruct a log-normal distribution curve.Mention should be made of the origin of the numbers 84 and 16%. In a
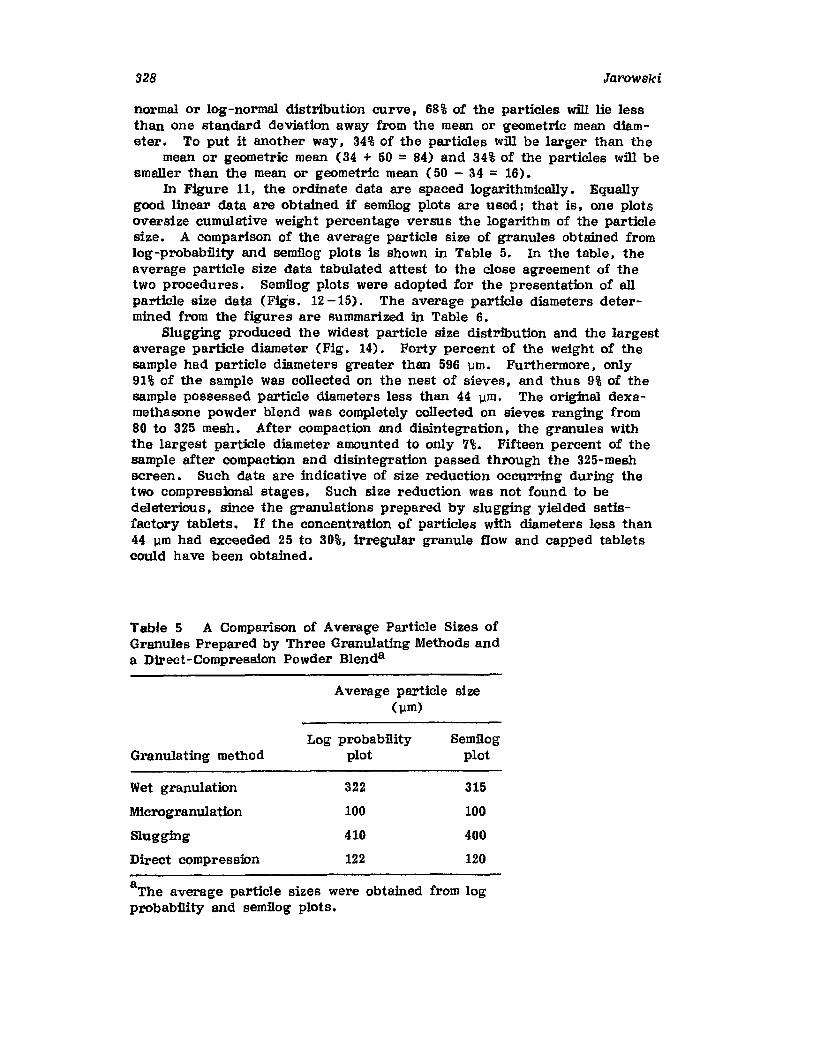
328 Jarowski
normal or log-normal distribution curve, 68% of the particles will lie lessthan one standard deviation away from the mean or geometric mean diameter. To put it another way, 34% of the particles will be larger than the
mean or geometric mean (34 + 50 = 84) and 34% of the particles will besmaller than the mean or geometric mean (50 - 34 = 16).
In Figure 11, the ordinate data are spaced logarithmically. Equallygood linear data are obtained if semilog plots are used; that is, one plotsoversize cumulative weight percentage versus the logarithm of the particlesize. A comparison of the average particle size of granules obtained fromlog-probability and semilog plots is shown in Table 5. In the table, theaverage particle size data tabulated attest to the close agreement of thetwo procedures. Semilog plots were adopted for the presentation of allparticle size data (Figs. 12-15). The average particle diameters determined from the figures are summarized in Table 6.
Slugging produced the widest particle size distribution and the largestaverage particle diameter (Fig. 14). Forty percent of the weight of thesample had particle diameters greater than 596 um. Furthermore, only91% of the sample was collected on the nest of sieves, and thus 9% of thesample possessed particle diameters less than 44 um, The original dexamethasone powder blend was completely collected on sieves ranging from80 to 325 mesh. After compaction and disintegration, the granules withthe largest particle diameter amounted to only 7%. Fifteen percent of thesample after compaction and disintegration passed through the 325-meshscreen. Such data are indicative of size reduction occurring during thetwo compressional stages. Such size reduction was not found to bedeleterious, since the granulations prepared by slugging yielded satisfactory tablets. If the concentration of particles with diameters less than44 um had exceeded 25 to 30%, irregular granule flow and capped tabletscotUd have been obtained.
Table 5 A Comparison of Average Particle Sizes ofGranules Prepared by Three Granulating Methods anda Direct-Compression Powder Blenda
Average particle size(um)
Log probability SemilogGranulating method plot plot
Wet granulation 322 315
Microgranulation 100 100
Slugging 410 400
Direct compression 122 120
aTh e average particle sizes were obtained from logprobab:ility and semilog plots.
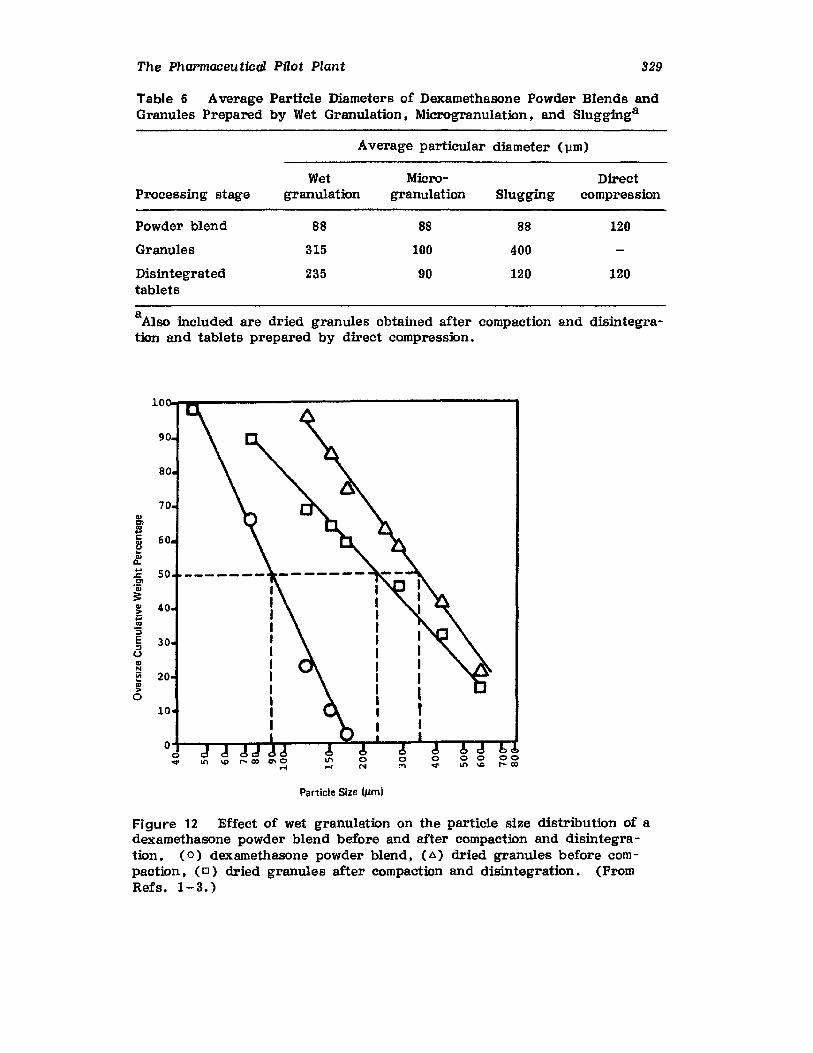
The Pharmaceutical PUot Plant 329
Table 6 Average Particle Diameters of Dexamethasone Powder Blends andGranules Prepared by Wet Granulation, Microgranulation, and Slugginga
Average particular diameter (11m)
Wet Micro- DirectProcessing stage granulation granulation Slugging compression
Powder blend 88 88 88 120
Granules 315 100 400
Disintegrated 235 90 120 120tablets
aAlso included are dried granules obtained after compaction and disintegration and tablets prepared by direct compression.
lOo-r_------------------.,
Particle Size l#.tml
Figure 12 Effect of wet granulation on the particle size distribution of adexamethasone powder blend before and after compaction and disintegration. ( 0) dexamethasone powder blend, (A) dried granules before compaction, (D) dried granules after compaction and disintegration. (FromRefs. 1-3.)
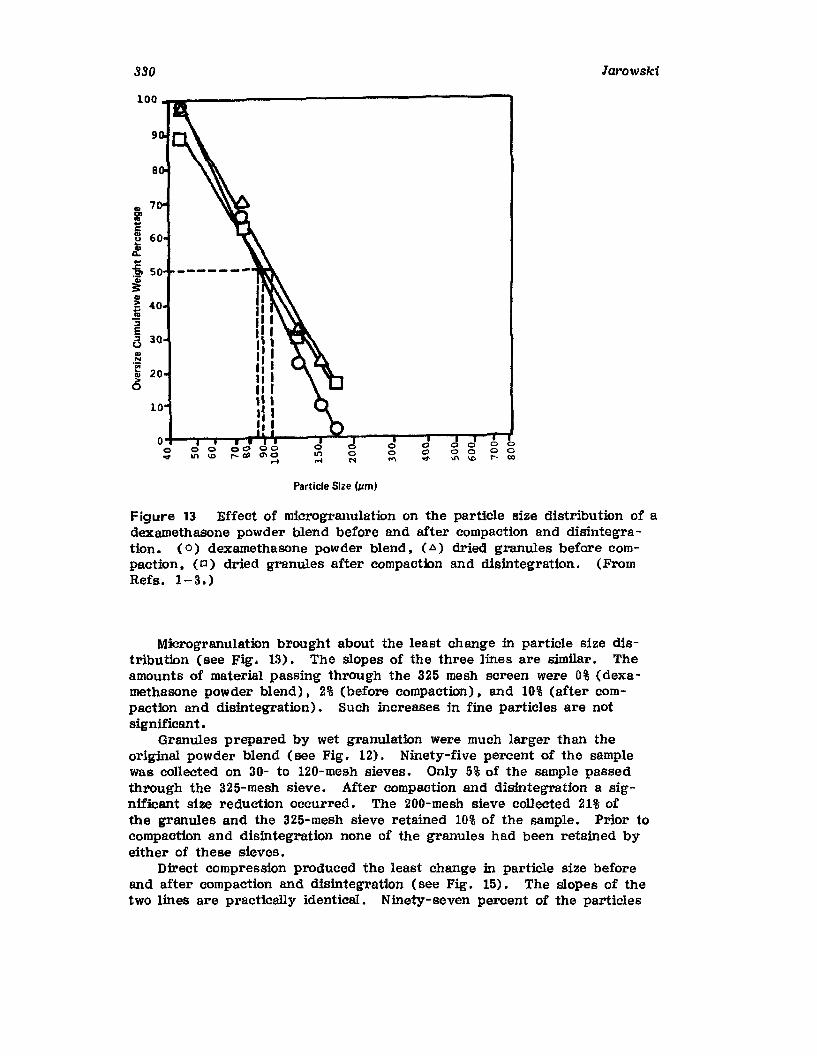
330 larowski
o 0 0o 0 0 0U"\ \0 r-- aJ
oo""
oo,.,o 0 00 00
ll'I \D r--a:I 0'10r-I
o.&--... ......TIr--r-'-,---,r----T-r--r--Ho...
Particle Size (101m)
Figure 13 Effect of microgranulation on the particle size distribution of adexamethasone powder blend before and after compaction and disintegration. (0) dexamethasone powder blend, (A) dried granules before compaction, (0) dried granules after compaction and disintegration. (FromRefs. 1-3.)
Microgranulation brought about the least change in particle size distribution (see Fig. 13) • The slopes of the three lines are similar. Theamounts of material passing through the 325 mesh screen were 0% (dexamethasone powder blend), 2% (before compaction), and 10% (after compaction and disintegration). Such increases in fine particles are notsignificant.
Granules prepared by wet granulation were much larger than theoriginal powder blend (see Fig. 12). Ninety-five percent of the samplewas collected on 30- to 120-mesh sieves. Only 5% of the sample passedthrough the 325-mesh sieve. After compaction and disintegration a significant size reduction occurred. The 200-mesh sieve collected 21% ofthe granules and the 325-mesh sieve retained 10% of the sample. Prior tocompaction and disintegration none of the granules had been retained byeither of these sieves.
Direct compression produced the least change in particle size beforeand after compaction and disintegration (see Fig. 15). The slopes of thetwo lines are practically identical. Ninety-seven percent of the particles
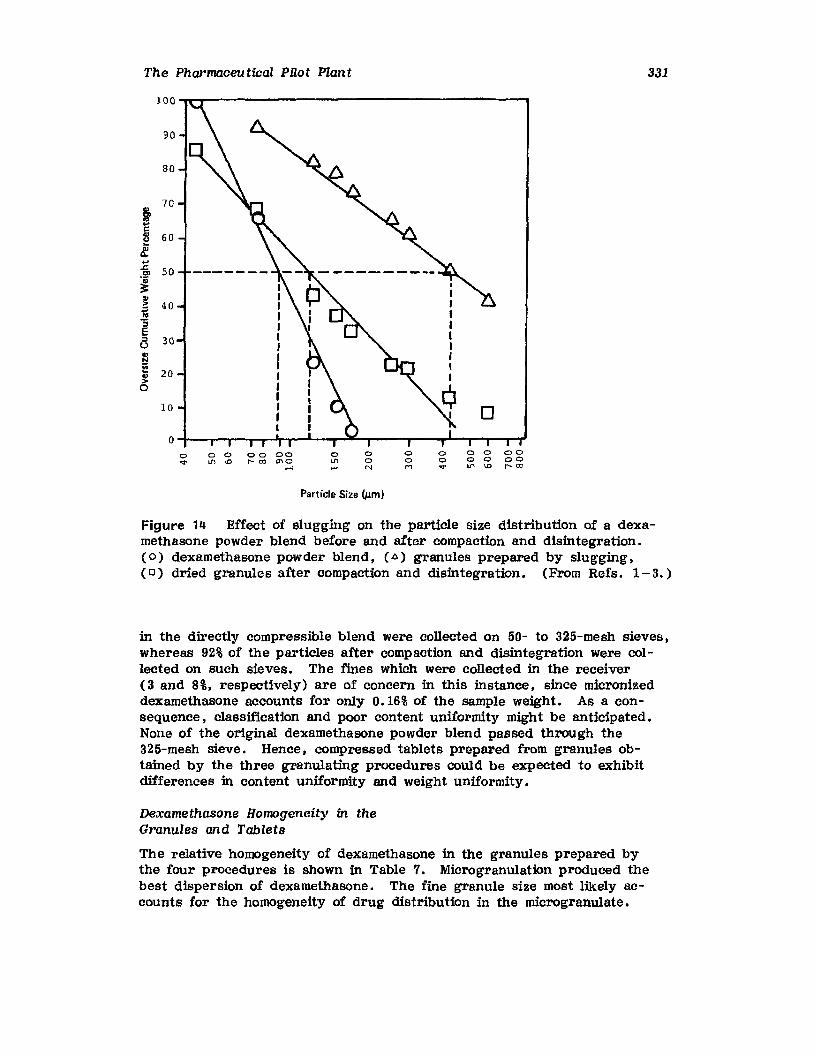
The Pharmaceutical Pilot Plant 331
100 -------------------------
o a 0 00o 0 0 00qo "" \0 r--oo
o<:>M
oo"'I
o a 0 00 00~ Lf> \0 r- 00 "'0
r-l
O-l--.....-...-.................._ ......-...-z;.........--r--.......-r--r-"""Y'"T
80
10
90
70
!~ 60
l1.~en 50
~~ 40~
~(5 30
l!l~ 20o
Particle Size (p:mJ
Figure 14 Effect of slugging on the particle size distribution of a dexamethasone powder blend before and after compaction and disintegration.(0) dexamethasone powder blend, (6) granules prepared by slugging,(0) dried granules after compaction and disintegration. (From Refs. 1-3.)
in the directly compressible blend were collected on 50- to 325-mesh sieves,whereas 92% of the particles after compaction and disintegration were collected on such sieves. The fines which were collected in the receiver(3 and 8%, respectively) are of concern in this instance, since micronizeddexamethasone accounts for only 0.16% of the sample weight. As a consequence, classification and poor content uniformity might be anticipated.None of the original dexamethasone powder blend passed through the325-mesh sieve. Hence, compressed tablets prepared from granules obtained by the three granulating procedures could be expected to exhibitdifferences in content uniformity and weight uniformity.
Dexamethasone Homogeneity in theGranules and Tablets
The relative homogeneity of dexamethasone in the granules prepared bythe four procedures is shown in Table 7. Microgranulation produced thebest dispersion of dexamethasone. The fine granule size most likely accounts for the homogeneity of drug distribution in the microgranulate.
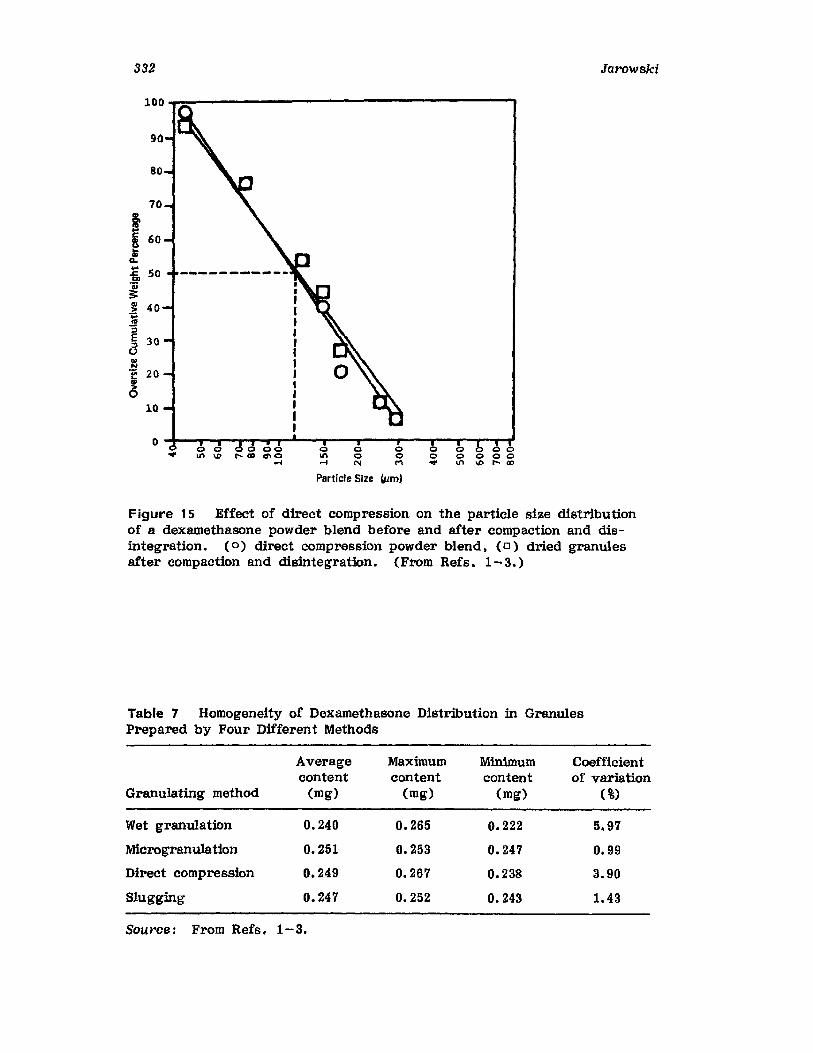
332
70
i...c 6080-..
a.
i. 50"ij
3:.~ 40~
~ 30<3..hi
'2 20..>0
10
00 0 00
r--m 0 0 0 00• li'l \0 1"-00
Particle Size (pm)
Jarowski
Figure 15 Effect of direct compression on the particle size distributionof a dexamethasone powder blend before and after compaction and disintegration. (0) direct compression powder blend, (0) dried granulesafter compaction and disintegration. (From Refs. 1- 3.)
Table 7 Homogeneity of Dexamethasone Distribution in GranulesPrepared by Four Different Methods
Average Maximum Minimum Coefficientcontent content content of variation
Granulating method (mg) (mg) (mg) (%)
Wet granulation 0.240 0.265 0.222 5.97
Microgranulation 0.251 0.253 0.247 0.99
Direct compression 0.249 0.267 0.238 3.90
Slugging 0.247 0.252 0.243 1.43
Source: From Refs. 1-3.
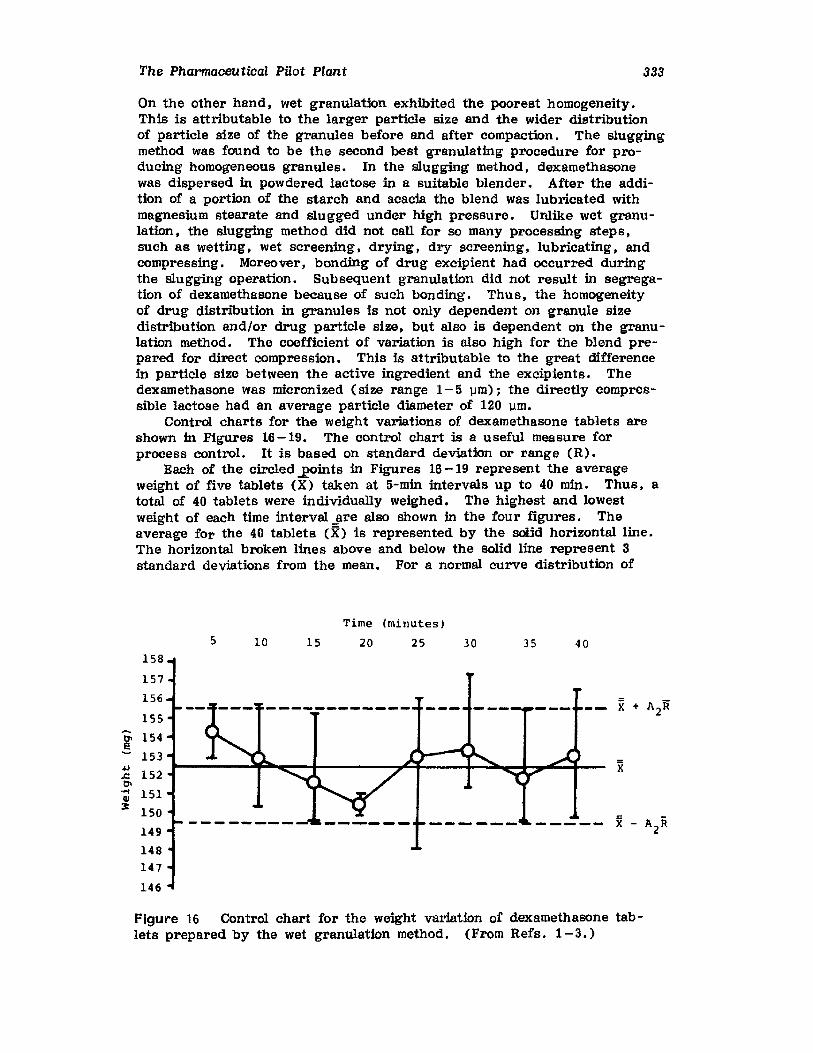
The Pharmaceutical Pilot Plant 333
On the other hand ~ wet granulation exhibited the poorest homogeneity.This is attributable to the larger particle size and the wider distributionof particle size of the granules before and after compaction. The sluggingmethod was found to be the second best granulating procedure for producing homogeneous granules. In the slugging method, dexamethasonewas dispersed in powdered lactose in a suitable blender. After the addition of a portion of the starch and acacia the blend was lubricated withmagnesium stearate and slugged under high pressure. Unlike wet granuIation , the slugging method did not call for SO many processing steps,such as wetting ~ wet screening, drying, dry screening ~ lUbricating ~ andcompressing. Moreover, bonding of drug excipient had occurred duringthe slugging operation. Subsequent granulation did not result in segregation of dexamethasone because of such bonding. Thus, the homogeneityof drug distribution in granules is not only dependent on granule sizedistribution and/or drug particle size, but also is dependent on the granu1ation method. The coefficient of variation is also high for the blend prepared for direct compression. This is attributable to the great differencein particle size between the active ingredient and the exeipienta. Thedexamethasone was micronized (size range 1-5 llm); the directly compressible lactose had an average particle diameter of 120 um.
Control charts for the weight variations of dexamethasone tablets areshown in Figures 16-19. The control chart is a useful measure forprocess control. It is based on standard deviation or range (R).
Each of the circled .20ints in Figures 16-19 represent the averageweight of five tablets (X) taken at s-mtn intervals up to 40 min. Thus, atotal of 40 tablets were individually weighed. The highest and lowestweight of each time interval Jlre also shown in the four figures. Theaverage for the 40 tablets (jC) is represented by the solid horizontal line.The horizontal broken lines above and below the solid line represent 3standard deviations from the mean. For a normal curve distribution of
Time (minutes)
5 10 15 20 25 30 35 40158
157
156
155
t1' 154! 153.,
152.c:t1'.... lSIIII~
150
149
148147
146
x - A R2
Figure 16 Control chart for the weight variation of dexamethasone tablets prepared by the wet granulation method. (From Refs. 1-3. )
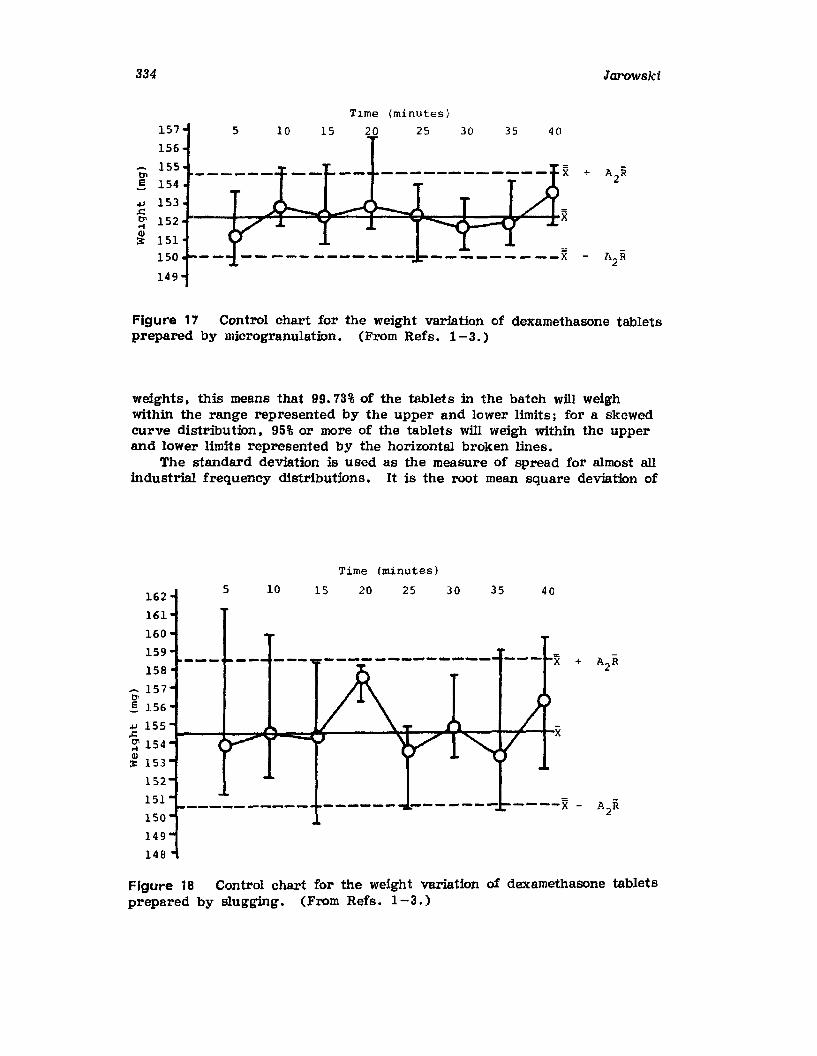
334
T1me (minutes)
157
156
155D'>E 154
+I 153~ 152 .J.._--I-~~~:::::~~:::::::~~:::::=G~~~--~,4:""+X
~ 151
150
149
Jarowski
Figure 17 Control chart for the weight variation of dexamethasone tabletsprepared by microgranulation. (From Refs. 1-3.)
weights. this means that 99.73% of the tablets in the batch will weighwithin the range represented by the upper and lower limits; for a skewedcurve distribution. 95% or more of the tablets wID weigh within the upperand lower limits represented by the horizontal broken lines.
The standard deviation is used as the measure of spread for almost allindustrial frequency distributions. It is the root mean square deviation of
Time (minutes)
162
161
160
159
158
~ 157tl',5 156
+I 155~
~ 154
&153
152
151
150
149
148
5 10 15 20 25 30 35 40
Figure 18 Control chart for the weight variation of dexamethasone tabletsprepared by slugging. (From Refs. 1-3.)
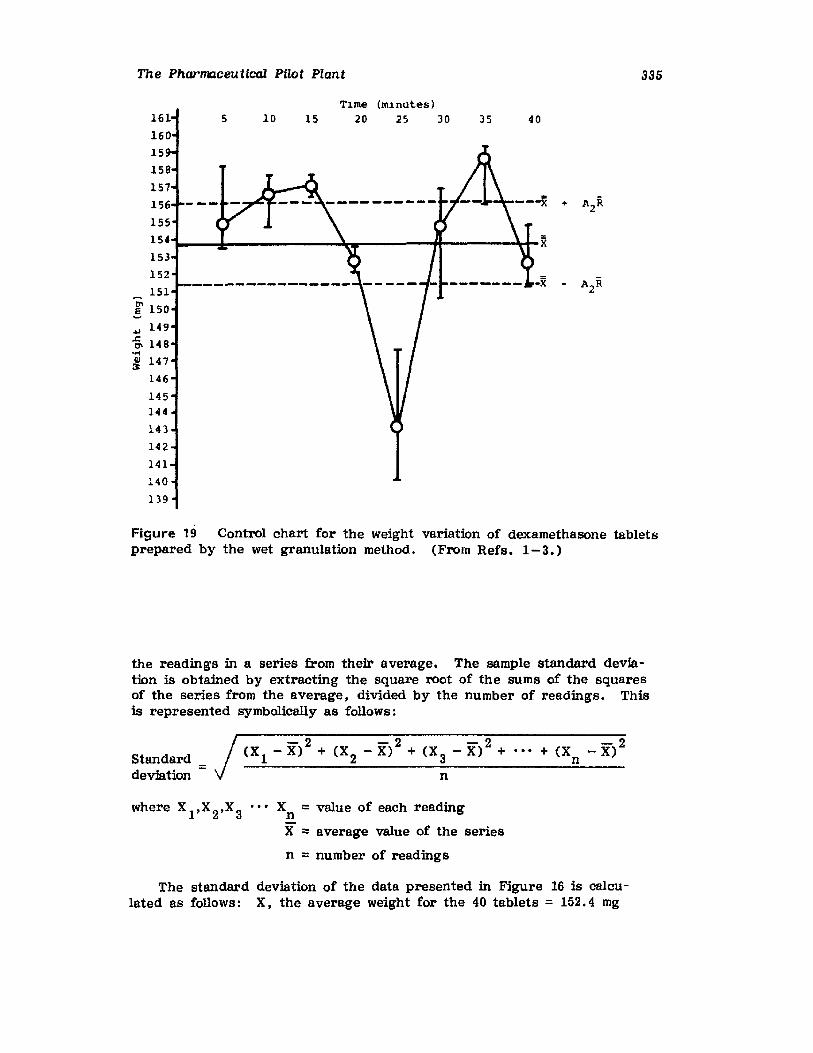
The Pharmaceutical Pilot Plant 335
4035T~me (m~nutes)
15 20 2S 30105161
160
159
159
157
156
155
lS4'1-_--:I:-------~I11""""---_1't_---~tt_X153
152
~ 151
!' 150
-4.1 149-§, 14 9·rot&147
146
145144
143142
141
140
139
Figure 19 Control chart for the weight variation of dexamethasone tabletsprepared by the wet granulation method. (From Refs. 1-3. )
the readings in a series from their average. The sample standard deviation is obtained by extracting the square root of the sums of the squaresof the series from the average, divided by the number of readings. Thisis represented symbolically as follows:
j -2 -2 -2Standard = (Xl - X) + (X2 - X) + (X 3 - X) +
deviation n
... + (X - X)2n
X :: value of each readingnX :: average value of the series
n :: number of readings
The standard deviation of the data presented in Figure 16 is calculated as follows: X, the average weight for the 40 tablets = 152.4 mg
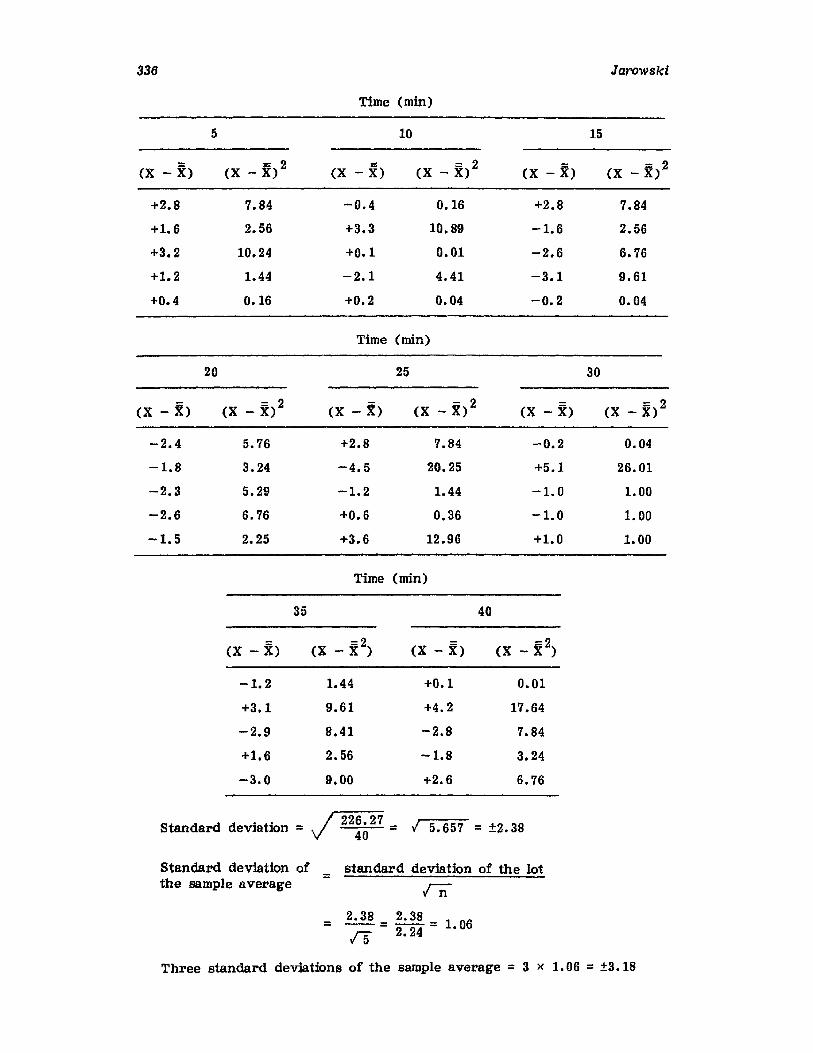
336 Jarowski
Time (min)
5 10 15
(X - X) (X - ib 2(X - X) (X - JC)2 (X - X) (X - Jb
2
+2.8 7.84 -0.4 0.16 +2.8 7.84
+1.6 2.56 +3.3 10.89 -1.6 2.56
+3.2 10.24 +0.1 0.01 -2.6 6.76
+1.2 1.44 -2.1 4.41 -3.1 9.61
+0.4 0.16 +0.2 0.04 -0.2 0.04
Time (min)
20 25 30
(X - X) (X - Jb2
(X - ,b (X - X) 2 (X - X) ex - X) 2
-2.4 5.76 +2.8 7.84 -0.2 0.04
-1.8 3.24 -4.5 20.25 +5.1 26.01
-2.3 5.29 -1.2 1.44 -1.0 1.00
-2.6 6.76 +0.6 0.36 -1.0 1.00
-1.5 2.25 +3.6 12.96 +1.0 1.00
Time (min)
35 40
eX - X) (X - 5(2) (X - X) (X - 5(2)
-1.2 1.44 +0.1 0.01
+3.1 9.61 +4.2 17.64
-2.9 8.41 -2.8 7.84
+1.6 2.56 -1.8 3.24
-3.0 9.00 +2.6 6.76
S d d d . t' / 226.27tan ar evia IOn = 40 = .; 5.657 = ±2.38
Standard deviation ofthe sample average
standard deviation of the lot=In
= 2. 38 = 2.38 =: 1. 0615 2.24
Three standard deviations of the sample average = 3 x 1.06 =: ±3. 18
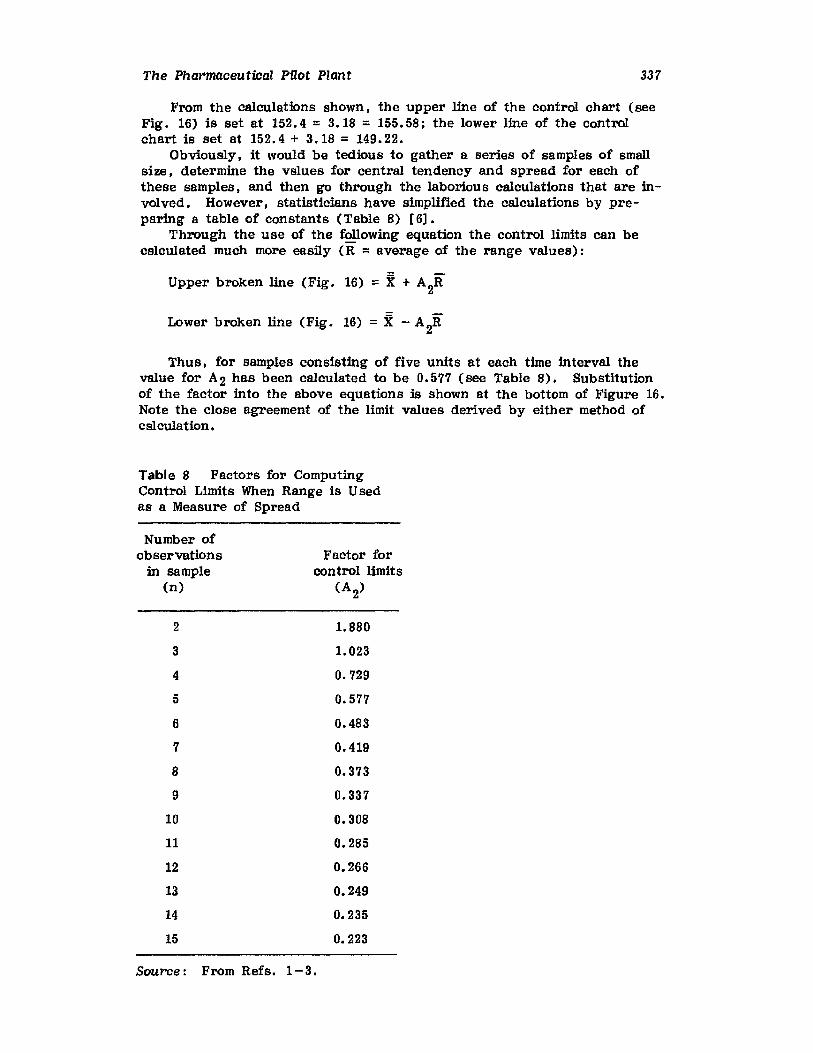
The Pharmaceutical Pilot Plant 337
From the calculations shown, the upper line of the control chart (seeFig. 16) is set at 152.4 = 3.18 = 155.58; the lower line of the controlchart is set at 152.4+ 3.18= 149.22.
Obviously, it would be tedious to gather a series of samples of smallsize, determine the values for central tendency and spread for each ofthese samples, and then go through the laborious calculations that are involved. However. statisticians have simplified the calculations by preparing a table of constants (Table 8) [6].
Through the use of the following equation the control limits can becslculated much more easily (R = average of the range values):
Upper broken line (Fig. 16) == X + A2R
Lower broken line (Fig. 16) = X - A2R
Thus. for samples consisting of five units at each time interval thevalue for A2 has been calculated to be 0.577 (see Table 8). Substitutionof the factor into the above equations is shown at the bottom of Figure 16.Note the close agreement of the limit values derived by either method ofcalculation,
Table 8 Factors for ComputingControl Limits When Range is Usedas a Measure of Spread
Number ofobservations
in sample(n)
Factor forcontrol limits
(A2)
2 1.880
3 1.023
4 0.729
5 0.577
6 0.483
7 0.419
8 0.373
9 0.337
10 0.308
11 0.285
12 0.266
13 0.249
14 0.235
15 0.223
Source: From Refs. 1-3.
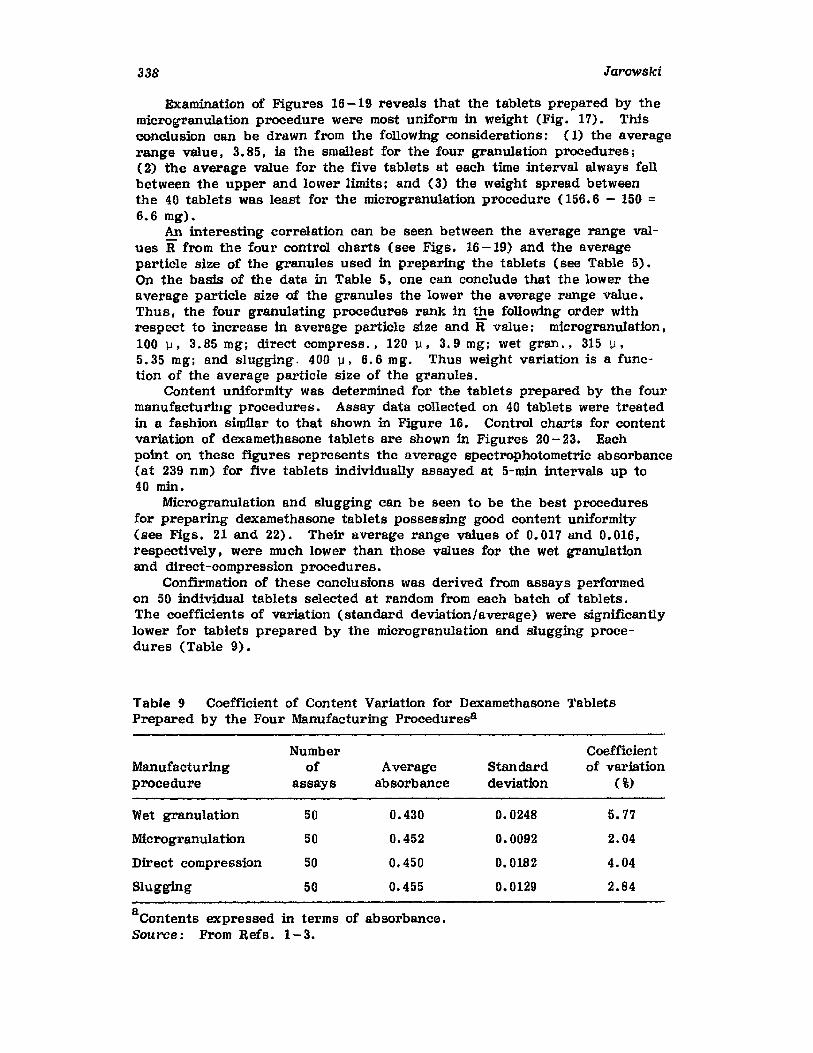
338 Jarowski
Examination of Figures 16-19 reveals that the tablets prepared by themicrogranulation procedure were most uniform in weight (Fig. 17). Thisconclusion can be drawn from the following considerations: (1) the averagerange value. 3. 85. is the smallest for the four granulation procedures;(2) the average value for the five tablets at each time interval always fellbetween the upper and lower limits; and (3) the weight spread betweenthe 40 tablets was least for the microgranulation procedure (156.6 - 150 =6.6 mg).
An interesting correlation can be seen between the average range values R from the four control charts (see Figs. 16-19) and the averageparticle size of the granules used in preparing the tablets (see Table 5).On the basis of the data in Table 5. one can conclude that the lower theaverage particle size of the granules the lower the average range value.Thus. the four granulating procedures rank in the following order withrespect to increase in average particle size and R value: microgranulation •1001-1, 3.85mg; direct compress., 120 u . 3.9mg; wet gran .. 31511,5.35 mg : and slugging. 400 u . 6.6 mg. Thus weight variation is a function of the average particle size of the granules.
Content uniformity was determined for the tablets prepared by the fourmanufacturing procedures. Assay data collected on 40 tablets were treatedin a fashion similar to that shown in Figure 16. Control charts for contentvariation of dexamethasone tablets are shown in Figures 20- 23. Eachpoint on these figures represents the average spectrophotometric absorbance(at 239 nm) for five tablets individually assayed at 5-min intervals up to40 min.
Microgranulation and slugging can be seen to be the best proceduresfor preparing dexamethasone tablets possessing good content uniformity(see Figs. 21 and 22). Their average range values of 0.017 and 0.016.respectively, were much lower than those values for the wet granulationand direct-compression procedures.
Confirmation of these conclusions was derived from assays performedon 50 individual tablets selected at random from each batch of tablets.The coefficients of variation (standard deviation/average) were significantlylower for tablets prepared by the microgranulation and slugging procedures (Table 9).
Table 9 Coefficient of Content Variation for Dexamethasone TabletsPrepared by the Four Manufacturing Proceduresa
NumberManufacturing of Average Standardprocedure assays absorbance deviation
Wet granulation 50 0.430 0.0248
Microgranulation 50 0.452 0.0092
Direct compression 50 0.450 0.0182
Slugging 50 0.455 0.0129
aContents expressed in terms of absorbance.Source: From Refs. 1-3.
Coefficientof variation
(%)
5.77
2.04
4.04
2.84
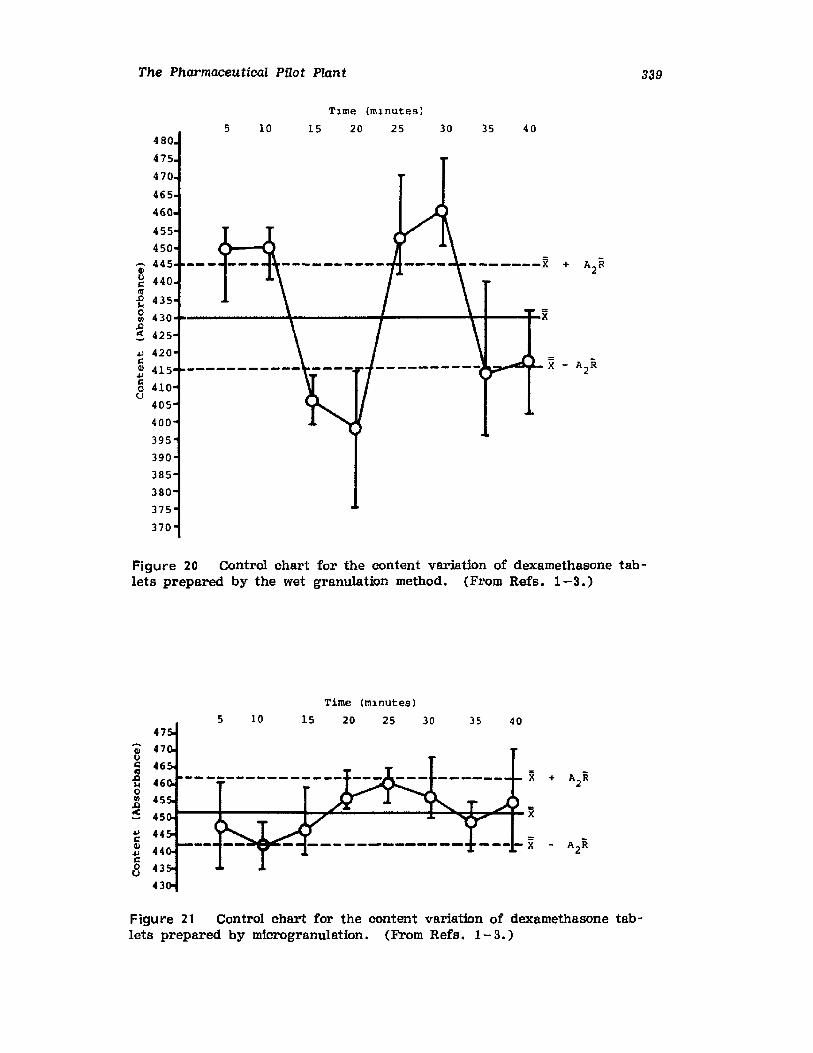
The Pharmaceutical Pilot Plant 339
5 10 15 20 25 30 35 40
41tlI::III£ 435
s 430+.-------+------+-----++---t-X~ 425
+J 420I::~ 415g 410o
405
400
395
390
385
380
375
370
Figure 20 Control chart for the content variation of dexamethasone tablets prepared by the wet granulation method. (From Refs. 1-3.)
Time (ml.nutes)
5 10 15 20 25 30 35 4047
QI 47l)I:: 46III X A}l.Q 46 +~01/1 45~ 45 X+J 44I:: A2RQ.I 44 -+JJ::0 43u
43
Figure 21 Control chart for the content variation of dexamethasone tablets prepared by microgranulation. (From Refs. 1-3.)
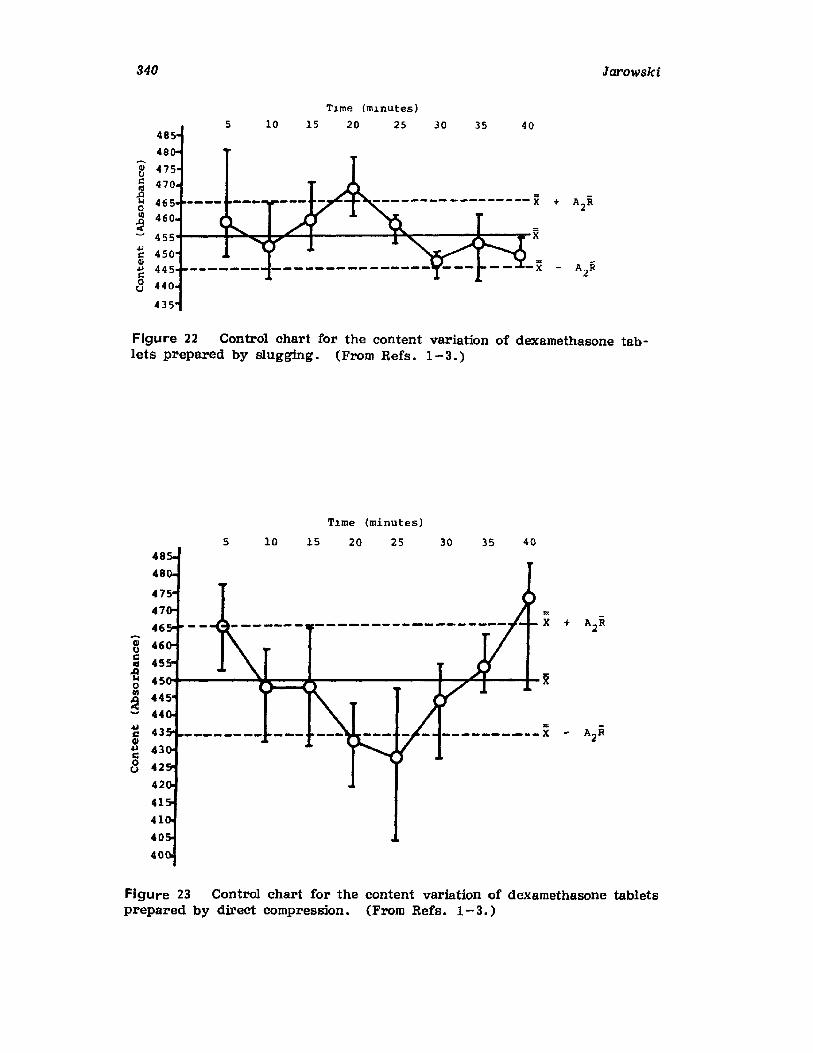
340
Tlme (mlnuteS)
Jarowski
5 10 15 20 25 30 35 40
QJUc.3
+ A2R""0III
~ X.j.JCQJ - Ai.j.Jc0u
Figure 22 Control chart for the content variation of dexamethasone tablets prepared by slugging. (From Refs. 1-3.)
Tlme (minutes)
5 10 15 20 25 30 35 4048
48
4754746
~
B 46
~ 45
~ 4SO+----....l~~:::::~-----.....-_t-~~--;_ XIII~ 445
44
~ 43<II~ 43
8 42
42
41
41
40
40
Figure 23 Control chart for the content variation of dexamethasone tabletsprepared by direct compression. (From Refs. 1-3. )

The Pharmaceutical Pilot Plant 341
Additional Properties of the Granulations andCompressed Dexamethasone Tablets
Additional properties of the granulations that were studied are (1) loss ondrying, (2) tapped, bulk, and true density, (3) compressibility, (4) porosity, (5) angle of repose, (6) flow rate, (7) mean granule diameter.Properties of the compressed tablets that were studied are (1) averageweight, (2) hardness, (3) disintegration time. These properties are summarized in Table 10.
LOSS ON DRYING. Residual moisture in the granules was determinedwith a moisture determination balance on duplicate samples. The sampleswere kept at 70°C for 30 min. The loss in weight was expressed in percentage units.
TAPPED, BULK, AND TRUE DENSITY. Tapped (packed) density wasmeasured by using a granulated cylinder and a motorized tapping deviceset to operate 200 cycles/5min. Volumes of the tapped granules (5-gmsamples) were read in the granulated cylinder after the device was runfor 10 min. The results in Table 9 are the average of three determinations.
Bulk densities were determined by measuring the volumes of 5-gmsamples of granules placed in graduated cylinders. True densities of the
Table 10 Properties of Dexamethasone Granules and Tablets Prepared byFour Different Methods
Wet Micro- DirectProperty granulation granulation compression Slugging
Loss on drying (%) 2.0 1. 60 1. 70 1.90
Density (gm/ml)
Tapped 0.754 0.798 0.872 0.961
Bulk 0.691 0.646 0.683 0.820
True 1.511 1.511 1. 562 1.511
Compressibfiity (%) 8.35 19.04 21. 67 14.67
Porosity (%) 54.27 57.25 56.25 45.74
Angle of repose ( %) 27.4 37.2 44.5 39.2
Flow rate (sec) 2.53 8.91 20.18 2.66
Flow (rotary press) Very good Very good Good Very good
Mean granule 315 100 120 400diameter (11m)
Average weight (mg) 152.5 152.3 153.5 154.6
Hardness (kg) 3.6 3.9 3.4 3.9
Disintegration (min) 2.5-3.8 1.1-1.5 3.7-4.7 1.4-1.7
Source: From Refs. 1-3.
342 Jarowski
powdered blends shown in Table 3 were determined with a pycnometerusing benzene as the immersion fluid.
COMPRESSIBILITY. Compressibility [7] was calculated by using thefollowing equation:
Percent compressibility = Eacked density - bulk density x 100packed density
POROSITY. Porosity [8] was calculated by dividing the bulk densityvalues by the true density values.
ANGLE OF REPOSE. The angles of repose [9,10] of the granules weremeasured after the lubricant had been blended in. Sixty-gram sampleswere poured into a lO-cm funnel having a stem diameter of 0.8 cm andresting atop a rubber stopper having a diameter of 5.4 ern, The funnelwas then slowly raised a distance of 7 em, allowing the granules to flowout and form a conical heap. The angle of repose was calculated by usingthe following equation:
height of the coneTangent of the angle of repose = d~ f thra IUS 0 e cone
Thus, it is evident that the angle of repose is the base angle of the coneformed when the granules fell freely on a flat surface from the funnel.The values reported in Table 9 were obtained by referring to a table oftrigonometric functions.
The repose angle values listed in Table 9 are the averages obtainedfrom five determinations made on the various granulations and the directlycompressible powder blend. The angle of repose gives some indication ofthe flow properties of granulations. Thus, granulations having reposeangles of less than 400 will flow freely through a hopper orifice. The repose angle depends on the nature of the powder and on variables whichinclude the shape and size distribution of the granules, presence ofmoisture, density of the particles, and technique of measurement. Therelative humidity was kept constant during the determinations, and themoisture content of the various granulations studied was less than 2%.
FLOW RATE. The flow rate was determined by passage of 50 gm ofgranules through a stainless steel funnel with a l-cm opening. The funnel was attached to a granule flow tester which recorded flow timeautomatically.
The three factors of compressibility, angle of repose, and flow rate,which give information on flow properties, predict that the granulationsprepared by the wet method will flow better. The lower the compressibUityfactor and the smaller the angle of repose, the faster is the predicted flowrate of the granules. Microgranulation was found to produce a blendwhich had a high porosity, indicating bridging due to cohesive forces [9].The porosity values of the granulations prepared by slugging were foundto be minimal, indicating little intraparticular void volume in the granules.The disintegration rates of the dexamethasone tablets prepared by any ofthe granulating procedures or by direct compression were all satisfactory.
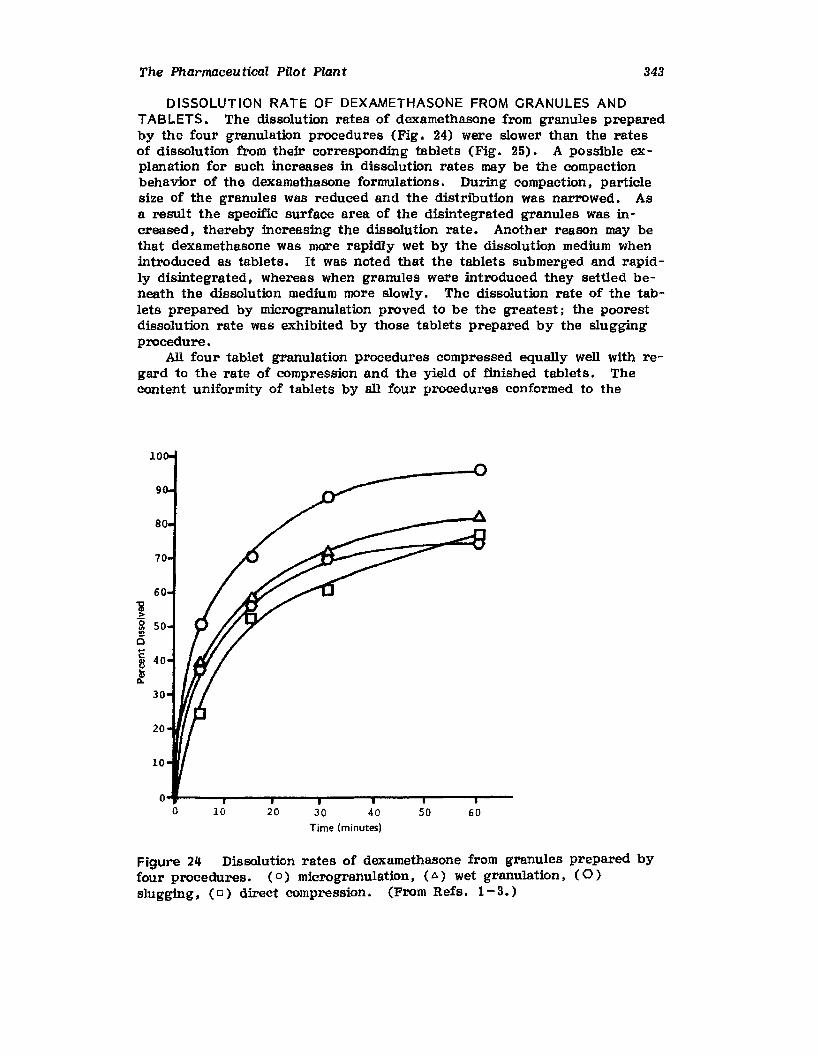
The Pharmaceu tical PIlot Plan t 343
DISSOLUTION RATE OF DEXAMETHASONE FROM GRANULES ANDTABLETS. The dissolution rates of dexamethasone from granules preparedby the four granulation procedures (Fig. 24) were slower than the ratesof dissolution from their corresponding tablets (Fig. 25). A possible explanation for such increases in dissolution rates may be the compactionbehavior of the dexamethasone formulations. During compaction. particlesize of the granules was reduced and the distribution was narrowed. Asa result the specific surface area of the disintegrated granules was increased. thereby increasing the dissolution rate. Another reason may bethat dexamethasone was more rapidly wet by the dissolution medium whenintroduced as tablets. It was noted that the tablets submerged and rapidly disintegrated. whereas when granules were introduced they settled beneath the dissolution medium more slowly. The dissolution rate of the tablets prepared by microgranulation proved to be the greatest; the poorestdissolution rate was exhibited by those tablets prepared by the sluggingprocedure.
All four tablet granulation procedures compressed equally well with regard to the rate of compression and the yield of finished tablets. Thecontent uniformity of tablets by all four procedures conformed to the
0+--_._--_._--_._--....,...---_--,---o 10 20 30 40
Time (minutes)
50 60
Figure 24 Dissolution rates of dexamethasone from granules prepared byfour procedures. ( 0) miorogranulation, (A) wet granulation. (0)slugging. (0) direct compression. (From Refs. 1-3. )
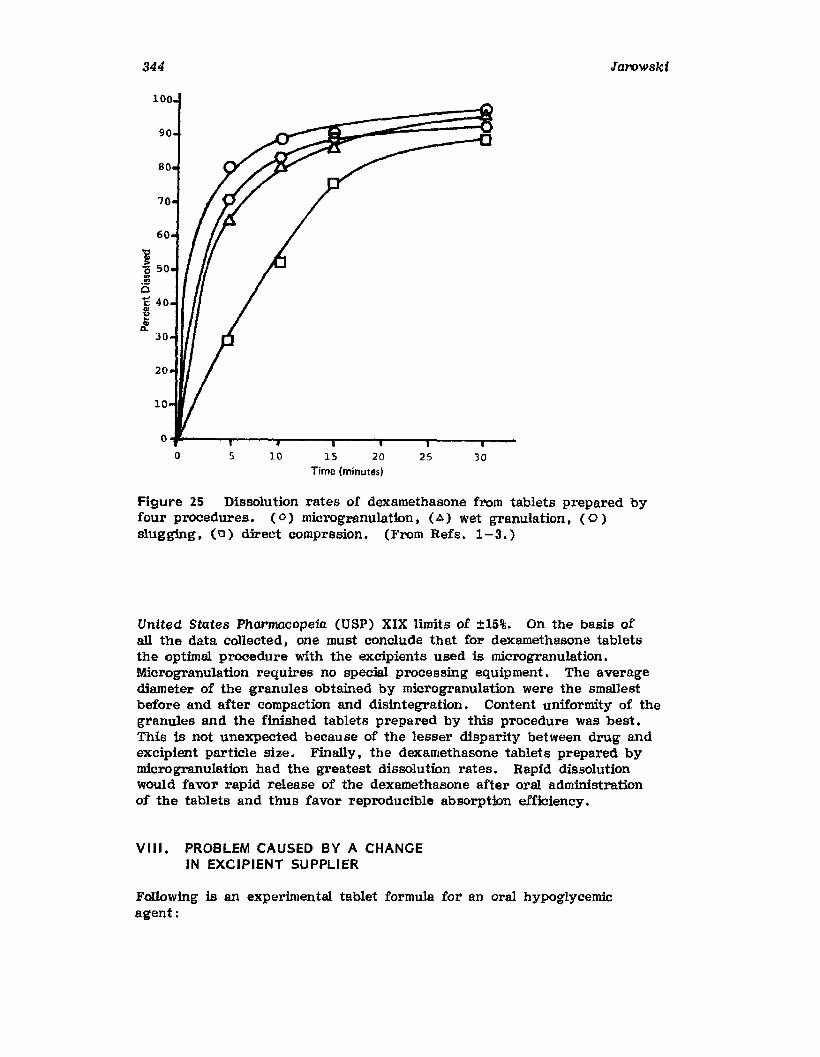
344
100
i'5 50::I01: 402l...'II
Q.
30
20
10
0
0 5 10 15 20Time (minutes)
25 30
Jarowski
Figure 2S Dissolution rates of dexamethasone from tablets prepared byfour procedures. ( 0) microgranulation t (A) wet granulation J (0)slugging. (0) direct comprssion. (From Refs. 1-3. )
United States Pharmacopeia (USP) XIX limits of ±15%. On the basis ofall the data collected, one must conclude that for dexamethasone tabletsthe optimal procedure with the excipients used is microgranulation.Microgranulation requires no special processing equipment. The averagediameter of the granules obtained by microgranulation were the smallestbefore and after compaction and disintegration. Content uniformity of thegranules and the finished tablets prepared by this procedure was best.This is not unexpected beeause of the lesser disparity between drug andexcipient particle size. Finally. the dexamethasone tablets prepared bymicro granulation had the greatest dissolution rates. Rapid dissolutionwould favor rapid release of the dexamethasone after oral administrationof the tablets and thus favor reproducible absorption efficiency.
VIII. PROBLEM CAUSED BY A CHANGEIN EXCIPIENT SUPPLIER
Following is an experimental tablet formula for an oral hypoglycemicagent:
The Pharmaceu tical Pilot Plant
ChlorpropamideKel acidDicalcium phosphateCornstarchMagnesium stearate
250 mg30 mg50 mg30 mg
7 mg
345
Granules of the above blend of powders with half of the magnesium stearaterequirement were prepared by slugging and passage of the slugs throughan oscillating granulator. The granules were lubricated with the remainderof the magnesium stearate and compressed into tablets. Tablets preparedin this manner disintegrated in less than 15 min in simulated gastric fluidat 37°C. The physical properties of the tablets prepared on a pilot andproduction scale duplicated those specified by research. After several successful production size runs had been made a subsequent production runyielded tablets that did not disintegrate within the specified time limit.The pilot plant research pharmacist was asked to determine the cause ofthe poor disintegration.
At the outset the cause for such poor disintegration was difficult todetermine. All the raw materials that had been used had been cleared forUse by quality control. The manufacturing procedure had been followedexactly as written. Eventually a clue to the cause of the problem wasfound. A new lot of kel acid had been purchased and used in making thebatch in question. This ingredient had been included in the tablet formulabecause of its disintegrant property. Discussions with the purchasing department revealed that this neW lot of kel acid had been purchased from anew supplier. Microscopic inspection of the new supplier's kel acid revealed that it had been micronized. The original supplier's kel acid appeared as 10- to 20-J.lm fibers under the microscope. Thus. the cause ofthe problem was discovered. It is well known that when water-swellinggums are used as disintegrants, they are effective as relatively coarseparticles because the swelling of coarse particles does not form a eontinuous film on the tablet surface as does a finely subdivided powder.
An attempt was made to rework the tablets in order to salvage them.The tablets were converted to granules by passage through a comminutingmill. Additional starch (5%) was added to the granules to ensure that thetime limit for disintegration would be met. Additional magnesium stearate(1%) was added and the reworked blend compressed. The disintegrationtime for the reworked tablets was less than 15 min. but the dissolutionrate of the chlorpropamide was unsatisfactory. A blood level study indogs confirmed that the oral absorption of the chlorpropamide had beenimpaired. One might have anticipated that the release of chlorpropamidefrom the granules obtained after disintegration of the reworked tabletswould be slow in vitro and in vivo because they contained the micronizedkel acid. As a result of this experience, a particle size specification forthe kel acid component was added by quality control.
IX. FRIABILITY RELATED TO PARTICLESIZE DISTRIBUTION
Lantz et al , [11] described how the cause of a friability problem was discovered. After many days of production no problems had been encountered
346 Jarowski
Table 11 Acetophenetidin Particle Size Difference
Acceptable Unacceptablematerial material
Mesh size (%) (%)
60 6.7 7.4
60-80 11. 5 33.6
80-100 13.5 18.3
100-200 38.6 29.4
<200 29.8 8.3
Source: From Ref. 11.
with an acetophenetidin tablet formulation. With production apparentlyproceeding satisfactorily one day. on three successive lots of tablets thequality control and production departments reported that tablet friabilitywas higher than usual. The statistics department ran an analysis on thefriabfiity data and concluded that a significant change had occurred. Acheck with the production operators revealed that nothing unusual hadoccurred. A check with the production operators revealed that nothingunusual had occurred during the production of these three lots of tablets.
A collaborative effort between the research, production, and qualitycontrol departments was initiated. A checking of the physical specifications on the raw materials used in the manufacture of these tablets revealed that the acetophenetidin was different in particle size distributionfrom previous lots (Table 11). The tablet blend containing the unacceptable material would not compress well. In the form of small particlesit acted as a binder when compressed with the other tablet excipients.The quality control division did not use particle size distribution as abasis of accepting or rejecting acetophenetidin at the time this problem hadarisen. Inclusion of a particle size specification for bulk acetophenetidincorrected the problem in subsequent production batches. The data inTable 11 clearly show that 30% of the acceptable bulk material passedthrough a 200~mesh sieve. Only 8.3% of the unacceptable acetophenetidinbulk passed through the 200-mesh sieve.
x. EFFECT OF DISINTEGRANT VISCOSITYON DISINTEGRATION RATE
Sodium starch glycolate is an excellent disintegrating agent. It is formedby reacting starch with monochloracetic acid. It was being used as adisintegrating agent in a research tablet formula at a 3% concentrationbased on the weight of the tablet. Such tablets consistently disintegratein less than 30 s in simulated gastric juice at 37°C. The first clinicalbatch of tablets prepared in the pUot plant exhibited disintegration timesgreater than 30 min. Discussions between research and pilot plant personnel revealed that a low viscosity grade had been used by research.
The Pharmaceutical Pilot Plant 347
whereas a regular grade had been used in the pilot plant. The two gradesdiffer markedly in viscosity. Aqueous dispersions of the regular grade(3.3%) have viscosities ranging from 100 to 700 centipoise (cp). The lowviscosity grade (3.3%) in aqueous dispersion can range from 10 to 40 cp inviscosity. The establishment of a specification of <40 cp for an aqueousdispersion (3. 3%) of the low-viscosity grade corrected the problem. All subsequent lots of tablets disintegrated within the time limits specified.
XI. INFLUENCE OF INGREDIENT MOISTURECONTENT ON FRIABILITY
A multivitamin film-coated tablet containing a high concentration of ascorbicacid had been routinely manufactured by direct compression. The film coating was applied to the tablet cores in a fluidized-bed apparatus. In-housestabfiity data had established that a moisture content above 2% in the finishedtablets would not provide a 2-year shelf life. As a consequence. the moisturecontent of each of the components of the tablet formula were specified to beas low as possible. The moisture content of the purchased bulk ascorbicacid. for example. was specified to be less than 0.6%.
During an intensive production campaign, serious friability problemswere encountered which led to a shutdown of the film-coating operation. Asearch for the cause of the friable cores ultimately led to an inspection of thequality control division's file samples and records of the raw materials usedin the manufacture of the cores. Since ascorbic acid possessed the greatestpercentage of the finished tablet weight, its file samples were scrutinizedmost thoroughly. Particle size distribution of file samples that had beenused in making excellent batches of multivitamin tablets in the past were similar to the more recent material used in the friable cores.
The solution to the problem was finally found to be the low moisture content in the bulk ascorbic acid. When the bulk ascorbic acid had a moisturecontent of 0.5-0.6% firm cores were obtained which could be film coated withease. However, if the bulk ascorbic acid had a moisture content of0.2 - 0.3%. then the multivitamin tablet cores Were apt to be friable andcause problems in the film-coating step. Additional studies were conductedto establish an ideal moisture content for the bulk ascorbic acid. Throughthe use of an instrument press it was established that a favorable compressibfiity Ihardness ratio resulted when the bulk ascorbic moisture content was raised to 1.1%. Tablets prepared with such material producedcores Which were efficiently film-coated. The moisture content of the finished tablets was less than 2%. and as a consequence shelf stability wasassured.
XII. DRUG AND DYE MIGRATION INWET GRANULATION
A. Drug Migration
Serious problems of content uniformity were being encountered in the manufacture of tablets containing small quantities of potent drugs. Wet granulation had been established as the method of choice for such tablets. Themanagement of the firm was reluctant to invest in alternate granulating
348 Jarowski
equipment. or in the purchase of more expensive direct-compression excipients. Additional problems of maintaining content uniformity could beanticipated because the company was planning to market several tabletformulas containing low concentrations of active ingredients. As a consequence, a development team from the pilot plant was asked to solve thisproblem.
Discussions with the pharmaceutical research formulators were not revealing. Poor content uniformity had not been encountered either duringthe development of the formulations or in the preparation of clinical batchesranging from 25.000 to 50.000 tablets. It was only during production campaigns to prepare several million tablets that such problems had arisen.The developmental team from the pilot plant focused their attention on thedrying step. They realized that when water-soluble dyes are used in wetgranulation tablet procedures dye migration can readily be noted both inthe dried granulations and in the compressed tablets. The degree towhich dye migration occurs is dependent upon (1) the water solubility ofthe colorant. (2) the rate of drying, (3) the thickness of the bed of wetgranules, and (4) the granulating solvents used.
Chaudry and King {12] studied the extent of sodium warfarin migration in compressed tablets prepared by the wet granulation procedure. Adry blend of excipients and drug was proven to be uniform by assay.The blend was mixed with starch paste or acacia dispersion, passedthrough a No.8 screen, and dried in a layer 1.27 em thick at 65-70oC
for 16-18 h in a shelf dryer. During the drying step migration of thesodium warfarin occurred. Higher concentrations of the drug were foundin the outer layers, with a reduced amount toward the center. The driedmaterial was passed through a No. 20 screen. The granules were blendedwith lubricant and tableted , Of the 50 tablets assayed only 12% fell withinUSP limits. Addition of 15% alginic acid to the blend of calcium phosphateand sodium warfarin prior to granulating with the acacia dispersion nullified drug migration during the drying step. As would be expected, content uniformity in the compressed tablets was significantly improved. Thedisintegration time was significantly increased by the addition of alginicacid. ThuB, sodium warfarin tablets prepared with calcium phosphate andstarch paste disintegrated in less than 12 s, On the other hand. tabletscontaining 15% alginic acid which had been granulated with an aqueousdispersion of acacia disintegrated in 16-18 min.
Warren and Price [13,14] reported on the effect of particle size of themajor diluent, dispersion viscosity, and drying temperature on propoxyphene hydrochloride migration in wet granules during the drying step.Wet granulations of the drug were prepared using lactose as the majordiluent and starch as the disintegrant. Particle size fractions of lactoseranging from 53 to 177 um in diameter were employed. Determination ofdrug content at various depths in a dried granulation bed was accomplishedby using a drying cell consisting of four layers. The cell was open onboth ends of the cylinder formed by the layers. When used for migrationstudies the drying cell was placed on an oven tray lined with porous paper.Migration increased with decreasing particle size of the major diluent,lactose. The authors singled out two factors that could explain the resultsobtained: (1) increased entry suction due to decreased intragranular capillary size and (2) increased intergranular contact area. The drug concentrations Were greatest at the top and bottom layers of granules. Thiswas not unanticipated, since it was expected that the drug, eolubiliaed in
The Pharmaceutical Pilot Plant 349
the water present, would be transported toward the evaporating surfacesby capillary action.
Binder solutions ranging in viscosity from 1 to 1000 cp were used todetermine the effect of viscosity on drug migration. Binder solutions withviscosities greater than 90 cp produced granulations that exhibited insignificant drug migration during the drying step. Drying temperaturesranging from 40 to 80aC had little influence on the extent of drug migration.
Tablets prepared from a granulation in which drug migration was highshowed a greater drug content variation than a granulation with lessermigration. This was so even though each dried granulation was blendedbefore tableting.
On the basis of the published data reported above, the decision wasmade to prepare granules with more viscous binder solutions. As a further deterrent to drug migration, fluid-bed dryers were used in the interest of reducing drying time. An additional refinement was introducedin the form of an automatically controlled temperature profile. Temperatureprobes that recorded the air-in granules and air-exit temperatures were installed. The result of such refinements in the granulating and dryingsteps was that tablets containing small quantities of active ingredients wereroutinely produced which had excellent content uniformity.
B. Effect of Aged Simple Syrup on Dye Migrationin Sugar-Coated Tablets
Soluble dyes. lake dyes, or insoluble pigments are added during the finalstages in the sugar coating of tablets to facilitate identification and to enhance the esthetic appearance of the final product. There is an increasingtendency to use the lake dyes as tablet colorants.
Lake dyes are made by adsorbing a dye onto some inert substance surface such as aluminum hydroxide. The dye adsorbates are less sensitiveto light degradation. Furthermore, when lakes are employed in the sugarcoating operation it is generally not necessary to use a variety of increasing concentrations of colorant to produce a uniform color. As a consequence, excellent results in tablet coloring are consistently being obtained by tablet coaters who use lake dyes in the regular and finishingcoats.
A newly hired tablet eoater was in the process of applying color coatsto an established sugar-coated tablet. Dye migration and mottling werenoted during the coating operation even though a lake dye was being used.Discussions with the tablet coater led to the solution of the problem. Although the proper lake dye had been used and the syrup contained theextender, calcium carbonate. their order of addition had been reversed.The simple syrup being used in the coating operation was slightly acidic.Adding the lake dye to the slightly acidic simple syrup resulted in partialsolution of the dye from the surface of the aluminum hydroxide. Suchpartial dye solubilization was the cause of the dye migration and mottlingobserved. However. when the calcium carbonate was added to the syrupfirst any acidity in the latter was effectively neutralized because the calcium carbonate is alkaline.
A revised manufacturing procedure was issued which stressed the significance of adhering to the order of addition of the calcium carbonate and
350 Jarowski
the lake dye. The dye migration and mottling problem was thereby effectively eradicated.
C. Effect of Acidic Salts on the Mottlingof Tablets Containing Lake Dyes
A directly compressible tablet blend containing spray-dried lactose, starch,microcrystalline cellulose, magnesium stearate, and a lake dye showed signsof mottling on exposure to 50% relative humidity. The drug, a weaklybasic compound, was present as the more soluble hydrochloride salt. A5% aqueous solution of the salt had a pH of 4.2. The cause of the mottlingproblem was readily explained by the troubleshooter when these facts werepresented. The close contact of the acidic salt, lake dye, and moisture ledto elution and migration of the dye from the aluminum hydroxide surface.The mottling problem was readily overcome by inclusion of an alkaline buffer in the directly compressible tablet formula.
XIII. EFFECT OF AGED SIMPLE SYRUP ON SMOOTHINGAND ROUNDING STEPS IN THE SUGAR COATINGOF TABLETS
The steps involved in sugar coating of tablets may be subdivided into thefollowing: (1) waterproofing and sealing, (2) subeoating , (3) smoothing orrounding, (4) coloring and finishing, and (5) polishing. Often the waterproofing and sealing steps are omitted. However', with sensitive drugs orvitamin mixtures they must be included. Subcoating involves alternatelywetting the tablets with subcoating solution and partially dry sprinklingwith dusting powder. This causes the tablets to be rapidly filled out.Rounding or smoothing involves applications of heavy syrup so that ahard, smooth surface is produced. Coloring and finishing involves theapplication of thinner, colored syrup in order to build up the tablet further and obtain the desired shade of color. Polishing involves rolling thetablets with wax or the application of a wax solution or suspension inorder to give the finished tablets a high gloss.
During a routine sugar-coating operation on an established product, adrying problem was encountered during the smoothing and rounding step.Ordinarily, when subeoated tablets are revolving in the coating pan, asufficient quantity of warm simple syrup is added to cover the tablets.The quantity of syrup is sufficient to loosen previous applications, so thatthe tablets will tend to cluster or adhere to the pan. However, stirringshould be maintained to prevent clustering. When the tablets are rollingfreely. ait' is blown on them until they are dry. The problem that aroseduring this routine coating operation was that the tablets showed no tendency to stick to the coating pan. The tablets slid rather than rolled.Drying was exceedingly slow. The dried tablets had a wrinkled, orangepeel appearance.
Once the tablet surface becomes rough during this smoothing stage,recovery is difficult. Roughness can be created by (1) excess dust thatremains after the dusting process. Such residual dust deposits on tabletsas agglomerates When the next application of syrup is applied. (2) Thetablets may be allowed to roll too long after the dusting power has been
The Pharmaceutical Pilot Plant 351
applied. (3) Insufficient syrup may have been added, so that incompletewetting of the tablets resulted.
After extensive discussions with production division personnel, noplausible explanation could be found for the roughness encountered. Attention was then given to the possible implication of the simple syrupused. Production records revealed that the simple syrup had been onhand for several weeks. Furthermore. it had been heated. as required.on three previous occasions. Such heating of simple syrup favors theformation of invert sugar by the partial hydrolysis of sucrose. An analysis of the suspected syrup showed that 9% invert sugar was present.Thus. the cause of the drying problem was discovered. As is well known.invert sugar is frequently added to syrupy dosage forms to obviate thecrystallization of sucrose beneath threaded bottle caps. Such sucrosedeposition results in freezing of the caps. After establishment of tightspecifications for invert sugar content in the coating syrup, the dryingproblem encountered during the smoothing operation disappeared.
XIV. EFFECT OF FILM-FORMER VISCOSITYON DISINTEGRATiON RATE
Developmental work had been initiated to film coat a tablet dosage form ofa bitter-tasting drug. A 9: 1 weight ratio of hydroxypropylmethylcellulose/ethylcellulose was found to be satisfactory because it masked the bittertaste.
Hydroxypropylmethylcellulose is a popular film former because of itssolubility in organic solvents and its facile dispersibility in gastrointestinaljuices. Such solubility and dispersibility characteristics permit its use inusual amounts without interfering with tablet disintegration and drugavailability. Ethylcellulose was included in the film because its presenceimparts film strength and elasticity. It cannot be used alone or in toohigh a concentration as it is completely insoluble in water.
Several lots prepared in research and in the pilot plant had disintegration times of less than 5 min in simulated gastric juice at 37°C. The uncoated cores consistently disintegrated within 2 min. A subsequent pilotbatch of tablets did not disintegrate within the time limits specified. Discussions between research and pilot plant personnel were initiated to ascertain the cause of the slow disintegration.
The weights of the film-coated tablets were within specification limits.Check weight records and inventory supplies confirmed that the intended9: 1 weight ratio had been used. Nothing unusual had been noted by thepilot plant operators who had prepared the film-coated tablets. As a consequence. the decision was made to check the viscosities of the variouslots of hydroxypropylmethylcellulose and ethylce1lulose used in preparingthe various batches of tablets. An interesting relationship between viscosity limits and tablet disintegration was found. The viscosity of a 2%aqueous dispersion of hydroxypropylmethylcellulose must be Iss than 15 cpand the viscosity of ethylcellulose in toluene/ethanol must be less than10 ep , The poorly disintegrating film-coated tablets had been coated withhydroxypropylmethylcellulose exhibiting; a viscosity of 50 cp for a 2%aqueous dispersion. The ethylcellulose used in the poorly disintegratingtablets was type 10 cp , Viscosity specification limits were set in collaboration with quality control to obviate recurrence of the problem.
352 Jarowski
xv. TABLET BINDING
When tablets adhere, seize, or tear in the die the cause is usually inadequate lubrication. A film is formed in the die and ejection of the tablet isdifficult. Such tablets have rough or vertically scratched sides. Thesurface of the tablets lacks a smooth or glossy finish, and they are oftencracked on the top edge. Additional lubricant or substitution of a moreeffective one will usually correct this problem. The method of adding thelubricant can sometimes be the cause of binding in the die. Some formulators recommend introducing the lubricant by sifting through a lOO-meshsilk screen.
Binding may be caused by attempting to compress granules that aretoo dry, too moist, too coarse, too hard, or too abrasive. Granules thatare too dry could be regranulated. However, an in-process control specification on moisture content would effectively guard against overly driedgranules. Granules that are too moist will likewise be prevented by anaccurately defined in-process moisture specification. Granules that are toocoarse are apt to cause lubricant failure. Corrective measures that can beconsidered are (1) reduce the size of the granules, and (2) increase theamount of lubricant. In the event the granules are too hard or too abrasive, modification of the granule formula should be considered.
After the compressional stage some tablets expand excessively. Insuch instances tapered dies should be considered as a practical correctivemeasure. When binding in the die occurs in one or two stations of arotary tablet press, the tooling should be checked. Replacement or polishing of those punches and dies that are poorly finished or rough fromabrasion would solve the problem.
XVI. PICKING AND STICK ING
The term picking is used to describe the removal of material from the surface of the tablet and its adherence to the face of the punch. Specifically,this term refers to monograms, lettering, or numbering. Letters such asA, B, P, and R, which possess small, enclosed areas, are apt to causepicking. Letters such as M, N, W, and Z, which have sharp angles, arealso troublesome. All such areas and angles are difficult for the engraverto cut cleanly and for the toolmaker to polish smoothly. Picking is usuallydue to moist granules when plain punches are used.
The term sticking may also refer to the build up of material on thepunch faces. However, the term is more often used to describe the adhesion of granulation to the die wall. Sticking is usually due to improperly dried or improperly lubricated granulationa. Sticking or picking ismore apt to occur if excessive binder is used, if the humidity is high, orif a low-melting component such as stearic acid is present.
When lettered punches are to be used, the letters should be made aslarge as possible. This is especially useful on punches with small diameters. Increasing the diameter and weight of the tablet will be usefulfrom two standpoints. Not only would the enlargement permit larger lettersto be used, but a low-melting drug component could be diluted further tominimize the picking and sticking tendency. Others have found it beneficial to include colloidal silica in the tablet formula. The colloidal silicaacts as a polishing agent and makes the punch face smooth, and thus
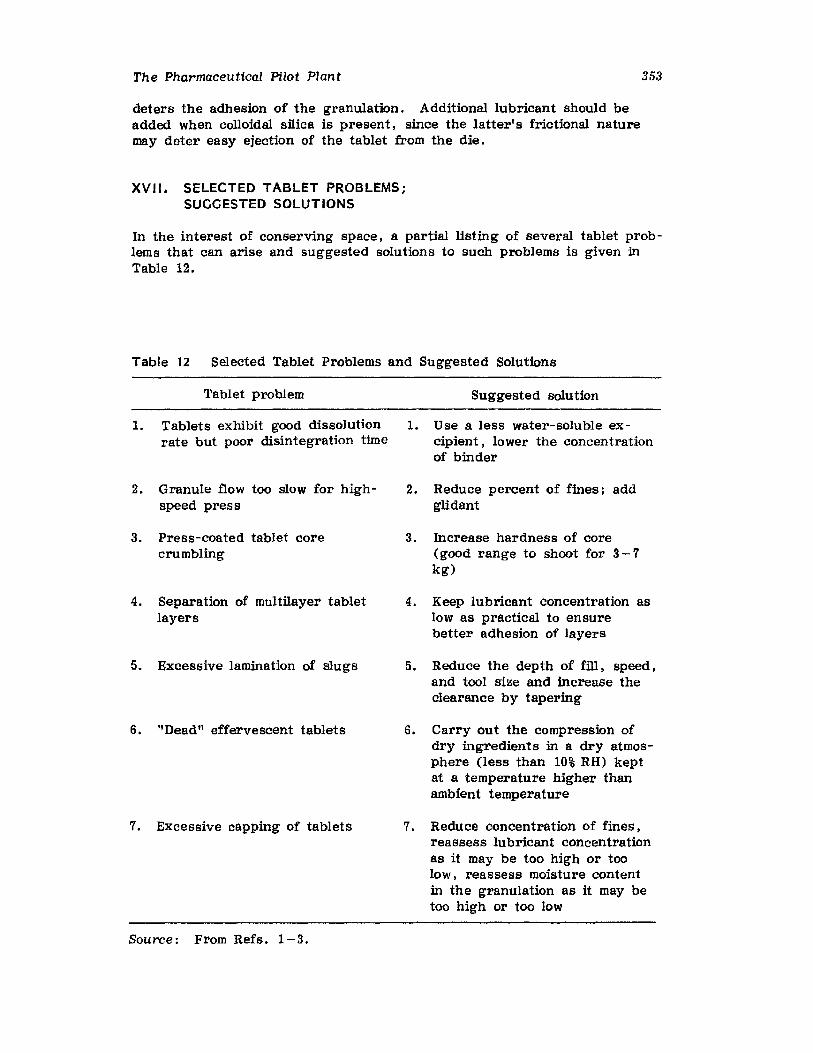
The Pharmaceutical Pilot Plant
deters the adhesion of the granulation. Additional lubricant should beadded when colloidal silica is present, since the latter's frictional naturemay deter easy ejection of the tablet from the die.
XVII. SELECTED TABLET PROBLEMS;SUGGESTED SOLUTIONS
353
In the interest of conserving space, a partial listing of several tablet problems that can arise and suggested solutions to such problems is given inTable 12.
Table 12 Selected Tablet Problems and Suggested Solutions
Tablet problem
1. Tablets exhibit good dissolutionrate but poor disintegration time
2. Granule flow too slow for highspeed press
3. Press-coated tablet corecrumbling
4. Separation of multilayer tabletlayers
5. Excessive lamination of slugs
6. "Dead" effervescent tablets
7. Excessive capping of tablets
Source: From Refs. 1-3.
Suggested solution
1. Use a less water-soluble excipient, lower the concentrationof binder
2. Reduce percent of fines; addglidant
3. Increase hardness of core(good range to shoot for 3- 7kg)
4. Keep lubricant concentration aslow as practical to ensurebetter adhesion of layers
5. Reduce the depth of fill, speed,and tool size and increase theclearance by tapering
6. Carry out the compression ofdry ingredients in a dry atmosphere (less than 10% RH) keptat a temperature higher thanambient temperature
7. Reduce concentration of fines,reassess lubricant concentrationas it may be too high or toolow, reassess moisture contentin the granulation as it may betoo high or too low
354 Jarowski
XVIII. SELECTED PROCESS DEVELOPMENTPROJECTS OF CURRENT INTEREST
Pilot plant personnel must ever be alert to significant new equipment offerings that can reduce manufacturing costs. In addition. process modifications should be evaluated that appear to offer economic advantages overexisting procedures and which do not sacrifice product quality. Selectedpilot plant developmental projects of current interest are briefly summarized below.
A. High-Volume Granulation Operation
Increasing the size of batches of granules is economically advantageous because it reduces assay costs as there would be fewer batches. Furthermore, the cost of blending would be reduced because it requires little additional time to prepare a much larger batch.
The Lodige mixer [15] can be used to blend as well as to granulatetablet components. A 90 ft 3 Lodige mixer with air-sealed bearings,equipped with chopper blades, has a capacity for approximately 3000 kg ofgranulation. A higher degree of uniformity in distribution of tablet components has been reported to occur within 3 min as compared with 30 minin a double-cone blender. Depending on the weight of the final tablet.the capacity of granulation is sufficient for 3 -5 million tablets.
Recently. equipment based on the fluidized-bed principle has been introduced which can mix, granulate, and dry the granules formed in thesame bowl. Obvious advantages of adopting such a mixer - dryer - granu1ator [16-201 are (1) less dusty plant operation, (2) reduction in granulating time, (3) drug exposed to less heat. and (4) better control ofmoisture content in the finished granulation.
Granulation by preliminary compression has been used for severalyears. Heavy-duty tablet presses were used to prepare the initial "slugs. 11
More recent equipment introductions to prepare granulates by preliminarycompression aim at increasing production capacity. The Chilsonator [21],a roll compactor, produces agglomerates by squeezing the tablet components.
Continuous processing should be considered When the volume of tabletsmanufactured is sufficiently large. The significant reduction achievable inmanufacturing costs is well worth the investment in equipment and developmental time [22]. The purchase of such equipment and its ultimate adoption by the production division must have been preceded by a thoroughpilot plant developmental study. Existing tablet formulas may have to bemodified radically in order to ensure optimal performance and adherence toqualrty,
B. Tablet-Coating Innovations
A modification of the normal pear-shaped Or subglobular coating pan whichhas been adopted by several companies is the side-vented coating pan[23]. Such pans have the advantage of a one-way flow of air throughthe tablet bed and the perforations in the pan. The increased popularityof such pans is due to the increased coating efficiency resulting fromtheir use.
The Pharmaceutical Pilot Plant 355
Delivery of the coating solutions manually by ladling is being replacedby spraying with and without the aid of an air jet. Two general spraysare available. Airless spraying relies on hydraulic pressure to produce aspray when material is forced through a nozzle. Atomization of the sprayis achieved by the introduction of turbulent jets of air. The airless oratomized spray of coating material can be applied to tablets contained inthe conventional pan, the side-vented pan. or in equipment based on thefluidized-bed principle developed by Wurster [24].
A concerted effort is being made by several companies to replace organic solvent solutions of fflm formers with aqueous dispersions. The obvious advantage of reduced cost and reduction in environmental contamination by the solvents are compelling reasons. The perfection of coatingtablets with aqueous dispersions of film-forming materials requires lengthyand thorough developmental efforts. The use of heated, less porous,highly compressed tablets have been found to be promising. Various gumsand gum combinations are being evaluated. Here again. existing tabletformulas may have to be radically modified in order to perfect coating withaqueous dispersions of film formers.
XIX. ADDITIONAL PILOT PLANT RESPONSIBILITIES
A. Clinical Supplies, Validation and Revalidation
The large number of patients that must be treated in the evaluation of newdrugs to be given chronically means that clinical batches of tablet will belarge. The preparation of several clinical batches in the pilot plant provides its personnel with the opportunity to perfect and validate theprocess.
Papariello [25] has suggested that validation of tablet dosage forms ofnot only new drugs, but also those already being marketed should be conducted in the pharmaceutical pilot plant. He states that pharmaceuticalresearch and its development division have developed the formulas andmanufacturing processes for the tablet dosage forms. Hence, the historyand experiences gained in the development of the manufacturing processare most familiar to the research and pilot plant personnel. This knowledge will prove to be most helpful during the validation process. Suchvalidation conducted on a pilot scale should simplify production scalevalidation.
Reworking a clinical batch of tablets that did not meet establishedspecifications followed by revalidation will prove to be of future value during the production operation. Chambliss and Hendrick [26] pointed outthat if an FDA-approved reprocessing instruction exists for a particularcombination of product and problem, the manufacturer may release and distribute the product without notifying the FDA. Lack of such approvedreprocessing instructions will necessitate submission of New Drug Application (NDA) supplement in which the reprocessing and revalidating aredescribed. After receiving FDA approval, the reworked batch can thenbe distributed. An extensive delay in obtaining approval could lead tothe sacrifice of the reprocessed batch.
Desirable goals to aim for are zero defects and zero batch rejections.Confidence in attaining such goals according to Berry [27] can beachieved and verified by process validation. EXhaustive finished testing
356 Jarowski
of product is not a substitute for in-process controls and process validation.
B. Bulk Drug Variation and AlternateExcipient Suppliers
During the clinical evaluation phase chemical processing modiftcatione maybe considered in the interest of improving the yield of the new compound.Solvents u sed for the final crystallization step during the early stages insynthesizing the new compound may be replaced by less costly ones.Slower cooling cycles encountered on scale-up could lead to large crystalsdiffering in shape from those prepared on a small scale. The preferredlarger crystals would be more rapidly filtered or centrifuged and washed.Size reduction by milling could lead to drug batches differing in particlesize distribution, bulk density, dissolution rate, and static charges fromearlier batches. Hence, another responsibility for the pharmaceutical pilotplant personnel is to validate the use of new batches of drug in the tabletformula under clinical study.
In many instances, the drug may be purchased by a drug company asare the purchase of excipients. Using alternate suppliers for such materWs makes it less likely that supply problems may arise. Furthermore,competitive pricing will be assured. Such drug and excipient suppliesshould be carefully characterized. Tablets prepared with the excipientsand drugs obtained from alternate suppliers should be compared with thetablets being evaluated clinically. The various physical properties of thestandard formula such as hardness, disintegration time, dissolution rate.and friability as well as tability should all be matched by the tablets containing the supplies from each alternate source of materials.
Chowhan [28] described the significant differences that were encountered with a water-soluble drug that had been crystallized from different solvents. The tablets under consideration contained 64% of drug.Tablets containing bulk compound crystallized from denatured ethanol(Source B) instead of methanol (Source A) developed a serious tendencytoward capping during the aqueous film-coating procedure. Additionalcomparisons were made with three batches of bulk drug from Source Bplus one from Source A. The Source B bulks were crystallized from methanol, ethanol, or isopropanol. Significantly different wetting characteristics were noted during the granulation of these batches. Although thevolume of the granulating SOlution, the rate of addition, and the mixinggranulating time were the same for each batch. finer granules were obtained from the methanol-crystallized drug (Source A) than from the isopropanol-crystallized drug (Source B). The· two batches with coarsergranules had significantly higher bulk densities than did the two batchesthat contained finer granules. The drug crystallized from ethanol was theleast compressible. Tablets containing isopropanol-crystallized drug exhibited greater friability than those obtained from methanol.
Dissolution studies on tablets containing the differently crystallizeddrug revealed that more rapid rates were observed with tablets made withmethanol-procesed drug from Source A than the isopropanol-treated drugfrom Source B. The results of this study demonstrated that the drug itself can cause major differences in the pharmaceutical scale-up process,and therefore should be thoroughly characterized. The final crystallization
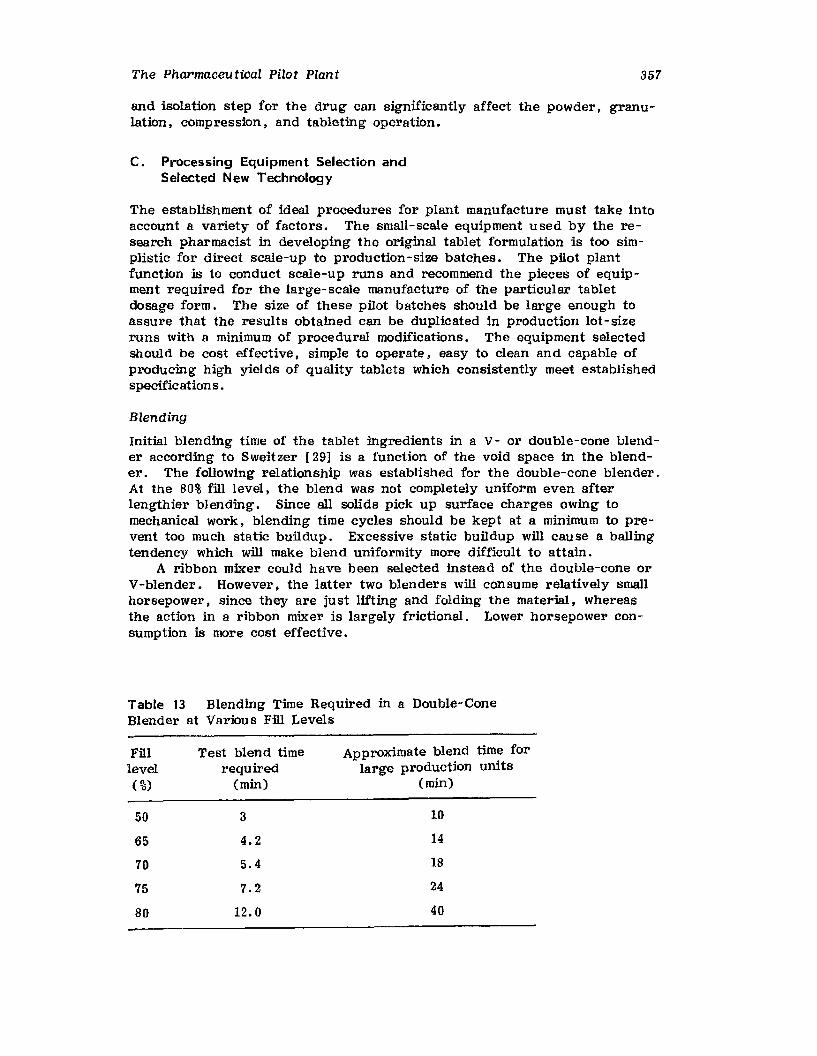
The Pharmaceutical Pilot Plant 357
and isolation step for the drug can significantly affect the powder, granulation, compression. and tableting operation.
c. Processing Equipment Selection andSelected New Technology
The establishment of ideal procedures for plant manufacture must take intoaccount a variety of factors. The small-scale equipment used by the research pharmacist in developing the original tablet formulation is too simplistic for direct scale-up to production-size batches. The pilot plantfunction is to conduct scale-up runs and recommend the pieces of equipment required for the large-scale manufacture of the particular tabletdosage form. The size of these pilot batches should be large enough toassure that the results obtained can be duplicated in production lot-sizeruns with a minimum of procedural modifications. The equipment selectedshould be cost effective. simple to operate, easy to clean and capable ofproducing high yields of quality tablets which consistently meet establishedspecifications.
Blending
Initial blending time of the tablet ingredients in a V- or double-cone blender according to Sweitzer [29J is a function of the void space in the blender. The following relationship was established for the double-cone blender.At the 80% fill level, the blend was not completely uniform even afterlengthier blending. Since all solids pick up surface charges owing tomechanical work, blending time cycles should be kept at a minimum to prevent too much static buildup , Excessive static buildup will cause a ballingtendency which will make blend uniformity more difficult to attain.
A ribbon mixer could have been selected instead of the double-cone orV-blender , However, the latter two blenders will consume relatively smallhorsepower, since they are just lifting and folding the material, Whereasthe action in a ribbon mixer is largely frictional. Lower horsepower consumption is more cost effective.
Table 13 Blending Time Required in a Double-ConeBlender at Various Fill Levels
Fill Test blend time Approximate blend time forlevel required large production units( %) (min) (min)
50 3 10
65 4.2 14
70 5.4 18
75 7.2 24
80 12.0 40
358 Jarowski
Granulation
Harder and Van Buskirk [30] have stated that the most common reasons tojustify granulation are: (1) to impart good flow properties to the materialso that the tablet presses can be properly fed and a uniform tablet weightmaintained, (2) to increase the apparent density of the powders, (3) toalter the particle size distribution so that the binding properties on compaction can be improved, and (4) to disperse potent active ingredients bysolvent deposition.
In addition to the traditional sigma blade or planetary mixer, thedouble-cone or V-blender equipped with agitators and a liquid feed mechanism could be used to carry out the granulation step. In the interest ofachieving greater efficiency and reduced cost, the Littleford Lodige Multifunctional Processor (Littleford Brothers, florence, Kentucky) can beused. In such equipment, dry blending, wet granulation, drying, sizing,and lubrication can be conducted in a continuous process. Chowhan [28]has pointed out that the volume of granulating fluid is perhaps the mostimportant factor that affects the granulation and tablet properties whensuch a continuous processor is used.
To evaluate the effects of small variations in the volume of granulationfluid, three 175-kg batches of granulation were prepared in a 22-ft3 Littleford Lodige apparatus under identical mixing and granulating conditions.The volume of granulating solution was varied slightly in order to optimizethe fluid volume for the mixer. In general, the granules were finer whena small amount of fluid was used in the granulation process. As the volume of granulating fluid was increased, the bulk and tapped densities increased correspondingly. At a granulation moisture content of 3.9%, allthree granulations were equally compressible. At lower levels of moisturecontent, the differences in compressibility that were caused by the fluidvolume used in the granulation step became evident. The granules thatwere made using lower fluid volumes were more compressible than thegranules made with the higher fluid volumes.
At a granulation moisture content of 3.9%, the various volumes ofgranulating fluid did not affect the friability of the tablets. At lowermoisture of the granulation such as 3.4% and 2.7%, tablets that were compressed from granulations made with the lower volumes of granulatingfluid were slightly more friable than those tablets that were compressedwith the higher volumes of granulating fluid.
A significant difference was observed for the in-vitro dissolution ratewhen the volume of granulating fluid was altered. The magnitude of thiseffect depends on the moisture content of the granulation and the hardness of the tablet. In general, a high volume of granulating fluid yieldsharder tablets exhibiting a low rate of drug dissolution and vice versa.
Fluid-Bed Granulation
The fluid-bed process has been shown to be superior to high-shear mixingwith regard to processing time and yield of product. Rowley [31] hasdescribed scale-up factors that should be considered in converting from aconventional high-Shear granulating process to a fluid-bed granulator.The unit operational steps for the former process include: (1) wetmassing (Littleford Lodige mixer); (2) wet milling (Fitzmill, FitzpatrickCompany, Elmhurst, illinois); (3) remilling (Fitzmill); (4) drying (Dryer/Granulator); (5) dry milling (Tornado Mill, Stokes, Division of Pennwalt
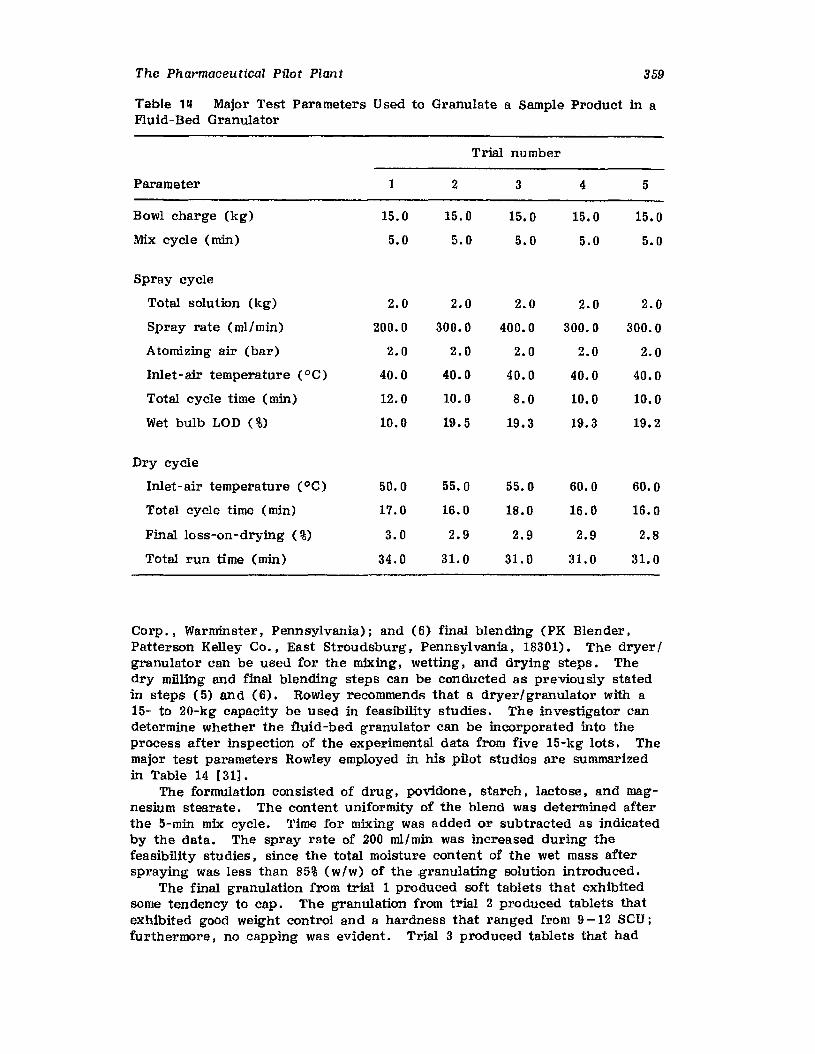
The Pharmaceutical Pilot Plant 359
Table 111 Major Test Parameters Used to Granulate a Sample Product in aFluid-Bed Granulator
Trial number
Parameter 1 2 3 4 5
Bowl charge (kg) 15.0 15.0 15.0 15.0 15.0
Mix cycle (min) 5.0 5.0 5.0 5.0 5.0
Spray cycle
Total solu tion (kg) 2.0 2.0 2.0 2.0 2.0
Spray rate (mIl min) 200.0 300.0 400.0 300.0 300.0
Atomizing air (bar) 2.0 2.0 2.0 2.0 2.0
Inlet-air temperature (OC) 40.0 40.0 40.0 40.0 40.0
Total cycle time (min) 12.0 10.0 8.0 10.0 10.0
Wet bulb LOD (%) 10.0 19.5 19.3 19.3 19.2
Dry cycle
Inlet-air temperature (OC) 50.0 55.0 55.0 60.0 60.0
Total cycle time (min) 17.0 16.0 18.0 16.0 16.0
Final loss-on-drying (%) 3.0 2.9 2.9 2.9 2.8
Total run time (min) 34.0 31. 0 31. 0 31.0 31. 0
Corp., Warminster, Pennsylvania); and (6) final blending (PK Blender,Patterson Kelley Co., East Stroudsburg, Pennsylvania, 18301). The dryer Igranulator can be used for the mixing, wetting. and drying steps. Thedry milling and final blending steps can be conducted as previously statedin steps (5) and (6). Rowley recommends that a dryerI granulator with a15- to 20-kg capacity be used in feasibility studies. The investigator candetermine Whether the fluid -bed granulator can be incorporated into theprocess after inspection of the experimental data from five IS-kg lots. Themajor test parameters Rowley employed in his pilot studies are summarizedin Table 14 [31].
The formulation consisted of drug, povidone, starch, lactose, and magnesium stearate. The content uniformity of the blend was determined afterthe 5-min mix cycle. Time for mixing was added or subtracted as indicatedby the data. The spray rate of 200 ml/min was increased during thefeasibility studies, since the total moisture content of the wet mass afterspraying was less than 85% (w/w) of the granulating solution introduced.
The final granulation from trial 1 produced soft tablets that exhibitedsome tendency to cap. The granulation from trial 2 produced tablets thatexhibited good weight control and a hardness that ranged from 9 -12 SCU;furthermore, no capping was evident. Trial 3 produced tablets that had
360 Jarowski
excellent weight control, a hardness from 12-13 seu, and no capping.The tablets from trials 2 and 3 passed current process specifications.Trial 4 was used to verify the results obtained in trial 2. The granulationfrom trial 4 had the same compression characteristics as the one fromtrial 2, and it also produced excellent tablets. Trial 5 served as the finalthird batch to complete the validation package and to support the processchange.
Recently. an excellent review article on wet granulation of a pharmaceutical product in fluidized beds and high shear mixers was published[ 32] . The fundamentals of granule growth. granulation variables. scale-up.and endpoint control are thoroughly covered.
Drug Granules Prepared by Precompression, WetGranulation, Fluidized-Bed Granulation, andSpra)l Drying
Seager [33] compared the following methods of producing paracetamol granulations: precompression , wet massing. fluidized-bed granulation, andspray drying. Precompressed granules containing 1-7% of hydrolyzedgelatin were compared by roller compaction. Such granules consist of compressed drug and binder particles welded together through bonds formedduring the compaction process; for example, varying melting points in theSame treated batch and differences in brittleness or plastic deformation.The granules are dense and may contain an uneven distribution of binderparticles. However, the binder makes little contribution to the granulationprocess, since it was added as dry particles.
Wet-massed granules were obtained by mixing the drug in a planetarymixer with an aqueous solution of hydrolyzed gelatin. The wet mass wasthen forced through a sieve and dried. The granules obtained consistedof more porous aggregates having drug particles held together in a spongelike network of binder. The drug particles are entrapped within the binder matrix and are partially bonded through crystalline bridges of drug andbinder which form during the gnsnulation process.
The fluidized-bed granules were prepared by spraying a hydrolyzedgelatin solution onto a bed of paracetamol being fluidized in the warm airstream of a fluidized-bed dryer. The fluidized-bed granules were similarto granules prepared by the wet-massing process. The intragranular porosity was greater, however, and the surface of the granules contained anuneven distribution of binding agent.
The granules prepared in an industrial spray dryer by spray dryinga suspension of the drug in an aqueous solution of hydrolyzed gelatin consisted of spherical particles composed of an outer shell of binder with aninner core of drug powder. The granules retained their integrity throughencapsulation by the binder and through the crystalline bridges whichformed between the drug particles during the spray-drying process. Thegranules were porous, and the core contained vacuoles of encapsulatedair.
Tablets were prepared by mixing and then compressing the four typesof paracetamol granules with 10% microcrystalline cellulose, and 1% each ofExplotab and magnesium stearate. At all binder concentrations the tabletsprepared with spray-dried granules were the hardest and exhibited dissolution rates equal to or greater than softer tablets prepared with wetmassed granules. Roller-compacted granules yielded tablets which weresoft at all compaction pressures. The dissolution rate of paracetamol
The Pharmaceutical Pilot Plant 361
from tablets containing roller-compacted granules was slower compared totablets containing wet-massed drug granules. Similar results were foundfor the tablets prepared from the larger granules manufactured by thefluidized-bed and wet-massing processes. Both the disintegration time andthe dissolution rate of the more porous fluidized-bed product were superiorto those of the wet-massed tablets for compacts of the same tensile strengtheven though in the case of the fluidized product, lower forces of compaction were used.
Seager [33} concluded that the binder distribution affects the compression characteristics of the granules. Furthermore, tablet strength is proportional to the concentration of binder at the granule surfaces and compact strength increases through intergranular bonding when the granulesare prepared by precompression, wet massing, fluidization and spray drying,respectively. Finally, dissoluton rates are related to the degree of intergranular bonding and to the compact porosities, which in turn are governedby the nature and position of the binder within the granule structure ofthe tablet.
Carrier Granulation and MoistureActivated Dry Granulation
Whenever new and significant granulation techniques are described in theliterature, alert pharmaceutical research and development personnel willascertain if their adoption might be advantageous. In many instances, thepharmaceutical pilot plant may be the most suitable area in which to evaluate such new procedures. ThUs, as an example, Michoel et al , [34} havedescribed the advantages of carrier granulation as a method that should beconsidered for the production of low-dosage-type tablets.
Carrier granulation is a one-step production process that greatly decreases the potential for segregation of drug particles encountered in someinstances with conventional direct-compression operations. Furthermore,the carrier technique yields granulations that exhibit improved flow andcompressibility. Content uniformity in tablets containing a small amount ofdrug is of concern when direct-compression procedures are employed. Tofavor content uniformity finely milled drug is used. The drug is blendedwith a directly compressible excipient, such as, spray-dried lactose. Thefinely milled drug may differ significantly in particle size with the directlycompressible excipient. As a consequence, drug classification may occurduring the blending operation.
In the carrier granulation technique, a portion of excipient is moistenedwith a small amount of solution containing a binder. The finely milleddrug and additional excipient are mixed with the excipient moistened withbinder solution. Granules obtained in this manner are less apt to classify.
The carrier granulation procedure was carried out on a laboratoryscale as well as on an industrial scale using a Topo Granulator (MachinesCollette, Wommelgem, Belgium). The Topo Granulator is a double-jacketed,cylindrical vessel that can be operated under vacuum conditions. Mixingis performed by a helical mixing arm that can rotate at variable speeds inboth directions.
The following tablet excipients were employed in the article cited [34}:(1) filler, 200-mesh hydrous lactose in Which a minimum of 90% of the particles were less than 100 um in diameter; (2) carrier, hydrous lactose inwhich 20% of the particles were less than 63 11m and a minimum of 80% ofthe particles were less than 200 11m in diameter; (3) adhering material,
362 Jarowski
anhydrous lactose in which 90% of the particles were less than 45 um indiameter: (4) binder, microcrystalline cellulose and povidone; (5) disintegrants, starch, and sodiu m starch glycolate; and (6) Iubr-icant , magnesiumstearate.
In a typical pilot run 4 kg of hydrous lactose, carrier grade, wasmoistened with 175 ml of aqueous solution containing 100 g::n of povidone.After mixing at 60°C for 15 min, 200 gm of drug and 600 gm of 450-meshlactose were introduced. After 10 more minutes of mixing, the mixturewas dried under a 5-kPa vacuum and then sized through a 1000-11 sieve.The carrier granulations possessed smaller geometric diameters and exhibited superior flowability than those granulations produced by conventional direct-compression or conventional wet-granulation procedures. The175-ml of solution containing 100 gm of povidone represented 3.5% of thetotal weight of the granulation. In the conventional wet-granulation procedure, the volume of povidone solution introduced represented 15% of thetotal weight of the granulation.
After adding the disintegrants and lubricant, then blending and compressing, the carrier-granulation process yielded tablets which exhibitedexcellent hardness and better content uniformity than those prepared bydirect compression. Tablets prepared by conventional wet granulation wereslightly harder than those containing carrier granulation; however, the dissolution rate of drug from the latter was more rapid. As was mentionedearlier, carrier granulation is a one-step process that requires a low demand on resources, such as, time, room space, and personnel. Since theprocess limits the amount of water added to effect gr-anulatfon , energy forremoval of the water is considerably reduced.
Avoidance of the costly drying step in the preparation of granules canbe achieved by following a modified wet process that has been referred toas moisture-activated dry granulation (MADG) by Ullah et al , [35]. Agglomeration and moisture distribution are the two basic steps of the MADGprocess. In the agglomeration step. 30- 60% of the final formula weight isblended with a dry binder. The binder must become tacky when moistenedand should be uniformly distributed throughout the powder that is intendedfor agglomeration. Since only a small amount of water is to be added, thismoisture must also be uniformly distributed.
During blending, a small quantity of moisture that is equal to 1-4% ofthe final formula weight is added in the form of fine droplets or spray.With the addition of moisture, the dry binder is activated and agglomeration takes place. If the dry binder and the moisture are equally dispersedthroughout the powdar , the process does not require the usual largeamount of shear to cause agglomeration; the shear generated by conventional wet-granulating equipment is adequate.
As blending continues, the balance of the drug or excipients, or both,is added to the agglomerated mass. During this step, the least absorbentmaterial is added first and the most absorbent last: this sequence facilitates the uniform distribution of the moisture. A highly absorbent materia!' such as microcrystalline cellulose, is added last to ab sorb any remaining free water. At this stage, the granules can be sieved, if necessary, to obtain a more uniform particle size distribution or to furtherdistribute the moisture throughout the granulation. The addition of a disintegrant and a lubrfcant completes the formulation. The type and amountof dry binder and excipients that are used as well as the amount ofmoisture that is added all control the agglomeration operation and determine
The Pharmaceutical Pilot Plant 363
the characteristics of the final granule and ultimately the tablet. The purpose of the agglomeration step in the MADG process is to eliminate fines.
To understand the mechanism involved in the MADG process, one canconsider the amount of pOWder used for agglomeration representing 30% ofthe final formula weight. If an amount of moisture that is equivalent to3% of the final weight is added to the powder, this would create a 10%moisture level at the agglomeration stage. This amount of moisture isoften sufficient for agglomeration. For any particular formulation, theamount of starting material as well as the quantity of moisture to be addedto effect agglomeration must be determined experimentally.
Ullah et al , [35] prepared acetaminophen tablets using MADG granulations and compared their properties to tablets made by wet-granulationand direct-compression methods. The excipients for the three types oftablets were simuar except that the water added in the MADG process wasnot removed. Each tablet prepared by the MADG process contained (inmilligrams) :
Acetaminophen, USPPovidone, USPPurified water, USPMicrocrystalline cellulose. NFSodium starch glycolate. NFMagnesium stearate. NF
3252015
179.57.53
The acetaminophen and povidone were blended for 10 min in a twinshell blender and then passed through a 30-mesh screen. The screenedblend was placed in a planetary mixer and agglomerated with water, whichwas added as a fine stream. While continually stirring. the microcrystalline cellulose was incorporated. After additional stirring for 5 min, thegranulation was again passed through a 30-mesh screen and then blendedwith sodium starch glycolate and magnesium stearate by mixing for 10 minin a twin-shell blender. This granulation was compressed without difficulties into highly satisfactory tablets.
This study illustrated that the MADG process combined the ease andspeed of a dry-blending process with the homogeneous distribution ofdrug and tablet hardness achieved by wet granulation. The MADG processwas capable of reducing fines. improving powder flow. and reducing thecompressional force required to produce tablets with appropriate hardness.Of particular significance, the MADG process does not require any specialgranulating equipment. Finally. since the water added to effect granulation is not removed. the MADG process is cost effective by eliminating thecustomary drying operation. However, water-sensitive drugs cannot beused in this tableting process.
Instrumen ted Tablet Presses
The benefit of having instrumented tablet presses in pharmaceutical research and development as well as in production has been described in anexcellent review article [36]. A Stokes Model F single-punch press instrumented with piezoelectric transducers is used by the Pharmaceutical Development Laboratory at Merck Sharp &: Dohme [37]. This instrumentedtablet press is interfaced with a PDP-ll Laboratory Computer (DigitalEquipment Corporation, Marlboro. Massachusetts). The computer was
364 Jarowstct
selected because it (1) allowed for rapid collection of data concerning alarge number of tablets, (2) increased the accuracy of force versus timereadings, and (3) facilitated the determination of peak height (compressional force) and other compression parameters.
The objectives in building the system were twofold. First, to generatecompression profiles of currently marketed products or those in the finalstages of development in order to provide a baseline for future comparisons.Second, to provide a tool for use in the development of future tablet formulations. Thus, for example, one could study the effects on tablet compression characteristics with changes in excipients. Third, compression profiles for excipients or only active ingredients may aid in future formulationstudies.
According to Schwartz [38], the first of the above cited objectivesprovides a basis for comparison that can be most useful once the formulation is in production. Processing concerns, such as (1) initial scale-upruns; (2) changes in location of manufacture; (3) changes in equipment;(4) changes in batch size; (5) excipient-supplier changes; (6) activeingredient changes, such as a change in solvent used in the crystallizationstep; (7) formulation changes; and (8) generation of validation data, mayeach be accommodated much more efficiently through proper use of thebaseline data made available by the basic compression data generated bythe instrumented press. Furthermore, such an instrumented tablet presswill be a valuable aid for investigating the behavior of various formulations when they are subjected to a range of different compaction forcesor when they are compressed at different rates. Such a system will alloweach batch of granulation to be checked before it is compressed in orderto establish the normal compression profile for a particular formulation andto check future batches for the same compression properties.
The rapid development of computer-integrated systems makes possiblefully automatic, unattended tablet production feasible. Weight monitoringand control systems for tablet production have been in use for severalyears. Ideally. the weight of every single tablet should be checked.Some modern presses are capable of producing 125 tablets/so This speedis beyond the capability of any currently available weighing system.Rather than use direct weight data from a small statistical sample, themajority of systems have employed compaction force for each and everytablet as an indirectly measured variable. The assumption is that for agiven tablet thickness there is a fixed relationship between compactionforce and weight deviations. This is only valid if variations in granuleconsistency, humidity, temperature, or compaction in the hopper for thefeed chute do not adversely affect feeding. Routine weight checks onsample tablets need to be made and machines adjusted from time-to-time.This is done by automatic weight control systems available today.
With both direct and indirect systems, compression force and fill depthare the variables. Weight, however, is not the only parameter of importance. Change in compaction force can result in considerable variationin tablet thickness and hardness. the latter of which may alter dissolutionproperties so that they are outside allowable limits.
Huddlestone {39] described the Kilian-developed automatic system fortablet production designated as CIT by the developer. Kilian, a Germanbased tablet press manufacturer, utilizes compaction force as the primarycontrol on every individual tablet, which in turn is routinely monitored andregulated using actual weight, thickness, and hardness data generated by
The Pharmaceutical Pilot Plant 365
an integrated test module. The real advance made by Kilian has been theintroduction of an electromechanical qualfty control unit to establish qualityparameters and to integrate signaled data into the adaptive control system.
The quality assurance module in the CIT system takes a predeterminednumber of sample tablets and performs individual weight, thickness, andhardness measurements. After integration of this data, signals are sent tothe control processor. This controller is capable of adjusting each ofthese parameters. For example, if the actual weight of the sampled tabletsfalls outside the preset range, the compaction fill set point for the primarycontrol will be adjusted. This in turn affects the weight of the tablet.
The actual weight data can only be used over a limited range as thecompaction variation affects hardness and dissolution. In its full form,CIT introduces tablet hardness as another control variable. Hardnesschanges caused by compaction force variation are compensated by alteringtablet thickness.
The total Kilian process management system, CIT, consists of threecontrols operating synchronoualy: (1) compaction force/fill depth; (2)actual weight with constant compaction force, varying fill and tabletthickness; and (3) hardness control with constant fill, varying compactionforce set value and thickness.
Pharmaceutical Pilot Operation inSmall and Large Companies
The instrumented tablet presses described in the preceding section arevery expensive. The small manufacturer not only is unable to providesuch sophisticated equipment, the company may not even be able to affordpilot plant space or personnel. In such instances, the pharmaceutical development personnel will be responsible for conducting scale-up runs andto validate the manufacturing procedures on production presses. The accumulated in-house experience should be taken advantage of when pilotruns are scheduled between production runs. Agreement should be soughtwith production and quality assurance personnel on the in-process controlsrecommended. Close cooperation, frequent communication, and unambiguouswritten procedures are essential if the established specifications for thenewly developed tablet formulation are to be consistently and competentlymatched by the production department personnel.
The large manufacturer can provide well-equipped pilot plant space andpersonnel. More numerous newly developed tablet formulations can bereadied for transter to the production department without causing frequentscheduling interruptions. Such well-equipped areas can more efficientlyevaluate and incorporate new tablet technology for the financial benefit ofthe company. Here again, the Same desirable spirit of cooperation, communication, and unambiguous written procedures between the various difisions of the company should prevail.
REFERENCES
1. Das, S. and Jarowski, C. I., Effect of granulating method on particlesize distribution of granules and disintegrated tablets. Drug Dev ,Ind. Pharm., 5( 5) :479 -488 (1979).
2. Das, S. and Jarowski, C. I., Effect of granulating method on content uniformity and other physical properties of granules and their
366 Jarowski
corresponding tablets. II. Drug Dev , Ind. Pharm., 5(5):489-500(1979) •
3. Das, S. and Jarowski, C. 1., Effect of granulating method on dlssolution rate of compressed tablets. III. Drug Dev, Ind. Pharm., 5( 5):501-505 (l979).
4. de Jemg, E. J., The preparation of microgranulations, an improvedtableting technique. Pharm. Week BIad., 104 (1979).
5. Khan, K. A. and Rhodes, C. T., Effect of compaction on particlesize. J. Pharm. sci., 64:444-446 (1979).
6. Feigenbaum, A. V., Total Quality Control Engineering and Management. McGraw-Hill, New York, 1961, p. 265.
7. Schwartz, J. B., Martin, E. T., and Dehner, E. J., Intragranularstarch: Comparison of starch USP and modified corn starch.J. Pharm. sci., 64: 329 (1975).
8. Martin, A. N., Swarbrick, J., and Cammarata, A., Physical Pharmacy,2nd ed , Lea & Febiger, Philadelphia, 1969, pp. 485 - 490.
9. Jones, T. M. and Pilpel, N., The flow properties of granular magnesia. J. Pharm. Pharmacol., 18:81 (1966).
10. Martin, A. N., Swarbrick, J., and Cammarata, A.• Physical Pharmacy,2nd ed , Lea & Febiger, Philadelphia, 1969, pp. 491-492.
11. Lantz, R. J., Jr., Daruwala, J., and Lachman, L., The importanceof interdisciplinary cooperation in pharmaceutical production troubleshooting. Drug Dev, Commun., 1(4) :349-368 (1975).
12. Chaudry, 1. A. and King, R. E., Migration of potent drugs in wetgranulations. J. Pharm. set., 61:1121-1125 (1972).
13. Warren. J. W., Jr. and Price, J. C., Drug migration during dryingof tablet granulattons , I: Effect of particle size of the major diluent.J. Pharm. sa., 66:1406-1409 (1977).
14. Warren, J. W., Jr. and Price, J. C .• Drug migration during dryingof tablet g ranulatjons , II: Effect of binder solution 'Viscosity anddrying temperature. J. Pharm. sct., 66:1409-1412 (1977).
15. Technical Evaluation of the Littleford Horizontal Mixer. LittlefordBrothers, Florence, Kentucky.
16. Schaefer, T. and Worts, 0., Control of fluidized bed granulation.I: Effects of spray angle, nozzle height and starting materials ongranuls size and size distribution. Arch. Pharm. Chern., 5: 51-60(1977) •
17. Schaefer, T. and Worts, 0., Control of fluidized bed granulation.II: Estimation of droplet size of atomized binder solution. Arch.Pnartn, Chem., 5:178-193 (1977).
18. Schaefer, T. and Worts, 0., Control of fluidized bed granulation.III: Effects of inlet air temperature and liquid flow rate on granulesize and size distribution. Control of moisture content of granulesin the drying phase. Arch. Pharm. Chem., 6:1-13 (l978).
19. SChaefer, T. and Worts, 0 •• Control of fluidized bed granulation.IV: Effects of binder solution and atomization on granule size andsize distribution. Arch. Pharm. Chern., 6: 14 - 25 (1978).
20. Schaefer, T. and Worts, 0., Control of fluidized bed granulation.V: Factors affecting granule growth. Arch. Pharm. Chem•• 6:69 -82 (1978).
21. Technical Bulletin on the Evaluation of the Chilsonator. FitzpatrickCo., Chicago.
The Pharmaceutical Pilot Plant 367
22. Continuous Liquid -Solids Blender Processor. Patterson-Kelley Co.,East Stroudsburg, Pennsylvania.
23. Survey Bulletin on the Operation of the Accela-Cota. Thomas Engineering, Hoffman Estates. illinois.
24. Wurster, D. E., Fluidized Bed Technique for Research and Development. Glatt Air Techniques, New York.
25. Papariello, G. J., Organizing for Validation-Process Development(R&D Division), Proceedings of the PMA Seminar Program on validation of solid dosage form processes (May), 31-35, 1980.
26. Chambliss, W. G. and Hendrick, M. G., One approach to reprocessing,Ph arm. Tech., 12: 37 - 43 (1986).
27. Berry, I. R., Practical process validation of pharmaceutical products,Drug Cosmet. Ind., 10:36 - 46 (1986).
28. Chowhan, Z. T., Aspects of granulation scale-up in high shearmixers, Pharm. Technol., 2: 26 -44 (1988).
29. Sweitzer, G. R., Blending and drying efficiency; Double cone vsV-shape, Internal publdeatlon of the General Machine Co. of NewJersey, Middlesex, New Jersey.
30. Harder, S. and Van BUskirk, G., Pilot plant scale-up techniques.In The Theory and Practice of Industrial Pharmacy, 3rd Ed.(L. Lachman, H. A. Lieberman, and J. L. Kanig, eds , ) , Lea &;
Febiger , Philadelphia, 1986. p. 687.31. Rowley, F. A., Scale-up factors in adapting a conventional granu
1ating process to a fluid -bed granulator, Pharm. Technol., 9: 76 -79(1987) •
32. Kristensen, H. G. and Schaefer, T., A review on pharmaceuticalwet-granulation, Drug Dev , Ind. Pharm., 4,5:803 -872 (1987).
33. Seager, H., Relationship between the process of manufacture and thestructure and properties of granules and tablets, Paper presented atthe Pharm. Tech. conference in New York, 1982.
34. Michoel, A., Verlinden, W., Rombaut, P., Kinget, R., andDe Smet, P., Carrier granulation: A new procedure for the production of low-dosage forms, Pharm. Technol., 6: 66 - 82 (1988).
35. Ullah, I., Carrao, R. G., Wiley, G. J., and Lipper. R. A.,Moisture-activated dry granulation: A general process, Pharm.Technol., 9:48-54 (1987).
36. Schwartz, J. B., The instrumented tablet press: Uses in researchand production, Ph arm. Technol., 9:102-132 (1981).
37. Rosenberg, A. S., Faini, G. J., Allegretti, J. E., and Schwartz,J. B., Development of an instrumented press-computer system.Presented to the IPT Section of the Academy of Pharmaceutical Sciences meeting, San Antonio Texas, November 1980.
38. Schwart z, J. B., Dehner, E. J., and Allegretti, J. E., Formulationand process monitoring by computerized instrumented press. Presented to the IPT Section of the Academy of Pharmaceutical Sciencesmeeting. San Antonio, Texas, November 1980.
39. Huddlestone , K., New developments for automatic tabletting, Manuf.Chem., 12:45-48 (1987).
6Tablet Production
Robert J. Connolly and Frank A. Ber stier
Superpharm Corporation, Central Islip. New York
David Coffin-Beach
Schering-Plough, Inc., Kenilworth, New Jersey
I. INTRODUCTION
Over the last decade the science of tablet production has changed as at noother time in recent history. There are many factors that have contributed to this. In the authors' opinion, the two dominant reasons are:(1) the manufacturers' realization for the need to improve their competitiveness owing to the increase of both foreign and domestic competition,and (2) the growth of the generic industry that mandates a less laborintensive environment and that by nature has greater numbers of products and normally shorter runs than the manufacturer of the brand nameproducts.
With the realization that tablet production is an evolving technologybased science, wherever possible, an attempt has been made to providenot only "current practice" but also emerging trends in this area. In sodoing. the goal of this chapter is to provide the readership with information which will serve today's needs as well as, hopefully, some of tomorrow's needs. With these objectives the following information is provided.
II. FOUR BASIC REQUIREMENTS FOR SUCCESSFULTABLET PRODUCTION
A. Design
The formulation and the ease with which that formulation can be processedis basic to productivity. The "equipment package" ultimately used toprepare the dosage form is primarily determined during the formulationdevelopment stages of the product. The efficient transfer of a product toproduction is predicated on a close working relationship between research
369
370 Connolly, Berstler, and Coffin-Beach
and production personnel to assure that research initiatives can be addressed when the product is commercialized. The importance of this closeworking relationship cannot be overemphasized, as typically the majority ofproduction calamities can be traced back to initial formulation development.Formulation development, which centers on equipment or technology whichthe production organization neither possesses nor recognizes the need for,typically results in significant delays and/or changes when the formulationis transferred to production. This detail becomes particularly importantwhen new technologies are introduced.
organizationally, a committee with appropriate representation from research. production, management, marketing, and quality assurance istypically utilized as a facilitator for the transfer of products from researchto production. Active planning and participation in the development andimplementation of an integrated plan for product development and introduction by this group is essential.
B. Equ ipment
The selection of equipment, the proper maintenance of the equipment, adequate training in its use and care, and a review of the types of equipmentavailable for each phase of the tablet-manufacturing process are as important as the initial design of the product in determining the success ofa tablet-production facility.
C. Facility
A comprehensive understanding of the current good manufacturing practices (CGMPs) is essential for determining the facility requirements such asadequate space for separation of operations, construction materials that arenot absorptive, additive, or reactive, and allow for proper cleaning andhousekeeping. Both dust control that will preclUde airborne cross Contamination and material flow that progresses with a minimum of materialcrossover are also musts.
D. Personnel
There can be no substitute for properly trained personnel at all levels ofthe production flow. A review of the type and intensity of training required for each individual involved in the manufacturing and support functions will be addressed later in this chapter.
A thorough review and understanding of each section of CGMPs areabsolute requirements for all personnel involved in the design, construction, and operations of a tablet-manufacturing facility.
III. OVERVIEW OF THE PROCESS
A. Ordering
The manufacturing process begins with a work order or supply plan andthe required materials are put on order from an approved bill of materials
Tablet Production 371
(master batch card and master packaging order card). In order for anyproduction planning/inventory control function to operate efficiently with aminimum of errors and/or delays, the accuracy of the bills of materialsmust be at a 99.5% level and the accuracy of the inventory at any giventime must be greater than 95%. An active vendor approval program willgenerate significant savings from a reduction in rejected materials andlabor losses due to work stoppages and nonstandard processing. Ideally,the supplier of raw materials and packaging components should have aclose working relationship with the purchasing department to fine tunetheir product specifications to more closely fit the manufacturer's requirements. This obviously becomes more difficult if there are multiple vendorsof the same components. Whatever efforts are expended toward this endwill be rewarded with consistency and quality during the entire productionprocess.
B. Receiving
A centralized warehousing function should be responsible for the receiptand storage of components in whatever stage of the process they are in.There must be adequate space for the receiving process. The initial stepis to identify the materials being received against the component code andname, the purchase order number, and the vendor lot number. A receiving number is then assigned that will be traceable throughout the manufacturing cycle. These numbers are clearly marked on all receipts according to CGMPs and company policy.
c. Sampling
The quality assurance group should have a separate area central to thereceiving area to take the required samples. Timely notification of receiptand expeditious sampling of materials will greatly reduce the space required and minimize confusion and clutter in the warehouse, assuringbetter material control.
D. Warehouse
The clearly marked quarantined materials are stored in a separate andidentified storage area until released by quality control personnel. Thematerials are then labeled as released and moved into a separate andidentified area for released material. Conversely, rejected material mustbe immediately labeled as such and moved to a remote and clearly identified reject storage area for ultimate disposition. As the components arephysically moved through each of the aforementioned stages they must alsobe traceable by inventory controllers so the availability of the inventory isknown at all times. This is being accomplished, to an ever increasingextent, by computer tracking systems such as Material RequirementsPlanning (MRP) or all Inclusive Manufacturing Resource Planning (MRP II).Obviously, it is as important to know the status of your inventory as itis to have adequate inventory on hand.
372 Connolly, Ber-stler, and Coffin-Beach
E. Dispensing
Once adequate released materials are on hand, the processing of a manufacturing order may begin. There are many ways to design a weighingarea; however, it must be designed SO as to minimize the generation ofdust. By having adequate dust-collection equipment placed strategically,material may be prevented from becoming airborne and from unnecessarilysettling on table and floor surfaces. This will greatly reduce the time required to clean each area after the specific weighing is accomplished.
Before weighing commences, the area must be inspected and certifiedas clean and any raw material containers being brought into the area mustbe inspected and certified as clean.
The weighing must be performed on calibrated weighing devices thatare sufficiently sensitive to the quantity of materials being weighed. Eachraw material must be weighed by one operator and checked by a secondoperator. A weigh ticket must be generated for each material weighedand an identifying label placed on each container of material weighed.Many companies have label printers interfaced with their weighing devicesto perform this task. Many have also integrated this process further byemploying automated dispensing and weighing equipment, label printing,and interfacing with their MRP or MRP. II systems to automatically recordthe withdrawal and instantly update the inventory. A running inventorymust be kept on materials used for each manufacturing lot and the balancereturned to stock. A t the end of each raw material lot, a reconciliationmust be performed and any significant discrepancies thoroughly investigated.
F. Granulating
Each manufacturing order as received from the weigh room must be checkedagainst the master formula and the weigh tickets as received in the batchfolder. This check must consist of identifying each component by its label,checking the correctness of the weights. and a visual inspection of thecontainers and material contained therein.
The size of the area in which this is accomplished must be adequate toprevent any crossover of batches being processed, and it must also havebeen inspected and certified as clean. The mixing and granulating areasmust be designed with adequate space for ease of cleaning and safety ofemployees. Each operation must be separated from any other activities toensure that no crossover of materials can occur. All containers must beclean and identified BS well as the equipment being used.
With each manufacturing order a specific quantity of equipment andcontainer identification labels are issued to the operators in a master batchrecord folder. This folder must be kept with the batch at all stages.As each ingredient is added to the processing equipment and each step ofthe production process is performed, one operator must sign that the additions took place and the step was completed and the second operatormust verify it with his/her signature.
At the completion of each major step of the process (i.e., after dryingand sizing or after final mixing), a reconciliation of yield is performedand verified and any discrepancies outside the norm are immediately investigated. The blend is staged while the final check of the master production record is performed and a blend analysis is completed if required.
Tablet Production 373
Four major processing techniques are employed in the manufacture oforal, solid-dosage forms today. These include direct compression, drygranulation (slugging/roll compacting), wet granulation, and combinationprocessing (a modification of one of the cited methods). Details of each ofthese processing techniques are to be found elsewhere in this text, but,from a manufacturingIprocessing perspective, the following considerationsshould be emphasized.
Direct Compression
The direct-compression processing technique offers simplicity, economy,and the potential for high-volume output. Equipment considerations areminimal, since typically only mixing and compression equipment are required. Facilities designed exclusively for this type of processing canconcentrate on efficient methods for bulk granulatton processing and transfer to dosage-form production. Batch sizes are limited typically only bythe capacity of the mixing equipment utilized, and operator handling ofthe granulation is, in a well-designed facility, minimal. Mindful of thelimitations which this type of processing possesses, from a production perspective it still represents the ideal methodology for dosage-form manufacture. In addition, with the continuing trend toward low-dose therapeutic entities, and with stability in the supply, functionality, and uniformity of direct-compressing excipients, many of the historical objectionsto this type of processing are no longer valid.
Dry Granulation
The dry-granulation technique offers an alternative to direct-compressionprocessing with many of the same advantages. Slugging is a techniquewhich has existed as long as tableting. Newer roll-compaction equipmenthas greatly improved potential granulation throughput rates and provideda justifiable economic basis for the adoption of this technology over traditional slugging. As with direct-compression processing, equipment requirements for this type of processing are minimal. Essentially, the addition ofonly a roll compactor to the equipment package for direct-compressionprocessing is required. Similar to direct-compression processing, drygranulation processing has benefited from the changes cited in actives aswell as excipients. Today it constitutes one of the manufacturing methodsof choice for antibiotics and moisture-sensitive active ingredients.
Wet Granulation
The traditional wet-granulation technique has benefited from the introduction of processing equipment which improves its historic economic liabilities. The introduction of the fluid-bed dryer, and later the dryerlgranulator (Fig. 1) and also the adaptation of the high-shear granulatorto the pharmaceutical processing environment have both contributed significantly to the maintenance of this technique for granulation processing.
The significant investment both in facilities and required equipment toperform this type of processing has already been made by most companies.Consequently, this technique is often employed in lieu of dry granulationwhere additional expenditures may be required. Perhaps, more significantly, the wet-granulation technique represents the tried and true, and manyof today's marketed products were developed utilizing this methodology.
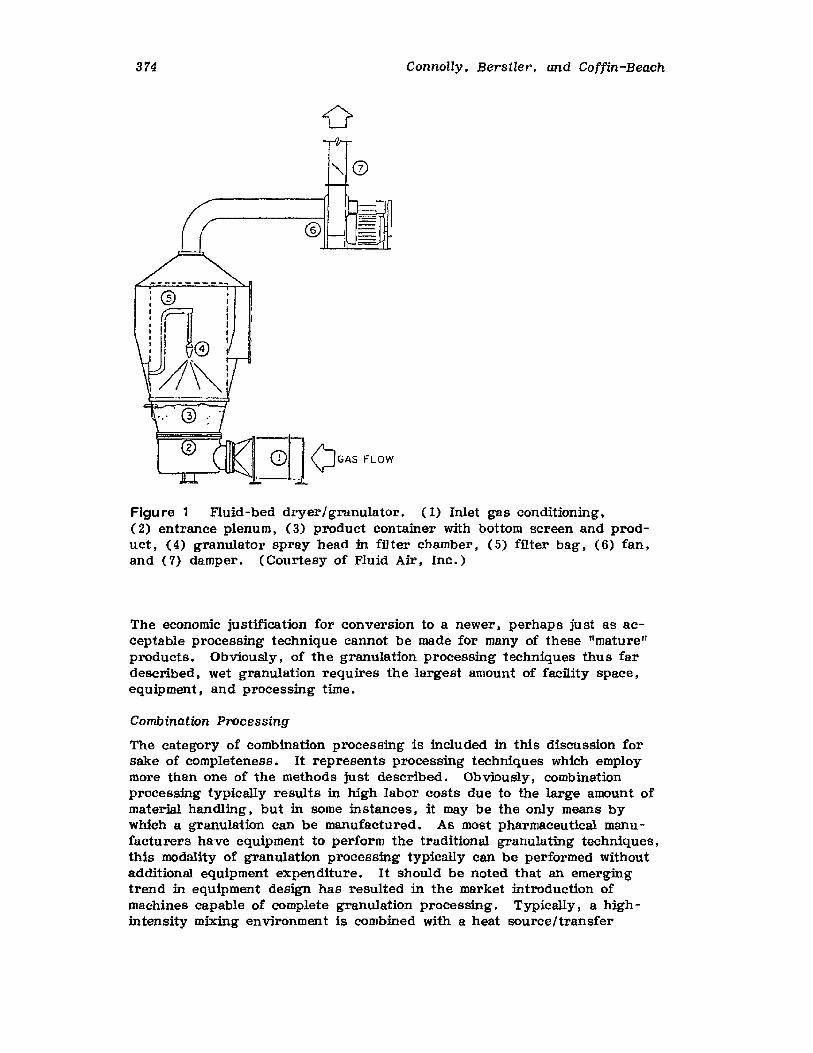
374 Connolly, Berstler, and Coffin -Beach
Figu re 1 Fluid-bed dryer/granulator. (1) Inlet gas conditioning,(2) entrance plenum, (3) product container with bottom screen and product, (4) granulator spray head in filter chamber, (5) filter bag, (6) fan,and (7) damper. (Courtesy of Fluid Air, Inc.)
The economic justification for conversion to a newer, perhaps just as acceptable processing technique cannot be made for many of these "mature"products. Obviously, of the granulation processing techniques thus fardescribed, wet granulation requires the largest amount of facility space,equipment, and processing time.
Combination Processing
The category of combination processing is included in this discussion forsake of completeness. It represents processing techniques which employmore than one of the methods just described. Obviously, combinationprocessing typically results in high labor costs due to the large amount ofmaterial handling, but in some instances, it may be the only means bywhich a granutatlon can be manufactured. As most pharmaceutical manufacturers have equipment to perform the traditional granulating techniques,this modality of granulation processing typically can be performed withoutadditional equipment expenditure. It should be noted that an emergingtrend in equipment design has resulted in the market introduction ofmachines capable of complete granulation processing. Typically, a highintensity mixing environment is combined with a heat source/transfer
Tablet Production 375
mechanism (Fig. 2). This type of equipment allows for high-speed mixingin the case of direct-compression formulations, but wet granulation withdrying can also be accomplished in the same equipment. From a facilities!equipment use perspective, the processor-type equipment represents ahighly efficient and flexible method of granulation preparation.
G. Tablet Compression
In the United States, tablets are the preferred vehicle for delivering medication to the patient. The advantages include convenience of administration, precision of dosage, efficiency of manufacturing and packaging, andthe ability to withstand extended storage.
There are several factors that must be taken into consideration whenselecting the final manufacturing equipment for a specific tablet formulation. The size of the tablet, quality of batch, ease of compressibility (isprecompression required), and abrasiveness of product are factors thatwill not only determine the type of tablet press used (large die, small die,single sided, or double sided). but also the type of tooling needed (standard steel, premium steel, or chromium plated). Tooling manufacturers areusually experts in determining the type of steel required for the size,shape. and abrasiveness of a product. Another factor that should be considered is the size of the run. Generally, it would not be economical onrelatively short runs to have to set up a high-speed multitooled tabletpress.
The tablet-compression area should be designed with separate boothsor rooms that are large enough to accommodate all equipment, materials,and personnel required for the batch. The rooms must be designed withadequate dust removal and containment. The materials of constructionmust be those that are easily cleanable but also have sound-absorbingqualities. The aisles should be of sufficient size to allow for the freemovement of materials in and out of the compression rooms and for thepersonnel required to operate. repair. or monitor the process.
The control of dust is of utmost importance when designing a tabletcompression area. Each room should be serviced by a centralized dustcollection system for the dust pickup stations on the tablet press, thetablet deduster, and at the feeding points unless the method of feedingprecludes the escape of any product dust. In Some cases, such as in thecompression of control substances, there are advantages in placing cyclone collectors between the dust pickups and the central dust collector.A cyclone collector traps and contains particles drawn into the dust collector without reducing the airflow. The trapped material can then beeasily removed for reconciliation.
When locating in-process test equipment, consideration should be givento centrally locating this equipment outside of the compression rooms.The advantages include the elimination of the duplication of expensive testequipment, and if no product is ever returned to the compression rooms,another potential source of product crossover is eliminated. A typical inprocess test station should consist of a balance, hardness tester, friabilitytester, and thickness gauge. There is equipment on the market to perform all of these tests automatically and to give a computer-generatedstatistical profile of each batch (Fig. 3). Batch records may also be heldin the centralized area for ease of reference by supervision and for
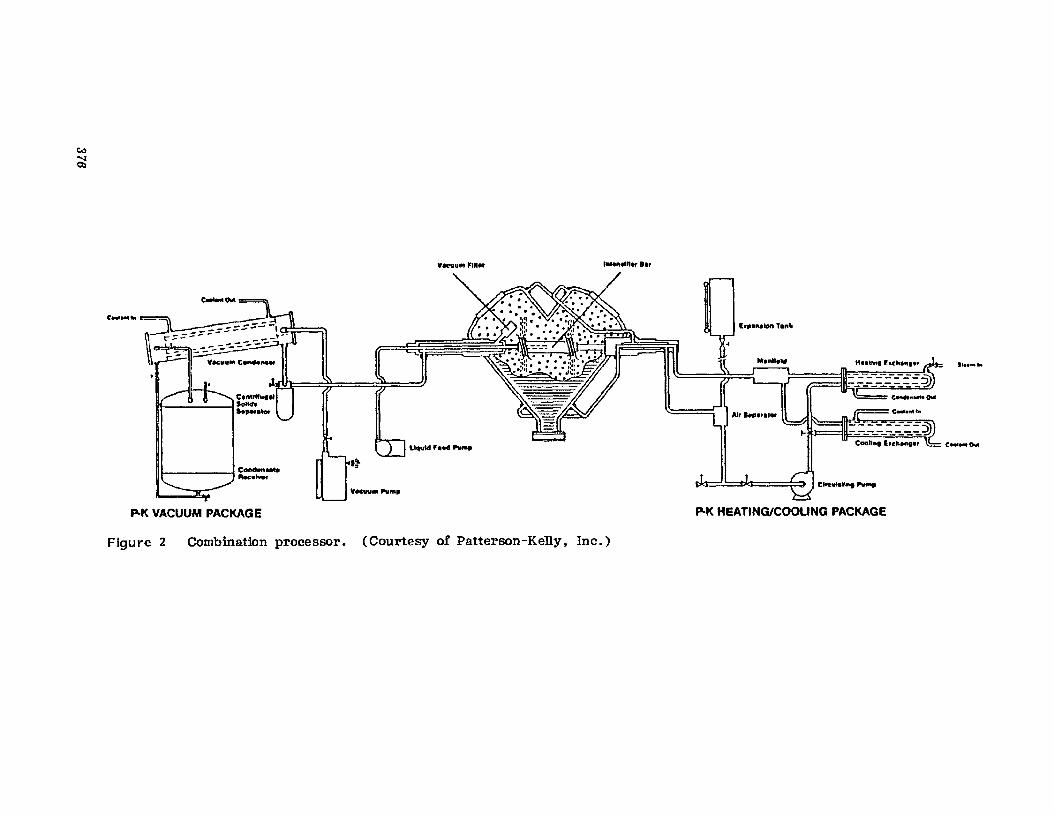
0;.,
~
1~..... hI
,~e-.....<----= -:::t):::-----=21-----
Cloe....~ .......
Q._-"......."..n......"aevuf"t '1._,
.}
y_...........
III I~":'''·
P.KVACUUM PACKAGE P.KHEATING/COOLING PACKAGE
Figure 2 Combination processor. (Courtesy of Patterson -Kelly, Inc.)
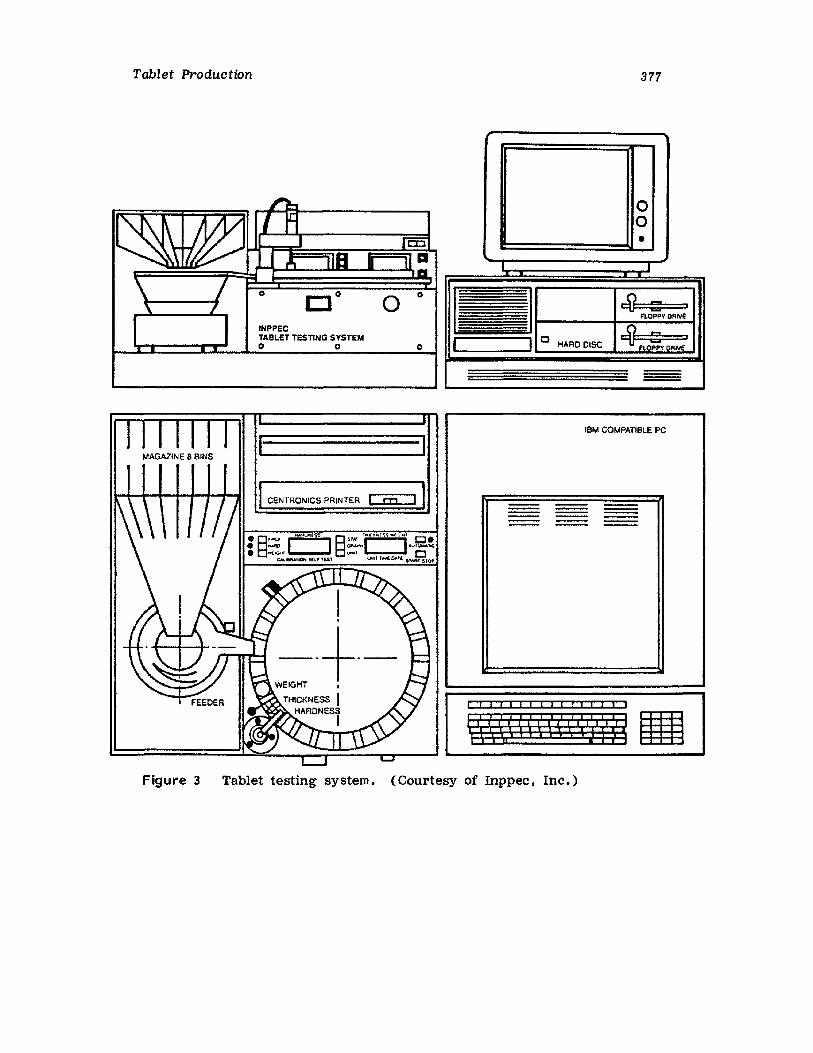
IHPPECTABLET TESTING SYSTEMo 0 0
Tablet Production
o
ICENTRONICS PRINTER
o
377
00•
I I
III c9 ::: i
FLOPPYDRIvE
~ C :II I C HARD DISC Fl.OPPYDRiVe:
---
leM COMPATIBLE PC
Figure 3 Tablet testing system. (Courtesy of Inppee , tnc.)
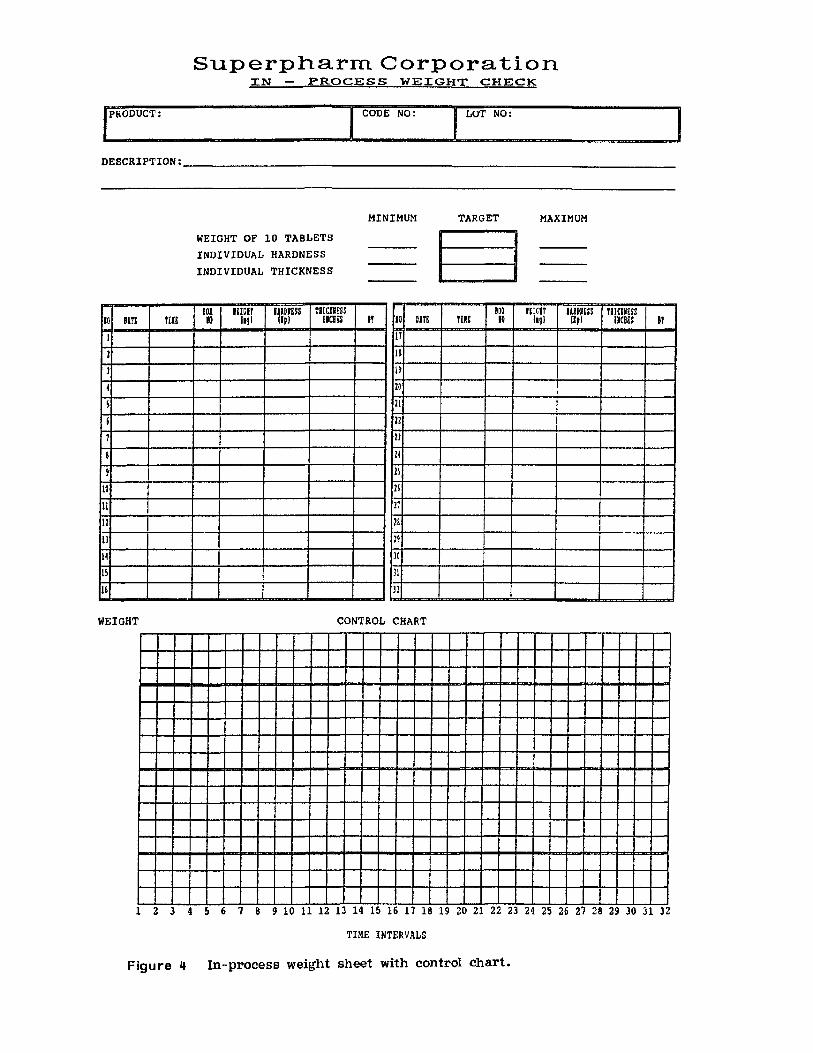
Superpharm CorporationIN - PROCESS WEIGHT CHECK
IPROOUCT: ICODE NO: I LoT NO:
DESCR!PTION: _
WEIGHT OF 10 TABLETS §INDIVIDUAL HARDNESSINDIVIDUAL THICKNESS
MINIMUM TARGET MAXIMUM
m IiIm IIIDIESS TIlcmss IDI I&lm mDms TBIm£ss10 IlTE flIE 10 11,1 lip' lIeSES IT 10 mE TIlE 10 1.,1 Ifp) IICSES IT
I 11
I 11
] it
4 20
~ 21
~ 22
7 II
I 14, 2\
U IS
It 21
II 2&
11 2'
L4 I JO
1\ II
U 12
WEIGHT CONTROL CHART
1 2 3 4 S 6 7 8 9 10 11 12 13 14 15 16 17 18 19 20 21 22 23 24 25 26 27 28 29 30 31 32
TIME INTERVALS
Figure 4 In-process weight sheet with control chart.
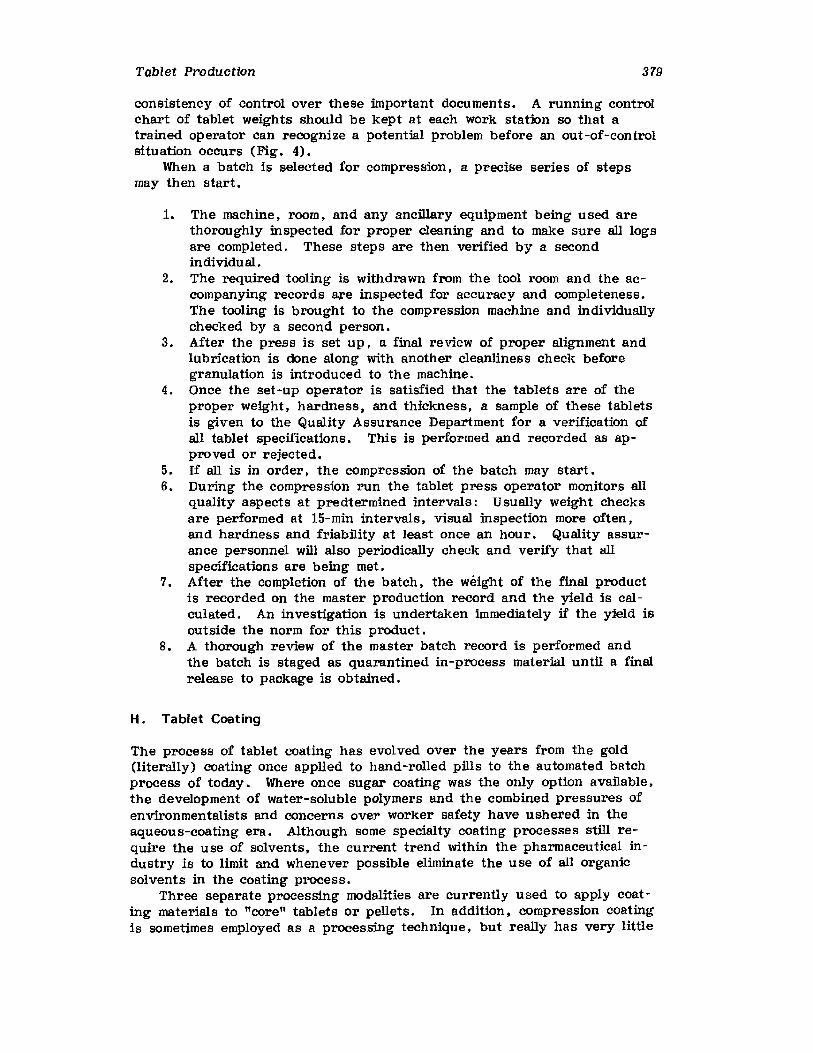
Tablet Production 379
consistency of control over these important documents. A running controlchart of tablet weights should be kept at each work station so that atrained operator can recognize a potential problem before an out-of-controlsituation occurs (Fig. 4).
When a batch is selected for compression, a precise series of stepsmay then start.
1. The machine, room, and any ancillary equipment being used arethoroughly inspected for proper cleaning and to make sure all logsare completed. These steps are then verified by a secondindividual.
2. The required tooling is withdrawn from the tool room and the accompanying records are inspected for accuracy and completeness.The tooling is brought to the compression machine and individuallychecked by a second person.
3. After the press is set up, a final review of proper alignment andIubzication is done along with another cleanliness check beforegranulation is introduced to the machine.
4. Once the set-up operator is satisfied that the tablets are of theproper weight, hardness, and thickness, a sample of these tabletsis given to the Quality Assurance Department for a verification ofall tablet specifications. This is performed and recorded as approved or rejected.
5. If all is in order, the compression of the batch may start.6. During the compression run the tablet press operator monitors all
quality aspects at predtermined intervals: Usually weight checksare performed at I5-min intervals. visual inspection more often,and hardness and friability at least once an hour. Quality assurance personnel will also periodically check and verify that allspecifications are being met.
7. After the completion of the batch, the weight of the final productis recorded on the master production record and the yield is calculated. An investigation is undertaken immediately if the yield isoutside the norm for this product.
8. A thorough review of the master batch record is performed andthe batch is staged as quarantined in-process material until a finalrelease to package is obtained.
H. Tablet Coating
The process of tablet coating has evolved over the years from the gold(literally) coating once applied to hand-rolled pills to the automated batchprocess of today. Where once sugar coating was the only option available.the development of water-soluble polymers and the combined pressures ofenvironmentalists and concerns over worker safety have ushered in theaqueous-coating era. Although some specialty coating processes still require the use of solvents, the current trend within the pharmaceutical industry is to limit and whenever possible eliminate the use of all organicsolvents in the coating process.
Three separate processing modalities are currently used to apply coating materials to "core" tablets or pellets. In addition, compression coatingis sometimes employed as a processing technique. but really has very little
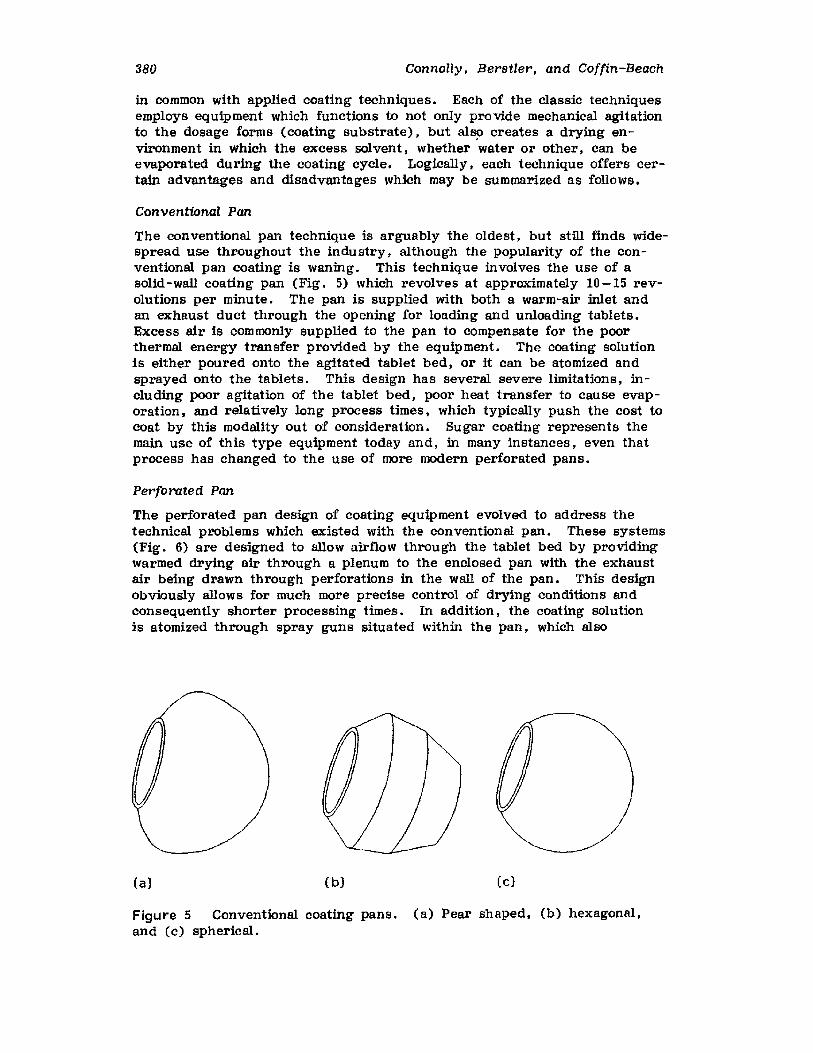
380 Connolly, Beretler; and Coffin-Beach
in common with applied coating techniques. Each of the classic techniquesemploys equipment which functions to not only provide mechanical agitationto the dosage forms (coating substrate), but also creates a drying environment in which the excess solvent, whether water or other, can beevaporated during the coating cycle. Logically, each technique offers certain advantages and disadvantages which may be summarized as follows.
Conventional Pan
The conventional pan technique is arguably the oldest, but still finds widespread USe throughout the industry, although the popularity of the conventional pan coating is waning. This technique involves the use of asolid -wall coating pan (Fig. 5) which revolves at approximately 10 -15 revolutions per minute. The pan is supplied with both a warm-air inlet andan exhaust duct through the opening for loading and unloading tablets.Excess air is commonly supplied to the pan to compensate for the poorthermal energy transfer provided by the equipment. The coating solutionis either poured onto the agitated tablet bed, or it can be atomized andsprayed onto the tablets. This design has several severe limitations, including poor agitation of the tablet bed, poor heat transfer to cause evaporation. and relatively long process times, which typically push the cost tocoat by this modality out of consideration. Sugar coating represents themain use of this type equipment today and, in many instances, even thatprocess has changed to the use of more modern perforated pans.
Perforated Pan
The perforated pan design of coating equipment evolved to address thetechnical problems which existed with the conventional pan. These systems(Fig. 6) are designed to allow airflow through the tablet bed by providingwarmed drying air through a plenum to the enclosed pan with the exhaustair being drawn through perforations in the wall of the pan. This designobviously allows for much more precise control of drying conditions andconsequently shorter processing times. In addition. the coating solutionis atomized through spray guns situated within the pan, which also
(al (bJ (e)
Figure 5 Conventional coating pans. (a) Pear shaped, (b) hexagonal,and (c) spherical.
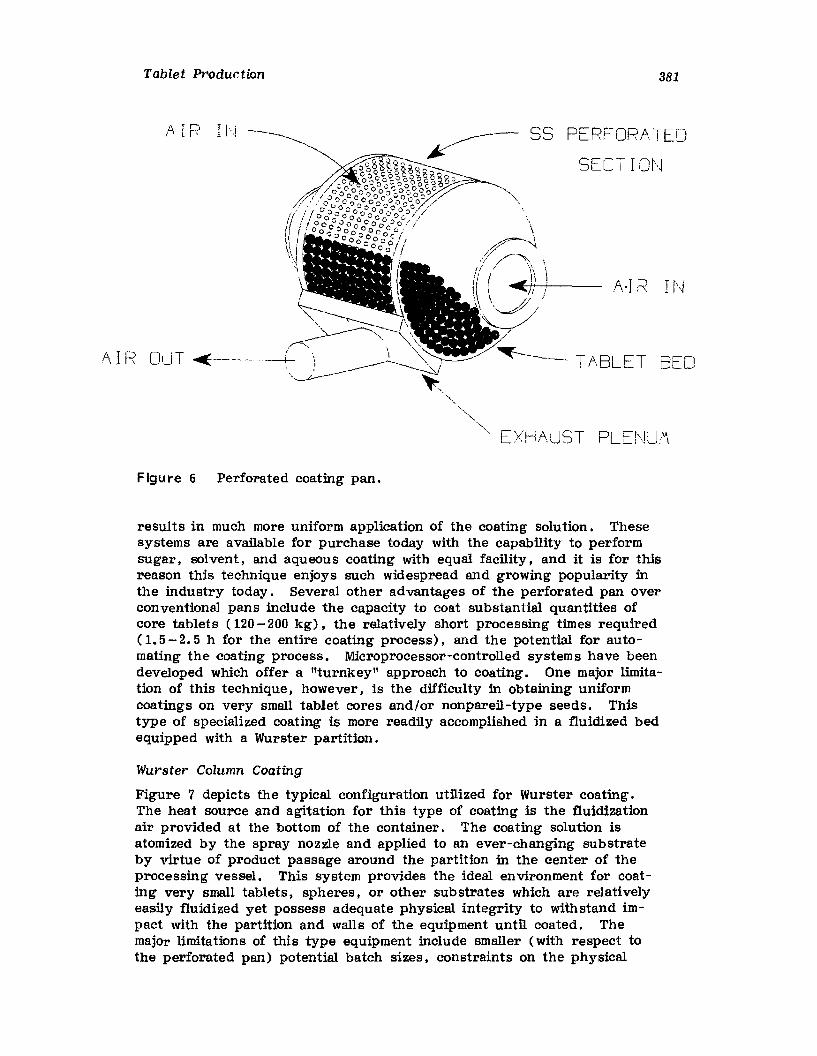
Tablet Production 381
E::<H/\LJST PLE[~]U'~
55 PERF--ORA. TEO
SECr IOI'J
It., IR HJ
AIR OJT ~--
Figure 6 Perforated coating pan.
,,
~,!~, \, . \
)I
A·I R
- T ,ABLET BED
results in much more uniform application of the coating solution. Thesesystems are available for purchase today with the capability to performsugar, solvent, and aqueous coating with equal facility, and it is for thisreason this technique enjoys such widespread and growing popularity inthe industry today. Several other advantages of the perforated pan overconventional pans include the capacity to coat substantial quantities ofcore tablets (120-200 kg), the relatively short processing times required( 1. 5 - 2.5 h for the entire coating process), and the potential for automating the coating process. Microprocessor-controlled systems have beendeveloped which offer a "turnkey" approach to coating. One major limitation of this technique, however J is the difficulty in obtaining uniformcoatings on very small tablet cores and/or nonpareil-type seeds. Thistype of specialized coating is more readily accomplished in a fluidized bedequipped with a Wurster partition.
Wurster Column Coating
Figure 7 depicts the typical configuration utilized for Wurster coating.The heat source and agitation for this type of coating is the fluidizationair provided at the bottom of the container. The coating solution isatomized by the spray nozzle and applied to an ever-changing substrateby virtue of product passage around the partition in the center of theprocessing vessel. This system provides the ideal environment for coating very small tablets, spheres. or other substrates which are relativelyeasily fluidized yet possess adequate physical integrity to withstand impact with the partition and walls of the equipment until coated. Themajor limitations of this type equipment include smaller (with respect tothe perforated pan) potential batch sizes, constraints on the physical
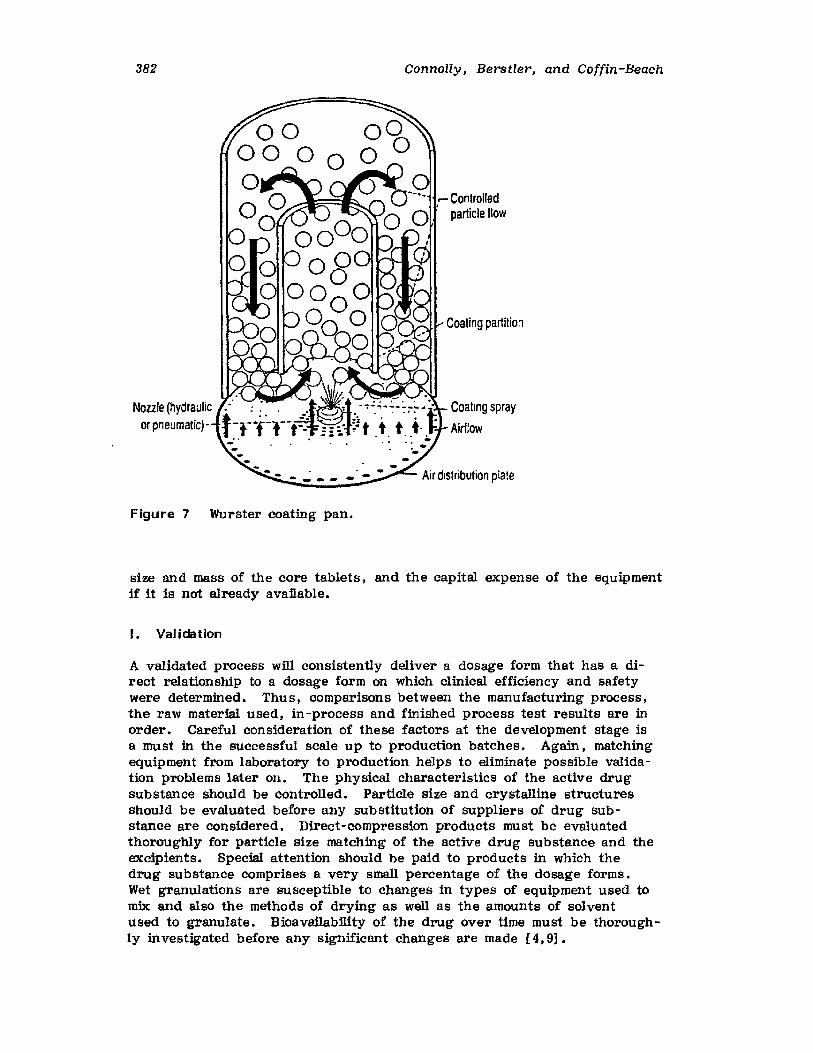
382
Nozzle (hydraulicor pneumatic)·
Figure 7 Wurster coating pan.
Connolly, Berstler, and Coffin-Beach
Coating partition
Coating spray
Airflow
Air dIstribution plate
size and mass of the core tablets, and the capital expense of the equipmentif it is not already available.
I. Validation
A validated process will consistently deliver a dosage form that has a direct relationship to a dosage form on which clinical efficiency and safetywere determined. Thus, comparisons between the manufacturing process,the raw material used, in-process and finished process test results are inorder. Careful consideration of these factors at the development stage isa must in the successful scale up to production batches. Again, matchingequipment from laboratory to production helps to eliminate possible validation problems later on. The physical characteristics of the active drugsubstance should be controlled. Particle size and crystalline structuresShould be evaluated before any substitution of suppliers of drug substance are considered. Direct-compression products must be evaluatedthoroughly for particle size matching of the active drug substance and theexcipients. Special attention should be paid to products in which thedrug substance comprises a very small percentage of the dosage forms.Wet granulations are susceptible to changes in types of equipment used tomix: and also the methods of drying as well as the amounts of solventused to granulate. BioavaUability of the drug over time must be thoroughly investigated before any significant changes are made [4,9].

Tablet Production 383
When reviewing validation of tablet production, the following key elements should be considered.
Raw Materials
The physical characteristics of raw materials play an important role in content uniformity and bioavailability.
The literature has shown that the physical quality (e.g., particle sizeof raw materials) can sometimes relate to the availability and clinical effectof a product. It would, therefore, seem appropriate that the critical physical characteristics of raw materials be considered in a validation program.It is expected that the physical characteristics of a drug substance becharacterized if necessary.
Physical characteristics of raw materials can vary among manufacturersof drug substances and, on occasion, have varied from lot to lot from thesame manufacturer. Therefore, it is important whenever changes are beingcontemplated, or when it is discovered there are changes in particle sizeor bulk density, that the dissolution rates of granulated products and thecontent uniformity of direct-compression products be examined very closely.
Particulate solids, once mixed, have a tendency to segregate by virtueof differences in the shape, size, and density of the particles of whichthey are composed. This process of separation occurs during mixing aswell as during subsequent handling of the completed mix. Generally, largedifferences in particle size, density, or shape within the mixture result ininstability. The segregation process normally requires energy input andcan be reduced by careful handling following the mixing process.
Control of the physical characteristics of excipients if the oral soliddosage form is made by direct compression can also be important. One ofthe most important ingredients in both granulated and direct compressionproducts affecting dissolution is the lubricant. Dissolution rates decreasewith increasing lubricant concentration and increasing blending time. Forthis reason it is normal practice to blend the lubricant briefly prior tocompression. Longer blending times of the alkaline stearates increase theirdistribution and ability to coat particles, resulting in slower dissolution.
Reproducibility of Manufacturing Process
When creating a master formula, particular attention must be paid to certain instructions that may affect the reproducibility of the process (e. g. ,the amount of granulating liquid and a measurable endpoint such as themeasurement of the amperage draw of a particular mixer). The screeningprocedures are also important. Excipients must be free of lumps and proper screening will aid raw material dispersion. Never leave the option touse improper equipment: It is always safer to specify the size and designof containers and sizing equipment along with the major equipment to beused.
Equipment
The pitfalls to avoid when specifying equipment to be used in the manufacturing process can be briefly addressed by identifying the various typesof mixers in general use.
Dry blending is normally accomplished in either tumble blenders orribbon blenders. When using the tumble blenders, such as the twin-shellor the double-cone blender, care should be taken to avoid lumps of powder
384 Connolly, Berstler; and COffin -Beacn
by prescreening and by controlling the ambient temperature and humidity.Also, do not exceed recommended volumes to assure adequate tumbleaction.
Ribbon blenders have two problems which must be addressed. Thefirst is the dead spot at the discharge port. Adequate directions must begiven to clear this area once or twice during the mixing cycle and to recycle the powder. The second problem, especially with low-dose actives,may be poor mixing at the shell wall because of blade clearance and also inthe bottom portion of the mixer at either end.
Wet granulations are usually done in either low-energy mixers, such asPony pan mixers, planetary mixers, Sigma or two-blade mixers. or highenergy mixers, such as Diosna, Gral. Lodige , or any number of the highshear mixers on the market today. Pony mixers and other types of planetary mixers should be avoided when designing a dry blending process.
The low-energy mixers for wet granulations have longer granulatingtimes and usually require larger amounts of granulating solution. Whenusing high-energy mixers, steps must be taken to measure the endpointso over-granulation is avoided. Also. the very high speed of the variousintensifier attachments can generate considerable heat and may damage sensitive materials.
Process Control Testing
With the advent of new manufacturing equipment and changes in process,decisions regarding suitability obviously cannot be made based on historical data. This should be recognized by management. and particularlyproduction personnel, when new equipment is employed. Equipmentchanges for some products might warrant additional dissolution and/or content uniformity studies.
The validation of a blending operation and blending equipment, particularly in the absence of historical data. occasionally presents problems.As with other elements, the degree and depth of a study is largely dependent upon the specific product.
The Theory and Practice of Industrial Pharmacy states:
In the evaluation of a mixture, care must be taken that the scaleof scrutiny is appropriate. That is, the samples chosen must belarge enough to contain sufficient particles to accurately representthe region from which they were taken, yet not so large as to obscure important small scale variations in composition. The selection of a scale of scrutiny is also dependent on the ultimate use ofthe mixture. For example, samples of the same weight as the finaltablet are proper for evaluating a tablet granulation. Analysis ofmultiple samples of this size would allow prediction of tablet totablet variations due to imperfect mixing [11].
As a general comment, for some products with very good historical content uniformity data coming from a reproducible and controlled process,end product content uniformity test results without in-process samplingof the mix for uniformity could be acceptable.
However, for many of the potent dosage forms, particularly those madeby direct compression, sampling of the mix is generally performed. Because of the additional analytical manipulation associated with testing(weighing). there is the tendency to rely more on dose uniformity testing
Tablet Production 385
of the tablets than of the blend for assurance of uniformity. However. avalidated process would require that the mix be uniform prior to compression.
Finished Product Testing
The next critical element includes finished product testing. For thoseproducts with little historical data. as previously pointed out, additionalfinished product testing might be warranted. This would pertain to dissolution testing as well as content uniformity testing.
It is implied that the finished product test should be meaningful. Individual dose-to-dose content uniformity. dissolution and, Where required.release variability must be addressed when modeling validation testing.
J. Tooling Control
Upon receipt of new production tooling ordered from a supplier. punchesand dies will be transferred to the appropriate inspection area. Here theindividual punches or dies will be inspected to assure that they meet allspecifications set forth by the particular drawings for that set of punchesor dies.
The follOWing punch specifications should be checked to assure uniformproduct:
1. Length of punch from tip to head2. Length of punch from depth of concavity to head3. Diameter of punch body4. Diameter of punch tip5. Overall concentricity6. Head angles7. Depth of concavities8. Embossing dimensions (Le., depth of monogram, angle. and height
of letters)9. Accuracy of emboss
Die specifications will include:
1. Inside diameters2. Outside diameters3. Inside concentricity4. Outside concentricity
Once a set has been inspected and approved. the individual tools ofthat set will be assigned a control number and a punch and die recordcard will be completed for that set (Fig. 8). This card will accompanythe set of tools into production and be kept with the set. All productionruns will be recorded. The set will be recalibrated at predetermined intervals; usually after approximately 25 - 50 million tablets.
Any tools that do not meet the required specifications. are damaged,or show abnormal wear will be removed from service. Punch tips will bedefaced and the tools will be disposed of in the proper manner. For moredetailed information. see the tableting specification manual issued by theIndustrisl Pharmaceutical Technology Section (IPT) of the Academy ofPharmaceutical Sciences [10].
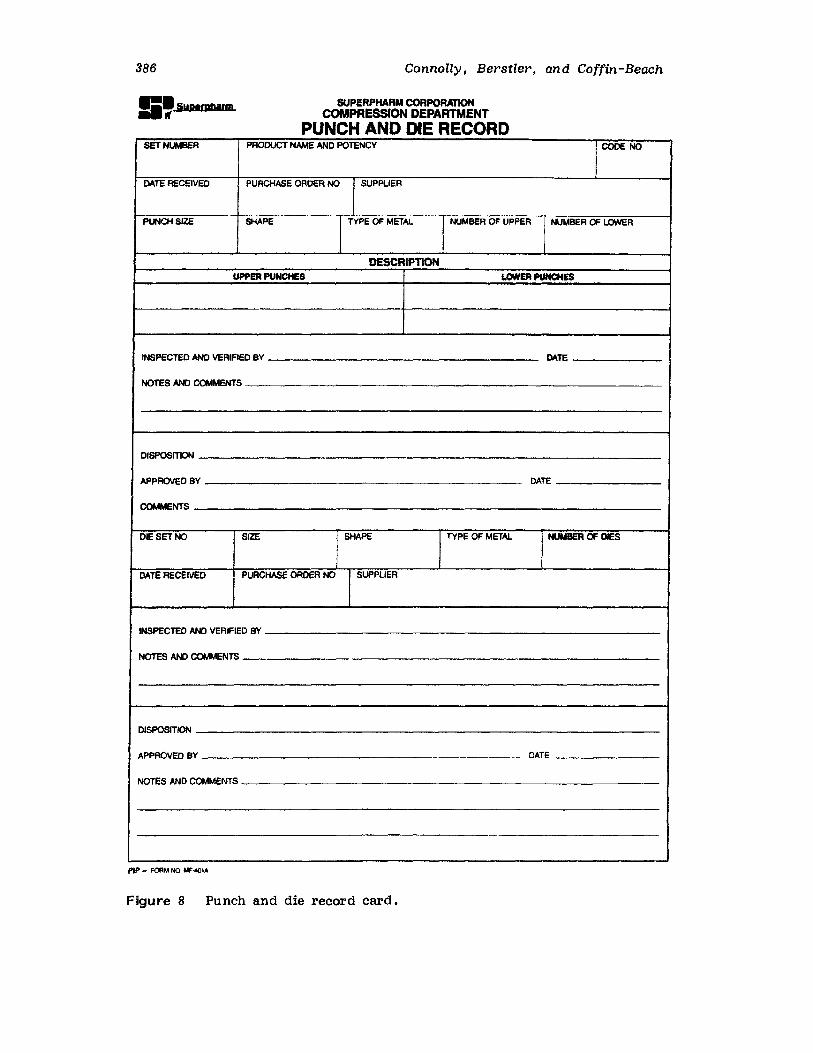
386 Connolly, Berstler, and Coffin-Beach
SUPERPHARM CORPORATIONCOMPRESSION DEPARTMENT
PUNCH AND DIE RECORDSETNUMBEA PAOOUCT NAMEANDPOTENCY CODE NO
DATE RECEIVED PURCHASE ORDER NO SUPPliER
PUNCHSIZE SHAPE ITYPEOF METAL INUMBER OF UPPER NUMBER OF LOWER
DESCRIPTIONUPPER PUNCHES LONERPUNCHES
INSPECTED AND VERIFIED BY DATE
NOTES AND COMMENTS
DISPOSITION
APPROVED BY DATE
COMMENTS
DIESETNO SIZE SHAPE TYPE OF METAL NUMBER OF DIES
DATE RECEIVED PURCHASE OADER NO SUPPLIER
INSPECTED ANDVERIFIED BY
NOTES ANDCOMMENTS
DISPOSITION
APPROVED BY DATE
NOTES ANDCOMMENTS
PI/' - FOIlM NO MF..o.A
Figure 8 Punch and die record card.
Tablet Production
K. Packag ing
387
The packaging area calls for great emphasis on type of construction because it is particularly sensitive to mix-ups in either product or labeling,Individual packaging lines should have a minimum separation between eachline of 15 ft. Depending on the equipment used, more space may need tobe utilized. Consideration should be given to the separation of lines bypartitions. The partitions need not be floor to ceiling, but should preventmigration of product by being closed at the floor, and high enough toprevent any crossover of product.
Some companies have started their packaging operations with a prestaging area large enough to contain all required components for thatpackaging operation. This area is separate but adjacent to or in front ofthe filling area. The filling area should be equipped. if possible, withair filtered through absolute filters. Dust-collector outlets from the centraldust-collector system should be located in the filling area to remove dustfrom the filling operation. After cleaning by vacuum, bottles move intothe filling area, are filled. then moved to the area where cottoning, capping, labeling, eto , , takes place. Th us, maximum product protection isexercised in the filling area while the product is exposed, with lesserdegrees of control being required in the other areas because the productis now containerized.
Standard operating procedures should be developed for all packagingoperations. These include specific procedures for line setup, approval ofline before start of operations, periodic line check during operation,close out of line, line clearance at end of operation, and reconciliation ofproduct and components.
Cleaning and Start-Up
Cleaning should be carried out with relative ease and with the use ofstandard cleaning materials. Vacuum facilities should be available forcleaning and contact parts should be wiped down and sanitized utilizinga sanitizing agent. The equipment should be washed, dried, covered,and stored in an equipment storage area.
As in the case of manufacturing, the packaging operation starts withthe generation of the packaging order. This consists of the approvedpackaging components listed by name and code number, the lot or controlnumber of each component, the batch number of the product to be packaged, and quantities of each. A supervisor verifies the accuraacy andcompleteness of the packaging order, including expiration date, line beingused, and any other special equipment being used for that operation.These steps are accomplished prior to bringing components to the line.The complete line area, including all equipment, is verified as being properly disassembled and cleaned of all product and components from theprevious packaging operation. After the Quality Assurance Departmentverifies that the area has been cleared and cleaned, the components arebrought to the line for mechanical setup. After the setup mechanic completes all the adjustments required, a supervisor oversees the prestartprocedure, which consists of clearing all product used during the setup,counting labels used in the labler setup, rechecking all components and
388 Connolly, Berstier, and Coffin -Beacn
lot numbers, verifying the bottle count, verifying all stamps and lot numbers, and signing of the packaging order that all is in readiness to startpackaging operations.
Labeling Operations
Labeling operations must receive very special attention. The use of cutlabels in the pharmaceutical industry is rapidly disappearing. Roll labels,whether they are glue, thermoplastic, or pressure-sensitive are now thelabels of choice. Electronic label counting and verification is the norm withbar codes. Universal Product Code (UPC). or Health Industry Bar Code(HIBC) being used more frequently as label identifiers. The storage oflabels for both security and preservation reasons is very important. Theverification of labeling at the final label application point is also becomingmore popular, as the U.S. Food and Drug Administration (FDA) hasidentified labeling errors as the single largest issue in product recalls.
Standard operating procedures must be developed for label accountability with specific tolerances for accountability spelled out. Provisionmust be made for label security, such as locked cabinets on the operatinglines. Accountability sheets for other components must be developed sothat reconciliation between used and finished packages can be developed.If possible, a cleaning area and shop should be set up for the cleaning offilters and parts, and the disassembly and assembly of filling machines.
Controls During Run
A packaging department check sheet is prepared each day by the supervisor for each packaging line (Fig. 9). This check sheet indicates thecomponents being used, the product name and description, packaging production order number, the manufacturing production order number. expiration date, etc. The checklist also includes weight, or tablet countbeing filled, line number, appearance of containers, and the effectivenessof any mechanical controls for detecting empty cartons, missing inserts,etc. The line and components are checked by the supervisor on all startups. In addition. the line and components are checked and initialed approximately every hour during the run by a supervisor.
End of a Packaging Production Order
When a packaging production order (PPO) is completed, the packaging linewill be cleared of all components which are not transferable to the nextorder. Those components which can be transferred to the next PPO (i.e.,components with identical code numbers) will be marked with a stickerindicating the new PPO number. The supervisor will fill out a clean cardand indicate in the appropriate space if the changeover is to be a productchangeover or a packaging order changeover (no cross-outs will appear inthis section). Clean cards for equipment that is mobile will be attacheddirectly to the equipment. A complete reconciliation of all labels andinserts will be performed and any discrepancies outside predeterminedlimits will be investigated immediately. Also, for inventory purposes, allquantities of all components will be recorded. Also, at this time a finalcheck of product container labels will be performed and recorded.
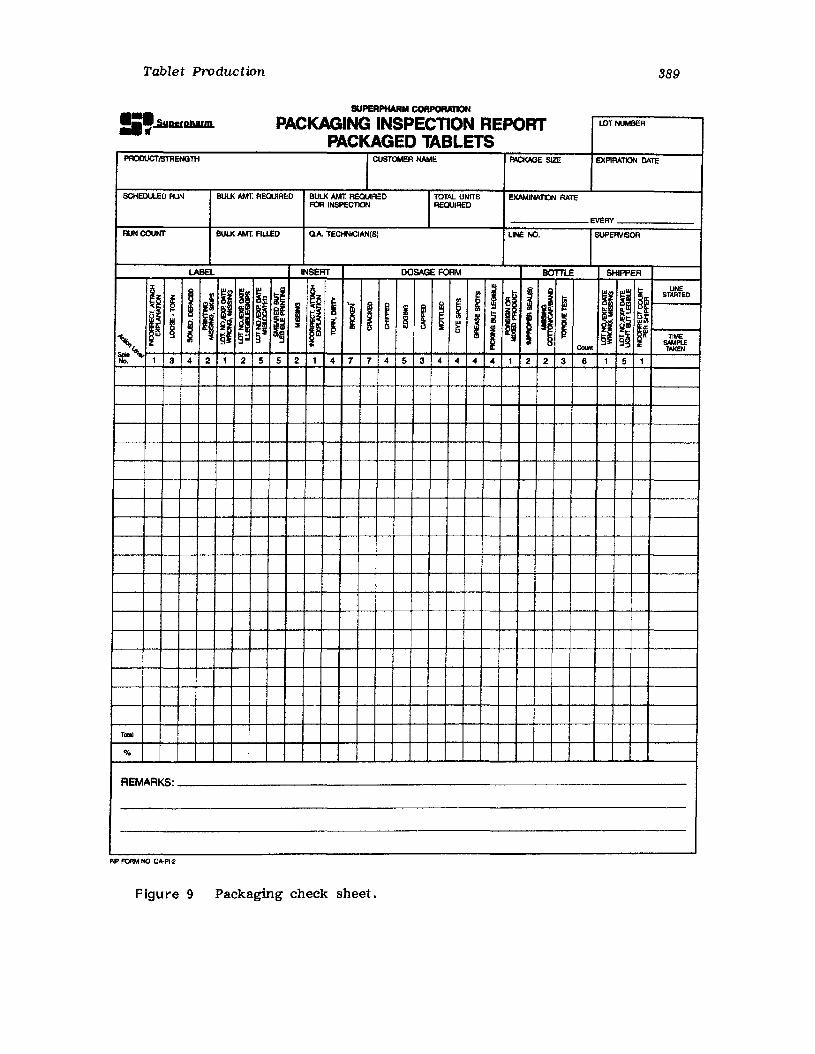
Tablet Production 389
!i~~IWRUmL PACKAGING INSPECTION REPORT LOTNUMBEA
PACKAGED TABLETSPRODUCTISTAENGlli ICUSTOMER NAME f'ACKAGE SIZE EXPIRATION DATE
SCHEOULED RUN BULK AMT. REQUIRED BULK AMT. REQUIRED TOIAL UNITS EXAMINATION RATEFORINSPECTION RECUIRED
EVERY
AUNCOUHf BULK AMt FIliED QA TECHNICIAN(Sl LINE NO. SUPEl'MSOR
LABEL INSERT DOSAGE FORM BOTTLE SHIPPER
!I ~ ; II ili ii !~ i ~~
fII~I sj ~~
LINE
il ~ I mSTARTlID
~~ I 'I ~Q
I I! I ~ ii I; III r i
i ~ g ~ ~ II~ ; ~I~ ~ ~ I ~I
i~
"§ § §~ TIME
5mPLEca... TI,I(EN
~ 1 3 4 2 1 2 5 5 2 1 4 7 7 4 5 3 4 4 4 4 1 2 2 3 6 1 5 1
TOI8I
%
REMARKS;
PlP fORMNO CA-PI-2
Figure 9 Packaging cheek sheet.
390 Connolly. Berstler, and Coffin-Beach
IV. DESIGN OF THE PRODUCT
Other considerations relating to tablet production must now be addressed.As Vias the case with formulation development activities. good communicationbetween research, production personnel, quality assurence , and marketingare essential to the efficient introduction of a product to the manufacturingenvironment. The decisions which must be made and the ideal informationwhich must be supplied are briefly discussed below.
A. Batch Sizes
Aside from the obvious limitations of batch size imposed by the capacitiesof the processing equipment, logical choices concerning optimum batchsizes will depend primarily on marketing projections of sales for the product. Early establishment of accurate batch size translates to more efficientintroduction to production. In today's regulatory environment. processvalidation information is required on standard batch sizes for the subjectproduct. Without firm batch size definition at the outset, not only will anyvalidation data which is generated have to be repeated if the batch sizechanges, but also SUbsequent decisions relating to equipment utilized forbatch processing, manpower required, raw material procurementl storagerequirements, production scheduling. and a myriad of similar issues willrequire redefinition in the case of a change. Therefore, the establishment by the marketing group of a solid sales estimate by unit for any newproduet cannot be overemphasized.
An EOQ (economic order quantity) model can be developed to calculatethe theoretical batch size that will generate the least total costs. It iscreated by taking the partial derivative with respect to Q of a total costequation. The result is usually in the following form:
EOQ ::: j 2:rnwhere EOQ = economic order quantity -that quantity which will generate
the least total cost of carrying costs plus manufacturingcosts
A = set-up costs ($)
D ::: demand (number of tablets/unit time)
v ::: total manufacturing costs (raw material + value added)($/tablet)
r = carrying costs ($/$/unit time)
It is clear from the equation that the forecast (D) will directly impactthe EOQ. The development of an EOQ, however, should be used as onlyone of the tools for batch sizing. A sensitivity analysis can also bederived to determine the additional costs incurred by deviating from theEOQ [3,8}.
Within the batch size requirements established by marketing, production, and research personnel is the need to assess operating characteristics of granulation and tableting equipment to determine the most
Tablet Production 391
efficient production cycle. An analysis which addresses marketing's product requirements linked to a temporal projection provides the basis for themanufacturing plan. With this assessment and knowledge of the typicaloperating cycle time for processing equipment, the impact on existing facilities can be assessed, and the demand for new equipment may be addressed.Careful consideration should be given at this point in the planning stagethat delivery times for processing equipment purchase, installation, validation (if required), and similar issues be calculated accurately to assuresmooth introduction of the product.
B. Equipment Considerations
In spite of restrictions applied to production based on development decisions with regard to processing equipment and technology, new equipmentpurchases for the production environment should be evaluated and addressthe following items.
Construction
Aside from functionality and durability, have the exigencies and growingconcerns around "c1eanability" and cleaning validation been addressed inthe design? This consideration is especially important if the equipment isto be used for multiple products.
Scalability
Does the proposed production equipment operate on the same or similarprinciple to the pilot-scale equipment? How linear is the scalability fromsize to size? This factor can be pivotal in successful scale up to production-size batches.
Capacity /Output Requirements
If this equipment will augment or supercede existing equipment, will its output meet the required demand? It is wise to remember that in the case oftablet presses, a factor of 0.6-0.7 times the maximum rated output wouldlogically provide a value for the optimum output of the equipment. Analysis based on using the manufacturer's stated maximum output will over-state the machfna's practical capabilities in some cases by 30-40%.
Installation /Operating Requiremen ts
Assess the equipment's space, utility, and any other special requirementsand determine the feasibility of the proposed installation. In addition, ifspecial features (i. e., explosion-proof electrics, etc.) are required, verifythat the equipment vendor's interpretation will address local requirements.
Processing Test
Even though production equipment is technically similar to the R&D equipment used, verify, if possible, that the equipment will perform up to expectations at production scale. Very careful evaluation should precedeany equipment purchase. An integral step in the prepurchase processshould include actual equipment testing with tests products representativeof typical production batches.
392 Connolly, Berstler, and Coffin-Beach
AvailabUity of Quantitative In-Process Data
The regulatory climate regarding process validation continues to requireever-increasing amounts of quantitative manufacturing process data.Whether it is amperage measurements on a high -shear mixer taken duringthe granulating process or compression force monitoring from a tabletpress, equipment should be evaluated with the anticipation that this information will be utilized and likely required at some point during its useful lifetime.
V. DESICN OF THE FAC ILiTY
A. Layout of Facilities
The overall facility as well as the individual process areas should alwaystake into consideration the most simplistic route of material flow and thecontrol of cross contamination. As previously noted, the prime objectiveat all stages of inventory is to separate released materials from quarantined or rejected materials. Several typical layouts for pharmaceuticalmanufacturing follow.
Figure 10 depicts one of the more popular solid-dosage form layouts.Basically, the center, or core, of the facility is a storage of warehousearea for raw materials, packaging components. and bulk stocks, with themanufacturing and packaging operations located at the outer perimeter.As can be observed, the flow of ra w materials and components is fromthe receiving and quarantine areas into approved storage. Materials areweighed into batch quantities in dispensing, and then moved into the manufacturing area. After completion of manufacturing. the finished tabletsare placed in quarantine, and moved to bulk stock upon release. When thepackaging run is scheduled, tablets and packaging components are delivered from the bulk stock and approved storage areas.
This layout has the advantage of space conservation by virtue ofhaving the supply areas close to the areas being supplied. However, asignificant disadvantage is the crossover traffic pattern of materials. withthe ensuing potential for contamination or mixup.
A second layout consisting of receiving, approved raw materials andcomponents storage, and dispensing on one side, with manufacturing,quarantine, bulk stock, and packaging across a centra! corridor is depicted in Figure 11. The movement of materials from one area to anotheris the same as in Figure 10. However, owing to the modified layout, theflow is basically circular, eliminating much of the crossover traffic previously shown.
The third layout in Figure 12 consists of a basic straight-line flowto minimize contamination or mixup, moving the materials along a criticalpath. The principal advantage over the other layouts is minimal crossover of materials, thus minimizing the potential for contamination or mixup.One disadvantage is the additional space required to accommodate thisconfiguration.
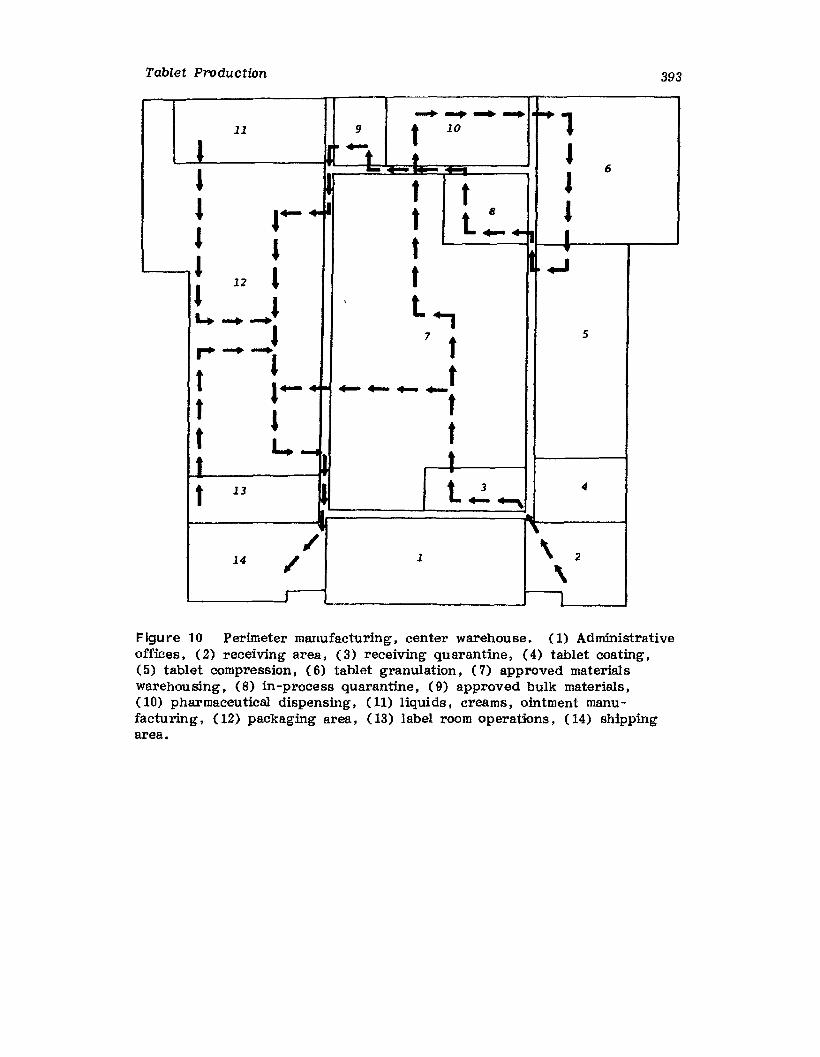
Tablet Production
.... -. ...... .... 111 9 t 10
1 10 ..... ,•I - I
6
~ t t! l.......~ t 8 It ......t II t
~....
I I t ..J
I12
...........J, t.,
,.. .........1 7 t 5
I ...............tt I..... ~
t I ttt
t L. ~~ t.t 13 ~ l~~
4
,/\
\14 ,/ 1 2
\I II
393
Figure 10 Perimeter manufacturing, center warehouse. (1) Administrativeoffices, (2) receiving area, (3) receiving quarantine, (4) tablet coating,(5) tablet compression, (6) tablet granulation, (7) approved materialswarehou sing. (8) in-process quarantine, (9) approved bulk materials.(10) pharmaceutical dispensing, (11) liquids. creams, ointment manufacturing' (12) packaging area, (13) label room operations, (14) shippingarea.

394 Connolly, Berstler, and Coffin-Beach
8 I'-- !'-- ..- +- ..- +- ..- .....,t
l t9 7 l 6 S
I tI
1 t t10 1111 .. t~ +-
t t1 J tJI 1 t
! 4..... - -- tJ ..- +- ... I- +-- ..- ....... .... +-12 t-+ .-. ........
t J ttt T1 3
t t13
/ft/ 1 2J4
1\I
Figure 11 Circular flow: (1) administrative offices, (2) receiving area,(3) receiving quarantine, (4) approved materials warehousing, (5) pharmaceutical dispensing, (6) tablet granulation, (7) tablet compression,(8) tablet coating, (9) liquids, creams, ointment manufacturing, (10) approved bulk materials, (11) in-process quarantine. (12) packagingarea, (13 label room operations, (14) shipping area.
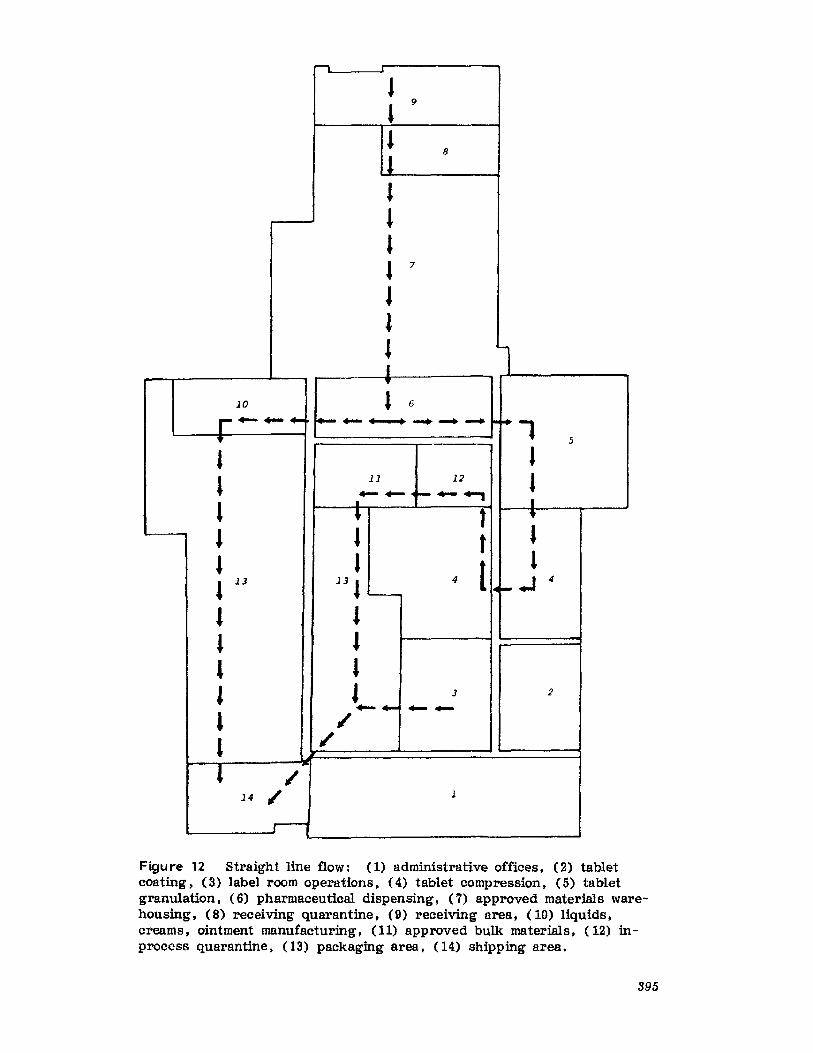
,.,J
I9
• 8
1
•lJ
•7
ll
• lI..,
10 I 6
r ........ f+- ... --.. .............. - ~,
• 5
I II 11 12 I... ..- 1- .......
•• _1.. t 't
• I t •l • 1 1~
13 13 I 4I..f- .J 4
~
• •• •l •• ,........ J 2......1 ,/
•,/
• ,/14 ,/ 1
r--1
Figure 12 Straight line flow: (1) administrative offices, (2) tabletcoating, (3) label room operations, (4) tablet compression, (5) tabletgranulation, (6) pharmaceutical dispensing, (7) approved materials warehousing, (8) receiving quarantine, (9) receiving area, (10) liquids,creams, ointment manufacturing, (11) approved bulk materials, (12) inprocess quarantine, (13) packaging area, (14) shipping area.
395
396 Connolly, Berstler, and Coffin-Beach
B. Control of Cross Contamination
Air-Handling Systems
One of the most important considerations in the design of a solid dosagefacility is the air-handling system. In considering air systems from thestandpoint of CGMPs, one begins with the supply of outside air, and thenmoves on to the filtration systems that will be utilized, determining wherepositive and negative air pressures are necessary, whether to recirculateor exhaust spent air 100%, and finally dust collection and exhaust systems.
The CGMP regulation 211. 46 section c specifically mandates that
Air filtration systems, including prefilters and particulate matterair filters, shall be used When appropriate on air supplies to production areas. If air is recirculated to production areas, measuresshall be taken to control recirculation of dust from production. Inareas where air contamination occurs during production, there sh811be adequate exhaust systems or other systems adequate to controlcontaminants [6].
A typical design involves one or more bag or cartridge filter-s locatedclose to the area of dust generation. Either of these coarse filtrationunits will remove at least 95% of the dust generated from normal pharmaceutical manufacturing operations. The prefiltered air is then mixed with10-15% outside make-up air and passed through a HEPA filter and reenters the rooms through the supply plenum diffuser.
Dust Collection
SAMPLING AND WEIGHING. The first area that must be addressed isthe raw material sampling rooms and the pharmacy or dispensing area.Both these functions can be handled with the same illustration. Figure 13shows a typical layout for sampling or weighing. The area should be a.nenclosed facility with separate booths or hoods where the individualweighing or sampling can take place. These areas may be designed usinghorizontal laminar flow or appropriate hoods and other dust pickup devices. The supply air to these stations will, therefore, either be HEPAfiltered at the pickup stations, or HEPA filtered after the dust collectorprior to returning to the general area or supply air.
GRANULATING. The next area to be addressed is granulating. Indesigning a granulating area the material flow should again be carefullyconsidered. Easy movement of materials into separate processing roomswill minimize the potential of cross-contamination. A typical design isshown in Figure 14. Here again there are two basic methods of airsystem design. In this illustration, the mixing rooms are negative to themain corridor. This prevents airborne particles from escaping into themain area and migrating to the other rooms.
COMPRESSION. Figures 15 and 16 illustrate a tablet-compression roomdesign using slightly negative pressure in the corridors to preclude contamination of other booths through open doorways. Both methods, designed and maintained properly, will work equally as well. The importantpoint being the supply air is prefiltered through a dust collector andfinal filtered through a HEPA filter.
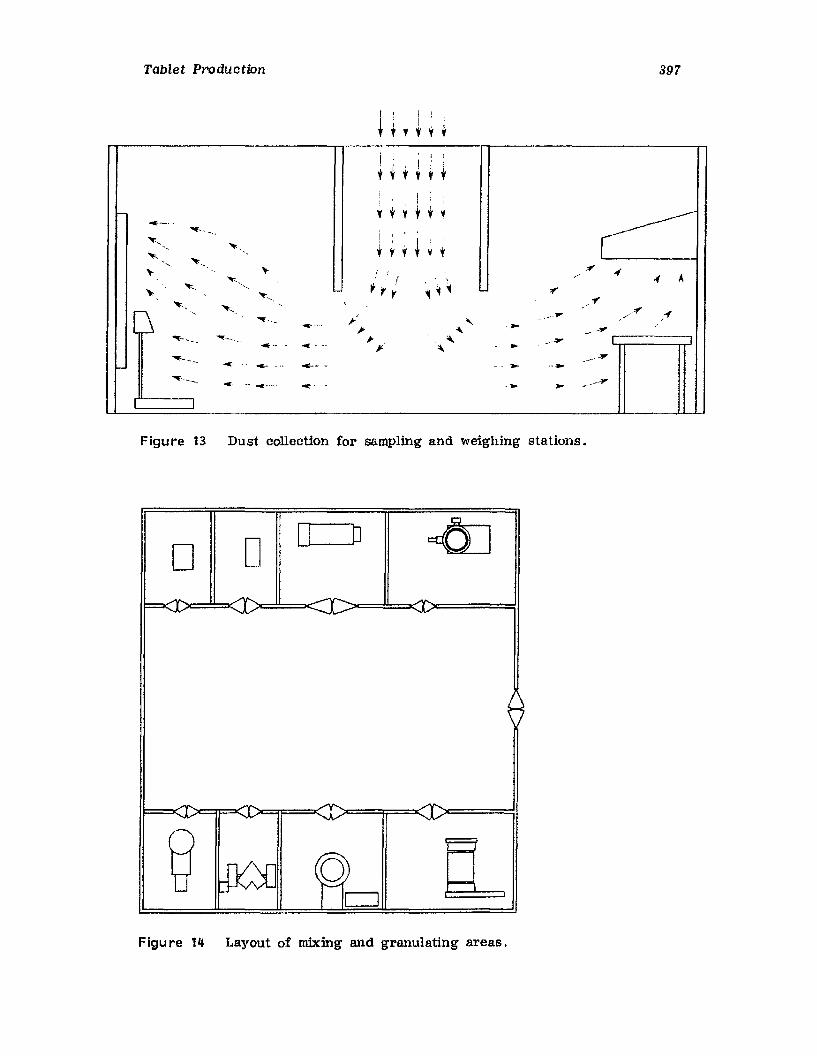
Tablet Production
I ! ' I
+ ~ f +Y~
397
i+
, ,++ t , f
I ! I
'( t V + ~ 'f r---.-_.. -- - i"'~ '" i
I : :-'- t "t .,. t"'- -<, ~
"'" "'"i
,""; - A~" / - .(
.", ""~<,
~ ,r ,~ ~ "'. ~""', ~ \ "-, ......- " ~.,.... j- .. _-r ./"- ...... _~- "'- -- .~,» "- -~---- "lIII('___~.
'- J- "- ---.. -- ..---- J!- "- -~
....-~ -- ----..- ... _ .. ... - - - . ~ ....'"O;- ___~
-c- -- - - _-l'""'l---' -<E" .... ._-..
Figure 13 Dust collection for sampling and weighing stations.
D D O-----lO
Figure 14 Layout of mixing and granulating areas.
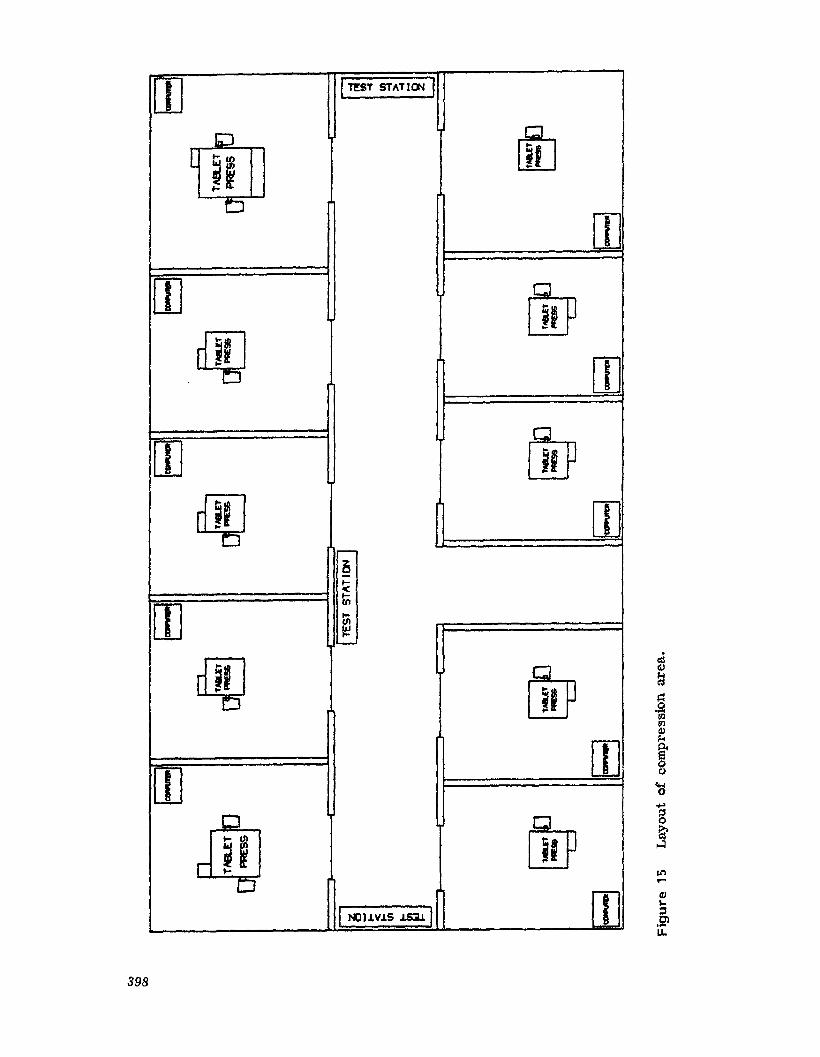
T ITEST 5T"l1CN I""-'='-
lito WJ
illrn 00.~ ill
00IT]
~ IT].--l5!;:I-
m III
~~
l...-
~ 00urL..o:::..oo
~ 00!r[]]II'f:J 1.1VJ.S J.S3J.]
398
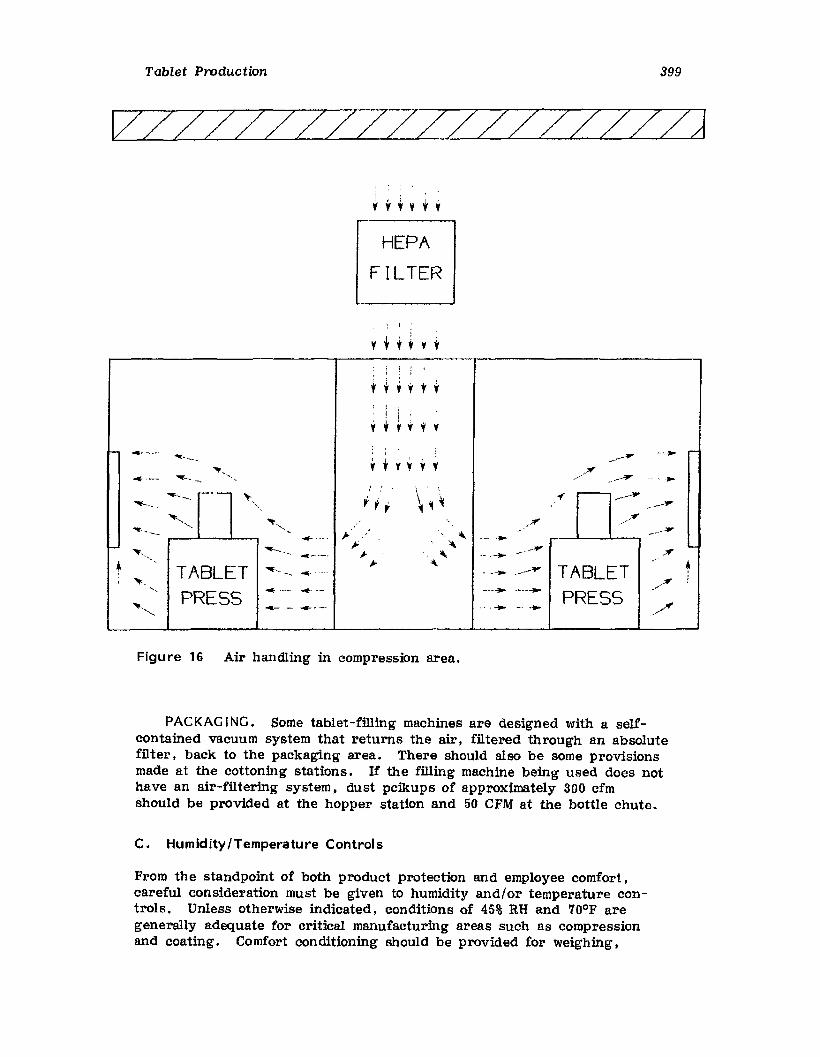
Tablet Production 399
~ZZZZZZZZZZZZZZZZZj
HEPAFILTER
+i ;
i
+,y ,y
,i !
y + .. y , ..I- 4~-'~ , _.. ~
"'""-- , ," ----....,. y y .- V ,~
/...- --- "', ~ .'- ._-~
r--- I \\ .----~... _--- ~, ~
.,. --"'f.-.._. -, r f ; ~ -.--T
<. ~'- "~ /j".._~ <,
J>, -, "-
.- _"--'11"...-,~-. --_. ..-.~
, ~~_." .#~. ;. "- --.-"<, ~'-"~'
-»
~ - ," TABLET ~TABLET
_.-. ..... _- -... ~--- ...."". ./"'"-,
PRESS....- _..- _...... ._--....
PRESS"lit"<,, 4- - .....~- ...... -- ... ./
Figure 16 Air handling in compression area.
PACKAGING. Some tablet-filling machines are designed with a selfcontained vacuum system that returns the air, filtered through an absolutefilter, back to the packaging area. There should also be some provisionsmade at the cottoning stations. If the filling machine being used does nothave an air-filtering system, dust pcikups of approximately 300 cfmshould be provided at the hopper station and 50 CFM at the bottle chute.
C. Humidity/Temperature Controls
From the standpoint of both product protection and employee comfort,careful consideration must be given to humidity and/or temperature controls. Unless otherwise indicated, conditions of 45% RH and 70°F aregenerally adequate for critical manufacturing areas such as compressionand coating. Comfort conditioning should be provided for weighing,
400 Connolly. Beretler, and Coffin-Beacn
granulation, compression. and packaging operations. However. temperature controls should be such that little or no variation will be caused byexternal ambient temperatures. Thus, comfortable working conditions areachieved and there should be no impact on characteristics of in-processmaterials, such as granulation. raw materials. etc. Warehousing operations should have some adequate type of ventilation, particularly in areasof high storage. either pallet racks or pallet-to-pallet-type storage. Theventilation could be provided by large roof fans to circulate air. In addition, some form of supplemental air heating. such as hot-air blowers.should be provided fol' cold areas. such as shipping or receiving docks.
D. Water Systems
Although water systems are not covered to any great extent in the CGMPs,CGMP regulation 211.48 states that the supply of potable water in a plumbing system must be free of defects that could contribute contamination toany drug product [6]. Thus, an effective water system is a necessity.In recent years, various techniques have been developed for producingthe high-quality water required in ever-increasing quantities in pharmaceutical manufacturing operations. These include ion-exchange treatment.reverse osmosis. distillation, electrodialysis. and ultrafiltration. In fact.the United States Pharmacopeia (USP) XXI defines purified water, USP.as water obtained by these processes or other suitable processes. Unfortunately, there is no single optimum system for producing high-puritywater. and selection of the final system(s) is dependent on such factorsas raw-water quality. intent of use. flow rate, cost. etc. [1].
In the pharmaceutical industry, the classes of water normally encountered are well water. potable water. USP (which complies with PublicHealth Service Drinking Water Standards), purified water. USP, and specially purified grades of water. such as water for injection. USP. or FDAwater for cleaning and initial rinse in parenteral areas (as defined in theCGMPs for large-volume parenterals). For purposes of this chapter. onlythe first three classes will be addressed because these are the classifications encountered in processing for solid- and semisolid-dosage forms.
Well Water
Well water, as the title indicates, is water drawn directly from a well.The water may not be either chemically or microbiologically pure because itis untreated. Therefore. the use of well water should be restricted tononmanufacturing operations. such as lawn sprinklers. fire protection systerns, utilities, and the like.
Potable Water
Potable water, USP, is city water or private well water that has usuallybeen subjected to some form of microbiological treatment. such as chlorination. to meet the United States Public Health Service Standard with respect to microbiological purity. Potable water is fit for drinking. and isgenerally used in processing operations for cleaning and sanitation purposes. Periodic monitoring of use points should be conducted to ensureadequate residual chlorine levels and the absence of microbial contamina-
Tablet Production
tion. If necessary t additional chlorine should be added to the watersupply as it enters the plant, or a suitable flushing program should beimplemented to ensure adequate chlorine levels at point of use.
401
Purified Water
Purified water t USP, is usually prepared from water that meets the potablewater standard. Purified water is treated to attain specified levels ofchemical purity and it is the type of water used in most pharmaceuticalprocessing operations. Bowever , this class of water is not without problems in that the requirements of no chlorides presents special concernsfrom a microbial contamination standpoint.
Purified water. USP. generally is produced by deionization or distillatton , although reverse osmosis or ultrafiltration systems might be utilizedif the required chemical purity could be achieved. As a starting point inthese processes, water softening or activated carbon filtration frequentlyis employed as a pretreatment process to remove calcium and magnesiumions or chlorine and organic materials. Ion exchange and demineralizationthrough deionization is a very common method of obtaining the purifiedwater, USP t used in the pharmaceutical industry.
Water-Treatment Equipment
Deionization equipment should be sized to ensure frequent regeneration anda recirculating system should be installed on the unit that approaches therated flow of the deionization unit. Procedures should be written to ensure that all water-treatment equipment is properly operated. monitored.maintained. and sanitized on a regular basis.
WATER FILTRATION. Water filtration generally is approached on thebasis of two major considerations: prefiltering to prevent large particulatesfrom entering the system and microfiltering to remove bacteria. Prefiltersare generally the replaceable cartridge type with porosities ranging ashigh as 25 u, Microfiltering is usually accomplished with a O.2-11 absolutefilters, which will remove most bacteria.
A proliferation of filters within the system should be avoided, sincewhat might be implemented as a protective measure could readily developinto a problem wherein retained bacteria are given the opportunity tomultiply. In any system employing filters for the control of bacteria t thefilters and all of the downstream piping must be effectively sanitized on aregular basis. There should be procedures written for filter inspection,replacement, integrity testing, and monitoring on a scheduled basis.
SAN ITIZATION PROCEDURES. Sanitization is best accomplishedthrough several methods. After periods of low usage of water, the system should be flushed. with a supply of water that has residual chlorine.Periodic hyperchlorination also is recommended. Effective microbial control can be maintained by storing water at 80°C. However, this approachis expensive and presents some hazards to personnel and material. Ultraviolet radiation may be used. but it has limited application because of themany factors which can reduce its effectiveness. written instructionsshould be developed for sanitization procedures for water-treatment equipment on a regular, prescribed basis.
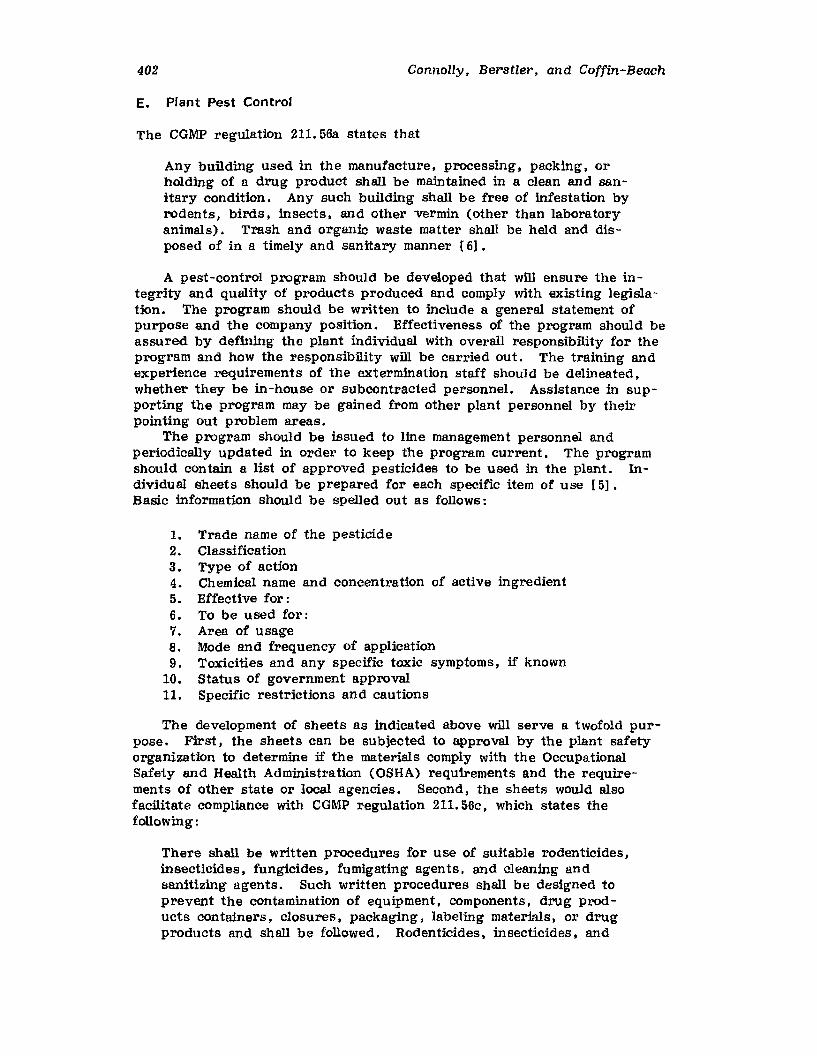
402 Connolly. Berstler. and Coffin-Beach
E. Plant Pest Control
The CGMP regulation 211. 56a states that
Any building used in the manufacture, processing, packing, orholding of a drug product shall be maintained in a clean and sanitary condition. Any such building shall be free of infestation byrodents, birds, insects, and other vermin (other than laboratoryanimals). Trash and organic waste matter shall be held and disposed of in a timely and sanitary manner [6].
A pest-control program should be developed that will ensure the integrity and quality of products produced and comply with existing legislation. The program should be written to include a general statement ofpurpose and the company position. Effectiveness of the program should beassured by defining the plant individual with overall responsibility for theprogram and how the responsibility will be carried out. The training andexperience requirements of the extermination staff should be delineated,whether they be in-house or SUbcontracted personnel. Assistance in supporting the program may be gained from other plant personnel by theirpointing out problem areas.
The program should be issued to Une management personnel andperiodically updated in order to keep the program current. The programshould contain a list of approved pesticides to be used in the plant. Individual sheets should be prepared for each specific item of use [5].Basic information should be spelled out as follows:
1. Trade name of the pesticide2. Classification3. Type of action4. Chemical name and concentration of active ingredient5. Effective for:6. To be used for:7. Area of usage8. Mode and frequency of application9. Toxicities and any specific toxic symptoms, if known
10. Status of government approval11. Specific restrictions and cautions
The development of sheets as indicated above will serve a twofold purpose. First, the sheets can be SUbjected to approval by the plant safetyorganization to determine if the materials comply with the OccupationalSafety and Health Administration (OSHA) requirements and the requirements of other state or local agencies. Second, the sheets would alsofacilitate compliance with CGMP regulation 211. 56c, which states thefollowing:
There shall be written procedures for use of suitable rodenticides J
insecticides, fungicides, fumigating agents. and cleaning andsanitizing agents. Such written procedures shall be designed toprevent the contamination of equipment, components, drug products containers, closures, packaging, labeling materials, or drugproducts and shall be followed. Rodenticides, insecticides, and
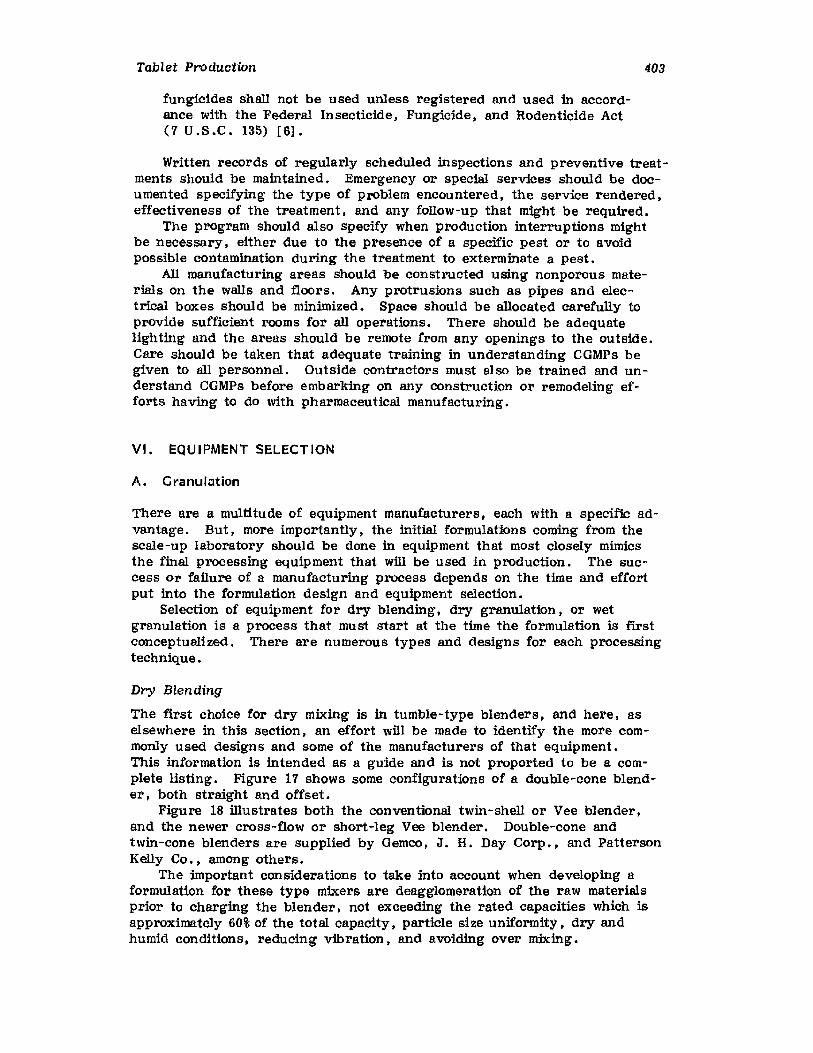
Tablet Production
fungicides shall not be used unless registered and used in accordance with the Federal Insecticide, Fungicide, and Rodenticide Act(7 U.S.C. 135) [6].
403
Written records of regularly scheduled inspections and preventive treatments should be maintained. Emergency or special service! should be documented specifying the type of problem encountered, the service rendered,effectiveness of the treatment, and any follow-up that might be required.
The program should also specify when production interruptions mightbe necessary, either due to the presence of a specific pest or to avoidpossible contamination during the treatment to exterminate a pest.
All manufacturing areas should be constructed using nonporous materials on the walls and floors. Any protrusions such as pipes and electrical boxes should be minimized. Space should be allocated carefully toprovide sufficient rooms for aU operations. There should be adequatelighting and the areas should be remote from any openings to the outside.Care should be taken that adequate training in understanding CGMPs begiven to all personnel. Outside contractors must also be trained and understand CGMPs before embarking on any construction or remodeling efforts having to do with pharmaceutical manufacturing.
VI. EQUIPMENT SELECTiON
A. Granulation
There are a multitude of equipment manufacturers, each with a specific advantage. But, more importantly, the initial formulations corning from thescale-up laboratory should be done in equipment that most closely mimicsthe final processing equipment that will be used in production. The success or failure of a manufacturing process depends on the time and effortput into the formulation design and equipment selection.
Selection of equipment for dry blending. dry granulation, or wetgranulation is a process that must start at the time the formulation is firstconceptualized. There are numerous types and designs for each processingtechnique.
Dry Blending
The first choice for dry mixing is in tumble-type blenders, and here, aselsewhere in this section, an effort will be made to identify the more commonly used designs and some of the manufacturers of that equipment.This information is intended as a guide and is not proported to be a complete listing. Figure 17 shows some configurations of a double-cone blender, both straight and offset.
Figure 18 illustrates both the conventional twin-shell or Vee blender,and the newer cross-flow or short-leg Vee blender. Double-cone andtwin-cone blenders are supplied by Gemeo, J. H. Day Corp •• and PattersonKelly Co., among others.
The important considerations to take into account when developing aformulation for these type mixers are deagglomeration of the raw materialsprior to charging the blender, not exceeding the rated capacities which isapproximately 60% of the total capacity. particle size uniformity, dry andhumid conditions, reducing vibration. and avoiding over mixing.
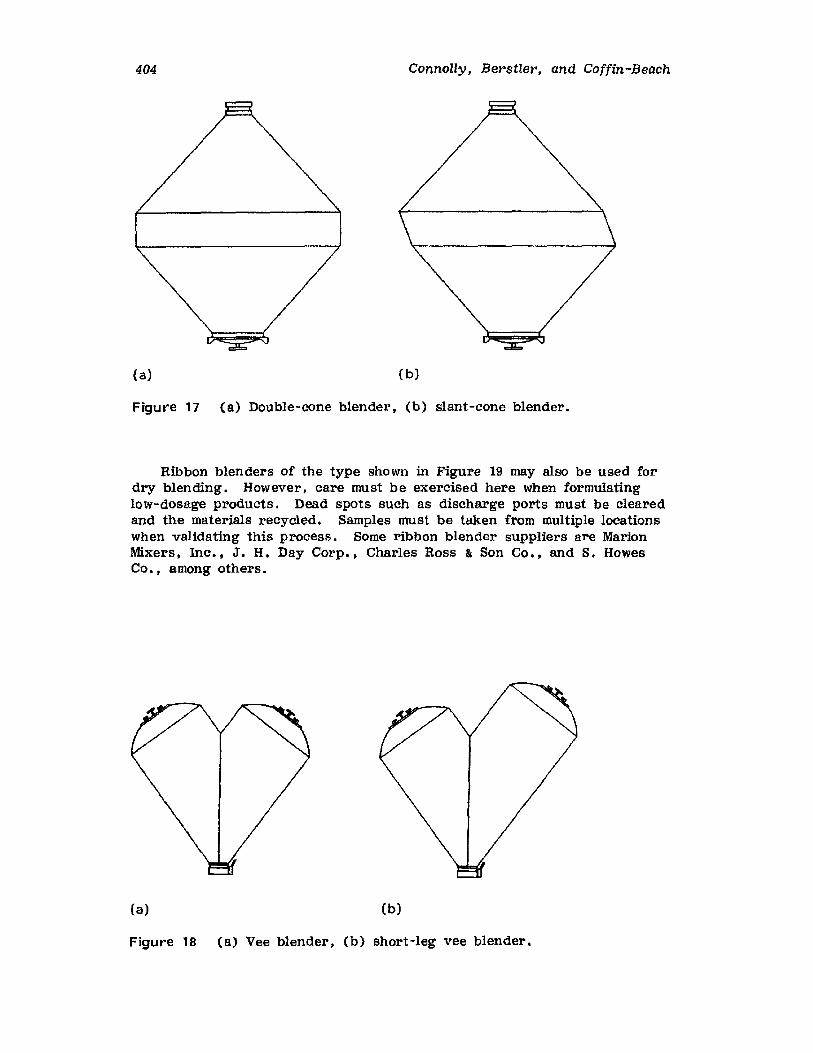
404 Connolly, Berstler, and Coffin-Beach
(a) (b)
Figure 17 (a) Double-cone blender, (b) slant-cone blender.
Ribbon blenders of the type shown in Figure 19 may also be used fordry blending. However, care must be exercised here when formulatingtow-dosage products. Dead spots such as discharge ports must be clearedand the materials recycled. Samples must be taken from multiple locationswhen validating this process. Some ribbon blender suppliers are MarionMixers, Ine; , J. H. Day Corp., Charles Ross & Son Co., and S. HowesCo., among others.
(a) (b)
Figure 18 (a) Vee blender, (b) short-leg vee blender.
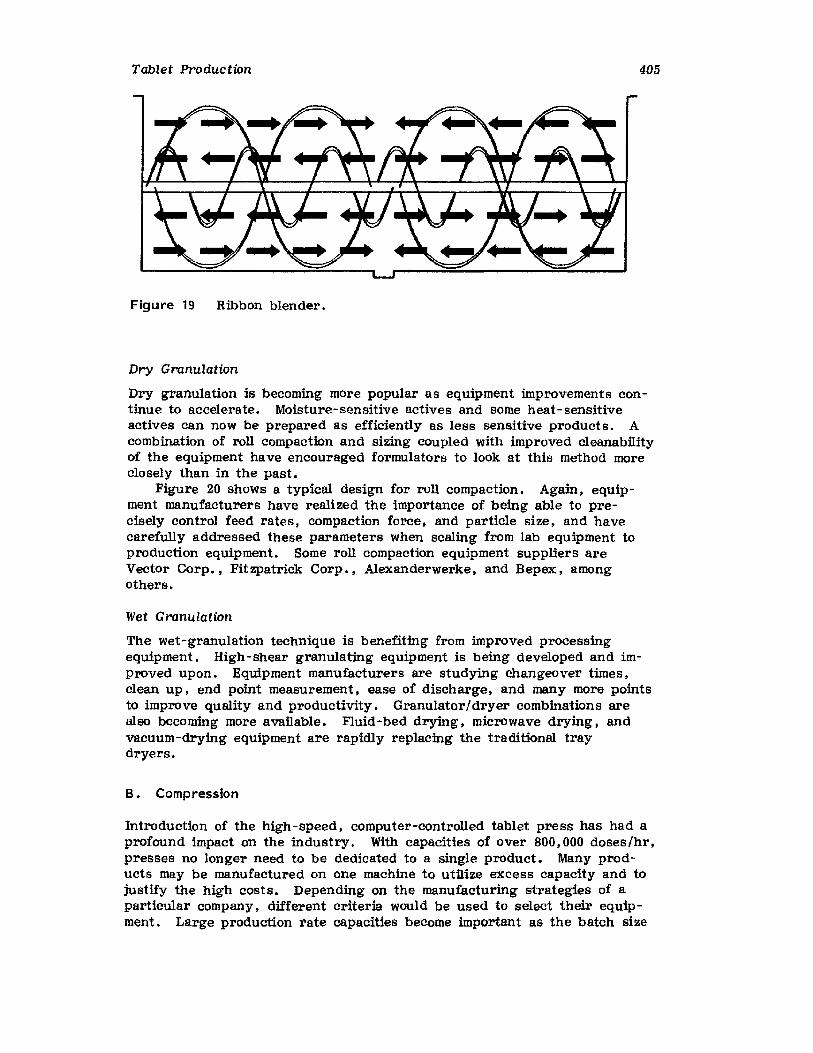
Tablet Production
Figure 19 Ribbon blender.
405
Dry Granulation
Dry granulation is becoming more popular as equipment improvements continue to accelerate. Moisture-sensitive actives and some heat-sensitiveactives can now be prepared as efficiently as less sensitive products. Acombination of roll compaction and sizing coupled with improved cleanabllityof the equipment have encouraged formulators to look at this method moreclosely than in the past.
Figure 20 shows a typical design for roll compaction. Again, equipment manufacturers have realized the importance of being able to precisely control feed rates, compaction force, and particle size, and havecarefully addressed these parameters when scaling from lab equipment toproduction equipment. Some roll compaction equipment suppliers areVector Corp., Fit zpatrick Corp., Alexanderwerke, and Bepex, amongothers.
Wet Granulation
The wet-granulation technique is benefiting from improved processingequipment. High-shear granulating equipment is being developed and improved upon. Equipment manufacturers are studying changeover times,clean up, end point measurement, ease of discharge. and many more pointsto improve quality and productivity. Granulator/dryer combinations arealso becoming more available. Fluid-bed drying, microwave drying J andvacuum -drying equipment are rapidly replacing the traditional traydryers.
B. Compression
Introduction of the high-speed, computer-controlled tablet press has had aprofound impact on the industry. With capacities of over 800,000 doses/hr.presses no longer need to be dedicated to a single product. Many products may be manufactured on one machine to utilize excess capacity and tojustify the high costs. Depending on the manufacturing strategies of aparticular company, different criteria would be used to select their equipment. Large production rate capacities become important as the batch size
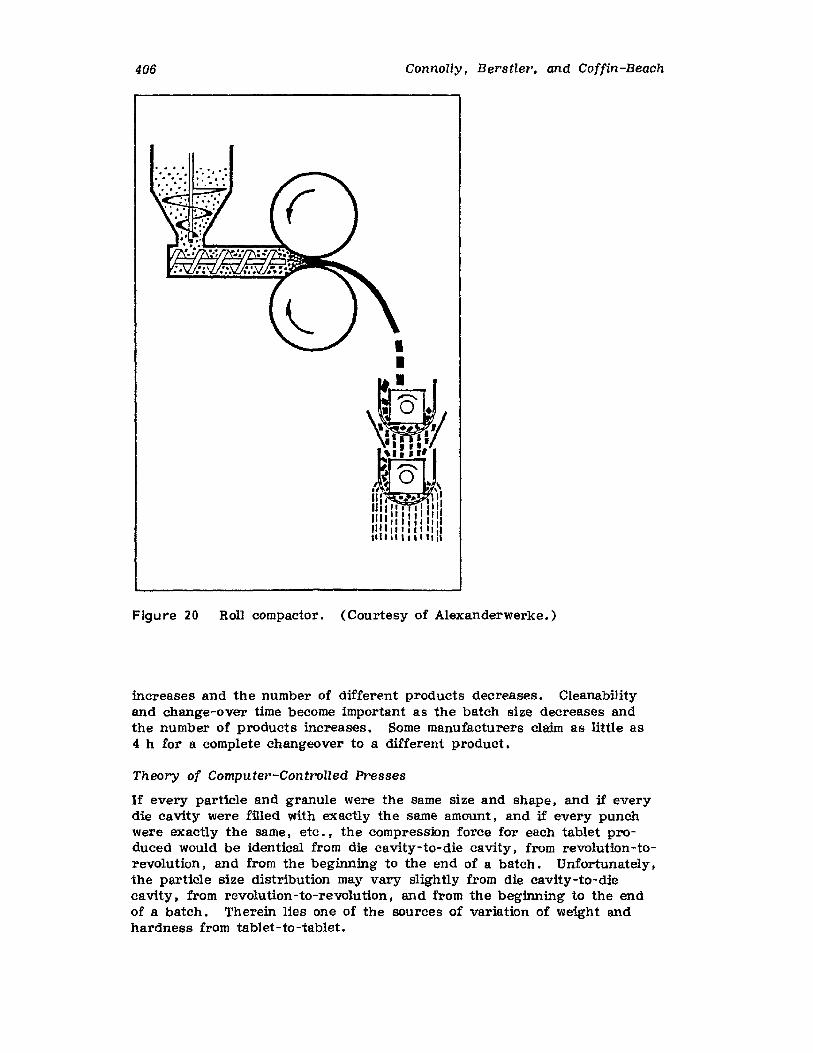
406 Connolly. Berstler, and Coffin-Beach
Figure 20 Roll compactor. (Courtesy of Alexanderwerke.)
increases and the number of different products decreases. Cleanabilityand change-over time become important as the batch size decreases andthe number of products increases. Some manufacturers claim as little as4 h for a complete changeover to a different product.
Theory of Computer-Controlled Presses
If every particle and granule were the same size and shape. and if everydie cavity were filled with exactly the same amount, and if every punchWere exactly the same, etc.. the compression force for each tablet produced would be identical from die cavity-to-die cavity, from revolution-torevolution, and from the beginning to the end of a batch. Unfortunately.the particle size distribution may vary slightly from die cavity-to-diecavity, from revolution-to-revolutton , and from the beginning to the endof a batch. Therein lies one of the sources of variation of weight andhardness from tablet-to-tablet.
Tablet Production 407
Consider two identical die cavities, A and B. A is filled with smallparticles, whereas B is filled with larger particles. While both die cavitiesare filled, the weight of the powder in A is heavier than the weight ofthe powder in B. The compression force will be larger for A than for Bas they pass under the same compression rollers. Obviously, the tabletresulting from A will be heavier than the tablet resulting from B. Thecompression forces can therefore be directly correlated to tablet weights.
The basic assumption used by all computer controlling systems is thatall significant variations in compression forces are resultant from the actial weight of the material being compressed, hence tablet weight. Thetarget tablet weight can be correlated to a target compression force that isdetermined during the setup operation. This target compression force canthen be used to control the compression operation.
During the prestart operation, a target compression force will be determined. As the press begins production, it will warm up and its operating condition will change. As the punches warm, they will elongateslightly. As the electronic components warm. their signals may varyslightly. The sum of the press's varying operating conditions is a driftin the compression force/target weight correlation.
Until recently, it was up t9 ~ the operator to verify that the target compression force correlated to the target tablet. If this was found not to bethe case, an adjustment needed to be made before compression could continue. With the Introduction of tablet measurement/feedback systems.control is taken a step further and the loop is closed. Compression forcesare periodically referenced to actual produced tablet measurements. Allnecessary adjustments, including weight and hardness adjustments, arethen performed automatically and the compression force/tablet weight correlation is adjusted automatically as necessary.
Instrumentation Strategies
There are currently two basic strategies used by the many tablet manufacturers to computer-control their presses. The first is to set up thepress to produce tablets with the desired weight. hardness, thickness, friability. etc. The next step is to convert the compression force signal to areference value. This reference value corresponds to the target tablet, andis usually displayed as an average per revolution of each station's actualcompression force. This reference value must be established at the startup for each batch and is then used to control the tablet weights. Whenthe average force value drifts from the reference value and reaches anadjustment value, a signal is sent to the weight-control motor to adjust thefilling depth appropriately. Some manufacturers provide for the durationof the weight-control signal to be set so that the adjustment brings theforce value back to the reference value. Compression forces of individualstations are measured, and if their force values are within a set rejectrange, the tablet is accepted as a good tablet. If the force value is outside the reject range, the tablet is rejected as an out-of-spec tablet.
The second strategy, which most tablet manufacturers are using ormoving toward, is the use of internal calibrations so that actual compression forces are measured and displayed. The benefits include a simplfiedcomputer setup and a standard/common base by which batches of the sameproduct can be compared for compression characteristics and statisticalanalysis. The adjustment range settings and the reject range settings
408 Connolly. Berstler, and Coffin-Beach
initiate the same responses as they do in the first strategy. The difference is that they are set and displayed as actual compression forces.
Rejection Strategies
The rejection mechanisms are also of two basic strategies. pneumatic reject and mechanical reject. The pneumatic reject relies on a timed burstof air to direct a bad tablet to a reject chute. The disadvantages with adusty product are clogging of the jets and inducing airborne dust particles. Also, depending on the speed of the press, up to six or moretablets may be rejected for each bad tablet. The advantages are nomoving parts and the timing is fixed and not varied owing to table speedchanges.
The mechanical reject is usually a gate or arm that swings out to divert the bad tablet to the reject chute. The timing is critical and mustbe set correctly. As the table speed changes, the timing may need to bechanged. Also, tablets of different sizes and shapes will require differenttimings and gate settings. Abrasive dusts can interfere with proper rejection by causing sluggishness. On the other hand, mechanical mechanisms can be set to reject only one tablet, regardless of speed.
Induced Die Feeder (IDF) Strategies
Another distinguishing feature of high-speed machines is the induced diefeeder (IDF). The IDF is basically a mechanism to ensure adequate anduniform filling of the die cavities as they pass the feeder at high speeds.It uses a combination of paddles which pushes or plows the powder overthe dies. Virtually every combination of paddle placement and blade configuration is represented by some manufacturer. Different IDF configurations and speeds may induce different compression characteristics of thesame material. Because the IDF agitates the powder, and its speed canbe varied, some additional mixing may be considered to occur in the feederfor some formulations. This can sometimes become a source of problemsrather than a solution.
Power Delivery Systems
Some manufacturers offer a powder feed controller which maintains a constant level of powder that feeds the IDF. The effects of the sudden increase of weight by adding a scoop full of powder to a hopper can beseen very clearly on computer monitoring/controlling devices that havegraphical displays. These effects are eliminated by the powder feed controller, and help to create more uniform products by eliminating thepowder level variable.
Future Trends
Most press manufacturers currently have on the market presses and controlling systems which provide a complete loop for controlling all of thetablet parameters. Tablet sampling and checking systems take a sample oftablets at specified intervals, automatically perform weight, hardness, andthickness measurements, perform statistical calculations, and feedback theappropriate signals to the press to adjust the weight and/or hardness.These signals include readjusting the target compression force and the
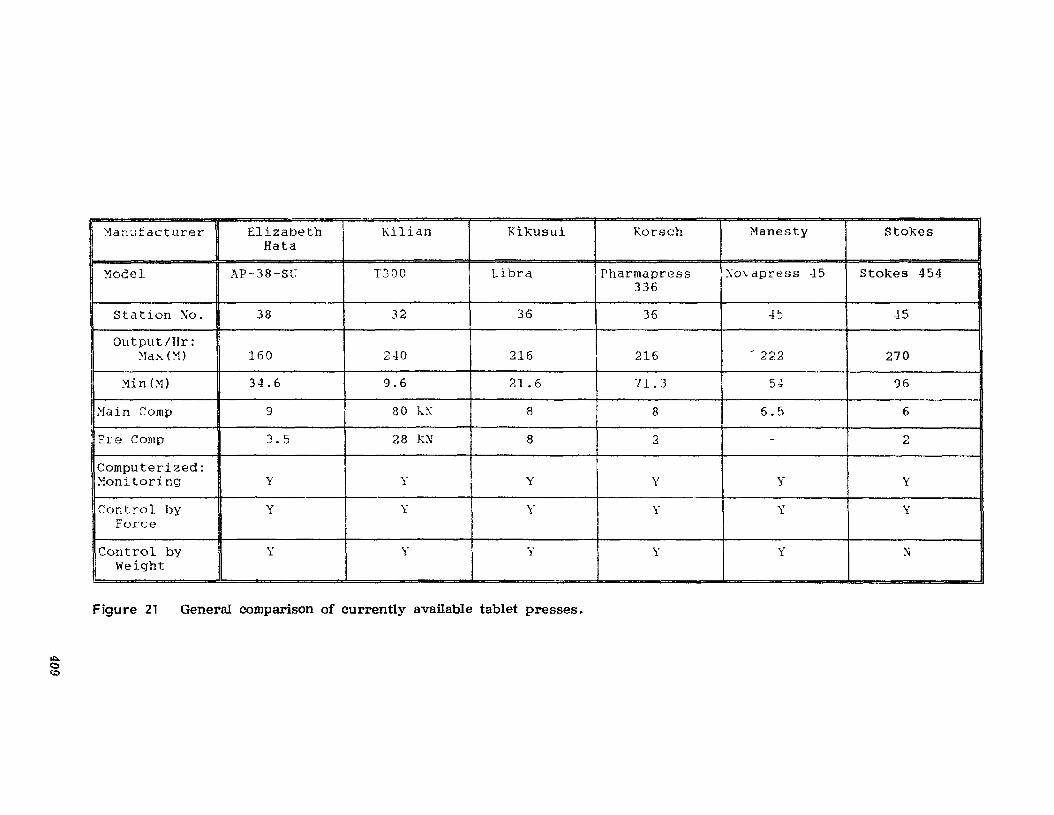
ol:lo.oco
~an~:fdcturer Elizabeth Kilian Kikusui Korsch Manesty StokesHata
:-1odel AP-38-SC T300 Libra Pharmdpress e xov apr ss s -15 Stokes 454336
Station :'-:0. 38 32 36 36 .,I5 .,I5
Output/Hr: Ii ~1ax (:,.1) 160 2-10 216 216 - 222 270
I ~in(Yl) 34.6 9.6 21.6 71.3 5J 96
:vrain Comp 9 80 kX 8 8 6.5 6
Pre Comp 3.5 28 k~ 8 2 - 2
Computerized: I~lonitoring y Y y Y Y YI
Control by y y y y y yPorce
Control by y Y Y y y :;:
I weight
Figure 21 General comparison of currently available tablet presses.
410 Connolly, Berstler, and Coffin-Beach
window of limits. The target compression force is therefore being constantly verified against actual tablet parameters.
Some manufacturers currently offer systems where all of a product'sparameters are stored on a disk and the operator loads the informationin a computer. The computer will tell the press where the initial settingsare, produce some tablets for automatic testing. make any necessary adjustments until the tablets are at target, and then begin production. Figure 21 is a general comparison of some of the tablet presses currentlyavailable and is not all inclusive.
VII. PERSONNEL
A. Training
operators
This group includes the mixmg and granulating operators and the compression operators. The training of the mixing and granulation operatorsshould include the following:
1. Cleaning procedures2. Familiarization with and ability to identify the codes and names of
the raw materials being used in the product being mixed3. Proper label control and reconciliation4. Handling, usage, and operation of equipment in area5. Proper handling of raw materials in each operation6. Importance of precise mixing times and geometric dilutions7. Proper labeling and handling of mixed materials8. Quality assurance and validation procedures9. Training to observe and look for foreign matter in the raw
materials10. Product reconciliation11. Ability to check mathematics required by the formula
The training of the compression operators should include the following:
1. Cleaning procedures2. Ability to identify and distinguish from quarantine and released
materials3. Proper label control and reconciliation4. Handling, usage, and operation of equipment in the area5. Proper handling and hopper loading of mixed material6. Proper handling of bulk tablets produced7. Quality assurance and validation procedures8. Training to observe and look for foreign matter in the mixed ma
terial and bulk tablets9. Product reconciliation
10. Ability to check mathematics required by the formula
Mechanics
Mechanics have specialized training in addition to the same training as theoperators. During their setup operation, mechanics operate the machine
Tablet Production 411
and, also during periods where there are no setups to be performed, theymay be asked to operate a machine. The training of mechanics, in addition to operator training, should therefore include the following:
1. Cleaning procedures for tooling and machinery2. Breakdown and setup of machinery3. Complete operation of the machines4. Proper handling of the tooling5. Theory behind computer-controlled tablet presses6. Setup and control of computerized units7. Maintenance and repair of machinery8. Troubleshooting of machinery
Supervisors
Supervisors need to have the necessary training and background to leadand direct their operators and mechanics. They must have an intimateknowledge and preferably some hands-on experience of the operators' andmechanics' jobs. In addition, supervisors must also possess the supervisory skills necessary to maintain the high standards demanded by thepharmaceutical industry.
In addition to the job-specific responsibilities outlined above, all manufacturing employees must be versed and trained in CGMPs and in the appropriate standard operating procedures (SOPs) governing their area.
VIII. ROLE OF MANUFACTURING
A. Marketing Support
Marketing is usually the only organizational link to the customer, and anyfeedback on the sales impact of quality and delivery COmes through asmarketing requests. Also, the direction that applied R&D takes should bedriven by the marketing function. Marketing should encourage the development of products that would generate the highest potential revenueswith the greatest margin. Each product developed or produced should fitinto an overall marketing plan. Without insight to the marketing plan, theR&D and Production Departments might question the wisdom of their directions, creating unnecessary, undesirable boundaries between departments.
The importance of marking to an organization is obvious. However,the importance of accurate, timely information from marketing to variousother departments cannot be stressed enough. The role of manufacturing,therefore, is to support the marketing function. Successful support mightbe defined by improving quality, reducing manufacturing lead times, lowering costs, and hastening manufacturing response to changing demands.The role of all other departments in the organization is to support, in oneway or another, manufacturing [7].
B. The Production Plan
A finished goods requirements plan should drive the master productionschedule, which provides a detailed action plan from placing purchaseorders to final packaging schedules.
412 Connolly. Beretler, and Coffin-Beach
The master schedule is the operations statement for production and related activities. It is a positive commitment to perform certain activitieswithin the required time span. In the packaging area, the master schedulestates that the Packaging Department will package X amount of a put-upduring week N on day Y. In order to fulfill this commitment, the QualityControl Department must release the bulk during week N-l. For qualitycontrol to meet its commitment, the Manufacturing Department must havethe bulk produced in time for the former to perform its functions. Inorder for the Manufacturing Department to produce the product, approvedmaterials must be available X number of weeks before the manufacturing isto be completed. the number of weeks being dependent on the manufacturing cycle time (including dispensing time). Having approved materialavailable to manufacturing requires that quality control perform theiranalysis in the stated time span for quality control lead time. For this tohappen the material must be received as sCheduled. The Purchasing Department must, therefore. place the order X weeks before the material isto be received, where X is the vendor lead time. Purchasing must alsofollow up with the blender to assure the material will be received on time.If the material is rejected, purchasing must issue a replacement order. Inorder for purchasing to issue the order on time, production planning mustrequisition the material at least 1 week before the order is to be placed.
Given the large number of components and materials involved in pharmaceutical production operations, the task of manually performing the above"time-phasing" routine would be virtually impossible. This time phasing ofthe production, quality control, and purchasing processes is one of thefunctions performed by materials requirement planning (MRP).
C. Material s Requ irement Plan
Materials requirement planning starts with the master schedule. Using thebill of materials, lead time, capacities, and other product-related databaseinformation, together with information on inventory, open production orders,and open purchase orders, the materials requirement planning system willdetermine the quantity of materials and the date they are needed for eachphase of the production process. The logic used in making the determination is basically the same as that described under the master SChedule.The master schedule states which put-ups are scheduled to be packagedduring the weekly time periods. By applying the bills of material for theput-ups to the quantities to be packaged, the system can determine thequantities of packaging components and bulk that are needed. Workingwithin the established lead times, the system will show a demand for theitems in the correct time segment. In turn, the system will plan replacement orders to maintain specified levels of inventory. The planned orderwill be shown as being available in the time frame needed and will beplaced "on order" by considering the purchasing, production, and qualitycontrol lead times. The procedure is carried out for each phase of production and the release of a planned order at one level generates requirements at the next level. For example, if finished products were assignedto 0 level code, items used to produce finished stock would be assigned a1, products used to produce bulk would be assigned a 2. and so on untilthe purchased materials are reached.
Tablet Production 413
The MRP lends itself well to computerization and can perform otherfunctions, such as alerting management to items with excessive inventory.It can suggest corrective actions (such as delaying or canceling openorders) and can predict inventory levels and investments for each timeperiod in the planning horizon [2].
D. Production Scheduling
All of the elements previously described could be categorized as planningelements. From the planning phase one must move into the executionphase, with the transition being supplied by the master schedule.
The development of a production schedule is of prime importance because this is the basic means for monitoring production activities. Progresscan be Checked and results reported based on the production or planningperiod. The production planning schedule forms a basis for decisionmaking during the production cycle. Production scheduling is one of themost detailed and demanding tasks in the organization.
Scheduling may be performed in an adequate manner either manually ormechanically, depending on the size and scope of the organization. Anyscheduling system requires basic input data from the production plan consisting of What?, When?, and How many? Regardless of the circumstances,monitoring production activities with the production schedule becomes thekey to successful fulfillment of the production plan. This is the method bywhich control is exercised over the production operation. A proper schedule can optimize production and inventory costs by proper sequencing oforder quantities and time phasing. No matter how small the organization.the development of a sound production schedule is a tool which cannot beneglected. The production schedule is the cement which creates thefoundation for an effective production organization that can meet salesdemands.
IX. INDUSTRY OUTLOOK
The advances over the next decade in equipment, design, instrumentation.and process control techniques will certainly be significant. The natureof these advancements are difficult to predict. Certainly, computer-integrated manufacturing will come into its own in the pharmaceutical manufacturing industry as a whole and most assuredly in tablet production.Statistical process-control techniques will become widespread throughoutthe industry. Numerous data-collection devices and computer systems arecurrently available and in use as a means of implementing statistical processcontrol. Computer-controlled tablet presses and automated materialhandling devices are available that virtually remove the operator from theneed to control the operation.
The general state of the industry is that there exists many islands ofautomation. The challenge for the future is to first integrate theseislands with a computer network so that process data can be easily collected, and so that the inventory position and scheduling can be optimizedon a real-time basis. The second challenge is that of validation of thesesystems to the complete satisfaction of the individual manufacturers and ofthe U.S. Food and Drug Administration.
414 Connolly, Berstler, and Coffin-Beach
The authors stated in the introduction to this chapter that "our-s is anevolving technology-based science that requires canstant attention. II Withthis in mind, the professionals of our industry must stay abreast of current practices and recognize the emerging trends. Only in this way, willthe industry continue to be profitable and provide an important service inan increasingly competitive world market.
APPENDIX: LIST OF SUPPLIERS
A C Compacting PressesNorth Brunswick, New Jersey
Aeromatic, Inc.Towaco, New Jersey
AlexanderwerkeRemscheid, West Germany
Bepex Corp.3 Crossroads of CommerceRolling Meadows, illinois
Charles Ross & Son Co.Hauppauge, New York
DiosnaOsnabruck, West Germany
Elizabeth Hata Int., Inc.North Huntingdon, Pennsylvania
Fitzpatrick Corp.Elmhurst, illinois
Fluid Air, Inc.Napersville, illinois
Gemco (The General Machine Co.of N.J.)
Middlesex, New Jersey
Glatt Air Techniques, Inc.Ramsey, New Jersey
Glen Mills, Inc.Maywood, New Jersey
Gral- ColletteNorthbrook, illinois
H. C. Davis Sons Mfg. Co., Inc.Bonner Springs, Kansas
Hollan d-McKinleyMalvern, Pennsylvania
Indupol Filtration Assoe , , Inc.Cresskill, New Jersey (Torit)
Inppec , Inc.Milford, Connecticut (Kilian)
J. H. Day Corp.Cincinnati, Ohio
Jaygo , Inc.Mahwah, New Jersey
Kemutec, Inc.Bristol, Pennsylvania
Korsch Tableting, Inc.Somerset, New Jersey
Lightnin Mixing Equipment Co.Rochester, New York
Littleford Bros., Inc.Florence, Kentucky
Mane sty , Thomas Engineering, Inc.Hoffman Estates, Illinois
Marion Mixers, Inc.Marion, Iowa
MicropulSummit, New Jersey
Millipore Corp.Bedford, Massachusetts
Mocon (Modern Controls, Inc.)Minneapolis, Minnesota
Tablet Production
Natoli EngineeringChesterfield, Missouri
Patterson-Kelly Co.East Stroudsburg, Pennsylvania
Raymond Automation Co , , Inc.Norwalk, Connecticut
S. Howes Co •• Inc.Silver Creek, New York
Scientific Instruments &Technology Corp.
Piscataway. New Jersey
Stokes-MerrillWarminster, Pennsylvania
SUGGESTED READINGS
Thomas Engineering. Inc.Hoffman Estates, Illinois
United Chemical MachinerySupply, Inc.
Toms River. New Jersey
(Kikusui)
Urschel Laboratories, Inc.Valparaiso, Indiana
Vector Corp.Marion, Iowa
415
Alessi. P. Operational MRP vs , Integrated MRP, P 811M with APIC SNews, June 1986.
Anton, C. J. and Malmborg, C. J. The Integration of InventoryModeling and MRP Processing: A Case Study. Production andInventory Management, 2nd Quarter, 1985.
Ballou, Ronald H. Estimating and auditing aggregate inventorylevels at multiple stocking points. J. Operations Management1(3): 143-154 (Feb. 1981).
Bryson, W. L. Profit-Oriented Inventory Management. APICS22nd Annual Conference Proceedings, 1979. pp , 88-91.
The Competitive Status of the U. S. Pharmaceutical Industry.National Academy Press, Washington, D.C., 1983.
Hadley, G. and Whitin, T. M. Analysis of Inventory Systems.Prentice-Hall, New York. 1963.
Lotenschtein, S. Just-in-Time in the MRP II Environment, P &1MReview with APICS News, Feb. 1986.
Mehta, N. How to Handle Safety Stock in an MRP System. Production and Inventory Management, 3rd Quarter. 1980.
Ott, E. T. Process Quality Control. McGraw-Hill. New York,1975.
REFERENCES
1. Artiss , D. H. and Klink, A. E. Good Manufacturing Practicesfor Water: Methods of ManUfacturing, Testing Requirementsand Intended Use. AIChE 70th Annual Meeting, New York,Nov. 1977.
2. Berry, W. L., Whybark, D. C., and Vollmann, T. E. Manufacturing Planning and Control Systems. Irwin. Homewood,Illinois , 1984.
416 Connolly, Berstler, and Coffin-Beach
3. Boucher. T. O. and Elsayed, E. A. Analysis and Control of Production Systems. Prentice-Hall, New York, 1985.
4. Guideline on General Principles of Process Validation. U •S. Foodand Drug Administration, Washington. D.C., May 1984.
5. Guidelines for Plant Pest Control Program. PMA. Washington, D.C.,Jan. 1975.
6. Hitchings. W. S.. IV, Tuckerman, M. M., and Willig, S. H. GoodManufacturing Practices for Pharmaceuticals. Marcel Dekker, Ine , ,New York, 1982.
7. Hutt , M. D. and Speh, T. W. Industrial Marketing Management.Dryden Press. Chicago. 198!.
8. Peterson, R. and Silver, E. A. Decision Systems for InventoryManagement and Production Planning. Wiley, New York, 1985.
9. Pharmaceutical Process Validation. Marcel Dekker. New York, 1984.10. Tableting Specification Manual, IPT Standard Specifications for
Tableting Tools. Academy of Pharmaceutical Sciences and AmericanPharmaceutical Association, 1981.
11. The Theory and Practice of Industrial Pharmacy. Lea & Febiger,Philadelphia, 1976.
7The Essentials ofProcess Validation
Robert A. Nash
St. John's University, Jamaica, New York
I. INTRODUCTION
The U. S. Food and Drug Administration (FDA) in its most recently proposed guidelines has offered the following definition for process validation[1] :
Process validation is a documented program which provides a highdegree of assurance that a specific process (such as the manufacture of pharmaceutical solid dosage forms) will consistently produce a product meeting its predetermined specifications and qualityattributes.
According to the FDA. assurance of product quality is derived fromcareful (and systemic) attention to a number of (important) factors, including: selection of quality (components) and materials. adequate product and process design. and (statistical) control of the process throughin-process and end-product testing.
Thus it is through careful design and validation of both the processand its control systems that a high degree of confidence can be established that all individual manufactured units of a given batch or successionof batches that meet specification will be acceptable.
According to FDA's Current Good Manufacturing Practices (21CFR211.110)
Control procedures shall be established to monitor output and tovalidate performance of the manufacturing processes that may beresponsible for causing variability in the characteristics of inprocess material and the drug product. Such control procedures
417
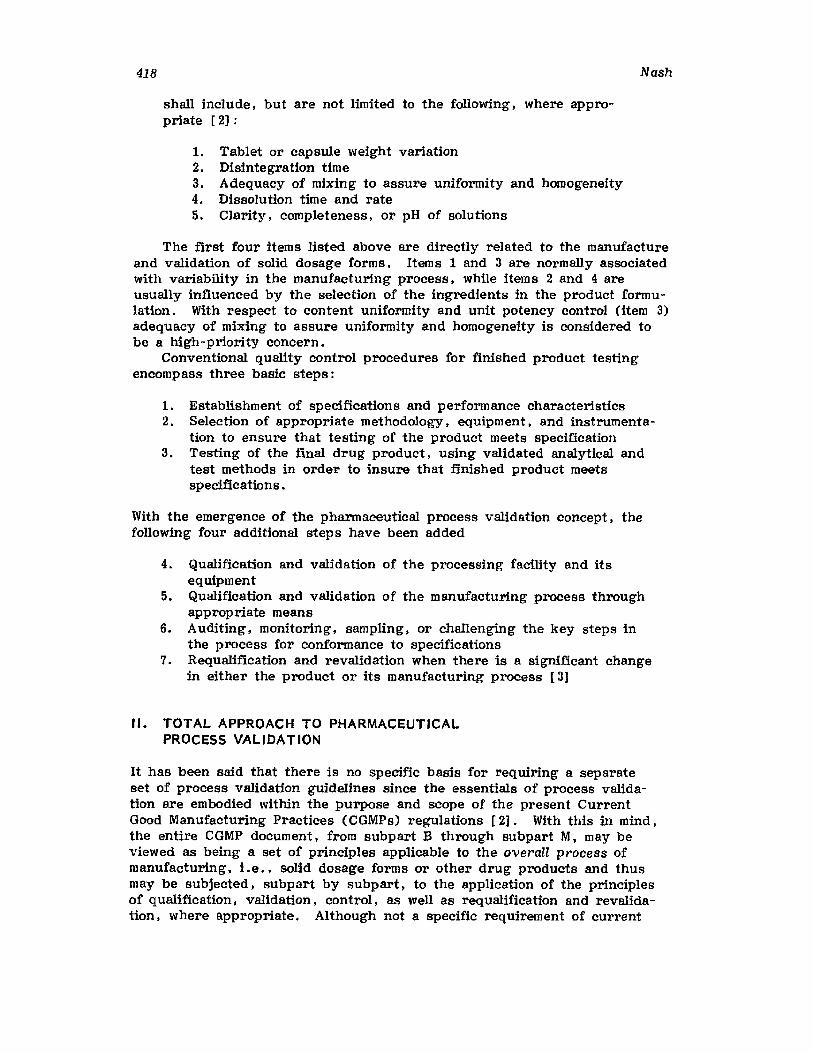
418
shall include, but are not limited to the following, where appropriate [2J:
1. Tablet or capsule weight variation2. Disintegration time3. Adequacy of mixing to assure uniformity and homogeneity4. Dissolution time and rate5. Clarity, completeness, or pH of solutions
Nash
The first four items listed above are directly related to the manufactureand validation of solid dosage forms. Items 1 and 3 are normally associatedwith variability in the manufacturing process, while items 2 and 4 areusually influenced by the selection of the ingredients in the product formulation. With respect to content uniformity and unit potency control (item 3)adequacy of mixing to assure uniformity and homogeneity is considered tobe a high-priority concern.
Conventional quality control procedures for finished product testingencompass three basic steps:
1. Establishment of specifications and performance characteristics2. Selection of appropriate methodology, equipment, and instrumenta
tion to ensure that testing of the product meets specification3. Testing of the final drug product, using validated analytical and
test methods in order to insure that finished product meetsspecifications.
With the emergence of the pharmaceutical process validation concept, thefollowing four additional steps have been added
4. Qualification and validation of the processing facility and itsequipment
5. Qualification and validation of the manufactUring process throughappropriate means
6. Auditing, monitoring, sampling, or challenging the key steps inthe process for conformance to specifications
7. Requalification and revalidation when there is a significant changein either the product or its manufacturing process [3J
II. TOTAL APPROACH TO PHARMACEUTICALPROCESS VALIDATION
It has been said that there is no specific basis for requiring a separateset of process validation guidelines since the essentials of process validation are embodied within the purpose and scope of the present CurrentGood Manufacturing Practices (CGMPs) regulations [21. With this in mind.the entire CGMP document. from subpart B through subpart M. may beviewed as being a set of principles applicable to the overall process ofmanufacturing, i.e., solid dosage forms or other drug products and thusmay be subjected, SUbpart by subpart, to the application of the principlesof qualification, validation, control, as well as requalification and revalidation. where appropriate. Although not a specific requirement of current
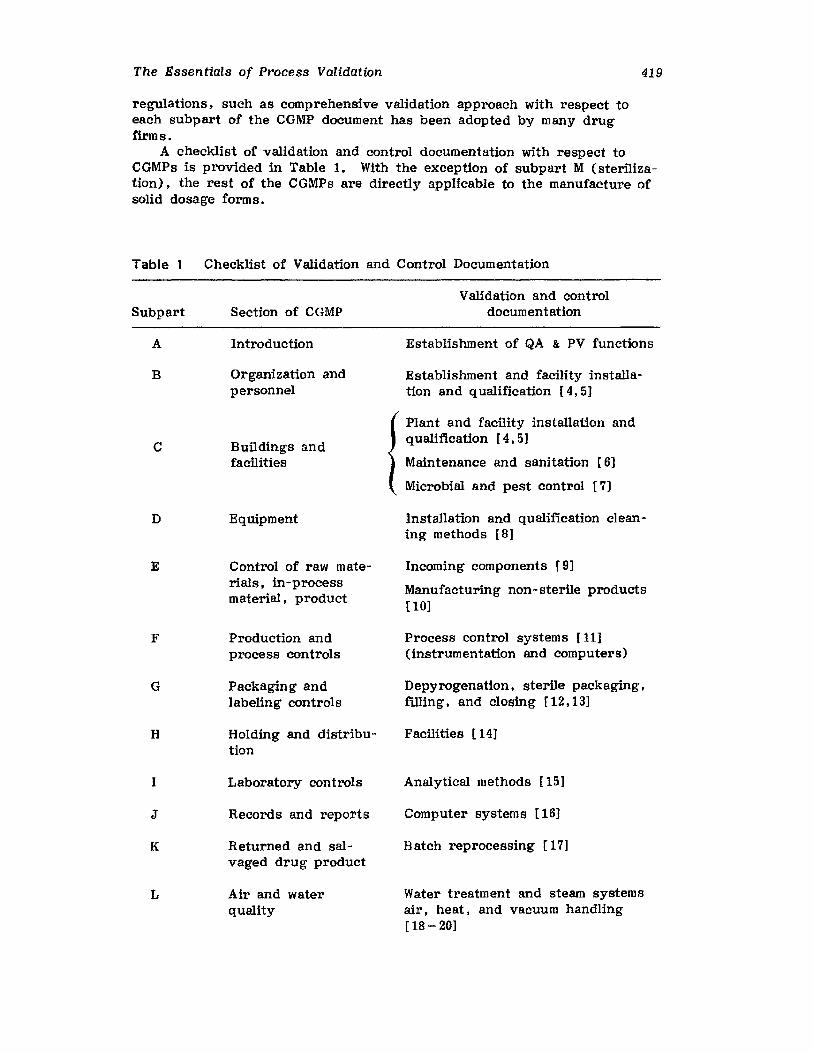
The Essentials of Process Validation 419
regulations. such as comprehensive validation approach with respect toeach subpart of the CGMP document has been adopted by many drugfirms.
A checklist of validation and control documentation with respect toCGMPs is provided in Table 1. With the exception of subpart M (sterilization), the rest of the CGMPs are directly applicable to the manufacture ofsolid dosage forms.
Table 1 Checklist of Validation and Control Documentation
Subpart
A
B
C
D
E
F
G
H
I
J
K
L
Section of CGMP
Introduction
Organization andpersonnel
Buildings andfacilities
Equipment
Control of raw materials, in-processmaterial, product
Production andprocess controls
Packaging andlabeling controls
Holding and distribution
Laboratory controls
Records and reports
Returned and salvaged drug product
Air and waterquality
Validation and controldocumentation
Establishment of QA & PV functions
Establishment and facility installation and qualification [4.5)
Plant and facility installation andqualification (4,5)
Maintenance and sanitation [6]
Microbial and pest control [7)
Installation and qualification cleaning methods [8]
Incoming components (9]
Manufacturing non-sterile products[10]
Process control systems [l1J(instrumentation and computers)
Depyrogenation, sterile packaging,filling, and closing [12.13]
Facilities [14]
Analytical methods [15]
Computer systems [16J
Batch reprocessing [17]
Water treatment and steam systemsair, heat, and vacuum handling[18 - 20]
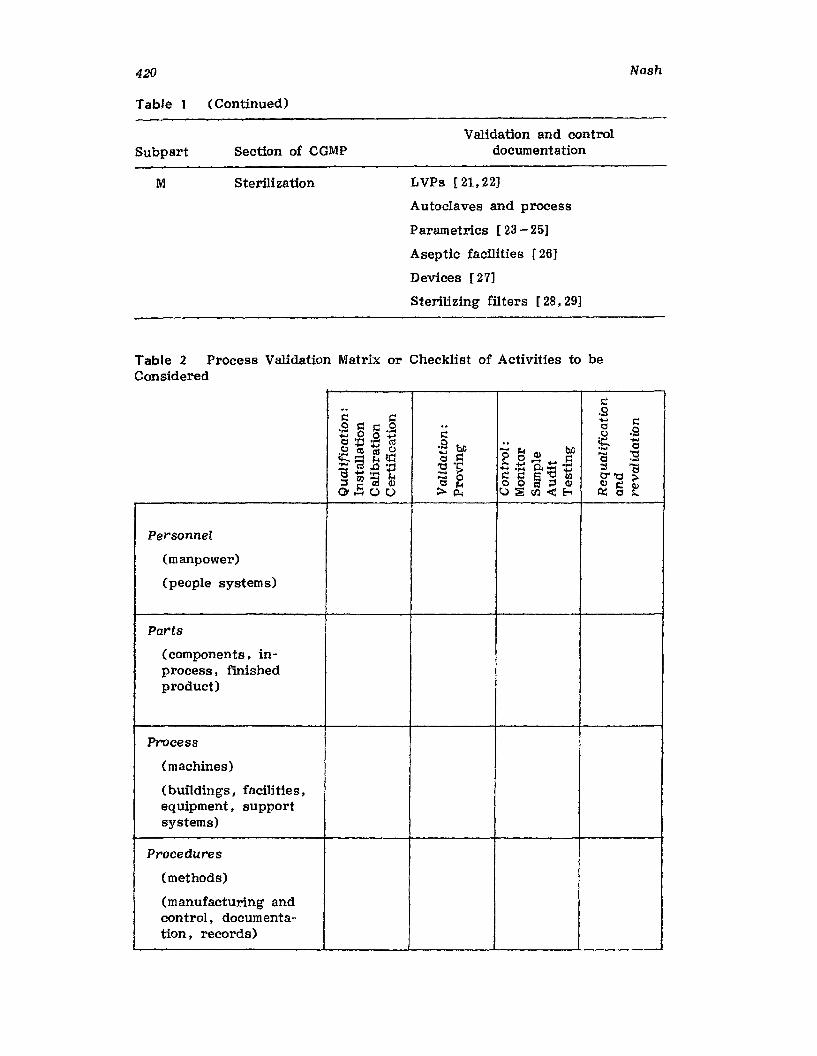
420
Table 1
Subpart
M
(Continued)
Section of CaMP
Sterilization
Validation and controldocumentation
LVPs [21,22]
Autoclaves and process
Parametrics [23 - 25]
Aseptic facilities r26J
Devices [27]
Sterilizing filters [28,29]
Nash
Table 2 Process Validation Matrix or Checklist of Activities to beConsidered
Personnel
(manpower)
(people systems)
Parts
(components. inprocess. finishedproduct)
Process
(machines)
(buildings, facilities.equipment. supportsystems)
Procedures
(methods)
(manufacturing andcontrol. documentation. records)
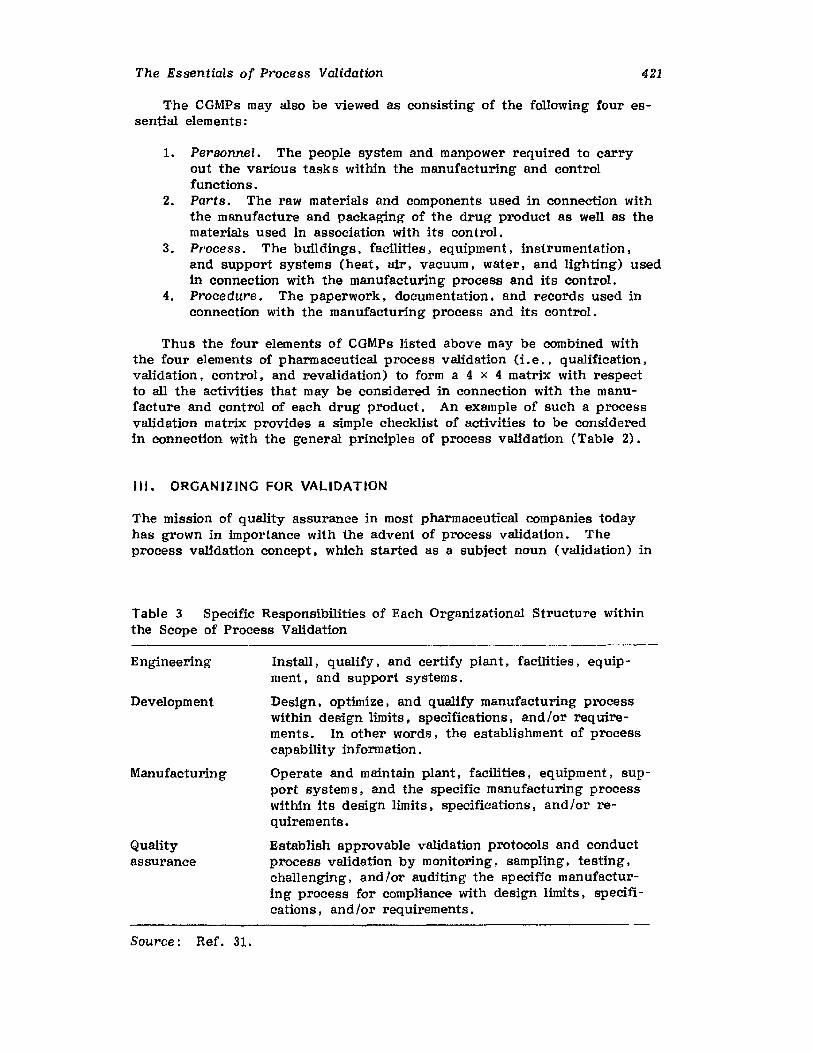
The Essentials of Process Validation 421
The CGMPs may also be viewed as consisting of the following four essential elements:
1. Personnel. The people system and manpower required to carryout the various tasks within the manufacturing and controlfunctions.
2. Parts. The raw materials and components used in connection withthe manufacture and packaging of the drug product as well as thematerials used in association with its control.
3. Process. The buildings. facilities. equipment. instrumentation.and support systems (heat. air. vacuum. water, and lighting) usedin connection with the manufacturing process and its control.
4. Procedure. The paperwork, documentation, and records used inconnection with the manufacturing process and its control.
Thus the four elements of CaMPs listed above may be combined withthe four elements of pharmaceutical process validation (Le .• qualification,validation. control, and revalidation) to form a 4 x 4 matrix with respectto all the activities that may be considered in connection with the manufacture and control of each drug product. An example of such a processvalidation matrix provides a simple checklist of activities to be consideredin connection with the general principles of process validation (Table 2).
III. ORGANIZING FOR VALIDATION
The mission of quality assurance in most pharmaceutical companies todayhas grown in importance with the advent of process validation. Theprocess validation concept, which started as a subject noun (validation) in
Table 3 Specific Responsibilities of Each Organizational Structure withinthe Scope of Process Validation
Engineering
Development
Manufacturing
Qualityassurance
Source: Ref. 31.
Install, qualify , and certify plant. facilities. equipment , and support systems.
Design, optimize, and qualify manufacturing processwithin design limits, specifications, and /or req uirements. In other words, the establishment of processcapability information.
Operate and maintain plant, facilities I equipment, support system s , and the specific manufacturing processwithin its design limits, specifications, and/or requirements.
Establish approvable validation protocols and conductprocess validation by monitoring. sampling, testing.challenging. and/or auditing the specific manufacturing process for compliance with design limits, specifications, and lor requirements.
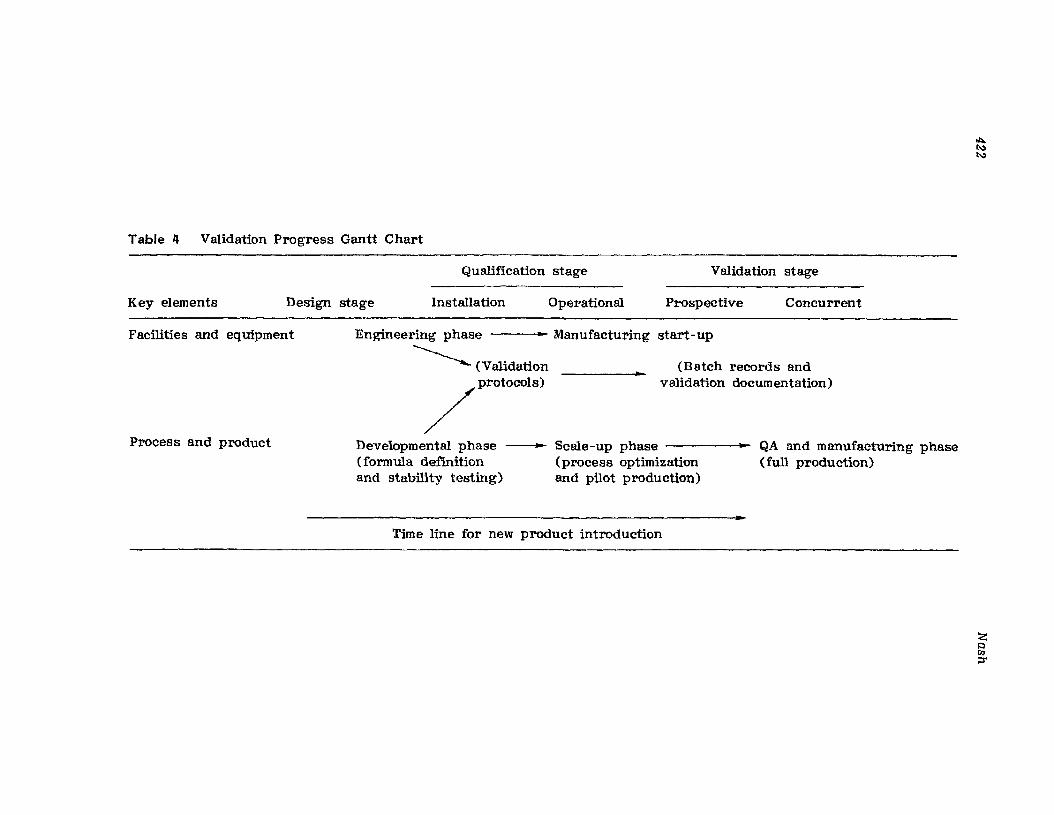
Table 4 Validation Progress Gantt Chart
Qualification stage Validation stage
II:>.1>.:11>.:1
Key elements Design stage Installation Operational Prospective Concurrent
(Batch records andvalidation documentation)
Scale-up phase -(process optimizationand pilot production)
Facilities and equipment
Process and product
Engineering phase .. Manufacturing
~ (Validation
/Pro'ocolSl
Developmental phase --(formula definitionand stability testing)
start-up
QA and manufactUring phase(full production)
--- _ .. --_ .._----- .Time line for new product introduction
~Qrn;::r
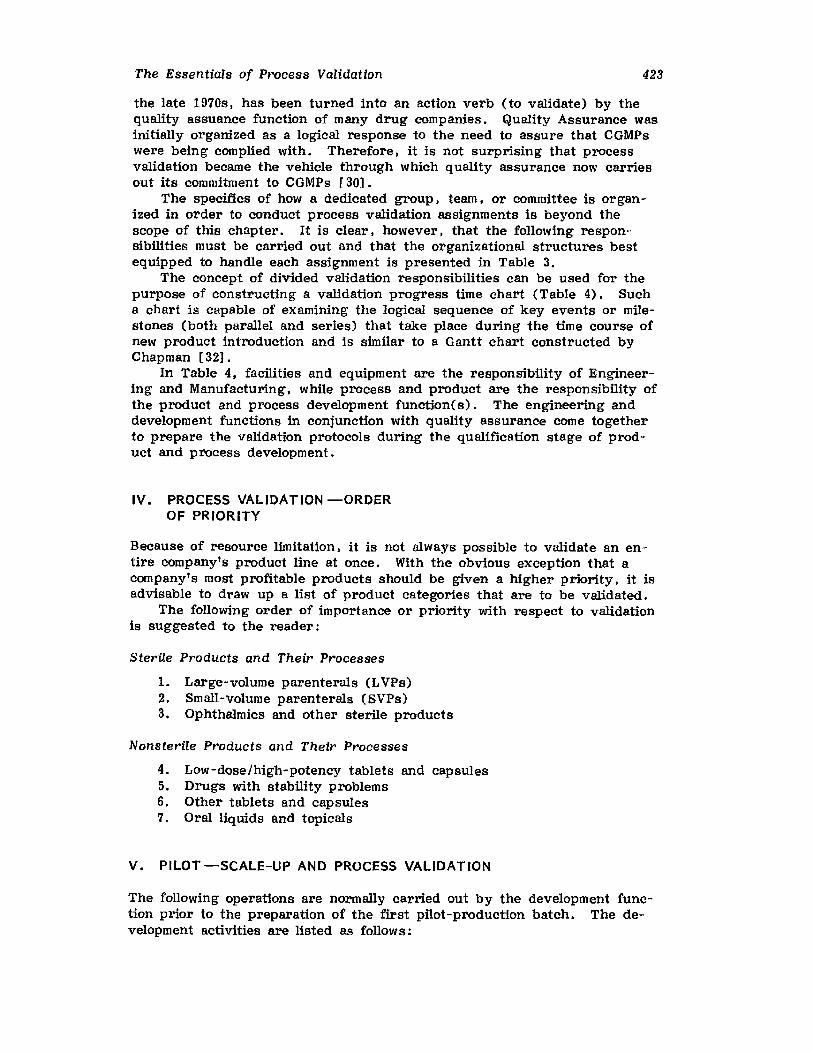
The Essentials of Process Validation 423
the late 1970s, has been turned into an action verb (to validate) by thequality assuance function of many drug companies. Quality Assurance wasinitially organized as a logical response to the need to assure that CGMPswere being complied with. Therefore, it is not surprising that processvalidation became the vehicle through which quality assurance now carriesout its commitment to CGMPs [301.
The specifics of how a dedicated group, team, or committee is organized in order to conduct process validation assignments is beyond thescope of this chapter. It is clear, however, that the following responsibilities must be carried out and that the organizational structures bestequipped to handle each assignment is presented in Table 3.
The concept of divided validation responsibilities can be used for thepurpose of constructing a validation progress time chart (Table 4). Sucha chart is capable of examining the logical sequence of key events or milestones (both parallel and series) that take place during the time course ofnew product introduction and is similar to a Gantt chart constructed byChapman [32J.
In Table 4, facilities and equipment are the responsibility of Engineering and Manufacturing, while process and product are the responsibility ofthe product and process development function(s). The engineering anddevelopment functions in conjunction with quality assurance come togetherto prepare the validation protocols during the qualification stage of product and process development.
IV. PROCESS VALIDATION -ORDEROF pRIORITY
Because of resource limitation, it is not always possible to validate an entire company's product line at once. With the obvious exception that acompany's most profitable products should be given a higher priority, it isadvisable to draw up a list of product categories that are to be validated.
The following order of importance or priority with respect to validationis suggested to the reader:
Sterile Products and Their Processes
1. Large-volume parenterals (L VPs)2. Small-volume parenterals (SVPs)3. Ophthalmics and other sterile products
Nonsteriie Products and Their Processes
4. Low-dose/high-potency tablets and capsules5. Drugs with stability problems6. Other tablets and capsules7. Oral liquids and topicals
V. PILOT-SCALE-UP AND PROCESS VALIDATION
The following operations are normally carried out by the development function prior to the preparation of the first pilot-production batch. The development activities are listed as follows:
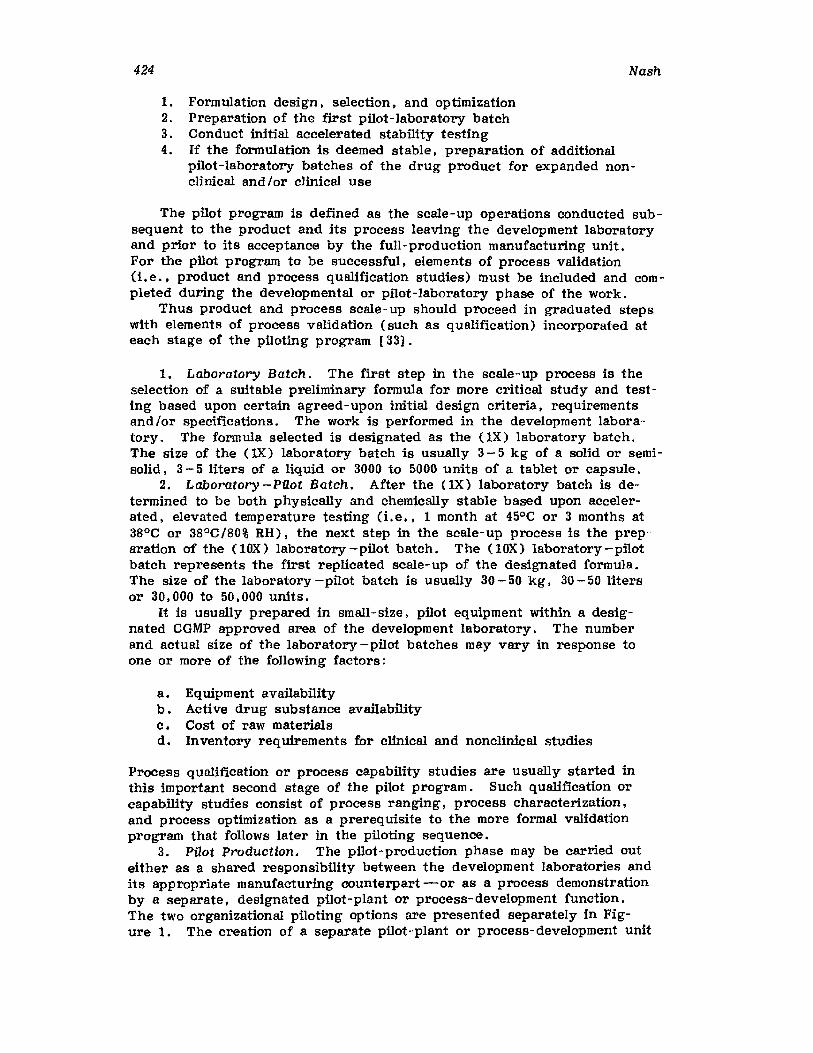
424 Nash
1. Formulation design I selection, and optimization2. Preparation of the first pilot-laboratory batch3. Conduct initial accelerated stability testing4. If the formulation is deemed stable I preparation of additional
pilot-laboratory batches of the drug product for expanded nonclinical and/or clinical use
The pilot program is defined as the scale-up operations conducted subsequent to the product and its process leaving the development laboratoryand prior to its acceptance by the full-production manufacturing unit.For the pilot program to be successful, elements of process validation(i.e., product and process qualification studies) must be included and completed during the developmental or pilot-laboratory phase of the work.
Thus product and process scale- up should proceed in graduated stepswith elements of process validation (such as qualification) incorporated ateach stage of the piloting program [33J.
1. Laboratory Batch. The first step in the scale-up process is theselection of a suitable preliminary formula for more critical study and testing based upon certain agreed-upon initial design criteria, requirementsand lor specifications. The work is performed in the development laboratory. The formula selected is designated as the (lX) laboratory batch.The size of the (1X) laboratory batch is usually 3 - 5 kg of a solid or semisolid, 3 - 5 liters of a liquid or 3000 to 5000 units of a tablet or capsule.
2. Laboratory -Pilot Batch. After the OX) laboratory batch is determined to be both physically and chemically stable based upon accelerated. elevated temperature testing (1. e.. 1 month at 45°C or 3 months at38°C or 38°C/80% RH). the next step in the scale-up process is the preparation of the (lOX) laboratory -pilot batch. The (lOX) laboratory -pilotbatch represents the first replicated scale-up of the designated formula.The size of the laboratory -pilot batch is usually 30 - 50 kg. 30 - 50 litersor 30,000 to 50.000 units.
It is usually prepared in small-size. pilot equipment within a designated CGMP approved area of the development laboratory. The numberand actual size of the laboratory -pilot batches may vary in response toone or more of the following factors:
a. Equipment availabilityb. Active drug substance availabilityc. Cost of raw materialsd. Inventory requirements for clinical and nonclinical studies
Process qualification or process capability studies are usually started inthis important second stage of the pilot program. Such qualification orcapability studies consist of process ranging, process characterization,and process optimization as a prerequisite to the more formal validationprogram that follows later in the piloting sequence.
3. Pilot Production. The pilot-production phase may be carried outeither as a shared responsibility between the development laboratories andits appropriate manufacturing counterpart -or as a process demonstrationby a separate, designated pilot-plant or process-development function.The two organizational piloting options are presented separately in Figure 1. The creation of a separate pilot-plant or process-development unit
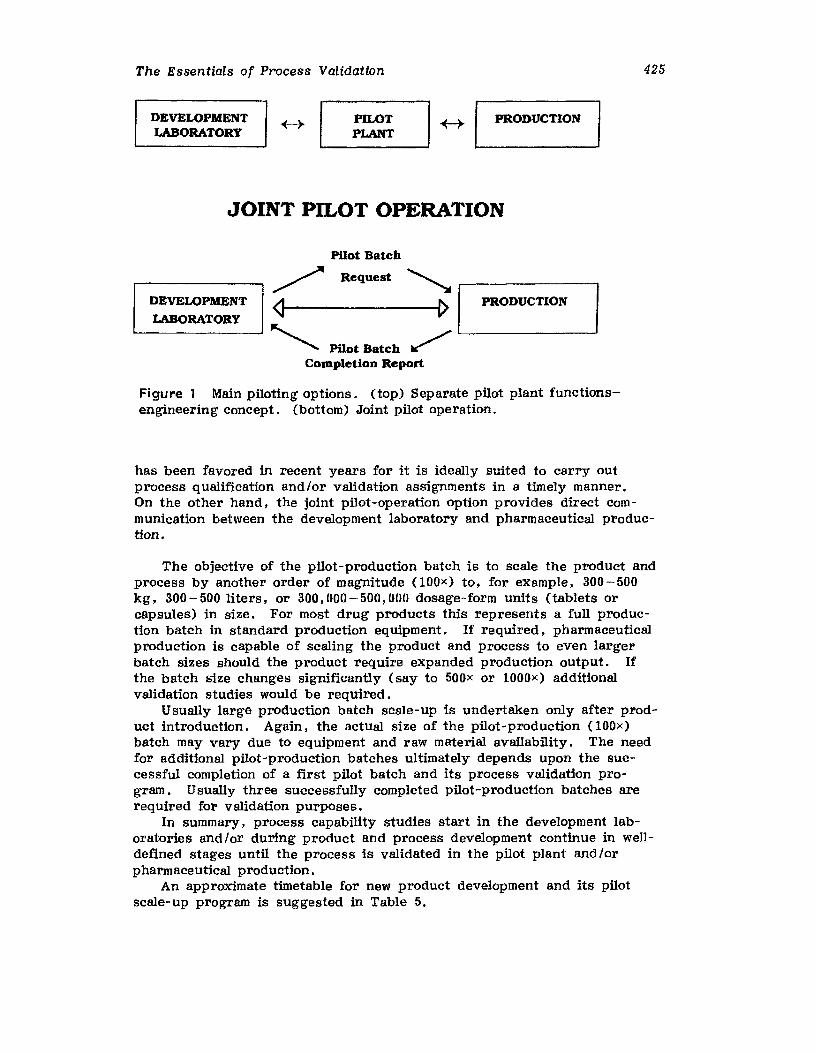
The Essentials of Process Validation 425
PRODUCTIONPILOTPLANT_I~I-
DEVELOPMENTLABORATORY
JOINT PILOT OPERATION
Pilot Batch
PRODUCTIONDEVELOPMENT
LABORATORY
~ Reque.t ';1" Pilot Batch /' --------
Completion Report
Figure 1 Main piloting options. (top) Separate pilot plant functionsengineering concept. (bottom) Joint pilot operation.
has been favored in recent years for it is ideally suited to carry outprocess qualification and/or validation assignments in a timely manner.On the other hand, the joint pilot-operation option provides direct communication between the development laboratory and pharmaceutical production.
The objective of the pilot-production batch is to scale the product andprocess by another order of magnitude OOOx) to, for example, 300-500kg, 300-500 liters, or 300,000-500,000 dosage-form units (tablets orcapsules) in size. For most drug products this represents a full production batch in standard production equipment. If required, pharmaceuticalproduction is capable of scaling the product and process to even largerbatch sizes should the product require expanded production output. Ifthe batch size changes significantly (say to 500x or 1000 x) additionalvalidation studies would be required.
Usually large production batch scale-up is undertaken only after product introduction. Again, the actual size of the pilot-production (lOOx)batch may vary due to equipment and raw material availability. The needfor additional pilot-production batches ultimately depends upon the successful completion of a first pilot batch and its process validation program. Usually three successfully completed pilot-production batches arerequired for validation purposes.
In summary, process capability studies start in the development laboratories and/or during product and process development continue in welldefined stages until the process is validated in the pilot plant and/orpharmaceutical production.
An approximate timetable for new product development and its pilotscale-up program is suggested in Table 5.
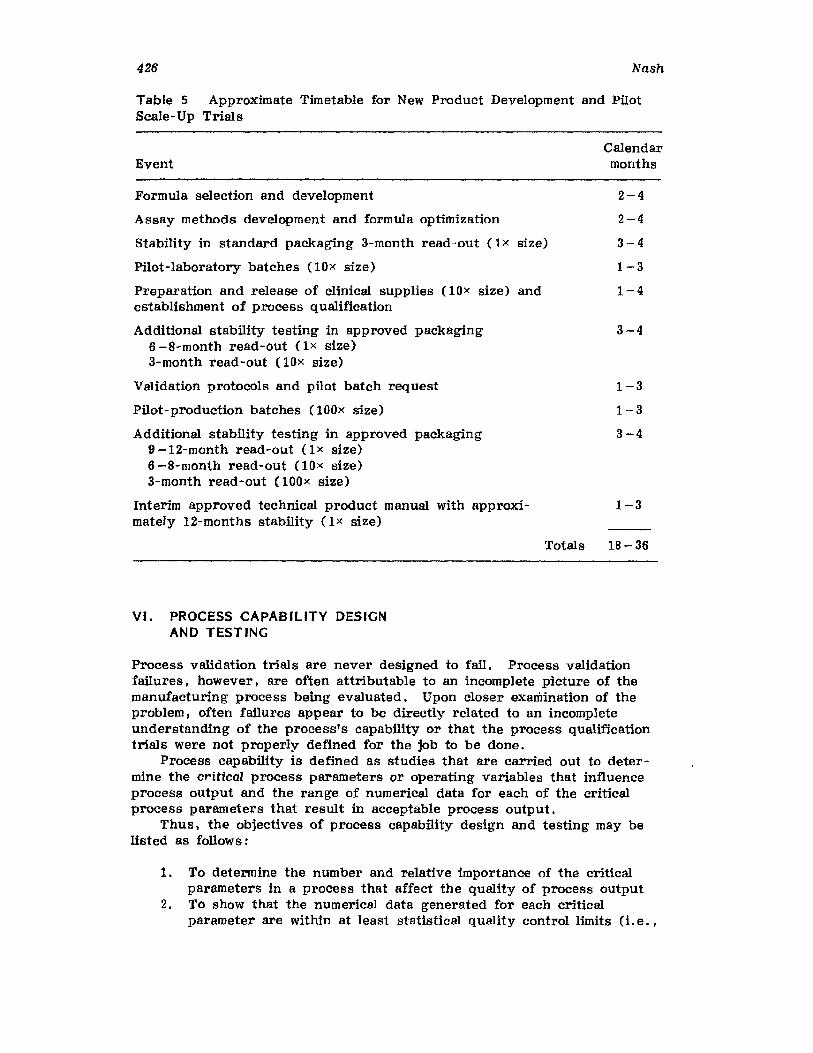
426 Nash
Table 5 Approximate Timetable for New Product Development and PilotScale-Up Trials
Event
Formula selection and development
Assay methods development and formula optimization
Stability in standard packaging 3-month read-out (Ix size)
Pilot-laboratory batches (lOx size)
Preparation and release of clinical supplies (lOx size) andestablishment of process qualification
Additional stability testing in approved packaging6 -8-month read-out (1x size)3-month read-out (lOx size)
Validation protocols and pilot batch request
Pilot-production batches (lOOx size)
Additional stability testing in approved packaging9 -12-month read-out (Ix size)6 -8-month read-out (lOx size)3-month read-out (lOOx size)
Interim approved technical product manual with approximately 12-months stability (Ix size)
Totals
VI. PROCESS CAPABILITY DESIGNAND TESTING
Calendarmonths
2-4
2-4
3-4
1-3
1-4
3-4
1-3
1-3
3-4
1-3
18-36
Process validation trials are never designed to fail. Process validationfailures> however, are often attributable to an incomplete picture of themanufacturing process being evaluated. Upon closer examination of theproblem, often failures appear to be directly related to an incompleteunderstanding of the process's capability or that the process qualificationtrials were not properly defined for the job to be done.
Process capability is defined as studies that are carried out to determine the critical process parameters or operating variables that influenceprocess output and the range of numerical data for each of the criticalprocess parameters that result in acceptable process output.
Thus. the objectives of process capability design and testing may belisted as follows:
1. To determine the number and relative importance of the criticalparameters in a process that affect the quality of process output
2. To show that the numerical data generated for each criticalparameter are within at least statistical quality control limits (i , e. ,
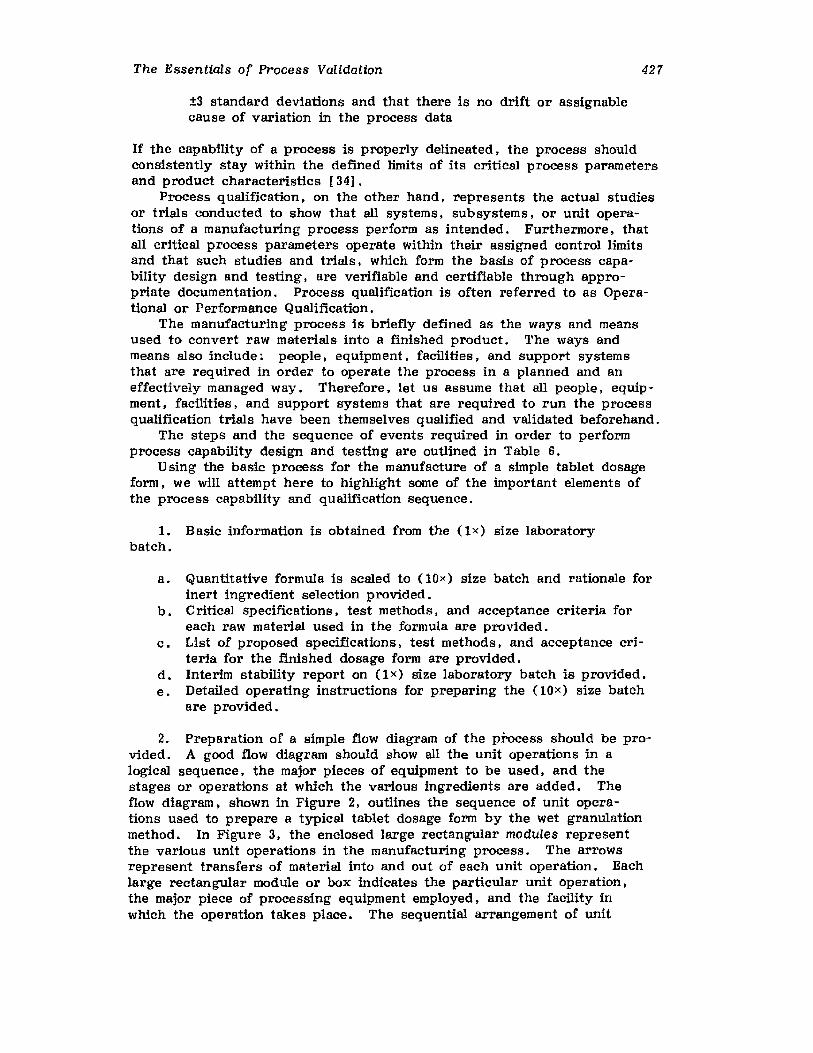
The Essentials of Process Validation
±3 standard deviations and that there is no drift or assignablecause of variation in the process data
427
If the capability of a process is properly delineated, the process shouldconsistently stay within the defined limits of its critical process parametersand product characteristics [34J.
Process qualification, on the other hand, represents the actual studiesor trials conducted to show that all systems, subsystems, or unit operations of a manufacturing process perform as intended. Furthermore, thatall critical process parameters operate within their assigned control limitsand that such studies and trials, which form the basis of process capability design and testing, are verifiable and certifiable through appropriate documentation. Process qualffleation is often referred to as Operational or Performance Qualification.
The manufacturing process is briefly defined as the ways and meansused to convert raw materials into a finished product. The ways andmeans also include: people, equipment, facilities, and support systemsthat are required in order to operate the process in a planned and aneffectively managed way. Therefore, let us assume that all people, equipment, facilities, and support system s that are required to run the processqualification trials have been themselves qualified and validated beforehand.
The steps and the sequence of events required in order to performprocess capability design and testing are outlined in Table 6.
Using the basic process for the manufacture of a simple tablet dosageform, we will attempt here to highlight some of the important elements ofthe process capability and qualification sequence.
1. Basic information is obtained from the (Ix) size laboratorybatch.
a. Quantitative formula is scaled to (lOx) size batch and rationale forinert ingredient selection provided.
b. Critical specifications, test methods, and acceptance criteria foreach raw material used in the formula are provided.
c. List of proposed specifications, test methods, and acceptance criteria for the finished dosage form are provided.
d. Interim stability report on (Lx) size laboratory batch is provided.e. Detailed operating instructions for preparing the (lOX) size batch
are provided.
2. Preparation of a simple flow diagram of the process should be provided. A good flow diagram should show all the unit operations in alogical sequence, the major pieces of equipment to be used, and thestages or operations at which the various ingredients are added. Theflow diagram, shown in Figure 2, outlines the sequence of unit operations used to prepare a typical tablet dosage form by the wet granulationmethod. In Figure 3, the enclosed large rectangular modules representthe various unit operations in the manufacturing process. The arrowsrepresent transfers of material into and out of each unit operation. Eachlarge rectangular module or box indicates the particular unit operation,the major piece of processing equipment employed, and the facility inwhich the operation takes place. The sequential arrangement of unit
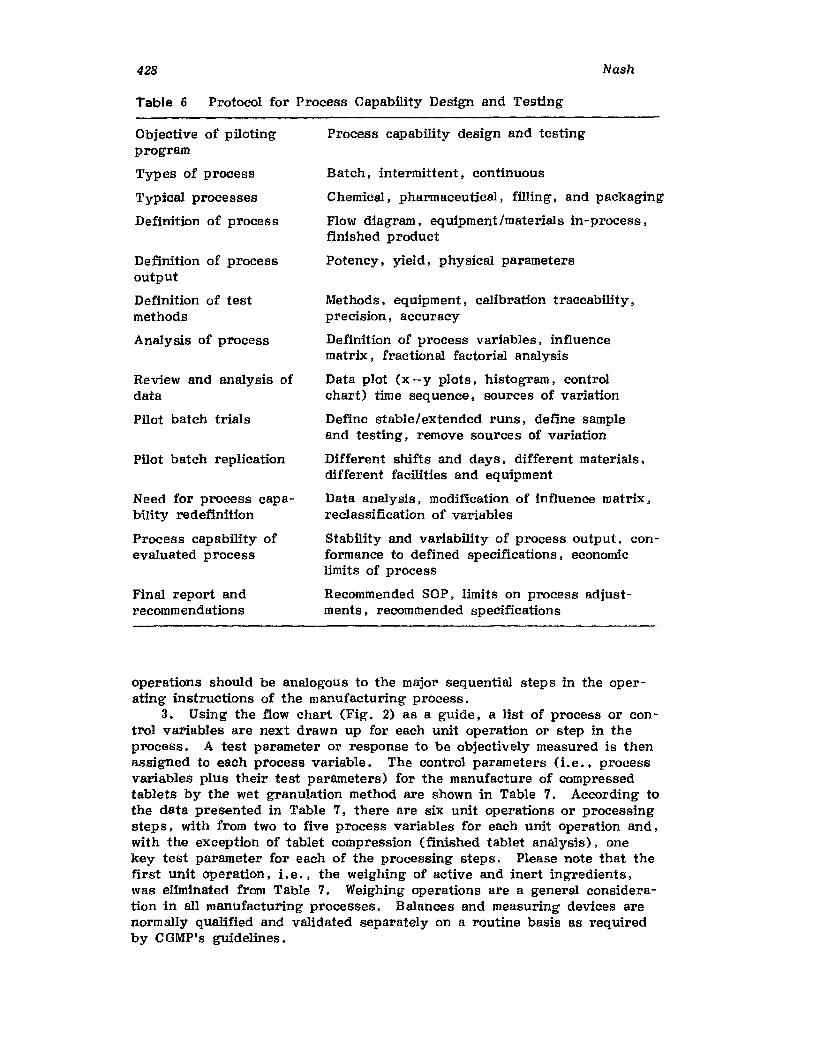
428 Nash
Table 6 Protocol for Process Capability Design and Testing
Objective of pilotingprogram
Types of process
Typical processes
Definition of process
Definition of processoutput
Definition of testmethods
Analysis of process
Review and analysis ofdata
Pilot batch trials
Pilot batch replication
Need for process capability redefinition
Process capability ofevaluated process
Final report andrecommendations
Process capability design and testing
Batch. intermittent. continuous
Chemical, pharmaceutical, filling, and packaging
Flow diagram. equipment/materials in-process,finished product
Potency. yield, physical parameters
Methods, equipment. calibration traceability,precision, accuracy
Definition of process variables, influencematrix, fractional factorial analysis
Data plot (x -y plots, histogram, controlchart) time sequence, sources of variation
Define stable/extended runs, define sampleand testing, remove sources of variation
Different shifts and days, different materials ,different facilities and equipment
Data analysis, modification of influence matrix.reclassification of variables
Stability and variability of process output, conformance to defined specifications, economiclimits of process
Recommended SOP, limits on process adjustments. recommended specifications
operations should be analogous to the major sequential steps in the operating instructions of the manufacturing process.
3. Using the flow chart (Fig. 2) as a guide , a list of process or control variables are next drawn up for each unit operation or step in theprocess. A test parameter or response to be objectively measured is thenassigned to each process variable. The control parameters (Le •• processvariables plus their test parameters) for the manufacture of compressedtablets by the wet granulation method are shown in Table 7. According tothe data presented in Table 7. there are six unit operations or processingsteps, with from two to five process variables for each unit operation and,with the exception of tablet compression (finished tablet analysis), onekey test parameter for each of the processing steps. Please note that thefirst unit operation, I, e .• the weighing of active and inert ingredients,was eliminated from Table 7. Weighing operations are a general consideration in all manufacturing processes. Balances and measuring devices arenormally qualified and validated separately on a routine basis as requiredby CGMP's guidelines.
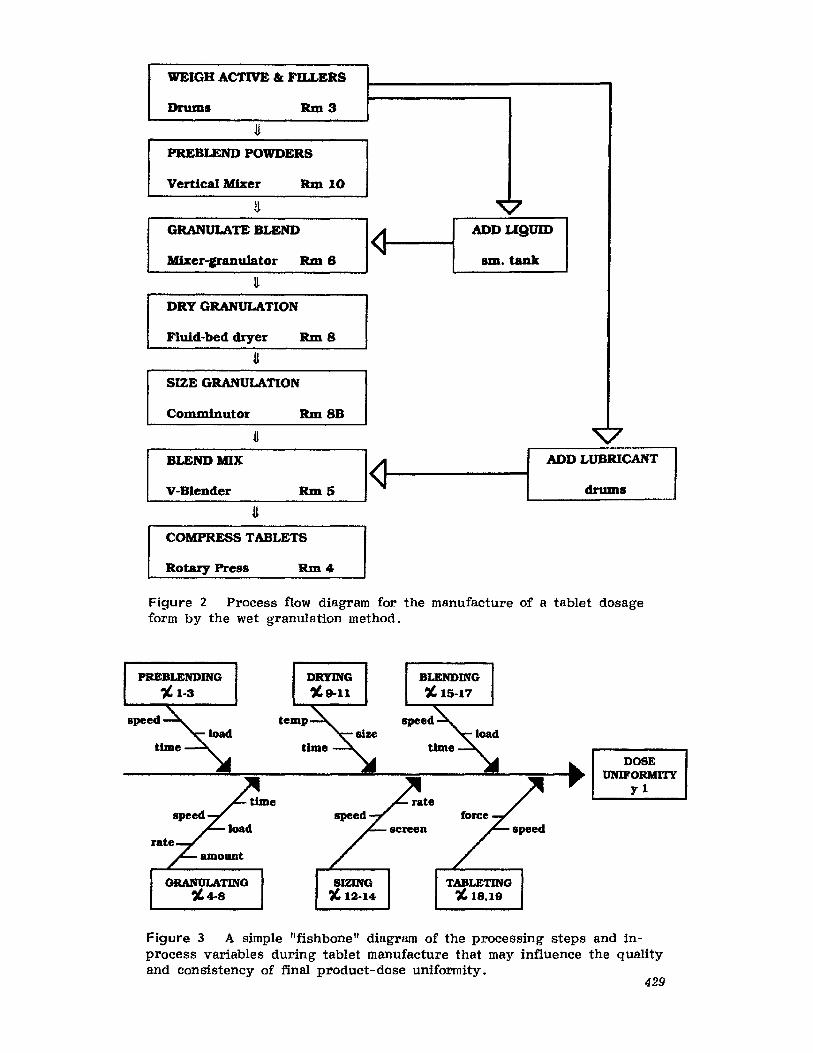
WEIGH ACTIVE &: FILLERS
Drums RmS
UPREBLEND POWDERS
Vertical MIxer Rm 10
~
GRANULATE BLEND
<JMIxer-granulator Rm6
~
DRY GRANULATION
Fluid-bed dryer Rm8
USIZE GRANULATION
Comminutor Rm8B
HBLEND MIX
I~V-Blender Rm5
U
COMPRESS TABLETS
Rotary Press Rm4
ADDUgUID
sm. tank
ADD LUBRICANT
drums
Figure 2 Process flow diagram for the manufacture of a tablet dosageform by the wet granulation method.
PltEBLENDING
" 1·3
DRYING
"9-11
BLENDING
~ 15-17
DOSEUNIFORMITY
yl
GRANULATING"4-8
SIZING~ 12-14
TABLETING~ 18.19
429
Figure 3 A simple "fishbone" diagram of the processing steps and inprocess variables during tablet manufacture that may influence the qualityand consistency of final product-dose uniformity.
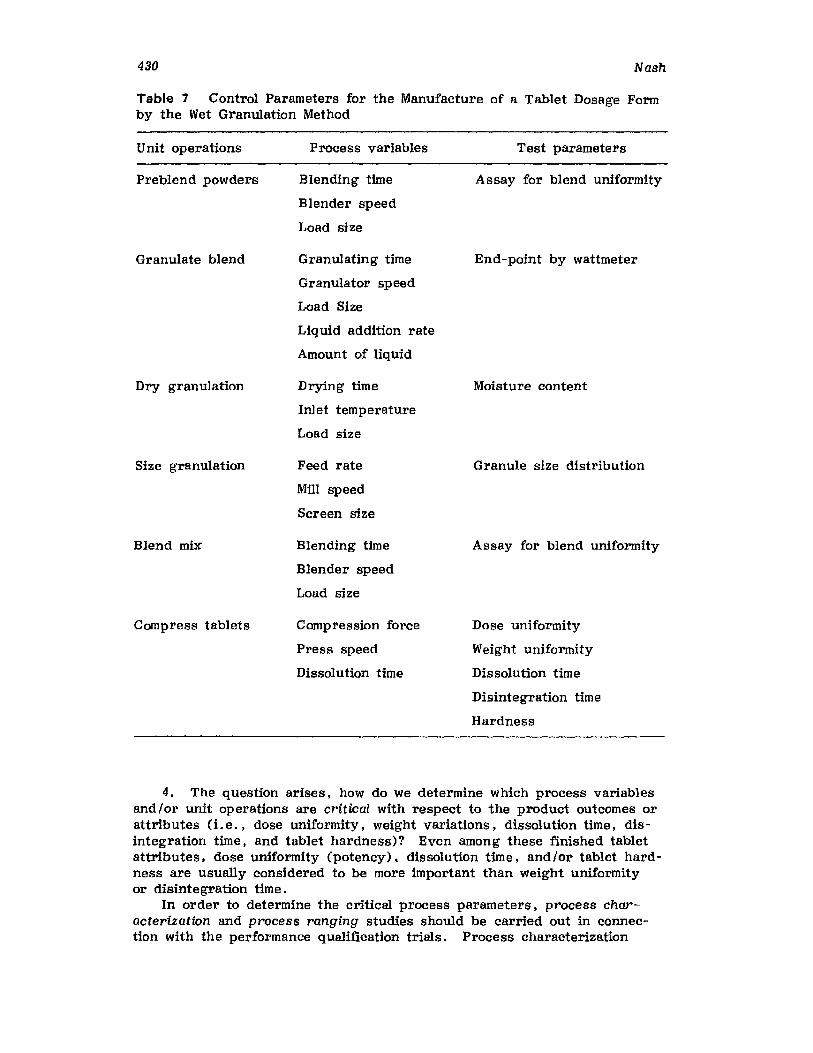
430 Nash
Table 7 Control Parameters for the Manufacture of a Tablet Dosage Formby the Wet Granulation Method
Unit operations
Preblend powders
Granulate blend
Dry granulation
Size granulation
Blend mix
Compress tablets
Process variables
Blending time
Blender speed
Load size
Granulating time
Granulator speed
Load Size
Liquid addition rate
Amount of liquid
Drying time
Inlet temperature
Load size
Feed rate
Mill speed
Screen size
Blending time
Blender speed
Load size
Compression force
Press speed
Dissolution time
Test parameters
Assay for blend uniformity
End-point by wattmeter
Moisture content
Granule size distribution
Assay for blend uniformity
Dose uniformity
Weight uniformity
Dissolution time
Disintegration time
Hardness
4. The question arises, how do we determine which process variablesand/or unit operations are critical with respect to the product outcomes orattributes (I, e., dose uniformity, weight variations, dissolution time, disintegration time, and tablet hardness)? Even among these finished tabletattributes, dose uniformity (potency). dissolution time, and/or tablet hardness are usually considered to be more important than weight uniformityor disintegration time.
In order to determine the critical process parameters, process characterization and process ranging studies should be carried out in connection with the performance qualification trials. Process characterization
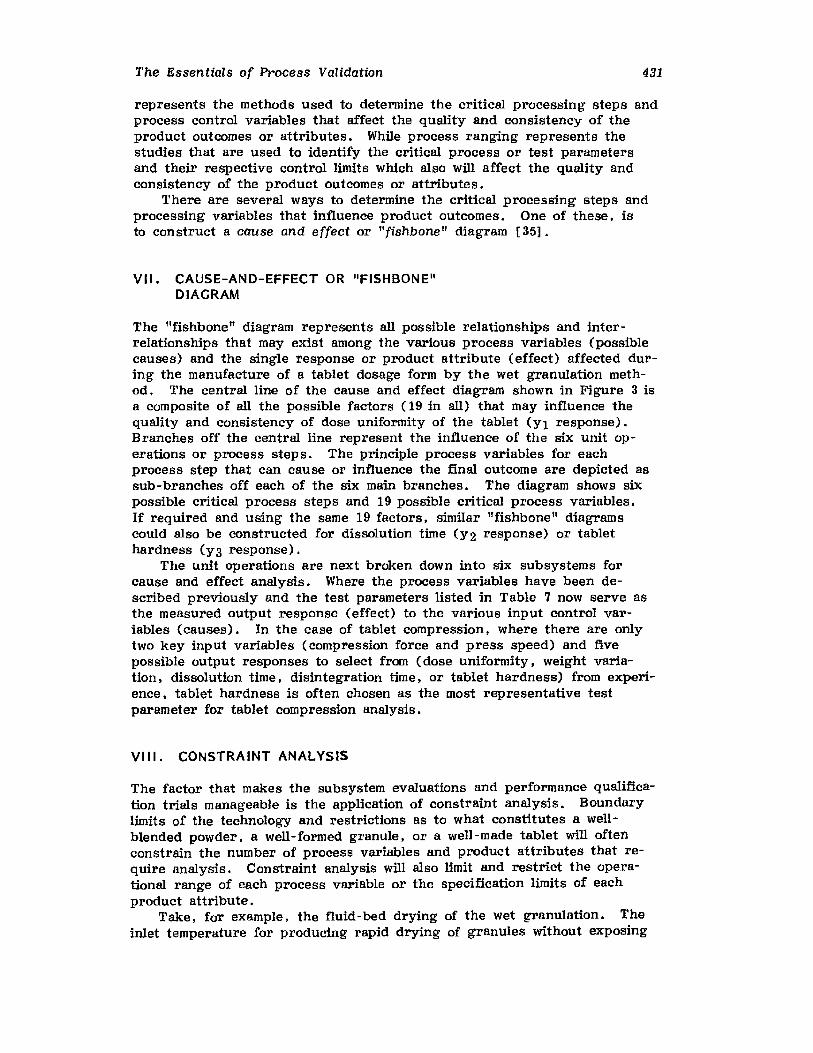
The Essentials of Process Validation 431
represents the methods used to determine the critical processing steps andprocess control variables that affect the quality and consistency of theproduct outcomes or attributes. While process ranging represents thestudies that are used to identify the critical process or test parametersand their respective control limits which also will affect the quality andconsistency of the product outcomes or attributes.
There are several ways to determine the critical processing steps andprocessing variables that influence product outcomes. One of these, isto construct a cause and effect or "fishbone" diagram [35].
VII. CAUSE-AND-EFFECT OR "FISHBONE fI
DIAGRAM
The "fishbona" diagram represents all possible relationships and interrelationships that may exist among the various process variables (possiblecauses) and the single response or product attribute (effect) affected during the manufacture of a tablet dosage form by the wet granulation method. The central line of the cause and effect diagram shown in Figure 3 isa composite of all the possible factors (19 in all) that may influence thequality and consistency of dose uniformity of the tablet (Yl response).Branches off the central line represent the influence of the six unit operations or process steps. The principle process variables for eachprocess step that can cause or influence the final outcome are depicted assub-branches off each of the six main branches. The diagram shows sixpossible critical process steps and 19 possible critical process variables.If required and using the same 19 factors, similar "fishbone" diagramscould also be constructed for dissolution time (Y2 response) or tablethardness (Y3 response).
The unit operations are next broken down into six subsystems forcause and effect analysis. Where the process variables have been described previously and the test parameters listed in Table 7 now serve asthe measured output response (effect) to the various input control variables (causes). In the case of tablet compression, where there are onlytwo key input variables (compression force and press speed) and fivepossible output responses to select from (dose uniformity, weight variation, dissolution time, disintegration time. or tablet hardness) from experience, tablet hardness is often chosen as the most representative testparameter for tablet compression analysis.
VIII. CONSTRAINT ANALYSIS
The factor that makes the SUbsystem evaluations and performance qualification trials manageable is the application of constraint analysis. Boundarylimits of the technology and restrictions as to what constitutes a wellblended powder, a well-formed granule, or a well-made tablet will oftenconstrain the number of process variables and product attributeS that require analysis. Constraint analysis will also limit and restrict the operational range of each process variable or the specification limits of eachproduct attribute.
Take, for example, the fluid-bed drying of the wet granulation. Theinlet temperature for producing rapid drying of granules without exposing
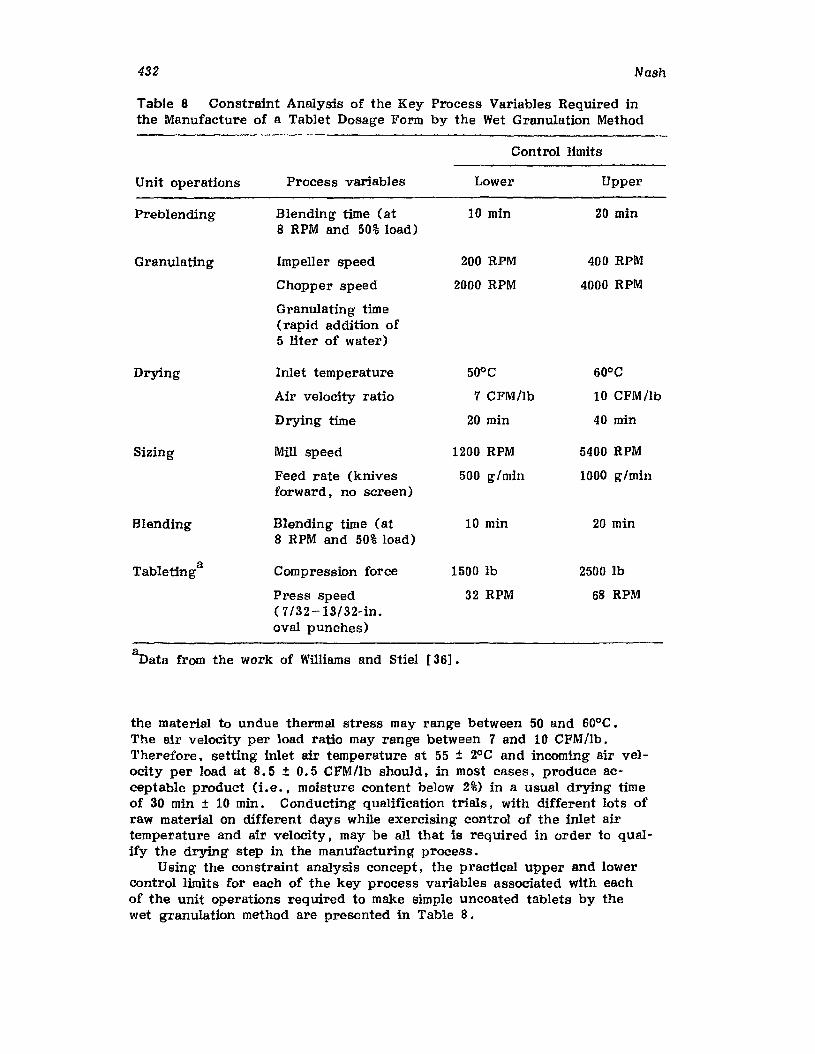
432 Nash
Table 8 Constraint Analysis of the Key Process Variables Required inthe Manufacture of a Tablet Dosage Form by the Wet Granulation Method
Control limits
Unit operations
Preblending
Granulating
Process variables
Blending time (at8 RPM and 50% load)
Impeller speed
Chopper speed
Granulating time(rapid addition of5 liter of water)
Lower
10 min
200 RPM
2000 RPM
Upper
20 min
400 RPM
4000 RPM
Drying
Sizing
Blending
Tabletinga
Inlet temperature
Air velocity ratio
Drying time
MID speed
Feed rate (knivesforward, no screen)
Blending time (at8 RPM and 50% load)
Compression force
Press speed0/32-13/32-in.oval punches)
50°C 60°C
7 CFM!lb 10 CFM/lb
20 min 40 min
1200 RPM 5400 RPM
500 g/min 1000 g/min
10 min 20 min
1500 lb 2500 Ib
32 RPM 68 RPM
aData from the work of Williams and Stiel [36].
the material to undue thermal stress may range between 50 and 60°C.The air velocity per load ratio may range between 7 and 10 CFM/lb.Therefore. setting inlet air temperature at 55 ± ZOC and incoming air velocity per load at 8.5 ± 0.5 CFM/lb should. in most cases, produce acceptable product (i.e., moisture content below 2%) in a usual drying timeof 30 min ± 10 min. Conducting qualification trials, with different lots ofraw material on different days while exercising control of the inlet airtemperature and air velocity, may be all that is required in order to qualify the drying step in the manufacturing process.
Using the constraint analysis concept, the practical upper and lowercontrol limits for each of the key process variables associated with eachof the unit operations required to make simple uncoated tablets by thewet granulation method are presented in Table 8.
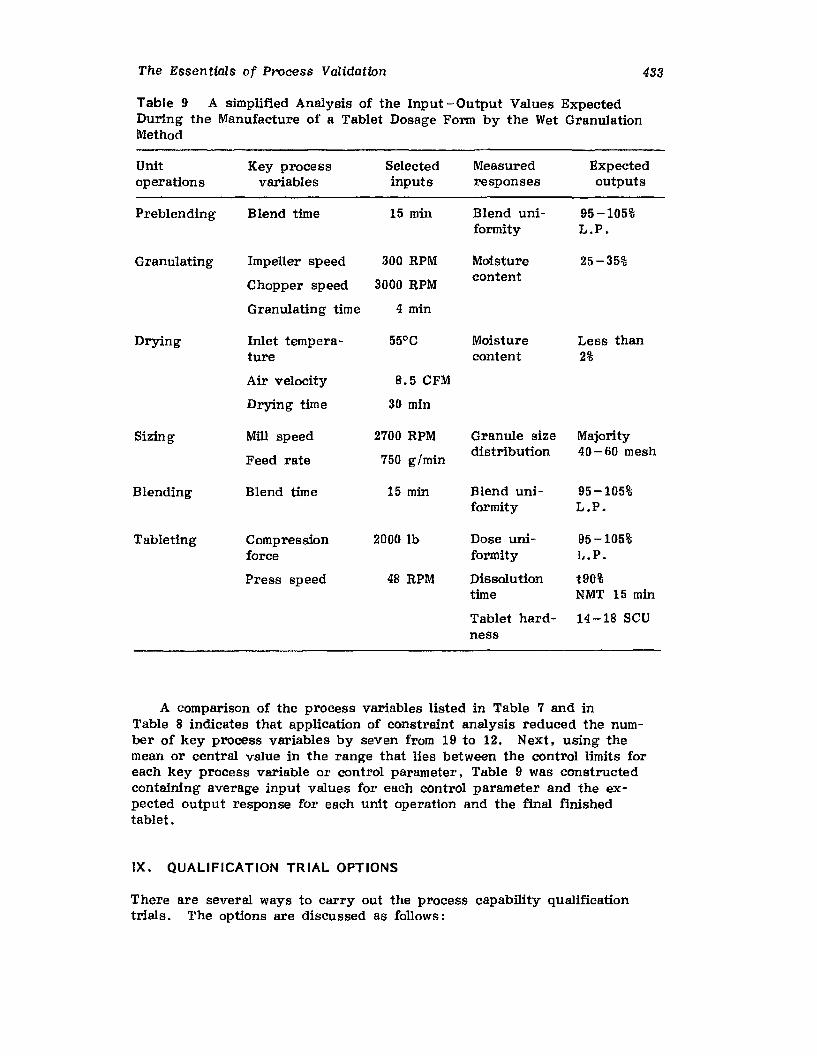
433The Essentials of Process Validation
Table 9 A simplified Analysis of the Input -Output Values ExpectedDuring the Manufacture of a Tablet Dosage Form by the Wet GranulationMethod
Unit Key process Selected Measured Expectedoperations variables inputs responses outputs
Preblending Blend time 15 min Blend uni- 95-105%formity L.P.
Granulating Impeller speed 300 RPM Moisture 25-35%
Chopper speed 3000 RPMcontent
Granulating time 4 min
Drying Inlet tempera- 55°C Moisture Less thanture content 2%
Air velocity 8.5 CFM
Drying time 30 min
Sizing Mill speed 2700 RPM Granule size Majority
Feed rate 750 g/mindistribution 40-60 mesh
Blending Blend time 15 min Blend uni- 95-105%formity L.P.
Tableting Compression 2000 lb Dose uni- 95-105%force formity L.P.
Press speed 48 RPM Dissolution t90%time NMT 15 min
Tablet hard- 14-18 SCDness
A comparison of the process variables listed in Table 7 and inTable 8 indicates that application of constraint analysis reduced the number of key process variables by seven from 19 to 12. Next, using themean or central value in the range that lies between the control limits foreach key process variable or control parameter. Table 9 was constructedcontaining average input values for each control parameter and the expected output response for each unit operation and the final finishedtablet.
IX. QUALIFICATION TRIAL OPTIONS
There are several ways to carry out the process capability qualifieationtrials. The options are discussed as follows:
434 Nash
A. Replication of Optimum or Midrange Values
Using the selected midrange input values presented in Table 9. theprocess may be run as a pilot-laboratory batch (lOx-size) in accordancewith an agreed upon standard operating procedure and the protocol forin-process testing. Expected outputs are then measured after each unitoperation and if the results are within in-process specifications. theprocess is permitted to continue to the next processing step. After tabletcompression has been successfully completed (Le .• tablet hardness. tabletweight. and tablet dimensions are within specifications). representativesample of final finished tablets are next subjected to end product testingfor dose uniformity and compliance with established dissolution time specifications. Having completed an acceptable run. the process may be repeated several times more in order to establish process reproducibility.
In the course of this work. if one or more of the processing stepsfail to comply with the expected in-process outcomes, additional development time will be spent to get these particular unit operations up tostandard operating conditions. The first option is. therefore. a simplego -no go approach, where the process qualification proceeds upon thecompletion of each unit operation and each pilot batch. In this simple.straight-forward qualtficatton procedure, control limits are never testedand critical steps in the overall process are never fully established.
B. Fractional Factorial Design
An experimental design is a series of statistically sufficient qualificationtrials that are planned in a specific arrangement and include all processingvariables that can possibly affect the expected outcome of the processunder investigation. In the case of a factorial design. n , equals thenumber of factors or process variables, each at two levels (1. e , , the 11upper- and lower-control limits). Such a simple design is known as a 2factorial. Using the process variables found in Table 8 we could. for example. run 212 or 4096 qualification trials.
The fractional factorial is designed to reduce the number of qualification trials to a reasonable number, say eight. while holding the numberof processing variables to be evaluated to a reasonable number as well,again eight. The technique was developed as a nonparametric test forprocess evaluation by Box and Hunter [37J and reviewed by Hendrix[3S].
Each processing variable. however. is studied at both its controllimits. The positive (+) symbol is used for the upper control limit andthe negative (-) symbol is used for the lower control limit. In this waya full factorial of 28 may be reduced from 256 experiments to only eight(see the design in Table 10).
Following the design, eight pilot-laboratory batches (lOx-size) arenext prepared for testing and evaluation. Trial No. 1 is run where eachprocess variable Xl through Xs is at its lower control limit (LCL), whilein trial No. S each process variable is at its upper control limit (UCL).
The design is so constructed that the total number of +'s and _IS arethe same for each process variable (4&4). With the exception of trailNo. 1 and No.8, the total number of +'s and _IS is also the same foreach trial run (4&4) .

The Essentials of Process Validation 435
Table 10 Fractional Factorial Design (8 Variables in 8 Experiments)
TrialNo. Xl X2 X3 X
4 X5X6 X7 X
8
1
2 + + + +
3 + + + +
4 + + + +
5 + + + +
6 + + + +
7 + + + +
8 + + + + + + + +
Next eight pilot-laboratory batches (lOx size each) of tablets are prepared following the design given in Table 10 and the conditions establishedfor each trial run in Table 11. For example. according to the conditionsestablished for trial No.4, powder preblend time is 10 min, granulatingtime is 5 min, inlet temperature in the dryer is set at 50°C, mill speed isset at 5400 RPM. feed rate to Fitzmill is 500 g /min , blend time is 20 min.compression force during tableting is 1500 Ib , and press speed is set at68 RPM.
Table 11 Process Variables and Control Limits Selected forFractional Factorial Design of Eight QUalification Trials
Process variable LCL (-) UCL (+)
Xl Preblend time 10 min 20 min
X2Granulating time 3 min 5 min
X3
Inlet temperature 50°C 60°C
X4 Mill speed 1200 RPM 5400 RPM
X5
Feed rate 500 g/min 1000 g/min
X6Blend time 10 min 20 min
X7Compression force 1500 lb 2500 lb
Xs Press Speed 32 RPM 68 RPM
436 Nash
Focusing our attention on the key processing variables listed inTables 8 and 9, the number selected for analysis have been reduced toeight in the following manner:
X1 = preblend time
X2 = granulating time (at 300 RPM and 3000 RPM)
X3
=: inlet temperature (at 8.5 eFM)
X4 = mill speed
X5 = feed rate
X6 = blend time
X7
= compression force
X8 =: press speed
The processing conditions to be evaluated using a fractional factorial experimental design are presented in Table 11.
When all trial runs have been completed, the finished tablets are thenSUbjected to end-product testing for compliance to content uniformity,weight uniformity, tablet hardness, disintegration time. and dissolutiontime specifications. Tablet hardness data were chosen for analysis offractional factorial experimental design for the following reasons:
1. A direct correlation between tablet hardness and dissolution timehad been previously established for the product
2. Variability for tablet hardness among trial runs was greater thanfor the other output parameters
3. Four batches (trial Nos. 3, 4. 5. and 7) were out of specificationwith respect to the proposed limits for tablet hardness (i.e., notless than 12 seu and not more than 16 seu)
The results of the analysis of the tablet hardness data are presented inTable 12.
Simple analysis of the data presented in Table 12 reveals the followinguseful inform arion:
1. The mean tablet hardness for all trial runs is 14 seu. Threebatches (Nos. 1, 4. and 7) fall below this mean. while three batches(Nos. 3, 5, and 8) are above the mean. Two batches (Nos. 2 and 6)have a mean value of 14 seu. The batches appear to be normally distributed about the value 14 seu.
2. If the process variables (Xs) have no effect on the process outcome and if the experimental design is reasonably balanced, one wouldexpect that the contrasting sum of + and - tablet hardness values in eachprocess variable column would approach a minimum numerical value and thatthe resultant average contrasting sum would approach a value of zero.Therefore on this basis, the following process variables appear to havelittle or no effect upon tablet hardness. These variables are preblending,granulating, drying, and press speed. On the other hand, the followingprocess variables appear to influence the outcome, i.e.. tablet hardness.These latter variables are mill speed and feed rate during comminution.blending time during lubricant addition, and compression force duringtableting.
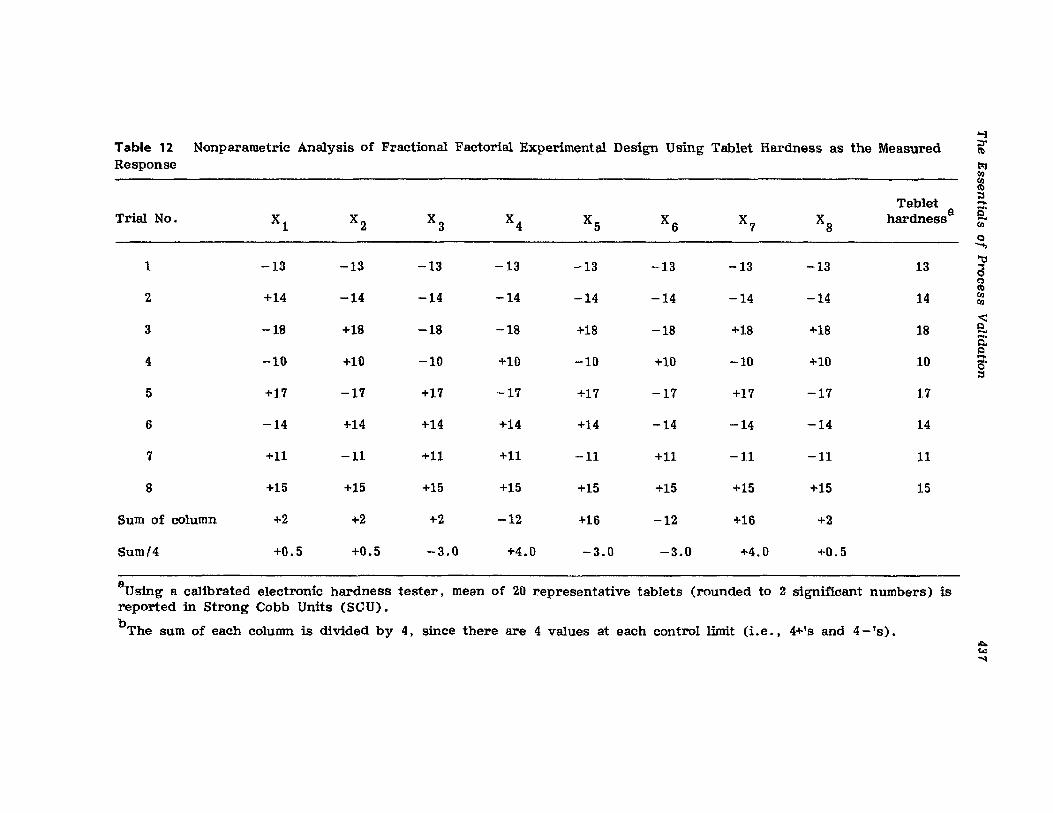
'"iTable 12 Nonparametric Analysis of Fractional Factorial Experimental Design Using Tablet Hardness as the Measured :::r
~
Response tql;f,Il'I:lCb
Tablet::s....
Trial No. X2
X3
X4 X5 X
6X7
Xs hardnessa [Xl l'I:l
Q.......
-13 -13 -13 -13 -13 -13 -13 -13 13"tt
1 ~C')
Cb2 +14 -14 -14 -14 -14 -14 -14 -14 14 l'I:l
l'I:l
<::3 -18 +18 -18 -18 +18 -18 +18 +18 18 eo....
c..I:l
4 -10 +10 -10 +10 -10 +10 -10 +10 10....o'::s
5 +17 -17 +17 -17 +17 -17 +17 -17 17
6 -14 +14 +14 +14 +14 -14 -14 -14 14
7 +11 -11 +11 +11 -11 +11 -11 -11 11
8 +15 +15 +15 +15 +15 +15 +15 +15 15
Sum of column +2 +2 +2 -12 +16 -12 +16 +2
Sum/4 +0.5 +0.5 -3.0 +4.0 -3.0 -3.0 +4.0 +0.5
aUsing a calibrated electronic hardness tester. mean of 20 representative tablets (rounded to 2 significant numbers) isreported in Strong Cobb Units (SCU).
b The sum of each column is divided by 4, since there are 4 values at each control limit (i. e . , 4+'s and 4 - IS) •>tI.t.:l
'"
438 Nash
3. The overall design does not balance to zero because there is aconstant +2 for each process variable. Since there are, this is due to thefact that in our design eight -13s in trial No. 1 and eight +15s in trialNo. 8 were created.
The advantage of the fractional factorial experimental design is that.using No. 8 qualifleation trial, eight important process variables weretested at both their lower and upper control limits. In addition. threeprocessing steps [dry milling. lubricant addition (blending). and tabletcompression] were all shown to be critical with respect to a measured response, namely tablet hardness. Since tablet hardness also influencestablet dissolution, this second outcome was also indirectly evaluated by theexperimental design chosen.
Using a larger fractional factorial experimental design, 12 or even 16process variables could be tested by expanding the qualification trials tosay 12 or 16 pilot runs. But in practice, eight pilot -laboratory batchesis most likely the maximum number that is reasonable to produce for thispurpose. Those unit operations that were found. by fractional factorialexperimental design, to be critical with respect to process capability design and testing (size reduction, blending. and tablet compression) couldthen be subjected to more extensive investigation during the laboratorystage of product and/or process development.
C. Optimization Techniques
Optimization techniques are used to find either the best possible quantitative formula for a product or the best possible set of experimental conditions (input values) that are needed to run the process. Optimizationtechniques may be employed in the laboratory state to develop the moststable, least sensitive formula. or in the qualification and Validation stagesof scale-up in order to develop the most stable. least variable processwithin its proven acceptable range(s) of operation, Chapman's so-calledPAR principle [39]
Optimization techniques may be classified as Parametric StatisticalMethods and Nonparametric Search Methods.
Parametric Statistical Methods
Parametric Statistical Methods, usually employed for optimization, arefull-factorial designs [40]. half-factorial designs [41]. simplex design [42].and Lagrangian multiple-regression analysis [43]. Parametric methods arebest suited for formula optimization in the early stages of product development. The application of constraint analysis. which was described previously. is used to simplify the testing protocol and the analysis of experimental results.
The steps involved in the parametric optimization procedure for pharmaceutical systems have been fully described by Schwartz [44]. Theoptimization technique consists of the following' essential operations:
1. Selection of a suitable experimental design2. Selection of variables (independent Xs and dependent Ys) to be
tested
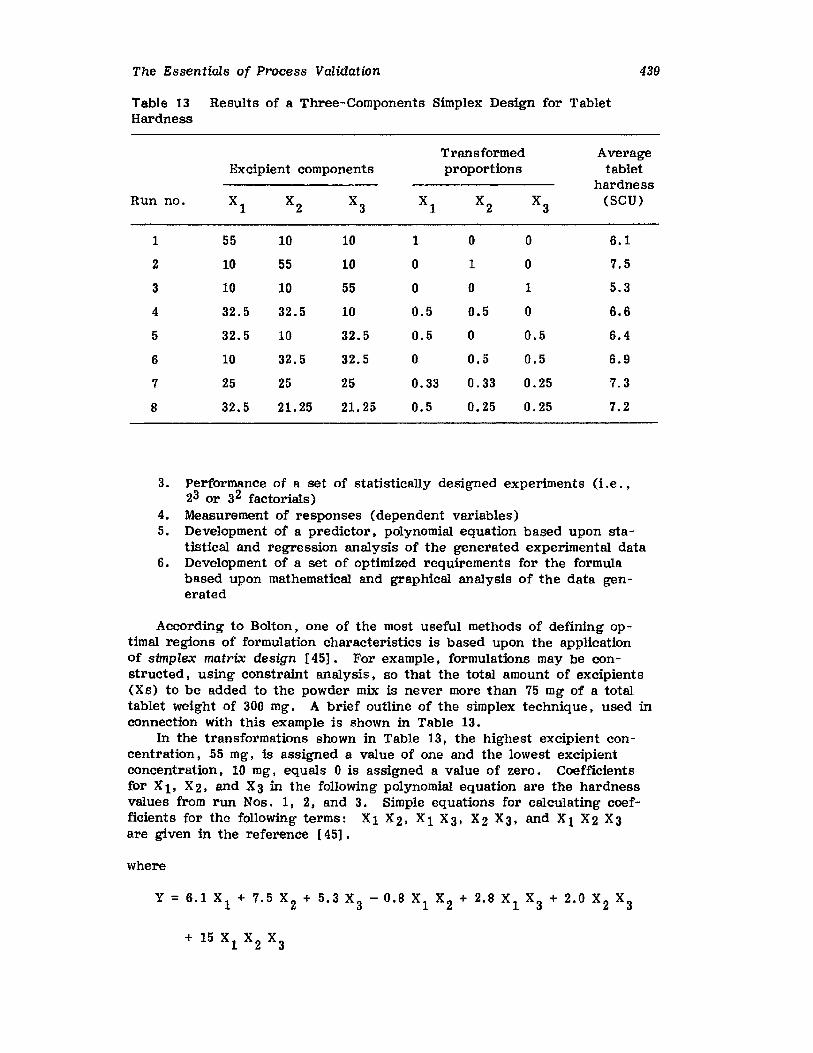
The Essentials of Process Validation 439
Table 13 Results of a Three-Components Simplex Design for TabletHardness
Transformed AverageExcipient components proportions tablet
hardnessRun no. Xl X2 X3 Xl X2 X
3(SCU)
I 55 10 10 1 0 0 6.1
2 10 55 10 0 1 0 7.5
3 10 10 55 0 0 1 5.3
4 32.5 32.5 10 0.5 0.5 0 6.6
5 32.5 10 32.5 0.5 0 0.5 6.4
6 10 32.5 32.5 0 0.5 0.5 6.9
7 25 25 25 0.33 0.33 0.25 7.3
8 32.5 21.25 21. 25 0.5 0.25 0.25 7.2
3. Performance of a set of statistically designed experiments (I.e.,23 or 32 factorials)
4. Measurement of responses (dependent variables)5. Development of a predictor, polynomial equation based upon sta
tistical and regression analysis of the generated experimental data6. Development of a set of optimized requirements for the formula
based upon mathematical and graphical analysis of the data generated
According to Bolton, one of the most useful methods of defining optimal regions of formulation characteristics is based upon the applicationof simplex matrix design [45]. For example, formulations may be constructed, using constraint analysis. so that the total amount of excipients(Xs) to be added to the powder mix is never more than 75 mg of a totaltablet weight of 300 mg. A brief outline of the simplex technique, used inconnection with this example is shown in Table 13.
In the transformations shown in Table 13, the highest excipient concentration. 55 mg, is assigned a value of one and the lowest excipientconcentration, 10 mg, equals 0 is assigned a value of zero. Coefficientsfor X10 X2. and X3 in the following polynomial equation are the hardnessvalues from run Nos. 1, 2, and 3. Simple equations for calculating coefficients for the following terms: xr X2. Xl X3, X2 X3. and Xl X2 X3are given in the reference [45].
where
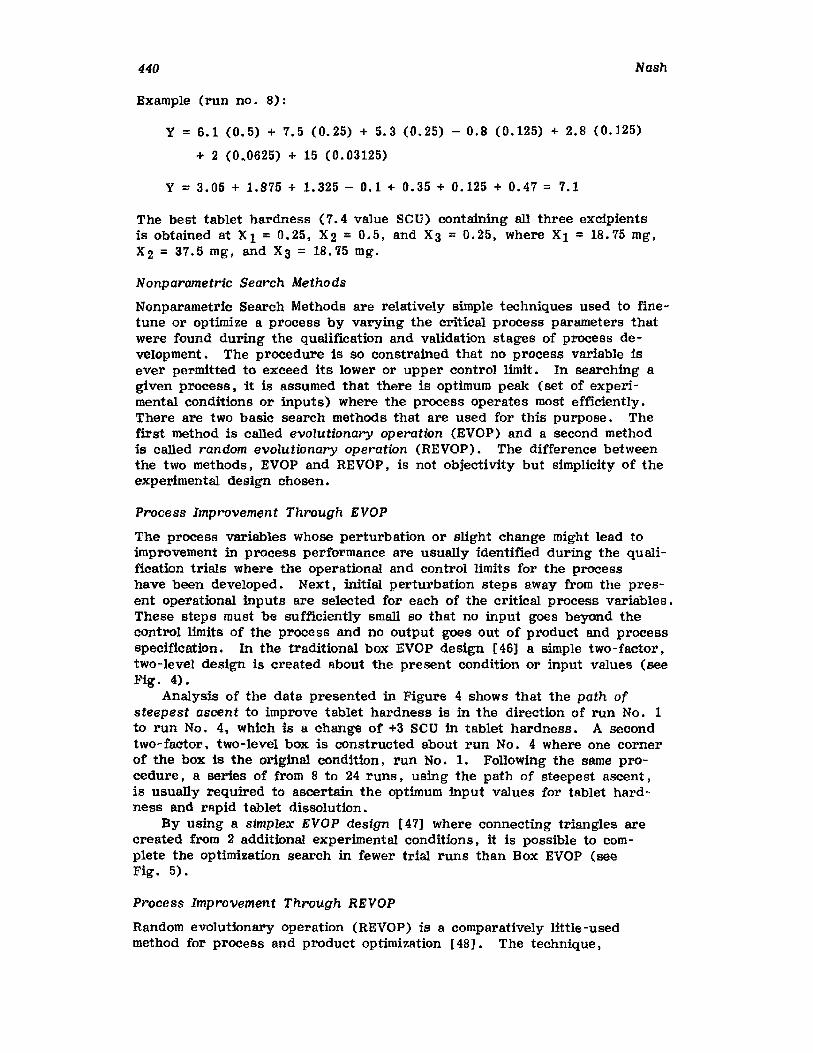
440
Example (run no. 8):
Nash
y =6.1 (0.5) + 7.5 (0.25) + 5.3 (0.25) - 0.8 (0.125) + 2.8 (0.125)
+ 2 (O~0625) + 15 (0.03125)
Y =3.05 + 1.875 + 1.325 - 0.1 + 0.35 + 0.125 + 0.47 = 7.1
The best tablet hardness (7.4 value SCU) containing all three excipientsis obtained at Xl = 0.25, X2 = 0.5. and X3 = 0.25. where Xl = 18.75 mg.X2 =37.5 mg. and X3 = 18.75 mg.
Nonparametric Search Methods
Nonparametric Search Methods are relatively simple techniques used to finetune or optimize a process by varying the critical process parameters thatwere found during the qUalification and validation stages of process development. The procedure is so constrained that no process variable isever permitted to exceed its lower or upper control limit. In searching agiven process. it is assumed that there is optimum peak (set of experimental conditions or inputs) where the process operates most efficiently.There are two basic search methods that are used for this purpose. Thefirst method is called evolutionary operation (EVOP) and a second methodis called random evolutionary operation (REVOP). The difference betweenthe two methods, EVOP and REVOP. is not objectivity but simplicity of theexperimental design chosen.
Process Improvement Through EVOP
The process variables whose perturbation or slight change might lead toimprovement in process performance are usually identified during the qualification trials where the operational and control limits for the processhave been developed. Next. initial perturbation steps away from the present operational inputs are selected for each of the critical process variables.These steps must be sufficiently small so that no input goes beyond thecontrol limits of the process and no output goes out of product and processspecification. In the traditional box EVOP design [46] a simple two-factor.two-level design is created about the present condition or input values (seeFig. 4).
Analysis of the data presented in Figure 4 shows that the path ofsteepest ascent to improve tablet hardness is in the direction of run No. 1to run No.4, which is a change of +3 seu in tablet hardness. A secondtwo-factor, two-level box is constructed about run No.4 where one cornerof the box is the original condition, run No.1. Following the same procedure, a series of from 8 to 24 runs, using the path of steepest ascent,is usually required to ascertain the optimum input values for tablet hardness and rapid tablet dissolution.
By using a simplex EVOP design [47] where connecting triangles arecreated from 2 additional experimental conditions, it is possible to complete the optimization search in fewer trial runs than Box EVOP (seeFig. 5).
Process Improvement Through REVOP
Random evolutionary operation (REVOP) is a comparatively little-usedmethod for process and product optimization [48 J• The technique.
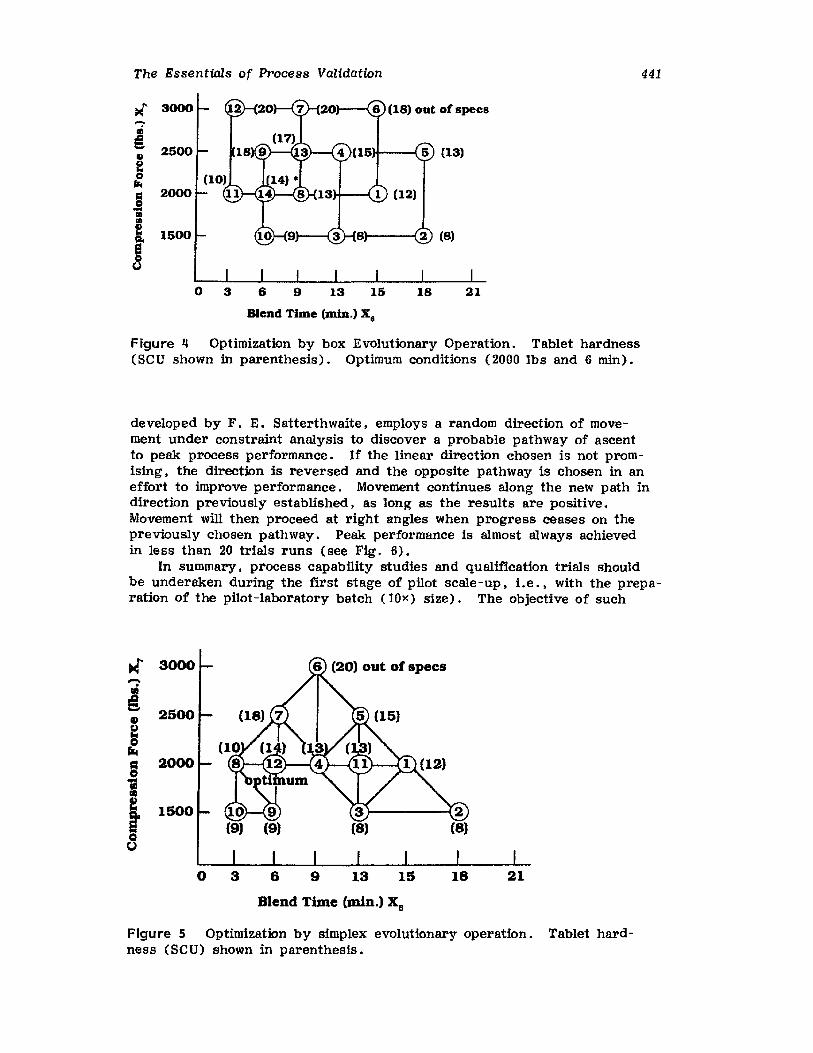
The Essentials of Process Validation 441
~ 3000....aiEl 2500G
20~
r:: 20000-;1ft
i 1500
0c
6 9 13 15 18 21
Blend Time (min.) Xs
Figure 4 Optimization by box Evolutionary Operation. Tablet hardness(SeU shown in parenthesis). Optimum conditions (2000 lbs and 6 min).
developed by F. E. Satterthwaite, employs a random direction of movement under constraint analysis to discover a probable pathway of ascentto peak process performance. If the linear direction chosen is not promising. the direction is reversed and the opposite pathway is chosen in aneffort to improve performance. Movement continues along the new path indirection previously established, as long as the results are positive.Movement will then proceed at right angles when progress ceases on thepreviously chosen pathway. Peak performance is almost always achievedin less than 20 trials runs (see Fig. 6).
In summary, process capability studies and qualification trials shouldbe underaken during the first stage of pilot scale-up, i.e .• with the preparation of the pilot-laboratory batch (lOx) size). The objective of such
~ 3000-~ 2500G
~~
~2000
1e 1500rc0 3 6 9 13 15 18 21
Blend Time (min.) x,
Figure 5 Optimization by simplex evolutionary operation. Tablet hardness (SeU) shown in parenthesis.
442 Nash
.< 3000 ~ (20) out of specs--..~(18J ~(l5)@
2500~
~(10) ~~
2000 ®-P<V (14) 1 (12)
i ~(8)t 1500
U0 3 6 9 13 21
Blend Time (min.) XI
Figure 6 Optimization by random evolutionary operation. Tablet hardness (SeU) shown in parenthesis.
studies is to test the proposed upper and lower control limits and to determine those critical processing steps and process variables that affectend -product performance. In this connection. nonparametric methods.such as fractional factorial experimental designs and search methods likeEVOP and REVOP should prove useful in connection with process optimization and process capability testing which should be carried out prior to thestart of the more formal process-validation program.
X. PROCESS VALIDATION
The topic. process validation of tablets and other solid dosage forms hasbeen covered in separate articles by Nash [49.50]. Simmons [51]. vonDoehren et al , [52]. Rudolph [53]. and Avallone [10]. Chapman writesabout the possibility of conducting three different types of validation programs [39]. They may be defined briefly as:
1. Prospective Process Validation. Where an experimental plancalled the validation protocol is executed (following completion of the qualification trials) before the process is put to commercial use. Most validation efforts require some degree of prospective experimentation in order togenerate validation support data.
2. Concurrent Process Validation. Establishing documented evidencethat the process is in a state of control during the actual implementationof the process. This is normally performed by conducting in-process testing and/or monitoring of critical operations during the manufacture of eachproduction batch.
3. Retrospective Process Validation. Where historic data taken fromthe records of the completed production batches are used to provide documented evidence that the process has been in a state of control prior tothe request for such evidence.
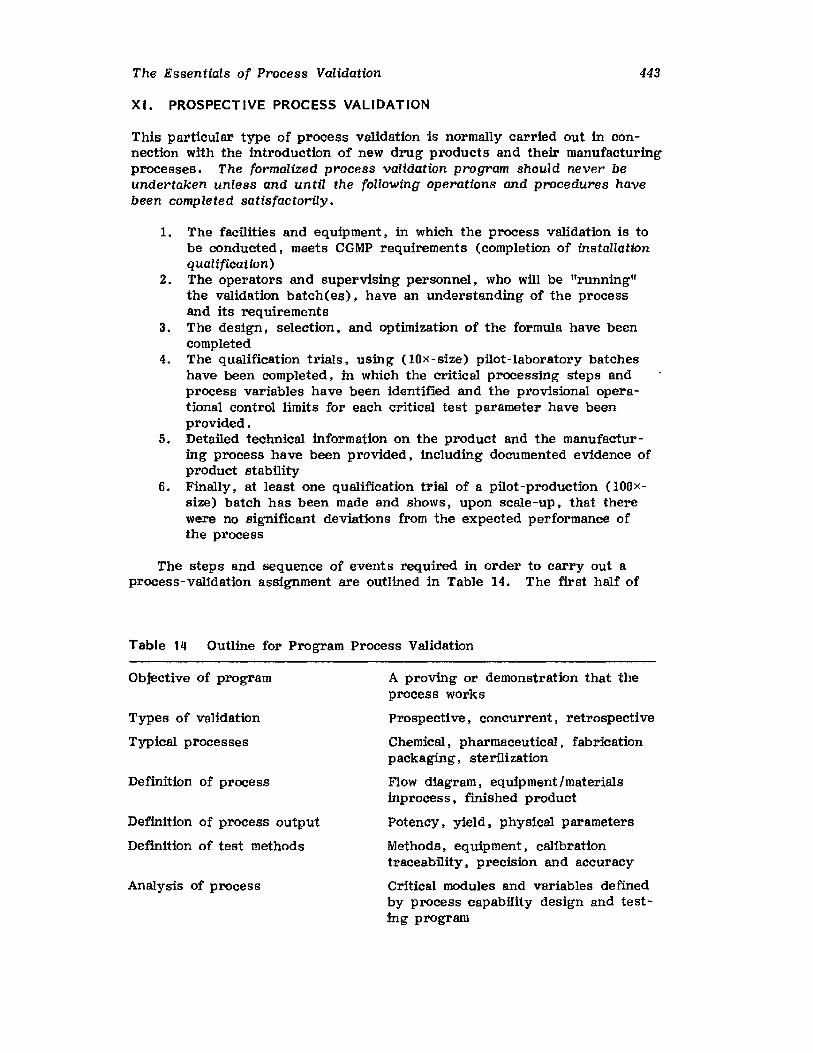
The Essentials of Process Validation
XI. PROSPECTIVE PROCESS VALIDATION
443
This particular type of process validation is normally carried out in connection with the introduction of new drug products and their manufacturingprocesses. The formalized process validation program should never beundertaken unless and until the following operations and procedures havebeen completed satisfactorily.
1. The facilities and equipment, in which the process validation is tobe conducted, meets CGMP requirements (completion of installationqualification)
2. The operators and supervising personnel, who will be "running"the validation batch(es), have an understanding of the processand its requirements
3. The design, selection, and optimization of the formula have beencompleted
4. The qualffication trials, using (lOx-size) pilot-laboratory batcheshave been completed, in which the critical processing steps andprocess variables have been identified and the provisional operational control limits for each critical test parameter have beenprovided.
5. Detailed technical information on the product and the manufacturing process have been provided. including documented evidence ofproduct stability
6. Finally. at least one quahficatlon trial of a pilot-production (lOOxsize) batch has been made and shows, upon scale-up, that therewere no significant deviations from the expected performance ofthe process
The step s and sequence of event s required in order to carry out aprocess-validation assignment are outlined in Table 14. The first half of
Table 14 Outline for Program Process Validation
Objective of program
Types of validation
Typical processes
Definition of process
Definition of process output
Definition of test methods
Analysis of process
A proving or demonstration that theprocess works
Prospective, concurrent, retrospective
Chemical, pharmaceutical, fabricationpackaging, sterilization
Flow diagram, equipment Imaterialsinprocess, finished product
Potency. yield, physical parameters
Methods. equipment. calibrationtraceability, precision and accuracy
Critical modules and variables definedby process capability design and testing program
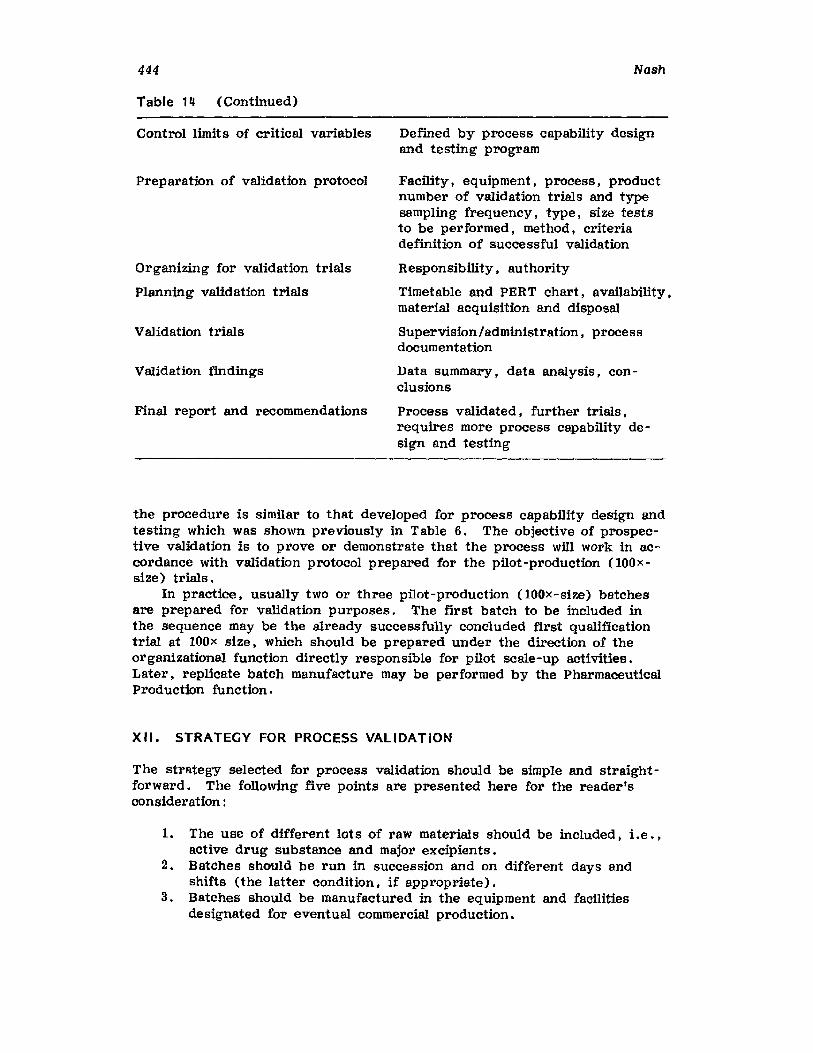
444 Nash
Table 14 (Continued)
Control limits of critical variables
Preparation of validation protocol
Organizing for validation trials
Planning validation trials
Validation trials
Validation findings
Final report and recommendations
Defined by process capability designand testing program
Facility. equipment. process. productnumber of Validation trials and typesampling frequency. type, size teststo be performed. method, criteriadefinition of successful validation
Responsibility. authority
Timetable and PER T chart, availability.material acquisition and disposal
Supervision /adminfstr-atfon , processdocumentation
Data summary, data analysis, conclusions
Process validated. further trials,requires more process capability design and testing
the procedure is similar to that developed for process capability design andtesting which was shown previously in Table 6. The objective of prospective validation is to prove or demonstrate that the process will work in accordance with validation protocol prepared for the pilot-production (lOOxsize) trials.
In practice. USUally two or three pilot-production (lOOx-size) batchesare prepared for validation purposes. The first batch to be included inthe sequence may be the already successfully concluded first qUalificationtrial at lOOx size. which should be prepared under the direction of theorganizational function directly responsible for pilot scale-up activities.Later, replicate batch manufacture may be performed by the PharmaceuticalProduction function.
XII. STRATEGY FOR PROCESS VALIDATION
The strategy selected for process validation should be simple and straightforward. The following five points are presented here for the reader'sconsideration:
1. The use of different lots of raw materials should be included. Le . ,active drug substance and major excipients.
2. Batches should be run in succession and on different days andshifts (the latter condition, if appropriate).
3. Batches should be manufactured in the equipment and facilitiesdesignated for eventual commercial production.
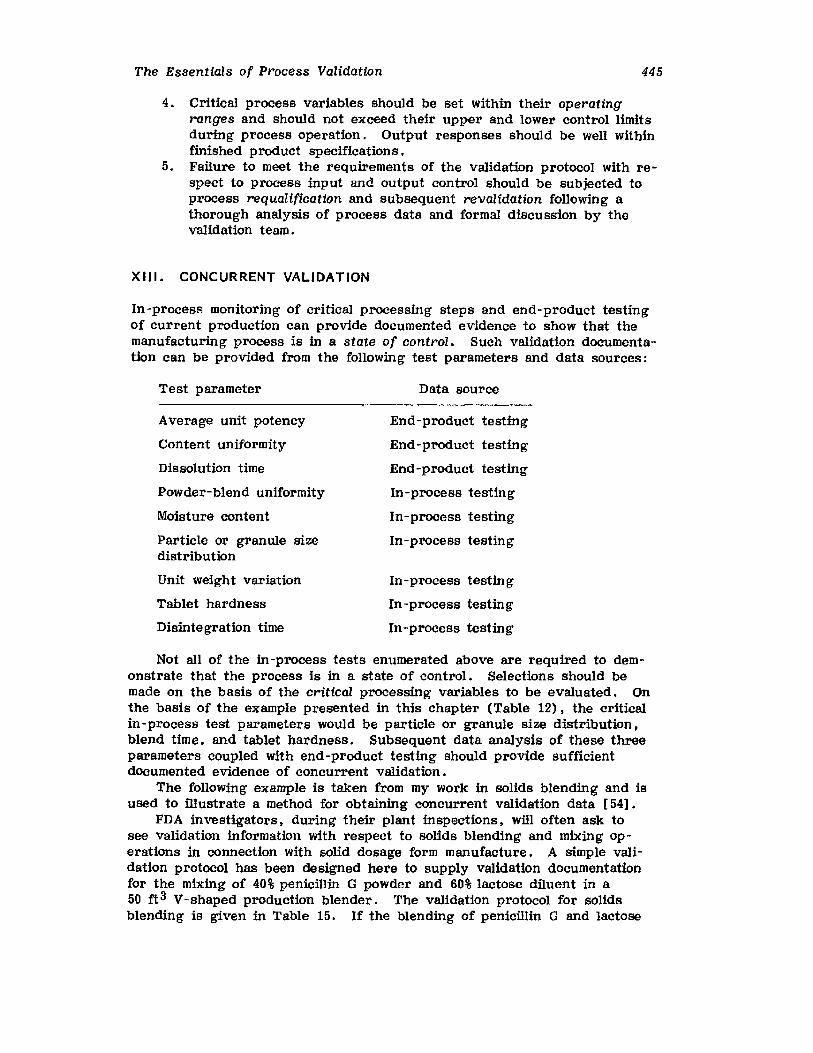
The Essentials of Process Validation 445
4. Critical process variables should be set within their operatingranges and should not exceed their upper and lower control limitsduring process operation. Output responses should be well withinfinished product specifications.
5. Failure to meet the requirements of the Validation protocol with respect to process input and output control should be subjected toprocess requalification and subsequent revalidation following athorough analysis of process data and formal discussion by thevalidation team.
XIII. CONCURRENT VALIDATION
In-process monitoring of critical processing steps and end-product testingof current production can provide documented evidence to show that themanufacturing process is in a state of control. Such validation documentation can be provided from the following test parameters and data sources:
Test parameter
Average unit potency
Content uniformity
Dissolution time
Powder-blend uniformity
Moisture content
Particle or granule sizedistribution
Unit weight variation
Tablet hardness
Disintegration time
Data source
End-product testing
End-product testing
End-product testing
In-process testing
In-process testing
In -process testing
In-process testing
In -process testing
In-proeess testing
Not all of the in-process tests enumerated above are required to demonstrate that the process is in a state of control. Selections should bemade on the basis of the critical processing variables to be evaluated. Onthe basis of the example presented in this chapter (Table 12), the criticalin -process test parameters would be particle or granule size distribution,blend time. and tablet hardness. SUbsequent data analysis of these threeparameters coupled with end-product testing should provide sufficientdocumented evidence of concurrent validation.
The following' example is taken from my work in solids blending and isused to illustrate a method for obtaining concurrent validation data [54].
FDA investigators. during their plant inspections, will often ask tosee validation information with respect to solids blending and mixing operations in connection with solid dosage form manufacture. A simple validation protocol has been designed here to supply Validation documentationfor the mixing of 40% penicillin G powder and 60% lactose diluent in a50 ft3 V-shaped production blender. The validation protocol for solidsblending is given in Table 15. If the blending of penicillin G and lactose
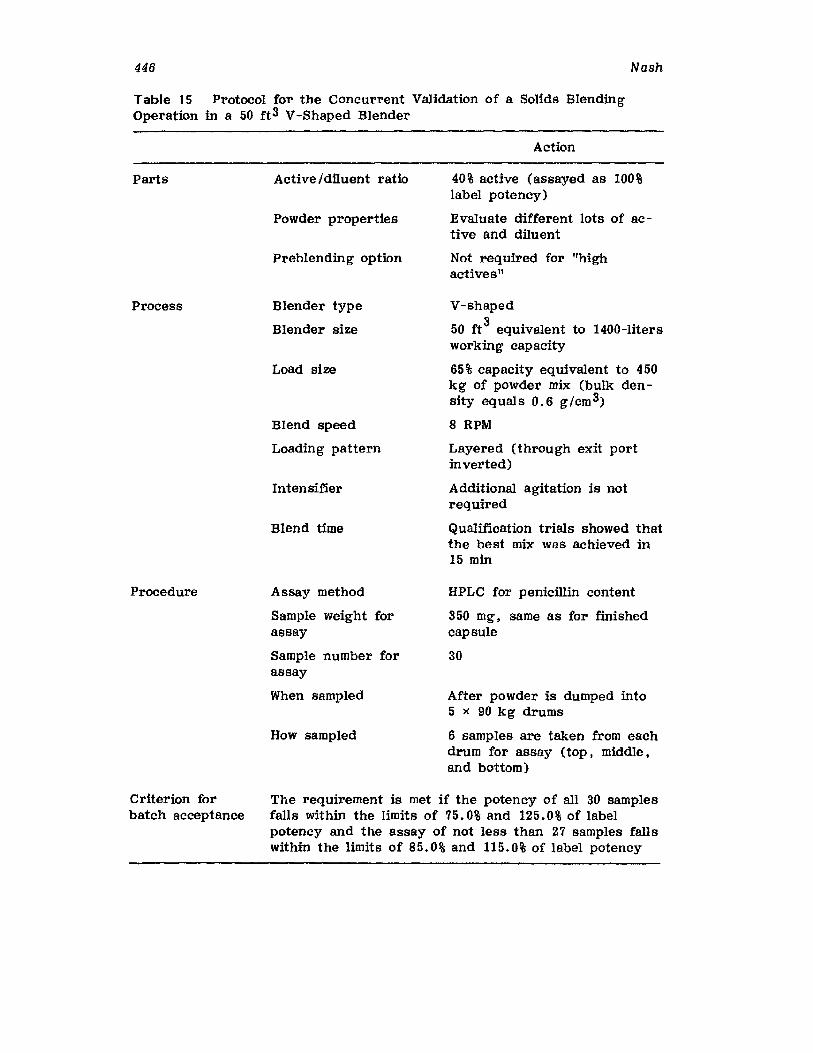
446
Table 15 Protocol for the Concurrent Validation of a Solids BlendingOperation in a 50 ft 3 V-Bhaped Blender
Action
Nash
Parts
Process
Procedure
Active Idiluent ratio
Powder properties
Preblending option
Blender type
Blender size
Load size
Blend speed
Loading pattern
Intensifier
Blend time
Assay method
Sample weight forassay
Sample number forassay
When sampled
How sampled
40% active (assayed as 100%label potency)
Evaluate different lots of active and diluent
Not required for "highactives"
V-shaped
50 ft 3 equivalent to 1400-litersworking capacity
65% capacity equivalent to 450kg of powder mix (bulk density equals 0.6 g/cm 3)
8 RPM
Layered (through exit portinverted)
Additional agitation is notrequired
Qualification trials showed thatthe best mix was achieved in15 min
HPLC for penicillin content
350 mg. same as for finishedcapsule
30
After powder is dumped into5 x 90 kg drums
6 samples are taken from eachdrum for assay (top, middle.and bottom)
Criterion forbatch acceptance
The requirement is met if the potency of all 30 samplesfalls within the limits of 75.0% and 125.0% of labelpotency and the assay of not less than 27 samples fallswithin the limits of 85.0% and 115.0% of label potency
The Essentials of Process Validation 447
was determined to be a critical processing step in the manufacture of penicillin hard-shell capsules, then the protocol presented in Table 15 couldbe used to monitor blend uniformity on either a regular or intermittentbasis. In either case the in -process test method so devised from the following protocol could be considered to be an example of concurrentvalidation.
XIV. RETROSPECTIVE VALIDATION
The retrospective validation option is chosen for established products wheretheir manufacturing processes are considered to be stable (Le., longhistory state-of-control operation) and where, on the basis of economicconsiderations alone and resource limitations, prospective qualification, andvalidation experimentation cannot be justified. Prior to undertaking retrospective validation, wherein the numerical in-process and/or end-producttest data of historic production batches are subjected to statistical analysis,the equipment, facilities, and subsystems used in connection with the manufacturing process must be qualified and validated in conformance withCGMP requirements.
The concept of using accumulated final product as well as in-processnumerical test data and batch records to provide documented evidence ofproduct and/or process validation was originally advanced by Meyers [55]and Simms [56J of Eli Lilly and Company in 1980. Retrospective validationhas gained wide acceptance since that time, and the topic has been covered adequately in separate articles by Agalloco [57J and Trubinski andMajeed [58]. The concept is also recognized in FDA's Guideline on General Principle of Process Validation [1J.
Using either data-based computer systems [59,60J or manual methods,retrospective Validation may be conducted in the following manner:
1. Gather the numerical values from the completed batch record andinclude assay values, end-product test results, and in-processdata.
2. Organize these data in a chronological sequence, according tobatch manufacturing data using a spread-sheet format.
3. Include data from at least the last 20- 30 manufactured batches foranalysis. If the number of manufactured batches is less than 20,then include all manufactured batches in your analysis.
4. Trim the data by eliminating test results from noncritical processing steps and delete all gratuitous numerical information.
5. Subject the resultant data to statistical analysis and evaluation ,6. Draw conclusions as to the state of control of the manufacturing
process based upon the analysis of retrospective validation data.7. Issue a report of your findings (documented evidence).
The following output data (measured responses) from the manufacturing process are usually selected for statistical analysis:
1. Individual assay results from content uniformity testing2. Individual tablet hardness values3. Dissolution time at t 50%

448 Nash
The statistical methods that may be employed to analyze numerical output data from the manufacturing process are listed as follows:
1. Basic statistics (mean, standard deviation, and tolerance limits)[45J
2. Analysis of variance (ANOVA and related techniques) [45J3. Regression analysis [45]4. Cumulative sum analysis (Cusum) [61J5. Cumulative difference analysis [56]6. Control charting (averages and range) [62.63]
Control charting; with the exception of basic statistical analysis, is probably the most useful statistical technique one might use to analyze retrospective and concurrent process data. Control charting forms the basisof modern statistical process control.
XV. CONTROL CHARTING
A detailed discussion of control charting and its use for the analysis ofretrospective production-batch data are given in the following references[56.63 - 65] . The control chart is used to decide periodically whether aprocess is in statistical control. The use of such a technique facilitatesthe detection and possible elimination of assignable causes of process variation. The use of control charts (for averages) is considered to be thebest statistical tool available for establishing, monitoring, and verifying aValidated product and/or manufacturing process. The control chart, asdevised by Shewhart (Bell Telephone Labs) in 1930, is a graphic presentation on which the numerical values of the test parameters (process outputs) of for example a tablet (potency. hardness. disintegration time, dissolution time. or weight variation) under investigation are plotted se-quentially. _
The control chart consists of a central line or grand average (X) anda control limit line above (UCL) and below (LCL) the central line. These:two control or action limits represent ±3 sigma (standard deviations) aboutX• Occasionally ±2 sigma warning or inner control limits are used to alertthe user of possible trends or systematic deviations in the process data.In either case. the distribution of the plotted numerical values (one valuefor each lot or batch) with respect to the control limits provides valuablestatistical information about the quality of the process outputs and theprocess itself.
In theory. using ±3 sigma control limits, if the individual lot of batchaverages were plotted over time on the graph or chart. one would expect,according to this statistic, that 99% of the individual lot averages wouldlie within the control limits. If appreciably more than 1% fell outside theselimits, one could then conclude that the process was not in (statistical)control on a lot-to-Iot or batch-to-batch basis. If, on the other hand, allof the 99% of the batch averages were within the limits, it then would provide supportive documented evidence of state-of-control process validation.
In addition, the following rules have been developed to detect shifts ortrends in the process batch-to-batch averages in order to avoid the possibility of a process tending to go out of control:
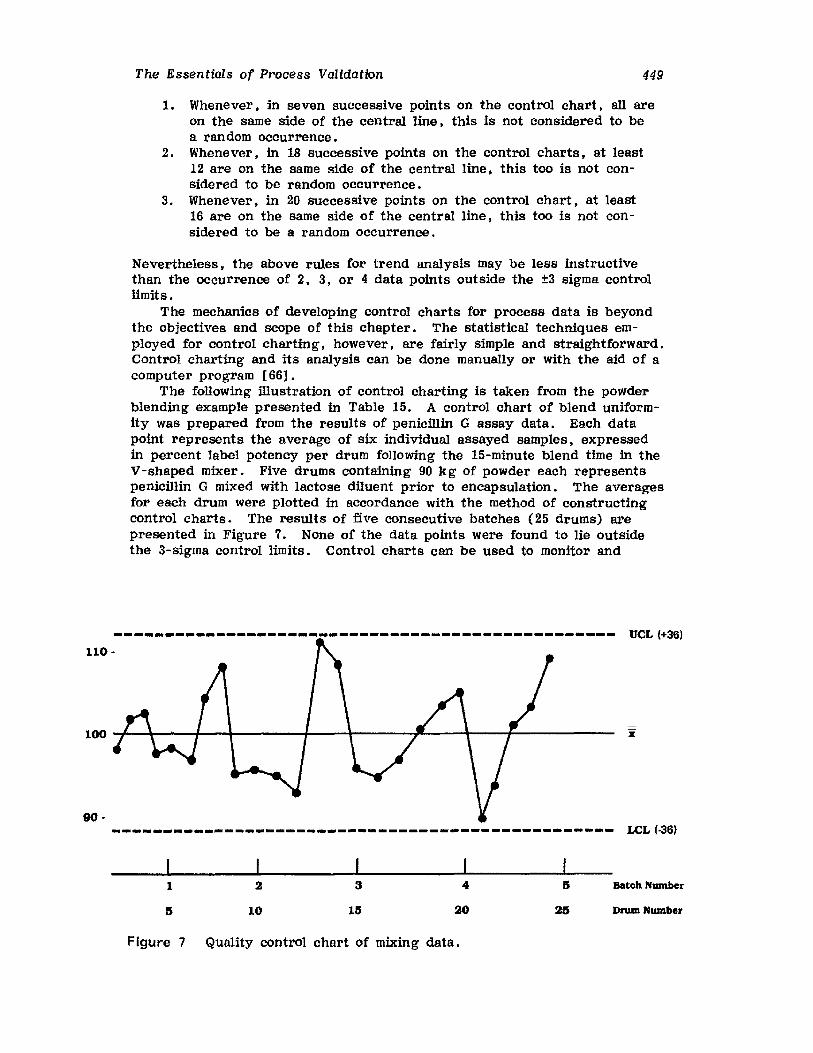
The Essentials of Process Validation 449
1. Whenever, in seven successive points on the control chart. all areon the same side of the central line. this is not considered to bea random occurrence.
2. Whenever, in 18 successive points on the control charts. at least12 are on the same side of the central line, this too is not considered to be random occurrence.
3. Whenever, in 20 successive points on the control chart, at least16 are on the same side of the central line. this too is not considered to be a random occurrence.
Nevertheless. the above rules for trend analysis may be less instructivethan the occurrence of 2, 3, or 4 data points outside the ±3 sigma controllimits.
The mechanics of developing control charts for process data is beyondthe objectives and scope of this chapter. The statistical techniques employed for control charting I however, are fairly simple and straightforward.Control charting and its analysis can be done manually or with the aid of acomputer program [66].
The following illustration of control charting is taken from the powderblending example presented in Table 15. A control chart of blend uniformity was prepared from the results of penicillin G assay data. Each datapoint represents the average of six individual assayed samples, expressedin percent label potency per drum following the I5-minute blend time in theV-shaped mixer. Five drums containing 90 kg of powder each representspenicillin G mixed with lactose diluent prior to encapsulation. The averagesfor each drum were plotted in accordance with the method of constructingcontrol charts. The results of five consecutive batches (25 drums) arepresented in Figure 7. None of the data points were found to lie outsidethe 3-sigma control limits. Control charts can be used to monitor and
---------------------...--------------------------- ueL (+36)110-
100 -+--\---~.....__+----+_-_t---~~-+-__,f_-----
90 .------------------------------------------------- .LCL (-36}
1
5
2
10
3
15
4
20
5
25
Batch Number
Drum Number
Figure 7 QUality control chart of mixing data.
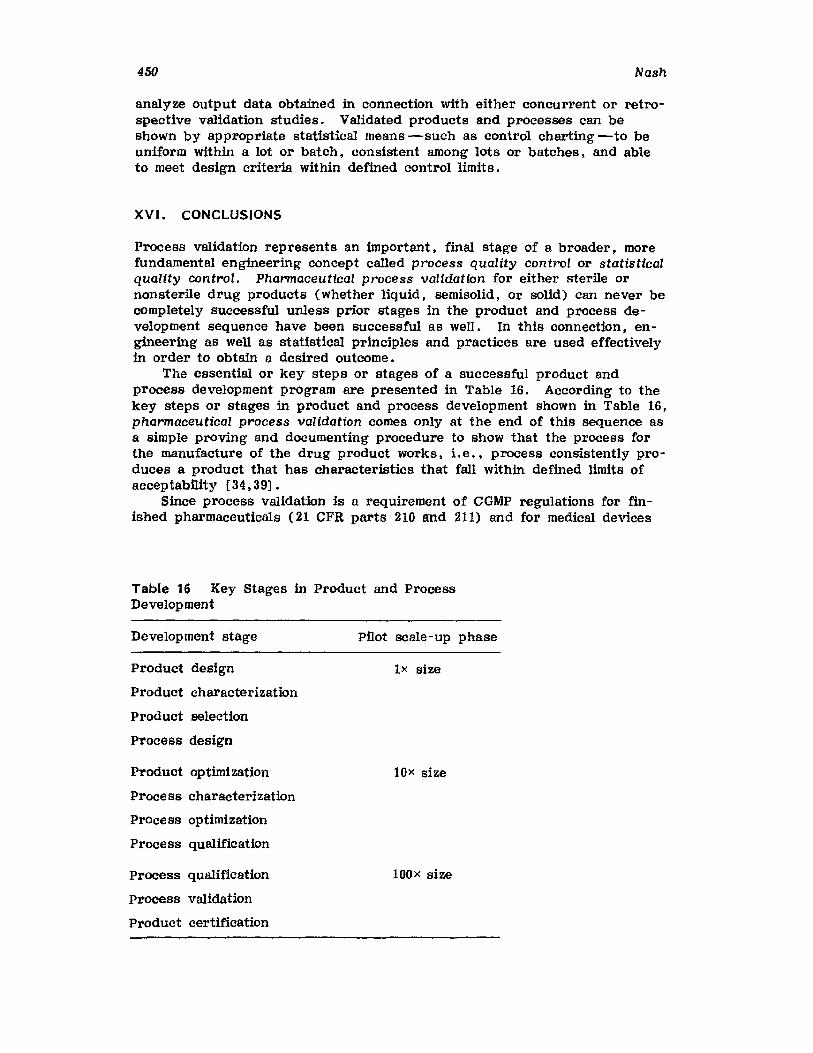
450 Nash
analyze output data obtained in connection with either concurrent or retrospective validation studies. Validated products and processes can beshown by appropriate statistical means -such as control charting -to beuniform within a lot or batch, consistent among lots or batches, and ableto meet design criteria within defined control limits.
XVI. CONCLUSIONS
Process validation represents an important, final stage of a broader, morefundamental engineering concept called process quality control or statisticalquality control. Pharmaceutical process validation for either sterile ornonsterile drug products (Whether liquid, semisolid, or solid) can never becompletely successful unless prior stages in the product and process development sequence have been successful as well. In this connection, engineering as well as statistical principles and practices are used effectivelyin order to obtain a desired outcome.
The essential or key steps or stages of a successful product andprocess development program are presented in Table 16. According to thekey steps or stages in product and process development shown in Table 16,pharmaceutical process validation comes only at the end of this sequence asa simple proving and documenting procedure to show that the process forthe manufacture of the drug product works. Le .• process consistently produces a product that has characteristics that fall within defined limits ofacceptability [34.39].
Since process Validation is a requirement of CGMP regulations for finished pharmaceuticals (21 CFR parts 210 and 211) and for medical devices
Table 16 Key Stages in Product and ProcessDevelopment
Development stage
Product design
Product characterization
Product selection
Process design
Product optimization
Process characterization
Process optimization
Process qualification
Process qua1ification
Process Validation
Product certification
pilot scale-up phase
Ix size
lOx size
lOOx size
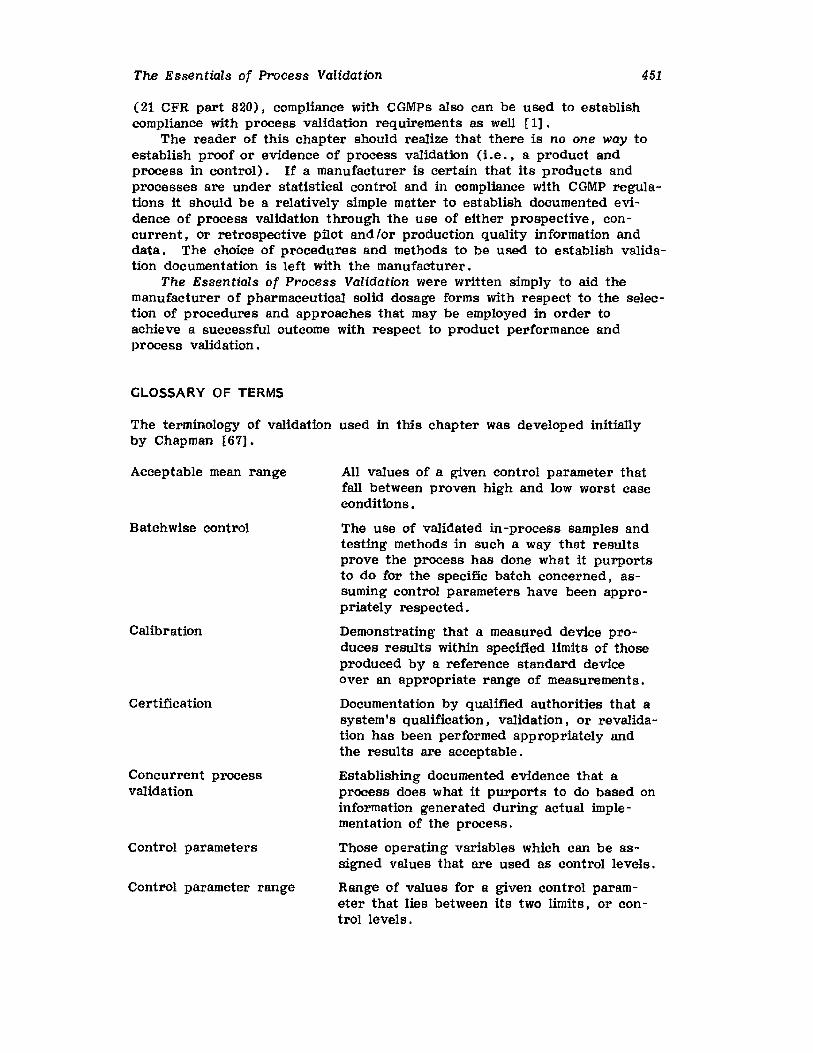
The Essentials of Process Validation 451
(21 CFR part 820), compliance with CGMPs also can be used to establishcompliance with process validation req uirements as well [1].
The reader of this chapter should realize that there is no one way toestablish proof or evidence of process validation (i.e., a product andprocess in control). If a manufacturer is certain that its products andprocesses are under statistical control and in compliance with CGMP regulations it should be a relatively simple matter to establish documented evidence of process validation through the use of either prospective, concurrent, or retrospective pilot and/or production qualrty information anddata. The choice of procedures and methods to be used to establish validation documentation is left with the manufacturer.
The Essentials of Process Validation were written simply to aid themanufacturer of pharmaceutioal solid dosage forms with respect to the selection of procedures and approaches that may be employed in order toachieve a successful outcome with respect to product performance andprocess validation.
GLOSSARY OF TERMS
The terminology of validation used in this chapter was developed initiallyby Chapman [67J.
Acceptable mean range
Batchwise control
Calibration
Certification
Concurrent processValidation
Control parameters
Control parameter range
All values of a given control parameter thatfall between proven high and low worst caseconditions.
The use of validated in -process samples andtesting methods in such a way that resultsprove the process has done what it purportsto do for the specific batch concerned, assuming control parameters have been appropriately respected.
Demonstrating that a measured device produces results within specified limits of thoseproduced by a reference standard deviceover an appropriate range of measurements.
Documentation by qualified authorities that asystem's qualification, validation, or revalidation has been performed appropriately andthe results are acceptable.
Establishing documented evidence that aprocess does what it purports to do based oninformation generated during actual implementation of the process.
Those operating variables which can be assigned values that are used as control levels.
Range of values for a given control parameter that lies between its two limits, or control levels.
452
Critical process parameter
Edge-of-failure
GMP
Installation qualification
Module
Operating variables
Operation qualification
Policy
Procedure
Process life cycle
Process parameters
Process validation
Process validation program
Prospective processvalidation
Protocol
Quality assurance
Nash
Those process parameters which are deemedimportant to product fitness-for-use.
Control parameter value which, if exceeded,means adverse effect on state-of-controland/or fitness-for-use.
Good manufacturing practices.
Documented verification that all key aspectsof the installation adhere to approved designintentions and that manufacturer's recommendations are suitably considered.
Subdivision of system or process into unitoperations or tasks.
All factors, including control parameters,which may potentially affect process stateof-control and/or fitness-for-use of the endproduct.
Documented verification that the system orsubsystem performs as intended throughoutall anticipated operating ranges; sometimescalled performance qualifications.
A directive usually specifying what is to beaccomplished.
A directive usually specifying how certainactivities are to be accomplished.
Time span from early stages of developmentuntil commercial use of the process isdiscontinued.
Those process operating variables which canbe assigned values that are used as controllevels or operating limits.
Establishing documented evidence that aprocess does what it purports to do.
Collection of activities which include and arespecifically related to process validation itself.
Establishing documented evidence that aprocess does what it purports to do based ona preplanned validation protocol.
A prospective experimental plan which, whenexecuted, is intended to produce documentedevidence that the system has been validated.
The activity of providing, to all concerned,the evidence needed to establish confidencethat the quality function is being performedadequately.
The Essentials of Process Validation 453
Quality function
Retrospective processvalidation
Revalidation
State-of-control
Sterilization process
Validation
Validation change control
Worst case
REFERENCES
The entire collection of activities from whichindustry achieves fitness-for-use, no matterwhere these activities are performed.
Establishing documented evidence that aprocess does what it purports to do basedon review and analysis of historic information. It is important that the terms retroactive and retrospective are not confused.Retroactive validation would imply that aprocess is validated after its product hasentered the marketplace.
Repetition of the validation process or aspecific portion of it.
A condition in which all process parametersthat can affect performance remain withinsuch ranges that the process performs consistently and as intended.
Treatment process from which probabilityof a microorganism's survival is less thanone in a million (10- 6) •
Establishing documented evidence that a system does what it purports to do.
Formal monitoring system by which qualifiedrepresentatives of appropriate disciplines review proposed or actual changes that mightaffect validated status and cause correctiveaction to be taken that will ensure that thesystem retains its validated state-of-control.
Highest or lowest value of a given controlparameter actually evaluated in a Validationexercise.
1. Guidelines on General Prtnciples of Process Validation, Division ofManufacturing and Product QUality (HFN-320) Center for Drugs andBiologics (FDA), Rockville, Maryland, May 1986.
2. Current Good Manufacturing Practices in Manufacture, Processing,Packaging and Holding of Human and Veterinary Drugs, FederalRegister 43( 190), 45085 and 45086, September 1978.
3. Pharmaceutical Process Validation, B. T. Loftus and R. A. Nash, eds.,Marcel Dekker, New York, 1984.
4. Ralston, A. H. and Ricigliano, J. V., Planning for commissioning andvalidation of pharmaceutical building systems, Pharm. Eng., July I Aug.(1988) .
5. Estes, G. K. and Luthell , G. H., An approach to process validationin a multiproduct pharmaceutical plan. Pharm. Tech., April (1983).
6. Hess, A., An integrated approach to Validation, BioPharm., March(1988) .
454 Nash
7. Cipriano, P. A., Designing clean rooms for FDA process Validation,BioPharm., June (1983).
8. Harder, S. W., The validation of cleaning procedures, BioPharm.,May (1984).
9. Berry, I. R., Process validation of raw materials, PharmaceuticalProcess Validation, Op , Cit.
10. Avallone, H. L., The primary elements of validation of solid oral andtopical dosage forms, Pharm. Eng., January (1985).
11. Motise, P. J., What to expect when FDA audits computer-controlledprocesses, Pharm. Mfg., July (1984).
12. Wolber, P. and Dosmar, M., Depyrogenation of pharmaceutical solutions by ultrafiltration: Aspects of validation, Piuirm, Tecti, ,September (198 7) .
13. Stellon, R. C., Sterile packaging: Process validation and GMP requirements, MD&DI, October (1986).
14. Cipriano, P. A., Process validation begins with initial plant design,Pharm, Eng., May/June (1982).
15. Williams, D. R., An overview of test method validation, BioPharm.,November (198 7) .
16. Kahan, J. S., Validating computer systems, MD&DI, March (1987).17. Concepts for reprocessing drug products, PMA Committee Report,
Pharm. Tech., September (1985).18. Protection of water treatment systems: Validation and control, PMA
Committee Report, Pharm. Tech., September (1984).19. Validation and control concepts for water treatment systems, PMA
Committee Report, Pharm. Tech., November (1985).20. Cattaneo, D. J., HVAC and the clean room, Pharm. Eng., November /
December (1984).21. Proceedings of Third PMA Seminar on Validation of Sterile Manu
facturing Processes, Lincolnshire, Illinois, February 1980.22. Validation of Aseptic Pharmaceutical Processes, F. J. Carleton and
J. P. Agalloco, eds , , Marcel Dekker, New York, 1986.23. Simmons, P. L., Sterilizer validation, Pharm. Tech: , April (1979).24. Vogel, D. G., Schmidt, W. C., and Sanford, B. G., A computer
interface for sterilization validation, Pborm, Tech., June (1984).25. Nash, R. A., A method for calculating thermal sterilization condi
tions based upon process parametrics, J. Parent. Sci. Tecn; , 39:251-255 (985).
26. Wasynczuk, J., Validation of aseptic filling processes, Pharm. Tech ••May (1986).
27. Cabernoch, J. L., Materials qualification and design for medical device packaging, MD&DI, August (1982).
28. Olson, W. P., Validation and qualification of filtration systems forbacterial removal, Pharm. Tech., November (1979).
29. Goldsmith, S. H. and Grundelman, G. P., Validation of pharmaceuticalfiltration products, Pharm. Mfg., November (1985).
30. Bader, M. E., Quality assurance and quality control (in four parts),Chem. Eng. (l980).
31. Organizing for Validation, Proceedings of PMA Seminar on Validationof Solid Dosage Form Processes, Atlanta, Georgia, May 1980.
32. Chapman, K. G.. a private communication.
The Essentials of Process Validation 455
33. Nash, R. A., Product formulation, CHEMTECH, April (1976).34. Concept Development in Process Validation Seminars by R. F.
Johnson, P.E., Quality Systems & Tech., P.O. Box 29, Naperville,Illinois 60566.
35. Chao, A. Y., St. John Forbes, F., Johnson, R. F., andvon Doehren, P., Prospective process validation, PharmaceuticalProcess Validation, Op. Cit.
36. Williams, J. J. and Stiel, D. M., An intelligent tablet press monitorfor formulation development, Pharm. Tech., March (1984).
37. Box, G. E., Hunter, W. G., and Hunter, J. S., Statistics forExperimenters, Wiley, New York, 1978.
38. Hendrix, C. D., What every technologist should know about ex perimental design, CHEMTECH, March (1979).
39. Schwartz, J. B., Klamholz , J. R., and Press, R. H., Computer optimization of pharmaceutical formulations, J. Pharm. Sci., 62:1165 -1170 (1973).
41. Cooper, L. and Steinberg, D., Introduction to Methods of Optimization, Saunders, Philadelphia, 1970.
42. O. L. Davies (ed.), The Design and Analysis of Industrial Experiments, Macmillan (Hafner), New York, 1967.
43. Fonner, D. E., Buck, J. R., and Banker, G. S., Mathematicaloptimization techniques in drug product design and process analysis,J. Pharm. Sci., 59: 1587 - 1596 (1970).
44. Schwartz, J. B., Optimization techniques in product formulation,J. Soc. Cosmet. Chem., 32:287-301 (1981).
45. Bolton, S., Pharmaceutical Statistics, Practical and Clinical Applications, 2nd Ed., Marcel Dekker, New York, 1990.
46. Hill, R. A., Process improvement by evolutionary operation, Amer.Perf. Cosm., September (1965).
47. Hahn, G. J., Process improvement through simplex EVOP, CHEMTECH ,May (1976).
48. F. E. Satterthwaite, Seminars on REVOP, Statistical EngineeringInstitute, Wellsley Hills, Massachusetts (1970).
49. Nash, R. A., Process validation for solid dosage forms, Pharm. Tech.,June (1979).
50. Nash, R. A., Process validation: Solid dosage forms, Drug CosmoInd •• September (1981).
51. Simmons, P., Solid process validation, Pharm. Eng., August /October(1981) .
52. von Doehren, P. J., St. John Forbes, F.. and Shively, C. D •• Anapproach to the characterization and technology transfer of soliddosage form processes, Pharm. Tech., June (1984).
53. Rudolph, J. S., Validation of solid dosage forms, PharmaceuticalProcess Validation, Op , Cit.
54. Nash, R. A., A validation experiment in solids blending, Pharm. Eng.,July/August (1985).
55. Meyer, R. J. , Validation of products and processes from a production,quality control viewpoint, PMA Seminar on Validation of Solid DosageForm Process, Atlanta, Georgia, May 1980.
56. Simms. L., Validation of existing products by statistical evaluation,Op. Cit.
456 Nash
57. Agalloco, J. P., Practical considerations in retrospective validation,Phar7rl. Tech., June (1983).
58. Trubinski, C. J. and Majeed, M., Retrospective process validation,Pharmaceutical Process Validation, Op. Cit.
59. Kuzel, N. R .• Fundamentals of computer system validation and documentation in the pharmaceutical industry, Pharm. Tech •• September(1985) •
60. Fraade, D. J.. The application of digital control systems in thepharmaceutical industry, Pharm. Mfg .• May (1984).
61. Butler, J. J., Statistical quallty control with CUSUM charts, Chem.Eng., August (1983).
62. Deming, S. N., Quality by design, Chemtech, September (1988).63. Contino, A. V., Improved plant performance with statistical process
control, Chem. Eng., July (1987).64. Ott, E. R., Process Quality Control, McGraw-Hill, New York, 1975.65. Cheng, P. H. and Dutt, J. E., Analysis of retrospective production
data using quality control charts, Pharmaceutical Process Validation,Op. Cit.
66. Ouehi , G., Control charting with Lotus 1-2 - 3, Amer. Lab., 19( 2) :82 -95 (1987).
67. Chapman, K. G., A suggested validation lexicon, Pharm. Tech.,September (198 5) .
8Stability Kinetics
Samir A. Hanna
Bristol-Myers Squibb Company, Syracuse, New York
I. INTRODUCT ION
Moral, legal, and economic reasons have been advanced for the need toverify the stability of drug products. Tablets of a particular formulationin a specific container are defined as stable if they remain within theirphysical, chemical, therapeutic, and toxicological specifications during theirdesignated shelf life.
II. CURRENT GOOD MANUFACTURINGPRACTICES REQUIREMENTS
The legal requirements stem from the Federal Food, Drug. and CosmeticAct and the Current Good Manufacturing Practices Regulations (CGMPs) aspublished in the Federal Register on March 28, 1979, and Title 21, Code ofFederal Regulations. The CGMPs state that there shall be assurances ofstability of the finished product and suitable expiration date, based on appropriate stability studies and related to specific storage conditions placedon the label. Stability tests are to be performed on tablets in their finished marketed container using reliable and specific test methods. EffectiveSeptember 28, 1979, all drug labels for tablets, prescription and nonprescriptions, are required to state the product's expiration date; i.e., thetime after which the drug can no longer be considered within the legal potency requirement.
III. CaMPENDIAL REQUIREMENTS
The United States Pharmacopeia/National Formulary (USP/NF) has requiredexpiration dates on all monograph drugs since January 1, 1976. The
457
458 Hanna
USP/NF states that for pharmacopeia tablets, the label shall bear an expiration date limiting the period during which the tablet may be expectedto retain the full label potency of the active ingredient provided the tabletis stored as directed. A set of label storage temperatures is provided bythe USP INF to cover the various types of storage conditions. These inelude: store in a freezer not exceeding -lODe, store in a refrigeratorheld between 2 and 8oe . store in a cool place between 8 and 15°e. storeat controlled room temperature between 15 and 30°C, store at room temperature which is the temperature prevailing in a working area, protectfrom excessive heat as any temperature above 40°C, protect from light,protect from freezing, and protect from moisture or keep tightly closed.
IV. U.S. FOOD AND DRUG ADMINISTRATiONREQUIREMENTS
In 1971, the Food and Drug Administration (FDA) published a set of Guidelines: Manufacturing and Controls for IND's and NDA's which defines ingreater detail the stability information required for a new drug application.The guidelines were subsequently republished as part of the book, FDAIntroduction to Total Drug Quality in November 1973. In July 1976, theBureau of Veterinary Medicine published a set of proposed stability studyguidelines in greater detail. As an example of such detailed requirements,the stability data generated from a tablet formulation under acceleratedconditions must be statistically related to shelf-life storage conditions. Itwould be desirable to have the degradation products quantitatively identified, the precurosors and degradation kinetics presented. Tablet physicalparameters recommended for testing at IND phase III are surface appearance, friability, fragility. hardness. disintegration. color. weight variation.odor. moisture, and dissolution rate.
In February 1987. the FDA published Guideline for Submitting Documentation for the Stability of Human Drugs and Biologics. These guidelines recommended that tablets stability studies should include tests for appearance, friability, hardness, color, odor, moisture, strength, anddissolution.
Stability and expiration dating for antibiotics has been required sincetheir advent in the 1940s. The stability requirements are covered in a general way in the federal regulations for each antibiotic. Section 4 (Forms5 and 6) requests a complete description and data derived from stabilitystudies of the potency and physical characteristics of the drug. Data wereto be accumulated on at least three batches of the exact formulatton , Separate data on different types of containers. if any, were also requested.The marketing container is to be used for all the stability studies andunder the same conditions of storage and reconstitution time as specifiedon the label. A sufficient number of assays must be run at each time interval to establish an accurate result, especially at the initial assay. Accelerated data could be submitted only as supporting evidence.
V. REACTION K INET ICS IN SOLID-DOSAGE FORMS
When evaluating the stability of a tablet formulation. both physical andchemical properties must be thoroughly considered. The chemical causes
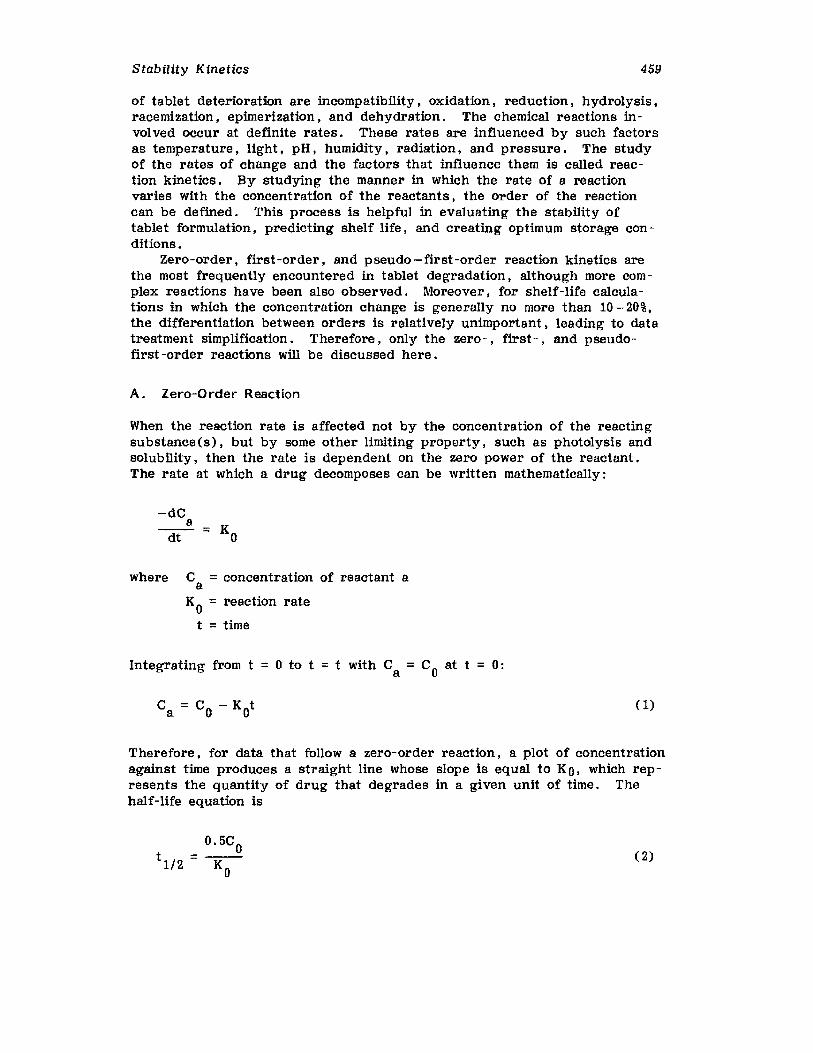
Stability Kinetics 459
of tablet deterioration are incompatibility. oxidation. reduction, hydrolysis.racemization. epimertaation , and dehydration. The chemical reactions involved occur at definite rates. These rates are influenced by such factorsas temperature, light. pH. humidity. radiation, and pressure. The studyof the rates of change and the factors that influence them is called reaction kinetics. By studying the manner in which the rate of a reactionvaries with the concentration of the reactants, the order of the reactioncan be defined. This process is helpful in evaluating the stability oftablet formulation, predicting shelf life, and creating optimum storage conditions.
Zero-order. first-order. and pseudo -first-order reaction kinetics arethe most frequently encountered in tablet degradation. although more complex reactions have been also observed. Moreover, for shelf-life calculations in which the concentration change is generally no more than 10 -20%.the differentiation between orders is relatively unimportant. leading to datatreatment simplification. Therefore. only the zero-, first-, and pseudofirst -order reactions will be discussed here.
A. Zero-O rder Reaction
When the reaction rate is affected not by the concentration of the reactingsubstanee Cs) , but by some other limiting property, such as photolysis andsolubility, then the rate is dependent on the zero power of the reactant.The rate at which a drug decomposes can be written mathematically:
-dCadt = KO
where C = concentration of reactant aaK0 = reaction rate
t =time
Integrating from t = 0 to t =t with Ca = Co at t = 0:
Therefore. for data that follow a zero-order reaction. a plot of concentrationagainst time produces a straight line whose slope is equal to KO. which represents the quantity of drug that degrades in a given unit of time. Thehalf-life equation is
0.5eot 1/ 2 =~ (2)
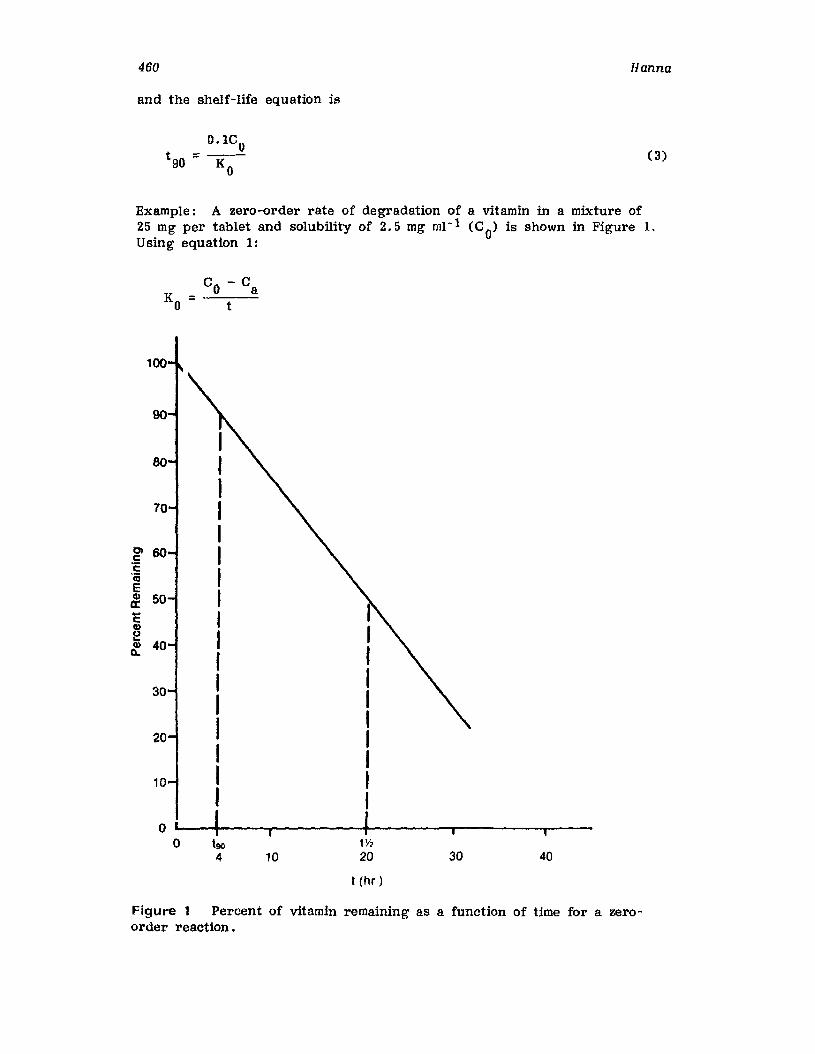
460
and the shelf-life equation is
Hanna
(3)
Example: A zero-order rate of degradation of a vitamin in a mixture of25 mg per tablet and solubility of 2.5 mg ml- 1 (CO) is shown in Figure 1.Using equation 1:
c - Co at
IIIII
0) Ic"c
I"1ijECD 50 Ia:- IeCDo
J~
40CD0. I
IIIIII
oW0 t90 tV,
4 10 20 30 40
t (hr )
Figure 1 Percent of vitamin remaining as a function of time for a zeroorder reaction.
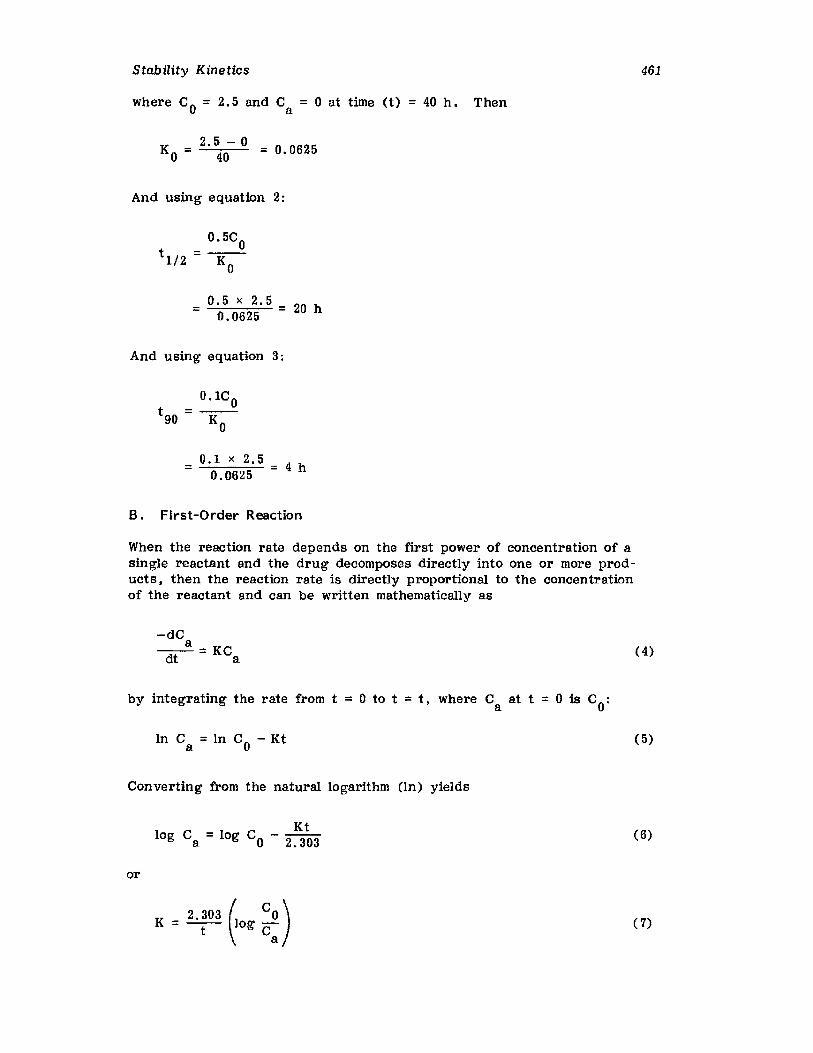
Stability Kinetics
where Co = 2.5 and Ca = 0 at time (t) = 40 h. Then
K = 2.5 - 0 0 0625o 40 =.
And using equation 2:
t 1/ 2
0.5CO=--Ko
0.5 x 2.520 h= =0.0625
And using equation 3:
O.lCO
t 90 = -K--0
0.1 x 2.54 h= =0.0625
B. First-Order Reaction
When the reaction rate depends on the first power of concentration of asingle reactant and the drug decomposes directly into one or more products, then the reaction rate is directly proportional to the concentrationof the reactant and can be written mathematically as
461
-dCa
~=KCa (4)
by integrating the rate from t = 0 to t = t , where Ca at t = 0 is CO:
In Ca = In Co - Kt ( 5)
Converting from the natural logarithm (In) yields
Ktlog Ca = log Co - 2.303
or
(6)
( 7)
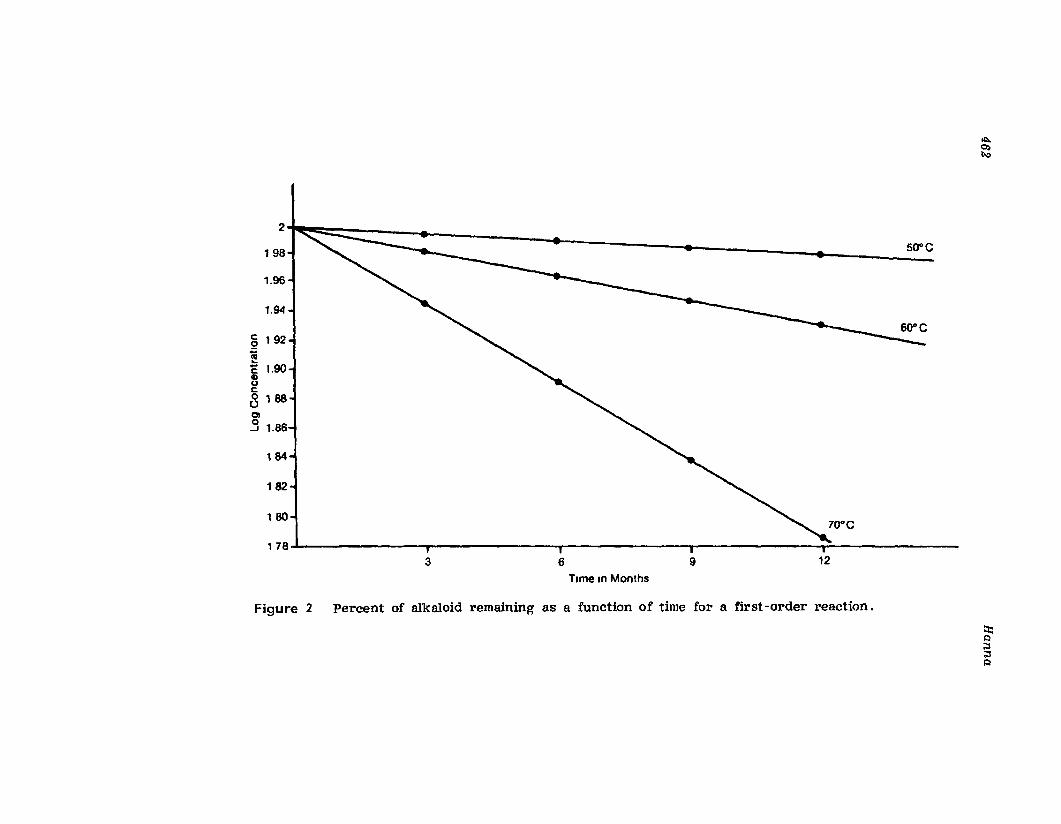
Ill>.Q)~
2
198J~ • • 50"C
1.96
1.94
§ 192lii...C 1.90CDuc:
8'88Cl
.3 1.86
184
182
180
1783 6 9 12
TIme 10Months
Figure 2 Percent of alkaloid remaining' as a function of time for a first -order reaction.
::r::~;:s;:s~
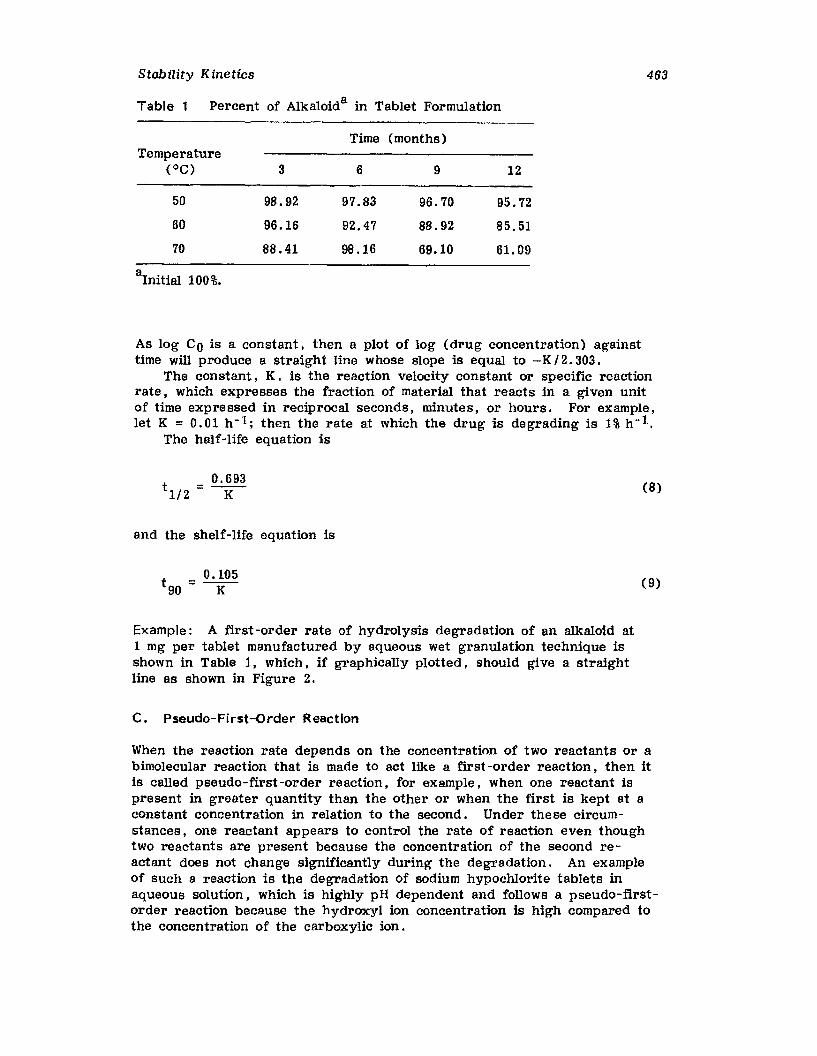
Stab ility Kinetics
Table 1 Percent of Alkaloida in Tablet Formulation
Time (months)Temperature
(OC) 3 6 9 12
50 98.92 97.83 96.70 95.72
60 96.16 92.47 88.92 85.51
70 88.41 98.16 69.10 61. 09
aInitial 100%.
463
As log Co is a constant I then a plot of log (drug concentration) againsttime will produce a straight line whose slope is equal to -K /2.303.
The constant, K. is the reaction velocity constant or specific reactionrate, which expresses the fraction of material that reacts in a given unitof time expressed in reciprocal seconds, minutes, or hours. For example,let K = 0.01 h -1; then the rate at which the drug is de grading is 1%h -1.
The half-life equation is
t =0.6931/2 K
and the shelf-life equation is
t = 0.10590 K
Example: A first-order rate of hydrolysis degradation of an alkaloid at1 mg per tablet manufactured by aqueous wet granulation technique isshown in Table 1, which. if graphically plotted I should give a straightline as shown in Figure 2.
C. Pseudo-First-Order Reaction
(8)
(9)
When the reaction rate depends on the concentration of two reactants or abimolecular reaction that is made to act like a first -order reaction. then itis called pseudo-first -order reaction. for example, when one reactant ispresent in greater quantity than the other or when the first is kept at aconstant concentration in relation to the second. Under these circumstances, one reactant appears to control the rate of reaction even thoughtwo reactants are present because the concentration of the second reactant does not change significantly during the degradation. An exampleof such a reaction is the degradation of sodium hypochlorite tablets inaqueous solution, which is highly pH dependent and follows a pseudo-firstorder reaction because the hydroxyl ion concentration is high compared tothe concentration of the carboxylic ion.
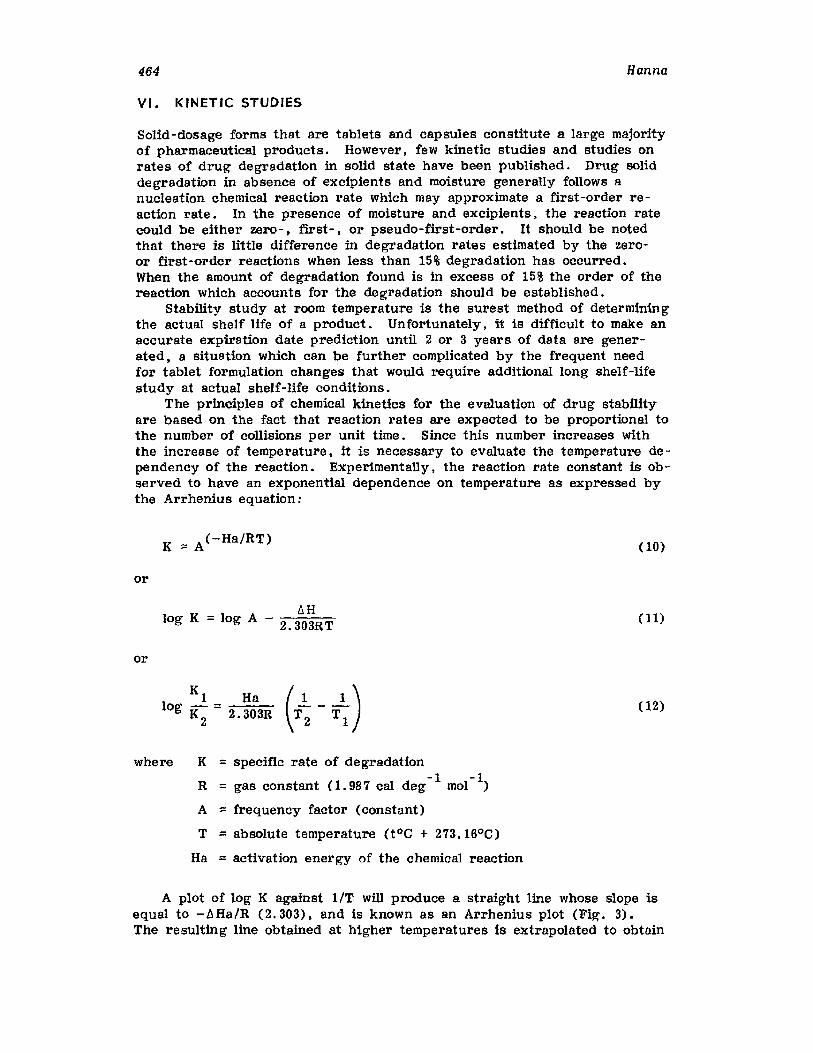
464 Hanna
VI. KINETIC STUDIES
Solid-dosage forms that are tablets and capsules constitute a large majorityof pharmaceutical products. However. few kinetic studies and studies onrates of drug degradation in solid state have been published. Drug soliddegradation in absence of excipients and moisture generally follows anucleation chemical reaction rate which may approximate a first-order reaction rate. In the presence of moisture and excipients, the reaction ratecould be either zero-. first-. or pseudo-first-order. It should be notedthat there is little difference in degradation rates estimated by the zeroor first-order reactions when less than 15% degradation has occurred.When the amount of degradation found is in excess of 15% the order of thereaction which accounts for the degradation should be established.
Stability study at room temperature is the surest method of determiningthe actual shelf life of a product. Unfortunately, it is difficult to make anaccurate expiration date prediction until 2 or 3 years of data are generated, a situation which can be further complicated by the frequent needfor tablet formulation changes that would require additional long shelf-lifestudy at actual shelf-life conditions.
The principles of chemical kinetics for the evaluation of drug stabilityare based on the fact that reaction rates are expected to be proportional tothe number of collisions per unit time. Since this number increases withthe increase of temperature, it is necessary to evaluate the temperature dependency of the reaction. Experimentally, the reaction rate constant is observed to have an exponential dependence on temperature as expressed bythe Arrhenius equation:
or
K ::: A (-Ha/RT) (10)
or
log K = log AlIH
2.303RT(11)
K1 Ha (1 1 )log K2 = 2. 303R T 2 - T1 (12)
where K = specific rate of degradation-1 -1
R = gas constant (1.987 cal deg mol )
A =frequency factor (constant)
T ::: absolute temperature (tOe + 273.16°e)
Ha = activation energy of the chemical reaction
A plot of log K against lIT will produce a straight line whose slope isequal to -lIHa/R (2.303), and is known as an Arrhenius plot (Fig-. 3).The reSUlting line obtained at higher temperatures is extrapolated to obtain
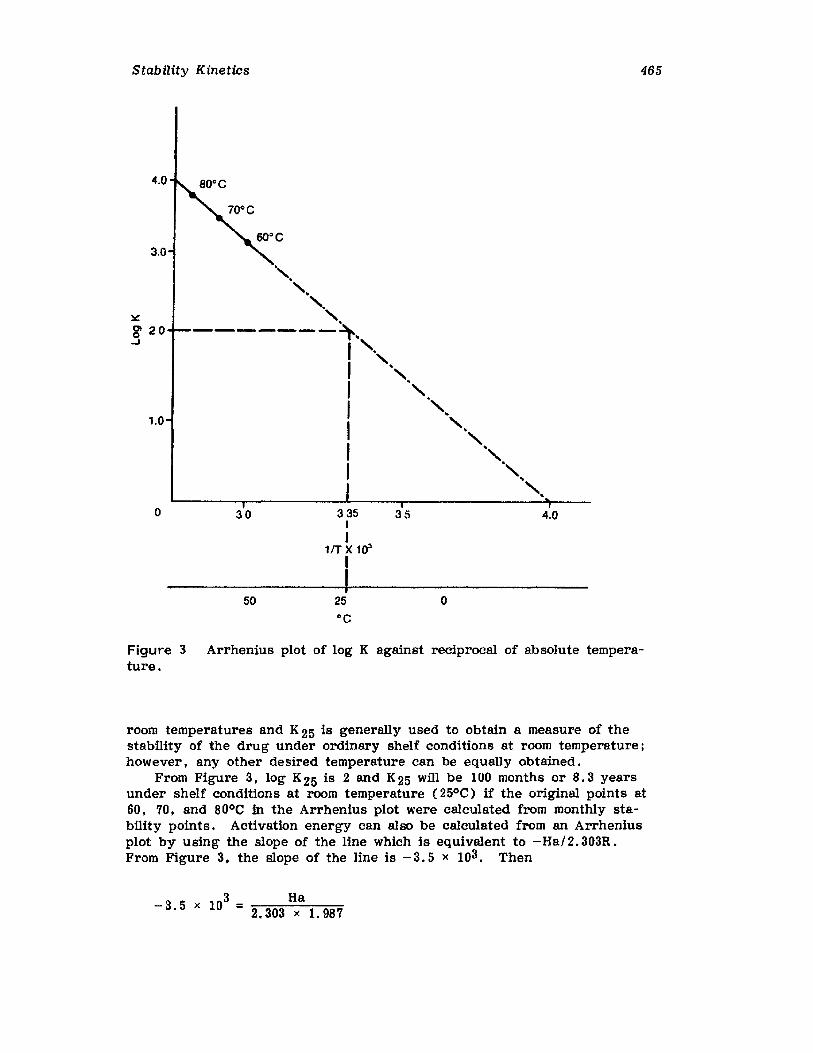
Stab ility Kinetics
4.0
3.0
1.0
465
o 30
50
335 35II
lIT X 103
I
I25 o
4.0
Figure 3 Arrhenius plot of log K against reciprocal of absolute temperature.
room temperatures and K 25 is generally used to obtain a measure of thestability of the drug under ordinary shelf conditions at room temperature;however, any other desired temperature can be equally obtained.
From Figure 3, log K25 is 2 and K25 will be 100 months or 8.3 yearsunder shelf conditions at room temperature (25°C) if the original points at60, 70, and 80°C in the Arrhenius plot were calculated from monthly stability points. Activation energy can also be calculated from an Arrheniusplot by using the slope of the line which is equivalent to -Ha/2.303R.From Figure 3, the slope of the line is - 3. 5 x 10³. Then
3 Ha-3.5 x 10 = 2.303 x 1.987
466
and
Ha =(-3.5 x 10³)(2.303)(1.987)
= 16.0 kcal/mOI- 1
Hanna
Arrhenius projection enables predictions to be made that are based onaccelerated data in such a way that any change in the relationship betweenthe degradation at different temperatures will be detected and estimated.For example, using equation 10 for the prediction of a tablet product expiration date at shelf storage (25°C) from accelerated stability study at40°C and activation energy of 10 keal Zmol ;
K =A(-Ha/RT1)40
and
K = A (-Ha/RT2)25
then
K 40 A (-Ha/RT1)
K25
:: A(-Ha/RT 2)
-1Assuming that Ha = 10 kcal/mol ,then T 1 = 273.15 + 40 = 313.15 andT
2= 273.15+ 25= 298.15.
K40
A-10,000/1,987(313.15)
K25
= A- 10, OOO/ 1. 98 7( 298 . 15)
= 2.24465
Shelf stability at 25°C = 12 x 2.245 = 26.94 months. Tablet productwith 10 kcal/mol- 1 activation energy of the chemical reaction and stable at40°C for 12 months will have an expiration date at shelf life (25°C) of27 months.
When reactant molecules, e. g., A + B, in a tablet formulation proceedsto products, e. g., C + D, the energy of the system must change higherthan that of the initial reactant and is defined as the activation energy(Ha) (Fig. 4).
The usual range for activation energies for tablet formulation decomposition is about 10-20 kcal/mor 1, except if diffusion or photolysis is ratedetermining. Then the rate is about 2 to 3 kcal Zmolr L, which rarely occursin tablet degradation. For reactions in which the heat activation energiesrange is more than 50 kcal Zmol r l , the rate of degradation is not of anypractical significance at the temperature of shelf-life storage of tabletformulations. For tablets with activation energy values higher than
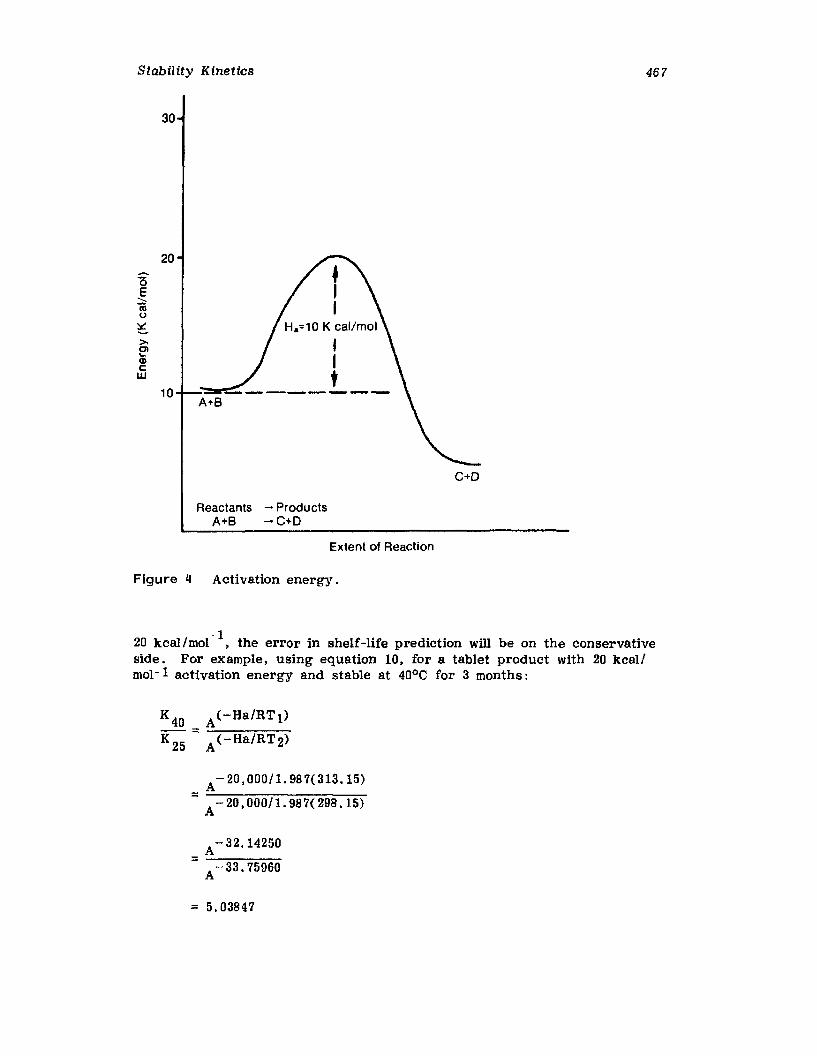
Stability Kinetics
30
20~
"0E<,
(;j0
~ H..=10 K cal/mol>. rCl~ IQ)c:w t
10A+B
Reactants - ProductsA+B -C+D
Extent of Reaction
Figure q Activation energy.
C+D
467
20 kCal/mol- 1, the error in shelf-life prediction will be on the conservativeside. For example, using equation 10, for a tablet product with 20 kcallmol- 1 activation energy and stable at 40°C for 3 months:
K 40 A(-Ha/RT1)
K 25 =A(-Ha/RT2)
A - 20,000/1. 987(313.15)= ~~~~~......,..,,....,..,,~---:-::-:-
A- 20.00011. 987( 298.15)
A -32.14250=~--:-::"---
A -33.75960
= 5.03847
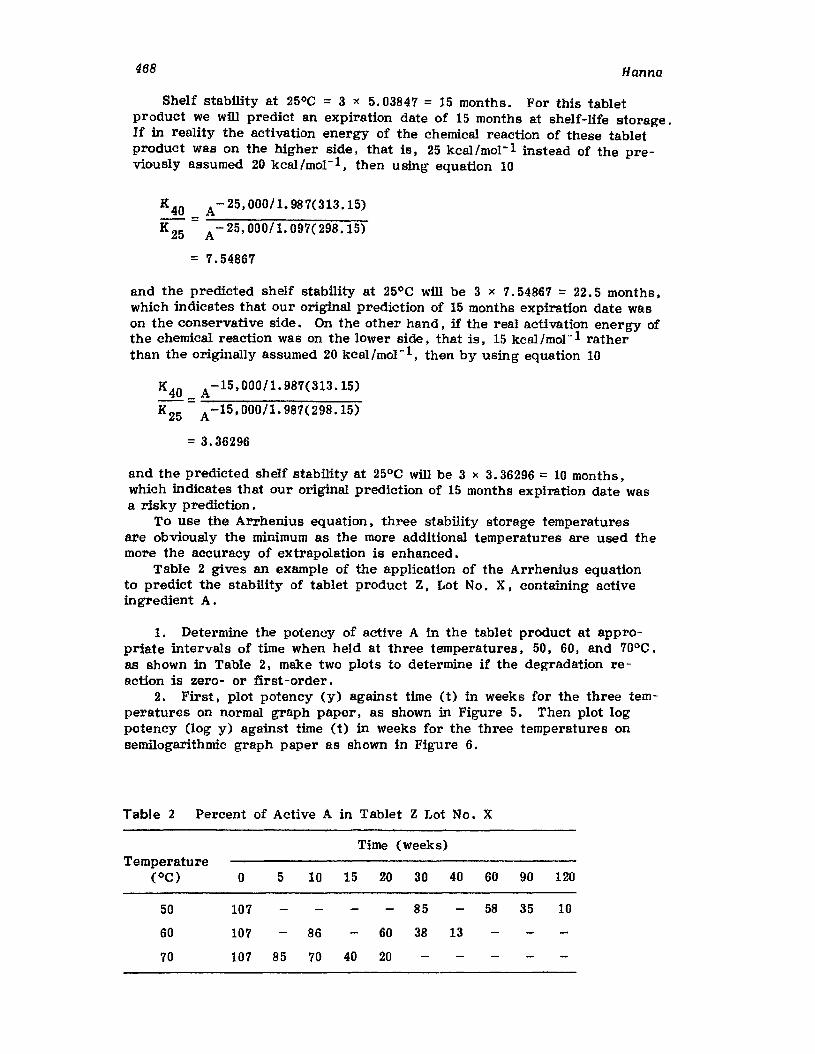
468 Hanna
Shelf stability at 25°C = 3 x 5.03847 = 15 months. For this tabletproduct we will predict an expiration date of 15 months at shelf-life storage.If in reality the activation energy of the chemical reaction of these tabletproduct was on the higher side, that is, 25 kcal/mol- 1 instead of the previously assumed 20 kcal/mol- l, then using equation 10
K40 A- 25,OOO/I.987(313.15)
K 25 = A- 25,OOO/1.097(298.15)
= 7.54867
and the predicted shelf stability at 25°C will be 3 x 7.54867 = 22.5 months.which indicates that our original prediction of 15 months expiration date wason the conservative side. On the other hand. if the real activation energy ofthe chemical reaction was on the lower side, that is. 15 kcal/mor- 1 ratherthan the originally assumed 20 kcal Imol- 1• then by using equation 10
K40 A-15.000/1. 987(313.15)--=K 25 A -15.000/1. 987(298.15)
=3.36296
and the predicted shelf stability at 25°C will be 3 x 3.36296 =10 months.which indicates that our original prediction of 15 months expiration date wasa risky prediction.
To USe the Arrhenius equation. three stability storage temperaturesare obviously the minimum as the more additional temperatures are used themore the accuracy of extrapolation is enhanced.
Table 2 gives an example of the application of the Arrhenius equationto predict the stability of tablet product Z, Lot No. X I containing activeingredient A.
1. Determine the potency of active A in the tablet product at appropriate intervals of time when held at three temperatures. 50. 60, and 70°C.as shown in Table 2. make two plots to determine if the degradation reaction is zero- or first-order.
2. First. plot potency (y) against time (t) in weeks for the three temperatures on normal graph paper, as shown in Figure 5. Then plot logpotency (log y) against time (t) in weeks for the three temperatures onsemilogarithmic graph paper as shown in Figure 6.
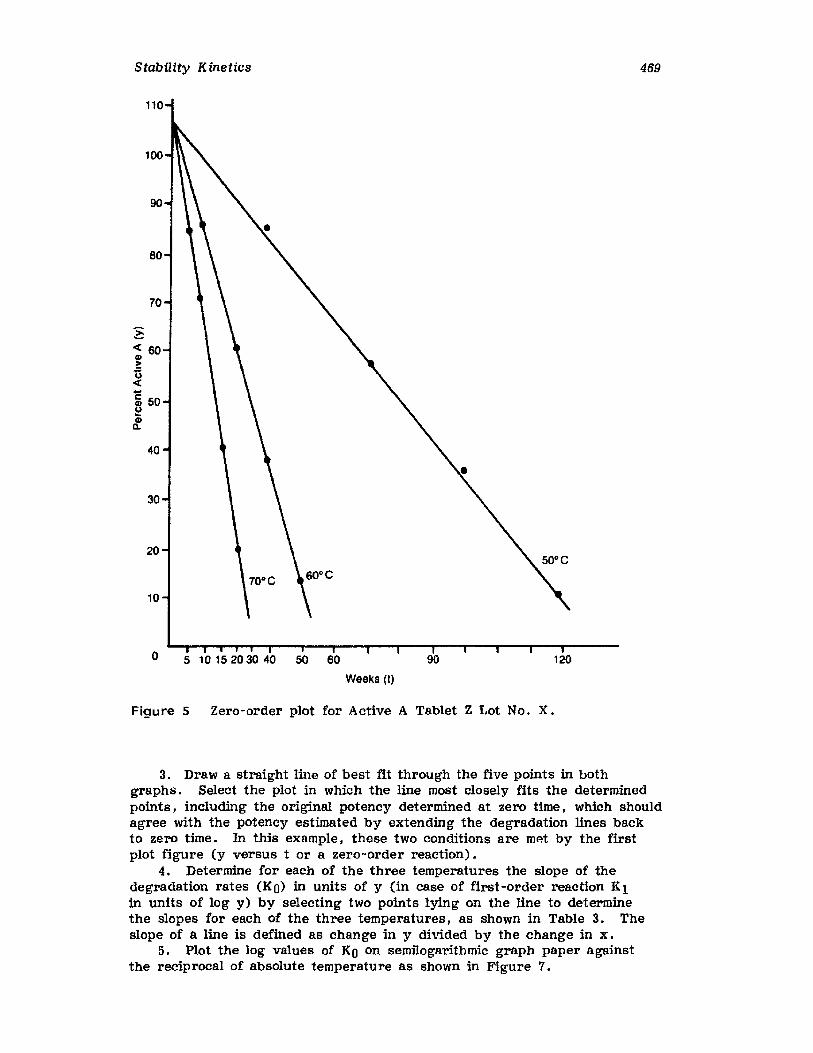
Stability Kinetics 469
110
100
90
80
70
<:( 60~ti<:(
~ 50~
8!.
40
30
20
10
o 5 10 15 2030 40 50 60
Weeks (I)
90 120
Figure 5 Zero-order plot for Active A Tablet Z Lot No. X.
3. Draw a straight line of best fit through the five points in bothgraphs. Select the plot in which the line most closely fits the determinedpoints, including the original potency determined at zero time. which shouldagree with the potency estimated by extending the degradation lines backto zero time. In this example, these two conditions are met by the firstplot figure (y versus t or a zero-order reaction).
4. Determine for each of the three temperatures the slope of thedegradation rates (KO) in units of y (in case of first-order reaction Klin units of log y) by selecting two points lying on the line to determinethe slopes for each of the three temperatures. as shown in Table 3. Theslope of a line is defined as change in y divided by the change in x,
5. Plot the log values of KO on semilogarithmic graph paper againstthe reciprocal of absolute temperature as shown in Figure 7.
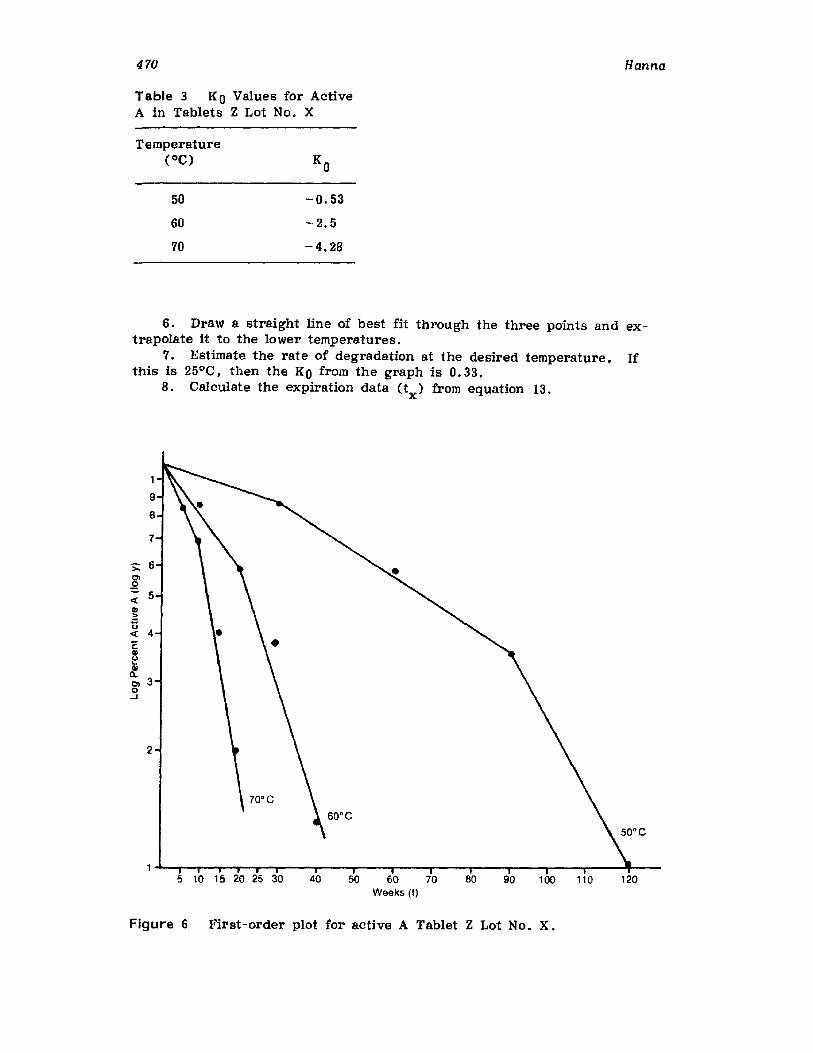
470
Table 3 KO Values for ActiveA in Tablets Z Lot No. X
Temperature(OC) KO
50 -0.53
60 -2.5
70 -4.28
Hanna
6. Draw a straight line of best fit through the three points and extrapolate it to the lower temperatures.
7. Estimate the rate of degradation at the desired temperature. Ifthis is 25°C, then the KO from the graph is 0.33.
8. Calculate the expiration data (tx) from equation 13.
1
9
8
7
>: 6Ols<t 5QI~U<t 4E
~Ol 3o..J
2
5 10 15 20 25 30 40 50 60 70Weeks (I)
80 90 100 110 120
Figure 6 First-order plot for active A Tablet Z Lot No. X.
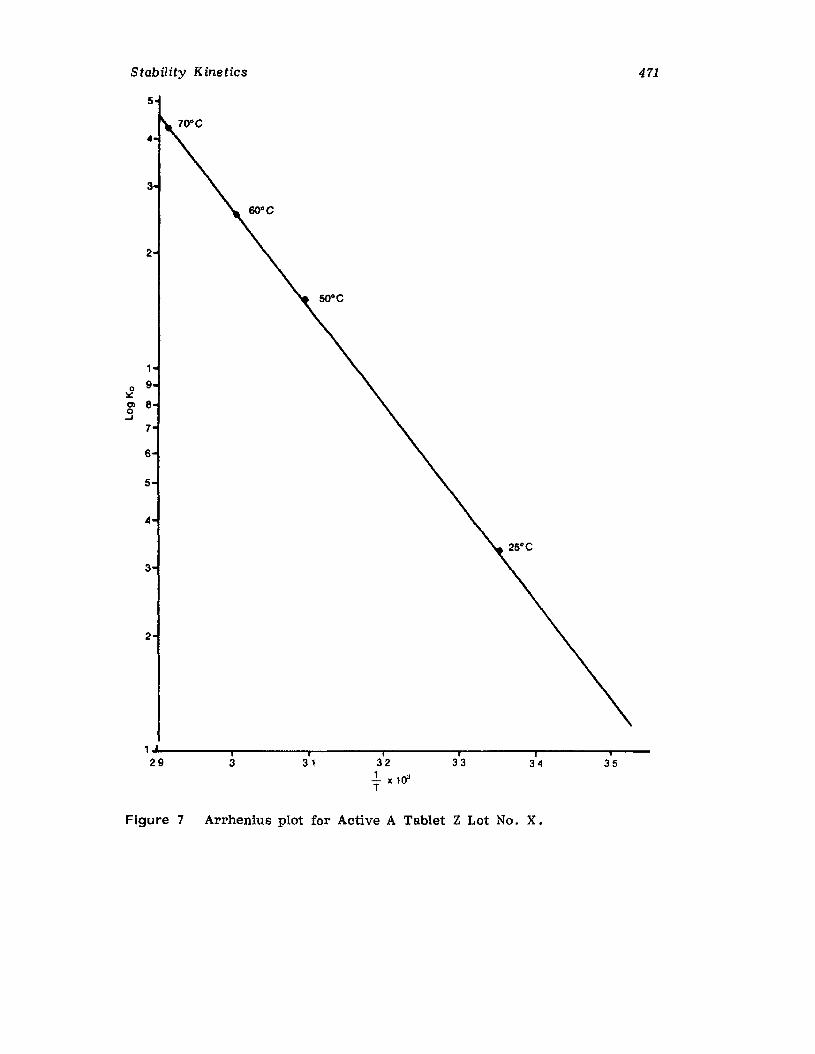
Stability Kinetics 471
5
..
3
2
1
o 9:.::C» 8o
...J
7
6
5
..
3
2
I
35i
34,
33i
31,3
1 ...'----..,..----.,.-----..,r-------r----..,..----T"""--29
Figure 7 Arrhenius plot for Active A Tablet Z Lot No. X.
472
or
t - Y - Y IK for aero-orderx - 0 x 0
= initial potency - minimum potencyreaction rate
tx = log yo - log yx /K1 for first-order
Hanna
(13)
(14)
Expiration date at 25°C = (107 - 90) 10. 33 = 51. 5 week s ,An understanding of the limitations of the collected stability data and
heat of activation values is important in stability prediction, as the obtained data may not fit the Arrhenius relationship. By using the Arrheniusplot, few assumptions are made regarding linearity extending to room temperature; that is, A and Ha independent of T, and the same chemical reaction is being considered at different stability-elevated temperatures. Thismeans that it is necessary to obtain the heats of activation for all bimolecular rate constants involved in a two or more mechanism of degradation at a pH value as the apparent heat of activation is not necessarilyconstant with temperature. For example, the rate of degradation after 24 hof 1%sodium ampicillin in 5% dextrose solution at - 20°C is 46%, which isequivalent to the same degradation at 27°C. whereas the degradation at 0 to5°C is only 28%. In photolysis degradation, no advantage is gained byhigher temperature studies as the activation energy of the reaction is smalland consequently the effect of temperature is small. Many tablet activescontain functional groups that are derivatives of carboxylic acids, e.g.,esters as in aspirin or Iactones as in penicillin occasionally exhibit complexdegradation reaction.
In lieu of these limitations of the application of the Arrhenius method,a number of statistical methods for stability prediction, which is easilyadapted to a computer, have been developed. One method is to use simplelinear regression to calculate the regression line for each of a number ofbatches. The resulting slopes are pooled if homogeneous and the standarderror of the grand slope is used to establish a confidence slope for stabilityprediction.
A second method is to obtain the stability results at various stabilitypoints at room temperature and then calculate the standard error of theresults at each discrete point to estimate confidence in potency being abovea certain value at a given point.
The most commonly used method involves the calculation of the regression for an ingredient from all batches of a tablet formulation available.The standard error of the line is then calculated and the confidence shelflife is determined or the standard error of the predicted value is calculatedwhereby the time predicted (t90) is the time at which the regression linereaches not less than 90% of potency claimed (Fig. 8).
For example: A vitamin tablet formulation, at a potency of 75 mg pertablet and overage of 33%, was released initially at 100 mg per tablet. Thebatch was put on stability at 40°C and assay results obtained with theirupper and lower limits are tabulated in Table 4. From Table 4 using thelower limits, we are 95% confident that the average potency of the vitamintablet will be not less than 90% of the label claim (67.5 mg per tablet) at
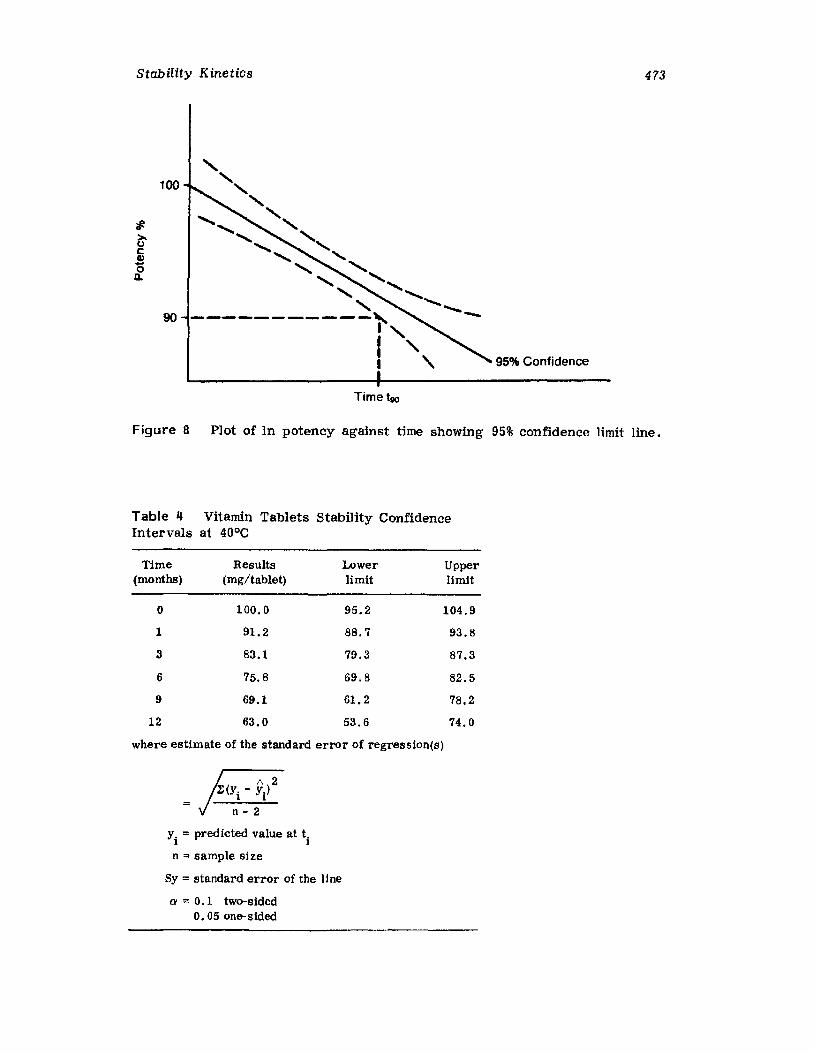
Stability Kinetics 473
Time teo
95%Confidence
Figure 8 Plot of In potency against time showing 95% confidence limit line.
Table 4 Vitamin Tablets Stability ConfidenceIntervals at 40°C
Time Results Lower Upper(months) (mg/tablet) limit limit
0 100.0 95.2 104.9
1 91.2 88.7 93.8
3 83.1 79.3 87.3
6 75.8 69.8 82.5
9 69.1 61. 2 78.2
12 63.0 53.6 74.0
where estimate of the standard error of regression(s)
Yi
= predicted value at ti
n = sample size
Sy = standard error of the line
a = O.1 two-sided0.05 one-sided
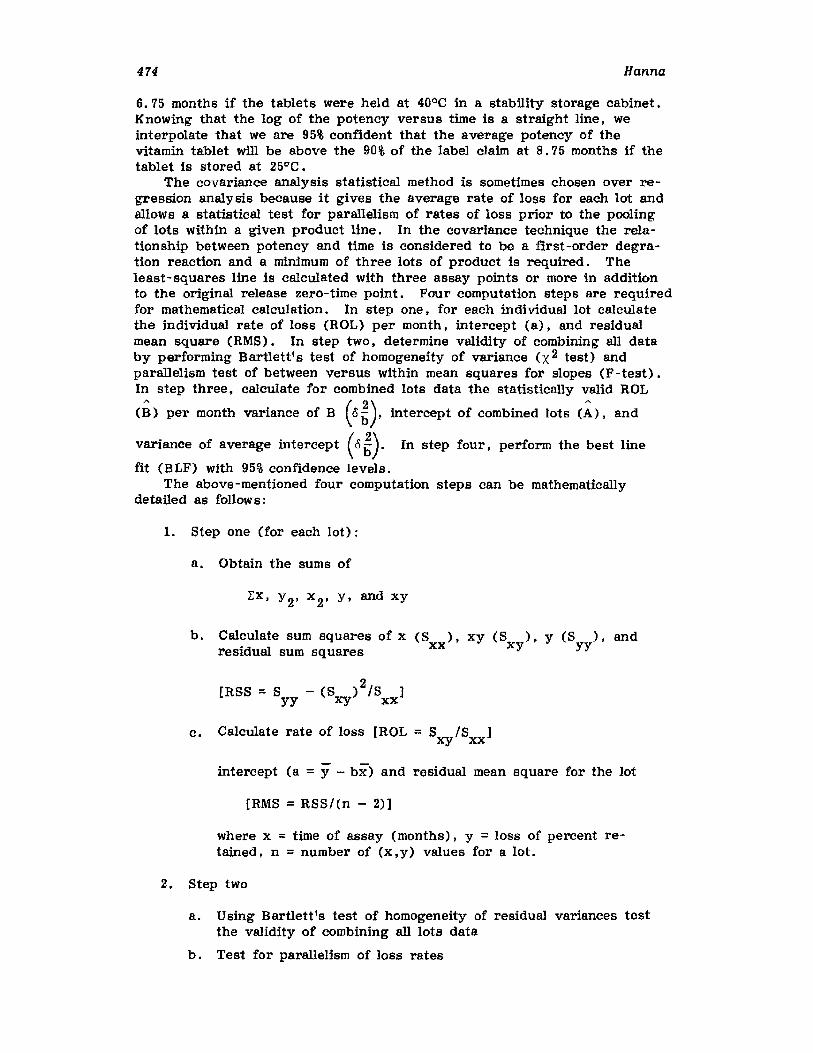
474 Hanna
6.75 months if the tablets were held at 40°C in a stability storage cabinet.Knowing that the log of the potency versus time is a straight line, weinterpolate that we are 95% confident that the average potency of thevitamin tablet will be above the 90% of the label claim at 8.75 months if thetablet is stored at 25°C.
The covariance analysis statistical method is sometimes chosen over regression analysis because it gives the average rate of loss for each lot andallows a statistical test for parallelism of rates of loss prior to the poolingof lots within a given product line. In the covariance technique the relationship between potency and time is considered to be a first-order degration reaction and a minimum of three lots of product is required. Theleast-squares line is calculated with three assay points or more in additionto the original release zero-time point. Four computation steps are requiredfor mathematical calculation. In step one, for each individual lot calculatethe individual rate of loss (ROL) per month. intercept (a). and residualmean square (RM8). In step two, determine validity of combining all databy performing Bartlett's test of homogeneity of variance (X2 test) andparallelism test of between versus within mean squares for slopes (F-test).In step three, calculate for combined lots data the statistically valid ROL
(:8) per month variance of B (o~), intercept of combined lots (A), and
variance of average intercept (<5 g). In step four, perform the best line
fit (BLF) with 95% confidence levels.The above-mentioned four computation steps can be mathematically
detailed as follows:
1. Step one (for each lot):
a. Obtain the sums of
EX, Y2' x 2, s, and xy
b. Calculate sum squares of x (8 ), xy (S ). Y (8 ), and'd al xx xy yyresr u sum squares
[R8S = S - (8 )2/S ]yy xy xx
c. Calculate rate of loss [ROL = S /S ]xy xx
intercept (a =y - bi) and residual mean square for the lot
[RMS = RSS!(n - 2)]
where x = time of assay (months), y = loss of percent retained, n = number of (x ,y) values for a lot.
2. Step two
a. Using Bartlett's test of homogeneity of residual variances testthe validity of combining all lots data
b. Test for parallelism of loss rates
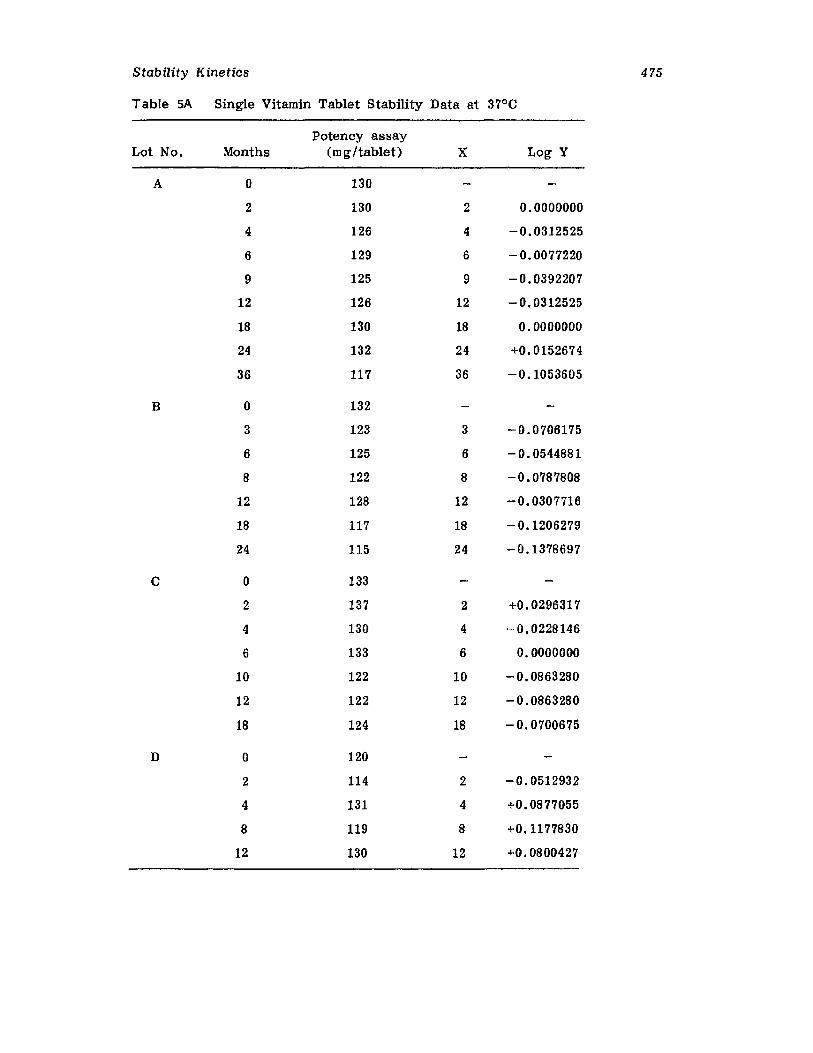
Stability Kinetics 475
Table SA Single Vitamin Tablet Stability Data at 37°C
Potency assayLot No. Months (mg/tablet) X Log Y
A 0 130
2 130 2 0.0000000
4 126 4 -0.0312525
6 129 6 - O.0077220
9 125 9 -0.0392207
12 126 12 -0.0312525
18 130 18 0.0000000
24 132 24 +0.0152674
36 117 36 -0.1053605
B 0 132
3 123 3 -0.0706175
6 125 6 - O.0544881
8 122 8 -0.0787808
12 128 12 -0.0307716
18 117 18 -0.1206279
24 115 24 -0.1378697
C 0 133
2 137 2 +0.0296317
4 130 4 - O.0228146
6 133 6 0.0000000
10 122 10 -0.0863280
12 122 12 -0.0863280
18 124 18 -0.0700675
D 0 120
2 114 2 -0.0512932
4 131 4 +0.0877055
8 119 8 +0.1177830
12 130 12 +0.0800427
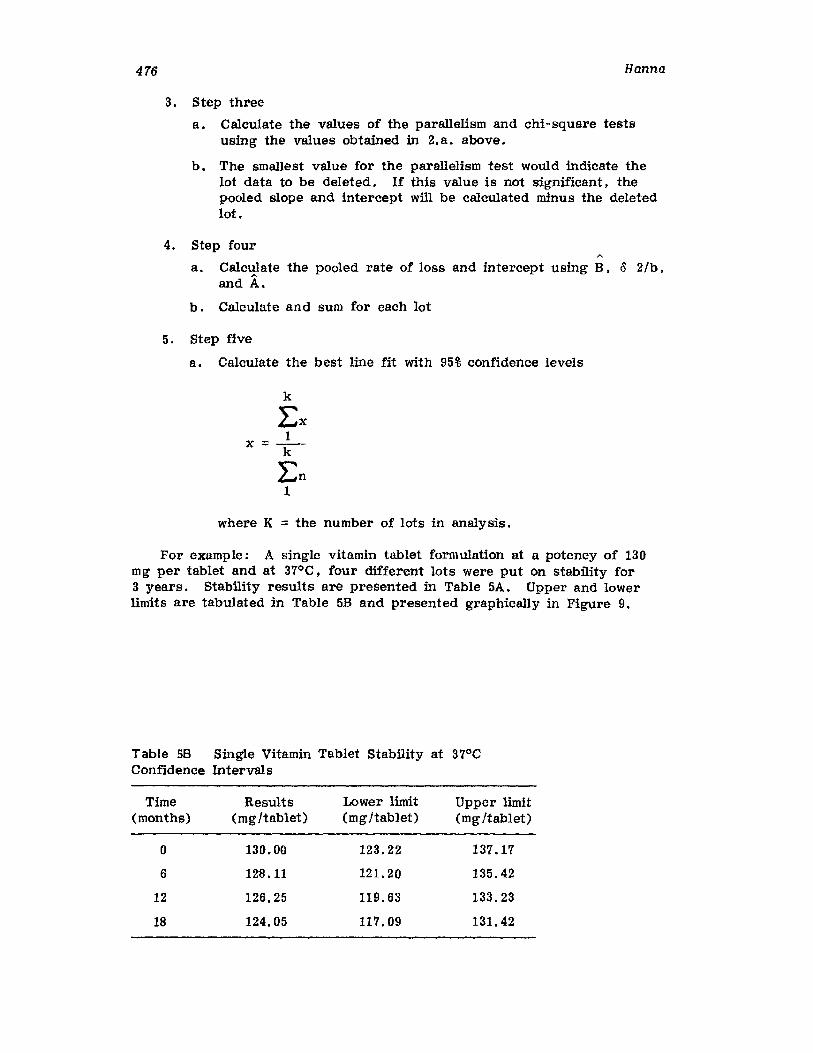
476 Hanna
3. Step three
a. Calculate the values of the parallelism and chi-square testsusing the values obtained in 2.a. above.
b. The smallest value for the parallelism test would indicate thelot data to be deleted. If this value is not significant. thepooled slope and intercept will be calculated minus the deletedlot.
4. Step four
a. Calculate the pooled rate of loss and intercept using B, 0 2/b,and A.
b. Calculate and sum for each lot
5. Step five
a. Calculate the best line fit with 95% confidence levels
x =
k
Lx1k
Ln1
where K = the number of lots in analysis.
For example: A single vitamin tablet formulation at a potency of 130mg per tablet and at 37°C. four different lots were put on stability for3 years. Stability results are presented in Table 5A. Upper and lowerlimits are tabulated in Table 5B and presented graphically in Figure 9.
Table 58 Single Vitamin Tablet Stability at 37°CConfidence Intervals
Time Results Lower limit Upper limit(months) (mg/tablet) (mg Itablet) (mg Itablet)
0 130.00 123.22 137.17
6 128.11 121. 20 135.42
12 126.25 119.63 133.23
18 124.05 117.09 131. 42
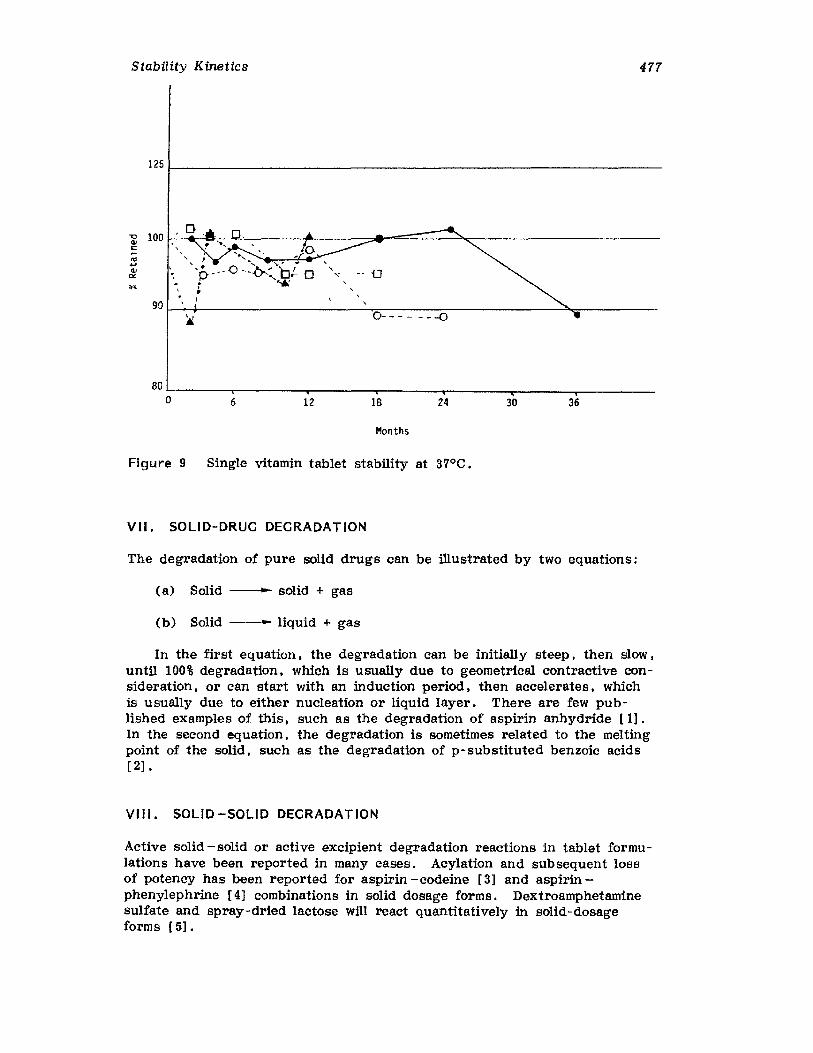
Stability Kinetics 477
1251- _
-, ---0
o---~ ---090 I-........ ~=_---~---------:~-----
3630241812680 .........---r------.----__._----"(""---~---__._-----o
Months
Figure 9 Single vitamin tablet stability at 37°C.
VII. SOLID-DRUG DEGRADATION
The degradation of pure solid drugs can be illustrated by two equations:
(a) Solid ---11._ solid + gas
(b) Solid --'-- liquid + gas
In the first equation, the degradation can be initially steep, then slow,until 100% degradation. which is usually due to geometrical contractive consideration, or can start with an induction period. then accelerates, whichis usually due to either nucleation or liquid layer. There are few published examples of this. such as the degradation of aspirin anhydride [lJ.In the second equation, the degradation is sometimes related to the meltingpoint of the solid. such as the degradation of p-substituted benzoic acids[2] •
VIII. SOLID -SOLID DEGRADATION
Active solid - solid or act!ve excipient degradation reactions in tablet formulations have been reported in many cases. Acylation and subsequent lossof potency has been reported for aspirin - codeine [3] and aspirinphenylephrine r4] combinations in solid dosage forms. Dextroamphetaminesulfate and spray-dried lactose will react quantitatively in solid-dosageforms [5].
478 Hanna
The stability of various vitamins with different tablet excipients wasstudied [6]. The influence of antacid compounds and other excipients inaspirin. alone or with other actives, has been published [7-10]. The absorption of some antirheumatics on antacids has been shown [11]. The effect of excipients on salicylamide [12] and amphetamine [13] sulfate discoloration has been investigated. The influence of tablet excipients oncolor fading [14] and other physical tablet parameters. e. g., disintegration[ 15J, has been demonstrated.
The detection of such active solid -solid or possible excipients interactions or incompatibilities is achieved through tablet preformulation studies. A detailed program for such studies is given in Volume 1.
IX. SOLID-DOSAGE FORM DEGRADATION
Solid dosage forms are solid heterogeneous systems whereby the active ingredents tend to decompose at a slower rate than the liquid heterogeneousor homogeneous systems. Since most tablet formulations are complex, thedegradation reaction may be complicated by possible interaction of the active and inert ingredients in the formulation. Therefore. it is more difficult to apply chemical kinetics and the Arrhenius relationship to stabilitydata for tablet systems, and it is sometimes impractical to perform throughbasic kinetics studies on the final tablet formulation to predict the shelflife of the product.
Because of the great structural variety of actives and the complexityof tablet formulations. many kinds of drug degradation reactions are possible. Although the degradation of active ingredients in tablet formulationscan occur through several degradative pathways, e.g., oxidation, hydrolysis. racemization, and photolysis. perhaps most of those that occur intablet degradation are either oxidation or hydrolysis.
X. MECHANISMS THAT AFFECT TABLETSTABILITY
A. Oxidation
Oxidative degradation is one of the major causes of tablet instability. Oneof the main reasons is that oxygen need not present in more than tracequantities to produce significant degradation. Another aspect is that oxidative reactions are influenced by light and metal ions (copper, iron, cobalt, and nickel) and many drugs either form colored products or produceobjectionable off-odors. Oxidation cannot happen without reduction.Oxidation/reduction reactions involve the transfer of one or more oxygenor hydrogen atoms or the transfer of electrons.
In inorganic compounds, oxidation is a loss of electrons and reductionis a gain of electrons.
2+ 3+-Fe ... Fe + e....Ferrous .. ferric + electron---
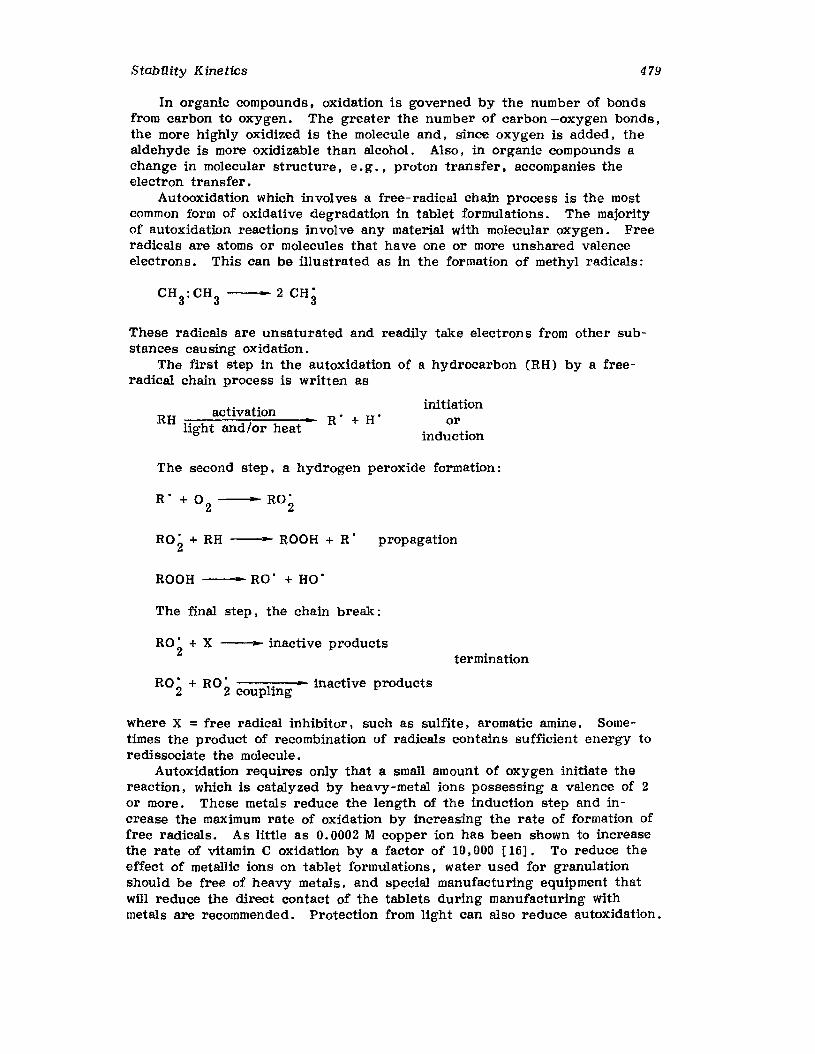
Stability Kinetics 479
In organic compounds, oxidation is governed by the number of bondsfrom carbon to oxygen. The greater the number of carbon -oxygen bonds,the more highly oxidized is the molecule and, since oxygen is added, thealdehyde is more oxidizable than alcohol. Also, in organic compounds achange in molecular structure, e. g ., proton transfer, accompanies theelectron transfer.
Autooxidation which involves a free-radical chain process is the mostcommon form of oxidative degradation in tablet formulations. The majorityof autoxidation reactions involve any material with molecular oxygen. Freeradicals are atoms or molecules that have one or more unshared valenceelectrons. This can be illustrated as in the formation of methyl radicals:
These radicals are unsaturated and readily take electrons from other substances causing oxidation.
The first step in the autoxidation of a hydrocarbon (RH) by a freeradical chain process is written as
RH activation a-
light and/or heat
initiationor
induction
The second step, a hydrogen peroxide formation:
ROi + RH --1_- ROOH + R' propagation
ROOH ---1_- RO' + HO'
The final step, the chain break:
ROi + X --- inactive products
R02'
+ ROZ'
1'· inactive productscoup mg
termination
where X = free radical inhibitor, such as sulfite, aromatic amine. Sometimes the product of recombination of radicals contains sufficient energy toredissociate the molecule.
Autoxidation requires only that a small amount of oxygen initiate thereaction, which is catalyzed by heavy-metal ions possessing a valence of Zor more. These metals reduce the length of the induction step and increase the maximum rate of oxidation by increasing the rate of formation offree radicals. As little as 0.0002 M copper ion has been shown to increasethe rate of vitamin C oxidation by a factor of 10,000 [16]. To reduce theeffect of metallic ions on tablet formulations, water used for granulationshould be free of heavy metals, and special manufacturing equipment thatwill reduce the direct contact of the tablets during manufacturing withmetals are recommended. Protection from light can also reduce autoxidation.
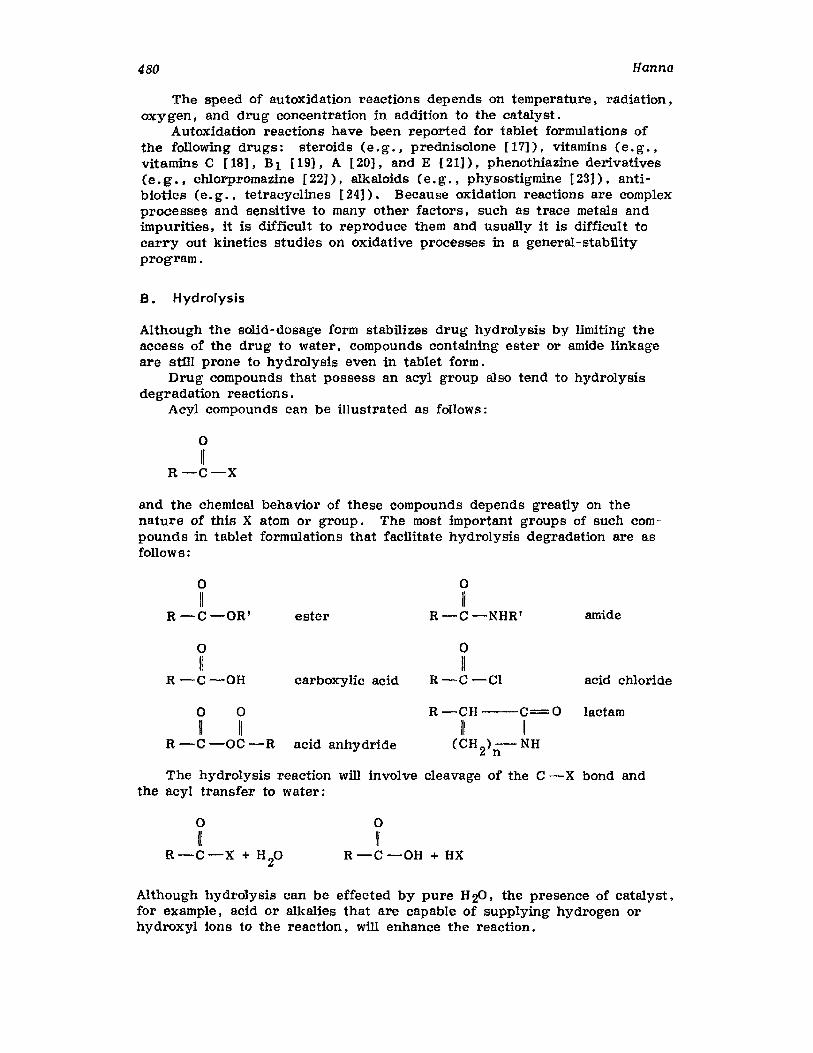
480 Hanna
The speed of autoxidation reactions depends on temperature. radiation,oxygen, and drug concentration in addition to the catalyst.
Autoxidation reactions have been reported for tablet formulations ofthe followin g drugs: steroids (e. g., prednisolone [17]), vitamins (e. g . ,vitamins C [18], B1 [19), A [20], and E [21]), phenothiazine derivatives(e. g .• chlorpromazine [22J), alkaloids (e. g ., physostigmine [231), antibiotics (e. g., tetracyclines [24]). Because oxidation reactions are complexprocesses and sensitive to many other factors, such as trace metals andimpurities, it is difficult to reproduce them and usually it is difficult tocarry out kinetics studies on oxidative processes in a general-stabilityprogram.
B. Hydrolysis
Although the solid-dosage form stabilizes drug hydrolysis by limiting theaccess of the drug to water, compounds containing ester or amide linkageare still prone to hydrolysis even in tablet form.
Drug compounds that possess an acyl group also tend to hydrolysisdegradation reactions.
Acyl compounds can be illustrated as follows;
o1/
R-C-X
and the chemical behavior of these compounds depends greatly on thenature of this X atom or group. The most important groups of such compounds in tablet formulations that facilitate hydrolysis degradation are asfollows:
oII
R -C-OR' ester
°IIR -c -OH carboxylic acid
o °II IIR -C -OC -R acid anhydride
oIi
R-C-NHRI amide
oII
R - C - Cl acid chloride
R -CH --C=0 laetamII I
(CHZ)n NH
The hydrolysis reaction will involve cleavage of the C -X bond andthe acyl transfer to water:
oII
R-C-X + H20
o~
R-C-OH + HX
Although hydrolysis can be effected by pure H:p. the presence of catalyst,for example. acid or alkalies that are capable of supplying hydrogen orhydroxyl ions to the reaction. will enhance the reaction.

Stability Kinetics 481
The hydrolysis of an ester for either acid- or alkaline-catalyzed reaction involves the covalent linkage between the carbon atom and the oxygenatom to form an acid and alcohol as follows:
oII +_
R-C-OR' + H + OH
oII
R-C-OH + HOR
acid alcohol
In case of alkaline-catalyzed reactions:
oII
R-C-OR' + OH
oII
----11.._ R -C -OR'
-- IOH
---1_- RCOO + R'OH
..
In case of acid-catalyzed reactions:
o 0 0
II + II + IIR-C-OR' + H - ............-R-C-OR'----o.-R-C-OH + R'OH
IH
The hydrolysis of an amide is similar to that of an ester-type compound, except that the hydrolytic cleavage in this case will result in theformation of an acid and an amine:
oII
R-C -NHR' + H a2
oII
- R-C-OH + R-NH2
acid amine
The general form of the reaction kinetic equation used to express suchtypes of hydrolysis is the first- or pseudo-first-order reaction. This isbased on the assumption that the OH- or H+ concentration is essentiallykept constant or is kept at a considerably higher concentration than theester concentration during the reaction.
As previously discussed. hydrolysis degradations are catalyzed byboth hydrogen and hydroxyl ions, the latter usually has the stronger effeet, and pH is an important factor in determining the rate of the reaction.Therefore, the choice of excipients for any particular tablet formulationmust be made only after a thorough evaluation of the influence of theseexcipients on the stability of drug product has been carried out. For example, atropine sulfate is most stable at pH 4 and excipients that will impart alkalinity to the tablet formulation. for example, sodium phosphatedibasie or calcium carbonate, should be avoided.
Hydrolysis reactions have been reported for tablet formulation of thefollowing drugs: atropine [25], aspirin [26], thiamine [27]. penicillins[28]. cephalosporins [29], and barbituric acid derivatives [30].
482 Hanna
C. Photolysis
Photolysis is a surface phenomenon and in most cases the interior of thetablet will be unaffected. Photolysis of a surface molecule should give riseto first-order degradation. However, many variables may be involved inphotolysis degradation; for example, intensity and wavelength of light,size, shape, composition and color of container, so that the kinetics of reactions is complex and zero-, first-, or pseudo-first-order reactions arepossible. An active will exhibit photolysis degradation if it absorbs radiation at a particular wavelength or the energy exceeds a threshold. Thus,not all absorbed radiation produces photolysis degradation, as part maychange to heat, inducing a thermal reaction that is identical or opposite orentirely different from the original photolysis reaction. Sometimes a photolysis degradation may produce a catalyst that will start the thermal degradation.
The intensity and wavelength of light, size, shape, color, and type oftablet container will greatly affect the rate of photolysis degradation.Ultraviolet radiation, which has the greatest energy supply, is more effective in initiating photolysis degradation.
Free radicals are important in photolysis degradation as they undergosubsequent reactions. The reaction is said to be photochemical if the molecules absorbing the radiation react, whereas it is said to be photosensitiveif the absorbing molecules do not participate directly in the reaction butpass on their energy to other molecules that are reacting.
The method commonly used to protect tablets from light is the use ofcolored glass or opaque plastic containers. The USP specifies the lighttransmission of different glass and plastic containers. It has been demonstrated that when fading of tablet surface penetrates to a depth of 0.03 cm ,the tablet surface appears white and the faded layer does not change uponfurther light exposure [31-36]. Drugs that are prone to photolysis degradation are folic acid [37], ascorbic acid [38], benzodiazepines derivatives[39], sulfonamide [15], and steroids [40].
D. Racemization
Racemization is a reaction whereby an optically active drug substancechanges to an optically inactive mixture of the corresponding dextro andlevo forms. This degradation reaction is important because some activesare more therapeutically effective in certain optical forms or the opticalisomer has a different biological effect. For example, I-hyoscyamine isthree times as active as the dl form, atropine. In general, racemizationfollows a first-order degradation reaction and is dependent upon temperature, solvent. catalyst. and light. The racemization of a compound appears to depend on the functional group bound to the asymmetrical carbonatom, with aromatic groups tending to accelerate the racemization. Tabletformulation that contains l-hyoscyamine should be as dryas possible andavoid the use of alkaline excipients [41].
XI. CONTAINER-CLOSURE SYSTEM
Tablet container-closure systems must provide functional protection againstsuch factors as moisture, oxygen, light, volatility, and drug /package
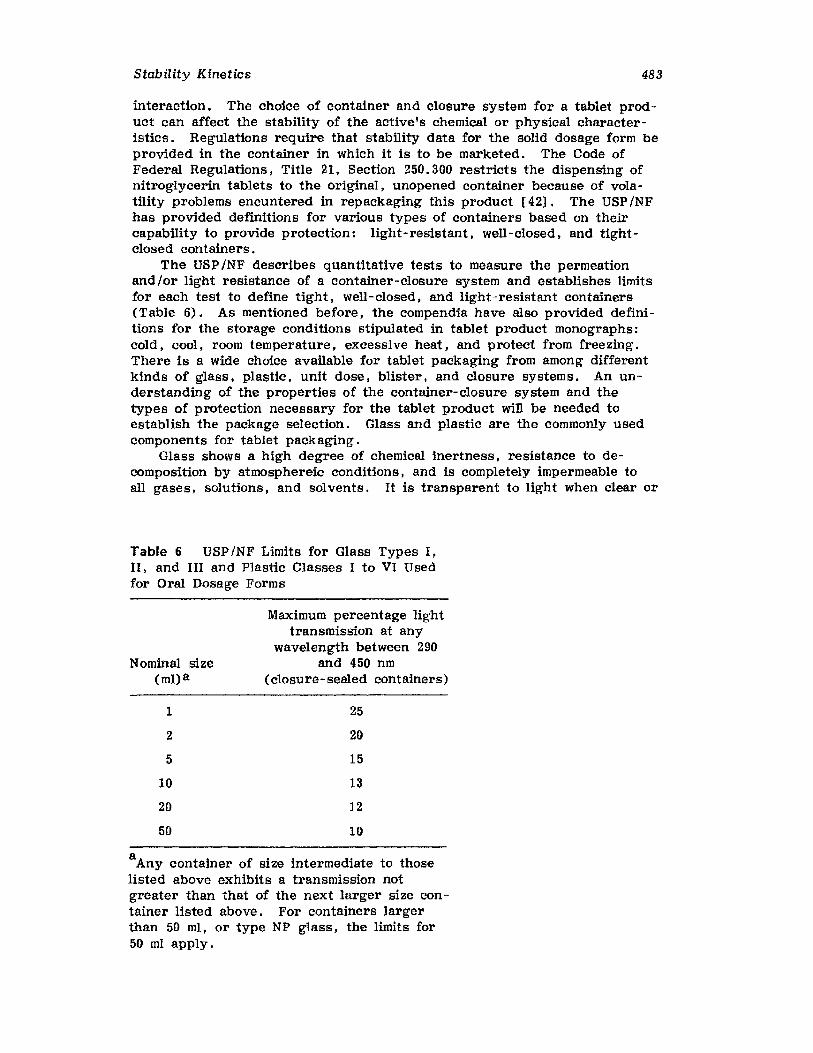
Stability Kinetics 483
interaction. The choice of container and closure system for a tablet product can affect the stability of the active's chemical or physical characteristics. Regulations require that stability data for the solid dosage form beprovided in the container in which it is to be marketed. The Code ofFederal Regulations, Title 21, Section 250.300 restricts the dispensing ofnitroglycerin tablets to the original, unopened container because of volatility problems encuntered in repackaging this product [42J. The USP/NFhas provided definitions for various types of containers based on theircapability to provide protection: light-resistant, well-closed, and tightclosed containers.
The USP INF describes quantitative tests to measure the permeationand/or light resistance of a container-closure system and establishes limitsfor each test to define tight, well-closed, and light-resistant containers(Table 6). As mentioned before, the compendia have also provided definitions for the storage conditions stipulated in tablet product monographs:cold, cool, room temperature, excessive heat, and protect from freezing.There is a wide choice available for tablet packaging from among differentkinds of glass, plastic, unit dose, blister. and closure system s . An understanding of the properties of the container-closure system and thetypes of protection necessary for the tablet product will be needed toestablish the package selection. Glass and plastic are the commonly usedcomponents for tablet packaging.
Glass shows a high degree of chemical inertness, resistance to decomposition by atmosphereic conditions. and is completely impermeable toall gases, solutions, and solvents. It is transparent to light when clear or
Table 6 USPJNF Limits for Glass Types I,II, and III and Plastic Classes I to VI Usedfor Oral Dosage Forms
Nominal size(ml)a
1
2
5
10
20
50
Maximum percentage lighttransmission at any
wavelength between 290and 450 nm
(closure-sealed containers)
25
20
15
13
12
10
aAny container of size intermediate to thoselisted above exhibits a transmission notgreater than that of the next larger size container listed above. For containers largerthan 50 ml, or type NP glass, the limits for50 ml apply.
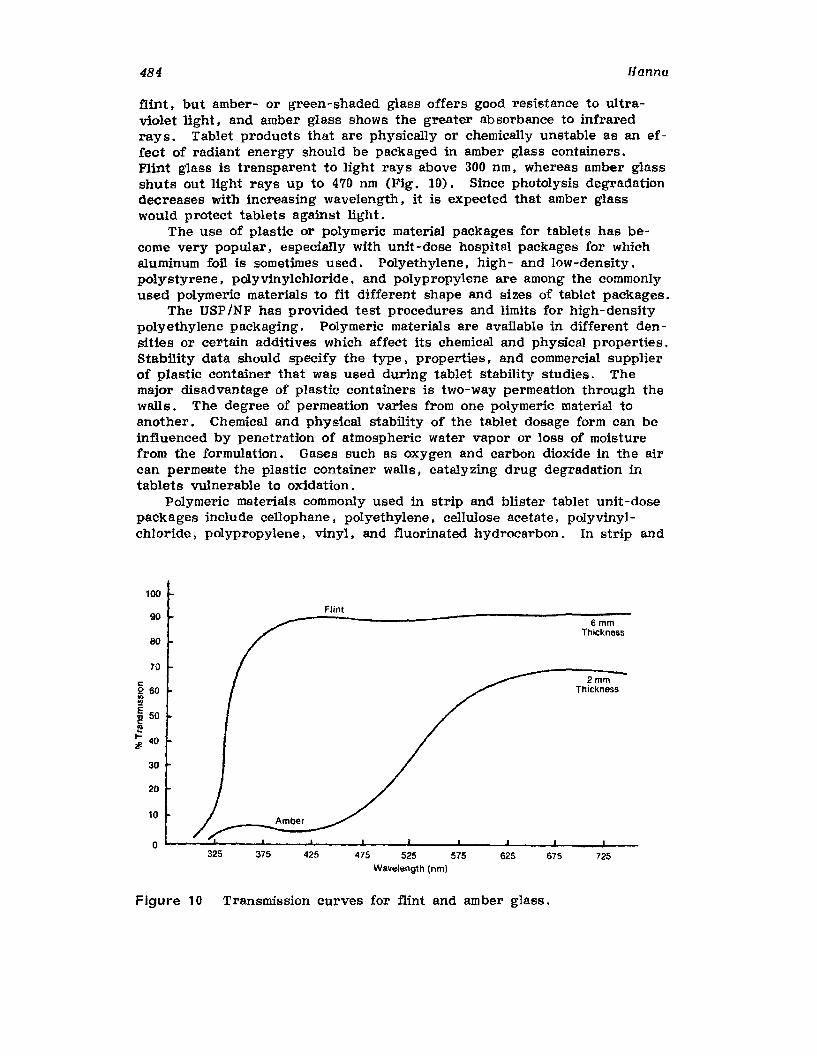
484 Hanna
flint, but amber- or green-shaded glass offers good resistance to ultraviolet light, and amber glass shows the greater absorbance to infraredrays. Tablet products that are physically or chemically unstable as an effect of radiant energy should be packaged in amber glass containers.Flint glass is transparent to light rays above 300 nm, whereas amber glassshuts out light rays up to 470 nm (Fig. 10). Since photolysis degradationdecreases with increasing wavelength, it is expected that amber glasswould protect tablets against light.
The use of plastic or polymeric material packages for tablets has become very popular, especially with unit-dose hospital packages for whichaluminum foil is sometimes used. Polyethylene, high- and low-density,polystyrene, polyvinylchloride, and polypropylene are among the commonlyused polymeric materials to fit different shape and sizes of tablet packages.
The USP INF has provided test procedures and limits for high-densitypolyethylene packaging. Polymeric materials are available in different densities or certain additives which affect its chemical and physical properties.Stability data should specify the type, properties, and commercial supplierof plastic container that was used during tablet stability studies. Themajor disadvantage of plastic containers is two-way permeation through thewalls. The degree of permeation varies from one polymeric material toanother. Chemical and physical stability of the tablet dosage form can beinfluenced by penetration of atmospheric water vapor or loss of moisturefrom the formulation. Gases such as oxygen and carbon dioxide in the aircan permeate the plastic container walls, catalyzing drug degradation intablets vulnerable to oxidation.
Polymeric materials commonly used in strip and blister tablet unit-dosepackages include cellophane I polyethylene, cellulose acetate, polyvinylchloride, polypropylene. vinyl, and fluorinated hydrocarbon. In strip and
100
90
80
70
c260..!!!
~ 50e~t- 40IF
30
20
10Amber
Flint
6mmThickness
2mmThickness
o'-----...--~--_L____L___.L...-__L.__ __I.__....J___...I__
325 375 425 475 525 575Wavelength (nm)
625 675 725
Figure 10 Transmission curves for flint and amber glass.
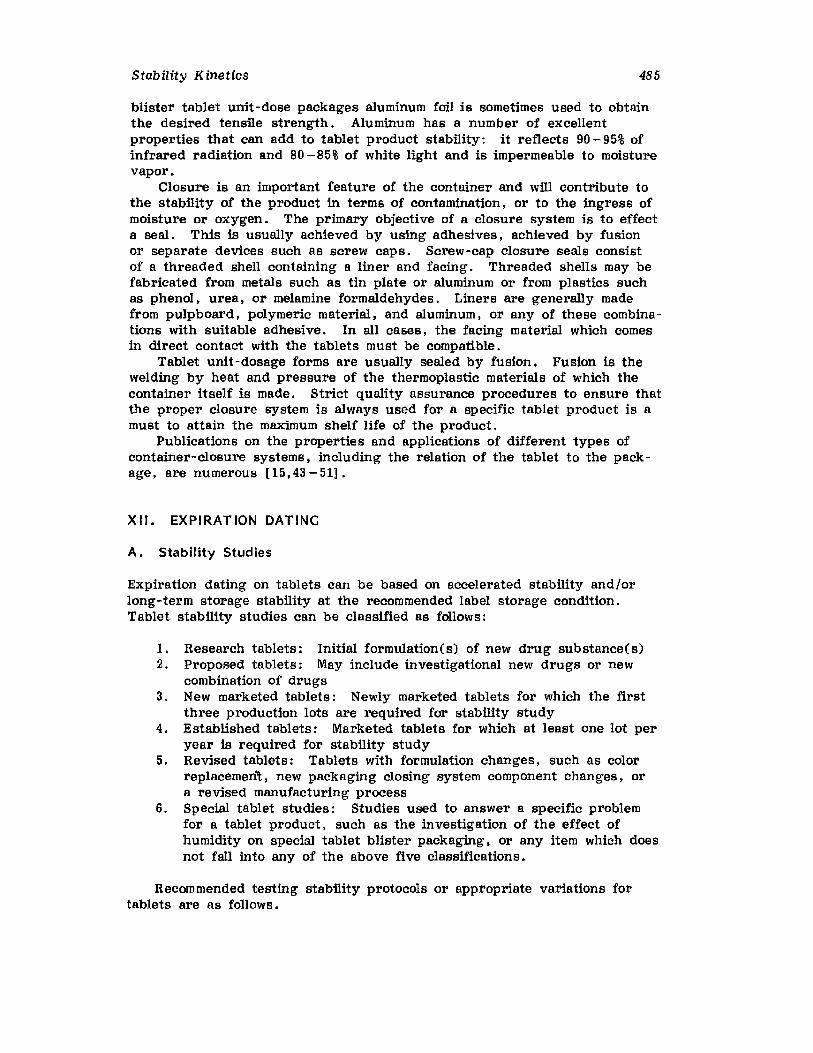
Stability Kinetics 485
blister tablet unit-dose packages aluminum foil is sometimes used to obtainthe desired tensile strength. Aluminum has a number of excellentproperties that can add to tablet product stability: it reflects 90 - 95% ofinfrared radiation and 80 -85% of white light and is impermeable to moisturevapor.
Closure is an important feature of the container and will contribute tothe stability of the product in terms of contamination, or to the ingress ofmoisture or oxygen. The primary objective of a closure system is to effecta seal. This is usually achieved by using adhesives, achieved by fusionor separate devices such as screw caps. Screw-cap closure seals consistof a threaded shell containing a liner and facing. Threaded shells may befabricated from metals such as tin plate or aluminum or from plastics suchas phenol. urea, or melamine formaldehydes. Liners are generally madefrom pulpboard , polymeric material, and aluminum, or any of these combinations with suitable adhesive. In all cases, the facing material which comesin direct contact with the tablets must be compatible.
Tablet unit-dosage forms are usually sealed by fusion. Fusion is thewelding by heat and pressure of the thermoplastic materials of which thecontainer itself is made. Strict quality assurance procedures to ensure thatthe proper closure system is always used for a specific tablet product is amust to attain the maximum shelf life of the product.
Publications on the properties and applications of different types ofcontainer-closure systems, including the relation of the tablet to the package, are numerous [15,43 - 51] .
XII. EXPIRATION DATING
A. Stability Studies
Expiration dating on tablets can be based on accelerated stability and/orlong-term storage stability at the recommended label storage condition.Tablet stability studies can be classified as follows:
1. Research tablets: Initial formulation ( s) of new drug substance( s)2. Proposed tablets: May include investigational new drugs or new
combination of drugs3. New marketed tablets: Newly marketed tablets for which the first
three production lots are required for stability study4. Established tablets: Marketed tablets for which at least one lot per
year is required for stability study5. Revised tablets: Tablets with formulation changes, such as color
replacemerft , new packaging closing system component changes, ora revised manufacturing process
6. Special tablet studies: Studies used to answer a specific problemfor a tablet product, such as the investigation of the effect ofhumidity on special tablet blister packaging, or any item which doesnot fall into any of the above five classifications.
Recommended testing stability protocols or appropriate variations fortablets are as follows.
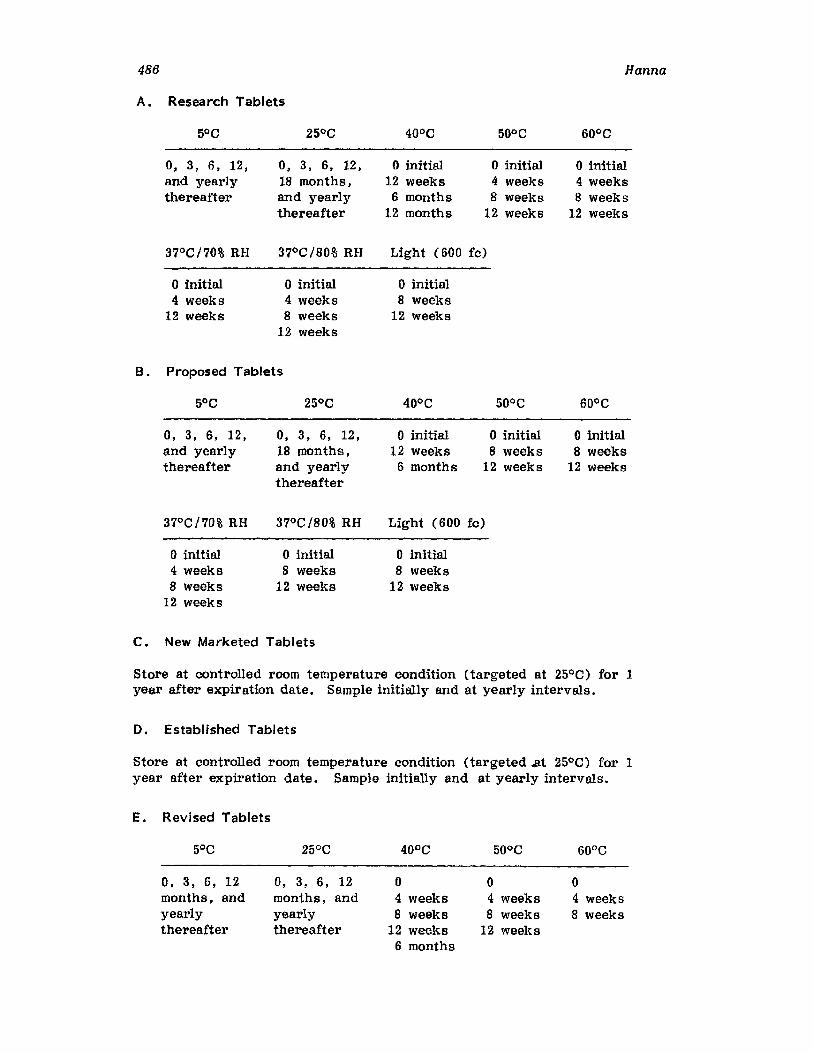
486 Hanna
A. Research Tablets
50°C
0, 3, 6, 12,and yearlythereafter
0, 3, 6, 12,18 months,and yearlythereafter
o initial12 weeks
6 months12 months
o initial4 weeks8 weeks
12 weeks
o initial4 weeks8 weeks
12 weeks
37°C/70% RH 37°C/80% RH Light (600 fc)
o initial o initial o initial4 weeks 4 weeks 8 weeks
12 weeks 8 weeks 12 weeks12 weeks
B. Proposed Tablets
5°C 25°C 40°C 50°C 60aC
0, 3, 6, 12, 0, 3, 6, 12, o initial o initial o initialand yearly 18 months, 12 weeks 8 weeks 8 weeksthereafter and yearly 6 months 12 weeks 12 weeks
thereafter
37°C!70% RH 37°C!80% RH Light (600 fc)
o initial o initial o initial4 weeks 8 weeks 8 weeks8 weeks 12 weeks 12 weeks
12 weeks
C. New Marketed Tablets
Store at controlled room temperature condition (targeted at 25°C) for 1year after expiration date. Sample initially and at yearly intervals.
D. Established Tablets
Store at controlled room temperature condition (targeted .at 25°C) for 1year after expiration date. Sample initially and at yearly intervals.
E. Revised Tablets
5°C 25°C 40°C 50°C 60aC
0, 3, 6, 12 0, 3, 6, 12 0 0 0months, and months, and 4 weeks 4 weeks 4 weeksyearly yearly 8 weeks 8 weeks 8 weeksthereafter thereafter 12 weeks 12 weeks
6 months
Stability Kinetics
37°C /80% RH
o8 weeks
12 weeks
Light (600 fc)
o8 weeks
12 weeks
487
Examples of appropriate variations of the previously mentioned protocolsare given in Tables 7-9.
As a general guideline, the following two principles should be takeninto consideration in formulating such tablet stability protocols:
1. Less stable tablet materials and formulas would require more frequent testing.
2. The amount of testing required for an active or tablet product depends on the amount of data already available.
A stability-indicating assay should be used for testing at the appropriate scheduled intervals. Tablets in final packing closure systems intended for marketing will be submitted to such tests. An assay will beconsidered stability indicating if it specifically determines the intact activematerial or determines the degradation product(s) in the presence of theintact active material or determines both the intact active material and itsdegradation product(s). The ideal approach is the third one. The reasonis mainly that a normal stability-indicating assay will generally have a precision of ±2% coefficient of variation. This means that a difference of 4%from the initial 100% value will not be detected by analytical variation as itwill be considered statistically insignificant. On the other hand. if anassay procedure for the degradation was developed with the same coefficientof variation, then less than 1%variation in the same 4% degradation can bedetected and estimated.
If the stability-indicating assay was initially developed on the intactactive raw material, then it is necessary to show that such an assay procedure is applicable in the presence of formulation-inactive materials ortheir degradation product( s) , if any.
F. Label Storage Conditions
The appropriate label storage condition for a tablet product can be basedon a long-term shelf-stability study at the recommended label storagecondition or short-term studies at accelerated stress conditions. Assumingthat the degradation reaction(s) is constant in the range from the highesttemperature studied to the anticipated shelf-storage temperature, t90,estimation could be used for calculating the label storage condition.
Data from at least three temperatures are evaluated and the t90 valuesare estimated. If each t90 value versus reciprocal temperature point (lIT)falls above 10 kcal (Fig. 11), or a minimum t90 was achieved after at least12 weeks at 50°C and 26 weeks at 40°C, then the label storage conditionof store at room temperature is recommended. If one or more t90 valueversus lIT falls between 10 kcal and 17 keal , or a minimum of t90 wasachieved after at least 12 weeks, but less than 24 weeks at 40°C and morethan 4 weeks at 50°C, then the label storage condition of store at room temperature and protect from temperature above 40°C is recommended. If t
90
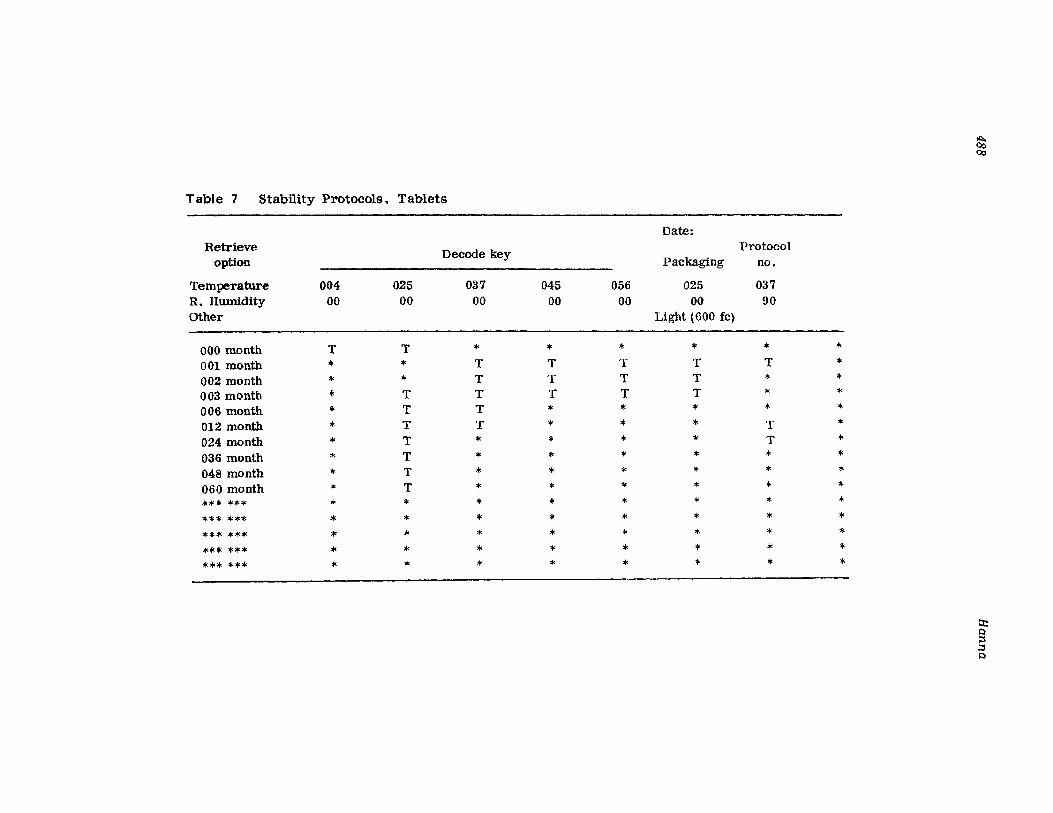
~0000
Table 7 Stability Protocols. Tablets
Date:Retrieve Decode key
Protocoloption Packaging no.
Temperature 004 025 037 045 056 025 037R. HUmidity 00 00 00 00 00 00 90Other Light (600 fc)
000 month T T '" '" '" * * '"001 month * '" T T T T T '"002 month * * T T T T * '"003 month '" T T T T T '" *006 month '" T T * * '" '" *012 month * T T '" * * T '"024 month * T * '" *
,.T *
036 month * T * '" '" '" '" '"048 month '" T * * '" '" * '"060 month "' T '" '" '" * '" '"*** "''''''' '" '" * '" * '" '" **** **'" * '" '" '" '" '" * '"*"'* **'" '" '" * '" '" '" '" ***'" **'" '" '" * * '" '" '" '"*** **'" * '" * * * '" '" '"
:t:l:);:$;:$I:l
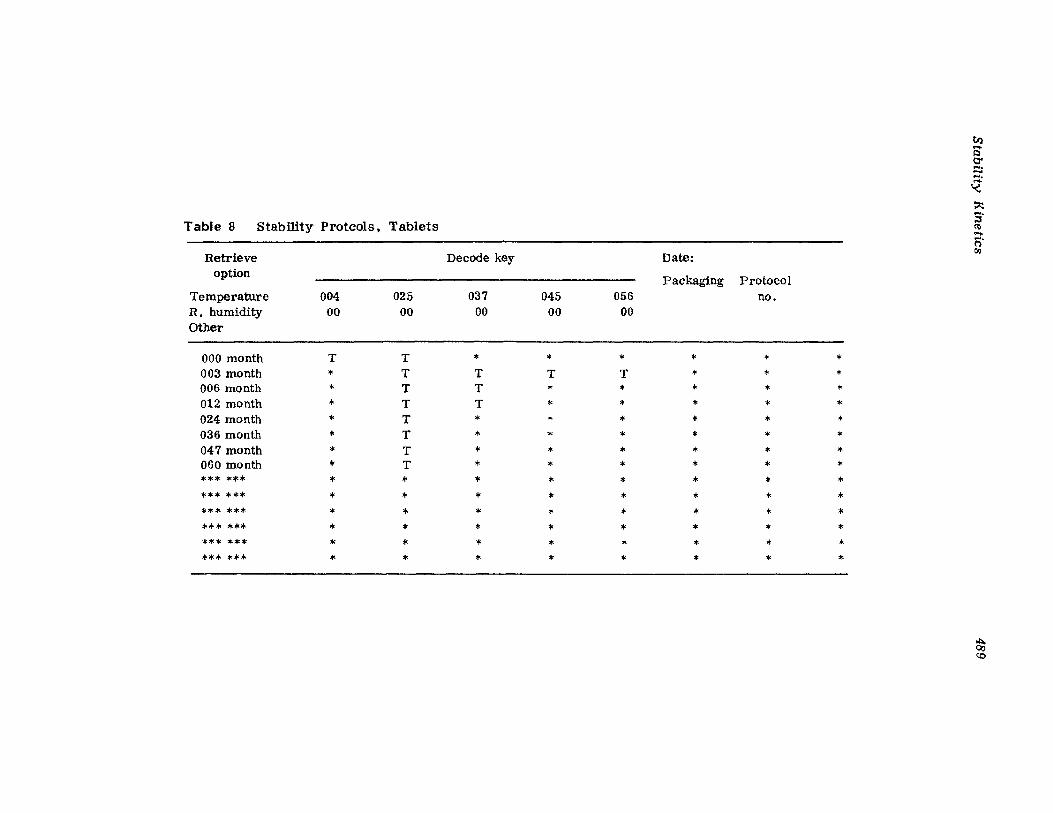
rn....I:ltl'~.-........'<t:'::
Table 8 Stability Protcols, TabletsS·(l)........(')
Retrieve Decode key Date:C'Jl
optionPackaging Protocol
Temperature 004 025 037 045 056 no.R. humidity 00 00 00 00 00Other
000 month T T '" '" '" '" '" '"003 month '" T T T T '" '" '"006 month '" T T '" '" '" '" '"012 month '" T T '" '" '" '" '"024 month * T * '" '" '" '" '"036 month '" T '" * '" '" '" '"047 month '" T '" '" '" '" '" '"060 month '" T '" '" '" '" '" '""'** *"'''' '" '" '" * '" '"
,..'"
"',..,.. '" ** '" '" '" * * '" * '""'** *"'''' '" * * '" '" '" '" '""'*'" "''''''' '" '" '" * '" '" '" '""'** "''''''' '" '" '" '" '" '" '" *"''''* "''''''' * '" '" '" '" '" '" '"
~se
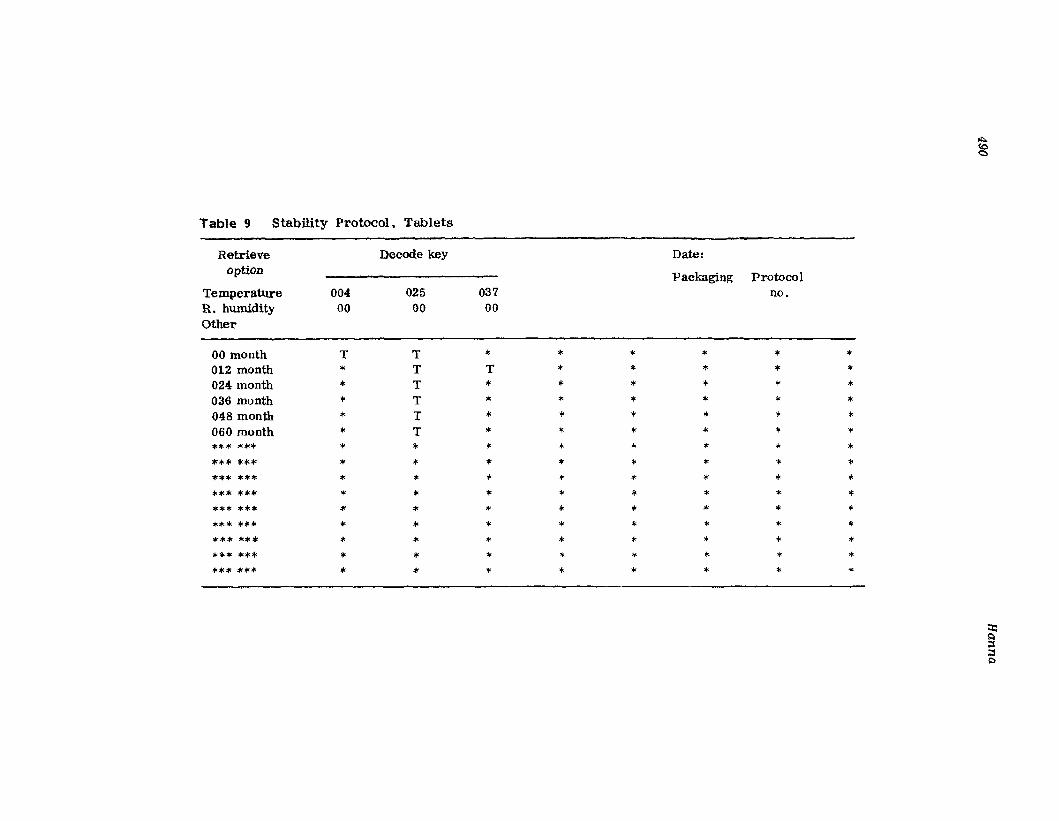
Table 9 Stability Protocol. Tablets
Retrieve Decode key Date:option Packaging Protocol
Temperature 004 025 037 no.R. humidity 00 00 00Other
00 month T T '" '" '" '" * *012 month * T T '" '" '" * '"024 month '" T '" '" '" * * *036 month '" T '" * * '" '" '"048 month '" T '" '" '" '" * *060 month '" T '" '" '" '" '" '"*"'* **'" '" '" >I< '" * * * '"*** *** '" '" '" '" '" " .. '"**'" *"'* '" '" >/< '" '" '" '" '"*"'* "'** '" '" '" '" '" '" * '""''''''' "''''''' * * '" '" '" '" '" '""'*'" "'*'" '" '" * '" '" * '" '"*** *** '" * '" '" '" " '" '""'** *"'* '" * '" ... * * '" '""''''* *** '" * 'I< '" '" '" '" '"
~
~
::t:~;:l;:l$:)
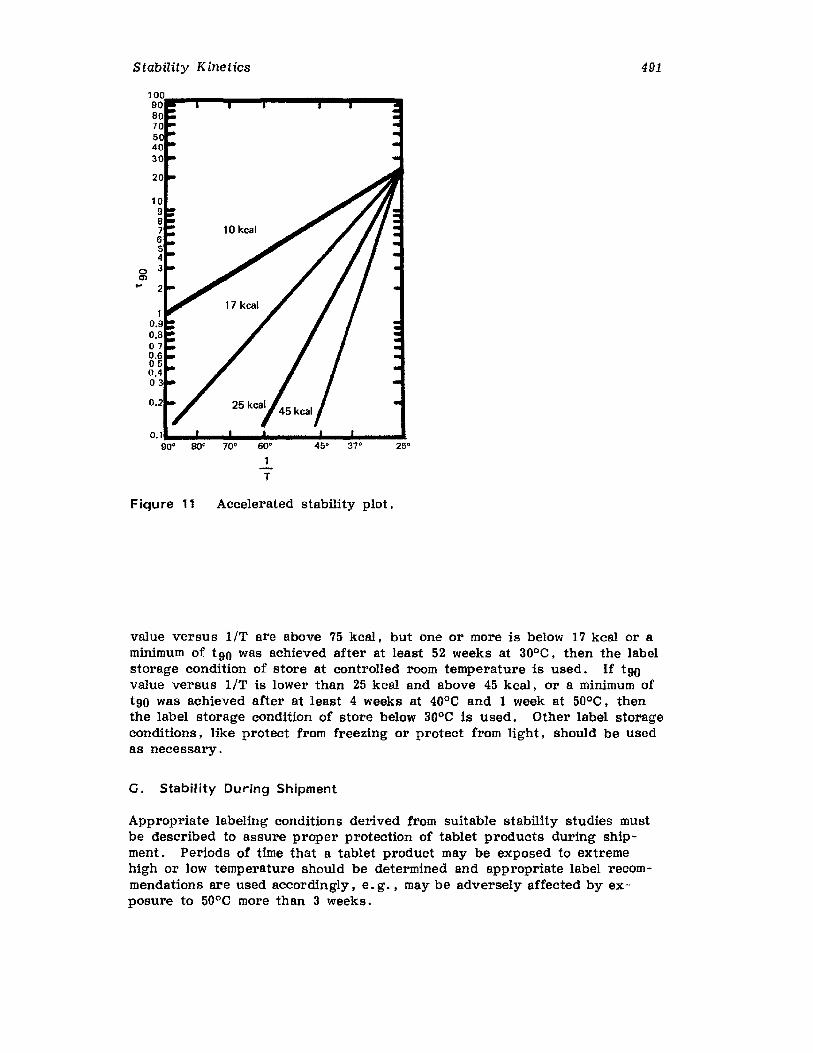
Stability Kinetics 491
25·45" 37·
0.1.._ ...._ ..._ ... .._ ...__..
90· SO' 70° 60·1
T
o~....
Fiqure 11 Accelerated stability plot.
value versus liT are above 75 kcal , but one or more is below 17 kcal or aminimum of t90 was achieved after at least 52 weeks at 30°C, then the labelstorage condition of store at controlled room temperature is used. If t90value versus liT is lower than 25 kcaI and above 45 kcal , or a minimum oft90 was achieved after at least 4 weeks at 40°C and 1 week at 50°C. thenthe label storage condition of store below 30°C is used. Other label storageconditions. like protect from freezing or protect from light, should be usedas necessary.
G. Stability During Shipment
Appropriate labeling conditions derived from suitable stability studies mustbe described to assure proper protection of tablet products during shipment. Periods of time that a tablet product may be exposed to extremehigh or low temperature should be determined and appropriate label recommendations are used accordingly. e. g .• may be adversely affected by exposure to 50°C more than 3 weeks.
492 Hanna
XIII. COMPUTER APPLICATION
Computer programs are an efficient means of assisting in the design of stability studies, especially complex models, and the interpretation of data.A typical computer program can provide an efficient control of samplestorage at given conditions, control inventory. schedule test intervals t
sample at schedule inter-vals , test requirements and analytical procedurefor each sample, determine manpower required for sample testing, reviewdata, evaluate statistical data, highlight out-of-limits results, maximize research and development capabilities, interpret data, plot results, estimateshelf life, prepare reports for regulatory submission or commitments andproduct stability trend analysis. Implementation of computer use in stability programs will allow efficient statistical evaluation of the kinetic data,handling of complex administrative functions t organization of voluminousamounts of data, and reduce the potential for human errors. Several stability computer programs are commercially available from pharmaceutical aswell as specialized computer companies. Example for such computer formsand stability reports are presented in Figures 12 and 13. Stability datalisted in these two figures are filled according to the instructions per thecoding letter mentioned beneath each requirement as follows:
a = Computer transaction codeb = Product list numberc =Product lot numberd = Assay type: chemical or biological, etc.e = Assay namef = Date of assay as per the stability protocolg = Time of the stability pointh = Number of assay code as per the written stability-indicating assay
monographi = Number of monograph code as per the written stability-indicating
assay monographj = %RHk = Temperature in °cI = Other atability conditions, e. g ., lightm = Date assay was performedn = Chemist or technician name/or initial who performed the assayo = Number of tests performedp = All results of assay performedq = Average assay resultsr = Previous assay results reporteds = Units the assay is to be run by, e. g., average tablet weight
(ATW)t = Number of samples analyzedu = Total time for stability study as per the stability protocolv = Product release limitw = In-house or action limity = Name of supervisor who checked and approved the analysisz = Date of supervisor approval
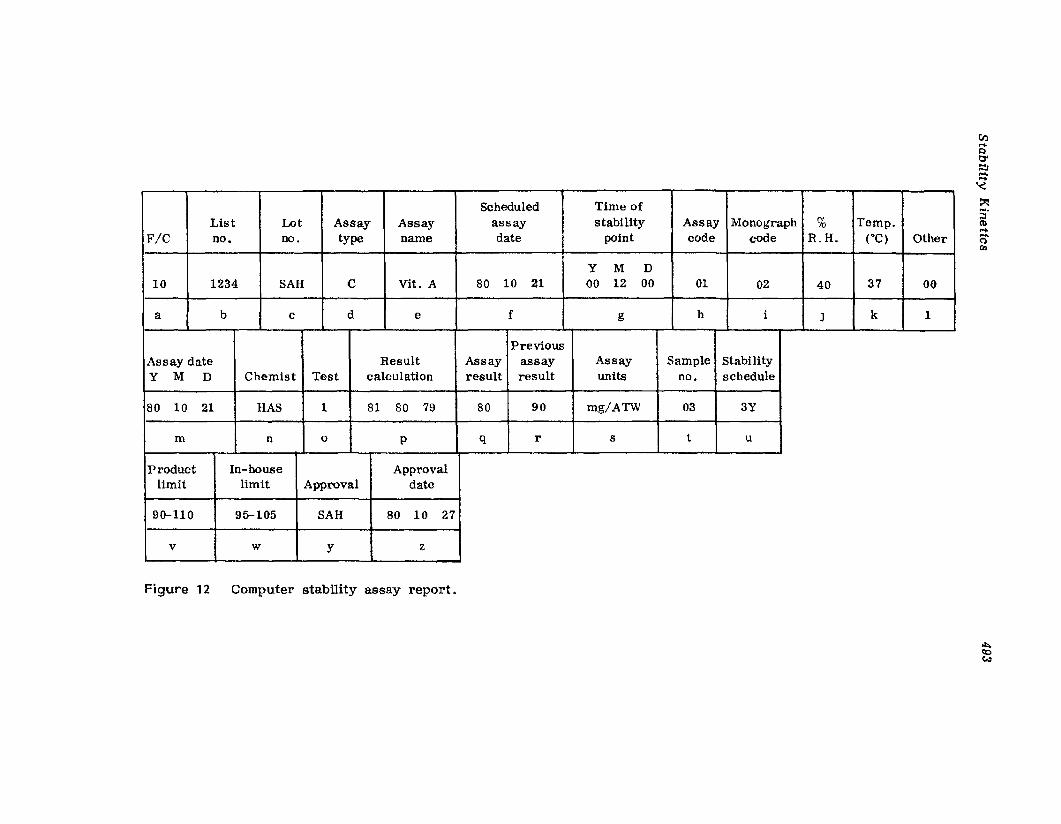
Scheduled Time ofList Lot Assay Assay assay stability Assay Monograph % Temp.
F/C no. no. type name date point code code R.H. (QC) Other
y M D10 1234 SAH C Vito A 80 10 21 00 12 00 01 02 40 37 00
a b c d e f g h i J k 1
PreviousAssay date Result Assay assay Assay Sample Stabilityy M D Chemist Test calculation result result units no. schedule
80 10 21 HAS 1 81 80 79 80 90 mg/ATW 03 3Y
m n 0 p q r s t u
Product In-house Approvallimit limit Approval date
90-110 95-105 SAH 80 10 27
v w Y z
Figure , 2 Computer stability assay report.
fn....1:1tr~....-<~
S·(I)....nCI:l
~~CJ,)
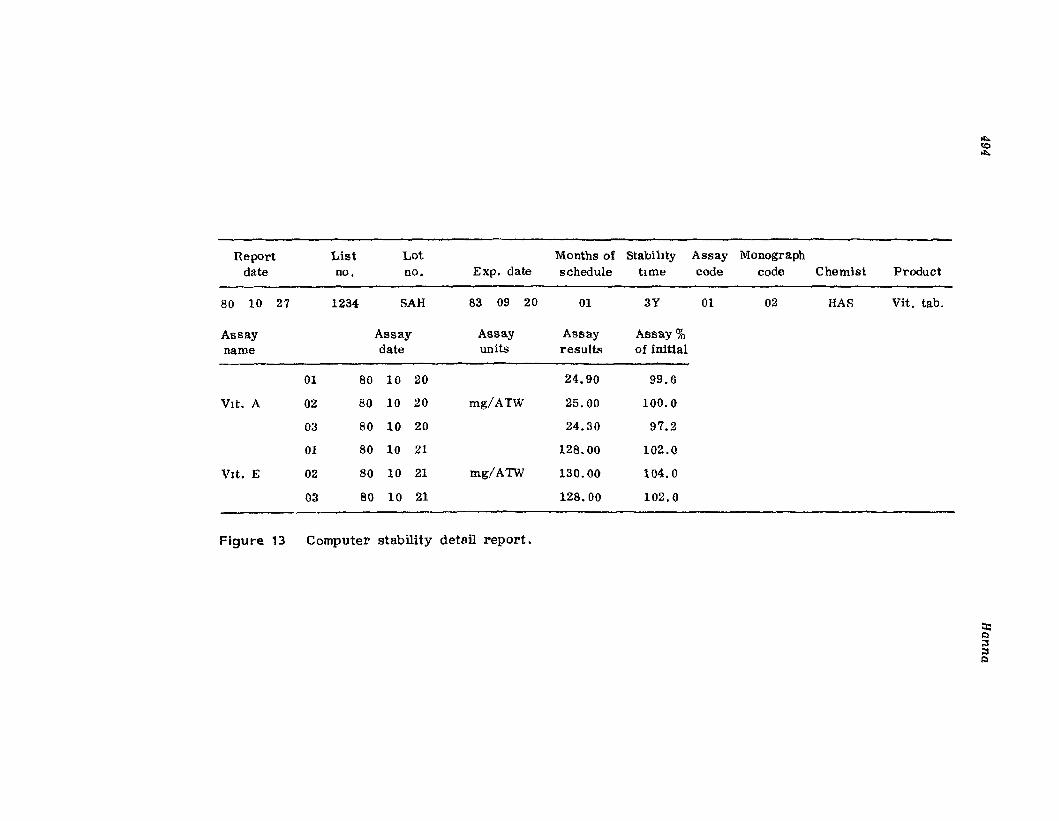
Report List Lot Months of Stabihty Assay Monographdate no. no. Exp. date schedule trme code code Chemist Product
80 10 27 1234 SAH 83 09 20 01 3Y 01 02 HAS Vito tab.
Assay Assay Assay Assay Assay %name date units results of initial
01 80 10 20 24.90 99.6
Vito A 02 80 10 20 mg/ATW 25.00 100.0
03 80 10 20 24.30 97.2
01 80 10 21 128.00 102.0
VIto E 02 80 10 21 mg/ATW 130.00 104.0
03 80 10 21 128.00 102.0
Figure 13 Computer stability detail report.
II>.toII>.
:::I:l;:s;:sI:l
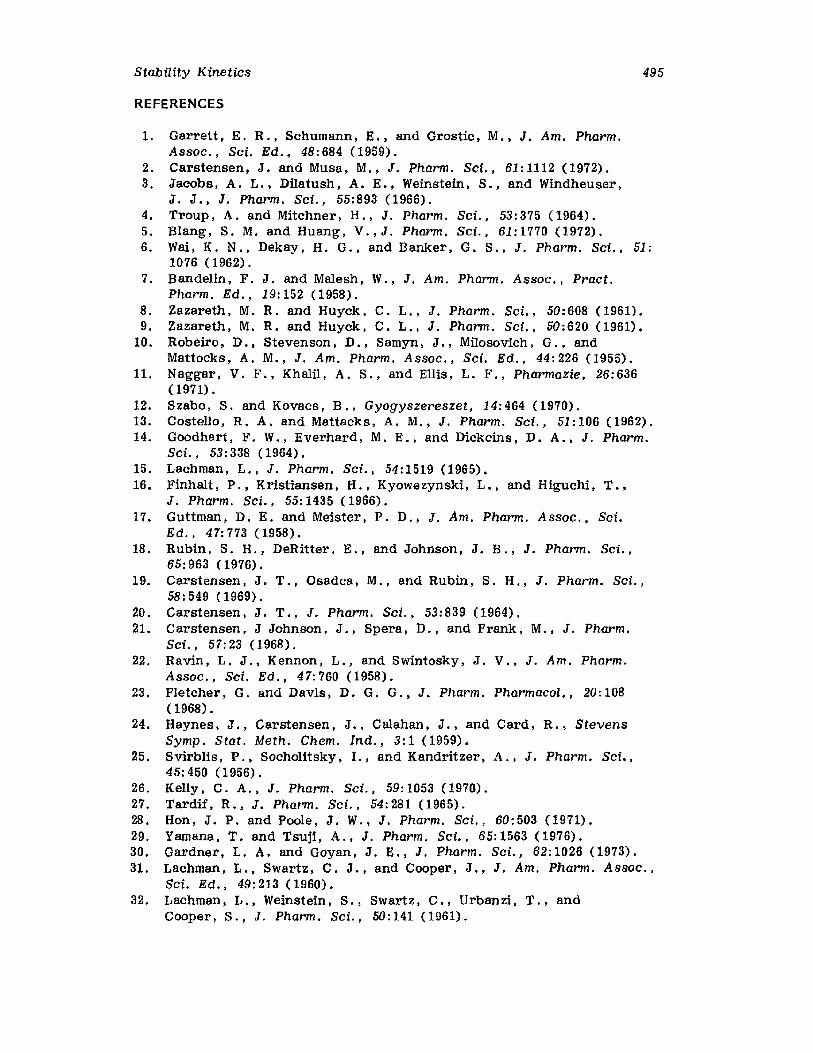
Stability Kinetics
REFERENCES
495
1. Garrett, E. R., Schumann, E., and Grostio , M.• J. Am. Pharm.Assoc., Sci. Ed., 48:684 (1959).
2. Carstensen. J. and Musa, M., J. Pharm. Sci.. 61: 1112 (1972).3. Jacobs, A. L., Dilatush, A. E., Weinstein. S., and Windheuser,
J. J., J. Pharm, sa., 55:893 (1966).4. Troup, A. and Mitchner, H., J. Pharm. Sci., 53:375 (1964).5. Blang, S. M. and Huang, V., J. Pharm. sa., 61: 1770 (1972).6. Wait K. N., Dekay, H. G.• and Banker, G. S., J. Pharm. ScL, 51:
1076 (1962).7. Bandelin , F. J. and Malesh, W., J. Am. Pharm. Assoc., Pract.
Pharm. Ed., 19: 152 (1958).8. Zazareth, M. R. and Huyck, C. L., J. Pharm. Sci., 50:608 (1961).9. Zazareth, M. R. and Huyck, C. L., J. Pharm. sa., 50:620 (1961).
10. Robeiro, D., Stevenson, D., Samyn, J., Milosovich, G., andMattocks, A. M., J. Am. Pharm. Assoc., Sci. Ed., 44: 226 (1955).
11. Naggar, V. F., Khalil, A. S., and Ellis, L. F., Pnarmazie , 26:636(1971) .
12. Szabo, S. and Kovacs, B., Gyogyszereszet, 14: 464 (1970).13. Costello, R. A. and Mattack s , A. M., J. Ptuirm, sa., 51:106 (1962).14. Goodhart, F. W., Everhard, M. E., and Dickcins, D. A., J. Ptuu-m,
sa., 53: 338 (1964).15. Lachman, L., J. Pharm. Sci., 54:1519 (1965).16. Finhalt, P., Kristiansen, H., Kyowezynski, L., and Higuchi, T.,
J. Pharm. Sci., 55:1435 (1966).17. Guttman, D. E. and Meister, P. D., J. Am. Pharm, Assoc., Sci.
sa., 47: 773 (1958).18. Rubin, S. H., DeRitter, E., and Johnson, J. B., J. Pharm. Sci.,
65: 963 (1976).19. Carstensen, J. T., Osadoa , M., and Rubin, S. H., J. Pharm. sci.,
58: 549 (1969).20. Carstensen, J. T., J. Pharm. ScL, 53:839 (1964).21. Carstensen, J Johnson, J., Spera, D., and Frank, M., J. Pharm.
Sci., 57: 23 (1968).22. Ravin, L. J., Kennon, L., and Swintosky, J. V., J. Am. Ptuirm,
Assoc., Sci. sa., 47: 760 (1958).23. Fletcher, G. and Davis, D. G. G., J. Pharm. Pharmacol., 20: 108
(1968).24. Haynes, J., Carstensen, J., Calahan, J., and Card, R., Stevens
Symp. Stat. Meth. Chem. Ind., 3: 1 (1959).25. Svirblis, P., Socholitsky, 1., and Kandritzer, A., J. Pharm. Sci.,
45: 450 (1956).26. Kelly, C. A., J. Pharm. Sci., 59: 1053 (1970).27. Tardif, R., J. Pharm, ScL, 54:281 (1965).28. Hon, J. P. and Poole, J. W., J. Pharm. ScL, 60:503 (1971).29. Yamana, T. and Tsuji, A., J. Pharm. Sct.; 65:1563 (1976).30. Gardner, L. A. and Goyan, J. E., J. Pharm. Sci., 62:1026 (1973).31. Lachman, L., Swartz, C. J., and Cooper, J., J. Am. Pharm. Assoc.,
Sci. Ed., 49:213 (1960).32. Lachman, L., Weinstein, S., Swartz, C., Urbanzi , T., and
Cooper, S., J. Pharm. sa., 50:141 (1961).
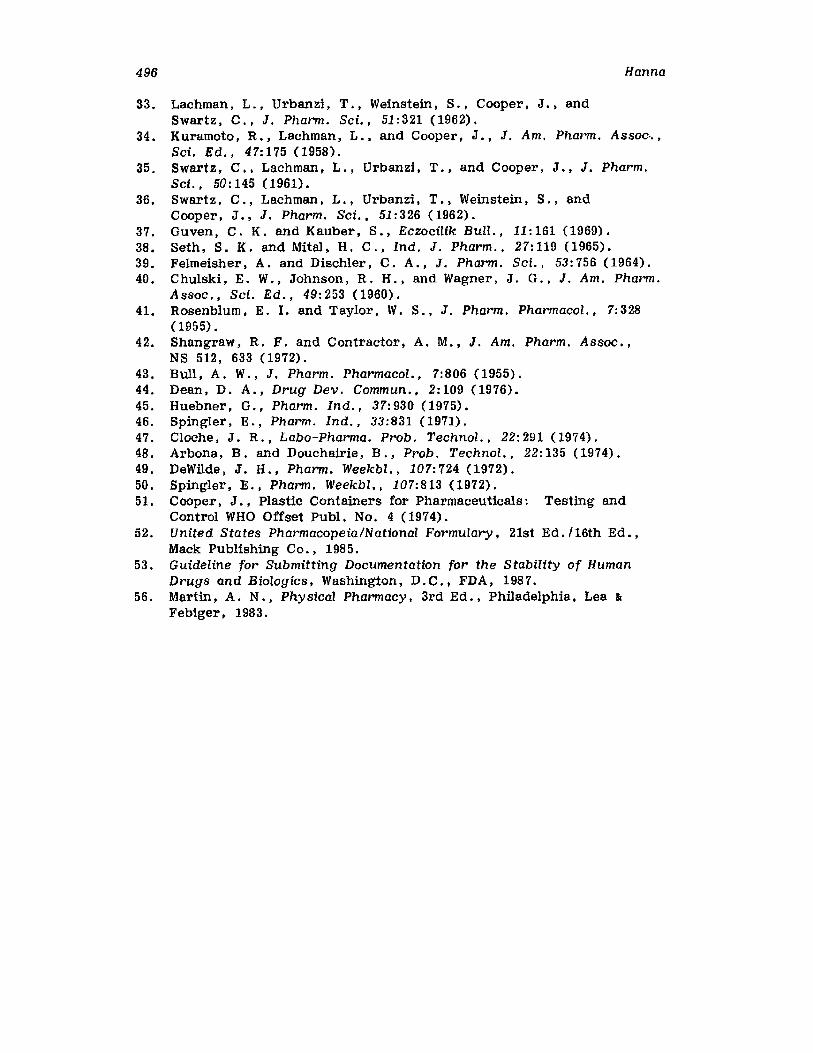
496 Hanna
33. Lachman, L., Urbanzi, T., Weinstein, S., Cooper, J., andSwartz, C., J. Pharm. ScL, 51:321 (1962).
34. Kuramoto, R., Lachman, L., and Cooper, J., J. Am. Pharm. Assoc.. ,Sci. sa., 47:175 (1958).
35. Swartz, C., Lachman, L., Urbanzi, T., and Cooper, J., J. Pharm.sa., 50:145 (1961).
36. Swartz, C., Lachman, L., Urbanzi, T.) Weinstein, S., andCooper, J., J. Pharm. sct., 51:326 (1962).
37. Guven, C. K. and Kauber , S') Eczocilik Bull., 11: 161 (1969).38. Seth. S. K. and Mital. H. C., Ind. J. Pharm., 27:119 (1965).39. Felmetsher , A. and Dischler, C. A., J. Pharm. Sci., 53:756 (1964).40. Chulski. E. W., Johnson, R. H., and Wagner, J. G., J. Am. Pharm.
Assoc., Sci. ea., 49: 253 (1960).41. Rosenblum, E. 1. and Taylor, W. S .• J. Pharm, Pharmacol., 7:328
(1955) •42. Shangraw, R. F. and Contractor, A. M., J. Am. Pharm. Assoc.,
NS 512, 633 (1972).43. Bull, A. W., J. Pharm , Pharmacol., 7:806 (1955).44. Dean, D. A., Drug Dev , Commun., 2: 109 (1976).45. Huebner, G., Pharm. Ind., 37:930 (1975).46. Spingler, E., Pharm . Ind., 33:831 (1971).47. Cloche. J. R., Labo-Pharma. Prob , Technol., 22: 291 (1974).48. Arbona , B. and Douchairie, B., Prob . Technol •• 22:135 (1974).49. DeWilde, J. H., Pharm. Weekbl., 107:724 (1972).50. Spingler, E., Pharm. Weekbl., 107:813 (1972).51. Cooper, J., Plastic Containers for Pharmaceuticals: Testing and
Control WHO Offset Publ , No. 4 (1974).52. United States Pharmacopeia/National Formulary, 21st Ed ./16th Ed , ,
Mack Publishing Co., 1985.53. Guideline for Submitting Documentation for the Stability of Human
Drugs and Biologics, Washing'ton, D. C., FDA, 1987.56. Martin, A. N., Phy sical Pharmacy, 3rd Ed., Philadelphia, Lea &
Febiger, 1983.
9Quality Assurance
Samir A. Hanna
Bristol-Myers Squibb Company, Syracuse, New York
I. INTRODUCTION
The total control of quality requires the organized effort of an entirecompany to assure the specified quality in each lot of drug product manufactured. The quality of oral solid-dosage forms as well as any drugdosage form must be built in during plant construction. product researchand development. purchasing of materials. production, testing, inspection,labeling. storage. and distribution. It cannot be assumed that end-product testing alone will ensure product quality.
Nearly all drug substances dispensed in the oral solid-dosage form arestable under ordinary conditions. The essential qualities of a good compressed tablet are characterized by a number of specifications. These include the appearance, size, shape, thickness, weight, homogeneity. stability, hardness, dissolution time, and disintegration time. The appearance, size, shape, and thickness of the tablet are generally used to distinguish and identify the active ingredients which they contain. The remaining specifications assure the manufacturer that the tablets do notvary from allowable limits within the same lot or from one production lot toanother. All such qualities are designed to ensure a safe, therapeuticallyeffective oral solid-dosage form.
II. QUALITY ASSURANCE SYSTEM
Since manufacturing produces the tablets, they should have prime responsibility for quality results. Removal of the responsibility from manufacturing for producing a quality product results in lackluster product qualityperformance. Quality assurance, however, must establish control points
497