TURKISH PHARMACEUTICAL INDUSTRY
45
TURKISH PHARMACEUTICAL INDUSTRY 2020
-
Upload
khangminh22 -
Category
Documents
-
view
2 -
download
0
Transcript of TURKISH PHARMACEUTICAL INDUSTRY

TURKISH PHARMACEUTICAL INDUSTRY
2020

1
TABLE OF CONTENTS Introduction 4 1. Turkish Pharmaceutical and Medicinal Products Market 6 1.1 Turkish Pharmaceutical Market 7 1.1.1 Market Growth and Resources 8
A. Price 9 B. Volume 9 C. Sales Distribution 9 D. New Product 9
1.1.2. Market Structure 10 A. Originator – Generic Products 10 B. Import – Local Products 13 C. Biotechnological Products 16 D. Therapeutical Groups 20 E. Average Prices 21 F. Retail Price Ranges 22 1.2. Medicinal Nutrition Market 25 1.3. Medicinal Products Market 26 2. Licensing 28 3. Investment Incentives 29 4. R&D 29 5. Production 30 6. Employment 31 7. Foreign Trade 32 8. Price Policies 38 9. Conclusion and Evaluation 41

2
CHARTS LIST
Chart 1 - Turkish Pharmaceutical and Medicinal Products Market 6 Chart 2 - Turkish Pharmaceutical Market 7 Chart 3 - Resources of Growth 8 Chart 4 - Originator - Generic Drugs (Value) 10 Chart 5 - Originator - Generic Drugs (Volume) 11 Chart 6 - Originator - Generic Drugs Market Share (Value) 11 Chart 7 - Originator - Generic Drugs Market Share (Volume) 12 Chart 8 - Import-Local Products (Value) 13 Chart 9 - Import-Local Products (Volume) 14 Chart 10 - Import-Local Products Market Share (Value) 14 Chart 11 - Import-Local Products Market Share (Volume) 15 Chart 12 - Biotechnological Products (Value) 17 Chart 13 - Biotechnological Products (Volume) 17 Chart 14 - Originator-Biosimilar Products Market Share (Value) 18 Chart 15 - Originator-Biosimilar Products Market Share (Volume) 18 Chart 16 - The Share of Imported Biopharmaceuticals Among Imported Products (Value) 19 Chart 17 - The Share of Imported Biopharmaceuticals Among Imported Products (Volume) 19 Chart 18 - Therapeutical Groups on Value Scale 20 Chart 19 - Therapeutical Groups on Volume Scale 21 Chart 20 - Retail Price Ranges 22 Chart 21 - Price Breakdown of Originator Products 23 Chart 22 - Price Breakdown of Generic Products 23 Chart 23 - Price Breakdown of Imported Products 24 Chart 24 - Price Breakdown of Local Products 24 Chart 25 - Medicinal Nutrition Market 25 Chart 26 - Medicinal Nutrition Growth Distribution 25 Chart 27 - Medicinal Products Market 26 Chart 28 - Sources of Medicinal Products Market Growth 26 Chart 29 - Medicinal Products Market Value 27 Chart 30 - Medicinal Products Market Volume 27 Chart 31 - Medicinal Products Market Average Price Distribution 28 Chart 32 - Number of Novel Product Licenses 28 Chart 33 - Number of Accredited R&D Centers in the Pharmaceutical Industry 30 Chart 34 - Pharmaceutical Industry R&D Expenditure 30 Chart 35 - Number of Production Facilities 31 Chart 36 - Industry Production Index Change (2015-2020) 31 Chart 37 - Employment in the Pharmaceutical Industry 32 Chart 38 - Export Value in the Pharmaceutical Industry 32 Chart 39 - Import Value in the Pharmaceutical Industry 33 Chart 40 - Pharmaceutical Industry in Turkish Foreign Trade 33 Chart 41 - Finished Product vs Raw Material in Pharmaceutical Industry 34 Chart 42 - Export Amount in the Pharmaceutical Industry 34 Chart 43 - Pharmaceutical Export Price Per Kilo 35 Chart 44 - Export Price per Kilo in Various Sectors 35 Chart 45 - Currency Trends (Euro/TRY) 39 Chart 46 - Pharmaceutical Pricing 39 Chart 47 - Real Changes in Net Sales (2015-2019) 40 Chart 48 - Real Changes in Equities (2015-2019) 40 Chart 49 - SSI Monthly Prescription Number 41

3
TABLE LIST Table 1- Breakdown of the Pharmaceutical Market 8 Table 2- Unit Distribution of New Products in the Market 9 Table 3- Originator-Generic Products Breakdown 12 Table 4- Import-Local Products Breakdown 15 Table 5- Biotechnological Products 20 Table 6- Distribution of Average Product Prices 22 Table 7- Investment Incentives in the Pharmaceutical Industry 29 Table 8- First Twenty Countries in Pharmaceutical Export 37 Table 9- First Twenty Countries in Pharmaceutical Import 37 Table 10- First Five Products in Pharmaceutical Export 38 Table 11- First Five Products in Pharmaceutical Import 38

4
Introduction
Having the potential to compete with developed countries, the Turkish pharmaceutical industry is the most dynamic, strategic industry among industries that support our country in its industrial transformation and has a deeply-rooted history, years-long production experience, qualified workforce and high added-value structure founded on leading-edge technology. The Covid-19 pandemic has once again shown the crucial importance of the pharmaceutical industry for countries and the strategic value of having a strong and self-reliant pharmaceutical industry. The extraordinary circumstances imposed by the pandemic on social and business life have implications for the pharmaceutical industry as well, just like all other industries. However, we believe that we create the privilege of having a strong pharmaceutical industry for our country by pursuing our activities in all conditions with a social responsibility awareness. In this period, the Turkish pharmaceutical industry has pursued its uninterrupted activities in production facilities despite difficulties ranging from the supply of raw material to logistics disruptions, increasing costs, fluctuations in pharmaceutical sales and the challenging circumstances created by the risk of contagion. By this means, our country’s supply safety could be maintained and nor our people neither our healthcare professionals faced any problems in accessing medicines. Our industry has uninterruptedly continued to produce both products included in the Covid-19 treatment allorhythmia and other medicines. Moreover, our country has started producing medicines used in the treatment of Covid-19 that are not normally manufactured in Turkey. The works of our industry in terms of developing and ensuring the production of novel medicines and domestic vaccines are continuing without pause. There are approximately 680 establishments operating in our industry, 96 pharmaceutical and radiopharmaceutical production facilities producing at international standards, and 11 raw material production facilities. The pharmaceutical industry provides our country’s growing and ageing population with more than 12 thousand products and imports to approximately 180 countries with its nearly more than 40 thousand employees. Our objective is for our industry to increase its added value in production by transitioning to a stronger R&D structure, to gain momentum in especially the area of biotechnology and to make Turkey a regional, even, a global base of pharmaceutical production and export with its new investments to be supported by the appropriate public policies. To reach that goal, we pursue our activities continuously as both the Pharmaceutical Manufacturers Association of Turkey (IEIS) and the Turkish Biopharmaceutical Platform and the Turkish Pharmaceutical Exporters Platform. We are working ardently and with determination to ensure the actualization of regulations that will clear the way for our industry in terms of R&D and biotechnology, production, employment and export.

5
In this scope, we consider the gathering of both market and macro-economic data on the pharmaceutical industry and their translation into a comprehensive analysis as a primary area of activity to shed light on our industry’s path. In this framework, we have published our Turkish Pharmaceutical Industry Report prepared on a yearly basis since 2015. In our report, we have included the analysis of both 2020 and the last 6 years. As part of the study, we have analyzed the pharmaceutical and medical health products market under the titles of pharmaceutical market, food for special medical purposes market and health products market. We have analyzed the Turkish pharmaceutical market based on both market structure and prices under different categories such as reference/generic medicines, imported/manufactured medicines, biotechnological pharmaceuticals. We have also focused on the food for special medical purposes market and Ministry of Health-approved traditional plant-based (herbal) medical products, biocidal products, some medical devices in pharmaceutic form, cosmetics and dermo cosmetics, and we have also scrutinized the health products market constituted of vitamins and food supplements approved by the Ministry of Agriculture and Forestry. Our report featured analyses pertaining to pharmaceutical licensing, investment incentives, R&D, production, employment, financial data and renewed foreign trade. As in recent years, we are delighted to be presenting our 2020 Turkish Pharmaceutical Industry Report to our shareholders in the public, academic and private sectors, and hope that it will be reviewed with interest, contribute to our industry’s development and transform into concrete steps to optimize the industry’s contribution.

6
1. Turkish Pharmaceutical and Medicinal Products Market
The Turkish pharmaceutical and medicinal products market has grown of 19.9% in 2020 in hospitals and pharmacies and reached 52.8 billion TRY. On a unit basis, it has declined of 5% and dropped to 2.43 billion units. The market including medicines, diet food for special medical purposes, traditional plant-based medical products approved by the Ministry of Health and vitamins and food supplements approved by the Ministry of Agriculture and Forestry had grown of 2.7% per unit in 2019, and of 31.6% in value in the same year.
Chart 1 - Turkish Pharmaceutical and Medicinal Products Market
When we review the 6-year period between 2015-2021, we see that the pharmaceutical and medicinal products market has grown of 178% in 2020 and reached 52.8 billion TRY from 19 billion TRY in 2015. While this growth indicates an increase of 22.7% on annual compound basis (CAGR), it also indicates a real growth of 21.9% when producer prices inflation during the same period is taken into consideration. When analyzed in terms of volume, it has reached 2.43 billion units in 2020 with a growth of 9.8% from 2.21 billion units in 2015. This increase is at a 1.9% level on annual compound basis (CAGR). Contributing factors to this growth were the increase of access to public health services in the medicines group and to doctors, the increase of demand by a growing and ageing population and the increasing demand for products such as non-pharmacological natural supplements and vitamins triggered by the presentation of options for these. Approximately one quarter of the 680 companies that constitute the market are domestic capital companies.
19,00 22,17 26,44 33,46
44,03 52,79
2,212,31
2,392,49
2,552,43
1,0
1,2
1,4
1,6
1,8
2,0
2,2
2,4
2,6
0
10
20
30
40
50
60
2015 * 2016 2017 2018 2019 2020Value Volume
* The Consumer Health Database information entered in the IQVIA Retail database in March 2021 are not included.
TRY (billion) Unit (billion)
Source: IQVIA, IEIS

7
1.1 Turkish Pharmaceutical Market The Turkish pharmaceutical market has reached 47.9 billion TRY in hospitals and pharmacies in 2020 with a growth of 17.7% on a value basis. It has declined of 7% on a unit basis and dropped to 2.2 billion units sold. The hospital market share has been of 11.8% in value, and of 12.3% in unit in 2020.
Chart 2 - Turkish Pharmaceutical Market
When the period between years 2015-2020 is analyzed periodically, it is observed that the pharmaceutical industry has reached 47.9 billion TRY in 2020 with a growth of 173% from 17.6 billion TRY in 2015. While this growth does indicate a compound annual growth rate of 22.2% (CAGR), reel growth was of 19.8% when producer prices inflation of 128% during the same period is taken into account. When we look at it on the basis of volume, the pharmaceutical industry has reached 2.2 billion units in 2020 with an increase of 6.9% from 2.06 billion units in 2015. This increase equals a ratio of 1.3% in compound annual growth rate (CAGR). The measures taken against the pandemic as of March 2020 in our country and the changes that happened in the flow of everyday life have had an impact on the pharmaceutical industry just like in other sectors. Many factors such as people staying home as a result of the pandemic, the postponing of treatments and needs as long as these are not urgent, access to public health services and doctors being restricted resulted in a recession of the pharmaceutical industry to levels before 2017 with 2.2 billion units. An analysis of the market in terms of concentration shows that the product range of 52 companies in the Turkish market constituted of the medicines of 242 distributors include imported medicines only, while 115 companies are present on the market with local medicines only. On the other hand, the 75 companies who own more than 60% of the medicines on the market possess both local and imported medicines and
15,5 17,7 21,3 26,8
35,5 42,3
2,1 2,73,2
4,2
5,2
5,7
2,1
2,2
2,2
2,3 2,4
2,2
1,8
2,0
2,2
2,4
0
10
20
30
40
50
60
2015 2016 2017 2018 2019 2020Total Sales Value - Pharmacies Total Sales Value - Hospitals Total Sales Volume
Unit (billion)
Source: IQVIA, IEIS
TRY (billion)

8
represent 72% of the market in value and 76% in volume. In 2020, the share of the first 50 companies in value ranking has increased from 85% to 86%, and from 77% to 78% in volume. The market value of reimbursed prescriptions in the pharmaceutical industry has been of 45,95 billion TRY in 2020. The more than three-fold difference between the average prices of medicines that are not reimbursed and those that are is striking. Table 1- Breakdown of the Pharmaceutical Market
Volume
(Billion Unit) Value
(Billion TRY) Average Price
(TRY)
Turkish Pharmaceutical Market 2,20 47,92 21,8 Prescription 2,18 47,57 21,9 Reimbursed 2,15 45,75 21,3
Non-reimbursed 0,03 1,81 64,1
Non- prescription 0,03 0,35 13,3 Reimbursed 0,02 0,20 10,0
Non-reimbursed 0,01 0,15 23,6 1.1.1 Market Growth and Resources There are 4 main factors that have contributed to value-based growth in the year 2020. These are: size of the current portfolio, price increases, changes in sales distribution and novel product entries to the portfolio.
Source: IQVIA, IEIS
Chart 3 – Resources of Growth
Source: IQVIA, IEIS
9
A. Price
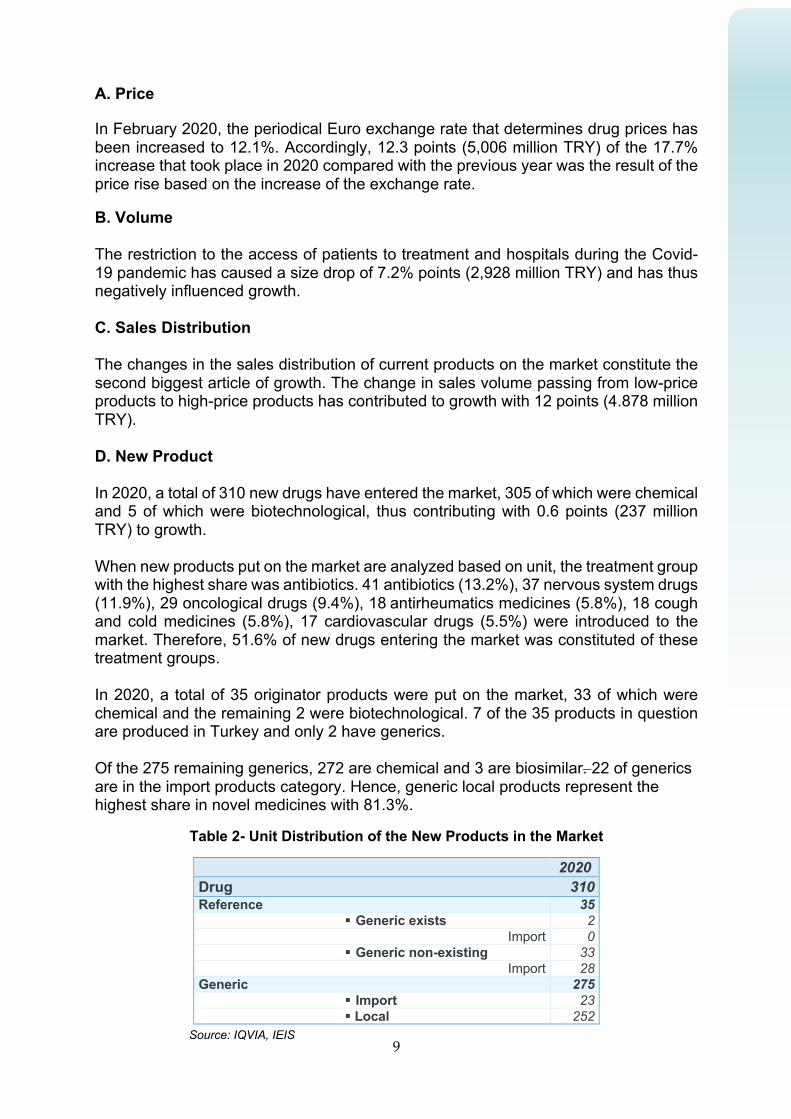
In February 2020, the periodical Euro exchange rate that determines drug prices has been increased to 12.1%. Accordingly, 12.3 points (5,006 million TRY) of the 17.7% increase that took place in 2020 compared with the previous year was the result of the price rise based on the increase of the exchange rate. B. Volume The restriction to the access of patients to treatment and hospitals during the Covid-19 pandemic has caused a size drop of 7.2% points (2,928 million TRY) and has thus negatively influenced growth. C. Sales Distribution The changes in the sales distribution of current products on the market constitute the second biggest article of growth. The change in sales volume passing from low-price products to high-price products has contributed to growth with 12 points (4.878 million TRY). D. New Product In 2020, a total of 310 new drugs have entered the market, 305 of which were chemical and 5 of which were biotechnological, thus contributing with 0.6 points (237 million TRY) to growth. When new products put on the market are analyzed based on unit, the treatment group with the highest share was antibiotics. 41 antibiotics (13.2%), 37 nervous system drugs (11.9%), 29 oncological drugs (9.4%), 18 antirheumatics medicines (5.8%), 18 cough and cold medicines (5.8%), 17 cardiovascular drugs (5.5%) were introduced to the market. Therefore, 51.6% of new drugs entering the market was constituted of these treatment groups. In 2020, a total of 35 originator products were put on the market, 33 of which were chemical and the remaining 2 were biotechnological. 7 of the 35 products in question are produced in Turkey and only 2 have generics. Of the 275 remaining generics, 272 are chemical and 3 are biosimilar. 22 of generics are in the import products category. Hence, generic local products represent the highest share in novel medicines with 81.3%.
Table 2- Unit Distribution of the New Products in the Market
2020 Drug 310 Reference 35
§ Generic exists 2 Import 0
§ Generic non-existing 33 Import 28
Generic 275 § Import 23 § Local 252
Source: IQVIA, IEIS

10
1.1.2. Market Structure A. Originator - Generic Products The size of the originators market has grown more than the pharmaceutical industry in 2020 and has increased of 21.3%, reaching 32.7 billion TRY from 27 billion TRY. On a unit basis, it has declined of 3.6% and corresponded to 0.89 billion units. As to the generic product market, it has gone from 13.7 billion TRY to 15.2 billion TRY in 2020 with a growth of 10.4 %. On the basis of units, generic products faced a fall of 9.1% and dropped to 1.31 billion units. Originator drugs have grown of a total of 168.9% between years 2015-2020 based on value. This growth has caused a compound annual growth rate (CAGR) of 21.9% and indicates a growth of 18% when inflation adjusted. The period in question has shown a decrease of 1% in reference medicines based on units. Although the continued increasing trend of generics until 2020 compared with originators has been tempered with the last data, in the period between 2015-2020, generics have shown a total increase of 182.3% compared with originator products. When we look at the compound annual growth rate (CAGR), this growth shows an increase of 23.1%. When inflation-adjusted, this increase corresponded to 23.8% in real terms. As for the basis on unit, a total increase of 13% has taken place in generic drugs between years 2015-2020.
Chart 4 - Originator – Generic Drugs (Value)
Source: IQVIA, IEIS
TRY (billion)

11
69% 68% 68% 68% 66% 68%
31% 32% 32% 32% 34% 32%
0%
20%
40%
60%
80%
100%
2015 2016 2017 2018 2019 2020
Originator Generic
Although generic drugs have decreased of 31.7% in value and of 59.6% in unit in the year 2020, these rates were of 30.6% in unit and 56.4% in value in 2015.
Chart 5 - Originator – Generic Drugs (Volume) Units (billion)
Chart 6 - Originator-Generic Products Market Share (Value)
Source: IQVIA, IEIS

12
Source: IQVIA, İEİS
When the import-local difference between reference - generic products is analyzed, we note that in 2020, reference products constitute 70% based on value, and that 30% of it was constituted of imported products based on unit. As to generic products, almost their entirety was constituted of medicines produced domestically. It is believed that overseas GMP audits played a role in the recession of the market shares of imported generic products. Table 3 - Originator - Generic Products Breakdown 2015 2016 2017 2018 2019 2020
Valu
e Orig
inat
or Import 80% 79% 78% 74% 71% 70%
Billion TRY 9,74 11,00 12,94 15,60 19,05 23,03
Local 20% 21% 22% 26% 29% 30% Billion TRY 2,44 2,90 3,75 5,42 7,93 9,71
Gen
eric
Import 6% 5% 5% 4% 3% 4% Billion TRY 0,34 0,35 0,39 0,43 0,48 0,59
Local 94% 95% 95% 96% 97% 96% Billion TRY 5,04 6,17 7,47 9,49 13,27 14,60
Uni
t Orig
inat
or Import 43% 44% 43% 37% 29% 28%
Billion Units 0,39 0,40 0,39 0,35 0,27 0,25
Local 57% 56% 57% 63% 71% 72% Billion Units 0,51 0,51 0,52 0,59 0,65 0,64
Gen
eric
Import 3% 3% 3% 2% 2% 2% Billion Units 0,04 0,04 0,04 0,03 0,02 0,02
Local 97% 97% 97% 98% 98% 98% Billion Units 1,12 1,21 1,27 1,34 1,42 1,29
Chart 7 - Originator-Generic Products Market Share (Volume)
Source: IQVIA, IEIS

13
B. Import-Local Products Import products have reached 23.6 billion TRY in 2020 with an increase rate of 20.9%. As for the period between 2015 - 2020, imported products have shown a value-based increase of 134.4%. While this indicates a compound annual growth rate of 21.9% (CAGR), it corresponds to an increase of 18% when inflation adjusted. Although it was below the average growth rate in 2020 with 14.7%, it has still reached 24.3 billion TRY. Local products have shown a value-based growth of 225.1% between years 2015-2020. This growth corresponds to a compound annual growth rate (CAGR) of 26.6%. When domestic producer prices are taken into account, it indicates a real increase of 42.6%.
When we analyze the year 2020 based on volume, we observe a drop of 9.2% in import products and a unit sales of 0.27 billion. As for the 2015-2020 period, import products have dropped of 38.2%. Local medicines have decreased of 6.6% based on unit and equaled a sales of 1.94 billion units. Between years 2015-2020, local medicines have shown a growth of 18.8%.
Chart 8- Import-Local Products (Value)
Source: IQVIA, IEIS
TRY (billion)
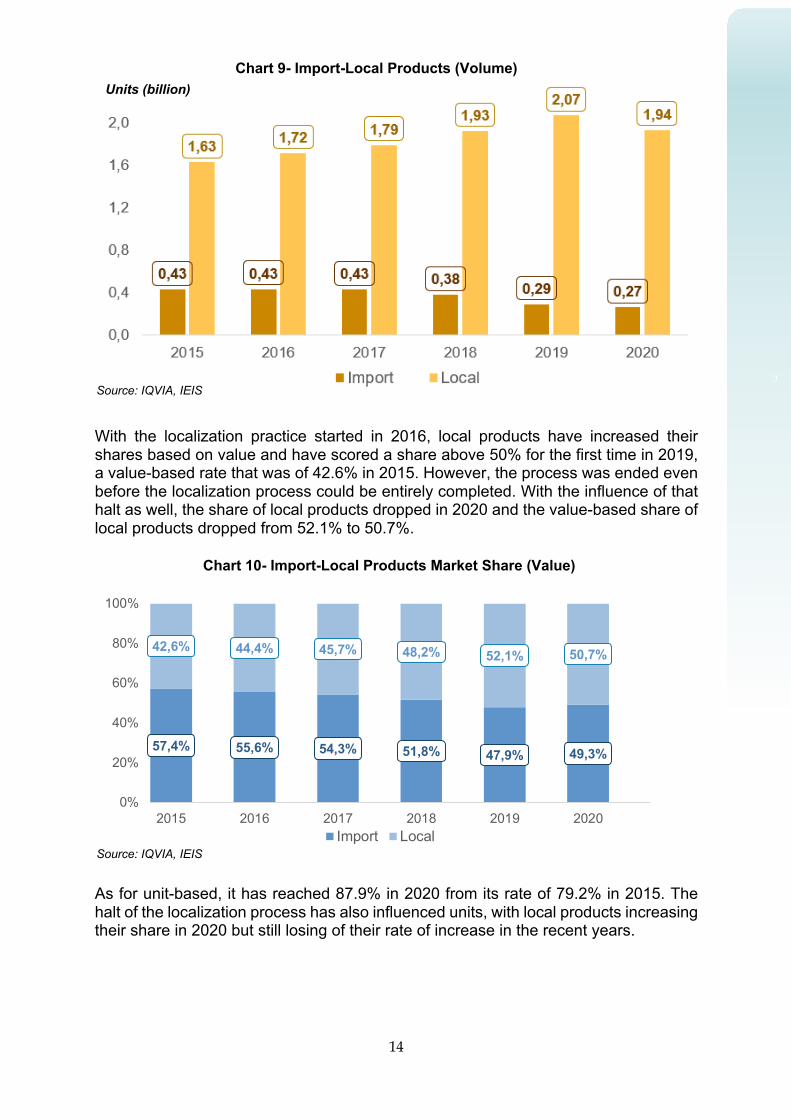
14
c
With the localization practice started in 2016, local products have increased their shares based on value and have scored a share above 50% for the first time in 2019, a value-based rate that was of 42.6% in 2015. However, the process was ended even before the localization process could be entirely completed. With the influence of that halt as well, the share of local products dropped in 2020 and the value-based share of local products dropped from 52.1% to 50.7%.
As for unit-based, it has reached 87.9% in 2020 from its rate of 79.2% in 2015. The halt of the localization process has also influenced units, with local products increasing their share in 2020 but still losing of their rate of increase in the recent years.
57,4% 55,6% 54,3% 51,8% 47,9% 49,3%
42,6% 44,4% 45,7% 48,2% 52,1% 50,7%
0%
20%
40%
60%
80%
100%
2015 2016 2017 2018 2019 2020Import Local
Chart 9- Import-Local Products (Volume)
Source: IQVIA, IEIS
Chart 10- Import-Local Products Market Share (Value)
Source: IQVIA, IEIS
Units (billion)

15
While almost all imported products based on value are constituted of originator products, these continue to represent a lower share in local products. As for generics, although there are slight changes in the unit-based share in local products, their value-based share has not changed. Among products produced in our country in 2020, 67% based on value were generic, and 60% based on unit were generic. Table 4 - Import-Local Products Breakdown 2015 2016 2017 2018 2019 2020
Valu
e
Impo
rt Generic 3% 3% 3% 3% 2% 2%
Billion TRY 0,34 0,35 0,39 0,43 0,48 0,59
Originator 97% 97% 97% 97% 98% 98% Billion TRY 9,74 11,00 12,94 15,60 19,05 23,03
Loca
l
Generic 67% 68% 67% 64% 63% 60% Billion TRY 5,04 6,17 7,47 9,49 13,27 14,60
Originator 33% 32% 33% 36% 37% 40% Billion TRY 2,44 2,90 3,75 5,42 7,93 9,71
Uni
t
Impo
rt Generic 9% 9% 8% 8% 8% 8%
Billion TRY 0,04 0,04 0,04 0,03 0,02 0,02
Originator 91% 91% 92% 92% 92% 92% Billion TRY 0,39 0,40 0,39 0,35 0,27 0,25
Loca
l
Generic 69% 70% 71% 70% 69% 67% Billion Units 1,12 1,21 1,27 1,34 1,42 1,29
Originator 31% 30% 29% 30% 31% 33% Billion Units 0,51 0,51 0,52 0,59 0,65 0,64
Chart 11- Import-Local Products Market Share (Volume)
Source: IQVIA, IEIS
Source: IQVIA, IEIS

16
C. Biotechnological Products The simplest definition of biotechnological pharmaceuticals is drugs created by using living systems and organisms. Biotechnological production in the pharmaceutical industry has first started with the creation of penicillin by Alexander Fleming in 1928 and has been used in the treatment of diabetes with human insulin created with recombinant DNA technology in the beginning of the 1980s for the first time. Since the raw material of biotechnological products is non-chemical living organisms, both the development and production of these medicines require significant innovative and technological background and investment. Biotechnological pharmaceuticals steer the present and the future of the international pharmaceutical industry. The treatment of many diseases which do not respond to conventional medicines is thus possible thanks to these medicines. Therefore, the market share of the products in question both in our country and in the world is increasing by the day. The share of biotechnological pharmaceuticals in the global pharmaceutical industry has reached 30% in a very short period of time and this rate is expected to continue increasing with the same speed in the period to come. The similar also applies to Turkey. When biotechnological pharmaceuticals in Turkey are analyzed on their own, it is possible to notice that they have a share of approximately 18.2% with 8.7 billion TRY in the pharmaceutical market. As of December 2020, there are 254 forms of originator biotechnological pharmaceuticals under 116 licensed brands in Turkey, and 94 forms of biosimilars under 25 brands. The biotechnological pharmaceuticals market is constituted of a total of 141 brands and 348 medical forms. The production of the 29 types of biosimilars under 7 different brands takes place in Turkey. Efforts are underway for the local production of 2 originator biotechnological, 39 biosimilar, 1 bio better products in our country until 2024. The development and production of these products whose import we are depending on will not only facilitate the access of patients to the medicines but will also decrease foreign trade deficit and thus contribute significantly to the country’s economy. When originator biotechnological products are observed, we notice that they have shown a growth of 22.5% in 2020 and reached a size of 7.82 billion TRY. As for the biosimilars market, it has increased of 48.3% in 2020 and reached 907.1 million TRY.

17
When analyzed on the basis of unit, biotechnological pharmaceuticals have increased of 16.3% in 2020 and reached a size of 34.3 million units. The sale of reference biotechnological products has increased of 16.1% compared with the previous year, and biosimilar medicines have increased of 16.7%. Unit-based sale of biosimilar medicines has been of 10.7 million in 2020.
In Turkey, biosimilar products containing, abciximab, bevacizumab, enoxaparin sodium, epoetin alfa, epoetin zeta, filgrastim, infliximab, insulin glargine, rituximab, somatropin and trastuzumab have been licensed, and those that are produced in Turkey have enoxaparin sodium, epoetin alfa, filgrastim, infliximab and insulin glargine as active ingredient. It is expected that the number of biosimilar products increases rapidly in the periods to come.
Chart 12- Biotechnological Drugs (Value)
Source: IQVIA, IEIS
Units (billion)
Source: IQVIA, IEIS
Chart 13- Biotechnological Drugs (Volume)
TRY (billion)

18
While the share of biosimilars in biotechnological pharmaceuticals in 2015 was of 3.1%, it has more than tripled its share in 2020 and risen to 10.4%.
The share of biosimilars based on unit of 9.6% in 2015 has risen to 31.3% in 2020.
Chart 14- Originator-Biosimilar Products Market Share (Value)
Source: IQVIA, IEIS
Chart 15- Originator-Biosimilar Products Market Share (Volume)
Source: IQVIA, IEIS

19
5,3% 5,2%5,5%
6,3%
7,1%
9,1%
4%
6%
8%
10%
2015 2016 2017 2018 2019 2020
Chart 16- The Share of Imported Biopharmaceuticals Among Imported Products (Value)
Biotechnological pharmaceuticals continue to increase their share in the Turkish pharmaceutical market each year. While the share of imported products was of 29.6% based on value and 5.3% based on unit in 2015, it has reached 34.3% based on value and 9.1% based on unit in 2020. Blood and hematopoietic products have very significantly increased their share in biosimilar medicines. As for the product market for originator biotechnological products, antineoplastics and immunomodulatory agents and gastrointestinal and metabolic products rank first and second based on value.
29,6% 29,9% 30,2%
32,9%33,7%
34,3%
27%
29%
31%
33%
35%
2015 2016 2017 2018 2019 2020
Chart 17- The Share of Imported Biopharmaceuticals Among Imported Products (Volume)
Source: IQVIA, IEIS
Source: IQVIA, IEIS

20
Table 5- Biotechnological Products
Unit Value
Biosimilar 100% 100%
Blood and hematopoietic organs 91,7% 62,5% Antineoplastics and immunomodulatory agents 4,9% 31,8% Systematic Hormonal Preparations (Excluding Sex Hormones and Insulins)
1,0% 3,6%
Digestive system and metabolism products 2,4% 2,1%
Originator 100% 100%
Antineoplastics and immunomodulatory agents 12,9% 51,8%
Digestive system and metabolism products 73,5% 27,0%
Blood and hematopoietic organs 2,5% 8,9%
Respiratory System 1,5% 3,0%
Systematic Hormonal Preparations (Excluding Sex Hormones and Insulins)
3,0% 2,8%
Genito Urinary System and Sex Hormones 4,8% 2,2%
Ophthalmologic 0,5% 2,0%
Systematically Used Anti-infectives 0,5% 1,2%
Muscle-Skeleton System 0,8% 1,1% D. Therapeutical Groups In the last 6 years, all treatment groups except antibiotics have had an increasing trend based on amount. Oncological products have once again been the most-sold treatment group based on value in 2020 with a share of 14.5%.
Source: IQVIA, IEIS
Chart 18 - Therapeutic Groups on Value Scale
Source: IQVIA, IEIS “Antibiotics: ATC groups of Antibacterial, Antimycotics and Antivirals”

21
As for the treatment groups with the highest market share based on unit in 2020, cardiovascular and antirheumatics medicines were the leaders with respectively 10.5% and 10.2%. The decline in prescription medicines such as antibiotics and flu medicines can be associated with the limitation of access to hospitals and treatment during the pandemic of Covid-19.
E. Average Prices The average product price has increased of 156% between 2015-2020 and has reached 21.77 TRY. When this change is inflation-adjusted, it indicates an increase of 12% in real terms. When average drug prices between years 2015-2020 are compared, it is observed that a growth of 26.5% in the pharmaceutical market and originator medicines has occurred along with growths of, respectively, 25.9%, 21.4%, 33.2% and 22.8% in originators, generics, imported products and local products. When the same period is inflation-adjusted, we see that the pharmaceutical market and reference medicines have preserved their approximate rates of 1.1% and 0.6% respectively, and that the average prices of generic and local medicines have decreased. During that period, only imported medicines have surpassed inflation with 6.4% and thus shown a considerable increase in real terms.
Chart 19 - Therapeutic Groups on Volume Scale
Source: IQVIA, IEIS “Antibiotics: ATC groups of Antibacterial, Antimycotics and Antivirals”

22
Table 6 - Distribution of Average Product Prices
Medicine Originator Generic Import Local 2015 8,52 13,55 4,63 23,50 4,59
2016 9,49 15,36 5,23 26,10 5,28
2017 11,03 18,16 6,02 30,94 6,25
2018 13,43 22,49 7,24 42,25 7,75
2019 17,21 29,23 9,53 66,82 10,22
2020 21,77 36,81 11,57 89,01 12,55
Change Rate 2015-2020 156% 172% 150% 279% 173% 2019-2020 26,5% 25,9% 21,4% 33,2% 22,8%
Real Change Rate 2015-2020 12% 19% 10% 66% 20% 2019-2020 1,1% 0,6% -3,0% 6,4% -1,9%
F. Retail Price Ranges When the unit-based retail price distribution of the medicines on the market between years 2015-2020 is observed, we note a decrease of 23 points due to the price increase resulting from exchange rates in product prices ranging between 0-10 TRY. In 2020, products priced at 25 TRY and less represented 41% of the market. In 2020, the greatest share of the market belonged to products priced between 10-25 TRY, with a share 31%.
33%
27%
14%10%
8% 8%10%
31%
17%13% 13%
16%
0%
10%
20%
30%
40%
0-10 TRY 10-25 TRY 25-50 TRY 50-100 TRY 100-250 TRY Productspriced at 250
TRY and more2015 2020
Source: IQVIA, IEIS
Source: TMMDA, IQVIA, IEIS
Chart 20- Retail Price Distribution

23
Chart 21 - Price Breakdown of Originator Products
When the last 6 years are assessed, we observe a drop in the share of originator drugs priced at 25 TRY and less, and an increase in the share of originator drugs priced at 50 TRY and more. Highest increase took place in the share of these products priced at 250 TRY and more with 12 points.
Medicines among generic products priced between 10-25 TRY as of 2020 were the product group with the largest market share with a rate of 34%. As for products priced between 0-10 TRY, a drop of 27 points took place.
22%
26%
14%12%
10%
17%
5%
23%
14% 13%15%
29%
0%
10%
20%
30%
0-10 TRY 10-25 TRY 25-50 TRY 50-100 TRY 100-250 TRY Productspriced at 250
TRY and more2015 2020
39%
28%
13%9%
7%
3%
12%
34%
18%
14% 12%9%
0%
10%
20%
30%
40%
0-10 TRY 10-25 TRY 25-50 TRY 50-100 TRY 100-250 TRY Productspriced at 250
TRY and more2015 2020
Source: TMMDA, IQVIA, IEIS
Chart 22- Price Breakdown of Generic Products
Source: TMMDA, IQVIA, IEIS

24
Medicines that saw an increase of their share based on unit in imported products in 2015 compared with 2020 were products priced at more than 100 TRY
Among local products, the product group with the largest share was that of products priced between 10-25 TRY with a rate of 37%. In 2020, products priced at 25 TRY and less represented 50% of the local medicines market. When the distributions of imported and local medicines in average prices are compared, the importance of policies aimed at increasing domestic production is once again demonstrated but from a different perspective.
11%
23%
17% 15%13%
21%
1%
14% 12%15%
19%
40%
0%
10%
20%
30%
40%
50%
0-10 TRY 10-25 TRY 25-50 TRY 50-100 TRY 100-250 TRY Productspriced at 250
TRY and more2015 2020
43%
29%
12%8% 6%
2%
13%
37%
19%
13% 11%8%
0%
10%
20%
30%
40%
50%
0-10 TRY 10-25 TRY 25-50 TRY 50-100 TRY 100-250 TRY Productspriced at 250
TRY and more2015 2020
Chart 23 - Price Breakdown of Import Products Şekil 1
Source: TMMDA, IQVIA, IEIS
Chart 24- Price Breakdown of Local Products Şekil 2
Source: TMMDA, IQVIA, IEIS

25
1.2. Medicinal Nutrition Market The medicinal nutrition market is constituted of enteral nutrition and special medical purposes formulas approved by the Ministry of Health. These products are prepared for responding to the nutrient requirements of people with ill health or who have been affected by a medical condition, or patients who suffer from eating disorders due to medical conditions, and are used as part of supportive therapy rather than improving health. 98% of the market which is constituted of exported reference products is part of the reimbursement scheme. The medicinal nutrition market has shown a unit-based growth of 13.5% in 2020 and reached 146 million units, and a value-based growth of 36.1% reaching 2 billion TRY. Between years 2015-2020, growth has reached 70.2% based on unit. In the same period, value-based increase has been of 291.2%. When inflation-adjusted, real growth was of 71.6%. The average price of 6 TRY in 2015 has reached 13.8 TRY in 2020.
Chart 25- Medicinal Nutrition Marketekil 3
TRY (billion) Units (billion)
Chart 26- Sources of Medicinal Nutrition Market Growth Şekil 4c
Source: IQVIA, IEIS
Source: IQVIA, IEIS

26
1.3. Medicinal Products Market The market in question includes traditional plant-based (herbal) medical products, biocidal products, some medical devices in pharmaceutic form, cosmetic and dermo cosmetic products approved by the Ministry of Health and included in the portfolios of pharmaceutical companies, as well as vitamins and food supplements approved by the Ministry of Agriculture and Forestry. During the pandemic of Covid-19, the limitation of access to doctors and hospitals and the circulation via many communication channels of news on the importance of strengthening the immune system has had a big impact on the growth of the market. As a result of these factors, in 2020, the health products market constituted of more than of 70% vitamins and food supplements has grown of 34.3% based on unit and reached 80 million units and increased of 56.6% and reached 2.87 billion TRY based on value.
Chart 27 - Medicinal Products Market
Source: IQVIA, IEIS
Chart 28- Sources of Medicinal Products Market Growth Şekil 5c
Source: IQVIA, IEIS
TRY (billion) Units (billion)

27
Imported products in the health product market in 2020 have reached 1.8 billion TRY in value with a growth of 44.8%, and 37.3 million units with a growth 25.2%. When local products are analyzed, we note an increase of 80.2% based on value reaching 1.1 billion TRY, and an increase of 43.5% based on unit reaching 42.5 million units, surpassing the imported products market for the first time. Between 2015-2020, while imported products have grown of 132% based on value, manufactured products have grown of 550% and market average has been of 208%. In the same period, based on unit, imported products have decreased of 13.6%, local products have increased of 353% and the whole health products market has grown of 22%.
Chart 29 – Medicinal Products Market (Value) TRY (billion)
Source: IQVIA, IEIS
Chart 30 – Medicinal Products Market (Volume) Units (billion)
Source: IQVIA, IEIS

28
Chart 32 – Number of Novel Product Licenses Chart 32 – Number of Novel Product Licenses
In 2015, the average price of 14.22 had increased of 153% and reached 35.92 in 2020. In the same period, the growth of the average price of imported products has been of 169% and the average price of manufactured products has shown a growth of 240%.
2. Licensing In 2020, only 191 new products were licensed, and this number was much lower than the 614 licenses that constituted the average for the period between years 2015-2019. Challenges faced in the licensing of new medications have grown throughout the years and become one of the main topics of discussion, becoming a hindrance for the industry. Lingering licensing processes and the inability to put new medications on the market seriously impact companies’ future investment plans and delay the consumer’s access to alternative medications. Additionally, the fact that new medications cannot be put on the market also negatively impacts production, employment, SSI (Social Security Institution) purchases and thus, public finance and export as well.
Chart 31 - Medicinal Products Market Average Price Distribution
Source: IQVIA, IEIS
Source: TMMDA, IEIS

29
3. Investment Incentives With the Decision of the Council of Ministers No. 2009/15199 entered into force in 2009, investment incentives that had previously been applied in different ways by public institutions have undergone extremely positive changes and have started being managed centrally under the coordination of the Ministry of Trade. This decision aimed at taking the biotechnological, oncological medications and blood products investments of the pharmaceutical industry of more than 20 million TRY into the scope of priority investments, apart from general and regional incentives for the industry. Later on, with the amendment made in 2015 in the Decision of the Council of Ministers No. 2012/3305, pharmaceutical investments have been given the right to benefit from the 5th Region incentives since they were classified as advanced (high) technology investments. With these developments, a total fixed investment incentive of 20 billion TRY has been earned by the pharmaceutical industry in the 6-year period between years 2015-2020. It is foreseen that 9,315 new employments will be created thanks to these investments. Furthermore, thanks to the amendment made in 2015, the fixed investment amount of 856 million TRY in 2015 reached 8.6 billion TRY in 2020 with an increase of 900%. Similarly, the increase rate of employment created with investment has been of 270%. Table 7- Investment Incentives in the Pharmaceutical Industry
Documents in Units Fixed Investment
(million TRY) Employment via
Investment Medicine Total Medicines Total Share Medicine Total Share
2015 21 4.288 856 111.367 0,77% 919 149.619 0,61%
2016 15 4.976 702 114.207 0,61% 843 154.042 0,55%
2017 31 7.259 3.833 197.657 1,94% 1.968 225.673 0,87%
2018 28 5.789 1.294 182.317 0,71% 1.117 250.356 0,45%
2019 36 5.648 4.718 170.651 2,76% 1.072 203.672 0,53%
2020 50 10.487 8.556 246.151 3,48% 3.396 302.141 1,12%
4. R&D The pharmaceutical industry is one of the priority industries to contribute significantly to our country’s industrial transformation with 33 R&D centers accredited by the Ministry of Industry and Technology and approximately 1,450 R&D personnel. With the advancement that will be achieved in the area of R&D, we will be able to produce domestically the products whose import we depend on.
Chart 26-
Source: Ministry of Industry and Technology, IEIS

30
11
23 3 3
0
5
10
15
20
25
30
35
2015 2016 2017 2018 2019 2020
Units The pharmaceutical R&D activities expenditure was of 234.3 million TRY in 2015 and has reached 423.8 million TRY with an increase of 80.9%.
5. Production The Turkish pharmaceutical industry has a deeply rooted history, a high production capacity and a strong technology. There are 96 world-class pharmaceutical and radiopharmaceutical production facilities, as well as 11 raw material production facilities in our country. One of the priority topics on the agenda the industry is domestic production. In this scope, the ‘Transition from Import to Manufacturing in the Pharmaceutical Industry Practice’ put into effect in 2016 under the leadership of the Ministry of Health has had very positive effects on the pharmaceutical industry. In this process, the industry has had the chance to invest in new technologies and has increased its usage of capacity
234,3 219,5 314,1
583,7
423,8
0
100
200
300
400
500
600
2015 2016 2017 2018 2019
Chart 34 - Pharmaceutical Industry R&D Expenditure TRY (million)
Chart 33 - Number of Accredited R&D Centers in the Pharmaceutical Industry
Source: Ministry of Industry and Technology, IEIS
Source: TurkStat, IEIS

31
and employment. Naturally, the investment made, and the increase of capacity had a positive contribution to foreign trade. We expect that the localization policy that has been executed with utmost sensitivity during its implementation period be pursued with the same determination.
According to the industry production index data, production in the manufacturing industry has increased of 15.4% in the period between years 2015-2020. While production in the medium technology-level chemical industry has grown of 22.0%, production has increased of 52.4% in the pharmaceutical industry.
6. Employment In 2019, total employment in Turkey faced a decrease of 3.1% compared with the year 2018. In the same period, the pharmaceutical industry’s employment rate has reached 39,068 people with an increase of 3.4%.
66
96
0
20
40
60
80
100
120
2015 2020
103,4
112,6 114,1 113,3 115,4
100,0 100,8107,3
113,5 115,2122,0
106,9114,3
123,5
140,2
152,4
80
100
120
140
160
2015 2016 2017 2018 2019 2020
Manufacturing Chemical Pharmaceutical Industry
Chart 35 - Number of Production Facilities
Source: TMMDA, IEIS
Chart 36- Industrial Production Index Change (2015-2020)
Source: TurkStat, IEIS

32
Chart 301-
7. Foreign Trade When we look at the period between years 2015-2020, we observe that a fast increase trend has been caught by pharmaceutical export. As for the 2015-2020 period when Turkey’s export grew of 12.3%, pharmaceutical export has shown a strong performance with an increase of 64.7%. In the last 3 years as well our pharmaceutical export has increased above Turkey’s average. As a matter of fact, in 2019 our export has increased of 10% compared with the previous year and reached a size of more than 1.44 billion dollars. As for the end of 2020, it has increased of 27.3% and reached a record-breaking level of 1.84 billion dollars.
32 008 32 550 33 018 35 552 37 788 39 068
0
10.000
20.000
30.000
40.000
2014 2015 2016 2017 2018 2019
1,10 0,97 1,02
1,31 1,44
1,84
0,5
0,8
1,1
1,4
1,7
2,0
2015 2016 2017 2018 2019 2020
US Dollars (billion) Chart 38 - Export Value in the Pharmaceutical Industry
Chart 37 - Employment in the Pharmaceutical Industry Number of people
Source: TurkStat, IEIS
Source: TurkStat, IEIS

33
In 2020, pharmaceutical import has increased of 1.5% and equaled 5.64 billion US Dollars. In the period between 2015-2020, the growth rate of the pharmaceutical import has shown an increase of 14.3%.
The share of pharmaceutical export in Turkey’s total export has increased to more than 1% for the first time in its history. This breakthrough of the pharmaceutical industry in export has reduced pharmaceutics’ share in the foreign trade deficit from 13.9% to 7.6%.
Chart 39 - Import Value in the Pharmaceutical Industry
Chart 40 - Pharmaceutical Industry in Turkish Foreign Trade
USD (billion)
Source: TurkStat, IEIS
Source: TurkStat, IEIS

34
38,5 37,6 46,5 49,5 50,4
60,6
0
10
20
30
40
50
60
70
2015 2016 2017 2018 2019 2020
When we observe the pharmaceutical raw material import and pharmaceutical finished product export, it is possible to better see the contribution that the pharmaceutical industry makes to the country’s economy. An export of 1.79 billion US Dollars took place versus a raw material entry of 815 million US Dollars. When the need for finished products in pharmaceutical import is met with domestic production capabilities, a contribution will be made to both the increase of export and to the decrease of foreign trade deficit.
Chart 42 - Export Amount in the Pharmaceutical Industry Kg (million)
Chart 41 – Finished Product vs Raw Material in Pharmaceutical Industry
USD (million)
Source: TurkStat, IEIS
Source: TurkStat, IEIS

35
30,28
20,26
8,406,04
4,241,28 0,65
PharmaceuticalIndustry
Computer Automotive Machine Textile Total Chemistry
When we look at the size of export in the period between 2015-2020, we see that pharmaceutical export has increased of 57.5% and has gone from 38.5 million kilograms in 2015 to 60.6 million kilograms in 2020. Pharmaceutical export is increasing based on kilogram but export price per kilogram is not increasing with the same rate. When we analyze the same period, we see that export price per kilogram has gone from 28.5 US Dollars to 30.3 US Dollars with an increase of 6.3%. It is evident that increase in high added-value end products will increase price per kilogram, thus, it will increase export value more than size increase does. Although our industry’s per kilogram export value is higher than many other industries’, it is still below potential added value.
28,525,9
21,926,5 28,6 30,3
0
5
10
15
20
25
30
2015 2016 2017 2018 2019 2020
Chart 43 - Pharmaceutical Export Price Per Kilo
Chart 44 - Export Price per Kilo in Various Sectors
USD
Source: TurkStat, IEIS
Source: TurkStat, IEIS

36
Becoming one of the world’s leading pharmaceutical producers and exporters is one of the main objectives of our industry. However, there are a few obstacles in front of that objective. Firstly, the fact that medication prices in our country are accepted as source price in the countries to which we export causes our companies to enter other countries’ markets with a price that is lower than it should. The other hindrance in front of our export is challenges related to processes such as licensing and customs in target countries. The support of the Ministries of Trade, Foreign Affairs and Health is of utmost importance to overcome these challenges. Another issue that needs resolving to increase pharmaceutical export is exports made by pharmaceutical warehouses without the authorization of companies. Exporting pharmaceutical companies are harmed by the unauthorized export of their own products by pharmaceutical warehouses. Pharmaceutical companies license their medications in the target country at the highest price following serious efforts, high costs and processes that last 1-2 years. Moreover, companies make significant investments in promotion activities that aim at presenting these medications to healthcare professionals in the target country and at ensuring they are prescribed. However, some pharmaceutical warehouses procure the products of exporting pharmaceutical companies from the internal market, from pharmacies and other warehouses. Since they do not face any expenses such as licensing and promotion, they are able to sell the products to a lower price than the license holder company. In that case, the exporting company is put in a difficult and inconvenient position vis-à-vis the country’s healthcare authorities and their business partners in the target country. As a result, the exporting company is forced to either lower the product’s price or to withdraw from the market. Consequently, the situation in question jeopardizes the brands that our companies work so hard to create and promote abroad with different supports from the public sector and puts at risk their success in foreign markets. In order to eliminate the negative picture created by this situation, we consider it more appropriate that the relevant public institutions do not authorize exports by pharmaceutical warehouses unless there is prior consent from the relevant producer company. When the countries exported to are analyzed, we see that in 2020, export was made to a total of 177 countries and primarily to the European Union (EU), the Commonwealth of Independent States (CIS), North Africa and Middle Eastern countries (MENA). Asia was the biggest market for pharmaceutical export with 62.4%.

37
Table 8 – First Twenty Countries in Pharmaceutical Export US Dollars (million) 2019 2020 2020 Share Change South Korea 397 616 33,5% 55% Iraq 73 92 5,0% 25% Kazakhstan 51 66 3,6% 31% Georgia 76 48 2,6% -36% Azerbaijan 37 64 3,5% 72% Uzbekistan 19 58 3,1% 208% Switzerland 37 39 2,1% 7% T. R. N. C 36 32 1,8% -9% Slovenia 32 33 1,8% 5% İran 32 38 2,0% 18% Germany 31 34 1,8% 10% Poland 24 32 1,8% 35% Russian Fed. 30 18 1,0% -38% Syria 25 28 1,5% 9% Libya 25 24 1,3% -4% UAE 11 24 1,3% 111% Romania 24 14 0,8% -41% Albania 17 25 1,3% 40% Kyrgyzstan 8 20 1,1% 165% France 15 19 1,0% 25% Total of List 999 1.324 72,1% 33% Total Export 1.442 1.836 100,0% 27%
61.6% of the pharmaceutical import from 90 countries in 2020 originated from the European region. Table 9 – First Twenty Countries in Pharmaceutical Import US Dollars (million) 2019 2020 2020 Share Change Germany 1.189 1.116 19,8% -6% USA 641 543 9,6% -15% South Korea 414 598 10,6% 45% Italy 420 413 7,3% -2% China 309 449 8,0% 45% Ireland 295 351 6,2% 19% Switzerland 356 342 6,1% -4% France 406 299 5,3% -26% India 224 233 4,1% 4% United Kingdom 196 188 3,3% -4% Belgium 158 158 2,8% 0% Spain 139 139 2,5% 0% Netherlands 84 91 1,6% 9% Brazil 87 91 1,6% 5% Sweden 101 85 1,5% -16% Austria 89 74 1,3% -16% Denmark 66 72 1,3% 9% Singapore 49 47 0,8% -5% Japan 50 60 1,1% 21% Canada 55 49 0,9% -10% Total of List 5.326 5.399 95,7% 1% Total Import 5.556 5.640 100,0% 2%
Source: TurkStat, IEIS
Source: TurkStat, IEIS

38
When pharmaceutical foreign trade in 2020 is analyzed based on CTSP (Customs Tariff Statistics Position), blood products, serums, vaccines, toxin products and medications prepared and dosed for usage in treatment or prevention represent 94% of our export and 81% of our import. Table 10 – First Five Products in Pharmaceutical Export - US Dollars (million)
CTSP Product 2019 2020 2020 Share Change
3004 Medications prepared for usage in treatment or prevention (dosed) 905 1.076 59% 19%
3002 Human blood, animal blood, serum, vaccines, toxins, etc. 440 652 36% 48%
3006 Pharmaceutical goods and ready-mades that are not included in any other part of the Tariff
39 43 2% 10%
3003 Medications mixed for usage in treatment or prevention (no dosage) 15 15 1% -1%
2936 Pro-vitamins and vitamins 8 15 1% 84% Total of List 1.407 1.801 98% 28% Total Export 1.442 1.836 100% 27%
Table 11 – First Five Products in Pharmaceutical Import - US Dollars (million)
CTSP Product 2019 2020 2020 Share Change
3004 Medications prepared for usage in treatment or prevention (dosed) 2.573 2.422 43% -6%
3002 Human blood, animal blood, serum, vaccines, toxins, etc. 1.995 2.151 38% 8%
2941 Antibiotics 189 184 3% -3%
3003 Medications mixed for usage in treatment or prevention (no dosage) 127 146 3% 15%
2936 Pro-vitamins and vitamins 109 119 2% 9% Total of List 4.993 5.022 89% 1% Total Import 5.556 5.640 100% 2%
8. Price Policies The global crisis that started in 2008 and its ever-increasing severity has deeply impacted our economy. Radical regulations were made in 2009 to overcome the challenges faced by public finances. In this scope, the global budgeting practice was launched. Increasing healthcare expenses due to improving service quality and more access to healthcare in the framework of the Health Transformation Program have been tried to be contained with measures solely targeting medication prices. Pharmaceutical budgets that were disproportionate with the service provided and medication prices have been constantly lowered with the pretext that the budget was exceeded. On the other hand, the Social Security Institution’s discount rates were increased. Additionally, although criteria determined by the legislation were met, the Euro value used for converting the price of medications originating from the EU into
Source: TurkStat, IEIS
Source: TurkStat, IEIS

39
TRY had not been updated between April 2009 and May 2015 and was kept at a fixed 1.9595 TRY in order to keep pharmaceutical expenses under control. The legal process started by the industry to update the exchange rate was concluded in favor of the pharmaceutical industry in April 2015. Following that, the practice has been changed as to fix the exchange rate to 70% of the average of Euro of the previous year. In this scope, the exchange rate value for 2017 was updated to 2.3421 TRY. And for 2018, while there should have been an increase of 23%, a provisional decree increased exchange rate of only 15% and fixed it to 2.6934 TRY. In 2019, the adjustment coefficient used for determining the annual average Euro value has been dropped from 70% to 60% and the conversion rate was fixed to 3.4037 TRY. As for 2020, the “60% of annual average Euro” rule was abided by and the rate was fixed at 3.8155 TRY with an increase of 12.1%.
In the chart below, the pricing in Turkey of a product whose source price is 10 Euros as of December 31, 2020 has been summarized. While the originator product’s price in Turkey is 2.5 Euros, the price of its generic product corresponds to 1.8 Euros.
Calculations were made based on the value 9.0241 TRY dated 31 December 2020 Reference Generic
10 €
2,5 €
4,2 €
10 €
2,5 € 1,8 € K
ayna
k Fi
yat 6 €
Ref
eren
ce P
rice
- 41%
Same MoH Price as
EU Due to Patent
Protection
10 €
Due to conversion rate set as 3.82 TRY
- 53%
- 28%
TR price after SSI discount - 58%
MoH price due to being
generic product
- 40%
Due to conversion rate set as 3.82 TRY TR price
after SSI discount
Ref
eren
ce P
rice
Chart 46 – Pharmaceutical Pricing
Chart 45 - Currency Trends (Euro/TRY)
Source: TurkStat, IEIS

40
In the period between 2015-2019, although real change in the net sales of the pharmaceutical industry -classified as strategically-important and of high technology- has been above other sectors, it has still lagged behind other industries that are also classified as strategically-important and high technology.
Although net sales increased in the pharmaceutical industry, the capability needed for creating resources for strengthening R&D capacity remains limited.
38%
21%14% 17%
10%16%
38%
67%
0%10%20%30%40%50%60%70%80%
Pharm
aceu
ticals
Chemica
l
Manufa
cturin
gTex
tile
Electro
nics
Automoti
ve
Inform
ation
Techn
ology
Air and
Space
craft
1…3…
4…
0… 0…-…
11…
8…
-20%0%
20%40%60%80%
100%120%140%
Pharmac
eutic
als
Chemica
l
Manufac
turing
Textile
Electro
nics
Automotive
Informati
on Technology
Air and Spac
ecraf
t
Chart 47- Real Changes in Net Sales (2015-2019)
Chart 48 – Real Change in Equities (2015-2019)
Source: Ministry of Industry and Technology, IEIS
Source: Ministry of Industry and Technology, IEIS

41
9. Conclusion and Evaluation The extraordinary circumstances imposed on social life and businesses by the Covid-19 pandemic which appeared in China at the end of 2019 and which swept across the whole world have impacted our pharmaceutical industry as well, just like all other industries. The effects of the period that started in March 2020 in our country have immediately made their presence felt by affecting monthly prescription numbers. The fast decline in the number of prescriptions starting from the month of March has collapsed to its lowest level in the last ten years in the month of May and dropped to 20 million prescriptions. Despite some little improvement in the month of June, the total number of prescriptions in 2020 has fallen of 15% and went back to the pre-2016 number with 342 million prescriptions.
During that period where access to public healthcare services and doctors was restricted and treatments that were not urgent were postponed, the Turkish pharmaceutical industry has continued its operations uninterruptedly in production facilities despite increasing costs, fluctuations in medication sales and challenging conditions created by the risk of contagion. During that difficult period, our country’s medication supply security was ensured and neither our people nor our healthcare professionals faced any challenges in accessing medications. The pharmaceutical industry is a dynamic one that needs to monitor technology closely, that is obligated to apply new technologies rapidly and thus, that has to continuously make new investments, to establish new facilities to build the capability to produce the products we are not able to produce, and to systematically conduct innovation activities. As a matter of fact, with its investments stretching across all corners of Turkey, its rising R&D production force, high technology, employment and export potential, the Turkish pharmaceutical industry is of critical importance for our county, both economically and strategically.
Chart 49 - SSI Monthly Prescription Number
Prescriptions in unit (million)
Source: SSI Health Statistics, IEIS

42
To ensure that our industry does not lag behind global transformation and taking our country’s economic necessities into account, we can state that it is imperative that Turkey succeeds in the biotechnological pharmaceuticals area. In this scope, the development and production of biotechnological pharmaceuticals in our country is of critical importance, just as it is the case in the defense industry where our country’s national interests are at stake. Countries that have made significant leaps forward in this domain in recent years such as South Korea, India and Argentina have created a legislative infrastructure concordant with their countries’ subjective conditions and have built their biotechnological pharmaceuticals industry on this legislative infrastructure. In this framework, it is crucial that a rational policy be built on a scientific basis and that more biosimilar products be put on the market, that the difficulties faced during the release to the market of biosimilar products be resolved and that the necessary legislative infrastructure necessary for the shortening of the process be created. As the IEIS, we pursue our activities intensively to increase our industry’s competence and competitiveness and to make more effective contributions to the development of this area in our country. With their long-term perspective on that area, our pharmaceutical companies have so far made high-cost investments. R&D and production capacities are now fully ready in the area of biotechnology in our country. The industry is working relentlessly to transform into an industry that develops conventional products and biotechnological pharmaceuticals with more added value, and that produces and exports more of that which it produces. As a matter of fact, the localization policy in pharmaceutics carried into effect in 2016 under the leadership of our Ministry of Health aligns fully with our industry’s targets. Therefore, many of both our national and international pharmaceutical companies have made all the necessary investments and carried out all activities that would contribute to the process. The positive effects on the pharmaceutical industry of the policy followed have become apparent as soon as implementation started and a significant growth in domestic pharmaceutical production ensued, idle capacities in production facilities were brought in usage, production technologies started to improve, and investments and employment have gone into an increasing trend. With the impact of the policy’s implementation, we started to produce the products that we normally import and thus, the pharmaceutical industry contributed in meeting Turkey’s current deficit. In this context, we expect that the localization in pharmaceutics practice put into effect under the leadership of our Ministry of Health in 2016 continues to be implemented with determination so that we may wield our capacity most actively and increase our production potential and technology. There is a need for consistent, sustainable and balanced policies whose application and processes have been clearly determined to ensure that the deeply-rooted and strong Turkish pharmaceutical industry renders its high potential more efficient and fast domestically and uses it more broadly on the international scene. Pricing, which is one of the important topics of the pharmaceutical industry, has been implemented in a financial discipline-oriented fashion for the last 10 years and hence jeopardizes and blurs the industry’s prospective plans.

43
In 2020, the Euro’s exchange rate has seriously increased throughout the year and this caused the deficit between the rate declared for medications and the real Euro value to soar up. Indeed, as of the last day of the year, the Euro’s exchange rate was of 9.0241; while the Euro’ annual real average rate for the year 2020 was of 8.0422, the rate determined for pharmaceuticals has been of 3.8155 throughout the year. This situation put a serious financial burden on the industry, especially when taking into account that the industry has to use actual exchange rates due to its input costs. As for the year 2021, the periodic exchange rate that needs to be of 4.8253 TRY with an increase of 26.47% according to the enactment has been fixed to 4.5786 TRY due to a provisory article that has been annexed to the price decree. Accordingly, the decision was made that the pharmaceutical Euro value would not exceed the 20% of Euro value as applied in 2020. In this context, the priority step to be taken to accelerate the improvement our country’s domestic and national pharmaceutical industry is the abandonment of the financial discipline-oriented pharmaceutical pricing policy. The pharmaceutical industry needs the active support of our public authorities. Thanks to the physical investment incentives provided thus far, our industry made significant investments and continues to do so. However, since the public incentive system mostly relies on tax reductions and exemptions, it is unsatisfactory for our industry and financial support in cash is needed, especially in the area of biosimilar products which requires large-scale and continued investments. Furthermore, the unconditional continuation of the 5th Region advantages granted to pharmaceuticals as is currently the case, and the elimination of obstacles in the fast and safe marketization of products to be produced are of crucial importance for the industry. We do know that with the right policies, there are no obstacles in front of our industry coming into a position where its investments will have picked-up pace, where it will have allocated more resources to R&D, where it will even have developed its own molecule, where it will have become strong in the area of biotechnology and where it will produce and export more. That is why we continue to work with all our efforts.

44
ANKARA OFFICE Kızılırmak Mahallesi Ufuk Üniversitesi Caddesi No: 18
Ambrosia Plaza Kat:10 Çukurambar Ankara T: +90 312 431 96 07 F: +90 312 435 15 78
ISTANBUL OFFICE Nef 09 B Blok Kat: 10 Sanayi Mah. Hümeyra Sok. No: 7 34115 Kağıthane Istanbul T: +90 212 353 11 20 F: +90 212 353 11 41
www.ieis.org.tr www.biopharma.org.tr
www.trpharmaexporters.org.tr