New chemical entity output of the international pharmaceutical industry from 1970 to 1992
11
PHARMACOEPIDEMIOLOGY AND DRUG UTILIZATION New chemical entity output of the international pharmaceutical industry from 1970 to 1992 A database has been established that contains confidential information, together with publicly available data, on various aspects of the development of 1106 new chemical entities and biological compounds (including products of biotechnology) first marketed as medicines since 1970 on one or more of 20 ma- jor international markets. These data have been used to examine the performance of the European, U.S., and Japanese pharmaceutical industries by examining the numbers and types of new medicines reaching the marketplace from 1970 to 1992 and the companies responsible for introducing them. Although the European marketing companies dominate in total numbers first marketed over this period, there has been a significant decline in their annual output. In contrast, the Japanese companies have shown a sig- nificant increase in the number of new compounds marketed annually. However, European marketing companies remain the most successful in terms of sales because they are responsible for first marketing approximately 50% of the top 50 products by international sales in 1992. The main therapeutic areas of output by all three regions have remained relatively unchanged over the 23-year period: cardiovascular system (21%), nervous system (18%), and anti-infectives (16%). This article provides insight into the changing status of the international pharmaceutical industry over the last 23 years in terms of output from research and development. (CLIN PHARMACOL THER 1994;56:339-49.) Rona MacInnes, MSc, Cynthia E. Lumley, PhD, and Stuart R. Walker, PhD Carshalton, England During the last six decades the pharmaceutical in- dustry has supported a high degree of biomedical and pharmaceutical research that has resulted in many im- portant innovations in medical therapies. Innovation in the industry relates to a logical sequence of events, beginning with a discovery and ending in the market- ing of a new medicine. Objective measurement of this process provides a means of monitoring the progress of the pharmaceutical industry and the trends and From the Centre for Medicines Research. Received for publication Nov. 24, 1993; accepted March 26, 1994. Reprint requests: Cynthia E. Lumley, PhD, Centre for Medicines Research, Woodmansteme Road, Carshalton, Surrey, SM5 4DS, England. Copyright C 1994 by MosbyYear Book, Inc. 0009-92361941$3.00 + 0 13/1/56330 changes in drug development. When assessing innova- tion it is important to distinguish between indexes of input and output. Several input indexes have been pro- posed, such as the number of new chemicals synthe- sized and the number of patents filed. 1-3 With the high attrition rates typically associated with the drug devel- opment process and the fact that it is not until a new chemical is tested in humans that it is regarded as a therapeutic candidate, perhaps more accurate and valid indexes to quantify output relate to either the number of new medicines evaluated in humans or to those marketed.'" Most early studies monitoring the activities of the pharmaceutical industry and the impact of economic, legislative, and regulatory issues on drug development were conducted on a national basis, including the United States 811 Switzerland,12 the United King- 339
-
Upload
westfieldhouse -
Category
Documents
-
view
3 -
download
0
Transcript of New chemical entity output of the international pharmaceutical industry from 1970 to 1992
PHARMACOEPIDEMIOLOGY AND DRUG UTILIZATION
New chemical entity output of the international pharmaceutical industry from 1970 to 1992
A database has been established that contains confidential information, together with publicly available data, on various aspects of the development of 1106 new chemical entities and biological compounds (including products of biotechnology) first marketed as medicines since 1970 on one or more of 20 ma- jor international markets. These data have been used to examine the performance of the European, U.S., and Japanese pharmaceutical industries by examining the numbers and types of new medicines reaching the marketplace from 1970 to 1992 and the companies responsible for introducing them. Although the European marketing companies dominate in total numbers first marketed over this period, there has been a significant decline in their annual output. In contrast, the Japanese companies have shown a sig- nificant increase in the number of new compounds marketed annually. However, European marketing companies remain the most successful in terms of sales because they are responsible for first marketing approximately 50% of the top 50 products by international sales in 1992. The main therapeutic areas of output by all three regions have remained relatively unchanged over the 23-year period: cardiovascular system (21%), nervous system (18%), and anti-infectives (16%). This article provides insight into the changing status of the international pharmaceutical industry over the last 23 years in terms of output from research and development. (CLIN PHARMACOL THER 1994;56:339-49.)
Rona MacInnes, MSc, Cynthia E. Lumley, PhD, and Stuart R. Walker, PhD Carshalton, England
During the last six decades the pharmaceutical in- dustry has supported a high degree of biomedical and pharmaceutical research that has resulted in many im- portant innovations in medical therapies. Innovation in the industry relates to a logical sequence of events, beginning with a discovery and ending in the market- ing of a new medicine. Objective measurement of this process provides a means of monitoring the progress of the pharmaceutical industry and the trends and
From the Centre for Medicines Research. Received for publication Nov. 24, 1993; accepted March 26, 1994. Reprint requests: Cynthia E. Lumley, PhD, Centre for Medicines
Research, Woodmansteme Road, Carshalton, Surrey, SM5 4DS, England.
Copyright C 1994 by MosbyYear Book, Inc. 0009-92361941$3.00 + 0 13/1/56330
changes in drug development. When assessing innova- tion it is important to distinguish between indexes of input and output. Several input indexes have been pro- posed, such as the number of new chemicals synthe- sized and the number of patents filed. 1-3 With the high attrition rates typically associated with the drug devel- opment process and the fact that it is not until a new chemical is tested in humans that it is regarded as a therapeutic candidate, perhaps more accurate and valid indexes to quantify output relate to either the number of new medicines evaluated in humans or to those marketed.'"
Most early studies monitoring the activities of the pharmaceutical industry and the impact of economic, legislative, and regulatory issues on drug development were conducted on a national basis, including the United States 811 Switzerland,12 the United King-
339

340 MacInnes, Lumley, and Walker
dom,6,13-15 and Sweden.16.17 As well as reviewing pharmaceutical products introduced onto the Swedish market, Berlin and Jonsson16 also compared the avail- ability and review times of these products on the ma- jor markets: France, Italy, West Germany, the United Kingdom and the United States. However, the first de- tailed insight into the innovative status of the interna- tional pharmaceutical industry was provided by Reis- Arndt,5 who highlighted a number of trends in new chemical entities (NCEs) introduced between 1961
and 1990. This survey indicated an annual average of 69 new pharmaceutical entities marketed for the first time for use as human or veterinary medicines world- wide. These new entities included new chemical struc- tures, derivatives of established entities already mar- keted showing some novelty, and new salts of existing compounds that had been assigned an international nonproprietary name. The number of veterinary prod- ucts included was relatively small compared with the total number of entities examined.
Another study that sought to quantify scientific progress was published by Barra1,7 who assessed the innovative characteristics of 775 NCEs marketed for the first time in the "world" over a 15-year period from 1975 to 1989. Compounds included in this study were new chemical substances or biological entities. Only the first genetically engineered product and the first vaccine against a given disease were included. This author defined the world as seven major pharma- ceutical producing countries: the United States, Japan, Great Britain, Germany, Switzerland, France, and Italy. NCEs and new biological entities were scientif- ically evaluated for chemical structure and activity by experts from both industry and academia.
However, the number of global studies monitoring the international pharmaceutical industry remains lim- ited. With more than 1000 new medicines being intro- duced on the world market in the past two decades alone, there is a need for a central source of accurate information to help identify and assess trends in inter- national drug development and marketing. In view of this demand and the limitations of the research con- ducted to date on factors affecting the international drug development process and their resultant impact, a
database of new medicines introduced on the major world markets has been established. The database contains information on new medicines introduced for the first time since 1970 to at least one of 20 defined markets (16 European countries, the United States, Canada, Japan, and Australia). These countries reflect the world's major markets and probably encompass al- most all first worldwide introductions.
CLINICAL PHARMACOLOGY & THERAPEUTICS SEPTEMBER 1994
The purpose of this article is to describe the estab- lishment of the database and to present analyses exam- ining the output of the international pharmaceutical in- dustry over the last two decades. This article reviews output by the pharmaceutical industry in terms of the number of NCEs and the nationality of marketing companies responsible for first introducing the NCEs on the defined 20-country market and so describes the status of the pharmaceutical industry in Europe, Ja- pan, and the United States.
METHODS The database of marketed medicines was estab-
lished to hold comprehensive information on new me- dicinal compounds marketed for the first time on one or more of 20 national markets since 1970. The 20 countries comprise Austria, Australia, Belgium, Can- ada, Denmark, Finland, France, Greece, Ireland, Italy, Japan, The Netherlands, Norway, Portugal, Spain, Sweden, Switzerland, the United Kingdom, the United States, and West Germany The date of first marketing is defined as the date of first introduction in any of these 20 countries. A compound was excluded if the first marketing in any one of these 20 countries occurred before January 1, 1970. Any compounds for which an approval date is known but for which no date of first marketing has been identified have also been excluded. However, compounds that were intro- duced and have since been withdrawn from the market have been included.
Compounds included. Compounds included in this database are new chemical entities and biological compounds (including products of biotechnology) that were not previously available for therapeutic use in humans and were destined to be made available as a "prescription only medicine" and to be used for the cure, alleviation, treatment, prevention or in vivo di- agnosis of diseases in humans. New salts and esters of existing compounds and certain biological compounds (e.g., vaccines and antigens) were excluded. All prod- ucts of biotechnology were included because it was deemed to be not within the scope of this work to judge the novelty of the structures differing by, for ex- ample, a few amino acids, as in the case of the second or third granulocyte colony-stimulating factor. Combi- nation products were also excluded from the database unless one of the active constituents had never been marketed previously in one of the defined 20 markets. For the purpose of this article, all new chemical enti- ties and biologicals included in the analyses are re- ferred to as NCEs.
Source of information. The database was initially
CLINICAL PHARMACOLOGY & THERAPEUTICS VOLUME 56, NUMBER 3
DETAILS HELD IN DATABASE ON EACH NCE
Generic name FDA rating Date and country of patent priority Country and date of first approval and first
marketing within the 20-country market Therapeutic category Date of the first synthesis/isolation Start of phase I and phase III studies The originating, developing (responsible for
evaluating in humans), and marketing companies
Brand name Dates of new drug application and approval Marketing date Price agreement or reimbursement date Patent application and expiry dates Type of patent cover (compound, process, or
use) and the length of the patent term
set up with confidential data collected from U.K.- based companies on NCEs marketed in the United Kingdom.6 It was subsequently expanded with use of several sources of publicly available data to encom- pass the 20-country market. 1827 Certain information was also provided directly to the Centre for Medicines Research including data from the Japanese Ministry of Health and Welfare* on NCE approvals from 1967 to
1987; originating and developing companies and mar- keting dates from Paul de Haent; patent data from IMS
World Publications Ltd., London, England; and patent filing and marketing dates, together with development times, from the Interpat Studyt (1977 and 1987 sur-
veys). The details held in the database for each NCE and specific details regarding each market are shown (see Box, Details held in database on each NCE).
To validate the data collated, a survey was under- taken among parent companies responsible for first marketing the NCEs. Printouts detailing the informa- tion available inhouse on each NCE were sent to the company responsible for first marketing in one of the
defined 20 countries. Each company was asked to ver- ify the accuracy of the data, provide any missing in-
*Personal communication, Ministry of Health and Welfare, Tokyo, Japan, 1988.
tPersonal communication, De Haen New Drug Analysis Europe and Japan, New York, N.Y., 1982.
Personal communication, Dr. H. Meyer, Hoffmann-La Roche,
Basel, Switzerland, May 1988.
MacInnes, Lumley, and Walker 341
formation requested, and confirm that there were no additional NCEs first marketed by their company. The 74 parent marketing companies responsible for first marketing the largest number of NCEs since 1970 in one of the defined 20 countries were included in this survey. These companies comprised 35 based in Eu- rope, 18 in the United States, and 21 in Japan. The response rate to this survey was 62%, with 22 Euro- pean, 11 U.S., and 13 Japanese companies agreeing to check the information. Some companies had diffi- culty locating data concerning NCEs first marketed in the 1970s because the majority of development of these compounds took place in the 1950s and 1960s. Therefore certain pieces of development information for NCEs marketed in the 1970s remain unavailable; the percentage of data available for a particular analy- sis is indicated in the following Results section. The database is regularly updated as new information be- comes available from both companies and the public domain. All information from individual companies is kept strictly confidential. For the purposes of the anal- yses presented in this article, all data have been aggre- gated and no information is provided that would serve to identify an individual company.
Therapeutic categories. Therapeutic and pharmaco- logic details were collated from companies and several sources of published information.26,28-30 NCEs were then allocated to one of seven major therapeutic cate- gories: gastrointestinal, immune system (including the nonsteroidal anti-inflammatory drugs), nervous sys- tem, cardiovascular system, respiratory, anti-infec- tives, and antineoplastics (including hormonal antine- oplastics). Those NCEs that could not be grouped under any of these categories were placed in an eighth group entitled "other."
RESULTS Composition of the database. The database con-
tains information on 1106 NCEs marketed for the first time between January 1, 1970, and December 31, 1992, in one or more of the 20 countries specified. Two hundred sixty-four companies were responsible for marketing 1104 of the 1106 NCEs (the marketing companies for the remaining two NCEs are unknown), and 33 of the NCEs were first marketed through a transnational joint venture (European and Japanese, European and U.S., or Japanese and U.S.). The top 50 companies, ranked by number of marketed NCEs according to our database, have been responsible for introducing over half of the NCEs to the 20-country market.
The pattern of introductions during this 23-year pe-
60
40
20
Nationality of Marketing Group
MN European American Japanese n=6010 ME n=258 n=213
Ii
Transnational JVs n=33
1 1970 1972 1974 1976 1978 1980 1982 1984 1986 1988 1990 1992
Year of first .marketing
342 MacInnes, Lumley, and Walker
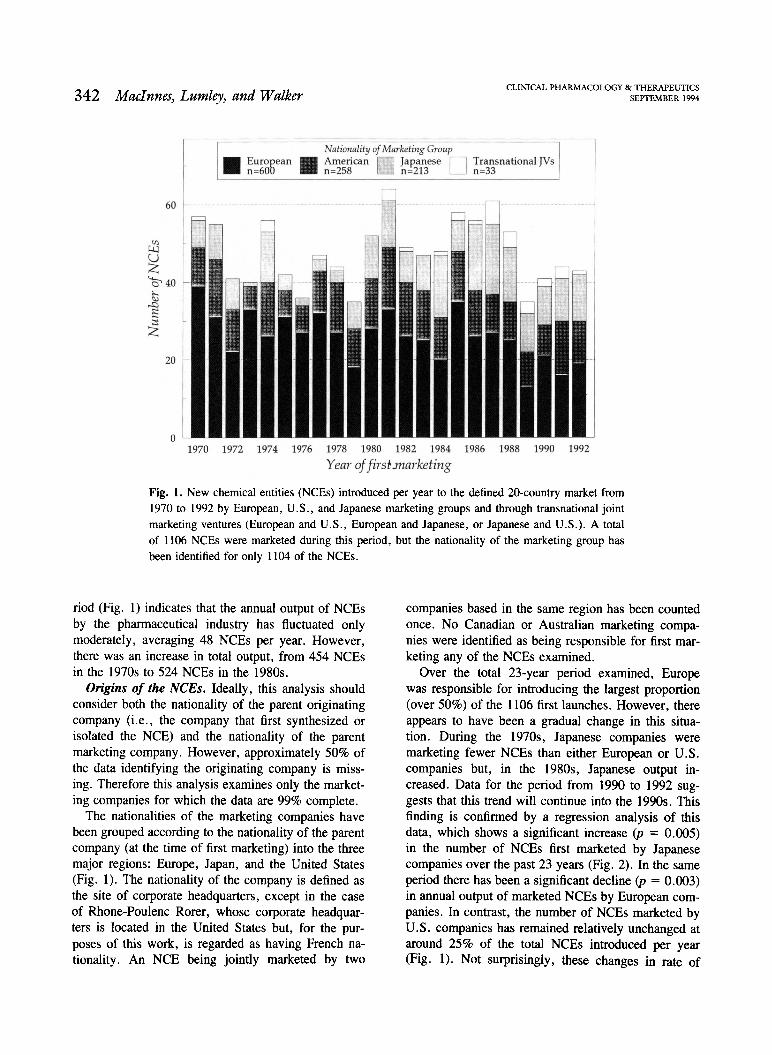
Fig. 1. New chemical entities (NCEs) introduced per year to the defined 20-country market from 1970 to 1992 by European, U.S., and Japanese marketing groups and through transnational joint marketing ventures (European and U.S., European and Japanese, or Japanese and U.S.). A total of 1106 NCEs were marketed during this period, but the nationality of the marketing group has
been identified for only 1104 of the NCEs.
nod (Fig. 1) indicates that the annual output of NCEs by the pharmaceutical industry has fluctuated only moderately, averaging 48 NCEs per year. However, there was an increase in total output, from 454 NCEs in the 1970s to 524 NCEs in the 1980s.
Origins of the NCEs. Ideally, this analysis should consider both the nationality of the parent originating company (i.e., the company that first synthesized or isolated the NCE) and the nationality of the parent marketing company. However, approximately 50% of the data identifying the originating company is miss- ing. Therefore this analysis examines only the market- ing companies for which the data are 99% complete.
The nationalities of the marketing companies have been grouped according to the nationality of the parent company (at the time of first marketing) into the three major regions: Europe, Japan, and the United States (Fig. 1). The nationality of the company is defined as the site of corporate headquarters, except in the case of Rhone-Poulenc Rorer, whose corporate headquar- ters is located in the United States but, for the pur- poses of this work, is regarded as having French na- tionality. An NCE being jointly marketed by two
CLINICAL PHARMACOLOGY & THERAPEUTICS SEPTEMBER 1994
companies based in the same region has been counted once. No Canadian or Australian marketing compa- nies were identified as being responsible for first mar- keting any of the NCEs examined.
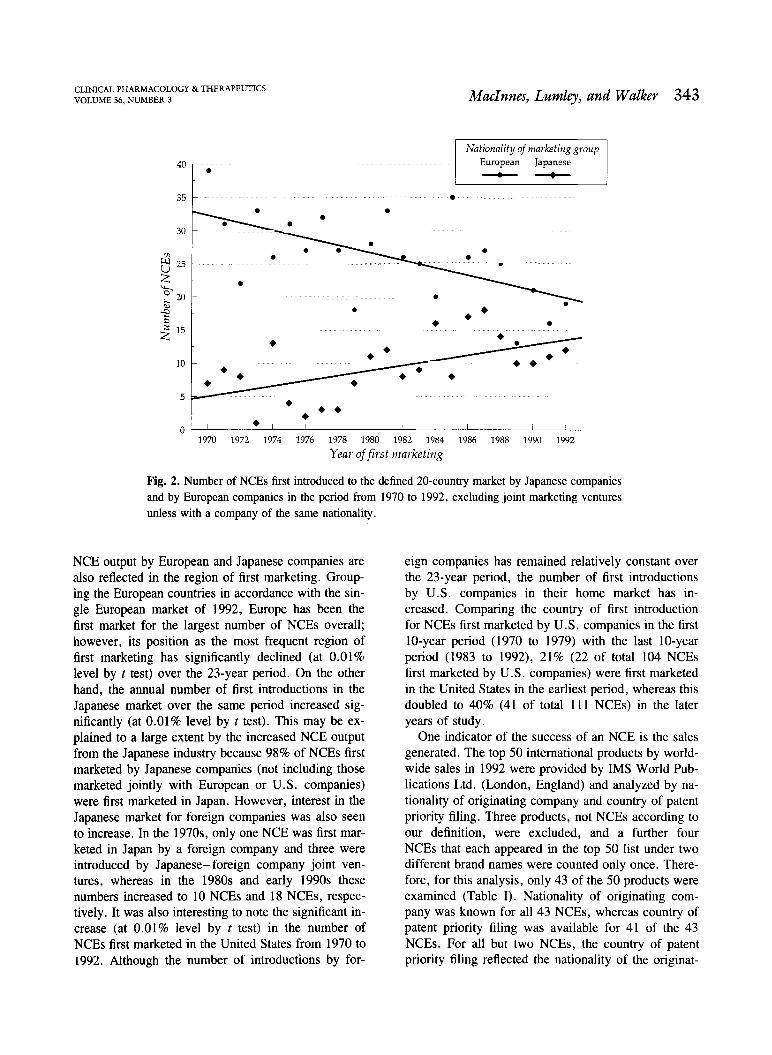
Over the total 23-year period examined, Europe was responsible for introducing the largest proportion (over 50%) of the 1106 first launches. However, there appears to have been a gradual change in this situa- tion. During the 1970s, Japanese companies were marketing fewer NCEs than either European or U.S. companies but, in the 1980s, Japanese output in- creased. Data for the period from 1990 to 1992 sug- gests that this trend will continue into the 1990s. This finding is confirmed by a regression analysis of this data, which shows a significant increase (p = 0.005) in the number of NCEs first marketed by Japanese companies over the past 23 years (Fig. 2). In the same period there has been a significant decline (p = 0.003) in annual output of marketed NCEs by European com- panies. In contrast, the number of NCEs marketed by U.S. companies has remained relatively unchanged at around 25% of the total NCEs introduced per year (Fig. 1). Not surprisingly, these changes in rate of
CLINICAL PHARMACOLOGY & THERAPEUTICS VOLUME 56, NUMBER 3
40
35
30
0 25
20
15
10
5
0
output by European and Japanese companies are also reflected in the region of first marketing. Group- ing the European countries in accordance with the sin- gle European market of 1992, Europe has been the first market for the largest number of NCEs overall; however, its position as the most frequent region of first marketing has significantly declined (at 0.01% level by t test) over the 23-year period. On the other hand, the annual number of first introductions in the Japanese market over the same period increased sig- nificantly (at 0.01% level by t test). This may be ex- plained to a large extent by the increased NCE output from the Japanese industry because 98% of NCEs first marketed by Japanese companies (not including those marketed jointly with European or U.S. companies) were first marketed in Japan. However, interest in the Japanese market for foreign companies was also seen to increase. In the 1970s, only one NCE was first mar- keted in Japan by a foreign company and three were introduced by Japaneseforeign company joint ven- tures, whereas in the 1980s and early 1990s these numbers increased to 10 NCEs and 18 NCEs, respec- tively. It was also interesting to note the significant in-
crease (at 0.01% level by t test) in the number of NCEs first marketed in the United States from 1970 to
1992. Although the number of introductions by for-
MacInnes, Lumley, and Walker 343
Nationality of marketing group European Japanese
eign companies has remained relatively constant over the 23-year period, the number of first introductions by U.S. companies in their home market has in- creased. Comparing the country of first introduction for NCEs first marketed by U.S. companies in the first 10-year period (1970 to 1979) with the last 10-year period (1983 to 1992), 21% (22 of total 104 NCEs first marketed by U.S. companies) were first marketed in the United States in the earliest period, whereas this doubled to 40% (41 of total 111 NCEs) in the later years of study.
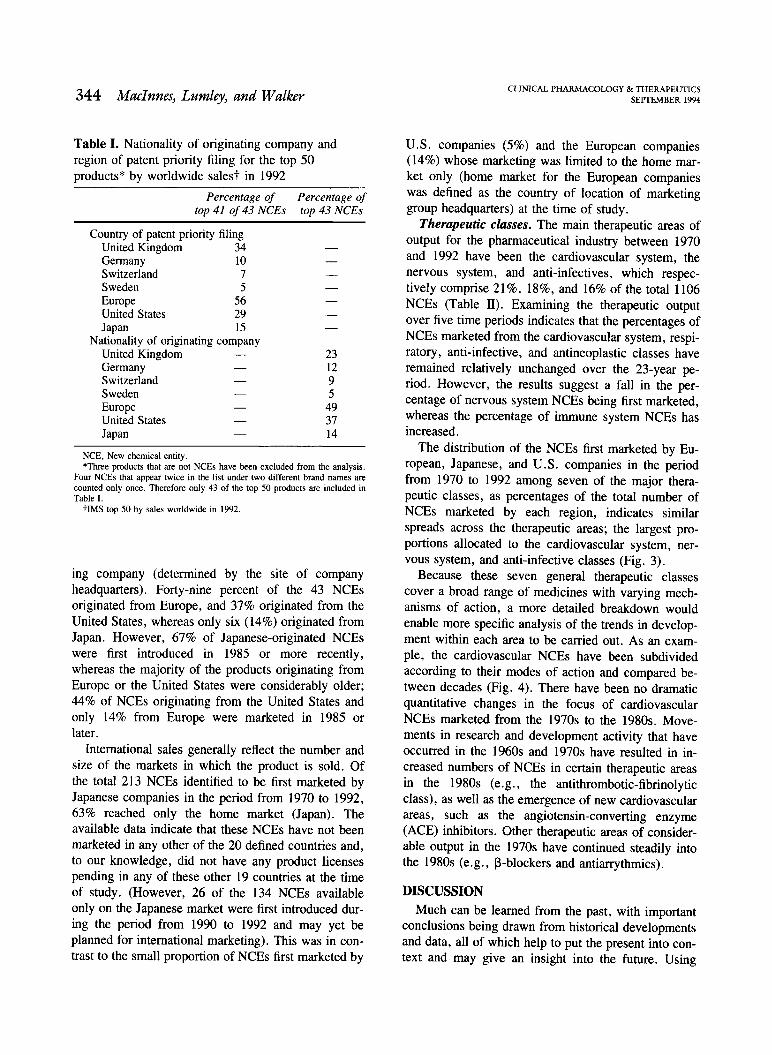
One indicator of the success of an NCE is the sales generated. The top 50 international products by world- wide sales in 1992 were provided by IMS World Pub- lications Ltd. (London, England) and analyzed by na- tionality of originating company and country of patent priority filing. Three products, not NCEs according to our definition, were excluded, and a further four NCEs that each appeared in the top 50 list under two different brand names were counted only once. There- fore, for this analysis, only 43 of the 50 products were examined (Table I). Nationality of originating com- pany was known for all 43 NCEs, whereas country of patent priority filing was available for 41 of the 43 NCEs. For all but two NCEs, the country of patent priority filing reflected the nationality of the originat-
1970 1972 1974 1976 1978 1980 1982 1984 1986 1988 1990 1992
Year of first marketing
Fig. 2. Number of NCEs first introduced to the defined 20-country market by Japanese companies and by European companies in the period from 1970 to 1992, excluding joint marketing ventures unless with a company of the same nationality.
344 MacInnes, Lumley, and Walker
Table I. Nationality of originating company and region of patent priority filing for the top 50 products* by worldwide salest in 1992
Nationality of originating company
NCE, New chemical entity. *Three products that are not NCEs have been excluded from the analysis.
Four NCEs that appear twice in the list under two different brand names are counted only once. Therefore only 43 of the top 50 products are included in Table I.
tIMS top 50 by sales worldwide in 1992.
ing company (determined by the site of company headquarters). Forty-nine percent of the 43 NCEs originated from Europe, and 37% originated from the United States, whereas only six (14%) originated from Japan. However, 67% of Japanese-originated NCEs were first introduced in 1985 or more recently, whereas the majority of the products originating from Europe or the United States were considerably older; 44% of NCEs originating from the United States and only 14% from Europe were marketed in 1985 or later.
International sales generally reflect the number and size of the markets in which the product is sold. Of the total 213 NCEs identified to be first marketed by Japanese companies in the period from 1970 to 1992, 63% reached only the home market (Japan). The available data indicate that these NCEs have not been marketed in any other of the 20 defined countries and, to our knowledge, did not have any product licenses pending in any of these other 19 countries at the time of study. (However, 26 of the 134 NCEs available only on the Japanese market were first introduced dur- ing the period from 1990 to 1992 and may yet be planned for international marketing). This was in con- trast to the small proportion of NCEs first marketed by
CLINICAL PHARMACOLOGY & THERAPEUTICS SEPTEMBER 1994
U.S. companies (5%) and the European companies (14%) whose marketing was limited to the home mar- ket only (home market for the European companies was defined as the country of location of marketing group headquarters) at the time of study.
Therapeutic classes. The main therapeutic areas of output for the pharmaceutical industry between 1970 and 1992 have been the cardiovascular system, the nervous system, and anti-infectives, which respec- tively comprise 21%, 18%, and 16% of the total 1106 NCEs (Table II). Examining the therapeutic output over five time periods indicates that the percentages of NCEs marketed from the cardiovascular system, respi- ratory, anti-infective, and antineoplastic classes have remained relatively unchanged over the 23-year pe- riod. However, the results suggest a fall in the per- centage of nervous system NCEs being first marketed, whereas the percentage of immune system NCEs has increased.
The distribution of the NCEs first marketed by Eu- ropean, Japanese, and U.S. companies in the period from 1970 to 1992 among seven of the major thera- peutic classes, as percentages of the total number of NCEs marketed by each region, indicates similar spreads across the therapeutic areas; the largest pro- portions allocated to the cardiovascular system, ner- vous system, and anti-infective classes (Fig. 3).
Because these seven general therapeutic classes cover a broad range of medicines with varying mech- anisms of action, a more detailed breakdown would enable more specific analysis of the trends in develop- ment within each area to be carried out. As an exam- ple, the cardiovascular NCEs have been subdivided according to their modes of action and compared be- tween decades (Fig. 4). There have been no dramatic quantitative changes in the focus of cardiovascular NCEs marketed from the 1970s to the 1980s. Move- ments in research and development activity that have occurred in the 1960s and 1970s have resulted in in- creased numbers of NCEs in certain therapeutic areas in the 1980s (e.g., the antithrombotic-fibrinolytic class), as well as the emergence of new cardiovascular areas, such as the angiotensin-converting enzyme (ACE) inhibitors. Other therapeutic areas of consider- able output in the 1970s have continued steadily into the 1980s (e.g., 13-blockers and antiarrythmics).
DISCUSSION Much can be learned from the past, with important
conclusions being drawn from historical developments and data, all of which help to put the present into con- text and may give an insight into the future. Using
Percentage of Percentage of top 41 of 43 NCEs top 43 NCEs
Country of patent priority filing United Kingdom 34 Germany 10 Switzerland 7 Sweden 5
Europe 56 United States 29 Japan 15
United Kingdom 23 Germany 12 Switzerland 9 Sweden 5 Europe 49 United States 37 Japan 14

CLINICAL PHARMACOLOGY & THERAPEUTICS VOLUME 56, NUMBER 3
z 2 25
(1)
20
c-ct
;-- cs 15
LL
cr)
u 10
"-Crt
''Thc) 5
o.)0
MacInnes, Lumley, and Walker 345
Nationality of Marketing Group IMOI European NM US
Japanese
Fig. 3. Distribution of the NCEs first introduced from 1970 to 1992 by European, U.S., and Jap-
anese marketing companies to the defined 20-country market among seven of the major therapeu- tic classes. NCEs introduced through transnational joint ventures are included in each region's therapeutic output.
Table II. Percentage* of NCEs first marketed from 1970 to 1992 according to therapeutic class
historical data concerning 1106 NCEs marketed in one or more of 20 countries in the period from 1970 to 1992, this article provides an insight into the status of the international pharmaceutical industry, with partic- ular emphasis on the output from research and devel- opment.
While global pharmaceutical research and develop- ment expenditure has escalated, particularly over the last decade, to an estimated 27 billion U.S. dollars in
*Percentage represents the number of NCEs first marketed for each therapeutic category with respect to the total number of NCEs first marketed for that particular time period.
1993,* the numbers of new drugs reaching the market have, to date, failed to show a similar increasing trend, averaging 48 NCEs marketed per year. This has also been observed in the United States, where an ex- amination of research and development expenditure
*Trends in worldwide pharmaceutical R & D expenditures for the 1990s. Centre for Medicines Research Report No. CMR 93-1R, Carshalton, England, 1993.
Total number Year of first of NCEs marketing first marketed
Nervous Anti- Immune system Gastrointestinal Cardiovascular Respiratory infectives system Antineoplastic Others
1970-74 249 22 5 22 5 14 8 7 16 1975-79 205 20 7 18 4 18 11 6 15
1980-84 260 18 6 18 4 16 12 7 18
1985-89 264 14 9 24 4 17 11 6 16 1990-92 128 17 2 22 5 16 15 5 17
1970-92 1106 18 6 21 4 16 11 6 17
GI Respiratory Antiinfective Immune system CVS NS Antineoplastic
Therapeutic class

Year of first marketing 1970-79 U 1980-89
associated with U.S. Food and Drug Administration (FDA)approved drugs in the period from 1970 to 1989 indicated the sharpest increase in the period from 1980 to 1989, whereas there has only been a moderate change in the annual number of new drugs ap- proved.31 The increases in research and development expenditure may partly reflect the increasing out-of- pocket costs of clinical trials, the move toward thera- peutics to treat chronic clinical conditions,32 and the increasing complexity of the science and technology involved in drug development.31 However, it must be remembered that the achievements of research and de- velopment effort in the more recent years will only be- come apparent in the late 1990s. Future monitoring of this NCE output is therefore important.
However, this lack of apparent change in the annual number of NCE introductions to the 20-country mar- ket over the period of this review hides significant trends that have emerged for the three major regions. European companies are still marketing the largest proportion of NCEs, although it appears from this study that their share has been declining since the 1970s. A reduction in the number of NCEs emanating from Europe in the 1980s was also reported by Grabowski,31 who suggested that one of the underly- ing factors has been the decrease in drug sales and
earnings in the domestic markets. Escalating research and development costs (the current estimate to de- velop an NCE is $359 million in 1990 dollars33), to- gether with increasing price pressures by govern- ments, are leading to declining sales and margins for European companies that in turn indirectly result in cuts in research and development budgets. This may have serious consequences in NCE output for Euro- pean companies in future years.
By contrast, Japanese companies have increased significantly their share of NCEs marketed for the first time between 1970 and 1992 in the 20 countries. However, nearly two thirds of the NCEs first mar- keted by Japanese companies in the period from 1970 to 1992 reached only the home market, whereas only small proportions of NCEs first marketed by European companies and those first marketed by U.S. compa- nies were limited to their home markets. Barral7 sug- gests that there is a strong correlation between innova- tion and global marketing, whereas the less-innovative new drugs tend to remain principally on the home market. The Japanese have historically had a reputa- tion as masterful imitators rather than breakthrough in- novators,34 but a recent survey by Hawkins and Reich,35 which examined the innovative quality of NCEs originated by Japanese companies, claims to
CLINICAL PHARMACOLOGY & THERAPEUTICS
346 MacInnes, Lumley, and Walker SEPTEMBER 1994
Cardiotonics
Beta blockers
Calcium antagonists
ACE inhibitors
Antihypertensives/ vasodilators - others
CI)
Antihyperlipidaemics
Antiarrythmics
Antithrombotic/ Fibrinolytics
0 2 4 6 8 10 12 14 16 18 20 22 24 26 28
Number of NCEs
Fig. 4. Disease areas of cardiovascular NCEs first marketed from 1970 to 1989 in the defined 20-country market.
CLINICAL PHARMACOLOGY & THERAPEUTICS VOLUME 56, NUMBER 3
dispel this. These authors concentrated on the 30 NCEs that had been approved by the FDA between 1960 and 1989, inclusive, for marketing in the United States. The findings from the study suggested that Jap- anese companies have produced a considerable num- ber of novel drugs that have reached the U.S. market. Twenty-seven percent of the compounds examined were found to be novel in chemical structure, whereas 10% showed pharmacologic novelty. However, this work focuses on a small sample that probably repre- sents the best Japanese compounds that meet global standards35 and does not attempt to examine the large number of Japanese-originated NCEs that have not been marketed outside Japan. These authors also sug- gest that Japanese companies have been stronger in
certain innovative strategies such as identifying, iso- lating, and modifying naturally occurring products (re- sulting in a relatively high output of anti-infective and antineoplastic agents) compared with other strategies, such as designing and synthesising target molecules .35
However, data presented in this article indicate that, in the period from 1970 to 1992, companies from Eu- rope, the United States, and Japan marketed similar proportions of their total NCE output from each of the seven major therapeutic classes, therefore suggesting fairly equal distribution of research and development resources among the therapeutic areas.
Throughout the 23-year period covered by this arti- cle, the proportion of NCEs marketed by U.S. compa- nies in the 20-country market has shown no significant increasing or decreasing trend. However, results do indicate that the home market has more frequently been the country of first introduction in recent years for the U.S. pharmaceutical industry, whereas the number of U.S. first introductions by foreign compa- nies remains relatively constant. The stringency of FDA requirements and the lengthy review times asso- ciated with the U.S. market have been said to influ- ence the introduction of new therapeutic drugs to the U.S. market. An assessment of how often NCEs were introduced in other markets before the United States has been examined in several studies.36-39 In recent years the FDA has introduced a series of new initia- tives to facilitate the review of important new drugs such as end-of-phase II conferences, expedited pro- cess, "NDA" (New Drug Application) days, and com- puter-assisted NDAs;4° results from this article sug- gest that, for the U.S. industry at least, such implementations may be proving effective. However, this study has been unable to identify the NCEs di- rectly involved in these FDA initiatives, and many of the NCEs affected by the most recent implementations
MacInnes, Lumley, and Walker 347
may not yet have reached the market. Therefore more detailed analyses and future data collection would be required to investigate this further. In addition to look- ing at first introductions, it is important to examine all NCEs available in the United States, particularly as it is the largest single marketworth $35.6 billion in 1991.41 According to Althius,42 64% of the top NCEs marketed in the United States in the 1970s were U.S.- originated NCEs, whereas in the 1980s the percentage had decreased to 39%. This author also showed that U.S.-based companies held 82% of the top 36 new medicines marketed in the United States in the 1970s (based on 1980 sales data), compared with only 62% in the 1980s (based on 1989 sales data).
The 1980s was a decade of considerable innovation by pharmaceutical companies as reflected by, for ex- ample, the introduction of ACE inhibitors, proton pump inhibitors, and selective serotonin reuptake in- hibitors. Innovation is stimulated by both medical need and scientific opportunity. Medical needs will be strongly influenced by the growing aged population in the developed world, with senile dementia, atheroscle- rosis, and cancer being disease areas of increasing im- portance and, as the prevalence of acquired immuno- deficiency syndrome continues to increase, there has been a concurrent spread of associated diseases such as tuberculosis and pneumonia. Companies also have to tackle conditions that have existed for many years for which early detection, as a result of diagnostic ad- vances, has now made possible treatment of diseases such as diabetes, cervical cancer, and breast cancer. They therefore face a moving target in planning their research programs and allocating appropriate research and development investment. Althuis42 reported that more than 50% of the top 36 NCEs of the 1980s in the United States were in therapeutic classes that had no comparable product, in terms of chemical class and mechanism, among the NCEs of the 1970s or before. In spite of these factors, the three therapeutic areas of highest NCE outputcardiovascular, central nervous system, and anti-infectivehave remained un- changed over the past 23 years. However, shifts have occurred in the types of disease areas being investi- gated and the products being marketed within these therapeutic classes, as shown in this article, for the cardiovascular NCEs. Competition within these areas is high. James43 suggested that the number of individ- ual companies competing in any one therapeutic area has greatly increased. Competition is particularly in- tense within chronic therapy areas that offer higher and long-term margins. For example, according to James ,43 at least 20 companies worldwide submitted
348 MacInnes, Lumley, and Walker
dossiers for marketing authorizations for different angiotensin-converting enzyme inhibitors in 1989 to add to the four compounds already marketed. A recent study by Halliday et al.' 4 indicated that companies in Europe, the United States, and Japan, on average, are active in about nine therapeutic categories with con- centration in four main areas: cardiovascular system and diuretics, drugs acting on the central nervous sys- tem, anti-infectives and vaccines, and antineoplastics and immunosuppressants.
In 1978, the proportion of the U.S. pharmaceutical industry research and development expenditure used to develop anti-infectives was 18.9%, whereas 16.6% was allocated to cardiovascular system products .39
Ten years later, in 1988, research and development expenditure decreased to 13.9% for anti-infectives, whereas investment in the cardiovascular system area rose to 25.1%. An increase in the number of NCEs first administered to humans in the United Kingdom in the cardiovascular area in the 1980s compared with the 1970s was reported by Prentis et al.45 Therefore shifts in the research and development investment by the pharmaceutical industry are apparent. However, the results of these reported shifts in research and de- velopment focus, in terms of marketed products, will be seen only in the 1990s.
This article has highlighted a number of trends in the output of the global pharmaceutical industry. Re- sults point to definite changes in research and develop- ment output by Japanese and European companies. With changing legislation, growing cost-containment pressures from governments, and reforms, it will be important to monitor not only the resulting impact on future trends in research and development output but also other aspects of the development process, such as development times, regulatory review times, effective patent life, and the time to internationalize a NCE. These analyses all measure research and development effort numerately, but it is also important to distin- guish the quality of research and development from the quantity. Future work will address these issues.
We thank all the pharmaceutical companies who have pro- vided the Centre for Medicines Research with confidential data for the international database of marketed medicines. We are grateful to IMS World Publications Ltd., Paul de Haen, A. E. Hass, the U.S. Pharmaceutical Manufactures Association, the U.S. Food and Drug Administration, the Health Protec- tion Branch of the Canadian Health and Welfare, and the Jap- anese Ministry of Health and Welfare for providing the Cen- tre for Medicines Research with data. We also thank Dr. Rita Karia and Dr. Yvonne Lis, who both played important roles in the establishment of the database.
CLINICAL PHARMACOLOGY & THERAPEUTICS SEPTEMBER 1994
References Wardell WM, DiRaddo J. The measurement of pharma- ceutical innovation. J Clin Pharmacol 1980;20:1-9. Walker, SR. Innovation and drug development-can the process be expedited? Br Inst Reg Affairs J 1982;1:34-42. Walker SR, Parrish JA. Innovation and new drug devel- opment. In: Walker BC, Walker SR, eds. Trends and changes in drug research and development. Lancaster: Kluwer Academic Press, 1988:1-28. Prentis RA, Walker SR. Trends in the development of new medicines by UK-owned pharmaceutical compa- nies (1964-1980). Br J Clin Phannacol 1986;21:433- 43. Reis-Arndt VE. 30 Jahre Arzneimittelentwicklung. Neue pharmazeutische Wirkstoffe 1961-1990. Pharma- ceutical Industry 1993;55:14-22. Lis Y, Walker SR. Novel medicines marketed in the UK (1960-87). Br J Clin Pharniacol 1989;28:333-43. Barral PE. Fifteen years of pharmaceutical research re- sults throughout the world (1975-1989). Research Med- icines Competition Communication 1990. Paris: Rhone Poulenc Health Foundation, 1990. May MS, Wardell WM, Lasagna L. New drug develop- ment during and after a period of regulatory change: clinical research activity of major United States phar- maceutical firms, 1958 to 1979. CLIN PHARMACOL THER
1983;33:691-700. Kaitin KI, Richard BW, Lasagna L. Trends in drug de- velopment: the 1985-86 new drug approvals. J Clin Phannacol 1987;27:542-8. Mattison N, Trimble AG, Lasagna L. New drug devel- opment in the United States, 1963 through 1984. CLIN
PHARMACOL THER 1988;43:290-301. Kaitin KI, DiCerbo PA, Lasagna L. The new drug ap- provals of 1987, 1988 and 1989: trends in drug devel- opment. J Clin Phannacol 1991;31:116-22. Mattison N, Thomas E, Trimble AG, Wardell WM. The development of self-originated new drugs by Swiss pharmaceutical firms, 1960-1980. Regul Toxicol Phar- macol 1984;4:157-73. Steward F, Wibberley G. Drug innovation-what's slowing it down? Nature 1980;284:118-20. Walker SR, Prentis RA, Ravenscroft MK. Pharmaceuti- cal innovation in the UK 1960-1983. Pharm Int 1986;June:135-7. Centre for Medicines Research. 25 New chemical enti- ties launched in the UK in 1990. CMR News 1991;9:4-8. Berlin H, Jonsson B. Market life, age structure and re- newal-an analysis of pharmaceutical specialities and substances in Sweden 1960-82. Managerial Decision Econ 1985;6:246-56. Berlin H, Jonsson B. International dissemination of new drugs: a comparative study of six countries. Mana- gerial Decision Econ 1986;7:235-42.

CLINICAL PHARMACOLOGY & THERAPEUTICS VOLUME 56, NUMBER 3
Patent Information Committee. In: Wittman WF, ed. Patent status of medicinals. Washington, DC: Pharma- ceutical Manufacturers Association, 1982. Hass AE. Compendium of new drug approvals in
eleven industrialized countries 1970-1983. Office of Planning and Evaluation report. Rockville, Maryland: US Food and Drug Administration, 1985. Hass AE Jr, Coppinger PL. Introductions and discontin- uations of new drugs in the United States and the United Kingdom 1970-1988. Office of Planning and Evaluation Study 78. Rockville, Maryland: Food and Drug Administration, 1989. IMS Patents International 1988. Vol 1 patents. London: IMS World Publications Ltd, 1988.
Pharma Japan Yearbook 1988-89. Tokyo: Yakugyo Jiho Co. Ltd, 1988. IMS Patents International 1989. London: IMS World Publications Ltd, 1989. Chem Index Plus 1989. London: IMS World Publica- tions Ltd, 1989. New drug evaluation statistical report. Rockville, Mary- land: US Department of Health and Human Services, Public Health Service, US Food and Drug Administra- tion, 1990. Scrip's NCE reviews 1981-1992. Surrey, England: PJB Publications, UK annual editions, 1982-1993. Pharmaceutical Manufactures Association. PMA new drug approvals 1989-1992. Washington, DC: PMA, 1990-1993. Reynolds JEF, ed. Martindale; the extra pharmaco- poeia. London: Pharmaceutical Press, 1993. Pharmaprojects. Surrey, England: PJB Publications, an- nual editions, 1991-93. Rang HP, Dale MM. Pharmacology. Edinburgh: Churchhill Livingstone, 1991. Grabowski HG. An analysis of US international com- petitiveness in pharmaceuticals. Managerial and Deci- sion Economics, 1989;Special Issue:27-33. Grabowski HG. The changing economics of pharma- ceutical research and development. In: Gelijns CG, Halm EA, eds. The changing economics of medical technology. Washington DC: National Academy Press, 1991:35-52.
MacInnes, Lumley, and Walker 349
Pharmaceutical R&D: costs, risks and rewards, OTA- H-522. US Congress, Office of Technology Assess- ment. Washington, DC: US Government Printing Of- fice, 1993. Yoshikawa A. The other drug war: US-Japan trade in pharmaceuticals. Calif Management Rev 1989;3l:76- 90. Hawkins ES, Reich MR. Japanese-originated pharma- ceutical products in the United States from 1960 to 1989: an assessment of innovation. CLIN PHARMACOL
THER l992;51:1-11. Wardell WM. Introduction of new therapeutic drugs in the United States and Great Britain: an international comparison. Curl PHARMACOL THER 1973;14:773-90. Kaitin KI, Mattison N, Northington FK, Lasagna L. The drug lag: an update of new drug introductions in the United States and in the United Kingdom, 1977 through 1987. CLIN PHARMACOL THER 1989;46:121-38. Coppinger PL, Peck CC, Temple RJ. Understanding comparisons of drug introductions between the United States and the United Kingdom. CLIN PHARMACOL THER
1989;46:139-45 .
Pharmaceutical Manufacturers Association. Facts at a glance. Washington, DC: PMA, 1990. Kaitin KI, Phelan BS, Raiford MLS, Morris B. Thera- peutic ratings and end-of-phase II conferences: initia- tives to accelerate the availability of important new drugs. CLIN PHARMACOL THER 1991;31:l7-24. Datamonitor. North american pharmaceutical market. London: Datamonitor Publications Ltd, 1993. Althius TH. A therapeutic and economic comparison of the top innovative new drugs of the 1970s and 1980s. Drug Inf J 1992;26:279-87. James B. The global pharmaceutical industry in the 1990s. The challenge of change. Special report No. 2071. London: The Economist Intelligence Unit, No- vember 1990. Halliday RG, Walker SR, Lumley CE. R&D philoso- phy and management in the world's leading pharmaceu- tical companies. J Pharm Med 1992;2:139-54. Prentis RA, Lis Y, Walker SR. Pharmaceutical innova- tion by the 7 UK-owned pharmaceutical companies (1964-1985). Br J Clin Pharmacol 1988;25:387-96.