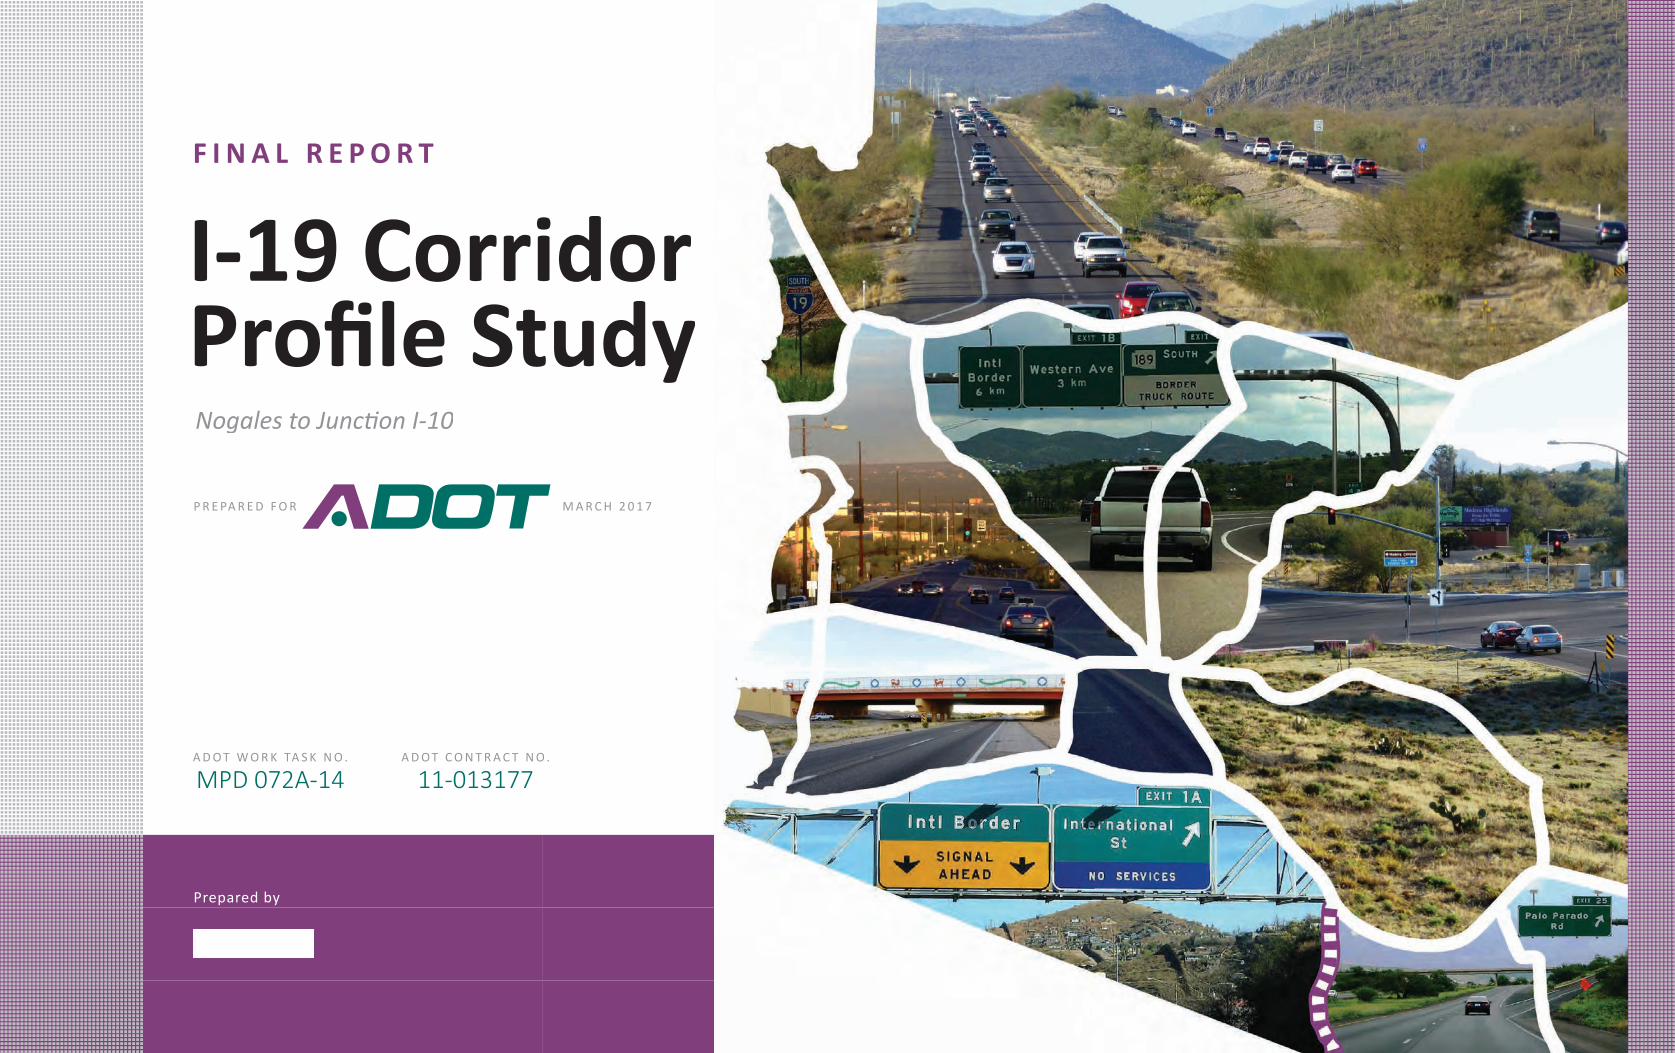
FINAL REPORT - I-19 Corridor Profile Study - ADOT
289
ADOT CONTRACT NO. 11-013177 PREPARED FOR Prepared by ADOT WORK TASK NO. MPD 072A-14 MARCH 2017 FINAL REPORT Nogales to Juncon I-10 I-19 Corridor Profile Study
-
Upload
khangminh22 -
Category
Documents
-
view
0 -
download
0
Transcript of FINAL REPORT - I-19 Corridor Profile Study - ADOT
A D O T C O N T R A C T N O .
11-013177
P R E PA R E D F O R
Prepared by
A D O T W O R K TA S K N O .
MPD 072A-14
M A R C H 2 0 1 7
F I N A L R E P O R T
Nogales to Junction I-10
I-19 CorridorProfile Study

I-19 CORRIDOR PROFILE STUDYNOGALES TO JUNCTION I-10
ADOT WORK TASK NO. MPD 072A-14ADOT CONTRACT NO. 11-013177
FINAL REPORT
MARCH 2017
PREPARED FOR:
ARIZONA DEPARTMENT OF TRANSPORTATION
PREPARED BY:
This report was funded in part through grants from the Federal Highway Administration, U.S. Department of Transportation. The contents of this report reflect the views of the authors, who are responsible for the facts and the accuracy of the data, and for the use or adaptation of previously published material, presented herein. The contents do not necessarily reflect the official views or policies of the Arizona Department of Transportation or the Federal Highway Administration, U.S. Department of Transportation. This report does not constitute a standard, specification, or regulation. Trade or manufacturers’ names that may appear herein are cited only because they are considered essential to the objectives of the report. The U.S. government and the State of Arizona do not endorse products or manufacturers.

March 2017 I-19 Corridor Profile Study i Final Report
Table of Contents
EXECUTIVE SUMMARY ................................................................................................................ 1
INTRODUCTION ............................................................................................................................. 1
1.0 INTRODUCTION .................................................................................................................. 1
1.1 CORRIDOR STUDY PURPOSE ............................................................................................ 2
1.2 STUDY GOALS AND OBJECTIVES ....................................................................................... 2
1.3 CORRIDOR OVERVIEW AND LOCATION ............................................................................... 2
1.4 CORRIDOR SEGMENTS ..................................................................................................... 2
1.5 CORRIDOR CHARACTERISTICS .......................................................................................... 5
1.6 CORRIDOR STAKEHOLDERS AND INPUT PROCESS ............................................................... 9
1.7 PRIOR STUDIES AND RECOMMENDATIONS .......................................................................... 9
2.0 CORRIDOR PERFORMANCE ........................................................................................... 17
2.1 CORRIDOR PERFORMANCE FRAMEWORK ......................................................................... 17
2.2 PAVEMENT PERFORMANCE AREA .................................................................................... 19
2.3 BRIDGE PERFORMANCE AREA ......................................................................................... 22
2.4 MOBILITY PERFORMANCE AREA ...................................................................................... 25
2.5 SAFETY PERFORMANCE AREA ......................................................................................... 29
2.6 FREIGHT PERFORMANCE AREA ....................................................................................... 32
2.7 CORRIDOR PERFORMANCE SUMMARY.............................................................................. 35
3.0 NEEDS ASSESSMENT...................................................................................................... 38
3.1 CORRIDOR OBJECTIVES ................................................................................................. 38
3.2 NEEDS ASSESSMENT PROCESS ...................................................................................... 40
3.3 CORRIDOR NEEDS ASSESSMENT ..................................................................................... 41
4.0 STRATEGIC SOLUTIONS ................................................................................................. 50
4.1 SCREENING PROCESS .................................................................................................... 50
4.2 CANDIDATE SOLUTIONS .................................................................................................. 53
5.0 SOLUTION EVALUATION AND PRIORITIZATION ........................................................... 56
5.1 LIFE-CYCLE COST ANALYSIS .......................................................................................... 57
5.2 PERFORMANCE EFFECTIVENESS EVALUATION .................................................................. 59
5.3 SOLUTION RISK ANALYSIS .............................................................................................. 62
5.4 CANDIDATE SOLUTION PRIORITIZATION ............................................................................ 63
6.0 SUMMARY OF CORRIDOR RECOMMENDATIONS ......................................................... 65
6.1 PRIORITIZED CANDIDATE SOLUTION RECOMMENDATIONS ................................................... 65
6.2 OTHER CORRIDOR RECOMMENDATIONS ........................................................................... 65
6.3 POLICY AND INITIATIVES RECOMMENDATIONS.................................................................... 66
6.4 NEXT STEPS .................................................................................................................. 69
March 2017 I-19 Corridor Profile Study ii Final Report
List of Figures Figure 1: Corridor Study Area ............................................................................................................ 1 Figure 2: Corridor Location and Segments ........................................................................................ 4 Figure 3: Corridor Assets ................................................................................................................... 8 Figure 4: Recommended Projects from Previous Studies ................................................................ 16 Figure 5: Corridor Profile Performance Framework ......................................................................... 17 Figure 6: Performance Area Template ............................................................................................. 18 Figure 7: Pavement Performance Measures .................................................................................... 19 Figure 8: Pavement Performance .................................................................................................... 21 Figure 9: Bridge Performance Measures ......................................................................................... 22 Figure 10: Bridge Performance ........................................................................................................ 24 Figure 11: Mobility Performance Measures ...................................................................................... 25 Figure 12: Mobility Performance ...................................................................................................... 28 Figure 13: Safety Performance Measures........................................................................................ 29 Figure 14: Safety Performance ........................................................................................................ 31 Figure 15: Freight Performance Measures ....................................................................................... 32 Figure 16: Freight Performance ....................................................................................................... 34 Figure 17: Performance Summary by Primary Measure .................................................................. 35 Figure 18: Corridor Performance Summary by Performance Measure ............................................ 36 Figure 19: Needs Assessment Process ........................................................................................... 40 Figure 20: Initial Need Ratings in Relation to Baseline Performance (Bridge Example) .................. 40 Figure 21: Corridor Needs Summary ............................................................................................... 49 Figure 22: Strategic Investment Areas ............................................................................................. 51 Figure 23: Candidate Solutions ........................................................................................................ 55 Figure 24: Candidate Solution Evaluation Process .......................................................................... 56 Figure 25: Risk Matrix ...................................................................................................................... 62 Figure 26: Numeric Risk Matrix ........................................................................................................ 62 Figure 27: Recommended Solutions ................................................................................................ 68
List of Tables Table 1: I-19 Corridor Segments ........................................................................................................ 3 Table 2: Current and Future Population ............................................................................................. 6 Table 3: Corridor Recommendations from Previous Studies ............................................................ 11 Table 4: Corridor Performance Measures......................................................................................... 18 Table 5: Pavement Performance ...................................................................................................... 20 Table 6: Bridge Performance ............................................................................................................ 23 Table 7: Mobility Performance .......................................................................................................... 27 Table 8: Safety Performance ............................................................................................................ 30 Table 9: Freight Performance ........................................................................................................... 33 Table 10: Corridor Performance Summary by Segment and Performance Measure ....................... 37 Table 11: Corridor Performance Goals and Objectives .................................................................... 39 Table 12: Final Pavement Needs ..................................................................................................... 42 Table 13: Final Bridge Needs ........................................................................................................... 43 Table 14: Final Mobility Needs.......................................................................................................... 44 Table 15: Final Safety Needs ........................................................................................................... 45 Table 16: Final Freight Needs .......................................................................................................... 46 Table 17: Summary of Needs by Segment ....................................................................................... 47 Table 18: Strategic Investment Area Screening ............................................................................... 52 Table 19: Candidate Solutions .......................................................................................................... 54 Table 20: Bridge Life-Cycle Cost Analysis Results ........................................................................... 58 Table 21: Pavement Life-Cycle Cost Analysis Results ..................................................................... 58 Table 22: Performance Effectiveness Scores ................................................................................... 61 Table 23: Performance Results ........................................................................................................ 64 Table 24: Prioritized Recommended Solutions List .......................................................................... 67
Appendices Appendix A: Corridor Performance Maps Appendix B: Performance Area Detailed Calculation Methodologies Appendix C: Performance Area Data Appendix D: Needs Analysis Contributing Factors and Scores Appendix E: Life-Cycle Cost Analysis Appendix F: Crash Modification Factors and Construction Costs Appendix G: Performance Area Risk Factors Appendix H: Candidate Solution Estimates Appendix I: Performance Effectiveness Scores Appendix J: Project Prioritization Scores Appendix K: Preliminary Scoping Reports for Prioritized Solutions
March 2017 I-19 Corridor Profile Study iii Final Report
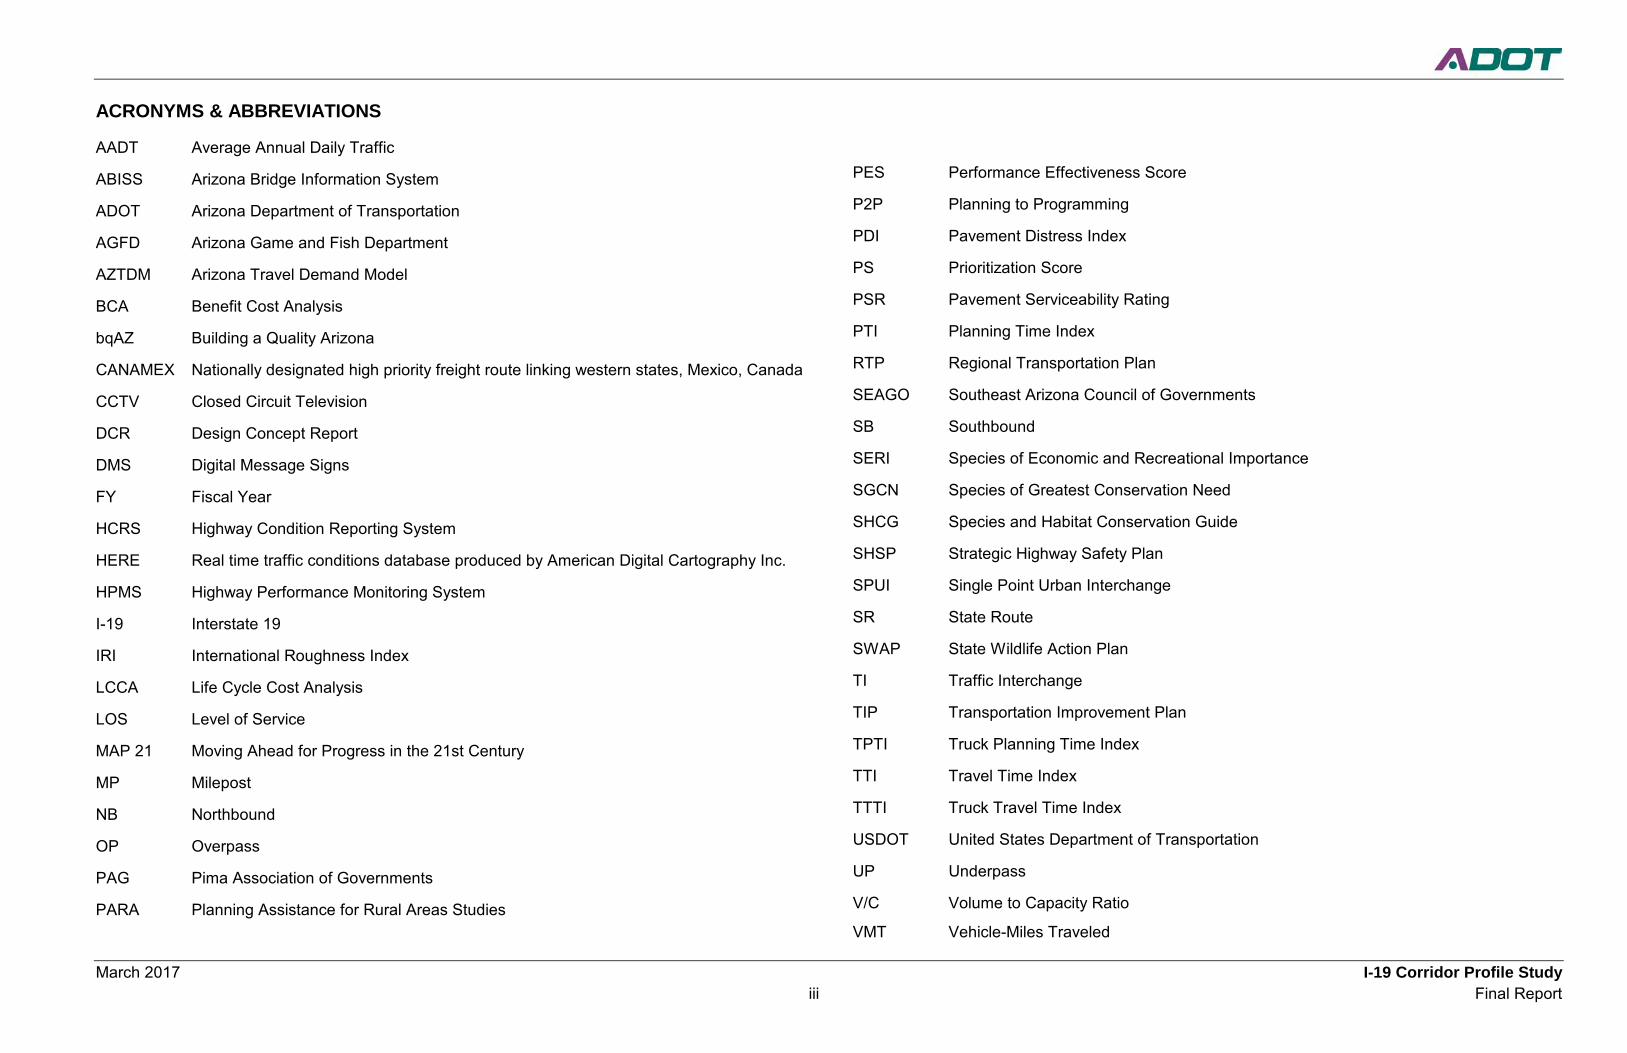
ACRONYMS & ABBREVIATIONS
AADT Average Annual Daily Traffic
ABISS Arizona Bridge Information System
ADOT Arizona Department of Transportation
AGFD Arizona Game and Fish Department
AZTDM Arizona Travel Demand Model
BCA Benefit Cost Analysis
bqAZ Building a Quality Arizona
CANAMEX Nationally designated high priority freight route linking western states, Mexico, Canada
CCTV Closed Circuit Television
DCR Design Concept Report
DMS Digital Message Signs
FY Fiscal Year
HCRS Highway Condition Reporting System
HERE Real time traffic conditions database produced by American Digital Cartography Inc.
HPMS Highway Performance Monitoring System
I-19 Interstate 19
IRI International Roughness Index
LCCA Life Cycle Cost Analysis
LOS Level of Service
MAP 21 Moving Ahead for Progress in the 21st Century
MP Milepost
NB Northbound
OP Overpass
PAG Pima Association of Governments
PARA Planning Assistance for Rural Areas Studies
PES Performance Effectiveness Score
P2P Planning to Programming
PDI Pavement Distress Index
PS Prioritization Score
PSR Pavement Serviceability Rating
PTI Planning Time Index
RTP Regional Transportation Plan
SEAGO Southeast Arizona Council of Governments
SB Southbound
SERI Species of Economic and Recreational Importance
SGCN Species of Greatest Conservation Need
SHCG Species and Habitat Conservation Guide
SHSP Strategic Highway Safety Plan
SPUI Single Point Urban Interchange
SR State Route
SWAP State Wildlife Action Plan
TI Traffic Interchange
TIP Transportation Improvement Plan
TPTI Truck Planning Time Index
TTI Travel Time Index
TTTI Truck Travel Time Index
USDOT United States Department of Transportation
UP Underpass
V/C Volume to Capacity Ratio
VMT Vehicle-Miles Traveled

Exec
utive
Sum
mar
y
Executive Summary

March 2017 I-19 Corridor Profile Study Executive Summary ES-1 Final Report
EXECUTIVE SUMMARY INTRODUCTION The Arizona Department of Transportation (ADOT) is the lead agency for this Corridor Profile Study (CPS) of Interstate 19 (I-19) between the International Border and Interstate 10 (I-10). This study examines key performance measures relative to the I-19 corridor, and the results of this performance evaluation will be used to identify potential strategic improvements. The intent of the corridor profile program, and of the Planning to Programming (P2P) process, is to conduct performance-based planning to identify areas of need and make the most efficient use of available funding to provide an efficient transportation network.
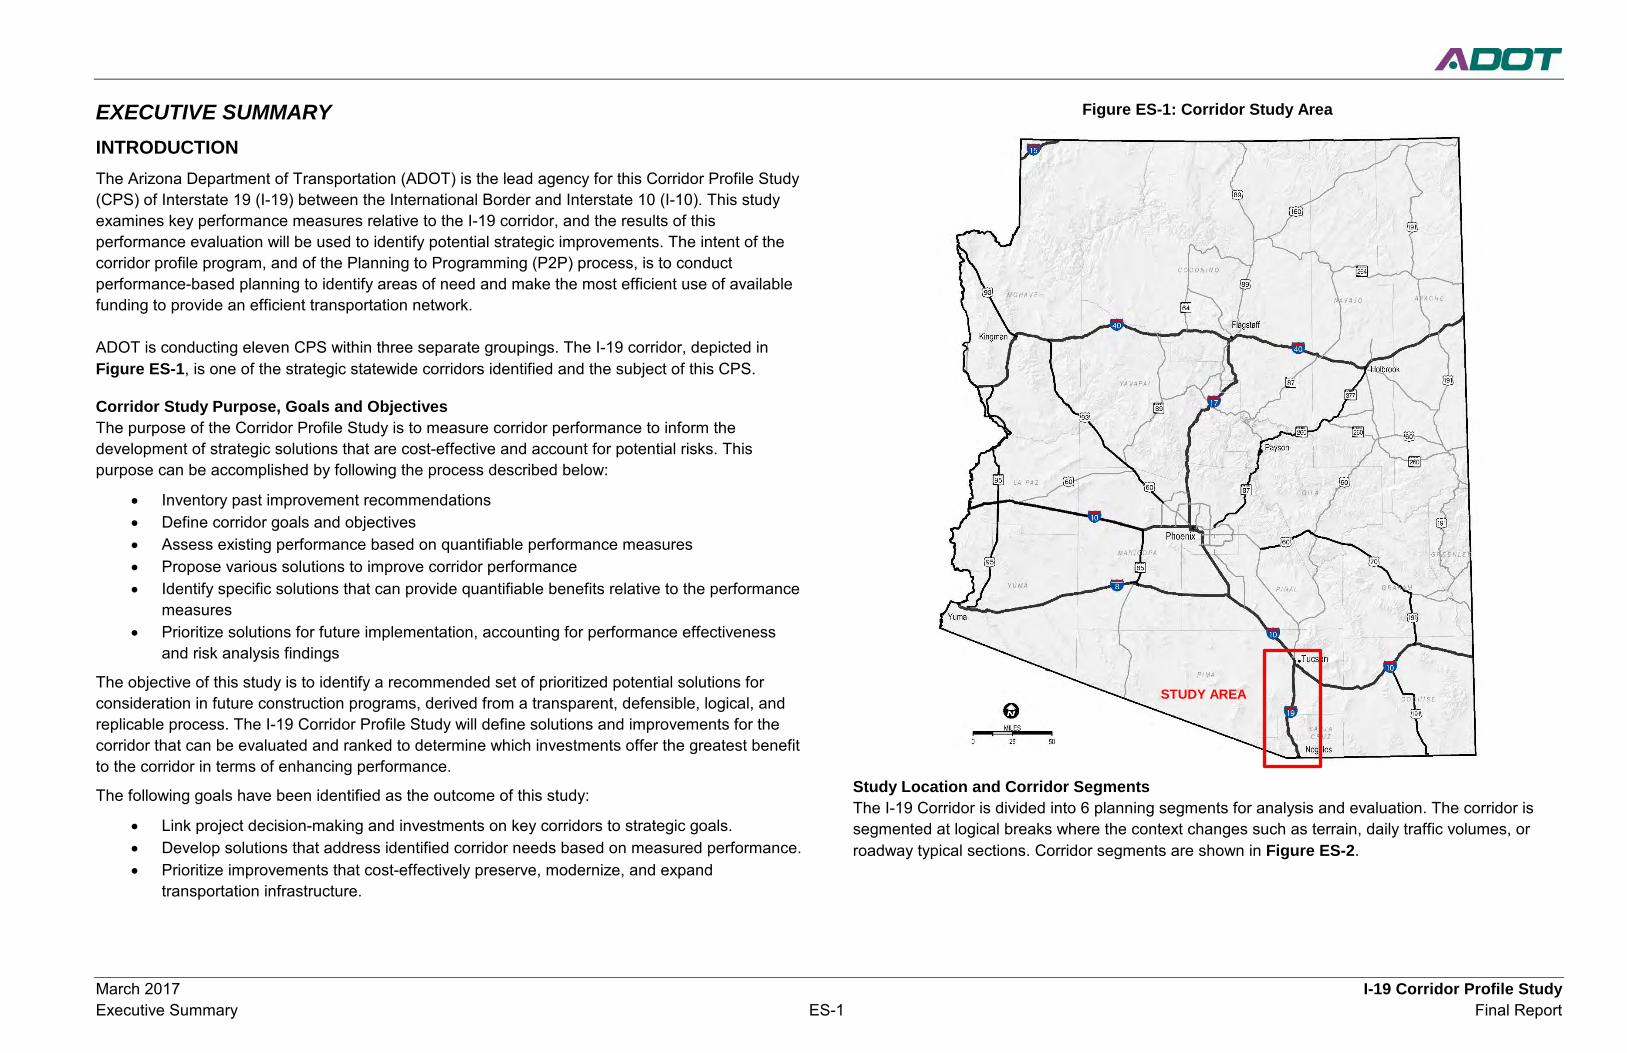
ADOT is conducting eleven CPS within three separate groupings. The I-19 corridor, depicted in Figure ES-1, is one of the strategic statewide corridors identified and the subject of this CPS.
Corridor Study Purpose, Goals and Objectives The purpose of the Corridor Profile Study is to measure corridor performance to inform the development of strategic solutions that are cost-effective and account for potential risks. This purpose can be accomplished by following the process described below:
• Inventory past improvement recommendations • Define corridor goals and objectives • Assess existing performance based on quantifiable performance measures • Propose various solutions to improve corridor performance • Identify specific solutions that can provide quantifiable benefits relative to the performance
measures • Prioritize solutions for future implementation, accounting for performance effectiveness
and risk analysis findings
The objective of this study is to identify a recommended set of prioritized potential solutions for consideration in future construction programs, derived from a transparent, defensible, logical, and replicable process. The I-19 Corridor Profile Study will define solutions and improvements for the corridor that can be evaluated and ranked to determine which investments offer the greatest benefit to the corridor in terms of enhancing performance.
The following goals have been identified as the outcome of this study:
• Link project decision-making and investments on key corridors to strategic goals. • Develop solutions that address identified corridor needs based on measured performance. • Prioritize improvements that cost-effectively preserve, modernize, and expand
transportation infrastructure.
Figure ES-1: Corridor Study Area
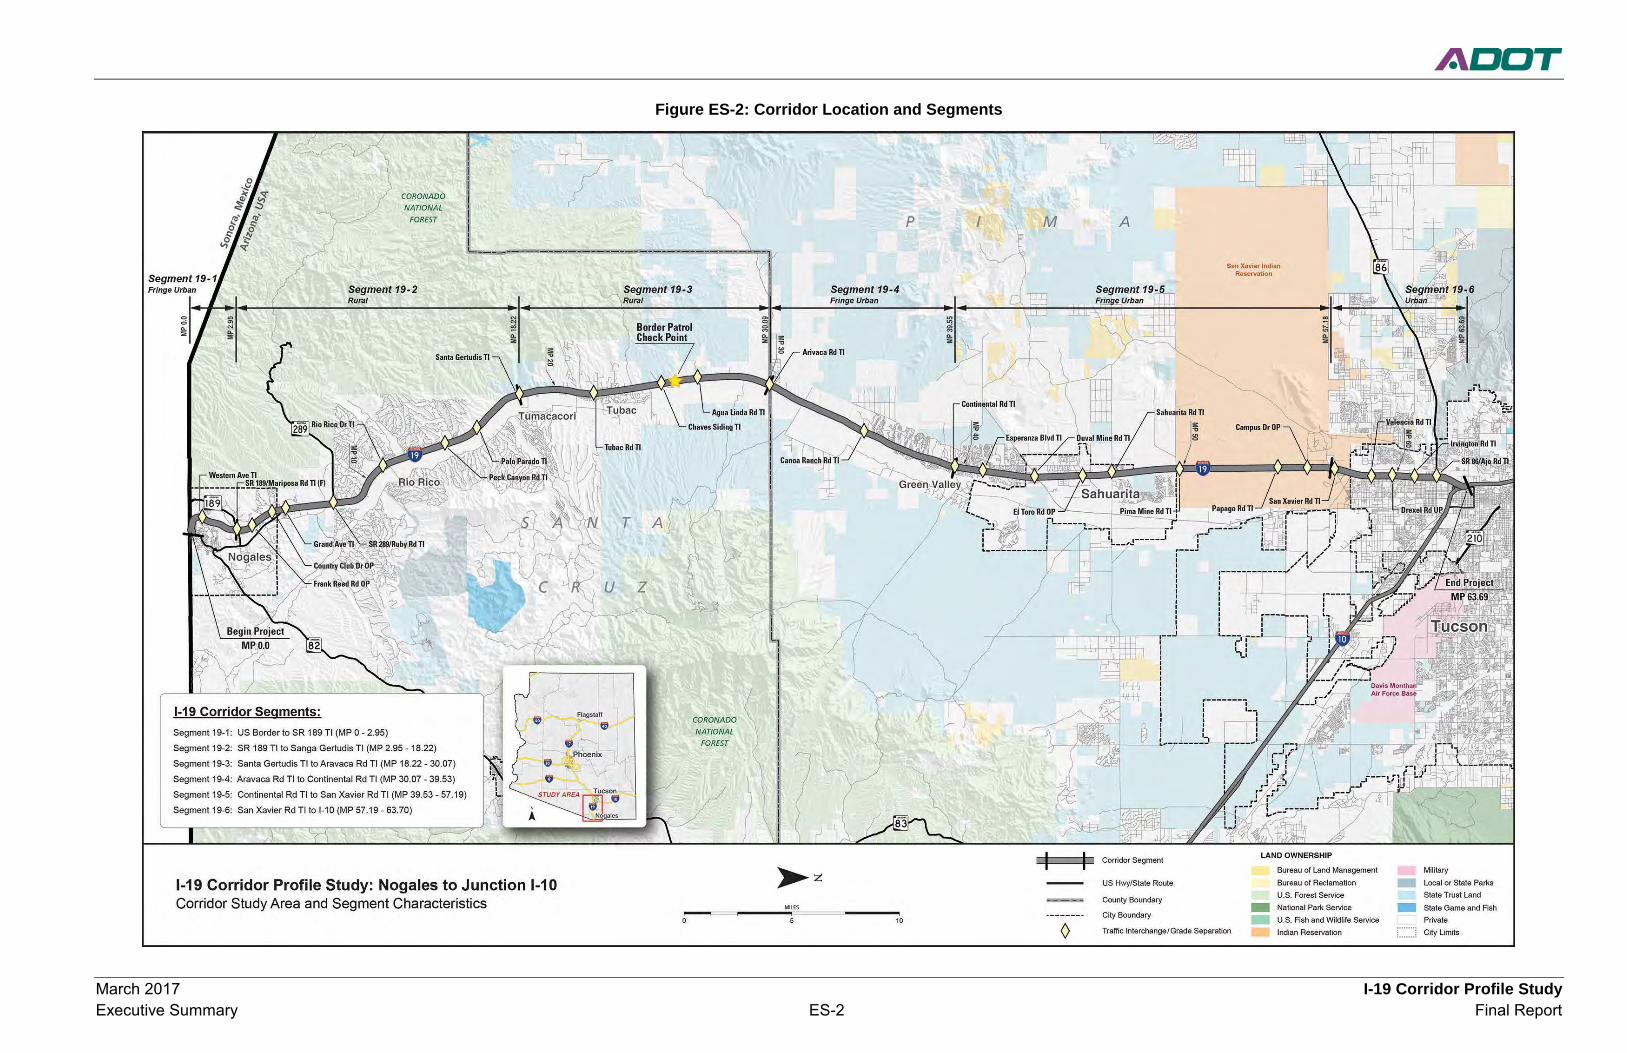
Study Location and Corridor Segments The I-19 Corridor is divided into 6 planning segments for analysis and evaluation. The corridor is segmented at logical breaks where the context changes such as terrain, daily traffic volumes, or roadway typical sections. Corridor segments are shown in Figure ES-2.
STUDY AREA
March 2017 I-19 Corridor Profile Study Executive Summary ES-2 Final Report
Figure ES-2: Corridor Location and Segments
March 2017 I-19 Corridor Profile Study Executive Summary ES-3 Final Report
CORRIDOR PERFORMANCE A series of performance measure were used to assess the I-19 corridor. The results of the performance evaluation were used to define overall corridor need relative to the long term goals and objectives for the corridor.
Corridor Performance Framework
This study uses a performance-based process to define baseline corridor performance, diagnose corridor needs, develop corridor solutions, and prioritize strategic corridor investments. In support of this objective, a framework for the performance-based process was developed through a collaborative process involving ADOT and the consultant teams for the Corridor Profile Studies.
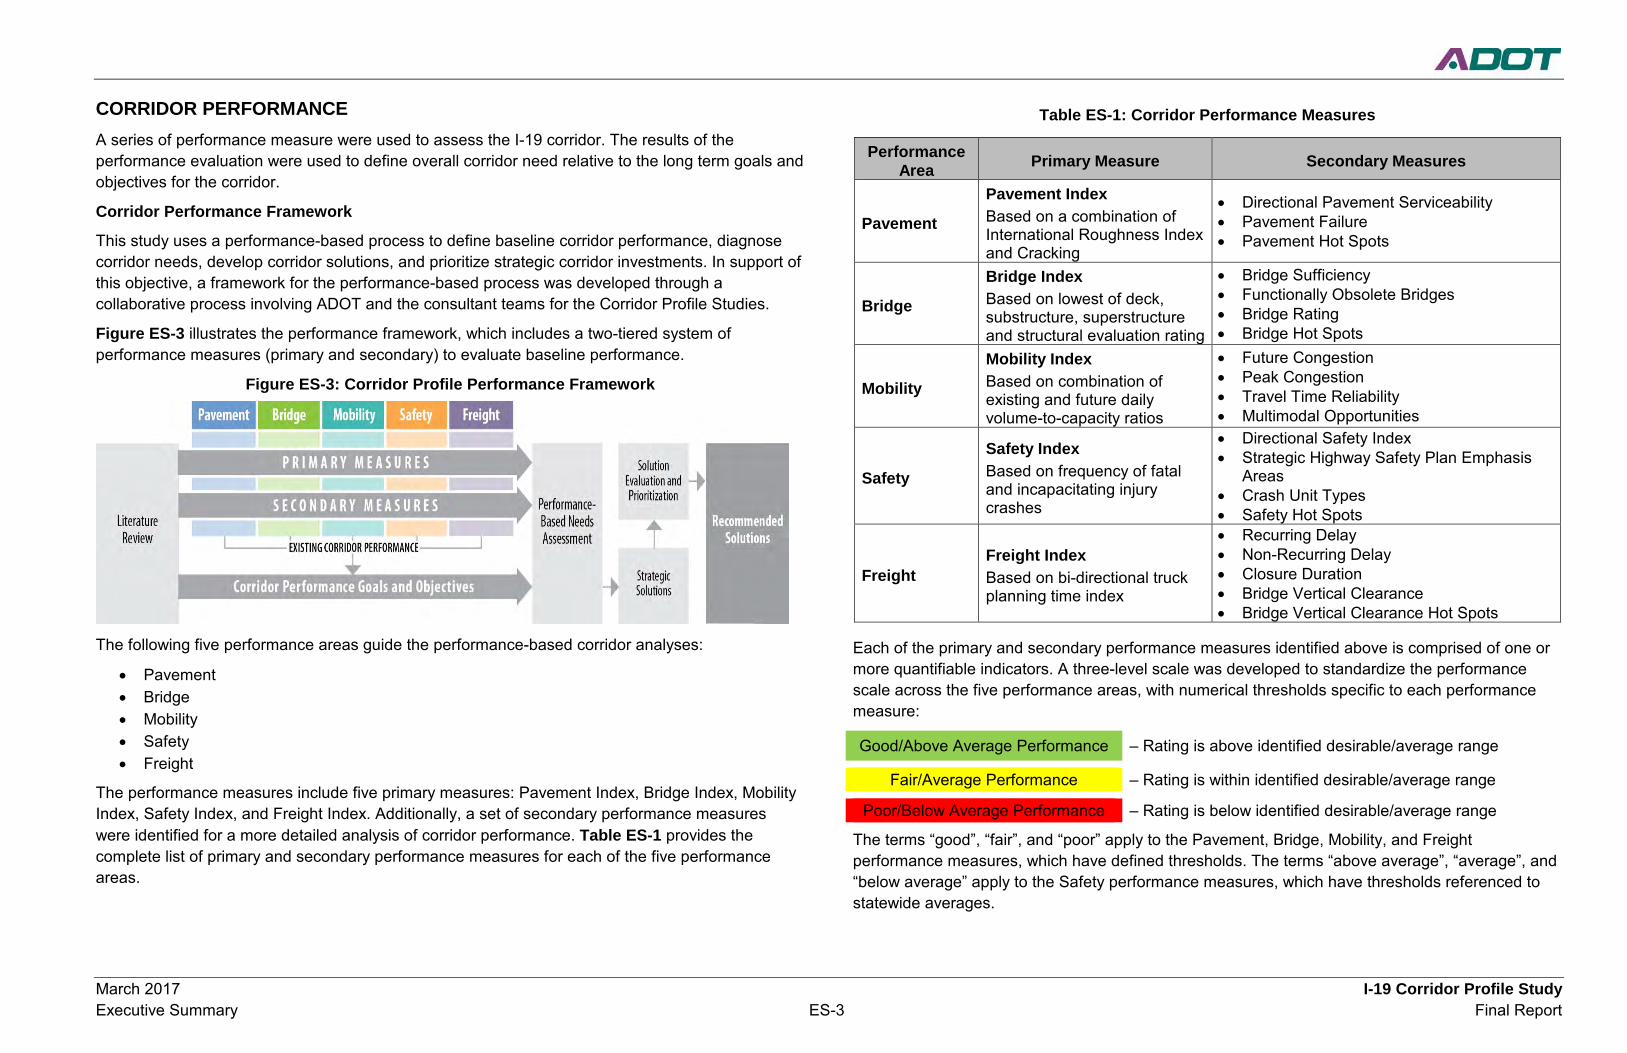
Figure ES-3 illustrates the performance framework, which includes a two-tiered system of performance measures (primary and secondary) to evaluate baseline performance.
Figure ES-3: Corridor Profile Performance Framework
The following five performance areas guide the performance-based corridor analyses:
• Pavement • Bridge • Mobility • Safety • Freight
The performance measures include five primary measures: Pavement Index, Bridge Index, Mobility Index, Safety Index, and Freight Index. Additionally, a set of secondary performance measures were identified for a more detailed analysis of corridor performance. Table ES-1 provides the complete list of primary and secondary performance measures for each of the five performance areas.
Table ES-1: Corridor Performance Measures
Performance Area Primary Measure Secondary Measures
Pavement
Pavement Index Based on a combination of International Roughness Index and Cracking
• Directional Pavement Serviceability • Pavement Failure • Pavement Hot Spots
Bridge
Bridge Index Based on lowest of deck, substructure, superstructure and structural evaluation rating
• Bridge Sufficiency • Functionally Obsolete Bridges • Bridge Rating • Bridge Hot Spots
Mobility
Mobility Index Based on combination of existing and future daily volume-to-capacity ratios
• Future Congestion • Peak Congestion • Travel Time Reliability • Multimodal Opportunities
Safety
Safety Index Based on frequency of fatal and incapacitating injury crashes
• Directional Safety Index • Strategic Highway Safety Plan Emphasis
Areas • Crash Unit Types • Safety Hot Spots
Freight Freight Index Based on bi-directional truck planning time index
• Recurring Delay • Non-Recurring Delay • Closure Duration • Bridge Vertical Clearance • Bridge Vertical Clearance Hot Spots
Each of the primary and secondary performance measures identified above is comprised of one or more quantifiable indicators. A three-level scale was developed to standardize the performance scale across the five performance areas, with numerical thresholds specific to each performance measure:
Good/Above Average Performance – Rating is above identified desirable/average range
Fair/Average Performance – Rating is within identified desirable/average range
Poor/Below Average Performance – Rating is below identified desirable/average range
The terms “good”, “fair”, and “poor” apply to the Pavement, Bridge, Mobility, and Freight performance measures, which have defined thresholds. The terms “above average”, “average”, and “below average” apply to the Safety performance measures, which have thresholds referenced to statewide averages.
March 2017 I-19 Corridor Profile Study Executive Summary ES-4 Final Report
Corridor Performance Summary Table ES-2 shows a summary of corridor performance for all primary measures and secondary measure indicators for the I-19 Corridor. A weighted corridor average rating (based on the length of the segment) was calculated for each primary and secondary measure as shown in Table ES-2.
• The most significant results for the I-19 corridor report Poor Safety performance on all segments except segment 19-4, including NB and SB lanes.
• Pavement performance is generally Good/Above Average throughout the corridor. • Bridge performance is generally Good/Above Average throughout the corridor. Exceptions
include a series of Functionally Obsolete bridges in segment 19-1 and an average bridge rating of 4 (Below Average) on segment 19-5.
• Mobility performance is generally Good/Above Average throughout the corridor. Exceptions include segment 19-6 in the Tucson urban area, where project traffic increases push the Mobility Index into the poor range.
• Freight performance is generally Good/Above Average throughout the corridor. Exceptions include a low clearance bridge on segment 19-5 and a corridor average PTI (NB) that is largely the result of:
o Conditions on segment 19-1 which delay trucks from reaching signed speed limits, and
o The US Customs Border Patrol Checkpoint on segment 19-3, where delays contribute to lower average speeds for the segment.
Table ES-2 shows a summary of all primary and secondary performance measures for the I-19 corridor. A weighted average rating (based on the length of the segment) was calculated for each primary and secondary measure as shown in Table ES-2.

March 2017 I-19 Corridor Profile Study Executive Summary ES-5 Final Report
Table ES-2: Corridor Performance Summary by Segment and Performance Measure
Segment Length (miles)
Pavement Performance Area Bridge Performance Area Mobility Performance Area
Pavement Index
Directional PSR Pavement
Failure Bridge Index
Bridge Sufficiency
Bridge Rating
% Deck Area of Functionally
Obsolete Bridges
Mobility Index
Future Daily V/C
Existing Peak Hour
V/C
Closure Extent (instances/milepost
/ year/mile) Directional TTI (all vehicles)
Directional PTI (all vehicles) % Bicycle Acc.
% Non-Single Occupancy Vehicle (SOV) Opportunities NB SB NB SB NB SB NB SB NB SB
19-11a* 3 4.03 3.72 3.96 16.7% 5.98 90.03 5 100.0% 0.16 0.19 0.12 0.11 0.27 0.20 1.40 1.01 2.28 1.30 90% 14%
19-22a^ 15 4.39 4.28 4.26 3.3% 5.79 92.24 5 27.3% 0.32 0.39 0.19 0.20 0.22 0.17 1.16 1.13 1.25 1.22 100% 17%
19-32b* 12 3.57 3.74 3.90 0.0% 6.18 93.08 6 19.7% 0.26 0.32 0.17 0.17 0.30 0.17 1.58 1.10 2.50 1.17 100% 15%
19-41a^ 10 3.54 3.76 3.90 0.0% 6.60 95.35 6 15.7% 0.34 0.41 0.23 0.23 0.20 0.02 1.06 1.06 1.08 1.12 100% 16%
19-51a^ 17 4.08 3.97 4.02 0.0% 5.30 90.92 4 21.3% 0.56 0.66 0.35 0.36 0.25 0.15 1.06 1.07 1.11 1.12 100% 13%
19-61a^ 7 3.61 3.54 3.57 18.8% 6.06 77.36 5 19.4% 1.01 1.21 0.78 0.76 0.38 0.06 1.00 1.04 1.03 1.12 95% 15% Weighted Corridor
Average 3.92 3.91 3.98 3.6% 5.90 90.80 5.08 25.0% 0.44 0.53 0.30 0.30 0.26 0.13 1.19 1.08 1.44 1.16 99% 15%
Scale Interstate Urban or Rural Uninterrupted or Interrupted Good/Above Average > 3.75 < 5% > 6.5 > 80 > 6 < 12% < 0.711
< 0.562 < 0.22 < 1.15^ < 1.30*
< 1.30^ < 3.00* > 90% > 17%
Fair/Average 3.2 - 3.75 5% - 20% 5.0 - 6.5 50 - 80 5 – 6 12% - 40% 0.71 - 0.891 0.56 - 0.762 0.22 – 0.62 1.15-1.33^
1.30-2.00* 1.30-1.50^ 3.00-6.00* 60% - 90% 11% - 17%
Poor/Below Average < 3.2 > 20% < 5.0 < 50 < 5 > 40 % > 0.891 >0.762 > 0.62 > 1.33^
> 2.00* > 1.50^ > 6.00* < 60% < 11%
Segment Length (miles)
Safety Performance Area Freight Performance Area
Safety Index Directional
Safety Index % of Fatal + Incapacitating Injury Crashes Involving SHSP Top 5
Emphasis Areas Behaviors
% of Fatal + Incapacitating Injury Crashes
Involving Trucks
Freight Index
Directional Truck TTI Directional Truck PTI Closure Duration (minutes/milepost closed/year/mile)
Vertical Bridge Clearance
NB SB NB SB NB SB NB SB 19-11a* 3 1.94 1.99 1.90 Insufficient Data Insufficient Data 0.46 1.54 1.08 2.37 1.96 30.03 46.78 No UP
19-22a^ 15 1.33 1.34 1.32 59% Insufficient Data 0.93 1.04 1.04 1.09 1.08 45.09 33.78 16.15
19-32b* 12 1.36 1.59 1.12 33% Insufficient Data 0.34 1.43 1.03 4.91 1.06 87.90 53.94 16.13
19-41a^ 10 0.52 0.59 0.44 44% Insufficient Data 0.95 1.02 1.03 1.05 1.06 22.82 7.36 No UP
19-51a^ 17 1.48 2.11 0.86 39% Insufficient Data 0.94 1.03 1.03 1.05 1.06 39.82 23.75 16.78
19-61a^ 7 1.42 0.80 2.04 53% Insufficient Data 0.88 1.02 1.08 1.06 1.20 66.47 22.61 15.98 Weighted Corridor
Average 1.29 1.45 1.13 45% Insufficient Data 0.80 1.13 1.04 1.85 1.12 49.87 30.16 16.33
Scale Urban 4 Lane Freeway or Rural 4 Lane < 25,000 vpd Uninterrupted or Interrupted Good/ Above Average < 0.79a
< 0.73b < 49.1%a < 42.8% b N/A > 0.77^
> 0.33* < 1.15 ^ < 1.30*
< 1.30^ < 3.00* < 44.18 > 16.5
Fair/ Average 0.79-1.21a 0.73-1.27b
49.1%-59.4%a 42.8%-52.9%b N/A 0.67 - 0.77^
0.17 - 0.33* 1.15 -1.33^ 1.30 -2.00*
1.30-1.50^ 3.00-6.00* 44.18 -124.86 16.0-16.5
Poor/ Below Average > 1.21a > 1.27b
> 59.4%a > 52.9%b N/A < 0.67^
< 0.17* > 1.33^ > 2.00*
>1.50^ > 6.00* > 124.86 < 16.0
^Uninterrupted Flow Facility aUrban 4 Lane Freeway 1Urban Operating Environment *Interrupted Flow Facility bRural 4 Lane < 25,000 2Rural Operating Environment
Note: “Insufficient Data” indicates there was not enough data available to generate reliable performance ratings
March 2017 I-19 Corridor Profile Study Executive Summary ES-6 Final Report
NEEDS ASSESSMENT Corridor Description The I-19 Corridor functions as a significant international and regional route, connecting the border city of Nogales to Tucson in southern Arizona. The corridor serves as a major truck route due to the border crossing, bringing manufactured goods and produce north from Mexico. ADOT has designated it as a critical link in Arizona’s Primary Freight Network and the CANAMEX Trade Corridor. The connection to I-10 gives those products access to distribution points throughout the country.
Corridor Objectives Statewide goals and performance measures were established by the ADOT Long-Range Transportation Plan (LRTP), 2010-2035. Statewide performance goals that are relevant to the I-19 performance framework areas were identified and corridor goals were then formulated for each of the five performance framework areas that aligned with the overall statewide goals established by the LRTP. Based on stakeholder input, corridor goals, corridor objectives, and performance three “Emphasis Areas” were identified for the I-19 corridor: Mobility, Safety, and Freight.
Taking into account the corridor goals and identified Emphasis Areas, performance objectives were developed for each quantifiable performance measure that identify the desired level of performance based on the performance scale levels for the overall corridor and for each segment of the corridor. For the performance Emphasis Areas, the corridor-wide weighted average performance objectives are identified with a higher standard than for the other performance areas.
Achieving corridor and segment objectives will help ensure that investments are targeted toward improvements that support the safe and efficient movement of travelers on the corridor. Corridor performance will be measured against corridor and segment objectives to determine needs – the gap between observed performance and the target.
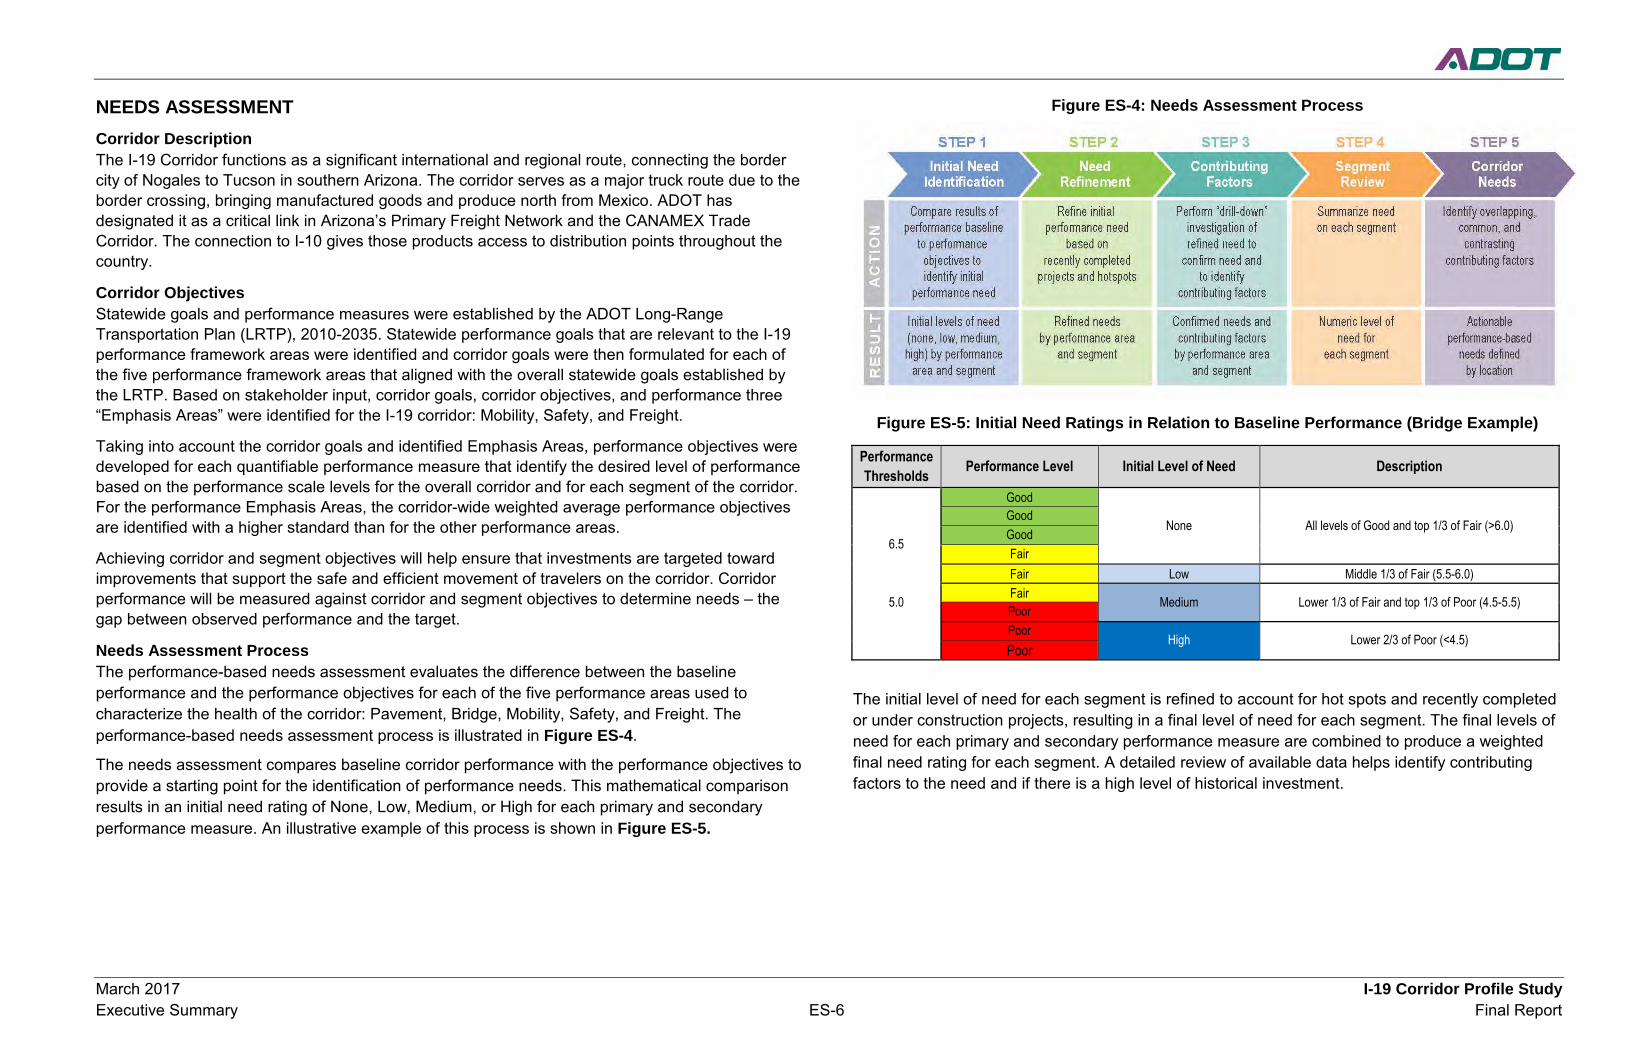
Needs Assessment Process The performance-based needs assessment evaluates the difference between the baseline performance and the performance objectives for each of the five performance areas used to characterize the health of the corridor: Pavement, Bridge, Mobility, Safety, and Freight. The performance-based needs assessment process is illustrated in Figure ES-4.
The needs assessment compares baseline corridor performance with the performance objectives to provide a starting point for the identification of performance needs. This mathematical comparison results in an initial need rating of None, Low, Medium, or High for each primary and secondary performance measure. An illustrative example of this process is shown in Figure ES-5.
Figure ES-4: Needs Assessment Process
Figure ES-5: Initial Need Ratings in Relation to Baseline Performance (Bridge Example)
Performance Thresholds Performance Level Initial Level of Need Description
Good
None All levels of Good and top 1/3 of Fair (>6.0) Good
6.5 Good Fair
Fair Low Middle 1/3 of Fair (5.5-6.0)
5.0 Fair Medium Lower 1/3 of Fair and top 1/3 of Poor (4.5-5.5) Poor Poor
High Lower 2/3 of Poor (<4.5) Poor
The initial level of need for each segment is refined to account for hot spots and recently completed or under construction projects, resulting in a final level of need for each segment. The final levels of need for each primary and secondary performance measure are combined to produce a weighted final need rating for each segment. A detailed review of available data helps identify contributing factors to the need and if there is a high level of historical investment.
March 2017 I-19 Corridor Profile Study Executive Summary ES-7 Final Report
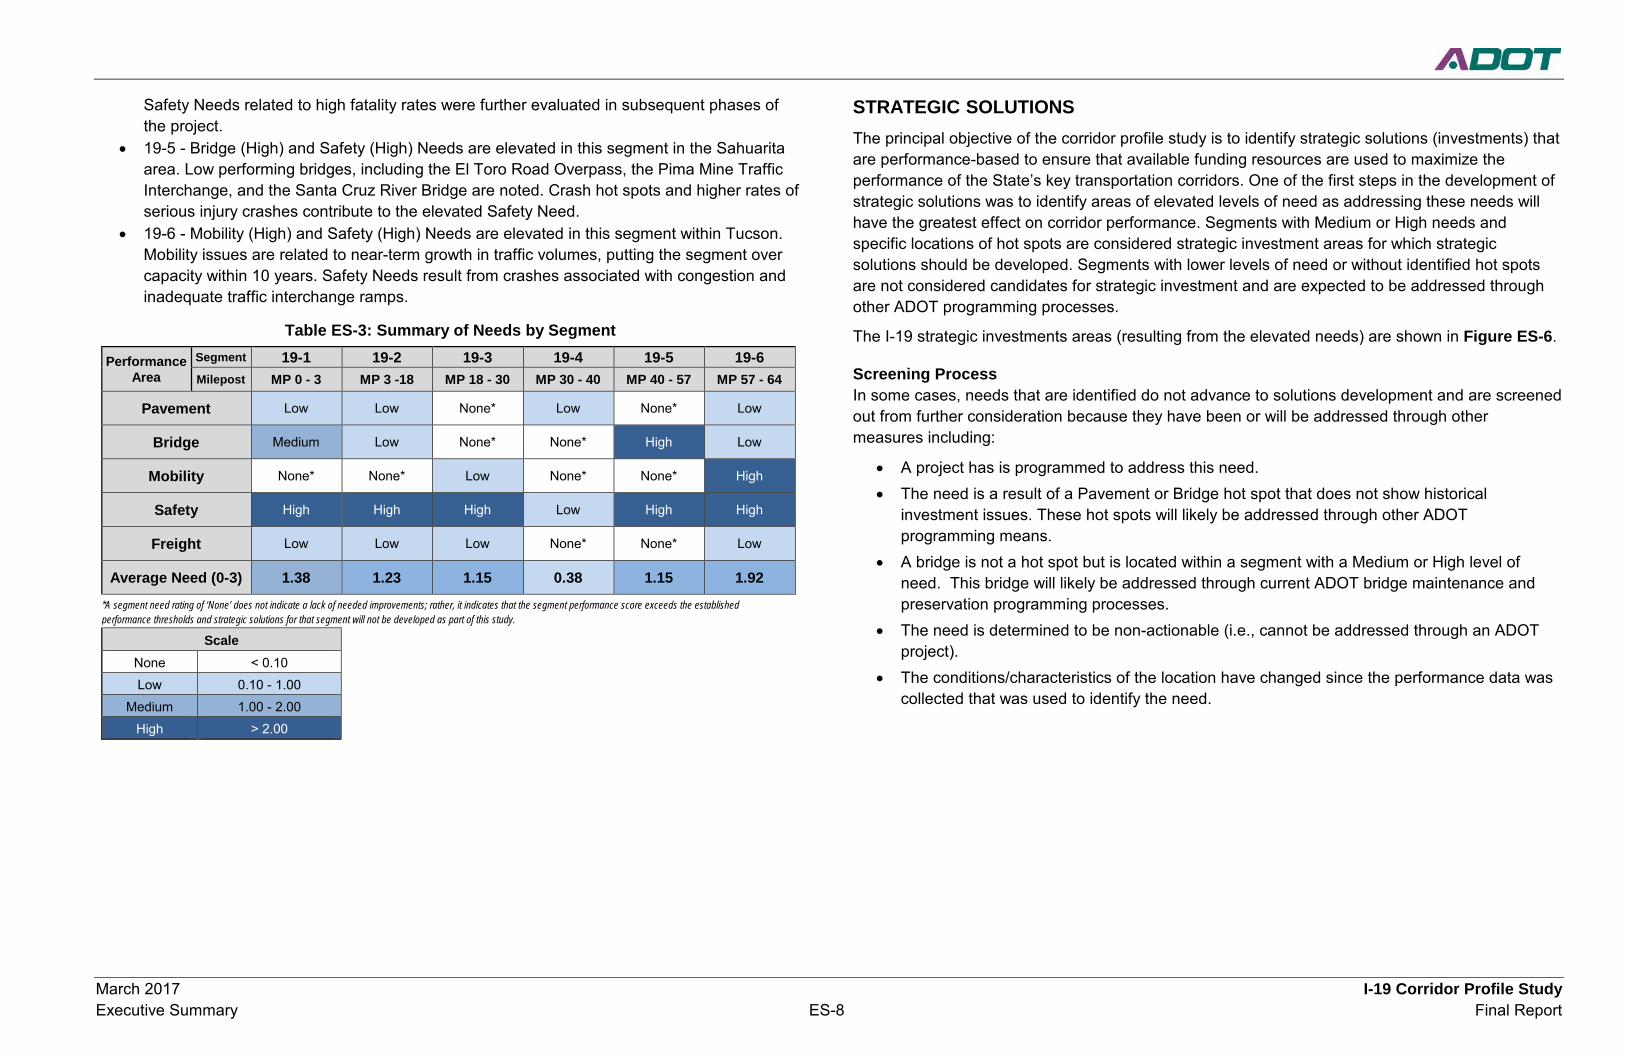
Summary of Needs
Table ES-3 provides a summary of needs for each segment across all performance areas, and the average needs for each segment. A weighting factor of 1.5 is applied to the average need scores of the performance areas identified as emphasis areas (mobility, safety, and freight for the I-19 corridor). There are no segments with a High average need, five segments with a Medium average need, and only one segment with a Low average need. More information on the identified final needs in each performance area is provided below.
Pavement Needs • Overall final pavement needs are Low or None throughout the corridor. No changes to the
level of need resulting from hot spot analysis occur on the corridor. • The pavement hot spot on segment 19-2 at MP 17-18 was addressed in a 2015 improvement
project. • Other pavement hot spots were identified on approximately six miles of the corridor on three
segments, but are generally expected to be mitigated through upcoming programmed projects.
Bridge Needs • Bridge needs occur due to poor performing bridges or hot spots on four of six segments, with
High needs identified in segment 19-5 and Medium needs identified in segment 19-1. • Bridge needs were identified at 17 of the total 74 bridges (23%). • Four bridges have potential historical issues and are candidates for life-cycle cost analysis to
evaluate alternative solutions. • Bridge hot spots along I-19 are not sufficient to change the Initial Need from its original
calculated value.
Mobility Needs • The Mobility Performance Area is an Emphasis Area for the I-19 corridor, giving it a heavier
weight in the analysis. • High Mobility Needs were identified only on segment 19-6 in the Tucson area related to high
traffic volumes and poor level of service values. • While commuting traffic from residential areas south of Tucson is partly responsible for
heavier traffic volumes, traffic volumes are high seven days per week. This results from Tucson’s position as the regional center for shopping, entertainment, and other services in addition to being an employment center.
• Directional TTI and PTI issues on segment 19-1 are attributed to slowdowns in truck traffic at grade level intersections in Nogales. Truck traffic is expected to be dramatically reduced with improvements to SR 189 connecting to the Mariposa International Border Crossing, reducing the level of need on the segment.
Safety Needs • The Safety Performance Area is an Emphasis Area for the I-19 corridor, giving it a heavier
weight in the analysis. • High Safety Needs were identified in all segments except 19-4, resulting in Poor performance
for the corridor as a whole. • Multiple crash hot spots are identified, especially in the northern part of the corridor,
segments 19-4 through 19-6. • The high rate of serious injury and fatal crashes throughout the corridor may be attributed to
outdated designs on some entrance ramps, lack of lighting, equipment failure, alcohol related crashes, low levels of seat belt use, and other driver behaviors.
• While a high rate of serious injury and fatal crashes is reported on segment 19-1, the low number of such crashes (2), especially within the Strategic Highway Safety Plan (SHSP) Top 5, reported during the analysis period points to caution in this result.
• Crashes involving trucks, motorcycles, and non-motorized during the analysis period were too few to provide significant results at any point on the corridor. Other crash types predominate.
Freight Needs • The Freight Performance Area is an Emphasis Area for the I-19 corridor, giving it a heavier
weight in the analysis. • Final Freight Needs are Low or None throughout the corridor. In general, limits on truck travel
and planning times are not significant factors. • The most significant need shows a Low performance in the Bridge Clearance secondary
measure. However, all of the low clearance bridges can be avoided by using ramps at the grade separated traffic interchanges and do not represent a hot spot under the criteria used for the analysis.
• Truck traffic is also affected by slowdowns in segment 19-3 related to the Border Patrol checkpoint north of Tubac, but is not sufficient to raise the level of need.
Overlapping Needs This section identifies overlapping performance needs on the I-19 Corridor, which provides guidance to develop strategic solutions that address more than one performance are with elevated levels of need. Completing projects that address multiple needs presents the opportunity to more effectively improve overall performance. A summary of the overlapping needs that relate to locations with elevated levels of need is provided below:
• 19-1 – Bridge (Medium) and Safety (High) Needs are elevated in this segment within Nogales. This relatively short section (three miles) has lower traffic volumes than the rest of the corridor and transitions to interrupted flow characteristics. Improvements on SR 189 from the Mariposa Interchange south to the Mariposa Border Crossing will remove some pressure from the segment. The Bridge Needs relating to several functionally obsolete bridges and
March 2017 I-19 Corridor Profile Study Executive Summary ES-8 Final Report
Safety Needs related to high fatality rates were further evaluated in subsequent phases of the project.
• 19-5 - Bridge (High) and Safety (High) Needs are elevated in this segment in the Sahuarita area. Low performing bridges, including the El Toro Road Overpass, the Pima Mine Traffic Interchange, and the Santa Cruz River Bridge are noted. Crash hot spots and higher rates of serious injury crashes contribute to the elevated Safety Need.
• 19-6 - Mobility (High) and Safety (High) Needs are elevated in this segment within Tucson. Mobility issues are related to near-term growth in traffic volumes, putting the segment over capacity within 10 years. Safety Needs result from crashes associated with congestion and inadequate traffic interchange ramps.
Table ES-3: Summary of Needs by Segment
Performance Area
Segment 19-1 19-2 19-3 19-4 19-5 19-6 Milepost MP 0 - 3 MP 3 -18 MP 18 - 30 MP 30 - 40 MP 40 - 57 MP 57 - 64
Pavement Low Low None* Low None* Low
Bridge Medium Low None* None* High Low
Mobility None* None* Low None* None* High
Safety High High High Low High High
Freight Low Low Low None* None* Low
Average Need (0-3) 1.38 1.23 1.15 0.38 1.15 1.92 *A segment need rating of ‘None’ does not indicate a lack of needed improvements; rather, it indicates that the segment performance score exceeds the established performance thresholds and strategic solutions for that segment will not be developed as part of this study.
Scale None < 0.10 Low 0.10 - 1.00
Medium 1.00 - 2.00 High > 2.00
STRATEGIC SOLUTIONS The principal objective of the corridor profile study is to identify strategic solutions (investments) that are performance-based to ensure that available funding resources are used to maximize the performance of the State’s key transportation corridors. One of the first steps in the development of strategic solutions was to identify areas of elevated levels of need as addressing these needs will have the greatest effect on corridor performance. Segments with Medium or High needs and specific locations of hot spots are considered strategic investment areas for which strategic solutions should be developed. Segments with lower levels of need or without identified hot spots are not considered candidates for strategic investment and are expected to be addressed through other ADOT programming processes.
The I-19 strategic investments areas (resulting from the elevated needs) are shown in Figure ES-6.
Screening Process In some cases, needs that are identified do not advance to solutions development and are screened out from further consideration because they have been or will be addressed through other measures including:
• A project has is programmed to address this need. • The need is a result of a Pavement or Bridge hot spot that does not show historical
investment issues. These hot spots will likely be addressed through other ADOT programming means.
• A bridge is not a hot spot but is located within a segment with a Medium or High level of need. This bridge will likely be addressed through current ADOT bridge maintenance and preservation programming processes.
• The need is determined to be non-actionable (i.e., cannot be addressed through an ADOT project).
• The conditions/characteristics of the location have changed since the performance data was collected that was used to identify the need.
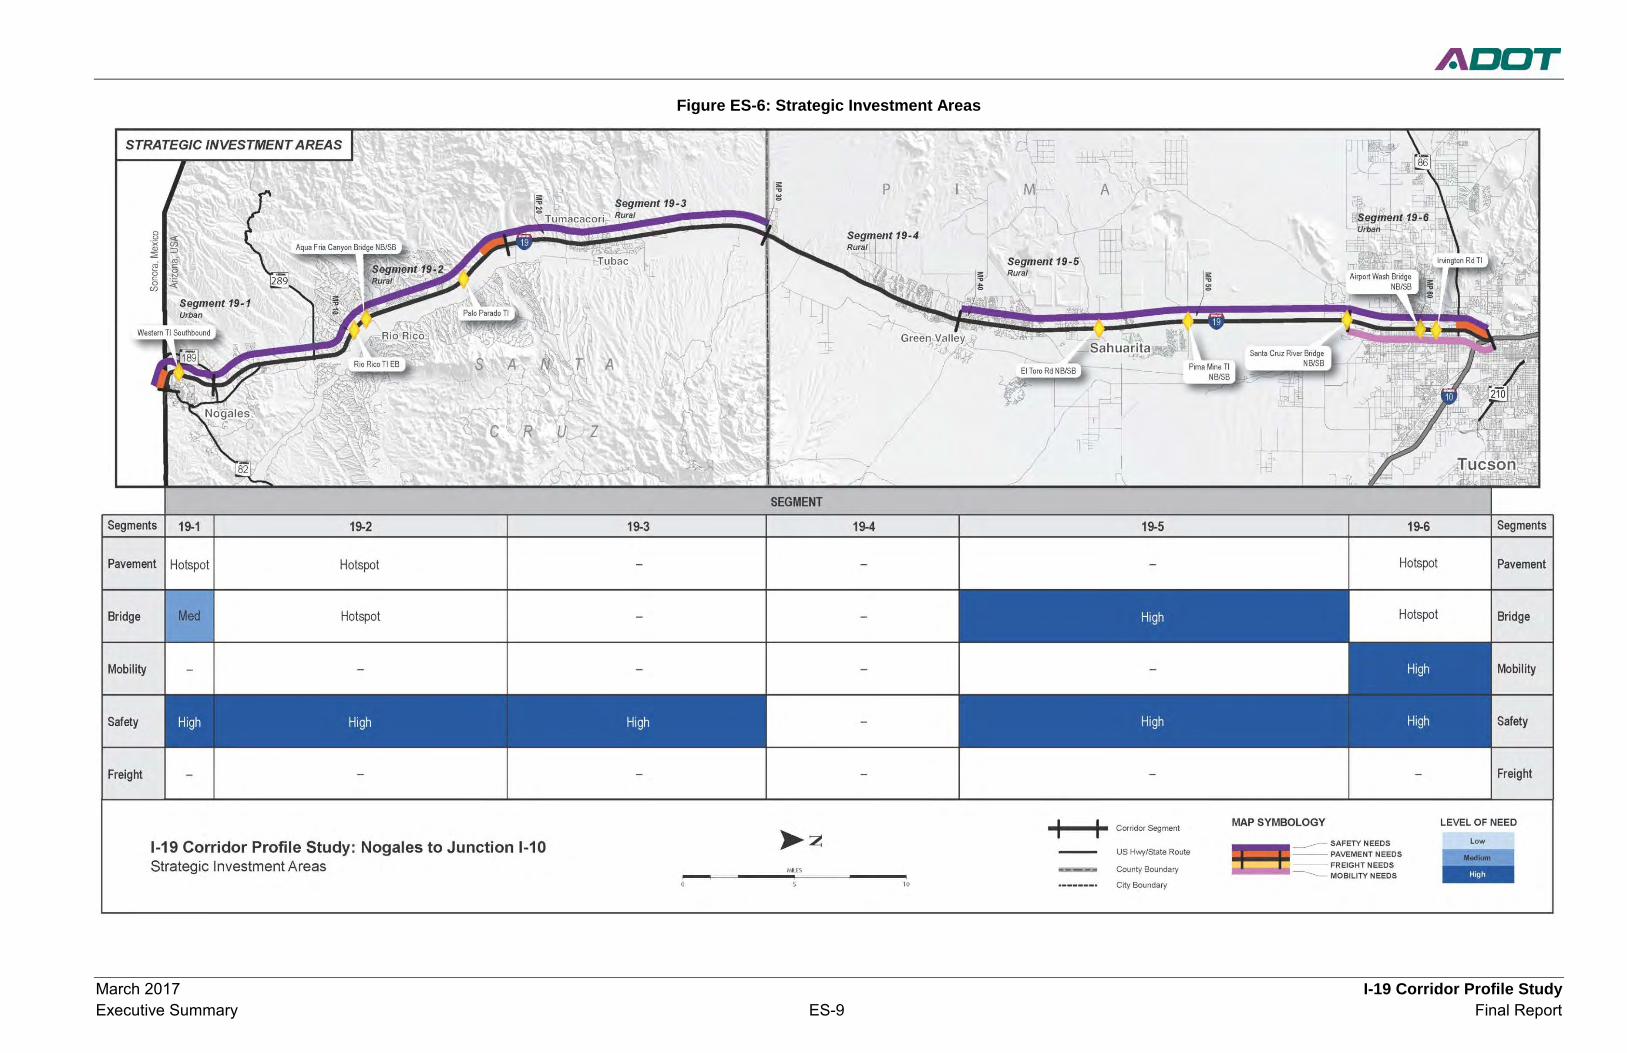
March 2017 I-19 Corridor Profile Study Executive Summary ES-9 Final Report
Figure ES-6: Strategic Investment Areas
March 2017 I-19 Corridor Profile Study Executive Summary ES-10 Final Report
Candidate Solutions For each elevated need within a strategic investment area that is not screened out, a candidate solution is developed to address the identified need. Each candidate solution is assigned to one of the following three P2P investment categories based on the scope of the solution:
• Preservation • Modernization • Expansion
Documented performance needs serve as the foundation for developing candidate solutions for corridor preservation, modernization, and expansion. Candidate solutions are not intended to be a substitute or replacement for traditional ADOT project development processes where various ADOT technical groups and districts develop candidate projects for consideration in the performance-based programming in the P2P process. Rather, these candidate solutions are intended to complement ADOT’s traditional project development processes through a performance-based process to address needs in one or more of the five performance areas of Pavement, Bridge, Mobility, Safety, and Freight. Candidate solutions developed for the I-19 Corridor will be considered along with other candidate projects in the ADOT statewide programming process. Candidate solutions include some or all of the following characteristics:
• Do not recreate or replace results from normal programming processes. • May include programs or initiatives, areas for further study, and infrastructure projects. • Address elevated levels of need (High or Medium) and hot spots. • Focus on investments in Modernization projects (to optimize current infrastructure). • Address overlapping needs. • Reduce costly repetitive maintenance. • Extend operational life of system and delay expansion. • Leverage programmed projects that can be expanded to address other strategic elements. • Provide measureable benefit (benefit/cost ratio, risk, LCCA, performance system, etc.).
Candidate solutions developed to address an elevated need in the Pavement or Bridge performance areas include two options; rehabilitation or full replacement. These solutions are initially evaluated through a Life-Cycle Cost Analysis (LCCA) to provide insights into the cost-effectiveness of these options so a recommended approach can be identified. Candidate solutions developed to address an elevated need in the Mobility, Safety, or Freight performance areas are advanced directly to the Performance Effectiveness Evaluation. In some cases, there may be multiple solutions identified to address the same area of need. Candidate solutions that are recommended to expand or modify the scope of an already programmed project are noted and are not advanced to solution evaluation and prioritization. These solutions are directly recommended for programming.
March 2017 I-19 Corridor Profile Study Executive Summary ES-11 Final Report
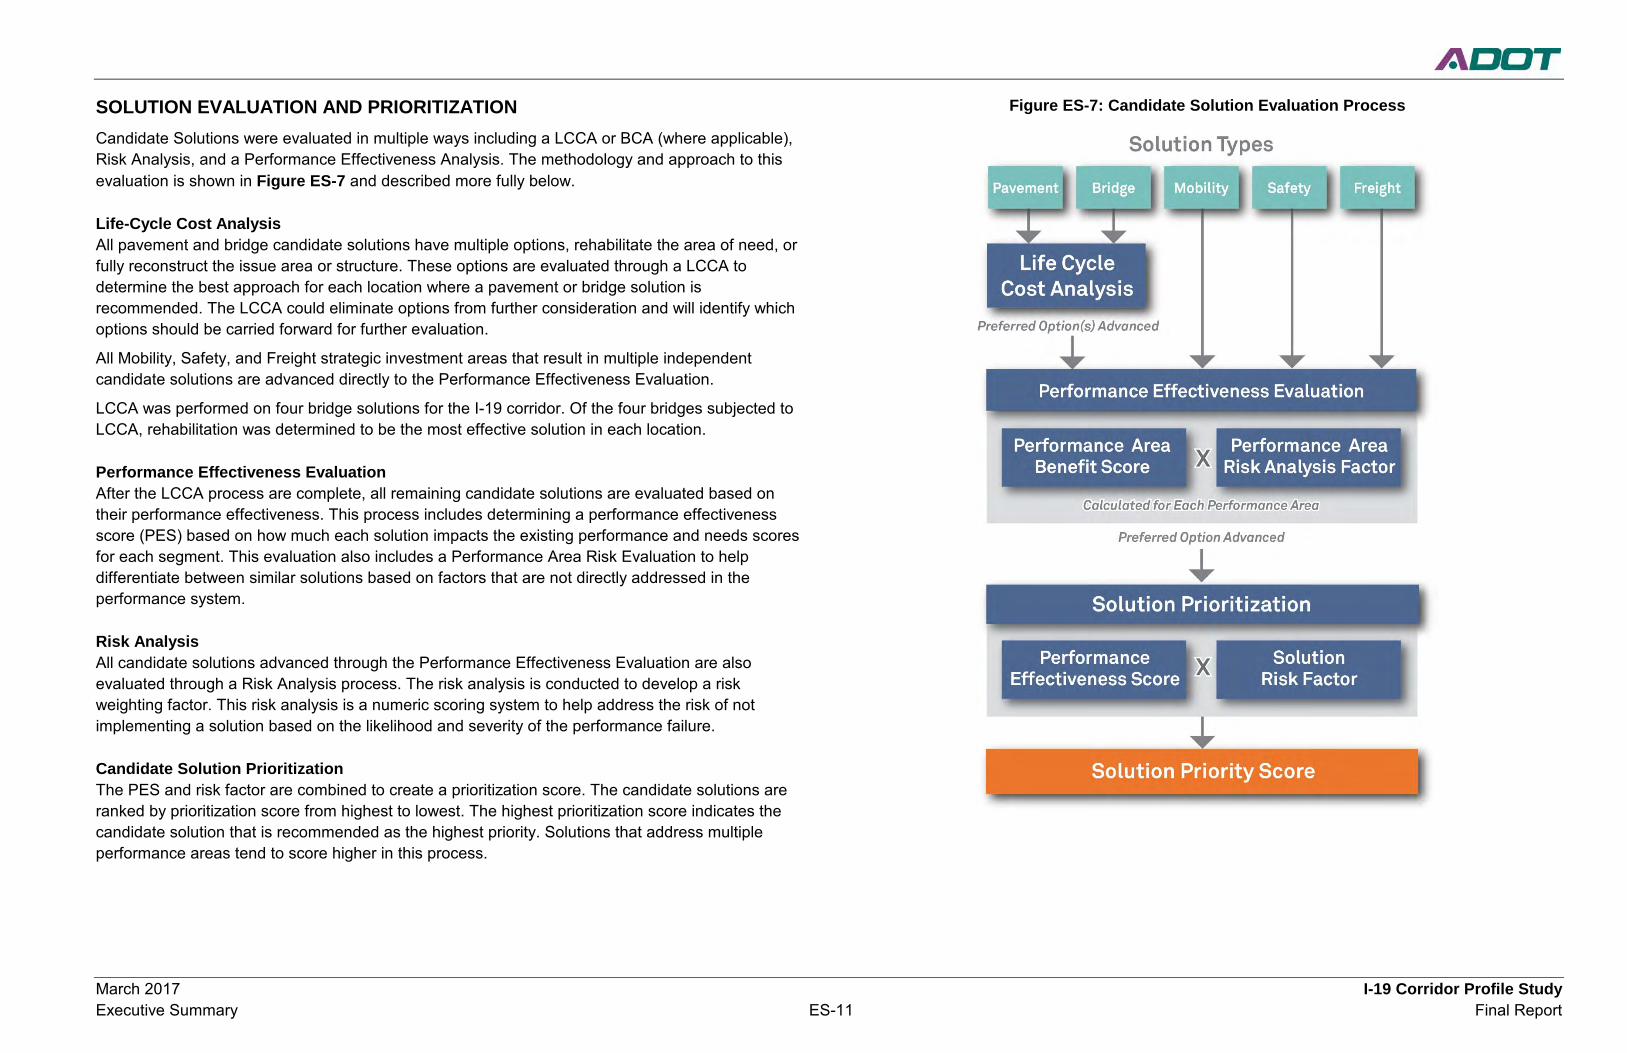
SOLUTION EVALUATION AND PRIORITIZATION Candidate Solutions were evaluated in multiple ways including a LCCA or BCA (where applicable), Risk Analysis, and a Performance Effectiveness Analysis. The methodology and approach to this evaluation is shown in Figure ES-7 and described more fully below. Life-Cycle Cost Analysis All pavement and bridge candidate solutions have multiple options, rehabilitate the area of need, or fully reconstruct the issue area or structure. These options are evaluated through a LCCA to determine the best approach for each location where a pavement or bridge solution is recommended. The LCCA could eliminate options from further consideration and will identify which options should be carried forward for further evaluation.
All Mobility, Safety, and Freight strategic investment areas that result in multiple independent candidate solutions are advanced directly to the Performance Effectiveness Evaluation.
LCCA was performed on four bridge solutions for the I-19 corridor. Of the four bridges subjected to LCCA, rehabilitation was determined to be the most effective solution in each location.
Performance Effectiveness Evaluation After the LCCA process are complete, all remaining candidate solutions are evaluated based on their performance effectiveness. This process includes determining a performance effectiveness score (PES) based on how much each solution impacts the existing performance and needs scores for each segment. This evaluation also includes a Performance Area Risk Evaluation to help differentiate between similar solutions based on factors that are not directly addressed in the performance system.
Risk Analysis All candidate solutions advanced through the Performance Effectiveness Evaluation are also evaluated through a Risk Analysis process. The risk analysis is conducted to develop a risk weighting factor. This risk analysis is a numeric scoring system to help address the risk of not implementing a solution based on the likelihood and severity of the performance failure.
Candidate Solution Prioritization The PES and risk factor are combined to create a prioritization score. The candidate solutions are ranked by prioritization score from highest to lowest. The highest prioritization score indicates the candidate solution that is recommended as the highest priority. Solutions that address multiple performance areas tend to score higher in this process.
Figure ES-7: Candidate Solution Evaluation Process
March 2017 I-19 Corridor Profile Study Executive Summary ES-12 Final Report
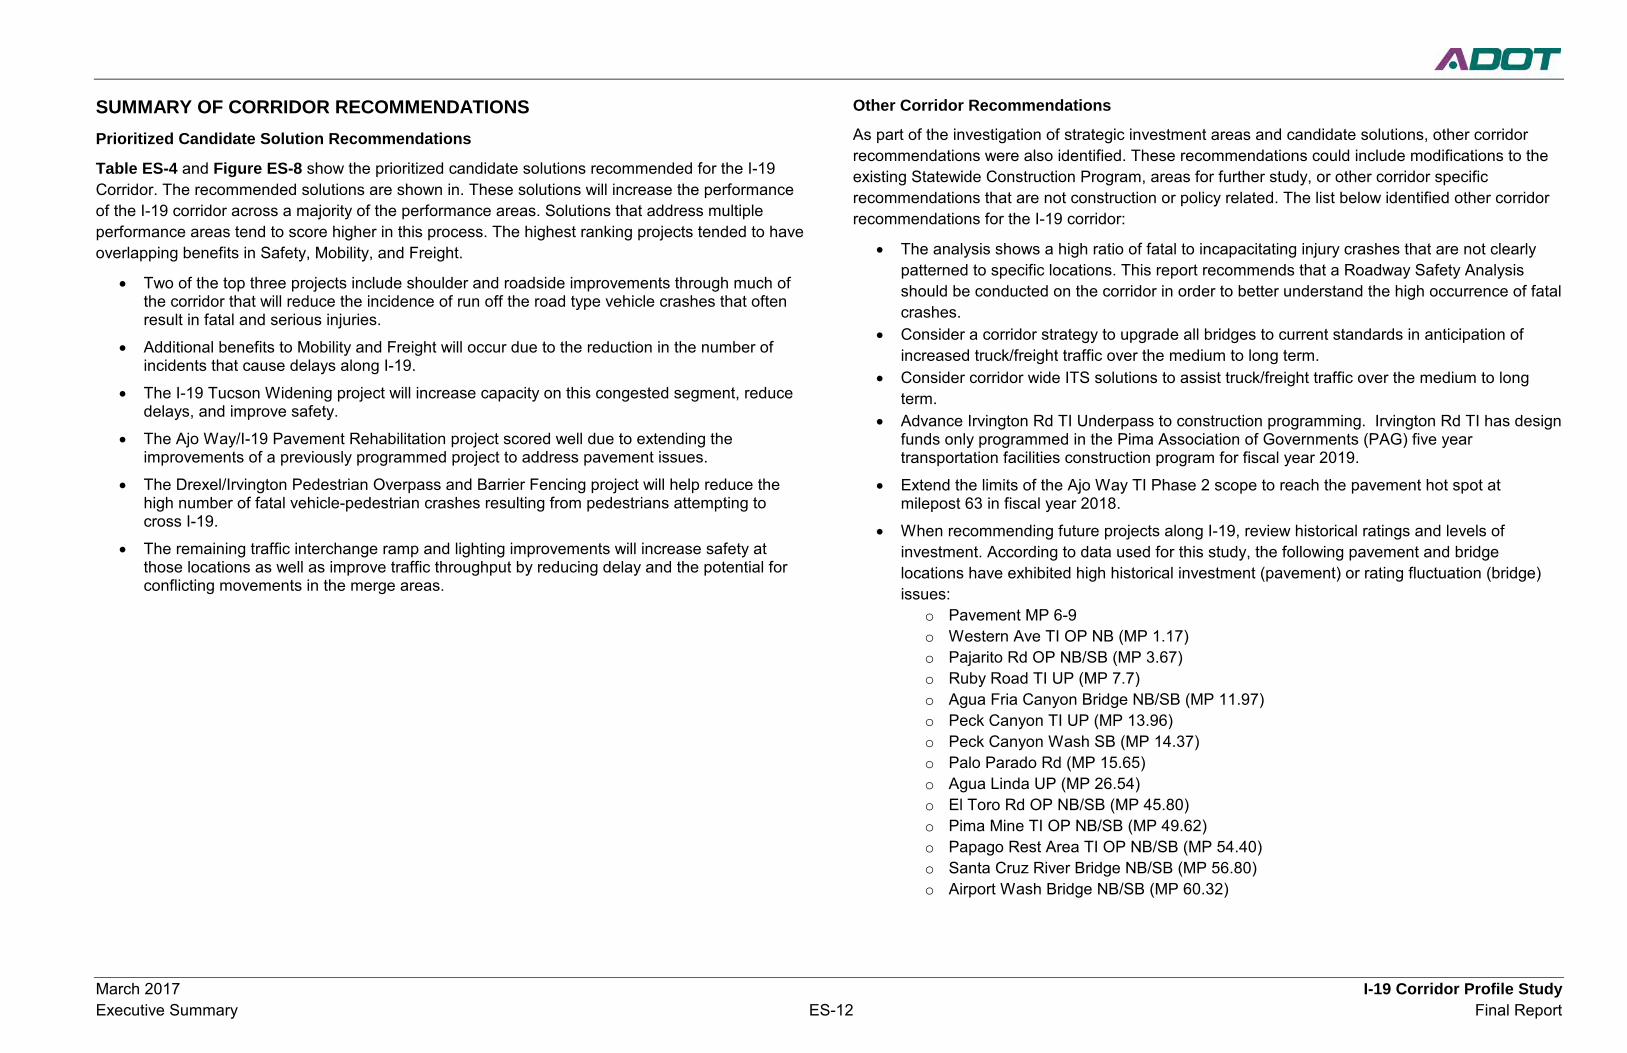
SUMMARY OF CORRIDOR RECOMMENDATIONS Prioritized Candidate Solution Recommendations
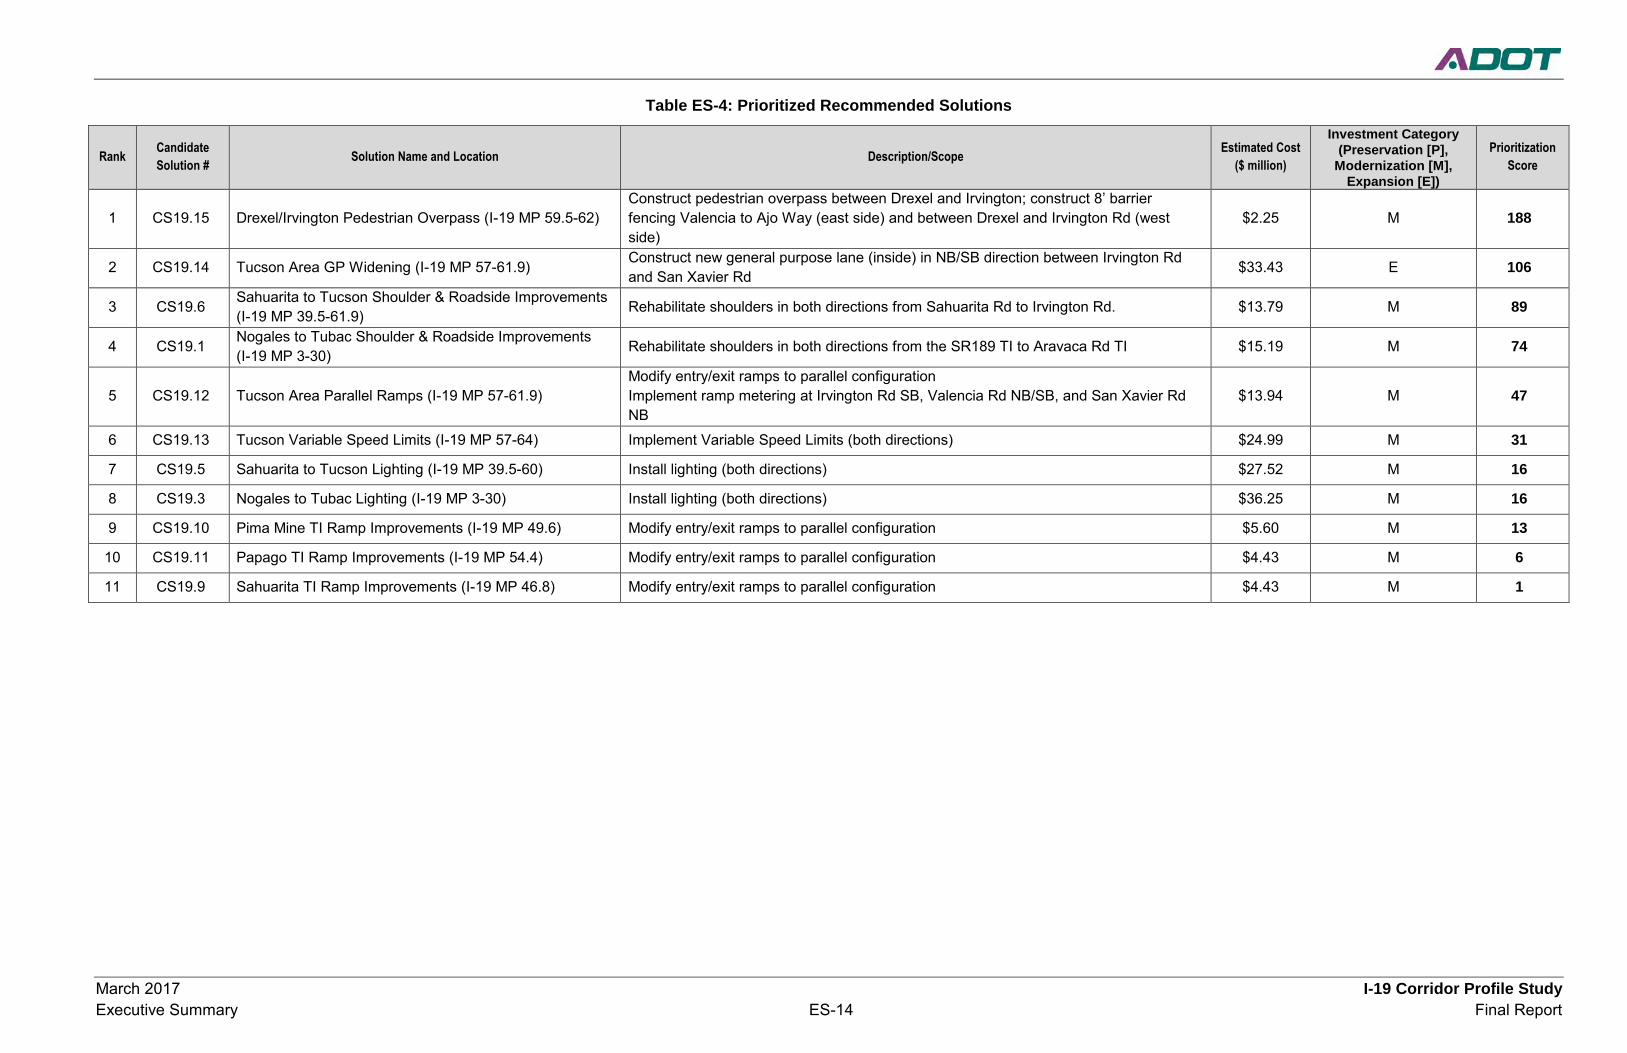
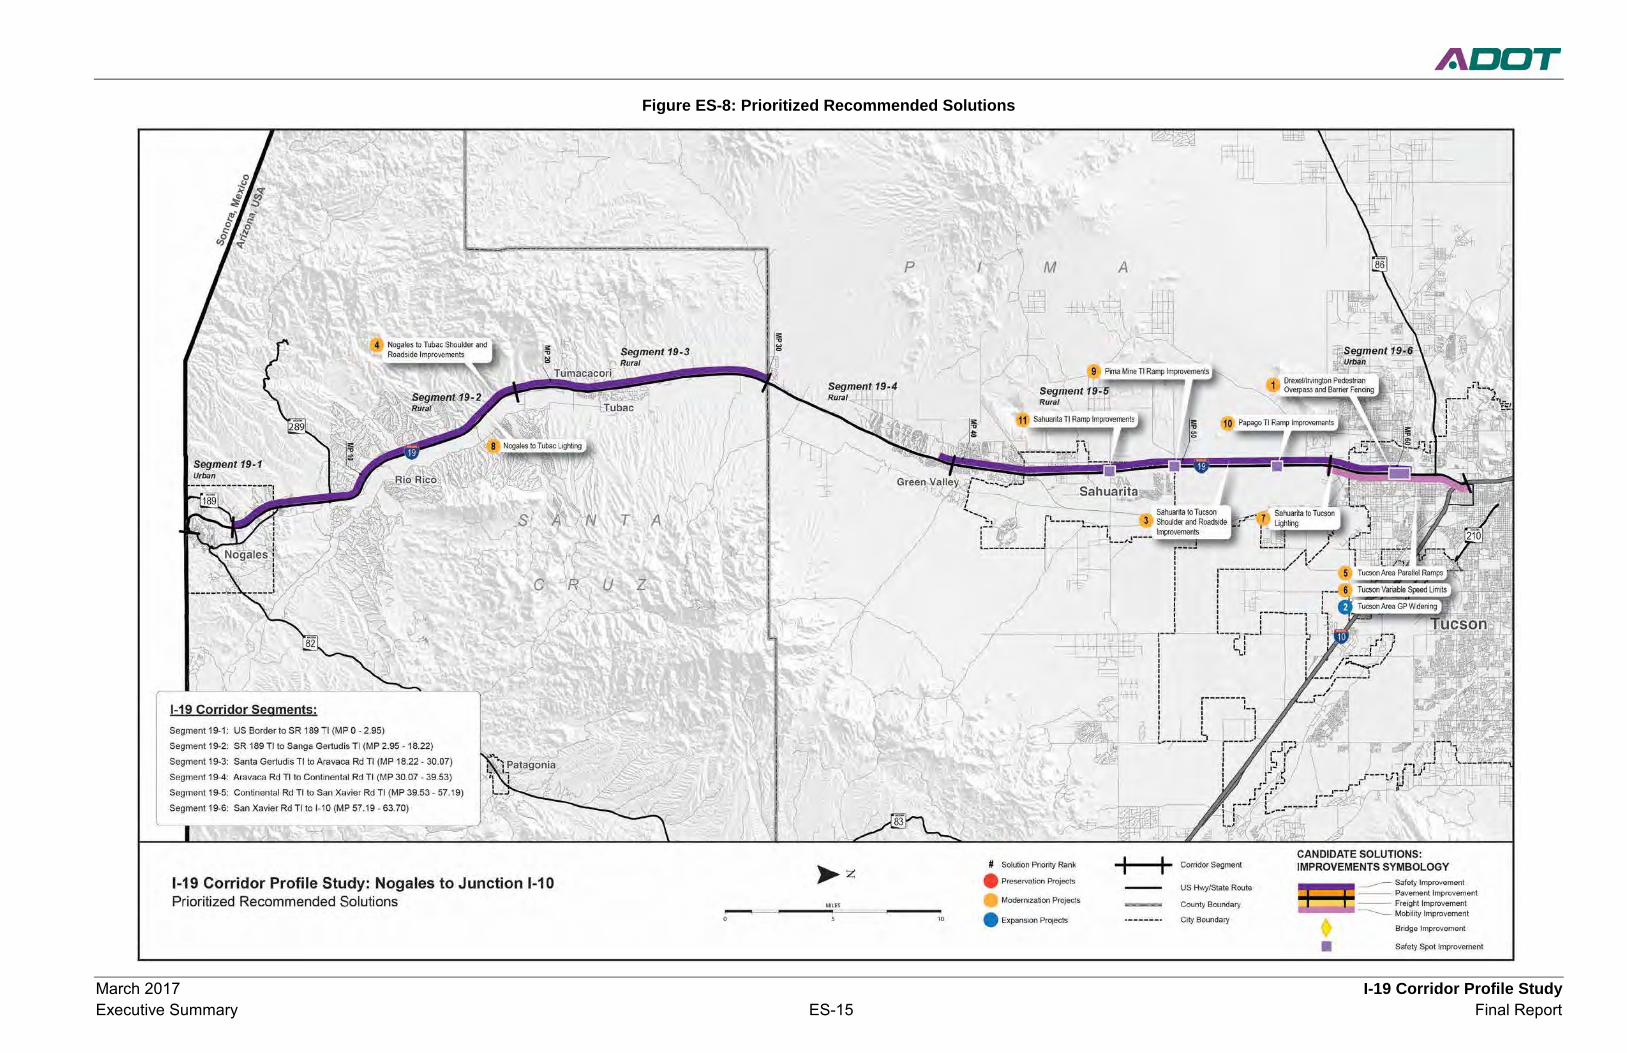
Table ES-4 and Figure ES-8 show the prioritized candidate solutions recommended for the I-19 Corridor. The recommended solutions are shown in. These solutions will increase the performance of the I-19 corridor across a majority of the performance areas. Solutions that address multiple performance areas tend to score higher in this process. The highest ranking projects tended to have overlapping benefits in Safety, Mobility, and Freight.
• Two of the top three projects include shoulder and roadside improvements through much of the corridor that will reduce the incidence of run off the road type vehicle crashes that often result in fatal and serious injuries.
• Additional benefits to Mobility and Freight will occur due to the reduction in the number of incidents that cause delays along I-19.
• The I-19 Tucson Widening project will increase capacity on this congested segment, reduce delays, and improve safety.
• The Ajo Way/I-19 Pavement Rehabilitation project scored well due to extending the improvements of a previously programmed project to address pavement issues.
• The Drexel/Irvington Pedestrian Overpass and Barrier Fencing project will help reduce the high number of fatal vehicle-pedestrian crashes resulting from pedestrians attempting to cross I-19.
• The remaining traffic interchange ramp and lighting improvements will increase safety at those locations as well as improve traffic throughput by reducing delay and the potential for conflicting movements in the merge areas.
Other Corridor Recommendations
As part of the investigation of strategic investment areas and candidate solutions, other corridor recommendations were also identified. These recommendations could include modifications to the existing Statewide Construction Program, areas for further study, or other corridor specific recommendations that are not construction or policy related. The list below identified other corridor recommendations for the I-19 corridor:
• The analysis shows a high ratio of fatal to incapacitating injury crashes that are not clearly patterned to specific locations. This report recommends that a Roadway Safety Analysis should be conducted on the corridor in order to better understand the high occurrence of fatal crashes.
• Consider a corridor strategy to upgrade all bridges to current standards in anticipation of increased truck/freight traffic over the medium to long term.
• Consider corridor wide ITS solutions to assist truck/freight traffic over the medium to long term.
• Advance Irvington Rd TI Underpass to construction programming. Irvington Rd TI has design funds only programmed in the Pima Association of Governments (PAG) five year transportation facilities construction program for fiscal year 2019.
• Extend the limits of the Ajo Way TI Phase 2 scope to reach the pavement hot spot at milepost 63 in fiscal year 2018.
• When recommending future projects along I-19, review historical ratings and levels of investment. According to data used for this study, the following pavement and bridge locations have exhibited high historical investment (pavement) or rating fluctuation (bridge) issues:
o Pavement MP 6-9 o Western Ave TI OP NB (MP 1.17) o Pajarito Rd OP NB/SB (MP 3.67) o Ruby Road TI UP (MP 7.7) o Agua Fria Canyon Bridge NB/SB (MP 11.97) o Peck Canyon TI UP (MP 13.96) o Peck Canyon Wash SB (MP 14.37) o Palo Parado Rd (MP 15.65) o Agua Linda UP (MP 26.54) o El Toro Rd OP NB/SB (MP 45.80) o Pima Mine TI OP NB/SB (MP 49.62) o Papago Rest Area TI OP NB/SB (MP 54.40) o Santa Cruz River Bridge NB/SB (MP 56.80) o Airport Wash Bridge NB/SB (MP 60.32)
March 2017 I-19 Corridor Profile Study Executive Summary ES-13 Final Report
Policy and Initiatives Recommendations In addition to location-specific needs, general corridor and system-wide needs have also been identified through the CPS process. While these needs are more overarching and cannot be individually evaluated through the CPS process, it is important to document them. A list of recommended policies and initiatives was developed for consideration when programming future projects not only on I-19, but across the entire state highway system where conditions are applicable. The following list, which is in no particular order of priority, was derived from the Round 1, Round 2, and Round 3 CPS:
• Install Intelligent Transportation System (ITS) conduit with all new infrastructure projects • Prepare strategic plans for Closed Circuit Television (CCTV) camera and Road Weather
Information System (RWIS) locations statewide • Leverage power and communication at existing weigh-in-motion (WIM), dynamic messaging
signs (DMS), and call box locations to expand ITS applications across the state • Consider solar power for lighting and ITS where applicable • Investigate ice formation prediction technology where applicable • Conduct highway safety manual evaluation for all future programmed projects • Develop infrastructure maintenance and preservation plans (including schedule and funding)
for all pavement and bridge infrastructure replacement or expansion projects • Develop standardized bridge maintenance procedures so districts can do routine
maintenance work • Review historical ratings and level of previous investment during scoping of pavement and
bridge projects; in pavement locations that warrant further investigation, conduct subsurface investigations during project scoping to determine if full replacement is warranted
• For pavement rehabilitation projects, enhance the amount/level of geotechnical investigations to address issues specific to the varying conditions along the project
• Expand programmed and future pavement projects as necessary to include shoulders • Expand median cable barrier guidelines to account for safety performance • Install CCTV cameras with all DMS • In locations with limited communications, use CCTV cameras to provide still images rather
than streaming video • Develop statewide program for pavement replacement
• Install additional continuous permanent count stations along strategic corridors to enhance traffic count data
• When reconstruction or rehabilitation activities will affect existing bridge vertical clearance, the dimension of the new bridge vertical clearance should be a minimum of 16.25 feet where feasible
• All new or reconstructed roadway/shoulder edges adjacent to an unpaved surface should be constructed with a Safety Edge
• Collision data on tribal lands may be incomplete or inconsistent; additional coordination for data on tribal lands is recommended to ensure adequate reflection of safety issues
• Expand data collection devices statewide to measure freight delay • Evaluate and accommodate potential changes in freight and goods movement trends that
may result from improvements and expansions to the state roadway network
Next Steps The candidate solutions recommended in this study are not intended to be a substitute or replacement for traditional ADOT project development processes where various ADOT technical groups and districts develop candidate projects for consideration in the performance-based programming in the P2P process. Rather, these candidate solutions are intended to complement ADOT’s traditional project development processes through a performance-based process to address needs in one or more of the five performance areas of Pavement, Bridge, Mobility, Safety, and Freight. Candidate solutions developed for the I-19 Corridor will be considered along with other candidate projects in the ADOT statewide programming process.
It is important to note that the candidate solutions are intended to represent strategic solutions to address existing performance needs related to the Pavement, Bridge, Mobility, Safety, and Freight performance areas. Therefore, the strategic solutions are not intended to preclude recommendations related to the ultimate vision for the corridor that may have been defined in the context of prior planning studies and/or design concept reports. Recommendations from such studies are still relevant to addressing the ultimate corridor objectives.
Upon completion of all three CPS rounds, the results will be incorporated into a summary document comparing all corridors that is expected to provide a performance-based review of statewide needs and candidate solutions.
March 2017 I-19 Corridor Profile Study Executive Summary ES-14 Final Report
Table ES-4: Prioritized Recommended Solutions
Rank Candidate Solution # Solution Name and Location Description/Scope Estimated Cost
($ million)
Investment Category (Preservation [P],
Modernization [M], Expansion [E])
Prioritization Score
1 CS19.15 Drexel/Irvington Pedestrian Overpass (I-19 MP 59.5-62) Construct pedestrian overpass between Drexel and Irvington; construct 8’ barrier fencing Valencia to Ajo Way (east side) and between Drexel and Irvington Rd (west side)
$2.25 M 188
2 CS19.14 Tucson Area GP Widening (I-19 MP 57-61.9) Construct new general purpose lane (inside) in NB/SB direction between Irvington Rd and San Xavier Rd $33.43 E 106
3 CS19.6 Sahuarita to Tucson Shoulder & Roadside Improvements (I-19 MP 39.5-61.9) Rehabilitate shoulders in both directions from Sahuarita Rd to Irvington Rd. $13.79 M 89
4 CS19.1 Nogales to Tubac Shoulder & Roadside Improvements (I-19 MP 3-30) Rehabilitate shoulders in both directions from the SR189 TI to Aravaca Rd TI $15.19 M 74
5 CS19.12 Tucson Area Parallel Ramps (I-19 MP 57-61.9) Modify entry/exit ramps to parallel configuration Implement ramp metering at Irvington Rd SB, Valencia Rd NB/SB, and San Xavier Rd NB
$13.94 M 47
6 CS19.13 Tucson Variable Speed Limits (I-19 MP 57-64) Implement Variable Speed Limits (both directions) $24.99 M 31
7 CS19.5 Sahuarita to Tucson Lighting (I-19 MP 39.5-60) Install lighting (both directions) $27.52 M 16
8 CS19.3 Nogales to Tubac Lighting (I-19 MP 3-30) Install lighting (both directions) $36.25 M 16
9 CS19.10 Pima Mine TI Ramp Improvements (I-19 MP 49.6) Modify entry/exit ramps to parallel configuration $5.60 M 13
10 CS19.11 Papago TI Ramp Improvements (I-19 MP 54.4) Modify entry/exit ramps to parallel configuration $4.43 M 6
11 CS19.9 Sahuarita TI Ramp Improvements (I-19 MP 46.8) Modify entry/exit ramps to parallel configuration $4.43 M 1
March 2017 I-19 Corridor Profile Study Executive Summary ES-15 Final Report
Figure ES-8: Prioritized Recommended Solutions

Fina
l Rep
ort
Final Report

March 2017 I-19 Corridor Profile Study 1 Final Report
1.0 INTRODUCTION
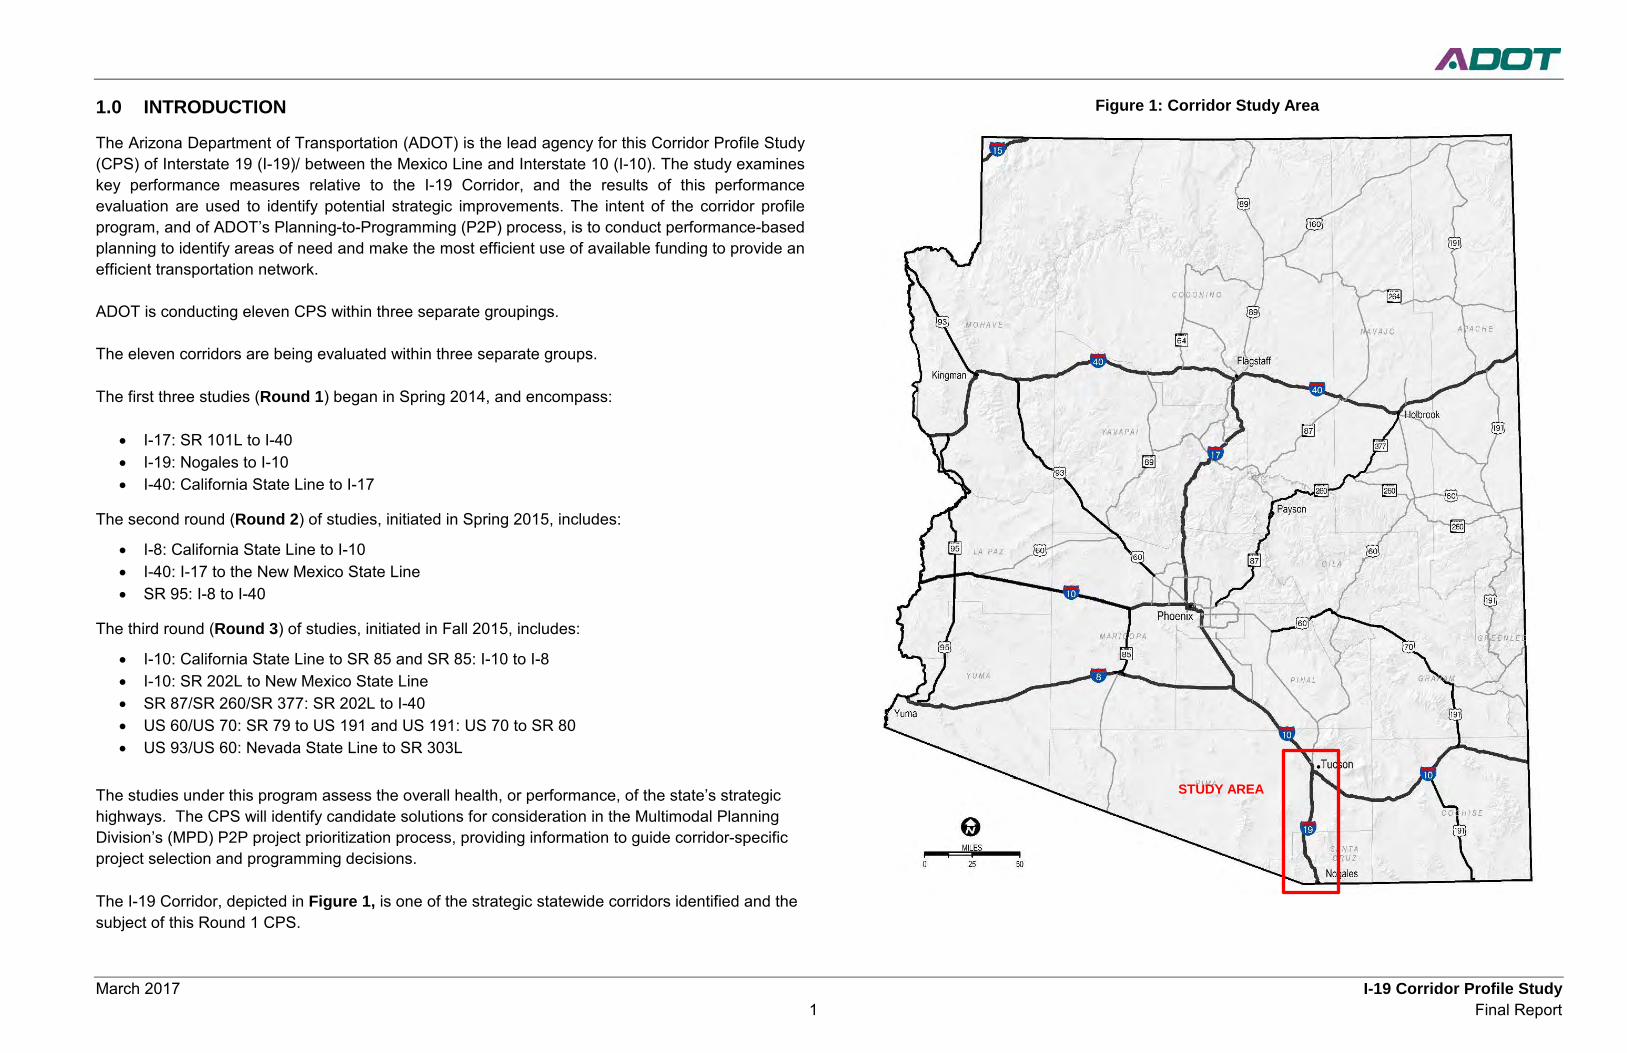
The Arizona Department of Transportation (ADOT) is the lead agency for this Corridor Profile Study (CPS) of Interstate 19 (I-19)/ between the Mexico Line and Interstate 10 (I-10). The study examines key performance measures relative to the I-19 Corridor, and the results of this performance evaluation are used to identify potential strategic improvements. The intent of the corridor profile program, and of ADOT’s Planning-to-Programming (P2P) process, is to conduct performance-based planning to identify areas of need and make the most efficient use of available funding to provide an efficient transportation network.
ADOT is conducting eleven CPS within three separate groupings.
The eleven corridors are being evaluated within three separate groups.
The first three studies (Round 1) began in Spring 2014, and encompass:
• I-17: SR 101L to I-40 • I-19: Nogales to I-10 • I-40: California State Line to I-17
The second round (Round 2) of studies, initiated in Spring 2015, includes:
• I-8: California State Line to I-10 • I-40: I-17 to the New Mexico State Line • SR 95: I-8 to I-40
The third round (Round 3) of studies, initiated in Fall 2015, includes:
• I-10: California State Line to SR 85 and SR 85: I-10 to I-8 • I-10: SR 202L to New Mexico State Line • SR 87/SR 260/SR 377: SR 202L to I-40 • US 60/US 70: SR 79 to US 191 and US 191: US 70 to SR 80 • US 93/US 60: Nevada State Line to SR 303L
The studies under this program assess the overall health, or performance, of the state’s strategic highways. The CPS will identify candidate solutions for consideration in the Multimodal Planning Division’s (MPD) P2P project prioritization process, providing information to guide corridor-specific project selection and programming decisions.
The I-19 Corridor, depicted in Figure 1, is one of the strategic statewide corridors identified and the subject of this Round 1 CPS.
Figure 1: Corridor Study Area
STUDY AREA
March 2017 I-19 Corridor Profile Study 2 Final Report
1.1 Corridor Study Purpose The purpose of the CPS is to measure corridor performance to inform the development of strategic solutions that are cost-effective and account for potential risks. This purpose can be accomplished by following the process described below:
• Inventory past improvement recommendations • Define corridor goals and objectives • Assess existing performance based on quantifiable performance measures • Propose various solutions to improve corridor performance • Identify specific solutions that can provide quantifiable benefits relative to the performance
measures • Prioritize solutions for future implementation, accounting for performance effectiveness and
risk analysis findings
1.2 Study Goals and Objectives The objective of this study is to identify a recommended set of prioritized potential solutions for consideration in future construction programs, derived from a transparent, defensible, logical, and replicable process. The I-19 CPS defines solutions and improvements for the corridor that are evaluated and ranked to determine which investments offer the greatest benefit to the corridor in terms of enhancing performance. Corridor benefits can be categorized by the following three investment types:
• Preservation: Activities that protect transportation infrastructure by sustaining asset condition or extending asset service life
• Modernization: Highway improvements that upgrade efficiency, functionality, and safety without adding capacity
• Expansion: Improvements that add transportation capacity through the addition of new facilities and/or services
This study identifies potential actions to improve the performance of the I-19 Corridor. Proposed actions are compared based on their likelihood of achieving desired performance levels, life-cycle costs, cost-effectiveness, and risk analysis to produce a prioritized list of solutions that help achieve corridor goals.
The following goals are identified as the desired outcome of this study:
• Link project decision-making and investments on key corridors to strategic goals • Develop solutions that address identified corridor needs based on measured performance • Prioritize improvements that cost-effectively preserve, modernize, and expand transportation
infrastructure
1.3 Corridor Overview and Location Interstate 19 (I-19) is a major corridor for intrastate and international commerce between Mexico and the United States. It is one of nine ADOT defined corridors that play a key role in the understanding the overall health of the statewide transportation system. I-19 is considered a strategic highway corridor by ADOT as well as a key commerce corridor as part of the National Primary Freight Network. Safe and reliable movement of people, vehicles, and goods, and the maintenance of corridor infrastructure are priorities for I-19. Within Tucson, I-19 serves as a route for daily commuters and intrastate and international travel to and from Mexico. As both Tucson and the use of international trade ports of Mexico continue to grow in the future, highway capacity, safety, and freight logistics will become higher priorities along I-19.
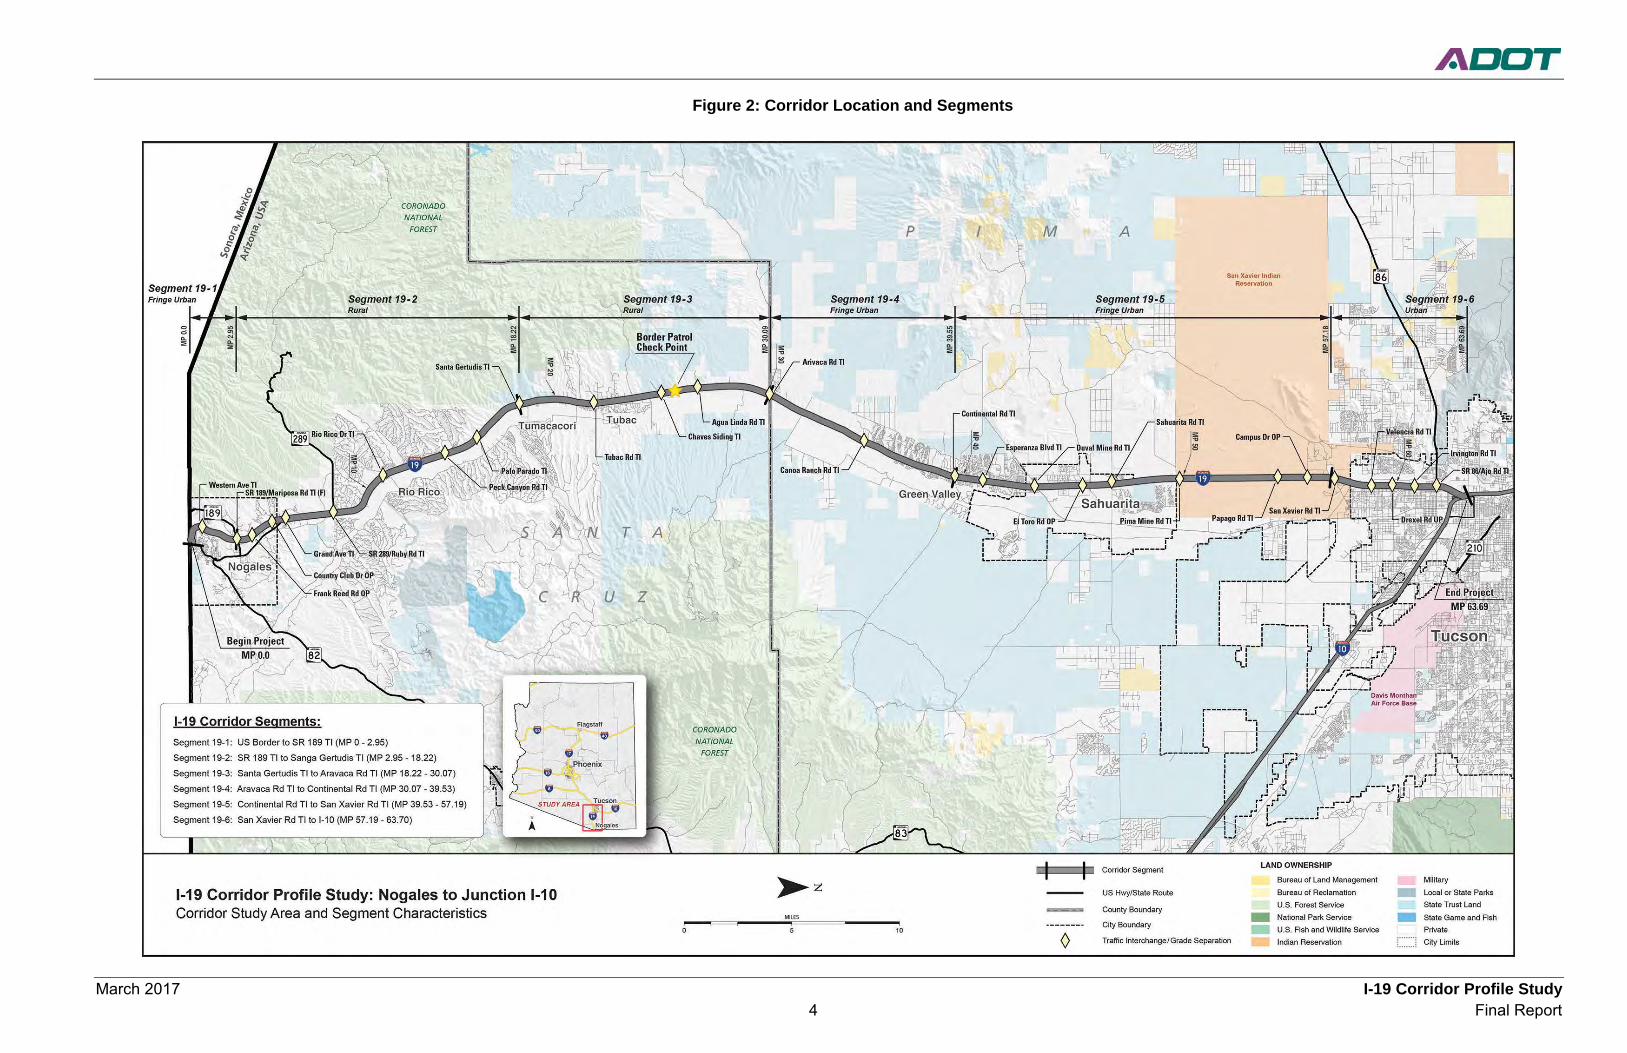
1.4 Corridor Segments The I-19 Corridor is a multi-modal corridor located in southern Arizona that serves international, regional, and local traffic and commerce demand between the United States and Mexico. I-19 spans approximately 63 miles from the international border near Nogales, Arizona at milepost 0.00 north to the junction with Interstate 10 (I-10) at milepost 63.69 in Tucson, Arizona as illustrated in Figure 2.
The I-19 Corridor is divided into 6 planning segments to allow for an appropriate level of detailed needs analysis, performance evaluation, and comparison between different segments of the corridor. The corridor is segmented at logical breaks where the context changes due to differences in characteristics such as terrain, daily traffic volumes, or roadway typical section. Corridor segments are described in Table 1 and shown in Figure 2.

March 2017 I-19 Corridor Profile Study 3 Final Report
Table 1: I-19 Corridor Segments
Segment Begin End Approx. Begin
Milepost
Approx. End Milepost
Approx. Length (miles)
Typical Through
Lanes (NB/EB, SB/WB)
2014/2035 Average Annual
Daily Traffic Volume (vpd)
Character Description
19-1 International Border Nogales 0.00 2.95 3 4 10,015 / 15,591 Fringe urban, rolling terrain, transition from 4-lane surface street to 4-lane divided, 0 interchanges, Santa Cruz County, City of Nogales
19-2 Nogales
Santa Gertudis TI (Rock Corral Rd) 2.95 18.22 15 4 20,595 / 31,603 Rural, level terrain, 4-lane divided, 6 interchanges, Santa Cruz County
19-3 Santa Gertudis TI Aravaca Rd TI 18.22 30.07 12 4 16,071 / 25,329 Rural, level terrain, 4-lane divided, 3 interchanges, Santa Cruz County,
19-4 Aravaca Rd TI Continental Rd TI 30.07 39.53 10 4 21,491 / 32,910 Fringe urban, level terrain, 4-lane divided, 4 interchanges, Pima County
19-5 Continental Rd TI San Xavier Rd. TI 39.53 57.19 17 4 36,855 / 51,970 Fringe urban, level terrain, 4-lane divided, 7 interchanges, Pima County, Tohono O’odham Nation San Xavier District
19-6 San Xavier Rd. TI Tucson 57.19 63.70 7 4-6 67,438 / 101,375 Urban, level terrain, 4-lane divided, 7 interchanges, Pima County, City of Tucson, Tohono O’odham Nation San Xavier District
March 2017 I-19 Corridor Profile Study 4 Final Report
Figure 2: Corridor Location and Segments

March 2017 I-19 Corridor Profile Study 5 Final Report
1.5 Corridor Characteristics I-19 is a major corridor for intrastate and international commerce between Mexico and the United States. It is one of nine ADOT defined corridors that play a key role in the understanding the overall health of the statewide transportation system.
National Context
The I-19 Corridor functions as a significant international and regional route, connecting the border city of Nogales to Tucson in southern Arizona. It is primarily a four-lane access controlled Interstate facility with a divided median. The terrain is generally flat with some rolling, or hilly, sections on the south end. Volumes are generally moderate to the south ranging from 11,000 – 22,000, increasing in the Tucson area up to 82,000 vehicles per day.
Regional Connectivity
There are approximately 60 miles of frontage roads, mostly on the southern two-thirds of the corridor. Frontage roads, cross roads, and freeway ramps are not included in this analysis. I-19 will eventually connect to the proposed I-11 corridor transporting freight and other traffic throughout Arizona.
Commercial Truck Traffic
The corridors serves as a major truck route due to the border crossing, bringing manufactured goods and produce north from Mexico and has been designated by ADOT as a critical link in Arizona’s Primary Freight Network and the CANAMEX Trade Corridor, envisioned to connect Mexico, the United States and Canada. The connection to I-10 gives those products access to distribution points throughout the country. Total truck volumes are about 8-14% of the total vehicle flow, with over 5,000 trucks per day on I-19 in the Tucson area.
Commuter Traffic
I-19 serves as a commuter route from communities south of Tucson to employment centers in the metropolitan area. With over 369,000 jobs in Tucson (US Census 2010), the City itself is a major traffic generator and receiver of local and regional trips. Resulting traffic volumes on the northern segments of the corridor, already pushing capacity limits with about 82,000 vehicles per day is projected to grow to over 100,000 vehicles per day by 2035. Efficient travel for commuting traffic must be maintained in order to fulfill the corridor’s role in support of the State’s economic vitality.
Recreation and Tourism
The corridor serves as a tourism and travel route between Arizona and Mexico. Recreational opportunities along the corridor include:
• Coronado National Forest – 1,783,639 acres of multiple use opportunities throughout southeastern Arizona
• Tubac - Home to the Art Colony of Tubac
• Presidio State Historic Park – Presidio established 1752 at Tubac
• Santa Cruz River - a top spot for Arizona birding
• Saguaro National Park - near Tucson, over 700,000 annual visitors
Multi-Modal Uses
Freight Rail
The CANAMEX Corridor is a nationally designated high priority freight route linking western states to Mexico and Canada. The CANAMEX Corridor generally follows I-19 from Nogales to Tucson, then north to Phoenix. Approximately six trains per day carry six million tons annually on the UPRR Nogales Subdivision. Growing international trade is expected to increase the need to develop the corridor in the near future.
Passenger Rail
No passenger rail services are currently available on the corridor. However, the Arizona State Rail Plan supports the possibility of intercity passenger rail from Tucson to Nogales and across the border to Mexico as a recommended action.
Bicycles/Pedestrians
Bicycles are permitted on the outside shoulders of I-19 from MP 0 – 43. They are prohibited on the portion of the corridor between MP 43 – 64 (Jct I-10). Pedestrians are prohibited along the entire length of I-19 mainline.
Bus/Transit
The Pima Association of Governments (PAG) manages federal transportation dollars apportioned to the Tucson region, including funding for regional transit improvements. Regional transit is also supported by a Regional Transportation Authority’s funded through a ½ cent transaction privilege tax (Short Range Transit Plan, PAG, 2013).
PAG operates a variety of services, designed as an integrated and seamless transit concept, including:
• Sun Tran • Sun Express • Sun Van • Sun Shuttle • Sun Shuttle Dial-a-Ride
Riders use an integrated fare payment system to access different services without the need to purchase additional full fare passes. The services provide an important link connecting the Tucson Metropolitan area to surrounding rural and suburban communities.
March 2017 I-19 Corridor Profile Study 6 Final Report
The current Sun Tran system provides over 20 million passenger trips annually utilizing a fleet of 253 buses on 27 local routes and 17 express routes serving the majority of the City of Tucson as well as South Tucson, Marana, unincorporated Pima County, and Oro Valley. Sun Tran’s 253 bus fleet runs 365 days a year to meet the transportation needs of customers.
Dial-a-Ride services extend to Oro Valley and Green Valley/Sahuarita. The Town of Oro Valley funds, manages and operates Sun Shuttle Dial-a-Ride senior services as well as general public services in Oro Valley.
Although there is interest in transit services from Nogales along the I-19 corridor to Rio Rico and Tubac, with connections to Tucson, no public agency has been identified to operate a transit system in the area (Unified Nogales South Santa Cruz County Transportation Plan 2010). No private service is available on the corridor.
Aviation
The region is served by Tucson International Airport. It is the second largest airport in Arizona, with approximately 1.5 million annual enplanements. The airport is not a hub or focus city for any airline. Public transportation to the airport is available through Sun Tran.
Tribes
The Tohono O’odham Nation, San Xavier District abuts the I-19 corridor south of Tucson. Approximately 1,250 people live within the District. It operates two Desert Diamond Casino locations near Valencia Road/Nogales Highway and at I-19/Pima Mine Road in Sahuarita.
The Pascua Yaqui Indian Reservation is located in Pima County, in the southwestern part of the Tucson metropolitan area near Drexel Heights and Valencia West, with a resident population over 3,300. The Tribe operates two gaming facilities, the Casino of the Sun and the Casino del Sol. While not directly adjacent to the I-19 corridor, it is nearby. It is adjacent to eastern section of the Tohono O’odham Nation, San Xavier District.
Land Ownership, Land Uses, and Jurisdictions
The I-19 corridor serves a variety of land uses and jurisdictions. The corridor begins in the City of Nogales on the south end at the border with Mexico. Segments 19-1 and 19-2 are characterized as fringe urban in nature, dominated by commercial, industrial, and transportation industry uses.
The north end is anchored by the City of Tucson, and transitions from fringe urban in segment 19-5 to urban uses and heavier traffic in segment 19-6. The outlying areas include residential subdivisions with a variety of lot sizes, dispersed residences, and light commercial development.
Population Centers
The corridor between the two cities is predominantly rural in nature, with several retirement and bedroom communities. The small towns of Rio Rico, Tumacacori, Tubac, and Amado are in Santa Cruz County. The communities of Green Valley and Sahuarita in Pima County orient more toward Tucson, with many people commuting to employment in the City.
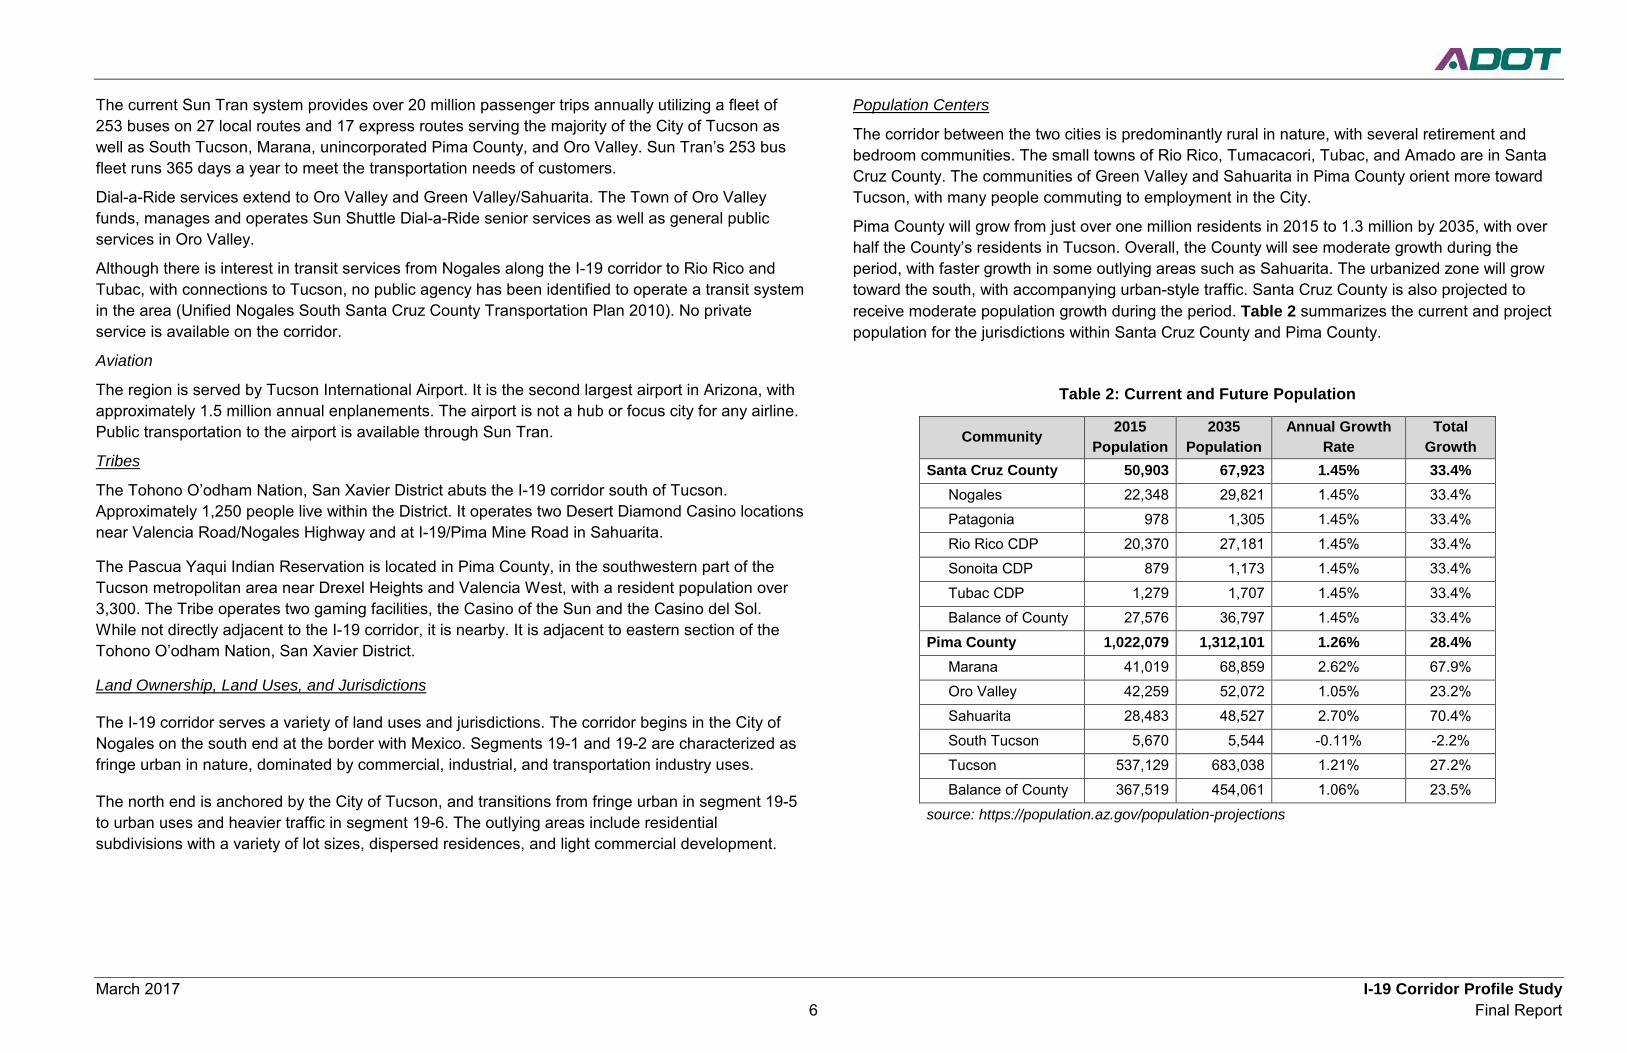
Pima County will grow from just over one million residents in 2015 to 1.3 million by 2035, with over half the County’s residents in Tucson. Overall, the County will see moderate growth during the period, with faster growth in some outlying areas such as Sahuarita. The urbanized zone will grow toward the south, with accompanying urban-style traffic. Santa Cruz County is also projected to receive moderate population growth during the period. Table 2 summarizes the current and project population for the jurisdictions within Santa Cruz County and Pima County.
Table 2: Current and Future Population
Community 2015 Population
2035 Population
Annual Growth Rate
Total Growth
Santa Cruz County 50,903 67,923 1.45% 33.4% Nogales 22,348 29,821 1.45% 33.4% Patagonia 978 1,305 1.45% 33.4% Rio Rico CDP 20,370 27,181 1.45% 33.4% Sonoita CDP 879 1,173 1.45% 33.4% Tubac CDP 1,279 1,707 1.45% 33.4% Balance of County 27,576 36,797 1.45% 33.4%
Pima County 1,022,079 1,312,101 1.26% 28.4% Marana 41,019 68,859 2.62% 67.9% Oro Valley 42,259 52,072 1.05% 23.2% Sahuarita 28,483 48,527 2.70% 70.4% South Tucson 5,670 5,544 -0.11% -2.2% Tucson 537,129 683,038 1.21% 27.2% Balance of County 367,519 454,061 1.06% 23.5%
source: https://population.az.gov/population-projections
March 2017 I-19 Corridor Profile Study 7 Final Report
Wildlife Linkages
The Arizona State Wildlife Action Plan (SWAP) provides a 10-year vision for the entire state, identifying wildlife and habitats in need of conservation, insight regarding the stressors to those resources, and suggestive actions that can be taken to alleviate those stressors. The Habimap ToolTM (http://www.habimap.org/) provides an interactive database of information included in the SWAP. These databases and other environmental resources should be conducted early on during all project related activities to ensure appropriate environmental compliance. Managers of potentially impacted areas should be included in outreach and coordination programs. The following wildlife and habitat considerations affecting rights-of-way along the I-19 corridor were identified should not be considered a comprehensive listing of affected resources:
• Wildlife waters – None • Important Bird Areas – None • Allotments/Pastures (grazing) including State Land Department, Bureau of Land
Management, US Forest Service – Tumacacori area, north of Tubac • Arizona Game and Fish Department Parcels – None • State Land Trust lands are present, immediately adjacent to the corridor near Tumacacori
and Sahuarita • Arizona Wildlife Linkages – Missing or Potential Linkages noted: Tumacacori Santa Ritas
Linkage at Polero Creek north of Nogales, in the Tumacacori area, north of Tubac, and near W. Arivaca Rd
• Species and Habitat Conservation Guide (SHCG) indicates several high value areas of sensitive habitats throughout the southern part of the corridor
• Species of Economic and Recreational Importance (SERI) model indicates areas of high importance throughout the southern end of the corridor
• Species of Greatest Conservation Need (SGCN) identifies several areas of high value sensitive habitats throughout the southern part of the corridor
Corridor Assets
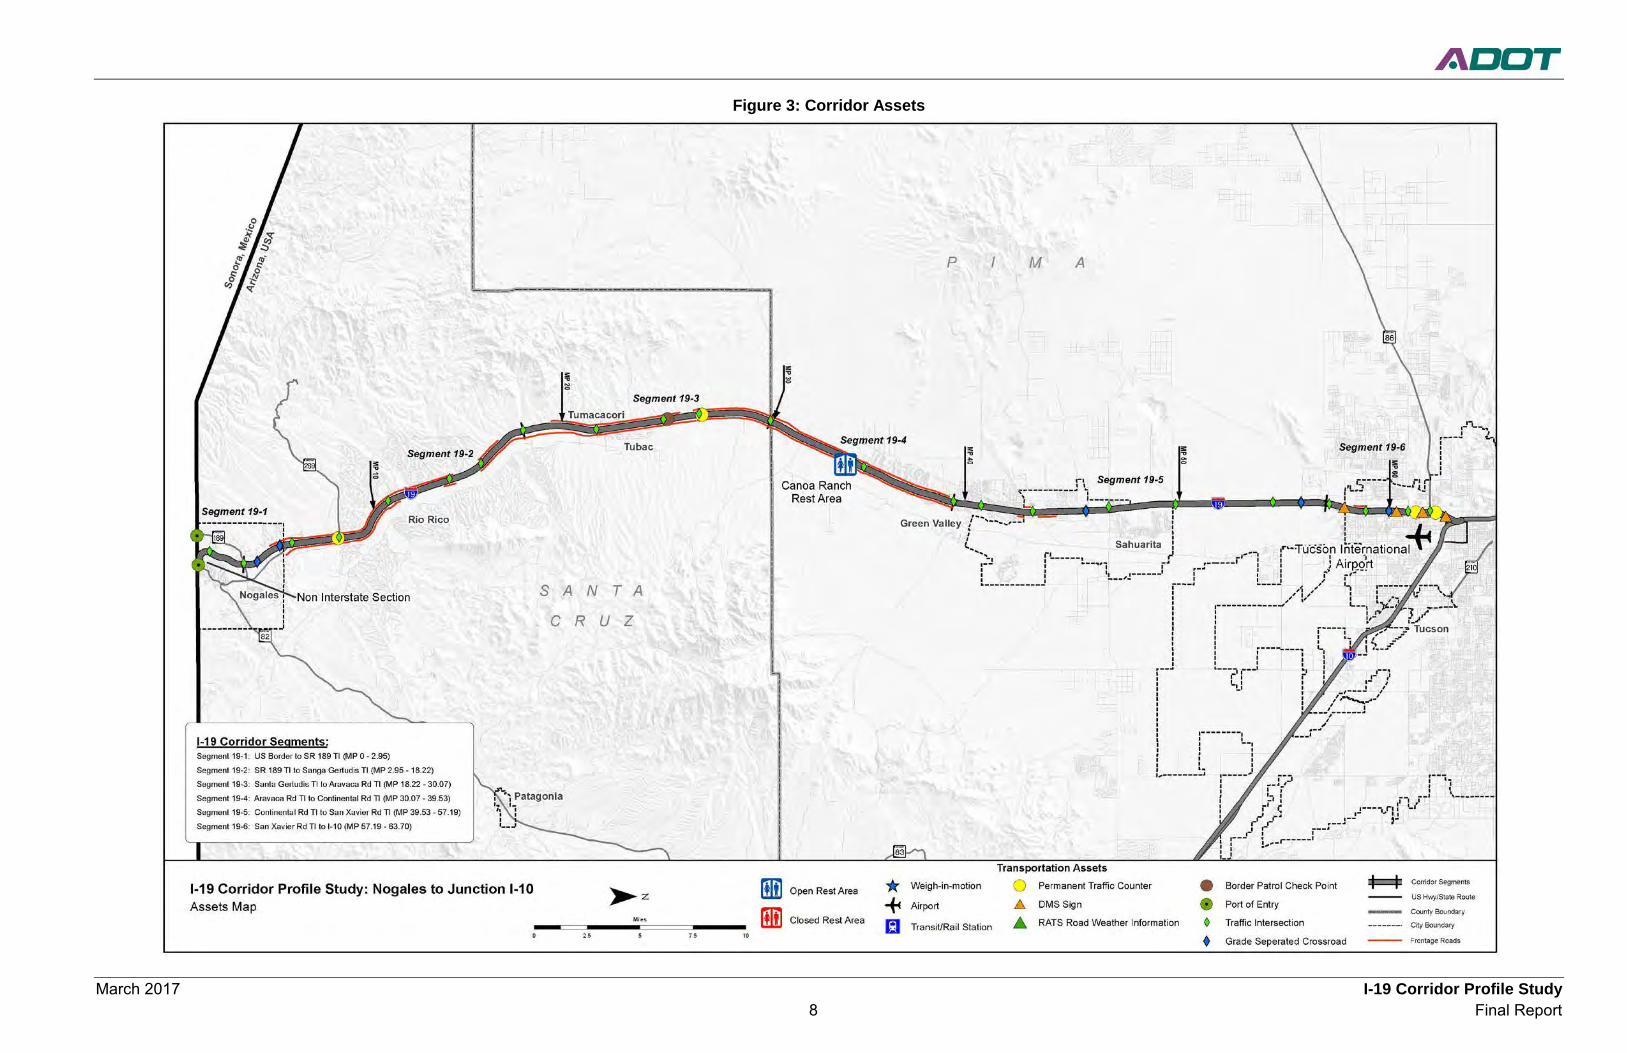
Corridor transportation assets of note are summarized in Figure 3.
• Grade separated traffic interchanges: 23 • Signalized intersections in Nogales: 3 • Un-signalized intersections in Nogales: 2 • Grade separated cross roads: 5 • Frontage roads: NB 32 miles; SB 29 miles • Port of Entry: 2
o Nogales - Private vehicles and pedestrians only at MP 0.0 o Mariposa Land Port of Entry - Commercial vehicles at US 189 MP 0.0
• Border Patrol check point: MP 25.0 NB • Rest Area: Canoa Ranch Rest Area MP 34.0 near Green Valley • Permanent traffic counters: MP 7.7, MP 26.6, MP 61.1, MP 62.1 • Digital Message Signs (DMS): MP 57.9 NB, MP 60.1 SB, MP 61.4 NB, MP 62.8 SB • Tucson International Airport
March 2017 I-19 Corridor Profile Study 8 Final Report
Figure 3: Corridor Assets
March 2017 I-19 Corridor Profile Study 9 Final Report
1.6 Corridor Stakeholders and Input Process A Technical Advisory Committee (TAC) was created that was comprised of representatives from the stakeholders. TAC meetings were held at key milestones to present results and obtain feedback. In addition, several meetings were conducted with key stakeholders between June 2014 and October 2016 to present the results and obtain feedback. Key stakeholders identified for this study include:
• ADOT South Central District • City of Nogales • City of Tucson • Fresh Produce Association of the Americas • Greater Nogales Santa Cruz County Port Authority • Pascua Yaqui Tribe • PAG • Pima County • Regional Transportation Authority/Mainstreet Program • Santa Cruz County • SEAGO • Tohono O’odham Nation • Town of Sahuarita • Tucson Hispanic Chamber
Several Working Papers were developed during the course of the Corridor Profile Study. The Working Papers were provided to the TAC for review and comment.
1.7 Prior Studies and Recommendations This study identified recommendations from previous studies, plans, and preliminary design documents. Studies, plans, and programs pertinent to the I-19 Corridor were reviewed to understand the full context of future planning and design efforts within and around the study area. These studies are organized below into four categories: Framework and Statewide Studies, Regional Planning Studies, Planning Assistance for Rural Areas (PARAs) and Small Area Transportation Studies (SATS), and Design Concept Reports (DCRs) and Project Assessments (PAs).
Framework Studies
• 2015-2019 Five-Year Transportation Facilities Construction Program • What Moves You Arizona, Arizona Long-Range Transportation Plan 2010-2035 • Arizona Statewide Travel Demand Model (AZTDM)
Regional Planning Studies
• PAG 2040 Regional Transportation Plan (RTP) • PAG 2015-2019 5-Year Regional Transportation Improvement Program • PAG Regional Significant Corridor Study • PAG State Transportation System Mobility and Regional Circulation Needs Feasibility Study • PAG Southeast Area Arterial Study • Regional Transportation Authority Our Mobility Plan • PAG Short-Range Transit Program Implementation Plan – FY2014-FY2018 • PAG High Capacity Transit System Plan • I-11 Southern Arizona Future Connectivity Corridor Feasibility Assessment Report • Arizona-Sonora Border Master Plan • Mariposa Port of Entry Bottleneck Study • Mariposa/I-19 Connector Route Study Final Report • Southeast Arizona Regional Transportation Profile Study – Nogales Railroad Assessment
Study • Santa Cruz County Comprehensive Plan • Unified Nogales Santa Cruz County Transportation Plan • City of Nogales General Plan
March 2017 I-19 Corridor Profile Study 10 Final Report
Planning Assistance for Rural Areas (PARA) Studies
• Sahuarita/El Toro Corridor Study Final Report • Rio Rico Walking and Biking Study • Town of Sahuarita Area Transportation Study • San Xavier District Pedestrian Access and Safety Study
Design Concept Studies and Final Design
• I-19 Pavement Preservation, MP 31.8 to MP 42.5 • SR 189: International Border to Grand Avenue Stage I Alternative Corridor Screening • I-19 East Frontage Rd Project Assessment, Ruby Road to Rio Rico Dr. • I-19, Southbound Valencia Road Exit Ramp Final Design • I-19, Ajo Way TI Final Design • I-19, San Xavier to I-10 DCR and EA • I-19 Frontage Roads Study • I-19 Corridor Study, I-10 to Pima/Santa Cruz County Line
Summary of Prior Recommendations
The recommendations of each study were carefully considered during the corridor profile study. Many of the studies recommend duplicate actions, representing significant capacity and operational improvements to the corridor. Many of these recommendations have already been implemented or programmed for completion. The aggregate recommendations are summarized in Table 3 and illustrated on Figure 4.
A summary of major prior recommendations includes:
Major Widening/Capacity Improvements
• Widen to 6 lanes from SR 189/Mariposa TI to Tubac Road TI • Widen to 6 lanes from Continental Road TI to Sahuarita Road TI • Widen to 8 lanes from Sahuarita Road TI to I-10
Interchanges
• SR 189/Mariposa Road pending completion of Environmental Assessment • Minor improvements have been recommended at all traffic interchanges from Nogales to
Continental Road TI • Reconstruction or other major improvements have been recommended at all traffic
interchanges from Continental Road TI north to I-10 • New traffic interchange at Los Reales Road • New traffic interchange at Drexel Road
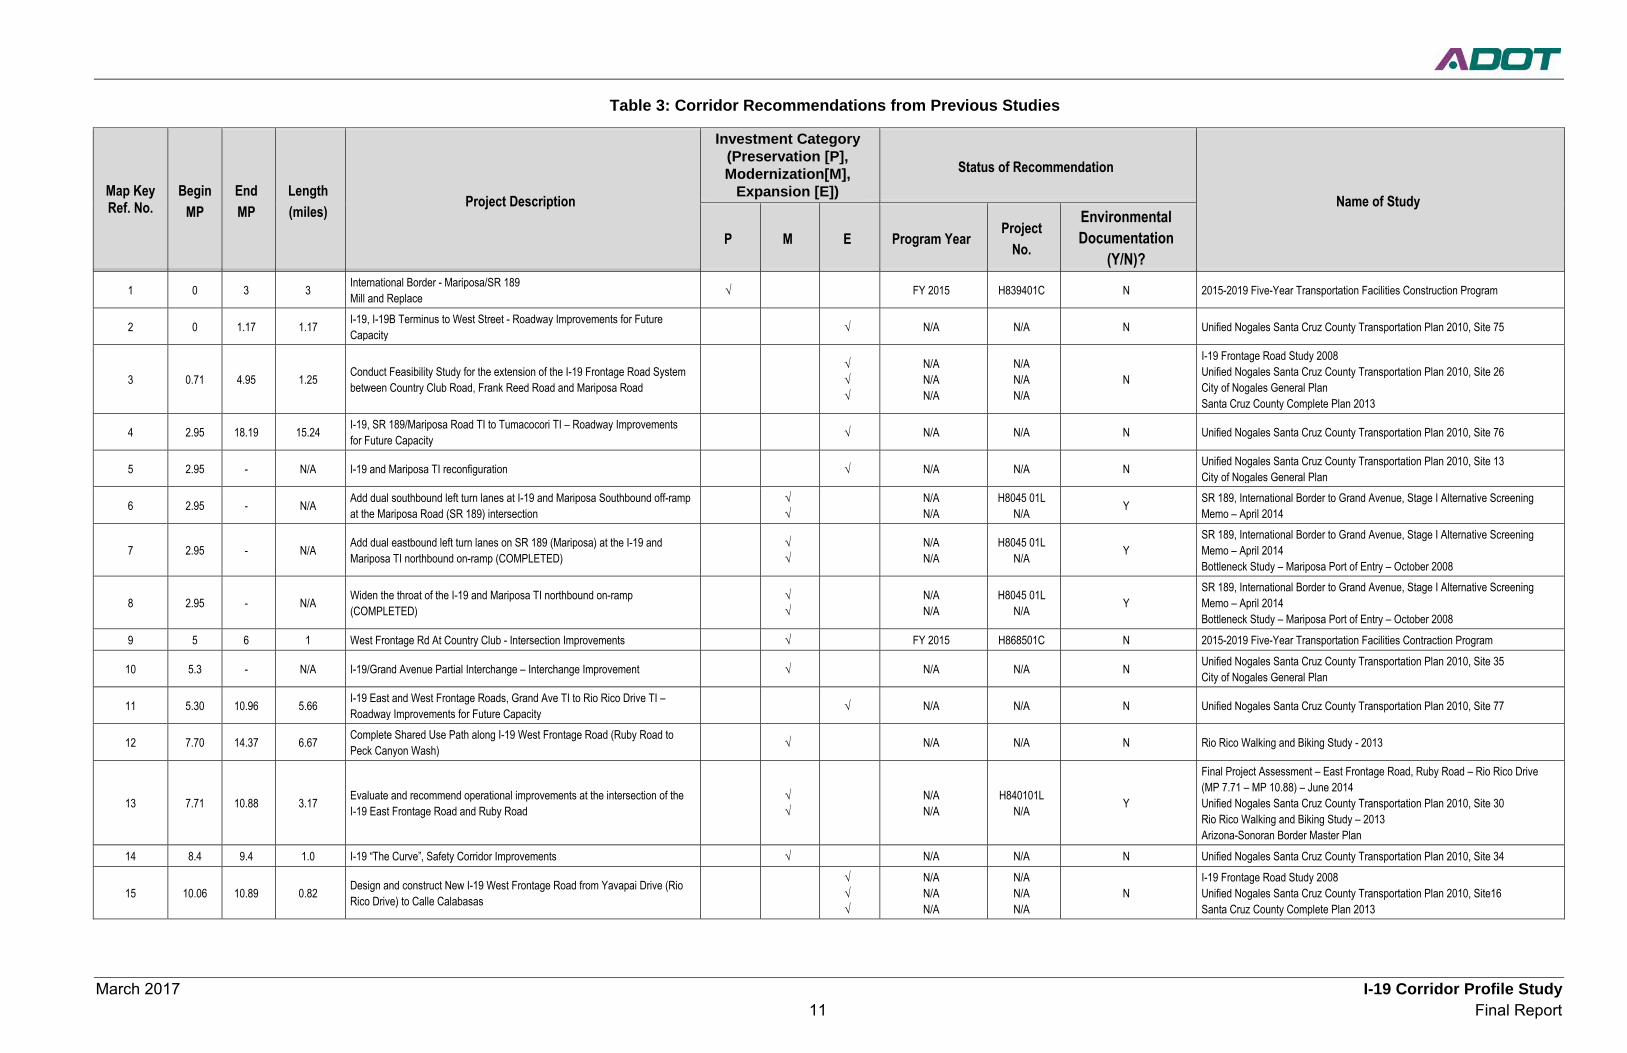
March 2017 I-19 Corridor Profile Study 11 Final Report
Table 3: Corridor Recommendations from Previous Studies
Map Key Ref. No.
Begin MP
End MP
Length (miles) Project Description
Investment Category (Preservation [P], Modernization[M],
Expansion [E]) Status of Recommendation
Name of Study
P M E Program Year Project No.
Environmental Documentation
(Y/N)?
1 0 3 3 International Border - Mariposa/SR 189 Mill and Replace √ FY 2015 H839401C N 2015-2019 Five-Year Transportation Facilities Construction Program
2 0 1.17 1.17 I-19, I-19B Terminus to West Street - Roadway Improvements for Future Capacity √ N/A N/A N Unified Nogales Santa Cruz County Transportation Plan 2010, Site 75
3 0.71 4.95 1.25 Conduct Feasibility Study for the extension of the I-19 Frontage Road System between Country Club Road, Frank Reed Road and Mariposa Road
√ √ √
N/A N/A N/A
N/A N/A N/A
N
I-19 Frontage Road Study 2008 Unified Nogales Santa Cruz County Transportation Plan 2010, Site 26 City of Nogales General Plan Santa Cruz County Complete Plan 2013
4 2.95 18.19 15.24 I-19, SR 189/Mariposa Road TI to Tumacocori TI – Roadway Improvements for Future Capacity √ N/A N/A N Unified Nogales Santa Cruz County Transportation Plan 2010, Site 76
5 2.95 - N/A I-19 and Mariposa TI reconfiguration √ N/A N/A N Unified Nogales Santa Cruz County Transportation Plan 2010, Site 13 City of Nogales General Plan
6 2.95 - N/A Add dual southbound left turn lanes at I-19 and Mariposa Southbound off-ramp at the Mariposa Road (SR 189) intersection √
√ N/A N/A
H8045 01L N/A Y SR 189, International Border to Grand Avenue, Stage I Alternative Screening
Memo – April 2014
7 2.95 - N/A Add dual eastbound left turn lanes on SR 189 (Mariposa) at the I-19 and Mariposa TI northbound on-ramp (COMPLETED) √
√ N/A N/A
H8045 01L N/A Y
SR 189, International Border to Grand Avenue, Stage I Alternative Screening Memo – April 2014 Bottleneck Study – Mariposa Port of Entry – October 2008
8 2.95 - N/A Widen the throat of the I-19 and Mariposa TI northbound on-ramp (COMPLETED) √
√ N/A N/A
H8045 01L N/A Y
SR 189, International Border to Grand Avenue, Stage I Alternative Screening Memo – April 2014 Bottleneck Study – Mariposa Port of Entry – October 2008
9 5 6 1 West Frontage Rd At Country Club - Intersection Improvements √ FY 2015 H868501C N 2015-2019 Five-Year Transportation Facilities Contraction Program
10 5.3 - N/A I-19/Grand Avenue Partial Interchange – Interchange Improvement √ N/A N/A N Unified Nogales Santa Cruz County Transportation Plan 2010, Site 35 City of Nogales General Plan
11 5.30 10.96 5.66 I-19 East and West Frontage Roads, Grand Ave TI to Rio Rico Drive TI – Roadway Improvements for Future Capacity √ N/A N/A N Unified Nogales Santa Cruz County Transportation Plan 2010, Site 77
12 7.70 14.37 6.67 Complete Shared Use Path along I-19 West Frontage Road (Ruby Road to Peck Canyon Wash) √ N/A N/A N Rio Rico Walking and Biking Study - 2013
13 7.71 10.88 3.17 Evaluate and recommend operational improvements at the intersection of the I-19 East Frontage Road and Ruby Road √
√ N/A N/A
H840101L N/A Y
Final Project Assessment – East Frontage Road, Ruby Road – Rio Rico Drive (MP 7.71 – MP 10.88) – June 2014 Unified Nogales Santa Cruz County Transportation Plan 2010, Site 30 Rio Rico Walking and Biking Study – 2013 Arizona-Sonoran Border Master Plan
14 8.4 9.4 1.0 I-19 “The Curve”, Safety Corridor Improvements √ N/A N/A N Unified Nogales Santa Cruz County Transportation Plan 2010, Site 34
15 10.06 10.89 0.82 Design and construct New I-19 West Frontage Road from Yavapai Drive (Rio Rico Drive) to Calle Calabasas
√ √ √
N/A N/A N/A
N/A N/A N/A
N I-19 Frontage Road Study 2008 Unified Nogales Santa Cruz County Transportation Plan 2010, Site16 Santa Cruz County Complete Plan 2013

March 2017 I-19 Corridor Profile Study 12 Final Report
Map Key Ref. No.
Begin MP
End MP
Length (miles) Project Description
Investment Category (Preservation [P], Modernization[M],
Expansion [E]) Status of Recommendation
Name of Study
P M E Program Year Project No.
Environmental Documentation
(Y/N)?
16 10.89 13.95 3.11 Improve pavement condition along I-19 West Frontage Road √ √ √
N/A N/A N/A
N/A N/A N/A
N I-19 Frontage Road Study 2008 Unified Nogales Santa Cruz County Transportation Plan 2010, Site 17 Santa Cruz County Complete Plan 2013
17 10.96 - N/A
Improvements recommended include a formal modification of the existing striped shoulder area to a striped and signed bike lane for one way travel together with a sidewalk in both directions at the Rio Rico Drive and I-19 OP (Approximately 700 feet including approaches and I-19 On Ramps)
√ N/A N/A N Rio Rico Walking and Biking Study - 2013
18 11.13 11.77 0.69 Design and construct continuous left-turn lane from the I-19 West Frontage Road and Circlo Mercado intersection to 0.25 miles south of Circulo Mercado intersection
√ √ √
N/A N/A N/A
N/A N/A N/A
N I-19 Frontage Road Study 2008
19 13.82 - N/A Design and construct a northbound left-turn lane and a southbound right-turn lane at the I-19 West Frontage Road and Camino Lito Galindo Intersection
√ √ √
N/A N/A N/A
N/A N/A N/A
N I-19 Frontage Road Study 2008 Unified Nogales Santa Cruz County Transportation Plan 2010, Site 19 Santa Cruz County Complete Plan 2013
20 13.96 30.00 N/A I-19, Exit 22 (Peck Canyon Rd) to Exit 48 (Arivaca Road) – Interchange Improvements √ N/A N/A N Unified Nogales Santa Cruz County Transportation Plan 2010, Site 53
21 13.96 - N/A I-19, Exit 22 (Peck Canyon Rd) widen overpass and approach roads √ N/A N/A N Unified Nogales Santa Cruz County Transportation Plan 2010, Site 18
22 14.03 14.17 0.13 Design and construct a continuous left-turn lane between the access to the San Cayetano Elementary School and the access to the school district bus barn along the I-19 West Frontage Road.
√ √ √
N/A N/A N/A
N/A N/A N/A
N I-19 Frontage Road Study 2008 Unified Nogales Santa Cruz County Transportation Plan 2010, Site 19 Santa Cruz County Complete Plan 2013
23 16 21 5 I-19 - MP 16 to MP 21.1 - RR (4" TL, 3" PL) + FR √ FY 2015 H815601C N 2015-2019 Five-Year Transportation Facilities Contraction Program
24 18.23 - N/A Design and construct a northbound left-turn lane at the I-19 East Frontage Road and Tumacacori Road Intersection
√ √ √
N/A N/A N/A
N/A N/A N/A
N I-19 Frontage Road Study 2008 Unified Nogales Santa Cruz County Transportation Plan 2010, Site 22 Santa Cruz County Complete Plan 2013
25 18.19 21.64 N/A I-19, Tumacocori to Tubac Wildlife Preservation Crossings √ N/A N/A N Unified Nogales Santa Cruz County Transportation Plan 2010, Site 29
26 21.71 - N/A Design and construct northbound and southbound left-turn lanes at the I-19 East Frontage Road and Barrio De Tubac Road intersection.
√ √ √
N/A N/A N/A
N/A N/A N/A
N I-19 Frontage Road Study 2008 Unified Nogales Santa Cruz County Transportation Plan 2010, Site 23 Santa Cruz County Complete Plan 2013
27 21.90 22.41 0.7 Design and construct a continuous left-turn lane at the I-19 East Frontage Road and Avenida Goya intersection to Bridge Road.
√ √ √
N/A N/A N/A
N/A N/A N/A
N I-19 Frontage Road Study 2008 Unified Nogales Santa Cruz County Transportation Plan 2010 Site 24 Santa Cruz County Complete Plan 2013
28 22.92 - N/A Design and construct a northbound right-turn lanes at the I-19 East Frontage Road and Avenida de Otero intersection
√ √ √
N/A N/A N/A
N/A N/A N/A
N I-19 Frontage Road Study 2008 Unified Nogales Santa Cruz County Transportation Plan 2010 Site 25 Santa Cruz County Complete Plan 2013
29 25.56 26.46 1.0 Design and construct a new one-way I-19 East Frontage Road from Chavez Siding to Agua Linda Road.
√ √ √
N/A N/A N/A
N/A N/A N/A
N I-19 Frontage Road Study 2008 Unified Nogales Santa Cruz County Transportation Plan 2010, Site 21 Santa Cruz County Complete Plan 2013
30 25.74 26.41 0.67 Design and construct a new one-way I-19 West Frontage Road from Chavez Siding to Agua Linda Road.
√ √ √
N/A N/A N/A
N/A N/A N/A
N I-19 Frontage Road Study 2008 Unified Nogales Santa Cruz County Transportation Plan 2010 Site 20 Santa Cruz County Complete Plan 2013
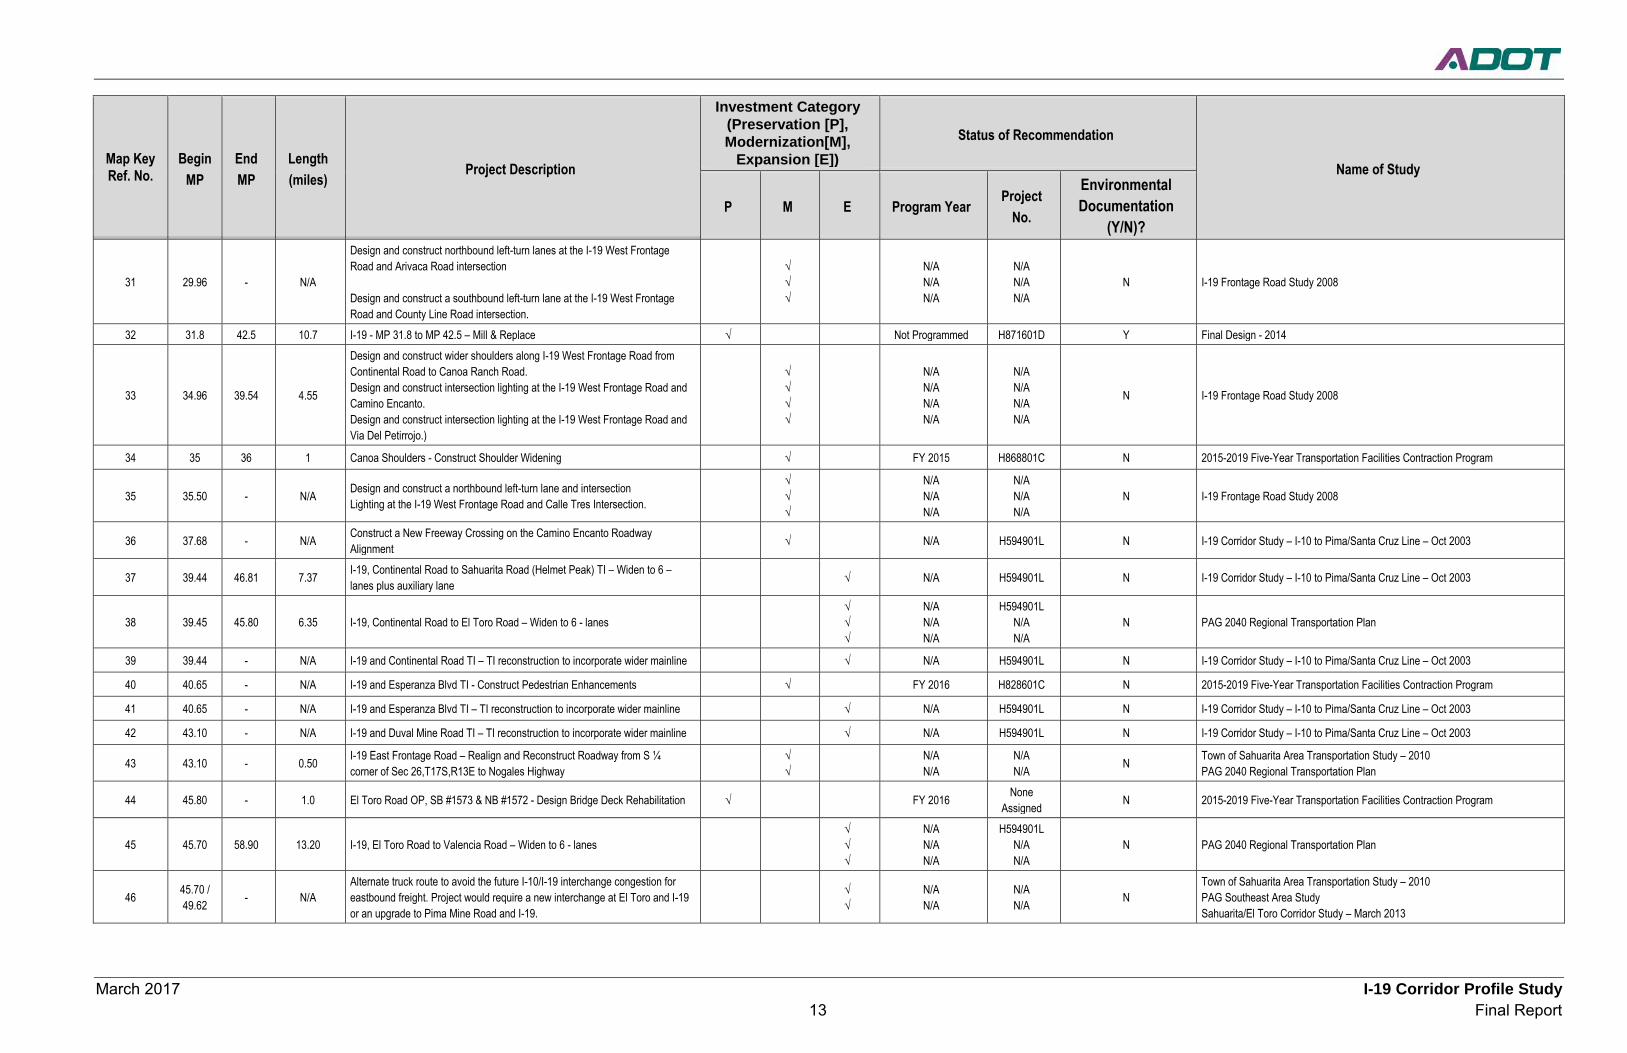
March 2017 I-19 Corridor Profile Study 13 Final Report
Map Key Ref. No.
Begin MP
End MP
Length (miles) Project Description
Investment Category (Preservation [P], Modernization[M],
Expansion [E]) Status of Recommendation
Name of Study
P M E Program Year Project No.
Environmental Documentation
(Y/N)?
31 29.96 - N/A
Design and construct northbound left-turn lanes at the I-19 West Frontage Road and Arivaca Road intersection Design and construct a southbound left-turn lane at the I-19 West Frontage Road and County Line Road intersection.
√ √ √
N/A N/A N/A
N/A N/A N/A
N I-19 Frontage Road Study 2008
32 31.8 42.5 10.7 I-19 - MP 31.8 to MP 42.5 – Mill & Replace √ Not Programmed H871601D Y Final Design - 2014
33 34.96 39.54 4.55
Design and construct wider shoulders along I-19 West Frontage Road from Continental Road to Canoa Ranch Road. Design and construct intersection lighting at the I-19 West Frontage Road and Camino Encanto. Design and construct intersection lighting at the I-19 West Frontage Road and Via Del Petirrojo.)
√ √ √ √
N/A N/A N/A N/A
N/A N/A N/A N/A
N I-19 Frontage Road Study 2008
34 35 36 1 Canoa Shoulders - Construct Shoulder Widening √ FY 2015 H868801C N 2015-2019 Five-Year Transportation Facilities Contraction Program
35 35.50 - N/A Design and construct a northbound left-turn lane and intersection Lighting at the I-19 West Frontage Road and Calle Tres Intersection.
√ √ √
N/A N/A N/A
N/A N/A N/A
N I-19 Frontage Road Study 2008
36 37.68 - N/A Construct a New Freeway Crossing on the Camino Encanto Roadway Alignment √ N/A H594901L N I-19 Corridor Study – I-10 to Pima/Santa Cruz Line – Oct 2003
37 39.44 46.81 7.37 I-19, Continental Road to Sahuarita Road (Helmet Peak) TI – Widen to 6 – lanes plus auxiliary lane √ N/A H594901L N I-19 Corridor Study – I-10 to Pima/Santa Cruz Line – Oct 2003
38 39.45 45.80 6.35 I-19, Continental Road to El Toro Road – Widen to 6 - lanes √ √ √
N/A N/A N/A
H594901L N/A N/A
N PAG 2040 Regional Transportation Plan
39 39.44 - N/A I-19 and Continental Road TI – TI reconstruction to incorporate wider mainline √ N/A H594901L N I-19 Corridor Study – I-10 to Pima/Santa Cruz Line – Oct 2003
40 40.65 - N/A I-19 and Esperanza Blvd TI - Construct Pedestrian Enhancements √ FY 2016 H828601C N 2015-2019 Five-Year Transportation Facilities Contraction Program
41 40.65 - N/A I-19 and Esperanza Blvd TI – TI reconstruction to incorporate wider mainline √ N/A H594901L N I-19 Corridor Study – I-10 to Pima/Santa Cruz Line – Oct 2003
42 43.10 - N/A I-19 and Duval Mine Road TI – TI reconstruction to incorporate wider mainline √ N/A H594901L N I-19 Corridor Study – I-10 to Pima/Santa Cruz Line – Oct 2003
43 43.10 - 0.50 I-19 East Frontage Road – Realign and Reconstruct Roadway from S ¼ corner of Sec 26,T17S,R13E to Nogales Highway √
√ N/A N/A
N/A N/A N Town of Sahuarita Area Transportation Study – 2010
PAG 2040 Regional Transportation Plan
44 45.80 - 1.0 El Toro Road OP, SB #1573 & NB #1572 - Design Bridge Deck Rehabilitation √ FY 2016 None Assigned N 2015-2019 Five-Year Transportation Facilities Contraction Program
45 45.70 58.90 13.20 I-19, El Toro Road to Valencia Road – Widen to 6 - lanes √ √ √
N/A N/A N/A
H594901L N/A N/A
N PAG 2040 Regional Transportation Plan
46 45.70 / 49.62 - N/A
Alternate truck route to avoid the future I-10/I-19 interchange congestion for eastbound freight. Project would require a new interchange at El Toro and I-19 or an upgrade to Pima Mine Road and I-19.
√ √
N/A N/A
N/A N/A N
Town of Sahuarita Area Transportation Study – 2010 PAG Southeast Area Study Sahuarita/El Toro Corridor Study – March 2013
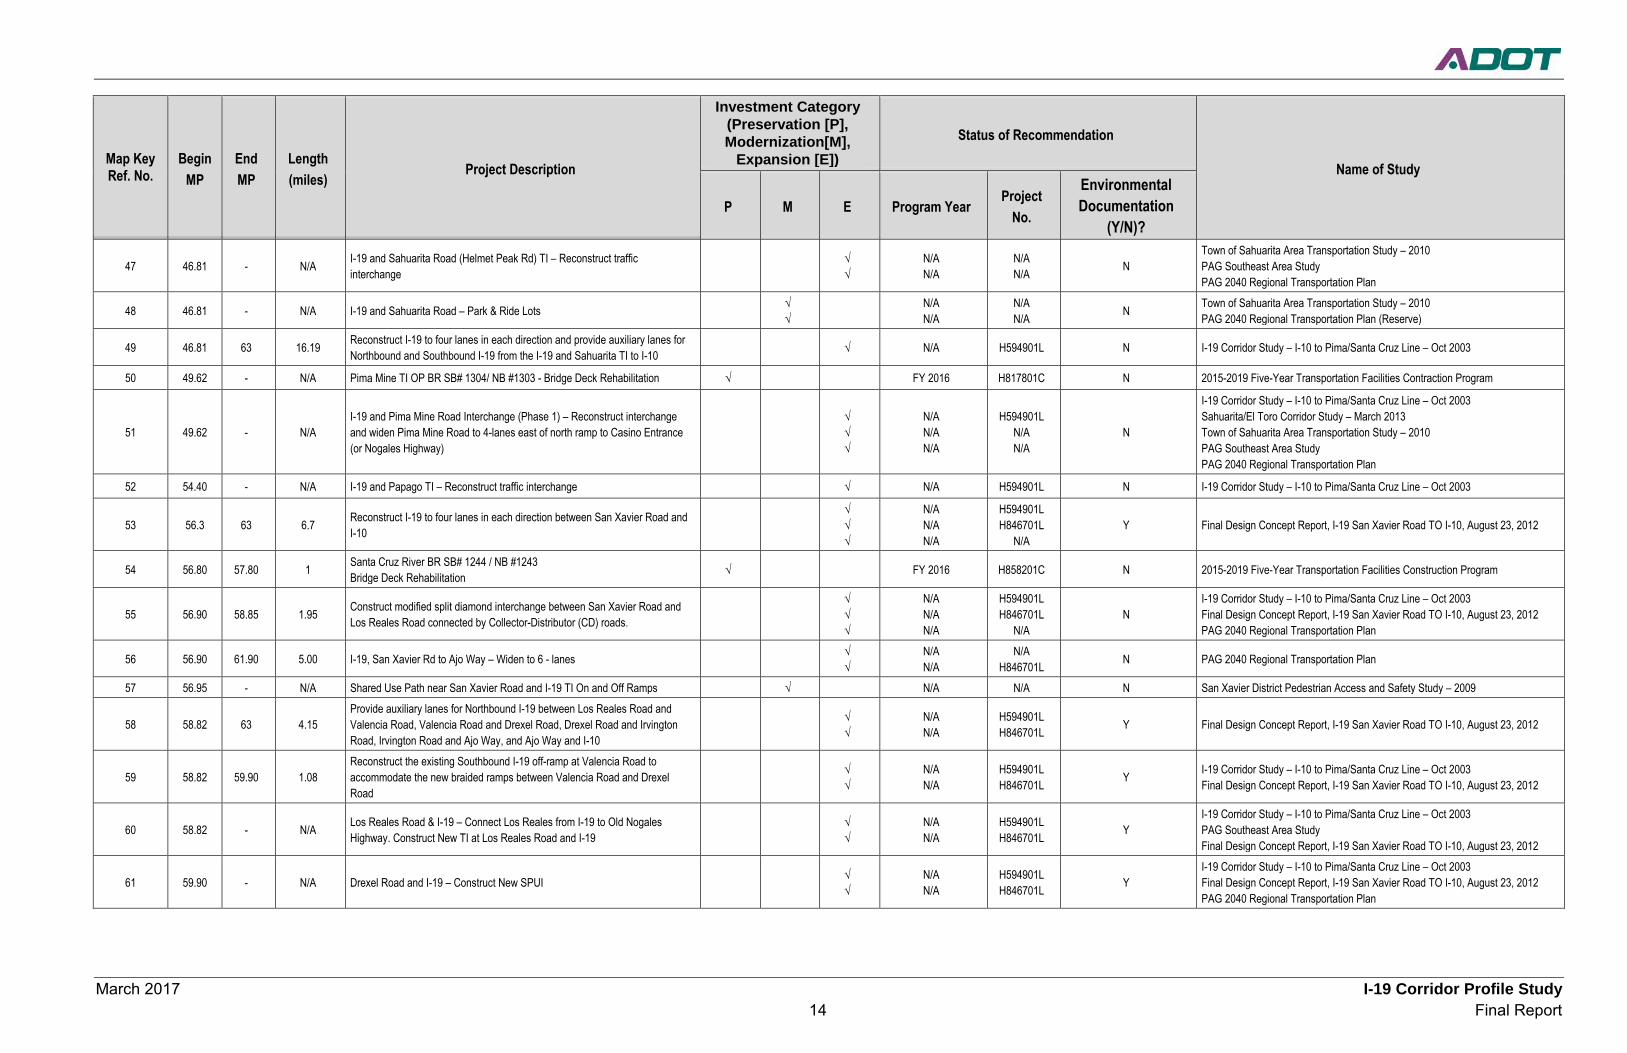
March 2017 I-19 Corridor Profile Study 14 Final Report
Map Key Ref. No.
Begin MP
End MP
Length (miles) Project Description
Investment Category (Preservation [P], Modernization[M],
Expansion [E]) Status of Recommendation
Name of Study
P M E Program Year Project No.
Environmental Documentation
(Y/N)?
47 46.81 - N/A I-19 and Sahuarita Road (Helmet Peak Rd) TI – Reconstruct traffic interchange √
√ N/A N/A
N/A N/A N
Town of Sahuarita Area Transportation Study – 2010 PAG Southeast Area Study PAG 2040 Regional Transportation Plan
48 46.81 - N/A I-19 and Sahuarita Road – Park & Ride Lots √ √ N/A
N/A N/A N/A N Town of Sahuarita Area Transportation Study – 2010
PAG 2040 Regional Transportation Plan (Reserve)
49 46.81 63 16.19 Reconstruct I-19 to four lanes in each direction and provide auxiliary lanes for Northbound and Southbound I-19 from the I-19 and Sahuarita TI to I-10 √ N/A H594901L N I-19 Corridor Study – I-10 to Pima/Santa Cruz Line – Oct 2003
50 49.62 - N/A Pima Mine TI OP BR SB# 1304/ NB #1303 - Bridge Deck Rehabilitation √ FY 2016 H817801C N 2015-2019 Five-Year Transportation Facilities Contraction Program
51 49.62 - N/A I-19 and Pima Mine Road Interchange (Phase 1) – Reconstruct interchange and widen Pima Mine Road to 4-lanes east of north ramp to Casino Entrance (or Nogales Highway)
√ √ √
N/A N/A N/A
H594901L N/A N/A
N
I-19 Corridor Study – I-10 to Pima/Santa Cruz Line – Oct 2003 Sahuarita/El Toro Corridor Study – March 2013 Town of Sahuarita Area Transportation Study – 2010 PAG Southeast Area Study PAG 2040 Regional Transportation Plan
52 54.40 - N/A I-19 and Papago TI – Reconstruct traffic interchange √ N/A H594901L N I-19 Corridor Study – I-10 to Pima/Santa Cruz Line – Oct 2003
53 56.3 63 6.7 Reconstruct I-19 to four lanes in each direction between San Xavier Road and I-10
√ √ √
N/A N/A N/A
H594901L H846701L
N/A Y Final Design Concept Report, I-19 San Xavier Road TO I-10, August 23, 2012
54 56.80 57.80 1 Santa Cruz River BR SB# 1244 / NB #1243 Bridge Deck Rehabilitation √ FY 2016 H858201C N 2015-2019 Five-Year Transportation Facilities Construction Program
55 56.90 58.85 1.95 Construct modified split diamond interchange between San Xavier Road and Los Reales Road connected by Collector-Distributor (CD) roads.
√ √ √
N/A N/A N/A
H594901L H846701L
N/A N
I-19 Corridor Study – I-10 to Pima/Santa Cruz Line – Oct 2003 Final Design Concept Report, I-19 San Xavier Road TO I-10, August 23, 2012 PAG 2040 Regional Transportation Plan
56 56.90 61.90 5.00 I-19, San Xavier Rd to Ajo Way – Widen to 6 - lanes √ √
N/A N/A
N/A H846701L N PAG 2040 Regional Transportation Plan
57 56.95 - N/A Shared Use Path near San Xavier Road and I-19 TI On and Off Ramps √ N/A N/A N San Xavier District Pedestrian Access and Safety Study – 2009
58 58.82 63 4.15 Provide auxiliary lanes for Northbound I-19 between Los Reales Road and Valencia Road, Valencia Road and Drexel Road, Drexel Road and Irvington Road, Irvington Road and Ajo Way, and Ajo Way and I-10
√ √
N/A N/A
H594901L H846701L Y Final Design Concept Report, I-19 San Xavier Road TO I-10, August 23, 2012
59 58.82 59.90 1.08 Reconstruct the existing Southbound I-19 off-ramp at Valencia Road to accommodate the new braided ramps between Valencia Road and Drexel Road
√ √
N/A N/A
H594901L H846701L Y I-19 Corridor Study – I-10 to Pima/Santa Cruz Line – Oct 2003
Final Design Concept Report, I-19 San Xavier Road TO I-10, August 23, 2012
60 58.82 - N/A Los Reales Road & I-19 – Connect Los Reales from I-19 to Old Nogales Highway. Construct New TI at Los Reales Road and I-19 √
√ N/A N/A
H594901L H846701L Y
I-19 Corridor Study – I-10 to Pima/Santa Cruz Line – Oct 2003 PAG Southeast Area Study Final Design Concept Report, I-19 San Xavier Road TO I-10, August 23, 2012
61 59.90 - N/A Drexel Road and I-19 – Construct New SPUI √ √
N/A N/A
H594901L H846701L Y
I-19 Corridor Study – I-10 to Pima/Santa Cruz Line – Oct 2003 Final Design Concept Report, I-19 San Xavier Road TO I-10, August 23, 2012 PAG 2040 Regional Transportation Plan
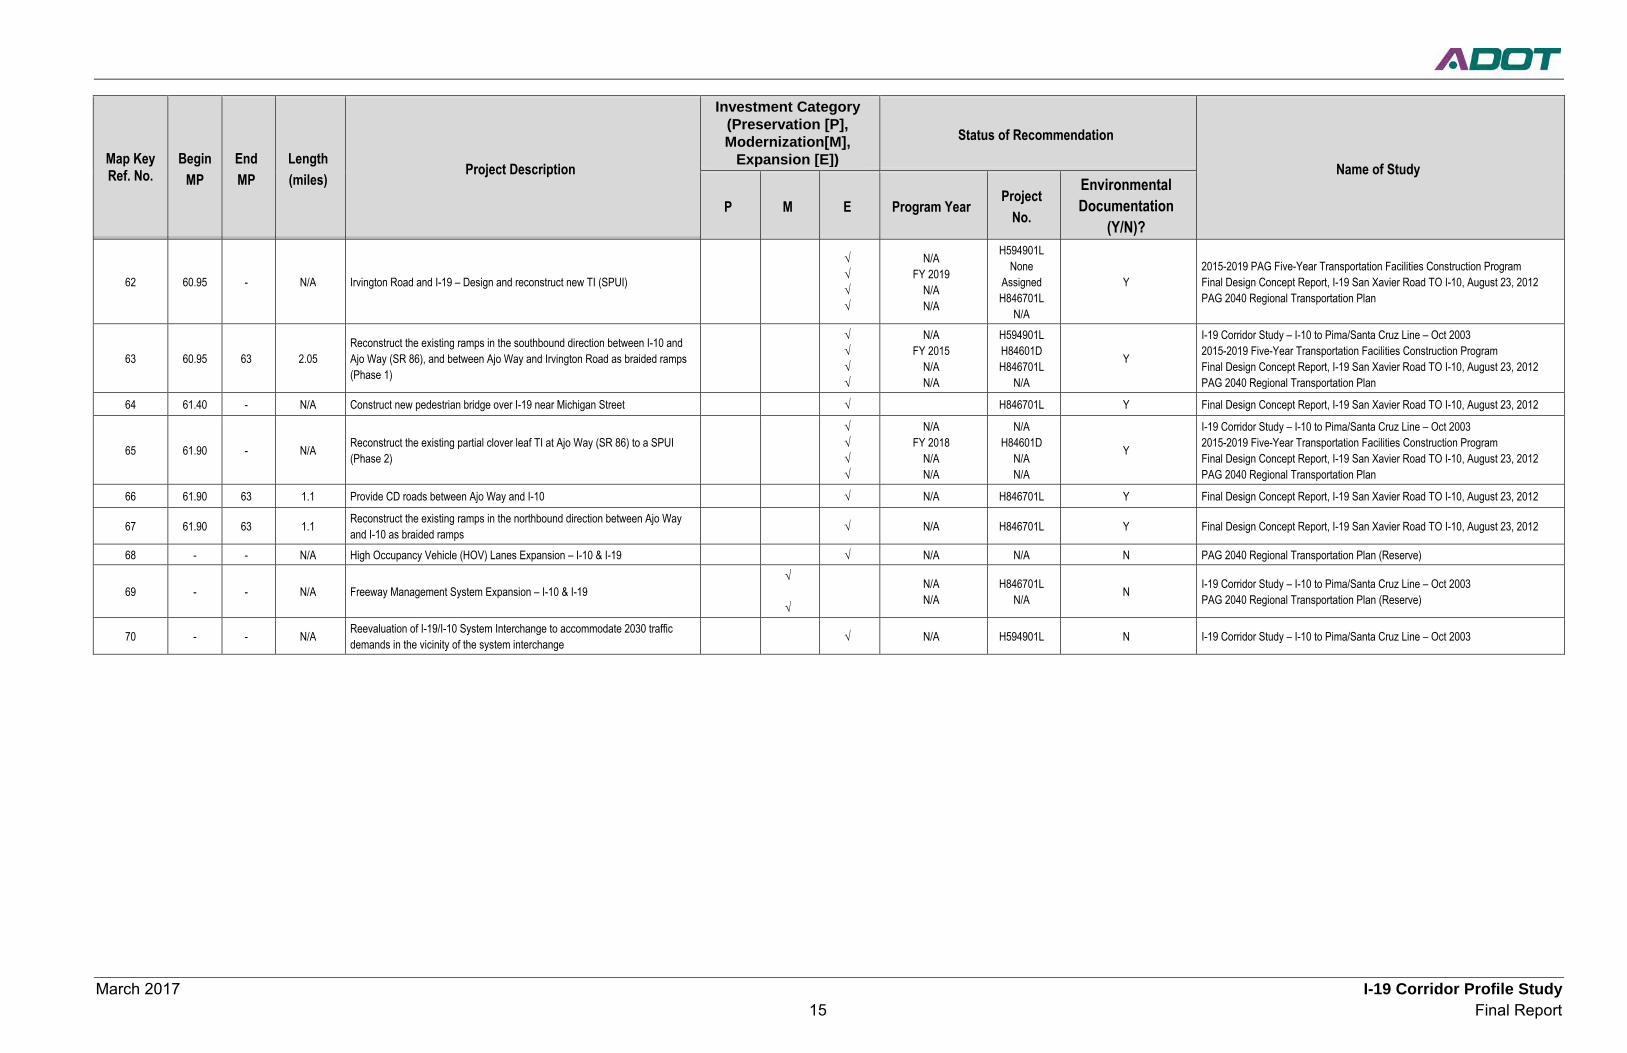
March 2017 I-19 Corridor Profile Study 15 Final Report
Map Key Ref. No.
Begin MP
End MP
Length (miles) Project Description
Investment Category (Preservation [P], Modernization[M],
Expansion [E]) Status of Recommendation
Name of Study
P M E Program Year Project No.
Environmental Documentation
(Y/N)?
62 60.95 - N/A Irvington Road and I-19 – Design and reconstruct new TI (SPUI)
√ √ √ √
N/A FY 2019
N/A N/A
H594901L None
Assigned H846701L
N/A
Y 2015-2019 PAG Five-Year Transportation Facilities Construction Program Final Design Concept Report, I-19 San Xavier Road TO I-10, August 23, 2012 PAG 2040 Regional Transportation Plan
63 60.95 63 2.05 Reconstruct the existing ramps in the southbound direction between I-10 and Ajo Way (SR 86), and between Ajo Way and Irvington Road as braided ramps (Phase 1)
√ √ √ √
N/A FY 2015
N/A N/A
H594901L H84601D H846701L
N/A
Y
I-19 Corridor Study – I-10 to Pima/Santa Cruz Line – Oct 2003 2015-2019 Five-Year Transportation Facilities Construction Program Final Design Concept Report, I-19 San Xavier Road TO I-10, August 23, 2012 PAG 2040 Regional Transportation Plan
64 61.40 - N/A Construct new pedestrian bridge over I-19 near Michigan Street √ H846701L Y Final Design Concept Report, I-19 San Xavier Road TO I-10, August 23, 2012
65 61.90 - N/A Reconstruct the existing partial clover leaf TI at Ajo Way (SR 86) to a SPUI (Phase 2)
√ √ √ √
N/A FY 2018
N/A N/A
N/A H84601D
N/A N/A
Y
I-19 Corridor Study – I-10 to Pima/Santa Cruz Line – Oct 2003 2015-2019 Five-Year Transportation Facilities Construction Program Final Design Concept Report, I-19 San Xavier Road TO I-10, August 23, 2012 PAG 2040 Regional Transportation Plan
66 61.90 63 1.1 Provide CD roads between Ajo Way and I-10 √ N/A H846701L Y Final Design Concept Report, I-19 San Xavier Road TO I-10, August 23, 2012
67 61.90 63 1.1 Reconstruct the existing ramps in the northbound direction between Ajo Way and I-10 as braided ramps √ N/A H846701L Y Final Design Concept Report, I-19 San Xavier Road TO I-10, August 23, 2012
68 - - N/A High Occupancy Vehicle (HOV) Lanes Expansion – I-10 & I-19 √ N/A N/A N PAG 2040 Regional Transportation Plan (Reserve)
69 - - N/A Freeway Management System Expansion – I-10 & I-19 √
√ N/A
N/A H846701L
N/A N I-19 Corridor Study – I-10 to Pima/Santa Cruz Line – Oct 2003 PAG 2040 Regional Transportation Plan (Reserve)
70 - - N/A Reevaluation of I-19/I-10 System Interchange to accommodate 2030 traffic demands in the vicinity of the system interchange √ N/A H594901L N I-19 Corridor Study – I-10 to Pima/Santa Cruz Line – Oct 2003
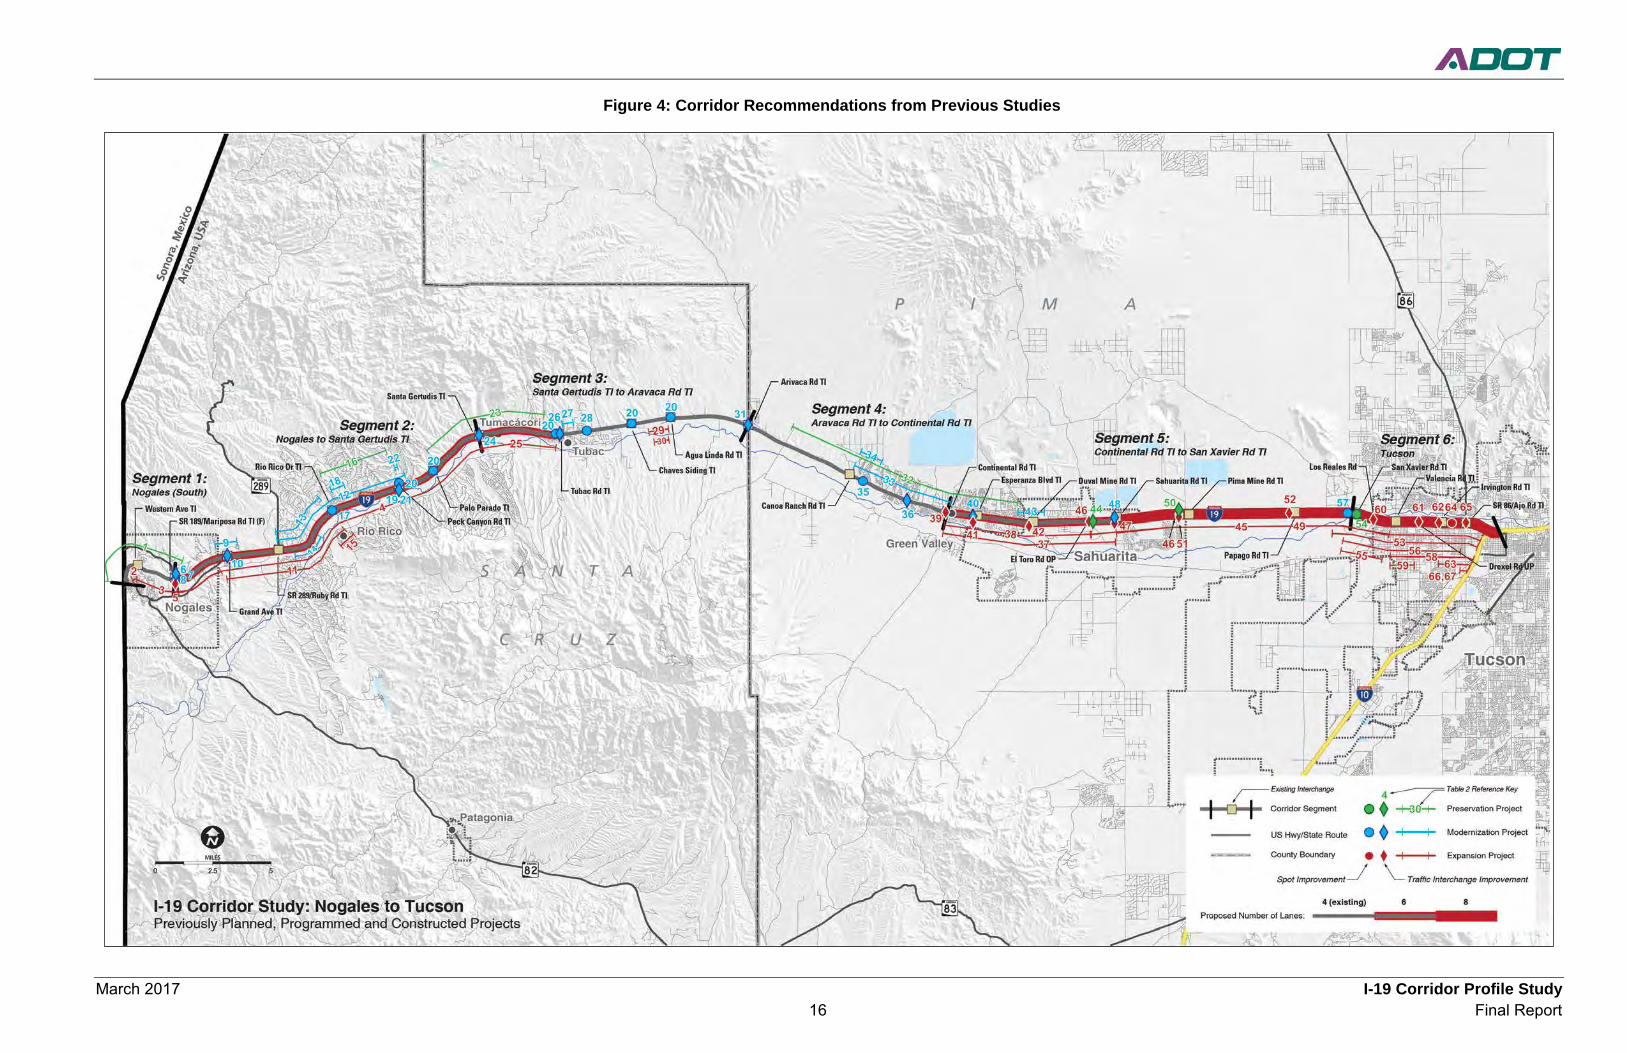
March 2017 I-19 Corridor Profile Study 16 Final Report
Figure 4: Corridor Recommendations from Previous Studies
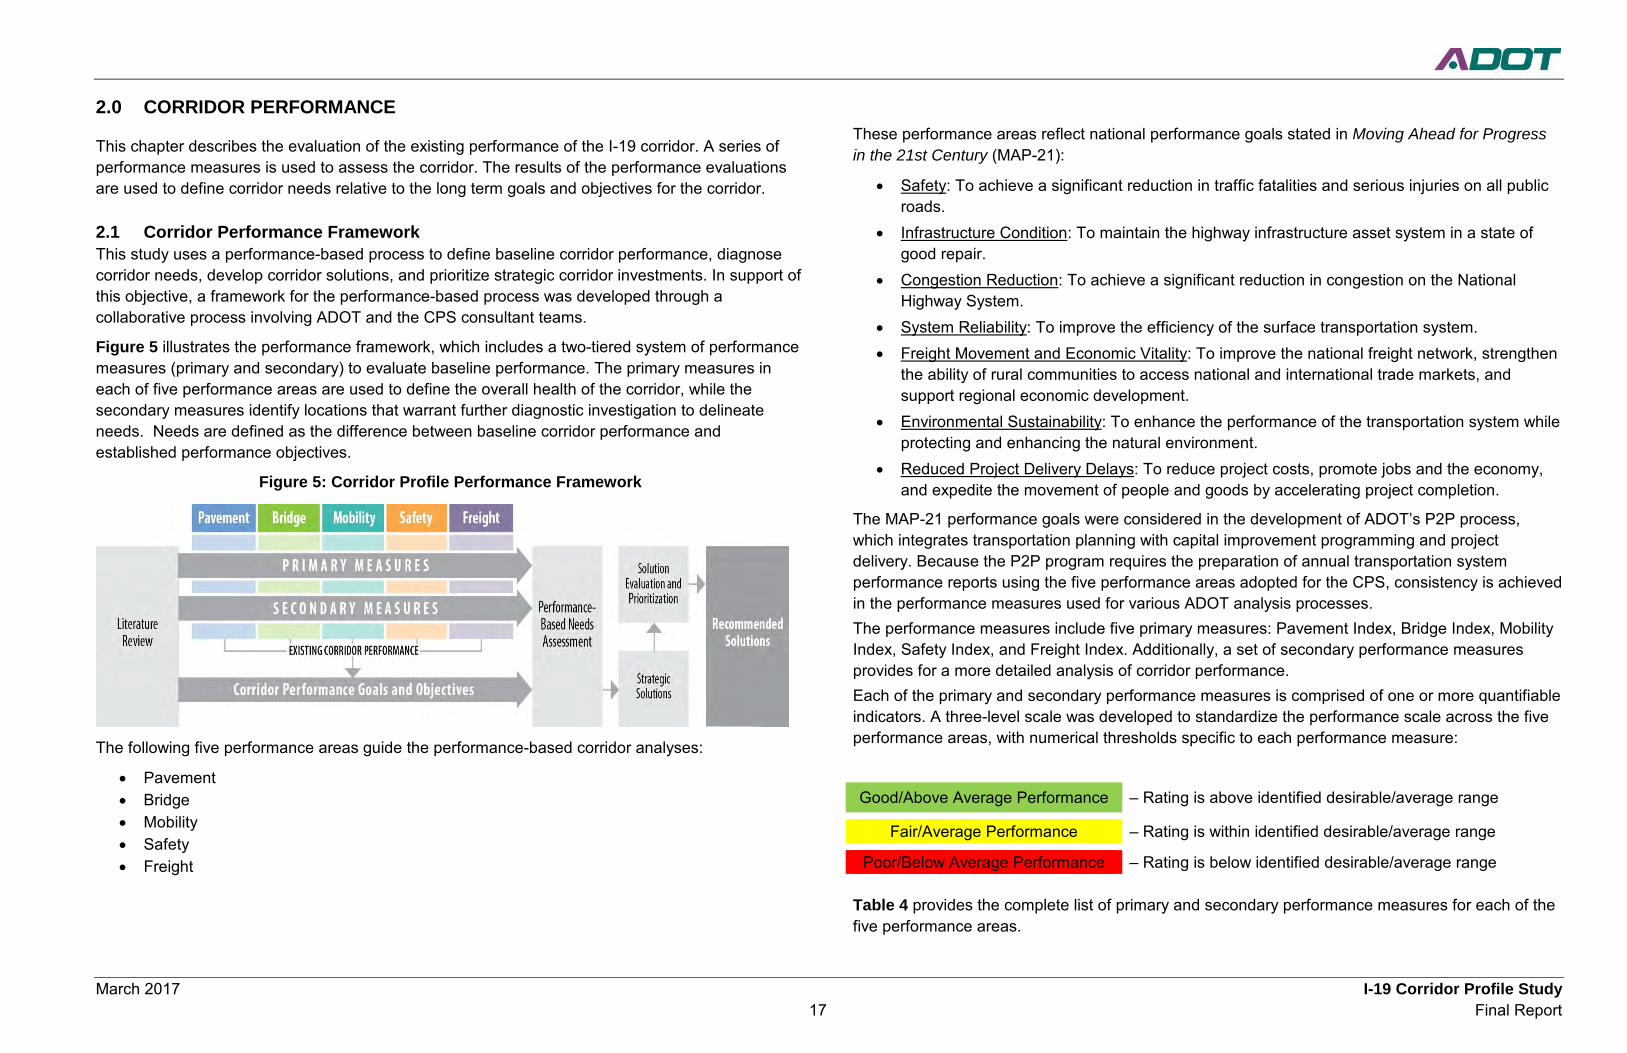
March 2017 I-19 Corridor Profile Study 17 Final Report
2.0 CORRIDOR PERFORMANCE
This chapter describes the evaluation of the existing performance of the I-19 corridor. A series of performance measures is used to assess the corridor. The results of the performance evaluations are used to define corridor needs relative to the long term goals and objectives for the corridor.
2.1 Corridor Performance Framework This study uses a performance-based process to define baseline corridor performance, diagnose corridor needs, develop corridor solutions, and prioritize strategic corridor investments. In support of this objective, a framework for the performance-based process was developed through a collaborative process involving ADOT and the CPS consultant teams.
Figure 5 illustrates the performance framework, which includes a two-tiered system of performance measures (primary and secondary) to evaluate baseline performance. The primary measures in each of five performance areas are used to define the overall health of the corridor, while the secondary measures identify locations that warrant further diagnostic investigation to delineate needs. Needs are defined as the difference between baseline corridor performance and established performance objectives.
Figure 5: Corridor Profile Performance Framework
The following five performance areas guide the performance-based corridor analyses:
• Pavement • Bridge • Mobility • Safety • Freight
These performance areas reflect national performance goals stated in Moving Ahead for Progress in the 21st Century (MAP-21):
• Safety: To achieve a significant reduction in traffic fatalities and serious injuries on all public roads.
• Infrastructure Condition: To maintain the highway infrastructure asset system in a state of good repair.
• Congestion Reduction: To achieve a significant reduction in congestion on the National Highway System.
• System Reliability: To improve the efficiency of the surface transportation system. • Freight Movement and Economic Vitality: To improve the national freight network, strengthen
the ability of rural communities to access national and international trade markets, and support regional economic development.
• Environmental Sustainability: To enhance the performance of the transportation system while protecting and enhancing the natural environment.
• Reduced Project Delivery Delays: To reduce project costs, promote jobs and the economy, and expedite the movement of people and goods by accelerating project completion.
The MAP-21 performance goals were considered in the development of ADOT’s P2P process, which integrates transportation planning with capital improvement programming and project delivery. Because the P2P program requires the preparation of annual transportation system performance reports using the five performance areas adopted for the CPS, consistency is achieved in the performance measures used for various ADOT analysis processes. The performance measures include five primary measures: Pavement Index, Bridge Index, Mobility Index, Safety Index, and Freight Index. Additionally, a set of secondary performance measures provides for a more detailed analysis of corridor performance. Each of the primary and secondary performance measures is comprised of one or more quantifiable indicators. A three-level scale was developed to standardize the performance scale across the five performance areas, with numerical thresholds specific to each performance measure:
Good/Above Average Performance – Rating is above identified desirable/average range
Fair/Average Performance – Rating is within identified desirable/average range
Poor/Below Average Performance – Rating is below identified desirable/average range Table 4 provides the complete list of primary and secondary performance measures for each of the five performance areas.
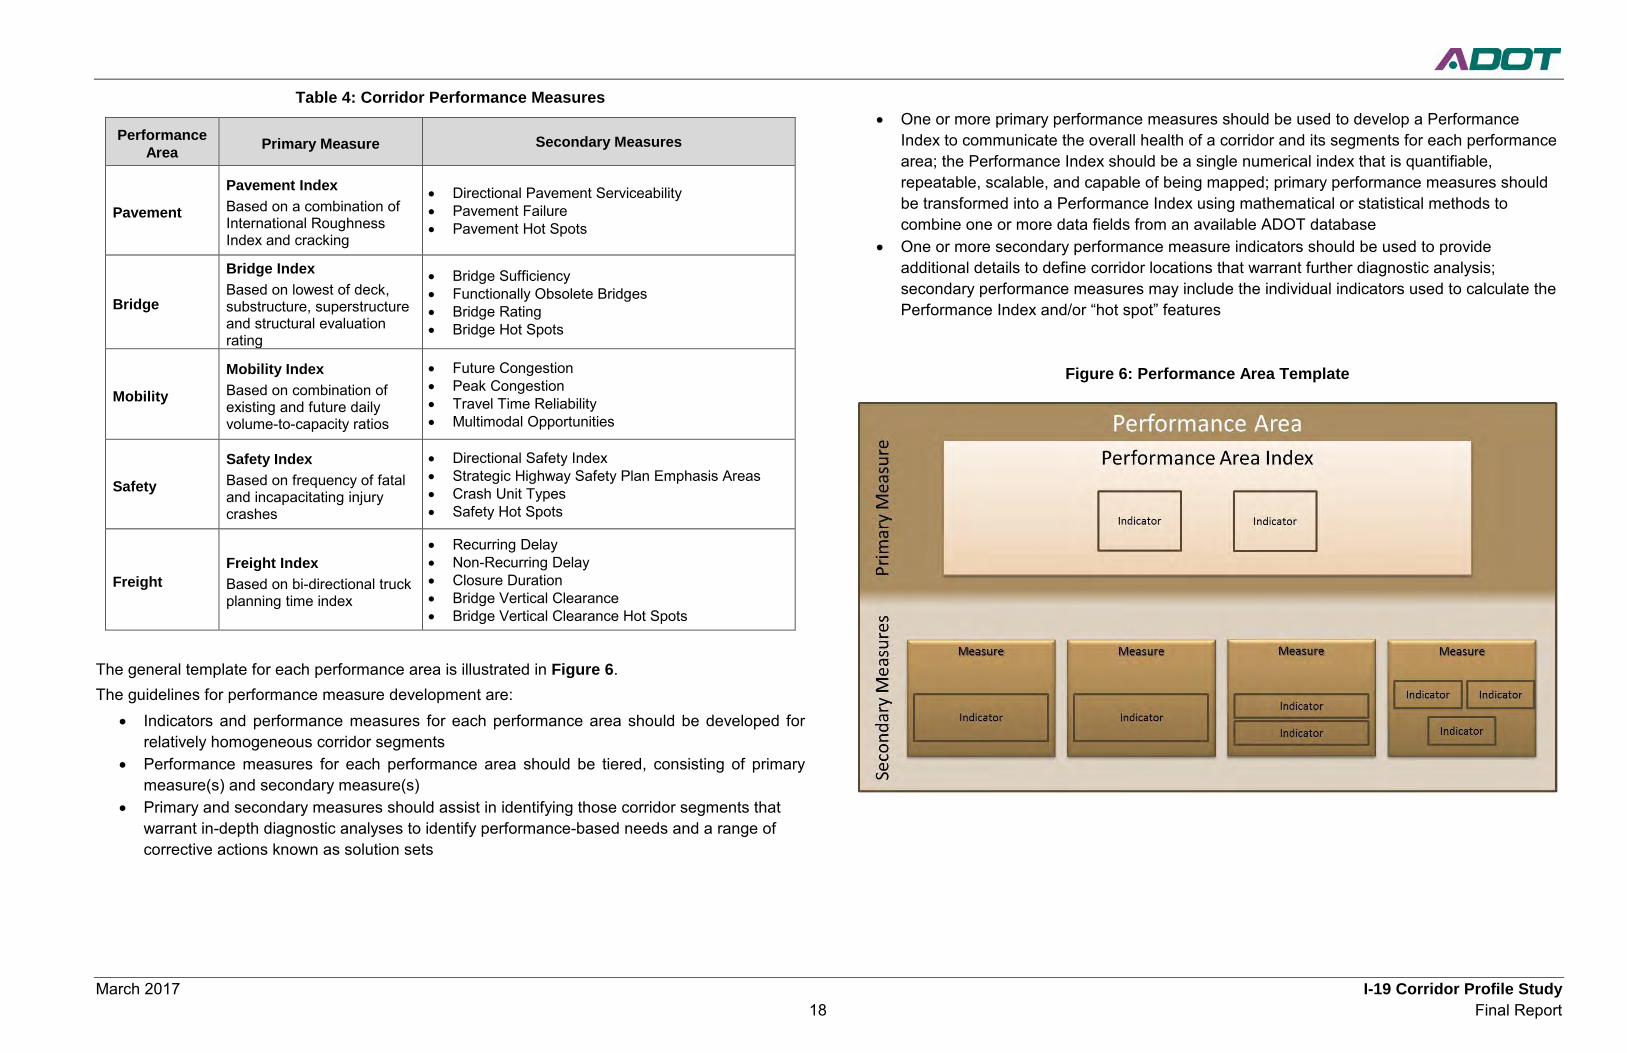
March 2017 I-19 Corridor Profile Study18 Final Report
Table 4: Corridor Performance Measures
Performance Area Primary Measure Secondary Measures
Pavement
Pavement IndexBased on a combination of International Roughness Index and cracking
• Directional Pavement Serviceability• Pavement Failure• Pavement Hot Spots
Bridge
Bridge IndexBased on lowest of deck,substructure, superstructureand structural evaluation rating
• Bridge Sufficiency • Functionally Obsolete Bridges• Bridge Rating• Bridge Hot Spots
Mobility
Mobility IndexBased on combination of existing and future daily volume-to-capacity ratios
• Future Congestion• Peak Congestion• Travel Time Reliability• Multimodal Opportunities
Safety
Safety IndexBased on frequency of fatal and incapacitating injury crashes
• Directional Safety Index• Strategic Highway Safety Plan Emphasis Areas• Crash Unit Types• Safety Hot Spots
FreightFreight IndexBased on bi-directional truck planning time index
• Recurring Delay• Non-Recurring Delay• Closure Duration• Bridge Vertical Clearance• Bridge Vertical Clearance Hot Spots
The general template for each performance area is illustrated in Figure 6.The guidelines for performance measure development are:
• Indicators and performance measures for each performance area should be developed for relatively homogeneous corridor segments
• Performance measures for each performance area should be tiered, consisting of primary measure(s) and secondary measure(s)
• Primary and secondary measures should assist in identifying those corridor segments that warrant in-depth diagnostic analyses to identify performance-based needs and a range of corrective actions known as solution sets
• One or more primary performance measures should be used to develop a Performance Index to communicate the overall health of a corridor and its segments for each performance area; the Performance Index should be a single numerical index that is quantifiable, repeatable, scalable, and capable of being mapped; primary performance measures should be transformed into a Performance Index using mathematical or statistical methods to combine one or more data fields from an available ADOT database
• One or more secondary performance measure indicators should be used to provide additional details to define corridor locations that warrant further diagnostic analysis; secondary performance measures may include the individual indicators used to calculate the Performance Index and/or “hot spot” features
Figure 6: Performance Area Template
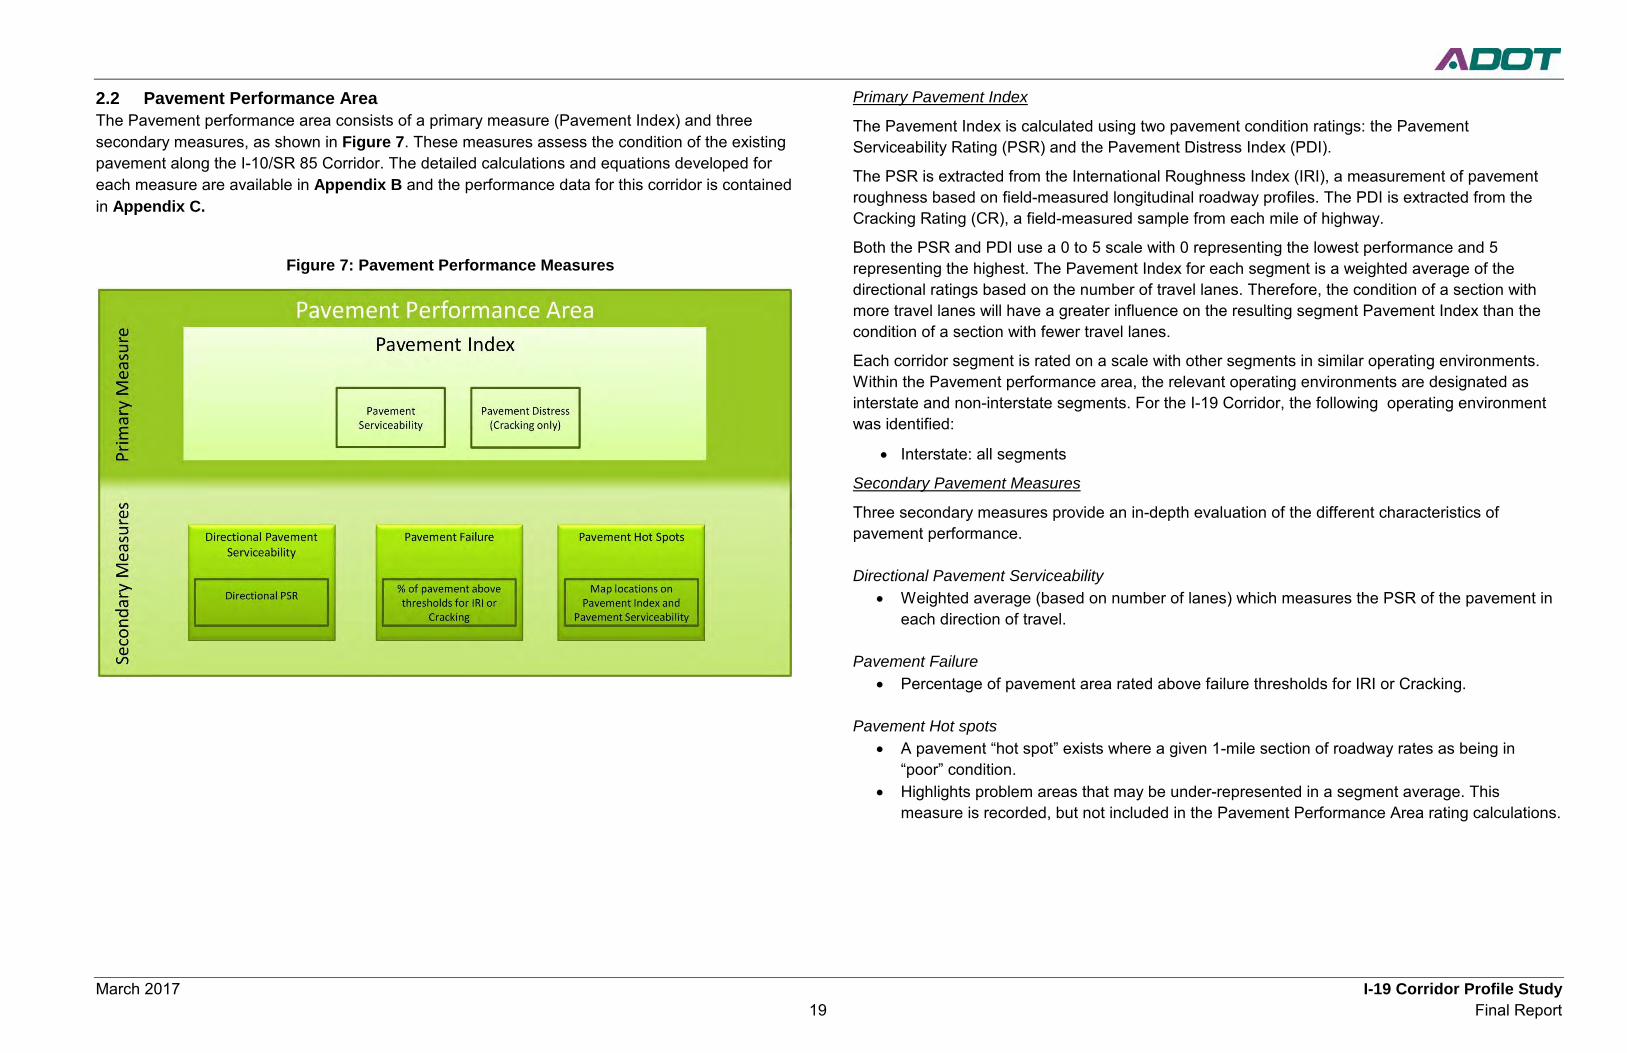
March 2017 I-19 Corridor Profile Study 19 Final Report
2.2 Pavement Performance Area The Pavement performance area consists of a primary measure (Pavement Index) and three secondary measures, as shown in Figure 7. These measures assess the condition of the existing pavement along the I-10/SR 85 Corridor. The detailed calculations and equations developed for each measure are available in Appendix B and the performance data for this corridor is contained in Appendix C.
Figure 7: Pavement Performance Measures
Primary Pavement Index
The Pavement Index is calculated using two pavement condition ratings: the Pavement Serviceability Rating (PSR) and the Pavement Distress Index (PDI).
The PSR is extracted from the International Roughness Index (IRI), a measurement of pavement roughness based on field-measured longitudinal roadway profiles. The PDI is extracted from the Cracking Rating (CR), a field-measured sample from each mile of highway.
Both the PSR and PDI use a 0 to 5 scale with 0 representing the lowest performance and 5 representing the highest. The Pavement Index for each segment is a weighted average of the directional ratings based on the number of travel lanes. Therefore, the condition of a section with more travel lanes will have a greater influence on the resulting segment Pavement Index than the condition of a section with fewer travel lanes.
Each corridor segment is rated on a scale with other segments in similar operating environments. Within the Pavement performance area, the relevant operating environments are designated as interstate and non-interstate segments. For the I-19 Corridor, the following operating environment was identified:
• Interstate: all segments
Secondary Pavement Measures
Three secondary measures provide an in-depth evaluation of the different characteristics of pavement performance.
Directional Pavement Serviceability • Weighted average (based on number of lanes) which measures the PSR of the pavement in
each direction of travel.
Pavement Failure • Percentage of pavement area rated above failure thresholds for IRI or Cracking.
Pavement Hot spots • A pavement “hot spot” exists where a given 1-mile section of roadway rates as being in
“poor” condition. • Highlights problem areas that may be under-represented in a segment average. This
measure is recorded, but not included in the Pavement Performance Area rating calculations.
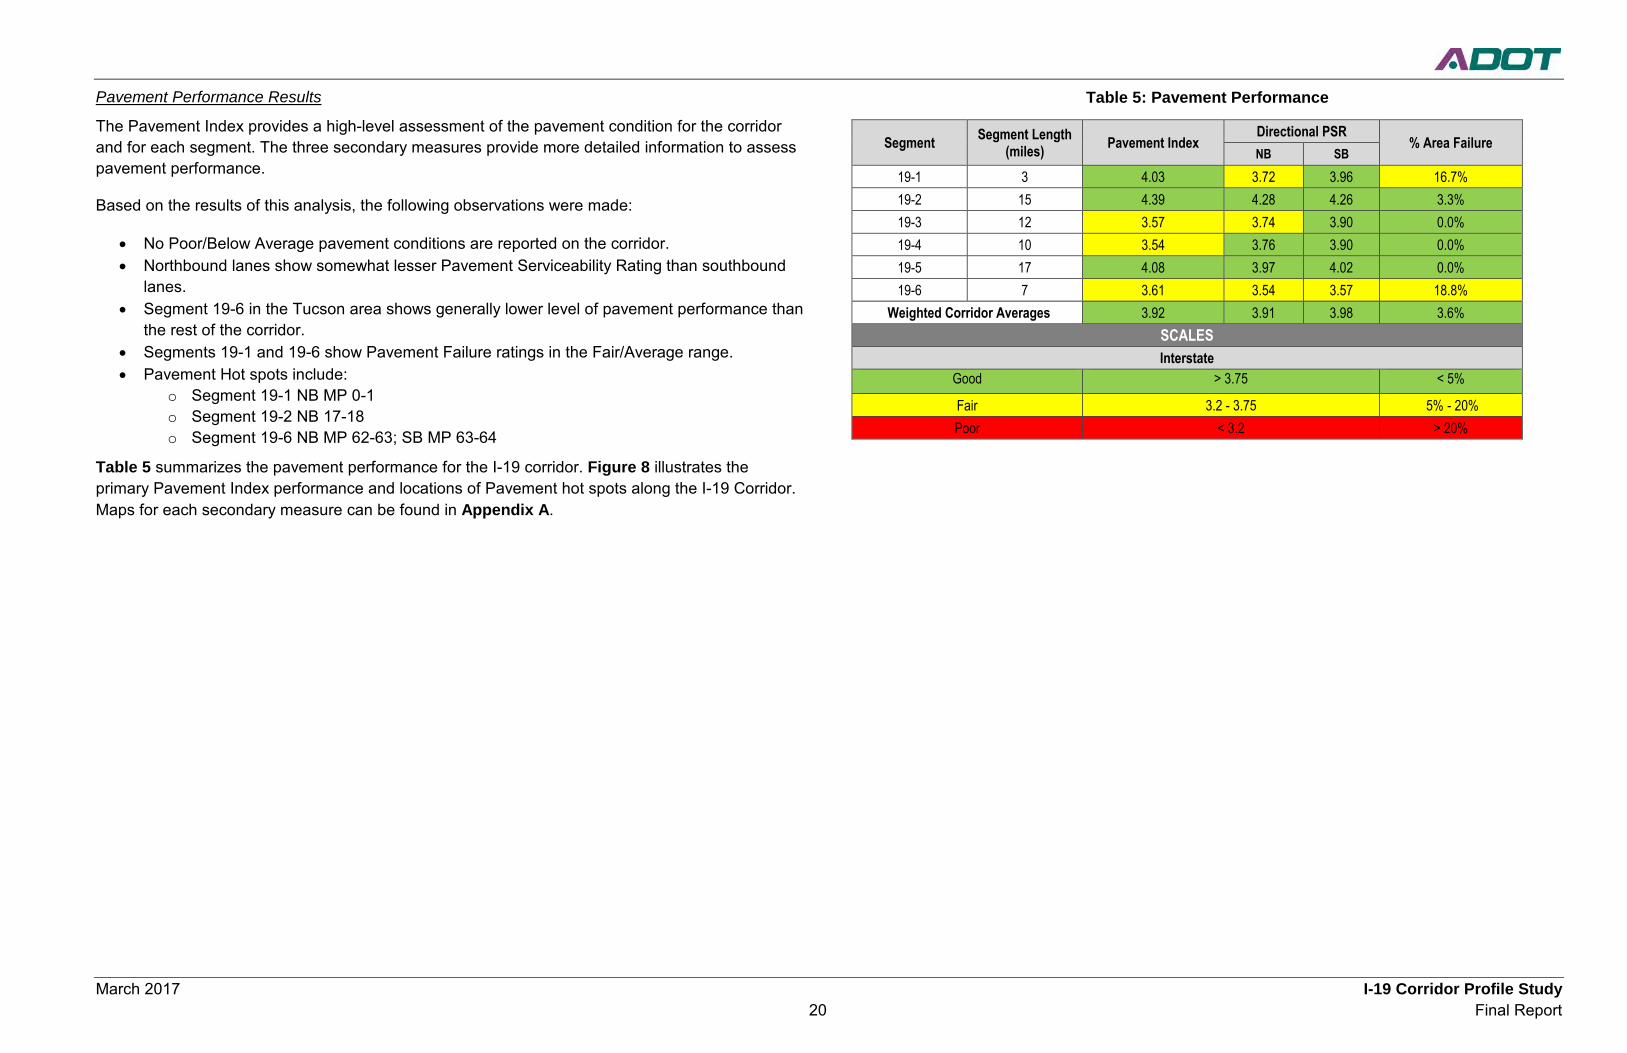
March 2017 I-19 Corridor Profile Study 20 Final Report
Pavement Performance Results
The Pavement Index provides a high-level assessment of the pavement condition for the corridor and for each segment. The three secondary measures provide more detailed information to assess pavement performance.
Based on the results of this analysis, the following observations were made:
• No Poor/Below Average pavement conditions are reported on the corridor. • Northbound lanes show somewhat lesser Pavement Serviceability Rating than southbound
lanes. • Segment 19-6 in the Tucson area shows generally lower level of pavement performance than
the rest of the corridor. • Segments 19-1 and 19-6 show Pavement Failure ratings in the Fair/Average range. • Pavement Hot spots include:
o Segment 19-1 NB MP 0-1 o Segment 19-2 NB 17-18 o Segment 19-6 NB MP 62-63; SB MP 63-64
Table 5 summarizes the pavement performance for the I-19 corridor. Figure 8 illustrates the primary Pavement Index performance and locations of Pavement hot spots along the I-19 Corridor. Maps for each secondary measure can be found in Appendix A.
Table 5: Pavement Performance
Segment Segment Length (miles) Pavement Index
Directional PSR % Area Failure
NB SB
19-1 3 4.03 3.72 3.96 16.7% 19-2 15 4.39 4.28 4.26 3.3% 19-3 12 3.57 3.74 3.90 0.0% 19-4 10 3.54 3.76 3.90 0.0% 19-5 17 4.08 3.97 4.02 0.0% 19-6 7 3.61 3.54 3.57 18.8%
Weighted Corridor Averages 3.92 3.91 3.98 3.6% SCALES Interstate
Good > 3.75 < 5% Fair 3.2 - 3.75 5% - 20% Poor < 3.2 > 20%
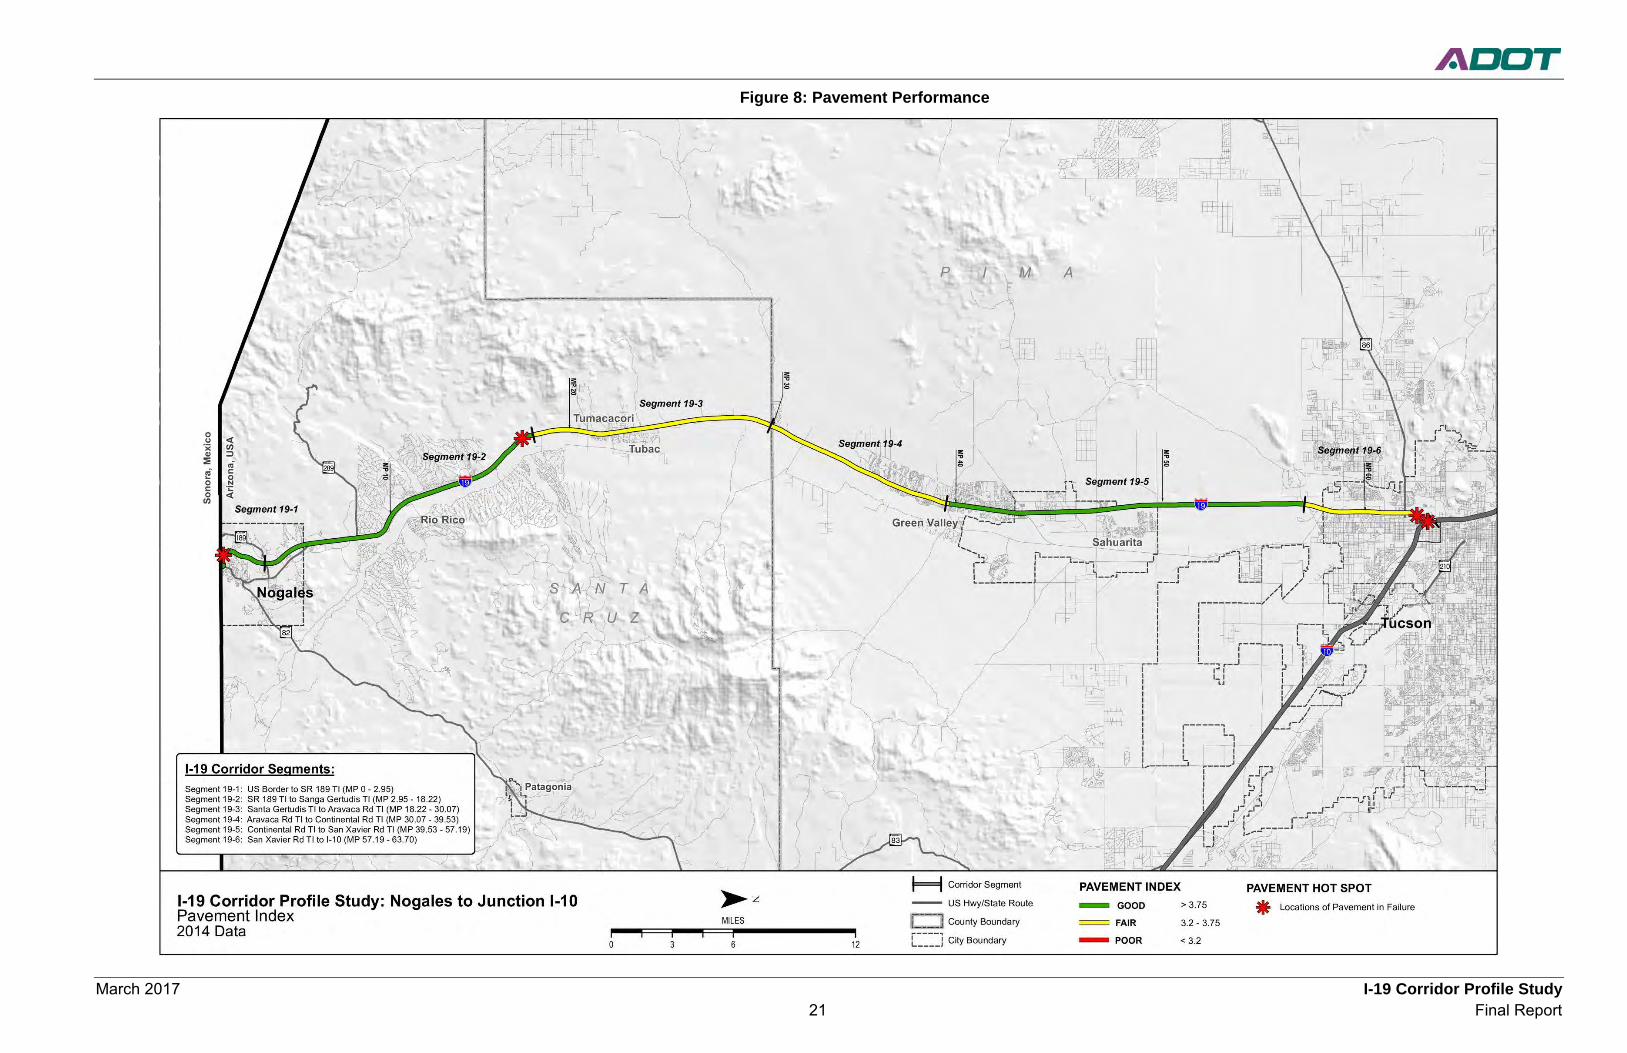
March 2017 I-19 Corridor Profile Study 21 Final Report
Figure 8: Pavement Performance
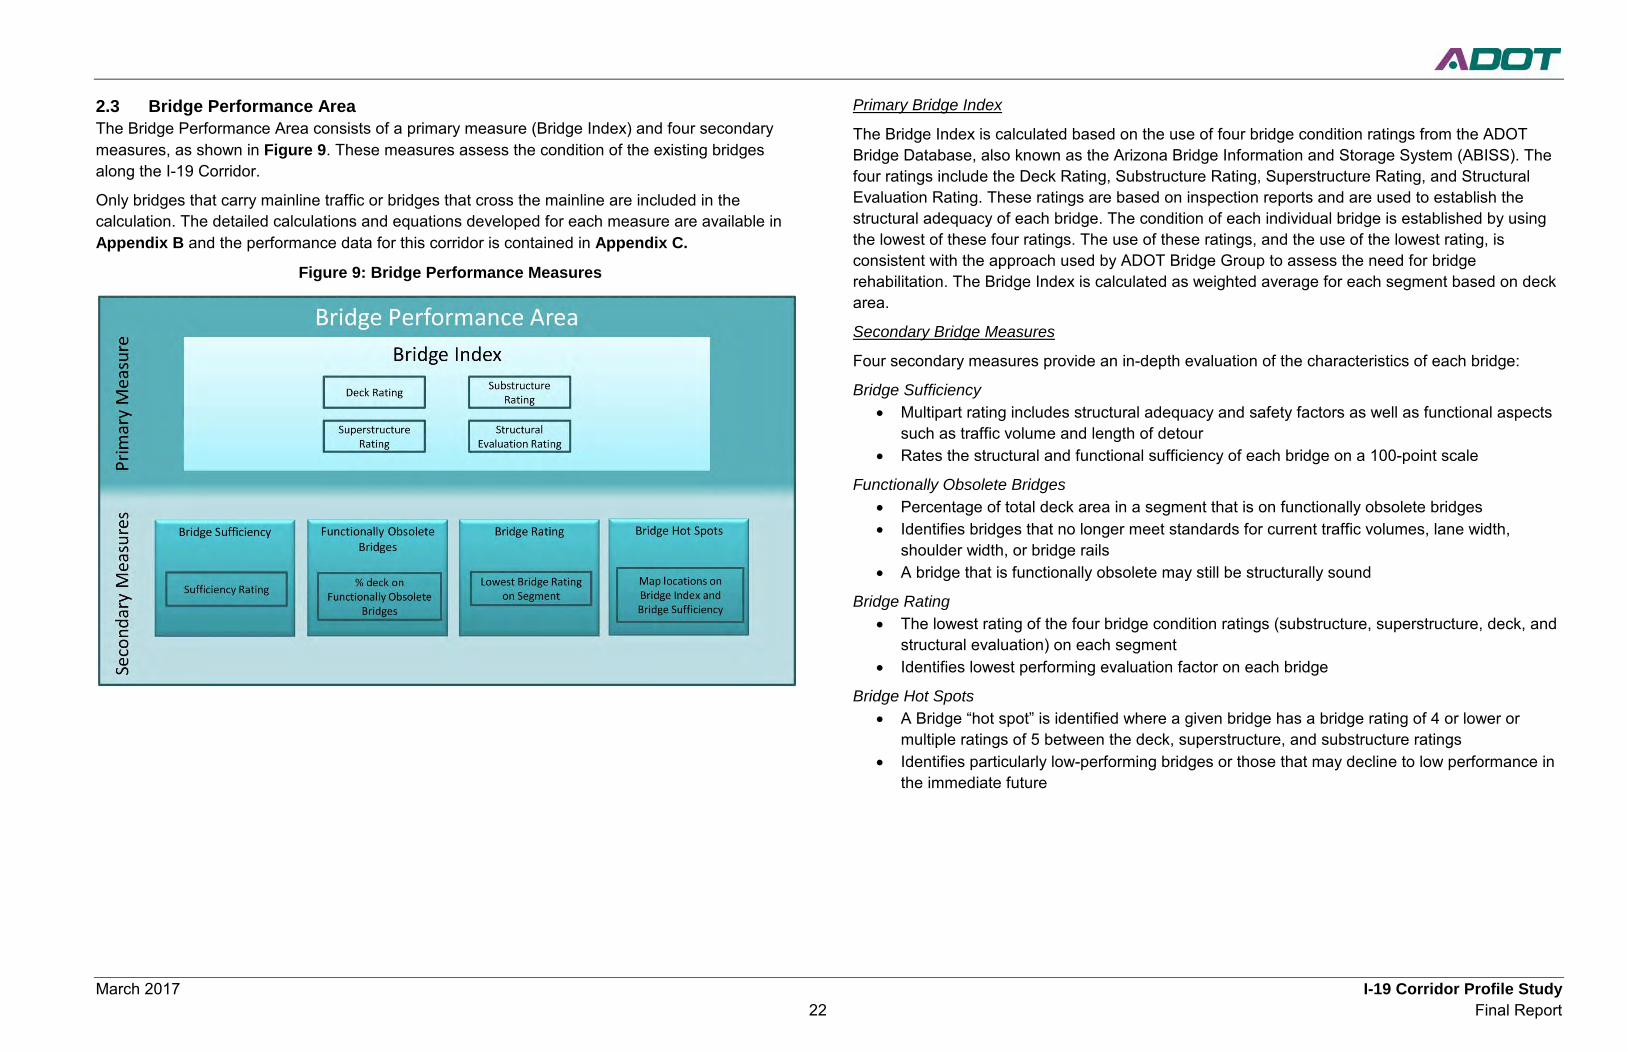
March 2017 I-19 Corridor Profile Study 22 Final Report
2.3 Bridge Performance Area The Bridge Performance Area consists of a primary measure (Bridge Index) and four secondary measures, as shown in Figure 9. These measures assess the condition of the existing bridges along the I-19 Corridor.
Only bridges that carry mainline traffic or bridges that cross the mainline are included in the calculation. The detailed calculations and equations developed for each measure are available in Appendix B and the performance data for this corridor is contained in Appendix C.
Figure 9: Bridge Performance Measures
Primary Bridge Index
The Bridge Index is calculated based on the use of four bridge condition ratings from the ADOT Bridge Database, also known as the Arizona Bridge Information and Storage System (ABISS). The four ratings include the Deck Rating, Substructure Rating, Superstructure Rating, and Structural Evaluation Rating. These ratings are based on inspection reports and are used to establish the structural adequacy of each bridge. The condition of each individual bridge is established by using the lowest of these four ratings. The use of these ratings, and the use of the lowest rating, is consistent with the approach used by ADOT Bridge Group to assess the need for bridge rehabilitation. The Bridge Index is calculated as weighted average for each segment based on deck area.
Secondary Bridge Measures
Four secondary measures provide an in-depth evaluation of the characteristics of each bridge:
Bridge Sufficiency • Multipart rating includes structural adequacy and safety factors as well as functional aspects
such as traffic volume and length of detour • Rates the structural and functional sufficiency of each bridge on a 100-point scale
Functionally Obsolete Bridges • Percentage of total deck area in a segment that is on functionally obsolete bridges • Identifies bridges that no longer meet standards for current traffic volumes, lane width,
shoulder width, or bridge rails • A bridge that is functionally obsolete may still be structurally sound
Bridge Rating • The lowest rating of the four bridge condition ratings (substructure, superstructure, deck, and
structural evaluation) on each segment • Identifies lowest performing evaluation factor on each bridge
Bridge Hot Spots • A Bridge “hot spot” is identified where a given bridge has a bridge rating of 4 or lower or
multiple ratings of 5 between the deck, superstructure, and substructure ratings • Identifies particularly low-performing bridges or those that may decline to low performance in
the immediate future
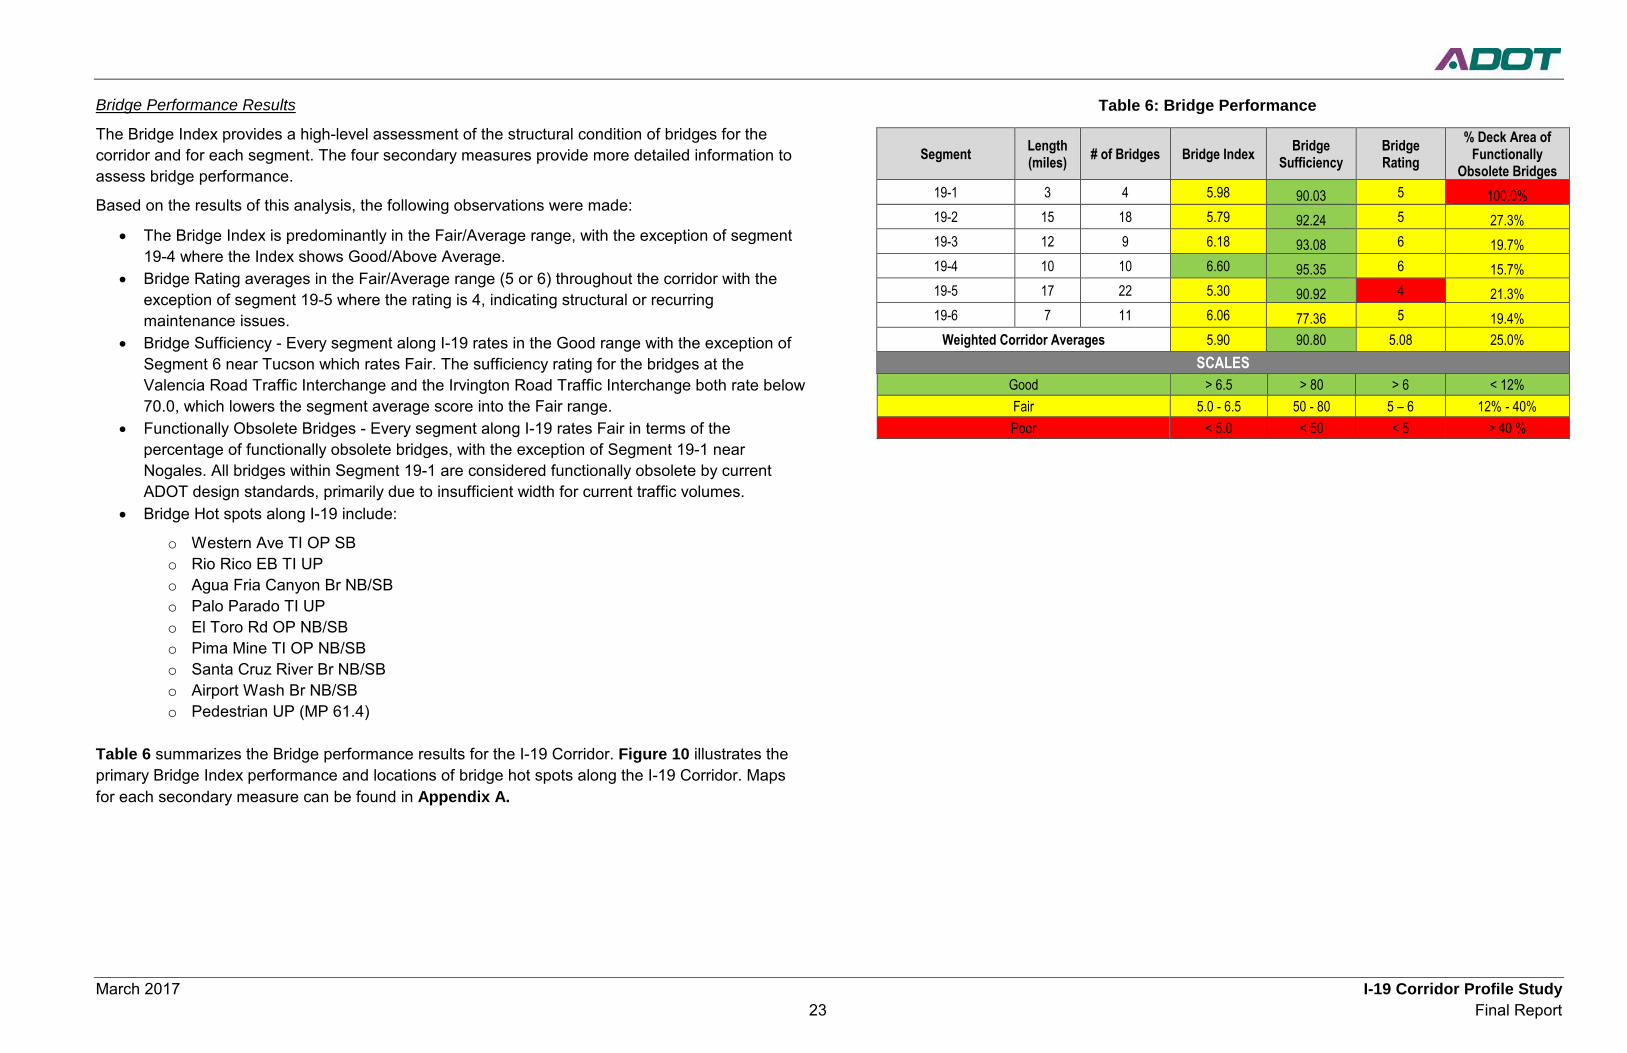
March 2017 I-19 Corridor Profile Study 23 Final Report
Bridge Performance Results
The Bridge Index provides a high-level assessment of the structural condition of bridges for the corridor and for each segment. The four secondary measures provide more detailed information to assess bridge performance.
Based on the results of this analysis, the following observations were made:
• The Bridge Index is predominantly in the Fair/Average range, with the exception of segment 19-4 where the Index shows Good/Above Average.
• Bridge Rating averages in the Fair/Average range (5 or 6) throughout the corridor with the exception of segment 19-5 where the rating is 4, indicating structural or recurring maintenance issues.
• Bridge Sufficiency - Every segment along I-19 rates in the Good range with the exception of Segment 6 near Tucson which rates Fair. The sufficiency rating for the bridges at the Valencia Road Traffic Interchange and the Irvington Road Traffic Interchange both rate below 70.0, which lowers the segment average score into the Fair range.
• Functionally Obsolete Bridges - Every segment along I-19 rates Fair in terms of the percentage of functionally obsolete bridges, with the exception of Segment 19-1 near Nogales. All bridges within Segment 19-1 are considered functionally obsolete by current ADOT design standards, primarily due to insufficient width for current traffic volumes.
• Bridge Hot spots along I-19 include:
o Western Ave TI OP SB o Rio Rico EB TI UP o Agua Fria Canyon Br NB/SB o Palo Parado TI UP o El Toro Rd OP NB/SB o Pima Mine TI OP NB/SB o Santa Cruz River Br NB/SB o Airport Wash Br NB/SB o Pedestrian UP (MP 61.4)
Table 6 summarizes the Bridge performance results for the I-19 Corridor. Figure 10 illustrates the primary Bridge Index performance and locations of bridge hot spots along the I-19 Corridor. Maps for each secondary measure can be found in Appendix A.
Table 6: Bridge Performance
Segment Length (miles) # of Bridges Bridge Index Bridge
Sufficiency Bridge Rating
% Deck Area of Functionally
Obsolete Bridges 19-1 3 4 5.98 90.03 5 100.0% 19-2 15 18 5.79 92.24 5 27.3% 19-3 12 9 6.18 93.08 6 19.7% 19-4 10 10 6.60 95.35 6 15.7% 19-5 17 22 5.30 90.92 4 21.3% 19-6 7 11 6.06 77.36 5 19.4%
Weighted Corridor Averages 5.90 90.80 5.08 25.0% SCALES
Good > 6.5 > 80 > 6 < 12% Fair 5.0 - 6.5 50 - 80 5 – 6 12% - 40% Poor < 5.0 < 50 < 5 > 40 %
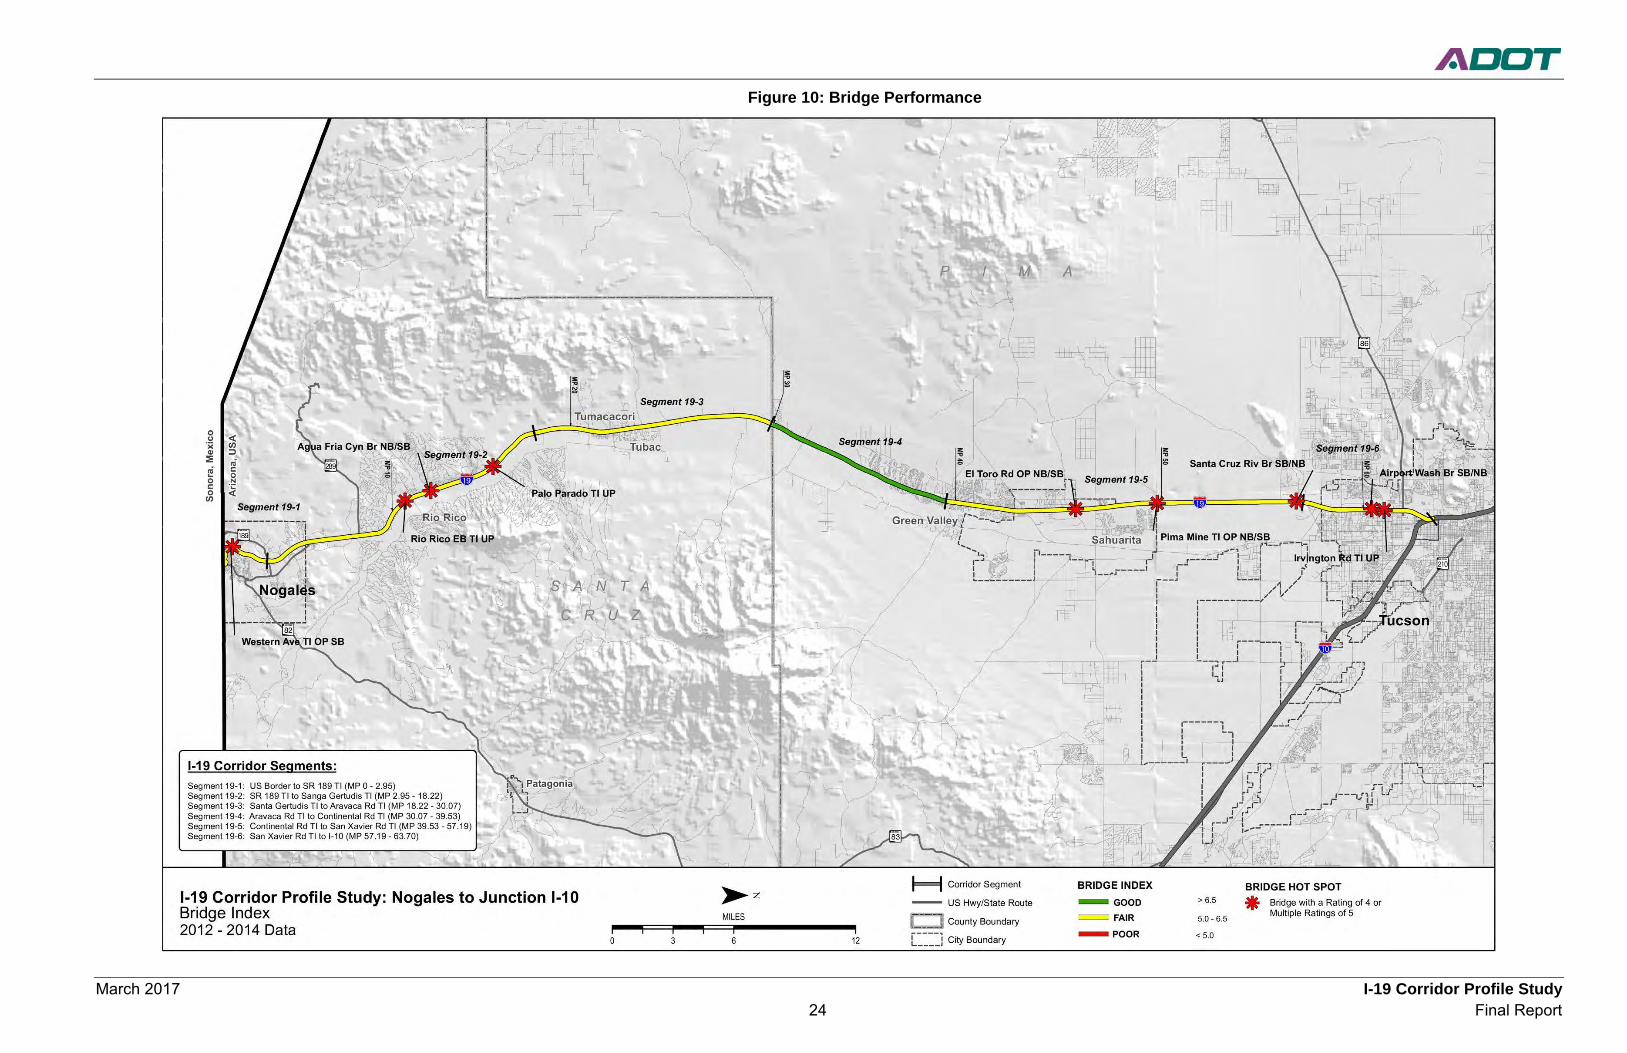
March 2017 I-19 Corridor Profile Study 24 Final Report
Figure 10: Bridge Performance
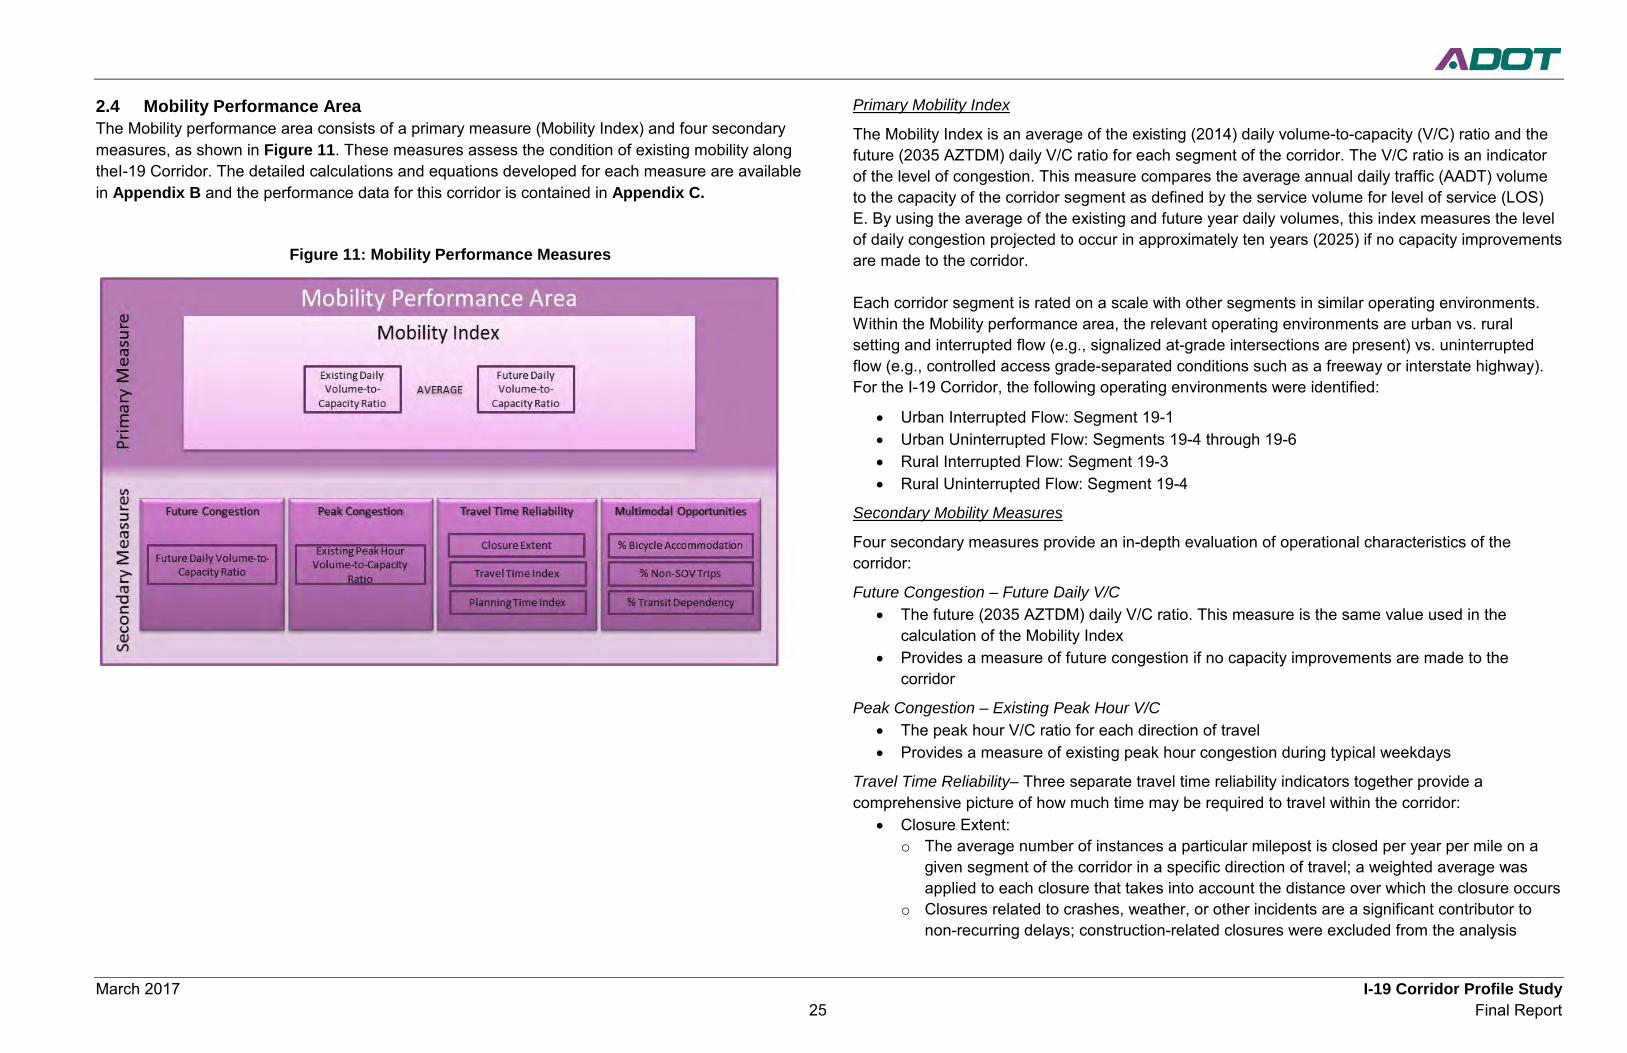
March 2017 I-19 Corridor Profile Study 25 Final Report
2.4 Mobility Performance Area The Mobility performance area consists of a primary measure (Mobility Index) and four secondary measures, as shown in Figure 11. These measures assess the condition of existing mobility along theI-19 Corridor. The detailed calculations and equations developed for each measure are available in Appendix B and the performance data for this corridor is contained in Appendix C.
Figure 11: Mobility Performance Measures
Primary Mobility Index
The Mobility Index is an average of the existing (2014) daily volume-to-capacity (V/C) ratio and the future (2035 AZTDM) daily V/C ratio for each segment of the corridor. The V/C ratio is an indicator of the level of congestion. This measure compares the average annual daily traffic (AADT) volume to the capacity of the corridor segment as defined by the service volume for level of service (LOS) E. By using the average of the existing and future year daily volumes, this index measures the level of daily congestion projected to occur in approximately ten years (2025) if no capacity improvements are made to the corridor.
Each corridor segment is rated on a scale with other segments in similar operating environments. Within the Mobility performance area, the relevant operating environments are urban vs. rural setting and interrupted flow (e.g., signalized at-grade intersections are present) vs. uninterrupted flow (e.g., controlled access grade-separated conditions such as a freeway or interstate highway). For the I-19 Corridor, the following operating environments were identified:
• Urban Interrupted Flow: Segment 19-1 • Urban Uninterrupted Flow: Segments 19-4 through 19-6 • Rural Interrupted Flow: Segment 19-3 • Rural Uninterrupted Flow: Segment 19-4
Secondary Mobility Measures
Four secondary measures provide an in-depth evaluation of operational characteristics of the corridor:
Future Congestion – Future Daily V/C • The future (2035 AZTDM) daily V/C ratio. This measure is the same value used in the
calculation of the Mobility Index • Provides a measure of future congestion if no capacity improvements are made to the
corridor
Peak Congestion – Existing Peak Hour V/C • The peak hour V/C ratio for each direction of travel • Provides a measure of existing peak hour congestion during typical weekdays
Travel Time Reliability– Three separate travel time reliability indicators together provide a comprehensive picture of how much time may be required to travel within the corridor:
• Closure Extent: o The average number of instances a particular milepost is closed per year per mile on a
given segment of the corridor in a specific direction of travel; a weighted average was applied to each closure that takes into account the distance over which the closure occurs
o Closures related to crashes, weather, or other incidents are a significant contributor to non-recurring delays; construction-related closures were excluded from the analysis
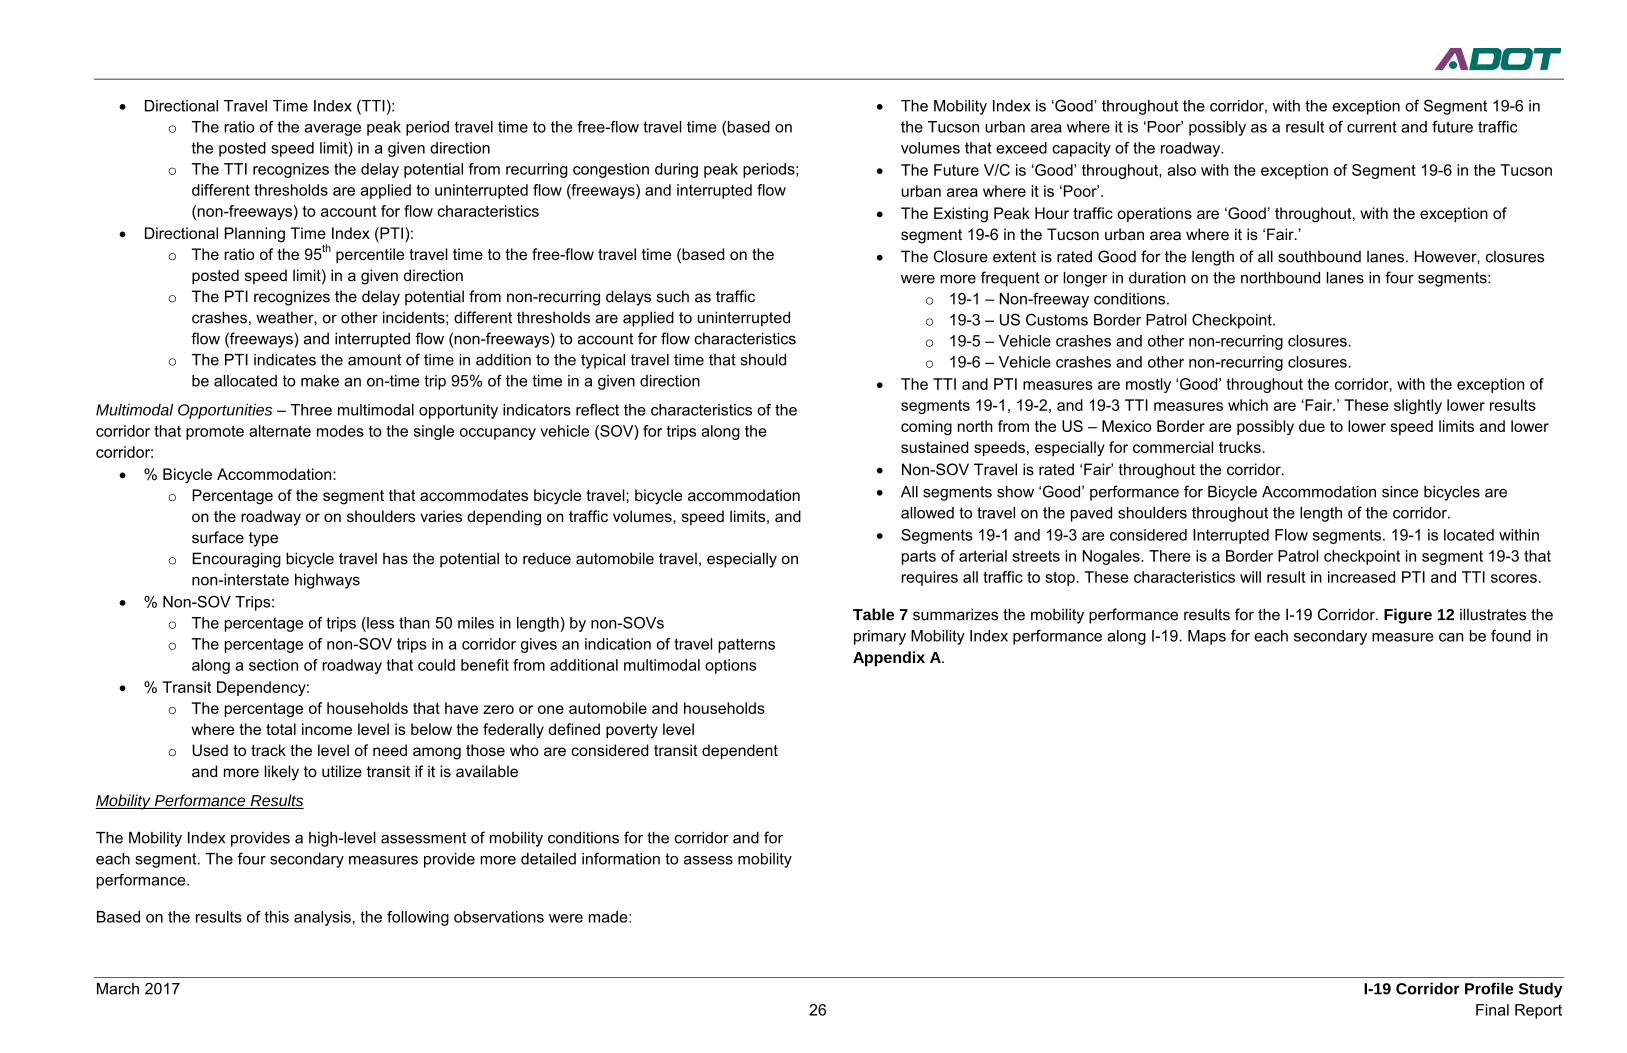
March 2017 I-19 Corridor Profile Study 26 Final Report
• Directional Travel Time Index (TTI): o The ratio of the average peak period travel time to the free-flow travel time (based on
the posted speed limit) in a given direction o The TTI recognizes the delay potential from recurring congestion during peak periods;
different thresholds are applied to uninterrupted flow (freeways) and interrupted flow (non-freeways) to account for flow characteristics
• Directional Planning Time Index (PTI): o The ratio of the 95th percentile travel time to the free-flow travel time (based on the
posted speed limit) in a given direction o The PTI recognizes the delay potential from non-recurring delays such as traffic
crashes, weather, or other incidents; different thresholds are applied to uninterrupted flow (freeways) and interrupted flow (non-freeways) to account for flow characteristics
o The PTI indicates the amount of time in addition to the typical travel time that should be allocated to make an on-time trip 95% of the time in a given direction
Multimodal Opportunities – Three multimodal opportunity indicators reflect the characteristics of the corridor that promote alternate modes to the single occupancy vehicle (SOV) for trips along the corridor:
• % Bicycle Accommodation: o Percentage of the segment that accommodates bicycle travel; bicycle accommodation
on the roadway or on shoulders varies depending on traffic volumes, speed limits, and surface type
o Encouraging bicycle travel has the potential to reduce automobile travel, especially on non-interstate highways
• % Non-SOV Trips: o The percentage of trips (less than 50 miles in length) by non-SOVs o The percentage of non-SOV trips in a corridor gives an indication of travel patterns
along a section of roadway that could benefit from additional multimodal options • % Transit Dependency:
o The percentage of households that have zero or one automobile and households where the total income level is below the federally defined poverty level
o Used to track the level of need among those who are considered transit dependent and more likely to utilize transit if it is available
Mobility Performance Results
The Mobility Index provides a high-level assessment of mobility conditions for the corridor and for each segment. The four secondary measures provide more detailed information to assess mobility performance.
Based on the results of this analysis, the following observations were made:
• The Mobility Index is ‘Good’ throughout the corridor, with the exception of Segment 19-6 in the Tucson urban area where it is ‘Poor’ possibly as a result of current and future traffic volumes that exceed capacity of the roadway.
• The Future V/C is ‘Good’ throughout, also with the exception of Segment 19-6 in the Tucson urban area where it is ‘Poor’.
• The Existing Peak Hour traffic operations are ‘Good’ throughout, with the exception of segment 19-6 in the Tucson urban area where it is ‘Fair.’
• The Closure extent is rated Good for the length of all southbound lanes. However, closures were more frequent or longer in duration on the northbound lanes in four segments:
o 19-1 – Non-freeway conditions. o 19-3 – US Customs Border Patrol Checkpoint. o 19-5 – Vehicle crashes and other non-recurring closures. o 19-6 – Vehicle crashes and other non-recurring closures.
• The TTI and PTI measures are mostly ‘Good’ throughout the corridor, with the exception of segments 19-1, 19-2, and 19-3 TTI measures which are ‘Fair.’ These slightly lower results coming north from the US – Mexico Border are possibly due to lower speed limits and lower sustained speeds, especially for commercial trucks.
• Non-SOV Travel is rated ‘Fair’ throughout the corridor. • All segments show ‘Good’ performance for Bicycle Accommodation since bicycles are
allowed to travel on the paved shoulders throughout the length of the corridor. • Segments 19-1 and 19-3 are considered Interrupted Flow segments. 19-1 is located within
parts of arterial streets in Nogales. There is a Border Patrol checkpoint in segment 19-3 that requires all traffic to stop. These characteristics will result in increased PTI and TTI scores.
Table 7 summarizes the mobility performance results for the I-19 Corridor. Figure 12 illustrates the primary Mobility Index performance along I-19. Maps for each secondary measure can be found in Appendix A.
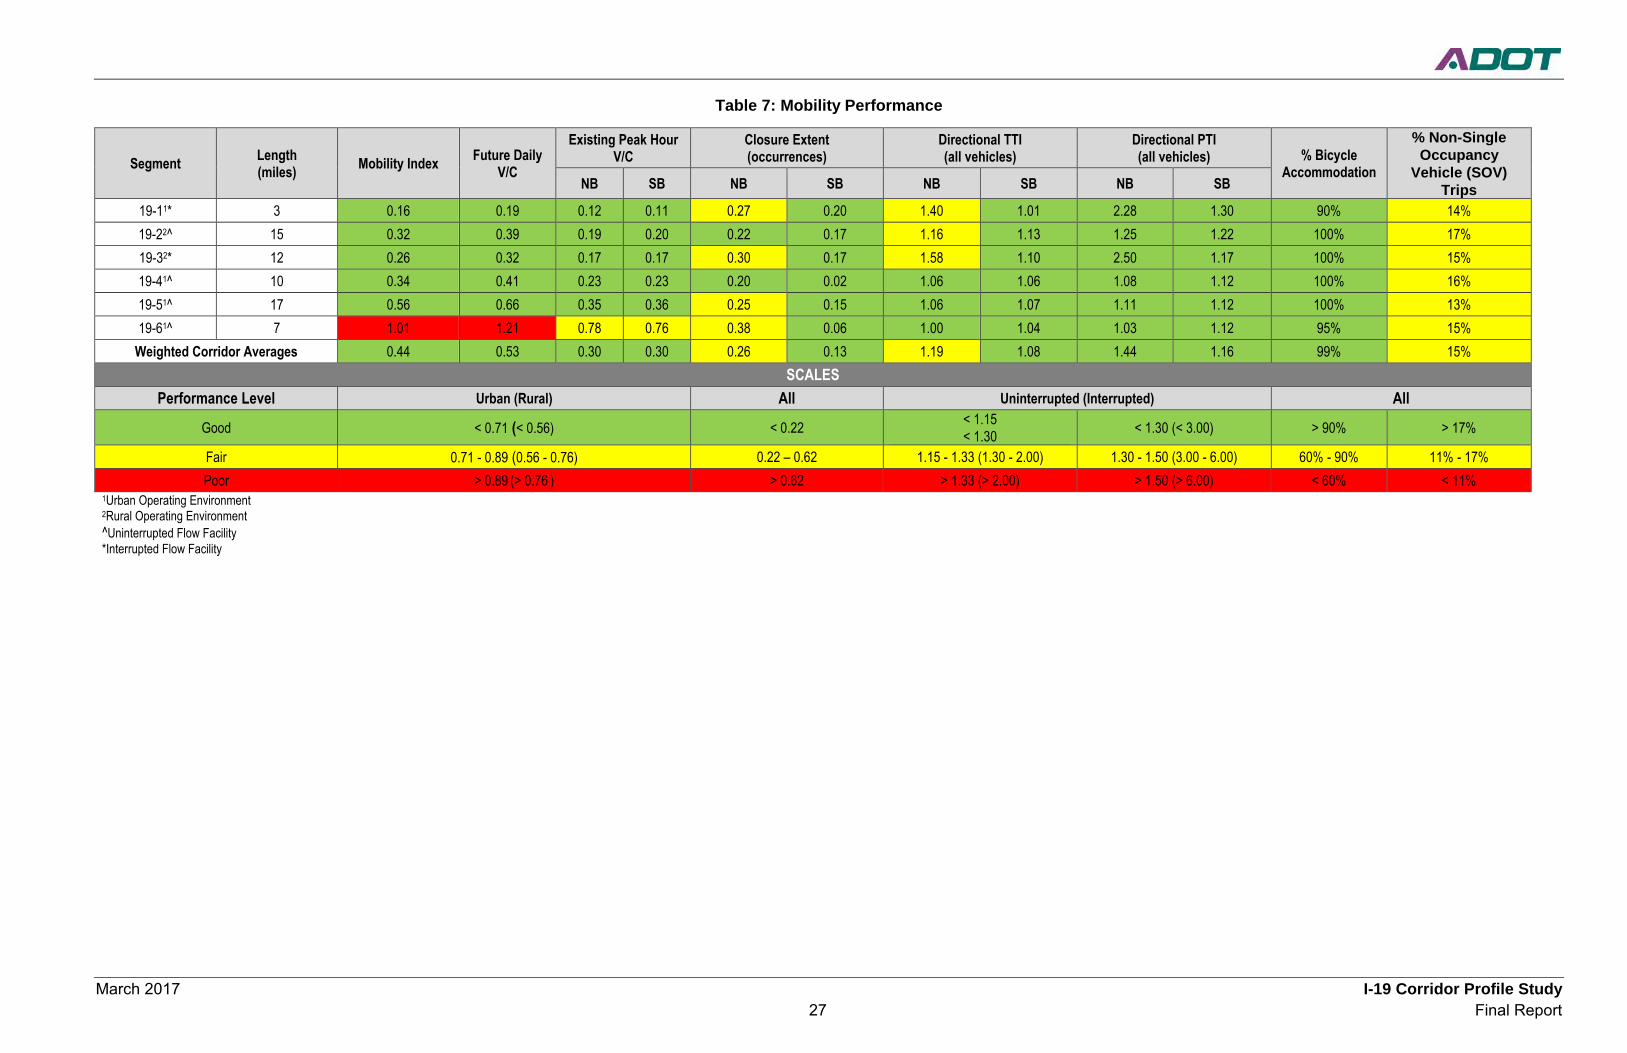
March 2017 I-19 Corridor Profile Study 27 Final Report
Table 7: Mobility Performance
Segment Length (miles) Mobility Index Future Daily
V/C
Existing Peak Hour V/C
Closure Extent (occurrences)
Directional TTI (all vehicles)
Directional PTI (all vehicles) % Bicycle
Accommodation
% Non-Single Occupancy
Vehicle (SOV) Trips NB SB NB SB NB SB NB SB
19-11* 3 0.16 0.19 0.12 0.11 0.27 0.20 1.40 1.01 2.28 1.30 90% 14% 19-22^ 15 0.32 0.39 0.19 0.20 0.22 0.17 1.16 1.13 1.25 1.22 100% 17% 19-32* 12 0.26 0.32 0.17 0.17 0.30 0.17 1.58 1.10 2.50 1.17 100% 15% 19-41^ 10 0.34 0.41 0.23 0.23 0.20 0.02 1.06 1.06 1.08 1.12 100% 16% 19-51^ 17 0.56 0.66 0.35 0.36 0.25 0.15 1.06 1.07 1.11 1.12 100% 13% 19-61^ 7 1.01 1.21 0.78 0.76 0.38 0.06 1.00 1.04 1.03 1.12 95% 15%
Weighted Corridor Averages 0.44 0.53 0.30 0.30 0.26 0.13 1.19 1.08 1.44 1.16 99% 15% SCALES
Performance Level Urban (Rural) All Uninterrupted (Interrupted) All
Good < 0.71 (< 0.56) < 0.22 < 1.15 < 1.30 < 1.30 (< 3.00) > 90% > 17%
Fair 0.71 - 0.89 (0.56 - 0.76) 0.22 – 0.62 1.15 - 1.33 (1.30 - 2.00) 1.30 - 1.50 (3.00 - 6.00) 60% - 90% 11% - 17% Poor > 0.89 (> 0.76 ) > 0.62 > 1.33 (> 2.00) > 1.50 (> 6.00) < 60% < 11%
1Urban Operating Environment 2Rural Operating Environment ^Uninterrupted Flow Facility *Interrupted Flow Facility
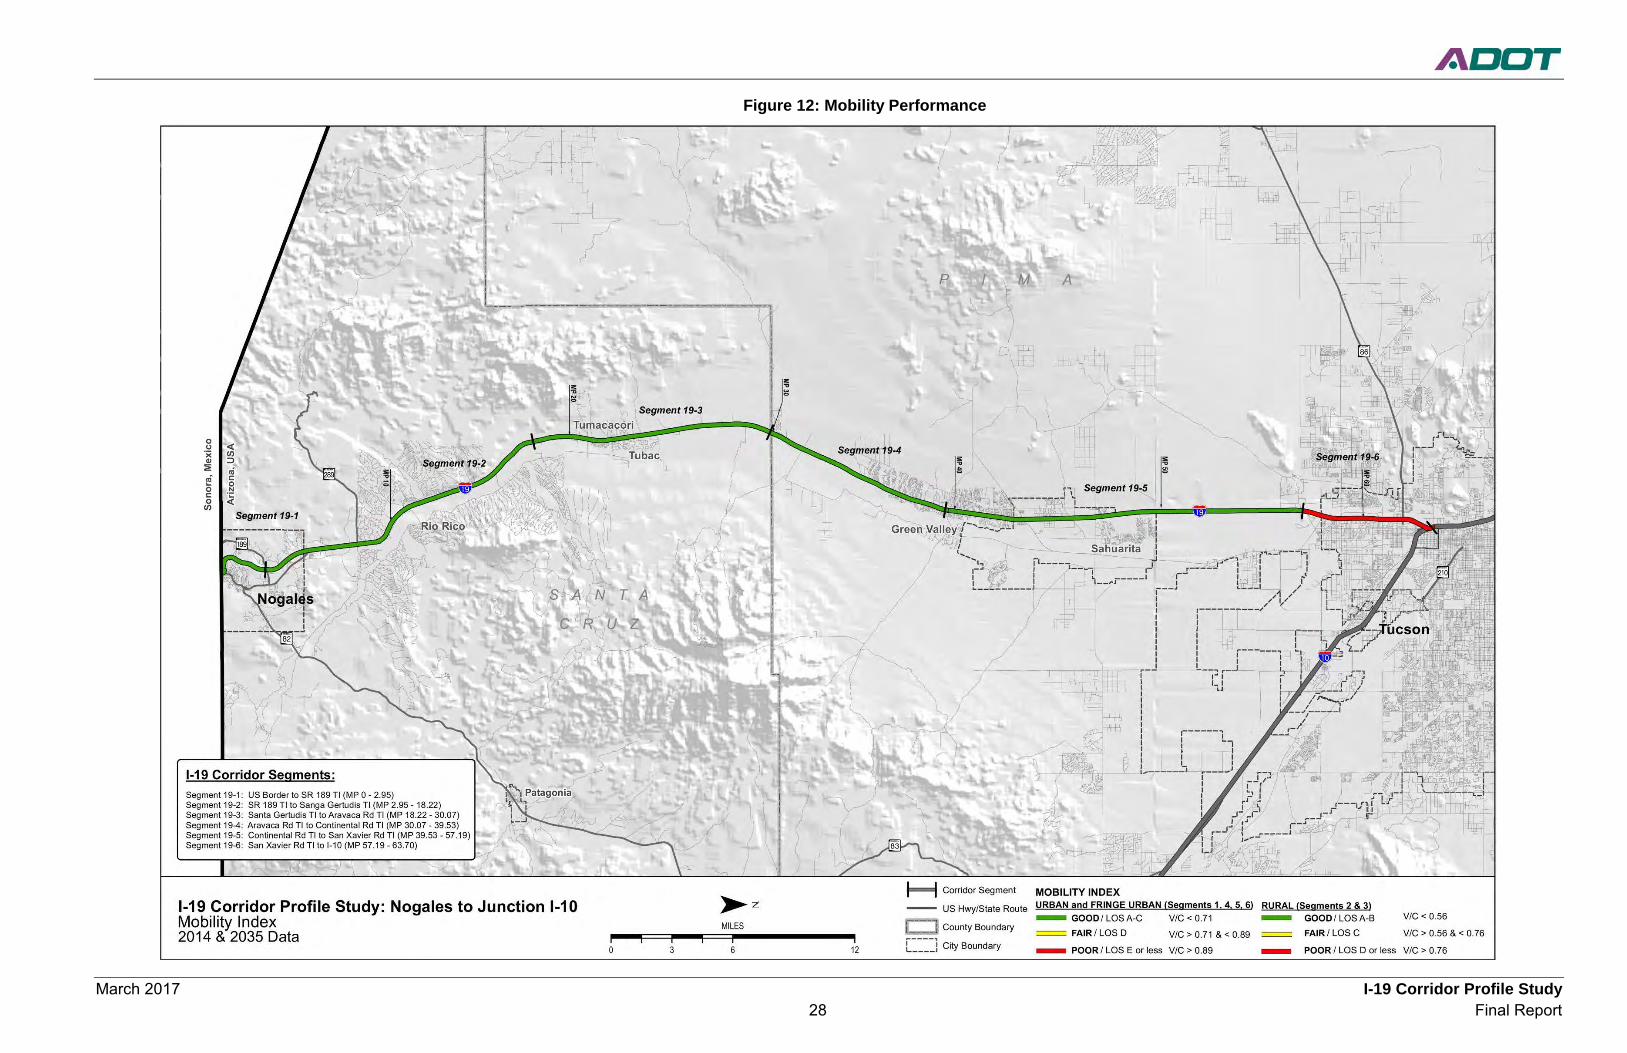
March 2017 I-19 Corridor Profile Study 28 Final Report
Figure 12: Mobility Performance
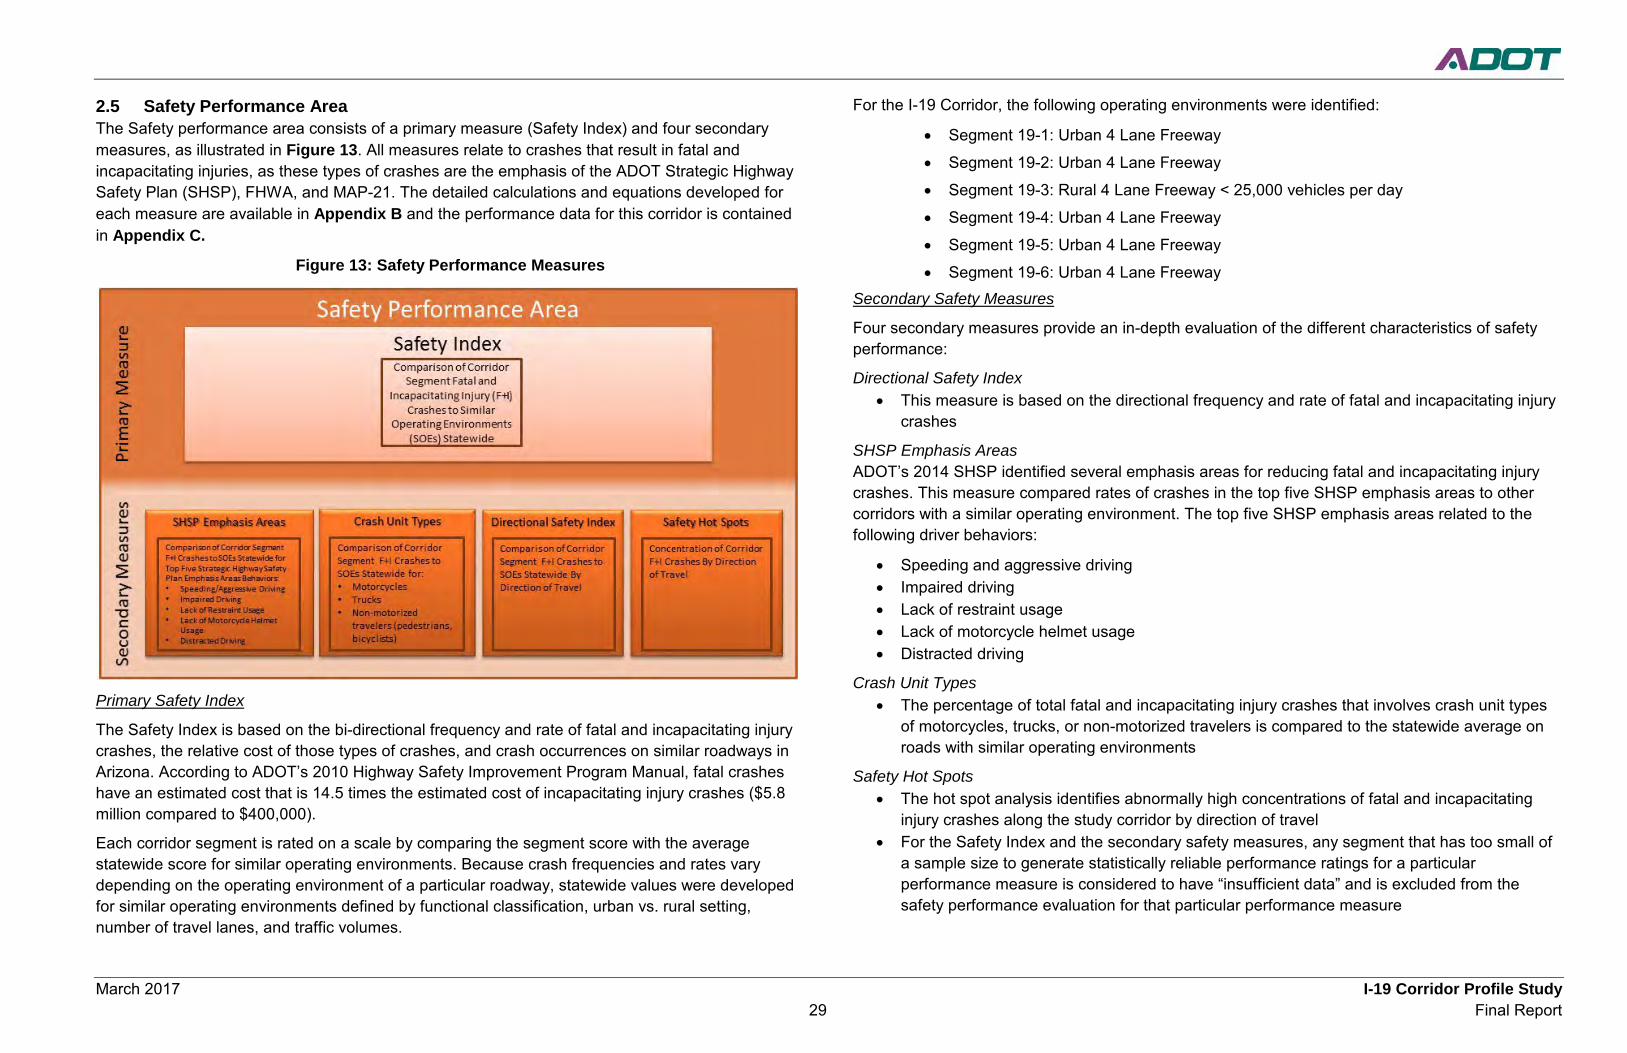
March 2017 I-19 Corridor Profile Study 29 Final Report
2.5 Safety Performance Area The Safety performance area consists of a primary measure (Safety Index) and four secondary measures, as illustrated in Figure 13. All measures relate to crashes that result in fatal and incapacitating injuries, as these types of crashes are the emphasis of the ADOT Strategic Highway Safety Plan (SHSP), FHWA, and MAP-21. The detailed calculations and equations developed for each measure are available in Appendix B and the performance data for this corridor is contained in Appendix C.
Figure 13: Safety Performance Measures
Primary Safety Index
The Safety Index is based on the bi-directional frequency and rate of fatal and incapacitating injury crashes, the relative cost of those types of crashes, and crash occurrences on similar roadways in Arizona. According to ADOT’s 2010 Highway Safety Improvement Program Manual, fatal crashes have an estimated cost that is 14.5 times the estimated cost of incapacitating injury crashes ($5.8 million compared to $400,000).
Each corridor segment is rated on a scale by comparing the segment score with the average statewide score for similar operating environments. Because crash frequencies and rates vary depending on the operating environment of a particular roadway, statewide values were developed for similar operating environments defined by functional classification, urban vs. rural setting, number of travel lanes, and traffic volumes.
For the I-19 Corridor, the following operating environments were identified:
• Segment 19-1: Urban 4 Lane Freeway
• Segment 19-2: Urban 4 Lane Freeway
• Segment 19-3: Rural 4 Lane Freeway < 25,000 vehicles per day
• Segment 19-4: Urban 4 Lane Freeway
• Segment 19-5: Urban 4 Lane Freeway
• Segment 19-6: Urban 4 Lane Freeway Secondary Safety Measures
Four secondary measures provide an in-depth evaluation of the different characteristics of safety performance:
Directional Safety Index • This measure is based on the directional frequency and rate of fatal and incapacitating injury
crashes
SHSP Emphasis Areas ADOT’s 2014 SHSP identified several emphasis areas for reducing fatal and incapacitating injury crashes. This measure compared rates of crashes in the top five SHSP emphasis areas to other corridors with a similar operating environment. The top five SHSP emphasis areas related to the following driver behaviors:
• Speeding and aggressive driving • Impaired driving • Lack of restraint usage • Lack of motorcycle helmet usage • Distracted driving
Crash Unit Types • The percentage of total fatal and incapacitating injury crashes that involves crash unit types
of motorcycles, trucks, or non-motorized travelers is compared to the statewide average on roads with similar operating environments
Safety Hot Spots • The hot spot analysis identifies abnormally high concentrations of fatal and incapacitating
injury crashes along the study corridor by direction of travel • For the Safety Index and the secondary safety measures, any segment that has too small of
a sample size to generate statistically reliable performance ratings for a particular performance measure is considered to have “insufficient data” and is excluded from the safety performance evaluation for that particular performance measure
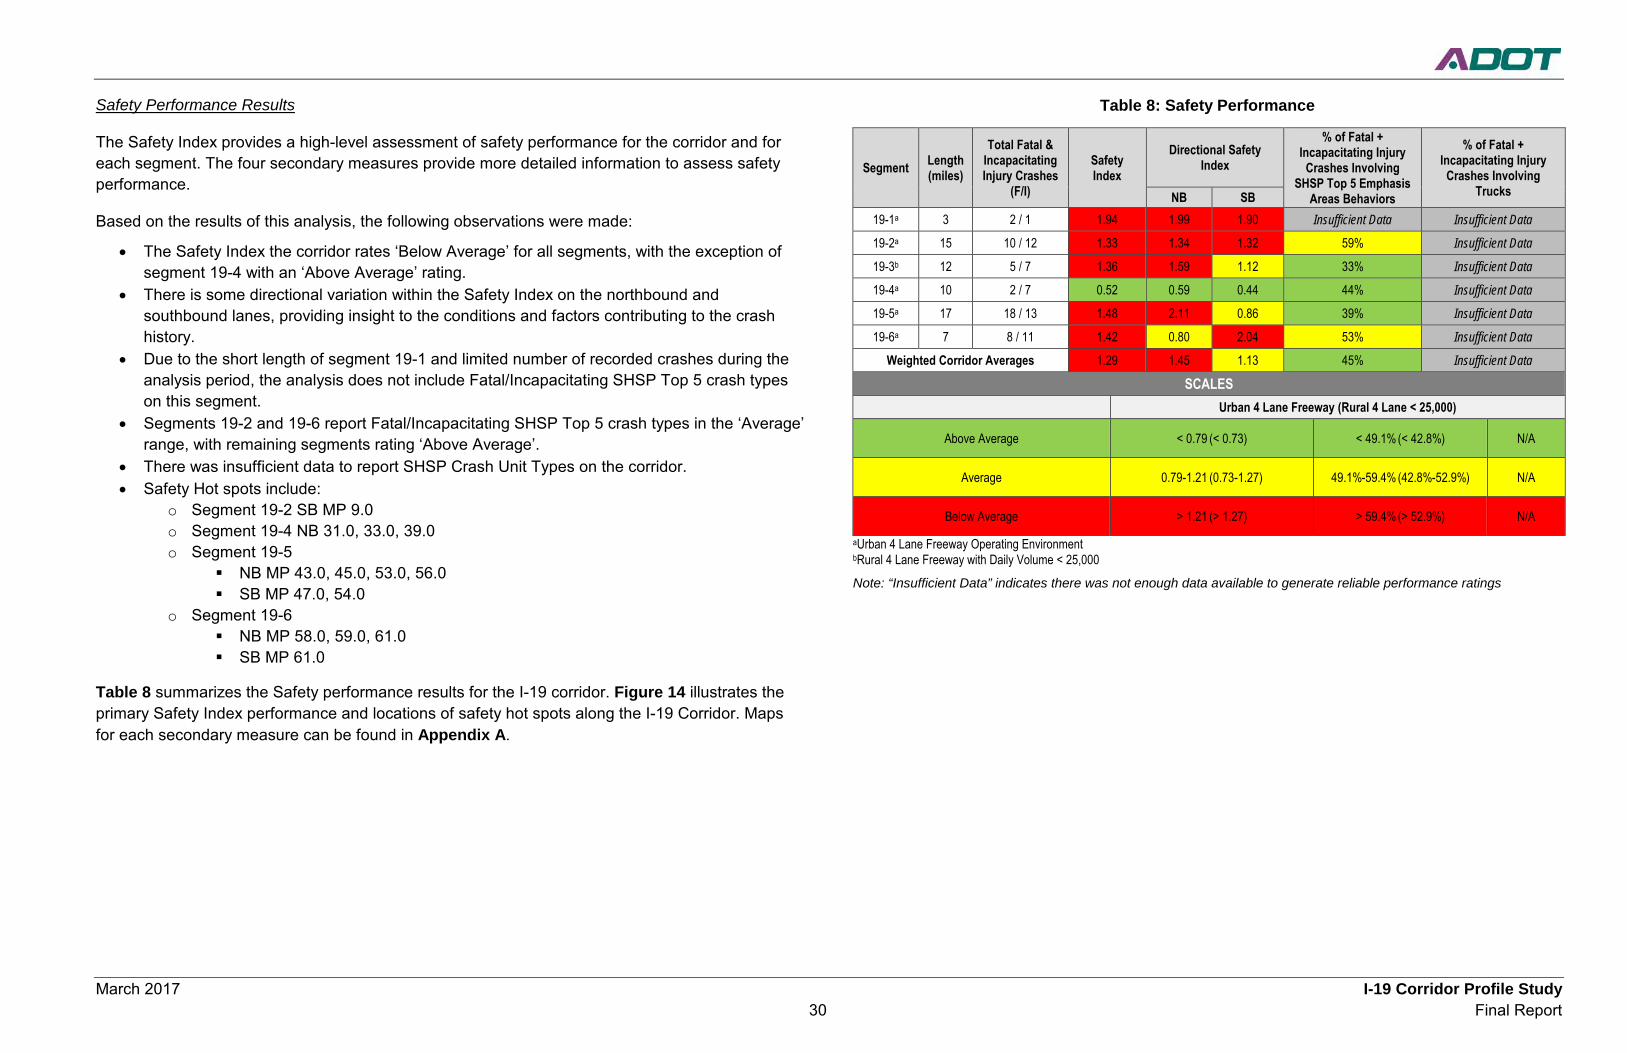
March 2017 I-19 Corridor Profile Study 30 Final Report
Safety Performance Results
The Safety Index provides a high-level assessment of safety performance for the corridor and for each segment. The four secondary measures provide more detailed information to assess safety performance.
Based on the results of this analysis, the following observations were made:
• The Safety Index the corridor rates ‘Below Average’ for all segments, with the exception of segment 19-4 with an ‘Above Average’ rating.
• There is some directional variation within the Safety Index on the northbound and southbound lanes, providing insight to the conditions and factors contributing to the crash history.
• Due to the short length of segment 19-1 and limited number of recorded crashes during the analysis period, the analysis does not include Fatal/Incapacitating SHSP Top 5 crash types on this segment.
• Segments 19-2 and 19-6 report Fatal/Incapacitating SHSP Top 5 crash types in the ‘Average’ range, with remaining segments rating ‘Above Average’.
• There was insufficient data to report SHSP Crash Unit Types on the corridor. • Safety Hot spots include:
o Segment 19-2 SB MP 9.0 o Segment 19-4 NB 31.0, 33.0, 39.0 o Segment 19-5
NB MP 43.0, 45.0, 53.0, 56.0 SB MP 47.0, 54.0
o Segment 19-6 NB MP 58.0, 59.0, 61.0 SB MP 61.0
Table 8 summarizes the Safety performance results for the I-19 corridor. Figure 14 illustrates the primary Safety Index performance and locations of safety hot spots along the I-19 Corridor. Maps for each secondary measure can be found in Appendix A.
Table 8: Safety Performance
Segment Length (miles)
Total Fatal & Incapacitating Injury Crashes
(F/I)
Safety Index
Directional Safety Index
% of Fatal + Incapacitating Injury
Crashes Involving SHSP Top 5 Emphasis
Areas Behaviors
% of Fatal + Incapacitating Injury
Crashes Involving Trucks NB SB
19-1a 3 2 / 1 1.94 1.99 1.90 Insufficient Data Insufficient Data
19-2a 15 10 / 12 1.33 1.34 1.32 59% Insufficient Data
19-3b 12 5 / 7 1.36 1.59 1.12 33% Insufficient Data
19-4a 10 2 / 7 0.52 0.59 0.44 44% Insufficient Data
19-5a 17 18 / 13 1.48 2.11 0.86 39% Insufficient Data
19-6a 7 8 / 11 1.42 0.80 2.04 53% Insufficient Data
Weighted Corridor Averages 1.29 1.45 1.13 45% Insufficient Data
SCALES Urban 4 Lane Freeway (Rural 4 Lane < 25,000)
Above Average < 0.79 (< 0.73) < 49.1% (< 42.8%) N/A
Average 0.79-1.21 (0.73-1.27) 49.1%-59.4% (42.8%-52.9%) N/A
Below Average > 1.21 (> 1.27) > 59.4% (> 52.9%) N/A
aUrban 4 Lane Freeway Operating Environment bRural 4 Lane Freeway with Daily Volume < 25,000
Note: “Insufficient Data” indicates there was not enough data available to generate reliable performance ratings
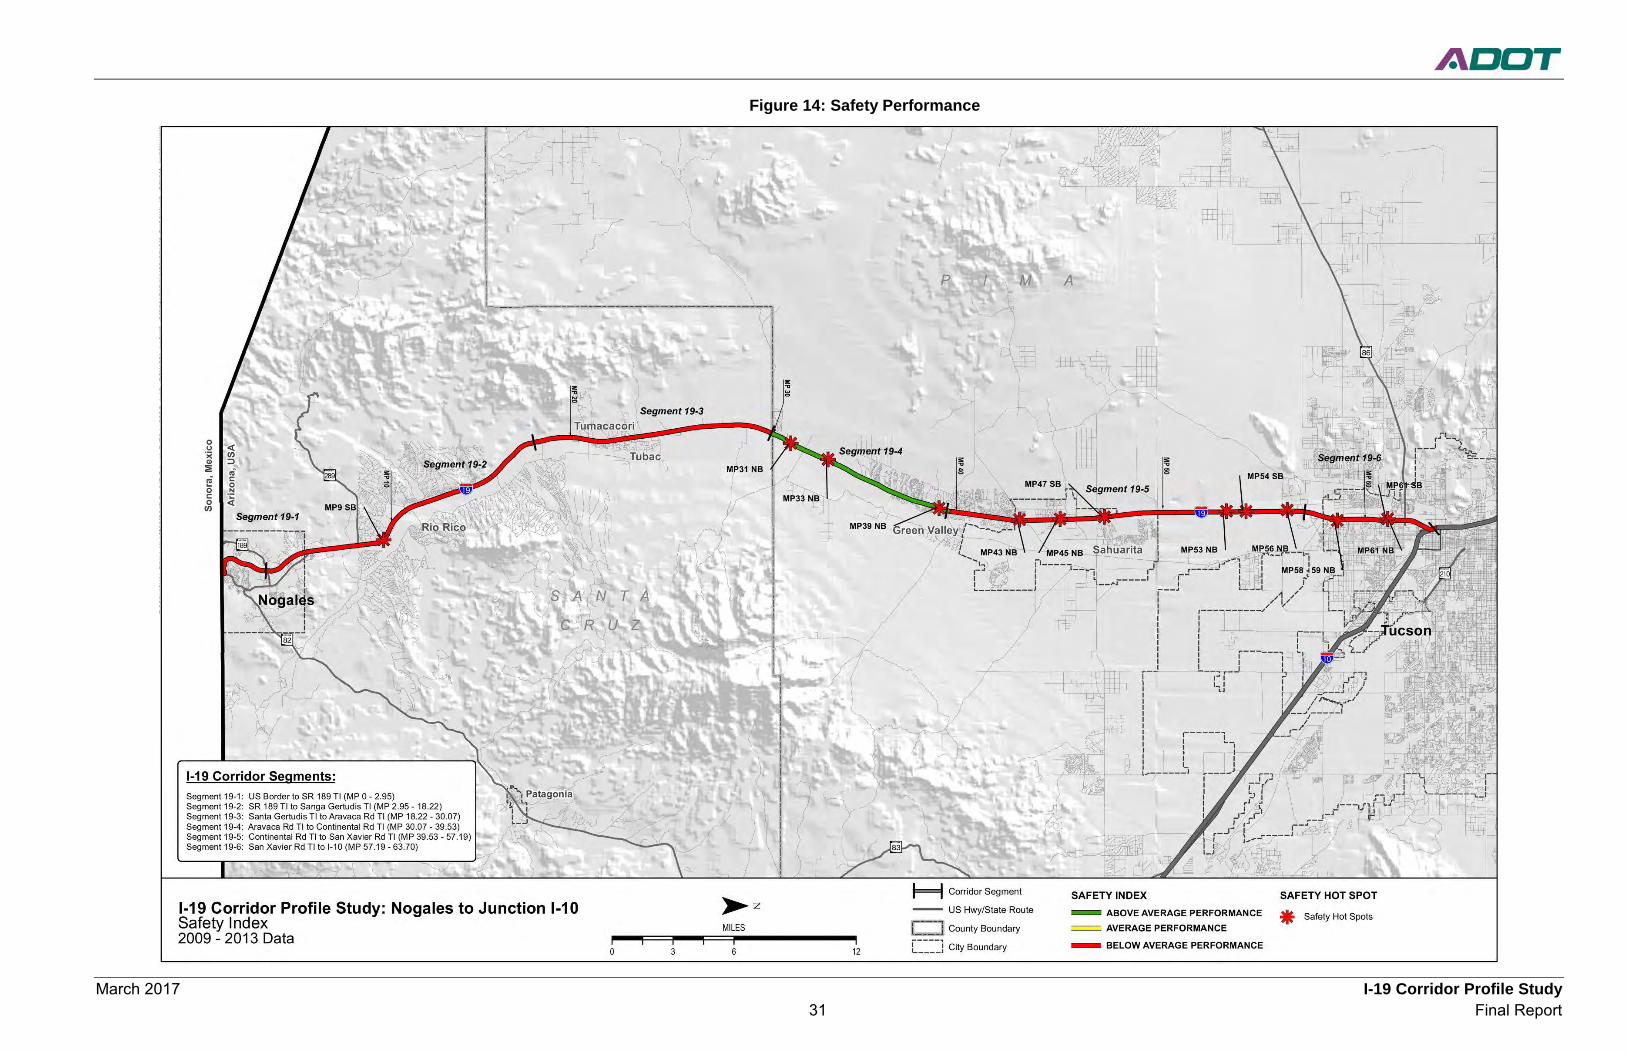
March 2017 I-19 Corridor Profile Study 31 Final Report
Figure 14: Safety Performance
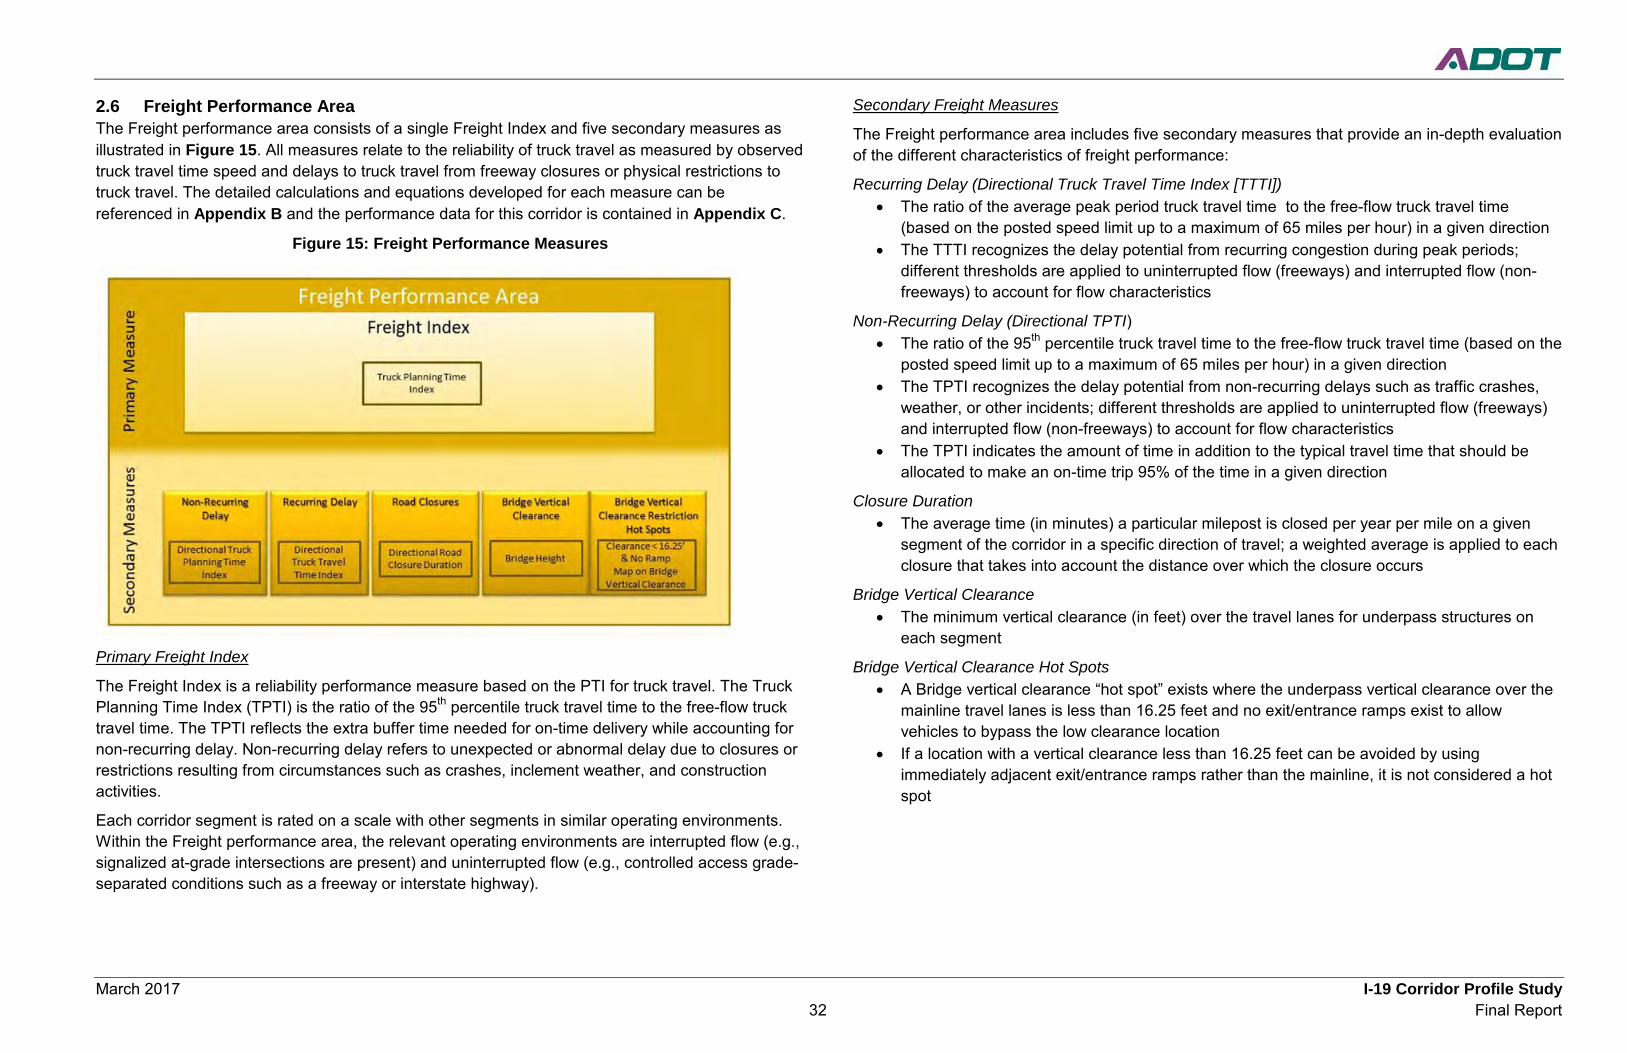
March 2017 I-19 Corridor Profile Study 32 Final Report
2.6 Freight Performance Area The Freight performance area consists of a single Freight Index and five secondary measures as illustrated in Figure 15. All measures relate to the reliability of truck travel as measured by observed truck travel time speed and delays to truck travel from freeway closures or physical restrictions to truck travel. The detailed calculations and equations developed for each measure can be referenced in Appendix B and the performance data for this corridor is contained in Appendix C.
Figure 15: Freight Performance Measures
Primary Freight Index
The Freight Index is a reliability performance measure based on the PTI for truck travel. The Truck Planning Time Index (TPTI) is the ratio of the 95th percentile truck travel time to the free-flow truck travel time. The TPTI reflects the extra buffer time needed for on-time delivery while accounting for non-recurring delay. Non-recurring delay refers to unexpected or abnormal delay due to closures or restrictions resulting from circumstances such as crashes, inclement weather, and construction activities.
Each corridor segment is rated on a scale with other segments in similar operating environments. Within the Freight performance area, the relevant operating environments are interrupted flow (e.g., signalized at-grade intersections are present) and uninterrupted flow (e.g., controlled access grade-separated conditions such as a freeway or interstate highway).
Secondary Freight Measures
The Freight performance area includes five secondary measures that provide an in-depth evaluation of the different characteristics of freight performance:
Recurring Delay (Directional Truck Travel Time Index [TTTI]) • The ratio of the average peak period truck travel time to the free-flow truck travel time
(based on the posted speed limit up to a maximum of 65 miles per hour) in a given direction • The TTTI recognizes the delay potential from recurring congestion during peak periods;
different thresholds are applied to uninterrupted flow (freeways) and interrupted flow (non-freeways) to account for flow characteristics
Non-Recurring Delay (Directional TPTI) • The ratio of the 95th percentile truck travel time to the free-flow truck travel time (based on the
posted speed limit up to a maximum of 65 miles per hour) in a given direction • The TPTI recognizes the delay potential from non-recurring delays such as traffic crashes,
weather, or other incidents; different thresholds are applied to uninterrupted flow (freeways) and interrupted flow (non-freeways) to account for flow characteristics
• The TPTI indicates the amount of time in addition to the typical travel time that should be allocated to make an on-time trip 95% of the time in a given direction
Closure Duration • The average time (in minutes) a particular milepost is closed per year per mile on a given
segment of the corridor in a specific direction of travel; a weighted average is applied to each closure that takes into account the distance over which the closure occurs
Bridge Vertical Clearance • The minimum vertical clearance (in feet) over the travel lanes for underpass structures on
each segment
Bridge Vertical Clearance Hot Spots • A Bridge vertical clearance “hot spot” exists where the underpass vertical clearance over the
mainline travel lanes is less than 16.25 feet and no exit/entrance ramps exist to allow vehicles to bypass the low clearance location
• If a location with a vertical clearance less than 16.25 feet can be avoided by using immediately adjacent exit/entrance ramps rather than the mainline, it is not considered a hot spot
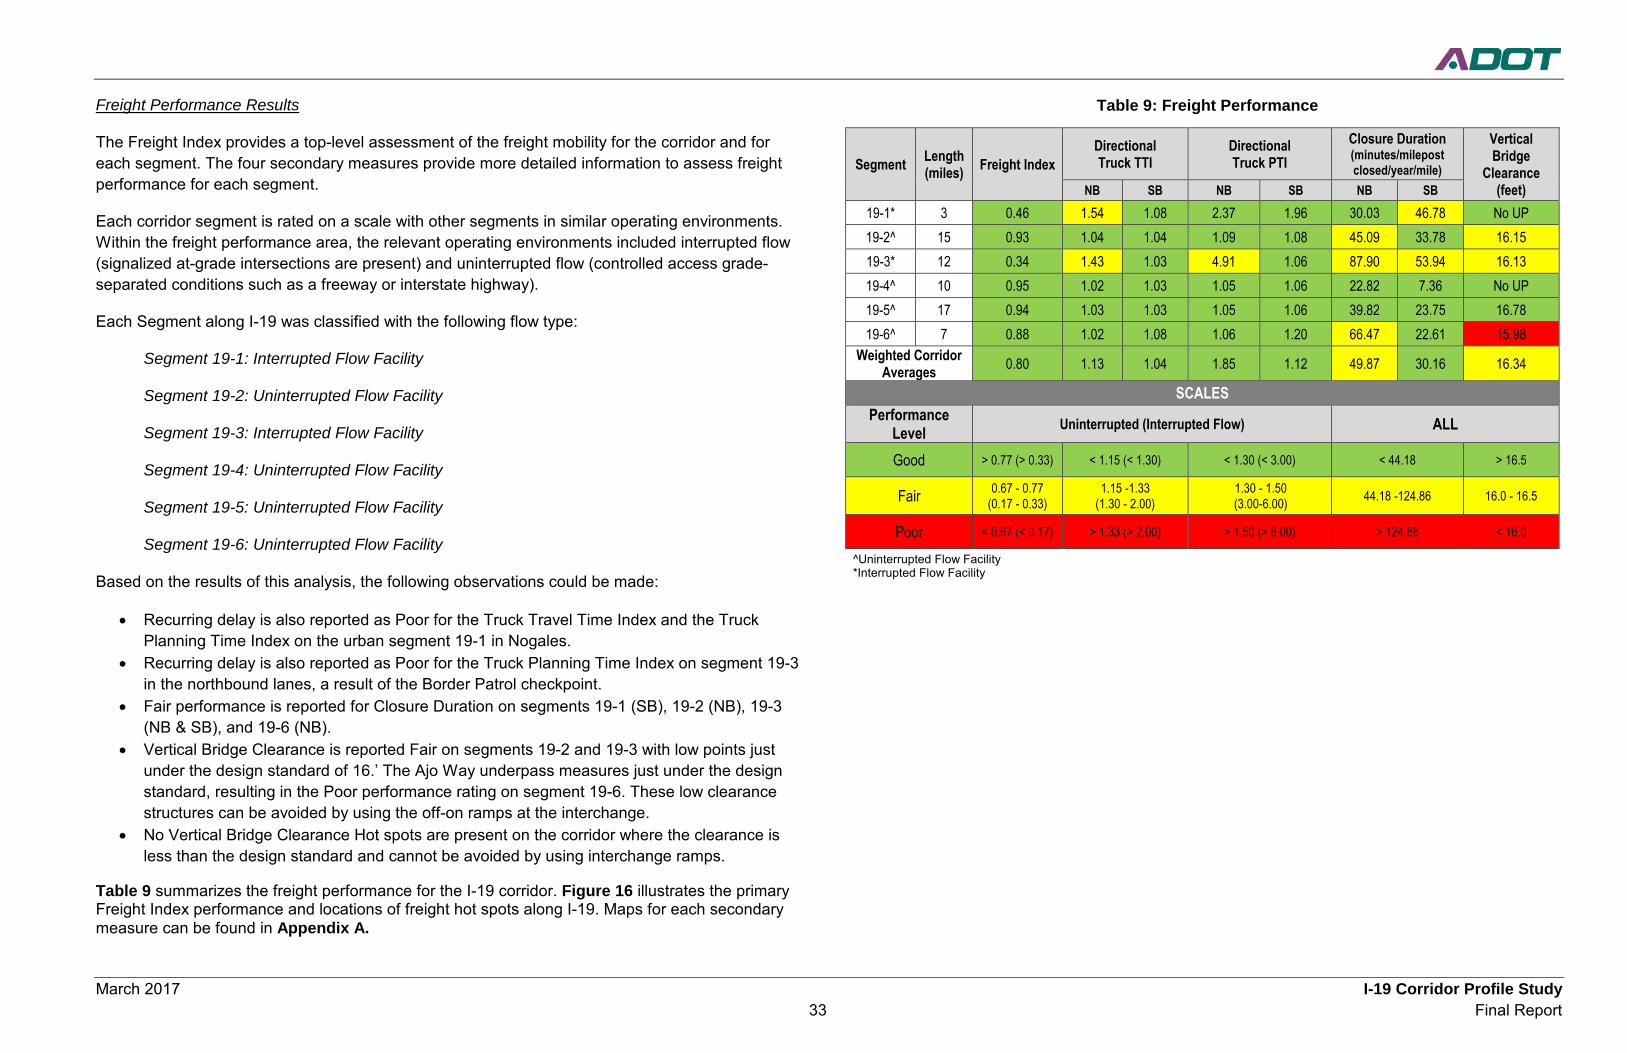
March 2017 I-19 Corridor Profile Study 33 Final Report
Freight Performance Results
The Freight Index provides a top-level assessment of the freight mobility for the corridor and for each segment. The four secondary measures provide more detailed information to assess freight performance for each segment.
Each corridor segment is rated on a scale with other segments in similar operating environments. Within the freight performance area, the relevant operating environments included interrupted flow (signalized at-grade intersections are present) and uninterrupted flow (controlled access grade-separated conditions such as a freeway or interstate highway).
Each Segment along I-19 was classified with the following flow type:
Segment 19-1: Interrupted Flow Facility
Segment 19-2: Uninterrupted Flow Facility
Segment 19-3: Interrupted Flow Facility
Segment 19-4: Uninterrupted Flow Facility
Segment 19-5: Uninterrupted Flow Facility
Segment 19-6: Uninterrupted Flow Facility
Based on the results of this analysis, the following observations could be made:
• Recurring delay is also reported as Poor for the Truck Travel Time Index and the Truck Planning Time Index on the urban segment 19-1 in Nogales.
• Recurring delay is also reported as Poor for the Truck Planning Time Index on segment 19-3 in the northbound lanes, a result of the Border Patrol checkpoint.
• Fair performance is reported for Closure Duration on segments 19-1 (SB), 19-2 (NB), 19-3 (NB & SB), and 19-6 (NB).
• Vertical Bridge Clearance is reported Fair on segments 19-2 and 19-3 with low points just under the design standard of 16.’ The Ajo Way underpass measures just under the design standard, resulting in the Poor performance rating on segment 19-6. These low clearance structures can be avoided by using the off-on ramps at the interchange.
• No Vertical Bridge Clearance Hot spots are present on the corridor where the clearance is less than the design standard and cannot be avoided by using interchange ramps.
Table 9 summarizes the freight performance for the I-19 corridor. Figure 16 illustrates the primary Freight Index performance and locations of freight hot spots along I-19. Maps for each secondary measure can be found in Appendix A.
Table 9: Freight Performance
Segment Length (miles) Freight Index
Directional Truck TTI
Directional Truck PTI
Closure Duration (minutes/milepost closed/year/mile)
Vertical Bridge
Clearance (feet) NB SB NB SB NB SB
19-1* 3 0.46 1.54 1.08 2.37 1.96 30.03 46.78 No UP 19-2^ 15 0.93 1.04 1.04 1.09 1.08 45.09 33.78 16.15 19-3* 12 0.34 1.43 1.03 4.91 1.06 87.90 53.94 16.13 19-4^ 10 0.95 1.02 1.03 1.05 1.06 22.82 7.36 No UP 19-5^ 17 0.94 1.03 1.03 1.05 1.06 39.82 23.75 16.78 19-6^ 7 0.88 1.02 1.08 1.06 1.20 66.47 22.61 15.98
Weighted Corridor Averages 0.80 1.13 1.04 1.85 1.12 49.87 30.16 16.34
SCALES Performance
Level Uninterrupted (Interrupted Flow) ALL
Good > 0.77 (> 0.33) < 1.15 (< 1.30) < 1.30 (< 3.00) < 44.18 > 16.5
Fair 0.67 - 0.77 (0.17 - 0.33)
1.15 -1.33 (1.30 - 2.00)
1.30 - 1.50 (3.00-6.00) 44.18 -124.86 16.0 - 16.5
Poor < 0.67 (< 0.17) > 1.33 (> 2.00) > 1.50 (> 6.00) > 124.86 < 16.0
^Uninterrupted Flow Facility *Interrupted Flow Facility
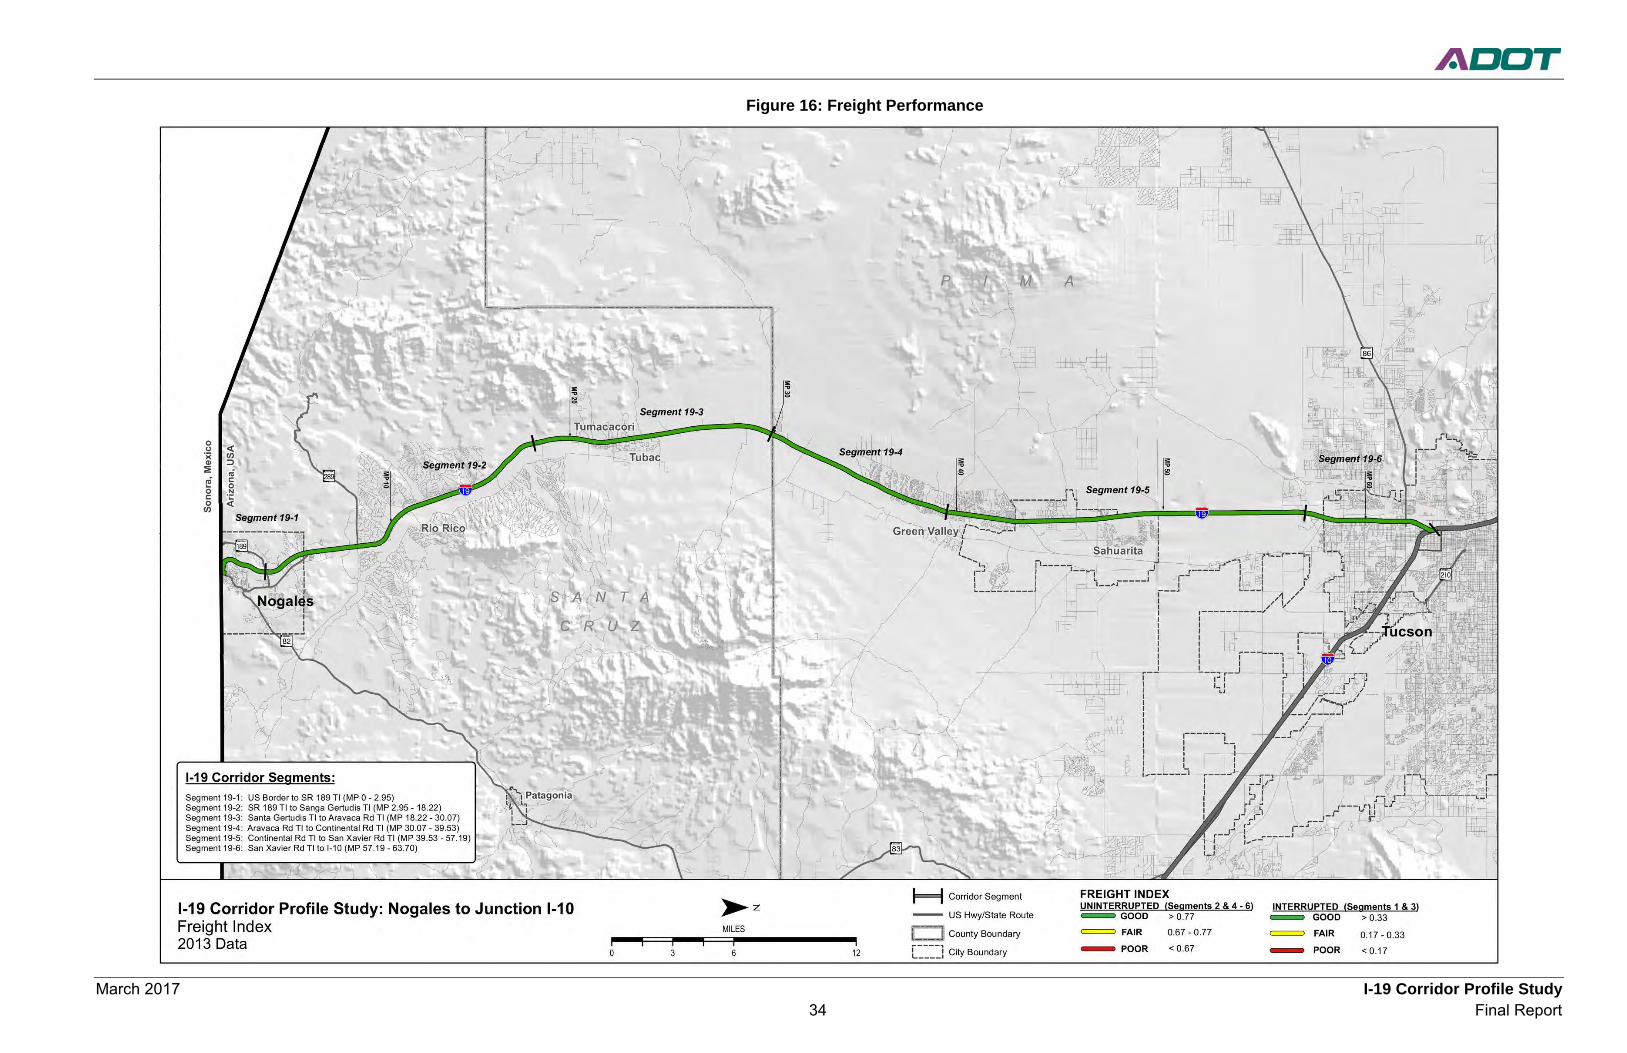
March 2017 I-19 Corridor Profile Study 34 Final Report
Figure 16: Freight Performance
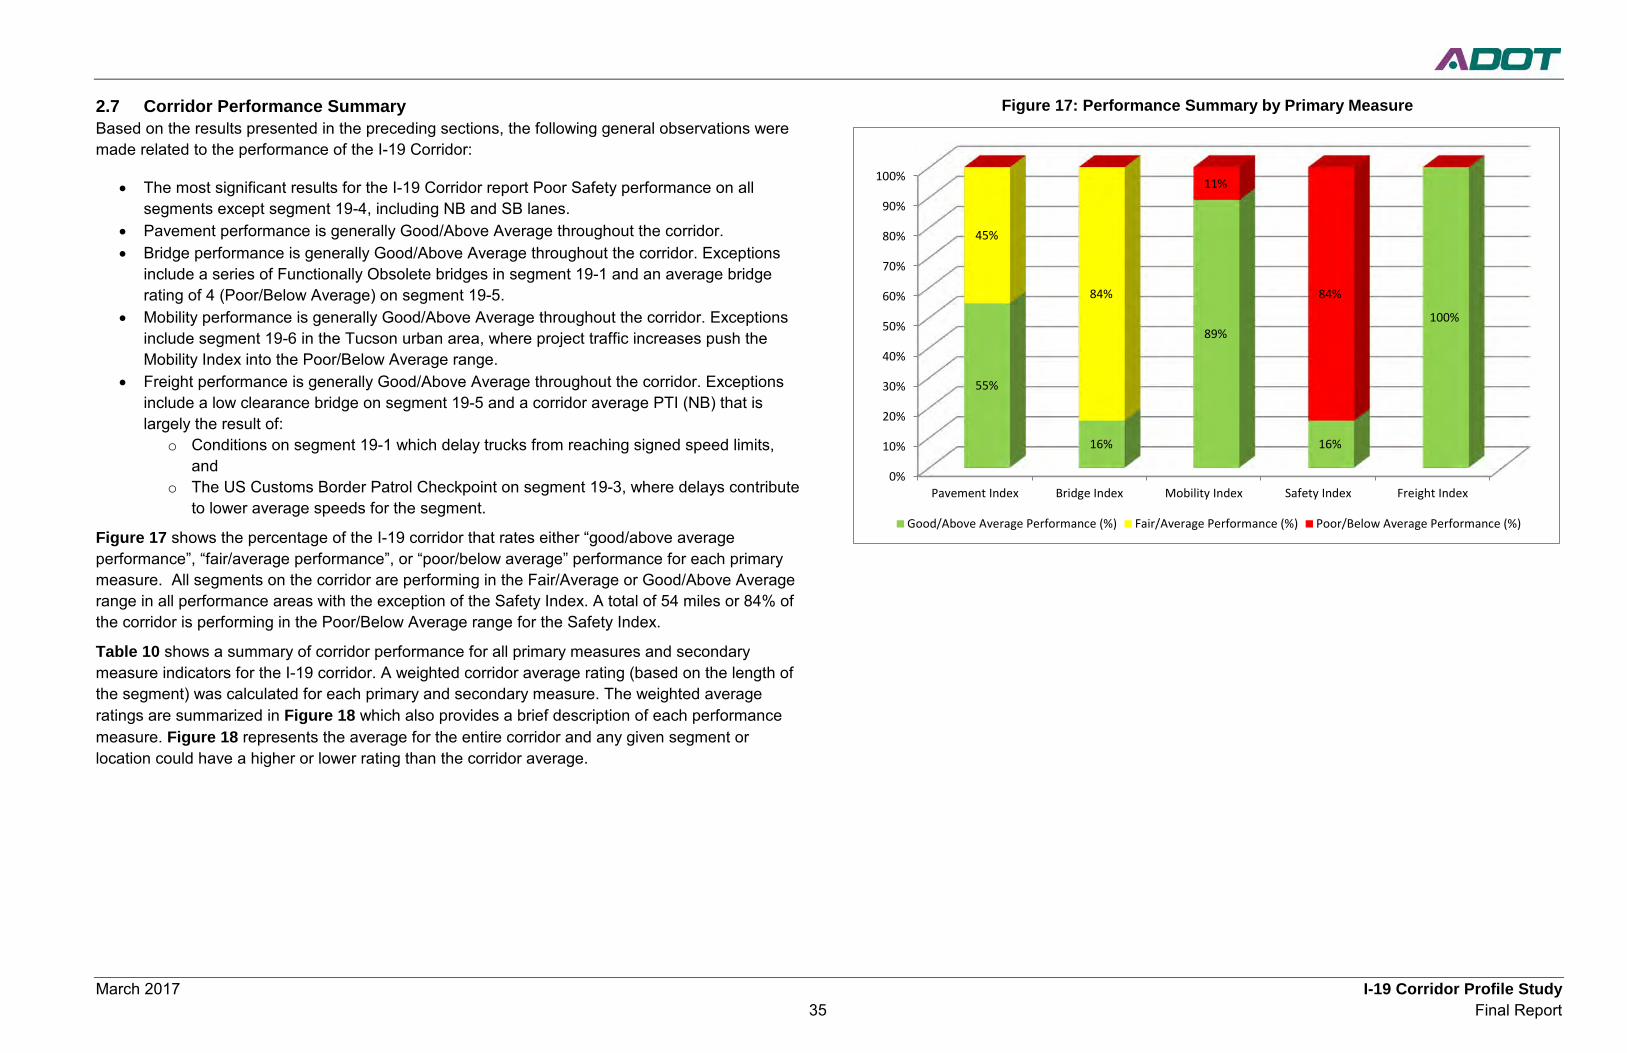
March 2017 I-19 Corridor Profile Study35 Final Report
2.7 Corridor Performance SummaryBased on the results presented in the preceding sections, the following general observations weremade related to the performance of the I-19 Corridor:
• The most significant results for the I-19 Corridor report Poor Safety performance on all segments except segment 19-4, including NB and SB lanes.
• Pavement performance is generally Good/Above Average throughout the corridor. • Bridge performance is generally Good/Above Average throughout the corridor. Exceptions
include a series of Functionally Obsolete bridges in segment 19-1 and an average bridge rating of 4 (Poor/Below Average) on segment 19-5.
• Mobility performance is generally Good/Above Average throughout the corridor. Exceptions include segment 19-6 in the Tucson urban area, where project traffic increases push the Mobility Index into the Poor/Below Average range.
• Freight performance is generally Good/Above Average throughout the corridor. Exceptions include a low clearance bridge on segment 19-5 and a corridor average PTI (NB) that is largely the result of:
o Conditions on segment 19-1 which delay trucks from reaching signed speed limits, and
o The US Customs Border Patrol Checkpoint on segment 19-3, where delays contribute to lower average speeds for the segment.
Figure 17 shows the percentage of the I-19 corridor that rates either “good/above average performance”, “fair/average performance”, or “poor/below average” performance for each primary measure. All segments on the corridor are performing in the Fair/Average or Good/Above Average range in all performance areas with the exception of the Safety Index. A total of 54 miles or 84% of the corridor is performing in the Poor/Below Average range for the Safety Index.
Table 10 shows a summary of corridor performance for all primary measures and secondary measure indicators for the I-19 corridor. A weighted corridor average rating (based on the length of the segment) was calculated for each primary and secondary measure. The weighted average ratings are summarized in Figure 18 which also provides a brief description of each performance measure. Figure 18 represents the average for the entire corridor and any given segment or location could have a higher or lower rating than the corridor average.
Figure 17: Performance Summary by Primary Measure
0%
10%
20%
30%
40%
50%
60%
70%
80%
90%
100%
Pavement Index Bridge Index Mobility Index Safety Index Freight Index
55%
16%
89%
16%
100%
45%
84%
11%
84%
Good/Above Average Performance (%) Fair/Average Performance (%) Poor/Below Average Performance (%)
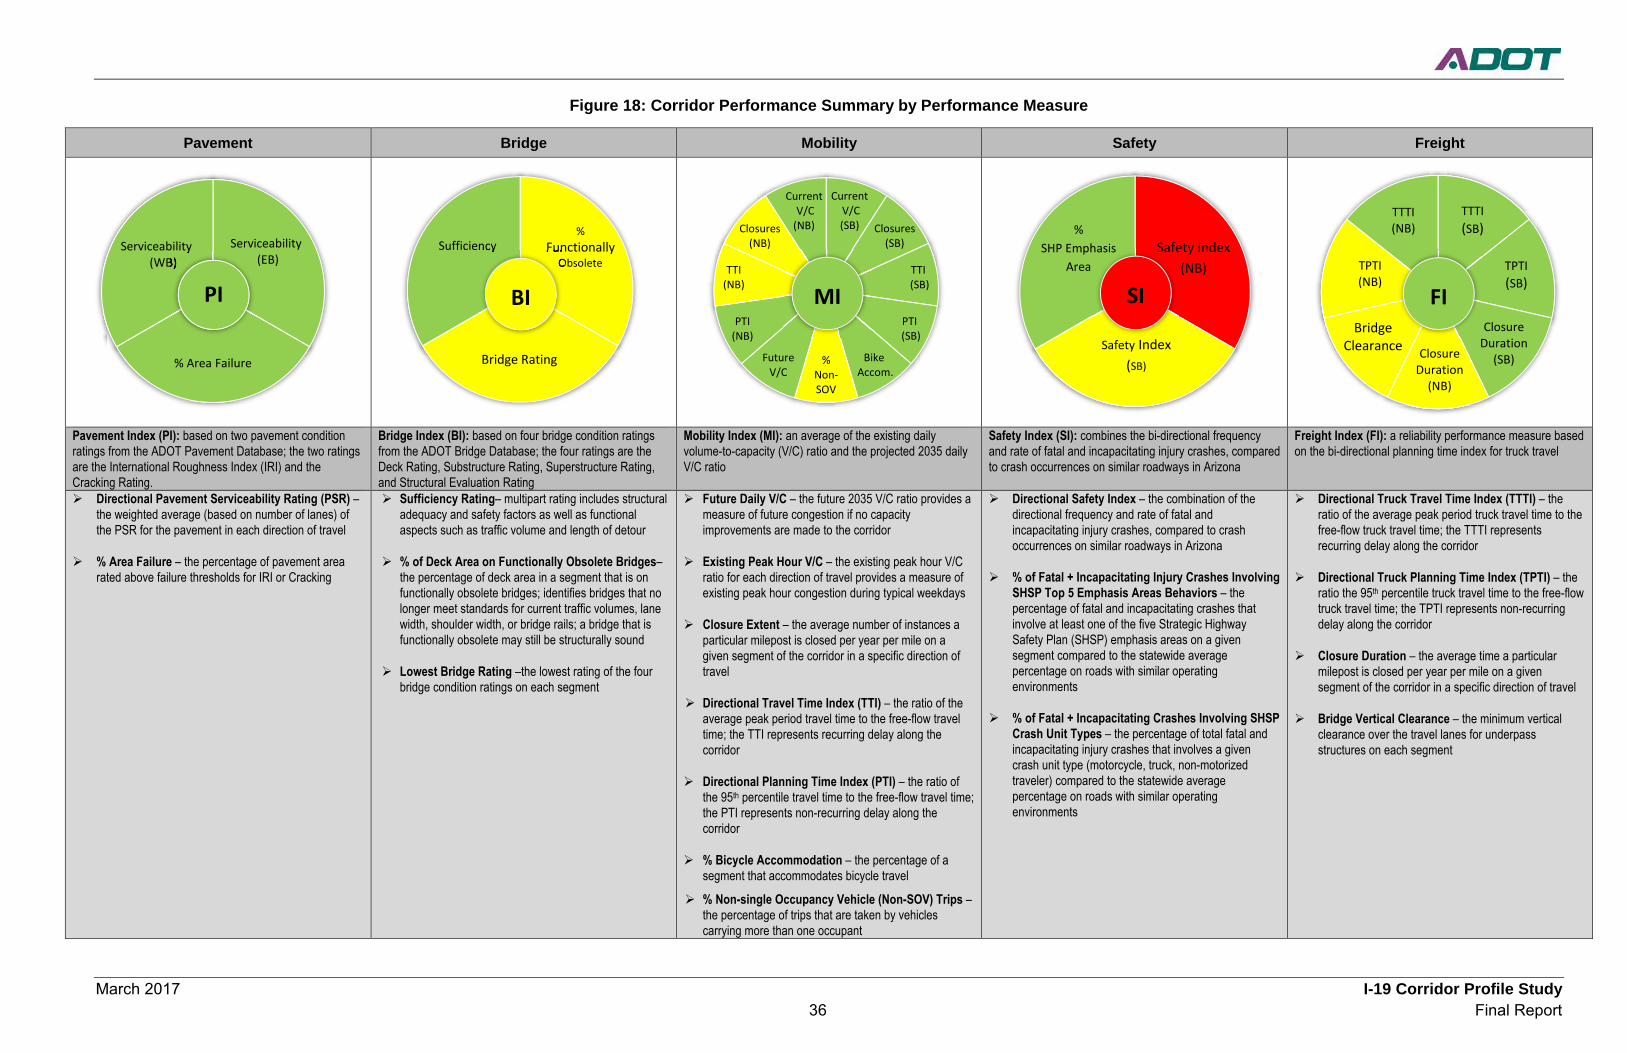
March 2017 I-19 Corridor Profile Study36 Final Report
Figure 18: Corridor Performance Summary by Performance Measure
Pavement Bridge Mobility Safety Freight
Pavement Index (PI): based on two pavement condition ratings from the ADOT Pavement Database; the two ratings are the International Roughness Index (IRI) and the Cracking Rating.
Bridge Index (BI): based on four bridge condition ratings from the ADOT Bridge Database; the four ratings are the Deck Rating, Substructure Rating, Superstructure Rating, and Structural Evaluation Rating
Mobility Index (MI): an average of the existing daily volume-to-capacity (V/C) ratio and the projected 2035 daily V/C ratio
Safety Index (SI): combines the bi-directional frequency and rate of fatal and incapacitating injury crashes, comparedto crash occurrences on similar roadways in Arizona
Freight Index (FI): a reliability performance measure based on the bi-directional planning time index for truck travel
Directional Pavement Serviceability Rating (PSR) –the weighted average (based on number of lanes) of the PSR for the pavement in each direction of travel
% Area Failure – the percentage of pavement area rated above failure thresholds for IRI or Cracking
Sufficiency Rating– multipart rating includes structural adequacy and safety factors as well as functional aspects such as traffic volume and length of detour
% of Deck Area on Functionally Obsolete Bridges–the percentage of deck area in a segment that is on functionally obsolete bridges; identifies bridges that no longer meet standards for current traffic volumes, lane width, shoulder width, or bridge rails; a bridge that is functionally obsolete may still be structurally sound
Lowest Bridge Rating –the lowest rating of the four bridge condition ratings on each segment
Future Daily V/C – the future 2035 V/C ratio provides a measure of future congestion if no capacity improvements are made to the corridor
Existing Peak Hour V/C – the existing peak hour V/C ratio for each direction of travel provides a measure of existing peak hour congestion during typical weekdays
Closure Extent – the average number of instances aparticular milepost is closed per year per mile on a given segment of the corridor in a specific direction of travel
Directional Travel Time Index (TTI) – the ratio of the average peak period travel time to the free-flow travel time; the TTI represents recurring delay along the corridor
Directional Planning Time Index (PTI) – the ratio of the 95th percentile travel time to the free-flow travel time;the PTI represents non-recurring delay along the corridor
% Bicycle Accommodation – the percentage of a segment that accommodates bicycle travel
% Non-single Occupancy Vehicle (Non-SOV) Trips –the percentage of trips that are taken by vehicles carrying more than one occupant
Directional Safety Index – the combination of the directional frequency and rate of fatal andincapacitating injury crashes, compared to crash occurrences on similar roadways in Arizona
% of Fatal + Incapacitating Injury Crashes Involving SHSP Top 5 Emphasis Areas Behaviors – the percentage of fatal and incapacitating crashes that involve at least one of the five Strategic Highway Safety Plan (SHSP) emphasis areas on a given segment compared to the statewide average percentage on roads with similar operating environments
% of Fatal + Incapacitating Crashes Involving SHSP Crash Unit Types – the percentage of total fatal and incapacitating injury crashes that involves a given crash unit type (motorcycle, truck, non-motorized traveler) compared to the statewide average percentage on roads with similar operating environments
Directional Truck Travel Time Index (TTTI) – the ratio of the average peak period truck travel time to the free-flow truck travel time; the TTTI represents recurring delay along the corridor
Directional Truck Planning Time Index (TPTI) – the ratio the 95th percentile truck travel time to the free-flow truck travel time; the TPTI represents non-recurring delay along the corridor
Closure Duration – the average time a particular milepost is closed per year per mile on a given segment of the corridor in a specific direction of travel
Bridge Vertical Clearance – the minimum vertical clearance over the travel lanes for underpass structures on each segment
PI
Serviceability (EB)
Serviceability (WB)
% Area Failure
Current V/C (SB) Closures
(SB)
TTI (SB)
PTI (SB)
Bike Accom.
% Non- SOV
Future V/C
PTI (NB)
TTI (NB)
Closures (NB)
Current V/C (NB) %
Functionally Obsolete
Bridge Rating
Sufficiency
TTTI (SB)
TPTI (SB)
Closure Duration
(NB)
TPTI (NB)
TTTI (NB)
Closure Duration
(SB)
Bridge Clearance
MI SI
FunctionallyObsolete
Sufficiency
BI FI
%SHP Emphasis
Area
Safety Index (SB)
Safety Index (NB)
Serviceability(WB)
PI
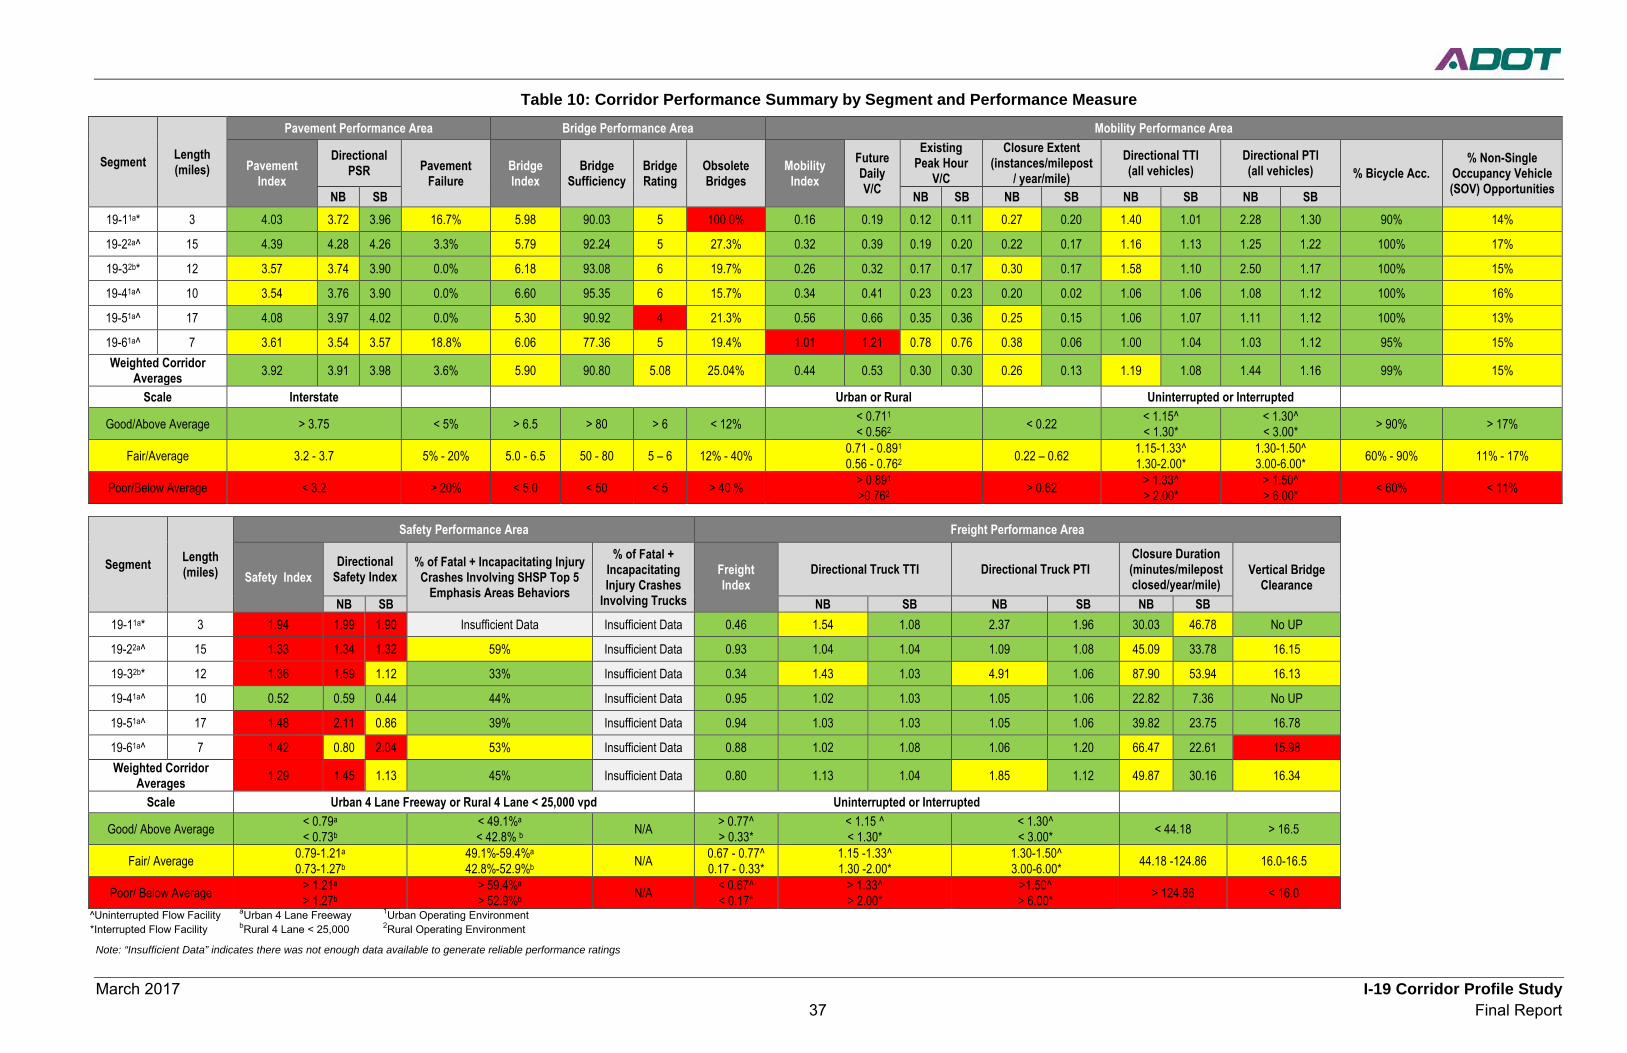
March 2017 I-19 Corridor Profile Study 37 Final Report
Table 10: Corridor Performance Summary by Segment and Performance Measure
Segment Length (miles)
Pavement Performance Area Bridge Performance Area Mobility Performance Area
Pavement Index
Directional PSR Pavement
Failure Bridge Index
Bridge Sufficiency
Bridge Rating
Obsolete Bridges
Mobility Index
Future Daily V/C
Existing Peak Hour
V/C
Closure Extent (instances/milepost
/ year/mile) Directional TTI (all vehicles)
Directional PTI (all vehicles) % Bicycle Acc.
% Non-Single Occupancy Vehicle (SOV) Opportunities NB SB NB SB NB SB NB SB NB SB
19-11a* 3 4.03 3.72 3.96 16.7% 5.98 90.03 5 100.0% 0.16 0.19 0.12 0.11 0.27 0.20 1.40 1.01 2.28 1.30 90% 14%
19-22a^ 15 4.39 4.28 4.26 3.3% 5.79 92.24 5 27.3% 0.32 0.39 0.19 0.20 0.22 0.17 1.16 1.13 1.25 1.22 100% 17%
19-32b* 12 3.57 3.74 3.90 0.0% 6.18 93.08 6 19.7% 0.26 0.32 0.17 0.17 0.30 0.17 1.58 1.10 2.50 1.17 100% 15%
19-41a^ 10 3.54 3.76 3.90 0.0% 6.60 95.35 6 15.7% 0.34 0.41 0.23 0.23 0.20 0.02 1.06 1.06 1.08 1.12 100% 16%
19-51a^ 17 4.08 3.97 4.02 0.0% 5.30 90.92 4 21.3% 0.56 0.66 0.35 0.36 0.25 0.15 1.06 1.07 1.11 1.12 100% 13%
19-61a^ 7 3.61 3.54 3.57 18.8% 6.06 77.36 5 19.4% 1.01 1.21 0.78 0.76 0.38 0.06 1.00 1.04 1.03 1.12 95% 15% Weighted Corridor
Averages 3.92 3.91 3.98 3.6% 5.90 90.80 5.08 25.04% 0.44 0.53 0.30 0.30 0.26 0.13 1.19 1.08 1.44 1.16 99% 15%
Scale Interstate Urban or Rural Uninterrupted or Interrupted Good/Above Average > 3.75 < 5% > 6.5 > 80 > 6 < 12% < 0.711
< 0.562 < 0.22 < 1.15^ < 1.30*
< 1.30^ < 3.00* > 90% > 17%
Fair/Average 3.2 - 3.7 5% - 20% 5.0 - 6.5 50 - 80 5 – 6 12% - 40% 0.71 - 0.891 0.56 - 0.762 0.22 – 0.62 1.15-1.33^
1.30-2.00* 1.30-1.50^ 3.00-6.00* 60% - 90% 11% - 17%
Poor/Below Average < 3.2 > 20% < 5.0 < 50 < 5 > 40 % > 0.891 >0.762 > 0.62 > 1.33^
> 2.00* > 1.50^ > 6.00* < 60% < 11%
Segment Length (miles)
Safety Performance Area Freight Performance Area
Safety Index Directional
Safety Index % of Fatal + Incapacitating Injury Crashes Involving SHSP Top 5
Emphasis Areas Behaviors
% of Fatal + Incapacitating Injury Crashes
Involving Trucks
Freight Index
Directional Truck TTI Directional Truck PTI Closure Duration (minutes/milepost closed/year/mile)
Vertical Bridge Clearance
NB SB NB SB NB SB NB SB 19-11a* 3 1.94 1.99 1.90 Insufficient Data Insufficient Data 0.46 1.54 1.08 2.37 1.96 30.03 46.78 No UP
19-22a^ 15 1.33 1.34 1.32 59% Insufficient Data 0.93 1.04 1.04 1.09 1.08 45.09 33.78 16.15
19-32b* 12 1.36 1.59 1.12 33% Insufficient Data 0.34 1.43 1.03 4.91 1.06 87.90 53.94 16.13
19-41a^ 10 0.52 0.59 0.44 44% Insufficient Data 0.95 1.02 1.03 1.05 1.06 22.82 7.36 No UP
19-51a^ 17 1.48 2.11 0.86 39% Insufficient Data 0.94 1.03 1.03 1.05 1.06 39.82 23.75 16.78
19-61a^ 7 1.42 0.80 2.04 53% Insufficient Data 0.88 1.02 1.08 1.06 1.20 66.47 22.61 15.98 Weighted Corridor
Averages 1.29 1.45 1.13 45% Insufficient Data 0.80 1.13 1.04 1.85 1.12 49.87 30.16 16.34
Scale Urban 4 Lane Freeway or Rural 4 Lane < 25,000 vpd Uninterrupted or Interrupted Good/ Above Average < 0.79a
< 0.73b < 49.1%a < 42.8% b N/A > 0.77^
> 0.33* < 1.15 ^ < 1.30*
< 1.30^ < 3.00* < 44.18 > 16.5
Fair/ Average 0.79-1.21a 0.73-1.27b
49.1%-59.4%a 42.8%-52.9%b N/A 0.67 - 0.77^
0.17 - 0.33* 1.15 -1.33^ 1.30 -2.00*
1.30-1.50^ 3.00-6.00* 44.18 -124.86 16.0-16.5
Poor/ Below Average > 1.21a > 1.27b
> 59.4%a > 52.9%b N/A < 0.67^
< 0.17* > 1.33^ > 2.00*
>1.50^ > 6.00* > 124.86 < 16.0
^Uninterrupted Flow Facility aUrban 4 Lane Freeway 1Urban Operating Environment *Interrupted Flow Facility bRural 4 Lane < 25,000 2Rural Operating Environment
Note: “Insufficient Data” indicates there was not enough data available to generate reliable performance ratings
March 2017 I-19 Corridor Profile Study 38 Final Report
3.0 NEEDS ASSESSMENT
3.1 Corridor Objectives Statewide goals and performance measures were established by the ADOT Long-Range Transportation Plan (LRTP), 2010-2035. Statewide performance goals that are relevant to I-19 performance areas were identified and corridor goals were then formulated for each of the five performance areas that aligned with the overall statewide goals established by the LRTP. Based on stakeholder input, corridor goals, corridor objectives, and performance results, three “Emphasis Areas” were identified for the I-19 Corridor: Mobility, Safety, and Freight.
Taking into account the corridor goals and identified emphasis areas, performance objectives were developed for each quantifiable performance measure that identify the desired level of performance based on the performance scale levels for the overall corridor and for each segment of the corridor. For the performance emphasis areas, the corridor-wide weighted average performance objectives are identified with a higher standard than for the other performance areas. Table 11 shows the I-19 Corridor goals, corridor objectives, and performance objectives, and how they align with the statewide goals.
It is not reasonable within a financially constrained environment to expect that every performance measure will always be at the highest levels on every corridor segment. Therefore, individual corridor segment objectives have been set as fair or better and should not fall below that standard.
Achieving corridor and segment performance objectives will help ensure that investments are targeted toward improvements that support the safe and efficient movement of travelers on the corridor. Addressing current and future congestion, thereby improving mobility on congested segments, will also help the corridor fulfill its potential as a significant contributor to the region’s economy.
Corridor performance is measured against corridor and segment objectives to determine needs – the gap between observed performance and performance objectives.
Goal achievement will improve or reduce current and future congestion, increase travel time reliability, and reduce fatalities and incapacitating injuries resulting from vehicle crashes. Where performance is currently rated “good”, the goal is always to maintain that standard, regardless of whether or not the performance is in an emphasis area.
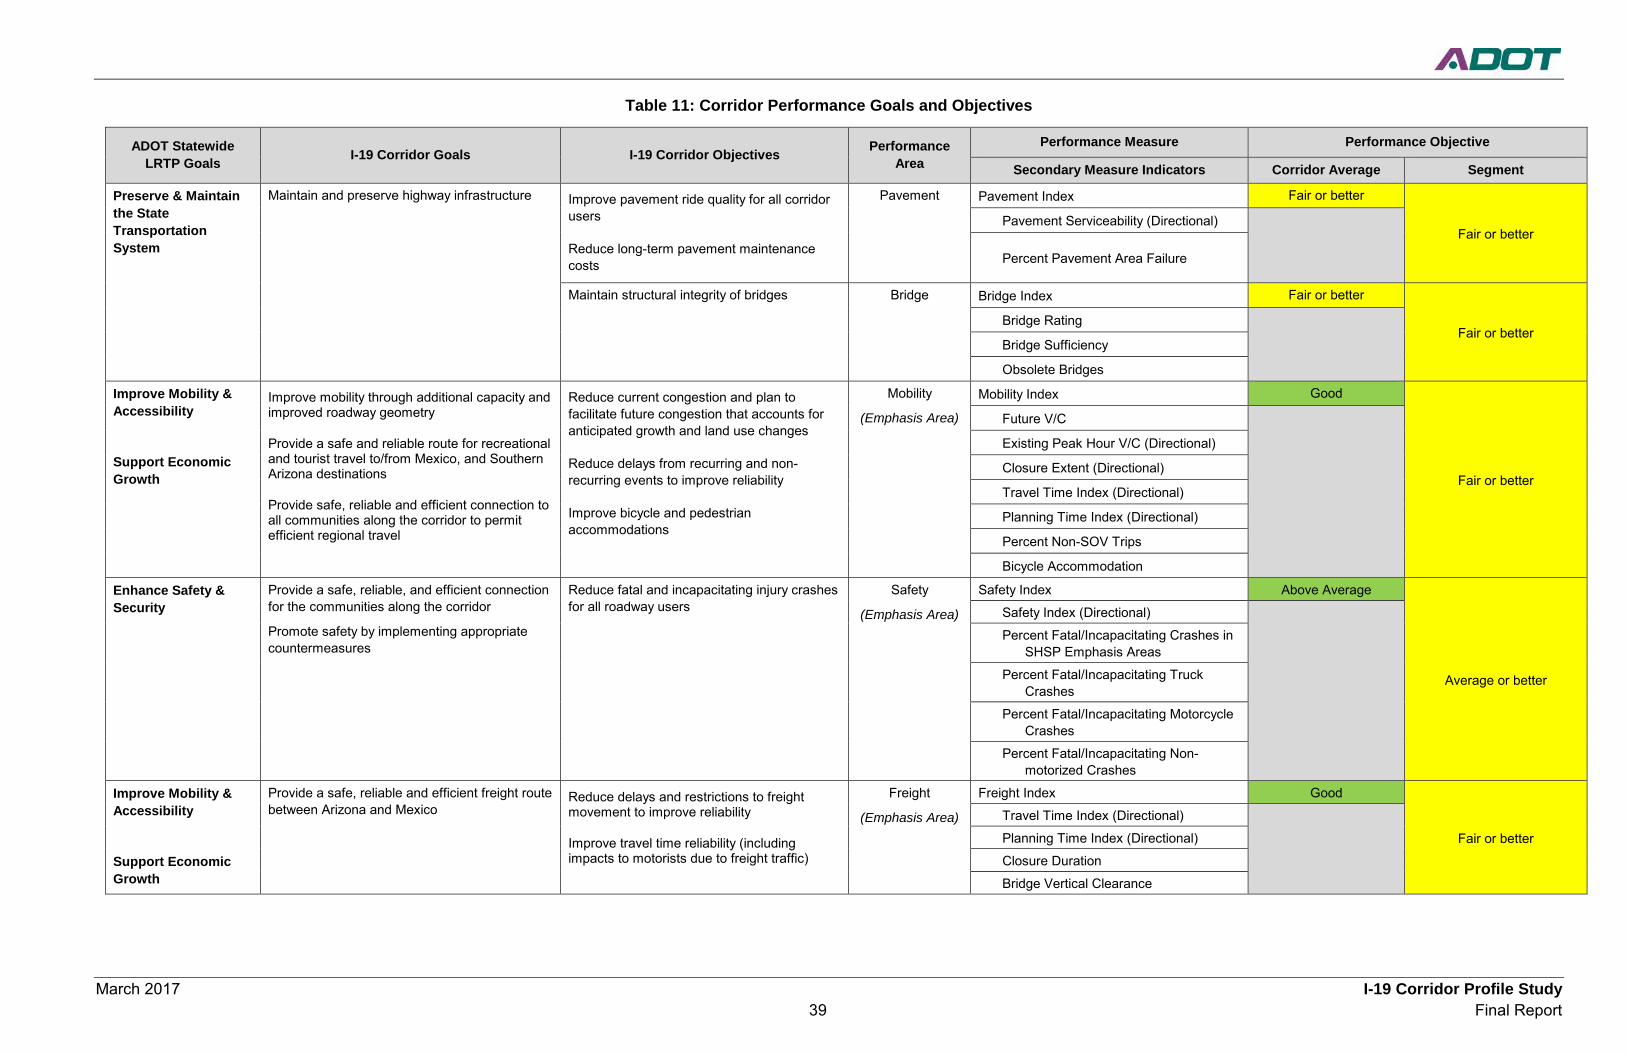
March 2017 I-19 Corridor Profile Study 39 Final Report
Table 11: Corridor Performance Goals and Objectives
ADOT Statewide LRTP Goals I-19 Corridor Goals I-19 Corridor Objectives Performance
Area Performance Measure Performance Objective
Secondary Measure Indicators Corridor Average Segment
Preserve & Maintain the State Transportation System
Maintain and preserve highway infrastructure Improve pavement ride quality for all corridor users
Reduce long-term pavement maintenance costs
Pavement Pavement Index Fair or better
Fair or better Pavement Serviceability (Directional)
Percent Pavement Area Failure
Maintain structural integrity of bridges Bridge Bridge Index Fair or better
Fair or better Bridge Rating
Bridge Sufficiency
Obsolete Bridges
Improve Mobility & Accessibility
Support Economic Growth
Improve mobility through additional capacity and improved roadway geometry
Provide a safe and reliable route for recreational and tourist travel to/from Mexico, and Southern Arizona destinations
Provide safe, reliable and efficient connection to all communities along the corridor to permit efficient regional travel
Reduce current congestion and plan to facilitate future congestion that accounts for anticipated growth and land use changes
Reduce delays from recurring and non-recurring events to improve reliability
Improve bicycle and pedestrian accommodations
Mobility
(Emphasis Area)
Mobility Index Good
Fair or better
Future V/C
Existing Peak Hour V/C (Directional)
Closure Extent (Directional)
Travel Time Index (Directional)
Planning Time Index (Directional)
Percent Non-SOV Trips
Bicycle Accommodation
Enhance Safety & Security
Provide a safe, reliable, and efficient connection for the communities along the corridor
Promote safety by implementing appropriate countermeasures
Reduce fatal and incapacitating injury crashes for all roadway users
Safety
(Emphasis Area)
Safety Index Above Average
Average or better
Safety Index (Directional)
Percent Fatal/Incapacitating Crashes in SHSP Emphasis Areas
Percent Fatal/Incapacitating Truck Crashes
Percent Fatal/Incapacitating Motorcycle Crashes
Percent Fatal/Incapacitating Non-motorized Crashes
Improve Mobility & Accessibility
Support Economic Growth
Provide a safe, reliable and efficient freight route between Arizona and Mexico
Reduce delays and restrictions to freight movement to improve reliability
Improve travel time reliability (including impacts to motorists due to freight traffic)
Freight
(Emphasis Area)
Freight Index Good
Fair or better
Travel Time Index (Directional) Planning Time Index (Directional)
Closure Duration
Bridge Vertical Clearance
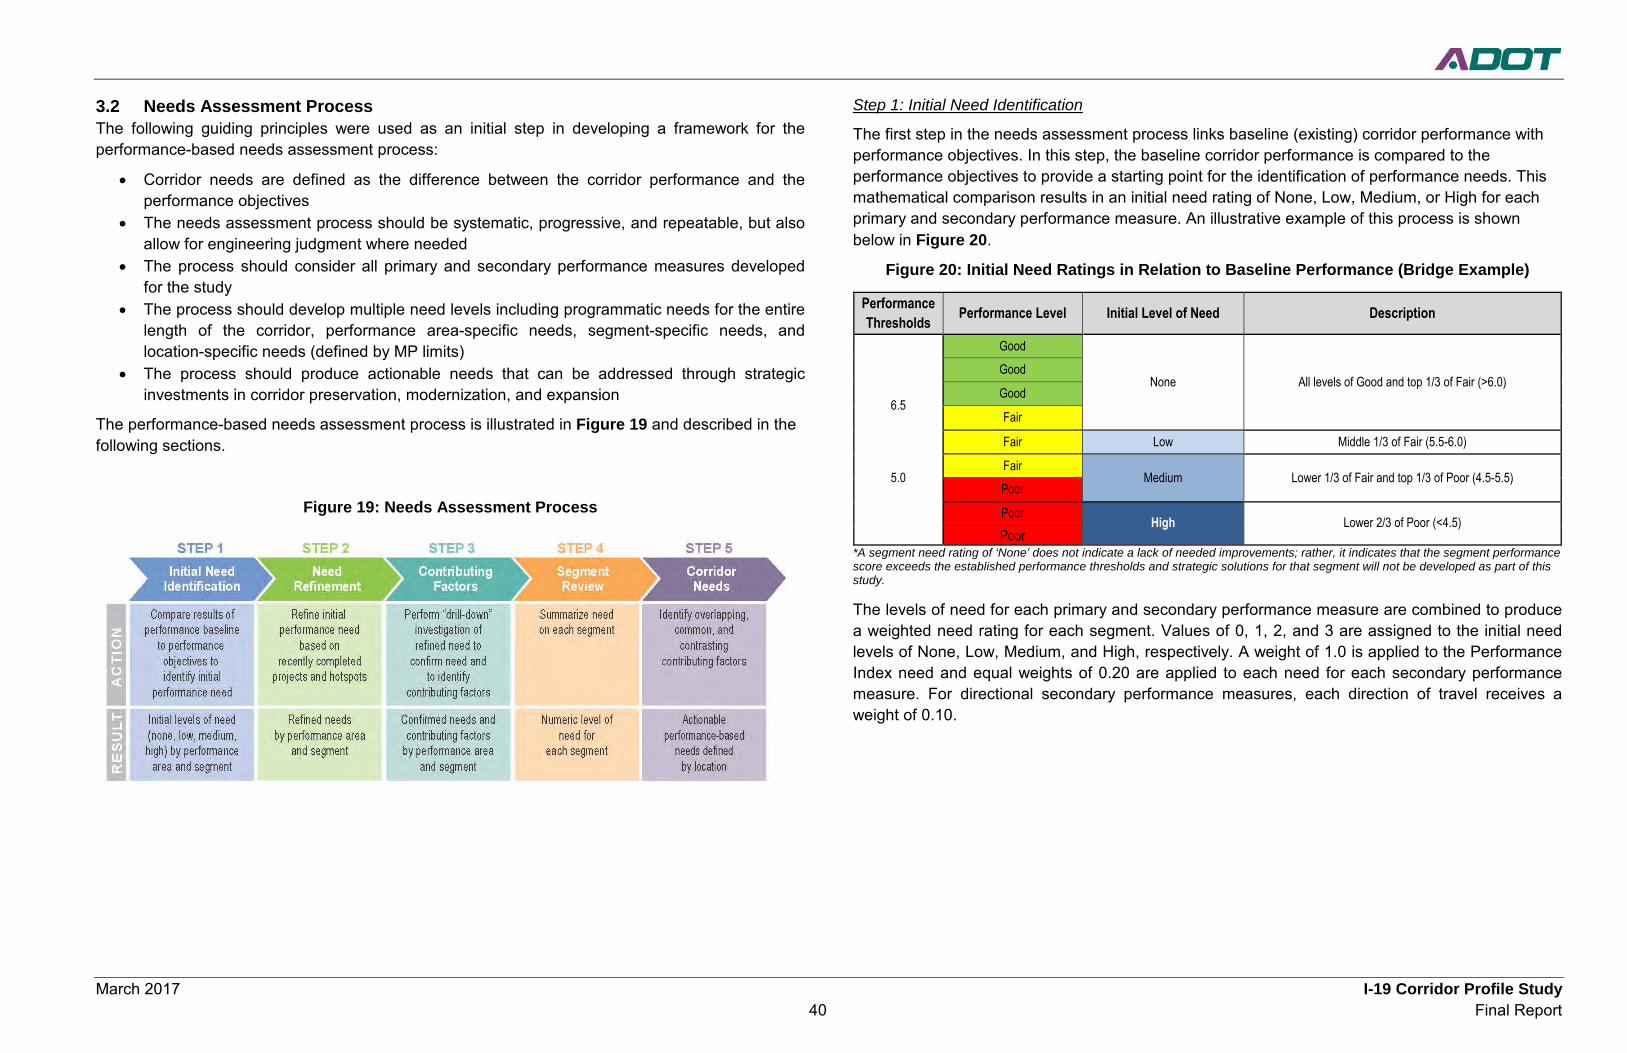
March 2017 I-19 Corridor Profile Study 40 Final Report
3.2 Needs Assessment Process The following guiding principles were used as an initial step in developing a framework for the performance-based needs assessment process:
• Corridor needs are defined as the difference between the corridor performance and the performance objectives
• The needs assessment process should be systematic, progressive, and repeatable, but also allow for engineering judgment where needed
• The process should consider all primary and secondary performance measures developed for the study
• The process should develop multiple need levels including programmatic needs for the entire length of the corridor, performance area-specific needs, segment-specific needs, and location-specific needs (defined by MP limits)
• The process should produce actionable needs that can be addressed through strategic investments in corridor preservation, modernization, and expansion
The performance-based needs assessment process is illustrated in Figure 19 and described in the following sections.
Figure 19: Needs Assessment Process
Step 1: Initial Need Identification
The first step in the needs assessment process links baseline (existing) corridor performance with performance objectives. In this step, the baseline corridor performance is compared to the performance objectives to provide a starting point for the identification of performance needs. This mathematical comparison results in an initial need rating of None, Low, Medium, or High for each primary and secondary performance measure. An illustrative example of this process is shown below in Figure 20.
Figure 20: Initial Need Ratings in Relation to Baseline Performance (Bridge Example)
Performance Thresholds Performance Level Initial Level of Need Description
Good
None All levels of Good and top 1/3 of Fair (>6.0) Good
6.5 Good
Fair
Fair Low Middle 1/3 of Fair (5.5-6.0)
5.0 Fair
Medium Lower 1/3 of Fair and top 1/3 of Poor (4.5-5.5) Poor
Poor High Lower 2/3 of Poor (<4.5)
Poor *A segment need rating of ‘None’ does not indicate a lack of needed improvements; rather, it indicates that the segment performance score exceeds the established performance thresholds and strategic solutions for that segment will not be developed as part of this study.
The levels of need for each primary and secondary performance measure are combined to produce a weighted need rating for each segment. Values of 0, 1, 2, and 3 are assigned to the initial need levels of None, Low, Medium, and High, respectively. A weight of 1.0 is applied to the Performance Index need and equal weights of 0.20 are applied to each need for each secondary performance measure. For directional secondary performance measures, each direction of travel receives a weight of 0.10.
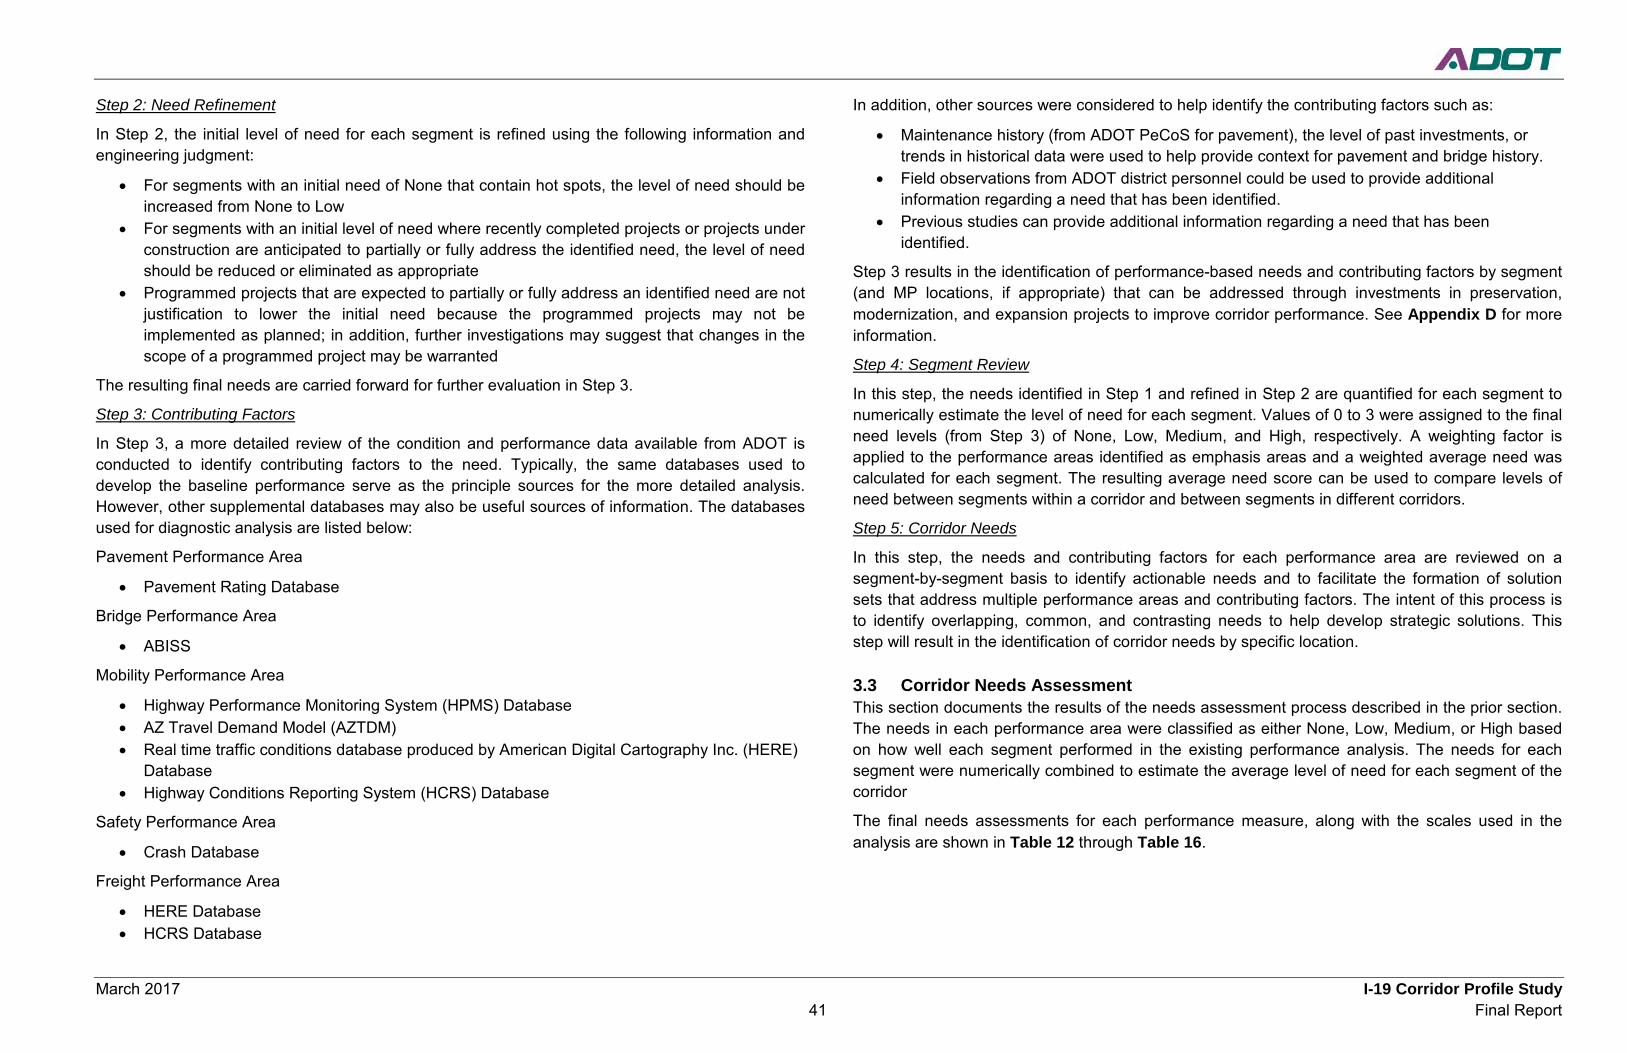
March 2017 I-19 Corridor Profile Study 41 Final Report
Step 2: Need Refinement
In Step 2, the initial level of need for each segment is refined using the following information and engineering judgment:
• For segments with an initial need of None that contain hot spots, the level of need should be increased from None to Low
• For segments with an initial level of need where recently completed projects or projects under construction are anticipated to partially or fully address the identified need, the level of need should be reduced or eliminated as appropriate
• Programmed projects that are expected to partially or fully address an identified need are not justification to lower the initial need because the programmed projects may not be implemented as planned; in addition, further investigations may suggest that changes in the scope of a programmed project may be warranted
The resulting final needs are carried forward for further evaluation in Step 3.
Step 3: Contributing Factors
In Step 3, a more detailed review of the condition and performance data available from ADOT is conducted to identify contributing factors to the need. Typically, the same databases used to develop the baseline performance serve as the principle sources for the more detailed analysis. However, other supplemental databases may also be useful sources of information. The databases used for diagnostic analysis are listed below:
Pavement Performance Area
• Pavement Rating Database
Bridge Performance Area
• ABISS
Mobility Performance Area
• Highway Performance Monitoring System (HPMS) Database • AZ Travel Demand Model (AZTDM) • Real time traffic conditions database produced by American Digital Cartography Inc. (HERE)
Database • Highway Conditions Reporting System (HCRS) Database
Safety Performance Area
• Crash Database
Freight Performance Area
• HERE Database • HCRS Database
In addition, other sources were considered to help identify the contributing factors such as:
• Maintenance history (from ADOT PeCoS for pavement), the level of past investments, or trends in historical data were used to help provide context for pavement and bridge history.
• Field observations from ADOT district personnel could be used to provide additional information regarding a need that has been identified.
• Previous studies can provide additional information regarding a need that has been identified.
Step 3 results in the identification of performance-based needs and contributing factors by segment (and MP locations, if appropriate) that can be addressed through investments in preservation, modernization, and expansion projects to improve corridor performance. See Appendix D for more information.
Step 4: Segment Review
In this step, the needs identified in Step 1 and refined in Step 2 are quantified for each segment to numerically estimate the level of need for each segment. Values of 0 to 3 were assigned to the final need levels (from Step 3) of None, Low, Medium, and High, respectively. A weighting factor is applied to the performance areas identified as emphasis areas and a weighted average need was calculated for each segment. The resulting average need score can be used to compare levels of need between segments within a corridor and between segments in different corridors.
Step 5: Corridor Needs
In this step, the needs and contributing factors for each performance area are reviewed on a segment-by-segment basis to identify actionable needs and to facilitate the formation of solution sets that address multiple performance areas and contributing factors. The intent of this process is to identify overlapping, common, and contrasting needs to help develop strategic solutions. This step will result in the identification of corridor needs by specific location.
3.3 Corridor Needs Assessment This section documents the results of the needs assessment process described in the prior section. The needs in each performance area were classified as either None, Low, Medium, or High based on how well each segment performed in the existing performance analysis. The needs for each segment were numerically combined to estimate the average level of need for each segment of the corridor
The final needs assessments for each performance measure, along with the scales used in the analysis are shown in Table 12 through Table 16.
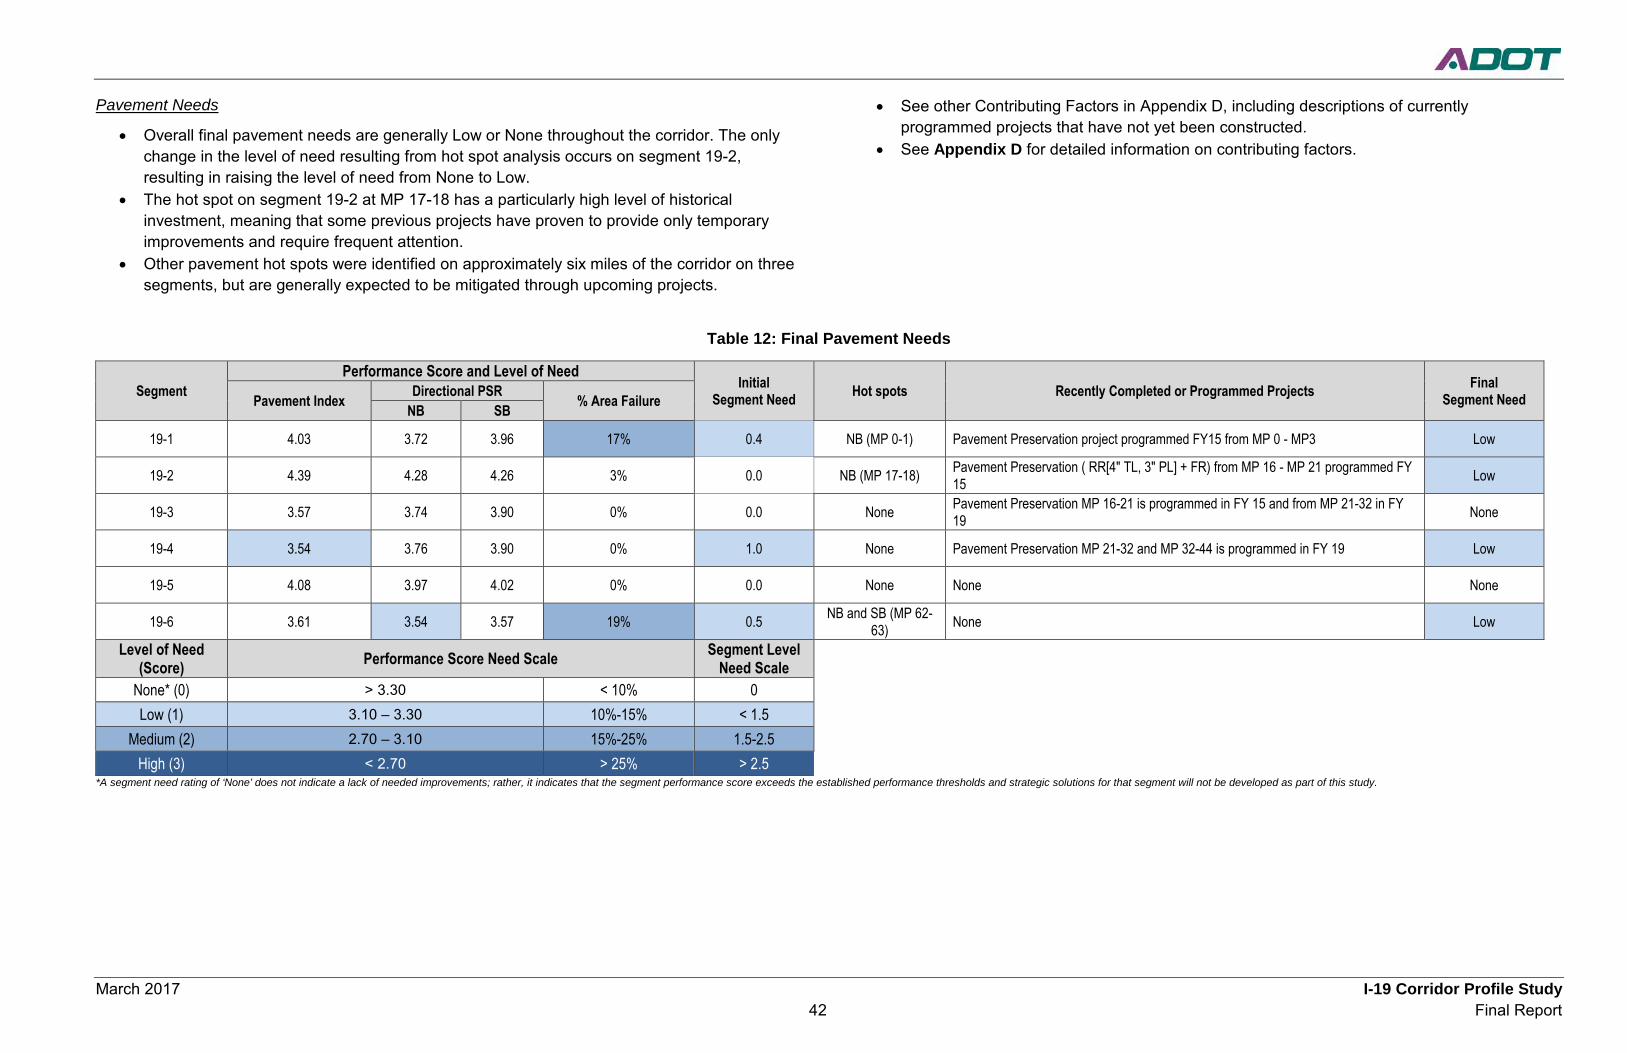
March 2017 I-19 Corridor Profile Study 42 Final Report
Pavement Needs
• Overall final pavement needs are generally Low or None throughout the corridor. The only change in the level of need resulting from hot spot analysis occurs on segment 19-2, resulting in raising the level of need from None to Low.
• The hot spot on segment 19-2 at MP 17-18 has a particularly high level of historical investment, meaning that some previous projects have proven to provide only temporary improvements and require frequent attention.
• Other pavement hot spots were identified on approximately six miles of the corridor on three segments, but are generally expected to be mitigated through upcoming projects.
• See other Contributing Factors in Appendix D, including descriptions of currently programmed projects that have not yet been constructed.
• See Appendix D for detailed information on contributing factors.
Table 12: Final Pavement Needs
Segment Performance Score and Level of Need
Initial Segment Need Hot spots Recently Completed or Programmed Projects Final
Segment Need Pavement Index Directional PSR % Area Failure NB SB 19-1 4.03 3.72 3.96 17% 0.4 NB (MP 0-1) Pavement Preservation project programmed FY15 from MP 0 - MP3 Low
19-2 4.39 4.28 4.26 3% 0.0 NB (MP 17-18) Pavement Preservation ( RR[4" TL, 3" PL] + FR) from MP 16 - MP 21 programmed FY 15 Low
19-3 3.57 3.74 3.90 0% 0.0 None Pavement Preservation MP 16-21 is programmed in FY 15 and from MP 21-32 in FY 19 None
19-4 3.54 3.76 3.90 0% 1.0 None Pavement Preservation MP 21-32 and MP 32-44 is programmed in FY 19 Low
19-5 4.08 3.97 4.02 0% 0.0 None None None
19-6 3.61 3.54 3.57 19% 0.5 NB and SB (MP 62-63) None Low
Level of Need (Score) Performance Score Need Scale Segment Level
Need Scale
None* (0) > 3.30 < 10% 0 Low (1) 3.10 – 3.30 10%-15% < 1.5
Medium (2) 2.70 – 3.10 15%-25% 1.5-2.5 High (3) < 2.70 > 25% > 2.5
*A segment need rating of ‘None’ does not indicate a lack of needed improvements; rather, it indicates that the segment performance score exceeds the established performance thresholds and strategic solutions for that segment will not be developed as part of this study.
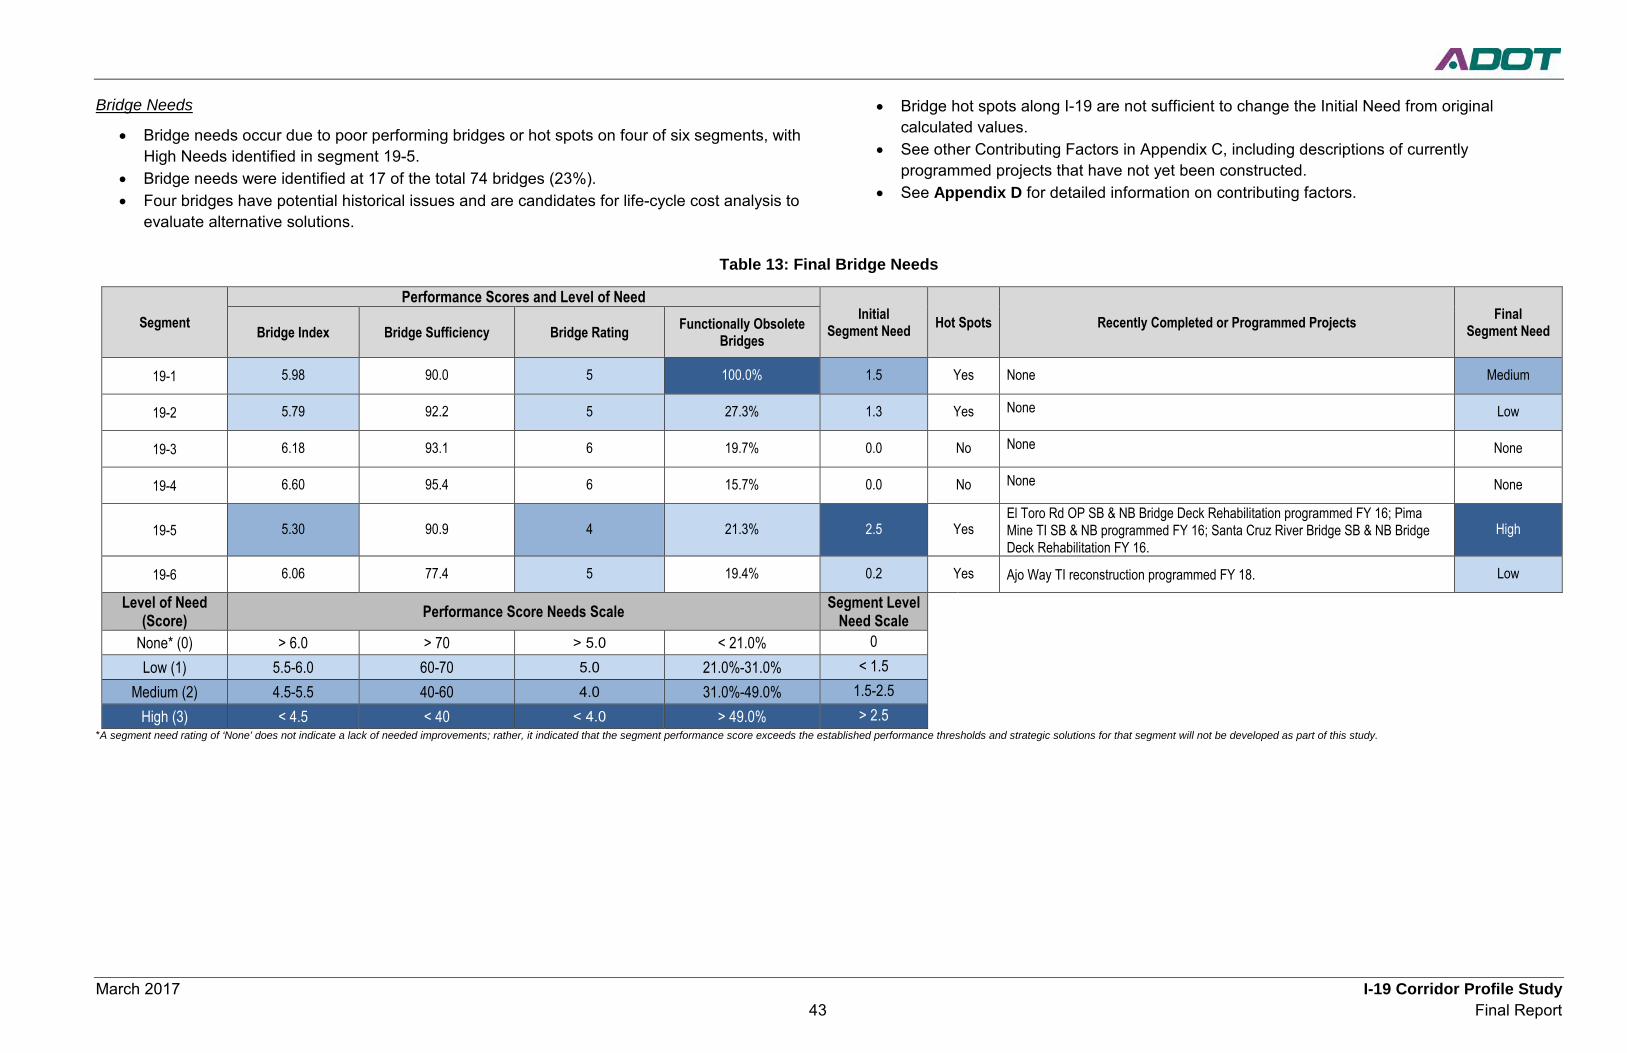
March 2017 I-19 Corridor Profile Study 43 Final Report
Bridge Needs
• Bridge needs occur due to poor performing bridges or hot spots on four of six segments, with High Needs identified in segment 19-5.
• Bridge needs were identified at 17 of the total 74 bridges (23%). • Four bridges have potential historical issues and are candidates for life-cycle cost analysis to
evaluate alternative solutions.
• Bridge hot spots along I-19 are not sufficient to change the Initial Need from original calculated values.
• See other Contributing Factors in Appendix C, including descriptions of currently programmed projects that have not yet been constructed.
• See Appendix D for detailed information on contributing factors.
Table 13: Final Bridge Needs
Segment Performance Scores and Level of Need
Initial Segment Need Hot Spots Recently Completed or Programmed Projects Final
Segment Need Bridge Index Bridge Sufficiency Bridge Rating Functionally Obsolete Bridges
19-1 5.98 90.0 5 100.0% 1.5 Yes None Medium
19-2 5.79 92.2 5 27.3% 1.3 Yes None Low
19-3 6.18 93.1 6 19.7% 0.0 No None None
19-4 6.60 95.4 6 15.7% 0.0 No None None
19-5 5.30 90.9 4 21.3% 2.5 Yes El Toro Rd OP SB & NB Bridge Deck Rehabilitation programmed FY 16; Pima Mine TI SB & NB programmed FY 16; Santa Cruz River Bridge SB & NB Bridge Deck Rehabilitation FY 16.
High
19-6 6.06 77.4 5 19.4% 0.2 Yes Ajo Way TI reconstruction programmed FY 18. Low
Level of Need (Score) Performance Score Needs Scale Segment Level
Need Scale
None* (0) > 6.0 > 70 > 5.0 < 21.0% 0
Low (1) 5.5-6.0 60-70 5.0 21.0%-31.0% < 1.5
Medium (2) 4.5-5.5 40-60 4.0 31.0%-49.0% 1.5-2.5
High (3) < 4.5 < 40 < 4.0 > 49.0% > 2.5 *A segment need rating of ‘None’ does not indicate a lack of needed improvements; rather, it indicated that the segment performance score exceeds the established performance thresholds and strategic solutions for that segment will not be developed as part of this study.
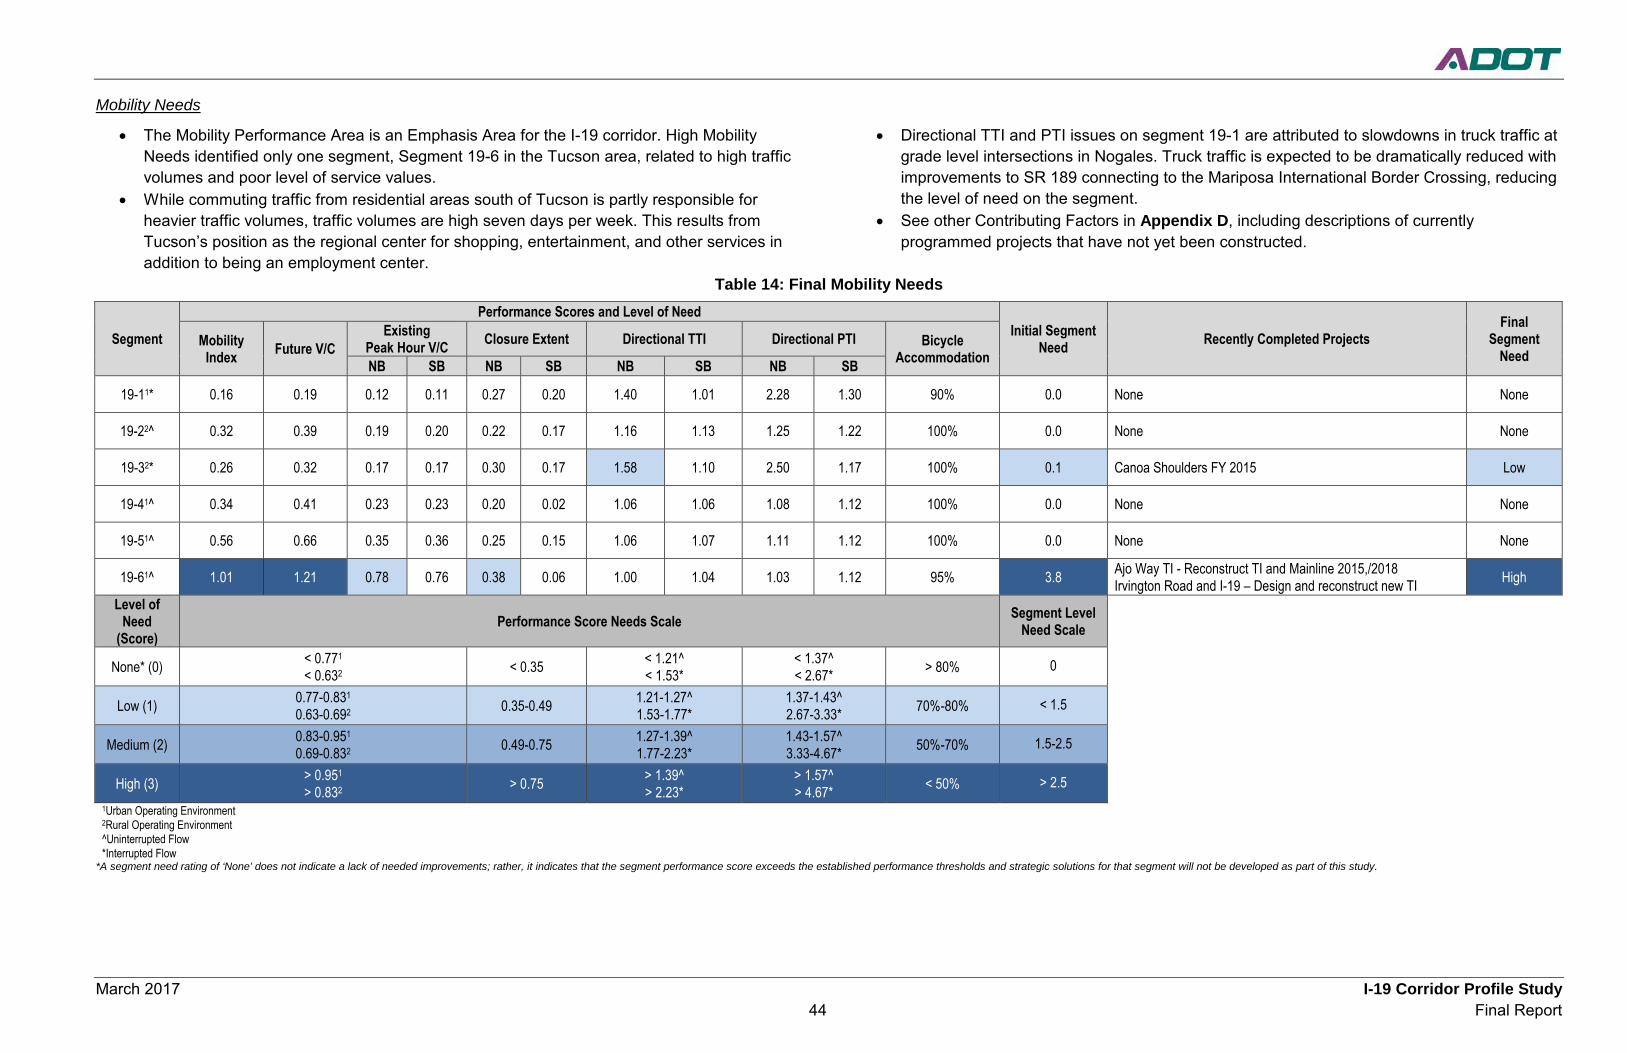
March 2017 I-19 Corridor Profile Study 44 Final Report
Mobility Needs
• The Mobility Performance Area is an Emphasis Area for the I-19 corridor. High Mobility Needs identified only one segment, Segment 19-6 in the Tucson area, related to high traffic volumes and poor level of service values.
• While commuting traffic from residential areas south of Tucson is partly responsible for heavier traffic volumes, traffic volumes are high seven days per week. This results from Tucson’s position as the regional center for shopping, entertainment, and other services in addition to being an employment center.
• Directional TTI and PTI issues on segment 19-1 are attributed to slowdowns in truck traffic at grade level intersections in Nogales. Truck traffic is expected to be dramatically reduced with improvements to SR 189 connecting to the Mariposa International Border Crossing, reducing the level of need on the segment.
• See other Contributing Factors in Appendix D, including descriptions of currently programmed projects that have not yet been constructed.
Table 14: Final Mobility Needs
Segment Performance Scores and Level of Need
Initial Segment Need Recently Completed Projects
Final Segment
Need Mobility
Index Future V/C Existing
Peak Hour V/C Closure Extent Directional TTI Directional PTI Bicycle Accommodation NB SB NB SB NB SB NB SB
19-11* 0.16 0.19 0.12 0.11 0.27 0.20 1.40 1.01 2.28 1.30 90% 0.0 None None
19-22^ 0.32 0.39 0.19 0.20 0.22 0.17 1.16 1.13 1.25 1.22 100% 0.0 None None
19-32* 0.26 0.32 0.17 0.17 0.30 0.17 1.58 1.10 2.50 1.17 100% 0.1 Canoa Shoulders FY 2015 Low
19-41^ 0.34 0.41 0.23 0.23 0.20 0.02 1.06 1.06 1.08 1.12 100% 0.0 None None
19-51^ 0.56 0.66 0.35 0.36 0.25 0.15 1.06 1.07 1.11 1.12 100% 0.0 None None
19-61^ 1.01 1.21 0.78 0.76 0.38 0.06 1.00 1.04 1.03 1.12 95% 3.8 Ajo Way TI - Reconstruct TI and Mainline 2015,/2018 Irvington Road and I-19 – Design and reconstruct new TI High
Level of Need
(Score) Performance Score Needs Scale Segment Level
Need Scale
None* (0) < 0.771 < 0.632 < 0.35 < 1.21^
< 1.53* < 1.37^ < 2.67* > 80% 0
Low (1) 0.77-0.831 0.63-0.692 0.35-0.49 1.21-1.27^
1.53-1.77* 1.37-1.43^ 2.67-3.33* 70%-80% < 1.5
Medium (2) 0.83-0.951 0.69-0.832 0.49-0.75 1.27-1.39^
1.77-2.23* 1.43-1.57^ 3.33-4.67* 50%-70% 1.5-2.5
High (3) > 0.951 > 0.832 > 0.75 > 1.39^
> 2.23* > 1.57^ > 4.67* < 50% > 2.5
1Urban Operating Environment 2Rural Operating Environment ^Uninterrupted Flow *Interrupted Flow
*A segment need rating of ‘None’ does not indicate a lack of needed improvements; rather, it indicates that the segment performance score exceeds the established performance thresholds and strategic solutions for that segment will not be developed as part of this study.
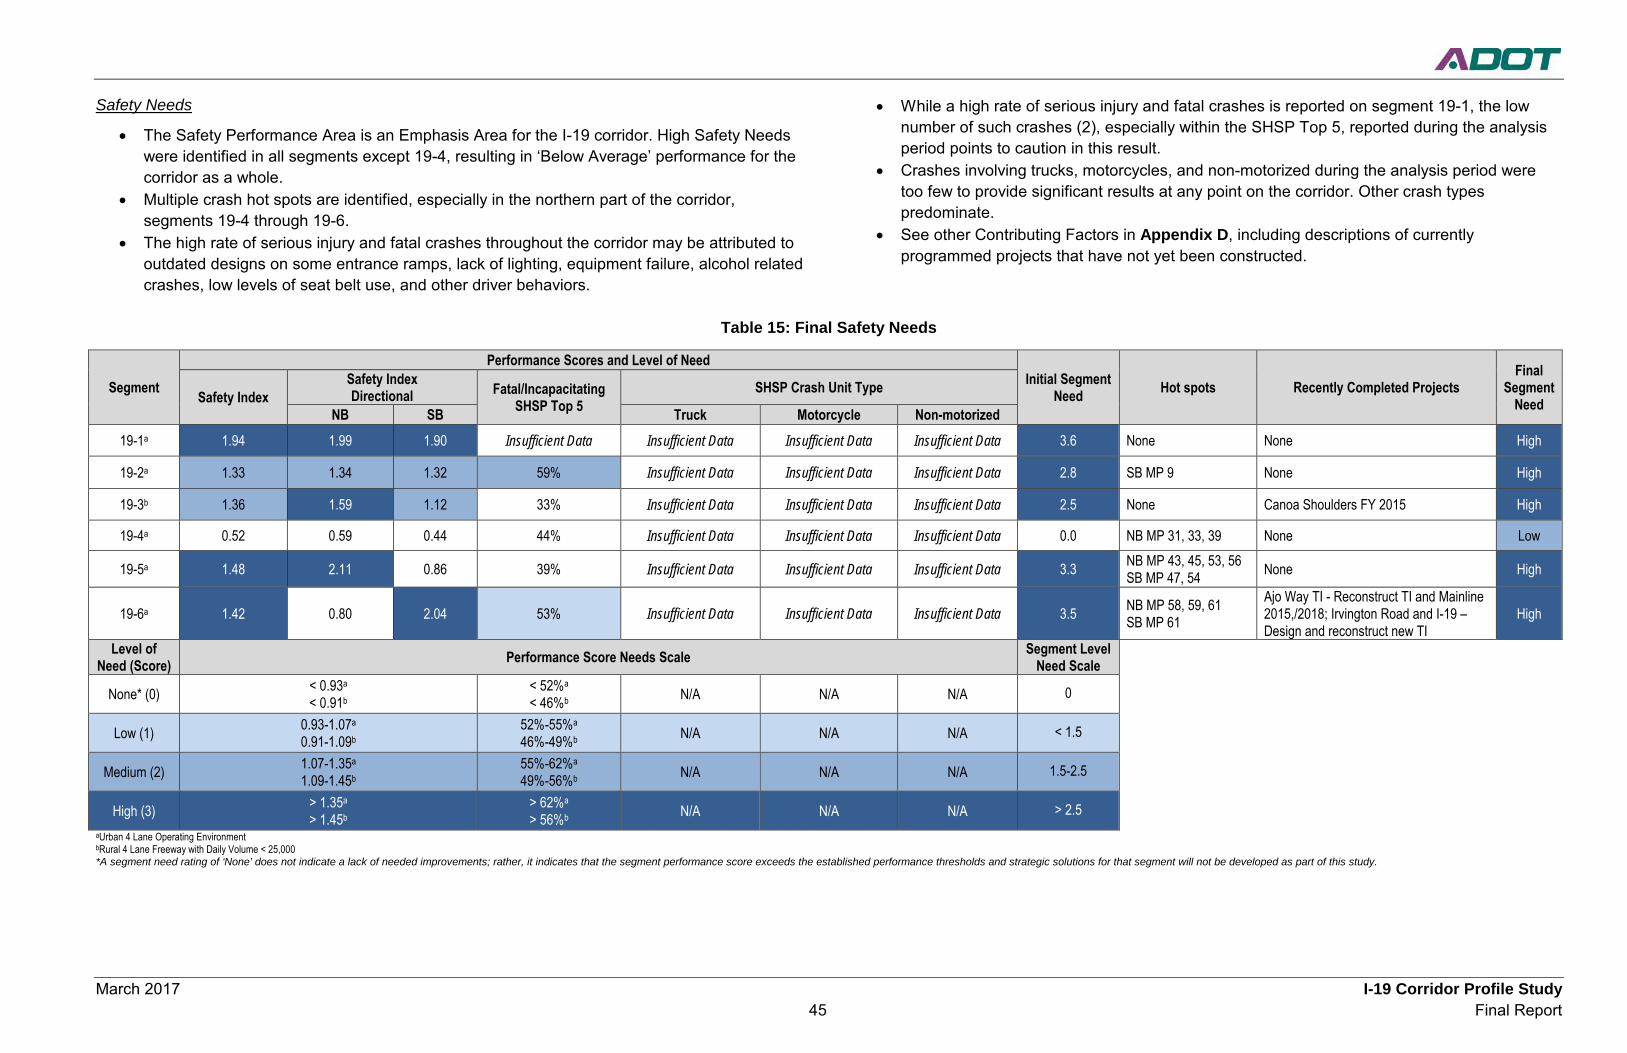
March 2017 I-19 Corridor Profile Study 45 Final Report
Safety Needs
• The Safety Performance Area is an Emphasis Area for the I-19 corridor. High Safety Needs were identified in all segments except 19-4, resulting in ‘Below Average’ performance for the corridor as a whole.
• Multiple crash hot spots are identified, especially in the northern part of the corridor, segments 19-4 through 19-6.
• The high rate of serious injury and fatal crashes throughout the corridor may be attributed to outdated designs on some entrance ramps, lack of lighting, equipment failure, alcohol related crashes, low levels of seat belt use, and other driver behaviors.
• While a high rate of serious injury and fatal crashes is reported on segment 19-1, the low number of such crashes (2), especially within the SHSP Top 5, reported during the analysis period points to caution in this result.
• Crashes involving trucks, motorcycles, and non-motorized during the analysis period were too few to provide significant results at any point on the corridor. Other crash types predominate.
• See other Contributing Factors in Appendix D, including descriptions of currently programmed projects that have not yet been constructed.
Table 15: Final Safety Needs
Segment Performance Scores and Level of Need
Initial Segment Need Hot spots Recently Completed Projects
Final Segment
Need Safety Index Safety Index Directional Fatal/Incapacitating
SHSP Top 5 SHSP Crash Unit Type
NB SB Truck Motorcycle Non-motorized 19-1a 1.94 1.99 1.90 Insufficient Data Insufficient Data Insufficient Data Insufficient Data 3.6 None None High
19-2a 1.33 1.34 1.32 59% Insufficient Data Insufficient Data Insufficient Data 2.8 SB MP 9 None High
19-3b 1.36 1.59 1.12 33% Insufficient Data Insufficient Data Insufficient Data 2.5 None Canoa Shoulders FY 2015 High
19-4a 0.52 0.59 0.44 44% Insufficient Data Insufficient Data Insufficient Data 0.0 NB MP 31, 33, 39 None Low
19-5a 1.48 2.11 0.86 39% Insufficient Data Insufficient Data Insufficient Data 3.3 NB MP 43, 45, 53, 56 SB MP 47, 54 None High
19-6a 1.42 0.80 2.04 53% Insufficient Data Insufficient Data Insufficient Data 3.5 NB MP 58, 59, 61 SB MP 61
Ajo Way TI - Reconstruct TI and Mainline 2015,/2018; Irvington Road and I-19 – Design and reconstruct new TI
High
Level of Need (Score) Performance Score Needs Scale Segment Level
Need Scale
None* (0) < 0.93a < 0.91b
< 52%a < 46%b N/A N/A N/A 0
Low (1) 0.93-1.07a 0.91-1.09b
52%-55%a 46%-49%b N/A N/A N/A < 1.5
Medium (2) 1.07-1.35a 1.09-1.45b
55%-62%a 49%-56%b N/A N/A N/A 1.5-2.5
High (3) > 1.35a > 1.45b
> 62%a > 56%b N/A N/A N/A > 2.5
aUrban 4 Lane Operating Environment bRural 4 Lane Freeway with Daily Volume < 25,000 *A segment need rating of ‘None’ does not indicate a lack of needed improvements; rather, it indicates that the segment performance score exceeds the established performance thresholds and strategic solutions for that segment will not be developed as part of this study.

March 2017 I-19 Corridor Profile Study 46 Final Report
Freight Needs
• The Freight Performance Area is an Emphasis Area for the I-19 corridor, giving it a heavier weight in the analysis.
• Final Freight Needs are Low or None throughout the corridor. In general, limits on truck travel and planning times are not significant factors.
• The most significant need evident on Table 16 shows a Low performance in the Bridge Clearance secondary measure. However, all of the low clearance bridges can be avoided by
using ramps at the grade separated traffic interchanges and do not represent a Hot spot under the criteria used for the analysis.
• Truck traffic is also affected by slowdowns in segment 19-3 related to the Border Patrol checkpoint north of Tubac, but is not sufficient to raise the level of need.
• See other Contributing Factors in Appendix C, including descriptions of currently programmed projects that have not yet been constructed.
• See Appendix D for detailed information on contributing factors.
Table 16: Final Freight Needs
Segment Performance Scores and Level of Need
Initial Segment Need Hot Spots Recently Completed Projects
Final Segment
Need Freight Index Directional TTTI Directional TPTI Closure Duration (min) Vertical Bridge Clearance
NB SB NB SB NB SB
19-1* 0.46 1.54 1.08 2.37 1.96 30.03 46.78 No Underpass in segment 0.1 None Mariposa Land Port of Entry in Nogales on SR 189 MP 0.12 DMS Low
19-2^ 0.93 1.04 1.04 1.09 1.08 45.09 33.78 16.15 0.4 None Low 19-3* 0.34 1.43 1.03 4.91 1.06 87.90 53.94 16.13 0.6 None Canoa Shoulders FY 2015 Low 19-4^ 0.95 1.02 1.03 1.05 1.06 22.82 7.36 No Underpass in segment 0.0 None None 19-5^ 0.94 1.03 1.03 1.05 1.06 39.82 23.75 16.78 0.0 None None
19-6^ 0.88 1.02 1.08 1.06 1.20 66.47 22.61 15.98 0.4 None Ajo Way TI - Reconstruct TI and Mainline 2015,/2018 Irvington Road and I-19 – Design and reconstruct new TI Low
Level of Need (Score) Performance Score Needs Scale Segment Level
Need Scale
None* (0) > 0.74^ > 0.28*
< 1.21^ < 1.53*
< 1.37^ < 4.0* < 71.07 > 16.33 0
Low (1) 0.70-0.74^ 0.22-0.28*
1.21-1.27^ 1.53-1.77*
1.37-1.43^ 4.0-5.0* 71.07-97.97 16.17-16.33 < 1.5
Medium (2) 0.64-0.70^ 0.12-0.22*
1.27-1.39^ 1.77-2.23*
1.43-1.57^ 5.0-7.0* 97.97-151.75 15.83-16.17 1.5-2.5
High (3) < 0.64^ < 0.12*
> 1.39^ > 2.23*
> 1.57^ > 7.0* > 151.75 < 15.83 > 2.5
^Uninterrupted Flow Facility *Interrupted Flow Facility
*A segment need rating of ‘None’ does not indicate a lack of needed improvements; rather, it indicates that the segment performance score exceeds the established performance thresholds and strategic solutions for that segment will not be developed as part of this study.
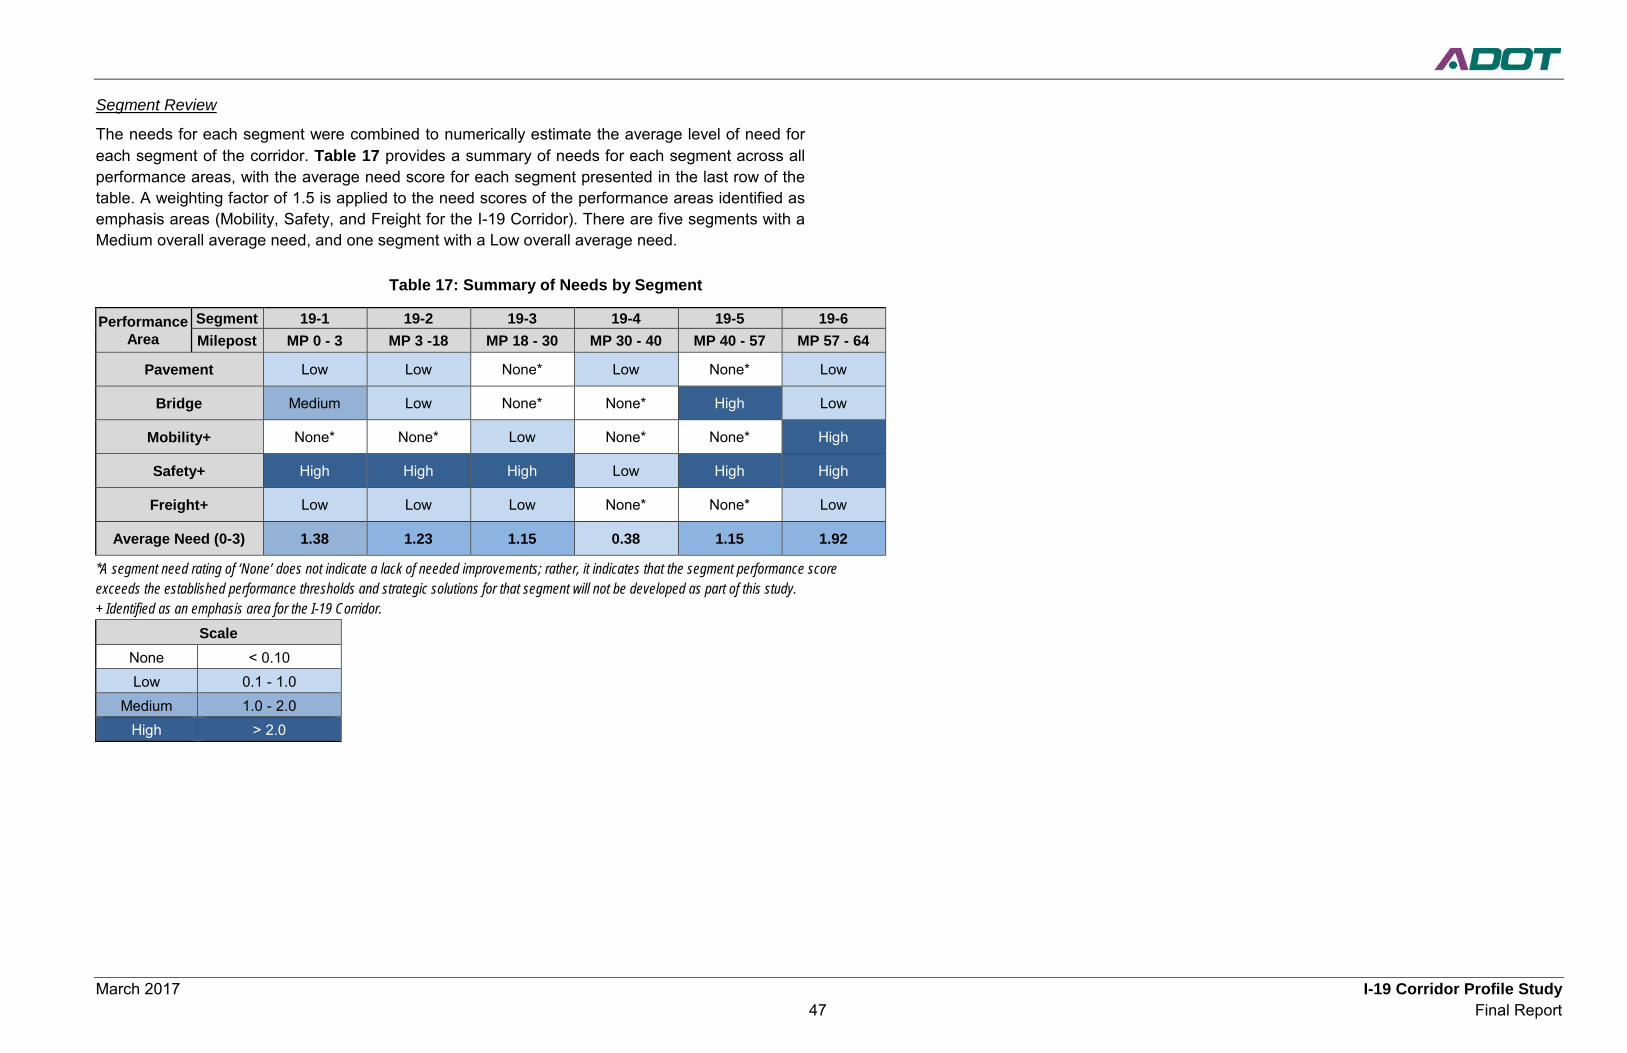
March 2017 I-19 Corridor Profile Study 47 Final Report
Segment Review
The needs for each segment were combined to numerically estimate the average level of need for each segment of the corridor. Table 17 provides a summary of needs for each segment across all performance areas, with the average need score for each segment presented in the last row of the table. A weighting factor of 1.5 is applied to the need scores of the performance areas identified as emphasis areas (Mobility, Safety, and Freight for the I-19 Corridor). There are five segments with a Medium overall average need, and one segment with a Low overall average need.
Table 17: Summary of Needs by Segment
Performance Area
Segment 19-1 19-2 19-3 19-4 19-5 19-6 Milepost MP 0 - 3 MP 3 -18 MP 18 - 30 MP 30 - 40 MP 40 - 57 MP 57 - 64
Pavement Low Low None* Low None* Low
Bridge Medium Low None* None* High Low
Mobility+ None* None* Low None* None* High
Safety+ High High High Low High High
Freight+ Low Low Low None* None* Low
Average Need (0-3) 1.38 1.23 1.15 0.38 1.15 1.92
*A segment need rating of ‘None’ does not indicate a lack of needed improvements; rather, it indicates that the segment performance score exceeds the established performance thresholds and strategic solutions for that segment will not be developed as part of this study. + Identified as an emphasis area for the I-19 Corridor.
Scale None < 0.10 Low 0.1 - 1.0
Medium 1.0 - 2.0 High > 2.0
March 2017 I-19 Corridor Profile Study 48 Final Report
Summary Corridor Needs
The needs in each performance area are shown in Figure 21 and summarized below:
Pavement Performance Area
• Overall final pavement needs are Low or None throughout the corridor. No changes to the level of need resulting from hot spot analysis occur on the corridor.
• The pavement hot spot on segment 19-2 at MP 17-18 was addressed in a 2015 improvement project.
• Other pavement hot spots were identified on approximately six miles of the corridor on three segments, but are generally expected to be mitigated through upcoming programmed projects.
Bridge Performance Area
• Bridge needs occur due to poor performing bridges or hot spots on four of six segments, with High needs identified in segment 19-5 and Medium needs identified in segment 19-1.
• Bridge needs were identified at 17 of the total 74 bridges (23%). • Four bridges have potential historical issues and are candidates for life-cycle cost analysis to
evaluate alternative solutions. • Bridge hot spots along I-19 are not sufficient to change the Initial Need from its original
calculated value.
Mobility Performance Area
• The Mobility Performance Area is an Emphasis Area for the I-19 corridor, giving it a heavier weight in the analysis.
• High Mobility Needs were identified only on segment 19-6 in the Tucson area related to high traffic volumes and poor level of service values.
• While commuting traffic from residential areas south of Tucson is partly responsible for heavier traffic volumes, traffic volumes are high seven days per week. This results from Tucson’s position as the regional center for shopping, entertainment, and other services in addition to being an employment center.
• Directional TTI and PTI issues on segment 19-1 are attributed to slowdowns in truck traffic at grade level intersections in Nogales. Truck traffic is expected to be dramatically reduced with improvements to SR 189 connecting to the Mariposa International Border Crossing, reducing the level of need on the segment.
Safety Performance Area
• The Safety Performance Area is an Emphasis Area for the I-19 corridor, giving it a heavier weight in the analysis.
• High Safety Needs were identified in all segments except 19-4, resulting in Poor performance for the corridor as a whole.
• Multiple crash hot spots are identified, especially in the northern part of the corridor, segments 19-4 through 19-6.
• The high rate of serious injury and fatal crashes throughout the corridor may be attributed to outdated designs on some entrance ramps, lack of lighting, equipment failure, alcohol related crashes, low levels of seat belt use, and other driver behaviors.
• While a high rate of serious injury and fatal crashes is reported on segment 19-1, the low number of such crashes (2), especially within the SHSP Top 5, reported during the analysis period points to caution in this result.
• Crashes involving trucks, motorcycles, and non-motorized during the analysis period were too few to provide significant results at any point on the corridor. Other crash types predominate.
Freight Performance Area
• The Freight Performance Area is an Emphasis Area for the I-19 corridor, giving it a heavier weight in the analysis.
• Final Freight Needs are Low or None throughout the corridor. In general, limits on truck travel and planning times are not significant factors.
• The most significant need evident on Table 16 shows a Low performance in the Bridge Clearance secondary measure. However, all of the low clearance bridges can be avoided by using ramps at the grade separated traffic interchanges and do not represent a hot spot under the criteria used for the analysis.
• Truck traffic is also affected by slowdowns in segment 19-3 related to the Border Patrol checkpoint north of Tubac, but is not sufficient to raise the level of need.
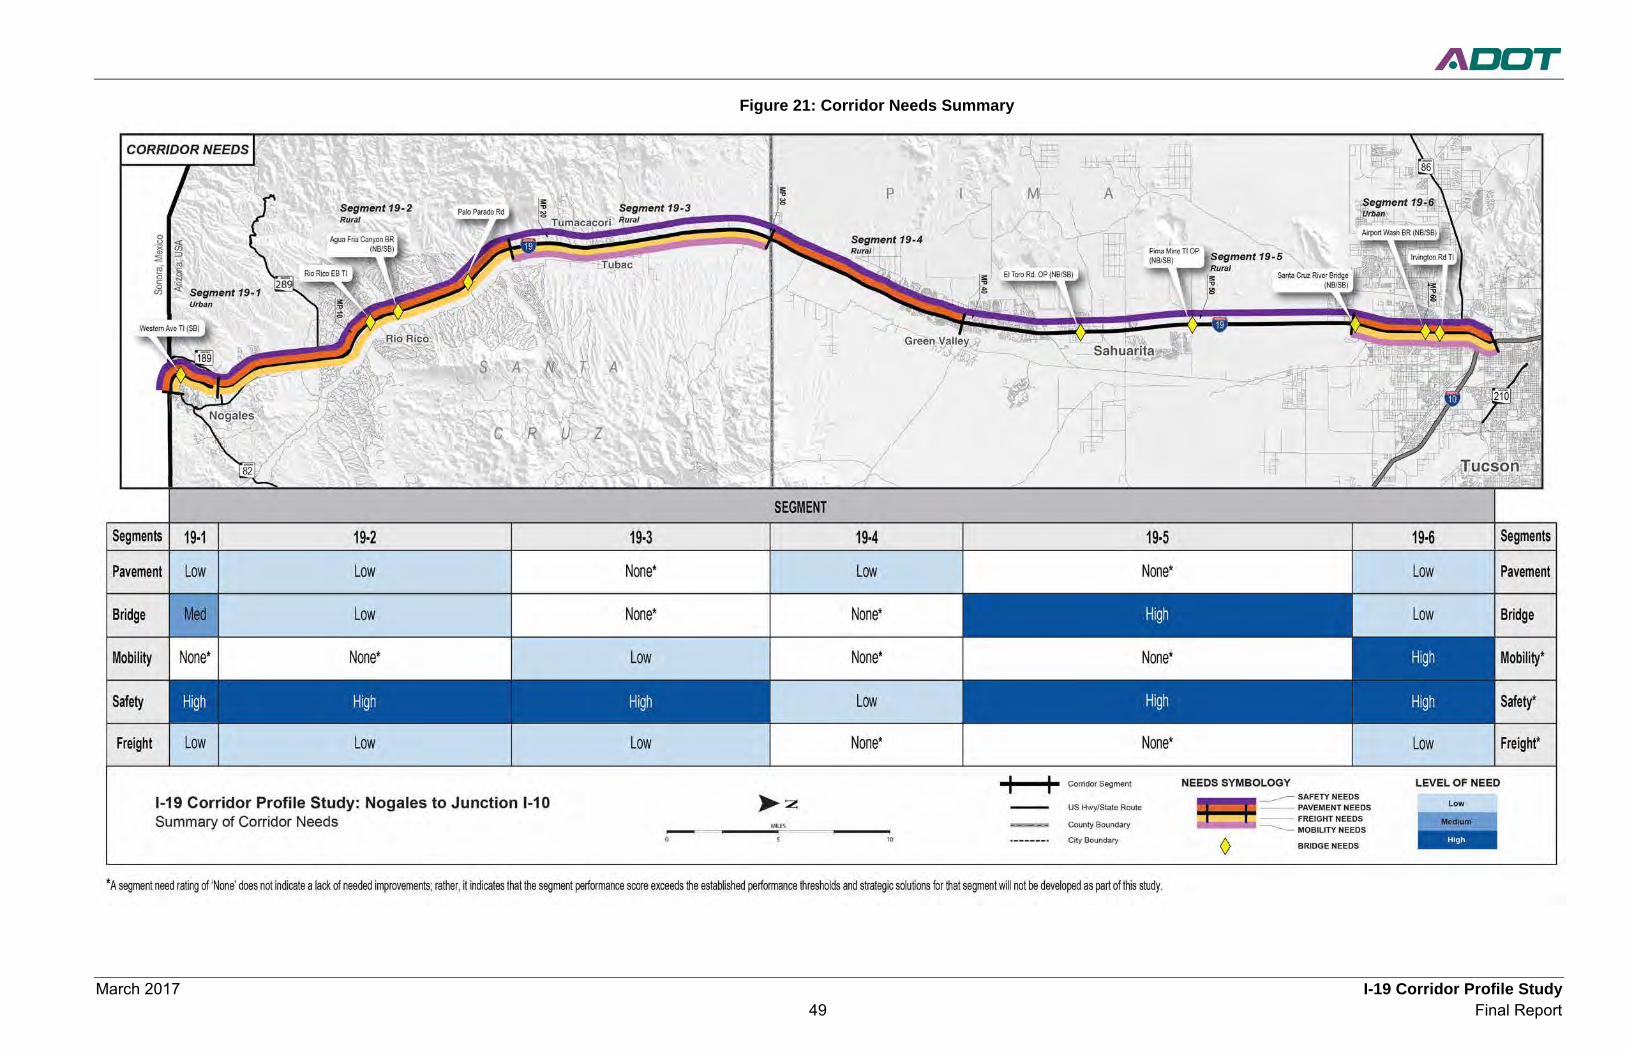
March 2017 I-19 Corridor Profile Study 49 Final Report
Figure 21: Corridor Needs Summary
March 2017 I-19 Corridor Profile Study 50 Final Report
4.0 STRATEGIC SOLUTIONS
The principal objective of the CPS is to identify strategic solutions (investments) that are performance-based to ensure that available funding resources are used to maximize the performance of the State’s key transportation corridors. One of the first steps in the development of strategic solutions is to identify areas of elevated levels of need (i.e., Medium or High). Addressing areas of Medium or High need would have the greatest effect on corridor performance and are the focus of the strategic solutions. Segments with Medium or High needs and specific locations of hot spots are considered strategic investment areas for which strategic solutions should be developed. Segments with lower levels of need or without identified hot spots are not considered candidates for strategic investment and are expected to be addressed through other ADOT programming processes. The I-19 strategic investment areas (resulting from the elevated needs) are shown in Figure 22.
4.1 Screening Process This section examines qualifying strategic needs and determines if the needs in those locations require action. In some cases, needs that are identified do not advance to solutions development and are screened out from further consideration because they have been or will be addressed through other measures including:
• A project is programmed to address this need • The need is a result of a Pavement or Bridge hot spot that does not show historical
investment or rating issues; these hot spots will likely be addressed through other ADOT programming means.
• A bridge is not a hot spot but is located within a segment with a Medium or High level of need; this bridge will likely be addressed through current ADOT bridge maintenance and preservation programming processes.
• The need is determined to be non-actionable (i.e., cannot be addressed through an ADOT project)
• The conditions/characteristics of the location have changed since the performance data was collected that was used to identify the need
Table 18 notes if each potential strategic need advanced to solution development, and if not, the reason for screening the potential strategic need out of the process. Locations advancing to solutions development are marked with Yes (Y); locations not advancing are marked with No (N) and highlighted. This screening table provides specific information about the needs in each segment that will be considered for strategic investment. The table identifies the level of need – either Medium or High segment needs, or segments without Medium or High level of need that have a hot spot. Each area of need is assigned a location number in the screening table to help document and track locations considered for strategic investment.

March 2017 I-19 Corridor Profile Study 51 Final Report
Figure 22: Strategic Investment Areas
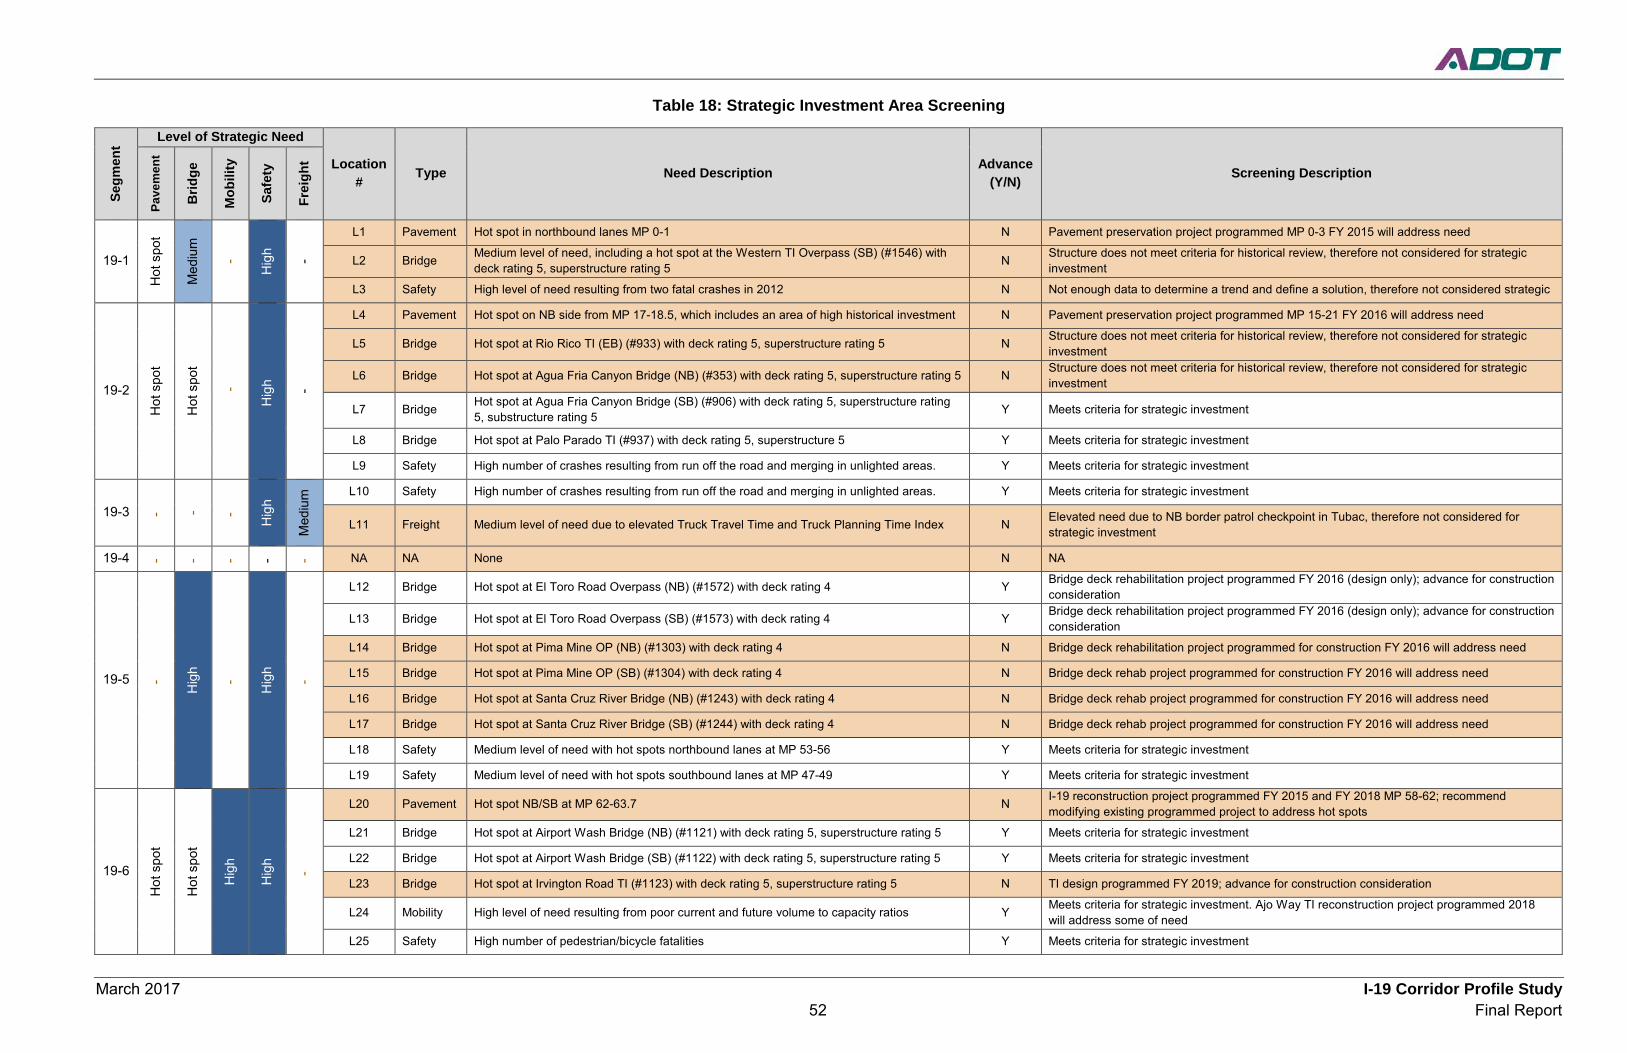
March 2017 I-19 Corridor Profile Study 52 Final Report
Table 18: Strategic Investment Area Screening Se
gmen
t Level of Strategic Need
Location # Type Need Description Advance
(Y/N) Screening Description Pa
vem
ent
Brid
ge
Mob
ility
Safe
ty
Frei
ght
19-1
Hot
spo
t
Med
ium
-
Hig
h -
L1 Pavement Hot spot in northbound lanes MP 0-1 N Pavement preservation project programmed MP 0-3 FY 2015 will address need
L2 Bridge Medium level of need, including a hot spot at the Western TI Overpass (SB) (#1546) with deck rating 5, superstructure rating 5 N Structure does not meet criteria for historical review, therefore not considered for strategic
investment
L3 Safety High level of need resulting from two fatal crashes in 2012 N Not enough data to determine a trend and define a solution, therefore not considered strategic
19-2
Hot
spo
t
Hot
spo
t
-
Hig
h
- L4 Pavement Hot spot on NB side from MP 17-18.5, which includes an area of high historical investment N Pavement preservation project programmed MP 15-21 FY 2016 will address need
L5 Bridge Hot spot at Rio Rico TI (EB) (#933) with deck rating 5, superstructure rating 5 N Structure does not meet criteria for historical review, therefore not considered for strategic investment
L6 Bridge Hot spot at Agua Fria Canyon Bridge (NB) (#353) with deck rating 5, superstructure rating 5 N Structure does not meet criteria for historical review, therefore not considered for strategic investment
L7 Bridge Hot spot at Agua Fria Canyon Bridge (SB) (#906) with deck rating 5, superstructure rating 5, substructure rating 5 Y Meets criteria for strategic investment
L8 Bridge Hot spot at Palo Parado TI (#937) with deck rating 5, superstructure 5 Y Meets criteria for strategic investment
L9 Safety High number of crashes resulting from run off the road and merging in unlighted areas. Y Meets criteria for strategic investment
19-3 - - -
Hig
h
Med
ium
L10 Safety High number of crashes resulting from run off the road and merging in unlighted areas. Y Meets criteria for strategic investment
L11 Freight Medium level of need due to elevated Truck Travel Time and Truck Planning Time Index N Elevated need due to NB border patrol checkpoint in Tubac, therefore not considered for strategic investment
19-4 - - - - - NA NA None N NA
19-5 -
Hig
h
-
Hig
h
-
L12 Bridge Hot spot at El Toro Road Overpass (NB) (#1572) with deck rating 4 Y Bridge deck rehabilitation project programmed FY 2016 (design only); advance for construction consideration
L13 Bridge Hot spot at El Toro Road Overpass (SB) (#1573) with deck rating 4 Y Bridge deck rehabilitation project programmed FY 2016 (design only); advance for construction consideration
L14 Bridge Hot spot at Pima Mine OP (NB) (#1303) with deck rating 4 N Bridge deck rehabilitation project programmed for construction FY 2016 will address need
L15 Bridge Hot spot at Pima Mine OP (SB) (#1304) with deck rating 4 N Bridge deck rehab project programmed for construction FY 2016 will address need
L16 Bridge Hot spot at Santa Cruz River Bridge (NB) (#1243) with deck rating 4 N Bridge deck rehab project programmed for construction FY 2016 will address need
L17 Bridge Hot spot at Santa Cruz River Bridge (SB) (#1244) with deck rating 4 N Bridge deck rehab project programmed for construction FY 2016 will address need
L18 Safety Medium level of need with hot spots northbound lanes at MP 53-56 Y Meets criteria for strategic investment
L19 Safety Medium level of need with hot spots southbound lanes at MP 47-49 Y Meets criteria for strategic investment
19-6
Hot
spo
t
Hot
spo
t
Hig
h
Hig
h
-
L20 Pavement Hot spot NB/SB at MP 62-63.7 N I-19 reconstruction project programmed FY 2015 and FY 2018 MP 58-62; recommend modifying existing programmed project to address hot spots
L21 Bridge Hot spot at Airport Wash Bridge (NB) (#1121) with deck rating 5, superstructure rating 5 Y Meets criteria for strategic investment
L22 Bridge Hot spot at Airport Wash Bridge (SB) (#1122) with deck rating 5, superstructure rating 5 Y Meets criteria for strategic investment
L23 Bridge Hot spot at Irvington Road TI (#1123) with deck rating 5, superstructure rating 5 N TI design programmed FY 2019; advance for construction consideration
L24 Mobility High level of need resulting from poor current and future volume to capacity ratios Y Meets criteria for strategic investment. Ajo Way TI reconstruction project programmed 2018 will address some of need
L25 Safety High number of pedestrian/bicycle fatalities Y Meets criteria for strategic investment
March 2017 I-19 Corridor Profile Study 53 Final Report
4.2 Candidate Solutions For each elevated need within a strategic investment area that is not screened out, a candidate solution is developed to address the identified need. Each candidate solution is assigned to one of the following three P2P investment categories based on the scope of the solution:
• Preservation • Modernization • Expansion
Documented performance needs serve as the foundation for developing candidate solutions for corridor preservation, modernization, and expansion. Candidate solutions are not intended to be a substitute or replacement for traditional ADOT project development processes where various ADOT technical groups and districts develop candidate projects for consideration in the performance-based programming in the P2P process. Rather, these candidate solutions are intended to complement ADOT’s traditional project development processes through a performance-based process to address needs in one or more of the five performance areas of Pavement, Bridge, Mobility, Safety, and Freight. Candidate solutions developed for the I-19 Corridor will be considered along with other candidate projects in the ADOT statewide programming process.
Characteristics of Strategic Solutions
Candidate solutions should include some or all of the following characteristics:
• Do not recreate or replace results from normal programming processes • May include programs or initiatives, areas for further study, and infrastructure projects • Address elevated levels of need (High or Medium) and hot spots • Focus on investments in modernization projects (to optimize current infrastructure) • Address overlapping needs • Reduce costly repetitive maintenance • Extend operational life of system and delay expansion • Leverage programmed projects that can be expanded to address other strategic elements • Provide measurable benefit
Candidate Solutions
A set of 17 candidate solutions are proposed to address the identified needs on the I-19 Corridor.
Table 19 identifies each strategic location that has been assigned a candidate solution with a number (e.g., CS19.1, CS19.2, etc.). Each candidate solution is comprised of one or more components to address the identified needs. The assigned candidate solution numbers are linked to the location number and provide tracking capability through the rest of the process. The locations of proposed solutions are shown on the map in Figure 23.
Candidate solutions developed to address an elevated need in the Pavement or Bridge performance area will include two options; rehabilitation or full replacement. These solutions are initially evaluated through a Life-Cycle Cost Analysis (LCCA) to provide insights into the cost-effectiveness of these options so a recommended approach can be identified. Candidate solutions developed to address an elevated need in the Mobility, Safety, or Freight performance areas are advanced directly to the Performance Effectiveness Evaluation. In some cases, there may be multiple solutions identified to address the same area of need.
Candidate solutions that are recommended to expand or modify the scope of an already programmed project are noted and are not advanced to solution evaluation and prioritization. These solutions are directly recommended for programming.

March 2017 I-19 Corridor Profile Study 54 Final Report
Table 19: Candidate Solutions
Candidate Solution Segment Location Beg
Milepost End
Milepost Candidate Solution Name Option* Scope
Investment Category (Preservation [P],
Modernization [M], Expansion [E])
CS19.1 19-2 19-3
L9 L10 3 30 Nogales to Tubac Shoulder & Roadside Improvements - Rehabilitate shoulders in both directions from the SR189 TI to Aravaca Rd TI M
CS19.2 19-2 L7 12.0 12.0 Agua Fria Canyon Bridge SB (#906) A Rehabilitate bridge P
B Replace bridge M
CS19.3 19-2 19-3 L8 3 30 Nogales to Tubac Lighting - Install lighting (both directions) M
CS19.4 19-2 L8 15.7 15.7 Palo Parado Rd Bridge (#937) A Rehabilitate bridge P
B Replace bridge M
CS 19.5 19-5 19-6 L10 39.5 60 Sahuarita to Tucson Lighting - Install lighting (both directions) M
CS19.6 19-5 19-6
L18 L19 39.5 62 Sahuarita to Tucson Shoulder & Roadside Improvements - Rehabilitate shoulders in both directions from Sahuarita Rd to Irvington Rd. M
CS19.7 19-5 L12 45.8 45.8 El Toro Bridge OP NB (#1572) - Rehabilitate bridge following programmed design FY 2016 P
CS19.8 19-5 L13 45.8 45.8 El Toro Bridge OP SB (#1573) - Rehabilitate bridge following programmed design FY 2016 P
CS 19.9 19-5 L18 L19 46.8 46.8 Sahuarita TI Ramp Improvements - Modify entry/exit ramps to parallel configuration M
CS19.10 19-5 L18 L19 49.6 49.6 Pima Mine TI Ramp Improvements - Modify entry/exit ramps to parallel configuration M
CS19.11 19-5 L18 L19 54.4 54.4 Papago TI Ramp Improvements - Modify entry/exit ramps to parallel configuration M
CS19.12 19-5 19-6 L24 57 62 Tucson Area Parallel Ramps -
Modify entry/exit ramps to parallel configuration Implement ramp metering at Irvington Rd SB, Valencia Rd NB/SB, and San Xavier Rd NB
M
CS19.13 19-5 19-6 L24 57 64 I-19 Tucson Variable Speed Limits - Implement Variable Speed Limits (both directions) M
CS19.14 19-5 19-6 L24 57 62 I-19/Tucson Widening - Construct new general purpose lane (inside) in NB/SB direction between
Irvington Rd and San Xavier Rd E
CS19.15 19-5 19-6 L25 59.5 61.5 Drexel-Irvington Pedestrian Overpass and Barrier Fencing - Construct pedestrian overpass between Drexel and Irvington; construct 8’
barrier fencing Valencia to Ajo Way (east side) M
CS19.16 19-6 L21 60.3 60.3 Airport Wash Bridge NB (#1121) A Rehabilitate bridge P
B Replace bridge M
CS19.17 19-6 L22 60.3 60.3 Airport Wash Bridge SB (#1122) A Rehabilitate bridge P
B Replace bridge M
* ‘-‘: Indicates only one solution is being proposed and no options are being considered
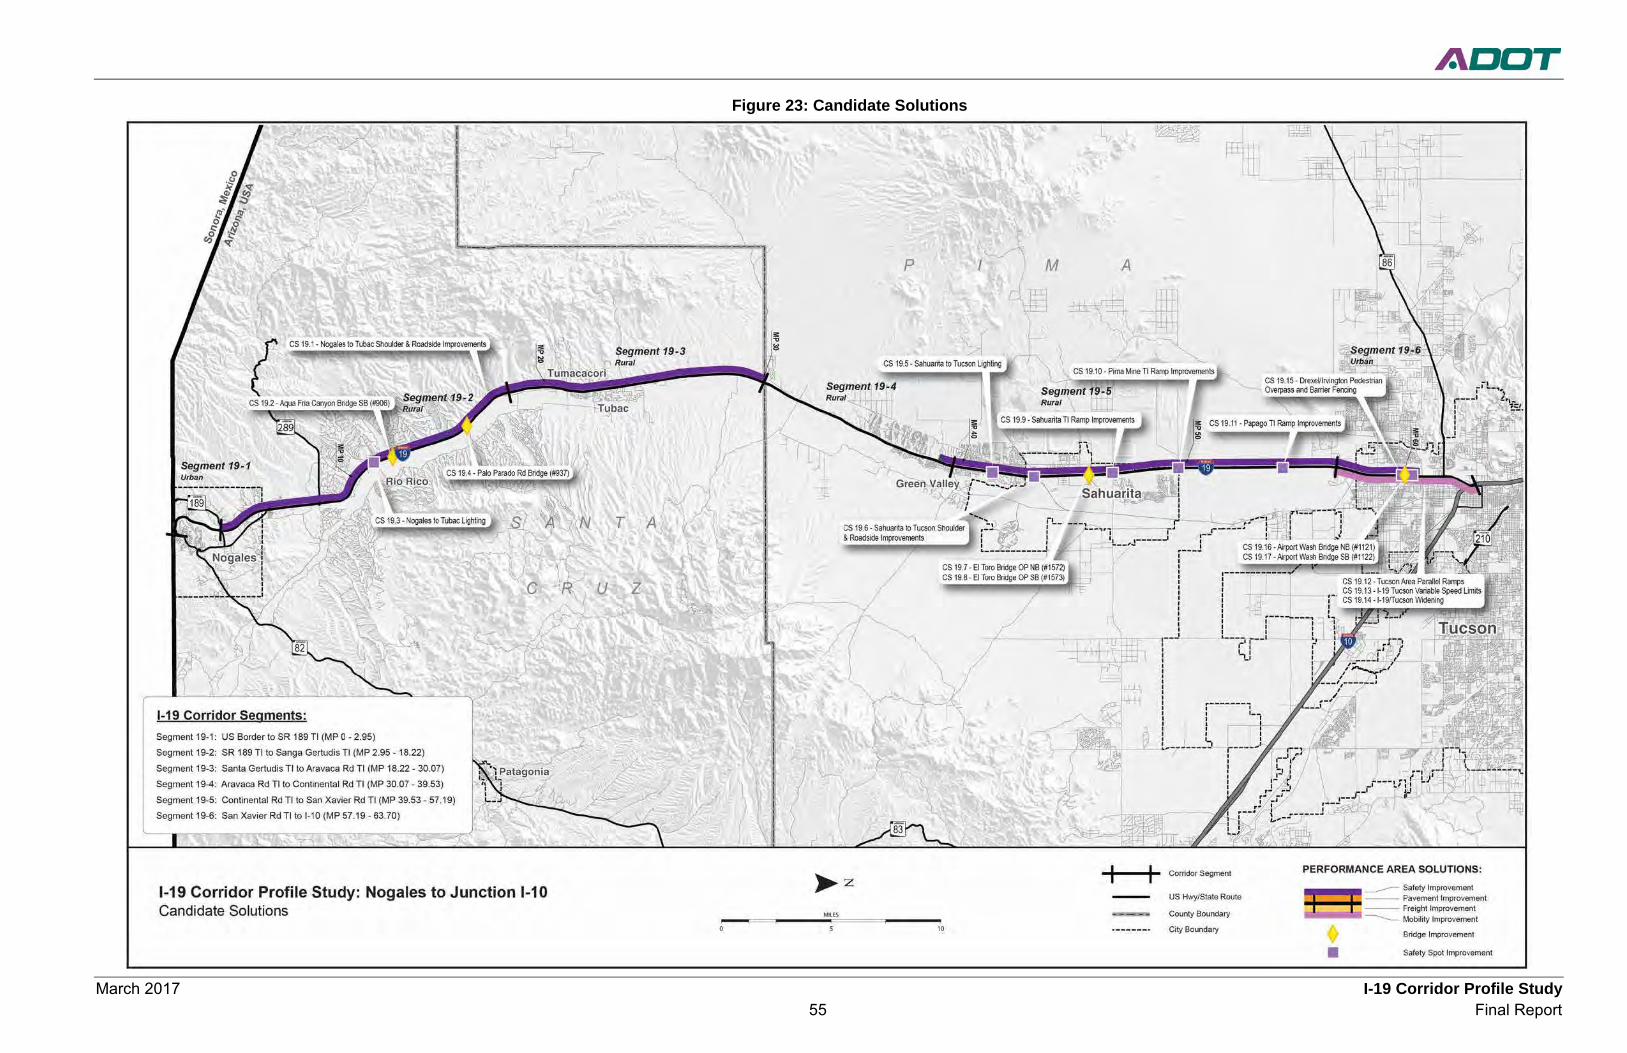
March 2017 I-19 Corridor Profile Study 55 Final Report
Figure 23: Candidate Solutions
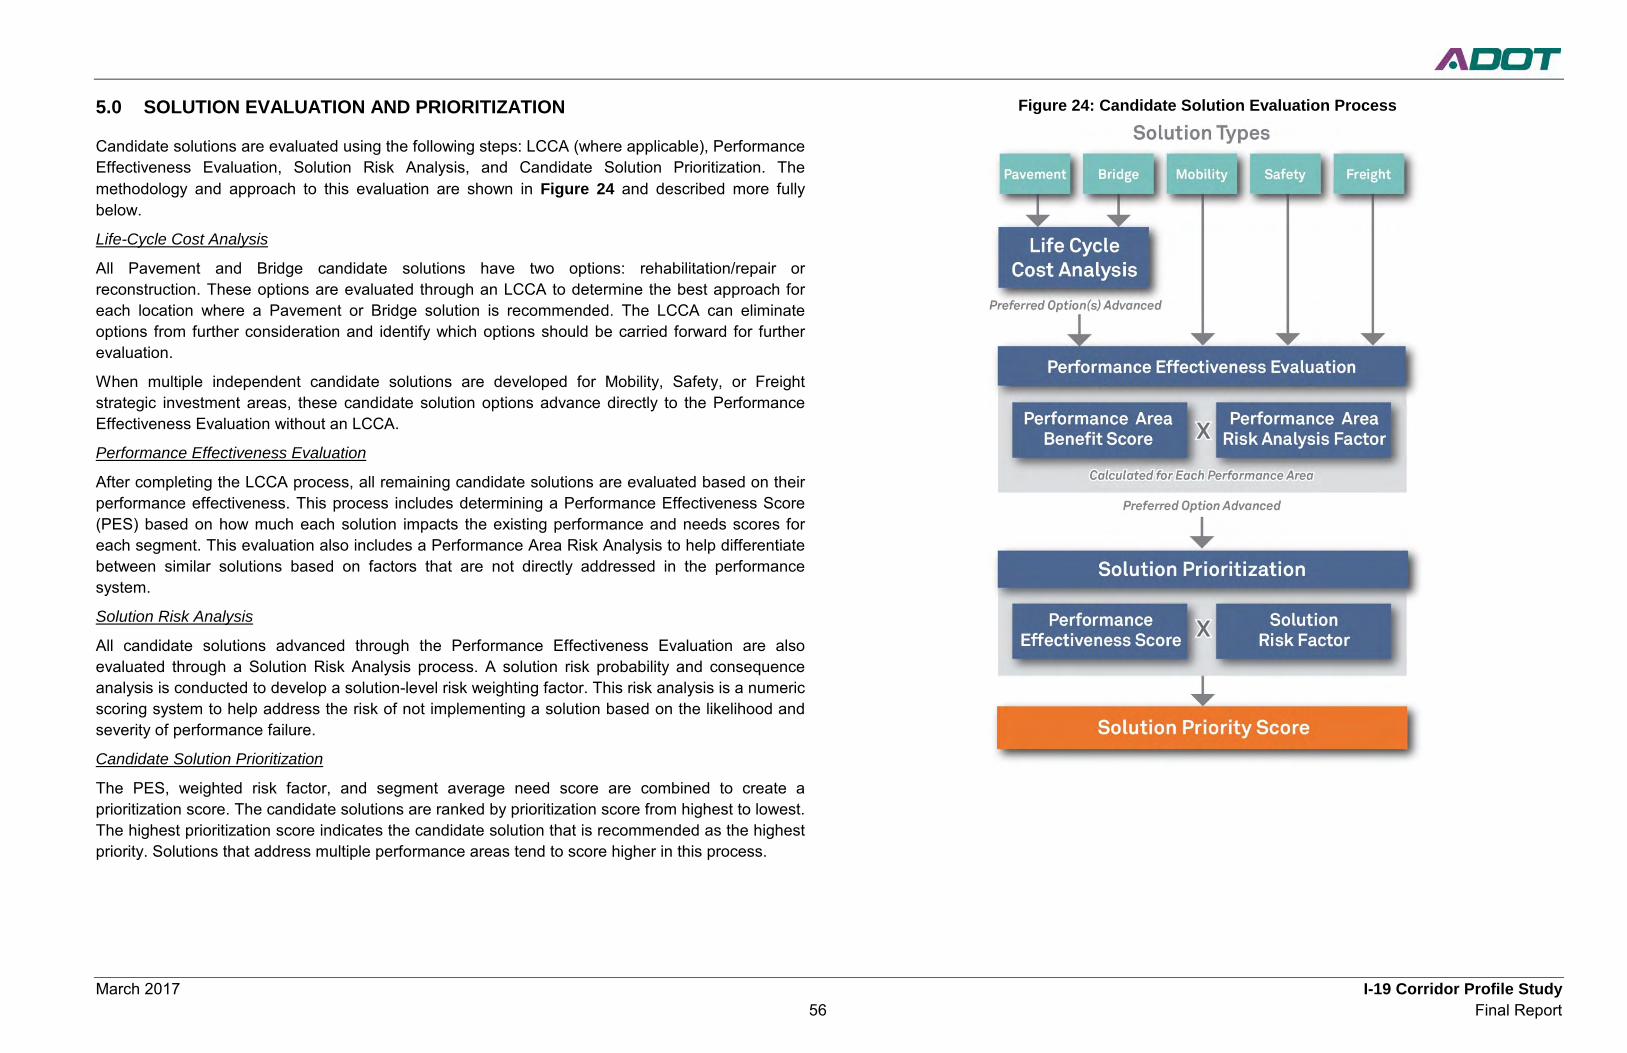
March 2017 I-19 Corridor Profile Study 56 Final Report
5.0 SOLUTION EVALUATION AND PRIORITIZATION
Candidate solutions are evaluated using the following steps: LCCA (where applicable), Performance Effectiveness Evaluation, Solution Risk Analysis, and Candidate Solution Prioritization. The methodology and approach to this evaluation are shown in Figure 24 and described more fully below.
Life-Cycle Cost Analysis
All Pavement and Bridge candidate solutions have two options: rehabilitation/repair or reconstruction. These options are evaluated through an LCCA to determine the best approach for each location where a Pavement or Bridge solution is recommended. The LCCA can eliminate options from further consideration and identify which options should be carried forward for further evaluation.
When multiple independent candidate solutions are developed for Mobility, Safety, or Freight strategic investment areas, these candidate solution options advance directly to the Performance Effectiveness Evaluation without an LCCA.
Performance Effectiveness Evaluation
After completing the LCCA process, all remaining candidate solutions are evaluated based on their performance effectiveness. This process includes determining a Performance Effectiveness Score (PES) based on how much each solution impacts the existing performance and needs scores for each segment. This evaluation also includes a Performance Area Risk Analysis to help differentiate between similar solutions based on factors that are not directly addressed in the performance system.
Solution Risk Analysis
All candidate solutions advanced through the Performance Effectiveness Evaluation are also evaluated through a Solution Risk Analysis process. A solution risk probability and consequence analysis is conducted to develop a solution-level risk weighting factor. This risk analysis is a numeric scoring system to help address the risk of not implementing a solution based on the likelihood and severity of performance failure.
Candidate Solution Prioritization
The PES, weighted risk factor, and segment average need score are combined to create a prioritization score. The candidate solutions are ranked by prioritization score from highest to lowest. The highest prioritization score indicates the candidate solution that is recommended as the highest priority. Solutions that address multiple performance areas tend to score higher in this process.
Figure 24: Candidate Solution Evaluation Process
March 2017 I-19 Corridor Profile Study 57 Final Report
5.1 Life-Cycle Cost Analysis LCCA is conducted for any candidate solution that is developed as a result of a need in the Pavement or Bridge performance area. The intent of the LCCA is to determine which options warrant further investigation and eliminate options that would not be considered strategic.
LCCA is an economic analysis that compares cost streams over time and presents the results in a common measure, the present value of all future costs. The cost stream occurs over an analysis period that is long enough to provide a reasonably fair comparison among alternatives that may differ significantly in scale of improvement actions over shorter time periods. For both bridge and pavement LCCA, the costs are focused on agency (ADOT) costs for corrective actions to meet the objective of keeping the bridge or pavement serviceable over a long period of time.
LCCA is performed to provide a more complete holistic perspective on asset performance and agency costs over the life of an investment stream. This approach helps ADOT look beyond initial and short-term costs, which often dominate the considerations in transportation investment decision making and programming.
Bridge LCCA For the bridge LCCA, three basic strategies are analyzed that differ in timing and scale of improvement actions to maintain the selected bridges, as described below:
• Bridge replacement (large upfront cost but small ongoing costs afterwards) • Bridge rehabilitation until replacement (moderate upfront costs then small to moderate
ongoing costs until replacement) • On-going repairs until replacement (low upfront and ongoing costs until replacement)
The bridge LCCA model developed for the CPS reviews the characteristics of the candidate bridges including bridge ratings and deterioration rates to develop the three improvement strategies (full replacement, rehabilitation until replacement, and repair until replacement). Each strategy consists of a set of corrective actions that contribute to keeping the bridge serviceable over the analysis period. Cost and effect of these improvement actions on the bridge condition are essential parts of the model. Other considerations in the model include bridge age, elevation, pier height, length to span ratio, skew angle, and substandard characteristics such as shoulders and vehicle clearance. The following assumptions are included in the bridge LCCA model:
• The bridge LCCA only addresses the structural condition of the bridge and does not address other issues or costs
• The bridge will require replacement at the end of its 75-year service life regardless of current condition
• The bridge elevation, pier height, skew angle, and length to span ratio can affect the replacement and rehabilitation costs
• The current and historical ratings are used to estimate a rate of deterioration for each candidate bridge
• Following bridge replacement, repairs will be needed every 20 years
• Different bridge repair and rehabilitation strategies have different costs, expected service life, and benefit to the bridge rating
• The net present value of future costs is discounted at 3% and all dollar amounts are in 2015 dollars
• If the LCCA evaluation recommends rehabilitation or repair, the solution is not considered strategic and the rehabilitation or repair will be addressed by normal programming processes
• Because this LCCA is conducted at a planning level, and due to the variabilities in costs and improvement strategies, the LCCA net present value results that are within 15% should be considered equally; in such a case, the solution should be carried forward as a strategic replacement project – more detailed scoping will confirm if replacement or rehabilitation is needed
Based on the candidate solutions presented in Table 19, LCCA was conducted on four bridges on the I-19 Corridor. A summary of this analysis is shown in Table 20. Additional information regarding the bridge LCCA is included in Appendix E.
Pavement LCCA
The LCCA approach to pavement is very similar to the process used for bridges. For the pavement LCCA, three basic strategies are analyzed that differ in timing and scale of improvement actions to maintain the selected pavement, as described below:
• Pavement replacement (large upfront cost but small ongoing costs afterwards – could be replacement with asphalt or concrete pavement)
• Pavement major rehabilitation until replacement (moderate upfront costs then small to moderate ongoing costs until replacement)
• Pavement minor rehabilitation until replacement (low upfront and ongoing costs until replacement)
The pavement LCCA model developed for the CPS reviews the characteristics of the candidate paving locations including the historical rehabilitation frequency to develop potential improvement strategies (full replacement, major rehabilitation until replacement, and minor rehabilitation until replacement, for either concrete or asphalt, as applicable). Each strategy consists of a set of corrective actions that contribute to keeping the pavement serviceable over the analysis period. The following assumptions are included in the pavement LCCA model:
• The pavement LCCA only addresses the condition of the pavement and does not address other issues or costs
• The historical pavement rehabilitation frequencies at each location are used to estimate future rehabilitation frequencies
• Different pavement replacement and rehabilitation strategies have different costs and expected service life
• The net present value of future costs is discounted at 3% and all dollar amounts are in 2015 dollars
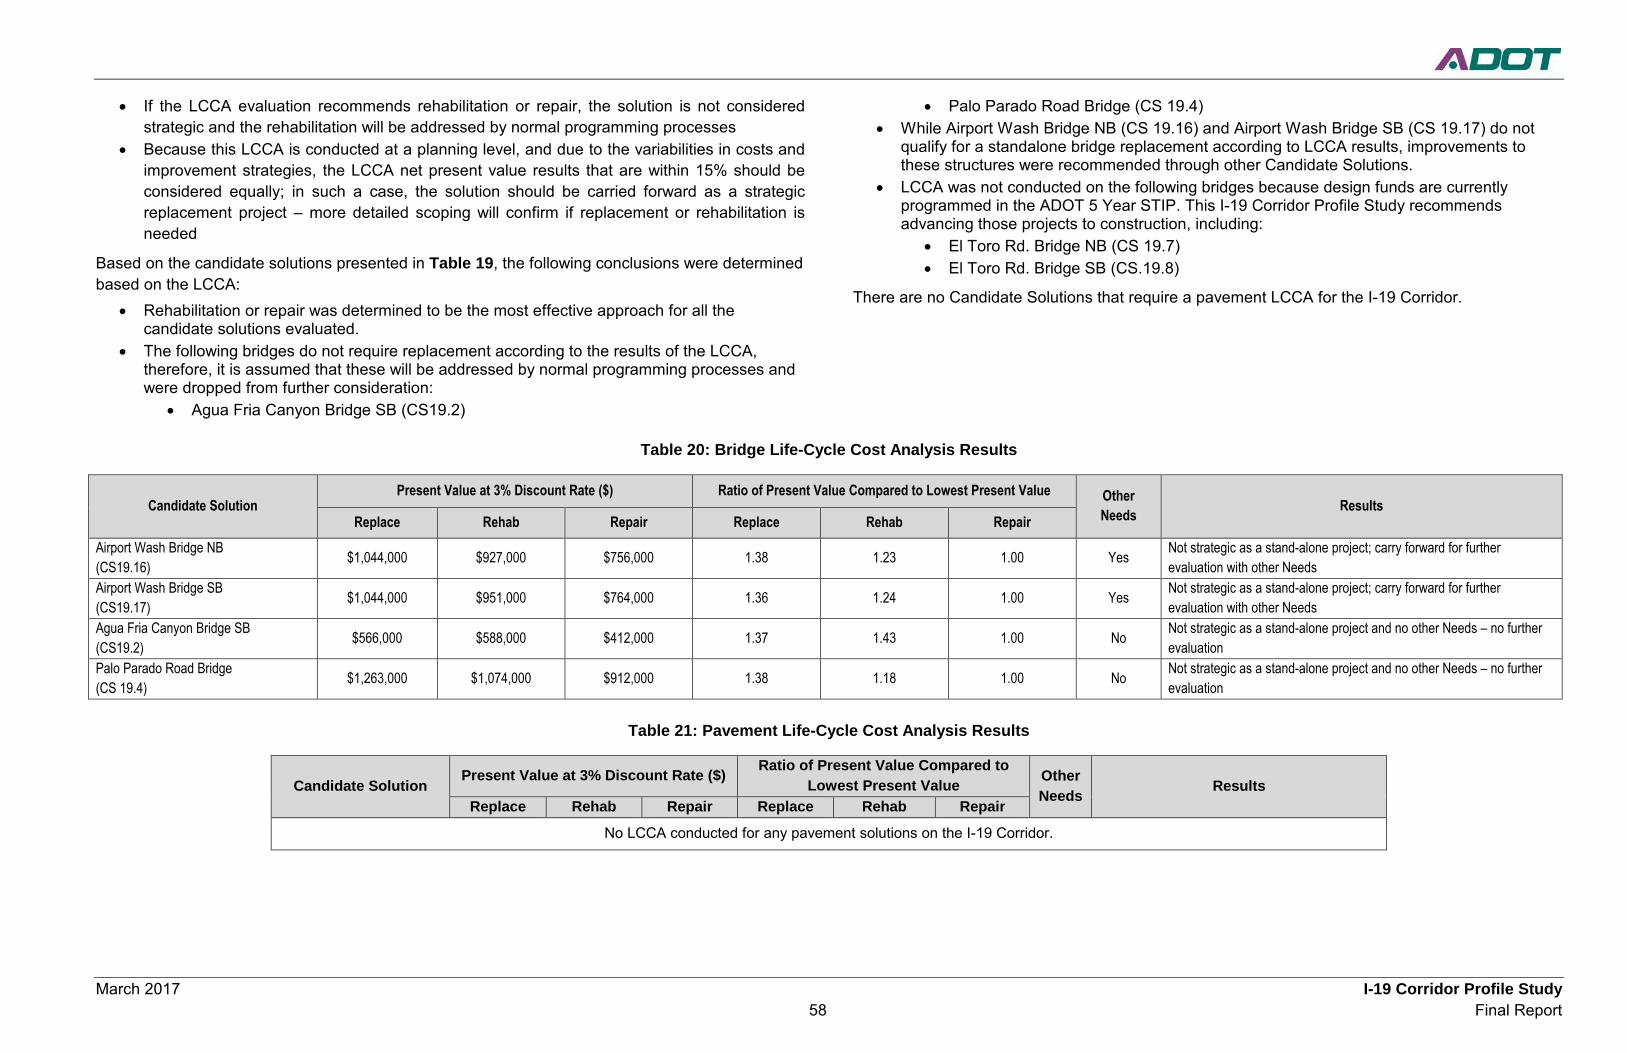
March 2017 I-19 Corridor Profile Study 58 Final Report
• If the LCCA evaluation recommends rehabilitation or repair, the solution is not considered strategic and the rehabilitation will be addressed by normal programming processes
• Because this LCCA is conducted at a planning level, and due to the variabilities in costs and improvement strategies, the LCCA net present value results that are within 15% should be considered equally; in such a case, the solution should be carried forward as a strategic replacement project – more detailed scoping will confirm if replacement or rehabilitation is needed
Based on the candidate solutions presented in Table 19, the following conclusions were determined based on the LCCA:
• Rehabilitation or repair was determined to be the most effective approach for all the candidate solutions evaluated.
• The following bridges do not require replacement according to the results of the LCCA, therefore, it is assumed that these will be addressed by normal programming processes and were dropped from further consideration:
• Agua Fria Canyon Bridge SB (CS19.2)
• Palo Parado Road Bridge (CS 19.4) • While Airport Wash Bridge NB (CS 19.16) and Airport Wash Bridge SB (CS 19.17) do not
qualify for a standalone bridge replacement according to LCCA results, improvements to these structures were recommended through other Candidate Solutions.
• LCCA was not conducted on the following bridges because design funds are currently programmed in the ADOT 5 Year STIP. This I-19 Corridor Profile Study recommends advancing those projects to construction, including:
• El Toro Rd. Bridge NB (CS 19.7) • El Toro Rd. Bridge SB (CS.19.8)
There are no Candidate Solutions that require a pavement LCCA for the I-19 Corridor.
Table 20: Bridge Life-Cycle Cost Analysis Results
Table 21: Pavement Life-Cycle Cost Analysis Results
Candidate Solution Present Value at 3% Discount Rate ($) Ratio of Present Value Compared to Lowest Present Value Other
Needs Results Replace Rehab Repair Replace Rehab Repair
No LCCA conducted for any pavement solutions on the I-19 Corridor.
Candidate Solution Present Value at 3% Discount Rate ($) Ratio of Present Value Compared to Lowest Present Value Other
Needs Results Replace Rehab Repair Replace Rehab Repair
Airport Wash Bridge NB (CS19.16) $1,044,000 $927,000 $756,000 1.38 1.23 1.00 Yes Not strategic as a stand-alone project; carry forward for further
evaluation with other Needs Airport Wash Bridge SB (CS19.17) $1,044,000 $951,000 $764,000 1.36 1.24 1.00 Yes Not strategic as a stand-alone project; carry forward for further
evaluation with other Needs Agua Fria Canyon Bridge SB (CS19.2) $566,000 $588,000 $412,000 1.37 1.43 1.00 No Not strategic as a stand-alone project and no other Needs – no further
evaluation Palo Parado Road Bridge (CS 19.4) $1,263,000 $1,074,000 $912,000 1.38 1.18 1.00 No Not strategic as a stand-alone project and no other Needs – no further
evaluation
March 2017 I-19 Corridor Profile Study 59 Final Report
5.2 Performance Effectiveness Evaluation The results of the Performance Effectiveness Evaluation are combined with the results of a Performance Area Risk Analysis to determine a Performance Effectiveness Score (PES). The objectives of the Performance Effectiveness Evaluation include:
• Measure the benefit to the performance system versus the cost of the solution • Include risk factors to help differentiate between similar solutions • Apply to each performance area that is affected by the candidate solution • Account for emphasis areas identified for the corridor
The Performance Effectiveness Evaluation includes the following steps:
• Estimate the post-solution performance for each of the five performance areas (Pavement, Bridge, Mobility, Safety, and Freight)
• Use the post-solution performance scores to calculate a post-solution level of need for each of the five performance areas
• Compare the pre-solution level of need to the post-solution level of need to determine the reduction in level of need (potential solution benefit) for each of the five performance areas
• Calculate performance area risk weighting factors for each of the five performance areas • Use the reduction in level of need (benefit) and risk weighting factors to calculate the PES
Post-Solution Performance Estimation For each performance area, a slightly different approach is used to estimate the post-solution performance. This process is based on the following assumptions:
• Pavement: o The IRI rating would decrease (to 30 for replacement or 45 for rehabilitation) o The Cracking rating would decrease (to 0 for replacement or rehabilitation)
• Bridge: o The structural ratings would increase (+1 for repair, +2 for rehabilitation, or increase to
8 for replacement) o The Sufficiency Rating would increase (+10 for repair, +20 for rehabilitation, or
increase to 98 for replacement) • Mobility:
o Additional lanes would increase the capacity and therefore affect the Mobility Index and associated secondary measures
o Other improvements (e.g., ramp metering, parallel ramps, variable speed limits) would also increase the capacity (to a lesser extent than additional lanes) and therefore would affect the Mobility Index and associated secondary measures
o Changes in the Mobility Index (due to increased capacity) would have a direct effect on the TTI secondary measure
o Changes in the Mobility Index (due to increased capacity) and Safety Index (due to crash reductions) would have a direct effect on the PTI secondary measure
o Changes in the Safety Index (due to crash reductions) would have a direct effect on the Closure Extent secondary measure
• Safety: o Crash modification factors were developed that would be applied to estimate the
reduction in crashes (for additional information see Appendix F) • Freight:
o Changes in the Mobility Index (due to increased capacity) and Safety Index (due to crash reductions) would have a direct effect on the Freight Index and the TPTI secondary measure
o Changes in the Mobility Index (due to increased capacity) would have a direct effect on the TTTI secondary measure
o Changes in the Safety Index (due to crash reductions) would have a direct effect on the Closure Duration secondary measure
Performance Area Risk Analysis The Performance Area Risk Analysis is intended to develop a numeric risk weighting factor for each of the five performance areas (Pavement, Bridge, Mobility, Safety, and Freight). This risk analysis addresses other considerations for each performance area that are not directly included in the performance system. A risk weighting factor is calculated for each candidate solution based on the specific characteristics at the solution location. For example, the Pavement Risk Factor is based on factors such as the elevation, daily traffic volumes, and amount of truck traffic. Additional information regarding the Performance Area Risk Factors is included in Appendix G.
Following the calculation of the reduction in level of need (benefit) and the Performance Area Risk Factors, these values are used to calculate the PES. In addition, the reduction in level of Need in each emphasis area is also included in the PES.
Net Present Value Factor The benefit (reduction in need) is measured as a one-time benefit. However, different types of solutions will have varying service lives during which the benefits will be obtained. For example, a preservation solution would likely have a shorter stream of benefits over time when compared to a modernization or expansion solution. To address the varying lengths of benefit streams, each solution is classified as a 10-year, 20-year, 30-year, or 75-year benefit stream, or the net present value (NPV) factor (FNPV). A 3% discount rate is used to calculate FNPV for each classification of solution. The service lives and respective factors are described below:
• A 10-year service life is generally reflective of preservation solutions such as pavement and bridge preservation; these solutions would likely have a 10-year stream of benefits; for these solutions, a FNPV of 8.8 is used in the PES calculation
• A 20-year service life is generally reflective of modernization solutions that do not include new infrastructure; these solutions would likely have a 20-year stream of benefits; for these solutions, a FNPV of 15.3 is used in the PES calculation
March 2017 I-19 Corridor Profile Study 60 Final Report
• A 30-year service life is generally reflective of expansion solutions or modernization solutions that include new infrastructure; these solutions would likely have a 30-year stream of benefits; for these solutions, a FNPV of 20.2 is used in the PES calculation
• A 75-year service life is used for bridge replacement solutions; these solutions would likely have a 75-year stream of benefits; for these solutions, a FNPV of 30.6 is used in the PES calculation
Vehicle-Miles Travelled Factor Another factor in assessing benefits is the number of travelers who would benefit from the implementation of the candidate solution. This factor varies between candidate solutions depending on the length of the solution and the magnitude of daily traffic volumes. Multiplying the solution length by the daily traffic volume results in vehicle-miles travelled (VMT), which provides a measure of the amount of traffic exposure that would receive the benefit of the proposed solution. The VMT is converted to a VMT factor (known as FVMT), which is on a scale between 0 and 5, using the equation below:
FVMT = 5 - (5 x e VMT x -0.0000139)
Performance Effectiveness Score The PES is calculated using the following equation:
PES = (Sum of all Risk Factored Benefit Scores + Sum of all Risk Factored Emphasis Area Scores) / Cost) x FVMT x FNPV
Where:
Risk Factored Benefit Score = Reduction in Segment-Level Need (benefit) x Performance Area Risk Weighting Factor (calculated for each performance area)
Risk Factored Emphasis Area Score = Reduction in Corridor-Level Need x Performance Area Risk Factors x Emphasis Area Factor (calculated for each emphasis area)
Cost = estimated cost of candidate solution in millions of dollars (see Appendix H)
FVMT = Factor between 0 and 5 to account for VMT at location of candidate solution based on existing (2014) daily volume and length of solution
FNPV = Factor (ranging from 8.8 to 30.6 as previously described) to address anticipated longevity of service life (and duration of benefits) for each candidate solution
The resulting PES values are shown in Table 22. Additional information regarding the calculation of the PES is contained in Appendix I.
For candidate solutions with multiple options to address Mobility, Safety, or Freight needs, the PES should be compared to help identify the best performing option. If one option clearly performs better than the others (more than twice the PES value and a difference in magnitude of at least 20 points) the lower scoring options can be eliminated from further consideration. If multiple options have similar PES values, or there are other factors not accounted for in the performance system that could significantly influence the ultimate selection of an option (e.g., potential environmental concerns, potential adverse economic impacts), those options should all be advanced to the prioritization process. On the I-19 Corridor, there were no candidate solutions with options to address Mobility, Safety, or Freight needs.
Following the LCCA, the following Candidate Solutions were eliminated from further consideration as standalone projects or have been directly recommended for construction programming. These Candidate Solutions have not been evaluated for prioritization:
• Agua Fria Canyon Bridge SB (CS19.2) – Eliminated • Palo Parado Road Bridge (CS19.4) - Eliminated • El Toro Road Bridge NB (CS19.7) – Advance to Programming • El Toro Road Bridge SB (CS19.8) – Advance to Programming • Airport Wash Bridge NB (CS19.16) – Eliminated • Airport Wash Bridge SB (CS19.17) – Eliminated
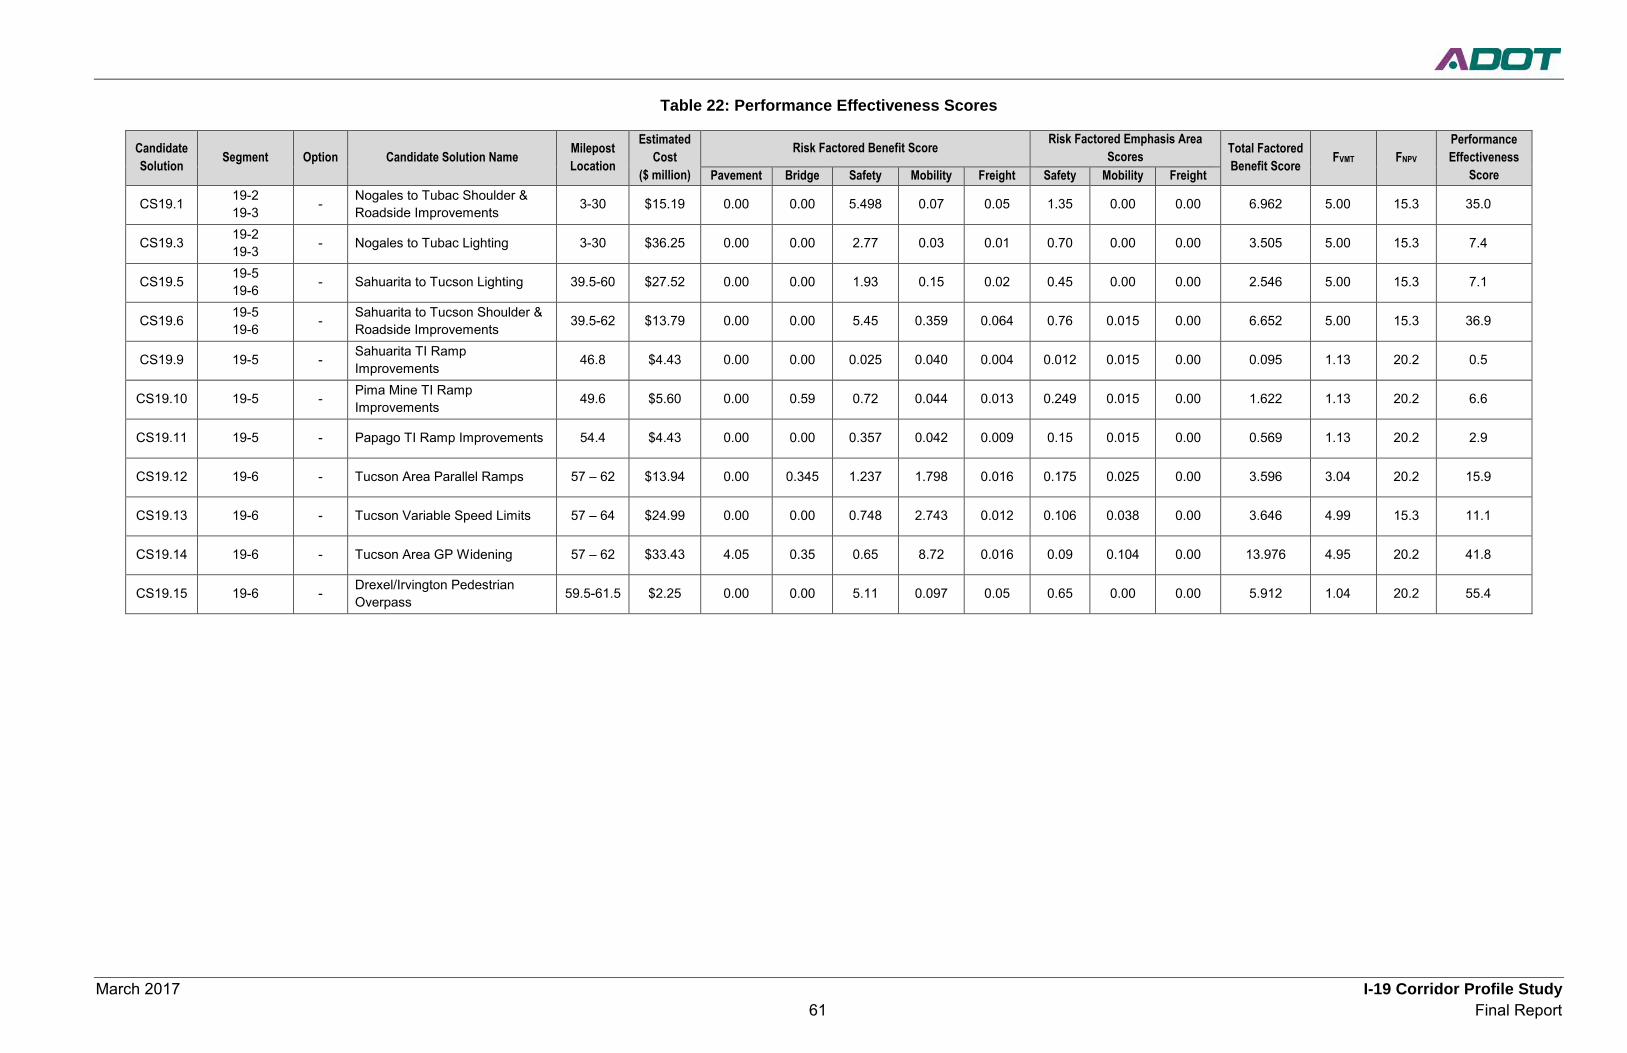
March 2017 I-19 Corridor Profile Study 61 Final Report
Table 22: Performance Effectiveness Scores
Candidate Solution Segment Option Candidate Solution Name Milepost
Location
Estimated Cost
($ million)
Risk Factored Benefit Score Risk Factored Emphasis Area Scores Total Factored
Benefit Score FVMT FNPV Performance Effectiveness
Score Pavement Bridge Safety Mobility Freight Safety Mobility Freight
CS19.1 19-2 19-3 - Nogales to Tubac Shoulder &
Roadside Improvements 3-30 $15.19 0.00 0.00 5.498 0.07 0.05 1.35 0.00 0.00 6.962 5.00 15.3 35.0
CS19.3 19-2 19-3 - Nogales to Tubac Lighting 3-30 $36.25 0.00 0.00 2.77 0.03 0.01 0.70 0.00 0.00 3.505 5.00 15.3 7.4
CS19.5 19-5 19-6 - Sahuarita to Tucson Lighting 39.5-60 $27.52 0.00 0.00 1.93 0.15 0.02 0.45 0.00 0.00 2.546 5.00 15.3 7.1
CS19.6 19-5 19-6 - Sahuarita to Tucson Shoulder &
Roadside Improvements 39.5-62 $13.79 0.00 0.00 5.45 0.359 0.064 0.76 0.015 0.00 6.652 5.00 15.3 36.9
CS19.9 19-5 - Sahuarita TI Ramp Improvements 46.8 $4.43 0.00 0.00 0.025 0.040 0.004 0.012 0.015 0.00 0.095 1.13 20.2 0.5
CS19.10 19-5 - Pima Mine TI Ramp Improvements 49.6 $5.60 0.00 0.59 0.72 0.044 0.013 0.249 0.015 0.00 1.622 1.13 20.2 6.6
CS19.11 19-5 - Papago TI Ramp Improvements 54.4 $4.43 0.00 0.00 0.357 0.042 0.009 0.15 0.015 0.00 0.569 1.13 20.2 2.9
CS19.12 19-6 - Tucson Area Parallel Ramps 57 – 62 $13.94 0.00 0.345 1.237 1.798 0.016 0.175 0.025 0.00 3.596 3.04 20.2 15.9
CS19.13 19-6 - Tucson Variable Speed Limits 57 – 64 $24.99 0.00 0.00 0.748 2.743 0.012 0.106 0.038 0.00 3.646 4.99 15.3 11.1
CS19.14 19-6 - Tucson Area GP Widening 57 – 62 $33.43 4.05 0.35 0.65 8.72 0.016 0.09 0.104 0.00 13.976 4.95 20.2 41.8
CS19.15 19-6 - Drexel/Irvington Pedestrian Overpass 59.5-61.5 $2.25 0.00 0.00 5.11 0.097 0.05 0.65 0.00 0.00 5.912 1.04 20.2 55.4
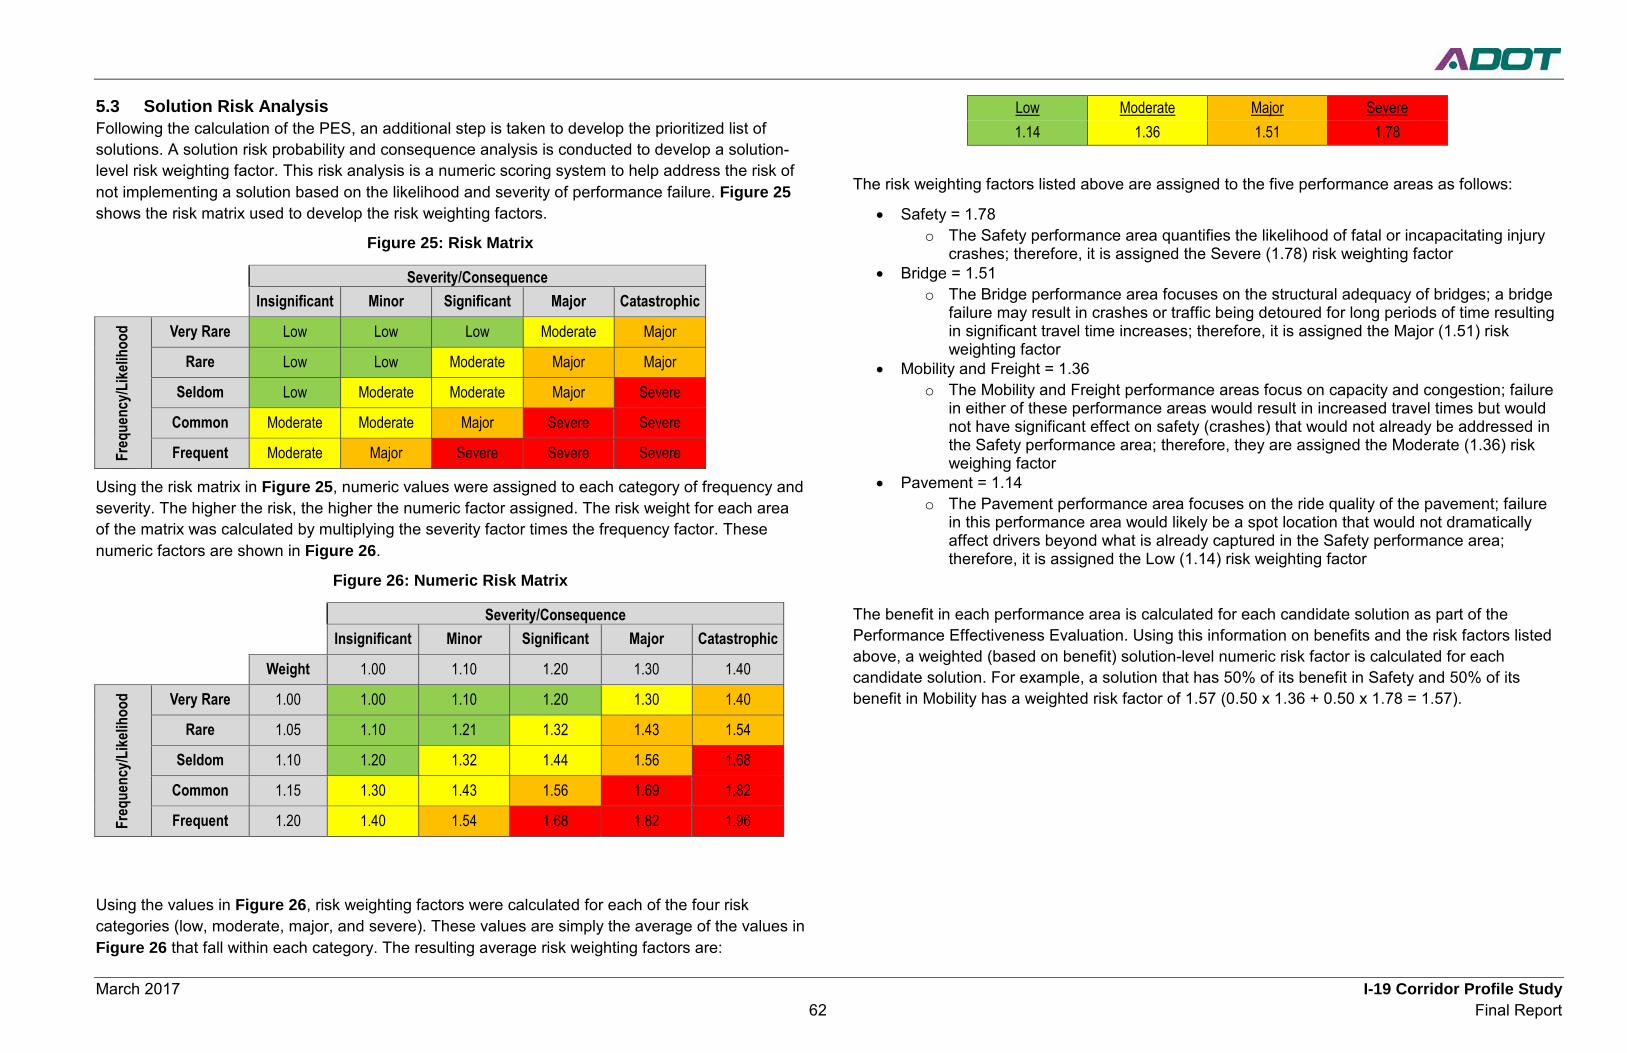
March 2017 I-19 Corridor Profile Study 62 Final Report
5.3 Solution Risk Analysis Following the calculation of the PES, an additional step is taken to develop the prioritized list of solutions. A solution risk probability and consequence analysis is conducted to develop a solution-level risk weighting factor. This risk analysis is a numeric scoring system to help address the risk of not implementing a solution based on the likelihood and severity of performance failure. Figure 25 shows the risk matrix used to develop the risk weighting factors.
Figure 25: Risk Matrix
Severity/Consequence
Insignificant Minor Significant Major Catastrophic
Freq
uenc
y/Like
lihoo
d Very Rare Low Low Low Moderate Major Rare Low Low Moderate Major Major
Seldom Low Moderate Moderate Major Severe Common Moderate Moderate Major Severe Severe Frequent Moderate Major Severe Severe Severe
Using the risk matrix in Figure 25, numeric values were assigned to each category of frequency and severity. The higher the risk, the higher the numeric factor assigned. The risk weight for each area of the matrix was calculated by multiplying the severity factor times the frequency factor. These numeric factors are shown in Figure 26.
Figure 26: Numeric Risk Matrix
Severity/Consequence
Insignificant Minor Significant Major Catastrophic
Weight 1.00 1.10 1.20 1.30 1.40
Freq
uenc
y/Like
lihoo
d Very Rare 1.00 1.00 1.10 1.20 1.30 1.40 Rare 1.05 1.10 1.21 1.32 1.43 1.54
Seldom 1.10 1.20 1.32 1.44 1.56 1.68 Common 1.15 1.30 1.43 1.56 1.69 1.82 Frequent 1.20 1.40 1.54 1.68 1.82 1.96
Using the values in Figure 26, risk weighting factors were calculated for each of the four risk categories (low, moderate, major, and severe). These values are simply the average of the values in Figure 26 that fall within each category. The resulting average risk weighting factors are:
Low Moderate Major Severe 1.14 1.36 1.51 1.78
The risk weighting factors listed above are assigned to the five performance areas as follows:
• Safety = 1.78 o The Safety performance area quantifies the likelihood of fatal or incapacitating injury
crashes; therefore, it is assigned the Severe (1.78) risk weighting factor • Bridge = 1.51
o The Bridge performance area focuses on the structural adequacy of bridges; a bridge failure may result in crashes or traffic being detoured for long periods of time resulting in significant travel time increases; therefore, it is assigned the Major (1.51) risk weighting factor
• Mobility and Freight = 1.36 o The Mobility and Freight performance areas focus on capacity and congestion; failure
in either of these performance areas would result in increased travel times but would not have significant effect on safety (crashes) that would not already be addressed in the Safety performance area; therefore, they are assigned the Moderate (1.36) risk weighing factor
• Pavement = 1.14 o The Pavement performance area focuses on the ride quality of the pavement; failure
in this performance area would likely be a spot location that would not dramatically affect drivers beyond what is already captured in the Safety performance area; therefore, it is assigned the Low (1.14) risk weighting factor
The benefit in each performance area is calculated for each candidate solution as part of the Performance Effectiveness Evaluation. Using this information on benefits and the risk factors listed above, a weighted (based on benefit) solution-level numeric risk factor is calculated for each candidate solution. For example, a solution that has 50% of its benefit in Safety and 50% of its benefit in Mobility has a weighted risk factor of 1.57 (0.50 x 1.36 + 0.50 x 1.78 = 1.57).
March 2017 I-19 Corridor Profile Study 63 Final Report
5.4 Candidate Solution Prioritization The PES, weighted risk factor, and segment average need score are combined to create a prioritization score as follows:
Prioritization Score = PES x Weighted Risk Factor x Segment Average Need Score
Where:
PES = Performance Effectiveness Score as shown in Table 22
Weighted Risk Factor = Weighted factor to address risk of not implementing a solution based on the likelihood and severity of the performance failure
Segment Average Need Score = Segment level need score as shown in Table 17
Table 23 shows the prioritization scores for the candidate solutions subjected to the solution evaluation and prioritization process. Solutions that address multiple performance areas tend to score higher in this process. The prioritized list of candidate solutions is provided in the subsequent section. See Appendix J for additional information on the prioritization process.
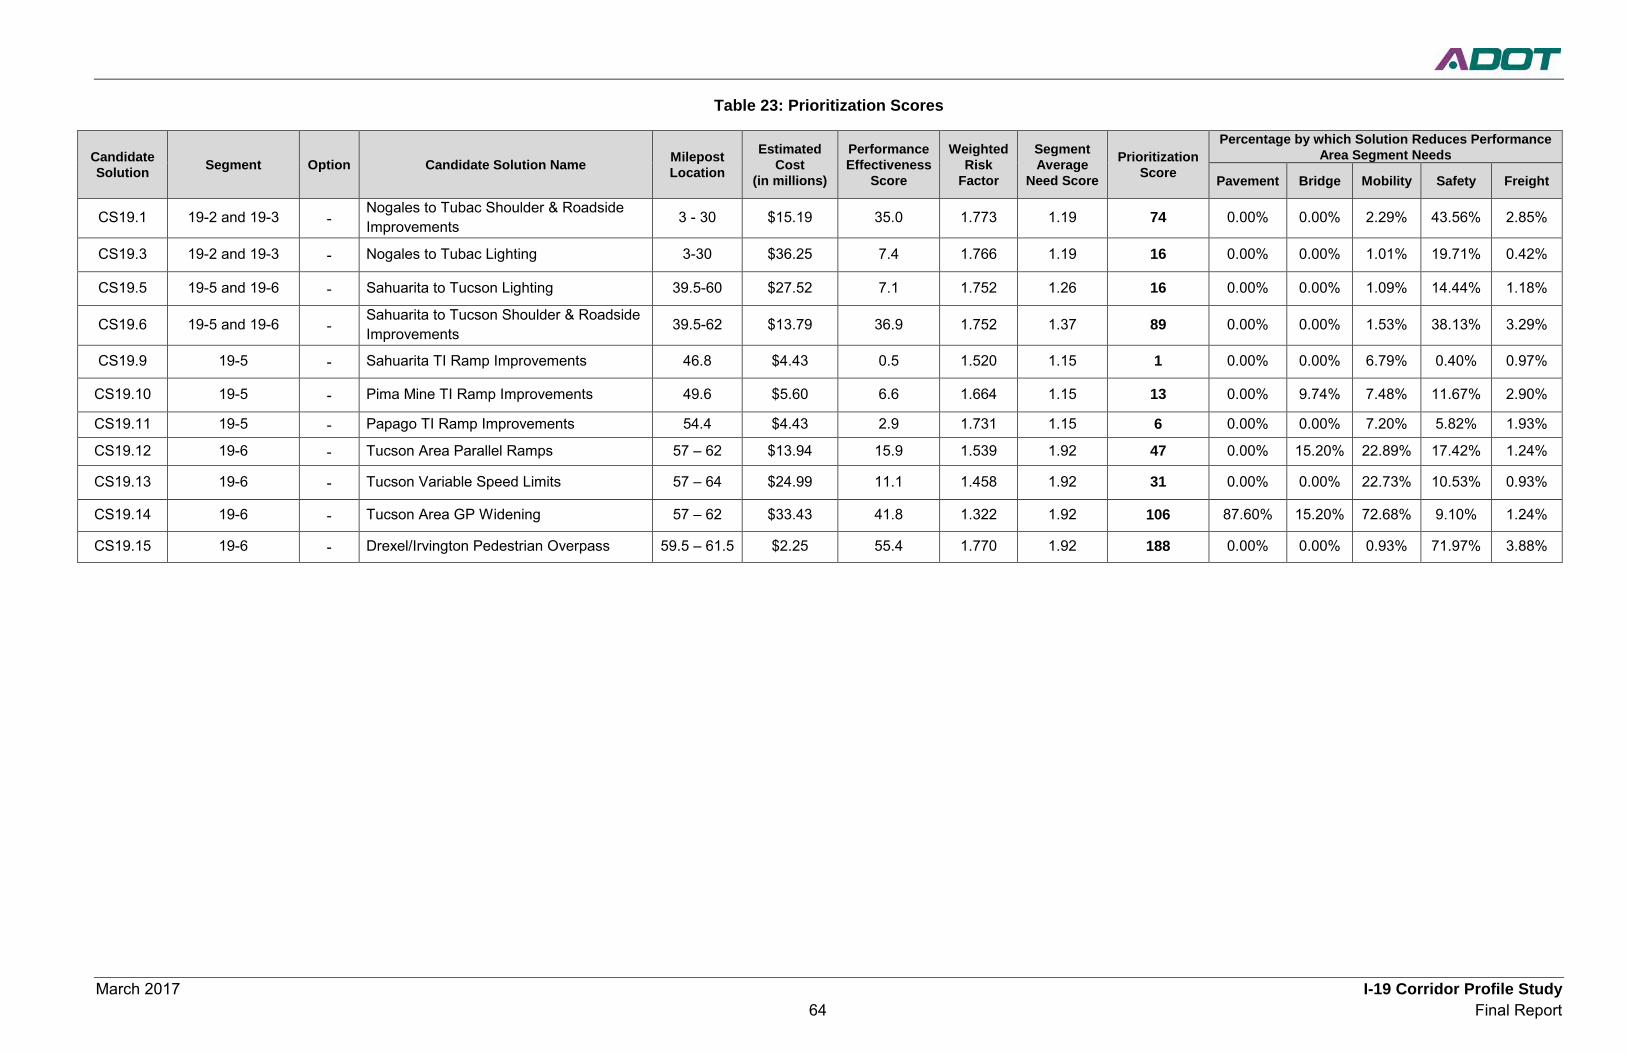
March 2017 I-19 Corridor Profile Study 64 Final Report
Table 23: Prioritization Scores
Candidate Solution Segment Option Candidate Solution Name Milepost
Location Estimated
Cost (in millions)
Performance Effectiveness
Score
Weighted Risk
Factor
Segment Average
Need Score
Prioritization Score
Percentage by which Solution Reduces Performance Area Segment Needs
Pavement Bridge Mobility Safety Freight
CS19.1 19-2 and 19-3 - Nogales to Tubac Shoulder & Roadside Improvements 3 - 30 $15.19 35.0 1.773 1.19 74 0.00% 0.00% 2.29% 43.56% 2.85%
CS19.3 19-2 and 19-3 - Nogales to Tubac Lighting 3-30 $36.25 7.4 1.766 1.19 16 0.00% 0.00% 1.01% 19.71% 0.42%
CS19.5 19-5 and 19-6 - Sahuarita to Tucson Lighting 39.5-60 $27.52 7.1 1.752 1.26 16 0.00% 0.00% 1.09% 14.44% 1.18%
CS19.6 19-5 and 19-6 - Sahuarita to Tucson Shoulder & Roadside Improvements 39.5-62 $13.79 36.9 1.752 1.37 89 0.00% 0.00% 1.53% 38.13% 3.29%
CS19.9 19-5 - Sahuarita TI Ramp Improvements 46.8 $4.43 0.5 1.520 1.15 1 0.00% 0.00% 6.79% 0.40% 0.97%
CS19.10 19-5 - Pima Mine TI Ramp Improvements 49.6 $5.60 6.6 1.664 1.15 13 0.00% 9.74% 7.48% 11.67% 2.90%
CS19.11 19-5 - Papago TI Ramp Improvements 54.4 $4.43 2.9 1.731 1.15 6 0.00% 0.00% 7.20% 5.82% 1.93% CS19.12 19-6 - Tucson Area Parallel Ramps 57 – 62 $13.94 15.9 1.539 1.92 47 0.00% 15.20% 22.89% 17.42% 1.24%
CS19.13 19-6 - Tucson Variable Speed Limits 57 – 64 $24.99 11.1 1.458 1.92 31 0.00% 0.00% 22.73% 10.53% 0.93%
CS19.14 19-6 - Tucson Area GP Widening 57 – 62 $33.43 41.8 1.322 1.92 106 87.60% 15.20% 72.68% 9.10% 1.24%
CS19.15 19-6 - Drexel/Irvington Pedestrian Overpass 59.5 – 61.5 $2.25 55.4 1.770 1.92 188 0.00% 0.00% 0.93% 71.97% 3.88%
March 2017 I-19 Corridor Profile Study 65 Final Report
6.0 SUMMARY OF CORRIDOR RECOMMENDATIONS
6.1 Prioritized Candidate Solution Recommendations Table 24 and Figure 27 show the ranked prioritized candidate solutions recommended for the I-10/SR 85 corridor. Implementation of these solutions is anticipated to improve performance of the I-10/SR 85 corridor. The following observations were noted about the prioritized solutions:
• Two of the top three projects include shoulder and roadside improvements through much of the corridor that will reduce the incidence of run off the road type vehicle crashes that often result in fatal and serious injuries.
• Additional benefits to Mobility and Freight will occur due to the reduction in the number of incidents that cause delays along I-19.
• The I-19 Tucson Area GP Widening project will increase capacity on this congested segment, reduce delays, and improve safety.
• The Drexel/Irvington Pedestrian Overpass and Barrier Fencing project will help reduce the high number of fatal vehicle-pedestrian crashes resulting from pedestrians attempting to cross I-19.
• The remaining traffic interchange ramp and lighting improvements will increase safety at those locations as well as improve traffic throughput by reducing delay and the potential for conflicting movements in the merge areas.
6.2 Other Corridor Recommendations As part of the investigation of strategic investment areas and candidate solutions, other corridor recommendations were also identified. These recommendations could include modifications to the existing Statewide Construction Program, areas for further study, or other corridor specific recommendations that are not construction or policy related. The list below identified other corridor recommendations for the I-19 corridor:
• The analysis shows a high ratio of fatal to incapacitating injury crashes that are not clearly patterned to specific locations. This report recommends that a Roadway Safety Analysis should be conducted on the corridor in order to better understand the high occurrence of fatal crashes.
• Consider a corridor strategy to upgrade all bridges to current standards in anticipation of increased truck/freight traffic over the medium to long term.
• Consider corridor wide ITS solutions to assist truck/freight traffic over the medium to long term.
• Advance Irvington Rd TI Underpass to construction programming. Irvington Rd TI has design funds only programmed in the Pima Association of Governments (PAG) five year transportation facilities construction program for fiscal year 2019.
• Extend the limits of the Ajo Way TI Phase 2 scope to reach the pavement hot spot at milepost 63 in fiscal year 2018.
• When recommending future projects along I-19, review historical ratings and levels of investment. According to data used for this study, the following pavement and bridge locations have exhibited high historical investment (pavement) or rating fluctuation (bridge) issues:
o Pavement MP 6-9 o Western Ave TI OP NB (MP 1.17) o Pajarito Rd OP NB/SB (MP 3.67) o Ruby Road TI UP (MP 7.7) o Agua Fria Canyon Bridge NB/SB (MP 11.97) o Peck Canyon TI UP (MP 13.96) o Peck Canyon Wash SB (MP 14.37) o Palo Parado Rd (MP 15.65) o Agua Linda UP (MP 26.54) o El Toro Rd OP NB/SB (MP 45.80) o Pima Mine TI OP NB/SB (MP 49.62) o Papago Rest Area TI OP NB/SB (MP 54.40) o Santa Cruz River Bridge NB/SB (MP 56.80) o Airport Wash Bridge NB/SB (MP 60.32)
March 2017 I-19 Corridor Profile Study 66 Final Report
6.3 Policy and Initiatives Recommendations In addition to location-specific needs, general corridor and system-wide needs have also been identified through the CPS process. While these needs are more overarching and cannot be individually evaluated through this process, it is important to document them. A list of recommended policies and initiatives was developed for consideration when programming future projects not only on I-19, but across the entire state highway system where the conditions are applicable. The following list, which is in no particular order of priority, was derived from the Round 1, Round 2, and Round 3 CPS:
• Install Intelligent Transportation System (ITS) conduit with all new infrastructure projects • Prepare strategic plans for Closed Circuit Television (CCTV) camera and Road Weather
Information System (RWIS) locations statewide • Leverage power and communication at existing weigh-in-motion (WIM), dynamic message
signs (DMS), and call box locations to expand ITS applications across the state • Consider solar power for lighting and ITS where applicable • Investigate ice formation prediction technology where applicable • Conduct highway safety manual evaluation for all future programmed projects • Develop infrastructure maintenance and preservation plans (including schedule and
funding) for all pavement and bridge infrastructure replacement or expansion projects • Develop standardized bridge maintenance procedures so districts can do routine
maintenance work • Review historical ratings and level of previous investment during scoping of pavement and
bridge projects. In pavement locations that warrant further investigation, conduct subsurface investigations during project scoping to determine if full replacement is warranted
• For pavement rehabilitation projects, enhance the amount/level of geotechnical investigations to address issues specific to the varying conditions along the project
• Expand programmed and future pavement projects as necessary to include shoulders • Expand median cable barrier guidelines to account for safety performance • Install CCTV cameras with all DMS • In locations with limited communications, use CCTV cameras to provide still images rather
than streaming video • Develop statewide program for pavement replacement • Install additional continuous permanent count stations along strategic corridors to enhance
traffic count data • When reconstruction or rehabilitation activities will affect existing bridge vertical clearance,
the dimension of the new bridge vertical clearance should be a minimum of 16.25 feet where feasible
• All new or reconstructed roadway/shoulder edges adjacent to an unpaved surface should be constructed with a Safety Edge
• Collision data on tribal lands may be incomplete or inconsistent; additional coordination for data on tribal lands is required to ensure adequate reflection of safety issues
• Expand data collection devices statewide to measure freight delay
• Evaluate and accommodate potential changes in freight and goods movement trends that may result from improvements and expansions to the state roadway network
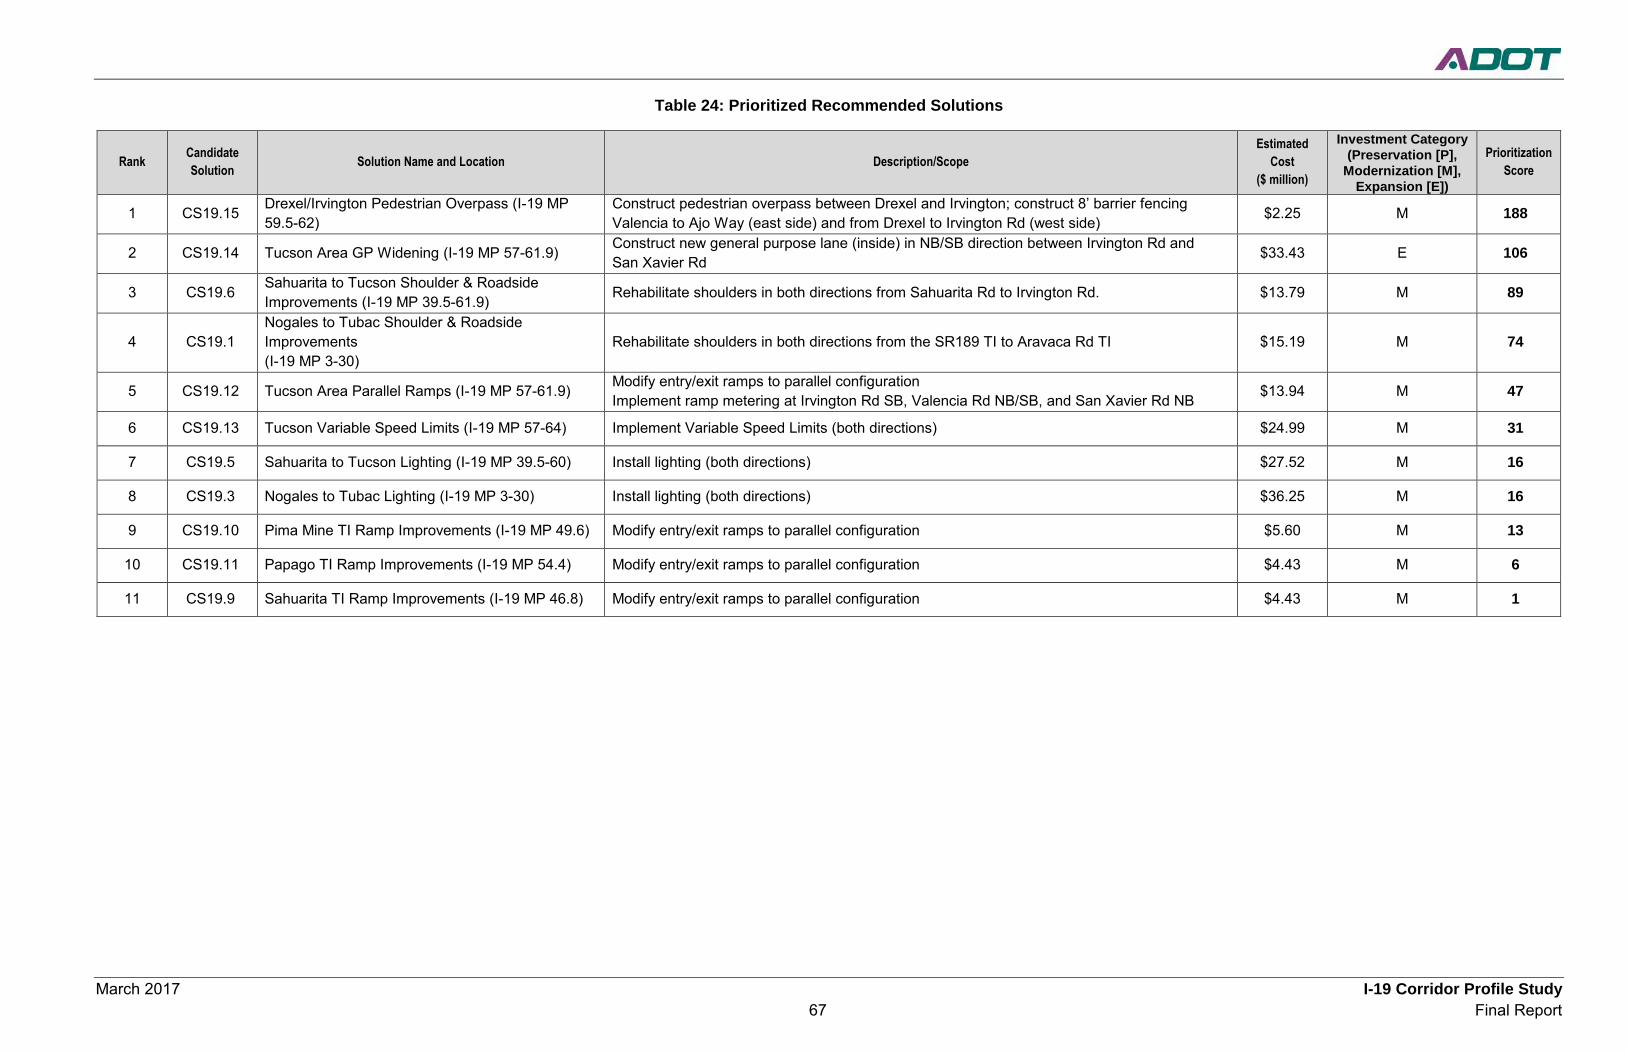
March 2017 I-19 Corridor Profile Study 67 Final Report
Table 24: Prioritized Recommended Solutions
Rank Candidate Solution Solution Name and Location Description/Scope
Estimated Cost
($ million)
Investment Category (Preservation [P],
Modernization [M], Expansion [E])
Prioritization Score
1 CS19.15 Drexel/Irvington Pedestrian Overpass (I-19 MP 59.5-62)
Construct pedestrian overpass between Drexel and Irvington; construct 8’ barrier fencing Valencia to Ajo Way (east side) and from Drexel to Irvington Rd (west side) $2.25 M 188
2 CS19.14 Tucson Area GP Widening (I-19 MP 57-61.9) Construct new general purpose lane (inside) in NB/SB direction between Irvington Rd and San Xavier Rd $33.43 E 106
3 CS19.6 Sahuarita to Tucson Shoulder & Roadside Improvements (I-19 MP 39.5-61.9) Rehabilitate shoulders in both directions from Sahuarita Rd to Irvington Rd. $13.79 M 89
4 CS19.1 Nogales to Tubac Shoulder & Roadside Improvements (I-19 MP 3-30)
Rehabilitate shoulders in both directions from the SR189 TI to Aravaca Rd TI $15.19 M 74
5 CS19.12 Tucson Area Parallel Ramps (I-19 MP 57-61.9) Modify entry/exit ramps to parallel configuration Implement ramp metering at Irvington Rd SB, Valencia Rd NB/SB, and San Xavier Rd NB $13.94 M 47
6 CS19.13 Tucson Variable Speed Limits (I-19 MP 57-64) Implement Variable Speed Limits (both directions) $24.99 M 31
7 CS19.5 Sahuarita to Tucson Lighting (I-19 MP 39.5-60) Install lighting (both directions) $27.52 M 16
8 CS19.3 Nogales to Tubac Lighting (I-19 MP 3-30) Install lighting (both directions) $36.25 M 16
9 CS19.10 Pima Mine TI Ramp Improvements (I-19 MP 49.6) Modify entry/exit ramps to parallel configuration $5.60 M 13
10 CS19.11 Papago TI Ramp Improvements (I-19 MP 54.4) Modify entry/exit ramps to parallel configuration $4.43 M 6
11 CS19.9 Sahuarita TI Ramp Improvements (I-19 MP 46.8) Modify entry/exit ramps to parallel configuration $4.43 M 1
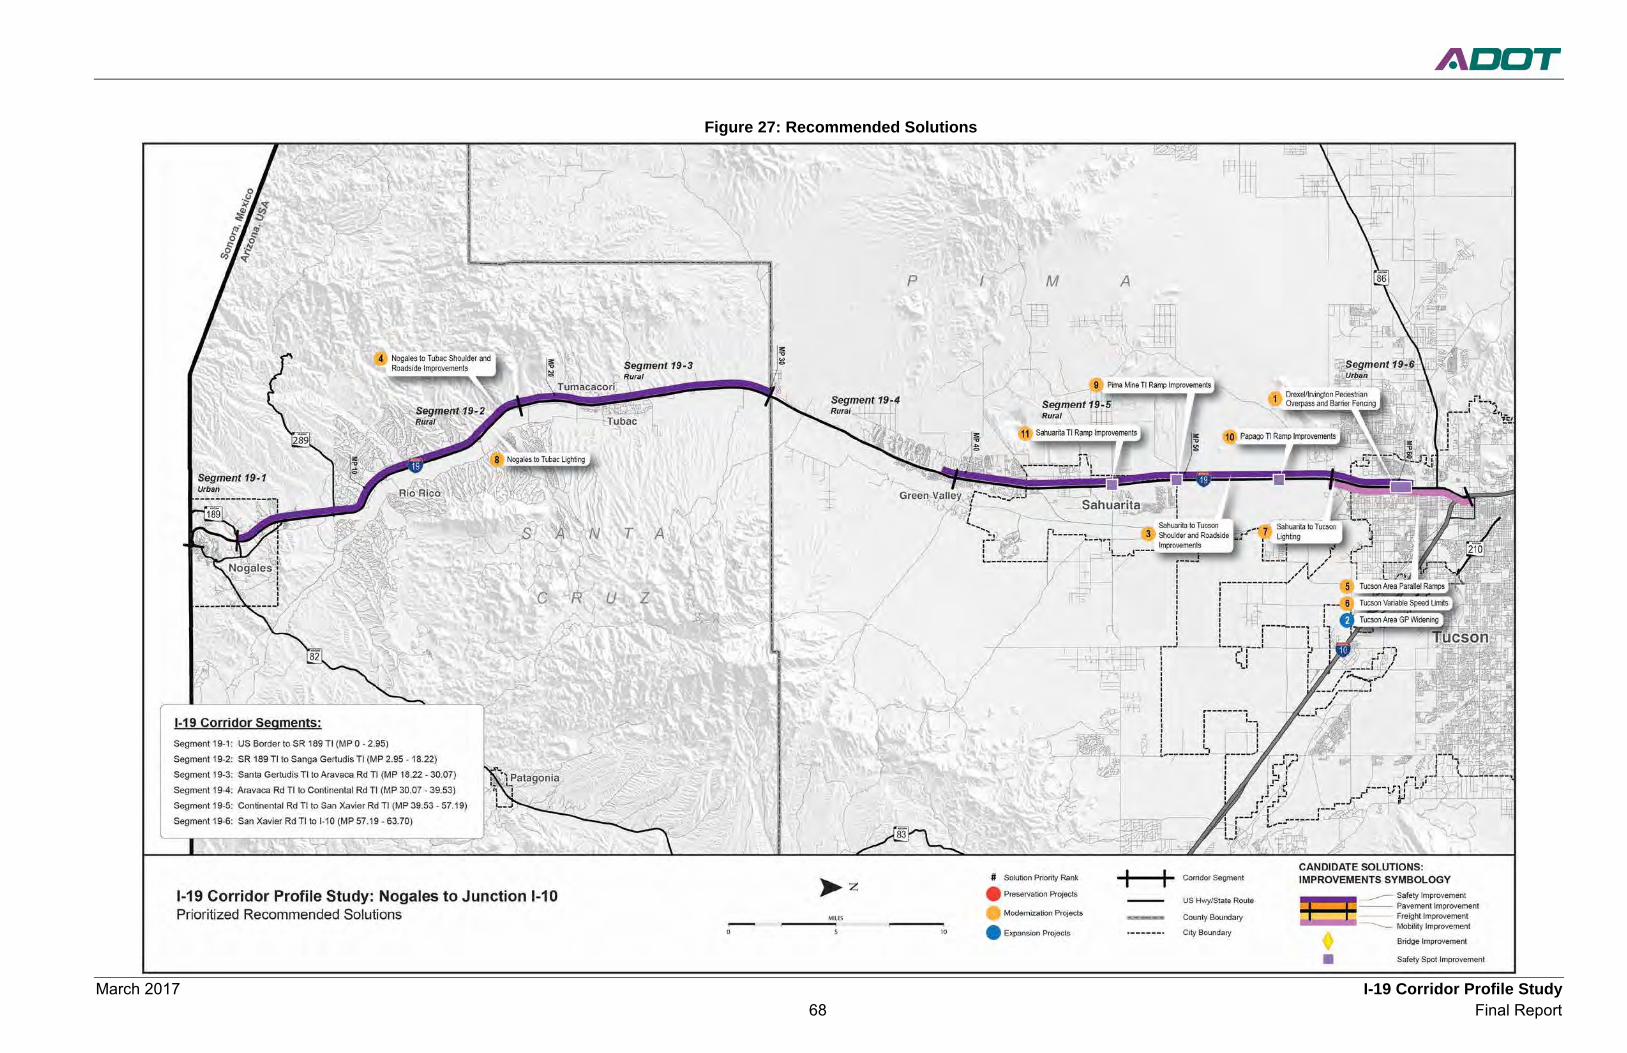
March 2017 I-19 Corridor Profile Study 68 Final Report
Figure 27: Recommended Solutions
March 2017 I-19 Corridor Profile Study 69 Draft Final Report
6.4 Next Steps The candidate solutions recommended in this study are not intended to be a substitute or replacement for traditional ADOT project development processes where various ADOT technical groups and districts develop candidate projects for consideration in the performance-based programming in the P2P process. Rather, these candidate solutions are intended to complement ADOT’s traditional project development processes through a performance-based process to address needs in one or more of the five performance areas of Pavement, Bridge, Mobility, Safety, and Freight. Candidate solutions developed for the I-19 Corridor will be considered along with other candidate projects in the ADOT statewide programming process.
It is important to note that the candidate solutions are intended to represent strategic solutions to address existing performance needs related to the Pavement, Bridge, Mobility, Safety, and Freight performance areas. Therefore, the strategic solutions are not intended to preclude recommendations related to the ultimate vision for the corridor that may have been defined in the context of prior planning studies and/or design concept reports. Recommendations from such studies are still relevant to addressing the ultimate corridor objectives.
Upon completion of all three CPS rounds, the results will be incorporated into a summary document comparing all corridors that is expected to provide a performance-based review of statewide needs and candidate solutions.


Appe
ndic
es
Appendices

March 2017 I-19 Corridor Profile Study Appendix A - 1 Final Report
Appendix A: Corridor Performance Maps
March 2017 I-19 Corridor Profile Study Appendix A - 2 Final Report
This appendix contains maps of each primary and secondary measure associated with the five performance areas for the I-19 Corridor. The following are the areas and maps included: Pavement Performance Area:
• Pavement Index and Hot Spots • Pavement Serviceability (directional) • Percentage of Pavement Area Failure
Bridge Performance Area:
• Bridge Index and Hot Spots • Bridge Sufficiency • Percent of Deck Area on Functionally Obsolete Bridges • Lowest Bridge Rating
Mobility Performance Area:
• Mobility Index • Future Daily V/C • Existing Peak V/C (directional) • Average Instances Per Year a Given Milepost is Closed Per Segment Mile • All Vehicles Travel Time Index • All Vehicles Planning Time Index • Multimodal Opportunities • Percentage of Bicycle Accommodation
Safety Performance Area:
• Safety Index and Hot Spots • Safety Index and Hot Spots (directional) • Relative Frequency of Fatal + Incapacitating Injury Crashes Involving SHSP Top 5
Emphasis Areas Behaviors Compared to the Statewide Average for Similar Segments
Freight Performance Area:
• Freight Index and Hot Spots • Truck Travel Time Index • Truck Planning Time Index • Average Minutes Per Year Given Milepost is Closed Per Segment Mile • Bridge Vertical Clearance
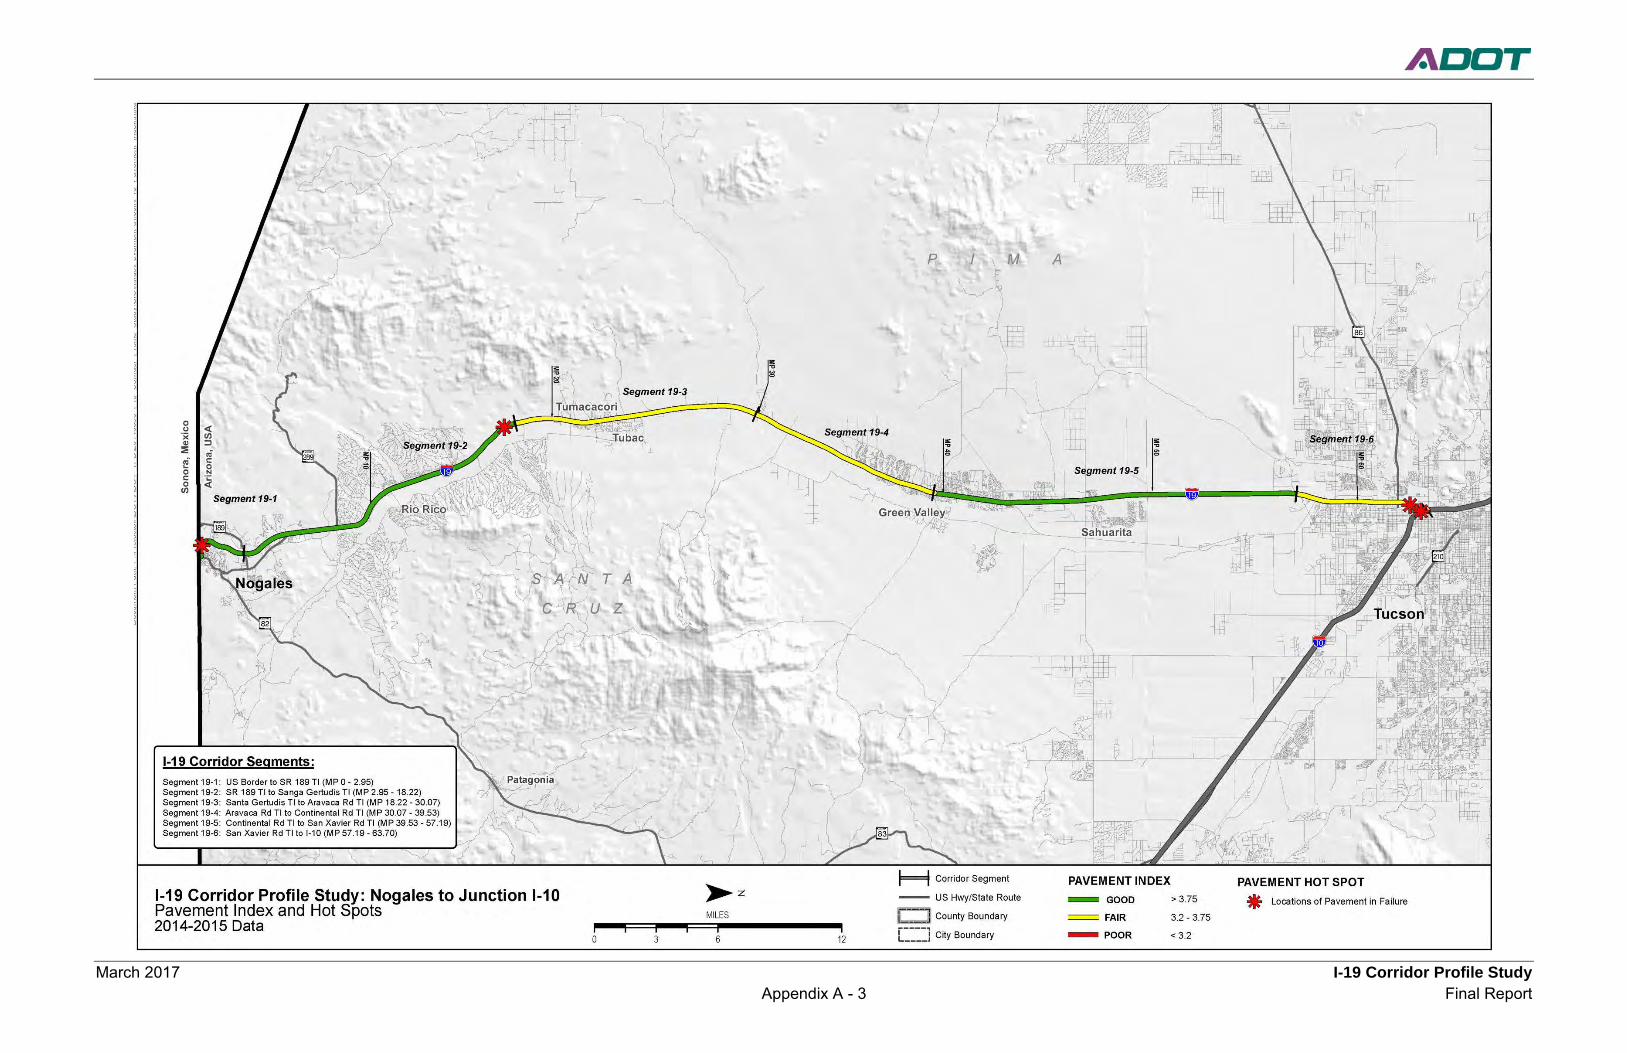
March 2017 I-19 Corridor Profile Study Appendix A - 3 Final Report

March 2017 I-19 Corridor Profile Study Appendix A - 4 Final Report
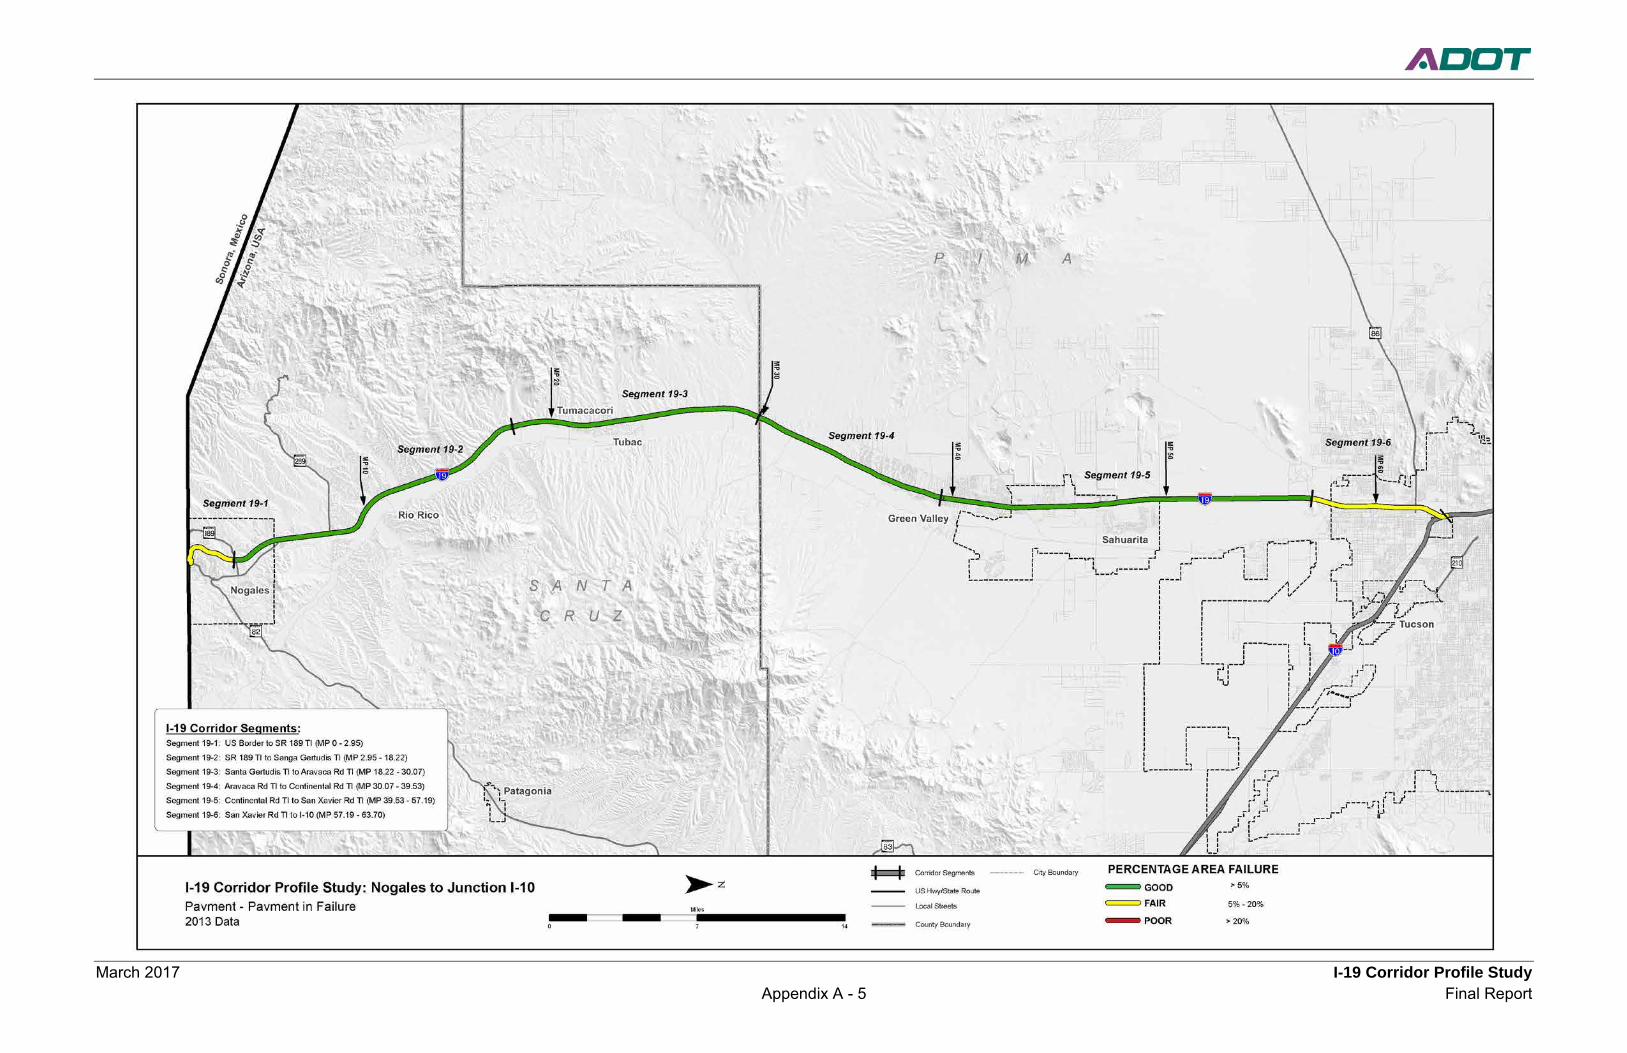
March 2017 I-19 Corridor Profile Study Appendix A - 5 Final Report

March 2017 I-19 Corridor Profile Study Appendix A - 6 Final Report
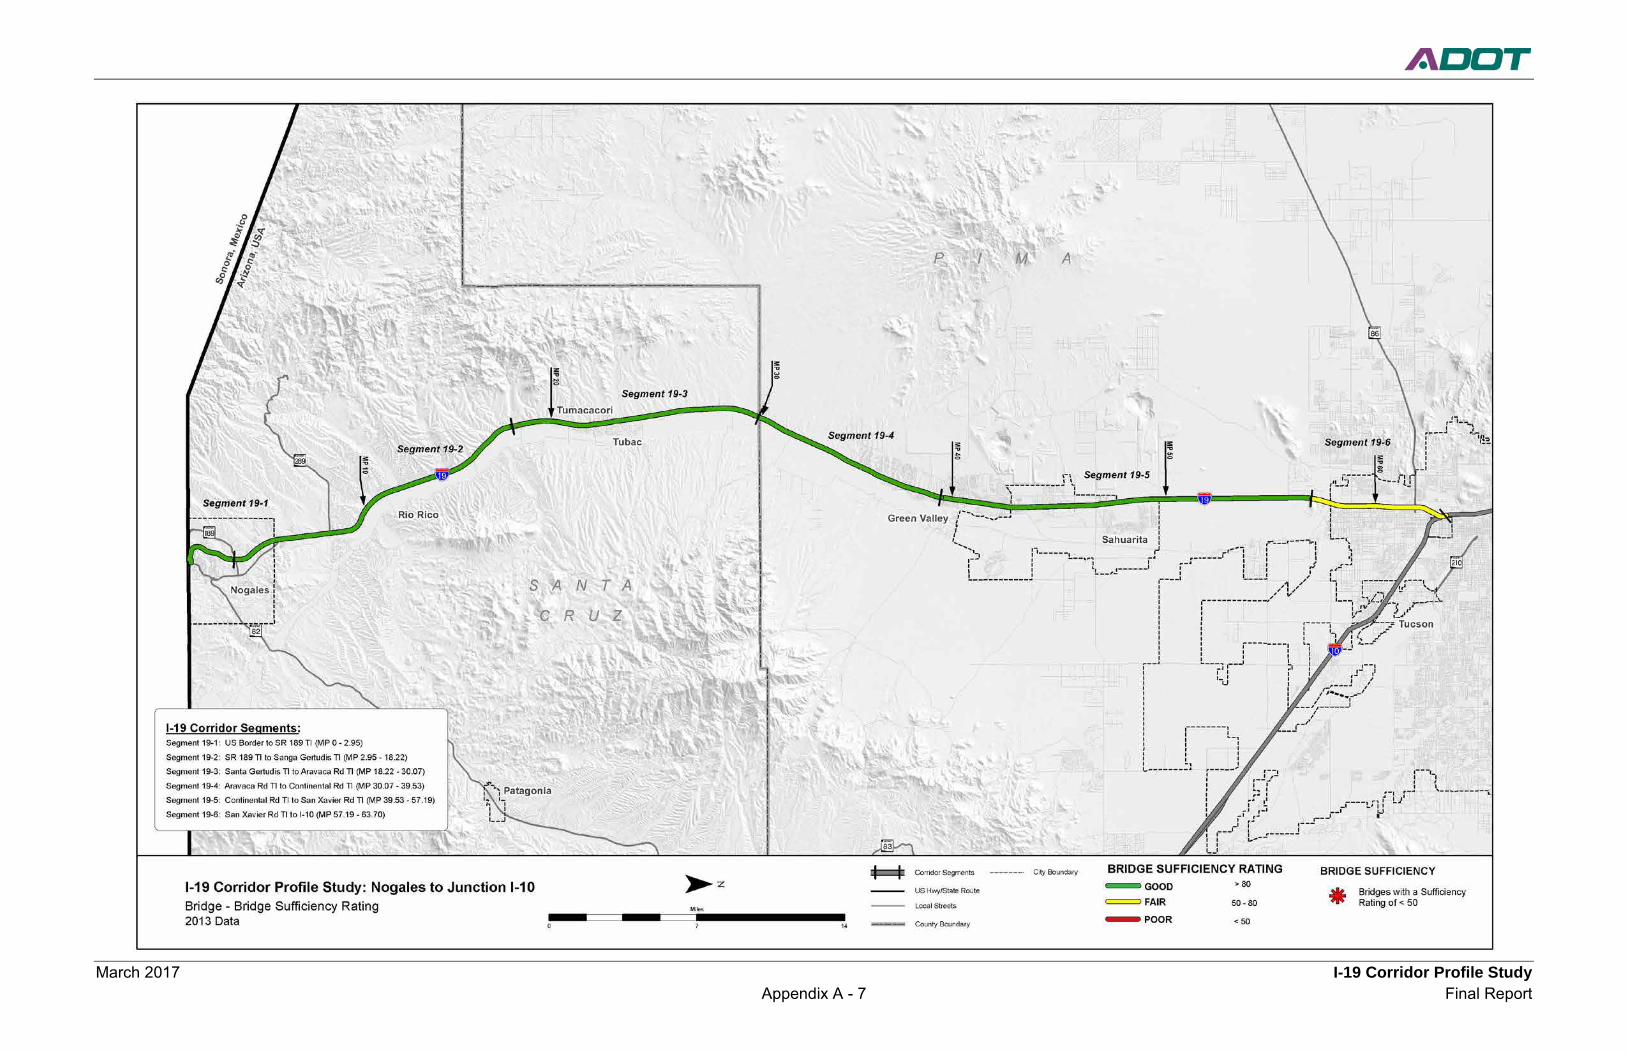
March 2017 I-19 Corridor Profile Study Appendix A - 7 Final Report
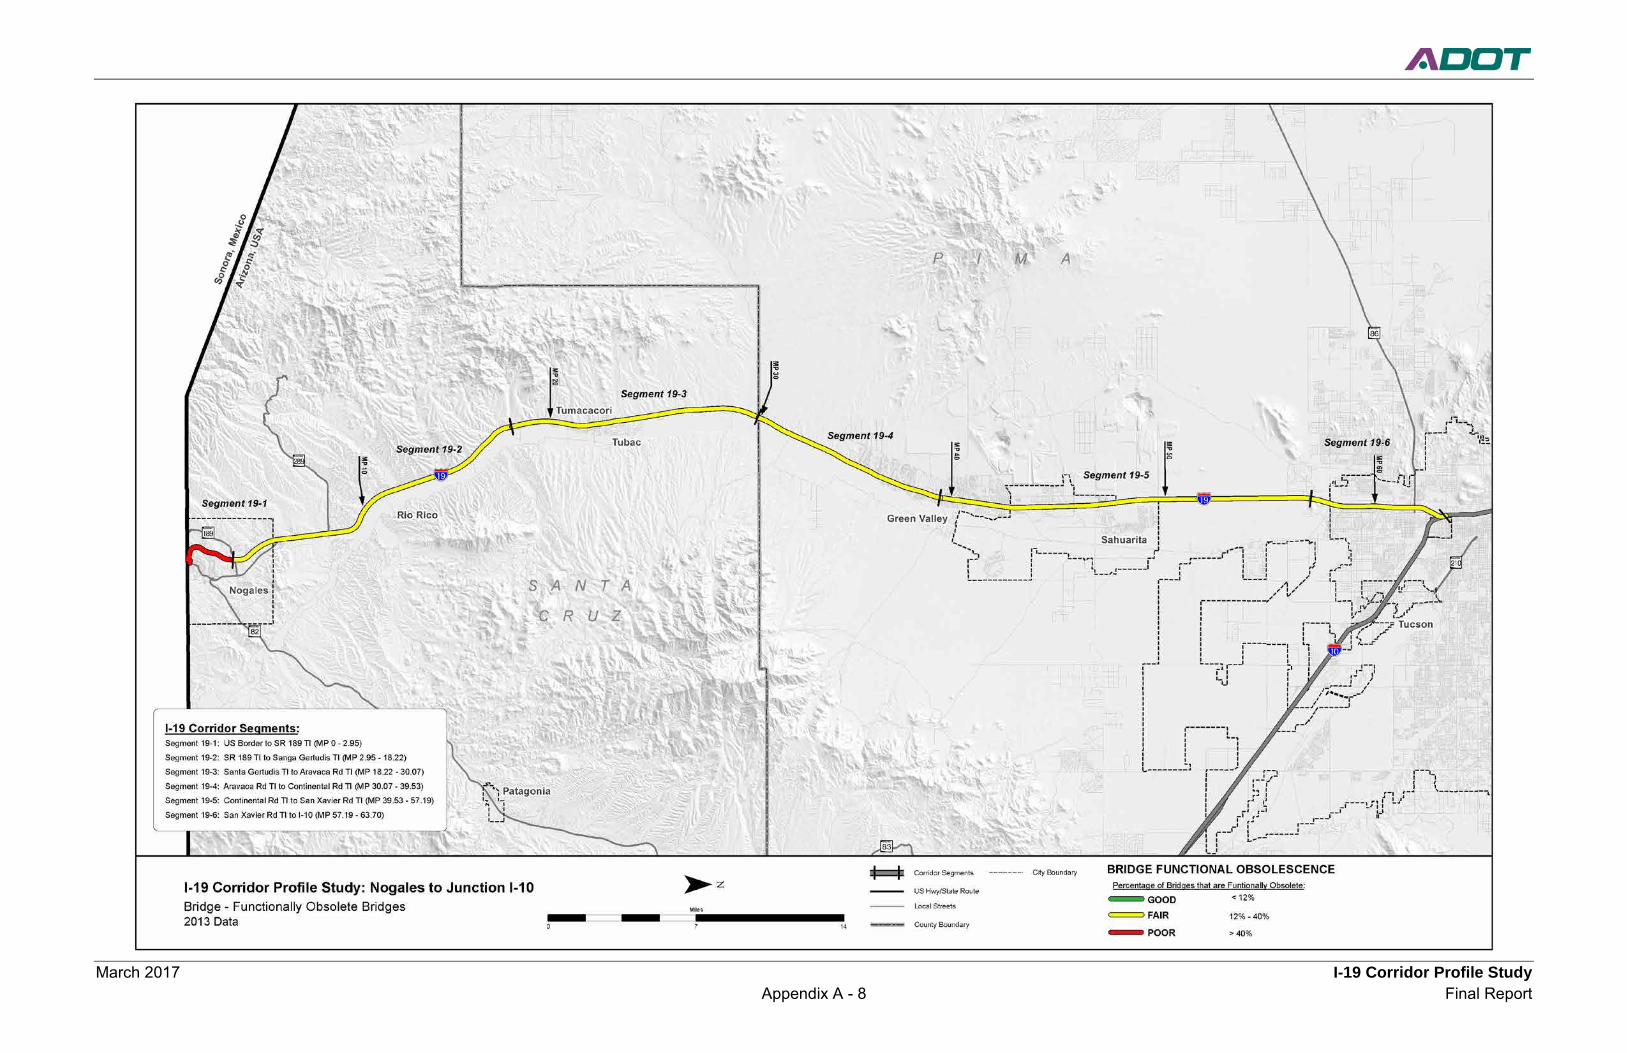
March 2017 I-19 Corridor Profile Study Appendix A - 8 Final Report
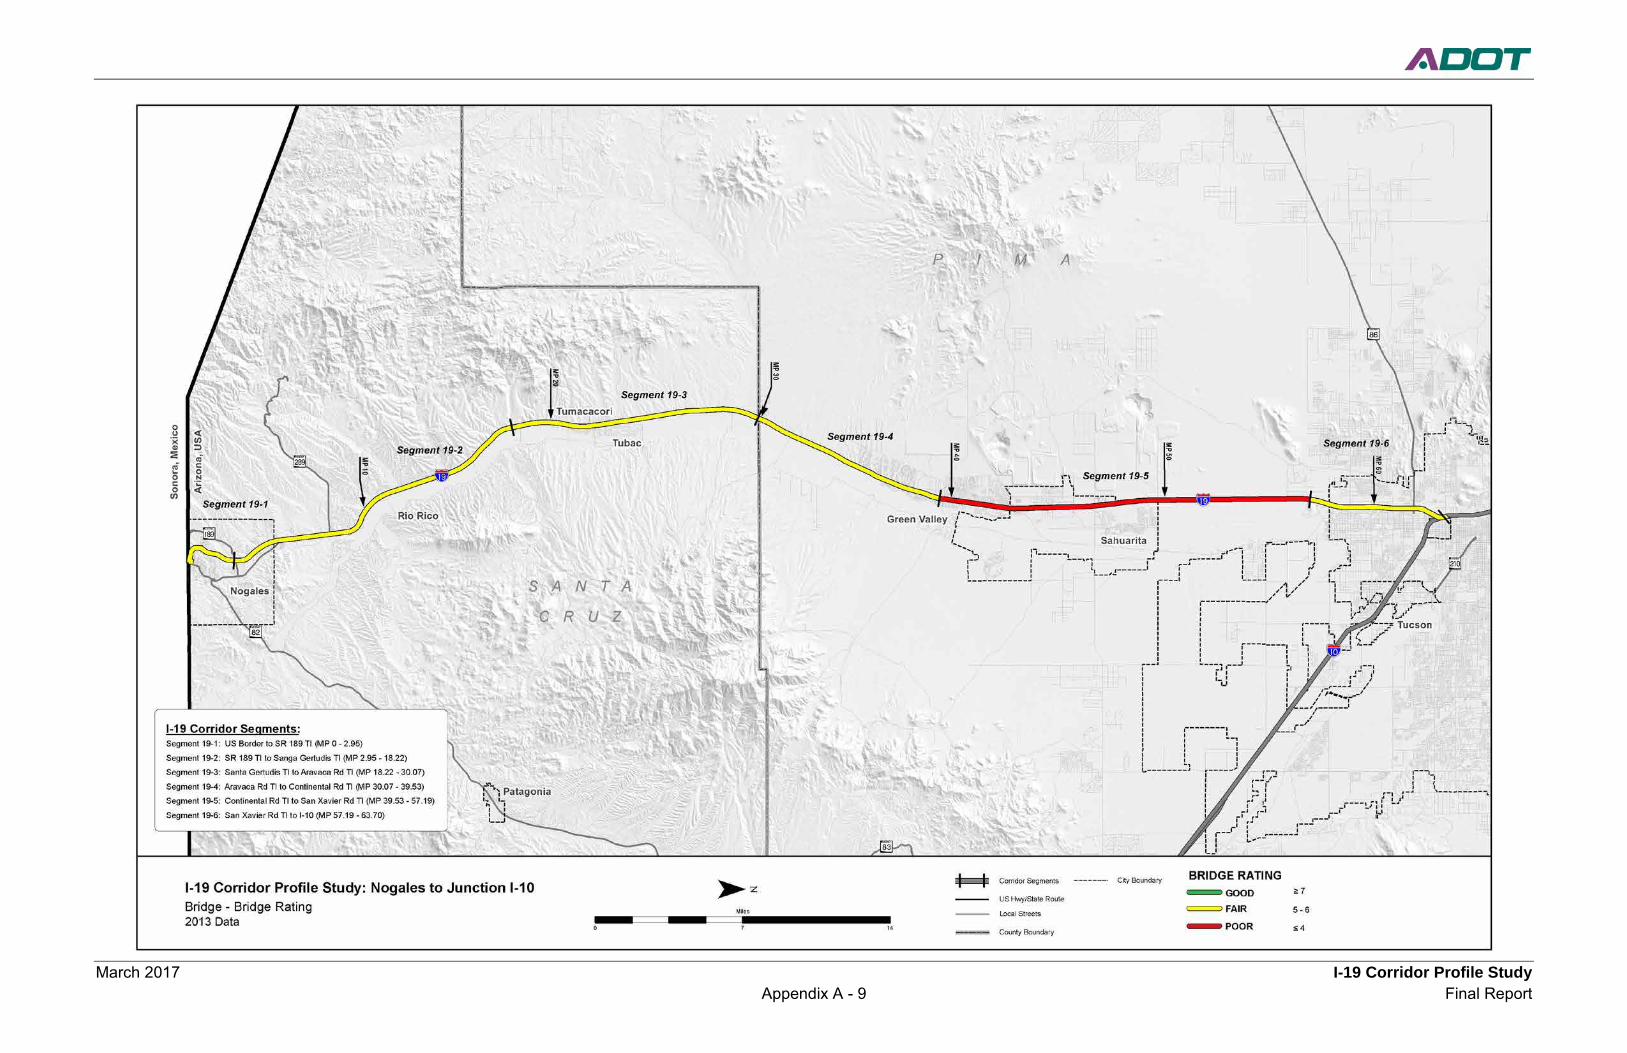
March 2017 I-19 Corridor Profile Study Appendix A - 9 Final Report
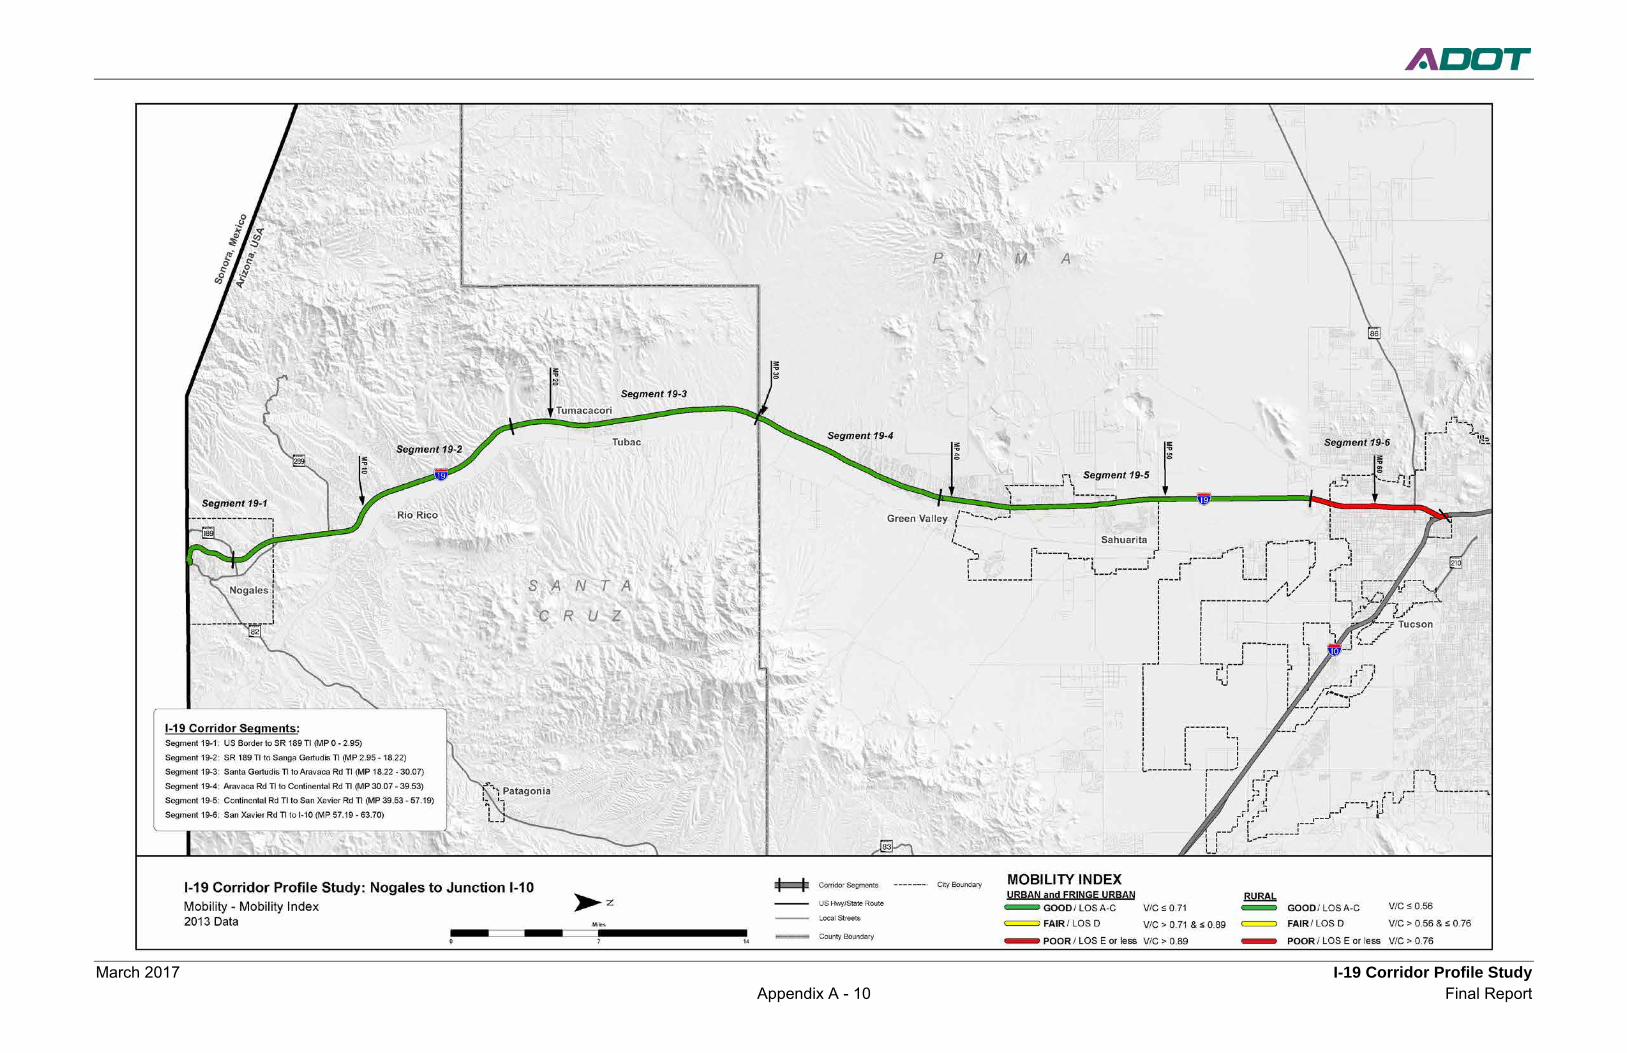
March 2017 I-19 Corridor Profile Study Appendix A - 10 Final Report
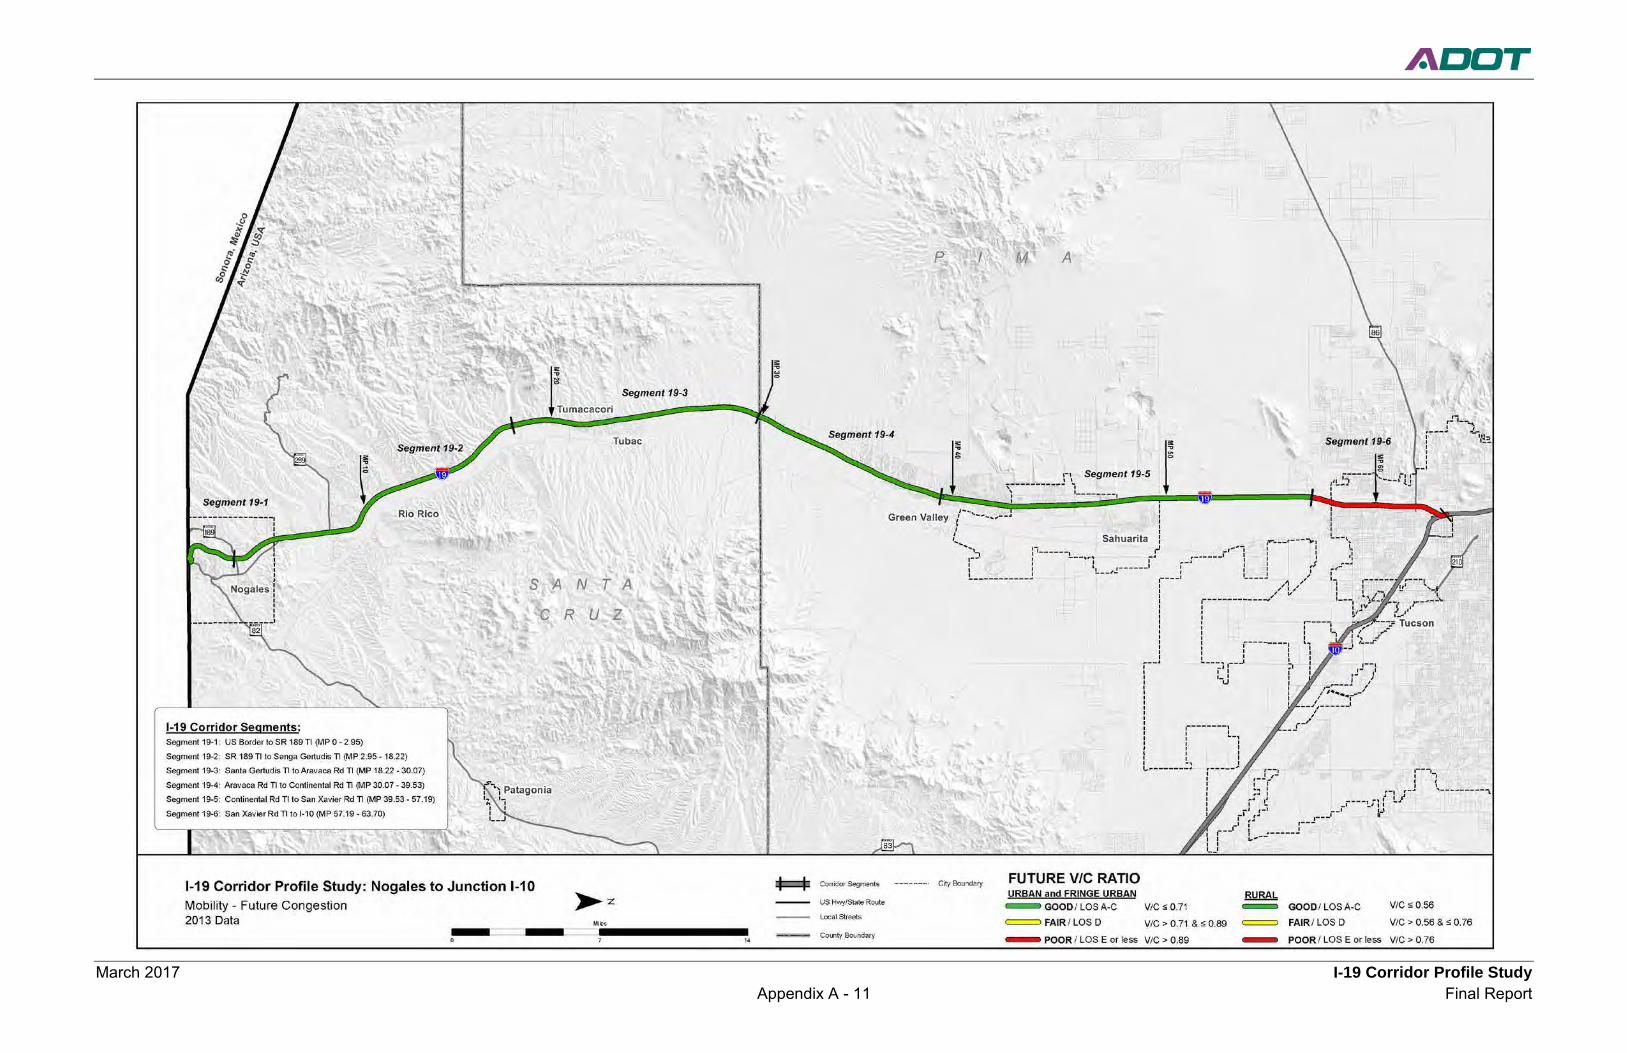
March 2017 I-19 Corridor Profile Study Appendix A - 11 Final Report
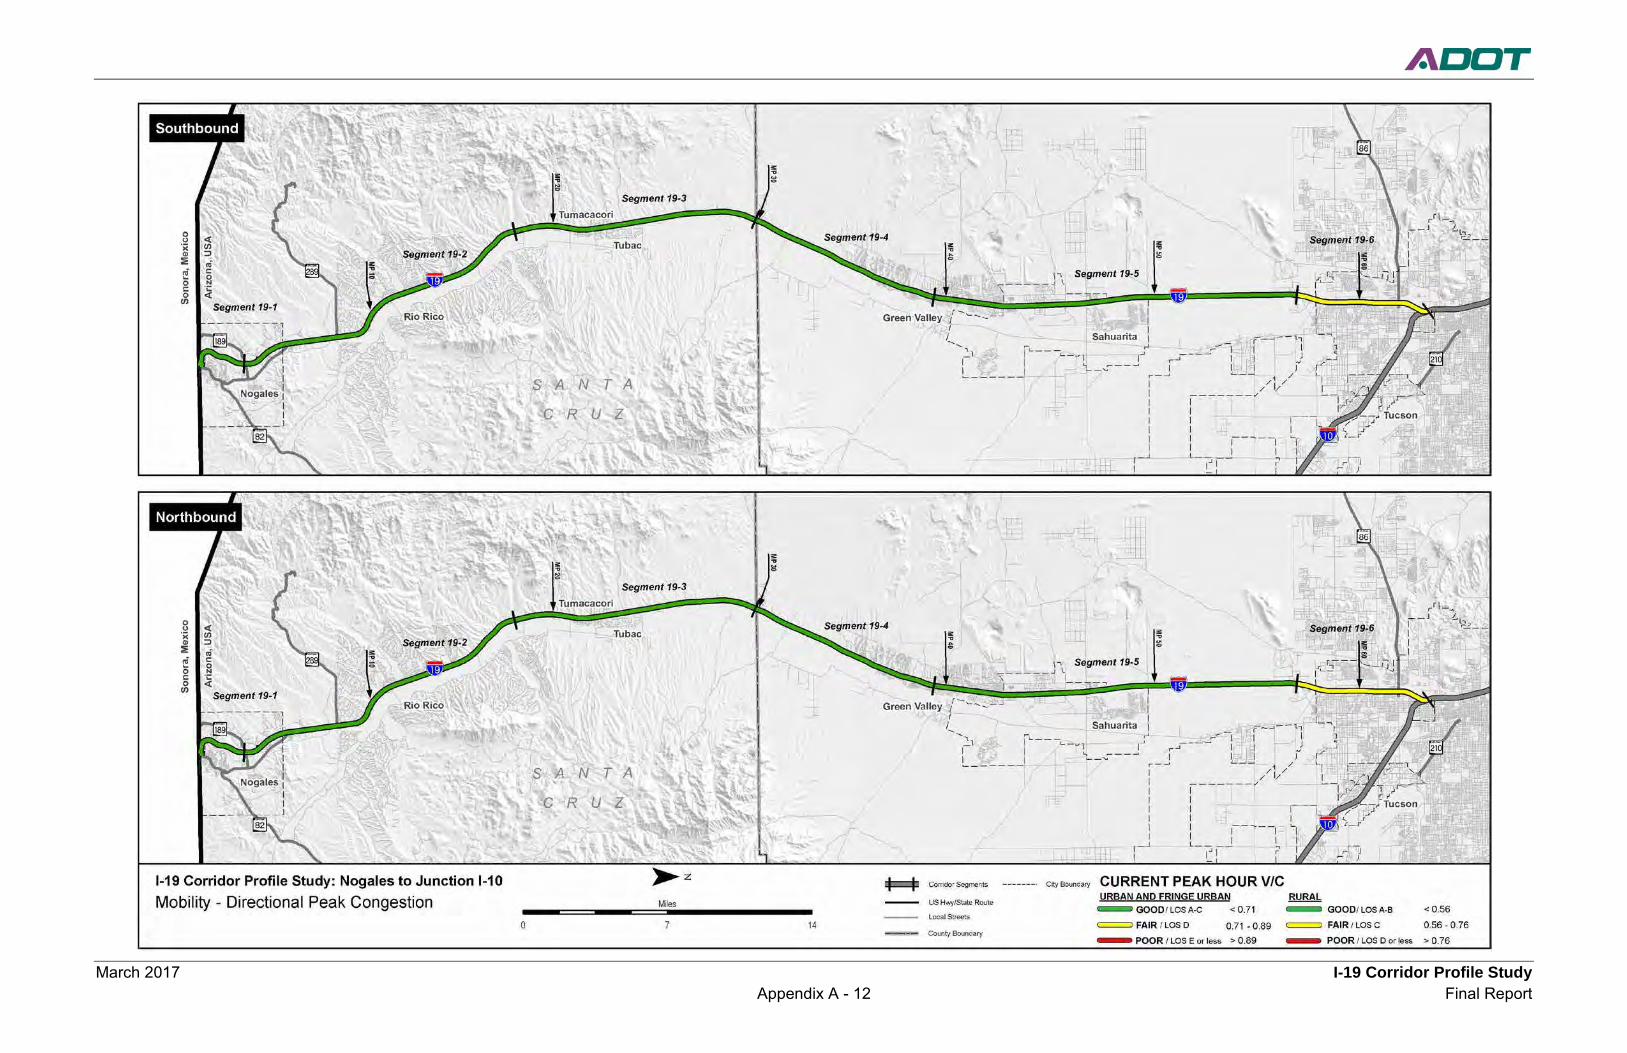
March 2017 I-19 Corridor Profile Study Appendix A - 12 Final Report
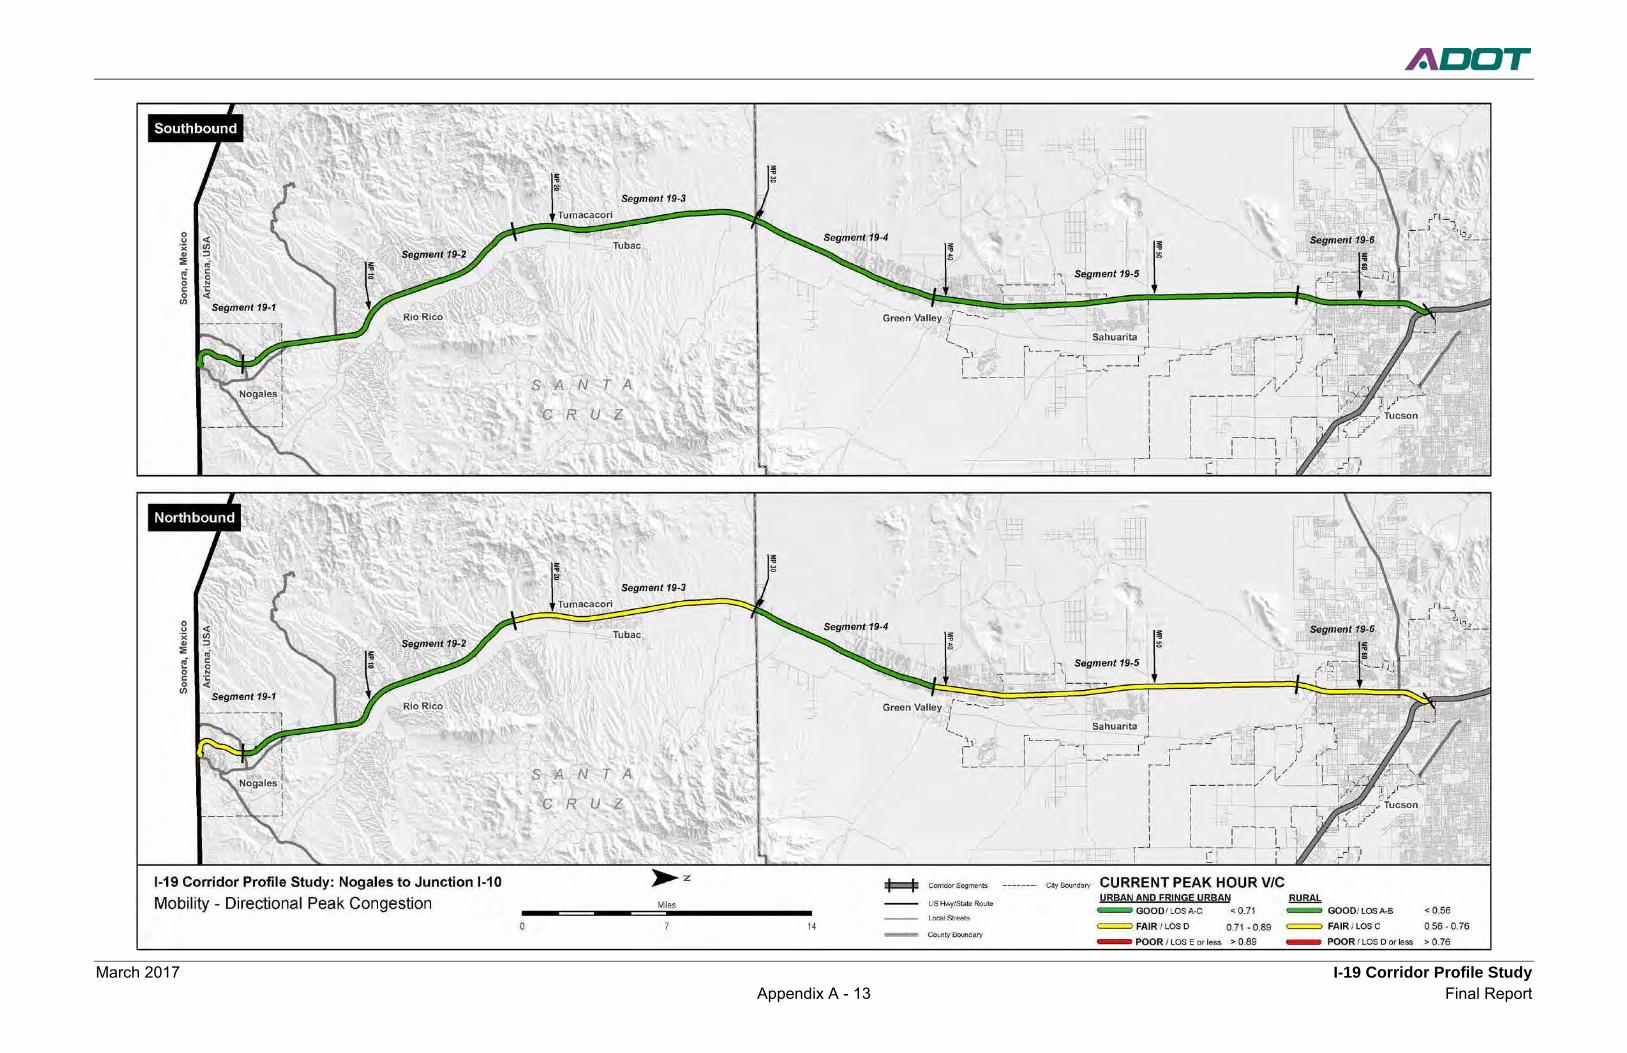
March 2017 I-19 Corridor Profile Study Appendix A - 13 Final Report
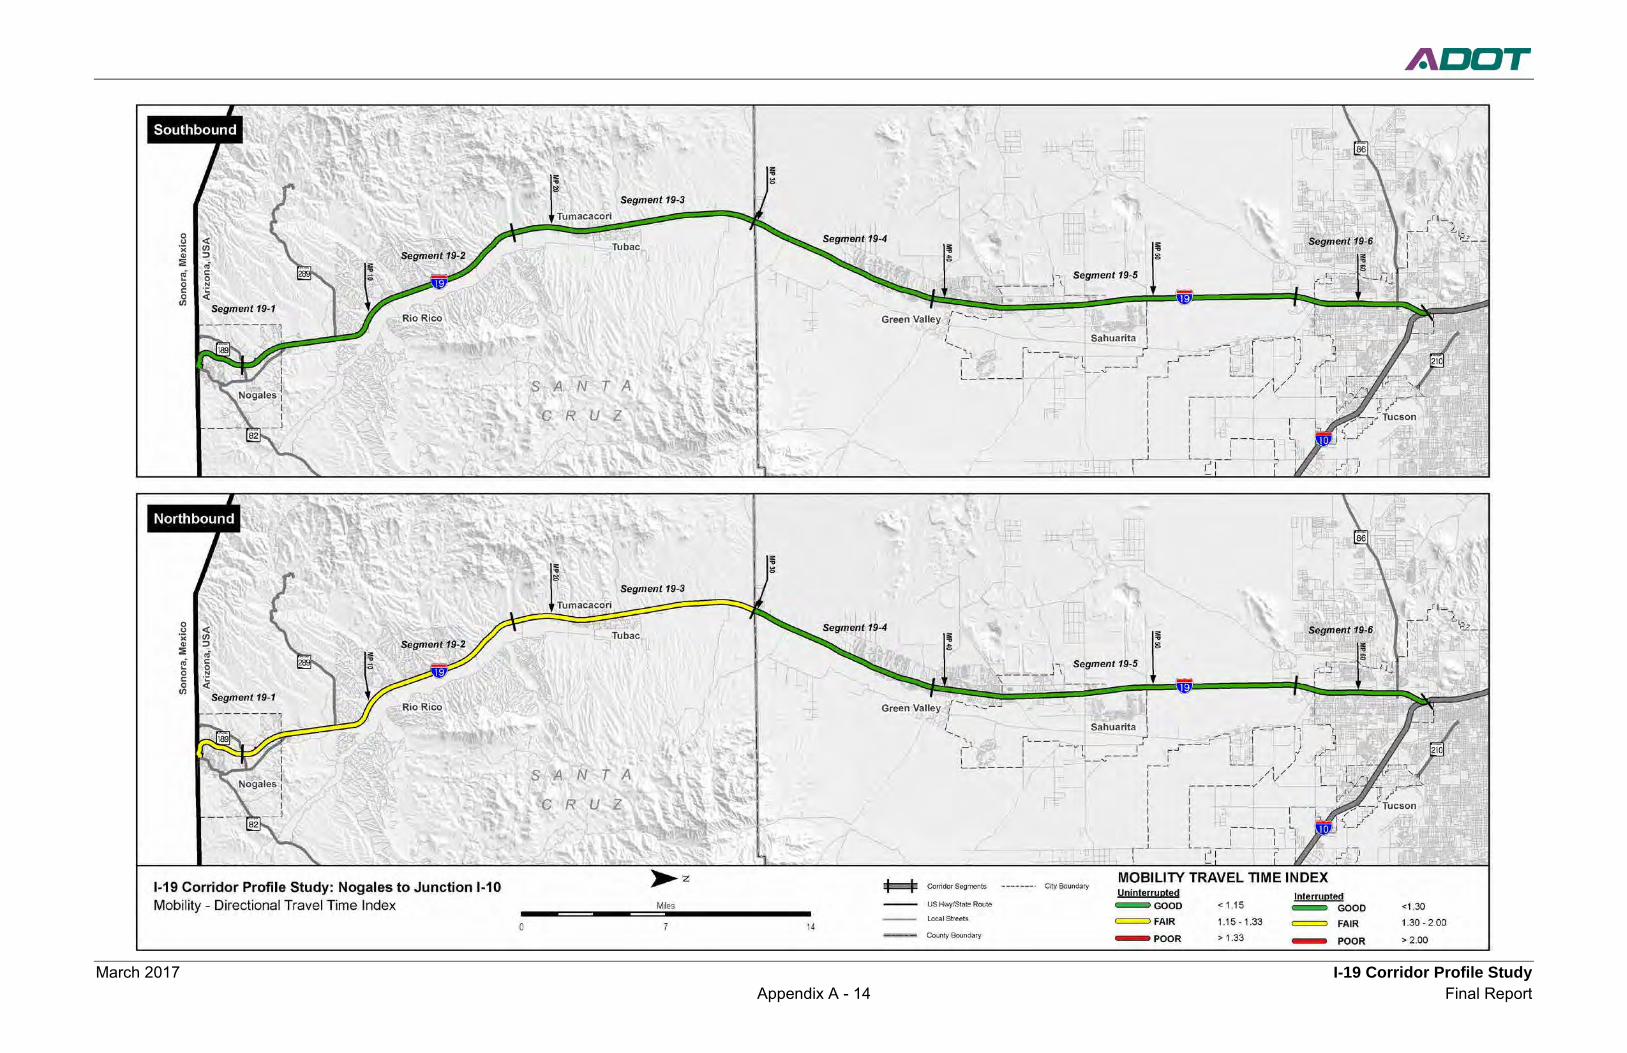
March 2017 I-19 Corridor Profile Study Appendix A - 14 Final Report
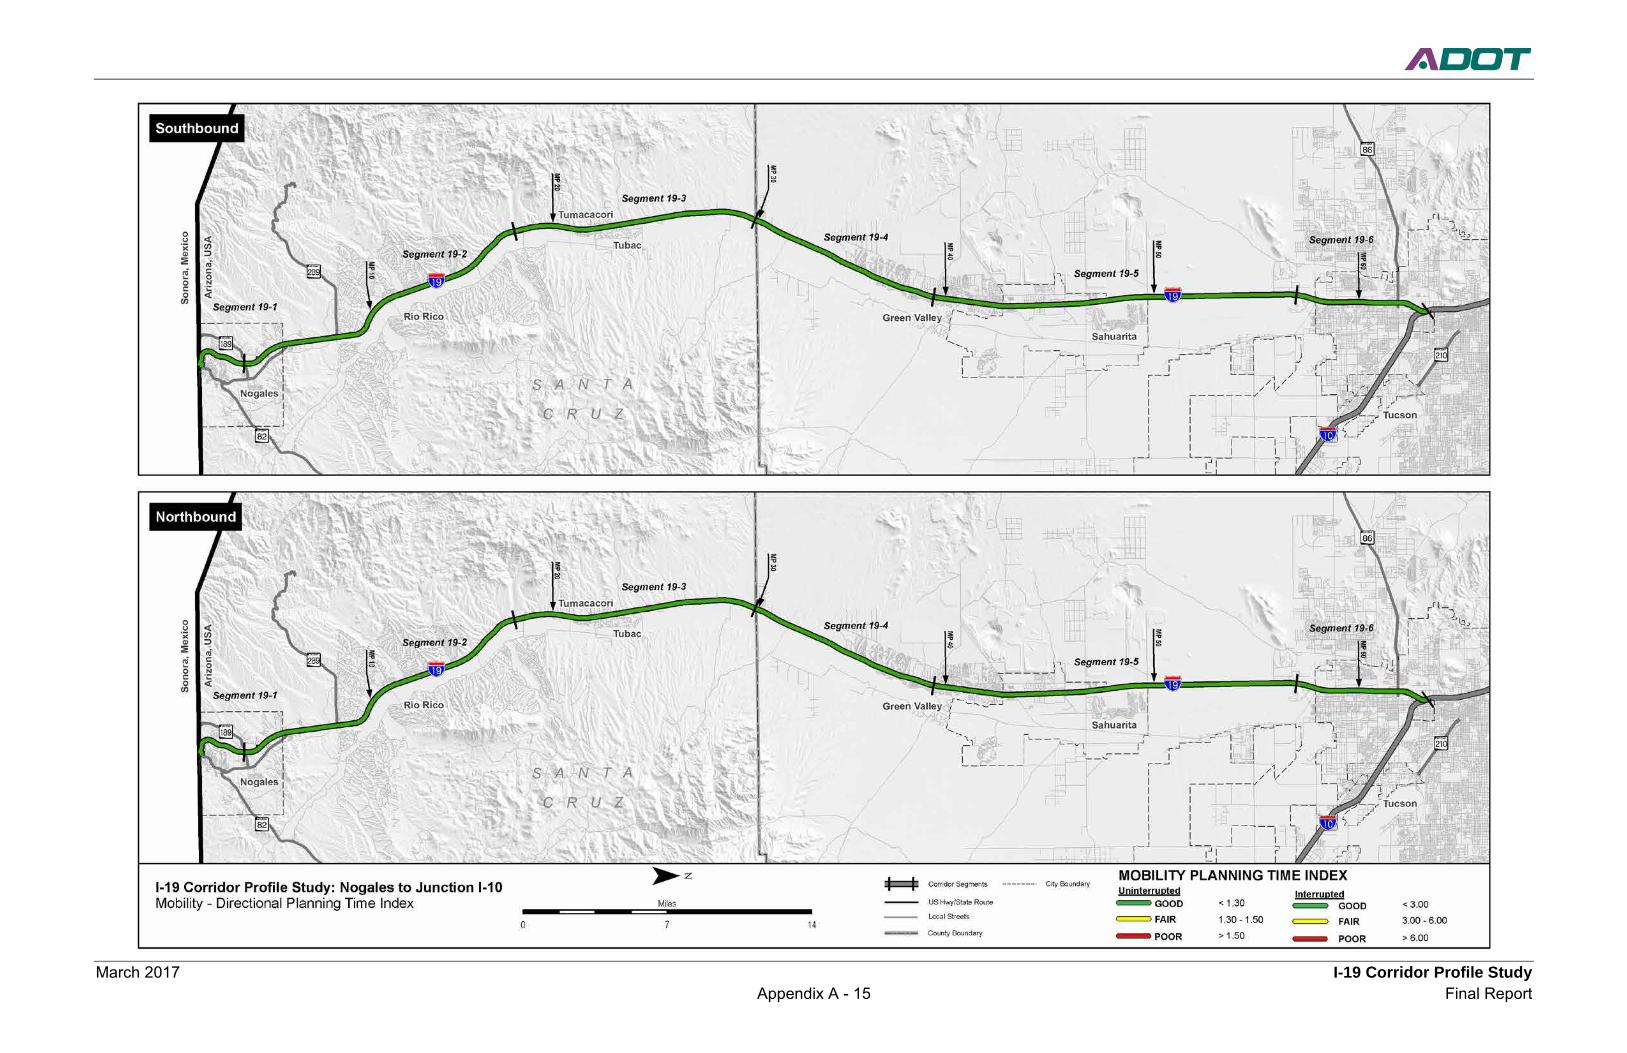
March 2017 I-19 Corridor Profile Study Appendix A - 15 Final Report
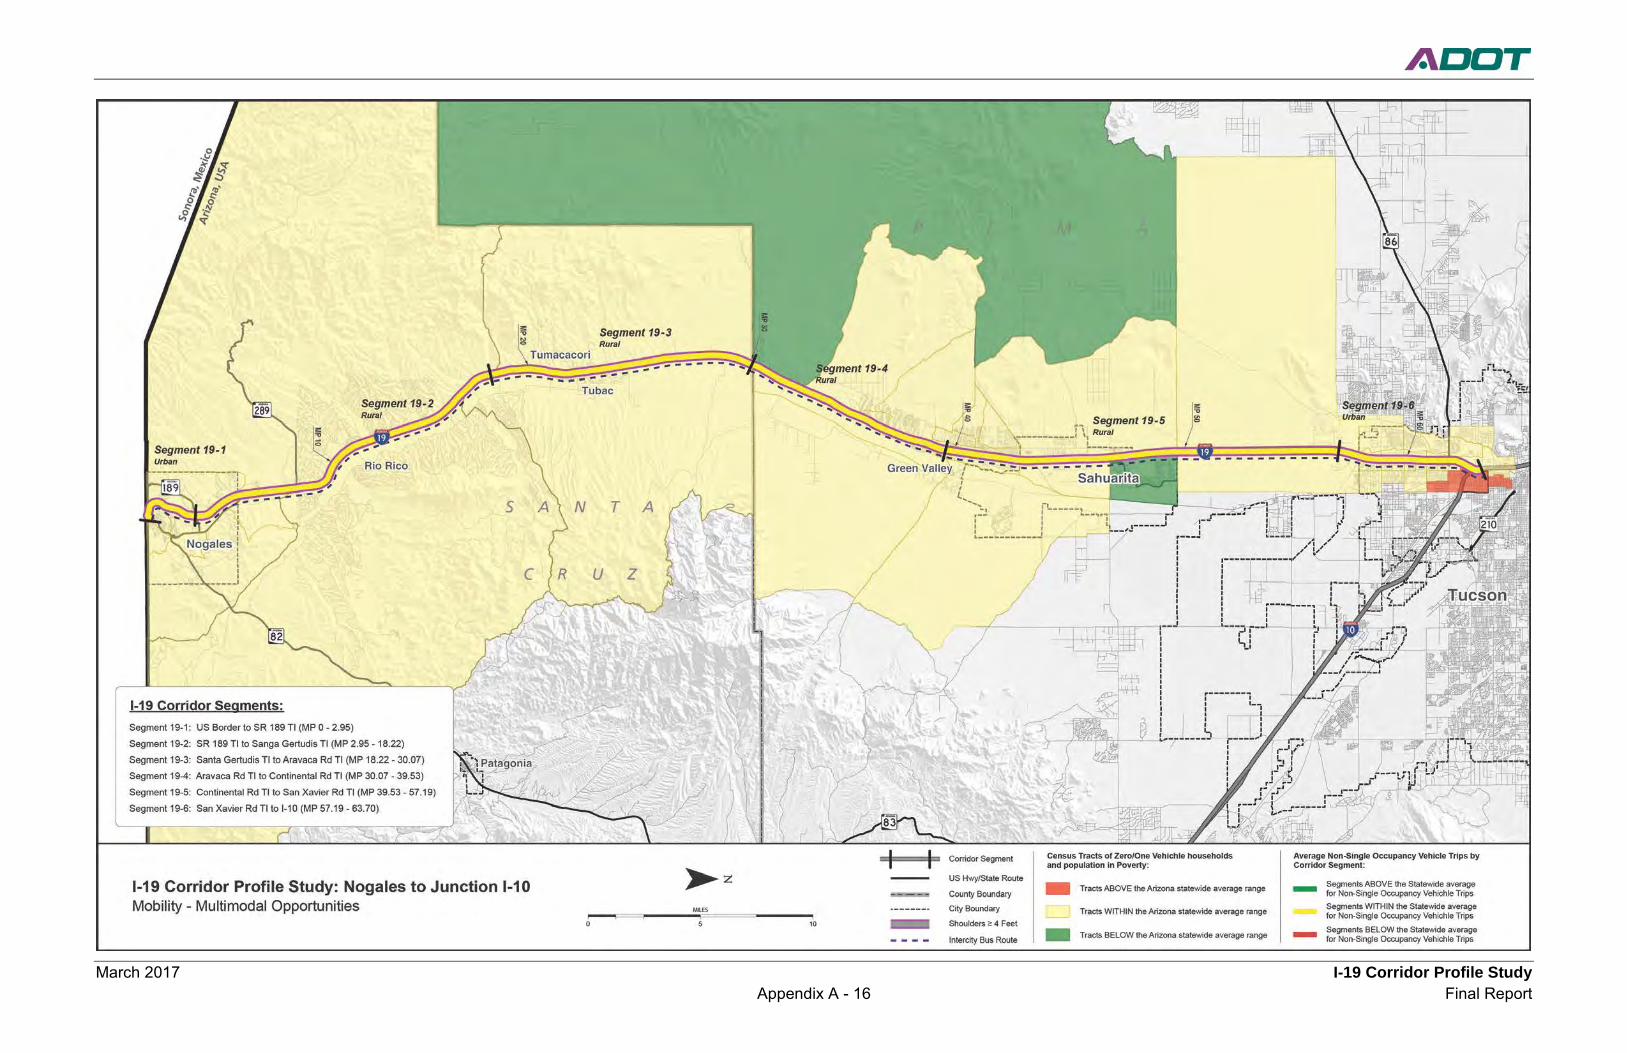
March 2017 I-19 Corridor Profile Study Appendix A - 16 Final Report
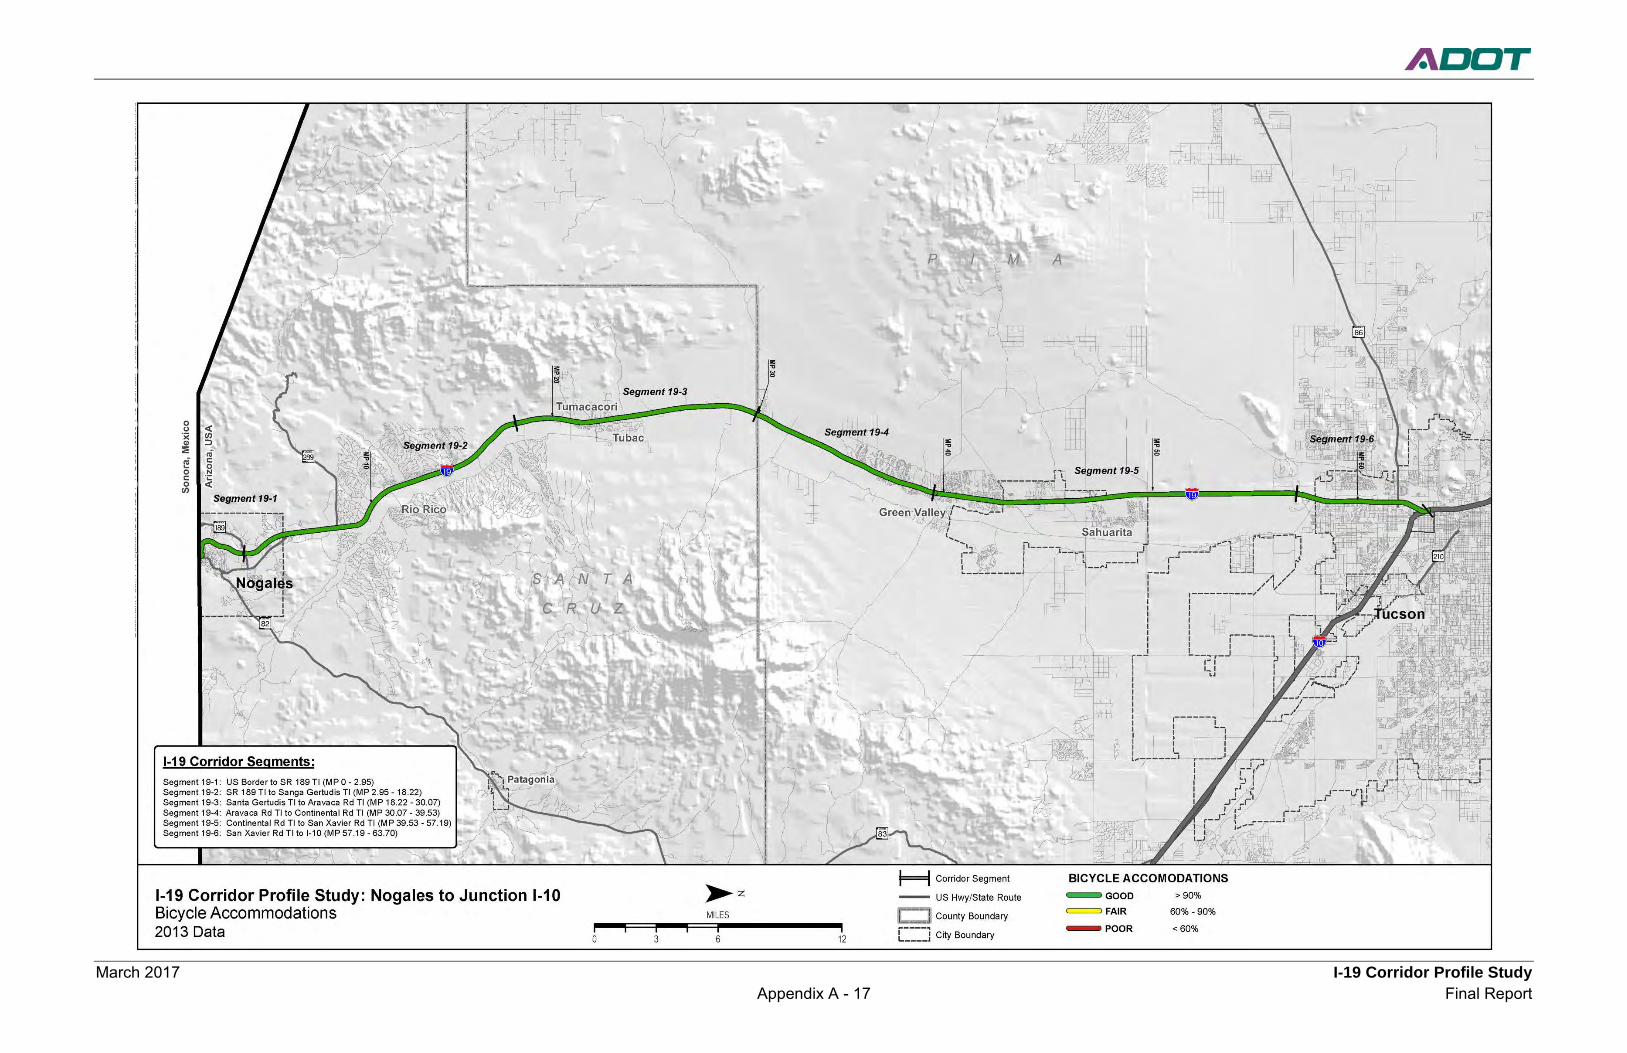
March 2017 I-19 Corridor Profile Study Appendix A - 17 Final Report
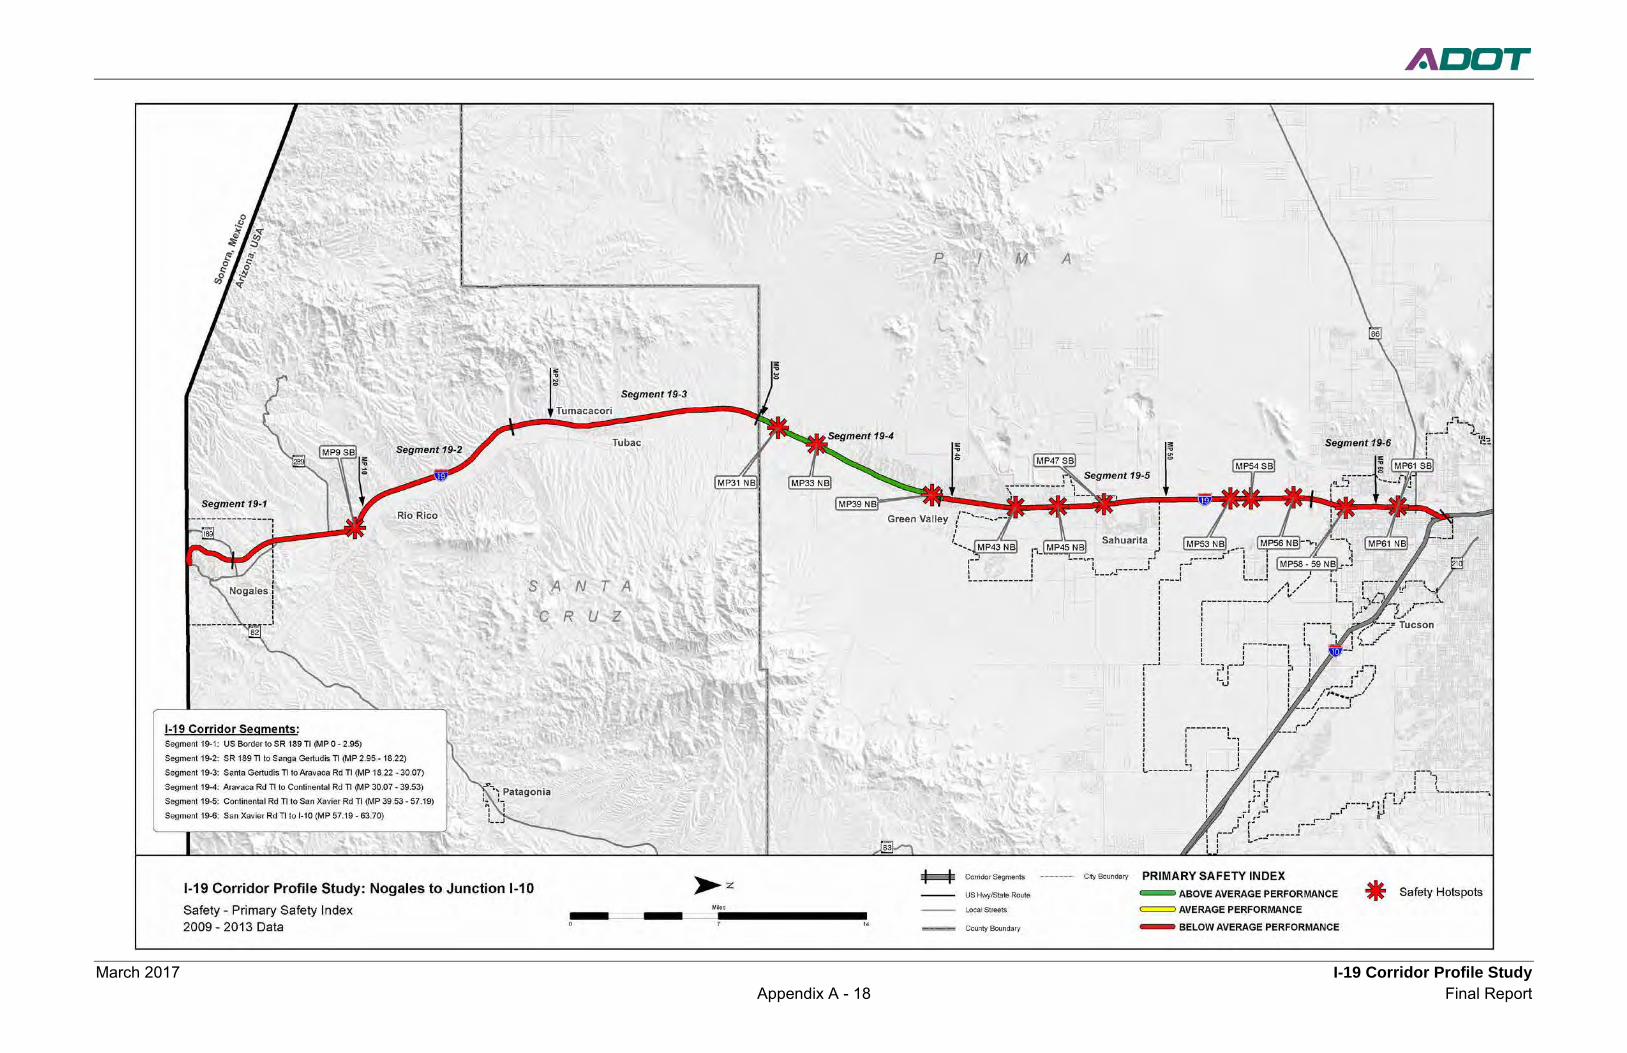
March 2017 I-19 Corridor Profile Study Appendix A - 18 Final Report
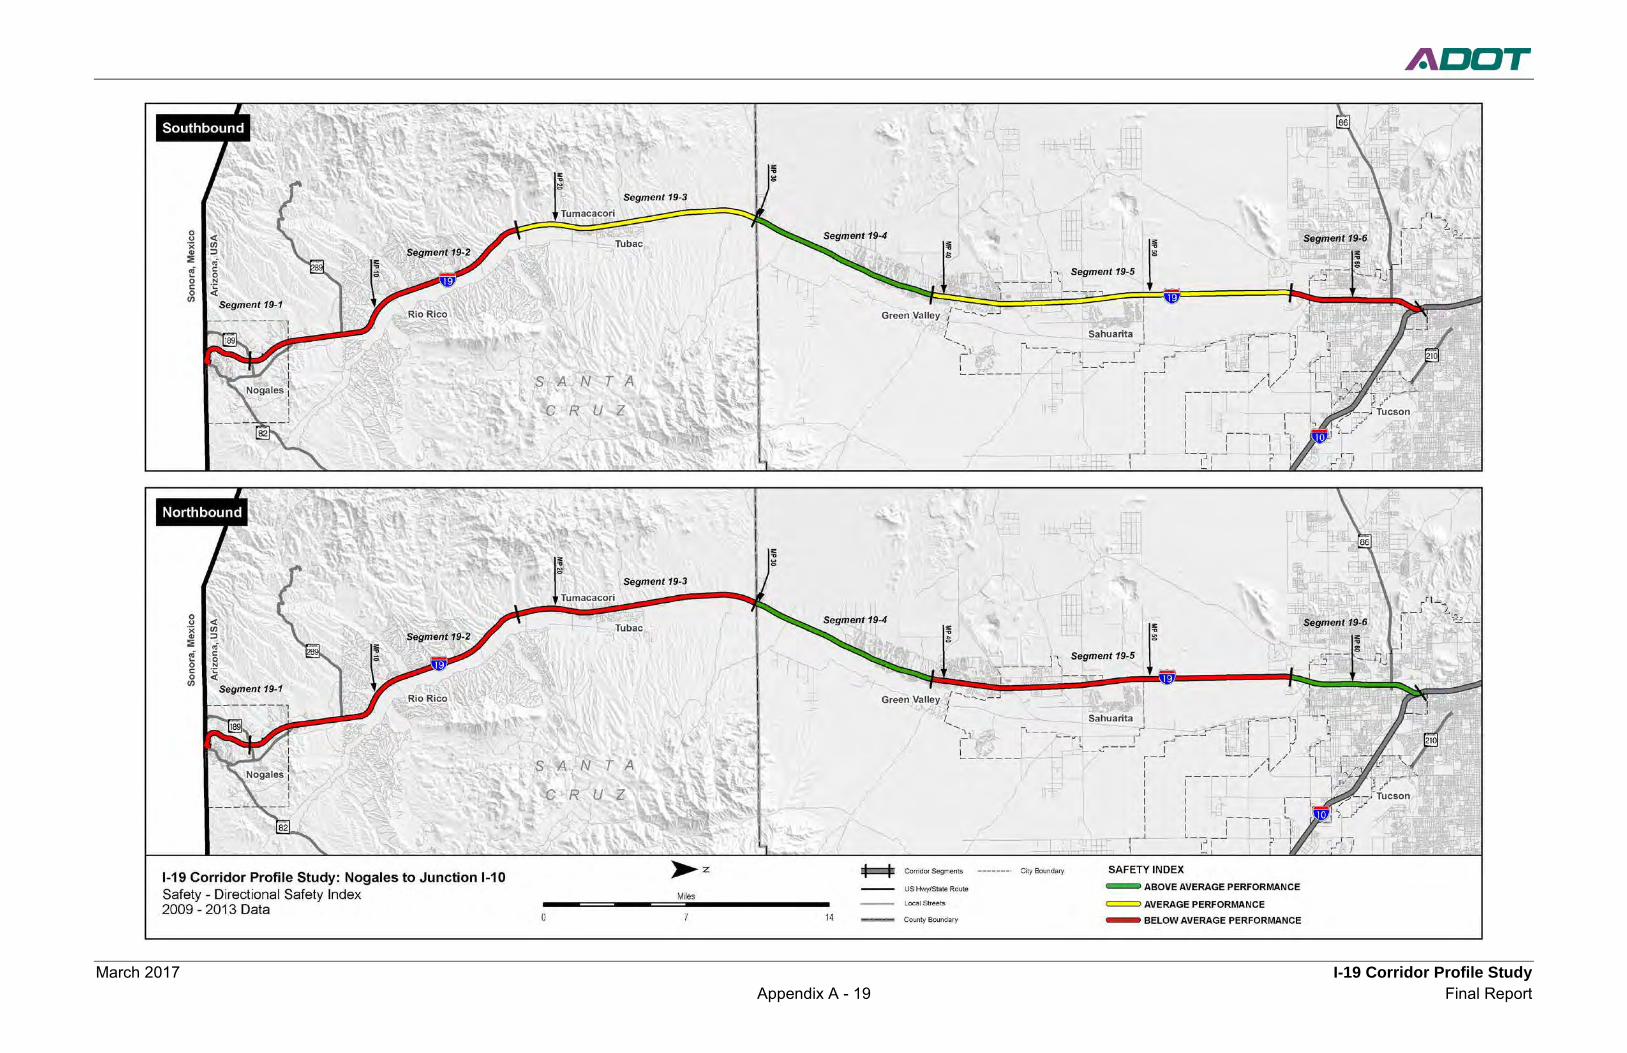
March 2017 I-19 Corridor Profile Study Appendix A - 19 Final Report
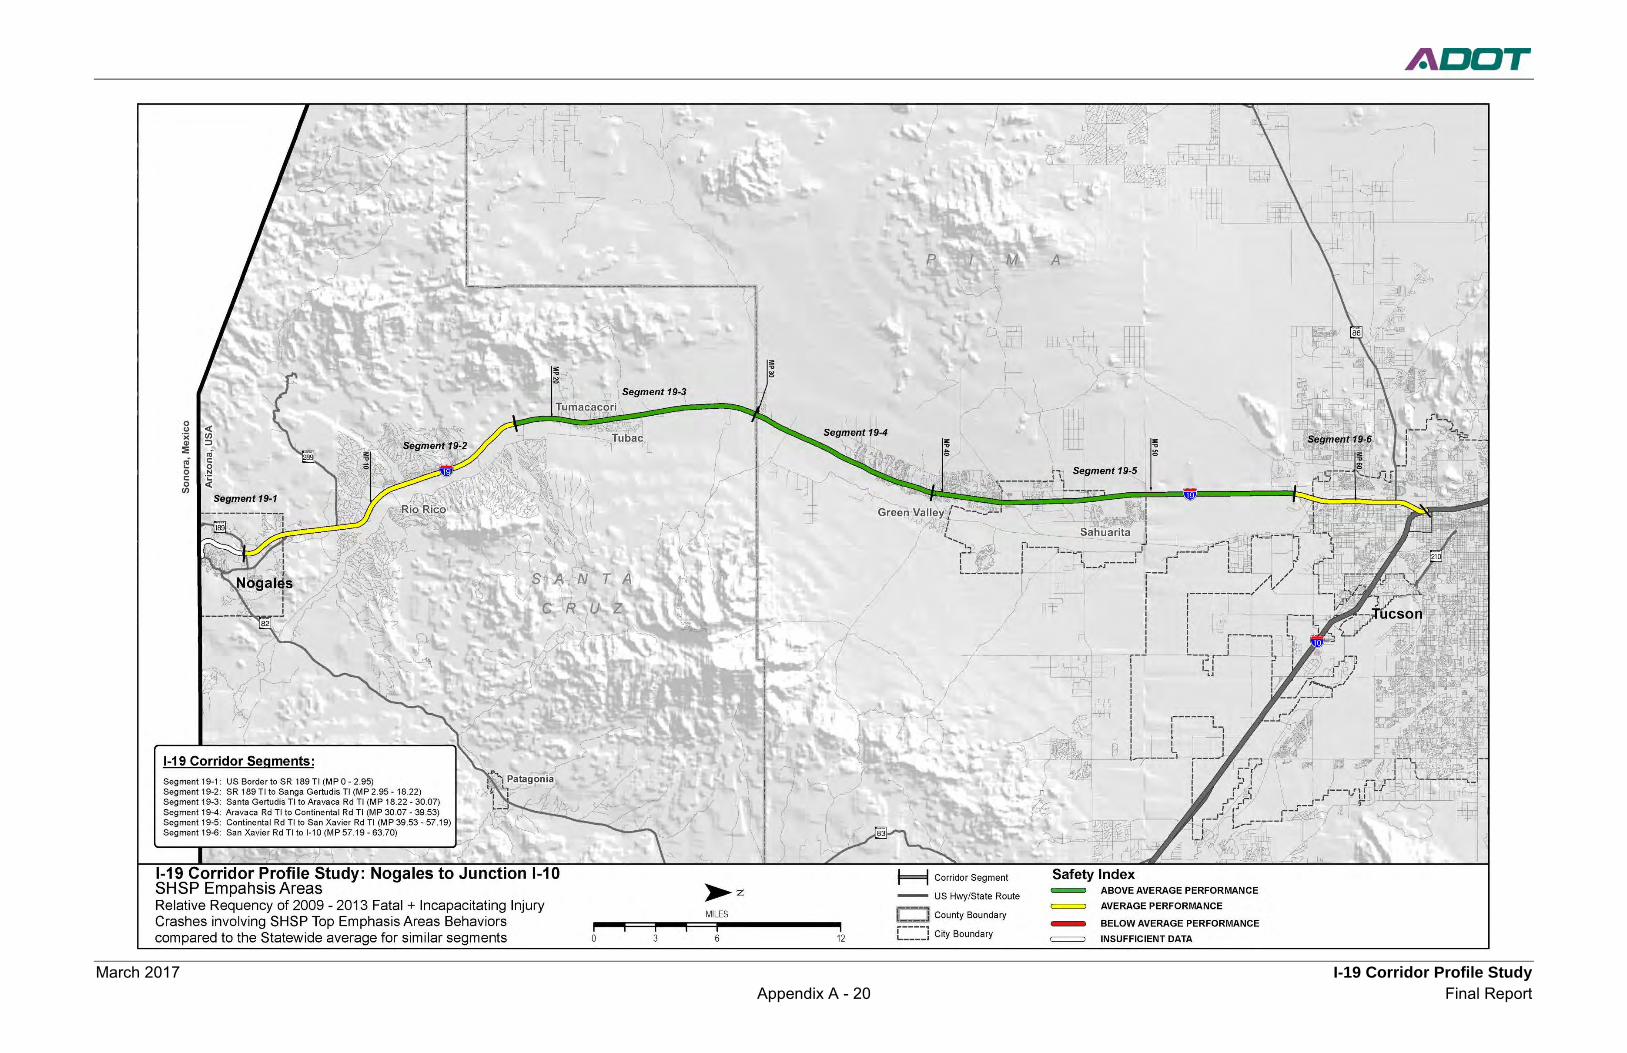
March 2017 I-19 Corridor Profile Study Appendix A - 20 Final Report
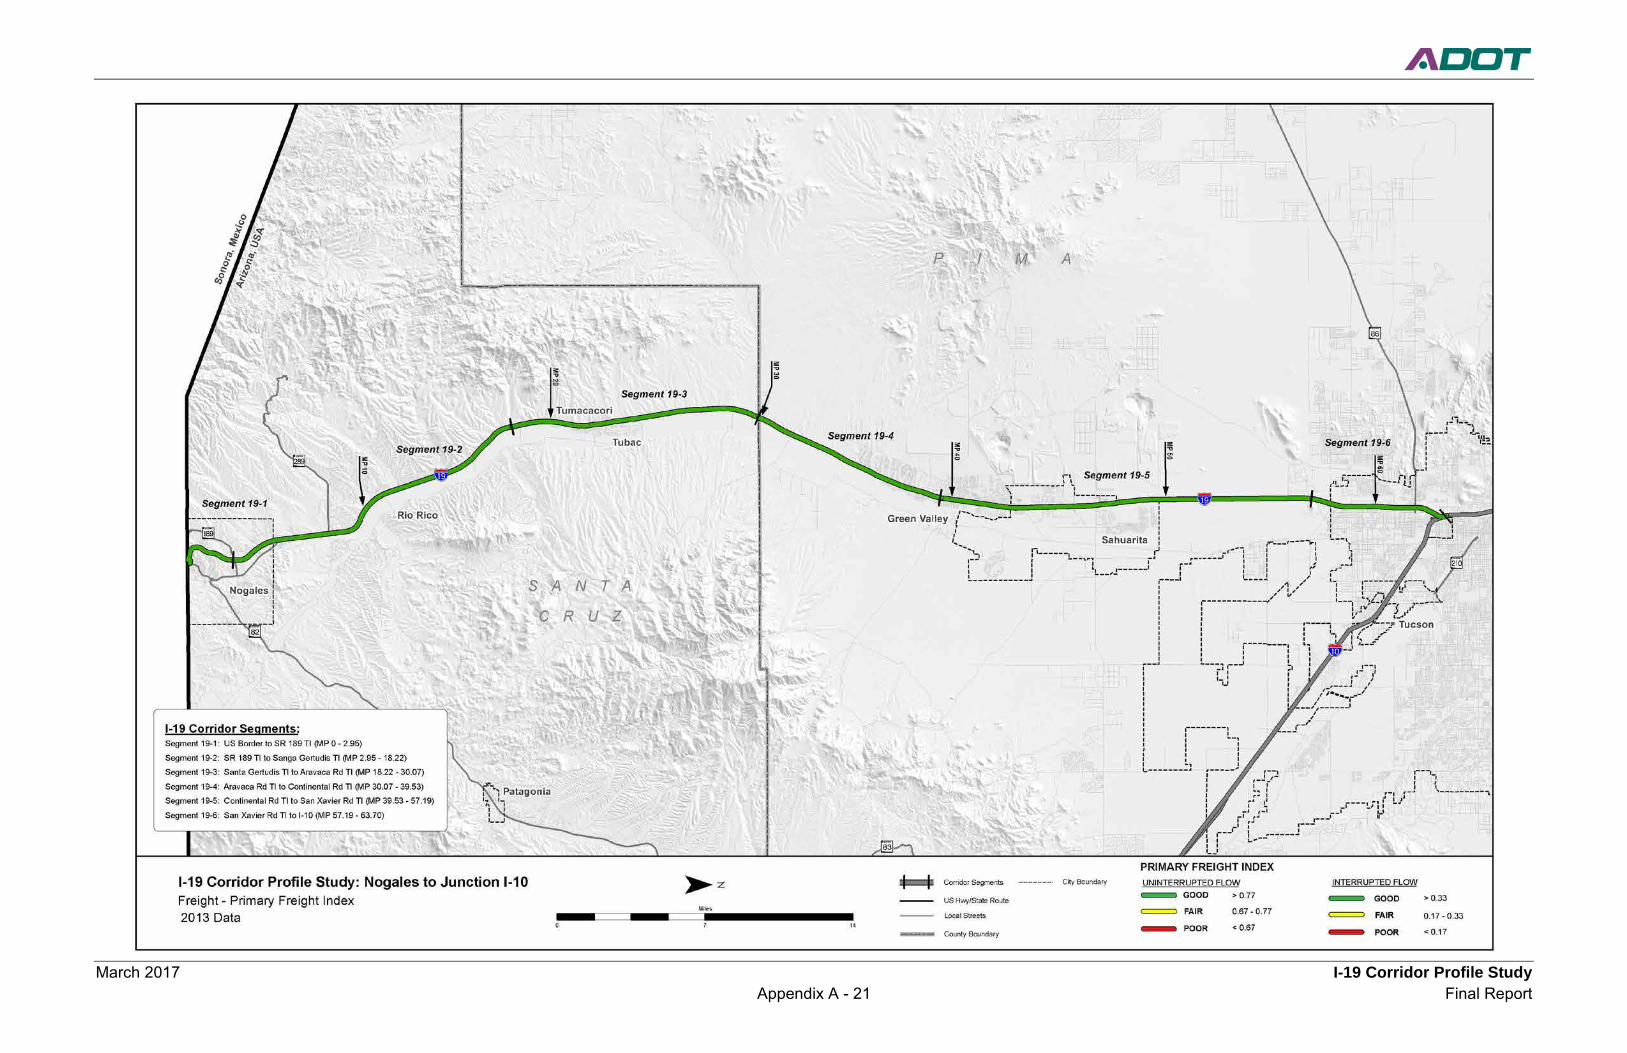
March 2017 I-19 Corridor Profile Study Appendix A - 21 Final Report
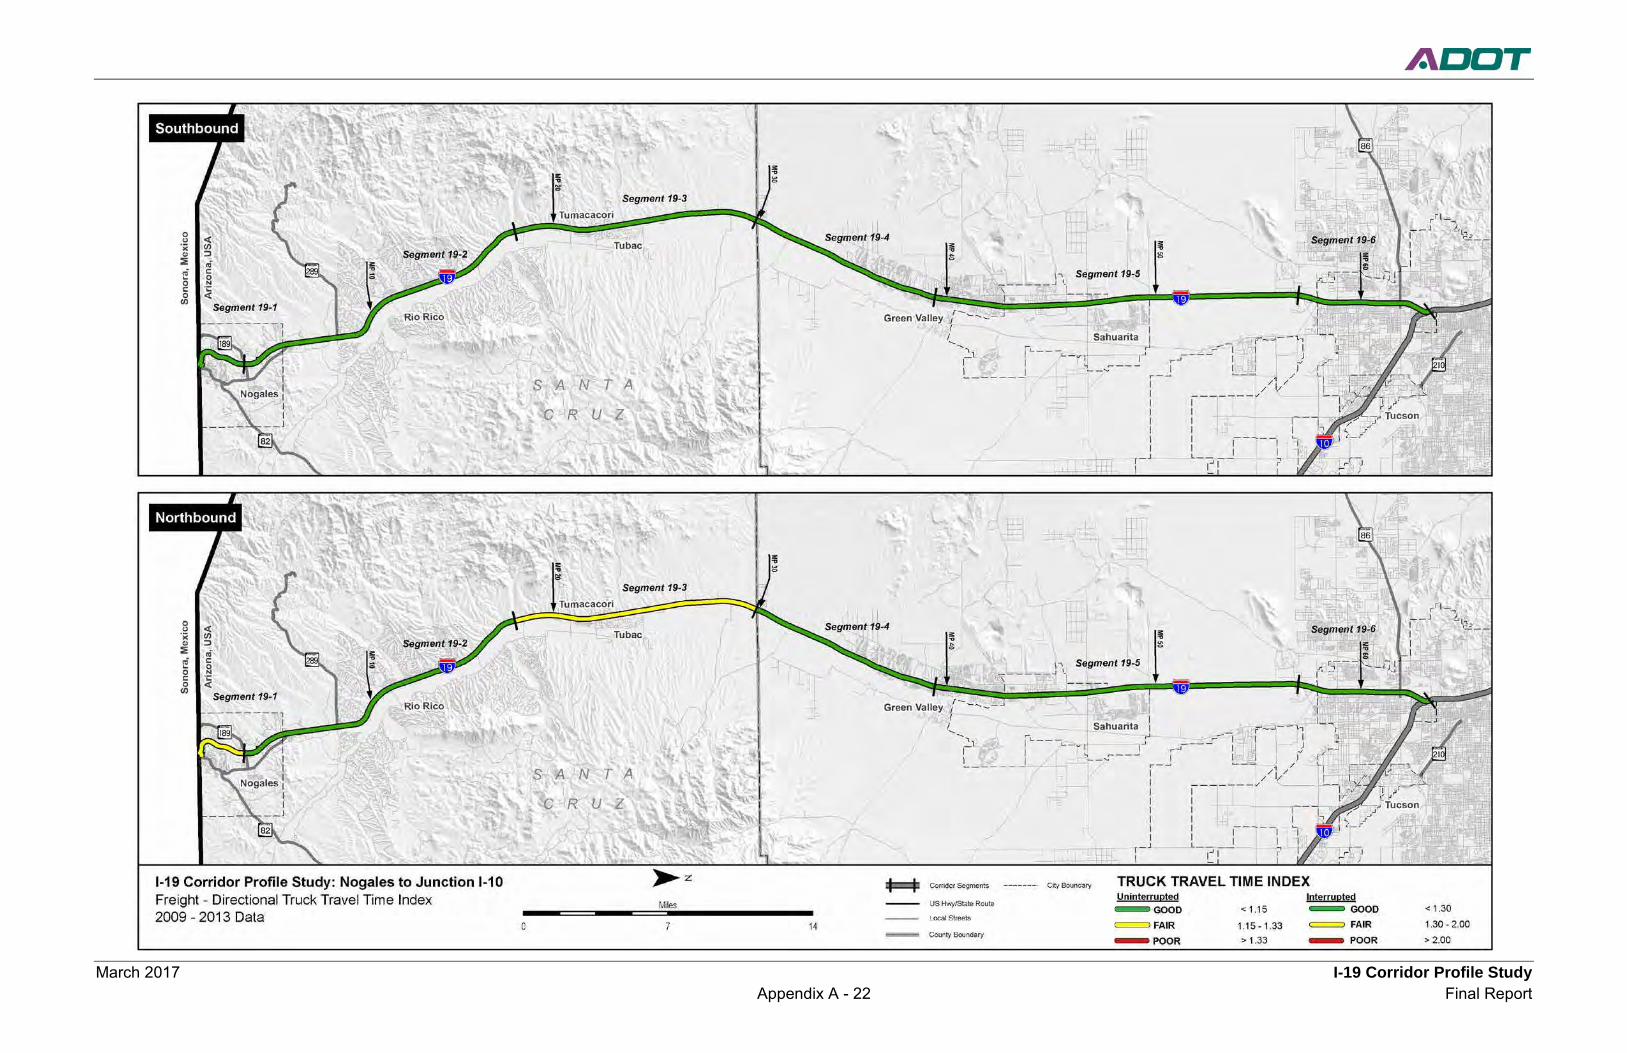
March 2017 I-19 Corridor Profile Study Appendix A - 22 Final Report
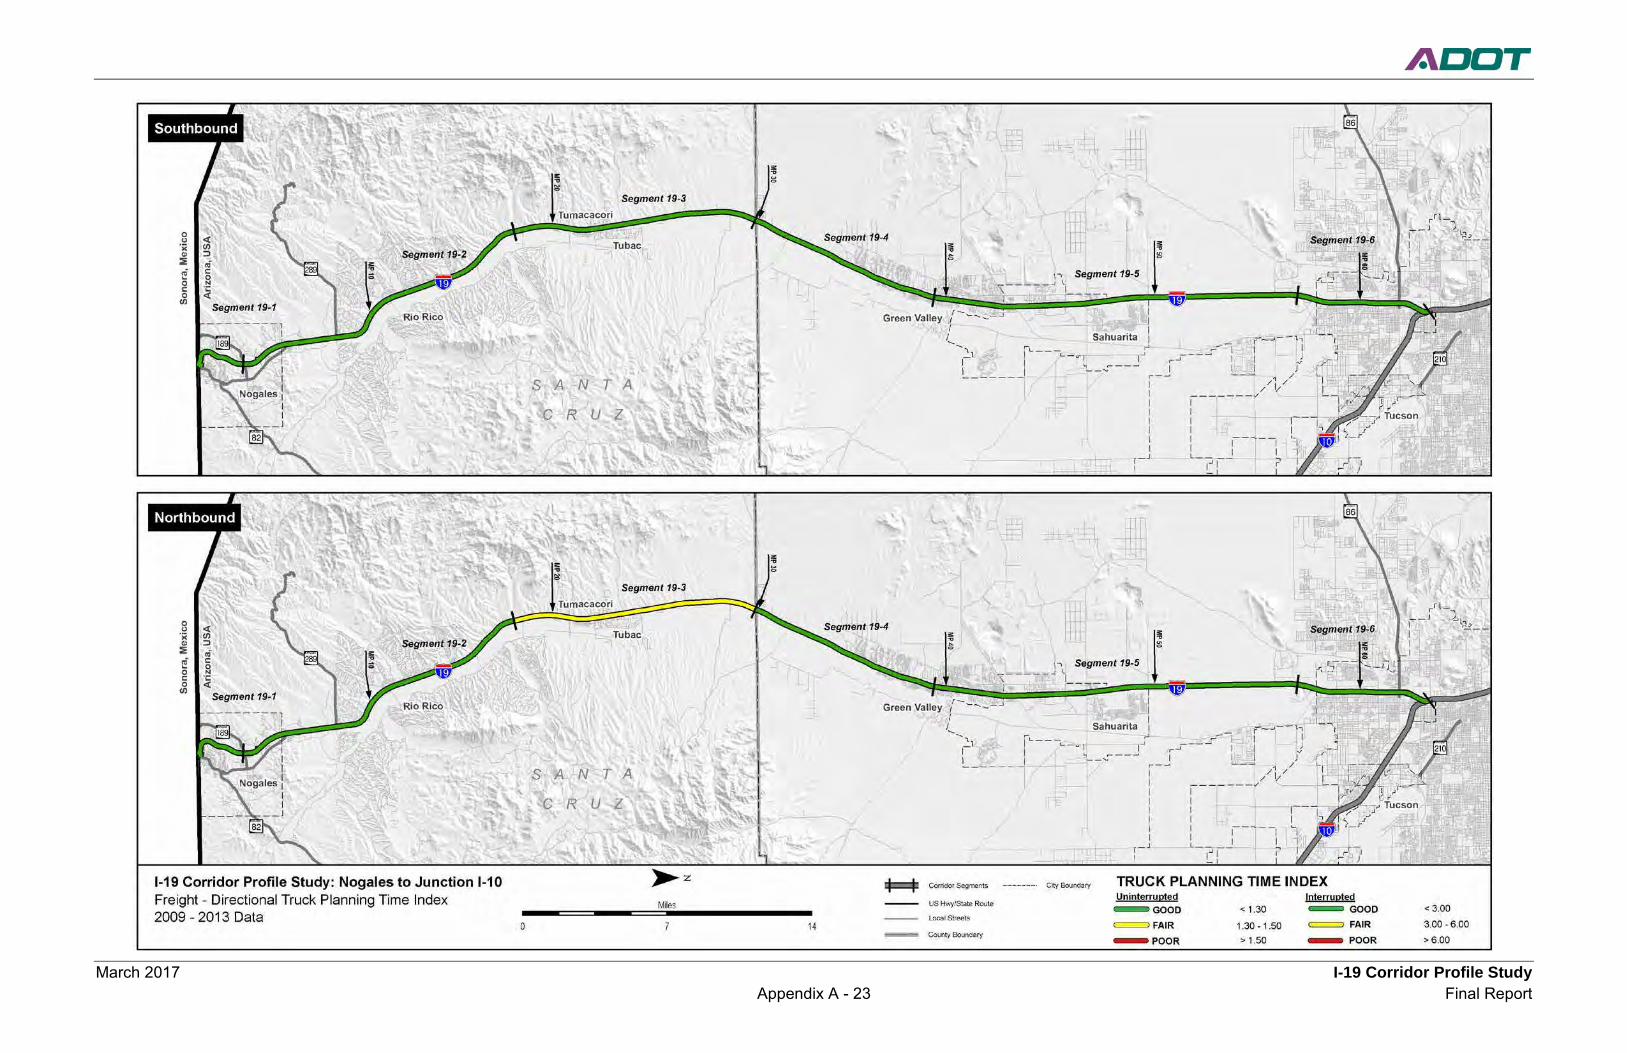
March 2017 I-19 Corridor Profile Study Appendix A - 23 Final Report
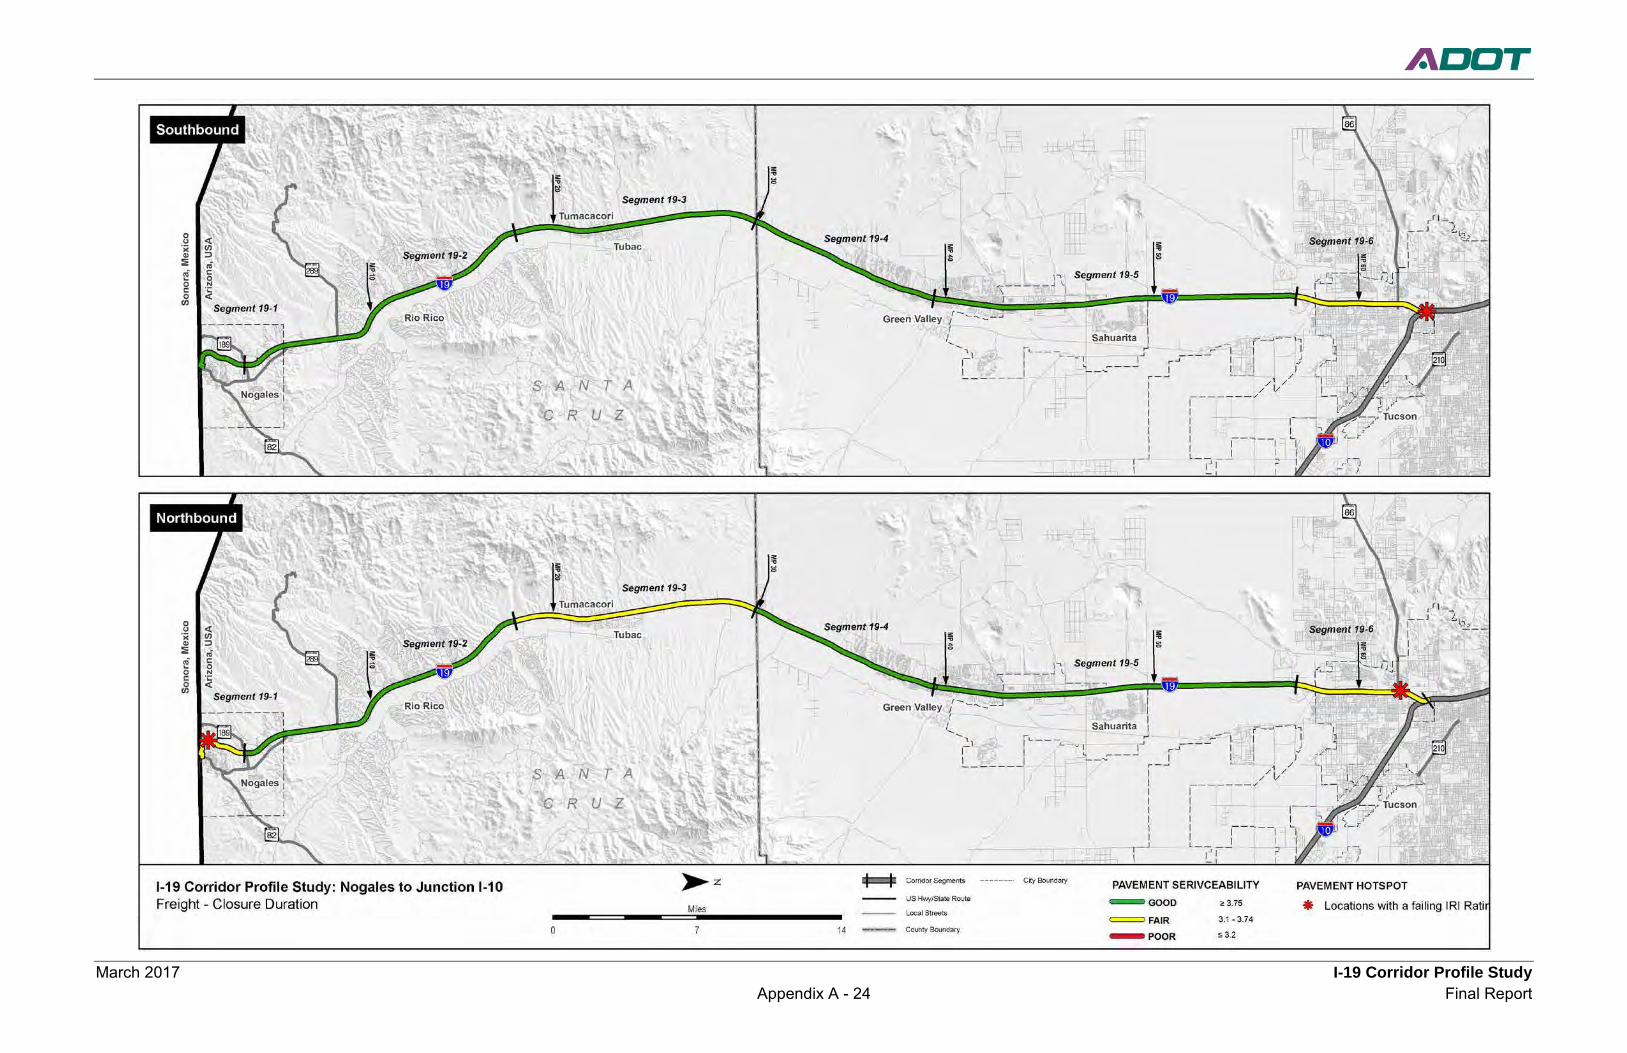
March 2017 I-19 Corridor Profile Study Appendix A - 24 Final Report

March 2017 I-19 Corridor Profile Study Appendix A - 25 Final Report

March 2017 I-19 Corridor Profile Study Appendix B - 1 Final Report
Appendix B: Performance Area Detailed Calculation Methodologies
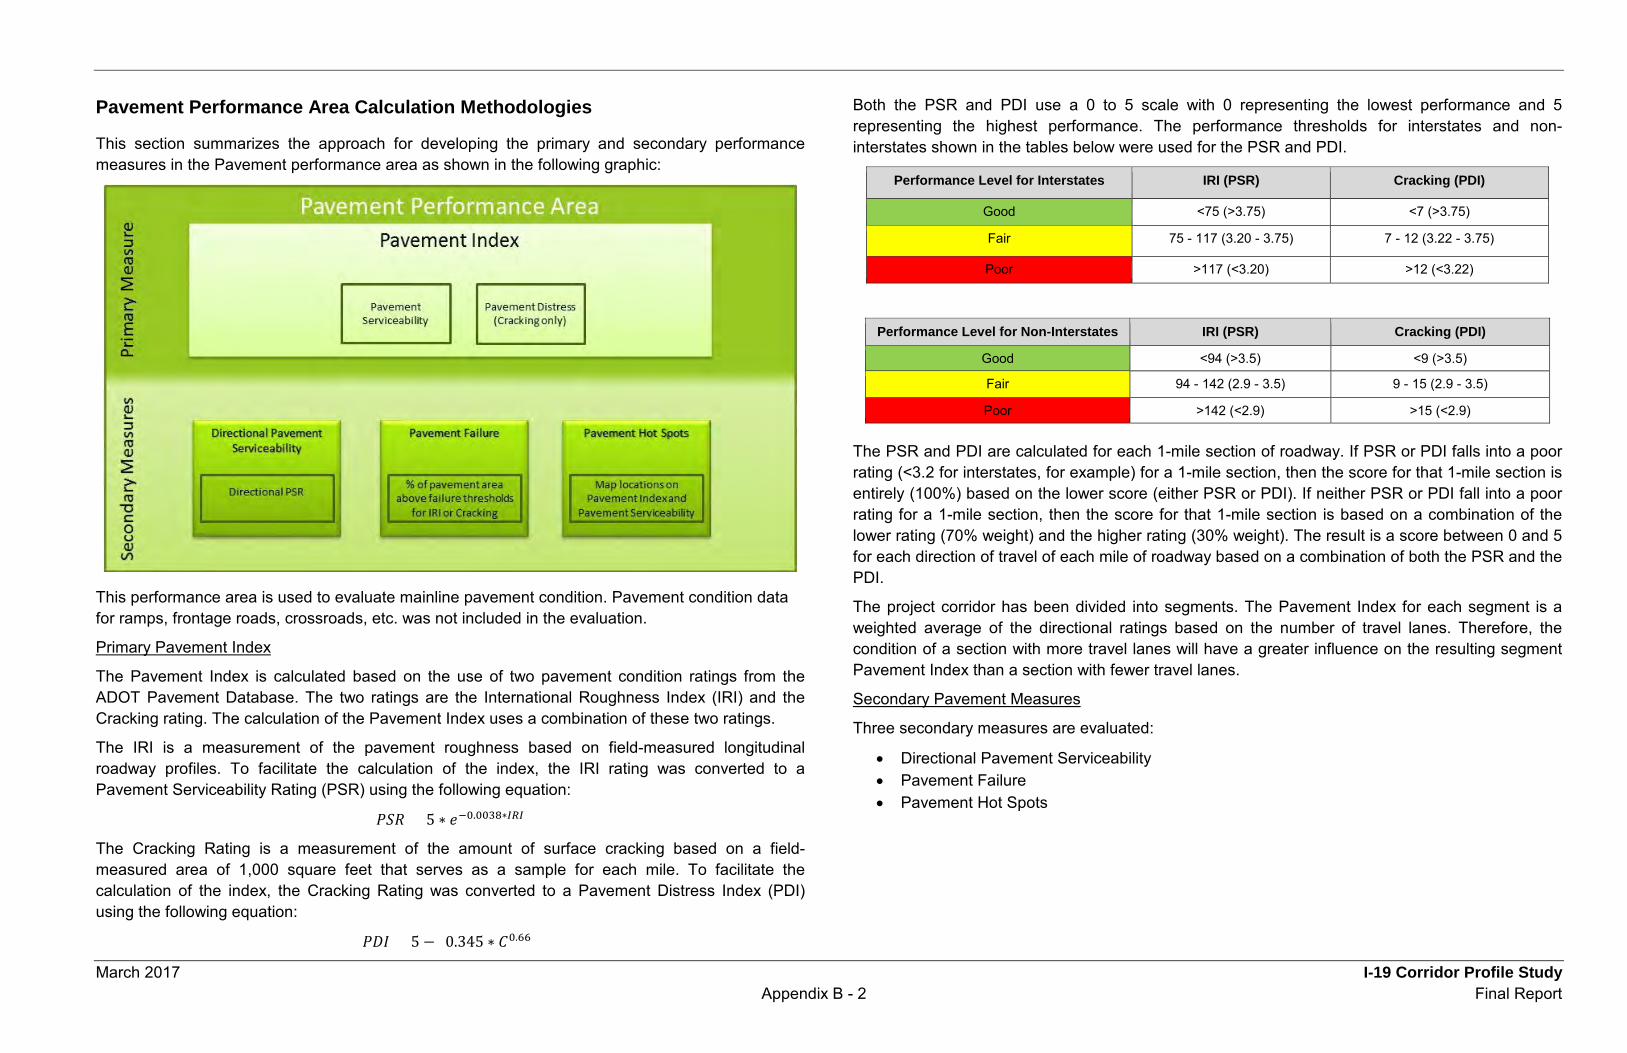
March 2017 I-19 Corridor Profile Study Appendix B - 2 Final Report
Pavement Performance Area Calculation Methodologies
This section summarizes the approach for developing the primary and secondary performance measures in the Pavement performance area as shown in the following graphic:
This performance area is used to evaluate mainline pavement condition. Pavement condition data for ramps, frontage roads, crossroads, etc. was not included in the evaluation.
Primary Pavement Index
The Pavement Index is calculated based on the use of two pavement condition ratings from the ADOT Pavement Database. The two ratings are the International Roughness Index (IRI) and the Cracking rating. The calculation of the Pavement Index uses a combination of these two ratings.
The IRI is a measurement of the pavement roughness based on field-measured longitudinal roadway profiles. To facilitate the calculation of the index, the IRI rating was converted to a Pavement Serviceability Rating (PSR) using the following equation:
𝑃𝑃𝑃𝑃𝑃𝑃 = 5 ∗ 𝑒𝑒−0.0038∗𝐼𝐼𝐼𝐼𝐼𝐼
The Cracking Rating is a measurement of the amount of surface cracking based on a field-measured area of 1,000 square feet that serves as a sample for each mile. To facilitate the calculation of the index, the Cracking Rating was converted to a Pavement Distress Index (PDI) using the following equation:
𝑃𝑃𝑃𝑃𝑃𝑃 = 5 − (0.345 ∗ 𝐶𝐶0.66)
Both the PSR and PDI use a 0 to 5 scale with 0 representing the lowest performance and 5 representing the highest performance. The performance thresholds for interstates and non-interstates shown in the tables below were used for the PSR and PDI.
Performance Level for Interstates IRI (PSR) Cracking (PDI)
Good <75 (>3.75) <7 (>3.75)
Fair 75 - 117 (3.20 - 3.75) 7 - 12 (3.22 - 3.75)
Poor >117 (<3.20) >12 (<3.22)
Performance Level for Non-Interstates IRI (PSR) Cracking (PDI)
Good <94 (>3.5) <9 (>3.5)
Fair 94 - 142 (2.9 - 3.5) 9 - 15 (2.9 - 3.5)
Poor >142 (<2.9) >15 (<2.9)
The PSR and PDI are calculated for each 1-mile section of roadway. If PSR or PDI falls into a poor rating (<3.2 for interstates, for example) for a 1-mile section, then the score for that 1-mile section is entirely (100%) based on the lower score (either PSR or PDI). If neither PSR or PDI fall into a poor rating for a 1-mile section, then the score for that 1-mile section is based on a combination of the lower rating (70% weight) and the higher rating (30% weight). The result is a score between 0 and 5 for each direction of travel of each mile of roadway based on a combination of both the PSR and the PDI.
The project corridor has been divided into segments. The Pavement Index for each segment is a weighted average of the directional ratings based on the number of travel lanes. Therefore, the condition of a section with more travel lanes will have a greater influence on the resulting segment Pavement Index than a section with fewer travel lanes.
Secondary Pavement Measures
Three secondary measures are evaluated:
• Directional Pavement Serviceability • Pavement Failure • Pavement Hot Spots
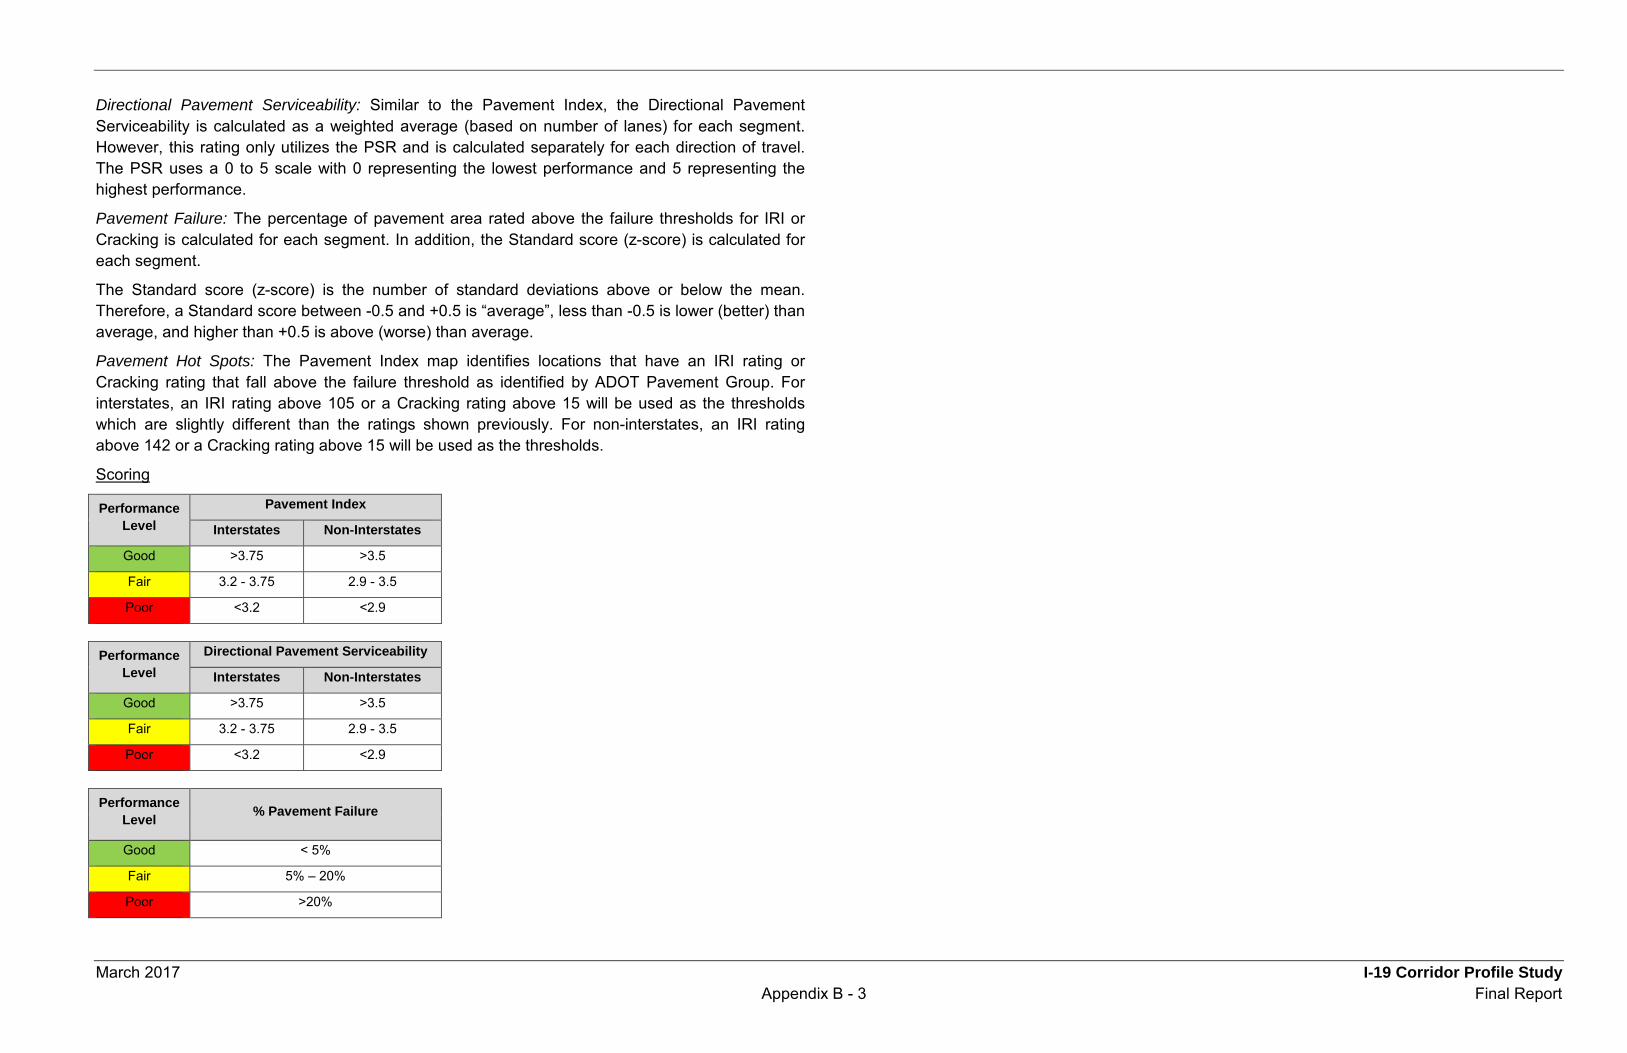
March 2017 I-19 Corridor Profile Study Appendix B - 3 Final Report
Directional Pavement Serviceability: Similar to the Pavement Index, the Directional Pavement Serviceability is calculated as a weighted average (based on number of lanes) for each segment. However, this rating only utilizes the PSR and is calculated separately for each direction of travel. The PSR uses a 0 to 5 scale with 0 representing the lowest performance and 5 representing the highest performance.
Pavement Failure: The percentage of pavement area rated above the failure thresholds for IRI or Cracking is calculated for each segment. In addition, the Standard score (z-score) is calculated for each segment.
The Standard score (z-score) is the number of standard deviations above or below the mean. Therefore, a Standard score between -0.5 and +0.5 is “average”, less than -0.5 is lower (better) than average, and higher than +0.5 is above (worse) than average.
Pavement Hot Spots: The Pavement Index map identifies locations that have an IRI rating or Cracking rating that fall above the failure threshold as identified by ADOT Pavement Group. For interstates, an IRI rating above 105 or a Cracking rating above 15 will be used as the thresholds which are slightly different than the ratings shown previously. For non-interstates, an IRI rating above 142 or a Cracking rating above 15 will be used as the thresholds.
Scoring
Performance Level
Pavement Index
Interstates Non-Interstates
Good >3.75 >3.5
Fair 3.2 - 3.75 2.9 - 3.5
Poor <3.2 <2.9
Performance
Level Directional Pavement Serviceability
Interstates Non-Interstates
Good >3.75 >3.5
Fair 3.2 - 3.75 2.9 - 3.5
Poor <3.2 <2.9
Performance
Level % Pavement Failure
Good < 5%
Fair 5% – 20%
Poor >20%
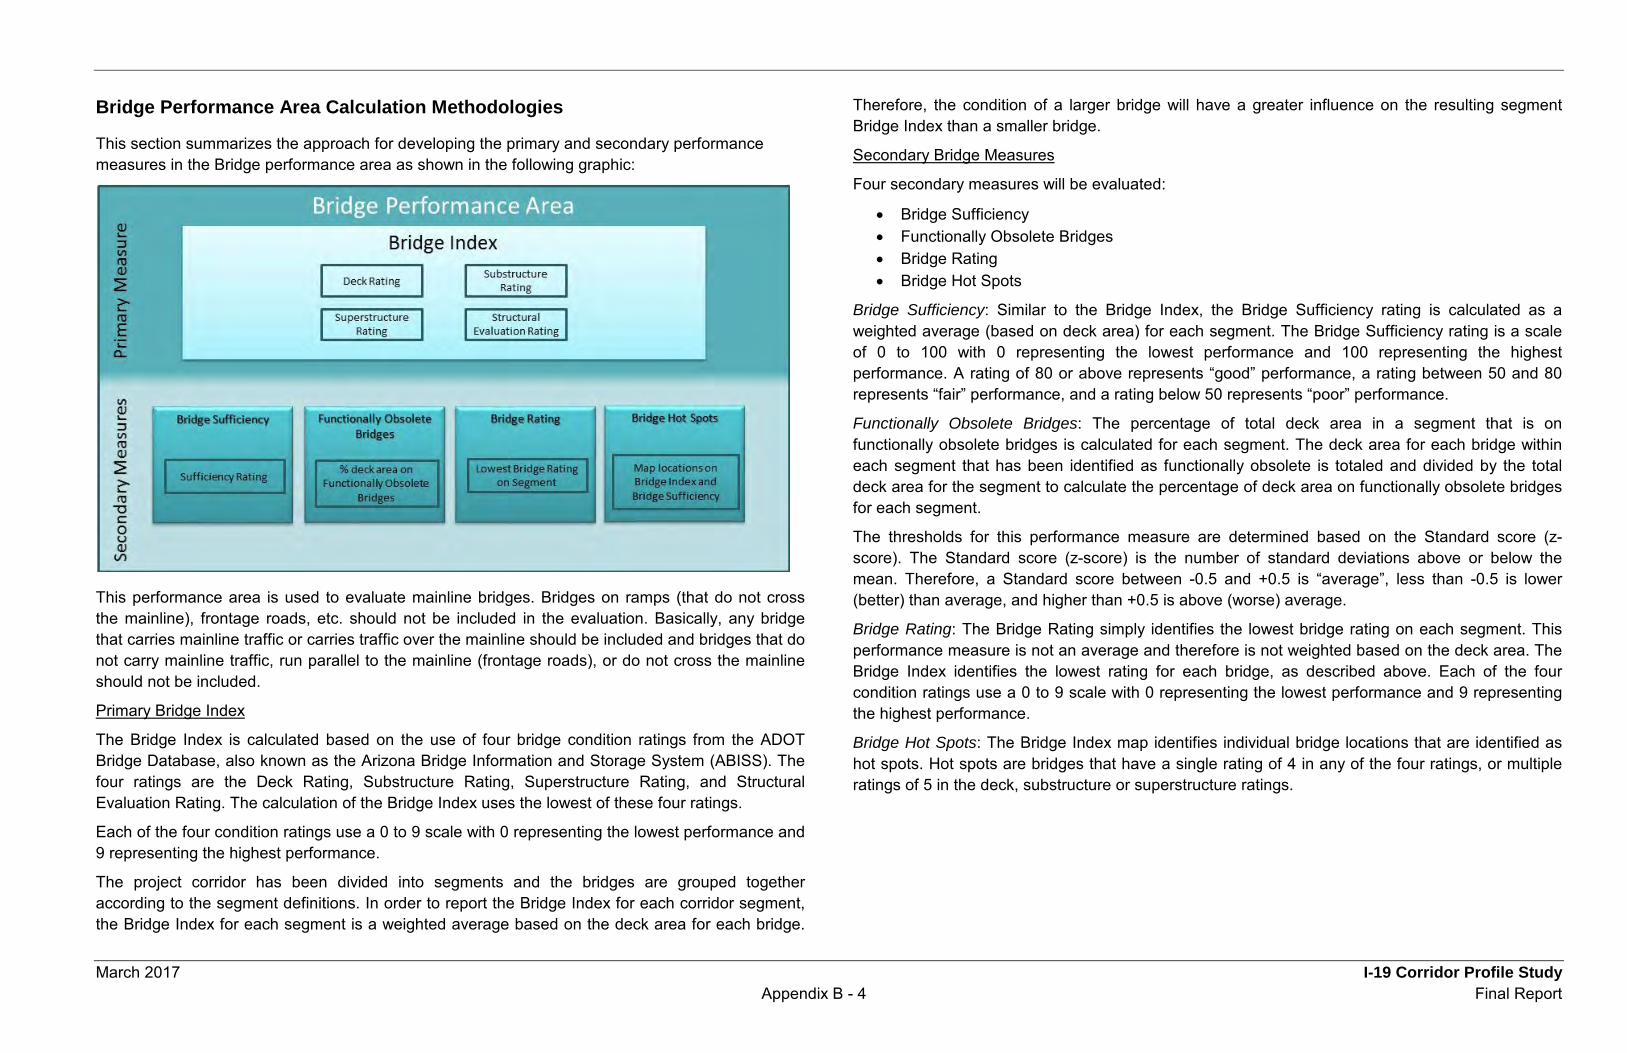
March 2017 I-19 Corridor Profile Study Appendix B - 4 Final Report
Bridge Performance Area Calculation Methodologies
This section summarizes the approach for developing the primary and secondary performance measures in the Bridge performance area as shown in the following graphic:
This performance area is used to evaluate mainline bridges. Bridges on ramps (that do not cross the mainline), frontage roads, etc. should not be included in the evaluation. Basically, any bridge that carries mainline traffic or carries traffic over the mainline should be included and bridges that do not carry mainline traffic, run parallel to the mainline (frontage roads), or do not cross the mainline should not be included.
Primary Bridge Index
The Bridge Index is calculated based on the use of four bridge condition ratings from the ADOT Bridge Database, also known as the Arizona Bridge Information and Storage System (ABISS). The four ratings are the Deck Rating, Substructure Rating, Superstructure Rating, and Structural Evaluation Rating. The calculation of the Bridge Index uses the lowest of these four ratings.
Each of the four condition ratings use a 0 to 9 scale with 0 representing the lowest performance and 9 representing the highest performance.
The project corridor has been divided into segments and the bridges are grouped together according to the segment definitions. In order to report the Bridge Index for each corridor segment, the Bridge Index for each segment is a weighted average based on the deck area for each bridge.
Therefore, the condition of a larger bridge will have a greater influence on the resulting segment Bridge Index than a smaller bridge.
Secondary Bridge Measures
Four secondary measures will be evaluated:
• Bridge Sufficiency • Functionally Obsolete Bridges • Bridge Rating • Bridge Hot Spots
Bridge Sufficiency: Similar to the Bridge Index, the Bridge Sufficiency rating is calculated as a weighted average (based on deck area) for each segment. The Bridge Sufficiency rating is a scale of 0 to 100 with 0 representing the lowest performance and 100 representing the highest performance. A rating of 80 or above represents “good” performance, a rating between 50 and 80 represents “fair” performance, and a rating below 50 represents “poor” performance.
Functionally Obsolete Bridges: The percentage of total deck area in a segment that is on functionally obsolete bridges is calculated for each segment. The deck area for each bridge within each segment that has been identified as functionally obsolete is totaled and divided by the total deck area for the segment to calculate the percentage of deck area on functionally obsolete bridges for each segment.
The thresholds for this performance measure are determined based on the Standard score (z-score). The Standard score (z-score) is the number of standard deviations above or below the mean. Therefore, a Standard score between -0.5 and +0.5 is “average”, less than -0.5 is lower (better) than average, and higher than +0.5 is above (worse) average.
Bridge Rating: The Bridge Rating simply identifies the lowest bridge rating on each segment. This performance measure is not an average and therefore is not weighted based on the deck area. The Bridge Index identifies the lowest rating for each bridge, as described above. Each of the four condition ratings use a 0 to 9 scale with 0 representing the lowest performance and 9 representing the highest performance.
Bridge Hot Spots: The Bridge Index map identifies individual bridge locations that are identified as hot spots. Hot spots are bridges that have a single rating of 4 in any of the four ratings, or multiple ratings of 5 in the deck, substructure or superstructure ratings.
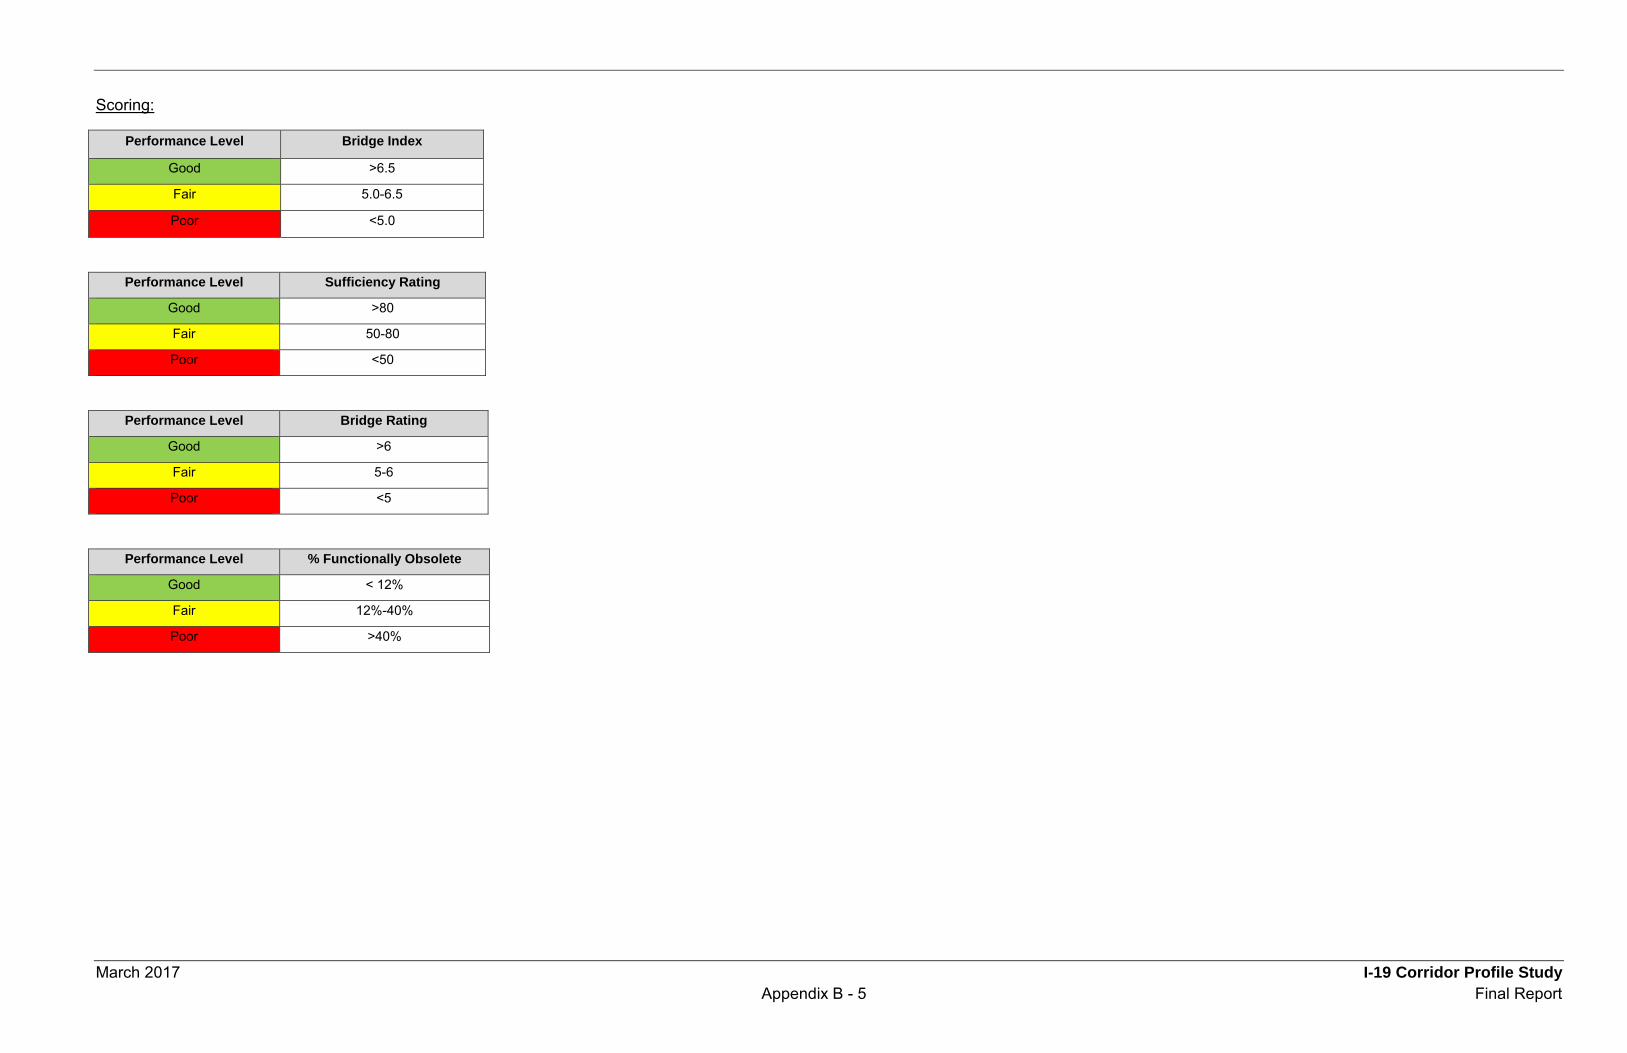
March 2017 I-19 Corridor Profile Study Appendix B - 5 Final Report
Scoring:
Performance Level Bridge Index
Good >6.5
Fair 5.0-6.5
Poor <5.0
Performance Level Sufficiency Rating
Good >80
Fair 50-80
Poor <50
Performance Level Bridge Rating Good >6
Fair 5-6
Poor <5
Performance Level % Functionally Obsolete
Good < 12%
Fair 12%-40%
Poor >40%
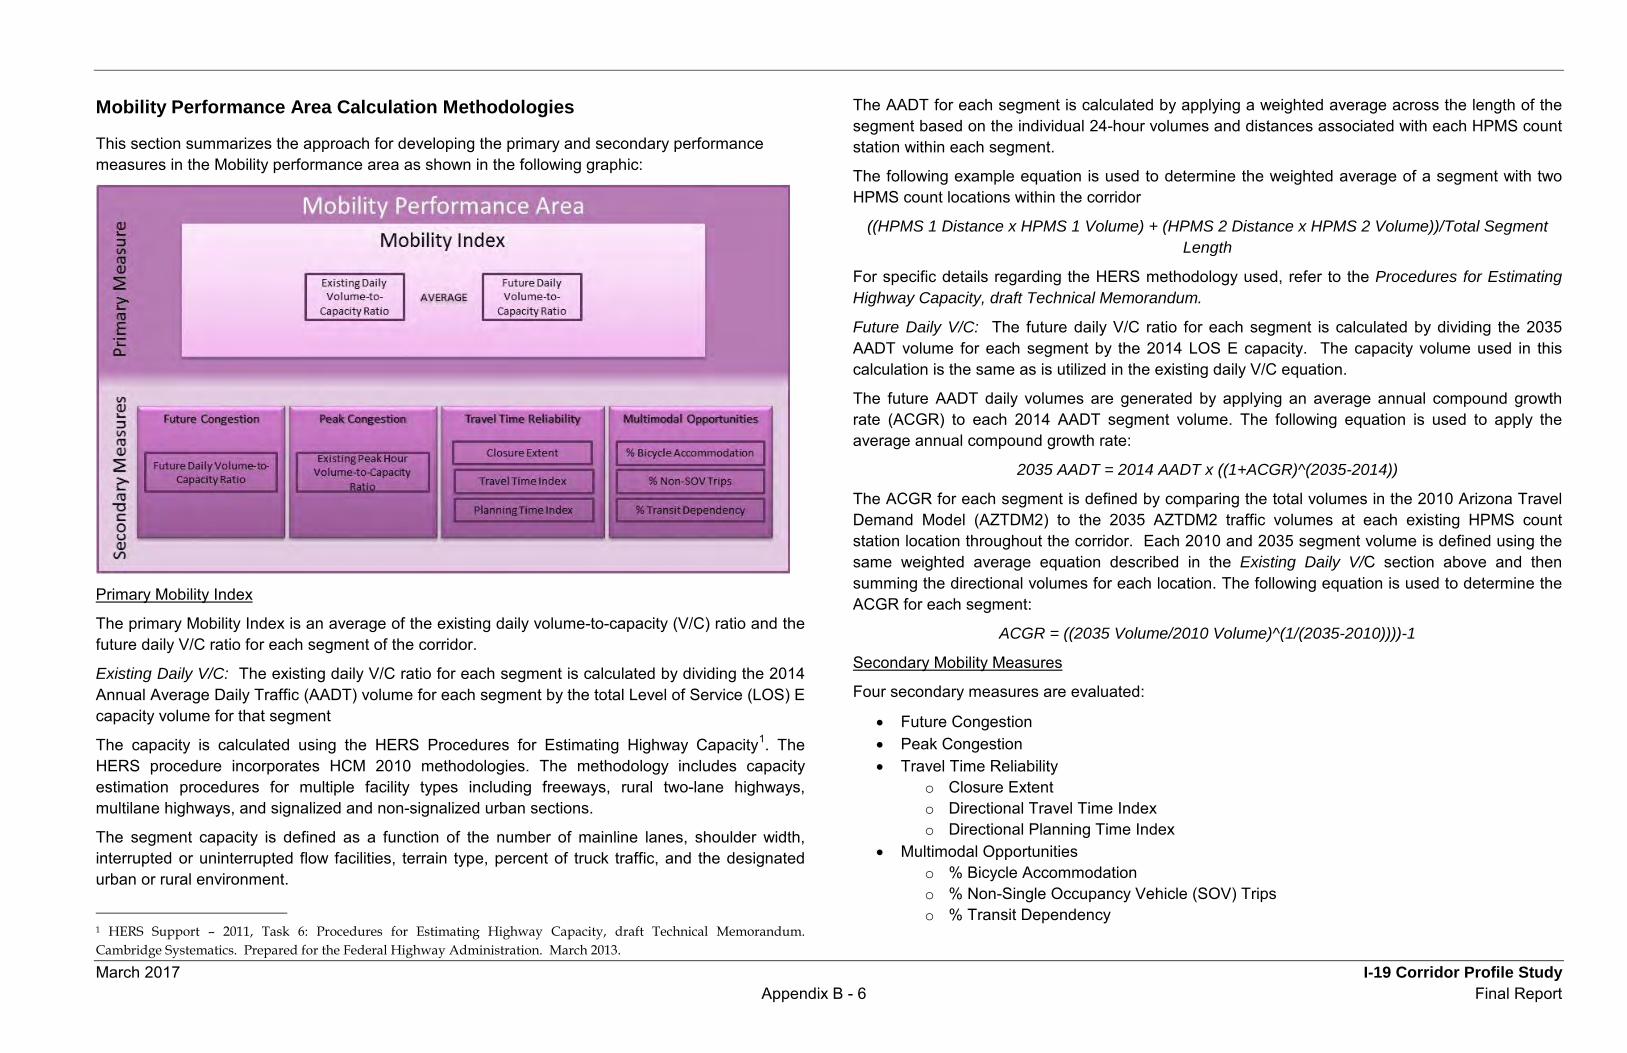
March 2017 I-19 Corridor Profile Study Appendix B - 6 Final Report
Mobility Performance Area Calculation Methodologies
This section summarizes the approach for developing the primary and secondary performance measures in the Mobility performance area as shown in the following graphic:
Primary Mobility Index
The primary Mobility Index is an average of the existing daily volume-to-capacity (V/C) ratio and the future daily V/C ratio for each segment of the corridor.
Existing Daily V/C: The existing daily V/C ratio for each segment is calculated by dividing the 2014 Annual Average Daily Traffic (AADT) volume for each segment by the total Level of Service (LOS) E capacity volume for that segment
The capacity is calculated using the HERS Procedures for Estimating Highway Capacity1. The HERS procedure incorporates HCM 2010 methodologies. The methodology includes capacity estimation procedures for multiple facility types including freeways, rural two-lane highways, multilane highways, and signalized and non-signalized urban sections.
The segment capacity is defined as a function of the number of mainline lanes, shoulder width, interrupted or uninterrupted flow facilities, terrain type, percent of truck traffic, and the designated urban or rural environment.
1 HERS Support – 2011, Task 6: Procedures for Estimating Highway Capacity, draft Technical Memorandum. Cambridge Systematics. Prepared for the Federal Highway Administration. March 2013.
The AADT for each segment is calculated by applying a weighted average across the length of the segment based on the individual 24-hour volumes and distances associated with each HPMS count station within each segment.
The following example equation is used to determine the weighted average of a segment with two HPMS count locations within the corridor
((HPMS 1 Distance x HPMS 1 Volume) + (HPMS 2 Distance x HPMS 2 Volume))/Total Segment Length
For specific details regarding the HERS methodology used, refer to the Procedures for Estimating Highway Capacity, draft Technical Memorandum.
Future Daily V/C: The future daily V/C ratio for each segment is calculated by dividing the 2035 AADT volume for each segment by the 2014 LOS E capacity. The capacity volume used in this calculation is the same as is utilized in the existing daily V/C equation.
The future AADT daily volumes are generated by applying an average annual compound growth rate (ACGR) to each 2014 AADT segment volume. The following equation is used to apply the average annual compound growth rate:
2035 AADT = 2014 AADT x ((1+ACGR)^(2035-2014))
The ACGR for each segment is defined by comparing the total volumes in the 2010 Arizona Travel Demand Model (AZTDM2) to the 2035 AZTDM2 traffic volumes at each existing HPMS count station location throughout the corridor. Each 2010 and 2035 segment volume is defined using the same weighted average equation described in the Existing Daily V/C section above and then summing the directional volumes for each location. The following equation is used to determine the ACGR for each segment:
ACGR = ((2035 Volume/2010 Volume)^(1/(2035-2010))))-1
Secondary Mobility Measures
Four secondary measures are evaluated:
• Future Congestion • Peak Congestion • Travel Time Reliability
o Closure Extent o Directional Travel Time Index o Directional Planning Time Index
• Multimodal Opportunities o % Bicycle Accommodation o % Non-Single Occupancy Vehicle (SOV) Trips o % Transit Dependency

March 2017 I-19 Corridor Profile Study Appendix B - 7 Final Report
Future Congestion: The future daily V/C ratios for each segment in the corridor that are calculated and used in the Mobility Index as part of the overall average between Existing Daily V/C and Future Daily V/C are applied independently as a secondary measure. The methods to calculate the Future Daily V/C can be referenced in the Mobility Index section.
Peak Congestion: Peak Congestion has been defined as the peak hour V/C ratio in both directions of the corridor. The peak hour V/C ratio is calculated using the HERS method as described previously. The peak hour volume utilizes the directional AADT for each segment, which is calculated by applying a weighted average across the length of the segment based on the individual directional 24-hour volumes and distances associated with each HPMS count station within each segment. The segment capacity is defined based on the characteristics of each segment including number of lanes, terrain type, and environment, similar to the 24-hour volumes using the HERS method.
Travel Time Reliability: Travel time reliability is a secondary measure that includes three indicators. The three indicators are the number of times a piece of a corridor is closed for any specific reason, the directional Travel Time Index (TTI), and the directional Planning Time Index (PTI).
Closure Extent: The number of times a roadway is closed is documented through the HCRS dataset. Closure Extent is defined as the average number of times a particular milepost of the corridor is closed per year per mile in a specific direction of travel. The weighted average of each occurrence takes into account the distance over which a specific occurrence spans.
Thresholds that determine levels of good, fair, and poor are based on the average number of closures per mile per year within each of the identified statewide significant corridors by ADOT. The thresholds shown at the end of this section represent statewide averages across those corridors.
Directional Travel Time and Planning Time Index: In terms of overall mobility, the TTI is the relationship of the mean peak period travel time in a specific section of the corridor to the free-flow travel time in the same location. The PTI is the relationship of the 95th percentile highest travel time to the free-flow travel time (based on the posted speed limit) in a specific section of the corridor. The TTI and PTI can be converted into speed-based indices by recognizing that speed is equal to distance traveled divided by travel time. The inverse relationship between travel time and speed means that the 95th percentile highest travel time corresponds to the 5th percentile lowest speed.
Using HERE data provided by ADOT, four time periods for each data point were collected throughout the day (AM peak, mid-day, PM peak, and off-peak). Using the mean speeds and 5th percentile lowest mean speeds collected over 2014 for these time periods for each data location, four TTI and PTI calculations were made using the following formulas:
TTI = Posted Speed Limit/Mean Peak Hour Speed
PTI = Posted Speed Limit/5th Percentile Lowest Speed
The highest value of the four time periods calculation is defined as the TTI for that data point. The average TTI is calculated within each segment based on the number of data points collected. The
value of the average TTI across each entry is used as the TTI for each respective segment within the corridor.
Multimodal Opportunities: Three multimodal opportunity indicators reflect the characteristics of the corridor that promote alternate modes to a single occupancy vehicle (SOV) for trips along the corridor. The three indicators include the percent bicycle accommodation, non-SOV trips, and transit dependency along the corridor.
Percent Bicycle Accommodation: For this secondary performance evaluation, outside shoulder widths are evaluated considering the roadway’s context and conditions. This requires use of the roadway data that includes right shoulder widths, shoulder surface types, and speed limits, all of which are available in the following ADOT geographic information system (GIS) data sets:
• Right Shoulder Widths • Left Shoulder Widths (for undivided roadways) • Shoulder Surface Type (Both Left/Right) • Speed Limit
Additionally, each segment’s average AADT, estimated earlier in the Mobility performance area methodology, is used for the criteria to determine if the existing shoulder width meets the effective width.
The criteria for screening if a shoulder segment meets the recommended width criteria are as followed:
(1) If AADT <= 1500 OR Speed Limit <= 25 miles per hour (mph): The segment’s general purpose lane can be shared with bicyclists (no effective shoulder width required)
(2) If AADT > 1500 AND Speed Limit between (25 - 50 mph) AND Pavement Surface is Paved: Effective shoulder width required is 4 feet or greater
(3) If AADT > 1500 AND Speed Limit >= 50 mph and Pavement Surface is Paved: Effective shoulder width required is 6 feet or greater
The summation of the length of the shoulder sections that meet the defined effective width criteria, based on criteria above, is divided by the segment’s total length to estimate the percent of the segment that accommodates bicycles as illustrated at the end of this section. If shoulder data is not available or appears erroneous, field measurements can substitute for the shoulder data.
Percent Non-SOV Trips: The percentage of non-SOV trips over distances less than 50 miles gives an indication of travel patterns along a section of the corridor that could benefit from additional multimodal options in the future.
Thresholds that determine levels of good, fair, and poor are based on the percent non-SOV trips within each of the identified statewide significant corridors by ADOT. The thresholds shown at the end of this section represent statewide averages across those corridors.
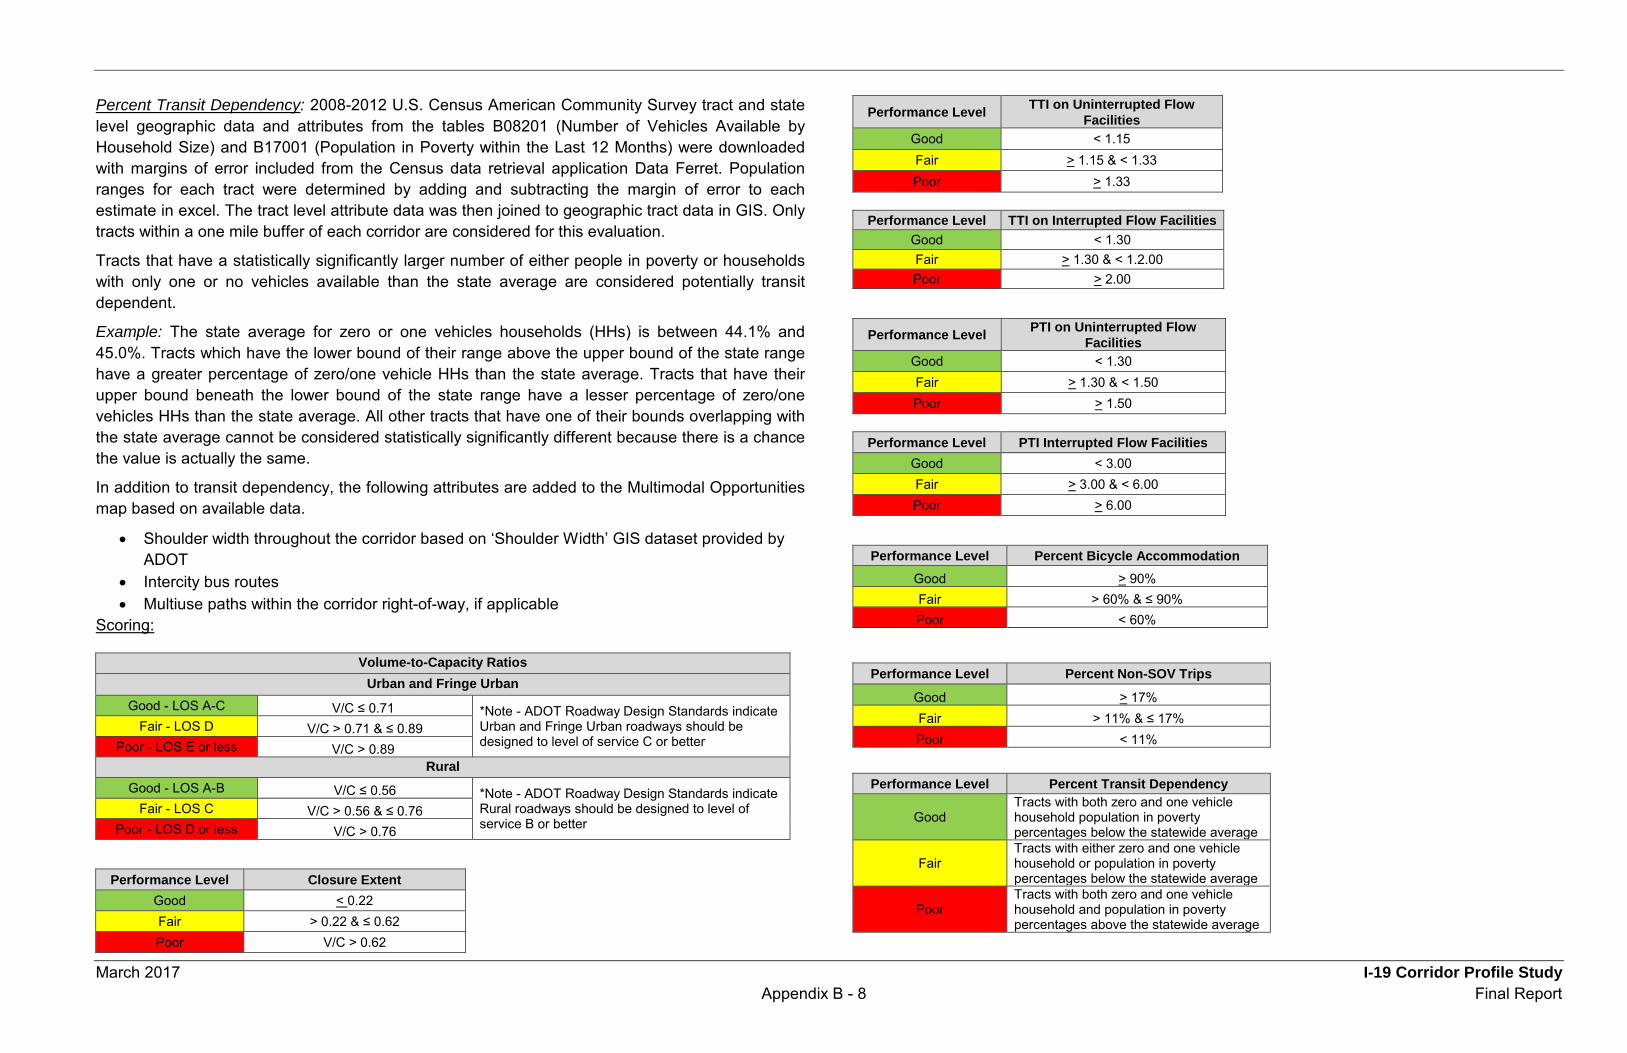
March 2017 I-19 Corridor Profile Study Appendix B - 8 Final Report
Percent Transit Dependency: 2008-2012 U.S. Census American Community Survey tract and state level geographic data and attributes from the tables B08201 (Number of Vehicles Available by Household Size) and B17001 (Population in Poverty within the Last 12 Months) were downloaded with margins of error included from the Census data retrieval application Data Ferret. Population ranges for each tract were determined by adding and subtracting the margin of error to each estimate in excel. The tract level attribute data was then joined to geographic tract data in GIS. Only tracts within a one mile buffer of each corridor are considered for this evaluation.
Tracts that have a statistically significantly larger number of either people in poverty or households with only one or no vehicles available than the state average are considered potentially transit dependent.
Example: The state average for zero or one vehicles households (HHs) is between 44.1% and 45.0%. Tracts which have the lower bound of their range above the upper bound of the state range have a greater percentage of zero/one vehicle HHs than the state average. Tracts that have their upper bound beneath the lower bound of the state range have a lesser percentage of zero/one vehicles HHs than the state average. All other tracts that have one of their bounds overlapping with the state average cannot be considered statistically significantly different because there is a chance the value is actually the same.
In addition to transit dependency, the following attributes are added to the Multimodal Opportunities map based on available data.
• Shoulder width throughout the corridor based on ‘Shoulder Width’ GIS dataset provided by ADOT
• Intercity bus routes • Multiuse paths within the corridor right-of-way, if applicable
Scoring:
Volume-to-Capacity Ratios Urban and Fringe Urban
Good - LOS A-C V/C ≤ 0.71 *Note - ADOT Roadway Design Standards indicate Urban and Fringe Urban roadways should be designed to level of service C or better
Fair - LOS D V/C > 0.71 & ≤ 0.89 Poor - LOS E or less V/C > 0.89
Rural Good - LOS A-B V/C ≤ 0.56 *Note - ADOT Roadway Design Standards indicate
Rural roadways should be designed to level of service B or better
Fair - LOS C V/C > 0.56 & ≤ 0.76 Poor - LOS D or less V/C > 0.76
Performance Level Closure Extent Good < 0.22 Fair > 0.22 & ≤ 0.62 Poor V/C > 0.62
Performance Level TTI on Uninterrupted Flow Facilities
Good < 1.15 Fair > 1.15 & < 1.33 Poor > 1.33
Performance Level TTI on Interrupted Flow Facilities
Good < 1.30 Fair > 1.30 & < 1.2.00 Poor > 2.00
Performance Level PTI on Uninterrupted Flow Facilities
Good < 1.30 Fair > 1.30 & < 1.50 Poor > 1.50
Performance Level PTI Interrupted Flow Facilities
Good < 3.00 Fair > 3.00 & < 6.00 Poor > 6.00
Performance Level Percent Bicycle Accommodation Good > 90% Fair > 60% & ≤ 90% Poor < 60%
Performance Level Percent Non-SOV Trips Good > 17% Fair > 11% & ≤ 17% Poor < 11%
Performance Level Percent Transit Dependency
Good Tracts with both zero and one vehicle household population in poverty percentages below the statewide average
Fair Tracts with either zero and one vehicle household or population in poverty percentages below the statewide average
Poor Tracts with both zero and one vehicle household and population in poverty percentages above the statewide average
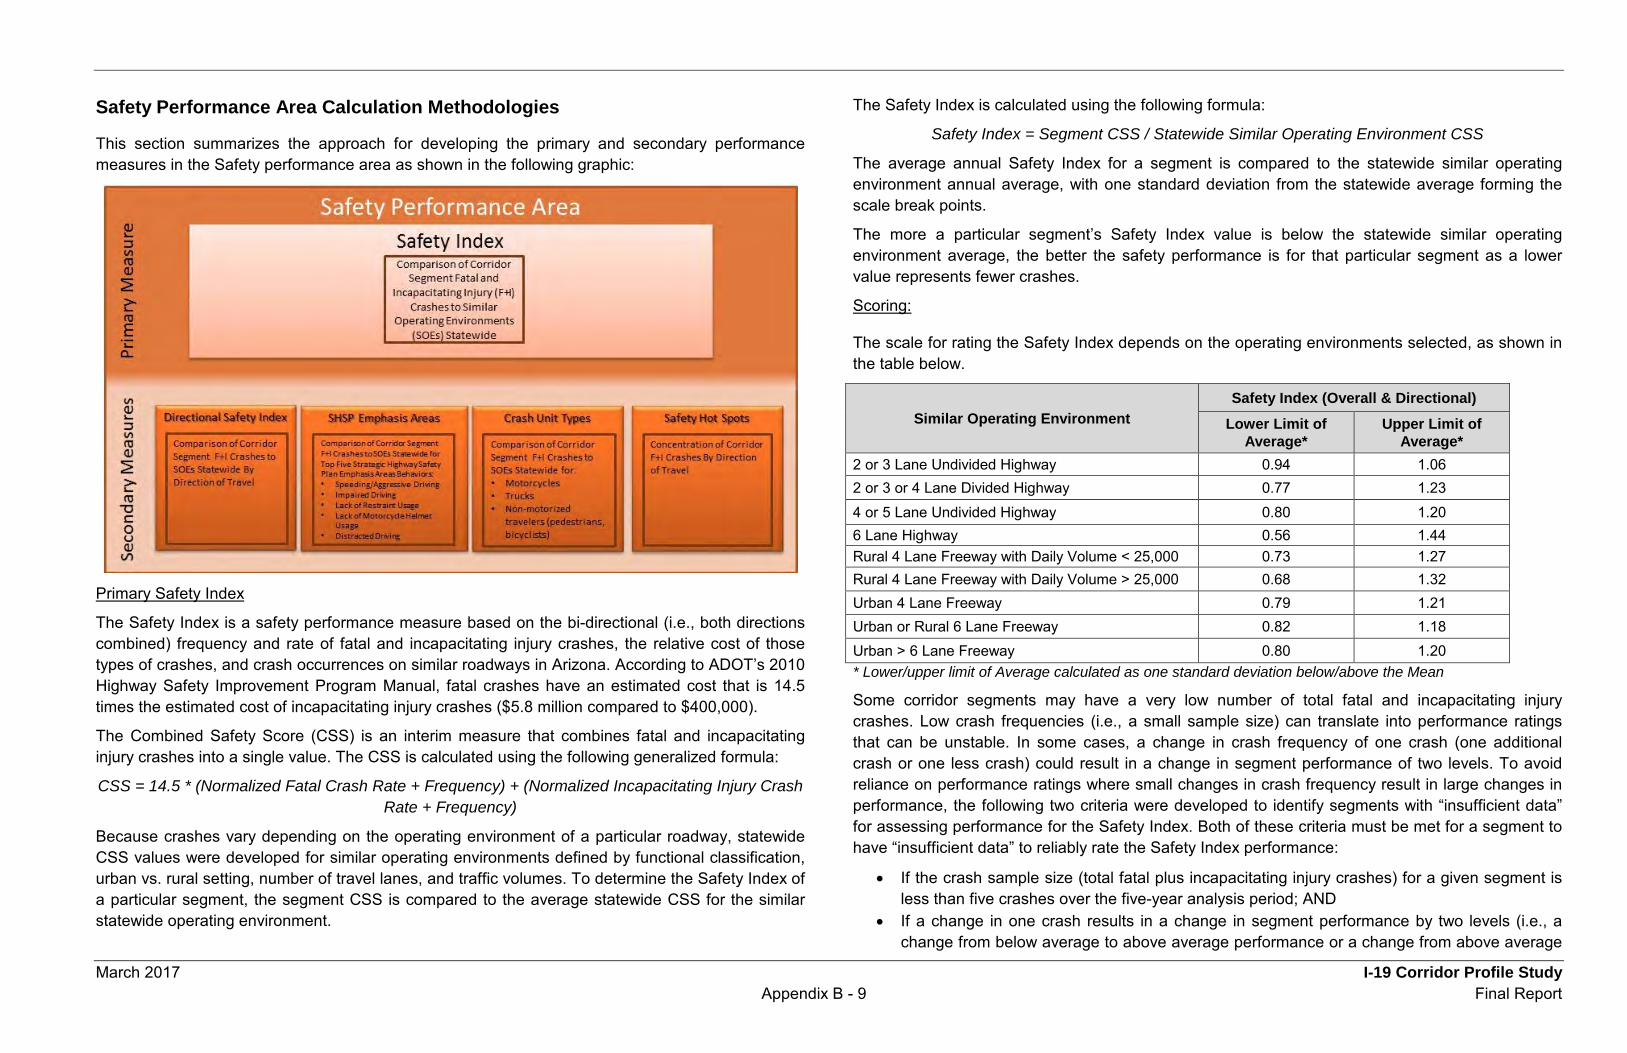
March 2017 I-19 Corridor Profile Study Appendix B - 9 Final Report
Safety Performance Area Calculation Methodologies
This section summarizes the approach for developing the primary and secondary performance measures in the Safety performance area as shown in the following graphic:
Primary Safety Index
The Safety Index is a safety performance measure based on the bi-directional (i.e., both directions combined) frequency and rate of fatal and incapacitating injury crashes, the relative cost of those types of crashes, and crash occurrences on similar roadways in Arizona. According to ADOT’s 2010 Highway Safety Improvement Program Manual, fatal crashes have an estimated cost that is 14.5 times the estimated cost of incapacitating injury crashes ($5.8 million compared to $400,000).
The Combined Safety Score (CSS) is an interim measure that combines fatal and incapacitating injury crashes into a single value. The CSS is calculated using the following generalized formula:
CSS = 14.5 * (Normalized Fatal Crash Rate + Frequency) + (Normalized Incapacitating Injury Crash Rate + Frequency)
Because crashes vary depending on the operating environment of a particular roadway, statewide CSS values were developed for similar operating environments defined by functional classification, urban vs. rural setting, number of travel lanes, and traffic volumes. To determine the Safety Index of a particular segment, the segment CSS is compared to the average statewide CSS for the similar statewide operating environment.
The Safety Index is calculated using the following formula:
Safety Index = Segment CSS / Statewide Similar Operating Environment CSS
The average annual Safety Index for a segment is compared to the statewide similar operating environment annual average, with one standard deviation from the statewide average forming the scale break points.
The more a particular segment’s Safety Index value is below the statewide similar operating environment average, the better the safety performance is for that particular segment as a lower value represents fewer crashes.
Scoring:
The scale for rating the Safety Index depends on the operating environments selected, as shown in the table below.
Similar Operating Environment Safety Index (Overall & Directional)
Lower Limit of Average*
Upper Limit of Average*
2 or 3 Lane Undivided Highway 0.94 1.06 2 or 3 or 4 Lane Divided Highway 0.77 1.23 4 or 5 Lane Undivided Highway 0.80 1.20 6 Lane Highway 0.56 1.44 Rural 4 Lane Freeway with Daily Volume < 25,000 0.73 1.27 Rural 4 Lane Freeway with Daily Volume > 25,000 0.68 1.32 Urban 4 Lane Freeway 0.79 1.21 Urban or Rural 6 Lane Freeway 0.82 1.18 Urban > 6 Lane Freeway 0.80 1.20 * Lower/upper limit of Average calculated as one standard deviation below/above the Mean
Some corridor segments may have a very low number of total fatal and incapacitating injury crashes. Low crash frequencies (i.e., a small sample size) can translate into performance ratings that can be unstable. In some cases, a change in crash frequency of one crash (one additional crash or one less crash) could result in a change in segment performance of two levels. To avoid reliance on performance ratings where small changes in crash frequency result in large changes in performance, the following two criteria were developed to identify segments with “insufficient data” for assessing performance for the Safety Index. Both of these criteria must be met for a segment to have “insufficient data” to reliably rate the Safety Index performance:
• If the crash sample size (total fatal plus incapacitating injury crashes) for a given segment is less than five crashes over the five-year analysis period; AND
• If a change in one crash results in a change in segment performance by two levels (i.e., a change from below average to above average performance or a change from above average
March 2017 I-19 Corridor Profile Study Appendix B - 10 Final Report
to below average frequency), the segment has “insufficient data” and Safety Index performance ratings are unreliable.
Secondary Safety Measures
The Safety performance area has four secondary measures related to fatal and incapacitating injury crashes:
• Directional Safety Index • Strategic Highway Safety Plan (SHSP) Behavior Emphasis Areas • Crash Unit Types • Safety Hot Spots
Directional Safety Index: The Direction Safety Index shares the same calculation procedure and thresholds as the Safety Index. However, the measure is based on the directional frequency and rate of fatal and incapacitating injury crashes.
Similar to the Safety Index, the segment CSS is compared to the average statewide CSS for the similar statewide operating environment. The Directional Safety Index follows the lead of the Safety Index in terms of “insufficient data” status. If the Safety Index meets both criteria for “insufficient data”, the Directional Safety Index should also be changed to “insufficient data”. If the Safety Index does not meet both criteria for “insufficient data”, the Directional Safety Index would also not change to say “insufficient data”
SHSP Behavior Emphasis Areas: ADOT’s 2014 SHSP identifies several emphasis areas for reducing fatal and incapacitating injury crashes. The top five SHSP emphasis areas relate to the following driver behaviors:
• Speeding and aggressive driving • Impaired driving • Lack of restraint usage • Lack of motorcycle helmet usage • Distracted driving
To develop a performance measure that reflects these five emphasis areas, the percentage of total fatal and incapacitating injury crashes that involves at least one of the emphasis area driver behaviors on a particular segment is compared to the statewide average percentage of crashes involving at least one of the emphasis area driver behaviors on roads with similar operating environments in a process similar to how the Safety Index is developed.
To increase the crash sample size for this performance measure, the five behavior emphasis areas are combined to identify fatal and incapacitating injury crashes that exhibit one or more of the behavior emphasis areas.
The SHSP behavior emphasis areas performance is calculated using the following formula:
% Crashes Involving SHSP Behavior Emphasis Areas = Segment Crashes Involving SHSP Behavior Emphasis Areas / Total Segment Crashes
The percentage of total crashes involving SHSP behavior emphasis areas for a segment is compared to the statewide percentages on roads with similar operating environments. One standard deviation from the statewide average percentage forms the scale break points.
When assessing the performance of the SHSP behavior emphasis areas, the more the frequency of crashes involving SHSP behavior emphasis areas is below the statewide average implies better levels of segment performance. Thus, lower values are better, similar to the Safety Index.
Scoring:
The scale for rating the SHSP behavior emphasis areas performance depends on the crash history on similar statewide operating environments, as shown in the table below:
Similar Operating Environment Crashes in SHSP Top 5 Emphasis Areas
Lower Limit of Average*
Upper Limit of Average*
2 or 3 Lane Undivided Highway 51.2% 57.5% 2 or 3 or 4 Lane Divided Highway 44.4% 54.4% 4 or 5 Lane Undivided Highway 42.4% 51.1% 6 Lane Highway 35.3% 46.5% Rural 4 Lane Freeway with Daily Volume < 25,000 42.8% 52.9% Rural 4 Lane Freeway with Daily Volume > 25,000 40.8% 57.1% Urban 4 Lane Freeway 49.1% 59.4% Urban or Rural 6 Lane Freeway 33.5% 57.2% Urban > 6 Lane Freeway 42.6% 54.8% * Lower/upper limit of Average calculated as one standard deviation below/above the Mean The SHSP behavior emphasis areas secondary safety performance measure for the Safety performance area includes proportions of specific types of crashes within the total fatal and incapacitating injury crash frequencies. This more detailed categorization of fatal and incapacitating injury crashes can result in low crash frequencies (i.e., a small sample size) that translate into performance ratings that can be unstable. In some cases, a change in crash frequency of one crash (one additional crash or one less crash) could result in a change in segment performance of two levels. To avoid reliance on performance ratings where small changes in crash frequency result in large changes in performance, the following criteria were developed to identify segments with “insufficient data” for assessing performance for the SHSP behavior emphasis areas secondary safety performance measure. If any of these criteria are met for a segment, that segment has “insufficient data” to reliably rate the SHSP behavior emphasis areas performance:
March 2017 I-19 Corridor Profile Study Appendix B - 11 Final Report
• If the crash sample size (total fatal plus incapacitating injury crashes) for a given segment is less than five crashes over the five-year analysis period, the segment has “insufficient data” and performance ratings are unreliable. OR
• If a change in one crash results in a change in segment performance by two levels (i.e., a change from below average to above average performance or a change from above average to below average frequency), the segment has “insufficient data” and performance ratings are unreliable. OR
• If the corridor average segment crash frequency for the SHSP behavior emphasis areas performance measure is less than two crashes over the five-year analysis period, the entire SHSP behavior emphasis areas performance measure has “insufficient data” and performance ratings are unreliable.
Crash Unit Type Emphasis Areas: ADOT’s SHSP also identifies emphasis areas that relate to the following “unit-involved” crashes:
• Heavy vehicle (trucks)-involved crashes • Motorcycle-involved crashes • Non-motorized traveler (pedestrians and bicyclists)-involved crashes
To develop a performance measure that reflects the aforementioned crash unit type emphasis areas, the percentage of total fatal and incapacitating injury crashes that involves a given crash unit type emphasis area on a particular segment is compared to the statewide average percentage of crashes involving that same crash unit type emphasis area on roads with similar operating environments in a process similar to how the Safety Index is developed.
The SHSP crash unit type emphasis areas performance is calculated using the following formula:
% Crashes Involving Crash Unit Type = Segment Crashes Involving Crash Unit Type / Total Segment Crashes
The percentage of total crashes involving crash unit types for a segment is compared to the statewide percentages on roads with similar operating environments. One standard deviation from the statewide average percentage forms the scale break points.
When assessing the performance of the crash unit types, the more the frequency of crashes involving crash unit types is below the statewide average implies better levels of segment performance. Thus, lower values are better, similar to the Safety Index. The scale for rating the unit-involved crash performance depends on the crash history on similar statewide operating environments, as shown in the following tables.
Scoring:
Similar Operating Environment Crashes Involving Trucks
Lower Limit of Average*
Upper Limit of Average*
2 or 3 Lane Undivided Highway 5.2% 7.1% 2 or 3 or 4 Lane Divided Highway 3.5% 7.3% 4 or 5 Lane Undivided Highway 6.1% 9.6% 6 Lane Highway 0.3% 8.7% Rural 4 Lane Freeway with Daily Volume < 25,000 13.2% 17.0% Rural 4 Lane Freeway with Daily Volume > 25,000 7.2% 12.9% Urban 4 Lane Freeway 6.8% 10.9% Urban or Rural 6 Lane Freeway 6.2% 11.0% Urban > 6 Lane Freeway 2.5% 6.0% * Lower/upper limit of Average calculated as one standard deviation below/above the Mean
Similar Operating Environment Crashes Involving Motorcycles
Lower Limit of Average*
Upper Limit of Average*
2 or 3 Lane Undivided Highway 18.5% 26.5% 2 or 3 or 4 Lane Divided Highway 16.3% 26.3% 4 or 5 Lane Undivided Highway 6.4% 9.4% 6 Lane Highway 0.0% 20.0% Rural 4 Lane Freeway with Daily Volume < 25,000 5.0% 8.5% Rural 4 Lane Freeway with Daily Volume > 25,000 7.7% 17.1% Urban 4 Lane Freeway 9.3% 11.5% Urban or Rural 6 Lane Freeway 6.7% 12.9% Urban > 6 Lane Freeway 12.6% 20.5% * Lower/upper limit of Average calculated as one standard deviation below/above the Mean

March 2017 I-19 Corridor Profile Study Appendix B - 12 Final Report
Similar Operating Environment
Crashes Involving Non-Motorized Travelers
Lower Limit of Average*
Upper Limit of Average*
2 or 3 Lane Undivided Highway 2.2% 4.2% 2 or 3 or 4 Lane Divided Highway 2.4% 4.5% 4 or 5 Lane Undivided Highway 4.7% 7.9% 6 Lane Highway 8.4% 17.4% Rural 4 Lane Freeway with Daily Volume < 25,000 1.7% 2.5% Rural 4 Lane Freeway with Daily Volume > 25,000 0.0% 0.0% Urban 4 Lane Freeway 4.8% 10.3% Urban or Rural 6 Lane Freeway 0.9% 6.7% Urban > 6 Lane Freeway 0.5% 1.5% * Lower/upper limit of Average calculated as one standard deviation below/above the Mean
The crash unit types have the same “insufficient data” criteria as the SHSP behavior emphasis areas.
Safety Hot Spots: A hot spot analysis was conducted that identified abnormally high concentrations of fatal and incapacitating injury crashes along the study corridor by direction of travel. The identification of crash concentrations involves a GIS-based function known as “kernel density analysis”. This measure is mapped for graphical display purposes with the Directional Safety Index but is not included in the Safety performance area rating calculations.
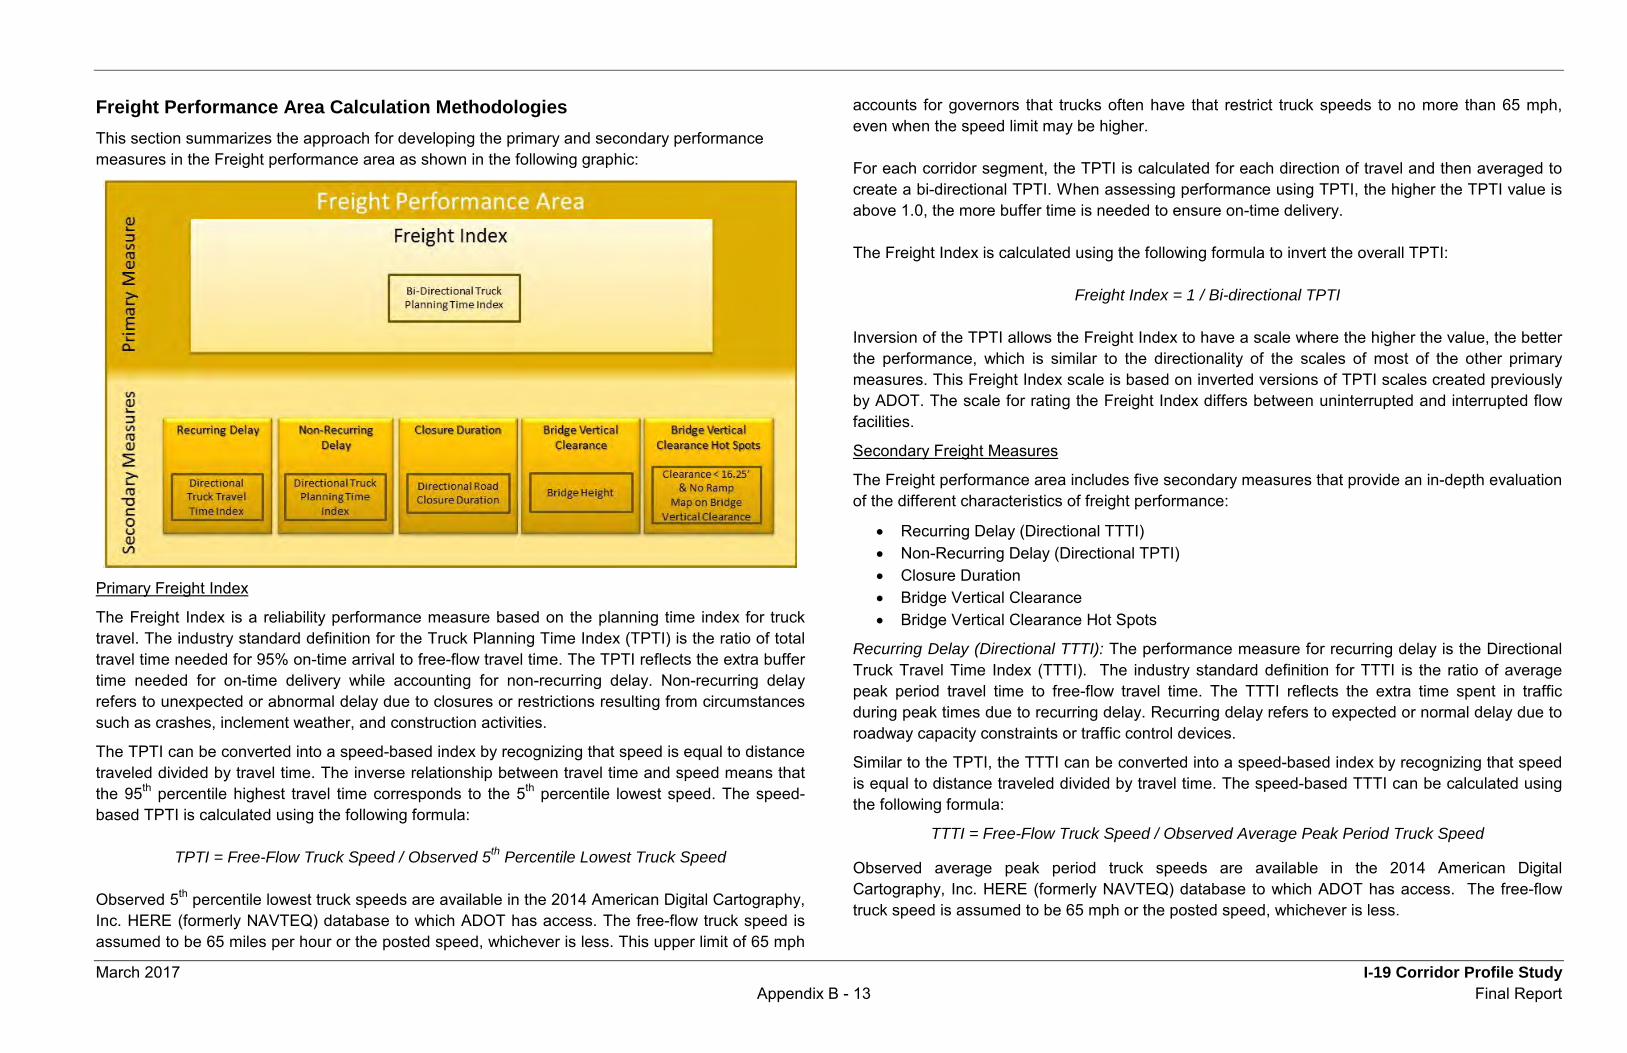
March 2017 I-19 Corridor Profile Study Appendix B - 13 Final Report
Freight Performance Area Calculation Methodologies This section summarizes the approach for developing the primary and secondary performance measures in the Freight performance area as shown in the following graphic:
Primary Freight Index
The Freight Index is a reliability performance measure based on the planning time index for truck travel. The industry standard definition for the Truck Planning Time Index (TPTI) is the ratio of total travel time needed for 95% on-time arrival to free-flow travel time. The TPTI reflects the extra buffer time needed for on-time delivery while accounting for non-recurring delay. Non-recurring delay refers to unexpected or abnormal delay due to closures or restrictions resulting from circumstances such as crashes, inclement weather, and construction activities.
The TPTI can be converted into a speed-based index by recognizing that speed is equal to distance traveled divided by travel time. The inverse relationship between travel time and speed means that the 95th percentile highest travel time corresponds to the 5th percentile lowest speed. The speed-based TPTI is calculated using the following formula:
TPTI = Free-Flow Truck Speed / Observed 5th Percentile Lowest Truck Speed
Observed 5th percentile lowest truck speeds are available in the 2014 American Digital Cartography, Inc. HERE (formerly NAVTEQ) database to which ADOT has access. The free-flow truck speed is assumed to be 65 miles per hour or the posted speed, whichever is less. This upper limit of 65 mph
accounts for governors that trucks often have that restrict truck speeds to no more than 65 mph, even when the speed limit may be higher.
For each corridor segment, the TPTI is calculated for each direction of travel and then averaged to create a bi-directional TPTI. When assessing performance using TPTI, the higher the TPTI value is above 1.0, the more buffer time is needed to ensure on-time delivery.
The Freight Index is calculated using the following formula to invert the overall TPTI:
Freight Index = 1 / Bi-directional TPTI
Inversion of the TPTI allows the Freight Index to have a scale where the higher the value, the better the performance, which is similar to the directionality of the scales of most of the other primary measures. This Freight Index scale is based on inverted versions of TPTI scales created previously by ADOT. The scale for rating the Freight Index differs between uninterrupted and interrupted flow facilities.
Secondary Freight Measures
The Freight performance area includes five secondary measures that provide an in-depth evaluation of the different characteristics of freight performance:
• Recurring Delay (Directional TTTI) • Non-Recurring Delay (Directional TPTI) • Closure Duration • Bridge Vertical Clearance • Bridge Vertical Clearance Hot Spots
Recurring Delay (Directional TTTI): The performance measure for recurring delay is the Directional Truck Travel Time Index (TTTI). The industry standard definition for TTTI is the ratio of average peak period travel time to free-flow travel time. The TTTI reflects the extra time spent in traffic during peak times due to recurring delay. Recurring delay refers to expected or normal delay due to roadway capacity constraints or traffic control devices.
Similar to the TPTI, the TTTI can be converted into a speed-based index by recognizing that speed is equal to distance traveled divided by travel time. The speed-based TTTI can be calculated using the following formula:
TTTI = Free-Flow Truck Speed / Observed Average Peak Period Truck Speed
Observed average peak period truck speeds are available in the 2014 American Digital Cartography, Inc. HERE (formerly NAVTEQ) database to which ADOT has access. The free-flow truck speed is assumed to be 65 mph or the posted speed, whichever is less.

March 2017 I-19 Corridor Profile Study Appendix B - 14 Final Report
For each corridor segment, the TTTI is calculated for each direction of travel. With the TTTI, the higher the TTTI value is above 1.0, the more time is spent in traffic during peak times. TTTI values are generally lower than TPTI values. The Directional TTTI scale is based on TTTI scales created previously by ADOT.
Non-Recurring Delay (Directional TPTI): The performance measure for non-recurring delay is the Directional TPTI. Directional TPTI is calculated as described previously as an interim step in the development of the Freight Index.
For each corridor segment, the TPTI is calculated for each direction of travel. With the TPTI, the higher the TPTI value is above 1.0, the more buffer time is needed to ensure on-time delivery.
Closure Duration: This performance measure related to road closures is average roadway closure (i.e., full lane closure) duration time in minutes. There are three main components to full closures that affect reliability – frequency, duration, and extent. In the freight industry, closure duration is the most important component because trucks want to minimize travel time and delay.
Data on the frequency, duration, and extent of full roadway closures on the ADOT State Highway System is available for 2010-2014 in the HCRS database that is managed and updated by ADOT.
The average closure duration in a segment – in terms of the average time a milepost is closed per mile per year on a given segment – is calculated using the following formula:
Closure Duration = Sum of Segment (Closure Clearance Time * Closure Extent) / Segment Length
The segment closure duration time in minutes can then be compared to statewide averages for closure duration in minutes, with one-half standard deviation from the average forming the scale break points. The scale for rating closure duration in minutes is found at the end of this section.
Bridge Vertical Clearance: This performance measure uses the vertical clearance information from the ADOT Bridge Database to identify locations with low vertical clearance. The minimum vertical clearance for all underpass structures (i.e., structures under which mainline traffic passes) is determined for each segment.
Bridge Vertical Clearance Hot Spots: This performance measure related to truck restrictions is the locations, or hot spots, where bridge vertical clearance issues restrict truck travel. Sixteen feet three inches (16.25’) is the minimum standard vertical clearance value for state highway bridges over travel lanes.
Locations with lower vertical clearance values than the minimum standard are categorized by the ADOT Intermodal Transportation Department Engineering Permits Section as either locations where ramps exist that allow the restriction to be avoided or locations where ramps do not exist and the restriction cannot be avoided. The locations with vertical clearances below the minimum standard that cannot be ramped around are considered hot spots. This measure is mapped for graphical display purposes with the bridge vertical clearance map but is not included in the Freight performance area rating calculations.
Scoring:
Performance Level Freight Index
Uninterrupted Flow Facilities Interrupted Flow Facilities
Good > 0.77 > 0.33
Fair 0.67 – 0.77 0.17 – 0.33
Poor < 0.67 < 0.17
Performance Level TTTI
Uninterrupted Flow Facilities Interrupted Flow Facilities
Good < 1.15 < 1.30
Fair 1.15 – 1.33 1.30 – 2.00
Poor > 1.33 > 2.00
Performance Level TPTI
Uninterrupted Flow Facilities Interrupted Flow Facilities
Good < 1.30 < 3.00
Fair 1.30 – 1.50 3.00 – 6.00
Poor > 1.50 > 6.00
Performance Level Closure Duration (minutes) Good < 44.18
Fair 44.18 – 124.86
Poor > 124.86
Performance Level Bridge Vertical Clearance Good > 16.5’ Fair 16.0’ – 16.5’ Poor < 16.0’

March 2017 I-19 Corridor Profile Study Appendix C - 1 Final Report
Appendix C: Performance Area Data
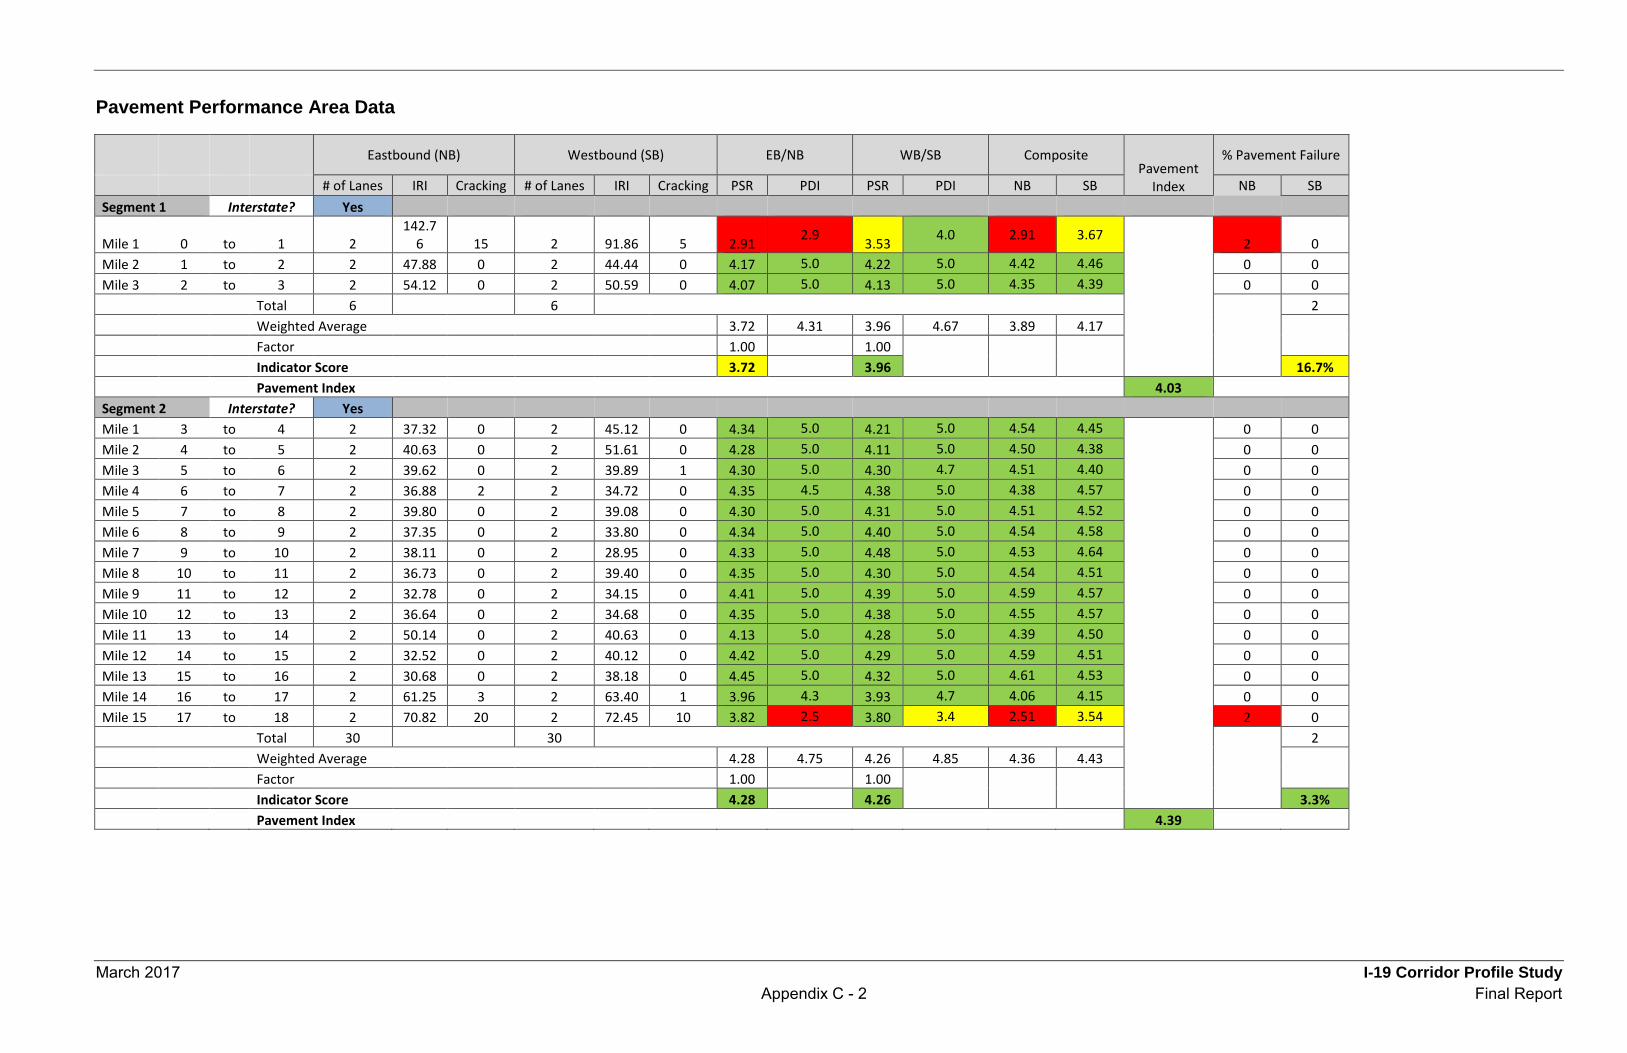
March 2017 I-19 Corridor Profile Study Appendix C - 2 Final Report
Pavement Performance Area Data
Eastbound (NB) Westbound (SB) EB/NB WB/SB Composite
Pavement Index
% Pavement Failure
# of Lanes IRI Cracking # of Lanes IRI Cracking PSR PDI PSR PDI NB SB NB SB Segment 1 Interstate? Yes
Mile 1 0 to 1 2 142.7
6 15 2 91.86 5 2.91 2.9 3.53 4.0 2.91 3.67 2 0 Mile 2 1 to 2 2 47.88 0 2 44.44 0 4.17 5.0 4.22 5.0 4.42 4.46 0 0 Mile 3 2 to 3 2 54.12 0 2 50.59 0 4.07 5.0 4.13 5.0 4.35 4.39 0 0 Total 6 6
2
Weighted Average 3.72 4.31 3.96 4.67 3.89 4.17
Factor 1.00 1.00
Indicator Score 3.72 3.96 16.7% Pavement Index 4.03
Segment 2 Interstate? Yes Mile 1 3 to 4 2 37.32 0 2 45.12 0 4.34 5.0 4.21 5.0 4.54 4.45 0 0 Mile 2 4 to 5 2 40.63 0 2 51.61 0 4.28 5.0 4.11 5.0 4.50 4.38 0 0 Mile 3 5 to 6 2 39.62 0 2 39.89 1 4.30 5.0 4.30 4.7 4.51 4.40 0 0 Mile 4 6 to 7 2 36.88 2 2 34.72 0 4.35 4.5 4.38 5.0 4.38 4.57 0 0 Mile 5 7 to 8 2 39.80 0 2 39.08 0 4.30 5.0 4.31 5.0 4.51 4.52 0 0 Mile 6 8 to 9 2 37.35 0 2 33.80 0 4.34 5.0 4.40 5.0 4.54 4.58 0 0 Mile 7 9 to 10 2 38.11 0 2 28.95 0 4.33 5.0 4.48 5.0 4.53 4.64 0 0 Mile 8 10 to 11 2 36.73 0 2 39.40 0 4.35 5.0 4.30 5.0 4.54 4.51 0 0 Mile 9 11 to 12 2 32.78 0 2 34.15 0 4.41 5.0 4.39 5.0 4.59 4.57 0 0 Mile 10 12 to 13 2 36.64 0 2 34.68 0 4.35 5.0 4.38 5.0 4.55 4.57 0 0 Mile 11 13 to 14 2 50.14 0 2 40.63 0 4.13 5.0 4.28 5.0 4.39 4.50 0 0 Mile 12 14 to 15 2 32.52 0 2 40.12 0 4.42 5.0 4.29 5.0 4.59 4.51 0 0 Mile 13 15 to 16 2 30.68 0 2 38.18 0 4.45 5.0 4.32 5.0 4.61 4.53 0 0 Mile 14 16 to 17 2 61.25 3 2 63.40 1 3.96 4.3 3.93 4.7 4.06 4.15 0 0 Mile 15 17 to 18 2 70.82 20 2 72.45 10 3.82 2.5 3.80 3.4 2.51 3.54 2 0 Total 30 30
2
Weighted Average 4.28 4.75 4.26 4.85 4.36 4.43
Factor 1.00 1.00
Indicator Score 4.28 4.26 3.3% Pavement Index 4.39

March 2017 I-19 Corridor Profile Study Appendix C - 3 Final Report
Eastbound (NB) Westbound (SB) EB/NB WB/SB Composite
Pavement Index
% Pavement Failure
# of Lanes IRI Cracking # of Lanes IRI Cracking PSR PDI PSR PDI NB SB NB SB Segment 3 Interstate? Yes Mile 1 18 to 19 2 60.27 15 2 79.09 7 3.98 2.9 3.70 3.8 2.94 3.72 0 0 Mile 2 19 to 20 2 68.35 5 2 68.96 7 3.86 4.0 3.85 3.8 3.90 3.78 0 0 Mile 3 20 to 21 2 69.13 7 2 66.15 15 3.84 3.8 3.89 2.9 3.78 2.94 0 0 Mile 4 21 to 22 2 72.92 5 2 64.61 12 3.79 4.0 3.91 3.2 3.85 3.43 0 0
Mile 5 22 to 23 2 104.9
8 6 2 56.77 8 3.36 3.9 4.03 3.6 3.51 3.76 0 0 Mile 6 23 to 24 2 84.81 10 2 65.17 5 3.62 3.4 3.90 4.0 3.48 3.93 0 0 Mile 7 24 to 25 2 71.37 12 2 63.52 4 3.81 3.2 3.93 4.1 3.40 3.99 0 0 Mile 8 25 to 26 2 81.95 4 2 63.73 5 3.66 4.1 3.92 4.0 3.81 3.95 0 0 Mile 9 26 to 27 2 68.93 10 2 56.71 8 3.85 3.4 4.03 3.6 3.55 3.76 0 0 Mile 10 27 to 28 2 57.72 15 2 51.20 12 4.02 2.9 4.12 3.2 2.94 3.49 0 0 Mile 11 28 to 29 2 90.02 12 2 65.19 12 3.55 3.2 3.90 3.2 3.32 3.43 0 0 Mile 12 29 to 30 2 87.00 9 2 82.54 10 3.59 3.5 3.65 3.4 3.55 3.49 0 0 Total 24 24
0
Weighted Average 3.74 3.54 3.90 3.58 3.50 3.64
Factor 1.00 1.00
Indicator Score 3.74 3.90 0.0% Pavement Index 3.57
Segment 4 Interstate? Yes Mile 1 30 to 31 2 81.81 9 2 74.89 10 3.66 3.5 3.76 3.4 3.57 3.52 0 0 Mile 2 31 to 32 2 68.92 9 2 66.62 10 3.85 3.5 3.88 3.4 3.62 3.56 0 0 Mile 3 32 to 33 2 67.39 15 2 59.06 8 3.87 2.9 3.99 3.6 2.94 3.75 0 0 Mile 4 33 to 34 2 67.41 9 2 63.59 7 3.87 3.5 3.93 3.8 3.63 3.81 0 0 Mile 5 34 to 35 2 68.54 9 2 58.97 8 3.85 3.5 4.00 3.6 3.63 3.75 0 0 Mile 6 35 to 36 2 71.07 5 2 71.31 12 3.82 4.0 3.81 3.2 3.87 3.40 0 0 Mile 7 36 to 37 2 71.83 8 2 60.81 12 3.81 3.6 3.97 3.2 3.69 3.45 0 0 Mile 8 37 to 38 2 86.20 12 2 60.03 12 3.60 3.2 3.98 3.2 3.34 3.45 0 0 Mile 9 38 to 39 2 83.38 9 2 63.91 9 3.64 3.5 3.92 3.5 3.56 3.65 0 0 Mile 10 39 to 40 2 82.57 8 2 72.98 15 3.65 3.6 3.79 2.9 3.64 2.94 0 0 Total 20 20
0
Weighted Average 3.76 3.51 3.90 3.40 3.55 3.53
Factor 1.00 1.00
Indicator Score 3.76 3.90 0.0% Pavement Index 3.54
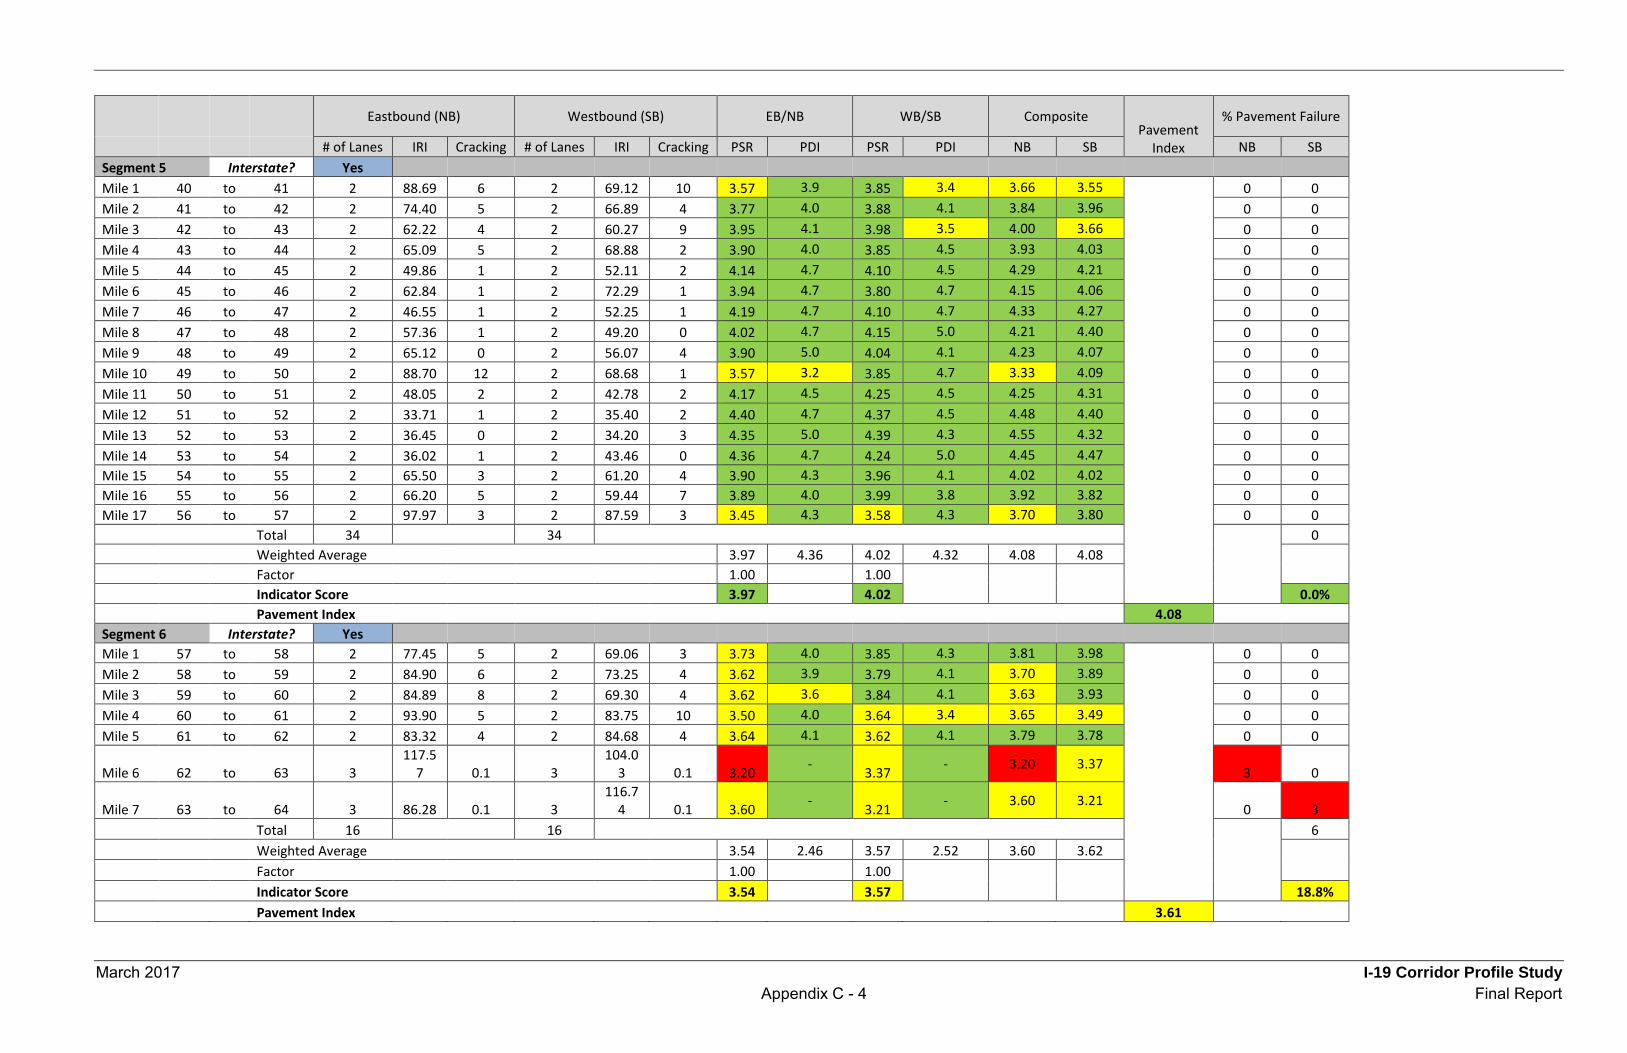
March 2017 I-19 Corridor Profile Study Appendix C - 4 Final Report
Eastbound (NB) Westbound (SB) EB/NB WB/SB Composite
Pavement Index
% Pavement Failure
# of Lanes IRI Cracking # of Lanes IRI Cracking PSR PDI PSR PDI NB SB NB SB Segment 5 Interstate? Yes Mile 1 40 to 41 2 88.69 6 2 69.12 10 3.57 3.9 3.85 3.4 3.66 3.55 0 0 Mile 2 41 to 42 2 74.40 5 2 66.89 4 3.77 4.0 3.88 4.1 3.84 3.96 0 0 Mile 3 42 to 43 2 62.22 4 2 60.27 9 3.95 4.1 3.98 3.5 4.00 3.66 0 0 Mile 4 43 to 44 2 65.09 5 2 68.88 2 3.90 4.0 3.85 4.5 3.93 4.03 0 0 Mile 5 44 to 45 2 49.86 1 2 52.11 2 4.14 4.7 4.10 4.5 4.29 4.21 0 0 Mile 6 45 to 46 2 62.84 1 2 72.29 1 3.94 4.7 3.80 4.7 4.15 4.06 0 0 Mile 7 46 to 47 2 46.55 1 2 52.25 1 4.19 4.7 4.10 4.7 4.33 4.27 0 0 Mile 8 47 to 48 2 57.36 1 2 49.20 0 4.02 4.7 4.15 5.0 4.21 4.40 0 0 Mile 9 48 to 49 2 65.12 0 2 56.07 4 3.90 5.0 4.04 4.1 4.23 4.07 0 0 Mile 10 49 to 50 2 88.70 12 2 68.68 1 3.57 3.2 3.85 4.7 3.33 4.09 0 0 Mile 11 50 to 51 2 48.05 2 2 42.78 2 4.17 4.5 4.25 4.5 4.25 4.31 0 0 Mile 12 51 to 52 2 33.71 1 2 35.40 2 4.40 4.7 4.37 4.5 4.48 4.40 0 0 Mile 13 52 to 53 2 36.45 0 2 34.20 3 4.35 5.0 4.39 4.3 4.55 4.32 0 0 Mile 14 53 to 54 2 36.02 1 2 43.46 0 4.36 4.7 4.24 5.0 4.45 4.47 0 0 Mile 15 54 to 55 2 65.50 3 2 61.20 4 3.90 4.3 3.96 4.1 4.02 4.02 0 0 Mile 16 55 to 56 2 66.20 5 2 59.44 7 3.89 4.0 3.99 3.8 3.92 3.82 0 0 Mile 17 56 to 57 2 97.97 3 2 87.59 3 3.45 4.3 3.58 4.3 3.70 3.80 0 0 Total 34 34
0
Weighted Average 3.97 4.36 4.02 4.32 4.08 4.08
Factor 1.00 1.00
Indicator Score 3.97 4.02 0.0% Pavement Index 4.08
Segment 6 Interstate? Yes Mile 1 57 to 58 2 77.45 5 2 69.06 3 3.73 4.0 3.85 4.3 3.81 3.98 0 0 Mile 2 58 to 59 2 84.90 6 2 73.25 4 3.62 3.9 3.79 4.1 3.70 3.89 0 0 Mile 3 59 to 60 2 84.89 8 2 69.30 4 3.62 3.6 3.84 4.1 3.63 3.93 0 0 Mile 4 60 to 61 2 93.90 5 2 83.75 10 3.50 4.0 3.64 3.4 3.65 3.49 0 0 Mile 5 61 to 62 2 83.32 4 2 84.68 4 3.64 4.1 3.62 4.1 3.79 3.78 0 0
Mile 6 62 to 63 3 117.5
7 0.1 3 104.0
3 0.1 3.20 - 3.37 - 3.20 3.37 3 0
Mile 7 63 to 64 3 86.28 0.1 3 116.7
4 0.1 3.60 - 3.21 - 3.60 3.21 0 3 Total 16 16
6
Weighted Average 3.54 2.46 3.57 2.52 3.60 3.62
Factor 1.00 1.00
Indicator Score 3.54 3.57 18.8% Pavement Index 3.61
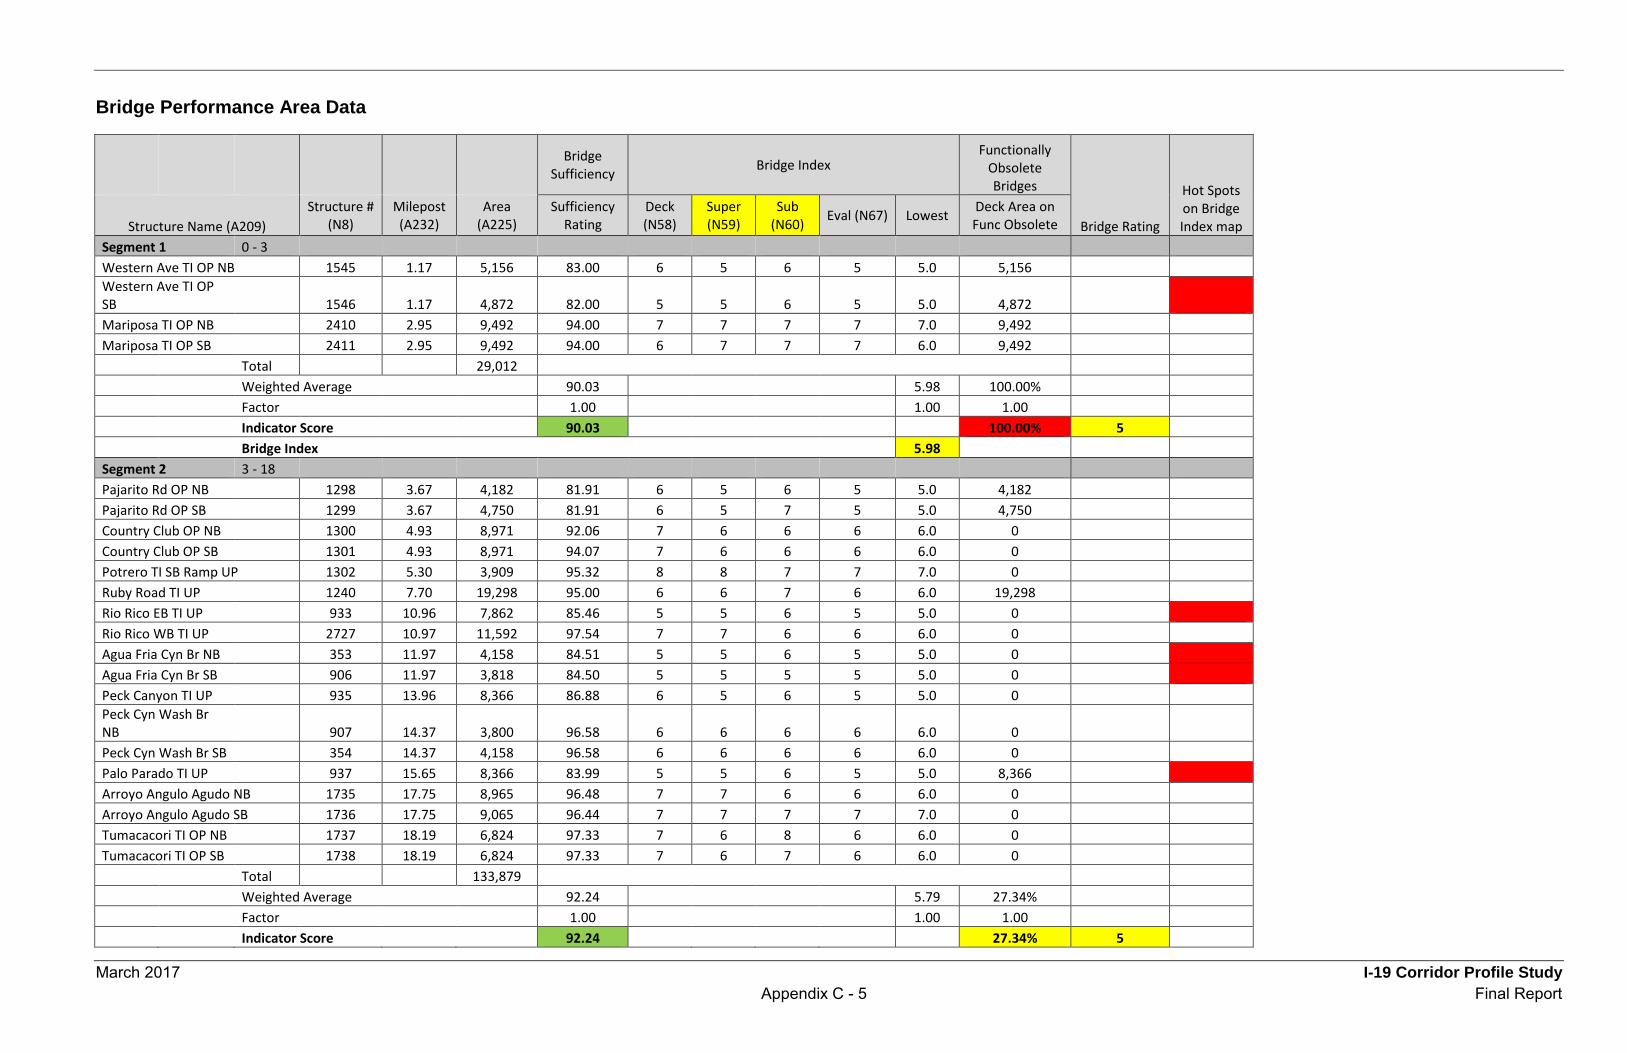
March 2017 I-19 Corridor Profile Study Appendix C - 5 Final Report
Bridge Performance Area Data
Bridge Sufficiency Bridge Index
Functionally Obsolete Bridges
Bridge Rating
Hot Spots on Bridge Index map Structure Name (A209)
Structure # (N8)
Milepost (A232)
Area (A225)
Sufficiency Rating
Deck (N58)
Super (N59)
Sub (N60) Eval (N67) Lowest Deck Area on
Func Obsolete Segment 1 0 - 3 Western Ave TI OP NB 1545 1.17 5,156 83.00 6 5 6 5 5.0 5,156 Western Ave TI OP SB 1546 1.17 4,872 82.00 5 5 6 5 5.0 4,872 Mariposa TI OP NB 2410 2.95 9,492 94.00 7 7 7 7 7.0 9,492 Mariposa TI OP SB 2411 2.95 9,492 94.00 6 7 7 7 6.0 9,492 Total 29,012
Weighted Average 90.03 5.98 100.00%
Factor
1.00
1.00 1.00
Indicator Score 90.03 100.00% 5 Bridge Index 5.98 Segment 2 3 - 18 Pajarito Rd OP NB 1298 3.67 4,182 81.91 6 5 6 5 5.0 4,182 Pajarito Rd OP SB 1299 3.67 4,750 81.91 6 5 7 5 5.0 4,750 Country Club OP NB 1300 4.93 8,971 92.06 7 6 6 6 6.0 0 Country Club OP SB 1301 4.93 8,971 94.07 7 6 6 6 6.0 0 Potrero TI SB Ramp UP 1302 5.30 3,909 95.32 8 8 7 7 7.0 0 Ruby Road TI UP 1240 7.70 19,298 95.00 6 6 7 6 6.0 19,298 Rio Rico EB TI UP 933 10.96 7,862 85.46 5 5 6 5 5.0 0 Rio Rico WB TI UP 2727 10.97 11,592 97.54 7 7 6 6 6.0 0 Agua Fria Cyn Br NB 353 11.97 4,158 84.51 5 5 6 5 5.0 0 Agua Fria Cyn Br SB 906 11.97 3,818 84.50 5 5 5 5 5.0 0 Peck Canyon TI UP 935 13.96 8,366 86.88 6 5 6 5 5.0 0 Peck Cyn Wash Br NB 907 14.37 3,800 96.58 6 6 6 6 6.0 0 Peck Cyn Wash Br SB 354 14.37 4,158 96.58 6 6 6 6 6.0 0 Palo Parado TI UP 937 15.65 8,366 83.99 5 5 6 5 5.0 8,366 Arroyo Angulo Agudo NB 1735 17.75 8,965 96.48 7 7 6 6 6.0 0 Arroyo Angulo Agudo SB 1736 17.75 9,065 96.44 7 7 7 7 7.0 0 Tumacacori TI OP NB 1737 18.19 6,824 97.33 7 6 8 6 6.0 0 Tumacacori TI OP SB 1738 18.19 6,824 97.33 7 6 7 6 6.0 0 Total 133,879
Weighted Average 92.24 5.79 27.34%
Factor
1.00
1.00 1.00
Indicator Score 92.24 27.34% 5
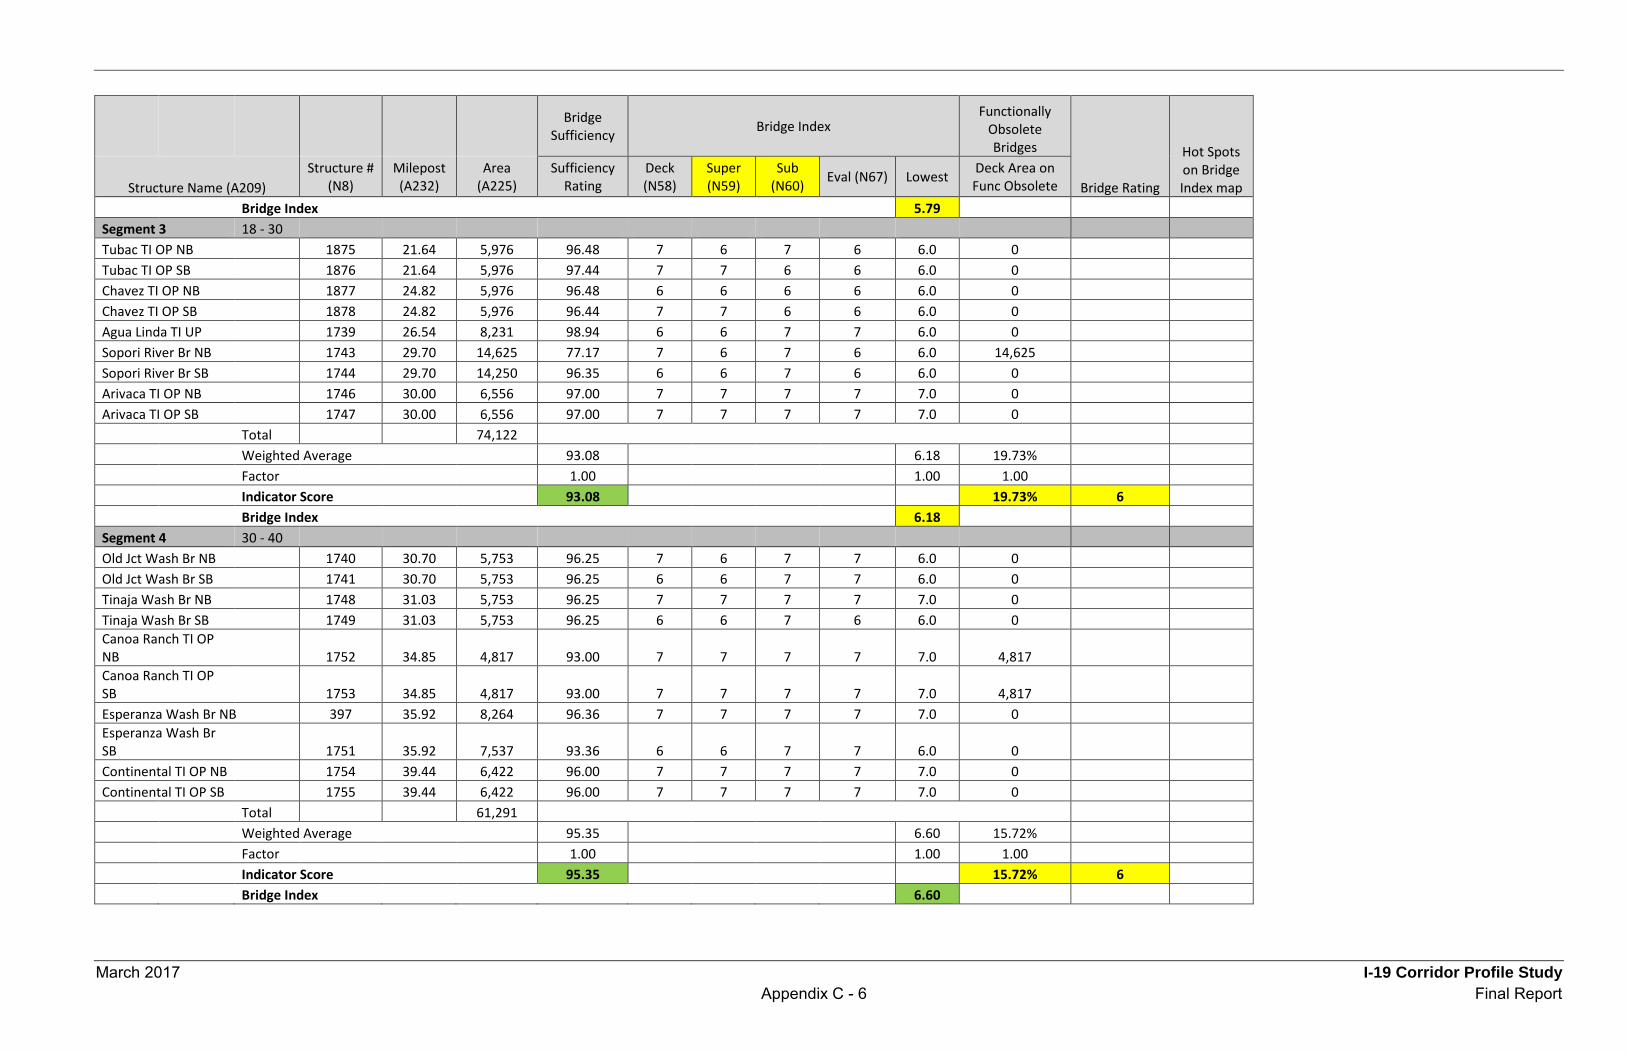
March 2017 I-19 Corridor Profile Study Appendix C - 6 Final Report
Bridge Sufficiency Bridge Index
Functionally Obsolete Bridges
Bridge Rating
Hot Spots on Bridge Index map Structure Name (A209)
Structure # (N8)
Milepost (A232)
Area (A225)
Sufficiency Rating
Deck (N58)
Super (N59)
Sub (N60) Eval (N67) Lowest Deck Area on
Func Obsolete Bridge Index 5.79 Segment 3 18 - 30 Tubac TI OP NB 1875 21.64 5,976 96.48 7 6 7 6 6.0 0 Tubac TI OP SB 1876 21.64 5,976 97.44 7 7 6 6 6.0 0 Chavez TI OP NB 1877 24.82 5,976 96.48 6 6 6 6 6.0 0 Chavez TI OP SB 1878 24.82 5,976 96.44 7 7 6 6 6.0 0 Agua Linda TI UP 1739 26.54 8,231 98.94 6 6 7 7 6.0 0 Sopori River Br NB 1743 29.70 14,625 77.17 7 6 7 6 6.0 14,625 Sopori River Br SB 1744 29.70 14,250 96.35 6 6 7 6 6.0 0 Arivaca TI OP NB 1746 30.00 6,556 97.00 7 7 7 7 7.0 0 Arivaca TI OP SB 1747 30.00 6,556 97.00 7 7 7 7 7.0 0 Total 74,122
Weighted Average 93.08 6.18 19.73%
Factor
1.00
1.00 1.00
Indicator Score 93.08 19.73% 6 Bridge Index 6.18 Segment 4 30 - 40 Old Jct Wash Br NB 1740 30.70 5,753 96.25 7 6 7 7 6.0 0 Old Jct Wash Br SB 1741 30.70 5,753 96.25 6 6 7 7 6.0 0 Tinaja Wash Br NB 1748 31.03 5,753 96.25 7 7 7 7 7.0 0 Tinaja Wash Br SB 1749 31.03 5,753 96.25 6 6 7 6 6.0 0 Canoa Ranch TI OP NB 1752 34.85 4,817 93.00 7 7 7 7 7.0 4,817 Canoa Ranch TI OP SB 1753 34.85 4,817 93.00 7 7 7 7 7.0 4,817 Esperanza Wash Br NB 397 35.92 8,264 96.36 7 7 7 7 7.0 0 Esperanza Wash Br SB 1751 35.92 7,537 93.36 6 6 7 7 6.0 0 Continental TI OP NB 1754 39.44 6,422 96.00 7 7 7 7 7.0 0 Continental TI OP SB 1755 39.44 6,422 96.00 7 7 7 7 7.0 0 Total 61,291
Weighted Average 95.35 6.60 15.72%
Factor
1.00
1.00 1.00
Indicator Score 95.35 15.72% 6 Bridge Index 6.60
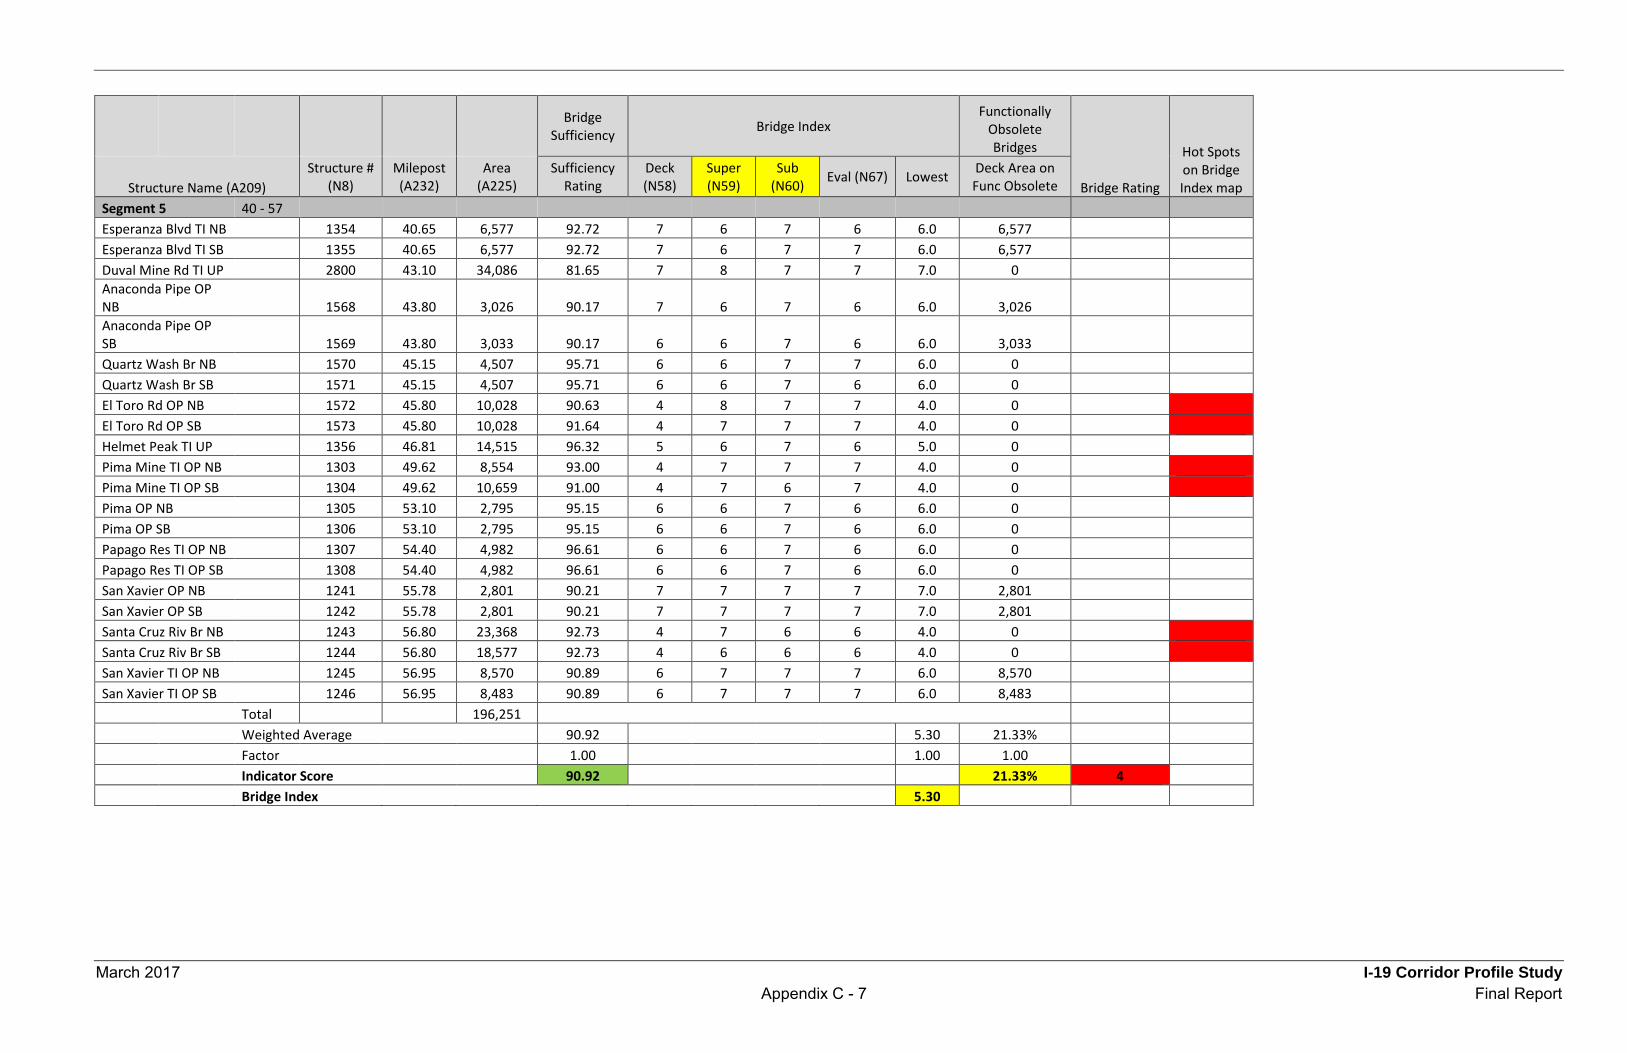
March 2017 I-19 Corridor Profile Study Appendix C - 7 Final Report
Bridge Sufficiency Bridge Index
Functionally Obsolete Bridges
Bridge Rating
Hot Spots on Bridge Index map Structure Name (A209)
Structure # (N8)
Milepost (A232)
Area (A225)
Sufficiency Rating
Deck (N58)
Super (N59)
Sub (N60) Eval (N67) Lowest Deck Area on
Func Obsolete Segment 5 40 - 57 Esperanza Blvd TI NB 1354 40.65 6,577 92.72 7 6 7 6 6.0 6,577 Esperanza Blvd TI SB 1355 40.65 6,577 92.72 7 6 7 7 6.0 6,577 Duval Mine Rd TI UP 2800 43.10 34,086 81.65 7 8 7 7 7.0 0 Anaconda Pipe OP NB 1568 43.80 3,026 90.17 7 6 7 6 6.0 3,026 Anaconda Pipe OP SB 1569 43.80 3,033 90.17 6 6 7 6 6.0 3,033 Quartz Wash Br NB 1570 45.15 4,507 95.71 6 6 7 7 6.0 0 Quartz Wash Br SB 1571 45.15 4,507 95.71 6 6 7 6 6.0 0 El Toro Rd OP NB 1572 45.80 10,028 90.63 4 8 7 7 4.0 0 El Toro Rd OP SB 1573 45.80 10,028 91.64 4 7 7 7 4.0 0 Helmet Peak TI UP 1356 46.81 14,515 96.32 5 6 7 6 5.0 0 Pima Mine TI OP NB 1303 49.62 8,554 93.00 4 7 7 7 4.0 0 Pima Mine TI OP SB 1304 49.62 10,659 91.00 4 7 6 7 4.0 0 Pima OP NB 1305 53.10 2,795 95.15 6 6 7 6 6.0 0 Pima OP SB 1306 53.10 2,795 95.15 6 6 7 6 6.0 0 Papago Res TI OP NB 1307 54.40 4,982 96.61 6 6 7 6 6.0 0 Papago Res TI OP SB 1308 54.40 4,982 96.61 6 6 7 6 6.0 0 San Xavier OP NB 1241 55.78 2,801 90.21 7 7 7 7 7.0 2,801 San Xavier OP SB 1242 55.78 2,801 90.21 7 7 7 7 7.0 2,801 Santa Cruz Riv Br NB 1243 56.80 23,368 92.73 4 7 6 6 4.0 0 Santa Cruz Riv Br SB 1244 56.80 18,577 92.73 4 6 6 6 4.0 0 San Xavier TI OP NB 1245 56.95 8,570 90.89 6 7 7 7 6.0 8,570 San Xavier TI OP SB 1246 56.95 8,483 90.89 6 7 7 7 6.0 8,483 Total 196,251
Weighted Average 90.92 5.30 21.33%
Factor
1.00
1.00 1.00
Indicator Score 90.92 21.33% 4 Bridge Index 5.30
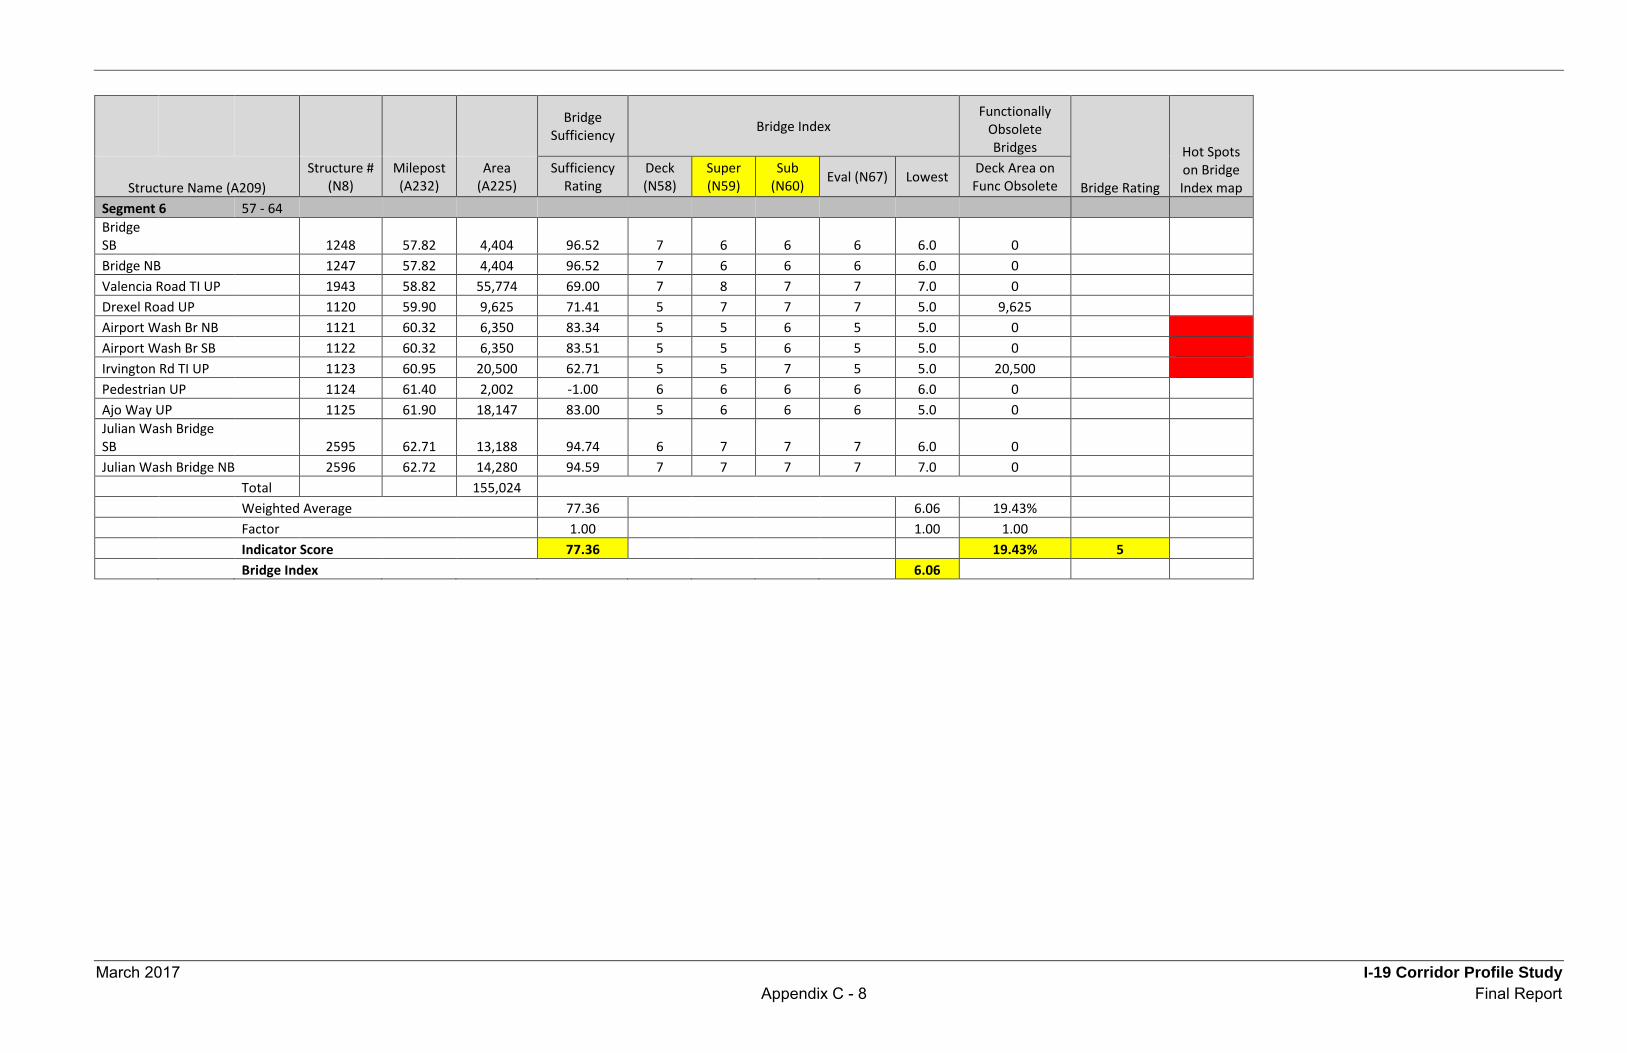
March 2017 I-19 Corridor Profile Study Appendix C - 8 Final Report
Bridge Sufficiency Bridge Index
Functionally Obsolete Bridges
Bridge Rating
Hot Spots on Bridge Index map Structure Name (A209)
Structure # (N8)
Milepost (A232)
Area (A225)
Sufficiency Rating
Deck (N58)
Super (N59)
Sub (N60) Eval (N67) Lowest Deck Area on
Func Obsolete Segment 6 57 - 64 Bridge SB 1248 57.82 4,404 96.52 7 6 6 6 6.0 0 Bridge NB 1247 57.82 4,404 96.52 7 6 6 6 6.0 0 Valencia Road TI UP 1943 58.82 55,774 69.00 7 8 7 7 7.0 0 Drexel Road UP 1120 59.90 9,625 71.41 5 7 7 7 5.0 9,625 Airport Wash Br NB 1121 60.32 6,350 83.34 5 5 6 5 5.0 0 Airport Wash Br SB 1122 60.32 6,350 83.51 5 5 6 5 5.0 0 Irvington Rd TI UP 1123 60.95 20,500 62.71 5 5 7 5 5.0 20,500 Pedestrian UP 1124 61.40 2,002 -1.00 6 6 6 6 6.0 0 Ajo Way UP 1125 61.90 18,147 83.00 5 6 6 6 5.0 0 Julian Wash Bridge SB 2595 62.71 13,188 94.74 6 7 7 7 6.0 0 Julian Wash Bridge NB 2596 62.72 14,280 94.59 7 7 7 7 7.0 0 Total 155,024
Weighted Average 77.36 6.06 19.43%
Factor
1.00
1.00 1.00
Indicator Score 77.36 19.43% 5 Bridge Index 6.06
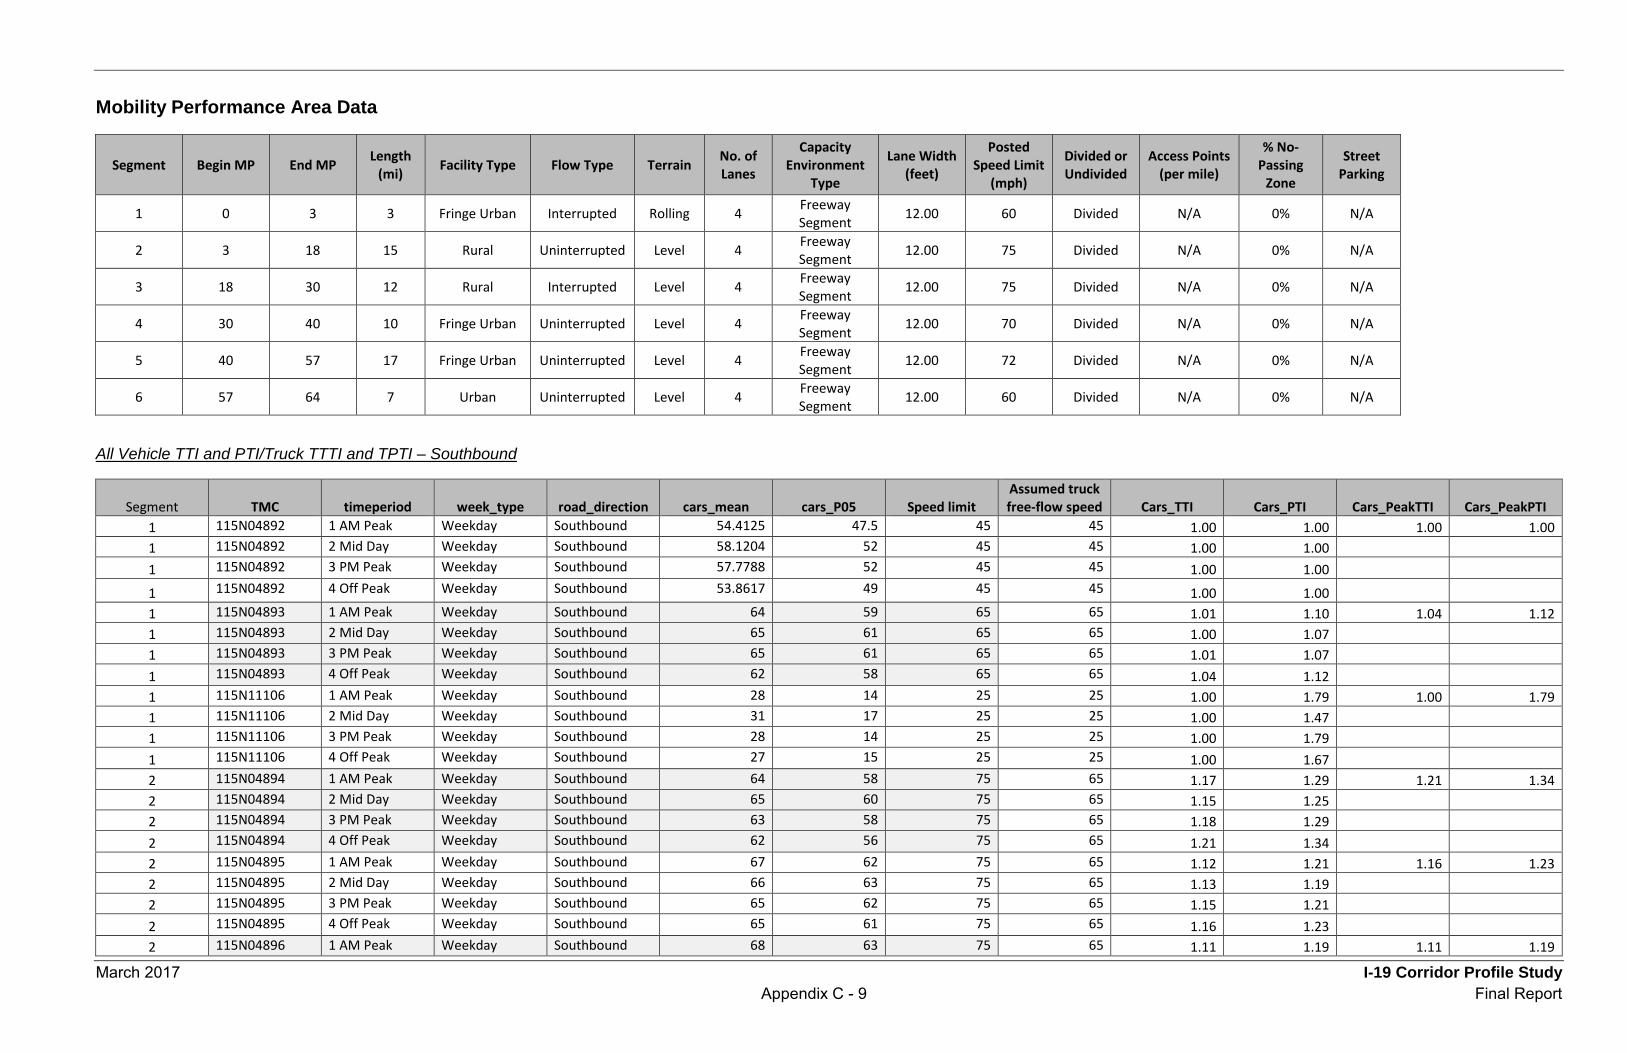
March 2017 I-19 Corridor Profile Study Appendix C - 9 Final Report
Mobility Performance Area Data
Segment Begin MP End MP Length (mi) Facility Type Flow Type Terrain No. of
Lanes
Capacity Environment
Type
Lane Width (feet)
Posted Speed Limit
(mph)
Divided or Undivided
Access Points (per mile)
% No-Passing
Zone
Street Parking
1 0 3 3 Fringe Urban Interrupted Rolling 4 Freeway Segment 12.00 60 Divided N/A 0% N/A
2 3 18 15 Rural Uninterrupted Level 4 Freeway Segment 12.00 75 Divided N/A 0% N/A
3 18 30 12 Rural Interrupted Level 4 Freeway Segment 12.00 75 Divided N/A 0% N/A
4 30 40 10 Fringe Urban Uninterrupted Level 4 Freeway Segment 12.00 70 Divided N/A 0% N/A
5 40 57 17 Fringe Urban Uninterrupted Level 4 Freeway Segment 12.00 72 Divided N/A 0% N/A
6 57 64 7 Urban Uninterrupted Level 4 Freeway Segment 12.00 60 Divided N/A 0% N/A
All Vehicle TTI and PTI/Truck TTTI and TPTI – Southbound
Segment TMC timeperiod week_type road_direction cars_mean cars_P05 Speed limit Assumed truck free-flow speed Cars_TTI Cars_PTI Cars_PeakTTI Cars_PeakPTI
1 115N04892 1 AM Peak Weekday Southbound 54.4125 47.5 45 45 1.00 1.00 1.00 1.00 1 115N04892 2 Mid Day Weekday Southbound 58.1204 52 45 45 1.00 1.00 1 115N04892 3 PM Peak Weekday Southbound 57.7788 52 45 45 1.00 1.00 1 115N04892 4 Off Peak Weekday Southbound 53.8617 49 45 45 1.00 1.00 1 115N04893 1 AM Peak Weekday Southbound 64 59 65 65 1.01 1.10 1.04 1.12 1 115N04893 2 Mid Day Weekday Southbound 65 61 65 65 1.00 1.07 1 115N04893 3 PM Peak Weekday Southbound 65 61 65 65 1.01 1.07 1 115N04893 4 Off Peak Weekday Southbound 62 58 65 65 1.04 1.12 1 115N11106 1 AM Peak Weekday Southbound 28 14 25 25 1.00 1.79 1.00 1.79 1 115N11106 2 Mid Day Weekday Southbound 31 17 25 25 1.00 1.47 1 115N11106 3 PM Peak Weekday Southbound 28 14 25 25 1.00 1.79 1 115N11106 4 Off Peak Weekday Southbound 27 15 25 25 1.00 1.67 2 115N04894 1 AM Peak Weekday Southbound 64 58 75 65 1.17 1.29 1.21 1.34 2 115N04894 2 Mid Day Weekday Southbound 65 60 75 65 1.15 1.25 2 115N04894 3 PM Peak Weekday Southbound 63 58 75 65 1.18 1.29 2 115N04894 4 Off Peak Weekday Southbound 62 56 75 65 1.21 1.34 2 115N04895 1 AM Peak Weekday Southbound 67 62 75 65 1.12 1.21 1.16 1.23 2 115N04895 2 Mid Day Weekday Southbound 66 63 75 65 1.13 1.19 2 115N04895 3 PM Peak Weekday Southbound 65 62 75 65 1.15 1.21 2 115N04895 4 Off Peak Weekday Southbound 65 61 75 65 1.16 1.23 2 115N04896 1 AM Peak Weekday Southbound 68 63 75 65 1.11 1.19 1.11 1.19
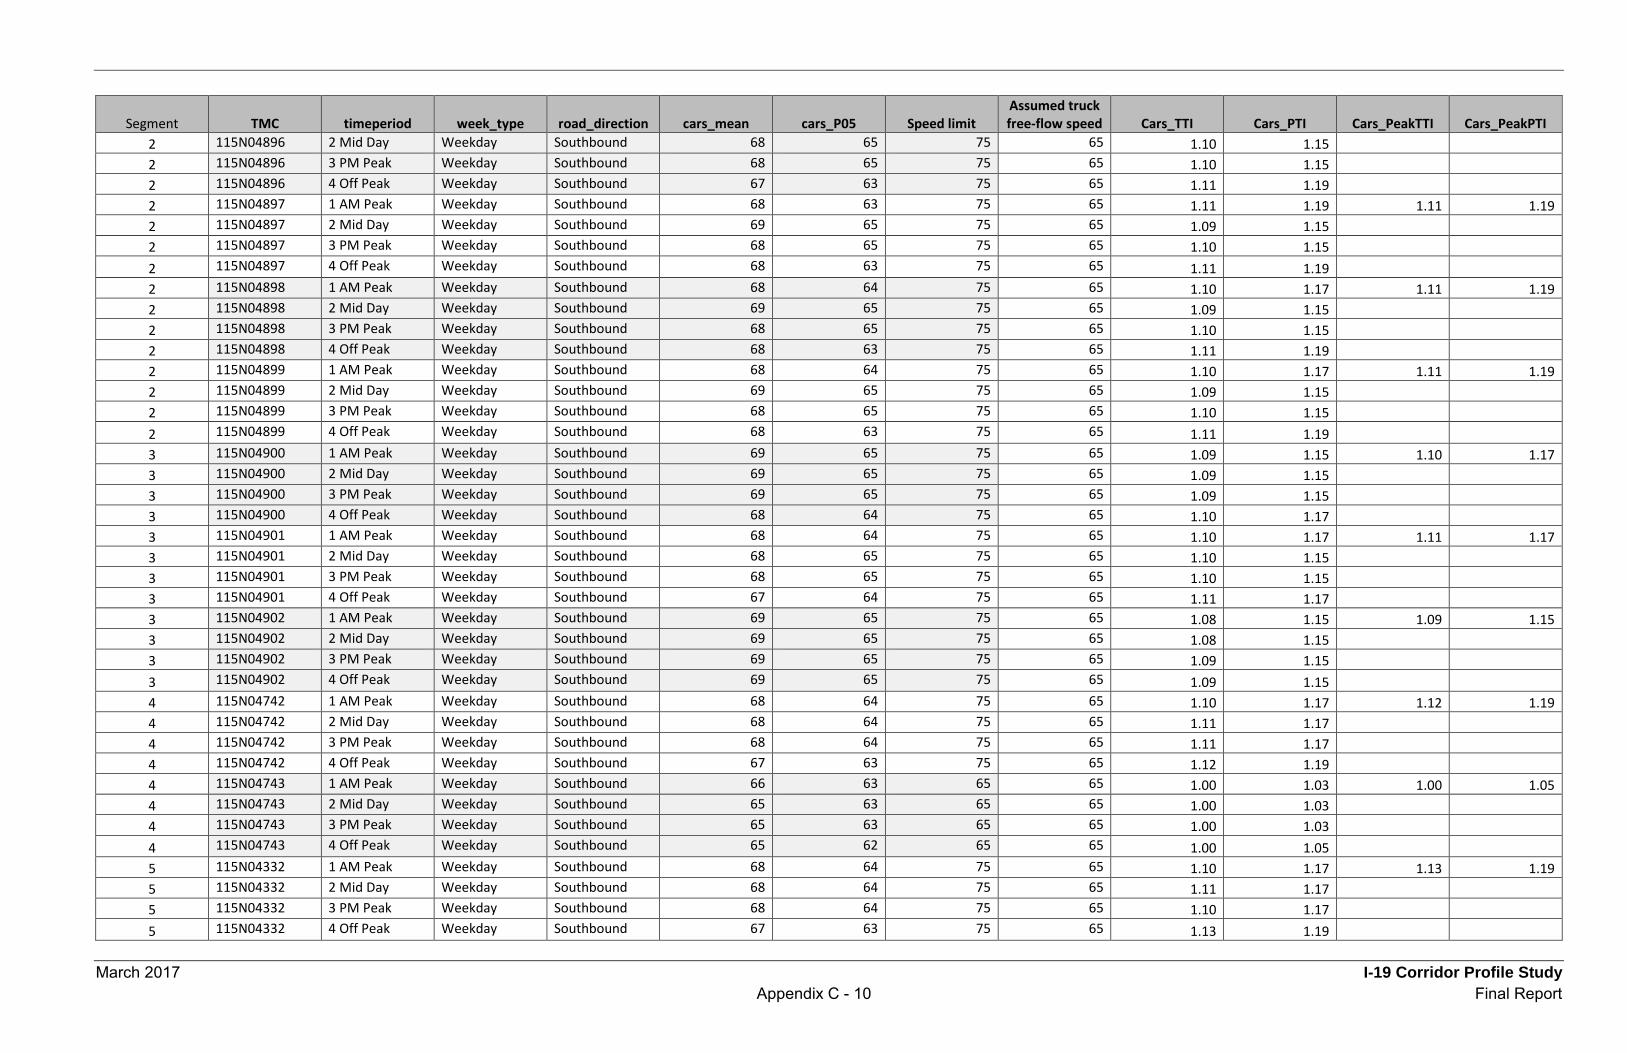
March 2017 I-19 Corridor Profile Study Appendix C - 10 Final Report
Segment TMC timeperiod week_type road_direction cars_mean cars_P05 Speed limit Assumed truck free-flow speed Cars_TTI Cars_PTI Cars_PeakTTI Cars_PeakPTI
2 115N04896 2 Mid Day Weekday Southbound 68 65 75 65 1.10 1.15 2 115N04896 3 PM Peak Weekday Southbound 68 65 75 65 1.10 1.15 2 115N04896 4 Off Peak Weekday Southbound 67 63 75 65 1.11 1.19 2 115N04897 1 AM Peak Weekday Southbound 68 63 75 65 1.11 1.19 1.11 1.19 2 115N04897 2 Mid Day Weekday Southbound 69 65 75 65 1.09 1.15 2 115N04897 3 PM Peak Weekday Southbound 68 65 75 65 1.10 1.15 2 115N04897 4 Off Peak Weekday Southbound 68 63 75 65 1.11 1.19 2 115N04898 1 AM Peak Weekday Southbound 68 64 75 65 1.10 1.17 1.11 1.19 2 115N04898 2 Mid Day Weekday Southbound 69 65 75 65 1.09 1.15 2 115N04898 3 PM Peak Weekday Southbound 68 65 75 65 1.10 1.15 2 115N04898 4 Off Peak Weekday Southbound 68 63 75 65 1.11 1.19 2 115N04899 1 AM Peak Weekday Southbound 68 64 75 65 1.10 1.17 1.11 1.19 2 115N04899 2 Mid Day Weekday Southbound 69 65 75 65 1.09 1.15 2 115N04899 3 PM Peak Weekday Southbound 68 65 75 65 1.10 1.15 2 115N04899 4 Off Peak Weekday Southbound 68 63 75 65 1.11 1.19 3 115N04900 1 AM Peak Weekday Southbound 69 65 75 65 1.09 1.15 1.10 1.17 3 115N04900 2 Mid Day Weekday Southbound 69 65 75 65 1.09 1.15 3 115N04900 3 PM Peak Weekday Southbound 69 65 75 65 1.09 1.15 3 115N04900 4 Off Peak Weekday Southbound 68 64 75 65 1.10 1.17 3 115N04901 1 AM Peak Weekday Southbound 68 64 75 65 1.10 1.17 1.11 1.17 3 115N04901 2 Mid Day Weekday Southbound 68 65 75 65 1.10 1.15 3 115N04901 3 PM Peak Weekday Southbound 68 65 75 65 1.10 1.15 3 115N04901 4 Off Peak Weekday Southbound 67 64 75 65 1.11 1.17 3 115N04902 1 AM Peak Weekday Southbound 69 65 75 65 1.08 1.15 1.09 1.15 3 115N04902 2 Mid Day Weekday Southbound 69 65 75 65 1.08 1.15 3 115N04902 3 PM Peak Weekday Southbound 69 65 75 65 1.09 1.15 3 115N04902 4 Off Peak Weekday Southbound 69 65 75 65 1.09 1.15 4 115N04742 1 AM Peak Weekday Southbound 68 64 75 65 1.10 1.17 1.12 1.19 4 115N04742 2 Mid Day Weekday Southbound 68 64 75 65 1.11 1.17 4 115N04742 3 PM Peak Weekday Southbound 68 64 75 65 1.11 1.17 4 115N04742 4 Off Peak Weekday Southbound 67 63 75 65 1.12 1.19 4 115N04743 1 AM Peak Weekday Southbound 66 63 65 65 1.00 1.03 1.00 1.05 4 115N04743 2 Mid Day Weekday Southbound 65 63 65 65 1.00 1.03 4 115N04743 3 PM Peak Weekday Southbound 65 63 65 65 1.00 1.03 4 115N04743 4 Off Peak Weekday Southbound 65 62 65 65 1.00 1.05 5 115N04332 1 AM Peak Weekday Southbound 68 64 75 65 1.10 1.17 1.13 1.19 5 115N04332 2 Mid Day Weekday Southbound 68 64 75 65 1.11 1.17 5 115N04332 3 PM Peak Weekday Southbound 68 64 75 65 1.10 1.17 5 115N04332 4 Off Peak Weekday Southbound 67 63 75 65 1.13 1.19
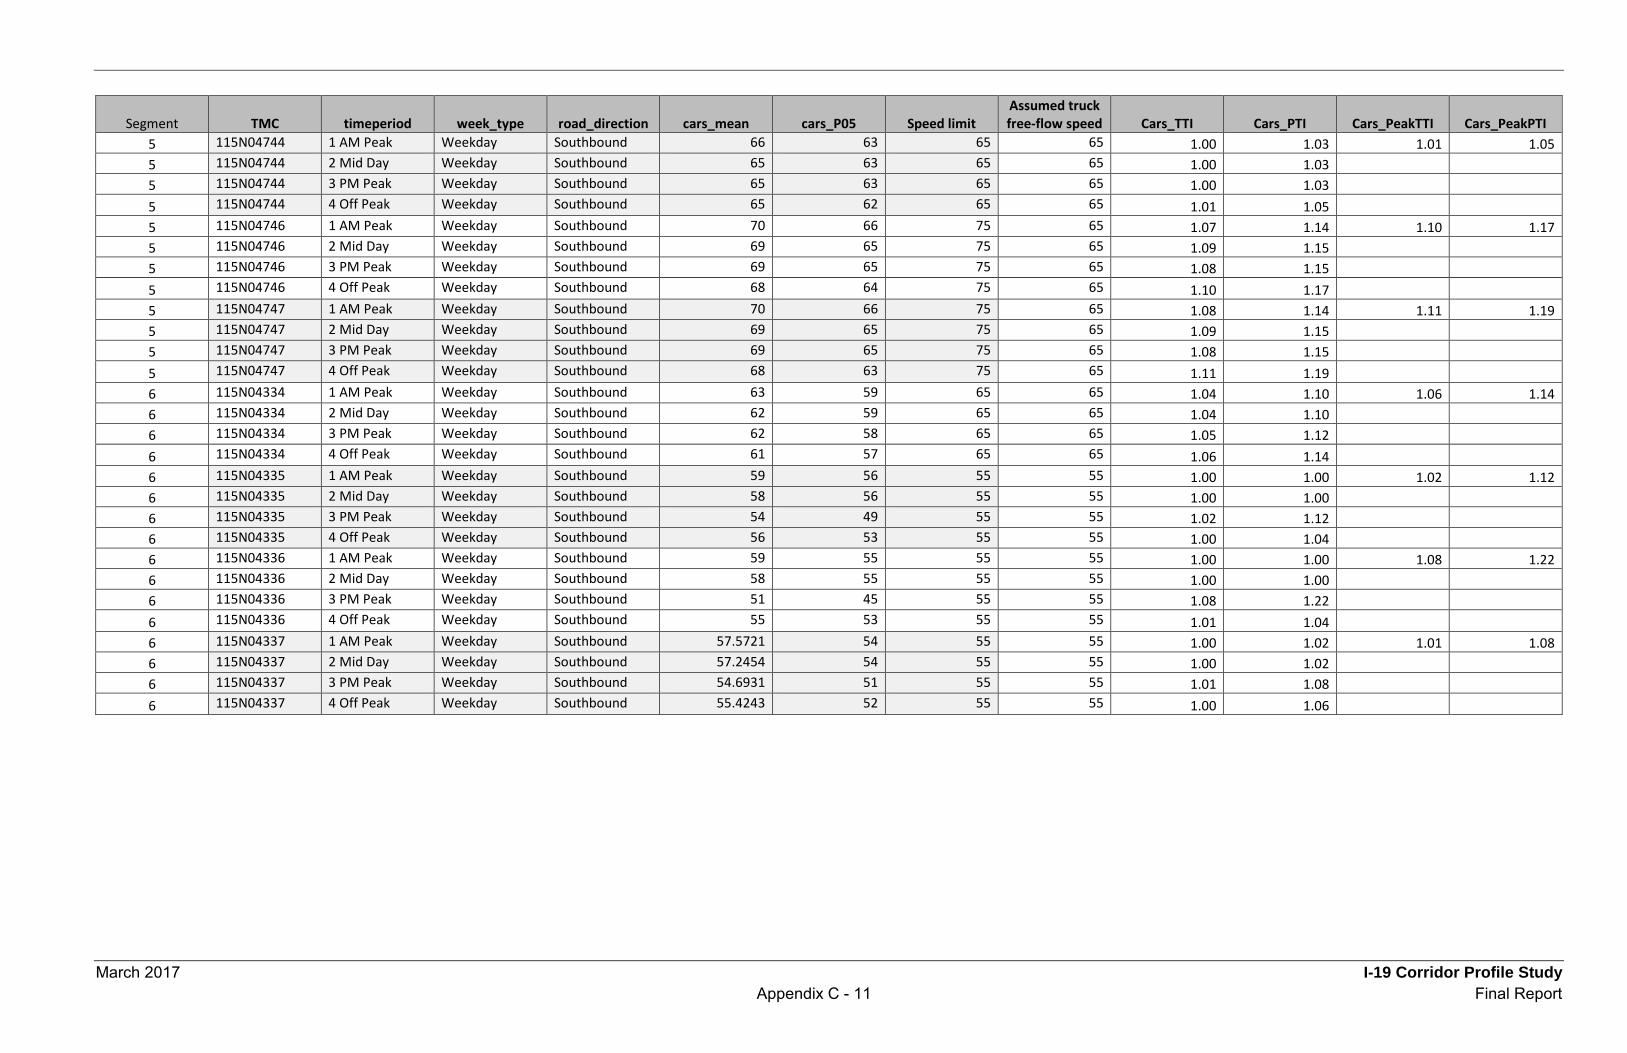
March 2017 I-19 Corridor Profile Study Appendix C - 11 Final Report
Segment TMC timeperiod week_type road_direction cars_mean cars_P05 Speed limit Assumed truck free-flow speed Cars_TTI Cars_PTI Cars_PeakTTI Cars_PeakPTI
5 115N04744 1 AM Peak Weekday Southbound 66 63 65 65 1.00 1.03 1.01 1.05 5 115N04744 2 Mid Day Weekday Southbound 65 63 65 65 1.00 1.03 5 115N04744 3 PM Peak Weekday Southbound 65 63 65 65 1.00 1.03 5 115N04744 4 Off Peak Weekday Southbound 65 62 65 65 1.01 1.05 5 115N04746 1 AM Peak Weekday Southbound 70 66 75 65 1.07 1.14 1.10 1.17 5 115N04746 2 Mid Day Weekday Southbound 69 65 75 65 1.09 1.15 5 115N04746 3 PM Peak Weekday Southbound 69 65 75 65 1.08 1.15 5 115N04746 4 Off Peak Weekday Southbound 68 64 75 65 1.10 1.17 5 115N04747 1 AM Peak Weekday Southbound 70 66 75 65 1.08 1.14 1.11 1.19 5 115N04747 2 Mid Day Weekday Southbound 69 65 75 65 1.09 1.15 5 115N04747 3 PM Peak Weekday Southbound 69 65 75 65 1.08 1.15 5 115N04747 4 Off Peak Weekday Southbound 68 63 75 65 1.11 1.19 6 115N04334 1 AM Peak Weekday Southbound 63 59 65 65 1.04 1.10 1.06 1.14 6 115N04334 2 Mid Day Weekday Southbound 62 59 65 65 1.04 1.10 6 115N04334 3 PM Peak Weekday Southbound 62 58 65 65 1.05 1.12 6 115N04334 4 Off Peak Weekday Southbound 61 57 65 65 1.06 1.14 6 115N04335 1 AM Peak Weekday Southbound 59 56 55 55 1.00 1.00 1.02 1.12 6 115N04335 2 Mid Day Weekday Southbound 58 56 55 55 1.00 1.00 6 115N04335 3 PM Peak Weekday Southbound 54 49 55 55 1.02 1.12 6 115N04335 4 Off Peak Weekday Southbound 56 53 55 55 1.00 1.04 6 115N04336 1 AM Peak Weekday Southbound 59 55 55 55 1.00 1.00 1.08 1.22 6 115N04336 2 Mid Day Weekday Southbound 58 55 55 55 1.00 1.00 6 115N04336 3 PM Peak Weekday Southbound 51 45 55 55 1.08 1.22 6 115N04336 4 Off Peak Weekday Southbound 55 53 55 55 1.01 1.04 6 115N04337 1 AM Peak Weekday Southbound 57.5721 54 55 55 1.00 1.02 1.01 1.08 6 115N04337 2 Mid Day Weekday Southbound 57.2454 54 55 55 1.00 1.02 6 115N04337 3 PM Peak Weekday Southbound 54.6931 51 55 55 1.01 1.08 6 115N04337 4 Off Peak Weekday Southbound 55.4243 52 55 55 1.00 1.06
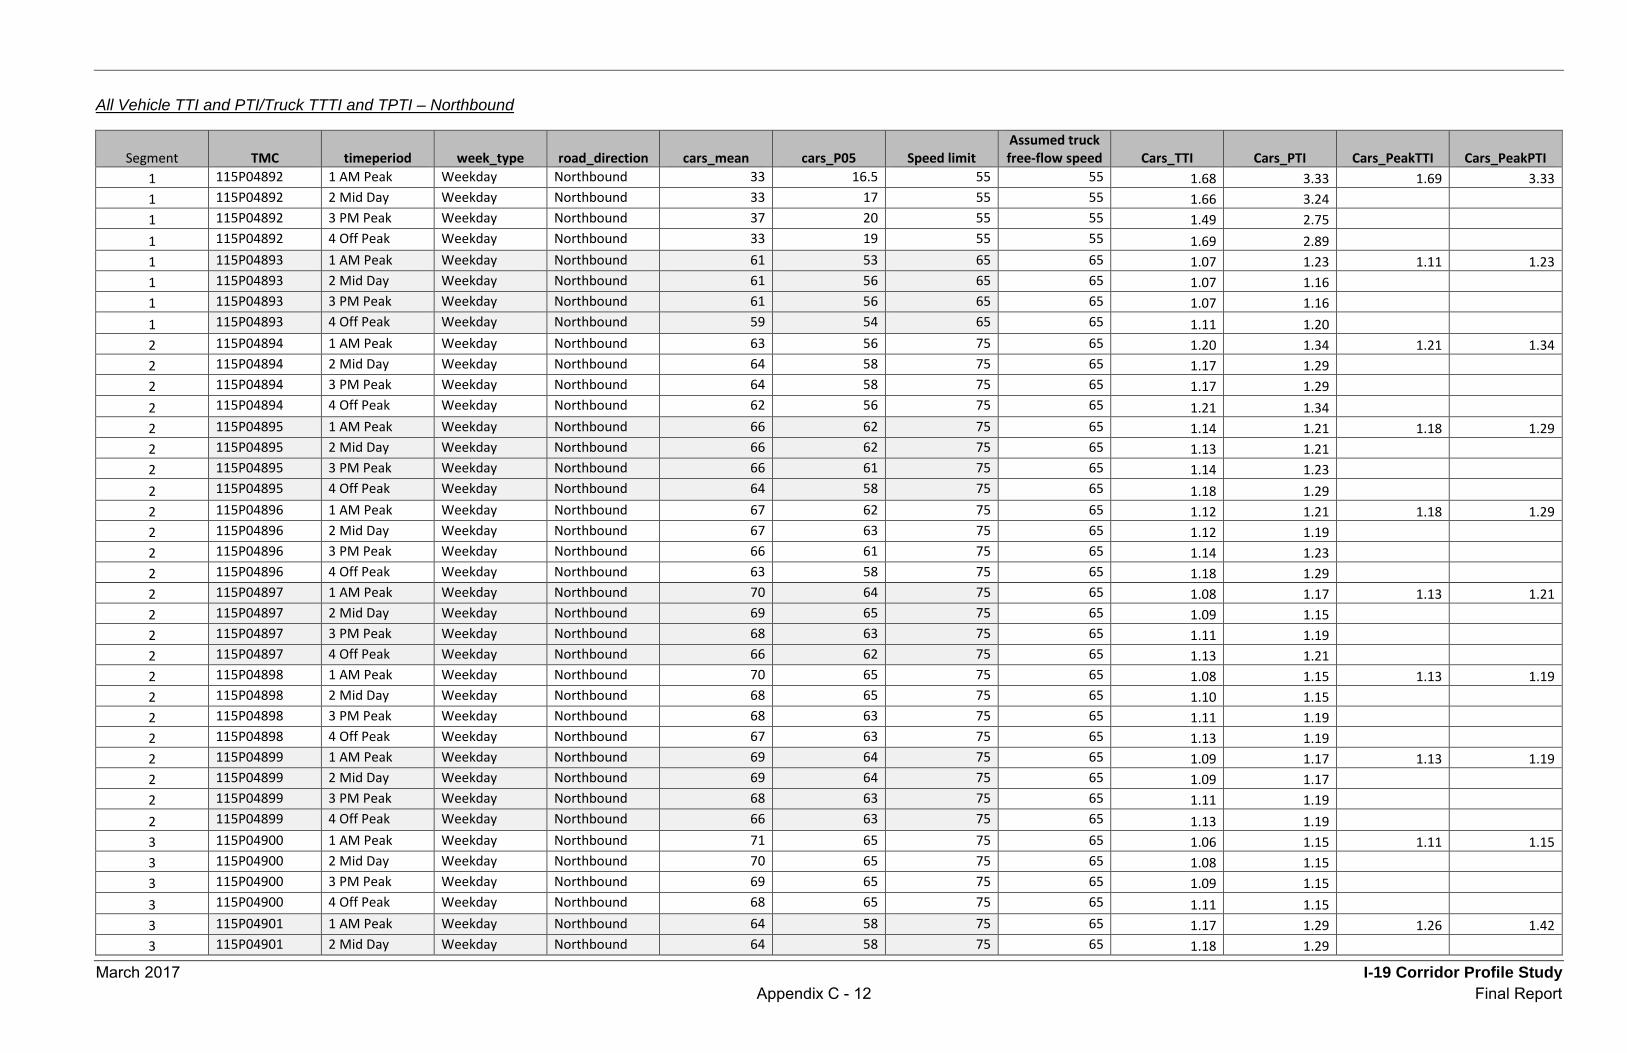
March 2017 I-19 Corridor Profile Study Appendix C - 12 Final Report
All Vehicle TTI and PTI/Truck TTTI and TPTI – Northbound
Segment TMC timeperiod week_type road_direction cars_mean cars_P05 Speed limit Assumed truck free-flow speed Cars_TTI Cars_PTI Cars_PeakTTI Cars_PeakPTI
1 115P04892 1 AM Peak Weekday Northbound 33 16.5 55 55 1.68 3.33 1.69 3.33 1 115P04892 2 Mid Day Weekday Northbound 33 17 55 55 1.66 3.24 1 115P04892 3 PM Peak Weekday Northbound 37 20 55 55 1.49 2.75 1 115P04892 4 Off Peak Weekday Northbound 33 19 55 55 1.69 2.89 1 115P04893 1 AM Peak Weekday Northbound 61 53 65 65 1.07 1.23 1.11 1.23 1 115P04893 2 Mid Day Weekday Northbound 61 56 65 65 1.07 1.16 1 115P04893 3 PM Peak Weekday Northbound 61 56 65 65 1.07 1.16 1 115P04893 4 Off Peak Weekday Northbound 59 54 65 65 1.11 1.20 2 115P04894 1 AM Peak Weekday Northbound 63 56 75 65 1.20 1.34 1.21 1.34 2 115P04894 2 Mid Day Weekday Northbound 64 58 75 65 1.17 1.29 2 115P04894 3 PM Peak Weekday Northbound 64 58 75 65 1.17 1.29 2 115P04894 4 Off Peak Weekday Northbound 62 56 75 65 1.21 1.34 2 115P04895 1 AM Peak Weekday Northbound 66 62 75 65 1.14 1.21 1.18 1.29 2 115P04895 2 Mid Day Weekday Northbound 66 62 75 65 1.13 1.21 2 115P04895 3 PM Peak Weekday Northbound 66 61 75 65 1.14 1.23 2 115P04895 4 Off Peak Weekday Northbound 64 58 75 65 1.18 1.29 2 115P04896 1 AM Peak Weekday Northbound 67 62 75 65 1.12 1.21 1.18 1.29 2 115P04896 2 Mid Day Weekday Northbound 67 63 75 65 1.12 1.19 2 115P04896 3 PM Peak Weekday Northbound 66 61 75 65 1.14 1.23 2 115P04896 4 Off Peak Weekday Northbound 63 58 75 65 1.18 1.29 2 115P04897 1 AM Peak Weekday Northbound 70 64 75 65 1.08 1.17 1.13 1.21 2 115P04897 2 Mid Day Weekday Northbound 69 65 75 65 1.09 1.15 2 115P04897 3 PM Peak Weekday Northbound 68 63 75 65 1.11 1.19 2 115P04897 4 Off Peak Weekday Northbound 66 62 75 65 1.13 1.21 2 115P04898 1 AM Peak Weekday Northbound 70 65 75 65 1.08 1.15 1.13 1.19 2 115P04898 2 Mid Day Weekday Northbound 68 65 75 65 1.10 1.15 2 115P04898 3 PM Peak Weekday Northbound 68 63 75 65 1.11 1.19 2 115P04898 4 Off Peak Weekday Northbound 67 63 75 65 1.13 1.19 2 115P04899 1 AM Peak Weekday Northbound 69 64 75 65 1.09 1.17 1.13 1.19 2 115P04899 2 Mid Day Weekday Northbound 69 64 75 65 1.09 1.17 2 115P04899 3 PM Peak Weekday Northbound 68 63 75 65 1.11 1.19 2 115P04899 4 Off Peak Weekday Northbound 66 63 75 65 1.13 1.19 3 115P04900 1 AM Peak Weekday Northbound 71 65 75 65 1.06 1.15 1.11 1.15 3 115P04900 2 Mid Day Weekday Northbound 70 65 75 65 1.08 1.15 3 115P04900 3 PM Peak Weekday Northbound 69 65 75 65 1.09 1.15 3 115P04900 4 Off Peak Weekday Northbound 68 65 75 65 1.11 1.15 3 115P04901 1 AM Peak Weekday Northbound 64 58 75 65 1.17 1.29 1.26 1.42 3 115P04901 2 Mid Day Weekday Northbound 64 58 75 65 1.18 1.29
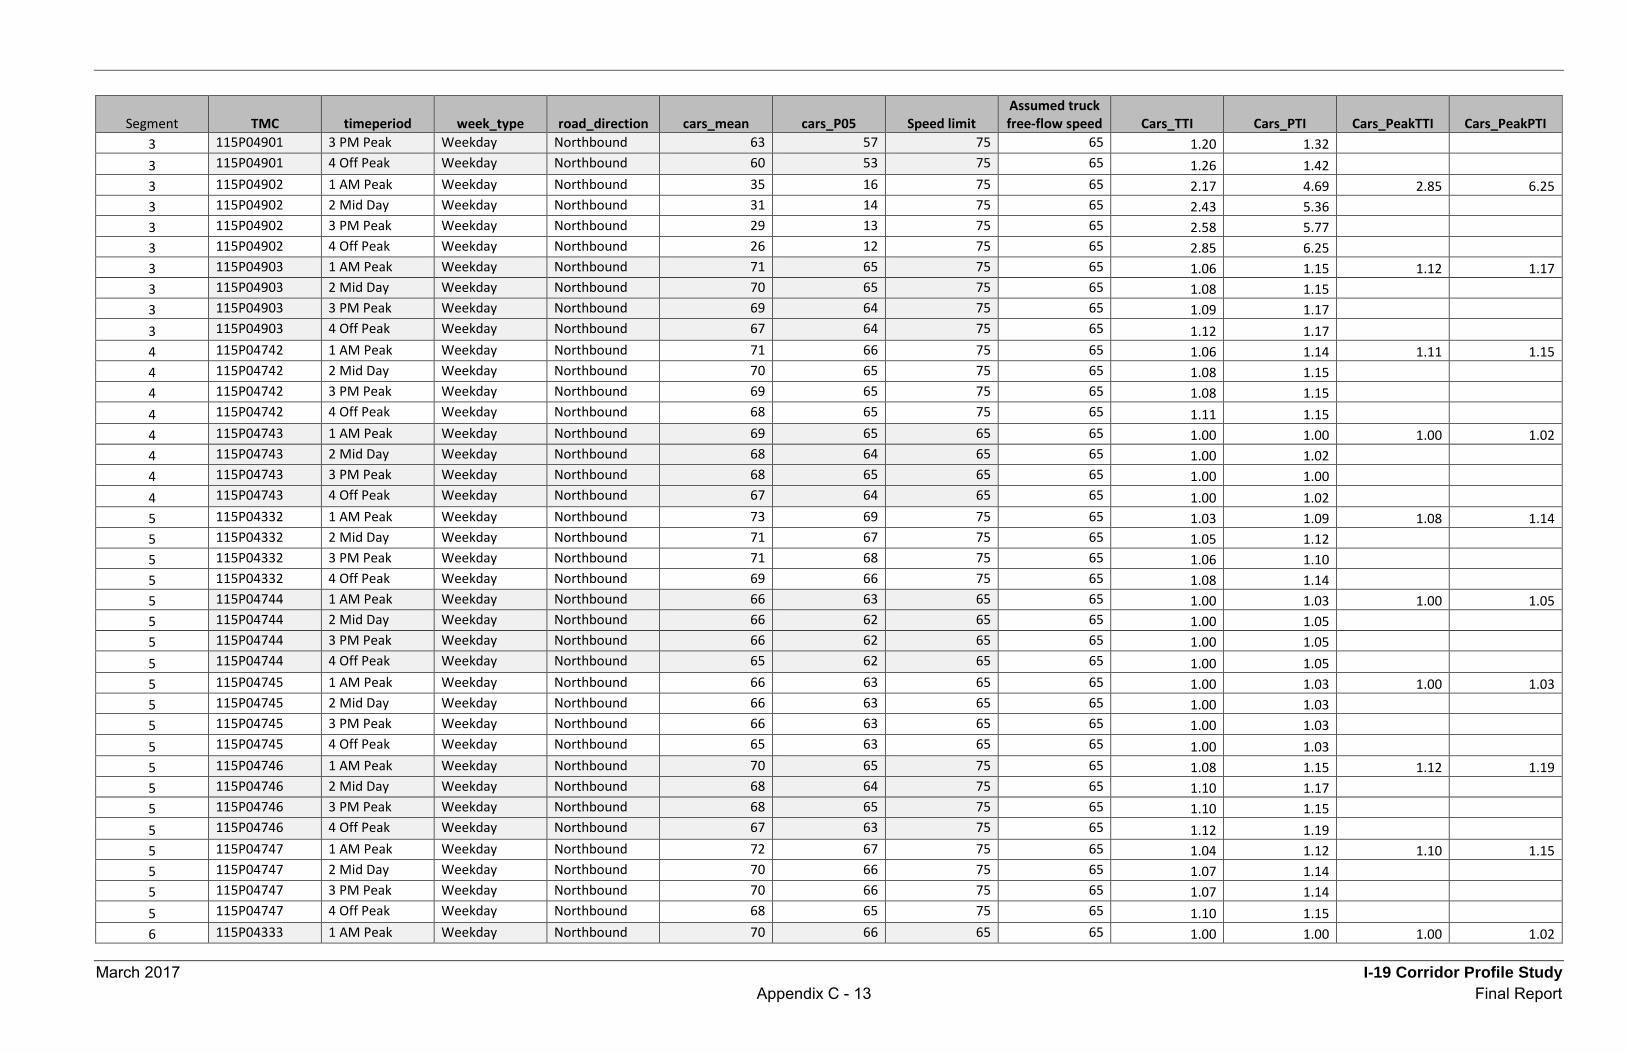
March 2017 I-19 Corridor Profile Study Appendix C - 13 Final Report
Segment TMC timeperiod week_type road_direction cars_mean cars_P05 Speed limit Assumed truck free-flow speed Cars_TTI Cars_PTI Cars_PeakTTI Cars_PeakPTI
3 115P04901 3 PM Peak Weekday Northbound 63 57 75 65 1.20 1.32 3 115P04901 4 Off Peak Weekday Northbound 60 53 75 65 1.26 1.42 3 115P04902 1 AM Peak Weekday Northbound 35 16 75 65 2.17 4.69 2.85 6.25 3 115P04902 2 Mid Day Weekday Northbound 31 14 75 65 2.43 5.36 3 115P04902 3 PM Peak Weekday Northbound 29 13 75 65 2.58 5.77 3 115P04902 4 Off Peak Weekday Northbound 26 12 75 65 2.85 6.25 3 115P04903 1 AM Peak Weekday Northbound 71 65 75 65 1.06 1.15 1.12 1.17 3 115P04903 2 Mid Day Weekday Northbound 70 65 75 65 1.08 1.15 3 115P04903 3 PM Peak Weekday Northbound 69 64 75 65 1.09 1.17 3 115P04903 4 Off Peak Weekday Northbound 67 64 75 65 1.12 1.17 4 115P04742 1 AM Peak Weekday Northbound 71 66 75 65 1.06 1.14 1.11 1.15 4 115P04742 2 Mid Day Weekday Northbound 70 65 75 65 1.08 1.15 4 115P04742 3 PM Peak Weekday Northbound 69 65 75 65 1.08 1.15 4 115P04742 4 Off Peak Weekday Northbound 68 65 75 65 1.11 1.15 4 115P04743 1 AM Peak Weekday Northbound 69 65 65 65 1.00 1.00 1.00 1.02 4 115P04743 2 Mid Day Weekday Northbound 68 64 65 65 1.00 1.02 4 115P04743 3 PM Peak Weekday Northbound 68 65 65 65 1.00 1.00 4 115P04743 4 Off Peak Weekday Northbound 67 64 65 65 1.00 1.02 5 115P04332 1 AM Peak Weekday Northbound 73 69 75 65 1.03 1.09 1.08 1.14 5 115P04332 2 Mid Day Weekday Northbound 71 67 75 65 1.05 1.12 5 115P04332 3 PM Peak Weekday Northbound 71 68 75 65 1.06 1.10 5 115P04332 4 Off Peak Weekday Northbound 69 66 75 65 1.08 1.14 5 115P04744 1 AM Peak Weekday Northbound 66 63 65 65 1.00 1.03 1.00 1.05 5 115P04744 2 Mid Day Weekday Northbound 66 62 65 65 1.00 1.05 5 115P04744 3 PM Peak Weekday Northbound 66 62 65 65 1.00 1.05 5 115P04744 4 Off Peak Weekday Northbound 65 62 65 65 1.00 1.05 5 115P04745 1 AM Peak Weekday Northbound 66 63 65 65 1.00 1.03 1.00 1.03 5 115P04745 2 Mid Day Weekday Northbound 66 63 65 65 1.00 1.03 5 115P04745 3 PM Peak Weekday Northbound 66 63 65 65 1.00 1.03 5 115P04745 4 Off Peak Weekday Northbound 65 63 65 65 1.00 1.03 5 115P04746 1 AM Peak Weekday Northbound 70 65 75 65 1.08 1.15 1.12 1.19 5 115P04746 2 Mid Day Weekday Northbound 68 64 75 65 1.10 1.17 5 115P04746 3 PM Peak Weekday Northbound 68 65 75 65 1.10 1.15 5 115P04746 4 Off Peak Weekday Northbound 67 63 75 65 1.12 1.19 5 115P04747 1 AM Peak Weekday Northbound 72 67 75 65 1.04 1.12 1.10 1.15 5 115P04747 2 Mid Day Weekday Northbound 70 66 75 65 1.07 1.14 5 115P04747 3 PM Peak Weekday Northbound 70 66 75 65 1.07 1.14 5 115P04747 4 Off Peak Weekday Northbound 68 65 75 65 1.10 1.15 6 115P04333 1 AM Peak Weekday Northbound 70 66 65 65 1.00 1.00 1.00 1.02
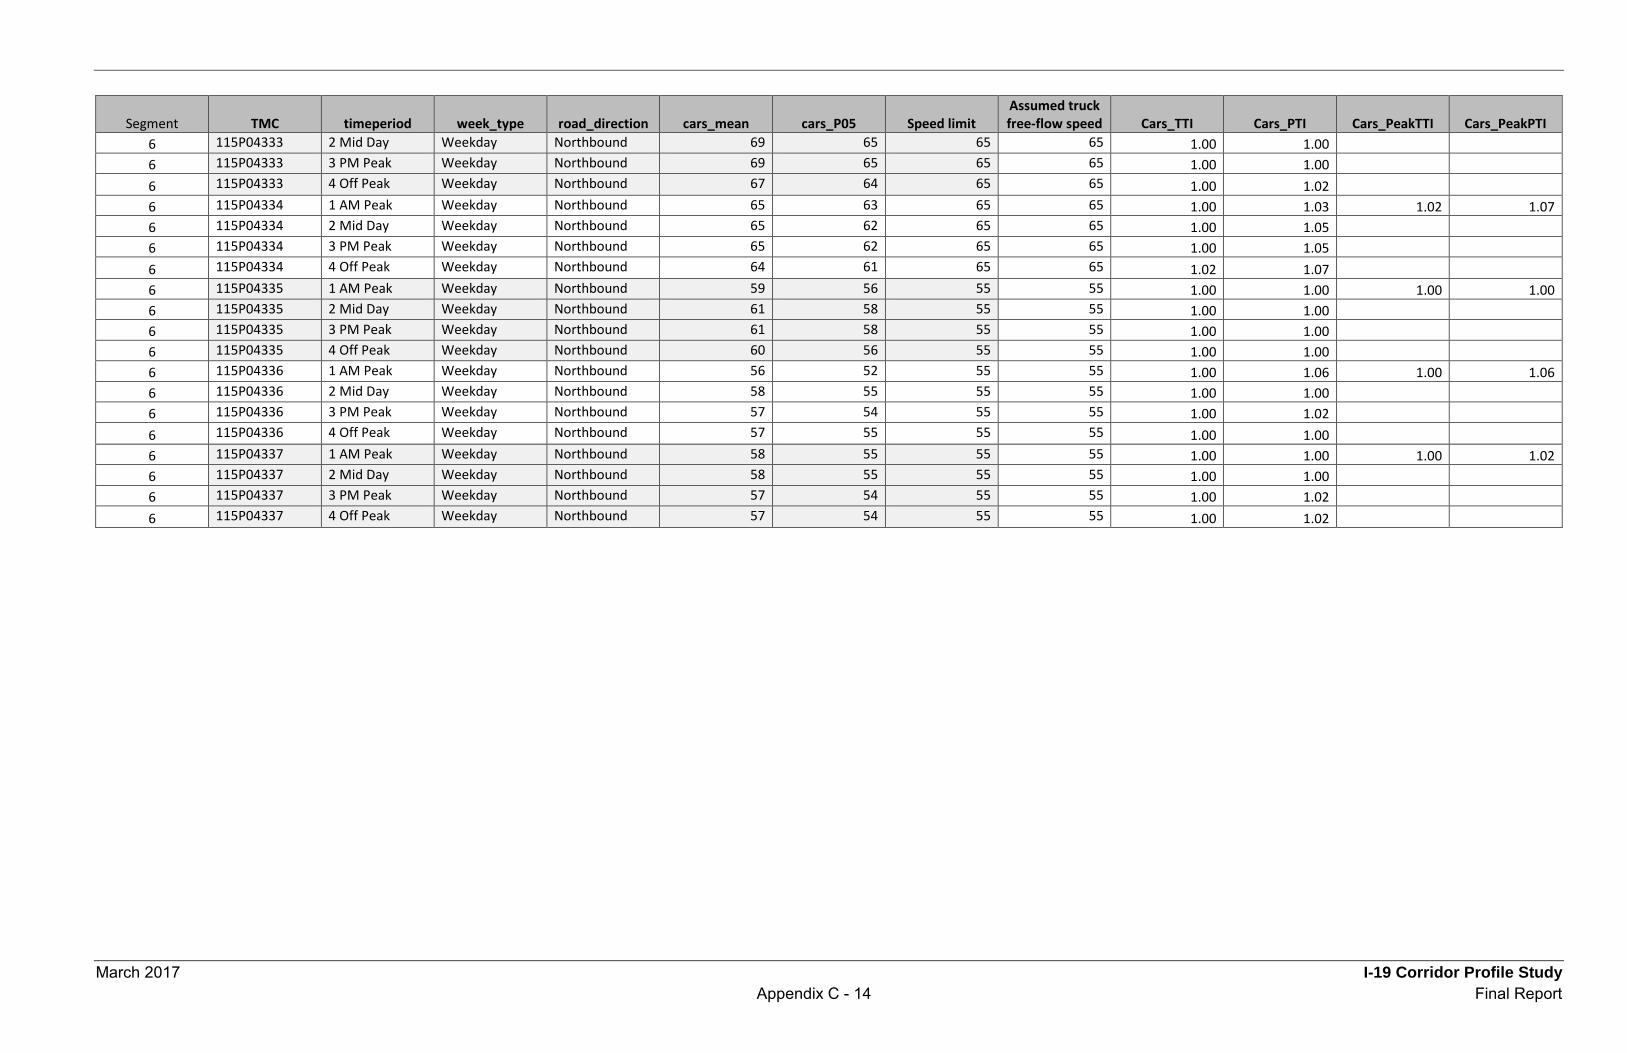
March 2017 I-19 Corridor Profile Study Appendix C - 14 Final Report
Segment TMC timeperiod week_type road_direction cars_mean cars_P05 Speed limit Assumed truck free-flow speed Cars_TTI Cars_PTI Cars_PeakTTI Cars_PeakPTI
6 115P04333 2 Mid Day Weekday Northbound 69 65 65 65 1.00 1.00 6 115P04333 3 PM Peak Weekday Northbound 69 65 65 65 1.00 1.00 6 115P04333 4 Off Peak Weekday Northbound 67 64 65 65 1.00 1.02 6 115P04334 1 AM Peak Weekday Northbound 65 63 65 65 1.00 1.03 1.02 1.07 6 115P04334 2 Mid Day Weekday Northbound 65 62 65 65 1.00 1.05 6 115P04334 3 PM Peak Weekday Northbound 65 62 65 65 1.00 1.05 6 115P04334 4 Off Peak Weekday Northbound 64 61 65 65 1.02 1.07 6 115P04335 1 AM Peak Weekday Northbound 59 56 55 55 1.00 1.00 1.00 1.00 6 115P04335 2 Mid Day Weekday Northbound 61 58 55 55 1.00 1.00 6 115P04335 3 PM Peak Weekday Northbound 61 58 55 55 1.00 1.00 6 115P04335 4 Off Peak Weekday Northbound 60 56 55 55 1.00 1.00 6 115P04336 1 AM Peak Weekday Northbound 56 52 55 55 1.00 1.06 1.00 1.06 6 115P04336 2 Mid Day Weekday Northbound 58 55 55 55 1.00 1.00 6 115P04336 3 PM Peak Weekday Northbound 57 54 55 55 1.00 1.02 6 115P04336 4 Off Peak Weekday Northbound 57 55 55 55 1.00 1.00 6 115P04337 1 AM Peak Weekday Northbound 58 55 55 55 1.00 1.00 1.00 1.02 6 115P04337 2 Mid Day Weekday Northbound 58 55 55 55 1.00 1.00 6 115P04337 3 PM Peak Weekday Northbound 57 54 55 55 1.00 1.02 6 115P04337 4 Off Peak Weekday Northbound 57 54 55 55 1.00 1.02
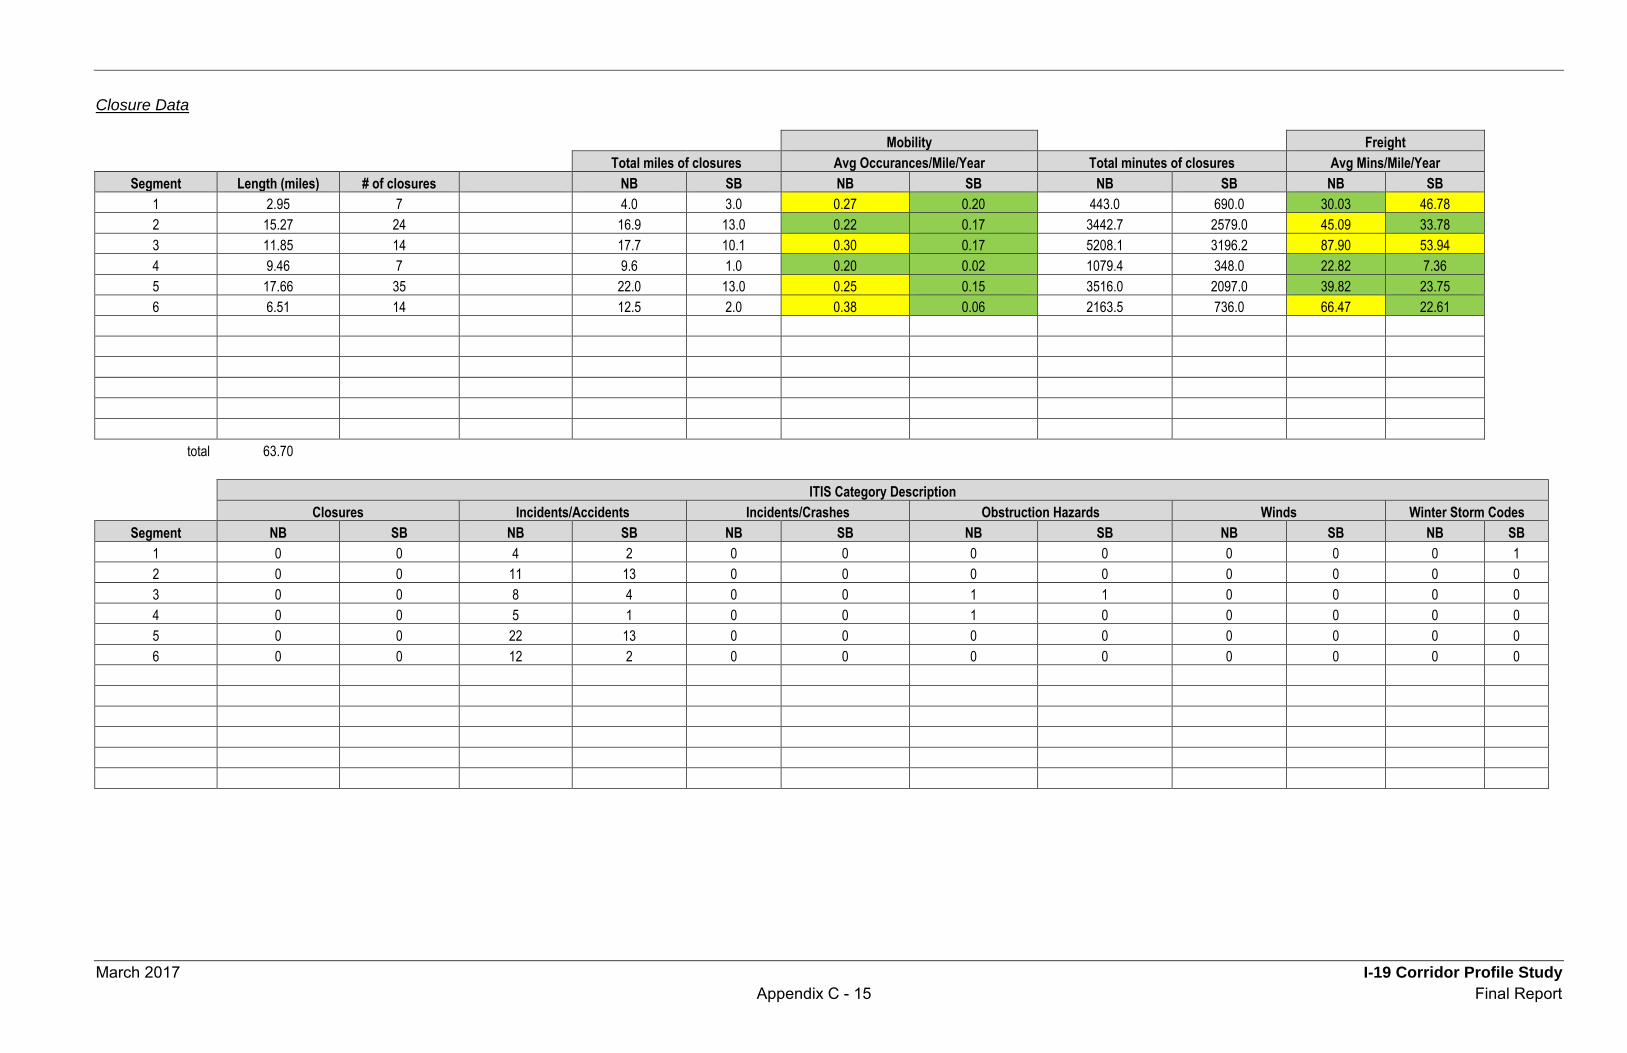
March 2017 I-19 Corridor Profile Study Appendix C - 15 Final Report
Closure Data
Mobility
Freight
Total miles of closures Avg Occurances/Mile/Year Total minutes of closures Avg Mins/Mile/Year Segment Length (miles) # of closures NB SB NB SB NB SB NB SB 1 2.95 7 4.0 3.0 0.27 0.20 443.0 690.0 30.03 46.78 2 15.27 24 16.9 13.0 0.22 0.17 3442.7 2579.0 45.09 33.78 3 11.85 14 17.7 10.1 0.30 0.17 5208.1 3196.2 87.90 53.94 4 9.46 7 9.6 1.0 0.20 0.02 1079.4 348.0 22.82 7.36 5 17.66 35 22.0 13.0 0.25 0.15 3516.0 2097.0 39.82 23.75 6 6.51 14 12.5 2.0 0.38 0.06 2163.5 736.0 66.47 22.61 total 63.70
ITIS Category Description
Closures Incidents/Accidents Incidents/Crashes Obstruction Hazards Winds Winter Storm Codes
Segment NB SB NB SB NB SB NB SB NB SB NB SB 1 0 0 4 2 0 0 0 0 0 0 0 1 2 0 0 11 13 0 0 0 0 0 0 0 0 3 0 0 8 4 0 0 1 1 0 0 0 0 4 0 0 5 1 0 0 1 0 0 0 0 0 5 0 0 22 13 0 0 0 0 0 0 0 0 6 0 0 12 2 0 0 0 0 0 0 0 0
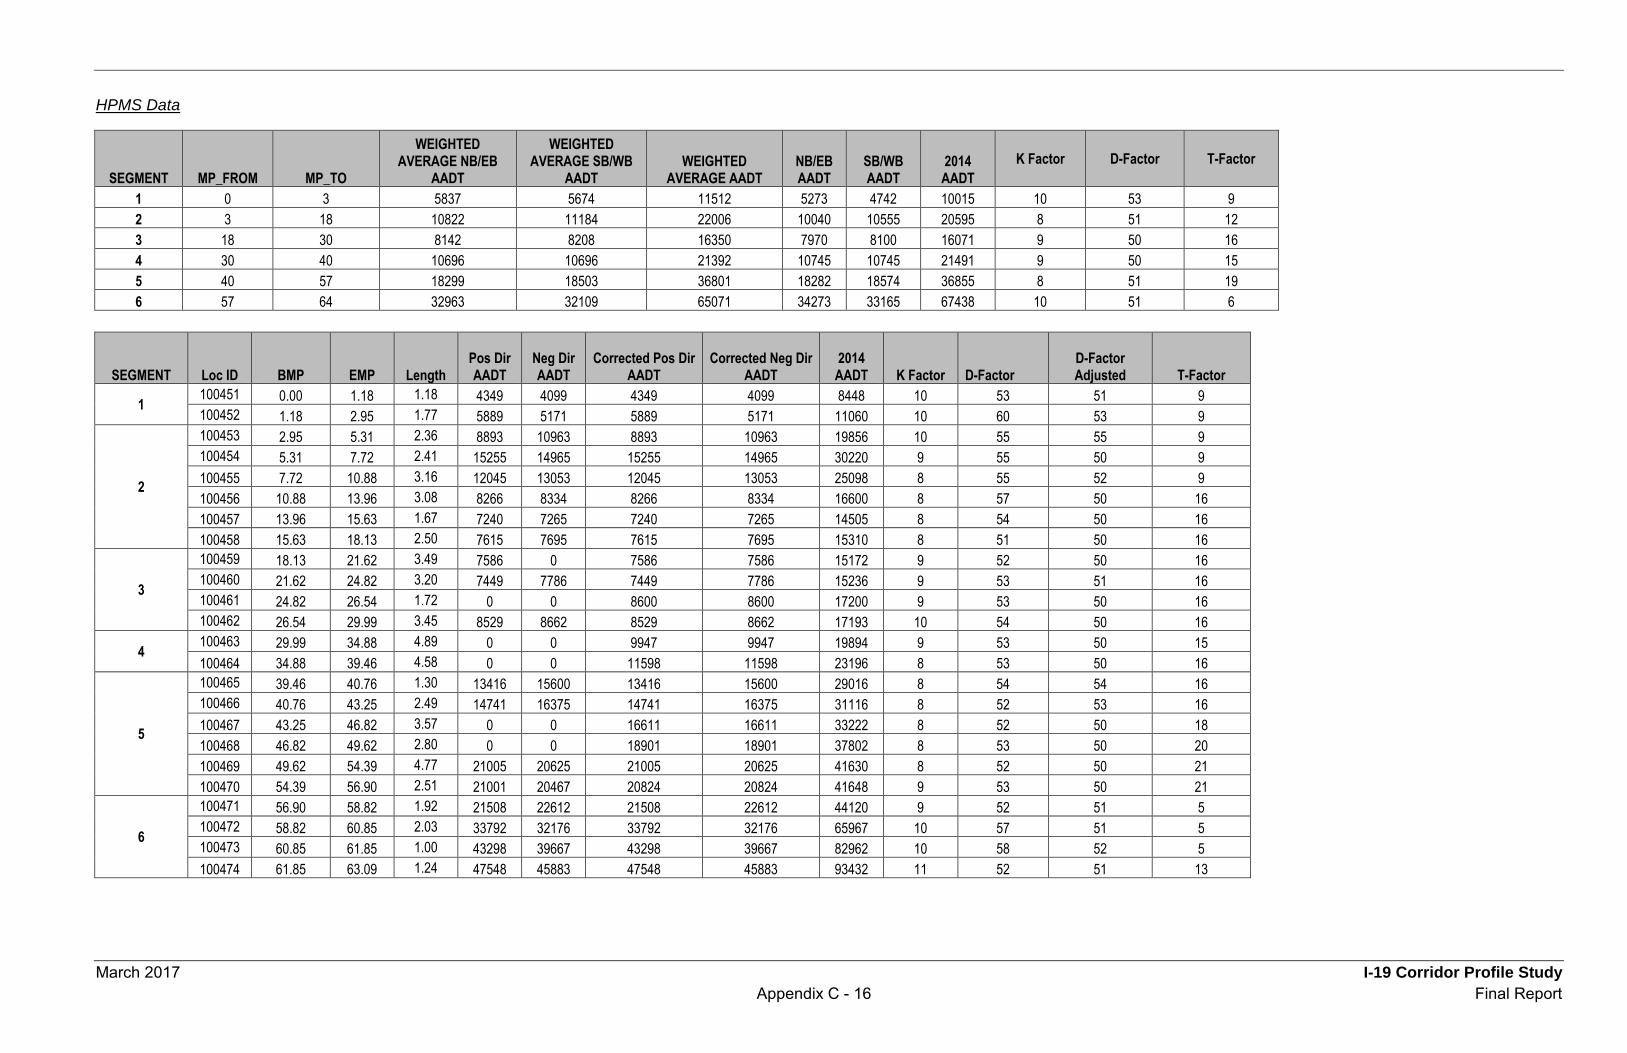
March 2017 I-19 Corridor Profile Study Appendix C - 16 Final Report
HPMS Data
SEGMENT MP_FROM MP_TO
WEIGHTED AVERAGE NB/EB
AADT
WEIGHTED AVERAGE SB/WB
AADT WEIGHTED
AVERAGE AADT NB/EB AADT
SB/WB AADT
2014 AADT
K Factor D-Factor T-Factor
1 0 3 5837 5674 11512 5273 4742 10015 10 53 9 2 3 18 10822 11184 22006 10040 10555 20595 8 51 12 3 18 30 8142 8208 16350 7970 8100 16071 9 50 16 4 30 40 10696 10696 21392 10745 10745 21491 9 50 15 5 40 57 18299 18503 36801 18282 18574 36855 8 51 19 6 57 64 32963 32109 65071 34273 33165 67438 10 51 6
SEGMENT Loc ID BMP EMP Length Pos Dir AADT
Neg Dir AADT
Corrected Pos Dir AADT
Corrected Neg Dir AADT
2014 AADT K Factor D-Factor
D-Factor Adjusted T-Factor
1 100451 0.00 1.18 1.18 4349 4099 4349 4099 8448 10 53 51 9 100452 1.18 2.95 1.77 5889 5171 5889 5171 11060 10 60 53 9
2
100453 2.95 5.31 2.36 8893 10963 8893 10963 19856 10 55 55 9 100454 5.31 7.72 2.41 15255 14965 15255 14965 30220 9 55 50 9 100455 7.72 10.88 3.16 12045 13053 12045 13053 25098 8 55 52 9 100456 10.88 13.96 3.08 8266 8334 8266 8334 16600 8 57 50 16 100457 13.96 15.63 1.67 7240 7265 7240 7265 14505 8 54 50 16 100458 15.63 18.13 2.50 7615 7695 7615 7695 15310 8 51 50 16
3
100459 18.13 21.62 3.49 7586 0 7586 7586 15172 9 52 50 16 100460 21.62 24.82 3.20 7449 7786 7449 7786 15236 9 53 51 16 100461 24.82 26.54 1.72 0 0 8600 8600 17200 9 53 50 16 100462 26.54 29.99 3.45 8529 8662 8529 8662 17193 10 54 50 16
4 100463 29.99 34.88 4.89 0 0 9947 9947 19894 9 53 50 15 100464 34.88 39.46 4.58 0 0 11598 11598 23196 8 53 50 16
5
100465 39.46 40.76 1.30 13416 15600 13416 15600 29016 8 54 54 16 100466 40.76 43.25 2.49 14741 16375 14741 16375 31116 8 52 53 16 100467 43.25 46.82 3.57 0 0 16611 16611 33222 8 52 50 18 100468 46.82 49.62 2.80 0 0 18901 18901 37802 8 53 50 20 100469 49.62 54.39 4.77 21005 20625 21005 20625 41630 8 52 50 21 100470 54.39 56.90 2.51 21001 20467 20824 20824 41648 9 53 50 21
6
100471 56.90 58.82 1.92 21508 22612 21508 22612 44120 9 52 51 5 100472 58.82 60.85 2.03 33792 32176 33792 32176 65967 10 57 51 5 100473 60.85 61.85 1.00 43298 39667 43298 39667 82962 10 58 52 5 100474 61.85 63.09 1.24 47548 45883 47548 45883 93432 11 52 51 13
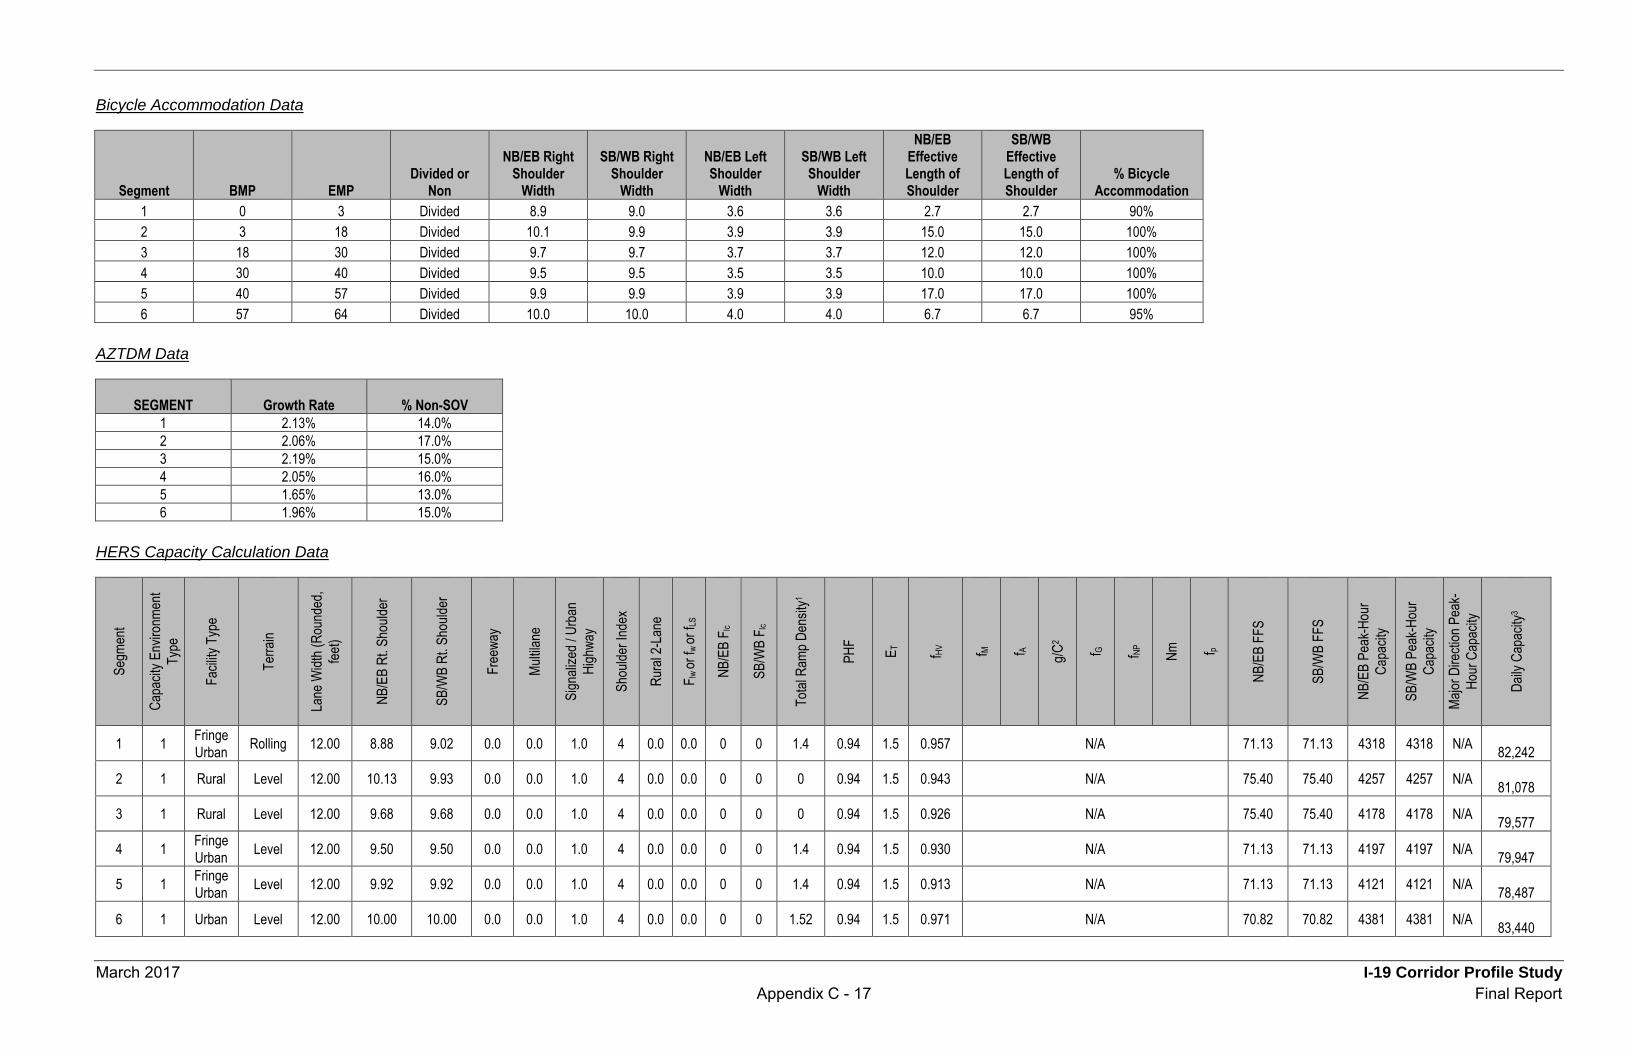
March 2017 I-19 Corridor Profile Study Appendix C - 17 Final Report
Bicycle Accommodation Data
Segment BMP EMP Divided or
Non
NB/EB Right Shoulder
Width
SB/WB Right Shoulder
Width
NB/EB Left Shoulder
Width
SB/WB Left Shoulder
Width
NB/EB Effective Length of Shoulder
SB/WB Effective Length of Shoulder
% Bicycle Accommodation
1 0 3 Divided 8.9 9.0 3.6 3.6 2.7 2.7 90% 2 3 18 Divided 10.1 9.9 3.9 3.9 15.0 15.0 100% 3 18 30 Divided 9.7 9.7 3.7 3.7 12.0 12.0 100% 4 30 40 Divided 9.5 9.5 3.5 3.5 10.0 10.0 100% 5 40 57 Divided 9.9 9.9 3.9 3.9 17.0 17.0 100% 6 57 64 Divided 10.0 10.0 4.0 4.0 6.7 6.7 95%
AZTDM Data
SEGMENT Growth Rate % Non-SOV 1 2.13% 14.0% 2 2.06% 17.0% 3 2.19% 15.0% 4 2.05% 16.0% 5 1.65% 13.0% 6 1.96% 15.0%
HERS Capacity Calculation Data
Segm
ent
Capa
city E
nviro
nmen
t Ty
pe
Facil
ity T
ype
Terra
in
Lane
Widt
h (Ro
unde
d, fee
t)
NB/E
B Rt
. Sho
ulder
SB/W
B Rt
. Sho
ulder
Free
way
Multil
ane
Sign
alize
d / U
rban
Hi
ghwa
y
Shou
lder I
ndex
Rura
l 2-L
ane
F lw or
f w or
f LS
NB/E
B F lc
SB/W
B F lc
Total
Ram
p Den
sity1
PHF
E T
f HV
f M f A g/C2
f G f NP
Nm
f p
NB/E
B FF
S
SB/W
B FF
S
NB/E
B Pe
ak-H
our
Capa
city
SB/W
B Pe
ak-H
our
Capa
city
Major
Dire
ction
Pea
k-Ho
ur C
apac
ity
Daily
Cap
acity
3
1 1 Fringe Urban Rolling 12.00 8.88 9.02 0.0 0.0 1.0 4 0.0 0.0 0 0 1.4 0.94 1.5 0.957 N/A 71.13 71.13 4318 4318 N/A
82,242 2 1 Rural Level 12.00 10.13 9.93 0.0 0.0 1.0 4 0.0 0.0 0 0 0 0.94 1.5 0.943 N/A 75.40 75.40 4257 4257 N/A
81,078 3 1 Rural Level 12.00 9.68 9.68 0.0 0.0 1.0 4 0.0 0.0 0 0 0 0.94 1.5 0.926 N/A 75.40 75.40 4178 4178 N/A
79,577 4 1 Fringe
Urban Level 12.00 9.50 9.50 0.0 0.0 1.0 4 0.0 0.0 0 0 1.4 0.94 1.5 0.930 N/A 71.13 71.13 4197 4197 N/A 79,947
5 1 Fringe Urban Level 12.00 9.92 9.92 0.0 0.0 1.0 4 0.0 0.0 0 0 1.4 0.94 1.5 0.913 N/A 71.13 71.13 4121 4121 N/A
78,487 6 1 Urban Level 12.00 10.00 10.00 0.0 0.0 1.0 4 0.0 0.0 0 0 1.52 0.94 1.5 0.971 N/A 70.82 70.82 4381 4381 N/A
83,440
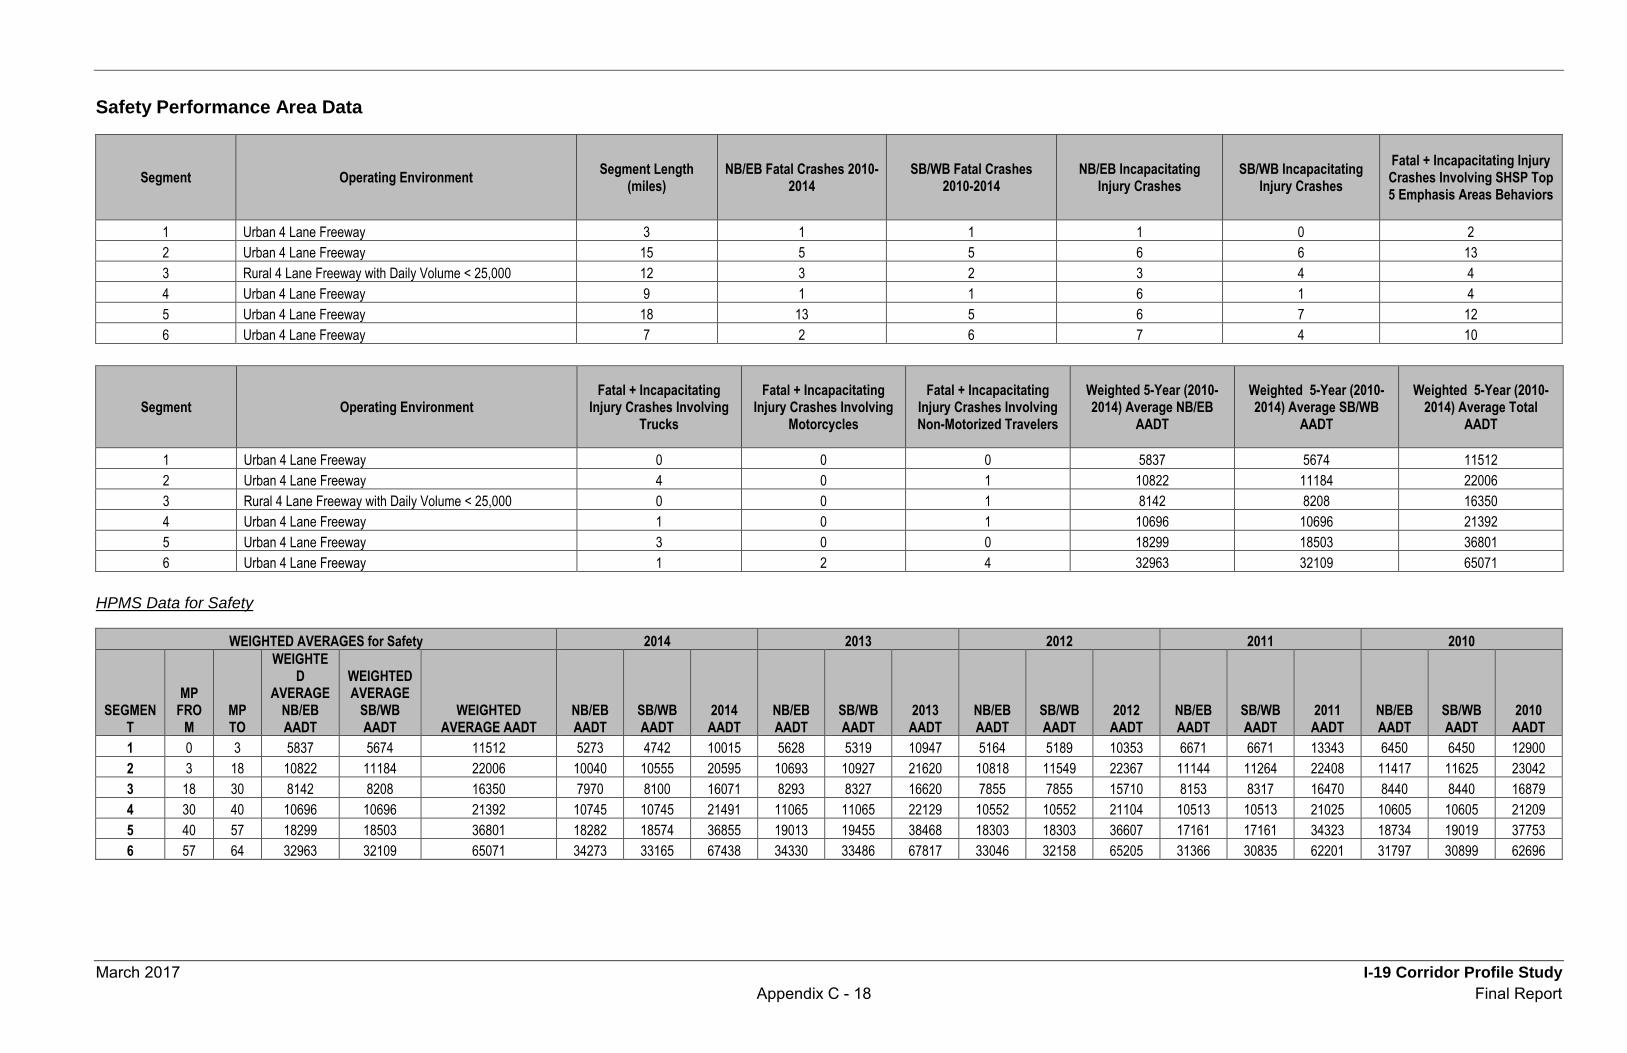
March 2017 I-19 Corridor Profile Study Appendix C - 18 Final Report
Safety Performance Area Data
Segment Operating Environment Segment Length (miles)
NB/EB Fatal Crashes 2010-2014
SB/WB Fatal Crashes 2010-2014
NB/EB Incapacitating Injury Crashes
SB/WB Incapacitating Injury Crashes
Fatal + Incapacitating Injury Crashes Involving SHSP Top 5 Emphasis Areas Behaviors
1 Urban 4 Lane Freeway 3 1 1 1 0 2 2 Urban 4 Lane Freeway 15 5 5 6 6 13 3 Rural 4 Lane Freeway with Daily Volume < 25,000 12 3 2 3 4 4 4 Urban 4 Lane Freeway 9 1 1 6 1 4 5 Urban 4 Lane Freeway 18 13 5 6 7 12 6 Urban 4 Lane Freeway 7 2 6 7 4 10
Segment Operating Environment Fatal + Incapacitating
Injury Crashes Involving Trucks
Fatal + Incapacitating Injury Crashes Involving
Motorcycles
Fatal + Incapacitating Injury Crashes Involving Non-Motorized Travelers
Weighted 5-Year (2010-2014) Average NB/EB
AADT
Weighted 5-Year (2010-2014) Average SB/WB
AADT
Weighted 5-Year (2010-2014) Average Total
AADT
1 Urban 4 Lane Freeway 0 0 0 5837 5674 11512 2 Urban 4 Lane Freeway 4 0 1 10822 11184 22006 3 Rural 4 Lane Freeway with Daily Volume < 25,000 0 0 1 8142 8208 16350 4 Urban 4 Lane Freeway 1 0 1 10696 10696 21392 5 Urban 4 Lane Freeway 3 0 0 18299 18503 36801 6 Urban 4 Lane Freeway 1 2 4 32963 32109 65071
HPMS Data for Safety
WEIGHTED AVERAGES for Safety 2014 2013 2012 2011 2010
SEGMENT
MP FRO
M MP TO
WEIGHTED
AVERAGE NB/EB AADT
WEIGHTED AVERAGE
SB/WB AADT
WEIGHTED AVERAGE AADT
NB/EB AADT
SB/WB AADT
2014 AADT
NB/EB AADT
SB/WB AADT
2013 AADT
NB/EB AADT
SB/WB AADT
2012 AADT
NB/EB AADT
SB/WB AADT
2011 AADT
NB/EB AADT
SB/WB AADT
2010 AADT
1 0 3 5837 5674 11512 5273 4742 10015 5628 5319 10947 5164 5189 10353 6671 6671 13343 6450 6450 12900 2 3 18 10822 11184 22006 10040 10555 20595 10693 10927 21620 10818 11549 22367 11144 11264 22408 11417 11625 23042 3 18 30 8142 8208 16350 7970 8100 16071 8293 8327 16620 7855 7855 15710 8153 8317 16470 8440 8440 16879 4 30 40 10696 10696 21392 10745 10745 21491 11065 11065 22129 10552 10552 21104 10513 10513 21025 10605 10605 21209 5 40 57 18299 18503 36801 18282 18574 36855 19013 19455 38468 18303 18303 36607 17161 17161 34323 18734 19019 37753 6 57 64 32963 32109 65071 34273 33165 67438 34330 33486 67817 33046 32158 65205 31366 30835 62201 31797 30899 62696
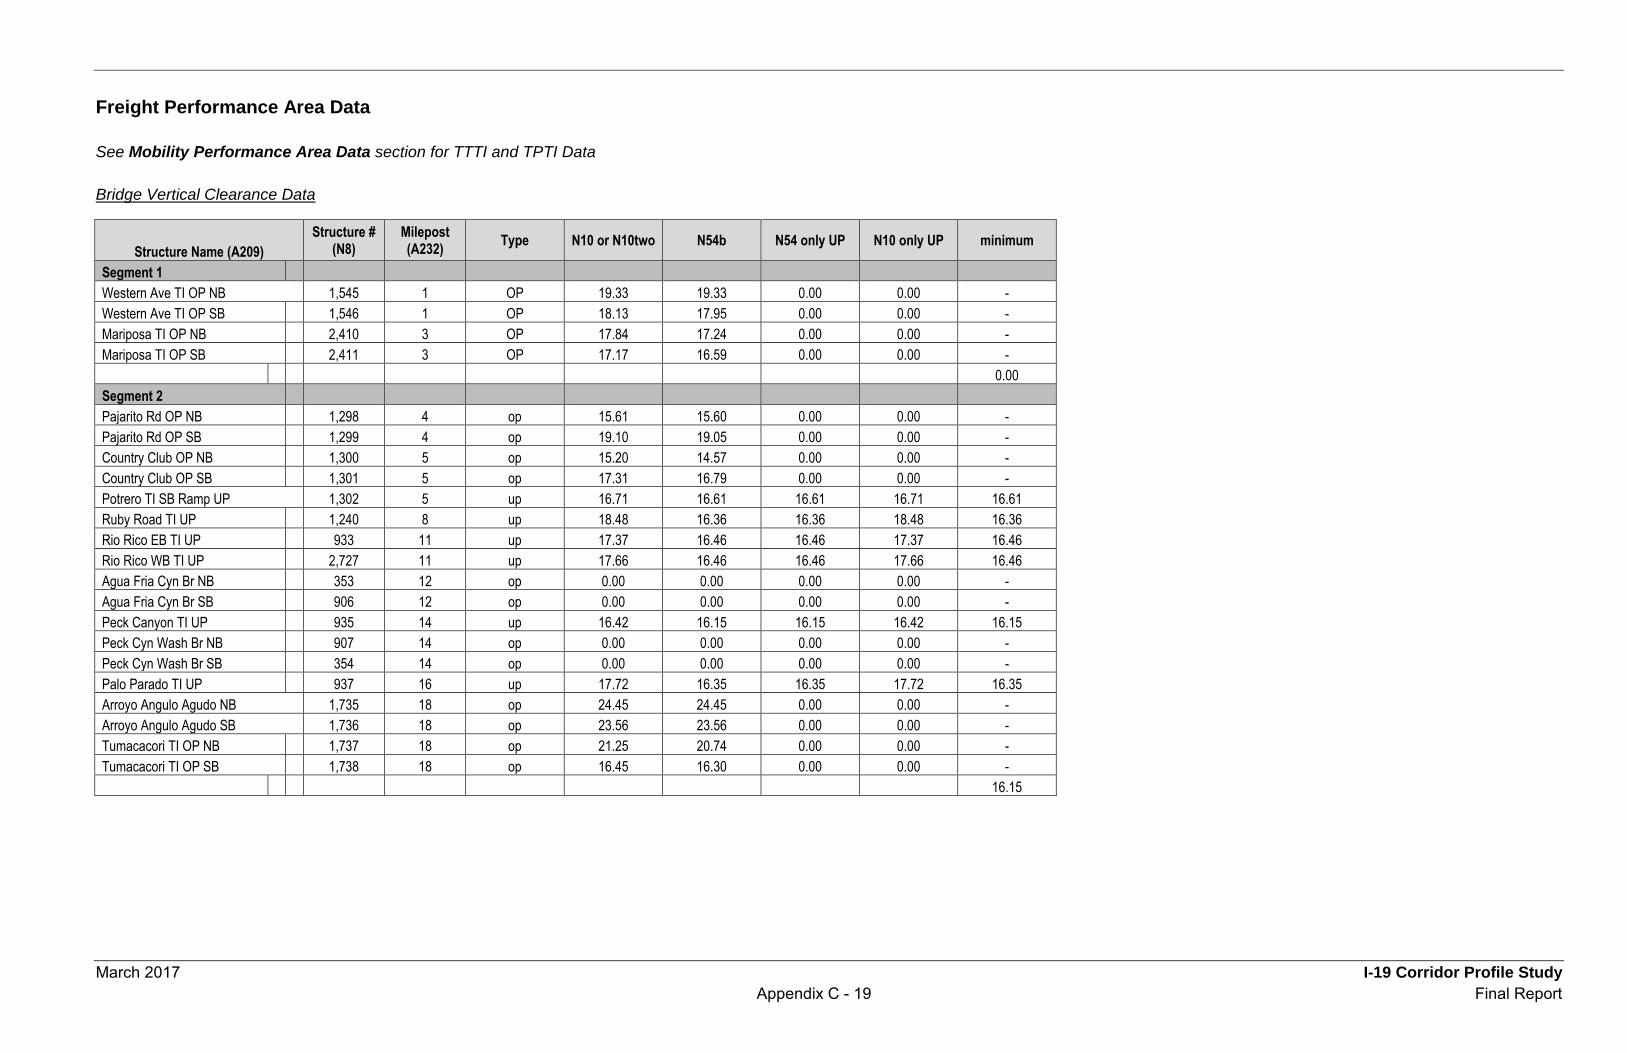
March 2017 I-19 Corridor Profile Study Appendix C - 19 Final Report
Freight Performance Area Data See Mobility Performance Area Data section for TTTI and TPTI Data Bridge Vertical Clearance Data
Structure Name (A209) Structure #
(N8) Milepost (A232) Type N10 or N10two N54b N54 only UP N10 only UP minimum
Segment 1 Western Ave TI OP NB 1,545 1 OP 19.33 19.33 0.00 0.00 - Western Ave TI OP SB 1,546 1 OP 18.13 17.95 0.00 0.00 - Mariposa TI OP NB 2,410 3 OP 17.84 17.24 0.00 0.00 - Mariposa TI OP SB 2,411 3 OP 17.17 16.59 0.00 0.00 - 0.00 Segment 2 Pajarito Rd OP NB 1,298 4 op 15.61 15.60 0.00 0.00 - Pajarito Rd OP SB 1,299 4 op 19.10 19.05 0.00 0.00 - Country Club OP NB 1,300 5 op 15.20 14.57 0.00 0.00 - Country Club OP SB 1,301 5 op 17.31 16.79 0.00 0.00 - Potrero TI SB Ramp UP 1,302 5 up 16.71 16.61 16.61 16.71 16.61 Ruby Road TI UP 1,240 8 up 18.48 16.36 16.36 18.48 16.36 Rio Rico EB TI UP 933 11 up 17.37 16.46 16.46 17.37 16.46 Rio Rico WB TI UP 2,727 11 up 17.66 16.46 16.46 17.66 16.46 Agua Fria Cyn Br NB 353 12 op 0.00 0.00 0.00 0.00 - Agua Fria Cyn Br SB 906 12 op 0.00 0.00 0.00 0.00 - Peck Canyon TI UP 935 14 up 16.42 16.15 16.15 16.42 16.15 Peck Cyn Wash Br NB 907 14 op 0.00 0.00 0.00 0.00 - Peck Cyn Wash Br SB 354 14 op 0.00 0.00 0.00 0.00 - Palo Parado TI UP 937 16 up 17.72 16.35 16.35 17.72 16.35 Arroyo Angulo Agudo NB 1,735 18 op 24.45 24.45 0.00 0.00 - Arroyo Angulo Agudo SB 1,736 18 op 23.56 23.56 0.00 0.00 - Tumacacori TI OP NB 1,737 18 op 21.25 20.74 0.00 0.00 - Tumacacori TI OP SB 1,738 18 op 16.45 16.30 0.00 0.00 - 16.15
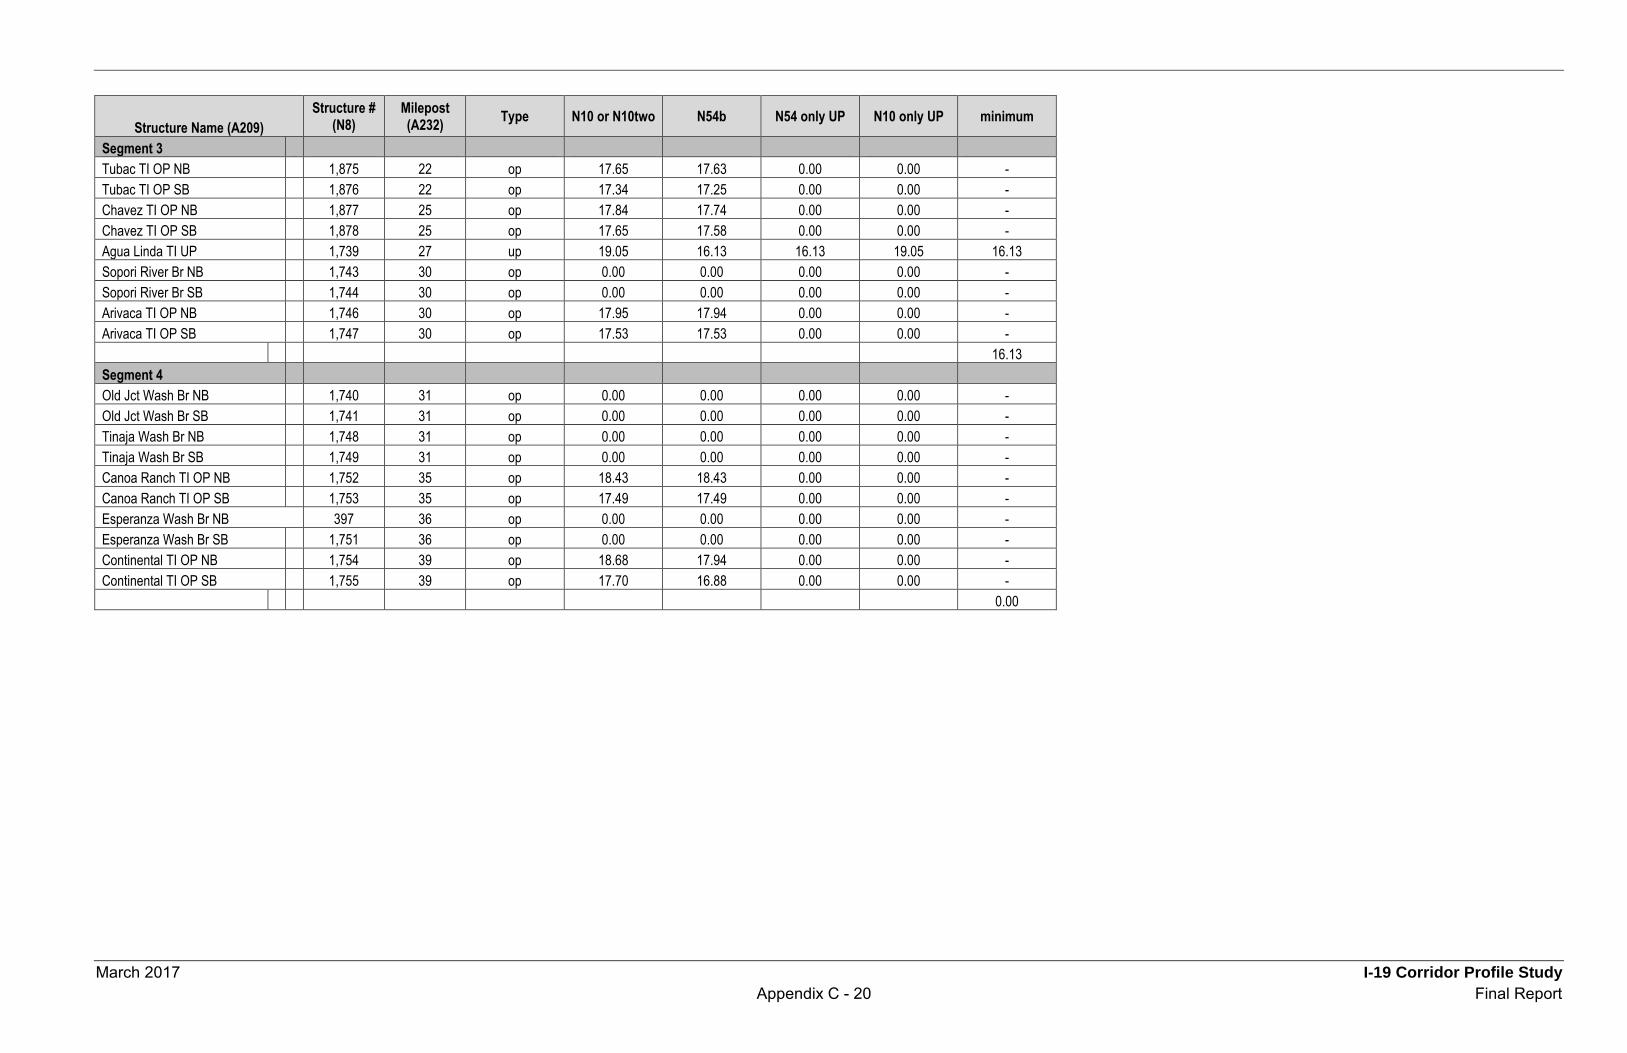
March 2017 I-19 Corridor Profile Study Appendix C - 20 Final Report
Structure Name (A209) Structure #
(N8) Milepost (A232) Type N10 or N10two N54b N54 only UP N10 only UP minimum
Segment 3 Tubac TI OP NB 1,875 22 op 17.65 17.63 0.00 0.00 - Tubac TI OP SB 1,876 22 op 17.34 17.25 0.00 0.00 - Chavez TI OP NB 1,877 25 op 17.84 17.74 0.00 0.00 - Chavez TI OP SB 1,878 25 op 17.65 17.58 0.00 0.00 - Agua Linda TI UP 1,739 27 up 19.05 16.13 16.13 19.05 16.13 Sopori River Br NB 1,743 30 op 0.00 0.00 0.00 0.00 - Sopori River Br SB 1,744 30 op 0.00 0.00 0.00 0.00 - Arivaca TI OP NB 1,746 30 op 17.95 17.94 0.00 0.00 - Arivaca TI OP SB 1,747 30 op 17.53 17.53 0.00 0.00 - 16.13 Segment 4 Old Jct Wash Br NB 1,740 31 op 0.00 0.00 0.00 0.00 - Old Jct Wash Br SB 1,741 31 op 0.00 0.00 0.00 0.00 - Tinaja Wash Br NB 1,748 31 op 0.00 0.00 0.00 0.00 - Tinaja Wash Br SB 1,749 31 op 0.00 0.00 0.00 0.00 - Canoa Ranch TI OP NB 1,752 35 op 18.43 18.43 0.00 0.00 - Canoa Ranch TI OP SB 1,753 35 op 17.49 17.49 0.00 0.00 - Esperanza Wash Br NB 397 36 op 0.00 0.00 0.00 0.00 - Esperanza Wash Br SB 1,751 36 op 0.00 0.00 0.00 0.00 - Continental TI OP NB 1,754 39 op 18.68 17.94 0.00 0.00 - Continental TI OP SB 1,755 39 op 17.70 16.88 0.00 0.00 - 0.00
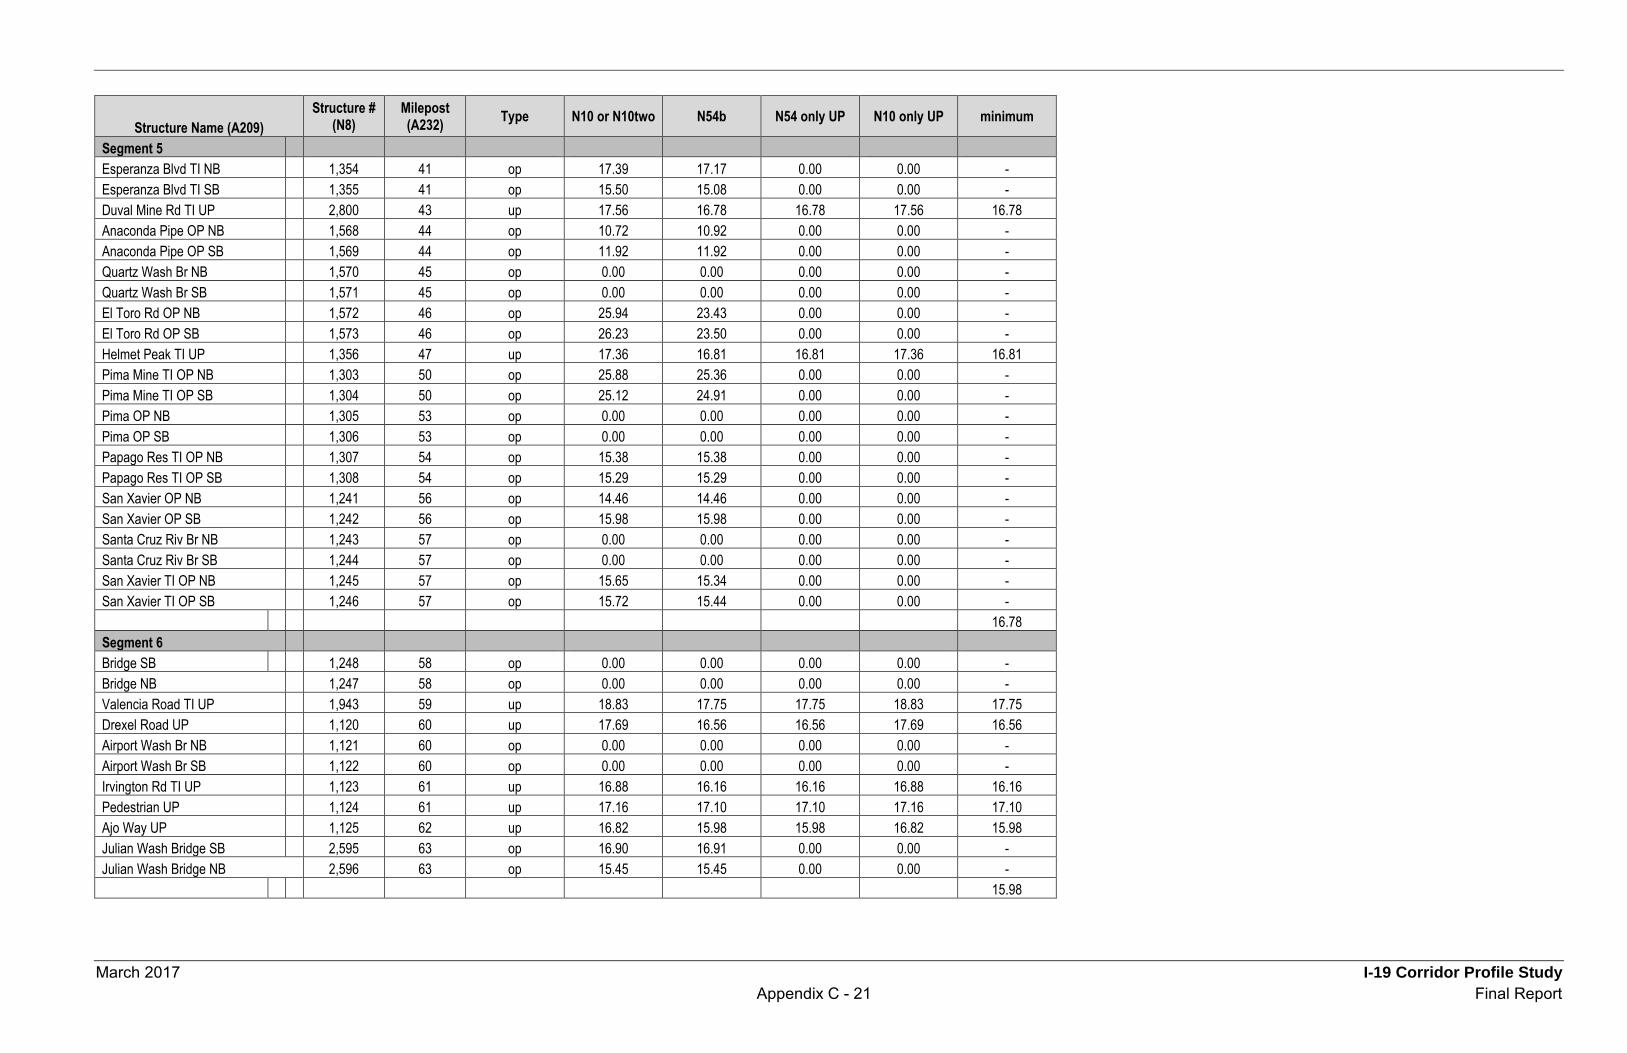
March 2017 I-19 Corridor Profile Study Appendix C - 21 Final Report
Structure Name (A209) Structure #
(N8) Milepost (A232) Type N10 or N10two N54b N54 only UP N10 only UP minimum
Segment 5 Esperanza Blvd TI NB 1,354 41 op 17.39 17.17 0.00 0.00 - Esperanza Blvd TI SB 1,355 41 op 15.50 15.08 0.00 0.00 - Duval Mine Rd TI UP 2,800 43 up 17.56 16.78 16.78 17.56 16.78 Anaconda Pipe OP NB 1,568 44 op 10.72 10.92 0.00 0.00 - Anaconda Pipe OP SB 1,569 44 op 11.92 11.92 0.00 0.00 - Quartz Wash Br NB 1,570 45 op 0.00 0.00 0.00 0.00 - Quartz Wash Br SB 1,571 45 op 0.00 0.00 0.00 0.00 - El Toro Rd OP NB 1,572 46 op 25.94 23.43 0.00 0.00 - El Toro Rd OP SB 1,573 46 op 26.23 23.50 0.00 0.00 - Helmet Peak TI UP 1,356 47 up 17.36 16.81 16.81 17.36 16.81 Pima Mine TI OP NB 1,303 50 op 25.88 25.36 0.00 0.00 - Pima Mine TI OP SB 1,304 50 op 25.12 24.91 0.00 0.00 - Pima OP NB 1,305 53 op 0.00 0.00 0.00 0.00 - Pima OP SB 1,306 53 op 0.00 0.00 0.00 0.00 - Papago Res TI OP NB 1,307 54 op 15.38 15.38 0.00 0.00 - Papago Res TI OP SB 1,308 54 op 15.29 15.29 0.00 0.00 - San Xavier OP NB 1,241 56 op 14.46 14.46 0.00 0.00 - San Xavier OP SB 1,242 56 op 15.98 15.98 0.00 0.00 - Santa Cruz Riv Br NB 1,243 57 op 0.00 0.00 0.00 0.00 - Santa Cruz Riv Br SB 1,244 57 op 0.00 0.00 0.00 0.00 - San Xavier TI OP NB 1,245 57 op 15.65 15.34 0.00 0.00 - San Xavier TI OP SB 1,246 57 op 15.72 15.44 0.00 0.00 - 16.78 Segment 6 Bridge SB 1,248 58 op 0.00 0.00 0.00 0.00 - Bridge NB 1,247 58 op 0.00 0.00 0.00 0.00 - Valencia Road TI UP 1,943 59 up 18.83 17.75 17.75 18.83 17.75 Drexel Road UP 1,120 60 up 17.69 16.56 16.56 17.69 16.56 Airport Wash Br NB 1,121 60 op 0.00 0.00 0.00 0.00 - Airport Wash Br SB 1,122 60 op 0.00 0.00 0.00 0.00 - Irvington Rd TI UP 1,123 61 up 16.88 16.16 16.16 16.88 16.16 Pedestrian UP 1,124 61 up 17.16 17.10 17.10 17.16 17.10 Ajo Way UP 1,125 62 up 16.82 15.98 15.98 16.82 15.98 Julian Wash Bridge SB 2,595 63 op 16.90 16.91 0.00 0.00 - Julian Wash Bridge NB 2,596 63 op 15.45 15.45 0.00 0.00 - 15.98

March 2017 I-19 Corridor Profile Study Appendix D - 1 Final Report
Appendix D: Needs Analysis Contributing Factors and Scores
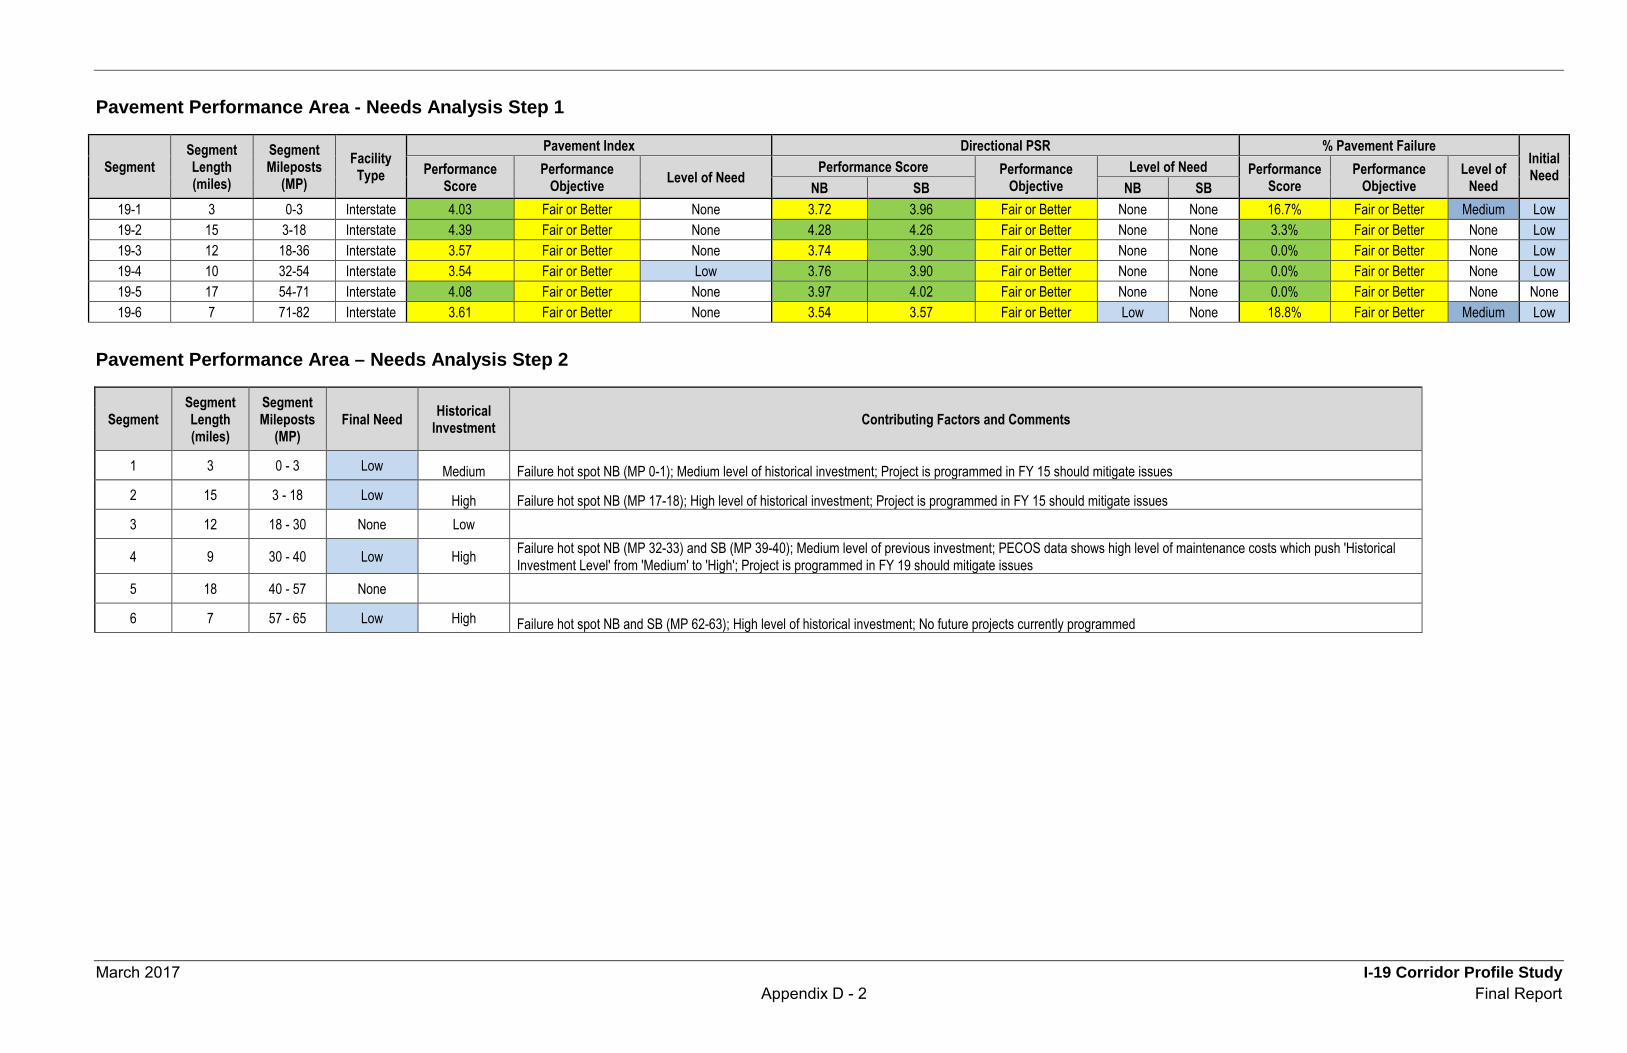
March 2017 I-19 Corridor Profile Study Appendix D - 2 Final Report
Pavement Performance Area - Needs Analysis Step 1
Segment Segment Length (miles)
Segment Mileposts
(MP) Facility
Type
Pavement Index Directional PSR % Pavement Failure Initial Need Performance
Score Performance
Objective Level of Need Performance Score Performance Objective
Level of Need Performance Score
Performance Objective
Level of Need NB SB NB SB
19-1 3 0-3 Interstate 4.03 Fair or Better None 3.72 3.96 Fair or Better None None 16.7% Fair or Better Medium Low 19-2 15 3-18 Interstate 4.39 Fair or Better None 4.28 4.26 Fair or Better None None 3.3% Fair or Better None Low 19-3 12 18-36 Interstate 3.57 Fair or Better None 3.74 3.90 Fair or Better None None 0.0% Fair or Better None Low 19-4 10 32-54 Interstate 3.54 Fair or Better Low 3.76 3.90 Fair or Better None None 0.0% Fair or Better None Low 19-5 17 54-71 Interstate 4.08 Fair or Better None 3.97 4.02 Fair or Better None None 0.0% Fair or Better None None 19-6 7 71-82 Interstate 3.61 Fair or Better None 3.54 3.57 Fair or Better Low None 18.8% Fair or Better Medium Low
Pavement Performance Area – Needs Analysis Step 2
Segment Segment Length (miles)
Segment Mileposts
(MP) Final Need Historical
Investment Contributing Factors and Comments
1 3 0 - 3 Low Medium Failure hot spot NB (MP 0-1); Medium level of historical investment; Project is programmed in FY 15 should mitigate issues 2 15 3 - 18 Low High Failure hot spot NB (MP 17-18); High level of historical investment; Project is programmed in FY 15 should mitigate issues 3 12 18 - 30 None Low
4 9 30 - 40 Low High Failure hot spot NB (MP 32-33) and SB (MP 39-40); Medium level of previous investment; PECOS data shows high level of maintenance costs which push 'Historical Investment Level' from 'Medium' to 'High'; Project is programmed in FY 19 should mitigate issues
5 18 40 - 57 None 6 7 57 - 65 Low High Failure hot spot NB and SB (MP 62-63); High level of historical investment; No future projects currently programmed
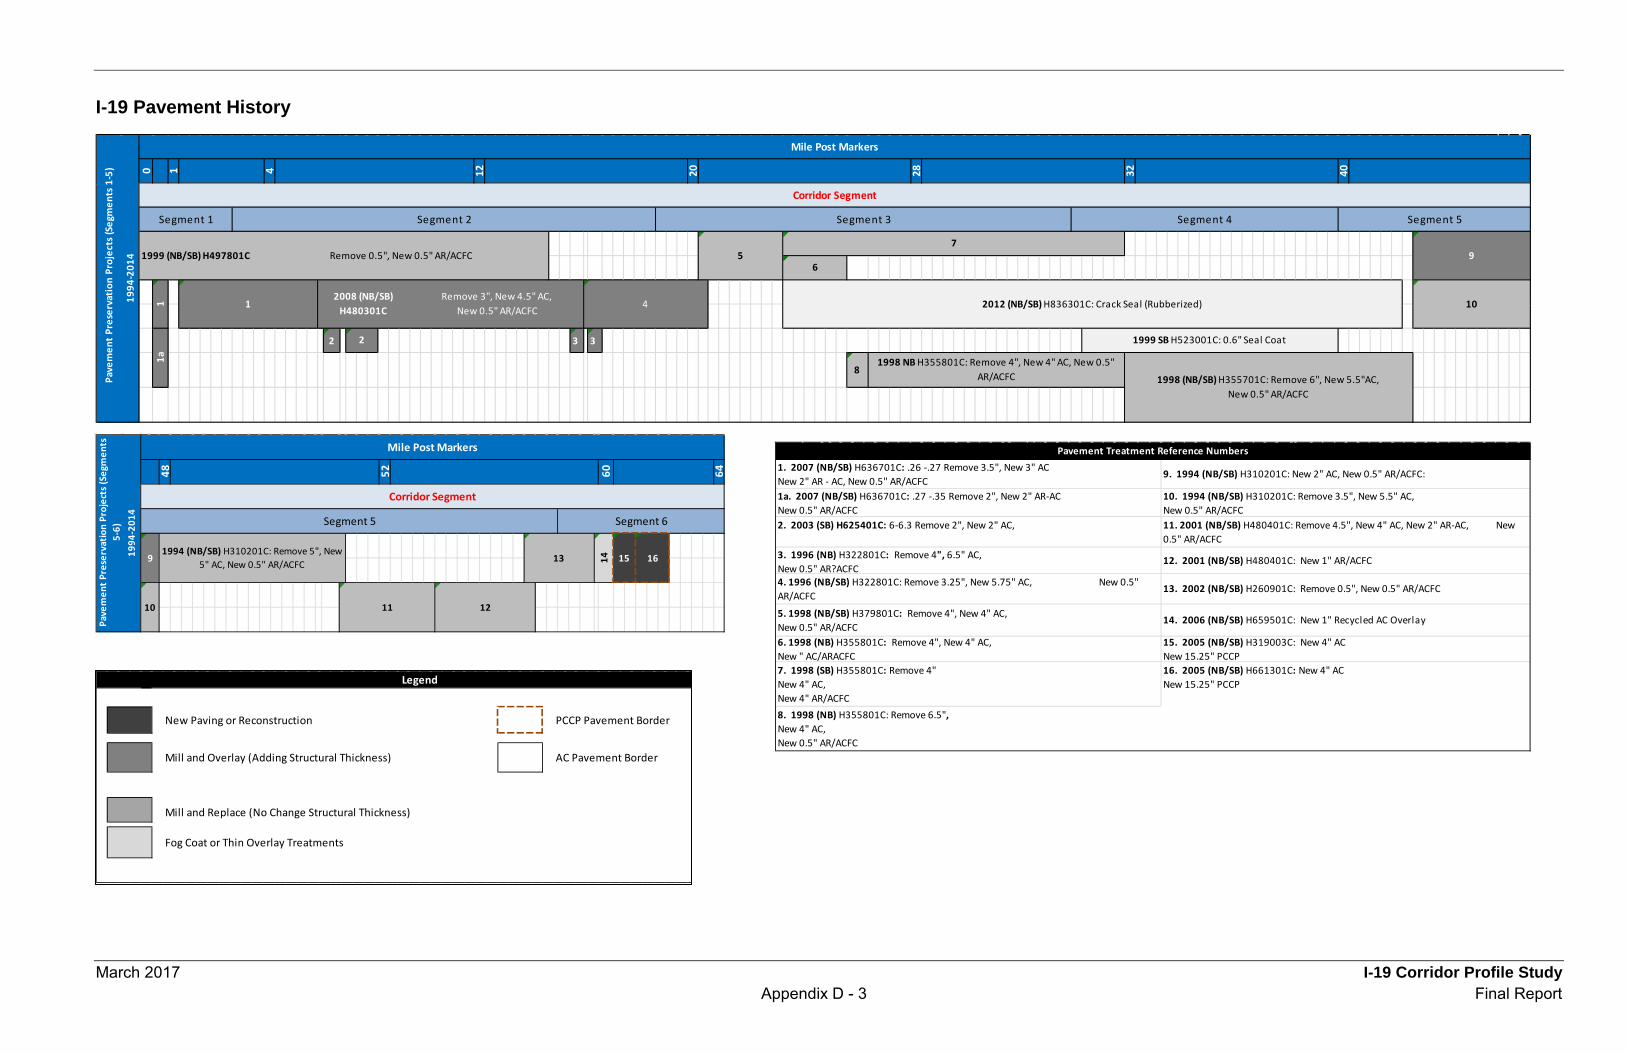
March 2017 I-19 Corridor Profile Study Appendix D - 3 Final Report
8. 1998 (NB) H355801C: Remove 6.5",New 4" AC, New 0.5" AR/ACFC
7. 1998 (SB) H355801C: Remove 4"New 4" AC, New 4" AR/ACFC
16. 2005 (NB/SB) H661301C: New 4" ACNew 15.25" PCCP
2. 2003 (SB) H625401C: 6-6.3 Remove 2", New 2" AC,
12. 2001 (NB/SB) H480401C: New 1" AR/ACFC
Pavement Treatment Reference Numbers1. 2007 (NB/SB) H636701C: .26 -.27 Remove 3.5", New 3" ACNew 2" AR - AC, New 0.5" AR/ACFC
10. 1994 (NB/SB) H310201C: Remove 3.5", New 5.5" AC,New 0.5" AR/ACFC
9. 1994 (NB/SB) H310201C: New 2" AC, New 0.5" AR/ACFC:
1a. 2007 (NB/SB) H636701C: .27 -.35 Remove 2", New 2" AR-ACNew 0.5" AR/ACFC
6. 1998 (NB) H355801C: Remove 4", New 4" AC,New " AC/ARACFC
4. 1996 (NB/SB) H322801C: Remove 3.25", New 5.75" AC, New 0.5" AR/ACFC
5. 1998 (NB/SB) H379801C: Remove 4", New 4" AC, New 0.5" AR/ACFC
14. 2006 (NB/SB) H659501C: New 1" Recycled AC Overlay
3. 1996 (NB) H322801C: Remove 4", 6.5" AC, New 0.5" AR?ACFC
13. 2002 (NB/SB) H260901C: Remove 0.5", New 0.5" AR/ACFC
11. 2001 (NB/SB) H480401C: Remove 4.5", New 4" AC, New 2" AR-AC, New 0.5" AR/ACFC
15. 2005 (NB/SB) H319003C: New 4" ACNew 15.25" PCCP
Fog Coat or Thin Overlay Treatments
New Paving or Reconstruction
Mill and Overlay (Adding Structural Thickness)
Legend
PCCP Pavement Border
Mill and Replace (No Change Structural Thickness)
AC Pavement Border
I-19 Pavement History
0 1 4 12 20 28 32 40
2 3 3
8
Segment 1 Segment 2
Corridor Segment
Segment 5
Mile Post Markers
Segment 3 Segment 4
1
6
1999 SB H523001C: 0.6" Seal Coat
Remove 3", New 4.5" AC, New 0.5" AR/ACFC
7
Pave
men
t Pr
eser
vati
on P
roje
cts
(Seg
men
ts 1
-5)
1994
-201
4
10
Remove 0.5", New 0.5" AR/ACFC1999 (NB/SB) H497801C
1
9
2012 (NB/SB) H836301C: Crack Seal (Rubberized)
5
4
1998 (NB/SB) H355701C: Remove 6", New 5.5"AC, New 0.5" AR/ACFC
2008 (NB/SB) H480301C
1a
2
1998 NB H355801C: Remove 4", New 4" AC, New 0.5" AR/ACFC
48 52 60 64
12
13 14 15
11
Pave
men
t Pre
serv
atio
n Pr
ojec
ts (S
egm
ents
5-
6)19
94-2
014
Segment 6
Corridor Segment
16
Segment 5
9
10
1994 (NB/SB) H310201C: Remove 5", New 5" AC, New 0.5" AR/ACFC
Mile Post Markers
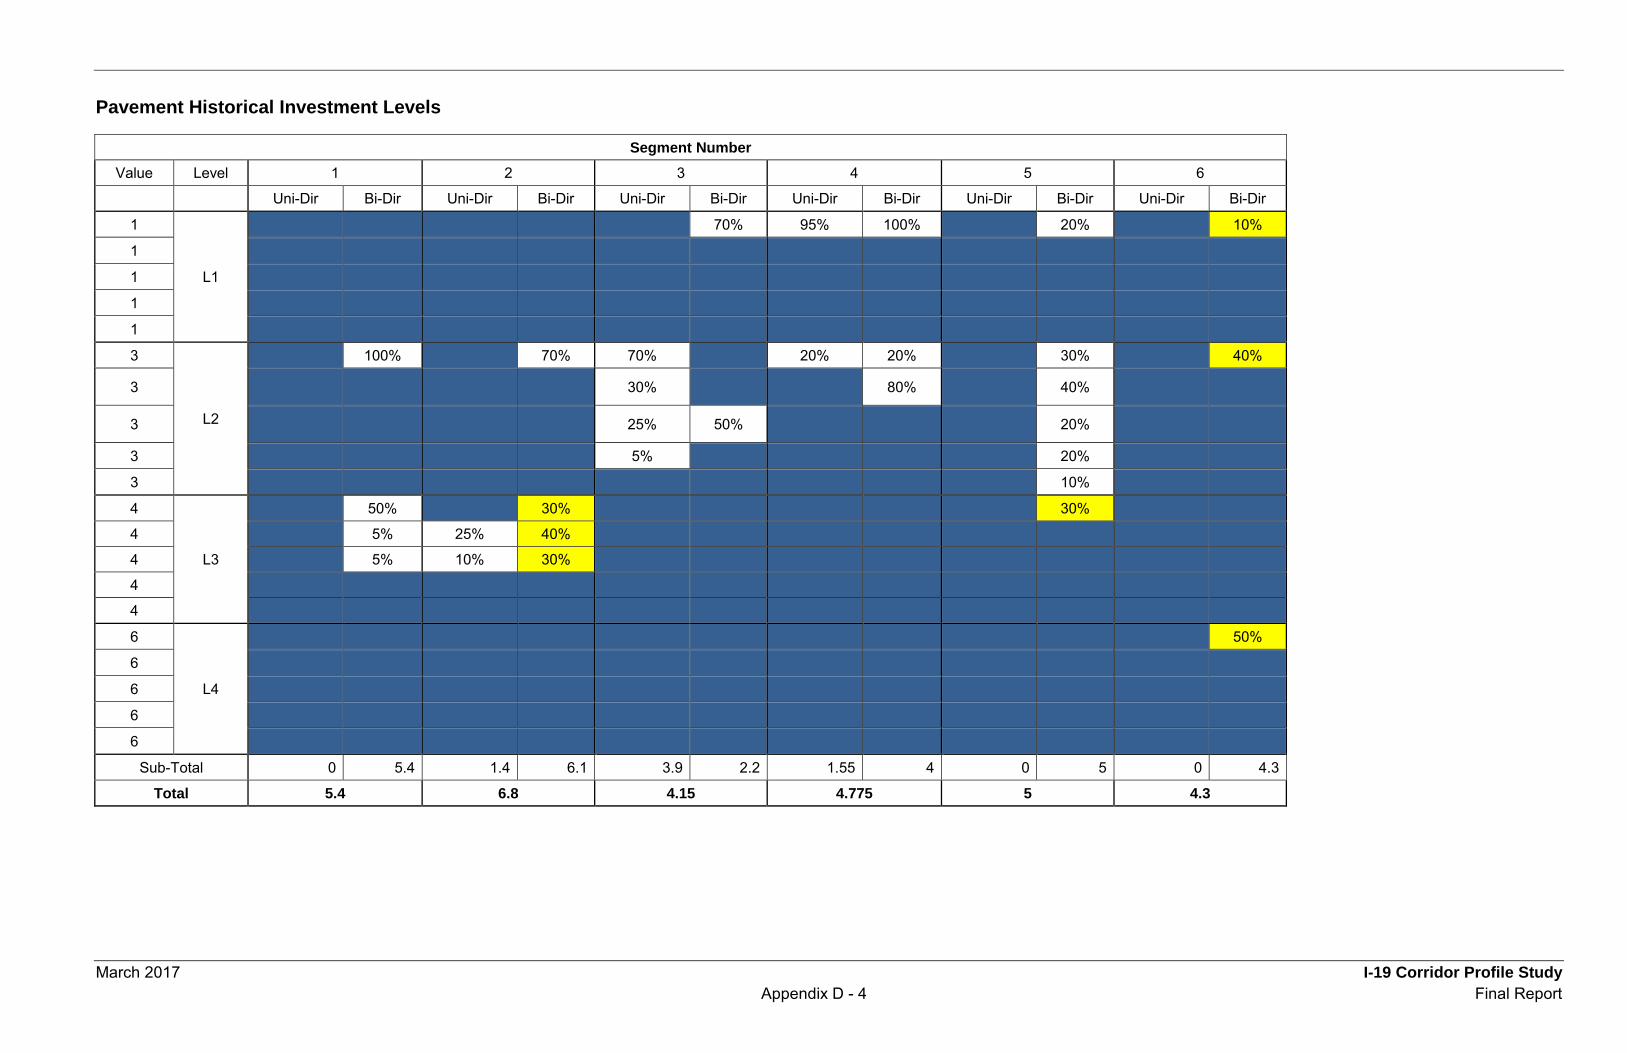
March 2017 I-19 Corridor Profile Study Appendix D - 4 Final Report
Pavement Historical Investment Levels
Segment Number Value Level 1 2 3 4 5 6
Uni-Dir Bi-Dir Uni-Dir Bi-Dir Uni-Dir Bi-Dir Uni-Dir Bi-Dir Uni-Dir Bi-Dir Uni-Dir Bi-Dir 1
L1
70% 95% 100% 20% 10% 1 1 1 1 3
L2
100% 70% 70% 20% 20% 30% 40%
3 30% 80% 40%
3 25% 50% 20%
3 5% 20% 3 10% 4
L3
50% 30% 30% 4 5% 25% 40% 4 5% 10% 30% 4 4 6
L4
50% 6 6 6 6
Sub-Total 0 5.4 1.4 6.1 3.9 2.2 1.55 4 0 5 0 4.3 Total 5.4 6.8 4.15 4.775 5 4.3
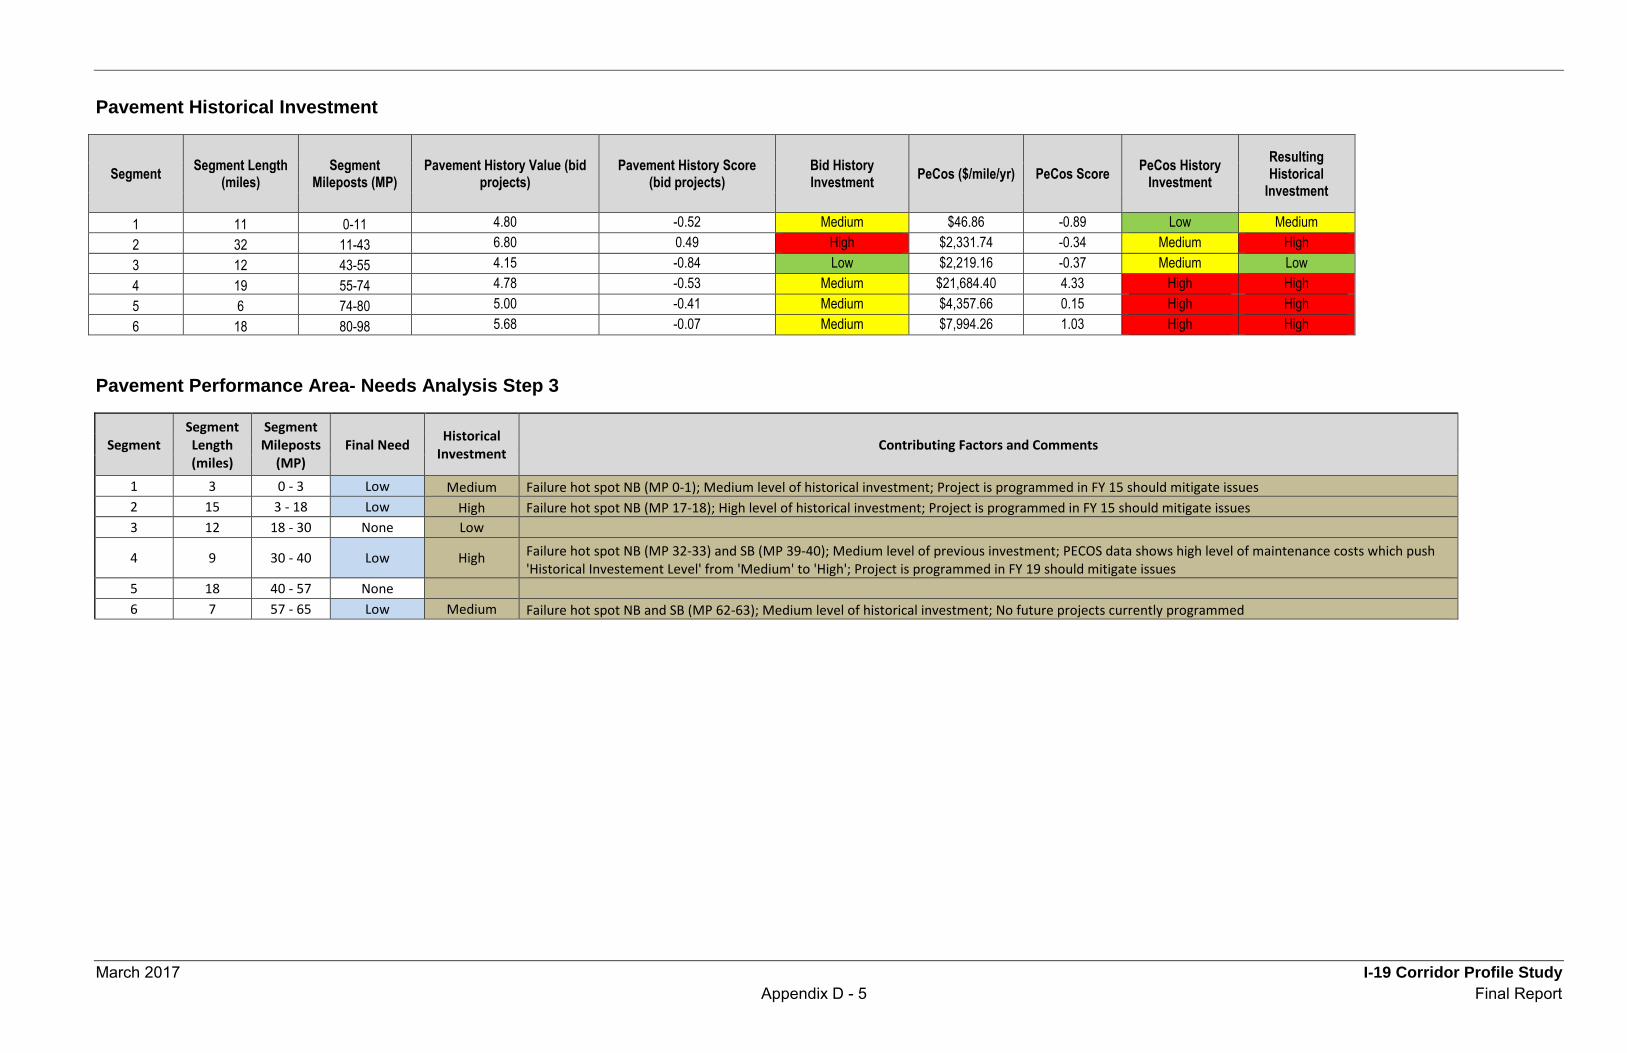
March 2017 I-19 Corridor Profile Study Appendix D - 5 Final Report
Pavement Historical Investment
Segment Segment Length (miles)
Segment Mileposts (MP)
Pavement History Value (bid projects)
Pavement History Score (bid projects)
Bid History Investment PeCos ($/mile/yr) PeCos Score PeCos History
Investment Resulting Historical
Investment
1 11 0-11 4.80 -0.52 Medium $46.86 -0.89 Low Medium 2 32 11-43 6.80 0.49 High $2,331.74 -0.34 Medium High 3 12 43-55 4.15 -0.84 Low $2,219.16 -0.37 Medium Low 4 19 55-74 4.78 -0.53 Medium $21,684.40 4.33 High High 5 6 74-80 5.00 -0.41 Medium $4,357.66 0.15 High High 6 18 80-98 5.68 -0.07 Medium $7,994.26 1.03 High High
Pavement Performance Area- Needs Analysis Step 3
Segment Segment Length (miles)
Segment Mileposts
(MP) Final Need Historical
Investment Contributing Factors and Comments
1 3 0 - 3 Low Medium Failure hot spot NB (MP 0-1); Medium level of historical investment; Project is programmed in FY 15 should mitigate issues 2 15 3 - 18 Low High Failure hot spot NB (MP 17-18); High level of historical investment; Project is programmed in FY 15 should mitigate issues 3 12 18 - 30 None Low
4 9 30 - 40 Low High Failure hot spot NB (MP 32-33) and SB (MP 39-40); Medium level of previous investment; PECOS data shows high level of maintenance costs which push 'Historical Investement Level' from 'Medium' to 'High'; Project is programmed in FY 19 should mitigate issues
5 18 40 - 57 None 6 7 57 - 65 Low Medium Failure hot spot NB and SB (MP 62-63); Medium level of historical investment; No future projects currently programmed
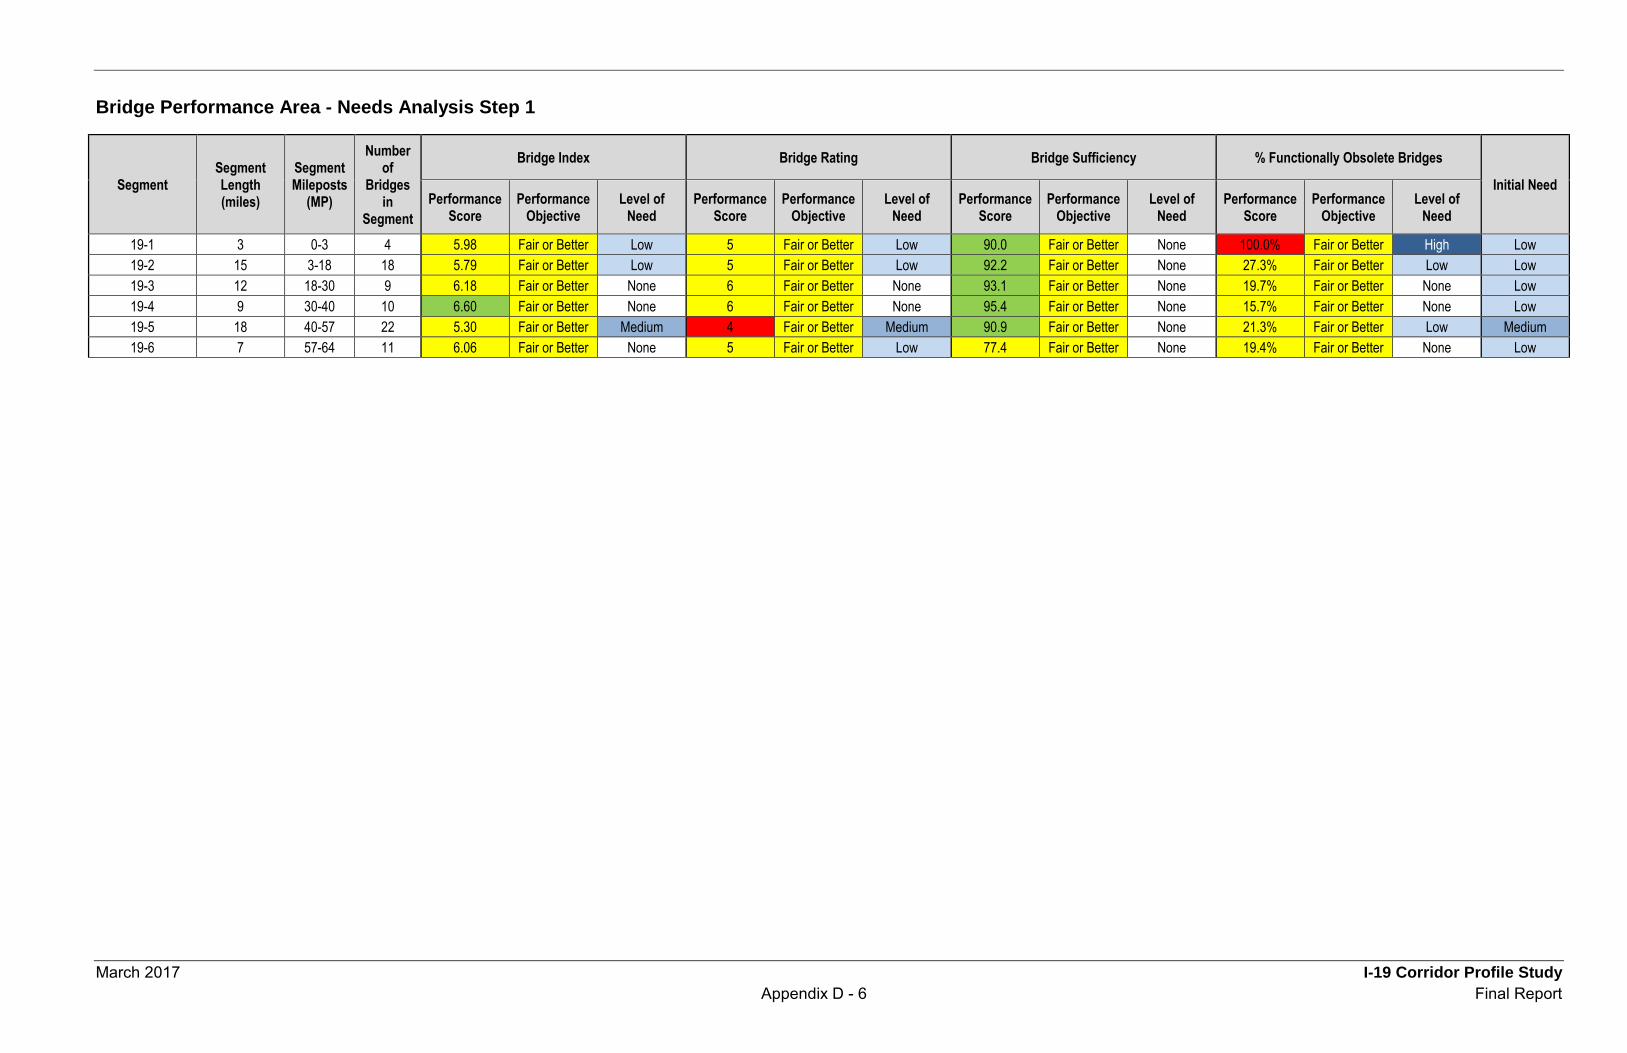
March 2017 I-19 Corridor Profile Study Appendix D - 6 Final Report
Bridge Performance Area - Needs Analysis Step 1
Segment Segment Length (miles)
Segment Mileposts
(MP)
Number of
Bridges in
Segment
Bridge Index Bridge Rating Bridge Sufficiency % Functionally Obsolete Bridges Initial Need
Performance Score
Performance Objective
Level of Need
Performance Score
Performance Objective
Level of Need
Performance Score
Performance Objective
Level of Need
Performance Score
Performance Objective
Level of Need
19-1 3 0-3 4 5.98 Fair or Better Low 5 Fair or Better Low 90.0 Fair or Better None 100.0% Fair or Better High Low 19-2 15 3-18 18 5.79 Fair or Better Low 5 Fair or Better Low 92.2 Fair or Better None 27.3% Fair or Better Low Low 19-3 12 18-30 9 6.18 Fair or Better None 6 Fair or Better None 93.1 Fair or Better None 19.7% Fair or Better None Low 19-4 9 30-40 10 6.60 Fair or Better None 6 Fair or Better None 95.4 Fair or Better None 15.7% Fair or Better None Low 19-5 18 40-57 22 5.30 Fair or Better Medium 4 Fair or Better Medium 90.9 Fair or Better None 21.3% Fair or Better Low Medium 19-6 7 57-64 11 6.06 Fair or Better None 5 Fair or Better Low 77.4 Fair or Better None 19.4% Fair or Better None Low
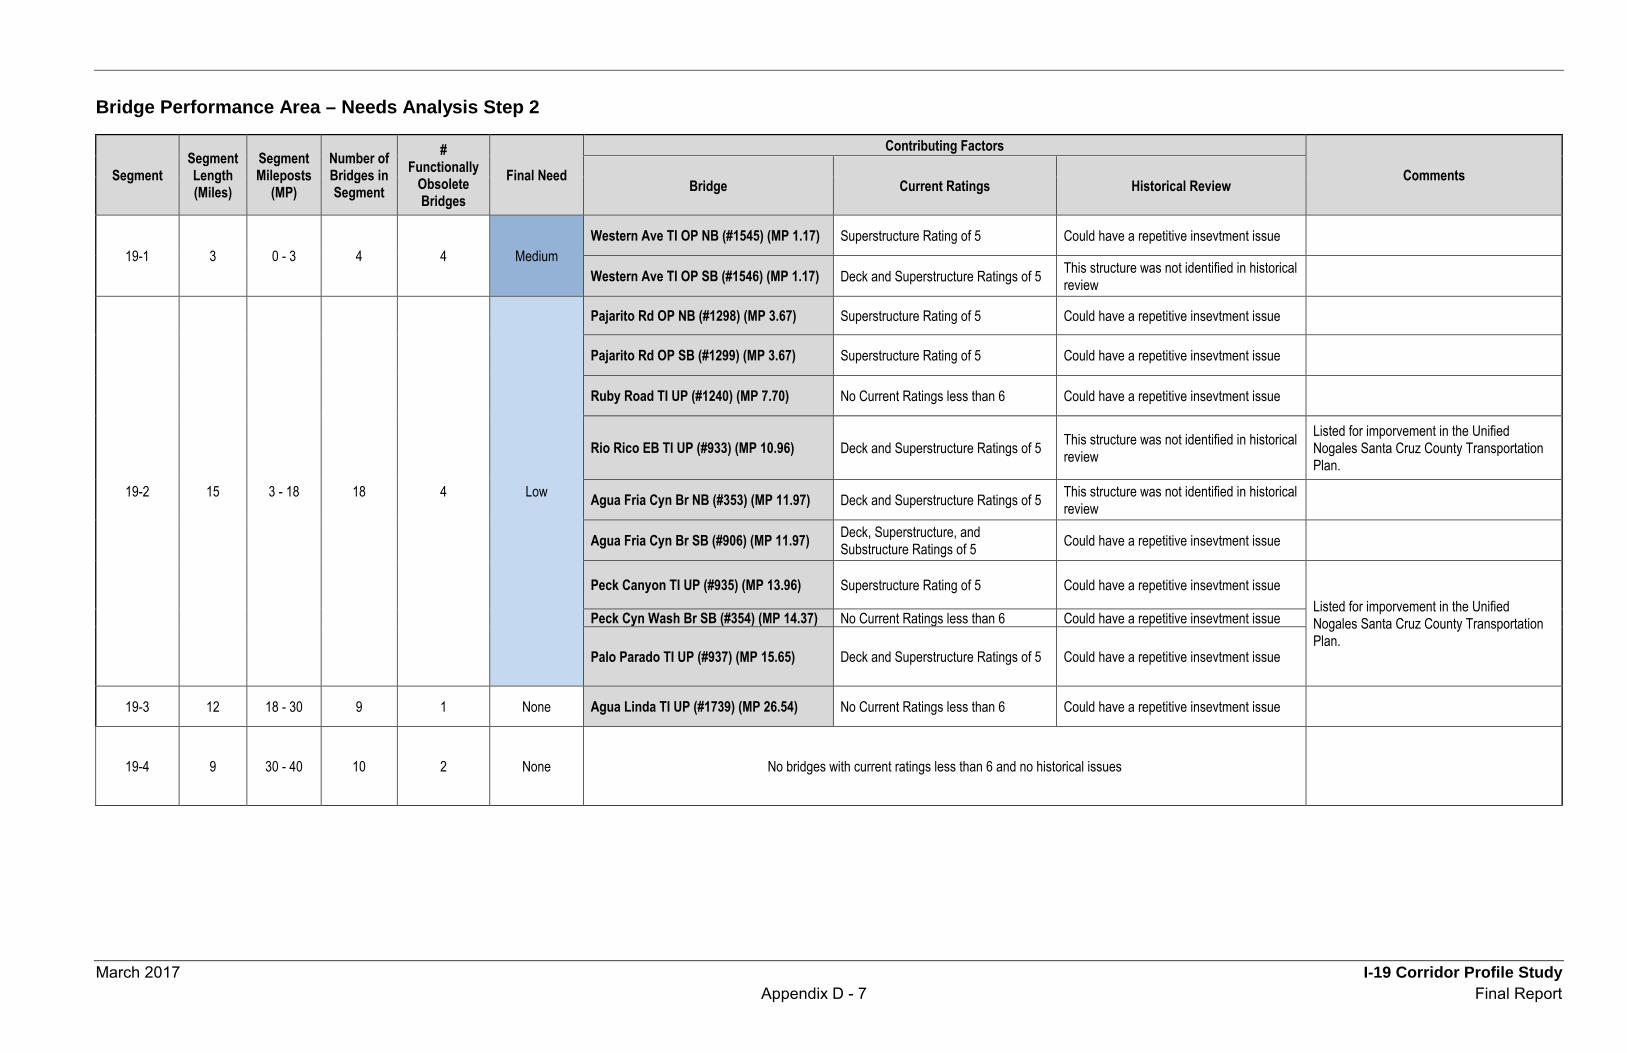
March 2017 I-19 Corridor Profile Study Appendix D - 7 Final Report
Bridge Performance Area – Needs Analysis Step 2
Segment Segment Length (Miles)
Segment Mileposts
(MP)
Number of Bridges in Segment
# Functionally
Obsolete Bridges
Final Need
Contributing Factors
Comments Bridge Current Ratings Historical Review
19-1 3 0 - 3 4 4 Medium Western Ave TI OP NB (#1545) (MP 1.17) Superstructure Rating of 5 Could have a repetitive insevtment issue
Western Ave TI OP SB (#1546) (MP 1.17) Deck and Superstructure Ratings of 5 This structure was not identified in historical review
19-2 15 3 - 18 18 4 Low
Pajarito Rd OP NB (#1298) (MP 3.67) Superstructure Rating of 5 Could have a repetitive insevtment issue
Pajarito Rd OP SB (#1299) (MP 3.67) Superstructure Rating of 5 Could have a repetitive insevtment issue
Ruby Road TI UP (#1240) (MP 7.70) No Current Ratings less than 6 Could have a repetitive insevtment issue
Rio Rico EB TI UP (#933) (MP 10.96) Deck and Superstructure Ratings of 5 This structure was not identified in historical review
Listed for imporvement in the Unified Nogales Santa Cruz County Transportation Plan.
Agua Fria Cyn Br NB (#353) (MP 11.97) Deck and Superstructure Ratings of 5 This structure was not identified in historical review
Agua Fria Cyn Br SB (#906) (MP 11.97) Deck, Superstructure, and Substructure Ratings of 5 Could have a repetitive insevtment issue
Peck Canyon TI UP (#935) (MP 13.96) Superstructure Rating of 5 Could have a repetitive insevtment issue Listed for imporvement in the Unified Nogales Santa Cruz County Transportation Plan.
Peck Cyn Wash Br SB (#354) (MP 14.37) No Current Ratings less than 6 Could have a repetitive insevtment issue
Palo Parado TI UP (#937) (MP 15.65) Deck and Superstructure Ratings of 5 Could have a repetitive insevtment issue
19-3 12 18 - 30 9 1 None Agua Linda TI UP (#1739) (MP 26.54) No Current Ratings less than 6 Could have a repetitive insevtment issue
19-4 9 30 - 40 10 2 None No bridges with current ratings less than 6 and no historical issues
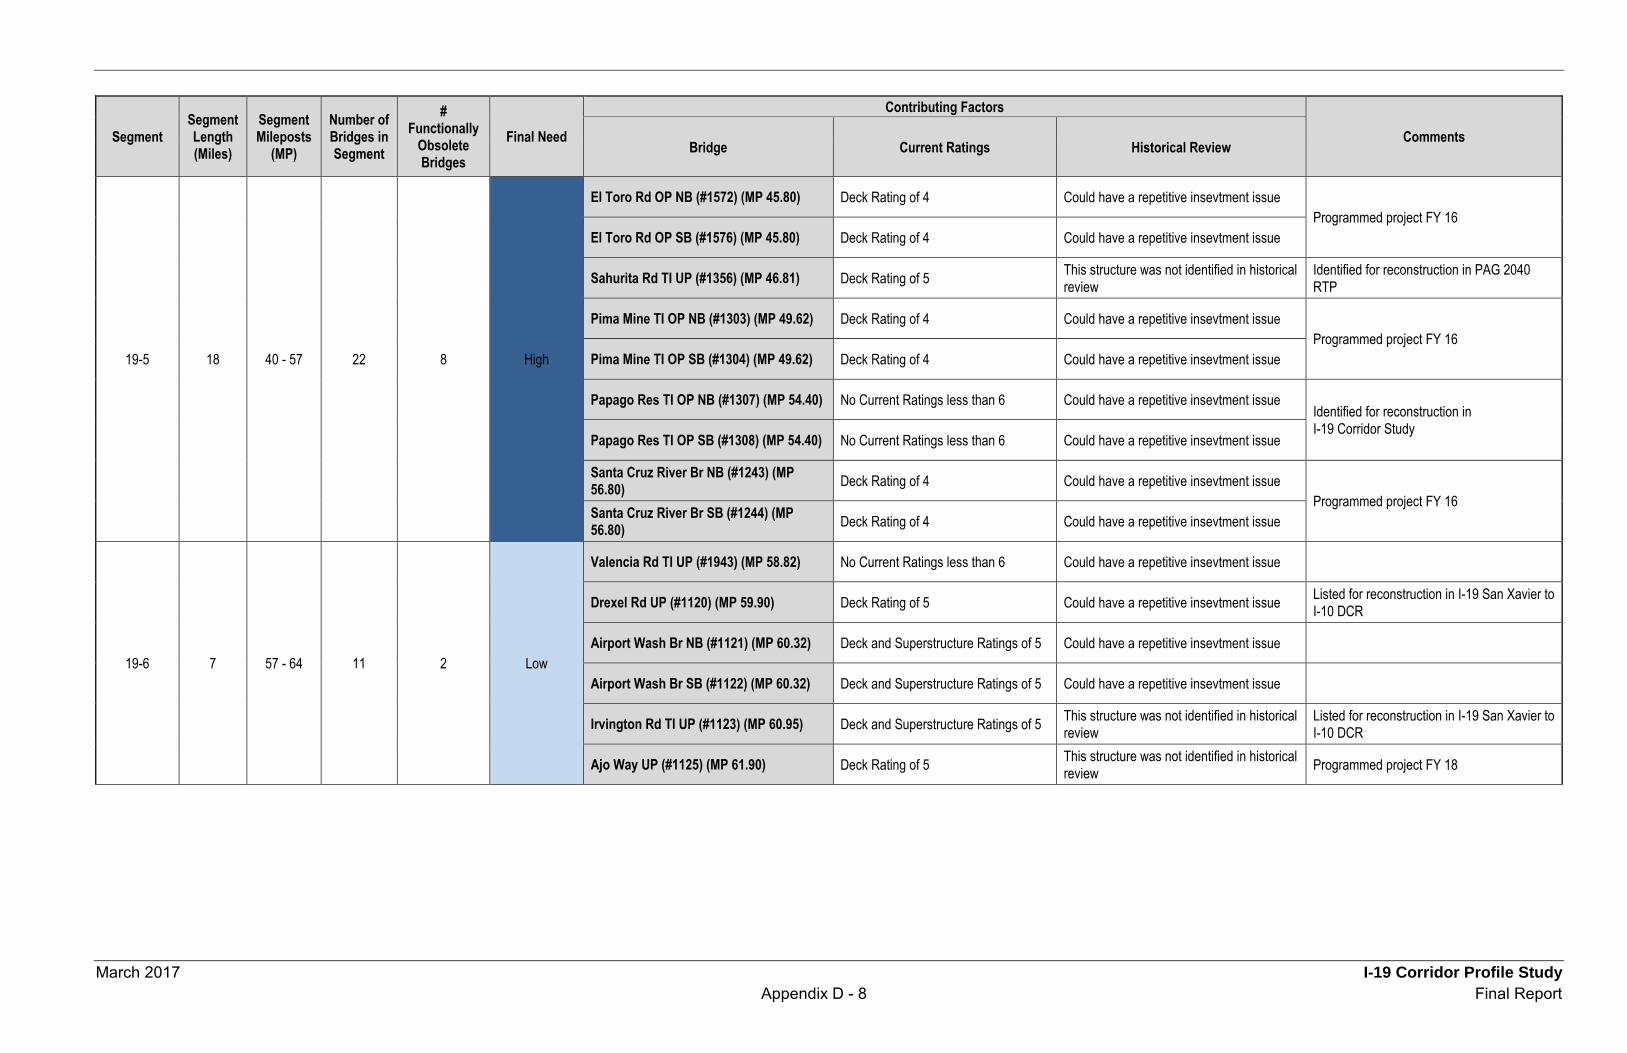
March 2017 I-19 Corridor Profile Study Appendix D - 8 Final Report
Segment Segment Length (Miles)
Segment Mileposts
(MP)
Number of Bridges in Segment
# Functionally
Obsolete Bridges
Final Need
Contributing Factors
Comments Bridge Current Ratings Historical Review
19-5 18 40 - 57 22 8 High
El Toro Rd OP NB (#1572) (MP 45.80) Deck Rating of 4 Could have a repetitive insevtment issue Programmed project FY 16
El Toro Rd OP SB (#1576) (MP 45.80) Deck Rating of 4 Could have a repetitive insevtment issue
Sahurita Rd TI UP (#1356) (MP 46.81) Deck Rating of 5 This structure was not identified in historical review
Identified for reconstruction in PAG 2040 RTP
Pima Mine TI OP NB (#1303) (MP 49.62) Deck Rating of 4 Could have a repetitive insevtment issue Programmed project FY 16
Pima Mine TI OP SB (#1304) (MP 49.62) Deck Rating of 4 Could have a repetitive insevtment issue
Papago Res TI OP NB (#1307) (MP 54.40) No Current Ratings less than 6 Could have a repetitive insevtment issue Identified for reconstruction in I-19 Corridor Study
Papago Res TI OP SB (#1308) (MP 54.40) No Current Ratings less than 6 Could have a repetitive insevtment issue
Santa Cruz River Br NB (#1243) (MP 56.80) Deck Rating of 4 Could have a repetitive insevtment issue
Programmed project FY 16 Santa Cruz River Br SB (#1244) (MP 56.80) Deck Rating of 4 Could have a repetitive insevtment issue
19-6 7 57 - 64 11 2 Low
Valencia Rd TI UP (#1943) (MP 58.82) No Current Ratings less than 6 Could have a repetitive insevtment issue
Drexel Rd UP (#1120) (MP 59.90) Deck Rating of 5 Could have a repetitive insevtment issue Listed for reconstruction in I-19 San Xavier to I-10 DCR
Airport Wash Br NB (#1121) (MP 60.32) Deck and Superstructure Ratings of 5 Could have a repetitive insevtment issue
Airport Wash Br SB (#1122) (MP 60.32) Deck and Superstructure Ratings of 5 Could have a repetitive insevtment issue
Irvington Rd TI UP (#1123) (MP 60.95) Deck and Superstructure Ratings of 5 This structure was not identified in historical review
Listed for reconstruction in I-19 San Xavier to I-10 DCR
Ajo Way UP (#1125) (MP 61.90) Deck Rating of 5 This structure was not identified in historical review Programmed project FY 18
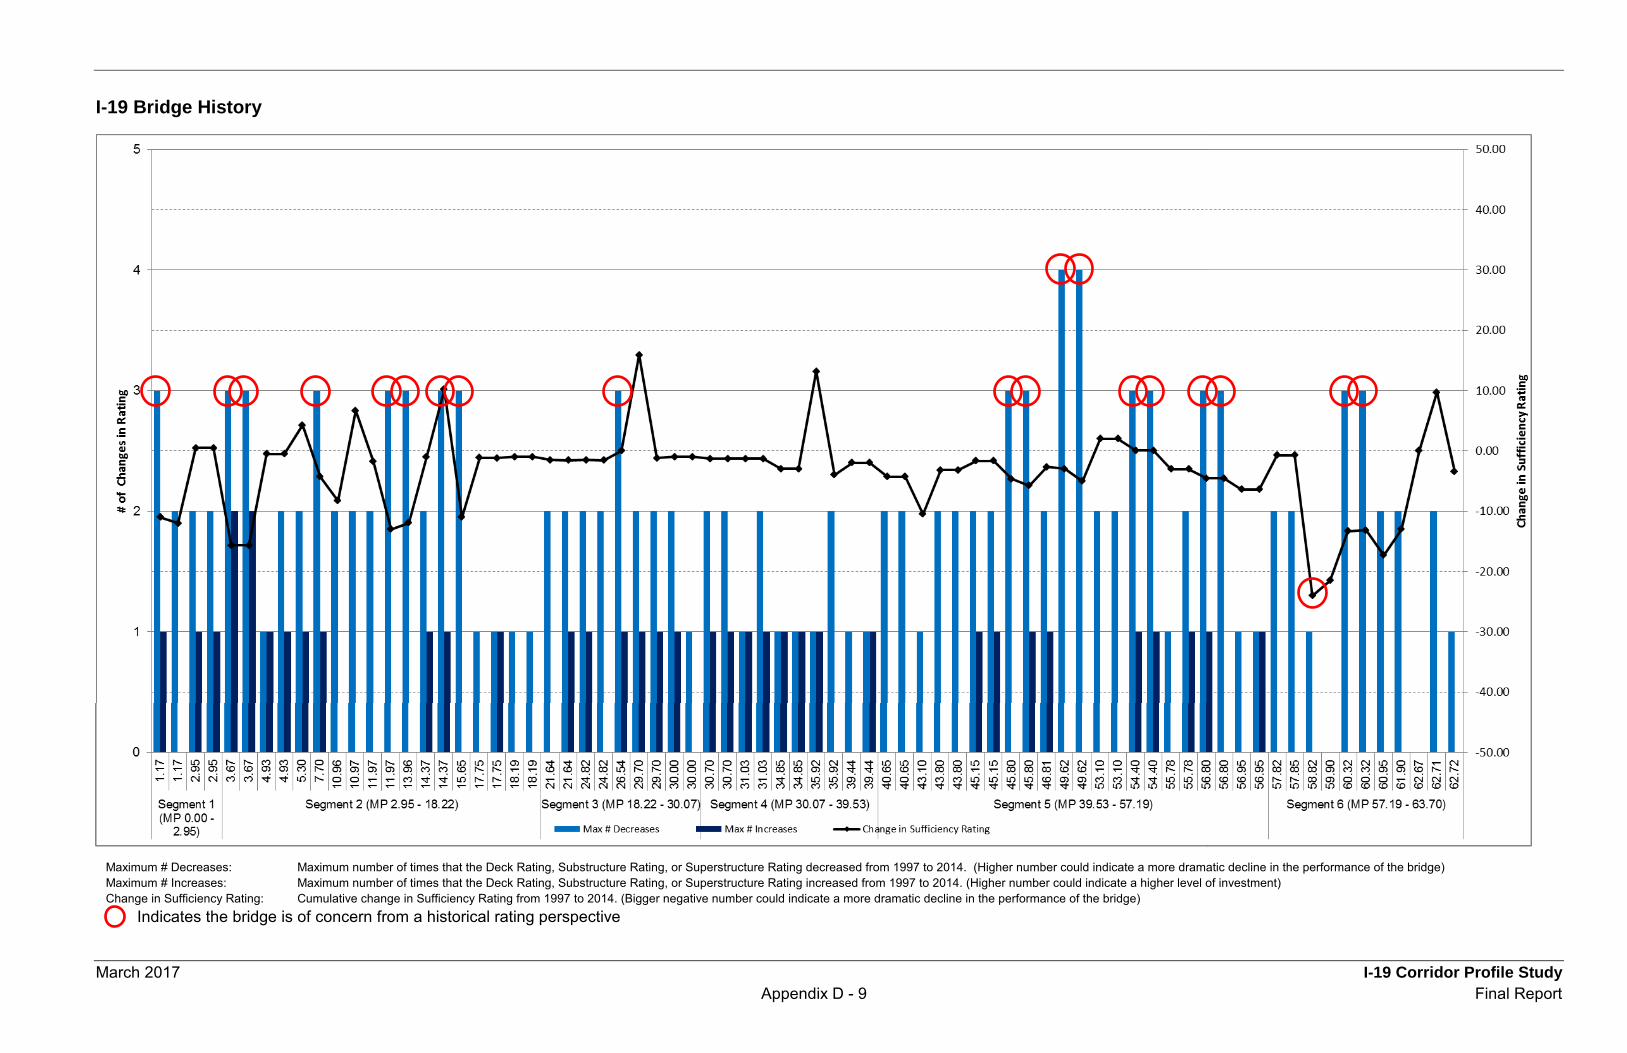
March 2017 I-19 Corridor Profile StudyAppendix D - 9 Final Report
I-19 Bridge History
Maximum # Decreases: Maximum number of times that the Deck Rating, Substructure Rating, or Superstructure Rating decreased from 1997 to 2014. (Higher number could indicate a more dramatic decline in the performance of the bridge)Maximum # Increases: Maximum number of times that the Deck Rating, Substructure Rating, or Superstructure Rating increased from 1997 to 2014. (Higher number could indicate a higher level of investment)Change in Sufficiency Rating: Cumulative change in Sufficiency Rating from 1997 to 2014. (Bigger negative number could indicate a more dramatic decline in the performance of the bridge)
Indicates the bridge is of concern from a historical rating perspective
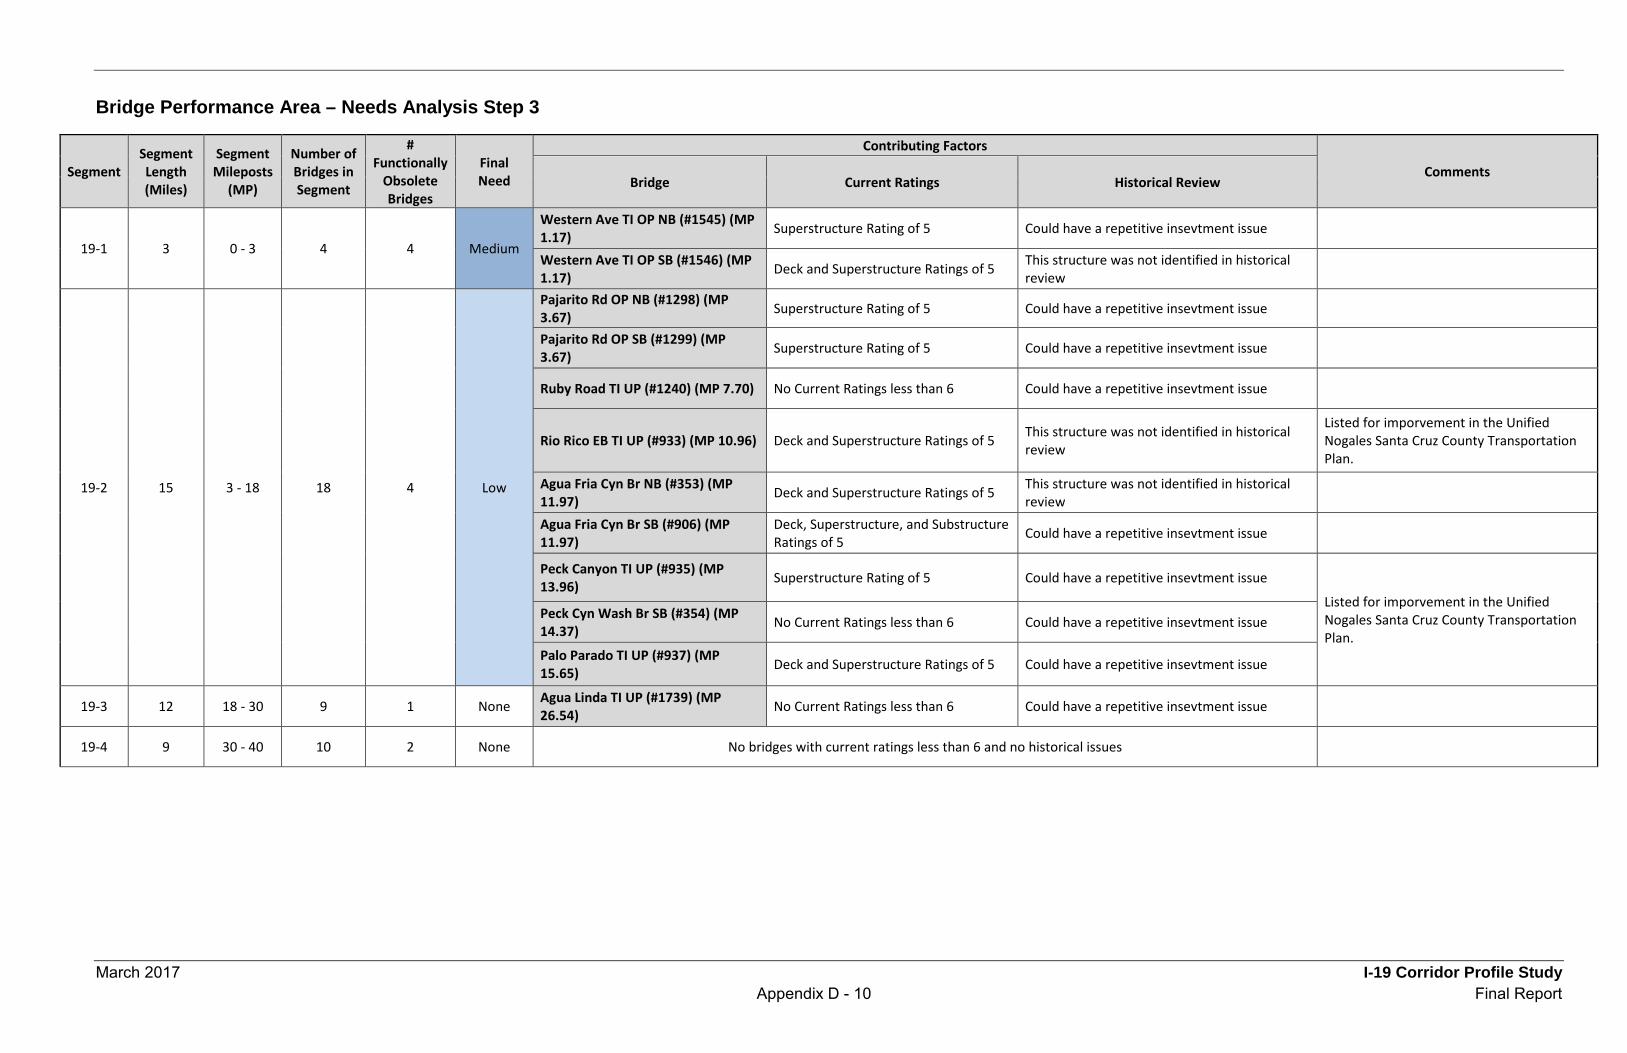
March 2017 I-19 Corridor Profile Study Appendix D - 10 Final Report
Bridge Performance Area – Needs Analysis Step 3
Segment Segment Length (Miles)
Segment Mileposts
(MP)
Number of Bridges in Segment
# Functionally
Obsolete Bridges
Final Need
Contributing Factors
Comments Bridge Current Ratings Historical Review
19-1 3 0 - 3 4 4 Medium
Western Ave TI OP NB (#1545) (MP 1.17) Superstructure Rating of 5 Could have a repetitive insevtment issue
Western Ave TI OP SB (#1546) (MP 1.17) Deck and Superstructure Ratings of 5 This structure was not identified in historical
review
19-2 15 3 - 18 18 4 Low
Pajarito Rd OP NB (#1298) (MP 3.67) Superstructure Rating of 5 Could have a repetitive insevtment issue
Pajarito Rd OP SB (#1299) (MP 3.67) Superstructure Rating of 5 Could have a repetitive insevtment issue
Ruby Road TI UP (#1240) (MP 7.70) No Current Ratings less than 6 Could have a repetitive insevtment issue
Rio Rico EB TI UP (#933) (MP 10.96) Deck and Superstructure Ratings of 5 This structure was not identified in historical review
Listed for imporvement in the Unified Nogales Santa Cruz County Transportation Plan.
Agua Fria Cyn Br NB (#353) (MP 11.97) Deck and Superstructure Ratings of 5 This structure was not identified in historical
review
Agua Fria Cyn Br SB (#906) (MP 11.97)
Deck, Superstructure, and Substructure Ratings of 5 Could have a repetitive insevtment issue
Peck Canyon TI UP (#935) (MP 13.96) Superstructure Rating of 5 Could have a repetitive insevtment issue
Listed for imporvement in the Unified Nogales Santa Cruz County Transportation Plan.
Peck Cyn Wash Br SB (#354) (MP 14.37) No Current Ratings less than 6 Could have a repetitive insevtment issue
Palo Parado TI UP (#937) (MP 15.65) Deck and Superstructure Ratings of 5 Could have a repetitive insevtment issue
19-3 12 18 - 30 9 1 None Agua Linda TI UP (#1739) (MP 26.54) No Current Ratings less than 6 Could have a repetitive insevtment issue
19-4 9 30 - 40 10 2 None No bridges with current ratings less than 6 and no historical issues
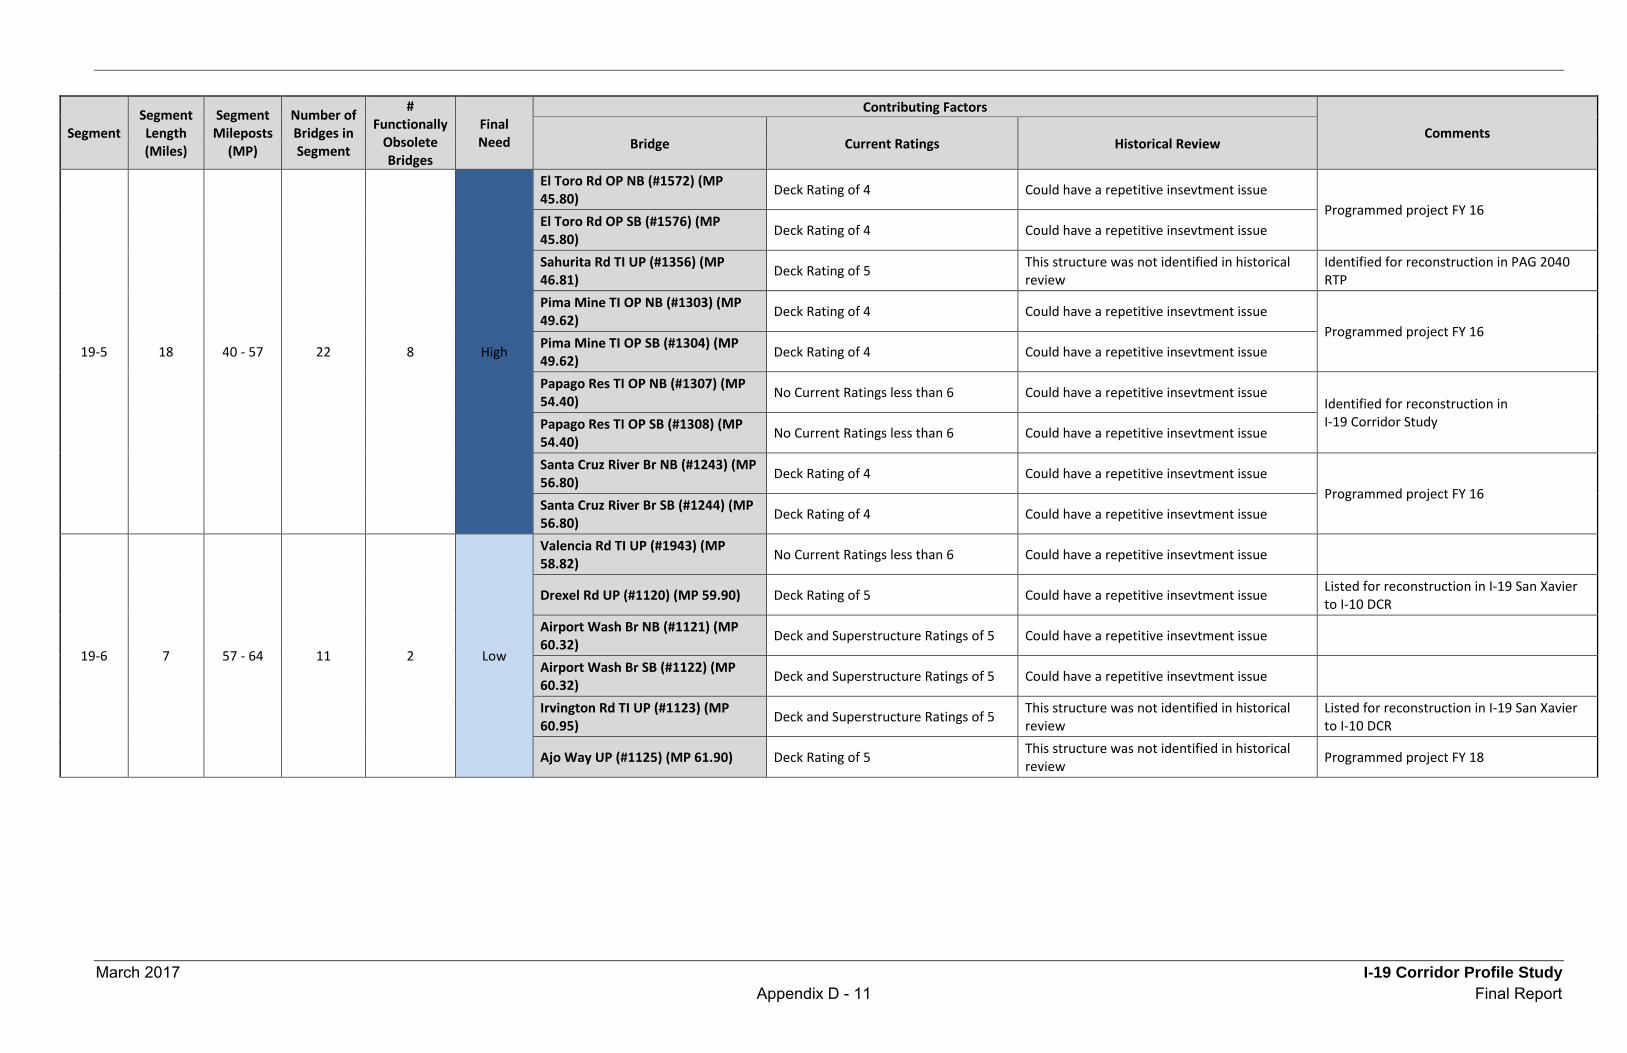
March 2017 I-19 Corridor Profile Study Appendix D - 11 Final Report
Segment Segment Length (Miles)
Segment Mileposts
(MP)
Number of Bridges in Segment
# Functionally
Obsolete Bridges
Final Need
Contributing Factors
Comments Bridge Current Ratings Historical Review
19-5 18 40 - 57 22 8 High
El Toro Rd OP NB (#1572) (MP 45.80) Deck Rating of 4 Could have a repetitive insevtment issue
Programmed project FY 16 El Toro Rd OP SB (#1576) (MP 45.80) Deck Rating of 4 Could have a repetitive insevtment issue
Sahurita Rd TI UP (#1356) (MP 46.81) Deck Rating of 5 This structure was not identified in historical
review Identified for reconstruction in PAG 2040 RTP
Pima Mine TI OP NB (#1303) (MP 49.62) Deck Rating of 4 Could have a repetitive insevtment issue
Programmed project FY 16 Pima Mine TI OP SB (#1304) (MP 49.62) Deck Rating of 4 Could have a repetitive insevtment issue
Papago Res TI OP NB (#1307) (MP 54.40) No Current Ratings less than 6 Could have a repetitive insevtment issue
Identified for reconstruction in I-19 Corridor Study Papago Res TI OP SB (#1308) (MP
54.40) No Current Ratings less than 6 Could have a repetitive insevtment issue
Santa Cruz River Br NB (#1243) (MP 56.80) Deck Rating of 4 Could have a repetitive insevtment issue
Programmed project FY 16 Santa Cruz River Br SB (#1244) (MP 56.80) Deck Rating of 4 Could have a repetitive insevtment issue
19-6 7 57 - 64 11 2 Low
Valencia Rd TI UP (#1943) (MP 58.82) No Current Ratings less than 6 Could have a repetitive insevtment issue
Drexel Rd UP (#1120) (MP 59.90) Deck Rating of 5 Could have a repetitive insevtment issue Listed for reconstruction in I-19 San Xavier to I-10 DCR
Airport Wash Br NB (#1121) (MP 60.32) Deck and Superstructure Ratings of 5 Could have a repetitive insevtment issue
Airport Wash Br SB (#1122) (MP 60.32) Deck and Superstructure Ratings of 5 Could have a repetitive insevtment issue
Irvington Rd TI UP (#1123) (MP 60.95) Deck and Superstructure Ratings of 5 This structure was not identified in historical
review Listed for reconstruction in I-19 San Xavier to I-10 DCR
Ajo Way UP (#1125) (MP 61.90) Deck Rating of 5 This structure was not identified in historical review Programmed project FY 18
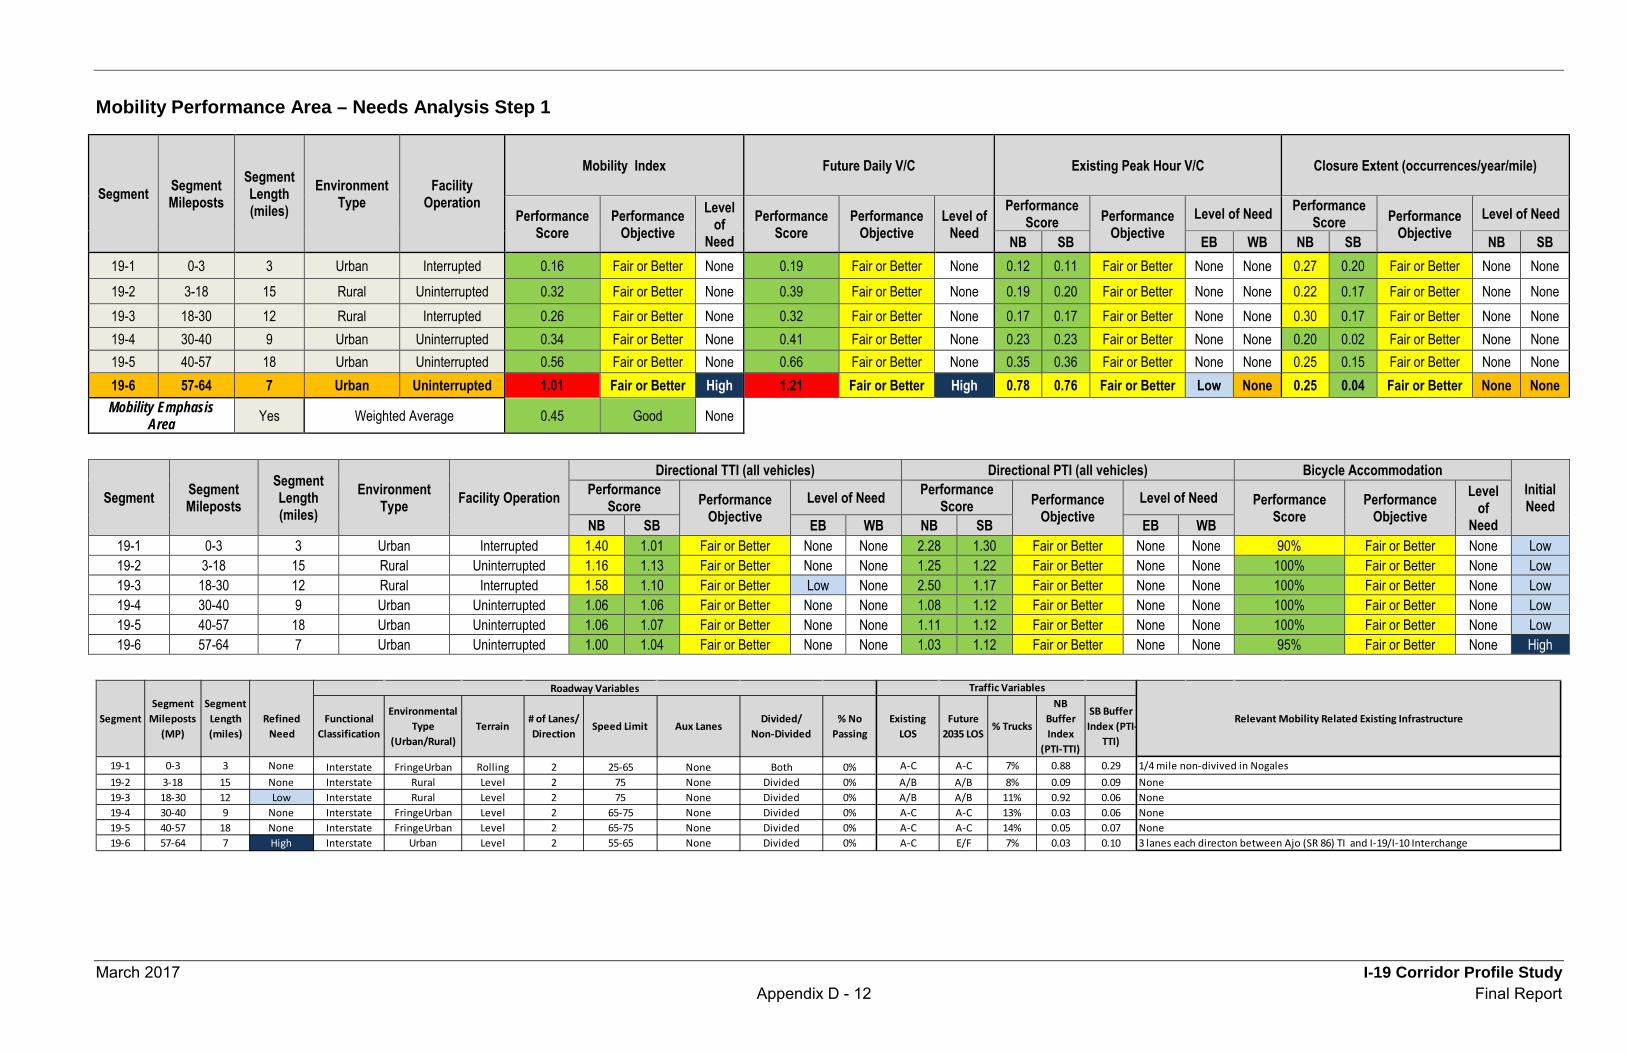
March 2017 I-19 Corridor Profile Study Appendix D - 12 Final Report
Mobility Performance Area – Needs Analysis Step 1
Segment Segment Mileposts
Segment Length (miles)
Environment Type
Facility Operation
Mobility Index Future Daily V/C Existing Peak Hour V/C Closure Extent (occurrences/year/mile)
Performance Score
Performance Objective
Level of
Need Performance
Score Performance
Objective Level of
Need Performance
Score Performance Objective
Level of Need Performance Score Performance
Objective Level of Need
NB SB EB WB NB SB NB SB 19-1 0-3 3 Urban Interrupted 0.16 Fair or Better None 0.19 Fair or Better None 0.12 0.11 Fair or Better None None 0.27 0.20 Fair or Better None None 19-2 3-18 15 Rural Uninterrupted 0.32 Fair or Better None 0.39 Fair or Better None 0.19 0.20 Fair or Better None None 0.22 0.17 Fair or Better None None 19-3 18-30 12 Rural Interrupted 0.26 Fair or Better None 0.32 Fair or Better None 0.17 0.17 Fair or Better None None 0.30 0.17 Fair or Better None None 19-4 30-40 9 Urban Uninterrupted 0.34 Fair or Better None 0.41 Fair or Better None 0.23 0.23 Fair or Better None None 0.20 0.02 Fair or Better None None 19-5 40-57 18 Urban Uninterrupted 0.56 Fair or Better None 0.66 Fair or Better None 0.35 0.36 Fair or Better None None 0.25 0.15 Fair or Better None None 19-6 57-64 7 Urban Uninterrupted 1.01 Fair or Better High 1.21 Fair or Better High 0.78 0.76 Fair or Better Low None 0.25 0.04 Fair or Better None None Mobility Emphasis
Area Yes Weighted Average 0.45 Good None
Segment Segment Mileposts
Segment Length (miles)
Environment Type Facility Operation
Directional TTI (all vehicles) Directional PTI (all vehicles) Bicycle Accommodation Initial Need
Performance Score Performance
Objective Level of Need Performance
Score Performance Objective
Level of Need Performance Score
Performance Objective
Level of
Need NB SB EB WB NB SB EB WB 19-1 0-3 3 Urban Interrupted 1.40 1.01 Fair or Better None None 2.28 1.30 Fair or Better None None 90% Fair or Better None Low 19-2 3-18 15 Rural Uninterrupted 1.16 1.13 Fair or Better None None 1.25 1.22 Fair or Better None None 100% Fair or Better None Low 19-3 18-30 12 Rural Interrupted 1.58 1.10 Fair or Better Low None 2.50 1.17 Fair or Better None None 100% Fair or Better None Low 19-4 30-40 9 Urban Uninterrupted 1.06 1.06 Fair or Better None None 1.08 1.12 Fair or Better None None 100% Fair or Better None Low 19-5 40-57 18 Urban Uninterrupted 1.06 1.07 Fair or Better None None 1.11 1.12 Fair or Better None None 100% Fair or Better None Low 19-6 57-64 7 Urban Uninterrupted 1.00 1.04 Fair or Better None None 1.03 1.12 Fair or Better None None 95% Fair or Better None High
Refined Need
Functional Classification
Environmental Type
(Urban/Rural)Terrain
# of Lanes/Direction
Speed Limit Aux LanesDivided/
Non-Divided% No
PassingExisting
LOSFuture
2035 LOS% Trucks
NB Buffer Index
(PTI-TTI)
SB Buffer Index (PTI-
TTI)
19-1 0-3 3 None Interstate FringeUrban Rolling 2 25-65 None Both 0% A-C A-C 7% 0.88 0.2919-2 3-18 15 None Interstate Rural Level 2 75 None Divided 0% A/B A/B 8% 0.09 0.0919-3 18-30 12 Low Interstate Rural Level 2 75 None Divided 0% A/B A/B 11% 0.92 0.0619-4 30-40 9 None Interstate FringeUrban Level 2 65-75 None Divided 0% A-C A-C 13% 0.03 0.0619-5 40-57 18 None Interstate FringeUrban Level 2 65-75 None Divided 0% A-C A-C 14% 0.05 0.0719-6 57-64 7 High Interstate Urban Level 2 55-65 None Divided 0% A-C E/F 7% 0.03 0.10
SegmentSegment
Length (miles)
Segment Mileposts
(MP)
None
Roadway Variables
Relevant Mobility Related Existing Infrastructure
Traffic Variables
1/4 mile non-divived in NogalesNone
NoneNone3 lanes each directon between Ajo (SR 86) TI and I-19/I-10 Interchange
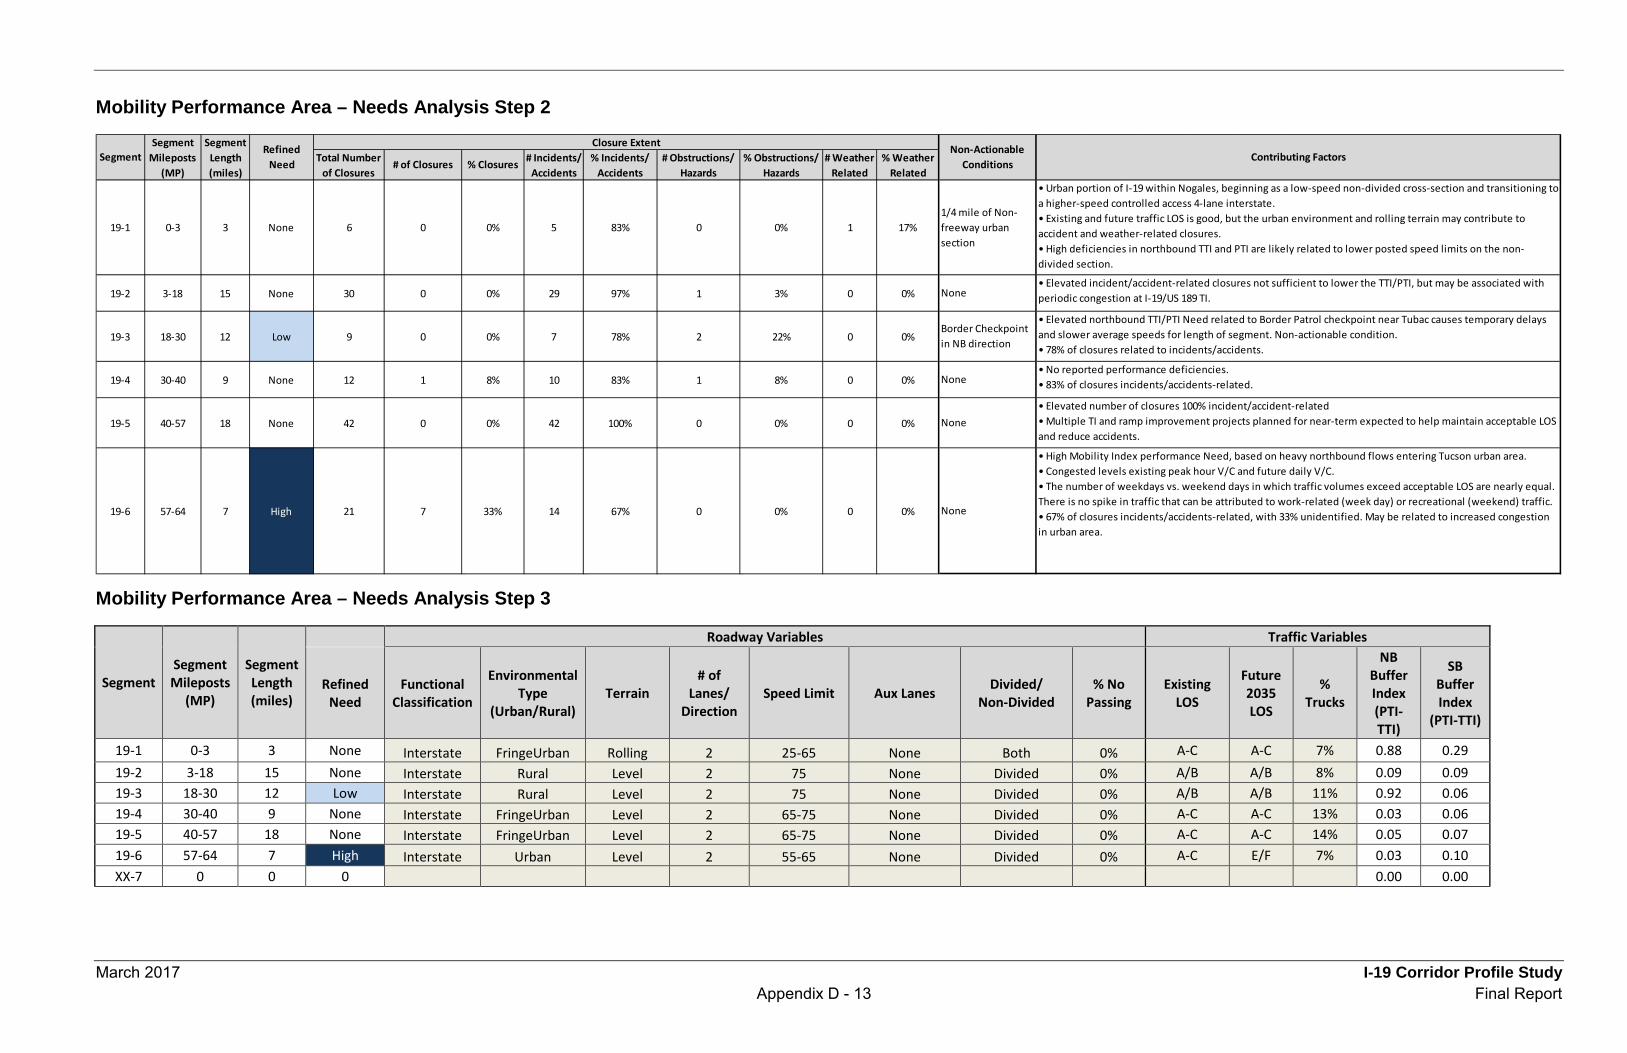
March 2017 I-19 Corridor Profile Study Appendix D - 13 Final Report
Mobility Performance Area – Needs Analysis Step 2
Mobility Performance Area – Needs Analysis Step 3
Segment Segment Mileposts
(MP)
Segment Length (miles)
Roadway Variables Traffic Variables
Refined Need
Functional Classification
Environmental Type
(Urban/Rural) Terrain
# of Lanes/
Direction Speed Limit Aux Lanes Divided/
Non-Divided % No
Passing Existing
LOS
Future 2035 LOS
% Trucks
NB Buffer Index (PTI-TTI)
SB Buffer Index
(PTI-TTI)
19-1 0-3 3 None Interstate FringeUrban Rolling 2 25-65 None Both 0% A-C A-C 7% 0.88 0.29 19-2 3-18 15 None Interstate Rural Level 2 75 None Divided 0% A/B A/B 8% 0.09 0.09 19-3 18-30 12 Low Interstate Rural Level 2 75 None Divided 0% A/B A/B 11% 0.92 0.06 19-4 30-40 9 None Interstate FringeUrban Level 2 65-75 None Divided 0% A-C A-C 13% 0.03 0.06 19-5 40-57 18 None Interstate FringeUrban Level 2 65-75 None Divided 0% A-C A-C 14% 0.05 0.07 19-6 57-64 7 High Interstate Urban Level 2 55-65 None Divided 0% A-C E/F 7% 0.03 0.10 XX-7 0 0 0 0.00 0.00
19-1 0-3 3 None 6 0 0% 5 83% 0 0% 1 17%
19-2 3-18 15 None 30 0 0% 29 97% 1 3% 0 0%
19-3 18-30 12 Low 9 0 0% 7 78% 2 22% 0 0%
19-4 30-40 9 None 12 1 8% 10 83% 1 8% 0 0%
19-5 40-57 18 None 42 0 0% 42 100% 0 0% 0 0%
19-6 57-64 7 High 21 7 33% 14 67% 0 0% 0 0%
Contributing Factors
None
None
None
Border Checkpoint in NB direction
• High Mobility Index performance Need, based on heavy northbound flows entering Tucson urban area.• Congested levels existing peak hour V/C and future daily V/C.• The number of weekdays vs. weekend days in which traffic volumes exceed acceptable LOS are nearly equal. There is no spike in traffic that can be attributed to work-related (week day) or recreational (weekend) traffic.• 67% of closures incidents/accidents-related, with 33% unidentified. May be related to increased congestion in urban area.
• Elevated northbound TTI/PTI Need related to Border Patrol checkpoint near Tubac causes temporary delays and slower average speeds for length of segment. Non-actionable condition.• 78% of closures related to incidents/accidents.
• No reported performance deficiencies.• 83% of closures incidents/accidents-related.
% Weather Related
Non-Actionable Conditions
SegmentSegment
Mileposts (MP)
Segment Length (miles)
Refined Need
Closure ExtentTotal Number
of Closures% Closures % Incidents/
Accidents# Incidents/
Accidents# of Closures # Obstructions/
Hazards# Weather
Related% Obstructions/
Hazards
• Elevated number of closures 100% incident/accident-related• Multiple TI and ramp improvement projects planned for near-term expected to help maintain acceptable LOS and reduce accidents.
1/4 mile of Non-freeway urban section
None
• Urban portion of I-19 within Nogales, beginning as a low-speed non-divided cross-section and transitioning to a higher-speed controlled access 4-lane interstate. • Existing and future traffic LOS is good, but the urban environment and rolling terrain may contribute to accident and weather-related closures.• High deficiencies in northbound TTI and PTI are likely related to lower posted speed limits on the non-divided section.
• Elevated incident/accident-related closures not sufficient to lower the TTI/PTI, but may be associated with periodic congestion at I-19/US 189 TI.

March 2017 I-19 Corridor Profile Study Appendix D - 14 Final Report
Segment Segment
Mileposts (MP)
Segment Length (miles)
Refined Need
Closure Extent Non-
Actionable Conditions
Contributing Factors Total
Number of
Closures
# of Closures
% Closures
# Incidents/ Accidents
% Incidents/ Accidents
# Obstructions/
Hazards
% Obstructions/
Hazards
# Weather Related
% Weather Related
19-1 0-3 3 None 6 0 0% 5 83% 0 0% 1 17%
1/4 mile of Non-freeway urban section
• Urban portion of I-19 within Nogales, beginning as a low-speed non-divided cross-section and transitioning to a higher-speed controlled access 4-lane interstate. • Existing and future traffic LOS is good, but the urban environment and rolling terrain may contribute to accident and weather-related closures. • High deficiencies in northbound TTI and PTI are likely related to lower posted speed limits on the non-divided section.
19-2 3-18 15 None 30 0 0% 29 97% 1 3% 0 0% None • Elevated incident/accident-related closures not sufficient to lower the TTI/PTI, but may be associated with periodic congestion at I-19/US 189 TI.
19-3 18-30 12 Low 9 0 0% 7 78% 2 22% 0 0%
Border Checkpoint in NB direction
• Elevated northbound TTI/PTI Need related to Border Patrol checkpoint near Tubac causes temporary delays and slower average speeds for length of segment. Non-actionable condition. • 78% of closures related to incidents/accidents.
19-4 30-40 9 None 12 1 8% 10 83% 1 8% 0 0% None • No reported performance deficiencies. • 83% of closures incidents/accidents-related.
19-5 40-57 18 None 42 0 0% 42 100% 0 0% 0 0% None • Elevated number of closures 100% incident/accident-related • Multiple TI and ramp improvement projects planned for near-term expected to help maintain acceptable LOS and reduce accidents.
19-6 57-64 7 High 21 7 33% 14 67% 0 0% 0 0% None
• High Mobility Index performance Need, based on heavy northbound flows entering Tucson urban area. • Congested levels existing peak hour V/C and future daily V/C. • The number of weekdays vs. weekend days in which traffic volumes exceed acceptable LOS are nearly equal. There is no spike in traffic that can be attributed to work-related (week day) or recreational (weekend) traffic. • 67% of closures incidents/accidents-related, with 33% unidentified. May be related to increased congestion in urban area.
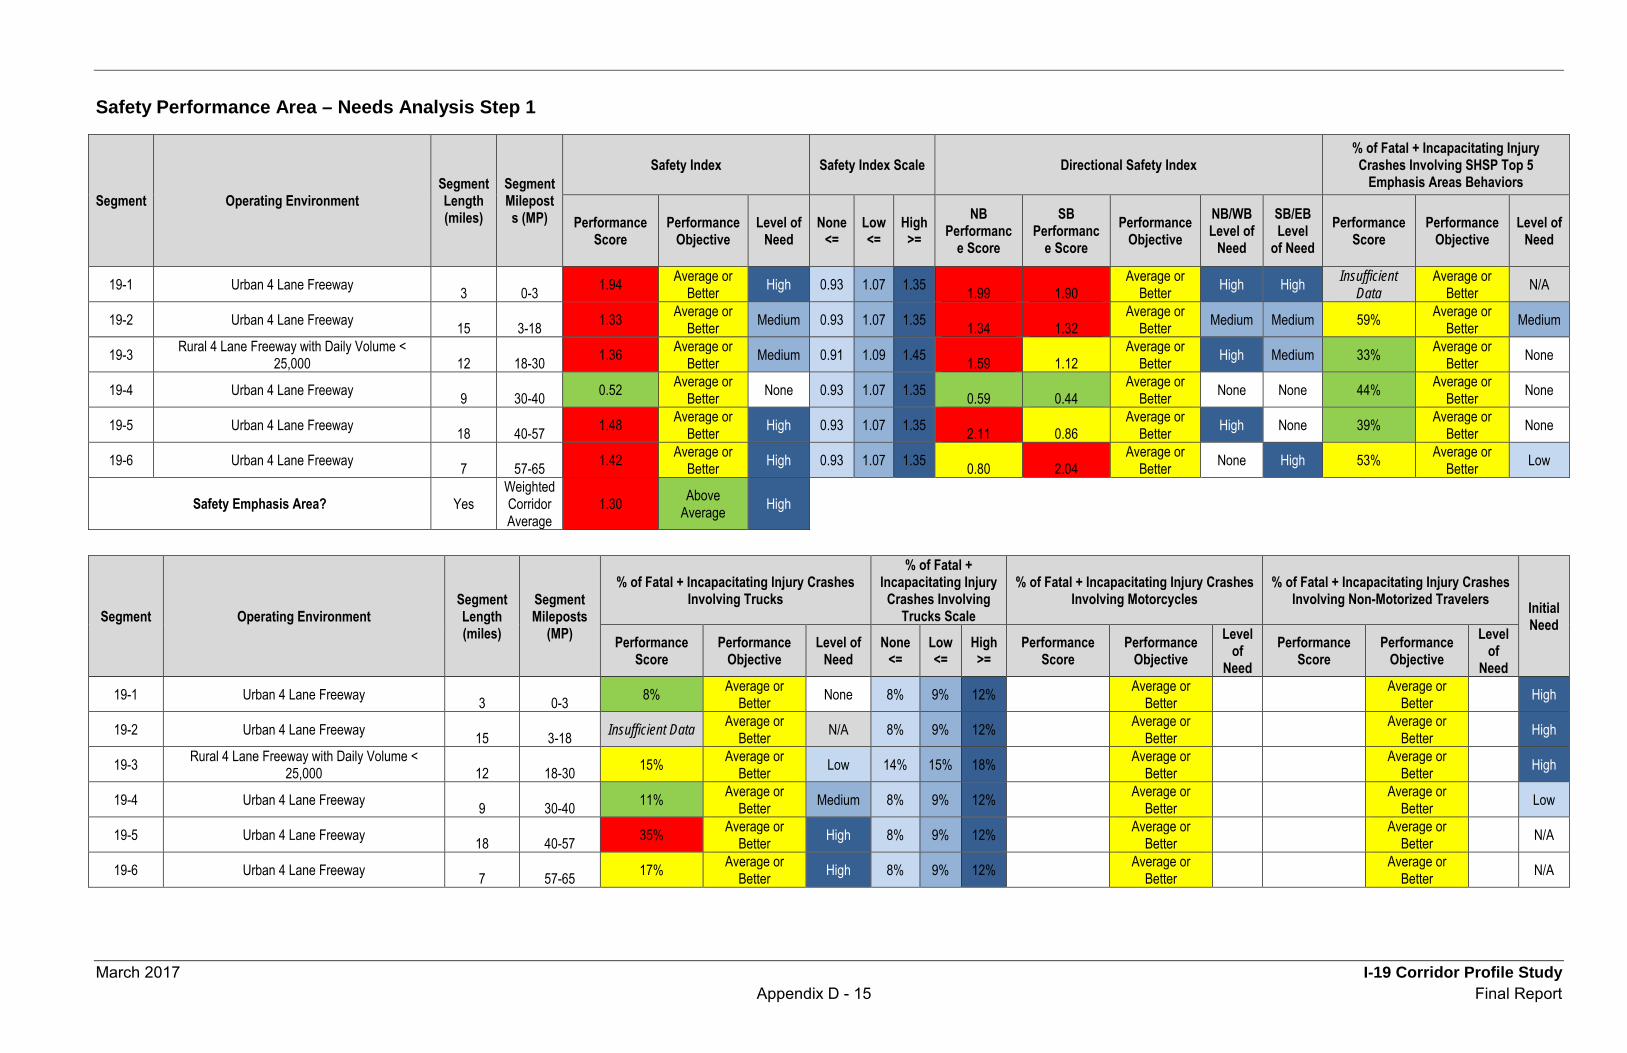
March 2017 I-19 Corridor Profile Study Appendix D - 15 Final Report
Safety Performance Area – Needs Analysis Step 1
Segment Operating Environment Segment Length (miles)
Segment Mileposts (MP)
Safety Index Safety Index Scale Directional Safety Index % of Fatal + Incapacitating Injury Crashes Involving SHSP Top 5
Emphasis Areas Behaviors
Performance Score
Performance Objective
Level of Need
None <=
Low <=
High >=
NB Performanc
e Score
SB Performanc
e Score Performance
Objective NB/WB Level of
Need
SB/EB Level
of Need Performance
Score Performance
Objective Level of
Need
19-1 Urban 4 Lane Freeway 3 0-3 1.94 Average or Better High 0.93 1.07 1.35 1.99 1.90
Average or Better High High Insufficient
Data Average or
Better N/A
19-2 Urban 4 Lane Freeway 15 3-18 1.33 Average or Better Medium 0.93 1.07 1.35 1.34 1.32
Average or Better Medium Medium 59% Average or
Better Medium
19-3 Rural 4 Lane Freeway with Daily Volume < 25,000 12 18-30 1.36 Average or
Better Medium 0.91 1.09 1.45 1.59 1.12 Average or
Better High Medium 33% Average or Better None
19-4 Urban 4 Lane Freeway 9 30-40 0.52 Average or Better None 0.93 1.07 1.35 0.59 0.44
Average or Better None None 44% Average or
Better None
19-5 Urban 4 Lane Freeway 18 40-57 1.48 Average or Better High 0.93 1.07 1.35 2.11 0.86
Average or Better High None 39% Average or
Better None
19-6 Urban 4 Lane Freeway 7 57-65 1.42 Average or Better High 0.93 1.07 1.35 0.80 2.04
Average or Better None High 53% Average or
Better Low
Safety Emphasis Area? Yes Weighted Corridor Average
1.30 Above Average High
Segment Operating Environment Segment Length (miles)
Segment Mileposts
(MP)
% of Fatal + Incapacitating Injury Crashes Involving Trucks
% of Fatal + Incapacitating Injury
Crashes Involving Trucks Scale
% of Fatal + Incapacitating Injury Crashes Involving Motorcycles
% of Fatal + Incapacitating Injury Crashes Involving Non-Motorized Travelers Initial
Need Performance
Score Performance
Objective Level of
Need None
<= Low <=
High >=
Performance Score
Performance Objective
Level of
Need Performance
Score Performance
Objective Level
of Need
19-1 Urban 4 Lane Freeway 3 0-3 8% Average or Better None 8% 9% 12% Average or
Better Average or Better High
19-2 Urban 4 Lane Freeway 15 3-18 Insufficient Data Average or Better N/A 8% 9% 12% Average or
Better Average or Better High
19-3 Rural 4 Lane Freeway with Daily Volume < 25,000 12 18-30 15% Average or
Better Low 14% 15% 18% Average or Better Average or
Better High
19-4 Urban 4 Lane Freeway 9 30-40 11% Average or Better Medium 8% 9% 12% Average or
Better Average or Better Low
19-5 Urban 4 Lane Freeway 18 40-57 35% Average or Better High 8% 9% 12% Average or
Better Average or Better N/A
19-6 Urban 4 Lane Freeway 7 57-65 17% Average or Better High 8% 9% 12% Average or
Better Average or Better N/A
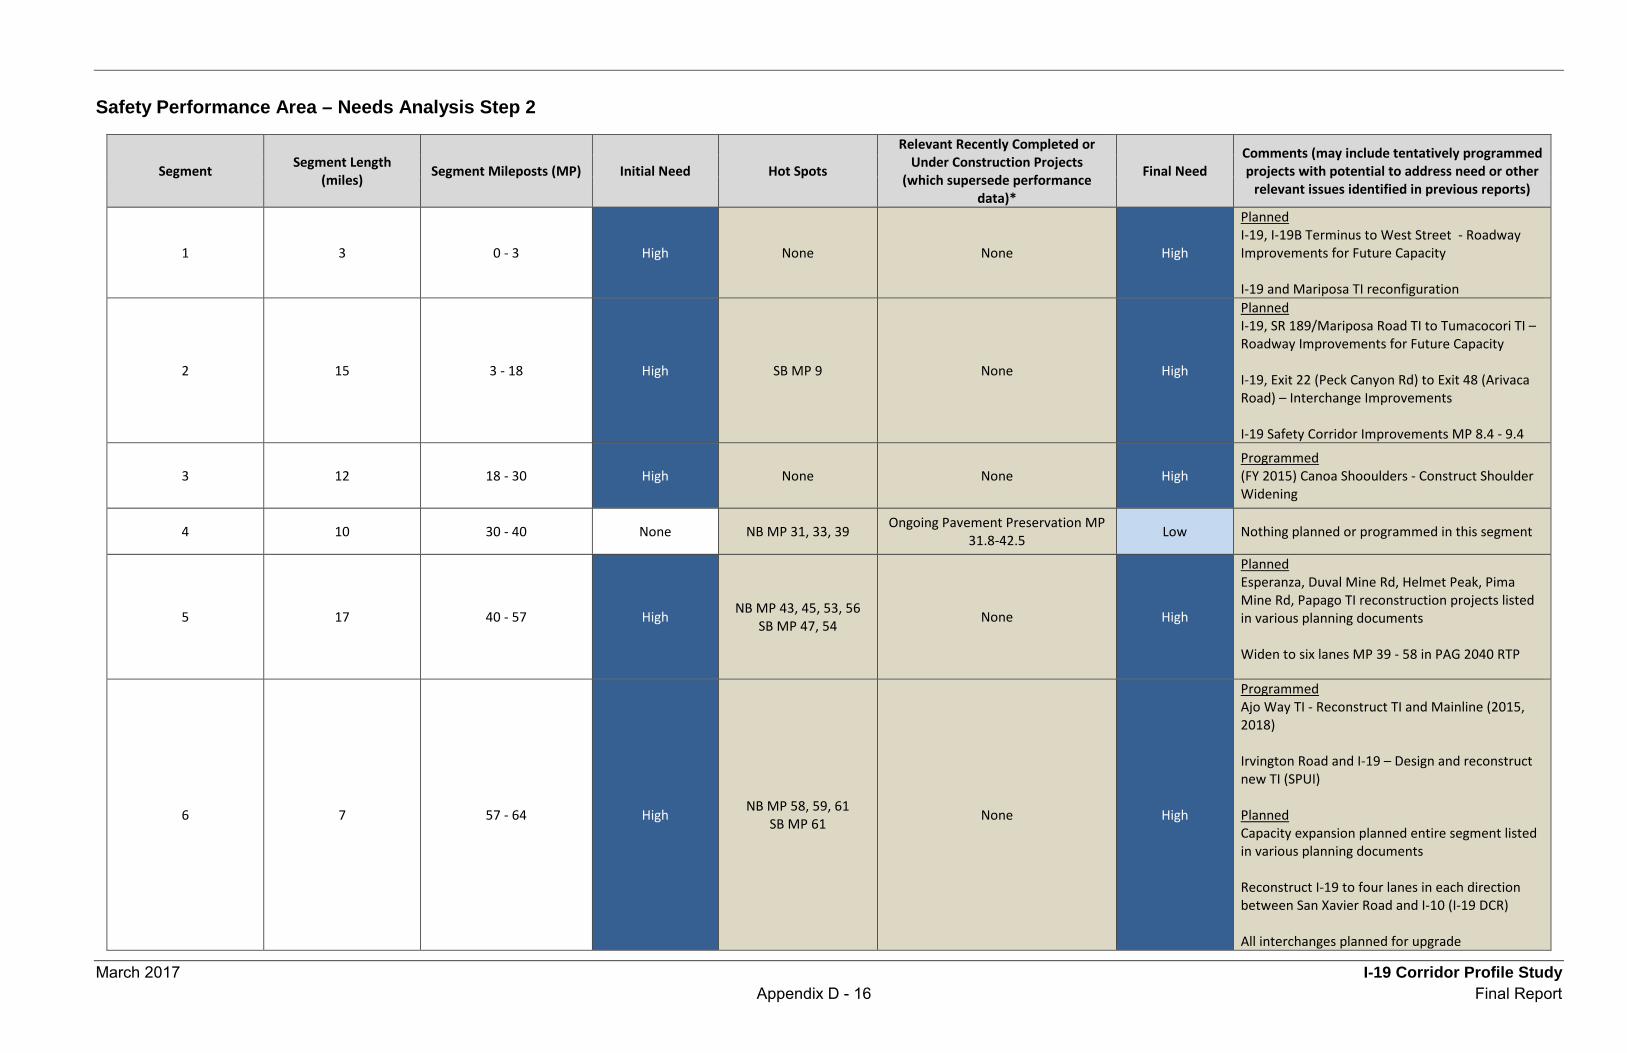
March 2017 I-19 Corridor Profile Study Appendix D - 16 Final Report
Safety Performance Area – Needs Analysis Step 2
Segment Segment Length (miles) Segment Mileposts (MP) Initial Need Hot Spots
Relevant Recently Completed or Under Construction Projects
(which supersede performance data)*
Final Need Comments (may include tentatively programmed projects with potential to address need or other
relevant issues identified in previous reports)
1 3 0 - 3 High None None High
Planned I-19, I-19B Terminus to West Street - Roadway Improvements for Future Capacity I-19 and Mariposa TI reconfiguration
2 15 3 - 18 High SB MP 9 None High
Planned I-19, SR 189/Mariposa Road TI to Tumacocori TI – Roadway Improvements for Future Capacity I-19, Exit 22 (Peck Canyon Rd) to Exit 48 (Arivaca Road) – Interchange Improvements I-19 Safety Corridor Improvements MP 8.4 - 9.4
3 12 18 - 30 High None None High Programmed (FY 2015) Canoa Shooulders - Construct Shoulder Widening
4 10 30 - 40 None NB MP 31, 33, 39 Ongoing Pavement Preservation MP 31.8-42.5 Low Nothing planned or programmed in this segment
5 17 40 - 57 High NB MP 43, 45, 53, 56 SB MP 47, 54 None High
Planned Esperanza, Duval Mine Rd, Helmet Peak, Pima Mine Rd, Papago TI reconstruction projects listed in various planning documents Widen to six lanes MP 39 - 58 in PAG 2040 RTP
6 7 57 - 64 High NB MP 58, 59, 61 SB MP 61 None High
Programmed Ajo Way TI - Reconstruct TI and Mainline (2015, 2018) Irvington Road and I-19 – Design and reconstruct new TI (SPUI) Planned Capacity expansion planned entire segment listed in various planning documents Reconstruct I-19 to four lanes in each direction between San Xavier Road and I-10 (I-19 DCR) All interchanges planned for upgrade
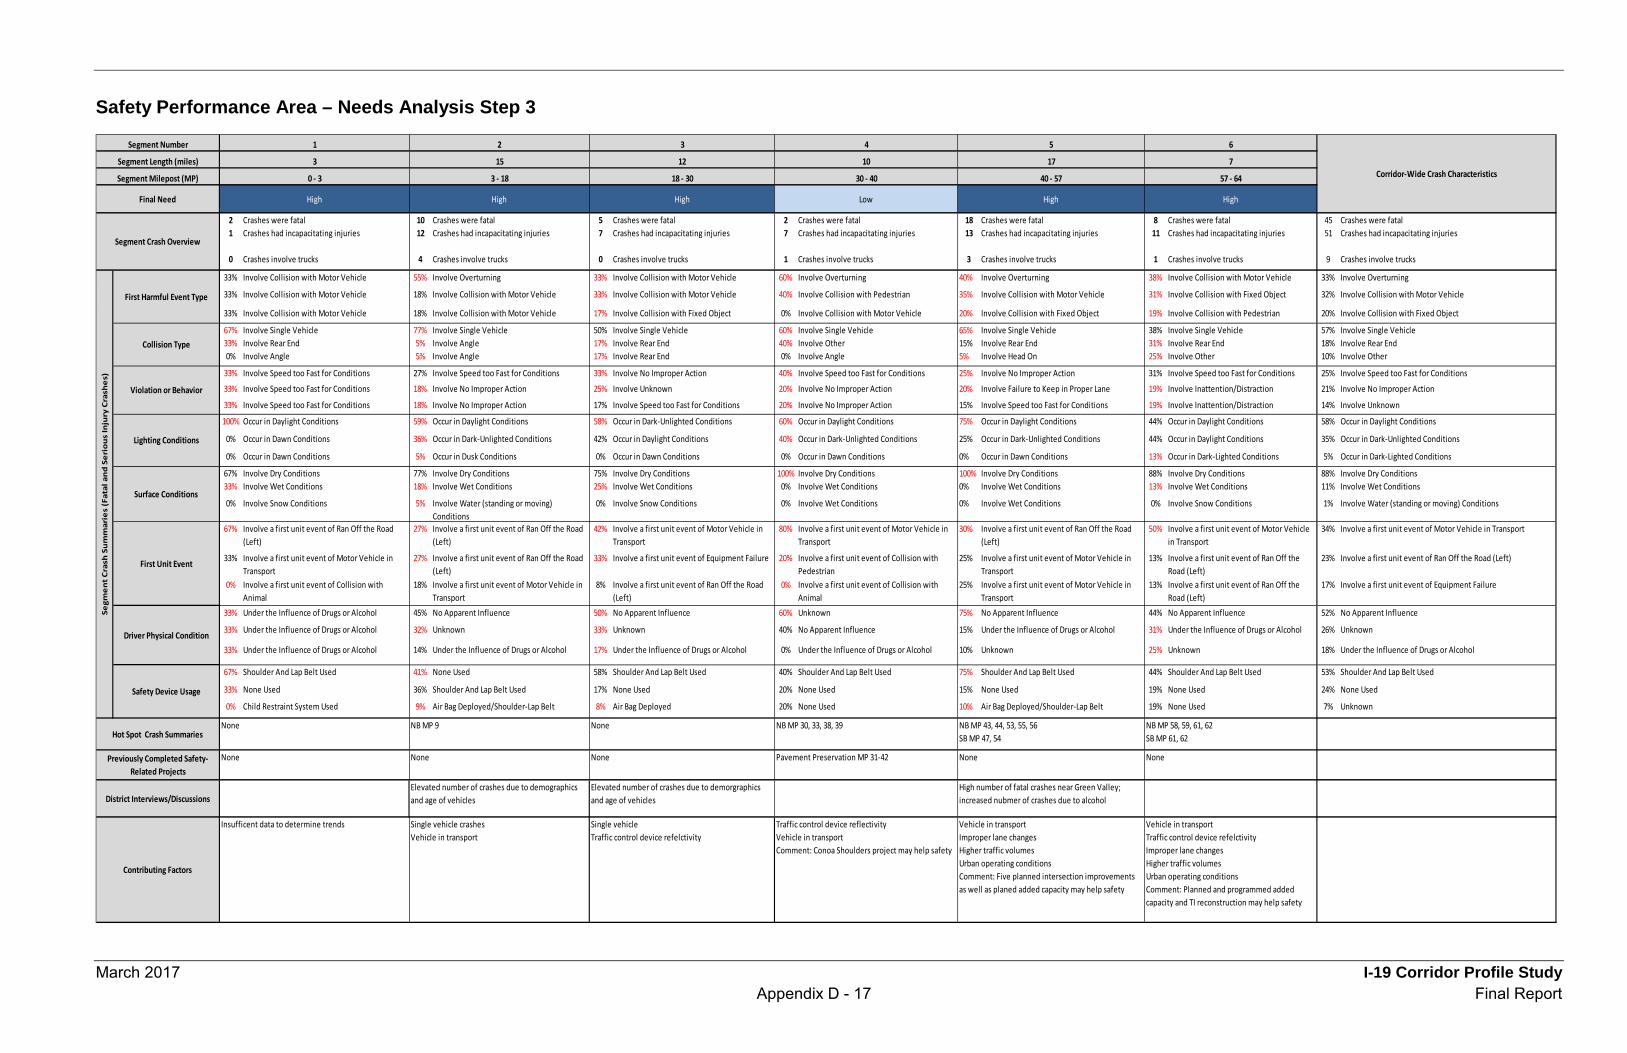
March 2017 I-19 Corridor Profile Study Appendix D - 17 Final Report
Safety Performance Area – Needs Analysis Step 3
2 Crashes were fatal 10 Crashes were fatal 5 Crashes were fatal 2 Crashes were fatal 18 Crashes were fatal 8 Crashes were fatal 45 Crashes were fatal1 Crashes had incapacitating injuries 12 Crashes had incapacitating injuries 7 Crashes had incapacitating injuries 7 Crashes had incapacitating injuries 13 Crashes had incapacitating injuries 11 Crashes had incapacitating injuries 51 Crashes had incapacitating injuries
0 Crashes involve trucks 4 Crashes involve trucks 0 Crashes involve trucks 1 Crashes involve trucks 3 Crashes involve trucks 1 Crashes involve trucks 9 Crashes involve trucks
33% Involve Collision with Motor Vehicle 55% Involve Overturning 33% Involve Collision with Motor Vehicle 60% Involve Overturning 40% Involve Overturning 38% Involve Collision with Motor Vehicle 33% Involve Overturning
33% Involve Collision with Motor Vehicle 18% Involve Collision with Motor Vehicle 33% Involve Collision with Motor Vehicle 40% Involve Collision with Pedestrian 35% Involve Collision with Motor Vehicle 31% Involve Collision with Fixed Object 32% Involve Collision with Motor Vehicle
33% Involve Collision with Motor Vehicle 18% Involve Collision with Motor Vehicle 17% Involve Collision with Fixed Object 0% Involve Collision with Motor Vehicle 20% Involve Collision with Fixed Object 19% Involve Collision with Pedestrian 20% Involve Collision with Fixed Object
67% Involve Single Vehicle 77% Involve Single Vehicle 50% Involve Single Vehicle 60% Involve Single Vehicle 65% Involve Single Vehicle 38% Involve Single Vehicle 57% Involve Single Vehicle33% Involve Rear End 5% Involve Angle 17% Involve Rear End 40% Involve Other 15% Involve Rear End 31% Involve Rear End 18% Involve Rear End0% Involve Angle 5% Involve Angle 17% Involve Rear End 0% Involve Angle 5% Involve Head On 25% Involve Other 10% Involve Other
33% Involve Speed too Fast for Conditions 27% Involve Speed too Fast for Conditions 33% Involve No Improper Action 40% Involve Speed too Fast for Conditions 25% Involve No Improper Action 31% Involve Speed too Fast for Conditions 25% Involve Speed too Fast for Conditions
33% Involve Speed too Fast for Conditions 18% Involve No Improper Action 25% Involve Unknown 20% Involve No Improper Action 20% Involve Failure to Keep in Proper Lane 19% Involve Inattention/Distraction 21% Involve No Improper Action
33% Involve Speed too Fast for Conditions 18% Involve No Improper Action 17% Involve Speed too Fast for Conditions 20% Involve No Improper Action 15% Involve Speed too Fast for Conditions 19% Involve Inattention/Distraction 14% Involve Unknown
100% Occur in Daylight Conditions 59% Occur in Daylight Conditions 58% Occur in Dark-Unlighted Conditions 60% Occur in Daylight Conditions 75% Occur in Daylight Conditions 44% Occur in Daylight Conditions 58% Occur in Daylight Conditions
0% Occur in Dawn Conditions 36% Occur in Dark-Unlighted Conditions 42% Occur in Daylight Conditions 40% Occur in Dark-Unlighted Conditions 25% Occur in Dark-Unlighted Conditions 44% Occur in Daylight Conditions 35% Occur in Dark-Unlighted Conditions
0% Occur in Dawn Conditions 5% Occur in Dusk Conditions 0% Occur in Dawn Conditions 0% Occur in Dawn Conditions 0% Occur in Dawn Conditions 13% Occur in Dark-Lighted Conditions 5% Occur in Dark-Lighted Conditions
67% Involve Dry Conditions 77% Involve Dry Conditions 75% Involve Dry Conditions 100% Involve Dry Conditions 100% Involve Dry Conditions 88% Involve Dry Conditions 88% Involve Dry Conditions33% Involve Wet Conditions 18% Involve Wet Conditions 25% Involve Wet Conditions 0% Involve Wet Conditions 0% Involve Wet Conditions 13% Involve Wet Conditions 11% Involve Wet Conditions
0% Involve Snow Conditions 5% Involve Water (standing or moving) Conditions
0% Involve Snow Conditions 0% Involve Wet Conditions 0% Involve Wet Conditions 0% Involve Snow Conditions 1% Involve Water (standing or moving) Conditions
67% Involve a first unit event of Ran Off the Road (Left)
27% Involve a first unit event of Ran Off the Road (Left)
42% Involve a first unit event of Motor Vehicle in Transport
80% Involve a first unit event of Motor Vehicle in Transport
30% Involve a first unit event of Ran Off the Road (Left)
50% Involve a first unit event of Motor Vehicle in Transport
34% Involve a first unit event of Motor Vehicle in Transport
33% Involve a first unit event of Motor Vehicle in Transport
27% Involve a first unit event of Ran Off the Road (Left)
33% Involve a first unit event of Equipment Failure 20% Involve a first unit event of Collision with Pedestrian
25% Involve a first unit event of Motor Vehicle in Transport
13% Involve a first unit event of Ran Off the Road (Left)
23% Involve a first unit event of Ran Off the Road (Left)
0% Involve a first unit event of Collision with Animal
18% Involve a first unit event of Motor Vehicle in Transport
8% Involve a first unit event of Ran Off the Road (Left)
0% Involve a first unit event of Collision with Animal
25% Involve a first unit event of Motor Vehicle in Transport
13% Involve a first unit event of Ran Off the Road (Left)
17% Involve a first unit event of Equipment Failure
33% Under the Influence of Drugs or Alcohol 45% No Apparent Influence 50% No Apparent Influence 60% Unknown 75% No Apparent Influence 44% No Apparent Influence 52% No Apparent Influence
33% Under the Influence of Drugs or Alcohol 32% Unknown 33% Unknown 40% No Apparent Influence 15% Under the Influence of Drugs or Alcohol 31% Under the Influence of Drugs or Alcohol 26% Unknown
33% Under the Influence of Drugs or Alcohol 14% Under the Influence of Drugs or Alcohol 17% Under the Influence of Drugs or Alcohol 0% Under the Influence of Drugs or Alcohol 10% Unknown 25% Unknown 18% Under the Influence of Drugs or Alcohol
67% Shoulder And Lap Belt Used 41% None Used 58% Shoulder And Lap Belt Used 40% Shoulder And Lap Belt Used 75% Shoulder And Lap Belt Used 44% Shoulder And Lap Belt Used 53% Shoulder And Lap Belt Used
33% None Used 36% Shoulder And Lap Belt Used 17% None Used 20% None Used 15% None Used 19% None Used 24% None Used
0% Child Restraint System Used 9% Air Bag Deployed/Shoulder-Lap Belt 8% Air Bag Deployed 20% None Used 10% Air Bag Deployed/Shoulder-Lap Belt 19% None Used 7% Unknown
Single vehicle Traffic control device refelctivity
Hot Spot Crash SummariesNone NB MP 9 None
Vehicle in transportImproper lane changesHigher traffic volumesUrban operating conditionsComment: Five planned intersection improvements as well as planed added capacity may help safety
Vehicle in transportTraffic control device refelctivityImproper lane changesHigher traffic volumesUrban operating conditionsComment: Planned and programmed added capacity and TI reconstruction may help safety
NB MP 30, 33, 38, 39
Contributing Factors
Insufficent data to determine trends Single vehicle crashesVehicle in transport
Previously Completed Safety-Related Projects
None None None Pavement Preservation MP 31-42
District Interviews/DiscussionsElevated number of crashes due to demorgraphics and age of vehicles
Elevated number of crashes due to demographics and age of vehicles
Traffic control device reflectivityVehicle in transportComment: Conoa Shoulders project may help safety
NB MP 58, 59, 61, 62SB MP 61, 62
None None
NB MP 43, 44, 53, 55, 56SB MP 47, 54
High number of fatal crashes near Green Valley; increased nubmer of crashes due to alcohol
1 2 3 4
High
3
0 - 3
15
3 - 18
12
18 - 30
10
30 - 40
17
40 - 57
7
57 - 64 Corridor-Wide Crash Characteristics
Final Need High High High Low High
65
Segment Length (miles)
Segment Milepost (MP)
Segment Crash Overview
First Harmful Event Type
Collision Type
Violation or Behavior
Lighting Conditions
Surface Conditions
First Unit Event
Segment Number
Segm
ent C
rash
Sum
mar
ies
(Fat
al a
nd S
erio
us In
jury
Cra
shes
)
Driver Physical Condition
Safety Device Usage
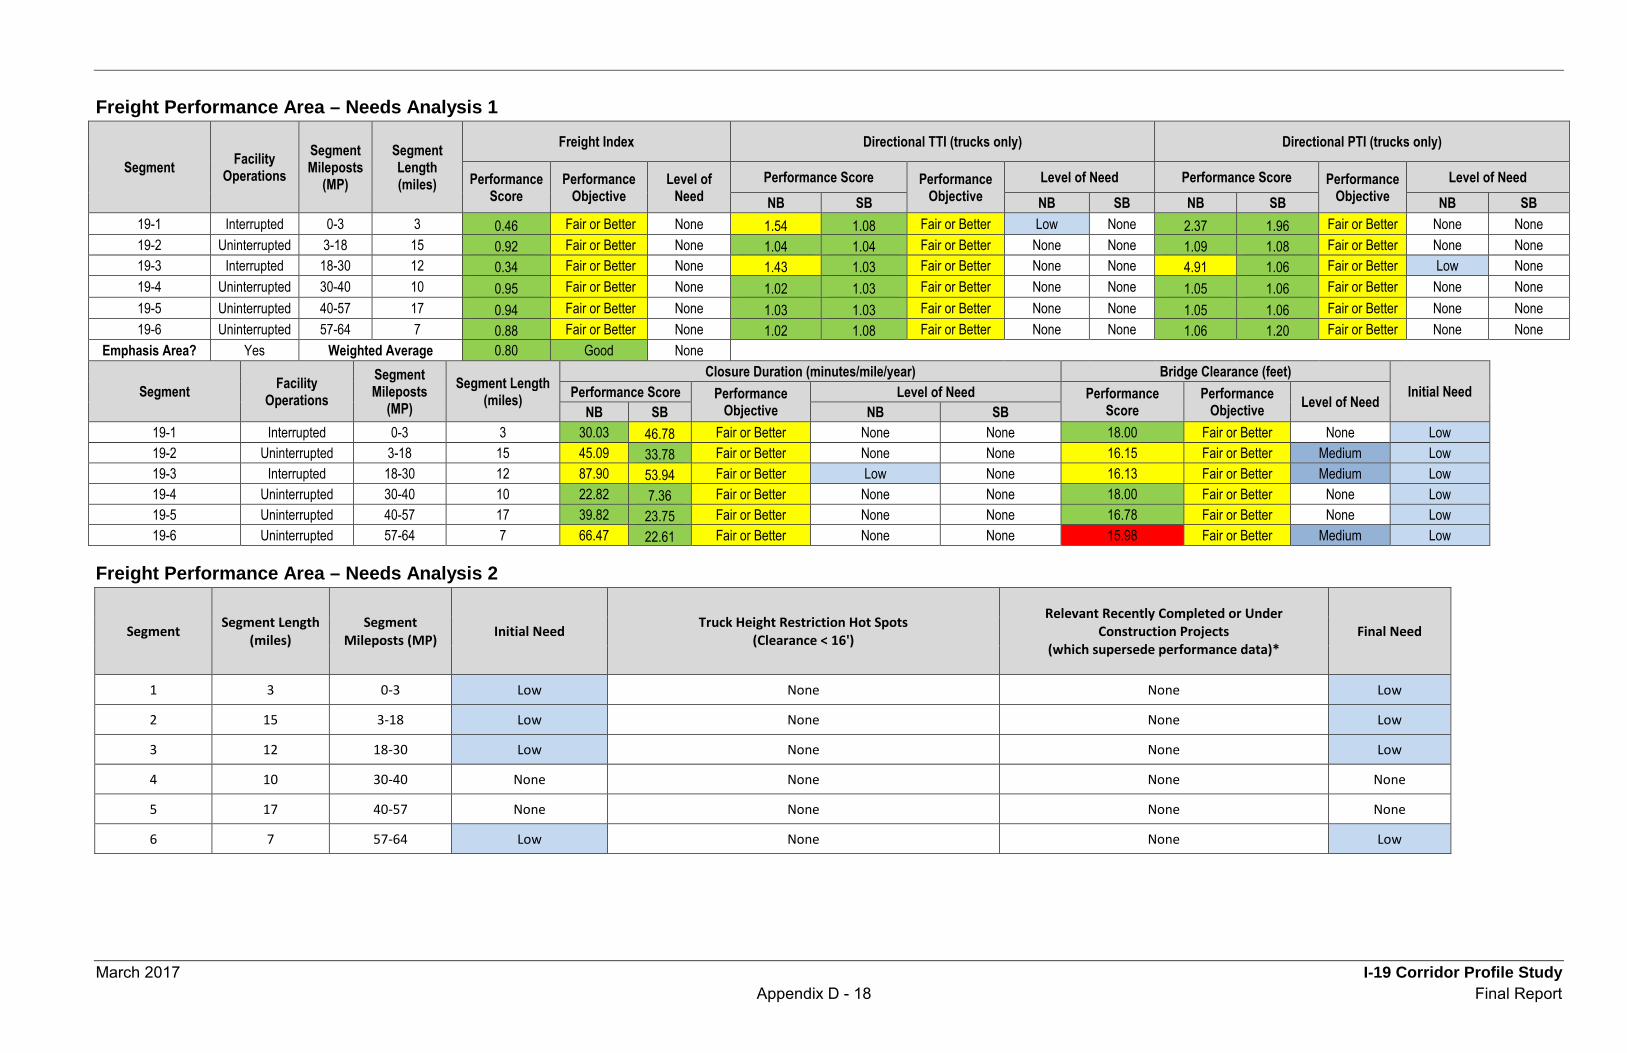
March 2017 I-19 Corridor Profile Study Appendix D - 18 Final Report
Freight Performance Area – Needs Analysis 1
Segment Facility Operations
Segment Mileposts
(MP)
Segment Length (miles)
Freight Index Directional TTI (trucks only) Directional PTI (trucks only)
Performance Score
Performance Objective
Level of Need
Performance Score Performance Objective
Level of Need Performance Score Performance Objective
Level of Need NB SB NB SB NB SB NB SB
19-1 Interrupted 0-3 3 0.46 Fair or Better None 1.54 1.08 Fair or Better Low None 2.37 1.96 Fair or Better None None 19-2 Uninterrupted 3-18 15 0.92 Fair or Better None 1.04 1.04 Fair or Better None None 1.09 1.08 Fair or Better None None 19-3 Interrupted 18-30 12 0.34 Fair or Better None 1.43 1.03 Fair or Better None None 4.91 1.06 Fair or Better Low None 19-4 Uninterrupted 30-40 10 0.95 Fair or Better None 1.02 1.03 Fair or Better None None 1.05 1.06 Fair or Better None None 19-5 Uninterrupted 40-57 17 0.94 Fair or Better None 1.03 1.03 Fair or Better None None 1.05 1.06 Fair or Better None None 19-6 Uninterrupted 57-64 7 0.88 Fair or Better None 1.02 1.08 Fair or Better None None 1.06 1.20 Fair or Better None None
Emphasis Area? Yes Weighted Average 0.80 Good None
Segment Facility Operations
Segment Mileposts
(MP) Segment Length
(miles)
Closure Duration (minutes/mile/year) Bridge Clearance (feet) Initial Need Performance Score Performance
Objective Level of Need Performance
Score Performance
Objective Level of Need NB SB NB SB 19-1 Interrupted 0-3 3 30.03 46.78 Fair or Better None None 18.00 Fair or Better None Low 19-2 Uninterrupted 3-18 15 45.09 33.78 Fair or Better None None 16.15 Fair or Better Medium Low 19-3 Interrupted 18-30 12 87.90 53.94 Fair or Better Low None 16.13 Fair or Better Medium Low 19-4 Uninterrupted 30-40 10 22.82 7.36 Fair or Better None None 18.00 Fair or Better None Low 19-5 Uninterrupted 40-57 17 39.82 23.75 Fair or Better None None 16.78 Fair or Better None Low 19-6 Uninterrupted 57-64 7 66.47 22.61 Fair or Better None None 15.98 Fair or Better Medium Low
Freight Performance Area – Needs Analysis 2
Segment Segment Length (miles)
Segment Mileposts (MP) Initial Need Truck Height Restriction Hot Spots
(Clearance < 16')
Relevant Recently Completed or Under Construction Projects
(which supersede performance data)* Final Need
1 3 0-3 Low None None Low
2 15 3-18 Low None None Low
3 12 18-30 Low None None Low
4 10 30-40 None None None None
5 17 40-57 None None None None
6 7 57-64 Low None None Low
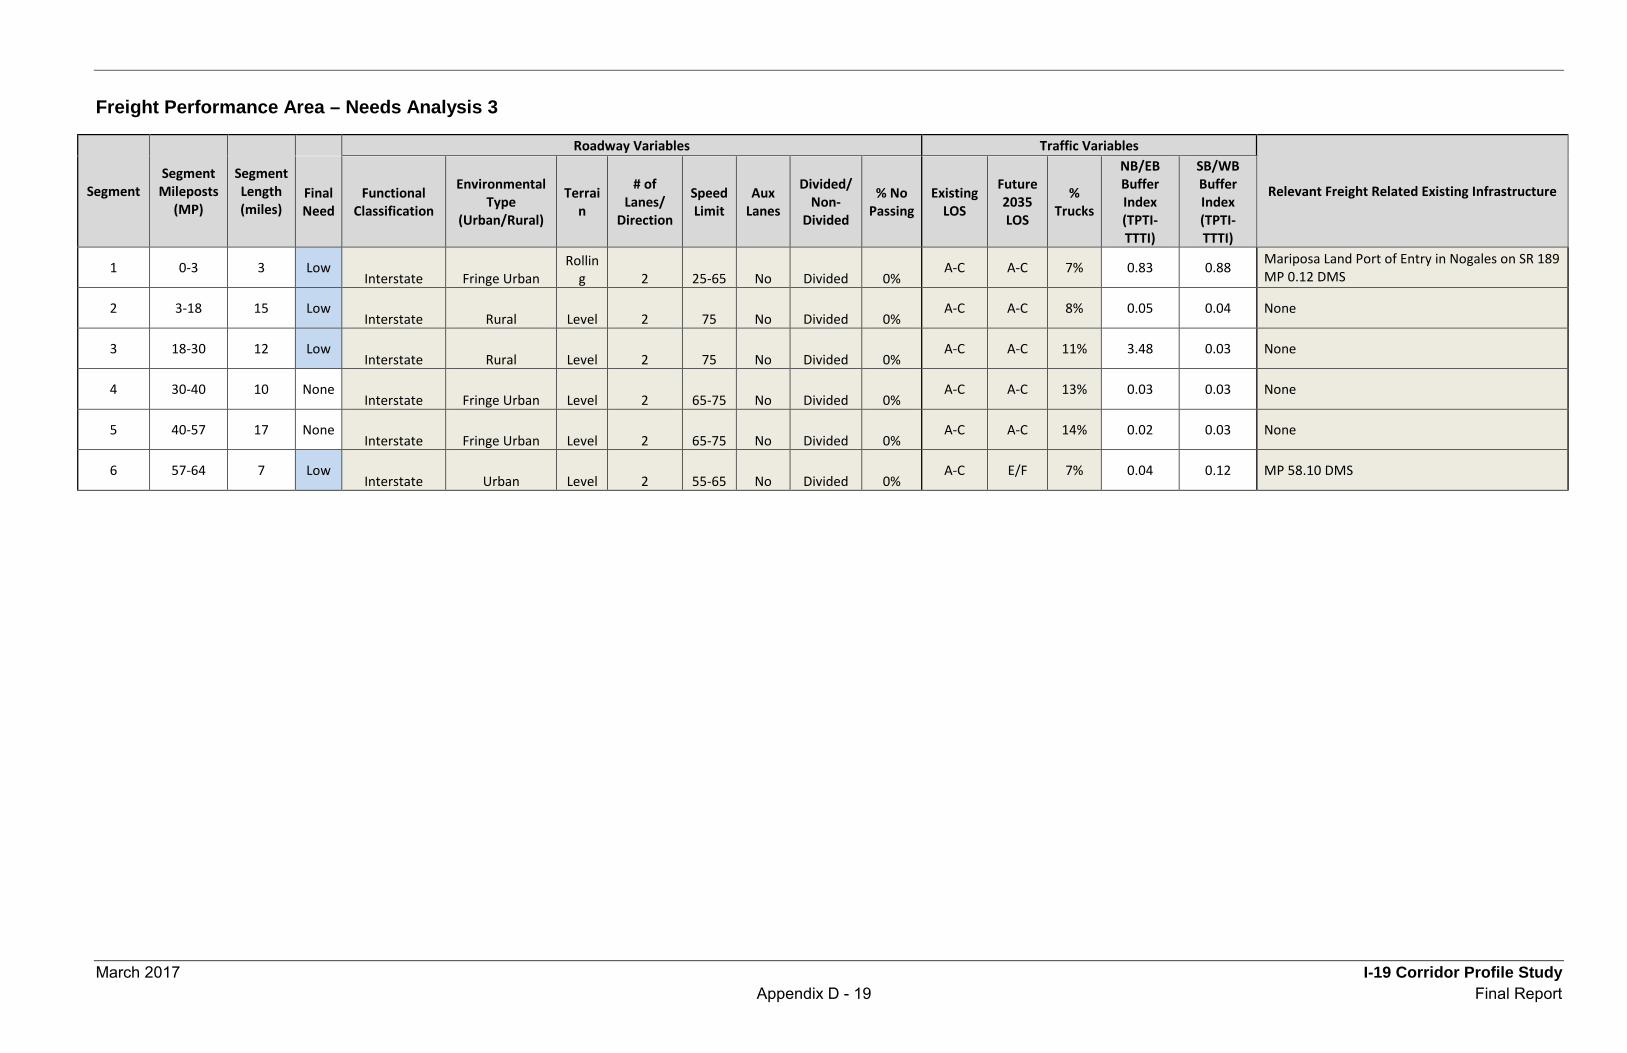
March 2017 I-19 Corridor Profile Study Appendix D - 19 Final Report
Freight Performance Area – Needs Analysis 3
Segment Segment Mileposts
(MP)
Segment Length (miles)
Roadway Variables Traffic Variables
Relevant Freight Related Existing Infrastructure Final Need
Functional Classification
Environmental Type
(Urban/Rural)
Terrain
# of Lanes/
Direction
Speed Limit
Aux Lanes
Divided/ Non-
Divided
% No Passing
Existing LOS
Future 2035 LOS
% Trucks
NB/EB Buffer Index (TPTI-TTTI)
SB/WB Buffer Index (TPTI-TTTI)
1 0-3 3 Low Interstate Fringe Urban
Rolling 2 25-65 No Divided 0%
A-C A-C 7% 0.83 0.88 Mariposa Land Port of Entry in Nogales on SR 189 MP 0.12 DMS
2 3-18 15 Low Interstate Rural Level 2 75 No Divided 0%
A-C A-C 8% 0.05 0.04 None
3 18-30 12 Low Interstate Rural Level 2 75 No Divided 0%
A-C A-C 11% 3.48 0.03 None
4 30-40 10 None Interstate Fringe Urban Level 2 65-75 No Divided 0%
A-C A-C 13% 0.03 0.03 None
5 40-57 17 None Interstate Fringe Urban Level 2 65-75 No Divided 0%
A-C A-C 14% 0.02 0.03 None
6 57-64 7 Low Interstate Urban Level 2 55-65 No Divided 0%
A-C E/F 7% 0.04 0.12 MP 58.10 DMS


March 2017 I-19 Corridor Profile Study Appendix E - 1 Final Report
Appendix E: Life-Cycle Cost Analysis
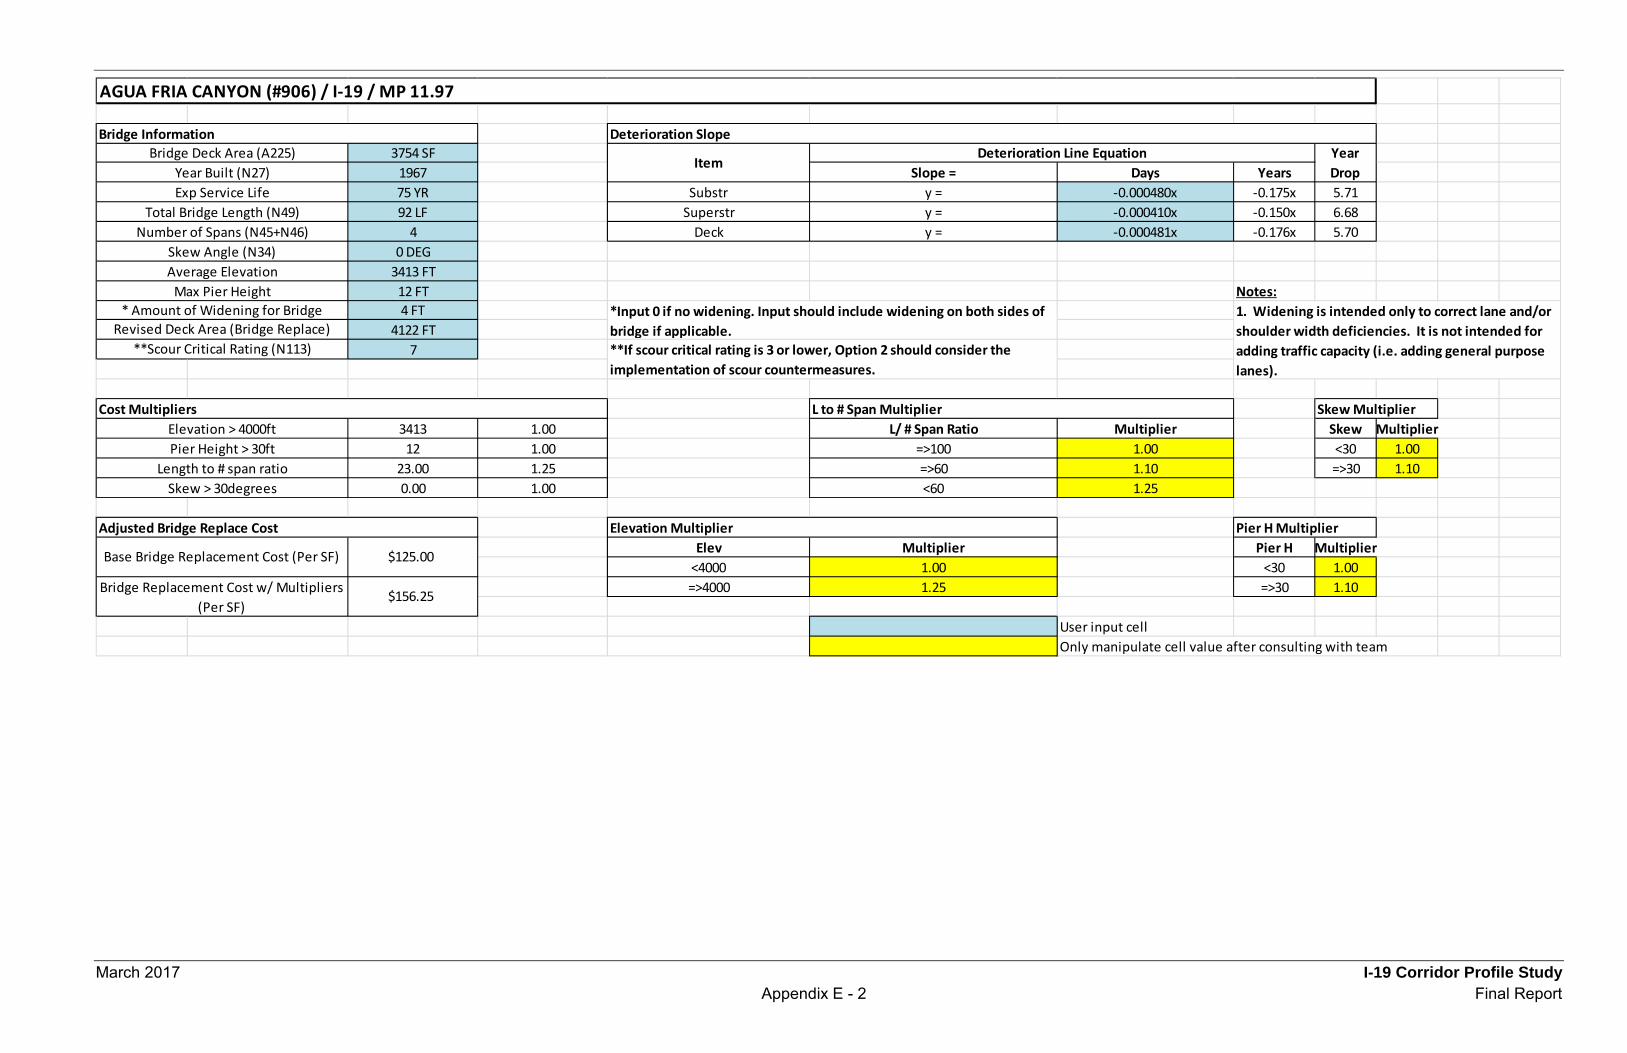
March 2017 I-19 Corridor Profile Study Appendix E - 2 Final Report
3754 SF1967 Slope = Days Years75 YR Substr y = -0.000480x -0.175x 5.7192 LF Superstr y = -0.000410x -0.150x 6.68
4 Deck y = -0.000481x -0.176x 5.700 DEG
3413 FT12 FT Notes:4 FT
4122 FT7
3413 1.00 L/ # Span Ratio Multiplier Skew Multiplier12 1.00 =>100 1.00 <30 1.00
23.00 1.25 =>60 1.10 =>30 1.100.00 1.00 <60 1.25
Elev Multiplier Pier H Multiplier<4000 1.00 <30 1.00=>4000 1.25 =>30 1.10
User input cellOnly manipulate cell value after consulting with team
AGUA FRIA CANYON (#906) / I-19 / MP 11.97
Skew Multiplier
Skew Angle (N34)
Bridge Replacement Cost w/ Multipliers (Per SF)
$156.25
Adjusted Bridge Replace Cost
Pier Height > 30ftLength to # span ratio
Bridge Deck Area (A225)Year Built (N27)Exp Service Life
Deterioration Line EquationDeterioration Slope
Elevation Multiplier Pier H Multiplier
Bridge Information
Total Bridge Length (N49)
Year Drop
1. Widening is intended only to correct lane and/or shoulder width deficiencies. It is not intended for adding traffic capacity (i.e. adding general purpose lanes).
* Amount of Widening for Bridge
L to # Span Multiplier
Base Bridge Replacement Cost (Per SF) $125.00
Skew > 30degrees
Elevation > 4000ftCost Multipliers
Item
Average ElevationMax Pier Height
Revised Deck Area (Bridge Replace)**Scour Critical Rating (N113)
*Input 0 if no widening. Input should include widening on both sides of bridge if applicable.**If scour critical rating is 3 or lower, Option 2 should consider the implementation of scour countermeasures.
Number of Spans (N45+N46)
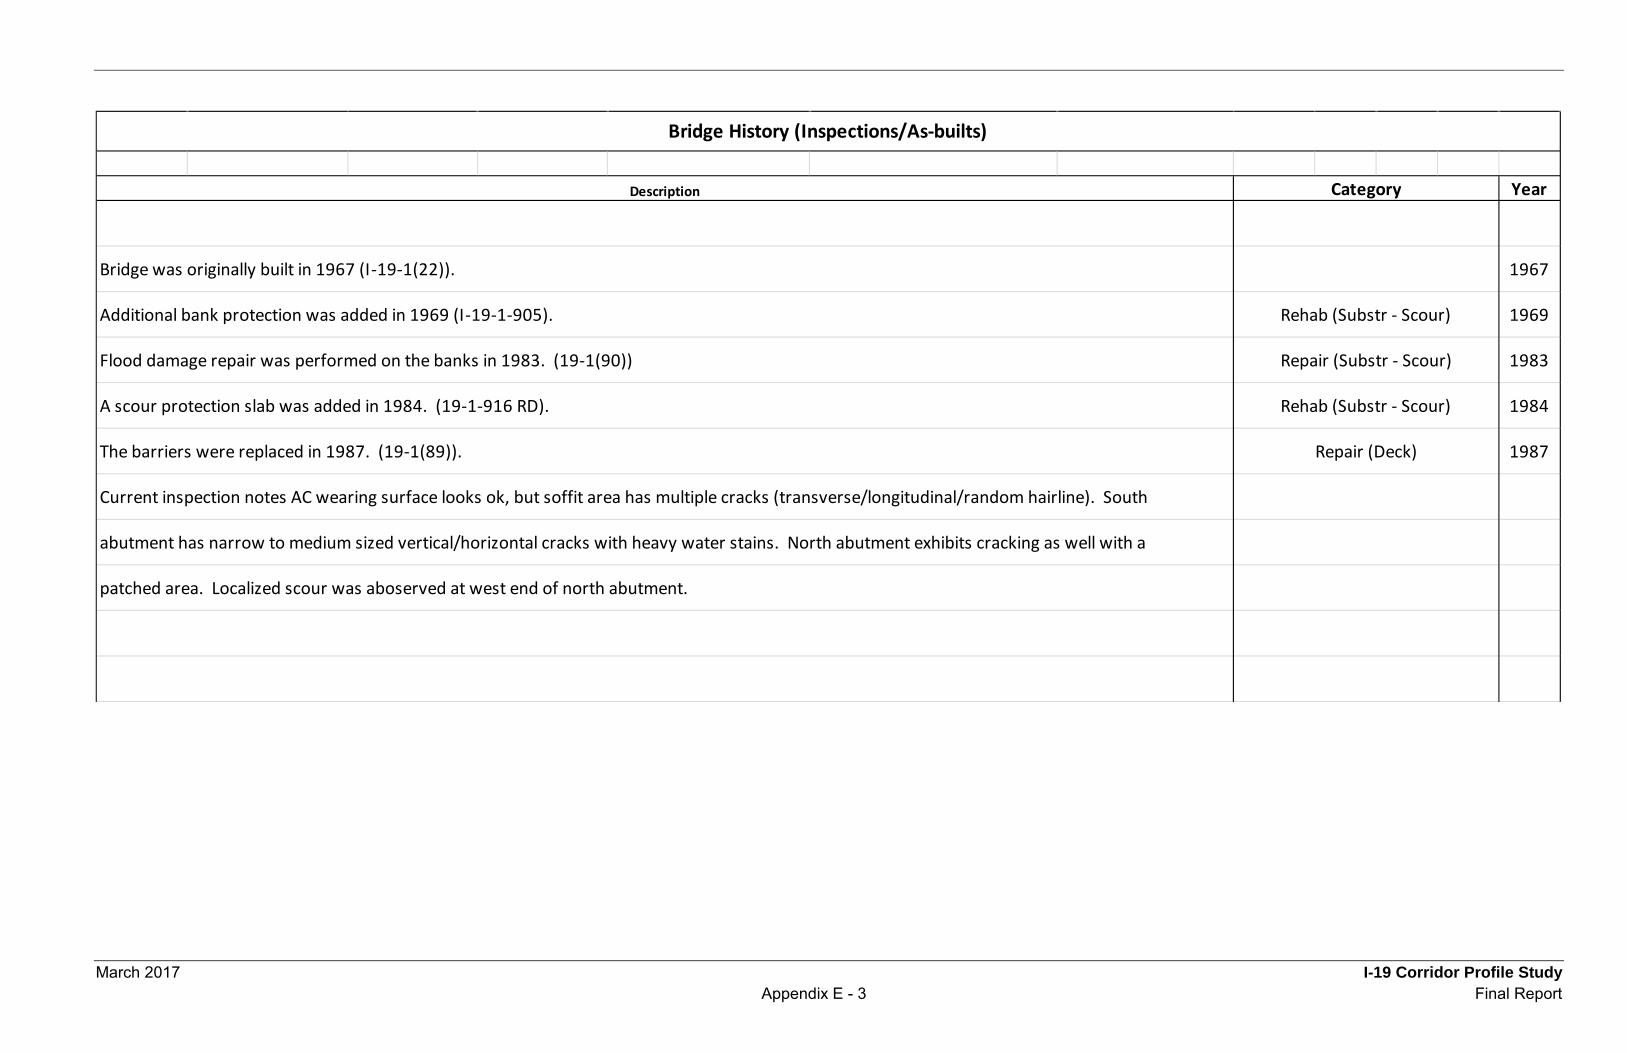
March 2017 I-19 Corridor Profile Study Appendix E - 3 Final Report
Year
1967
1969
1983
1984
1987
Bridge was originally built in 1967 (I-19-1(22)).
Bridge History (Inspections/As-builts)
The barriers were replaced in 1987. (19-1(89)).
abutment has narrow to medium sized vertical/horizontal cracks with heavy water stains. North abutment exhibits cracking as well with a
Current inspection notes AC wearing surface looks ok, but soffit area has multiple cracks (transverse/longitudinal/random hairline). South
CategoryDescription
Additional bank protection was added in 1969 (I-19-1-905).
A scour protection slab was added in 1984. (19-1-916 RD). Rehab (Substr - Scour)
Repair (Deck)
Flood damage repair was performed on the banks in 1983. (19-1(90))
Rehab (Substr - Scour)
Repair (Substr - Scour)
patched area. Localized scour was aboserved at west end of north abutment.
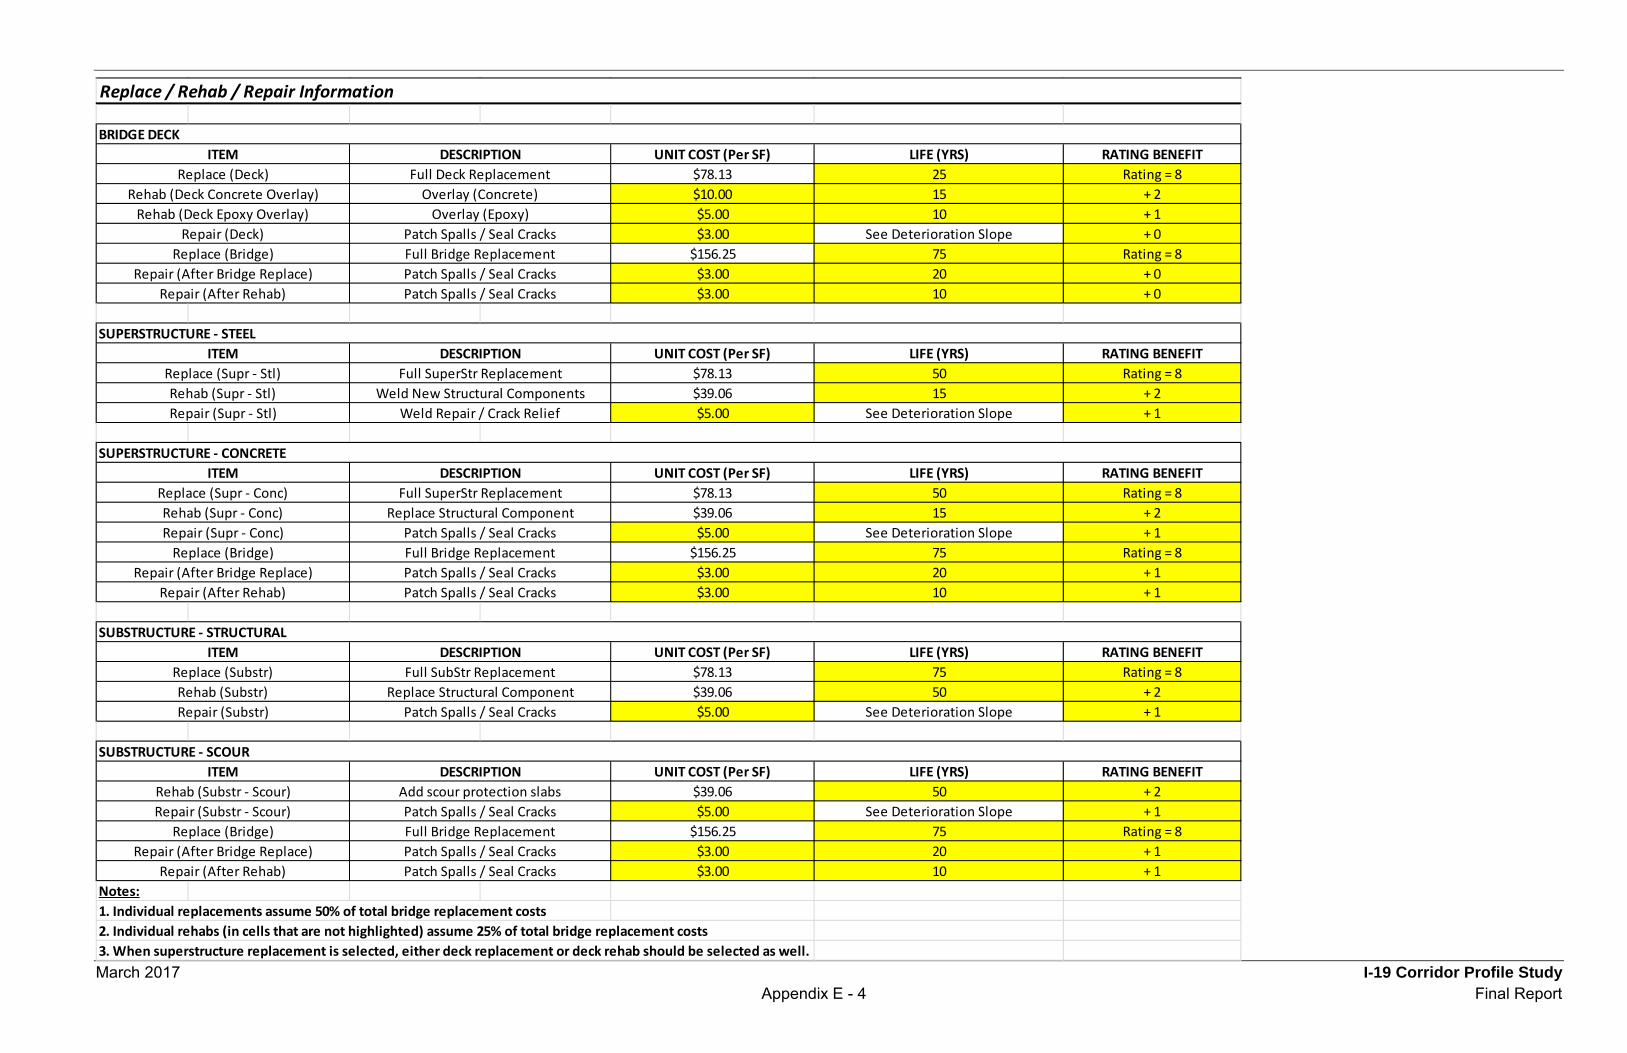
March 2017 I-19 Corridor Profile Study Appendix E - 4 Final Report
UNIT COST (Per SF) LIFE (YRS) RATING BENEFIT$78.13 25 Rating = 8$10.00 15 + 2$5.00 10 + 1$3.00 See Deterioration Slope + 0
$156.25 75 Rating = 8$3.00 20 + 0$3.00 10 + 0
UNIT COST (Per SF) LIFE (YRS) RATING BENEFIT$78.13 50 Rating = 8$39.06 15 + 2$5.00 See Deterioration Slope + 1
UNIT COST (Per SF) LIFE (YRS) RATING BENEFIT$78.13 50 Rating = 8$39.06 15 + 2$5.00 See Deterioration Slope + 1
$156.25 75 Rating = 8$3.00 20 + 1$3.00 10 + 1
UNIT COST (Per SF) LIFE (YRS) RATING BENEFIT$78.13 75 Rating = 8$39.06 50 + 2$5.00 See Deterioration Slope + 1
UNIT COST (Per SF) LIFE (YRS) RATING BENEFIT$39.06 50 + 2$5.00 See Deterioration Slope + 1
$156.25 75 Rating = 8$3.00 20 + 1$3.00 10 + 1
Notes:1. Individual replacements assume 50% of total bridge replacement costs2. Individual rehabs (in cells that are not highlighted) assume 25% of total bridge replacement costs3. When superstructure replacement is selected, either deck replacement or deck rehab should be selected as well.
Replace / Rehab / Repair Information
BRIDGE DECK
Repair (Supr - Conc)Rehab (Supr - Conc)
Replace (Supr - Conc)ITEM
Repair (Supr - Stl)
SUPERSTRUCTURE - CONCRETE
Weld Repair / Crack Relief
DESCRIPTIONFull SuperStr Replacement
Replace Structural ComponentPatch Spalls / Seal Cracks
Rehab (Supr - Stl)Replace (Supr - Stl)
ITEM
Repair (After Rehab)Repair (After Bridge Replace)
ITEM
Rehab (Deck Epoxy Overlay)
Full Deck ReplacementOverlay (Concrete)
SUPERSTRUCTURE - STEEL
Patch Spalls / Seal CracksPatch Spalls / Seal Cracks
Full SubStr Replacement
DESCRIPTIONFull SuperStr Replacement
Weld New Structural Components
DESCRIPTION
ITEM
Repair (After Rehab)Repair (After Bridge Replace)
Replace (Bridge)
SUBSTRUCTURE - STRUCTURAL
Full Bridge ReplacementPatch Spalls / Seal CracksPatch Spalls / Seal Cracks
DESCRIPTION
Patch Spalls / Seal CracksFull Bridge Replacement
Overlay (Epoxy)
Replace (Bridge)Repair (Deck)
Rehab (Deck Concrete Overlay)Replace (Deck)
Full Bridge ReplacementPatch Spalls / Seal CracksPatch Spalls / Seal CracksRepair (After Rehab)
Repair (After Bridge Replace)Replace (Bridge)
Repair (Substr - Scour)Rehab (Substr - Scour)
ITEM
Repair (Substr)Rehab (Substr)
SUBSTRUCTURE - SCOUR
Replace Structural ComponentPatch Spalls / Seal Cracks
DESCRIPTIONAdd scour protection slabsPatch Spalls / Seal Cracks
Replace (Substr)
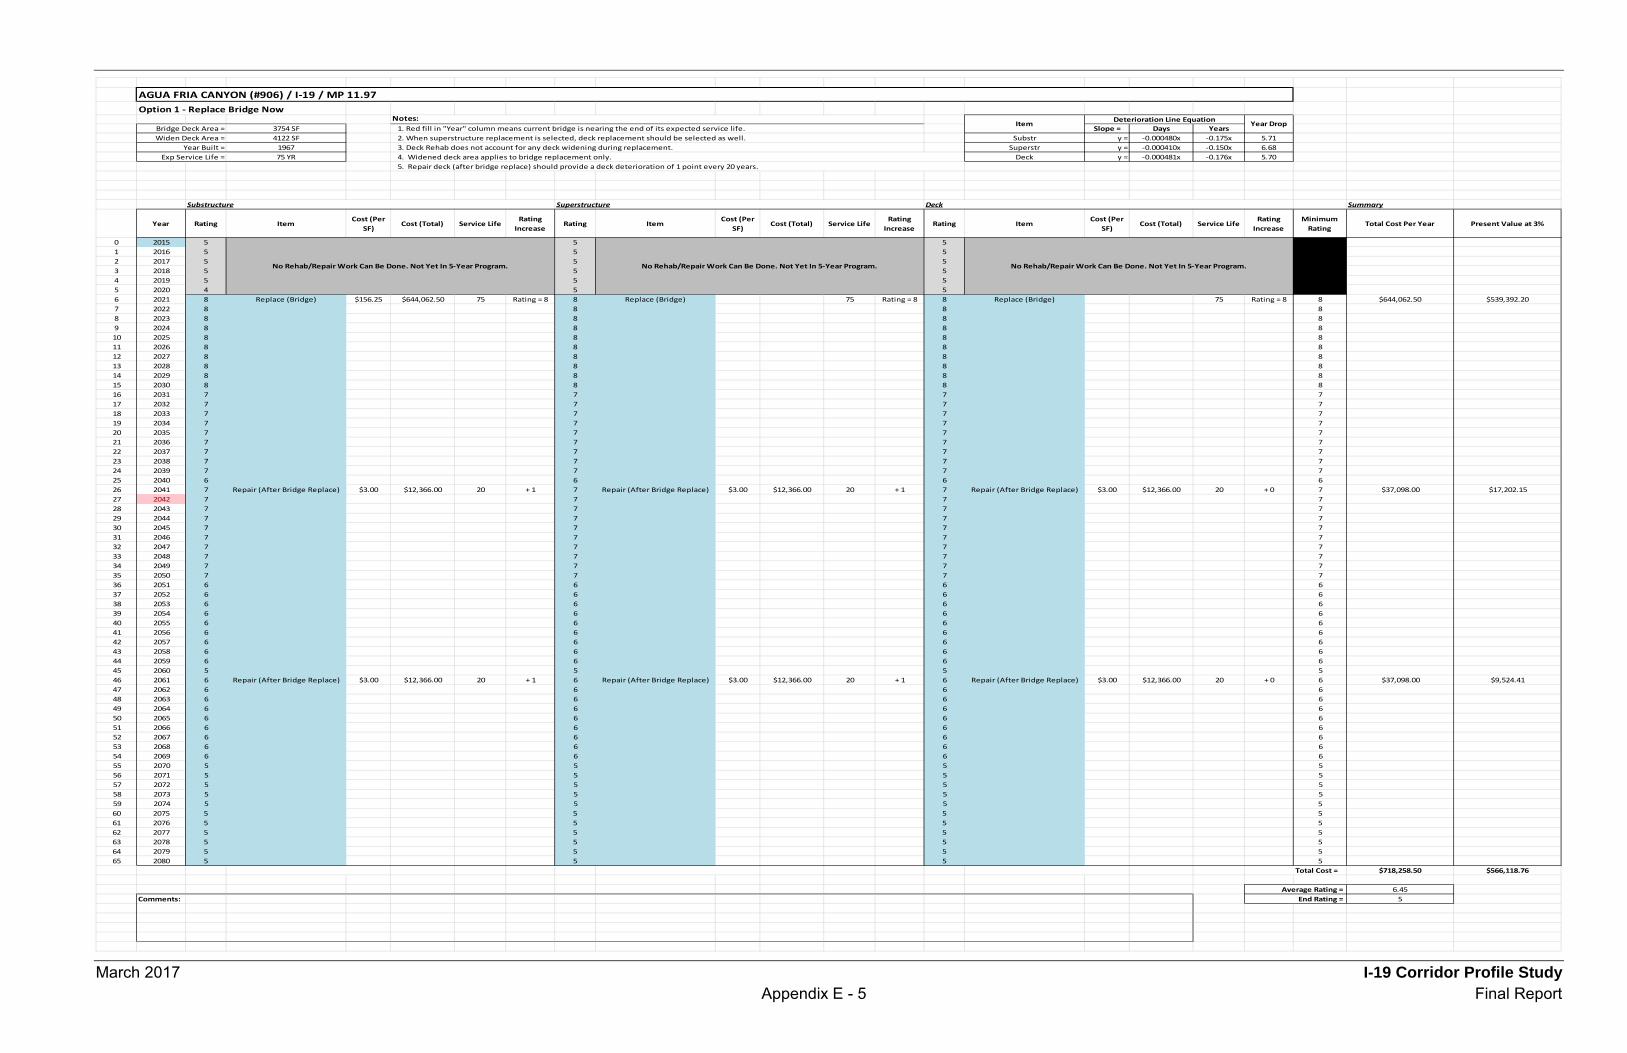
March 2017 I-19 Corridor Profile Study Appendix E - 5 Final Report
Option 1 - Replace Bridge Now
3754 SF Slope = Days Years4122 SF Substr y = -0.000480x -0.175x 5.71
1967 Superstr y = -0.000410x -0.150x 6.6875 YR Deck y = -0.000481x -0.176x 5.70
Summary
Year Rating ItemCost (Per
SF)Cost (Total) Service Life
Rating Increase
Rating ItemCost (Per
SF)Cost (Total) Service Life
Rating Increase
Rating ItemCost (Per
SF)Cost (Total) Service Life
Rating Increase
Minimum Rating
Total Cost Per Year Present Value at 3%
0 2015 5 5 51 2016 5 5 52 2017 5 5 53 2018 5 5 54 2019 5 5 55 2020 4 5 56 2021 8 Replace (Bridge) $156.25 $644,062.50 75 Rating = 8 8 Replace (Bridge) 75 Rating = 8 8 Replace (Bridge) 75 Rating = 8 8 $644,062.50 $539,392.207 2022 8 8 8 88 2023 8 8 8 89 2024 8 8 8 810 2025 8 8 8 811 2026 8 8 8 812 2027 8 8 8 813 2028 8 8 8 814 2029 8 8 8 815 2030 8 8 8 816 2031 7 7 7 717 2032 7 7 7 718 2033 7 7 7 719 2034 7 7 7 720 2035 7 7 7 721 2036 7 7 7 722 2037 7 7 7 723 2038 7 7 7 724 2039 7 7 7 725 2040 6 6 6 626 2041 7 Repair (After Bridge Replace) $3.00 $12,366.00 20 + 1 7 Repair (After Bridge Replace) $3.00 $12,366.00 20 + 1 7 Repair (After Bridge Replace) $3.00 $12,366.00 20 + 0 7 $37,098.00 $17,202.1527 2042 7 7 7 728 2043 7 7 7 729 2044 7 7 7 730 2045 7 7 7 731 2046 7 7 7 732 2047 7 7 7 733 2048 7 7 7 734 2049 7 7 7 735 2050 7 7 7 736 2051 6 6 6 637 2052 6 6 6 638 2053 6 6 6 639 2054 6 6 6 640 2055 6 6 6 641 2056 6 6 6 642 2057 6 6 6 643 2058 6 6 6 644 2059 6 6 6 645 2060 5 5 5 546 2061 6 Repair (After Bridge Replace) $3.00 $12,366.00 20 + 1 6 Repair (After Bridge Replace) $3.00 $12,366.00 20 + 1 6 Repair (After Bridge Replace) $3.00 $12,366.00 20 + 0 6 $37,098.00 $9,524.4147 2062 6 6 6 648 2063 6 6 6 649 2064 6 6 6 650 2065 6 6 6 651 2066 6 6 6 652 2067 6 6 6 653 2068 6 6 6 654 2069 6 6 6 655 2070 5 5 5 556 2071 5 5 5 557 2072 5 5 5 558 2073 5 5 5 559 2074 5 5 5 560 2075 5 5 5 561 2076 5 5 5 562 2077 5 5 5 563 2078 5 5 5 564 2079 5 5 5 565 2080 5 5 5 5
$718,258.50 $566,118.76
6.45Comments: 5End Rating =
Widen Deck Area =
Item Year Drop
Average Rating =
Total Cost =
Year Built =2. When superstructure replacement is selected, deck replacement should be selected as well.
Exp Service Life =3. Deck Rehab does not account for any deck widening during replacement.4. Widened deck area applies to bridge replacement only.5. Repair deck (after bridge replace) should provide a deck deterioration of 1 point every 20 years.
Substructure Superstructure Deck
No Rehab/Repair Work Can Be Done. Not Yet In 5-Year Program. No Rehab/Repair Work Can Be Done. Not Yet In 5-Year Program. No Rehab/Repair Work Can Be Done. Not Yet In 5-Year Program.
AGUA FRIA CANYON (#906) / I-19 / MP 11.97
Notes: Deterioration Line EquationBridge Deck Area = 1. Red fill in "Year" column means current bridge is nearing the end of its expected service life.
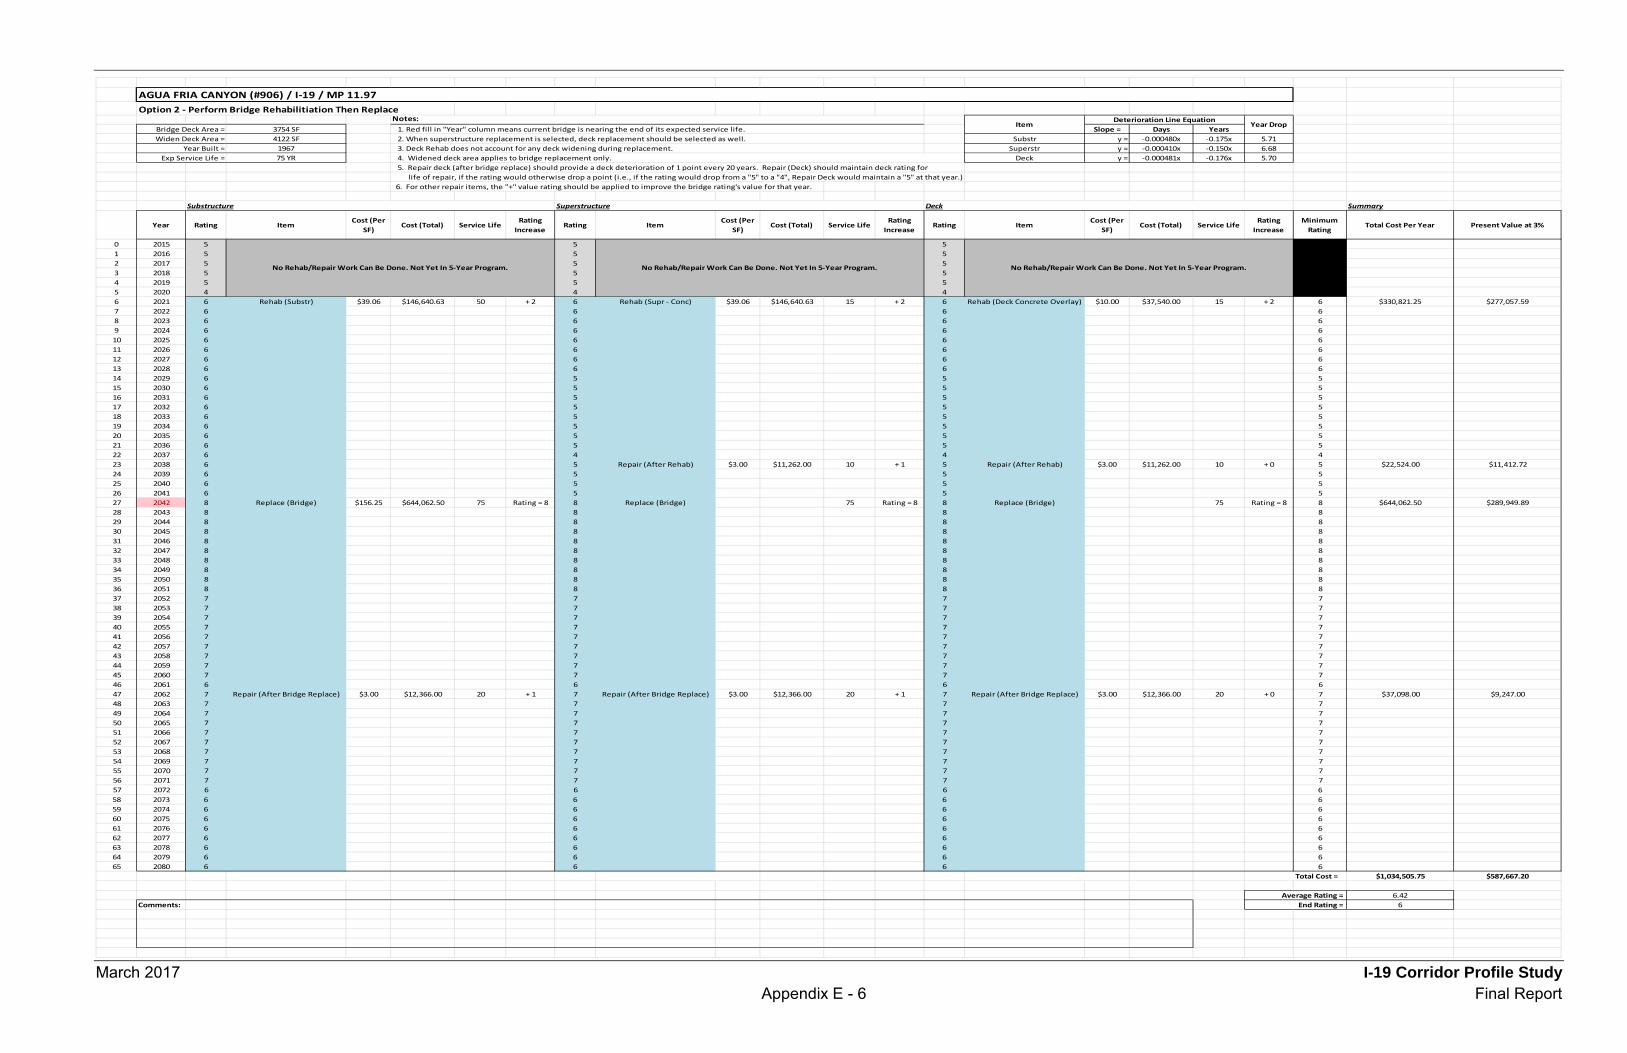
March 2017 I-19 Corridor Profile Study Appendix E - 6 Final Report
Option 2 - Perform Bridge Rehabilitiation Then Replace
3754 SF Slope = Days Years4122 SF Substr y = -0.000480x -0.175x 5.71
1967 Superstr y = -0.000410x -0.150x 6.6875 YR Deck y = -0.000481x -0.176x 5.70
5. Repair deck (after bridge replace) should provide a deck deterioration of 1 point every 20 years. Repair (Deck) should maintain deck rating for life of repair, if the rating would otherwise drop a point (i.e., if the rating would drop from a "5" to a "4", Repair Deck would maintain a "5" at that year.)
6. For other repair items, the "+" value rating should be applied to improve the bridge rating's value for that year.
Summary
Year Rating ItemCost (Per
SF)Cost (Total) Service Life
Rating Increase
Rating ItemCost (Per
SF)Cost (Total) Service Life
Rating Increase
Rating ItemCost (Per
SF)Cost (Total) Service Life
Rating Increase
Minimum Rating
Total Cost Per Year Present Value at 3%
0 2015 5 5 51 2016 5 5 52 2017 5 5 53 2018 5 5 54 2019 5 5 55 2020 4 4 46 2021 6 Rehab (Substr) $39.06 $146,640.63 50 + 2 6 Rehab (Supr - Conc) $39.06 $146,640.63 15 + 2 6 Rehab (Deck Concrete Overlay) $10.00 $37,540.00 15 + 2 6 $330,821.25 $277,057.597 2022 6 6 6 68 2023 6 6 6 69 2024 6 6 6 610 2025 6 6 6 611 2026 6 6 6 612 2027 6 6 6 613 2028 6 6 6 614 2029 6 5 5 515 2030 6 5 5 516 2031 6 5 5 517 2032 6 5 5 518 2033 6 5 5 519 2034 6 5 5 520 2035 6 5 5 521 2036 6 5 5 522 2037 6 4 4 423 2038 6 5 Repair (After Rehab) $3.00 $11,262.00 10 + 1 5 Repair (After Rehab) $3.00 $11,262.00 10 + 0 5 $22,524.00 $11,412.7224 2039 6 5 5 525 2040 6 5 5 526 2041 6 5 5 527 2042 8 Replace (Bridge) $156.25 $644,062.50 75 Rating = 8 8 Replace (Bridge) 75 Rating = 8 8 Replace (Bridge) 75 Rating = 8 8 $644,062.50 $289,949.8928 2043 8 8 8 829 2044 8 8 8 830 2045 8 8 8 831 2046 8 8 8 832 2047 8 8 8 833 2048 8 8 8 834 2049 8 8 8 835 2050 8 8 8 836 2051 8 8 8 837 2052 7 7 7 738 2053 7 7 7 739 2054 7 7 7 740 2055 7 7 7 741 2056 7 7 7 742 2057 7 7 7 743 2058 7 7 7 744 2059 7 7 7 745 2060 7 7 7 746 2061 6 6 6 647 2062 7 Repair (After Bridge Replace) $3.00 $12,366.00 20 + 1 7 Repair (After Bridge Replace) $3.00 $12,366.00 20 + 1 7 Repair (After Bridge Replace) $3.00 $12,366.00 20 + 0 7 $37,098.00 $9,247.0048 2063 7 7 7 749 2064 7 7 7 750 2065 7 7 7 751 2066 7 7 7 752 2067 7 7 7 753 2068 7 7 7 754 2069 7 7 7 755 2070 7 7 7 756 2071 7 7 7 757 2072 6 6 6 658 2073 6 6 6 659 2074 6 6 6 660 2075 6 6 6 661 2076 6 6 6 662 2077 6 6 6 663 2078 6 6 6 664 2079 6 6 6 665 2080 6 6 6 6
$1,034,505.75 $587,667.20
6.42Comments: 6
Average Rating = End Rating =
Substructure Superstructure Deck
Total Cost =
No Rehab/Repair Work Can Be Done. Not Yet In 5-Year Program. No Rehab/Repair Work Can Be Done. Not Yet In 5-Year Program. No Rehab/Repair Work Can Be Done. Not Yet In 5-Year Program.
Year Built =2. When superstructure replacement is selected, deck replacement should be selected as well.
Exp Service Life =3. Deck Rehab does not account for any deck widening during replacement.
Widen Deck Area =
4. Widened deck area applies to bridge replacement only.
AGUA FRIA CANYON (#906) / I-19 / MP 11.97
Notes: Deterioration Line EquationBridge Deck Area = 1. Red fill in "Year" column means current bridge is nearing the end of its expected service life.
Item Year Drop
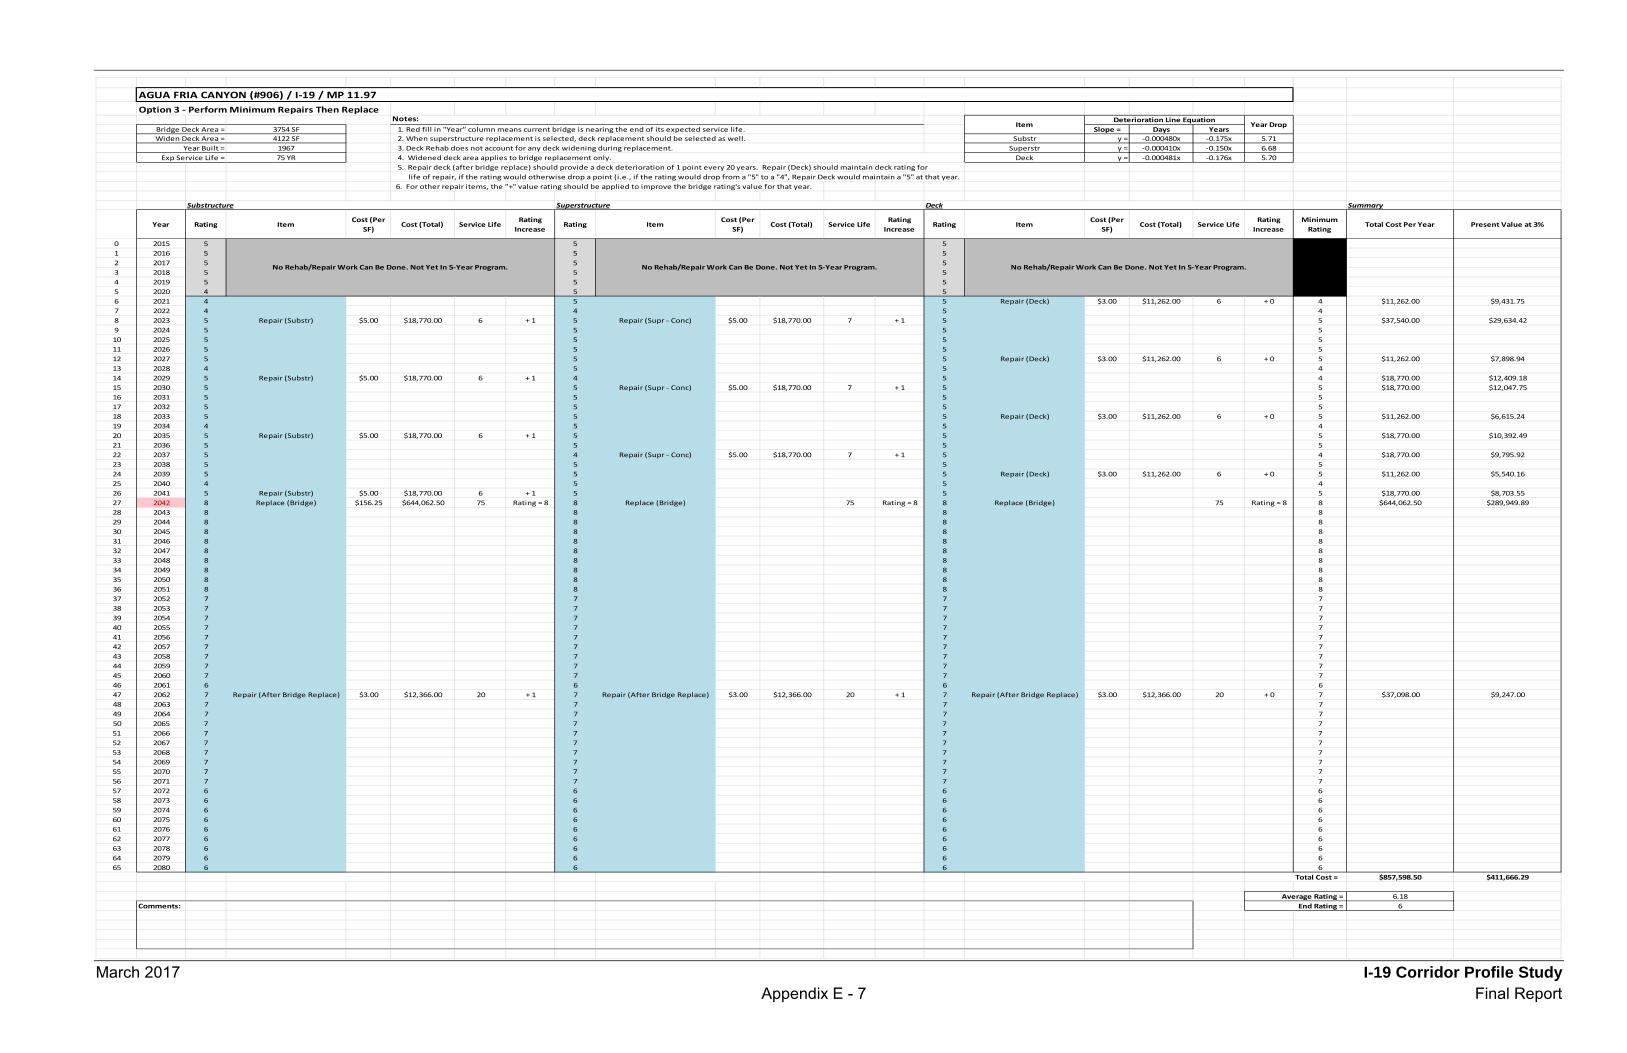
March 2017 I-19 Corridor Profile Study Appendix E - 7 Final Report
Option 3 - Perform Minimum Repairs Then Replace
3754 SF Slope = Days Years4122 SF Substr y = -0.000480x -0.175x 5.71
1967 Superstr y = -0.000410x -0.150x 6.6875 YR Deck y = -0.000481x -0.176x 5.70
5. Repair deck (after bridge replace) should provide a deck deterioration of 1 point every 20 years. Repair (Deck) should maintain deck rating for life of repair, if the rating would otherwise drop a point (i.e., if the rating would drop from a "5" to a "4", Repair Deck would maintain a "5" at that year.
6. For other repair items, the "+" value rating should be applied to improve the bridge rating's value for that year.
Summary
Year Rating ItemCost (Per
SF)Cost (Total) Service Life
Rating Increase
Rating ItemCost (Per
SF)Cost (Total) Service Life
Rating Increase
Rating ItemCost (Per
SF)Cost (Total) Service Life
Rating Increase
Minimum Rating
Total Cost Per Year Present Value at 3%
0 2015 5 5 51 2016 5 5 52 2017 5 5 53 2018 5 5 54 2019 5 5 55 2020 4 5 56 2021 4 5 5 Repair (Deck) $3.00 $11,262.00 6 + 0 4 $11,262.00 $9,431.757 2022 4 4 5 48 2023 5 Repair (Substr) $5.00 $18,770.00 6 + 1 5 Repair (Supr - Conc) $5.00 $18,770.00 7 + 1 5 5 $37,540.00 $29,634.429 2024 5 5 5 510 2025 5 5 5 511 2026 5 5 5 512 2027 5 5 5 Repair (Deck) $3.00 $11,262.00 6 + 0 5 $11,262.00 $7,898.9413 2028 4 5 5 414 2029 5 Repair (Substr) $5.00 $18,770.00 6 + 1 4 5 4 $18,770.00 $12,409.1815 2030 5 5 Repair (Supr - Conc) $5.00 $18,770.00 7 + 1 5 5 $18,770.00 $12,047.7516 2031 5 5 5 517 2032 5 5 5 518 2033 5 5 5 Repair (Deck) $3.00 $11,262.00 6 + 0 5 $11,262.00 $6,615.2419 2034 4 5 5 420 2035 5 Repair (Substr) $5.00 $18,770.00 6 + 1 5 5 5 $18,770.00 $10,392.4921 2036 5 5 5 522 2037 5 4 Repair (Supr - Conc) $5.00 $18,770.00 7 + 1 5 4 $18,770.00 $9,795.9223 2038 5 5 5 524 2039 5 5 5 Repair (Deck) $3.00 $11,262.00 6 + 0 5 $11,262.00 $5,540.1625 2040 4 5 5 426 2041 5 Repair (Substr) $5.00 $18,770.00 6 + 1 5 5 5 $18,770.00 $8,703.5527 2042 8 Replace (Bridge) $156.25 $644,062.50 75 Rating = 8 8 Replace (Bridge) 75 Rating = 8 8 Replace (Bridge) 75 Rating = 8 8 $644,062.50 $289,949.8928 2043 8 8 8 829 2044 8 8 8 830 2045 8 8 8 831 2046 8 8 8 832 2047 8 8 8 833 2048 8 8 8 834 2049 8 8 8 835 2050 8 8 8 836 2051 8 8 8 837 2052 7 7 7 738 2053 7 7 7 739 2054 7 7 7 740 2055 7 7 7 741 2056 7 7 7 742 2057 7 7 7 743 2058 7 7 7 744 2059 7 7 7 745 2060 7 7 7 746 2061 6 6 6 647 2062 7 Repair (After Bridge Replace) $3.00 $12,366.00 20 + 1 7 Repair (After Bridge Replace) $3.00 $12,366.00 20 + 1 7 Repair (After Bridge Replace) $3.00 $12,366.00 20 + 0 7 $37,098.00 $9,247.0048 2063 7 7 7 749 2064 7 7 7 750 2065 7 7 7 751 2066 7 7 7 752 2067 7 7 7 753 2068 7 7 7 754 2069 7 7 7 755 2070 7 7 7 756 2071 7 7 7 757 2072 6 6 6 658 2073 6 6 6 659 2074 6 6 6 660 2075 6 6 6 661 2076 6 6 6 662 2077 6 6 6 663 2078 6 6 6 664 2079 6 6 6 665 2080 6 6 6 6
$857,598.50 $411,666.29
6.18Comments: 6
Average Rating =
Notes:
End Rating =
Total Cost =
No Rehab/Repair Work Can Be Done. Not Yet In 5-Year Program.
AGUA FRIA CANYON (#906) / I-19 / MP 11.97
Substructure Superstructure Deck
Deterioration Line Equation
Widen Deck Area =
Item Year DropBridge Deck Area =
Year Built =Exp Service Life =
1. Red fill in "Year" column means current bridge is nearing the end of its expected service life.2. When superstructure replacement is selected, deck replacement should be selected as well.3. Deck Rehab does not account for any deck widening during replacement.4. Widened deck area applies to bridge replacement only.
No Rehab/Repair Work Can Be Done. Not Yet In 5-Year Program. No Rehab/Repair Work Can Be Done. Not Yet In 5-Year Program.

March 2017 I-19 Corridor Profile StudyAppendix E - 8 Final Report
AGENCY COST 3% 7% Option Agency Cost 3% 7%718,258.50$ $566,118.76 $437,204.96 2 (Rehab) 69.43% 96.33% 132.33%
1,034,505.75$ $587,667.20 $330,383.56 3 (Repair) 83.75% 137.52% 254.93%857,598.50$ $411,666.29 $171,499.45
AVG RATING END RATING6.45 56.42 66.18 6
Present Value at 7% Present Value at 3% AGENCY COSTOption 1 (Replace) $437,204.96 $566,118.76 718,258.50$ Option 2 (Rehab) $330,383.56 $587,667.20 1,034,505.75$ Option 3 (Repair) $171,499.45 $411,666.29 857,598.50$
Option 1 (Replace)Option 2 (Rehab)Option 3 (Repair)
OPTIONBridge Ratings Per Option
Comparison to Replacement
AGUA FRIA CANYON (#906) / I-19 / MP 11.97
Option 3 (Repair)
OPTIONCOST COMPARISON Present Value Dollars
Option 2 (Rehab)Option 1 (Replace)
0
1
2
3
4
5
6
7
8
9
2018
2020
2022
2024
2026
2028
2030
2032
2034
2036
2038
2040
2042
2044
2046
2048
2050
2052
2054
2056
2058
2060
2062
2064
2066
2068
2070
2072
2074
2076
2078
2080
RATING COMPARISON
Option 1 - Replace Bridge Now
Option 2 - Perform Bridge Rehabilitiation ThenReplace
Option 3 - Perform Minimum Repairs ThenReplace
Present Value at 7%
Present Value at 3%
AGENCY COST
$0.00
$200,000.00
$400,000.00
$600,000.00
$800,000.00
$1,000,000.00
$1,200,000.00
Option 1 (Replace)Option 2 (Rehab)
Option 3 (Repair)
COST COMPARISON
Present Value at 7%
Present Value at 3%
AGENCY COST

March 2017 I-19 Corridor Profile Study Appendix E - 9 Final Report
8366 SF1966 Slope = Days Years75 YR Substr y = -0.000557x -0.203x 4.92252 LF Superstr y = -0.000293x -0.107x 9.35
4 Deck y = -0.000515x -0.188x 5.320 DEG
3372 FT22 FT Notes:8 FT
10382 FTN/A
3372 1.00 L/ # Span Ratio Multiplier Skew Multiplier22 1.00 =>100 1.00 <30 1.00
63.00 1.1 =>60 1.10 =>30 1.100.00 1.00 <60 1.25
Elev Multiplier Pier H Multiplier<4000 1.00 <30 1.00=>4000 1.25 =>30 1.10
User input cellOnly manipulate cell value after consulting with team
PALO PARADO ROAD (#937) / I-19 / MP 15.65
Skew Multiplier
Skew Angle (N34)
Bridge Replacement Cost w/ Multipliers (Per SF)
$137.50
Adjusted Bridge Replace Cost
Pier Height > 30ftLength to # span ratio
Bridge Deck Area (A225)Year Built (N27)Exp Service Life
Deterioration Line EquationDeterioration Slope
Elevation Multiplier Pier H Multiplier
Bridge Information
Total Bridge Length (N49)Number of Spans (N45+N46)
L to # Span Multiplier
Base Bridge Replacement Cost (Per SF) $125.00
Skew > 30degrees
Elevation > 4000ftCost Multipliers
Item
Average ElevationMax Pier Height
Year Drop
1. Widening is intended only to correct lane and/or shoulder width deficiencies. It is not intended for adding traffic capacity (i.e. adding general purpose lanes).
* Amount of Widening for Bridge Revised Deck Area (Bridge Replace)
**Scour Critical Rating (N113)
*Input 0 if no widening. Input should include widening on both sides of bridge if applicable.**If scour critical rating is 3 or lower, Option 2 should consider the implementation of scour countermeasures.
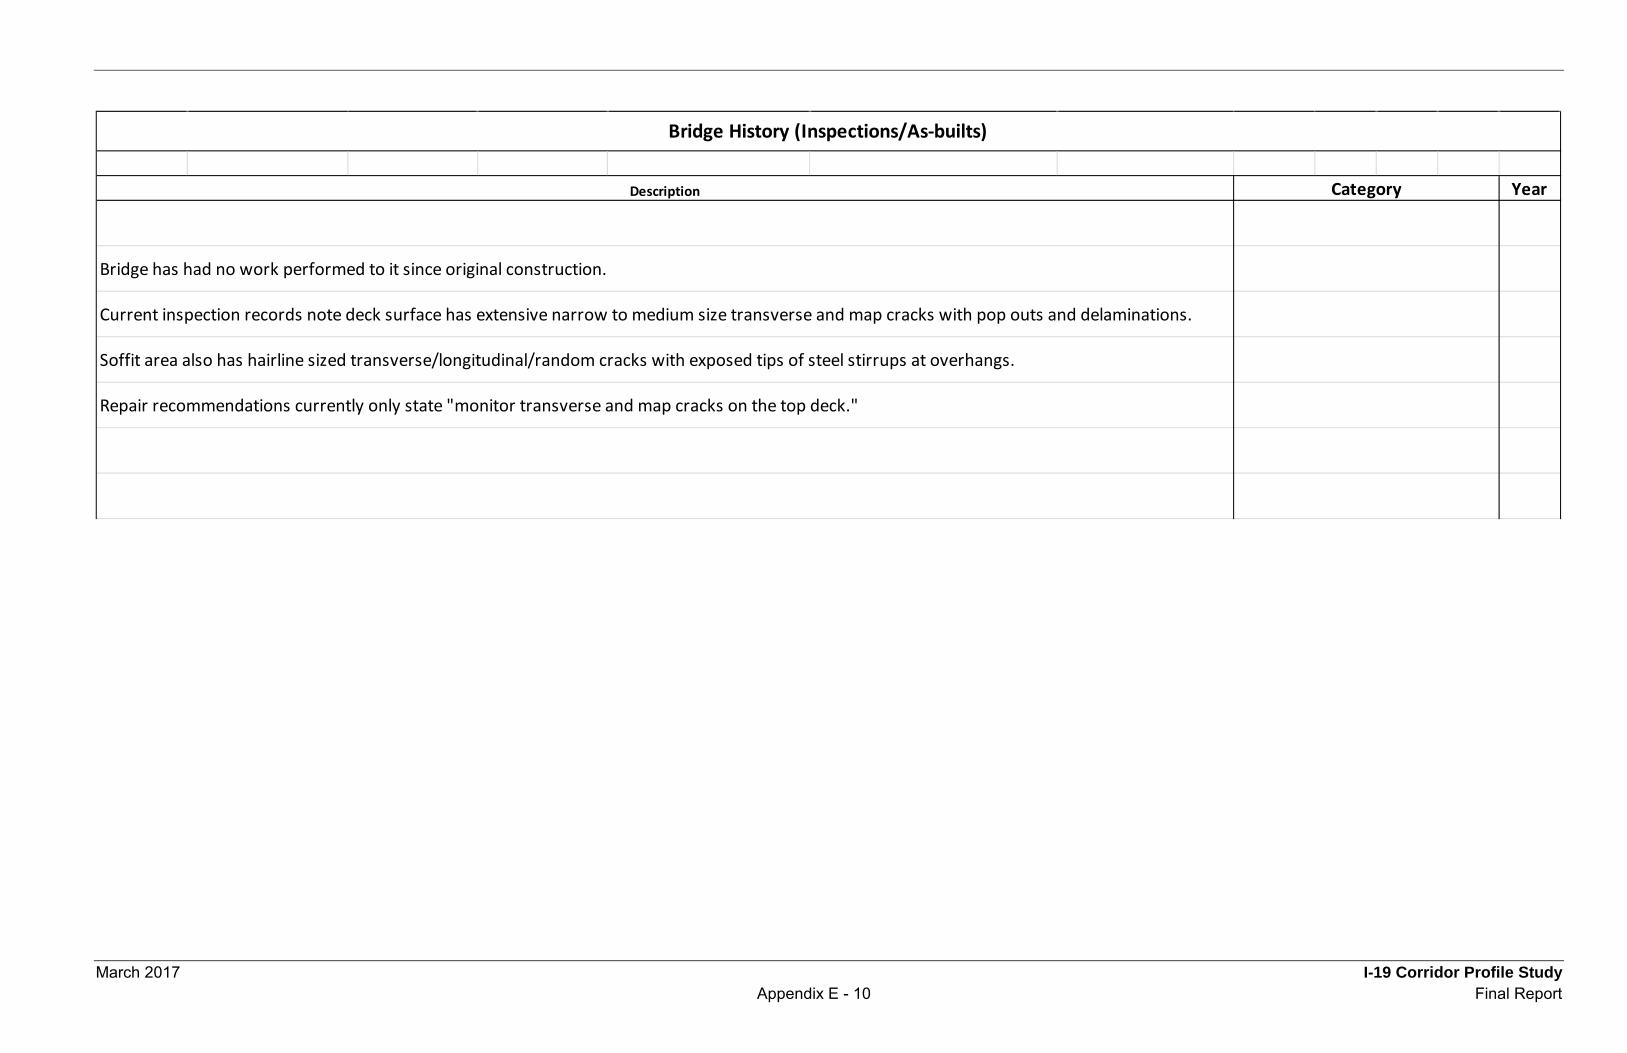
March 2017 I-19 Corridor Profile Study Appendix E - 10 Final Report
Year
Bridge has had no work performed to it since original construction.
Bridge History (Inspections/As-builts)
CategoryDescription
Current inspection records note deck surface has extensive narrow to medium size transverse and map cracks with pop outs and delaminations.
Soffit area also has hairline sized transverse/longitudinal/random cracks with exposed tips of steel stirrups at overhangs.
Repair recommendations currently only state "monitor transverse and map cracks on the top deck."

March 2017 I-19 Corridor Profile Study Appendix E - 11 Final Report
UNIT COST (Per SF) LIFE (YRS) RATING BENEFIT$68.75 25 Rating = 8$10.00 15 + 2$5.00 10 + 1$3.00 See Deterioration Slope + 0
$137.50 75 Rating = 8$3.00 20 + 0$3.00 10 + 0
UNIT COST (Per SF) LIFE (YRS) RATING BENEFIT$68.75 50 Rating = 8$34.38 15 + 2$5.00 See Deterioration Slope + 1
UNIT COST (Per SF) LIFE (YRS) RATING BENEFIT$68.75 50 Rating = 8$34.38 15 + 2$5.00 See Deterioration Slope + 1
$137.50 75 Rating = 8$3.00 20 + 1$3.00 10 + 1
UNIT COST (Per SF) LIFE (YRS) RATING BENEFIT$68.75 75 Rating = 8$34.38 50 + 2$5.00 See Deterioration Slope + 1
UNIT COST (Per SF) LIFE (YRS) RATING BENEFIT$34.38 50 + 2$5.00 See Deterioration Slope + 1
$137.50 75 Rating = 8$3.00 20 + 1$3.00 10 + 1
Notes:1. Individual replacements assume 50% of total bridge replacement costs2. Individual rehabs (in cells that are not highlighted) assume 25% of total bridge replacement costs3. When superstructure replacement is selected, either deck replacement or deck rehab should be selected as well.
Replace / Rehab / Repair Information
BRIDGE DECKDESCRIPTIONITEM
Full Deck ReplacementOverlay (Concrete)
Patch Spalls / Seal CracksFull Bridge Replacement
Overlay (Epoxy)
Replace (Bridge)Repair (Deck)
Rehab (Deck Concrete Overlay)Replace (Deck)
Rehab (Deck Epoxy Overlay)
Repair (Supr - Conc)Rehab (Supr - Conc)
Replace (Supr - Conc)ITEM
Repair (Supr - Stl)
SUPERSTRUCTURE - CONCRETE
Weld Repair / Crack Relief
DESCRIPTIONFull SuperStr Replacement
Replace Structural ComponentPatch Spalls / Seal Cracks
Rehab (Supr - Stl)Replace (Supr - Stl)
ITEM
Repair (After Rehab)Repair (After Bridge Replace)
SUPERSTRUCTURE - STEEL
Patch Spalls / Seal CracksPatch Spalls / Seal Cracks
DESCRIPTIONFull SuperStr Replacement
Weld New Structural Components
ITEM
Repair (After Rehab)Repair (After Bridge Replace)
Replace (Bridge)
SUBSTRUCTURE - STRUCTURAL
Full Bridge ReplacementPatch Spalls / Seal CracksPatch Spalls / Seal Cracks
DESCRIPTION
Repair (Substr)Rehab (Substr)
SUBSTRUCTURE - SCOUR
Replace Structural ComponentPatch Spalls / Seal Cracks
DESCRIPTIONAdd scour protection slabsPatch Spalls / Seal Cracks
Replace (Substr) Full SubStr Replacement
Full Bridge ReplacementPatch Spalls / Seal CracksPatch Spalls / Seal CracksRepair (After Rehab)
Repair (After Bridge Replace)Replace (Bridge)
Repair (Substr - Scour)Rehab (Substr - Scour)
ITEM

March 2017 I-19 Corridor Profile Study Appendix E - 12 Final Report
Option 1 - Replace Bridge Now
8366 SF Slope = Days Years10382 SF Substr y = -0.000557x -0.203x 4.92
1966 Superstr y = -0.000293x -0.107x 9.3575 YR Deck y = -0.000515x -0.188x 5.32
Summary
Year Rating ItemCost (Per
SF)Cost (Total) Service Life
Rating Increase
Rating ItemCost (Per
SF)Cost (Total) Service Life
Rating Increase
Rating ItemCost (Per
SF)Cost (Total) Service Life
Rating Increase
Minimum Rating
Total Cost Per Year Present Value at 3%
0 2015 6 5 51 2016 6 5 52 2017 6 5 53 2018 6 5 54 2019 6 5 55 2020 5 5 56 2021 8 Replace (Bridge) $137.50 $1,427,525.00 75 Rating = 8 8 Replace (Bridge) 75 Rating = 8 8 Replace (Bridge) 75 Rating = 8 8 $1,427,525.00 $1,195,529.717 2022 8 8 8 88 2023 8 8 8 89 2024 8 8 8 810 2025 8 8 8 811 2026 8 8 8 812 2027 8 8 8 813 2028 8 8 8 814 2029 8 8 8 815 2030 8 8 8 816 2031 7 7 7 717 2032 7 7 7 718 2033 7 7 7 719 2034 7 7 7 720 2035 7 7 7 721 2036 7 7 7 722 2037 7 7 7 723 2038 7 7 7 724 2039 7 7 7 725 2040 6 6 6 626 2041 7 Repair (After Bridge Replace) $3.00 $31,146.00 20 + 1 7 Repair (After Bridge Replace) $3.00 $31,146.00 20 + 1 7 Repair (After Bridge Replace) $3.00 $31,146.00 20 + 0 7 $93,438.00 $43,326.7127 2042 7 7 7 728 2043 7 7 7 729 2044 7 7 7 730 2045 7 7 7 731 2046 7 7 7 732 2047 7 7 7 733 2048 7 7 7 734 2049 7 7 7 735 2050 7 7 7 736 2051 6 6 6 637 2052 6 6 6 638 2053 6 6 6 639 2054 6 6 6 640 2055 6 6 6 641 2056 6 6 6 642 2057 6 6 6 643 2058 6 6 6 644 2059 6 6 6 645 2060 5 5 5 546 2061 6 Repair (After Bridge Replace) $3.00 $31,146.00 20 + 1 6 Repair (After Bridge Replace) $3.00 $31,146.00 20 + 1 6 Repair (After Bridge Replace) $3.00 $31,146.00 20 + 0 6 $93,438.00 $23,988.9547 2062 6 6 6 648 2063 6 6 6 649 2064 6 6 6 650 2065 6 6 6 651 2066 6 6 6 652 2067 6 6 6 653 2068 6 6 6 654 2069 6 6 6 655 2070 5 5 5 556 2071 5 5 5 557 2072 5 5 5 558 2073 5 5 5 559 2074 5 5 5 560 2075 5 5 5 561 2076 5 5 5 562 2077 5 5 5 563 2078 5 5 5 564 2079 5 5 5 565 2080 5 5 5 5
$1,614,401.00 $1,262,845.37
6.45Comments: 5End Rating =
Widen Deck Area =
Item Year Drop
Average Rating =
Total Cost =
Year Built =2. When superstructure replacement is selected, deck replacement should be selected as well.
Exp Service Life =3. Deck Rehab does not account for any deck widening during replacement.4. Widened deck area applies to bridge replacement only.5. Repair deck (after bridge replace) should provide a deck deterioration of 1 point every 20 years.
Substructure Superstructure Deck
No Rehab/Repair Work Can Be Done. Not Yet In 5-Year Program. No Rehab/Repair Work Can Be Done. Not Yet In 5-Year Program. No Rehab/Repair Work Can Be Done. Not Yet In 5-Year Program.
PALO PARADO ROAD (#937) / I-19 / MP 15.65
Notes: Deterioration Line EquationBridge Deck Area = 1. Red fill in "Year" column means current bridge is nearing the end of its expected service life.

March 2017 I-19 Corridor Profile Study Appendix E - 13 Final Report
Option 2 - Perform Bridge Rehabilitiation Then Replace
8366 SF Slope = Days Years10382 SF Substr y = -0.000557x -0.203x 4.92
1966 Superstr y = -0.000293x -0.107x 9.3575 YR Deck y = -0.000515x -0.188x 5.32
5. Repair deck (after bridge replace) should provide a deck deterioration of 1 point every 20 years. Repair (Deck) should maintain deck rating for life of repair, if the rating would otherwise drop a point (i.e., if the rating would drop from a "5" to a "4", Repair Deck would maintain a "5" at that year.)
6. For other repair items, the "+" value rating should be applied to improve the bridge rating's value for that year.
Summary
Year Rating ItemCost (Per
SF)Cost (Total) Service Life
Rating Increase
Rating ItemCost (Per
SF)Cost (Total) Service Life
Rating Increase
Rating ItemCost (Per
SF)Cost (Total) Service Life
Rating Increase
Minimum Rating
Total Cost Per Year Present Value at 3%
0 2015 6 5 51 2016 6 5 52 2017 6 5 53 2018 6 5 54 2019 6 5 55 2020 5 5 56 2021 5 7 Rehab (Supr - Conc) $34.38 $287,581.25 15 + 2 7 Rehab (Deck Concrete Overlay) $10.00 $83,660.00 15 + 2 5 $371,241.25 $310,908.707 2022 5 7 7 58 2023 5 7 7 59 2024 5 7 7 510 2025 4 7 7 411 2026 5 Repair (Substr) $5.00 $41,830.00 5 + 1 7 7 5 $41,830.00 $30,218.8812 2027 5 7 7 513 2028 5 7 7 514 2029 5 7 7 515 2030 5 6 6 516 2031 4 6 6 417 2032 5 Repair (Substr) $5.00 $41,830.00 5 + 1 6 6 5 $41,830.00 $25,307.8418 2033 5 6 6 519 2034 5 6 6 520 2035 5 6 6 521 2036 5 6 6 522 2037 4 6 6 423 2038 5 Repair (Substr) $5.00 $41,830.00 5 + 1 5 5 5 $41,830.00 $21,194.9224 2039 5 5 5 525 2040 5 5 5 526 2041 8 Replace (Bridge) $137.50 $1,427,525.00 75 Rating = 8 8 Replace (Bridge) 75 Rating = 8 8 Replace (Bridge) 75 Rating = 8 8 $1,427,525.00 $661,935.8227 2042 8 8 8 828 2043 8 8 8 829 2044 8 8 8 830 2045 8 8 8 831 2046 8 8 8 832 2047 8 8 8 833 2048 8 8 8 834 2049 8 8 8 835 2050 8 8 8 836 2051 7 7 7 737 2052 7 7 7 738 2053 7 7 7 739 2054 7 7 7 740 2055 7 7 7 741 2056 7 7 7 742 2057 7 7 7 743 2058 7 7 7 744 2059 7 7 7 745 2060 6 6 6 646 2061 7 Repair (After Bridge Replace) $3.00 $31,146.00 20 + 1 7 Repair (After Bridge Replace) $3.00 $31,146.00 20 + 1 7 Repair (After Bridge Replace) $3.00 $31,146.00 20 + 0 7 $93,438.00 $23,988.9547 2062 7 7 7 748 2063 7 7 7 749 2064 7 7 7 750 2065 7 7 7 751 2066 7 7 7 752 2067 7 7 7 753 2068 7 7 7 754 2069 7 7 7 755 2070 7 7 7 756 2071 6 6 6 657 2072 6 6 6 658 2073 6 6 6 659 2074 6 6 6 660 2075 6 6 6 661 2076 6 6 6 662 2077 6 6 6 663 2078 6 6 6 664 2079 6 6 6 665 2080 5 5 5 5
$2,017,694.25 $1,073,555.10
6.25Comments: 5
Average Rating = End Rating =
Substructure Superstructure Deck
Total Cost =
No Rehab/Repair Work Can Be Done. Not Yet In 5-Year Program. No Rehab/Repair Work Can Be Done. Not Yet In 5-Year Program. No Rehab/Repair Work Can Be Done. Not Yet In 5-Year Program.
Year Built =2. When superstructure replacement is selected, deck replacement should be selected as well.
Exp Service Life =3. Deck Rehab does not account for any deck widening during replacement.
Widen Deck Area =
4. Widened deck area applies to bridge replacement only.
PALO PARADO ROAD (#937) / I-19 / MP 15.65
Notes: Deterioration Line EquationBridge Deck Area = 1. Red fill in "Year" column means current bridge is nearing the end of its expected service life.
Item Year Drop
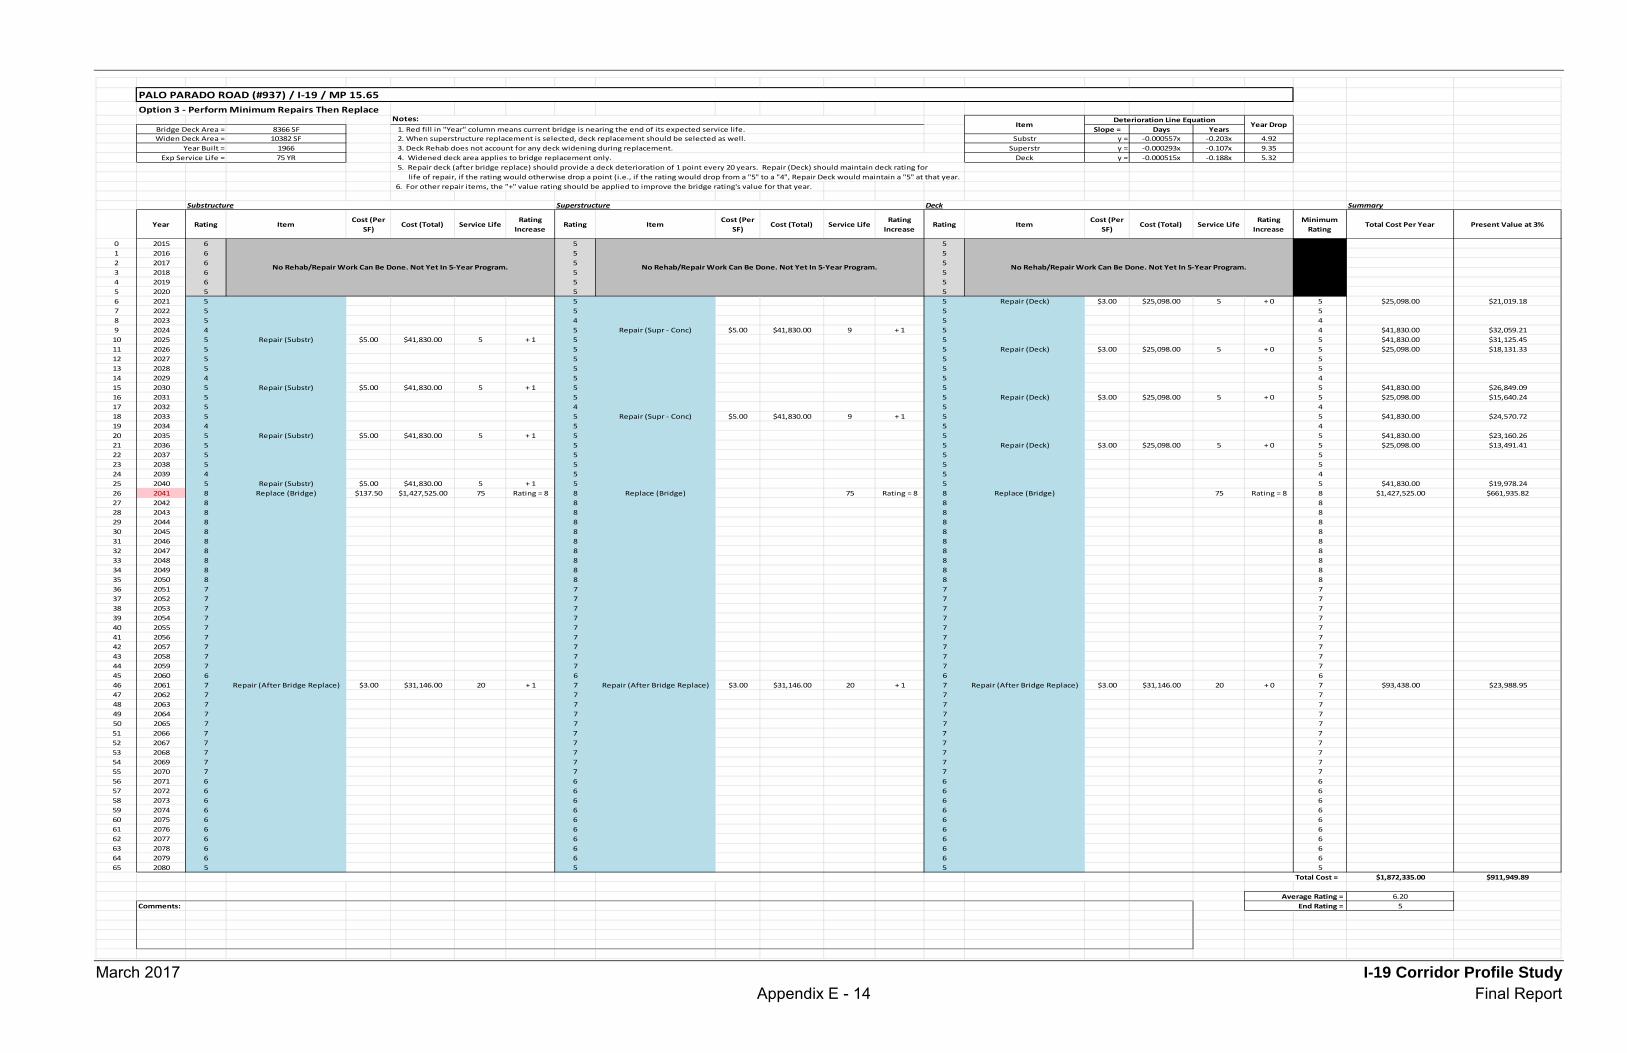
March 2017 I-19 Corridor Profile Study Appendix E - 14 Final Report
Option 3 - Perform Minimum Repairs Then Replace
8366 SF Slope = Days Years10382 SF Substr y = -0.000557x -0.203x 4.92
1966 Superstr y = -0.000293x -0.107x 9.3575 YR Deck y = -0.000515x -0.188x 5.32
5. Repair deck (after bridge replace) should provide a deck deterioration of 1 point every 20 years. Repair (Deck) should maintain deck rating for life of repair, if the rating would otherwise drop a point (i.e., if the rating would drop from a "5" to a "4", Repair Deck would maintain a "5" at that year.
6. For other repair items, the "+" value rating should be applied to improve the bridge rating's value for that year.
Summary
Year Rating ItemCost (Per
SF)Cost (Total) Service Life
Rating Increase
Rating ItemCost (Per
SF)Cost (Total) Service Life
Rating Increase
Rating ItemCost (Per
SF)Cost (Total) Service Life
Rating Increase
Minimum Rating
Total Cost Per Year Present Value at 3%
0 2015 6 5 51 2016 6 5 52 2017 6 5 53 2018 6 5 54 2019 6 5 55 2020 5 5 56 2021 5 5 5 Repair (Deck) $3.00 $25,098.00 5 + 0 5 $25,098.00 $21,019.187 2022 5 5 5 58 2023 5 4 5 49 2024 4 5 Repair (Supr - Conc) $5.00 $41,830.00 9 + 1 5 4 $41,830.00 $32,059.2110 2025 5 Repair (Substr) $5.00 $41,830.00 5 + 1 5 5 5 $41,830.00 $31,125.4511 2026 5 5 5 Repair (Deck) $3.00 $25,098.00 5 + 0 5 $25,098.00 $18,131.3312 2027 5 5 5 513 2028 5 5 5 514 2029 4 5 5 415 2030 5 Repair (Substr) $5.00 $41,830.00 5 + 1 5 5 5 $41,830.00 $26,849.0916 2031 5 5 5 Repair (Deck) $3.00 $25,098.00 5 + 0 5 $25,098.00 $15,640.2417 2032 5 4 5 418 2033 5 5 Repair (Supr - Conc) $5.00 $41,830.00 9 + 1 5 5 $41,830.00 $24,570.7219 2034 4 5 5 420 2035 5 Repair (Substr) $5.00 $41,830.00 5 + 1 5 5 5 $41,830.00 $23,160.2621 2036 5 5 5 Repair (Deck) $3.00 $25,098.00 5 + 0 5 $25,098.00 $13,491.4122 2037 5 5 5 523 2038 5 5 5 524 2039 4 5 5 425 2040 5 Repair (Substr) $5.00 $41,830.00 5 + 1 5 5 5 $41,830.00 $19,978.2426 2041 8 Replace (Bridge) $137.50 $1,427,525.00 75 Rating = 8 8 Replace (Bridge) 75 Rating = 8 8 Replace (Bridge) 75 Rating = 8 8 $1,427,525.00 $661,935.8227 2042 8 8 8 828 2043 8 8 8 829 2044 8 8 8 830 2045 8 8 8 831 2046 8 8 8 832 2047 8 8 8 833 2048 8 8 8 834 2049 8 8 8 835 2050 8 8 8 836 2051 7 7 7 737 2052 7 7 7 738 2053 7 7 7 739 2054 7 7 7 740 2055 7 7 7 741 2056 7 7 7 742 2057 7 7 7 743 2058 7 7 7 744 2059 7 7 7 745 2060 6 6 6 646 2061 7 Repair (After Bridge Replace) $3.00 $31,146.00 20 + 1 7 Repair (After Bridge Replace) $3.00 $31,146.00 20 + 1 7 Repair (After Bridge Replace) $3.00 $31,146.00 20 + 0 7 $93,438.00 $23,988.9547 2062 7 7 7 748 2063 7 7 7 749 2064 7 7 7 750 2065 7 7 7 751 2066 7 7 7 752 2067 7 7 7 753 2068 7 7 7 754 2069 7 7 7 755 2070 7 7 7 756 2071 6 6 6 657 2072 6 6 6 658 2073 6 6 6 659 2074 6 6 6 660 2075 6 6 6 661 2076 6 6 6 662 2077 6 6 6 663 2078 6 6 6 664 2079 6 6 6 665 2080 5 5 5 5
$1,872,335.00 $911,949.89
6.20Comments: 5
Average Rating =
Notes:
End Rating =
Total Cost =
No Rehab/Repair Work Can Be Done. Not Yet In 5-Year Program.
PALO PARADO ROAD (#937) / I-19 / MP 15.65
Substructure Superstructure Deck
Deterioration Line Equation
Widen Deck Area =
Item Year DropBridge Deck Area =
Year Built =Exp Service Life =
1. Red fill in "Year" column means current bridge is nearing the end of its expected service life.2. When superstructure replacement is selected, deck replacement should be selected as well.3. Deck Rehab does not account for any deck widening during replacement.4. Widened deck area applies to bridge replacement only.
No Rehab/Repair Work Can Be Done. Not Yet In 5-Year Program. No Rehab/Repair Work Can Be Done. Not Yet In 5-Year Program.
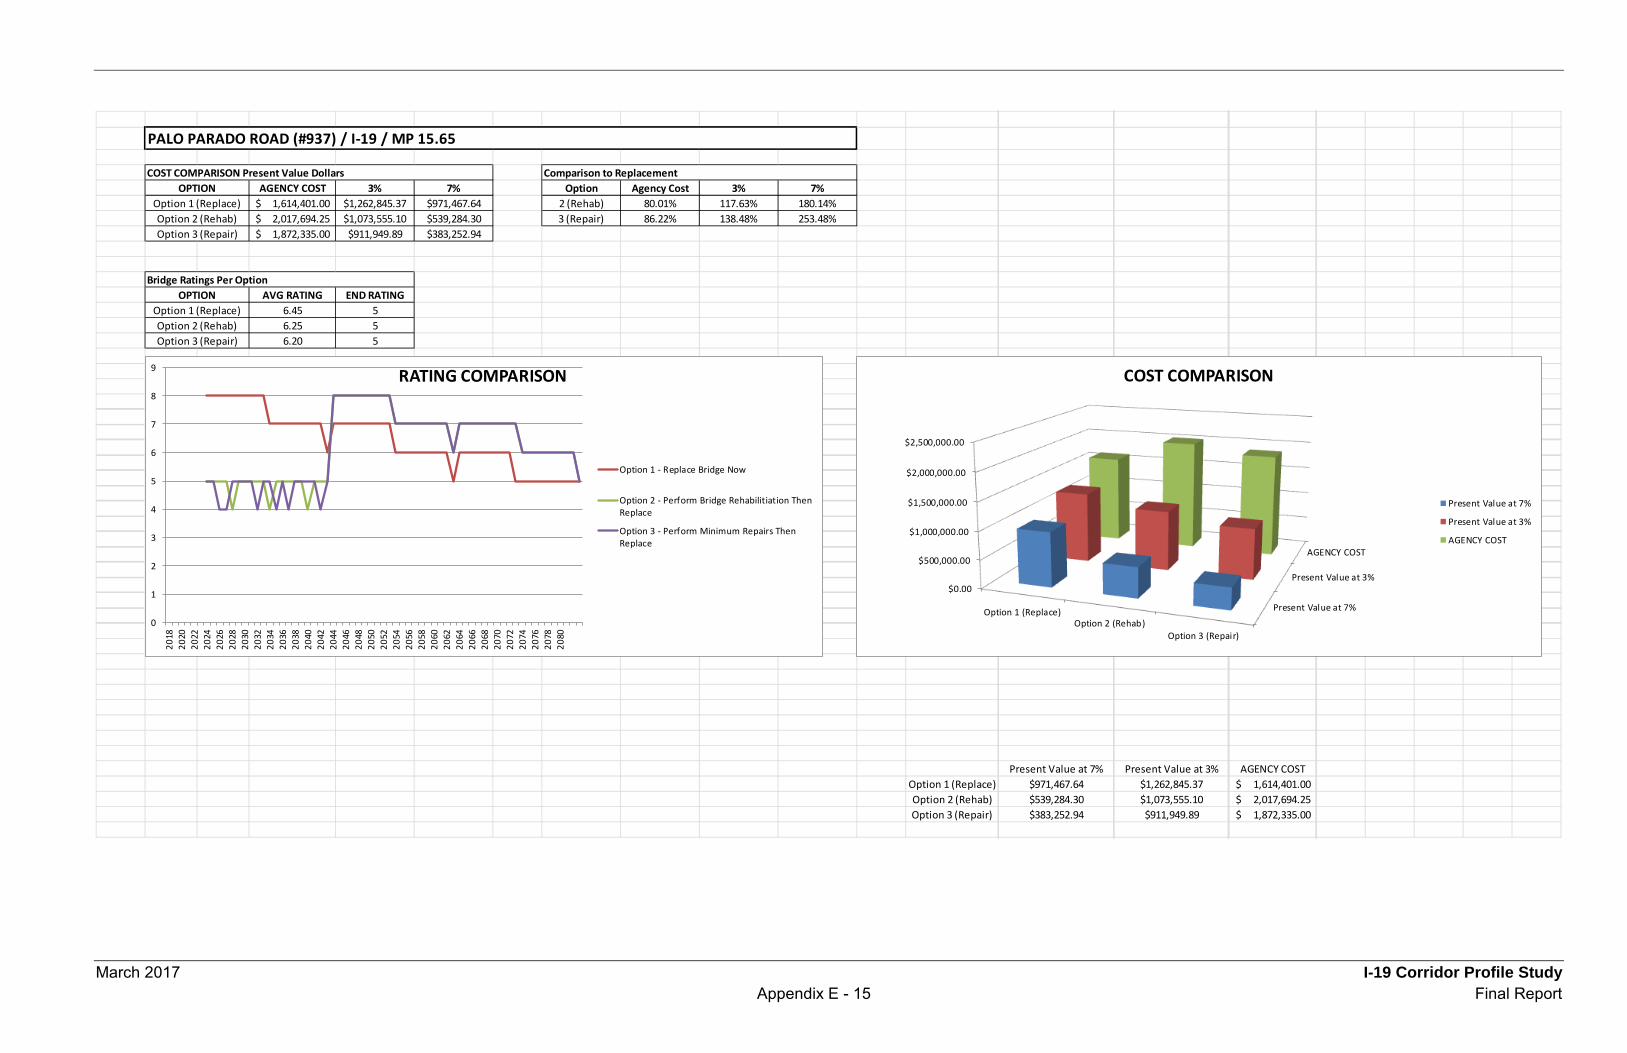
March 2017 I-19 Corridor Profile StudyAppendix E - 15 Final Report
AGENCY COST 3% 7% Option Agency Cost 3% 7%1,614,401.00$ $1,262,845.37 $971,467.64 2 (Rehab) 80.01% 117.63% 180.14%2,017,694.25$ $1,073,555.10 $539,284.30 3 (Repair) 86.22% 138.48% 253.48%1,872,335.00$ $911,949.89 $383,252.94
AVG RATING END RATING6.45 56.25 56.20 5
Present Value at 7% Present Value at 3% AGENCY COSTOption 1 (Replace) $971,467.64 $1,262,845.37 1,614,401.00$ Option 2 (Rehab) $539,284.30 $1,073,555.10 2,017,694.25$ Option 3 (Repair) $383,252.94 $911,949.89 1,872,335.00$
Option 1 (Replace)Option 2 (Rehab)Option 3 (Repair)
OPTIONBridge Ratings Per Option
Comparison to Replacement
PALO PARADO ROAD (#937) / I-19 / MP 15.65
Option 3 (Repair)
OPTIONCOST COMPARISON Present Value Dollars
Option 2 (Rehab)Option 1 (Replace)
0
1
2
3
4
5
6
7
8
9
2018
2020
2022
2024
2026
2028
2030
2032
2034
2036
2038
2040
2042
2044
2046
2048
2050
2052
2054
2056
2058
2060
2062
2064
2066
2068
2070
2072
2074
2076
2078
2080
RATING COMPARISON
Option 1 - Replace Bridge Now
Option 2 - Perform Bridge Rehabilitiation ThenReplace
Option 3 - Perform Minimum Repairs ThenReplace
Present Value at 7%
Present Value at 3%
AGENCY COST
$0.00
$500,000.00
$1,000,000.00
$1,500,000.00
$2,000,000.00
$2,500,000.00
Option 1 (Replace)Option 2 (Rehab)
Option 3 (Repair)
COST COMPARISON
Present Value at 7%
Present Value at 3%
AGENCY COST
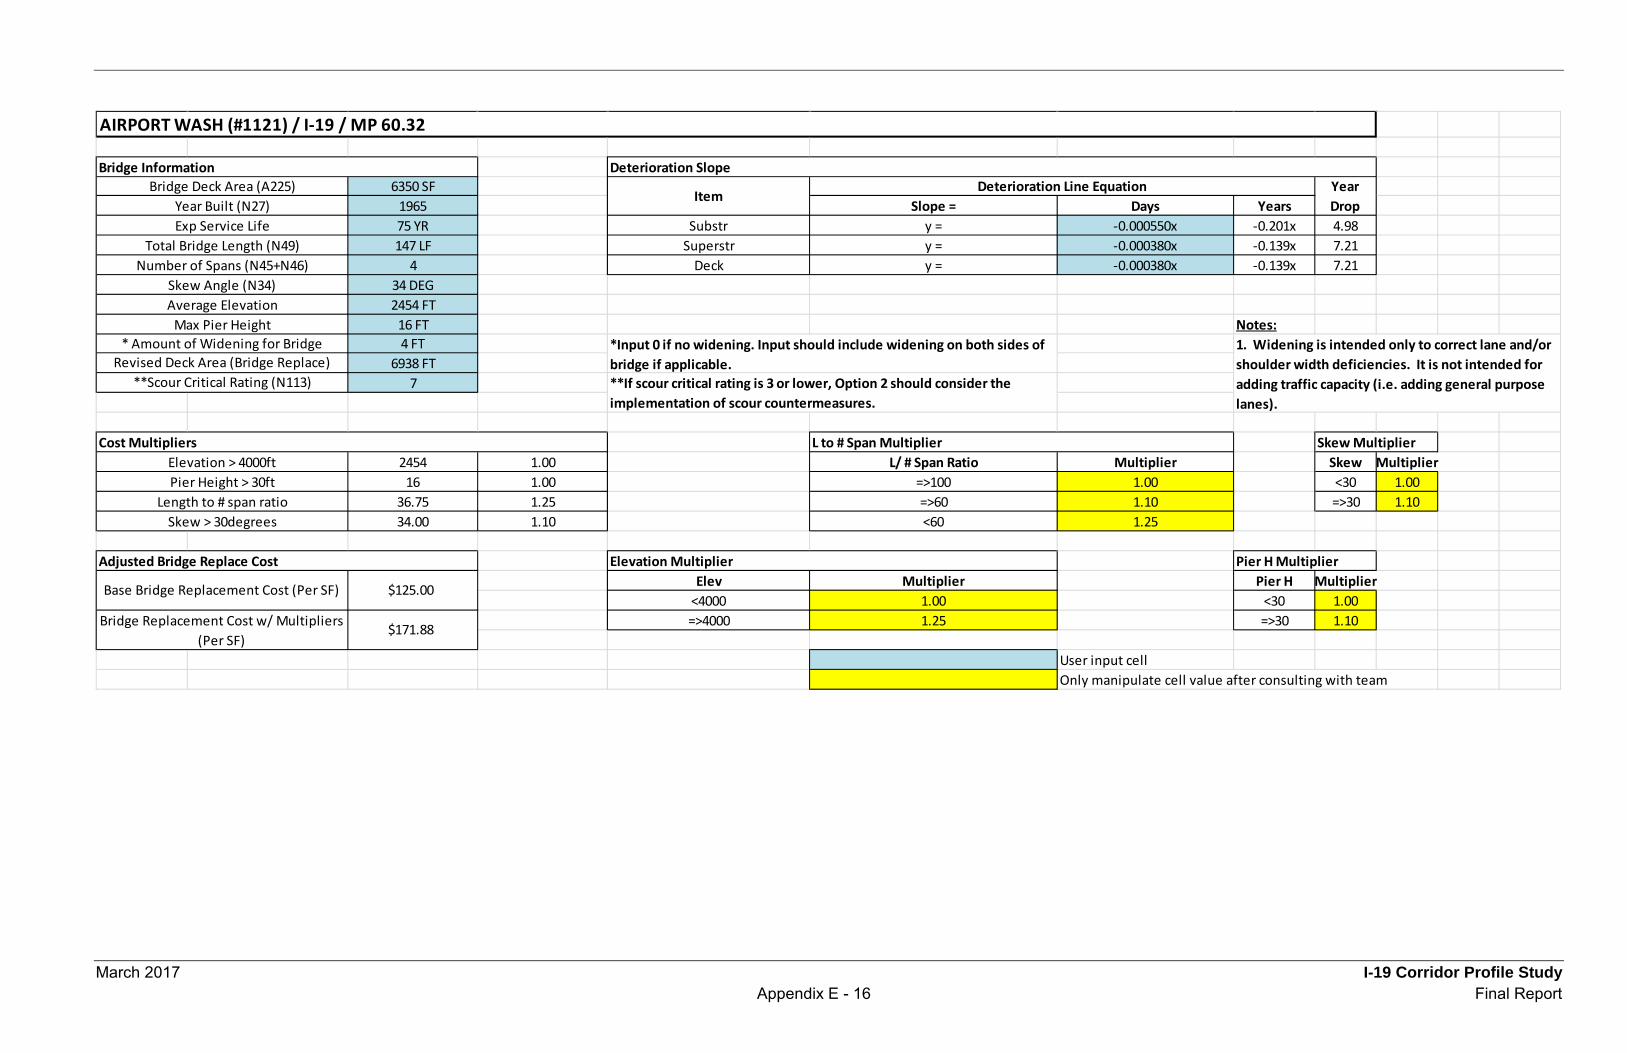
March 2017 I-19 Corridor Profile Study Appendix E - 16 Final Report
6350 SF1965 Slope = Days Years75 YR Substr y = -0.000550x -0.201x 4.98147 LF Superstr y = -0.000380x -0.139x 7.21
4 Deck y = -0.000380x -0.139x 7.2134 DEG2454 FT
16 FT Notes:4 FT
6938 FT7
2454 1.00 L/ # Span Ratio Multiplier Skew Multiplier16 1.00 =>100 1.00 <30 1.00
36.75 1.25 =>60 1.10 =>30 1.1034.00 1.10 <60 1.25
Elev Multiplier Pier H Multiplier<4000 1.00 <30 1.00=>4000 1.25 =>30 1.10
User input cellOnly manipulate cell value after consulting with team
AIRPORT WASH (#1121) / I-19 / MP 60.32
Skew Multiplier
Skew Angle (N34)
Bridge Replacement Cost w/ Multipliers (Per SF)
$171.88
Adjusted Bridge Replace Cost
Pier Height > 30ftLength to # span ratio
Bridge Deck Area (A225)Year Built (N27)Exp Service Life
Deterioration Line EquationDeterioration Slope
Elevation Multiplier Pier H Multiplier
Bridge InformationYear Drop
1. Widening is intended only to correct lane and/or shoulder width deficiencies. It is not intended for adding traffic capacity (i.e. adding general purpose lanes).
* Amount of Widening for Bridge
L to # Span Multiplier
Base Bridge Replacement Cost (Per SF) $125.00
Skew > 30degrees
Elevation > 4000ftCost Multipliers
Item
Average ElevationMax Pier Height
Revised Deck Area (Bridge Replace)**Scour Critical Rating (N113)
*Input 0 if no widening. Input should include widening on both sides of bridge if applicable.**If scour critical rating is 3 or lower, Option 2 should consider the implementation of scour countermeasures.
Total Bridge Length (N49)Number of Spans (N45+N46)
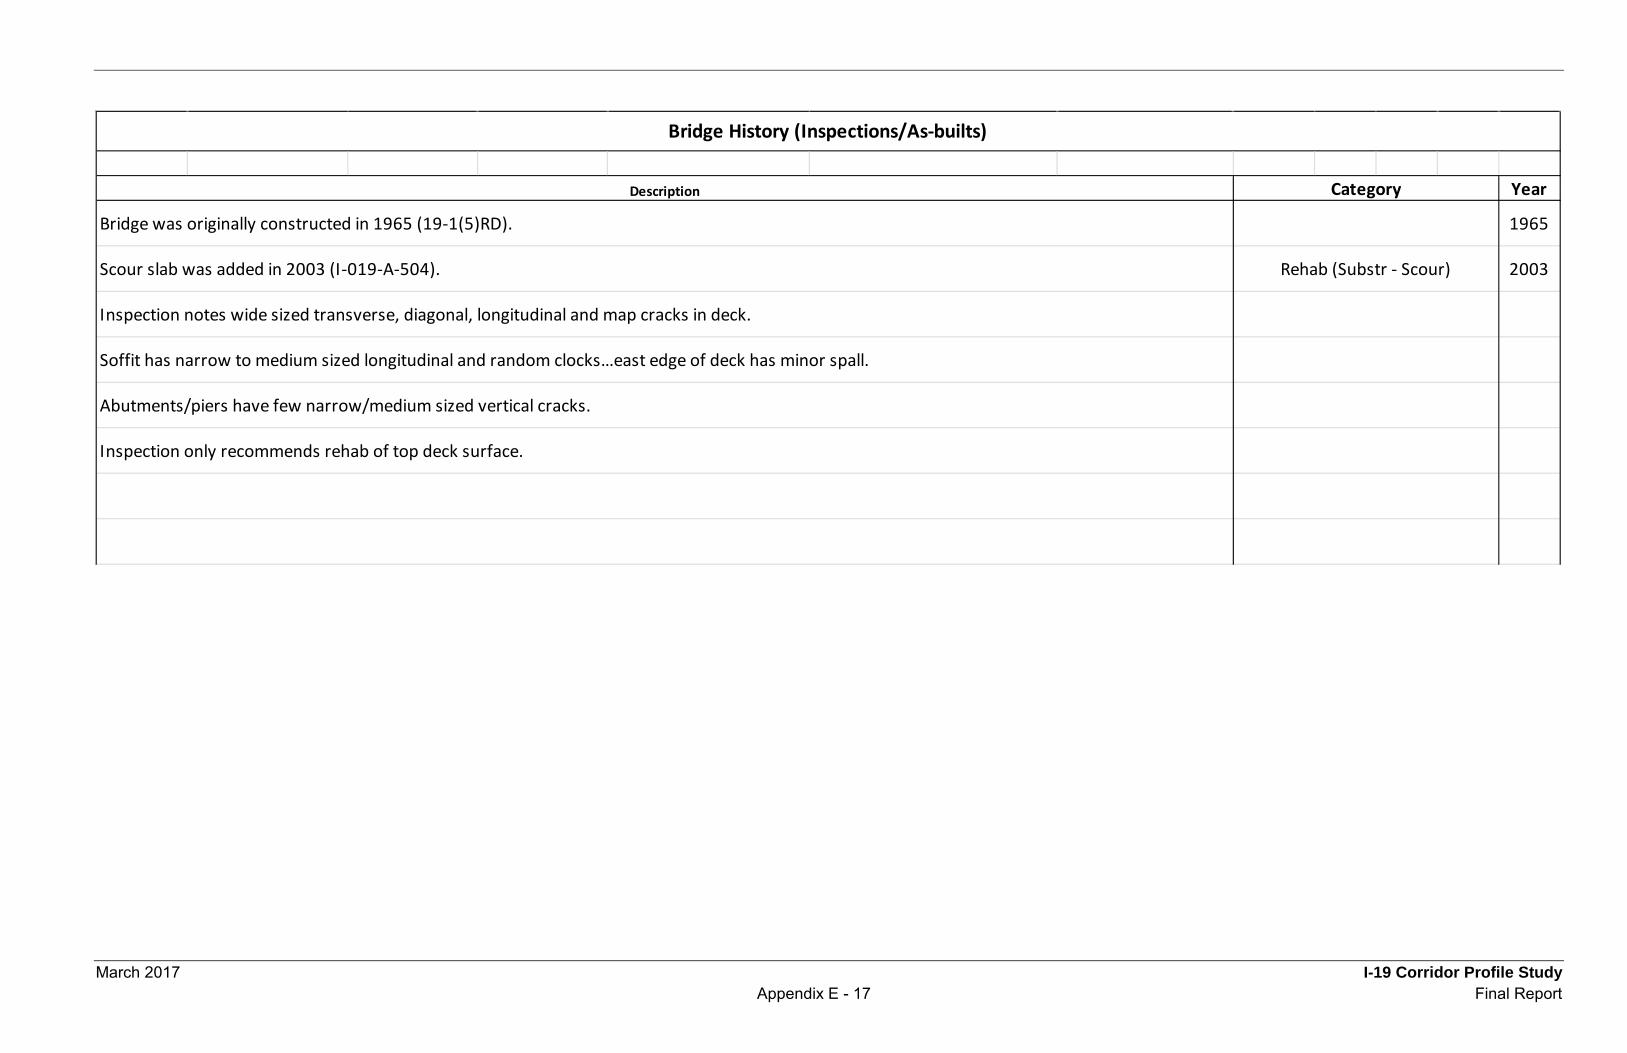
March 2017 I-19 Corridor Profile Study Appendix E - 17 Final Report
Year
1965
2003
Bridge was originally constructed in 1965 (19-1(5)RD).
Scour slab was added in 2003 (I-019-A-504).
Inspection notes wide sized transverse, diagonal, longitudinal and map cracks in deck.
Bridge History (Inspections/As-builts)
Inspection only recommends rehab of top deck surface.
CategoryDescription
Abutments/piers have few narrow/medium sized vertical cracks.
Rehab (Substr - Scour)
Soffit has narrow to medium sized longitudinal and random clocks…east edge of deck has minor spall.

March 2017 I-19 Corridor Profile Study Appendix E - 18 Final Report
UNIT COST (Per SF) LIFE (YRS) RATING BENEFIT$85.94 25 Rating = 8$10.00 15 + 2$5.00 10 + 1$3.00 See Deterioration Slope + 0
$171.88 75 Rating = 8$3.00 20 + 0$3.00 10 + 0
UNIT COST (Per SF) LIFE (YRS) RATING BENEFIT$85.94 50 Rating = 8$42.97 15 + 2$5.00 See Deterioration Slope + 1
UNIT COST (Per SF) LIFE (YRS) RATING BENEFIT$85.94 50 Rating = 8$42.97 15 + 2$5.00 See Deterioration Slope + 1
$171.88 75 Rating = 8$3.00 20 + 1$3.00 10 + 1
UNIT COST (Per SF) LIFE (YRS) RATING BENEFIT$85.94 75 Rating = 8$42.97 50 + 2$5.00 See Deterioration Slope + 1
UNIT COST (Per SF) LIFE (YRS) RATING BENEFIT$42.97 50 + 2$5.00 See Deterioration Slope + 1
$171.88 75 Rating = 8$3.00 20 + 1$3.00 10 + 1
Notes:1. Individual replacements assume 50% of total bridge replacement costs2. Individual rehabs (in cells that are not highlighted) assume 25% of total bridge replacement costs3. When superstructure replacement is selected, either deck replacement or deck rehab should be selected as well.
Replace / Rehab / Repair Information
BRIDGE DECK
Repair (Supr - Conc)Rehab (Supr - Conc)
Replace (Supr - Conc)ITEM
Repair (Supr - Stl)
SUPERSTRUCTURE - CONCRETE
Weld Repair / Crack Relief
DESCRIPTIONFull SuperStr Replacement
Replace Structural ComponentPatch Spalls / Seal Cracks
Rehab (Supr - Stl)Replace (Supr - Stl)
ITEM
Repair (After Rehab)Repair (After Bridge Replace)
ITEM
Rehab (Deck Epoxy Overlay)
Full Deck ReplacementOverlay (Concrete)
SUPERSTRUCTURE - STEEL
Patch Spalls / Seal CracksPatch Spalls / Seal Cracks
Full SubStr Replacement
DESCRIPTIONFull SuperStr Replacement
Weld New Structural Components
DESCRIPTION
ITEM
Repair (After Rehab)Repair (After Bridge Replace)
Replace (Bridge)
SUBSTRUCTURE - STRUCTURAL
Full Bridge ReplacementPatch Spalls / Seal CracksPatch Spalls / Seal Cracks
DESCRIPTION
Patch Spalls / Seal CracksFull Bridge Replacement
Overlay (Epoxy)
Replace (Bridge)Repair (Deck)
Rehab (Deck Concrete Overlay)Replace (Deck)
Full Bridge ReplacementPatch Spalls / Seal CracksPatch Spalls / Seal CracksRepair (After Rehab)
Repair (After Bridge Replace)Replace (Bridge)
Repair (Substr - Scour)Rehab (Substr - Scour)
ITEM
Repair (Substr)Rehab (Substr)
SUBSTRUCTURE - SCOUR
Replace Structural ComponentPatch Spalls / Seal Cracks
DESCRIPTIONAdd scour protection slabsPatch Spalls / Seal Cracks
Replace (Substr)

March 2017 I-19 Corridor Profile Study Appendix E - 19 Final Report
Option 1 - Replace Bridge Now
6350 SF Slope = Days Years6938 SF Substr y = -0.000550x -0.201x 4.98
1965 Superstr y = -0.000380x -0.139x 7.2175 YR Deck y = -0.000380x -0.139x 7.21
Summary
Year Rating ItemCost (Per
SF)Cost (Total) Service Life
Rating Increase
Rating ItemCost (Per
SF)Cost (Total) Service Life
Rating Increase
Rating ItemCost (Per
SF)Cost (Total) Service Life
Rating Increase
Minimum Rating
Total Cost Per Year Present Value at 3%
0 2015 6 5 51 2016 6 5 52 2017 6 5 53 2018 6 5 54 2019 6 5 55 2020 5 5 56 2021 8 Replace (Bridge) $171.88 $1,192,503.44 75 Rating = 8 8 Replace (Bridge) 75 Rating = 8 8 Replace (Bridge) 75 Rating = 8 8 $1,192,503.44 $998,702.867 2022 8 8 8 88 2023 8 8 8 89 2024 8 8 8 810 2025 8 8 8 811 2026 8 8 8 812 2027 8 8 8 813 2028 8 8 8 814 2029 8 8 8 815 2030 8 8 8 816 2031 7 7 7 717 2032 7 7 7 718 2033 7 7 7 719 2034 7 7 7 720 2035 7 7 7 721 2036 7 7 7 722 2037 7 7 7 723 2038 7 7 7 724 2039 7 7 7 725 2040 6 6 6 626 2041 7 Repair (After Bridge Replace) $3.00 $20,814.00 20 + 1 7 Repair (After Bridge Replace) $3.00 $20,814.00 20 + 1 7 Repair (After Bridge Replace) $3.00 $20,814.00 20 + 0 7 $62,442.00 $28,954.0327 2042 7 7 7 728 2043 7 7 7 729 2044 7 7 7 730 2045 7 7 7 731 2046 7 7 7 732 2047 7 7 7 733 2048 7 7 7 734 2049 7 7 7 735 2050 7 7 7 736 2051 6 6 6 637 2052 6 6 6 638 2053 6 6 6 639 2054 6 6 6 640 2055 6 6 6 641 2056 6 6 6 642 2057 6 6 6 643 2058 6 6 6 644 2059 6 6 6 645 2060 5 5 5 546 2061 6 Repair (After Bridge Replace) $3.00 $20,814.00 20 + 1 6 Repair (After Bridge Replace) $3.00 $20,814.00 20 + 1 6 Repair (After Bridge Replace) $3.00 $20,814.00 20 + 0 6 $62,442.00 $16,031.1447 2062 6 6 6 648 2063 6 6 6 649 2064 6 6 6 650 2065 6 6 6 651 2066 6 6 6 652 2067 6 6 6 653 2068 6 6 6 654 2069 6 6 6 655 2070 5 5 5 556 2071 5 5 5 557 2072 5 5 5 558 2073 5 5 5 559 2074 5 5 5 560 2075 5 5 5 561 2076 5 5 5 562 2077 5 5 5 563 2078 5 5 5 564 2079 5 5 5 565 2080 5 5 5 5
$1,317,387.44 $1,043,688.03
6.45Comments: 5End Rating =
Widen Deck Area =
Item Year Drop
Average Rating =
Total Cost =
Year Built =2. When superstructure replacement is selected, deck replacement should be selected as well.
Exp Service Life =3. Deck Rehab does not account for any deck widening during replacement.4. Widened deck area applies to bridge replacement only.5. Repair deck (after bridge replace) should provide a deck deterioration of 1 point every 20 years.
Substructure Superstructure Deck
No Rehab/Repair Work Can Be Done. Not Yet In 5-Year Program. No Rehab/Repair Work Can Be Done. Not Yet In 5-Year Program. No Rehab/Repair Work Can Be Done. Not Yet In 5-Year Program.
AIRPORT WASH (#1121) / I-19 / MP 60.32
Notes: Deterioration Line EquationBridge Deck Area = 1. Red fill in "Year" column means current bridge is nearing the end of its expected service life.
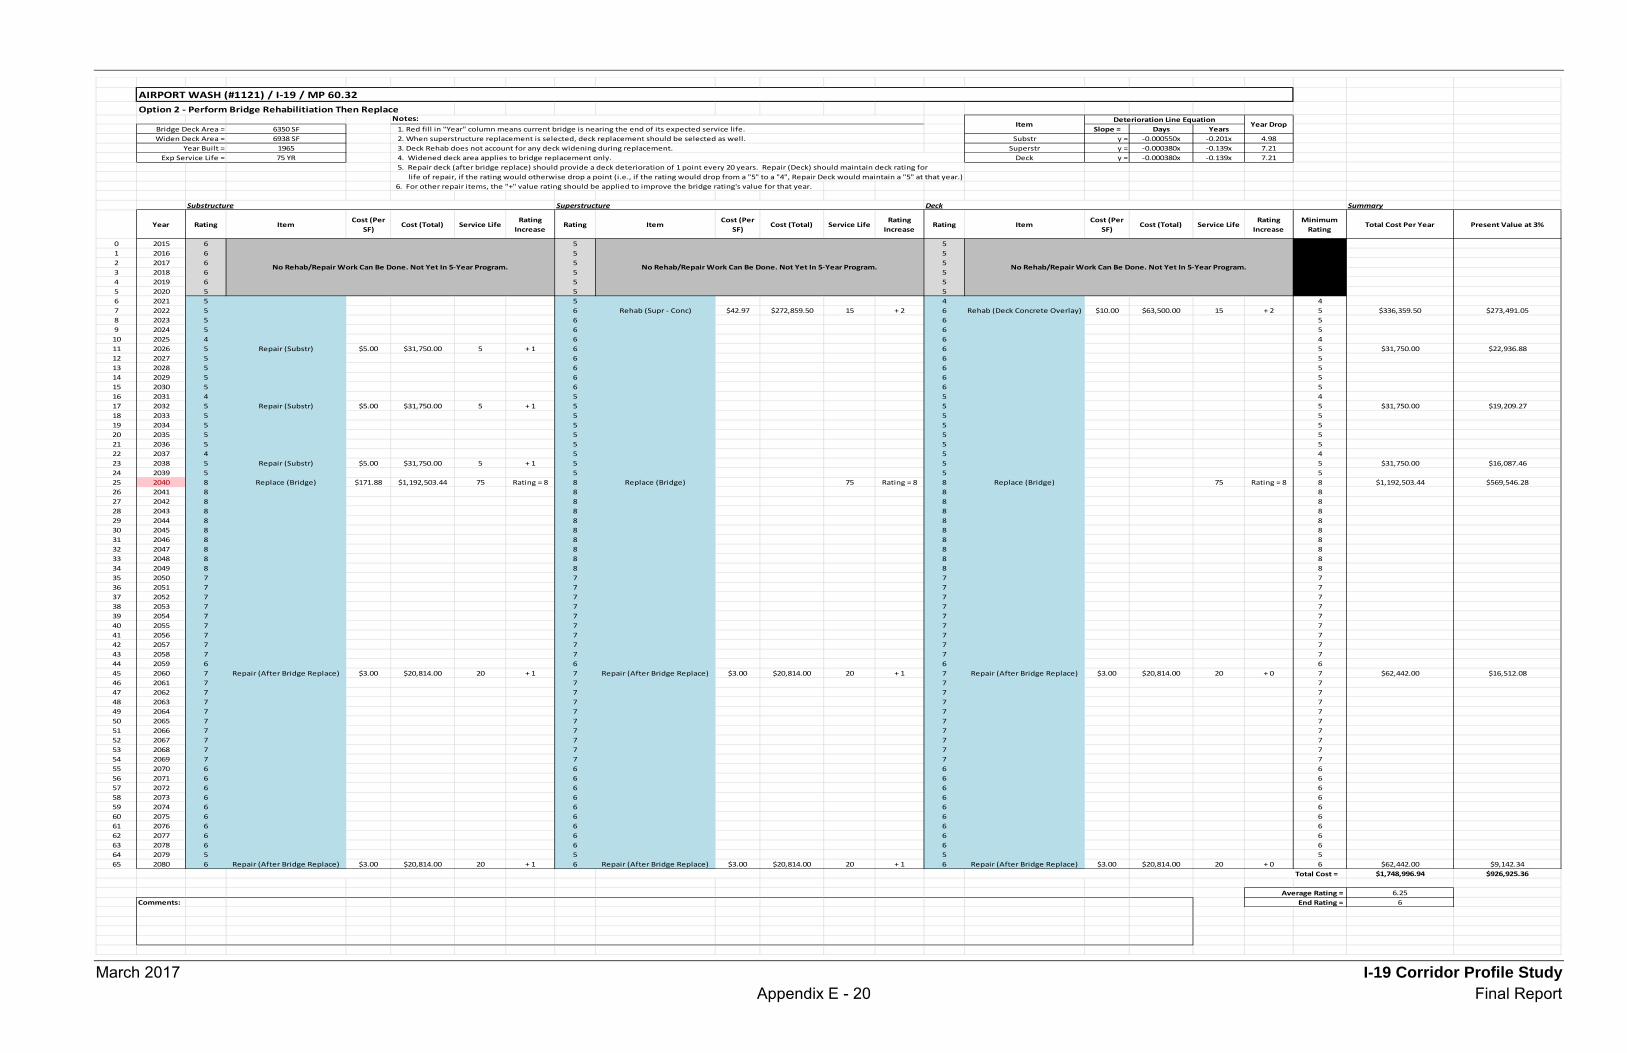
March 2017 I-19 Corridor Profile Study Appendix E - 20 Final Report
Option 2 - Perform Bridge Rehabilitiation Then Replace
6350 SF Slope = Days Years6938 SF Substr y = -0.000550x -0.201x 4.98
1965 Superstr y = -0.000380x -0.139x 7.2175 YR Deck y = -0.000380x -0.139x 7.21
5. Repair deck (after bridge replace) should provide a deck deterioration of 1 point every 20 years. Repair (Deck) should maintain deck rating for life of repair, if the rating would otherwise drop a point (i.e., if the rating would drop from a "5" to a "4", Repair Deck would maintain a "5" at that year.)
6. For other repair items, the "+" value rating should be applied to improve the bridge rating's value for that year.
Summary
Year Rating ItemCost (Per
SF)Cost (Total) Service Life
Rating Increase
Rating ItemCost (Per
SF)Cost (Total) Service Life
Rating Increase
Rating ItemCost (Per
SF)Cost (Total) Service Life
Rating Increase
Minimum Rating
Total Cost Per Year Present Value at 3%
0 2015 6 5 51 2016 6 5 52 2017 6 5 53 2018 6 5 54 2019 6 5 55 2020 5 5 56 2021 5 5 4 47 2022 5 6 Rehab (Supr - Conc) $42.97 $272,859.50 15 + 2 6 Rehab (Deck Concrete Overlay) $10.00 $63,500.00 15 + 2 5 $336,359.50 $273,491.058 2023 5 6 6 59 2024 5 6 6 510 2025 4 6 6 411 2026 5 Repair (Substr) $5.00 $31,750.00 5 + 1 6 6 5 $31,750.00 $22,936.8812 2027 5 6 6 513 2028 5 6 6 514 2029 5 6 6 515 2030 5 6 6 516 2031 4 5 5 417 2032 5 Repair (Substr) $5.00 $31,750.00 5 + 1 5 5 5 $31,750.00 $19,209.2718 2033 5 5 5 519 2034 5 5 5 520 2035 5 5 5 521 2036 5 5 5 522 2037 4 5 5 423 2038 5 Repair (Substr) $5.00 $31,750.00 5 + 1 5 5 5 $31,750.00 $16,087.4624 2039 5 5 5 525 2040 8 Replace (Bridge) $171.88 $1,192,503.44 75 Rating = 8 8 Replace (Bridge) 75 Rating = 8 8 Replace (Bridge) 75 Rating = 8 8 $1,192,503.44 $569,546.2826 2041 8 8 8 827 2042 8 8 8 828 2043 8 8 8 829 2044 8 8 8 830 2045 8 8 8 831 2046 8 8 8 832 2047 8 8 8 833 2048 8 8 8 834 2049 8 8 8 835 2050 7 7 7 736 2051 7 7 7 737 2052 7 7 7 738 2053 7 7 7 739 2054 7 7 7 740 2055 7 7 7 741 2056 7 7 7 742 2057 7 7 7 743 2058 7 7 7 744 2059 6 6 6 645 2060 7 Repair (After Bridge Replace) $3.00 $20,814.00 20 + 1 7 Repair (After Bridge Replace) $3.00 $20,814.00 20 + 1 7 Repair (After Bridge Replace) $3.00 $20,814.00 20 + 0 7 $62,442.00 $16,512.0846 2061 7 7 7 747 2062 7 7 7 748 2063 7 7 7 749 2064 7 7 7 750 2065 7 7 7 751 2066 7 7 7 752 2067 7 7 7 753 2068 7 7 7 754 2069 7 7 7 755 2070 6 6 6 656 2071 6 6 6 657 2072 6 6 6 658 2073 6 6 6 659 2074 6 6 6 660 2075 6 6 6 661 2076 6 6 6 662 2077 6 6 6 663 2078 6 6 6 664 2079 5 5 5 565 2080 6 Repair (After Bridge Replace) $3.00 $20,814.00 20 + 1 6 Repair (After Bridge Replace) $3.00 $20,814.00 20 + 1 6 Repair (After Bridge Replace) $3.00 $20,814.00 20 + 0 6 $62,442.00 $9,142.34
$1,748,996.94 $926,925.36
6.25Comments: 6
Average Rating = End Rating =
Substructure Superstructure Deck
Total Cost =
No Rehab/Repair Work Can Be Done. Not Yet In 5-Year Program. No Rehab/Repair Work Can Be Done. Not Yet In 5-Year Program. No Rehab/Repair Work Can Be Done. Not Yet In 5-Year Program.
Year Built =2. When superstructure replacement is selected, deck replacement should be selected as well.
Exp Service Life =3. Deck Rehab does not account for any deck widening during replacement.
Widen Deck Area =
4. Widened deck area applies to bridge replacement only.
AIRPORT WASH (#1121) / I-19 / MP 60.32
Notes: Deterioration Line EquationBridge Deck Area = 1. Red fill in "Year" column means current bridge is nearing the end of its expected service life.
Item Year Drop

March 2017 I-19 Corridor Profile Study Appendix E - 21 Final Report
Option 3 - Perform Minimum Repairs Then Replace
6350 SF Slope = Days Years6938 SF Substr y = -0.000550x -0.201x 4.98
1965 Superstr y = -0.000380x -0.139x 7.2175 YR Deck y = -0.000380x -0.139x 7.21
5. Repair deck (after bridge replace) should provide a deck deterioration of 1 point every 20 years. Repair (Deck) should maintain deck rating for life of repair, if the rating would otherwise drop a point (i.e., if the rating would drop from a "5" to a "4", Repair Deck would maintain a "5" at that year.
6. For other repair items, the "+" value rating should be applied to improve the bridge rating's value for that year.
Summary
Year Rating ItemCost (Per
SF)Cost (Total) Service Life
Rating Increase
Rating ItemCost (Per
SF)Cost (Total) Service Life
Rating Increase
Rating ItemCost (Per
SF)Cost (Total) Service Life
Rating Increase
Minimum Rating
Total Cost Per Year Present Value at 3%
0 2015 6 5 51 2016 6 5 52 2017 6 5 53 2018 6 5 54 2019 6 5 55 2020 5 5 56 2021 5 4 5 47 2022 5 5 Repair (Supr - Conc) $5.00 $31,750.00 7 + 1 5 Repair (Deck) $3.00 $19,050.00 7 + 0 5 $50,800.00 $41,305.058 2023 5 5 5 59 2024 5 5 5 510 2025 4 5 5 411 2026 5 Repair (Substr) $5.00 $31,750.00 5 + 1 5 5 5 $31,750.00 $22,936.8812 2027 5 5 5 513 2028 5 4 5 414 2029 5 5 Repair (Supr - Conc) $5.00 $31,750.00 7 + 1 5 Repair (Deck) $3.00 $19,050.00 7 + 0 5 $50,800.00 $33,584.7815 2030 5 5 5 516 2031 4 5 5 417 2032 5 Repair (Substr) $5.00 $31,750.00 5 + 1 5 5 5 $31,750.00 $19,209.2718 2033 5 5 5 519 2034 5 5 5 520 2035 5 5 5 521 2036 5 4 Repair (Supr - Conc) $5.00 $31,750.00 7 + 1 5 Repair (Deck) $3.00 $19,050.00 7 + 0 4 $50,800.00 $27,307.5022 2037 4 5 5 423 2038 5 Repair (Substr) $5.00 $31,750.00 5 + 1 5 5 5 $31,750.00 $16,087.4624 2039 5 5 5 525 2040 8 Replace (Bridge) $171.88 $1,192,503.44 75 Rating = 8 8 Replace (Bridge) 75 Rating = 8 8 Replace (Bridge) 75 Rating = 8 8 $1,192,503.44 $569,546.2826 2041 8 8 8 827 2042 8 8 8 828 2043 8 8 8 829 2044 8 8 8 830 2045 8 8 8 831 2046 8 8 8 832 2047 8 8 8 833 2048 8 8 8 834 2049 8 8 8 835 2050 7 7 7 736 2051 7 7 7 737 2052 7 7 7 738 2053 7 7 7 739 2054 7 7 7 740 2055 7 7 7 741 2056 7 7 7 742 2057 7 7 7 743 2058 7 7 7 744 2059 6 6 6 645 2060 7 Repair (After Bridge Replace) $3.00 $20,814.00 20 + 1 7 Repair (After Bridge Replace) $3.00 $20,814.00 20 + 1 7 Repair (After Bridge Replace) $3.00 $20,814.00 20 + 0 7 $62,442.00 $16,512.0846 2061 7 7 7 747 2062 7 7 7 748 2063 7 7 7 749 2064 7 7 7 750 2065 7 7 7 751 2066 7 7 7 752 2067 7 7 7 753 2068 7 7 7 754 2069 7 7 7 755 2070 6 6 6 656 2071 6 6 6 657 2072 6 6 6 658 2073 6 6 6 659 2074 6 6 6 660 2075 6 6 6 661 2076 6 6 6 662 2077 6 6 6 663 2078 6 6 6 664 2079 5 5 5 565 2080 6 Repair (After Bridge Replace) $3.00 $20,814.00 20 + 1 6 Repair (After Bridge Replace) $3.00 $20,814.00 20 + 1 6 Repair (After Bridge Replace) $3.00 $20,814.00 20 + 0 6 $62,442.00 $9,142.34
$1,565,037.44 $755,631.64
6.22Comments: 6
Average Rating =
Notes:
End Rating =
Total Cost =
No Rehab/Repair Work Can Be Done. Not Yet In 5-Year Program.
AIRPORT WASH (#1121) / I-19 / MP 60.32
Substructure Superstructure Deck
Deterioration Line Equation
Widen Deck Area =
Item Year DropBridge Deck Area =
Year Built =Exp Service Life =
1. Red fill in "Year" column means current bridge is nearing the end of its expected service life.2. When superstructure replacement is selected, deck replacement should be selected as well.3. Deck Rehab does not account for any deck widening during replacement.4. Widened deck area applies to bridge replacement only.
No Rehab/Repair Work Can Be Done. Not Yet In 5-Year Program. No Rehab/Repair Work Can Be Done. Not Yet In 5-Year Program.
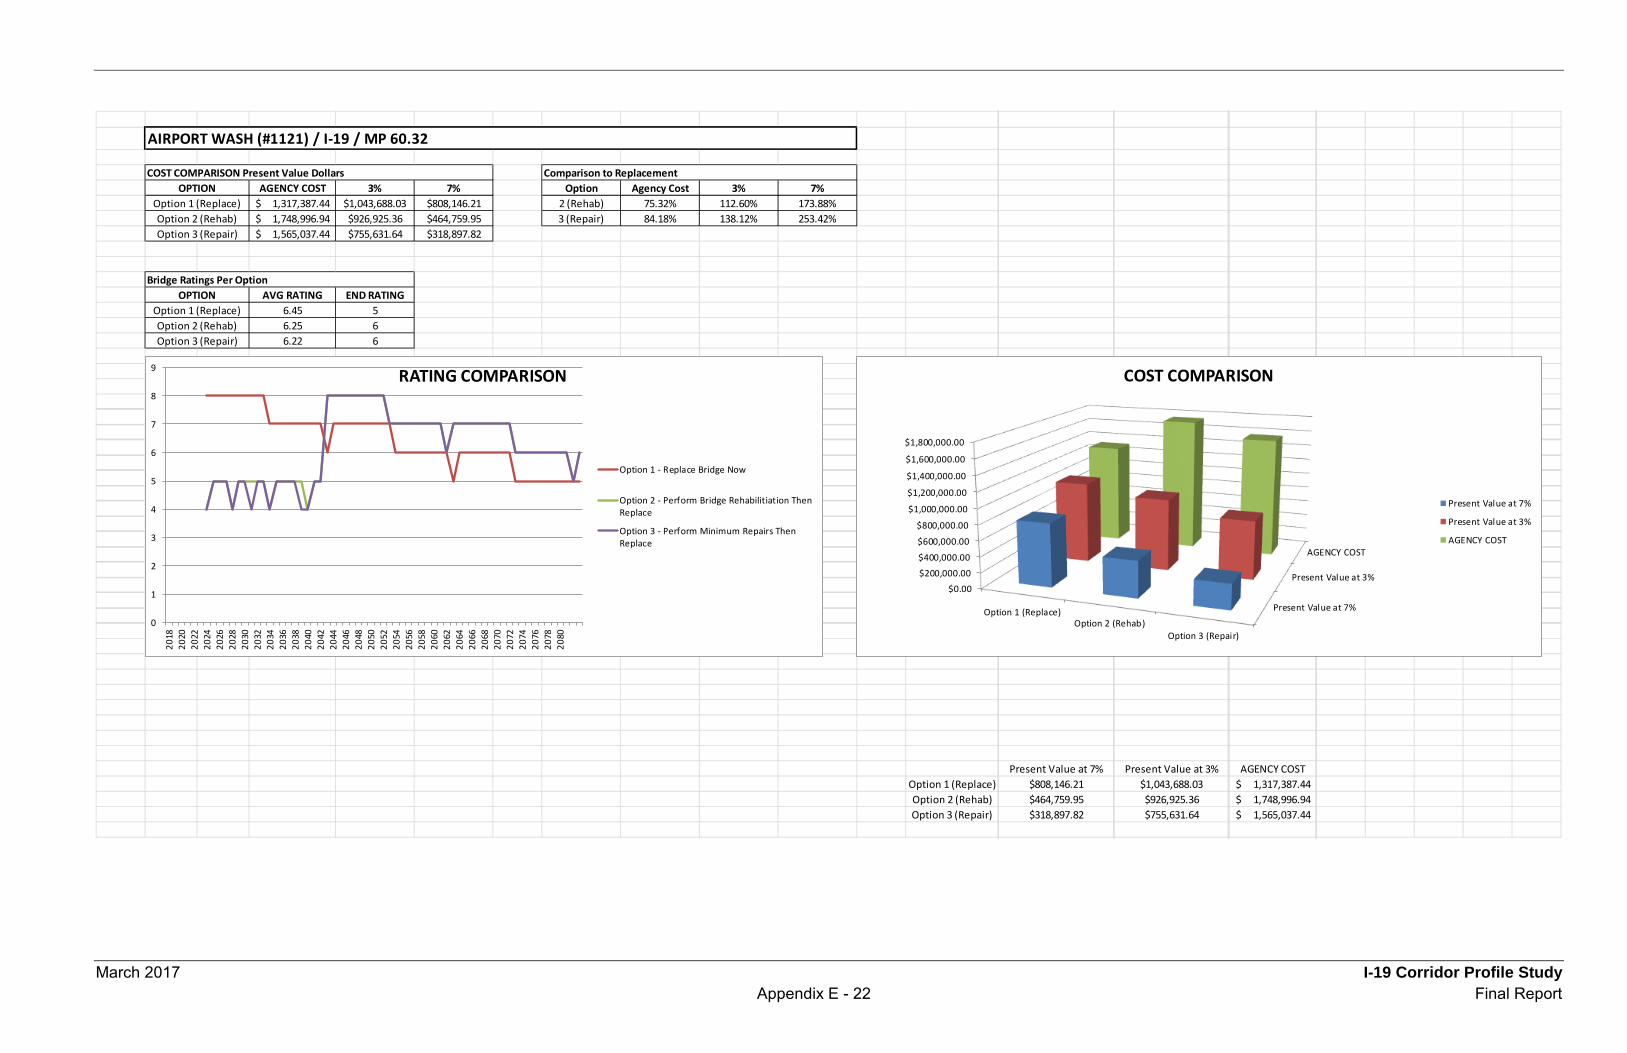
March 2017 I-19 Corridor Profile StudyAppendix E - 22 Final Report
AGENCY COST 3% 7% Option Agency Cost 3% 7%1,317,387.44$ $1,043,688.03 $808,146.21 2 (Rehab) 75.32% 112.60% 173.88%1,748,996.94$ $926,925.36 $464,759.95 3 (Repair) 84.18% 138.12% 253.42%1,565,037.44$ $755,631.64 $318,897.82
AVG RATING END RATING6.45 56.25 66.22 6
Present Value at 7% Present Value at 3% AGENCY COSTOption 1 (Replace) $808,146.21 $1,043,688.03 1,317,387.44$ Option 2 (Rehab) $464,759.95 $926,925.36 1,748,996.94$ Option 3 (Repair) $318,897.82 $755,631.64 1,565,037.44$
Option 1 (Replace)Option 2 (Rehab)Option 3 (Repair)
OPTIONBridge Ratings Per Option
Comparison to Replacement
AIRPORT WASH (#1121) / I-19 / MP 60.32
Option 3 (Repair)
OPTIONCOST COMPARISON Present Value Dollars
Option 2 (Rehab)Option 1 (Replace)
0
1
2
3
4
5
6
7
8
9
2018
2020
2022
2024
2026
2028
2030
2032
2034
2036
2038
2040
2042
2044
2046
2048
2050
2052
2054
2056
2058
2060
2062
2064
2066
2068
2070
2072
2074
2076
2078
2080
RATING COMPARISON
Option 1 - Replace Bridge Now
Option 2 - Perform Bridge Rehabilitiation ThenReplace
Option 3 - Perform Minimum Repairs ThenReplace
Present Value at 7%
Present Value at 3%
AGENCY COST
$0.00$200,000.00
$400,000.00
$600,000.00
$800,000.00
$1,000,000.00
$1,200,000.00
$1,400,000.00
$1,600,000.00
$1,800,000.00
Option 1 (Replace)Option 2 (Rehab)
Option 3 (Repair)
COST COMPARISON
Present Value at 7%
Present Value at 3%
AGENCY COST

March 2017 I-19 Corridor Profile Study Appendix E - 23 Final Report
6350 SF1965 Slope = Days Years75 YR Substr y = -0.000594x -0.217x 4.61147 LF Superstr y = -0.000300x -0.110x 9.13
4 Deck y = -0.000436x -0.159x 6.2834 DEG2454 FT
16 FT Notes:4 FT
6938 FT7
2454 1.00 L/ # Span Ratio Multiplier Skew Multiplier16 1.00 =>100 1.00 <30 1.00
36.75 1.25 =>60 1.10 =>30 1.1034.00 1.10 <60 1.25
Elev Multiplier Pier H Multiplier<4000 1.00 <30 1.00=>4000 1.25 =>30 1.10
User input cellOnly manipulate cell value after consulting with team
Item
Average ElevationMax Pier Height
Revised Deck Area (Bridge Replace)**Scour Critical Rating (N113)
*Input 0 if no widening. Input should include widening on both sides of bridge if applicable.**If scour critical rating is 3 or lower, Option 2 should consider the implementation of scour countermeasures.
Total Bridge Length (N49)Number of Spans (N45+N46)
L to # Span Multiplier
Base Bridge Replacement Cost (Per SF) $125.00
Skew > 30degrees
Elevation > 4000ftCost Multipliers
AIRPORT WASH (#1122) / I-19 / MP 60.32
Skew Multiplier
Skew Angle (N34)
Bridge Replacement Cost w/ Multipliers (Per SF)
$171.88
Adjusted Bridge Replace Cost
Pier Height > 30ftLength to # span ratio
Bridge Deck Area (A225)Year Built (N27)Exp Service Life
Deterioration Line EquationDeterioration Slope
Elevation Multiplier Pier H Multiplier
Bridge InformationYear Drop
1. Widening is intended only to correct lane and/or shoulder width deficiencies. It is not intended for adding traffic capacity (i.e. adding general purpose lanes).
* Amount of Widening for Bridge

March 2017 I-19 Corridor Profile Study Appendix E - 24 Final Report
Year
1965
2003
Inspection only recommends rehab of top deck surface.
CategoryDescription
Abutments/piers have few narrow/medium sized vertical cracks.
Rehab (Substr - Scour)
Soffit has narrow to medium sized longitudinal and random clocks…east edge of deck has minor spall.
Bridge was originally constructed in 1965 (19-1(5)RD).
Scour slab was added in 2003 (I-019-A-504).
Inspection notes wide sized transverse, diagonal, longitudinal and map cracks in deck.
Bridge History (Inspections/As-builts)

March 2017 I-19 Corridor Profile Study Appendix E - 25 Final Report
UNIT COST (Per SF) LIFE (YRS) RATING BENEFIT$85.94 25 Rating = 8$10.00 15 + 2$5.00 10 + 1$3.00 See Deterioration Slope + 0
$171.88 75 Rating = 8$3.00 20 + 0$3.00 10 + 0
UNIT COST (Per SF) LIFE (YRS) RATING BENEFIT$85.94 50 Rating = 8$42.97 15 + 2$5.00 See Deterioration Slope + 1
UNIT COST (Per SF) LIFE (YRS) RATING BENEFIT$85.94 50 Rating = 8$42.97 15 + 2$5.00 See Deterioration Slope + 1
$171.88 75 Rating = 8$3.00 20 + 1$3.00 10 + 1
UNIT COST (Per SF) LIFE (YRS) RATING BENEFIT$85.94 75 Rating = 8$42.97 50 + 2$5.00 See Deterioration Slope + 1
UNIT COST (Per SF) LIFE (YRS) RATING BENEFIT$42.97 50 + 2$5.00 See Deterioration Slope + 1
$171.88 75 Rating = 8$3.00 20 + 1$3.00 10 + 1
Notes:1. Individual replacements assume 50% of total bridge replacement costs2. Individual rehabs (in cells that are not highlighted) assume 25% of total bridge replacement costs3. When superstructure replacement is selected, either deck replacement or deck rehab should be selected as well.
Full Bridge ReplacementPatch Spalls / Seal CracksPatch Spalls / Seal CracksRepair (After Rehab)
Repair (After Bridge Replace)Replace (Bridge)
Repair (Substr - Scour)Rehab (Substr - Scour)
ITEM
Repair (Substr)Rehab (Substr)
SUBSTRUCTURE - SCOUR
Replace Structural ComponentPatch Spalls / Seal Cracks
DESCRIPTIONAdd scour protection slabsPatch Spalls / Seal Cracks
Replace (Substr) Full SubStr Replacement
DESCRIPTIONFull SuperStr Replacement
Weld New Structural Components
DESCRIPTION
ITEM
Repair (After Rehab)Repair (After Bridge Replace)
Replace (Bridge)
SUBSTRUCTURE - STRUCTURAL
Full Bridge ReplacementPatch Spalls / Seal CracksPatch Spalls / Seal Cracks
DESCRIPTION
Patch Spalls / Seal CracksFull Bridge Replacement
Overlay (Epoxy)
Replace (Bridge)Repair (Deck)
Rehab (Deck Concrete Overlay)Replace (Deck)
BRIDGE DECK
Repair (Supr - Conc)Rehab (Supr - Conc)
Replace (Supr - Conc)ITEM
Repair (Supr - Stl)
SUPERSTRUCTURE - CONCRETE
Weld Repair / Crack Relief
DESCRIPTIONFull SuperStr Replacement
Replace Structural ComponentPatch Spalls / Seal Cracks
Rehab (Supr - Stl)Replace (Supr - Stl)
ITEM
Repair (After Rehab)Repair (After Bridge Replace)
ITEM
Rehab (Deck Epoxy Overlay)
Full Deck ReplacementOverlay (Concrete)
SUPERSTRUCTURE - STEEL
Patch Spalls / Seal CracksPatch Spalls / Seal Cracks
Replace / Rehab / Repair Information
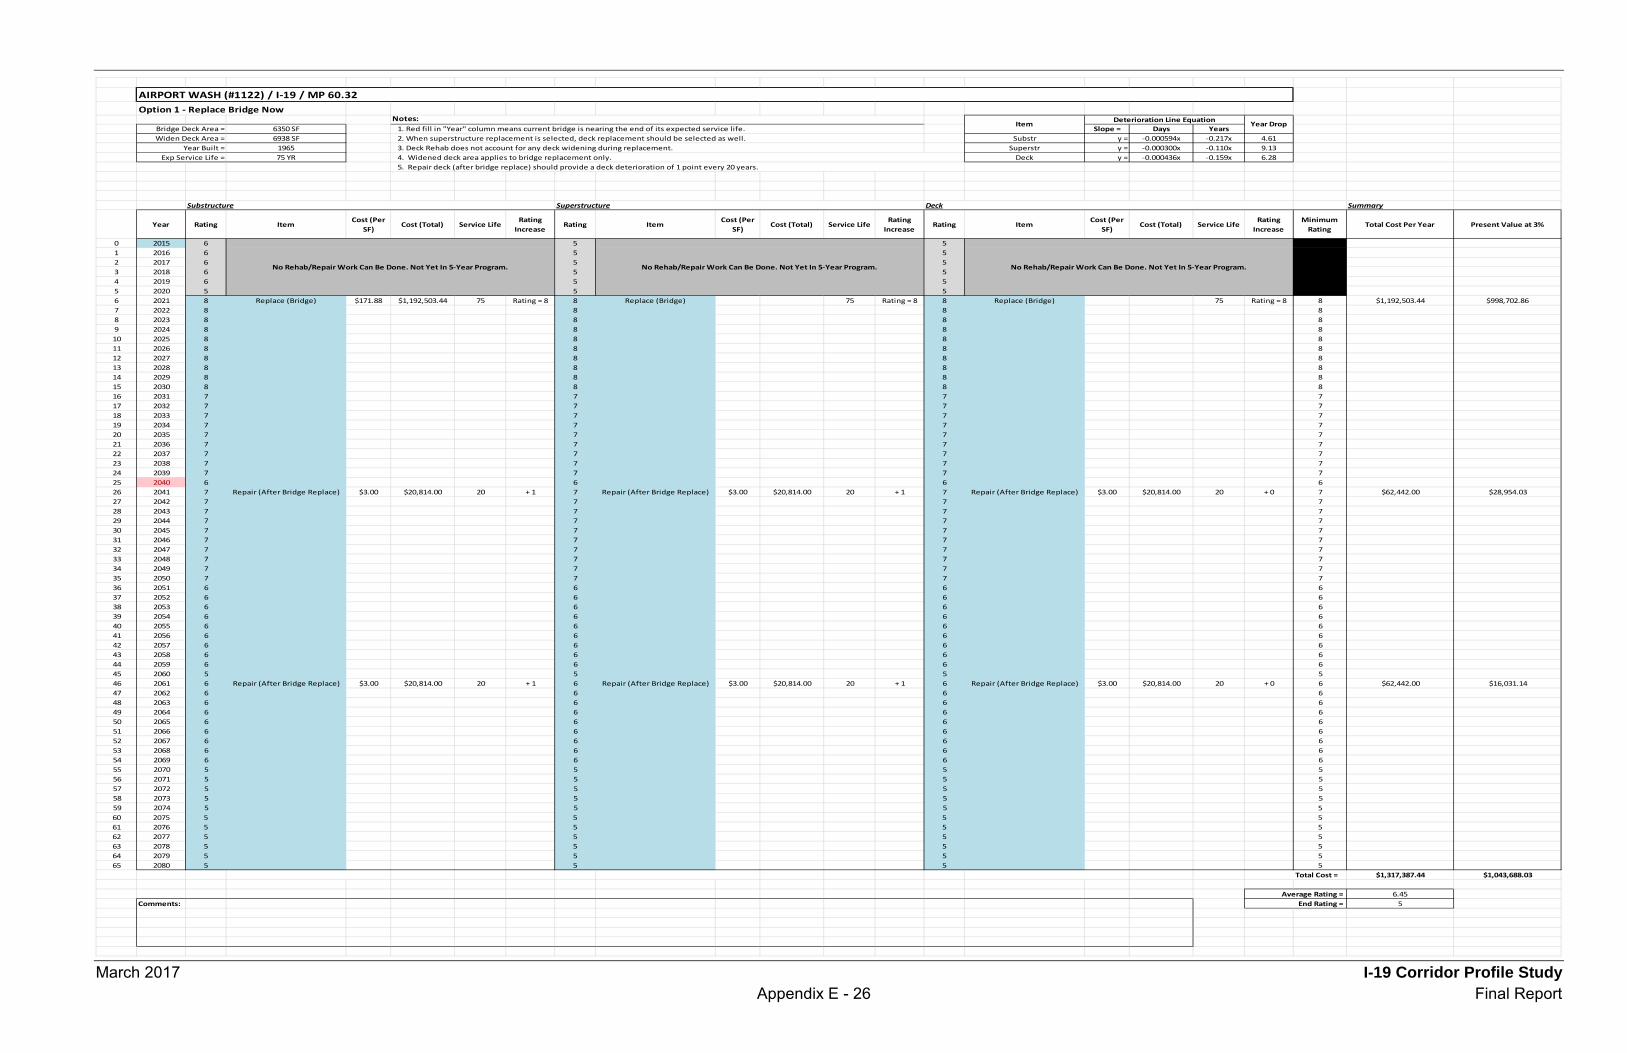
March 2017 I-19 Corridor Profile Study Appendix E - 26 Final Report
Option 1 - Replace Bridge Now
6350 SF Slope = Days Years6938 SF Substr y = -0.000594x -0.217x 4.61
1965 Superstr y = -0.000300x -0.110x 9.1375 YR Deck y = -0.000436x -0.159x 6.28
Summary
Year Rating ItemCost (Per
SF)Cost (Total) Service Life
Rating Increase
Rating ItemCost (Per
SF)Cost (Total) Service Life
Rating Increase
Rating ItemCost (Per
SF)Cost (Total) Service Life
Rating Increase
Minimum Rating
Total Cost Per Year Present Value at 3%
0 2015 6 5 51 2016 6 5 52 2017 6 5 53 2018 6 5 54 2019 6 5 55 2020 5 5 56 2021 8 Replace (Bridge) $171.88 $1,192,503.44 75 Rating = 8 8 Replace (Bridge) 75 Rating = 8 8 Replace (Bridge) 75 Rating = 8 8 $1,192,503.44 $998,702.867 2022 8 8 8 88 2023 8 8 8 89 2024 8 8 8 810 2025 8 8 8 811 2026 8 8 8 812 2027 8 8 8 813 2028 8 8 8 814 2029 8 8 8 815 2030 8 8 8 816 2031 7 7 7 717 2032 7 7 7 718 2033 7 7 7 719 2034 7 7 7 720 2035 7 7 7 721 2036 7 7 7 722 2037 7 7 7 723 2038 7 7 7 724 2039 7 7 7 725 2040 6 6 6 626 2041 7 Repair (After Bridge Replace) $3.00 $20,814.00 20 + 1 7 Repair (After Bridge Replace) $3.00 $20,814.00 20 + 1 7 Repair (After Bridge Replace) $3.00 $20,814.00 20 + 0 7 $62,442.00 $28,954.0327 2042 7 7 7 728 2043 7 7 7 729 2044 7 7 7 730 2045 7 7 7 731 2046 7 7 7 732 2047 7 7 7 733 2048 7 7 7 734 2049 7 7 7 735 2050 7 7 7 736 2051 6 6 6 637 2052 6 6 6 638 2053 6 6 6 639 2054 6 6 6 640 2055 6 6 6 641 2056 6 6 6 642 2057 6 6 6 643 2058 6 6 6 644 2059 6 6 6 645 2060 5 5 5 546 2061 6 Repair (After Bridge Replace) $3.00 $20,814.00 20 + 1 6 Repair (After Bridge Replace) $3.00 $20,814.00 20 + 1 6 Repair (After Bridge Replace) $3.00 $20,814.00 20 + 0 6 $62,442.00 $16,031.1447 2062 6 6 6 648 2063 6 6 6 649 2064 6 6 6 650 2065 6 6 6 651 2066 6 6 6 652 2067 6 6 6 653 2068 6 6 6 654 2069 6 6 6 655 2070 5 5 5 556 2071 5 5 5 557 2072 5 5 5 558 2073 5 5 5 559 2074 5 5 5 560 2075 5 5 5 561 2076 5 5 5 562 2077 5 5 5 563 2078 5 5 5 564 2079 5 5 5 565 2080 5 5 5 5
$1,317,387.44 $1,043,688.03
6.45Comments: 5
AIRPORT WASH (#1122) / I-19 / MP 60.32
Notes: Deterioration Line EquationBridge Deck Area = 1. Red fill in "Year" column means current bridge is nearing the end of its expected service life.
Substructure Superstructure Deck
No Rehab/Repair Work Can Be Done. Not Yet In 5-Year Program. No Rehab/Repair Work Can Be Done. Not Yet In 5-Year Program. No Rehab/Repair Work Can Be Done. Not Yet In 5-Year Program.
End Rating =
Widen Deck Area =
Item Year Drop
Average Rating =
Total Cost =
Year Built =2. When superstructure replacement is selected, deck replacement should be selected as well.
Exp Service Life =3. Deck Rehab does not account for any deck widening during replacement.4. Widened deck area applies to bridge replacement only.5. Repair deck (after bridge replace) should provide a deck deterioration of 1 point every 20 years.
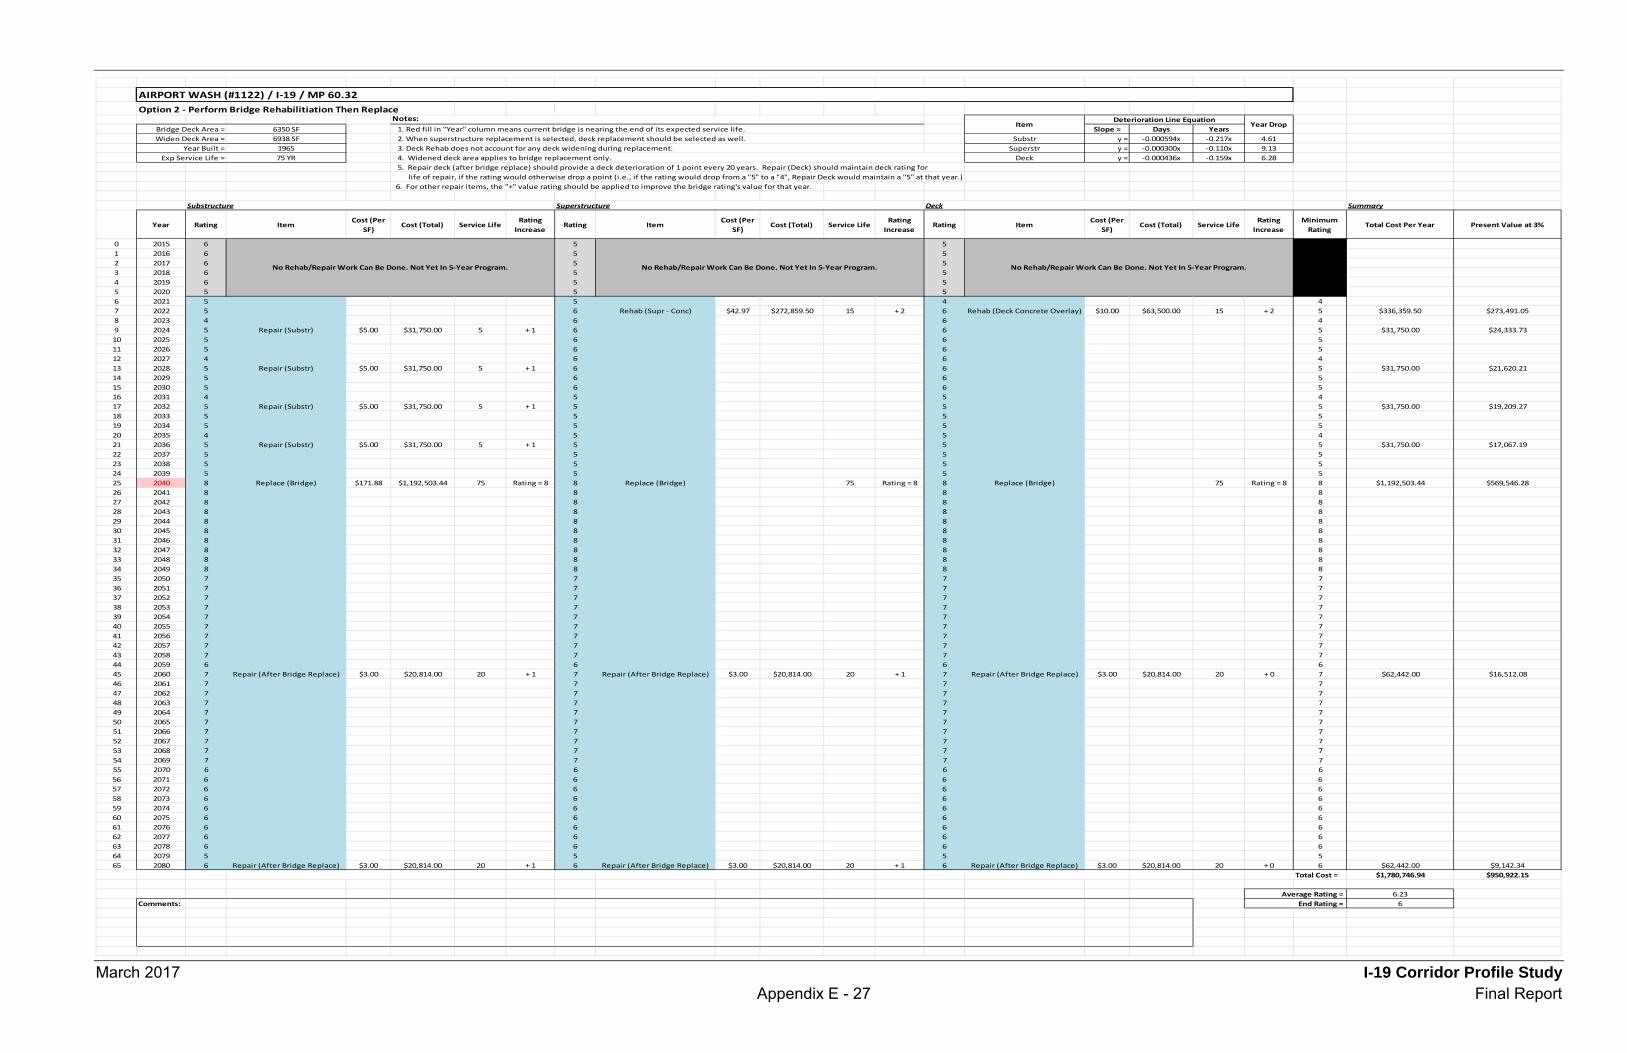
March 2017 I-19 Corridor Profile Study Appendix E - 27 Final Report
Option 2 - Perform Bridge Rehabilitiation Then Replace
6350 SF Slope = Days Years6938 SF Substr y = -0.000594x -0.217x 4.61
1965 Superstr y = -0.000300x -0.110x 9.1375 YR Deck y = -0.000436x -0.159x 6.28
5. Repair deck (after bridge replace) should provide a deck deterioration of 1 point every 20 years. Repair (Deck) should maintain deck rating for life of repair, if the rating would otherwise drop a point (i.e., if the rating would drop from a "5" to a "4", Repair Deck would maintain a "5" at that year.)
6. For other repair items, the "+" value rating should be applied to improve the bridge rating's value for that year.
Summary
Year Rating ItemCost (Per
SF)Cost (Total) Service Life
Rating Increase
Rating ItemCost (Per
SF)Cost (Total) Service Life
Rating Increase
Rating ItemCost (Per
SF)Cost (Total) Service Life
Rating Increase
Minimum Rating
Total Cost Per Year Present Value at 3%
0 2015 6 5 51 2016 6 5 52 2017 6 5 53 2018 6 5 54 2019 6 5 55 2020 5 5 56 2021 5 5 4 47 2022 5 6 Rehab (Supr - Conc) $42.97 $272,859.50 15 + 2 6 Rehab (Deck Concrete Overlay) $10.00 $63,500.00 15 + 2 5 $336,359.50 $273,491.058 2023 4 6 6 49 2024 5 Repair (Substr) $5.00 $31,750.00 5 + 1 6 6 5 $31,750.00 $24,333.7310 2025 5 6 6 511 2026 5 6 6 512 2027 4 6 6 413 2028 5 Repair (Substr) $5.00 $31,750.00 5 + 1 6 6 5 $31,750.00 $21,620.2114 2029 5 6 6 515 2030 5 6 6 516 2031 4 5 5 417 2032 5 Repair (Substr) $5.00 $31,750.00 5 + 1 5 5 5 $31,750.00 $19,209.2718 2033 5 5 5 519 2034 5 5 5 520 2035 4 5 5 421 2036 5 Repair (Substr) $5.00 $31,750.00 5 + 1 5 5 5 $31,750.00 $17,067.1922 2037 5 5 5 523 2038 5 5 5 524 2039 5 5 5 525 2040 8 Replace (Bridge) $171.88 $1,192,503.44 75 Rating = 8 8 Replace (Bridge) 75 Rating = 8 8 Replace (Bridge) 75 Rating = 8 8 $1,192,503.44 $569,546.2826 2041 8 8 8 827 2042 8 8 8 828 2043 8 8 8 829 2044 8 8 8 830 2045 8 8 8 831 2046 8 8 8 832 2047 8 8 8 833 2048 8 8 8 834 2049 8 8 8 835 2050 7 7 7 736 2051 7 7 7 737 2052 7 7 7 738 2053 7 7 7 739 2054 7 7 7 740 2055 7 7 7 741 2056 7 7 7 742 2057 7 7 7 743 2058 7 7 7 744 2059 6 6 6 645 2060 7 Repair (After Bridge Replace) $3.00 $20,814.00 20 + 1 7 Repair (After Bridge Replace) $3.00 $20,814.00 20 + 1 7 Repair (After Bridge Replace) $3.00 $20,814.00 20 + 0 7 $62,442.00 $16,512.0846 2061 7 7 7 747 2062 7 7 7 748 2063 7 7 7 749 2064 7 7 7 750 2065 7 7 7 751 2066 7 7 7 752 2067 7 7 7 753 2068 7 7 7 754 2069 7 7 7 755 2070 6 6 6 656 2071 6 6 6 657 2072 6 6 6 658 2073 6 6 6 659 2074 6 6 6 660 2075 6 6 6 661 2076 6 6 6 662 2077 6 6 6 663 2078 6 6 6 664 2079 5 5 5 565 2080 6 Repair (After Bridge Replace) $3.00 $20,814.00 20 + 1 6 Repair (After Bridge Replace) $3.00 $20,814.00 20 + 1 6 Repair (After Bridge Replace) $3.00 $20,814.00 20 + 0 6 $62,442.00 $9,142.34
$1,780,746.94 $950,922.15
6.23Comments: 6
AIRPORT WASH (#1122) / I-19 / MP 60.32
Notes: Deterioration Line EquationBridge Deck Area = 1. Red fill in "Year" column means current bridge is nearing the end of its expected service life.
Item Year Drop
Year Built =2. When superstructure replacement is selected, deck replacement should be selected as well.
Exp Service Life =3. Deck Rehab does not account for any deck widening during replacement.
Widen Deck Area =
4. Widened deck area applies to bridge replacement only.
Substructure Superstructure Deck
Total Cost =
No Rehab/Repair Work Can Be Done. Not Yet In 5-Year Program. No Rehab/Repair Work Can Be Done. Not Yet In 5-Year Program. No Rehab/Repair Work Can Be Done. Not Yet In 5-Year Program.
Average Rating = End Rating =

March 2017 I-19 Corridor Profile Study Appendix E - 28 Final Report
Option 3 - Perform Minimum Repairs Then Replace
6350 SF Slope = Days Years6938 SF Substr y = -0.000594x -0.217x 4.61
1965 Superstr y = -0.000300x -0.110x 9.1375 YR Deck y = -0.000436x -0.159x 6.28
5. Repair deck (after bridge replace) should provide a deck deterioration of 1 point every 20 years. Repair (Deck) should maintain deck rating for life of repair, if the rating would otherwise drop a point (i.e., if the rating would drop from a "5" to a "4", Repair Deck would maintain a "5" at that year.
6. For other repair items, the "+" value rating should be applied to improve the bridge rating's value for that year.
Summary
Year Rating ItemCost (Per
SF)Cost (Total) Service Life
Rating Increase
Rating ItemCost (Per
SF)Cost (Total) Service Life
Rating Increase
Rating ItemCost (Per
SF)Cost (Total) Service Life
Rating Increase
Minimum Rating
Total Cost Per Year Present Value at 3%
0 2015 6 5 51 2016 6 5 52 2017 6 5 53 2018 6 5 54 2019 6 5 55 2020 5 5 56 2021 5 4 5 Repair (Deck) $3.00 $19,050.00 6 + 0 4 $19,050.00 $15,954.087 2022 5 5 Repair (Supr - Conc) $5.00 $31,750.00 9 + 1 5 5 $31,750.00 $25,815.668 2023 4 5 5 49 2024 5 Repair (Substr) $5.00 $31,750.00 5 + 1 5 5 5 $31,750.00 $24,333.7310 2025 5 5 5 511 2026 5 5 5 512 2027 4 5 5 Repair (Deck) $3.00 $19,050.00 6 + 0 4 $19,050.00 $13,361.2913 2028 5 Repair (Substr) $5.00 $31,750.00 5 + 1 5 5 5 $31,750.00 $21,620.2114 2029 5 4 5 415 2030 5 5 Repair (Supr - Conc) $5.00 $31,750.00 9 + 1 5 5 $31,750.00 $20,379.1216 2031 4 5 5 417 2032 5 Repair (Substr) $5.00 $31,750.00 5 + 1 5 5 5 $31,750.00 $19,209.2718 2033 5 5 5 Repair (Deck) $3.00 $19,050.00 6 + 0 5 $19,050.00 $11,189.8719 2034 5 5 5 520 2035 4 5 5 421 2036 5 Repair (Substr) $5.00 $31,750.00 5 + 1 5 5 5 $31,750.00 $17,067.1922 2037 5 5 5 523 2038 5 4 5 424 2039 5 4 4 425 2040 8 Replace (Bridge) $171.88 $1,192,503.44 75 Rating = 8 8 Replace (Bridge) 75 Rating = 8 8 Replace (Bridge) 75 Rating = 8 8 $1,192,503.44 $569,546.2826 2041 8 8 8 827 2042 8 8 8 828 2043 8 8 8 829 2044 8 8 8 830 2045 8 8 8 831 2046 8 8 8 832 2047 8 8 8 833 2048 8 8 8 834 2049 8 8 8 835 2050 7 7 7 736 2051 7 7 7 737 2052 7 7 7 738 2053 7 7 7 739 2054 7 7 7 740 2055 7 7 7 741 2056 7 7 7 742 2057 7 7 7 743 2058 7 7 7 744 2059 6 6 6 645 2060 7 Repair (After Bridge Replace) $3.00 $20,814.00 20 + 1 7 Repair (After Bridge Replace) $3.00 $20,814.00 20 + 1 7 Repair (After Bridge Replace) $3.00 $20,814.00 20 + 0 7 $62,442.00 $16,512.0846 2061 7 7 7 747 2062 7 7 7 748 2063 7 7 7 749 2064 7 7 7 750 2065 7 7 7 751 2066 7 7 7 752 2067 7 7 7 753 2068 7 7 7 754 2069 7 7 7 755 2070 6 6 6 656 2071 6 6 6 657 2072 6 6 6 658 2073 6 6 6 659 2074 6 6 6 660 2075 6 6 6 661 2076 6 6 6 662 2077 6 6 6 663 2078 6 6 6 664 2079 5 5 5 565 2080 6 Repair (After Bridge Replace) $3.00 $20,814.00 20 + 1 6 Repair (After Bridge Replace) $3.00 $20,814.00 20 + 1 6 Repair (After Bridge Replace) $3.00 $20,814.00 20 + 0 6 $62,442.00 $9,142.34
$1,565,037.44 $764,131.10
6.18Comments: 6
Bridge Deck Area =
Year Built =Exp Service Life =
1. Red fill in "Year" column means current bridge is nearing the end of its expected service life.2. When superstructure replacement is selected, deck replacement should be selected as well.3. Deck Rehab does not account for any deck widening during replacement.4. Widened deck area applies to bridge replacement only.
No Rehab/Repair Work Can Be Done. Not Yet In 5-Year Program. No Rehab/Repair Work Can Be Done. Not Yet In 5-Year Program.
AIRPORT WASH (#1122) / I-19 / MP 60.32
Substructure Superstructure Deck
Deterioration Line Equation
Widen Deck Area =
Item Year Drop
Average Rating =
Notes:
End Rating =
Total Cost =
No Rehab/Repair Work Can Be Done. Not Yet In 5-Year Program.

March 2017 I-19 Corridor Profile StudyAppendix E - 29 Final Report
AGENCY COST 3% 7% Option Agency Cost 3% 7%1,317,387.44$ $1,043,688.03 $808,146.21 2 (Rehab) 73.98% 109.76% 167.98%1,780,746.94$ $950,922.15 $481,091.25 3 (Repair) 84.18% 136.58% 245.12%1,565,037.44$ $764,131.10 $329,691.88
AVG RATING END RATING6.45 56.23 66.18 6
Present Value at 7% Present Value at 3% AGENCY COSTOption 1 (Replace) $808,146.21 $1,043,688.03 1,317,387.44$ Option 2 (Rehab) $481,091.25 $950,922.15 1,780,746.94$ Option 3 (Repair) $329,691.88 $764,131.10 1,565,037.44$
Comparison to Replacement
AIRPORT WASH (#1122) / I-19 / MP 60.32
Option 3 (Repair)
OPTIONCOST COMPARISON Present Value Dollars
Option 2 (Rehab)Option 1 (Replace)
Option 1 (Replace)Option 2 (Rehab)Option 3 (Repair)
OPTIONBridge Ratings Per Option
0
1
2
3
4
5
6
7
8
9
2018
2020
2022
2024
2026
2028
2030
2032
2034
2036
2038
2040
2042
2044
2046
2048
2050
2052
2054
2056
2058
2060
2062
2064
2066
2068
2070
2072
2074
2076
2078
2080
RATING COMPARISON
Option 1 - Replace Bridge Now
Option 2 - Perform Bridge Rehabilitiation ThenReplace
Option 3 - Perform Minimum Repairs ThenReplace
Present Value at 7%
Present Value at 3%
AGENCY COST
$0.00$200,000.00
$400,000.00
$600,000.00
$800,000.00
$1,000,000.00
$1,200,000.00
$1,400,000.00
$1,600,000.00
$1,800,000.00
Option 1 (Replace)Option 2 (Rehab)
Option 3 (Repair)
COST COMPARISON
Present Value at 7%
Present Value at 3%
AGENCY COST

March 2017 I-19 Corridor Profile Study Appendix F - 1 Final Report
Appendix F: Crash Modification Factors and Factored Unit Construction Costs

March 2017 I-19 Corridor Profile Study Appendix F - 2 Final Report
SOLUTION CONSTRUCTION UNIT COST UNIT FACTOR^
FACTORED CONSTRUCTION
UNIT COST DESCRIPTION
CMF FOR CORRIDOR PROFILE STUDIES
CMF NOTES
REHABILITATION
Rehabilitate Pavement (AC) $276,500 Mile 2.20 $610,000 Mill and replace 1"-3" AC pvmt; accounts for 38' width; for one direction of travel on two lane roadway; includes pavement, striping, delineators, RPMs, rumble strips
0.70 Combination of rehabilitate pavement (0.92), striping, delineators, RPMs (0.77 for combination), and rumble strips (0.89) = 0.70
Rehabilitate Bridge $65 SF 2.20 $140 Based on deck area; bridge only - no other costs included 0.95 Assumed - should have a minor effect on crashes at the bridge
GEOMETRIC IMPROVEMENT
Re-profile Roadway $974,500 Mile 2.20 $2,140,000 Includes excavation of approximately 3", pavement replacement (AC), striping, delineators, RPMs, rumble strips, for one direction of travel of 2-lane roadway (38' width)
0.70 Assumed - this is similar to rehab pavement. This solution is intended to address vertical clearance at bridge, not profile issue; factor the cost as a ratio of needed depth to 3".
Realign Roadway $2,960,000 Mile 2.20 $6,510,000 All costs per direction except bridges; applicable to areas with small or moderate fills and cuts, minimal retaining walls 0.50 Based on CalTrans and NC DOT
Improve Skid Resistance $675,000 Mile 2.20 $1,490,000 Average cost of pvmt replacement and variable depth paving to increase super-elevation; for one direction of travel on two lane roadway; includes pavement, striping, delineators, RPMs, rumble strips
0.66 Combination of avg of 5 values from clearinghouse (0.77) and calculated value from HSM (0.87) for skid resistance; striping, delineators, RPMs (0.77 for combination), and rumble strips (0.89) = 0.66
INFRASTRUCTURE IMPROVEMENT
Reconstruct to Urban Section $1,000,000 Mile 2.20 $2,200,000 Includes widening by 16' total (AC = 12'+2'+2') to provide median, curb & gutter along both side of roadway, single curb for median, striping (doesn't include widening for additional travel lane).
0.88 From HSM
Construct Auxiliary Lanes (AC) $914,000 Mile 2.20 $2,011,000 For addition of aux lane (AC) in one direction of travel; includes all costs except bridges; for generally at-grade facility with minimal walls and no major drainage improvements
0.78 Average of 4 values from clearinghouse
Construct Climbing Lane (High) $3,000,000 Mile 2.20 $6,600,000 In one direction; all costs except bridges; applicable to areas with large fills and cuts, retaining walls, rock blasting, steep slopes on both sides of road
0.75 From HSM
Construct Climbing Lane (Medium) $2,250,000 Mile 2.20 $4,950,000 In one direction; all costs except bridges; applicable to areas with medium or large fills and cuts, retaining walls, rock blasting, steep slopes on one side of road
0.75 From HSM
Construct Climbing Lane (Low) $1,500,000 Mile 2.20 $3,300,000 In one direction; all costs except bridges; applicable to areas with small or moderate fills and cuts, minimal retaining walls 0.75 From HSM
Construct Reversible Lane (Low) $2,400,000 Lane-Mile 2.20 $5,280,000 All costs except bridges; applicable to areas with small or moderate fills and cuts, minimal retaining walls
0.73 for uphill and 0.88 for
downhill Based on proposed conditions on I-17 with 2 reversible lanes and a conc barrier
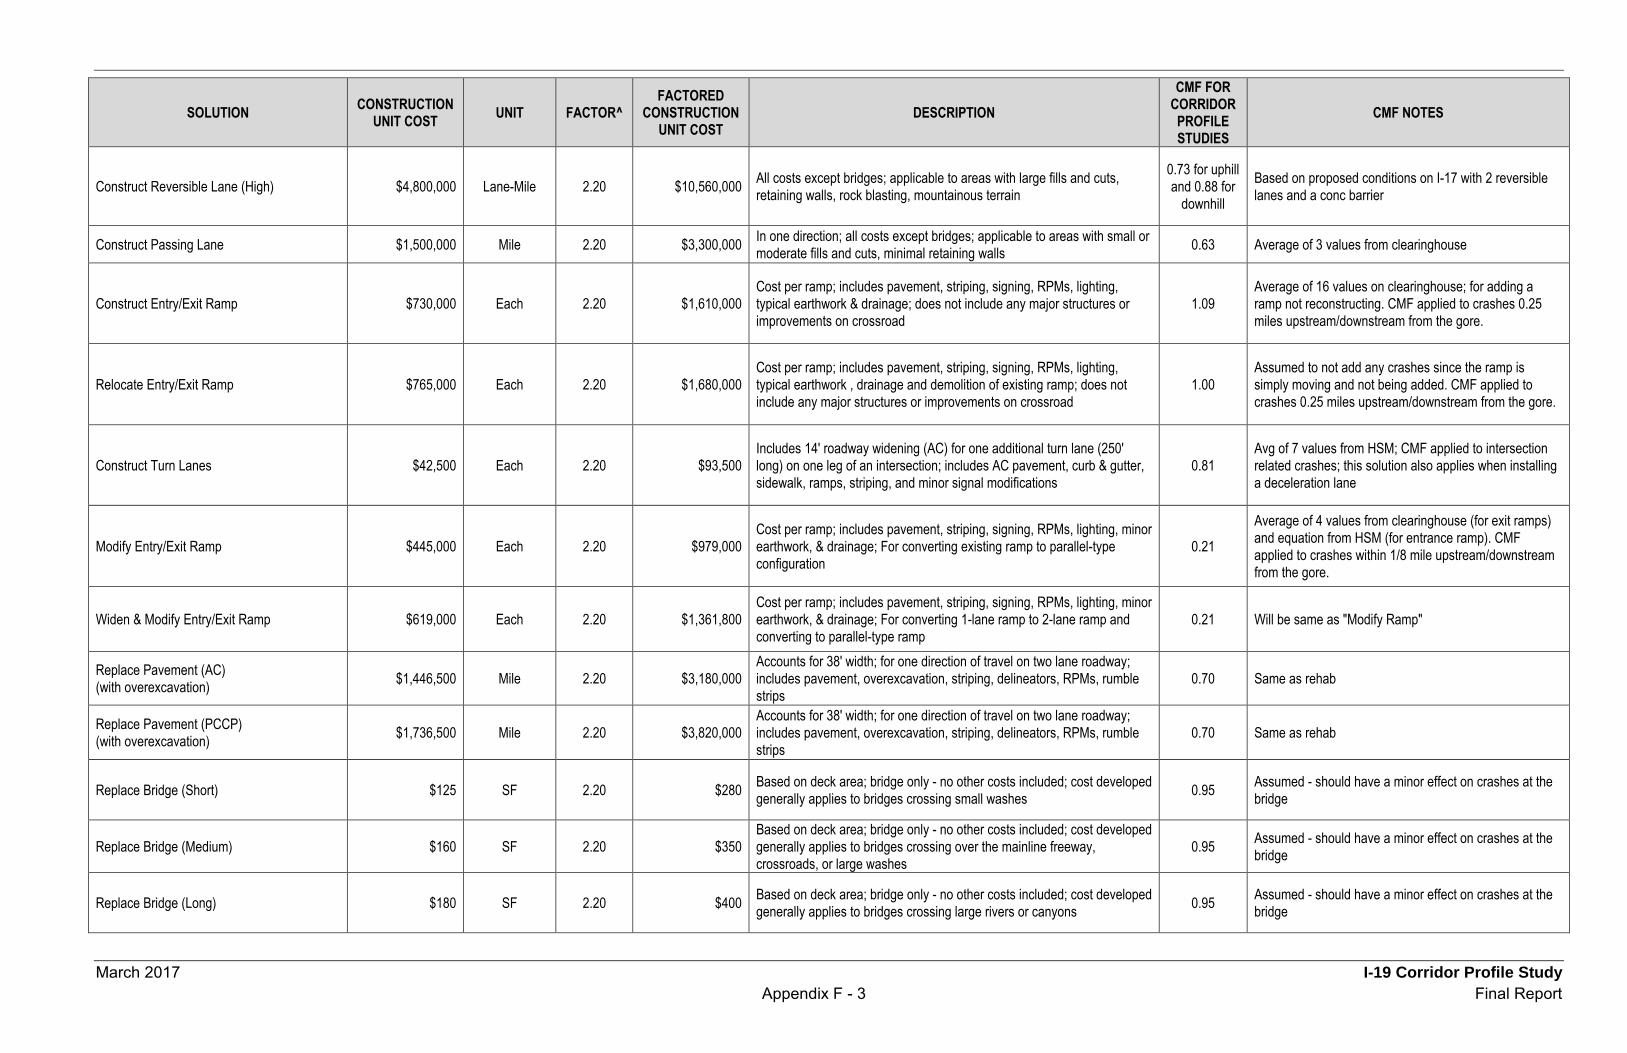
March 2017 I-19 Corridor Profile Study Appendix F - 3 Final Report
SOLUTION CONSTRUCTION UNIT COST UNIT FACTOR^
FACTORED CONSTRUCTION
UNIT COST DESCRIPTION
CMF FOR CORRIDOR PROFILE STUDIES
CMF NOTES
Construct Reversible Lane (High) $4,800,000 Lane-Mile 2.20 $10,560,000 All costs except bridges; applicable to areas with large fills and cuts, retaining walls, rock blasting, mountainous terrain
0.73 for uphill and 0.88 for
downhill Based on proposed conditions on I-17 with 2 reversible lanes and a conc barrier
Construct Passing Lane $1,500,000 Mile 2.20 $3,300,000 In one direction; all costs except bridges; applicable to areas with small or moderate fills and cuts, minimal retaining walls 0.63 Average of 3 values from clearinghouse
Construct Entry/Exit Ramp $730,000 Each 2.20 $1,610,000 Cost per ramp; includes pavement, striping, signing, RPMs, lighting, typical earthwork & drainage; does not include any major structures or improvements on crossroad
1.09 Average of 16 values on clearinghouse; for adding a ramp not reconstructing. CMF applied to crashes 0.25 miles upstream/downstream from the gore.
Relocate Entry/Exit Ramp $765,000 Each 2.20 $1,680,000 Cost per ramp; includes pavement, striping, signing, RPMs, lighting, typical earthwork , drainage and demolition of existing ramp; does not include any major structures or improvements on crossroad
1.00 Assumed to not add any crashes since the ramp is simply moving and not being added. CMF applied to crashes 0.25 miles upstream/downstream from the gore.
Construct Turn Lanes $42,500 Each 2.20 $93,500 Includes 14' roadway widening (AC) for one additional turn lane (250' long) on one leg of an intersection; includes AC pavement, curb & gutter, sidewalk, ramps, striping, and minor signal modifications
0.81 Avg of 7 values from HSM; CMF applied to intersection related crashes; this solution also applies when installing a deceleration lane
Modify Entry/Exit Ramp $445,000 Each 2.20 $979,000 Cost per ramp; includes pavement, striping, signing, RPMs, lighting, minor earthwork, & drainage; For converting existing ramp to parallel-type configuration
0.21 Average of 4 values from clearinghouse (for exit ramps) and equation from HSM (for entrance ramp). CMF applied to crashes within 1/8 mile upstream/downstream from the gore.
Widen & Modify Entry/Exit Ramp $619,000 Each 2.20 $1,361,800 Cost per ramp; includes pavement, striping, signing, RPMs, lighting, minor earthwork, & drainage; For converting 1-lane ramp to 2-lane ramp and converting to parallel-type ramp
0.21 Will be same as "Modify Ramp"
Replace Pavement (AC) (with overexcavation) $1,446,500 Mile 2.20 $3,180,000
Accounts for 38' width; for one direction of travel on two lane roadway; includes pavement, overexcavation, striping, delineators, RPMs, rumble strips
0.70 Same as rehab
Replace Pavement (PCCP) (with overexcavation) $1,736,500 Mile 2.20 $3,820,000
Accounts for 38' width; for one direction of travel on two lane roadway; includes pavement, overexcavation, striping, delineators, RPMs, rumble strips
0.70 Same as rehab
Replace Bridge (Short) $125 SF 2.20 $280 Based on deck area; bridge only - no other costs included; cost developed generally applies to bridges crossing small washes 0.95 Assumed - should have a minor effect on crashes at the
bridge
Replace Bridge (Medium) $160 SF 2.20 $350 Based on deck area; bridge only - no other costs included; cost developed generally applies to bridges crossing over the mainline freeway, crossroads, or large washes
0.95 Assumed - should have a minor effect on crashes at the bridge
Replace Bridge (Long) $180 SF 2.20 $400 Based on deck area; bridge only - no other costs included; cost developed generally applies to bridges crossing large rivers or canyons 0.95 Assumed - should have a minor effect on crashes at the
bridge
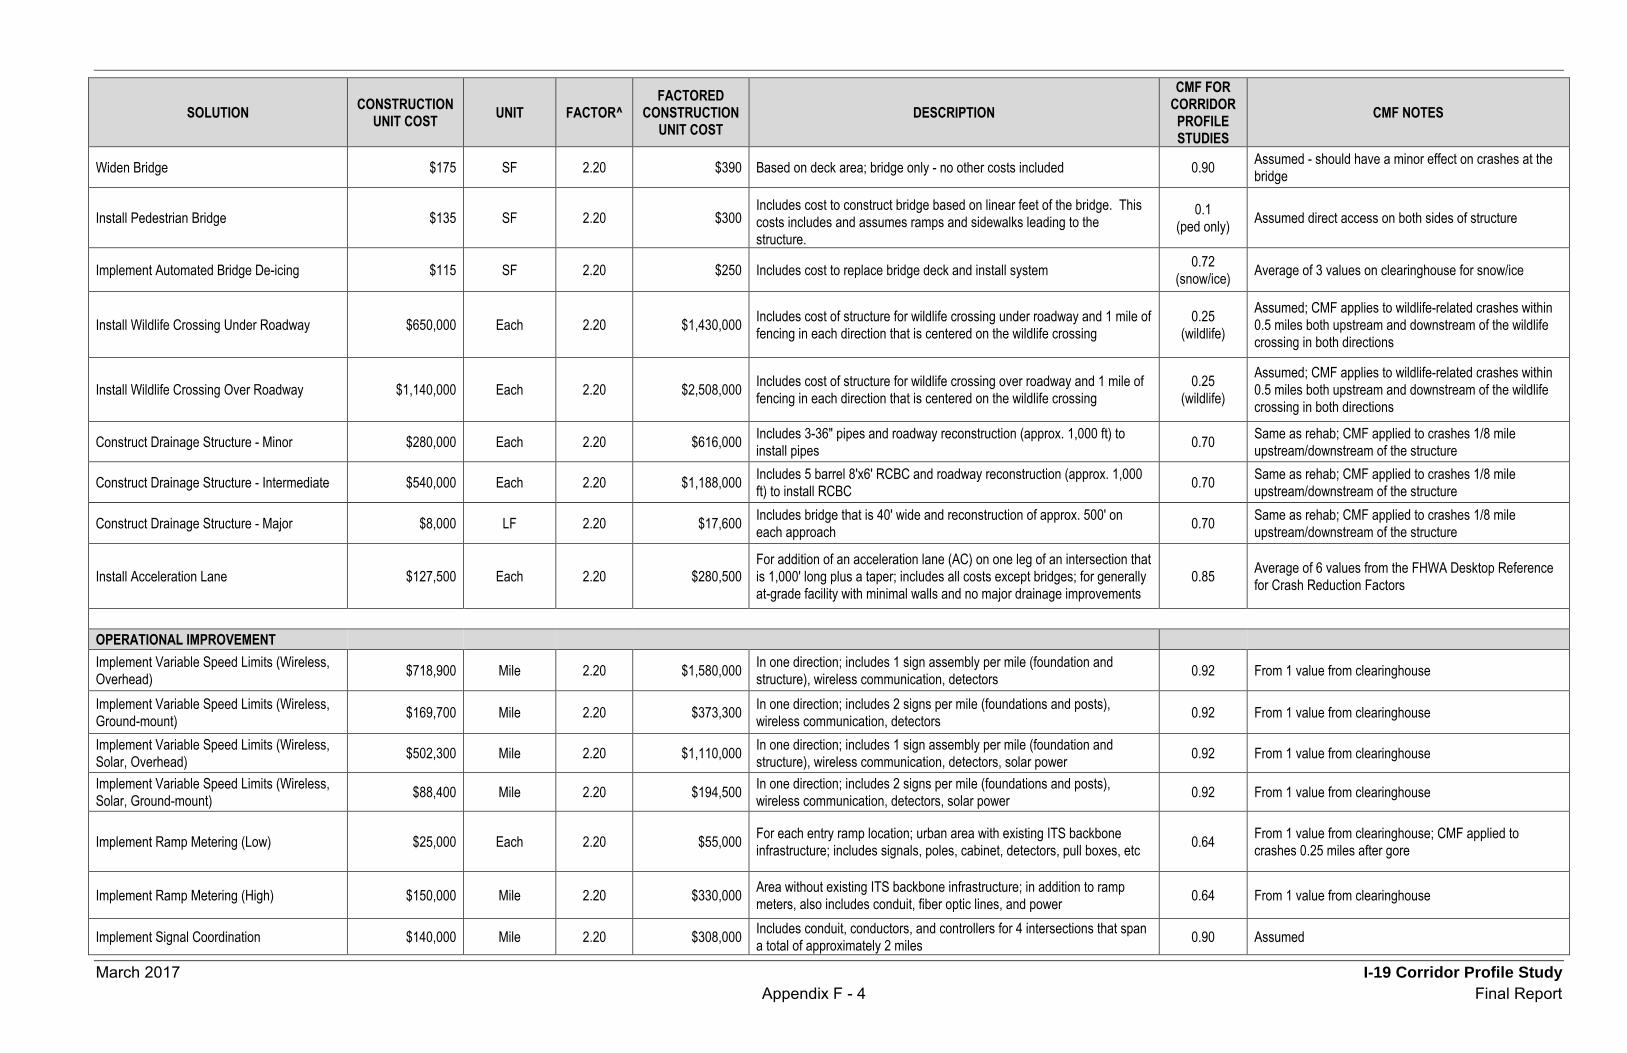
March 2017 I-19 Corridor Profile Study Appendix F - 4 Final Report
SOLUTION CONSTRUCTION UNIT COST UNIT FACTOR^
FACTORED CONSTRUCTION
UNIT COST DESCRIPTION
CMF FOR CORRIDOR PROFILE STUDIES
CMF NOTES
Widen Bridge $175 SF 2.20 $390 Based on deck area; bridge only - no other costs included 0.90 Assumed - should have a minor effect on crashes at the bridge
Install Pedestrian Bridge $135 SF 2.20 $300 Includes cost to construct bridge based on linear feet of the bridge. This costs includes and assumes ramps and sidewalks leading to the structure.
0.1 (ped only) Assumed direct access on both sides of structure
Implement Automated Bridge De-icing $115 SF 2.20 $250 Includes cost to replace bridge deck and install system 0.72 (snow/ice) Average of 3 values on clearinghouse for snow/ice
Install Wildlife Crossing Under Roadway $650,000 Each 2.20 $1,430,000 Includes cost of structure for wildlife crossing under roadway and 1 mile of fencing in each direction that is centered on the wildlife crossing
0.25 (wildlife)
Assumed; CMF applies to wildlife-related crashes within 0.5 miles both upstream and downstream of the wildlife crossing in both directions
Install Wildlife Crossing Over Roadway $1,140,000 Each 2.20 $2,508,000 Includes cost of structure for wildlife crossing over roadway and 1 mile of fencing in each direction that is centered on the wildlife crossing
0.25 (wildlife)
Assumed; CMF applies to wildlife-related crashes within 0.5 miles both upstream and downstream of the wildlife crossing in both directions
Construct Drainage Structure - Minor $280,000 Each 2.20 $616,000 Includes 3-36" pipes and roadway reconstruction (approx. 1,000 ft) to install pipes 0.70 Same as rehab; CMF applied to crashes 1/8 mile
upstream/downstream of the structure
Construct Drainage Structure - Intermediate $540,000 Each 2.20 $1,188,000 Includes 5 barrel 8'x6' RCBC and roadway reconstruction (approx. 1,000 ft) to install RCBC 0.70 Same as rehab; CMF applied to crashes 1/8 mile
upstream/downstream of the structure
Construct Drainage Structure - Major $8,000 LF 2.20 $17,600 Includes bridge that is 40' wide and reconstruction of approx. 500' on each approach 0.70 Same as rehab; CMF applied to crashes 1/8 mile
upstream/downstream of the structure
Install Acceleration Lane $127,500 Each 2.20 $280,500 For addition of an acceleration lane (AC) on one leg of an intersection that is 1,000' long plus a taper; includes all costs except bridges; for generally at-grade facility with minimal walls and no major drainage improvements
0.85 Average of 6 values from the FHWA Desktop Reference for Crash Reduction Factors
OPERATIONAL IMPROVEMENT Implement Variable Speed Limits (Wireless, Overhead) $718,900 Mile 2.20 $1,580,000 In one direction; includes 1 sign assembly per mile (foundation and
structure), wireless communication, detectors 0.92 From 1 value from clearinghouse
Implement Variable Speed Limits (Wireless, Ground-mount) $169,700 Mile 2.20 $373,300 In one direction; includes 2 signs per mile (foundations and posts),
wireless communication, detectors 0.92 From 1 value from clearinghouse
Implement Variable Speed Limits (Wireless, Solar, Overhead) $502,300 Mile 2.20 $1,110,000 In one direction; includes 1 sign assembly per mile (foundation and
structure), wireless communication, detectors, solar power 0.92 From 1 value from clearinghouse
Implement Variable Speed Limits (Wireless, Solar, Ground-mount) $88,400 Mile 2.20 $194,500 In one direction; includes 2 signs per mile (foundations and posts),
wireless communication, detectors, solar power 0.92 From 1 value from clearinghouse
Implement Ramp Metering (Low) $25,000 Each 2.20 $55,000 For each entry ramp location; urban area with existing ITS backbone infrastructure; includes signals, poles, cabinet, detectors, pull boxes, etc 0.64 From 1 value from clearinghouse; CMF applied to
crashes 0.25 miles after gore
Implement Ramp Metering (High) $150,000 Mile 2.20 $330,000 Area without existing ITS backbone infrastructure; in addition to ramp meters, also includes conduit, fiber optic lines, and power 0.64 From 1 value from clearinghouse
Implement Signal Coordination $140,000 Mile 2.20 $308,000 Includes conduit, conductors, and controllers for 4 intersections that span a total of approximately 2 miles 0.90 Assumed

March 2017 I-19 Corridor Profile Study Appendix F - 5 Final Report
SOLUTION CONSTRUCTION UNIT COST UNIT FACTOR^
FACTORED CONSTRUCTION
UNIT COST DESCRIPTION
CMF FOR CORRIDOR PROFILE STUDIES
CMF NOTES
Implement Left-Turn Phasing $7,500 Each 2.20 $16,500 Includes four new signal heads (two in each direction) and associated conductors for one intersection
0.88 (protected)
0.98 (perm/prot or
prot/perm)
From HSM; CMF = 0.94 for each protected approach and 0.99 for each perm/prot or prot/perm approach. CMFs of different approaches should be multiplied together. CMF applied to crashes within intersection
ROADSIDE DESIGN Install Guardrail $130,000 Mile 2.20 $286,000 One side of road 0.62 (ROR) 0.62 is avg of 2 values from clearinghouse
Install Cable Barrier $80,000 Mile 2.20 $176,000 In median 0.81 0.81 is average of 5 values from clearinghouse
Widen Shoulder (AC) $256,000 Mile 2.20 $563,000
Assumes 10' of existing shoulder (combined left and right), includes widening shoulder by a total of 4'; new pavement for 4' width and mill and replace existing 10' width; includes pavement, minor earthwork, striping edge lines, RPMs, high-visibility delineators, safety edge, and rumble strips
0.68 (1-4') 0.64 (>= 4')
0.86 is avg of 5 values from clearing house for widening shoulder 1-4'. 0.76 is calculated from HSM for widening shoulder >= 4'. (Cost needs to be updated if dimension of existing and widened shoulder differ from Description.)
Rehabilitate Shoulder (AC) $113,000 Mile 2.20 $249,000 One direction of travel (14' total shldr width-4' left and 10' right); includes paving (mill and replace), striping, high-visibility delineators, RPMs, safety edge, and rumble strips for both shoulders
0.72
0.98 is average of 34 values on clearinghouse for shldr rehab/replace; include striping, delineators, RPMs (0.77 combined CMF), and rumble strips (0.89). (Cost needs to be updated if dimension of existing shoulder differs from Description.)
Replace Shoulder (AC) $364,000 Mile 2.20 $801,000 One direction of travel (14' total shldr width-4' left and 10' right); includes paving (full reconstruction), striping, high-visibility delineators, RPMs, safety edge, and rumble strips for both shoulders
0.72
0.98 is average of 34 values on clearinghouse for shldr rehab/replace; include striping, delineators, RPMs (0.77 combined CMF), and rumble strips (0.89). (Cost needs to be updated if dimension of existing shoulder differs from Description.)
Install Rumble Strip $5,500 Mile 2.20 $12,000 Both edges - one direction of travel; includes only rumble strip; no shoulder rehab or paving or striping 0.89 Average of 75 values on clearinghouse and consistent
with HSM
Install Centerline Rumble Strip $2,800 Mile 2.20 $6,000 Includes rumble strip only; no pavement rehab or striping 0.85 From HSM
Install Wildlife Fencing $340,000 Mile 2.20 $748,000 Fencing only plus jump outs for 1 mile (both directions) 0.50 (wildlife) Assumed
Remove Tree/Vegetation $200,000 Mile 2.20 $440,000 Intended for removing trees that shade the roadway to allow sunlight to help melt snow and ice (see Increase Clear Zone CMF for general tree/vegetation removal in clear zone)
0.72 (snow/ice) Average of 3 values on clearinghouse for snow/ice
Increase Clear Zone $59,000 Mile 2.20 $130,000 In one direction; includes widening the clear zone by 10' to a depth of 3'
0.71 Median of 14 values from FHWA Desktop Reference for Crash Reduction Values
Install Access Barrier Fence $15 LF 2.20 $33 8' fencing along residential section of roadway 0.10 (ped only) Equal to ped overpass
Install Rock-Fall Mitigation - Wire Mesh $1,320,000 Mile 2.20 $2,904,000 Includes wire mesh and rock stabilization (one direction) 0.75 (debris) Assumed
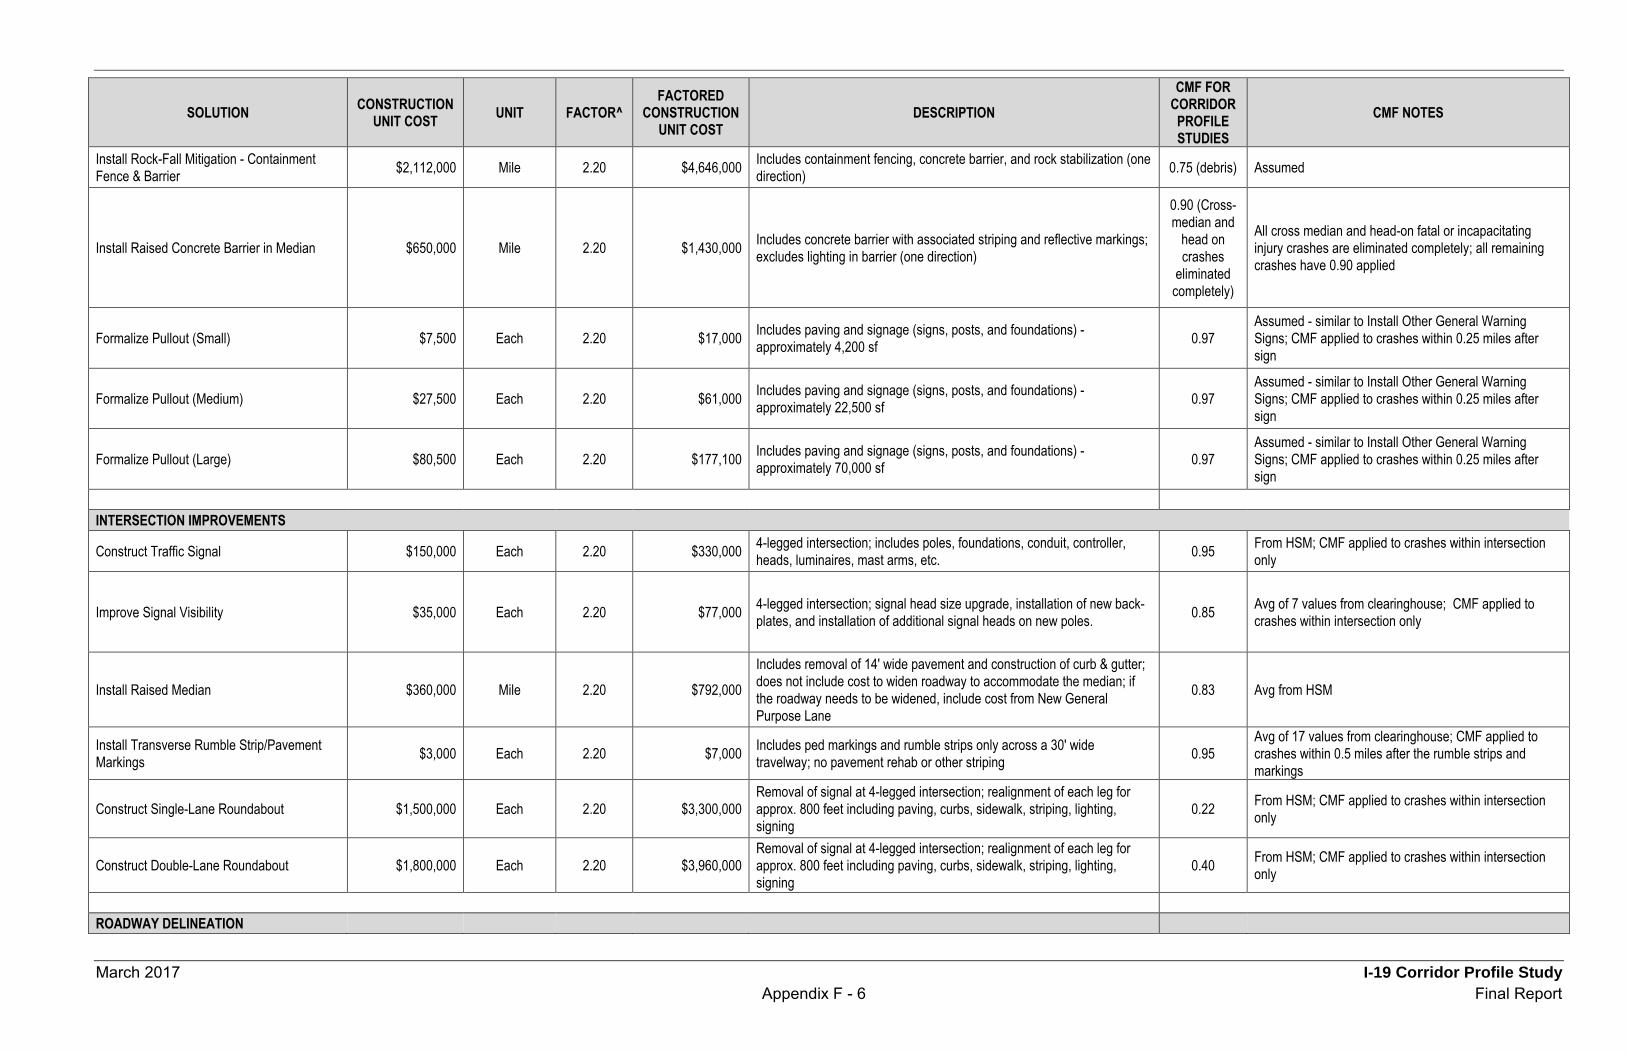
March 2017 I-19 Corridor Profile Study Appendix F - 6 Final Report
SOLUTION CONSTRUCTION UNIT COST UNIT FACTOR^
FACTORED CONSTRUCTION
UNIT COST DESCRIPTION
CMF FOR CORRIDOR PROFILE STUDIES
CMF NOTES
Install Rock-Fall Mitigation - Containment Fence & Barrier $2,112,000 Mile 2.20 $4,646,000 Includes containment fencing, concrete barrier, and rock stabilization (one
direction) 0.75 (debris) Assumed
Install Raised Concrete Barrier in Median $650,000 Mile 2.20 $1,430,000 Includes concrete barrier with associated striping and reflective markings; excludes lighting in barrier (one direction)
0.90 (Cross-median and
head on crashes
eliminated completely)
All cross median and head-on fatal or incapacitating injury crashes are eliminated completely; all remaining crashes have 0.90 applied
Formalize Pullout (Small) $7,500 Each 2.20 $17,000 Includes paving and signage (signs, posts, and foundations) - approximately 4,200 sf 0.97
Assumed - similar to Install Other General Warning Signs; CMF applied to crashes within 0.25 miles after sign
Formalize Pullout (Medium) $27,500 Each 2.20 $61,000 Includes paving and signage (signs, posts, and foundations) - approximately 22,500 sf 0.97
Assumed - similar to Install Other General Warning Signs; CMF applied to crashes within 0.25 miles after sign
Formalize Pullout (Large) $80,500 Each 2.20 $177,100 Includes paving and signage (signs, posts, and foundations) - approximately 70,000 sf 0.97
Assumed - similar to Install Other General Warning Signs; CMF applied to crashes within 0.25 miles after sign
INTERSECTION IMPROVEMENTS
Construct Traffic Signal $150,000 Each 2.20 $330,000 4-legged intersection; includes poles, foundations, conduit, controller, heads, luminaires, mast arms, etc. 0.95 From HSM; CMF applied to crashes within intersection
only
Improve Signal Visibility $35,000 Each 2.20 $77,000 4-legged intersection; signal head size upgrade, installation of new back-plates, and installation of additional signal heads on new poles. 0.85 Avg of 7 values from clearinghouse; CMF applied to
crashes within intersection only
Install Raised Median $360,000 Mile 2.20 $792,000 Includes removal of 14' wide pavement and construction of curb & gutter; does not include cost to widen roadway to accommodate the median; if the roadway needs to be widened, include cost from New General Purpose Lane
0.83 Avg from HSM
Install Transverse Rumble Strip/Pavement Markings $3,000 Each 2.20 $7,000 Includes ped markings and rumble strips only across a 30' wide
travelway; no pavement rehab or other striping 0.95 Avg of 17 values from clearinghouse; CMF applied to crashes within 0.5 miles after the rumble strips and markings
Construct Single-Lane Roundabout $1,500,000 Each 2.20 $3,300,000 Removal of signal at 4-legged intersection; realignment of each leg for approx. 800 feet including paving, curbs, sidewalk, striping, lighting, signing
0.22 From HSM; CMF applied to crashes within intersection only
Construct Double-Lane Roundabout $1,800,000 Each 2.20 $3,960,000 Removal of signal at 4-legged intersection; realignment of each leg for approx. 800 feet including paving, curbs, sidewalk, striping, lighting, signing
0.40 From HSM; CMF applied to crashes within intersection only
ROADWAY DELINEATION

March 2017 I-19 Corridor Profile Study Appendix F - 7 Final Report
SOLUTION CONSTRUCTION UNIT COST UNIT FACTOR^
FACTORED CONSTRUCTION
UNIT COST DESCRIPTION
CMF FOR CORRIDOR PROFILE STUDIES
CMF NOTES
Install High-Visibility Edge Line Striping $10,800 Mile 2.20 $23,800 2 edge lines and lane line - one direction of travel
0.77
Avg of 3 values from clearinghouse. Assumes package of striping, delineators, and RPMs. (If implemented separately, CMF will be higher.)
Install High-Visibility Delineators $6,500 Mile 2.20 $14,300 Both edges - one direction of travel Avg of 3 values from clearinghouse. Assumes package of striping, delineators, and RPMs. (If implemented separately, CMF will be higher.)
Install Raised Pavement Markers $2,000 Mile 2.20 $4,400 Both edges - one direction of travel Avg of 3 values from clearinghouse. Assumes package of striping, delineators, and RPMs. (If implemented separately, CMF will be higher.)
Install In-Lane Route Markings $6,000 Each 2.20 $13,200 Installation of a series of three in-lane route markings in one lane 0.95 Assumed; CMF applied to crashes within 1.0 mile before the gore
IMPROVED VISIBILITY
Cut Side Slopes $80 LF 2.20 $200 For small grading to correct sight distance issues; not major grading 0.85 Intent of this solution is to improve sight distance. Most CMF's are associated with vehicles traveling on slope. Recommended CMF is based on FDOT and NCDOT but is more conservative.
Install Lighting (connect to existing power) $270,000 Mile 2.20 $594,000 One side of road only; offset lighting, not high-mast; does not include power supply; includes poles, luminaire, pull boxes, conduit, conductor 0.75 (night) Average of 3 values on clearinghouse & consistent with
HSM
Install Lighting (solar powered LED) $10,000 Pole 2.20 $22,000 Offset lighting, not high-mast; solar power LED; includes poles, luminaire, solar panel 0.75 (night) Average of 3 values on clearinghouse & consistent with
HSM
DRIVER INFORMATION/WARNING
Install Dynamic Message Sign (DMS) $250,000 Each 2.20 $550,000 Includes sign, overhead structure, and foundations; wireless communication; does not include power supply 1.00 Not expected to reduce crashes
Install Dynamic Weather Warning Beacons $40,000 Each 2.20 $88,000 Assumes solar operation and wireless communication or connection to existing power and communication; ground mounted; includes posts, foundations, solar panel, and dynamic sign
0.80 (weather related)
Avg of 3 values from FHWA Desktop Reference for Crash Reduction Factors; CMF applies to crashes within 0.25 miles after a sign
Install Dynamic Speed Feedback Signs $25,000 Each 2.20 $55,000 Assumes solar operation and no communication; ground mounted; includes regulatory sign, posts, foundations, solar panel, and dynamic sign
0.94 Average of 2 clearinghouse values; CMF applies to crashes within 0.50 miles after a sign
Install Chevrons $18,400 Mile 2.20 $40,500 On one side of road - includes signs, posts, and foundations 0.79 Average of 11 clearinghouse values
Install Curve Warning Signs $2,500 Each 2.20 $5,500 Includes 2 signs, posts, and foundations 0.83 Average of 4 clearinghouse values; CMF applies to crashes within 0.25 miles after a sign
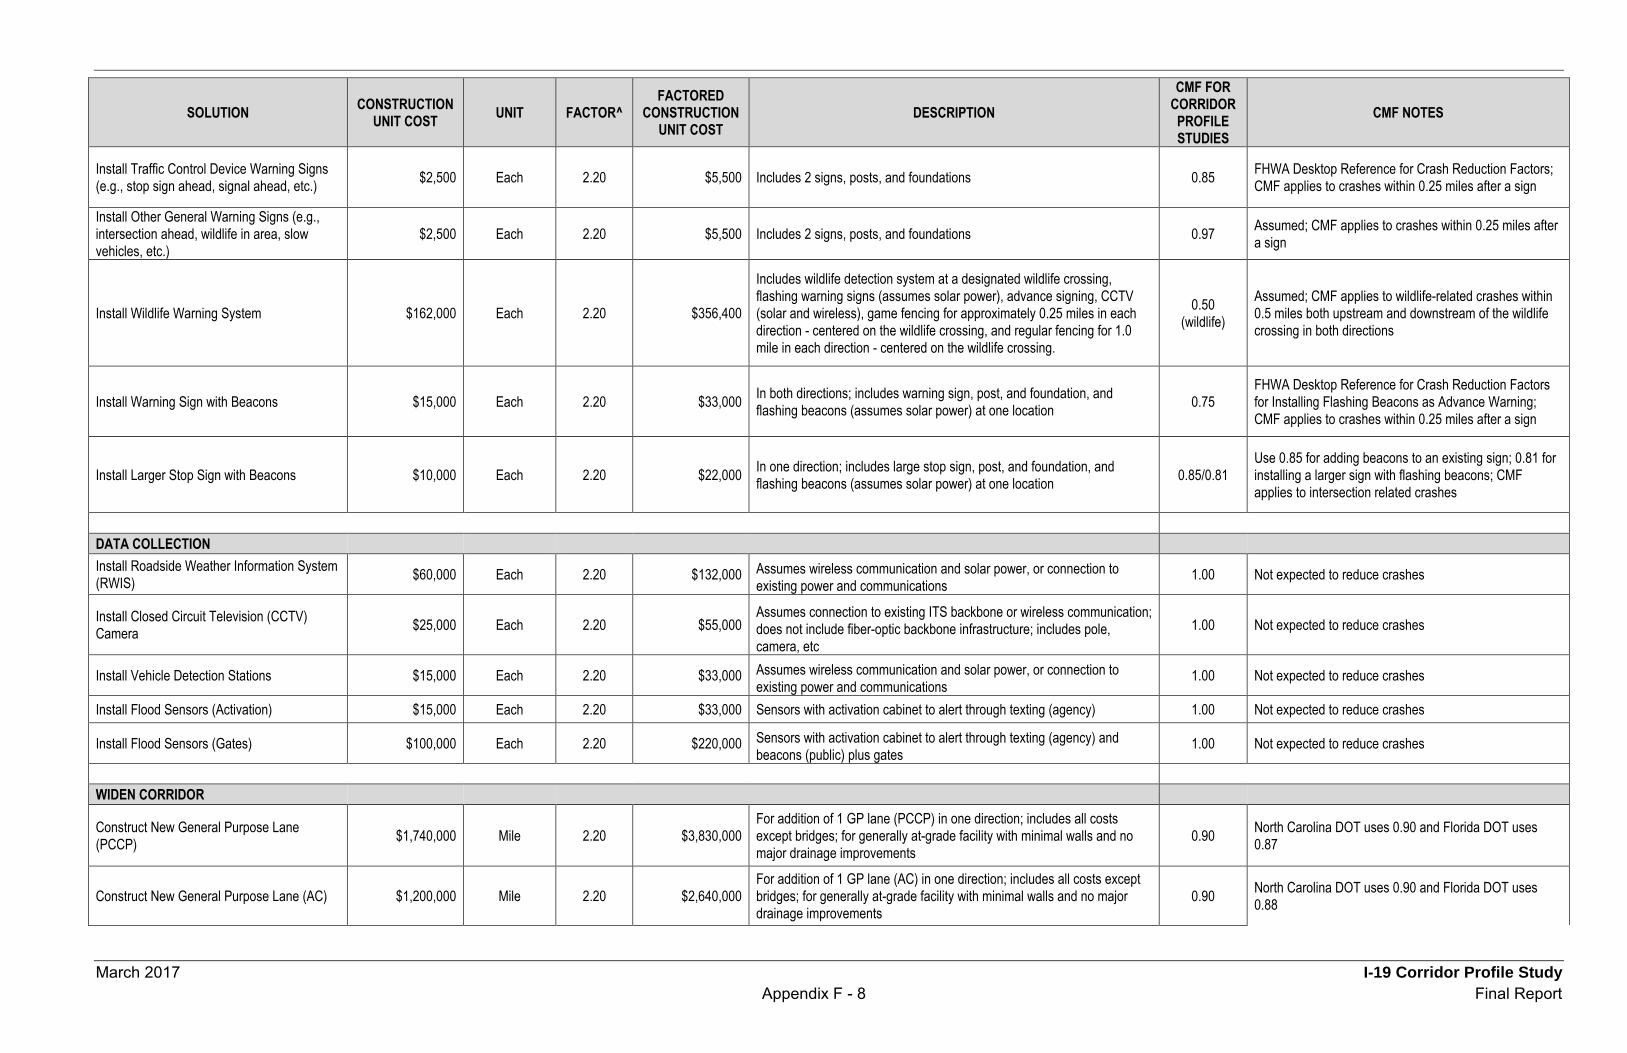
March 2017 I-19 Corridor Profile Study Appendix F - 8 Final Report
SOLUTION CONSTRUCTION UNIT COST UNIT FACTOR^
FACTORED CONSTRUCTION
UNIT COST DESCRIPTION
CMF FOR CORRIDOR PROFILE STUDIES
CMF NOTES
Install Traffic Control Device Warning Signs (e.g., stop sign ahead, signal ahead, etc.) $2,500 Each 2.20 $5,500 Includes 2 signs, posts, and foundations 0.85 FHWA Desktop Reference for Crash Reduction Factors;
CMF applies to crashes within 0.25 miles after a sign
Install Other General Warning Signs (e.g., intersection ahead, wildlife in area, slow vehicles, etc.)
$2,500 Each 2.20 $5,500 Includes 2 signs, posts, and foundations 0.97 Assumed; CMF applies to crashes within 0.25 miles after a sign
Install Wildlife Warning System $162,000 Each 2.20 $356,400
Includes wildlife detection system at a designated wildlife crossing, flashing warning signs (assumes solar power), advance signing, CCTV (solar and wireless), game fencing for approximately 0.25 miles in each direction - centered on the wildlife crossing, and regular fencing for 1.0 mile in each direction - centered on the wildlife crossing.
0.50 (wildlife)
Assumed; CMF applies to wildlife-related crashes within 0.5 miles both upstream and downstream of the wildlife crossing in both directions
Install Warning Sign with Beacons $15,000 Each 2.20 $33,000 In both directions; includes warning sign, post, and foundation, and flashing beacons (assumes solar power) at one location 0.75
FHWA Desktop Reference for Crash Reduction Factors for Installing Flashing Beacons as Advance Warning; CMF applies to crashes within 0.25 miles after a sign
Install Larger Stop Sign with Beacons $10,000 Each 2.20 $22,000 In one direction; includes large stop sign, post, and foundation, and flashing beacons (assumes solar power) at one location 0.85/0.81
Use 0.85 for adding beacons to an existing sign; 0.81 for installing a larger sign with flashing beacons; CMF applies to intersection related crashes
DATA COLLECTION Install Roadside Weather Information System (RWIS) $60,000 Each 2.20 $132,000 Assumes wireless communication and solar power, or connection to
existing power and communications 1.00 Not expected to reduce crashes
Install Closed Circuit Television (CCTV) Camera $25,000 Each 2.20 $55,000
Assumes connection to existing ITS backbone or wireless communication; does not include fiber-optic backbone infrastructure; includes pole, camera, etc
1.00 Not expected to reduce crashes
Install Vehicle Detection Stations $15,000 Each 2.20 $33,000 Assumes wireless communication and solar power, or connection to existing power and communications
1.00 Not expected to reduce crashes
Install Flood Sensors (Activation) $15,000 Each 2.20 $33,000 Sensors with activation cabinet to alert through texting (agency) 1.00 Not expected to reduce crashes
Install Flood Sensors (Gates) $100,000 Each 2.20 $220,000 Sensors with activation cabinet to alert through texting (agency) and beacons (public) plus gates
1.00 Not expected to reduce crashes
WIDEN CORRIDOR
Construct New General Purpose Lane (PCCP) $1,740,000 Mile 2.20 $3,830,000
For addition of 1 GP lane (PCCP) in one direction; includes all costs except bridges; for generally at-grade facility with minimal walls and no major drainage improvements
0.90 North Carolina DOT uses 0.90 and Florida DOT uses 0.87
Construct New General Purpose Lane (AC) $1,200,000 Mile 2.20 $2,640,000 For addition of 1 GP lane (AC) in one direction; includes all costs except bridges; for generally at-grade facility with minimal walls and no major drainage improvements
0.90 North Carolina DOT uses 0.90 and Florida DOT uses 0.88
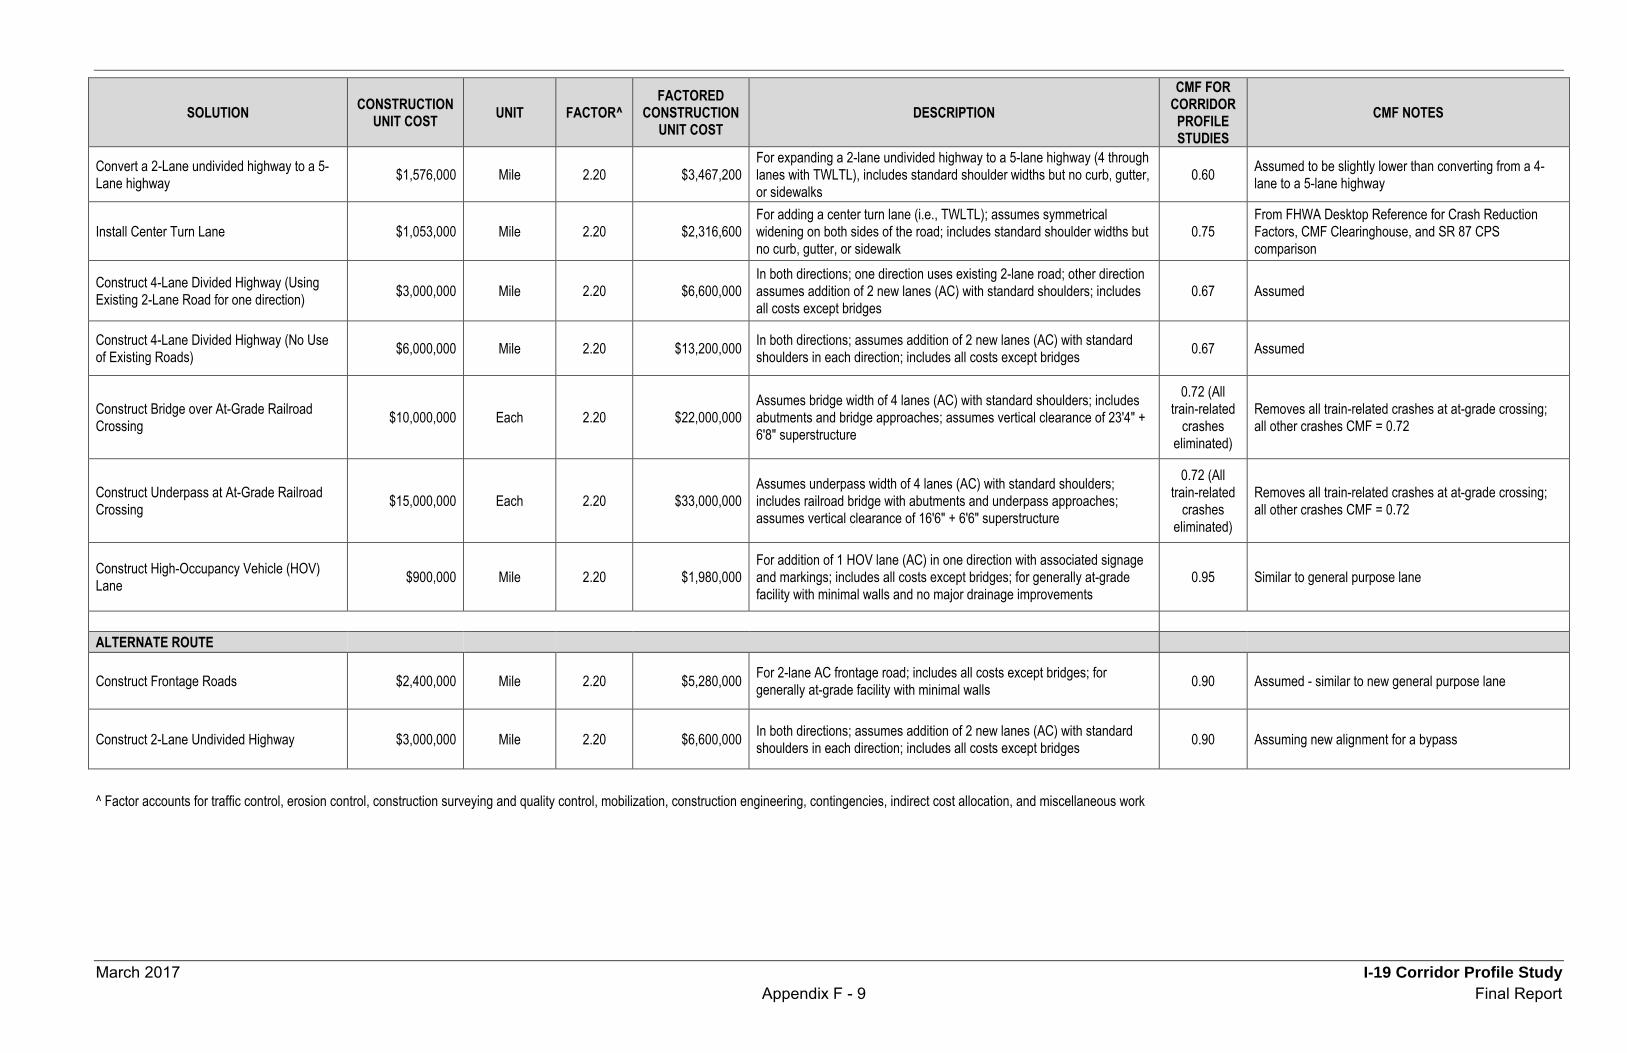
March 2017 I-19 Corridor Profile Study Appendix F - 9 Final Report
SOLUTION CONSTRUCTION UNIT COST UNIT FACTOR^
FACTORED CONSTRUCTION
UNIT COST DESCRIPTION
CMF FOR CORRIDOR PROFILE STUDIES
CMF NOTES
Convert a 2-Lane undivided highway to a 5-Lane highway $1,576,000 Mile 2.20 $3,467,200
For expanding a 2-lane undivided highway to a 5-lane highway (4 through lanes with TWLTL), includes standard shoulder widths but no curb, gutter, or sidewalks
0.60 Assumed to be slightly lower than converting from a 4-lane to a 5-lane highway
Install Center Turn Lane $1,053,000 Mile 2.20 $2,316,600 For adding a center turn lane (i.e., TWLTL); assumes symmetrical widening on both sides of the road; includes standard shoulder widths but no curb, gutter, or sidewalk
0.75 From FHWA Desktop Reference for Crash Reduction Factors, CMF Clearinghouse, and SR 87 CPS comparison
Construct 4-Lane Divided Highway (Using Existing 2-Lane Road for one direction) $3,000,000 Mile 2.20 $6,600,000
In both directions; one direction uses existing 2-lane road; other direction assumes addition of 2 new lanes (AC) with standard shoulders; includes all costs except bridges
0.67 Assumed
Construct 4-Lane Divided Highway (No Use of Existing Roads) $6,000,000 Mile 2.20 $13,200,000 In both directions; assumes addition of 2 new lanes (AC) with standard
shoulders in each direction; includes all costs except bridges 0.67 Assumed
Construct Bridge over At-Grade Railroad Crossing $10,000,000 Each 2.20 $22,000,000
Assumes bridge width of 4 lanes (AC) with standard shoulders; includes abutments and bridge approaches; assumes vertical clearance of 23'4" + 6'8" superstructure
0.72 (All train-related
crashes eliminated)
Removes all train-related crashes at at-grade crossing; all other crashes CMF = 0.72
Construct Underpass at At-Grade Railroad Crossing $15,000,000 Each 2.20 $33,000,000
Assumes underpass width of 4 lanes (AC) with standard shoulders; includes railroad bridge with abutments and underpass approaches; assumes vertical clearance of 16'6" + 6'6" superstructure
0.72 (All train-related
crashes eliminated)
Removes all train-related crashes at at-grade crossing; all other crashes CMF = 0.72
Construct High-Occupancy Vehicle (HOV) Lane $900,000 Mile 2.20 $1,980,000
For addition of 1 HOV lane (AC) in one direction with associated signage and markings; includes all costs except bridges; for generally at-grade facility with minimal walls and no major drainage improvements
0.95 Similar to general purpose lane
ALTERNATE ROUTE
Construct Frontage Roads $2,400,000 Mile 2.20 $5,280,000 For 2-lane AC frontage road; includes all costs except bridges; for generally at-grade facility with minimal walls 0.90 Assumed - similar to new general purpose lane
Construct 2-Lane Undivided Highway $3,000,000 Mile 2.20 $6,600,000 In both directions; assumes addition of 2 new lanes (AC) with standard shoulders in each direction; includes all costs except bridges 0.90 Assuming new alignment for a bypass
^ Factor accounts for traffic control, erosion control, construction surveying and quality control, mobilization, construction engineering, contingencies, indirect cost allocation, and miscellaneous work

March 2017 I-19 Corridor Profile Study Appendix G - 1 Final Report
Appendix G: Performance Area Risk Factors
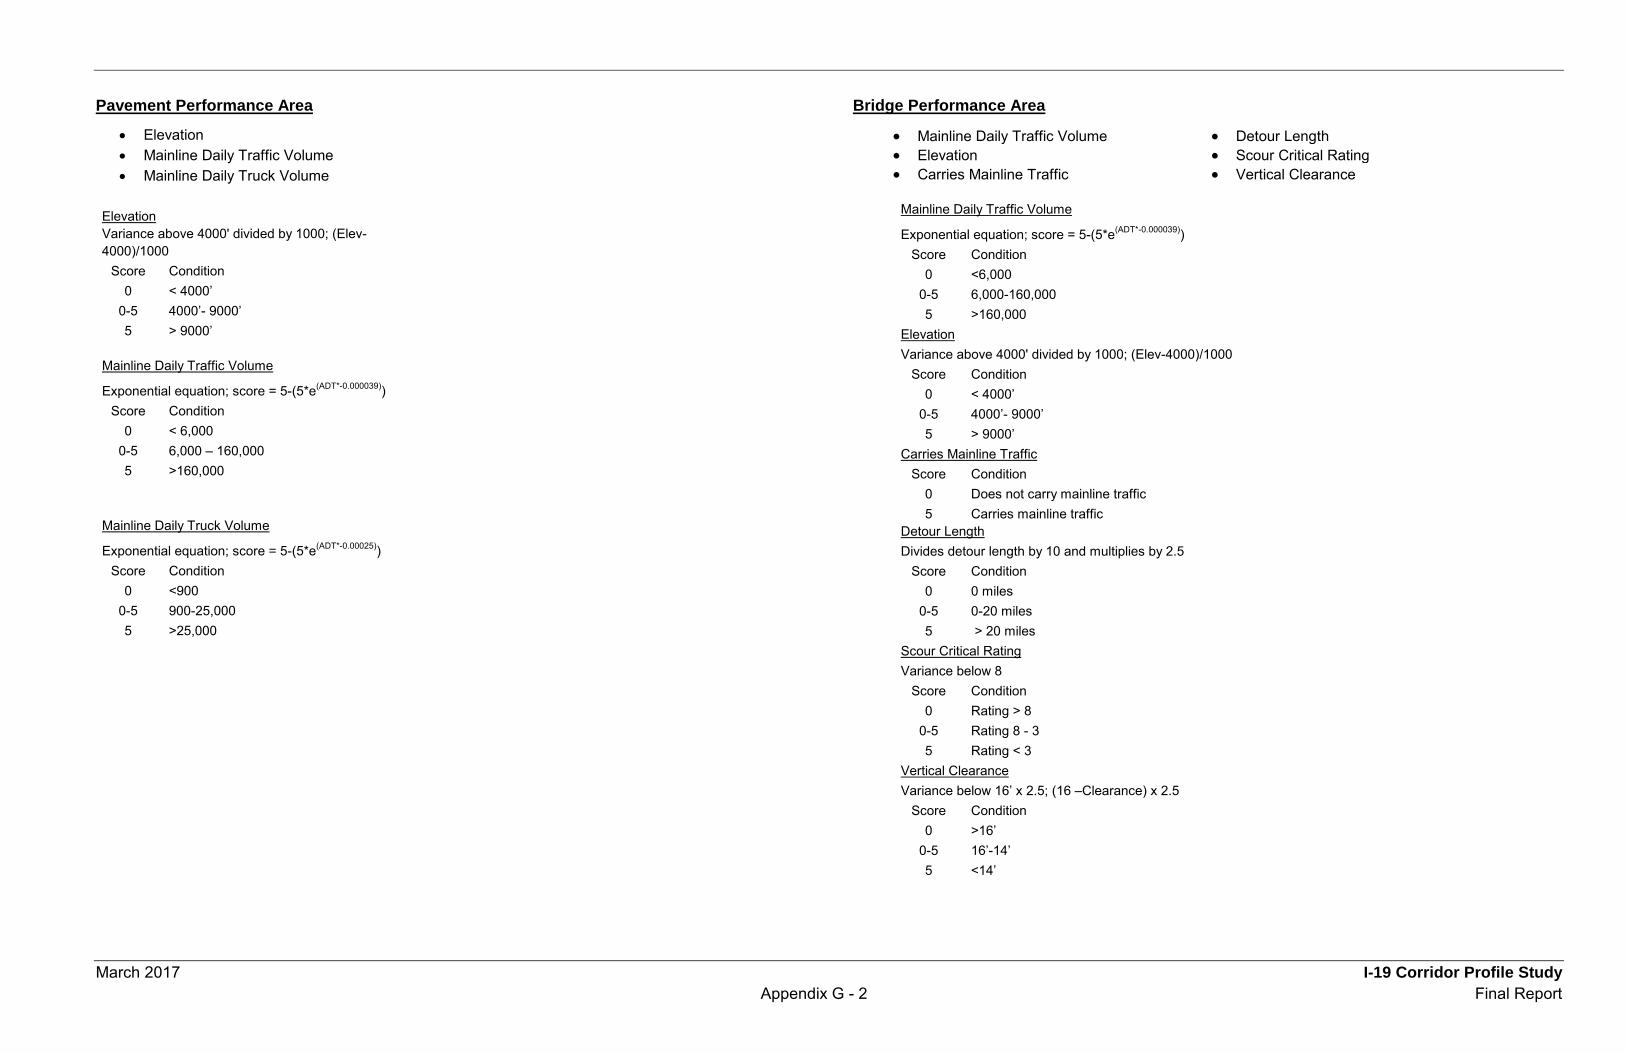
March 2017 I-19 Corridor Profile Study Appendix G - 2 Final Report
Pavement Performance Area
• Elevation • Mainline Daily Traffic Volume • Mainline Daily Truck Volume
Elevation Variance above 4000' divided by 1000; (Elev-4000)/1000
Score Condition 0 < 4000’
0-5 4000’- 9000’ 5 > 9000’
Mainline Daily Traffic Volume
Exponential equation; score = 5-(5*e(ADT*-0.000039)) Score Condition
0 < 6,000 0-5 6,000 – 160,000 5 >160,000
Mainline Daily Truck Volume
Exponential equation; score = 5-(5*e(ADT*-0.00025)) Score Condition
0 <900 0-5 900-25,000 5 >25,000
Bridge Performance Area
• Mainline Daily Traffic Volume • Detour Length • Elevation • Scour Critical Rating • Carries Mainline Traffic • Vertical Clearance
Mainline Daily Traffic Volume
Exponential equation; score = 5-(5*e(ADT*-0.000039)) Score Condition
0 <6,000 0-5 6,000-160,000 5 >160,000
Elevation Variance above 4000' divided by 1000; (Elev-4000)/1000
Score Condition 0 < 4000’
0-5 4000’- 9000’ 5 > 9000’
Carries Mainline Traffic Score Condition
0 Does not carry mainline traffic 5 Carries mainline traffic
Detour Length Divides detour length by 10 and multiplies by 2.5
Score Condition 0 0 miles
0-5 0-20 miles 5 > 20 miles
Scour Critical Rating Variance below 8
Score Condition 0 Rating > 8
0-5 Rating 8 - 3 5 Rating < 3
Vertical Clearance Variance below 16’ x 2.5; (16 –Clearance) x 2.5
Score Condition 0 >16’
0-5 16’-14’ 5 <14’
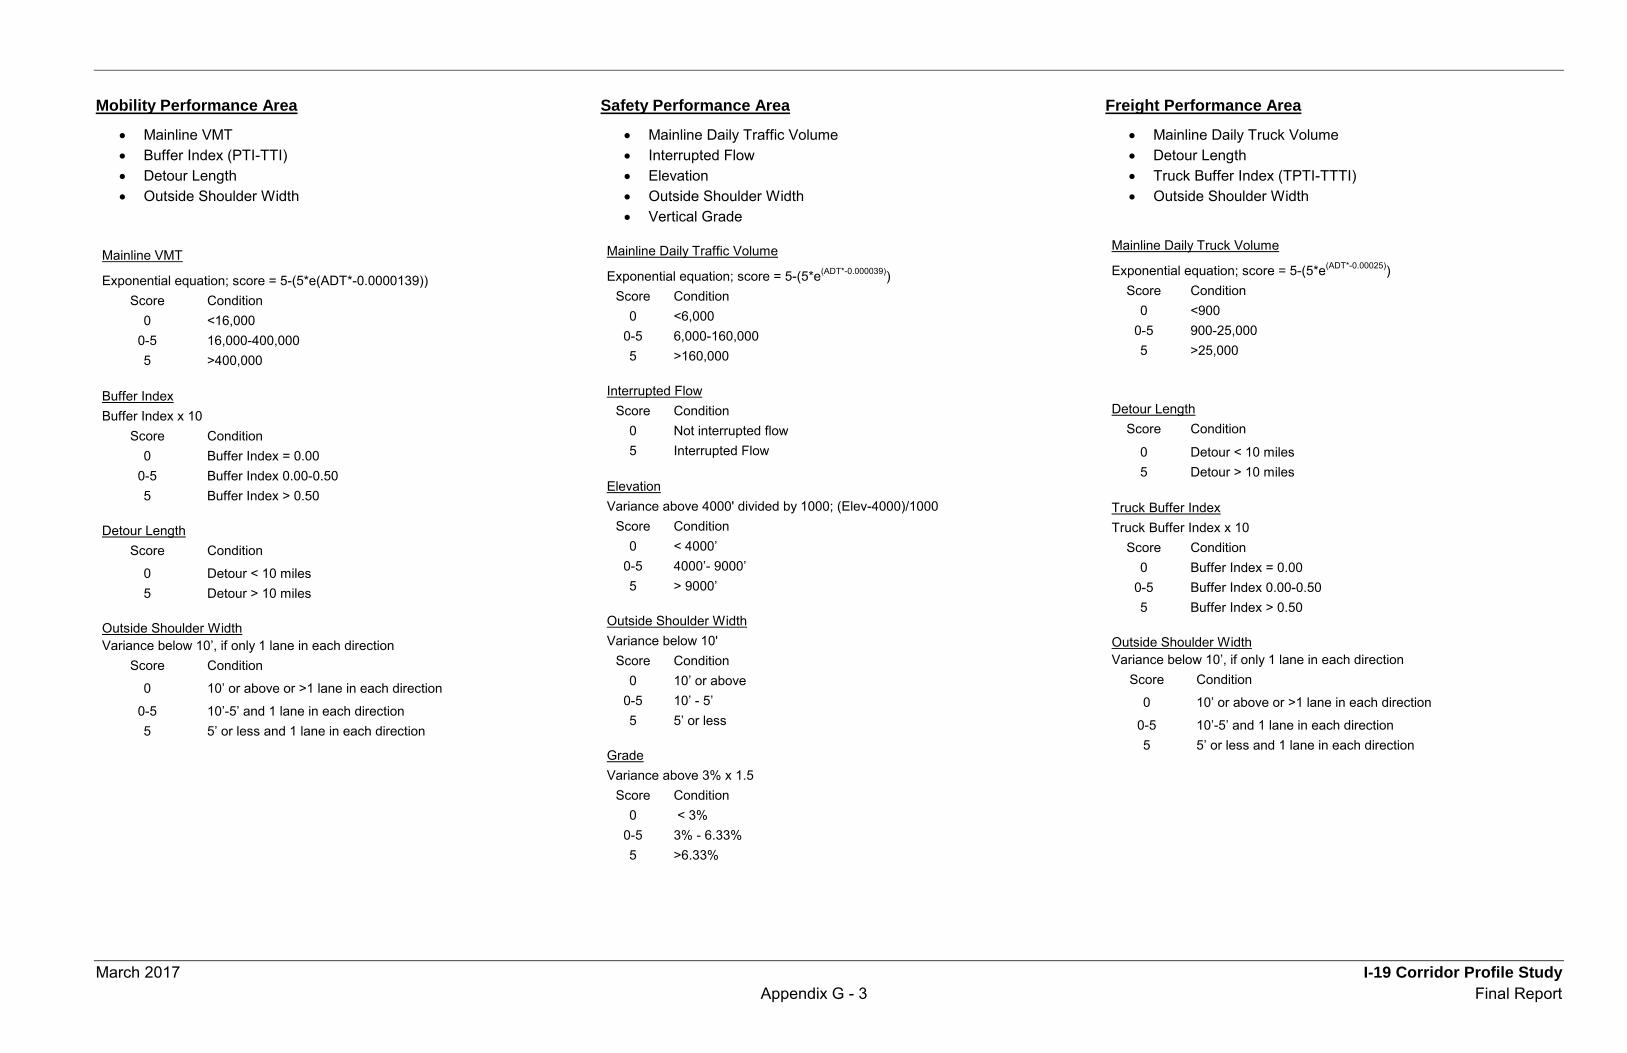
March 2017 I-19 Corridor Profile Study Appendix G - 3 Final Report
Mobility Performance Area
• Mainline VMT • Buffer Index (PTI-TTI) • Detour Length • Outside Shoulder Width
Mainline VMT
Exponential equation; score = 5-(5*e(ADT*-0.0000139)) Score Condition
0 <16,000 0-5 16,000-400,000 5 >400,000
Buffer Index Buffer Index x 10
Score Condition 0 Buffer Index = 0.00
0-5 Buffer Index 0.00-0.50 5 Buffer Index > 0.50
Detour Length
Score Condition
0 Detour < 10 miles 5 Detour > 10 miles
Outside Shoulder Width Variance below 10’, if only 1 lane in each direction
Score Condition
0 10’ or above or >1 lane in each direction
0-5 10’-5’ and 1 lane in each direction 5 5’ or less and 1 lane in each direction
Safety Performance Area
• Mainline Daily Traffic Volume • Interrupted Flow • Elevation • Outside Shoulder Width • Vertical Grade
Mainline Daily Traffic Volume
Exponential equation; score = 5-(5*e(ADT*-0.000039)) Score Condition
0 <6,000 0-5 6,000-160,000 5 >160,000
Interrupted Flow
Score Condition 0 Not interrupted flow 5 Interrupted Flow
Elevation Variance above 4000' divided by 1000; (Elev-4000)/1000
Score Condition 0 < 4000’
0-5 4000’- 9000’ 5 > 9000’
Outside Shoulder Width Variance below 10'
Score Condition 0 10’ or above
0-5 10’ - 5’ 5 5’ or less
Grade Variance above 3% x 1.5
Score Condition 0 < 3%
0-5 3% - 6.33% 5 >6.33%
Freight Performance Area
• Mainline Daily Truck Volume • Detour Length • Truck Buffer Index (TPTI-TTTI) • Outside Shoulder Width
Mainline Daily Truck Volume
Exponential equation; score = 5-(5*e(ADT*-0.00025)) Score Condition
0 <900 0-5 900-25,000 5 >25,000
Detour Length
Score Condition
0 Detour < 10 miles 5 Detour > 10 miles
Truck Buffer Index Truck Buffer Index x 10
Score Condition 0 Buffer Index = 0.00
0-5 Buffer Index 0.00-0.50 5 Buffer Index > 0.50
Outside Shoulder Width Variance below 10’, if only 1 lane in each direction
Score Condition
0 10’ or above or >1 lane in each direction
0-5 10’-5’ and 1 lane in each direction 5 5’ or less and 1 lane in each direction

March 2017 I-19 Corridor Profile Study Appendix G - 4 Final Report
Performance Area Risk Factors
Solution Number
Mainline Traffic Vol (vpd) (2-way)
Solution Length (miles)
Bridge Detour Length (miles)
(N19) Elevation (ft)
Scour Critical Rating (0-9)
Carries Mainline
Traffic (Y/N) Bridge Vert.
Clear (ft)
Mainline Truck Vol (vpd) (2-way)
Detour Length > 10 miles (Y/N)
Truck Buffer Index
Non-Truck Buffer Index Grade (%)
Interrupted Flow (Y/N)
Outside/ Right Shoulder Width (ft)
19.1-1 20,595 15 3,390 2,471 n 0.04 0.09 0.5 n 10 19.1-2 16,071 12 3,150 2,571 n 0.00 0.00 0.6 y 9.6 19.3-1 20,595 15 3,390 2,471 n 0.04 0.09 0.5 n 10 19.3-2 16,071 12 3,150 2,571 n 0.00 0.00 0.6 y 9.6 19.5-1 36,855 17.5 2,850 7,002 n 0.03 0.05 0.3 n 9.92 19.5-2 67,438 3 2,460 4,046 n 0.08 0.06 0.5 n 10 19.6-1 36,855 17.5 2,850 7,002 n 0.03 0.05 0.3 n 9.92 19.6-2 67,438 7 2,460 4,046 n 0.08 0.06 0.5 n 10 19.9 36,855 0.5 2,850 7,002 n 0.03 0.05 0.3 n 9.92
19.10 36,855 0.5 0 2,850 8 y 16.00 7,002 n 0.03 0.05 0.3 n 9.92 19.11 36,855 0.5 2,850 7,002 n 0.03 0.05 0.3 n 9.92 19.12 67,438 1 1 2,450 7 y 16.00 4,046 n 0.08 0.06 1.5 n 10 19.13 67,438 7 2,450 4,046 n 0.08 0.06 0.7 n 10 19.14 67,438 5 1 2,450 7 y 16.00 4,046 n 0.08 0.06 0.7 n 10 19.15 67,438 2 1,450 4,046 n 0.08 0.06 0.7 n 10
Solution Number Bridge Pavement Mobility Safety Freight
Risk Score (0 to 10)
Bridge Pavement Mobility Safety Freight 19.1-1 n n y y y 0.00 0.00 2.92 1.10 1.36 19.1-2 n n y y y 0.00 0.00 2.33 3.09 1.19 19.3-1 n n y y y 0.00 0.00 2.92 1.10 1.36 19.3-2 n n y y y 0.00 0.00 2.33 3.09 1.19 19.5-1 n n y y y 0.00 0.00 2.75 1.55 2.22 19.5-2 n n y y y 0.00 0.00 2.65 1.85 2.00 19.6-1 n n y y y 0.00 0.00 2.75 1.55 2.22 19.6-2 n n y y y 0.00 0.00 2.80 1.85 2.00 19.9 n n y y y 0.00 0.00 0.81 1.55 2.22
19.10 y n y y y 2.93 0.00 0.81 1.55 2.22 19.11 n n y y y 0.00 0.00 0.81 1.55 2.22 19.12 y y y y y 3.71 5.21 1.82 1.85 2.00 19.13 n n y y y 0.00 0.00 2.80 1.85 2.00 19.14 y y y y y 3.71 5.21 2.78 1.85 2.00 19.15 n n y y y 0.00 0.00 2.42 1.85 2.00
March 2017 I-19 Corridor Profile Study Appendix H - 1 Final Report
Appendix H: Candidate Solution Cost Estimates
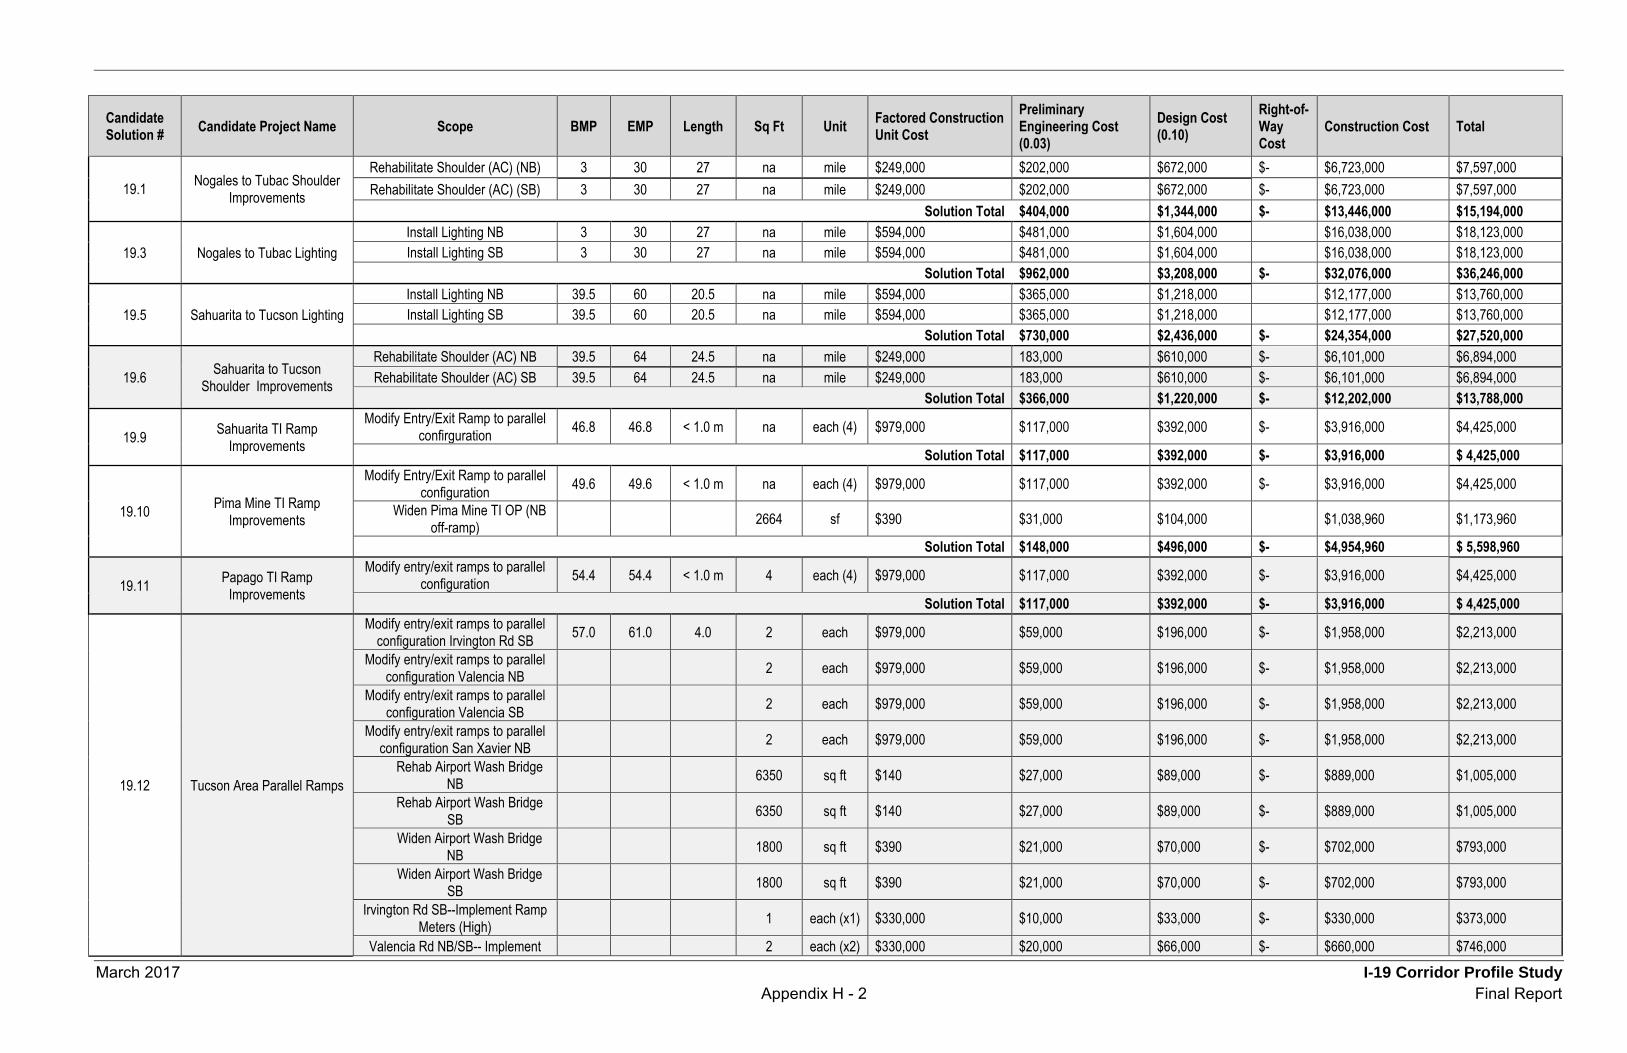
March 2017 I-19 Corridor Profile Study Appendix H - 2 Final Report
Candidate Solution # Candidate Project Name Scope BMP EMP Length Sq Ft Unit Factored Construction
Unit Cost Preliminary Engineering Cost (0.03)
Design Cost (0.10)
Right-of-Way Cost
Construction Cost Total
19.1 Nogales to Tubac Shoulder Improvements
Rehabilitate Shoulder (AC) (NB) 3 30 27 na mile $249,000 $202,000 $672,000 $- $6,723,000 $7,597,000 Rehabilitate Shoulder (AC) (SB) 3 30 27 na mile $249,000 $202,000 $672,000 $- $6,723,000 $7,597,000
Solution Total $404,000 $1,344,000 $- $13,446,000 $15,194,000
19.3 Nogales to Tubac Lighting Install Lighting NB 3 30 27 na mile $594,000 $481,000 $1,604,000 $16,038,000 $18,123,000 Install Lighting SB 3 30 27 na mile $594,000 $481,000 $1,604,000 $16,038,000 $18,123,000
Solution Total $962,000 $3,208,000 $- $32,076,000 $36,246,000
19.5 Sahuarita to Tucson Lighting Install Lighting NB 39.5 60 20.5 na mile $594,000 $365,000 $1,218,000 $12,177,000 $13,760,000 Install Lighting SB 39.5 60 20.5 na mile $594,000 $365,000 $1,218,000 $12,177,000 $13,760,000
Solution Total $730,000 $2,436,000 $- $24,354,000 $27,520,000
19.6 Sahuarita to Tucson Shoulder Improvements
Rehabilitate Shoulder (AC) NB 39.5 64 24.5 na mile $249,000 183,000 $610,000 $- $6,101,000 $6,894,000 Rehabilitate Shoulder (AC) SB 39.5 64 24.5 na mile $249,000 183,000 $610,000 $- $6,101,000 $6,894,000
Solution Total $366,000 $1,220,000 $- $12,202,000 $13,788,000
19.9 Sahuarita TI Ramp Improvements
Modify Entry/Exit Ramp to parallel confirguration 46.8 46.8 < 1.0 m na each (4) $979,000 $117,000 $392,000 $- $3,916,000 $4,425,000
Solution Total $117,000 $392,000 $- $3,916,000 $ 4,425,000
19.10 Pima Mine TI Ramp Improvements
Modify Entry/Exit Ramp to parallel configuration 49.6 49.6 < 1.0 m na each (4) $979,000 $117,000 $392,000 $- $3,916,000 $4,425,000
Widen Pima Mine TI OP (NB off-ramp) 2664 sf $390 $31,000 $104,000 $1,038,960 $1,173,960
Solution Total $148,000 $496,000 $- $4,954,960 $ 5,598,960
19.11 Papago TI Ramp Improvements
Modify entry/exit ramps to parallel configuration 54.4 54.4 < 1.0 m 4 each (4) $979,000 $117,000 $392,000 $- $3,916,000 $4,425,000
Solution Total $117,000 $392,000 $- $3,916,000 $ 4,425,000
19.12 Tucson Area Parallel Ramps
Modify entry/exit ramps to parallel configuration Irvington Rd SB 57.0 61.0 4.0 2 each $979,000 $59,000 $196,000 $- $1,958,000 $2,213,000
Modify entry/exit ramps to parallel configuration Valencia NB 2 each $979,000 $59,000 $196,000 $- $1,958,000 $2,213,000
Modify entry/exit ramps to parallel configuration Valencia SB 2 each $979,000 $59,000 $196,000 $- $1,958,000 $2,213,000
Modify entry/exit ramps to parallel configuration San Xavier NB 2 each $979,000 $59,000 $196,000 $- $1,958,000 $2,213,000
Rehab Airport Wash Bridge NB 6350 sq ft $140 $27,000 $89,000 $- $889,000 $1,005,000
Rehab Airport Wash Bridge SB 6350 sq ft $140 $27,000 $89,000 $- $889,000 $1,005,000
Widen Airport Wash Bridge NB 1800 sq ft $390 $21,000 $70,000 $- $702,000 $793,000
Widen Airport Wash Bridge SB 1800 sq ft $390 $21,000 $70,000 $- $702,000 $793,000
Irvington Rd SB--Implement Ramp Meters (High) 1 each (x1) $330,000 $10,000 $33,000 $- $330,000 $373,000
Valencia Rd NB/SB-- Implement 2 each (x2) $330,000 $20,000 $66,000 $- $660,000 $746,000
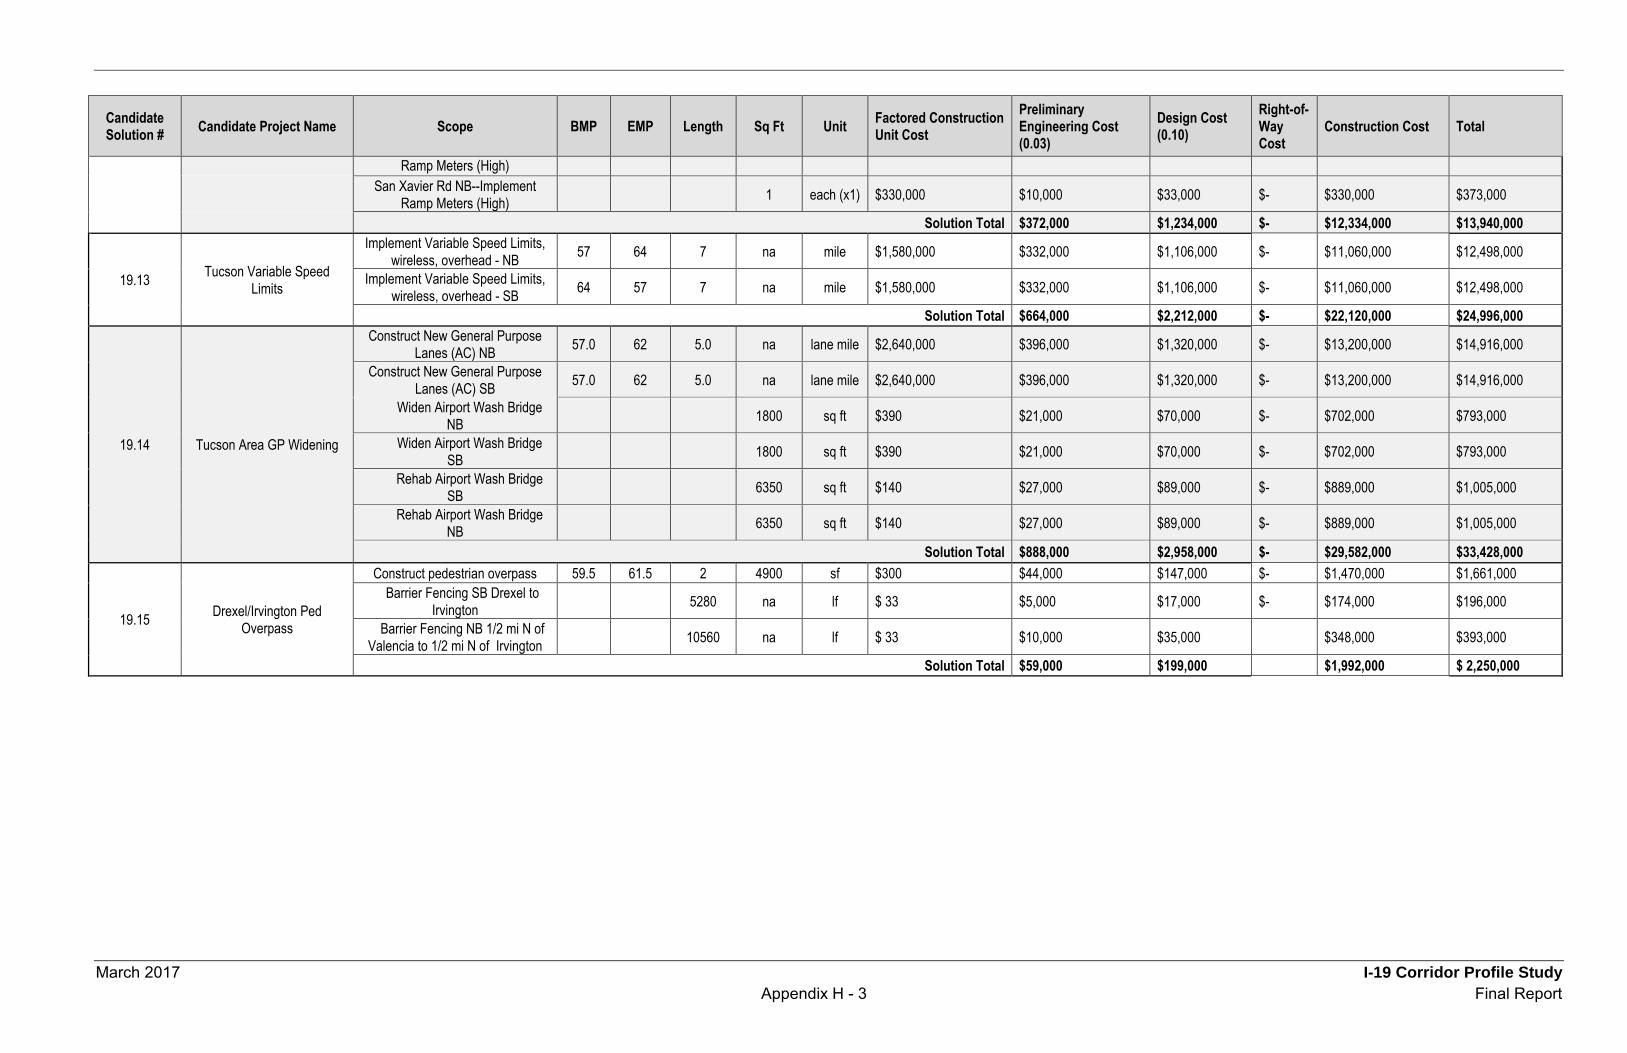
March 2017 I-19 Corridor Profile Study Appendix H - 3 Final Report
Candidate Solution # Candidate Project Name Scope BMP EMP Length Sq Ft Unit Factored Construction
Unit Cost Preliminary Engineering Cost (0.03)
Design Cost (0.10)
Right-of-Way Cost
Construction Cost Total
Ramp Meters (High) San Xavier Rd NB--Implement
Ramp Meters (High) 1 each (x1) $330,000 $10,000 $33,000 $- $330,000 $373,000
Solution Total $372,000 $1,234,000 $- $12,334,000 $13,940,000
19.13 Tucson Variable Speed Limits
Implement Variable Speed Limits, wireless, overhead - NB 57 64 7 na mile $1,580,000 $332,000 $1,106,000 $- $11,060,000 $12,498,000
Implement Variable Speed Limits, wireless, overhead - SB 64 57 7 na mile $1,580,000 $332,000 $1,106,000 $- $11,060,000 $12,498,000
Solution Total $664,000 $2,212,000 $- $22,120,000 $24,996,000
19.14 Tucson Area GP Widening
Construct New General Purpose Lanes (AC) NB 57.0 62 5.0 na lane mile $2,640,000 $396,000 $1,320,000 $- $13,200,000 $14,916,000
Construct New General Purpose Lanes (AC) SB 57.0 62 5.0 na lane mile $2,640,000 $396,000 $1,320,000 $- $13,200,000 $14,916,000
Widen Airport Wash Bridge NB 1800 sq ft $390 $21,000 $70,000 $- $702,000 $793,000
Widen Airport Wash Bridge SB 1800 sq ft $390 $21,000 $70,000 $- $702,000 $793,000
Rehab Airport Wash Bridge SB 6350 sq ft $140 $27,000 $89,000 $- $889,000 $1,005,000
Rehab Airport Wash Bridge NB 6350 sq ft $140 $27,000 $89,000 $- $889,000 $1,005,000
Solution Total $888,000 $2,958,000 $- $29,582,000 $33,428,000
19.15 Drexel/Irvington Ped Overpass
Construct pedestrian overpass 59.5 61.5 2 4900 sf $300 $44,000 $147,000 $- $1,470,000 $1,661,000 Barrier Fencing SB Drexel to
Irvington 5280 na lf $ 33 $5,000 $17,000 $- $174,000 $196,000 Barrier Fencing NB 1/2 mi N of
Valencia to 1/2 mi N of Irvington 10560 na lf $ 33 $10,000 $35,000 $348,000 $393,000
Solution Total $59,000 $199,000 $1,992,000 $ 2,250,000

March 2017 I-19 Corridor Profile Study Appendix I - 1 Final Report
Appendix I: Performance Effectiveness Scores
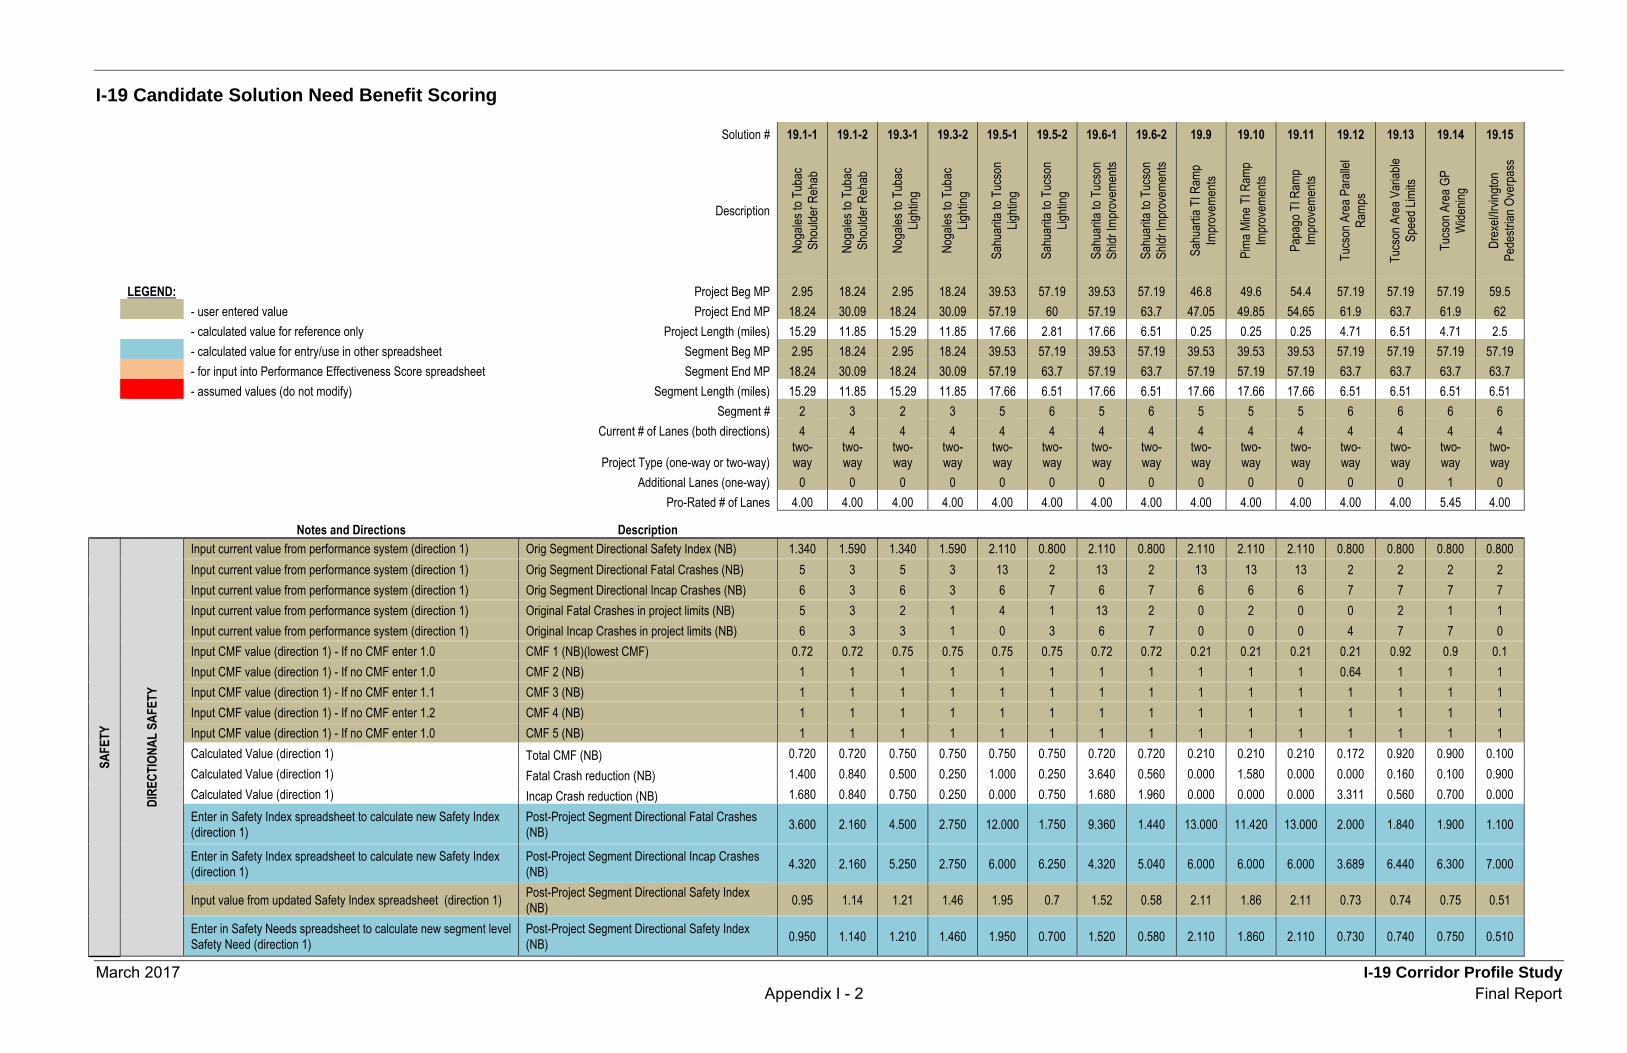
March 2017 I-19 Corridor Profile Study Appendix I - 2 Final Report
I-19 Candidate Solution Need Benefit Scoring
Solution # 19.1-1 19.1-2 19.3-1 19.3-2 19.5-1 19.5-2 19.6-1 19.6-2 19.9 19.10 19.11 19.12 19.13 19.14 19.15
Description
Noga
les to
Tub
ac
Shou
lder R
ehab
Noga
les to
Tub
ac
Shou
lder R
ehab
Noga
les to
Tub
ac
Lighti
ng
Noga
les to
Tub
ac
Lighti
ng
Sahu
arita
to T
ucso
n Lig
hting
Sahu
arita
to T
ucso
n Lig
hting
Sahu
arita
to T
ucso
n Sh
ldr Im
prov
emen
ts
Sahu
arita
to T
ucso
n Sh
ldr Im
prov
emen
ts
Sahu
artia
TI R
amp
Impr
ovem
ents
Pima
Mine
TI R
amp
Impr
ovem
ents
Papa
go T
I Ram
p Im
prov
emen
ts
Tucs
on A
rea P
arall
el Ra
mps
Tucs
on A
rea V
ariab
le Sp
eed L
imits
Tucs
on A
rea G
P W
idenin
g
Drex
el/Irv
ington
Pe
destr
ian O
verp
ass
LEGEND:
Project Beg MP 2.95 18.24 2.95 18.24 39.53 57.19 39.53 57.19 46.8 49.6 54.4 57.19 57.19 57.19 59.5
- user entered value Project End MP 18.24 30.09 18.24 30.09 57.19 60 57.19 63.7 47.05 49.85 54.65 61.9 63.7 61.9 62
- calculated value for reference only Project Length (miles) 15.29 11.85 15.29 11.85 17.66 2.81 17.66 6.51 0.25 0.25 0.25 4.71 6.51 4.71 2.5
- calculated value for entry/use in other spreadsheet Segment Beg MP 2.95 18.24 2.95 18.24 39.53 57.19 39.53 57.19 39.53 39.53 39.53 57.19 57.19 57.19 57.19
- for input into Performance Effectiveness Score spreadsheet Segment End MP 18.24 30.09 18.24 30.09 57.19 63.7 57.19 63.7 57.19 57.19 57.19 63.7 63.7 63.7 63.7
- assumed values (do not modify) Segment Length (miles) 15.29 11.85 15.29 11.85 17.66 6.51 17.66 6.51 17.66 17.66 17.66 6.51 6.51 6.51 6.51
Segment # 2 3 2 3 5 6 5 6 5 5 5 6 6 6 6
Current # of Lanes (both directions) 4 4 4 4 4 4 4 4 4 4 4 4 4 4 4
Project Type (one-way or two-way)
two-way
two-way
two-way
two-way
two-way
two-way
two-way
two-way
two-way
two-way
two-way
two-way
two-way
two-way
two-way
Additional Lanes (one-way) 0 0 0 0 0 0 0 0 0 0 0 0 0 1 0
Pro-Rated # of Lanes 4.00 4.00 4.00 4.00 4.00 4.00 4.00 4.00 4.00 4.00 4.00 4.00 4.00 5.45 4.00
Notes and Directions Description
SAFE
TY
DIRE
CTIO
NAL
SAFE
TY
Input current value from performance system (direction 1) Orig Segment Directional Safety Index (NB) 1.340 1.590 1.340 1.590 2.110 0.800 2.110 0.800 2.110 2.110 2.110 0.800 0.800 0.800 0.800 Input current value from performance system (direction 1) Orig Segment Directional Fatal Crashes (NB) 5 3 5 3 13 2 13 2 13 13 13 2 2 2 2 Input current value from performance system (direction 1) Orig Segment Directional Incap Crashes (NB) 6 3 6 3 6 7 6 7 6 6 6 7 7 7 7 Input current value from performance system (direction 1) Original Fatal Crashes in project limits (NB) 5 3 2 1 4 1 13 2 0 2 0 0 2 1 1 Input current value from performance system (direction 1) Original Incap Crashes in project limits (NB) 6 3 3 1 0 3 6 7 0 0 0 4 7 7 0 Input CMF value (direction 1) - If no CMF enter 1.0 CMF 1 (NB)(lowest CMF) 0.72 0.72 0.75 0.75 0.75 0.75 0.72 0.72 0.21 0.21 0.21 0.21 0.92 0.9 0.1 Input CMF value (direction 1) - If no CMF enter 1.0 CMF 2 (NB) 1 1 1 1 1 1 1 1 1 1 1 0.64 1 1 1 Input CMF value (direction 1) - If no CMF enter 1.1 CMF 3 (NB) 1 1 1 1 1 1 1 1 1 1 1 1 1 1 1 Input CMF value (direction 1) - If no CMF enter 1.2 CMF 4 (NB) 1 1 1 1 1 1 1 1 1 1 1 1 1 1 1 Input CMF value (direction 1) - If no CMF enter 1.0 CMF 5 (NB) 1 1 1 1 1 1 1 1 1 1 1 1 1 1 1 Calculated Value (direction 1) Total CMF (NB) 0.720 0.720 0.750 0.750 0.750 0.750 0.720 0.720 0.210 0.210 0.210 0.172 0.920 0.900 0.100 Calculated Value (direction 1) Fatal Crash reduction (NB) 1.400 0.840 0.500 0.250 1.000 0.250 3.640 0.560 0.000 1.580 0.000 0.000 0.160 0.100 0.900 Calculated Value (direction 1) Incap Crash reduction (NB) 1.680 0.840 0.750 0.250 0.000 0.750 1.680 1.960 0.000 0.000 0.000 3.311 0.560 0.700 0.000 Enter in Safety Index spreadsheet to calculate new Safety Index (direction 1)
Post-Project Segment Directional Fatal Crashes (NB) 3.600 2.160 4.500 2.750 12.000 1.750 9.360 1.440 13.000 11.420 13.000 2.000 1.840 1.900 1.100
Enter in Safety Index spreadsheet to calculate new Safety Index (direction 1)
Post-Project Segment Directional Incap Crashes (NB) 4.320 2.160 5.250 2.750 6.000 6.250 4.320 5.040 6.000 6.000 6.000 3.689 6.440 6.300 7.000
Input value from updated Safety Index spreadsheet (direction 1) Post-Project Segment Directional Safety Index (NB) 0.95 1.14 1.21 1.46 1.95 0.7 1.52 0.58 2.11 1.86 2.11 0.73 0.74 0.75 0.51
Enter in Safety Needs spreadsheet to calculate new segment level Safety Need (direction 1)
Post-Project Segment Directional Safety Index (NB) 0.950 1.140 1.210 1.460 1.950 0.700 1.520 0.580 2.110 1.860 2.110 0.730 0.740 0.750 0.510
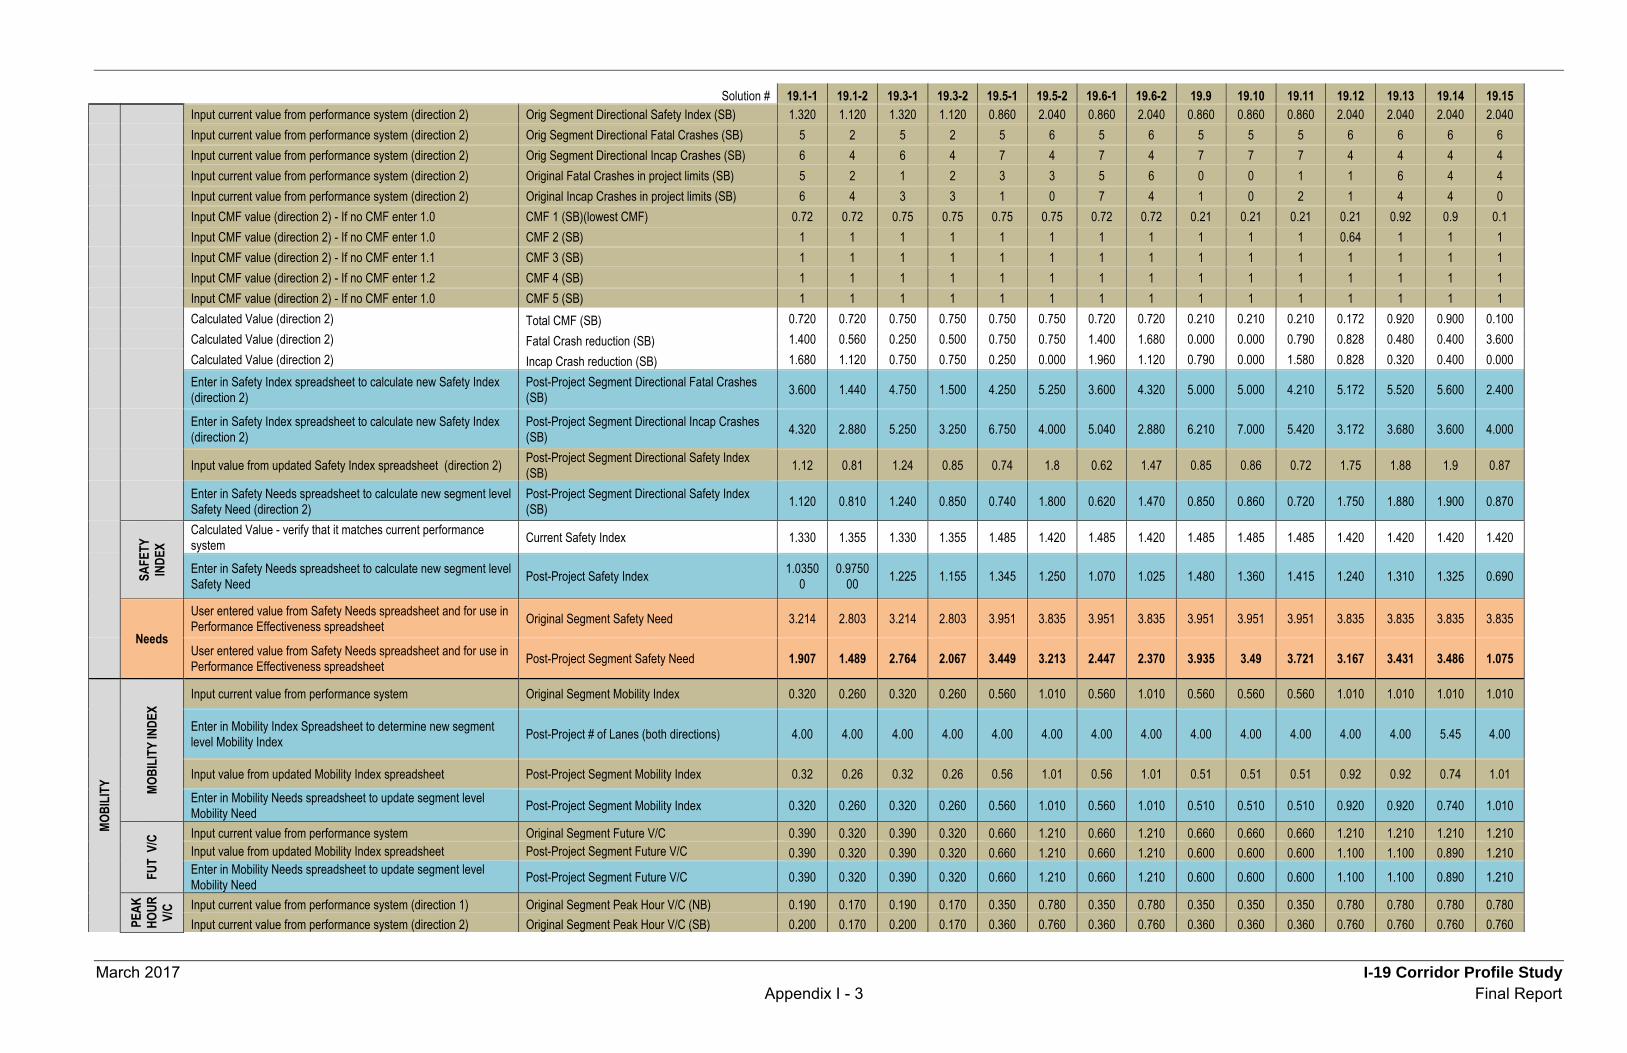
March 2017 I-19 Corridor Profile Study Appendix I - 3 Final Report
Solution # 19.1-1 19.1-2 19.3-1 19.3-2 19.5-1 19.5-2 19.6-1 19.6-2 19.9 19.10 19.11 19.12 19.13 19.14 19.15
Input current value from performance system (direction 2) Orig Segment Directional Safety Index (SB) 1.320 1.120 1.320 1.120 0.860 2.040 0.860 2.040 0.860 0.860 0.860 2.040 2.040 2.040 2.040 Input current value from performance system (direction 2) Orig Segment Directional Fatal Crashes (SB) 5 2 5 2 5 6 5 6 5 5 5 6 6 6 6 Input current value from performance system (direction 2) Orig Segment Directional Incap Crashes (SB) 6 4 6 4 7 4 7 4 7 7 7 4 4 4 4 Input current value from performance system (direction 2) Original Fatal Crashes in project limits (SB) 5 2 1 2 3 3 5 6 0 0 1 1 6 4 4 Input current value from performance system (direction 2) Original Incap Crashes in project limits (SB) 6 4 3 3 1 0 7 4 1 0 2 1 4 4 0 Input CMF value (direction 2) - If no CMF enter 1.0 CMF 1 (SB)(lowest CMF) 0.72 0.72 0.75 0.75 0.75 0.75 0.72 0.72 0.21 0.21 0.21 0.21 0.92 0.9 0.1 Input CMF value (direction 2) - If no CMF enter 1.0 CMF 2 (SB) 1 1 1 1 1 1 1 1 1 1 1 0.64 1 1 1 Input CMF value (direction 2) - If no CMF enter 1.1 CMF 3 (SB) 1 1 1 1 1 1 1 1 1 1 1 1 1 1 1 Input CMF value (direction 2) - If no CMF enter 1.2 CMF 4 (SB) 1 1 1 1 1 1 1 1 1 1 1 1 1 1 1 Input CMF value (direction 2) - If no CMF enter 1.0 CMF 5 (SB) 1 1 1 1 1 1 1 1 1 1 1 1 1 1 1 Calculated Value (direction 2) Total CMF (SB) 0.720 0.720 0.750 0.750 0.750 0.750 0.720 0.720 0.210 0.210 0.210 0.172 0.920 0.900 0.100 Calculated Value (direction 2) Fatal Crash reduction (SB) 1.400 0.560 0.250 0.500 0.750 0.750 1.400 1.680 0.000 0.000 0.790 0.828 0.480 0.400 3.600 Calculated Value (direction 2) Incap Crash reduction (SB) 1.680 1.120 0.750 0.750 0.250 0.000 1.960 1.120 0.790 0.000 1.580 0.828 0.320 0.400 0.000 Enter in Safety Index spreadsheet to calculate new Safety Index (direction 2)
Post-Project Segment Directional Fatal Crashes (SB) 3.600 1.440 4.750 1.500 4.250 5.250 3.600 4.320 5.000 5.000 4.210 5.172 5.520 5.600 2.400
Enter in Safety Index spreadsheet to calculate new Safety Index (direction 2)
Post-Project Segment Directional Incap Crashes (SB) 4.320 2.880 5.250 3.250 6.750 4.000 5.040 2.880 6.210 7.000 5.420 3.172 3.680 3.600 4.000
Input value from updated Safety Index spreadsheet (direction 2) Post-Project Segment Directional Safety Index (SB) 1.12 0.81 1.24 0.85 0.74 1.8 0.62 1.47 0.85 0.86 0.72 1.75 1.88 1.9 0.87
Enter in Safety Needs spreadsheet to calculate new segment level Safety Need (direction 2)
Post-Project Segment Directional Safety Index (SB) 1.120 0.810 1.240 0.850 0.740 1.800 0.620 1.470 0.850 0.860 0.720 1.750 1.880 1.900 0.870
SAFE
TY
INDE
X
Calculated Value - verify that it matches current performance system Current Safety Index 1.330 1.355 1.330 1.355 1.485 1.420 1.485 1.420 1.485 1.485 1.485 1.420 1.420 1.420 1.420
Enter in Safety Needs spreadsheet to calculate new segment level Safety Need Post-Project Safety Index 1.0350
0 0.9750
00 1.225 1.155 1.345 1.250 1.070 1.025 1.480 1.360 1.415 1.240 1.310 1.325 0.690
Needs
User entered value from Safety Needs spreadsheet and for use in Performance Effectiveness spreadsheet Original Segment Safety Need 3.214 2.803 3.214 2.803 3.951 3.835 3.951 3.835 3.951 3.951 3.951 3.835 3.835 3.835 3.835
User entered value from Safety Needs spreadsheet and for use in Performance Effectiveness spreadsheet Post-Project Segment Safety Need 1.907 1.489 2.764 2.067 3.449 3.213 2.447 2.370 3.935 3.49 3.721 3.167 3.431 3.486 1.075
MOBI
LITY
MOBI
LITY
INDE
X
Input current value from performance system Original Segment Mobility Index 0.320 0.260 0.320 0.260 0.560 1.010 0.560 1.010 0.560 0.560 0.560 1.010 1.010 1.010 1.010
Enter in Mobility Index Spreadsheet to determine new segment level Mobility Index Post-Project # of Lanes (both directions) 4.00 4.00 4.00 4.00 4.00 4.00 4.00 4.00 4.00 4.00 4.00 4.00 4.00 5.45 4.00
Input value from updated Mobility Index spreadsheet Post-Project Segment Mobility Index 0.32 0.26 0.32 0.26 0.56 1.01 0.56 1.01 0.51 0.51 0.51 0.92 0.92 0.74 1.01
Enter in Mobility Needs spreadsheet to update segment level Mobility Need Post-Project Segment Mobility Index 0.320 0.260 0.320 0.260 0.560 1.010 0.560 1.010 0.510 0.510 0.510 0.920 0.920 0.740 1.010
FUT
V/C
Input current value from performance system Original Segment Future V/C 0.390 0.320 0.390 0.320 0.660 1.210 0.660 1.210 0.660 0.660 0.660 1.210 1.210 1.210 1.210 Input value from updated Mobility Index spreadsheet Post-Project Segment Future V/C 0.390 0.320 0.390 0.320 0.660 1.210 0.660 1.210 0.600 0.600 0.600 1.100 1.100 0.890 1.210 Enter in Mobility Needs spreadsheet to update segment level Mobility Need Post-Project Segment Future V/C 0.390 0.320 0.390 0.320 0.660 1.210 0.660 1.210 0.600 0.600 0.600 1.100 1.100 0.890 1.210
PEAK
HO
UR
V/C Input current value from performance system (direction 1) Original Segment Peak Hour V/C (NB) 0.190 0.170 0.190 0.170 0.350 0.780 0.350 0.780 0.350 0.350 0.350 0.780 0.780 0.780 0.780
Input current value from performance system (direction 2) Original Segment Peak Hour V/C (SB) 0.200 0.170 0.200 0.170 0.360 0.760 0.360 0.760 0.360 0.360 0.360 0.760 0.760 0.760 0.760
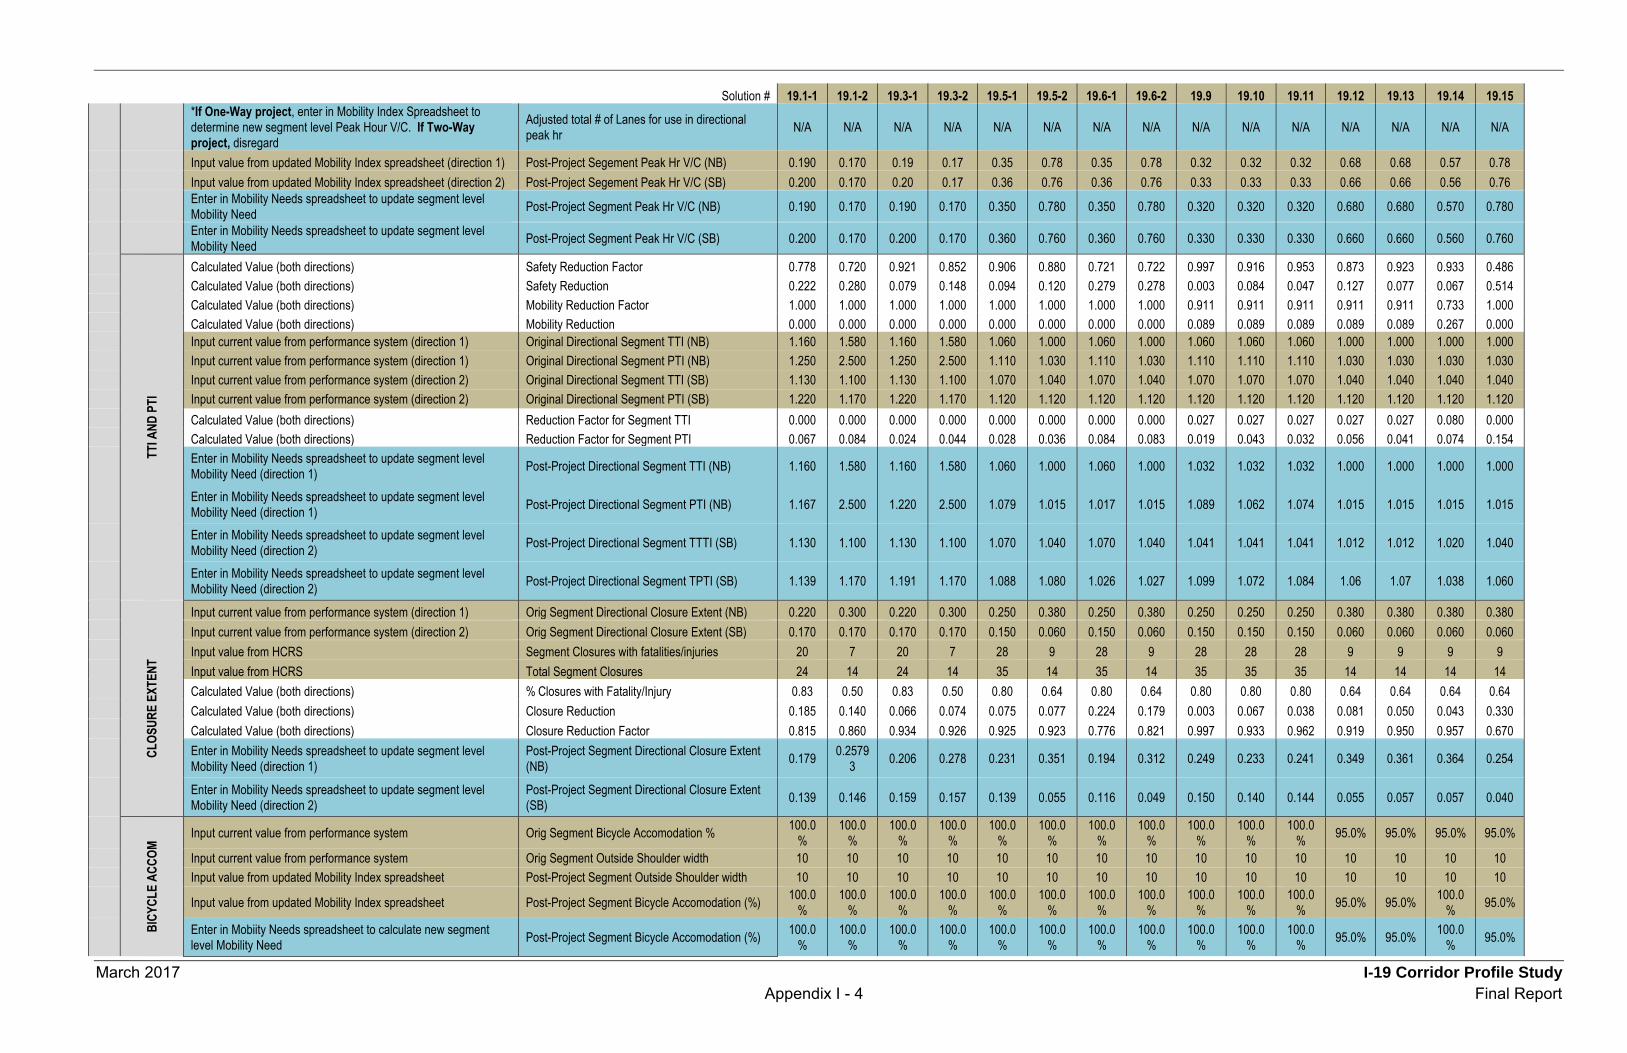
March 2017 I-19 Corridor Profile Study Appendix I - 4 Final Report
Solution # 19.1-1 19.1-2 19.3-1 19.3-2 19.5-1 19.5-2 19.6-1 19.6-2 19.9 19.10 19.11 19.12 19.13 19.14 19.15
*If One-Way project, enter in Mobility Index Spreadsheet to determine new segment level Peak Hour V/C. If Two-Way project, disregard
Adjusted total # of Lanes for use in directional peak hr N/A N/A N/A N/A N/A N/A N/A N/A N/A N/A N/A N/A N/A N/A N/A
Input value from updated Mobility Index spreadsheet (direction 1) Post-Project Segement Peak Hr V/C (NB) 0.190 0.170 0.19 0.17 0.35 0.78 0.35 0.78 0.32 0.32 0.32 0.68 0.68 0.57 0.78 Input value from updated Mobility Index spreadsheet (direction 2) Post-Project Segement Peak Hr V/C (SB) 0.200 0.170 0.20 0.17 0.36 0.76 0.36 0.76 0.33 0.33 0.33 0.66 0.66 0.56 0.76 Enter in Mobility Needs spreadsheet to update segment level Mobility Need Post-Project Segment Peak Hr V/C (NB) 0.190 0.170 0.190 0.170 0.350 0.780 0.350 0.780 0.320 0.320 0.320 0.680 0.680 0.570 0.780
Enter in Mobility Needs spreadsheet to update segment level Mobility Need Post-Project Segment Peak Hr V/C (SB) 0.200 0.170 0.200 0.170 0.360 0.760 0.360 0.760 0.330 0.330 0.330 0.660 0.660 0.560 0.760
TTI A
ND P
TI
Calculated Value (both directions) Safety Reduction Factor 0.778 0.720 0.921 0.852 0.906 0.880 0.721 0.722 0.997 0.916 0.953 0.873 0.923 0.933 0.486 Calculated Value (both directions) Safety Reduction 0.222 0.280 0.079 0.148 0.094 0.120 0.279 0.278 0.003 0.084 0.047 0.127 0.077 0.067 0.514 Calculated Value (both directions) Mobility Reduction Factor 1.000 1.000 1.000 1.000 1.000 1.000 1.000 1.000 0.911 0.911 0.911 0.911 0.911 0.733 1.000 Calculated Value (both directions) Mobility Reduction 0.000 0.000 0.000 0.000 0.000 0.000 0.000 0.000 0.089 0.089 0.089 0.089 0.089 0.267 0.000 Input current value from performance system (direction 1) Original Directional Segment TTI (NB) 1.160 1.580 1.160 1.580 1.060 1.000 1.060 1.000 1.060 1.060 1.060 1.000 1.000 1.000 1.000 Input current value from performance system (direction 1) Original Directional Segment PTI (NB) 1.250 2.500 1.250 2.500 1.110 1.030 1.110 1.030 1.110 1.110 1.110 1.030 1.030 1.030 1.030 Input current value from performance system (direction 2) Original Directional Segment TTI (SB) 1.130 1.100 1.130 1.100 1.070 1.040 1.070 1.040 1.070 1.070 1.070 1.040 1.040 1.040 1.040 Input current value from performance system (direction 2) Original Directional Segment PTI (SB) 1.220 1.170 1.220 1.170 1.120 1.120 1.120 1.120 1.120 1.120 1.120 1.120 1.120 1.120 1.120 Calculated Value (both directions) Reduction Factor for Segment TTI 0.000 0.000 0.000 0.000 0.000 0.000 0.000 0.000 0.027 0.027 0.027 0.027 0.027 0.080 0.000 Calculated Value (both directions) Reduction Factor for Segment PTI 0.067 0.084 0.024 0.044 0.028 0.036 0.084 0.083 0.019 0.043 0.032 0.056 0.041 0.074 0.154 Enter in Mobility Needs spreadsheet to update segment level Mobility Need (direction 1) Post-Project Directional Segment TTI (NB) 1.160 1.580 1.160 1.580 1.060 1.000 1.060 1.000 1.032 1.032 1.032 1.000 1.000 1.000 1.000
Enter in Mobility Needs spreadsheet to update segment level Mobility Need (direction 1) Post-Project Directional Segment PTI (NB) 1.167 2.500 1.220 2.500 1.079 1.015 1.017 1.015 1.089 1.062 1.074 1.015 1.015 1.015 1.015
Enter in Mobility Needs spreadsheet to update segment level Mobility Need (direction 2) Post-Project Directional Segment TTTI (SB) 1.130 1.100 1.130 1.100 1.070 1.040 1.070 1.040 1.041 1.041 1.041 1.012 1.012 1.020 1.040
Enter in Mobility Needs spreadsheet to update segment level Mobility Need (direction 2) Post-Project Directional Segment TPTI (SB) 1.139 1.170 1.191 1.170 1.088 1.080 1.026 1.027 1.099 1.072 1.084 1.06 1.07 1.038 1.060
CLOS
URE
EXTE
NT
Input current value from performance system (direction 1) Orig Segment Directional Closure Extent (NB) 0.220 0.300 0.220 0.300 0.250 0.380 0.250 0.380 0.250 0.250 0.250 0.380 0.380 0.380 0.380 Input current value from performance system (direction 2) Orig Segment Directional Closure Extent (SB) 0.170 0.170 0.170 0.170 0.150 0.060 0.150 0.060 0.150 0.150 0.150 0.060 0.060 0.060 0.060 Input value from HCRS Segment Closures with fatalities/injuries 20 7 20 7 28 9 28 9 28 28 28 9 9 9 9 Input value from HCRS Total Segment Closures 24 14 24 14 35 14 35 14 35 35 35 14 14 14 14 Calculated Value (both directions) % Closures with Fatality/Injury 0.83 0.50 0.83 0.50 0.80 0.64 0.80 0.64 0.80 0.80 0.80 0.64 0.64 0.64 0.64 Calculated Value (both directions) Closure Reduction 0.185 0.140 0.066 0.074 0.075 0.077 0.224 0.179 0.003 0.067 0.038 0.081 0.050 0.043 0.330 Calculated Value (both directions) Closure Reduction Factor 0.815 0.860 0.934 0.926 0.925 0.923 0.776 0.821 0.997 0.933 0.962 0.919 0.950 0.957 0.670 Enter in Mobility Needs spreadsheet to update segment level Mobility Need (direction 1)
Post-Project Segment Directional Closure Extent (NB) 0.179 0.2579
3 0.206 0.278 0.231 0.351 0.194 0.312 0.249 0.233 0.241 0.349 0.361 0.364 0.254
Enter in Mobility Needs spreadsheet to update segment level Mobility Need (direction 2)
Post-Project Segment Directional Closure Extent (SB) 0.139 0.146 0.159 0.157 0.139 0.055 0.116 0.049 0.150 0.140 0.144 0.055 0.057 0.057 0.040
BICY
CLE
ACCO
M
Input current value from performance system Orig Segment Bicycle Accomodation % 100.0%
100.0%
100.0%
100.0%
100.0%
100.0%
100.0%
100.0%
100.0%
100.0%
100.0% 95.0% 95.0% 95.0% 95.0%
Input current value from performance system Orig Segment Outside Shoulder width 10 10 10 10 10 10 10 10 10 10 10 10 10 10 10 Input value from updated Mobility Index spreadsheet Post-Project Segment Outside Shoulder width 10 10 10 10 10 10 10 10 10 10 10 10 10 10 10
Input value from updated Mobility Index spreadsheet Post-Project Segment Bicycle Accomodation (%) 100.0%
100.0%
100.0%
100.0%
100.0%
100.0%
100.0%
100.0%
100.0%
100.0%
100.0% 95.0% 95.0% 100.0
% 95.0%
Enter in Mobiity Needs spreadsheet to calculate new segment level Mobility Need Post-Project Segment Bicycle Accomodation (%) 100.0
% 100.0
% 100.0
% 100.0
% 100.0
% 100.0
% 100.0
% 100.0
% 100.0
% 100.0
% 100.0
% 95.0% 95.0% 100.0% 95.0%

March 2017 I-19 Corridor Profile Study Appendix I - 5 Final Report
Solution # 19.1-1 19.1-2 19.3-1 19.3-2 19.5-1 19.5-2 19.6-1 19.6-2 19.9 19.10 19.11 19.12 19.13 19.14 19.15
Needs
User entered value from Mobility Needs spreadsheet and for use in Performance Effectiveness spreadsheet
Original Segment Mobility Need 0.589 0.504 0.589 0.5039 0.722 4.316 0.722 4.316 0.722 0.722 0.722 4.316 4.316 4.316 4.316
User entered value from Mobility Needs spreadsheet and for use in Performance Effectiveness spreadsheet
Post-Project Segment Mobility Need 0.573 0.495 0.583 0.4989 0.715 4.268 0.702 4.259 0.673 0.668 0.670 3.328 3.335 1.179 4.276
FREI
GHT
TTTI
AND
TPT
I
Input current value from performance system (direction 1) Original Directional Segment TTTI (NB) 1.040 1.430 1.040 1.430 1.030 1.020 1.030 1.020 1.030 1.030 1.030 1.020 1.020 1.020 1.020 Input current value from performance system (direction 1) Original Directional Segment TPTI (NB) 1.090 4.910 1.090 4.910 1.050 1.060 1.050 1.060 1.050 1.050 1.050 1.060 1.060 1.060 1.060 Input current value from performance system (direction 2) Original Directional Segment TTTI (SB) 1.040 1.030 1.040 1.030 1.030 1.080 1.030 1.080 1.030 1.030 1.030 1.080 1.080 1.080 1.080 Input current value from performance system (direction 2) Original Directional Segment TPTI (SB) 1.080 1.060 1.080 1.060 1.060 1.200 1.060 1.200 1.060 1.060 1.060 1.200 1.200 1.200 1.200
Calculated Value (both directions) Reduction Factor for Segment TTTI (both directions) 0.000 0.000 0.000 0.000 0.000 0.000 0.000 0.000 0.013 0.013 0.013 0.013 0.013 0.040 0.000
Calculated Value (both directions) Reduction Factor for Segment TPTI (both directions) 0.033 0.042 0.012 0.022 0.014 0.018 0.042 0.042 0.009 0.022 0.016 0.028 0.021 0.037 0.077
Enter in Freight Needs spreadsheet to update segment level Freight Need (direction 1) Post-Project Directional Segment TTTI (NB) 1.040 1.4300
0 1.040 1.430 1.030 1.020 1.030 1.020 1.016 1.016 1.016 1.006 1.006 1.000 1.020
Enter in Freight Needs spreadsheet to update segment level Freight Need (direction 1) Post-Project Directional Segment TPTI (NB) 1.054 4.9100
0 1.077 4.910 1.035 1.041 1.006 1.016 1.040 1.027 1.033 1.030 1.038 1.021 1.019
Enter in Freight Needs spreadsheet to update segment level Freight Need (direction 2) Post-Project Directional Segment TTTI (SB) 1.040 1.0300
0 1.040 1.030 1.030 1.080 1.030 1.080 1.016 1.016 1.016 1.066 1.066 1.037 1.080
Enter in Freight Needs spreadsheet to update segment level Freight Need (direction 2) Post-Project Directional Segment TPTI (SB) 1.044 1.0600
0 1.067 1.060 1.045 1.178 1.016 1.150 1.050 1.037 1.043 1.166 1.175 1.156 1.107
FREI
GHT
INDE
X
Value from above Original Segment TPTI (NB) 1.090 4.910 1.090 4.910 1.050 1.060 1.050 1.060 1.050 1.050 1.050 1.060 1.060 1.060 1.060 Value from above Original Segment TPTI (SB) 1.080 1.060 1.080 1.060 1.060 1.200 1.060 1.200 1.060 1.060 1.060 1.200 1.200 1.200 1.200 Calculated Value Original Segment Freight Index 0.9217 0.3350 0.922 0.335 0.948 0.885 0.948 0.885 0.948 0.948 0.948 0.885 0.885 0.885 0.885 Calculated Value Post-Project Segment TPTI (NB) 1.054 4.910 1.077 4.910 1.035 1.041 1.006 1.016 1.040 1.027 1.033 1.030 1.038 1.021 1.019 Calculated Value Post-Project Segment TPTI (SB) 1.044 1.060 1.067 1.060 1.045 1.178 1.016 1.150 1.050 1.037 1.043 1.166 1.175 1.156 1.107 Enter in Freight Needs spreadsheet to update segment level Freight Need Post-Project Segment Freight Index 0.9533
79 0.3350
1 0.933 0.335 0.961 0.901 0.989 0.923 0.957 0.969 0.963 0.910 0.904 0.919 0.940
CLOS
URE
DURA
TION
Input current value from performance system (direction 1) Orig Segment Directional Closure Duration (dir 1) 45.090 87.900 45.090 87.900 39.820 66.470 39.820 66.470 39.820 39.820 39.820 66.470 66.470 66.470 66.470 Input current value from performance system (direction 2) Orig Segment Directional Closure Duration (dir 2) 33.780 53.940 33.780 53.940 23.750 22.610 23.750 22.610 23.750 23.750 23.750 22.610 22.610 22.610 22.610 Calculated Value Segment Closures with fatalities 20 7 20 7 28 9 28 9 28 28 28 9 9 9 9 Calculated Value Total Segment Closures 24 14 24 14 35 14 35 14 35 35 35 14 14 14 14 Calculated Value % Closures with Fatality 0.83 0.50 0.83 0.50 0.80 0.64 0.80 0.64 0.80 0.80 0.80 0.64 0.64 0.64 0.64 Calculated Value Closure Reduction 0.185 0.140 0.066 0.074 0.075 0.077 0.224 0.179 0.003 0.067 0.038 0.081 0.050 0.043 0.330 Calculated Value Closure Reduction Factor 0.815 0.860 0.934 0.926 0.925 0.923 0.776 0.821 0.997 0.933 0.962 0.919 0.950 0.957 0.670 Enter in Freight Needs spreadsheet to update segment level Freight Need (direction 1)
Post-Project Segment Directional Closure Duration (NB) 36.756 75.575 42.124 81.413 36.817 61.354 30.917 54.584 39.713 37.139 38.318 61.053 63.160 63.611 44.503
Enter in Freight Needs spreadsheet to update segment level Freight Need (direction 2)
Post-Project Segment Directional Closure Duration (SB) 27.536 46.376 31.558 49.959 21.959 20.870 18.440 18.567 23.686 22.151 22.854 20.768 21.484 21.638 15.138
VERT
CL
R
Input current value from performance system Original Segment Vertical Clearance NA NA NA NA NA NA NA NA NA NA NA NA NA NA NA Input current value from performance system Original vertical clearance for specific bridge NA NA NA NA NA NA NA NA NA NA NA NA NA NA NA Input post-project value (depends on solution) Post-Project vertical clearance for specific bridge NA NA NA NA NA NA NA NA NA NA NA NA NA NA NA Input post-project value (depends on solution)(force segment clearance to equal this specific bridge) Post-Project Segment Vertical Clearance NA NA NA NA NA NA NA NA NA NA NA NA NA NA NA
Enter in Freight Needs spreadsheet to update segment level Post-Project Segment Vertical Clearance NA NA NA NA NA NA NA NA NA NA NA NA NA NA NA
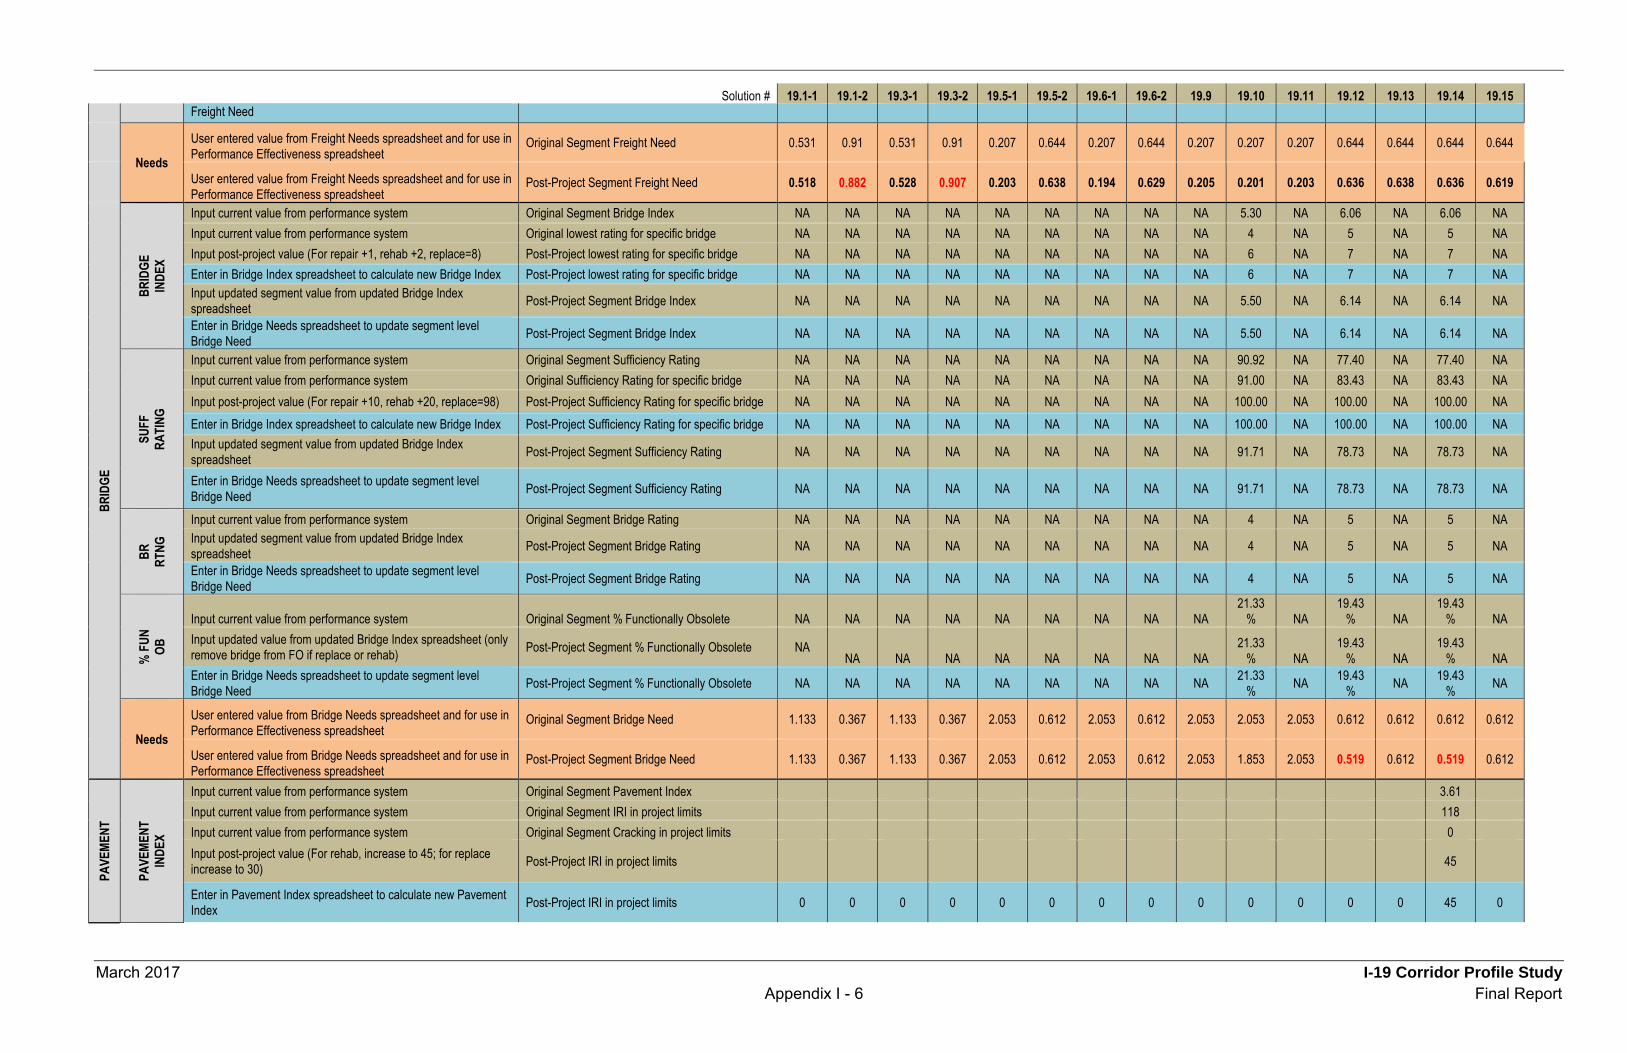
March 2017 I-19 Corridor Profile Study Appendix I - 6 Final Report
Solution # 19.1-1 19.1-2 19.3-1 19.3-2 19.5-1 19.5-2 19.6-1 19.6-2 19.9 19.10 19.11 19.12 19.13 19.14 19.15
Freight Need
Needs
User entered value from Freight Needs spreadsheet and for use in Performance Effectiveness spreadsheet
Original Segment Freight Need 0.531 0.91 0.531 0.91 0.207 0.644 0.207 0.644 0.207 0.207 0.207 0.644 0.644 0.644 0.644
User entered value from Freight Needs spreadsheet and for use in Performance Effectiveness spreadsheet
Post-Project Segment Freight Need 0.518 0.882 0.528 0.907 0.203 0.638 0.194 0.629 0.205 0.201 0.203 0.636 0.638 0.636 0.619
BRID
GE
BRID
GE
INDE
X
Input current value from performance system Original Segment Bridge Index NA NA NA NA NA NA NA NA NA 5.30 NA 6.06 NA 6.06 NA Input current value from performance system Original lowest rating for specific bridge NA NA NA NA NA NA NA NA NA 4 NA 5 NA 5 NA Input post-project value (For repair +1, rehab +2, replace=8) Post-Project lowest rating for specific bridge NA NA NA NA NA NA NA NA NA 6 NA 7 NA 7 NA Enter in Bridge Index spreadsheet to calculate new Bridge Index Post-Project lowest rating for specific bridge NA NA NA NA NA NA NA NA NA 6 NA 7 NA 7 NA Input updated segment value from updated Bridge Index spreadsheet Post-Project Segment Bridge Index NA NA NA NA NA NA NA NA NA 5.50 NA 6.14 NA 6.14 NA
Enter in Bridge Needs spreadsheet to update segment level Bridge Need Post-Project Segment Bridge Index NA NA NA NA NA NA NA NA NA 5.50 NA 6.14 NA 6.14 NA
SUFF
RA
TING
Input current value from performance system Original Segment Sufficiency Rating NA NA NA NA NA NA NA NA NA 90.92 NA 77.40 NA 77.40 NA Input current value from performance system Original Sufficiency Rating for specific bridge NA NA NA NA NA NA NA NA NA 91.00 NA 83.43 NA 83.43 NA Input post-project value (For repair +10, rehab +20, replace=98) Post-Project Sufficiency Rating for specific bridge NA NA NA NA NA NA NA NA NA 100.00 NA 100.00 NA 100.00 NA Enter in Bridge Index spreadsheet to calculate new Bridge Index Post-Project Sufficiency Rating for specific bridge NA NA NA NA NA NA NA NA NA 100.00 NA 100.00 NA 100.00 NA Input updated segment value from updated Bridge Index spreadsheet Post-Project Segment Sufficiency Rating NA NA NA NA NA NA NA NA NA 91.71 NA 78.73 NA 78.73 NA
Enter in Bridge Needs spreadsheet to update segment level Bridge Need Post-Project Segment Sufficiency Rating NA NA NA NA NA NA NA NA NA 91.71 NA 78.73 NA 78.73 NA
BR
RTNG
Input current value from performance system Original Segment Bridge Rating NA NA NA NA NA NA NA NA NA 4 NA 5 NA 5 NA Input updated segment value from updated Bridge Index spreadsheet Post-Project Segment Bridge Rating NA NA NA NA NA NA NA NA NA 4 NA 5 NA 5 NA
Enter in Bridge Needs spreadsheet to update segment level Bridge Need Post-Project Segment Bridge Rating NA NA NA NA NA NA NA NA NA 4 NA 5 NA 5 NA
% F
UN
OB
Input current value from performance system Original Segment % Functionally Obsolete NA NA NA NA NA NA NA NA NA 21.33
% NA 19.43
% NA 19.43
% NA Input updated value from updated Bridge Index spreadsheet (only remove bridge from FO if replace or rehab) Post-Project Segment % Functionally Obsolete NA
NA NA NA NA NA NA NA NA 21.33
% NA 19.43
% NA 19.43
% NA Enter in Bridge Needs spreadsheet to update segment level Bridge Need Post-Project Segment % Functionally Obsolete NA NA NA NA NA NA NA NA NA 21.33
% NA 19.43% NA 19.43
% NA
Needs
User entered value from Bridge Needs spreadsheet and for use in Performance Effectiveness spreadsheet
Original Segment Bridge Need 1.133 0.367 1.133 0.367 2.053 0.612 2.053 0.612 2.053 2.053 2.053 0.612 0.612 0.612 0.612
User entered value from Bridge Needs spreadsheet and for use in Performance Effectiveness spreadsheet
Post-Project Segment Bridge Need 1.133 0.367 1.133 0.367 2.053 0.612 2.053 0.612 2.053 1.853 2.053 0.519 0.612 0.519 0.612
PAVE
MENT
PAVE
MENT
IN
DEX
Input current value from performance system Original Segment Pavement Index 3.61 Input current value from performance system Original Segment IRI in project limits 118 Input current value from performance system Original Segment Cracking in project limits 0 Input post-project value (For rehab, increase to 45; for replace increase to 30) Post-Project IRI in project limits 45
Enter in Pavement Index spreadsheet to calculate new Pavement Index Post-Project IRI in project limits 0 0 0 0 0 0 0 0 0 0 0 0 0 45 0
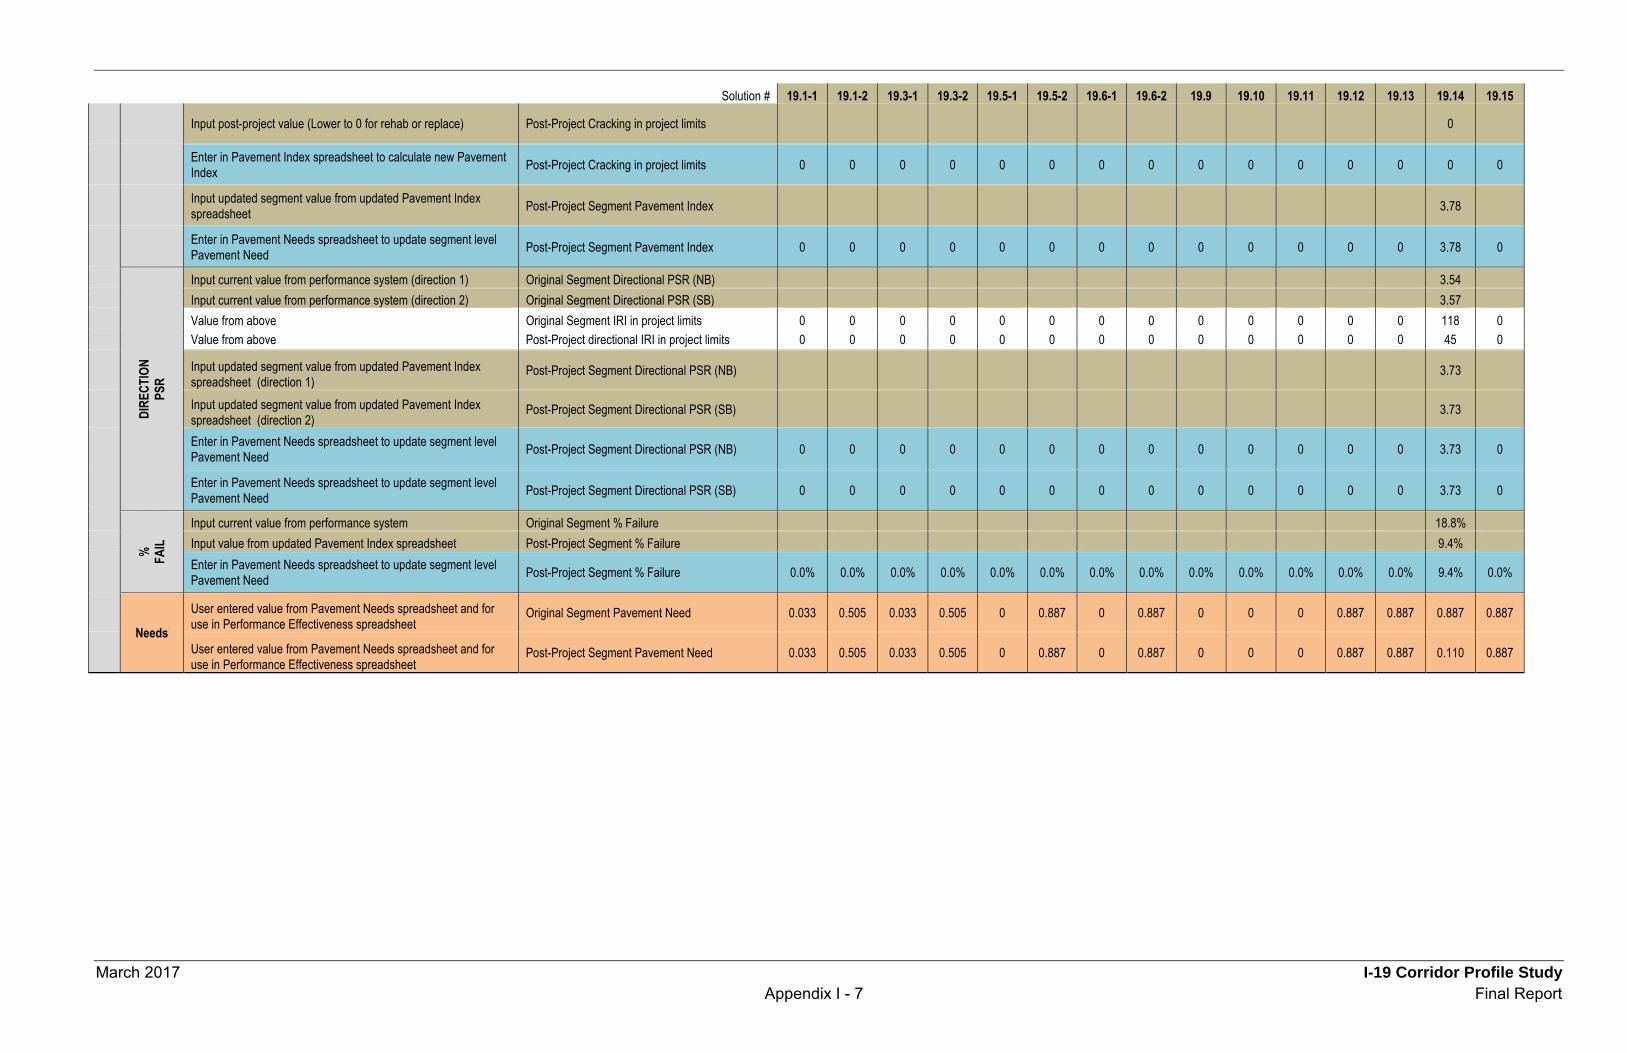
March 2017 I-19 Corridor Profile Study Appendix I - 7 Final Report
Solution # 19.1-1 19.1-2 19.3-1 19.3-2 19.5-1 19.5-2 19.6-1 19.6-2 19.9 19.10 19.11 19.12 19.13 19.14 19.15
Input post-project value (Lower to 0 for rehab or replace) Post-Project Cracking in project limits 0
Enter in Pavement Index spreadsheet to calculate new Pavement Index Post-Project Cracking in project limits 0 0 0 0 0 0 0 0 0 0 0 0 0 0 0
Input updated segment value from updated Pavement Index spreadsheet Post-Project Segment Pavement Index 3.78
Enter in Pavement Needs spreadsheet to update segment level Pavement Need Post-Project Segment Pavement Index 0 0 0 0 0 0 0 0 0 0 0 0 0 3.78 0
DIRE
CTIO
N PS
R
Input current value from performance system (direction 1) Original Segment Directional PSR (NB) 3.54 Input current value from performance system (direction 2) Original Segment Directional PSR (SB) 3.57 Value from above Original Segment IRI in project limits 0 0 0 0 0 0 0 0 0 0 0 0 0 118 0 Value from above Post-Project directional IRI in project limits 0 0 0 0 0 0 0 0 0 0 0 0 0 45 0
Input updated segment value from updated Pavement Index spreadsheet (direction 1)
Post-Project Segment Directional PSR (NB) 3.73
Input updated segment value from updated Pavement Index spreadsheet (direction 2)
Post-Project Segment Directional PSR (SB) 3.73
Enter in Pavement Needs spreadsheet to update segment level Pavement Need Post-Project Segment Directional PSR (NB) 0 0 0 0 0 0 0 0 0 0 0 0 0 3.73 0
Enter in Pavement Needs spreadsheet to update segment level Pavement Need Post-Project Segment Directional PSR (SB) 0 0 0 0 0 0 0 0 0 0 0 0 0 3.73 0
%
FAIL
Input current value from performance system Original Segment % Failure 18.8% Input value from updated Pavement Index spreadsheet Post-Project Segment % Failure 9.4% Enter in Pavement Needs spreadsheet to update segment level Pavement Need Post-Project Segment % Failure 0.0% 0.0% 0.0% 0.0% 0.0% 0.0% 0.0% 0.0% 0.0% 0.0% 0.0% 0.0% 0.0% 9.4% 0.0%
Needs
User entered value from Pavement Needs spreadsheet and for use in Performance Effectiveness spreadsheet
Original Segment Pavement Need 0.033 0.505 0.033 0.505 0 0.887 0 0.887 0 0 0 0.887 0.887 0.887 0.887
User entered value from Pavement Needs spreadsheet and for use in Performance Effectiveness spreadsheet
Post-Project Segment Pavement Need 0.033 0.505 0.033 0.505 0 0.887 0 0.887 0 0 0 0.887 0.887 0.110 0.887
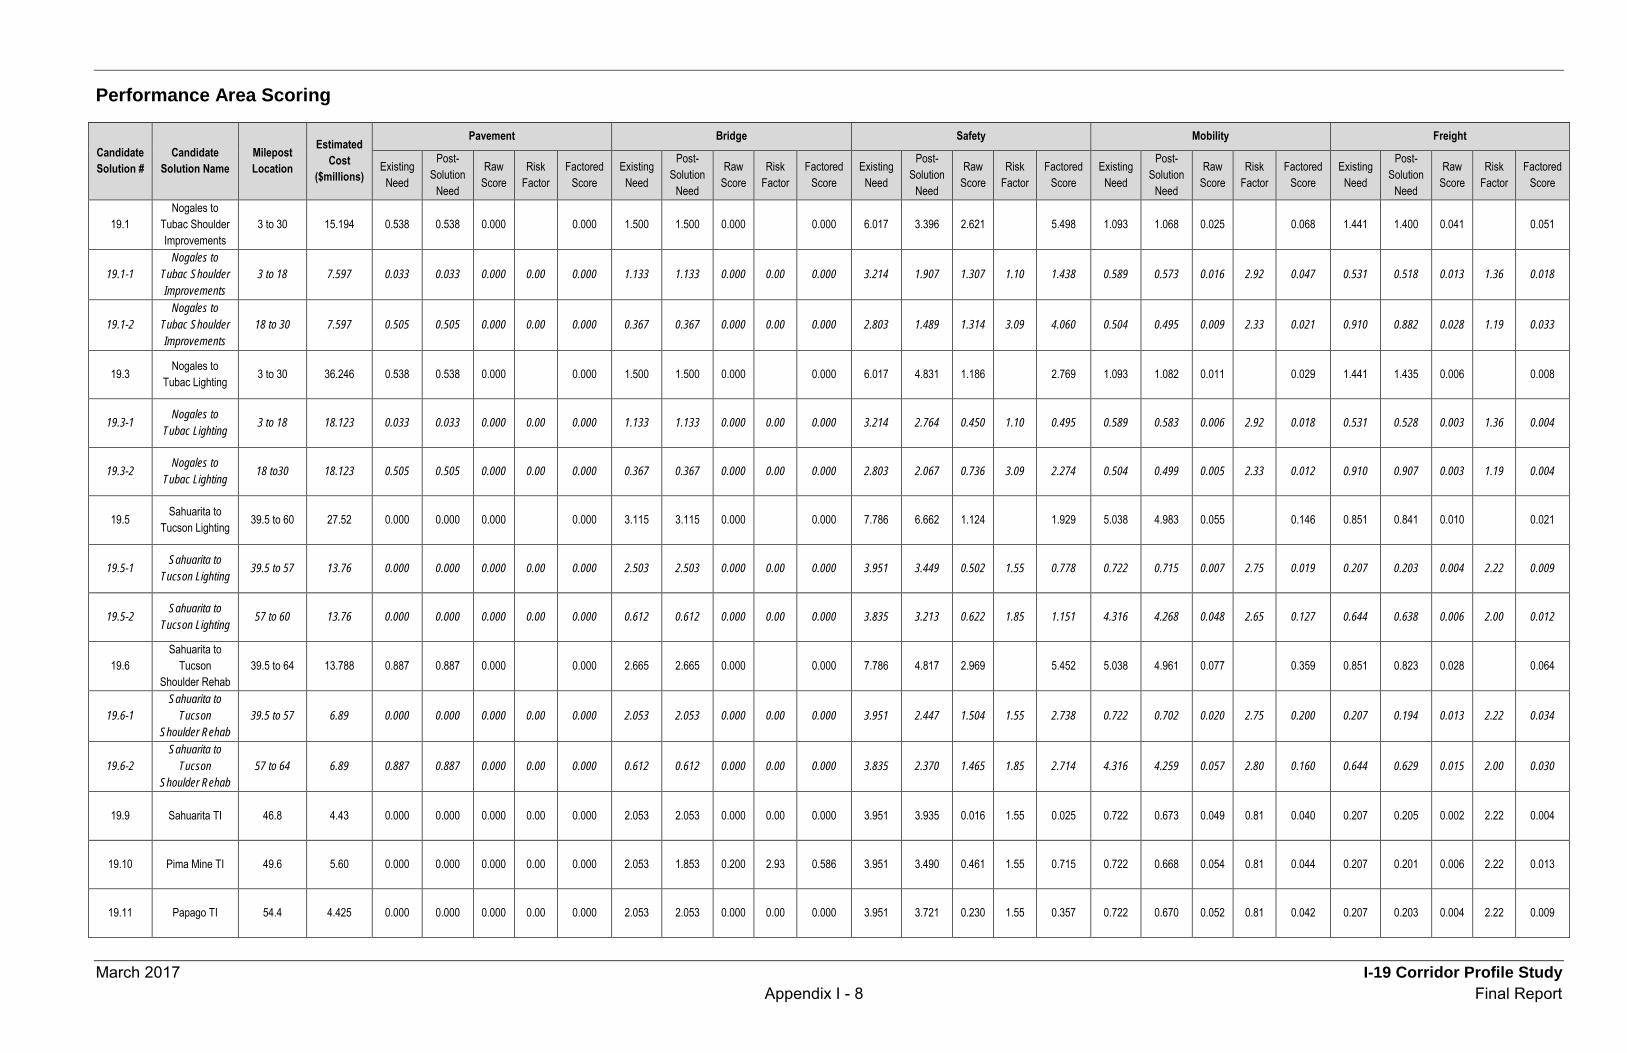
March 2017 I-19 Corridor Profile Study Appendix I - 8 Final Report
Performance Area Scoring
Candidate Solution #
Candidate Solution Name
Milepost Location
Estimated Cost
($millions)
Pavement Bridge Safety Mobility Freight
Existing Need
Post-Solution
Need
Raw Score
Risk Factor
Factored Score
Existing Need
Post-Solution
Need
Raw Score
Risk Factor
Factored Score
Existing Need
Post-Solution
Need
Raw Score
Risk Factor
Factored Score
Existing Need
Post-Solution
Need
Raw Score
Risk Factor
Factored Score
Existing Need
Post-Solution
Need
Raw Score
Risk Factor
Factored Score
19.1 Nogales to
Tubac Shoulder Improvements
3 to 30 15.194 0.538 0.538 0.000 0.000 1.500 1.500 0.000 0.000 6.017 3.396 2.621 5.498 1.093 1.068 0.025 0.068 1.441 1.400 0.041 0.051
19.1-1 Nogales to
Tubac Shoulder Improvements
3 to 18 7.597 0.033 0.033 0.000 0.00 0.000 1.133 1.133 0.000 0.00 0.000 3.214 1.907 1.307 1.10 1.438 0.589 0.573 0.016 2.92 0.047 0.531 0.518 0.013 1.36 0.018
19.1-2 Nogales to
Tubac Shoulder Improvements
18 to 30 7.597 0.505 0.505 0.000 0.00 0.000 0.367 0.367 0.000 0.00 0.000 2.803 1.489 1.314 3.09 4.060 0.504 0.495 0.009 2.33 0.021 0.910 0.882 0.028 1.19 0.033
19.3 Nogales to Tubac Lighting 3 to 30 36.246 0.538 0.538 0.000 0.000 1.500 1.500 0.000 0.000 6.017 4.831 1.186 2.769 1.093 1.082 0.011 0.029 1.441 1.435 0.006 0.008
19.3-1 Nogales to
Tubac Lighting 3 to 18 18.123 0.033 0.033 0.000 0.00 0.000 1.133 1.133 0.000 0.00 0.000 3.214 2.764 0.450 1.10 0.495 0.589 0.583 0.006 2.92 0.018 0.531 0.528 0.003 1.36 0.004
19.3-2 Nogales to
Tubac Lighting 18 to30 18.123 0.505 0.505 0.000 0.00 0.000 0.367 0.367 0.000 0.00 0.000 2.803 2.067 0.736 3.09 2.274 0.504 0.499 0.005 2.33 0.012 0.910 0.907 0.003 1.19 0.004
19.5 Sahuarita to Tucson Lighting 39.5 to 60 27.52 0.000 0.000 0.000 0.000 3.115 3.115 0.000 0.000 7.786 6.662 1.124 1.929 5.038 4.983 0.055 0.146 0.851 0.841 0.010 0.021
19.5-1 Sahuarita to
Tucson Lighting 39.5 to 57 13.76 0.000 0.000 0.000 0.00 0.000 2.503 2.503 0.000 0.00 0.000 3.951 3.449 0.502 1.55 0.778 0.722 0.715 0.007 2.75 0.019 0.207 0.203 0.004 2.22 0.009
19.5-2 Sahuarita to
Tucson Lighting 57 to 60 13.76 0.000 0.000 0.000 0.00 0.000 0.612 0.612 0.000 0.00 0.000 3.835 3.213 0.622 1.85 1.151 4.316 4.268 0.048 2.65 0.127 0.644 0.638 0.006 2.00 0.012
19.6 Sahuarita to
Tucson Shoulder Rehab
39.5 to 64 13.788 0.887 0.887 0.000 0.000 2.665 2.665 0.000 0.000 7.786 4.817 2.969 5.452 5.038 4.961 0.077 0.359 0.851 0.823 0.028 0.064
19.6-1 Sahuarita to
Tucson Shoulder Rehab
39.5 to 57 6.89 0.000 0.000 0.000 0.00 0.000 2.053 2.053 0.000 0.00 0.000 3.951 2.447 1.504 1.55 2.738 0.722 0.702 0.020 2.75 0.200 0.207 0.194 0.013 2.22 0.034
19.6-2 Sahuarita to
Tucson Shoulder Rehab
57 to 64 6.89 0.887 0.887 0.000 0.00 0.000 0.612 0.612 0.000 0.00 0.000 3.835 2.370 1.465 1.85 2.714 4.316 4.259 0.057 2.80 0.160 0.644 0.629 0.015 2.00 0.030
19.9 Sahuarita TI 46.8 4.43 0.000 0.000 0.000 0.00 0.000 2.053 2.053 0.000 0.00 0.000 3.951 3.935 0.016 1.55 0.025 0.722 0.673 0.049 0.81 0.040 0.207 0.205 0.002 2.22 0.004
19.10 Pima Mine TI 49.6 5.60 0.000 0.000 0.000 0.00 0.000 2.053 1.853 0.200 2.93 0.586 3.951 3.490 0.461 1.55 0.715 0.722 0.668 0.054 0.81 0.044 0.207 0.201 0.006 2.22 0.013
19.11 Papago TI 54.4 4.425 0.000 0.000 0.000 0.00 0.000 2.053 2.053 0.000 0.00 0.000 3.951 3.721 0.230 1.55 0.357 0.722 0.670 0.052 0.81 0.042 0.207 0.203 0.004 2.22 0.009
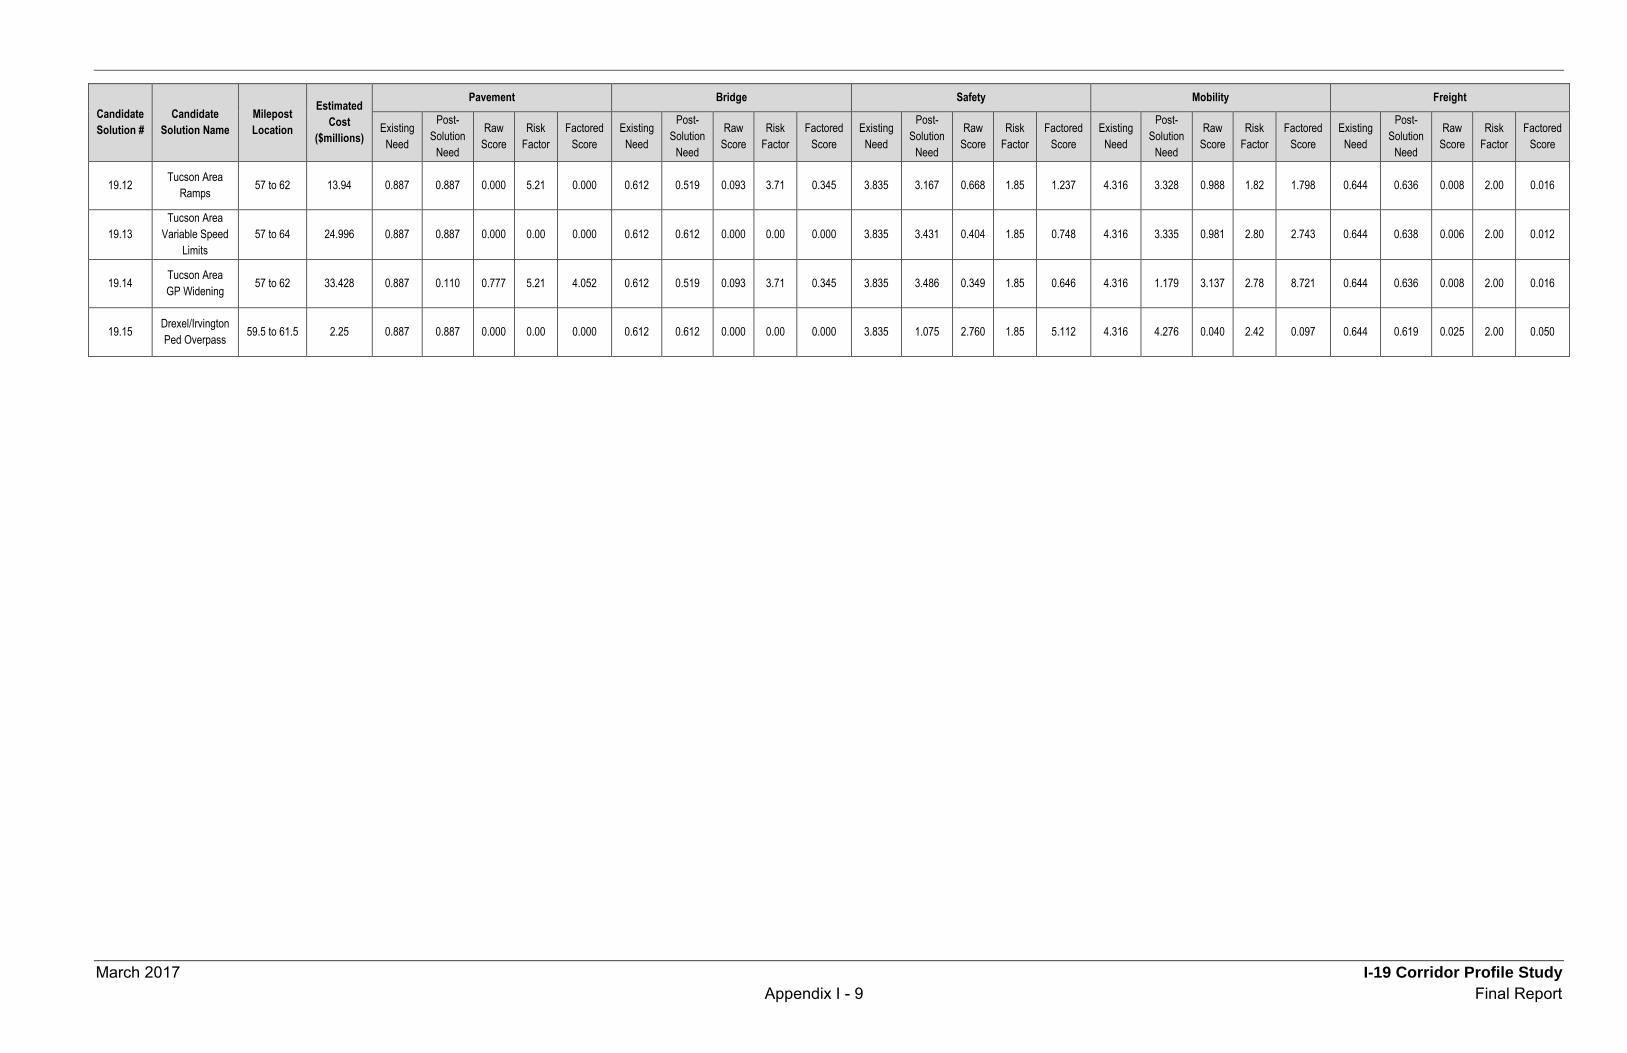
March 2017 I-19 Corridor Profile Study Appendix I - 9 Final Report
Candidate Solution #
Candidate Solution Name
Milepost Location
Estimated Cost
($millions)
Pavement Bridge Safety Mobility Freight
Existing Need
Post-Solution
Need
Raw Score
Risk Factor
Factored Score
Existing Need
Post-Solution
Need
Raw Score
Risk Factor
Factored Score
Existing Need
Post-Solution
Need
Raw Score
Risk Factor
Factored Score
Existing Need
Post-Solution
Need
Raw Score
Risk Factor
Factored Score
Existing Need
Post-Solution
Need
Raw Score
Risk Factor
Factored Score
19.12 Tucson Area Ramps 57 to 62 13.94 0.887 0.887 0.000 5.21 0.000 0.612 0.519 0.093 3.71 0.345 3.835 3.167 0.668 1.85 1.237 4.316 3.328 0.988 1.82 1.798 0.644 0.636 0.008 2.00 0.016
19.13 Tucson Area
Variable Speed Limits
57 to 64 24.996 0.887 0.887 0.000 0.00 0.000 0.612 0.612 0.000 0.00 0.000 3.835 3.431 0.404 1.85 0.748 4.316 3.335 0.981 2.80 2.743 0.644 0.638 0.006 2.00 0.012
19.14 Tucson Area GP Widening 57 to 62 33.428 0.887 0.110 0.777 5.21 4.052 0.612 0.519 0.093 3.71 0.345 3.835 3.486 0.349 1.85 0.646 4.316 1.179 3.137 2.78 8.721 0.644 0.636 0.008 2.00 0.016
19.15 Drexel/Irvington Ped Overpass 59.5 to 61.5 2.25 0.887 0.887 0.000 0.00 0.000 0.612 0.612 0.000 0.00 0.000 3.835 1.075 2.760 1.85 5.112 4.316 4.276 0.040 2.42 0.097 0.644 0.619 0.025 2.00 0.050
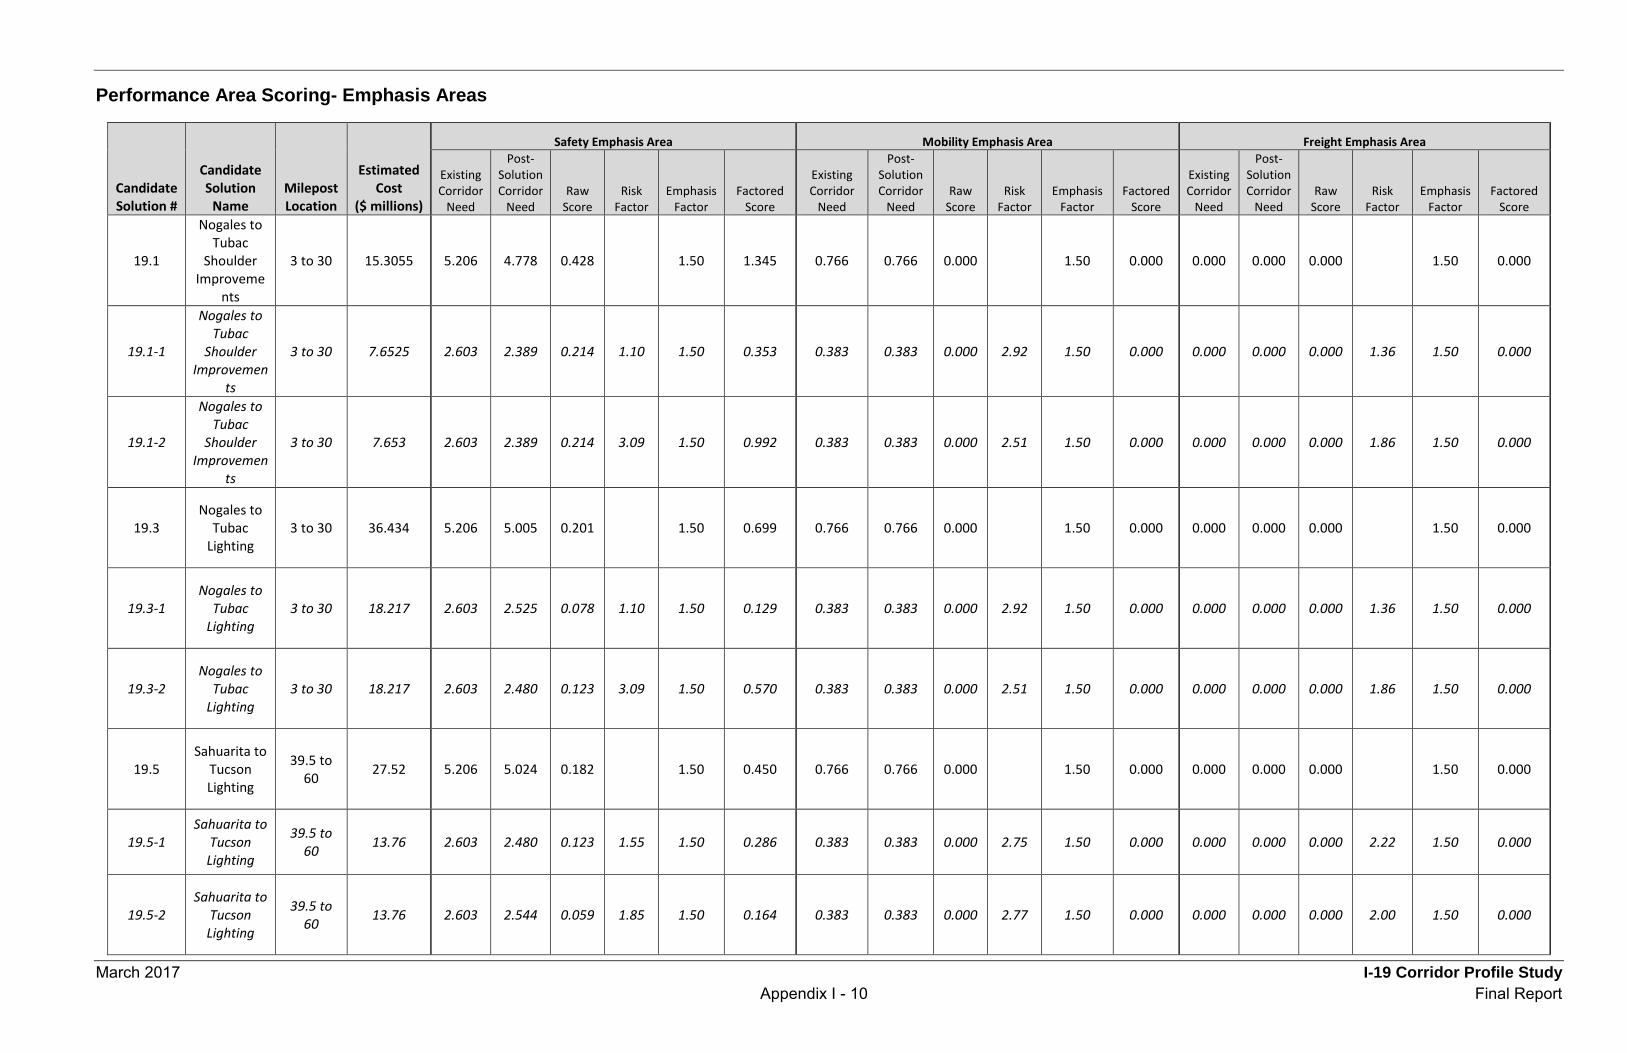
March 2017 I-19 Corridor Profile Study Appendix I - 10 Final Report
Performance Area Scoring- Emphasis Areas
Candidate Solution #
Candidate Solution
Name Milepost Location
Estimated Cost
($ millions)
Safety Emphasis Area Mobility Emphasis Area Freight Emphasis Area
Existing Corridor
Need
Post-Solution Corridor
Need Raw
Score Risk
Factor Emphasis
Factor Factored
Score
Existing Corridor
Need
Post-Solution Corridor
Need Raw
Score Risk
Factor Emphasis
Factor Factored
Score
Existing Corridor
Need
Post-Solution Corridor
Need Raw
Score Risk
Factor Emphasis
Factor Factored
Score
19.1
Nogales to Tubac
Shoulder Improveme
nts
3 to 30 15.3055 5.206 4.778 0.428 1.50 1.345 0.766 0.766 0.000 1.50 0.000 0.000 0.000 0.000 1.50 0.000
19.1-1
Nogales to Tubac
Shoulder Improvemen
ts
3 to 30 7.6525 2.603 2.389 0.214 1.10 1.50 0.353 0.383 0.383 0.000 2.92 1.50 0.000 0.000 0.000 0.000 1.36 1.50 0.000
19.1-2
Nogales to Tubac
Shoulder Improvemen
ts
3 to 30 7.653 2.603 2.389 0.214 3.09 1.50 0.992 0.383 0.383 0.000 2.51 1.50 0.000 0.000 0.000 0.000 1.86 1.50 0.000
19.3 Nogales to
Tubac Lighting
3 to 30 36.434 5.206 5.005 0.201 1.50 0.699 0.766 0.766 0.000 1.50 0.000 0.000 0.000 0.000 1.50 0.000
19.3-1 Nogales to
Tubac Lighting
3 to 30 18.217 2.603 2.525 0.078 1.10 1.50 0.129 0.383 0.383 0.000 2.92 1.50 0.000 0.000 0.000 0.000 1.36 1.50 0.000
19.3-2 Nogales to
Tubac Lighting
3 to 30 18.217 2.603 2.480 0.123 3.09 1.50 0.570 0.383 0.383 0.000 2.51 1.50 0.000 0.000 0.000 0.000 1.86 1.50 0.000
19.5 Sahuarita to
Tucson Lighting
39.5 to 60 27.52 5.206 5.024 0.182 1.50 0.450 0.766 0.766 0.000 1.50 0.000 0.000 0.000 0.000 1.50 0.000
19.5-1 Sahuarita to
Tucson Lighting
39.5 to 60 13.76 2.603 2.480 0.123 1.55 1.50 0.286 0.383 0.383 0.000 2.75 1.50 0.000 0.000 0.000 0.000 2.22 1.50 0.000
19.5-2 Sahuarita to
Tucson Lighting
39.5 to 60 13.76 2.603 2.544 0.059 1.85 1.50 0.164 0.383 0.383 0.000 2.77 1.50 0.000 0.000 0.000 0.000 2.00 1.50 0.000
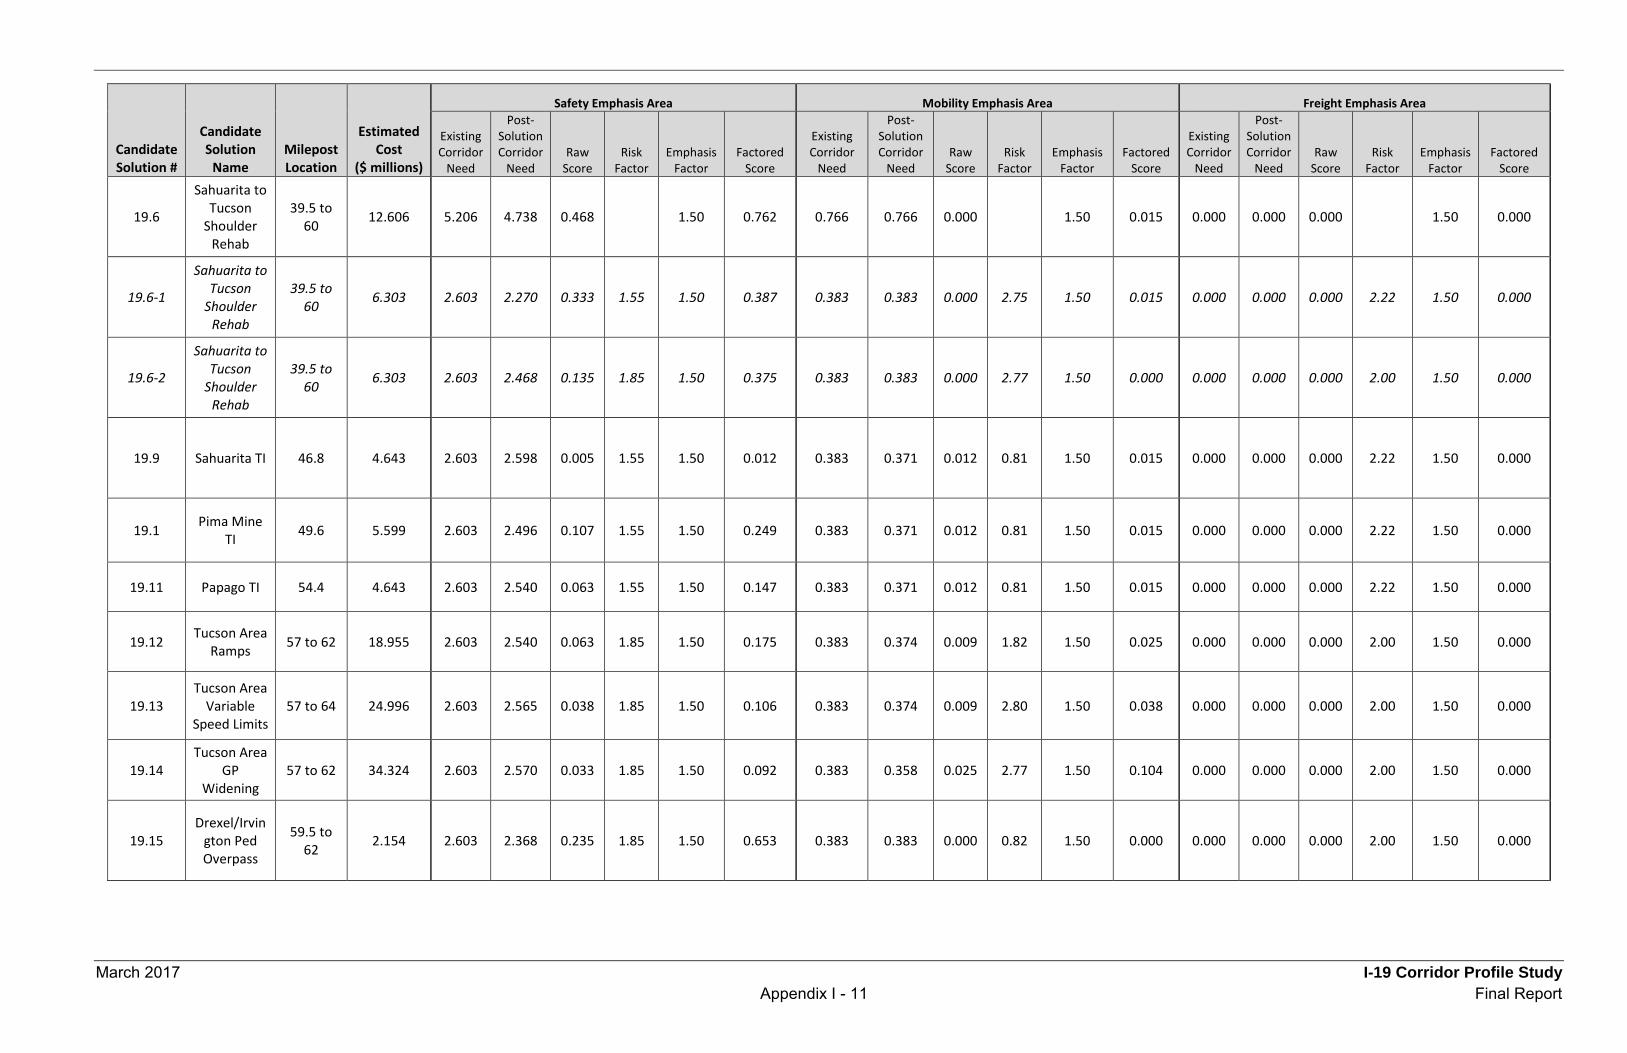
March 2017 I-19 Corridor Profile Study Appendix I - 11 Final Report
Candidate Solution #
Candidate Solution
Name Milepost Location
Estimated Cost
($ millions)
Safety Emphasis Area Mobility Emphasis Area Freight Emphasis Area
Existing Corridor
Need
Post-Solution Corridor
Need Raw
Score Risk
Factor Emphasis
Factor Factored
Score
Existing Corridor
Need
Post-Solution Corridor
Need Raw
Score Risk
Factor Emphasis
Factor Factored
Score
Existing Corridor
Need
Post-Solution Corridor
Need Raw
Score Risk
Factor Emphasis
Factor Factored
Score
19.6
Sahuarita to Tucson
Shoulder Rehab
39.5 to 60 12.606 5.206 4.738 0.468 1.50 0.762 0.766 0.766 0.000 1.50 0.015 0.000 0.000 0.000 1.50 0.000
19.6-1
Sahuarita to Tucson
Shoulder Rehab
39.5 to 60 6.303 2.603 2.270 0.333 1.55 1.50 0.387 0.383 0.383 0.000 2.75 1.50 0.015 0.000 0.000 0.000 2.22 1.50 0.000
19.6-2
Sahuarita to Tucson
Shoulder Rehab
39.5 to 60 6.303 2.603 2.468 0.135 1.85 1.50 0.375 0.383 0.383 0.000 2.77 1.50 0.000 0.000 0.000 0.000 2.00 1.50 0.000
19.9 Sahuarita TI 46.8 4.643 2.603 2.598 0.005 1.55 1.50 0.012 0.383 0.371 0.012 0.81 1.50 0.015 0.000 0.000 0.000 2.22 1.50 0.000
19.1 Pima Mine TI 49.6 5.599 2.603 2.496 0.107 1.55 1.50 0.249 0.383 0.371 0.012 0.81 1.50 0.015 0.000 0.000 0.000 2.22 1.50 0.000
19.11 Papago TI 54.4 4.643 2.603 2.540 0.063 1.55 1.50 0.147 0.383 0.371 0.012 0.81 1.50 0.015 0.000 0.000 0.000 2.22 1.50 0.000
19.12 Tucson Area Ramps 57 to 62 18.955 2.603 2.540 0.063 1.85 1.50 0.175 0.383 0.374 0.009 1.82 1.50 0.025 0.000 0.000 0.000 2.00 1.50 0.000
19.13 Tucson Area
Variable Speed Limits
57 to 64 24.996 2.603 2.565 0.038 1.85 1.50 0.106 0.383 0.374 0.009 2.80 1.50 0.038 0.000 0.000 0.000 2.00 1.50 0.000
19.14 Tucson Area
GP Widening
57 to 62 34.324 2.603 2.570 0.033 1.85 1.50 0.092 0.383 0.358 0.025 2.77 1.50 0.104 0.000 0.000 0.000 2.00 1.50 0.000
19.15 Drexel/Irvin
gton Ped Overpass
59.5 to 62 2.154 2.603 2.368 0.235 1.85 1.50 0.653 0.383 0.383 0.000 0.82 1.50 0.000 0.000 0.000 0.000 2.00 1.50 0.000
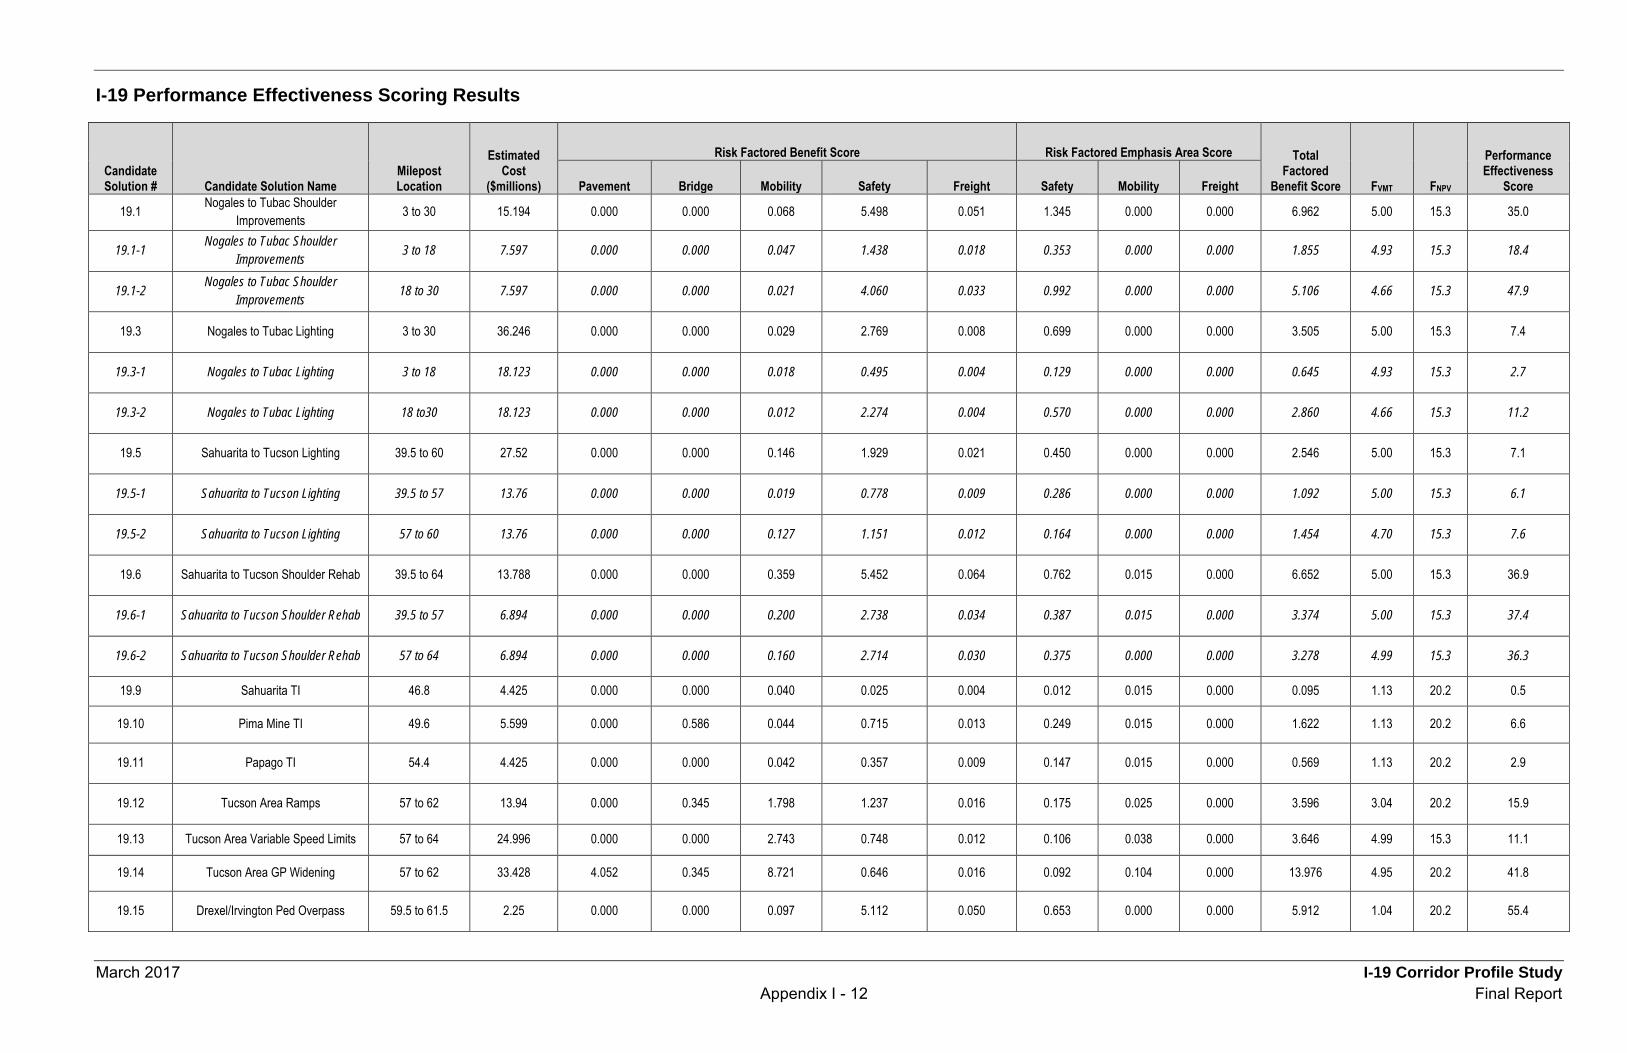
March 2017 I-19 Corridor Profile Study Appendix I - 12 Final Report
I-19 Performance Effectiveness Scoring Results
Candidate Solution # Candidate Solution Name
Milepost Location
Estimated Cost
($millions)
Risk Factored Benefit Score Risk Factored Emphasis Area Score Total Factored
Benefit Score FVMT FNPV
Performance Effectiveness
Score Pavement Bridge Mobility Safety Freight Safety Mobility Freight
19.1 Nogales to Tubac Shoulder Improvements 3 to 30 15.194 0.000 0.000 0.068 5.498 0.051 1.345 0.000 0.000 6.962 5.00 15.3 35.0
19.1-1 Nogales to Tubac Shoulder
Improvements 3 to 18 7.597 0.000 0.000 0.047 1.438 0.018 0.353 0.000 0.000 1.855 4.93 15.3 18.4
19.1-2 Nogales to Tubac Shoulder
Improvements 18 to 30 7.597 0.000 0.000 0.021 4.060 0.033 0.992 0.000 0.000 5.106 4.66 15.3 47.9
19.3 Nogales to Tubac Lighting 3 to 30 36.246 0.000 0.000 0.029 2.769 0.008 0.699 0.000 0.000 3.505 5.00 15.3 7.4
19.3-1 Nogales to Tubac Lighting 3 to 18 18.123 0.000 0.000 0.018 0.495 0.004 0.129 0.000 0.000 0.645 4.93 15.3 2.7
19.3-2 Nogales to Tubac Lighting 18 to30 18.123 0.000 0.000 0.012 2.274 0.004 0.570 0.000 0.000 2.860 4.66 15.3 11.2
19.5 Sahuarita to Tucson Lighting 39.5 to 60 27.52 0.000 0.000 0.146 1.929 0.021 0.450 0.000 0.000 2.546 5.00 15.3 7.1
19.5-1 Sahuarita to Tucson Lighting 39.5 to 57 13.76 0.000 0.000 0.019 0.778 0.009 0.286 0.000 0.000 1.092 5.00 15.3 6.1
19.5-2 Sahuarita to Tucson Lighting 57 to 60 13.76 0.000 0.000 0.127 1.151 0.012 0.164 0.000 0.000 1.454 4.70 15.3 7.6
19.6 Sahuarita to Tucson Shoulder Rehab 39.5 to 64 13.788 0.000 0.000 0.359 5.452 0.064 0.762 0.015 0.000 6.652 5.00 15.3 36.9
19.6-1 Sahuarita to Tucson Shoulder Rehab 39.5 to 57 6.894 0.000 0.000 0.200 2.738 0.034 0.387 0.015 0.000 3.374 5.00 15.3 37.4
19.6-2 Sahuarita to Tucson Shoulder Rehab 57 to 64 6.894 0.000 0.000 0.160 2.714 0.030 0.375 0.000 0.000 3.278 4.99 15.3 36.3
19.9 Sahuarita TI 46.8 4.425 0.000 0.000 0.040 0.025 0.004 0.012 0.015 0.000 0.095 1.13 20.2 0.5
19.10 Pima Mine TI 49.6 5.599 0.000 0.586 0.044 0.715 0.013 0.249 0.015 0.000 1.622 1.13 20.2 6.6
19.11 Papago TI 54.4 4.425 0.000 0.000 0.042 0.357 0.009 0.147 0.015 0.000 0.569 1.13 20.2 2.9
19.12 Tucson Area Ramps 57 to 62 13.94 0.000 0.345 1.798 1.237 0.016 0.175 0.025 0.000 3.596 3.04 20.2 15.9
19.13 Tucson Area Variable Speed Limits 57 to 64 24.996 0.000 0.000 2.743 0.748 0.012 0.106 0.038 0.000 3.646 4.99 15.3 11.1
19.14 Tucson Area GP Widening 57 to 62 33.428 4.052 0.345 8.721 0.646 0.016 0.092 0.104 0.000 13.976 4.95 20.2 41.8
19.15 Drexel/Irvington Ped Overpass 59.5 to 61.5 2.25 0.000 0.000 0.097 5.112 0.050 0.653 0.000 0.000 5.912 1.04 20.2 55.4
March 2017 I-19 Corridor Profile Study Appenidx J - 1 Final Report
Appendix J: Solution Prioritization Scores
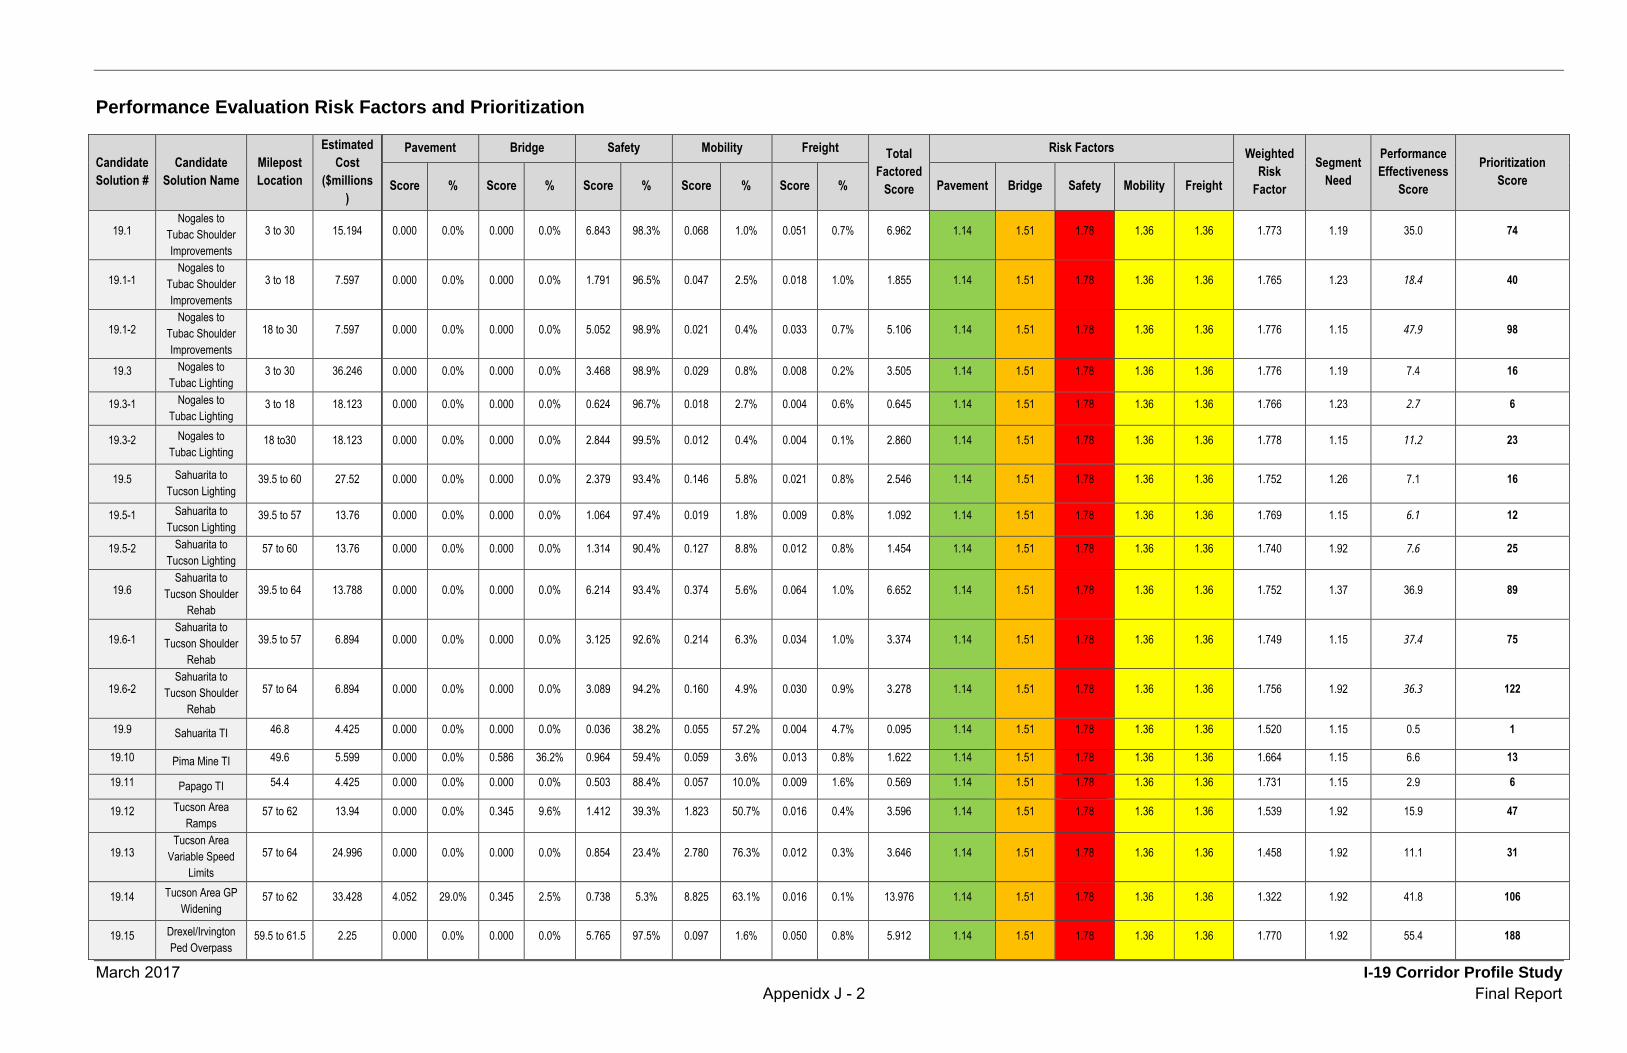
March 2017 I-19 Corridor Profile Study Appenidx J - 2 Final Report
Performance Evaluation Risk Factors and Prioritization
Candidate Solution #
Candidate Solution Name
Milepost Location
Estimated Cost
($millions)
Pavement Bridge Safety Mobility Freight Total Factored
Score
Risk Factors Weighted Risk
Factor
Segment Need
Performance Effectiveness
Score
Prioritization Score Score % Score % Score % Score % Score % Pavement Bridge Safety Mobility Freight
19.1 Nogales to
Tubac Shoulder Improvements
3 to 30 15.194 0.000 0.0% 0.000 0.0% 6.843 98.3% 0.068 1.0% 0.051 0.7% 6.962 1.14 1.51 1.78 1.36 1.36 1.773 1.19 35.0 74
19.1-1 Nogales to
Tubac Shoulder Improvements
3 to 18 7.597 0.000 0.0% 0.000 0.0% 1.791 96.5% 0.047 2.5% 0.018 1.0% 1.855 1.14 1.51 1.78 1.36 1.36 1.765 1.23 18.4 40
19.1-2 Nogales to
Tubac Shoulder Improvements
18 to 30 7.597 0.000 0.0% 0.000 0.0% 5.052 98.9% 0.021 0.4% 0.033 0.7% 5.106 1.14 1.51 1.78 1.36 1.36 1.776 1.15 47.9 98
19.3 Nogales to Tubac Lighting
3 to 30 36.246 0.000 0.0% 0.000 0.0% 3.468 98.9% 0.029 0.8% 0.008 0.2% 3.505 1.14 1.51 1.78 1.36 1.36 1.776 1.19 7.4 16
19.3-1 Nogales to Tubac Lighting
3 to 18 18.123 0.000 0.0% 0.000 0.0% 0.624 96.7% 0.018 2.7% 0.004 0.6% 0.645 1.14 1.51 1.78 1.36 1.36 1.766 1.23 2.7 6
19.3-2 Nogales to Tubac Lighting
18 to30 18.123 0.000 0.0% 0.000 0.0% 2.844 99.5% 0.012 0.4% 0.004 0.1% 2.860 1.14 1.51 1.78 1.36 1.36 1.778 1.15 11.2 23
19.5 Sahuarita to Tucson Lighting
39.5 to 60 27.52 0.000 0.0% 0.000 0.0% 2.379 93.4% 0.146 5.8% 0.021 0.8% 2.546 1.14 1.51 1.78 1.36 1.36 1.752 1.26 7.1 16
19.5-1 Sahuarita to Tucson Lighting
39.5 to 57 13.76 0.000 0.0% 0.000 0.0% 1.064 97.4% 0.019 1.8% 0.009 0.8% 1.092 1.14 1.51 1.78 1.36 1.36 1.769 1.15 6.1 12
19.5-2 Sahuarita to Tucson Lighting
57 to 60 13.76 0.000 0.0% 0.000 0.0% 1.314 90.4% 0.127 8.8% 0.012 0.8% 1.454 1.14 1.51 1.78 1.36 1.36 1.740 1.92 7.6 25
19.6 Sahuarita to
Tucson Shoulder Rehab
39.5 to 64 13.788 0.000 0.0% 0.000 0.0% 6.214 93.4% 0.374 5.6% 0.064 1.0% 6.652 1.14 1.51 1.78 1.36 1.36 1.752 1.37 36.9 89
19.6-1 Sahuarita to
Tucson Shoulder Rehab
39.5 to 57 6.894 0.000 0.0% 0.000 0.0% 3.125 92.6% 0.214 6.3% 0.034 1.0% 3.374 1.14 1.51 1.78 1.36 1.36 1.749 1.15 37.4 75
19.6-2 Sahuarita to
Tucson Shoulder Rehab
57 to 64 6.894 0.000 0.0% 0.000 0.0% 3.089 94.2% 0.160 4.9% 0.030 0.9% 3.278 1.14 1.51 1.78 1.36 1.36 1.756 1.92 36.3 122
19.9 Sahuarita TI 46.8 4.425 0.000 0.0% 0.000 0.0% 0.036 38.2% 0.055 57.2% 0.004 4.7% 0.095 1.14 1.51 1.78 1.36 1.36 1.520 1.15 0.5 1
19.10 Pima Mine TI 49.6 5.599 0.000 0.0% 0.586 36.2% 0.964 59.4% 0.059 3.6% 0.013 0.8% 1.622 1.14 1.51 1.78 1.36 1.36 1.664 1.15 6.6 13
19.11 Papago TI 54.4 4.425 0.000 0.0% 0.000 0.0% 0.503 88.4% 0.057 10.0% 0.009 1.6% 0.569 1.14 1.51 1.78 1.36 1.36 1.731 1.15 2.9 6
19.12 Tucson Area Ramps
57 to 62 13.94 0.000 0.0% 0.345 9.6% 1.412 39.3% 1.823 50.7% 0.016 0.4% 3.596 1.14 1.51 1.78 1.36 1.36 1.539 1.92 15.9 47
19.13 Tucson Area
Variable Speed Limits
57 to 64 24.996 0.000 0.0% 0.000 0.0% 0.854 23.4% 2.780 76.3% 0.012 0.3% 3.646 1.14 1.51 1.78 1.36 1.36 1.458 1.92 11.1 31
19.14 Tucson Area GP Widening
57 to 62 33.428 4.052 29.0% 0.345 2.5% 0.738 5.3% 8.825 63.1% 0.016 0.1% 13.976 1.14 1.51 1.78 1.36 1.36 1.322 1.92 41.8 106
19.15 Drexel/Irvington Ped Overpass
59.5 to 61.5 2.25 0.000 0.0% 0.000 0.0% 5.765 97.5% 0.097 1.6% 0.050 0.8% 5.912 1.14 1.51 1.78 1.36 1.36 1.770 1.92 55.4 188
March 2017 I-19 Corridor Profile Study Appenidx K - 1 Draft Final Report
Appendix K: Preliminary Scoping Reports for Prioritized Solutions


PRELIMINARY SCOPING REPORT
GENERAL PROJECT INFORMATIONDate: March 3, 2017 ADOT Project Manager: n/aProject Name: Nogales to Tubac Shoulder ImprovementsCity/Town Name: Tucson County: Santa CruzPrimary Route/Street: I-19Beginning Limit: 3End Limit: 30Project Length: 27 milesRight-of-Way Ownership(s) (where proposed project construction would occur): (Check all that apply)
City/Town; County; ADOT ; Private ; Federal; Tribal; Other:Adjacent Land Ownership(s): (Check all that apply)
City/Town; County; ADOT; Private; Federal; Tribal; Other:http://gis.azland.gov/webapps/parcel/
LOCAL PUBLIC AGENCY (LPA) or TRIBAL GOVERNMENT INFORMATION(If applicable)
LPA/Tribal Name:LPA/Tribal Contact:Email Address: Phone Number:Administration: ADOT Administered Self-Administered Certification Acceptance
PROJECT NEEDA high rate of crashes with fatalities and serious injuries are reported by the Tucson District and confirmed by theCorridor Profile Study. Segments 19-2 and 19-3 show increased levels of safety need. Prevalent crash types includesingle vehicle crashes, overturning, rear-end, collision with fixed object, and failure to keep in lane. Contributingfactors include excess speeds, improper lane changes, and higher traffic volumes.
PROJECT PURPOSEWhat is the Primary Purpose of the Project? Preservation Modernization Expansion
The project will rehabilitate shoulders; improve striping, edge of pavement delineation, and signage from the MariposaRd TI (Nogales) to the Aravaca Rd TI (Tubac). The project will assist drivers’ awareness of lane and edge of roadmarkings in an effort to reduce associated types of crashes.
PRELIMINARY SCOPING REPORT
PROJECT TYPEPavement Preservation Roadway Widening System EnhancementBridge Scour/Rehab Bridge Replacement Sign ReplacementOther : Roadside safety improvements
PROJECT RISKSCheck any risks identified that may impact the project’s scope, schedule, or budget:
Access / Traffic Control / Detour Issues Right-of-Way Constructability / Construction Window Issues Environmental
Stakeholder Issues Utilities Structures & Geotech Other: Serious crashes
Risk Description: (If a box is checked above, briefly explain the risk)Temporary traffic controls must be implemented during the construction period.The project is expected to mitigate the risks of continued higher rates of serious crashes.
FUNDING SOURCE(S)Anticipated Project Design/Construction FundingType: (Check all that apply)
STP TAP HSIP State Local Private Other:
COST ESTIMATEPreliminary Eng
$404,000Design
$1,344,000Right-of-Way
$0Construction$13,446,000
Total$15,194,000
PROJECT DELIVERYDelivery: Design-Bid-Build Design-Build Other:
Design Program Year: FYConstruction Program Year: FY
ATTACHMENTS1) State Location Map X2) Project Vicinity Map X3) Project Scope of Work4) Project Schedule5) Itemized Cost Estimate6) 15% Design Plan Sheets (as needed)
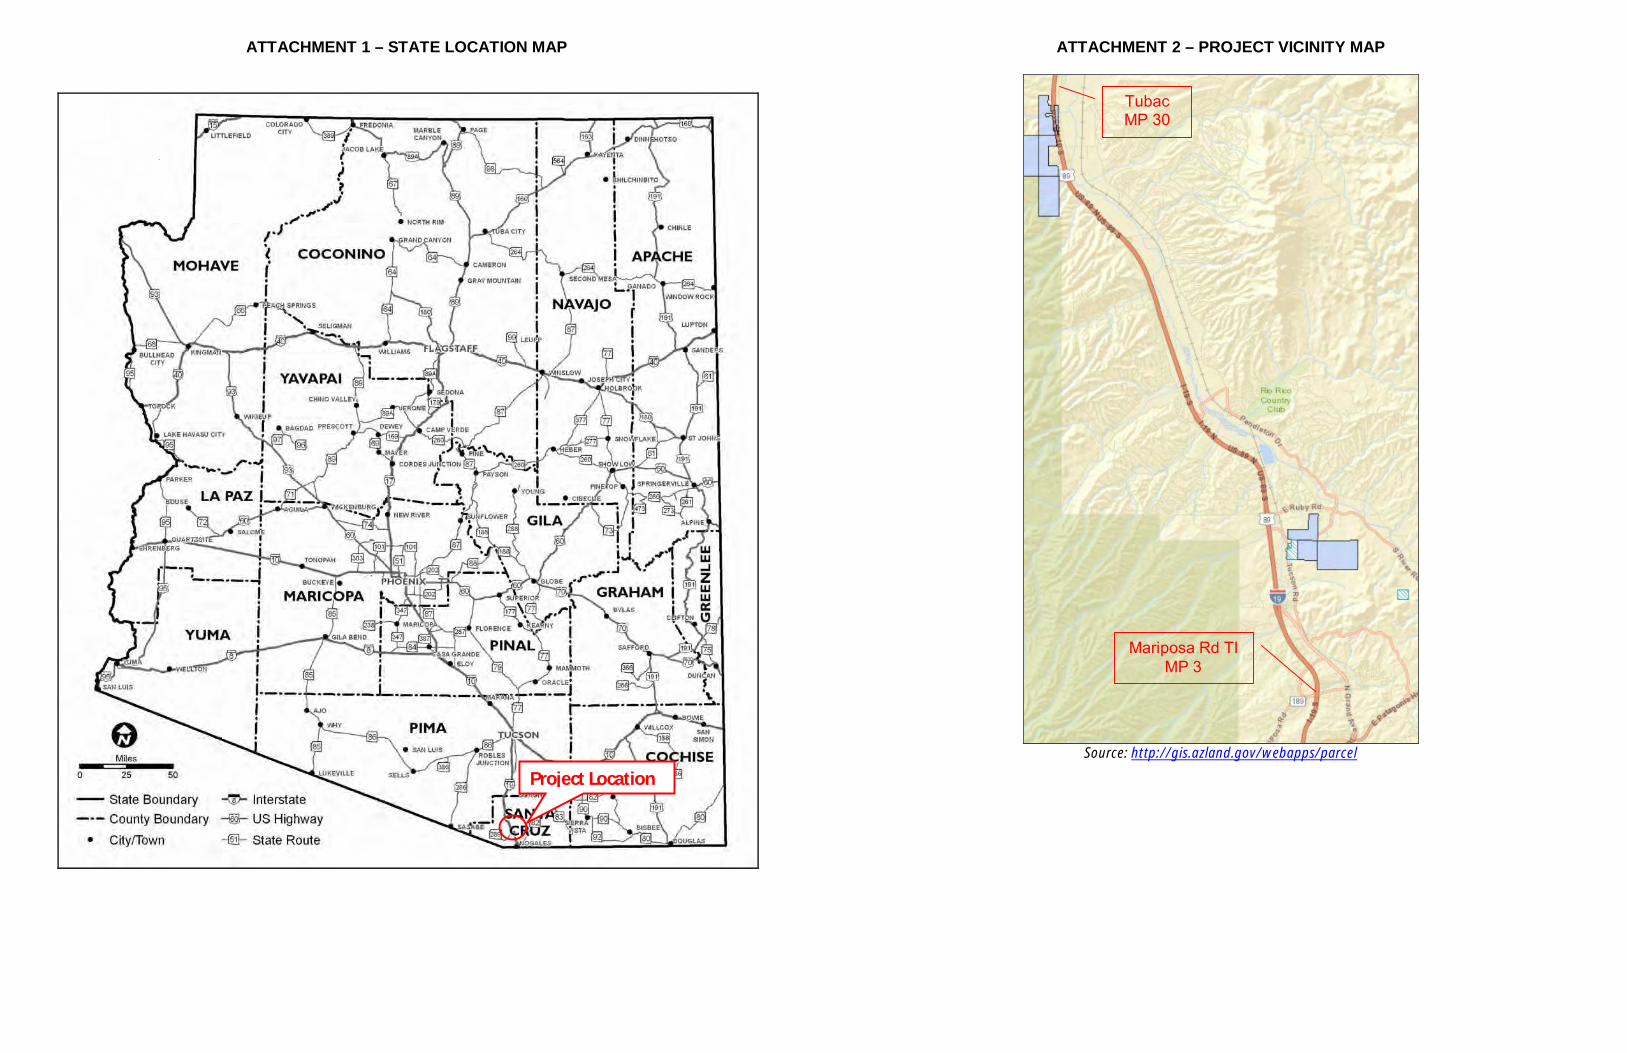
ATTACHMENT 1 – STATE LOCATION MAP
Project Location
ATTACHMENT 2 – PROJECT VICINITY MAP
Source: http://gis.azland.gov/webapps/parcel
TubacMP 30
Mariposa Rd TIMP 3
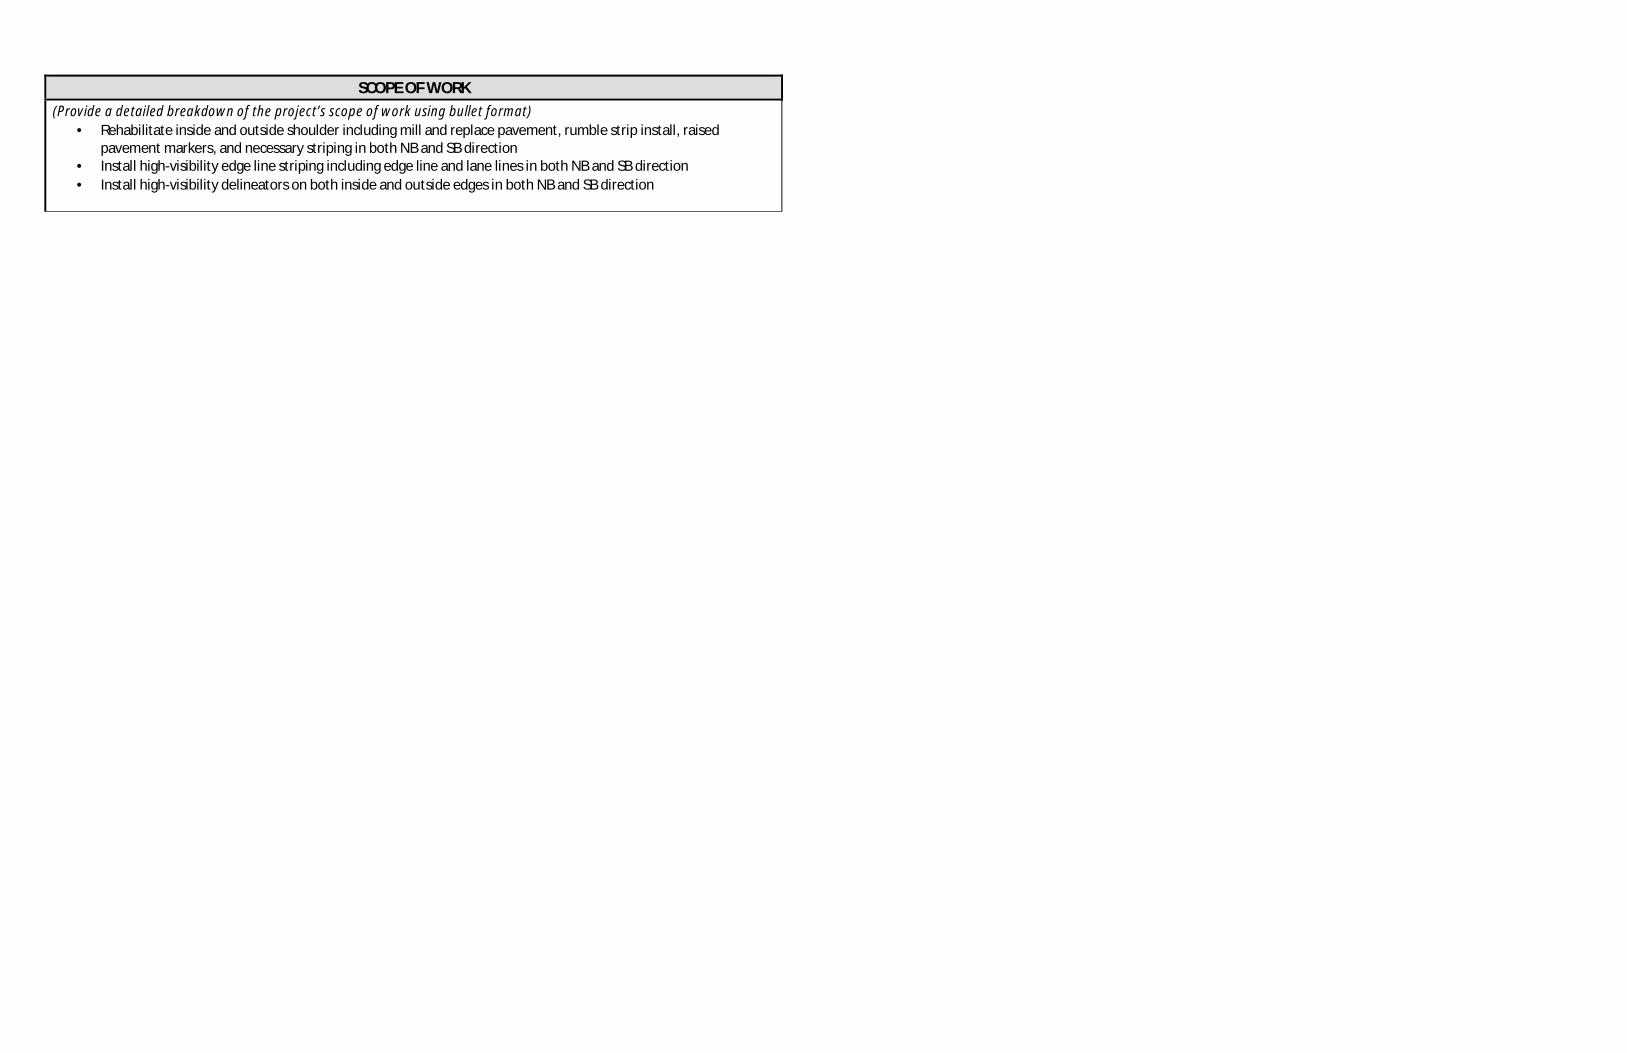
SCOPE OF WORK(Provide a detailed breakdown of the project’s scope of work using bullet format)
• Rehabilitate inside and outside shoulder including mill and replace pavement, rumble strip install, raisedpavement markers, and necessary striping in both NB and SB direction
• Install high-visibility edge line striping including edge line and lane lines in both NB and SB direction· Install high-visibility delineators on both inside and outside edges in both NB and SB direction

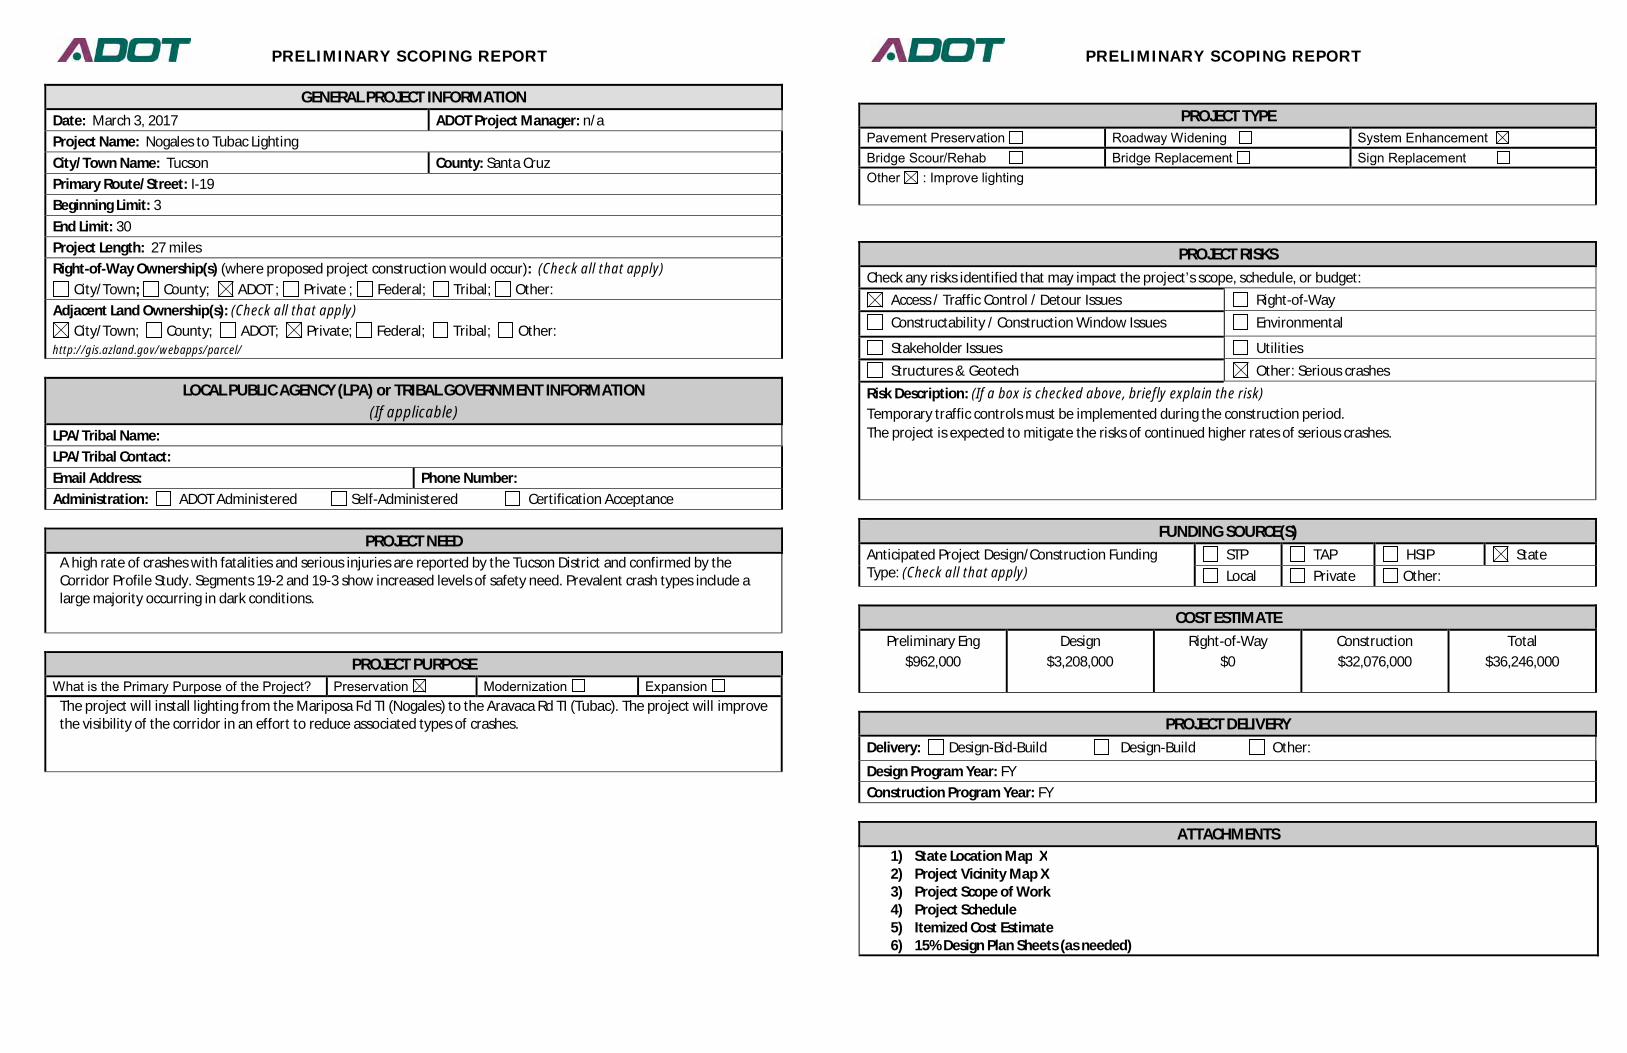
PRELIMINARY SCOPING REPORT
GENERAL PROJECT INFORMATIONDate: March 3, 2017 ADOT Project Manager: n/aProject Name: Nogales to Tubac LightingCity/Town Name: Tucson County: Santa CruzPrimary Route/Street: I-19Beginning Limit: 3End Limit: 30Project Length: 27 milesRight-of-Way Ownership(s) (where proposed project construction would occur): (Check all that apply)
City/Town; County; ADOT ; Private ; Federal; Tribal; Other:Adjacent Land Ownership(s): (Check all that apply)
City/Town; County; ADOT; Private; Federal; Tribal; Other:http://gis.azland.gov/webapps/parcel/
LOCAL PUBLIC AGENCY (LPA) or TRIBAL GOVERNMENT INFORMATION(If applicable)
LPA/Tribal Name:LPA/Tribal Contact:Email Address: Phone Number:Administration: ADOT Administered Self-Administered Certification Acceptance
PROJECT NEEDA high rate of crashes with fatalities and serious injuries are reported by the Tucson District and confirmed by theCorridor Profile Study. Segments 19-2 and 19-3 show increased levels of safety need. Prevalent crash types include alarge majority occurring in dark conditions.
PROJECT PURPOSEWhat is the Primary Purpose of the Project? Preservation Modernization Expansion
The project will install lighting from the Mariposa Rd TI (Nogales) to the Aravaca Rd TI (Tubac). The project will improvethe visibility of the corridor in an effort to reduce associated types of crashes.
PRELIMINARY SCOPING REPORT
PROJECT TYPEPavement Preservation Roadway Widening System EnhancementBridge Scour/Rehab Bridge Replacement Sign ReplacementOther : Improve lighting
PROJECT RISKSCheck any risks identified that may impact the project’s scope, schedule, or budget:
Access / Traffic Control / Detour Issues Right-of-Way Constructability / Construction Window Issues Environmental
Stakeholder Issues Utilities Structures & Geotech Other: Serious crashes
Risk Description: (If a box is checked above, briefly explain the risk)Temporary traffic controls must be implemented during the construction period.The project is expected to mitigate the risks of continued higher rates of serious crashes.
FUNDING SOURCE(S)Anticipated Project Design/Construction FundingType: (Check all that apply)
STP TAP HSIP State Local Private Other:
COST ESTIMATEPreliminary Eng
$962,000Design
$3,208,000Right-of-Way
$0Construction$32,076,000
Total$36,246,000
PROJECT DELIVERYDelivery: Design-Bid-Build Design-Build Other:
Design Program Year: FYConstruction Program Year: FY
ATTACHMENTS1) State Location Map X2) Project Vicinity Map X3) Project Scope of Work4) Project Schedule5) Itemized Cost Estimate6) 15% Design Plan Sheets (as needed)
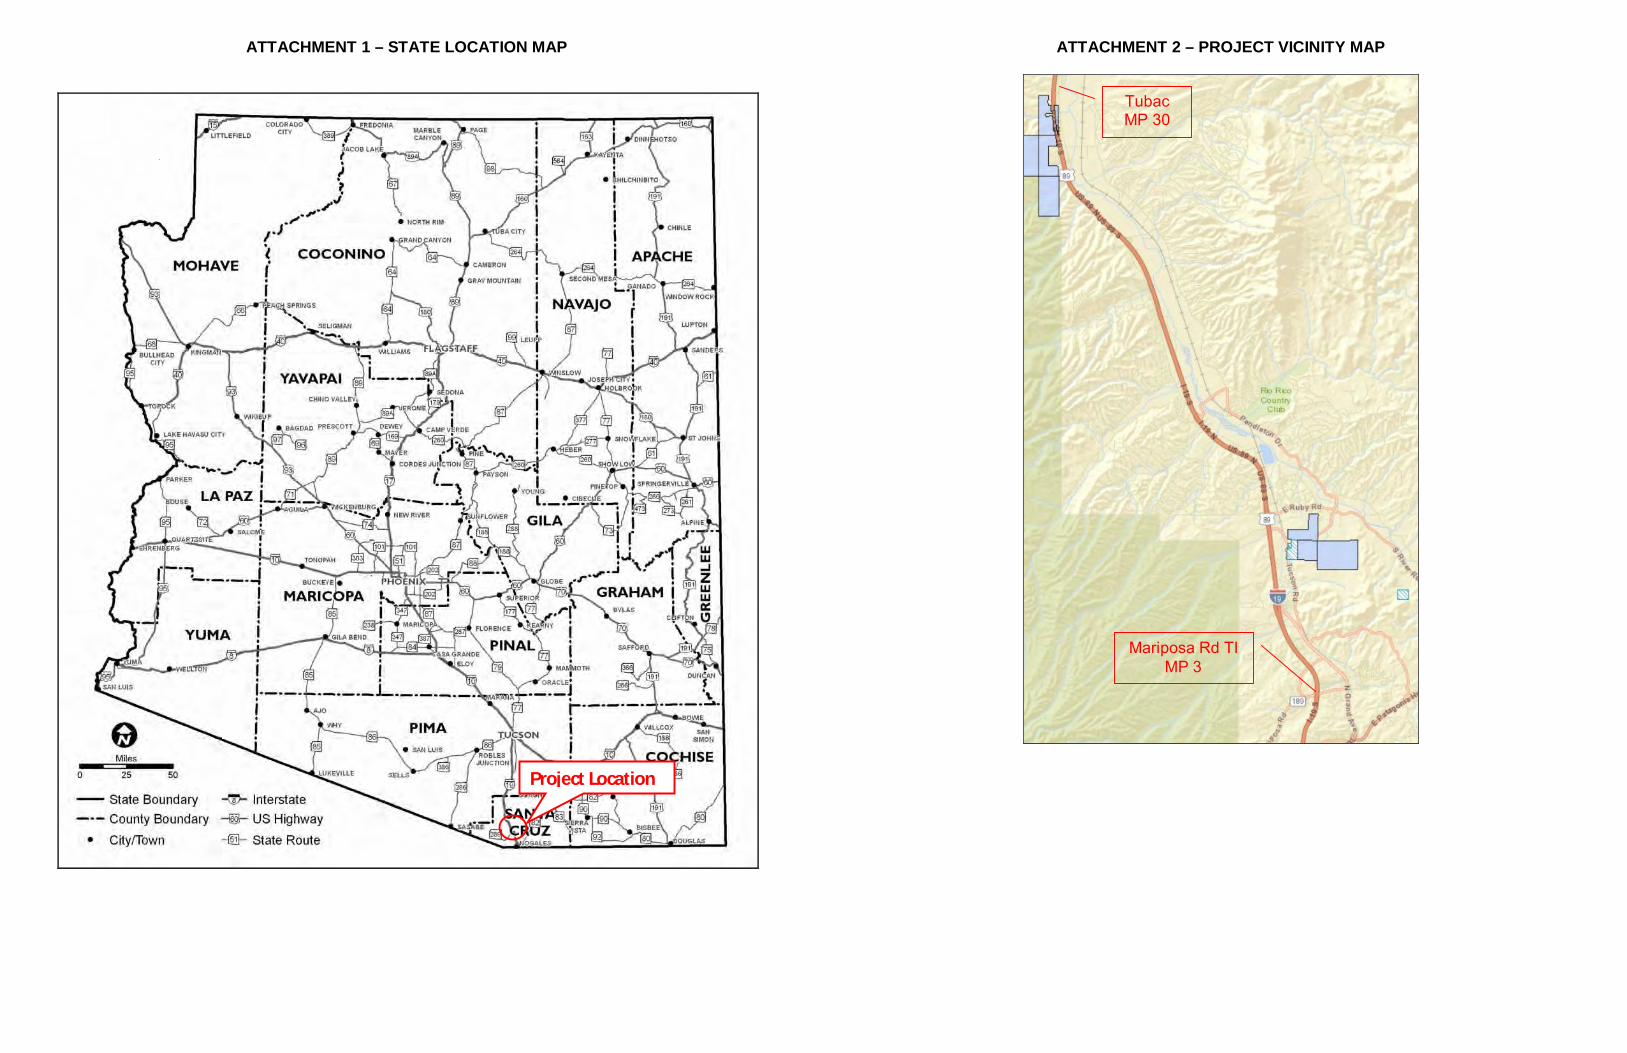
ATTACHMENT 1 – STATE LOCATION MAP
Project Location
ATTACHMENT 2 – PROJECT VICINITY MAP
TubacMP 30
Mariposa Rd TIMP 3

SCOPE OF WORK(Provide a detailed breakdown of the project’s scope of work using bullet format)
· Install lighting NB from Maricopa Rd TI to Tubac at MP 30· Install lighting SB from Tubac at MP 30 to Maricopa Rd TI

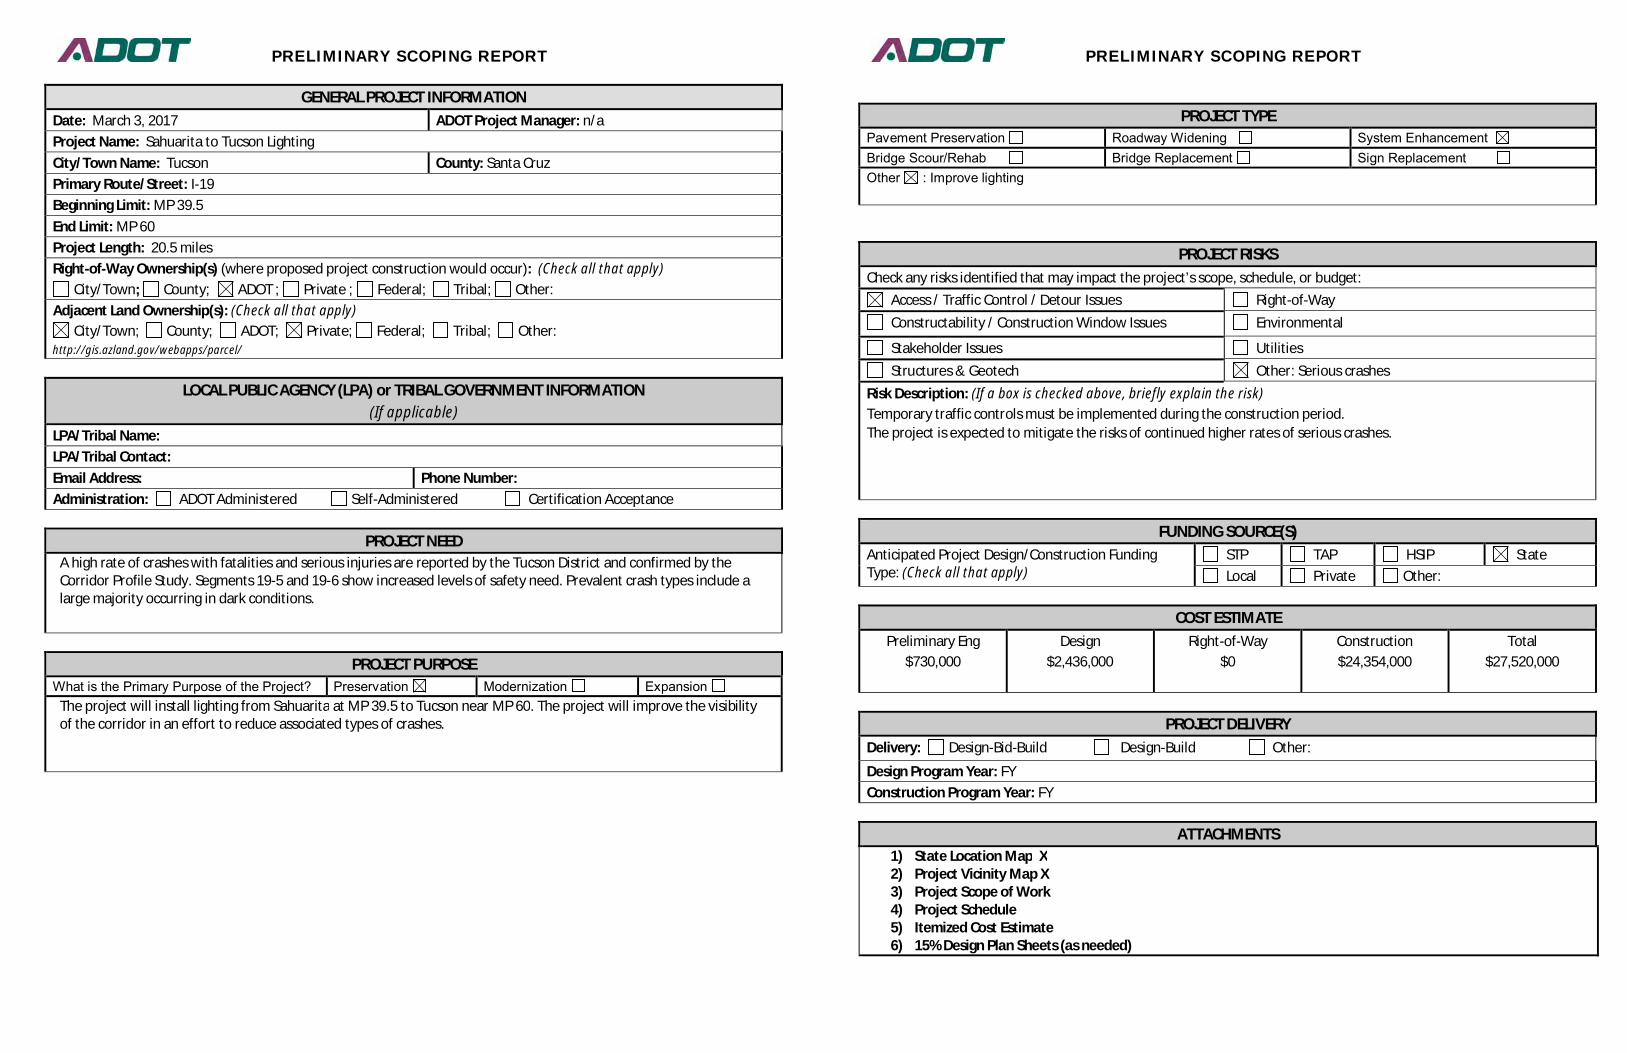
PRELIMINARY SCOPING REPORT
GENERAL PROJECT INFORMATIONDate: March 3, 2017 ADOT Project Manager: n/aProject Name: Sahuarita to Tucson LightingCity/Town Name: Tucson County: Santa CruzPrimary Route/Street: I-19Beginning Limit: MP 39.5End Limit: MP 60Project Length: 20.5 milesRight-of-Way Ownership(s) (where proposed project construction would occur): (Check all that apply)
City/Town; County; ADOT ; Private ; Federal; Tribal; Other:Adjacent Land Ownership(s): (Check all that apply)
City/Town; County; ADOT; Private; Federal; Tribal; Other:http://gis.azland.gov/webapps/parcel/
LOCAL PUBLIC AGENCY (LPA) or TRIBAL GOVERNMENT INFORMATION(If applicable)
LPA/Tribal Name:LPA/Tribal Contact:Email Address: Phone Number:Administration: ADOT Administered Self-Administered Certification Acceptance
PROJECT NEEDA high rate of crashes with fatalities and serious injuries are reported by the Tucson District and confirmed by theCorridor Profile Study. Segments 19-5 and 19-6 show increased levels of safety need. Prevalent crash types include alarge majority occurring in dark conditions.
PROJECT PURPOSEWhat is the Primary Purpose of the Project? Preservation Modernization Expansion
The project will install lighting from Sahuarita at MP 39.5 to Tucson near MP 60. The project will improve the visibilityof the corridor in an effort to reduce associated types of crashes.
PRELIMINARY SCOPING REPORT
PROJECT TYPEPavement Preservation Roadway Widening System EnhancementBridge Scour/Rehab Bridge Replacement Sign ReplacementOther : Improve lighting
PROJECT RISKSCheck any risks identified that may impact the project’s scope, schedule, or budget:
Access / Traffic Control / Detour Issues Right-of-Way Constructability / Construction Window Issues Environmental
Stakeholder Issues Utilities Structures & Geotech Other: Serious crashes
Risk Description: (If a box is checked above, briefly explain the risk)Temporary traffic controls must be implemented during the construction period.The project is expected to mitigate the risks of continued higher rates of serious crashes.
FUNDING SOURCE(S)Anticipated Project Design/Construction FundingType: (Check all that apply)
STP TAP HSIP State Local Private Other:
COST ESTIMATEPreliminary Eng
$730,000Design
$2,436,000Right-of-Way
$0Construction$24,354,000
Total$27,520,000
PROJECT DELIVERYDelivery: Design-Bid-Build Design-Build Other:
Design Program Year: FYConstruction Program Year: FY
ATTACHMENTS1) State Location Map X2) Project Vicinity Map X3) Project Scope of Work4) Project Schedule5) Itemized Cost Estimate6) 15% Design Plan Sheets (as needed)

ATTACHMENT 1 – STATE LOCATION MAP
Project Location
ATTACHMENT 2 – PROJECT VICINITY MAP
Source: http://gis.azland.gov/webapps/parcel
MP 39.5
MP 60
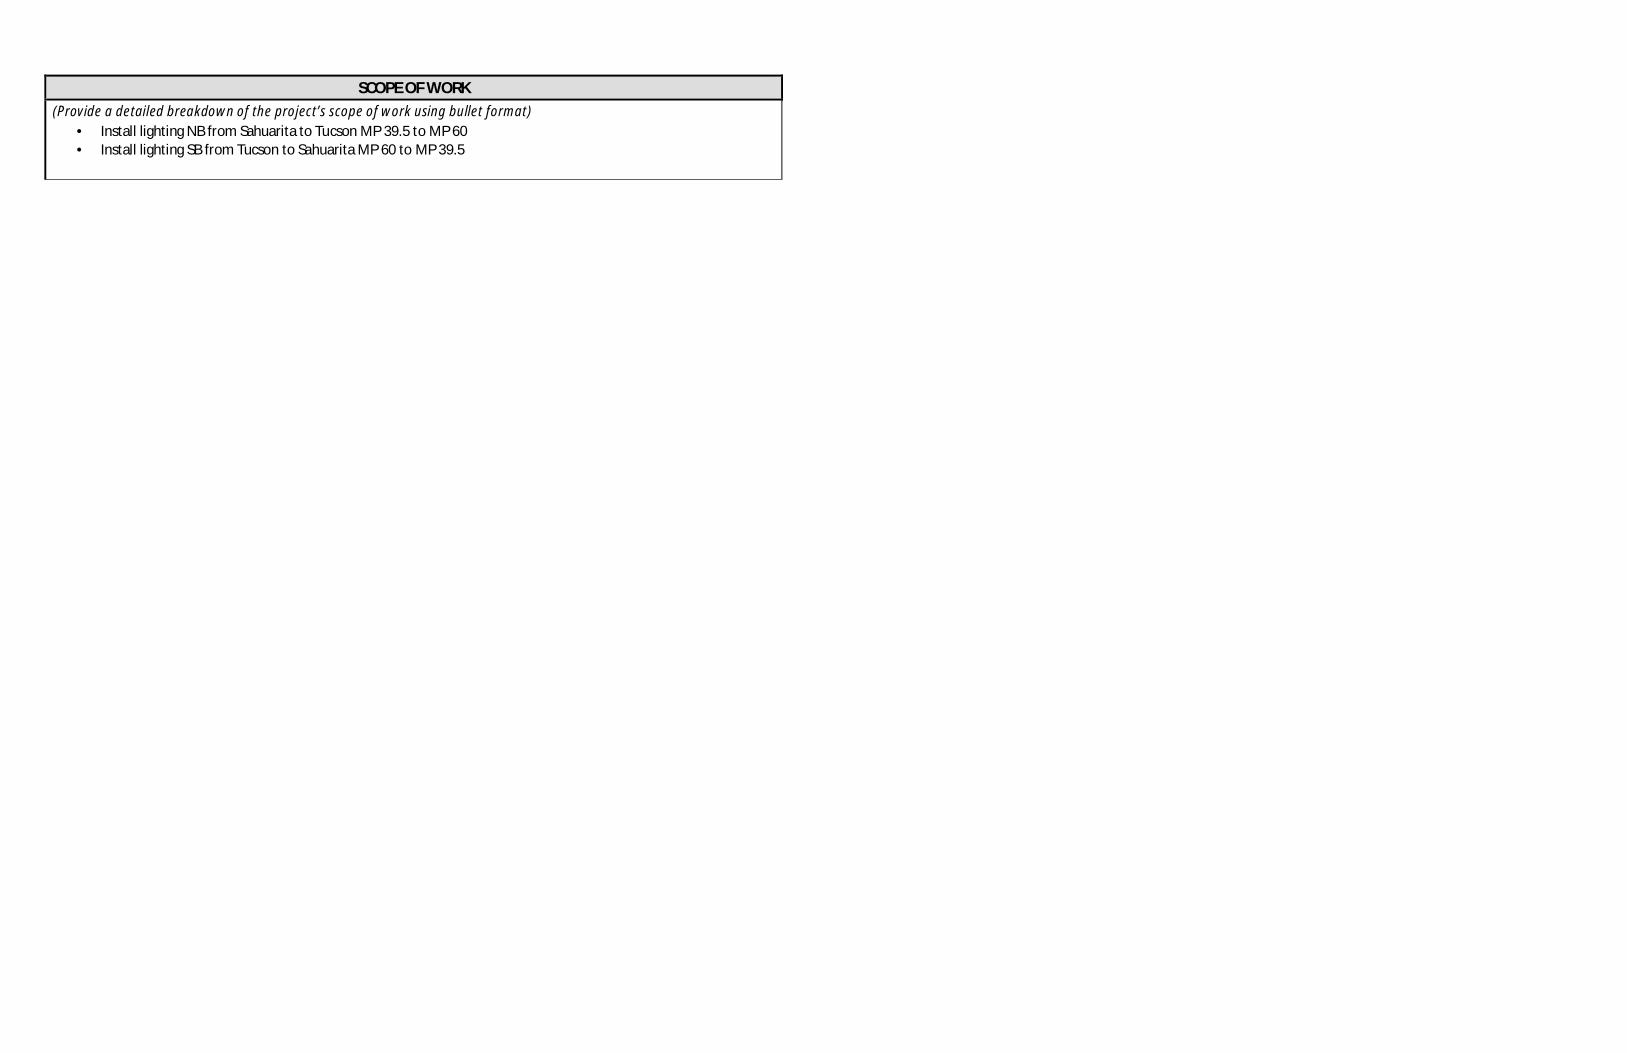
SCOPE OF WORK(Provide a detailed breakdown of the project’s scope of work using bullet format)
· Install lighting NB from Sahuarita to Tucson MP 39.5 to MP 60· Install lighting SB from Tucson to Sahuarita MP 60 to MP 39.5

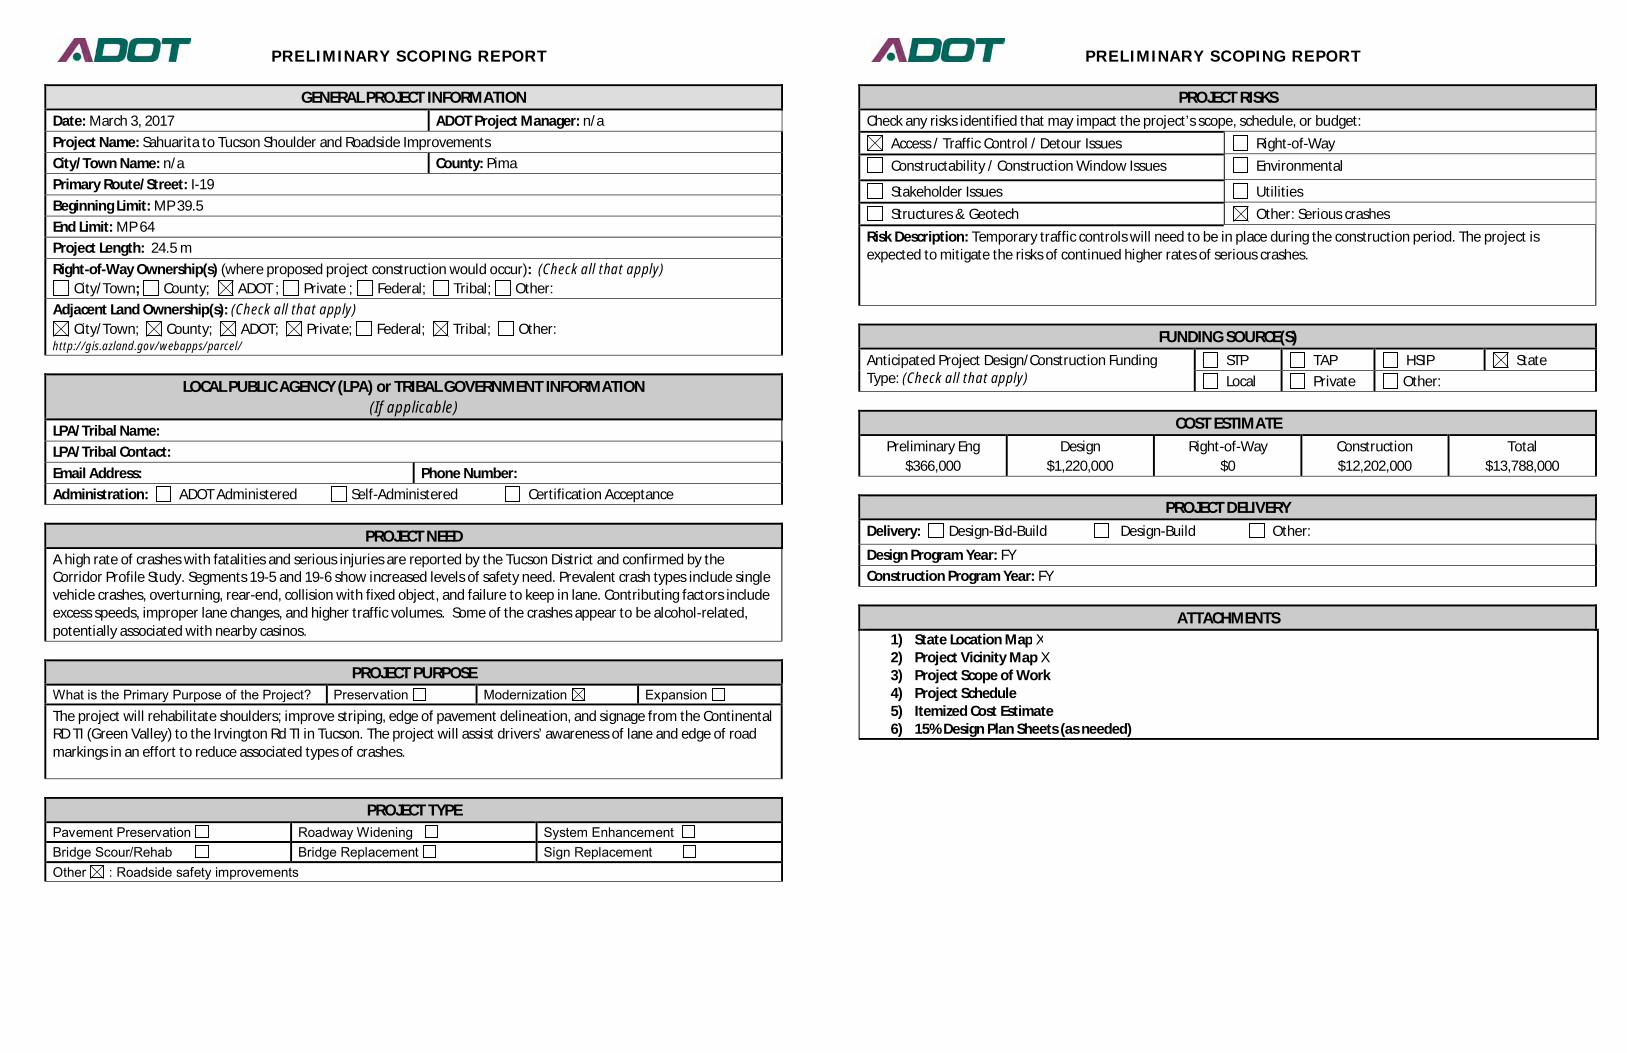
PRELIMINARY SCOPING REPORT
GENERAL PROJECT INFORMATIONDate: March 3, 2017 ADOT Project Manager: n/aProject Name: Sahuarita to Tucson Shoulder and Roadside ImprovementsCity/Town Name: n/a County: PimaPrimary Route/Street: I-19Beginning Limit: MP 39.5End Limit: MP 64Project Length: 24.5 mRight-of-Way Ownership(s) (where proposed project construction would occur): (Check all that apply)
City/Town; County; ADOT ; Private ; Federal; Tribal; Other:Adjacent Land Ownership(s): (Check all that apply)
City/Town; County; ADOT; Private; Federal; Tribal; Other:http://gis.azland.gov/webapps/parcel/
LOCAL PUBLIC AGENCY (LPA) or TRIBAL GOVERNMENT INFORMATION(If applicable)
LPA/Tribal Name:LPA/Tribal Contact:Email Address: Phone Number:Administration: ADOT Administered Self-Administered Certification Acceptance
PROJECT NEEDA high rate of crashes with fatalities and serious injuries are reported by the Tucson District and confirmed by theCorridor Profile Study. Segments 19-5 and 19-6 show increased levels of safety need. Prevalent crash types include singlevehicle crashes, overturning, rear-end, collision with fixed object, and failure to keep in lane. Contributing factors includeexcess speeds, improper lane changes, and higher traffic volumes. Some of the crashes appear to be alcohol-related,potentially associated with nearby casinos.
PROJECT PURPOSEWhat is the Primary Purpose of the Project? Preservation Modernization ExpansionThe project will rehabilitate shoulders; improve striping, edge of pavement delineation, and signage from the ContinentalRD TI (Green Valley) to the Irvington Rd TI in Tucson. The project will assist drivers’ awareness of lane and edge of roadmarkings in an effort to reduce associated types of crashes.
PROJECT TYPEPavement Preservation Roadway Widening System EnhancementBridge Scour/Rehab Bridge Replacement Sign ReplacementOther : Roadside safety improvements
PRELIMINARY SCOPING REPORT
PROJECT RISKSCheck any risks identified that may impact the project’s scope, schedule, or budget:
Access / Traffic Control / Detour Issues Right-of-Way Constructability / Construction Window Issues Environmental
Stakeholder Issues Utilities Structures & Geotech Other: Serious crashes
Risk Description: Temporary traffic controls will need to be in place during the construction period. The project isexpected to mitigate the risks of continued higher rates of serious crashes.
FUNDING SOURCE(S)Anticipated Project Design/Construction FundingType: (Check all that apply)
STP TAP HSIP State Local Private Other:
COST ESTIMATEPreliminary Eng
$366,000Design
$1,220,000Right-of-Way
$0Construction$12,202,000
Total$13,788,000
PROJECT DELIVERYDelivery: Design-Bid-Build Design-Build Other:
Design Program Year: FYConstruction Program Year: FY
ATTACHMENTS1) State Location Map X2) Project Vicinity Map X3) Project Scope of Work4) Project Schedule5) Itemized Cost Estimate6) 15% Design Plan Sheets (as needed)

ATTACHMENT 1 – STATE LOCATION MAP
Project Location
ATTACHMENT 2 – PROJECT VICINITY MAP
MP 39.5
MP 64

SCOPE OF WORK(Provide a detailed breakdown of the project’s scope of work using bullet format)· Rehabilitate inside and outside shoulder including mill and replace pavement, rumble strip install, raised pavement
markers, and necessary striping in both NB and SB direction· Install high-visibility edge line striping including edge line and lane lines in both NB and SB direction· Install high-visibility delineators on both inside and outside edges in both NB and SB direction

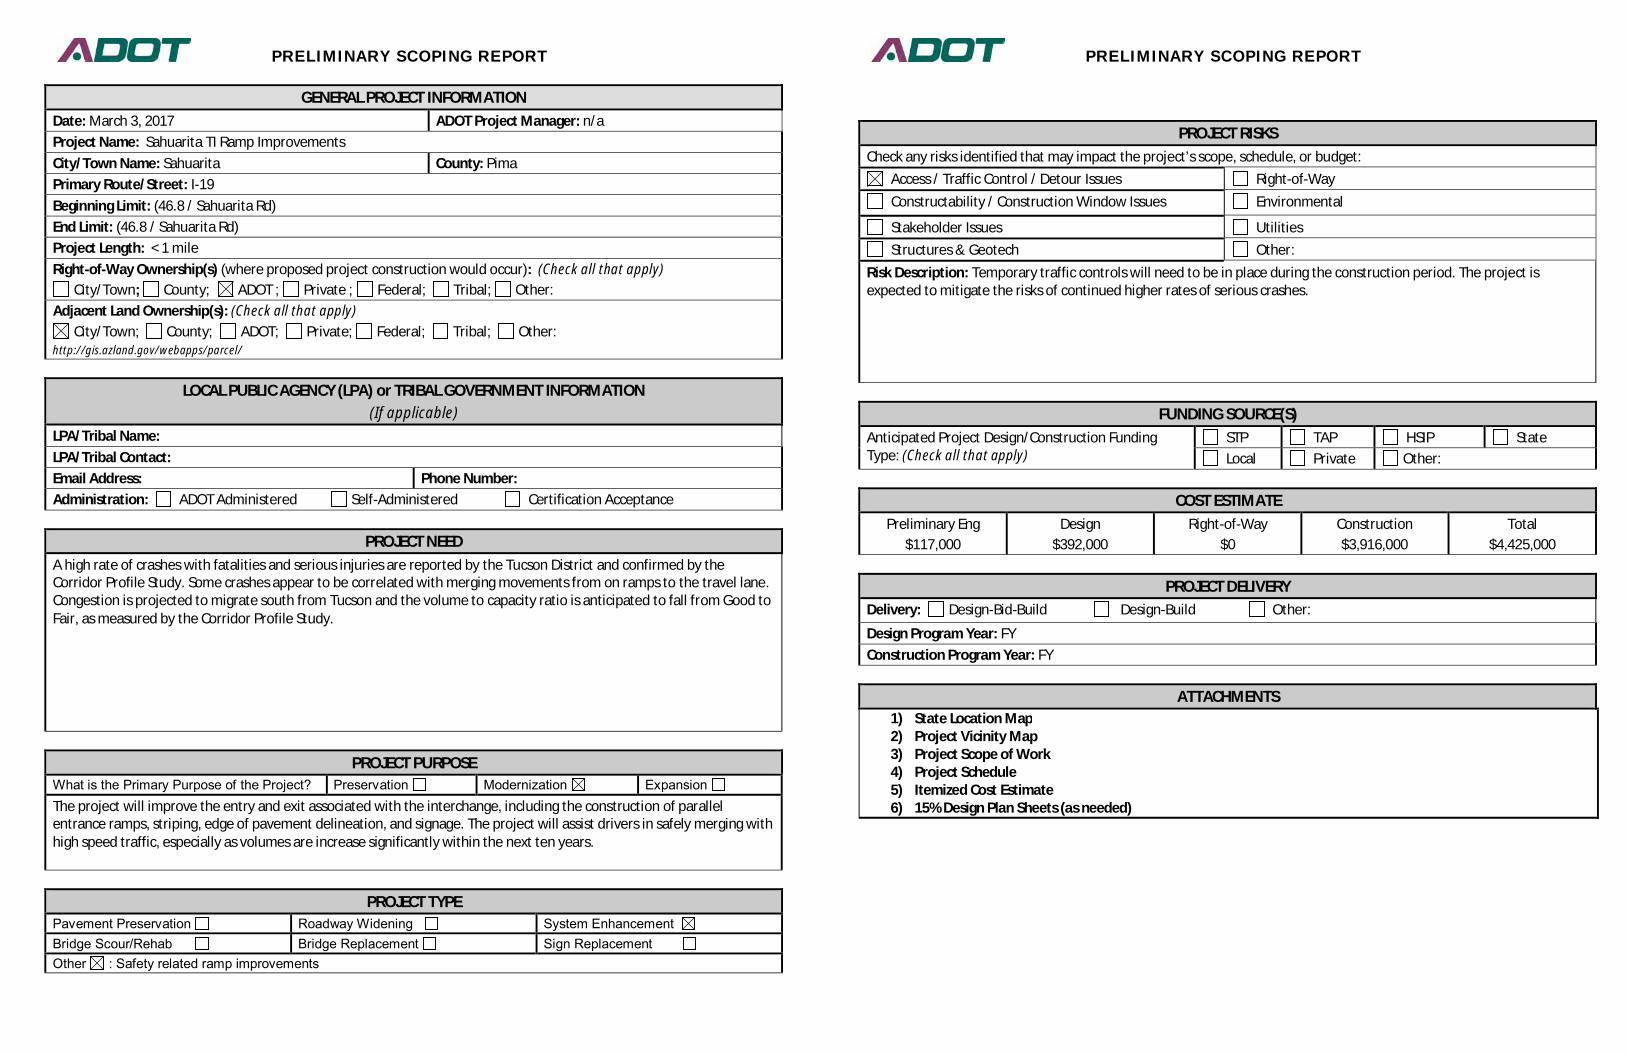
PRELIMINARY SCOPING REPORT
GENERAL PROJECT INFORMATIONDate: March 3, 2017 ADOT Project Manager: n/aProject Name: Sahuarita TI Ramp ImprovementsCity/Town Name: Sahuarita County: PimaPrimary Route/Street: I-19Beginning Limit: (46.8 / Sahuarita Rd)End Limit: (46.8 / Sahuarita Rd)Project Length: < 1 mileRight-of-Way Ownership(s) (where proposed project construction would occur): (Check all that apply)
City/Town; County; ADOT ; Private ; Federal; Tribal; Other:Adjacent Land Ownership(s): (Check all that apply)
City/Town; County; ADOT; Private; Federal; Tribal; Other:http://gis.azland.gov/webapps/parcel/
LOCAL PUBLIC AGENCY (LPA) or TRIBAL GOVERNMENT INFORMATION(If applicable)
LPA/Tribal Name:LPA/Tribal Contact:Email Address: Phone Number:Administration: ADOT Administered Self-Administered Certification Acceptance
PROJECT NEEDA high rate of crashes with fatalities and serious injuries are reported by the Tucson District and confirmed by theCorridor Profile Study. Some crashes appear to be correlated with merging movements from on ramps to the travel lane.Congestion is projected to migrate south from Tucson and the volume to capacity ratio is anticipated to fall from Good toFair, as measured by the Corridor Profile Study.
PROJECT PURPOSEWhat is the Primary Purpose of the Project? Preservation Modernization ExpansionThe project will improve the entry and exit associated with the interchange, including the construction of parallelentrance ramps, striping, edge of pavement delineation, and signage. The project will assist drivers in safely merging withhigh speed traffic, especially as volumes are increase significantly within the next ten years.
PROJECT TYPEPavement Preservation Roadway Widening System EnhancementBridge Scour/Rehab Bridge Replacement Sign ReplacementOther : Safety related ramp improvements
PRELIMINARY SCOPING REPORT
PROJECT RISKSCheck any risks identified that may impact the project’s scope, schedule, or budget:
Access / Traffic Control / Detour Issues Right-of-Way Constructability / Construction Window Issues Environmental
Stakeholder Issues Utilities Structures & Geotech Other:
Risk Description: Temporary traffic controls will need to be in place during the construction period. The project isexpected to mitigate the risks of continued higher rates of serious crashes.
FUNDING SOURCE(S)Anticipated Project Design/Construction FundingType: (Check all that apply)
STP TAP HSIP State Local Private Other:
COST ESTIMATEPreliminary Eng
$117,000Design
$392,000Right-of-Way
$0Construction$3,916,000
Total$4,425,000
PROJECT DELIVERYDelivery: Design-Bid-Build Design-Build Other:
Design Program Year: FYConstruction Program Year: FY
ATTACHMENTS1) State Location Map2) Project Vicinity Map3) Project Scope of Work4) Project Schedule5) Itemized Cost Estimate6) 15% Design Plan Sheets (as needed)
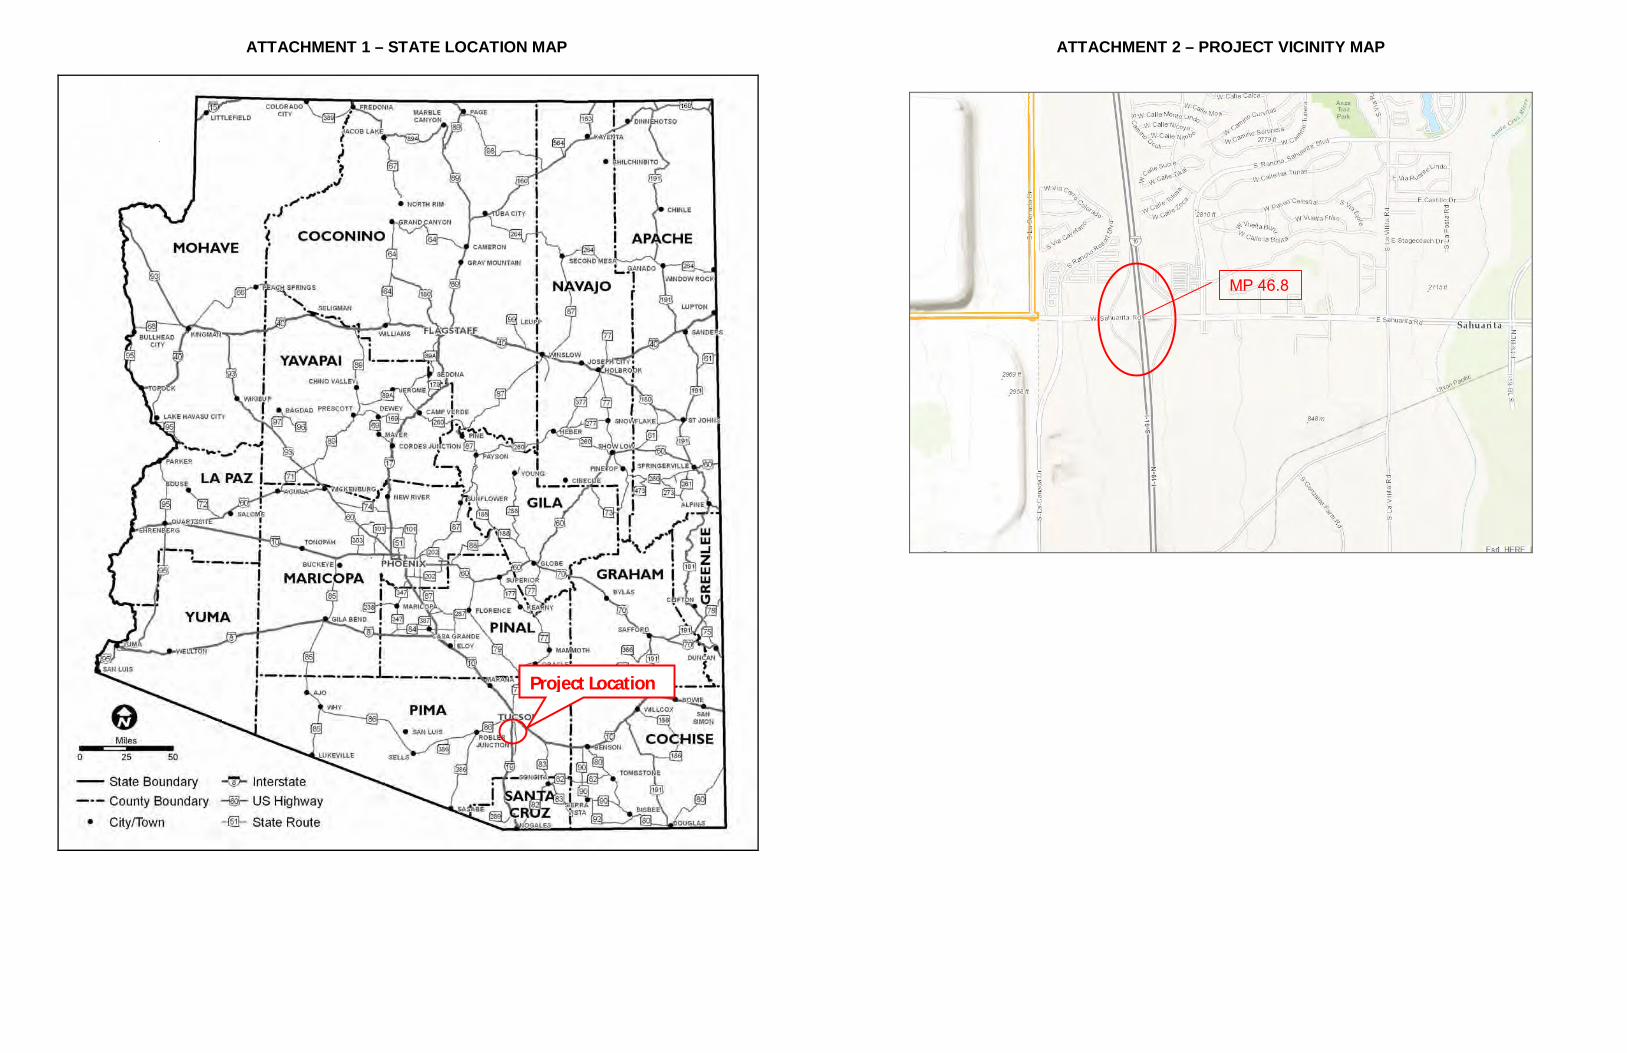
ATTACHMENT 1 – STATE LOCATION MAP
Project Location
ATTACHMENT 2 – PROJECT VICINITY MAP
MP 46.8
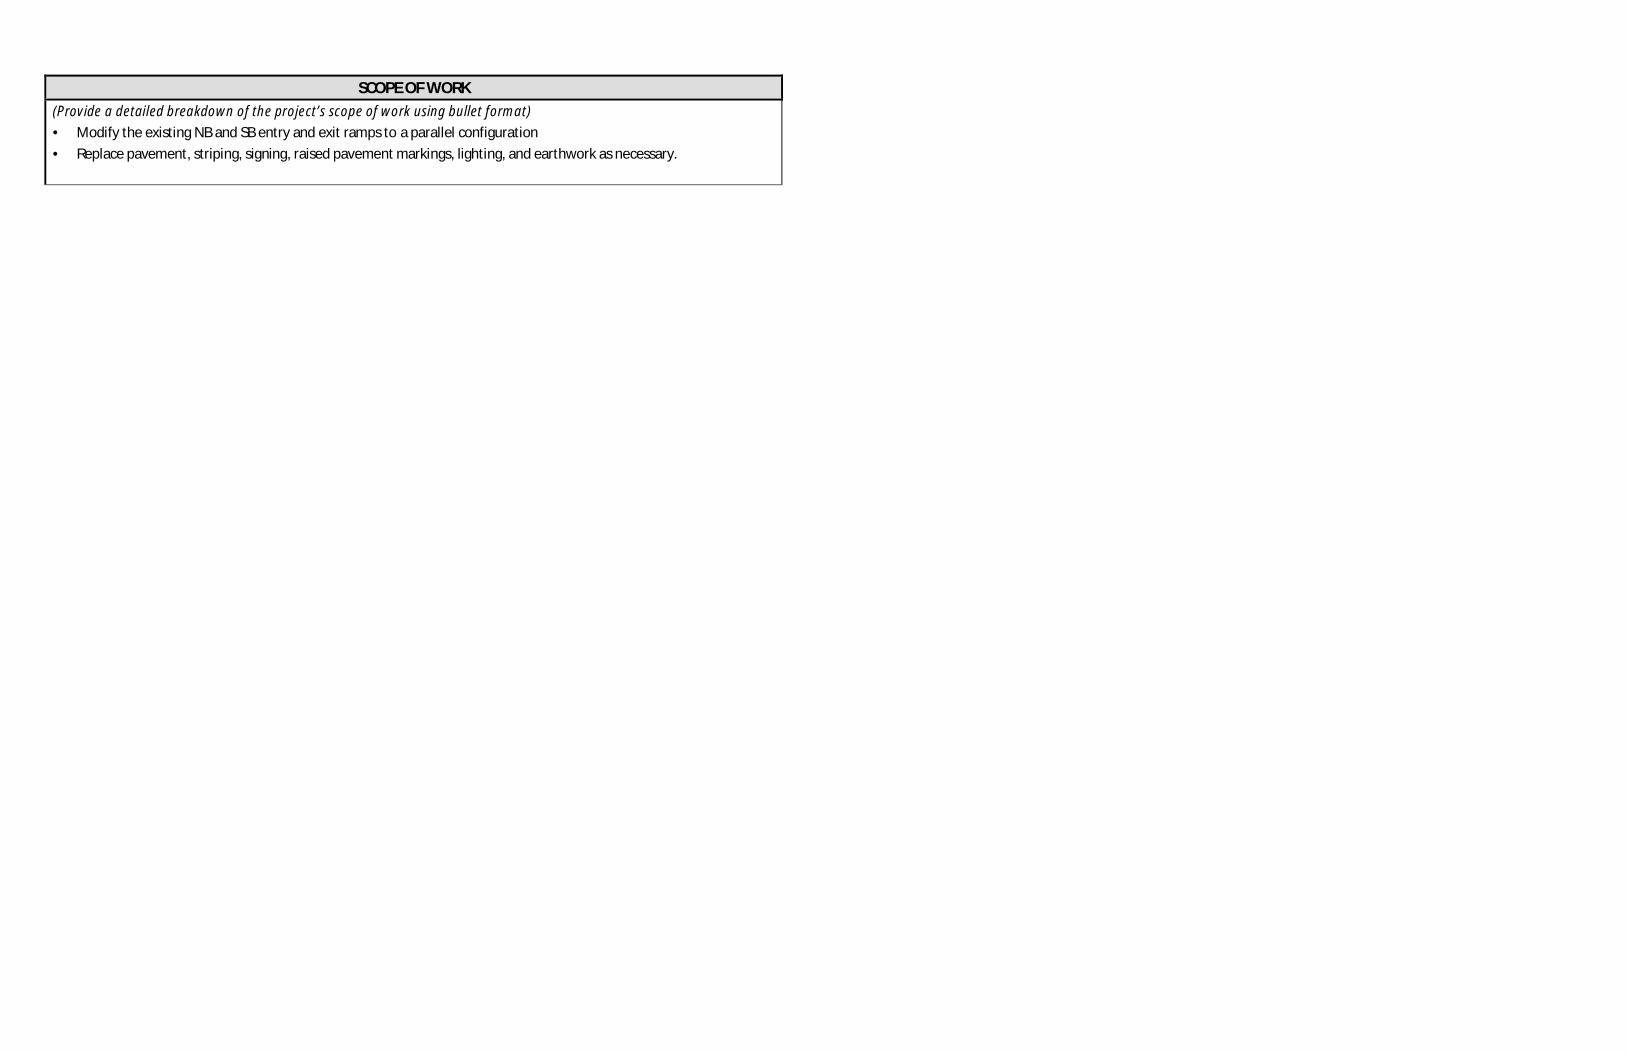
SCOPE OF WORK(Provide a detailed breakdown of the project’s scope of work using bullet format)· Modify the existing NB and SB entry and exit ramps to a parallel configuration· Replace pavement, striping, signing, raised pavement markings, lighting, and earthwork as necessary.

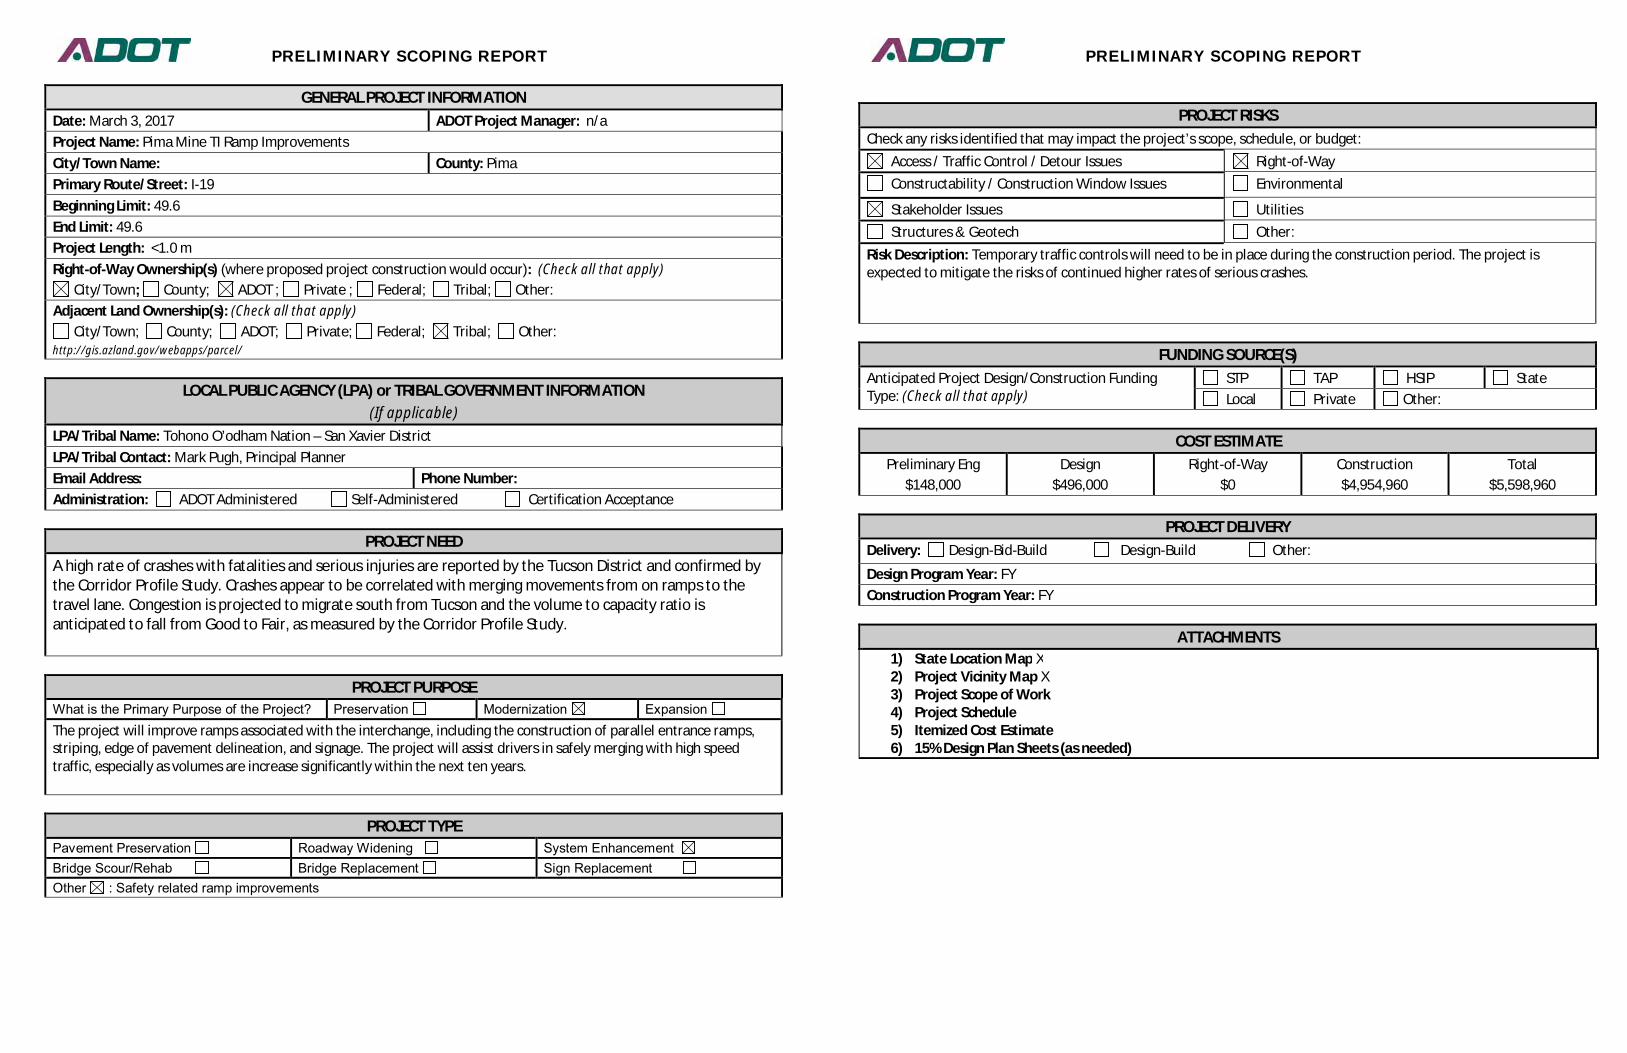
PRELIMINARY SCOPING REPORT
GENERAL PROJECT INFORMATIONDate: March 3, 2017 ADOT Project Manager: n/aProject Name: Pima Mine TI Ramp ImprovementsCity/Town Name: County: PimaPrimary Route/Street: I-19Beginning Limit: 49.6End Limit: 49.6Project Length: <1.0 mRight-of-Way Ownership(s) (where proposed project construction would occur): (Check all that apply)
City/Town; County; ADOT ; Private ; Federal; Tribal; Other:Adjacent Land Ownership(s): (Check all that apply)
City/Town; County; ADOT; Private; Federal; Tribal; Other:http://gis.azland.gov/webapps/parcel/
LOCAL PUBLIC AGENCY (LPA) or TRIBAL GOVERNMENT INFORMATION(If applicable)
LPA/Tribal Name: Tohono O’odham Nation – San Xavier DistrictLPA/Tribal Contact: Mark Pugh, Principal PlannerEmail Address: Phone Number:Administration: ADOT Administered Self-Administered Certification Acceptance
PROJECT NEEDA high rate of crashes with fatalities and serious injuries are reported by the Tucson District and confirmed bythe Corridor Profile Study. Crashes appear to be correlated with merging movements from on ramps to thetravel lane. Congestion is projected to migrate south from Tucson and the volume to capacity ratio isanticipated to fall from Good to Fair, as measured by the Corridor Profile Study.
PROJECT PURPOSEWhat is the Primary Purpose of the Project? Preservation Modernization ExpansionThe project will improve ramps associated with the interchange, including the construction of parallel entrance ramps,striping, edge of pavement delineation, and signage. The project will assist drivers in safely merging with high speedtraffic, especially as volumes are increase significantly within the next ten years.
PROJECT TYPEPavement Preservation Roadway Widening System EnhancementBridge Scour/Rehab Bridge Replacement Sign ReplacementOther : Safety related ramp improvements
PRELIMINARY SCOPING REPORT
PROJECT RISKSCheck any risks identified that may impact the project’s scope, schedule, or budget:
Access / Traffic Control / Detour Issues Right-of-Way Constructability / Construction Window Issues Environmental
Stakeholder Issues Utilities Structures & Geotech Other:
Risk Description: Temporary traffic controls will need to be in place during the construction period. The project isexpected to mitigate the risks of continued higher rates of serious crashes.
FUNDING SOURCE(S)Anticipated Project Design/Construction FundingType: (Check all that apply)
STP TAP HSIP State Local Private Other:
COST ESTIMATEPreliminary Eng
$148,000Design
$496,000Right-of-Way
$0Construction$4,954,960
Total$5,598,960
PROJECT DELIVERYDelivery: Design-Bid-Build Design-Build Other:
Design Program Year: FYConstruction Program Year: FY
ATTACHMENTS1) State Location Map X2) Project Vicinity Map X3) Project Scope of Work4) Project Schedule5) Itemized Cost Estimate6) 15% Design Plan Sheets (as needed)
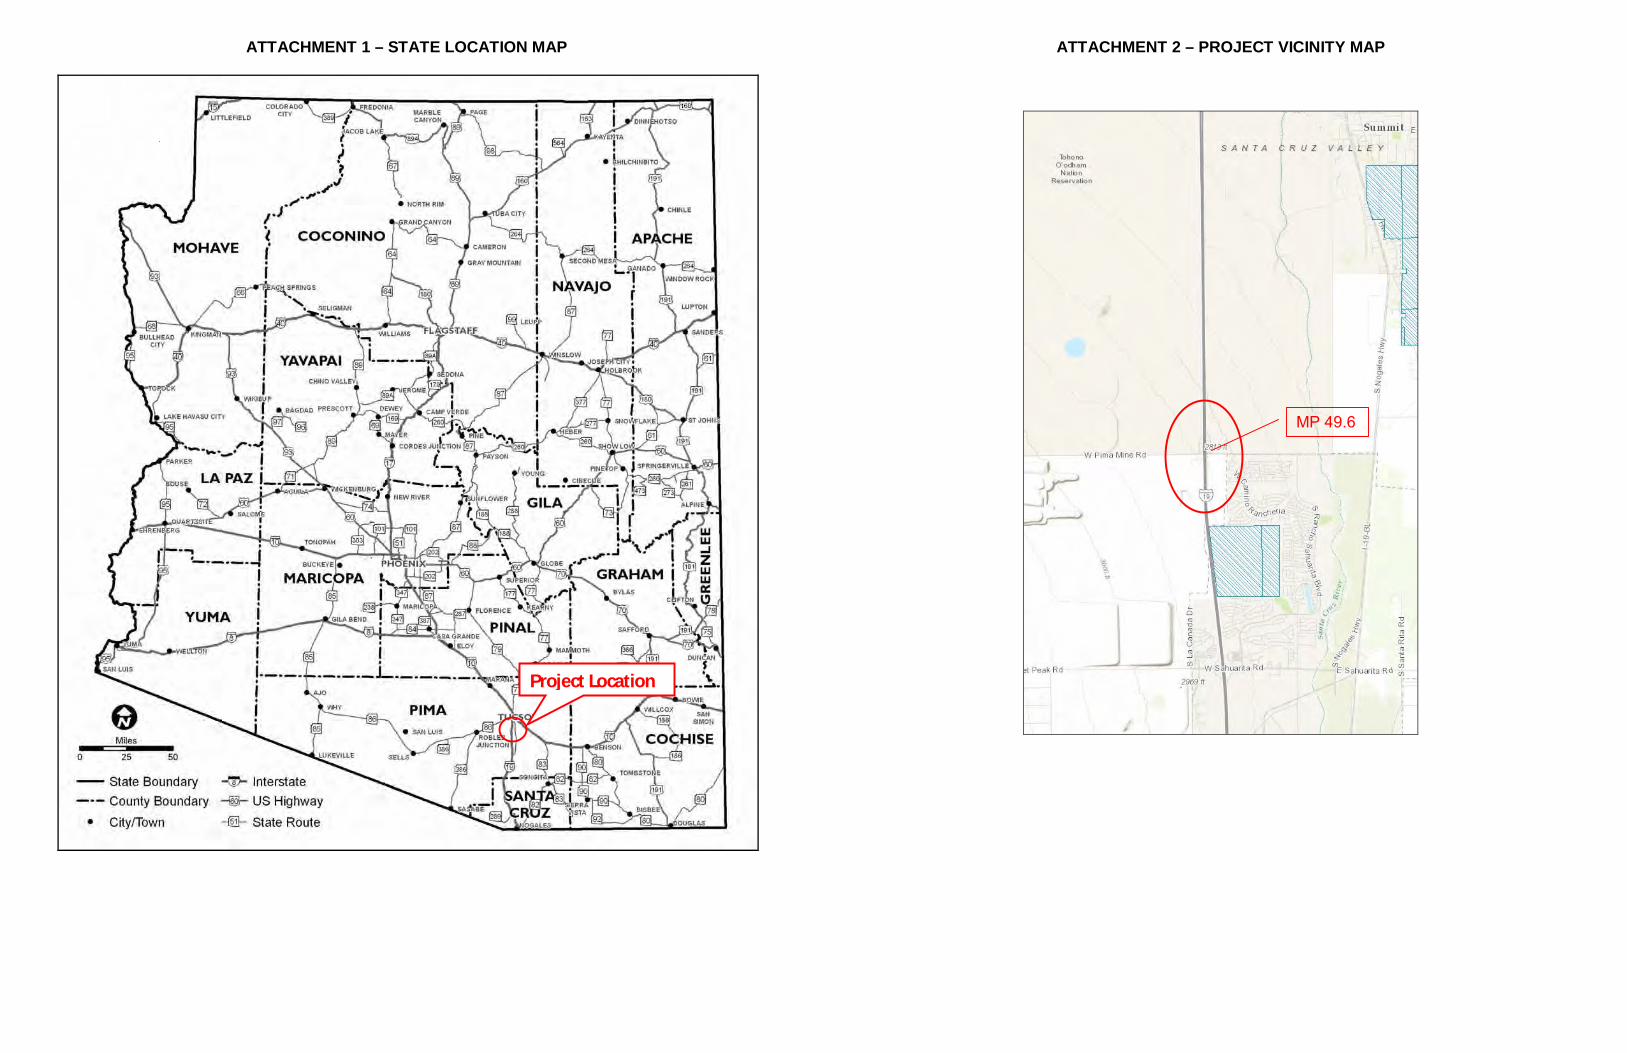
ATTACHMENT 1 – STATE LOCATION MAP
Project Location
ATTACHMENT 2 – PROJECT VICINITY MAP
MP 49.6
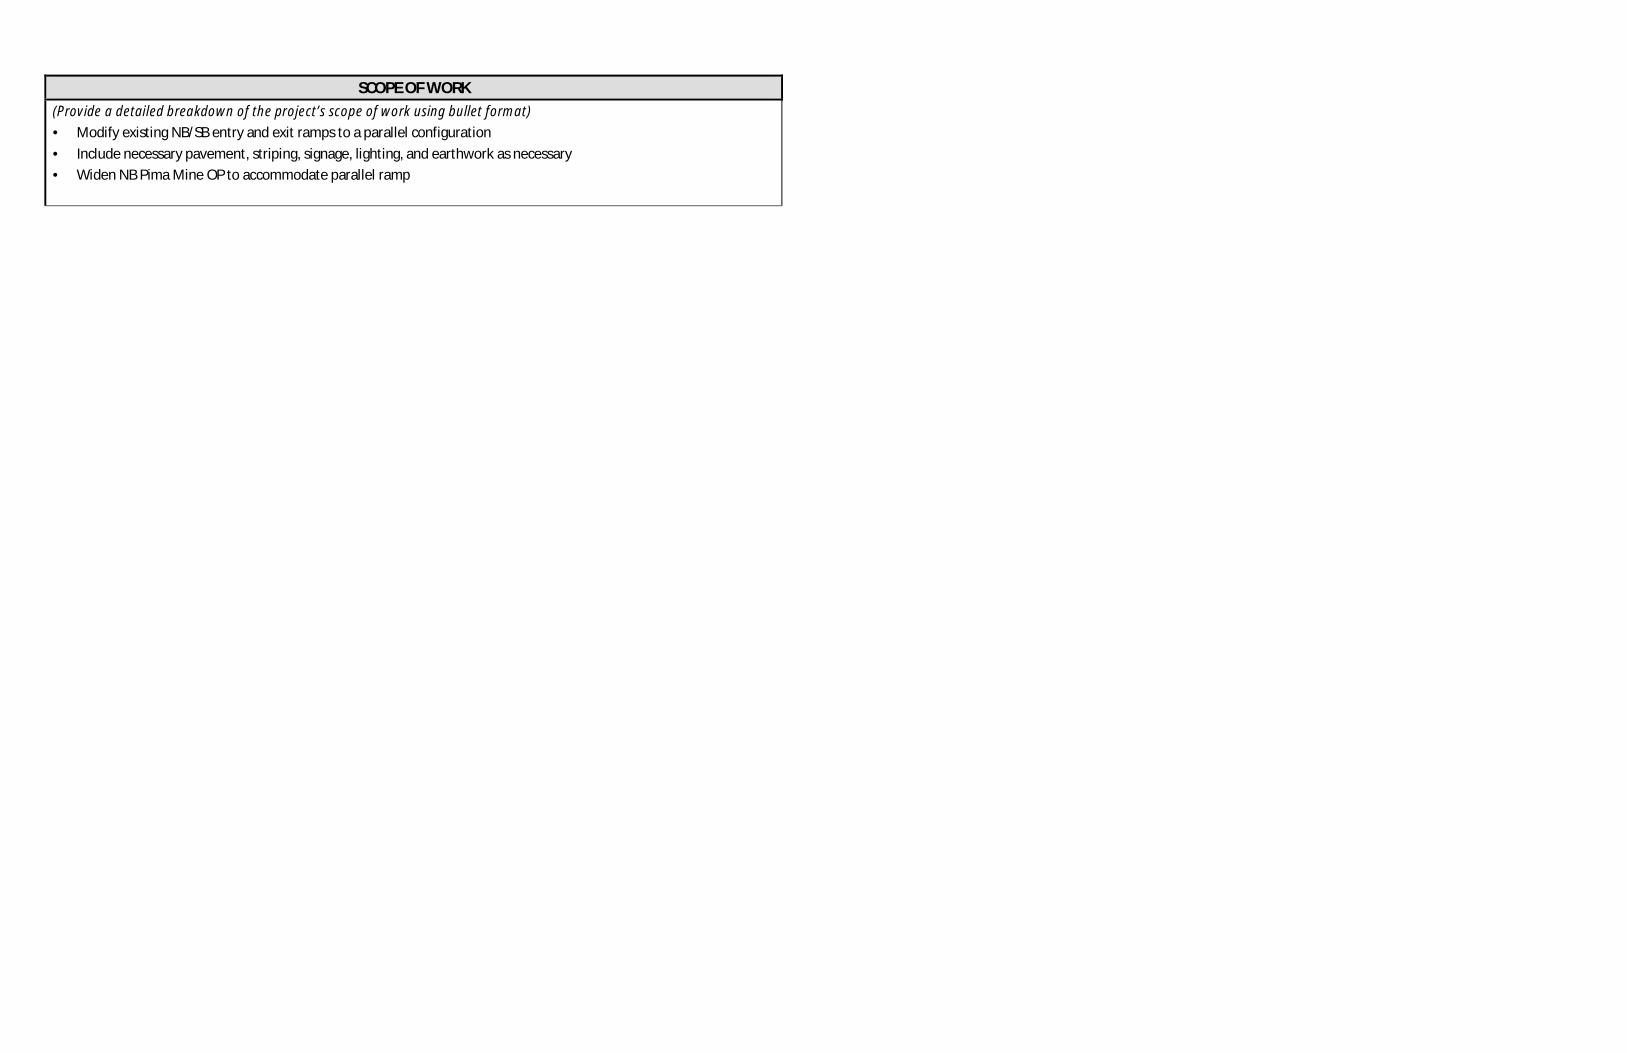
SCOPE OF WORK(Provide a detailed breakdown of the project’s scope of work using bullet format)· Modify existing NB/SB entry and exit ramps to a parallel configuration· Include necessary pavement, striping, signage, lighting, and earthwork as necessary· Widen NB Pima Mine OP to accommodate parallel ramp

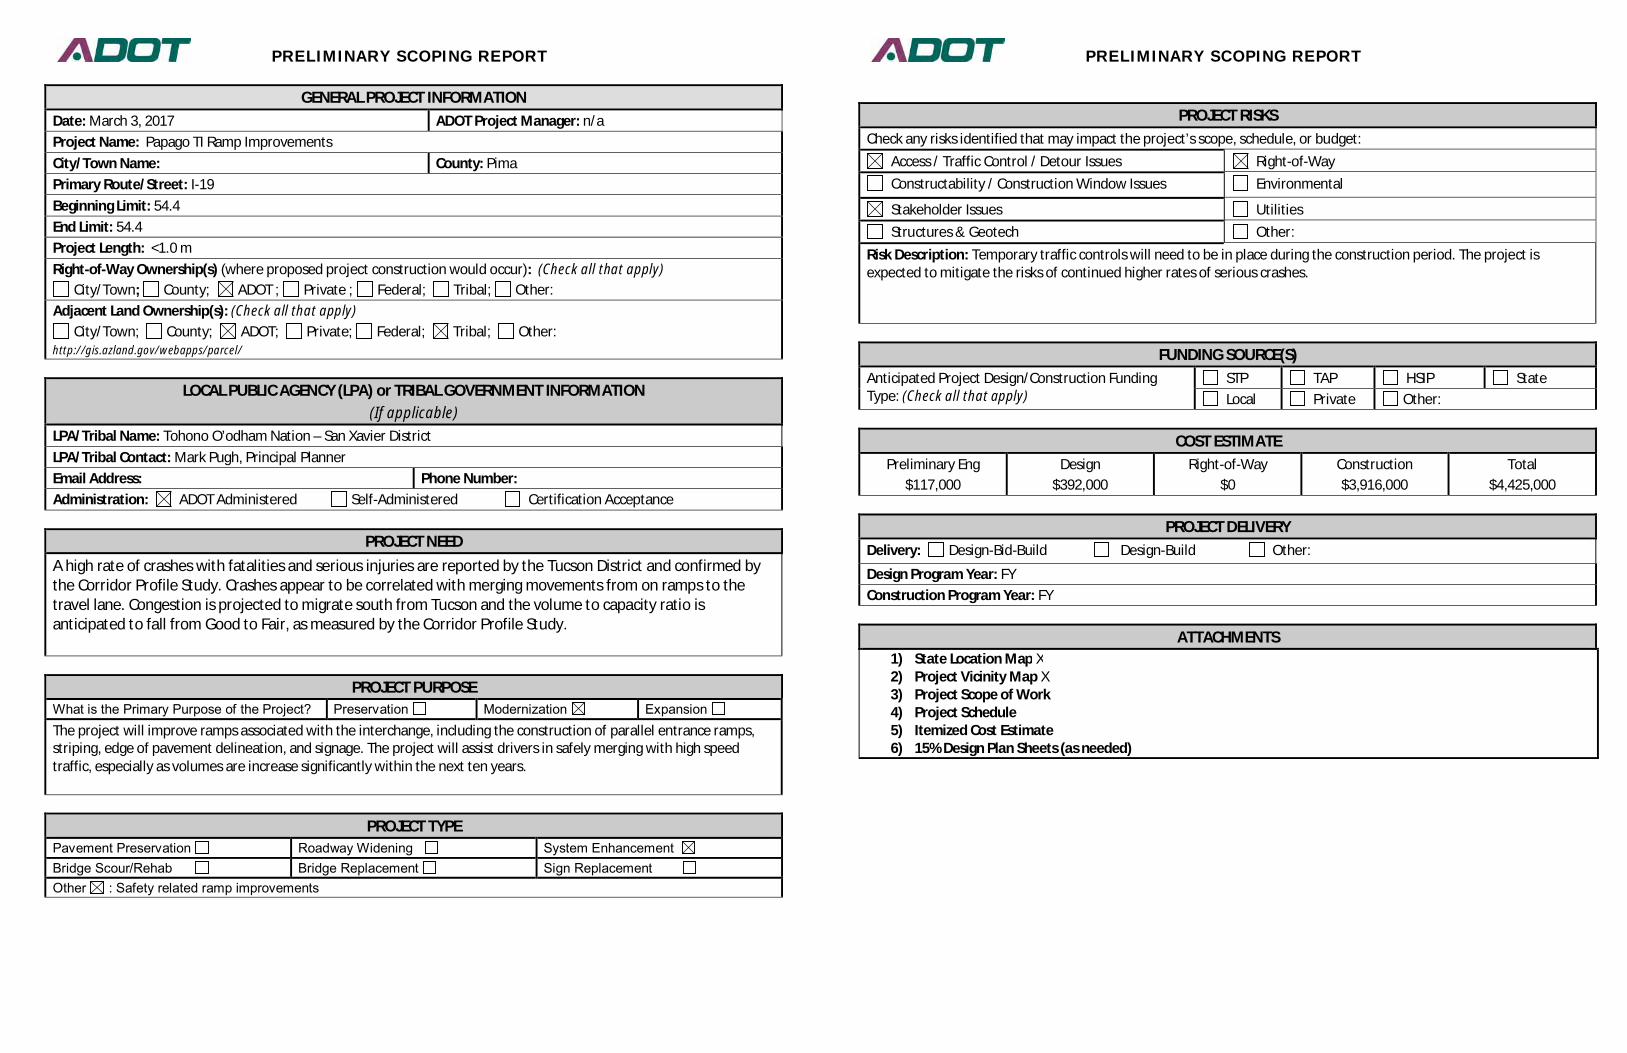
PRELIMINARY SCOPING REPORT
GENERAL PROJECT INFORMATIONDate: March 3, 2017 ADOT Project Manager: n/aProject Name: Papago TI Ramp ImprovementsCity/Town Name: County: PimaPrimary Route/Street: I-19Beginning Limit: 54.4End Limit: 54.4Project Length: <1.0 mRight-of-Way Ownership(s) (where proposed project construction would occur): (Check all that apply)
City/Town; County; ADOT ; Private ; Federal; Tribal; Other:Adjacent Land Ownership(s): (Check all that apply)
City/Town; County; ADOT; Private; Federal; Tribal; Other:http://gis.azland.gov/webapps/parcel/
LOCAL PUBLIC AGENCY (LPA) or TRIBAL GOVERNMENT INFORMATION(If applicable)
LPA/Tribal Name: Tohono O’odham Nation – San Xavier DistrictLPA/Tribal Contact: Mark Pugh, Principal PlannerEmail Address: Phone Number:Administration: ADOT Administered Self-Administered Certification Acceptance
PROJECT NEEDA high rate of crashes with fatalities and serious injuries are reported by the Tucson District and confirmed bythe Corridor Profile Study. Crashes appear to be correlated with merging movements from on ramps to thetravel lane. Congestion is projected to migrate south from Tucson and the volume to capacity ratio isanticipated to fall from Good to Fair, as measured by the Corridor Profile Study.
PROJECT PURPOSEWhat is the Primary Purpose of the Project? Preservation Modernization ExpansionThe project will improve ramps associated with the interchange, including the construction of parallel entrance ramps,striping, edge of pavement delineation, and signage. The project will assist drivers in safely merging with high speedtraffic, especially as volumes are increase significantly within the next ten years.
PROJECT TYPEPavement Preservation Roadway Widening System EnhancementBridge Scour/Rehab Bridge Replacement Sign ReplacementOther : Safety related ramp improvements
PRELIMINARY SCOPING REPORT
PROJECT RISKSCheck any risks identified that may impact the project’s scope, schedule, or budget:
Access / Traffic Control / Detour Issues Right-of-Way Constructability / Construction Window Issues Environmental
Stakeholder Issues Utilities Structures & Geotech Other:
Risk Description: Temporary traffic controls will need to be in place during the construction period. The project isexpected to mitigate the risks of continued higher rates of serious crashes.
FUNDING SOURCE(S)Anticipated Project Design/Construction FundingType: (Check all that apply)
STP TAP HSIP State Local Private Other:
COST ESTIMATEPreliminary Eng
$117,000Design
$392,000Right-of-Way
$0Construction$3,916,000
Total$4,425,000
PROJECT DELIVERYDelivery: Design-Bid-Build Design-Build Other:
Design Program Year: FYConstruction Program Year: FY
ATTACHMENTS1) State Location Map X2) Project Vicinity Map X3) Project Scope of Work4) Project Schedule5) Itemized Cost Estimate6) 15% Design Plan Sheets (as needed)
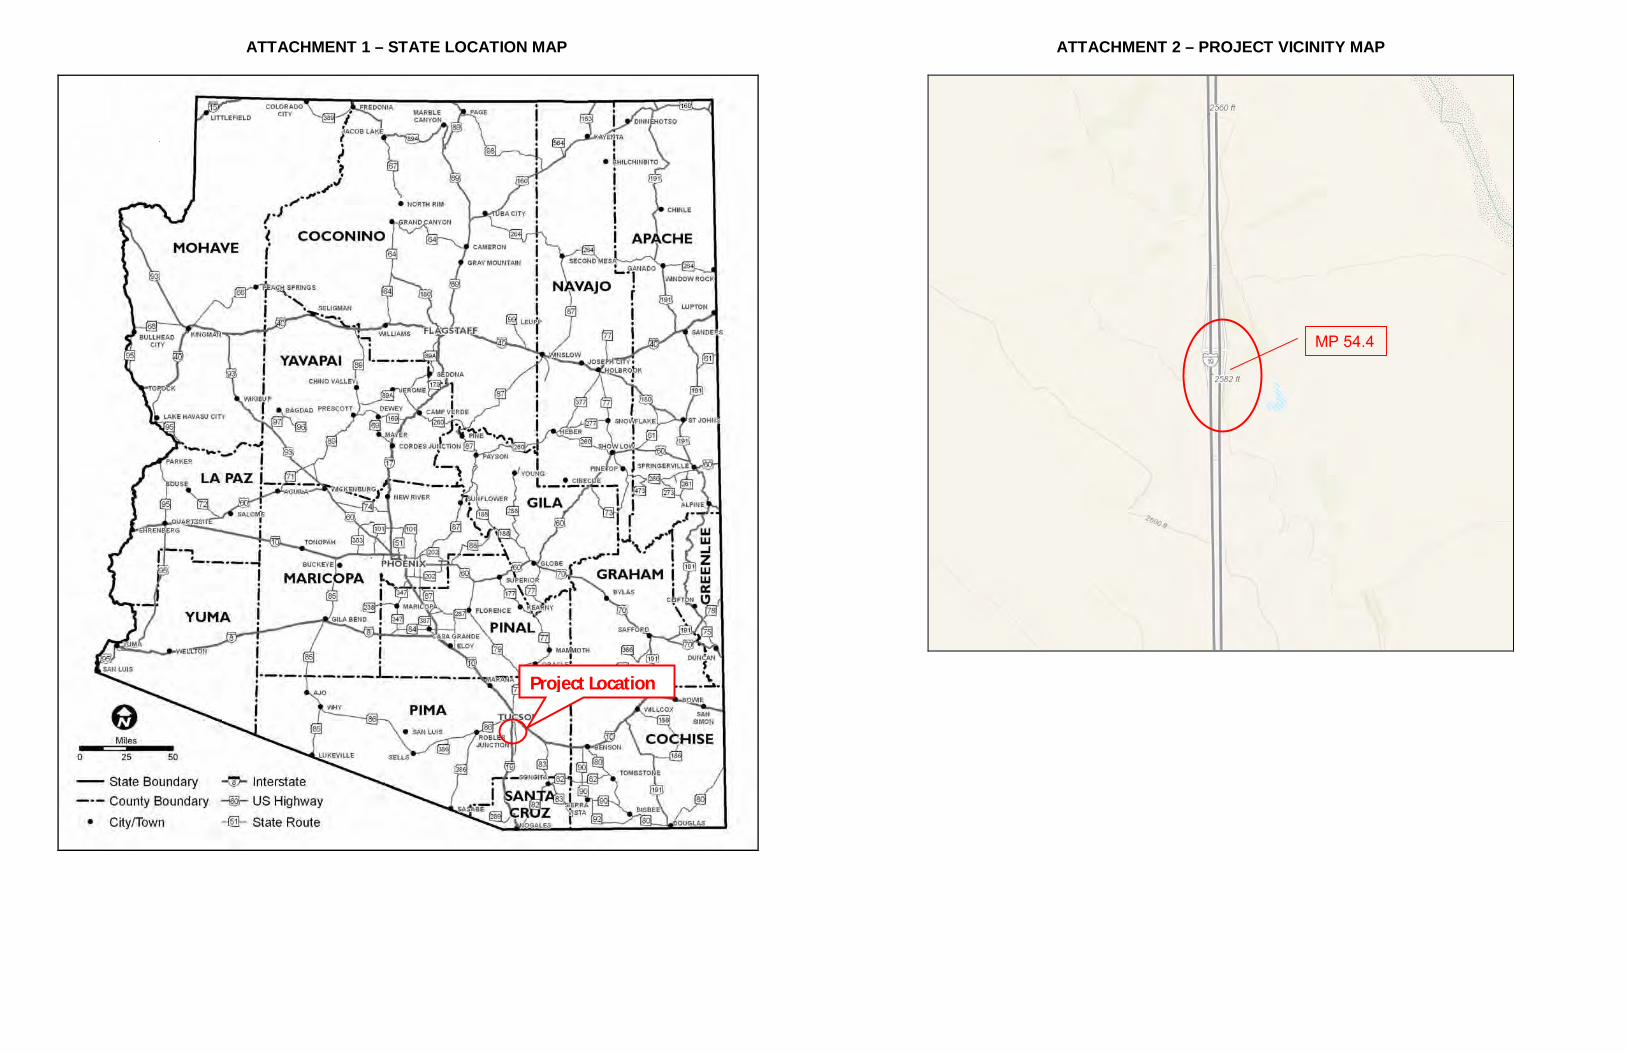
ATTACHMENT 1 – STATE LOCATION MAP
Project Location
ATTACHMENT 2 – PROJECT VICINITY MAP
MP 54.4

SCOPE OF WORK(Provide a detailed breakdown of the project’s scope of work using bullet format)· Modify existing NB/SB entry and exit ramps to a parallel configuration· Update pavement, lane striping, signage, lighting, edge of pavement markings, and earthwork as necessary

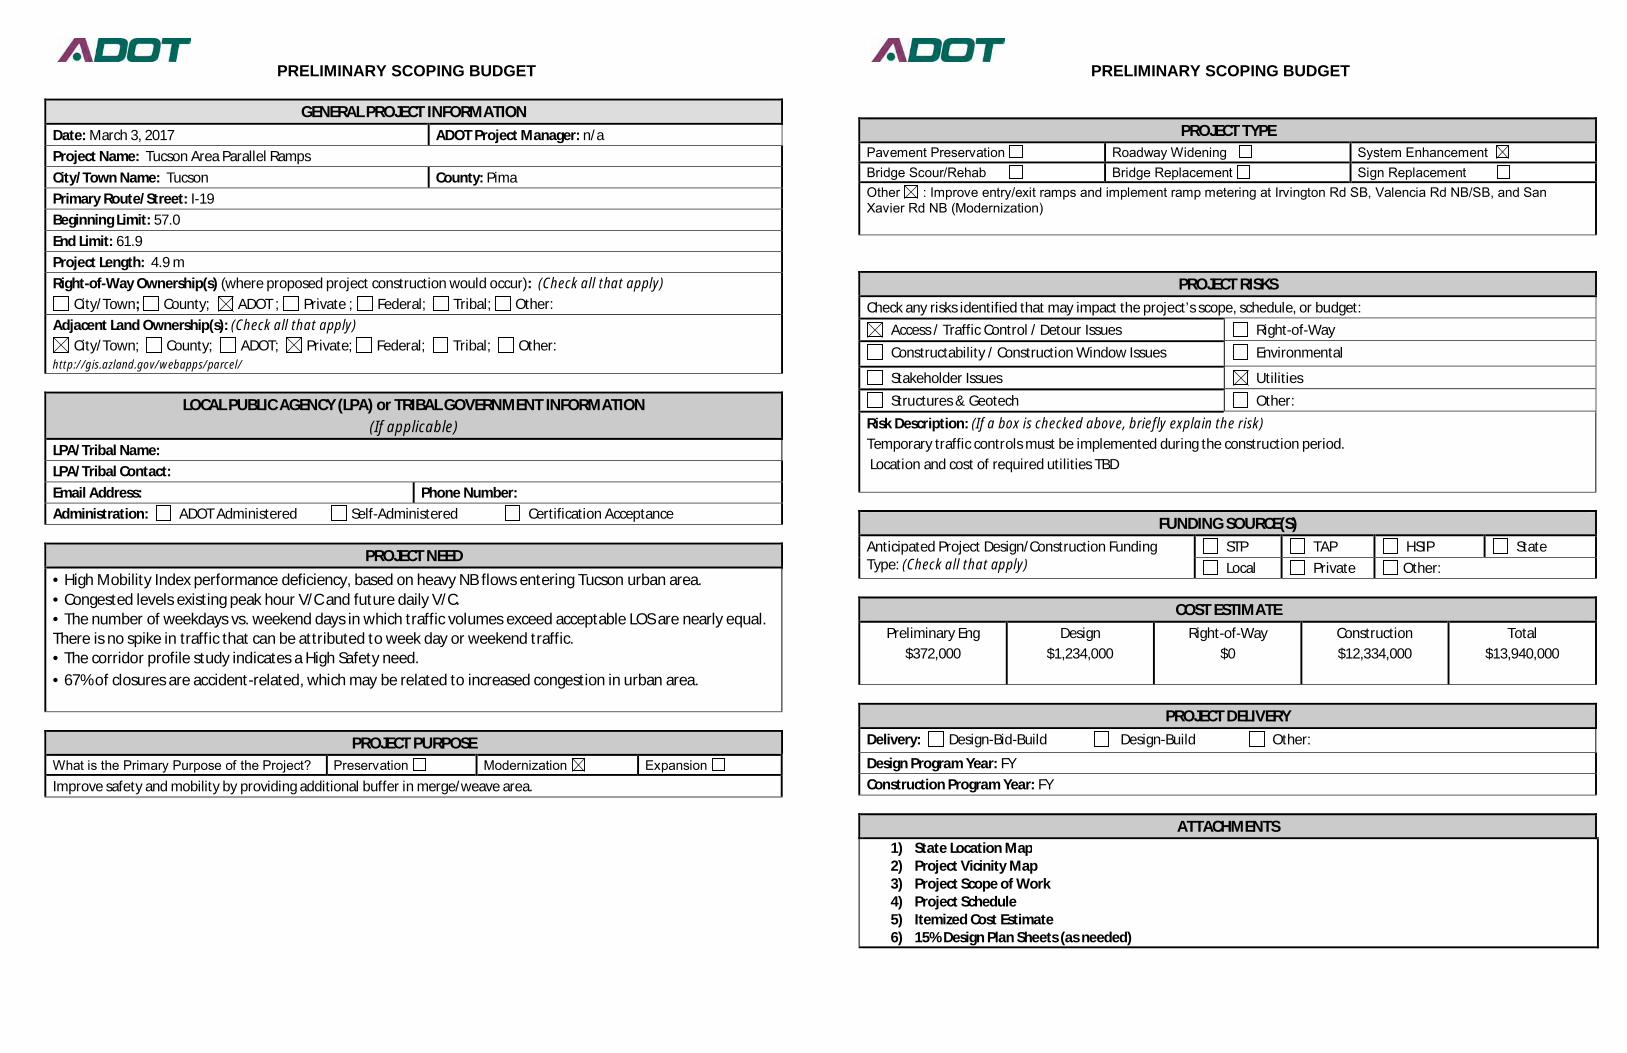
PRELIMINARY SCOPING BUDGET
GENERAL PROJECT INFORMATIONDate: March 3, 2017 ADOT Project Manager: n/aProject Name: Tucson Area Parallel RampsCity/Town Name: Tucson County: PimaPrimary Route/Street: I-19Beginning Limit: 57.0End Limit: 61.9Project Length: 4.9 mRight-of-Way Ownership(s) (where proposed project construction would occur): (Check all that apply)
City/Town; County; ADOT ; Private ; Federal; Tribal; Other:Adjacent Land Ownership(s): (Check all that apply)
City/Town; County; ADOT; Private; Federal; Tribal; Other:http://gis.azland.gov/webapps/parcel/
LOCAL PUBLIC AGENCY (LPA) or TRIBAL GOVERNMENT INFORMATION(If applicable)
LPA/Tribal Name:LPA/Tribal Contact:Email Address: Phone Number:Administration: ADOT Administered Self-Administered Certification Acceptance
PROJECT NEED• High Mobility Index performance deficiency, based on heavy NB flows entering Tucson urban area.• Congested levels existing peak hour V/C and future daily V/C.• The number of weekdays vs. weekend days in which traffic volumes exceed acceptable LOS are nearly equal.There is no spike in traffic that can be attributed to week day or weekend traffic.• The corridor profile study indicates a High Safety need.• 67% of closures are accident-related, which may be related to increased congestion in urban area.
PROJECT PURPOSEWhat is the Primary Purpose of the Project? Preservation Modernization ExpansionImprove safety and mobility by providing additional buffer in merge/weave area.
PRELIMINARY SCOPING BUDGET
PROJECT TYPEPavement Preservation Roadway Widening System EnhancementBridge Scour/Rehab Bridge Replacement Sign ReplacementOther : Improve entry/exit ramps and implement ramp metering at Irvington Rd SB, Valencia Rd NB/SB, and SanXavier Rd NB (Modernization)
PROJECT RISKSCheck any risks identified that may impact the project’s scope, schedule, or budget:
Access / Traffic Control / Detour Issues Right-of-Way Constructability / Construction Window Issues Environmental
Stakeholder Issues Utilities Structures & Geotech Other:
Risk Description: (If a box is checked above, briefly explain the risk)Temporary traffic controls must be implemented during the construction period. Location and cost of required utilities TBD
FUNDING SOURCE(S)Anticipated Project Design/Construction FundingType: (Check all that apply)
STP TAP HSIP State Local Private Other:
COST ESTIMATEPreliminary Eng
$372,000Design
$1,234,000Right-of-Way
$0Construction$12,334,000
Total$13,940,000
PROJECT DELIVERYDelivery: Design-Bid-Build Design-Build Other:
Design Program Year: FYConstruction Program Year: FY
ATTACHMENTS1) State Location Map2) Project Vicinity Map3) Project Scope of Work4) Project Schedule5) Itemized Cost Estimate6) 15% Design Plan Sheets (as needed)

ATTACHMENT 1 – LOCATION MAP
Project Location
ATTACHMENT 2 – PROJECT VICINITY MAP
MP 57.0
MP 61.9
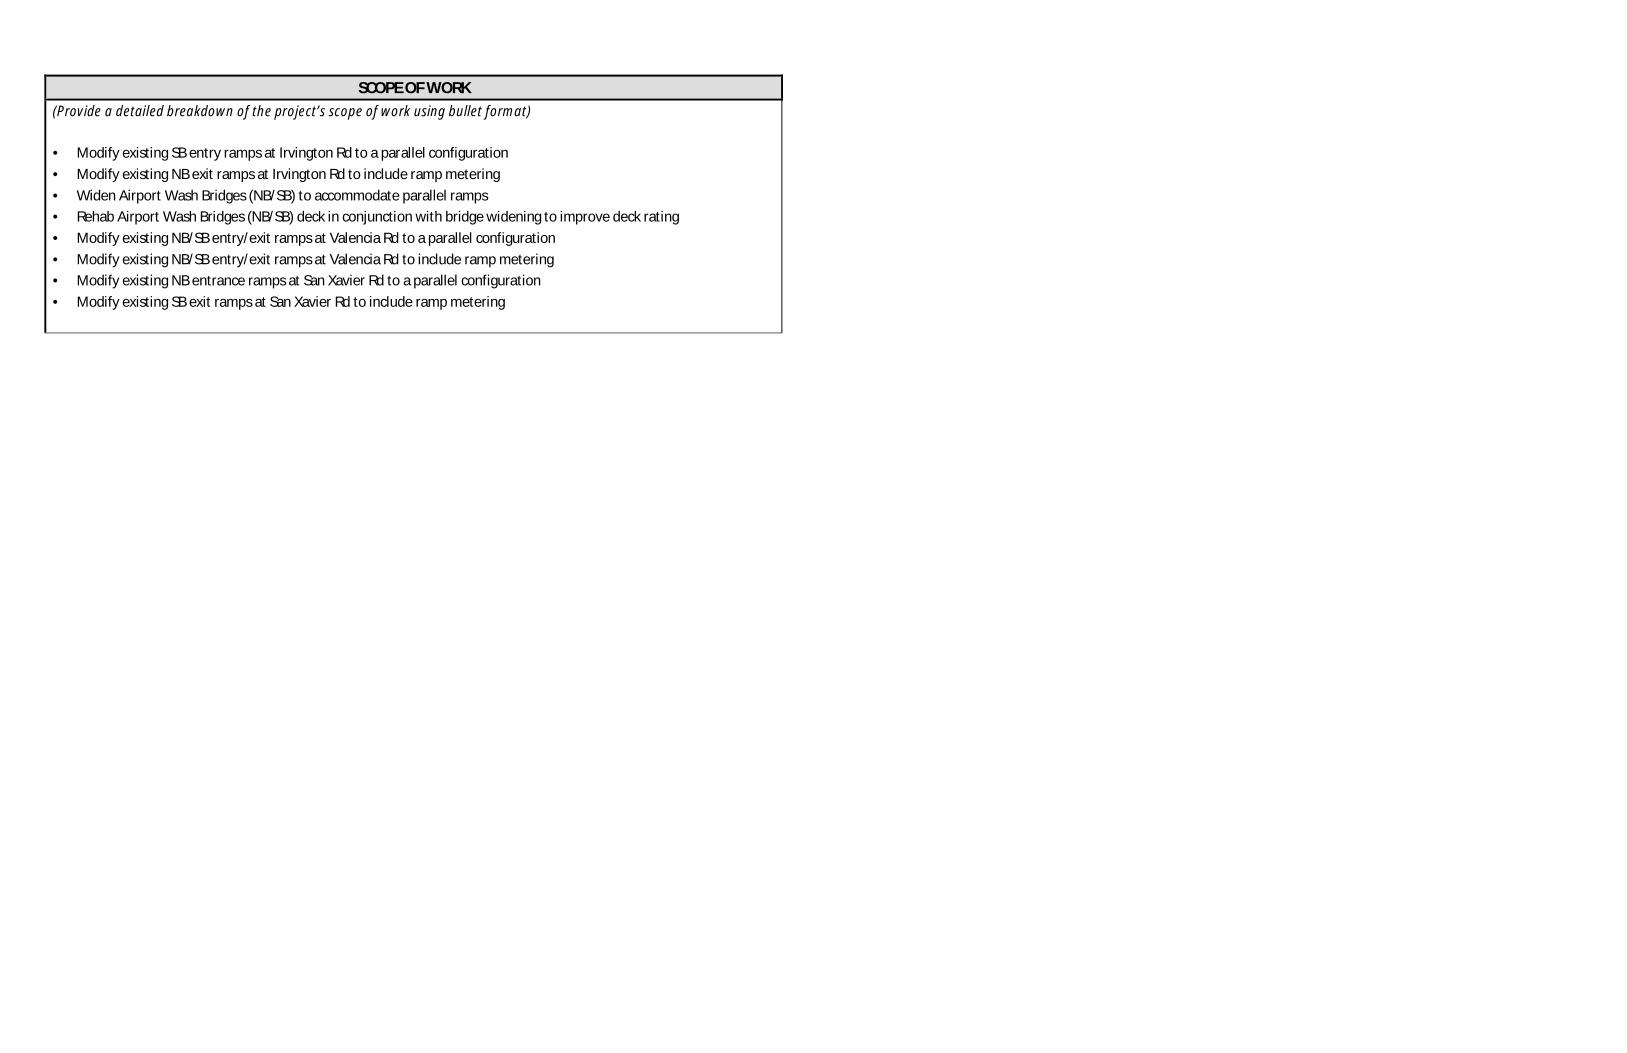
SCOPE OF WORK(Provide a detailed breakdown of the project’s scope of work using bullet format)
· Modify existing SB entry ramps at Irvington Rd to a parallel configuration· Modify existing NB exit ramps at Irvington Rd to include ramp metering· Widen Airport Wash Bridges (NB/SB) to accommodate parallel ramps· Rehab Airport Wash Bridges (NB/SB) deck in conjunction with bridge widening to improve deck rating· Modify existing NB/SB entry/exit ramps at Valencia Rd to a parallel configuration· Modify existing NB/SB entry/exit ramps at Valencia Rd to include ramp metering· Modify existing NB entrance ramps at San Xavier Rd to a parallel configuration· Modify existing SB exit ramps at San Xavier Rd to include ramp metering


PRELIMINARY SCOPING REPORT
GENERAL PROJECT INFORMATIONDate: March 3, 2017 ADOT Project Manager: n/aProject Name: Tucson Variable Speed LimitsCity/Town Name: Tucson County: PimaPrimary Route/Street: I-19Beginning Limit: 57.0End Limit: 64.0Project Length: 7 milesRight-of-Way Ownership(s) (where proposed project construction would occur): (Check all that apply)
City/Town; County; ADOT ; Private ; Federal; Tribal; Other:Adjacent Land Ownership(s): (Check all that apply)
City/Town; County; ADOT; Private; Federal; Tribal; Other:http://gis.azland.gov/webapps/parcel/
LOCAL PUBLIC AGENCY (LPA) or TRIBAL GOVERNMENT INFORMATION(If applicable)
LPA/Tribal Name:LPA/Tribal Contact:Email Address: Phone Number:Administration: ADOT Administered Self-Administered Certification Acceptance
PROJECT NEED• High Mobility Index performance deficiency, based on heavy NB flows entering Tucson urban area.• Congested levels existing peak hour V/C and future daily V/C.• The number of weekdays vs. weekend days in which traffic volumes exceed acceptable LOS are nearly equal.There is no spike in traffic that can be attributed to week day or weekend traffic.• The corridor profile study indicates a High Safety need.• 67% of closures are accident-related, which may be related to increased congestion in urban area.
PROJECT PURPOSEWhat is the Primary Purpose of the Project? Preservation Modernization ExpansionImprove safety and mobility with improved traffic controls
PRELIMINARY SCOPING REPORT
PROJECT TYPEPavement Preservation Roadway Widening System EnhancementBridge Scour/Rehab Bridge Replacement Sign ReplacementOther :Implement variable speed limits, wireless, overhead, NB/SB (extend north to MP 64.0)
PROJECT RISKSCheck any risks identified that may impact the project’s scope, schedule, or budget:
Access / Traffic Control / Detour Issues Right-of-Way Constructability / Construction Window Issues Environmental
Stakeholder Issues Utilities Structures & Geotech Other:
Risk Description: (If a box is checked above, briefly explain the risk)Temporary traffic controls must be implemented during the construction period. Location and cost of required utilities TBD
FUNDING SOURCE(S)Anticipated Project Design/Construction FundingType: (Check all that apply)
STP TAP HSIP State Local Private Other:
COST ESTIMATEPreliminary Eng
$664,000Design
$2,212,000Right-of-Way
$0Construction$22,120,000
Total$24,996,000
PROJECT DELIVERYDelivery: Design-Bid-Build Design-Build Other:
Design Program Year: FYConstruction Program Year: FY
ATTACHMENTS1) State Location Map2) Project Vicinity Map3) Project Scope of Work4) Project Schedule5) Itemized Cost Estimate6) 15% Design Plan Sheets (as needed)
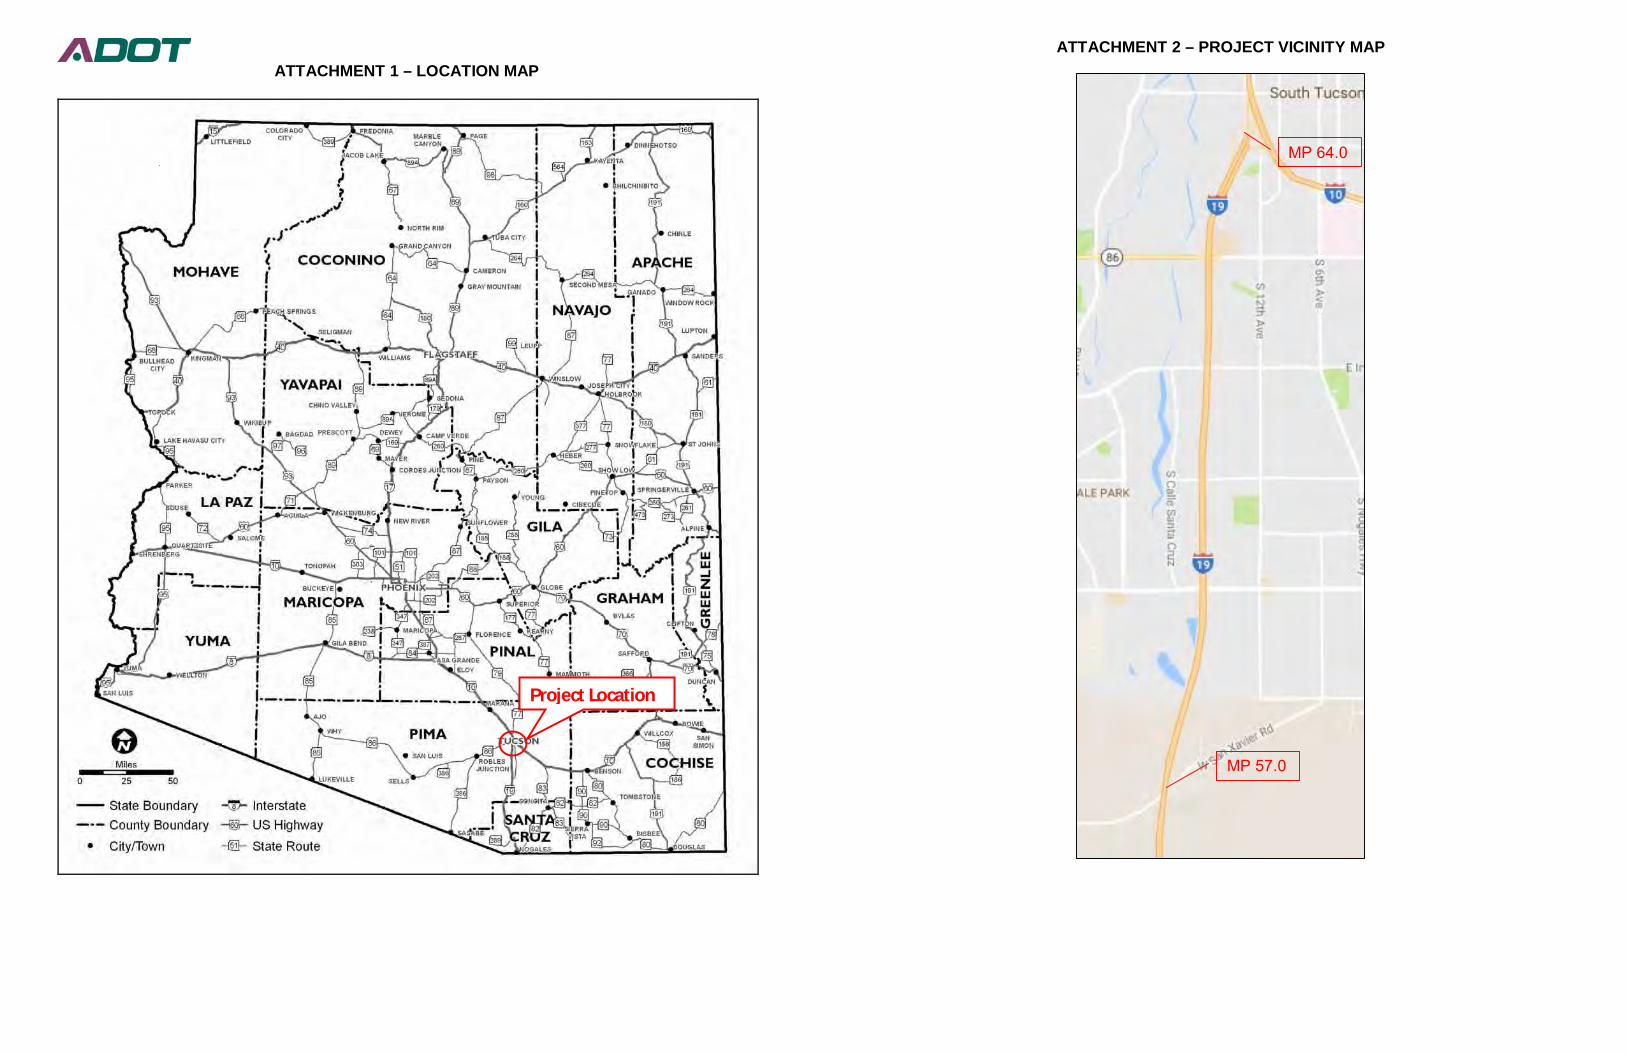
ATTACHMENT 1 – LOCATION MAP
Project Location
ATTACHMENT 2 – PROJECT VICINITY MAP
MP 57.0
MP 64.0
SCOPE OF WORK(Provide a detailed breakdown of the project’s scope of work using bullet format)· Implement variable speed limits in project area, timed to peak hour congestion

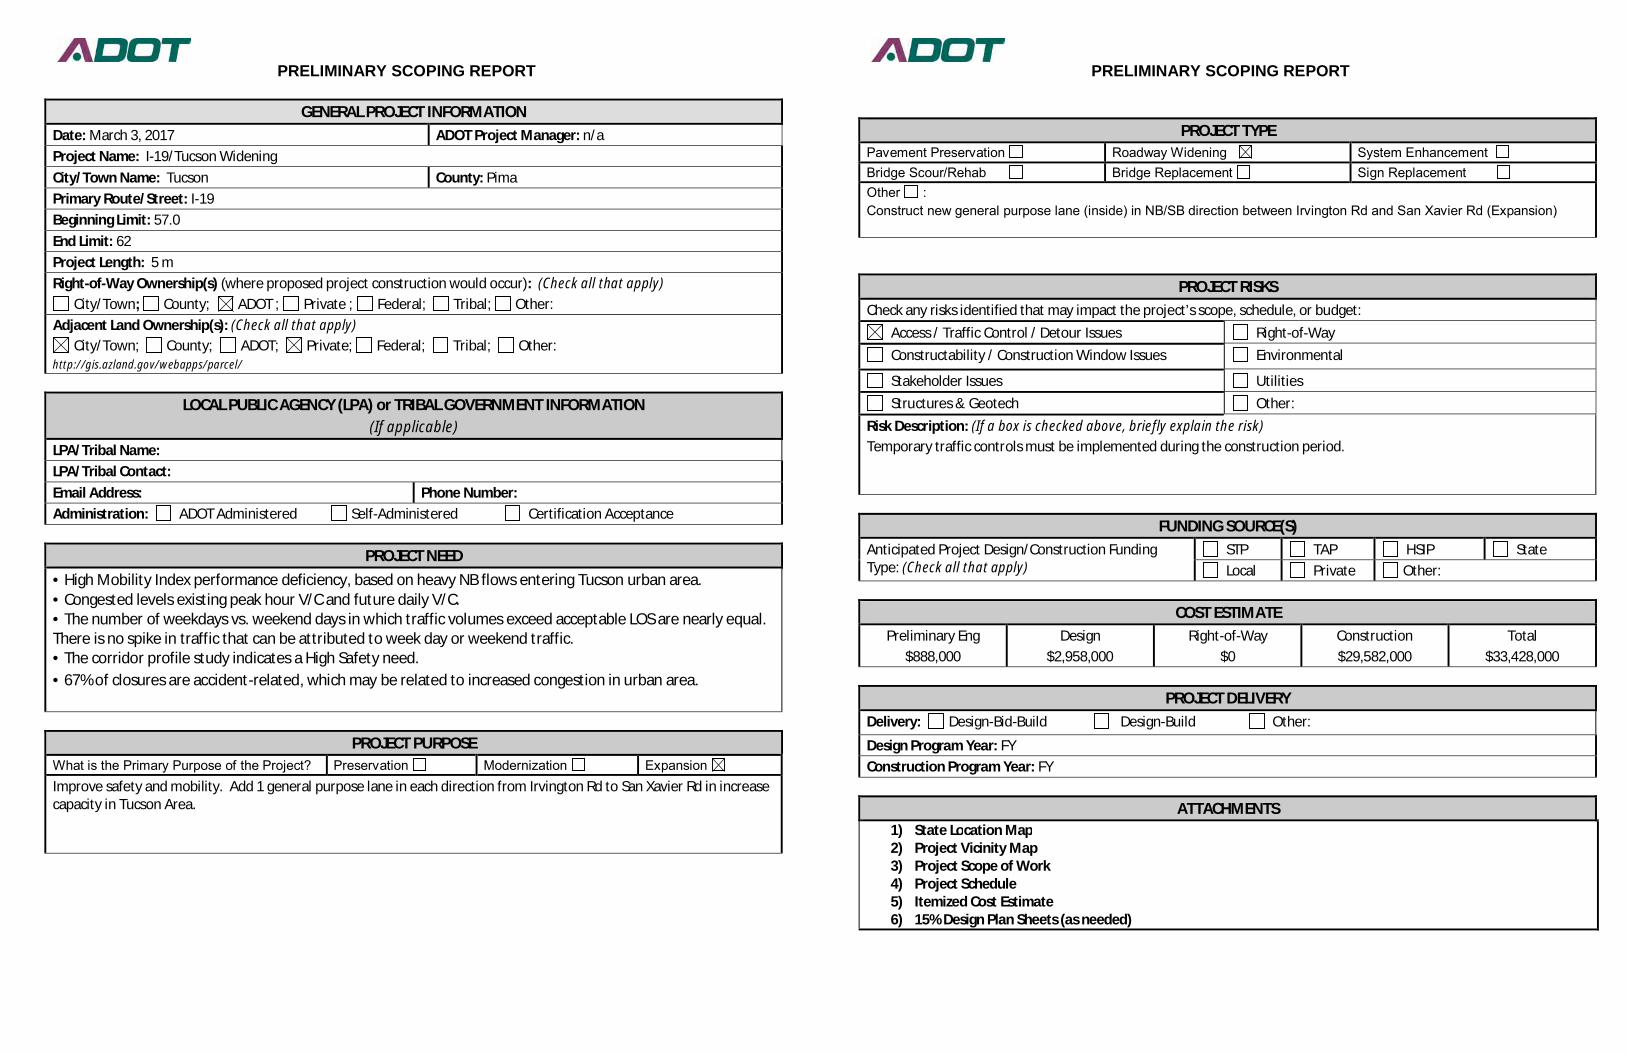
PRELIMINARY SCOPING REPORT
GENERAL PROJECT INFORMATIONDate: March 3, 2017 ADOT Project Manager: n/aProject Name: I-19/Tucson WideningCity/Town Name: Tucson County: PimaPrimary Route/Street: I-19Beginning Limit: 57.0End Limit: 62Project Length: 5 mRight-of-Way Ownership(s) (where proposed project construction would occur): (Check all that apply)
City/Town; County; ADOT ; Private ; Federal; Tribal; Other:Adjacent Land Ownership(s): (Check all that apply)
City/Town; County; ADOT; Private; Federal; Tribal; Other:http://gis.azland.gov/webapps/parcel/
LOCAL PUBLIC AGENCY (LPA) or TRIBAL GOVERNMENT INFORMATION(If applicable)
LPA/Tribal Name:LPA/Tribal Contact:Email Address: Phone Number:Administration: ADOT Administered Self-Administered Certification Acceptance
PROJECT NEED• High Mobility Index performance deficiency, based on heavy NB flows entering Tucson urban area.• Congested levels existing peak hour V/C and future daily V/C.• The number of weekdays vs. weekend days in which traffic volumes exceed acceptable LOS are nearly equal.There is no spike in traffic that can be attributed to week day or weekend traffic.• The corridor profile study indicates a High Safety need.• 67% of closures are accident-related, which may be related to increased congestion in urban area.
PROJECT PURPOSEWhat is the Primary Purpose of the Project? Preservation Modernization ExpansionImprove safety and mobility. Add 1 general purpose lane in each direction from Irvington Rd to San Xavier Rd in increasecapacity in Tucson Area.
PRELIMINARY SCOPING REPORT
PROJECT TYPEPavement Preservation Roadway Widening System EnhancementBridge Scour/Rehab Bridge Replacement Sign ReplacementOther :Construct new general purpose lane (inside) in NB/SB direction between Irvington Rd and San Xavier Rd (Expansion)
PROJECT RISKSCheck any risks identified that may impact the project’s scope, schedule, or budget:
Access / Traffic Control / Detour Issues Right-of-Way Constructability / Construction Window Issues Environmental
Stakeholder Issues Utilities Structures & Geotech Other:
Risk Description: (If a box is checked above, briefly explain the risk)Temporary traffic controls must be implemented during the construction period.
FUNDING SOURCE(S)Anticipated Project Design/Construction FundingType: (Check all that apply)
STP TAP HSIP State Local Private Other:
COST ESTIMATEPreliminary Eng
$888,000Design
$2,958,000Right-of-Way
$0Construction$29,582,000
Total$33,428,000
PROJECT DELIVERYDelivery: Design-Bid-Build Design-Build Other:
Design Program Year: FYConstruction Program Year: FY
ATTACHMENTS1) State Location Map2) Project Vicinity Map3) Project Scope of Work4) Project Schedule5) Itemized Cost Estimate6) 15% Design Plan Sheets (as needed)
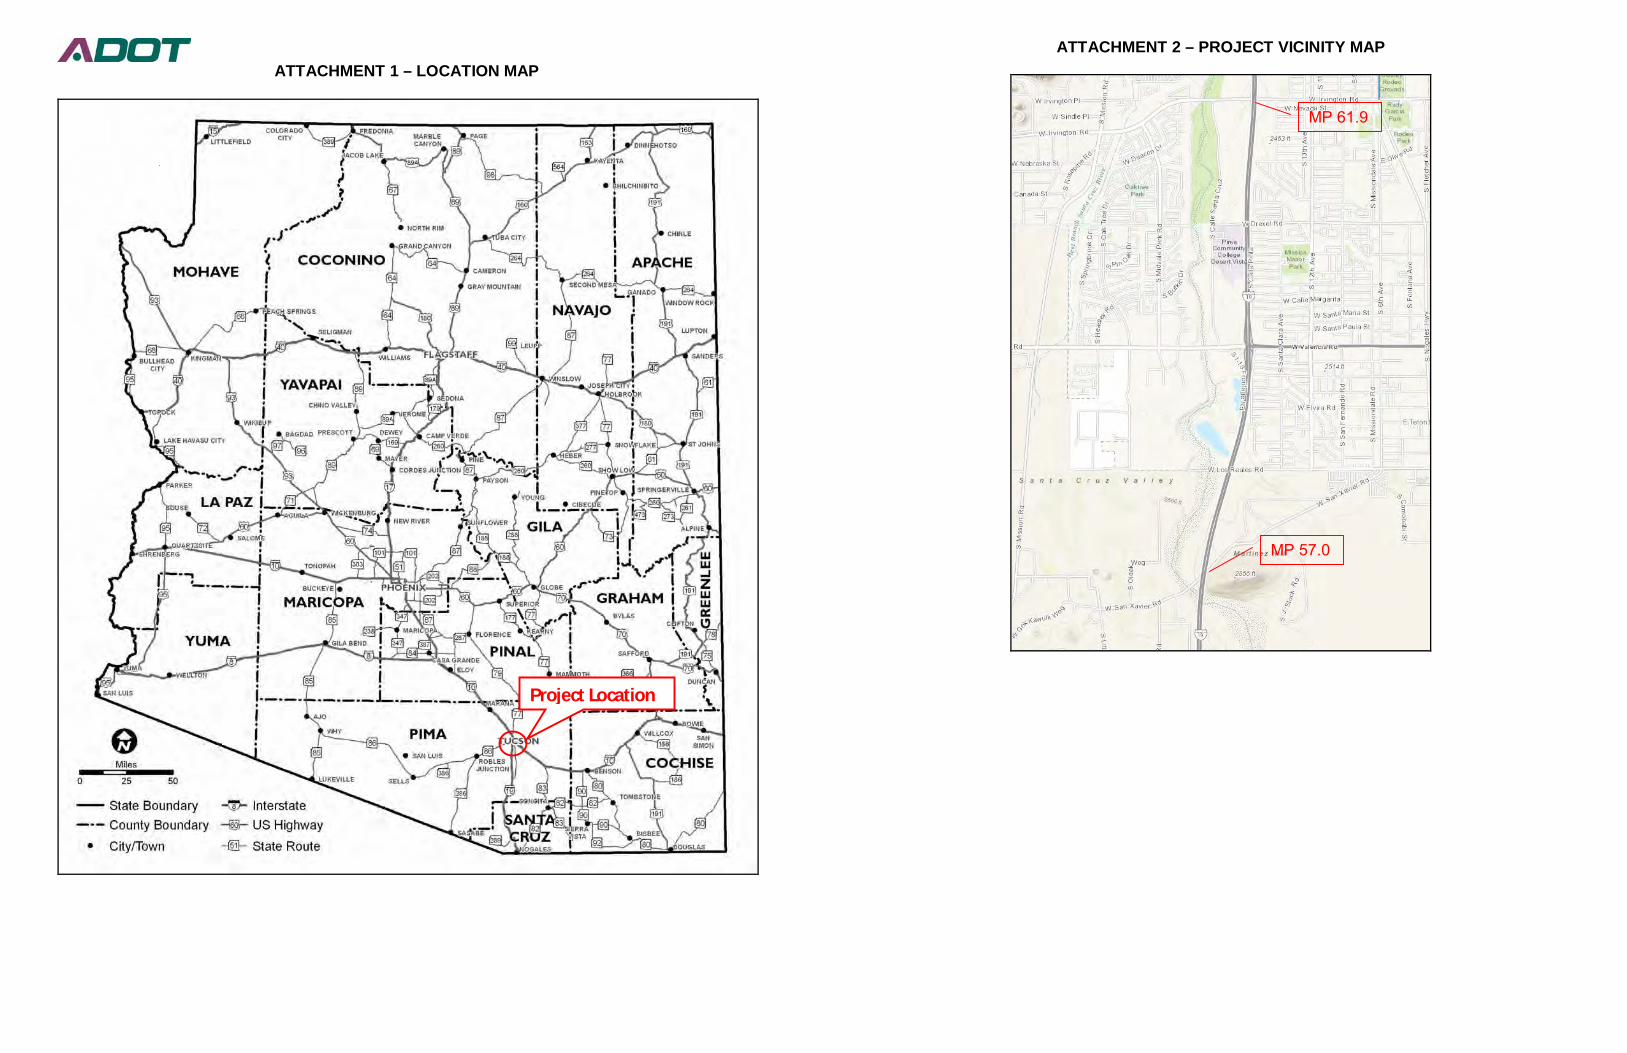
ATTACHMENT 1 – LOCATION MAP
Project Location
ATTACHMENT 2 – PROJECT VICINITY MAP
MP 57.0
MP 61.9

SCOPE OF WORK(Provide a detailed breakdown of the project’s scope of work using bullet format)· Construct New NB/SB GP Lanes between Irvington Rd and San Xavier Rd (inside widening)· Widen Airport Wash Bridge to accommodate new GP lanes· Rehab Airport Wash Bridge deck and superstructure in conjunction with bridge widening to improve ratings

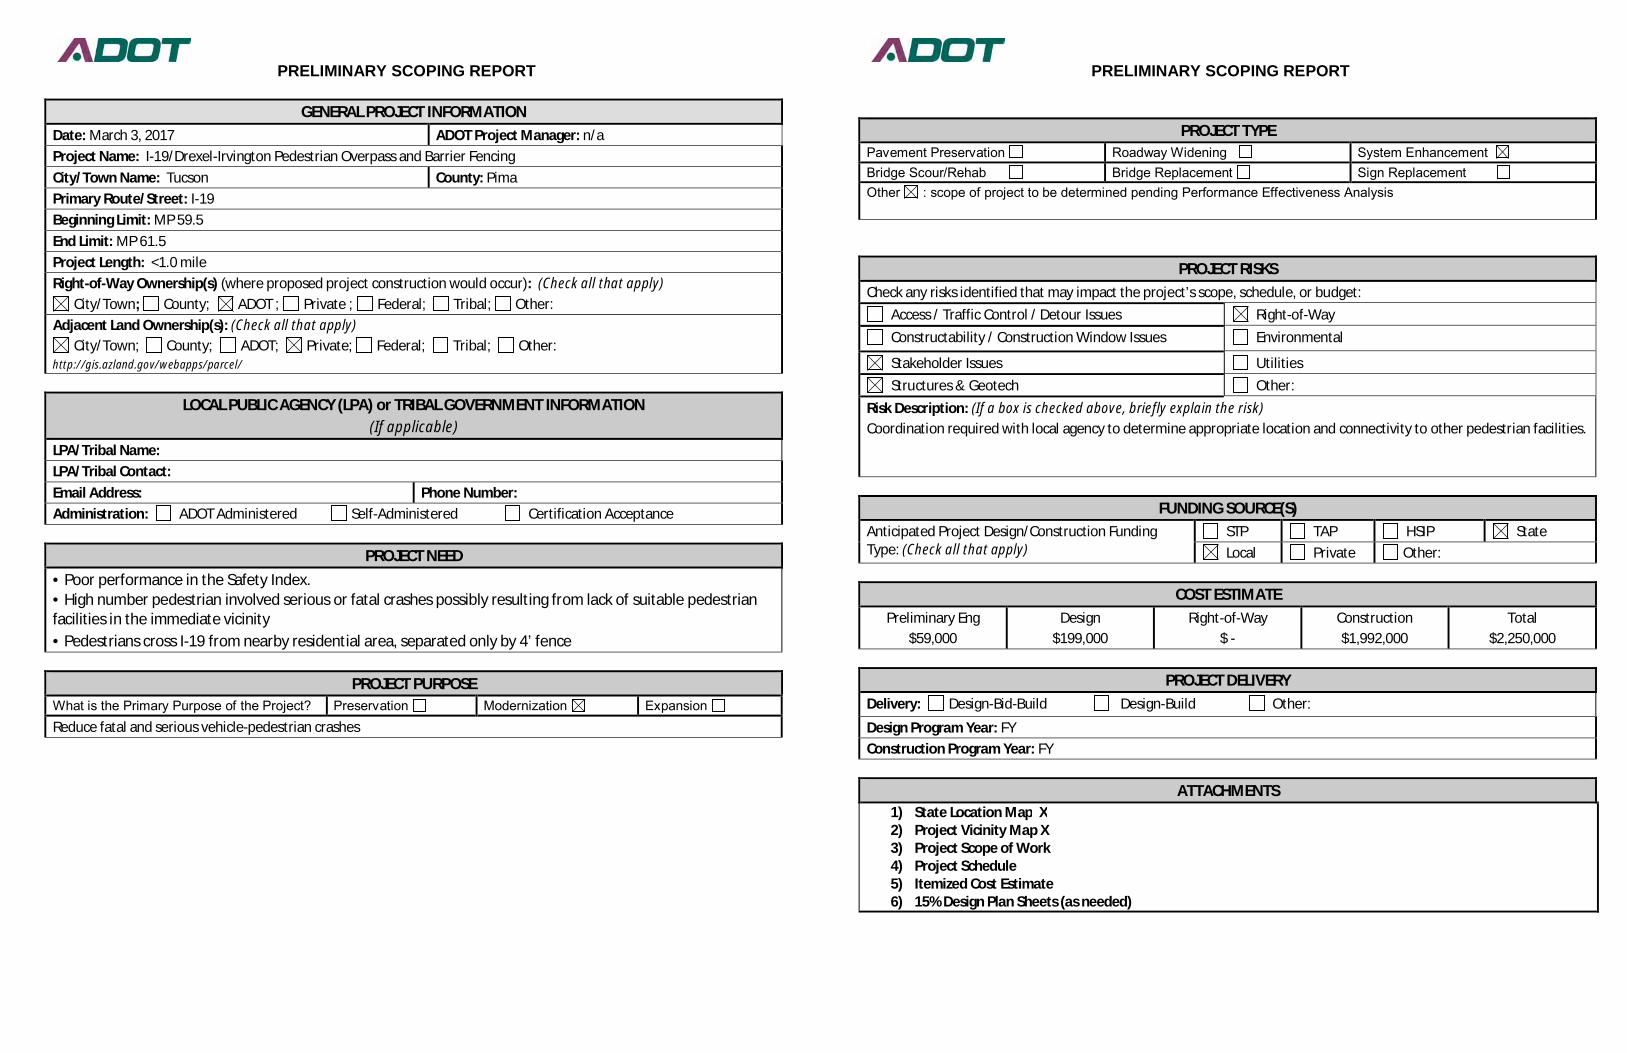
PRELIMINARY SCOPING REPORT
GENERAL PROJECT INFORMATIONDate: March 3, 2017 ADOT Project Manager: n/aProject Name: I-19/Drexel-Irvington Pedestrian Overpass and Barrier FencingCity/Town Name: Tucson County: PimaPrimary Route/Street: I-19Beginning Limit: MP 59.5End Limit: MP 61.5Project Length: <1.0 mileRight-of-Way Ownership(s) (where proposed project construction would occur): (Check all that apply)
City/Town; County; ADOT ; Private ; Federal; Tribal; Other:Adjacent Land Ownership(s): (Check all that apply)
City/Town; County; ADOT; Private; Federal; Tribal; Other:http://gis.azland.gov/webapps/parcel/
LOCAL PUBLIC AGENCY (LPA) or TRIBAL GOVERNMENT INFORMATION(If applicable)
LPA/Tribal Name:LPA/Tribal Contact:Email Address: Phone Number:Administration: ADOT Administered Self-Administered Certification Acceptance
PROJECT NEED• Poor performance in the Safety Index.• High number pedestrian involved serious or fatal crashes possibly resulting from lack of suitable pedestrianfacilities in the immediate vicinity• Pedestrians cross I-19 from nearby residential area, separated only by 4’ fence
PROJECT PURPOSEWhat is the Primary Purpose of the Project? Preservation Modernization ExpansionReduce fatal and serious vehicle-pedestrian crashes
PRELIMINARY SCOPING REPORT
PROJECT TYPEPavement Preservation Roadway Widening System EnhancementBridge Scour/Rehab Bridge Replacement Sign ReplacementOther : scope of project to be determined pending Performance Effectiveness Analysis
PROJECT RISKSCheck any risks identified that may impact the project’s scope, schedule, or budget:
Access / Traffic Control / Detour Issues Right-of-Way Constructability / Construction Window Issues Environmental
Stakeholder Issues Utilities Structures & Geotech Other:
Risk Description: (If a box is checked above, briefly explain the risk)Coordination required with local agency to determine appropriate location and connectivity to other pedestrian facilities.
FUNDING SOURCE(S)Anticipated Project Design/Construction FundingType: (Check all that apply)
STP TAP HSIP State Local Private Other:
COST ESTIMATEPreliminary Eng
$59,000Design
$199,000Right-of-Way
$ -Construction$1,992,000
Total$2,250,000
PROJECT DELIVERYDelivery: Design-Bid-Build Design-Build Other:
Design Program Year: FYConstruction Program Year: FY
ATTACHMENTS1) State Location Map X2) Project Vicinity Map X3) Project Scope of Work4) Project Schedule5) Itemized Cost Estimate6) 15% Design Plan Sheets (as needed)

ATTACHMENT 1 – LOCATION MAP
Project Location
ATTACHMENT 2 – PROJECT VICINITY MAP
MP 60.5 – approx. pedoverpass location
MP 59.5 – approx. southlimit barrier fence
MP 61.5 – approx. northlimit barrier fence

SCOPE OF WORK(Provide a detailed breakdown of the project’s scope of work using bullet format)
· Construct pedestrian overpass· Construct 2.0 miles 8’ barrier fencing, east side of I-19 from north end of existing noise wall near Valencia
Blvd. to ½ mile south of Ajo Way· Construct 1.0 mile of 8’ barrier fencing along commercial development west of I-19 between Irvington Rd
and Drexel Rd .