Sustainable Energy for Water Desalination System Relative to Basra Climate
Upload
independentCategory
view
2download
0
Energy and Environment Research; Vol. 2, No. 1; 2012 ISSN 1927-0569 E-ISSN 1927-0577
Published by Canadian Center of Science and Education
182
Feasibility Study of Using Excess Heat from GTL Process for
Seawater Desalination
Jagannath Saiyee Srivatsan1 & Mahmood Amani1 1 Petroleum Engineering Program, Texas A&M University at Qatar, Doha, Qatar
Correspondence: Mahmood Amani, Petroleum Engineering Program, Texas A&M University at Qatar, P.O. Box
23874, Doha, Qatar. Tel: 974-4423-0119. E-mail: [email protected]
Received: May 14, 2012 Accepted: May 20, 2012 Online Published: May 22, 2012
doi:10.5539/eer.v2n1p182 URL: http://dx.doi.org/10.5539/eer.v2n1p182
Abstract
Over the years, the increasing prices of crude oil and environmental issues have been the major factors for
monetizing natural gas to several products such as LNG, NGL and GTL. With over 910 Tcf of natural gas
reserves in Qatar (gas-in-place and recoverable resources), there is tremendous capacity for additional GTL
plants in Qatar. Out of the global projected GTL production of 1.92 million B/d, Qatar alone already has planned
to produce 696,000 B/d (36% of total global production). One of the efficient ways of using the exothermic heat
from GTL is for desalination. This helps in reducing a large quantity of the fresh fuel to be used as energy input
for desalination.
The need for this study is to investigate the availability of exothermic heat from the Gas-To-Liquids (GTL)
process to desalinate seawater thereby producing substantial volumes for industrial and/or domestic sectors. This
is performed by first designing a schematic base case model of the GTL operation using Aspen Plus. The
quantity and quality of heat available from the cooling of the syngas and syncrude streams is used as the energy
source for the desalination process. Both thermal desalination and reverse osmosis processes are considered to
determine the optimal process for desalination. An integrated GTL-Desalination (GTL-D) process is later
designed to compare the output ratio of the GTL-D as opposed to a standalone desalination process.
Keywords: desalination, excess heat, gas to liquid plants, syngas
1. Introduction
1.1 Gas to Liquid (GTL) Unists
The global GTL production projected by the year 2011 is 1.92 million bbl/day and out of this Qatar alone has
planned to contribute a liquid production of 696,000 bbl/day (Chedid et al., 2007), which is around 36% of the
total production. This is seemingly possible due to the abundant reserves (gas-in-place and recoverable) located
in the North Field region of Qatar. Currently Oryx GTL (joint venture between Sasol and Qatar Petroleum)
produces 34,000 bbl/day and plans to expand its production capacity of about 130,000 bbl/day in the future.
Shell along with Qatar Petroleum commissioned the world’s largest integrated GTL project ith a production
capacity of 140,000 bbl/day. This shows tremendous potential for the development of more GTL plants in Qatar
and a stepping stone in making a transition from conventional crude oil to a cleaner fuel.
The need for water is increasing tremendously every year that it is becoming scarce in so many regions. Usually
heat is imported from external sources or burning fuel to produce the energy required for desalination. An
integrated desalination system promotes reduced fuel consumption and energy utilization by using the available
excess heat from an exothermic process. Integration can be done with several systems like acid manufacturing
plants, refineries and any exothermic process. In our study, we focus on integrating gas-to-liquid (GTL) plant
with a desalination system by quantifying the excess available heat to generate electric power to run a reverse
osmosis system.
1.2 Process Description
Gas-to-Liquids (GTL) is a catalytic chemical process which converts natural gas (primarily methane) into liquid
fuels. The process consists of several steps:
1) Pretreatment of natural gas to remove impurities: This is the preliminary stage of the process in which

www.ccsenet.org/eer Energy and Environment Research Vol. 2, No. 1; 2012
183
the methane rich natural gas is treated to remove the impurities like H2S and CO2. The treated natural
gas is then sent to the reformer for generation of syngas (synthesis gas).
2) The syngas generation can be carried out either by partial oxidation or by reforming. Partial oxidation
(POx) method involves partial combustion of natural gas at sufficiently high temperatures
(1200-13000C). The stoichiometry of the reaction is maintained to yield syngas with the right
proportions. A side reaction also occurs where the feed gas reacts with CO2 to produce more syngas
(Adesola et al., 2006)
CH4 + 0.5O2 → CO + 2H2 (1)
CO2 + CH4 → 2CO + 2H2 (2)
The alternate method to produce syngas is ‘reforming’. Currerntly there are two types of reforming
widely used in the industry – Steam Methane Reforning (SMR) and Autothermal Reforming (ATR).
The SMR consists of the following two steps:
Reformation of natural gas: This is the first step of the SMR process where methane reacts
with steam at temperatures 750-8000C to produce syngas, a mixture of H2 and CO.
CH4 + H2O → CO + 3H2 (3)
Water-gas shift reaction: This is the second step where CO from the reforming stage reacts
with steam over a nickel catalyst to form hydrogen and carbon dioxide.
CO + H2O → CO2 + H2 (4)
Autothermal Reforming (ATR): This is a combination of SMR and POx where oxygen and steam is
treated with natural gas in an autothermal reactor. These reactions are very fast since the exothermic
reaction of the POx process can supply the energy for the SMR reaction directly. The reactor operates at
a very high temperature of 12000C and pressure of 70 bar.
CH4 + 0.5O2 → CO + 2H2 (5)
CH4 + H2O → CO + 3H2 (6)
In modelling the process in Aspen Plus, the autothermal reforming was selected. The advantage of the
ATR over the POx is that H2/CO ratio is often easily favourable. Since the reaction is autothermal, the
heat required for steam reforming is provided within the reator and hence no external heating is
required.
3) Fischer-Tropsch conversion to produce hydrocarbons: The Fischer-Tropsch (FT) process is a catalyzed
chemical reaction in which syngas from the reforming stage is converted to syncrude in the presence of
Iron or Cobalt catalysts. The reactions occur in a FT reactor maintained at a temperature of 2300C and
pressure less than 20 bar.
Figure 1. Schematic layout of a Fischer-Tropsch process
Syncrude is a mixture of hydrocarbons with carbon chain length ranging upto 50. The FT reaction is
highly exothermic, yielding products like naphtha, diesel and waxes along with water as by-product.
(2n+1)H2 + nCO → CnH(2n+2) + nH2O (7)
The reaction proceeds via chain propogation of (–CH2–) groups to yield paraffinic long chain

www.ccsenet.org/eer Energy and Environment Research Vol. 2, No. 1; 2012
184
hydrocarbons which are later fractioned into a range of products, viz. diesel, naphtha, wax etc. The
product yield is characterized by the optimum ratios of syngas (2:1), S/C (steam/carbon) of 0.6 and O/C
(oxygen/carbon) of 0.5. These ratios are controlled and maintained for enchanced product yield.
4) Upgrading to produce finished products: Upgrading can produce a wide range of commercial products
from gasoline to diesel o candle wax by the process of hydrocracking and hydroisomerisation (Choi et
al., 1996). Fuels produced from the FT process are of a high quality since they have low aromaticity and
zero sulphur content. The diesel fraction in syncrude has a high cetane number resulting in superior
combustion propertied and reduced emissions. This diesel is blended with conventionally used diesel
and used as fuel in automobiles. Apart from diesel, other products such as alcohols, naphtha and waxes
can be produced by suitable upgrading processes.
1.3 Problem Statement
To design a base case model of a GTL process and use the exothermic heat as the energy source for desalination
as opposed to using a fresh source of energy. Both thermal and membrane options of desalination were analyzed
and compared. The aim was to develop a techno-economic analysis of the process and reduce its cost and
enhance its energy efficiency.
The following steps were incorporated:
Aspen Plus to develop the base case GTL model
Perform pinch analysis to assess the heat profile during heat integration
Quantifying the energy requirements for both desalination techniques
Techno-economic evaluation of the GTL process
A PFD of the Integrated GTL-Desalination system with MED and RO techniques are presented below in Figures
2 and 3.
Figure 2. Integrated GTL-MED layout

www.ccsenet.org/eer Energy and Environment Research Vol. 2, No. 1; 2012
185
Figure 2 represents integrated GTL model using MED desalination techniques where the excess heat produced
from the ATR and FT reactor are used to provide energy for the thermal desalination process.
Figure 3. Schematic integrated GTL using RO technique
2. Process Heat Balance
In a typical process, there are several hot and cold streams which need to be cooled and heated respectively. For
a cost effective process, the best approach is to integrate all the heating and cooling utilities as opposed to using
external utilities. Hence the concept of HENs (Heat Exchange Networks) is of paramount importance where the
heat between the hot and cold streams can be transferred minimizing the usage of external utilities (El-Halwagi
2006). Figure 4 schematically represents a HEN where the supply and target temperatures of the hot and cold
streams are given.

www.ccsenet.org/eer Energy and Environment Research Vol. 2, No. 1; 2012
186
Figure 4. Heat exchange network
3. GTL Process
3.1 Model and Pinch Analysis
A GTL process model was developed using Aspen Plus. The input streams – NATGAS, H2O and O2 flow rates
were assumed to adhere to the syngas ratio of 1:2. This simulation was performed to produce 100,000 bpd
(barrels per day) of GTL products. In Figure 4, natural gas is first sent to a pre-reformer to remove H2S and other
impurities. The treated natural gas, now rich in its methane content along with oxygen is sent to the ATR for
manufacture of syngas. This is an autothermal reaction where the exothermic heat from the partial oxidation
process provides energy to the steam reforming process. Syngas leaving the reformer is at a temperature of
1200°C and 64 bar pressure. This is cooled down using a cooler before entering the Fischer-Tropsch reactor. The
reaction conditions inside the reactor are 237°C and 18 bar. Syncrude leaving the reactor is cooled again before
it is sent for product upgrading.
Figure 5. Aspen model of the GTL process
Table 1 shows the feed gas composition for the inlet NATGAS stream.
The flow rate, temperature and pressure of the feed streams are listed below in Table 2.
Table 3 shows the reaction conditions inside the reformer and the reactor.
NATGAS
H2O
WASTE
SATURAT
MKUPST
A1 A2
O2
SYNGAS
LIQUID
SYNGAS2
WATEROUT
B1
B2
OFFGAS
LPRODUCT
VPROD
LPROD2A
TAILGAS1
SYNCRUDE
1
WATER2
SATURATE
M1
HEAT1
ATR
COOL1
H2OSEP1
HEAT2
FTREACT
SEP
M2
COOL2
SEP2
Cold streams out
Hot streams in
Cold streams in
Hot streams out Heat Exchange Network
(HEN)

www.ccsenet.org/eer Energy and Environment Research Vol. 2, No. 1; 2012
187
Table 1. Feed gas composition
Component Mole %
Methane 95.39
Ethane 3.91
Propane 0.03
Nitrogen 0.08
Carbon di-oxide 0.59
Table 2. Composition of feed stream
Stream Name Flowrate (Kg/Hr) Temperature(0c) Pressure(Bar)
NATGAS 896,280 40 34
H2O 1,195,020 600 63
O2 990,000 260 35
Table 3. Block configurations
Block Name Temperature (0c) Pressure (Bar)
ATR 1200 64
FTREACT 237 18
The reactions taking place in both the autothermal reformer and the Fischer-Tropsch reactor are highly
exothermic. The GTL process is 60% thermally efficient resulting in 40% heat loss internally (within the
process). The major heat losses are encountered with the syngas stream from the ATR and the vapor stream from
the FT reactor due to their exothermic nature. An overall steam balance for the process is performed using Pinch
analysis (El-Halwagi, 2006) to quantify the amount of steam that can be used for desalination. Table 4 below
lists the heat duties across each heat exchanger.
Table 4. Hot and cold streams for pinch analysis
Utilities Enthalpy (Mw)
Heat 1 540.73
Heat 2 540.73
Heat 3 22.9
Cool 1 2564.72
Cool 2 205.84
Figure 6. Representation of hot and cold streams

www.ccsenet.org/eer Energy and Environment Research Vol. 2, No. 1; 2012
188
HEAT 1 represents the heat load between SATURAT and A2 streams (465K to 1000K)
HEAT 2 represents the heat load between MKUPST and A2 streams (498K to 1000K)
HEAT 3 represents the heat load between B1 and B2 streams (350K to 400K)
COOL 1 represents the heat load between SYNGAS and SYNGAS2 streams (1473K to 350K)
COOL 2 represents the heat load between TAILGAS1 and 1 streams (510K to 343K)
The blocks HEAT and COOL are the heat exchangers across which there is transfer of heat between streams.
The thermal pinch analysis is conducted to determine the amount of potential heat that could be exchanged
between the hot and the cold streams. This helps in deciding how much hot and cold utilities are available after
before and after heat integration. A cascade diagram was constructed using the heat loads across the heat
exchangers. Hence after integration, it was found that no heating utilities were required which indicates the
exothermic nature of the GTL process and the cooling utilities available was calculated to be 1667 MW. Now,
all of this 1667MW cannot be used as some of it is recycled internally. In order to minimize the cost of utilities,
it is necessary to screen them which is done by plotting the grand composite curve (GCC). The GCC is
constructed directly from the cascade diagram. The GCC helps in demarcating the pressure regions and
identifying ‘pockets’ which are regions that are fully integrated by transferring heat from process hot to process
cold streams.
The GCC for the process is show in Figure 7.
Figure 7. Grand composite curve after heat integration
3.2 Desalination by Multiple-effect Distillations (MED)
An innovative vapor-compression desalination system is used by employing the method of dropwise
condensation (Lara Ruiz, 2005). The vapor-compression method produces water at satisfactory energy
efficiencies. MED has a number of effects (evaporators) that operates at successively lower temperatures. Heat is
supplied only to the first effect where seawater enters and is raised to its boiling point producing vapors which is
passed to the successive evaporator allowing the condensed steam to be collected at the bottom. The vapors
continue to pass through successive evaporators of lower temperatures and pressures until it is collected in the
final stage in the condenser the mass and energy balance for the evaporator are given below:
Steam side enthalpy balance is
qs = ms(Hs – Hc) = mshfg
where,
qs = rate of heat transfer (BTU/hr)
Hs = specific enthalpy of steam (KJ/kg)
Hc = specific enthalpy of condensate (KJ/kg)
hfg = latent heat of evaporation (KJ/kg)
ms = mass flow rate of steam (kg/hr)
0
200
400
600
800
1000
1200
1400
1600
0 500 1000 1500 2000
Av
erag
e T
emp
, K
Enthalpy, MW
www.ccsenet.org/eer Energy and Environment Research Vol. 2, No. 1; 2012
189
Seawater side enthalpy balance is
q = mvHv – mfHf +mbHb = (mf – mb)Hv – mfHf +mbHb
where,
Hv = specific enthalpy of vapor (KJ/kg)
Hf = specific enthalpy of feed (KJ/kg)
Hb = specific enthalpy of exiting brine (KJ/kg)
At steady state,
qs = q
mshfg = (mf – mb)Hv – mfHf +mbHb
Since seawater does not have appreciable heat of dilution,
Enthalpy of exiting brine = 0 (Lara Ruiz 2005)
Hf = Cpf(Tb – Tf)
where,
Cpf = specific heat of seawater (KJ/kg K)
mshfg = (mf – mb)λ – mf Cpf(Tb – Tf)
where,
λ = latent heat of vaporization (KJ/kg K)
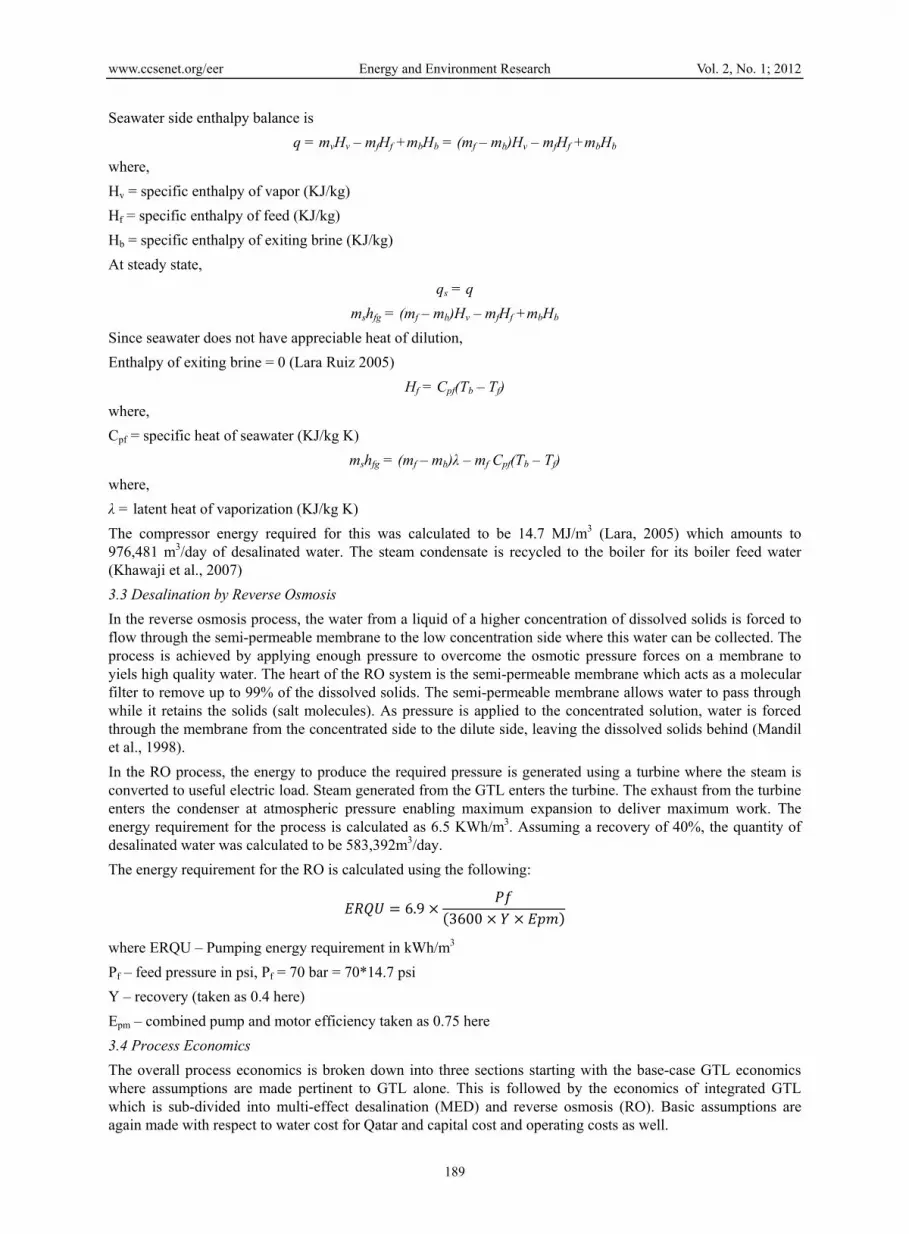
The compressor energy required for this was calculated to be 14.7 MJ/m3 (Lara, 2005) which amounts to
976,481 m3/day of desalinated water. The steam condensate is recycled to the boiler for its boiler feed water
(Khawaji et al., 2007)
3.3 Desalination by Reverse Osmosis
In the reverse osmosis process, the water from a liquid of a higher concentration of dissolved solids is forced to
flow through the semi-permeable membrane to the low concentration side where this water can be collected. The
process is achieved by applying enough pressure to overcome the osmotic pressure forces on a membrane to
yiels high quality water. The heart of the RO system is the semi-permeable membrane which acts as a molecular
filter to remove up to 99% of the dissolved solids. The semi-permeable membrane allows water to pass through
while it retains the solids (salt molecules). As pressure is applied to the concentrated solution, water is forced
through the membrane from the concentrated side to the dilute side, leaving the dissolved solids behind (Mandil
et al., 1998).
In the RO process, the energy to produce the required pressure is generated using a turbine where the steam is
converted to useful electric load. Steam generated from the GTL enters the turbine. The exhaust from the turbine
enters the condenser at atmospheric pressure enabling maximum expansion to deliver maximum work. The
energy requirement for the process is calculated as 6.5 KWh/m3. Assuming a recovery of 40%, the quantity of
desalinated water was calculated to be 583,392m3/day.
The energy requirement for the RO is calculated using the following: 6.9 3600
where ERQU – Pumping energy requirement in kWh/m3
Pf – feed pressure in psi, Pf = 70 bar = 70*14.7 psi
Y – recovery (taken as 0.4 here)
Epm – combined pump and motor efficiency taken as 0.75 here
3.4 Process Economics
The overall process economics is broken down into three sections starting with the base-case GTL economics
where assumptions are made pertinent to GTL alone. This is followed by the economics of integrated GTL
which is sub-divided into multi-effect desalination (MED) and reverse osmosis (RO). Basic assumptions are
again made with respect to water cost for Qatar and capital cost and operating costs as well.

www.ccsenet.org/eer Energy and Environment Research Vol. 2, No. 1; 2012
190
3.5 Evaluating Process Economics
In this study, a GTL plant with a capacity of 100,000 bbl/day has been designed and the economics has been
calculated for the same. The entire calculations for calculating the excess heat loads have been performed and
the economics has been done for the same.
The economics is calculated by performing the following steps:
1) Developing an annual cash flow analysis for a stand-alone GTL process and for an integrated
GTL-desalination process using both thermal (MED) and membrane (RO) desalination techniques.
2) Taking economic assumptions such as;
Natural gas feed basis is 1Bcf/day
Economic plant life is 20 years
Capital cost amortized over 10-year period
Straight line depreciation model
Salvage value is 10%
Capital is only for year 0 and production starts from year 1
3) Taking process assumptions such as;
Thermal efficiency of GTL is 10%
Syncrude composition is 75% diesel, 20% naphtha and 5% LPG
4) Cost assumptions
Capital cost of GTL is $25,000/bbl/d (World Energy Source, 2009)
MED plant capital is $1200/m3/d (European Membrane House)
RO plant capital is $750/m3/d (European Membrane House)
Operating costs for MED is $0.16/m3 (Ophir et al., 2006)
Operating costs for RO is $0.27/m3 (Ejjeh, 2007)
Desalinated water cost is $1.2/m3 (QEWC)
5) Net Present Value (NPV)
6) Payback period (PI)
7) Annual CAPEX, OPEX and revenue
3.6 Economics of GTL
An industrial scale GTL plant of capacity 100,000 bbl/day with 1Bcf/day of natural gas feed whose product
breakdown is as follows (Adegoke, 2006):
Diesel – 75%
Naphtha – 20%
LPG – 5%
The capital cost for GTL typically ranges between $20,000 - $30,000/bbl/day (World Energy Source). However,
the Shell GTL plant (Pearl GTL) in Qatar which will be producing 140,000 bbl/day of GTL fuel has reported the
total investment for the plant ot be between $12 billion and $18 billion. This would mean that the capital cost for
daily production of GTL fuels will range between $85,000 and $130,000. Using this as a ballpark, the total
capital investment (TCI) for a 100,000 bbl/day productions rate will be $9.8 billion. Assuming the fixed capital
investment (FCI) to be 85% of TCI, the fixed capital cost is $8.33 billion. The breakdown of GTL expenditure is
as follows
Syngas production – 30%
Fischer-Tropsch process – 15%
Product upgrade – 10%
Utilities – 15%
Offsites – 20%

www.ccsenet.org/eer Energy and Environment Research Vol. 2, No. 1; 2012
191
Other process units – 10%
Using the unit capital cost, the annual investment cost was calculated to be $2.5 billion.
To calculate OPEX, the natural gas heating value was assumed to be 1000BTU/cf.
The following assumptions were made to calculate the OPEX (World Energy Source, 2009):
Feedstock gas cost - $1.50/MMBTU
Non-gas OPEX - $5/bbl of product
Based on calculations the net OPEX was found to be $351 million/year over the entire 20 year period.
To calculate the price of GTL products, the following prices for diesel, naphtha and LPG were used:
Diesel - $77/bbl (World Energy Source, 2009)
Naphtha - $71/bbl
LPG - $40/bbl (Nymex)
The operating cost is calculated as the sum of the raw materials cost (shown in Table 5) which is calculated
based on the selling price of the commodities and the other costs such as labor, maintenance etc. from ASPEN
ICARUS.
Table 5. Operating costs for GTL
Raw materials Cost of commodity Flowrate (kg/hr) Annual cost ($/yr)
Natural gas $0.2/kg 850,000 1,489,200,000
Water $0.21/ton 1,300,000 2,391,480
Oxygen $0.2/kg 1,150,000 2,014,800,000
Operating costs 4,906,000
Total 3,511,297,480
Table 6. GTL sales
Products Production rate (gal/hr) Selling price ($) Annual sales ($/yr)
Diesel 131,250 $3.06/gal 3,518,235,000
LPG 8,750 $1.87/gal 143,335,500
Naphtha 35,000 $1.85/gal 567,210,000
Total 4,228,780,500
Table 7. Annual net cash flow
Items Value
Plant capacity 100,000 bbl/day
Plant life (years) 20
Fixed capital investment (FCI) ($/yr) 8.33 billion
Total capital investment (TCI) ($/yr) 9.8 billion
Operating costs ($/yr) 3,511,297,480
GTL sales ($/yr) 4,228,780,500
Salvage value ($) 0.833 billion
Depreciation ($/yr) 0.374 billion
Annual net cash flow (profitability, $) 3,885,297,480
Return on Investment: This is calculated as the ratio of profits to total capital investment on a
percentage basis.
ROI = (4,228,780,500 – 3,885,297,480)/9,800,000,000 *100 = 3.5%

www.ccsenet.org/eer Energy and Environment Research Vol. 2, No. 1; 2012
192
Payback period: This is the ratio of fixed capital investment over the annual net cash flow.
Payback period = 8,330,000,000/(4,228,780,500 – 3,885,297,480) = 24 years
3.7 Economics of MED
Similar to the economics of GTL, and with assumptions stated previously, economics for the MED which
delivers 976,481m3/day has also been calculated. Unit capital costs for MED has been assumed with unit
operating costs per cubic meter of desalinated water.
Depreciation costs are assumed to be over a 20 year period.
Discount rate is 10%
Capital cost is $1200/m3/day
CAPEX is taken only at year zero and assumed to kick production from year 1
Operating costs MED is taken to be $0.16/m3.
Cost of water is $1.20 /m3
For unit capital cost of $1200/m3/day the investment cost was found to be $1.17 billion.
Annual operating cost over the 20 year period was found to be $57.02 million/year.
Depreciation is $0.05 billion/year.
Net revenue was calculated to be $427.7 million/year.
Total annualized cost (TAC) is the difference of revenue and the sum of OPEX and depreciation.
TAC = revenue – (OPEX + depreciation) = $0.32 billion/year.
3.8 Economics of Reverse Osmosis
Similar to the economics of MED, economics for the RO which desalinates 583,392m3/day has also been
calculated. Unit capital costs for RO have been assumed with unit operating costs per cubic meter of desalinated
water.
Depreciation costs are assumed to be over a 20 year period.
Discount rate is 10%
Capital cost is $750/m3/day
Cost of water is $1.20 /m3
CAPEX is taken only at year zero and assumed to kick production from year 1
Operating costs MED is taken to be $0.27/m3 and it is higher than for MED although it has a lower
capital cost. More operating personnel are required for RO thus increasing the labor costs. Membrane
has to be replaced periodically and this adds to the maintenance cost. After performing the after-tax
cash flow analysis, the following were calculated:
For unit capital cost of $750/m3/day the investment cost was found to be $0.43 billion approx.
Annual operating cost over the 20 year period was found to be $57.5 million/year.
Net revenue was calculated to be $256 million/year.
Depreciation is $19 million/year.
TAC = revenue – (OPEX + depreciation) = $0.18 billion/year.
3.9 Economics of Integrated GTL-Desalination
The final economics study is for the integrated GTL-desalination. Although this is not a complete step-by-step
process in design, the economics is calculated for the complete industrial scale level process. Assumptions
similar to GTL and desalination are assumed with capital cost taken as the sum of the two capital costs; and
economics for the integrated process has also been calculated. Depreciation costs are assumed to be over a 20
year period.
Discount rate is 10%
Total investment cost is $10.97 billion for MED and $10.23 billion for RO
CAPEX is taken only at year zero and assumed to kick production from year 1

www.ccsenet.org/eer Energy and Environment Research Vol. 2, No. 1; 2012
193
Operating costs MED is taken to be $0.16/m3 although the capital cost is lesser.
Water cost is $1.20 per m3
More operating personnel are required for RO thus increasing the labor costs. Membrane has to be replaced
periodically and this adds to the maintenance cost. After performing the after-tax cash flow analysis, the
following were calculated as shown in Table 8.
Table 8. Comparative economic analysis
Process parameters GTL GTL-MED GTL-RO
CAPEX $9.80 billion $10.97 billion $10.23 billion
Annual OPEX $3.51 billion $4.0 billion $4.1 billion
Annual revenue $4.2 billion $4.64 billion $4.4 billion
Payback period 24 years 21.6 years 22.09 years
We see that there is not much difference between the economics in the above three cases. This is possibly
because of the low water price in the region that favors the installation of the system to be cheaper. But in terms
of net revenue, there are no significant higher returns as compared to the stand-alone GTL system. This is an
area of interest that could possibly create more interest in future research in terms of the economic approach. If
we can device a method to build the GTL system at a lower cost (bulk of the cost is attributed towards the ATR
and FT-reactor), this can become much more promising and as a viable option in catering to the needs of the
domestic and industrial sector.
4. Conclusion
Qatar has a growing potential in terms of being the energy capital of the world. Its vast resources can help in
utilizing the natural gas to set up GTL plants and also help in meeting the country’s water demands. The
auto-thermal reforming technique and the Fischer-Tropsch are promising techniques which can help in
developing the process. Advancement in these two technologies mainly in terms of cost reduction will help in
better GTL economics thus able to make GTL as a fuel by itself. Desalination techniques have been developing
over the years. The most recent dropwise condensation method of heat transfer delivers high results in terms of
water that can be desalinated. Energy requirements for both processes help in determining the quantity of water
that can be desalinated. The pinch point analysis helps in achieving maximum heat exchange and in determining
the amount of heating and cooling utilities. Economics was calculated for all systems and there was no
significant difference in terms of revenue. As expected the integrated system requires a higher OPEX and
CAPEX when compared to the base case GTL system. Adding desalination to the GTL system did not elevate
the costs so much, hence it can be considered a feasible option, Depending on the price of water and other
regional parameters, the costs for the integrated system could vary.
In conclusion, gas-to-liquids technology offers excellent prospects to countries with gas resources. GTL has
proven to be an attractive alternative to crude oil with substantial benefits in terms of social and environmental
development. The fuel shows tremendous compatibility with vehicles in terms of emissions, making it an
environmentally better fuel as opposed to the conventional diesel. This gives options to decide if we want to
maximize GTL production by recirculating the natural gas back into the system or to maximize electricity/water
production. The possibility of using GTL as a fuel by itself and not by blending with conventional diesel is
feasible only if the price of crude oil stays high.
Acknowledgement
The authors would like to express their appreciation for the valuable guidance provided by Dr. Patrick Linke, Dr.
Christine Ehlig-Economides and Dr. Mahmoud El-Halwagi.
References
Adegoke, A. A., Barrufet, M., & Ehlig-Economides, C. (2006). Integrated GTL Power-Generation Technology:
The Optimal Solution to Natural Gas Exploitation in Nigeria. SPE 105966.
Chedid, R., Kobrosly, M., & Ghajar, R. (2007). The potential of gas-to-liquid technology in the energy market:
The case of Qatar. Energy Policy, 35(10), 4799-4811. http://dx.doi.org/10.1016/j.enpol.2007.03.017

www.ccsenet.org/eer Energy and Environment Research Vol. 2, No. 1; 2012
194
Choi, G. N., Kramer, S. J., Tam, S. T., & Fox, J. M. (1996). Gas to Liquids Chemlink Australasia, 1992. Spring
National Meeting, American Institute of Chemical Engineers, Houston. Retrieved from
http://www.chemlink.com.au/gtl.htm
El-Halwagi, M. M. (2006). Process Integration, process systems engineering.
Lara Ruiz, J. H. J. (2005). An advanced vapor-compression desalination system. PhD Dissertation, Texas A&M
University.
Mandil, M. A., Farag, H. A., Naim, H. A., & Attia, M. K. (1998). Feed salinity and cost-effectiveness of energy
recovery in reverse osmosis desalination. Journal of Desalination, 120(1-2), 89-94.
http://dx.doi.org/10.1016/S0011-9164(98)00205-7
Michael, J. Economides. (2005). The Economics of Gas to Liquids Compared to Liquefied Natural Gas. World
Energy, 8(1), 136-140.
Copyright © 2022 FDOKUMEN