FEASIBILITY STUDY OF THE COPPERWOOD PROJECT ...
392
KDE FORM No. A263a-7/12/99 FEASIBILITY STUDY OF THE COPPERWOOD PROJECT, UPPER PENINSULA, MICHIGAN, USA PREPARED FOR: Orvana Resource US Corp. 181 University Street, Suite 1901 Toronto, Ontario Canada M5H 3M7 PREPARED BY: Joseph M. Keane, P.E. Steve Milne, P.E. Thomas Kerr, P.E. K D Engineering 7701 N. Business Park Drive Tucson, Arizona 85743 Document No. Q431-01-028 Project No. 431-01 21 March 2012
-
Upload
khangminh22 -
Category
Documents
-
view
0 -
download
0
Transcript of FEASIBILITY STUDY OF THE COPPERWOOD PROJECT ...

KDE FORM No. A263a-7/12/99
FEASIBILITY STUDY OF THE COPPERWOOD PROJECT,
UPPER PENINSULA, MICHIGAN, USA
PREPARED FOR:
Orvana Resource US Corp. 181 University Street, Suite 1901
Toronto, Ontario Canada M5H 3M7
PREPARED BY:
Joseph M. Keane, P.E. Steve Milne, P.E. Thomas Kerr, P.E. K D Engineering
7701 N. Business Park Drive Tucson, Arizona 85743
Document No. Q431-01-028 Project No. 431-01
21 March 2012


MILNE & ASSOCIATES INC.Underground Mining Consultants
1651 Calle El Cid • Tucson, Arizona 85718 • Tel/Far (520) 297-1291 • Email stmilne(üjcomcasLnet
CERTIFICATE OF AUTHOR
I, Steve L. Mime, P.E. do hereby certify that:
1. I am an independent mining engineering consultant, and a contributor to the technical report entitled “FeasibilityStudy of the Copperwood Project, Upper Peninsula, Michigan, USA” dated March 21, 2012 and am president ofthe following organization:
MILNE & ASSOCIATES, INC.1651 CaIle El CidTucson, AZ 85718Tellfax: (520) 297-1291Email: stmiIneccomcast.net
2. I graduated from the Colorado School of Mines in 1959 with a professional degree of “Engineer of Mines”3. I am a 50+year member of the Society for Mining, Metallurgical, and Exploration, Inc. (SME #2225200) and am a
registered professional mining engineer in Arizona (#12111), and two other states.4. I have worked as a supervisor/mining engineer for over 50 years since my graduation from the Colorado School
of Mines5. I have read the definition of “Qualified Person” set out in the National Instrument 43-101 (NI 43-101) and certify
that by reason of my education, affiliation with a professional association (as defined in NI-43101), and pastrelevant work experience, I fulfill the requirements to be a “Qualified Person” for the purposes of NI-43101.
6. I am responsible for portions of Sections 15,16 and Section 21.1 (of the above referenced report that is concernedwith the mineral resources and mine planning aspects of the Copperwood deposit. I have not visited the property,but am familiar with the area and have worked with the nearby White Pine mine, where the same mineral-bearingsequences were mined.
7. I am not aware of any material fact, or material change with respect to the subject matter of the Technical Report,that is not reflected in the Technical Report, the omission to disclose, which would make the Technical Reportmisleading.
8. I am independent of the issuer applying all the tests in Section 1.5 of NI-431 019. I have read NI-43lOland Form 43-101 Fl, and the Technical Report has been prepared in compliance with that
instrument and form.
Dated this 23rd Day of March, 2012
Signature of Qualified Person
Steve L. Milne, P.E.Print Name of Qualified Person

MILNE & ASSOCIATES, INC.Underground Mining Consultants
1651 Calle El Cid • Tucson, Arizona 85718 • Tel/Far (520) 297-1291 • Email stmilne(4comcasLnet
March 23, 2012
To: ORVANA MINERALS CORP.ALBERTA SECURITIES COMMISSIONBRITISH COLUMBIA SECURITIES COMMISSIONMANATOBA SECURITIES COMMISSIONNOVA SCOTIA SECURITIES COMMISSIONONTARIO SECURITIES COMMISSION
I, Steve L. Mime, P.E. am a “Qualified Person” as defined in the National Instrument 43-101 (NI-43-101)and prepared part of the technical report titled “Feasibility Study of the Copperwood Project, UpperPeninsula, Michigan, USA dated March 21, 2012 (“TECHNICAL REPORT”)
I hereby consent to the public filing with the regulatory authorities referred to above, the “TechnicalReport” dated March 21, 2012. I also consent to any extracts from, or summary from, Sections 15, 16and Section 21.1 of the “Technical Report’ in the press release of Orvana Minerals Corp. dated March21, 2012.
I certify that I have read the press release of “Orvana Minerals Corp. dated 7 February 2012 and findthat the press release fairly and accurately represents the information contained in the Sections of the“Technical Report” for which that I am responsible.
Dated this 23rd Day of March 2012
Signature of Qualified Person
Steve L. MilnePrint Name of Qualified Person

Orvana Resources - Copperwood Project Feasibility Study
K D Engineering Document No. Q431-01-028 21 March 2012 KDE FORM No. A263a-7/12/99
TABLE OF CONTENTS 1.0 SUMMARY ............................................................................................... 1 2.0 INTRODUCTION ........................................................................................... 14 3.0 RELIANCE ON OTHER EXPERTS .............................................................. 15 4.0 PROPERTY DESCRIPTION AND LOCATION ............................................. 16 5.0 ACCESSIBILITY, CLIMATE, LOCAL RESOURCES, INFRASTRUCTURE & PHYSIOGRAPHY ............................ 24 6.0 HISTORY ....................................................................................................... 29 7.0 GEOLOGIC SETTING AND MINERALIZATION ........................................... 33 8.0 DEPOSIT TYPES .......................................................................................... 52 9.0 EXPLORATION ............................................................................................. 54 10.0 DRILLING ...................................................................................................... 55 11.0 SAMPLE PREPARATION, ANALYSIS AND SECURITY ............................. 57 12.0 DATA VERIFICATION .................................................................................. 58 13.0 MINERAL PROCESSING AND METALLURGICAL TESTING ................... 59 14.0 MINERAL RESOURCE ESTIMATES .......................................................... 68 15.0 MINERAL RESERVE ESTIMATES ............................................................... 100 16.0 MINING ......................................................................................................... 106 17.0 RECOVERY METHODS ............................................................................... 167 18.0 PROJECT INFRASTRUCTURE .................................................................... 171 19.0 MARKET STUDIES AND CONTRACTS ...................................................... 173 20.0 ENVIRONMENTAL STUDIES, PERMITTING AND SOCIAL OR COMMUNITY IMPACT ................................................... 175

Orvana Resources - Copperwood Project Feasibility Study
K D Engineering Document No. Q431-01-028 21 March 2012 KDE FORM No. A263a-7/12/99
TABLE OF CONTENTS (Continued)
21.0 CAPITAL AND OPERATING COST ESTIMATES ........................................ 222
22.0 ECONOMIC ANALYSIS ................................................................................ 249 23.0 ADJACENT PROPERTIES ........................................................................... 256 24.0 OTHER RELEVANT DATA AND INFORMATION ........................................ 257 25.0 INTERPRETATION AND CONCLUSIONS ................................................... 258 26.0 RECOMMENDATIONS ................................................................................. 259 27.0 REFERENCES .............................................................................................. 264 28.0 APPENDICES ............................................................................................... 265 Appendix 1 - Design Criteria Appendix 2 - Drawings Appendix 3 - Equipment List Appendix 4 - Process Capital Cost Estimate Appendix 5 - CNI Report

Orvana Resources - Copperwood Project Feasibility Study
K D Engineering Document No. Q431-01-028 21 March 2012 KDE FORM No. A263a-7/12/99
LIST OF TABLES
Table 1.1 Summary of Key Financial Parameters Table 1.2 Copperwood Resource Estimate Summary Table 1.3 Tailings Disposal Facility Staged Storage Capacities Table 1.4 Staged Tailings Disposal Facility CAPEX Estimate Table 1.5 Summary of Total Project Capital Costs (Million US$) Table 4.1 Lease Details Table 4.2 Lease Payments Table 4.3 Chesbrough Lease Payments Table 5.1 Historic Temperature Data Table 5.2 Historic Precipitation Data Table 6.1 Summary of Copperwood Exploration Table 6.2 Copperwood Historic Resource Estimates Table 10.1 Drilling Program Summary Table 13.1 Copper and Silver Head Assays Table 13.2 Multi-Element Analyses on Head Samples Table 13.3 KCA Locked Cycle Flotation Tests Table 13.4 Composite 4 Rougher Flotation - Grind Size Table 13.5 Composite 4 Rougher Flotation - Reagent Table 13.6 Locked Cycle Flotation On Composite 4 Table 13.7 Locked Cycle Flotation On Composite 5 Table 13.8 Head Composite Samples Table 13.9 Locked Cycle Flotation Testing On Composite No. 4 For Metallurgical Mass Balance Summary of Result Table 13.10 Locked Cycle Flotation Testing On Composite No. 5 For Metallurgical Mass Balance Summary of Results Table 13.11 Reagent Consumption for Froth Flotation Study on Composite Samples Table 14.1 Drill Holes Not Used Table 14.2 Drill Holes Used in Model Table 14.3 Descriptive Statistics for Drill Hole Composites Table 14.4 Descriptive Statistics for Stratigraphic Model Table 14.5 Descriptive Statistics for Drill Hole Distances Table 14.6 Block Model Statistics Table 14.7 Prefeasibility Study Economic Parameters Table 14.8 Mineral Resource Estimate Table 15.1 PFS Mineral Reserve Estimate Table 15.1 A Proven+Probable Mineral Reserve Estimate Table 16.1 Average UCS for Geologic Units at Copperwood Main Ore Body Table 16.2 First Pass Pillar Dimensions for Copperwood Table 16.3 Second Pass Pillar Dimensions for Copperwood Table 16.4 Recovery and Dilution of Dipping Seams - DB Method Table 16.5 Total Tons & Grade by 100 ft. Overburden Depth Table 16.6 Production Build-up Table 16.7 Copperwood Project Production Schedule Table 16.8 Section Ventilation Requirements
Orvana Resources - Copperwood Project Feasibility Study
K D Engineering Document No. Q431-01-028 21 March 2012 KDE FORM No. A263a-7/12/99
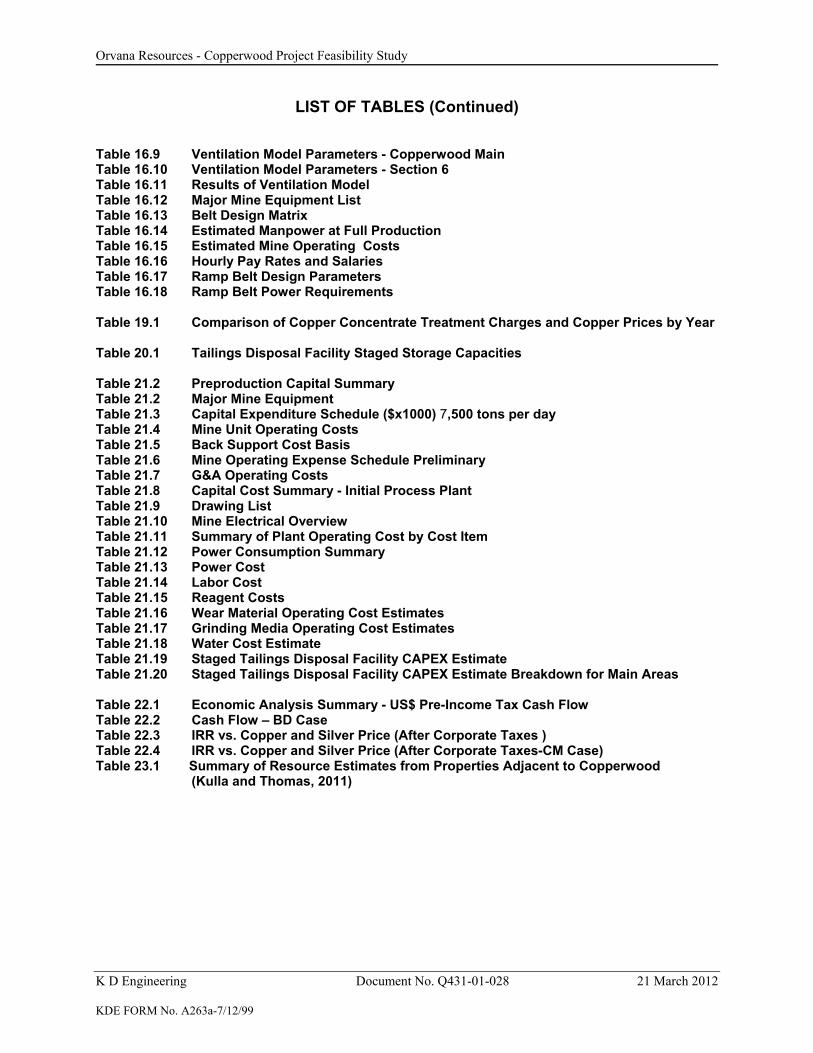
LIST OF TABLES (Continued) Table 16.9 Ventilation Model Parameters - Copperwood Main Table 16.10 Ventilation Model Parameters - Section 6 Table 16.11 Results of Ventilation Model Table 16.12 Major Mine Equipment List Table 16.13 Belt Design Matrix Table 16.14 Estimated Manpower at Full Production Table 16.15 Estimated Mine Operating Costs Table 16.16 Hourly Pay Rates and Salaries Table 16.17 Ramp Belt Design Parameters Table 16.18 Ramp Belt Power Requirements Table 19.1 Comparison of Copper Concentrate Treatment Charges and Copper Prices by Year Table 20.1 Tailings Disposal Facility Staged Storage Capacities Table 21.2 Preproduction Capital Summary Table 21.2 Major Mine Equipment Table 21.3 Capital Expenditure Schedule ($x1000) 7,500 tons per day Table 21.4 Mine Unit Operating Costs Table 21.5 Back Support Cost Basis Table 21.6 Mine Operating Expense Schedule Preliminary Table 21.7 G&A Operating Costs Table 21.8 Capital Cost Summary - Initial Process Plant Table 21.9 Drawing List Table 21.10 Mine Electrical Overview Table 21.11 Summary of Plant Operating Cost by Cost Item Table 21.12 Power Consumption Summary Table 21.13 Power Cost Table 21.14 Labor Cost Table 21.15 Reagent Costs Table 21.16 Wear Material Operating Cost Estimates Table 21.17 Grinding Media Operating Cost Estimates Table 21.18 Water Cost Estimate Table 21.19 Staged Tailings Disposal Facility CAPEX Estimate Table 21.20 Staged Tailings Disposal Facility CAPEX Estimate Breakdown for Main Areas Table 22.1 Economic Analysis Summary - US$ Pre-Income Tax Cash Flow Table 22.2 Cash Flow – BD Case Table 22.3 IRR vs. Copper and Silver Price (After Corporate Taxes ) Table 22.4 IRR vs. Copper and Silver Price (After Corporate Taxes-CM Case) Table 23.1 Summary of Resource Estimates from Properties Adjacent to Copperwood (Kulla and Thomas, 2011)

Orvana Resources - Copperwood Project Feasibility Study
K D Engineering Document No. Q431-01-028 21 March 2012 KDE FORM No. A263a-7/12/99
LIST OF FIGURES
Figure 4.1 Copperwood Location Map Figure 4.2 Copperwood Lease Area Figure 5.1 Access Roads Figure 7.1 General Geology of the Western Upper Peninsula of Michigan showing the location
of Copperwood and the White Pine Mine Figure 7.2 Lithostratigraphy of the Lake Superior Basin Figure 7.3 Geology of the Copperwood Area Figure 7.4 Lithostratigraphy of the base of the Nonesuch Formation at Copperwood showing
representative thicknesses Figure 7.5 Copper Harbor Top Triangulated Drill Hole Pierce Point Dip (degrees) Map Figure 7.6 Drill Hole Location Plan Showing Location of Cross Sections Figure 7.7 Cross Section 90,000E Figure 7.8 Cross Section 92,000E Figure 7.9 Cross Section 94,000E Figure 7.10 Cross Section Showing Apparent Displacement of CBS Caused by Interpreted
Thrust Fault Figure 7.11 Comparison of the Lithostratigraphy of the Base of the Nonesuch Formation at
Copperwood and the White Pine Mine. Figure 7.12 Disseminated Chalcocite in Domino Figure 7.13 Copperwood Composite Grade Profiles Figure 8.1 Reduced Facies Model (Lindsey et al., 1995) Figure 10.1 Copperwood Drill Plan Figure 13.1 Locked Cycle Flow Sheet Figure 14.1 Typical Stratigraphicf Model Cross Section S - N Figure 14.2 Typical Stratigraphic Model Cross Section W - E Figure 14.3 Histogram of Copper (Cu%) Assay Figure 14.4 Histogram of Silver (ppm) Figure 14.5 Validation of Domino Structure Figure 14.6 Validation of Domino Thickness Figure 14.7 Validation of Red Massive Thickness Figure 14.8 Validation of Gray Laminated Thickness Figure 14.9 Structure and Thickness Gray Siltstone Figure 14.10 Structure and Thickness Red Laminated Figure 14.11 Structure and Thickness Gray Laminated Figure 14.12 Structure and Thickness Red Massive Figure 14.13 Structure and Thickness Domino Figure 14.14 Structure and Thickness Copper Harbor Siltsone Figure 14.15 Slope of Domino Structure (%) Figure 14.16 Typical Block Model Cross Section W-E Figure 14.17 Typical Block Model Cross Section S-N Figure 14.18 Potential Economic Mineralized Zone Thickness (ft) Figure 14.19 Composite Copper Assay (%Cu) Figure 14.20 Composite Silver Assay (ppm Ag) Figure 14.21 Typical Variogram of Copper Grade x Thickness Figure 14.22 Resource Classification Boundaries

Orvana Resources - Copperwood Project Feasibility Study
K D Engineering Document No. Q431-01-028 21 March 2012 KDE FORM No. A263a-7/12/99
LIST OF FIGURES (Continued) Figure 15.1 Resource Classification Boundaries Figure 16.1 Stratigraphic Column Figure 16.2 CBS Thickness Figure 16.3 CBS Structure Figure 16.4 CBS Overburden Thickness Figure 16.5 Diluted Copper Grade Isopach Figure 16.6 Diluted Silver Grade Isopach Figure 16.7 Dipping Seam Geometry Figure 16.8 Pillar Layout at +/- 500 ft Overburden Figure 16.9 Advance / Retreat Pillar layout at 500' Depth Figure 16.10 Deposit Boundaries & Main Entry Layout Figure 16.11 Production Schedule Figure 16.12 Main Mine Fan Curve (1 Fan) Figure 16.13 Main Mine Fan Curve (2 Fans) Figure 16.14 Conveyor Belt Layout Figure 16.15 Electrical Line Diagram Figure 16.16 Box Cut Location Figure 16.17 Box Cut Profile Figure 16.18 Surface Facilities Layout Figure 20.1 General Site Plan Figure 20.2 TDF 2011 Site Investigation General Arrangement Figure 20.3 TDF General Cross-Sections Figure 20.4-1 TDF Storage Capacity Curve: Tons vs. Time (0.25 percent Sloped Tailings Figure 20.4-2 TDF Storage Capacity Curve: Tons vs. Elevation (0.25 percent Sloped Tailings
Surface) Figure 20.5 TDF General Arrangement Stage 1 Figure 20.6 TDF General Arrangement Stage 2 Figure 20.7 TDF General Arrangement Stage 3 Figure 20.8 TDF Typical Embankment Configuration Figure 20.9 TDF Monitoring Well Plan Figure 20.10 TDF Conceptual Closure Plan Figure 20.11 Typical Details Figure 20.12 Process Water Balance Schematic Figure 20.13 TDF Supernatant Pool Height (inclusive of Storm Event) Figure 22.1 IRR Sensitivity Resource at US$ 2.75 per lb Copper, US$ 20.00 per oz Silver Figure 22.2 NPV Sensitivity Resource at US$ 2.75 per lb Copper, US$ 20.00 per oz Silver

Orvana Resources - Copperwood Project Feasibility Study
K D Engineering Document No. Q431-01-028 21 March 2012 KDE FORM No. A263a-7/12/99
Glossary
Day .................................................................................... d Days per year (annum) ....................................................................... dpa Degree .................................................................................... ° Foot / Feet .................................................................................... ft Feet above sea level ........................................................................... fasl Grams per ton ................................................................................... gpt Greater than .................................................................................... > Horsepower .................................................................................... hp Hour .................................................................................... h Hours per day .................................................................................... h/d Less than .................................................................................... < Life of Mine .................................................................................... LOM Metric ton .................................................................................... tonne Michigan Department of Environmental Quality................................... MDEQ Million .................................................................................... M Million tons .................................................................................... Mt Million tons per year (annum) .............................................................. Mtpa Minute (plane angle) ........................................................................... ' Minute (time) .................................................................................... min Ounce .................................................................................... oz Percent .................................................................................... % Pound(s) .................................................................................... lb Second (time) .................................................................................... s Ton (Short Ton or 2,000 lb) ................................................................. t Tons per day .................................................................................... tpd Tons per hour .................................................................................... tph Tons per year .................................................................................... tpa United States Army Corps of Engineers .............................................. USACE Year (annum) .................................................................................... a

Orvana Resources - Copperwood Project Feasibility Study Page 1
K D Engineering Document No. Q431-01-028 21 March 2012 KDE FORM No. A263a-7/12/99
1.0 SUMMARY This Technical Report is a Feasibility Study (FS) pertaining to the Copperwood stratiform copper deposit, Upper Peninsula, Michigan, USA and summarizes the findings of various independent Qualified Persons for the purposes of National Instrument 43-101 (NI 43-101). The summary includes a detailed mine plan based on a drill and blast room and pillar mining method for extracting the ore, a mineral beneficiation circuit designed to accommodate the nature of the ore, alternatives for power and water sources, and a cash flow model as well as other items pertinent to a mine development. This study is based on an NI 43-101-compliant resource estimate with an effective date of 7 March 2011 in “Resource Estimate and NI 43-101 Technical Report for Copperwood Project, Ironwood, Michigan” (Ward, 2011). The study considers the application of conventional drill-and-blast, room-and-pillar mining method, and presents a detailed mine plan for extracting and processing the ore. The fully-diluted mineable proven reserves are 23.14 million tons of 1.46 percent copper and 3.98 ppm silver proven and 7.09 million tons of 1.21 percent copper and 2.44 ppm silver probable, for a total of 30.2 million tons of 1.41 percent copper (850 million lb) and 3.62 ppm silver, which would be mined over 13 years. Pre-production capital cost of US$ 213.5 million and sustaining capital and closure costs of US$ 167.1 million were estimated. The economic parameters at various copper prices and discount rates are summarized in Table 1.1.
Table 1.1 Summary of Key Financial Parameters
Copper Price (US$)/Silver Price (US$) 2.50/17.50 2.75/20.00 3.00/22.50 3.25/25.00 3.50/27.50
NPV(8), (000's) 30,799 104,365 177,587 246,905 313,079 IRR (After Tax) 11.0% 17.2% 22.8% 27.9% 32.6% Payback, yrs 6.2 5.2 4.6 4.2 3.8
Note: Property tax liabilities are not included since no assessment has been completed The ore would be processed by froth flotation. The Copperwood deposit is controlled by Orvana Resources US Corp, a wholly-owned subsidiary of Orvana Minerals Corp, which is listed on the Toronto Stock Exchange under the symbol “ORV”. These two companies are used interchangeably in this document and are collectively referred to as “Orvana”.
Orvana Resources - Copperwood Project Feasibility Study Page 2
K D Engineering Document No. Q431-01-028 21 March 2012 KDE FORM No. A263a-7/12/99
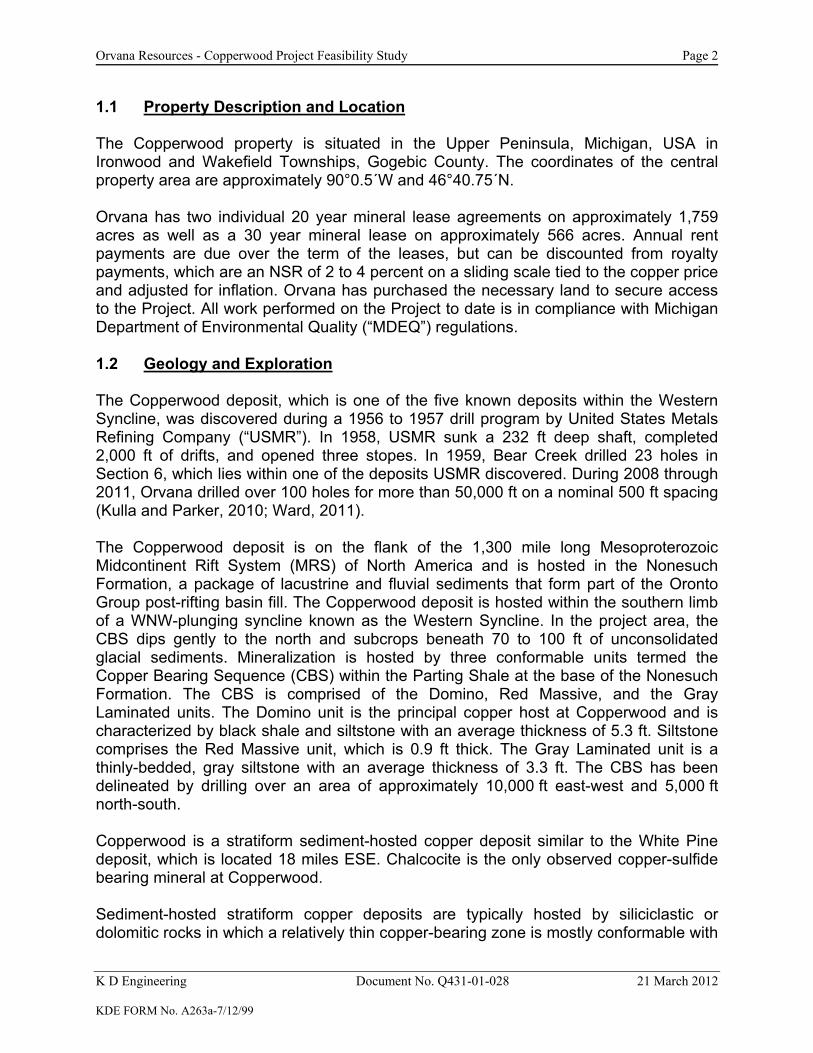
1.1 Property Description and Location
The Copperwood property is situated in the Upper Peninsula, Michigan, USA in Ironwood and Wakefield Townships, Gogebic County. The coordinates of the central property area are approximately 90°0.5´W and 46°40.75´N. Orvana has two individual 20 year mineral lease agreements on approximately 1,759 acres as well as a 30 year mineral lease on approximately 566 acres. Annual rent payments are due over the term of the leases, but can be discounted from royalty payments, which are an NSR of 2 to 4 percent on a sliding scale tied to the copper price and adjusted for inflation. Orvana has purchased the necessary land to secure access to the Project. All work performed on the Project to date is in compliance with Michigan Department of Environmental Quality (“MDEQ”) regulations. 1.2 Geology and Exploration The Copperwood deposit, which is one of the five known deposits within the Western Syncline, was discovered during a 1956 to 1957 drill program by United States Metals Refining Company (“USMR”). In 1958, USMR sunk a 232 ft deep shaft, completed 2,000 ft of drifts, and opened three stopes. In 1959, Bear Creek drilled 23 holes in Section 6, which lies within one of the deposits USMR discovered. During 2008 through 2011, Orvana drilled over 100 holes for more than 50,000 ft on a nominal 500 ft spacing (Kulla and Parker, 2010; Ward, 2011). The Copperwood deposit is on the flank of the 1,300 mile long Mesoproterozoic Midcontinent Rift System (MRS) of North America and is hosted in the Nonesuch Formation, a package of lacustrine and fluvial sediments that form part of the Oronto Group post-rifting basin fill. The Copperwood deposit is hosted within the southern limb of a WNW-plunging syncline known as the Western Syncline. In the project area, the CBS dips gently to the north and subcrops beneath 70 to 100 ft of unconsolidated glacial sediments. Mineralization is hosted by three conformable units termed the Copper Bearing Sequence (CBS) within the Parting Shale at the base of the Nonesuch Formation. The CBS is comprised of the Domino, Red Massive, and the Gray Laminated units. The Domino unit is the principal copper host at Copperwood and is characterized by black shale and siltstone with an average thickness of 5.3 ft. Siltstone comprises the Red Massive unit, which is 0.9 ft thick. The Gray Laminated unit is a thinly-bedded, gray siltstone with an average thickness of 3.3 ft. The CBS has been delineated by drilling over an area of approximately 10,000 ft east-west and 5,000 ft north-south. Copperwood is a stratiform sediment-hosted copper deposit similar to the White Pine deposit, which is located 18 miles ESE. Chalcocite is the only observed copper-sulfide bearing mineral at Copperwood. Sediment-hosted stratiform copper deposits are typically hosted by siliciclastic or dolomitic rocks in which a relatively thin copper-bearing zone is mostly conformable with

Orvana Resources - Copperwood Project Feasibility Study Page 3
K D Engineering Document No. Q431-01-028 21 March 2012 KDE FORM No. A263a-7/12/99
bedding of the host sedimentary rocks. Copper occurs as disseminations and veinlets. Examples of these deposits include the Central African Copperbelt (Nkana, Nchanga, Mufulira, Luanshya, Tenke-Fungurume, and Kolwezi), the Kupferschiefer (Poland), Redstone (Canada), and White Pine (USA). 1.3 Mineral Resources The basis of this study is the mineral resource estimate summarized in the Marston Technical Report (Ward, 2011). This resource estimate included 2010-11 drilling in Copperwood and S6, which is adjacent to and east of Copperwood. Whereas the estimate in Copperwood is an update of that reported by Kulla and Parker (April, 2010), the S6 estimate is an update of that reported by Kulla and Thomas (January, 2011). The measured and indicated resources are 33.2 million tons of 1.65 percent copper (Table 1.2); the mine plan presented herein only uses measured and indicated resources for reserve conversion. The conceptual mine schedule, using the base-case dill-and-blast mining method, defines a fully-diluted reserve of 30.3 million tons of 1.41 percent copper and 3.62 gpt silver over a 13 year mine life (see Section 15). Verification and validation of the database, which was used for the resource estimate, is detailed by Ward (2011).
Table 1.2 Copperwood Resource Estimate Summary
Resource Category
Short Tons (million)
Metric Tons (million)
Copper, %
Silver, gpt
Copper, Mlb
Measured 25.7 23.2 1.71 4.7 878 Indicated 7.5 6.8 1.53 3.1 216 Total M&I 33.2 30.1 1.65 4.3 1,094 Inferred 3.0 2.8 1.07 2.01 51
1.4 Mine Plan The mine plan is based on extracting the deposit utilizing a room and pillar mining method by conventional drilling and blasting. The annual production is planned at 7,500 tpd over 350 days per year, or 2.625 Mtpa; no inferred resources were considered for this study. Access to the mineralization will be via a ramp and box cut. The results of the 1950s underground work were incorporated and improved upon in order to provide for adequate ground stability during mining. Five geological considerations associated with the mine plan were as follows:
▪ mineralized zone thickness ▪ dip of the mineralized zone ▪ fault locations ▪ mine back ▪ mine floor characteristics

Orvana Resources - Copperwood Project Feasibility Study Page 4
K D Engineering Document No. Q431-01-028 21 March 2012 KDE FORM No. A263a-7/12/99
Mineralized zone thickness for the Domino, Red Massive and Gray Laminated is generally consistent at about 9.6 ft throughout a majority of the mineable areas, although their combined thickness thins to below 5 ft in the east. The mineralized zones dip to the north at approximately 12° near the sub-outcrop to about 7° at the northern end. The Copperwood Project mine back typically consists of red laminated shales overlain by a gray to red siltstone. For a pillar height average, the design of the room-and-pillar method, outside of the entry mains, incorporates 20 ft. wide rooms; with rectangular pillars along the strike of the deposit that range from 16.5 ft wide by 45 ft long at a depth of 300 ft. to 22 ft. wide by 56 ft. long at a depth of 950 ft. The mine plan includes bisecting pillars on retreat extraction. A back bolt pattern using 4 ft. x 4 ft. staggered bolting pattern using 5/8 inch grouted 8 ft. cable bolts. In the main entries, wire mesh would assist the mine in preserving the back by creating a tensile skin for the immediate back strata, and flaking due to moisture sensitivity of the overlying strata may be mitigated. Bolting the up dip pillar ribs may be required. The room and pillar plan is based on a no, to low, probability of pillar failure criteria. To minimize the risk that subsidence cracks do not intersect Lake Superior there is no mining planned within 200 feet of the lake, and there is no pillar recovery planned within 500 feet of the lake. If no pillars fail, the subsidence will range between zero feet and 0.3 feet. If pillars do fail, the estimated subsidence would be between zero feet and five feet, depending on the pillar height, depth of overburden, and the area failed. In order to delineate the mineable boundary between ore and waste, a breakeven cutoff grade of 0.80 percent copper was calculated and applied. The annual production rate is planned for 2,625, at a minimum of 0.80 percent copper. Daily tonnage estimates for the mine and mill are planned at 7,500 tpd, working 350 days per year. 1.5 Metallurgy In year 2011 METCON Research (METCON) conducted a froth flotation study on Composite No. 4 and Composite No. 5 from the Copperwood Project. The main objective was to simulate the White Pine concentrator flow sheet. At the of year 2011 and beginning of year 2012 METCON conducted a froth flotation study on the same composite samples to study frother dosages, insoluble depressants, cleaner flotation stages, locked cycle flotation testing and developed a simplified flotation flow sheet. Copper and silver concentrate average grade of 17 to 24 percent and 23 to 47 g/t was obtained on Composite No. 4 and Composite No. 5 after six cycles of locked cycle flotation. Copper recoveries of 85 percent were produced on Composite No. 4. An 86 percent copper recovery and 24 percent copper grade in concentrate and a 56 percent

Orvana Resources - Copperwood Project Feasibility Study Page 5
K D Engineering Document No. Q431-01-028 21 March 2012 KDE FORM No. A263a-7/12/99
silver recovery and 1.3 ounce per ton silver grade in concentrate is supported by the current stage of testing. 1.6 Tailings Disposal Facility The Feasibility-level design of the tailings disposal facility (TDF) was based on a facility sizing and layout exercise, a mill and tailings circuit water balance, a geotechnical site investigation and associated soil and rock testing, hydrogeologic and geologic investigations, tailings samples testing, seepage and consolidation modeling, and geotechnical stability analyses. The storage capacity requirements were designed to meet the mine production schedule provided by Orvana on 10 January 2012. The TDF will be developed in three stages over the life of the project, with the ultimate configuration designed to store 30.3 million dry tons (Mt). The stage capacities and development schedule are summarized as follows:
Table 1.3 Tailings Disposal Facility Staged Storage Capacities
Stage Storage through
Year Storage Mass
Mt Dry Density
tons/yd3 Storage Volume
Myd3 1 4 6.82 0.86 7.93 2 7 15.36 0.99 15.52 3 13 30.23 1.09 27.84
(1) Tailings deposition is planned to start in October of Year 1, and conclude in September of Year 13. Years 1 and 13 are “short” operating years and therefore the overall life of operations will be approximately 12 years. The TDF site is in an area of variable but generally quite deep, very low permeability glacial till. Tailings will be contained partially below-grade in a basin excavated into the till and partially above-grade behind a zoned earthfill embankment constructed by the conventional downstream method. At full build-out, the embankment will range in height up to 140 ft above existing grade (from downstream toe). The embankment has been designed as a water storage dam due to the soft and wet nature of the tailings to be stored, and the relatively large size of the operational water pond (supernatant pond) that will be contained in the TDF above the tailings. The embankment will include a 40 ft wide upstream Seal Zone to minimize seepage and a large Downstream Shell for stability. A 5 ft wide Chimney Drain (which will also act as a filter) will be constructed between these zones to intercept seepage that may pass through the Seal Zone and transport it to a collection system at the base of the embankment so it can be safely routed out of the dam. This drain will act in conjunction with a partial foundation drainage blanket below the Downstream Shell to dissipate pore pressures and prevent the development of a phreatic surface in the embankment downstream of the Seal Zone. The upstream side of the Seal Zone will be armored with a riprap protection layer to limit erosion that could otherwise result from direct precipitation and wave action on the TDF supernatant pond.

Orvana Resources - Copperwood Project Feasibility Study Page 6
K D Engineering Document No. Q431-01-028 21 March 2012 KDE FORM No. A263a-7/12/99
Under the embankment and within the TDF basin, topsoil and unsuitable materials will be removed and stockpiled to establish a suitable working construction surface. At each stage of TDF construction, the glacial till will be excavated to provide tailings storage capacity and fill material for the embankment. The Feasibility level design of the TDF provides for an approximate cut-and-fill balance over the life of the facility. Excess material excavated during Stage 1 and 2 construction will be temporarily stockpiled adjacent to the TDF for later use during Stage 3 and closure cover construction. Stage divider berms will be utilized at the eastern edge of Stages 1 and 2 to contain the tailings within the stage areal limits and thus prevent flooding of the adjacent future stage area and covering of the future stage borrow source. After excavation and grading, the basin surface will be scarified to remove any local silty/sandy lenses, and recompacted to form a dense and low permeability base. A drainage blanket (underdrain) will then be installed to drain the underside of the tailings and reduce the hydraulic head on the till during operations. Tailings will be deposited into the TDF in slurry form from spigots installed in the tailings discharge pipeline routed around the north, west and east sides. The tailings solids will settle out from the slurry, with a portion of the water being entrained in the inter-particle voids of the settled tailings. The remainder of the slurry water will either collect in a supernatant pond over an area of the tailings surface, enter the underdrain, or evaporate from the top surface (from the supernatant pool and tailings surface). Water in the supernatant pond will be removed from the TDF by decant structures installed along the upstream face of the embankment in the southwest corner of each stage of the TDF, and conveyed to a decant sump downstream of the dam, from where it will be pumped to the mill for re-use in the process or to a treatment plant prior to discharge. Some portion of the reclaimed water may also require treatment before re-use in the mill. Flocculant will be added to the tailings within the mill and again just prior to deposition to enhance liquid/solids separation and increase the density of the tailings in the deposit. A metered system to add the flocculent to the tailings will be used, allowing adjustment of mix ratio to optimize effect and minimize cost. Any mixing water required for the flocculant addition will be pumped from the decant sump via a separate pump and piping system. An overflow pond will be installed adjacent to the decant sump to receive water from the sump if the pumps cease operation due to power outages. Backup emergency power will be required to keep these periods short. The decant sump overflow pond will be geomembrane-lined and has been configured to store approximately 46,000 ft3 of water, which accounts for roughly 2 hrs of unregulated inflow from the TDF in addition to direct precipitation from a 100-yr/24-hr storm event. An additional 1 ft of dry freeboard below the pond crest is included in the pond volume.

Orvana Resources - Copperwood Project Feasibility Study Page 7
K D Engineering Document No. Q431-01-028 21 March 2012 KDE FORM No. A263a-7/12/99
Closure and reclamation provisions for the TDF have also been considered and included. They include a mechanically-placed (most likely in winter), sloped soil cap over the final tailings surface consisting of (from bottom to top):
▪ A filter fabric and geogrid for material separation and tensile strength at the tailings surface;
▪ A capillary break layer to limit the upward migration of pore fluids constituents
from the tailings;
▪ An initial soil grading layer (to offset consolidation of the tailings that is predicted to occur during closure cover placement);
▪ A low-permeability layer to reduce infiltration of precipitation into the tailings
mass; and
▪ An upper topsoil layer that will be vegetated. A spillway with an armored inlet apron, control section and outlet channel will be constructed near the southwest corner of the closed TDF to convey runoff from the surface of the closure cap out of the TDF. The spillway channel will discharge into a retention/detention basin to dissipate energy prior to releasing water to the environment. 1.7 Capital Cost 1.7.1 Mining Preproduction development, equipment, facilities, sustaining and replacement capital were estimated for extracting the deposit by a drilling and blasting, room and pillar mining method. The estimated pre-production capital is US$ 29.5 million and the replacement/sustaining capital is estimated at US$ 39.6 million. 1.7.2 Process Plant Costs
A total capital cost of approximately US$ 132.8 million was developed for the Orvana Copperwood Process plant facilities and infrastructure. The total initial capital cost includes US$ 95.2 million for total direct costs, US$ 20.3 million for total indirect costs and US$ 17.3 million for contingency. The total sustaining capital cost of US$ 15.6 million will be included in the process plant capex. 1.7.3 Tailings Disposal Facility (TDF) Costs Feasibility Study-level estimates were developed for the capital expenditure (CAPEX) and operating expenditure (OPEX) costs associated with the TDF, its decant system with sump and overflow pond, and the conceptual closure plan for the TDF. All costs

Orvana Resources - Copperwood Project Feasibility Study Page 8
K D Engineering Document No. Q431-01-028 21 March 2012 KDE FORM No. A263a-7/12/99
were developed for the life of the project based on a time schedule that matches the current mine production plan. The largest CAPEX costs occur during the construction of the Stage 1 TDF. This is primarily due to the significant amount of earthworks required to generate a cut-and-fill balance for the project and achieve the necessary storage capacity from this stage. While this increases the upfront CAPEX, it significantly decreases the out-year CAPEX. In interpreting these cost estimates the following must be borne in mind:
▪ The cost estimates are presented in 2011 US$ with no escalation or time value of money factors applied for out-year costs.
▪ Costs associated with the tailings delivery and deposition system, flocculant
addition to the tailings slurry stream, reclaim water pumping from the decant sump and overflow pond, surface water diversions around the ultimate TDF, detention ponds, and entrance road have been provided separate from the TDF costs. Based on the overall cut-fill balance projected for the TDF, the development of external borrow areas specifically for TDF embankment construction is not anticipated.
▪ The costs for development of temporary stockpiles (to store excess cut material
reserved for later TDF embankment stages and closure cover) is included in the costs for project TDF earthworks.
▪ Geosynthetics for the TDF and decant pond have been increased 10 percent
over neat line quantities to account for waste, trench anchorage, and overlap.
▪ Pipework quantities associated with the TDF include the various drains and the decant system, and have been increased 5 percent over neat-line quantities to account for waste.
▪ The costs for engineering design, construction supervision and construction
quality assurance/quality control (QA/QC) have been accounted for at 5 percent of capital construction direct costs.
▪ The costs are considered to be within a ±15 percent level of accuracy, which is
commensurate with a Feasibility Study level design.
▪ A 15 percent contingency has been included to account for uncertainties associated with unit rates, as well as potential changes that may be implemented as the project progresses to final design.
The Feasibility Study-level staged CAPEX, and annual OPEX cost estimates associated with the Copperwood TDF and ancillary structures, in consideration of the above qualifiers, are summarized as follows:

Orvana Resources - Copperwood Project Feasibility Study Page 9
K D Engineering Document No. Q431-01-028 21 March 2012 KDE FORM No. A263a-7/12/99
Table 1.4
Staged Tailings Disposal Facility CAPEX Estimate Stage 1 2 3 Closure Years 0 - 1 3-4 7 15-17 Total
Cost, 106 $30.95 $30.14 $20.36 $20.82 $102.27 1.7.4 Infrastructure Components of the infrastructure include an access road, water-intake system and power lines to the project site. County Road 519 is the main public access to the project and will require an upgrade to accommodate heavy traffic year round. This road upgrade is also an advantage to the area and county officials are working together with Orvana to upgrade the road in the event that the mine construction decision is approved. Costs for the road upgrade as well as for upgrading the road from the county road to the project are estimated at US$ 5.6 million. The water for the project will come from Lake Superior, which is located adjacent to the mine. In a joint effort with the Gogebic Range Water Authority, a water-intake pump can be installed to not only provide water for the project, but water for the local communities as well. Cost to provide water for the project only is estimated at US$ 7.5 million, for which economic-development funds may be available for the installation and hookup of the pump. Orvana has discussed power needs with a local energy provider. An initial estimate for the power line and utility substation upgrade is US$ 16.8 million and includes a new power line 25 miles long to the project site. 1.7.5 Total Project Capital Cost Summary The total project capital costs are summarized in Table 1.5 below separated by area of responsibility and separated into pre-production, replacement and sustaining costs.
Orvana Resources - Copperwood Project Feasibility Study Page 10
K D Engineering Document No. Q431-01-028 21 March 2012 KDE FORM No. A263a-7/12/99
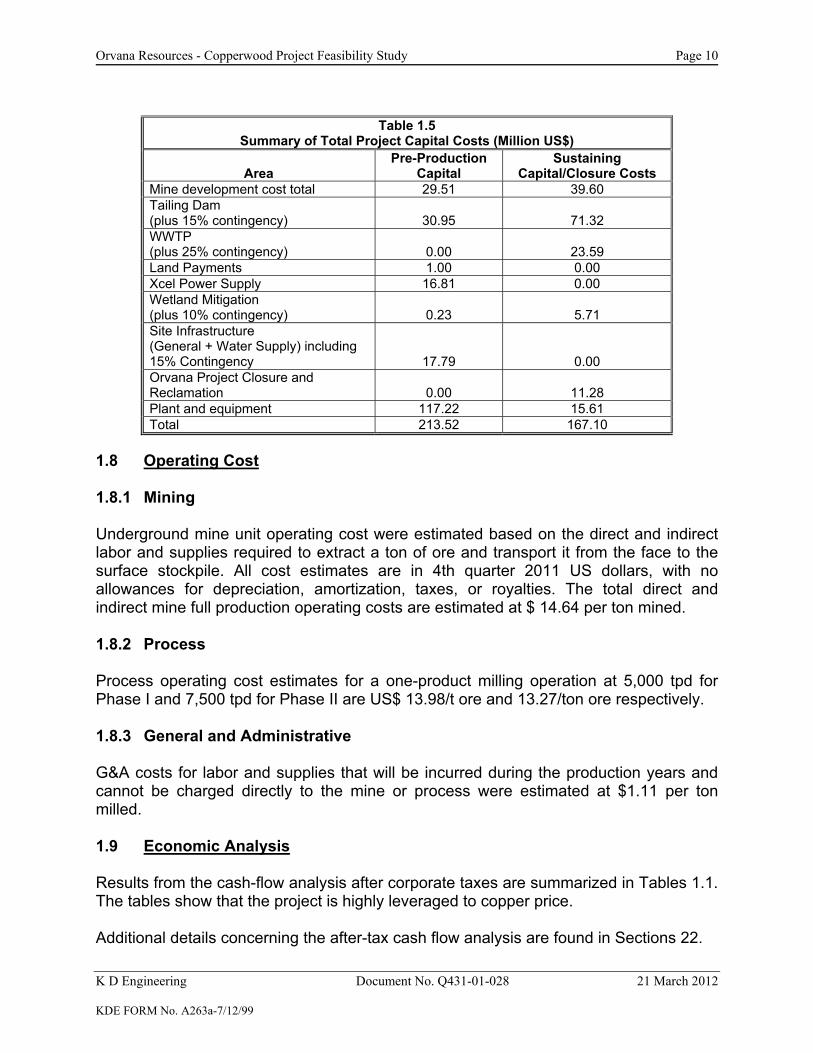
Table 1.5
Summary of Total Project Capital Costs (Million US$)
Area Pre-Production
Capital Sustaining
Capital/Closure Costs Mine development cost total 29.51 39.60 Tailing Dam (plus 15% contingency) 30.95 71.32 WWTP (plus 25% contingency) 0.00 23.59 Land Payments 1.00 0.00 Xcel Power Supply 16.81 0.00 Wetland Mitigation (plus 10% contingency) 0.23 5.71 Site Infrastructure (General + Water Supply) including 15% Contingency 17.79 0.00 Orvana Project Closure and Reclamation 0.00 11.28 Plant and equipment 117.22 15.61 Total 213.52 167.10
1.8 Operating Cost 1.8.1 Mining Underground mine unit operating cost were estimated based on the direct and indirect labor and supplies required to extract a ton of ore and transport it from the face to the surface stockpile. All cost estimates are in 4th quarter 2011 US dollars, with no allowances for depreciation, amortization, taxes, or royalties. The total direct and indirect mine full production operating costs are estimated at $ 14.64 per ton mined. 1.8.2 Process Process operating cost estimates for a one-product milling operation at 5,000 tpd for Phase I and 7,500 tpd for Phase II are US$ 13.98/t ore and 13.27/ton ore respectively. 1.8.3 General and Administrative G&A costs for labor and supplies that will be incurred during the production years and cannot be charged directly to the mine or process were estimated at $1.11 per ton milled. 1.9 Economic Analysis Results from the cash-flow analysis after corporate taxes are summarized in Tables 1.1. The tables show that the project is highly leveraged to copper price. Additional details concerning the after-tax cash flow analysis are found in Sections 22.

Orvana Resources - Copperwood Project Feasibility Study Page 11
K D Engineering Document No. Q431-01-028 21 March 2012 KDE FORM No. A263a-7/12/99
1.10 Conclusions and Opportunities The Copperwood Mine is characterized by a high production rate and low operating costs. The success of the project will be highly dependent on the copper price, good management and dilution control. 1.10.1 Conclusions The following measures are recommended in order to improve the economic viability of the project: Mining
▪ As mining progresses, improve labor and equipment productivity, where possible
▪ Prioritize efforts to minimize floor and back dilution in all areas
▪ Refine geotechnical recommendations for pillar/opening designs and implement an on-going stress monitoring and management plan
▪ Review incremental cutoff options and production areas as copper prices vary to maximize cash flow
1.10.2 Opportunities Milling (KDE)
▪ Further Metallurgical Testing to Improve - Plant Design - Recovery - Costs-optimal design to reduce power requirements since this will be a
significant operating costs, high capital costs for larger HP motors, and higher capital costs for power feed to mine site
▪ Continue metallurgical testing to improve recovery and concentrate grade
▪ Improve and refine the tailings impoundment facility
Infrastructure (KDE)
▪ Roads - DOT Grant CR519 could offset road upgrade costs - Review access Road costs
▪ Water
- Water Intake Minimization to improve withdrawal rates and reduce costs

Orvana Resources - Copperwood Project Feasibility Study Page 12
K D Engineering Document No. Q431-01-028 21 March 2012 KDE FORM No. A263a-7/12/99
- Water conservation initiative to reduce consumption and size of intake - Strategically locating borrow pits to act as water reservoirs that could be
used to collect water during run off to use as process water
▪ Power - Consultant hired to review and assist in negotiations and design options. - Financing through power supplier, dialogue with Xcel currently being
done, expected to be topic of discussion with any of the 3 providers. Water Treatment (Golder)
▪ Review of current design to reduce overall treatment and contingency costs.
▪ Further geochemical analysis to determine if, and when, the reclaim water must be treated to reduce total dissolved solids concentrations and thereby prevent negative impacts to the milling process. In the current design, a portion, but not all, of the reclaim water is treated throughout the mining period.
▪ Further analysis of water balance to reduce treatment requirements by using
a water conservation policy to reduce intake consumption. TDF (Golder)
▪ Further analysis of groundwater levels and pressures in the till and bedrock beneath the proposed TDF with adjustments to the bottom of the excavation, if necessary.
▪ Additional hydraulic conductivity testing should be performed on candidate
drainage materials to assess whether they will meet the design criteria for the project. Depending on the results, other material sources may need to be secured, and/or drainage components of the design may need to be re-sized to reflect design flow capacities computed based on the actual hydraulic conductivity testing.
▪ Confirm that the material planned for use in the TDF embankment drains meets
the appropriate filter criteria for placement against the till in the Seal Zone and Downstream Shell zone of the embankment.
▪ Conduct triaxial testing on remolded samples of till based on moisture-density
test results to better represent the fill materials in the embankment. These results can be used to confirm or modify the effective stress parameters for use in the TDF embankment stability analyses.
▪ Further evaluate potential means or method(s) to protect the TDF underdrain
during the initial period of operations, both to guard against erosion of the
Orvana Resources - Copperwood Project Feasibility Study Page 13
K D Engineering Document No. Q431-01-028 21 March 2012 KDE FORM No. A263a-7/12/99
drainage layer during initial deposition and to prevent the decant sump from being overwhelmed (due to the supernatant pond being in direct contact with the drain).
▪ Further investigate and select alternate means for secondary flocculant
addition and/or reduction of flocculent addition to the tailings through additional product analysis and testing.
▪ Evaluate the need for increasing the size of the Decant Sump Overflow Pond
based on any changes to the flocculent addition strategy and consideration for multiple usages (i.e., power outages) during each winter.
▪ Further evaluate the anticipated strength of the consolidated tailings and its
suitability to support the mechanically-placed closure cap.
Orvana Resources - Copperwood Project Feasibility Study Page 14
K D Engineering Document No. Q431-01-028 21 March 2012 KDE FORM No. A263a-7/12/99
2.0 INTRODUCTION Orvana Resources US Corp. has commissioned K D Engineering (KDE) of Tucson, Arizona to provide a Feasibility study (FS) for the Copperwood Project located In the Upper Peninsula, Michigan, USA. Contributions to this report were made by a number of organizations and individuals. Mr. Joseph M. Keane, P.E. has overall responsibility for the report contents and specifically Sections 1 through 12, 13, 14, 17, 18, 19 and 21 through 28. Mr. Keane visited the property on 16 through 19 May 2010. During the site visit discussions were conducted concerning possible mining methods that might be used for Copperwood ore extraction. Metallurgical testing that had been completed and ongoing work required to support a prefeasibility study were addressed. Mineralogical differences and similarities between the White Pine and Copperwood deposits were considered. The visit ended with a trip to the mine site. Mr. Steve Milne, P.E. is primarily responsible for Sections 15 , 16 and a portion of 21. Mr. Don Poulter, P.E. and Mr. David List, P.E. of Golder Associates Inc. were jointly responsible for preparation of complimentary portions of Sections 1.6, 1.7.3, 20.4.3, 20.6, 21.3 and portions of 26.0 involving civil and geotechnical design of the TDF. Mr. List visited the property multiple times, most recently in September, 2011. . Additional important contributions to the report were provided by KDE personnel and those employed by Orvana Resources US Corp.

Orvana Resources - Copperwood Project Feasibility Study Page 15
K D Engineering Document No. Q431-01-028 21 March 2012 KDE FORM No. A263a-7/12/99
3.0 RELIANCE ON OTHER EXPERTS
In preparing this Report, K D Engineering and the Qualified Persons have relied on assistance and information from various parties and sources. Sources of information are acknowledged throughout the Report, where the information is relied upon. K D Engineering and the Qualified Persons have followed standard procedures in preparing this report that is based in part on details, information, and assumptions provided by others. Neither K D Engineering, nor the Qualified Persons, can guarantee the correctness of all information, but to the extent of this investigation and within the scope of the assignment, assumptions, conditions, and qualifications, it is believed that this report is substantially correct. Mineral reserve estimates for the Copperwood deposit are forward-looking statements and may differ from the actual amount of saleable minerals recovered in mining operations. Principle deviation may result from grade variations within the deposit, metallurgical response of the mineralization, market prices and operating cost levels achieved by the operator. The Report contains information relating to mineral titles, permitting, regulatory matters and legal agreements. The information in the Report concerning these matters is required by NI Form 43-101F1. The Authors are generally knowledgeable concerning these issues in the context of the mineral industry, but are neither legal nor regulatory professionals. K D Engineering and the Qualified Persons have not conducted a detailed land status evaluation and have relied upon information and representations supplied by Orvana Resources US on land ownership and permitting, although Ward (2011) presented a professional legal opinion concerning Orvana’s mineral and surface rights.

Orvana Resources - Copperwood Project Feasibility Study Page 16
K D Engineering Document No. Q431-01-028 21 March 2012 KDE FORM No. A263a-7/12/99
4.0 PROPERTY DESCRIPTION AND LOCATION The Property Description and Location are fully described in the March 2011 Technical Report that is filed on www.sedar.com (specifically, the report entitled “Resource Estimate And NI 43-101 Technical Report For Copperwood Project Ironwood, Michigan” and authored by M. Ward). The reader is referred to that document for location and ownership details. The following summary is based on that document. 4.1 Location The Copperwood project is located on private land in Gogebic County at the western end of Michigan’s Upper Peninsula. The coordinates of the central property area are approximately 90°0.5´W and 46°40.75´N. The site is located approximately 13 miles north of Wakefield, Michigan (Figures 4.1 and 4.2). Access to the site is provided by approximately three miles of a graded gravel road and approximately thirteen miles along the paved Gogebic County Road 519 from State Highway M-28. The state highway, county highway, and site access road are suitable for the transportation of major project components. Drive time to the nearest airport, Gogebic-Iron County Airport in Ironwood, Michigan, is approximately 40 minutes.
Figure 4.1 - Copperwood Location Map

Orvana Resources - Copperwood Project Feasibility Study Page 17
K D Engineering Document No. Q431-01-028 21 March 2012 KDE FORM No. A263a-7/12/99
4.2 Land and Tenure and Property Agreements 4.2.1 Mineral Rights
Orvana have entered into two individual 20-year mineral lease agreements with Sage Minerals Inc. (Sage) and Keweenaw Land Association, Limited (KLA) as well as a 30-year lease with A. M. Chesbrough LLC (Chesbrough). The lease agreements are for the purpose of exploring for and mining all metallic and non-metallic minerals. The mineral rights boundaries are defined by Township 49N, Range 46W, Sections 1 and 2; Township 50N, Range 46W, Sections 35 and 36; and Township 49N, Range 45W, Section 6. The section boundaries are generally marked at corners with a monument established by the federal government as part of the Public Lands Survey System. The combined leases comprise approximately 2,325 acres. Lease details are summarized in Table 4.1 and a plan of the combined lease area is shown in Figure 4.2.
Table 4.1
Lease Details Township Range Section Acres
49N 46W 36 530 Sage Minerals Inc. 50N 46W 2 548 49N 46W 35 70 Keweenaw Land Association, Limited50N 46W 1 611
A.M. Chesbrough LLC 49N 45W 36 566 Total 2,325

Orvana Resources - Copperwood Project Feasibility Study Page 18
K D Engineering Document No. Q431-01-028 21 March 2012 KDE FORM No. A263a-7/12/99
Note: Number in each square represents Section Number. Township and Range are not shown Figure 4.2 - Copperwood Lease Area
In Michigan, as with many other States, mineral rights are distinct from surface rights. Mineral rights may be sold or retained separately from the surface rights, in which case the mineral rights are said to be severed. The Copperwood mineral rights are severed.
Orvana has had external legal counsel examine the recorded instruments of conveyance listed in the Tract Index of the Gogebic County Register of Deeds through to February, 2011 and have concluded the marketable title to mineral rights for Copperwood are held by Sage, KLA, and Chesbrough, who in turn have the right to lease the mineral rights to Orvana.
Concurrent with entering into the Copperwood mineral leases, Orvana obtained exclusive 20-year options to enter into 20-year mineral leases with respect to an additional 3,852 acres located in the general area of the Copperwood mineral leases. In the event that Orvana exercises any of its options to enter into additional mineral leases, such leases would be on the same terms as the Copperwood mineral leases. These lands are considered an opportunity, but non-essential to the viability of the current Copperwood Project discussed in this report.

Orvana Resources - Copperwood Project Feasibility Study Page 19
K D Engineering Document No. Q431-01-028 21 March 2012 KDE FORM No. A263a-7/12/99
Rents and Royalties Under the terms of the leases, Sage and KLA are each entitled to annual rent payments over the term of the leases. These lease payments may be applied as a credit against royalty payments during production. The payments are made on an annual basis as is detailed in Table 4.2. The payment schedule is the same for both parties.
Table 4.2
Lease Payments
Date Amount
US$ Commencement Date 10,000 1st Anniversary of Commencement Date 15,000 2nd Anniversary of Commencement Date 20,000 3rd Anniversary of Commencement Date 25,000 4th Anniversary of Commencement Date 30,000 5th through 10th Anniversary of Commencement Date 40,000 11th through 15th Anniversary of Commencement Date 50,000 16th through 20th Anniversary of Commencement Date 90,000
In the case of the Chesbrough lease, annual rent payments are paid over the term of the lease. These lease payments may be applied as a credit against royalty payments during production. The payments are made on an annual basis as is detailed in Table 4.3.
Table 4.3 Chesbrough Lease Payments
Date Amount
US$ Commencement Date 12,500 1st through 4th Anniversary of Commencement Date 9,000 5th through 10th Anniversary of Commencement Date 11,250 11th through 15th Anniversary of Commencement Date 15,000 16th through 20th Anniversary of Commencement Date 18,750 21st through 25th Anniversary of Commencement Date 22,500 26th through 30th Anniversary of Commencement Date 26,250
Sage, KLA, and Chesbrough are each entitled to a sliding scale Net Smelter Return (NSR) royalty based on the price of copper. Initially the royalty will be;
▪ 2 percent NSR for an invoiced copper price below a lower bench mark price
▪ 4 percent NSR for an invoiced copper price above an upper bench mark price

Orvana Resources - Copperwood Project Feasibility Study Page 20
K D Engineering Document No. Q431-01-028 21 March 2012 KDE FORM No. A263a-7/12/99
for an invoiced copper price greater than the lower benchmark price and less than the upper benchmark price the following equation is used:
pricecopperbenchmarklower
pricecopperinvoiced___
__*%2
Invoiced copper is the price per pound of copper shown on a concentrate invoice. The lower and upper benchmark prices are subject to adjustment for inflation on a quarterly basis based on the Producer Price Index – Finished Goods, prepared by the United States Department of Labor. Benchmark prices are initially set at US$ 2 per lb copper and US$ 4 per lb copper, respectively. There are no other known encumbrances on the mineral rights. 4.2.2 Surface Rights Michigan common law provides a private lease holder of severed mineral rights access to such minerals for purposes of exploration and removal through the surface estate, provided that such access be limited to particular and small parcels of the surface, used only as needed, and the lease holder acts reasonably to otherwise minimize interference with the rights of the surface holder. There is an obligation on the part of the mineral-rights holder to reimburse the surface-estate owner for any damage to the surface estate made incident to the mineral rights holder's activities, but reparation payments for felled trees is common. Orvana has secured access to the property from County Road 519 through the purchase of surface rights within which the project access road is located. In addition, these surface rights would be occupied by certain planned infrastructure. 4.3 Permits and Environment The Michigan Department of Environmental Quality (MDEQ) is responsible for enforcing state laws for protecting natural resources. Michigan’s environmental regulations are complied under the Natural Resources and Environmental Protection Act, Act 451 of the Public Acts 1994, as amended. Mining of nonferrous metals is regulated under Part 632, Nonferrous Metallic Mining and Reclamation, of the Natural Resources and Environmental Protection Act, 1994 PA 451, as amended (NREPA); Part 632 was enacted in December, 2004. 4.3.1 Exploration The drilling, operating, plugging, and site restoration of test wells (drill holes) are regulated under Part 625, Mineral Wells, of the Natural Resources and Environment Protection Act, 1994 PA 451, as amended (NREPA). In addition, test wells must meet the requirements of other Parts of the NREPA to prevent damage to water, air, soil, wetlands, and other environmental values. In most areas of the state, Part 625 requires

Orvana Resources - Copperwood Project Feasibility Study Page 21
K D Engineering Document No. Q431-01-028 21 March 2012 KDE FORM No. A263a-7/12/99
a permit for a test well that penetrates 50 ft or more into bedrock or below the deepest fresh water aquifer. However, a permit is not required for test wells where the bedrock is Precambrian in age, although these wells must meet all other requirements of Part 625. A test well must be plugged promptly after abandonment, following procedures specified by the MDEQ. A well is considered abandoned if it is inactive for one year, unless an extension is granted by the MDEQ based on the owner showing a good reason to keep the well open. Wells must be plugged in a manner that seals off and confines any fluids in the formations penetrated by the well, and prevents any surface water or other materials from entering the well. Removal of overburden and extraction of limited amounts of materials for the purpose of exploration to the extent necessary to determine the location, quantity, or quality of a mineral deposit on land that does not become a part of a mining operation within 2 years must be graded and revegetated. All drilling at Copperwood is in Precambrian bedrock and therefore no permits for drilling are required. Orvana notified MDEQ of the 2008, 2009 and 2010-11 drilling programs and the MDEQ have visited and inspected the site and plugging activities. All drill holes and sites have been plugged and restored per state requirements. Plugging reports have been completed and are on file with MDEQ. 4.3.2 Development In the event Orvana chooses to proceed with development of an access decline to assess the Copperwood mineral resources in more detail, then that work will be governed by the Parts of Act 451 that regulate metallic mining as listed below.
▪ Part 17 - Michigan Environmental Protection. ▪ Part 31 - Water Resources Protection ▪ Part 55 - Air Pollution Control ▪ Part 301 - Inland Lakes and Streams ▪ Part 303 - Wetlands ▪ Part 365 - Endangered Species Protection ▪ Part 631 - Reclamation of Mining Lands Act
Mining of nonferrous metals is regulated under Part 632 , Nonferrous Metallic Mining and Reclamation, of the Natural Resources and Environmental Protection Act, 1994 PA 451, as amended (NREPA). Part 632 covers all aspects of nonferrous metal mining including transportation, storage, treatment, and disposal of ore, waste rock, and other materials. A permit application under Part 632 must include an environmental impact assessment that describes baseline conditions, expected impacts to the mined area and surrounding affected areas, and alternatives. An application must also include a detailed plan for mining and

Orvana Resources - Copperwood Project Feasibility Study Page 22
K D Engineering Document No. Q431-01-028 21 March 2012 KDE FORM No. A263a-7/12/99
reclamation that would minimize impacts of the proposed operation, and a contingency plan for dealing with any accidents or failures. Part 632 provides extensive opportunities for public input, including a public meeting on an application and a public hearing on a proposed permit decision. A permit can be granted only if the applicant demonstrates that the mining operation will not pollute, impair, or destroy the air, water, or other natural resources or the public trust in those resources in accordance with the Michigan Environmental Protection Act. Upon completion of mining, the mine site and associated lands must be reclaimed to achieve a self-sustaining ecosystem that does not require perpetual care. Post-closure monitoring of water quality must be continued for at least 20 years, subject to modification after public review. Part 632 requires a mining company to maintain financial assurance throughout the mining operation and the post-closure monitoring period. The financial assurance must cover the cost for the MDEQ to conduct any necessary reclamation and remediation measures and must be updated at least every three years. Funding to cover the costs for the MDEQ to administer the law comes from permit fees and from annual operating fees based on tons of material mined. 4.4 Socio-Economics The State of Michigan, and in particular the Upper Peninsula, has a long mining history, primarily for copper and iron. The large-scale underground White Pine copper mine in Ontonagon County began operation in 1953 and ended in 1996. Exploration programs and mining operations in Michigan are governed by modern mining and environmental laws. The workforce of the western Upper Peninsula of Michigan is currently experiencing high unemployment levels. The local employment base holds strong numbers of experienced miners and related trades. Many experienced locally-owned firms also exist in the region with necessary mining support capabilities. All local units of government with jurisdiction over various project elements have passed resolutions of support for the project. The project as presented is currently in compliance with all local land use regulations. 4.5 Summary
▪ Orvana holds two 20-year leases and one 30-year lease to 2,325 acres on severed mineral rights.
▪ Orvana must pay rent totalling US$ 2,080,000 over 20 years and $528,500
over 30 years to certain mineral rights owners in order to maintain the leases. Rentals are credits against royalties during production.
▪ Orvana must pay to the mineral right owners a NSR royalty on production from their leases. The royalty rate ranges from 2 to 4 percent on a sliding scale based on inflation-adjusted copper prices.
Orvana Resources - Copperwood Project Feasibility Study Page 23
K D Engineering Document No. Q431-01-028 21 March 2012 KDE FORM No. A263a-7/12/99
▪ Orvana determined that they have the legal right to explore for and to extract minerals from the lease lands (see Ward, 2011 for legal opinion).
▪ Orvana have the legal right to access the lands for purposes of exploration
and removal of minerals.
▪ Orvana have an obligation to reimburse the surface rights owners for any damage to the surface made incident to Orvana’s activities.
▪ Orvana has completed cementing, reclamation and monumenting of all drill
holes from the 2008, 2009, and 2010 -11 drill programs.
▪ Orvana has submitted an administratively complete Part 632 Permit Application and has received a draft permit from MDEQ.
▪ Orvana has very favorable community relations.

Orvana Resources - Copperwood Project Feasibility Study Page 24
K D Engineering Document No. Q431-01-028 21 March 2012 KDE FORM No. A263a-7/12/99
5.0 ACCESSIBILITY, CLIMATE, LOCAL RESOURCES, INFRASTRUCTURE & PHYSIOGRAPHY
5.1 Accessibility Road access to the site is along County Road 519 from Wakefield, Michigan approximately thirteen miles northerly to the site access road. The site access road will pass through a security gate and then travel approximately two miles westerly then northerly to the site (Figure 5.1). County Road 519 is a paved, all-purpose/weather road, but will need to be upgraded to handle the projected loads of concentrate shipments and construction materials from the project site during the spring thaws. Orvana cooperated with the Gogebic County Road Commissioner to submit a grant application to the Michigan Department of Transportation, whereby funds for up to 75 percent of the cost could be provided. The Michigan Department of Transportation approved the Gogebic County Road Commission Grant application and has awarded the 75 percent funding for the CR519 Road upgraded, the remaining 25 percent of the cost have been included in the capital costs for the project. Orvana has secured access to the project from County Road 519 through the purchase of surface rights within which the access road lies. Entry from the County Road is in the eastern half of Section 8; the road then passes westward through the northern parts of Sections 7 and 12, then northward into the project area. Improvement of this road is considered in the capital costs for the project.

Orvana Resources - Copperwood Project Feasibility Study Page 25
K D Engineering Document No. Q431-01-028 21 March 2012 KDE FORM No. A263a-7/12/99
Figure 5.1 - Access Roads

Orvana Resources - Copperwood Project Feasibility Study Page 26
K D Engineering Document No. Q431-01-028 21 March 2012 KDE FORM No. A263a-7/12/99
5.2 Climate This region has a humid continental climate which is strongly influenced by the presence of Lake Superior. This indicates that the area generally experiences cool summers and weather patterns driven by the phenomenon commonly known as “lake effect”. Lake effect influences a variety of factors including temperature, amount and timing of precipitation (including snowfall), and cloud cover. Pertinent climatic statistics from the climate stations located in the vicinity of the Copperwood Project are as follows:
Table 5.1 Historic Temperature Data
Average Daily Temperature (oF) Climate Station Period Annual Maximum Minimum
204104 IRONWOOD 1901-2009 40.5 104 -41 200718 BERGLAND DAM 1909-2009 39.3 100 -48 206210 1905-1977 206220
ONTONAGON 1977-2009
42.2 102 -38
(MRCC 2009)
Table 5.2 Historic Precipitation Data
Average Annual Climate Station Period
Precipitation (in) Snowfall (in)
204104 IRONWOOD 1901-2009 34.7 147.8 200718 BERGLAND DAM 1909-2009 37.2 161.5 206210 1900-1977 206220
ONTONAGON 1977-2009
32.5 137.2
(MRCC 2009)
The climate station in Ironwood is located approximately 16 miles from the site of Copperwood Project and is the closest currently operating climate station. The other currently operating stations in the vicinity of the site are located at the Bergland Dam (approximately 22 miles away) and Ontonagon (approximately 40 miles away). Although the Ontonagon station is the furthest away of these three stations, the weather patterns it experiences are likely to be the most similar to those at the project site since they share a common proximity to Lake Superior. The proximity of the site to Lake Superior results in cooler temperatures during the late spring and early summer and warmer temperatures during the late fall and early winter. This influence is strongest closer to the lake, but is felt across the region. This lake-effect phenomenon is due to the fact that the water in the lake warms and cools more slowly than the surrounding air. Therefore when the lake is cooler than the surrounding air it exerts a cooling influence back on the air and when the lake is warmer than the

Orvana Resources - Copperwood Project Feasibility Study Page 27
K D Engineering Document No. Q431-01-028 21 March 2012 KDE FORM No. A263a-7/12/99
surrounding air it exerts a warming influence bank on the air; thus moderating temperatures. The surface of the lake rarely freezes completely; however, as surface ice increases, the lake exerts less of a moderating effect on temperatures and thus colder temperatures are likely. The proximity of Lake Superior also results in increased cloudiness and precipitation because of the large amount of moisture available for air masses to acquire as they travel across the lake. This is a common occurrence since the predominant wind direction is from the west. This effect is exacerbated in the winter as cold air blows across the warmer lake acquiring moisture which it then releases as it comes in contacted with the colder land mass; thus resulting in frequent heavy snowfall. High amounts of precipitation during the summer months result from a combination of the lake effect phenomenon and the fact that the temperature of moist air masses traveling from the south often does not fall below the dew point until reaching this region. 5.3 Local Resources and Infrastructure 5.3.1 Power Supply and Distribution Power to the site is expected to be achieved through a tie-in to the commercial 115 kV overhead power transmission line from Hurley, Wisconsin, which is some 31 miles from the project. Currently, Xcel Energy has reviewed alternative routing and has held public meetings with the local community to seek comments in preparation for permitting. For the purpose of this feasibility study, cost estimates for a 25 mile long high-tension line, a transformer, and easements to connect to the Norrie substation in Ironwood. It has been indicated that a load-factor discount would apply to the capital costs and Xcel Energy has tentatively agreed to construction time line and payment plan to support the completion of the power line that meets the construction and production plan for the Copperwood Project. Emergency diesel generators will be installed to allow for continuous safety and protection, following a potential power interruption, of the underground mine and critical operations of the flotation plant and tailings and return water pumps. 5.3.2 Water Supply and Distribution The process plant will require a considerable amount of raw water at the start up of operations and make-up water thereafter. There will be a net-positive water balance and excess waters will be discharged after treatment. The conceptual plan is for Orvana to install a private intake in Lake Superior with a water-treatment plant constructed on site to provide for potable water requirements. This plan is being developed in cooperation with the Gogebic Range Water Authority (GRWA), who manages water distribution throughout Gogebic County; eventually, this

Orvana Resources - Copperwood Project Feasibility Study Page 28
K D Engineering Document No. Q431-01-028 21 March 2012 KDE FORM No. A263a-7/12/99
intake could provide potable water, administered by GRWA for the surrounding communities. At the mine site, raw water will be supplied to a large raw-water storage tank which will contain regulatory volumes for fire-water service as well as provide water storage for the process plant. The mine will require small water volumes for drilling and dust containment. All water from the mine and tailings will be contained in the Tailings Disposal Facility (TDF) and will be recycled to the maximum degree. 5.4 Physiography The Copperwood Project is located in the Lake Superior Lake Plain regional landscape ecosystem, which consists of “level clay lake plain and water-reworked moraine of clayey till” with spruce-fir and white pine-hemlock forests. Pre-logging vegetation in this area was likely dominated by a mixture of species including hemlock, northern white-cedar, balsam fir, white spruce, black ash, basswood, American elm, balsam poplar, and trembling aspen with scattered red pine, white pine, red oak, paper birch, and sugar maple. Post-logging vegetation in the region generally consists of less hemlock and white pine and more aspen. Current dominant tree species at the project site include birch, aspen, and northern hardwoods with stands of pine, lowland hardwood, and other upland conifers. The topography of the area consists of moderate slopes toward Lake Superior with steeper slopes corresponding to the locations of streams and the shoreline of the lake. Surface elevations range from approximately 680 fasl at the lake to approximately 820 fasl at the southeast corner of the project site. Four streams exist within the project area, all flowing in a northwestern direction toward the lake. Streams in and around the project area tend to have poor water quality (high temperature/low dissolved oxygen) and tend to be highly turbid systems with little to no flow in late summer.

Orvana Resources - Copperwood Project Feasibility Study Page 29
K D Engineering Document No. Q431-01-028 21 March 2012 KDE FORM No. A263a-7/12/99
6.0 HISTORY The Project history is fully described in the April 2010 Technical Report that is filed on www.sedar.com (Kulla & Parker, 2010). The reader is referred to that document for historical details. The following summary is based on that document. About 7,000 years ago, humans first mined native copper on the Keweenaw Peninsula. From 1610 to 1845, early European and American explorers became increasingly interested in Lake Superior copper. From 1845 to 1968 the mines of the Keweenaw Peninsula produced about 11 billion lbs of refined copper from 380 million tons of ore hosted by tops of subaerial lava flows, interflow clastic sedimentary beds, and cross vein systems. Native copper represented over 99 percent of the metallic minerals in the mined ore bodies of the Keweenaw Peninsula. Copper mineralization in the base of the Nonesuch Formation was first recognized in the 1850s in the White Pine area about 20 miles northeast of Copperwood (Ensign et al., 1968). About 65 years later, from 1915 to 1921, native copper was economically extracted from the base of the Nonesuch Formation. Subsequent exploration led to the discovery and opening of the White Pine mine in 1953 by Copper Range Company. The construction of the White Pine mine, mill, smelter, refinery, and power plant was financed by the U.S. Government. The White Pine mine produced about 4.5 billion lbs of copper and 4.5 million ounces of silver, with an average grade of 1.14 percent copper and 0.23 ounce per ton silver from 1954 until its closure in 1996. Chalcocite accounted for 85 to 90 percent of the copper with the remainder as native copper. The history of exploration completed in the Copperwood area is summarized in Table 6.1 below. From about 1948 to 1954, geologists Walter White and James Wright of U.S. Geological Survey conducted a major study of the Nonesuch Formation at the White Pine Mine and surrounding area. In a paper summarizing their work (White and Wright, 1954) the Western Syncline is clearly shown. There is no comment on copper mineralization in the Western Syncline. However they did conclude that: “The environment favorable for deposition of sediments like those at White Pine therefore existed over an area many times larger than that of the White Pine copper deposit itself". This publication led to the leasing of the Western Syncline area by United States Metals Refining Company (USMR), after a field review by Chester Ensign, the discoverer of the deposit.

Orvana Resources - Copperwood Project Feasibility Study Page 30
K D Engineering Document No. Q431-01-028 21 March 2012 KDE FORM No. A263a-7/12/99
Table 6.1
Summary of Copperwood Exploration Year Company Activity 1954 U.S. Geological
Survey Economic Geology Publication demonstrates potential of Western Syncline
1956 USMR Leases 13,833 acres in Western Syncline area (Cox, 2003)1956 USMR Drills 26 holes focused on margin of Western Syncline and
discovers Copperwood 1957 USMR Drills 136 holes throughout the Western Syncline
1957-1958 USMR Vertical shaft 233 ft, 2,083 ft of drifting, and 3 small stopes 1959 USMR Internal engineering and economic study that ends
activities by USMR 1959 Bear Creek Mining
Company Bear Creek Mining drills 23 holes in Section 6, which is east of and adjacent to Copperwood
1974 AMAX Engineering and economic review concludes deposit is mineable
1983 AMAX Terminates Western Syncline leases 2008 Orvana Leases 1759 acres at Copperwood and options 3,852 acres
in Western Syncline 2008 Orvana Begins environmental studies with 5 drill holes. Intersecting
copper mineralization 2009 Orvana Drills 82 delineation and infill holes (10 of which doubled as
water-monitoring wells ; 20 water-monitoring wells 2010 Orvana NI 43-101-compliant mineral resource estimate completed 2010 Orvana Drills 41 holes in Copperwood and Section 6 for further
delineation and infill, water-monitoring wells, and metallurgical and geotechnical sampling/testing
2010 Orvana Announced NI 43-101 compliant resource estimate for Section 6 and Satellites.
2011 Orvana Announced updated NI 43-101 compliant resource estimate for Copperwood and included Section 6.
2011 Orvana Announced updated NI 43-101 compliant Prefeasibility Study
2011 Orvana Submitted the 632 Mine Permit Application, and after the formal review process was notified on 16 February that a Draft of the Permit with Conditions was provisionally approved pending final public meeting and comment period
USMR secured an option to lease mineral rights over and proximal to the Western Syncline in 1956 from Keweenaw Land Association Ltd. and Sage Minerals Inc., timber companies who had retained the mineral rights after selling the surface rights. Between August of 1956 and November of 1957, USMR drilled a total of 162 vertical holes, which delineated the Western Syncline deposit. The first 26 holes were drilled to define the margin of the syncline and to sample the base of the Nonesuch Formation. One hundred thirty-six holes were then completed at nominal 1,000 ft spacing in the best mineralized areas. Forty-two of these holes, the deepest of which reached 1,100 ft,

Orvana Resources - Copperwood Project Feasibility Study Page 31
K D Engineering Document No. Q431-01-028 21 March 2012 KDE FORM No. A263a-7/12/99
were drilled within the area of the Copperwood leased mineral rights. This drilling essentially delineated the Copperwood deposit. In July 1958, USMR initiated an underground exploration program. A vertical shaft was sunk to a depth of 232 ft through 91 ft of glacial overburden, 127 ft of Nonesuch Formation, and 14 ft of Copper Harbor Formation sandstones. Drifts were driven along strike 1,225 ft to the east and 860 ft to the west, and three small stopes were driven up dip to assess rock-mechanic characteristics and the nature of the mineralized zone. On completion of the underground exploration, the shaft was refilled from the surface. In 1959, USMR completed an internal engineering and economic study of the entire Western Syncline and reported an historical mineral resource of 88.1 Mt at 1.14 percent copper at a 1 percent cutoff. The Copperwood portion of this historic resource estimate was 26.2 Mt at 1.46 percent copper. USMR planned to mine the deposit by applying room-and-pillar methods. The study concluded it would be necessary to extract barren siltstone hanging wall to reach a stable back. This resulted in excessive dilution and unfavorable economics. In 1959, Bear Creek Mining Company drilled 23 holes in Section 6, which is east of and adjacent to Copperwood. They discontinued their lease soon thereafter. During a proposed merger of Copper Range Company, the operator of the White Pine Mine, and AMAX in 1974, an independent consultant completed an engineering study by reviewing existing data and concluded that the back could be controlled by using resin bolts, which had been recently employed at the White Pine mine. By controlling the back, the problem of excessive dilution was eliminated and the economics of mining the Western Syncline deposit was deemed favorable. The 1974 review included a new independent historical mineral resource estimate for the Western syncline of 74.4 Mt at 1.38 percent copper at a 1 percent cutoff using the same raw data as used by USMR. The Copperwood portion of this historic resource estimate was 24.1 Mt at 1.68 percent copper. USMR and the independent consultant historic mineral resource estimates for the Copperwood portion of the Western Syncline are summarized in Table 6.2.
Table 6.2 Copperwood Historic Resource Estimates
Historic Resource Million Tons
Grade Cu %
Copper (million
lbs) Cutoff Cu %
Minimum Thickness
(ft) 1959 USMR Engineering and Economic Study 26.2 1.46 765 1.0 8.5 1974 Independent Consultant Engineering and Economic Review 24.1 1.68 800 1.0 6.6 The historical estimate cited herein has no equivalent category under CIM Definition Standards (2005). These estimates are of unknown quality and should not be relied upon.
The U.S. government disallowed the proposed merger and in 1983, and due to corporate financial issues, AMAX terminated the Western Syncline mineral lease agreements. No further work was completed in the area until 2008 when Orvana leased

Orvana Resources - Copperwood Project Feasibility Study Page 32
K D Engineering Document No. Q431-01-028 21 March 2012 KDE FORM No. A263a-7/12/99
the Copperwood project area from Keweenaw Land Association Ltd. and Sage Minerals Inc. In 2008, Orvana initiated an Environmental Impact Assessment as required by Michigan’s Nonferrous Metallic Mining Regulations. In the fall of 2008, groundwater monitoring wells were completed. Five of these water monitoring holes intersected the mineralized zone of the Copperwood deposit. In 2009, Orvana completed 82 exploration drill holes. On 22 March 2010, Orvana announced an NI 43-101-compliant resource estimate for the Copperwood deposit. During 2010-11, Orvana drilled an additional 41 holes, many of which were for geotechnical and metallurgical sampling purposes; some of the holes were drilled in Section 6, or S6, which is east of and adjacent to Copperwood; in December, 2010, an NI 43-101-compliant resource estimate was announced for S6. This drilling was included in an updated Copperwood NI 43-101-compliant resource estimate that included S6, thus increasing the measured and indicated resources that were used for this Technical Report.

Orvana Resources - Copperwood Project Feasibility Study Page 33
K D Engineering Document No. Q431-01-028 21 March 2012 KDE FORM No. A263a-7/12/99
7.0 GEOLOGIC SETTING AND MINERALIZATION 7.1 Geology The following description of the geology of the Copperwood area is summarized in the AMEC Technical Report (Kulla and Parker, 30 April 2010). 7.1.1 Regional Geology The Copperwood area is on the flank of the 1,300-mile long Mesoproterozoic Midcontinent Rift System (MRS) of North America. The MRS is filled by up to an 18-mile thick package of Keweenawan Supergroup volcanic and clastic sedimentary rocks. These rocks are exposed in the Lake Superior region and are notable for hosting economic deposits of copper (Figure 7.1).
Figure 7.1 - General Geology of the Western Upper Peninsula of Michigan showing the
location of Copperwood and the White Pine Mine Keweenawan Supergroup rift phase rocks comprise tholeiitic flood basalts with minor interbedded red conglomerate and sandstone were deposited within a 90 mile wide rift. Keweenawan Supergroup post-rift phase rocks comprise basin-sag fluvial and lacustrine clastic rocks of the Oronto and Bayfield Groups. The Oronto Group is subdivided into three formations (Figure 7.2).
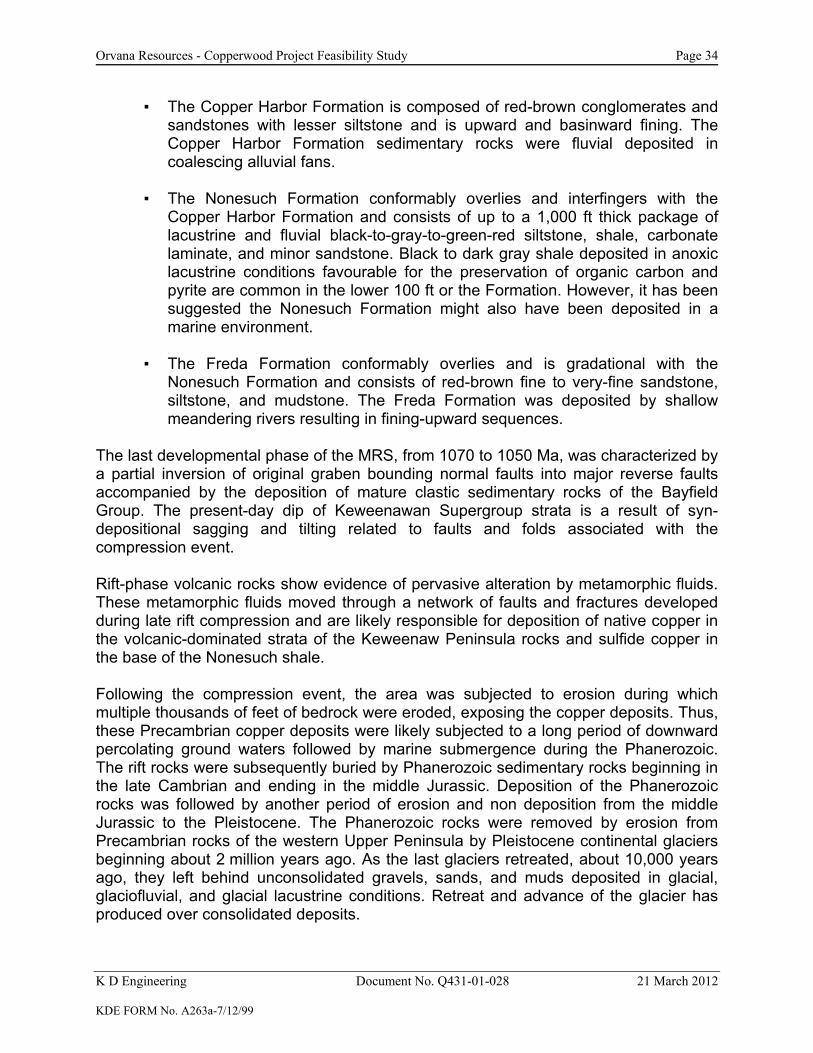
Orvana Resources - Copperwood Project Feasibility Study Page 34
K D Engineering Document No. Q431-01-028 21 March 2012 KDE FORM No. A263a-7/12/99
▪ The Copper Harbor Formation is composed of red-brown conglomerates and sandstones with lesser siltstone and is upward and basinward fining. The Copper Harbor Formation sedimentary rocks were fluvial deposited in coalescing alluvial fans.
▪ The Nonesuch Formation conformably overlies and interfingers with the
Copper Harbor Formation and consists of up to a 1,000 ft thick package of lacustrine and fluvial black-to-gray-to-green-red siltstone, shale, carbonate laminate, and minor sandstone. Black to dark gray shale deposited in anoxic lacustrine conditions favourable for the preservation of organic carbon and pyrite are common in the lower 100 ft or the Formation. However, it has been suggested the Nonesuch Formation might also have been deposited in a marine environment.
▪ The Freda Formation conformably overlies and is gradational with the
Nonesuch Formation and consists of red-brown fine to very-fine sandstone, siltstone, and mudstone. The Freda Formation was deposited by shallow meandering rivers resulting in fining-upward sequences.
The last developmental phase of the MRS, from 1070 to 1050 Ma, was characterized by a partial inversion of original graben bounding normal faults into major reverse faults accompanied by the deposition of mature clastic sedimentary rocks of the Bayfield Group. The present-day dip of Keweenawan Supergroup strata is a result of syn-depositional sagging and tilting related to faults and folds associated with the compression event. Rift-phase volcanic rocks show evidence of pervasive alteration by metamorphic fluids. These metamorphic fluids moved through a network of faults and fractures developed during late rift compression and are likely responsible for deposition of native copper in the volcanic-dominated strata of the Keweenaw Peninsula rocks and sulfide copper in the base of the Nonesuch shale. Following the compression event, the area was subjected to erosion during which multiple thousands of feet of bedrock were eroded, exposing the copper deposits. Thus, these Precambrian copper deposits were likely subjected to a long period of downward percolating ground waters followed by marine submergence during the Phanerozoic. The rift rocks were subsequently buried by Phanerozoic sedimentary rocks beginning in the late Cambrian and ending in the middle Jurassic. Deposition of the Phanerozoic rocks was followed by another period of erosion and non deposition from the middle Jurassic to the Pleistocene. The Phanerozoic rocks were removed by erosion from Precambrian rocks of the western Upper Peninsula by Pleistocene continental glaciers beginning about 2 million years ago. As the last glaciers retreated, about 10,000 years ago, they left behind unconsolidated gravels, sands, and muds deposited in glacial, glaciofluvial, and glacial lacustrine conditions. Retreat and advance of the glacier has produced over consolidated deposits.

Orvana Resources - Copperwood Project Feasibility Study Page 35
K D Engineering Document No. Q431-01-028 21 March 2012 KDE FORM No. A263a-7/12/99
Figure 7.2 - Lithostratigraphy of the Lake Superior Basin
7.1.2 Copperwood Geology The Copperwood deposit, which now includes S6, is hosted in the base of the Nonesuch Formation shale on the southwest limb of the northwest-plunging Western Syncline (Figure 7.3). The Oronto Group sedimentary rock in this area thins dramatically eastward toward the Porcupine Mountains’ volcanic structure indicating an ancestral high during deposition. Only the upper part of the Copper Harbor Formation occurs at Copperwood. A complete stratigraphic section up to about 720 ft thick of Nonesuch Formation occurs in the northern part of the Copperwood mineral lease area; elsewhere the upper contact is missing due to erosion. The Nonesuch Formation marks a dramatic change from the oxidized red colored Copper Harbor Formation to a gray to black-colored clastic sedimentary section. The lowermost part of the Nonesuch Formation is termed the Parting Shale.

Orvana Resources - Copperwood Project Feasibility Study Page 36
K D Engineering Document No. Q431-01-028 21 March 2012 KDE FORM No. A263a-7/12/99
Drilling by Orvana at Copperwood has delineated the stratigraphy of the uppermost Copper Harbor Formation and Parting Shale member of the Nonesuch Formation as shown in the generalized stratigraphic column in Figure 7.4.
Figure 7.3 - Geology of the Copperwood Area (Figure provided by Orvana, Copperwood Mineral Resource)
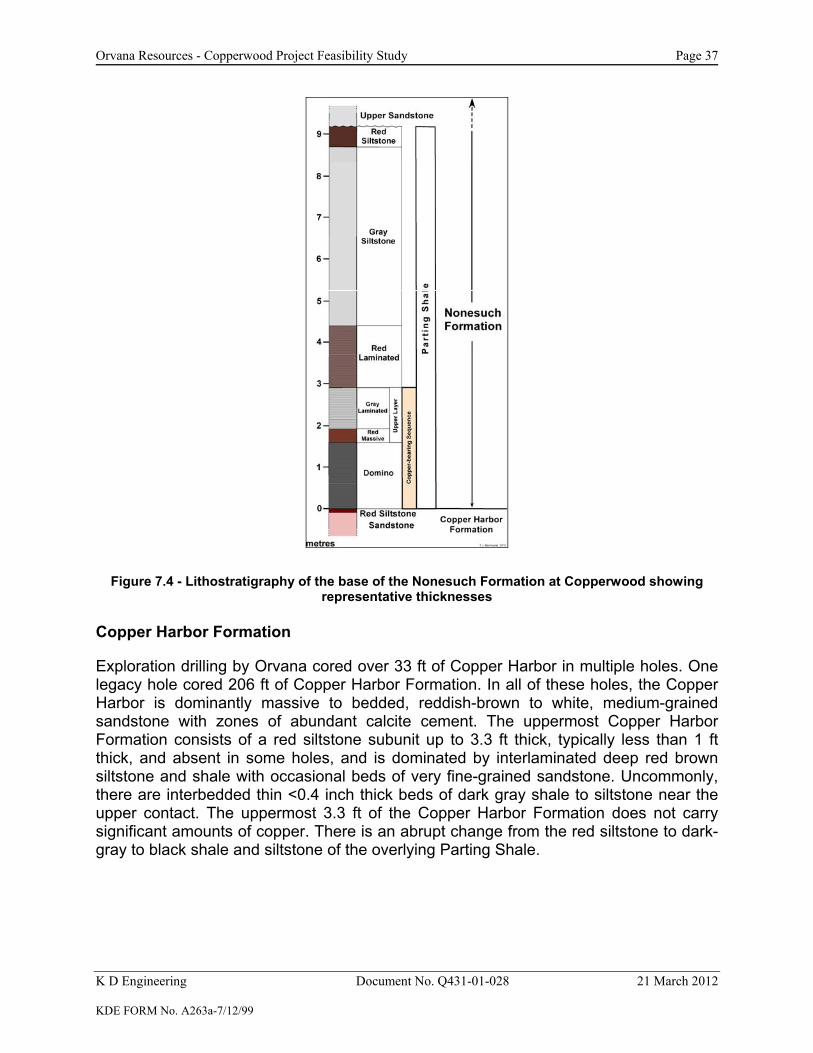
Orvana Resources - Copperwood Project Feasibility Study Page 37
K D Engineering Document No. Q431-01-028 21 March 2012 KDE FORM No. A263a-7/12/99
Figure 7.4 - Lithostratigraphy of the base of the Nonesuch Formation at Copperwood showing representative thicknesses
Copper Harbor Formation Exploration drilling by Orvana cored over 33 ft of Copper Harbor in multiple holes. One legacy hole cored 206 ft of Copper Harbor Formation. In all of these holes, the Copper Harbor is dominantly massive to bedded, reddish-brown to white, medium-grained sandstone with zones of abundant calcite cement. The uppermost Copper Harbor Formation consists of a red siltstone subunit up to 3.3 ft thick, typically less than 1 ft thick, and absent in some holes, and is dominated by interlaminated deep red brown siltstone and shale with occasional beds of very fine-grained sandstone. Uncommonly, there are interbedded thin <0.4 inch thick beds of dark gray shale to siltstone near the upper contact. The uppermost 3.3 ft of the Copper Harbor Formation does not carry significant amounts of copper. There is an abrupt change from the red siltstone to dark-gray to black shale and siltstone of the overlying Parting Shale.
Orvana Resources - Copperwood Project Feasibility Study Page 38
K D Engineering Document No. Q431-01-028 21 March 2012 KDE FORM No. A263a-7/12/99
Parting Shale
The Parting Shale at the base of the Nonesuch Formation is subdivided into the Domino, Red Massive, Gray Laminated, Red Laminated, Gray Siltstone and Red Siltstone sub -units.
▪ The Domino sub-unit is the principal copper host at Copperwood and has an average thickness of 5.2 ft. Thicknesses range from zero to 7.5 ft. The Domino lies immediately above the Copper Harbor Formation and is characterized by laminated dark gray to black shale and siltstone. Red-brown layers are present throughout in varying frequency. There are occasionally very fine-grained gray sandstone beds with thicknesses of a few tenths of an inch within the upper half of Domino. A thin, typically less than 4 inch thick zone convoluted sedimentary layers is often, but not always, present at or near the base. This bed is referred to as the “Basal Zone” and is believed to reflect soft-sediment deformation.
▪ The Red Massive sub-unit has an average thickness of 1 ft and ranges from
zero to 4 ft thick. The contact with the Domino is sharp and easily recognized in drill core as an abrupt change from dark gray or black of Domino to red-brown of Red Massive. Red Massive consists of massive dark red-brown siltstone with beds of fine-grained sandstone. Towards the top of the Red Massive the color changes from red-brown to reddish-gray and the upper contact is placed where the color changes from reddish gray to gray. This upward color change occurs over a thickness of a few inches.
▪ The Gray Laminated sub-unit has an average thickness of 3.3 ft and ranges
from zero to 8.5 ft thick. The contact with the Red Massive is transitional. This unit consists of light-to-medium, gray-to-reddish gray laminated and locally massive siltstone. Brownish layers are occasionally present in parts of the Gray Laminated interval. A 0.4 to 2 inch thick zone of calcareous nodules in gray siltstone occurs in all holes near the base of Gray Laminated. The upper contact is placed where the colour change from dominantly gray to mixed maroon and gray. The transition zone is roughly on the order of 4 inches thick.
▪ The Red Laminated sub-unit has an average thickness of 4.6 ft and ranges
from zero to 10 ft thick. The contact with the underlying Gray Laminated is transitional. This unit is characterized by laminated siltstone with bimodal color distribution of maroon to red-brown and gray. Typical Red Laminated has mottled or wavy maroon intervals interspersed with medium-gray to reddish-gray siltstone. Copper-rich mineralization is typically restricted to the lower 12 inches of the Red Laminated unit.

Orvana Resources - Copperwood Project Feasibility Study Page 39
K D Engineering Document No. Q431-01-028 21 March 2012 KDE FORM No. A263a-7/12/99
▪ Red and Gray Siltstone overly the Red Laminated and mark the top of the Parting Shale. An informally named Upper Sandstone sub-unit of the Nonesuch Formation overlies the Parting Shale.
Copper-Bearing Sequence The Domino, Red Massive, and Gray Laminated are together termed the Copper Bearing Sequence (CBS). For the initial resource calculations (Kulla and Parker, 2010), the Domino was defined as a separate layer and the Red Massive and Gray Laminated were combined and collectively termed the Upper Layer. In a few areas, the upper part of the Gray Laminated is copper-poor and is excluded from the Upper Layer. Likewise, some areas of the Red Laminated have sufficiently high grade to be included into the Upper Layer for resource estimation. For the resource estimation used for this Technical Report, the CBS was modeled as one unit throughout Copperwood, including S6 (Ward, 2011). Structure The units at Copperwood dip gently to the north. The lower contact of the Nonesuch Formation subcrops beneath 66 to 115 ft of unconsolidated glacial sediments and is approximately 900 ft beneath the bedrock surface about 0.9 miles to the north. Dips for all units vary from 12 degrees in the south near the interface with overburden to 8 degrees in the north near the synclinal axis. Figure 7.5 represents a triangulated surface of the drill hole pierce points of the top of the Copper Harbor. This figure shows the change in dip is relatively constant and approximates a slightly curved plane except for an apparent flexure which trends east-northeast through the south-central area of the deposit. This flexure is coincident with faulted intersections logged in three holes and has been interpreted to represent a north dipping shallow reverse fault (thrust fault) with 10 to 23 ft vertical displacement. The lateral extent of this fault is unknown. Figure 7.6 is a drill plan showing the location of three cross sections presented in Figure 7.7, Figure 7.8 and Figure 7.9. The cross sections show the constant gentle dip of the CBS and the shows the location of the interpreted reverse fault across an east-west distance of 4,000 ft .The cross sections also show the CBS copper and silver grades as well as the intersection thicknesses. Figure 7.10 shows the apparent vertical displacement associated with the interpreted thrust fault.

Orvana Resources - Copperwood Project Feasibility Study Page 40
K D Engineering Document No. Q431-01-028 21 March 2012 KDE FORM No. A263a-7/12/99
Note: Dashed line represents an apparent flexure corridor where the dip flattens relative to triangulated surfaces NW and SE of the corridor. Further work has interpreted the flexure as a thrust fault.
Figure 7.5 - Copper Harbor Top Triangulated Drill Hole Pierce Point Dip (degrees) Map

Orvana Resources - Copperwood Project Feasibility Study Page 41
K D Engineering Document No. Q431-01-028 21 March 2012 KDE FORM No. A263a-7/12/99
Figure 7.6 - Drill Hole Location Plan Showing Location of Cross Sections
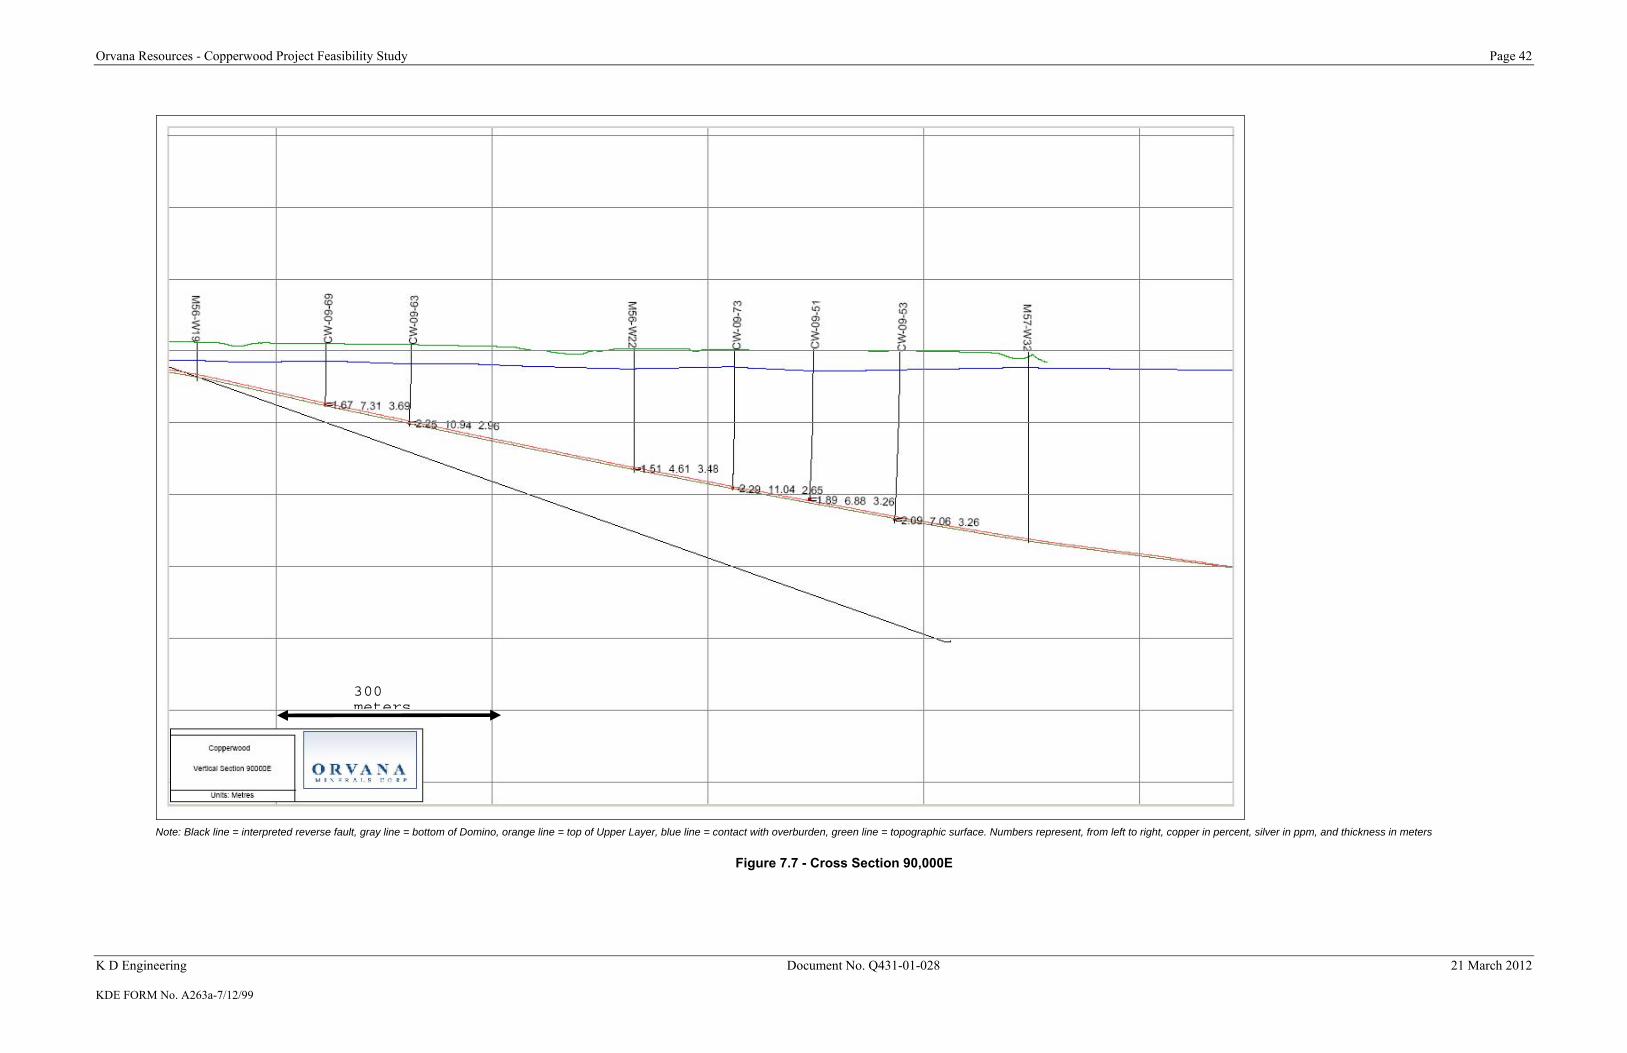
Orvana Resources - Copperwood Project Feasibility Study Page 42
K D Engineering Document No. Q431-01-028 21 March 2012 KDE FORM No. A263a-7/12/99
Note: Black line = interpreted reverse fault, gray line = bottom of Domino, orange line = top of Upper Layer, blue line = contact with overburden, green line = topographic surface. Numbers represent, from left to right, copper in percent, silver in ppm, and thickness in meters
Figure 7.7 - Cross Section 90,000E
300 meters

Orvana Resources - Copperwood Project Feasibility Study Page 43
K D Engineering Document No. Q431-01-028 21 March 2012 KDE FORM No. A263a-7/12/99
Note: Black line = interpreted reverse fault, gray line = bottom of Domino, orange line = top of Upper Layer, blue line = contact with overburden, green line = topographic surface. Numbers represent, from left to right, copper in percent, silver in ppm, and thickness in meters
Figure 7.8 - Cross Section 92,000E
300 meters

Orvana Resources - Copperwood Project Feasibility Study Page 44
K D Engineering Document No. Q431-01-028 21 March 2012 KDE FORM No. A263a-7/12/99
Note: Black line = interpreted reverse fault, gray line = bottom of Domino, orange line = top of Upper Layer, blue line = contact with overburden, green line = topographic surface. Numbers represent, from left to right, copper in percent, silver in ppm, and thickness in meters
Figure 7.9 - Cross Section 94,000E
300 meters
300 meters

Orvana Resources - Copperwood Project Feasibility Study Page 45
K D Engineering Document No. Q431-01-028 21 March 2012 KDE FORM No. A263a-7/12/99
Note: Orange line = interpreted reverse fault, green dashed lines = top and bottom of CBS, blue line = contact with overburden, green line = topographic surface.
Figure 7.10 - Cross Section Showing Apparent Displacement of CBS Caused by Interpreted Thrust Fault
50 meters

Orvana Resources - Copperwood Project Feasibility Study Page 46
K D Engineering Document No. Q431-01-028 21 March 2012 KDE FORM No. A263a-7/12/99
Alteration
Most minerals in the siltstone-dominated lithologies of the Parting Shale are too fine-grained to be identified in drill core using a hand lens. An exception is calcite, which fills very thin, single- healed fractures that cut across bedding typically at high angles. At least a few calcite-healed fractures are found in the CBS of every hole. The non-sulfide mineralogy was determined by quantitative phase analysis using the Rietveld method and X-ray powder diffraction at the University of British Columbia under contract to Orvana. One composite sample from the 2008 Orvana exploration drilling of the CBS contained the following approximate percentages of non-sulfide minerals: 30 percent quartz, 22 percent clinochlore, 16 percent plagioclase, 12 percent muscovite, 14 percent K-feldspar, 3 percent hematite, and 2 percent calcite. In addition, X-ray diffraction shows the presence of a small amount of probable illite-smectite. Microscopic examination of this same composite shows trace amounts of magnetite and rutile. Results from X-ray diffraction, microscopic, and SEM mineralogy study on rejects of CBS rocks from legacy holes are consistent with the quantitative X-ray diffraction results presented above. The samples studied contained the non-sulfide minerals: quartz, albite, chlorite with minor titaniferous iron oxide (hematite or magnetite), and patchy domains of a Fe-O mineral that appears to have replaced pyrite grains. The non-sulfide mineralogy of the CBS is consistent with low-temperature and low-pressure alteration. 7.1.3 Comparison to White Pine Mine The White Pine Mine is located about 18 miles northeast of Copperwood. The principal similarity between White Pine and Copperwood is that both are stratiform copper deposits hosted by shales and siltstones at the same overall stratigraphic position, the base of the Nonesuch Formation. There are both similarities and differences between White Pine and Copperwood. A stratigraphic column for the White Pine area is depicted in Figure 7.11. The lowermost three subunits of the Parting Shale are lithologically similar but their thicknesses are not. At Copperwood, the thickness of the Parting Shale and Domino is typically 2.5 times that found at White Pine. The Domino at Copperwood is significantly thicker, averaging 5.22 ft, compared to ~2 ft at White Pine. Full-column bulk mining at White Pine included all of the Parting Shale, the weakly mineralized Upper Sandstone, and the Upper Shale. The Parting Shale at White Pine is similar to Copperwood except at White Pine the back was Upper Sandstone whereas the proposed back for Copperwood is Red Laminated siltstone. Structurally, there are significant differences between Copperwood and White Pine. The White Pine deposit straddles an anticline and a right-lateral strike-slip fault. Both the southwest and northwest domains of the White Pine deposit contain strike-slip and

Orvana Resources - Copperwood Project Feasibility Study Page 47
K D Engineering Document No. Q431-01-028 21 March 2012 KDE FORM No. A263a-7/12/99
thrust faults. These faults are interpreted as being generated during the regional rift compressional event. In contrast, at Copperwood, only one fault has been identified, otherwise the deposit geometry approximates a simple dipping plane. The copper grades at Copperwood are remarkably consistent within individual units averaging 2.58 percent, 0.39 percent, and 1.32 percent for the Domino, Red Massive, and Gray Laminated, respectively. A similar pattern of relatively consistent grades occurs at White Pine with the stratigraphically equivalent Domino, Red Massive, and Dark Gray Massive sub-units. The higher stratigraphic units at Copperwood do not correlate with White Pine. The copper-bearing mineral at Copperwood is exclusively fine-grained chalcocite. In contrast, the White Pine Mine has two distinct types of mineralization; about 85 to 90 percent of the copper occurs as chalcocite and the rest as native copper. At White Pine, the second-stage copper mineralization is characterized by native copper occurring as sheets along faults and adjacent beds. Thus, second-stage mineralizing fluids were likely of the same origin as those related to native copper in the Keweenaw Peninsula. There is no evidence to demonstrate a similar second stage of copper mineralization at Copperwood.

Orvana Resources - Copperwood Project Feasibility Study Page 48
K D Engineering Document No. Q431-01-028 21 March 2012 KDE FORM No. A263a-7/12/99
Note: Column heights are drawn to same scale. White Pine column height is drawn in feet and Copperwood column is drawn in
meters.
Figure 7.11 - Comparison of the Lithostratigraphy of the Base of the Nonesuch Formation at Copperwood and the White Pine Mine.

Orvana Resources - Copperwood Project Feasibility Study Page 49
K D Engineering Document No. Q431-01-028 21 March 2012 KDE FORM No. A263a-7/12/99
7.2 Mineralization Mineralization is fully described in the April 2010 Technical Report that is filed on www.sedar.com (Kulla and Parker, 2010). The reader is referred to that document for mineralization details. The following summary is based on that document. The Copperwood deposit is located on the western limb of the Western Syncline within the Noneshuch Formation. The mineralized zone lies at the base of the Nonesuch Formation and is stratigraphically equivalent to the mineralized zone at the White Pine Mine. In comparison to the White Pine mine, where the bulk of mining was in the full column of Parting Shale to Upper Shale, the Domino, Red Massive, and Gray Laminated units of the Parting Shale comprise the CBS at Copperwood. The Domino at Copperwood is significantly thicker, averaging 5.22 ft as compared to 2 ft at White Pine. Like White Pine, the copper assays at Copperwood are remarkably consistent. Locally, the Red Laminated has greater than 1 percent copper grades at its base adjacent to the Gray Laminated. Silver is also present at Copperwood, averaging 0.2 ounces per ton. The CBS has been delineated over an area of approximately 13,000 ft east-west and 5,000 ft north-south. Chalcocite is the only observed copper-bearing sulfide mineral at Copperwood. Samples collected within the CBS return a 4:1 copper/sulfur ratio. This is consistent with chalcocite being the almost exclusive sulfide mineral. Chalcocite principally occurs as disseminations within shale and siltstone. Individual disseminated grains of chalcocite are most commonly very-fine grained, approximately 5 to 50 microns in diameter. Chalcocite occurs as free grains as evidenced by remnant patchy domains of an iron-oxide mineral (probably hematite); pseudomorphs of pyrite have been indentified microscopicallly. In the highest grade samples, especially within the top one ft of Domino, chalcocite occurs as layers that are parallel to laminations in the rock with the layers usually less than 2 millimeters thick (Figure 7.12). Occasionally, ovoids of chalcocite occur that are up to 3 millimeters in their long axis.

Orvana Resources - Copperwood Project Feasibility Study Page 50
K D Engineering Document No. Q431-01-028 21 March 2012 KDE FORM No. A263a-7/12/99
Note: light gray colour is lamina-parallel disseminated chalcocite
Figure 7.12 - Disseminated Chalcocite in Domino
There is an overall correlation with the degree of redness of the host rock within the CBS and the abundance of chalcocite within the copper bearing sequence. The dark gray to gray colored Domino has the highest copper grades, the medium to light gray colored Gray Laminated has lower copper grades, and the red brown colored Red Massive has the lowest copper grades. Grade profiles for each of the CBS units in each hole show there is a natural break in the grade profile at approximately 1 percent copper (Figure 7.13). The 1 percent copper grade is a natural cutoff and is extensively used in Zambian and other African sediment-hosted copper deposits where most intercepts grade a few tenths of a percent copper above or below the mineralized interval and well over 1 percent copper inside the mineralized interval. Nonetheless, the resource estimate used for this Technical Report applied a 0.8 percent copper cutoff. The chalcocite mineralization of the Western Syncline, including Copperwood, is interpreted to have the same origin as White Pine and the two deposits mirror each other on either side of the Porcupine Mountains volcanic structure. The following discussion is based on the summary in Kulla and Parker, 2010 and the references therein.

Orvana Resources - Copperwood Project Feasibility Study Page 51
K D Engineering Document No. Q431-01-028 21 March 2012 KDE FORM No. A263a-7/12/99
Note: Drill Hole Trace from bottom upwards: Orange=Copper Harbor, Blue=Domino, Red=Red Massive, Gray=Gray Laminated, Brown=Red Laminated, Light Gray=undifferentiated. Drill Hole Color Histogram: Gray=<1% Cu, Green=<2% Cu, Red=>2% Cu
Figure 7.13 - Copperwood Composite Grade Profiles Mineralization at White Pine is divided into main-stage stratiform chalcocite and second stage native copper and minor chalcocite. The main-stage mineralization is representative of the classic sediment-hosted stratiform copper deposit formed at low temperatures during early diagenesis. Copper is interpreted to have been derived from the footwall red-bed Copper Harbor Formation. Thinning of the Copper Harbor aquifer rocks focused upward movement of mineralizing fluids, which may have been further focused by faults. The driving mechanism for fluid flow is topographic and density driven recharge or marginward directed, compaction driven discharge of cupriferous brines.
Orvana Resources - Copperwood Project Feasibility Study Page 52
K D Engineering Document No. Q431-01-028 21 March 2012 KDE FORM No. A263a-7/12/99
8.0 DEPOSIT TYPES The following description of sediment-hosted copper deposits is derived from Kulla and Parker, 2010 and the references therein. Sediment-hosted stratiform copper deposits consist of copper and copper-iron sulfide minerals hosted by siliciclastic or dolomitic rocks in which a relatively thin (typically less than 10 ft) copper-bearing zone is mostly conformable with stratification of the host sedimentary rocks. Copper occurs as disseminations and veinlets. These deposits have been grouped on the basis of the reductant into three subtypes: reduced facies, Red-bed copper, and Revett copper or, based on basinal setting, into two subtypes: Kupferschiefer and Red-bed. The reduced facies and Kupferschiefer subtypes are similar. Examples of the reduced facies or Kupferschiefer subtypes include most of the deposits within the Central African Copperbelt (such as Nkana, Nchanga, Mufulira, Tenke-Fungurume, and Kolwezi), the Kupferschiefer (Poland), Redstone (Canada), and White Pine (USA). The common features of the reduced facies or Kupferschiefer subtype sediment-hosted copper deposits are summarized as follows: Geological Setting: intracratonic rift with coarse-grained subaerial sediments overlain by fine-grained sediments or restricted marine setting/basin margin followed by widespread euxinic marine deposits; near paleo-equator; partly evaporitic on the flanks of basement highs; footwall sediments highly permeable; host ranging in age from Early Proterozoic to late Tertiary, but predominate in late Mesoproterozoic to late Neoproterozoic. Host Rocks: marine or lacustrine; thin-bedded to finely-laminated green, black, or gray shale, thinly laminated tidal/sabkha facies or reefoid carbonate rocks, and dolomitic shales; common organic carbon and finely disseminated pyrite; tend to have large lateral extent; during transgression over oxidized sequences of hematite-bearing sandstones siltstones, and conglomerates (red-beds). Mineralization: chalcocite and other Cu2S-CuS minerals + bornite are diagnostic; typical minerals hematite-chalcocite-bornite-chalcopyrite-pyrite; may be zoned with chalcocite-bornite central, chalcopyrite-pyrite medial, galena-sphalerite peripheral; finely disseminated; copper sulfides replace framboidal or colloform pyrite; carbon-rich materials in favorable host rocks but usually consumed by redox reactions during or deposition. Alteration: diagenetic alteration minerals in host rocks and underlying red-beds (albite, potassic feldspar, chlorite, quartz, carbonate minerals, dolimitization, etc.); bleaching of red sediments to greenish gray or light gray where in contact with reducing fluids.
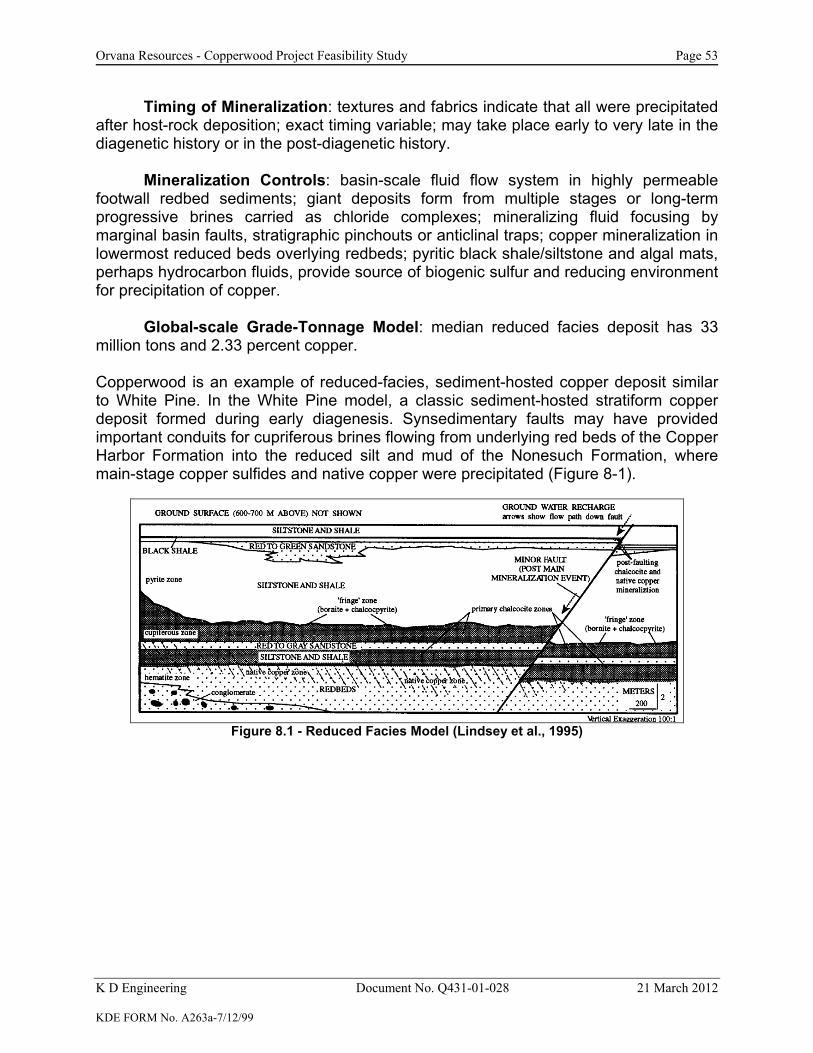
Orvana Resources - Copperwood Project Feasibility Study Page 53
K D Engineering Document No. Q431-01-028 21 March 2012 KDE FORM No. A263a-7/12/99
Timing of Mineralization: textures and fabrics indicate that all were precipitated after host-rock deposition; exact timing variable; may take place early to very late in the diagenetic history or in the post-diagenetic history. Mineralization Controls: basin-scale fluid flow system in highly permeable footwall redbed sediments; giant deposits form from multiple stages or long-term progressive brines carried as chloride complexes; mineralizing fluid focusing by marginal basin faults, stratigraphic pinchouts or anticlinal traps; copper mineralization in lowermost reduced beds overlying redbeds; pyritic black shale/siltstone and algal mats, perhaps hydrocarbon fluids, provide source of biogenic sulfur and reducing environment for precipitation of copper. Global-scale Grade-Tonnage Model: median reduced facies deposit has 33 million tons and 2.33 percent copper. Copperwood is an example of reduced-facies, sediment-hosted copper deposit similar to White Pine. In the White Pine model, a classic sediment-hosted stratiform copper deposit formed during early diagenesis. Synsedimentary faults may have provided important conduits for cupriferous brines flowing from underlying red beds of the Copper Harbor Formation into the reduced silt and mud of the Nonesuch Formation, where main-stage copper sulfides and native copper were precipitated (Figure 8-1).
Figure 8.1 - Reduced Facies Model (Lindsey et al., 1995)

Orvana Resources - Copperwood Project Feasibility Study Page 54
K D Engineering Document No. Q431-01-028 21 March 2012 KDE FORM No. A263a-7/12/99
9.0 EXPLORATION
There are no known surface geochemical or geophysical exploration programs for the Copperwood project. Delineation of mineralization has primarily been completed through drilling from surface (1956-2011) and limited underground channel sampling (1958-59).

Orvana Resources - Copperwood Project Feasibility Study Page 55
K D Engineering Document No. Q431-01-028 21 March 2012 KDE FORM No. A263a-7/12/99
10.0 DRILLING Drilling information is fully described in the April 2010 and March 2011 Technical Reports that are filed on www.sedar.com (Kulla and Parker, 2010; Ward, 2011). The reader is referred to those documents for exploration and drilling details. The following summary is based on those documents. Drilling at the Copperwood project has delineated a gently north-dipping zone of disseminated copper mineralization approximately 10 ft thick and hosted at the base of the Nonesuch Formation on the western limb of the Western Syncline. The majority of holes used to delineate the deposit were drilled vertically. The deposit dips approximately 9 degrees to the north; therefore, the drilled intersections are usually between 0 and 1.5 percent greater than the true thickness. Drill-collar locations have been measured by a professional surveyor and are considered accurate. Down-hole survey measurements have allowed for reasonably accurate determination of lithologic contacts. Core recovery has been good to excellent. Drilling on the Copperwood property has been undertaken in two phases of work. The initial program was completed in 1956 and 1957 and comprised 42 holes totaling 21,330 ft of drilling; during 1959-60, 23 holes for 13,116 ft. were drilled. The second phase of drilling was completed between 2008 and 2011 and comprised 148 holes totaling 66,629 ft of drilling. Drilling programs are summarized in Table 10.1.
Table 10.1 Drilling Program Summary
Company Type No. Holes Feet Year USMR Exploration 42 19,935 1956 to 1957 BCM Exploration 23 13,116 1959 to 1960
Orvana Delineation/Infill 109 58,525 2008 to 2011 Orvana Water Monitor Wells 29 5,059 2008 to 2010 Orvana Geotechnical/Metallurgical 10 3,045 2009 to 2010
213 99,680 Note: Geotechnical and metallurgical information was collected from delineation/infill holes. Drill-hole collar locations are shown in relation to the Copperwood mineral lease boundaries and in relation to the surface projection of the resource area (Figure 10.1).

Orvana Resources - Copperwood Project Feasibility Study Page 56
K D Engineering Document No. Q431-01-028 21 March 2012 KDE FORM No. A263a-7/12/99
Note: Grid Coordinates in NAD83 Michigan North State Plane International Feet Projection
Figure 10.1 - Copperwood Drill Plan
Drilling in 2008 was completed by Boart Longyear of Salt Lake City, Utah using a truck-mounted core drill. Drilling in 2009 was completed by Layne Christensen Co. of Arizona using a truck-mounted core drill and a track mounted core drill. Drilling in 2010 to 2011 was completed by IDEA drilling of Hibbing, Minnesota and Boart Longyear of Salt Lake City, Utah using truck-mounted rigs. Contractor and equipment details for the 1956 and 1957 drill programs are not known. Kulla and Parker, 2010 and Ward, 2011 discuss the details of the collar surveys, down-hole surveys and geologic logging. Subsequent to the filing of the Kulla and Parker (2010) and Ward, 2011 reports, Orvana logged the hangingwall rocks to the overlying clay layer for selective drill holes and analyzed samples with ICP methods.

Orvana Resources - Copperwood Project Feasibility Study Page 57
K D Engineering Document No. Q431-01-028 21 March 2012 KDE FORM No. A263a-7/12/99
11.0 SAMPLE PREPARATION, ANALYSES AND SECURITY
Sample preparation, analysis and security is fully described in the April 2010 and March 2011 Technical Report that is filed on www.sedar.com (Kulla and Parker, 2010; Ward, 2011). The reader is referred to that document for sample preparation details. The following summary is based on that document. Sampling at Copperwood comprises half and quarter core collected from surface diamond-drill programs and channel samples collected from an underground exploration drift. Sample intervals are variable and honor logged lithologic intervals. Extensive specific gravity measurements and core recovery observations and measurements were collected. Sample preparation, security, and analytical procedures undertaken during the 2008 and 2009 drill programs were completed following industry best practices. Legacy data was verified either though resampling or through comparison with twin holes completed in 2008 and 2009. It was the opinion of Kulla and Parker, 2010 and Ward, 2011 that the sample preparation, security, and analytical procedures undertaken during the 2009 and 2010-11 drill programs were completed following industry best practices and that the analytical results are suitable for use in the estimation of mineral resources at Copperwood. It is the opinion of the qualified person that the sample preparation, security, and analytical procedures performed on Copperwood drill samples and metallurgical test samples reflect standard practice.
`

Orvana Resources - Copperwood Project Feasibility Study Page 58
K D Engineering Document No. Q431-01-028 21 March 2012 KDE FORM No. A263a-7/12/99
12.0 DATA VERIFICATION All aspects of data verification were rendered to be acceptable for a mineral-resource estimate and completed in a professional manner (Kulla and Parker, 2010; Ward, 2011). The reader is referred to those documents for data verification details. The survey, assay and geological databases and quality-control data for copper and silver used to support the Copperwood mineral resource estimation were checked and were found sufficiently free of errors, and sufficiently accurate, precise, and free of contamination. The databases are considered suitable to support mineral resource estimation. It is the opinion of the qualified person that the data verification procedures performed on Copperwood drill samples and metallurgical test samples reflect standard minerals industry practice.

Orvana Resources - Copperwood Project Feasibility Study Page 59
K D Engineering Document No. Q431-01-028 21 March 2012 KDE FORM No. A263a-7/12/99
13.0 MINERAL PROCESSING AND METALLURGICAL TESTING
Metallurgical testwork for Copperwood Project has been completed by Kappes, Cassiday & Associates (KCA) located in Reno, Nevada, Mountain States Research and Development Inc. (MSRDI) of Vail, Arizona, and METCON Research (METCON) located in Tucson, Arizona. These metallurgical reports formed the basis for the following recovery estimates. From the testwork, the overall copper recovery from material of this type is expected to be between 82 and 87 percent producing a concentrate having a grade between 23 and 26 percent copper; the silver recovery is greater than 50 percent and the silver grade in the concentrate is 1.25 ounces. The results indicate the material can be processed by conventional flotation methods. KCA, MSRDI and METCON do not hold ISO certifications for metallurgical testing activities; this is typical for metallurgical testwork facilities. 13.1 Composite Samples Three composite samples were prepared by KCA from 1/4 split HQ core samples of Domino, Red Massive, and Gray Laminated material. Samples were collected from five individual 2008 holes drilled on the east side, within the resource area and within an area where the Domino is greater than 5 ft thick. The composite sample (Composite 1) prepared by MSRDI was from 1/4 split NQ core and assay reject samples from 32 drill holes. Two composite samples, Composite 4 and Composite 5, were prepared by METCON, the former from six drill holes and the latter from eight. Head assay analyses of the five samples subjected to metallurgical testing are shown in Table 13.1.
Table 13.1 Copper and Silver Head Assays
Laboratory Sample Copper, % Silver, gpt
Domino 2.58 6.2 Red Massive 0.47 10.0 KCA
Gray Laminated 1.43 4.0 MSRDI Composite 1 1.76 8.2
Composite 4 1.40 4.0 METCON
Composite 5 1.49 3.0
Sequential copper assays conducted on the MSRDI and METCON samples show that of the copper present in the samples 65 and 88 percent was cyanide soluble,
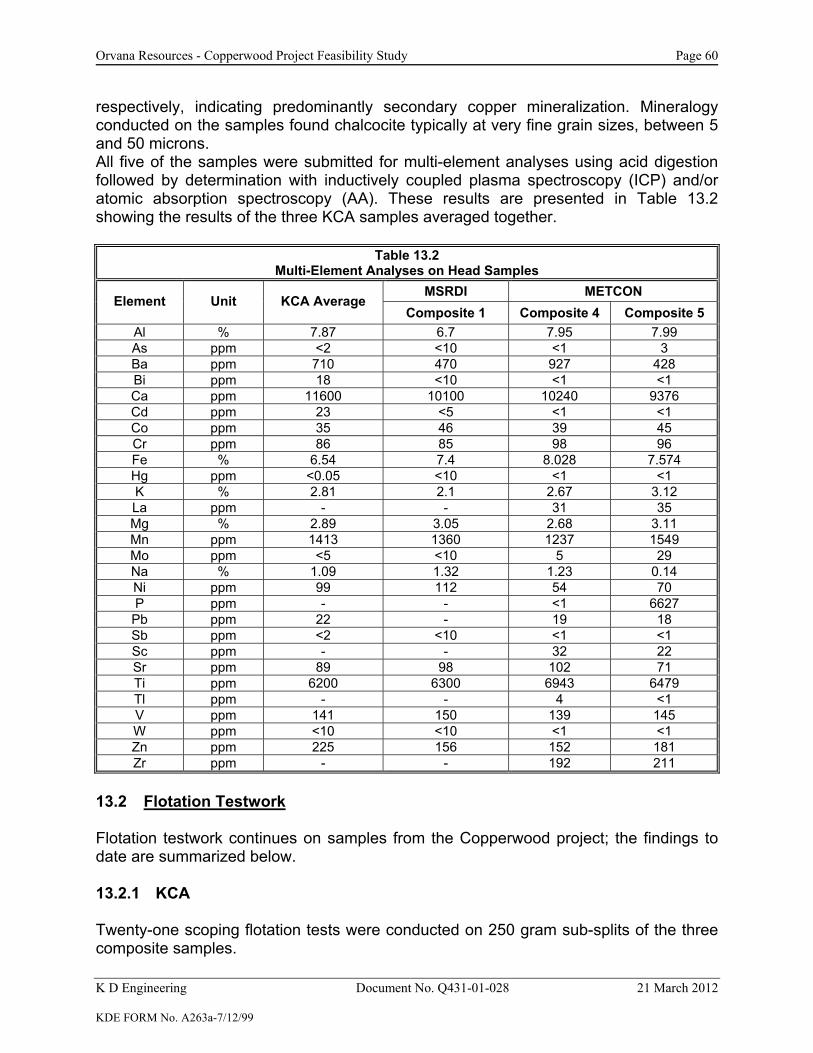
Orvana Resources - Copperwood Project Feasibility Study Page 60
K D Engineering Document No. Q431-01-028 21 March 2012 KDE FORM No. A263a-7/12/99
respectively, indicating predominantly secondary copper mineralization. Mineralogy conducted on the samples found chalcocite typically at very fine grain sizes, between 5 and 50 microns. All five of the samples were submitted for multi-element analyses using acid digestion followed by determination with inductively coupled plasma spectroscopy (ICP) and/or atomic absorption spectroscopy (AA). These results are presented in Table 13.2 showing the results of the three KCA samples averaged together.
Table 13.2 Multi-Element Analyses on Head Samples
MSRDI METCON Element Unit KCA Average
Composite 1 Composite 4 Composite 5 Al % 7.87 6.7 7.95 7.99 As ppm <2 <10 <1 3 Ba ppm 710 470 927 428 Bi ppm 18 <10 <1 <1 Ca ppm 11600 10100 10240 9376 Cd ppm 23 <5 <1 <1 Co ppm 35 46 39 45 Cr ppm 86 85 98 96 Fe % 6.54 7.4 8.028 7.574 Hg ppm <0.05 <10 <1 <1 K % 2.81 2.1 2.67 3.12 La ppm - - 31 35 Mg % 2.89 3.05 2.68 3.11 Mn ppm 1413 1360 1237 1549 Mo ppm <5 <10 5 29 Na % 1.09 1.32 1.23 0.14 Ni ppm 99 112 54 70 P ppm - - <1 6627
Pb ppm 22 - 19 18 Sb ppm <2 <10 <1 <1 Sc ppm - - 32 22 Sr ppm 89 98 102 71 Ti ppm 6200 6300 6943 6479 Tl ppm - - 4 <1 V ppm 141 150 139 145 W ppm <10 <10 <1 <1 Zn ppm 225 156 152 181 Zr ppm - - 192 211
13.2 Flotation Testwork Flotation testwork continues on samples from the Copperwood project; the findings to date are summarized below. 13.2.1 KCA Twenty-one scoping flotation tests were conducted on 250 gram sub-splits of the three composite samples.

Orvana Resources - Copperwood Project Feasibility Study Page 61
K D Engineering Document No. Q431-01-028 21 March 2012 KDE FORM No. A263a-7/12/99
The final series of batch tests indicated the following conditions and conventional reagent dosages:
▪ Fine (100 percent passing 325 mesh) primary grind ▪ Soda ash (sodium carbonate) for staged pH control ▪ Xanthate and Aero 407 (mercaptobenzothiazole and alkyl dithiophosphate)
collectors ▪ Methyl isobutyl alcohol (Aero 70, MIBC) frother ▪ Sodium silicate dispersant ▪ Sodium hydrosulfide to regulate the solution ORP ▪ Conditioning time of 10 minutes, followed by 5 minutes of flotation for each of
the rougher, first and second cleaner floats
These conditions were utilized for six-stage locked cycle flotation tests on the Domino material and on a blend of the Domino, Gray Laminated and Red Massive (60, 12 and 28 percent by mass respectively). The results are summarized in Table 13.3.
Table 13.3 KCA Locked Cycle Flotation Tests
Sample Mass Pull,
% Concentrate Cu Grade,
% Cu Recovery,
% Domino 7.4 28.5 88
Domino/Gray Laminated/Red Massive 7.6 30.7 86 13.2.2 MSRDI Over 50 open-cycle and limited locked-cycle tests were conducted on Composite 1, which is considered a representative sample for the first four years of mining. Included in this testing was a modified White Pine flowsheet where it is known that recoveries as high as 87 percent and concentrate grades as high as 30 percent were achieved on similar ore before the operation closed in 1996 (R. Johnson pers. comm., 2010). Preliminary testing revealed that a very fine grind, preferably -25 microns or 500 mesh, is necessary to optimize recovery and certain tests included a very fine grind in an attempt to quantify the effect. Six-stage locked cycle testing resulted in an average copper recovery of 82 percent, a sixth cycle recovery of 86 percent and a sixth cycle silver recovery of 49 percent. These were achieved using the following reagents:
▪ Soda ash ▪ Z-200 ▪ NaSH ▪ Sodium Silicate ▪ Dowfroth 250 ▪ PAX
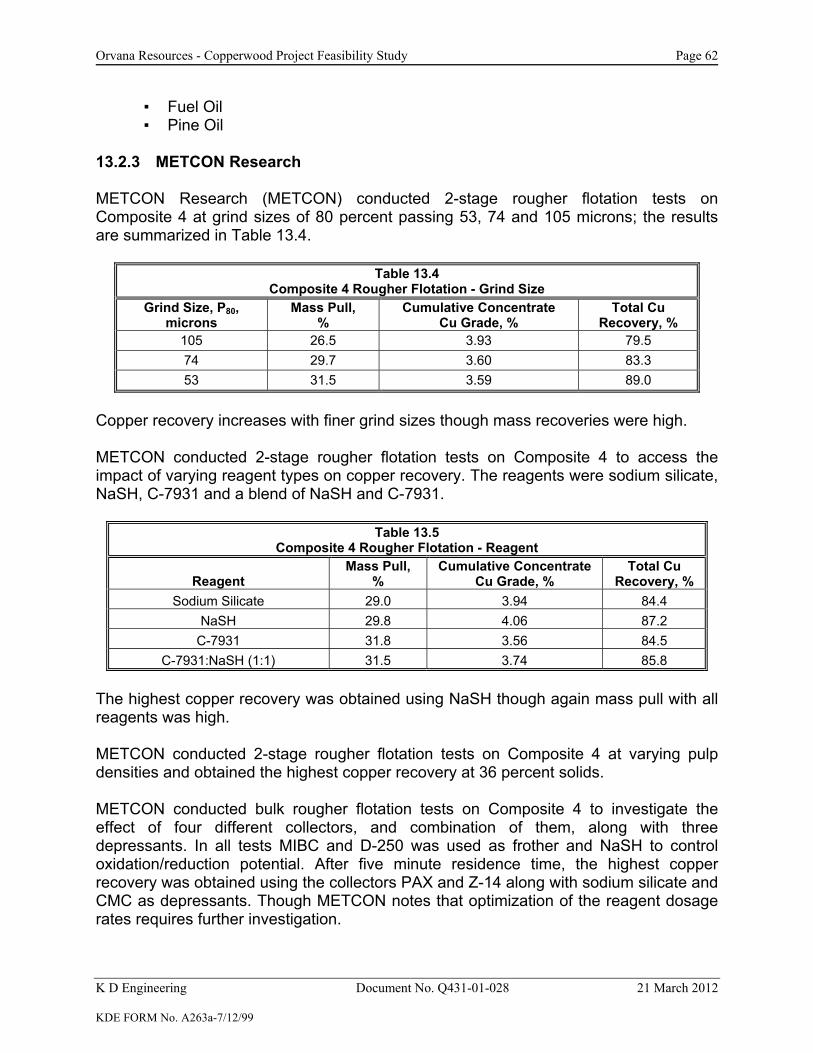
Orvana Resources - Copperwood Project Feasibility Study Page 62
K D Engineering Document No. Q431-01-028 21 March 2012 KDE FORM No. A263a-7/12/99
▪ Fuel Oil ▪ Pine Oil
13.2.3 METCON Research METCON Research (METCON) conducted 2-stage rougher flotation tests on Composite 4 at grind sizes of 80 percent passing 53, 74 and 105 microns; the results are summarized in Table 13.4.
Table 13.4 Composite 4 Rougher Flotation - Grind Size
Grind Size, P80, microns
Mass Pull, %
Cumulative Concentrate Cu Grade, %
Total Cu Recovery, %
105 26.5 3.93 79.5 74 29.7 3.60 83.3 53 31.5 3.59 89.0
Copper recovery increases with finer grind sizes though mass recoveries were high. METCON conducted 2-stage rougher flotation tests on Composite 4 to access the impact of varying reagent types on copper recovery. The reagents were sodium silicate, NaSH, C-7931 and a blend of NaSH and C-7931.
Table 13.5 Composite 4 Rougher Flotation - Reagent
Reagent Mass Pull,
% Cumulative Concentrate
Cu Grade, % Total Cu
Recovery, % Sodium Silicate 29.0 3.94 84.4
NaSH 29.8 4.06 87.2 C-7931 31.8 3.56 84.5
C-7931:NaSH (1:1) 31.5 3.74 85.8 The highest copper recovery was obtained using NaSH though again mass pull with all reagents was high. METCON conducted 2-stage rougher flotation tests on Composite 4 at varying pulp densities and obtained the highest copper recovery at 36 percent solids. METCON conducted bulk rougher flotation tests on Composite 4 to investigate the effect of four different collectors, and combination of them, along with three depressants. In all tests MIBC and D-250 was used as frother and NaSH to control oxidation/reduction potential. After five minute residence time, the highest copper recovery was obtained using the collectors PAX and Z-14 along with sodium silicate and CMC as depressants. Though METCON notes that optimization of the reagent dosage rates requires further investigation.
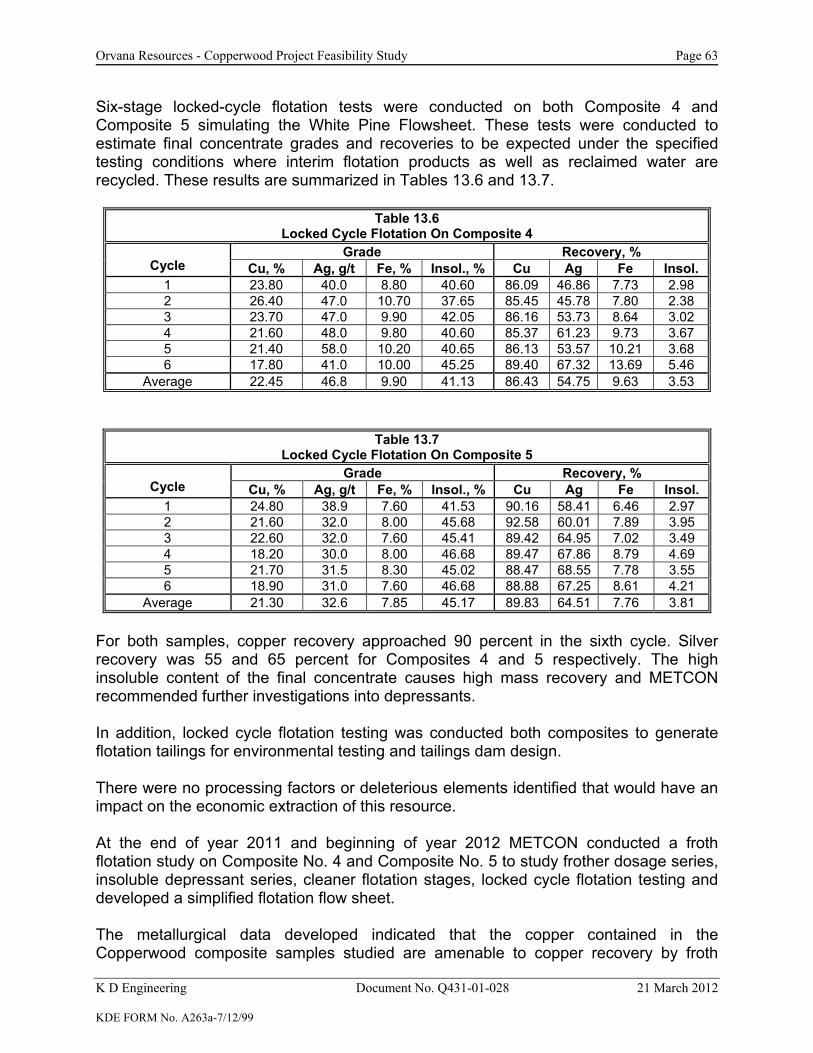
Orvana Resources - Copperwood Project Feasibility Study Page 63
K D Engineering Document No. Q431-01-028 21 March 2012 KDE FORM No. A263a-7/12/99
Six-stage locked-cycle flotation tests were conducted on both Composite 4 and Composite 5 simulating the White Pine Flowsheet. These tests were conducted to estimate final concentrate grades and recoveries to be expected under the specified testing conditions where interim flotation products as well as reclaimed water are recycled. These results are summarized in Tables 13.6 and 13.7.
Table 13.6
Locked Cycle Flotation On Composite 4 Grade Recovery, %
Cycle Cu, % Ag, g/t Fe, % Insol., % Cu Ag Fe Insol. 1 23.80 40.0 8.80 40.60 86.09 46.86 7.73 2.98 2 26.40 47.0 10.70 37.65 85.45 45.78 7.80 2.38 3 23.70 47.0 9.90 42.05 86.16 53.73 8.64 3.02 4 21.60 48.0 9.80 40.60 85.37 61.23 9.73 3.67 5 21.40 58.0 10.20 40.65 86.13 53.57 10.21 3.68 6 17.80 41.0 10.00 45.25 89.40 67.32 13.69 5.46
Average 22.45 46.8 9.90 41.13 86.43 54.75 9.63 3.53
Table 13.7 Locked Cycle Flotation On Composite 5
Grade Recovery, % Cycle Cu, % Ag, g/t Fe, % Insol., % Cu Ag Fe Insol.
1 24.80 38.9 7.60 41.53 90.16 58.41 6.46 2.97 2 21.60 32.0 8.00 45.68 92.58 60.01 7.89 3.95 3 22.60 32.0 7.60 45.41 89.42 64.95 7.02 3.49 4 18.20 30.0 8.00 46.68 89.47 67.86 8.79 4.69 5 21.70 31.5 8.30 45.02 88.47 68.55 7.78 3.55 6 18.90 31.0 7.60 46.68 88.88 67.25 8.61 4.21
Average 21.30 32.6 7.85 45.17 89.83 64.51 7.76 3.81
For both samples, copper recovery approached 90 percent in the sixth cycle. Silver recovery was 55 and 65 percent for Composites 4 and 5 respectively. The high insoluble content of the final concentrate causes high mass recovery and METCON recommended further investigations into depressants. In addition, locked cycle flotation testing was conducted both composites to generate flotation tailings for environmental testing and tailings dam design. There were no processing factors or deleterious elements identified that would have an impact on the economic extraction of this resource.
At the end of year 2011 and beginning of year 2012 METCON conducted a froth flotation study on Composite No. 4 and Composite No. 5 to study frother dosage series, insoluble depressant series, cleaner flotation stages, locked cycle flotation testing and developed a simplified flotation flow sheet.
The metallurgical data developed indicated that the copper contained in the Copperwood composite samples studied are amenable to copper recovery by froth

Orvana Resources - Copperwood Project Feasibility Study Page 64
K D Engineering Document No. Q431-01-028 21 March 2012 KDE FORM No. A263a-7/12/99
flotation process. The metallurgical data developed are summarized in the following paragraphs. Head Assays The drill core samples from each composite were stage crushed to 100 percent minus 10 mesh in approximately 10 hours to minimize sample oxidation. Test charges of approximately 1,200 grams were split for head assays and flotation testing. The test charges were placed inside a freezer to avoid oxidation. A test charges from Composite No. 4 and Composite 5 was selected at random, pulverized then a sample split and submitted for copper, iron, silver and sequential copper analysis. The analytical data developed on the composite samples are summarized in Table 13.8 below.
Table 13.8 Head Composite Samples
Assays (%) Sequential Copper Analysis (%) Sample
ID Cu Fe Ag (g/t)
As Cu1
CNs Cu2
Residual Cu3
Calculated Total Cu4
Composite No. 4 1.40 5.7 4.0 0.146 1.25 0.022 1.42 Composite No. 5 1.49 5.9 3.0 0.155 1.24 0.034 1.43
Remarks: (1) Acid Soluble Copper, (2) Cyanide Soluble Copper, (3) Residual Total Copper (4) as Cu + CNs Cu + Residual Cu
Locked Cycle Flotation Testing Six stage locked-cycle flotation tests were conducted on Composite No. 4 and Composite No. 5 using a simplified flow sheet developed by METCON to determine final concentrate grades and recoveries to be expected under the specified testing conditions where interim flotation products as well as reclaimed water are recycled. The metallurgical data developed are summarized in Table 13.9 and Table 13.10 below.
The metallurgical results obtained are on Composite No. 4 are summarized in Table 13.9 below.
Table 13.9
Locked Cycle Flotation Testing On Composite No. 4 For Metallurgical Mass Balance Summary of Results
Grade (%) Recovery (%) Cycle Cu Ag (g/t) Fe Insol. Cu Ag Fe Insol.
1 24.50 52 9.00 41.00 89.58 61.90 6.81 2.67 2 25.00 46 9.60 36.60 85.46 52.90 6.86 2.20 3 21.90 42 9.70 40.90 85.24 52.56 7.46 2.66 4 24.30 48 9.50 39.50 83.16 52.87 6.65 2.45 5 23.50 45 10.00 41.05 85.07 56.77 8.36 3.01 6 24.30 46 10.40 34.05 87.46 60.56 8.42 2.70
Average 24.03 47 9.97 38.20 85.23 56.26 7.81 2.72
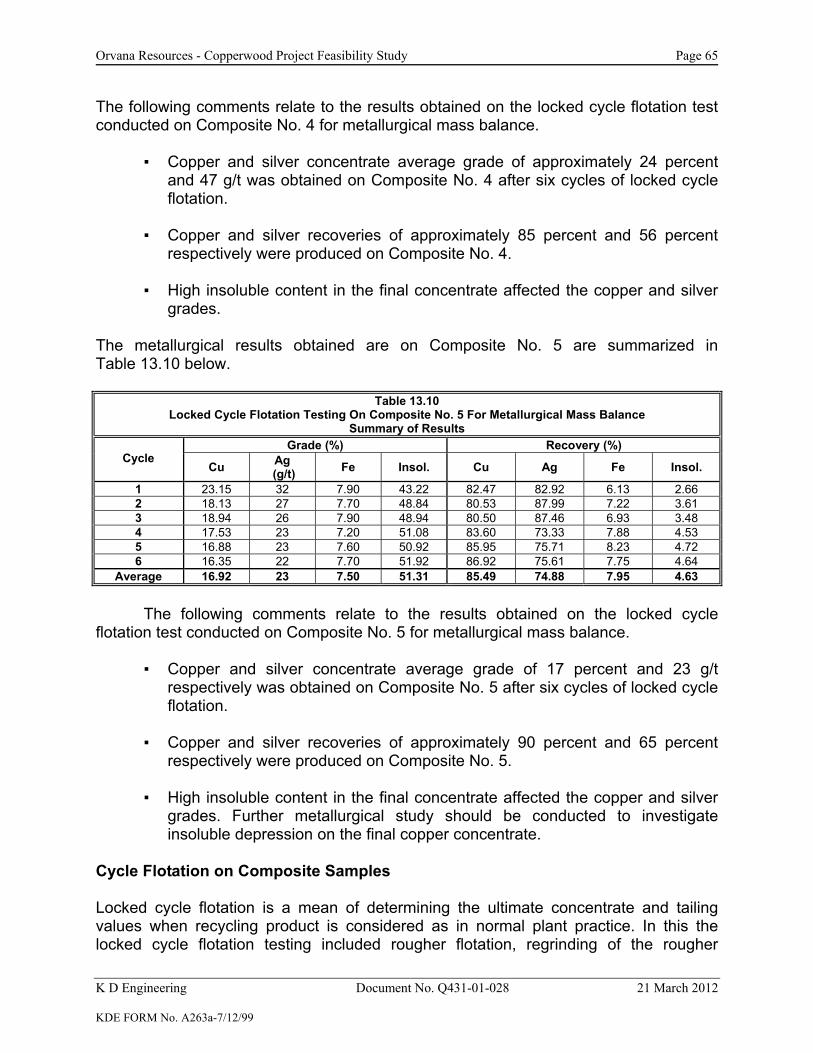
Orvana Resources - Copperwood Project Feasibility Study Page 65
K D Engineering Document No. Q431-01-028 21 March 2012 KDE FORM No. A263a-7/12/99
The following comments relate to the results obtained on the locked cycle flotation test conducted on Composite No. 4 for metallurgical mass balance.
▪ Copper and silver concentrate average grade of approximately 24 percent
and 47 g/t was obtained on Composite No. 4 after six cycles of locked cycle flotation.
▪ Copper and silver recoveries of approximately 85 percent and 56 percent
respectively were produced on Composite No. 4.
▪ High insoluble content in the final concentrate affected the copper and silver grades.
The metallurgical results obtained are on Composite No. 5 are summarized in Table 13.10 below.
Table 13.10
Locked Cycle Flotation Testing On Composite No. 5 For Metallurgical Mass Balance Summary of Results
Grade (%) Recovery (%) Cycle
Cu Ag (g/t) Fe Insol. Cu Ag Fe Insol.
1 23.15 32 7.90 43.22 82.47 82.92 6.13 2.66 2 18.13 27 7.70 48.84 80.53 87.99 7.22 3.61 3 18.94 26 7.90 48.94 80.50 87.46 6.93 3.48 4 17.53 23 7.20 51.08 83.60 73.33 7.88 4.53 5 16.88 23 7.60 50.92 85.95 75.71 8.23 4.72 6 16.35 22 7.70 51.92 86.92 75.61 7.75 4.64
Average 16.92 23 7.50 51.31 85.49 74.88 7.95 4.63 The following comments relate to the results obtained on the locked cycle
flotation test conducted on Composite No. 5 for metallurgical mass balance. ▪ Copper and silver concentrate average grade of 17 percent and 23 g/t
respectively was obtained on Composite No. 5 after six cycles of locked cycle flotation.
▪ Copper and silver recoveries of approximately 90 percent and 65 percent
respectively were produced on Composite No. 5.
▪ High insoluble content in the final concentrate affected the copper and silver grades. Further metallurgical study should be conducted to investigate insoluble depression on the final copper concentrate.
Cycle Flotation on Composite Samples Locked cycle flotation is a mean of determining the ultimate concentrate and tailing values when recycling product is considered as in normal plant practice. In this the locked cycle flotation testing included rougher flotation, regrinding of the rougher

Orvana Resources - Copperwood Project Feasibility Study Page 66
K D Engineering Document No. Q431-01-028 21 March 2012 KDE FORM No. A263a-7/12/99
flotation concentrate, three cleaner stages and one cleaner-scavenger stage. Locked cycle flotation testing on Composite No. 4 and Composite No. 5 were conducted using the simplified flow in Figure 13.1 below.
Mill Feed = 1200 gWater = 800 ml
Bulk Roughert= 30 minutes
Condition5 min
C-3430A-249NaSH
Primary Grind
Solid=60%
DF-250/MIBCSS/CMC
C-3430A-249DF-250/MIBC
Bulk 3rd Cleaner Concentrate
Bulk 1st Cleanert= 6 minutes
Bulk 1st CleanerScavenger Tails
Classification500 Mesh
RegrindSolid=50%
Condition5 min
C-3430A-249NaSH
NaSHSS/CMC
+ 500 mesh
‐ 500 mesh
Bulk 2nd Cleaner
t= 5 minBulk 2nd Cleaner
Tails
Bulk Roughert= 5 minutes
A-249NDMDF-250/MIBC
Bulk Rougher Tails
Bulk 3rd Cleaner
t= 3 min
Bulk 3rd Cleaner Tails
Bulk 1st Cleaner Scavenger
t= 10 minutes
C-3430A-249
Figure 13.1 - Locked Cycle Flow Sheet
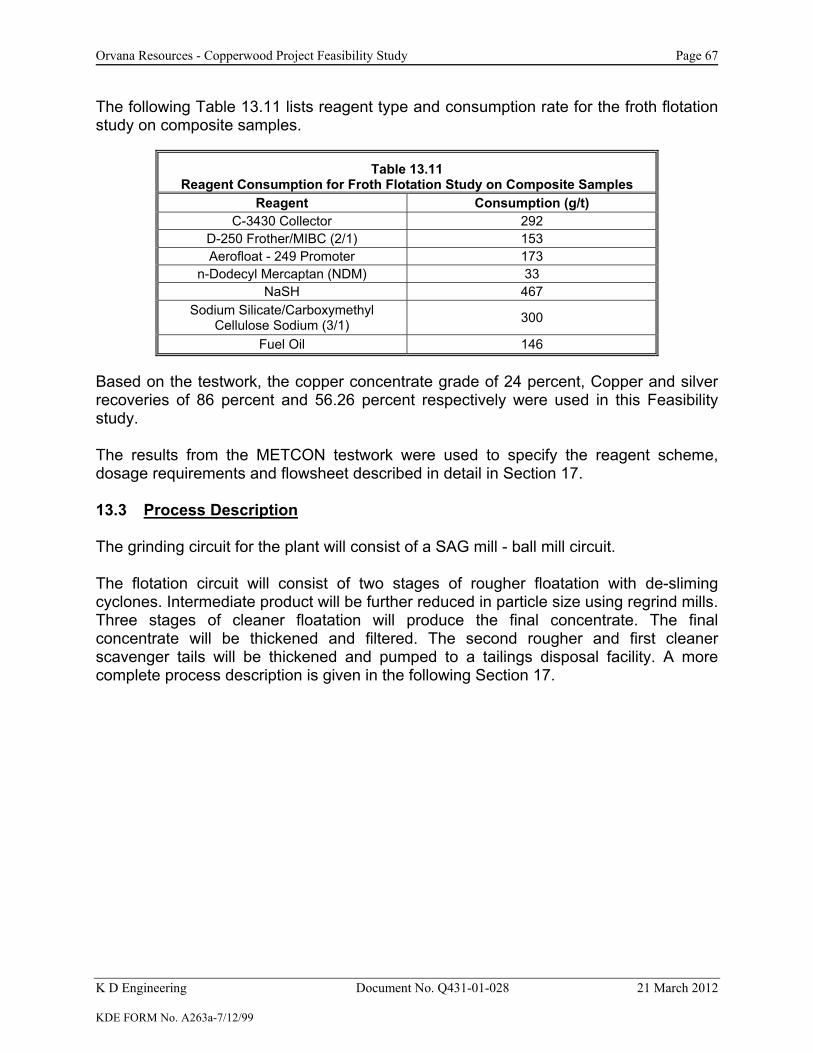
Orvana Resources - Copperwood Project Feasibility Study Page 67
K D Engineering Document No. Q431-01-028 21 March 2012 KDE FORM No. A263a-7/12/99
The following Table 13.11 lists reagent type and consumption rate for the froth flotation study on composite samples.
Table 13.11 Reagent Consumption for Froth Flotation Study on Composite Samples
Reagent Consumption (g/t) C-3430 Collector 292
D-250 Frother/MIBC (2/1) 153 Aerofloat - 249 Promoter 173
n-Dodecyl Mercaptan (NDM) 33 NaSH 467
Sodium Silicate/Carboxymethyl Cellulose Sodium (3/1) 300
Fuel Oil 146 Based on the testwork, the copper concentrate grade of 24 percent, Copper and silver recoveries of 86 percent and 56.26 percent respectively were used in this Feasibility study. The results from the METCON testwork were used to specify the reagent scheme, dosage requirements and flowsheet described in detail in Section 17. 13.3 Process Description The grinding circuit for the plant will consist of a SAG mill - ball mill circuit. The flotation circuit will consist of two stages of rougher floatation with de-sliming cyclones. Intermediate product will be further reduced in particle size using regrind mills. Three stages of cleaner floatation will produce the final concentrate. The final concentrate will be thickened and filtered. The second rougher and first cleaner scavenger tails will be thickened and pumped to a tailings disposal facility. A more complete process description is given in the following Section 17.

Orvana Resources - Copperwood Project Feasibility Study Page 68
K D Engineering Document No. Q431-01-028 21 March 2012 KDE FORM No. A263a-7/12/99
14.0 MINERAL RESOURCE ESTIMATES
The most recent Copperwood Project resource estimates were prepared by Marston & Marston, Inc. (Marston) under the supervision of Michael B. Ward, CPG, Senior Geological Consultant. The report was titled, Resource Estimate and NI 43-101 Technical Report for Copperwood Project, Ironwood, Michigan, dated 7 March 2011. The mineral resource estimates were completed using Mincom© Stratmodel™ and Block Model software. Marston adhered to the Canadian Institute of Mining Metallurgy and Petroleum (CIM) definitions of Resources. Mineral resources were confined by the software to the appropriate stratigraphic units. Two previous resource estimates were performed by AMEC for these properties. In April 2010 Orvana Resources US Corp. (Orvana) published a resource estimate for the Copperwood Project written by AMEC. In January 2011 Orvana published a resource estimate for the Satellite property areas including S6. The resource estimation for this project includes additional data from drilling completed in 2010 and 2011. Marston believes that the Mineral Resources for the Project adhere to the requirements of CIM (2005) and that Measured and Indicated mineral resources are compliant with the guidelines for disclosure under NI 43-101. 14.1 Database Orvana provided Marston with drill data information in the form of Microsoft Excel spreadsheets for the Copperwood Project and S6. The assay information, downhole surveys and collar information were imported to a Microsoft Access database. Data checking routines were employed to check for duplicate assay information, collar locations that contained missing lithology, assay and downhole surveys, lithology containing missing intervals, and errant values. Typographical, transposition or other potential data entry errors were corrected where encountered. Drill sample information was available from 149 drill holes for the Copperwood Project and 156 drill holes (142 legacy + 14 in 2010) for the S6 resource estimate and nearby satellites. Drill holes from adjacent sections to S6 were used to enhance this model on boundary areas. A total of 2,411 samples from 197 drill holes were used in this estimation. The four twinned holes excluded from the database by AMEC (April 2010) were also excluded from this data set and were replaced by the more recently drilled holes. Holes PC 13 and PC 15 in S6 were also excluded from the data and replaced with twin holes CW-10- 133 and CW-10-136, respectively. Holes that contained repeated instances of the Domino, for example drill hole CW-09-82, were not used in the modeling process. Holes that fell outside of the model extents and any additional legacy holes that were twinned were not used. Drill holes completed in the 2010 drilling program that were not used for modeling include all holes where the copper-bearing sequence was not differentiated. These holes also do not have assay
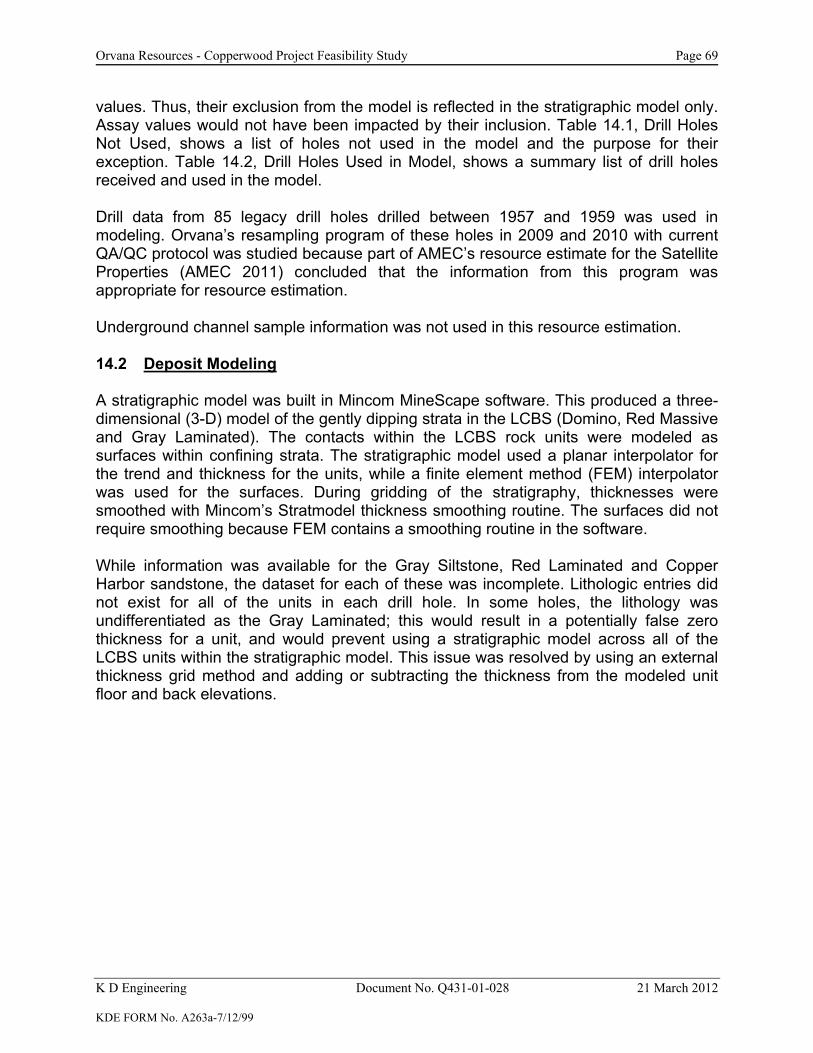
Orvana Resources - Copperwood Project Feasibility Study Page 69
K D Engineering Document No. Q431-01-028 21 March 2012 KDE FORM No. A263a-7/12/99
values. Thus, their exclusion from the model is reflected in the stratigraphic model only. Assay values would not have been impacted by their inclusion. Table 14.1, Drill Holes Not Used, shows a list of holes not used in the model and the purpose for their exception. Table 14.2, Drill Holes Used in Model, shows a summary list of drill holes received and used in the model. Drill data from 85 legacy drill holes drilled between 1957 and 1959 was used in modeling. Orvana’s resampling program of these holes in 2009 and 2010 with current QA/QC protocol was studied because part of AMEC’s resource estimate for the Satellite Properties (AMEC 2011) concluded that the information from this program was appropriate for resource estimation. Underground channel sample information was not used in this resource estimation. 14.2 Deposit Modeling A stratigraphic model was built in Mincom MineScape software. This produced a three-dimensional (3-D) model of the gently dipping strata in the LCBS (Domino, Red Massive and Gray Laminated). The contacts within the LCBS rock units were modeled as surfaces within confining strata. The stratigraphic model used a planar interpolator for the trend and thickness for the units, while a finite element method (FEM) interpolator was used for the surfaces. During gridding of the stratigraphy, thicknesses were smoothed with Mincom’s Stratmodel thickness smoothing routine. The surfaces did not require smoothing because FEM contains a smoothing routine in the software. While information was available for the Gray Siltstone, Red Laminated and Copper Harbor sandstone, the dataset for each of these was incomplete. Lithologic entries did not exist for all of the units in each drill hole. In some holes, the lithology was undifferentiated as the Gray Laminated; this would result in a potentially false zero thickness for a unit, and would prevent using a stratigraphic model across all of the LCBS units within the stratigraphic model. This issue was resolved by using an external thickness grid method and adding or subtracting the thickness from the modeled unit floor and back elevations.

Orvana Resources - Copperwood Project Feasibility Study Page 70
K D Engineering Document No. Q431-01-028 21 March 2012 KDE FORM No. A263a-7/12/99
Table 14.1 Drill Holes Not Used
Drill Hole ID # Comments
CW-10-103 CBS not differentiated
CW-10-104 CBS not differentiated
CW-10-106 CBS not differentiated
CW-10-107 CBS not differentiated
CW-10-108 CBS not differentiated
CW-10-109 CBS not differentiated
CW-10-115 CBS not differentiated
CW-09-82 Multiple Zones of Domino - Faulted?
M56-W19 CBS not differentiated
M56-W28 Twinned Hole in AMEC report
M57-W62 Twinned Hole in AMEC report
M57-W69 Twinned Hole in AMEC report
M57-W72 Twinned Hole in AMEC report
M56-W12 Incomplete Lith Records-possibly redrilled?
PC-15 Twinned Hole with CW-10-131
PC-13 Twinned Hole with CW-10-137
M56-W15 No lith or survey data
M57-W122 No lith or survey data
M57-W129 No lith or survey data
M57-W100 Outside of model area - no topography
M57-W41 Outside of model area - no topography
M57-W56 Outside of model area - no topography
M57-W106 Outside of model area - no topography
M57-W43 Outside of model area - no topography
M57-W74 Outside of model area - no topography
M57-W42 Outside of model area - no topography
M57-W120 Outside of model area - no topography
M56-W20 Outside of model area - no topography
M56-W17 Outside of model area - no topography
M57-W121 Outside of model area - no topography
M56-W16 Outside of model area - no topography

Orvana Resources - Copperwood Project Feasibility Study Page 71
K D Engineering Document No. Q431-01-028 21 March 2012 KDE FORM No. A263a-7/12/99
Table 14.1 Drill Holes Not Used (cont’d)
Drill Hole ID # Comments
M56-W8 Outside of model area - no topography
M57-W158 Outside of model area - no topography
M56-W5 Outside of model area - no topography
M57-W152 Outside of model area - no topography
M57-W124 Outside of model area - no topography
M57-W139 Outside of model area - no topography
M57-W157 Outside of model area - no topography
M57-W127 Outside of model area - no topography
M57-W118 Outside of model area - no topography
M57-W44 Outside of model area - no topography
M57-W67 Outside of model area - no topography
M57-W134 Outside of model area - no topography
M57-W50 Outside of model area - no topography
M56-W14
M57-W131
PC-16No confidence in hole location - collar matches but Domino appears abnormally high in elevation
M56-W2 Outside of Model Area
M56-W2A Outside of Model Area
M57-W84 Outside of Model Area
M57-W88 Outside of Model Area
M57-W68 Outside of Model Area
M57-W78 Outside of Model Area
M56-W1 Outside of Model Area
M57-W71 Outside of Model Area
M57-W107 Outside of Model Area
M57-W34 Outside of Model Area
M57-W87 Outside of Model Area
M57-W30 Outside of Model Area
M57-W105 Outside of Model Area
M57-W111 Outside of Model Area
M57-W94 Outside of Model Area

Orvana Resources - Copperwood Project Feasibility Study Page 72
K D Engineering Document No. Q431-01-028 21 March 2012 KDE FORM No. A263a-7/12/99
Table 14.1 Drill Holes Not Used (cont’d)
Drill Hole ID # Comments
M57-W153 Outside of Model Area
M57-W102 Outside of Model Area
M57-W155 Outside of Model Area
M57-W92 Outside of Model Area
M57-W138 Outside of Model Area
M57-W144 Outside of Model Area
M57-W145 Outside of Model Area
M57-W125 Outside of Model Area
M57-W81 Outside of Model Area
M57-W133 Outside of Model Area
M57-W79 Outside of Model Area
M57-W123 Outside of Model Area
M57-W128 Outside of Model Area
M57-W151 Outside of Model Area
M57-W99 Outside of Model Area
M57-W154 Outside of Model Area
M57-W93 Outside of Model Area
M57-W146 Outside of Model Area
M57-W90 Outside of Model Area
M57-W142 Outside of Model Area
M57-W140 Outside of Model Area
M57-W156 Outside of Model Area
M57-W91 Outside of Model Area
M57-W86 Outside of Model Area
M57-W135 Outside of Model Area
M57-W141 Outside of Model Area
M57-W143 Outside of Model Area
M57-W132 Outside of Model Area
M57-W137 Outside of Model Area
M57-W136 Outside of Model Area
M57-W85 Outside of Model Area

Orvana Resources - Copperwood Project Feasibility Study Page 73
K D Engineering Document No. Q431-01-028 21 March 2012 KDE FORM No. A263a-7/12/99
Table 14.2 Drill Holes Used in Model
BC-10-113 CW-09-38 CW-09-68 CW-09-98 M56-W09 M57-W35 M57-W77BC-10-117 CW-09-39 CW-09-69 CW-09-99 M56-W11 M57-W36 M57-W80BC-10-118 CW-09-41 CW-09-70 CW-10-105 M56-W12A M57-W37 M57-W82CW-08-09 CW-09-42 CW-09-71 CW-10-110 M56-W13 M57-W38 M57-W83CW-08-11 CW-09-43 CW-09-72 CW-10-111 M56-W18 M57-W39 M57-W89CW-08-13 CW-09-44 CW-09-73 CW-10-112 M56-W21 M57-W40 M57-W95CW-08-16 CW-09-45 CW-09-74 CW-10-114 M56-W22 M57-W45 M57-W98CW-08-17 CW-09-46 CW-09-75 CW-10-116 M56-W23 M57-W46 PC-1CW-08-20 CW-09-47 CW-09-76 CW-10-119 M56-W24 M57-W47 PC-10
CW-09-100 CW-09-48 CW-09-77 CW-10-121 M56-W25 M57-W48 PC-11CW-09-101 CW-09-49 CW-09-78 CW-10-122 M56-W26 M57-W49 PC-12CW-09-102 CW-09-50 CW-09-79 CW-10-123 M56-W3 M57-W51 PC-14CW-09-21 CW-09-51 CW-09-80 CW-10-125 M56-W4A M57-W52 PC-17CW-09-22 CW-09-52 CW-09-81 CW-10-126 M57-W101 M57-W53 PC-18CW-09-23 CW-09-53 CW-09-83 CW-10-127 M57-W103 M57-W54 PC-19CW-09-24 CW-09-54 CW-09-84 CW-10-128 M57-W108 M57-W55 PC-2CW-09-25 CW-09-55 CW-09-85 CW-10-129 M57-W109 M57-W57 PC-20CW-09-26 CW-09-56 CW-09-86 CW-10-130 M57-W110 M57-W58 PC-21CW-09-27 CW-09-57 CW-09-87 CW-10-131 M57-W114 M57-W59 PC-22CW-09-28 CW-09-58 CW-09-88 CW-10-132 M57-W116 M57-W60 PC-23CW-09-29 CW-09-59 CW-09-89 CW-10-133 M57-W117 M57-W61 PC-3CW-09-30 CW-09-60 CW-09-90 CW-10-136 M57-W126 M57-W63 PC-4CW-09-31 CW-09-61 CW-09-91 CW-10-137 M57-W148 M57-W64 PC-5CW-09-32 CW-09-62 CW-09-92 CW-10-138 M57-W159 M57-W65 PC-6CW-09-33 CW-09-63 CW-09-93 CW-10-139 M57-W27 M57-W66 PC-7CW-09-34 CW-09-64 CW-09-94 CW-11-140 M57-W29 M57-W70 PC-8
CW-09-35A CW-09-65 CW-09-95 CW-11-141 M57-W31 M57-W73 PC-9CW-09-36 CW-09-66 CW-09-96 CW-11-142 M57-W32 M57-W75CW-09-37 CW-09-67 CW-09-97 CW-11-143 M57-W33 M57-W76
Drill Holes Used In Model
Thus the thicknesses, where reported, of the Gray Siltstone, Red Laminated and Copper Harbor Sandstone were interpolated using a FEM interpolator. These thicknesses were added, or subtracted, from the Gray Laminated back, or Domino/Copper Harbor Siltstone floor. Using this method, Marston was able to create a contiguous and continuous surface for each of the units from the Gray Siltstone through the Copper Harbor Sandstone. Figure 14.1, Typical Stratigraphic Model Cross Section S-N, and Figure 14.2, Typical Stratigraphic Model Cross Section W-E, show a typical stratigraphic cross section of the modeled units along a generally north-south and east-west direction, respectively.

Orvana Resources - Copperwood Project Feasibility Study Page 74
K D Engineering Document No. Q431-01-028 21 March 2012 KDE FORM No. A263a-7/12/99
Figure 14.1 - Typical Stratigraphicf Model Cross Section S - N

Orvana Resources - Copperwood Project Feasibility Study Page 75
K D Engineering Document No. Q431-01-028 21 March 2012 KDE FORM No. A263a-7/12/99
Figure 14.2 - Typical Stratigraphic Model Cross Section W - E
While the Red Laminated would add some tonnage to the resource estimate, the ultimate goal of this exercise was to eventually interpolate grade across all units that may be intercepted within the extraction of the Copperwood resource. This will aid in future mine design and provide a better estimation of potential dilution. The primary copper hosts in the LCBS are the Domino (DOM), the Red Massive (RM) sandstone and the Gray Laminated (GLAM) while the overlying Red Laminated (RLAM) siltstone and underlying Copper Harbor formation which consists of the Copper Harbor sandstone and conglomerate (CHST) and Copper Harbor Siltstone (CHSS) may contain ore grade mineralization. 14.3 Deposit Data Analysis Descriptive Statistics The assay statistics shown in Table 14.3, Descriptive Statistics for Drill Hole Composites, display the relatively consistent nature of the mineralization. The mineralized stratigraphy in the Copperwood Project area continues into S6, but the primary copper host, the Domino, thins from over 1.5 m (5 ft) in the Copperwood Project
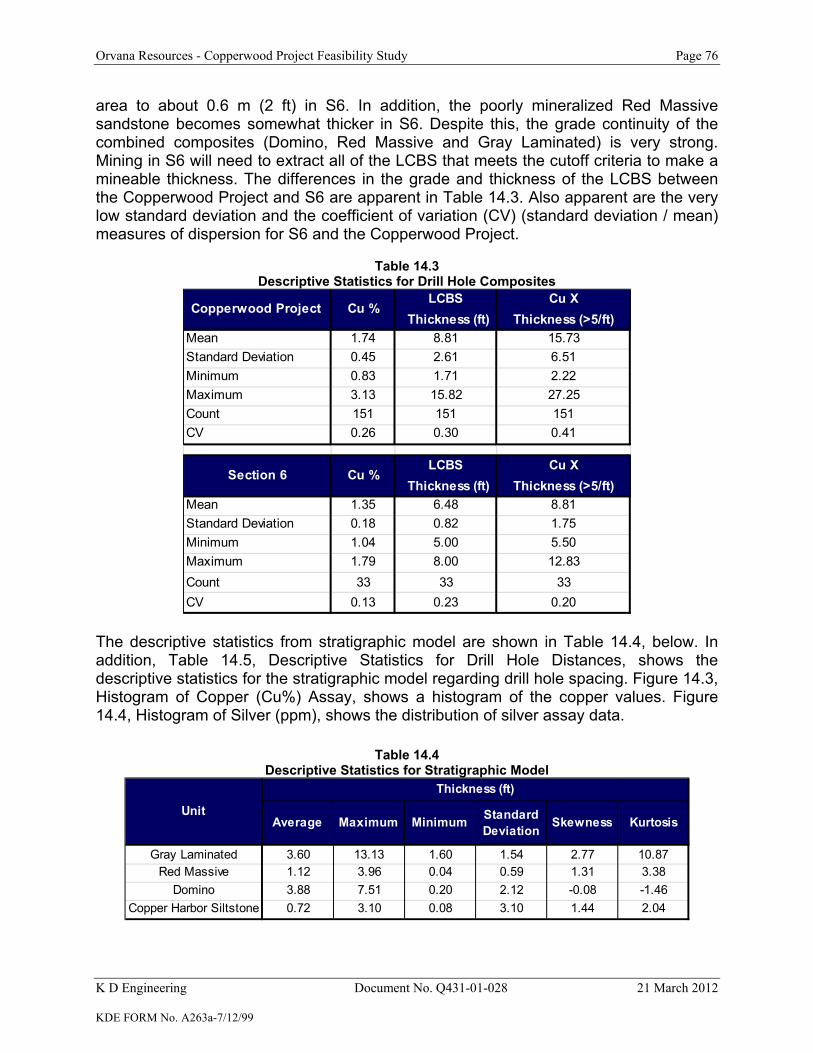
Orvana Resources - Copperwood Project Feasibility Study Page 76
K D Engineering Document No. Q431-01-028 21 March 2012 KDE FORM No. A263a-7/12/99
area to about 0.6 m (2 ft) in S6. In addition, the poorly mineralized Red Massive sandstone becomes somewhat thicker in S6. Despite this, the grade continuity of the combined composites (Domino, Red Massive and Gray Laminated) is very strong. Mining in S6 will need to extract all of the LCBS that meets the cutoff criteria to make a mineable thickness. The differences in the grade and thickness of the LCBS between the Copperwood Project and S6 are apparent in Table 14.3. Also apparent are the very low standard deviation and the coefficient of variation (CV) (standard deviation / mean) measures of dispersion for S6 and the Copperwood Project.
Table 14.3 Descriptive Statistics for Drill Hole Composites
LCBS Cu X Thickness (ft) Thickness (>5/ft)
Mean 1.74 8.81 15.73Standard Deviation 0.45 2.61 6.51Minimum 0.83 1.71 2.22Maximum 3.13 15.82 27.25Count 151 151 151CV 0.26 0.30 0.41
LCBS Cu X Thickness (ft) Thickness (>5/ft)
Mean 1.35 6.48 8.81Standard Deviation 0.18 0.82 1.75Minimum 1.04 5.00 5.50Maximum 1.79 8.00 12.83Count 33 33 33CV 0.13 0.23 0.20
Copperwood Project Cu %
Section 6 Cu %
The descriptive statistics from stratigraphic model are shown in Table 14.4, below. In addition, Table 14.5, Descriptive Statistics for Drill Hole Distances, shows the descriptive statistics for the stratigraphic model regarding drill hole spacing. Figure 14.3, Histogram of Copper (Cu%) Assay, shows a histogram of the copper values. Figure 14.4, Histogram of Silver (ppm), shows the distribution of silver assay data.
Table 14.4 Descriptive Statistics for Stratigraphic Model
Average Maximum Minimum Standard Deviation Skewness Kurtosis
Gray Laminated 3.60 13.13 1.60 1.54 2.77 10.87Red Massive 1.12 3.96 0.04 0.59 1.31 3.38
Domino 3.88 7.51 0.20 2.12 -0.08 -1.46Copper Harbor Siltstone 0.72 3.10 0.08 3.10 1.44 2.04
Thickness (ft)
Unit

Orvana Resources - Copperwood Project Feasibility Study Page 77
K D Engineering Document No. Q431-01-028 21 March 2012 KDE FORM No. A263a-7/12/99
Table 14.5 Descriptive Statistics for Drill Hole Distances
Description Number UnitsNumber of Distances 199 holesMinimum Distance 146 FeetMaximum Distance 1977 FeetAverage Distance 552 FeetStandard Deviation 316 Feet
Figure 14.5, Validation of Domino Structure, shows a graph of the validation of the Domino floor from the model and in the drill holes while Figure 14.6, Validation of Domino Thickness, shows the variance between the drill hole data and the Marston model. Figure 14.7, Validation of Red Massive Thickness, shows the validations conducted on the Red Massive Thickness, and Figure 14.8, Validation of Gray Laminated Thickness, shows the validations conducted on the Gray Laminated Thickness. Validations were not necessary for the structure of each unit because all units from the stratigraphic model were modeled as contiguous; thus, each floor is adjacent to the lower neighboring unit’s back. Thus, if one unit’s floor and the corresponding thicknesses are reasonably close, validation of each surface should not be required. A suite of maps showing the structure of each seam is shown in the figures below.
▪ Figure 14.9, Structure and Thickness of Gray Siltstone ▪ Figure 14.10, Structure and Thickness of Red Laminated ▪ Figure 14.11, Structure and Thickness of Gray Laminated ▪ Figure 14.12, Structure and Thickness of Red Massive ▪ Figure 14.13, Structure and Thickness of Domino ▪ Figure 14.14, Structure and Thickness of Copper Harbor Siltstone
The slope of the Domino floor is shown in Figure 14.15, Slope of Domino Structure. Extreme Values Marston’s inspection of the copper values agrees with the conclusions of AMEC in 2010 and 2011 TR filings for the Copperwood Project and for S6; i.e., the composite data do not show high outliers that would justify the use of a cap grade applied to copper composites. The CV for the population is low. Grade capping was not applied to copper values.

Orvana Resources - Copperwood Project Feasibility Study Page 78
K D Engineering Document No. Q431-01-028 21 March 2012 KDE FORM No. A263a-7/12/99
Figure 14.3 - Histogram of Copper (Cu%) Assay
Figure 14.4 - Histogram of Silver (ppm)
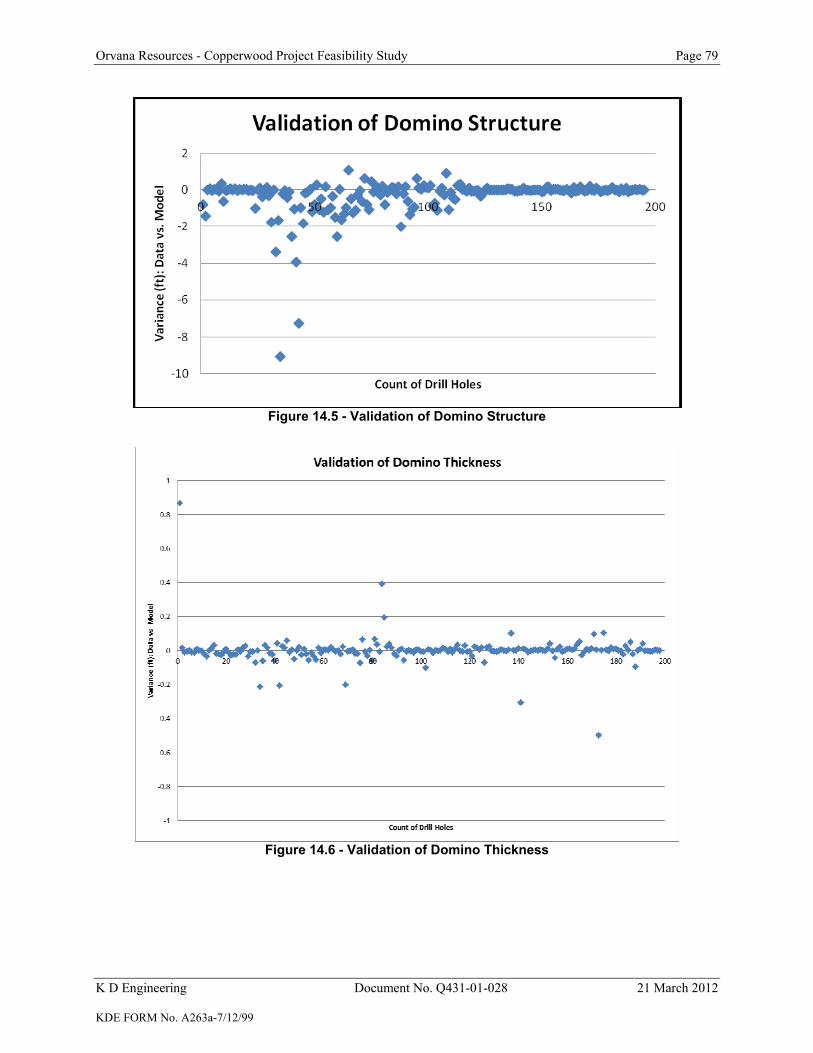
Orvana Resources - Copperwood Project Feasibility Study Page 79
K D Engineering Document No. Q431-01-028 21 March 2012 KDE FORM No. A263a-7/12/99
Figure 14.5 - Validation of Domino Structure
Figure 14.6 - Validation of Domino Thickness

Orvana Resources - Copperwood Project Feasibility Study Page 80
K D Engineering Document No. Q431-01-028 21 March 2012 KDE FORM No. A263a-7/12/99
Figure 14.7 - Validation of Red Massive Thickness
Figure 14.8 - Validation of Gray Laminated Thickness

Orvana Resources - Copperwood Project Feasibility Study Page 81
K D Engineering Document No. Q431-01-028 21 March 2012 KDE FORM No. A263a-7/12/99
Figure 14.9 - Structure and Thickness Gray Siltstone

Orvana Resources - Copperwood Project Feasibility Study Page 82
K D Engineering Document No. Q431-01-028 21 March 2012 KDE FORM No. A263a-7/12/99
Figure 14.10 - Structure and Thickness Red Laminated
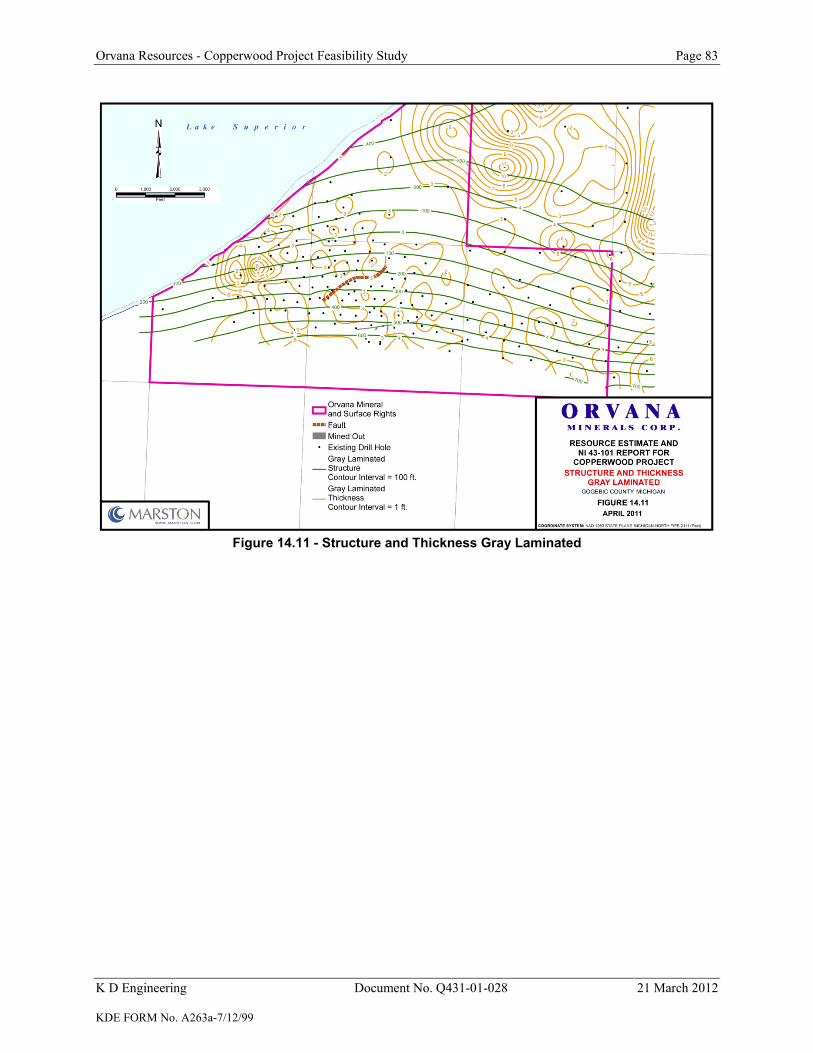
Orvana Resources - Copperwood Project Feasibility Study Page 83
K D Engineering Document No. Q431-01-028 21 March 2012 KDE FORM No. A263a-7/12/99
Figure 14.11 - Structure and Thickness Gray Laminated

Orvana Resources - Copperwood Project Feasibility Study Page 84
K D Engineering Document No. Q431-01-028 21 March 2012 KDE FORM No. A263a-7/12/99
Figure 14.12 - Structure and Thickness Red Massive

Orvana Resources - Copperwood Project Feasibility Study Page 85
K D Engineering Document No. Q431-01-028 21 March 2012 KDE FORM No. A263a-7/12/99
Figure 14.13 - Structure and Thickness Domino

Orvana Resources - Copperwood Project Feasibility Study Page 86
K D Engineering Document No. Q431-01-028 21 March 2012 KDE FORM No. A263a-7/12/99
Figure 14.14 - Structure and Thickness Copper Harbor Siltsone

Orvana Resources - Copperwood Project Feasibility Study Page 87
K D Engineering Document No. Q431-01-028 21 March 2012 KDE FORM No. A263a-7/12/99
Figure 14.15 - Slope of Domino Structure (%)
Silver values did exhibit some extreme values that needed evaluation. Seven sample assays exist in the database above three standard deviations over the mean, with a high value of 108 ppm. If not capped, these samples would have a disproportionate impact on the composite values. These samples represented less than 0.3 percent of the data but produced blocks during an early evaluation that comprise about 1 percent of the model at grades above the mean plus three standard deviations. A simplified approach to capping was taken; outlier values were reduced to the mean plus three standard deviations. A cap grade for silver of 25 ppm was used in this resource estimate. Table 14.6, below, shows the block model statistics regarding interpolated assay data within the model before and after the capping of the silver grade.

Orvana Resources - Copperwood Project Feasibility Study Page 88
K D Engineering Document No. Q431-01-028 21 March 2012 KDE FORM No. A263a-7/12/99
Table 14.6 Block Model Statistics
Model Type
Attribute Copper Silver Copper SilverAVERAGE 1.67 3.42 1.71 3.47Minimum 0.80 0.00 0.00 0.00Maximum 6.51 25.00 8.72 25.00Standard Deviation 0.70 3.79 0.88 4.86Count 116,156 116,033 116,156 116,033Coefficient of Variance 0.42 1.11 0.52 1.40
Inverse Distance Nearest Neighbor
14.4 Compositing Potentially economic mineralization was defined where the copper grade in a block was above 0.8 percent copper. Each block was determined individually. To determine whether the full height of blocks in a 30 m by 30 m (100 ft by 100 ft) area met grade and thickness criteria, the copper grade between the back and floor of the zones of the mineralization was composited. These composites were then gridded and contoured and used to assist in delineating the boundary of potential extraction. While the floor of the mineralization tended to be along the contact between the Domino and Copper Harbor Siltstone, there were exceptions where the grade of the Domino, in close proximity to the floor, was not above cutoff, and the block grade was below 0.8 percent. In this case, the floor of the mineralization was placed within the Domino unit rather than at the contact. Figure 14.13 shows typical cross sections of the block model along the dip of the main Copperwood resource, while Figure 14.16, Typical Block Model Cross Section W-E, shows the grade along the dip of the Section 6 portion of the resource. Figure 14.17, Typical Block Model Cross Section S-N, shows the cross section along the strike of both the main Copperwood Project and Section 6 blocks. The cross sections display the block grades interpolated by the block model. For the back, the typical extent of the economic mineralized zone was the contact between the Red and Gray Laminated siltstones. Similar to the determination of the mineralized zone floor, exceptions existed for the back as well. Some parts of the Red Laminated contained sufficient copper grade to make cutoff while in other areas, portions of the Gray Laminated did not meet the 0.8 percent copper cutoff grade. In these locations, the back of the mineralized zone occurs within the Gray Laminated unit. Figure 14.18, Potential Economic Mineralized Zone Thickness, shows a plan view of the block model thickness where copper assay is above the assigned cutoff grade of 0.8 percent copper. The composite copper assays are shown in Figure 14.19, Composite Copper Assay (% Cu). Silver did not influence the determination of the mineralized zone. Composite silver assay contours are shown in Figure 14.20, Composite Silver Assay (ppm Ag).
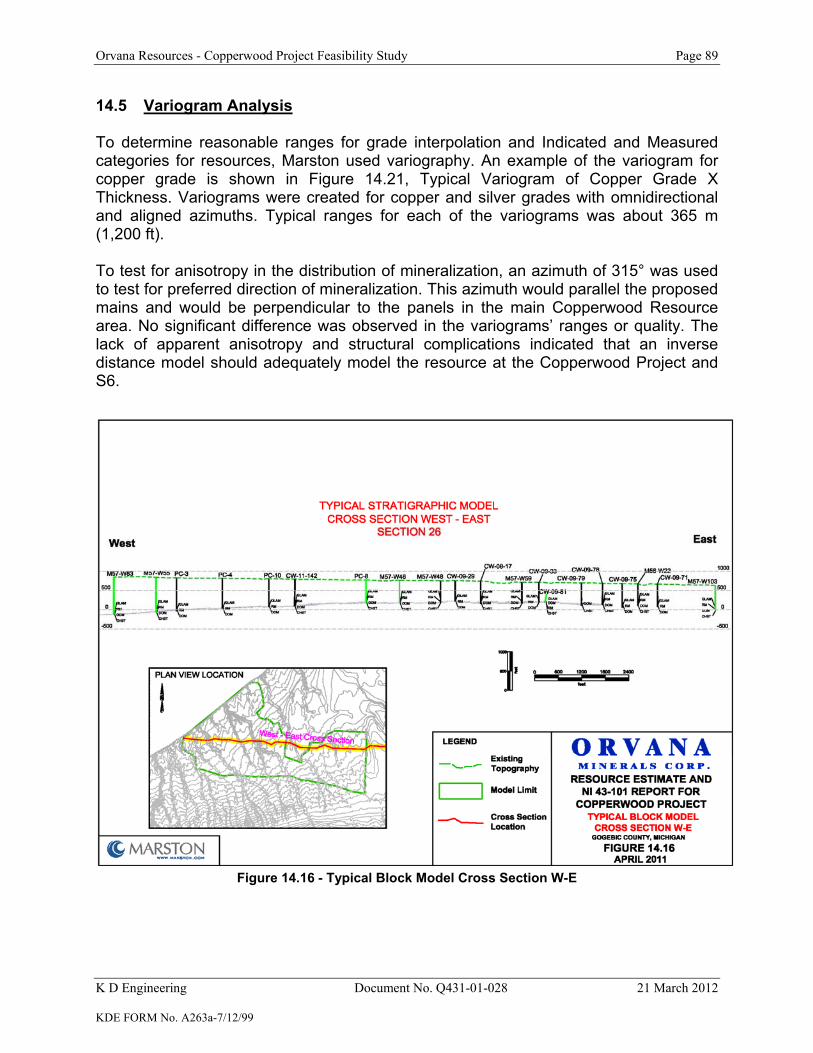
Orvana Resources - Copperwood Project Feasibility Study Page 89
K D Engineering Document No. Q431-01-028 21 March 2012 KDE FORM No. A263a-7/12/99
14.5 Variogram Analysis To determine reasonable ranges for grade interpolation and Indicated and Measured categories for resources, Marston used variography. An example of the variogram for copper grade is shown in Figure 14.21, Typical Variogram of Copper Grade X Thickness. Variograms were created for copper and silver grades with omnidirectional and aligned azimuths. Typical ranges for each of the variograms was about 365 m (1,200 ft). To test for anisotropy in the distribution of mineralization, an azimuth of 315° was used to test for preferred direction of mineralization. This azimuth would parallel the proposed mains and would be perpendicular to the panels in the main Copperwood Resource area. No significant difference was observed in the variograms’ ranges or quality. The lack of apparent anisotropy and structural complications indicated that an inverse distance model should adequately model the resource at the Copperwood Project and S6.
Figure 14.16 - Typical Block Model Cross Section W-E

Orvana Resources - Copperwood Project Feasibility Study Page 90
K D Engineering Document No. Q431-01-028 21 March 2012 KDE FORM No. A263a-7/12/99
Figure 14.17 - Typical Block Model Cross Section S-N
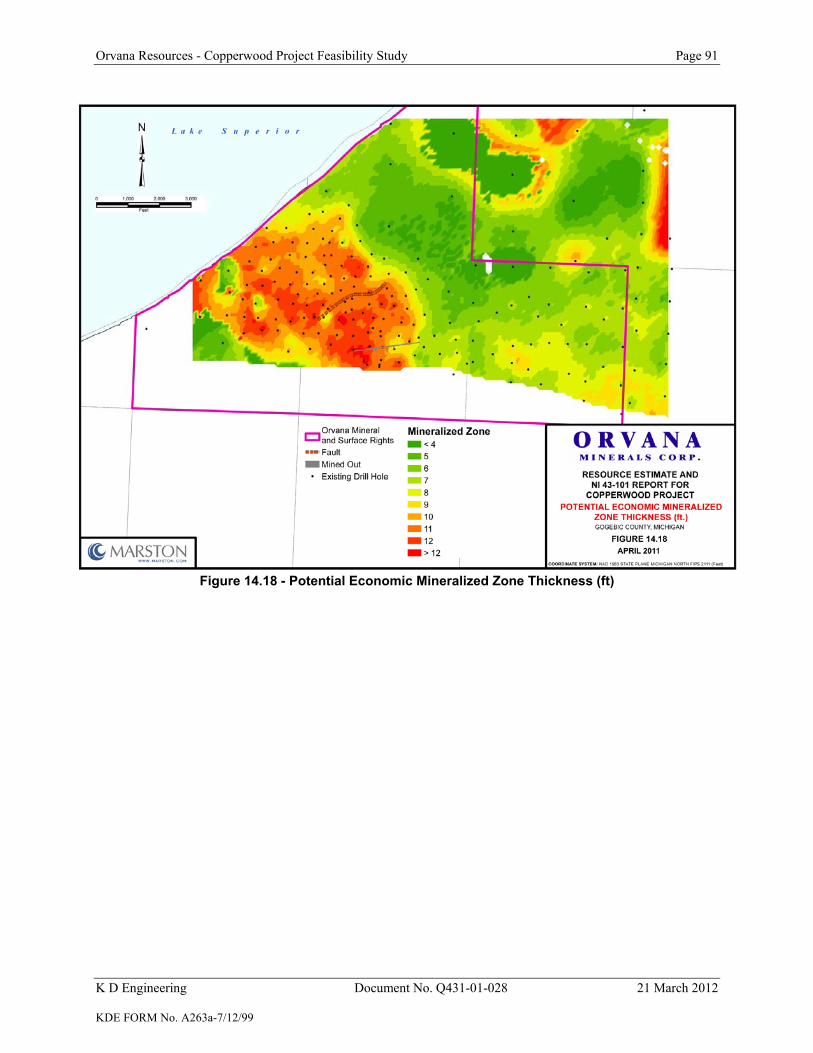
Orvana Resources - Copperwood Project Feasibility Study Page 91
K D Engineering Document No. Q431-01-028 21 March 2012 KDE FORM No. A263a-7/12/99
Figure 14.18 - Potential Economic Mineralized Zone Thickness (ft)

Orvana Resources - Copperwood Project Feasibility Study Page 92
K D Engineering Document No. Q431-01-028 21 March 2012 KDE FORM No. A263a-7/12/99
Figure 14.19 - Composite Copper Assay (%Cu)

Orvana Resources - Copperwood Project Feasibility Study Page 93
K D Engineering Document No. Q431-01-028 21 March 2012 KDE FORM No. A263a-7/12/99
Figure 14.20 - Composite Silver Assay (ppm Ag)

Orvana Resources - Copperwood Project Feasibility Study Page 94
K D Engineering Document No. Q431-01-028 21 March 2012 KDE FORM No. A263a-7/12/99
Figure 14.21 - Typical Variogram of Copper Grade x Thickness
Orvana Resources - Copperwood Project Feasibility Study Page 95
K D Engineering Document No. Q431-01-028 21 March 2012 KDE FORM No. A263a-7/12/99
14.6 Block Model and Grade Estimation Procedures To estimate the grade across rock type, a block model was created. Blocks within the block model consisted of non-subcelled, orthogonal 30 m x 30 m (100 ft x 100 ft) x 0.15 m (0.5 ft) (x, y, z) size blocks. These blocks were generated from the existing stratigraphic model. The sparse model does not contain blocks that were outside of the stratigraphic model (Gray Siltstone - Copper Harbor Sandstone). The drill hole grades were interpolated between data points using an inverse distance squared method. To allow better control of the horizontal (within-seam) distribution of the mineralization within the LCBS block model, the anisotropy of the x and y axes was 1,000 times that of the z axis. To interpolate grades across the block model, a tiered search radius of 245 m (800 ft), 366 m (1,200 ft) and 915 m (3,000 ft) was used. Octant searches were used with a minimum three octants, minimum of three samples per cell, one minimum sample per octant, and three maximum samples per octant. No data transformations were used in the interpolation of the assay data. 14.7 Specific Gravity Orvana collected 172 specific gravity (SG) measurements from within the Domino, Red Massive, Gray Laminated and Red Laminated units of the LCBS for the Copperwood Project area. The results were very consistent with a low CV. Thirty-seven additional SG measurements were collected within S6 in 2010 with similar results. SG's were consistently between 2.70 and 2.72. The block model was updated to set the SG of all blocks in the Red Laminated and Gray Laminated to 2.72 with all other blocks being 2.70. 14.8 Model Validation 14.8.1 Nearest Neighbor Model Comparison To validate the block model created with an inverse-distance squared interpolator, Marston created a second block model using a nearest neighbor (NN) interpolation method. The block datasets were exported from Mincom. The datasets were reduced to the blocks where the inverse method copper grade was greater than 0.8 percent. Statistical results of the average, maximum and minimum grades in addition to the number of blocks meeting the selection criteria are shown in Table 14.6 (under statistics). Resources were also checked between the NN and inverse distance methods. Due to differing interpolation methods, it was anticipated that the nearest neighbor method would yield a higher grade and lower tonnage. This is exhibited in Table 14.6. Thus, it is reasonable to assume that the inverse model can provide an accurate representation of the Copperwood and S6 resource.

Orvana Resources - Copperwood Project Feasibility Study Page 96
K D Engineering Document No. Q431-01-028 21 March 2012 KDE FORM No. A263a-7/12/99
14.8.2 Visual Validation The blocks were inspected using cross sections of the block model. From these cross sections, it appears that the block model has been able to adequately interpolate the grade between data points. Figure 14.16 and Figure 14.17 show examples of the block grades and drill hole locations and grades. Marston reviewed cross sections through, or within close proximity to, nearly all of the holes within the resource area. Modeled block grades appeared to reasonably reflect the neighboring drill hole composites. 14.9 Resources Classification The model blocks were categorized based on the distance from the block to the nearest data point (drill hole composite). One half of the range, 183 m (600 ft) based on variography, was used for blocks to be classified as Measured. Blocks were considered Indicated if they were within a distance of 366 m (1,200 ft), a distance equivalent to the variographic range. Inferred resources were allowed to extend approximately 3,000 ft from the nearest data point. The search ranges were reduced to half the accepted distance on the edges of the model where either no further data was available for interpolation or, the geology was unfavorable. The model was manually adjusted in peripheral areas. All Measured and Indicated resources were required to meet the composite grade cutoff of 0.8 percent copper and 1.5 m (5 ft) thickness. Inferred resources were not required to meet both of these values, provided the composite thickness multiplied by composite grade was greater than 1.2 m-percent (4 ft-percent); i.e., can be mined 5 ft with an average grade of 0.8 percent copper. This case would occur where a thin band of high grade material can maintain an average grade above cutoff when mining a mineable thickness of 1.5 m (5 ft). Boundaries for the Measured and Indicated used dipping polygons of influence. Some smoothing of these ellipsoids was performed by hand to create more realistic blocks for mine planning purposes. 14.10 Assessment of Prospects for Economic Development Marston was requested to examine the use of a 0.80 percent copper grade cutoff with a minimum thickness of 1.5 m (5 ft). Marston felt that this grade and thickness cutoff meet the requirement of the resource having a reasonable expectation of being profitable based on the scoping study published in July of 2010. The Marston-generated parameters presented in Table 14.7 were used (U.S. dollars) for preliminary economic evaluation of the resource, and show units in short tons. Subsequent economic evaluations for the minable portion of the resource indicates slightly higher anticipated operating costs.

Orvana Resources - Copperwood Project Feasibility Study Page 97
K D Engineering Document No. Q431-01-028 21 March 2012 KDE FORM No. A263a-7/12/99
Table 14.7 Prefeasibility Study Economic Parameters
Cutoff Grade ( % Cu) 0.80 Mill Recovery (% Cu) 83 Smelter Recovery (%) 96.5 Conc. Ratio (t conc/t ore) 0.02 Copper Price ($/lb) 2.50 Concentrate Grade (%Cu) 25 Mining Cost ($/t) 10.00 Milling Cost ($/t) 10.80 G&A Cost ($/t) 2.75 Freight/Smelting/refining ($/t) 5.63 Total Operating Cost ($/t) 29.18
14.11 Mineral Resource Statement Mr. Michael Ward was the QP for the mineral resource estimate for the update of the Copperwood Project and S6 resources. The mineral resource update has an effective date of 7 March 2011, although the last date information received for use in this estimate was 25 January 2011. A summary of the mineral resource estimate is provided in Table 14.8 titled Mineral Resource Estimate. Resources estimates were presented for three areas: the Copperwood Project Area (CW Main), Bridge and Section 6 (S6). The Bridge subdivision is an area contiguous with both the Copperwood Project Area and S6 as shown in Figure 14.22, Resource Classification Boundaries. Resource Areas The mineral resources are presented as in-situ tons and grades, without external dilution. The resource represented here has a minimum thickness within the LCBS of 5 ft, with composite grades greater than 0.80 percent copper. The combined thickness comes from any combination of the Domino and the upper layer of the LCBS that meets the grade criteria when combined.
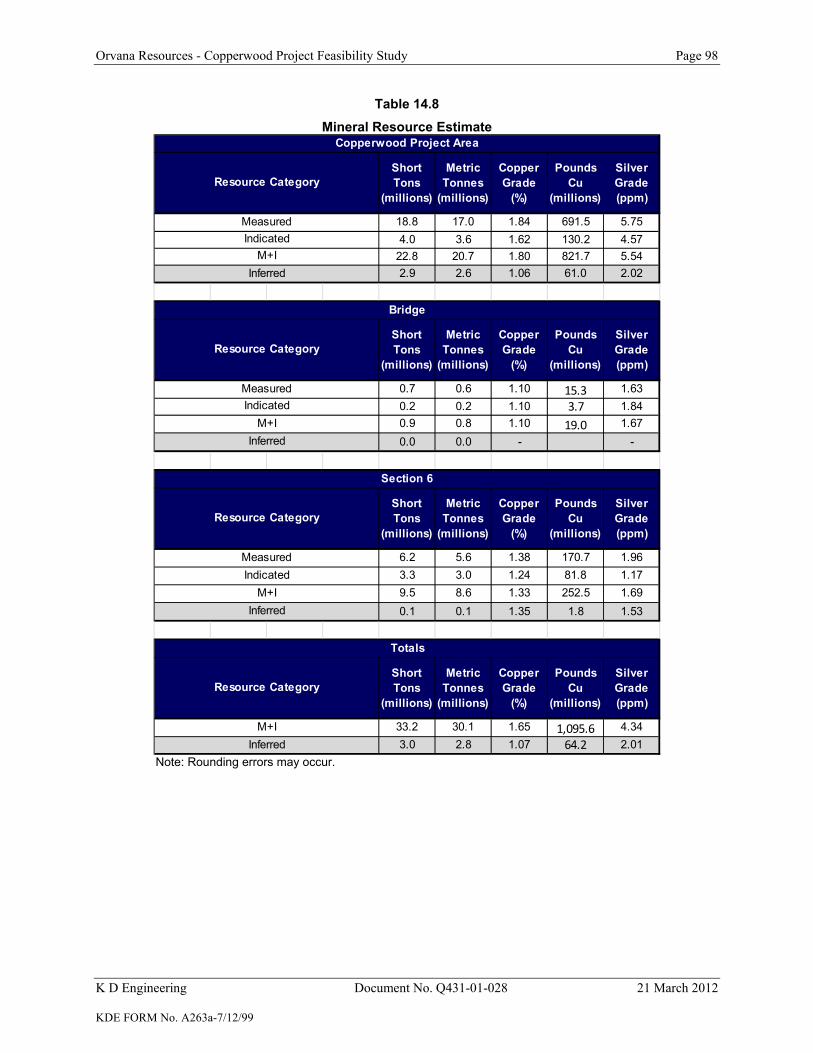
Orvana Resources - Copperwood Project Feasibility Study Page 98
K D Engineering Document No. Q431-01-028 21 March 2012 KDE FORM No. A263a-7/12/99
Table 14.8 Mineral Resource Estimate
Short Tons
(millions)
Metric Tonnes
(millions)
Copper Grade
(%)
Pounds Cu
(millions)
Silver Grade (ppm)
18.8 17.0 1.84 691.5 5.754.0 3.6 1.62 130.2 4.57
22.8 20.7 1.80 821.7 5.542.9 2.6 1.06 61.0 2.02
Short Tons
(millions)
Metric Tonnes
(millions)
Copper Grade
(%)
Pounds Cu
(millions)
Silver Grade (ppm)
0.7 0.6 1.10 15.3 1.630.2 0.2 1.10 3.7 1.840.9 0.8 1.10 19.0 1.670.0 0.0 - -
Short Tons
(millions)
Metric Tonnes
(millions)
Copper Grade
(%)
Pounds Cu
(millions)
Silver Grade (ppm)
6.2 5.6 1.38 170.7 1.963.3 3.0 1.24 81.8 1.179.5 8.6 1.33 252.5 1.690.1 0.1 1.35 1.8 1.53
Short Tons
(millions)
Metric Tonnes
(millions)
Copper Grade
(%)
Pounds Cu
(millions)
Silver Grade (ppm)
33.2 30.1 1.65 1,095.6 4.343.0 2.8 1.07 64.2 2.01
Totals
Resource Category
M+I
Copperwood Project Area
Resource Category
Measured
Inferred
IndicatedM+I
Inferred
Bridge
Resource Category
MeasuredIndicated
M+IInferred
Section 6
Resource Category
MeasuredIndicated
M+I
Inferred
Note: Rounding errors may occur.

Orvana Resources - Copperwood Project Feasibility Study Page 99
K D Engineering Document No. Q431-01-028 21 March 2012 KDE FORM No. A263a-7/12/99
Figure 14.22 - Resource Classification Boundaries
Silver Values The silver grades for this resource have been estimated using similar estimation parameters as used for the copper grades but are considered a by-product and are insufficient to pay for extraction alone; further, extracting the copper mineralization without the silver is not believed possible. Details regarding the silver mineralogy are not yet fully evaluated. Silver will be mined along with the copper mineralization and bears no additional mining or transportation costs; however, it will be processed with the copper and the concentrate shipped to a smelting facility, where it may have to carry a penalty charge. Nevertheless, it is believed that there is a reasonable expectation of the silver being mined and contributing to the profit; thus, it has been included in this Resource statement. Milne & Associates, Inc. (M&A) has reviewed the resource evaluation and estimation work performed by Marston, Mr. Partington, and Mr. Ward on the Copperwood deposit and found that the work has been performed in a professional manner and should fairly represent the mineral resources at Copperwood using a 0.80 percent copper grade shell and a 5 ft. minimum height.

Orvana Resources - Copperwood Project Feasibility Study Page 100
K D Engineering Document No. Q431-01-028 21 March 2012 KDE FORM No. A263a-7/12/99
15.0 MINERAL RESERVE ESTIMATES
In order to calculate the minable reserve portion of the measured and indicated resource, it was necessary to identify that part of the resource that could be economically extracted, and then apply factors for mining dilution and mining recovery. These factors were based on the mining method, the deposit parameters, and underground ground conditions that exist at the site. The economic portion of the resource determination is typically determined by the application of a breakeven cutoff grade, or value, that considers the total operating cost (mine, plant and administration), metal price(s), process recovery(s), applicable royalties, and forward costs for concentrate freight, insurance, smelting and/or refining. These parameters are equated to determine the minimum grade, grade equivalent, or value of metal(s) that will need to be mined in order to cover the total direct operating costs. At the Copperwood deposit, the principal payable metal will be copper, with a possible minor contribution by silver. Since the breakeven cutoff grade represents the minimum grade, or value, that will be mined; the average grade, or value, delivered to the mill, will always be higher. This increment, between the breakeven cutoff grade and the head grade, provides the return of capital investment and profit. Other cutoff grades (incremental) may be employed later in the mine planning process by the mine planners/management to handle situations where mineralized material, with a value below the economic cutoff grade, must be mined in order to reach ore, or to optimize the cash flow. However, these incremental cutoff grades are not normally used in determining the initial breakeven cutoff grade used to establish minable reserves. The following algorithm illustrates the typical relationship between the various parameters to calculate at the breakeven cutoff copper equivalent grade: Cueq. = Total Operating Cost (Cu Price + Credits – Fwd. Costs) x Cu Rec. x 20 lbs/% If the breakeven cutoff is expressed as a value, it is the sum of the mine, mill, G&A, and forward costs. If an NSR (net smelter return) is used (including concentrate freight and royalties), it must exceed the total on-site unit operating costs. At Copperwood, the following economic parameters for a production rate of 7,500 tons per day (tpd) have been estimated to determine the copper equivalent breakeven cutoff grade:
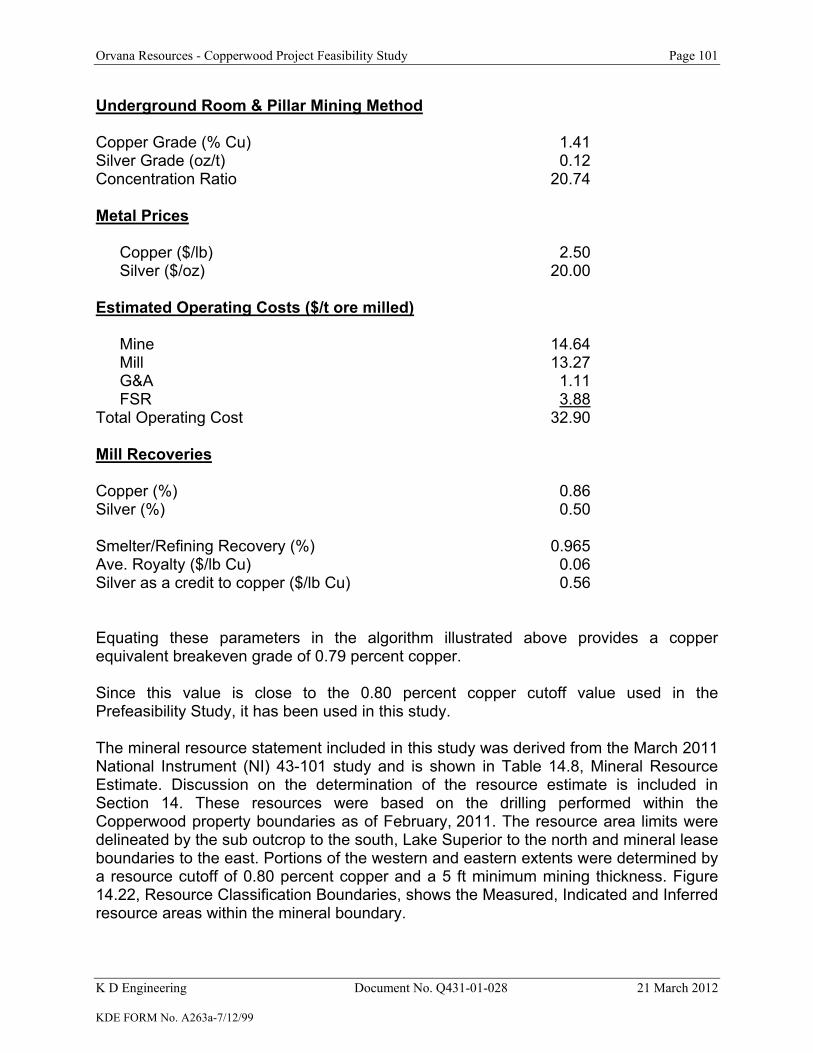
Orvana Resources - Copperwood Project Feasibility Study Page 101
K D Engineering Document No. Q431-01-028 21 March 2012 KDE FORM No. A263a-7/12/99
Underground Room & Pillar Mining Method Copper Grade (% Cu) 1.41 Silver Grade (oz/t) 0.12 Concentration Ratio 20.74 Metal Prices Copper ($/lb) 2.50 Silver ($/oz) 20.00 Estimated Operating Costs ($/t ore milled) Mine 14.64 Mill 13.27 G&A 1.11 FSR 3.88 Total Operating Cost 32.90 Mill Recoveries Copper (%) 0.86 Silver (%) 0.50 Smelter/Refining Recovery (%) 0.965 Ave. Royalty ($/lb Cu) 0.06 Silver as a credit to copper ($/lb Cu) 0.56 Equating these parameters in the algorithm illustrated above provides a copper equivalent breakeven grade of 0.79 percent copper. Since this value is close to the 0.80 percent copper cutoff value used in the Prefeasibility Study, it has been used in this study. The mineral resource statement included in this study was derived from the March 2011 National Instrument (NI) 43-101 study and is shown in Table 14.8, Mineral Resource Estimate. Discussion on the determination of the resource estimate is included in Section 14. These resources were based on the drilling performed within the Copperwood property boundaries as of February, 2011. The resource area limits were delineated by the sub outcrop to the south, Lake Superior to the north and mineral lease boundaries to the east. Portions of the western and eastern extents were determined by a resource cutoff of 0.80 percent copper and a 5 ft minimum mining thickness. Figure 14.22, Resource Classification Boundaries, shows the Measured, Indicated and Inferred resource areas within the mineral boundary.

Orvana Resources - Copperwood Project Feasibility Study Page 102
K D Engineering Document No. Q431-01-028 21 March 2012 KDE FORM No. A263a-7/12/99
For the purposes of determining the mineable reserves, the same boundaries and breakeven cutoff grade were used. These boundaries included, the 200 ft buffer zone, which separates the mining layout from the lake, thus ensuring that the lake will not be impacted by any subsidence that might occur. The same model used to estimate the resource was also used as the basis for the reserve estimate presented in the PFS. Copper and silver grades for the floor and overlying units were modeled to determine tons and grades of external dilution. The elevation of the modeled back and floor surfaces of the ore zone was increased, or decreased, based on the dip of the mineralized seam. The Prefeasibility Study for mining this deposit incorporated options for both a drill and blast option and a continuous miner option for extraction of the ore. Because the continuous miner (CM) option required a flatter dip, mine planning for both options was based on a panel layout that incorporated an apparent dip of 8.6 degrees, by mining at an angle across the true dip of the deposit. Figure 16.7 (Dipping Seam Geometry), provides an example of the dilution wedges that would have had to be taken with the ore when using a drill and blast mining method, mining on the apparent dip. The amount of dilution from Table 16.4, for an average deposit height of 10 ft for full seam extraction, was estimated at 22.9 percent. Additional dilution results from overbreak in the back and floor, which may or may not carry grade. Both the resource and reserve modeling used a cutoff grade of 0.80 percent copper, with a minimum mining height of 5 ft. This height would be acceptable for the resource calculation, but the mining reserve statement needs to include dilution consistent with expected mining heights. The probable minimum height will be around 7 ft for mining equipment and personnel, Most of the “CW Main section” contains ore thicknesses well in excess of 7 ft, so this area would not be affected. However, parts of the “Bridge Section” and “Section 6” are between 5.3 ft and 7 ft, and this dilution, which carries some grade, was considered in the minable reserve determination. The mining extraction equipment that is planned for the drill and blast option can negotiate the true deposit dip, which would significantly decrease the 23.9 percent “corner” dilution resulting from mining on an apparent dip, and included in the Prefeasibility Study. Mining on the true dip also has the advantage of better-managing the horizontal stresses induced by room and pillar mining. These horizontal stresses were the principal problem stresses at the White Mine, which is located nearby and which was mined in the same sedimentary sequence that occurs at the Copperwood deposit. Recent geotechnical evaluations and mine planning indicate that the preferred mining plan would place the panels in an east-west orientation to minimize stresses in the back, with mining progressing down-dip to minimize dilution. This layout would minimize stress management requirements, and provide an opportunity for safer extraction of the deposit at a higher mill feed grade.

Orvana Resources - Copperwood Project Feasibility Study Page 103
K D Engineering Document No. Q431-01-028 21 March 2012 KDE FORM No. A263a-7/12/99
With a room and pillar mining method, mining recovery is always a factor in the final economic analyses. Depending on the pillar and opening sizes included in the mining plan this recovery factor can vary from less than 50 percent to over 65 percent, without considering retreat recovery of pillars. The following Table 15.1 presents the Mineral Reserve Statement that was included in the Prefeasibility Study for the Copperwood Project as a reference. Table 15-1A presents the currently-estimated minable reserve based on a mining plan mining that extracts ore on strike with a slanted back, and down dip, rather than on an apparent dip. This new mining plan incorporates a minimum mining height of 7 ft. and a 0.80 percent Cueq. breakeven cutoff grade, with allowances for floor “wedge” and “back” dilution for on-strike mining, and “back” dilution for on-dip mining. All dilution is at the diluting grade. This minable reserve statement is the basis of the economic evaluation of the Copperwood deposit included in this study. Based on geotechnical recommendations by CNI, the initial advance recovery would be approximately 65 percent. An additional 12 percent recovery results from pillar retreat mining. The resource to minable reserve conversion performed in documents leading up to the Prefeasibility Study has been evaluated, with the conclusion that the work was performed in a professional manner. However, the work was based on maintaining a mine plan that would accommodate a continuous miner (CM) option, if warranted, In addition, some of the geotechnical evaluations were based on coal mine techniques and standards. This work has been reviewed by Call & Nicholas, Inc., one of the principal hard-rock geotechnical firms in the U.S. This review resulted in an indication that the 25 ft. square pillar and 20 ft opening sizes, recommended for all mining outside of the mains in the Prefeasibility Study, would be marginal and would result in a low safety factor for some areas of the mine design. This conclusion prompted a re-design of the mining layout. This qualified person is unaware of any environmental, permitting, legal, title, taxation, socio-economic, marketing, political, mining, metallurgical, infrastructure or other relevant factors that would materially affect the minable reserve estimated in the Prefeasibility Study, which has been included in this study.

Orvana Resources - Copperwood Project Feasibility Study Page 104
K D Engineering Document No. Q431-01-028 21 March 2012 KDE FORM No. A263a-7/12/99
Figure 15.1 - Resource Classification Boundaries

Orvana Resources - Copperwood Project Feasibility Study Page 105
K D Engineering Document No. Q431-01-028 21 March 2012 KDE FORM No. A263a-7/12/99
Table 15.1
PFS Mineral Reserve Estimate
Reserve Block
Reserve Category
Mineable Reserves
(Mt)
Ore Grade Copper (% Cu)
Recoverable Copper (M lbs)
Ore Grade Silver
(ppm AG)
Recoverable Silver
(000 ozs) Proven 18.1 1.45 525 4.99 2629
Probable 2.3 1.23 57 4.04 265 Copperwood Main Subtotal 20.4 1.43 581 4.88 2894
Proven 6.8 1.16 158 2.02 355 Probable 2.8 1.02 59 1.79 85 Section 6 Subtotal 9.6 1.13 217 1.95 562 Proven 24.9 1.37 683 4.18 2984
Probable 5.1 1.11 115 2.80 472 Total Subtotal 30.0 1.33 798 3.95 3456
Table 15.1A Copperwood Project
Proven+ Probable Minable Reserves
Reserve Category Tons Cu
Grade(%) lbs Copper Ag Grade
(ppm) Oz. Silver CW Main Proven 15,861,045 1.62 513,897,858 5.08 2,590,516 Probable 3,364,464 1.43 98,633,091 4.04 439,092Subtotal CW Main 19,225,509 1.59 612,530,949 4.09 3,029,608 Bridge Proven 592,212 0.95 11,252,028 1.41 26,846 Probable 169,966 0.95 3,251,749 1.60 8,605Subtotal Bridge 762,178 0.95 14,503,777 1.45 35,451 Section 6 Proven 6,686,732 1.13 151,120,143 1.62 348273 Probable 3,553,287 1.02 71,491,004 0.96 109,379Subtotal Sect. 6 10,240,014 1.09 222,611,148 1.39 457,652 Total Deposit Proven 23,139,989 1.46 676,270,029 3.98 2,960,990 Probable 7,087,717 1.21 173,375,844 2.44 561,721Grand Total 30,227,706 1.41 849,645,873 3.62 3,522,711*Totals may vary due to rounding

Orvana Resources - Copperwood Project Feasibility Study Page 106
K D Engineering Document No. Q431-01-028 21 March 2012 KDE FORM No. A263a-7/12/99
16.0 MINING 16.1 Geology Copperwood is a sediment-hosted stratiform copper deposit. Sediment-hosted stratiform copper deposits consist of copper and copper-iron sulfide minerals hosted by silciclastic, or dolomitic rocks, in which a relatively thin (typically less than 10 ft (3 m) copper-bearing zone is conformably situated within stratification of the host sedimentary rocks. Copper occurs as disseminations and veinlets. The Copperwood deposit is on the flank of the 1,360 mile long Mesoproterozoic Midcontinent Rift System of North America and is hosted in the Nonesuch Formation, a package of lacustrine and fluvial sediments that form part of the Oronto Group post-rifting basin fill. The Parting Shale at the base of the Nonesuch Formation is subdivided into (from the base upwards) the Domino, Red Massive, Gray Laminated, Red Laminated, Gray Siltstone and Red Siltstone sub-units. Mineralization is hosted within three conformable units collectively termed the Copper Bearing Sequence (CBS) within the Parting Shale. The CBS is composed of the Domino, Red Massive and the Gray Laminated Siltstone lithologic units. The Domino is the principal copper host at Copperwood and is characterized by black shale and siltstone with an average thickness of 5.25 ft (1.6 m). The Red Massive consists of siltstone and sandstone and has an average thickness of 1.0 ft (0.3 m). The Gray Laminated is a thinly laminated siltstone and has an average thickness of 3.3 ft (1.0 m). The CBS at Copperwood has been delineated by drilling over an area of approximately 10,000 ft (3,048 m) east-west and 3,800 ft (1,158 m) north-south. A generalized stratigraphic column is shown in Figure 16.1, (Stratigraphic Column). Figure 16.2, (CBS Thickness), shows the thickness of the CBS, within the project area. There is mineralization, although less than the 0.80 percent copper cutoff, in some of the back and floor rocks. The Copperwood deposit is hosted within the western limb of the broad, gently west-plunging Western Syncline. The CBS dips 12º in the south to 7º in the north. Figure 16.3 shows the CBS structure on the base of the Domino. The CBS sub-outcrops beneath 65 ft (20 m) to 115 ft (35 m) of unconsolidated glacial sediments along the southern edge of the project area. At the northern limit of the project area, the overburden thickness is approximately 900 ft (274 m). Figure 16.4, CBS Overburden Thickness, is an overburden isopach map for the project area.
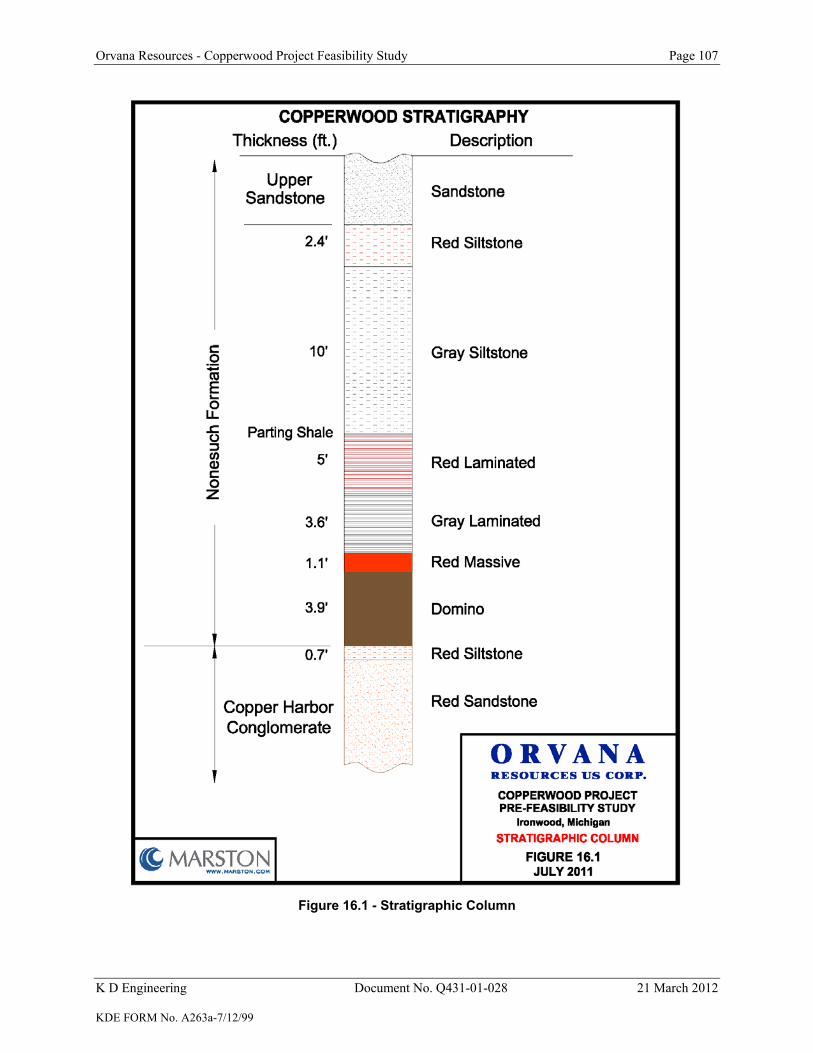
Orvana Resources - Copperwood Project Feasibility Study Page 107
K D Engineering Document No. Q431-01-028 21 March 2012 KDE FORM No. A263a-7/12/99
Figure 16.1 - Stratigraphic Column

Orvana Resources - Copperwood Project Feasibility Study Page 108
K D Engineering Document No. Q431-01-028 21 March 2012 KDE FORM No. A263a-7/12/99
Figure 16.2 - CBS Thickness

Orvana Resources - Copperwood Project Feasibility Study Page 109
K D Engineering Document No. Q431-01-028 21 March 2012 KDE FORM No. A263a-7/12/99
Figure 16.3 - CBS Structure

Orvana Resources - Copperwood Project Feasibility Study Page 110
K D Engineering Document No. Q431-01-028 21 March 2012 KDE FORM No. A263a-7/12/99
Figure 16.4 - CBS Overburden Thickness

Orvana Resources - Copperwood Project Feasibility Study Page 111
K D Engineering Document No. Q431-01-028 21 March 2012 KDE FORM No. A263a-7/12/99
AMEC’s review of the property in their 2010 Technical Report indicated an apparent change in the dip of the strata. This was felt to reflect the presence of a northward-dipping shallow reverse fault, with a minor displacement of 9.8 ft (3 m) to 23 ft (7 m). Three drill holes logged fault intersections in the vicinity of the flexure. Concerns over how this might affect mining and the projected length of this structure motivated Orvana to invest in drilling in the area of the fault during their 2010 drilling campaign. Based on observations from this drilling, the strike length of the fault was reduced. Minimal impact to mining is expected. No other indications of faulting were noted in the drilling program. Orvana collected 172 Specific Gravity (SG) measurements from within the Domino, Red Massive, Gray Laminated and Red Laminated units within the Copperwood area and an additional 37 measurements from the Section 6 area. SGs were consistently between 2.70 and 2.72. The block model was updated to set the SG of all blocks in the Red Laminated and Gray Laminated to 2.72, with all other blocks being 2.70. The land surface at the property slopes northwest towards the Lake Superior shoreline. The ground surface elevation along the southern edge of the site is approximately 985 ft (300 m) above mean sea level. The approximate elevation at the top of the bluff at the Lake Superior shoreline is 650 ft. (198 m). The elevation of the water in Lake Superior is approximately 602 ft (184 m). The topographic contours across the area are generally parallel to the Lake Superior shoreline with the ground surface sloping at a rate of approximately 100 ft per mile (19 m per kilometer) to the northwest. The gently undulating planar surface is dissected by small intermittent streams that flow northwest towards Lake Superior. The larger of these streams form steep-walled valleys in glacial deposits that are 10 to 15 ft (3 to 4.6 m) deep in the upper reaches, and as much as 40 ft (12 m) deep near Lake Superior. The following are some of the geological considerations that will impact mining.
▪ CBS thickness ▪ CBS ore grade ▪ Continuity of ore grade ▪ Dip of the ore zone ▪ Faults ▪ Overburden thickness ▪ Hanging wall and footwall rocks ▪ Grade control ▪ Hydrology ▪ Joints ▪ Slump
The total CBS thickness varies from approximately 5 ft (1.6 m) to greater than 12 ft (3.7 m) within the resource boundary, whereas the mineralization grades decrease towards the northern resource boundary. The economic CBS thickness varies from about 6.4 ft (2 m) in the “Section 6 zone” of the deposit to over 12 ft. (3.7 m) in the “CW Main zone”. The minimum mining height, based on the selected low-profile mining

Orvana Resources - Copperwood Project Feasibility Study Page 112
K D Engineering Document No. Q431-01-028 21 March 2012 KDE FORM No. A263a-7/12/99
equipment and the personnel working in the mine, has been set at 7 ft (2.1 m). Typical minimum mining heights within the deposit will vary between 7 ft and 12 ft. The minimum ore grade for the resource estimate was set at 0.80 percent copper. After evaluating anticipated full-production mining costs at Copperwood, process recoveries, freight, smelting, and refining costs, plus considering royalties, the breakeven cutoff grade was calculated to be 0.79 percent Cueq. Therefore, the cutoff grade for determining the economic viability of minable reserve was also set at 0.80 percent Cueq. Figures 16.5 and 16.6 provide grade distribution isopachs for copper and silver respectively. The ore deposit dips from approximately 12 degrees near the sub-outcrop in the south to less than 7 degrees near the northern mineral boundary. In previous studies continuous mining equipment was considered for extracting the ore, which could cut down dip as long as the floor was not slick and the continuous miner (CM) could back out of the cut, but this equipment has limited capability to cut up dip (insufficient cutting force into the face). When cutting on strike, a CM needs to operate in a plane close to horizontal. Operating in a horizontal plan facilitates lubrication of the CM and lateral traction, and the CM cut creates vertical pillar ribs. However, the CM would have to cut exclusively in the CBS, thus lowering recovery, or include cuts in both the back and the floor in opposing corners, which would add dilution to the ore. To partially mitigate these effects, the mine plan for the Prefeasibility Study (PFS) was oriented on an apparent dip of approximately 8.6 degrees. This resulted in including approximately 24 percent dilution to arrive at the minable reserve. Although the drilling and blasting equipment could also operate on the apparent dip and follow the mine plan as outlined the Prefeasibility Study, this plan would also accept higher ore dilution than was necessary. A mining plan change to mining on-strike and down-dip reduces dilution and allows for better horizontal stress management, thus reducing back control costs and raising the mill feed grade. Since the drilling and blasting equipment has the ability to work on the true dip, this study has been based entirely on mining the deposit entirely with drilling and blasting equipment, mining on-strike and down-dip. Although the vertical stress will be over 1,000 psi (6.9 Mpa), this is not a significant level of stress. Of greater concern is the potential for high horizontal stresses - up to three times the vertical stress. Horizontal stresses were a major factor at the nearby White Pine mine. Observations of the impacts on back and pillar stability during mining will be critical to mine safety and production. The hanging wall, or immediate back rocks are the Red Laminated and the Gray Siltstone. Observations of drill core, and the geomechanical testing, indicate that the rock should not be difficult to support, but could fail during when the secondary mining of pillars occurs.
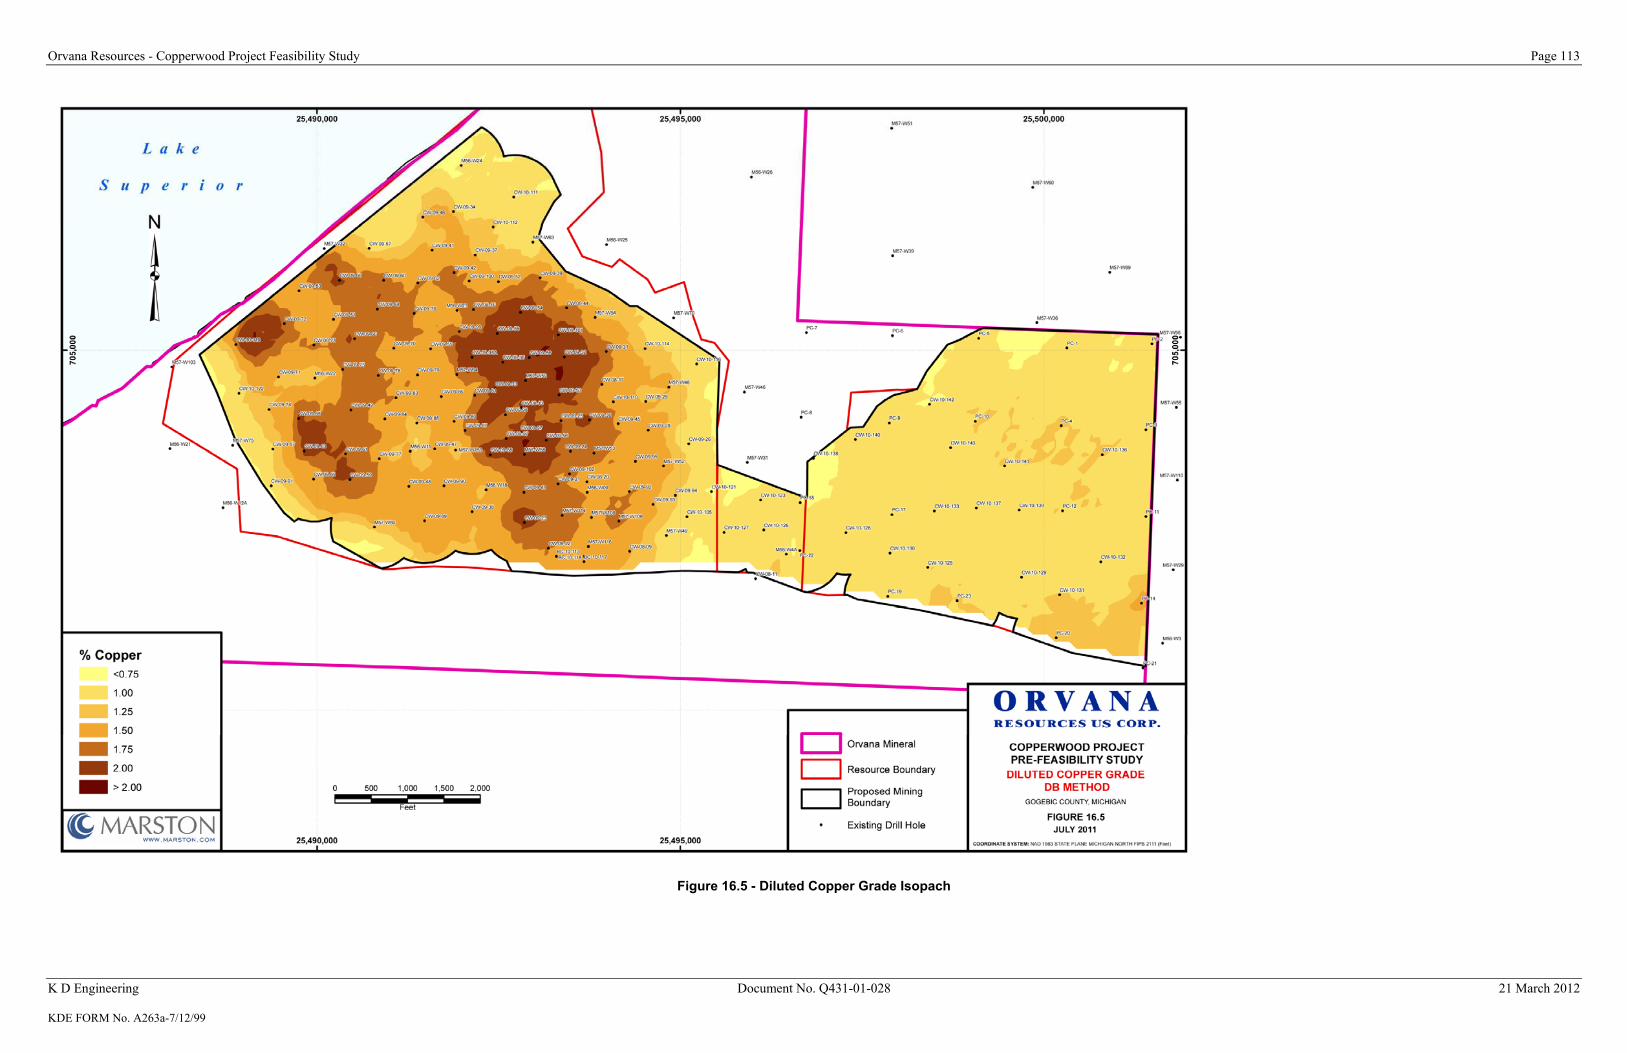
Orvana Resources - Copperwood Project Feasibility Study Page 113
K D Engineering Document No. Q431-01-028 21 March 2012 KDE FORM No. A263a-7/12/99
Figure 16.5 - Diluted Copper Grade Isopach
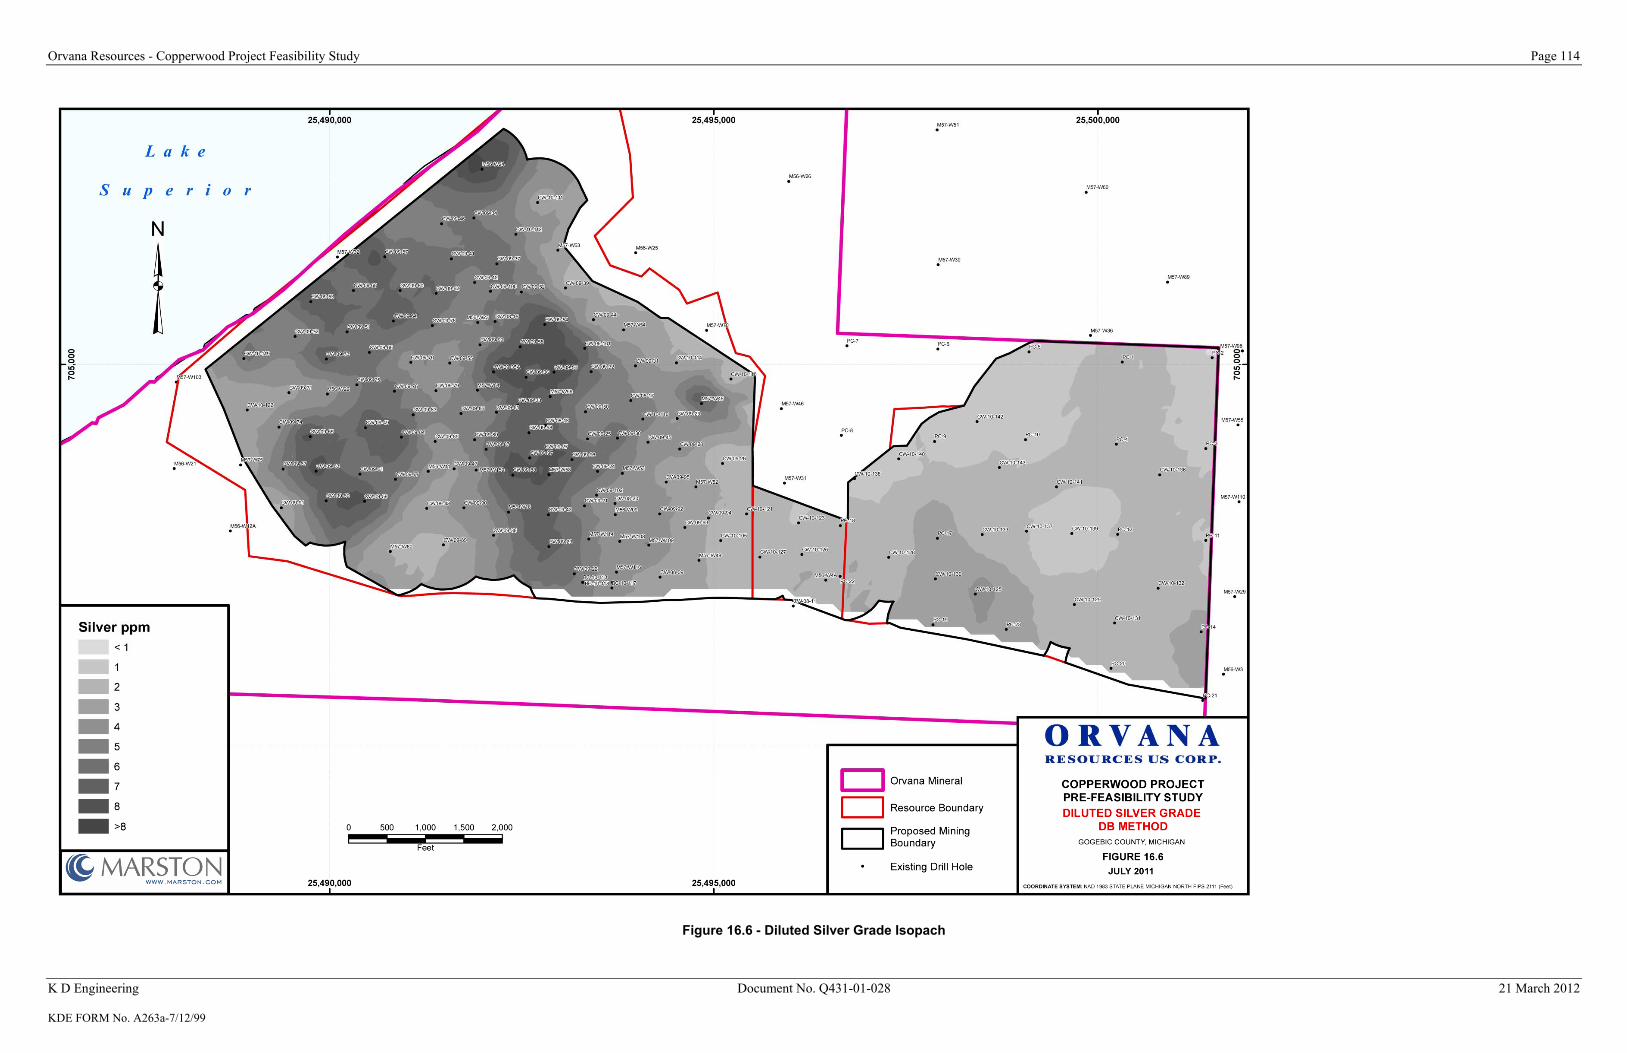
Orvana Resources - Copperwood Project Feasibility Study Page 114
K D Engineering Document No. Q431-01-028 21 March 2012 KDE FORM No. A263a-7/12/99
Figure 16.6 - Diluted Silver Grade Isopach

Orvana Resources - Copperwood Project Feasibility Study Page 115
K D Engineering Document No. Q431-01-028 21 March 2012 KDE FORM No. A263a-7/12/99
Unfortunately, these same rocks failed in a test mine. The likely difference is in the mining method, and the back control plan and procedures. The test mine mining method was performed by drilling and blasting methods, and it is highly likely that the back was damaged during blasting. The back bolt plan included 4 ft (1.2 m) bolts (probably point anchor bolts) on 4 ft (1.2 m) centers in at least one of the stopes. The time difference between blasting, excavation and installation of the back bolting is unknown. Although the siltstones are not moisture sensitive, the bedding plane surfaces appear to be. If the back is allowed to relax before it is bolted, it is much easier for moisture to penetrate the tiny fractures and to weaken the back significantly. A well-designed and closely supervised mining plan utilizing drilling and blasting equipment should minimize damage to the back. The back should be bolted immediately following blasting, scaling and mucking. The back control plan for this study recommends a minimum of 5/8 inch, 8 ft (2.44 m) long fully grouted cable bolts on 4 ft x 4 ft staggered centers for 20 ft (6.1 m) wide entries and crosscuts. Bolting immediately after the ore extraction is recommended as standard operating procedure. Differentiating the ore/waste boundary in the hanging wall may be difficult. The Red Laminated contact with the underlying Gray Laminated is transitional. Because of this, it is recommended that grade control geologists rotate with the mining crews to assist in identifying the contact between the ore and the waste. The footwall, or floor, is on the Copper Harbor Conglomerate, which consists of siltstones and sandstones. The rocks are very durable and have high unconfined compressive strength (UCS). The rock should provide an excellent floor. The impact of hydrology on the mine plan is expected to be minimal. Hydrology is discussed in Section 16.2.8. Although the current room and pillar plan is designed for a no, to low probability of failure criteria, some surface subsidence may occur when secondary extraction mining plans are implemented. If no pillars fail, the subsidence will range between zero feet and 0.3 feet. If the pillars do fail, the estimated subsidence would be between zero feet and five feet, depending on the pillar height, depth below the surface, and the area failed. Because the retreat mining planned will still leave pillars throughout the mine, and the fact that the topographic surface has significant relief, the subsidence impacts to topography should be minimal. A subsidence monitoring program is recommended to quantify any subsidence effects on the surface. Joints were mapped during the United States Metals Refining Company (USMRC) Michigan Shaft Project (The Project) (Frobes, 1959). The joints that were mapped included a dominant joint set (vertical) striking N75W - N80W, with joints spaced 3 ft (0.9 m) to 8 ft (2.4 m) apart. A secondary set at N10W - N30W, and a minor set at N3E - N25E. Most of the joints were tight, but some dripped water. Some joints showed slickensides with a suggested east-west movement, which technically would make them

Orvana Resources - Copperwood Project Feasibility Study Page 116
K D Engineering Document No. Q431-01-028 21 March 2012 KDE FORM No. A263a-7/12/99
faults. The Project stated, “Mine openings that parallel the major joints should be held at a minimum, since openings in this direction would undoubtedly give the weakest back conditions.” The currently-proposed mine plan is oriented 90 degrees horizontally to the dip of the deposit, or approximately E-W, which should ensure that most entries and cross cuts do not end up parallel to any of the joint patterns. Joints will still need to be considered because of the potential planes of weakness in the back as they cross mine openings. Metal strapping installed between back bolts is a common method of reinforcing the back where joints or faults are identified. Slump and slump fractures formed in the sedimentary sequences at the White Pine mine were observed, and were apparently associated with back control problems there. These slump features were typically in the upper part of the mineralized zone and the first foot or two of the immediate back, indicating that rock bolts with wire mesh will be required in most areas. 16.2 Mining Equipment for mining the Copperwood deposit in this study consists of low-profile; two-boom electric-hydraulic jumbos for drilling, ANFO for blasting, 6-cy LHD’s for ore removal, and 30 ton haulage trucks for transporting the broken ore from muck bays to a feeder breakers where the blasted ore will be reduced to approximately 6 inches and placed on a conveyor that will transport the ore to the surface and on the mill. The mining method of choice for the Copperwood deposit is room-and-pillar mining, using conventional drilling and blasting mining equipment. The method consists of a mining a series of entries and cross cuts in the ore, leaving pillars in place to support the back. The entries, cross cuts and pillars have been sized using geotechnical analysis of the back, CBS rock characteristics, and experience in this series of rocks in other mines. Once primary advance mining is completed and pillars are all that remain secondary extraction (retreat mining) of the pillars can occur. Pillar extraction typically results in lower operating costs, since the placement of infrastructure and back support, that is required for development or advance mining, is not necessary. During retreat mining, frequent geotechnical assessments are recommended to determine how the back is behaving, and if the remaining pillars are bearing acceptable loads. Thus, modeling of pillar stresses prior to pillar extraction and calibration of the model during the pillar extraction process is crucial to the success of a responsible pillar recovery operation.

Orvana Resources - Copperwood Project Feasibility Study Page 117
K D Engineering Document No. Q431-01-028 21 March 2012 KDE FORM No. A263a-7/12/99
16.2.1 Mining Parameters The basic operational assumptions are summarized as follows.
▪ Minimum mining height - 7 ft (2.2 m) ▪ Maximum mining height - 15 ft (4.5 m) ▪ Average mining height - 9.6 ft (2.9 m) ▪ Ore specific gravity - 168 lb/ft3 (1.68 g/cm3) ▪ Ore cutoff grade - 0.80 percent copper ▪ Manpower Schedules at full production - three, eight-hour shifts per day,
seven days per week, 350 days per year ▪ Productivity - approximately 834 tons (756 tonnes) per shift per Section ▪ Main entry advance - approximately 400 ft/month ▪ Build up schedule First Year (530,000 tons)
- 64,000 for the 1st Quarter - 100,000 tons for the 2nd Quarter - 150,000 tons in the 3rd Quarter - 216,000 tons in the 4th Quarter
Second Year (1,700,000 tons)
- 250,000 tons in the 1st Quarter - 350,000 tons in the 2nd Quarter - 450,000 tons in the 3rd Quarter - 650,000 tons in the 4th Quarter
▪ Annual production - 2,625,000 tons ROM (2,382,000 tonnes) ▪ Pillars sizes - Variable, depending on the depth ▪ Entry and cross cut width - 20 ft (6.1 m) ▪ Mine advance development on strike and dip ▪ Setback from Lake Superior for advance mining - 200 ft (61 m) ▪ Setback from Lake Superior for retreat mining – 500 ft. (152 m)
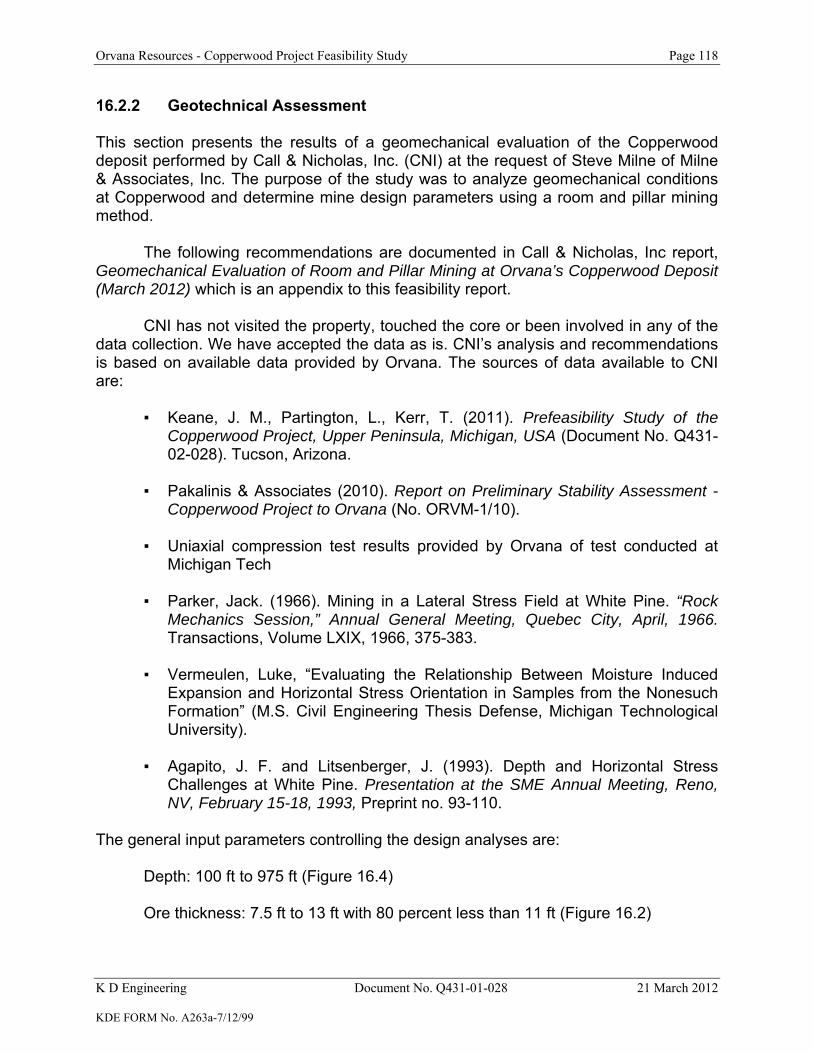
Orvana Resources - Copperwood Project Feasibility Study Page 118
K D Engineering Document No. Q431-01-028 21 March 2012 KDE FORM No. A263a-7/12/99
16.2.2 Geotechnical Assessment This section presents the results of a geomechanical evaluation of the Copperwood deposit performed by Call & Nicholas, Inc. (CNI) at the request of Steve Milne of Milne & Associates, Inc. The purpose of the study was to analyze geomechanical conditions at Copperwood and determine mine design parameters using a room and pillar mining method.
The following recommendations are documented in Call & Nicholas, Inc report, Geomechanical Evaluation of Room and Pillar Mining at Orvana’s Copperwood Deposit (March 2012) which is an appendix to this feasibility report.
CNI has not visited the property, touched the core or been involved in any of the
data collection. We have accepted the data as is. CNI’s analysis and recommendations is based on available data provided by Orvana. The sources of data available to CNI are:
▪ Keane, J. M., Partington, L., Kerr, T. (2011). Prefeasibility Study of the
Copperwood Project, Upper Peninsula, Michigan, USA (Document No. Q431-02-028). Tucson, Arizona.
▪ Pakalinis & Associates (2010). Report on Preliminary Stability Assessment -
Copperwood Project to Orvana (No. ORVM-1/10). ▪ Uniaxial compression test results provided by Orvana of test conducted at
Michigan Tech ▪ Parker, Jack. (1966). Mining in a Lateral Stress Field at White Pine. “Rock
Mechanics Session,” Annual General Meeting, Quebec City, April, 1966. Transactions, Volume LXIX, 1966, 375-383.
▪ Vermeulen, Luke, “Evaluating the Relationship Between Moisture Induced
Expansion and Horizontal Stress Orientation in Samples from the Nonesuch Formation” (M.S. Civil Engineering Thesis Defense, Michigan Technological University).
▪ Agapito, J. F. and Litsenberger, J. (1993). Depth and Horizontal Stress
Challenges at White Pine. Presentation at the SME Annual Meeting, Reno, NV, February 15-18, 1993, Preprint no. 93-110.
The general input parameters controlling the design analyses are:
Depth: 100 ft to 975 ft (Figure 16.4) Ore thickness: 7.5 ft to 13 ft with 80 percent less than 11 ft (Figure 16.2)
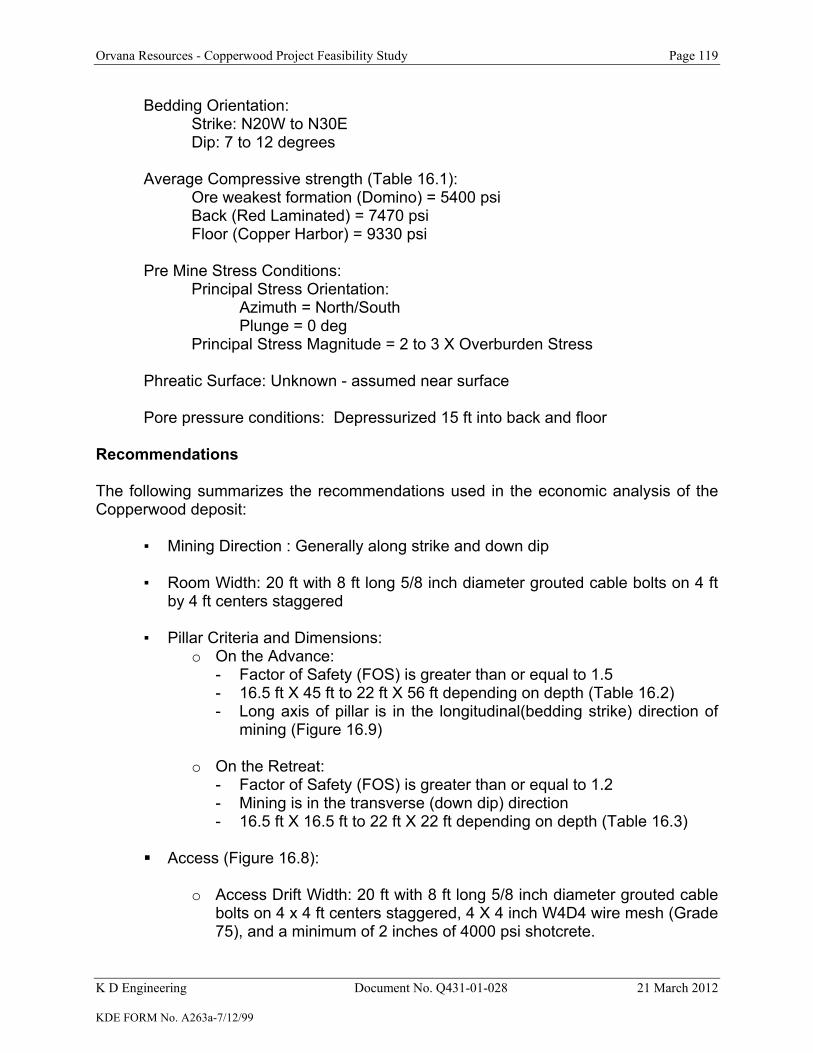
Orvana Resources - Copperwood Project Feasibility Study Page 119
K D Engineering Document No. Q431-01-028 21 March 2012 KDE FORM No. A263a-7/12/99
Bedding Orientation: Strike: N20W to N30E Dip: 7 to 12 degrees Average Compressive strength (Table 16.1): Ore weakest formation (Domino) = 5400 psi Back (Red Laminated) = 7470 psi Floor (Copper Harbor) = 9330 psi Pre Mine Stress Conditions: Principal Stress Orientation: Azimuth = North/South Plunge = 0 deg Principal Stress Magnitude = 2 to 3 X Overburden Stress Phreatic Surface: Unknown - assumed near surface Pore pressure conditions: Depressurized 15 ft into back and floor
Recommendations The following summarizes the recommendations used in the economic analysis of the Copperwood deposit:
▪ Mining Direction : Generally along strike and down dip ▪ Room Width: 20 ft with 8 ft long 5/8 inch diameter grouted cable bolts on 4 ft
by 4 ft centers staggered ▪ Pillar Criteria and Dimensions:
o On the Advance: - Factor of Safety (FOS) is greater than or equal to 1.5 - 16.5 ft X 45 ft to 22 ft X 56 ft depending on depth (Table 16.2) - Long axis of pillar is in the longitudinal(bedding strike) direction of
mining (Figure 16.9)
o On the Retreat: - Factor of Safety (FOS) is greater than or equal to 1.2 - Mining is in the transverse (down dip) direction - 16.5 ft X 16.5 ft to 22 ft X 22 ft depending on depth (Table 16.3)
Access (Figure 16.8):
o Access Drift Width: 20 ft with 8 ft long 5/8 inch diameter grouted cable
bolts on 4 x 4 ft centers staggered, 4 X 4 inch W4D4 wire mesh (Grade 75), and a minimum of 2 inches of 4000 psi shotcrete.

Orvana Resources - Copperwood Project Feasibility Study Page 120
K D Engineering Document No. Q431-01-028 21 March 2012 KDE FORM No. A263a-7/12/99
o Internal Pillars: 15 ft wide and at least 100 ft long with a minimum 2 inches of 4000 psi shotcrete
o Barrier Pillars:
- 45 ft wide and at least 200 ft long for depths of 0 to 500 ft with a minimum of two (2) inches of 4000 psi shotcrete
- 65 ft wide and at least 200 ft long for depths from 500 ft to 1100 ft with a minimum of two (2) inches of 4000 psi shotcrete
▪ Subsidence: The room and pillar plan is based on a no to low probability of
pillar failure criteria.
o To minimize the risk that subsidence cracks do not intersect Lake Superior there is no mining within 200 ft of Lake Superior and there is no pillar recovery within 500 ft of Lake Superior.
o If no pillars fail, the subsidence will range between zero feet and 0.3 ft.
▪ If the pillars do fail, the estimated subsidence would between zero feet
and 5 ft., depending on the pillar height, depth below the surface, and area failed.
Additional Geomechanical Work Required Additional work has been divided into two groups, work required before mining starts and work that should be performed during mining.
Work Required Before Mining Starts Additional work required before the project can go forward is as follows:
▪ Drill four (4) to six (6) core holes to collect geomechanical data, to collect samples for rock strength testing and if necessary to install piezometers to measure the phreatic surface.
▪ In addition to the above core holes, drill at least 2 oriented core holes to
determine the orientation of the joints in the deposit. ▪ The rock strength data base must be improved. Testing per rock type should
include the following:
o Triaxial Compression – 8 tests per rock type o Uniaxial Compression - 4 tests per rock type o Fracture Shear Strength – 4 test per rock type
We estimate there are at least 7 rock types, 3 in the ore zone, 2 in the back and 2 in the floor.

Orvana Resources - Copperwood Project Feasibility Study Page 121
K D Engineering Document No. Q431-01-028 21 March 2012 KDE FORM No. A263a-7/12/99
▪ Map joint sets in any underground workings or on exposed outcrops in the area to provide guidance on joint lengths, spacing and orientation.
Work Required During Mining Once development starts, stress measurements should be made to determine the stress conditions at Copperwood. The results from the stress measurements should be used in a numerical model to determine if the mine plan, as proposed, has any stress conditions that would require changes to ground support, room widths, or orientation of mine workings.
A monitoring program will be required for the life of the mine. The primary foundation should be convergence monitoring of pillars and the back. In addition borehole extensometers should be used early in the mining to evaluate pillar performance and back performance during advance and retreat mining. Given the large area of the mine, a micro seismic system would provide total coverage of the mine and provide early warning to stress build up.
Table 16.1
Average UCS for Geologic Units at Copperwood Main Ore Body
Mining Position Rock Unit Number of
Samples Average
UCS (psi) Upper Sandstone 5 9,210
Back Red Siltstone 5 5,160 Back Gray Siltstone 3 11,060
Back/Pillar Red Laminated 15 7,470 Back/Pillar Gray Laminated 9 11,130
Red Massive 7 11,100 Pillar Domino 17 5,400 Floor Copper Harbor 18 9,330
Table 16.2 First Pass Pillar Dimensions for Copperwood
Overburden Thickness (ft)
Length (ft)
Width (ft)
Area (ft2)
Height (ft) FOS
First Pass Recovery
(%) 300 46 17 782 11 1.8 68.0 600 53 20.5 1086.5 11 1.7 63.3 800 56 22 1232 11 1.6 61.4 950 58 23 1334 11 1.6 60.2 300 45 16.5 742.5 10 1.7 68.7 600 52 20 1040 10 1.6 63.9 800 55 21.5 1182.5 10 1.6 62.0 950 56 22 1232 10 1.6 61.4 300 44 16 704 7.5 1.7 69.4 600 50 19 950 7.5 1.6 65.2 800 52 20 1040 7.5 1.6 63.9 950 54 21 1134 7.5 1.6 62.6

Orvana Resources - Copperwood Project Feasibility Study Page 122
K D Engineering Document No. Q431-01-028 21 March 2012 KDE FORM No. A263a-7/12/99
Table 16.3 Second Pass Pillar Dimensions for Copperwood
Overburden Thickness (ft)
Length (ft)
Width (ft)
Area (ft2)
Height (ft) FOS
Second Pass Recovery
(%) 300 17 17 782 11 1.2 76.3 600 20.5 20.5 1086.5 11 1.2 71.6 800 22 22 1232 11 1.2 69.7 950 23 23 1334 11 1.2 68.5 300 16.5 16.5 742.5 10 1.2 77.0 600 20 20 1040 10 1.2 72.2 800 21.5 21.5 1182.5 10 1.2 70.3 950 22 22 1232 10 1.2 69.7 300 16 16 704 7.5 1.2 77.8 600 19 19 950 7.5 1.2 73.6 800 20 20 1040 7.5 1.2 72.2 950 21 21 1134 7.5 1.2 70.9
16.2.3 Layout Geometry Mining layout geometry will play a major factor in determining dilution. By developing entries at a 90 degree angle to the dipping deposit, only cross cuts will have to take extra non-economical mineralized material as dilution, or leave behind potential economic mineralization in the back, or floor. When using conventional mobile-tired mining equipment, working on a level floor, a wedge of dilution material will be taken from the floor. The percentage of dilution from these “wedges” is a function of the deposit height where the extraction takes place. The geometry of this can be seen in Figure 16.7, (Dipping Seam Geometry) of the using an average deposit CBS thickness of 9.6 ft, for a “Slanted Back Extraction”. The percentage dilution and total recovery options are also shown in Table 16.4, (Recovery and Dilution of Dipping Seams) for a “Slanted Back Extraction” option. 16.2.4 Mine Design The primary main entry layout is based on four entry mains that are driven on 35 ft (10.7 m) centers. The four entry mains will be bounded by 45 ft (13.7 m) by 200 ft (30.5 m) barrier pillars from the surface to a depth of 500 ft (152.4 m). Below 500 ft the barrier pillars increase in size to 65 ft (19.8 m) by 200 ft (30.5 m) barrier pillars below 500 ft (152.4 m). A schematic of the proposed Main Entry design details above and below 500 ft of overburden depth is shown in Figure 16.8. The deposit extraction mine plan proposes 20 ft wide access entries in all areas, with varying pillar sizes with depth. At an average mining height of 10 ft. (3.05 m), the panel pillar sizes vary from 45 ft by 16.5 ft (14 m by 5 m) at a depth of 300 feet to 56 ft by 22 ft (17 m by 6.7 m) at a depth of 950 ft. Figure 16.9 presents a schematic of the pillar/opening relationship at a depth of 500 ft.

Orvana Resources - Copperwood Project Feasibility Study Page 123
K D Engineering Document No. Q431-01-028 21 March 2012 KDE FORM No. A263a-7/12/99
Secondary mining of pillars on retreat is proposed for the current mining plan. Figure 16.9, presents a conceptual layout for secondary extraction from the pillars at a depth of 500 ft (152.4 m). A breakeven copper equivalent cutoff grade of 0.80 was calculated based on the estimated total operating costs, process recoveries, freight, smelting and refining (FSR) costs, and expected royalties. Using this cutoff grade, and a minimum ore zone thickness of 7 ft (2.1 m), the minable reserve boundary and mine entry layout are shown in Figure 16.10. From this mine layout, estimated tonnages and grades for each mining sector was determined and presented in Table 16.5 (Tons and Grade by 100 ft Overburden Depth).

Orvana Resources - Copperwood Project Feasibility Study Page 124
K D Engineering Document No. Q431-01-028 21 March 2012 KDE FORM No. A263a-7/12/99
Figure 16.7 - Dipping Seam Geometry

Orvana Resources - Copperwood Project Feasibility Study Page 125
K D Engineering Document No. Q431-01-028 21 March 2012 KDE FORM No. A263a-7/12/99
Mineral Area
(sq. ft.)
Waste Area
(sq. ft.) Dilution Recovery
Mineral Area
(sq. ft.)
Waste Area
(sq. ft.) Dilution Recovery
Mineral Area
(sq. ft.)
Waste Area
(sq. ft.) Dilution Recovery
Mineral Area
(sq. ft.)
Waste Area
(sq. ft.) Dilution Recovery
Upper Layers 70.8 30.1 29.8% 100.0% 40.7 0.0 0.0% 57.5% 40.0 0.0 0.0% 56.5% 70.8 0.0 0.0% 100.0%
Domino 50.6 30.1 37.3% 100.0% 50.6 30.1 37.3% 100.0% 21.3 0.0 0.0% 42.1% 50.6 30.1 37.3% 100.0%
Total 121.4 60.2 33.1% 100.0% 91.3 30.1 24.8% 75.2% 61.3 0.0 0.0% 50.5% 121.4 30.1 19.9% 100.0%
Upper Layers 70.8 30.1 29.8% 100.0% 40.7 0.0 0.0% 57.5% 40.7 0.0 0.0% 57.5% 70.8 0.0 0.0% 100.0%
Domino 91.0 30.1 24.9% 100.0% 91.0 30.1 24.9% 100.0% 60.9 0.0 0.0% 66.9% 91.0 30.1 24.9% 100.0%
Total 161.8 60.2 27.1% 100.0% 131.7 30.1 18.6% 81.4% 101.6 0.0 0.0% 62.8% 161.8 30.1 15.7% 100.0%
Upper Layers 70.8 30.1 29.8% 100.0% 40.7 0.0 0.0% 57.5% 40.7 0.0 0.0% 57.5% 70.8 0.0 0.0% 100.0%
Domino 131.5 30.1 18.6% 100.0% 131.5 30.1 18.6% 100.0% 101.4 0.0 0.0% 77.1% 131.5 30.1 18.6% 100.0%
Total 202.3 60.2 22.9% 100.0% 172.2 30.1 14.9% 85.1% 142.1 0.0 0.0% 70.2% 202.3 30.1 13.0% 100.0%
Upper Layers 108.6 30.1 21.7% 100.0% 78.5 0.0 0.0% 72.3% 78.5 0.0 0.0% 72.3% 108.6 0.0 0.0% 100.0%
Domino 125.0 30.1 19.4% 100.0% 125.0 30.1 19.4% 100.0% 94.9 0.0 0.0% 75.9% 125.0 30.1 19.4% 100.0%
Total 233.6 60.2 20.5% 100.0% 203.5 30.1 12.9% 87.1% 173.4 0.0 0.0% 74.2% 233.6 30.1 11.4% 100.0%
Assumes constant density between seams.
11.5'
Table 16.4Recovery and Dilution of Dipping Seams - DB Method
Combined Seam
Thickness
Mineralized Zone
Full Seam Extraction Partial Seam Extraction In-Seam Extraction Slanted-Roof Extraction
6'
8'
10'

Orvana Resources - Copperwood Project Feasibility Study Page 126
K D Engineering Document No. Q431-01-028 21 March 2012 KDE FORM No. A263a-7/12/99
Figure 16.8 - Pillar Layout at +/- 500 ft Overburden

Orvana Resources - Copperwood Project Feasibility Study Page 127
K D Engineering Document No. Q431-01-028 21 March 2012 KDE FORM No. A263a-7/12/99
Figure 16.9 - Advance / Retreat Pillar layout at 500' Depth

Orvana Resources - Copperwood Project Feasibility Study Page 128
K D Engineering Document No. Q431-01-028 21 March 2012 KDE FORM No. A263a-7/12/99
Figure 16.10 - Deposit Boundaries & Main Entry Layout

Orvana Resources - Copperwood Project Feasibility Study Page 129
K D Engineering Document No. Q431-01-028 21 March 2012 KDE FORM No. A263a-7/12/99
Table 16.5 Total Tons & Grade by 100 ft. Overburden Depth
Area O’Burden Depth KTons Cu (%) Ag (ppm)
100 514 1.28 3.45
200 1841 1.34 3.41
300 2132 1.44 4.13
400 2690 1.53 4.51
500 2798 1.61 4.94
600 2705 1.68 5.14
700 2757 1.78 5.31
800 1831 1.88 6.44
900 1378 1.52 5.68
1000 580 1.22 5.49
Copperwood
Main
Subtotal 19,226 1.59 4.90
200 596 1.15 1.94
300 1375 1.18 1.98
400 1409 1.15 1.91
500 1446 1.09 1.48
600 1341 1.10 1.12
700 1323 1.11 1.95
800 1265 1.05 0.84
900 1147 0.92 1.17
1000 339 0.87 1.05
Section 6
Subtotal 10,240 1.09 1.39
200 189 1.00 1.61
300 298 0.99 1.54
400 274 0.88 1.23
500 1 0.64 1.29
Bridge
Subtotal 762 0.95 1.45
Total 30,228 1.41 3.62

Orvana Resources - Copperwood Project Feasibility Study Page 130
K D Engineering Document No. Q431-01-028 21 March 2012 KDE FORM No. A263a-7/12/99
Comments Although a room-and-pillar mining method, using drilling and blasting, is the recommended mining method for mining the Copperwood deposit the mine plan could be modified to accommodate a continuous miner plan. However, the drill and blast plan is the only method that can be used to extract the ore under all rock strength conditions, and provide for a high resource recovery at a higher mill feed grade. In order to minimize horizontal stress management and dilution from the back and floor, it has been recommended that the mining advance be oriented along the strike of the deposit, and that crosscuts be oriented along the dip of the deposit. 16.2.5 Production Schedule The production schedule is based upon mining a fixed tonnage target of 2,500 t/d from three separate areas. However, this number may vary depending on the mine management decisions, and current economics. The mine is planned to operate three shifts per day, seven days per week and 350 working days per year. The daily production rate is planned for 7,500 tons per day, or 2,625,000 tons per year. The mine will be accessed via an open boxcut at the mine entrance on the surface. Once the boxcut is completed, including three main access portals 20 ft wide x 60 ft long, initial underground development can begin. The boxcut construction estimate is based on using a local contractor for the boxcut and the initial 60 ft of underground development. Company trained personnel would expand the three boxcut portals to the proposed four-entry main access entry for the rest of the mine. Production would then build up to the full production rate of 7,500 tons per day by the end of the second year. Initial development rates are projected to be approximately 21,000 tons per month (tpm) for the first three months of production from driving the Main Entry in the CW Main Section, and then increasing this production from driving Mains to approximately 70,000 tons by the end of the first year. In the second year the production will continue to increase from about 250,000 tons in the 1st Quarter to 650,000 tons in the 4th Quarter. A second section will be added in the 4th Quarter of the second year. In the third year of mining, it is anticipated that the third section will come on-line at an annual rate of 875,000 tons (794,000 tonnes). The annual rate for each section will be approximately 875,000 tpy (794,000), resulting in a total mine production of 2.625 million tons per year (Mtpy) (2.382 million tonnes). Once the planned primary access entries are developed in the CW Main and Section 6 areas of the mine during the first two years, access will be available to all areas of the mine for production. This represents a large underground footprint, which easily allows access to the working areas necessary to meet the proposed full production rate of 7,500 tpd.

Orvana Resources - Copperwood Project Feasibility Study Page 131
K D Engineering Document No. Q431-01-028 21 March 2012 KDE FORM No. A263a-7/12/99
By having the flexibility of unlimited access along the entries to all sectors of the mine, this will mitigate the risk of a production loss from any one working area. Completing the entry mains early in the mine life to the bottom of the deposit in both the CW Main and Section 6 sectors will also facilitate water handling and pumping. The early development of the main entry into Section 6 will also permit stress monitoring and experience in ground control in this area. A summary of the scheduled production build-up is shown in the following Table 16.6.
Table 16.6
Production Build-up Period Tonnage
1st Quarter 64,000 2nd Quarter 100,000 3rd Quarter 150,000 Year 1
4th Quarter 216,000 1st Quarter 250,000 2nd Quarter 350,000 3rd Quarter 450,000 Year 2
4th Quarter 650,000
Year 3
Year 3 2,625,000
Year 4 to End of Mine Life (t/yr) 2,625,000 The production schedule for the life of the mine (including the production build-up, is shown in the following Table 16.7, (Production Schedule). The expected mine life will be thirteen years. The general development plan is to drive the main entries down dip to the north end of the CW Main Section, and simultaneously toward the north end of Section 6. When accessed, advance mining would begin in the bottom, or north end, of the CW Main Section, then and proceed southward (up dip) toward the surface. Mining in Section 6 north end would follow. After leaving a 200 ft. safety barrier, in the advance section of the north end of the CW Main Section and a 500 ft safety barrier for retreat mining, retreat mining would begin and proceed southward. This early start of retreat mining will allow the lower extremes of CW Main and Section 6 to act as sumps for water storage, or as a tailings repository, if desired A color-coded map, with the mine production by year is shown in Figure 16.11 (Production Schedule).

Orvana Resources - Copperwood Project Feasibility Study Page 132
K D Engineering Document No. Q431-01-028 21 March 2012 KDE FORM No. A263a-7/12/99
Table 16.7 ORVANA RESOURCES
Copperwood Project Production Schedule
Year→ 1 2 3 4 5 6 7 8 9 10 11 12 13 Total Advance Tons Produced (Ktons) 530 1700 2625 2367 2367 2367 2367 2367 2367 2367 2012 2011 1134 26,581 Copper Grade (%) 1.58 1.57 1.63 1.71 1.62 1.56 1.48 1.38 1.17 1.13 1.09 1.12 1.01 1.40 Copper K Pounds 16748 53380 85575 80951 76691 73850 70063 65329 55388 53494 43862 45046 22907 743,285 Silver Grade (ppm) 4.27 3.73 5.46 5.11 4.97 4.80 4.43 3.96 2.78 1.70 1.70 1.76 2.19 3.69 Silver K Ounces 73 204 461 389 378 365 337 301 212 129 110 114 80 3153 Retreat Tons Produced 0 0 0 258 258 258 258 258 258 258 613 614 614 3,647 Copper Grade (%) 0 0 0 1.53 1.67 1.75 1.84 1.78 1.62 1.58 1.52 1.47 1.22 1.54 Copper K Pounds 0 0 0 9030 9494 9185 8359 8153 7843 7585 14957 18052 14982 112,402 Silver Grade (ppm) 0 0 0 4.13 4.55 5.13 5.54 5.48 5.35 4.87 4.23 3.67 3.63 4.42 Silver K Ounces 0 0 0 34 38 43 46 45 44 40 83 72 72 518 Total Tons Produced 530 1700 2625 2625 2625 2625 2625 2625 2625 2625 2625 2625 1748 30,228 Copper Grade (%) 1.58 1.57 1.63 1.69 1.62 1.58 1.52 1.42 1.21 1.17 1.19 1.20 1.08 1.42 Copper K Pounds 16748 53380 85575 88846 85308 82880 79558 74514 63747 61647 62497 63098 37888 855,686 Silver Grade (ppm) 4.28 5.60 5.37 5.37 5.20 4.81 3.86 2.18 1.55 1.11 2.44 4.20 1.75 3.63 Silver K Ounces 73 306 453 453 439 406 326 184 131 94 206 354 98 3523

Orvana Resources - Copperwood Project Feasibility Study Page 133
K D Engineering Document No. Q431-01-028 21 March 2012 KDE FORM No. A263a-7/12/99
Figure 16.11 - Production Schedule

Orvana Resources - Copperwood Project Feasibility Study Page 134
K D Engineering Document No. Q431-01-028 21 March 2012 KDE FORM No. A263a-7/12/99
16.2.6 Subsidence Surface subsidence would typically occur when underground mining has extracted a sufficiently high percentage of the deposit. When sufficient back support (pillars) have been removed, or because of pillar failure, the back over the mined-out area will fail and eventually fills the mined-out area. When the back rock fails, it tends to bulk, so there are voids between the pieces of rock. The bulked rock will not completely fill the mined-out area. At some vertical distance above the opening, the rock layers flex and sag to fill the subsiding space below. As such, subsidence at the surface will never be equal to the space extracted by mining. Mining at shallow overburden depths will create more surface subsidence than mining at greater depths. The current mine plan includes a secondary mining option that may, or may not, lead to some surface subsidence. The secondary (retreat) mining plan in this study includes a partial removal of each pillar left in the advance mining. The immediate back may relax, but the remaining pillars are designed to a safety factor that should provide a stable back. If the pillars fail, then some subsidence is likely. The current mine plan pillar design is based on a no, to low, probability of pillar failure. To minimize the risk that subsidence cracks do not intersect Lake Superior, there is no mining planned within 200 feet of the lake and there is no pillar retreat extraction planned within 500 feet of the lake. If no pillars fail, the subsidence will range between zero feet and 0.3 feet. If the pillars fail, the estimated subsidence would be between zero feet and five feet, depending on the pillar height, depth below the surface, and area failed. 16.2.7 Ventilation Once the initial development of the boxcut is complete and the main mine fan is installed, the ventilation system can begin to bring fresh air to the mine. The development drifts for the conveyor belt and the main intake travel way will carry fresh air into the mine. Exhaust air will be carried out of the mine via a main exhaust mine fan at the return portal. This portal exhaust will be ducted to a suitable location above the boxcut to allow for no recirculation of ventilating air. The main mine fan in this study is to be located at the return entry portal at the base of the boxcut. As this mine would be considered a Class VI metal mine (non-gassy, no accumulation of explosive or flammable dust, and no incidence of radioactive gases), MSHA regulations that typically restrict mine fans to surface use are more relaxed. Locating the main fan underground in the return entry may be a way to reduce ambient surface noise. Placing the mine fan at the return entry portal implies that the mine would be operated as an exhausting system. One benefit of an exhausting system is that the mine need not install ventilation doors on the intake entries to prevent short-circuiting that might occur on a blowing system. This allows for faster transport of men and materials into

Orvana Resources - Copperwood Project Feasibility Study Page 135
K D Engineering Document No. Q431-01-028 21 March 2012 KDE FORM No. A263a-7/12/99
and out of the mine. Additionally, if the belt conveyor is run as an intake entry, there is no need for ventilation controls in the belt entry; thus, both the intake and belt portals would be open, and men and materials would be free to enter them at any point in time. Special attention must be paid to certain hazards in exhausting systems. Primarily, in an exhausting system, the main mine fan is more susceptible to damage should a major event occur that might drastically increase the mine’s total pressure requirements (a major fall of the back that prohibits normal ventilation). In this case, the mine fan would begin to build up negative pressure and go into stall. This is mitigated through placement of a weak-wall stopping underground, or a pressure controlled regulator that can be electrically or hydraulically, opened should negative pressures build up to dangerous levels. Since the boxcut is left open, the main mine fan will be located on the surface at the bottom of the boxcut, where it can be accessed, monitored and maintained by surface personnel. Selection of a primary fan to serve the mine will be specific to the mine’s needs. Most fan manufacturers will modify typical fans to fit specific applications. A fan curve that serves as an example of a primary mine fan for a single fan is shown in Figure 16.12, Main Mine Fan Curve (1 Fan). An example of the curve for the two fans in parallel is seen in Figure 16.13, Main Mine Fan Curve (2 Fans).
Source: SMJ Fans
Figure 16.12 - Main Mine Fan Curve (1 Fan)

Orvana Resources - Copperwood Project Feasibility Study Page 136
K D Engineering Document No. Q431-01-028 21 March 2012 KDE FORM No. A263a-7/12/99
Source: SMJ Fans
Figure 16.13 - Main Mine Fan Curve (2 Fans) In order to adequately size the primary fans for the mine, determination of the ventilation quantities at the face and development of a ventilation model for a worst-case scenario, where the mine is farthest from the portal were performed. Marston initially determined minimum face ventilation based on the nameplate ventilation requirement. MSHA regulations indicate that approximately 125 cfm is required per engine horsepower to dilute diesel particulate matter (DPM) to acceptable standards. Table 16.8, (Section Ventilation Requirements) - , tabulates the approximate personnel, equipment, and horsepower, that will be utilized in one section of the mine at full production.
Table 16.8 Section Ventilation Requirements
Quantity Description Hp/ea. Total Hp CFM Req’d 2 Jumbos 100 200 12,500 1 6-cy LHD 225 225 28,125 1 2-cy LHD 75 75 9,375 1 30-ton Truck 320 320 40,000 1 Bolter/Scaler 100 100 12,500 2 Utility Trucks 175 175 43750
50 Personnel 500 cfm/ea 25,000 Total 193,125
Consideration of recirculation losses and equipment utilizations indicates an average of approximately 200,000 cfm in each section, or a total of approximately 600,000 cfm.
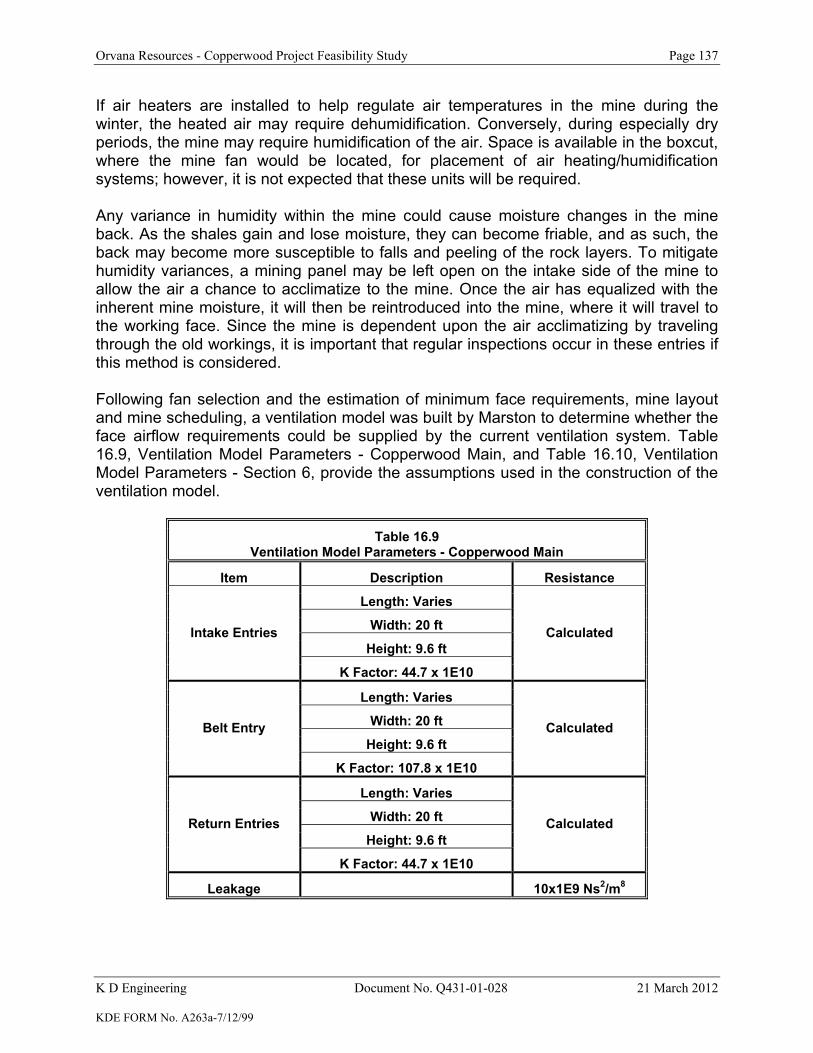
Orvana Resources - Copperwood Project Feasibility Study Page 137
K D Engineering Document No. Q431-01-028 21 March 2012 KDE FORM No. A263a-7/12/99
If air heaters are installed to help regulate air temperatures in the mine during the winter, the heated air may require dehumidification. Conversely, during especially dry periods, the mine may require humidification of the air. Space is available in the boxcut, where the mine fan would be located, for placement of air heating/humidification systems; however, it is not expected that these units will be required. Any variance in humidity within the mine could cause moisture changes in the mine back. As the shales gain and lose moisture, they can become friable, and as such, the back may become more susceptible to falls and peeling of the rock layers. To mitigate humidity variances, a mining panel may be left open on the intake side of the mine to allow the air a chance to acclimatize to the mine. Once the air has equalized with the inherent mine moisture, it will then be reintroduced into the mine, where it will travel to the working face. Since the mine is dependent upon the air acclimatizing by traveling through the old workings, it is important that regular inspections occur in these entries if this method is considered. Following fan selection and the estimation of minimum face requirements, mine layout and mine scheduling, a ventilation model was built by Marston to determine whether the face airflow requirements could be supplied by the current ventilation system. Table 16.9, Ventilation Model Parameters - Copperwood Main, and Table 16.10, Ventilation Model Parameters - Section 6, provide the assumptions used in the construction of the ventilation model.
Table 16.9 Ventilation Model Parameters - Copperwood Main
Item Description Resistance
Length: Varies
Width: 20 ft
Height: 9.6 ft Intake Entries
K Factor: 44.7 x 1E10
Calculated
Length: Varies
Width: 20 ft
Height: 9.6 ft Belt Entry
K Factor: 107.8 x 1E10
Calculated
Length: Varies
Width: 20 ft
Height: 9.6 ft Return Entries
K Factor: 44.7 x 1E10
Calculated
Leakage 10x1E9 Ns2/m8

Orvana Resources - Copperwood Project Feasibility Study Page 138
K D Engineering Document No. Q431-01-028 21 March 2012 KDE FORM No. A263a-7/12/99
Table 16.10 Ventilation Model Parameters - Section 6
Item Description Resistance
Length: Varies
Width: 20 ft
Height: 6 ft Intake Entries
K Factor: 44.7 x 1E10
Calculated
Length: Varies
Width: 20 ft
Height: 6 ft Belt Entry
K Factor: 107.8 x 1E10
Calculated
Length: Varies
Width: 20 ft
Height: 6 ft Return Entries
K Factor: 44.7 x 1E10
Calculated
Leakage 10x1E9 Ns2/m8
From the ventilation model, the main mine fan requirements for three sections were:
▪ Capacity - 550,000 ft3/min (260 m3/s); and, ▪ Pressure - 7.22” w.g.
Table 16.11, below, shows the effective use of air in the ventilation model and the total mine pressure. For this ventilation model, the requirements were dependent on the types of stoppings used, and leakage through the stoppings. The ratio of air delivered to the development face compared to the air at the fan should be moderately efficient (40 to 50 percent of the air at the fan will make it to the faces). However, it is recommended that the actual leakage be measured once mining commences in order to update the ventilation models.
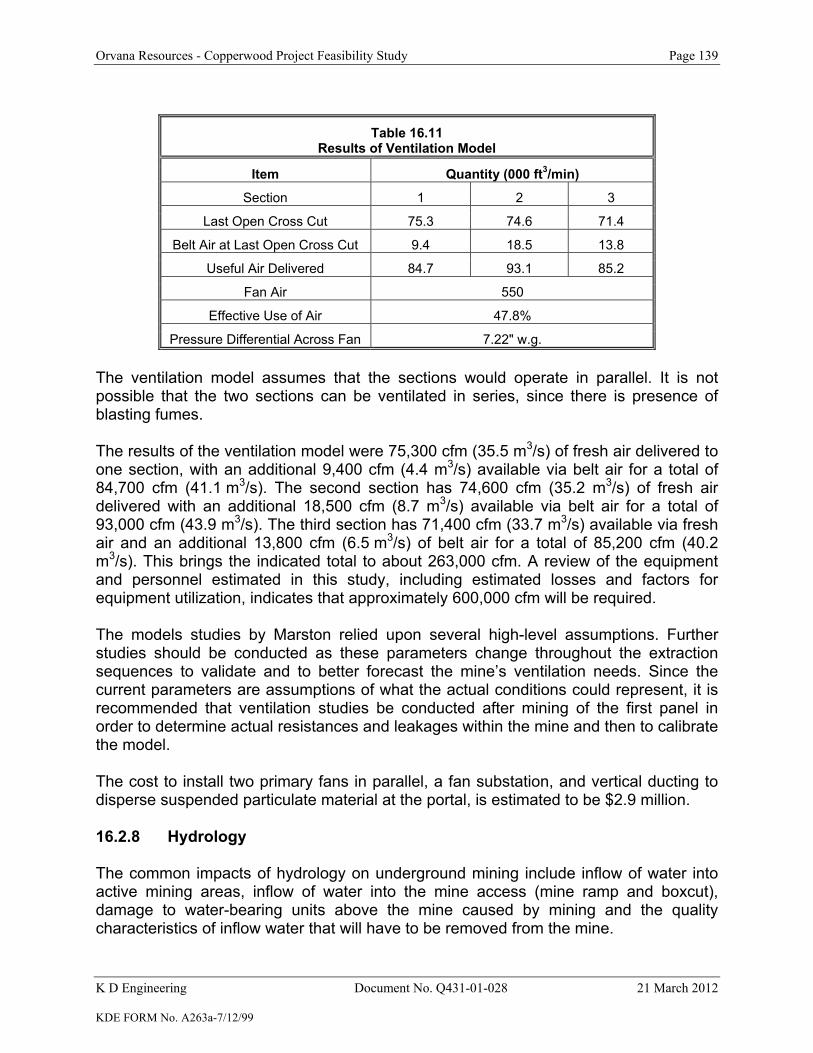
Orvana Resources - Copperwood Project Feasibility Study Page 139
K D Engineering Document No. Q431-01-028 21 March 2012 KDE FORM No. A263a-7/12/99
Table 16.11 Results of Ventilation Model
Item Quantity (000 ft3/min)
Section 1 2 3
Last Open Cross Cut 75.3 74.6 71.4
Belt Air at Last Open Cross Cut 9.4 18.5 13.8
Useful Air Delivered 84.7 93.1 85.2
Fan Air 550
Effective Use of Air 47.8%
Pressure Differential Across Fan 7.22" w.g. The ventilation model assumes that the sections would operate in parallel. It is not possible that the two sections can be ventilated in series, since there is presence of blasting fumes. The results of the ventilation model were 75,300 cfm (35.5 m3/s) of fresh air delivered to one section, with an additional 9,400 cfm (4.4 m3/s) available via belt air for a total of 84,700 cfm (41.1 m3/s). The second section has 74,600 cfm (35.2 m3/s) of fresh air delivered with an additional 18,500 cfm (8.7 m3/s) available via belt air for a total of 93,000 cfm (43.9 m3/s). The third section has 71,400 cfm (33.7 m3/s) available via fresh air and an additional 13,800 cfm (6.5 m3/s) of belt air for a total of 85,200 cfm (40.2 m3/s). This brings the indicated total to about 263,000 cfm. A review of the equipment and personnel estimated in this study, including estimated losses and factors for equipment utilization, indicates that approximately 600,000 cfm will be required. The models studies by Marston relied upon several high-level assumptions. Further studies should be conducted as these parameters change throughout the extraction sequences to validate and to better forecast the mine’s ventilation needs. Since the current parameters are assumptions of what the actual conditions could represent, it is recommended that ventilation studies be conducted after mining of the first panel in order to determine actual resistances and leakages within the mine and then to calibrate the model. The cost to install two primary fans in parallel, a fan substation, and vertical ducting to disperse suspended particulate material at the portal, is estimated to be $2.9 million. 16.2.8 Hydrology The common impacts of hydrology on underground mining include inflow of water into active mining areas, inflow of water into the mine access (mine ramp and boxcut), damage to water-bearing units above the mine caused by mining and the quality characteristics of inflow water that will have to be removed from the mine.

Orvana Resources - Copperwood Project Feasibility Study Page 140
K D Engineering Document No. Q431-01-028 21 March 2012 KDE FORM No. A263a-7/12/99
Orvana commissioned AECOM to prepare a Subsurface Geology and Hydrogeology Study for the Copperwood Project (AECOM, 2010). The following findings have been important to underground planning.
▪ Estimated seepage into underground workings - 0.14 to 0.38 gallons per minute (gpm)/acre (0.009 to 0.024 liters/sec
(l/sec)) of mined area - 150 to 404 gpm (9.5 to 25.9 l/sec) at full build-out - Inflow increases as mining advances towards Lake Superior.
▪ Glacial overburden
- Massive uniform matrix-supported diamicton - Consistent over several square miles - Silty clay with trace to some sand and gravel - Dense and over consolidated - 65 ft (19.8 m) - 120 ft (36.6 m) thick (average approximately 85 ft (25.9 m))
▪ Hydrostratigraphic units - Geological formations at Copperwood do not yield
significant or sufficient quantities of water to local wells or springs; therefore, Marston defines them as “Hydrostratigraphic Units.”
- Glacial Overburden - Massive, not weathered and not fractured - Nonesuch Shale - Gray to black laminated shale and siltstone. Thin
(hairline) fractures; most are closed and calcite filled. No porosity or open bedding planes.
- Copper Harbor Conglomerate - Red to white lithic greywacke with conglomerate layers. Abundant calcite cement. Very few fractures.
- Groundwater flow - All units towards the northwest - Downward movement from shallow groundwater to deeper overburden, but
very slowly - Very little seasonal variation in potentiometric surface in the overburden or
bedrock, some variation in shallow sections of overburden - Limited (or very slow) migration between units
▪ Groundwater chemistry
- Scatter on Piper diagram indicates lack of groundwater flow/connection within till and bedrock
- Glacial overburden
▪ Moderate total dissolved solids (TDS)
▪ Shallow at 230-670 mg/l
▪ Till at 110-7,300 mg/l - Bedrock
▪ Elevated TDS
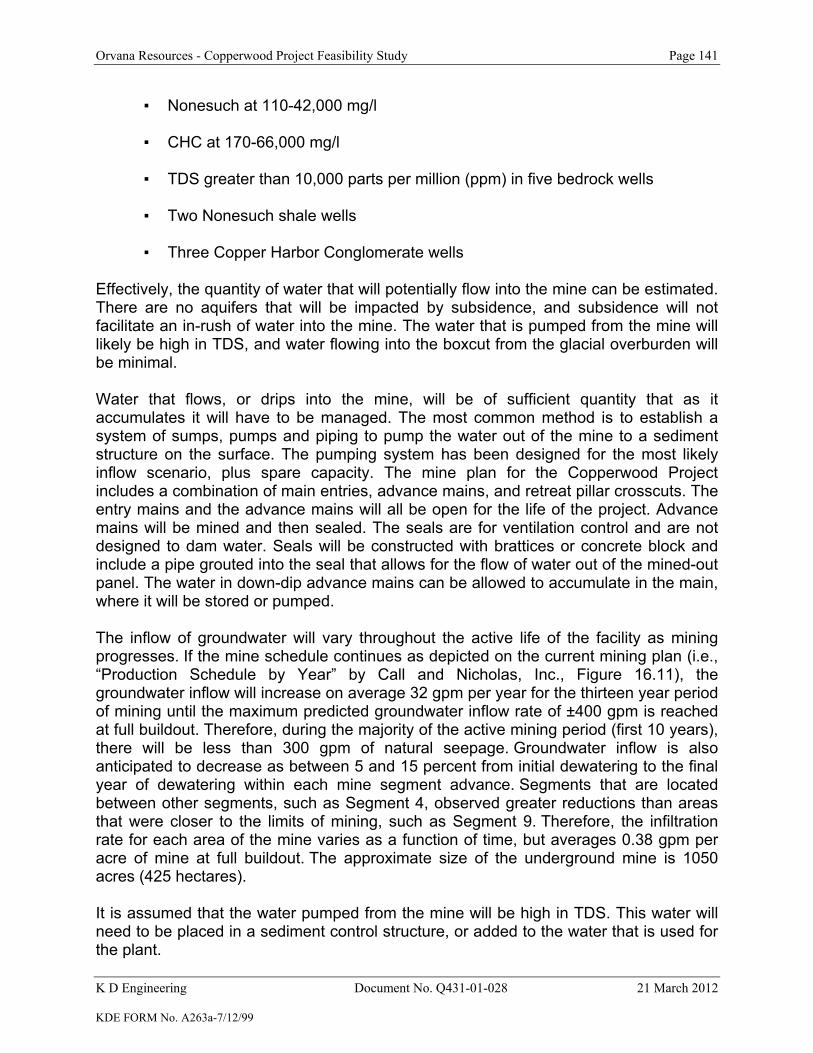
Orvana Resources - Copperwood Project Feasibility Study Page 141
K D Engineering Document No. Q431-01-028 21 March 2012 KDE FORM No. A263a-7/12/99
▪ Nonesuch at 110-42,000 mg/l
▪ CHC at 170-66,000 mg/l
▪ TDS greater than 10,000 parts per million (ppm) in five bedrock wells
▪ Two Nonesuch shale wells
▪ Three Copper Harbor Conglomerate wells Effectively, the quantity of water that will potentially flow into the mine can be estimated. There are no aquifers that will be impacted by subsidence, and subsidence will not facilitate an in-rush of water into the mine. The water that is pumped from the mine will likely be high in TDS, and water flowing into the boxcut from the glacial overburden will be minimal. Water that flows, or drips into the mine, will be of sufficient quantity that as it accumulates it will have to be managed. The most common method is to establish a system of sumps, pumps and piping to pump the water out of the mine to a sediment structure on the surface. The pumping system has been designed for the most likely inflow scenario, plus spare capacity. The mine plan for the Copperwood Project includes a combination of main entries, advance mains, and retreat pillar crosscuts. The entry mains and the advance mains will all be open for the life of the project. Advance mains will be mined and then sealed. The seals are for ventilation control and are not designed to dam water. Seals will be constructed with brattices or concrete block and include a pipe grouted into the seal that allows for the flow of water out of the mined-out panel. The water in down-dip advance mains can be allowed to accumulate in the main, where it will be stored or pumped. The inflow of groundwater will vary throughout the active life of the facility as mining progresses. If the mine schedule continues as depicted on the current mining plan (i.e., “Production Schedule by Year” by Call and Nicholas, Inc., Figure 16.11), the groundwater inflow will increase on average 32 gpm per year for the thirteen year period of mining until the maximum predicted groundwater inflow rate of ±400 gpm is reached at full buildout. Therefore, during the majority of the active mining period (first 10 years), there will be less than 300 gpm of natural seepage. Groundwater inflow is also anticipated to decrease as between 5 and 15 percent from initial dewatering to the final year of dewatering within each mine segment advance. Segments that are located between other segments, such as Segment 4, observed greater reductions than areas that were closer to the limits of mining, such as Segment 9. Therefore, the infiltration rate for each area of the mine varies as a function of time, but averages 0.38 gpm per acre of mine at full buildout. The approximate size of the underground mine is 1050 acres (425 hectares). It is assumed that the water pumped from the mine will be high in TDS. This water will need to be placed in a sediment control structure, or added to the water that is used for the plant.
Orvana Resources - Copperwood Project Feasibility Study Page 142
K D Engineering Document No. Q431-01-028 21 March 2012 KDE FORM No. A263a-7/12/99
16.2.9 Mining Equipment In order to estimate the type and size of mining equipment, the general operating parameters and the number of mining sections that will be necessary to produce 2.625 Mtpy (2.38 Mt) were evaluated. This evaluation indicated that three sections, or separate production areas will be needed to produce the required tonnage from within the deposit boundaries. The following describes the various types of equipment that are proposed to be used for mining the deposit. A feeder breaker is proposed to receive the blasted ROM ore from the face, reduce the size, and transfer the crushed material at a steady pace onto a series of stationary conveyor belts leading to the surface and on to the mill. Feeders typically utilize chain conveyors to convey the material toward a rotary crusher that uses picks, hammers or other methods of comminution. The reduction in particle size is to ensure a more uniform product is delivered to the conveyor belt. Material that is oversized may cause the belts to tear, or to damage permanent belt structure. Too much material at once on the belt will cause spillage. These hazards can be mitigated through use of a feeder breaker. Roof bolting machines are mechanized drills that drill holes in the back of a newly excavated heading and insert rebar, braided cables, expanding tubes, or split set rods (any of which may be colloquially referred to as “bolts”) into the back. The purpose of back bolts is to bind the laminated back layers together to create a unified beam that will have a much higher tensile strength. Various types of back bolts are available for different applications. The bolts proposed for the Copperwood Project are 5/8 inch cable bolts using cemented grout to hold the bolts in place and bind the sedimentary layers together. Typically, a 6 in by 6 in (15.2 cm by 15.2 cm) rectangular steel plate will be installed at the base of each bolt and will stay flush with the back. The plate helps distribute the load on the bolt. A “Load-Haul-Dump” (LHD) unit is a mobile, low-profile front-end loader, capable of picking up blasted at ore at the face and loading the ore on to trucks, which would transport the ore to the feeder breaker. The proposed LHD equipment will be diesel fuel-powered, rubber-tired articulated vehicles. Diesel-powered, low-profile, two-boomed, electric-hydraulic jumbo drills are proposed for blast hole drilling at Copperwood. These drills require a small, electric power pack, to provide electric power to the drills. Diesel-powered personnel carriers are recommended for transporting miners from a centralized location on the surface to the mine interior at the beginning of the shift, and the reverse at the end of each shift. These personnel carriers will operate in the dedicated fresh air entries. These entries will serve as the main travel ways throughout the mine. Two large man-trips have been allocated and in addition, diesel-powered,
Orvana Resources - Copperwood Project Feasibility Study Page 143
K D Engineering Document No. Q431-01-028 21 March 2012 KDE FORM No. A263a-7/12/99
rubber-tired, utility vehicles are planned as support equipment for the mine. These vehicles include, lube trucks, explosive trucks, scissors trucks. personnel carriers, and boss buggies. Power (load) centers will be located in the working sections of the mine to allow electric power distribution to the various pieces of equipment that use electric power. The principal electric power consumers are the conveyor drives, feeder breakers, secondary fans, and the electric-hydraulic drills on the jumbos. The load centers transform the incoming high voltage power (4,160 V to 7,200 V) to lower voltages used by the electrical equipment. As mining advances, the load centers, belts and feeder breakers will be moved closer to the face. To achieve the 2.625 Mtpy (2.38 Mt) production level, it is planned that the mine would operate 350 days per year. Each working day would consist of three, eight-hour shifts. The average production rates would be approximately 2,500 tons (3,024 tonnes) per shift.
2.625 Mtpy ÷ 350 days ÷ 3 shifts per day = 2,500 tons/shift In order to meet this production per shift, an average of approximately four rounds (4.2) per section will be required. Given an average mining height of 10 ft (3.05 m) in the Copperwood Main, an average round pull of 11.0 ft, and a mining width of 20 ft, the shift tonnage estimate for one conventional mining section is shown below. 4.2 rounds/section/shift × 11.0 ft (d) × 20 ft (w) × 10 ft (h) × 1.1 (overbreak) x 0.084 ton / ft3 x 3 (sections) = 2,561 tons / shift In-house loading and haulage estimating programs were used to provide the basis for estimating the number of jumbos, LHD’s and haul trucks required to handle the scheduled production. Discussions with major mining equipment dealers provided the type and model of low-profile equipment needed for this project Support mobile equipment requirements were selected on the basis of the production rate, personnel working in the mine, and the number of sectors active in the mine. Fixed underground installations, such as conveyor belts were estimated from the work done in the Prefeasibility Study, and adjusted to fit the new conveyor layout, which was based on the same annual production rate. Surface mine infrastructure and mining equipment selections were based on the equipment number of personnel planned for the mine and experience with other similar mines. A summary of the major mine equipment required for an ore production rate of 7,500 /d is listed in the following Table 16.12.

Orvana Resources - Copperwood Project Feasibility Study Page 144
K D Engineering Document No. Q431-01-028 21 March 2012 KDE FORM No. A263a-7/12/99
Table 16.12
Major Mine Equipment List
Qty Description Size Model Total Kw
Total Diesel Hp
8 Drill Jumbos 2-Boom DD230L 1,000 800 5 Scooptrams 6-cy LH209L 1,125 2 Scooptrams 2-cy LH203 150 5 Haul. Trucks 30-ton TH230L 1,600 2 Bolter/Scaler 1-Boom DS210L 90 200 4 Explosive Trucks Getman A-64 608 1 Lube Truck Getman A-64 175 1 Scissors Lift Truck Getman A-64 175 2 Personnel Carriers Getman A-64 350 1 U.G. Grader Getman A-64 150 4 Boss Buggies Ford or Equal 300 3 Feeder Breakers Stamler 750 4 Load Centers I.M. Elect. 7200/480 3 Jackleg Drills G.D. or Equal lot Conveyor System 1,065 3 Refuge Chambers 2 Water Pumps 152 2 Primary Surface Fans Joy or Equal 720 6 Sec. Axial Fans Joy or Equal 120 1 Surface F.E.L. 966 Cat or Equal 1 Surface Forklift Cat or Equal 1 Surface Compressor 1,200 cfm Atlas Copco lot Maint. Equip./Tools 125 lot Mine Safety Equip.
200 Mine Lamps/Chargers MSA 20 lot Mine Commun. Sys. Leaky-Feeder 15 2 Mine Pickup Trucks Ford or Equal 10 lot Mine Office Equipment
Totals 4,067 5,633
16.2.10 U.G. Mine Infrastructure Ore Handling System The Copperwood Project is being designed to produce an average of 7,500 tons of ore per day (6,806 tonnes/day). For an effective work schedule of 19.5 hours per day (3 x 6,5 hours per shift) the average hourly tonnage rates would need to be approximately 385 tph (350 tonnes). Although the conveyor belt production rate has remained similar to what Marston based their PFS designs on, the current mine plan and conveyor belt layout has changed significantly.
Orvana Resources - Copperwood Project Feasibility Study Page 145
K D Engineering Document No. Q431-01-028 21 March 2012 KDE FORM No. A263a-7/12/99
Marston used a surge factor of 25 percent, which means that the belts should be capable of handling up to 125 percent of the average 385 tph (350 tonnes per hour). In addition, belt availability and utilization factors were applied to this tonnage target. Availability pertains to the percent of time that the belt is available for service. Utilization is a factor that relates the amount of time that the belt is being used (running empty versus running with product). Given a utilization of 75 percent and an availability of 97 percent the required capacity of the main conveyor belt is 662 tph (600 tonnes per hour).
Calculation: 385 tph × 1.25 (surge) ÷ 75% (utilization) ÷ 97% (availability) = 662 tph In their designs, Marston designed a general belt conveyor system using the principles stated in the Conveyor Equipment Manufacturer’s Association (CEMA) Publication Belt Conveyors for Bulk Materials. This method used a graphical method to develop power and size requirements for a given belt. It was assumed that a 48 inch (1,220 mm) belt would use idlers with a 35 degree trough angle, and the broken material would weigh approximately 120 lb/ft3 (1.92 grams/cm3) with a 25 degree surcharge angle. Efficiencies for the motor and belt drive were both assumed to be 95 percent. Since the current mining plan has changed, the belt parameters presented in the PFS were reviewed and updated to include all 42 inch wide belts, with piw strengths ranging from 440 to 900. The total horse power is estimated to be approximately 1,050. From each working section a haulage truck will transport broken ore from the active mining face to the feeder breaker. The feeder breaker will reduce the broken material size such that it will be suitable for transport by conveyor belt from the section via the section belt to a main belt, where the main conveyor belt would transport the ore to the ramp slope conveyor and on to the surface. The worst case scenario for material transport is when the mine extracts the northern and deepest areas of Section 6. To power the Copperwood Main belt, Marston recommended two options. First, the mine could install multiple belt drives at a single belt header near the slope belt. By placing all drives at the head, the mine may be able to localize its belt power centers. The other option was to install two belts in series. By staging the belts, each belt would require less power to operate and would lower the total belt tension. This would allow the mine to potentially utilize a lower piw strength belt, as opposed to placing all drives at a single head pulley. These options will be further evaluated prior to final design of the belt system for the new mine plan. Table 16.13, (Belt Design Matrix), summarizes the belt requirements and power demands with the greatest power demand. Figure 16.14, shows the belt system layout for this study.

Orvana Resources - Copperwood Project Feasibility Study Page 146
K D Engineering Document No. Q431-01-028 21 March 2012 KDE FORM No. A263a-7/12/99
Table 16.13
Belt Design Matrix Belt TPH Size (in) Length (ft) Lift (ft) Hp Req’d
Slope 650 42 1,800 250 300 Copperwood Main 600 42 2,035 325 300 Crosscut Main 500 42 7,275 0 250 Section 6 Main 500 42 1,530 325 200 Total 2,350 12,640 1,050
U.G. Mine Support Facilities and Utilities Based on the estimated mine personnel and equipment needed for a production rate of 7,500 t/d, the mine facilities and utilities requirements were estimated. The underground mine utilities primarily include compressed air, electricity, water to all parts of the mine, and pumping to remove groundwater inflows and water used in drilling and muck pile wetting. Final designs of these facilities will be required before production is initiated.

Orvana Resources - Copperwood Project Feasibility Study Page 147
K D Engineering Document No. Q431-01-028 21 March 2012 KDE FORM No. A263a-7/12/99
Figure 16.14 - Conveyor Belt Layout

Orvana Resources - Copperwood Project Feasibility Study Page 148
K D Engineering Document No. Q431-01-028 21 March 2012 KDE FORM No. A263a-7/12/99
Electrical Power A single line electrical distribution system drawing has been prepared for supplying the various electric power consumers in the mine. This drawing provides a preliminary analysis of electrical load, transformer sizing, circuit protection, cable sizing and substation sizing. Power will be supplied from the main substation at 13,800 V (3-phase, 60 Hz) via an overhead transmission line. The power supply voltage will be stepped down to 4,160 V for power distribution within the mine and mine facilities via a 5 / 6 MVA (open air / forced air) step-down transformer. In order to minimize voltage drop within the mine, it is recommended that 4,160 V be transmitted to each section within the mine and 4,160 V will be fed directly or stepped down to 480 V for mine surface equipment and facilities, and 480 V will be stepped down to 277 V for lighting and 120 V for instrumentation, communications and office equipment. The three feeder breakers planned to crush the ore and feed the ore onto the conveyor belts will require a mine load center (portable, dry transformer - 4160 V: 480 V). In addition, other small, portable transformers will be used to provide electric power to each of the six operating drill jumbos (2 x 55 kW each) hydraulic systems. Additional electrical equipment will include the mine ventilation fans, main sump pumps and any other auxiliary electrical needs. All power distribution, grounding, lightning protection and lighting will be installed as per latest federal, state and local standards. A 2000 kW standby generator will be installed to provide back-up power for emergency situations in case of a utility power supply failure. Figure 16.15, Electrical Line Diagram illustrates the proposed primary electrical layout for the underground mine.

Orvana Resources - Copperwood Project Feasibility Study Page 149
K D Engineering Document No. Q431-01-028 21 March 2012 KDE FORM No. A263a-7/12/99
Figure 16.15 - Electrical Line Diagram

Orvana Resources - Copperwood Project Feasibility Study Page 150
K D Engineering Document No. Q431-01-028 21 March 2012 KDE FORM No. A263a-7/12/99
Communication Systems Voice communication will be provided via simple twisted pair telephone lines connected to paging-type mine phones. The units are simple to install and to maintain and to provide communication between fixed points. Radio communications via a leaky feeder system can also be provided for access to persons whose responsibilities cause them to be at multiple locations in the mine during a given work shift. These communications require the installation of antennae and signal boosting stations at various locations throughout the mine. Monitoring Systems A computer-based monitoring system is proposed for the mine. This system will monitor levels of carbon monoxide in the mine and fan operational parameters (barometric pressure, fan pressure, air flow quantity, bearing temperature and vibration). It will have the ability to sound warnings and alarms both at the surface and at sites underground in the event of an emergency. The monitoring system central computer and main terminal will be located at the mine surface administration facilities. The system will require a network of sensors connected to a central computer system via an Ethernet, or similar type of cable system. The sensors will require regular maintenance and calibration and replacement as needed. Emergency Response Systems Increasingly, underground mines are implementing systems that track the movements of individual miners underground to facilitate improved response to emergency situations. These systems generally employ a small chip powered by each miner’s cap lamp battery that communicates with reading stations deployed in the mine with the information being transmitted and displayed at a surface location. In addition to tracking employee locations in the mine, emergency shelters (refuge chambers) are proposed to be deployed near each active mining section. These shelters provide a safe atmosphere, water, food and underground to surface communications to employees who are unable to escape from the mine in the event of an emergency. Freshwater Delivery Water is required underground for control of dust generated by drilling and muck pile wetting, equipment operating on roadways and for cooling of some equipment. It must also be available for firefighting. Water will be stored in a large tank located adjacent to the surface infrastructure facilities. Water will be piped underground and distributed as needed.
Orvana Resources - Copperwood Project Feasibility Study Page 151
K D Engineering Document No. Q431-01-028 21 March 2012 KDE FORM No. A263a-7/12/99
Water sprays are sometimes needed to control dust at the transfer of rock from one belt flight to another. It is estimated that this dust control activity will require an additional 30 gallons (gpm). General mining practice, and some safety regulations, require that 50 gpm (3.2 l/s) at 50 psi (345 Mpa) be available for firefighting. Water pipes with an inside diameter of 4 inch (102 mm) will be routed throughout the mine. This pipe size will provide adequate quantity and pressure to meet the needs of dust control and fire protection. The ramp pipe will require insulation, or heat taping near the portal, to prevent freezing during the winter months. Mine Water Removal The latest AECOM modeling shows that the mine area is 1,050 acres (426 hectares) and that the full build out inflow should be around 405 gpm. Since water is likely to be stored in the Copperwood Main Section when mining would allow it, the actual maximum inflow rate at any one time would be less than 405 gpm. A pumping capacity of 500 gpm has been planned for in the new mine plan.
16.2.11 Manpower and Operating Schedule The Copperwood Project underground and surface personnel requirements are dependent on the required production rate, work schedule, and the number of sections in production. The mine work schedule is based on working three shifts per day, seven days per week, for 350 days per year. A fourth (rotated off) crew will be required to meet this schedule, in addition to the three working crews each day. No allowance has been made for absenteeism, sickness, snow days, or dumped shifts. Holidays and vacation expenses are covered in the fringe benefit allowance. Three operating sections, or areas, are anticipated to be required to achieve full production. Two, 2-boom jumbo drills are required in each section. Once the face has been drilled, a loading and blasting crew will load the holes with explosives and blast the round. Once blasted, 6-cy LHD operators will load the broken ore into 30 ton trucks for transport to the feeder breaker assigned to the area. Four LHD operators, and four truck operators per shift, operating between the areas, will be required to load and haul the broken ore to the feeder breaker. Immediately after blasting, back-scalers will inspect the back and knock down any loose material. Following ore removal, a back bolter, requiring two operators will install rockbolts, mats and/or wire mesh to properly secure the back. Once the back is secure, it will be ready for blasthole drilling. Additional direct support personnel will be required for material movement, ground repair, ventilation, road maintenance, belt maintenance, electrical needs, mobile equipment mechanical maintenance, and underground labor.

Orvana Resources - Copperwood Project Feasibility Study Page 152
K D Engineering Document No. Q431-01-028 21 March 2012 KDE FORM No. A263a-7/12/99
Indirect mining personnel will include the mine superintendent, a general mine foreman, mine and maintenance shift bosses, mine engineers, grade control geologists, mine office personnel, a mine safety person, and mine dry attendants. A total of 119 direct hourly employees, and 26 indirect salaried employees are estimated to be required, for a total of 145 mine personnel working each day. The following Table 16.14, lists the estimated direct and indirect manpower, subdivided into major cost centers, scheduled for each day.
Table 16.14
Estimated Manpower at Full Production Cost Center Working/Day Rotated Off On Payroll
Direct Production Drilling/Blasting 42 14 56 Bolting/Scaling 12 4 16 LHD Operators 12 4 16 U.G. Truck Operators 12 4 16 U.G. Conveying 6 2 8 Subtotal Production 84 28 112 Service & Support Stoppings Const. 2 0 2 Road Maintenance 1 0 1 Pumping 1 0 1 Ventilation 1 0 1 Sanitation 1 0 1 Mechanical Maint. 14 5 19 Electrical Maint 2 0 2 Utility Persons 6 2 8 U.G. Labor 6 2 8 Subtotal Service & Support 34 9 43 TOTAL DIRECT 119 37 156 Indirect Mine Sup’t 1 0 1 General Foreman 1 0 1 Mine Shift Bosses 9 3 12 Maint. Shift Bosses 3 1 4 Engineering/Planning 3 0 3 Geologists/Grade Control 4 1 4 Safety Person 1 0 1 Mine Office 1 0 1 Mine Dry 3 1 4 TOTAL INDIRECT 26 6 32 TOTAL MINE 145 43 188

Orvana Resources - Copperwood Project Feasibility Study Page 153
K D Engineering Document No. Q431-01-028 21 March 2012 KDE FORM No. A263a-7/12/99
16.2.12 Mine Operating Costs Underground mine operating costs were estimated and broken down into major cost centers for direct labor and supplies for production, service and support, plus mine indirect costs for mine supervision, technical support, and the mine office and dry operations. These costs were prepared in fall 2011 U.S. dollars, with no allowance for escalation. A summary of these costs, at full production, is presented in the following Table 16.15.
Table 16.15 Estimated Mine Operating Costs
Cost Center Labor ($/t) Supplies ($/t) Total ($/t) Direct Production 4.53 5.34 9.87 Service/Support 1.15 2.53 3.67 Subtotal Direct 5.68 7.87 13.54 Indirect 0.93 0.16 1.09 Total Operating Cost 6.614 8.03 14.64
The estimated labor costs were based on a 145 person underground workforce being required for the full production rate of 7,500 tons per day. During the first two years of production build-up period, operating costs were increased to reflect the lower production rates and lack of sufficient working areas. The labor counts were based on the mine working 3-shifts per day, 7-days per week, 350 - days per year, with a fourth rotating crew included to cover scheduled days off. Hourly and indirect quantities (working per day), and the pay rates used in the labor cost estimates are shown in the following Table 16.16. Fringe benefit costs for hourly and salaried personnel will add an additional 35 percent and 30 percent respectively to the base wages.

Orvana Resources - Copperwood Project Feasibility Study Page 154
K D Engineering Document No. Q431-01-028 21 March 2012 KDE FORM No. A263a-7/12/99
Table 16.16
Hourly Pay Rates and Salaries
Classification Quantity Base
Wage ($/hr) Direct Miners 22 25.50 Miners Helpers 22 22.00 Bolter/Scalers 12 24.25 Equipment Operators 31 23.50 Mine Mechanics 7 24.00 Mechanic Helpers 7 21.00 Electrician 1 27.00 Electrician Helper 1 21.00 Utilitymen 9 20.00 U.G. Labor 6 18.00
119 Indirect Superintendent 1 125,000 General Forman 1 100,000 Mine/Maint. Shift Bosses 12 70,000 Engineering 4 85,000 Geology 3 85,000 Mine Safety 1 60,000 Mine Office 1 45,000 Mine Dry 3 40,000
26
Back control costs are expected to be about 15 percent of the cost of mining. A cost per ton was derived by using 8 ft cable bolts, as described in Section 16.2. Cement grout, coupled with wire mesh are expected to be used in all bolted locations. Shotcrete over wire mesh is planned where ground conditions dictate its use. . The back control costs were then calculated on a per foot basis, which would be applied to the scheduled footage. Thus, where the CBS was thicker, such as Copperwood Main, the back control costs are expected to be lower when compared to the thinner mining conditions expected in Section 6. Maintenance, material and supply costs were based on in-house estimates of costs for major and minor equipment repairs, lubricants, bits, ongoing ventilation controls and replacements for waterline, diesel line and high voltage cable. Fuel and electrical costs were broken down and presented on a per ton basis. Electrical costs include electric motor requirements for the jumbo and back bolter, ventilation, conveyors, pumps compressors, and miscellaneous small tools and lighting. Electric power costs were estimated using $0.08/kWh. Fuel costs include the diesel used to power the drills, LHD’s, haulage trucks and utility vehicles.

Orvana Resources - Copperwood Project Feasibility Study Page 155
K D Engineering Document No. Q431-01-028 21 March 2012 KDE FORM No. A263a-7/12/99
16.3 Mine Access Based on the July 2010 Scoping Study and subsequent PFS, the preferred access option for the Copperwood Property is by way of a boxcut. Any access design is required to provide two emergency escapeways out of the mine, a method of transporting the extracted ore out of the mine, access for men, materials to operate the mine and adequate ventilation for mining activities. 16.3.1 Boxcut The relatively shallow depth of overburden along the sub-outcrop of the mineralized zone provides an ideal location for mine access via a boxcut. Drilling during the 2010 exploration program pinpointed the sub-outcrop at the proposed boxcut location at a depth of approximately 100 ft (30 m). Location of the boxcut and a profile are included in Figure 16.16, Box Cut Location, and Figure 16.17, Box Cut Profile. The boxcut design is based on 2:1 slope batter angles, with 10 ft safety benches every 25 ft (7.6 m) of elevation change. The latest geotechnical analyses indicate the unconsolidated material overlying the Nonesuch Formation should be stable at this slope angle. Bolts, wire mesh, and shotcrete are included in the slope stability design and over the mine entry portals. The boxcut will be accessed by a ramp approximately 710 ft (216 m) long, inclined at a minus 15 percent grade. The boxcut design includes a 150 ft (46 m) by 200 ft (61 m) staging area at the base of the ramp, with sufficient room for a sump, primary fans, and any other necessary stationary equipment. Three, 20 ft. wide x 10 ft. high and 60 ft. long mine entry portals will be constructed from the boxcut, which will provide the primary initial accesses to the mine. Access to the mine from the southern sub-outcrop has been located to the west of the test mine developed by USMRC circa 1960. The boxcut location is based on the information provided in the USMRC document. The location of the old mining workings should be validated prior to finalizing the location of the boxcut.

Orvana Resources - Copperwood Project Feasibility Study Page 156
K D Engineering Document No. Q431-01-028 21 March 2012 KDE FORM No. A263a-7/12/99
Figure 16.16 - Box Cut Location

Orvana Resources - Copperwood Project Feasibility Study Page 157
K D Engineering Document No. Q431-01-028 21 March 2012 KDE FORM No. A263a-7/12/99
Figure 16.17 - Box Cut Profile

Orvana Resources - Copperwood Project Feasibility Study Page 158
K D Engineering Document No. Q431-01-028 21 March 2012 KDE FORM No. A263a-7/12/99
The total volume of unconsolidated and consolidated material required to be excavated is approximately 630,000 cubic yards. This includes approximately 319,000 cy of unconsolidated material and 311,000 cy of consolidated material. Of the consolidated material, approximately 37,000 tons will be potentially mineralized CBS. All of the unconsolidated and non-mineralized material will be used in the construction of the tailing impoundment. To prevent surface water inflow into the ramp and boxcut, a series of diversion ditches will be constructed adjacent to the ramp and boxcut to direct the drainage away from the site. Meteoric and groundwater inflows occurring within the ramp and boxcut during excavation will be gathered in localized low points or sumps, and pumps will be used to remove this water. Based on a third party expert’s analysis of the unconsolidated material, stability of the material should not be a concern over time. However, if necessary, shotcrete fencing may need to be applied to the walls of the boxcut and directly above the portal. Once the boxcut has been fully excavated, a permanent sump will be constructed in the base of the boxcut that will service the mine. The base of the ramp from ground level to the boxcut level will be paved. Concrete-lined drains will be constructed along the edges of the ramp. These drains would flow into the permanent sump. Any continuing meteoric or groundwater inflows will be managed by the drains and the sump. Water encountered during the mining process will be pumped back to this point, and a main permanent pump will be installed in the sump. The earthmoving cost with a 1,000 ft (305 m) haul distance is estimated at $3.50 per cubic yard for unconsolidated material and $6.00 for consolidated material. The cost of excavating, installing erosion control and concreting the boxcut design is approximately $4.1 million, with an estimated construction timeline of approximately five months to complete. Of this timeline, approximately 3.5 months would be earthwork, with the balance of the project time spent in stabilization and pavement work. 16.3.2 Portals The initial boxcut excavation would include three, 60 ft long, entries into the mine. One entry would serve as an air intake, another an air return and the third as an entry for the slope conveyor belt leading into the mine. Personnel and equipment would travel in either the belt, or air intake, entries. For the purposes of this study, the westernmost portal is planned as the return portal and the two easternmost portals as the intake portal. The center portal will be reserved for the slope conveyor leading out of the mine. Since the mine is proposed to operate on an exhausting system, the intake airway can be left open. The intake portal will be the main travel way for all vehicles in and out of the mine.
Orvana Resources - Copperwood Project Feasibility Study Page 159
K D Engineering Document No. Q431-01-028 21 March 2012 KDE FORM No. A263a-7/12/99
The available area for the belt portal will be restricted by the 42 inch (1,066 mm) conveyor belt, electrical cables and pipes for supply water and wastewater. Freshwater will be supplied either through the existing wastewater filtration system, or via the freshwater pipeline running from the lake to the plant. The return portal will be covered to create a nearly air-tight seal around the portal so that fan leakage is minimized. To prevent injuries and damage to equipment and infrastructure, the highwall of the boxcut will use 10 ft (3 m) safety benches. Additional safety measures are the use of fencing and shotcrete to further stabilize the slopes above the portals. At this time, it is not expected that the additional support measures will be required. The primary fans will be installed at the return portal, and the air will be exhausted from the mine. The fan installation will have a wall, or door, built into the housing such that if fan pressures ever become too great, a door would open to allow air to short circuit the mine, and the fan may continue to operate without risk of major damage. A two-fan system, operating in parallel, is recommended to supply the mine ventilating air. These fans can be run individually, or both at once. This will facilitate the mine ventilation as it transitions from a single section into a three section mine. The fan surface layout will incorporate a Y to allow both fans to be protected from debris and explosions within the mine, as opposed to a fan being placed directly in front of the portal. A fan exhaust tower leading from the fans to above the box cut is anticipated to dissipate particulate matter in accordance with local air quality standards. The primary surface substation for operation of the surface fans, pumps and initial mine development, will be placed between the belt and return portal. There will be a fence around the substation to protect them from unwanted access. Since the fan is required to have an independent power source from the mine, the substation will require an independent circuit supplying the fan. Cost Estimate The cost to install two fans in parallel, a fan substation and mine substation is $2.9 million. Additional costs for the sump construction are included in the excavation cost. Costs for the mine sump are included in the capital costs for the mine water discharge system. 16.3.3 Slope Belt Conveyor In order to convey material from the mine, up the access ramp and onto the mill ROM stockpile, a single 42 in. belt conveyor is proposed. Belt conveying will provide the lowest per ton cost for material transport from the portal to the run-of-mine stockpile. Typically, belt conveyors operate at well over 95 percent availability at relatively low-cost maintenance levels.

Orvana Resources - Copperwood Project Feasibility Study Page 160
K D Engineering Document No. Q431-01-028 21 March 2012 KDE FORM No. A263a-7/12/99
The proposed ramp belt conveyor would be 42 in (1,066 mm) wide, and approximately 1,800 ft (549 m) in length. Elevation lift of the belt would be approximately 240 ft (61 m). Other belt design parameters are shown in following Table 16.17
Table 16.17
Ramp Belt Design Parameters Description Unit
Annual Production 2,625,000 tons Operating Days/Year 350 Shifts per Day 3 Hours per Shift 8 Belt Utilization 75 % Belt Availability 97 % Surge Factor 1.25 Length 1,800 ft. Lift 250 ft Belt Trough Angle 35 degrees Surcharge Angle 25 degrees Belt Width 42 inches Belt Speed 600 fpm Material Density 169 lbs/ft3
Belt Drive efficiency 95 % Motor Efficiency 95%
From these parameters the anticipated belt power requirements are shown in the following Table 16.18.
Table 16.18 Ramp Belt Power Requirements
Power Component Hp Empty Belt Horizontal 31 Lift Material & Belt 300 Convey Material Horizontally 64 Power Required Subtotal 395
The ROM material that would be produced by in the blasting process should average approximately 8 to 10 inch, although the ultimate size will be impacted by blasthole spacing and how the laminated beds behave when blasted. If the material tends to form slabs as opposed to fragmenting evenly, then greater reduction must occur at the feeder breaker. The feeder breakers in each mining section will reduce the material size to 4 to 6 inches. Typically, feed rates on a feeder breaker are inversely proportional to the reduction in material size. As there is a significant reduction in size from the material produced at the face, a feeder breaker should obtain average production rates Broken material transported via the belt conveyor from underground will go through a transfer tower onto another belt conveyor and then will be discharged onto the ROM stockpile.

Orvana Resources - Copperwood Project Feasibility Study Page 161
K D Engineering Document No. Q431-01-028 21 March 2012 KDE FORM No. A263a-7/12/99
The total cost to construct a 42 inch (1,066 mm) ramp conveyor from the underground mains intersection to the surface stockpile is estimated at $1,936,000. This cost does not include any cost for a power load center, since the existing mill electrical infrastructure can be used to supply power to the ramp conveyor. 16.4 Mine Surface Infrastructure Surface facilities proposed in this section are based on a full production rate of 2.625 Mtpy (2.38 Mt) and a mine staffing level of approximately 144 direct and indirect personnel working each day, plus an additional 43 on the payroll, but rotated off. To limit the disturbance footprint at the mine site, these facilities are to be located adjacent to the entrance of the boxcut ramp. Surface infrastructure required for the underground mine primarily includes the mine office and dry facilities, and a portion of the surface maintenance facilities. Infrastructure buildings required for mine operations are discussed within this section. A layout of the surface facilities is presented in Figure 16.18, Surface Facilities Layout.

Orvana Resources - Copperwood Project Feasibility Study Page 162
K D Engineering Document No. Q431-01-028 21 March 2012 KDE FORM No. A263a-7/12/99
Figure 16.18 - Surface Facilities Layout

Orvana Resources - Copperwood Project Prefeasibility Study Page 163
K D Engineering Document No. Q431-01-028 21 March 2012 KDE FORM No. A263a-7/12/99
16.4.1 Mine Office and Change House The mine office would service all administrative and engineering purposes for the mine. The mine office will be built using modular construction; however, given the length of mining and restrictive modular construction codes within the state of Michigan, it is recommended that a permanent slab be laid prior to construction and the modular building be secured to the slab. The office will include private offices and a large bull pen specifically for Geology and Mining. This building will also include a lunch room, conference room, mine safety training room, mine rescue room, lockers and men's and women's bathrooms and showers. The change house/dry room will be built to accommodate a training room, lockers and clothes hanging baskets for approximately 180 mine and visitor personnel. Toilet facilities and shower rooms should accommodate one shift’s personnel (approximately 50 persons). The modules for the office and change house are expected to meet all of the heating, plumbing and electrical codes of the state of Michigan, and prior to construction, the structures must have been approved and labeled as such by the state of Michigan. 16.4.2 Surface Maintenance Shops The maintenance shop building will consist of a 65 ft by 75 ft pre-engineered building which includes a truck shop, two offices, showers, bathroom, storage and overhead crane. Attached on the south side of the Maintenance building is a 25 ft by 25 ft Instrumentation shop and a 25 ft by 25 ft electric shop. Off the north side of the maintenance shop are additional offices and rooms for safety, training, bathrooms, lunch room and environmental rooms. The maintenance shop will have three roll-up bay doors for transport of equipment and parts. Due to logistical constraints, most minor repairs and small maintenance repairs would take place underground, while the surface central maintenance shop would be responsible for all major repairs. 16.4.3 Surface Supply Storage Supply/storage areas will consist of 50 ft by 120 ft heated, enclosed storage space which also includes a 20 ft by 50 ft covered unheated storage space. A roll-up door will provide forklift access on at least one side of the enclosed storage structure. Items that only need protection from rain, and snow will be stored in a structure that is covered, unheated and open on at least one side. This area will be used to store items such as conveyor structure, pipes, back bolts and similar goods. The man-trips can also be parked here as well. On one end of the building is a tool crib, offices, purchasing area and bathrooms. The uncovered storage area should also be easily accessed by forklift to facilitate materials handling. The uncovered storage area will be located adjacent to the covered storage and will be fenced off to prevent unwanted access.

Orvana Resources - Copperwood Project Prefeasibility Study Page 164
K D Engineering Document No. Q431-01-028 21 March 2012 KDE FORM No. A263a-7/12/99
16.4.4 Surface Utilities All electrical, freshwater and wastewater lines would be placed within reasonable access to the mine facilities. Given the proximity to the mill site, it is likely that synergies between the mine site and mill will greatly reduce capital costs for utility development. 16.4.5 Ore Stockpile and Materials Handling Once the ore has been conveyed to the surface, the ramp belt will discharge the ore onto the run-of-mine stockpile belt conveyor, which will discharge the ore into run-of-mine stockpile. 16.5 Risk Assessment Mining risks to the Copperwood Project are categorized as geological and geotechnical, equipment and climate. 16.5.1 Geological and Geotechnical The geological risks to the project include faulting, joints, slump features, water inflow, differentiating the ore/waste boundary and geotechnical. Only one fault was identified during the drilling program, although faulting was mentioned in the USMRC test mine report. The fault is potentially a northward dipping shallow reverse fault with minor displacement of 9.8 ft to 23 ft (3 m to 7 m). The trace length of the fault is unknown, but it may be intersected by the mains that access the main Copperwood Block; see Figure 16.3. Likely impacts to mining include poor back conditions along the fault plane as mining crosses the fault, difficulty in identify the ore zone and ramping to follow it, localized increase in mining grade (slope of the floor) and potential water inflow along the plane of the fault. In mine drilling and underground, geological mapping will probably be needed to determine the location of the ore zone and secondary back support such as wire mesh, and strapping will need to be installed while crossing the fault. Other than a short-term (days) loss of production, the expected impact to mining is minimal. As mentioned earlier, the USMRC study identified several small faults striking north-south with spacing of 100 ft to 400 ft (30 m to 122 m). Displacements indicated strike-slip movement with vertical displacements of less than 1/2 ft. The fault between E110 and E120 in the east drift was weak and a source of water. The orientation of the mine on apparent dip should minimize the impact of these small faults on back control. Again, secondary back support may be needed when these small structures are intersected. The joints that were mapped in the USMRC test mine included a dominant joint set (vertical) striking N75W - N80W with joints spaced 3 ft to 8 ft (0.9 m to 2.4 m) apart, a secondary set at N10W - N30W and a minor set at N3E - N25E. Most of the joints were tight, but some dripped water. Some showed slickensides with a suggested east-west movement which technically makes them faults. The project stated, “Mine openings that
Orvana Resources - Copperwood Project Prefeasibility Study Page 165
K D Engineering Document No. Q431-01-028 21 March 2012 KDE FORM No. A263a-7/12/99
parallel the major joints should be held at a minimum since openings in this direction would undoubtedly give the weakest back conditions.” The proposed mine plan that is oriented 90 degrees horizontally to the dip of the seam or approximately N45W or N45E should insure that most entries and cross cuts do not end up parallel to any of the joint patterns. Joints will still need to be considered because of the potential planes of weakness in the back as they cross mine openings. Metal strapping mats installed between back bolts is a common method of reinforcing the back where joints, or faults are identified. Apparently slump and slump fractures that formed in the sediments were a back control problem in the test mine and at the White Pine Mine. These slump features were typically in the upper part of the mineralized zone and the first foot or two of the immediate back. Mr. Jack Parker identified one of these features during the White Pine Mine visit and noted that they were a localized back control issue. The miners will have to learn to identify these features. Strapping mats between back bolts and wire mesh may be required. The quantity of water expected to inflow into the mine is minimal. If as mentioned in the USMRC report that dripping does take place along some joints and small faults, limiting the impact of these minor water sources on the surrounding back rock will be critical. “Over fracturing” is possible with a drill-blast mining method, and will need to be minimized by utilizing proper blasting techniques. All backs relax or start to sag once the ore is removed. Sagging induces small fractures in the back rock, and at some point, the back will fail. Back support (fully grouted bolts) installed immediately after ore extraction limits the ability of the back rock to sag, minimizes fractures which, in turn, minimizes water migration and reduces the likelihood of back failure. In cycle back bolting is an essential part of the mining cycle. Because of the dip of the CBS, water on roadways can have an impact on the equipment. Although the Copper Harbor Conglomerate should make an excellent floor, any water falling on the floor will need to be collected in sumps and pumped from the mine. Differentiating the ore/waste boundary in the hanging wall may be difficult. The Red Laminated sub-unit contact with the underlying Gray Laminated is transitional. It will likely take special training for operators to tell the difference between back and ore and a regular sampling protocol at the mining face to identify ore that may be in either the back or floor rock. For this reason, it is recommended that geologists be available on each shift to assist in identifying the ore-waste boundaries. A geotechnical risk is associated with the uniaxial compressive strength (UCS) of the various sedimentary layers. Additional geotech drillholes have been recommended, including additional UCS and fracture direct shear testing. In general the UCS of the CBS rocks have higher compressive strengths than coal and are slightly harder in the main Copperwood Block than most of the industrial minerals

Orvana Resources - Copperwood Project Prefeasibility Study Page 166
K D Engineering Document No. Q431-01-028 21 March 2012 KDE FORM No. A263a-7/12/99
such as trona, potash and salt. The UCS's of the CBS units increase towards the east, Section 6 by approximately 45 percent for the Domino and Red Massive and 22 percent for the Gray Laminated as compared to the averages in the main Copperwood Block. 16.5.2 Equipment The equipment risks are minimal. The equipment lead times are expected to be twelve to fourteen months. 16.5.3 Climate The climatic risks to the project include temperature and humidity. Extremely cold temperatures impact the operation of the belt conveyors and water piping exposed to the cold, and exposes personnel to freezing conditions while accessing the mine and when they are working underground near the mine portals. Belt conveyors can slip while attempting to start during extremes of cold. Belt conveyors should be completely empty before stopping and should be run full time, when temperatures dictate. The ramp water lines (freshwater into the mine and wastewater from the sump) need to be insulated and equipped with heat trapping near the portals. To reduce exposure to the cold, snow and rain, men will be transported into the mine in enclosed man-trips. The air intake entries and the primary travel way will remain cold for at least the first 1,000 ft underground. During mine development, the quantity of fresh air entering the mine should be restricted to the legal limit to minimize wind chill. If necessary, heating equipment can be installed in the ventilation system. The capital and operating costs for heating equipment were not included in this study. Another option would be to use one of the first panels extracted as a tempering panel. The intake air would be routed through the tempering panel and allowed to equilibrate with the mine rock before being directed through active mine workings. The pillars in this panel would not be extracted until the panel is no longer needed to moderate the temperature. There remains the possibility that the panel conditions could deteriorate to the point where the pillars could not be extracted. Changes in humidity can impact back conditions especially if the back rock is susceptible to moisture. These changes typically would take place in the fall, when the humidity decreases, and moisture sensitive shales, and some siltstones, dry out and shrink, and again in the spring as humidity increases when the shales and siltstones absorb moisture and swell. In general the back rocks do not appear to be moisture sensitive, although some of the bedding plane laminations may. To limit the impact, secondary support typically could be installed in the first 1,000 ft of intake airways. The secondary support would include wire mesh covered with shotcrete. Limiting back sag and the formation of micro-cracks in the back can be controlled by bolting immediately after the blast is extracted. If necessary, a dehumidifying system could be installed in conjunction with the ventilation system.
Orvana Resources - Copperwood Project Prefeasibility Study Page 167
K D Engineering Document No. Q431-01-028 21 March 2012 KDE FORM No. A263a-7/12/99
17.0 RECOVERY METHODS The Copperwood Project will be developed in two phases. In Phase I, a facility will be installed to process ore at a rate of 5,000 tpd. In the third year of operation, the Phase II expansion will increase throughput to 7,500 tpd. The expansion to the process plant will entail installation of a second ball mill, three additional rougher flotation tank cells, two additional cleaner flotation columns and a third regrind mill. The plant design is based upon the most current metallurgical testwork and is detailed in the following appendices. Attached in Appendix 1 are Design Criteria for Phase I and Phase II. Attached in Appendix 2 are the following Flowsheets and General Arrangement drawings.
▪ 00-F-00 Mass Balance ▪ 10-F-01 Flowsheet SAG Grinding ▪ 20-F-02 Flowsheet Ball Mill Grinding ▪ 30-F-03 Flowsheet Flotation ▪ 40-F-04 Flowsheet Regrind ▪ 50-F-05 Flowsheet Copper Concentrate Handling ▪ 60-F-06 Flowsheet Tails Thickening ▪ 70-F-10 Flowsheet Reagents ▪ 75-F-15 Flowsheet Sampling ▪ 80-F-20 Flowsheet Process & Reclaim Water ▪ 90-F-30 Flowsheet Fresh Water
Attached in Appendix 3 are Equipment Lists for Phase I and Phase II. Attached in Appendix 4 is the detailed basis for the process Capital Costs. 17.1 ROM Ore Handling Ore is stored in the 7,500 tonnes live capacity mill feed stockpile. Ore will be withdrawn at a controlled rate from the mill feed stockpile by variable speed apron feeders (three operating and one standby) onto the SAG mill feed conveyor and ultimately the SAG mill. A covered stockpile is required due to rain in summer and heavy snow in winter. When required, ore will be moved from the "dead" storage area to the "live" storage area by front-end loader or bulldozer. Dust control in the mill feed stockpile area will be by high efficiency cartridge-type dust collectors and dust suppression water sprays. 17.2 SAG Mill Grinding The primary grinding circuit will consist of a semi-autogenous (SAG) mill equipped with grate discharge and a trommel screen to size the mill discharge. Water will be added to the SAG mill to produce slurry and the ore will be ground. The SAG mill discharges through a trommel screen with 3/8 inch openings. Oversize will be recycled to the SAG feed system by a series of conveyors. Preliminary tests indicate that crushing of the SAG mill trommel oversize is not needed; however, space will be provided for a recycle

Orvana Resources - Copperwood Project Prefeasibility Study Page 168
K D Engineering Document No. Q431-01-028 21 March 2012 KDE FORM No. A263a-7/12/99
crusher so a recycle crusher can be added in the future if it is demonstrated that a crusher is required. Weigh scales will be installed so that the weight of material recycled can be monitored. The future crusher will be able to be bypassed for maintenance purposes or when not needed. SAG mill trommel screen undersize will flow by gravity to the ball mill discharge pump box where it will join the ball mill discharge.
17.3 Ball Mill Grinding The secondary grinding circuit will consist of a ball mill in closed circuit with cyclones. For Phase I, one large ball mill is required. For Phase II, a second identical ball mill will be added. Water will be added to the ball mill to control the mill density. Ball mill discharge will join SAG mill discharge and will be pumped to the cyclones for classification. Cyclone underflow will return to the ball mill. Cyclone overflow at approximately 80 percent minus 63 microns will overflow by gravity to the flotation feed sampler. Flotation reagents may be added to either the SAG mill or the ball mill.
17.4 Flotation Hydrocyclone overflow will flow by gravity to the flotation circuit. The flotation circuit will consist of one row of rougher flotation cells, two concentrate regrind circuits for phase I and three concentrate regrind circuits for phase II, one row of first cleaner/first cleaner scavenger flotation cells. Two second cleaner flotation column cells and two third cleaner flotation column cells for phase I, for phase II, add one more flotation column cell for second and third cleaner flotation. The rougher row will consist of five (5) tank type rougher flotation cells for phase I and will add three (3) more for phase II. The rougher concentrate will be sampled with the rougher concentrate primary sampler and pumped by classification cyclone feed pump (one operating and one stand-by) to the classification cyclone cluster, the cyclone underflow (+500 mesh) will go to regrind circuit and cyclone overflow will be sampled by the classification cyclone overflow sampler and particle size monitor, and flow to the 1st cleaner flotation cell. The concentrate samples cut by the samplers will be analyzed for process control by the copper on-stream analyzer. Tailing from last rougher flotation cell will be sampled with primary samplers and analyzed by the copper on-stream analyzer. Copper concentrate regrinding will be performed in two vertical mills (phase I) and three vertical mills (Phase II) operated in parallel. The vertical mills will operate in closed circuit with hydrocyclones. Vertical mill discharge will be combined with classification underflow (+500 mesh) in regrind cyclone feed pump box and will be pumped by variable speed horizontal centrifugal slurry pumps (one operating and one stand-by) to a hydrocyclone cluster. Hydrocyclone underflow will be split to feed each regrind mill which will discharge back to the copper regrind cyclone feed pump box. Hydrocyclone overflow (final regrind circuit product) will be sampled by the regrind cyclone overflow sampler for particle size distribution analysis by the copper regrind cyclone particle size monitor, analyzed by the copper on-stream analyzer, and flow by gravity to the first cleaner flotation circuit.
Orvana Resources - Copperwood Project Prefeasibility Study Page 169
K D Engineering Document No. Q431-01-028 21 March 2012 KDE FORM No. A263a-7/12/99
Reground rougher concentrate combined with classification cyclone overflow (-500 mesh) will feed six (6) first cleaner flotation cells. Concentrate from the first cleaner flotation cells will flow by gravity to the second cleaner feed pump box. Tailings from the first cleaner cells will flow by gravity to eight (8) first cleaner scavenger flotation cells. Concentrate from the first cleaner scavenger flotation cells will flow by gravity to the 1st cleaner scavenger concentrate pump box. Tailings from the cleaner scavenger cells, sampled by the scavenger tail primary sampler for process control, will flow by gravity to the tailings launder. First cleaner flotation concentrate will be pumped (one operating and one stand-by) from the second cleaner feed pump box to the 2nd cleaner column feed distributor to feed three second cleaner column cells (two for Phase I and one more will be added for phase II) in parallel. Second cleaner flotation concentrate will be pumped (one operating and one stand-by) from the second cleaner feed pump box to the 3rd cleaner column feed distributor to feed three third cleaner column cells (two for Phase I and one more will be added for Phase II) in parallel. Tailings from the 2nd column cells will flow by gravity to 2nd cleaner tailing pump box Concentrate from the 3rd column cells will flow by gravity to the concentrate thickener. Tailings from the 3rd column cells will flow by gravity to 2nd cleaner feed pump box and then to the classification cyclone feed pump box. Flotation air for the cleaner flotation column cells will be supplied by column cell compressed air system. Air compressor, air receiver, and instrument air dryer will be installed for general plant operation and maintenance. A bridge crane will be installed for maintenance of the flotation and regrind equipment. Flotation reagents will be added at several points in the flotation circuit. 17.5 Concentrate Sedimentation and Filtration Copper flotation concentrate will be thickened and filtered prior to transport to the concentrate stockpile and shipment to a smelter. The thickener underflow will be pumped to the filter feed tank and then will be pumped to the filter. The filter cake will be conveyed to concentrate stockpile. The filtrate will be pumped back to the concentrate thickener. Filtered concentrate final moisture content will be approximately 9 percent. 17.6 Tailing Sedimentation
Tailing from the flotation circuit is thickened. The thickener underflow will be pumped to the tailing dam. Other waste streams will also be sent to the thickener for water recovery. The recovered water will be used in milling and bulk flotation. Thickener overflow will be stored in the mill water tank. A tank with 30 minutes of live capacity is specified.

Orvana Resources - Copperwood Project Prefeasibility Study Page 170
K D Engineering Document No. Q431-01-028 21 March 2012 KDE FORM No. A263a-7/12/99
17.7 Plant Water Management The fresh water distribution system provides fresh water for process requirements such as process water makeup, reagent mixing, gland water, and fire water. The bulk of the process makeup water will be added to the thickener. From the head tank, low pressure water will flow to the systems that do not require high pressure. The process water tank receives tailings thickener overflow, tailings reclaim water, and fresh water if sufficient reclaim water is not available. The water is pumped to the grinding circuit and may contain a small amount of solids so it is not suitable for general distribution throughout the process plant.
17.8 Flotation Reagents Reagents required for the operation will be stored, prepared as required and distributed to the process. Reagents which require storage and distribution include:
▪ Sodium hydrosulfide (NaSH) ▪ Sodium Isobutyl Xanthate (C-3430) ▪ Methyl Isobutyl Carbinol ▪ Dowfroth 250 (D-250) ▪ Alkylaryl Dithiophosphate (A-249) ▪ n-Dodecyl Mercaptan (NDM) ▪ Sodium Silicates ▪ Carboxymethyl Cellulose Sodium ▪ Flocculant ▪ Fuel Oil

Orvana Resources - Copperwood Project Prefeasibility Study Page 171
K D Engineering Document No. Q431-01-028 21 March 2012 KDE FORM No. A263a-7/12/99
18.0 PROJECT INFRASTRUCTURE
A number of infrastructure items are included in the estimate as detailed below. 18.1 Buildings and Structures A number of buildings and structures are included in the estimate and are detailed in the cost estimate. These items include
▪ Administration and engineering building ▪ Laboratory ▪ Warehouse ▪ Maintenance shops ▪ Plant and mine offices ▪ Change room ▪ Security - guard gate ▪ Core storage building ▪ Truck Shop ▪ Miscellaneous modular buildings for MCC, Analyzer etc. ▪ Mill building ▪ Concentrate storage ▪ Reagents ▪ Electric Room
A camp will not be required due to the close proximity of several nearby towns. 18.2 Fresh Water C2AE has provided an “Opinion of Cost” of a water supply alternative for the Copperwood project site. This plan is based on 0.5 million gallons per day and provides a lake intake, a low service pump station, and a raw water transmission main that will be sized to serve the Copperwood project. The cost basis is for serving the project only and includes a storage tank. Gravel roads will also be provided to access the pump station near the lake and the sump pump station near the tailings pond. 18.3 Access Roads Budget costs for access roads were provided by Coleman Engineering. Costs are included for upgrading County Road 519 as well as extending a new northern route from County Trail 519 to the mine site. Coleman also provided unit costs for the onsite road preparation, parking lots, pavement and sub-base. These costs are detailed in the capital cost estimate

Orvana Resources - Copperwood Project Prefeasibility Study Page 172
K D Engineering Document No. Q431-01-028 21 March 2012 KDE FORM No. A263a-7/12/99
18.4 Water Treatment Plant The water treatment plant will be constructed in Year 3 and will begin operation in Year 4. The plant maximum design flow rate for the mining period and closure is 350 gpm. The initial cost allowance (i.e., capital cost) is US$ 19.0 million plus contingencies. The water treatment plant will treat excess water which will be released either at a storage tank within the plant for further use or discharged at West Branch Namebinag Creek. The plant installation is delayed until Year 3 due to the fact that the TDF will be utilized to store water until the start of Year 4 and there will not be any TDF discharge until that time. 18.5 Electrical Power Supply The closest utility substation is located at Norrie, Wisconsin and operated by XCEL Energy. It is assumed that XCEL will run a 115 KV power transmission line to the proposed mine site to provide electrical service. The assumption for the transmission line extension is the allowance for a 25.2 mile long run, associated right-of-way and mine substation. Emergency generated power will be provided on site for critical equipment. The total electrical load for the project is approximately 21 MW (24 MVA). The incoming power supply at 115 KV will be stepped down to 13.8 KV via a 28 MVA liquid filled transformer and distributed through the mine at 13.8 KV and 4.16 KV (3-phase, 3 wire system) as required, for operating the mill motors and this distributing voltage will be stepped down to 480 VAC for feeding motors below 300 HP. The 480 VAC, 3-phase system, will be stepped down to 480/277 VAC and 208/120 VAC for lighting and instrumentation power requirements, respectively.

Orvana Resources - Copperwood Project Prefeasibility Study Page 173
K D Engineering Document No. Q431-01-028 21 March 2012 KDE FORM No. A263a-7/12/99
19.0 MARKET STUDIES AND CONTRACTS There have been no market studies for this study. Copper concentrates are subjected to a number of charges associated with their sale. Typically, charges accrued by the concentrate production organization include treatment charges, refining charges, transportation charges, and, possibility, a marketing charge. Concentrate treatment and refining charges (TC/RC) vary depending upon the state of the economy and the amount of copper concentrates available for smelting. The following Table 19.1 which was derived from 2010 InfoMine USA Inc. compares TC/RC charges for the years 1996 through 2010.
Table 19.1 Comparison of Copper Concentrate Treatment Charges and Copper Prices by Year
Year Long-term Treatment Charge
(US$ per metric ton clean concentrates) Refining Charge
(US$ per lb) Average LME1 Grade A Cash Price (US$ per lb)
1996 $95 - $105 $0.095 - $0.10 $1.040 1997 $105 - $115 $0.105 - $0.12 $1.032 1998 $85 - $107 $0.085 - $0.1025 $0.750 1999 $62 -$ 70 $0.062 - $0.070 $0.713 2000 $64 - $80 $0.064 - $0.070 $0.822 2001 $73 - $80 $0.073 - $0.080 $0.716 2002 $60 - $70 $0.060 - $0.070 $0.707 2003 $45 - $58 $0.045 - $0.058 $0.807 2004 $65 - $86 $0.065 - $0.086 $1.300 2005 $83 - $95 $0.083 - $0.095 $1.994 2006 $70 - $110 $0.070 - $0.110 $3.049 2007 $50 - $60 $0.050 - $0.060 $3.238 2008 $45 - $50 $0.045 - $0.050 $3.154 2009 $50 - $75 $0.050 - $0.075 $2.336 2010 $42.00 - $46.50 $0.042 - $0.0465 $3.416 - 10 Sept 2010
1 London Metal Exchange As can be seen from the foregoing tabulation, the TC/RC charges can vary dramatically with time. Currently, TC/RC charges by smelters are near all-time low levels. Transportation charges vary with the distance that the concentrate must be transported to the smelter. It is anticipated that the White Pine Smelter will not be in operation when the Copperwood facility is in production. Possible candidates for smelting include the Horne smelter and refinery in Quebec, the copper-nickel smelters in Sudbury, Ontario or European smelters. The transportation costs per ton of copper concentrate will vary with the distance that the concentrate must be transported and the mode of transport (rail, truck, or ship). A typical smelter schedule will pay for 95 to 98 percent of the copper content at market value. A minimum deduction of 1.0 unit (1 percent of a ton) for copper concentrates grading below 30 percent is usually applied. The silver payment is 92 to 95 percent of the silver content if it is over one ounce per ton. From this calculated value, the TC/RC

Orvana Resources - Copperwood Project Prefeasibility Study Page 174
K D Engineering Document No. Q431-01-028 21 March 2012 KDE FORM No. A263a-7/12/99
charges are applied together with transportation costs and any deleterious element deduction. There may be penalties applied to copper concentrates that have excessive amounts of the following elements; lead, zinc, arsenic, antimony, bismuth, nickel, alumina, fluorine, chlorine, magnesium oxide, and mercury. The Copperwood concentrate can be classified as "clean" and no penalties for deleterious elements are expected.

Orvana Resources - Copperwood Project Prefeasibility Study Page 175
K D Engineering Document No. Q431-01-028 21 March 2012 KDE FORM No. A263a-7/12/99
20.0 ENVIRONMENTAL STUDIES, PERMITTING, AND SOCIAL OR COMMUNITY IMPACT
The project is currently in compliance with all local, state and federal environmental regulations. Minimizing and preventing environmental impacts have been, and continue to be, a primary component of the project. The following section briefly identifies general environmental conditions, key environmental regulations, and preliminary findings. The site is primarily forested and contains four small, warm water / intermittent streams. The site has been heavily logged since the late 1800s with a northern hardwood forest (aspen and soft maple dominant) that is less than 50 years old. The site is currently managed as commercial forest. Multiple roads traverse the site. There are no permanent inhabitants on or near the site. Lake Superior is located approximately one mile from the proposed surface facilities. Key environmental regulatory agencies with jurisdiction over parts of the project include:
▪ The State of Michigan, Department of Environmental Quality (MDEQ) and
the Michigan Department of Natural Resources (MDNR)
▪ US Environmental Protection Agency (USEPA)
▪ US Army Corps of Engineers (USACE) The State of Michigan has been delegated authority by the USEPA for most federal environmental programs associated with the nation’s primary environmental statutes (CWA, SDWA, RCRA, CAA). The State of Michigan specifically regulates nonferrous metallic mining under the Natural Resources and Environmental Protection Act (NREPA), Act 451 of Public Acts of 1994, as amended. The Michigan Department of Environmental Quality, as the administering agency, has developed administrative rules under the act with requirements found in Part 632 of the NREPA, Michigan’s Nonferrous Metallic Mining Regulations (Part 632). 20.1 Environmental Regulations in Michigan Part 632 regulates the construction, operation, closure, post-closure monitoring, reclamation and remediation of nonferrous metallic mineral mines in Michigan though issuance of a mining permit. The mining permit is administered though the Michigan Department of Environmental Quality, Office of Geological Survey. For an approved mining permit to be effective, all other, environment and non-environment related, required permits must also be approved.

Orvana Resources - Copperwood Project Prefeasibility Study Page 176
K D Engineering Document No. Q431-01-028 21 March 2012 KDE FORM No. A263a-7/12/99
The Michigan Part 632 mining permit application requires that the following items be submitted along with other administrative information and financial assurances:
▪ An environmental impact assessment ▪ A mining, reclamation and environmental protection plan ▪ A contingency plan ▪ A listing of additional anticipated permits and licenses
As part of the mine permit application, an environmental impact assessment (EIA) is required. The rules specify the type of baseline data that must be collected to characterize the site. For some data, a collection period of two years is required. The EIA includes an analysis of the project impacts and alternatives and tradeoffs to prevent, reduce or mitigate those projected impacts. The Part 632 mine permit application for the Copperwood Project was submitted and found to be administratively complete by the MDEQ on 23 September 2011. The permit review process has moved forward according to a statutory timeline and resulted in a proposed decision on 15 February 2012 to issue a mine permit to ORUSC. A final permit decision is expected by 1 May 2012. 20.2 Additional Environmental Regulations The surface facilities will require additional environmental permits. Some of these permits will be consolidated some will be applied for separately as required pre-construction. Additional environmental permits required and their current status (all statutory references to Public Act 451 of 1994 as amended, unless otherwise noted):
▪ Part 301 Inland Lakes and Streams and Part 303 Wetlands (joint permit application to MDEQ with EPA & USACE review) - Draft application submitted in October, 2011 with revisions on March 2, 2012. Review is pending.
▪ Part 315 Dam Safety – Application not submitted yet. Pending completion of
the BFS and final TDF design.
▪ Part 55 Permit to Install, Air Discharge Permit– Application submitted in November, 2011 with preliminary permit conditions issued on February 27, 2012. Next step is public notice and comment period.
▪ Part 31 NPDES Individual Permit for process wastewater and contact storm
water – Application submitted in November, 2011 with revision pending completion of the BFS.

Orvana Resources - Copperwood Project Prefeasibility Study Page 177
K D Engineering Document No. Q431-01-028 21 March 2012 KDE FORM No. A263a-7/12/99
▪ Part 31 NPDES General Permit for sanitary wastewater lagoon system and non-contact storm water – Application submitted in January, 2012. Review is pending, public notice and comment period may not be required.
▪ Part 31 NPDES for construction – Soil Erosion and Sediment Control and
Construction Storm Water permits. Pre-Construction, covered under Part 632 Mine Permit also.
▪ Part 365 Threatened and Endangered Species Permit (needed to relocate
state threatened plant for TDF construction) – Pre-Construction, 3 to 4 week notice required.
▪ Act 207 of 1941, Michigan Fire Prevention Code – Pre-construction approvals
as needed to cover installation of storage tanks for flammable and combustible liquids.
▪ Part 325 and Section 404 Structure on Bed, Lake Superior water intake –
permit application pending by Gogebic Range Water Authority (GRWA).
▪ Part 323 Shore Land Protection (water intake) – permit application pending by GRWA.
▪ Part 327 Great Lakes Water Withdrawal Permit – Application submitted by
GRWA with permit approved in December, 2011. 20.3 Current Environmental Monitoring and Conditions Beginning in the fall of 2008, Orvana Resources US Corp retained AECOM to prepare the EIA for the Copperwood Project as required by Part 632. AECOM has collected the spectrum of data as prescribed by Part 632. Data collection began in January 2009 for those requiring two years of baseline data. The EIA has been included in the mining permit application. The design of the facilities will focus on cost-effective alternatives that reduce or mitigate impacts to the environment. The following subsections contain brief descriptions of selected preliminary findings. This is NOT inclusive of efforts to date and should NOT be interpreted for any regulatory purposes. 20.3.1 Hydrogeology Groundwater monitoring wells have been installed within and around the project area. The wells have been monitored since January 2009 for groundwater movement and quality within the glacial overburden as well as the underlying bedrock units. A groundwater model has been developed by AECOM for the project area. There are no public or private wells within 1 mile of the project area and there is no usable aquifer within 1 mile of the project area. Groundwater quality and quantity are generally low, with very low rates of groundwater flow and generally high concentrations of total

Orvana Resources - Copperwood Project Prefeasibility Study Page 178
K D Engineering Document No. Q431-01-028 21 March 2012 KDE FORM No. A263a-7/12/99
dissolved solids and chloride. Inflow of groundwater into the underground workings is expected to be minimal. There are no significant obstacles to minimizing the impacts to groundwater from surface and underground facilities such that the project will meet regulatory limits in this aspect. 20.3.2 Surface Water Surface water monitoring began in January 2009. It includes numerous streams, rivers, wetlands, and Lake Superior within and surrounding the proposed surface facilities. Data collected include physical, biological and chemical attributes. Four small streams flow through the project area into Lake Superior. The streams generally have poor water quality (high temperature / low dissolved oxygen) and tend to be flashy, highly turbid systems with little to no flow in late summer. There are no significant obstacles to minimizing the impacts to surface water from surface and underground facilities such that the project will meet regulatory limits in this aspect. 20.3.3 Wetlands A complete wetland survey has been performed for the entire project area. Most wetlands are disconnected, small (less than one acre) areas and primarily occur due to the low-permeability soil found near the surface throughout the site, which prohibits infiltration of precipitation into the subsurface. There is sufficient area within the site with low to no wetlands to place surface facilities in order to minimize impact to wetlands. The project will require wetland mitigation. There are no significant obstacles to minimizing the impacts to wetlands from surface and underground facilities such that the project will meet regulatory limits in this aspect. 20.3.4 Wildlife and Flora Monitoring for all forms of wildlife (birds, mammals, reptiles, amphibians, fish, and aquatic insects) has been carried out throughout the site. In addition, mapping and documentation of aquatic and terrestrial flora has been conducted. Species common to the northern hardwoods found in Upper Michigan are generally present in and around the area. Only one (previously) federally endangered species exists near the site. The gray (timber) wolf (Canus lupis) population in the region and the Great Lakes has recently warranted federal delisting. Delisting is supported by Minnesota, Wisconsin and Michigan. Delisting of the gray wolf occurred in December 2011, and the gray wolves in the Western Great Lakes are no longer listed on the Threatened and Endangered Species List. A State of Michigan endangered fish, the Redside Dace (Clinostomus Elongatus) was found in two streams crossing the site, and a state threatened plant, the showy orchid (Galearis spectabilis) was also observed. There are no significant obstacles to minimizing the impacts to wildlife from surface and underground facilities such that the project will meet regulatory limits in this aspect.

Orvana Resources - Copperwood Project Prefeasibility Study Page 179
K D Engineering Document No. Q431-01-028 21 March 2012 KDE FORM No. A263a-7/12/99
20.4 Project Considerations There are three general areas of the project which could impact environmental attributes found on the site: underground mine, surface processing facilities, and tailings disposal facility. Final design of these facilities and other ancillary aspects will include analysis of alternatives in light of environmental data and those presented herein are subject to change. 20.4.1 Underground Mine Key environmental areas related to the mine workings include inflow of groundwater into the mine and its discharge during operation, groundwater flow during operation, groundwater quality in post closure, and surface subsidence. Current preliminary groundwater modeling projects estimate total groundwater inflow for the project will be in the range of 150 to 400 gpm for completed underground workings. All waters discharged from the mine will be treated before they are released in compliance with applicable water quality standards. 20.4.2 Surface Processing Facility Key environmental areas related to the surface processing facility includes: hazardous materials storage and use, spill prevention, monitoring and management; and water use, conservation, and recycling. All waters collected in and around the surface processing facility will be treated before they are released in compliance with applicable water quality standards. Construction of surface processing facilities will require the filling and disruption of wetlands. Mitigation of these wetlands will be completed as required by applicable laws. 20.4.3 Tailings Disposal Facility The tailings disposal facility (TDF) has been designed to store the solids and manage the liquids from the Copperwood tailings, both during the period of operations and after closure. The solids will be retained in the impoundment together with some of the liquid, while liquids not retained will be collected via underdrains or decanted from the tailings surface and recycled to the mill for re-use in the process or treated and released. Treatment and release will be in compliance with applicable water quality standards. A cover system will be placed over the tailings as part of mine closure to cap the tailings surface and reduce the amount of meteoric water recharge to the facility after closure. In the State of Michigan, tailings storage and disposal is regulated under Part 632 of Michigan Act 451, the Natural Resources and Environmental Protection Act (NREPA). Specific administrative rules found under Part 632, R 425.409, “Treatment and Containment of Reactive Materials”, provides requirements and management objectives for both temporary tailings storage facilities (TSF)(R. 425.409(a)) and permanent tailings disposal facilities (TDF) (R. 425.409(b)).

Orvana Resources - Copperwood Project Prefeasibility Study Page 180
K D Engineering Document No. Q431-01-028 21 March 2012 KDE FORM No. A263a-7/12/99
The proposed tailings disposal facility (TDF) for the Copperwood Mine has been designed in compliance with the applicable rules found under Part 632 R 425.409(b). Geochemical characterization of the tailings and process water have also been completed. Testing to date has demonstrated the tails are non-acid generating; however, due to the definition used by the State of Michigan, Department of Environmental Quality (Part 632 R. 425.103 (j), “Reactive” - “means susceptible to reacting, dissolving, or otherwise forming a leachate that is or may be harmful to the environment…”. Any and all non-ferrous tailings in the State of Michigan will likely require management in accordance with rule 425.409. Testing of the Copperwood tailings has confirmed this to be so. Construction of the TDF will require the disruption of certain wetlands and the diversion of some intermittent stream channels; therefore mitigation measures are planned to address both as required by applicable laws. Refer to Section 20 of this document for additional information on these activities. Location of the TDF was based on a variety of considerations, including available land, capacity requirements, wetland and stream avoidance, proximity of Lake Superior, soil conditions, groundwater and hydrogeologic conditions, and worker safety. 20.5 Summary of Environmental Considerations The project is expected to meet or exceed all applicable regulatory requirements, including meeting water quality standards and concentration thresholds of measured constituents in any water released to the environment from the facility. Natural resource conservation protection and mitigation measures remain key components in the project design and ongoing environmental analysis. A Part 632 permit from Michigan DEQ has not yet been issued for the facility and may include permit conditions. Final design may require minor modifications to comply with any such permit conditions. 20.6 Tailings Disposal Facility 20.6.1 Site Characterization A number of small intermittent streams pass through the TDF site and have eroded channels into the overburden soils. The channels are typically on the order of 10 to 20 ft deep in the southern area of the TDF site and reach up to 30 ft in the northern area. The main drainages are Namebinag Creek, which is just to the west of the TDF site, and Lehigh and Gypsy Creeks, which run through or partially through the site. Lehigh and Gypsy Creeks will be diverted around the TDF. The western edge of the TDF has been designed to maintain a minimum 150-ft setback from Namebinag Creek to avoid interfering with its channel alignment and near-bank environment. The TDF site is located along the base of a north-facing, moderate- to steeply-sloping bluff. The existing ground surface within the TDF boundaries generally slopes to the north-northwest at an average grade of about 3 percent. The maximum existing ground

Orvana Resources - Copperwood Project Prefeasibility Study Page 181
K D Engineering Document No. Q431-01-028 21 March 2012 KDE FORM No. A263a-7/12/99
elevation within the TDF footprint is approximately 950 ft at the southeast corner of the TDF, while the minimum existing ground elevation is approximately 825 ft at the northwest corner. The alignment of the TDF has been designed such that it does not overlie the current limits of the planned underground mine to the north. Due to the gently-sloping ground surface throughout the TDF site, the TDF will be formed by constructing a continuous earthen embankment around the entire site (commonly referred to as a ring-dike). This type of embankment configuration often results in an increased amount of earthworks compared to a valley-fill type of dam structure. To optimize the required volume of earthworks, the proposed TDF layout has been designed to produce an overall balanced cut-and-fill construction sequence, thus eliminating the need for imported embankment fill while maintaining adequate capacity for tailings disposal and water management. This approach reduces the design height of the embankment and fill volume required compared to above-ground construction or only minimal excavation of foundation soils within the impoundment area. The general site plan showing the configuration of the TDF is shown on Figure 20.1.

Orvana Resources - Copperwood Project Feasibility Study Page 182
K D Engineering Document No. Q431-01-028 21 March 2012 KDE FORM No. A263a-7/12/99
Figure 20.1 - General Site Plan
Orvana Resources - Copperwood Project Feasibility Study Page 183
K D Engineering Document No. Q431-01-028 21 March 2012 KDE FORM No. A263a-7/12/99
Geotechnical Conditions
The foundation materials beneath the TDF site consist of glacial till underlain by the Copper Harbor Conglomerate formation bedrock. The Nonesuch Shale formation, which contains the ore body host rock, is present to the north-northwest of the TDF. A geotechnical investigation of the area under and closely surrounding the TDF site was conducted in early 2011 to support the pre-feasibility design of the TDF. This investigation was completed by Coleman Engineering under the direction and partial supervision of Knight Piésold. The investigation consisted of excavating test pits and drilling geotechnical boreholes to visually inspect and sample the subsurface materials and carrying out certain in-situ and laboratory tests to evaluate the foundation soil geotechnical properties. A supplemental investigation to augment the previous field exploration data and support the feasibility-level design of the TDF included several additional boreholes drilled in December 2011, along with several test pits located in the southwest part of the TDF. This investigation was carried out by Coleman Engineering, with Golder Associates providing general guidance. The information gathered from the two investigations was combined along with regional information compiled by AECOM to support the feasibility-level design of the TDF. Details of the 2011 and previous site investigations are presented in separate reports by Coleman Engineering and Knight Piésold (2011). Findings from the site investigations are summarized as follows. The glacial till appears to be largely homogeneous and varies in thickness within the TDF site from 20 to 120 ft. The majority of the till classifies as lean clay (CL) with some silt, little sand, and occasionally trace gravel, as classified in accordance with the Unified Soil Classification System (USCS) guidelines. Several localized lenses of silty sand (SM) were encountered within the till matrix, and generally range in thickness from less than 1 ft to 2 ft and do not appear to be continuous. The locations of the test pits and boreholes completed in the site investigations are presented in a plan view of the site on Figure 20.2, while cross-sections are presented on Figure 20.3. Standard and Modified Proctor compaction tests were performed on bulk samples of the till collected from the test pits to estimate the moisture-density relationship of this potential construction material for the TDF embankment. Both types of tests were carried out to determine the effect of the different compaction efforts on the optimum moisture content (OMC) and the maximum dry density (MDD) of the soils. The Modified Proctor test imparts a much higher compaction effort than the Standard Proctor test. The results of the Modified Proctor tests averaged 8.6 percent OMC and 134.2 pcf MDD. The results of the Standard Proctor test averaged 11.6 percent OMC and 122.5 pcf MDD. The OMC for both the Standard and Modified Proctor tests were below the average natural moisture content of 13.3 percent of the till, which indicates that some air drying will be required before it is placed as fill into the embankment. Placement and compaction of low-permeability material wet of OMC can be problematic due to the potential for pore pressure build up in the fill during construction, which could lead to temporarily reduced shear strength parameters in the soil and negatively impact the embankment stability.

Orvana Resources - Copperwood Project Feasibility Study Page 184
K D Engineering Document No. Q431-01-028 21 March 2012 KDE FORM No. A263a-7/12/99
Hydraulic conductivity testing was performed in the till by conducting falling-head tests through the standpipe piezometers in the boreholes, and laboratory testing on recovered samples using flexible-wall, constant-head permeability methods in the triaxial cell. The hydraulic conductivity test results ranged between approximately 1 x 10⁻⁷ and 1 x 10⁻⁹ cm/s, which are very low and consistent with typical values for compacted soil liners. The geometric mean of the laboratory hydraulic conductivity test results was 5.1 x 10⁻⁹ cm/s, while the geometric mean of the in-situ test results was 1.5 x 10⁻⁸ cm/s. It is not uncommon for laboratory test results to exhibit lower values than field tests due to macro-scale discontinuities that exist in the field being disturbed or absent in laboratory samples. The low hydraulic conductivity values will have a beneficial effect on minimizing seepage from the TDF but may have a detrimental effect on short-term construction stability as excess pore pressures may develop in and under the embankment as it is constructed. This will have to be monitored and managed. Overall the test results indicate that the till has a very low hydraulic conductivity, a significant potential for generating excess pore pressures when loaded and compacted, and a moderate strength and stiffness. It will be desirable to dry the material before placement in the fill, and in the final design, limits on the rate of embankment fill placement and loading of the foundation will be considered. Monitoring of pore pressures developed during construction will be required to mitigate the potential for undrained slope instability. Hydraulic conductivity testing was also conducted on the Copper Harbor Conglomerate bedrock below the till under the TDF site. This rock is of sedimentary origin and contains many rounded pebbles cemented together by finer materials. The particles are often of durable igneous rock. In-situ packer testing was performed and resulted in an average value of 1.2 x 10⁻⁶ cm/s, which is approximately two orders of magnitude greater (more permeable) than the overlaying glacial till. The compressibility characteristics of the till were estimated by Oedometer consolidation testing. At low stresses the average values for the coefficient of consolidation (a measure of the rate of compression) and coefficient of compressibility (a measure of the amount of compression) were found to be 1.7 x 10⁻³ cm2/s and 6.7 x 10⁻⁵ 1/kPa, respectively. At high stresses, the average values were found to be 1.6 x 10⁻³ cm2/s and 5.1 x 10⁻⁵ 1/kPa, respectively. The coefficient of consolidation values are low, which indicates that consolidation of the till under load will take significant time. The coefficient of compressibility values are low to moderate, which indicates that some compression of the till will occur over time. The average calculated hydraulic conductivities were found to be 1.6 x 10⁻⁸ and 1.9 x 10⁻⁹ cm/s at low and high stresses, which is in agreement with the values obtained from the hydraulic conductivity testing. The compression index was calculated over the entire stress range and resulted in an average of 0.15. The overconsolidation ratio (OCR) of the samples was estimated from the tests to range between 2.4 and 1.7, with an average of 2.0. These results indicate that the till is slightly overconsolidated and that the time rate of consolidation is quite slow but the amount may be significant. Some over-building of the embankment

Orvana Resources - Copperwood Project Feasibility Study Page 185
K D Engineering Document No. Q431-01-028 21 March 2012 KDE FORM No. A263a-7/12/99
crest may be necessary but staged raising of the TDF dam will also allow for settlement of the fill to be taken up by the next raise. Shear strength parameters of the till were estimated using three different tests as follows:
▪ Unconsolidated, undrained (UU) triaxial testing
▪ Isotropically consolidated, undrained (ICU) triaxial testing with pore pressure measurements
▪ Direct shear testing
The UU triaxial tests provided an estimate of the in-situ, undrained shear strength of the till and the results, indicated that the strengths were relatively high but variable (ranging from 1,600 to 6,700 psf). The ICU triaxial tests gave an estimate of the in-situ undrained (total stress) and drained (effective stress) shear strength parameters, which define how these strengths vary with effective confining stress. The rate of loading of the ICU triaxial tests was quite high considering the low permeability of the till and this could result in a slight under-estimate of the material strength. Based on the ICU test data, the undrained (total strength) parameters indicate cohesion between 0 and 2090 psf and a friction angle between 13 and 27 degrees. Additionally, the ICU test data indicates that for drained (effective strength) conditions the cohesion is equal to 0 psf and the friction angle is between 25 and 37 degrees. Direct shear testing gave an estimate of the in-situ strength along a pre-defined horizontal plane. These tests indicate that for undrained (total stress) conditions, the cohesion is between 15 and 35 psf and the friction angle is between 21 and 31 degrees, which is similar to the range of total stress parameters determined from the ICU triaxial tests. In-situ Standard Penetration Tests (SPTs) were performed in the boreholes to evaluate the consistency of the till beneath the TDF. The results gave N-values that generally increased with depth. The SPT test results also indicated that the till is medium-dense, which is consistent with the slight overconsolidation ratio. Seepage and slope stability analyses were performed on cross-sections of the TDF embankments. Cross-sections were cut in several locations that capture both the critical and the typical geometry of the impoundment. Analyses were performed using two-dimensional finite element software (Geostudio 2007, SEEP/W and SLOPE/W). The material properties for the analyses were based on laboratory data and in-situ soil testing from previous and recent field investigations. The seepage analysis was conducted to verify that the drains (embankment chimney and foundation drains, and tailings underdrain) are properly designed to collect and convey the predicted flows. The results of the seepage analysis indicate that the drains will have sufficient capacity, thus

Orvana Resources - Copperwood Project Feasibility Study Page 186
K D Engineering Document No. Q431-01-028 21 March 2012 KDE FORM No. A263a-7/12/99
ensuring the structural integrity of the dam and minimizing seepage of tailings pore water into the environment. The stability analysis was performed for end-of-construction (short-term), static (long-term), and seismic (pseudo-static) loading conditions. The minimum recommended factors-of-safety for long-term and pseudo-static conditions (1.5 and 1.1, respectively) were met or exceeded in all cases considered in the stability analysis. Estimated factors-of-safety from the stability evaluations of the cut slopes in the foundation at the most critical cross-section under end-of-construction stress conditions were estimated to be at least 1.2, except for very shallow-seated failure surfaces. The potential occurrence of minor surficial/sloughing slope failures will be addressed during construction.

Orvana Resources - Copperwood Project Feasibility Study Page 187
K D Engineering Document No. Q431-01-028 21 March 2012 KDE FORM No. A263a-7/12/99
Figure 20.2 - TDF 2011 Site Investigation General Arrangement

Orvana Resources - Copperwood Project Feasibility Study Page 188
K D Engineering Document No. Q431-01-028 21 March 2012 KDE FORM No. A263a-7/12/99
Figure 20.3 - TDF General Cross-Sections

Orvana Resources - Copperwood Project Feasibility Study Page 189
K D Engineering Document No. Q431-01-028 21 March 2012 KDE FORM No. A263a-7/12/99
Meteorological Conditions
Climatic conditions at the site were characterized for the design of the TDF. The site experiences a continental climate with seasonally cold winters and warm summers. Precipitation is generally evenly distributed throughout the year and occurs as rainfall in spring and summer, and snowfall during the winter. A moderate amount of evaporation typically occurs during the non-winter months (April through October). A search of the Michigan State Climatologist’s database, the Midwestern Climate Center database, and the National Climatic Data Center found that nearby weather stations with long-term records include Ironwood, Ontonagon, and the Bergland Hydro Plant. These data were obtained and analyzed together with daily precipitation and temperature data from the mine site weather station from June to October 2009 and from April to September 2010 and the Ontonagon station was found provide a good representation of the climatic conditions at the mine site. Data from October 1977 to December 2010 from the Ontonagon station were then selected to represent precipitation as well as mean monthly minimum and mean monthly maximum air temperatures at the site. The following bullets summarize the key findings of the climatic analysis, based on the Ontonagon station data:
▪ The design 100-yr/24-hr return storm event for the region is 4.25 inches.
- Utilized for the design of the decant sump overflow pond based on a “low-hazard potential” dam classification according to the Natural Resources and Environmental Protection Act, 1994 PA 451, Part 315, Dam Safety.
▪ The design 72-hr/one-half Probable Maximum Precipitation (half-PMP) storm
event is 16.4 inches, likely to occur in August.
- Utilized for the design of the TDF supernatant pond based on a “high-hazard potential” dam, greater than 40 ft in height, classification according to the Natural Resources and Environmental Protection Act, 1994 PA 451, Part 315, Dam Safety.
▪ The average annual precipitation for the site was found to be 34.26 inches.
▪ The average maximum temperature for July was found to be 79.2 degrees
Fahrenheit (°F), while the average minimum temperature for July was found to be 54.7°F.
▪ The average maximum temperature for January was found to be 25.1°F,
while the average minimum temperature for January was found to be 8.3°F.
▪ The average annual potential evaporation was found to be 36.5 inches.
▪ The average annual evaporation from exposed tailings areas was found to be 16.8 inches.

Orvana Resources - Copperwood Project Feasibility Study Page 190
K D Engineering Document No. Q431-01-028 21 March 2012 KDE FORM No. A263a-7/12/99
▪ The average annual pond evaporation was found to be 23.7 inches.
Because rain-on-snow events can result in higher total runoff values than runoff due to rainfall on bare ground, snowmelt runoff due to rainfall was estimated using equations developed by the U.S. Army Corps of Engineers (USACE, 1998). Rain-on-snow events were assumed only to occur from October through May of each year. The maximum precipitation associated with the 72-hr/half-PMP storm event has been modeled to occur during the month of August (16.4 inches). This precipitation, occurring as rainfall alone, exceeds the modeled monthly maximum rain-on-snow event (13.0 inches occurring in March) which combines the 72-hr/half-PMP precipitation in that month with the associated amount of snowmelt that would occur during that storm event. Therefore, the 72-hr/half-PMP storm event, neglecting rain-on-snow conditions, was found to govern the design. Details of the development of these data are provided in the Knight Piésold memorandum titled, Copperwood Project, Climatic Data Analysis, Revision 0, 15 June 2011. 20.6.2 Feasibility-Level Design of Tailings Disposal Facility Tailings Characteristics and Tailings Disposal Facility Development Ore processing, and hence tailings production, will ramp up to 2.625 Mt per year by the start of Year 3 operations. Start-up production (Year 1) and Year 2 operations will be 0.5 Mt and 1.7 Mt ore processing, respectively. The tailings management plan involves flocculating and thickening the tailings in a thickener prior to pumping to the TDF. This will bring the tailings slurry to a solids content of approximately 50 percent by weight. In the process of pumping the tailings to the TDF it is expected that the flocculants will become sheared, and therefore the slurry may require re-flocculating prior to deposition within the TDF. A secondary dose of flocculant will be added to the tailings in the pipeline just prior to discharging into the TDF. This additional dose of flocculant is intended to:
▪ Increase the sedimentation and settlement rate of the solid particles;
▪ Reduce the quantity of Total Suspended Solids (TSS) within the decant water that will be reclaimed to the mill.
By reducing the amount of TSS, the reclaim system can work more efficiently with less maintenance over time. Based on information provided by Orvana and its consultants, Hychem Hyperfloc AF-305 is planned for use on the Copperwood Project. It should be noted that this flocculant is often used in conjunction with a coagulant (Hychem Hyperfloc CD-650); however, for this Feasibility Study it was assumed that only the flocculant will be added in the second dose to the tailings stream prior to deposition.

Orvana Resources - Copperwood Project Feasibility Study Page 191
K D Engineering Document No. Q431-01-028 21 March 2012 KDE FORM No. A263a-7/12/99
A detailed testing program was conducted by Knight Piésold (KP) on three tailings samples (WPC-1, WPC-2, and WPC-4) that were provided by Orvana. The following paragraphs present a summary of the testing program and test results reported by KP. Each sample was tested for physical and geotechnical characteristics to evaluate the anticipated tailings behavior upon deposition and to estimate the settled densities and rates of consolidation of the tailings over time that may occur during operation of the TDF (12 years) and the closure period (4 years). Basic index testing of the tailings samples included determination of particle size distributions, Atterberg limits, specific gravity, and as-received solids contents. Sedimentation, classical consolidation testing (Oedometer testing), and Seepage Induced Consolidation (SIC) testing, were also performed on the WPC-1, and WPC-4 samples, with the WPC-4 sample tested under both flocculated and unflocculated conditions. The results of this testing were used as input to the proposed deposition plan and to size the staged configurations of the TDF over the life of the project. As part of the SIC testing, the WPC-4 tailings sample was prepared to 50 percent solids content and then sheared in a high speed mixer followed by re-flocculating to mimic the process that would occur during operation of the TDF. Flocculant solution was prepared using the Hychem Hyperfloc AF-305 at a concentration of 0.012 pound per ton of water. Flocculant solution equal to approximately 150 percent of the tailings solids volume was required for the tested sample to exhibit a fully-flocculated condition. The index test results indicate that the tailings can be classified as lean clay (CL) according to the Unified Soil Classification System (USCS). The tailings samples were found to have 100 percent of their particles passing the No. 200 sieve (fines), which is quite fine-grained for copper tailings. The material was also found to have a liquid limit of 33 and a plasticity index of 13, confirming the presence of clay mineralogy and thus supporting the flocculant addition to assist in liquid/solids separation. The material specific gravity was determined to be 2.8. Relatively good agreement was achieved between the low stress consolidation, high stress consolidation, and seepage induced consolidation testing in terms of the void ratio versus effective stress and void ratio versus hydraulic conductivity relationships. The coefficient of volume compressibility (mv) was found to range from approximately 2 x 10⁻⁴ to 4 x 10⁻⁶ (1/kPa) and the hydraulic conductivity was found to range from approximately 5 x 10⁻⁶ to 1 x 10⁻⁸ cm/s. These material properties suggest that the tailings will be highly compressible, and that the time rate of consolidation will be relatively slow due to the low hydraulic conductivities estimated, over the range of stresses expected. From the laboratory testing and consolidation modeling, a predicted dry density profile for the tailings deposit was developed using the large strain consolidation model, CONDES based on the revised TDF configuration developed by Golder. This density profile was estimated using the SIC test results on the WPC-4 tailings, which assumed the addition of a second dose of flocculant at the point of deposition and 50 percent solids. The consolidation model also assumed that the tailings deposit will be drained at

Orvana Resources - Copperwood Project Feasibility Study Page 192
K D Engineering Document No. Q431-01-028 21 March 2012 KDE FORM No. A263a-7/12/99
its base by a drainage blanket under the tailings, which is the current design. This density profile, together with the depth versus capacity characteristics of the TDF and the rate of tailing discharge into the TDF, were then used to estimate the staged embankment crest elevations over the life of the project. Storage capacity curves showing storage capacity versus time and storage capacity vs. embankment elevation/stage, assuming the tailings surface is sloped at minus 0.25 percent from the north to the south, are presented as Figures 20.4-1 and 20.4-2, respectively. General Arrangement and Staged Development of the TDF The TDF has been designed to account for the subsurface conditions below the site, the anticipated embankment fill materials, the water and tailings storage requirements, and the physical characteristics of the tailings. The primary criteria for optimizing the TDF to the proposed layout were:
▪ Balanced cut and fill within the footprint of the TDF;
▪ Staged construction of the facility; and
▪ Storage capacity for the proposed mine production and estimated TDF water balance.
The TDF will be located in the southeast portion of the Copperwood Project site and will be developed in three stages for the ultimate storage of 30.3 Mt of tailings. Although the volume of tailings produced will be less the amount of copper concentrate that is generated and shipped off-site (currently estimated at 1.5 Mt tons), for conservatism the TDF was designed to hold the entire total reported tons of ore to be processed. The proposed facility footprint will extend approximately 2,200 yds in the east-west direction, 850 yds in the north-south direction, and will cover approximately 322 acres (including embankments but excluding perimeter roads). Staged construction of the facility will primarily be horizontally from west-to-east in order to meet a balanced cut-and-fill, staged layout. Some vertical expansion of the dam crest will occur under each stage of construction. The Stages 1 through 3 TDF layouts are presented on Figures 20.5 through 20.7 and the TDF stage-storage capacities are summarized as follows:

Orvana Resources - Copperwood Project Feasibility Study Page 193
K D Engineering Document No. Q431-01-028 21 March 2012 KDE FORM No. A263a-7/12/99
Table 20.1
Tailings Disposal Facility Staged Storage Capacities
Stage Storage through
Year Storage Mass
Mt Dry Density
tons/yd3 Storage Volume
Myd3 1 4 6.82 0.86 7.93 2 7 15.36 0.99 15.52 3 13 30.23 1.09 27.84
(1)Tailings deposition is planned to start in October of Year 1, and conclude in September of Year 13. Years 1 and 13 are “short” operating years and therefore the overall life of operations will be approximately 12 years.
Figure 20.4-1 - TDF Storage Capacity Curve: Tons vs. Time (0.25 percent Sloped Tailings Surface)

Orvana Resources - Copperwood Project Feasibility Study Page 194
K D Engineering Document No. Q431-01-028 21 March 2012 KDE FORM No. A263a-7/12/99
Figure 20.4-2 - TDF Storage Capacity Curve: Tons vs. Elevation (0.25 percent Sloped Tailings Surface)

Orvana Resources - Copperwood Project Feasibility Study Page 195
K D Engineering Document No. Q431-01-028 21 March 2012 KDE FORM No. A263a-7/12/99
Figure 20.5 - TDF General Arrangement Stage 1

Orvana Resources - Copperwood Project Feasibility Study Page 196
K D Engineering Document No. Q431-01-028 21 March 2012 KDE FORM No. A263a-7/12/99
Figure 20.6 - TDF General Arrangement Stage 2

Orvana Resources - Copperwood Project Feasibility Study Page 197
K D Engineering Document No. Q431-01-028 21 March 2012 KDE FORM No. A263a-7/12/99
Figure 20.7 - TDF General Arrangement Stage 3

Orvana Resources - Copperwood Project Feasibility Study Page 198
K D Engineering Document No. Q431-01-028 21 March 2012 KDE FORM No. A263a-7/12/99
Stage 1 - Tailings Disposal Facility The Stage 1 TDF will encompass approximately the western one-third of the ultimate TDF footprint. Development of storage capacity and fill material will be by excavation into the till material within the facility basin and placement of this material for construction of the impounding embankment around the west, north, and south sides of the TDF perimeter. The Stage 1 perimeter embankment will be constructed to elevation 910 ft amsl. An interior stage divider berm (Stage 1 Divider Berm) will be constructed along the eastern crest of the cut area. This berm is necessary to contain the tailings within the Stage 1 areal limits and to prevent flooding of the adjacent Stage 2 area and covering of the Stage 2 borrow source. A typical stage divider berm detail is provided on Figure 20.11. The amount of excavation required to generate the Stage 1 TDF will exceed the amount of fill required to develop the minimum storage capacity required for the Stage 1 operations of the TDF. Therefore, the perimeter embankment construction will include a portion of embankment required for development of Stage 2, or the material will be stockpiled for Stage 2 construction. In either case, the material will not be wasted or left in place and covered with tailings, as this would result in a material shortage in the overall TDF cut-and-fill material balance. For purposes of this feasibility study, it is assumed that any excess material available from Stage 1 excavation and overall project development will be stored in temporary stockpiles immediately adjacent to the downstream toe of the embankments. This will limit disturbance to areas within the approved construction limits delineated in the environmental permits, and potentially reduce overall start-up costs. Final design and bid documents will be used to determine the most economical approach to handling the excess embankment fill generated during Stage 1 construction. The Stage 1 embankment will be constructed primarily from the basin excavation material. Additional fill materials will also be available from the mine opening box-cut, wetland creation areas, and entrance road and detention ponds construction. Depending on material type/suitability, construction timing, and proximity to the TDF Stage 1 construction activities, these excavated materials may be stockpiled in the manner noted above or directly incorporated into the Stage 1 TDF for construction in areas such as the embankment, stage divider berm, safety berms, etc. Imported material required for the Stage 1 TDF will include drainage sand for the embankment drains and blanket underdrain covering the prepared basin floor, drainage aggregate for the decant structure, and riprap material for erosion protection on the upstream face. Collection pipes will be installed within the blanket underdrain to enhance collection and removal of seepage from the base of the tailings to the TDF low point at the northwest corner and routed via solid drain pipe to the decant sump located approximately 2,200 feet to the northwest of the TDF northwest corner. In addition to the TDF impoundment blanket drain, the Stage 1 TDF will include construction of the initial TDF decant structure and outlet pipe to the decant sump. Both the blanket drain and decant outlet pipes will be equipped with a valve to shut off flow to the decant structure. These valves are provided as no removal of stored water for reuse

Orvana Resources - Copperwood Project Feasibility Study Page 199
K D Engineering Document No. Q431-01-028 21 March 2012 KDE FORM No. A263a-7/12/99
is anticipated, and treat-and-discharge will not be allowed during the first three years of TDF operations since the water treatment plant will not yet be operating. See Section 20.6.3 for TDF water management requirements regarding these TDF operations criteria. For dam safety and seepage control considerations, the decant and blanket drain discharge pipelines will be encased in concrete from the upstream toe of the TDF to the downstream toe of the TDF dam. The purpose of the decant structure is to drain the supernatant pond on the surface of the tailings and route that water to the decant sump/overflow pond for recycle back to the process plant and mill, or to the water treatment plant for treatment and release. The Stage 1 TDF will cover approximately 138 acres, not including a construction buffer zone and a planned 20-ft wide perimeter road. Due to the magnitude of the earthworks required and the relatively short construction season, it is anticipated that Stage 1 will be constructed over two seasons, starting in the pre-production period, Year 0, and concluding in the third quarter of Year 1. The TDF will be available for the start of project commissioning and tailings deposition immediately following the completion of construction. (Note: Subject to final mine production and mill start-up schedules, allowances for tailings deposition prior to final completion of Stage 1 construction may be incorporated in the Stage 1 construction sequence.) The Stage 1 divider berm will have a crest elevation of 900 ft amsl and will extend roughly north-south across the TDF footprint as shown on Figure 20.5. A typical stage divider berm section is presented on Figure 20.11. Stages 2 and 3 - Tailings Disposal Facility Stages 2 and 3 will add both basin area and embankment height to the TDF and will become operational in Years 4 and 7 respectively. The Stage 2 expansion will involve developing the middle one-third of the TDF footprint (approximately 80 additional acres including embankments) in a manner similar to Stage 1, including excavation into the bottom of the tailings basin and installation of the Stage 2 divider berm. The floor area will be excavated as needed to provide embankment fill and storage capacity. The Stage 1 divider berm will be left in place so that tailings do not breach or overflow into Stage 2 construction activities, and a Stage 2 divider berm will be constructed at elevation 920 ft amsl on the east side of Stage 2 to protect the future Stage 3 area from tailings inundation. The north and south perimeter embankments constructed for Stage 1 will be extended eastward to complete the Stage 2 containment area and the Stage 1 crest raised (including the west end section of the perimeter embankment) to create sufficient storage for Stage 2 operations. The Stage 1 crest raise will be a downstream raise (as shown in Figure 20.8) and will bring the overall Stage 2 embankment crest to elevation 930 ft. In the later years of Stage 2 operations (approximately Year 5), the tailings surface will rise above the Stage 1 divider berm, creating a continuous tailings surface contained by the perimeter embankment and the Stage 2 divider berm. The excavation cut and embankment fill required to obtain the necessary tailings storage for Stage 2 is predicted to result in a net excess fill of being available for the stage. Excess fill will, as for Stage 1, be placed in temporary stockpiles adjacent to the

Orvana Resources - Copperwood Project Feasibility Study Page 200
K D Engineering Document No. Q431-01-028 21 March 2012 KDE FORM No. A263a-7/12/99
downstream toe of the perimeter embankments for later use in Stage 3 construction and final closure activities. The entire Stage 2 TDF footprint will cover approximately 218 acres, around which will extend the 20-ft wide perimeter road and a construction buffer zone, as for Stage 1. Stage 2 will be constructed during Years 3 and 4 of operations such that it will be available by the end of the third quarter of Year 4 of the current mine production schedule. The Stage 3 TDF expansion will develop the final (eastern) one-third of the TDF (approximately 103 acres including embankments), completing construction of the ultimate 322-acre facility. It will be constructed during Year(s) (6 and) 7 of operations such that it will be available by the end of Year 7 of the current mine production schedule. The Stage 3 TDF will include cut from the remaining TDF footprint area, but is anticipated to result in a net shortage of fill material. The remainder of the fill required for the Stage 3 embankments is to be sourced from soil stockpiled in the vicinity of the TDF, either from prior TDF stage construction events or from earlier development of other project facilities (e.g., wetland creation areas, detention ponds). The Stage 3 (ultimate) embankment crest elevation is designed at 946 ft amsl. The Stage 2 divider berm is expected to be submerged by tailings late in Year 8 of operations. As part of construction for Stages 2 and 3, the embankment chimney drain will be extended up the full height of the dam and the embankment foundation drains will be extended under the downstream shell fill. Additionally during Stages 2 and 3, the corresponding segments of the TDF decant structures will be installed and the main decant structure extended. Embankment Configuration The TDF embankment has been designed as a zoned-fill, water containment type of dam that will be raised in stages using the conventional downstream method of construction. In this method the upstream toe remains fixed, while the centerline and downstream toe progressively advance to the downstream as the embankment height increases by extending the upstream slope to the higher elevation. A typical section of the stage-developed embankment is shown on Figure 20.8. The embankment will consist of four general zones:
▪ Seal Zone (Zone 1) - This zone will be comprised of moisture-conditioned and well-compacted glacial till to create a low-permeability zone to minimize seepage through the embankment.
▪ Chimney Drain (Zone 2) - This zone will be comprised of relatively high-
permeability drainage materials that will serve as a filter and drain between the Seal Zone and Downstream Shell. The purpose of this drain is to collect seepage that may pass through the Seal Zone and route it safely out of the dam, and to prevent a phreatic surface from developing through the dam.
▪ Downstream Shell (Zones 3 and 4) - The Downstream Shell will provide
structural stability to the embankment. It has been designed with upstream

Orvana Resources - Copperwood Project Feasibility Study Page 201
K D Engineering Document No. Q431-01-028 21 March 2012 KDE FORM No. A263a-7/12/99
and downstream zones that will be constructed from the local glacial till material but with different compaction efforts in order to reduce the cost of dam construction.

Orvana Resources - Copperwood Project Feasibility Study Page 202
K D Engineering Document No. Q431-01-028 21 March 2012 KDE FORM No. A263a-7/12/99
Figure 20.8– TDF Typical Embankment Configuration

Orvana Resources - Copperwood Project Feasibility Study Page 203
K D Engineering Document No. Q431-01-028 21 March 2012 KDE FORM No. A263a-7/12/99
In addition to these four embankment zones, a riprap layer will be installed on the upstream face of the embankment to protect the Seal Zone from erosion due to direct precipitation and wave action on the surface of the supernatant pond. Partial drainage blankets, constructed of the same or similar relatively high-permeability material as the Chimney Drain, will be constructed at the base of the Downstream Shell. These foundation drains will serve to reduce the seepage path lengths in the fill for more rapid dissipation of excess pore pressures that could develop in the Downstream Shell and foundation during construction of the embankment. The embankment will be founded directly on the glacial till that covers the TDF site. Excavations to key the embankment into bedrock are not required to enhance the dam stability or reduce potential seepage from the TDF. Foundation preparation will include topsoil stripping and stockpiling and removal and disposal of deleterious material, followed by rough grading as described below. The upstream Seal Zone (Zone 1) and Downstream Shell (Zones 3 and 4) will be constructed from till excavated from within the tailings basin, or from similar material suitable for dam construction removed from the project construction activities. This material is anticipated to be relatively fine-grained and clayey, with in-situ moisture contents greater than optimum. Some drying of these materials will be necessary, but placement moisture contents will be allowed to remain slightly wet of optimum. While these embankment zones will be constructed with similar and likely consistent materials, the lift thicknesses and compaction efforts will differ by zone. Currently it is envisioned that the materials placed into Zones 1, 3, and 4 will be placed and compacted in lifts not to exceed 1, 2, and 4 ft, respectively, and that method specifications (e.g., compaction efforts) will be established based on test pads carried out just prior to embankment construction. The ultimate and intermediate stages of the TDF embankment are designed with 40 ft crest widths, downstream slopes of 2.5H:1V (horizontal:vertical), and upstream slopes of 2H:1V. The flatter downstream slope was required for long-term stability and access during reclamation. The steeper upstream slope was allowed because it will be buttressed by the tailings and will not be reclaimed. Basin Preparation and Arrangement The TDF interior basin will be fully developed in sections as delineated for Stages 1 through 3, described above. Basin preparation will initially include removal and stockpiling of topsoil and unsuitable materials and the removal of vegetation. The locations of these stockpile facilities have not yet been defined, but are anticipated to be mainly around the immediate perimeter of the TDF. Subsurface till will be excavated to defined lines and grades to increase the storage capacity of the TDF and to provide construction materials for the TDF embankment. The current design excavation depth of the foundation materials will range from approximately 0 (in the southeast corner of the TDF) to 60 ft (in the northwest corner of the TDF), generally increasing from south to north and following the trend of increasing depth

Orvana Resources - Copperwood Project Feasibility Study Page 204
K D Engineering Document No. Q431-01-028 21 March 2012 KDE FORM No. A263a-7/12/99
to bedrock. Approximately 15 to 75 feet of the till will remain above the estimated bedrock surface once the TDF basin excavation is completed. The allowable depth of TDF basin excavation was developed using information from the boreholes and monitoring wells shown in Figure 20.2. The basin excavation is designed using cut slopes of 2.5H:1V as shown on Figure 20.3. This slope angle for the excavation below natural grade will provide end-of-construction stability given the large depth of cut, and will also to facilitate subgrade preparation (recompaction of upper 1 ft of foundation material). Based on the subsurface geology and hydrogeologic conditions presented in these boreholes and monitoring well logs, Golder believes it is reasonable to assume the bedrock and weathered bedrock units act as a type of “aquifer unit” and the silty glacial overburden unit acts as a confining unit over the aquifer. Under the assumed site conditions, the bedrock piezometric surface (shown in the sections on Figure 20.3) applies an upward piezometric pressure, i.e., hydrostatic uplift, at the bottom of the confining layer (the glacial overburden). The hydrostatic uplift pressure must be resisted by an equal weight of the glacial overburden to prevent soil boiling or upheaval. A factor of safety against hydrostatic uplift is commonly calculated as a ratio between the resisting weight of confining soil (glacial overburden) and the uplift pressure. For this evaluation, Golder maintained a factor of safety of 1.4 to develop the TDF allowable excavation limit. For each of the monitoring wells in the TDF area, Golder selected the top of “aquifer unit” base on the corresponding borehole lithology log. Additionally, to calculate the hydrostatic uplift force, Golder selected the maximum piezometric water level recorded for each well screened in the “aquifer unit”. The hydrostatic pressure is equal to the height of the piezometric elevation above the top of the “aquifer unit” times the unit weight of water (62.4 pcf). The glacial overburden thickness required to resist the hydrostatic uplift was calculated by dividing the hydrostatic uplift pressure by the assumed glacial overburden soil wet density (130 pcf), then multiplying by the required factor of safety. Golder then calculated the allowable excavation elevation by adding the required glacial overburden thickness to the top of the “aquifer unit” elevation. The piezometric elevation and glacial overburden/”aquifer unit” contact elevation varies throughout the TDF area. Thus, the hydrostatic uplift pressure will vary throughout the TDF area. To develop a three-dimensional allowable excavation surface, Golder repeated the calculation described at each well in the TDF area. Using the allowable excavation elevations calculated at each point, Golder created a three-dimensional surface using AutoCAD Civil 3D 2011. This allowable excavation surface was used the basis for the TDF basin excavation grades. The depth of the TDF basin was designed to remain above the allowable excavation surface in all areas.
Orvana Resources - Copperwood Project Feasibility Study Page 205
K D Engineering Document No. Q431-01-028 21 March 2012 KDE FORM No. A263a-7/12/99
A calculation for one example point within the TDF excavation (at piezometer PZ-A) is provided below.
▪ If the piezometric elevation is 798.1 ft amsl and the glacial overburden/“aquifer unit” contact is elevation 757.9 ft amsl, the height of the hydrostatic surface above the top of the aquifer is 40.2 feet (798.1 ft amsl – 757.9 ft amsl)
▪ Thus, the hydrostatic uplift pressure would be 2,509 psf (40.2 feet x 62.4 pcf)
▪ The glacial overburden thickness required to achieve a factor of safety of 1.0
would be 19.3 feet (2,509 psf / 130 pcf)
▪ Applying an appropriate factor of safety of 1.4 results in a required glacial overburden thickness of 27.0 feet (19.3 feet x 1.4)
▪ Therefore, the allowable excavation elevation at that point would be 784.9 ft-
msl (757.9 ft amsl + 27.0 feet)
Typical liner and underdrain system details are provided on Figure 20.11. After excavating to the design basin surface, the top 1 ft of in-situ material will be scarified and re-compacted by smooth drum rolling to form a prepared subgrade. The objective is to remove any localized small cracks or sandy/silty lenses and produce a dense, uniform low permeability layer upon which to place the blanket drain. For the purposes of the design, a target maximum permeability of 1 x 10⁻⁷ cm/s was established since it is a conventional value commonly used for soil liners by Michigan regulatory agencies. This is a higher value than the measured average permeability of the in-situ material, at 2 x 10⁻⁸ cm/s; thus actual permeability values more in line with the in-situ values are expected. The 1 ft low permeability layer, combined with the in-situ glacial till material remaining below the base of the TDF excavation, will further limit seepage from the base of the TDF. A 1.5-ft thick layer of drainage material will be placed above the prepared subgrade on the TDF basin floor. A network of perforated 4-inch diameter CPT lateral pipes will be installed at a nominal 50-foot spacing within the drainage blanket to collect and transport seepage from the underside of the tailings mass to the northwest corner of each stage. The underdrain in each of the three staged sections of the TDF will be connected by a collector pipe located along the north edge of the blanket drain at the toe of the cut slope. The collector pipe will drain to the northwest corner of Stage 1 into a solid-wall HDPE outlet pipe that will convey the total underdrain flow volume beneath the northwest corner of the embankment to the decant sump. The blanket drain will significantly reduce the pressure head acting on the prepared subgrade, which in turn will significantly reduce seepage from the base of the TDF. The drainage blanket will also aid in consolidation of the tailings mass by providing bottom drainage of the tailings. This will reduce seepage path lengths and increase the time rate of consolidation, increase the overall dry density achieved at the end of operations,
Orvana Resources - Copperwood Project Feasibility Study Page 206
K D Engineering Document No. Q431-01-028 21 March 2012 KDE FORM No. A263a-7/12/99
which therefore decreases the embankment heights needed to store the required tailings production. Drainage Collection Systems Water routed out of the TDF will primarily be collected from four different points:
▪ Decant water from the supernatant pond on top of the tailings
▪ Chimney Drain flows in the embankment
▪ Pore water expelled from the compacted embankment fill collected by the embankment blanket foundation drains
▪ Consolidation seepage from the tailings, intercepted by the drainage blanket
(underdrain) system on the floor of the TDF. The TDF embankment Chimney Drain (Zone 2) will be 5 ft wide (measured horizontally) and will primarily collect any small amounts of seepage passing through the upstream face of the embankment for conveyance to the downstream decant sump. The embankment foundation drains will primarily collect small amounts of water from dissipating construction pore pressures in the fill and underlying foundation, as well as small amounts of infiltration from precipitation on the downstream face of the embankment. The embankment foundation drains will be comprised of two partial drainage blankets containing perforated CPT drain pipes running parallel to the embankment for added hydraulic capacity. The drainage blankets will cover approximately the upstream and downstream thirds of the embankment footprint, and will be sloped for gravity flow to an outlet pipe that drains to the northwest corner of the embankment and from there is routed to the decant sump. Flow monitoring sensors will be installed on the outlet pipes from the different drain systems to quantify the flows in each. These sensors will be located immediately upstream of the decant sump. The decant sump will be approximately 20 feet lower in elevation than the TDF low point. It will be constructed as a rectangular reinforced concrete structure with interior dimensions 20 ft wide, 30 ft long, and 15 ft deep. The sump will include an overflow pipe which will discharge into an adjacent 60 mil smooth HDPE geomembrane-lined pond. The decant sump will accommodate a volume of approximately 8,400 ft3, or 60,000 gallons, up to a maximum water surface level 1 ft below the crest. This is equivalent to approximately 20 minutes of maximum inflow. A heated and insulated shed will be constructed over the top of the decant sump to protect it and prevent the water from freezing during winter. It is anticipated that the following pumps will be installed in the sump to remove the water:
Orvana Resources - Copperwood Project Feasibility Study Page 207
K D Engineering Document No. Q431-01-028 21 March 2012 KDE FORM No. A263a-7/12/99
▪ Reclaim pumps to the process plant,
▪ Reclaim pumps to the treatment plant, and
▪ Reclaim pumps for water addition as needed for mixing secondary flocculant
into tailings stream.
The overflow pond will receive water from the decant sump only if the pumps go down and remain down for periods greater than 20 minutes due to power outages. Backup emergency power will be provided to keep these occurrences to a minimum. In the event that longer shut-down periods are experienced, the decant structure and embankment and tailings underdrain outlet pipe valves will be closed until power is restored to the decant sump. The decant sump overflow pond has been configured to store approximately 46,000 ft3, accounting for 2 hours of roughly 110 percent of the maximum design decant flow (1,000 gpm) and added flow rate for secondary flocculent mixing and re-injection into the tailings stream (up to 2,100 gpm), in addition to the direct precipitation from the 100-yr/24-hr storm event. An additional 1 ft of dry freeboard below the pond crest is included in the pond volume. Deposition Plan and Decant System Tailings deposition will take place primarily from the north side of the impoundment crest, with lesser amounts deposited from the west and east embankments. The deposition pattern was developed to facilitate management of the supernatant pond location and fully utilize the capacity of the TDF. Deposition from the south side will be as-needed for control of the water pool and final sloping of the tailings surface prior to closure. Final design studies will include development of an operation plan than outlines deposition sequences and frequency of rotation of discharge points to achieve the desired deposition pattern and configuration of the tailings surface. The supernatant pond on top of the tailings will receive bleed water from the tailings slurry upon deposition (i.e., water that separates from the tailings mass following deposition and initial settlement of the solids), as well as direct precipitation and snowmelt into the TDF. It will be removed by a decant system constructed in the southwest corner of each of the three stages of the TDF. The main decant system will be located in the Stage 1 section of the TDF. The decants in Stages 2 and 3 will drain into a collection pipe located along the south side of the TDF invert that will in turn drain into the Stage 1 decant structure. The Stage 1 decant outlet pipe will extend along the west side of the Stage 1 floor and exit the TDF in parallel with the tailings underdrain outlet pipe at the northwest corner of the TDF. The decant structure has been optimized to achieve the following:
▪ Simplify operation of the structure;
▪ Accommodate the staged configuration and operation sequence of the TDF;

Orvana Resources - Copperwood Project Feasibility Study Page 208
K D Engineering Document No. Q431-01-028 21 March 2012 KDE FORM No. A263a-7/12/99
▪ Enhance operability during winter months, when icing of the pond surface will occur; and
▪ Provide redundancy in the system and flexibility in deposition patterns to best
control the supernatant pond location. Control of suspended solids in the reclaim water will be critical due to the fine gradation of the tailings and anticipated minimal slope over the tailings surface. The anticipated low-angle slope of the tailings and relatively short travel distances from discharge points to the decant structure will impede settlement of the finer solids and development of a ‘clean’ water pool at the decant structure. The system will consist of two 36-in slotted HDPE pipes set along the embankment slope in the southwest corner of each stage excavation. The pipes will be wrapped in a filter media such as non-woven geofabric and embedded in a gravel drain. The pipe and gravel drain will be constructed up to the crest elevation of each stage. The top of pipe for each stage will remain accessible for extension up to the next lift. The pipe will be bedded in a shallow trench up the embankment such that the pipe diameter is set equal to the embankment face. The pipe will be placed on a 12-in gravel bed at the pipe invert with 2 ft between the pipe and trench walls. The gravel will then extend a minimum of 6 ft around the exposed pipe. The two pipes will be run parallel up the embankment face, a minimum of 1 pipe diameter apart but no greater than 1.5 pipe diameters apart. The tee connection for the collector pipe and decant pipe will be encased in a concrete thrust block to support the structure prior to being inundated and supported by the tailings. Flow from the decant structure will be controlled by a valve installed on the decant collector pipeline at the decant sump as discussed above. At each stage, the top of pipe will be sealed with a removable cap and covered with gravel a minimum of one foot. Once the decant pipe reaches the Stage 3 crest elevation, the pipe will be permanently sealed and covered with a minimum of 2 feet of gravel. The decant pipes and gravel drain will be extended up the slope in a minimum of 10-ft increments, but no greater than 20-ft increments. The decant structure in each of the three stages of the TDF will be designed for 1.5 to 2 times the maximum anticipated discharge rate, currently estimated at 1,425 gpm based on the current water balance model. The tailings surface will achieve a steeper slope within the aggregate around each riser pipe. This will serve to locally increase the depth of water in the immediate vicinity of the decant structure. This has the advantages of: (1) reducing the inflow velocities and thus reducing the potential for tailings to be carried into the decant pipes; and (2) allowing for the water to be decanted under the predicted 3 to 4 ft ice cover. The surrounding aggregate will also protect the decant structure from incidental ice damage. Instrumentation and Monitoring Plan The TDF embankment will be instrumented to measure its performance with respect to the design assumptions and estimations. These data will be collected during all stages of
Orvana Resources - Copperwood Project Feasibility Study Page 209
K D Engineering Document No. Q431-01-028 21 March 2012 KDE FORM No. A263a-7/12/99
construction and operations to better predict, and if necessary adjust, the embankment and tailings designs and/or construction procedures for subsequent stages. The instrumentation program will consist of ground water monitoring wells, piezometers, earth pressure and settlement cells, surface movement monuments, and flow meters as described herein. Groundwater monitoring wells are planned for installation around the entire perimeter of the fully-developed TDF so they become a part of the permanent monitoring system to meet the requirements of Michigan’s Nonferrous Metallic Mining Regulations, Part 632, R425.406 Protection of Water. Due to the varying thickness of the till (20 to 120 ft) and depth to the more conductive Copper Harbor bedrock, the groundwater wells will be installed in nested pairs at different elevations to monitor for potential impacts in the two observed water-bearing zones typically observed beneath the TDF. Monitoring wells are planned for installation corresponding to the stages of TDF construction as follows:
▪ Stage 1
- Monitoring well MW1 - to be located north of the northwest corner of the ultimate TDF embankment.
- Monitoring well MW3 - to be located west of the northwest corner of the
ultimate TDF embankment.
- Monitoring well MW6 - to be located west of the mid-point of the ultimate TDF western embankment.
- Monitoring well MW7 - to be located west of the southwest corner of the
ultimate TDF embankment.
▪ Stage 2
- Monitoring well MW2 - to be located north of the mid-point of the ultimate TDF northern embankment.
- Monitoring well MW4 - to be located south of the southwest section of the
ultimate TDF southern embankment.
▪ Stage 3
- Monitoring well MW5 - to be located south of the southeast section of the ultimate TDF southern embankment.
- Monitoring well MW8 - to be located north of the northeast corner of the
ultimate TDF embankment.
- Monitoring well MW9 - to be located east of the northeast corner of the ultimate TDF embankment.

Orvana Resources - Copperwood Project Feasibility Study Page 210
K D Engineering Document No. Q431-01-028 21 March 2012 KDE FORM No. A263a-7/12/99
These wells will allow for groundwater samples to be obtained and analyzed for appropriate water quality parameters to evaluate whether impacts are occurring that are a result of seepage from the TDF. They will also allow for groundwater levels to be monitored in order to determine directions of flow in each monitorable zone. Installation of the wells will be performed in accordance with ASTM standard D 5092-90 entitled Practice for Design and Installation of Groundwater Monitoring Wells in Aquifers. The monitoring well plan is presented on Figure 20.9.

Orvana Resources - Copperwood Project Feasibility Study Page 211
K D Engineering Document No. Q431-01-028 21 March 2012 KDE FORM No. A263a-7/12/99
Figure 20.9 – TDF Monitoring Well Plan

Orvana Resources - Copperwood Project Feasibility Study Page 212
K D Engineering Document No. Q431-01-028 21 March 2012 KDE FORM No. A263a-7/12/99
Vibrating-wire piezometers and earth pressure and settlement cells will be installed within the TDF dam in the western and northern embankment sections where the embankments will be relatively tall at full build-out. The piezometers will be installed in the drains to confirm that they are functioning properly as determined by the measurements of atmospheric pressures. They will also be installed in the Seal Zone and Downstream Shell to confirm that construction pore pressures remain acceptably low in these zones and to confirm that the development of any steady-state phreatic surface in the Downstream Shell also remains suitably low over the life of the mine. The earth pressure and settlement cells will be installed in the embankment base to measure vertical load and settlements at selected points. The results will be used to continually evaluate the stability of the embankment and predict future performance of the dam. Surface movement monuments will be installed on the staged crests of the embankments at similar locations from stage to stage. Their data will be used to predict future deformations and to check for areas of anomalous movement. Flow monitoring will be conducted at the outflow point of each of the water collection systems to the decant sump. These data will be used to evaluate the effectiveness of each of the drain systems by comparing them against the design flow rates. These values will also assist in refining the operation of the water reclaim systems to the process plant or the water treatment plant. Conceptual Closure Strategy The current TDF closure concept will be facilitated through the proposed deposition scheme, which will create a tailings surface (beach) sloping from north to south, toward a spillway discharge structure. Near the end of operations, the supernatant pond will be drawn down to the extent practicable to minimize the pond volume remaining at the end of deposition. After the cessation of deposition, the pond will continue to be drawn down for up to 1 year until it is removed. The water removed from the supernatant pond during the closure period will be passed through the water treatment plant prior to being released to the environment. Once the pond is removed, a soil cover will be placed over the tailings (likely during the winter months when the frozen tailings surface allows for trafficability) to direct surface run-off toward an outlet spillway to be constructed on the south side of the TDF. The spillway will be excavated through the TDF embankment and armored with riprap for erosion protection. The outlet of the spillway will discharge into a stilling basin to dissipate excess energy; from there the flow will discharge into Namebinag Creek. The closure cover will consist of a multi-layered system of geosynthetics and soils, from bottom to top, as follows (see detail on Figure 20.11):
▪ A filter fabric (non-woven geotextile) and geogrid placed on top of the tailings surface. These will be used to prevent tailings intrusion into the cover and provide tensile strength to facilitate placement of the remaining cover components.

Orvana Resources - Copperwood Project Feasibility Study Page 213
K D Engineering Document No. Q431-01-028 21 March 2012 KDE FORM No. A263a-7/12/99
▪ A capillary break layer placed above the fabric and geogrid. This will consist of
1 ft of sand or gravel to prevent the upward passage of pore fluids from the tailings mass to the surface of the closure cap.
▪ An initial soil grading layer of till placed over the capillary break layer. This will
be used to overbuild the tailings surface to account for the predicted 2-3 percent consolidation of the tailings height during cover placement (which is a function of tailings thickness, and would thus be greatest in the northern part of the TDF), as necessary to maintain slope of the cover to the southwest corner.
▪ A low-permeability layer (2 feet thick) placed over the soil grading layer. This
will be used to shed rainfall and reduce the amount of infiltration of rainwater into the tailings mass. Grading and maintenance of this layer will be important to remove any cracking that may occur due to different settlements caused by consolidation of the tailings mass and underlying till.
▪ An upper topsoil layer that will be seeded with an appropriate mix of grasses
and forbs capable of maintaining an adequate stand of vegetation under the predicted conditions.
It has been estimated that the conceptual closure cap will be overbuilt to accommodate tailings consolidation that will occur during cap construction. This additional consolidation will also produce seepage from the tailings mass that will need to be collected and treated. A maintenance bond will be established for periodic repair of the closure cap and spillway extending beyond at least the time period predicted for the primary portion of the tailings consolidation process. Soil for the closure cover will be obtained from stockpiles of material excavated from the TDF during stage construction and placed near the TDF, and/or from available stockpiles of excess excavated material generated from other sources during the life of the project (e.g., wetland creation, detention ponds). Figure 20.10 presents the general arrangement of the conceptual closure plan.
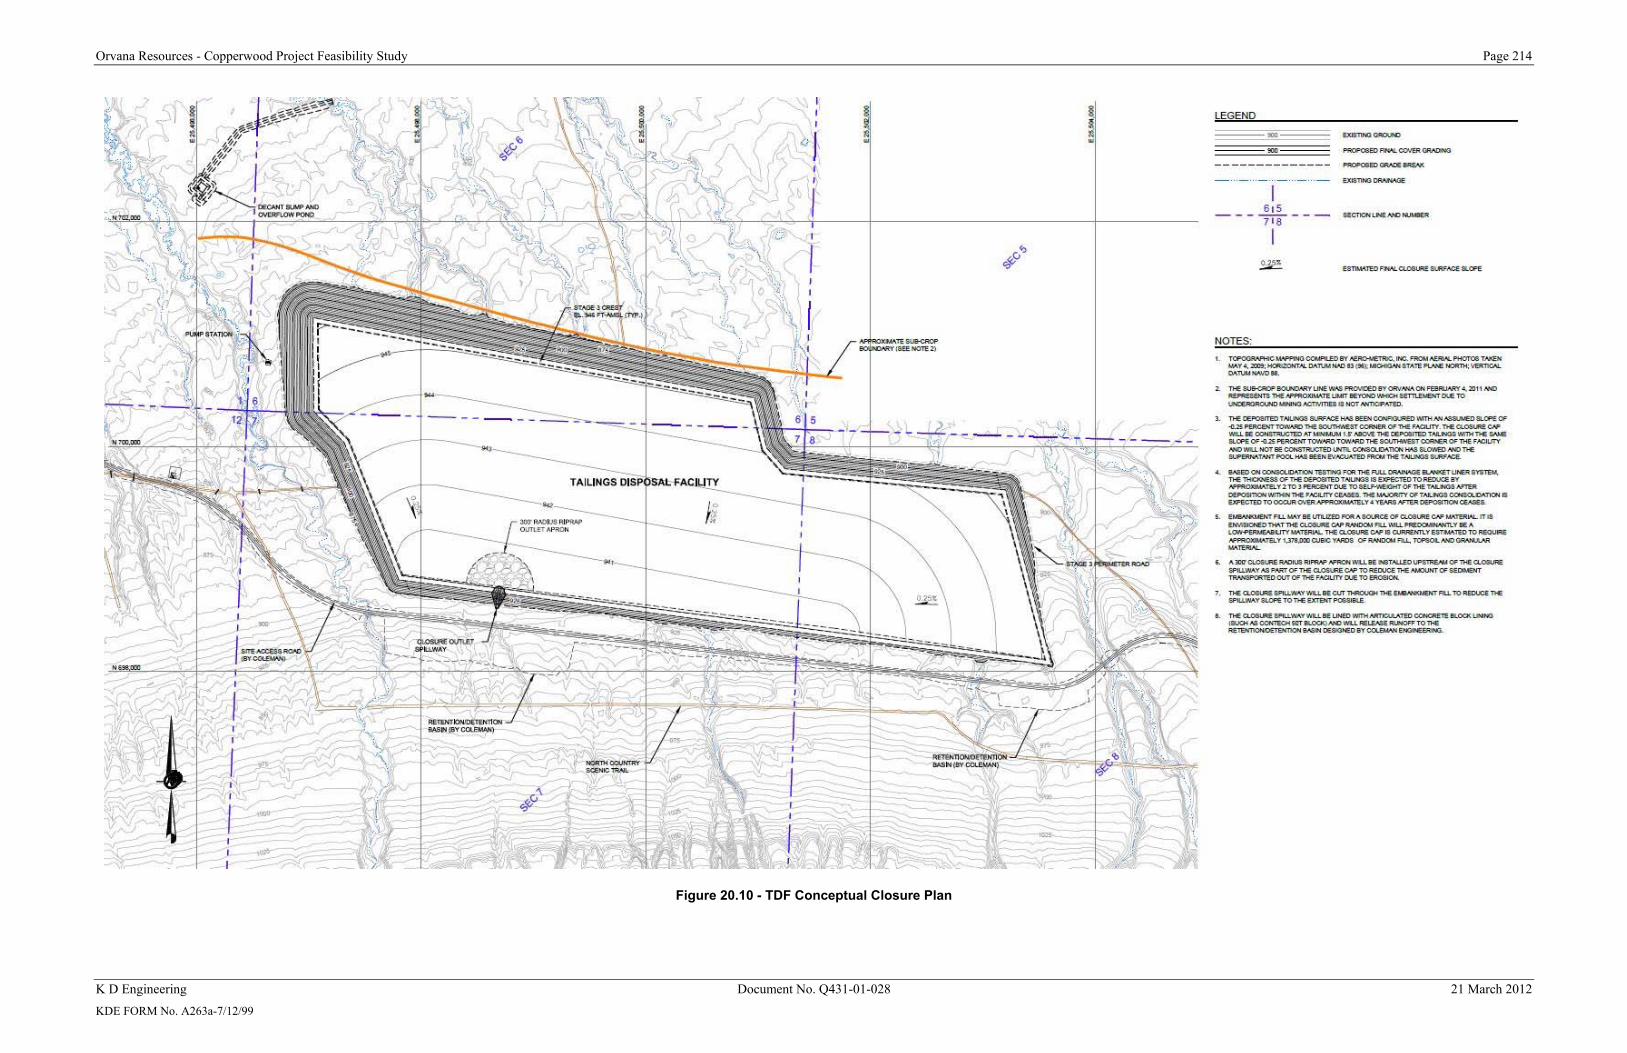
Orvana Resources - Copperwood Project Feasibility Study Page 214
K D Engineering Document No. Q431-01-028 21 March 2012 KDE FORM No. A263a-7/12/99
Figure 20.10 - TDF Conceptual Closure Plan
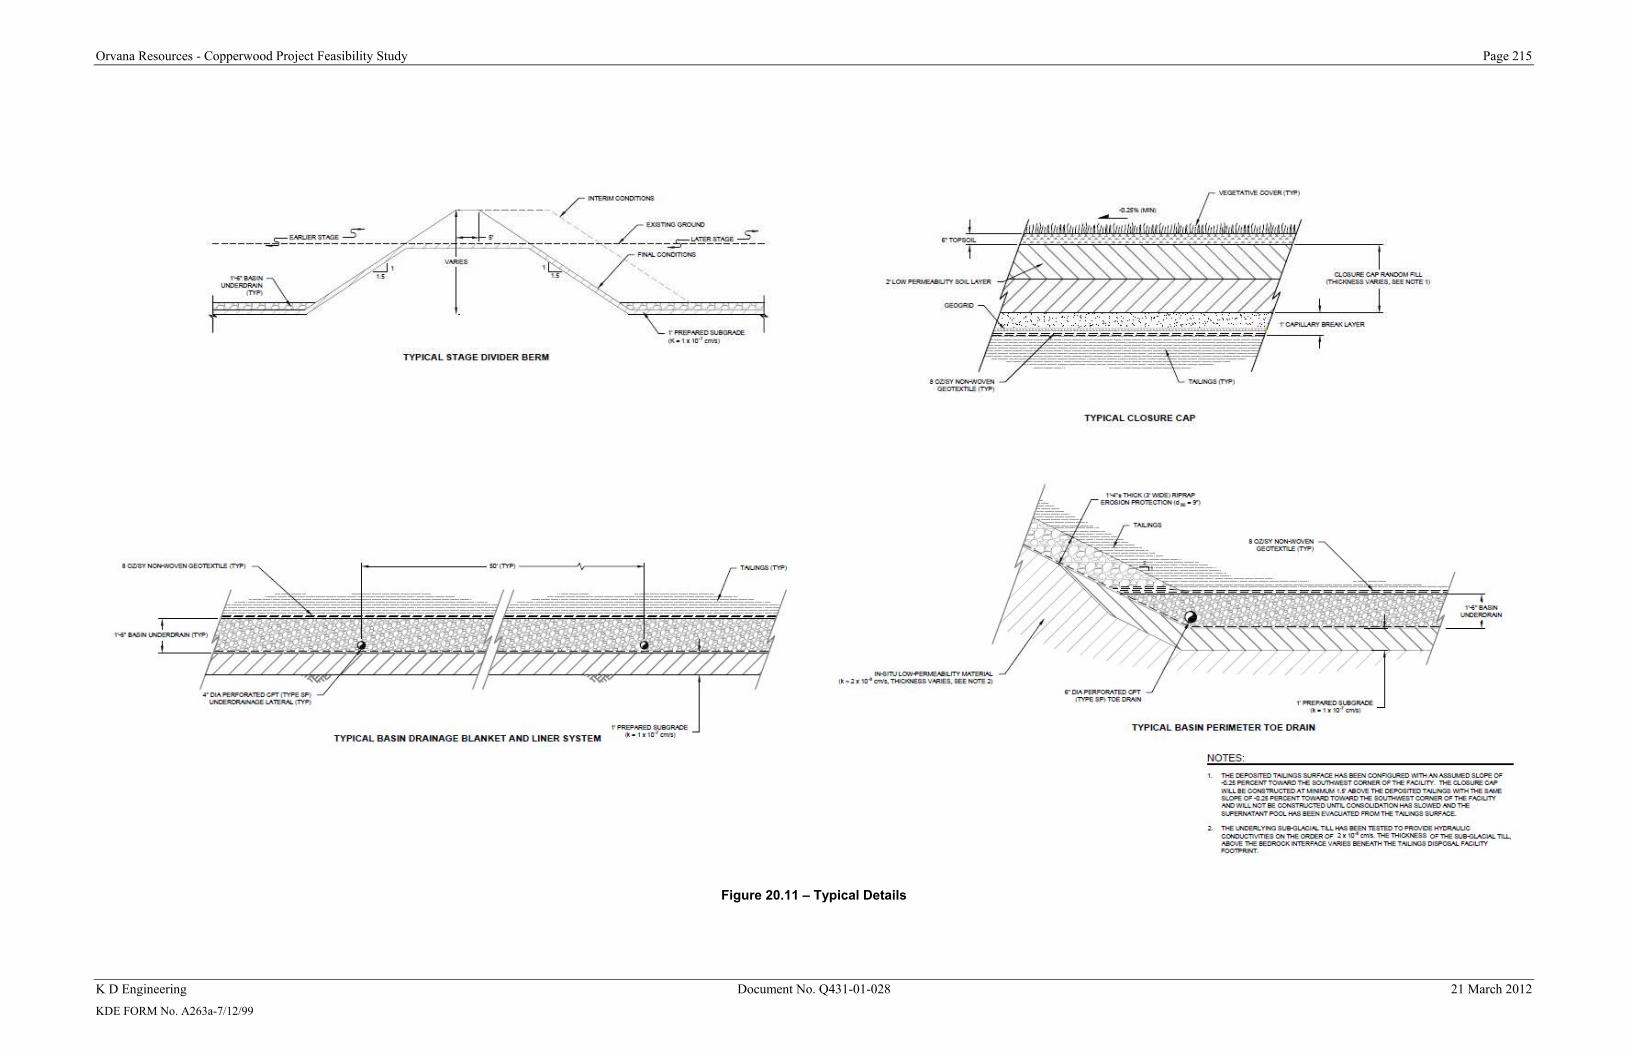
Orvana Resources - Copperwood Project Feasibility Study Page 215
K D Engineering Document No. Q431-01-028 21 March 2012 KDE FORM No. A263a-7/12/99
Figure 20.11 – Typical Details

Orvana Resources - Copperwood Project Feasibility Study Page 216
K D Engineering Document No. Q431-01-028 21 March 2012 KDE FORM No. A263a-7/12/99
20.6.3 Process Water Balance General Overview and Operating Conditions A process water balance was completed for the project using the climate information presented in the Knight Piésold memorandum DV-11-0154 titled Climatic Data Analysis, Revision 0, dated June 15, 2011, and summarized in Section 20.6.1 of this report. The process water balance governs the management, storage, and to a minor degree the treatment of water in the tailings slurry and the TDF, mine dewatering water, and water in the process circuit. The objectives of the water balance were:
▪ To identify the fluctuations of water volumes in the process circuit on a daily basis over the operating life of the facility;
▪ To provide an estimate of the range of potential water deficits and water
surpluses that may occur during operations so that appropriate sources of make-up water as well as provisions for storage or disposition of surplus water can be provided for; and
▪ To provide a basis for sizing the TDF, the treatment plant, and other facilities.
Sizing of the three stages of the TDF included the operational storage required for the supernatant pond as it increases and decreases over the operating seasons and years, as well as storage of the design storm, which was selected as the 72-hr/half-PMP storm event. The general operating strategy avoids the accumulation of an excessive amount of water in the TDF that will require treatment at closure. The water balance model was developed to reclaim and re-use as much water as possible from the TDF. Process water at the mill will be primarily sourced from the TDF as reclaimed supernatant or drainage flows, and fresh water makeup from Lake Superior. Mine dewatering will be stored in the TDF through at least Year 3 and is expected to contain dissolved metals and anions. The TDF supernatant water may also contain dissolved metals, anions, suspended solids, and residual process flotation reagents and some treatment has been planned. The water balance model performs daily calculations of the amounts of water contained in the system from defined or calculated inflows and outflows due to tailings production, process water requirements, mine dewatering, tailings consolidation, and climatic events. The model computes the volume in the TDF supernatant pond together with certain other outputs (reclaim, treated and discharged water) for each day of the model duration. The period of modeling was taken as approximately 16.5 years, which includes:
▪ Approximately 12 years from the start to end of tailings deposition;
▪ 4 months of start-up (where the TDF would accumulate water prior to initiating deposition); and

Orvana Resources - Copperwood Project Feasibility Study Page 217
K D Engineering Document No. Q431-01-028 21 March 2012 KDE FORM No. A263a-7/12/99
▪ Approximately 4 years after the end of deposition for draining the TDF
supernatant pond and completing closure capping and related activities.
Other assumptions factored into the water balance include:
▪ Approximately 3 years of mine dewatering which will be stored in the TDF. Mine dewatering will cease in Year 4, after which mine water will be stored underground; and
▪ Approximately 14.5 years of water treatment plant operations beginning in Year
4 and ending in Year 17.
The Copperwood water balance uses a probabilistic simulation approach, referred to as the Monte Carlo method. Monte Carlo simulations can be used to describe any technique that approximates solutions to quantitative problems through statistical sampling. The entire system is simulated a large number of times, and each simulation is referred to as a realization. Multiple realizations of a system are carried out in order to simulate a large number of possible future outcomes. The result of a Monte Carlo simulation is a qualified probability. Figure 20.12 presents a schematic diagram of the water balance flow chart. A brief summary of the results is presented in the following sections, while a more detailed description of the water balance model will be included in the upcoming water treatment feasibility study report.
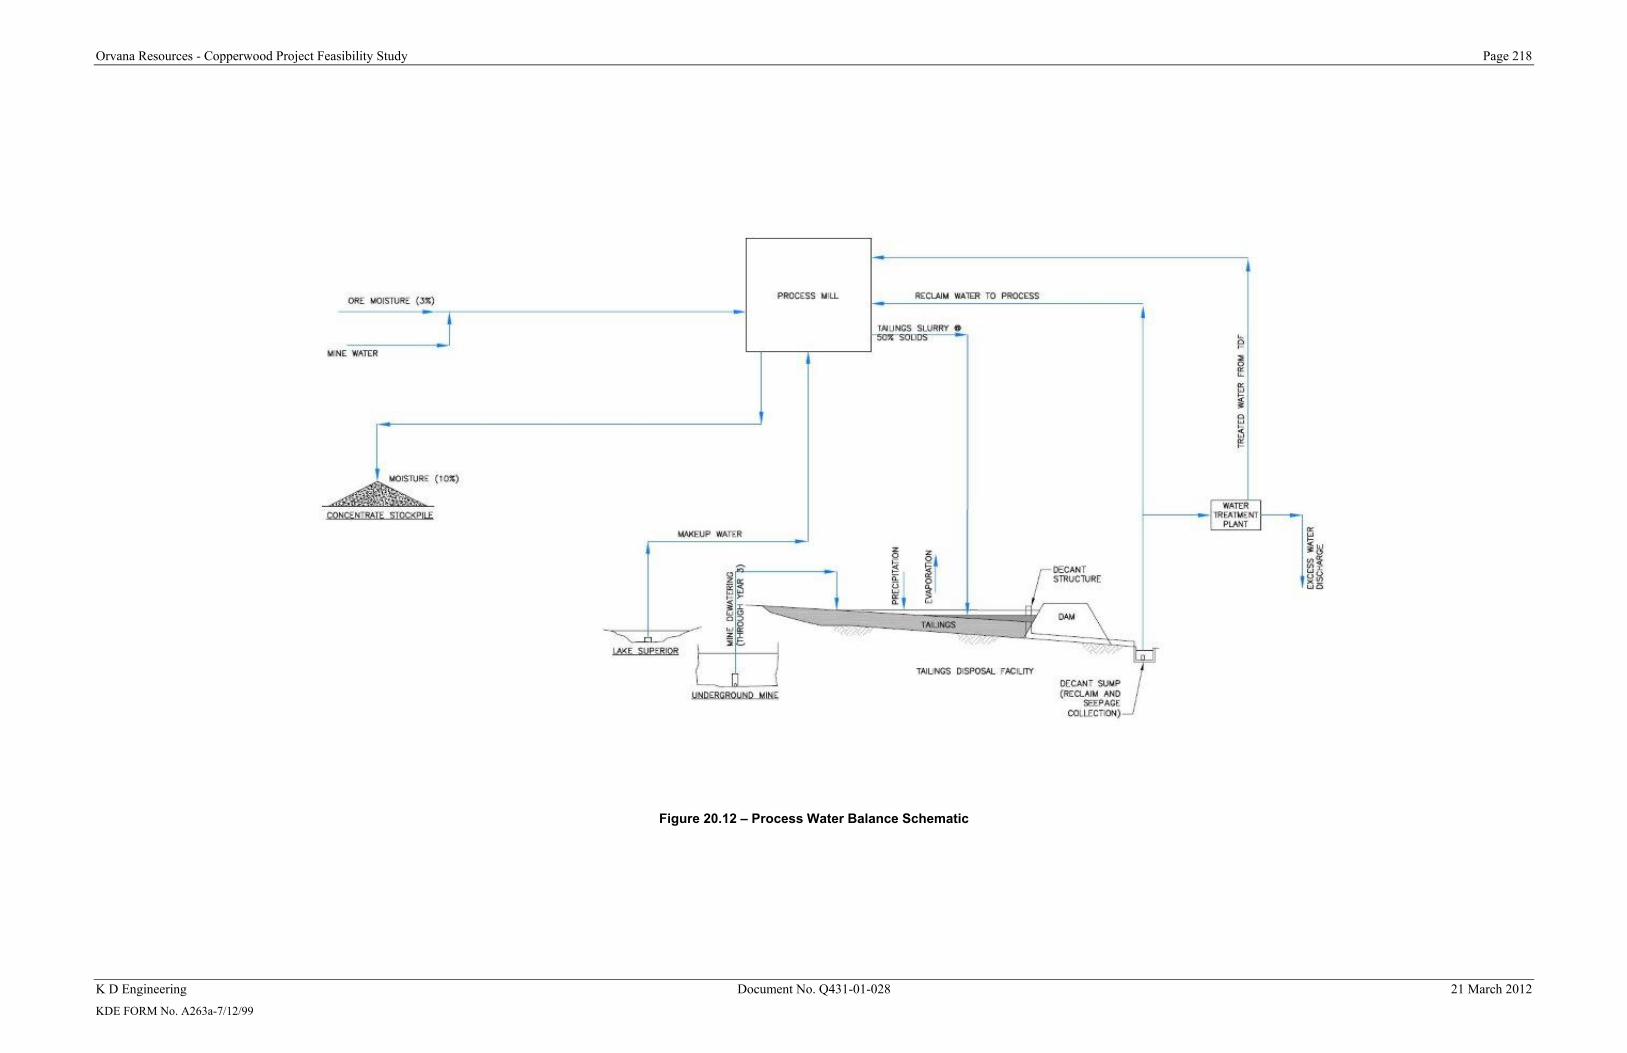
Orvana Resources - Copperwood Project Feasibility Study Page 218
K D Engineering Document No. Q431-01-028 21 March 2012 KDE FORM No. A263a-7/12/99
Figure 20.12 – Process Water Balance Schematic

Orvana Resources - Copperwood Project Feasibility Study Page 219
K D Engineering Document No. Q431-01-028 21 March 2012 KDE FORM No. A263a-7/12/99
Tailings Disposal Facility Supernatant Pond Operation The TDF supernatant pond will be a primary source of water for operation of the mill. The TDF has been designed with sufficient freeboard capacity to contain all direct precipitation falling on the footprint of the facility, mine dewatering (through Year 3), additional incident precipitation resulting from the 72-hr/half-PMP storm event, and any water released from the deposited tailings. Supernatant water will be removed by a decant system on the upstream face of the TDF embankment and conveyed to a decant sump downstream of the dam. From there, water will be pumped to the mill for re-use in the process or pumped to the treatment plant for treatment and discharge. Some portion of the reclaim water may also require treatment before reuse in the mill. Water from the flocculant addition process will also be decanted to the decant sump for pumping back to the flocculant circuit; however, the flocculant circuit has been considered as a closed loop and therefore these waters have not been included in the process water balance. During the winter months (December through March) it has been estimated that all direct precipitation falling on the footprint of the facility is accumulated as ice. The TDF was developed to reclaim and re-use as much water as possible, allowing minimal ponding of water in the TDF. Some makeup water from Lake Superior will be required when the TDF is unable to fulfill the demand required by the mill process. The average operational supernatant pond volume is predicted by the water balance model to fluctuate between 0 and 4.4 Mft3 from the start to the end of the project. Reclaim flows from the TDF to the process mill are predicted to range from 320 gpm to 1,100 gpm over the life of operations. The maximum decant flow rate is estimated at approximately 1,425 gpm. The depth of the supernatant pond is predicted to vary from less than 0.5 ft to approximately 4.4 ft during the life of the TDF, as illustrated in Figure 20.13.

Orvana Resources - Copperwood Project Feasibility Study Page 220
K D Engineering Document No. Q431-01-028 21 March 2012 KDE FORM No. A263a-7/12/99
Figure 20.13 – TDF Supernatant Pool Height (inclusive of Storm Event)

Orvana Resources - Copperwood Project Feasibility Study Page 221
K D Engineering Document No. Q431-01-028 21 March 2012 KDE FORM No. A263a-7/12/99
The tailings surface area will increase from about 4.2 Mft2 in Stage 1 to about 6.9 Mft2 in Stage 2, then to about 10.5 Mft2 during Stage 3 until the end of deposition. The supernatant pond is anticipated to cover as much as 70 percent of the tailings surface at its maximum. Treatment and Makeup Water Requirements The current operating strategy includes storage of mine dewatering in the TDF for three years (Year 1 – Year 3). Beginning in January of Year 4, excess water from the TDF will be pumped to the water treatment plant to maintain the process mill and TDF water quality. The maximum design treatment rate for the mining period and closure is 350 gpm. The mill makeup water requirements were estimated by the water balance to range from 0 to 657 gpm during mill operations. The water balance model assumes the TDF will begin filling with direct precipitation in July of Year 1, and will accumulate water until the start of operations in October of Year 1. If desired, the construction of Stage 1 of the TDF could be moved up earlier to allow for more water to be accumulated from precipitation for process start-up.

Orvana Resources - Copperwood Project Feasibility Study Page 222
K D Engineering Document No. Q431-01-028 21 March 2012 KDE FORM No. A263a-7/12/99
21.0 CAPITAL AND OPERATING COST ESTIMATES
Costs in the Section are presented for both capital and operating major cost centers.
Capital purchases are those expended in the preproduction for construction, equipment purchases and associated costs, owner's costs during the preproduction period, and all final design, consulting and engineering costs prior to installation of ore production. Capitalized mine equipment purchases will also occur during the first two years of production build-up. Replacement capital will occur as equipment requires replacing, and sustaining capital has been concluded in the LOM capital schedule to provide for justified capital projects and equipment purchases.
Operating costs include those expenditures for labor, equipment operation, and operating supplies required for ore production during the life of the mine (Years 1 through 13).
All expenditures are based on 4th quarter 2011 US dollar estimates. Economic evaluations and cash flows are also presented in constant dollars, with no allowance for escalation, or inflation. 21.1 Mine Costs 2.1.1 Capital Costs Preproduction and LOM capital cost estimates were prepared for the underground mine and included:
▪ Boxcut and mine entry portal excavation, paving and support ▪ Mine surface and underground mobile and stationary mine equipment ▪ Mine conveyors ▪ Mine fans and ventilation requirements ▪ Mine primary and secondary pumps ▪ Mine utilities ▪ Communications monitoring systems ▪ Mine surface infrastructure ▪ Mine final design and consulting ▪ Owners costs during preproduction ▪ Warehouse spares for mine equipment ▪ Freight and commissioning of mine equipment
Vendor quotations and in-house references were utilized for estimating each of the major pieces of production and production support equipment. A summary of the estimated preproduction mine capital costs are shown in Table 21.1. Owner’s costs include costs for the owner's project staff during the boxcut construction

Orvana Resources - Copperwood Project Feasibility Study Page 223
K D Engineering Document No. Q431-01-028 21 March 2012 KDE FORM No. A263a-7/12/99
and training of hourly employees to begin underground excavation. The major mine equipment required for full production is shown in Table 21.2, Equipment spares are based on a factor of eight percent of the equipment cost, and the freight & commissioning cost is based on a factor of five percent of the equipment cost. All of these costs, plus the replacement costs for equipment, are included in the capital replacement schedules shown in Table 21.3.
The capital estimates are based on operating three drill & blast sections to meet the daily programmed production. The major equipment required for each section consists of two drill jumbos, a back bolter, two Load Haul Dump (LHD) machines, two haulage trucks, one feeder breaker, one power load center, and several service vehicles. The second and third sections will require the same complement of equipment
Table 21.2
Preproduction Capital Summary
Cost Center Capital Cost
(US$) Boxcut 4,100,000Permitting/Design 1,000,000Mine Equipment 10,737,000Warehouse Spares 859,000Freight/Commissioning 537,000Owners Costs 900,000
Subtotal 18,133,000 Contingency @15% 2,720,000
Total Estimate 20,853,000
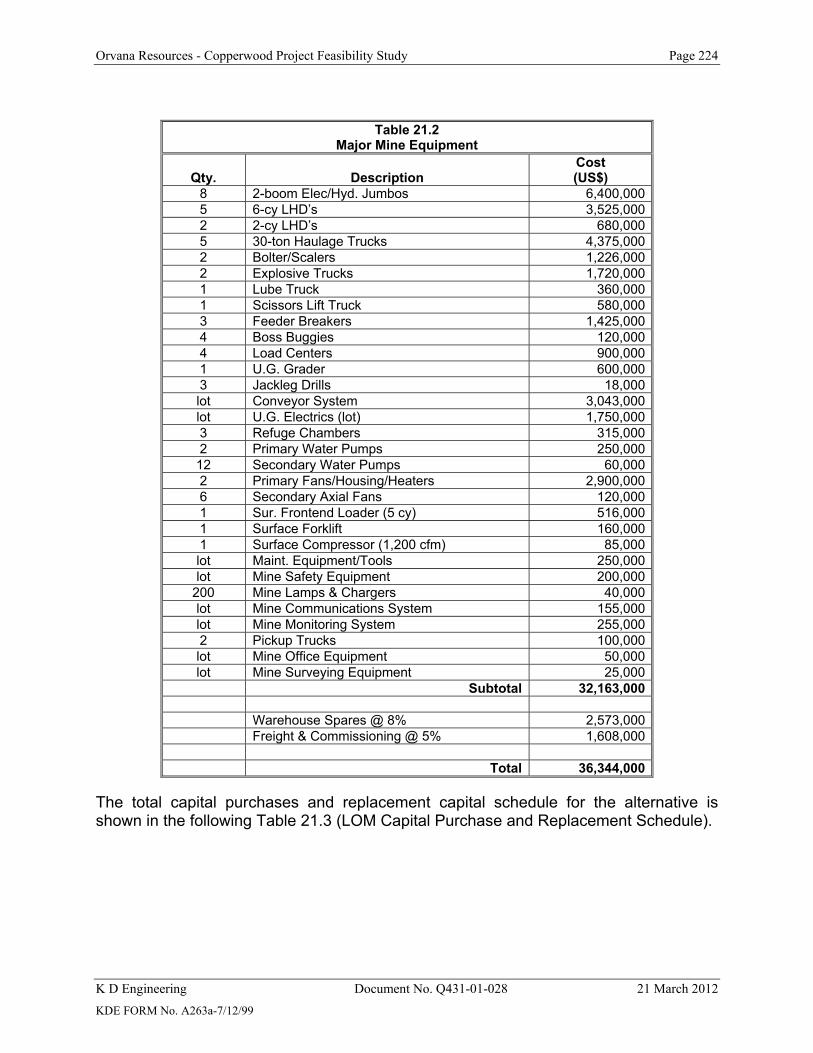
Orvana Resources - Copperwood Project Feasibility Study Page 224
K D Engineering Document No. Q431-01-028 21 March 2012 KDE FORM No. A263a-7/12/99
Table 21.2
Major Mine Equipment
Qty. Description Cost (US$)
8 2-boom Elec/Hyd. Jumbos 6,400,000 5 6-cy LHD’s 3,525,000 2 2-cy LHD’s 680,000 5 30-ton Haulage Trucks 4,375,000 2 Bolter/Scalers 1,226,000 2 Explosive Trucks 1,720,000 1 Lube Truck 360,000 1 Scissors Lift Truck 580,000 3 Feeder Breakers 1,425,000 4 Boss Buggies 120,000 4 Load Centers 900,000 1 U.G. Grader 600,000 3 Jackleg Drills 18,000 lot Conveyor System 3,043,000 lot U.G. Electrics (lot) 1,750,000 3 Refuge Chambers 315,000 2 Primary Water Pumps 250,000 12 Secondary Water Pumps 60,000 2 Primary Fans/Housing/Heaters 2,900,000 6 Secondary Axial Fans 120,000 1 Sur. Frontend Loader (5 cy) 516,000 1 Surface Forklift 160,000 1 Surface Compressor (1,200 cfm) 85,000 lot Maint. Equipment/Tools 250,000 lot Mine Safety Equipment 200,000
200 Mine Lamps & Chargers 40,000 lot Mine Communications System 155,000 lot Mine Monitoring System 255,000 2 Pickup Trucks 100,000 lot Mine Office Equipment 50,000 lot Mine Surveying Equipment 25,000 Subtotal 32,163,000 Warehouse Spares @ 8% 2,573,000 Freight & Commissioning @ 5% 1,608,000 Total 36,344,000
The total capital purchases and replacement capital schedule for the alternative is shown in the following Table 21.3 (LOM Capital Purchase and Replacement Schedule).

Orvana Resources - Copperwood Project Feasibility Study Page 225
K D Engineering Document No. Q431-01-028 21 March 2012 KDE FORM No. A263a-7/12/99
Table 21.3 ORVANA RESOURCES
Copperwood Project Mine Capital Expenditure Schedule ($x1000)
7,500 tons per day
Preproduct. Production Years → Capital Item -1 1 2 3 4 5 6 7 8 9 10 11 12 13 Total Ore Prod - K tons 530 1700 2625 2625 2625 2625 2625 2625 2625 2625 2625 2625 1748 30,228Boxcut 4,100 4,100Warehouse Spares 859 533 1,143 287 78 447 186 151 3,684Freight/Commissioning 537 333 714 81 49 280 116 94 2,204Permitting/Design 1,000 1,000Owners Costs 900 0 0 0 0 0 0 900Subtotal 7,396 866 1,858 368 - - 127 727 301 245 - - - - 11,887 SURFACE EQUIP. Compressor 85 - - 85Fork Lift 160 - 160 320Frontend Loader 516 - 516 1,032Mine Lamps/Charger 40 - - 40Mine Office Equip. 50 - 0 8 8 8 8 8 8 8 8 8 8 8 138Mine Surveying Equip. 25 - 0 1 1 1 1 1 1 1 1 1 1 1 36Pickup Trucks 100 - 100 200Mine Safety Equip. 200 - 0 10 10 10 10 100 10 10 10 10 10 10 400Prim. Fans/Housings/Heat. 450 1,000 1,450 - 2,900Small Eq. Replacement - - - 50 50 50 50 50 50 50 50 50 50 - 500Subtotal Sur. Equip. 1,626 1,000 1,450 69 69 69 69 935 69 69 69 69 69 19 5,651 U.G. MOBILE EQUIP. Drill Jumbos 2,400 1,600 2,400 250 250 125 7,0256 cy LHD's 1,410 705 1,410 705 352 705 5,2872 cy LHD's 340 340 340 340 1,360Haul Trucks 1,750 875 1,750 875 438 875 6,563Bolter/Scalers 613 613 125 125 1,476Explosives Truck 860 860 430 430 2,580Personnel Carriers 290 145 145 145 145 870Boss Buggies 30 30 60 60 60 240Scissor Lift Truck 360 - - 180 540U.G. Lube Truck - 330 - - 165 495U.G. Grader 260 - - - - - 260Subtotal Mobile Eq. 8,313 3,685 7,578 - - - - 3,275 2,140 1,705 - - - - 26,696

Orvana Resources - Copperwood Project Feasibility Study Page 226
K D Engineering Document No. Q431-01-028 21 March 2012 KDE FORM No. A263a-7/12/99
Table 21.3 ORVANA RESOURCES
Copperwood Project Mine Capital Expenditure Schedule ($x1000)
7,500 tons per day
Preproduct. Production Years → Capital Item -1 1 2 3 4 5 6 7 8 9 10 11 12 13 Total Ore Prod - K tons 530 1700 2625 2625 2625 2625 2625 2625 2625 2625 2625 2625 1748 30,228U.G. STATIONARY EQ. Conveyor System - 2,976 2,425 800 50 250 250 50 50 50 250 250 50 7,451Feeder Breakers 475 950 25 25 25 475 950 2,925Jackleg Drills 18 - - - - 18Load Centers 225 225 225 225 - - 900Secondary Fans 60 60 - 60 60 240Maint. Equip/Tools 125 125 - 10 10 10 10 10 10 10 10 10 10 - 350Refuge Chambers - 105 105 105 - - 315U.G. Electrics 250 750 750 623 20 20 20 20 20 20 20 20 20 - 2,553Comm./Monotoring Eq. 40 130 130 85 5 5 5 5 5 5 5 5 5 - 430U.G. Pumps 80 105 125 60 60 430Small Eq. Replacement - - - 25 25 25 25 25 25 25 25 25 25 - 250Subtotal U.G.Stat. Eq. 798 1,975 5,261 3,523 885 135 905 1,380 110 110 110 310 310 50 15,862 -Subtotal Capital 18,133 7,526 16,147 3,960 954 204 1,101 6,317 2,620 2,129 179 379 379 69 60,096 Contingency @ 15% 2,720 1,129 2,422 594 143 31 165 948 393 319 27 57 57 10 9,014 Grand Total LOM Cap. 20,853 8,655 18,569 4,554 1,097 235 1,266 7,264 3,014 2,448 206 436 436 79 69,111
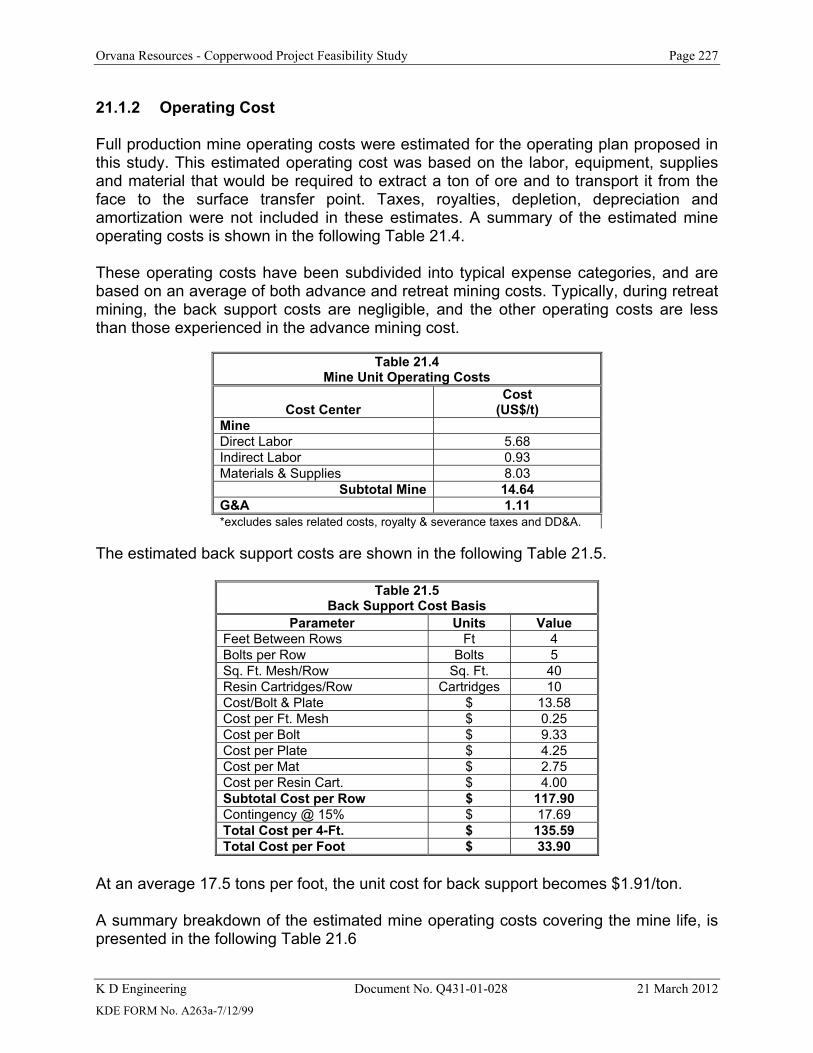
Orvana Resources - Copperwood Project Feasibility Study Page 227
K D Engineering Document No. Q431-01-028 21 March 2012 KDE FORM No. A263a-7/12/99
21.1.2 Operating Cost Full production mine operating costs were estimated for the operating plan proposed in this study. This estimated operating cost was based on the labor, equipment, supplies and material that would be required to extract a ton of ore and to transport it from the face to the surface transfer point. Taxes, royalties, depletion, depreciation and amortization were not included in these estimates. A summary of the estimated mine operating costs is shown in the following Table 21.4. These operating costs have been subdivided into typical expense categories, and are based on an average of both advance and retreat mining costs. Typically, during retreat mining, the back support costs are negligible, and the other operating costs are less than those experienced in the advance mining cost.
Table 21.4
Mine Unit Operating Costs
Cost Center Cost
(US$/t) Mine Direct Labor 5.68 Indirect Labor 0.93 Materials & Supplies 8.03
Subtotal Mine 14.64 G&A 1.11 *excludes sales related costs, royalty & severance taxes and DD&A.
The estimated back support costs are shown in the following Table 21.5.
Table 21.5 Back Support Cost Basis
Parameter Units Value Feet Between Rows Ft 4 Bolts per Row Bolts 5 Sq. Ft. Mesh/Row Sq. Ft. 40 Resin Cartridges/Row Cartridges 10 Cost/Bolt & Plate $ 13.58 Cost per Ft. Mesh $ 0.25 Cost per Bolt $ 9.33 Cost per Plate $ 4.25 Cost per Mat $ 2.75 Cost per Resin Cart. $ 4.00 Subtotal Cost per Row $ 117.90 Contingency @ 15% $ 17.69 Total Cost per 4-Ft. $ 135.59 Total Cost per Foot $ 33.90
At an average 17.5 tons per foot, the unit cost for back support becomes $1.91/ton. A summary breakdown of the estimated mine operating costs covering the mine life, is presented in the following Table 21.6

Orvana Resources - Copperwood Project Feasibility Study Page 228
K D Engineering Document No. Q431-01-028 21 March 2012 KDE FORM No. A263a-7/12/99
Table 21.6 ORVANA RESOURCES
Copperwood Project Mine Operating Expense Schedule
Year→ 1 2 3 4 5 6 7 8 9 10 11 12 13 Total Description Production (tons) 530,000 1,700,000 2,625,000 2,625,000 2,625,000 2,625,000 2,625,000 2,625,000 2,625,000 2,625,000 2,625,000 2,625,000 1,748,000 30,228,000
Average Advance (ft/day) 42 274 423 423 423 423 423 423 423 423 423 423 423 411
Mine Oper. Costs ($/t)
Direct:
Labor 8.52 7.10 5.68 5.68 5.68 5.68 5.68 5.68 5.68 5.68 5.68 5.68 5.68 5.81
Supplies 11.81 9.84 7.87 7.87 7.87 7.87 7.87 7.87 7.87 7.87 7.87 7.87 7.87 8.05
Subtotal Direct 20.33 16.94 13.55 13.55 13.55 13.55 13.55 13.55 13.55 13.55 13.55 13.55 13.55 13.86
Indirect:
Labor 1.40 1.16 0.93 0.93 0.93 0.93 0.93 0.93 0.93 0.93 0.93 0.93 0.93 0.95
Supplies 0.24 0.20 0.16 0.16 0.16 0.16 0.16 0.16 0.16 0.16 0.16 0.16 0.16 0.16
Subtotal Indirect 1.64 1.36 1.09 1.09 1.09 1.09 1.09 1.09 1.09 1.09 1.09 1.09 1.09 1.11
Total Mine ($/t) 21.96 18.30 14.64 14.64 14.64 14.64 14.64 14.64 14.64 14.64 14.64 14.64 14.64 14.91
Cost per Year ($x1,000) $11,639 $31,110 $38,430 $38,430 $38,430 $38,430 $38,430 $38,430 $38,430 $38,430 $38,430 $38,430 $25,591 $452,640
Gen. & Admin. Op. Cost $2,914 $2,914 $2,914 $2,914 $2,914 $2,914 $2,914 $2,914 $2,914 $2,914 $2,914 $2,914 $2,914 $37,880

Orvana Resources - Copperwood Project Feasibility Study Page 229
K D Engineering Document No. Q431-01-028 21 March 2012 KDE FORM No. A263a-7/12/99
Table 21.7 presents a breakdown of the estimated general and administrative (G&A) labor and the resulting estimated unit cost estimate
Table 21.7 Orvana Resources
Copperwood Project G&A Operating Costs
No. Labor Classification Base Salary Fringe @ 30% Tot. Labor Cost/Yr. 1 Project Manager $175,000 $52,500 $227,5001 Safety Manager 80,000 24,000 104,0001 Accounting Manager 80,000 24,000 104,0001 Purchasing Manager 80,000 24,000 104,0001 Warehouse Manager 80,000 24,000 104,0001 Environmental Mgr. 80,000 24,000 104,0001 Maintenance Manager 100,000 30,000 130,0001 HR Manager 80,000 24,000 104,0002 Accountants 50,000 15,000 130,0003 Warehousemen 50,000 15,000 195,0001 Purchasing Agent 50,000 15,000 65,0002 Surface Equip. Operator 50,000 15,000 130,0004 Secretaries/Clerks 40,000 12,000 208,0004 Security 45,000 13,500 234,0002 Surface Infrast. Maint. 50,000 15,000 130,0004 Sur. Mech. Maint. 50,000 15,000 260,0001 Sur. Road Maint. 50,000 15,000 65,00031 Subtotal Labor $2,398,500 G&A non-labor @ 21% $503,685 Total G&A Cost $2,902,185 Cost per Ton $1.11
21.2 Process Capital Costs The total process plant capital cost including utility and process plant costs of US$ 167.5 million was developed for the Orvana Copperwood Process plant facilities and infrastructure. The sustaining costs will add an additional US$ 6.0 million for wetland mitigation and sewer pond reclamation cost.

Orvana Resources - Copperwood Project Feasibility Study Page 230
K D Engineering Document No. Q431-01-028 21 March 2012 KDE FORM No. A263a-7/12/99
Table 21.8
Capital Cost Summary Initial Process Plant
Description Total CostUTILITY COST Area 00 - Site Infrastructure
General Site 8,003,714 Water Supply 7,469,500 Power Supply (Do not add Contingency) 16,809,000
TOTAL INITIAL COST 32,282,214 CONTINGENCY (15%) 2,320,982
TOTAL (Incl. CONTINGENCY) INITIAL COST 34,603,197 PROCESS PLANT - PHASE I DIRECT COSTS
Area 10 SAG Grinding & Stockpile Area 29,010,706 Area 20 - Ball Mill Grinding 7,446,548 Area 30 - Flotation 11,503,428 Area 40 - Regrind 5,339,292 Area 50 - Copper Concentrate Handling 8,754,635 Area 60 - Tails 4,299,537 Area 70 - Reagents 1,055,929 Area 75 - Sampling 1,298,519 Area 80/90 - Process & Reclaim Water / Fresh Water 1,058,113 Area 95 - Electrical Distribution 6,023,069 Area 100 - Ancillaries 7,234,059
TOTAL DIRECT 83,023,835 INDIRECT COSTS
Engineering 4,320,249 Procurement 795,600 Construction Management 1,831,840 Field Office Expense and Construction Support 469,776 Training 225,000 Initial Fill 2,882,700 Startup 370,000 Spare Parts 999,165 Owner's Costs 5,500,000 Mobile Equipment 1,515,000
TOTAL INDIRECT 18,909,330 TOTAL DIRECT AND INDIRECT (PHASE I) 101,933,165
CONTINGENCY (15%) 15,289,975 TOTAL (Incl. CONTINGENCY) PHASE I 117,223,140
PROCESS PLANT - PHASE II DIRECT COST
Area 20 - Ball Mill Grinding 5,931,296 Area 30 - Flotation 3,644,741

Orvana Resources - Copperwood Project Feasibility Study Page 231
K D Engineering Document No. Q431-01-028 21 March 2012 KDE FORM No. A263a-7/12/99
Table 21.8 Capital Cost Summary
Initial Process Plant Area 40- Regrind 2,565,649
TOTAL DIRECT 12,141,687 INDIRECT COST
Procurement 79,560 Construction Management 183,184 Field Office Expense and Construction Support 46,978 Initial Fill 288,270 Startup 37,000 Spare Parts 99,917 Owner's Costs 550,000 Mobile Equipment 151,500
TOTAL INDIRECT 1,436,408 TOTAL DIRECT AND INDIRECT (PHASE II) 13,578,095 CONTINGENCY (15%) 2,036,714
TOTAL (Incl. CONTINGENCY) PHASE II 15,614,809
TOTAL - INITIAL and PROCESS PLANT (PHASE I and II) 167,441,146 Additional Costs (Including 10% Contingency)
Wetland Mitigation Cost - Road for Year 0 233,922 Wetland Mitigation Cost - Boxcut, Mill and Phase 1 TDF for Year 2 3,637,403 Wetland Mitigation Cost - Phase 2 TDF for Year 3 967,831 Wetland Mitigation Cost - Monitoring of Constructed Wetland for Year 5 96,250 Wetland Mitigation Cost - Phase 3 TDF for Year 7 967,831 Sewer Pond Reclaim Cost - Year 15 132,000
21.2.1 Direct Costs The direct costs exhibited in this estimate include, but are not limited to, labor, equipment and materials for the detailed construction activities. The Direct capital costs were based on the following list of documents;
▪ Design Criteria
▪ Equipment List
▪ Xcel Energy issued a letter with an “indicative” estimate of the spending schedule for the extension of the power line to the Orvana Copperwood Mine. This cost estimate included the Copperwood substation, Norrie substation upgrade, new transmission line, permitting and easements.

Orvana Resources - Copperwood Project Feasibility Study Page 232
K D Engineering Document No. Q431-01-028 21 March 2012 KDE FORM No. A263a-7/12/99
▪ Engineering Report by C2AE to the Gogebic Range Water Authority for the Copperwood Water system dated 11-24-10 and subsequent e-mails regarding costs.
▪ Report by Coleman regarding capital costs for CR519 Upgrade, new paved road
to the mine site, septic system and non-contact water pond.
▪ Engineering Drawings performed by KDE which can be found in the following table.
Table 21.9
Drawing List
Drawing No Description
Flowsheet 00-F-01 Flowsheet Mass Balance 10-F-01 Flowsheet SAG Grinding 20-F-02 Flowsheet Ball Mill Grinding 30-F-03 Flowsheet Flotation 40-F-04 Flowsheet Regrind 50-F-05 Flowsheet Copper Concentrate Handling 60-F-06 Flowsheet Tails Thickening 70-F-10 Flowsheet Reagents 75-F-15 Flowsheet Sampling 80-F-20 Flowsheet Process & Reclaim Water 90-F-30 Flowsheet Fresh Water
Civil
05-G-01 Site Plan - Overall 05-G-05 Site Plan - Process Plant
General Arrangement
05-L-001 General Arrangement Overall Site Plan 05-L-005 General Arrangement Process Plant Site Plan 05-L-006 General Arrangement Plant Site - Plan 2 of 2 05-L-010 General Arrangement Process Plant Plan 05-L-011 General Arrangement Plant Site - Section 2 of 2 05-L-020 General Arrangement Mill & Cu Conc Area Section 05-L-035 General Arrangement Mill & Cu Conc Area Section 05-L-037 General Arrangement Flotation/Cu Conc Area Section 10-L-001 General Arrangement Stockpile Feed Conveyor Plan 10-L-005 General Arrangement Stockpile Feed Conveyor Section 10-L-010 General Arrangement Mill Feed Stockpile Plan 10-L-011 General Arrangement Mill Feed Stockpile Plan 10-L-012 General Arrangement Mill Feed Stockpile Plan 10-L-015 General Arrangement Mill Feed Stockpile Section 10-L-016 General Arrangement Mill Feed Stockpile Section 10-L-020 General Arrangement Mill Area Recycle Crusher Plan 10-L-025 General Arrangement Mill Area Recycle Crusher Section 10-L-030 General Arrangement SAG/Ball Mill Area - Plan 10-L-035 General Arrangement SAG/Ball Mill Area - Section 1 of 2

Orvana Resources - Copperwood Project Feasibility Study Page 233
K D Engineering Document No. Q431-01-028 21 March 2012 KDE FORM No. A263a-7/12/99
Table 21.9 Drawing List
Drawing No Description
10-L-036 General Arrangement SAG/Ball Mill Area - Section 2 of 2 30-L-001 General Arrangement Flotation Area - Plan 30-L-005 General Arrangement Flotation Area - Section 1 of 3 30-L-006 General Arrangement Flotation Area - Section 2 of 3 30-L-007 General Arrangement Flotation Area - Section 3 of 3 100-L-001 General Arrangement Administration Building Plan 100-L-005 General Arrangement Pre-Engineered Metal Building Section 100-L-010 General Arrangement Laboratory Building Plan 100-L-020 General Arrangement Warehouse Building Plan 100-L-030 General Arrangement Maint. Shop and Plant Offices Plan 100-L-040 General Arrangement Mine Office and Change Room Plan 100-L-050 General Arrangement Guard Gate Plan 100-L-060 General Arrangement Core Storage Building Plan
P&ID
00-Q-001 P&ID Symbols & Designations Index Sheet 1 of 2 00-Q-002 P&ID Symbols & Designations Index Sheet 2 of 2 10-Q-001 P&ID Conveying SAG Mill Feed 10-Q-002 P&ID Grinding SAG Mill 10-Q-003 P&ID Grinding SAG Mill Lubrication System 10-Q-004 P&ID Grinding Recycle 10-Q-005 P&ID Grinding Recycle Crusher 10-Q-006 P&ID Grinding Recycle Crusher Lubrication 10-Q-007 P&ID Grinding Recycle Crusher Hydraulics 20-Q-001 P&ID Cyclone Feed 20-Q-002 P&ID Grinding Ball Mill 20-Q-003 P&ID Grinding Mill Lubrication System 20-Q-004 P&ID Grinding Mill Lubrication System (Future) 30-Q-001 P&ID Flotation Rougher Cells 30-Q-002 P&ID Flotation Rougher Cells (Future) 30-Q-003 P&ID Flotation Classification Cyclones 30-Q-004 P&ID Flotation 1st Cleaner 1st cleaner Scavenger 40-Q-001 P&ID Regrind Cyclone Feed 40-Q-002 P&ID Regrind Mill 40-Q-003 P&ID Regrind Mill 40-Q-004 P&ID Regrind Mill (Future) 50-Q-001 P&ID Compressed Air 50-Q-002 P&ID Copper Concentrate Handling Thickening & Filter Feed 50-Q-003 P&ID Copper Concentrate Handling Filter Press 50-Q-004 P&ID Copper Concentrate Handling Loadout 60-Q-001 P&ID Tails Thickening 80-Q-001 P&ID Process & Reclaim Water 90-Q-001 P&ID Fresh Water
Electrical
00-E-001 Electrical Single Line Diagram Power Distribution Plan 05-E-001 Electrical Single Line Diagram Underground Mine 10-E-001 Electrical Single Line Diagram Area 10: SAG Grinding 20-E-001 Electrical Single Line Diagram Area 20: Ball Mill Grinding
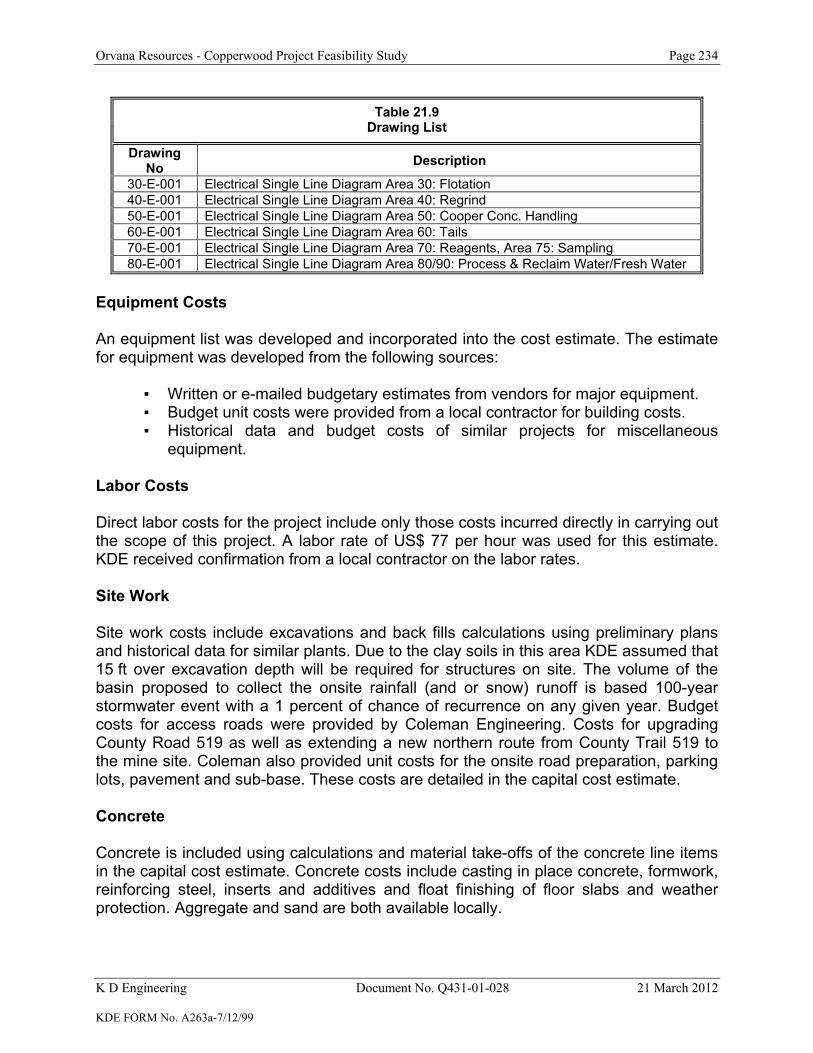
Orvana Resources - Copperwood Project Feasibility Study Page 234
K D Engineering Document No. Q431-01-028 21 March 2012 KDE FORM No. A263a-7/12/99
Table 21.9 Drawing List
Drawing No Description
30-E-001 Electrical Single Line Diagram Area 30: Flotation 40-E-001 Electrical Single Line Diagram Area 40: Regrind 50-E-001 Electrical Single Line Diagram Area 50: Cooper Conc. Handling 60-E-001 Electrical Single Line Diagram Area 60: Tails 70-E-001 Electrical Single Line Diagram Area 70: Reagents, Area 75: Sampling 80-E-001 Electrical Single Line Diagram Area 80/90: Process & Reclaim Water/Fresh Water
Equipment Costs An equipment list was developed and incorporated into the cost estimate. The estimate for equipment was developed from the following sources:
▪ Written or e-mailed budgetary estimates from vendors for major equipment. ▪ Budget unit costs were provided from a local contractor for building costs. ▪ Historical data and budget costs of similar projects for miscellaneous
equipment.
Labor Costs Direct labor costs for the project include only those costs incurred directly in carrying out the scope of this project. A labor rate of US$ 77 per hour was used for this estimate. KDE received confirmation from a local contractor on the labor rates. Site Work Site work costs include excavations and back fills calculations using preliminary plans and historical data for similar plants. Due to the clay soils in this area KDE assumed that 15 ft over excavation depth will be required for structures on site. The volume of the basin proposed to collect the onsite rainfall (and or snow) runoff is based 100-year stormwater event with a 1 percent of chance of recurrence on any given year. Budget costs for access roads were provided by Coleman Engineering. Costs for upgrading County Road 519 as well as extending a new northern route from County Trail 519 to the mine site. Coleman also provided unit costs for the onsite road preparation, parking lots, pavement and sub-base. These costs are detailed in the capital cost estimate. Concrete Concrete is included using calculations and material take-offs of the concrete line items in the capital cost estimate. Concrete costs include casting in place concrete, formwork, reinforcing steel, inserts and additives and float finishing of floor slabs and weather protection. Aggregate and sand are both available locally.

Orvana Resources - Copperwood Project Feasibility Study Page 235
K D Engineering Document No. Q431-01-028 21 March 2012 KDE FORM No. A263a-7/12/99
Structural Steel Structural steel is included using calculations and material take-offs of the concrete line items in the capital cost estimate The unit pricing includes shop and field fabrication and installation. The structural steel does not include buildings. Buildings and covered structures have been quoted by several vendors and estimated separate from the structural steel. Fresh Water C2AE has provided a preliminary cost estimate for the water supply system to the Copperwood project site. This plan is based on 0.5 million gallons per day and provides a lake intake, a low service pump station, and a raw water transmission main that will be sized to serve the Copperwood project. The cost basis is for serving the project only and includes a 200,000 gallon storage tank. Water Treatment Plant The water treatment plant will be constructed in Year 3 and will begin operation in Year 4. The water treatment plant will treat excess water, which will be released either at a storage tank within the plant for further use or discharged at West Branch of Namebinag Creek. The plant installation is delayed until Year 3 due to the fact that the TDF will be utilized to store water until the start of Year 4 and there will not be any discharge from the TDF until that time. A cost estimate was developed for the water treatment plant for a flow rate of 350 gallons per minute based on the water balance model. The cost estimates have been developed to a budgetary level of detail (+/- 20 percent) for initial capital and annual operations and maintenance (O&M). Capital cost estimates for process equipment were developed through use of vendor budgetary quotes that are specific to the WTP projected flow, water quality characterization and treatment targets for the major components. Other factored items in the total capital cost estimate include: equipment installation, shipping, commissioning, general contractor costs, design engineering, construction management and contingency. O&M major categories include labor, utility power, chemical reagents, process consumables, compliance sampling, analysis and reporting. O&M costs will be provided per year due to the treatment flow rate variations throughout the mine life and closure period. Electrical and Instrumentation Electrical and instrumentation are included using historical data for similar plants. Emergency powered generators have been included to continue to supply power to critical pieces of equipment (thickener mechanisms, agitators, etc) in the event of a power outage.

Orvana Resources - Copperwood Project Feasibility Study Page 236
K D Engineering Document No. Q431-01-028 21 March 2012 KDE FORM No. A263a-7/12/99
An estimate for a power line installation and substation from XCEL Energy (Electrical Utility) was given for approximately US$ 19.3 million. The power line estimated for this project runs approximately 25.2 miles. Power Supply to Mine The closest utility substation is located at Norrie, Wisconsin and operated by XCEL Energy. It is assumed XCEL will run a 115 kV power transmission line to the proposed mine site to provide electrical service. The transmission line extension was assumed to follow existing highway 519 where applicable. The assumption for the transmission line extension is the allowance for a 25.2 mile long run, associated right-of-way and mine substation. Generating electric power on site was also considered using either diesel or natural gas; however, this idea was discarded during the scoping study, but can be explored in the future as required (for complete or partial power generation). Mine Electrical Plan Overview Upon review of the most recently proposed equipment list a total electrical load of approximately 24 MVA was determined. The average effective electrical load consists of the following (Table 21.10).
Table 21.10 Mine Electrical Overview
Area Electrical Load Mill + Process + Water Supply + Water Treatment + Tailings 15.9 MVA Underground Mine 3.5 MVA Administrative Facilities + Fuel Station + Warehouse 0.6 MVA Reserve capacity (Future Expansion + Motor Starting Capability) (20%) 4.0 MVA
Total 24.0 MVA The electrical system upon entering the mine site will be configured as a radial type system. The utility transmission line voltage will be stepped down to 13.8 kV at the main substation, owned by XCEL Energy (utility) and installed at a suitable location on mine property. The utility substation will provide 13.8KV feeders which will connect to 13.8 kV overhead power-lines for distribution within the mine facility – underground mining, grinding + process plant, and water supply pump station (near Lake Superior), where each facility has its own substation for power distribution within that facility. The substation near the process plant, installed by Orvana Resources, will feed a 5 kV, 3-phase, 3-wire, 1200 Amp switchgear lineup. This switchgear will consist of a main circuit breaker and several 600 Amp circuit breakers. Each of the 13.8 kV circuit breakers will feed a dedicated load. Depending on the load, the distribution voltage of 13.8 kV will be stepped down to 4.16 kV to be utilized directly (operating voltage for motors larger than 300 HP – mill motors, etc.) or it will be further stepped down to a 480 VAC, 3-phase, 3-wire system for feeding motors below 300 HP. The 480 VAC will be further reduced or transformed to feed lighting loads at 480/277VAC and 208/120 VAC to feed instrumentation requirements and general office equipment (receptacles,

Orvana Resources - Copperwood Project Feasibility Study Page 237
K D Engineering Document No. Q431-01-028 21 March 2012 KDE FORM No. A263a-7/12/99
computers, printers, etc.). Power distribution design will follow the latest edition of the National Electric Code (NEC). Similar power distribution will be designed for power distribution at the tailings impoundment and water pump-station by Lake Superior. The substation and power distribution for underground mining will be designed by the mining group. The mine site will be provided with a grounding grid to which all building steel, equipment, etc. will be connected for safety. This grounding grid will consist of #4/0 AWG bare copper conductor buried below ground connecting all items previously mentioned. All above ground connections except connections to building steel will be mechanical type connections so that equipment can be removed or replaced easily. All underground connections including those to building steel will be of the thermoweld type. A test well will be provided for periodically measuring / testing the resistance of the ground grid. Grounding design will follow the latest edition of the NEC. Lighting will be of the high intensity discharge type. High pressure sodium type light fixtures will be utilized for exterior areas and high bay interior applications. Metal halide lighting fixtures will be utilized indoors for low bay application and where color rendition is a factor. Fluorescent lighting fixtures will be used in interior applications such as office lighting, electrical rooms, etc. All areas will be equipped with emergency light fixtures utilizing battery packs which will provide a minimum of 90 minutes of illumination. Lighting levels will be designated by the Illumination Engineering Society (IES) published guidelines. A computer based data gathering system, Supervisory Control and Data Acquisition System (SCADA), will be incorporated in the control and monitoring of the underground mine and mill operation. The SCADA system will use remote termination devices to channel appropriate control and monitoring signals from field locations back to the central processing unit (CPU) computer where an operator can physically operate equipment from his computer work station. The configuration of the SCADA will be based on the latest industrial standards. The SCADA will comprise of programmable logic controllers (PLC) for respective areas which collect and analyze all input/output (I/O) signals from the field. The SCADA system will be based on equipment types preferred and designated by the Owner. A 2000 kW stand by diesel generator, rated 4160 V, will be provided to handle emergency situations at the underground mine substation. This generator will be connected on the secondary side of the distribution transformer feeding the underground mine. This will increase the reliability of the emergency power system. A 200 kW diesel generator, rated 480 V, will be provided to handle stand by situations at the mill and process plant. This generator will provide power to the thickeners agitators and other process agitators that may affect the process production line equipment should they stop operating. Also, a 125 kW diesel generator, rated 480V, will be provided for backup power at the tailings impoundment and another 480 V rated generator will be provided for backup power at the pump station near Lake Superior.

Orvana Resources - Copperwood Project Feasibility Study Page 238
K D Engineering Document No. Q431-01-028 21 March 2012 KDE FORM No. A263a-7/12/99
Both generators will be installed to keep pumps operating and prevent pipelines from freezing. Construction Consumables Construction consumables are included using a rate of 7.0 percent of labor costs. Freight and Equipment Insurance Freight is included using a rate of 5.0 percent of the equipment and bulk material costs. 21.2.2 Indirect Costs Certain indirect costs exhibited in this estimate include, but are not limited to, labor, equipment and materials for the detailed activities set forth below. The indirect costs for Phase 1 are detailed as shown below. It should also be noted that 100 percent of the engineering is included in the Phase 1 cost. The Phase 2 cost was factored based on 10 percent of the Phase 1 costs minus the engineering.
▪ Detailed Engineering - Includes estimated time, costs, and generated documents for the project to move into procurement and construction. Some of the costs have been provided by the owner or their representatives for the access road, water and power development.
▪ Procurement - Includes efforts for placement of RFQ’s and bid documents as
well as coordination through delivery and storage on site.
▪ Construction Management - Includes management and scheduling of the construction effort.
▪ Training - Includes an allowance of $225,000 for training personal to operate
the process plant.
▪ Initial Fill - Includes estimate at 2.5 percent of direct costs.
▪ Startup - Includes an allowance of $250,000 for the startup of the water supply system by the Gogegic Range Water Authority Services and $120,000 for startup and process engineers to commissioning and start up of the process plant.
▪ Spare parts - Includes an allowance of 2.5 percent of the Equipment cost. ▪ Owner’s Costs – Includes an allowance of US$ 3 million for Owners
participation in the project. In addition we have added $2.5 million dollars into the Owners costs for environmental permitting.
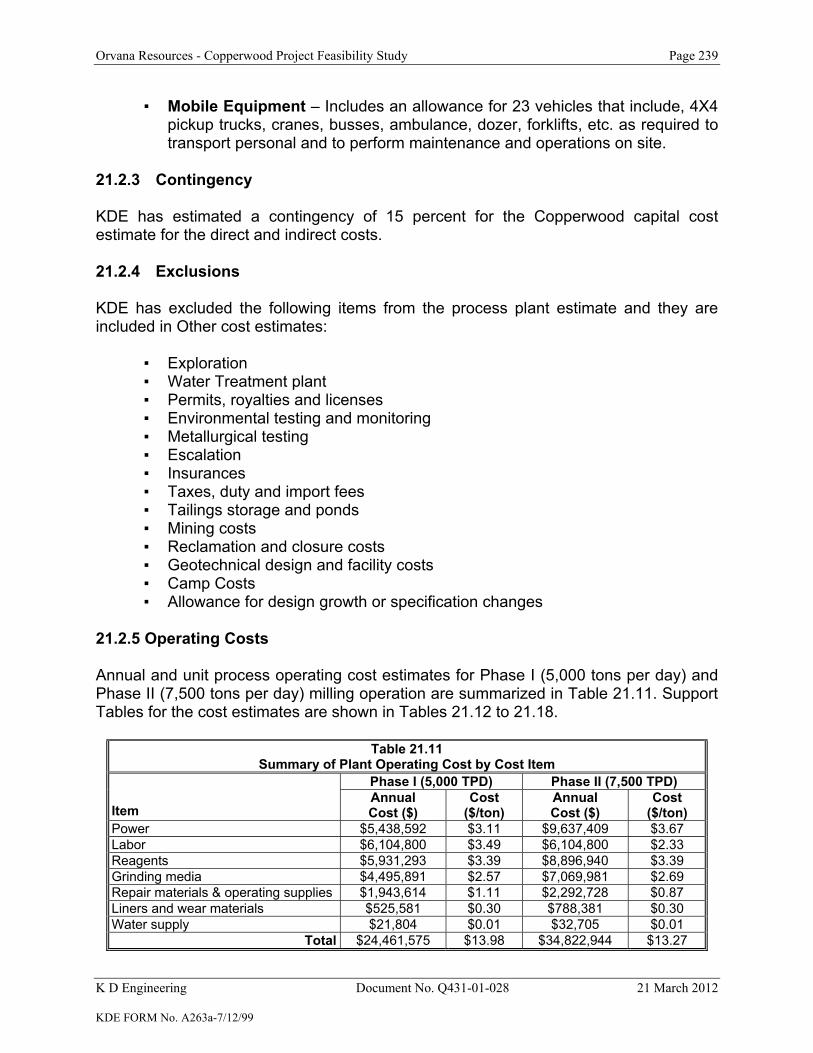
Orvana Resources - Copperwood Project Feasibility Study Page 239
K D Engineering Document No. Q431-01-028 21 March 2012 KDE FORM No. A263a-7/12/99
▪ Mobile Equipment – Includes an allowance for 23 vehicles that include, 4X4 pickup trucks, cranes, busses, ambulance, dozer, forklifts, etc. as required to transport personal and to perform maintenance and operations on site.
21.2.3 Contingency KDE has estimated a contingency of 15 percent for the Copperwood capital cost estimate for the direct and indirect costs. 21.2.4 Exclusions KDE has excluded the following items from the process plant estimate and they are included in Other cost estimates:
▪ Exploration ▪ Water Treatment plant ▪ Permits, royalties and licenses ▪ Environmental testing and monitoring ▪ Metallurgical testing ▪ Escalation ▪ Insurances ▪ Taxes, duty and import fees ▪ Tailings storage and ponds ▪ Mining costs ▪ Reclamation and closure costs ▪ Geotechnical design and facility costs ▪ Camp Costs ▪ Allowance for design growth or specification changes
21.2.5 Operating Costs Annual and unit process operating cost estimates for Phase I (5,000 tons per day) and Phase II (7,500 tons per day) milling operation are summarized in Table 21.11. Support Tables for the cost estimates are shown in Tables 21.12 to 21.18.
Table 21.11 Summary of Plant Operating Cost by Cost Item
Phase I (5,000 TPD) Phase II (7,500 TPD)
Item Annual Cost ($)
Cost ($/ton)
Annual Cost ($)
Cost ($/ton)
Power $5,438,592 $3.11 $9,637,409 $3.67 Labor $6,104,800 $3.49 $6,104,800 $2.33 Reagents $5,931,293 $3.39 $8,896,940 $3.39 Grinding media $4,495,891 $2.57 $7,069,981 $2.69 Repair materials & operating supplies $1,943,614 $1.11 $2,292,728 $0.87 Liners and wear materials $525,581 $0.30 $788,381 $0.30 Water supply $21,804 $0.01 $32,705 $0.01
Total $24,461,575 $13.98 $34,822,944 $13.27

Orvana Resources - Copperwood Project Feasibility Study Page 240
K D Engineering Document No. Q431-01-028 21 March 2012 KDE FORM No. A263a-7/12/99
The detailed power consumption estimate is based on the equipment noted in the equipment list and the installed power with estimates of the operating power draft and operating time. The process power consumption is summarized in Table 21.12. The power cost calculation is shown in Table 21.13.
Table 21.12 Power Consumption Summary
Area Phase I kWh/ton
Phase II kWh/ton
Area 10 - SAG Grinding 12.010 8.006 Area 20 - Ball Mill Grinding 11.984 13.758 Area 30 - Flotation 5.683 4.863 Area 40 - Regrind 5.428 5.297 Area 50 - Copper Concentrate Handling 0.558 0.372 Area 60 - Tails 2.340 1.560 Area 70 - Reagents 0.062 0.041 Area 75 - Sampling 0.018 0.012 Area 80/90 - Process & Reclaim Water / Fresh Water 0.764 0.509
Total 38.85 34.42
Table 21.13 Power Cost
Phase I Phase II Usage
kWh per ton 38.85 34.42 Power Cost, $ per kWh $0.080 $0.080 Power Cost, $ per ton $3.11 $2.75 Power Cost, $ per year $5,438,592 $9,637,409
The labor cost estimate for mill operations is shown in Table 21.14. The labor rates and burden are based on the rates for similar job classifications. The staff and manning level is based on a typical organizational chart for an operation of this size in the Michigan.
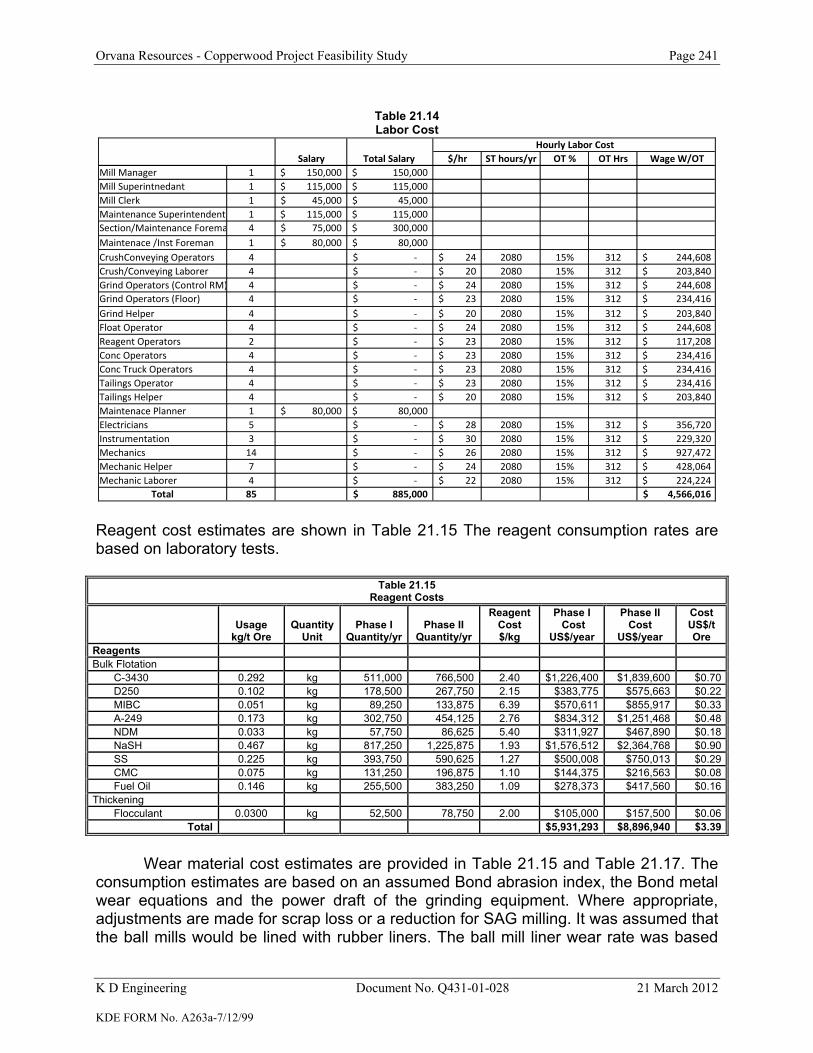
Orvana Resources - Copperwood Project Feasibility Study Page 241
K D Engineering Document No. Q431-01-028 21 March 2012 KDE FORM No. A263a-7/12/99
Table 21.14 Labor Cost
$/hr ST hours/yr OT % OT Hrs Wage W/OTMill Manager 1 150,000$ 150,000$ Mill Superintnedant 1 115,000$ 115,000$ Mill Clerk 1 45,000$ 45,000$ Maintenance Superintendent 1 115,000$ 115,000$ Section/Maintenance Forema 4 75,000$ 300,000$ Maintenace /Inst Foreman 1 80,000$ 80,000$ CrushConveying Operators 4 ‐$ 24$ 2080 15% 312 244,608$ Crush/Conveying Laborer 4 ‐$ 20$ 2080 15% 312 203,840$ Grind Operators (Control RM) 4 ‐$ 24$ 2080 15% 312 244,608$ Grind Operators (Floor) 4 ‐$ 23$ 2080 15% 312 234,416$ Grind Helper 4 ‐$ 20$ 2080 15% 312 203,840$ Float Operator 4 ‐$ 24$ 2080 15% 312 244,608$ Reagent Operators 2 ‐$ 23$ 2080 15% 312 117,208$ Conc Operators 4 ‐$ 23$ 2080 15% 312 234,416$ Conc Truck Operators 4 ‐$ 23$ 2080 15% 312 234,416$ Tailings Operator 4 ‐$ 23$ 2080 15% 312 234,416$ Tailings Helper 4 ‐$ 20$ 2080 15% 312 203,840$ Maintenace Planner 1 80,000$ 80,000$ Electricians 5 ‐$ 28$ 2080 15% 312 356,720$ Instrumentation 3 ‐$ 30$ 2080 15% 312 229,320$ Mechanics 14 ‐$ 26$ 2080 15% 312 927,472$ Mechanic Helper 7 ‐$ 24$ 2080 15% 312 428,064$ Mechanic Laborer 4 ‐$ 22$ 2080 15% 312 224,224$
Total 85 885,000$ 4,566,016$
Hourly Labor CostSalary Total Salary
Reagent cost estimates are shown in Table 21.15 The reagent consumption rates are based on laboratory tests.
Table 21.15 Reagent Costs
Usage kg/t Ore
QuantityUnit
Phase I Quantity/yr
Phase II Quantity/yr
Reagent Cost $/kg
Phase I Cost
US$/year
Phase II Cost
US$/year
Cost US$/t Ore
Reagents Bulk Flotation
C-3430 0.292 kg 511,000 766,500 2.40 $1,226,400 $1,839,600 $0.70D250 0.102 kg 178,500 267,750 2.15 $383,775 $575,663 $0.22MIBC 0.051 kg 89,250 133,875 6.39 $570,611 $855,917 $0.33A-249 0.173 kg 302,750 454,125 2.76 $834,312 $1,251,468 $0.48NDM 0.033 kg 57,750 86,625 5.40 $311,927 $467,890 $0.18NaSH 0.467 kg 817,250 1,225,875 1.93 $1,576,512 $2,364,768 $0.90SS 0.225 kg 393,750 590,625 1.27 $500,008 $750,013 $0.29CMC 0.075 kg 131,250 196,875 1.10 $144,375 $216,563 $0.08Fuel Oil 0.146 kg 255,500 383,250 1.09 $278,373 $417,560 $0.16
Thickening Flocculant 0.0300 kg 52,500 78,750 2.00 $105,000 $157,500 $0.06
Total $5,931,293 $8,896,940 $3.39
Wear material cost estimates are provided in Table 21.15 and Table 21.17. The consumption estimates are based on an assumed Bond abrasion index, the Bond metal wear equations and the power draft of the grinding equipment. Where appropriate, adjustments are made for scrap loss or a reduction for SAG milling. It was assumed that the ball mills would be lined with rubber liners. The ball mill liner wear rate was based
Orvana Resources - Copperwood Project Feasibility Study Page 242
K D Engineering Document No. Q431-01-028 21 March 2012 KDE FORM No. A263a-7/12/99
on experience with similar mills. The cost for a set of rubber liners was factored based on recent cost data from a larger mill.

Orvana Resources - Copperwood Project Feasibility Study Page 243
K D Engineering Document No. Q431-01-028 21 March 2012 KDE FORM No. A263a-7/12/99
Table 21.16 Wear Material Operating Cost Estimates
Power Consumption kWh per ton
Usage Pounds per ton
Actual Usage Pounds per ton
Cost US$ per ton
Cost US$ per year
Bond
Wear Equations
Usage
Pounds per kWh Phase I Phase II Phase I Phase II
Scrap or Wear Factor
(%) Phase I Phase II
Cost $ per
pound Phase I Phase II Phase I Phase II SAG Mill liners =0.026 x (Ai - 0.015)^0.3 0.012 7.219 4.550 0.090 0.056 0.5 0.179 0.113 0.45 0.081 0.051 142,238 134,462Ball Mill liners =0.026 x (Ai - 0.015)^0.3 0.012 7.731 10.400 0.096 0.129 0.5 0.192 0.258 0.45 0.087 0.117 152,319 307,382
Regrind Mill liners =0.026 x (Ai - 0.015)^0.3 0.012 11.725 11.725 0.146 0.146 0.5 0.291 0.291 0.45 0.132 0.132 231,024 346,537Total Wear Material 0.300 0.300 525,581 788,381
Table 21.17 Grinding Media Operating Cost Estimates
Power Consumption kWh per ton
Usage Pounds per ton
Actual Usage Pounds per ton
Cost US$ per ton
Cost US$ per year
Bond
Wear Equations
Usage
Pounds per kWh Phase I Phase II Phase I Phase II
Scrap or Wear Factor
(%) Phase I Phase II
Cost $ per
pound Phase
I Phase II Phase I Phase II SAG Mill Balls =0.35 x (Ai - 0.015)^(1/3) 0.154 7.219 4.550 1.111 0.700 3 0.370 0.233 0.45 0.168 0.106 293,950 277,881 Ball Mill Balls =0.35 x (Ai - 0.015)^(1/3) 0.154 7.731 10.400 1.190 1.601 1 1.190 1.601 0.45 0.540 0.726 944,347 1,905,710
Regrind Mill Balls =0.35 x (Ai - 0.015)^(1/3) 0.350 11.725 11.725 4.104 4.104 1 4.104 4.104 0.45 1.861 1.861 3,257,594 4,886,391 Total Grinding Media 2.569 2.693 4,495,891 7,069,981
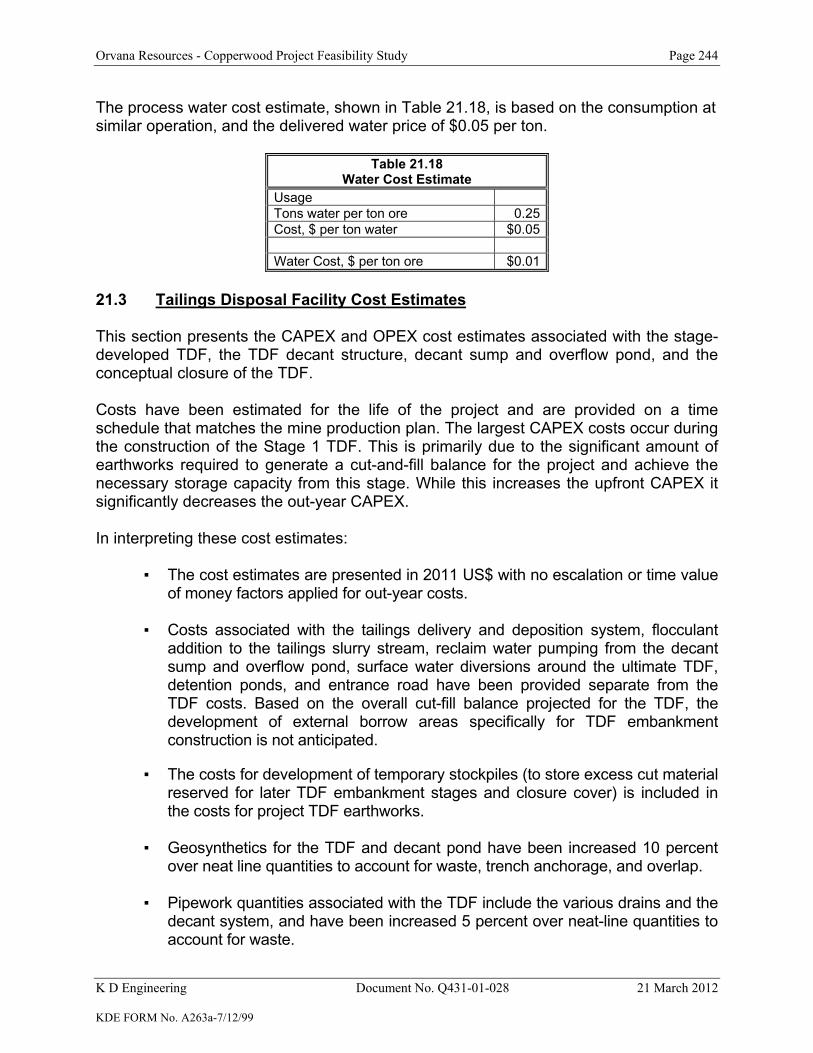
Orvana Resources - Copperwood Project Feasibility Study Page 244
K D Engineering Document No. Q431-01-028 21 March 2012 KDE FORM No. A263a-7/12/99
The process water cost estimate, shown in Table 21.18, is based on the consumption at similar operation, and the delivered water price of $0.05 per ton.
Table 21.18 Water Cost Estimate
Usage Tons water per ton ore 0.25Cost, $ per ton water $0.05 Water Cost, $ per ton ore $0.01
21.3 Tailings Disposal Facility Cost Estimates This section presents the CAPEX and OPEX cost estimates associated with the stage-developed TDF, the TDF decant structure, decant sump and overflow pond, and the conceptual closure of the TDF. Costs have been estimated for the life of the project and are provided on a time schedule that matches the mine production plan. The largest CAPEX costs occur during the construction of the Stage 1 TDF. This is primarily due to the significant amount of earthworks required to generate a cut-and-fill balance for the project and achieve the necessary storage capacity from this stage. While this increases the upfront CAPEX it significantly decreases the out-year CAPEX. In interpreting these cost estimates:
▪ The cost estimates are presented in 2011 US$ with no escalation or time value of money factors applied for out-year costs.
▪ Costs associated with the tailings delivery and deposition system, flocculant
addition to the tailings slurry stream, reclaim water pumping from the decant sump and overflow pond, surface water diversions around the ultimate TDF, detention ponds, and entrance road have been provided separate from the TDF costs. Based on the overall cut-fill balance projected for the TDF, the development of external borrow areas specifically for TDF embankment construction is not anticipated.
▪ The costs for development of temporary stockpiles (to store excess cut material
reserved for later TDF embankment stages and closure cover) is included in the costs for project TDF earthworks.
▪ Geosynthetics for the TDF and decant pond have been increased 10 percent
over neat line quantities to account for waste, trench anchorage, and overlap.
▪ Pipework quantities associated with the TDF include the various drains and the decant system, and have been increased 5 percent over neat-line quantities to account for waste.

Orvana Resources - Copperwood Project Feasibility Study Page 245
K D Engineering Document No. Q431-01-028 21 March 2012 KDE FORM No. A263a-7/12/99
▪ The costs for engineering design, construction supervision and construction
quality assurance/quality control (QA/QC) have been accounted for at 5 percent of capital construction direct costs.
21.3.1 Initial CAPEX The initial CAPEX cost estimate accounts for the development of the Stage 1 TDF, which has been designed to provide storage through the third quarter of Year 4 of operations under the current mine production schedule. The items accounted for are summarized as follows:
▪ Clearing, stripping, and subgrade preparation of the Stage 1 footprint area, ▪ Stage 1 embankment foundation drains, ▪ Stage 1 basin excavation, ▪ Stage 1 embankment and Stage 1 divider berm construction, ▪ Stage 1 decant structure and outlet pipe, ▪ Decant sump and overflow pond, ▪ Stage 1 basin liner and tailings underdrain system, ▪ Basin underdrainage outlet pipe, and the ▪ Stage 1 perimeter road.
The initial CAPEX has been assumed to occur during Year 0 (pre-production) and the first part of Year 1, while the boxcut is being completed. 21.3.2 Out-Year CAPEX The out-year CAPEX cost estimates account for the remaining staged development of the TDF beyond Stage 1. Stage 2 has been designed to provide storage for approximately 3.5 years based on the current mine production schedule (Years 4-7), and Stage 3 has been designed to hold the tails for the remaining life-of-mine (Years 8-13). The items accounted for are summarized as follows:
▪ Clearing. stripping, and subgrade preparation of the staged footprint area, ▪ Staged embankment foundation drains, ▪ Staged basin excavation and Stage 2 divider berm construction, ▪ Staged embankment construction (completed during Stage 3), ▪ Staged decant structures, ▪ Staged basin liner and tailings underdrain system (completed during Stage 3),
and the ▪ Staged perimeter road.
Material take-offs and unit rates were used to calculate the CAPEX cost estimates for the three staged configurations, and the CAPEX values were assumed to be expended in the year when the additional storage will be required (and also the prior year in the case of Stages 1 and 2) according to the current mine production schedule.

Orvana Resources - Copperwood Project Feasibility Study Page 246
K D Engineering Document No. Q431-01-028 21 March 2012 KDE FORM No. A263a-7/12/99
21.3.3 Conceptual Closure CAPEX Conceptual closure CAPEX cost estimates were calculated for the TDF for a mechanically-placed closure cap. The items accounted for are summarized as follows:
▪ Geosynthetics to prevent intrusion of tailings into the closure cap and to improve the strength of the tailings surface for placement of overlying material
▪ Capillary break drainage layer
▪ Low-permeability closure cap fill
▪ Topsoil and seeding for re-establishment of native vegetation
▪ Outlet spillway and diversion channel with energy dissipation structures
The annualized closure costs were assumed to occur over a 3 year period starting in Year 15, one year after tailings deposition ceases in Year 13, with one-third of the closure cap costs occurring in each of Years 15-17. 21.3.4 OPEX The OPEX costs have been estimated for the following items:
▪ Monitoring and reporting of instrumentation and groundwater wells, ▪ Decant system operation and closure, and ▪ Decant sump and overflow pond maintenance.
As noted previously, the tailings delivery pipeline and deposition system, as well as the water reclaim system associated with the return to both the process and flotation circuits, and associated OPEX costs have been provided separate from the TDF. Operating costs have been based on the following assumptions:
▪ Years 1 and 13 of operations are considered partial years consisting of 3 and 9 months, respectively
▪ Monitoring and reporting of instrumentation and groundwater wells:
- $40,000 annual cost - 2 field employees, with an assumed annual salary of $80,000 each, working 25 percent of the time
- $50,000 annual cost - Installation of replacement or added instrumentation - $100,000 annual cost - Water quality analytical testing - $30,000 annual cost - Reporting to state regulators - Groundwater levels and quality will be monitored for approximately 1 year
prior to the start of operations. - Monitoring and testing will continue throughout the closure period (although
additional monitoring and testing may be required beyond this period)

Orvana Resources - Copperwood Project Feasibility Study Page 247
K D Engineering Document No. Q431-01-028 21 March 2012 KDE FORM No. A263a-7/12/99
▪ Decant system operation and closure
- $24,000 annual cost - 4 field employees, with an assumed annual salary of $60,000 each, working 10 percent of the time
- $5,000 annual cost – Progressive installation/extension of decant structures - $5,000 annual cost – Decant maintenance
▪ Decant sump and overflow pond maintenance
- $24,000 annual cost - 4 field employees, with an assumed annual salary of $60,000 each, working 10 percent of the time
- $30,000 annual cost - Lighting equipment for working around sump and pond
- 21.3.5 Cost Estimates The cost estimates presented herein are considered to be within a ±15 percent level of accuracy, which is commensurate with a BFS level design. A 15 percent contingency has been included to account for uncertainties associated with unit rates as well as potential changes that may be implemented as the project progresses to final design. The staged BFS CAPEX cost estimate associated with the Copperwood TDF and ancillary structures is summarized as follows:
Table 21.19 Staged Tailings Disposal Facility CAPEX Estimate
Stage 1 2 3 Closure Years 0 - 1 3-4 7 15-17 Total
Cost, 106 $30.95 $30.14 $20.36 $20.82 $102.27 Table 21.20 presents an overall summary of the staged development CAPEX costs for the main areas of work associated with the TDF and the decant sump and overflow pond (DOP). The costs presented reflect allowances for Engineering Design/Construction Quality Assurance (at 5 percent of direct costs), Unlisted Items (at 5 percent of direct costs), and Contingency (15 percent of total costs).
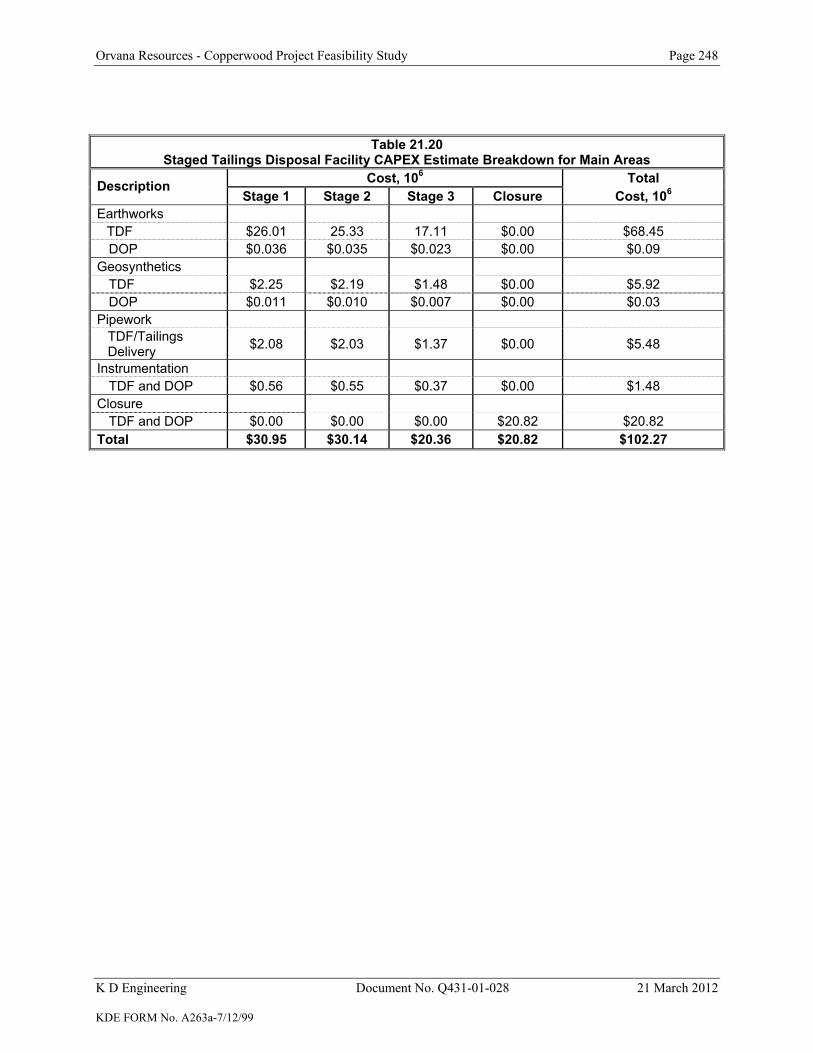
Orvana Resources - Copperwood Project Feasibility Study Page 248
K D Engineering Document No. Q431-01-028 21 March 2012 KDE FORM No. A263a-7/12/99
Table 21.20 Staged Tailings Disposal Facility CAPEX Estimate Breakdown for Main Areas
Cost, 106 Total Description Stage 1 Stage 2 Stage 3 Closure Cost, 106
Earthworks TDF $26.01 25.33 17.11 $0.00 $68.45 DOP $0.036 $0.035 $0.023 $0.00 $0.09 Geosynthetics TDF $2.25 $2.19 $1.48 $0.00 $5.92 DOP $0.011 $0.010 $0.007 $0.00 $0.03 Pipework TDF/Tailings
Delivery $2.08 $2.03 $1.37 $0.00 $5.48
Instrumentation TDF and DOP $0.56 $0.55 $0.37 $0.00 $1.48 Closure TDF and DOP $0.00 $0.00 $0.00 $20.82 $20.82 Total $30.95 $30.14 $20.36 $20.82 $102.27

Orvana Resources - Copperwood Project Feasibility Study Page 249
K D Engineering Document No. Q431-01-028 21 March 2012 KDE FORM No. A263a-7/12/99
22.0 ECONOMIC ANALYSIS 22.1 Copper Price Assumptions Copper pricing for the financial model is from US$ 2.50 to US$ 3.50 per lb at US$ 0.25 intervals. Silver pricing for the financial model is from US$ 17.50 to US$ 27.50 per oz at US$ 2.50 intervals. For reporting purposes, US$ 2.75 per lb copper and US$ 20.00 per oz silver were used.
22.2 Royalty There is a sliding-scale royalty on Copperwood. It is 2-4 percent NSR based on the copper price, the base of which is US$ 2 per lb copper and a maximum of US$ 4 per lb copper, and paid on a quarterly basis. It is subject to adjustments according to the PPI-Finished Goods index. As an example, if the copper price averages US$ 2.50 per lb for the period that applies to the first royalty payment, the royalty is 2.50 percent; if it is US$ 3.50 per lb, it is 3.50 percent, i.e., it is a graphical sliding scale. The rental payments are deducted from this payment 22.3 Taxes The cash flow analyses are after corporate tax. Property tax liabilities are not included since no assessment has been completed 22.4 Financing The economic analysis has been run on a basis of 100 percent equity financing. 22.5 Inflation The economic analysis has been run with no inflation. 22.6 Economic Results Underground mining in this study is based on using mechanized drilling and blasting equipment methods. The after-tax economic analysis for the case is summarized in the following Figures 22.1 and 22.2 and shown in Tables 22.1 and 22.2. The after-tax financial analysis is based on a copper price of US$ 2.75 per lb and a silver price of US$ 20.00 per oz. The after-tax economic analysis results indicate that an IRR of 17.2 percent is achieved. The corresponding after-tax NPV is US$ 163.09 million at a 5 percent discount rate, US$ 104.37 million at an 8 percent discount rate and US$ 73.58 million at a 10 percent discount rate. Payback of capital invested is achieved after 5.2 years of operation.

Orvana Resources - Copperwood Project Feasibility Study Page 250
K D Engineering Document No. Q431-01-028 21 March 2012 KDE FORM No. A263a-7/12/99
At a copper price of US$ 2.16 per lb an NPV of zero is produced at a zero percent discount rate (break even copper price). With a discount rate of 8.0 percent, an NPV of zero is produced at a copper price of US$ 2.39 per lb. Sensitivity analysis indicating the effects of varying the capital and operating costs and metal prices, copper grade and recovery are shown in Figures 22.1 and 22.2. Conventional financial criteria including the internal rate of return (IRR) and the net present value (NPV) at various discount rates are also indicated. As shown in Figures 22.1 and 22.2, the project is most sensitive to copper price. Table 22.1 summarizes the project’s revenue, costs and pre-income tax cash flow and also shows the values in units of resource processed and saleable copper pound.
Table 22.1 Economic Analysis Summary - US$ Pre-Income Tax Cash Flow
$US x 1000 $US/t
Resource $US/lb Copper
Mine Gate Value of All Resource Net of Transportation and Refining 1,824,315 60.35 0.60 Mining Operating Cost (452,640) (14.97) (0.14) Processing Cost (406,328) (13.44) (0.13) Freight to mill/smelter (38,146) (1.26) (0.01) General & Administration (37,880) (1.25) (0.01) Royalties (50,169) (1.66) (0.02) Cash Operating Cost (985,162) (32.59) (0.32) Cash Operating Cash Flow 839,153 27.76 0.27 Capital Cost including Pre-Production Development (380,624) (12.59) (0.12) Pre-Income Tax Cash Flow 458,529 15.17 0.15

Orvana Resources - Copperwood Project Feasibility Study Page 251
K D Engineering Document No. Q431-01-028 21 March 2012 KDE FORM No. A263a-7/12/99
Sensitivity -15% -10% -5% Base 5% 10% 15%Copper Price % -23.6% #DIV/0! 14.0% 17.2% 20.3% 23.2% 25.9%Copper Grade % -24.1% 11.0% 14.2% 17.2% 20.1% 22.8% 25.4%Copper Recovery % 16.4% 16.7% 17.0% 17.2% 17.4% 17.6% 17.8%Operating Cost % 21.7% 20.3% 18.8% 17.2% 15.6% 14.0% 12.2%Capital Cost % 22.7% 20.7% 18.9% 17.2% 15.7% 14.2% 12.9%
Copperwood Project After-Tax Sensitivity IRR (DB Case)
-30.0%
-20.0%
-10.0%
0.0%
10.0%
20.0%
30.0%
-20% -15% -10% -5% Base 5% 10% 15% 20%
Variance from Base Case
IRR
Afte
r-Ta
x C
alcu
latio
n
Copper Grade Copper Recovery Operating Cost Capital Cost Copper Price
Figure 22.1 - IRR Sensitivity Resource at US$ 2.75 per lb Copper, US$ 20.00 per oz Silver

Orvana Resources - Copperwood Project Feasibility Study Page 252
K D Engineering Document No. Q431-01-028 21 March 2012 KDE FORM No. A263a-7/12/99
Sensitivity -20% -15% -10% -5% Base 5% 10% 15% 20%Copper Price ($ x 1000) ($54,241.5) ($14,256.6) $25,400.2 $64,929.1 $104,365.2 $143,700.0 $182,920.4 $220,572.2 $256,664.3Copper Grade ($ x 1000) ($42,012.8) ($5,402.3) $31,190.4 $67,767.2 $104,365.2 $140,973.8 $177,582.4 $213,341.6 $247,406.1Copper Recovery ($ x 1000) $90,208.5 $94,372.3 $98,073.3 $101,384.8 $104,365.2 $107,061.7 $109,513.0 $111,751.2 $113,802.9Operating Cost ($ x 1000) $182,161.6 $164,317.6 $144,484.9 $124,425.0 $104,365.2 $84,305.2 $64,266.4 $44,239.0 $24,255.7Capital Cost ($ x 1000) $162,235.1 $147,767.6 $133,300.1 $118,832.6 $104,365.2 $89,897.7 $75,430.2 $60,962.7 $46,495.2
Copperwood Project After-Tax Sensitivity [email protected]% (DB Case)
($100,000.0)
($50,000.0)
$0.0
$50,000.0
$100,000.0
$150,000.0
$200,000.0
$250,000.0
$300,000.0
-20% -15% -10% -5% Base 5% 10% 15% 20%
Variance from Base Case
NPV
@ 8
.0%
Afte
r-Ta
x C
alcu
latio
n
Copper Price Copper Recovery Operating Cost Capital Cost Copper Grade
Figure 22.2 - NPV Sensitivity Resource at US$ 2.75 per lb Copper, US$ 20.00 per oz Silver

Orvana Resources - Copperwood Project Feasibility Study Page 253
K D Engineering Document No. Q431-01-028 21 March 2012 KDE FORM No. A263a-7/12/99
Table 22.2 Cash Flow – BD Case
Orvana Minerals Corp.Copperwood
Set Year -2 Year -1 Year 0 Year 1 Year 2 Year 3 Year 4 Year 5 Year 6 Year 7 Year 8 Year 9 Year 10 Year 11 Year 12 Year 13 Year 14 Year 15 Year 16 Year 17 Year 18 Year 19 Year 20 TotalCopper Price US$/lb 2.75 $2.75 $2.75 $2.75 $2.75 $2.75 $2.75 $2.75 $2.75 $2.75 $2.75 $2.75 $2.75 $2.75 $2.75 $2.75 $2.75 $2.75 $2.75Silver Price US$/oz 20 $20.00 $20.00 $20.00 $20.00 $20.00 $20.00 $20.00 $20.00 $20.00 $20.00 $20.00 $20.00 $20.00 $20.00 $20.00 $20.00 $20.00 $20.00
MININGProduction 000s tons 530 1,700 2,625 2,625 2,625 2,625 2,625 2,625 2,625 2,625 2,625 2,625 1,748 30,228 Copper grade, % total copper 1.52% 1.63% 1.61% 1.55% 1.58% 1.58% 1.45% 1.24% 1.12% 1.06% 1.22% 1.63% 1.23% 1.41%Silver grade, ppm 4.28 5.60 5.37 5.37 5.20 4.81 3.86 2.18 1.55 1.11 2.44 4.20 1.75 3.63
MILLINGOre Milled 000s tons 530 1,700 2,625 2,625 2,625 2,625 2,625 2,625 2,625 2,625 2,625 2,625 1,748 30,228
Concentrate Production tons recovery Grade 28,867 99,294 151,441 145,797 148,619 148,619 136,391 116,638 105,350 99,706 114,756 153,322 77,043 1,525,842 % Copper 86% 24.0% 24.00% 24.00% 24.00% 24.00% 24.00% 24.00% 24.00% 24.00% 24.00% 24.00% 24.00% 24.00% 24.00% 24.00%ppm Silver 56.26% 44.21 53.94 52.37 54.39 51.67 47.80 41.80 27.60 21.73 16.44 31.40 40.46 22.34 40.41
Transportation losses, % 0.25 0.25 0.25 0.25 0.25 0.25 0.25 0.25 0.25 0.25 0.25 0.25 0.25
Tonnes of Concentrate smelted tons 28,795 99,046 151,062 145,432 148,247 148,247 136,050 116,346 105,087 99,457 114,469 152,939 76,850 1,522,027 Copper contained 000's lbs 13,822 47,542 72,510 69,808 71,159 71,159 65,304 55,846 50,442 47,739 54,945 73,411 36,888 730,573 Silver contained troy ounces 37,219 156,201 231,286 231,286 223,965 207,167 166,251 93,893 66,759 47,808 105,091 180,894 50,191 1,798,011
REVENUE PayablePayable Copper in Concentrate 96.50% 36,679 126,165 192,423 185,252 188,837 188,837 173,300 148,201 133,859 126,688 145,811 194,813 97,892 1,938,759 Payable Silver in Concentrate 90% 670 2,812 4,163 4,163 4,031 3,729 2,993 1,690 1,202 861 1,892 3,256 903 32,364 Total 37,349 128,976 196,586 189,415 192,869 192,566 176,293 149,891 135,061 127,549 147,703 198,069 98,796 1,971,123
Payable Copper tons 6,669 22,939 34,986 33,682 34,334 34,334 31,509 26,946 24,338 23,034 26,511 35,421 17,799 352,502 Payable Silver troy ounces 33,497 140,581 208,158 208,158 201,568 186,450 149,626 84,504 60,083 43,027 94,582 162,805 45,172 1,618,210
RCs/TCs ($ 000's) Per Smelting ($/ton of concentrate) 63.5 ton 1,828 6,289 9,592 9,235 9,414 9,414 8,639 7,388 6,673 6,316 7,269 9,712 4,880 96,649 Refining-Cu ($/Cu. lb.) 0.07 per lb 933.65 3,211.47 4,898.04 4,715.50 4,806.77 4,806.77 4,411.27 3,772.40 3,407.33 3,224.79 3,711.55 4,958.88 2,491.80 49,350.22 Ag Refining-Cu Conc.($/Ag. oz) 0.45 per oz 16.75 70.29 104.08 104.08 100.78 93.23 74.81 42.25 30.04 21.51 47.29 81.40 22.59 809.11 Total 2,779 9,571 14,595 14,055 14,321 14,314 13,125 11,203 10,110 9,562 11,028 14,752 7,394 146,808
Revenue (US$ 000's) 34,570 119,405 181,991 175,360 178,547 178,253 163,167 138,689 124,951 117,987 136,675 183,317 91,401 1,824,315
OPERATING COST Underground mining (US$ 000's) 11,639 31,110 38,430 38,430 38,430 38,430 38,430 38,430 38,430 38,430 38,430 38,430 25,591 - - - - - - 452,640 Milling (US$ 000's) 7,408 23,763 36,692 36,692 34,823 34,823 34,823 34,823 34,823 34,823 34,823 34,823 23,189 - - - - - - 406,328 WWTP (US$ 000's) - - - 900 900 1,100 1,470 1,470 1,470 1,470 1,470 2,200 2,200 2,200 2,200 2,200 2,200 - - 23,450 Freight to mill/smelter (US$ 000's) 722 2,482 3,786 3,645 3,715 3,715 3,410 2,916 2,634 2,493 2,869 3,833 1,926 - - - - - - 38,146
General & administrative (US$ 000's) 2,914 2,914 2,914 2,914 2,914 2,914 2,914 2,914 2,914 2,914 2,914 2,914 2,914 - - - - - - 37,880 TOTAL OPERATING COSTS (US$ 000's) 22,683 60,269 81,822 82,581 80,782 80,982 81,046 80,553 80,270 80,129 80,506 82,200 55,820 2,200 2,200 2,200 2,200 - - 958,443 Cash Cost US$/lb of Cu 1.64 1.27 1.13 1.18 1.14 1.14 1.24 1.44 1.59 1.68 1.47 1.12 1.51 1.31 Cash Cost US$/oz of Cu w/Ag byproduct 1.59 1.20 1.06 1.12 1.07 1.08 1.19 1.41 1.56 1.66 1.43 1.07 1.49 1.26
Operating Margin 11,887 59,136 100,169 92,779 97,765 97,270 82,121 58,136 44,680 37,858 56,169 101,118 35,582 (2,200) (2,200) (2,200) (2,200) - - 865,872
CAPITAL COST Mine development cost total (US$ 000's) 20,853 8,655 18,569 4,554 1,097 235 1,266 7,264 3,014 2,448 206 436 436 79 69,111 Tailing Dam (plus 15% contingency) (US$ 000's) 19,452 11,500 - 18,637 11,500 - - 20,363 - - - - - - 6,939 6,939 6,939 102,269 WWTP (plus 25% contingency) (US$ 000's) - - - 23,250 - - - - - - - 336 - - - - - - - - 23,586 Land Payments (US$ 000's) 1,000 - - - - - - - - 1,000 Xcell Power Supply (US$ 000's) - 10,085 6,724 16,809 Wetland Mitigation (plus 10% contingency) (US$ 000's) - 234 - 667 667 667 667 726 726 726 726 - - - - 132 5,939 Site Infrastructure (General + Water Supply) including 15% Contingency (US$ 000's) - 17,794 17,794
Orvana Project Closure and Reclamation (US$ 000's) 2,319 2,319 2,319 2,319 2,004 11,278 Plant and equipment (US$ 000's) 35,167 82,056 15,615 132,838 Total Capital Costs (US$ 000's) - 86,557 126,963 34,183 47,109 13,264 902 1,933 28,353 3,739 3,174 932 772 436 79 - 7,071 9,257 9,257 2,319 2,319 2,004 380,624
0 1 2 3 4 5 6 7 8 9 10 11 12 13 14 15
Royalty 0.00% 0.00% 2.75% 2.75% 2.75% 2.75% 2.75% 2.75% 2.75% 2.75% 2.75% 2.75% 2.75% 2.75% 2.75%Royalty & Fees (US$ 000's) - - 951 3,284 5,005 4,822 4,910 4,902 4,487 3,814 3,436 3,245 3,759 5,041 2,514 50,169
Pre-Tax Cash Flow (US$ 000's) - - 86,557- 116,026- 21,669 48,055 74,692 91,953 90,435 49,281 50,583 38,070 33,681 51,639 95,641 32,989 2,200- 9,271- 11,457- 11,457- 2,319- 2,319- 2,004- 435,079 Cumulative Cash Flow (US$ 000's) - - 86,557- 202,583- 180,914- 132,858- 58,166- 33,787 124,223 173,503 224,086 262,156 295,837 347,476 443,117 476,106 473,906 464,635 453,178 441,721 439,402 437,084 435,079 Payback, operating years 4.6 5.6 5.6Pre- Tax Net Present Value
0.0% (US$ 000's) $435,0795.0% (US$ 000's) $249,5778.0% (US$ 000's) $174,57010.0% (US$ 000's) $135,11912.5% (US$ 000's) $94,98815.0% (US$ 000's) $62,946
Pre- Tax Internal Rate of ReturnCalculated IRR 22.5%
Cumulative IRR #NUM! #NUM! #NUM! #NUM! #NUM! -11.3% 4.6% 13.0% 16.0% 18.2% 19.4% 20.2% 21.1% 22.4% 22.7% 22.7% 22.6% 22.5% 22.5% 22.5% 22.5% 22.5%

Orvana Resources - Copperwood Project Feasibility Study Page 254
K D Engineering Document No. Q431-01-028 21 March 2012 KDE FORM No. A263a-7/12/99
DepreciationTotal 21,352 24,770 20,826 25,570 30,371 31,891 34,817 35,384 38,537 39,004 13,436 10,061 5,359 4,032 335,410
Book Depreciation - 21,352 24,770 20,826 25,570 30,371 31,891 34,817 35,384 38,537 39,004 13,436 10,061 5,359 4,032 Book Income - - - (10,415) 31,082 74,339 62,387 62,484 60,477 42,817 18,938 2,707 (4,391) 38,975 86,015 27,710 (6,232) 486,893 US federal and Michigan state corporate income tax - - - - 3,882 15,305 14,993 16,331 16,251 12,581 7,211 4,484 3,092 9,970 18,258 4,159 - - - - 126,517 After Tax Cash Flow - - (86,557) (116,026) 17,787 32,750 59,700 75,623 74,184 36,699 43,372 33,586 30,589 41,669 77,383 28,829 (2,200) (9,271) (11,457) (11,457) (2,319) (2,319) (2,004) 310,566
Regular Taxable income (14,831) (16,383) - 4,035 31,069 40,122 41,072 29,106 15,122 11,555 8,702 22,370 46,645 4,548 (7,545) (7,391) (7,363) (7,111) (4,516) (3,410) (2,888) 254,347 Alternative Minimum Taxable income (14,831) (5,266) 19,410 74,127 64,067 67,582 66,851 52,699 30,751 18,366 12,408 42,004 72,285 16,610 (8,104) (8,427) (8,536) (7,678) (4,811) (3,499) (2,979) 537,160 Federal Corporate tax - - 3,882 14,825 12,813 13,516 13,370 10,540 6,150 3,673 2,482 8,401 14,457 3,322 - - - - - - - 107,432
0% 0% 20% 20% 20% 20% 20% 20% 20% 20% 20% 20% 20% 20% 0% 0% 0% 0% 0% 0% 0% 20%Michigan corporate tax - - - 480 2,179 2,814 2,881 2,042 1,061 811 610 1,569 3,801 837 - - - - - - - 19,085
Total Corporate Income Tax - - 3,882 15,305 14,993 16,331 16,251 12,581 7,211 4,484 3,092 9,970 18,258 4,159 - - - - - - - 126,517 Cumulative Cash Flow (US$ 000's) - - 86,557- 202,583- 184,796- 152,046- 92,346- 16,724- 57,461 94,160 137,532 171,118 201,707 243,377 320,759 349,588 347,388 338,118 326,661 315,203 312,885 310,566 308,562 Payback, operating years 5.2 6.2 6.2After- Tax Net Present Value
0.0% (US$ 000's) $308,5625.0% (US$ 000's) $163,0908.0% (US$ 000's) $104,36510.0% (US$ 000's) $73,58112.5% (US$ 000's) $42,40215.0% (US$ 000's) $17,665
After- Tax Internal Rate of ReturnCalculated IRR 17.2%
Cumulative IRR #NUM! #NUM! #NUM! #NUM! #NUM! #NUM! -2.4% 6.5% 9.4% 12.0% 13.5% 14.5% 15.6% 17.1% 17.6% 17.5% 17.4%

Orvana Resources - Copperwood Project Feasibility Study Page 255
K D Engineering Document No. Q431-01-028 21 March 2012 KDE FORM No. A263a-7/12/99
22.7 IRR vs. Copper and Silver Price The following table shows IRR values for different copper and silver price scenarios of Drill and Blast Case.
Table 22.3 IRR vs. Copper and Silver Price
(After Corporate Taxes ) Copper Price (US$)/Silver Price (US$) IRR (%)
2.25 / 22.50 -23.1 2.50 / 25.00 15.7 3.00 / 30.00 27.2 3.50 / 35.00 36.1 4.00 / 40.00 43.6
Table 22.4 IRR vs. Copper and Silver Price
(After Corporate Taxes-CM Case) Copper Price (US$)/Silver Price (US$) IRR (%)
2.25 / 22.50 10.8 2.50 / 25.00 16.9 3.00 / 30.00 26.4 3.50 / 35.00 33.9 4.00 / 40.00 40.4

Orvana Resources - Copperwood Project Feasibility Study Page 256
K D Engineering Document No. Q431-01-028 21 March 2012 KDE FORM No. A263a-7/12/99
23.0 ADJACENT PROPERTIES
Orvana holds options to lease mineral rights on adjacent properties, which were also explored in the late 1950’s and are known to host mineralization similar to that found at Copperwood. This mineralization, referred to as the Copperwood Satellite deposits, was described in “Copperwood S6 and Satellite Project NI 43-101 Technical Report” prepared by AMEC Mining and Metals Consulting Services, Vancouver, BC, Canada under the supervision of G. Kulla, P. Geo., and .D. Thomas, P. Geo. both independent qualified persons for the purposes of NI 43-101; the effective date of the report is 24 January 2011. The resource estimates reported therein are summarized in Table 23.1.
Table 23.1 Summary of Resource Estimates from Properties Adjacent to Copperwood
(Kulla and Thomas, 2011)
Area
Metric Tonnes, million
Short Tons,
million Copper, %
Copper, million pounds Class Status
Copperwood S6 8.41 9.27 1.42 264 Indicated LeasedCopperwood Satellites 25.01 27.57 1.40 771 Indicated Optioned
33.42 36.85 1.41 1,036
AreaTons,
million Copper, %
Copper, million pounds Class Status
Copperwood S6 0.46 0.51 1.29 14 Inferred LeasedCopperwood Satellites 36.14 39.84 1.30 1,033 Inferred Optioned
36.60 40.35 1.30 1,047 .
It is important to note that an updated resource estimate, which included additional drilling, for Copperwood S6 was a part of the updated Copperwood resource estimate (Ward, 2011), which estimate was used for the reserve estimate reported herein.
Orvana Resources - Copperwood Project Feasibility Study Page 257
K D Engineering Document No. Q431-01-028 21 March 2012 KDE FORM No. A263a-7/12/99
24.0 OTHER RELEVANT DATA AND INFORMATION The information presented herein is considered to be sufficient for a feasibility study. It is anticipated that additional details regarding mining methods, metallurgical testwork and flowsheet development, permitting, tailings management, and infrastructure items will be expanded upon in the detail engineering effort.

Orvana Resources - Copperwood Project Feasibility Study Page 258
K D Engineering Document No. Q431-01-028 21 March 2012 KDE FORM No. A263a-7/12/99
25.0 INTERPRETATION AND CONCLUSIONS
This feasibility study is based upon mining the deposit using conventional drill-and-blast methods. Although the use of continuous mining equipment has been successfully employed in salt, potash, trona, and coal mining, and might be adapted to extract the Copperwood project sediment-hosted copper-sulfide ores, the conclusion is that extraction of the ores would be best performed using drill and blast methods. Metallurgical testing as been conducted in order to refine the Copperwood flotation process and maximize both copper and silver extraction. This work studied impact of fine grinding upon copper extraction and concentrate grade and also examined whether a modification to the White Pine process flowsheet, which was noted to evolve with time, would have an application to the contemplated Copperwood beneficiation scheme. Additional work has been devoted to infrastructure components including power acquisition, road upgrading, raw water procurement, and tailings management. Grants and loans will be sought to minimize the capital outlay for public infrastructure. The designs presented herein are preparatory in nature and are not intended for regulatory purposes such as a mining permit application. The major project risk, as demonstrated by the financial analysis, is the realization price of copper and silver metal in the Copperwood flotation concentrates. The mining method, concentrate shipping distance, and concentrate treatment charge/refining charge also impact the profitability of the project. The Copperwood flotation concentrate does not contain any deleterious elements and would be accepted at all copper smelters.
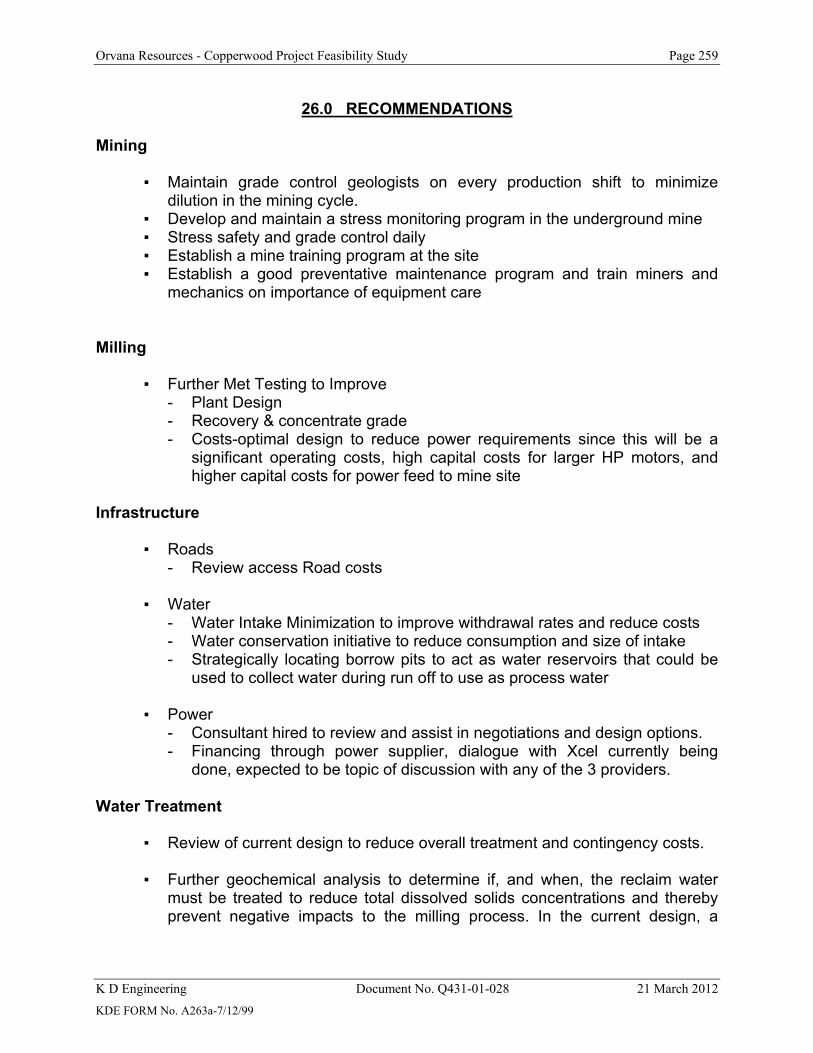
Orvana Resources - Copperwood Project Feasibility Study Page 259
K D Engineering Document No. Q431-01-028 21 March 2012 KDE FORM No. A263a-7/12/99
26.0 RECOMMENDATIONS Mining
▪ Maintain grade control geologists on every production shift to minimize dilution in the mining cycle.
▪ Develop and maintain a stress monitoring program in the underground mine ▪ Stress safety and grade control daily ▪ Establish a mine training program at the site ▪ Establish a good preventative maintenance program and train miners and
mechanics on importance of equipment care
Milling
▪ Further Met Testing to Improve - Plant Design - Recovery & concentrate grade - Costs-optimal design to reduce power requirements since this will be a
significant operating costs, high capital costs for larger HP motors, and higher capital costs for power feed to mine site
Infrastructure
▪ Roads - Review access Road costs
▪ Water
- Water Intake Minimization to improve withdrawal rates and reduce costs - Water conservation initiative to reduce consumption and size of intake - Strategically locating borrow pits to act as water reservoirs that could be
used to collect water during run off to use as process water
▪ Power - Consultant hired to review and assist in negotiations and design options. - Financing through power supplier, dialogue with Xcel currently being
done, expected to be topic of discussion with any of the 3 providers.
Water Treatment
▪ Review of current design to reduce overall treatment and contingency costs.
▪ Further geochemical analysis to determine if, and when, the reclaim water must be treated to reduce total dissolved solids concentrations and thereby prevent negative impacts to the milling process. In the current design, a

Orvana Resources - Copperwood Project Feasibility Study Page 260
K D Engineering Document No. Q431-01-028 21 March 2012 KDE FORM No. A263a-7/12/99
portion, but not all, of the reclaim water is treated throughout the mining period.
▪ Further analysis of water balance to reduce treatment requirements by using
a water conservation policy to reduce intake consumption.
▪ Investigate grant opportunities from Michigan Economic Development Corporation (MEDC) in collaboration with Gogebic Range Water Authority (GRWA) for water intake. Initial estimate of grant funding is $1.8M.
Tailings Disposal Facility The following presents conclusions based on the additional work carried out for this FS, as well as recommendations for future design considerations and refinements to incorporate into the Copperwood TDF final design based on the results of the work to date:
Additional Site Investigations and Monitoring
▪ Ongoing Monitoring of Site Groundwater Levels
Supplemental field investigation work conducted in December 2011 for this FS was used to support a revised TDF design incorporating a deeper excavation depth for the TDF basin. Water level measurements should be continued in the piezometers installed in the 2011 geotechnical investigations to facilitate further evaluation and understanding of groundwater conditions (direction, vertical and horizontal gradients). While the flows are likely to be low in the till as a result of its low hydraulic conductivity, the pressure regimes should be further defined in order to avoid problems with potentially quick conditions developing in the base of the excavation for the TDF. Specifically, additional paired piezometer locations should be considered to further ensure the hydraulic separation between the bedrock and glacial overburden. The bedrock appears to be acting as an aquifer confined under the till, leading to the possibility that once the excavation is carried out, if the base of the excavation is too close to the bedrock, upward flows may occur into the excavation. Uplift analyses carried out to support the design of the revised TDF base grades utilized a 1.4 factor-of-safety to avoid this condition occurring. However, if it were to occur, the solution would be to dewater the excavation and/or possibly install a groundwater cutoff trench upgradient of the area.
▪ On-Site Borrow for Riprap and/or Filter/Drain Material
Riprap and filter/drain material represent significant costs to the project. It is known that these materials are commercially available in close proximity to the Copperwood site. On-site borrow sourcing of these materials was investigated as part of this FS, and at present it appears that, although the Copper Harbor Conglomerate would likely be able to be processed to meet the material

Orvana Resources - Copperwood Project Feasibility Study Page 261
K D Engineering Document No. Q431-01-028 21 March 2012 KDE FORM No. A263a-7/12/99
specifications, it may not be practical to excavate large quantities of this material for use in the TDF since access to near-surface deposits of this geologic unit is limited to a relatively small area in the vicinity of the southwest side of the TDF.
Additional Materials Testing ▪ Triaxial Testing for Embankment Stability Parameters
Additional undisturbed samples were acquired and tested for this FS, and the results used to modify the parameters incorporated into the TDF embankment stability analyses. Prior to construction, triaxial testing on remolded samples of proposed borrow material (based on moisture-density testing) should be completed to represent the embankment fill materials in confirmatory stability analyses.
▪ Construction Pore Pressures
The consolidation tests on the till indicate that the time rate of consolidation is quite slow, which is consistent with the low hydraulic conductivity. Such a material may contain significant excess pore pressures when loaded and compacted, and this indicates that monitoring of pore pressures during construction will be important. The final design of the TDF should investigate limits on the rate of construction and the number and positions of the embankment drains adopted.
▪ Drainage Material Testing
Additional hydraulic conductivity testing should be performed on candidate drainage materials to assess whether they will meet the design criteria for the project. Depending on the results, other material sources may need to be secured, and/or drainage components of the design may need to be re-sized to reflect design flow capacities computed based on the actual hydraulic conductivity testing.
Tailings Disposal Facility Design
▪ Alternative Tailings Disposal
The TDF design has been developed assuming storage of 100 percent of the tailings from the mine at surface. However, the footprint of the TDF could be significantly reduced if some of the tailings can be used as backfill for the underground mine. The reduction of the tailings stored at surface would reduce the required dike construction, surface water diversions, and wetlands impact and thus the total construction and closure costs of the facility. Further

Orvana Resources - Copperwood Project Feasibility Study Page 262
K D Engineering Document No. Q431-01-028 21 March 2012 KDE FORM No. A263a-7/12/99
engineering studies are on-going to evaluate methods to thicken or paste the tailings in order to produce a suitable material for backfill. The technical feasibility of this alternative will include an assessment of the tradeoff of a reduced TDF footprint, wetlands implications, and construction costs against the operating costs associated with a thickened or filtered tailings plant.
Decant System and Overflow Pond Design
▪ Decant Structure
The decant system design will be further optimized during final design through evaluation of the system needs and operation of the system, particularly as related to staged TDF development and operation.
▪ Flocculent Analysis
As determined through sample preparation for consolidation testing, additional flocculent may be required to be added to the tailings prior to deposition for the slurry to exhibit fully-flocculated behavior. Although addition through recirculated water is possible, alternative means to add the flocculent should be investigated to optimize the process.
▪ Evaluation of Decant Sump Overflow Pond
The decant sump overflow pond will need to be re-evaluated during final design based on any changes to the flocculent addition strategy and consideration for multiple usages (i.e., power outages) during each winter. The location and elevation of the decant sump was set to provide gravity pipe flow from the lowered TDF floor.
Closure Design
For this stage of design, the conceptual closure plan envisages mechanical placement of the cap materials with a thickness ranging from approximately 4 to 7 ft. The closure plan cover system will be further evaluated to confirm compatibility with the final design of tailings deposition and water management plan. A 0.25 percent slope was utilized on the closure surface to mimic the slope of the tailings surface; the actual slope will be confirmed as part of the final closure plan evaluation.
General
▪ Contingency costs for WWTP and TDF are at 15 percent; may be able to be reduced by combining these separate projects into one to maximize overall design.

Orvana Resources - Copperwood Project Feasibility Study Page 263
K D Engineering Document No. Q431-01-028 21 March 2012 KDE FORM No. A263a-7/12/99
▪ Staffing requirements: shared services or combined departments, possibly combine maintenance into centralized department.
▪ Wages and benefits currently based on UMW hourly rates, rates in area are
much lower.
▪ Other Grants for training and or support.

Orvana Resources - Copperwood Project Feasibility Study Page 264
K D Engineering Document No. Q431-01-028 21 March 2012 KDE FORM No. A263a-7/12/99
27.0 REFERENCES AMEC Mining and Metals Consulting Services, "Copperwood Project - Michigan, USA - 43-101 Technical Report" dated 30 April 2010. C2AE, "Gogebic County, Michigan Gogebic Range Water Authority Copperwood Water System, Draft Preliminary Engineering Report, dated 10 May 2010 Crescent Park Consulting Ltd, "Orvana Minerals US Corp Copperwood Project, Michigan, Tailings Scoping Study", dated 13 June 2010 Knight Piésold, 2011, Orvana Resources U.S. Corporation, Copperwood Project, Pre-Feasibility Study Report on Tailings Disposal Facility and Ancillary Structures, Revision 0, July 29, 2011 METCON Research, "Copperwood Project - Flotation Test Work on composite No. 4 and Composite No. 5", dated May 2011 Michigan 2004, State of Michigan Department of Environmental Quality, Land and Water Management Division, “Calculating a Water Budget”, 12/14/2004
Mitchell, J.K., Fundamentals of Soil Behavior, John Wiley and Sons, New York, 1976, pg 422 U.S. Metals Refining Co. report, "Comparative Study of Rock Characteristics and Probable Mining Conditions,” dated September 29, 1958 U.S. Metals Refining Co. report "Geology of the Western Syncline", dated March 24, 1959

Orvana Resources - Copperwood Project Feasibility Study Page 265
K D Engineering Document No. Q431-01-028 21 March 2012 KDE FORM No. A263a-7/12/99
28.0 APPENDICES

Orvana Resources - Copperwood Project Feasibility Study
K D Engineering Document No. Q431-01-028 21 March 2012 KDE FORM No. A263a-7/12/99
APPENDIX 1
DESIGN CRITERIA

REV BY DATE KDE DATE DESCRIPTION PAGESNO APPRP1 JJ 12/28/2011 BCS 12/28/2011 Preliminary 26
SIGNATURE:
DATE:
ORVANA RESOURCE US CORP.
K D Engineering
ORVANA APPROVAL
Feasibility Study
DESIGN CRITERIA
DOCUMENT NO. KDE Q431-01-010
KDE FORM No. A131a-7/12/99

Client: ORVANA RESOURCE US CORP.Project: Feasibility StudyProject No.: 431-01 Date: December 28, 2011
Nominal Design Nominal Design Source Code1.0 SCOPE
2.0 CODES AND STANDARDS
I
Code Source
A Assumptions For StudyB CalculatedC Client InformationI Industry Standard PracticeK KDEO Information Provided by OthersP Published Information / CriteriaT Engineering, Testwork or ReportsV Vendor Data
PRELIMINARY DESIGN CRITERIADocument No.: KDE Q431-01-010Rev: P1
Phase I Phase II
This document defines the process design criteria to be applied to the grinding, flotation, and dewatering facilities for a proposed 2.625 million tons per year copper ore processing plant to be located in Gogebic County at the western end of Michigan’s Upper Peninsula. During the phase I of the operation, a two stage milling with one SAG mill and one ball mill operating is planned, the throughput during this period will be 1.8 million tons per year. Three years later, adding a second ball mill operating with the original ball mill in parallel is planned, to expand to 2.625 million tons per year. Concentrates produced will be trucked off site for further processing.
North American Codes, Standards and Regulations will be used. Applicable codes, standards and regulations will be referenced in each Technical Specification that is applicable for the particular piece of equipment or system that is being designed. Specific design standards will be referenced, as required, in each Technical Specification.
KDE FORM NO.: E132-7/12/99 Page 1 of 23 KD Engineering

Client: ORVANA RESOURCE US CORP.Project: Feasibility StudyProject No.: 431-01 Date: December 28, 2011
Nominal Design Nominal Design Source Code
PRELIMINARY DESIGN CRITERIADocument No.: KDE Q431-01-010Rev: P1
Phase I Phase II
3.0 SITE DATA
LocationC
Michigan State Planes Coordinates: C
Mill Elevation, Feet Above Sea Level 750 C
Ambient Air Pressure, inches Hg C
Ambient Air TemperatureMaximum: °F 102 CMinimum: °F -38 CBuilding Design Temperature: °F 70 C
Precipitation, inches ( 24 hr / 100 year event) C
Precipitation, inches (Annual Average) 32.5 T
Snowload inches 137.2 Tpounds per square foot
Evaporation, inches (Annual Average) 10 P
Wind Direction, Prevailing SW C
Design Wind Load 90 miles per hour C
Seismic Zone Seismic Zone 0 P
Copperwood is located approximately 13 miles north of Wakefield Michigan.
KDE FORM NO.: E132-7/12/99 Page 2 of 23 KD Engineering
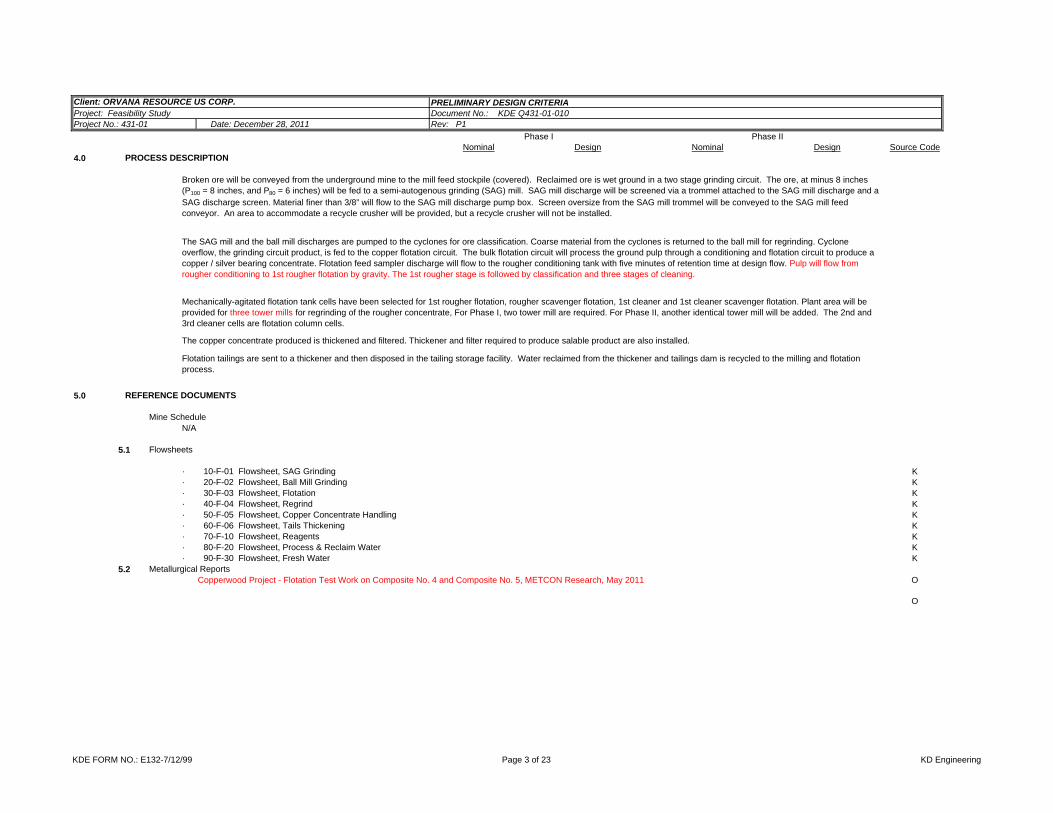
Client: ORVANA RESOURCE US CORP.Project: Feasibility StudyProject No.: 431-01 Date: December 28, 2011
Nominal Design Nominal Design Source Code
PRELIMINARY DESIGN CRITERIADocument No.: KDE Q431-01-010Rev: P1
Phase I Phase II
4.0 PROCESS DESCRIPTION
5.0 REFERENCE DOCUMENTS
Mine ScheduleN/A
5.1 Flowsheets
· 10-F-01 Flowsheet, SAG Grinding K· 20-F-02 Flowsheet, Ball Mill Grinding K· 30-F-03 Flowsheet, Flotation K· 40-F-04 Flowsheet, Regrind K· 50-F-05 Flowsheet, Copper Concentrate Handling K· 60-F-06 Flowsheet, Tails Thickening K· 70-F-10 Flowsheet, Reagents K· 80-F-20 Flowsheet, Process & Reclaim Water K· 90-F-30 Flowsheet, Fresh Water K
5.2 Metallurgical ReportsO
O
Copperwood Project - Flotation Test Work on Composite No. 4 and Composite No. 5, METCON Research, May 2011
Broken ore will be conveyed from the underground mine to the mill feed stockpile (covered). Reclaimed ore is wet ground in a two stage grinding circuit. The ore, at minus 8 inches (P100 = 8 inches, and P80 = 6 inches) will be fed to a semi-autogenous grinding (SAG) mill. SAG mill discharge will be screened via a trommel attached to the SAG mill discharge and a SAG discharge screen. Material finer than 3/8” will flow to the SAG mill discharge pump box. Screen oversize from the SAG mill trommel will be conveyed to the SAG mill feed conveyor. An area to accommodate a recycle crusher will be provided, but a recycle crusher will not be installed.
The copper concentrate produced is thickened and filtered. Thickener and filter required to produce salable product are also installed.
Mechanically-agitated flotation tank cells have been selected for 1st rougher flotation, rougher scavenger flotation, 1st cleaner and 1st cleaner scavenger flotation. Plant area will be provided for three tower mills for regrinding of the rougher concentrate, For Phase I, two tower mill are required. For Phase II, another identical tower mill will be added. The 2nd and 3rd cleaner cells are flotation column cells.
The SAG mill and the ball mill discharges are pumped to the cyclones for ore classification. Coarse material from the cyclones is returned to the ball mill for regrinding. Cyclone overflow, the grinding circuit product, is fed to the copper flotation circuit. The bulk flotation circuit will process the ground pulp through a conditioning and flotation circuit to produce a copper / silver bearing concentrate. Flotation feed sampler discharge will flow to the rougher conditioning tank with five minutes of retention time at design flow. Pulp will flow from rougher conditioning to 1st rougher flotation by gravity. The 1st rougher stage is followed by classification and three stages of cleaning.
Flotation tailings are sent to a thickener and then disposed in the tailing storage facility. Water reclaimed from the thickener and tailings dam is recycled to the milling and flotation process.
KDE FORM NO.: E132-7/12/99 Page 3 of 23 KD Engineering

Client: ORVANA RESOURCE US CORP.Project: Feasibility StudyProject No.: 431-01 Date: December 28, 2011
Nominal Design Nominal Design Source Code
PRELIMINARY DESIGN CRITERIADocument No.: KDE Q431-01-010Rev: P1
Phase I Phase II
6.0 PROCESS DESIGN CRITERIA
6.1 GENERAL
I
Fuel Source
Electric PowerOperating Voltage 4,160 V over 225 kW, 440 V
underC
Operating Frequency 60 Hz POperating Phase 3 phase PControl VoltageControl Frequency 60 Hz PControl Phase 3 phase I
Processing Rate, Tons ore per year 1,750,000 2,625,000 C
Processing Rate, Tons ore per day 5,000 7,500 C
Design Processing Rate, Tons ore per day 15% above Nominal 5,750 8,625 B
Nominal Mine Life, years
Average Ore Grade, percentCopper
Design 1.50 1.50 1.50 1.50 C
Nominal Copper Recovery, PercentDesign 86 86 86 86 C
Nominal Annual Production Rate, Pounds per Yearcopper 45,150,000 67,725,000 B
Process Design Criteria provide the basis for the selection of the type, number, duty and size of process equipment. Process Design Criteria are not a guarantee of plant performance.
KDE FORM NO.: E132-7/12/99 Page 4 of 23 KD Engineering

Client: ORVANA RESOURCE US CORP.Project: Feasibility StudyProject No.: 431-01 Date: December 28, 2011
Nominal Design Nominal Design Source Code
PRELIMINARY DESIGN CRITERIADocument No.: KDE Q431-01-010Rev: P1
Phase I Phase II
ORE CHARACTERISTICS
Specific GravityResource Total 2.75 2.75 A
Ore Size, inches (Estimated)Percent Passing Size, inches
P100 8 8 8 8 O
P80 6 6 6 6 O
Ore MoistureNormal, Percent 3 3 3 3 A
Angle of Repose, Degrees 37 37 ADraw Down Angle, Degrees 60 60 A
Bulk Density dry pounds per cubic footFor Volume Calculations 124 124 AFor Structural Calculations 200 200 A
Bulk Density wet pounds per cubic footFor Volume Calculations 128 128 AFor Structural Calculations 200 200 A
Bond Work Index, kWh per tonAverage 13.39 13.39 A
Bond Impact Crushing Work Index, kWh/TonAverage 13.00 13.00 A
Bond Abrasion Index, gAverage 0.10 0.10 A
OPERATING TIMES
Mining and Crushing ScheduleDays per Year 350 350 CShifts per Day 3 3 CHours per Shift 8 8 CAvailability, percent 80 80 I
Average Operating Hours per Day 19.2 19.2 B
Milling ScheduleDays per Year 350 350 CShifts per Day 2 3 CHours per Shift 12 12 CAvailability 92.5 92.5 CAverage Operating Hours per Day 22.2 22.2 22.2 22.2 B
KDE FORM NO.: E132-7/12/99 Page 5 of 23 KD Engineering

Client: ORVANA RESOURCE US CORP.Project: Feasibility StudyProject No.: 431-01 Date: December 28, 2011
Nominal Design Nominal Design Source Code
PRELIMINARY DESIGN CRITERIADocument No.: KDE Q431-01-010Rev: P1
Phase I Phase II
6.2 MILL FEED STOCKPILE
K
Stockpile Feed ConveyorNumber KSize, width x length x lift, in x ft x ft KCapacity, flow sheet design, tph 299.5 449.2 BCapacity, operating maximum, tph 389.3 584.0 B
Stockpile Tripper ConveyorNumber KSize, width x length x lift, in x ft x ft KCapacity, flow sheet design, dtph 299.5 449.2 BCapacity, operating maximum, dtph 389.3 584.0 B
Mill Feed StockpileNumber of Mill Feed Stockpiles KCapacity, live tonnes 7,500 7,500 KStorage, live days 1.5 1 BCapacity, total tons BGeometry KAngle of repose, degrees AAngle of drawdown, degrees A
Bulk Density, pounds / ft3 I
Dust collection I
Mill Feed Stockpile Reclaim Feeder Number 3 working and 1 stand-by 3 working and 1 stand-by KType IDrive ISize, width x length, in x ft KCapacity, flow sheet design, each, tph 86.3 129.5 BCapacity, operating maximum, each, tph 112.2 168.3 BFeeder Arrangement K
100
water spray
Apronhydraulic, variable speed
In parallel
1
1
Rectangular37
Ore is stored in the 7,500 tonnes live capacity mill feed stockpile. Ore will be withdrawn at a controlled rate from the mill feed stockpile by variable speed apron feeders (three operating and one standby) onto SAG mill feed conveyor and ultimately the SAG mill. A covered stockpile is required due to rains in summer and heavy snow in winter. When required, ore will be moved from the "dead" storage area to the "live" storage area by front-end loader or bulldozer. Dust control in the mill feed stockpile area will be by the wet type dust collector systems.
60
1
KDE FORM NO.: E132-7/12/99 Page 6 of 23 KD Engineering
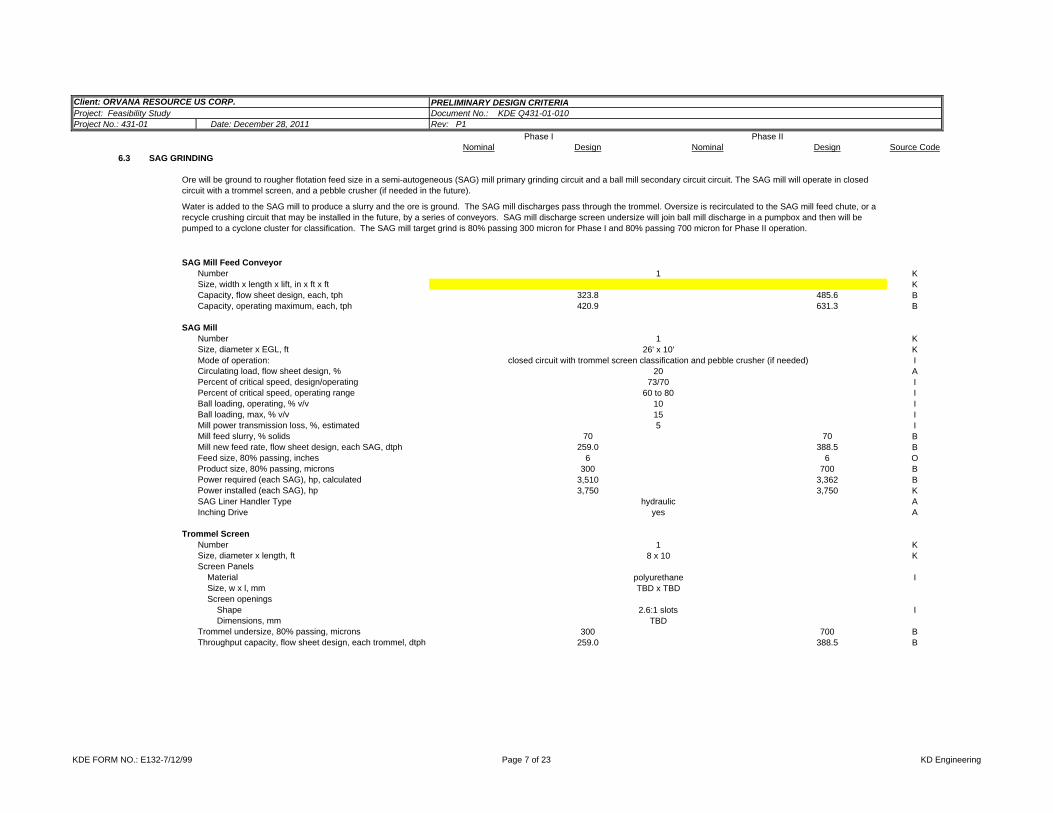
Client: ORVANA RESOURCE US CORP.Project: Feasibility StudyProject No.: 431-01 Date: December 28, 2011
Nominal Design Nominal Design Source Code
PRELIMINARY DESIGN CRITERIADocument No.: KDE Q431-01-010Rev: P1
Phase I Phase II
6.3 SAG GRINDING
SAG Mill Feed ConveyorNumber KSize, width x length x lift, in x ft x ft KCapacity, flow sheet design, each, tph 323.8 485.6 BCapacity, operating maximum, each, tph 420.9 631.3 B
SAG MillNumber KSize, diameter x EGL, ft KMode of operation: ICirculating load, flow sheet design, % APercent of critical speed, design/operating IPercent of critical speed, operating range IBall loading, operating, % v/v IBall loading, max, % v/v IMill power transmission loss, %, estimated IMill feed slurry, % solids 70 70 BMill new feed rate, flow sheet design, each SAG, dtph 259.0 388.5 BFeed size, 80% passing, inches 6 6 OProduct size, 80% passing, microns 300 700 BPower required (each SAG), hp, calculated 3,510 3,362 BPower installed (each SAG), hp 3,750 3,750 KSAG Liner Handler Type AInching Drive A
Trommel ScreenNumber KSize, diameter x length, ft KScreen Panels Material I Size, w x l, mm Screen openings Shape I Dimensions, mmTrommel undersize, 80% passing, microns 300 700 BThroughput capacity, flow sheet design, each trommel, dtph 259.0 388.5 B
polyurethaneTBD x TBD
2.6:1 slotsTBD
155
hydraulicyes
2073/70
60 to 8010
Water is added to the SAG mill to produce a slurry and the ore is ground. The SAG mill discharges pass through the trommel. Oversize is recirculated to the SAG mill feed chute, or a recycle crushing circuit that may be installed in the future, by a series of conveyors. SAG mill discharge screen undersize will join ball mill discharge in a pumpbox and then will be pumped to a cyclone cluster for classification. The SAG mill target grind is 80% passing 300 micron for Phase I and 80% passing 700 micron for Phase II operation.
Ore will be ground to rougher flotation feed size in a semi-autogeneous (SAG) mill primary grinding circuit and a ball mill secondary circuit circuit. The SAG mill will operate in closed circuit with a trommel screen, and a pebble crusher (if needed in the future).
1
126' x 10'
18 x 10
closed circuit with trommel screen classification and pebble crusher (if needed)
KDE FORM NO.: E132-7/12/99 Page 7 of 23 KD Engineering

Client: ORVANA RESOURCE US CORP.Project: Feasibility StudyProject No.: 431-01 Date: December 28, 2011
Nominal Design Nominal Design Source Code
PRELIMINARY DESIGN CRITERIADocument No.: KDE Q431-01-010Rev: P1
Phase I Phase II
6.4 BALL MILLING
Ball MillNumber 1 2 KSize, diameter x EGL, ft 16 x 22 16 x 22 BMode of operation ICirculating load, flow sheet design, % IPercent of critical speed IBall loading, % v/v IMill power transmission loss, %, estimated AMill feed slurry, % solids 70 70 BMill fresh ore feed rate operating average, each mill, dtph 259 194.3 BBall mill work index, kWhr/t @ 100 mesh, design value AFeed size, 80% passing, microns 300 700 BProduct size, 80% passing, microns TPower required, each mill, hp, calculated 3,059 2,856 BPower installed, each mill, hp 3,250 3,250 KGrinding Media Consumption, pounds per ton mill feed
Sag Mill 5’ balls BBall Mill 3” balls BRegrind Mill 1” balls B
Ball Mill Cyclone Feed PumpsNumber 1 operating and 1 stand-by 1 operating and 1 stand-by KType ISize, mmCapacity, each pump, flow sheet design, gpm 6,237 9,356 BCapacity, each pump, maximum, gpm 7,796 11,694 BPower installed, each pump, hp 700 700 B
Cyclone Cluster Model ISize, diameter, inches KNumber of cyclone cluster 1 1 K
Installed, total 5 6 KOperating, total 4 5 KOperating pressure, psi KStream flow rates, flow sheet design, per manifold, dtph Feed 1,036 1,554 B Overflow 259 389 B Underflow 777 1,166 B
horizontal centrifugal
gMAX20
10 - 11 (8 psi nominal flow)
540
13.39
63
closed circuit with hydrocyclones30075
SAG mill discharge joins to the ball mill discharge pumpbox. The SAG discharge is combined with the ball mill discharge and pumped to a cluster of cyclones. Cyclone overflow at approximately 80% minus 63 microns then flows by gravity to the flotation distributor. Cyclone underflow returns to the ball mill circuit.
KDE FORM NO.: E132-7/12/99 Page 8 of 23 KD Engineering

Client: ORVANA RESOURCE US CORP.Project: Feasibility StudyProject No.: 431-01 Date: December 28, 2011
Nominal Design Nominal Design Source Code
PRELIMINARY DESIGN CRITERIADocument No.: KDE Q431-01-010Rev: P1
Phase I Phase II
Stream % solids, flow sheet design Feed 46.5 46.5 B Overflow 23.1 23.2 B Underflow 70.0 70.0 B Separation size, D50, microns Overflow size, P80, microns 63 63 T
6.5 FLOTATION
Feed Assay Distribution Assay DistributionCu, % 1.42 1.42 1.42 1.42 A
Copper ConcentrateCu, % 24 24 24 24 K
Hydrocyclone overflow will flow by gravity to the flotation circuit. The flotation circuit will consist of one row of rougher flotation cells, two concentrate regrind circuits for phase I and three concentrate regrind circuits for phase II, one row of first cleaner/first cleaner scavenger flotation cells. Two second cleaner flotation column cells and two third cleaner flotation column cells for phase I, for phase II, add one more flotation column cell for second and third cleaner flotation.
A bridge crane will be installed for maintenance of the flotation and regrind equipment.
The design residence times selected are based 2 to 4 times the laboratory test program retention times. Key flotation stage design parameters are summarized below
Flotation reagents will be added at several points in the flotation circuit.
First cleaner flotation concentrate will be pumped (one operating and one stand-by) from the second cleaner feed pump box to the 2nd cleaner column feed distributor to feed three second cleaner column cells (two for Phase I and will add one more for phase II) in parallel. Second cleaner flotation concentrate will be pumped (one operating and one stand-by) from the second cleaner feed pump box to the 3rd cleaner column feed distributor to feed three third cleaner column cells (two for Phase I and will add one more for phase II) in parallel. Tailings from the 2nd column cells will flow by gravity to 2nd cleaner tailing pump box Concentrate from the 3rd column cells will flow by gravity to the concentrate thickener. Tailings from the 3rd column cells will flow by gravity to 2nd cleaner feed pumpbox and then to the classification cyclone feed pump box.
Flotation air for the cleaner flotation column cells will be supplied by column cell compressed air system.Air compressor, air receiver, and instrument air dryer will be installed for general plant operation and maintenance.
The rougher row will consist of five (5) tank type rougher flotation cells for phase I and will add three (3) more for phase II. The rougher concentrate will be sampled with the rougher concentrate primary sampler and pumped by classification cyclone feed pump (one operating and one stand-by) to the classification cyclone cluster, the cyclone underflow (+500 meshes) will go to regrind circuit and cyclone overflow will be sampled with classification cyclone overflow sampler and particle size monitor, and flow to the 1st cleaner flotation cell. The concentrate samples cut by the samplers will be analyzed for process control by the copper on-stream analyzer. Tailing from last rougher flotation cell will be sampled with primary samplers and analyzed by the copper on-stream analyzer.
Copper concentrate regrinding will be performed in two vertical mills (phase I) and three vertical mills (Phase II) operated in parallel. The vertical mills will operate in closed circuit with hydrocyclones. Vertical mill discharge will be combined with classification underflow (+500 meshes) in regrind cyclone feed pump box and will be pumped by variable speed horizontal centrifugal slurry pumps (one operating and one stand-by) to hydrocyclone cluster. Hydrocyclone underflow will be split to feed each regrind mill which will discharge back to the copper regrind cyclone feed pump box. Hydrocyclone overflow (final regrind circuit product) will be sampled by regrind cyclone overflow sampler for particle size distribution analysis by the copper regrind cyclone particle size monitor, analyzed by the copper on-stream analyzer, and flow by gravity to the first cleaner flotation circuit.
Reground rougher concentrate combined with classification cyclone overflow (-500 meshes) will feed six (6) first cleaner flotation cells. Concentrate from the first cleaner flotation cells will flow by gravity to the second cleaner feed pump box. Tailings from the first cleaner cells will flow by gravity to eight (8) first cleaner scavenger flotation cells. Concentrate from the first cleaner scavenger flotation cells will flow by gravity to the 1st cleaner scavenger concentrate pump box. Tailings from the cleaner scavenger cells, sampled by the scavenger tail primary sampler for process control, will flow by gravity to the tailings launder.
KDE FORM NO.: E132-7/12/99 Page 9 of 23 KD Engineering

Client: ORVANA RESOURCE US CORP.Project: Feasibility StudyProject No.: 431-01 Date: December 28, 2011
Nominal Design Nominal Design Source Code
PRELIMINARY DESIGN CRITERIADocument No.: KDE Q431-01-010Rev: P1
Phase I Phase II
Conditioning TankNumber of Tanks 1 1 I
Feed Solids, tph 280.0 420.0 BWeight Percent Solids 23.2 23.3 BVolume, gpm 4,107 6,136 BVolume, cfm 549 820 BSpecific Gravity of Pulp 1.17 1.17
Conditioning Tank SizeRetention Time, minutes 5 5 TTank Live Volume, gallons 20,535 30,681 B
Tank Live Volume, ft3 2,745 4,102 B
Approximate Tank Dimensions Diameter, ft 15.2 17.3 B Height, ft 16.7 18.8 B
Rougher FlotationNumber of Lines 1 1 ICells per Line 5 8 ICell Size, cubic foot 4,500 4,500 I
Feed Solids, tph 280.0 420.0 BFeed Grade, % Cu 1.31 1.31 BWeight Percent Solids 23.2 23.3 BVolume, gpm 4,107 6,136 BVolume, cfm 549 820 BSpecific Gravity of Pulp 1.17 1.17 B
ConcentrateMass Recovery, % of Feed 43.0 43.0 BStage Copper Recovery, % 98.2 98.2 ASolids, tph 120.4 180.6 BConcentrate Grade, % Cu 3.00 3.00Weight Percent Solids 25.0 25.0 AVolume, gpm 1,621 2,431 BSpecific Gravity of Pulp 1.19 1.19 B
TailingSolids, tph 159.6 239.4 BWeight Percent Solids 22.1 22.2 AVolume, gpm 2,489 3,708 BSpecific Gravity of Pulp 1.16 1.16
KDE FORM NO.: E132-7/12/99 Page 10 of 23 KD Engineering
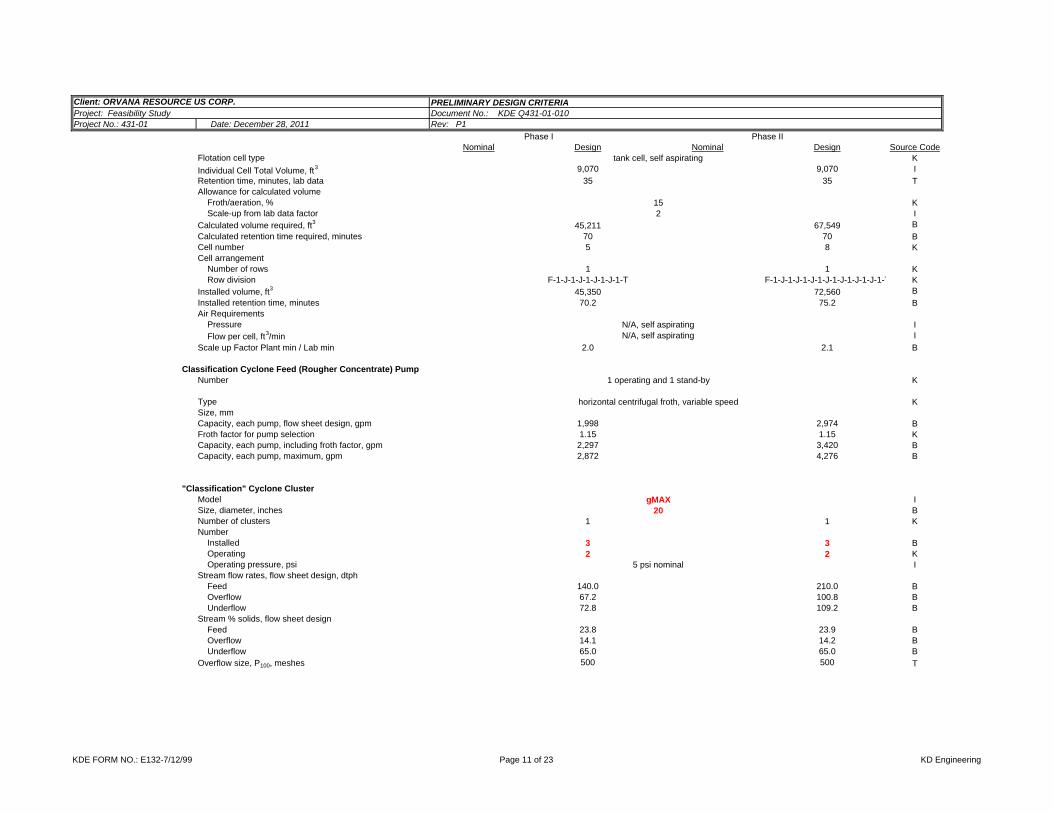
Client: ORVANA RESOURCE US CORP.Project: Feasibility StudyProject No.: 431-01 Date: December 28, 2011
Nominal Design Nominal Design Source Code
PRELIMINARY DESIGN CRITERIADocument No.: KDE Q431-01-010Rev: P1
Phase I Phase II
Flotation cell type K
Individual Cell Total Volume, ft3 9,070 9,070 IRetention time, minutes, lab data 35 35 TAllowance for calculated volume Froth/aeration, % K Scale-up from lab data factor ICalculated volume required, ft3 45,211 67,549 BCalculated retention time required, minutes 70 70 BCell number 5 8 KCell arrangement Number of rows 1 1 K Row division F-1-J-1-J-1-J-1-J-1-T F-1-J-1-J-1-J-1-J-1-J-1-J-1-J-1-T KInstalled volume, ft3 45,350 72,560 BInstalled retention time, minutes 70.2 75.2 BAir Requirements Pressure I Flow per cell, ft3/min I
Scale up Factor Plant min / Lab min 2.0 2.1 B
Classification Cyclone Feed (Rougher Concentrate) PumpNumber K
Type KSize, mmCapacity, each pump, flow sheet design, gpm 1,998 2,974 BFroth factor for pump selection 1.15 1.15 KCapacity, each pump, including froth factor, gpm 2,297 3,420 BCapacity, each pump, maximum, gpm 2,872 4,276 B
"Classification" Cyclone ClusterModel ISize, diameter, inches BNumber of clusters 1 1 KNumber Installed 3 3 B Operating 2 2 K Operating pressure, psi IStream flow rates, flow sheet design, dtph Feed 140.0 210.0 B Overflow 67.2 100.8 B Underflow 72.8 109.2 BStream % solids, flow sheet design Feed 23.8 23.9 B Overflow 14.1 14.2 B Underflow 65.0 65.0 BOverflow size, P100, meshes 500 500 T
tank cell, self aspirating
15
1 operating and 1 stand-by
horizontal centrifugal froth, variable speed
2
N/A, self aspiratingN/A, self aspirating
gMAX20
5 psi nominal
KDE FORM NO.: E132-7/12/99 Page 11 of 23 KD Engineering

Client: ORVANA RESOURCE US CORP.Project: Feasibility StudyProject No.: 431-01 Date: December 28, 2011
Nominal Design Nominal Design Source Code
PRELIMINARY DESIGN CRITERIADocument No.: KDE Q431-01-010Rev: P1
Phase I Phase II
Copper Regrind MillNumber 2 3 BType KModel KMode of operation ICirculating load, flow sheet design, % IBall loading, % v/v AMill feed slurry, % solids 62.0 62.0 KMill new feed rate operating average, each mill, dtph 109.2 109.2 BBall mill work index TFeed size, 80% passing, microns AProduct size, 80% passing, microns TPower installed, each mill, hp 800 800 K
Regrind Cyclone Feed PumpNumber K
Type KSize, in. BCapacity, each pump, flow sheet design, gpm 1,393 2,080 BCapacity, maximum gpm 1,742 2,600 B
"Regrind" Cyclone ClusterModel KSize, diameter, inches BNumber of clustersNumber Installed 4 5 B Operating 3 4 K Operating pressure, psi IStream flow rates, flow sheet design, dtph Feed 291.2 436.8 B Overflow 72.8 109.2 B Underflow 218.4 327.6 BStream % solids, flow sheet design Feed 54.5 54.7 B Overflow 40.0 40.3 B Underflow 62.0 62.0 BOverflow size, P80, microns 20 20 T
VTM-800-WBclosed circuit with hydrocyclones
300
13.39
Vertical, ball mill
6320
6
5 psi nominal
1 operating and 1 stand-by
horizontal centrifugal, variable speed
gMax
KDE FORM NO.: E132-7/12/99 Page 12 of 23 KD Engineering

Client: ORVANA RESOURCE US CORP.Project: Feasibility StudyProject No.: 431-01 Date: December 28, 2011
Nominal Design Nominal Design Source Code
PRELIMINARY DESIGN CRITERIADocument No.: KDE Q431-01-010Rev: P1
Phase I Phase II
Copper 1st Cleaner FlotationNumber of Banks Total 1 1 KCells per Line 4 6 ICell Size, cubic feet 1,000 1,000 K
FeedSolids, tph 140.0 210.0 BFeed Grade, % Cu 2.58 2.58 BWeight Percent Solids 21.2 21.4 BVolume, gpm 2,279 3,386 BVolume, cfm 305 453 BSpecific Gravity of Pulp 1.16 1.16 B
ConcentrateMass Recovery, % of Feed 25.0 25.0 BStage Copper Recovery, % 97.9 97.9 ASolids, tph 35.0 52.5 BConcentrate Grade, % Cu 10.10 10.10Weight Percent Solids 24.9 24.9 AVolume, gpm 471 705 BSpecific Gravity of Pulp 1.19 1.19 B
TailingSolids, tph 105.0 157.5 BWeight Percent Solids 20.2 20.4 AVolume, gpm 1,811 2,683 BSpecific Gravity of Pulp 1.14 1.15 B
Flotation cell type KRetention time, minutes, lab data 6 6 TAllowance for calculated volume Froth/aeration, % K Scale-up from lab data factor ICalculated volume required, ft3 4,300 6,389 BCalculated retention time required, minutes 12 12 BCell number 4 6 KCell arrangement Number of rows 1 1 K Row division F-1-J-1-J-1-J-1-J-1-J-1-T F-1-J-1-J-1-J-1-J-1-J-1-T KInstalled volume, ft3 4,000 6,000 BInstalled retention time, minutes 11.2 11.3 BAir Requirements Pressure I Flow per cell, ft3/min I
Scale up Factor Plant min / Lab min 1.9 1.9 B
15
N/A, self aspiratingN/A, self aspirating
rectangular, self aspirating
2
KDE FORM NO.: E132-7/12/99 Page 13 of 23 KD Engineering

Client: ORVANA RESOURCE US CORP.Project: Feasibility StudyProject No.: 431-01 Date: December 28, 2011
Nominal Design Nominal Design Source Code
PRELIMINARY DESIGN CRITERIADocument No.: KDE Q431-01-010Rev: P1
Phase I Phase II
Copper 1st Cleaner Scavenger FlotationNumber of Banks Total 1 1 KCells per Line 6 8 ICell Size, cubic feet 1,000 1,000 K
FeedSolids, tph 105.0 157.5 BFeed Grade, % Cu 2.58 2.58 BWeight Percent Solids 20.2 20.4 BVolume, gpm 1,811 2,683 BVolume, cfm 242 359 BSpecific Gravity of Pulp 1.14 1.15 B
ConcentrateMass Recovery, % of Feed 20.0 20.0 BStage Copper Recovery, % 78.3 78.3 ASolids, tph 21.0 31.5 BConcentrate Grade, % Cu 10.10 10.10Weight Percent Solids 25.0 25.0 AVolume, gpm 283 424 BSpecific Gravity of Pulp 1.19 1.19 B
TailingSolids, tph 84.0 126.0 BWeight Percent Solids 19.3 19.6 AVolume, gpm 1,528 2,259 BSpecific Gravity of Pulp 1.14 1.14 B
Flotation cell type KRetention time, minutes, lab data 10 10 TAllowance for calculated volume Froth/aeration, % K Scale-up from lab data factor ICalculated volume required, ft3 5,695 8,440 BCalculated retention time required, minutes 20 20 BCell number 6 8 KCell arrangement Number of rows 1 1 K Row division F-1-J-1-J-1-J-1-J-1-J-1-T F-1-J-1-J-1-J-1-J-1-J-1-T KInstalled volume, ft3 6,000 8,000 BInstalled retention time, minutes 21.1 19.0 BAir Requirements Pressure I Flow per cell, ft3/min I
Scale up Factor Plant min / Lab min 2.1 1.9 B
2
N/A, self aspiratingN/A, self aspirating
rectangular, self aspirating
15
KDE FORM NO.: E132-7/12/99 Page 14 of 23 KD Engineering

Client: ORVANA RESOURCE US CORP.Project: Feasibility StudyProject No.: 431-01 Date: December 28, 2011
Nominal Design Nominal Design Source Code
PRELIMINARY DESIGN CRITERIADocument No.: KDE Q431-01-010Rev: P1
Phase I Phase II
1st Cleaner Scavenger Concentrate PumpNumber KType KSize, in. BCapacity, each pump, flow sheet design, gpm 287 428 BCapacity, maximum gpm 359 535 B
2nd Cleaner Feed PumpNumber KType KSize, in. BCapacity, each pump, flow sheet design, gpm 567 845 BCapacity, maximum gpm 709 1,056 B
Copper 2nd Cleaner Flotation
Number of Lines 1 1 CFlotation Columns per Line 2 3 CColumn Size
Diameter, feet 12 12 VCell Area, square feet 113.1 113.1 BCell Circumference, feet 37.7 37.7 BInternal Launders, number 1 1 VConcentrate Launder Lip Length, feet 68.61 68.61 VHeight, feet 47.57 47.57 VTotal Volume, ft3 5380 5380 BFroth Depth, feet 1.7 1.7 ASparger Height, feet 3 3 VAeration Volume, % 15 15 A
Effective Volume, ft3 4125 4125 B
FeedSolids, tph 44.8 67.2 BWeight Percent Solids 26.2 26.4 AVolume, gpm 567.2 844.8 BVolume, cfm 76 113 BSpecific Gravity of Pulp 1.2 1.2 B
ConcentrateMass Recovery, % of Feed 56.3 56.2 BSolids, tph 25.2 37.8 BWeight Percent Solids 35.0 35.0 AVolume, gpm 220.8 331.2 BSpecific Gravity of Pulp 1.3 1.3 B
Wash Water, gpmLaunder Water, gpm
Column cells are planned for upgrading the copper concentrate to a product that can be marketed.
horizontal centrifugal, variable speed
1 operating and 1 stand-by horizontal centrifugal, variable speed
1 operating and 1 stand-by
KDE FORM NO.: E132-7/12/99 Page 15 of 23 KD Engineering

Client: ORVANA RESOURCE US CORP.Project: Feasibility StudyProject No.: 431-01 Date: December 28, 2011
Nominal Design Nominal Design Source Code
PRELIMINARY DESIGN CRITERIADocument No.: KDE Q431-01-010Rev: P1
Phase I Phase II
TailingSolids, tph 19.6 29.4 BWeight Percent Solids 19.8 20.0 AVolume, gpm 346.4 513.6 BVolume, cfm 46 69 BSpecific Gravity of Pulp 1.1 1.1 B
Froth Area Unit Capacitytph concentrate per square foot 0.11 0.11tonnes per hour per square meter (x<2.5) 1.20 1.20
Lip Length Unit Capacitytph concentrate solids per foot 0.18 0.18 Btonnes per hour solids per meter 0.6 0.6 Btph concentrate pulp per foot 0.52 0.52 Btonnes per hour concentrate pulp per meter (x<2.5) 1.72 1.72 B
Nominal Column Residence Time, minFeed 54.4 36.5 BTailing 89.1 60.1 B
Superficial Feed Velocityfeet per second 0.011 0.017 Bcentimeters per second 0.341 0.507 B
Superficial Tailing Velocityfeet per second 0.007 0.010 Bcentimeters per second 0.208 0.308 B
Bias Flow (Tailing - Feed) gpm -221 -331 Bm3 per hour -50.1 -75.2 B
Superficial Bias (Tailing - Feed) Velocityfeet per second -0.004 -0.007 Bcentimeters per second -0.133 -0.199 B
Superficial Wash Velocityfeet per second 0.000 0.000 Bcentimeters per second 0.000 0.000 B
Superficial Gas Ratefeet per second 0.08 0.08 Bcentimeters per second 2.5 2.5 B
Gas Loadinglb concentrate per cubic foot sparger air 1.5 2.3 Bkg concentrate per cubic meter sparger air 24.2 36.3 B
KDE FORM NO.: E132-7/12/99 Page 16 of 23 KD Engineering

Client: ORVANA RESOURCE US CORP.Project: Feasibility StudyProject No.: 431-01 Date: December 28, 2011
Nominal Design Nominal Design Source Code
PRELIMINARY DESIGN CRITERIADocument No.: KDE Q431-01-010Rev: P1
Phase I Phase II
Specific Aeration RateCubic foot sparger air per ton feed 12.4 8.3 BCubic meters sparger air per tonne feed 23.2 15.5 B
Atmospheric (Free) Gas Ratecubic feet per minute 557 557 Bcubic meters per hour 946 946 B
Standard (Normal) Gas Ratecubic feet per minute 459 459 Bcubic meters per hour 780 780 B
SlamJet DataModel SLJ-40 SLJ-40 VGas Rate per SlamJet, cfm 0 0 VNumber of SlamJets Required 23 23 B
Air Manifold Pressure, PSIg 80-100 80-100 I
2nd Cleaner Tailing PumpNumber KType KSize, in. BCapacity, each pump, flow sheet design, gpm 346 514 BCapacity, maximum gpm 433 642 B
3rd Cleaner Feed PumpNumber KType KSize, in. BCapacity, each pump, flow sheet design, gpm 230 340 BCapacity, maximum gpm 287 425 B
Copper 3rd Cleaner Flotation
Number of Lines 1 1 CFlotation Columns per Line 2 3 CColumn Size
Diameter, feet 10 10 VCell Area, square feet 78.5 78.5 BCell Circumference, feet 31.4 31.4 BInternal Launders, number 1 1 VConcentrate Launder Lip Length, feet 57.18 57.18 VHeight, feet 39.37 39.37 VTotal Volume, ft3 3092 3092 BFroth Depth, feet 1.7 1.7 ASparger Height, feet 3 3 VAeration Volume, % 15 15 A
Effective Volume, ft3 2317 2317 B
Feed
Column cells are planned for upgrading the copper concentrate to a product that can be marketed.
1 operating and 1 stand-by horizontal centrifugal, variable speed
1 operating and 1 stand-by horizontal centrifugal, variable speed
KDE FORM NO.: E132-7/12/99 Page 17 of 23 KD Engineering

Client: ORVANA RESOURCE US CORP.Project: Feasibility StudyProject No.: 431-01 Date: December 28, 2011
Nominal Design Nominal Design Source Code
PRELIMINARY DESIGN CRITERIADocument No.: KDE Q431-01-010Rev: P1
Phase I Phase II
Solids, tph 25.2 37.8 BWeight Percent Solids 35.0 35.0 AVolume, gpm 220.8 331.2 BVolume, cfm 30 44 BSpecific Gravity of Pulp 1.3 1.3 B
ConcentrateMass Recovery, % of Feed 61.1 61.1 BSolids, tph 15.4 23.1 BWeight Percent Solids 35.0 35.0 AVolume, gpm 133.6 200.4 BSpecific Gravity of Pulp 1.3 1.3 B
Wash Water, gpmLaunder Water, gpmTailing
Solids, tph 9.8 14.7 BWeight Percent Solids 32.4 33.2 AVolume, gpm 96.2 139.8 BVolume, cfm 13 19 BSpecific Gravity of Pulp 1.3 1.3 B
Froth Area Unit Capacitytph concentrate per square foot 0.10 0.10tonnes per hour per square meter (x<2.5) 1.05 1.05
Lip Length Unit Capacitytph concentrate solids per foot 0.13 0.13 Btonnes per hour solids per meter 0.4 0.4 Btph concentrate pulp per foot 0.38 0.38 Btonnes per hour concentrate pulp per meter (x<2.5) 1.26 1.26 B
Nominal Column Residence Time, minFeed 78.5 52.3 BTailing 180.1 124.0 B
Superficial Feed Velocityfeet per second 0.006 0.009 Bcentimeters per second 0.191 0.286 B
Superficial Tailing Velocityfeet per second 0.003 0.004 Bcentimeters per second 0.083 0.121 B
Bias Flow (Tailing - Feed) gpm -125 -191 Bm3 per hour -28.3 -43.5 B
KDE FORM NO.: E132-7/12/99 Page 18 of 23 KD Engineering

Client: ORVANA RESOURCE US CORP.Project: Feasibility StudyProject No.: 431-01 Date: December 28, 2011
Nominal Design Nominal Design Source Code
PRELIMINARY DESIGN CRITERIADocument No.: KDE Q431-01-010Rev: P1
Phase I Phase II
Superficial Bias (Tailing - Feed) Velocityfeet per second -0.004 -0.005 Bcentimeters per second -0.108 -0.165 B
Superficial Wash Velocityfeet per second 0.000 0.000 Bcentimeters per second 0.000 0.000 B
Superficial Gas Ratefeet per second 0.08 0.08 Bcentimeters per second 2.5 2.5 B
Gas Loadinglb concentrate per cubic foot sparger air 1.3 2.0 Bkg concentrate per cubic meter sparger air 21.3 32.0 B
Specific Aeration RateCubic foot sparger air per ton feed 15.3 10.2 BCubic meters sparger air per tonne feed 28.7 19.1 B
Atmospheric (Free) Gas Ratecubic feet per minute 387 387 Bcubic meters per hour 657 657 B
Standard (Normal) Gas Ratecubic feet per minute 319 319 Bcubic meters per hour 542 542 B
SlamJet DataModel SLJ-40 SLJ-40 VGas Rate per SlamJet, cfm 0 0 VNumber of SlamJets Required 16 16 B
Air Manifold Pressure, PSIg 80-100 80-100 I
KDE FORM NO.: E132-7/12/99 Page 19 of 23 KD Engineering

Client: ORVANA RESOURCE US CORP.Project: Feasibility StudyProject No.: 431-01 Date: December 28, 2011
Nominal Design Nominal Design Source Code
PRELIMINARY DESIGN CRITERIADocument No.: KDE Q431-01-010Rev: P1
Phase I Phase II
TAILING THICKENING
Thickener type High Rate High RateThickener Dimensions, feet
Diameter 70 70 BFlocculant consumption, lb / ton 0.15 Feed
Solids, tons per hour 243.6 365.4 BDensity, weight percent solids 21.0 21.2 AFlowrate, gpm 4,016 5,968 BUnit rate, square foot per tpd 0.7 0.4 A
UnderflowSolids, tons per hour 243.6 365.4 BDensity, weight percent solids 50.0 50.0 BFlowrate, gpm 1,332 1,998 B
OverflowFlowrate, gpm 2,684 3,970 B
Tails Thickener Underflow PumpNumber KType KSize, in. BCapacity, each pump, flow sheet design, gpm 1,332 1,998 BCapacity, maximum gpm 1,665 2,497 B
PROCESS AIR
4 operating and 4 stand-by in series operationhorizontal centrifugal, variable speed
For the type of cells selected, process air is not required in the flotation circuit tank cell or conventional flotation cells.
6.6
Tailing from the flotation circuit is thickened. Thickener underflow is pumped to the tailing dam and thickener overflow is recycled to the mill water system.
6.7
KDE FORM NO.: E132-7/12/99 Page 20 of 23 KD Engineering

Client: ORVANA RESOURCE US CORP.Project: Feasibility StudyProject No.: 431-01 Date: December 28, 2011
Nominal Design Nominal Design Source Code
PRELIMINARY DESIGN CRITERIADocument No.: KDE Q431-01-010Rev: P1
Phase I Phase II
COPPER CONCENTRATE THICKENER
Thickener type Conventional Conventional KThickener Dimensions, feet
Diameter 110 110 BFlocculant consumption, lb / ton 0.01 A Feed
Solids, tons per hour 15.4 23.1 ADensity, weight percent solids 29.0 29.1 AFlowrate, gpm 169.8 253.8 AUnit rate, square foot per tpd 25.7 16.5 A
UnderflowSolids, tons per hour 15.4 23.1 ADensity, weight percent solids 60.0 60.0 AFlowrate, gpm 60.3 90.4 A
OverflowFlowrate, gpm 110 163 B
Cu Concentrate Thickener Underflow PumpNumber KType KSize, in. BCapacity, each pump, flow sheet design, gpm 60 90 BCapacity, maximum gpm 75 113 B
CONCENTRATE FILTERS
Copper FiltersFilter Type PressureNormal Filter feed rate, tons per hour 15.4 23.1 AFilter availability, percent 90 90 90 90 KFilter Design Feed Rate, tons per hour 17.1 25.7 BFilter Feed Size, % minus 325 mesh 90.0 90.0 AFeed Slurry percent solids 60.0 60.0 AFilter Cake Moisture, % 9.0 9.0 A
Filter Cycle Time, min 12.0 12.0 A
Filter Unit Capacity, tph / ft2 0.05 0.05 A
Filter Area required, ft2 301 451 B
Filter Area selected, ft2 500 500 K
Number of Filters 1 1 B
6.8
6.9A horizontal plate (Larox style) filter has been selected as the basis for this study. Concentrate moisture levels are based on estimates for similar feed characteristics. Moisture level can be controlled by varying air blow time. Pressure Filter design criteria are summarized below.
1 operating and 1 stand-byhorizontal centrifugal, variable speed
Copper concentrate produced is thickened. Thickener overflow is returned to the mill process and thickener underflow is pumped to the copper concentrate filter.
KDE FORM NO.: E132-7/12/99 Page 21 of 23 KD Engineering

Client: ORVANA RESOURCE US CORP.Project: Feasibility StudyProject No.: 431-01 Date: December 28, 2011
Nominal Design Nominal Design Source Code
PRELIMINARY DESIGN CRITERIADocument No.: KDE Q431-01-010Rev: P1
Phase I Phase II
Copper StorageConcentrate Grade, % 24.0 24.0 ACopper Concentrate Production, tpd 341.9 512.8 BStorage, days 7.0 7.0 I
Bulk Density, lb / ft3 (dry) 127.5 127.5 A
Angle of Repose, degree 40 40 A
Concentrate Storage, ft3 37,531 56,299 B
FRESH WATER
Total Fresh Water Flow, gpm 250 400 BTotal Fresh Water Flow, cubic meters per hour 56.7 90.7 BRetention Time, Hours 8.0 8.0 ALive Volume, cubic meters 453.7 725.9 BApproximate Diameter, meters 9.7 BApproximate Height, meters 10.2 B
PROCESS WATER
Total Process Water Flow, gpm 3,573 5,387
Total Process Water Flow, cubic meters per hour 811.5 1223.5 BRetention Time, minutes 45 30.0 ALive Volume, cubic meters 611.7 611.7 BApproximate Diameter, meters 9.2 9.2 BApproximate Height, meters 9.7 9.7 B
REAGENTS
Reagent addition are provided below.Consumption (g/t) Consumption (g/t)
Collector, C-3430 292.0 292.0 T
Frother, MIBC 51.0 51.0 T
Frother, DOWFROTH 250 102.0 102.0 T
Redox, NaHS 467.0 467.0 T
Depressant, NDM 33.0 33.0 T
6.12
6.10
6.11
The fresh water distribution system provides fresh water only for process requirements such as reagent mixing, and gland water. The fire water system and potable water system do not draw water from the process fresh water tank. Process fresh water storage is sufficient for a short (nominally two to three hours) disruption of the fresh water supply pumps. All other reagent preparation systems use water from the process fresh water tank. Gland water pumps also draw directly from the fresh water tank.
The process water tank receives tailings thickener overflow and tailings reclaim water, and fresh water if sufficient reclaim water is not available. The water is pumped to the grinding circuit and may contain a small amount of solids so it is not suitable for general distribution throughout the process plant.
KDE FORM NO.: E132-7/12/99 Page 22 of 23 KD Engineering

Client: ORVANA RESOURCE US CORP.Project: Feasibility StudyProject No.: 431-01 Date: December 28, 2011
Nominal Design Nominal Design Source Code
PRELIMINARY DESIGN CRITERIADocument No.: KDE Q431-01-010Rev: P1
Phase I Phase II
Promoter 249 AEROFLOAT 173.0 173.0 T
SS/CMC (3/1) 300.0 300.0 T
Flocculant Addition points are copper concentrate thickener and tail thickener.
KDE FORM NO.: E132-7/12/99 Page 23 of 23 KD Engineering

Orvana Resources - Copperwood Project Feasibility Study
K D Engineering Document No. Q431-01-028 21 March 2012 KDE FORM No. A263a-7/12/99
APPENDIX 2
DRAWINGS

Orvana Resources - Copperwood Project Feasibility Study
K D Engineering Document No. Q431-01-028 21 March 2012 KDE FORM No. A263a-7/12/99
The following Drawings can be viewed and are available in the Orvana Resource US Corp. offices in Ironwood, Michigan after signing a confidentiality agreement.
Orvana Resource Copperwood Project
Feasibility Study - Drawing List
Drawing No Description
Flowsheet 00-F-01 Flowsheet Mass Balance 10-F-01 Flowsheet SAG Grinding 20-F-02 Flowsheet Ball Mill Grinding 30-F-03 Flowsheet Flotation 40-F-04 Flowsheet Regrind 50-F-05 Flowsheet Copper Concentrate Handling 60-F-06 Flowsheet Tails Thickening 70-F-10 Flowsheet Reagents 75-F-15 Flowsheet Sampling 80-F-20 Flowsheet Process & Reclaim Water 90-F-30 Flowsheet Fresh Water
Civil
05-G-01 Site Plan - Overall 05-G-05 Site Plan - Process Plant
General Arrangement
05-L-001 General Arrangement Overall Site Plan 05-L-005 General Arrangement Process Plant Site Plan 05-L-006 General Arrangement Plant Site - Plan 2 of 2 05-L-010 General Arrangement Process Plant Plan 05-L-011 General Arrangement Plant Site - Section 2 of 2 05-L-020 General Arrangement Mill & Cu Conc Area Section 05-L-035 General Arrangement Mill & Cu Conc Area Section 05-L-037 General Arrangement Flotation/Cu Conc Area Section 10-L-001 General Arrangement Stockpile Feed Conveyor Plan 10-L-005 General Arrangement Stockpile Feed Conveyor Section 10-L-010 General Arrangement Mill Feed Stockpile Plan 10-L-011 General Arrangement Mill Feed Stockpile Plan 10-L-012 General Arrangement Mill Feed Stockpile Plan 10-L-015 General Arrangement Mill Feed Stockpile Section 10-L-016 General Arrangement Mill Feed Stockpile Section 10-L-020 General Arrangement Mill Area Recycle Crusher Plan 10-L-025 General Arrangement Mill Area Recycle Crusher Section 10-L-030 General Arrangement SAG/Ball Mill Area - Plan 10-L-035 General Arrangement SAG/Ball Mill Area - Section 1 of 2 10-L-036 General Arrangement SAG/Ball Mill Area - Section 2 of 2 30-L-001 General Arrangement Flotation Area - Plan 30-L-005 General Arrangement Flotation Area - Section 1 of 3 30-L-006 General Arrangement Flotation Area - Section 2 of 3 30-L-007 General Arrangement Flotation Area - Section 3 of 3 100-L-001 General Arrangement Administration Building Plan 100-L-005 General Arrangement Pre-Engineered Metal Building Section 100-L-010 General Arrangement Laboratory Building Plan

Orvana Resources - Copperwood Project Feasibility Study
K D Engineering Document No. Q431-01-028 21 March 2012 KDE FORM No. A263a-7/12/99
Orvana Resource Copperwood Project Feasibility Study - Drawing List
Drawing No Description
100-L-020 General Arrangement Warehouse Building Plan 100-L-030 General Arrangement Maint. Shop and Plant Offices Plan 100-L-040 General Arrangement Mine Office and Change Room Plan 100-L-050 General Arrangement Guard Gate Plan 100-L-060 General Arrangement Core Storage Building Plan
P&ID
00-Q-001 P&ID Symbols & Designations Index Sheet 1 of 2 00-Q-002 P&ID Symbols & Designations Index Sheet 2 of 2 10-Q-001 P&ID Conveying SAG Mill Feed 10-Q-002 P&ID Grinding SAG Mill 10-Q-003 P&ID Grinding SAG Mill Lubrication System 10-Q-004 P&ID Grinding Recycle 10-Q-005 P&ID Grinding Recycle Crusher 10-Q-006 P&ID Grinding Recycle Crusher Lubrication 10-Q-007 P&ID Grinding Recycle Crusher Hydraulics 20-Q-001 P&ID Cyclone Feed 20-Q-002 P&ID Grinding Ball Mill 20-Q-003 P&ID Grinding Mill Lubrication System 20-Q-004 P&ID Grinding Mill Lubrication System (Future) 30-Q-001 P&ID Flotation Rougher Cells 30-Q-002 P&ID Flotation Rougher Cells (Future) 30-Q-003 P&ID Flotation Classification Cyclones 30-Q-004 P&ID Flotation 1st Cleaner 1st cleaner Scavenger 40-Q-001 P&ID Regrind Cyclone Feed 40-Q-002 P&ID Regrind Mill 40-Q-003 P&ID Regrind Mill 40-Q-004 P&ID Regrind Mill (Future) 50-Q-001 P&ID Compressed Air 50-Q-002 P&ID Copper Concentrate Handling Thickening & Filter Feed 50-Q-003 P&ID Copper Concentrate Handling Filter Press 50-Q-004 P&ID Copper Concentrate Handling Loadout 60-Q-001 P&ID Tails Thickening 80-Q-001 P&ID Process & Reclaim Water 90-Q-001 P&ID Fresh Water
Electrical
00-E-001 Electrical Single Line Diagram Power Distribution Plan 05-E-001 Electrical Single Line Diagram Underground Mine 10-E-001 Electrical Single Line Diagram Area 10: SAG Grinding 20-E-001 Electrical Single Line Diagram Area 20: Ball Mill Grinding 30-E-001 Electrical Single Line Diagram Area 30: Flotation 40-E-001 Electrical Single Line Diagram Area 40: Regrind 50-E-001 Electrical Single Line Diagram Area 50: Cooper Conc. Handling 60-E-001 Electrical Single Line Diagram Area 60: Tails 70-E-001 Electrical Single Line Diagram Area 70: Reagents, Area 75: Sampling 80-E-001 Electrical Single Line Diagram Area 80/90: Process & Reclaim Water/Fresh Water

Orvana Resources - Copperwood Project Feasibility Study
K D Engineering Document No. Q431-01-028 21 March 2012 KDE FORM No. A263a-7/12/99
APPENDIX 3
EQUIPMENT LIST

KD EngineeringTucson, Arizona
P1 JJ 1/3/2012 BCS 1/3/2012 Preliminary 12
ORVANA RESOURCE US CORP. APPROVAL
KDE APPR
SIGNATURE:
DATE:
DATE DESCRIPTION PAGES
ORVANA RESOURCE US CORP.
EQUIPMENT LISTFeasibility Study
DOCUMENT NO: Q431‐01‐008
REV NO
BY DATE

Q431‐01‐008 Description: Feasibility StudyP1 Date:
Area 10 ‐ SAG Grinding10‐ST‐100 Mill Feed Stockpile 1 7,500 tons live capacity10‐CV‐101 Stockpile Feed Conveyor 1 42" (W) 125.0 93.3 10‐WX‐101 Belt Scale 110‐CV‐102 Stockpile Tripper Conveyor 1 42" (W) 15.0 11.2 10‐BD‐103 Stockpile Building 110‐AF‐104 Apron Feeder 1 25.0 18.7 10‐AF‐105 Apron Feeder 1 25.0 18.7 10‐AF‐106 Apron Feeder 1 25.0 18.7 10‐AF‐107 Apron Feeder 1 25.0 18.7 10‐DC‐108 Dust Collection 1 5.0 3.7 10‐CV‐110 SAG Mill Feed Conveyor 1 42" (W) 50.0 37.3 10‐WX‐115 SAG Mill Feed Weightometer 1 0.7 0.5 10‐ZB‐120 SAG Feed Chute 110‐LH‐120 Liner Machine 1 15.0 11.2 10‐DA‐120 SAG Mill Inching Drive 1 50.0 37.3 10‐WX‐145 Belt Scale 110‐CV‐150 Recycle Conveyor 1 36" (W) 10.0 7.5 10‐CV‐151 Recycle Conveyor 1 36" (W) 20.0 14.9 10‐SP‐155 Splitter 110‐BN‐175 Mill Ball Bin 110‐ZM‐175 Mill Ball Kibble 110‐PP‐185 Grinding Area Sump Pump 1 70 gpm @ 50' 7.5 5.6 10‐PP‐186 Reclaim Area Sump Pump 1 70 gpm @ 50' 7.5 5.6 10‐ES‐190 Emergency Shower 1 Grinding Area10‐CN‐195 Crane 1 Grinding Area 20.0 14.9
10‐BN‐230 Surge Bin 110‐GV‐230 Slide Gate Valve 110‐BF‐235 Belt Feeder 110‐MA‐250 Cross Belt Tramp Iron Magnet 110‐CR‐255 Recycle Crusher 1TOTAL Area 10 ‐ SAG Grinding 4,190.7 3,126.3
Future (depend on the ore property)
Document No:Revision:
EQUIPMENT LIST
Code DescriptionOperating
Qty.
KD Engineering
HPInstalled
kW
January 3, 2012
Spare Qty. Detail

Q431‐01‐008 Description: Feasibility StudyP1 Date:
Document No:Revision:
EQUIPMENT LIST
Code DescriptionOperating
Qty.
KD Engineering
HPInstalled
kW
January 3, 2012
Spare Qty. Detail
Area 20 ‐ Ball Mill Grinding20‐PB‐145 Cyclone Feed Pumpbox 1 12,000 gallons20‐PP‐145 Cyclone Feed Pump 1 11,400 gpm @ 115' 700.0 522.2 20‐PP‐146 Cyclone Feed Pump 1 11,400 gpm @ 115' 700.0 522.2
20‐CY‐150 Primary Cyclones Cluster 120", 4 working, 1 spare for Phase I, for phase II, add one more cyclone
20‐ML‐160 Ball Mill 1 16' x 22' 3,250.0 2,424.5 20‐SC‐165 Cyclone Overflow Screen 120‐SA‐170 Cyclone Overflow Primary Sampler 120‐PP‐170 Sample Delivery Pump 1 Metso, Vertical 2" Sala, VT50 7.5 5.6 20‐SA‐171 Cyclone Overflow Particle Size Monitor 120‐ES‐190 Emergency Shower 1 Grinding Area
20‐ML‐161 Ball Mill 1 Future 2,750.0 2,051.5 TOTAL Area 20 ‐ Ball Mill Grinding 7,407.5 5,526.0
Phase II

Q431‐01‐008 Description: Feasibility StudyP1 Date:
Document No:Revision:
EQUIPMENT LIST
Code DescriptionOperating
Qty.
KD Engineering
HPInstalled
kW
January 3, 2012
Spare Qty. Detail
Area 30 ‐ Flotation30‐TK‐100 Conditioning Tank 1 17.3' dia x18.8'30‐AG‐100 Conditioning Tank Agitator 1 25.0 18.7 30‐FC‐101 1st Rougher Flotation Cell 1 4,500 ft3 200.0 149.2 30‐FC‐102 1st Rougher Flotation Cell 1 4,500 ft3 200.0 149.2 30‐FC‐103 1st Rougher Flotation Cell 1 4,500 ft3 200.0 149.2 30‐FC‐104 1st Rougher Flotation Cell 1 4,500 ft3 200.0 149.2 30‐FC‐105 1st Rougher Flotation Cell 1 4,500 ft3 200.0 149.2 30‐FC‐106 1st Rougher Flotation Cell 1 4,500 ft 3 200.0 149.2 30‐FC‐107 1st Rougher Flotation Cell 1 4,500 ft 3 200.0 149.2 30‐FC‐108 1st Rougher Flotation Cell 1 4,500 ft 3 200.0 149.2 30‐SA‐111 Rougher Tailing Primary Sampler 130‐PP‐111 Sample Delivery Pump 1 Metso, Vertical 2" Sala, VT50 7.5 5.6 30‐SA‐112 Rougher Conc Primary Sampler 130‐PP‐112 Sample Delivery Pump 1 Metso, Vertical 2" Sala, VT50 7.5 5.6 30‐PP‐113 Rougher Tailing Pump 1 3750 gpm @ 65' 150.0 111.9 30‐PP‐114 Rougher Tailing Pump 1 3750 gpm @ 65' 150.0 111.9 30‐PB‐115 Classification Cyclone Feed Pumpbox 1 4,500 gallons30‐PP‐115 Classification Cyclone Feed Pump 1 3000 gpm @ 110' 150.0 111.9 30‐PP‐116 Classification Cyclone Feed Pump 1 3000 gpm @ 110' 150.0 111.9 30‐CY‐120 Classification Cyclones Cluster 1 20", 2 working, 1 spare30‐SA‐121 Classification Cyclone Overflow Primary Sampler 130‐PP‐121 Sample Delivery Pump 1 Metso, Vertical 2" Sala, VT50 7.5 5.6 30‐SA‐122 Classification Cyclone Overflow Particle Size Monito 130‐FC‐131 1st Cleaner Flotation Cell 1 1000 ft3 40.0 29.8 30‐FC‐132 1st Cleaner Flotation Cell 1 1000 ft3 40.0 29.8 30‐FC‐133 1st Cleaner Flotation Cell 1 1000 ft3 40.0 29.8 30‐FC‐134 1st Cleaner Flotation Cell 1 1000 ft3 40.0 29.8 30‐FC‐135 1st Cleaner Flotation Cell 1 1000 ft3 40.0 29.8 30‐FC‐136 1st Cleaner Flotation Cell 1 1000 ft3 40.0 29.8 30‐FC‐137 1st Cleaner Scavenger Flotation Cell 1 1000 ft3 40.0 29.8 30‐FC‐138 1st Cleaner Scavenger Flotation Cell 1 1000 ft3 40.0 29.8 30‐FC‐139 1st Cleaner Scavenger Flotation Cell 1 1000 ft3 40.0 29.8 30‐FC‐140 1st Cleaner Scavenger Flotation Cell 1 1000 ft3 40.0 29.8

Q431‐01‐008 Description: Feasibility StudyP1 Date:
Document No:Revision:
EQUIPMENT LIST
Code DescriptionOperating
Qty.
KD Engineering
HPInstalled
kW
January 3, 2012
Spare Qty. Detail
30‐FC‐141 1st Cleaner Scavenger Flotation Cell 1 1000 ft3 40.0 29.8 30‐FC‐142 1st Cleaner Scavenger Flotation Cell 1 1000 ft3 40.0 29.8 30‐FC‐143 1st Cleaner Scavenger Flotation Cell 1 1000 ft3 40.0 29.8 30‐FC‐144 1st Cleaner Scavenger Flotation Cell 1 1000 ft3 40.0 29.8 30‐PP‐145 Cleaner Tailing Pump 1 2250 gpm @ 60' 100.0 74.6 30‐PP‐146 Cleaner Tailing Pump 1 2250 gpm @ 60' 100.0 74.6 30‐PB‐147 1st Cleaner Scavenger Concentrate Pumpbox 1 550 gallons30‐PP‐147 1st Cleaner Scavenger Concentrate Pump 1 550 gpm @ 65' 20.0 14.9 30‐PP‐148 1st Cleaner Scavenger Concentrate Pump 1 550 gpm @ 65' 20.0 14.9 30‐SP‐150 2nd Cleaner Column Feed Distributor 130‐FC‐151 2nd Cleaner Flotation Column 1 12' dia x 47.6' H30‐FC‐152 2nd Cleaner Flotation Column 1 12' dia x 47.6' H30‐FC‐153 2nd Cleaner Flotation Column 1 12' dia x 47.6' H (Future)30‐PB‐155 3rd Cleaner Feed Pumpbox 1 450 gallons30‐PP‐155 3rd Cleaner Feed Pump 1 450 gpm @ 82' 20.0 14.9 30‐PP‐156 3rd Cleaner Feed Pump 1 450 gpm @ 82' 20.0 14.9 30‐PB‐158 2nd Cleaner Tailing Pumpbox 1 650 gallons30‐PP‐158 2nd Cleaner Tailing Pump 1 650 gpm @ 45' 15.0 11.2 30‐PP‐159 2nd Cleaner Tailing Pump 1 650 gpm @ 45' 15.0 11.2 30‐FC‐161 3rd Cleaner Flotation Column 1 10' dia x 39.4' H30‐FC‐162 3rd Cleaner Flotation Column 1 10' dia x 39.4' H30‐FC‐163 3rd Cleaner Flotation Column 1 10' dia x 39.4' H (Future)30‐PB‐165 2nd Cleaner Feed Pumpbox 1 1,100 gallons30‐PP‐165 2nd Cleaner Feed Pump 1 1,100 gpm @ 80' 40.0 29.8 30‐PP‐166 2nd Cleaner Feed Pump 1 1,100 gpm @ 80' 40.0 29.8 30‐SA‐171 Cleaner Tailing Primary Sampler 130‐PP‐171 Sample Delivery Pump 1 Metso, Vertical 2" Sala, VT50 7.5 5.6 30‐SA‐172 Concentrate Primary Sampler 130‐PP‐172 Sample Delivery Pump 1 Metso, Vertical 2" Sala, VT50 7.5 5.6 30‐CP‐175 Flotation Air Compressor 1 25.0 18.7 30‐PV‐175 Flotation Air Receiver 1 1000 gal30‐PP‐185 Flotation Area Sump Pump 1 70 gpm @ 50' 7.5 5.6 30‐ES‐190 Emergency Shower 130‐CN‐195 Bridge Crane 1 10 ton 15.0 11.2 TOTAL Area 30 ‐ Flotation 3,260.0 2,432.0

Q431‐01‐008 Description: Feasibility StudyP1 Date:
Document No:Revision:
EQUIPMENT LIST
Code DescriptionOperating
Qty.
KD Engineering
HPInstalled
kW
January 3, 2012
Spare Qty. Detail
Area 40 ‐ Regrind40‐PB‐105 Regrind Cyclone Feed Pumpbox 1 2,500 gallons40‐PP‐105 Regrind Cyclone Feed Pump 1 2,200 gpm @ 110' 150.0 111.9 40‐PP‐106 Regrind Cyclone Feed Pump 1 2,200 gpm @ 110' 150.0 111.9 40‐CY‐110 Regrind Cyclones Cluster 1 6", 4 working, 1 spare40‐SP‐111 Regrind Mill Feed Distributor 140‐ML‐115 Regrind Mill 1 Vertical Ball Mill, VTM‐800‐WB 800.0 596.8 40‐ML‐116 Regrind Mill 1 Vertical Ball Mill, VTM‐800‐WB 800.0 596.8 40‐ML‐215 Regrind Mill 1 Vertical Ball Mill, VTM‐800‐WB 800.0 596.8 40‐ZB‐115 Ball Charge Chute 140‐ZB‐116 Ball Charge Chute 140‐ZB‐215 Ball Charge Chute 1 Future40‐SA‐170 Regrind Cyclone Overflow Sampler 140‐PP‐170 Sample Delivery Pump 1 Metso, Vertical 2" Sala, VT50 7.5 5.6 40‐SA‐171 Cyclone Overflow Particle Size Monitor 140‐PP‐185 Regrind Area Sump Pump 1 70 gpm @ 50' 7.5 5.6 40‐ES‐190 Emergency Shower 1 Grinding AreaTOTAL Area 40 ‐ Regrind 2,715.0 2,025.4

Q431‐01‐008 Description: Feasibility StudyP1 Date:
Document No:Revision:
EQUIPMENT LIST
Code DescriptionOperating
Qty.
KD Engineering
HPInstalled
kW
January 3, 2012
Spare Qty. Detail
Area 50 ‐ Copper Concentrate Handling50‐TK‐100 Cu Conc Thickener 1 110' dia. ‐ Conventional50‐TM‐100 Cu Conc Thickener Mechanism 1 110' dia. Dia (Drive 2@5hp; Lifting 1@2hp) 12.0 9.0 50‐PP‐105 Cu Conc Thickener Underflow Pump 1 120 gpm @ 70' 7.5 5.6 50‐PP‐106 Cu Conc Thickener Underflow Pump 1 120 gpm @ 70' 7.5 5.6 50‐TK‐107 Slurry Feed Tank 1 6'7" x 11'6"50‐AG‐107 Slurry Feed Agitator 1 Brawn 4 BTO 5.0 3.7 50‐PP‐108 Slurry Feed Pump 1 160 gpm @ 380' 60.0 44.8 50‐PP‐109 Seal Water Pump 1 5.0 3.7 50‐FL‐110 Cu Conc Filter Package 1 EIMCO 50.0 37.3 50‐PP‐111 Hydraulic Pump 1 25.0 18.7 50‐HX‐112 Oil Cooler 1 1.0 0.7 50‐TK‐115 Filtrate Tank 150‐TK‐116 Core Separation Tank 150‐TK‐117 Filter Wash Water Surge Tank 150‐PP‐118 Filter Wash Water Pump 1 15.0 11.2 50‐CV‐120 Cu Conc Filter Cake Conveyor 1 14" (W) x 90' (L)? 15.0 11.2 50‐WX‐125 Belt Scale 150‐SA‐130 Belt Sampler 150‐CP‐135 Plant Air Compressor 1 25.0 18.7 50‐PV‐136 Plant Air Receiver 1 1000 gal50‐PV‐137 Instrument Air Receiver 1 400 gal50‐AD‐138 Instrument Air Dryer 150‐PP‐140 Filter Area Cleanup Pump 1 70 gpm @ 50' 7.5 5.6 50‐TK‐141 Wheel Wash Surge Tank 1 10' dia.. x 10' H, 5800 gal., C.S. 50‐PP‐141 Wheel Wash Pump 1 TDH 15.0 11.2 50‐PP‐145 Scale Area Cleanup Pump 1 70 gpm @ 50' 7.5 5.6 50‐BD‐148 Cu Conc Load Out Building 150‐ZM‐149 Cu Conc Area Front End Loader 150‐WX‐150 Truck Scale 150‐ES‐190 Emergency Shower 1 Concentrate AreaTOTAL Area 50 ‐ Copper Concentrate Handling 258.0 192.5

Q431‐01‐008 Description: Feasibility StudyP1 Date:
Document No:Revision:
EQUIPMENT LIST
Code DescriptionOperating
Qty.
KD Engineering
HPInstalled
kW
January 3, 2012
Spare Qty. Detail
Area 60 ‐ Tails60‐TK‐101 Tails Thickener 1 70' dia.‐ High Rate60‐TM‐101 Tails Thickener Mechanism 1 15.0 11.2 60‐PP‐101 Tails Thickener Underflow Pump 1 2,350 gpm @ 125' 200.0 149.2 60‐PP‐102 Tails Thickener Underflow Pump 1 2,350 gpm @ 125' 200.0 149.2 60‐PP‐103 Tails Thickener Underflow Pump 1 2,350 gpm @ 125' 200.0 149.2 60‐PP‐104 Tails Thickener Underflow Pump 1 2,350 gpm @ 125' 200.0 149.2 60‐PP‐111 Tails Thickener Underflow Pump 1 2,350 gpm @ 125' 200.0 149.2 60‐PP‐112 Tails Thickener Underflow Pump 1 2,350 gpm @ 125' 200.0 149.2 60‐PP‐113 Tails Thickener Underflow Pump 1 2,350 gpm @ 125' 200.0 149.2 60‐PP‐114 Tails Thickener Underflow Pump 1 2,350 gpm @ 125' 200.0 149.2 60‐PP‐105 Tails Thickener Overflow Pump 1 4,900 gpm @ 90' 125.0 93.3 60‐PP‐130 Tails Thickener Area Sump Pump 1 70 gpm @ 50' 7.5 5.6 60‐ES‐190 Emergency Shower 1 Tails Thickener AreaTOTAL Area 60 ‐ Tails 1,747.5 1,303.6

Q431‐01‐008 Description: Feasibility StudyP1 Date:
Document No:Revision:
EQUIPMENT LIST
Code DescriptionOperating
Qty.
KD Engineering
HPInstalled
kW
January 3, 2012
Spare Qty. Detail
Area 70 ‐ Reagents70‐TK‐100 D250/MIBC Storage Tank 170‐PP‐105 D250/MIBC Circulation Pump 1 1.0 0.7 70‐PP‐106 D250/MIBC Circulation Pump 1 1.0 0.7 70‐TK‐110 C‐3430 Storage Tank 170‐PP‐115 C‐3430 Circulation Pump 1 1.0 0.7 70‐PP‐116 C‐3430 Circulation Pump 1 1.0 0.7 70‐TK‐120 NaHS Storage Tank 170‐PP‐125 NaHS Circulation Pump 1 1.0 0.7 70‐PP‐126 NaHS Circulation Pump 1 1.0 0.7 70‐TK‐130 A249 Storage Tank 170‐TK‐135 A249 Circulation Pump 1 1.0 0.7 70‐PP‐136 A249 Circulation Pump 1 1.0 0.7 70‐BN‐140 Flocculant Storage Bin 170‐FE‐140 Flocculant Feeder 1 5.0 3.7 70‐TK‐145 Flocculant Mix/Storage Tank 1 12' dia. x 14 ' 70‐AG‐145 Flocculant Mix Agitator 1 7.5 5.6 70‐PP‐145 Flocculant Pump 1 5.0 3.7 70‐TK‐150 Flocculant Storage Tank 1 12' dia. x 14 ' 70‐PP‐155 Flocculant Circulation Pump 1 1.0 0.7 70‐PP‐156 Flocculant Circulation Pump 1 1.0 0.7 70‐PP‐158 Flocculant Sump Pump 1 5.0 3.7 70‐TK‐160 NDM Storage Tank 170‐PP‐165 NDM Circulation Pump 1 1.0 0.7 70‐PP‐166 NDM Circulation Pump 1 1.0 0.7 70‐TK‐170 SS/CMC Storage Tank 170‐PP‐175 SS/CMC Circulation Pump 1 1.0 0.7 70‐PP‐176 SS/CMC Circulation Pump 1 1.0 0.7 70‐ES‐190 Emergency Shower 1 Reagent AreaTOTAL Area 70 ‐ Reagents 36.5 27.2

Q431‐01‐008 Description: Feasibility StudyP1 Date:
Document No:Revision:
EQUIPMENT LIST
Code DescriptionOperating
Qty.
KD Engineering
HPInstalled
kW
January 3, 2012
Spare Qty. Detail
Area 75 ‐ Sampling75‐TK‐101 Multiplexer Tank 175‐TK‐105 Multiplexer Tank 175‐SA‐110 On‐Stream Analyzer 1 Courier 6iSL, 14 Streams 4.0 3.0 75‐ZM‐115 Demultiplexer 175‐ZM‐116 Demultiplexer 175‐TK‐105 Multiplexer 175‐PP‐121 Sample Delivery Pump 1 Metso, Vertical 2" Sala, VT50 7.5 5.6 75‐PP‐122 Sample Delivery Pump 1 Metso, Vertical 2" Sala, VT50 7.5 5.6 75‐PP‐123 Sample Delivery Pump 1 Metso, Vertical 2" Sala, VT50 7.5 5.6 75‐PP‐124 Sample Delivery Pump 1 Metso, Vertical 2" Sala, VT50 7.5 5.6 TOTAL Area 75 ‐ Sampling 34.0 25.4

Q431‐01‐008 Description: Feasibility StudyP1 Date:
Document No:Revision:
EQUIPMENT LIST
Code DescriptionOperating
Qty.
KD Engineering
HPInstalled
kW
January 3, 2012
Spare Qty. Detail
Area 80/90 ‐ Process & Reclaim Water / Fresh Water80‐TK‐100 Process Water Tank 1 10' (dia) x 12' (H)80‐PP‐105 Process Water Pump 1 3,200 gpm @ 210' 250.0 186.5 80‐PP‐106 Process Water Pump 1 3,200 gpm @ 210' 250.0 186.5 80‐PP‐107 Process Water Pump 1 3,200 gpm @ 210' 250.0 186.5 80‐PT‐110 Reclaim Water Pump 1 1,200 gpm @ 50' 25.0 18.7 80‐PT‐111 Reclaim Water Pump 1 1,200 gpm @ 50' 25.0 18.7 80‐PT‐115 Reclaim Seepage Well Pump 1 7.5 5.6 80‐SA‐120 Reclaim Water Sampler 1 Wire sampler90‐TK‐100 Fresh Water Tank 1 10' (dia) x 12' (H)90‐TK‐105 Gland Seal Water Tank 190‐TK‐110 Portable Water Tank 190‐PP‐115 Gland Seal Water Pump 1 160 gpm @ 300' 25.0 18.7 90‐PP‐116 Gland Seal Water Pump 1 160 gpm @ 300' 25.0 18.7 TOTAL Area 80/90 ‐ Process & Reclaim Water / Fresh Water 857.5 639.7

Q431‐01‐008 Description: Feasibility StudyP1 Date:
Document No:Revision:
EQUIPMENT LIST
Code DescriptionOperating
Qty.
KD Engineering
HPInstalled
kW
January 3, 2012
Spare Qty. Detail
Area 95 ‐ Emergency Power Generation95‐TK‐100 Day Fuel Tank 195‐GE‐100 Emergency Power Generator (package) 1 750kW; transfer switch and fan95‐TK‐110 Day Fuel Tank 195‐GE‐110 Emergency Power Generator (package) 1 2MVA; transfer switch and fanTOTAL Area 95 ‐ Emergency Power Generation ‐ ‐
TOTAL ALL AREAS 20,507 15,298

Orvana Resources - Copperwood Project Feasibility Study
K D Engineering Document No. Q431-01-028 21 March 2012 KDE FORM No. A263a-7/12/99
APPENDIX 4
PROCESS CAPITAL COST ESTIMATE

KD EngineeringProject Description: Copperwood Project - Bankable Feasibility Study Date: January 27, 2012
Project No: 431-01 Rev.: P1
Extensions Total
Description Manhours Contract Labor Client
Purchase Bulk Mat'l Owner Cost Cost
UTILITY COST
Area 00 - Site Infrastructure
General Site 170 13,090 6,627,589 1,060,000 303,035 8,003,714
Water Supply - - 7,469,500 - - 7,469,500
Power Supply (Do not add Contigency) - - 19,283,703 - (2,474,703) 16,809,000
TOTAL INITIAL COST 170 13,090 33,380,792 1,060,000 (2,171,668) 32,282,214 CONTINGENCY 15% 2,320,982
TOTAL (Incl. CONTINGENCY) INITIAL COST 34,603,197
PRCOESS PLANT - PHASE I
DIRECT COSTS
Area 10 SAG Grinding & Stockpile Area 99,267 7,643,562 20,407,595 959,549 - 29,010,706
Area 20 - Ball Mill Grinding 13,425 1,033,742 6,196,544 216,262 - 7,446,548
Area 30 - Flotation 21,109 1,625,406 9,271,544 606,478 - 11,503,428
Area 40 - Regrind 10,956 843,645 4,316,092 179,555 - 5,339,292
Area 50 - Copper Concentrate Handling 35,535 2,736,228 5,344,457 673,950 - 8,754,635
Area 60 - Tails 27,805 2,141,014 1,740,752 417,771 - 4,299,537
Area 70 - Reagents 4,100 315,700 501,830 238,399 - 1,055,929
Area 75 - Sampling 2,502 192,662 1,072,360 33,498 - 1,298,519
Area 80/90 - Process & Reclaim Water / Fresh Water 1,976 152,152 785,110 120,851 - 1,058,113
Area 95 - Electrical Distribution 19,305 1,486,485 1,922,530 2,614,054 - 6,023,069
Area 100 - Ancillaries 38,609 2,972,927 3,973,027 288,105 - 7,234,059
TOTAL DIRECT 274,591 21,143,522 55,531,841 6,348,472 - 83,023,835 INDIRECT COSTS
Engineering 4,320,249 Procurement 795,600 Construction Management 1,831,840 Field Office Expense and Construction Support 469,776 Training 225,000 Initial Fill 2,882,700 Startup 370,000 Spare Parts 999,165 Owner's Costs 5,500,000 Mobile Equipment 1,515,000
TOTAL INDIRECT 18,909,330 TOTAL DIRECT AND INDIRECT (PHASE I) 101,933,165
CONTINGENCY 15% 15,289,975
TOTAL (Incl. CONTINGENCY) PHASE I 117,223,140
SUMMARY ESTIMATE WORKSHEET
W:\KDE PROJECTS\431‐01 Orvana Resources Copperwood Project BFS\REPORT AND APPENDICES\Final Report\Appendix 4 ‐ Process Capital Cost Estimate\Q‐431‐01‐024 ‐ Capital Cost Estimate ‐ P1_2012‐03‐01
3/22/20125:08 PM Page 1

KD EngineeringProject Description: Copperwood Project - Bankable Feasibility Study Date: January 27, 2012
Project No: 431-01 Rev.: P1
Extensions Total
Description Manhours Contract Labor Client
Purchase Bulk Mat'l Owner Cost Cost
SUMMARY ESTIMATE WORKSHEET
PROCESS PLANT - PHASE II
DIRECT COST
Area 20 - Ball Mill Grinding 7,740 595,981 5,149,696 185,619 - 5,931,296
Area 30 - Flotation 7,770 598,263 2,695,307 351,171 - 3,644,741
Area 40- Regrind 4,419 340,278 2,129,670 95,701 - 2,565,649
TOTAL DIRECT 19,929 1,534,523 9,974,673 632,491 - 12,141,687 INDIRECT COST (10% of Phase I Cost)
Procurement 79,560 Construction Management 183,184 Field Office Expense and Construction Support 46,978 Initial Fill 288,270 Startup 37,000 Spare Parts 99,917 Owner's Costs 550,000 Mobile Equipment 151,500
TOTAL INDIRECT 1,436,408 TOTAL DIRECT AND INDIRECT (PHASE II) 13,578,095
CONTINGENCY 15% 2,036,714
TOTAL (Incl. CONTINGENCY) PHASE II 15,614,809
TOTAL - PROCESS PLANT (PHASE I and II) 132,837,949
TOTAL - INITIAL and PROCESS PLANT (PHASE I and II) 167,441,146
Additional Costs (Including 10% contigency)
Wetland Mitigation Cost - Road for Year 0 233,922 Wetland Mitigation Cost - Boxcut, Mill and Phase 1 TDF for Year 2 3,637,403 Wetland Mitigation Cost - Phase 2 TDF for Year 3 967,831 Wetland Mitigation Cost - Monitoring of Constrcuted Wetland for Year 5 96,250 Wetland Mitigation Cost - Phase 3 TDF for Year 7 967,831 Sewer Pond Reclaim for Year 15 132,000
ExclusionsExplorationMetallurgical TestingMining and HaulageTaxes, duty and import fees; IVALocal sales & Import taxesWorking Capital Environmental monitoring & TestingEscalationTailings Storage FacilitiesWater Treatment Plant
W:\KDE PROJECTS\431‐01 Orvana Resources Copperwood Project BFS\REPORT AND APPENDICES\Final Report\Appendix 4 ‐ Process Capital Cost Estimate\Q‐431‐01‐024 ‐ Capital Cost Estimate ‐ P1_2012‐03‐01
3/22/20125:08 PM Page 2
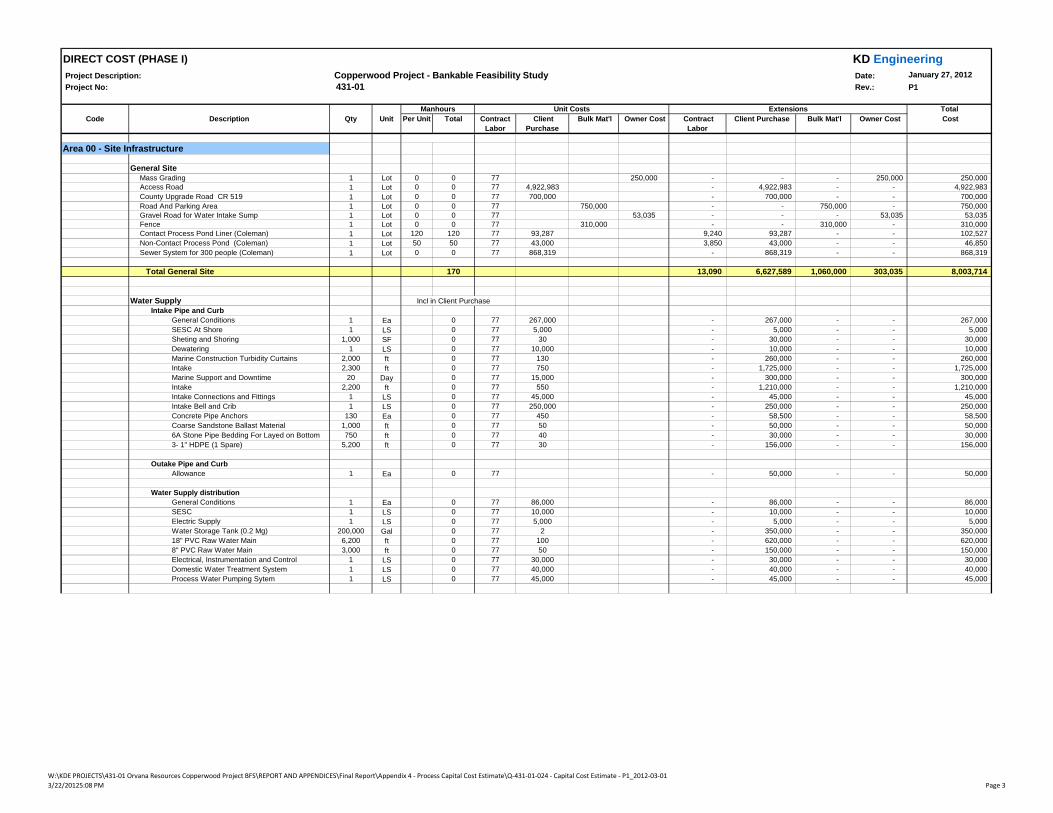
DIRECT COST (PHASE I) KD EngineeringProject Description: Copperwood Project - Bankable Feasibility Study Date: January 27, 2012
Project No: 431-01 Rev.: P1
TotalCode Description Qty Unit Per Unit Total Contract
Labor Client
Purchase Bulk Mat'l Owner Cost Contract
Labor Client Purchase Bulk Mat'l Owner Cost Cost
Area 00 - Site Infrastructure
General SiteMass Grading 1 Lot 0 0 77 250,000 - - - 250,000 250,000 Access Road 1 Lot 0 0 77 4,922,983 - 4,922,983 - - 4,922,983 County Upgrade Road CR 519 1 Lot 0 0 77 700,000 - 700,000 - - 700,000 Road And Parking Area 1 Lot 0 0 77 750,000 - - 750,000 - 750,000 Gravel Road for Water Intake Sump 1 Lot 0 0 77 53,035 - - - 53,035 53,035 Fence 1 Lot 0 0 77 310,000 - - 310,000 - 310,000 Contact Process Pond Liner (Coleman) 1 Lot 120 120 77 93,287 9,240 93,287 - - 102,527 Non-Contact Process Pond (Coleman) 1 Lot 50 50 77 43,000 3,850 43,000 - - 46,850 Sewer System for 300 people (Coleman) 1 Lot 0 0 77 868,319 - 868,319 - - 868,319
Total General Site 170 13,090 6,627,589 1,060,000 303,035 8,003,714
Water Supply Incl in Client Purchase Intake Pipe and Curb General Conditions 1 Ea 0 77 267,000 - 267,000 - - 267,000 SESC At Shore 1 LS 0 77 5,000 - 5,000 - - 5,000 Sheting and Shoring 1,000 SF 0 77 30 - 30,000 - - 30,000 Dewatering 1 LS 0 77 10,000 - 10,000 - - 10,000 Marine Construction Turbidity Curtains 2,000 ft 0 77 130 - 260,000 - - 260,000 Intake 2,300 ft 0 77 750 - 1,725,000 - - 1,725,000 Marine Support and Downtime 20 Day 0 77 15,000 - 300,000 - - 300,000 Intake 2,200 ft 0 77 550 - 1,210,000 - - 1,210,000 Intake Connections and Fittings 1 LS 0 77 45,000 - 45,000 - - 45,000 Intake Bell and Crib 1 LS 0 77 250,000 - 250,000 - - 250,000 Concrete Pipe Anchors 130 Ea 0 77 450 - 58,500 - - 58,500 Coarse Sandstone Ballast Material 1,000 ft 0 77 50 - 50,000 - - 50,000
Manhours Unit Costs Extensions
, ft , , 6A Stone Pipe Bedding For Layed on Bottom 750 ft 0 77 40 - 30,000 - - 30,000 3- 1" HDPE (1 Spare) 5,200 ft 0 77 30 - 156,000 - - 156,000
Outake Pipe and Curb Allowance 1 Ea 0 77 - 50,000 - - 50,000
Water Supply distribution General Conditions 1 Ea 0 77 86,000 - 86,000 - - 86,000 SESC 1 LS 0 77 10,000 - 10,000 - - 10,000 Electric Supply 1 LS 0 77 5,000 - 5,000 - - 5,000 Water Storage Tank (0.2 Mg) 200,000 Gal 0 77 2 - 350,000 - - 350,000 18" PVC Raw Water Main 6,200 ft 0 77 100 - 620,000 - - 620,000 8" PVC Raw Water Main 3,000 ft 0 77 50 - 150,000 - - 150,000 Electrical, Instrumentation and Control 1 LS 0 77 30,000 - 30,000 - - 30,000 Domestic Water Treatment System 1 LS 0 77 40,000 - 40,000 - - 40,000 Process Water Pumping Sytem 1 LS 0 77 45,000 - 45,000 - - 45,000
W:\KDE PROJECTS\431‐01 Orvana Resources Copperwood Project BFS\REPORT AND APPENDICES\Final Report\Appendix 4 ‐ Process Capital Cost Estimate\Q‐431‐01‐024 ‐ Capital Cost Estimate ‐ P1_2012‐03‐01
3/22/20125:08 PM Page 3

DIRECT COST (PHASE I) KD EngineeringProject Description: Copperwood Project - Bankable Feasibility Study Date: January 27, 2012
Project No: 431-01 Rev.: P1
TotalCode Description Qty Unit Per Unit Total Contract
Labor Client
Purchase Bulk Mat'l Owner Cost Contract
Labor Client Purchase Bulk Mat'l Owner Cost Cost
Manhours Unit Costs Extensions
Low Service Pump Station General Conditions 1 LS 0 77 131,000 - 131,000 - - 131,000 SESC 1 LS 0 77 3,000 - 3,000 - - 3,000 Sheting and Shoring 4,000 SF 0 77 20 - 80,000 - - 80,000 Dewatering 1 LS 0 77 30,000 - 30,000 - - 30,000 Seawall Construction 200 CY 0 77 500 - 100,000 - - 100,000 LSPS Base Slab 50 CY 0 77 400 - 20,000 - - 20,000 LSPS Walls 200 CY 0 77 700 - 140,000 - - 140,000 LSPS Supported Slab 24 CY 0 77 1,000 - 24,000 - - 24,000 Miscellaneous Concrete 100 CY 0 77 400 - 40,000 - - 40,000 LSPS Superstructure 1,000 SF 0 77 300 - 300,000 - - 300,000 Plumbing and HVAC 1 LS 0 77 50,000 - 50,000 - - 50,000 Electrical Distribution 1 LS 0 77 100,000 - 100,000 - - 100,000 Excavation For Pump Station 1,000 CY 0 77 30 - 30,000 - - 30,000 Rock Excavation 600 CY 0 77 110 - 66,000 - - 66,000 Access Road 1,500 ft 0 77 80 - 120,000 - - 120,000 Electrical Service To Site 1 LS 0 77 140,000 - 140,000 - - 140,000 Valves 8 Ea 0 77 3,500 - 28,000 - - 28,000 Gates 3 Ea 0 77 5,000 - 15,000 - - 15,000 16" RW Piping 100 ft 0 77 200 - 20,000 - - 20,000 Fittings Allowance 1 LS 0 77 20,000 - 20,000 - - 20,000 Instrumentation 1 LS 0 77 80,000 - 80,000 - - 80,000 Vertical Turbine Pumps 1 Ea 0 77 40,000 - 40,000 - - 40,000 Vertical Turbine Pumps 2 Ea 0 77 35,000 - 70,000 - - 70,000 Chemical Feed System 1 LS 0 77 40,000 - 40,000 - - 40,000
Total Water Supply 0 - 7,469,500 - - 7,469,500
Power Supply
Power Supply 115KV LinePower Supply 115KV Line New Transmission Line (TAM) 1 Lot 0 77 11,703,000 - 11,703,000 - - 11,703,000 New 3629 Underbuild (TAM) 1 Lot 0 77 138,000 - 138,000 - - 138,000 Transmission Line Permitting (TAM) 1 Lot 0 77 299,703 - 299,703 - - 299,703 Transmission Line Easements (TAM) 1 Lot 1,938,000 - 1,938,000 - - 1,938,000
Subtotal - Power Supply 115KV Line 0 - 14,078,703 - - 14,078,703
Substations Copperwood Substation (DCP) 1 Lot 0 77 3,970,000 - 3,970,000 - - 3,970,000 Copperwood Substation (TAM) 1 Lot 0 77 75,000 - 75,000 - - 75,000 Norrie Substation (TAM) 1 Lot 0 77 1,160,000 - 1,160,000 - - 1,160,000
Subtotal Substations 0 - 5,205,000 - - 5,205,000
2011 SUNK Cost 1 Lot -224,703 - - - (224,703) (224,703) Customer Revenue Allowance 1 Lot -2,250,000 - - - (2,250,000) (2,250,000)
Total Power Supply 0 - 19,283,703 - (2,474,703) 16,809,000
TOTAL Area 00 - Site Infrastructure 170 13,090 33,380,792 1,060,000 (2,171,668) 32,282,214
W:\KDE PROJECTS\431‐01 Orvana Resources Copperwood Project BFS\REPORT AND APPENDICES\Final Report\Appendix 4 ‐ Process Capital Cost Estimate\Q‐431‐01‐024 ‐ Capital Cost Estimate ‐ P1_2012‐03‐01
3/22/20125:08 PM Page 4

DIRECT COST (PHASE I) KD EngineeringProject Description: Copperwood Project - Bankable Feasibility Study Date: January 27, 2012
Project No: 431-01 Rev.: P1
TotalCode Description Qty Unit Per Unit Total Contract
Labor Client
Purchase Bulk Mat'l Owner Cost Contract
Labor Client Purchase Bulk Mat'l Owner Cost Cost
Manhours Unit Costs Extensions
Area 10 SAG Grinding & Stockpile Area
Conveyor Transfer Building 1,600 SF 0.39 623 77 30 48,000 48,000 - - 96,000 Recycle Crusher Building 1,518 SF 0.39 591 77 50 45,540 75,240 - - 120,780 Escape Tunnel 75 ft 1.688 127 77 214.00 9,748 16,050 - - 25,798 Access Tunnel 140 ft 4.220 591 77 535.00 45,492 74,900 - - 120,392 Mill Building Sag Grinding Area (440 x 100) 44,000 SF 0.30 13200 77 80 1,016,400 3,520,000 - - 4,536,400
10-ST-100 Stockpile Cover Building 24,500 SF 0.45 11136 77 50 857,500 1,225,000 - - 2,082,500
10-CV-101 Stockpile Feed Conveyor 1 Ea 2040 2040 77 1,458,270 157,080 1,458,270 - - 1,615,350 10-WX-101 Belt Scale 1 Ea 10 10 77 7,000 770 7,000 - - 7,770 10-CV-102 Stockpile Tripper Conveyor 1 Ea 525 525 77 473,580 40,425 473,580 - - 514,005 10-BF-104-107 Belt Feeder 4 Ea 235 941 77 60,000 72,442 240,000 - - 312,442 10-DC-108 Dust Collection 1 Ea 80 80 77 62,000 6,160 62,000 - - 68,160 10-CV-110 SAG Mill Feed Conveyor 1 Ea 2000 2000 77 564,775 154,000 564,775 - - 718,775 10-WX-115 SAG Mill Feed Weightometer 1 Ea 40 40 77 15,000 3,080 15,000 - - 18,080 10-ZB-120 SAG Feed Chute 1 Ea 60 60 77 20,000 4,620 20,000 - - 24,620 10-LH-120 Liner Machine 1 Ea 125 125 77 150,000 9,625 150,000 - - 159,625 10-DA-120 SAG Mill Inching Drive 1 INCL 0 77 - - - - - 10-ML-125 SAG Mill 1 Ea 5000 5000 77 8,125,600 385,000 8,125,600 - - 8,510,600 10-SN-131 SAG Mill Discharge Screen 1 Ea 160 160 77 141,000 12,320 141,000 - - 153,320 10-WX-145 Belt Scale 1 Ea 10 10 77 7,000 770 7,000 - - 7,770 10-CV-150 Recycle Conveyor 1 Ea 120 120 77 36,175 9,240 36,175 - - 45,415 10-CV-151 Recyle Conveyor 1 Ea 2000 2000 77 444,400 154,000 444,400 - - 598,400 10-SP-155 Splitter 1 Ea 80 80 77 30,000 6,160 30,000 - - 36,160 10-BN-175 Mill Ball Bin 1 Ea 140 140 77 29,500 10,780 29,500 - - 40,280 10-ZM-175 Mill Ball Kibble 1 Ea 120 120 77 10,000 9,240 10,000 - - 19,240 10-PP-185 Grinding Area Sump Pump 1 Ea 40 40 77 6,890 3,080 6,890 - - 9,970 10-PP-186 Reclaim Area Sump Pump 1 Ea 40 40 77 6,890 3,080 6,890 - - 9,970 10-ES-190 Emergency Shower 1 Ea 12 12 77 1,200 924 1,200 - - 2,124 g y , , ,10-CN-195 Crane 1 Ea 500 500 77 150,000 38,500 150,000 - - 188,500
Subtotal - Equipment 40311 3,103,975 16,938,470 - - 20,042,445
Piping & DuctingPiping Allowance, Fittings, Valves Etc. 1 Lot 1411 1411 77 100,000 108,639 100,000 208,639 Ducting Allowance, Joints, Fittings & Dampers 1 Lot 800 800 77 45,000 61,600 45,000 106,600
Subtotal - Piping & Ducting 2211 170,239 - 145,000 - 315,239
W:\KDE PROJECTS\431‐01 Orvana Resources Copperwood Project BFS\REPORT AND APPENDICES\Final Report\Appendix 4 ‐ Process Capital Cost Estimate\Q‐431‐01‐024 ‐ Capital Cost Estimate ‐ P1_2012‐03‐01
3/22/20125:08 PM Page 5

DIRECT COST (PHASE I) KD EngineeringProject Description: Copperwood Project - Bankable Feasibility Study Date: January 27, 2012
Project No: 431-01 Rev.: P1
TotalCode Description Qty Unit Per Unit Total Contract
Labor Client
Purchase Bulk Mat'l Owner Cost Contract
Labor Client Purchase Bulk Mat'l Owner Cost Cost
Manhours Unit Costs Extensions
SiteworkTransfer Excavation 3,000 CY 0.045 135 77 0.0 10,395 - - - 10,395 Backfill 2,000 CY 0.015 30 77 5.0 2,310 10,000 - - 12,310 Backfill Engineered 1,000 CY 0.050 50 77 6.5 3,850 6,500 - - 10,350 Gravity Take UP Excavation 2,600 CY 0.045 117 77 0.0 9,009 - - - 9,009 Backfill 1,600 CY 0.015 24 77 5.0 1,848 8,000 - - 9,848 Backfill Engineered 1,000 CY 0.050 50 77 6.5 3,850 6,500 - - 10,350 Stockpile Feed Conveyor Excavation 5,600 CY 0.045 252 77 0.0 19,404 - - - 19,404 Backfill 3,600 CY 0.015 54 77 5.0 4,158 18,000 - - 22,158 Backfill Engineered 2,000 CY 0.050 100 77 6.5 7,700 13,000 - - 20,700 Stockpile Cover Area Excavation 32,250 CY 0.045 1451 77 0.0 111,746 - - - 111,746 Backfill 24,000 CY 0.015 360 77 5.0 27,720 120,000 - - 147,720 Backfill Engineered 8,250 CY 0.050 413 77 6.5 31,763 53,625 - - 85,388 Recycler System Excavation 4,320 CY 0.045 194 77 0.0 14,969 - - - 14,969 Backfill 3,000 CY 0.015 45 77 5.0 3,465 15,000 - - 18,465 Backfill Engineered 1,220 CY 0.050 61 77 6.5 4,697 7,930 - - 12,627 Mill Building Excavation 24,000 CY 0.045 1080 77 0.0 83,160 - - - 83,160 Backfill 16,000 CY 0.015 240 77 5.0 18,480 80,000 - - 98,480 Backfill Engineered 8,000 CY 0.050 400 77 6.5 30,800 52,000 - - 82,800
Subtotal - Sitework 5056 389,324 390,555 - - 779,879
ConcreteTransfer
Foundation Wall/Footing 107 CY 6 642 77 150 49 434 16 050 65 484 Foundation Wall/Footing 107 CY 6 642 77 150 49,434 16,050 - - 65,484 Foundation Column 38 CY 6 228 77 150 17,556 5,700 - - 23,256 Gravity Take Up Foundation Column 150 CY 6 900 77 150 69,300 22,500 - - 91,800 Stockpile Feed Conveyor Bent 150 CY 6 900 77 150 69,300 22,500 - - 91,800 StockPile Building Foundation Wall (Side and end wall) 585 CY 6 3510 77 150 270,270 87,750 - - 358,020 Slab 575 CY 6 3450 77 150 265,650 86,250 - - 351,900 Foundation / Tunnel 1,587 CY 8 12692 77 200 977,284 317,300 - - 1,294,584 Recycle System Columns/Slab Foundation Wall/Footing 70 CY 6 420 77 150 32,340 10,500 - - 42,840 Mill Building Bldg Col Foundation 650 CY 6 3900 77 150 300,300 97,500 - - 397,800 Slab 1,200 CY 6 7200 77 150 554,400 180,000 - - 734,400 SAG Foundation 600 CY 6 3600 77 150 277,200 90,000 - - 367,200 Side Wall 275 CY 6 1650 77 150 127,050 41,250 - - 168,300
Subtotal - Concrete 39092 3,010,084 977,300 - - 3,987,384
W:\KDE PROJECTS\431‐01 Orvana Resources Copperwood Project BFS\REPORT AND APPENDICES\Final Report\Appendix 4 ‐ Process Capital Cost Estimate\Q‐431‐01‐024 ‐ Capital Cost Estimate ‐ P1_2012‐03‐01
3/22/20125:08 PM Page 6

DIRECT COST (PHASE I) KD EngineeringProject Description: Copperwood Project - Bankable Feasibility Study Date: January 27, 2012
Project No: 431-01 Rev.: P1
TotalCode Description Qty Unit Per Unit Total Contract
Labor Client
Purchase Bulk Mat'l Owner Cost Contract
Labor Client Purchase Bulk Mat'l Owner Cost Cost
Manhours Unit Costs Extensions
Structural Transfer Columns 18,480 lbs 0.020 370 77 2.00 28,459 36,960 - - 65,419 Handrail 3,360 lbs 0.025 84 77 3.60 6,468 12,096 - - 18,564 Platform 23,296 lbs 0.023 536 77 1.15 41,257 26,790 - - 68,048 Stairs 4,029 lbs 0.020 81 77 1.50 6,205 6,044 - - 12,248 Take Up Gravity Columns 36,864 lbs 0.020 737 77 2.00 56,771 73,728 - - 130,499 Handrail 7,056 lbs 0.025 176 77 3.60 13,583 25,402 - - 38,984 Platform 10,240 lbs 0.023 236 77 1.15 18,135 11,776 - - 29,911 Stairs 4,029 lbs 0.020 81 77 1.50 6,205 6,044 - - 12,248 Belt Feeder Platform Columns 3,584 lbs 0.020 72 77 2.00 5,519 7,168 - - 12,687 Handrail 2,688 lbs 0.025 67 77 3.60 5,174 9,677 - - 14,851 Platform 61,440 lbs 0.023 1413 77 1.15 108,810 70,656 - - 179,466 Stairs 3,759 lbs 0.020 75 77 1.50 5,789 5,639 - - 11,428 Mill Building Sag Griding Area Columns 40,000 lbs 0.020 800 77 2.00 61,600 80,000 - - 141,600 Handrail 5,000 lbs 0.025 125 77 3.60 9,625 18,000 - - 27,625 Platform 60,000 lbs 0.023 1380 77 1.15 106,260 69,000 - - 175,260 Stairs 11,100 lbs 0.020 222 77 1.50 17,094 16,650 - - 33,744
Subtotal - Structural 6454 496,954 475,628 - - 972,582
Mechanical Chutes (Qty 3) 38,197 lbs 0.025 955 77 2.5 73,529 95,492 - - 169,021 Misc. plate work, bolts,etc (5% subtotal) 1,910 lbs 0.025 48 77 2.0 3,676 3,820 - - 7,496
0 77 - - - - - Subtotal - Mechanical 1003 77,205 99,312 - - 176,517
Electrical & InstrumentationElectrical installation 1 Lot 1560 1560 77 113,100 120,120 - 113,100 - 233,220 480v MCC 1 Ea 160 160 77 60,800 12,320 60,800 - - 73,120 4160V Switchgear 1 Ea 100 100 77 250,000 7,700 250,000 - - 257,700 Lightinh & Grounding 1 Lot 3210 3210 77 156,900 247,170 - 156,900 - 404,070 Instrumentation & PLC 1 Lot 110 110 77 19,000 9,500 8,470 19,000 9,500 - 36,970
Total Electrical & Instrumentation 5140 395,780 329,800 279,500 - 1,005,080
Total (Excluding Freight and misc) 99267 7,643,562 19,211,065 424,500 - 27,279,127
Construction Consummables 1 Lot 535,049 535,049 535,049
Freight Allowance 1 Lot 1,008,530 1,008,530 1,008,530
Large Crane Rental CostsCrane Mob & Demob 1 Lot 0 77 20,000 - 20,000 20,000 Crane Usage Cost 6 Months 0 77 28,000 - 168,000 168,000
TOTAL Area 10 SAG Grinding & Stockpile Area 99267 7,643,562 20,407,595 959,549 - 29,010,706
W:\KDE PROJECTS\431‐01 Orvana Resources Copperwood Project BFS\REPORT AND APPENDICES\Final Report\Appendix 4 ‐ Process Capital Cost Estimate\Q‐431‐01‐024 ‐ Capital Cost Estimate ‐ P1_2012‐03‐01
3/22/20125:08 PM Page 7
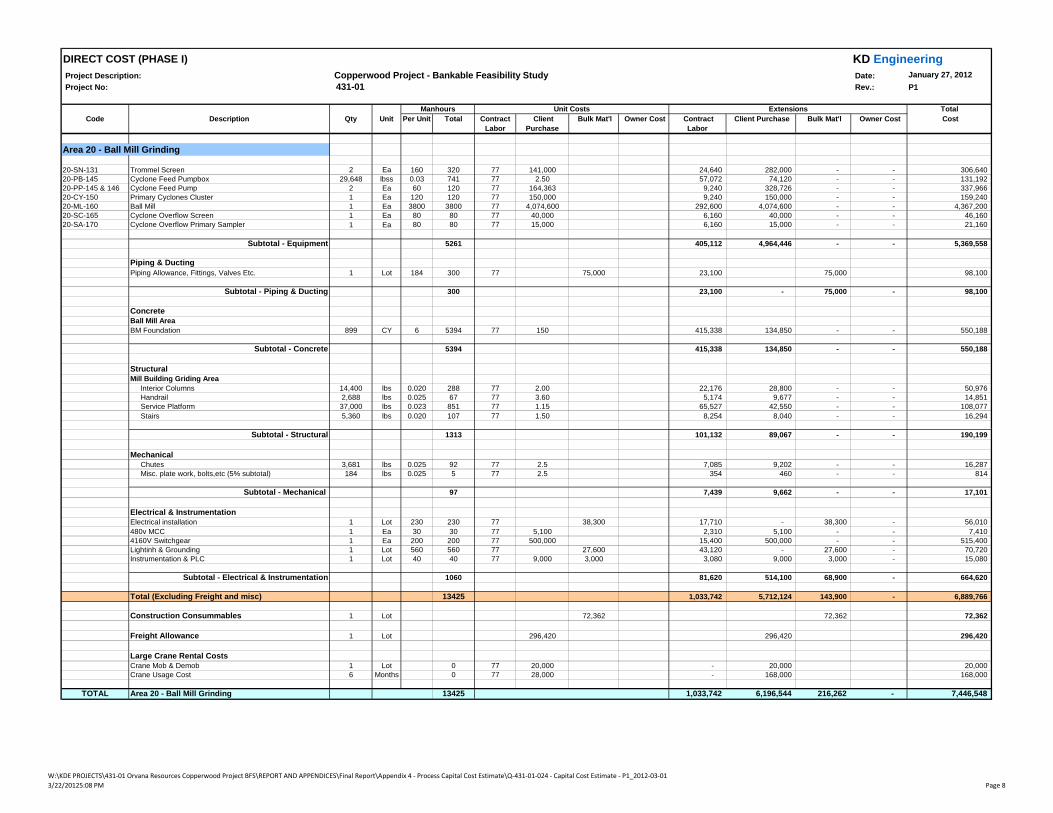
DIRECT COST (PHASE I) KD EngineeringProject Description: Copperwood Project - Bankable Feasibility Study Date: January 27, 2012
Project No: 431-01 Rev.: P1
TotalCode Description Qty Unit Per Unit Total Contract
Labor Client
Purchase Bulk Mat'l Owner Cost Contract
Labor Client Purchase Bulk Mat'l Owner Cost Cost
Manhours Unit Costs Extensions
Area 20 - Ball Mill Grinding
20-SN-131 Trommel Screen 2 Ea 160 320 77 141,000 24,640 282,000 - - 306,640 20-PB-145 Cyclone Feed Pumpbox 29,648 lbss 0.03 741 77 2.50 57,072 74,120 - - 131,192 20-PP-145 & 146 Cyclone Feed Pump 2 Ea 60 120 77 164,363 9,240 328,726 - - 337,966 20-CY-150 Primary Cyclones Cluster 1 Ea 120 120 77 150,000 9,240 150,000 - - 159,240 20-ML-160 Ball Mill 1 Ea 3800 3800 77 4,074,600 292,600 4,074,600 - - 4,367,200 20-SC-165 Cyclone Overflow Screen 1 Ea 80 80 77 40,000 6,160 40,000 - - 46,160 20-SA-170 Cyclone Overflow Primary Sampler 1 Ea 80 80 77 15,000 6,160 15,000 - - 21,160
Subtotal - Equipment 5261 405,112 4,964,446 - - 5,369,558
Piping & DuctingPiping Allowance, Fittings, Valves Etc. 1 Lot 184 300 77 75,000 23,100 75,000 98,100
Subtotal - Piping & Ducting 300 23,100 - 75,000 - 98,100
ConcreteBall Mill AreaBM Foundation 899 CY 6 5394 77 150 415,338 134,850 - - 550,188
Subtotal - Concrete 5394 415,338 134,850 - - 550,188
StructuralMill Building Griding Area Interior Columns 14,400 lbs 0.020 288 77 2.00 22,176 28,800 - - 50,976 Handrail 2,688 lbs 0.025 67 77 3.60 5,174 9,677 - - 14,851 Service Platform 37,000 lbs 0.023 851 77 1.15 65,527 42,550 - - 108,077 Stairs 5,360 lbs 0.020 107 77 1.50 8,254 8,040 - - 16,294
Subtotal - Structural 1313 101,132 89,067 - - 190,199
Mechanical Chutes 3,681 lbs 0.025 92 77 2.5 7,085 9,202 - - 16,287 Misc. plate work, bolts,etc (5% subtotal) 184 lbs 0.025 5 77 2.5 354 460 - - 814
Subtotal - Mechanical 97 7,439 9,662 - - 17,101
Electrical & InstrumentationElectrical installation 1 Lot 230 230 77 38,300 17,710 - 38,300 - 56,010 480v MCC 1 Ea 30 30 77 5,100 2,310 5,100 - - 7,410 4160V Switchgear 1 Ea 200 200 77 500,000 15,400 500,000 - - 515,400 Lightinh & Grounding 1 Lot 560 560 77 27,600 43,120 - 27,600 - 70,720 Instrumentation & PLC 1 Lot 40 40 77 9,000 3,000 3,080 9,000 3,000 - 15,080
Subtotal - Electrical & Instrumentation 1060 81,620 514,100 68,900 - 664,620
Total (Excluding Freight and misc) 13425 1,033,742 5,712,124 143,900 - 6,889,766
Construction Consummables 1 Lot 72,362 72,362 72,362
Freight Allowance 1 Lot 296,420 296,420 296,420
Large Crane Rental CostsCrane Mob & Demob 1 Lot 0 77 20,000 - 20,000 20,000 Crane Usage Cost 6 Months 0 77 28,000 - 168,000 168,000
TOTAL Area 20 - Ball Mill Grinding 13425 1,033,742 6,196,544 216,262 - 7,446,548
W:\KDE PROJECTS\431‐01 Orvana Resources Copperwood Project BFS\REPORT AND APPENDICES\Final Report\Appendix 4 ‐ Process Capital Cost Estimate\Q‐431‐01‐024 ‐ Capital Cost Estimate ‐ P1_2012‐03‐01
3/22/20125:08 PM Page 8

DIRECT COST (PHASE I) KD EngineeringProject Description: Copperwood Project - Bankable Feasibility Study Date: January 27, 2012
Project No: 431-01 Rev.: P1
TotalCode Description Qty Unit Per Unit Total Contract
Labor Client
Purchase Bulk Mat'l Owner Cost Contract
Labor Client Purchase Bulk Mat'l Owner Cost Cost
Manhours Unit Costs Extensions
Area 30 - Flotation
30-TK-100 Conditioning Tank 1 Ea 60 60 77 95,300 4,620 95,300 - - 99,920 30-AG-100 Conditioning Tank Agitator 1 0 60 60 77 76,600 4,620 76,600 - - 81,220 30-FC-101 to105 1st Rougher Flotation Cell 5 Ea 960 4800 77 488,000 369,600 2,440,000 - - 2,809,600 30-SA-111 Rougher Tailing Primary Sampler 1 Ea 40 40 77 35,000 3,080 35,000 - - 38,080 30-PP-111 Sample Delivery Pump 1 Ea 20 20 77 10,000 1,540 10,000 - - 11,540 30-SA-112 Rougher Conc Primary Sampler 1 Ea 40 40 77 35,000 3,080 35,000 - - 38,080 30-PP-112 Sample Delivery Pump 1 Ea 20 20 77 10,000 1,540 10,000 - - 11,540 30-PP-113 Rougher Tailing Pump 1 Ea 20 20 77 75,000 1,540 75,000 - - 76,540 30-PP-114 Rougher Tailing Pump 1 Ea 20 20 77 75,000 1,540 75,000 - - 76,540 30-PB-115 Classification Cyclone Feed Pumpbox 11,118 lbs 0.025 278 77 2.50 21,402 27,795 - - 49,197 30-PP-115 to 116 Classification Cyclone Feed Pump 2 Ea 40 80 77 46,479 6,160 92,958 - - 99,118 30-CY-120 Classification Cyclones Cluster 1 Ea 80 80 77 26,000 6,160 26,000 - - 32,160 30-SA-121 Classification Cyclone Overflow Primary Sampler 1 Ea 40 40 77 35,000 3,080 35,000 - - 38,080 30-PP-121 Sample Delivery Pump 1 Ea 20 20 77 10,000 1,540 10,000 - - 11,540 30-SA-122 Classification Cyclone Overflow Particle Size Monitor 1 Ea 120 120 77 300,000 9,240 300,000 - - 309,240 30-FC-131 to 136 1st Cleaner Flotation Cell 6 Ea 120 720 77 203,000 55,440 1,218,000 - - 1,273,440 30-FC-137 to 144 1st Cleaner Scavenger Flotation Cell 8 Ea 120 960 77 203,000 73,920 1,624,000 - - 1,697,920 30-PP-145 & 146 Cleaner Tailing Pump 2 Ea 20 40 77 30,261 3,080 60,522 - - 63,602 30-PB-147 1st Cleaner Scavenger Concentrate Pumpbox 1,359 lbs 0.025 34 77 2.50 2,616 3,398 - - 6,014 30-PP-147 & 148 1st Cleaner Scavenger Concentrate Pump 2 Ea 20 40 77 13,077 3,080 26,154 - - 29,234 30-SP-150 2nd Cleaner Column Feed Distributor 1 Ea 40 40 77 8,200 3,080 8,200 - - 11,280 30-FC-151 & 152 2nd Cleaner Flotation Column 2 Ea 250 500 77 471,496 38,500 942,992 - - 981,492 30-PB-155 3rd Cleaner Feed Pumpbox 1 Ea 60 60 77 15,000 4,620 15,000 - - 19,620 30-PP-155 & 156 3rd Cleaner Feed Pump 2 Ea 20 40 77 13,293 3,080 26,586 - - 29,666 30-PB-158 2nd Cleaner Tailing Pumpbox 1 Ea 60 60 77 15,000 4,620 15,000 - - 19,620 30PP-158 & 159 2nd Cleaner Tailing Pump 2 Ea 20 40 77 14,970 3,080 29,940 - - 33,020 30-FC-161 & 162 3rd Cleaner Flotation Column 2 Ea 200 400 77 276,910 30,800 553,821 - - 584,621 30 PB 165 2nd Cleaner Feed Pumpbox 1 Ea 60 60 77 25 000 4 620 25 000 29 62030-PB-165 2nd Cleaner Feed Pumpbox 1 Ea 60 60 77 25,000 4,620 25,000 - - 29,620 30-PP-165 2nd Cleaner Feed Pump 1 Ea 20 20 77 18,683 1,540 18,683 - - 20,223 30-PP-166 3rd Cleaner Conc. Pump 1 Ea 20 20 77 18,683 1,540 18,683 - - 20,223 30-SA-171 Cleaner Tailing Primary Sampler 1 Ea 40 40 77 35,000 3,080 35,000 - - 38,080 30-PP-171 Sample Delivery Pump 1 Ea 20 20 77 10,000 1,540 10,000 - - 11,540 30-SA-172 Concentrate Primary Sampler 1 Ea 40 40 77 35,000 3,080 35,000 - - 38,080 30-PP-172 Sample Delivery Pump 1 Ea 20 20 77 10,000 1,540 10,000 - - 11,540 30-CP-175 Flotation Air Compressor 1 Ea 10 10 77 15,000 770 15,000 - - 15,770 30-PV-175 Flotation Air Receiver 1 Ea 110 110 77 5,000 8,470 5,000 - - 13,470 30-PP-185 Flotation Area Sump Pump 1 Ea 40 40 77 6,890 3,080 6,890 - - 9,970 30-ES-190 Emergency Shower 1 Ea 20 20 77 1,500 1,540 1,500 - - 3,040 30-CN-195 Bridge Crane 1 Ea 120 120 77 152,500 9,240 152,500 - - 161,740
Subtotal - Equipment 9152 704,698 8,200,522 - - 8,905,220 .
Piping & DuctingPiping Allowance, Fittings, Valves Etc. 1 Lot 320 320 77 200,000 24,664 200,000 224,664 Ducting Allowance, Joints, Fittings & Dampers 0 Lot 0 0 77 0 - - -
Subtotal - Piping & Ducting 320 24,664 - 200,000 - 224,664
Concrete Columns 88 CY 6 530 77 150 40,841 13,260 - - 54,101 Foundation (Rougher, Col Cells) 900 CY 6 5400 77 150 415,800 135,000 - - 550,800
Subtotal - Concrete 5930 456,641 148,260 - - 604,901
Structural Columns 10,500 lbs 0.020 210 77 2.00 16,170 21,000 - - 37,170 Handrail 5,880 lbs 0.025 147 77 3.60 11,319 21,168 - - 32,487 Platform 38,400 lbs 0.023 883 77 1.15 68,006 44,160 - - 112,166 Stairs 18,816 lbs 0.020 376 77 1.50 28,977 28,224 - - 57,201
Subtotal - Structural 1617 124,472 114,552 - - 239,024
W:\KDE PROJECTS\431‐01 Orvana Resources Copperwood Project BFS\REPORT AND APPENDICES\Final Report\Appendix 4 ‐ Process Capital Cost Estimate\Q‐431‐01‐024 ‐ Capital Cost Estimate ‐ P1_2012‐03‐01
3/22/20125:08 PM Page 9
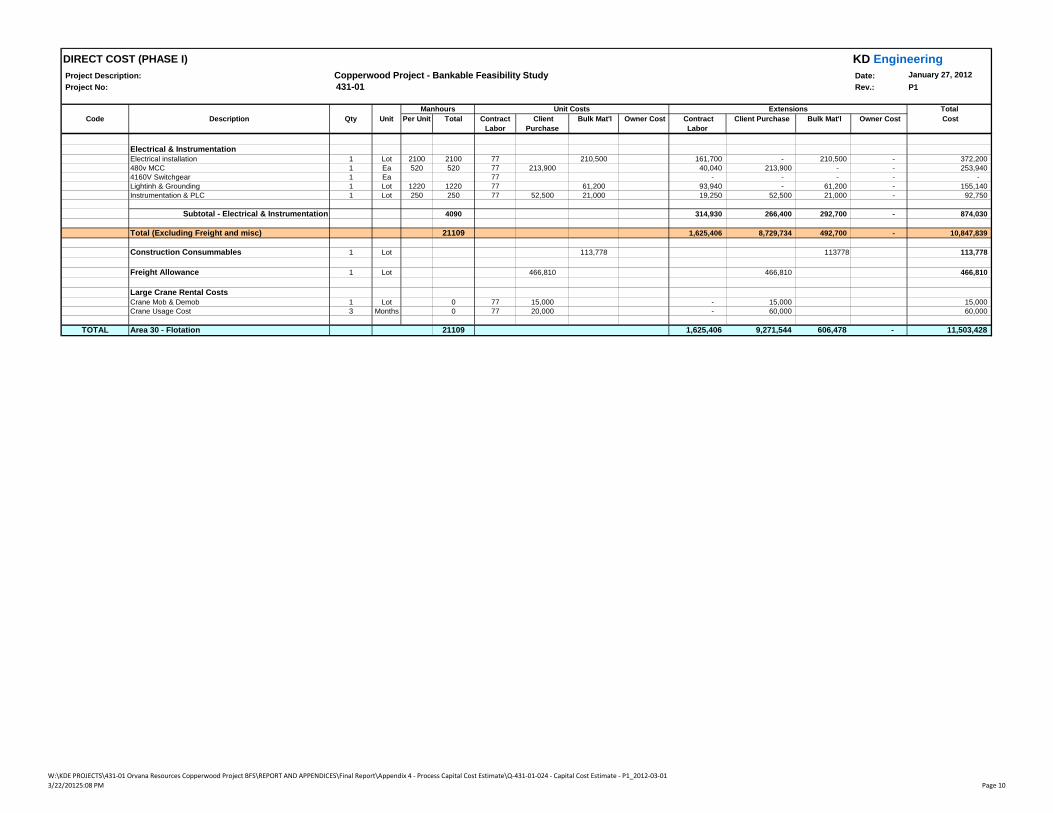
DIRECT COST (PHASE I) KD EngineeringProject Description: Copperwood Project - Bankable Feasibility Study Date: January 27, 2012
Project No: 431-01 Rev.: P1
TotalCode Description Qty Unit Per Unit Total Contract
Labor Client
Purchase Bulk Mat'l Owner Cost Contract
Labor Client Purchase Bulk Mat'l Owner Cost Cost
Manhours Unit Costs Extensions
Electrical & InstrumentationElectrical installation 1 Lot 2100 2100 77 210,500 161,700 - 210,500 - 372,200 480v MCC 1 Ea 520 520 77 213,900 40,040 213,900 - - 253,940 4160V Switchgear 1 Ea 77 - - - - - Lightinh & Grounding 1 Lot 1220 1220 77 61,200 93,940 - 61,200 - 155,140 Instrumentation & PLC 1 Lot 250 250 77 52,500 21,000 19,250 52,500 21,000 - 92,750
Subtotal - Electrical & Instrumentation 4090 314,930 266,400 292,700 - 874,030
Total (Excluding Freight and misc) 21109 1,625,406 8,729,734 492,700 - 10,847,839
Construction Consummables 1 Lot 113,778 113778 113,778
Freight Allowance 1 Lot 466,810 466,810 466,810
Large Crane Rental CostsCrane Mob & Demob 1 Lot 0 77 15,000 - 15,000 15,000 Crane Usage Cost 3 Months 0 77 20,000 - 60,000 60,000
TOTAL Area 30 - Flotation 21109 1,625,406 9,271,544 606,478 - 11,503,428
W:\KDE PROJECTS\431‐01 Orvana Resources Copperwood Project BFS\REPORT AND APPENDICES\Final Report\Appendix 4 ‐ Process Capital Cost Estimate\Q‐431‐01‐024 ‐ Capital Cost Estimate ‐ P1_2012‐03‐01
3/22/20125:08 PM Page 10
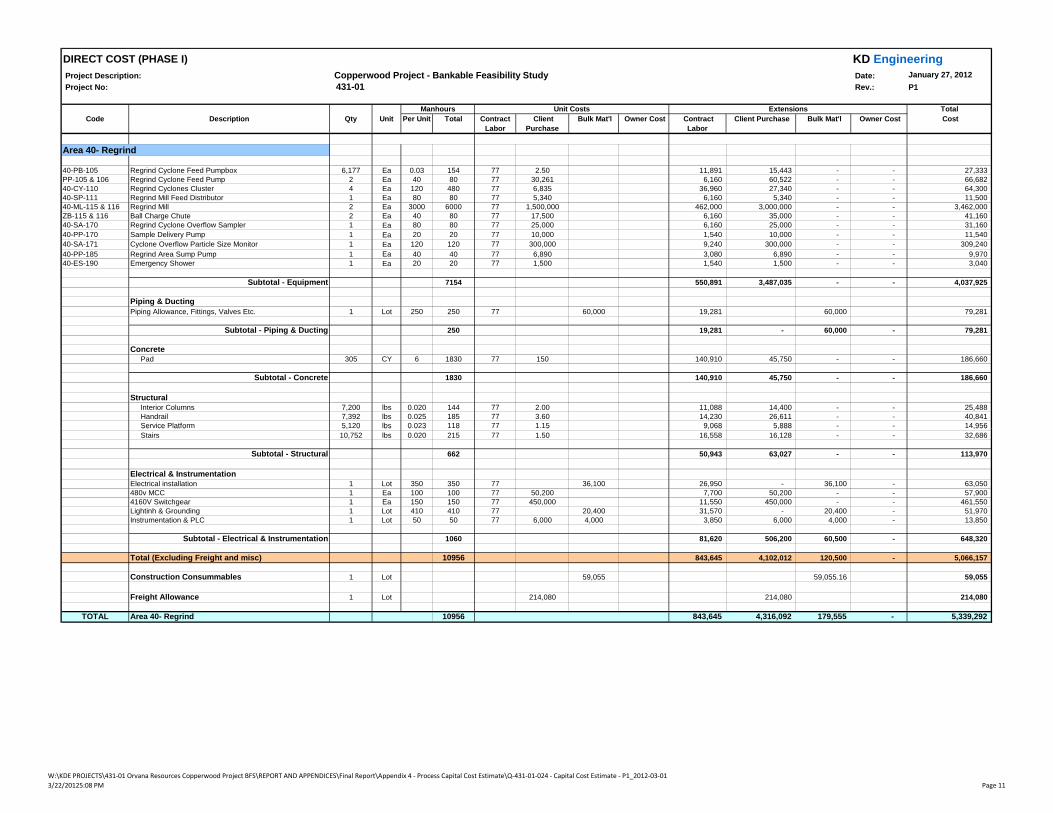
DIRECT COST (PHASE I) KD EngineeringProject Description: Copperwood Project - Bankable Feasibility Study Date: January 27, 2012
Project No: 431-01 Rev.: P1
TotalCode Description Qty Unit Per Unit Total Contract
Labor Client
Purchase Bulk Mat'l Owner Cost Contract
Labor Client Purchase Bulk Mat'l Owner Cost Cost
Manhours Unit Costs Extensions
Area 40- Regrind
40-PB-105 Regrind Cyclone Feed Pumpbox 6,177 Ea 0.03 154 77 2.50 11,891 15,443 - - 27,333 PP-105 & 106 Regrind Cyclone Feed Pump 2 Ea 40 80 77 30,261 6,160 60,522 - - 66,682 40-CY-110 Regrind Cyclones Cluster 4 Ea 120 480 77 6,835 36,960 27,340 - - 64,300 40-SP-111 Regrind Mill Feed Distributor 1 Ea 80 80 77 5,340 6,160 5,340 - - 11,500 40-ML-115 & 116 Regrind Mill 2 Ea 3000 6000 77 1,500,000 462,000 3,000,000 - - 3,462,000 ZB-115 & 116 Ball Charge Chute 2 Ea 40 80 77 17,500 6,160 35,000 - - 41,160 40-SA-170 Regrind Cyclone Overflow Sampler 1 Ea 80 80 77 25,000 6,160 25,000 - - 31,160 40-PP-170 Sample Delivery Pump 1 Ea 20 20 77 10,000 1,540 10,000 - - 11,540 40-SA-171 Cyclone Overflow Particle Size Monitor 1 Ea 120 120 77 300,000 9,240 300,000 - - 309,240 40-PP-185 Regrind Area Sump Pump 1 Ea 40 40 77 6,890 3,080 6,890 - - 9,970 40-ES-190 Emergency Shower 1 Ea 20 20 77 1,500 1,540 1,500 - - 3,040
Subtotal - Equipment 7154 550,891 3,487,035 - - 4,037,925
Piping & DuctingPiping Allowance, Fittings, Valves Etc. 1 Lot 250 250 77 60,000 19,281 60,000 79,281
Subtotal - Piping & Ducting 250 19,281 - 60,000 - 79,281
Concrete Pad 305 CY 6 1830 77 150 140,910 45,750 - - 186,660
Subtotal - Concrete 1830 140,910 45,750 - - 186,660
Structural Interior Columns 7,200 lbs 0.020 144 77 2.00 11,088 14,400 - - 25,488 Handrail 7,392 lbs 0.025 185 77 3.60 14,230 26,611 - - 40,841 Service Platform 5,120 lbs 0.023 118 77 1.15 9,068 5,888 - - 14,956 Se ce at o 5, 0 bs 0 0 3 8 5 9,068 5,888 ,956 Stairs 10,752 lbs 0.020 215 77 1.50 16,558 16,128 - - 32,686
Subtotal - Structural 662 50,943 63,027 - - 113,970
Electrical & InstrumentationElectrical installation 1 Lot 350 350 77 36,100 26,950 - 36,100 - 63,050 480v MCC 1 Ea 100 100 77 50,200 7,700 50,200 - - 57,900 4160V Switchgear 1 Ea 150 150 77 450,000 11,550 450,000 - - 461,550 Lightinh & Grounding 1 Lot 410 410 77 20,400 31,570 - 20,400 - 51,970 Instrumentation & PLC 1 Lot 50 50 77 6,000 4,000 3,850 6,000 4,000 - 13,850
Subtotal - Electrical & Instrumentation 1060 81,620 506,200 60,500 - 648,320
Total (Excluding Freight and misc) 10956 843,645 4,102,012 120,500 - 5,066,157
Construction Consummables 1 Lot 59,055 59,055.16 59,055
Freight Allowance 1 Lot 214,080 214,080 214,080
TOTAL Area 40- Regrind 10956 843,645 4,316,092 179,555 - 5,339,292
W:\KDE PROJECTS\431‐01 Orvana Resources Copperwood Project BFS\REPORT AND APPENDICES\Final Report\Appendix 4 ‐ Process Capital Cost Estimate\Q‐431‐01‐024 ‐ Capital Cost Estimate ‐ P1_2012‐03‐01
3/22/20125:08 PM Page 11
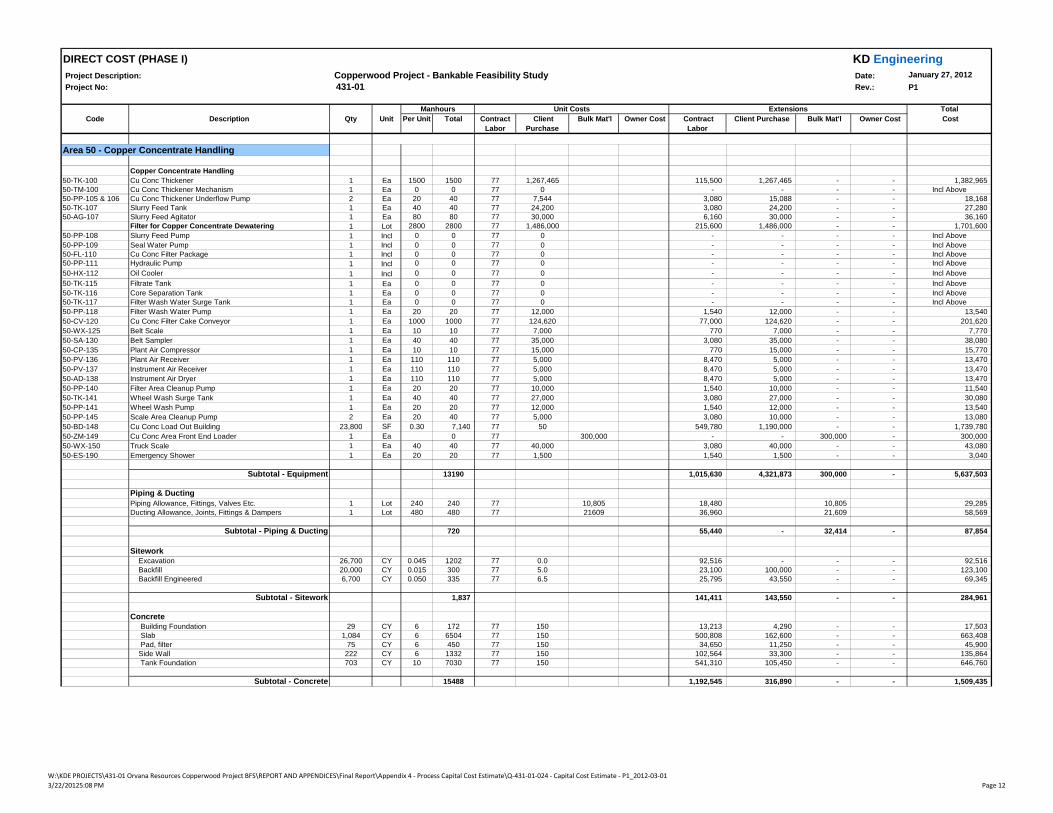
DIRECT COST (PHASE I) KD EngineeringProject Description: Copperwood Project - Bankable Feasibility Study Date: January 27, 2012
Project No: 431-01 Rev.: P1
TotalCode Description Qty Unit Per Unit Total Contract
Labor Client
Purchase Bulk Mat'l Owner Cost Contract
Labor Client Purchase Bulk Mat'l Owner Cost Cost
Manhours Unit Costs Extensions
Area 50 - Copper Concentrate Handling
Copper Concentrate Handling50-TK-100 Cu Conc Thickener 1 Ea 1500 1500 77 1,267,465 115,500 1,267,465 - - 1,382,965 50-TM-100 Cu Conc Thickener Mechanism 1 Ea 0 0 77 0 - - - - Incl Above50-PP-105 & 106 Cu Conc Thickener Underflow Pump 2 Ea 20 40 77 7,544 3,080 15,088 - - 18,168 50-TK-107 Slurry Feed Tank 1 Ea 40 40 77 24,200 3,080 24,200 - - 27,280 50-AG-107 Slurry Feed Agitator 1 Ea 80 80 77 30,000 6,160 30,000 - - 36,160
Filter for Copper Concentrate Dewatering 1 Lot 2800 2800 77 1,486,000 215,600 1,486,000 - - 1,701,600 50-PP-108 Slurry Feed Pump 1 Incl 0 0 77 0 - - - - Incl Above50-PP-109 Seal Water Pump 1 Incl 0 0 77 0 - - - - Incl Above50-FL-110 Cu Conc Filter Package 1 Incl 0 0 77 0 - - - - Incl Above50-PP-111 Hydraulic Pump 1 Incl 0 0 77 0 - - - - Incl Above50-HX-112 Oil Cooler 1 Incl 0 0 77 0 - - - - Incl Above50-TK-115 Filtrate Tank 1 Ea 0 0 77 0 - - - - Incl Above50-TK-116 Core Separation Tank 1 Ea 0 0 77 0 - - - - Incl Above50-TK-117 Filter Wash Water Surge Tank 1 Ea 0 0 77 0 - - - - Incl Above50-PP-118 Filter Wash Water Pump 1 Ea 20 20 77 12,000 1,540 12,000 - - 13,540 50-CV-120 Cu Conc Filter Cake Conveyor 1 Ea 1000 1000 77 124,620 77,000 124,620 - - 201,620 50-WX-125 Belt Scale 1 Ea 10 10 77 7,000 770 7,000 - - 7,770 50-SA-130 Belt Sampler 1 Ea 40 40 77 35,000 3,080 35,000 - - 38,080 50-CP-135 Plant Air Compressor 1 Ea 10 10 77 15,000 770 15,000 - - 15,770 50-PV-136 Plant Air Receiver 1 Ea 110 110 77 5,000 8,470 5,000 - - 13,470 50-PV-137 Instrument Air Receiver 1 Ea 110 110 77 5,000 8,470 5,000 - - 13,470 50-AD-138 Instrument Air Dryer 1 Ea 110 110 77 5,000 8,470 5,000 - - 13,470 50-PP-140 Filter Area Cleanup Pump 1 Ea 20 20 77 10,000 1,540 10,000 - - 11,540 50-TK-141 Wheel Wash Surge Tank 1 Ea 40 40 77 27,000 3,080 27,000 - - 30,080 50-PP-141 Wheel Wash Pump 1 Ea 20 20 77 12,000 1,540 12,000 - - 13,540 50-PP-145 Scale Area Cleanup Pump 2 Ea 20 40 77 5,000 3,080 10,000 - - 13,080 50-BD-148 Cu Conc Load Out Building 23 800 SF 0 30 7 140 77 50 549 780 1 190 000 - - 1 739 78050 BD 148 Cu Conc Load Out Building 23,800 SF 0.30 7,140 77 50 549,780 1,190,000 1,739,780 50-ZM-149 Cu Conc Area Front End Loader 1 Ea 0 77 300,000 - - 300,000 - 300,000 50-WX-150 Truck Scale 1 Ea 40 40 77 40,000 3,080 40,000 - - 43,080 50-ES-190 Emergency Shower 1 Ea 20 20 77 1,500 1,540 1,500 - - 3,040
Subtotal - Equipment 13190 1,015,630 4,321,873 300,000 - 5,637,503
Piping & DuctingPiping Allowance, Fittings, Valves Etc. 1 Lot 240 240 77 10,805 18,480 10,805 29,285 Ducting Allowance, Joints, Fittings & Dampers 1 Lot 480 480 77 21609 36,960 21,609 58,569
Subtotal - Piping & Ducting 720 55,440 - 32,414 - 87,854
Sitework Excavation 26,700 CY 0.045 1202 77 0.0 92,516 - - - 92,516 Backfill 20,000 CY 0.015 300 77 5.0 23,100 100,000 - - 123,100 Backfill Engineered 6,700 CY 0.050 335 77 6.5 25,795 43,550 - - 69,345
Subtotal - Sitework 1,837 141,411 143,550 - - 284,961
Concrete Building Foundation 29 CY 6 172 77 150 13,213 4,290 - - 17,503 Slab 1,084 CY 6 6504 77 150 500,808 162,600 - - 663,408 Pad, filter 75 CY 6 450 77 150 34,650 11,250 - - 45,900 Side Wall 222 CY 6 1332 77 150 102,564 33,300 - - 135,864 Tank Foundation 703 CY 10 7030 77 150 541,310 105,450 - - 646,760
Subtotal - Concrete 15488 1,192,545 316,890 - - 1,509,435
W:\KDE PROJECTS\431‐01 Orvana Resources Copperwood Project BFS\REPORT AND APPENDICES\Final Report\Appendix 4 ‐ Process Capital Cost Estimate\Q‐431‐01‐024 ‐ Capital Cost Estimate ‐ P1_2012‐03‐01
3/22/20125:08 PM Page 12
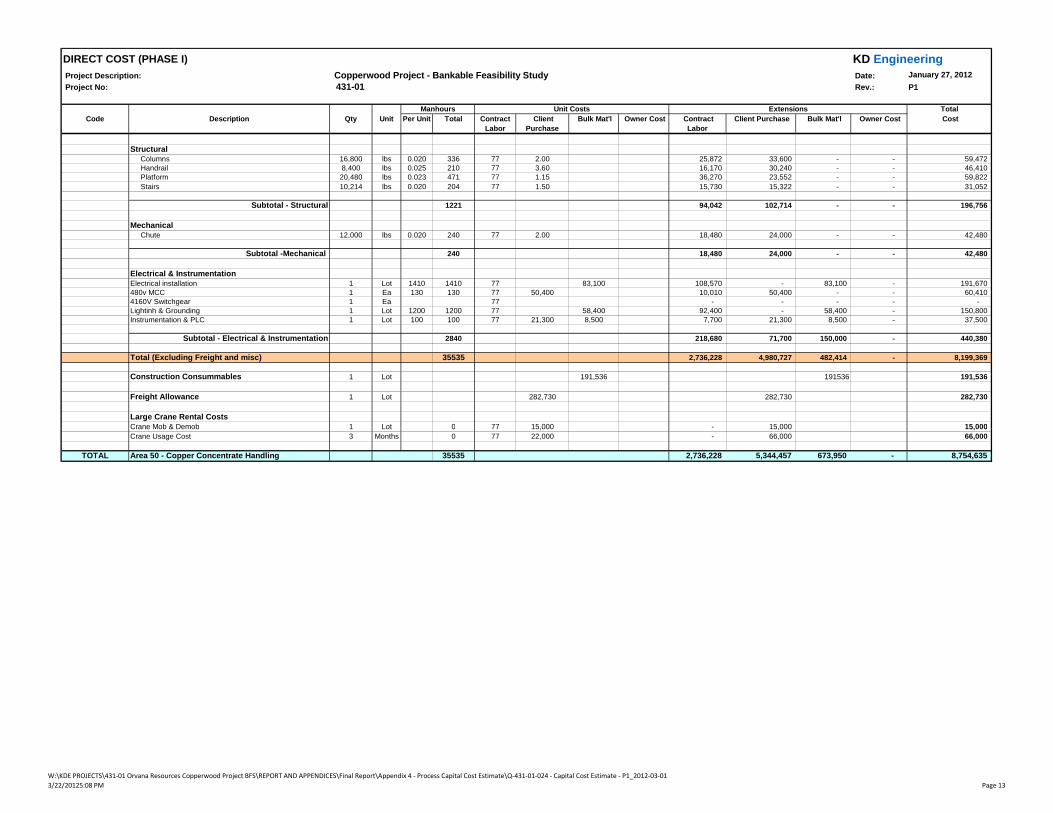
DIRECT COST (PHASE I) KD EngineeringProject Description: Copperwood Project - Bankable Feasibility Study Date: January 27, 2012
Project No: 431-01 Rev.: P1
TotalCode Description Qty Unit Per Unit Total Contract
Labor Client
Purchase Bulk Mat'l Owner Cost Contract
Labor Client Purchase Bulk Mat'l Owner Cost Cost
Manhours Unit Costs Extensions
Structural Columns 16,800 lbs 0.020 336 77 2.00 25,872 33,600 - - 59,472 Handrail 8,400 lbs 0.025 210 77 3.60 16,170 30,240 - - 46,410 Platform 20,480 lbs 0.023 471 77 1.15 36,270 23,552 - - 59,822 Stairs 10,214 lbs 0.020 204 77 1.50 15,730 15,322 - - 31,052
Subtotal - Structural 1221 94,042 102,714 - - 196,756
Mechanical Chute 12,000 lbs 0.020 240 77 2.00 18,480 24,000 - - 42,480
Subtotal -Mechanical 240 18,480 24,000 - - 42,480
Electrical & InstrumentationElectrical installation 1 Lot 1410 1410 77 83,100 108,570 - 83,100 - 191,670 480v MCC 1 Ea 130 130 77 50,400 10,010 50,400 - - 60,410 4160V Switchgear 1 Ea 77 - - - - - Lightinh & Grounding 1 Lot 1200 1200 77 58,400 92,400 - 58,400 - 150,800 Instrumentation & PLC 1 Lot 100 100 77 21,300 8,500 7,700 21,300 8,500 - 37,500
Subtotal - Electrical & Instrumentation 2840 218,680 71,700 150,000 - 440,380
Total (Excluding Freight and misc) 35535 2,736,228 4,980,727 482,414 - 8,199,369
Construction Consummables 1 Lot 191,536 191536 191,536
Freight Allowance 1 Lot 282,730 282,730 282,730
Large Crane Rental CostsCrane Mob & Demob 1 Lot 0 77 15 000 - 15 000 15,000Crane Mob & Demob 1 Lot 0 77 15,000 15,000 15,000 Crane Usage Cost 3 Months 0 77 22,000 - 66,000 66,000
TOTAL Area 50 - Copper Concentrate Handling 35535 2,736,228 5,344,457 673,950 - 8,754,635
W:\KDE PROJECTS\431‐01 Orvana Resources Copperwood Project BFS\REPORT AND APPENDICES\Final Report\Appendix 4 ‐ Process Capital Cost Estimate\Q‐431‐01‐024 ‐ Capital Cost Estimate ‐ P1_2012‐03‐01
3/22/20125:08 PM Page 13

DIRECT COST (PHASE I) KD EngineeringProject Description: Copperwood Project - Bankable Feasibility Study Date: January 27, 2012
Project No: 431-01 Rev.: P1
TotalCode Description Qty Unit Per Unit Total Contract
Labor Client
Purchase Bulk Mat'l Owner Cost Contract
Labor Client Purchase Bulk Mat'l Owner Cost Cost
Manhours Unit Costs Extensions
Area 60 - Tails
Flocculant Area/Trailings Pump Building 5,600 SF 0.32 1,818 77 20 140,000 112,000 - - 252,000 60-TK-101 Tails Thickener 1 Ea 1000 1000 77 641,735 77,000 641,735 - - 718,735 60-TM-101 Tails Thickener Mechanism 1 Ea 0 0 77 0 - - - - Incl. abovePP-101 & 102 Tails Thickener Underflow Pump 8 Ea 40 80 77 46,186 6,160 369,488 - - 375,648 60-PP-105 Tails Thickener Overflow Pump 1 Ea 0 77 41,279 - 41,279 - - 41,279 60-PP-130 Tails Thickener Area Sump Pump 1 Ea 0 77 21,000 - 21,000 - - 21,000 60-ES-190 Emergency Shower 1 Ea 20 20 77 1,500 1,540 1,500 - - 3,040
Subtotal - Equipment 2918 224,700 1,187,002 - - 1,411,702
Piping & DuctingTailings Pipeline 12" Sch 40 Steel 12,000 ft 0.25 3000 77 18 231,000 216,000 - - 447,000 Misc Piping Allowance, Fittings, Valves Etc. 1 Lot 240 240 77 65,000 18,480 65,000 83,480
Subtotal - Piping & Ducting 3240 249,480 216,000 65,000 - 530,480
Sitework Excavation 4,320 CY 0.045 7525 77 0.0 579,425 - - - 579,425 Backfill 3,000 CY 0.015 5525 77 5.0 425,425 15,000 - - 440,425 Backfill Engineered 1,220 CY 0.050 2000 77 6.5 154,000 7,930 - - 161,930
Subtotal - Sitework 15050 1,158,850 22,930 - - 1,181,780
Concrete Building Floundation 31 CY 6 187 77 150 14,414 4,680 - - 19,094 Slab 155 CY 6 930 77 150 71,610 23,250 - - 94,860 Tank Foundation W Slab 330 CY 10 3300 77 150 254,100 49,500 - - 303,600
Subtotal - Concrete 4417 340,124 77,430 - - 417,554
Structural Thickener Access Cover 15,000 lbs 0.020 300 77 2.00 23,100 30,000 - - 53,100
Subtotal - Structural 300 23,100 30,000 - - 53,100
Electrical & InstrumentationElectrical installation 1 Lot 1220 1220 77 177,100 93,940 - 177,100 - 271,040 480v MCC 1 Ea 210 210 77 88,300 16,170 88,300 - - 104,470 4160V Switchgear 1 Ea 77 - - - - - Lightinh & Grounding 1 Lot 370 370 77 19,300 28,490 - 19,300 - 47,790 Instrumentation & PLC 1 Lot 80 80 77 16,300 6,500 6,160 16,300 6,500 - 28,960
Subtotal - Electrical & Instrumentation 1880 144,760 104,600 202,900 - 452,260
Total (Excluding Freight and misc) 27805 2,141,014 1,637,962 267,900 - 4,046,876
Construction Consummables 1 Lot 149,871 149871 149,871
Freight Allowance 1 Lot 102,790 102,790 102,790
TOTAL Area 60 - Tails 27805 2,141,014 1,740,752 417,771 - 4,299,537
W:\KDE PROJECTS\431‐01 Orvana Resources Copperwood Project BFS\REPORT AND APPENDICES\Final Report\Appendix 4 ‐ Process Capital Cost Estimate\Q‐431‐01‐024 ‐ Capital Cost Estimate ‐ P1_2012‐03‐01
3/22/20125:08 PM Page 14

DIRECT COST (PHASE I) KD EngineeringProject Description: Copperwood Project - Bankable Feasibility Study Date: January 27, 2012
Project No: 431-01 Rev.: P1
TotalCode Description Qty Unit Per Unit Total Contract
Labor Client
Purchase Bulk Mat'l Owner Cost Contract
Labor Client Purchase Bulk Mat'l Owner Cost Cost
Manhours Unit Costs Extensions
Area 70 - Reagents
Reagent Building 3,750 SF 0.32 1,218 77 30 93,750 112,500 - - 206,250 70-TK-100 MIBC Storage Tank 1 Ea 60 60 77 5,200 4,620 5,200 - - 9,820 PP-105 & 106 MIBC Circulation Pump 2 Ea 10 20 77 10,000 1,540 20,000 - - 21,540 70-TK-110 PAX Storage Tank 1 Ea 60 60 77 5,200 4,620 5,200 - - 9,820 70-PP-115 & 116 PAX Circulation Pump 2 Ea 10 20 77 10,000 1,540 20,000 - - 21,540 70-TK-120 NaHS Storage Tank 1 Ea 60 60 77 5,200 4,620 5,200 - - 9,820 PP-125 & 126 NaHS Circulation Pump 2 Ea 10 20 77 10,000 1,540 20,000 - - 21,540 70-TK-130 Na2SiO3 Storage Tank 1 Ea 60 60 77 5,200 4,620 5,200 - - 9,820 TK-135 & 136 Na2SiO3 Circulation Pump 2 Ea 10 20 77 10,000 1,540 20,000 - - 21,540 70-BN-140 Flocculant Storage Bin 1 Ea 40 40 77 70,000 3,080 70,000 - - 73,080 70-FE-140 Flocculant Feeder 1 Ea 40 40 77 15,000 3,080 15,000 - - 18,080 70-TK-145 Flocculant Mix/Storage Tank 1 Ea 60 60 77 44,100 4,620 44,100 - - 48,720 70-AG-145 Flocculant Mix Agitator 1 Ea 60 60 77 50,000 4,620 50,000 - - 54,620 70-PP-145 Flocculant Pump 1 Ea 20 20 77 15,000 1,540 15,000 - - 16,540 70-TK-150 Flocculant Storage Tank 1 Ea 60 60 77 44,100 4,620 44,100 - - 48,720 PP-155 & 156 Flocculant Circulation Pump 2 Ea 10 20 77 10,000 1,540 20,000 - - 21,540 70-PP-158 Flocculant Sump Pump 1 Ea 20 20 77 12,000 1,540 12,000 - - 13,540 70-TK-160 NDM Storage 1 Ea 20 20 77 5,200 1,540 5,200 - - 6,740 70-TK-170 SS/CMC Storage 1 Ea 20 20 77 4,000 1,540 4,000 - - 5,540 70-ES-190 Emergency Shower 1 Ea 20 20 77 1,500 1,540 1,500 - - 3,040
Subtotal - Equipment 700 53,900 381,700 - - 435,600
Piping & DuctingPiping Allowance, Fittings, Valves Etc. 1 Lot 240 240 77 35,000 18,480 35,000 53,480 Ducting Allowance, Joints, Fittings & Dampers 1 Lot 160 160 77 15,000 12,320 15,000 27,320
Subtotal - Piping & Ducting 400 30,800 - 50,000 - 80,800
Concrete Slab 105 CY 6 630 77 150 48,510 15,750 - - 64,260 Foundation 80 CY 6 480 77 150 36,960 12,000 - - 48,960
Subtotal - Concrete 1,110 85,470 27,750 - - 113,220
Electrical & InstrumentationElectrical installation 1 Lot 1100 1100 77 52,000 84,700 - 52,000 - 136,700 480v MCC 1 Ea 100 100 77 36,900 7,700 36,900 - - 44,600 4160V Switchgear 1 Ea 77 - - - - - Lightinh & Grounding 1 Lot 580 580 77 29,800 44,660 - 29,800 - 74,460 Instrumentation & PLC 1 Lot 110 110 77 23,800 9,500 8,470 23,800 9,500 - 41,770
Subtotal - Electrical & Instrumentation 1890 145,530 60,700 91,300 - 297,530
Total (Excluding Freight and misc) 4100 315,700 470,150 141,300 - 927,150
Construction Consummables 1 Lot 22,099 22099 22,099
Freight Allowance 1 Lot 31,680 31,680 31,680
Large Crane Rental CostsCrane Mob & Demob 1 Lot 0 77 15,000 - - 15,000 - 15,000 Crane Usage Cost 3 Months 0 77 20,000 - - 60,000 - 60,000
TOTAL Area 70 - Reagents 4100 315,700 501,830 238,399 - 1,055,929
W:\KDE PROJECTS\431‐01 Orvana Resources Copperwood Project BFS\REPORT AND APPENDICES\Final Report\Appendix 4 ‐ Process Capital Cost Estimate\Q‐431‐01‐024 ‐ Capital Cost Estimate ‐ P1_2012‐03‐01
3/22/20125:08 PM Page 15

DIRECT COST (PHASE I) KD EngineeringProject Description: Copperwood Project - Bankable Feasibility Study Date: January 27, 2012
Project No: 431-01 Rev.: P1
TotalCode Description Qty Unit Per Unit Total Contract
Labor Client
Purchase Bulk Mat'l Owner Cost Contract
Labor Client Purchase Bulk Mat'l Owner Cost Cost
Manhours Unit Costs Extensions
Area 75 Sampling
75-F-15 Sampling Package 1 Ea 2000 2000 77 1,000,000 154,000 1,000,000 - - 1,154,000 75-TK-101 Sample Tanks 1 Ea 0 77 0 - - - - Incl. above75-TK-105 Sample Tanks 1 Ea 0 77 0 - - - - Incl. above70-ES-190 Emergency Shower 1 Ea 20 20 77 1,500 1,540 1,500 - - 3,040
Subtotal - Equipment 2020 155,540 1,001,500 - - 1,157,040
Piping & DuctingPiping Allowance, Fittings, Valves Etc. 1 Lot 71 71 77 2,504 5,444 2,504 7,948 Ducting Allowance, Joints, Fittings & Dampers 1 Lot 141 141 77 5,008 10,888 5,008 15,895
Subtotal - Piping & Ducting 212 16,332 - 7,511 - 23,843
Electrical & InstrumentationElectrical installation 1 Lot 80 80 77 3,600 6,160 - 3,600 - 9,760 480v MCC 1 Ea 40 40 77 12,200 3,080 12,200 - - 15,280 4160V Switchgear 1 Ea 0 0 77 - - - - - Lightinh & Grounding 1 Lot 110 110 77 5,900 8,470 - 5,900 - 14,370 Instrumentation & PLC 1 Lot 40 40 77 6,000 3,000 3,080 6,000 3,000 - 12,080
Subtotal - Electrical & Instrumentation 270 20,790 18,200 12,500 - 51,490
Total (Excluding Freight and misc) 2502 192,662 1,019,700 20,011 - 1,232,373
Construction Consummables 1 Lot 13,486 13486 13,486
Freight Allowance 1 Lot 52,660 52,660 52,660
Additional cost required for Labor Productivity 1 Lot - 77 - -
TOTAL Area 75 Sampling 2502 192,662 1,072,360 33,498 - 1,298,519
W:\KDE PROJECTS\431‐01 Orvana Resources Copperwood Project BFS\REPORT AND APPENDICES\Final Report\Appendix 4 ‐ Process Capital Cost Estimate\Q‐431‐01‐024 ‐ Capital Cost Estimate ‐ P1_2012‐03‐01
3/22/20125:08 PM Page 16

DIRECT COST (PHASE I) KD EngineeringProject Description: Copperwood Project - Bankable Feasibility Study Date: January 27, 2012
Project No: 431-01 Rev.: P1
TotalCode Description Qty Unit Per Unit Total Contract
Labor Client
Purchase Bulk Mat'l Owner Cost Contract
Labor Client Purchase Bulk Mat'l Owner Cost Cost
Manhours Unit Costs Extensions
Area 80/90 - Process & Reclaim Water / Fresh Water
80-TK-100 Process Water Tank 1 Ea 20 20 77 31,300 1,540 31,300 - - 32,840 PP-105 & 106 Process Water Pump 2 Ea 40 80 77 72,126 6,160 144,252 - - 150,412 PT-110 & 111 Reclaim Water Pump 2 Ea 20 40 77 16,350 3,080 32,700 - - 35,780 80-PT-115 Reclaim Seepage Well Pump 2 Each 20 40 77 34,345 3,080 68,690 - - 71,770 80-SA-120 Reclaim Water Sampler 1 Ea 40 40 77 35,000 3,080 35,000 - - 38,080 90-TK-100 Fresh Water Tank 1 Ea 40 40 77 31,300 3,080 31,300 - - 34,380 90-TK-105 Gland Seal Water Tank 1 Ea 40 40 77 20,800 3,080 20,800 - - 23,880 90-TK-110 Portable Water Tank 1 Ea 40 40 77 31,300 3,080 31,300 - - 34,380 90-PP-115 & 116 Gland Seal Water Pump 2 Ea 20 40 77 18,114 3,080 36,228 - - 39,308 90-TK-100 Day Fuel Tank 1 Ea 20 20 77 27,000 1,540 27,000 - - 28,540 90-TK-110 Day Fuel Tank 1 Ea 20 20 77 27,000 1,540 27,000 - - 28,540
Subtotal - Equipment 420 32,340 485,570 - - 517,910
Piping & DuctingReclaim Water Pipe 10" HDPE 6,200 ft 0.08 496 77 14 38,192 86,800 - - 124,992 Piping Allowance, Fittings, Valves Etc. 1 Lot 160 160 77 25,000 12,320 25,000 37,320
Subtotal - Piping & Ducting 656 50,512 86,800 25,000 - 162,312
Electrical & InstrumentationElectrical installation 1 Lot 570 570 77 75,600 43,890 - 75,600 - 119,490 480v MCC 1 Ea 180 180 77 142,600 13,860 142,600 - - 156,460 4160V Switchgear 1 Ea 77 - - - - - Lightinh & Grounding 1 Lot 100 100 77 5,100 7,700 - 5,100 - 12,800 Instrumentation & PLC 1 Lot 50 50 77 27,000 4,500 3,850 27,000 4,500 - 35,350
Subtotal - Electrical & Instrumentation 900 69,300 169,600 85,200 - 324,100 , , , ,
Total (Excluding Freight and misc) 1976 152,152 741,970 110,200 - 1,004,322
Construction Consummables 1 Lot 10,651 10651 10,651
Freight Allowance 1 Lot 43,140 43,140 43,140
TOTAL Area 80/90 - Process & Reclaim Water / Fresh Water 1976 152,152 785,110 120,851 - 1,058,113
W:\KDE PROJECTS\431‐01 Orvana Resources Copperwood Project BFS\REPORT AND APPENDICES\Final Report\Appendix 4 ‐ Process Capital Cost Estimate\Q‐431‐01‐024 ‐ Capital Cost Estimate ‐ P1_2012‐03‐01
3/22/20125:08 PM Page 17

DIRECT COST (PHASE I) KD EngineeringProject Description: Copperwood Project - Bankable Feasibility Study Date: January 27, 2012
Project No: 431-01 Rev.: P1
TotalCode Description Qty Unit Per Unit Total Contract
Labor Client
Purchase Bulk Mat'l Owner Cost Contract
Labor Client Purchase Bulk Mat'l Owner Cost Cost
Manhours Unit Costs Extensions
Area 95 - Electrical
Power Distribution
Plant: 13.8KV Power line 1 Lot 1750 1750 77 157,500 134,750 - 157,500 - 292,250 Transformers: 0 77 - - - - - Substation 2 Ea 250 500 77 200,000 38,500 400,000 - - 438,500 Electrical Room 2 Ea 125 250 77 52,000 19,250 104,000 - - 123,250 Water Treatment Plant 1 Lot 100 100 77 44,000 7,700 44,000 - - 51,700 Admin Bldg. + Change Rm. + Lab 3 Ea 50 150 77 10,000 11,550 30,000 - - 41,550 Warehouse + Maint. Shop 2 Ea 50 100 77 15,000 7,700 30,000 - - 37,700 Electrical Install'n (Switchgear, feeders) 1 Lot 5320 5320 77 400,000 1,264,500 409,640 400,000 1,264,500 - 2,074,140 Lighting & gounding 1 Lot 1110 1110 77 71,800 85,470 - 71,800 - 157,270
Portal: 13.8KV Power line 1 Lot 1500 1500 77 0 175,000 115,500 - 175,000 - 290,500 Transformer 1 Ea 200 200 77 100,000 0 15,400 100,000 - - 115,400
Tailings Impoundment: 13.8KV Power line 1 Lot 1200 1200 77 0 96,000 92,400 - 96,000 - 188,400 Transformer, 13.8KV ]480V 1 Ea 50 50 77 20,000 0 3,850 20,000 - - 23,850 Electrical Install'n (Switchgear, feeders) 1 Lot 350 350 77 0 82,900 26,950 - 82,900 - 109,850 Lighting & gounding 1 Lot 150 150 77 0 9,200 11,550 - 9,200 - 20,750
Water Pump station: 13.8KV Power line 1 Lot 5000 5000 77 500,000 385,000 - 500,000 - 885,000 Transformer 1 Ea 75 75 77 25,000 5,775 25,000 - - 30,775 Electrical Installation 1 Lot 140 140 77 32,500 10,780 - 32,500 - 43,280 Lighting & gounding 1 Lot 110 110 77 6,800 8,470 - 6,800 - 15,270 g g g g
Guard gate: Transformer 1 Ea 40 40 77 8,000 3,080 8,000 - - 11,080 Electrical Installation 1 Lot 50 50 77 7,500 3,200 3,850 7,500 3,200 - 14,550 Lighting & gounding 1 Lot 110 110 77 6,800 8,470 - 6,800 - 15,270
Emergency Power Gen: 480V feeders & installation 1 Lot 460 460 77 103,800.00 35,420 - 103,800 - 139,220 Generator Setup (Genset + ATS + Tank): 1 Lot 77 - - - - - 200kw @ Plant 1 Lot 100 100 77 50,000 7,700 50,000 - - 57,700 2000kw @ Mine 1 Lot 250 250 77 400,000 19,250 400,000 - - 419,250 125kw @ Tails Impoundment PS 1 Lot 80 80 77 38,000 6,160 38,000 - - 44,160
Communications: 1 Lot 160 160 77 50,000 12,320 50,000 - - 62,320
Total (Excluding Freight and misc) 19305 1,486,485 1,706,500 2,510,000 - 5,702,985
Construction Consummables 1 Lot 104,054 104,054 104,054
Freight Allowance 1 Lot 216,030 216,030 216,030
TOTAL Area 95 - Electrical 19305 1,486,485 1,922,530 2,614,054 - 6,023,069
W:\KDE PROJECTS\431‐01 Orvana Resources Copperwood Project BFS\REPORT AND APPENDICES\Final Report\Appendix 4 ‐ Process Capital Cost Estimate\Q‐431‐01‐024 ‐ Capital Cost Estimate ‐ P1_2012‐03‐01
3/22/20125:08 PM Page 18

DIRECT COST (PHASE I) KD EngineeringProject Description: Copperwood Project - Bankable Feasibility Study Date: January 27, 2012
Project No: 431-01 Rev.: P1
TotalCode Description Qty Unit Per Unit Total Contract
Labor Client
Purchase Bulk Mat'l Owner Cost Contract
Labor Client Purchase Bulk Mat'l Owner Cost Cost
Manhours Unit Costs Extensions
Area 100 - Non-Process Buildings
Pre-Fab Buildings100-L-001 Administration Building 6,000 SF 0.42 2494 77 50 192,000 300,000 - - 492,000 100-L-010 Laboratory 4,000 SF 0.68 2701 77 68 208,000 272,000 - - 480,000
Laboratory Equipment 1 Lot 0.00 0 77 400,000 - 400,000 - - 400,000 100-L-020 Warehouse Building 7,000 SF 0.31 2182 77 35 168,000 245,000 - - 413,000 100-L-030 Maintenance Shops and Plant Offices
Plant Offices 2,500 SF 0.39 974 77 50 75,000 125,000 - - 200,000 Plant Maintenance Shop 4,875 SF 0.43 2089 77 45 160,875 219,375 - - 380,250 Plant Instrumentation and Elect. Shop 1,250 SF 0.34 422 77 35 32,500 43,750 - - 76,250
100-L-040 Mine Offices and Change Room 10,800 SF 0.52 5610 77 70 432,000 756,000 - - 1,188,000 Guard Gate 1,500 SF 1.27 1909 77 70 147,000 105,000 - - 252,000 Core Storage Building 3,750 SF 0.52 1950 77 35 150,150 131,250 - - 281,400 Diesel Truck Building 2,000 SF 0.39 779 77 35 60,000 70,000 - - 130,000
100-L-010 Modular Building 4,000 SF 0.32 1299 77 35 100,000 140,000 - - 240,000 Modular Buildings Mill (MCC Analyzer etc) 8,500 SF 0.10 883 77 35 68,000 297,500 - - 365,500
Subtotal - Pre-Fab Buildings 23293 1,793,525 3,104,875 - - 4,898,400
SiteworkAdministration Building Excavation 8,010 CY 0.045 360 77 0.0 27,755 - - - 27,755 Backfill 6,010 CY 0.015 90 77 5.0 6,942 30,050 - - 36,992 Backfill Engineered 2,000 CY 0.050 100 77 6.5 7,700 13,000 - - 20,700 Laboratory Building Excavation 5,800 CY 0.045 261 77 0.0 20,097 - - - 20,097 Backfill 4,000 CY 0.015 60 77 5.0 4,620 20,000 - - 24,620 Backfill Engineered 1,800 CY 0.050 90 77 6.5 6,930 11,700 - - 18,630 W h B ildiWarehouse Building Excavation 9,100 CY 0.045 410 77 0.0 31,532 - - - 31,532 Backfill 6,500 CY 0.015 98 77 5.0 7,508 32,500 - - 40,008 Backfill Engineered 3,600 CY 0.050 180 77 6.5 13,860 23,400 - - 37,260 Maintenance and Shops and Plant Offices Excavation 12,250 CY 0.045 551 77 0.0 42,446 - - - 42,446 Backfill 8,000 CY 0.015 120 77 5.0 9,240 40,000 - - 49,240 Backfill Engineered 4,250 CY 0.050 213 77 6.5 16,363 27,625 - - 43,988 Mine Offices and Change Room Excavation 11,100 CY 0.045 500 77 0.0 38,462 - - - 38,462 Backfill 8,000 CY 0.015 120 77 5.0 9,240 40,000 - - 49,240 Backfill Engineered 3,100 CY 0.050 155 77 6.5 11,935 20,150 - - 32,085 Guard Gate Excavation 3,720 CY 0.045 167 77 0.0 12,890 - - - 12,890 Backfill 2,020 CY 0.015 30 77 5.0 2,333 10,100 - - 12,433 Backfill Engineered 1,700 CY 0.050 85 77 6.5 6,545 11,050 - - 17,595 Core Storage Building Excavation 5,670 CY 0.045 255 77 0.0 19,647 - - - 19,647 Backfill 4,000 CY 0.015 60 77 5.0 4,620 20,000 - - 24,620 Backfill Engineered 1,670 CY 0.050 84 77 6.5 6,430 10,855 - - 17,285 Electrical Substation Excavation 5,000 CY 0.045 225 77 0.0 17,325 - - - 17,325 Backfill 3,500 CY 0.015 53 77 5.0 4,043 17,500 - - 21,543 Backfill Engineered 1,500 CY 0.050 75 77 6.5 5,775 9,750 - - 15,525 Truck Wash Building Excavation 4,320 CY 0.045 194 77 0.0 14,969 - - - 14,969 Backfill 3,000 CY 0.015 45 77 5.0 3,465 15,000 - - 18,465 Backfill Engineered 1,220 CY 0.050 61 77 6.5 4,697 7,930 - - 12,627 Fence Excavation 80 CY 0.150 12 77 0.0 924 - - - 924 Backfill 60 CY 0.150 9 77 5.0 693 300 - - 993 Backfill Engineered 20 CY 0.150 3 77 6.5 231 130 - - 361
Subtotal - Sitework 4665 359,213 361,040 - - 720,253
W:\KDE PROJECTS\431‐01 Orvana Resources Copperwood Project BFS\REPORT AND APPENDICES\Final Report\Appendix 4 ‐ Process Capital Cost Estimate\Q‐431‐01‐024 ‐ Capital Cost Estimate ‐ P1_2012‐03‐01
3/22/20125:08 PM Page 19

DIRECT COST (PHASE I) KD EngineeringProject Description: Copperwood Project - Bankable Feasibility Study Date: January 27, 2012
Project No: 431-01 Rev.: P1
TotalCode Description Qty Unit Per Unit Total Contract
Labor Client
Purchase Bulk Mat'l Owner Cost Contract
Labor Client Purchase Bulk Mat'l Owner Cost Cost
Manhours Unit Costs Extensions
ConcreteAdministration/ Engineering Foundation Wall/Footing 46 CY 6 275 77 150 21,166 6,872 - - 28,039 Administration/ Engineering Pad 107 CY 6 642 77 150 49,434 16,050 - - 65,484 Laboratory Foundation Wall/Footing 35 CY 6 210 77 150 16,153 5,244 - - 21,397 Laboratory Pad 71 CY 6 426 77 150 32,802 10,650 - - 43,452 Warehouse Foundation Wall/Footing 46 CY 6 278 77 150 21,389 6,944 - - 28,333 Warehouse Pad 108 CY 6 648 77 150 49,896 16,200 - - 66,096 Maintenance Shops and Plant Offices Foundation Wall/Fo 65 CY 6 392 77 150 30,201 9,806 - - 40,007 Maintenance Shops and Plant Offices Pad 180 CY 6 1080 77 150 83,160 27,000 - - 110,160 Mine Offices and Change Room Foundation Wall/Footing 121 CY 6 726 77 150 55,902 18,150 - - 74,052 Mine Offices and Change Room Pad 163 CY 6 978 77 150 75,306 24,450 - - 99,756 Guard Gate Foundation Wall/Footing 25 CY 6 147 77 150 11,356 3,687 - - 15,043 Guard Gate Slab 37 CY 6 222 77 150 17,094 5,550 - - 22,644 Core Storage Building Foundation Wall/Footing 30 CY 6 177 77 150 13,634 4,427 - - 18,060 Core Storage Building Slab 64 CY 6 384 77 150 29,568 9,600 - - 39,168 Electrical Sub-Station Foundation Wall/Footing 33 CY 6 198 77 150 15,229 4,944 - - 20,173 Electrical Sub-Station Slab 67 CY 6 402 77 150 30,954 10,050 - - 41,004 Truck Wash Building Foundation Wall/Footing 25 CY 6 151 77 150 11,636 3,778 - - 15,413 Truck Wash Building Parking and Building Slab 71 CY 6 426 77 150 32,802 10,650 - - 43,452 Fence Foundation Column 74 CY 6 444 77 150 34,188 11,100 - - 45,288
Subtotal - Concrete 8206 631,869 205,152 - - 837,021
Piping & DuctingPiping Allowance, Fittings, Valves Etc. 1 Lot 815 815 77 45,000 62,773 45,000 107,773 Ducting Allowance, Joints, Fittings & Dampers 1 Lot 1630 1630 77 35,000 125,547 35,000 160,547
Subtotal - Piping & Ducting 2446 188,320 - 80,000 - 268,320
Total - Non Process Buildings 38609 2,972,927 3,671,067 80,000 - 6,723,994
Total (Excluding Freight and misc) 38609 2,972,927 3,671,067 80,000 - 6,723,994
Construction Consummables 1 Lot 208,105 208,105 208,105
Freight Allowance 1 Lot 197,960 197,960 197,960
Large Crane Rental CostsCrane Mob & Demob 1 Lot 0 77 20,000 - 20,000 20,000 Crane Usage Cost 3 Months 0 77 28,000 - 84,000 84,000
TOTAL Area 100 - Non-Process Buildings 38609 2,972,927 3,973,027 288,105 - 7,234,059
TOTAL DIRECT COSTS- ALL AREAS 274761 21,156,612 88,912,633 7,408,472 -2,171,668 115,306,049
W:\KDE PROJECTS\431‐01 Orvana Resources Copperwood Project BFS\REPORT AND APPENDICES\Final Report\Appendix 4 ‐ Process Capital Cost Estimate\Q‐431‐01‐024 ‐ Capital Cost Estimate ‐ P1_2012‐03‐01
3/22/20125:08 PM Page 20

DIRECT COST (PHASE II) KD EngineeringProject Description: Copperwood Project - Bankable Feasibility Study Date: January 27, 2012
Project No: 431-01 Rev.: P1
TotalCode Description Qty Unit Per Unit Total Contract
Labor Client
Purchase Bulk Mat'l Owner Cost Contract Labor Client Purchase Bulk Mat'l Owner Cost Cost
Area 20 - Ball Mill Grinding
20-ML-160 Ball Mill 1 Ea 3800 3800 77.0 4,074,600 292,600 4,074,600 - - 4,367,200
Subtotal - Equipment 3800 292,600 4,074,600 - - 4,367,200
Piping & DuctingPiping Allowance, Fittings, Valves Etc. 1 Lot 133 300 77.0 75,000 23,100 75,000 98,100
Subtotal - Piping & Ducting 300 23,100 - 75,000 - 98,100
ConcreteBall Mill Area Piers 195 CY 6 1170 77.0 150 90,090 29,250 - - 119,340
Subtotal - Concrete 1170 90,090 29,250 - - 119,340
StructuralMill Building Griding Area Interior Columns 14,400 lbs 0.020 288 77 2.00 22,176 28,800 - - 50,976 Handrail 2,688 lbs 0.025 67 77 3.60 5,174 9,677 - - 14,851 Service Platform 37,000 lbs 0.023 851 77 1.15 65,527 42,550 - - 108,077 Stairs 5,360 lbs 0.020 107 77 1.50 8,254 8,040 - - 16,294
Subtotal - Structural 1313 101,132 89,067 - - 190,199
Mechanical Chutes 3,681 lbs 0.025 92 77 2.5 7,085 9,202 - - 16,287 Misc. plate work, bolts,etc (5% subtotal) 184 lbs 0.025 5 77 2.0 354 368 - - 722
Subtotal - Mechanical 97 7,439 9,570 - - 17,009
Electrical & InstrumentationElectrical installation 1 Lot 230 230 77 38,300.00 17,710 - 38,300 - 56,010 480v MCC 1 Ea 30 30 77 5,100 2,310 5,100 - - 7,410 4160V Switchgear 1 Ea 200 200 77 500,000 15,400 500,000 - - 515,400 Lightinh & Grounding 1 Lot 560 560 77 27,600.00 43,120 - 27,600 - 70,720 Instrumentation & PLC 1 Lot 40 40 77 9,000 3,000.00 3,080 9,000 3,000 - 15,080
Subtotal - Electrical & Instrumentation 1060 81,620 514,100 68,900 - 664,620
Total (Excluding Freight and misc) 7740 595,981 4,716,586 143,900 - 5,456,468
Construction Consummables 1 Lot 41,719 - - 41,719 - 41,719
Freight Allowance 1 Lot 245,110 - 245,110 - - 245,110
Large Crane Rental CostsCrane Mob & Demob 1 Lot 0 77 20,000 - 20,000 20,000 Crane Usage Cost 6 Lot 0 77 28,000 - 168,000 168,000
TOTAL Area 20 - Ball Mill Grinding 7740 595,981 5,149,696 185,619 - 5,931,296
Manhours Unit Costs Extensions
W:\KDE PROJECTS\431‐01 Orvana Resources Copperwood Project BFS\REPORT AND APPENDICES\Final Report\Appendix 4 ‐ Process Capital Cost Estimate\Q‐431‐01‐024 ‐ Capital Cost Estimate ‐ P1_2012‐03‐01
3/22/20125:08 PM Page 21

DIRECT COST (PHASE II) KD EngineeringProject Description: Copperwood Project - Bankable Feasibility Study Date: January 27, 2012
Project No: 431-01 Rev.: P1
TotalCode Description Qty Unit Per Unit Total Contract
Labor Client
Purchase Bulk Mat'l Owner Cost Contract Labor Client Purchase Bulk Mat'l Owner Cost Cost
Manhours Unit Costs Extensions
Area 30 - Flotation
30-FC-106 to108 1st Rougher Flotation Cell 3 Ea 960 2880 77 488,000 221,760 1,464,000 - - 1,685,760 30-FC-153 2nd Cleaner Flotation Column 1 Ea 250 250 77 471,496 19,250 471,496 - - 490,746 30-FC-163 3rd Cleaner Flotation Column 1 Ea 200 200 77 276,910 15,400 276,910 - - 292,310
Subtotal - Equipment 3330 256,410 2,212,407 - - 2,468,817 .
Piping & DuctingPiping Allowance, Fittings, Valves Etc. 1 Lot 117 117 77 5,531 8,974 5,531 14,505 Ducting Allowance, Joints, Fittings & Dampers 1 Lot 233 233 77 11,062 17,949 11,062 29,011
Subtotal - Piping & Ducting 350 26,923 - 16,593 - 43,516
Electrical & InstrumentationElectrical installation 1 Lot 2100 2100 77 210,500.00 161,700 - 210,500 - 372,200 480v MCC 1 Ea 520 520 77 213,900 40,040 213,900 - - 253,940 4160V Switchgear 1 Ea 77 - - - - - Lightinh & Grounding 1 Lot 1220 1220 77 61,200.00 93,940 - 61,200 - 155,140 Instrumentation & PLC 1 Lot 250 250 77 52,500 21,000.00 19,250 52,500 21,000 - 92,750
Subtotal - Electrical & Instrumentation 4090 314,930 266,400 292,700 - 874,030
Total (Excluding Freight and misc) 7770 598,263 2,478,807 309,293 - 3,386,363
Construction Consummables 1 Lot 41,878 41878 41,878
Freight Allowance 1 Lot 141,500 141,500 141,500
Large Crane Rental CostsCrane Mob & Demob 1 Lot 0 77 15,000.00 - 15,000 15,000 Crane Usage Cost 3 Months 0 77 20,000.00 - 60,000 60,000
TOTAL Area 30 - Flotation 7770 598,263 2,695,307 351,171 - 3,644,741
W:\KDE PROJECTS\431‐01 Orvana Resources Copperwood Project BFS\REPORT AND APPENDICES\Final Report\Appendix 4 ‐ Process Capital Cost Estimate\Q‐431‐01‐024 ‐ Capital Cost Estimate ‐ P1_2012‐03‐01
3/22/20125:08 PM Page 22

DIRECT COST (PHASE II) KD EngineeringProject Description: Copperwood Project - Bankable Feasibility Study Date: January 27, 2012
Project No: 431-01 Rev.: P1
TotalCode Description Qty Unit Per Unit Total Contract
Labor Client
Purchase Bulk Mat'l Owner Cost Contract Labor Client Purchase Bulk Mat'l Owner Cost Cost
Manhours Unit Costs Extensions
Area 40- Regrind
40-ML-215 Regrind Mill 1 Ea 3000 3000 77 1,500,000 231,000 1,500,000 - - 1,731,000 40-ZB-215 Ball Charge Chute 1 Ea 40 40 77 17,500 3,080 17,500 - - 20,580
Subtotal - Equipment 3040 234,080 1,517,500 - - 1,751,580
Piping & DuctingPiping Allowance, Fittings, Valves Etc. 1 Lot 106 106 77 3,794 8,193 3,794 11,987 Ducting Allowance, Joints, Fittings & Dampers 1 Lot 212.800 213 77 7587.5 16,386 7,588 23,973
Subtotal - Piping & Ducting 319 24,578 - 11,381 - 35,960
Electrical & InstrumentationElectrical installation 1 Lot 350 350 77 36,100.00 26,950 - 36,100 - 63,050 480v MCC 1 Ea 100 100 77 50,200 7,700 50,200 - - 57,900 4160V Switchgear 1 Ea 150 150 77 450,000 11,550 450,000 - - 461,550 Lightinh & Grounding 1 Lot 410 410 77 20,400.00 31,570 - 20,400 - 51,970 Instrumentation & PLC 1 Lot 50 50 77 6,000 4,000.00 3,850 6,000 4,000 - 13,850
Subtotal - Electrical & Instrumentation 1060 81,620 506,200 60,500 - 648,320
Total (Excluding Freight and misc) 4419 340,278 2,023,700 71,881 - 2,435,860
Construction Consummables 1 Lot 23,819 23,819.49 23,819
Freight Allowance 1 Lot 105,970 105,970 105,970
TOTAL Area 40- Regrind 4419 340,278 2,129,670 95,701 - 2,565,649
TOTAL DIRECT COST- ALL AREAS 19929 1,534,523 9,974,673 632,491 0 12,141,687
W:\KDE PROJECTS\431‐01 Orvana Resources Copperwood Project BFS\REPORT AND APPENDICES\Final Report\Appendix 4 ‐ Process Capital Cost Estimate\Q‐431‐01‐024 ‐ Capital Cost Estimate ‐ P1_2012‐03‐01
3/22/20125:08 PM Page 23

KD EngineeringProject Description: Copperwood Project - Bankable Feasibility Study Date: January 27, 2012
Project No: 431-01 Rev.: P1
TotalCode Description Qty Unit Per Unit Total Contract
Labor Client
Purchase Bulk Mat'l Owner
Cost Contract Labor Client
Purchase Bulk Mat'l Owner Cost Cost
ENGINEERING
MANAGEMENT Coleman Engineering - road 519 to site, North route 1 Lot 1.00 1.00 251,134 251,134 - - - 251,134 Gogebic Range Water Authority Engineering (C2AE) 1 Lot 1.00 1.00 950,000 950,000 - - - 950,000 Project Management 50 Wk 16.00 800.00 125 100,000 - - - 100,000 Meetings, Schedules, Misc 2 Wk 40.00 80.00 150 12,000 - - - 12,000 Document Control 40 Wk 16.00 640.00 115 73,600 - - - 73,600 Site Visits 14 Trip - 800 - 11,200 - - 11,200 Per Diem Expenses 3 Wk - 700 - 2,100 - - 2,100 Project Engineering 25 Wk 16.00 400.00 115 46,000 - - - 46,000 Management for Sub-contractors 10 Wk 40.00 400.00 150 60,000 - - - 60,000
PROCESS DESIGNEquipment Specifications 18 Wk 24.00 432.00 125 54,000 - - - 54,000 Construction and Material Specifications 4 Wk 32.00 128.00 125 16,000 - - - 16,000 Trade off Evaluations 4 Wk 40.00 160.00 150 24,000 - - - 24,000 Vendor Drawing Coordination 12 Wk 24.00 288 125 36,000 - - - 36,000 Review Difinitive Cost Estimate Study 2 Wk 40.00 80 125 10,000 - - - 10,000 Finalize Equipment List 3 Wk 40.00 120 125 15,000 - - - 15,000 Finalize Design Criteria 1 Wk 40.00 40 125 5,000 - - - 5,000 Finalize Plant Location & Layout 4 Wk 40.00 160 125 20,000 - - - 20,000 Home Office Clerical 20 Wk 16.00 320 65 20,800 - - - 20,800 Miscellaneous Technical support 1 Lot 1.00 1 75,000 75,000 - - - 75,000
DETAILED DRAWINGSFlow Sheets 12 Dwg 24.00 288 115.00 33,120 - - - 33,120 General Arrangements / Sections Drawings 51 Dwg 60.00 3,060 115.00 351,900 - - - 351,900 Civil Drawings 32 Dwg 45.00 1,440 115.00 165,600 - - - 165,600 Concrete Drawings 48 Dwg 45.00 2,160 115.00 248,400 - - - 248,400 Structural Detail Drawings 50 Dwg 45.00 2,250 115.00 258,750 - - - 258,750 G t h i l D i 1 L t 60 000 00 60 000 60 000
INDIRECT COST
Manhours Unit Costs Extensions
Geotechnical Drawings 1 Lot - 60,000.00 - 60,000 - - 60,000 Piping & Instrument Diagrams 36 Dwg 55.00 1,980 115.00 227,700 - - - 227,700 Mechanical Detail Drawings 55 Dwg 45.00 2,475 115.00 284,625 - - - 284,625 Piping / Ducting Drawings 32 Dwg 45.00 1,440 115.00 165,600 - - - 165,600 Electrical / Instrumentation - 115.00 - - - - -
Single Line Diagrams 12 Dwg 48.00 576 115.00 66,240 - - - 66,240 Overhead 4160V Powerline Drawings 4 Dwg 32.00 128 115.00 14,720 - - - 14,720 Substation, Electrical Room Drawings 6 Dwg 32.00 192 115.00 22,080 - - - 22,080 Raceway Drawings 20 Dwg 32.00 640 115.00 73,600 - - - 73,600 Grounding Drawings 8 Dwg 32.00 256 115.00 29,440 - - - 29,440 Lighting Drawings 12 Dwg 36.00 432 115.00 49,680 - - - 49,680 Schematic & Interconnect Drawings 32 Dwg 24.00 768 115.00 88,320 - - - 88,320 PLC Architecture/Nework Block Drawings 4 Dwg 48.00 192 115.00 22,080 - - - 22,080 PLC Engineering Drawings 10 Dwg 32.00 320 115.00 36,800 - - - 36,800 Instrumentation Loop Diagrams 20 Dwg 24.00 480 115.00 55,200 - - - 55,200 Control Philosophy Drawings 10 Dwg 24.00 240 115.00 27,600 - - - 27,600 Electrical Details/Standards 6 Dwg 24.00 144 115.00 16,560 - - - 16,560 Instrumentation Details/Standards 30 Dwg 32.00 960 115.00 110,400 - - - 110,400
Vendor Data Manuals; Operating/Maintanence Manuals 1 Lot 1.00 1 130,000 - 130,000 - - 130,000
TOTAL - ENGINEERING 4,116,949 203,300 - - 4,320,249
W:\KDE PROJECTS\431‐01 Orvana Resources Copperwood Project BFS\REPORT AND APPENDICES\Final Report\Appendix 4 ‐ Process Capital Cost Estimate\Q‐431‐01‐024 ‐ Capital Cost Estimate ‐ P1_2012‐03‐01
3/22/20125:08 PM Page 24

KD EngineeringProject Description: Copperwood Project - Bankable Feasibility Study Date: January 27, 2012
Project No: 431-01 Rev.: P1
TotalCode Description Qty Unit Per Unit Total Contract
Labor Client
Purchase Bulk Mat'l Owner
Cost Contract Labor Client
Purchase Bulk Mat'l Owner Cost Cost
INDIRECT COST
Manhours Unit Costs Extensions
PROCUREMENTPrepare Contractor Scope of Work and Bid Package 6 Wk 40.00 240.00 125.00 30,000 - - - 30,000 Prepare Equipment Bid Package 12 Wk 40.00 480.00 125.00 60,000 - - - 60,000 Prepare RFQ's 14 Wk 40.00 560.00 125.00 70,000 - - - 70,000 Issue Contractor RFQ & Bid Walkthrough 4 Wk 40.00 160.00 125.00 20,000 - - - 20,000 Compile Bidders List 6 Wk 40.00 240.00 125.00 30,000 - - - 30,000 Perform Bid Analysis 6 Wk 40.00 240.00 125.00 30,000 - - - 30,000 Expedite - schedule, certified drawings, etc. 6 Wk 40.00 240.00 125.00 30,000 - - - 30,000 Technical Support - review certified drawings, etc. 6 Wk 40.00 240.00 125.00 30,000 - - - 30,000 Overland Freight Coordination 6 Wk 40.00 240.00 125.00 30,000 - - - 30,000 Factory Equipment Inspections 6 Wk 40.00 240.00 125.00 30,000 - - - 30,000 Purchase Order Placement 12 Wk 40.00 480.00 125.00 60,000 - - - 60,000 Refurbishment Coordination Mechanical 0 Wk 40.00 - 125.00 - - - - - Refurbishment Coordination Electrical 0 Wk 40.00 - 125.00 - - - - - Vendor Services - comissioning and start-up 12 Wk 40.00 480.00 200.00 96,000 - - - 96,000 Consultant - (grinding or process expert, etc as needed) 4 Wk 40.00 160.00 200.00 32,000 - - - 32,000 On site equipment quality control check 24 Wk 16.00 384.00 150.00 57,600 - - - 57,600 IVA Broker Coordination (if needed) 0 Wk 40.00 - 125.00 - - - - - Procurement Engineer 14 Wk 40.00 560.00 125.00 70,000 - - - 70,000 Procurement Manager 20 Wk 40.00 800.00 150.00 120,000 - - - 120,000
TOTAL - PROCUREMENT 795,600 - - - 795,600
CONSTRUCTION MANAGEMENTProject manager (14 months) 56 Wk 50.00 2,800 150.00 420,000 - - - 420,000 Safety Engineer 24 Wk 32.00 768 125.00 96,000 - - - 96,000 Construction Manager 56 Wk 60.00 3,360 125.00 420,000 - - - 420,000 Engineering Manager 6 Wk 40.00 240 175.00 42,000 - - - 42,000 Quality Control Manager 24 Wk 16.00 384 125.00 48,000 - - - 48,000 Cost Controller 56 Wk 16.00 896 75.00 67,200 - - - 67,200 Construction Superintendents and field engineering 16 Wk 40.00 640 125.00 80,000 - - - 80,000 S h d l / B d t E i 56 Wk 16 00 896 115 00 103 040 103 040Schedule / Budget Engineer 56 Wk 16.00 896 115.00 103,040 - - - 103,040 Disciplined Engineers as Required 12 Wk 40.00 480 125.00 60,000 - - - 60,000 Engineer Per Diem Expenses 200 Wk - 700.00 - 140,000 - - 140,000 Construction Management Travel 24 Trip - 800.00 - 19,200 - - 19,200 Geotechnical Engineer 16 Wk 32.00 512 150.00 76,800 - - - 76,800 Manufacturing Equipment Erection 240 Lot 1.00 240 150.00 36,000 - - - 36,000 Manufacturing Tavel Expenses 1 Lot 1.00 1 15,000.00 - 15,000 - - 15,000 Vehicle Rental (3) 52 Wk 3.00 156 200.00 - 10,400 - - 10,400 Contractor Mob and Demob 1 Lot - 180,000.00 - 180,000 - - 180,000 Contractor Modular Office and Communications (3) 52 Wk 3.00 156 350.00 - 18,200 - - 18,200
TOTAL - CONSTRUCTION MANAGEMENT 1,449,040 382,800 - - 1,831,840
FIELD OFFICE EXPENSE & CONSTRUCTION SUPPORTApproval Process for Construction (2% of CM Cost) 1 Lot - 49,776.00 - 49,776 - - 49,776 Field Office Expense 1 Lot - 80,000.00 - 80,000 - - 80,000 Surveying 1 Lot - 65,000.00 - 65,000 - - 65,000 Temporary Power 3 Mths - 20,000.00 - 60,000 - - 60,000 Computers & Software 1 Lot - 30,000.00 - 30,000 - - 30,000 Mobilize / Demobilize 1 Lot - 60,000.00 - 60,000 - - 60,000 Insurance on Rental Equipment 1 Lot - 125,000.00 - 125,000 - - 125,000
TOTAL - FIELD OFFICE EXPENSE & CONSTRUCTION SUPPORT - 469,776 - - 469,776
TRAININGAllow 1 Lot - 225,000.00 - 225,000 - - 225,000 Training Engineer, 2 Required - - - - - - Training Manuals / CD's Lot - - - - - -
Manufacturing Equipment Erection Wk - - - - - - Manufacturing Travel Expenses Trip - - - - - - Per Diem Expenses Wk - - - - - -
TOTAL - TRAINING - 225,000 - - 225,000
W:\KDE PROJECTS\431‐01 Orvana Resources Copperwood Project BFS\REPORT AND APPENDICES\Final Report\Appendix 4 ‐ Process Capital Cost Estimate\Q‐431‐01‐024 ‐ Capital Cost Estimate ‐ P1_2012‐03‐01
3/22/20125:08 PM Page 25

KD EngineeringProject Description: Copperwood Project - Bankable Feasibility Study Date: January 27, 2012
Project No: 431-01 Rev.: P1
TotalCode Description Qty Unit Per Unit Total Contract
Labor Client
Purchase Bulk Mat'l Owner
Cost Contract Labor Client
Purchase Bulk Mat'l Owner Cost Cost
INDIRECT COST
Manhours Unit Costs Extensions
INITIAL FILLInitial Fill 1 Lot - 2,882,700.00 - 2,882,700 - - 2,882,700 Lime - - - - - - Initial SAG Mill Liners - - - - - - Initial Ball Mill Liners - - - - - - Regrind Ball Mill Liners - - - - - - SAG Mill Balls - - - - - - Ball Mill Balls - - - - - -
TOTAL - INITIAL FILL - 2,882,700 - - 2,882,700
STARTUPGogebic Range Water Authority Services 1 Lot - 250,000.00 - 250,000 - - 250,000 Other Engineers - allow 1 Lot - 120,000.00 - 120,000 - - 120,000
Per Diem Expenses Wk - - - - - -
TOTAL - STARTUP - 370,000 - - 370,000
SPARE PARTSSpare Part Allowance (2.5% of Equipment Cost) 1 Lot - 999,165.43 - 999,165 - - 999,165 SAG Mill Liners, Steel Ton - - - - - - Ball Mill Liners, Rubber Sets - - - - - -
TOTAL - SPARE PARTS - 999,165 - - 999,165
OWNER'S COSTSOwner's Costs 1 Lot - 3,000,000 - - 3,000,000 - 3,000,000 Plant Staff Personel Allowance 1 Lot - - - - - Incl aboveOperating Personnel 1 Lot - - - - - Incl aboveMaintenance Personnel 1 Lot - - - - - Incl aboveGeotechnical Engineering 1 Lot - - - - - Incl aboveGeotechnical Engineering 1 Lot Incl aboveAllowance for Development Study 1 Lot - - - - - Incl aboveAllowance for Feasibility Study 1 Lot - - - - - Incl aboveGeotechnical Construction Quality Assurance 1 Lot - - - - - Incl above
Review Engineering and TestingReview Detail Engineering Dwgs 1 Lot - - - - - Incl aboveProject Manager On Site for Start-Up 1 Lot - - - - - Incl aboveProject Manager at Engineering Office 1 Lot - - - - - Incl aboveDrill and case exploratory water wells 1 Lot - - - - - Incl aboveHydrologist 1 Lot - - - - - Incl aboveGeotechnical consultant 1 Lot - - - - - Incl aboveFollow-up Metallurgical Testing 1 Lot - - - - - Incl aboveTravel to Plant Site 1 Lot - - - - - Incl aboveTravel to Engineering Office 1 Lot - - - - - Incl above
PermittingEnvironmental Permit 1 Lot - 2,500,000 - - 2,500,000 - 2,500,000
TOTAL - OWNER'S COSTS - - 5,500,000 - 5,500,000
W:\KDE PROJECTS\431‐01 Orvana Resources Copperwood Project BFS\REPORT AND APPENDICES\Final Report\Appendix 4 ‐ Process Capital Cost Estimate\Q‐431‐01‐024 ‐ Capital Cost Estimate ‐ P1_2012‐03‐01
3/22/20125:08 PM Page 26
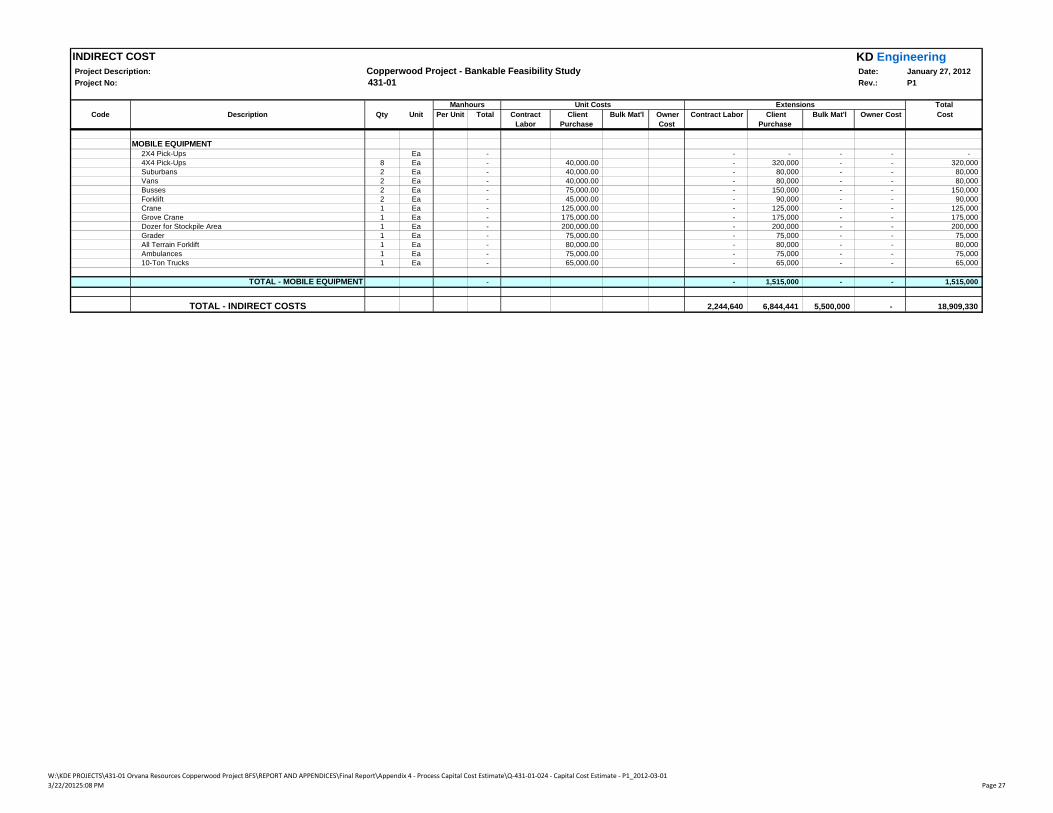
KD EngineeringProject Description: Copperwood Project - Bankable Feasibility Study Date: January 27, 2012
Project No: 431-01 Rev.: P1
TotalCode Description Qty Unit Per Unit Total Contract
Labor Client
Purchase Bulk Mat'l Owner
Cost Contract Labor Client
Purchase Bulk Mat'l Owner Cost Cost
INDIRECT COST
Manhours Unit Costs Extensions
MOBILE EQUIPMENT2X4 Pick-Ups Ea - - - - - - 4X4 Pick-Ups 8 Ea - 40,000.00 - 320,000 - - 320,000 Suburbans 2 Ea - 40,000.00 - 80,000 - - 80,000 Vans 2 Ea - 40,000.00 - 80,000 - - 80,000 Busses 2 Ea - 75,000.00 - 150,000 - - 150,000 Forklift 2 Ea - 45,000.00 - 90,000 - - 90,000 Crane 1 Ea - 125,000.00 - 125,000 - - 125,000 Grove Crane 1 Ea - 175,000.00 - 175,000 - - 175,000 Dozer for Stockpile Area 1 Ea - 200,000.00 - 200,000 - - 200,000 Grader 1 Ea - 75,000.00 - 75,000 - - 75,000 All Terrain Forklift 1 Ea - 80,000.00 - 80,000 - - 80,000 Ambulances 1 Ea - 75,000.00 - 75,000 - - 75,000 10-Ton Trucks 1 Ea - 65,000.00 - 65,000 - - 65,000
TOTAL - MOBILE EQUIPMENT - - 1,515,000 - - 1,515,000
TOTAL - INDIRECT COSTS 2,244,640 6,844,441 5,500,000 - 18,909,330
W:\KDE PROJECTS\431‐01 Orvana Resources Copperwood Project BFS\REPORT AND APPENDICES\Final Report\Appendix 4 ‐ Process Capital Cost Estimate\Q‐431‐01‐024 ‐ Capital Cost Estimate ‐ P1_2012‐03‐01
3/22/20125:08 PM Page 27

Orvana Resources - Copperwood Project Feasibility Study
K D Engineering Document No. Q431-01-028 21 March 2012 KDE FORM No. A263a-7/12/99
APPENDIX 5
CNI REPORT
CALL & NICHOLAS, INC.
GEOMECHANICAL EVALUATION OF ROOM AND PILLAR MINING
AT ORVANA’S COPPERWOOD DEPOSIT
Prepared for
ORVANA
By
Larry R. Standridge
David E. Nicholas, P.E.
March 2012

CALL & NICHOLAS, INC.
TABLE OF CONTENTS
1.0 SUMMARY AND RECOMMENDATIONS ............................................................................ 1-1
1.1 RECOMMENDATIONS ................................................................................................................ 1-2
1.2 ADDITIONAL GEOMECHANICAL WORK REQUIRED .................................................................. 1-3
1.2.1 Work Required Before Mining Starts ................................................................................... 1-3
1.2.2 Work Required During Mining............................................................................................. 1-3
2.0 GEOLOGY .................................................................................................................................. 2-1
2.1 GEOLOGIC STRUCTURE............................................................................................................. 2-1
3.0 PRE-MINE STRESS CONDITIONS AND HYDROLOGY................................................... 3-1
4.0 ROCK STRENGTHS ................................................................................................................. 4-1
4.1 INTACT SHEAR STRENGTH ........................................................................................................ 4-1
4.2 ESTIMATE OF FRACTURE SHEAR STRENGTH ............................................................................ 4-2
4.3 ROCK QUALITY DESIGNATION (RQD) ..................................................................................... 4-2
4.4 ROCK-MASS STRENGTH ........................................................................................................... 4-2
5.0 ROOM AND PILLAR DIMENSIONS ..................................................................................... 5-1
5.1 MINING SEQUENCE ................................................................................................................... 5-1
5.2 ROOM ORIENTATION, WIDTHS, AND SUPPORT ......................................................................... 5-1
5.3 PRODUCTION PILLARS .............................................................................................................. 5-2
5.4 ACCESS ..................................................................................................................................... 5-3
6.0 SUBSIDENCE AND CAVING TO THE SURFACE .............................................................. 6-1
6.1 CAVING SUBSIDENCE ............................................................................................................... 6-1
6.2 TROUGH SUBSIDENCE ............................................................................................................... 6-1
6.3 CRACK LIMITS AND LAKE SUPERIOR ....................................................................................... 6-2

CALL & NICHOLAS, INC.
LIST OF TABLES
1-1 Average UCS for Geologic Units at Copperwood
1-2 Advance Mining Pass Pillar Dimensions for Copperwood
1-3 Retreat Mining Pass Pillar Dimensions for Copperwood
3-1 Stress Assumptions for Copperwood
4-1 Uniaxial Compressive Test Data
4-2 Intact Properties used in Rock-Mass Strength Calculations
4-3 Rock-Mass Strength Values
5-1 Advance Mining Pass Pillar Dimensions for Copperwood
5-2 Retreat Mining Pass Pillar Dimensions for Copperwood

CALL & NICHOLAS, INC.
LIST OF FIGURES
1-1 Overburden Thickness
1-2 Mineralized Zone Thickness (ft)
1-3 Access Area Design
2-1 Stratigraphic Column
2-2 Overburden Thickness with Interpreted Fault
4-1 Distribution of Domino UCS Test
4-2 RQD Distribution for Mineralized Zone
4-3 Rock-mass Calculation for Domino
5-1 Proposed Rock Bolt Pattern for Production Mining
5-2 Maximum Transfer Distance Related to Depth for Coal
5-3 Overburden Thickness
5-4 Mineralized Zone Thickness (ft)
5-5 Production Pillar Layout at 500 Foot Depth
5-6 Tributary Area Load for Barrier Pillars
5-7 Access Area Design
6-1 Setback Requirements from Lake Superior Shoreline

1-1
CALL & NICHOLAS, INC.
1.0 SUMMARY AND RECOMMENDATIONS
This section presents the results of a geomechanical evaluation of the Copperwood
deposit performed by Call & Nicholas, Inc. (CNI) at the request of Steve Milne of Milne &
Associates. The purpose of the study was to analyze geomechanical conditions at Copperwood
and determine mine design parameters using a room and pillar mining method.
CNI has not visited the property, touched the core or been involved in any of the data
collection. We have accepted the data as is. CNI’s analysis and recommendations are based on
available data provided by Orvana. The sources of data are:
Keane, J. M., Partington, L., Kerr, T. (2011). Prefeasibility Study of the
Copperwood Project, Upper Peninsula, Michigan, USA (Document No. Q431-02-
028). Tucson, Arizona.
Pakalinis & Associates (2010). Report on Preliminary Stability Assessment -
Copperwood Project to Orvana (No. ORVM-1/10).
Uniaxial compression test results provided by Orvana of test conducted at
Michigan Tech
Parker, Jack. (1966). Mining in a Lateral Stress Field at White Pine. “Rock
Mechanics Session,” Annual General Meeting, Quebec City, April, 1966.
Transactions, Volume LXIX, 1966, 375-383.
Vermeulen, Luke, “Evaluating the Relationship Between Moisture Induced
Expansion and Horizontal Stress Orientation in Samples from the Nonesuch
Formation” (M.S. Civil Engineering Thesis Defense, Michigan Technological
University).
Agapito, J. F. and Litsenberger, J. (1993). Depth and Horizontal Stress Challenges
at White Pine. Presentation at the SME Annual Meeting, Reno, NV, February 15-
18, 1993, Preprint no. 93-110.
The general input parameters controlling the design analyses are:
Depth: 100 ft to 975 ft (Figure 1-1)
Ore thickness: 7.5ft to 13 ft with 80% less than 11 ft (Figure 1-2)
Bedding Orientation:
o Strike: N20W to N30E
o Dip: 7 to 12 degrees to the north
Average Compressive strength (Table 1-1):
o Ore weakest formation (Domino) = 5400 psi
o Back (Red Laminated) = 7470 psi
o Floor (Copper Harbor) = 9330 psi

1-2
CALL & NICHOLAS, INC.
Pre Mine Stress Conditions:
o Principal Stress Orientation:
Azimuth = North/South
Plunge = 0 deg
o Principal Stress Magnitude = 2 to 3 times Overburden Stress
Phreatic Surface: Unknown – assumed near surface
Pore Pressure Conditions: Depressurized 15 ft into back and floor
1.1 Recommendations
The following summarizes the recommendations used in the economic analysis of the
Copperwood deposit:
1) Mining Direction : Generally along strike and down dip
2) Room Width: 20 ft with 8 ft long 5/8 inch diameter grouted cable bolts on 4ft by 4 ft
centers staggered
3) Pillar Criteria and Dimensions:
a. On the Advance:
i. Factor of safety (FOS) is greater than or equal to 1.5
ii. 16.5 ft x 45 ft to 22 ft x 56 ft depending on depth (Table 1-2)
iii. Long axis of pillar is in the longitudinal (bedding strike) direction of
mining (Figure 16.9)
b. On the Retreat:
i. FOS is greater than or equal to 1.2
ii. Mining is in the transverse (down dip) direction
iii. 16.5 ft x 16.5 ft to 22 ft x 22 ft depending on depth (Table 1-3)
4) Access (Figure 1-3):
a. Access Drift Width: 20 ft with 8 ft long 5/8 inch diameter grouted cable bolts
on 4 x 4 ft centers staggered, 4 x 4 inch W4D4 wire mesh (Grade 75), and a
minimum of 2 inches of 4000 psi shotcrete.
b. Internal Pillars: 15 ft wide and at least 100 ft long with a minimum 2 inches of
4000 psi shotcrete
c. Barrier Pillars:
i. 45 ft wide and at least 200 ft long for depths of 0 to 500 ft with a
minimum of two (2) inches of 4000 psi shotcrete
ii. 65 ft wide and at least 200 ft long for depths from 500 ft to 1100 ft
with a minimum of two (2) inches of 4000 psi shotcrete

1-3
CALL & NICHOLAS, INC.
5) Subsidence: The room and pillar plan is based on a no to low probability of pillar
failure criteria.
a. To minimize the risk of subsidence cracks intersecting Lake Superior, no
mining should be performed within 200 ft of Lake Superior and there should
be no pillar recovery within 500 ft of Lake Superior.
b. If no pillars fail, the subsidence will range between zero feet and 0.3 ft.
c. If the pillars do fail, the estimated subsidence would be between zero feet and
5 ft, depending on the pillar height, depth below the surface, and failed area.
1.2 Additional Geomechanical Work Required
Additional work has been divided into two groups: work required before mining starts
and work that should be performed during mining.
1.2.1 Work Required Before Mining Starts
Additional work required before the project can go forward is as follows:
1) Drill four (4) to six (6) core holes to collect geomechanical data, to collect samples
for rock strength testing and, if necessary, to install piezometers to measure the
phreatic surface.
2) In addition to the above core holes, drill at least two oriented core holes to determine
the orientation of the joints in the deposit.
3) The rock strength data base must be improved. Testing per rock type should include
the following:
a. Triaxial Compression – 8 tests per rock type
b. Uniaxial Compression – 4 tests per rock type
c. Fracture Shear Strength – 4 test per rock type
We estimate there are at least seven rock types: three in the ore zone, two in the back
and two in the floor.
4) Map joint sets in any underground workings or on exposed outcrops in the area to
provide guidance on joint lengths, spacing and orientation.
1.2.2 Work Required During Mining
Once development starts, stress measurements should be made to determine the stress
conditions at Copperwood. The results from the stress measurements should be used in a
numerical model to determine if the mine plan, as proposed, has any stress conditions that would
require changes to ground support, room widths, or orientation of mine workings.
As the mine opens, cell and/or scan line mapping should be performed to determine joint
orientations, lengths, and spacing as well identifying any faults in the mining area. The structure

1-4
CALL & NICHOLAS, INC.
mapping should continue as new areas of the mine open. The mine design can then be re-
evaluated and modified if necessary.
A monitoring program will be required for the life of the mine. The primary foundation
should be convergence monitoring of pillars and the back. In addition borehole extensometers
should be used early in the mining to evaluate pillar performance and back performance during
advance and retreat mining. Given the large area of the mine, a micro seismic system would
provide total coverage of the mine and provide early warning to stress build up.
Table 1-1: Average UCS for Geologic Units at Copperwood
Main Ore Body
Mining Position
Rock Unit Number of Samples
Average UCS (psi)
Upper Sandstone 5 9,210
Back Red Siltsone 5 5,160
Back Gray Siltstone 3 11,060
Back/Pillar Red Laminated 15 7,470
Back/Pillar Gray Laminated 9 11,130
Pillar Red Massive 7 11,100
Domino 17 5,400
Floor Copper Harbor 18 9,330
Table 1-2: Advance Mining Pass Pillar Dimensions for Copperwood
Overburden
Thickness (ft)
Length
(ft)
Width
(ft)Area (ft2)
Height
(ft)FOS Recovery
300 46 17 782 11 1.8 68.0%
600 53 20.5 1086.5 11 1.7 63.3%
800 56 22 1232 11 1.6 61.4%
950 58 23 1334 11 1.6 60.2%
300 45 16.5 742.5 10 1.7 68.7%
600 52 20 1040 10 1.6 63.9%
800 55 21.5 1182.5 10 1.6 62.0%
950 56 22 1232 10 1.6 61.4%
300 44 16 704 7.5 1.7 69.4%
600 50 19 950 7.5 1.6 65.2%
800 52 20 1040 7.5 1.6 63.9%
950 54 21 1134 7.5 1.6 62.6%

1-5
CALL & NICHOLAS, INC.
Table 1-3: Retreat Mining Pass Pillar Dimensions for Copperwood
Overburden
Thickness (ft)
Length
(ft)
Width
(ft)Area (ft2)
Height
(ft)FOS Recovery
300 17 17 782 11 1.2 76.3%
600 20.5 20.5 1086.5 11 1.2 71.6%
800 22 22 1232 11 1.2 69.7%
950 23 23 1334 11 1.2 68.5%
300 16.5 16.5 742.5 10 1.2 77.0%
600 20 20 1040 10 1.2 72.2%
800 21.5 21.5 1182.5 10 1.2 70.3%
950 22 22 1232 10 1.2 69.7%
300 16 16 704 7.5 1.2 77.8%
600 19 19 950 7.5 1.2 73.6%
800 20 20 1040 7.5 1.2 72.2%
950 21 21 1134 7.5 1.2 70.9%


2-1
CALL & NICHOLAS, INC.
2.0 GEOLOGY
The Copperwood deposit is located adjacent to Lake Superior in the Upper Peninsula,
Michigan in Gogebic County. The mineralized zone is contained in the Parting Shale at the base
of the Nonesuch Formation shale and immediately above the Copper Harbor Formation (Figure
2-1).
The copper bearing sequence, which will also comprise the pillars, consists of the
following units;
Domino – the principal copper host, comprised of black shale and siltstone with an
average thickness of 5.2 feet.
Red Massive – a siltstone with an average thickness of 0.9 feet.
Gray Laminated – a thinly bedded gray siltstone with an average thickness of 3.3 feet.
The back at Copperwood will mainly be in the Red Laminated unit. The average
thickness of this siltstone unit is 4.6 feet with ranges from 0 to 10 feet. In some areas, due to
grade cut offs, the upper portion of the Gray Laminated will not be mined and will remain in the
back.
The floor will be in the units at the top of the Copper Harbor Formation. In some areas
this will be the Red Siltstone unit, which is dominated by interlaminated siltstone and shale,
while in others it will be a massive bedded sandstone with calcite cement.
2.1 Geologic Structure
The mineralized sequence within the Nonesuch Formation has a strike between N20W
and N30E and dips gently to the north at 7 to 12 degrees. The overburden thickness increases
from 66 feet at the southern project boundary to approximately 975 feet at the northern limits of
the deposit. A north dipping shallow thrust fault striking N65E, with 10 to 23 feet of vertical
displacement, has been interpreted from modeled surfaces and drill core. The lateral extent of
this fault is unknown. Figure 2-2 shows the surface of the mineralized sequence along with the
interpreted fault. CNI expects there to be more structures than just this one fault and that these
structures are likely to impact pillar stability.


3-1
CALL & NICHOLAS, INC.
3.0 PRE-MINE STRESS CONDITIONS AND HYDROLOGY
No stress measurements are available for the Copperwood deposit; however, stress
measurements were taken at the White Pine Mine. The White Pine Mine, located about 18 miles
northeast of Copperwood, produced about 4.5 billion lbs of copper between 1954 and 1996 from
the same overall Stratigraphic position as the Copperwood mineralized zone. High horizontal
stresses at White Pine, which in some instances were more than three times the vertical stress,
caused both back and pillar failures. The back failures were often violent and occurred days or
even months after the back was exposed. The mining methods at White Pine, including pillar
dimensions, ground support, and mine orientation, were modified to deal with the impacts of the
horizontal stresses.
For the purpose of this study, stress ratios of 2H:1V up to 3H:1V have been assumed at
Copperwood. These ratios are similar to those experienced at White Pine. The orientation is
assumed to be a North-South direction perpendicular to the Keweenaw Fault. Table 3-1 presents
the magnitude and orientation assumptions for the principal stresses at Copperwood. The
magnitude and orientation of the horizontal stress field should be measured at Copperwood to
verify this assumption. If necessary, the ground support, pillar designs and/or development
orientations may need to be modified to reduce the impact of the high horizontal stresses.
CNI has not seen any hydrology data for the Copperwood project site but has assumed
that the phreatic level is near the surface. For analysis purposes, it is assumed that the mining
area will be depressurized in a zone extending from 15 feet above the back to 15 feet below the
floor and that this depressurized condition will continue for the life of mine.
Table 3-1: Stress Assumptions for Copperwood
Where:
ρ = Density
h = Depth
Principle Stress Orientation Magnitude
σ1North/South (2 to 3) * ρ * h
σ2Vertical ρ * h
σ3East/West (0.5 to 0.8) * ρ * h
Copperwood Stress Assumptions

4-1
CALL & NICHOLAS, INC.
4.0 ROCK STRENGTHS
A key element of any geotechnical study is the determination of the mechanical
properties of the various rock types within and around the area to be mined. The strength
properties of the rock must be defined for both the fractures and intact rock. With these
properties the rock-mass strength can be estimated.
The term rock mass refers to the rock on a large scale and represents the composite
system of intact rock, faults, joints, and other planes of weakness present within a given rock
unit. Since rock-mass properties cannot be measured directly, estimates of the rock-mass
properties are made using methods that relate the rock-mass properties to the more easily
measured intact rock and fracture shear strength properties. Therefore, the mechanical properties
of the rock mass will be dependent on the characteristics of the intact rock and the discontinuities
present.
4.1 Intact Shear Strength
In a uniaxial compression test, a cylinder of drill core is loaded axially without lateral
confining load until the sample fails. Unless the specimen fails along an obvious discontinuity,
the compressive strength determined by uniaxial compression testing should be assigned to the
intact rock. For this study, 79 uniaxial compression tests were reviewed. These tests were
conducted at Michigan Tech on samples collected from the main ore body. Table 4-1 contains
the number of samples and the average UCS for each of the geologic units tested while Figure 4-
1 shows the distribution of the uniaxial test results for the Domino, which is the weakest unit in
the pillars.
At White Pine, for comparison, the UCS for dry samples collected from the pillars ranged
from 19,500 to 29,700 psi while the range of UCS for the Domino at Copperwood is between
1,230 and 16,600 psi. The rocks at White Pine typically experienced a 50% or more reduction in
UCS when wet (10,200 – 10,500 psi). The samples tested at Copperwood were dry so additional
test should be performed on saturated samples to determine wet UCS strengths.
Additional parameters needed to determine the intact shear strength have been estimated
using empirical methods from the UCS results. Tensile strength of intact rock is typically
between
and
of the UCS. For this study a tensile strength equal to
of the UCS has been
used. The estimate for the linear triaxial compressive strength, defined by the intact friction

4-2
CALL & NICHOLAS, INC.
angle ( s ) and the intact cohesion ( sc ), is based on the following equations where
(or 12);
Table 4-2 presents the average UCS along with the estimated tensile strength, intact
friction angle, and intact cohesion for the units tested.
4.2 Estimate of Fracture Shear Strength
Fracture shear strength is the shear strength along existing fractures within the rock. This
strength is typically determined by direct-shear test conducted on two pieces of rock core that are
separated by a natural fracture; a load perpendicular to the fracture is applied, and then the shear
load necessary to displace the blocks relative to each other is monitored. The shear strengths of
the fractures for each rock type can then be calculated by using the data from multiple direct
shear tests at varying normal loads.
In the absence of direct-shear test, CNI estimated the fracture shear strengths based on
laboratory test for similar rock types from different locations. For this study a shear friction
angle ( f ) of 28° with a shear cohesion ( fc ) of 2 psi were used.
4.3 Rock Quality Designation (RQD)
RQD is used to represent the degree of fracturing within the rock-mass. It is defined as
the percentage of drill core with a length ≥ 2 times the core diameter. Figure 4-2 shows the
distribution of the RQD data for the mineralized zone at Copperwood. An RQD of 80%, which
approximately 90% of the logged core is greater than, was assumed for calculations during this
evaluation.
4.4 Rock-Mass Strength
Rock-mass strength parameters are necessary to evaluate geotechnical conditions and
support requirements of the proposed mine openings. Through the assessment of intact-rock
properties, fracture properties and the intensity of fracturing, empirical estimates of the rock-
mass strength can be derived. The rock-mass shear strength is bracketed on the high end by the
intact rock strength and on the low end by the fracture shear strength.
m
ms
2
1tan85.0 1
mc c
s2
98.0

4-3
CALL & NICHOLAS, INC.
Rock-mass strength values were estimated for the Red Laminated, Domino, and Red
Sandstone rock types (Table 4-3) using an approach developed at CNI (Karzulovic, Antonio.
2009. “Rock Mass Model.” In Guidelines for Open Pit Slope Design, edited by John Read and
Peter Stacey, 128-130. Australia: CSIRO Publishing. ). The Red Laminate is the dominant rock
type in the back while the Red Sandstone occurs mainly in the floor, and the Domino is the
weakest unit in the pillars. The method derives estimates of the rock-mass strength through a
combination of fracture and intact shear strengths along with the degree of fracturing (RQD)
present in the rock mass. An example showing the Domino rock-mass calculation is illustrated
in Figure 4-3.
Table 4-1: Uniaxial Compressive Test Data
Table 4-2: Intact Properties used in Rock-Mass Strength Calculations
Unit # Samples Average UCS (psi)
Upper Sandstone 5 9,210
(Red) Siltstone 5 5,160
Gray Siltstone 3 11,060
Red Laminated (Back) 15 7,470
Gray Laminated 9 11,130
Red Massive 7 11,100
Domino (Pillar) 17 5,400
Copper Harbor (Floor) 18 9,330
Main Ore Body
Tensile Strength
(psi)
Friction Angle
(deg)
Cohesion
(psi)
Upper Sandstone 9,210 770 49.1 1300
(Red) Siltstone 5,160 430 49.1 730
Gray Siltstone 11,060 920 49.1 1560
Red Laminated 7,470 620 49.1 1060
Gray Laminated 11,130 930 49.1 1570
Red Massive 11,100 930 49.1 1570
Domino 5,400 450 49.1 760
Copper Harbor 9,330 780 49.1 1320
UnitAverage UCS
(psi)
Estimated Values
Intact Properties

4-4
CALL & NICHOLAS, INC.
Table 4-3: Rock-Mass Strength Values
Rock Type Mining PositionTensile Strength
(psi)
Friction Angle
(deg)
Cohesion
(psi)
Red Laminated Back 75 39.6 210
Domino Pillar 55 39.6 160
Red Sandstone Floor 95 39.6 270
Rock-Mass Strengths

4-5
CALL & NICHOLAS, INC.
Figure 4-1: Distribution of Domino UCS Test
0.0
10.0
20.0
30.0
40.0
50.0
60.0
70.0
80.0
90.0
100.0
0 2000 4000 6000 8000 10000 12000 14000 16000
Cu
mm
ula
tive
Pe
rce
nt
Less
Th
an (
%)
Uniaxial Compressive Strength (psi)
Domino Rock Type

4-6
CALL & NICHOLAS, INC.
Figure 4-2: RQD Distribution for Mineralized Zone
0
10
20
30
40
50
60
70
80
90
100
30 40 50 60 70 80 90 100
Cu
mm
ula
tive
Pe
rce
nt
Less
Th
an (
%)
RQD (%)
Mineralized Zone RQD

4-7
CALL & NICHOLAS, INC.
Figure 4-3: Rock-mass Calculation for Domino
(a) Substance (b) Fracture
psi Filling: Nonepsi
28.0 °2 psi
(106) psi 80 %
0 psi/in0 psi/in
0.5
49.1 ° 49.1 °25
764.3 psi 764.3 psi 45
S3 Max = 2500
(c) Mass
0.4052
0.5948
°
psi
(106) psi
psi
psi
lbs/ft3
0.5269
660.2
55.0
450.3
740.3
4.0000.25
PRS = % Rock Substance PRF = % Rock Fracture
0.4731
TriaxialEmpirical
5403.0
12.00
165
39.6
155.5
2.546
0.27
m298.0c c
s
c
E :for
mt
c
cs ts
sEs
f c f
RQD
sk sn k20k
2RQD013.0e225.0 PRS(c)
PRS(c) -1 PRF(c)
2007503775.0 )(PRS RQD.e
)PRS( -1 )PRF(
)c(PRSE E sm
)2
45tan(c2 mmcm
s
)tan( )(PRF)tan( )(PRStan fs1
m
m
mm sin2
sin1
rfc
m2
1mtan85.0 1
s
c c PRF c )c(PRSc rffsm
cs
tscmtm σ
σσσ
Mi
RMR

5-1
CALL & NICHOLAS, INC.
5.0 ROOM AND PILLAR DIMENSIONS
Based on the geomechanical characteristics, CNI has provided following parameters for
room and pillar mining at the Copperwood property:
1. Mining Sequence
2. Room Parameters
a. Orientation of primary rooms
b. Room widths
c. Ground support
3. Pillar dimensions given mining thickness, overburden thickness (OBT), and rock
strengths
4. Access Parameters
a. Room Widths
b. Pillar Sizes
c. Ground Support
5.1 Mining Sequence
From a geomechanical point of view, mining of the Copperwood deposit should utilize an
advance mining pass with pillar dimensions that result in a high reliability, and retreat to the
mine entrance with a partial pillar recovery. The access location has already been identified and
is located on the south end of the deposit. Consequently advance mining should start at the
north, end and progress to the south. Because of the time to develop the access to the north,
advance mining can be performed in some of the areas until access to the north is reached.
Panels should be defined to fit the mining sequence but from a geotechnical point of view, a
panel width that includes three or four rooms would be appropriate.
The panels can be developed on the advance out to the east and west limits. The distance
between primary mining and pillar recovery should be in the range of 300 ft. This distance
should provide sufficient buffer so that the ground in the primary mining is not impacted by the
stress change due to pillar recovery.
5.2 Room Orientation, Widths, and Support
From a mining operation perspective, the long axis of development should be parallel to
the strike of bedding which is between N20W and N30E. This will provide the least amount of
dilution and result in a flat floor. The design recommendations call for production drifts in an

5-2
CALL & NICHOLAS, INC.
east/west orientation with crosscuts being aligned parallel to dip in a north/south direction. From
White Pine’s experience with high horizontal stress, they found that developing the dominant
room parallel to the primary stress reduced failures in the back. Unfortunately the direction of
the horizontal stress is near north/south which is perpendicular to the continuous room but
parallel with the crosscuts. The high horizontal stress at White Pine was in the range of 4000 to
10,000 psi while at Copperwood the high horizontal stress will be in the range of 800 to 4000
psi. The rock mass compressive strength of the rock in the back is in the range of 4000 to 6000
psi which should be able to handle most of the high stress.
The work performed by Marston & Associates for the prefeasibility study indicated that a
20 ft room width was acceptable. CNI agrees with this assessment as long as a beam equal to ¼
of the span can be maintained.
The ground support required to minimize instability due to the high stress is as follows
(Figure 5-1):
1. Fully grouted cable bolts 8 ft long and 5/8 inch diameter
2. Bolt spacing of 4 ft centers and staggered
Welded wire mesh or straps can be used in areas where the rock is highly fractured.
5.3 Production Pillars
Pillar dimensions were determined by calculating the load that the pillars can carry using
A.H. Wilson’s (1972) method and comparing that to the estimated load on the pillar.
Wilson’s method of calculating the load carrying capacity of a pillar is based on field
measurements where the outer yield zone carries little load but confines the core of the pillar and
the confined core carries most of the load. The load on the production pillars was based on the
tributary load area (TAL), which means that each pillar is designed to carry the entire overburden
load halfway to each adjacent pillar. The tributary area load was used because the width of the
deposit is so great that the stresses cannot arch across the entire deposit (Figure 5-2). The
calculation for tributary area load (TAL) is as follows:
Where:
W = Pillar width (ft) L = Pillar length (ft)
R = Room width (ft) OBT = Over Burden Thickness (ft)
γ = Density (lb/ft3)

5-3
CALL & NICHOLAS, INC.
The over burden thickness at Copperwood ranges from approximately 100 ft in the south
to nearly 975 ft at the northern boundary of the project area (Figure 5-3) while the mineralized
zone ranges from 7.5 to 13 ft (Figure 5-4). The design criteria used to determine ore pillar
dimensions are as follows:
1. Load = TAL to the surface
2. OBT ranges = 300, 600, 800, and 950 ft
3. Pillar heights = 7.5, 10, and 11 ft
4. Minimum FOS:
a. Primary Mining – FOS ≥ 1.5
b. Pillar Recovery – FOS ≥ 1.2
The rectangular pillar dimensions for the advance mining pass (Table 5-1) range from
16.5 ft x 45 ft to 22 ft x 56 ft depending on the overburden thickness and depth. They are offset
from one side of the panel drift to the other at a distance equal to half the pillar length
(Figure 5-5). The purpose of this offset is to limit the intersection area during primary mining
and to ensure easy access for the pillar recovery. The offset creates a geometry where the
crosscuts on one side of the panel drift line up with the center of the pillar on the opposite side.
The pillar recovery is accomplished by bisecting the rectangular pillars with a 12 ft wide room of
material from the center (length wise) of the pillars resulting in two square pillars (Table 5-2).
As additional rock strength testing, geologic mapping, hydrology, monitoring, and pillar
performance becomes available, the pillar analysis should be updated to ensure acceptable safety
factors or to maximize recovery.
As presented in Section 4, the units in the back (Red Laminated) and floor (Red
Sandstone) have a significantly higher rock-mass strength than the pillar units (Domino).
Therefore the pillars should not punch into the back or floor.
5.4 Access
For access and ventilation four drifts are required. The access drifts must be stable for
the life of the mine and therefore require a high reliability. The four access drifts are 20 ft wide
separated by long internal pillars that are 15 ft wide and at least 100 ft long. Cross cuts, which
can be up to 20 ft wide, should be offset between drifts to minimize intersection area. They can,
however, be aligned to improve access but additional ground support may be required.

5-4
CALL & NICHOLAS, INC.
To provide the high reliability and minimize maintenance, the ground support required is
as follows:
1) 8 ft long, 5/8 inch diameter fully grouted cable bolts
2) Bolt spacing of 4 ft centers and staggered
3) 4 x 4 inch W4D4 wire mesh (Grade 75)
4) Shotcrete the pillars with a minimum of 2 inches of 4000 psi.
The shotcrete is needed to minimize the air slacking of pillar’s sides. If air slacking were
permitted then the effective pillar dimensions would be reduced, possibly resulting in instability.
The internal pillars are designed at a FOS ≥ 1.5 using the tributary area load with an
overburden thickness of 800 ft. The access drifts are isolated from the mining panels by barrier
pillars on each side. The barrier pillars are designed at a FOS ≥ 1.5 with an area load equivalent
to the load transfer distance (LTD) over the mining panels plus half the width of the access area
for 500 and 800 ft depths (Figure 5-6). This load design assumes that the production pillars
adjacent to the barrier pillars have all failed. The load calculation for the barrier pillars is as
follows:
Where:
Aw = Access width (125 ft)
W = Pillar width (ft)
Tm= Maximum load transfer distance [ L = Pillar length (ft)
R = Room width (ft)
D = Depth or Overburden Thickness (ft)
γ = Density (lb/ft3)
Figure 5-7 shows the layout for the access areas as they transition from the 500 ft OBT
design to the 800 ft OBT design.

5-5
CALL & NICHOLAS, INC.
Table 5-1 – Advance Mining Pass Pillar Dimensions for Copperwood
Table 5-2 – Retreat Mining Pass Pillar Dimensions for Copperwood
Overburden
Thickness (ft)
Length
(ft)
Width
(ft)Area (ft2)
Height
(ft)FOS Recovery
300 46 17 782 11 1.8 68.0%
600 53 20.5 1086.5 11 1.7 63.3%
800 56 22 1232 11 1.6 61.4%
950 58 23 1334 11 1.6 60.2%
300 45 16.5 742.5 10 1.7 68.7%
600 52 20 1040 10 1.6 63.9%
800 55 21.5 1182.5 10 1.6 62.0%
950 56 22 1232 10 1.6 61.4%
300 44 16 704 7.5 1.7 69.4%
600 50 19 950 7.5 1.6 65.2%
800 52 20 1040 7.5 1.6 63.9%
950 54 21 1134 7.5 1.6 62.6%
Overburden
Thickness (ft)
Length
(ft)
Width
(ft)Area (ft2)
Height
(ft)FOS Recovery
300 17 17 782 11 1.2 76.3%
600 20.5 20.5 1086.5 11 1.2 71.6%
800 22 22 1232 11 1.2 69.7%
950 23 23 1334 11 1.2 68.5%
300 16.5 16.5 742.5 10 1.2 77.0%
600 20 20 1040 10 1.2 72.2%
800 21.5 21.5 1182.5 10 1.2 70.3%
950 22 22 1232 10 1.2 69.7%
300 16 16 704 7.5 1.2 77.8%
600 19 19 950 7.5 1.2 73.6%
800 20 20 1040 7.5 1.2 72.2%
950 21 21 1134 7.5 1.2 70.9%


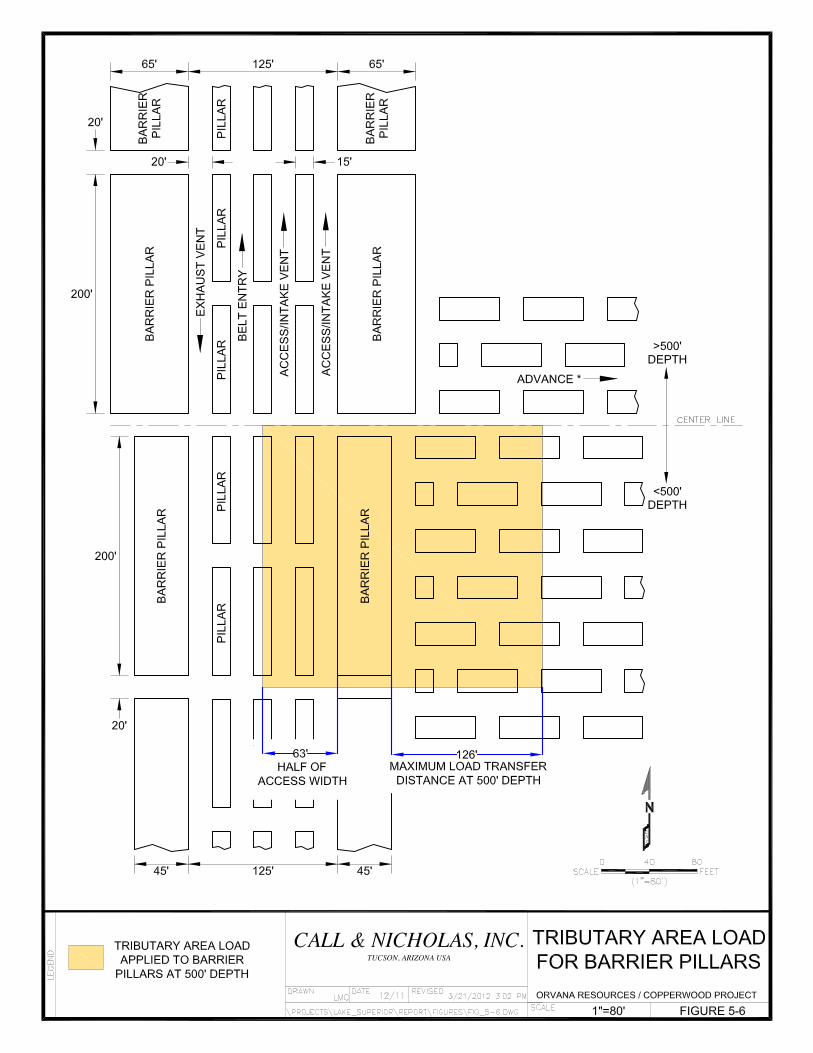


6-1
CALL & NICHOLAS, INC.
6.0 SUBSIDENCE AND CAVING TO THE SURFACE
Two failure mechanisms can result in surface effects, caving or chimney subsidence and
trough subsidence. Caving subsidence would result in a rubblized zone from the underground
workings to the surface Trough subsidence is the result of flexure of the beds due to limited or no
ground support from pillars.
6.1 Caving Subsidence
The caving subsidence is a function of ore thickness, swell factor during caving and
depth to ore. Given a mining height of15 ft and swell factor of 25% in the cave there should be
no surface effects for depths greater than 200 ft. The pillars have been designed for a minimum
depth of 300ft which results in the pillars at depths of 200 ft or less exceeding the minimum
design FOS of 1.6 on the advance and 1.2 on the retreat. Therefore CNI does expect surface
disturbances due to caving, however, it is still possible for local poor ground conditions to cause
localized collapses that could impact the surface.
6.2 Trough Subsidence
The pillar design and spacing provides for a low probability of pillar failure. Even if the
pillars do not fail, however, they do yield (strain). It is estimated that this yielding could be as
much as 2%, so a 15 ft pillar would converge around 0.3 ft. Given this, if no pillars fail, the
subsidence will range between zero feet and 0.3 ft. This small amount of subsidence can be
measured given the quality of equipment available today, however, it is unlikely it could be
detected on visual inspection.
If the pillars do fail, the amount of subsidence will depend on the extraction ratio, pillar
height, depth below the surface, and area failed. The range of expected subsidence from pillar
failure is between zero and 5.5 ft (if all of the pillars fail). This range is based on the following
equation (Abel, 1983);
Where:
K = 0.0226 MPa/m
D = Depth (m)
R = Extraction Ratio
H = Mining Height (m)
W = Pillar Width (m)
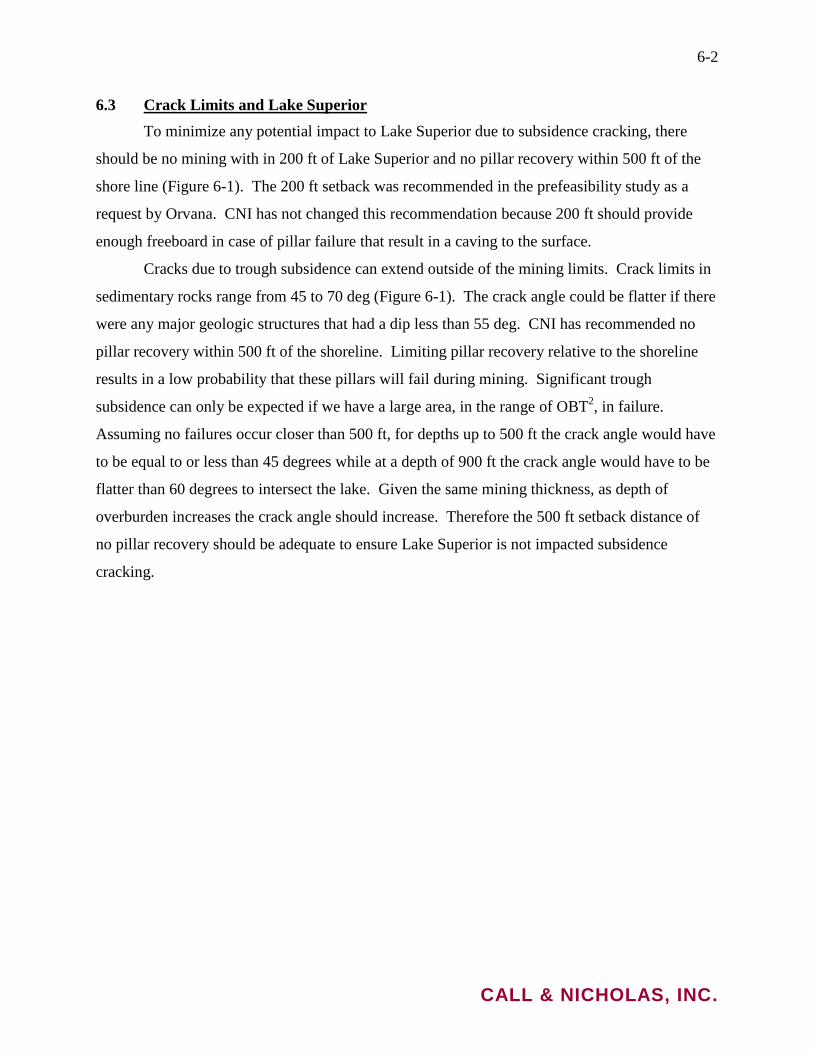
6-2
CALL & NICHOLAS, INC.
6.3 Crack Limits and Lake Superior
To minimize any potential impact to Lake Superior due to subsidence cracking, there
should be no mining with in 200 ft of Lake Superior and no pillar recovery within 500 ft of the
shore line (Figure 6-1). The 200 ft setback was recommended in the prefeasibility study as a
request by Orvana. CNI has not changed this recommendation because 200 ft should provide
enough freeboard in case of pillar failure that result in a caving to the surface.
Cracks due to trough subsidence can extend outside of the mining limits. Crack limits in
sedimentary rocks range from 45 to 70 deg (Figure 6-1). The crack angle could be flatter if there
were any major geologic structures that had a dip less than 55 deg. CNI has recommended no
pillar recovery within 500 ft of the shoreline. Limiting pillar recovery relative to the shoreline
results in a low probability that these pillars will fail during mining. Significant trough
subsidence can only be expected if we have a large area, in the range of OBT2, in failure.
Assuming no failures occur closer than 500 ft, for depths up to 500 ft the crack angle would have
to be equal to or less than 45 degrees while at a depth of 900 ft the crack angle would have to be
flatter than 60 degrees to intersect the lake. Given the same mining thickness, as depth of
overburden increases the crack angle should increase. Therefore the 500 ft setback distance of
no pillar recovery should be adequate to ensure Lake Superior is not impacted subsidence
cracking.