Levin signals project feasibility report - Waka Kotahi NZ ...
48
ŌTAKI TO NORTH OF LEVIN PFRs Report No. 7: Levin Signals Prepared for NZ Transport Agency February 2013
-
Upload
khangminh22 -
Category
Documents
-
view
0 -
download
0
Transcript of Levin signals project feasibility report - Waka Kotahi NZ ...

ŌTAKI TO NORTH OF LEVIN PFRs
Report No. 7: Levin Signals
Prepared for NZ Transport Agency February 2013


Report 7: Levin Signals
This document has been prepared for the benefit of NZ Transport Agency. No liability is accepted by this company or any employee or sub-consultant of this company with respect to its use by any other person.
This disclaimer shall apply notwithstanding that the report may be made available to other persons for an application for permission or approval to fulfil a legal requirement.
QUALITY STATEMENT PROJECT MANAGER PROJECT TECHNICAL LEAD
Tracy Couchman Phil Peet
PREPARED BY
………………………………............... ……/……/…… Ian Robertson
CHECKED BY
………………………………............... ……/……/…… Phil Peet
REVIEWED BY
………………………………............... ……/……/…… Marten Oppenhuis
APPROVED FOR ISSUE BY
………………………………............... ……/……/…… Phil Peet
WELLINGTON Level 1, 123 Taranaki Street, Wellington 6011 PO Box 9624, Te Aro, Wellington 6141 TEL +64 4 381 6700, FAX +64 4 381 6739
REVISION SCHEDULE
Rev No Date Description
Signature or Typed Name (documentation on file).
Prepared by Checked by Reviewed by Approved by
A Draft for Comment DW PP MO PP
Status: Final February 2013 Project number: Z1925700 Our ref: PFR07 Levin Signals Final.docx

Report 7: Levin Signals
Status Final February 2013 Project number: Z1925700 Our ref: PFR07 Levin Signals Final.docx
Report 7: Levin Signals
Executive Summary This report is one of a number of reports being undertaken to determine the package of improvements that should be implemented to improve the safety and efficiency of the highway between Ōtaki and north of Levin as part of the Wellington Northern Corridor Road of National Significance (RoNS).
The purpose of this report is to determine the capacity of the existing coordinated traffic signals on SH1 in Levin to accommodate predicted medium to long term future traffic flows, and to ascertain and assess what measures might be necessary to do so.
SIDRA (version 5.1.12) was used to assess the existing and future flows for the critical PM peak. The existing flows (and peak flow factors) were based on the classified turning count surveys undertaken on Thursday 12 May 2011, and the existing phasing based on SCATS data downloaded at the same time.
Future flows were based on the Otaki to Levin SATURN transport model forecast average weekday PM peak flows for 2011, 2016 and 2041. In addition the higher Friday peak future flows were derived and analysed based on the mid May SCATS detector flow data and the SH1 and SH57 link flow data.
At present the weekday PM peak operates with a common 70 second cycle (Queen Street is 2 phase, Bath Street is 3 phase) and capacity level of service (LoS) B or C. The worst movement LoS is D.
The analysis of the 2041 weekday PM peak indicates that the intersections can continue to operate satisfactorily, with a common 80 second cycle and at the same level of service, albeit it with a modest increase in delay and queue lengths.
The analysis of the 2041 Friday PM peak indicates that the existing intersections can continue to operate satisfactorily, with a common 70 second cycle and intersection LOS C with the worst movements operating at LoS D. This indicates that it can be concluded that there is no perceived need at the present time to proceed with considering modifications to the signals for the purpose of improving capacity in the short to medium term.
An assessment of the safety of the intersections including the short length in between was also undertaken for the past five years. A safety assessment of the signals was made with respect to the High-Risk Intersection Guide. The safety examination and analyses indicated that while the signals have a low or medium safety risk, and operate with a level of safety service of I or II, nevertheless the crash history indicates safety concerns relating to elderly pedestrians in particular.
It is recommended that a low cost safety improvement is made at the Bath Street signals by way of providing a splitter island and left slip turn on the New World corner that was widened in 2009. This could be implemented as part of the Minor Improvements Programme.
Status Final February 2013 Project number: Z1925700 Our ref: PFR07 Levin Signals Final.docx

Report 7: Levin Signals
Status: Final February 2013 Project number: Z1925700 Our ref: PFR07 Levin Signals Final.docx
Report 7: Levin Signals
NZ Transport Agency Report 7: Levin Signals
CONTENTS Executive Summary .................................................................................................................................. ii 1 Introduction and Background .............................................................................................................. 1
2 Projects Currently Being Investigated ................................................................................................ 1
3 Description of Problem ....................................................................................................................... 3
3.1 Otaki to North of Levin ................................................................................................................... 3 3.2 Central Levin ................................................................................................................................. 3
4 Site Description .................................................................................................................................. 3 5 Traffic Statistics .................................................................................................................................. 3
6 Crash History ...................................................................................................................................... 4
6.1 Crash Data..................................................................................................................................... 4 6.2 Crash Risk ..................................................................................................................................... 7
7 Capacity Analysis of the existing signals ............................................................................................ 8
7.1 Existing PM peak traffic capacity ................................................................................................... 9 7.2 Future PM peak traffic capacity ..................................................................................................... 9
7.3 Future Friday PM peak traffic capacity .......................................................................................... 9
7.4 Comments ................................................................................................................................... 10
7.5 Other Aspects .............................................................................................................................. 10
8 Conclusions and Recommendations ................................................................................................ 10
LIST OF TABLES Table 6-1: Annual Distribution of Crashes: At or within 50 m of SH1 Oxford Street / Queen Street ........ 4 Table 6-2: Annual Distribution of Crashes: At or within 50 m of SH1 Oxford Street / Bath Street ........... 4
Table 6-3: Annual Distribution of Crashes: SH1 Oxford Street between Queen St and Bath St .............. 5
Table 6-4: CAS Crash Type ..................................................................................................................... 5
Table 6-5: HRIG Injury Crash Types – SH1 Oxford Street / Queen Street Intersection ............................ 5
Table 6-6: HRIG Injury Crash Types –SH57 Oxford Street / Bath Street Intersection .............................. 5 Table 6-7: Crash Causation Factors of Reported Injury and Non-Injury Crashes .................................... 6
Table 6-8: Environmental Factors ............................................................................................................ 6
Table 6-9: Estimation of F&S Collective Risk Using Severity Index SH1 Oxford Street / Queen Street Intersection ................................................................................................................................................ 7
Table 6-10: Estimation of F&S Collective Risk Using Severity Index SH1 Oxford Street / Bath Street Intersection ................................................................................................................................................ 8
LIST OF FIGURES
Status: Final February 2013 Project number: Z1925700 Our ref: PFR07 Levin Signals Final.docx
Report 7: Levin Signals
Figure 2-1: Projects Currently Being Investigated ..................................................................................... 2
APPENDICES Appendix A Site Location Appendix B Photographs
Appendix C Controller Information Sheets
Appendix D Cycle and Phasing output
Appendix E Traffic Data Appendix F SIDRA output
Appendix G Crash Data
Appendix H Bath Street pedestrian improvements
Status: Final February 2013 Project number: Z1925700 Our ref: PFR07 Levin Signals Final.docx
Report 7: Levin Signals Introduction and Background
1 Introduction and Background Using the outcomes of the Ōtaki to North of Levin Scoping Report and addendum, the NZTA decided that the most appropriate strategy for the highway between Ōtaki and North of Levin is to upgrade the existing highways as the first stage of a long term strategy. This allows the NZTA to realise important safety benefits in the short to medium term whilst deferring the need to construct four lanes for the time being.
This report is one of a number of reports being undertaken to determine the package of improvements that should be implemented to improve the safety and efficiency of the highway between Ōtaki and north of Levin as part of the Wellington Northern Corridor Road of National Significance (RoNS).
The objectives of the Wellington Northern Corridor RoNS, which runs from Wellington Airport to north of Levin, are:
• To enhance inter regional and national economic growth and productivity;
• To improve access to Wellington’s CBD, key industrial and employment centres, port, airport and hospital;
• To provide relief from severe congestion on the state highway and local road networks;
• To improve the journey time reliability of travel on the section of SH1 between Levin and the Wellington Airport; and
• To improve the safety of travel on state highways.
For the Ōtaki to north of Levin section; the objectives are:
• To provide best value solutions which will progressively meet (via a staged approach) the long term RoNS goals for this corridor of achieving a high quality four lane route;
• To provide better Levels of Service, particularly for journey time and safety, between north of Ōtaki and north of Levin;
• To remove or improve at-grade intersections between north of Ōtaki and north of Levin;
• To engage effectively with key stakeholders; and
• To lodge Notices of Requirement and resource consents as appropriate with the relevant consent authorities for the first individual project by the 2013/14 financial year.
The projects that are being developed to help meet these objectives are presented in Section 2.
The purpose of this report is to determine the capacity of the existing coordinated traffic signals on State Highway 1 (SH1) in Levin to accommodate predicted medium to long term future traffic flows, and to ascertain and assess what measures might be necessary to do so.
The outcome of this report will be considered alongside the outcomes of the other investigations and used to determine the best package of works to progress as the first stage of the long term strategy.
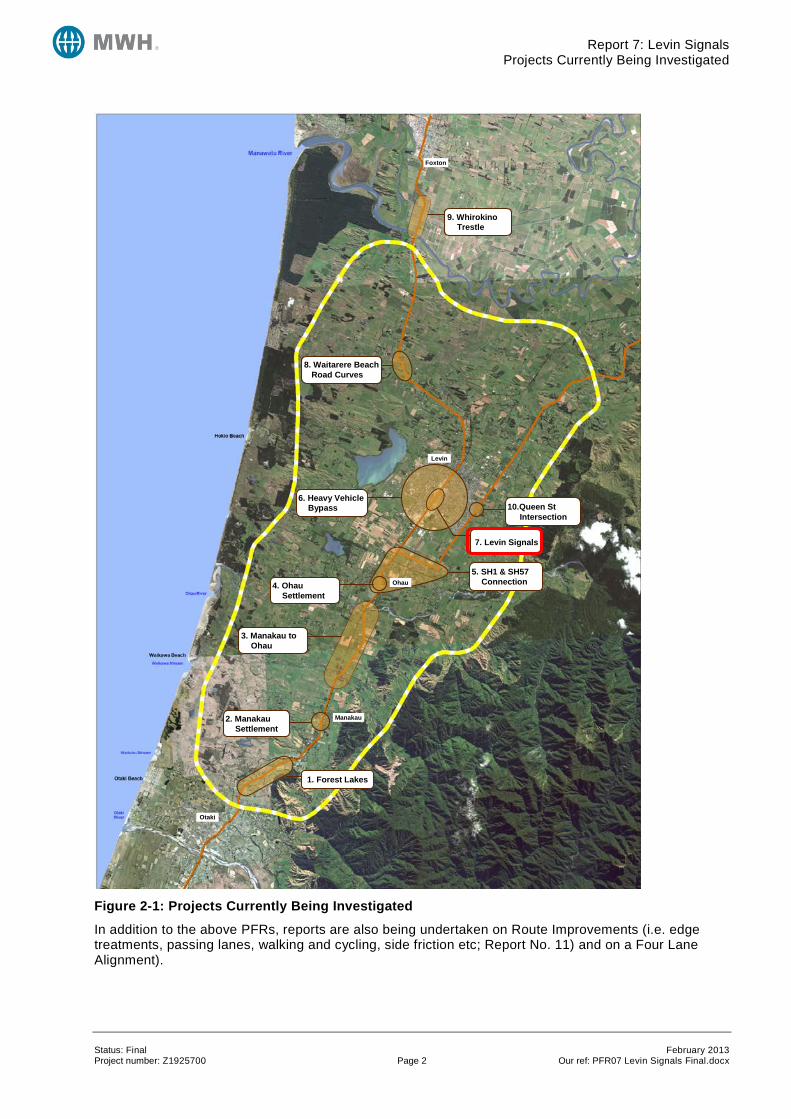
2 Projects Currently Being Investigated The projects that are currently being investigated to meet the short to medium term objectives of the Ōtaki to north of Levin RoNS project are presented in the figure below.
Status: Final February 2013 Project number: Z1925700 Page 1 Our ref: PFR07 Levin Signals Final.docx
Report 7: Levin Signals Projects Currently Being Investigated
Figure 2-1: Projects Currently Being Investigated
In addition to the above PFRs, reports are also being undertaken on Route Improvements (i.e. edge treatments, passing lanes, walking and cycling, side friction etc; Report No. 11) and on a Four Lane Alignment).
Foxton
Levin
Ohau
Manakau
Otaki
1. Forest Lakes
2. Manakau Settlement
3. Manakau to Ohau
4. Ohau Settlement
5. SH1 & SH57 Connection
6. Heavy Vehicle Bypass
7. Levin Signals
10.Queen St Intersection
8. Waitarere Beach Road Curves
9. Whirokino Trestle
Status: Final February 2013 Project number: Z1925700 Page 2 Our ref: PFR07 Levin Signals Final.docx

Report 7: Levin Signals Description of Problem
3 Description of Problem 3.1 Ōtaki to North of Levin State Highway 1 (SH1) and State Highway 57 (SH57) through the study area have a number of deficiencies, resulting in a poor crash history and a number of locations where the free flow of vehicles is restricted by the physical characteristics of the highway.
State Highway 1 currently follows the historic route established in the late 19th and early 20th centuries. As a consequence it is constrained by a now substandard alignment, towns and settlements, narrow curved bridges and significant side friction caused by local roads, commercial frontages and property accesses for the entire stretch.
3.2 Central Levin While the existing traffic signals do not necessarily have any major deficiencies, there is a perception that the current arrangement will not be able to perform safely and efficiently in the medium to long term. This is particularly due to the decision to upgrade the existing highway(s) and defer plans for a new four lane expressway bypass of Levin.
The section of SH1 through central Levin has a single through lane in each direction. Solid and flush medians are provided and both parallel and angled car parking along the commercial frontages. Pedestrians cross SH1 not only at the signalised (parallel) pedestrian crossings but also between the signals and elsewhere. There is also considerable side-friction from parking manoeuvres which contribute to the perception that SH1 is inhibited in its primary function of catering for through traffic.
The location of the North Island Main Trunk (NIMT) rail line and the service lane to the east of SH1 results in short block lengths. While this might potentially contribute to less than desirable driver behaviour (particularly at times when there might be insufficient length for motorists’ vehicles to queue without obstructing other motorists) this is not a present matter of concern. The location of the rail line also has the potential to effect the operation of the highway. However this concern has been addressed as the control of the traffic signals is linked with the operation of the railway barrier arms.
4 Site Description The project area consists of the 350 m section of SH1 Oxford Street from 50 m north of the Queen Street signals to 50 m south of the Bath Street signals (RP 967 / 13.706 to 14.056) and including the Queen Street and Bath Street approaches to the traffic signals.
The section of road is a wide two lane undivided carriageway. Effective lane widths vary considerably depending on the type of parking and provision of a median. The posted speed limit is within central Levin is 50 km/h with terrain that is generally flat. There are currently no cycle lanes along this urban section of SH1. To the west of SH1 are land use activities attracting significant levels of traffic, including the main supermarkets and the Levin Mall. Consequently there are considerable volumes of cross-traffic and a variety of traffic patterns.
At the two sets of signalised crossroad intersections, on SH1 Oxford Street three approach lanes are provided and one exit lane. The signals are coordinated (“flexilink”) and are connected to the Wellington region SCATS network. Currently they operate with simple 2 and 3 phasing and relatively short 70 second cycle throughout the day.
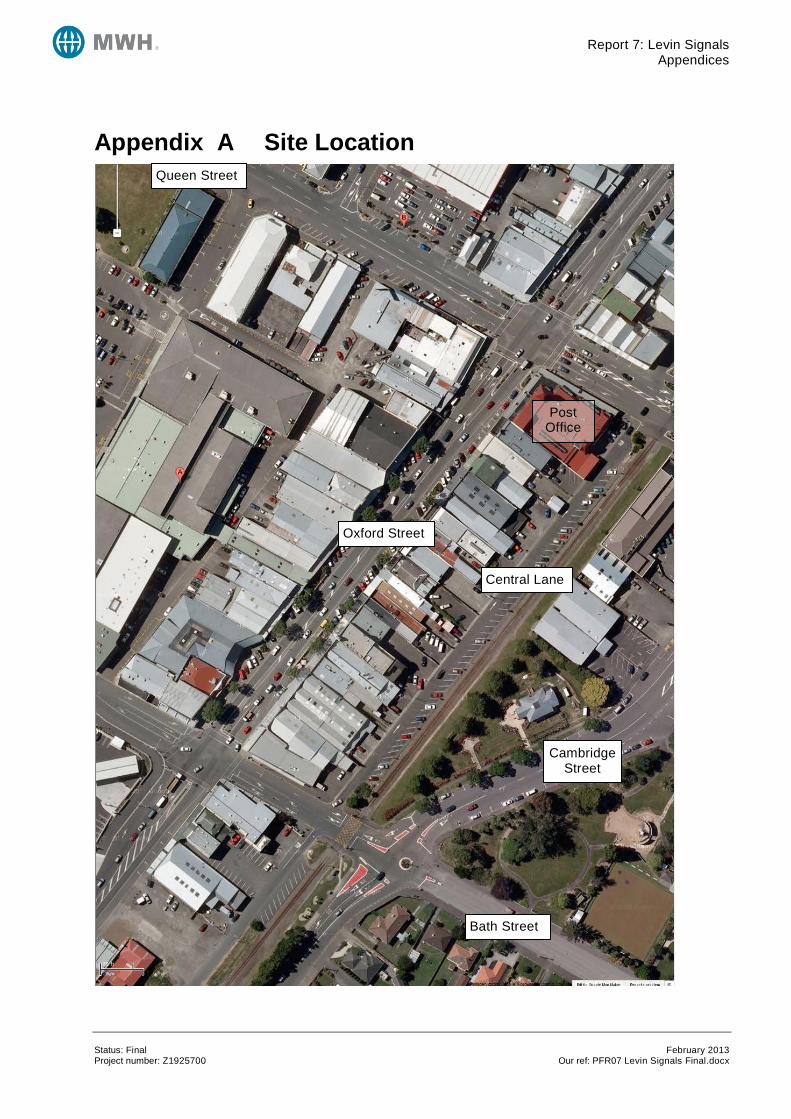
Appendix A shows an aerial of SH1 Oxford Street, while various photos are provided in Appendix B.
5 Traffic Statistics The Annual Average Daily Traffic (AADT) flow at the NZTA count site on Oxford Street (ID: 01N00981, RP 967/13.58) was 13,600 vehicles per day (2011) with the proportion of Heavy Commercial Vehicles (HCVs) at 7 % (the current site is stated as being dual loop).
Status: Final February 2013 Project number: Z1925700 Page 3 Our ref: PFR07 Levin Signals Final.docx
Report 7: Levin Signals Crash History
The traffic growth rate at the count site is estimated to be 1.3%,based on the Ohau Telemetry Site, using data from 1992 to 2011.
The estimated AADT for SH1 in central Levin is;
• Oxford St north of Queen Street: 15,200
• Oxford St between Queen and Bath: 15,500
• Oxford Street south of Bath Street: 14,800
Side road traffic daily volumes were estimated as follows:
• Queen Street East: 13,300
• Queen Street West: 11,600
• Bath Street (east): 8,700
• Bath Street (west) 8,400
Further traffic information can be found in Appendix E.
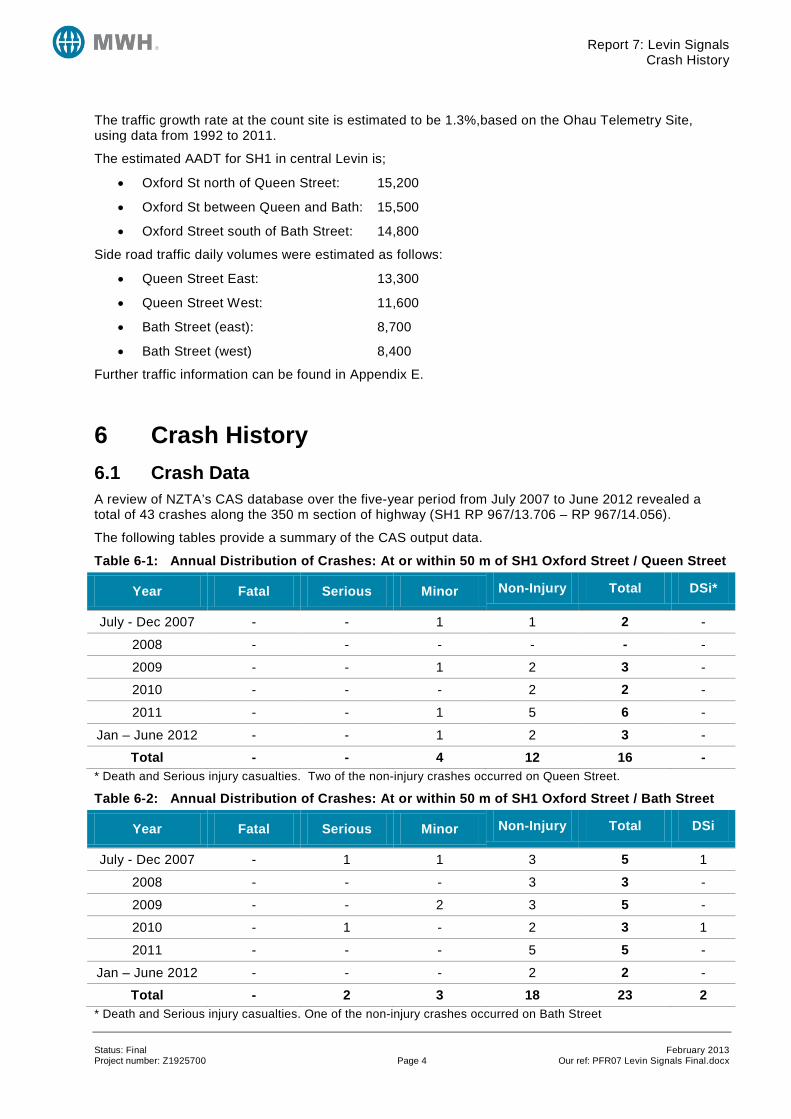
6 Crash History 6.1 Crash Data A review of NZTA’s CAS database over the five-year period from July 2007 to June 2012 revealed a total of 43 crashes along the 350 m section of highway (SH1 RP 967/13.706 – RP 967/14.056).
The following tables provide a summary of the CAS output data.
Table 6-1: Annual Distribution of Crashes: At or within 50 m of SH1 Oxford Street / Queen Street
Year Fatal Serious Minor Non-Injury Total DSi*
July - Dec 2007 - - 1 1 2 -
2008 - - - - - -
2009 - - 1 2 3 -
2010 - - - 2 2 -
2011 - - 1 5 6 -
Jan – June 2012 - - 1 2 3 -
Total - - 4 12 16 - * Death and Serious injury casualties. Two of the non-injury crashes occurred on Queen Street.
Table 6-2: Annual Distribution of Crashes: At or within 50 m of SH1 Oxford Street / Bath Street
Year Fatal Serious Minor Non-Injury Total DSi
July - Dec 2007 - 1 1 3 5 1
2008 - - - 3 3 -
2009 - - 2 3 5 -
2010 - 1 - 2 3 1
2011 - - - 5 5 -
Jan – June 2012 - - - 2 2 -
Total - 2 3 18 23 2 * Death and Serious injury casualties. One of the non-injury crashes occurred on Bath Street
Status: Final February 2013 Project number: Z1925700 Page 4 Our ref: PFR07 Levin Signals Final.docx
Report 7: Levin Signals Crash History
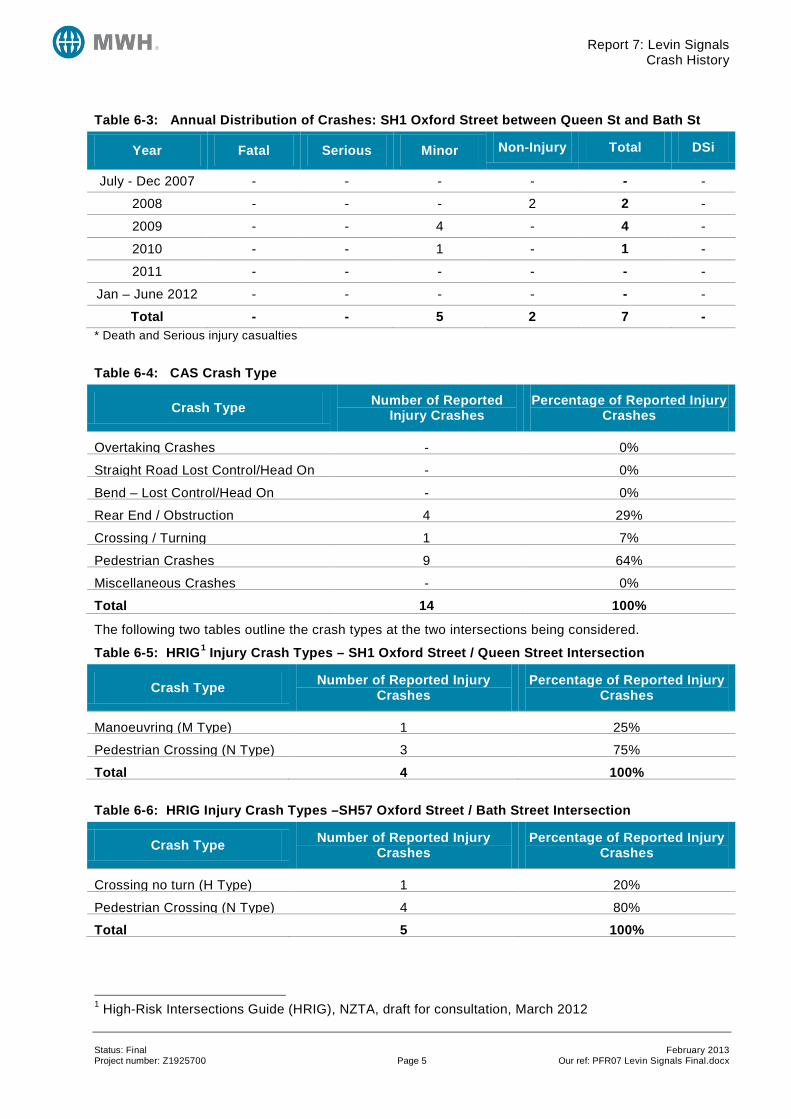
Table 6-3: Annual Distribution of Crashes: SH1 Oxford Street between Queen St and Bath St
Year Fatal Serious Minor Non-Injury Total DSi
July - Dec 2007 - - - - - -
2008 - - - 2 2 -
2009 - - 4 - 4 -
2010 - - 1 - 1 -
2011 - - - - - -
Jan – June 2012 - - - - - -
Total - - 5 2 7 - * Death and Serious injury casualties
Table 6-4: CAS Crash Type
Crash Type Number of Reported Injury Crashes
Percentage of Reported Injury Crashes
Overtaking Crashes - 0%
Straight Road Lost Control/Head On - 0%
Bend – Lost Control/Head On - 0%
Rear End / Obstruction 4 29%
Crossing / Turning 1 7%
Pedestrian Crashes 9 64%
Miscellaneous Crashes - 0%
Total 14 100%
The following two tables outline the crash types at the two intersections being considered.
Table 6-5: HRIG1 Injury Crash Types – SH1 Oxford Street / Queen Street Intersection
Crash Type Number of Reported Injury Crashes
Percentage of Reported Injury Crashes
Manoeuvring (M Type) 1 25%
Pedestrian Crossing (N Type) 3 75%
Total 4 100%
Table 6-6: HRIG Injury Crash Types –SH57 Oxford Street / Bath Street Intersection
Crash Type Number of Reported Injury Crashes
Percentage of Reported Injury Crashes
Crossing no turn (H Type) 1 20%
Pedestrian Crossing (N Type) 4 80%
Total 5 100%
1 High-Risk Intersections Guide (HRIG), NZTA, draft for consultation, March 2012
Status: Final February 2013 Project number: Z1925700 Page 5 Our ref: PFR07 Levin Signals Final.docx
Report 7: Levin Signals Crash History
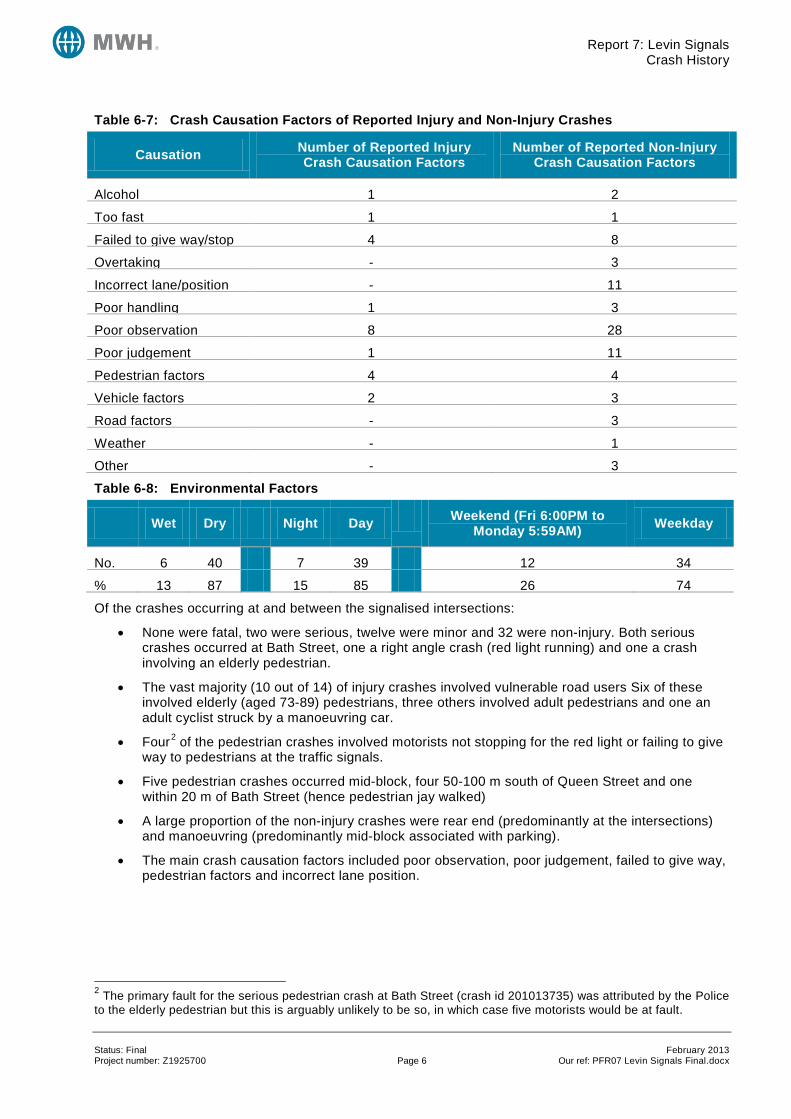
Table 6-7: Crash Causation Factors of Reported Injury and Non-Injury Crashes
Causation Number of Reported Injury Crash Causation Factors
Number of Reported Non-Injury Crash Causation Factors
Alcohol 1 2
Too fast 1 1
Failed to give way/stop 4 8
Overtaking - 3
Incorrect lane/position - 11
Poor handling 1 3
Poor observation 8 28
Poor judgement 1 11
Pedestrian factors 4 4
Vehicle factors 2 3
Road factors - 3
Weather - 1
Other - 3
Table 6-8: Environmental Factors
Wet Dry Night Day Weekend (Fri 6:00PM to Monday 5:59AM) Weekday
No. 6 40 7 39 12 34
% 13 87 15 85 26 74
Of the crashes occurring at and between the signalised intersections:
• None were fatal, two were serious, twelve were minor and 32 were non-injury. Both serious crashes occurred at Bath Street, one a right angle crash (red light running) and one a crash involving an elderly pedestrian.
• The vast majority (10 out of 14) of injury crashes involved vulnerable road users Six of these involved elderly (aged 73-89) pedestrians, three others involved adult pedestrians and one an adult cyclist struck by a manoeuvring car.
• Four2 of the pedestrian crashes involved motorists not stopping for the red light or failing to give way to pedestrians at the traffic signals.
• Five pedestrian crashes occurred mid-block, four 50-100 m south of Queen Street and one within 20 m of Bath Street (hence pedestrian jay walked)
• A large proportion of the non-injury crashes were rear end (predominantly at the intersections) and manoeuvring (predominantly mid-block associated with parking).
• The main crash causation factors included poor observation, poor judgement, failed to give way, pedestrian factors and incorrect lane position.
2 The primary fault for the serious pedestrian crash at Bath Street (crash id 201013735) was attributed by the Police to the elderly pedestrian but this is arguably unlikely to be so, in which case five motorists would be at fault.
Status: Final February 2013 Project number: Z1925700 Page 6 Our ref: PFR07 Levin Signals Final.docx
Report 7: Levin Signals Crash History
6.2 Crash Risk This section of SH1 has been analysed using the High Risk Intersection Guide (HRIG) has been utilised to calculate crash risk at this intersections of SH1 Oxford Street / Queen Street and SH1 Oxford Street / Bath Street.
HRIG identifies that crash risk can be defined in two specific ways:
• Collective Risk, also known as Crash Density, is measured as the number of fatal and serious (F&S) crashes per intersection in a crash period
• Personal risk or crash rate is measured in terms of the number of F&S crashes per 100 million vehicles using an intersection
6.2.1 Crash Risk: SH1 Oxford Street / Queen Street Intersection In terms of collective crash risk for the intersection of SH1 Oxford Street / Queen Street, there are two methods of calculation
• Reported F&S Crashes: Over the 5 year assessment period: there have been zero F&S crashes.
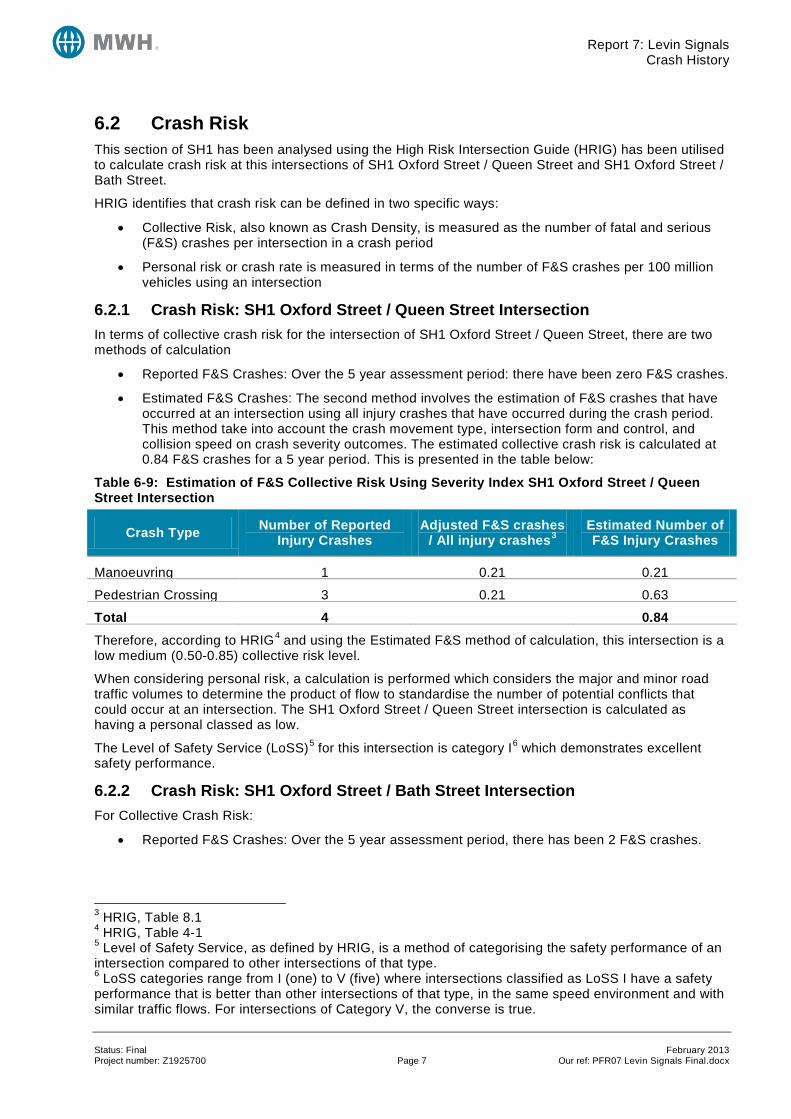
• Estimated F&S Crashes: The second method involves the estimation of F&S crashes that have occurred at an intersection using all injury crashes that have occurred during the crash period. This method take into account the crash movement type, intersection form and control, and collision speed on crash severity outcomes. The estimated collective crash risk is calculated at 0.84 F&S crashes for a 5 year period. This is presented in the table below:
Table 6-9: Estimation of F&S Collective Risk Using Severity Index SH1 Oxford Street / Queen Street Intersection
Crash Type Number of Reported Injury Crashes
Adjusted F&S crashes / All injury crashes3
Estimated Number of F&S Injury Crashes
Manoeuvring 1 0.21 0.21
Pedestrian Crossing 3 0.21 0.63
Total 4 0.84 Therefore, according to HRIG4 and using the Estimated F&S method of calculation, this intersection is a low medium (0.50-0.85) collective risk level.
When considering personal risk, a calculation is performed which considers the major and minor road traffic volumes to determine the product of flow to standardise the number of potential conflicts that could occur at an intersection. The SH1 Oxford Street / Queen Street intersection is calculated as having a personal classed as low.
The Level of Safety Service (LoSS)5 for this intersection is category I6 which demonstrates excellent safety performance.
6.2.2 Crash Risk: SH1 Oxford Street / Bath Street Intersection For Collective Crash Risk:
• Reported F&S Crashes: Over the 5 year assessment period, there has been 2 F&S crashes.
3 HRIG, Table 8.1 4 HRIG, Table 4-1 5 Level of Safety Service, as defined by HRIG, is a method of categorising the safety performance of an intersection compared to other intersections of that type. 6 LoSS categories range from I (one) to V (five) where intersections classified as LoSS I have a safety performance that is better than other intersections of that type, in the same speed environment and with similar traffic flows. For intersections of Category V, the converse is true.
Status: Final February 2013 Project number: Z1925700 Page 7 Our ref: PFR07 Levin Signals Final.docx

Report 7: Levin Signals Capacity Analysis of the existing signals
• Estimated F&S Crashes: The estimated collective crash risk is calculated at 0.99 F&S crashes for a 5 year period. This is presented is the table below:
Table 6-10: Estimation of F&S Collective Risk Using Severity Index SH1 Oxford Street / Bath Street Intersection
Crash Type Number of Reported Injury Crashes
Adjusted F&S crashes / All injury crashes7
Estimated Number of F&S Injury Crashes
Crossing (No Turns) 1 0.15 0.15
Pedestrian Crossing 4 0.21 0.84
Total 5 0.99 Therefore, according to HRIG, using Estimated F&S method of calculation, this intersection is medium (0.85-1.2) collective risk level. Whilst using the actual F&S crash numbers this intersection is considered high risk.
The SH1 Oxford Street / Bath Street intersection is calculated as having a personal classed as low.
This intersection is determined to be near the LoSS I / II category boundary, which represents a good safety performance level relative to similar intersections.
However, while the two signalised intersections are operating reasonably safely, as noted in the crash history there appears to be problems with elderly pedestrians in particular both at the intersections and in the relatively short block in between where parking manoeuvres add to crossing difficulties.
Further crash data can be found in Appendix G.
7 Capacity Analysis of the existing signals The Do Minimum has been assumed to be the continued maintenance and operation of the existing traffic signals and current layout.
The critical period for capacity is the PM peak. From inspection of the available traffic data, this was taken to be 4:15-5:15 pm which is slightly higher overall than the 4:30-5:30 pm hour.
Examination of the SCATS detector flows for a week indicated that the Friday PM peak appeared to be significantly greater than the Monday to Thursday averages. Accordingly the observed turning count values for the classified survey undertaken on Thursday 12 May 2011 as part of the earlier work were used for modelling the average weekday PM peak, and growth factors applied to them to represent the Friday PM peak.
SIDRA version 5.1.12 was used for a one hour analysis period and 15 minutes peak flow period (PFP) recognising the sharp 5:00-5:15 pm peak quarter hour. The peak flow factors (PFF) were set for each movement (to the nearest 1%) and the light and heavy vehicle flows were entered rounded to the nearest 5 vph, with the model setting changed to include the effect of all heavy vehicles. Lane widths were set at the default 3.3 metres except for the wide left turn lanes.
The SIDRA phasing options were run in a variety of ways to check calibration with the observed phase times, which reflect that the pedestrian demand appears not to be called every cycle. The minimum green times, amber and red intergreen settings were set as per the Contoller Information Sheets (CIS, refer Appendix C). The pedestrian green man and clearance times were also set as per the CIS but the late starts were reduced to reflect that the pedestrian sub-phases appear not to be called every cycle (and the long clearance times for the SH1 crossing had also to be adjusted later to enable SIDRA to run at the average observed phase time for the Bath Street phase). The pedestrian crossing widths were specified and default 1.2 m/s crossing speed used (adjusted to 1.3 m/s if need be).
The SIDRA lane results are included in Appendix F.
7 HRIG, Table 8.10
Status: Final February 2013 Project number: Z1925700 Page 8 Our ref: PFR07 Levin Signals Final.docx
Report 7: Levin Signals Capacity Analysis of the existing signals
7.1 Existing PM peak traffic capacity For the Queen Street two phase intersection, when specifying a 70 second cycle time the resulting SIDRA derived phase times were consistent with those observed (refer Appendix D). It was noted however that selecting optimum cycle time resulted in a 54 second cycle.
For the Bath Street three phase intersection, specifying a 70 second cycle resulted in SIDRA allocating shorter Oxford Street and longer Bath Street phase times so it proved necessary to instead specify the observed phase times.
For the Queen Street intersection, the overall intersection delay was 19 seconds per vehicle (LoS B) with the worst movement delay for the right turn movements of 32 seconds (LoS C). SH1 Oxford Street through movements operated at LoS B.
For the Bath Street intersection, the overall intersection delay was 22½ seconds per vehicle (LoS C) with the worst movement delay for the right turn movements of 46½ seconds (LoS D). SH1 Oxford Street through movements operated at LoS B (southbound at LoS A).
7.2 Future PM peak traffic capacity The future traffic was estimated based on the Ōtaki to Levin SATURN Transport Model flows for the base (‘Business As Usual’) case for 2011, 2016, 2026 and 2041. These indicated that low growth is expected for SH1 traffic and minimal growth for the side road traffic.
The design year chosen was 2041 (30 years from the 2011 base) with the SH1 Oxford Street approach (arithmetic) traffic growth set as 1.0% per annum (slightly higher than present predictions) and that for Queen Street and Bath Street as 0.5% per annum.
For modelling of the 2041 situation, maintaining a 70 second cycle time resulted in too great a delay for the Bath Street eastern approach; however an 80 second cycle time was adequate. With it being necessary for both signals to operate at the same common cycle time, specifying an 80 second cycle at Queen Street resulted in a 43 seconds Oxford Street and 37 seconds Queen Street phasing split (compared to 38 seconds and 32 seconds as modelled for the base year 2011 flows). Currently the average phase time for Oxford Street at Bath Street during the PM peak is about 5 seconds longer than at Queen Street. Adjusting the phase splits at Bath Street to 48, 21 and 11 seconds (80 second cycle) resulted in the best phasing split consistent with SCATS operation.
For the Queen Street intersection, the overall intersection delay was 23 seconds per vehicle (LoS C) with the worst movement delay for the right turn movements of 41½ seconds (LoS D). SH1 Oxford Street through movements operated at LoS B.
For the Bath Street intersection, the overall intersection delay was 24½ seconds per vehicle (LoS C) with the worst movement delay for the right turn movements of 49½ seconds (LoS D). SH1 Oxford Street through movements operated at LoS B.
7.3 Future Friday PM peak traffic capacity The Friday peak future traffic flows were based on an equivalent of 44 years of traffic growth representing that the base Friday flows for SH1 are about 20% higher and adding 30 years of growth at a 0.8 percent per annum (that is 24 %). With a base model growth rate of 1.0% as previously used the total of 44 % for SH1 amounts to specifying a 44 year design life in SIDRA. As the difference in Friday PM flows compared to average weekday PM peak flows is typically less for local roads than for state highways, the presumed overall equivalent 22 % increase for the side roads seems reasonable (15% for average weekday PM peak).
For the future Friday peak the option to specify the cycle time was chosen not just for the Queen Street intersection but also for the Bath Street intersection to reflect the likely better alignment of the SCATS phase split plans with those required as derived by SIDRA. The optimum cycle time for the Queen Street intersection was 70 seconds with 38 seconds for the SH1 Oxford Street phase (and 32 seconds for Queen Street). For the Bath Street intersection the equivalent for its Oxford Street was 40 seconds which means coordination will still be effective.
Status: Final February 2013 Project number: Z1925700 Page 9 Our ref: PFR07 Levin Signals Final.docx

Report 7: Levin Signals Conclusions and Recommendations
For the Queen Street intersection, the overall intersection delay was 24 seconds per vehicle (LoS C) with the worst movement delay for the right turn movements of 48½ seconds (LoS D). SH1 Oxford Street through movements operated at LoS B or C.
For the Bath Street intersecion, the overall intersection delay was 27 seconds per vehicle (LoS C) with the worst movement delay for the right turn movements of 46 seconds (LoS D). SH1 Oxford Street through movements operated at LoS B or C.
7.4 Comments It is evident that the existing signals are operating well and can continue to do so for the medium to long term without any changes being necessary. From the high level analysis undertaken, there appears to be considerable spare capacity to sufficiently cope for additional demand by changing the phase splits and/or increasing the cycle lengths.
This might be useful since it would appear that the current Bath Street phase is operating shorter than is desired and there is only about 55 metres of queuing space between the limit lines at SH1 and the rail crossing limit lines. However, like other traffic signal controlled intersections on SH1 close to an active (barrier arms) railway crossing on the side road, there is a special SCATS routine for when the railway crossing is closed (same applies at Queen Street).
That only an 80 second cycle is needed for the future PM peak is useful to ensure that the pedestrian level of service provided at the traffic signals is good, so that pedestrians will be less likely to jay walk.
7.5 Other Aspects It is noted that half of the pedestrian crossings at the two intersections do not comply with current requirements that there be at least a one metre separation at the kerb between them.
At Queen Street there are two bollards at every corner except for the single bollard at the eastern Lotto shop corner and at this corner the drop kerb is contiguous for both the northern crossing of Oxford Street and the eastern crossing of Queen Street.
At Bath Street there is no separation between the crossings except at the southern corner. The latter probably resulted from shifting the southern crossing of Oxford Street slightly south when road widening was undertaken in 2009 along the New World frontages (for both Oxford Street and Bath Street).
It would seem that the northbound through lane for the southern approach at Bath Street is too narrow, although the left turn bay by New World is very wide (presumably for tracking path requirements for supermarket servicing vehicles in particular, given also the wide departure lane on Bath Street).
The pedestrian crossing on the Bath Street west approach is angled, presumably also as a result of the widening by New World. A sketch of a possible low cost pedestrian (and cyclist) improvement option is provided in Appendix H. This reduces the pedestrian crossing distances, which is important given the crash history. It also enables a cyclist holding bay to be provided and possible short cycle lane at the signals for the northbound approach. Furthermore the left turn could then revert from being signalised to become a give way movement resulting in less traffic delay.
8 Conclusions and Recommendations It is concluded that there is no foreseeable need to improve the existing set of signalised intersections on capacity ground.
It is recommended that a low cost pedestrian (and cyclist) improvement project at the Bath Street signals proceed to the next stage to help address the pedestrian crash history.
Status: Final February 2013 Project number: Z1925700 Page 10 Our ref: PFR07 Levin Signals Final.docx
Report 7: Levin Signals Appendices
Appendix A Site Location
Bath Street
Queen Street
Oxford Street
Central Lane
CambridgeStreet
Post Office
Status: Final February 2013 Project number: Z1925700 Our ref: PFR07 Levin Signals Final.docx
Report 7: Levin Signals Appendices
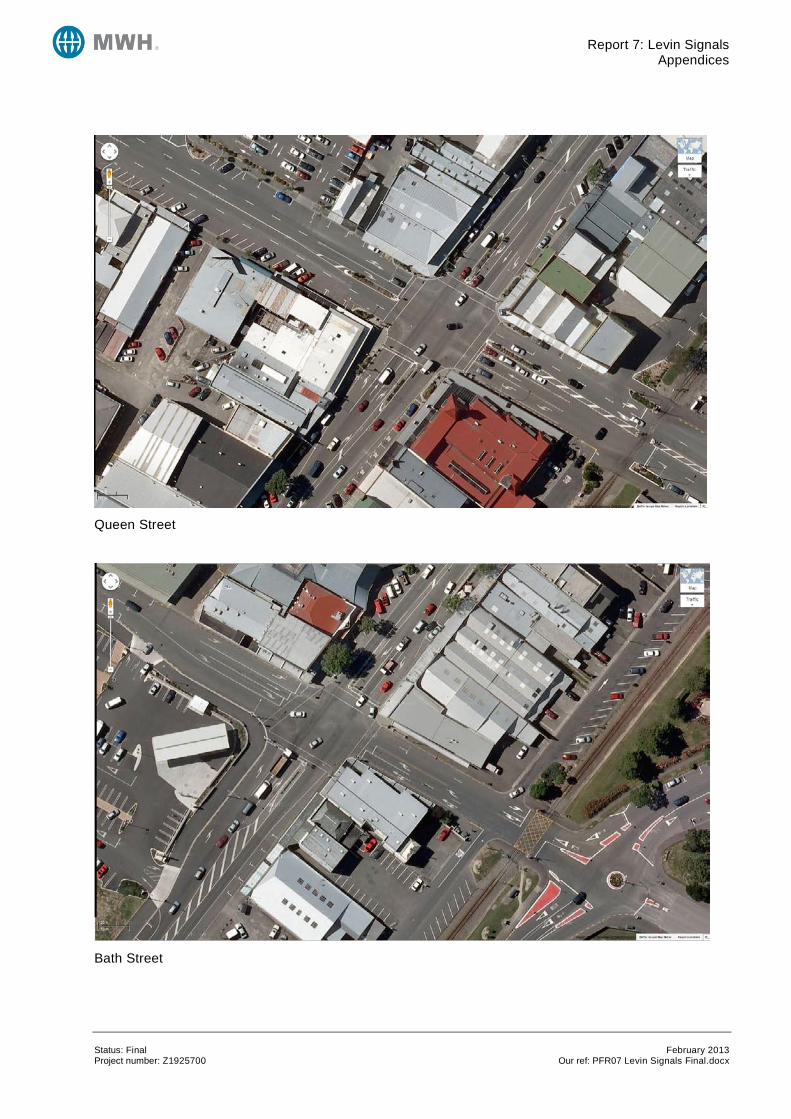
Queen Street
Bath Street
Status: Final February 2013 Project number: Z1925700 Our ref: PFR07 Levin Signals Final.docx
Report 7: Levin Signals Appendices
Appendix B Photographs
Status: Final February 2013 Project number: Z1925700 Our ref: PFR07 Levin Signals Final.docx
Report 7: Levin Signals Appendices
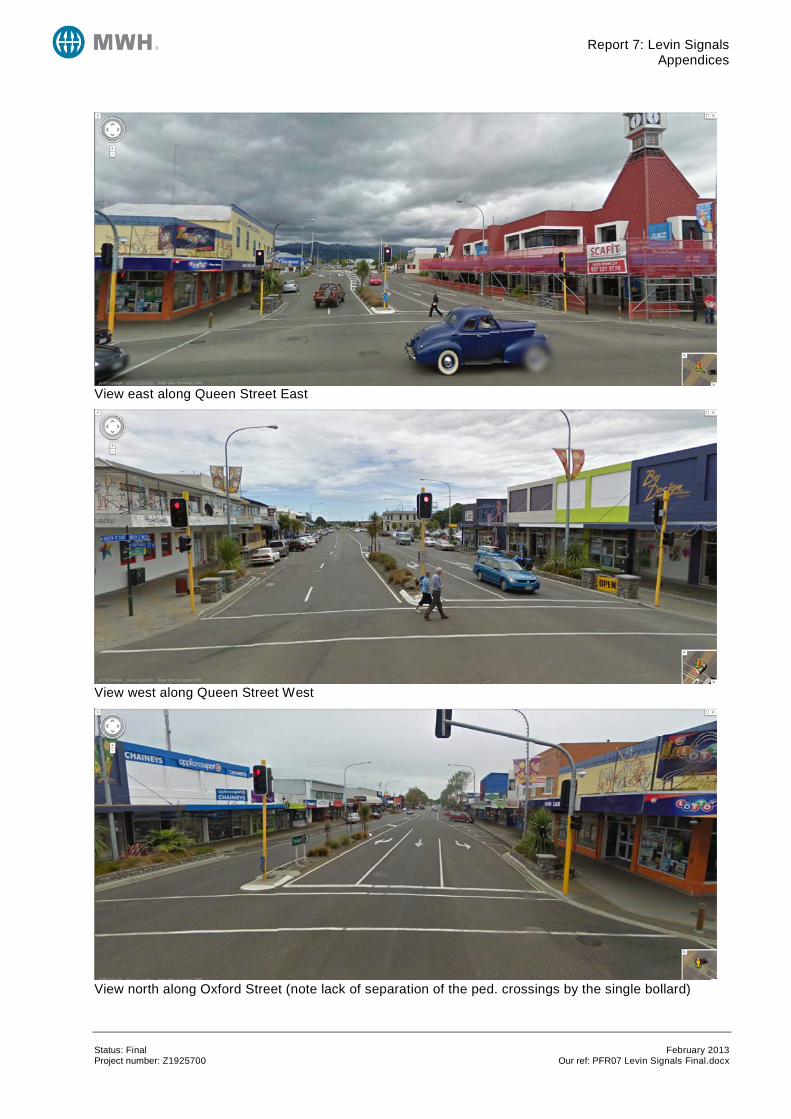
View east along Queen Street East
View west along Queen Street West
View north along Oxford Street (note lack of separation of the ped. crossings by the single bollard)
Status: Final February 2013 Project number: Z1925700 Our ref: PFR07 Levin Signals Final.docx
Report 7: Levin Signals Appendices
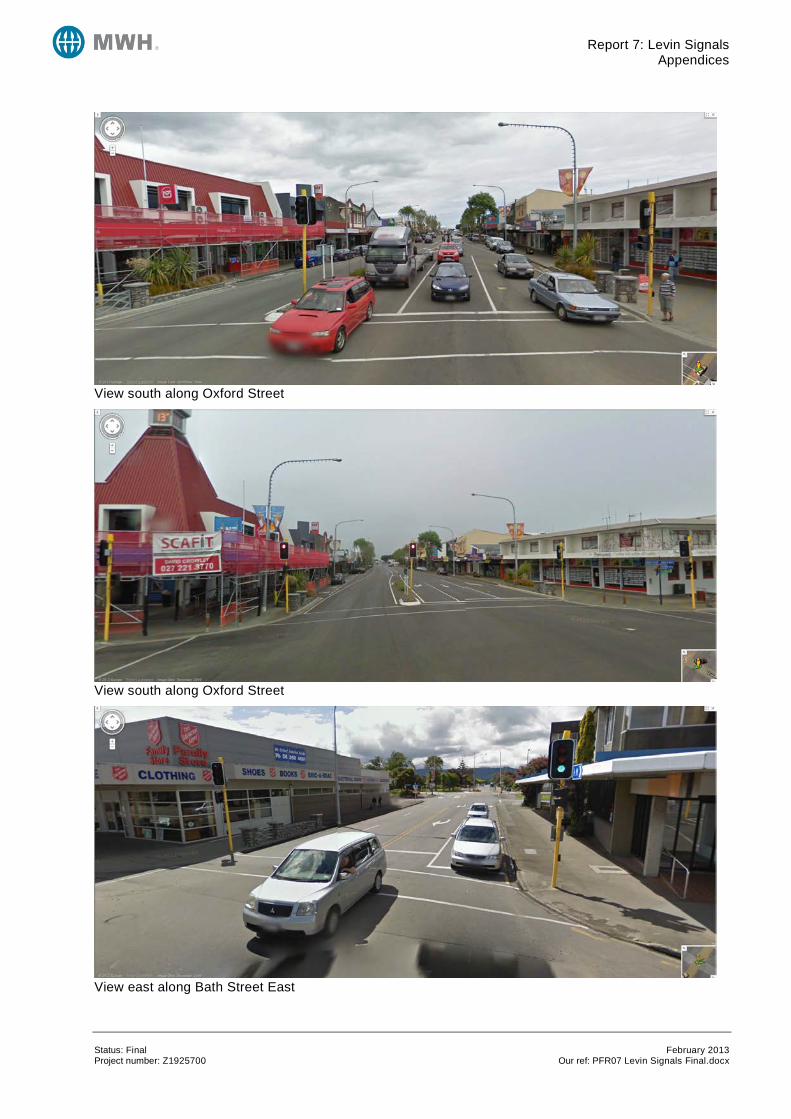
View south along Oxford Street
View south along Oxford Street
View east along Bath Street East
Status: Final February 2013 Project number: Z1925700 Our ref: PFR07 Levin Signals Final.docx

Report 7: Levin Signals Appendices
View west along Bath Street West
View north along Oxford Street
View north along Oxford Street
Status: Final February 2013 Project number: Z1925700 Our ref: PFR07 Levin Signals Final.docx
Report 7: Levin Signals Appendices
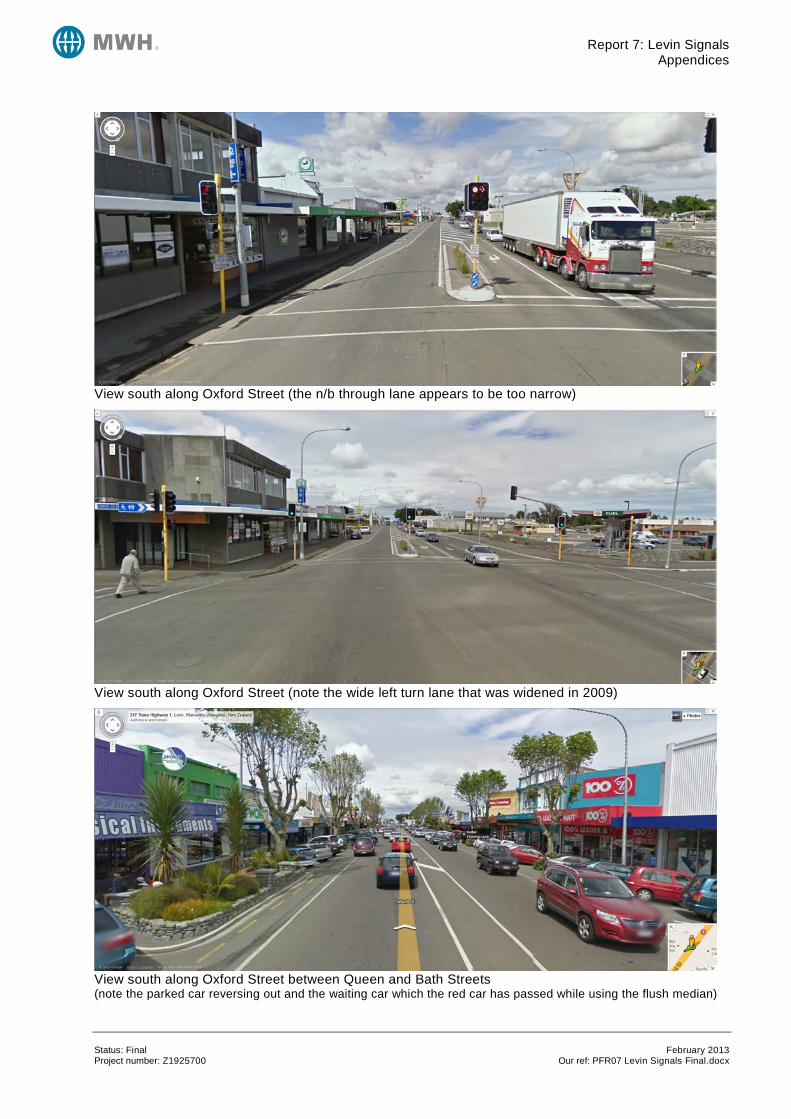
View south along Oxford Street (the n/b through lane appears to be too narrow)
View south along Oxford Street (note the wide left turn lane that was widened in 2009)
View south along Oxford Street between Queen and Bath Streets (note the parked car reversing out and the waiting car which the red car has passed while using the flush median)
Status: Final February 2013 Project number: Z1925700 Our ref: PFR07 Levin Signals Final.docx

Report 7: Levin Signals Appendices
View south along Oxford Street between Queen and Bath Streets (note the two pedestrians walking along the road, the bicycle lying on the road and the double parked car)
View north along Oxford Street between Bath and Queen Streets (note the pedestrians waiting to cross and the double parked delivery truck)
Status: Final February 2013 Project number: Z1925700 Our ref: PFR07 Levin Signals Final.docx
Report 7: Levin Signals Appendices
Appendix C Controller Information Sheets
Status: Final February 2013 Project number: Z1925700 Our ref: PFR07 Levin Signals Final.docx
Report 7: Levin Signals Appendices
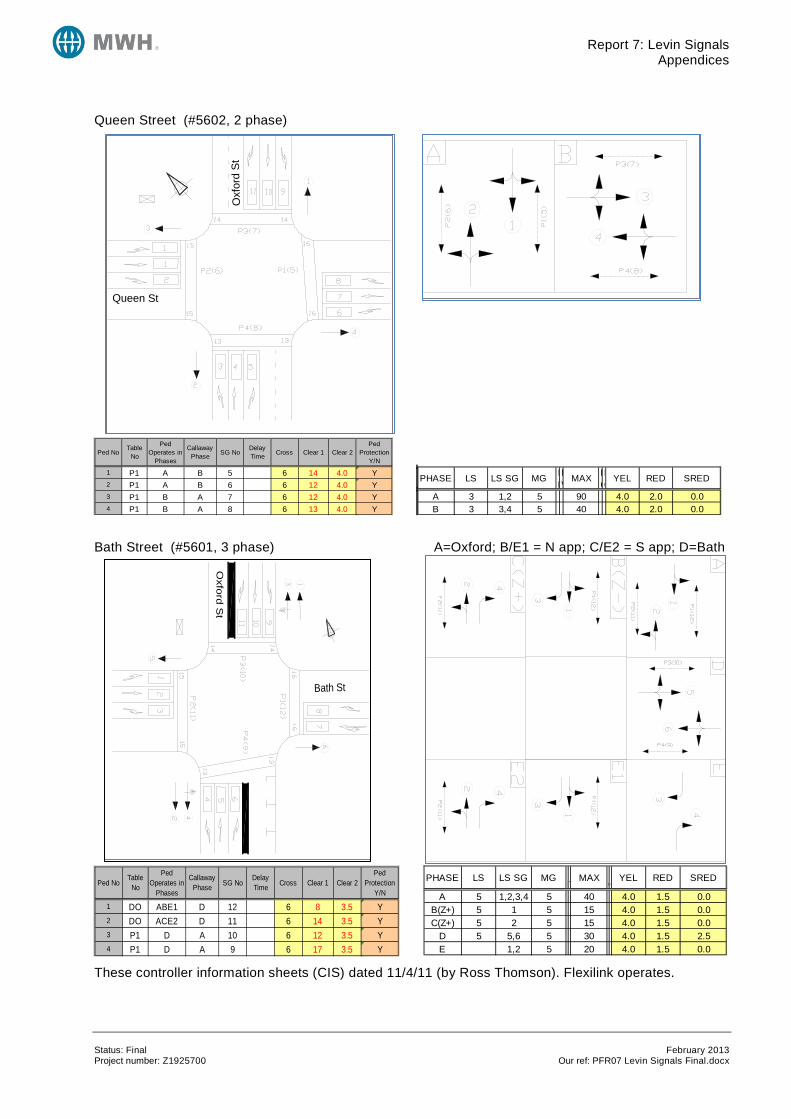
Queen Street (#5602, 2 phase)
Bath Street (#5601, 3 phase) A=Oxford; B/E1 = N app; C/E2 = S app; D=Bath
These controller information sheets (CIS) dated 11/4/11 (by Ross Thomson). Flexilink operates.
1 P1 A B 5 6 14 4.0 Y2 P1 A B 6 6 12 4.0 Y3 P1 B A 7 6 12 4.0 Y4 P1 B A 8 6 13 4.0 Y
Delay Time CrossPed No
Table No
Callaway Phase
Ped Protection
Y/N
Ped Operates in
PhasesSG No Clear 1 Clear 2
PHASE LS LS SG MG INMV
MAX ECEC
YEL RED SRED
A 3 1,2 5 90 4.0 2.0 0.0B 3 3,4 5 40 4.0 2.0 0.0
1 DO ABE1 D 12 6 8 3.5 Y2 DO ACE2 D 11 6 14 3.5 Y3 P1 D A 10 6 12 3.5 Y4 P1 D A 9 6 17 3.5 Y
Ped Protection
Y/N
Delay Time Cross Clear 1 Clear 2
Ped Operates in
PhasesPed No
Table No
Callaway Phase SG No PHASE LS LS SG MG
NMV
MAXCC
YEL RED SRED
A 5 1,2,3,4 5 40 4.0 1.5 0.0B(Z+) 5 1 5 15 4.0 1.5 0.0C(Z+) 5 2 5 15 4.0 1.5 0.0
D 5 5,6 5 30 4.0 1.5 2.5E 1,2 5 20 4.0 1.5 0.0
Queen St
Oxf
ord
St
Oxford S
t
Bath St
Status: Final February 2013 Project number: Z1925700 Our ref: PFR07 Levin Signals Final.docx

Report 7: Levin Signals Appendices
Appendix D Cycle and Phasing output
Status: Final February 2013 Project number: Z1925700 Our ref: PFR07 Levin Signals Final.docx
Report 7: Levin Signals Appendices
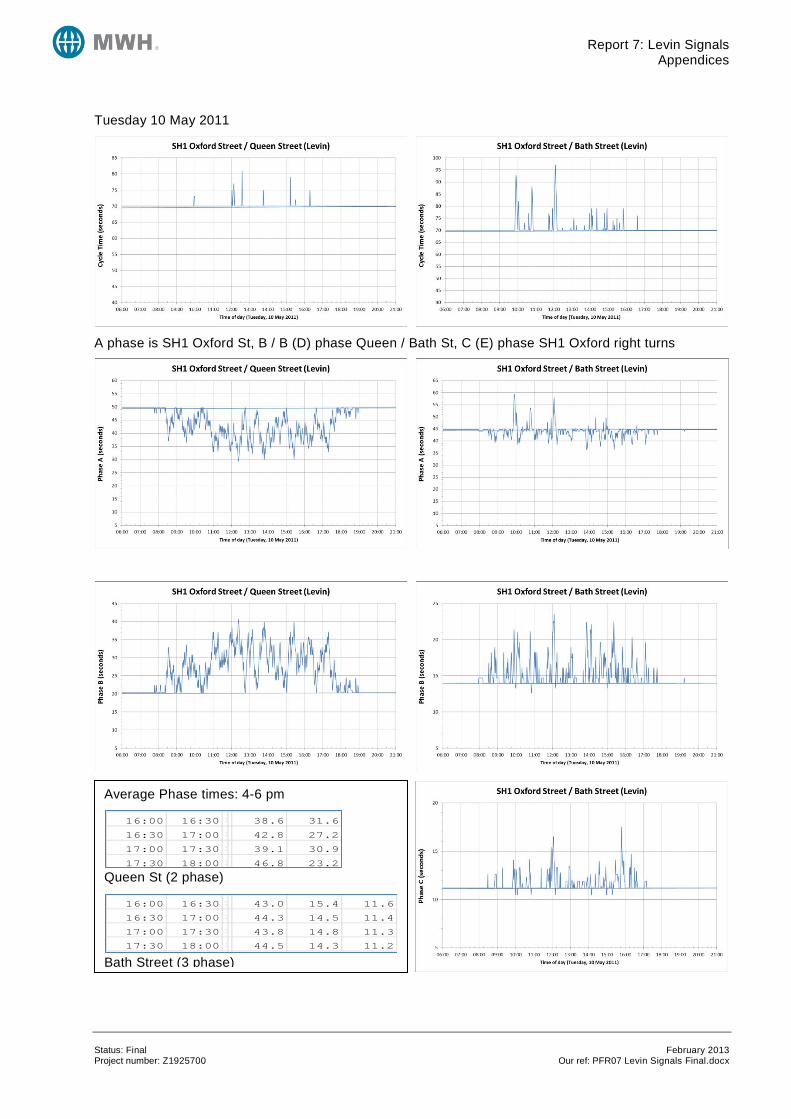
Tuesday 10 May 2011
A phase is SH1 Oxford St, B / B (D) phase Queen / Bath St, C (E) phase SH1 Oxford right turns
Average Phase times: 4-6 pm
Queen St (2 phase)
Bath Street (3 phase)
16:00 16:30 >< 38.6 31.6
16:30 17:00 >< 42.8 27.2
17:00 17:30 >< 39.1 30.9
17:30 18:00 >< 46.8 23.2
16:00 16:30 >< 43.0 15.4 11.6
16:30 17:00 >< 44.3 14.5 11.4
17:00 17:30 >< 43.8 14.8 11.3
17:30 18:00 >< 44.5 14.3 11.2
Status: Final February 2013 Project number: Z1925700 Our ref: PFR07 Levin Signals Final.docx

Report 7: Levin Signals Appendices
Appendix E Traffic Data
Status: Final February 2013 Project number: Z1925700 Our ref: PFR07 Levin Signals Final.docx

Report 7: Levin Signals Appendices
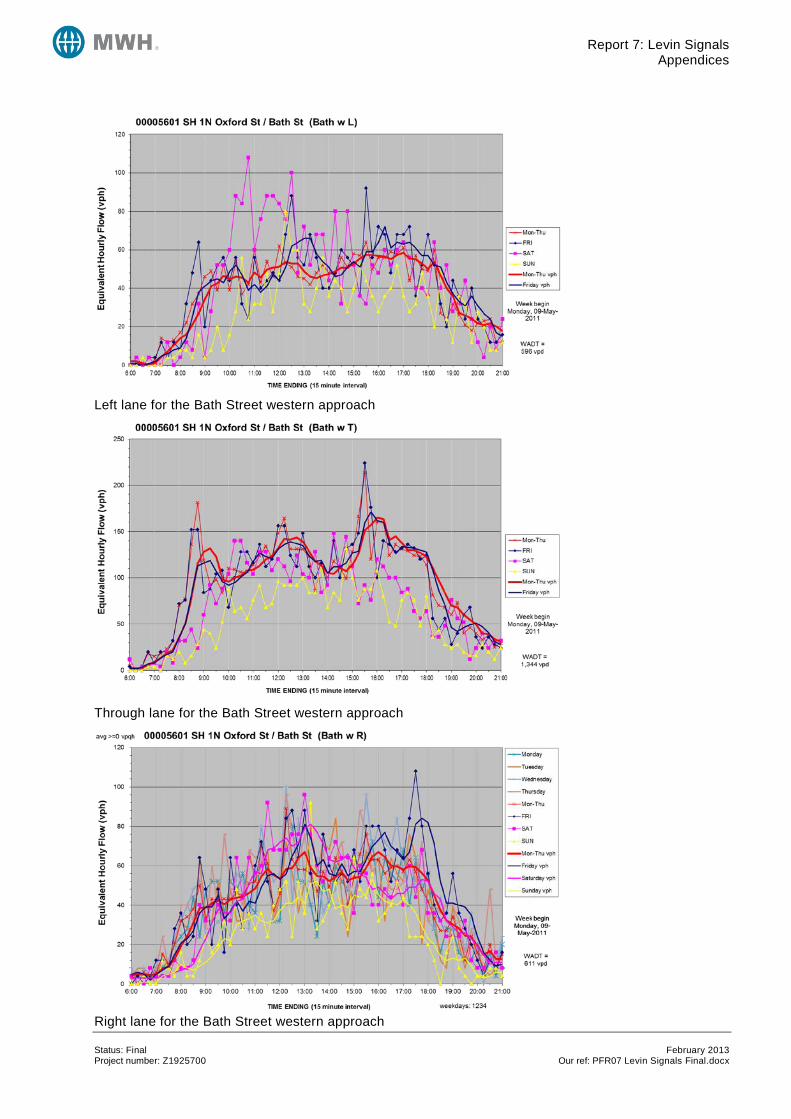
1: SCATS detector flows at Bath Street (5601) for 9-16 May 2011
Shared left/through lane for the Bath Street eastern approach
Right turn bay for the Bath Street eastern approach
Status: Final February 2013 Project number: Z1925700 Our ref: PFR07 Levin Signals Final.docx
Report 7: Levin Signals Appendices
Left lane for the Bath Street western approach
Through lane for the Bath Street western approach
Right lane for the Bath Street western approach Status: Final February 2013 Project number: Z1925700 Our ref: PFR07 Levin Signals Final.docx

Report 7: Levin Signals Appendices
Left lane for the Oxford Street northern approach
Southbound through lane for the Oxford Street northern approach
Right lane for the Oxford Street northern approach
Status: Final February 2013 Project number: Z1925700 Our ref: PFR07 Levin Signals Final.docx
Report 7: Levin Signals Appendices
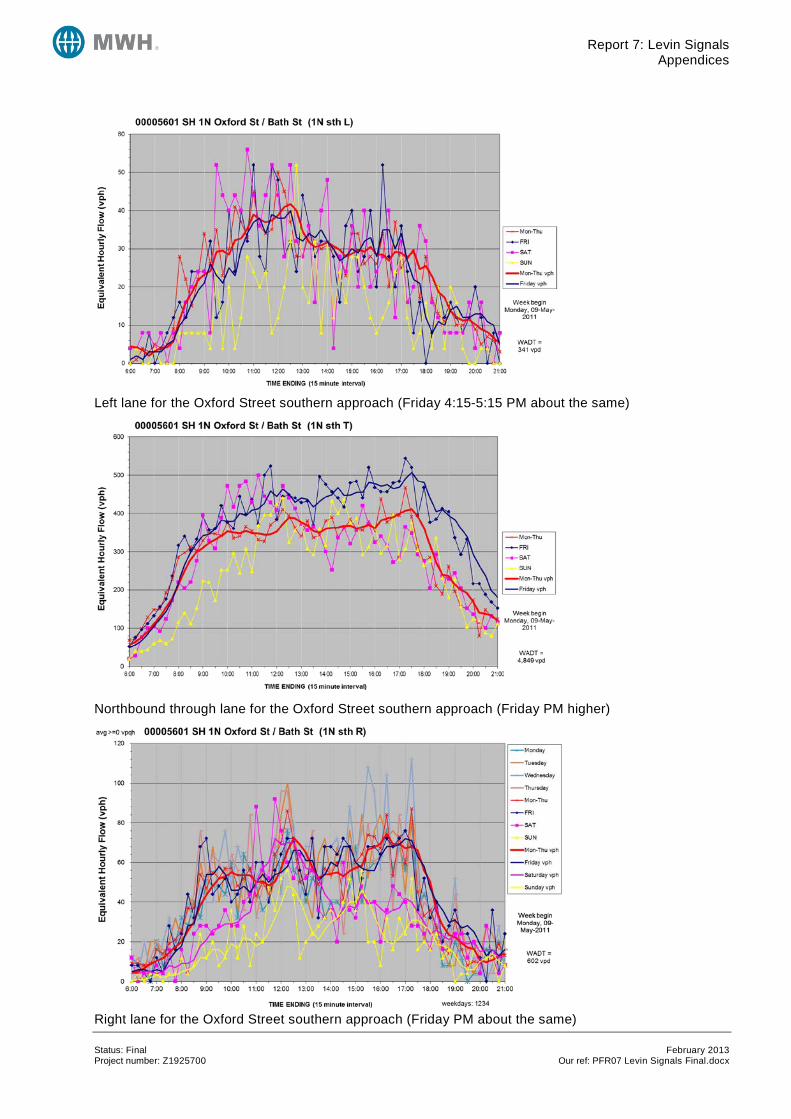
Left lane for the Oxford Street southern approach (Friday 4:15-5:15 PM about the same)
Northbound through lane for the Oxford Street southern approach (Friday PM higher)
Right lane for the Oxford Street southern approach (Friday PM about the same) Status: Final February 2013 Project number: Z1925700 Our ref: PFR07 Levin Signals Final.docx

Report 7: Levin Signals Appendices
2: Classified turning count survey: Thursday 12 May 2011 SH1 Oxford Street / Queen Street
SH1 Oxford Street / Bath Street
Queen St/ SH 1 Thurs 12/05/11 Weather rain on and off for most of the day
Time Cars Trucks Buses Cars Trucks Buses Cars Trucks Buses Cars Trucks Buses Cars Trucks Buses Cars Trucks Buses Cars Trucks Buses Cars Trucks Buses Cars Trucks Buses Cars Trucks Buses Cars Trucks Buses Cars Trucks Buses7:00 5 5 44 5 8 9 12 1 4 19 7 6 1 1 16 1 137:15 12 5 62 1 9 14 1 8 3 41 14 6 3 15 77:30 13 7 45 1 5 6 22 11 2 4 40 7 2 7 1 1 26 1 17 17:45 12 9 61 1 1 5 9 44 4 9 5 41 14 8 1 6 36 158:00 15 6 66 9 1 27 45 2 23 1 51 14 9 2 4 34 1 17 48:15 23 6 77 1 14 13 53 1 20 2 1 54 10 1 14 1 7 42 1 15 28:30 19 9 61 11 24 67 1 21 57 11 17 9 58 1 19 18:45 26 7 78 1 13 31 90 1 2 21 3 55 15 16 1 9 1 76 17
11:00 25 1 72 5 9 1 26 42 2 31 26 61 12 14 15 44 27 111:15 26 83 5 14 1 28 1 53 1 28 1 24 1 2 68 5 12 2 14 1 1 55 1 28 111:30 26 62 7 2 16 24 1 53 1 2 23 1 13 70 9 2 20 2 16 1 55 18 111:45 25 64 7 1 13 24 1 1 69 1 1 33 1 24 1 93 8 25 16 58 1 2412:00 28 73 9 12 2 23 1 61 1 1 41 1 26 73 13 17 11 61 20 1 All 112:15 10 49 2 6 25 55 17 27 1 61 10 11 7 46 20 AM 1538 2 307612:30 23 89 3 8 28 1 71 2 1 31 22 1 1 64 10 15 1 15 41 20 2 IP 1786 11.4 2036012:45 25 1 70 7 10 1 37 1 68 1 1 33 21 82 8 1 5 9 63 2 24 PM 2179 2 435813:00 24 68 8 8 19 1 51 2 1 20 2 28 83 7 23 2 10 68 23 1786 2779413:15 15 66 10 1 19 28 64 1 26 15 64 11 1 13 3 9 1 75 19 3 entering AADT13:30 20 72 8 10 23 1 1 54 1 29 22 68 13 2 20 1 10 1 62 16 2 0.94013:45 24 71 7 14 1 27 66 1 28 1 26 82 10 2 18 1 10 55 1 22 2 556
16:00 26 74 9 11 33 80 4 35 3 21 105 5 13 1 11 1 56 4 28 493 29 522 5.6%16:15 20 78 8 14 24 90 2 41 29 1 101 5 25 14 84 1 18 538 20 558 3.6%16:30 31 2 81 13 14 29 68 1 32 1 26 100 10 12 6 63 1 20 1 482 31 513 6.0%16:45 25 2 80 13 7 26 1 73 34 41 1 119 5 14 1 17 61 1 34 531 31 562 5.5%17:00 29 2 1 82 5 14 30 88 2 1 29 2 23 127 5 24 1 16 88 21 571 21 592 3.5%17:15 28 1 69 5 16 23 74 1 36 17 117 7 18 12 81 1 16 1 507 13 520 2.5%17:30 21 64 7 1 13 22 39 1 37 21 79 4 23 14 56 17 406 18 424 4.2%17:45 21 58 6 16 23 54 1 29 11 77 2 11 20 53 11 Intersection
LV HV All LV HV All LV HV All LV HV All LV HV All LV HV All LV HV All LV HV All LV HV All LV HV All LV HV All LV HV All LV HV All %HV7-9 am 125 54 179 494 5 499 63 1 64 127 0 127 344 12 356 125 10 135 16 0 16 358 95 453 83 7 90 40 1 41 303 5 308 120 8 128 2198 198 2396 8.3%7:45-8:45 69 30 99 265 3 268 39 1 40 73 0 73 209 8 217 73 4 77 5 0 5 203 50 253 48 4 52 26 0 26 170 3 173 66 7 73 1246 110 1356 8.1%8:00-9:00 83 28 111 282 2 284 47 1 48 95 0 95 255 7 262 85 7 92 0 0 0 217 51 268 56 4 60 29 1 30 210 3 213 68 7 75 1427 111 1538 7.2%
11-12 102 1 103 281 27 308 52 2 54 102 4 106 217 8 225 115 3 118 87 4 91 292 36 328 71 4 75 61 3 64 212 2 214 97 3 100 1689 97 1786 5.4%12-1 pm 86 1 87 281 21 302 36 3 39 113 3 116 255 7 262 122 1 123 96 3 99 280 42 322 48 1 49 42 0 42 211 2 213 84 3 87 1654 87 1741 5.0%1-2 pm 83 0 83 277 34 311 51 1 52 97 3 100 235 6 241 103 3 106 91 0 91 297 46 343 74 7 81 39 2 41 260 1 261 80 7 87 1687 110 1797 6.1%
4-6 pm 201 8 209 586 67 653 105 0 105 210 1 211 566 13 579 273 6 279 189 2 191 825 43 868 140 3 143 110 1 111 542 8 550 165 2 167 3912 154 4066 3.8%4:15-5:15 105 7 112 321 39 360 49 0 49 109 1 110 319 6 325 136 3 139 119 2 121 447 25 472 75 2 77 53 0 53 296 3 299 93 1 94 2122 89 2211 4.0%4:30-5:30 113 8 121 312 36 348 51 0 51 108 1 109 303 5 308 131 3 134 107 1 108 463 27 490 68 2 70 51 0 51 293 3 296 91 2 93 2091 88 2179 4.0%
5:00-5:15 443 2.0 0.875 465 11.4 1.034 520 2.0 0.875 449 2.0 0.917 449 11.4 0.893 551 2.0 1.121 328 2.0 1.315 494 11.4 0.894 668 2.0 0.770 318 2.0 0.828 378 11.4 0.849 440 2.0 1.119 0.979 0.944 0.931 0.892
appr PFF 390 2.0 7227 510 11.4 7944 675 2.0 15171 384 2.0 7119 392 11.4 6211 487 2.0 13329 454 2.0 7624 514 11.4 7868 550 2.0 15491 310 2.0 5825 370 11.4 5772 467 2.0 11597 15171 13329 15491 11597
2011 PM 119 412 2 69 384 141 0 496 87 0 338 0 908 1116 2048 T,app,a l l2016 PM 124 402 0 91 406 162 0 503 84 25 520 4 905 1113 2321 SH1,1,a l l2026 PM 123 436 0 86 403 161 0 534 83 6 505 0 970 1176 23372041 PM 120 480 1 83 399 159 0 595 83 0 480 0 1075 1279 2400
Queen St WestSH 1 North SH 1 North SH 1 North Queen St East Queen St East Queen St East SH 1 South SH 1 South SH 1 South Queen St West Queen St WestRight into SH 1Left into Queen St Straight into SH 1 St Right into Queen St Left into SH 1 Straight into Queen Right into SH 1 Left into Queen St Straight into SH 1 Nt Right into Queen St Left into SH 1 Straight into Queen
Bath St/ SH 1 Thurs 12/05/11 Weather rain on and off for most of the day
Time Cars Trucks Buses Cars Trucks Buses Cars Trucks Buses Cars Trucks Buses Cars Trucks Buses Cars Trucks Buses Cars Trucks Buses Cars Trucks Buses Cars Trucks Buses Cars TrucksBuses Cars Trucks Buses Cars TrucksBuses7:00 10 53 8 3 3 9 5 2 34 7 3 1 4 6 1 57:15 5 69 1 3 1 7 1 10 3 1 1 36 17 5 6 5 1 1 27:30 5 56 6 4 1 5 8 1 0 2 51 6 3 4 10 37:45 13 65 10 1 7 13 26 1 7 1 11 1 47 17 7 7 1 15 10 18:00 21 2 73 8 5 7 25 4 1 2 63 13 1 10 5 22 1 8 18:15 14 73 6 10 22 43 1 7 5 79 10 12 1 11 35 1 98:30 15 75 11 12 10 50 1 14 8 80 12 1 19 4 54 1 1 14 18:45 17 83 8 16 20 51 12 7 80 16 1 15 12 30 6
11:00 25 78 7 25 1 13 1 27 1 10 13 1 91 13 15 14 1 30 1 15 111:15 17 2 86 6 22 14 30 3 1 9 1 83 8 12 1 10 1 46 1 1811:30 22 1 66 7 1 19 10 39 17 1 13 78 9 18 15 27 1 1011:45 23 74 10 1 14 13 45 1 16 8 2 99 9 26 18 54 1 2012:00 16 1 86 8 16 2 11 29 16 11 83 10 26 12 46 21 1 1 All 112:15 17 84 2 13 12 1 30 16 8 82 8 2 19 11 44 21 2 AM 1368 2 273612:30 23 1 88 7 13 14 36 1 13 2 8 71 12 13 13 38 17 IP 1542 11.4 1757912:45 20 77 7 19 19 1 31 12 6 87 9 1 17 13 34 17 1 1 PM 1689 2 337813:00 16 3 74 10 10 12 36 18 1 16 1 93 9 22 12 1 25 3 12 1 1542 2369313:15 20 2 81 11 1 12 1 12 24 10 9 70 14 11 1 10 24 3 1 16 entering AADT13:30 24 1 78 14 1 13 17 33 1 17 1 9 81 16 10 1 11 34 17 1 0.88513:45 22 82 7 15 13 26 15 6 1 89 13 1 14 1 12 30 1 13 1 420
16:00 19 96 7 13 9 41 15 4 116 6 24 21 37 17 412 14 426 3.3%16:15 15 82 6 17 14 31 1 17 6 97 8 1 6 16 29 12 342 14 356 3.9%16:30 22 1 83 8 14 1 11 45 1 18 13 101 11 1 19 26 39 1 13 1 404 22 426 5.2%16:45 29 94 11 20 9 1 34 13 10 117 7 1 17 12 32 12 399 25 424 5.9%17:00 16 102 6 16 10 45 23 1 9 133 6 19 1 19 1 50 20 1 462 13 475 2.7%17:15 22 71 6 10 8 43 8 5 100 5 6 1 22 40 16 351 12 363 3.3%17:30 17 70 8 15 7 1 16 14 4 92 5 1 9 10 30 16 1 300 19 319 6.0%17:45 10 64 6 10 1 7 1 20 6 7 81 3 10 11 33 1 9 Intersection
LV HV All LV HV All LV HV All LV HV All LV HV All LV HV All LV HV All LV HV All LV HV All LV HV All LV HV All LV HV All LV HV All %HV7-9 am 100 2 102 547 59 606 60 2 62 87 1 88 222 4 226 52 3 55 38 1 39 470 101 571 74 2 76 53 1 54 177 7 184 57 3 60 1937 186 2123 8.8%7:45-8:45 63 2 65 286 36 322 34 0 34 52 0 52 144 3 147 32 2 34 26 1 27 269 54 323 48 1 49 27 1 28 126 4 130 41 3 44 1148 107 1255 8.5%8:00-9:00 a 67 2 69 304 33 337 43 0 43 59 0 59 169 2 171 37 1 38 22 0 22 302 54 356 56 1 57 32 0 32 141 4 145 37 2 39 1269 99 1368 7.2%
11-12 87 3 90 304 32 336 80 1 81 50 1 51 141 2 143 46 2 48 43 4 47 351 39 390 71 1 72 57 2 59 157 4 161 63 1 64 1450 92 1542 6.0%12-1 pm 76 2 78 335 24 359 61 2 63 56 2 58 126 1 127 57 2 59 33 0 33 323 42 365 75 0 75 49 0 49 162 0 162 76 6 82 1429 81 1510 5.4%1-2 pm 82 6 88 315 44 359 50 1 51 54 0 54 119 1 120 60 2 62 40 2 42 333 53 386 57 3 60 45 1 46 113 8 121 58 3 61 1326 124 1450 8.6%
4-6 pm 150 1 151 662 58 720 115 2 117 75 3 78 275 2 277 114 1 115 58 0 58 837 55 892 110 2 112 137 1 138 290 2 292 115 3 118 2938 130 3068 4.2%4:15-5:15 82 1 83 361 31 392 67 1 68 44 1 45 155 2 157 71 1 72 38 0 38 448 35 483 61 1 62 73 1 74 150 1 151 57 2 59 1607 77 1684 4.6%4:30-5:30 89 1 90 350 31 381 60 1 61 38 1 39 167 1 168 62 1 63 37 0 37 451 31 482 61 2 63 79 1 80 161 1 162 61 2 63 1616 73 1689 4.3%
5:00-5:15 449 2.0 1.297 507 11.4 0.907 532 2.0 1.063 268 2.0 1.125 242 11.4 0.872 270 2.0 0.750 435 2.0 1.056 509 11.4 0.869 582 2.0 0.775 216 2.0 0.925 284 11.4 0.755 305 2.0 0.702 0.970 0.867 0.868 0.780
appr PFF 426 2.0 7742 497 11.4 7768 625 2.0 15510 271 2.0 3835 323 11.4 4854 315 2.0 8689 435 2.0 7837 451 11.4 6977 483 2.0 14814 236 2.0 4280 271 11.4 4093 266 2.0 8373 15510 8689 14814 8373
2011 PM 41 351 54 44 138 18 48 464 134 0 214 63 815 1092 1569 T,app,a l l2016 PM 34 369 56 31 151 7 48 483 23 0 114 59 852 1013 1375 SH1,1,a l l2026 PM 24 393 56 30 151 7 48 518 32 0 127 64 911 1071 14502041 PM 24 438 60 38 153 8 49 574 49 0 173 64 1012 1194 1630
Bath St WestSH 1 North SH 1 North SH 1 North Bath St East Bath St East Bath St East SH 1 South SH 1 South SH 1 South Bath St West Bath St WestRight into SH 1Left into Bath St Straight into SH 1 St Right into Bath St Left into SH 1 Straight into Bath St Right into SH 1 Left into Bath St Straight into SH 1 Nt Right into Bath St Left into SH 1 Straight into Bath St
Status: Final February 2013 Project number: Z1925700 Our ref: PFR07 Levin Signals Final.docx
Report 7: Levin Signals Appendices
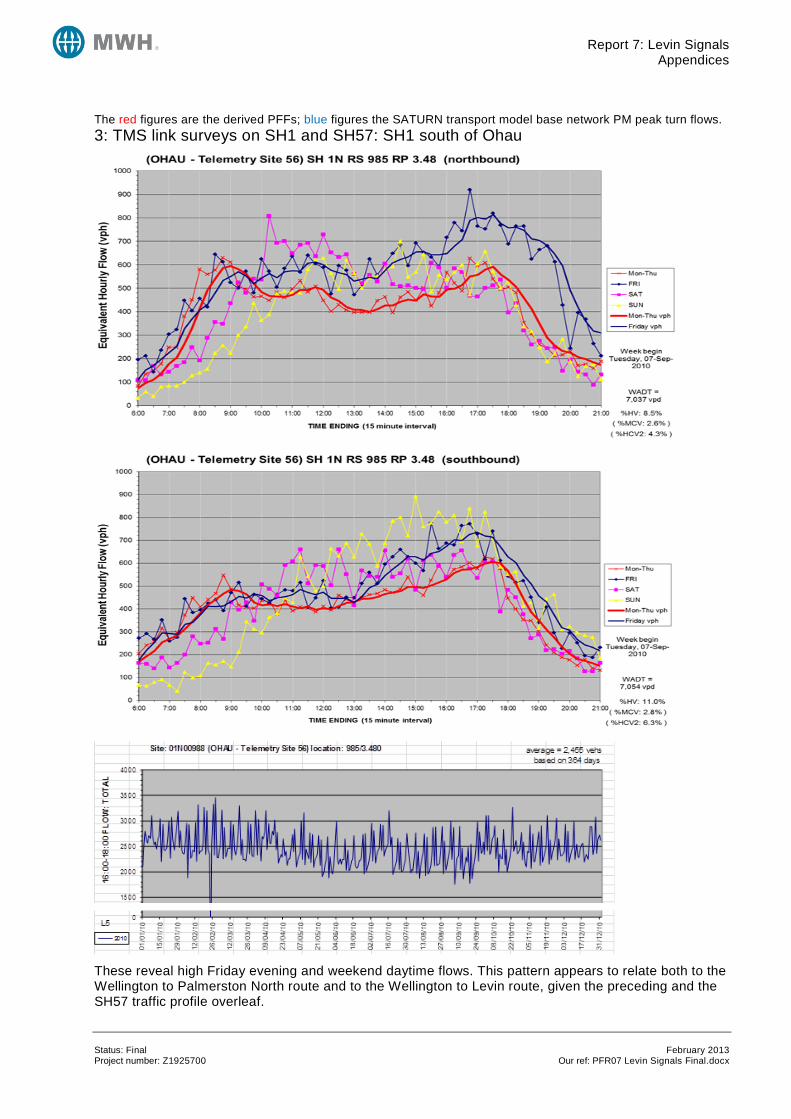
The red figures are the derived PFFs; blue figures the SATURN transport model base network PM peak turn flows. 3: TMS link surveys on SH1 and SH57: SH1 south of Ohau
These reveal high Friday evening and weekend daytime flows. This pattern appears to relate both to the Wellington to Palmerston North route and to the Wellington to Levin route, given the preceding and the SH57 traffic profile overleaf.
Status: Final February 2013 Project number: Z1925700 Our ref: PFR07 Levin Signals Final.docx

Report 7: Levin Signals Appendices
SH57 Kimberley Road east of SH1
The reason for the Sunday late afternoon eastbound spike is unknown.
Status: Final February 2013 Project number: Z1925700 Our ref: PFR07 Levin Signals Final.docx

Report 7: Levin Signals Appendices
Appendix F SIDRA output
Status: Final February 2013 Project number: Z1925700 Our ref: PFR07 Levin Signals Final.docx
Report 7: Levin Signals Appendices
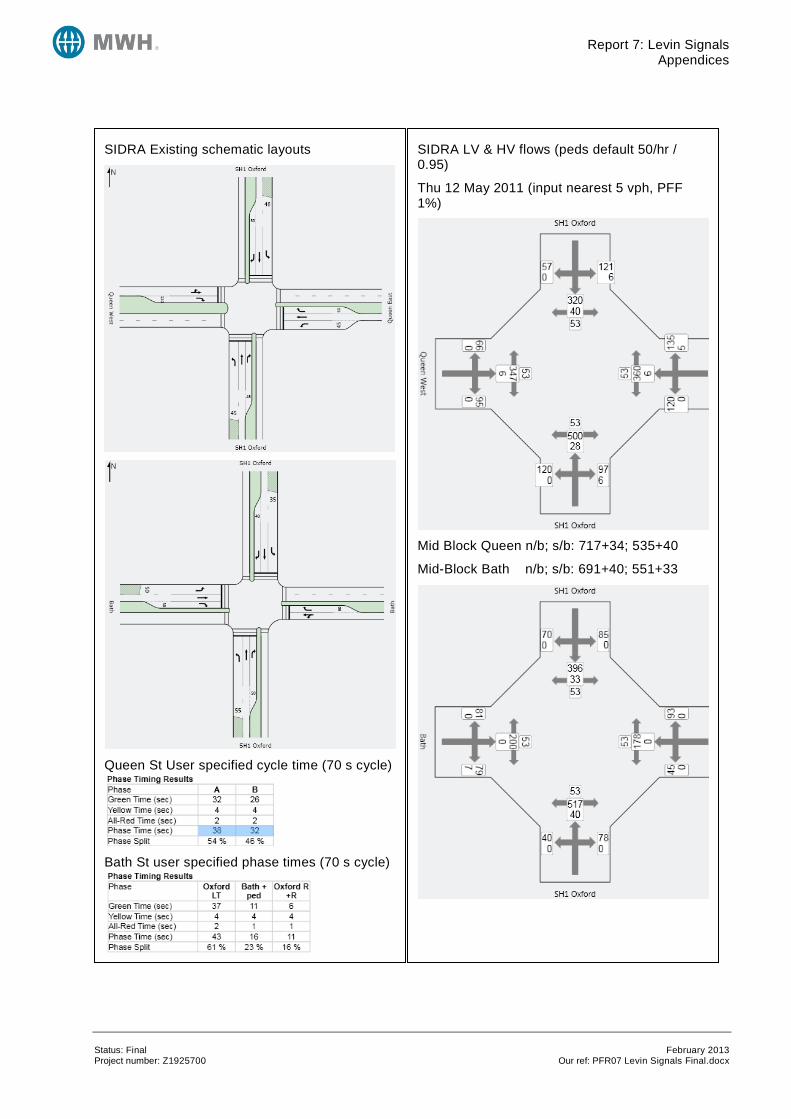
SIDRA Existing schematic layouts
Queen St User specified cycle time (70 s cycle)
Bath St user specified phase times (70 s cycle)
SIDRA LV & HV flows (peds default 50/hr / 0.95)
Thu 12 May 2011 (input nearest 5 vph, PFF 1%)
Mid Block Queen n/b; s/b: 717+34; 535+40
Mid-Block Bath n/b; s/b: 691+40; 551+33
Status: Final February 2013 Project number: Z1925700 Our ref: PFR07 Levin Signals Final.docx

Report 7: Levin Signals Appendices
Queen St: 2011 PM, user specified 70 s cycle [38 s Oxford, 32 s Bath]
Bath St: 2011 PM user specified phase times, 70 s cycle [43, 16, 11]
The 95th percentile queuing along SH1 Oxford Street between the intersections reaches 83 metres. The 95th percentile queuing along Queen Street east extends back beyond the NIMT railway line, and to or beyond the rail line for Bath Street (depending on whether queued vehicles keep clear of the South Lane intersection).
Status: Final February 2013 Project number: Z1925700 Our ref: PFR07 Levin Signals Final.docx
Report 7: Levin Signals Appendices
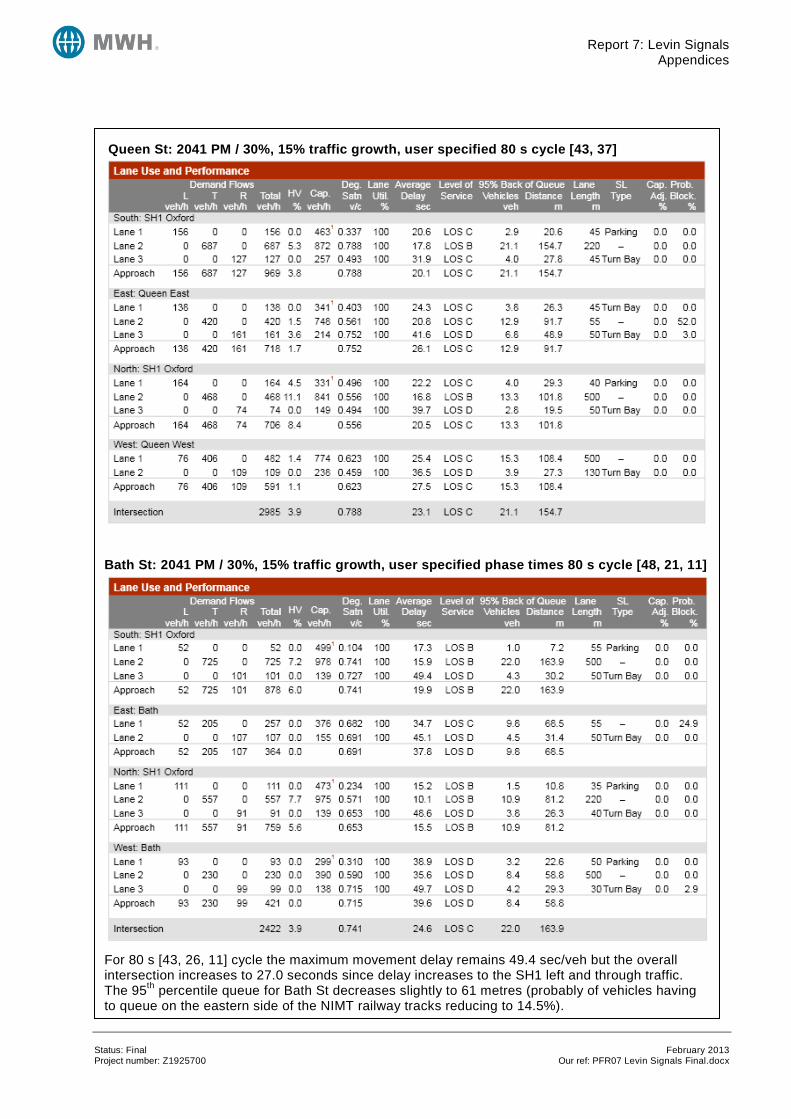
Queen St: 2041 PM / 30%, 15% traffic growth, user specified 80 s cycle [43, 37]
Bath St: 2041 PM / 30%, 15% traffic growth, user specified phase times 80 s cycle [48, 21, 11]
For 80 s [43, 26, 11] cycle the maximum movement delay remains 49.4 sec/veh but the overall intersection increases to 27.0 seconds since delay increases to the SH1 left and through traffic. The 95th percentile queue for Bath St decreases slightly to 61 metres (probably of vehicles having to queue on the eastern side of the NIMT railway tracks reducing to 14.5%).
Status: Final February 2013 Project number: Z1925700 Our ref: PFR07 Levin Signals Final.docx
Report 7: Levin Signals Appendices
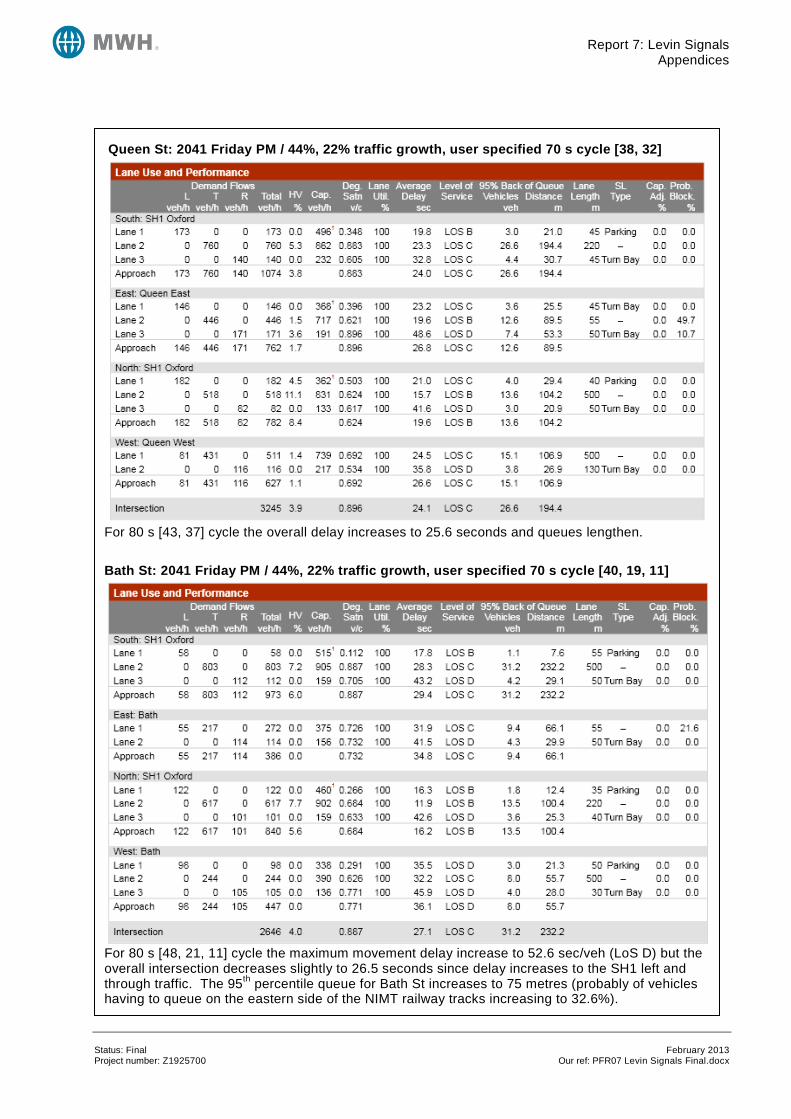
Queen St: 2041 Friday PM / 44%, 22% traffic growth, user specified 70 s cycle [38, 32]
For 80 s [43, 37] cycle the overall delay increases to 25.6 seconds and queues lengthen.
Bath St: 2041 Friday PM / 44%, 22% traffic growth, user specified 70 s cycle [40, 19, 11]
For 80 s [48, 21, 11] cycle the maximum movement delay increase to 52.6 sec/veh (LoS D) but the overall intersection decreases slightly to 26.5 seconds since delay increases to the SH1 left and through traffic. The 95th percentile queue for Bath St increases to 75 metres (probably of vehicles having to queue on the eastern side of the NIMT railway tracks increasing to 32.6%).
Status: Final February 2013 Project number: Z1925700 Our ref: PFR07 Levin Signals Final.docx
Report 7: Levin Signals Appendices
Status: Final February 2013 Project number: Z1925700 Our ref: PFR07 Levin Signals Final.docx
Report 7: Levin Signals Appendices
Appendix G Crash Data
Status: Final February 2013 Project number: Z1925700 Our ref: PFR07 Levin Signals Final.docx

Report 7: Levin Signals Appendices
Coded Crash listing (Red=Queen, Yellow=between, Blue=Bath; orange = serious injury, green = minor)
ROAD DIST FROMINTNSIDE IDNO DATE DYWK TIME MVMT VEHS CSCD OBJS CURV SURF LITE WTHJNTY TRAF MARKSPDLNFATNSER NMIN PEDACYCA
BATH ST 30 W SH 1N 2950251 07/01/09 Wed 1335 MA CE1CC 370A 386B M R D B F N C 50 0 0 0QUEEN ST EAST 20 E SH 1N 201054963 26/09/10 Sun 2000 AA CW1C 157A 372A R D DO F X T C 50 0 0 0QUEEN ST WEST 25 W SH 1N OXFORD 201250373 21/02/12 Tue 1346 MO CS1C 330A 357A 371A 352B 440B R D B F N C 50 0 0 01N/967/13.705 50 N QUEEN ST EAST 2713559 13/11/07 Tue 1934 MC CN1C 101A 372B 377B R W O L N P 50 0 0 11N/967/13.707 50 N QUEEN ST EAST 201150778 20/02/11 Sun 1207 FD CS1C 331A 358A R D B F N P 50 0 0 01N/967/13.737 20 N QUEEN ST WEST 201152153 02/06/11 Thu 1715 FD VS14 386A 402A E D DO F X T R 50 0 0 01N/967/13.755 I QUEEN ST EAST 2955642 24/10/09 Sat 645 LB CS1C 303B 375B R D TF F X T R 50 0 0 01N/967/13.755 I QUEEN ST WEST 2950184 03/01/09 Sat 1930 FE TN1C 181A 387A R D B F X T C 50 0 0 0QUEEN ST EAST I OXFORD ST 201153676 30/08/11 Tue 1118 LB CS1C 157A 330A 357A R D B F X T R 50 0 0 0QUEEN ST EAST I 1N/967/13.757 201155551 29/12/11 Thu 1650 KC CS1C 305A 330A 402A S D O F X T R 50 0 0 01N/967/13.757 I QUEEN ST EAST 201056337 18/12/10 Sat 1205 FE TN14 181A R W O L X T R 50 0 0 01N/967/13.757 I QUEEN ST WEST 201152335 29/06/11 Wed 1330 EC CN14 374B Q R D B F X T R 50 0 0 01N/967/13.757 I QUEEN ST WEST 2913299 13/11/09 Fri 1100 NF CE2E 307A 353A R D O F X T R 50 0 0 1 841N/967/13.795 40 S QUEEN ST WEST 2755387 20/09/07 Thu 1709 MC CN1C 372B R D B F N C 50 0 0 01N/967/13.797 40 S QUEEN ST EAST 201250528 05/03/12 Mon 1521 MO CS1V 372B 671B R D B F N C 50 0 0 01N/967/13.807 50 S QUEEN ST EAST 201111996 03/06/11 Fri 1617 NB MN1E 112A 376A R D O F N P 90 0 0 1 561N/967/13.807 50 S QUEEN ST WEST 201211610 21/04/12 Sat 1010 NG CW1E 371A 427A R D B F N C 50 0 0 1 771N/967/13.835 80 S QUEEN ST EAST 2913048 29/09/09 Tue 1200 MF CN1T 381A R D B F N P 50 0 0 11N/967/13.855 100 S QUEEN ST EAST 2912712 26/08/09 Wed 1655 FD CS1CCC 331A R D O F N C 50 0 0 11N/967/13.855 100 S QUEEN ST WEST 2855550 16/10/08 Thu 1350 MO VN14 386A M R D O F N N 50 0 0 01N/967/13.855 100 S QUEEN ST WEST 2912510 26/07/09 Sun 1232 NA CN1E 711B R D B F N C 50 0 0 1 231N/967/13.855 100 S QUEEN ST WEST 2912254 24/06/09 Wed 1255 NG CS1E 730B R D B F N C 50 0 0 1 891N/967/13.857 100 S QUEEN ST WEST 201012221 22/06/10 Tue 1258 MO CS1S 372A 671A R D B F N C 50 0 0 1 331N/967/13.934 70 N BATH ST 2856652 31/08/08 Sun 2030 MF CN14 371B R D DO F N C 50 0 0 01N/967/13.966 40 N BATH ST 201250640 09/03/12 Fri 1610 MC CN1C 191A 330B 372B R D B F N C 50 0 0 01N/967/13.974 30 N BATH ST 2754032 20/07/07 Fri 1829 MA CN1C 103B 374B R W DO F N C 50 0 0 01N/967/13.976 30 N BATH ST 201055673 12/11/10 Fri 1530 FD 4S1CCC 331A 402A R D B F T C 50 0 0 01N/967/13.984 20 N BATH ST 2754031 24/07/07 Tue 1209 FD CS1C4 331A 351A R D B F X T C 50 0 0 01N/967/13.989 15 N BATH ST 2911849 01/05/09 Fri 1025 NA CS1E 711B 712B R D B F X T R 50 0 0 1 411N/967/13.994 10 N BATH ST 2854707 05/08/08 Tue 1055 MO TN1V 386A 440B 817 R D B F X S N 50 0 0 01N/967/14.004 I BATH ST 2950142 05/01/09 Mon 1012 FE VS1VC 181A R D O F X T C 50 0 0 01N/967/14.004 I BATH ST 2856913 28/11/08 Fri 1635 FD CN1C 181A 352A 817 R D B F X T C 50 0 0 01N/967/14.004 I BATH ST 2950653 09/02/09 Mon 543 EC CS1 377A 901 IP R W DO H X T R 50 0 0 01N/967/14.004 I BATH ST 2755381 21/09/07 Fri 1105 FD VN1CC 331A R D B F X T C 50 0 0 01N/967/14.004 I BATH ST 2852127 06/05/08 Tue 1100 HA CE2C 322A R D B F X T C 50 0 0 01N/967/14.004 I BATH ST 2912060 21/05/09 Thu 1549 NA VN1 322A R D B F X T C 50 0 0 1 73BATH ST I OXFORD ST 201150609 28/02/11 Mon 1708 AC VW14 159A 172A R D B F X T L 50 0 0 01N/967/14.006 I BATH ST 201155072 09/12/11 Fri 930 DA TN2C 130A 386A 818 M R D B F X T C 50 0 0 01N/967/14.006 I BATH ST 201154581 17/10/11 Mon 1158 JB CN14 129B 386B R D O F X T R 50 0 0 01N/967/14.006 I BATH ST 201151525 25/04/11 Mon 1102 GO TW1C 175A 179A 372A 333B R W O L X T L 50 0 0 01N/967/14.006 I BATH ST 201013735 09/12/10 Thu 1242 NC TW2E 378A 671A 718B R D B F X T R 50 0 1 0 831N/967/14.006 I BATH ST 2713244 13/10/07 Sat 1951 HA CW2T 322A R D DO F X T C 50 0 1 01N/967/14.006 I BATH ST 2712477 20/07/07 Fri 1000 NF XE2E 307A 376A R W O L X T C 50 0 0 1 831N/967/14.006 I BATH ST 201153855 11/08/11 Thu 1635 FE CN1C 181A 427A R D B F X T R 50 0 0 01N/967/14.006 I BATH ST 201251148 07/04/12 Sat 1120 FA VN14 181A 331A 402A R D B F X T P 50 0 0 01N/967/14.026 20 S BATH ST 201054884 05/10/10 Tue 1240 JA CN1C 205A 308B 314B 925 R D B F D N P 50 0 0 0
Status: Final February 2013 Project number: Z1925700 Our ref: PFR07 Levin Signals Final.docx
Report 7: Levin Signals Appendices
Appendix H Bath Street pedestrian improvements
Status: Final February 2013 Project number: Z1925700 Our ref: PFR07 Levin Signals Final.docx
Report 7: Levin Signals Appendices
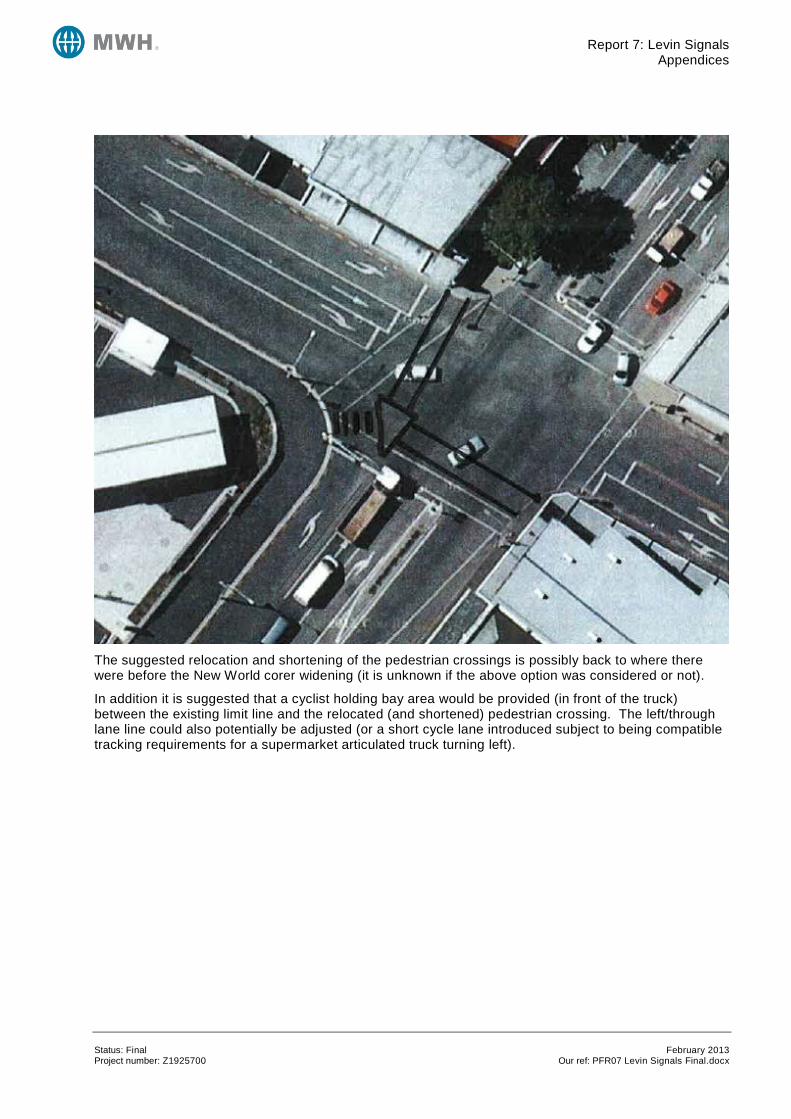
The suggested relocation and shortening of the pedestrian crossings is possibly back to where there were before the New World corer widening (it is unknown if the above option was considered or not).
In addition it is suggested that a cyclist holding bay area would be provided (in front of the truck) between the existing limit line and the relocated (and shortened) pedestrian crossing. The left/through lane line could also potentially be adjusted (or a short cycle lane introduced subject to being compatible tracking requirements for a supermarket articulated truck turning left).
Status: Final February 2013 Project number: Z1925700 Our ref: PFR07 Levin Signals Final.docx