pre-feasibility study (waste) of lombok
203
PRE-FEASIBILITY STUDY (WASTE) OF LOMBOK FINAL REPORT
-
Upload
khangminh22 -
Category
Documents
-
view
1 -
download
0
Transcript of pre-feasibility study (waste) of lombok
PRE-FEASIBILITY STUDY (WASTE) OF LOMBOK FINAL REPORT
Rambøll Danmark A/S DK reg.no. 35128417
Ramboll - Pre-feasibility Study (Waste) of Lombok
PRE-FEASIBILITY STUDY (WASTE) OF LOMBOK
Project name Pre-feasibility Study (Waste) of Lombok Project no. 1100045950-001 Recipient Danish Environmental Protection Agency (DEPA) Document type Report Version 4 Date 05/01/2022 Prepared by Ova Candra Dewi, Widita Vidyaningrum, Christiana Yuni Kusmiati and Reno
Munksgaard Checked by [Name] Approved by [Name] Description Final draft report Recipient ID MST Id.: 2187653 [Optional 2] [Text - If no optional text is needed then remember to delete the fields.]
Ramboll - Pre-feasibility Study (Waste) of Lombok
3/150
CONTENTS
LIST OF ANNEXES 4 LIST OF FIGURES 5 LIST OF TABLES 7 LIST OF ABBREVIATION 9 LIST OF DEFINITION 11 EXECUTIVE SUMMARY 13 1. Introduction 16 1.1 Introduction 16 1.2 Background 16 1.3 Objective 17 1.4 Output 17 1.5 Scope of Work 18 1.6 Methodology 19 2. City/Regencies in Lombok Island Profile 21 2.1 The Island of Lombok 21 2.2 Mataram City 21 2.3 West Lombok Regency 22 2.4 Central Lombok Regency 23 2.5 East Lombok Regency 24 2.6 North Lombok Regency 26 3. Waste management in Indonesia and West Nusa tenggara
province 28 3.1 Waste Management in Indonesia 28 3.1.1 Waste Generation and Composition 29 3.1.2 Operational Model and Sector Performance 31 3.1.3 Waste Management Policy and Strategy 32 3.2 Waste Management in West Nusa Tenggara Province 34 4. Waste management in lombok municipalities 41 4.1.1 Waste Management in Mataram City 41 4.1.2 Waste Management in West Lombok Regency 44 4.1.3 Waste Management in Central Lombok Regency 48 4.1.4 Waste Management in East Lombok Regency 52 4.1.5 Waste Management in North Lombok Regency 56 4.2 Overall Situation and Improvement Scenario of Waste Management
in Lombok Island 59 4.2.1 Overall Situation of Waste Management Practiced in Lombok Island 59 4.2.2 Overall Improvement of Waste Management System in Lombok
Island 64 5. Potential Sources of Organic Waste and Potential Off-
takers/end users 68
Ramboll - Pre-feasibility Study (Waste) of Lombok
4/150
5.1 Potential Sources of Organic Waste 68 5.2 Potential Off-Takers and End Users of the Waste Treatment Facility 74 5.2.1 Compost 74 5.2.2 Energy 75 6. Institutional Analysis 82 6.1 Institutional Mapping of Waste Management in Lombok Island 82 6.1.1 Waste Management Institution and Stakeholders in Lombok Island 82 6.1.2 Institutional Capacity in Waste Management in Lombok Island 84 6.1.3 Human Resources Capacity of Waste Management Institutions on
Lombok Island 88 6.1.4 Waste Management Infrastructure and Facility in Lombok Island 89 6.2 Institutional Analysis of Waste Management in Lombok Island 95 6.2.1 Institutional Enabling Factors for Implementation of the Scenario 96 6.2.2 The Need for Institutional Strengthening for the Development of
Regional Waste Management Facilities on Lombok Island 99 7. Screening and determination of preferred technology 104 7.1 Analyse and identify appropriate options for technologies for waste
handling 104 7.1.1 Waste separation 105 7.1.2 Waste collection 105 7.1.3 Waste treatment 105 7.2 Evaluation of waste management and treatment options 105 7.2.1 Landfill 106 7.2.2 MBT 106 7.2.3 MRF 107 7.2.4 AD 107 7.2.5 Incineration 108 7.2.6 Gasification/Pyrolysis 108 7.2.7 Composting 109 7.3 Recommendation of appropriate technology 113 7.3.1 MBT 113 7.4 Evaluation of energy and fertiliser utilisation options at Lombok 113 7.5 Evaluation of availability of co-substrates 114 7.6 Detailed description of the selected technical option 115 7.6.1 MBT 115 7.6.2 Revenue 136 7.7 Evaluation of selected technology 141 7.8 Required land 142 7.9 Roadmap 143 8. Conclusion and key recommendation 145 8.1 Conclusion 145 8.2 Key Recommendation 147
LIST OF ANNEXES
Annex 1: Methodology of waste projection Annex 2: Potential sources of organic waste Annex 3: Circular Economy
Ramboll - Pre-feasibility Study (Waste) of Lombok
5/150
LIST OF FIGURES
Figure 1. Waste Generation Rates in the East Asia and the Pacific. 29 Figure 2. Waste Composition in Indonesia. 31 Figure 3. Sub-National Strategy on Waste Reduction and Handling. 32 Figure 4 Stages in Development of Jakstrada. 33 Figure 5 Waste Composition at TPAR Kebon kongok (2019). 37 Figure 6 Waste Composition at TPAR Kebon Kongok (2020). 38 Figure 7 Highlighted Issues on Waste Management in NTB Province. 40 Figure 8 Sources of Waste in Mataram City. 41 Figure 9 Highlighted Issues on Waste Management in Mataram City. 44 Figure 10 Waste Composition in West Lombok Regency. 45 Figure 11Highlighted Issues on Waste Management in West Lombok Regency. 48 Figure 12 Sources of Waste in Central Lombok Regency. 49 Figure 13 Waste Composition in Central Lombok Regency. 49 Figure 14 Highlighted Issues on Waste management in Central Lombok Regency. 52 Figure 15 Sources of Waste in East Lombok Regency. 53 Figure 16 Waste Composition in East Lombok Regency. 53 Figure 17 Waste Management Budget of DLHK East Lombok Regency. 55 Figure 18 Highlighted Issues on Waste Management in East Lombok Regency. 56 Figure 19. Waste Composition in North Lombok Regency. 56 Figure 20 Highlighted Issues on Waste Management in North Lombok Regency. 59 Figure 21 General Solid Waste Management System in Lombok Island. 61 Figure 22 Summary of Waste Management Practices in Lombok. 63 Figure 23 Projection of Waste Management in City and Regencies in Lombok Island (2020 – 2039). 64 Figure 24 Energy Consumption in West Nusa Tenggara Province (2015). 76 Figure 25 Projection of Energy Consumption - Medium Scenario. 77 Figure 26 Projection of Energy Consumption - Optimistic Scenario. 78 Figure 27 Electricity Supply in West Nusa Tenggara Province (2015). 79 Figure 28 Mapping of Lombok Municipalities and Geographical Condition. 91 Figure 29 Mapping and General Information of Landfills in Lombok Island. 91 Figure 30 Mapping of Transportation Access in Lombok Island. 93 Figure 31 Road Condition in Lombok Island 93 Figure 32. Flow chart from source to final disposal for future handling on Lombok. 104 Figure 33. Flow Chart MBT plant. 116 Figure 34. Example of Sorted Plastic Fraction for Recycling. 117 Figure 35. Flow Chart for MRF System. 118 Figure 36. Weighbridge. 118 Figure 37. Hooper. 119 Figure 38. Different Types of Conveyors. 120 Figure 39. Drum Screen and Combined Drum Screen and Bag Opener. 121 Figure 40. Example of Manual Sorting Facility. 122 Figure 41. Flow Chart Dry AD and Composting. 123
Ramboll - Pre-feasibility Study (Waste) of Lombok
6/150
Figure 42. Process diagram dry AD and composting. Source: Aikan technology process from Solum Gruppen. 124 Figure 43. Windrow Turning Machine. Source: Eggersmann. 126 Figure 44. Simplified model of AD in a CE context. Source: Foreningen Biogasbranchen. 134 Figure 45. Roadmap – Lombok waste treatment (MBT) 2021 to 2041. 143
Ramboll - Pre-feasibility Study (Waste) of Lombok
7/150
LIST OF TABLES Table 1. City/Regencies in Lombok Island. 21 Table 2. Districts in Mataram City. 22 Table 3. Districts in West Lombok Regency. 23 Table 4. Districts in Central Lombok. 24 Table 5. Districts in East Lombok Regency. 25 Table 6. Districts in North Lombok Regency. 26 Table 7. Sharing of Responsibilities based on The Regional Government Act 23/2014. 28 Table 8. Population Size and Waste Generation Rate in Indonesia. 30 Table 9. Estimation of Waste Generation Rates of City/Regency in Indonesia. 30 Table 10 NTB Zero Waste Program. 35 Table 11 Waste Handling based on Perda 5/2019. 35 Table 12 Waste Management Budget of DLHK NTB Province. 39 Table 13 Waste Management Budget of DLH Mataram City. 43 Table 14 Waste Management Budget of West Lombok Regency. 46 Table 15 Histroical Data of Waste Management Budget of Central Lombok Regency. 51 Table 16 Waste Management Budget of DLHPP North Lombok Regency. 58 Table 17 Overview of Waste Management in Lombok Island. 60 Table 18 Typical Waste Management Cost. 62 Table 19 Overview of current situation and possible starting point of scenario. 66 Table 20 Types, Retail Prices and Allocation of Subsidized Fertilizer in West Nusa Tenggara Province. 74 Table 21 Modelling of Energy Demand in West Nusa Tenggara Province. 78 Table 22 Feed-in-Tariff based on Ministerial Decree 55/2019. 80 Table 23 Main and Supporting Institutions for Waste Management in Lombok Island. 82 Table 24 Realization of Forestry and Environment Office Performance in Waste Management. 85 Table 25 Number of DLHK Technical Operator Personnel for Waste Management. 88 Table 26 General Information on SWM Infrastructures in Lombok Island. 89 Source: Team Analysis (2021) 91 Table 27 Number of Waste Collection and Transport Vehicles in Lombok Island. 92 Source: Team Analysis (2021) 93 Table 28 Number of Waste Infrastructure and facility in Lombok Island. 94 Table 29 Number of Landfill in Lombok Island. 95 Table 30 Waste Management Operator Institution at the Regency/City Level on Lombok Island. 96 Table 31 Mapping Potential to Increase Waste Collection Rate. 97 Table 32 Capacity Building Needs for Waste Management Operator Staff. 101 Table 33. Assessment of Landfill. 106 Table 34. Assessment of MBT. 106 Table 35. Assessment of MRF. 107 Table 36. Assessment of AD. 108 Table 37. Assessment of Incineration. 108

Ramboll - Pre-feasibility Study (Waste) of Lombok
8/150
Table 38. Assessment of Pyrolysis and Gasification. 109 Table 39. Assessment of Composting. 109 Table 40. Comparison of Technologies. 110 Table 41. Amount of organic waste available on Lombok. 114 Table 42. Size of Reception area. 119 Table 43. Required Area for MBT. 126 Table 44. Operation Regime based on 16 hours of Operation per Day 127 Table 45. Amount and Volume of Incoming Waste based on the two Scenarios. 127 Table 46. Requirement for increasing capacity based on higher collection rates and projection of future waste amounts. 127 Table 47. Projection for required MBT capacity 2021-2041. 128 Table 48. Input and Output from a simple MBT system. 128 Table 49. Organic Matter Content. 133 Table 50. Estimated Total CAPEX for MRF for the two Scenarios. 135 Table 51. Breakdown of CAPEX for 60,000 tpa (Scenario 1) and 50,000 tpa (Scenario 2). 135 Table 52. Assumptions for OPEX for MRF at the Proposed Capacities in the two Scenarios. 136 Table 53. Estimated Market Price for Sales of Recyclables and Other Materials. 136 Table 54. Waste composition of non-organic MSW fraction. 137 Table 55. Output Amounts and Potential Revenue of Recyclables. 137 Table 56. Financial Dry AD/Composting. 139 Table 57. Estimations for Maximum Landfill Reduction. 140 Table 58. Evaluation of MBT. 141 Table 59. Financial summary. 141 Table 60. Required land for MBT facility. 143
Ramboll - Pre-feasibility Study (Waste) of Lombok
9/150
LIST OF ABBREVIATION
3R Reduce, Reuse, and Recycle AD Anaerobic Digestion APBD Anggaran Pendapatan dan Belanja Daerah / Provincial/Local
budget BAPPEDA Badan Perencanaan Pembangunan Daerah / Regional
Development Planning Board BLUD Badan Layanan Umum Daerah / Regional Public Service Agency BUMD Badan Usaha Milik Daerah / Regional-Owned Enterprise BUMDES Badan Usaha Milik Desa / Village-Owned Enterprise CAPEX Capital Expenditure CSO/CBO/KSM Kelompok Swadaya Masyarakat / Community Sustainable
Organization / Community Based Organization DinKes Dinas Kesehatan / Health Agency DEA Danish Energy Agency DESDM Dinas Energi dan Sumber Daya Mineral / Energy and Mineral
Resources Agency DEPA Danish Environmental Protection Agency Disperindag Dinas perindustrian dan Perdagangan / local Industry and
Trading Agency DLH/DLHK Dinas Lingkungan Hidup dan Kehutanan/ Local Environmental
and Forestry Agency DLHK Provinsi Dinas Lingkungan Hidup dan Kehutanan Provinsi / Provincial
Environmental and Forestry Agency (DLHK) DLHPP Dinas Lingkungan Hidup Perumahan dan Permukiman / Local
Environmental, Housing and Settlement Agency DPRD Dewan Perwakilan Rakyat Daerah/ The Regional People’s
Representative Council DPMD Dinas Pemberdayaan Masyarakat dan Desa / Village
Community Empowerment Agency DPUPR Dinas Pekerjaan Umum dan Penataan Ruang / Public Works
and Spatial Planning Agency DPP Dinas Pertanian dan Perkebunan / Agriculture and Plantation
Agency Jakstrada Kebijakan dan Strategi Pengelolaan Sampah Daerah / Local
Waste Management Policy and Strategy Jakstranas Kebijakan dan Strategi Pengelolaan Sampah Nasional / National
Waste Management Policy and Strategy KDN Kompensasi Dampak Negatif / (Impact) Compensation Fee KLHK Kementerian Lingkungan Hidup dan Kehutanan / Ministry of
Environment and Forestry KJP Kompensasi Jasa Pelayanan / Tipping Fee MSME/UMKM Micro Small Medium Enterprises / Usaha Mikro Kecil dan
Menengah MSW Municipal Solid Waste MSWM Municipal Solid Waste Management NTB Nusa Tenggara Barat / West Nusa Tenggara OPEX Operational Expenditure
Ramboll - Pre-feasibility Study (Waste) of Lombok
10/150
Perbup Peraturan Bupati / Regent Regulation Perda Peraturan Daerah / Local Regulation Permendagri Peraturan Menteri Dalam Negeri / Ministerial Regulation of
Home Affairs Permenlhk Peraturan Menteri Lingkungan Hidup / Ministerial Regulation of
Environment and Forestry Perwali Peraturan Walikota / Mayor Regulation PLN Perusahaan Listrik Negara / National Electricity Company RDF Refuse Derived Fuel RPJMN Rencana Pembangunan Jangka Menengah Nasional / National
Medium-term Development Plan RPJMD Rencana Pembangunan Jangka Menengah Daerah / Local
Medium-term Development Plan RT/RW Rukun Tetangga & Rukun Warga / Neighborhood association SEKDA Sekretariat Daerah/ The Regional Secretariate SIPSN Sistem Informasi Pengelolaan Sampah Nasional / National
Waste Management Information System SII Small Island Initiative SNI Standar Nasional Indonesia / Indonesian National Standard SSC Strategic Sector Coorporation TPA Tempat Pemrosesan Akhir / Landfill TPS 3R Tempat Pengolahan Sampah 3R / Waste Treatment Facility with
3R concept TPS Tempat Pengumpulan Sementara / Temporary waste collection
point/facility TPST Tempat Pengolahan Sampah Terpadu / Integrated waste
treatment facility UPTD Unit Pelaksana Teknis Daerah / Regional Technical
Implementation Unit WtE Waste to Energy

Ramboll - Pre-feasibility Study (Waste) of Lombok
11/150
LIST OF DEFINITION
APBD The annual financial plan of local governments in Indonesia approved by the Regional House of Representatives.
BAPPEDA Regional agency tasked with formulating regional development plans, technical policies, coordination and facilitation, monitoring, and evaluating governance in the field of regional planning and development. In NTB Provincial Government, this agency is tasked with research and development also.
BLUD Regional public service provider that providing service to the community and has flexibility in financial management and can obtain funding from the APBD and other legitimate funding sources outside the APBD in order to improve service quality without seeking profit.
BUMD Business entity who’s whole or most of the capital is owned by the Regional Government.
CSO/CBO Community organization that works voluntarily to achieve a common goal in waste management.
KDN The amount of fees that must be paid by all parties that counted as reward to individuals, groups of people, and/or other parties affected by negative impact of the waste handling activities at the Regional Landfill as well as for the community facilitation activities to those negatively affected.
KJP The amount of fees paid by users to the management of regional landfill for operation and maintenance of the regional landfill
RPJMD Local Medium-term Development Plan. Document of regional development plan for 5 years, consist of vision, mission, and Governor’s or Mayor’s or Regent’s programs based on local long-term development plan and national medium-term development plan.
RPJMN National Medium-term Development Plan. Document of regional development plan for 5 years, consist of vision, mission, and President’s programs based on national long-term development plan.
RT Household Association. The Smallest division of villages in Indonesia which consist of several houses.
RW Neighborhood Association. The Community group which consists of several Household Associations.
SEKDA The Regional Secretariat. Its function is to assist the Governor/Regent/ Mayor carrying out the task of administering the government.
SIPSN National Waste Management Information system managed by Ministry of Environment and Forestry.
SSC Strategic Sector Cooperation TPS 3R A facility where collection, sorting, reuse, and recycling
activities are carried out on the sub-district/village level. TPS A point/location where the waste is collected before it is
transported to recycling/processing facility and/or TPST
Ramboll - Pre-feasibility Study (Waste) of Lombok
12/150
TPST TPA
A facility where collection, sorting, reusing, recycling, processing/treatment, and final processing activities are taken place. A facility to process and return the waste back to the environment sphere
UPTD An organization that carries out operational technical activities, providing services to the community and/or certain supporting technical activities at the Regional Office or Agency.
Ramboll - Pre-feasibility Study (Waste) of Lombok
13/150
EXECUTIVE SUMMARY
The overall objective with this report - pre-feasibility study of solid waste management in Lombok - is to prepare a study on current and future scenarios for solid waste management as basis for future investments in WtE projects at Lombok. The project has been divided into 5 tasks:
Task 1- Data collection and analysis Task 2 - Discussions with local stakeholders and survey Task 3 – Institutional analysis Task 4 – Screening and determination of preferred treatment technology Task 5 - Final report
The Study describes the present situation and future scenario for waste generation and management and recommend possible interventions at Lombok for improving conditions for advancing WtE investments. The scope of work has been divided into the following three main phases:
Assessment of the current situation; Analysis of existing waste data; Analysis (institutional, framework conditions, technical, financial, economical, social,
environmental and risks) and recommendations for options for enhanced MSW and WtE solutions.
The Study describes the present situation and future scenario for waste generation and management and recommend possible interventions at Lombok for improving conditions for advancing WtE investments. The study can form the basis for further studies, i.e. detailed feasibility studies, if found relevant and feasible. In below section conclusions and recommendations for Waste Management aspects, Institutional aspects and Technical aspects are described. The recommendations are divided into high and medium priority. Waste Management Aspect High priority
Increased collection capacities (provision of adequate waste collection equipment and vehicles);
Ensure financial security & sustainability (operational budget); Provision of waste segregated facilities and infrastructures; Ensure sufficient number of proper transportations fleet; Appropriate allocation of waste budget (APBD) based on Permendagri 07/2021. • Appropriate allocation of O&M budget based on Permendagri 07/2021; • Increased resource (technical) capacity; • Reducing amount of waste landfilled (saving land required for expansion). • Adjustment of budget allocation & retribution tariff, referring to Permendagri 07/2021; • Explore other potential sources of revenue; • Increase efficiency of waste retribution collection mechanism.
Ramboll - Pre-feasibility Study (Waste) of Lombok
14/150
Medium priority Strengthen/support CSOs/NGOs providing collection service; Fostering and enhancing CSOs/NGOs capacities; Explore collaboration with start-ups in providing waste service. Continuous social behavior changes activities at all level, particularly at schools
(innovative approaches: social media, link to local values); Support & participate in EPR implementation initiated by private sectors. Incremental development of treatment facility: start with high collection rates/secured
feedstock; Grouping of regional facility based on proximity, access, collection rates among
municipalities; Balanced with gradually improved basic service (collection, transport, disposal); Potential sources of organic waste prioritized to be secured: Traditional market, followed
by Household waste stream. • Taking account of more inclusive measures in reduction initiatives (private sector, NGOs); • Support private sector/local businesses in implementing the waste reduction
roadmap/EPR; • Collaborate with startups/innovators (better tracking of waste data collected by informal
sector); • Improve the collection of primary data; • Better data inventory on waste facilities/infrastructures (collab with local universities,
startups, NGOs); • Improve data management (close consultation with national government); • Strengthen coordination on data among three level of governments (validity & consistency
of data). Institutional Aspect High Priority
The regulatory framework at the provincial and municipalities level have to support the prepared scenarios;
The improvement of the UPTD (PelayananTerpadu/ Regional Technical Implementation Unit) Regional to BLUD (Badan LayananUmumDaerah / Public Service Agency) should be the main agenda to support the implementation of the Waste to Energy project scenarios. At the same time, it is necessary for the West Lombok Regency to develop their UPTD to ensure the operational activities in the area;
The development of the Lombok Island Regional Waste Management Coordination Forum is very important to get started, to ensure that waste sorting and collection takes place more efficiently at the district and city level and to influence the effective management at the regional level. In addition, this forum can serve to tailor policies, strategies and waste management efforts between provincial and district governments as well as between districts and cities.
Medium priority
To ensure the sustainability of the waste management scenario, which is often disrupted due to frequent staff changes, especially in strategic management positions, provincial, regional and urban governments must ensure that the exchange system in DLHK and DLH complies with National Civil Agency Regulation No. 5/2019 on procedures for implementing changes;
In order to protect the waste management operators in the field, provincial, district and city governments must provide remuneration in accordance with the provisions or
Ramboll - Pre-feasibility Study (Waste) of Lombok
15/150
standard of the minimum wage for the province of NTB and each district and / or city, protect their health through the BPJS health insurance mechanism;
Regarding the waste facility, it is necessary to evaluate ownership, optimal number, level of maintenance and performance regularly.
Technical Aspect There is a huge potential for utilising the available waste on Lombok for energy and fertiliser respectively as biogas and RDF and as compost. There is a minor potential in sorting out recyclables from the none segregated collected MSW. Based on high-level estimations in the report it seems probable to establish a MBT solution that is economical feasible, provided that the solution is kept simple and robust. It can be concluded that:
There is a potential need for gas and electricity on Lombok; There is an ongoing project with a potential local off-taker for RDF – Jerangjang Power
Plant; There is a huge energy demand in the transport sector, but at the moment only for
gasoline and diesel; There seems to be limited sources of co-substrates like manure from cows and similar; There is a logistic challenge to collect potential co-substrates; There is high consumption of both organic (liquid) and inorganic (Urea and NPK) fertiliser
on Lombok; According to performed calculations OPEX and potential revenues are in balance.
In order to support the development of regional and big scale waste treatment facility in Lombok some key recommendations in connection with the technical part is listed. High Priority It is recommended to:
Implement waste sorting with minimum two fractions – organic and non-organic waste. Segregation of waste in two fractions will enable higher recovery rate and purity of recyclables;
Investigate further in a MBT solution for treatment of both organic and non-organic waste. Locate a few appropriate sites, preferably close to existing landfills for location of MBT
facilities; Establish a cooperation with existing RDF project at Jerangjang Power Plant.
Medium Priority It is recommended to:
Establish a campaign to avoid removal of recyclables during transportation from source to treatment plant;
Focus on electricity (power) from biogas. Upgrading and compacting of biogas is expensive and technologically complicated;
Further analysis of potential need for fertiliser as compost; Investigate further advantage/disadvantage and economy in bio-drying of RDF. The
advantage of drying RDF is lower moisture content and higher caloric value and higher sales value;
Conduct further analysis and calculations of the opportunity to get a revenue from sales of carbon credits.
Ramboll - Pre-feasibility Study (Waste) of Lombok
16/150
1. INTRODUCTION
1.1 Introduction
Indonesia and Denmark have entered into a Strategic Sector Cooperation (SSC) on Circular Economy and Solid Waste Management. The SSC is carried out between environmental authorities of the two countries. The SSC has been approved and will cover June 2018 to December 2022. The overall objective of the cooperation is to foster a green and sustainable economy with sound environmental management and explore valuable resources through a Circular Economy hereby reducing negative impacts on the environment, livelihoods, economy and health in Indonesia. The partners of the SSC comprise Danish Environmental Protection Agency (DEPA), Danish Energy Agency (DEA) and the Indonesian Ministry of Environment and Forestry (KLHK). The SSC is hence a cooperation between environmental authorities working on a peer-to-peer basis in order to support conducive policies and regulatory frameworks. This will be done by exchanging knowledge, improving performance in the sector and creating better framework conditions for private sector investment. The SSC is an important tool for the Danish Ministry of Foreign Affairs in growth economies and a high priority area for the Danish Trade Council.
1.2 Background
Indonesia is facing significant challenges associated with ensuring effective handling of increasing amounts of municipality waste in accordance with the National Waste Policy and Strategy as well as ensuring that the continued increase of electricity generation capacity is done in line with the objective of transitioning towards more renewable energy generation as stipulated in the National Energy Policy. The Government of Indonesia aims at 30% reduction and 70% handling by 2025 through its National Waste Management Policy and Strategies (Jakstranas). The ambitious goals are calling for immediate and concrete action at provincial and municipality levels throughout the country, not at least on the many islands, including Lombok. While the National Medium-Term Development Plan (RPJMN 2020-2024), which aims at 20% reduction and 80% handling, estimated the latest nation-wide status in 2018 to reach 67% handling and 2.26% reduction at source.
Lombok has been chosen as one of the islands, as part of the SII collaboration, and offers good opportunities for advancement in Municipal Solid Waste (MSW) systems and Waste to Energy (WtE) investments. The provincial environment authorities (DLHK) and the local authorities have requested assistance from the SII for carrying out a study that will assess the current MSW situation and provide advice for future Solid Waste Management (SWM) systems and WtE investments. In this context Ramboll perceive WtE not only as incineration but also as Anaerobic Digestion (AD), thermal gasification, pyrolysis etc.
The provincial government of NTB has prepared the Jakstrada, which is the waste policy and strategy at the provincial level in line with the national waste policy and strategy (Jakstranas). Under the Medium-Term Development Plan of NTB Province (RPJMD), the provincial government sets a target of managing 100 % of waste by 2023, which is two years earlier than the National Waste Strategy.
The Study will describe the present situation and future scenario for waste generation and management and recommend possible interventions at Lombok for improving conditions for advancing WtE investments. The Study will focus on compiling existing waste data, describe and analyse present waste streams and systems as well make recommendations for initiatives as basis for WtE projects.

Ramboll - Pre-feasibility Study (Waste) of Lombok
17/150
A working group (or referred to as steering group) have been established with participation of DEPA, local partners from Lombok and the Consultant.
1.3 Objective
The overall objective of the consultancy is to prepare a study on current and future scenarios for solid waste management as basis for future investments in WtE projects at Lombok and similar under the Small Island Initiatives (SII). The Study can form the basis for further studies, i.e. detailed feasibility studies, if found relevant and feasible.
1.4 Output The overall objective of the project is to create basis for Indonesian decision-makers in the Indonesian Ministry of Environment and Forestry (KLHK) and city governments to decide on which treatment technologies for treating organic household waste and waste to energy project(s) to invest in. Comprising, to recommend the ideal input capacity of the recommended treatment technology, considering principles of Circular Economy. In the report following outputs are delivered:
Initial assessment of the waste collection systems together with the institutional opportunities and challenges for separate treatment of organic household waste in Lombok Island.
Danish and global treatment technology concepts are screened. Treatment technologies for treating organic household waste with potential energy recovery should be relevant and suitable as a technology for recycling of organic waste. Technology provider’s willingness to seize the Indonesian market should be part of the screening process. To make the treatment technology relevant for further study, it must be clarified through the screening that the technology provider has interest, capacity and willingness to try entering the Indonesian market.
1-2 relevant treatment technologies from the screening process selected and described in detail including a justification for why it is relevant for the Indonesian market, especially on lsland like Lombok.
Criteria developed in order to assess, score and prioritize best technology options in order to recommend:
The most appropriate treatment technology in Lombok Island and similar, The ideal capacity in which a treatment facility should be established, including clarifying
the minimum capacity the treatment facility could be established in while still being profitable.
Criteria applied in each of the 5 Municipalities in Lombok Island: o Mataram City, o North Lombok Regency, o East Lombok Regency, o Central Lombok Regency, and o West Lombok Regency.
Engagement of relevant decision-makers in the West Nusa Tenggara provincial governments and the local authorities, as well as consultations of implementers from the previous and existing facilities within similar treatment technologies to explore potential technologies and the lessons learned. This entails literature research and inquires experiences made in other Indonesian cities.
Ramboll - Pre-feasibility Study (Waste) of Lombok
18/150
Assessment of whether a demonstration facility of the recommended treatment plants would be necessary in order to market the selected technologies and prove the way for an ideal capacity treatment plant and land.
Suggestion and description of future activities of the KLHK, DEPA and local stakeholders in order to facilitate increased treatment capacity on organic household waste in Lombok Island.
Theme-and stakeholder-based workshops held to share, analyse and commit to activities of the Strategic Sector Cooperation (SSC) on Circular Economy and Solid Waste Management.
Evaluation of the recommended scenarios, including overall advantages and disadvantages on organic waste for waste to energy technologies in Lombok Island in terms of CAPEX, OPEX, Technical Availability, potential revenues, job creation, potential emission reductions, environmental impacts and scalability and the recyclables value.
Lombok Island probable location and required land for the development of future waste treatment plant
1.5 Scope of Work The activities consist of several activities. Due to the pandemic, only limited site visits and personals were doing the field studies. However, the development of the criteria in order to assess, score and prioritize best options for establishment of a treatment technology in Lombok Island, the consultant addressed the below aspects: Collection Data and Current Waste Management Analysis Due to travel restrictions, the collection data analysis was mainly done through desk study. However, interviews were still conducted through online meeting platforms and field studies were conducted with limited personals. The current waste management analysis gives an understanding of the current situation in Lombok. Discussion with Local Stakeholders The discussion with the local agencies key to waste management. The discussion includes survey to the waste treatment facilities in Lombok Island and offline and online discussions with the local authorities from The Environmental Agency. It helps to understand the local context for establishing waste treatment with energy and potential nutrient recovery. Institutional Analysis This activity mainly identifies the main institutions and stakeholders within MSW management in the province and municipality including staffing capacity, equipment, treatment and disposal activities, location and the capacity of 3R Facility, TPA, Waste Bank, etc. It provides analysis and identification of relevant institutional capacity and descries the needs for expansion and improvement of the existing systems and future investment. Screening and Determination of Preferred Treatment Technology This activity provides evaluation of the potential solutions (Technology, energy utilization, feedstock, etc.) including economy (CAPEX, OPEX, potential incomes and the required land). It analyses and identifies the appropriate options for technologies for waste handling, collection and treatment based COWI Technology Catalogue. At the end it gives the list of selected technical options which are scored based on key parameters. It presents overview of appropriate options for technologies for waste treatment. It recommends the appropriate handling technologies with focus on organic waste and ensuring a reliable and consistent waste and/or biomass for future investment of Waste to Energy projects in Lombok Island.
Ramboll - Pre-feasibility Study (Waste) of Lombok
19/150
1.6 Methodology Task 1 – Desktop study of the current waste management practices, plans and other relevant information in order The aim of this task is to understand the starting point of the project concerning the Lombok Island, by:
Review the national, regional and local regulatory frameworks in MSW Management Identification of main institutions and stakeholders within MSW management, agriculture
and energy Compilation and assessment of waste data (generation, collection, composition, current
treatment) Identification of main energy plants in the areas Identification of main industries, which generate organic waste in Lombok Island
Task 2 – Discussion with the local stakeholders The aim of this task is to understand the local context for establishing organic waste treatment with energy and nutrient recovery, by:
Discussions with the local agencies key to waste management, including discussion on finding of task 1, where local agencies may contribute additional key information
Initial assessment of waste collection systems and opportunities and challenges for separate treatment of organic household waste in Lombok Island
Discussion with regional and national agencies key to waste management Visit the local management facilities, energy plants, and industries in Lombok Island.
Task 3 – Screening of treatment technologies The aim of this task is to identify relevant treatment technologies for pre-treatment, anaerobic digestion and energy utilization of organic household waste and other waste, by:
Assessment of strength and weakness of the different technology options including their application in different scales with regards to input capacity (economy of scale)
Screening of technology providers including their interest, capability and willingness to deliver to the Indonesian market
Identification of model waste management strategies/cases Scoring key parameters (capital cost, operational cost, security supply, availability
revenues) on each treatment technology
Task 4 – Determination of preferred treatment technologies and need for changes to waste management practices The aim of this task is to determine the best technology options for each city and changes needed to the existing waste management practices, by:
Presentation and discussion with SSC regarding Task 3 Evaluation of treatment options in Lombok Island including initial assessment of cost,
incomes, nutrient recovery, energy production Evaluation of energy utilization options in Lombok Island Evaluation of availability of co-substrates (manure, organic, industrial waste etc.) for co
digestion of organic fraction of organic household in Lombok Island Outline implementation plans
Task 5 – Compilation The aim of this task is to finalize finding and discussion from Task 1 to Task 4 in a coherent report, by:
Confirming action planning, timelines and responsibilities Pre-feasibility studies regarding biogas production from waste in Lombok Island
Ramboll - Pre-feasibility Study (Waste) of Lombok
20/150
Assessment of whether a demonstration facility of the recommended treatment plant would be necessary to market the selected technologies and prove the way for an ideal capacity treatment plant
Comparison (advantages/disadvantages) of biogas production from organic waste compared to other technology options including waste incineration
Suggestion and description of future SSC activities to KLHK, DEPA and Local stakeholders in order to facilitate increased treatment capacity on organic waste in Indonesia
Identification of available substrates potentially relevant in broader Indonesian content for co-digestion with organic waste
Final workshop: Confirmation of the project’s areas/cities and participation of local government, matching expectation and input from KLHK, local government and other participants.
Ramboll - Pre-feasibility Study (Waste) of Lombok
21/150
2. CITY/REGENCIES IN LOMBOK ISLAND PROFILE
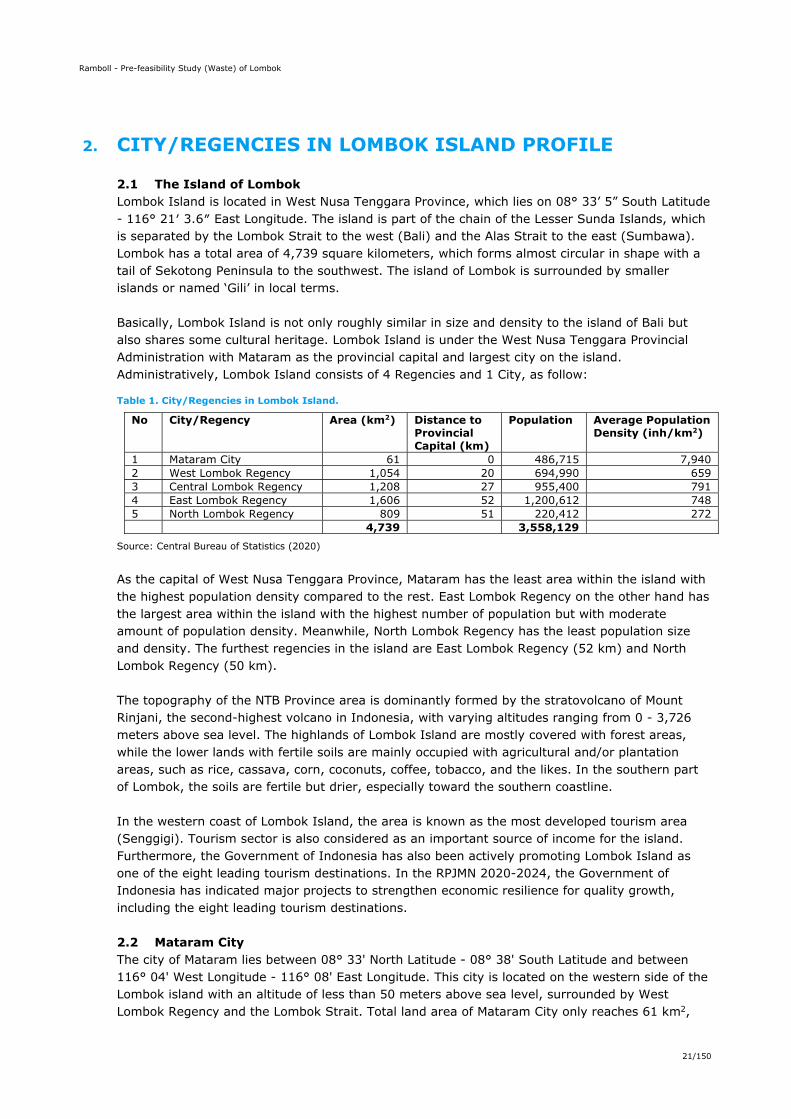
2.1 The Island of Lombok Lombok Island is located in West Nusa Tenggara Province, which lies on 08° 33’ 5” South Latitude - 116° 21′ 3.6″ East Longitude. The island is part of the chain of the Lesser Sunda Islands, which is separated by the Lombok Strait to the west (Bali) and the Alas Strait to the east (Sumbawa). Lombok has a total area of 4,739 square kilometers, which forms almost circular in shape with a tail of Sekotong Peninsula to the southwest. The island of Lombok is surrounded by smaller islands or named ‘Gili’ in local terms. Basically, Lombok Island is not only roughly similar in size and density to the island of Bali but also shares some cultural heritage. Lombok Island is under the West Nusa Tenggara Provincial Administration with Mataram as the provincial capital and largest city on the island. Administratively, Lombok Island consists of 4 Regencies and 1 City, as follow:
Table 1. City/Regencies in Lombok Island.
No City/Regency Area (km2) Distance to Provincial Capital (km)
Population Average Population Density (inh/km2)
1 Mataram City 61 0 486,715 7,940 2 West Lombok Regency 1,054 20 694,990 659 3 Central Lombok Regency 1,208 27 955,400 791 4 East Lombok Regency 1,606 52 1,200,612 748 5 North Lombok Regency 809 51 220,412 272 4,739 3,558,129
Source: Central Bureau of Statistics (2020)
As the capital of West Nusa Tenggara Province, Mataram has the least area within the island with the highest population density compared to the rest. East Lombok Regency on the other hand has the largest area within the island with the highest number of population but with moderate amount of population density. Meanwhile, North Lombok Regency has the least population size and density. The furthest regencies in the island are East Lombok Regency (52 km) and North Lombok Regency (50 km). The topography of the NTB Province area is dominantly formed by the stratovolcano of Mount Rinjani, the second-highest volcano in Indonesia, with varying altitudes ranging from 0 - 3,726 meters above sea level. The highlands of Lombok Island are mostly covered with forest areas, while the lower lands with fertile soils are mainly occupied with agricultural and/or plantation areas, such as rice, cassava, corn, coconuts, coffee, tobacco, and the likes. In the southern part of Lombok, the soils are fertile but drier, especially toward the southern coastline. In the western coast of Lombok Island, the area is known as the most developed tourism area (Senggigi). Tourism sector is also considered as an important source of income for the island. Furthermore, the Government of Indonesia has also been actively promoting Lombok Island as one of the eight leading tourism destinations. In the RPJMN 2020-2024, the Government of Indonesia has indicated major projects to strengthen economic resilience for quality growth, including the eight leading tourism destinations.
2.2 Mataram City The city of Mataram lies between 08° 33' North Latitude - 08° 38' South Latitude and between 116° 04' West Longitude - 116° 08' East Longitude. This city is located on the western side of the Lombok island with an altitude of less than 50 meters above sea level, surrounded by West Lombok Regency and the Lombok Strait. Total land area of Mataram City only reaches 61 km2,
Ramboll - Pre-feasibility Study (Waste) of Lombok
22/150
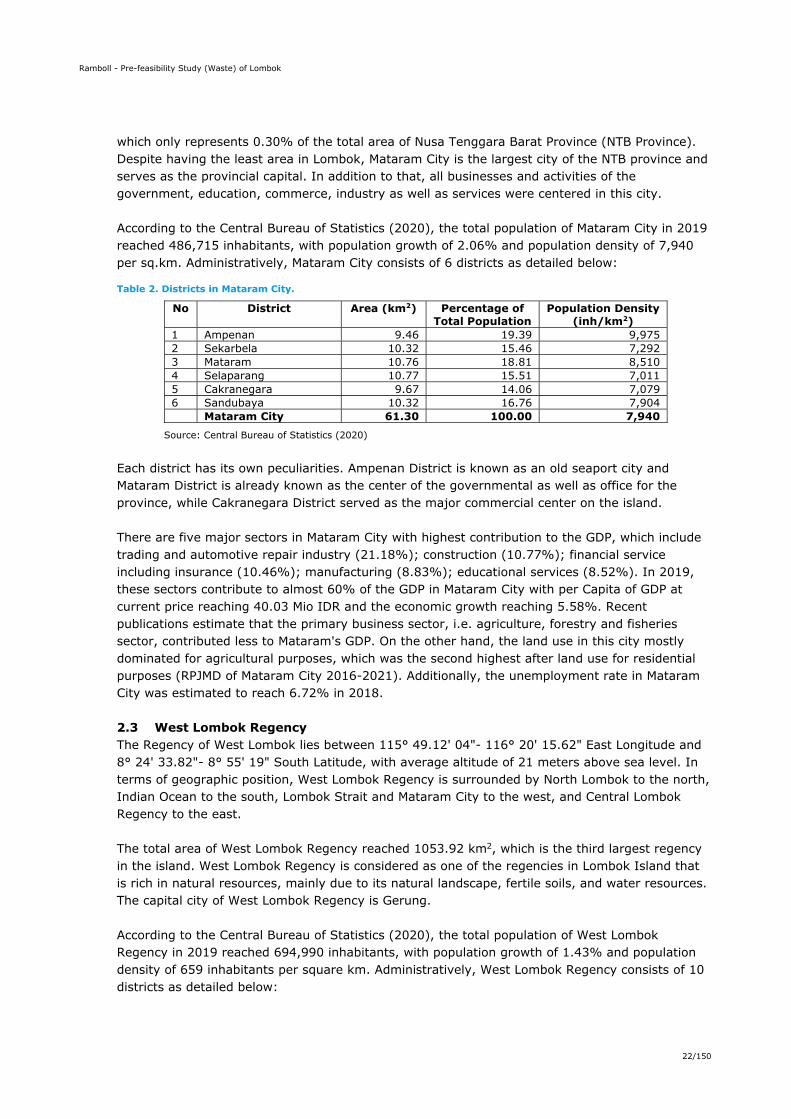
which only represents 0.30% of the total area of Nusa Tenggara Barat Province (NTB Province). Despite having the least area in Lombok, Mataram City is the largest city of the NTB province and serves as the provincial capital. In addition to that, all businesses and activities of the government, education, commerce, industry as well as services were centered in this city. According to the Central Bureau of Statistics (2020), the total population of Mataram City in 2019 reached 486,715 inhabitants, with population growth of 2.06% and population density of 7,940 per sq.km. Administratively, Mataram City consists of 6 districts as detailed below:
Table 2. Districts in Mataram City.
No District Area (km2) Percentage of Total Population
Population Density (inh/km2)
1 Ampenan 9.46 19.39 9,975 2 Sekarbela 10.32 15.46 7,292 3 Mataram 10.76 18.81 8,510 4 Selaparang 10.77 15.51 7,011 5 Cakranegara 9.67 14.06 7,079 6 Sandubaya 10.32 16.76 7,904 Mataram City 61.30 100.00 7,940
Source: Central Bureau of Statistics (2020)
Each district has its own peculiarities. Ampenan District is known as an old seaport city and Mataram District is already known as the center of the governmental as well as office for the province, while Cakranegara District served as the major commercial center on the island. There are five major sectors in Mataram City with highest contribution to the GDP, which include trading and automotive repair industry (21.18%); construction (10.77%); financial service including insurance (10.46%); manufacturing (8.83%); educational services (8.52%). In 2019, these sectors contribute to almost 60% of the GDP in Mataram City with per Capita of GDP at current price reaching 40.03 Mio IDR and the economic growth reaching 5.58%. Recent publications estimate that the primary business sector, i.e. agriculture, forestry and fisheries sector, contributed less to Mataram's GDP. On the other hand, the land use in this city mostly dominated for agricultural purposes, which was the second highest after land use for residential purposes (RPJMD of Mataram City 2016-2021). Additionally, the unemployment rate in Mataram City was estimated to reach 6.72% in 2018.
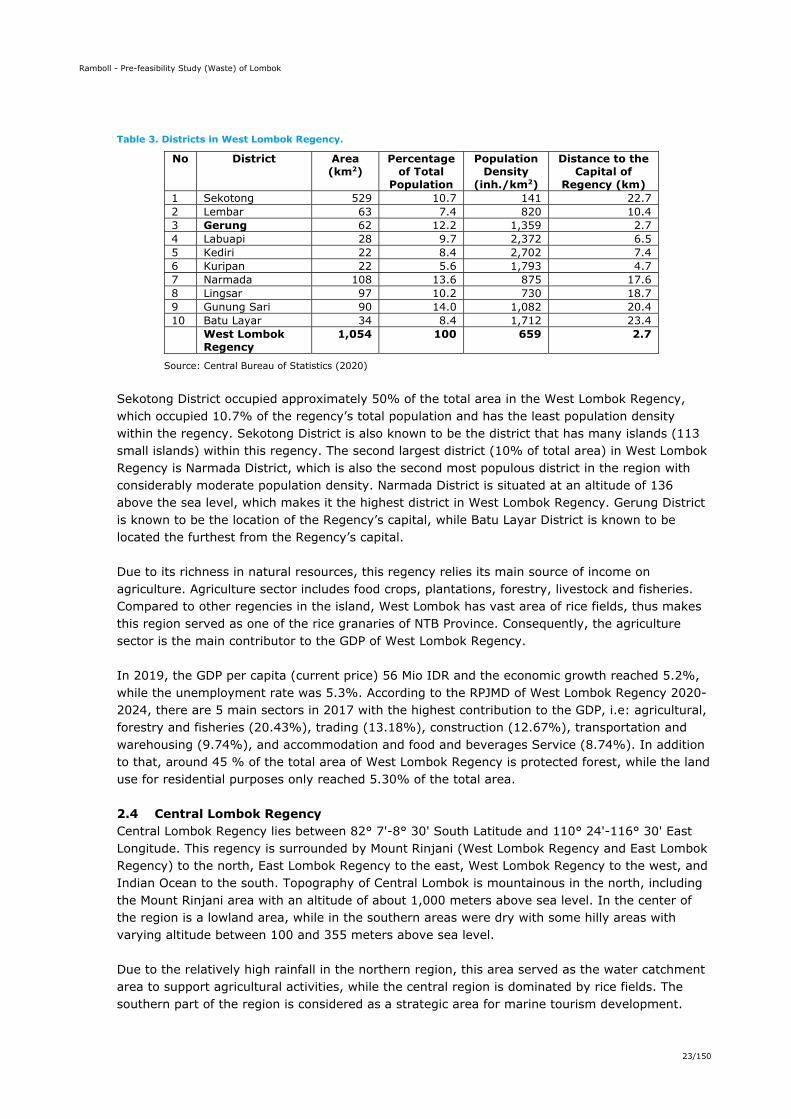
2.3 West Lombok Regency The Regency of West Lombok lies between 115° 49.12' 04"- 116° 20' 15.62" East Longitude and 8° 24' 33.82"- 8° 55' 19" South Latitude, with average altitude of 21 meters above sea level. In terms of geographic position, West Lombok Regency is surrounded by North Lombok to the north, Indian Ocean to the south, Lombok Strait and Mataram City to the west, and Central Lombok Regency to the east. The total area of West Lombok Regency reached 1053.92 km2, which is the third largest regency in the island. West Lombok Regency is considered as one of the regencies in Lombok Island that is rich in natural resources, mainly due to its natural landscape, fertile soils, and water resources. The capital city of West Lombok Regency is Gerung. According to the Central Bureau of Statistics (2020), the total population of West Lombok Regency in 2019 reached 694,990 inhabitants, with population growth of 1.43% and population density of 659 inhabitants per square km. Administratively, West Lombok Regency consists of 10 districts as detailed below:
Ramboll - Pre-feasibility Study (Waste) of Lombok
23/150
Table 3. Districts in West Lombok Regency.
No District Area (km2)
Percentage of Total
Population
Population Density
(inh./km2)
Distance to the Capital of
Regency (km) 1 Sekotong 529 10.7 141 22.7 2 Lembar 63 7.4 820 10.4 3 Gerung 62 12.2 1,359 2.7 4 Labuapi 28 9.7 2,372 6.5 5 Kediri 22 8.4 2,702 7.4 6 Kuripan 22 5.6 1,793 4.7 7 Narmada 108 13.6 875 17.6 8 Lingsar 97 10.2 730 18.7 9 Gunung Sari 90 14.0 1,082 20.4 10 Batu Layar 34 8.4 1,712 23.4 West Lombok
Regency 1,054 100 659 2.7
Source: Central Bureau of Statistics (2020)
Sekotong District occupied approximately 50% of the total area in the West Lombok Regency, which occupied 10.7% of the regency’s total population and has the least population density within the regency. Sekotong District is also known to be the district that has many islands (113 small islands) within this regency. The second largest district (10% of total area) in West Lombok Regency is Narmada District, which is also the second most populous district in the region with considerably moderate population density. Narmada District is situated at an altitude of 136 above the sea level, which makes it the highest district in West Lombok Regency. Gerung District is known to be the location of the Regency’s capital, while Batu Layar District is known to be located the furthest from the Regency’s capital. Due to its richness in natural resources, this regency relies its main source of income on agriculture. Agriculture sector includes food crops, plantations, forestry, livestock and fisheries. Compared to other regencies in the island, West Lombok has vast area of rice fields, thus makes this region served as one of the rice granaries of NTB Province. Consequently, the agriculture sector is the main contributor to the GDP of West Lombok Regency. In 2019, the GDP per capita (current price) 56 Mio IDR and the economic growth reached 5.2%, while the unemployment rate was 5.3%. According to the RPJMD of West Lombok Regency 2020-2024, there are 5 main sectors in 2017 with the highest contribution to the GDP, i.e: agricultural, forestry and fisheries (20.43%), trading (13.18%), construction (12.67%), transportation and warehousing (9.74%), and accommodation and food and beverages Service (8.74%). In addition to that, around 45 % of the total area of West Lombok Regency is protected forest, while the land use for residential purposes only reached 5.30% of the total area.
2.4 Central Lombok Regency Central Lombok Regency lies between 82° 7'-8° 30' South Latitude and 110° 24'-116° 30' East Longitude. This regency is surrounded by Mount Rinjani (West Lombok Regency and East Lombok Regency) to the north, East Lombok Regency to the east, West Lombok Regency to the west, and Indian Ocean to the south. Topography of Central Lombok is mountainous in the north, including the Mount Rinjani area with an altitude of about 1,000 meters above sea level. In the center of the region is a lowland area, while in the southern areas were dry with some hilly areas with varying altitude between 100 and 355 meters above sea level. Due to the relatively high rainfall in the northern region, this area served as the water catchment area to support agricultural activities, while the central region is dominated by rice fields. The southern part of the region is considered as a strategic area for marine tourism development.
Ramboll - Pre-feasibility Study (Waste) of Lombok
24/150
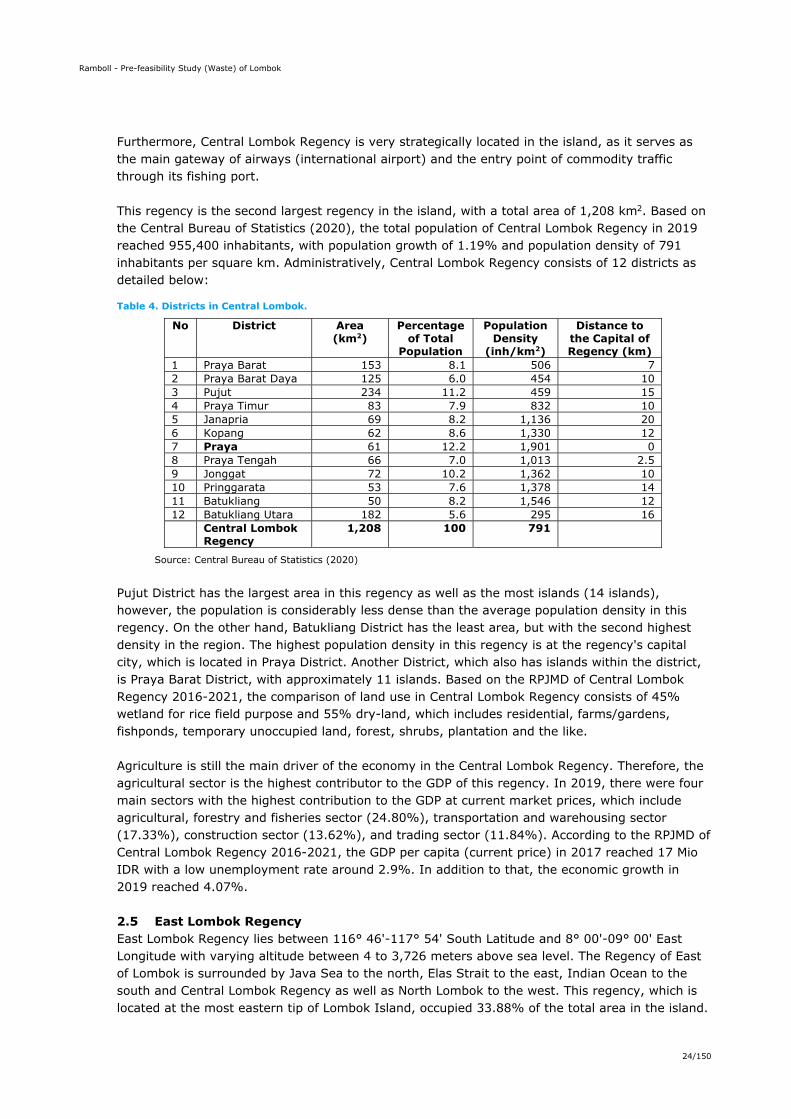
Furthermore, Central Lombok Regency is very strategically located in the island, as it serves as the main gateway of airways (international airport) and the entry point of commodity traffic through its fishing port. This regency is the second largest regency in the island, with a total area of 1,208 km2. Based on the Central Bureau of Statistics (2020), the total population of Central Lombok Regency in 2019 reached 955,400 inhabitants, with population growth of 1.19% and population density of 791 inhabitants per square km. Administratively, Central Lombok Regency consists of 12 districts as detailed below:
Table 4. Districts in Central Lombok.
No District Area (km2)
Percentage of Total
Population
Population Density
(inh/km2)
Distance to the Capital of Regency (km)
1 Praya Barat 153 8.1 506 7 2 Praya Barat Daya 125 6.0 454 10 3 Pujut 234 11.2 459 15 4 Praya Timur 83 7.9 832 10 5 Janapria 69 8.2 1,136 20 6 Kopang 62 8.6 1,330 12 7 Praya 61 12.2 1,901 0 8 Praya Tengah 66 7.0 1,013 2.5 9 Jonggat 72 10.2 1,362 10 10 Pringgarata 53 7.6 1,378 14 11 Batukliang 50 8.2 1,546 12 12 Batukliang Utara 182 5.6 295 16 Central Lombok
Regency 1,208 100 791
Source: Central Bureau of Statistics (2020)
Pujut District has the largest area in this regency as well as the most islands (14 islands), however, the population is considerably less dense than the average population density in this regency. On the other hand, Batukliang District has the least area, but with the second highest density in the region. The highest population density in this regency is at the regency's capital city, which is located in Praya District. Another District, which also has islands within the district, is Praya Barat District, with approximately 11 islands. Based on the RPJMD of Central Lombok Regency 2016-2021, the comparison of land use in Central Lombok Regency consists of 45% wetland for rice field purpose and 55% dry-land, which includes residential, farms/gardens, fishponds, temporary unoccupied land, forest, shrubs, plantation and the like. Agriculture is still the main driver of the economy in the Central Lombok Regency. Therefore, the agricultural sector is the highest contributor to the GDP of this regency. In 2019, there were four main sectors with the highest contribution to the GDP at current market prices, which include agricultural, forestry and fisheries sector (24.80%), transportation and warehousing sector (17.33%), construction sector (13.62%), and trading sector (11.84%). According to the RPJMD of Central Lombok Regency 2016-2021, the GDP per capita (current price) in 2017 reached 17 Mio IDR with a low unemployment rate around 2.9%. In addition to that, the economic growth in 2019 reached 4.07%.
2.5 East Lombok Regency East Lombok Regency lies between 116° 46'-117° 54' South Latitude and 8° 00'-09° 00' East Longitude with varying altitude between 4 to 3,726 meters above sea level. The Regency of East of Lombok is surrounded by Java Sea to the north, Elas Strait to the east, Indian Ocean to the south and Central Lombok Regency as well as North Lombok to the west. This regency, which is located at the most eastern tip of Lombok Island, occupied 33.88% of the total area in the island.
Ramboll - Pre-feasibility Study (Waste) of Lombok
25/150
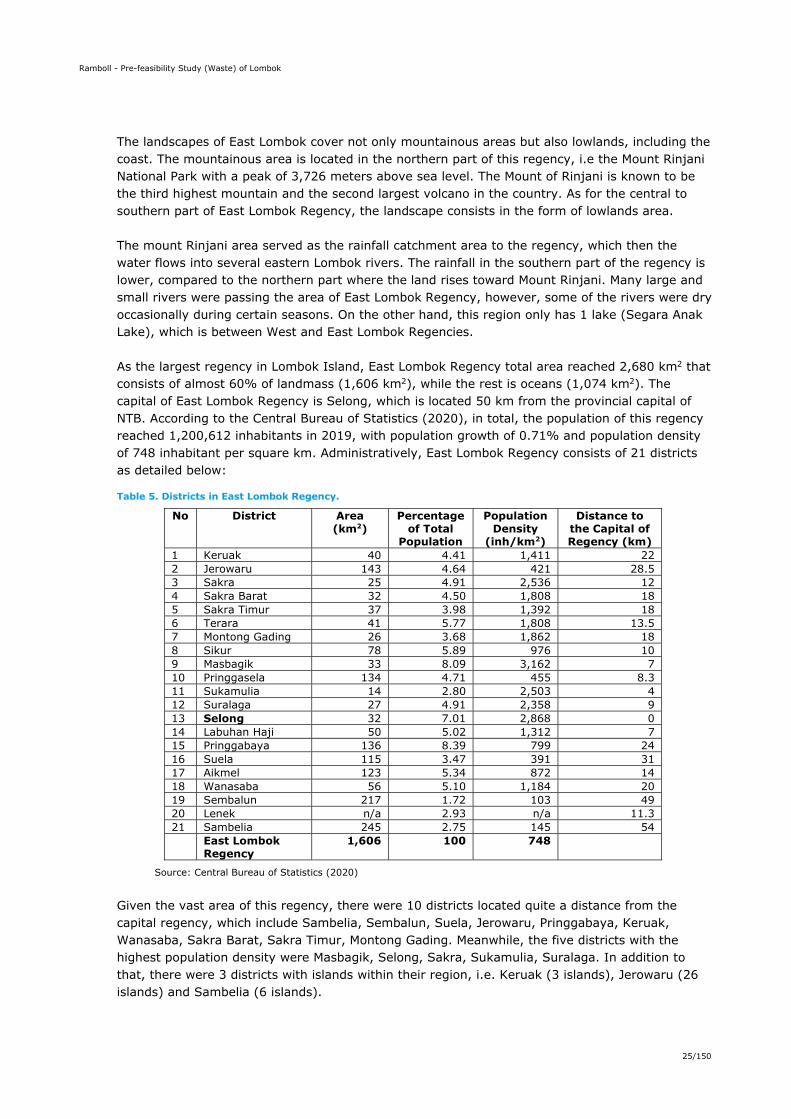
The landscapes of East Lombok cover not only mountainous areas but also lowlands, including the coast. The mountainous area is located in the northern part of this regency, i.e the Mount Rinjani National Park with a peak of 3,726 meters above sea level. The Mount of Rinjani is known to be the third highest mountain and the second largest volcano in the country. As for the central to southern part of East Lombok Regency, the landscape consists in the form of lowlands area. The mount Rinjani area served as the rainfall catchment area to the regency, which then the water flows into several eastern Lombok rivers. The rainfall in the southern part of the regency is lower, compared to the northern part where the land rises toward Mount Rinjani. Many large and small rivers were passing the area of East Lombok Regency, however, some of the rivers were dry occasionally during certain seasons. On the other hand, this region only has 1 lake (Segara Anak Lake), which is between West and East Lombok Regencies. As the largest regency in Lombok Island, East Lombok Regency total area reached 2,680 km2 that consists of almost 60% of landmass (1,606 km2), while the rest is oceans (1,074 km2). The capital of East Lombok Regency is Selong, which is located 50 km from the provincial capital of NTB. According to the Central Bureau of Statistics (2020), in total, the population of this regency reached 1,200,612 inhabitants in 2019, with population growth of 0.71% and population density of 748 inhabitant per square km. Administratively, East Lombok Regency consists of 21 districts as detailed below:
Table 5. Districts in East Lombok Regency.
No District Area (km2)
Percentage of Total
Population
Population Density
(inh/km2)
Distance to the Capital of Regency (km)
1 Keruak 40 4.41 1,411 22 2 Jerowaru 143 4.64 421 28.5 3 Sakra 25 4.91 2,536 12 4 Sakra Barat 32 4.50 1,808 18 5 Sakra Timur 37 3.98 1,392 18 6 Terara 41 5.77 1,808 13.5 7 Montong Gading 26 3.68 1,862 18 8 Sikur 78 5.89 976 10 9 Masbagik 33 8.09 3,162 7 10 Pringgasela 134 4.71 455 8.3 11 Sukamulia 14 2.80 2,503 4 12 Suralaga 27 4.91 2,358 9 13 Selong 32 7.01 2,868 0 14 Labuhan Haji 50 5.02 1,312 7 15 Pringgabaya 136 8.39 799 24 16 Suela 115 3.47 391 31 17 Aikmel 123 5.34 872 14 18 Wanasaba 56 5.10 1,184 20 19 Sembalun 217 1.72 103 49 20 Lenek n/a 2.93 n/a 11.3 21 Sambelia 245 2.75 145 54 East Lombok
Regency 1,606 100 748
Source: Central Bureau of Statistics (2020)
Given the vast area of this regency, there were 10 districts located quite a distance from the capital regency, which include Sambelia, Sembalun, Suela, Jerowaru, Pringgabaya, Keruak, Wanasaba, Sakra Barat, Sakra Timur, Montong Gading. Meanwhile, the five districts with the highest population density were Masbagik, Selong, Sakra, Sukamulia, Suralaga. In addition to that, there were 3 districts with islands within their region, i.e. Keruak (3 islands), Jerowaru (26 islands) and Sambelia (6 islands).
Ramboll - Pre-feasibility Study (Waste) of Lombok
26/150
According to the Central Bureau of Statistics (2020), the land use in this regency can be categorized into 3 types: agricultural land (wetland), agricultural land (non-rice fields - dryland), non-agricultural land. Nevertheless, around 77% of the land use in East Lombok Regency is intended for agricultural purposes, including both wetland and dryland. Meanwhile, the land used for non-agricultural purposes, such as residentials, only accounts for 23% of the total land area. In 2019, around 56% of the GDP in East Lombok Regency was generated from 3 main sectors, with the largest contribution from the agricultural, forestry and fisheries sector (27%). The second largest contributor was the trading and automotive repair industry (17.5%), while the third largest contributor was the construction sector (almost 12%). However, the contribution from the agricultural, forestry and fisheries sector has been decreasing year by year, which indicates the declining tendency of businesses in the agricultural, forestry and fisheries sector as well as transition into other sectors. GDP per capita (current price) in 2019 reached 16.9 Mio IDR with the economic growth of 4.68% and the unemployment rate of 3.47%.
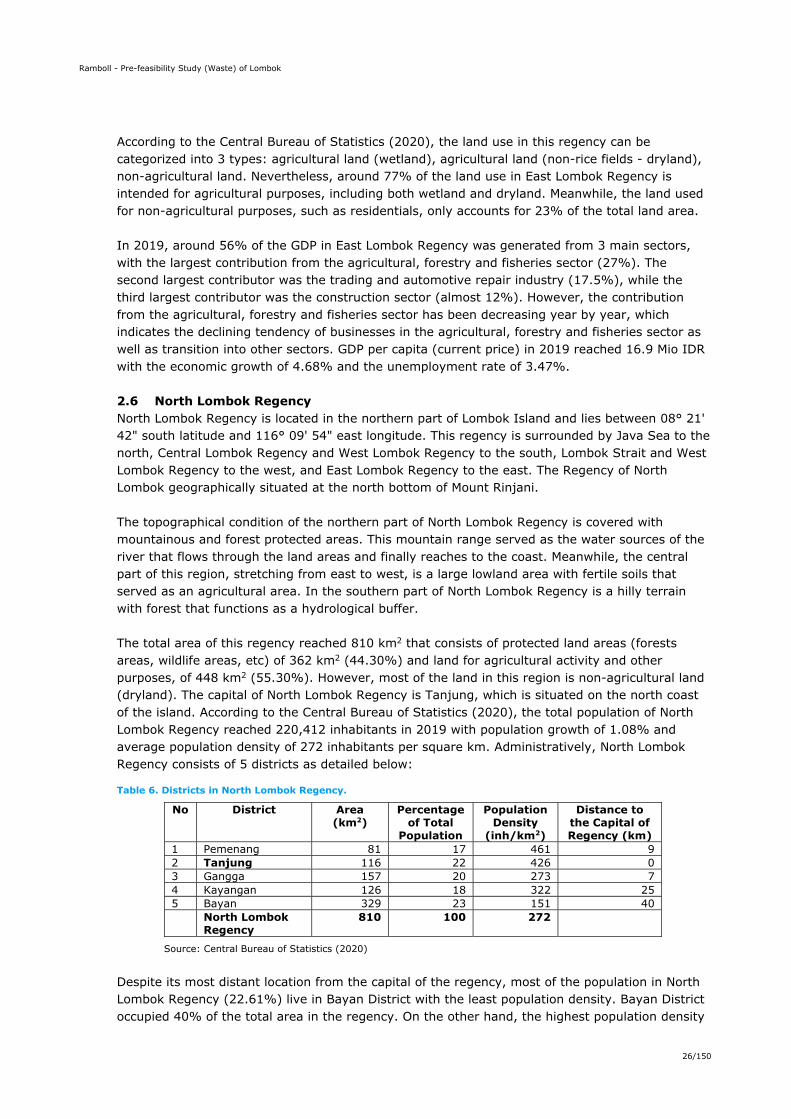
2.6 North Lombok Regency North Lombok Regency is located in the northern part of Lombok Island and lies between 08° 21' 42" south latitude and 116° 09' 54" east longitude. This regency is surrounded by Java Sea to the north, Central Lombok Regency and West Lombok Regency to the south, Lombok Strait and West Lombok Regency to the west, and East Lombok Regency to the east. The Regency of North Lombok geographically situated at the north bottom of Mount Rinjani. The topographical condition of the northern part of North Lombok Regency is covered with mountainous and forest protected areas. This mountain range served as the water sources of the river that flows through the land areas and finally reaches to the coast. Meanwhile, the central part of this region, stretching from east to west, is a large lowland area with fertile soils that served as an agricultural area. In the southern part of North Lombok Regency is a hilly terrain with forest that functions as a hydrological buffer. The total area of this regency reached 810 km2 that consists of protected land areas (forests areas, wildlife areas, etc) of 362 km2 (44.30%) and land for agricultural activity and other purposes, of 448 km2 (55.30%). However, most of the land in this region is non-agricultural land (dryland). The capital of North Lombok Regency is Tanjung, which is situated on the north coast of the island. According to the Central Bureau of Statistics (2020), the total population of North Lombok Regency reached 220,412 inhabitants in 2019 with population growth of 1.08% and average population density of 272 inhabitants per square km. Administratively, North Lombok Regency consists of 5 districts as detailed below:
Table 6. Districts in North Lombok Regency.
No District Area (km2)
Percentage of Total
Population
Population Density
(inh/km2)
Distance to the Capital of Regency (km)
1 Pemenang 81 17 461 9 2 Tanjung 116 22 426 0 3 Gangga 157 20 273 7 4 Kayangan 126 18 322 25 5 Bayan 329 23 151 40 North Lombok
Regency 810 100 272
Source: Central Bureau of Statistics (2020)
Despite its most distant location from the capital of the regency, most of the population in North Lombok Regency (22.61%) live in Bayan District with the least population density. Bayan District occupied 40% of the total area in the regency. On the other hand, the highest population density
Ramboll - Pre-feasibility Study (Waste) of Lombok
27/150
is situated in Pemenang District, which also has the least area within the regency. This district also manages 3 small islands within its region. Tanjung, the capital of this regency also has a high population density of 426 inhabitant/km2 that represents 22.35% of total population (the second highest) in the regency. Based on the Central Bureau of Statistics (2020), there were 3 main sectors contributed to 58% of the North Lombok Regency’s GDP in 2019, which include agricultural, forestry and fisheries sector (33.88%), trading sector and automotive repair industry (14.4%), and construction sector (10.14%). In the future, it is expected that the industrial sector would replace the contribution from the agricultural sector. Currently, the industrial sector only contributes 1.28% to the GDP of North Lombok. In 2019, the GDP per capita (current price) reached 22.08 Mio IDR with the economic growth of 5.92% and the unemployment rate of 2.11%.
Ramboll - Pre-feasibility Study (Waste) of Lombok
28/150
3. WASTE MANAGEMENT IN INDONESIA AND WEST NUSA TENGGARA PROVINCE
3.1 Waste Management in Indonesia As stated in Waste Management Act 18/2008, the categories of waste regulated under this policy umbrella comprise of Household Waste, Waste similar to household waste, Specific Waste. Household waste defines solid waste generated from household daily activities, excluding feces and specific waste. While, household-like waste defines the household waste type generated from commercial areas, industrial areas, special areas, social facilities, public facilities, and/or other facilities. As for the specific waste, it is defined as the waste generated, in which due to its character, concentration and/or volume requires specific handling (different handling stream than MSW). The first two waste categories are further stipulated under Government Regulation 81/2012 on Management of Household waste and household-like waste and later categorized as municipal solid waste, which is the main scope of this study. The Government Regulation 81/2012 is further supplemented by local regulation at each city/regency in Indonesia. Meanwhile, specific waste is further defined under Government Regulation 27/2020. According to the Regional Government Act 23/2014, waste management classifies as concurrent government affairs, which then further included as mandatory government affairs. This indicates the sharing of responsibilities between the national and sub-national levels (provincial and city government) in providing waste management service. In addition to that, waste management is also considered as a cross-sectoral affair as it involves two sectors of government affairs: public works & spatial planning sector and environmental sector. Sharing of responsibilities among three levels of government that touch the two sectors were detailed in the following table.
Table 7. Sharing of Responsibilities based on The Regional Government Act 23/2014.
No. National Government Provincial Government City Government 1. Government Affairs in Public Works & Spatial Planning Sector
a. Determining the development of solid waste management system nationally
b. Developing the solid waste management system cross provincial boundaries and waste management system for national strategic interests.
Regional waste management and system development.
City/Regency waste management and system development.
2. Government Affairs in Environmental Sector a. Issuance of permits for Waste to
Energy facility b. Issuance of permits for the
utilization of landfill gas to energy at Regional Landfill by the private sector
c. Assisting and supervising waste handling at regional landfill/TPST by private sector
d. Determining and supervising the producers’ responsibilities in waste reduction initiatives/activities
e. Assisting and supervising the producers’ responsibilities in waste reduction initiatives/activities
Waste handling at regional landfill/TPST
a. Implementation of Waste Management
b. Issuance of permits for recycling/treatment of waste, transportation of waste, and final processing of waste organized by the private operators
c. Assisting and supervising the implementation of waste management organized by the private sector
Source: Regional Government Act 23/2014
As indicated in the table, the city government plays the leading role in the implementation of waste management with the support from national and provincial governments in order to ensure effective implementation. Furthermore, relevant policies on waste management have further
Ramboll - Pre-feasibility Study (Waste) of Lombok
29/150
defined the roles of all stakeholders involved, including individual, communities, government, commercials/businesses and private sectors, etc. This signifies that local government must lead the provision of waste services by coordinating and collaborating with all related actors involved. It is important to note that a proper and effective implementation of waste management in a city would depend on related factors, such as local priority, sufficient financing, institutional and technical capacity, stakeholders’ participation, facilities and infrastructures, supportive regulatory framework, etc. Thus, a comprehensive approach that satisfies each aspect would be essential to ensure adequate implementation of waste management in a city. In understanding the implementation of waste management in a city, simple performance indicators such as collection rate, recycling rate, percentage of unmanaged or handled waste, could be essential parameters to indicate the waste management performance. Given the specific situation and different challenges in each city, hence, the performance of waste management in a city may only serve to provide an overview, trend, or progress made by a specific city, rather than to compare one another.
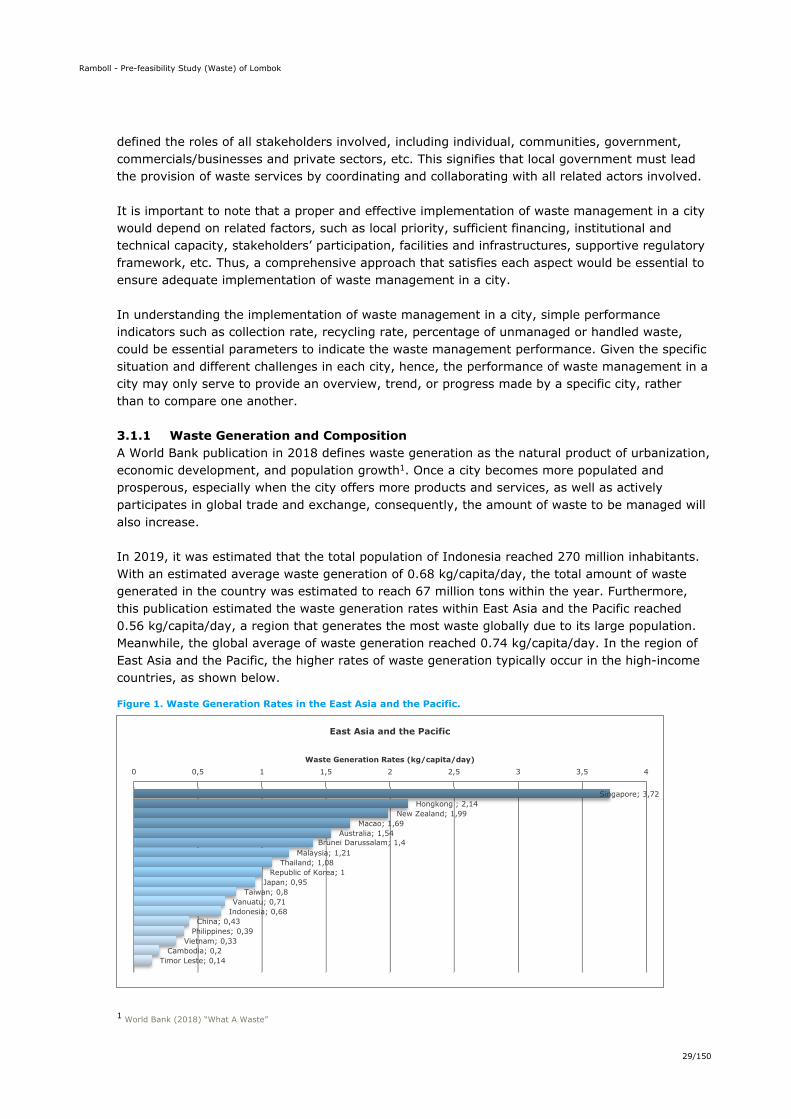
3.1.1 Waste Generation and Composition A World Bank publication in 2018 defines waste generation as the natural product of urbanization, economic development, and population growth1. Once a city becomes more populated and prosperous, especially when the city offers more products and services, as well as actively participates in global trade and exchange, consequently, the amount of waste to be managed will also increase. In 2019, it was estimated that the total population of Indonesia reached 270 million inhabitants. With an estimated average waste generation of 0.68 kg/capita/day, the total amount of waste generated in the country was estimated to reach 67 million tons within the year. Furthermore, this publication estimated the waste generation rates within East Asia and the Pacific reached 0.56 kg/capita/day, a region that generates the most waste globally due to its large population. Meanwhile, the global average of waste generation reached 0.74 kg/capita/day. In the region of East Asia and the Pacific, the higher rates of waste generation typically occur in the high-income countries, as shown below.
Figure 1. Waste Generation Rates in the East Asia and the Pacific.
1 World Bank (2018) “What A Waste”
Singapore; 3,72Hongkong ; 2,14
New Zealand; 1,99Macao; 1,69
Australia; 1,54Brunei Darussalam; 1,4
Malaysia; 1,21Thailand; 1,08
Republic of Korea; 1Japan; 0,95
Taiwan; 0,8Vanuatu; 0,71
Indonesia; 0,68China; 0,43
Philippines; 0,39Vietnam; 0,33
Cambodia; 0,2Timor Leste; 0,14
0 0,5 1 1,5 2 2,5 3 3,5 4Waste Generation Rates (kg/capita/day)
East Asia and the Pacific
Ramboll - Pre-feasibility Study (Waste) of Lombok
30/150
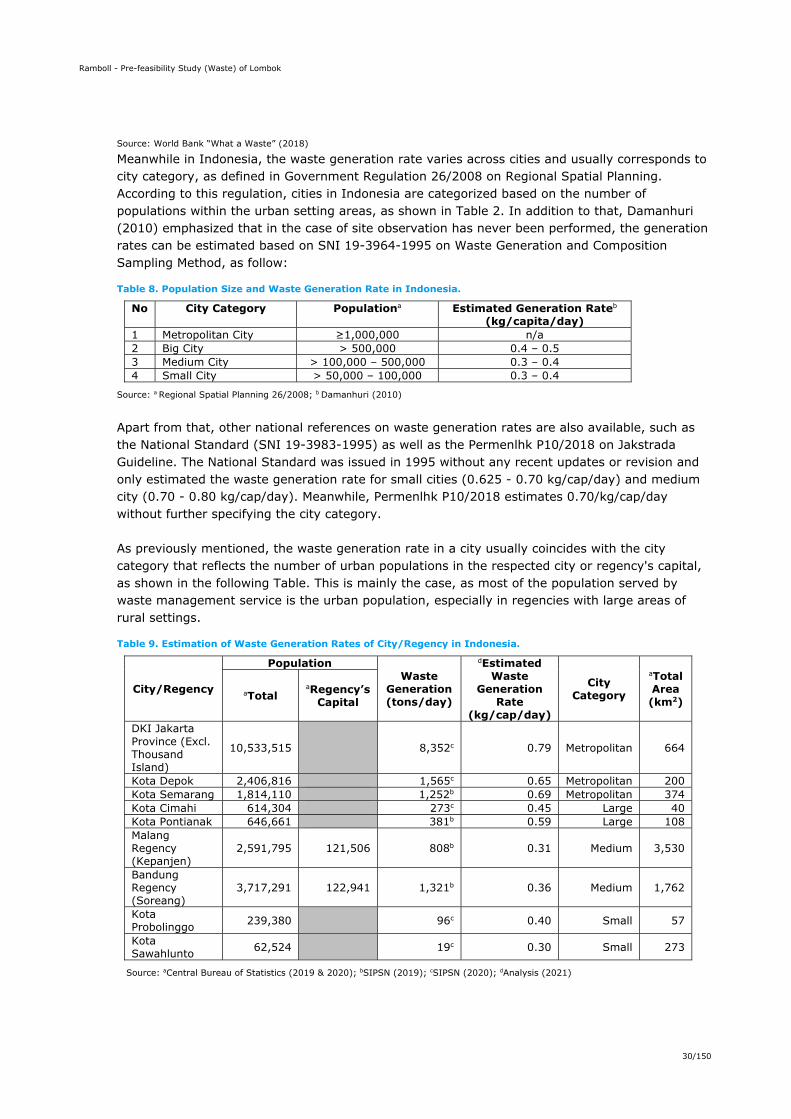
Source: World Bank “What a Waste” (2018) Meanwhile in Indonesia, the waste generation rate varies across cities and usually corresponds to city category, as defined in Government Regulation 26/2008 on Regional Spatial Planning. According to this regulation, cities in Indonesia are categorized based on the number of populations within the urban setting areas, as shown in Table 2. In addition to that, Damanhuri (2010) emphasized that in the case of site observation has never been performed, the generation rates can be estimated based on SNI 19-3964-1995 on Waste Generation and Composition Sampling Method, as follow:
Table 8. Population Size and Waste Generation Rate in Indonesia.
No City Category Populationa Estimated Generation Rateb (kg/capita/day)
1 Metropolitan City ≥1,000,000 n/a 2 Big City > 500,000 0.4 – 0.5 3 Medium City > 100,000 – 500,000 0.3 – 0.4 4 Small City > 50,000 – 100,000 0.3 – 0.4
Source: a Regional Spatial Planning 26/2008; b Damanhuri (2010)
Apart from that, other national references on waste generation rates are also available, such as the National Standard (SNI 19-3983-1995) as well as the Permenlhk P10/2018 on Jakstrada Guideline. The National Standard was issued in 1995 without any recent updates or revision and only estimated the waste generation rate for small cities (0.625 - 0.70 kg/cap/day) and medium city (0.70 - 0.80 kg/cap/day). Meanwhile, Permenlhk P10/2018 estimates 0.70/kg/cap/day without further specifying the city category. As previously mentioned, the waste generation rate in a city usually coincides with the city category that reflects the number of urban populations in the respected city or regency's capital, as shown in the following Table. This is mainly the case, as most of the population served by waste management service is the urban population, especially in regencies with large areas of rural settings.
Table 9. Estimation of Waste Generation Rates of City/Regency in Indonesia.
City/Regency
Population Waste
Generation (tons/day)
dEstimated Waste
Generation Rate
(kg/cap/day)
City Category
aTotal Area (km2)
aTotal aRegency’s
Capital
DKI Jakarta Province (Excl. Thousand Island)
10,533,515 8,352c 0.79 Metropolitan 664
Kota Depok 2,406,816 1,565c 0.65 Metropolitan 200 Kota Semarang 1,814,110 1,252b 0.69 Metropolitan 374 Kota Cimahi 614,304 273c 0.45 Large 40 Kota Pontianak 646,661 381b 0.59 Large 108 Malang Regency (Kepanjen)
2,591,795 121,506 808b 0.31 Medium 3,530
Bandung Regency (Soreang)
3,717,291 122,941 1,321b 0.36 Medium 1,762
Kota Probolinggo 239,380 96c 0.40 Small 57
Kota Sawahlunto 62,524 19c 0.30 Small 273
Source: aCentral Bureau of Statistics (2019 & 2020); bSIPSN (2019); cSIPSN (2020); dAnalysis (2021)
Ramboll - Pre-feasibility Study (Waste) of Lombok
31/150
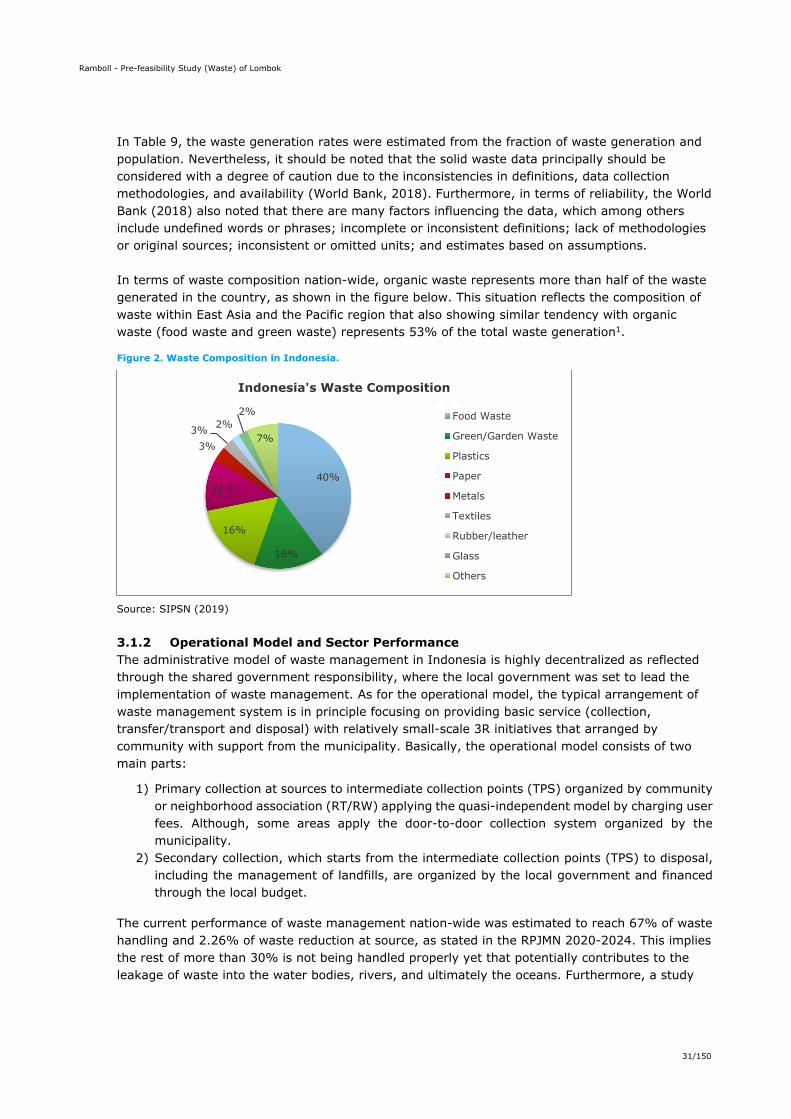
In Table 9, the waste generation rates were estimated from the fraction of waste generation and population. Nevertheless, it should be noted that the solid waste data principally should be considered with a degree of caution due to the inconsistencies in definitions, data collection methodologies, and availability (World Bank, 2018). Furthermore, in terms of reliability, the World Bank (2018) also noted that there are many factors influencing the data, which among others include undefined words or phrases; incomplete or inconsistent definitions; lack of methodologies or original sources; inconsistent or omitted units; and estimates based on assumptions. In terms of waste composition nation-wide, organic waste represents more than half of the waste generated in the country, as shown in the figure below. This situation reflects the composition of waste within East Asia and the Pacific region that also showing similar tendency with organic waste (food waste and green waste) represents 53% of the total waste generation1.
Figure 2. Waste Composition in Indonesia.
Source: SIPSN (2019)
3.1.2 Operational Model and Sector Performance The administrative model of waste management in Indonesia is highly decentralized as reflected through the shared government responsibility, where the local government was set to lead the implementation of waste management. As for the operational model, the typical arrangement of waste management system is in principle focusing on providing basic service (collection, transfer/transport and disposal) with relatively small-scale 3R initiatives that arranged by community with support from the municipality. Basically, the operational model consists of two main parts:
1) Primary collection at sources to intermediate collection points (TPS) organized by community or neighborhood association (RT/RW) applying the quasi-independent model by charging user fees. Although, some areas apply the door-to-door collection system organized by the municipality.
2) Secondary collection, which starts from the intermediate collection points (TPS) to disposal, including the management of landfills, are organized by the local government and financed through the local budget.
The current performance of waste management nation-wide was estimated to reach 67% of waste handling and 2.26% of waste reduction at source, as stated in the RPJMN 2020-2024. This implies the rest of more than 30% is not being handled properly yet that potentially contributes to the leakage of waste into the water bodies, rivers, and ultimately the oceans. Furthermore, a study
40%
16%
16%
11%
3%3% 2%
2%
7%
Indonesia's Waste Composition
Food Waste
Green/Garden Waste
Plastics
Paper
Metals
Textiles
Rubber/leather
Glass
Others
Ramboll - Pre-feasibility Study (Waste) of Lombok
32/150
prepared by Jambeck et al. (2015) revealed Indonesia as the second largest plastic polluter into the oceans.2 In order to improve the sector performance, the Government of Indonesia has placed waste management in the national agenda, which is reflected through the national policy and development agenda. The Government of Indonesia aims at 30% waste reduction and 70% waste handling by 2025 as laid out in the National Waste Management Policy and Strategy (Presidential Regulation No.97/2017). In the national development plan of 2020-2024, waste management has been highlighted and included, particularly in the two development agendas, i.e.: 1) strengthening infrastructure to support economic development and basic services (by improving access to a proper waste management system); 2) improving the environmental quality, improving disaster resilience, and climate change (by increasing waste handling and reduction rate). In addition to that, the government has also pledged to reduce marine debris by 70% in 2025 as stated in Presidential Regulation 83/2018.
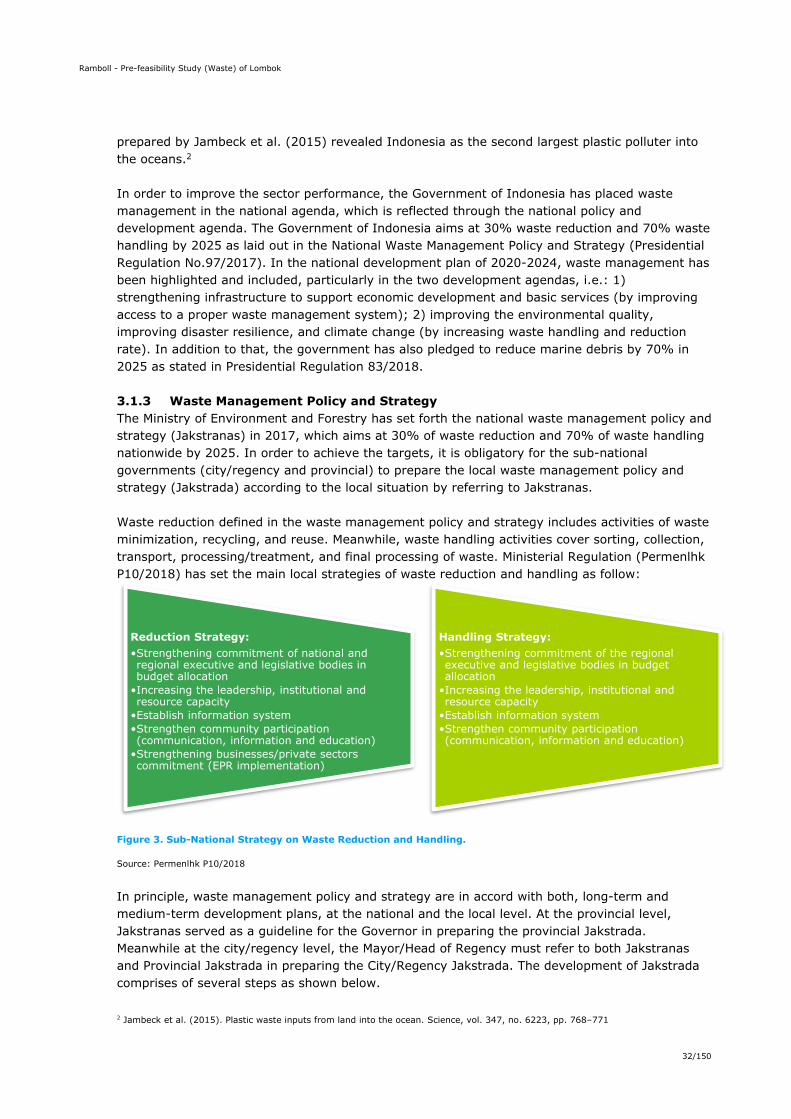
3.1.3 Waste Management Policy and Strategy The Ministry of Environment and Forestry has set forth the national waste management policy and strategy (Jakstranas) in 2017, which aims at 30% of waste reduction and 70% of waste handling nationwide by 2025. In order to achieve the targets, it is obligatory for the sub-national governments (city/regency and provincial) to prepare the local waste management policy and strategy (Jakstrada) according to the local situation by referring to Jakstranas. Waste reduction defined in the waste management policy and strategy includes activities of waste minimization, recycling, and reuse. Meanwhile, waste handling activities cover sorting, collection, transport, processing/treatment, and final processing of waste. Ministerial Regulation (Permenlhk P10/2018) has set the main local strategies of waste reduction and handling as follow:
Figure 3. Sub-National Strategy on Waste Reduction and Handling.
Source: Permenlhk P10/2018
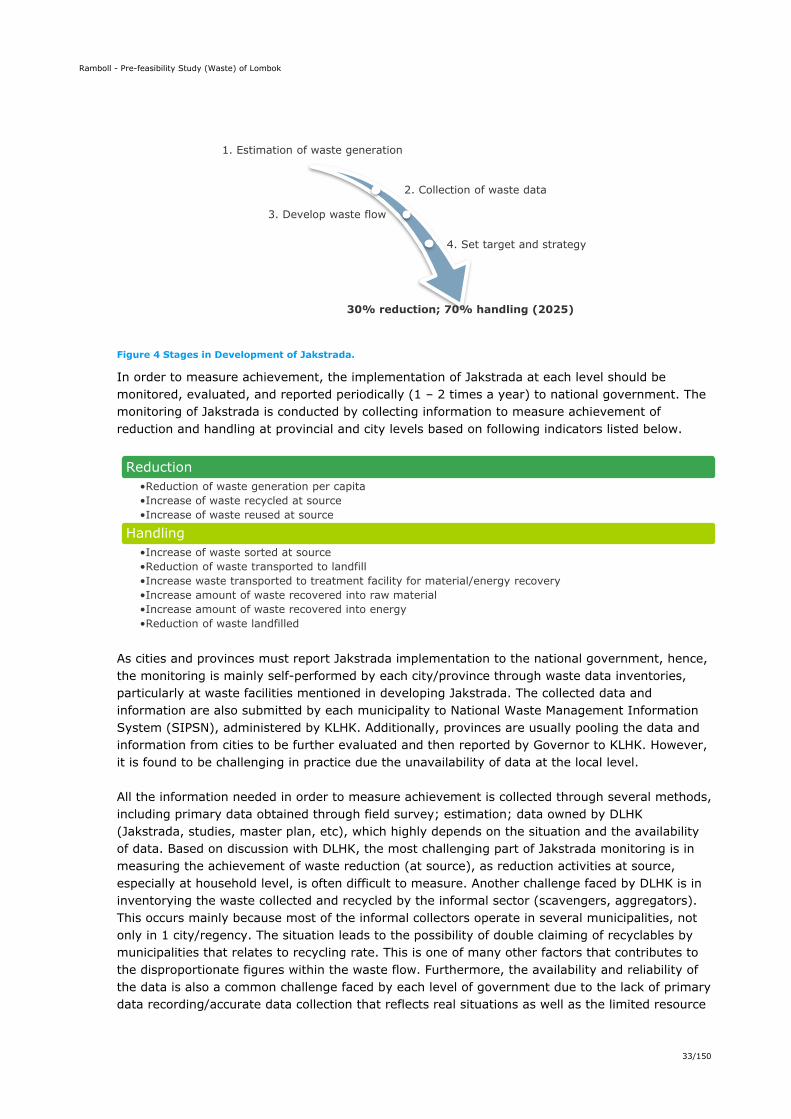
In principle, waste management policy and strategy are in accord with both, long-term and medium-term development plans, at the national and the local level. At the provincial level, Jakstranas served as a guideline for the Governor in preparing the provincial Jakstrada. Meanwhile at the city/regency level, the Mayor/Head of Regency must refer to both Jakstranas and Provincial Jakstrada in preparing the City/Regency Jakstrada. The development of Jakstrada comprises of several steps as shown below. 2 Jambeck et al. (2015). Plastic waste inputs from land into the ocean. Science, vol. 347, no. 6223, pp. 768–771
Reduction Strategy:•Strengthening commitment of national and regional executive and legislative bodies in budget allocation
•Increasing the leadership, institutional and resource capacity
•Establish information system•Strengthen community participation (communication, information and education)
•Strengthening businesses/private sectors commitment (EPR implementation)
Handling Strategy:•Strengthening commitment of the regional executive and legislative bodies in budget allocation
•Increasing the leadership, institutional and resource capacity
•Establish information system•Strengthen community participation (communication, information and education)
Ramboll - Pre-feasibility Study (Waste) of Lombok
33/150
Figure 4 Stages in Development of Jakstrada.
In order to measure achievement, the implementation of Jakstrada at each level should be monitored, evaluated, and reported periodically (1 – 2 times a year) to national government. The monitoring of Jakstrada is conducted by collecting information to measure achievement of reduction and handling at provincial and city levels based on following indicators listed below.
As cities and provinces must report Jakstrada implementation to the national government, hence, the monitoring is mainly self-performed by each city/province through waste data inventories, particularly at waste facilities mentioned in developing Jakstrada. The collected data and information are also submitted by each municipality to National Waste Management Information System (SIPSN), administered by KLHK. Additionally, provinces are usually pooling the data and information from cities to be further evaluated and then reported by Governor to KLHK. However, it is found to be challenging in practice due the unavailability of data at the local level. All the information needed in order to measure achievement is collected through several methods, including primary data obtained through field survey; estimation; data owned by DLHK (Jakstrada, studies, master plan, etc), which highly depends on the situation and the availability of data. Based on discussion with DLHK, the most challenging part of Jakstrada monitoring is in measuring the achievement of waste reduction (at source), as reduction activities at source, especially at household level, is often difficult to measure. Another challenge faced by DLHK is in inventorying the waste collected and recycled by the informal sector (scavengers, aggregators). This occurs mainly because most of the informal collectors operate in several municipalities, not only in 1 city/regency. The situation leads to the possibility of double claiming of recyclables by municipalities that relates to recycling rate. This is one of many other factors that contributes to the disproportionate figures within the waste flow. Furthermore, the availability and reliability of the data is also a common challenge faced by each level of government due to the lack of primary data recording/accurate data collection that reflects real situations as well as the limited resource
1. Estimation of waste generation
2. Collection of waste data
3. Develop waste flow
4. Set target and strategy
30% reduction; 70% handling (2025)
Reduction•Reduction of waste generation per capita•Increase of waste recycled at source•Increase of waste reused at source
Handling•Increase of waste sorted at source•Reduction of waste transported to landfill•Increase waste transported to treatment facility for material/energy recovery•Increase amount of waste recovered into raw material•Increase amount of waste recovered into energy•Reduction of waste landfilled
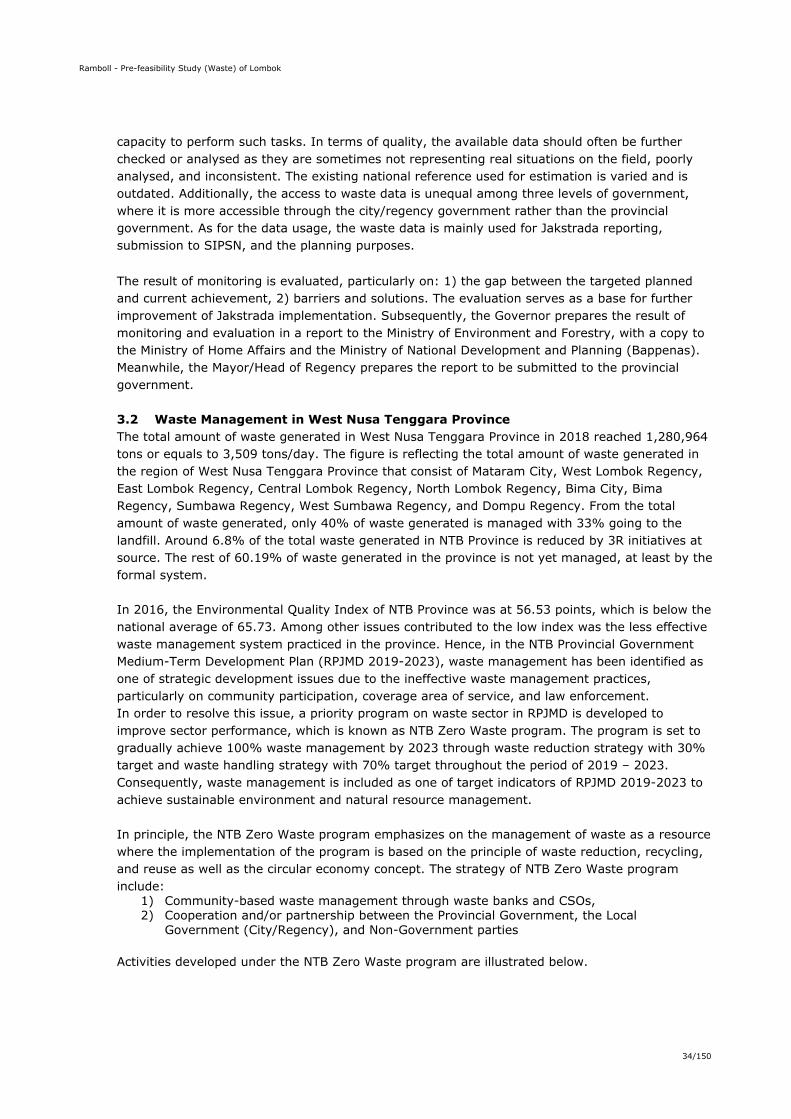
Ramboll - Pre-feasibility Study (Waste) of Lombok
34/150
capacity to perform such tasks. In terms of quality, the available data should often be further checked or analysed as they are sometimes not representing real situations on the field, poorly analysed, and inconsistent. The existing national reference used for estimation is varied and is outdated. Additionally, the access to waste data is unequal among three levels of government, where it is more accessible through the city/regency government rather than the provincial government. As for the data usage, the waste data is mainly used for Jakstrada reporting, submission to SIPSN, and the planning purposes. The result of monitoring is evaluated, particularly on: 1) the gap between the targeted planned and current achievement, 2) barriers and solutions. The evaluation serves as a base for further improvement of Jakstrada implementation. Subsequently, the Governor prepares the result of monitoring and evaluation in a report to the Ministry of Environment and Forestry, with a copy to the Ministry of Home Affairs and the Ministry of National Development and Planning (Bappenas). Meanwhile, the Mayor/Head of Regency prepares the report to be submitted to the provincial government.
3.2 Waste Management in West Nusa Tenggara Province The total amount of waste generated in West Nusa Tenggara Province in 2018 reached 1,280,964 tons or equals to 3,509 tons/day. The figure is reflecting the total amount of waste generated in the region of West Nusa Tenggara Province that consist of Mataram City, West Lombok Regency, East Lombok Regency, Central Lombok Regency, North Lombok Regency, Bima City, Bima Regency, Sumbawa Regency, West Sumbawa Regency, and Dompu Regency. From the total amount of waste generated, only 40% of waste generated is managed with 33% going to the landfill. Around 6.8% of the total waste generated in NTB Province is reduced by 3R initiatives at source. The rest of 60.19% of waste generated in the province is not yet managed, at least by the formal system. In 2016, the Environmental Quality Index of NTB Province was at 56.53 points, which is below the national average of 65.73. Among other issues contributed to the low index was the less effective waste management system practiced in the province. Hence, in the NTB Provincial Government Medium-Term Development Plan (RPJMD 2019-2023), waste management has been identified as one of strategic development issues due to the ineffective waste management practices, particularly on community participation, coverage area of service, and law enforcement. In order to resolve this issue, a priority program on waste sector in RPJMD is developed to improve sector performance, which is known as NTB Zero Waste program. The program is set to gradually achieve 100% waste management by 2023 through waste reduction strategy with 30% target and waste handling strategy with 70% target throughout the period of 2019 – 2023. Consequently, waste management is included as one of target indicators of RPJMD 2019-2023 to achieve sustainable environment and natural resource management. In principle, the NTB Zero Waste program emphasizes on the management of waste as a resource where the implementation of the program is based on the principle of waste reduction, recycling, and reuse as well as the circular economy concept. The strategy of NTB Zero Waste program include:
1) Community-based waste management through waste banks and CSOs, 2) Cooperation and/or partnership between the Provincial Government, the Local
Government (City/Regency), and Non-Government parties
Activities developed under the NTB Zero Waste program are illustrated below.
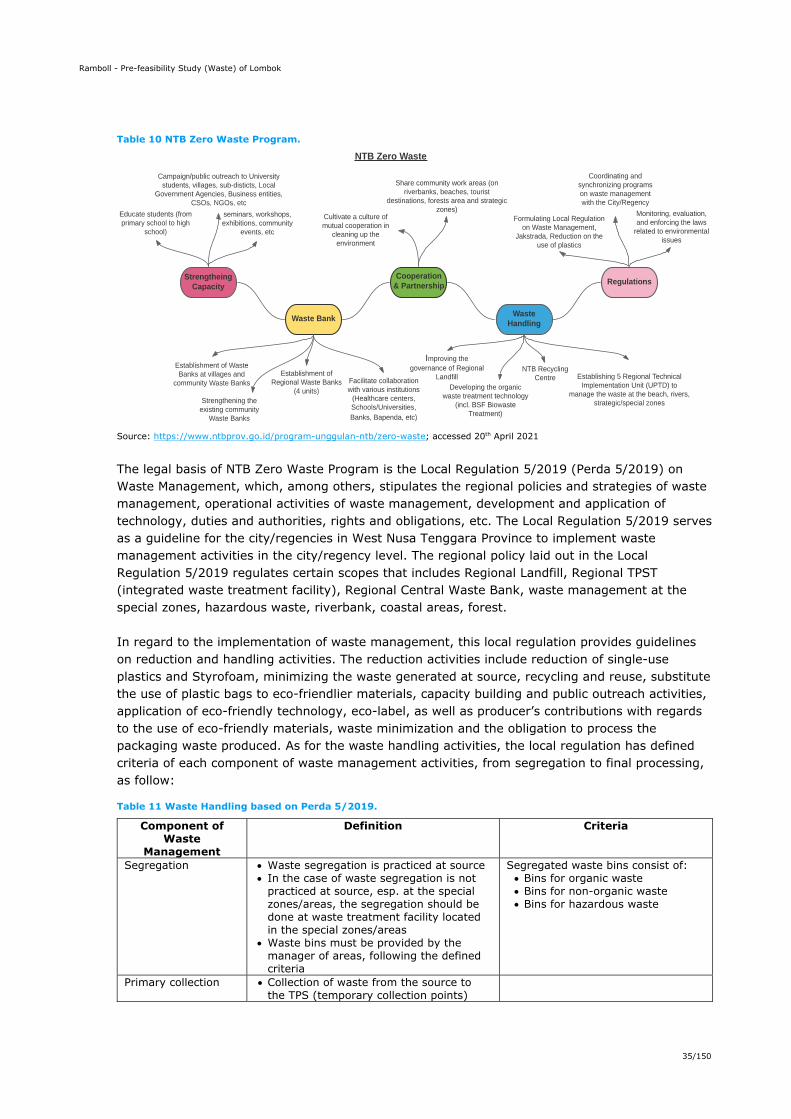
Ramboll - Pre-feasibility Study (Waste) of Lombok
35/150
Table 10 NTB Zero Waste Program.
Source: https://www.ntbprov.go.id/program-unggulan-ntb/zero-waste; accessed 20th April 2021
The legal basis of NTB Zero Waste Program is the Local Regulation 5/2019 (Perda 5/2019) on Waste Management, which, among others, stipulates the regional policies and strategies of waste management, operational activities of waste management, development and application of technology, duties and authorities, rights and obligations, etc. The Local Regulation 5/2019 serves as a guideline for the city/regencies in West Nusa Tenggara Province to implement waste management activities in the city/regency level. The regional policy laid out in the Local Regulation 5/2019 regulates certain scopes that includes Regional Landfill, Regional TPST (integrated waste treatment facility), Regional Central Waste Bank, waste management at the special zones, hazardous waste, riverbank, coastal areas, forest. In regard to the implementation of waste management, this local regulation provides guidelines on reduction and handling activities. The reduction activities include reduction of single-use plastics and Styrofoam, minimizing the waste generated at source, recycling and reuse, substitute the use of plastic bags to eco-friendlier materials, capacity building and public outreach activities, application of eco-friendly technology, eco-label, as well as producer’s contributions with regards to the use of eco-friendly materials, waste minimization and the obligation to process the packaging waste produced. As for the waste handling activities, the local regulation has defined criteria of each component of waste management activities, from segregation to final processing, as follow:
Table 11 Waste Handling based on Perda 5/2019.
Component of Waste
Management
Definition Criteria
Segregation Waste segregation is practiced at source In the case of waste segregation is not
practiced at source, esp. at the special zones/areas, the segregation should be done at waste treatment facility located in the special zones/areas
Waste bins must be provided by the manager of areas, following the defined criteria
Segregated waste bins consist of: Bins for organic waste Bins for non-organic waste Bins for hazardous waste
Primary collection Collection of waste from the source to the TPS (temporary collection points)

Ramboll - Pre-feasibility Study (Waste) of Lombok
36/150
Component of Waste
Management
Definition Criteria
Secondary collection (transport to landfill)
Transport activities defined as collecting/transporting the waste from: a. House to TPS, performed and further
arranged by the village government b. TPS to Regional landfill and/or
Regional TPST, performed by the city/regency government
c. Special zones to regional landfill and/or Regional TPST, performed by area manager
d. Central waste banks to regional central waste bank, performed by administrator of central waste bank
e. Regional central waste bank to regional landfill, performed by administrator of regional central waste bank
Transport can also be performed by cooperating with the third party
The regional government may support the City/Regency in transporting waste from the TPS to the Regional TPST and/or the Regional TPA, if the City/Regency is unable to carry out the transportation independently.
Technical standard and requirement of waste transport vehicles must comply with security, safety, health, conformity, and cleanliness requirements
Technical standard of waste transportation vehicles: a. Container must be equipped
with cover (closed) b. The height of container must
not exceed 1.6 meters c. The container should be
equipped with partition d. The vehicles should be
equipped with supporting tools e.g., leverage breaker bar
e. No leakage f. Lifespan between 5-7 years g. Volume of container = 6-8 m3
per trip, equals to 3-5 tons/trip
Regional Facility (Treatment and Final Processing): Regional TPST and Regional Landfill
Waste treatment facility (district-scale) must be provided by the management of residential, commercial area, special zone, industrial zone, public facilities, social amenities, etc.
Waste treatment activities include compacting; composting; material recovery; energy recovery
Regional landfill is established through an agreement and cooperation between two or more Cities/Regencies and the Provincial Government with main consideration on the effectiveness of regional waste management.
Provincial government is responsible for management of Regional TPST and Regional landfill
In the development of regional landfill, the Provincial Government responsible for selecting location based on spatial planning of NTB Province, perform analysis on costs and technology (feasibility study), as well as preparing the detail engineering design.
The regional landfill must be supported with basic facilities, environmental protection/safeguard facilities, operational facilities, supporting facilities
Regional TPST should meet following criteria: a. TPST must be supported with
environment-friendly and land-saving technology
b. TPST must supported with waste (water) treatment facility
c. Taking into account the surrounding geological aspects and environment
d. Taking into account the social and economic aspects of the surrounding community
e. Taking into account the financial feasibility
f. Taking into account the distance and existing facilities
g. TPST should include land available for the buffer zone.
Regional Central Waste Bank
The Waste Bank must be established by the Provincial Government
Waste Bank activities include collection, transportation, sorting, recycling
The management of this Waste Bank can be cooperated with the third party
Responsibilities of Regional Central Waste Bank: a. Set the reduction target for
the waste bank at the regional scale
b. Develop the waste management programs
c. Collection of data and empowering the waste bank unit
d. Recording the quantity of the waste handled, including residues
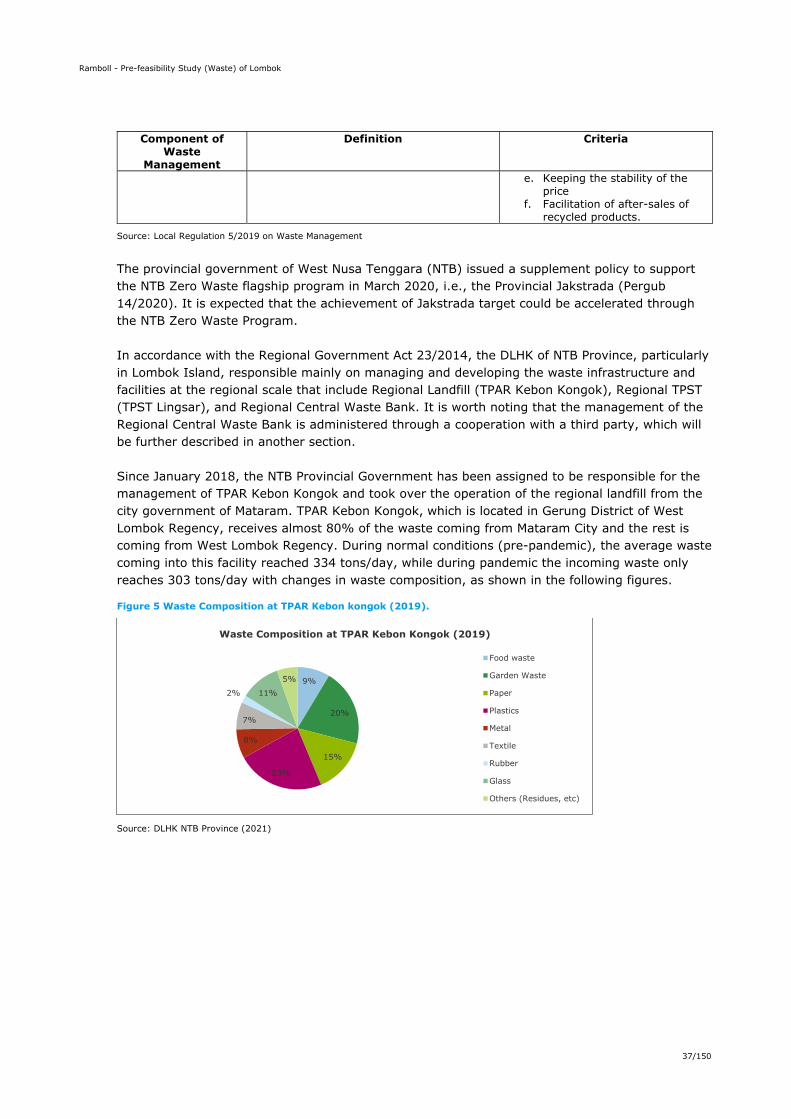
Ramboll - Pre-feasibility Study (Waste) of Lombok
37/150
Component of Waste
Management
Definition Criteria
e. Keeping the stability of the price
f. Facilitation of after-sales of recycled products.
Source: Local Regulation 5/2019 on Waste Management
The provincial government of West Nusa Tenggara (NTB) issued a supplement policy to support the NTB Zero Waste flagship program in March 2020, i.e., the Provincial Jakstrada (Pergub 14/2020). It is expected that the achievement of Jakstrada target could be accelerated through the NTB Zero Waste Program. In accordance with the Regional Government Act 23/2014, the DLHK of NTB Province, particularly in Lombok Island, responsible mainly on managing and developing the waste infrastructure and facilities at the regional scale that include Regional Landfill (TPAR Kebon Kongok), Regional TPST (TPST Lingsar), and Regional Central Waste Bank. It is worth noting that the management of the Regional Central Waste Bank is administered through a cooperation with a third party, which will be further described in another section. Since January 2018, the NTB Provincial Government has been assigned to be responsible for the management of TPAR Kebon Kongok and took over the operation of the regional landfill from the city government of Mataram. TPAR Kebon Kongok, which is located in Gerung District of West Lombok Regency, receives almost 80% of the waste coming from Mataram City and the rest is coming from West Lombok Regency. During normal conditions (pre-pandemic), the average waste coming into this facility reached 334 tons/day, while during pandemic the incoming waste only reaches 303 tons/day with changes in waste composition, as shown in the following figures.
Figure 5 Waste Composition at TPAR Kebon kongok (2019).
Source: DLHK NTB Province (2021)
9%
20%
15%
23%
8%
7%
2% 11%
5%
Waste Composition at TPAR Kebon Kongok (2019)
Food waste
Garden Waste
Paper
Plastics
Metal
Textile
Rubber
Glass
Others (Residues, etc)

Ramboll - Pre-feasibility Study (Waste) of Lombok
38/150
Figure 6 Waste Composition at TPAR Kebon Kongok (2020).
Source: DLHK NTB Province (2021)
The existing operational activities occur in TPAR Kebon Kongok include the landfilling of waste (324 tons/day), composting (25 kg/day), pre-treatment of recyclables i.e. shredding/crushing (50 kg/day), RDF production at pilot stage for research and development (100 kg/day), incineration (small-scale of 200 kg/day), landfill gas recovery, and leachate treatment. The composting and RDF production activities are currently still in the trial phase. The latest landfilling status has currently reached level 6 (height of 25 meters) and will reach level 8 (dangerous status) by March 2022 (height of 40 meters), if no significant intervention is taken to reduce the amount of waste landfilled. Thus, the authority has taken measures to resolve this issue by developing two alternative plans as follow:
1) Short-term plan: Extension of landfill area to southern part to increase capacity and extend the lifetime of landfill. Additionally, the Provincial Government has submitted a proposal for financial support for the construction of the Regional TPST (production of SRF/RDF) to Ministry of Public Work and Housing in order to reduce the waste landfilled and increase the RDF production capacity from 100 kg day to 15 tons/day, which will be used by Jeranjang Power Plant. The regional TPST will be constructed in the eastern part of TPAR Kebon Kongok on an area of 28 Ha. At the time of discussion, DLHK of NTB Province was waiting for the revision of proposal and has submitted all the required readiness criteria documents.
2) Long-term plan: Relocation of the regional landfill to Sekotong, West Lombok Regency. Apart from Regional Landfill, DLHK of NTB Province is also responsible for managing the Regional TPST Lingsar, located in Narmada District of West Lombok Regency. This facility is designed to process 4 tons/day of the organic waste, applying the Black Soldier Flies composting method. The input of organic waste is coming from hospitals, markets, hotels, which is segregated at source. However, the current waste input to facility only reaches 0.5 to 1 ton per day. While in the pre-pandemic period, the average waste input reached 1.5 tons/day. In 2020, the provincial government provided incentive, in the forms of monetary award for waste workers in the market to segregate the waste. This effort has successfully increased the waste input to 3 tons/day. Nevertheless, when the budget allocated for incentive was discontinued, the segregation activity also ended. As a consequence, the waste input to Lingsar TPST decreased to the current state. All activities related to waste management under the responsibility of DLHK Province, are financed by provincial government through provincial budget (Province APBD). There are two main components of expenditure on waste management at DLHK of NTB Province, i.e. expenditure of waste management department and expenditure of Regional Landfill (UPTD). Based on discussion with DLHK of NTB Province, since the fiscal year of 2020, some portion of the budget has been
32%
23%6%
17%
0%1%
0%
2%
20%
Waste Composition at TPAR Kebon Kongok (2020)
Food waste
Garden Waste
Paper
Plastics
Metal
Textile
Rubber
Glass
Others (Residues, etc)
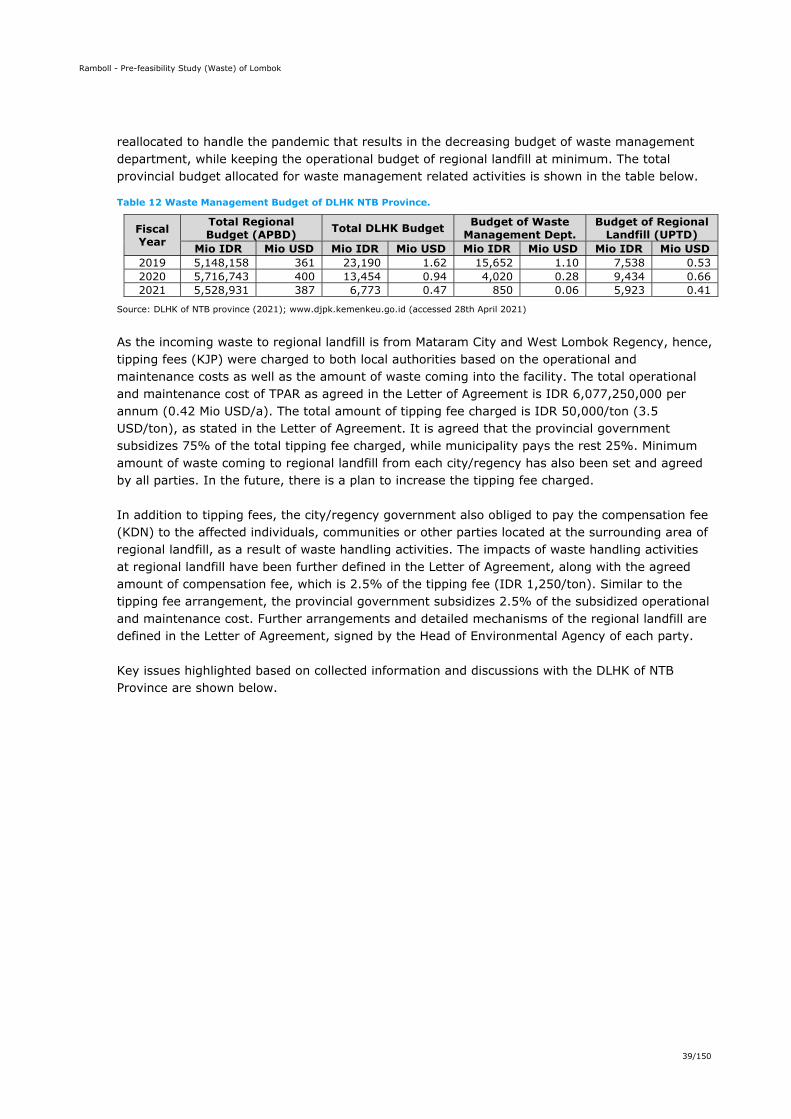
Ramboll - Pre-feasibility Study (Waste) of Lombok
39/150
reallocated to handle the pandemic that results in the decreasing budget of waste management department, while keeping the operational budget of regional landfill at minimum. The total provincial budget allocated for waste management related activities is shown in the table below.
Table 12 Waste Management Budget of DLHK NTB Province.
Fiscal Year
Total Regional Budget (APBD) Total DLHK Budget Budget of Waste
Management Dept. Budget of Regional
Landfill (UPTD) Mio IDR Mio USD Mio IDR Mio USD Mio IDR Mio USD Mio IDR Mio USD
2019 5,148,158 361 23,190 1.62 15,652 1.10 7,538 0.53 2020 5,716,743 400 13,454 0.94 4,020 0.28 9,434 0.66 2021 5,528,931 387 6,773 0.47 850 0.06 5,923 0.41
Source: DLHK of NTB province (2021); www.djpk.kemenkeu.go.id (accessed 28th April 2021)
As the incoming waste to regional landfill is from Mataram City and West Lombok Regency, hence, tipping fees (KJP) were charged to both local authorities based on the operational and maintenance costs as well as the amount of waste coming into the facility. The total operational and maintenance cost of TPAR as agreed in the Letter of Agreement is IDR 6,077,250,000 per annum (0.42 Mio USD/a). The total amount of tipping fee charged is IDR 50,000/ton (3.5 USD/ton), as stated in the Letter of Agreement. It is agreed that the provincial government subsidizes 75% of the total tipping fee charged, while municipality pays the rest 25%. Minimum amount of waste coming to regional landfill from each city/regency has also been set and agreed by all parties. In the future, there is a plan to increase the tipping fee charged. In addition to tipping fees, the city/regency government also obliged to pay the compensation fee (KDN) to the affected individuals, communities or other parties located at the surrounding area of regional landfill, as a result of waste handling activities. The impacts of waste handling activities at regional landfill have been further defined in the Letter of Agreement, along with the agreed amount of compensation fee, which is 2.5% of the tipping fee (IDR 1,250/ton). Similar to the tipping fee arrangement, the provincial government subsidizes 2.5% of the subsidized operational and maintenance cost. Further arrangements and detailed mechanisms of the regional landfill are defined in the Letter of Agreement, signed by the Head of Environmental Agency of each party. Key issues highlighted based on collected information and discussions with the DLHK of NTB Province are shown below.
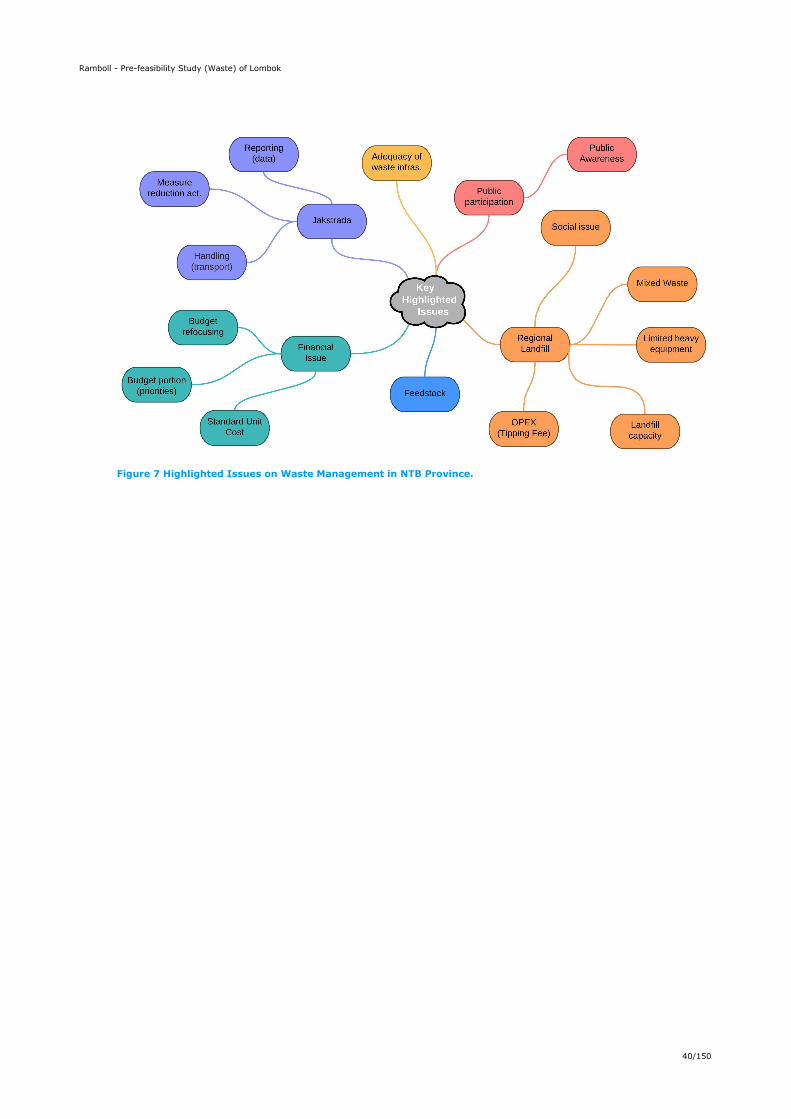
Ramboll - Pre-feasibility Study (Waste) of Lombok
40/150
Figure 7 Highlighted Issues on Waste Management in NTB Province.
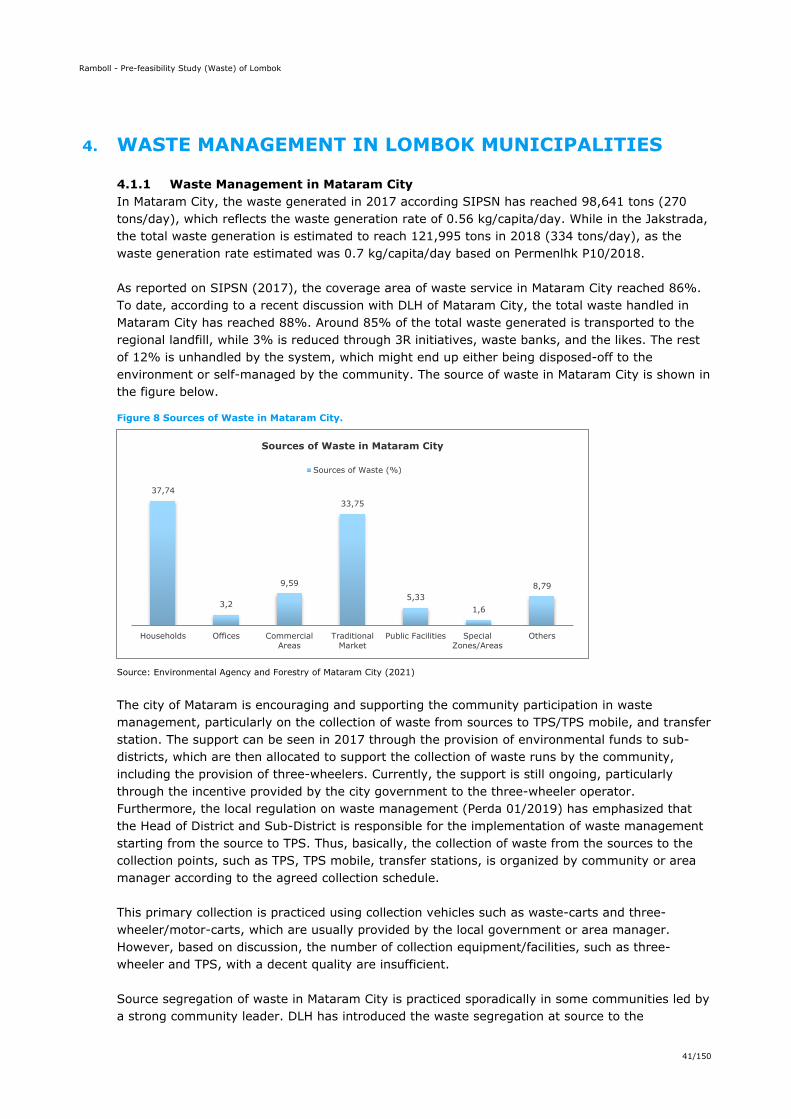
Ramboll - Pre-feasibility Study (Waste) of Lombok
41/150
4. WASTE MANAGEMENT IN LOMBOK MUNICIPALITIES
4.1.1 Waste Management in Mataram City In Mataram City, the waste generated in 2017 according SIPSN has reached 98,641 tons (270 tons/day), which reflects the waste generation rate of 0.56 kg/capita/day. While in the Jakstrada, the total waste generation is estimated to reach 121,995 tons in 2018 (334 tons/day), as the waste generation rate estimated was 0.7 kg/capita/day based on Permenlhk P10/2018. As reported on SIPSN (2017), the coverage area of waste service in Mataram City reached 86%. To date, according to a recent discussion with DLH of Mataram City, the total waste handled in Mataram City has reached 88%. Around 85% of the total waste generated is transported to the regional landfill, while 3% is reduced through 3R initiatives, waste banks, and the likes. The rest of 12% is unhandled by the system, which might end up either being disposed-off to the environment or self-managed by the community. The source of waste in Mataram City is shown in the figure below.
Figure 8 Sources of Waste in Mataram City.
Source: Environmental Agency and Forestry of Mataram City (2021)
The city of Mataram is encouraging and supporting the community participation in waste management, particularly on the collection of waste from sources to TPS/TPS mobile, and transfer station. The support can be seen in 2017 through the provision of environmental funds to sub-districts, which are then allocated to support the collection of waste runs by the community, including the provision of three-wheelers. Currently, the support is still ongoing, particularly through the incentive provided by the city government to the three-wheeler operator. Furthermore, the local regulation on waste management (Perda 01/2019) has emphasized that the Head of District and Sub-District is responsible for the implementation of waste management starting from the source to TPS. Thus, basically, the collection of waste from the sources to the collection points, such as TPS, TPS mobile, transfer stations, is organized by community or area manager according to the agreed collection schedule.
This primary collection is practiced using collection vehicles such as waste-carts and three-wheeler/motor-carts, which are usually provided by the local government or area manager. However, based on discussion, the number of collection equipment/facilities, such as three-wheeler and TPS, with a decent quality are insufficient.
Source segregation of waste in Mataram City is practiced sporadically in some communities led by a strong community leader. DLH has introduced the waste segregation at source to the
37,74
3,2
9,59
33,75
5,331,6
8,79
Households Offices CommercialAreas
TraditionalMarket
Public Facilities SpecialZones/Areas
Others
Sources of Waste in Mataram City
Sources of Waste (%)

Ramboll - Pre-feasibility Study (Waste) of Lombok
42/150
community through public campaign and awareness long ago, while the community leaders (head of sub-district) enforce the implementation at their community level. Apart from disseminating information on waste segregation, DLH also provides support in the provision of segregated bins. In addition to that, Waste Banks also play a significant role in educating the community on waste segregation at source. In case waste segregation has not yet been practiced at source, segregation can take place in TPST or other waste treatment facilities, as emphasized in the local regulation (Perda 1/2019). Communities practicing waste segregation at source are mainly located in Mataram Timur sub-district; Mataram Barat sub-district; Dasan Cermen sub-district; Pejanggit sub-district; Ampenan Selatan sub-district.
Usually, the waste is sorted at source into organics and non-organics, then placed in the segregated bins to be further processed at the composting facility, Black-Soldier Flies composting facility, or waste banks. Nevertheless, in some cases, the sorted waste got mixed again during collection or transport because it is done without segregated collection/transport vehicles. In order to resolve this issue, DLH initiated to provide the community with the contact number of informal waste collectors (scavengers, intermediaries), as DLH planned to use mobile apps for tracking the waste and perform transactions at agreed price. Although most intermediaries already own communication tools, that is not the case for scavengers.
As part of effort in diverting the waste from landfill, small portion of organic waste generated in Mataram City mostly processed in TPS3R/TPST into compost, either by applying windrow composting or Black-Soldier Flies method the compost product can be used at no cost and mostly utilized as fertilizers by communities in the social events, women association in trees planting activity, at schools, as well as greening the facilities managed by DLH. Nevertheless, many of TPS3R facilities are no longer functioning due to difficulties in securing the operational and maintenance budget as well as the off takers of composts. Usually, the TPS3R facility is constructed by the government, but then handover the operational to the community, which is seen as part of support from the government to the community-based waste management practices. In contrast to TPST, activities in TPST managed by DLH have increased since DLH is also responsible for the green space. The landscaping maintenance activities that generate green waste is then counted as an additional feedstock for the TPST, while the output is mainly used by DLH for greening and tree planting.
Meanwhile the non-organic waste is delivered to waste banks to be further processed prior to shipment to Java Island. Since pandemic, however, the collection of recyclables in waste banks has reduced from 101 tons/year in 2019 to 8 tons/year in 2020. In the future, there is a plan, organized by Geo Trash, to process the non-organics e.g. packaging, single-use plastics, etc. into fuel through pyrolysis. It is expected that the community will then be more willing to segregate the waste at source with the price set of IDR 2,000/kg. Furthermore, this plan is intended for 12% of unmanaged waste.
Every day, around 85% of waste generated in the city is transported by arm-roll truck (container), pick-up, or dump truck to TPAR Kebon Kongok, located 15 km from Mataram City. Usually, it would need 2 to 3 trips per day to transport all the waste generated in the city to TPAR. The recent Presidential Regulation 33/2020 on the regional standard unit costs has determined the limit of operational and maintenance costs (including fuels, spare parts, etc.) for official/operational vehicles per unit annually, including trucks. Based on this regulation, the operational and maintenance cost of truck type vehicles is set to IDR 36.8 million (USD 2,545) per unit for West Nusa Tenggara Region. The set budget may not be considering specific activity that requires transportation frequency more than 1 trip per day, such as in the case of waste handling. Thus, since the Presidential Regulation 33/2020 has been enforced per FY 2021, many waste

Ramboll - Pre-feasibility Study (Waste) of Lombok
43/150
transportation activities got delayed due to the reduced transport frequency in order to comply with this policy. As the condition urges the need to transport the waste more than 1 trip/day, the city government is temporarily advancing the disbursement of budget, which is planned to be used by end of the year. As a result of this temporary policy, the advance disbursement of budget will be included in the revised budget while waiting for other policies. It is to be noted that based on discussion with DLH of Mataram City, the city has sufficient financial resources, however, it cannot be used to finance the operational cost, particularly fuels, as it may violate the provisions of the Presidential Decree. The mayor has communicated this issue with the Ministry of Home Affairs and is waiting for other policies that support the resolving of this issue.
Based on discussion, since the management of TPAR is handled by DLHK of NTB Province, there has not been a significant issue related to the landfilling activity at the regional landfill. The only issue that arises is related to the plan of raising tipping fee to IDR 68,000/tons (4.8 USD/tons) and the compensation fee. As most of the waste management budget has been allocated to collect and transport the waste, thus, the increasing fee would be burdensome so long there is no significant increase on the allocated budget. However, there had been an incident of fires in the landfill, thus the transported waste could not be disposed-off to the landfill.
As commonly practiced across Indonesian cities, the financing model of waste management in Mataram City is applying a combination between retribution fee collected to finance collection activity and local budget to finance activities from TPS to landfill. However, there are also some areas where the waste retribution fee already covers activities from collection to landfill. In addition to that, the local budget is not only covering the transportation activity from TPS to landfill, but also includes the allocation of tipping fee and compensation fee. The waste management budget of Mataram City is shown below.
Table 13 Waste Management Budget of DLH Mataram City.
Parameter Fiscal Year 2020a Fiscal Year 2021a Mio IDR Mio USD Mio IDR Mio USD
Total Local Budget (APBD) 1,525,018 107 1,441,077 101 Total Waste Management Budget 19,900 1.39 16,513 1.15
Operational and Maintenance Budget 14,411 1.01 n/a n/a
Portion Budget allocated to Waste Management 1.30% 1.15%
Revenue (Waste Retribution) 7,000 0.49 n/a n/a
Source: DLH of Mataram City (2021); www.djpk.kemenkeu.go.id (accessed 28th April 2021); aAllocated budget/targeted retribution
The city government budget allocated for waste management in 2020 reached 1.30% of the total city budget (APBD), which according to discussion with DLH of Mataram City, the budget trend indeed has been decreasing. As reported by the DLH, most of the waste management budget is incurred, around 72% in 2020, for operational and maintenance expenditures, i.e. transportation of waste from TPS to Regional Landfill. While the retribution revenue is only collected from activities implemented by the local authorities as previously mentioned and then accounted as Local-Own Source Revenue (PAD).
As for the retribution fee, the amount charged is usually based on agreement between the served population and the collection organizers or area managers with varying rates, starting from 10,000/month to > IDR 100,000/month depending on the category of sources. The amount of waste fees charged is defined in the Local Regulation 12/2016 on public service charged based on the category of sources. In many areas, the total amount of retribution fee paid also includes
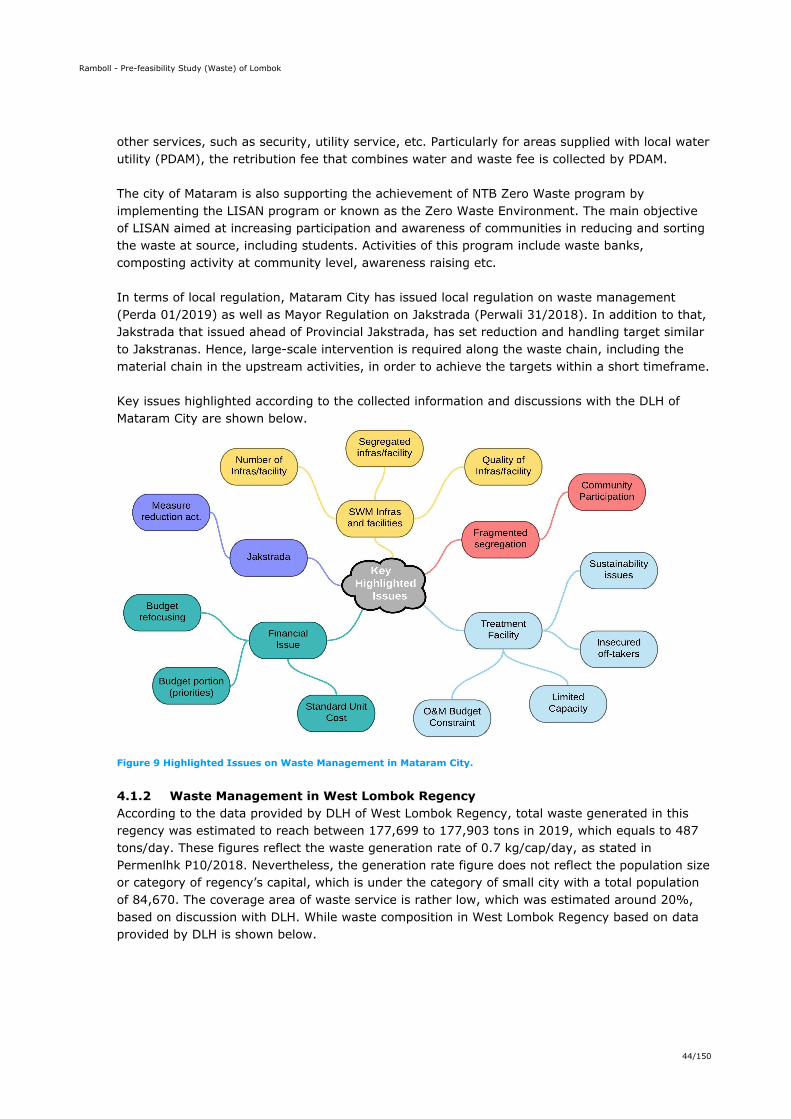
Ramboll - Pre-feasibility Study (Waste) of Lombok
44/150
other services, such as security, utility service, etc. Particularly for areas supplied with local water utility (PDAM), the retribution fee that combines water and waste fee is collected by PDAM. The city of Mataram is also supporting the achievement of NTB Zero Waste program by implementing the LISAN program or known as the Zero Waste Environment. The main objective of LISAN aimed at increasing participation and awareness of communities in reducing and sorting the waste at source, including students. Activities of this program include waste banks, composting activity at community level, awareness raising etc. In terms of local regulation, Mataram City has issued local regulation on waste management (Perda 01/2019) as well as Mayor Regulation on Jakstrada (Perwali 31/2018). In addition to that, Jakstrada that issued ahead of Provincial Jakstrada, has set reduction and handling target similar to Jakstranas. Hence, large-scale intervention is required along the waste chain, including the material chain in the upstream activities, in order to achieve the targets within a short timeframe. Key issues highlighted according to the collected information and discussions with the DLH of Mataram City are shown below.
Figure 9 Highlighted Issues on Waste Management in Mataram City.
4.1.2 Waste Management in West Lombok Regency According to the data provided by DLH of West Lombok Regency, total waste generated in this regency was estimated to reach between 177,699 to 177,903 tons in 2019, which equals to 487 tons/day. These figures reflect the waste generation rate of 0.7 kg/cap/day, as stated in Permenlhk P10/2018. Nevertheless, the generation rate figure does not reflect the population size or category of regency’s capital, which is under the category of small city with a total population of 84,670. The coverage area of waste service is rather low, which was estimated around 20%, based on discussion with DLH. While waste composition in West Lombok Regency based on data provided by DLH is shown below.

Ramboll - Pre-feasibility Study (Waste) of Lombok
45/150
Figure 10 Waste Composition in West Lombok Regency.
Source: DLH of West Lombok Regency (2021)
Based on discussion with DLH of West Lombok regency, the total waste managed is estimated around 18% - 22% of total waste generated, which corresponds to 87 to 107 tons per day. From the total amount, less than 5% (estimated between 1.5% and 3.5%), is reduced at the community level, such as TPS3R and waste banks, while the rest is transported to the landfill (80 - 90 tons/day). This signifies the rest of 78% - 82% of the waste generated is not captured by formal system. Although the waste management service provided by DLH has served all the 10 districts in West Lombok Regency, the service does not cover all areas within these districts. Basically, the current waste management system applied in West Lombok Regency focused on providing basic service of collection, transport, and disposal, with 3R initiatives at community level. Waste segregation at source has been encouraged at the community level through the local community leaders. Nevertheless, such practices seem to occur fragmentedly at some areas or villages led by leaders with strong commitment. The waste segregation at source is practiced mostly by providing segregated bins and sorting the waste into organics and non-organics. The primary collection of waste, from sources to collection points (TPS, TPS3R) is organized by the community or village (through household association (RT/RW), CSO/KSM) with support from DLH or village government. In some areas, direct waste management service from collection to landfill, which uses a door-to-door collection system, is also applied. As for the non-direct collection system, the community usually brings the waste generated from their households to the collection points (TPS). While in some areas, the community assigns a worker or through CSO to collect the waste from houses using three-wheelers, and then transfer it to TPS. The typical collection vehicles include three-wheeler and pick-up. DLH has been decreasing the number of waste-carts and prefer to use three-wheelers instead. Most of TPS in this regency that serves as intermediary collection point is in the form of vacant land, not buildings due to community resistance related to potential environmental impacts caused by TPS. It is to be noted that the waste is often piling up at TPS that caused bad odors due to the limited number of transport vehicles. As a result, sometimes TPS should be relocated to other locations (mobile-TPS). As for the non-household sources, the collection of waste at source is organized by area managers. In the case of traditional markets, the waste at each stall is collected by the market workers to TPS, provided by the Regional Finance and Asset Management Agency. While the waste retribution collected is counted as local revenue generated from the Regional Finance and Asset Management Agency. Only a small part of total retribution collected is shared to DLH to cover transport fees. It is to be noted that DLH provides waste transport service from market TPS to regional landfill.
31%
20%11%
14%
5%
2%3%
4%10%
Waste Composition in West Lombok Regency
Food waste
Garden Waste
Paper
Plastics
Metal
Textile
Rubber
Glass
Others (Residues, etc)
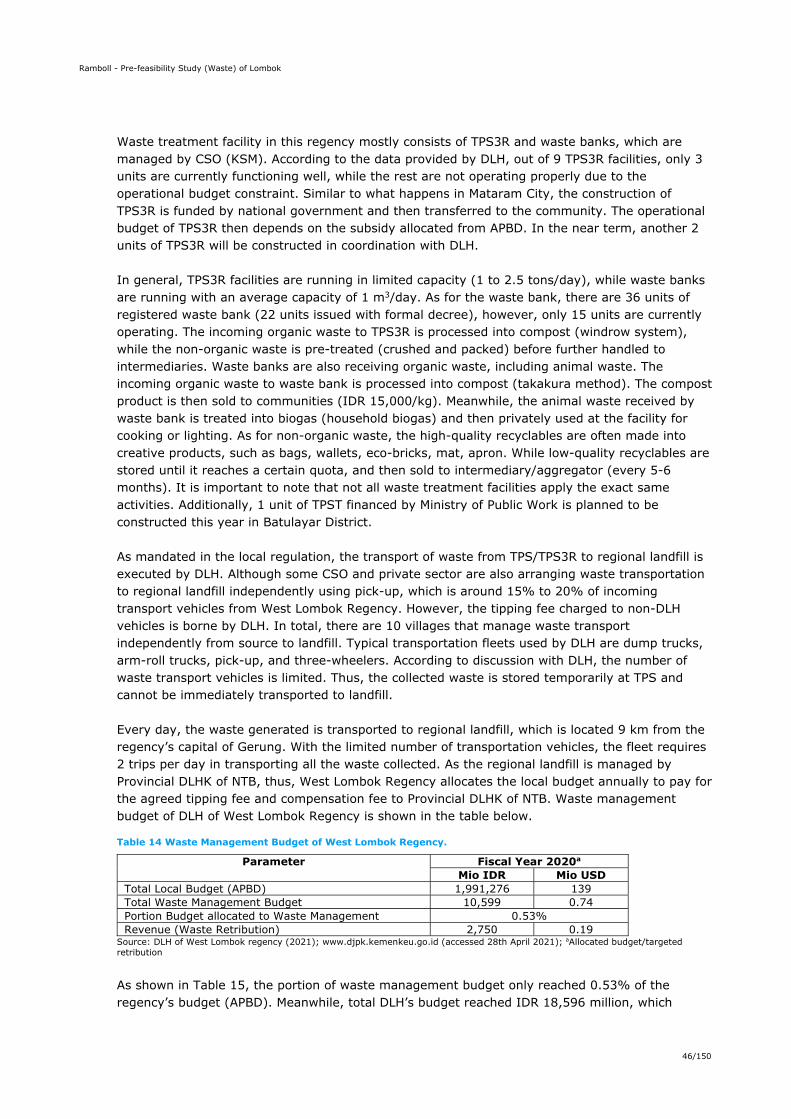
Ramboll - Pre-feasibility Study (Waste) of Lombok
46/150
Waste treatment facility in this regency mostly consists of TPS3R and waste banks, which are managed by CSO (KSM). According to the data provided by DLH, out of 9 TPS3R facilities, only 3 units are currently functioning well, while the rest are not operating properly due to the operational budget constraint. Similar to what happens in Mataram City, the construction of TPS3R is funded by national government and then transferred to the community. The operational budget of TPS3R then depends on the subsidy allocated from APBD. In the near term, another 2 units of TPS3R will be constructed in coordination with DLH. In general, TPS3R facilities are running in limited capacity (1 to 2.5 tons/day), while waste banks are running with an average capacity of 1 m3/day. As for the waste bank, there are 36 units of registered waste bank (22 units issued with formal decree), however, only 15 units are currently operating. The incoming organic waste to TPS3R is processed into compost (windrow system), while the non-organic waste is pre-treated (crushed and packed) before further handled to intermediaries. Waste banks are also receiving organic waste, including animal waste. The incoming organic waste to waste bank is processed into compost (takakura method). The compost product is then sold to communities (IDR 15,000/kg). Meanwhile, the animal waste received by waste bank is treated into biogas (household biogas) and then privately used at the facility for cooking or lighting. As for non-organic waste, the high-quality recyclables are often made into creative products, such as bags, wallets, eco-bricks, mat, apron. While low-quality recyclables are stored until it reaches a certain quota, and then sold to intermediary/aggregator (every 5-6 months). It is important to note that not all waste treatment facilities apply the exact same activities. Additionally, 1 unit of TPST financed by Ministry of Public Work is planned to be constructed this year in Batulayar District. As mandated in the local regulation, the transport of waste from TPS/TPS3R to regional landfill is executed by DLH. Although some CSO and private sector are also arranging waste transportation to regional landfill independently using pick-up, which is around 15% to 20% of incoming transport vehicles from West Lombok Regency. However, the tipping fee charged to non-DLH vehicles is borne by DLH. In total, there are 10 villages that manage waste transport independently from source to landfill. Typical transportation fleets used by DLH are dump trucks, arm-roll trucks, pick-up, and three-wheelers. According to discussion with DLH, the number of waste transport vehicles is limited. Thus, the collected waste is stored temporarily at TPS and cannot be immediately transported to landfill. Every day, the waste generated is transported to regional landfill, which is located 9 km from the regency’s capital of Gerung. With the limited number of transportation vehicles, the fleet requires 2 trips per day in transporting all the waste collected. As the regional landfill is managed by Provincial DLHK of NTB, thus, West Lombok Regency allocates the local budget annually to pay for the agreed tipping fee and compensation fee to Provincial DLHK of NTB. Waste management budget of DLH of West Lombok Regency is shown in the table below.
Table 14 Waste Management Budget of West Lombok Regency.
Parameter Fiscal Year 2020a Mio IDR Mio USD
Total Local Budget (APBD) 1,991,276 139 Total Waste Management Budget 10,599 0.74 Portion Budget allocated to Waste Management 0.53% Revenue (Waste Retribution) 2,750 0.19
Source: DLH of West Lombok regency (2021); www.djpk.kemenkeu.go.id (accessed 28th April 2021); aAllocated budget/targeted retribution
As shown in Table 15, the portion of waste management budget only reached 0.53% of the regency’s budget (APBD). Meanwhile, total DLH’s budget reached IDR 18,596 million, which
Ramboll - Pre-feasibility Study (Waste) of Lombok
47/150
signifies that more than 56% of DLH's budget is incurred for waste management. It is not uncommon to find DLH spent more than half of its total budget for waste management, as the sector is known to be one of the most labor-intensive, costly, as well as logistically complex, especially in the developing countries. Based on discussion with DLH, it was also mentioned that some portion of the budget was shifted to handle the pandemic that results in decreasing local subsidies to finance the sector. Similar to Mataram City, the operational and maintenance budget allocated is getting even more limited particularly for transportation fleet (spare parts, fuel), due to the enforcement of Presidential Regulation 33/2020. The waste service charge generally refers to local regulation 03/2011 on Public Service Charged and the amended local regulation 26/2019 on waste retribution tariff adjustment. Retribution fee is also collected by CSO that provides waste service, where some portion of the collected amount is transferred to DLH, particularly if waste transportation is executed by DLH. According to the data reported, the realization of waste retribution in the past 3 years has always exceeded the targeted amount, although it may never fully recover the total costs. West Lombok Regency's strategic program to support the implementation of Zero Waste NTB program is called "Ijo, Nol Dedoro", which signifies green and zero waste. Basically, Ijo, Nol Dedoro emphasizes on green lifestyle and green governance, with main programs on reforestation, tree planting, conservation and the application of 3R concept starts at individual and public awareness. The program supports waste reduction programs such as public awareness, education, facilitating the establishment of 1 waste bank or TPS3R in each village or sub-district. Community participation is strengthened through the provision of technical counsel on waste management at community level, schools, and other local agencies to raise awareness and build their capacity. Additionally, the practice of waste segregation at source, minimizing the use of plastic, and no littering practices are also highlighted in the program. The local regulation on waste management 03/2017 stipulates several fundamental aspects on waste management and is supported with supplementary regulation, which is Regent Regulation 05/2018 on implementation guideline. This complementary regulation provides technical guidelines on segregated bins; TPS; waste management practices at sources; sanctions up to criteria for incentives and disincentives. In regard to Jakstrada, West Lombok Regency issued the Regent Regulation 92/2020 in November 2020, after the Provincial Jakstrada issued. The targets set in Jakstrada refer to national target and less considerate to current condition. Consequently, the targets set far from current state and capacities, hence, more resources required to achieve the targets, including the financial resource and large-scale intervention. Key issues highlighted based on collected information and discussions with DLH of West Lombok Regency are shown as follow.
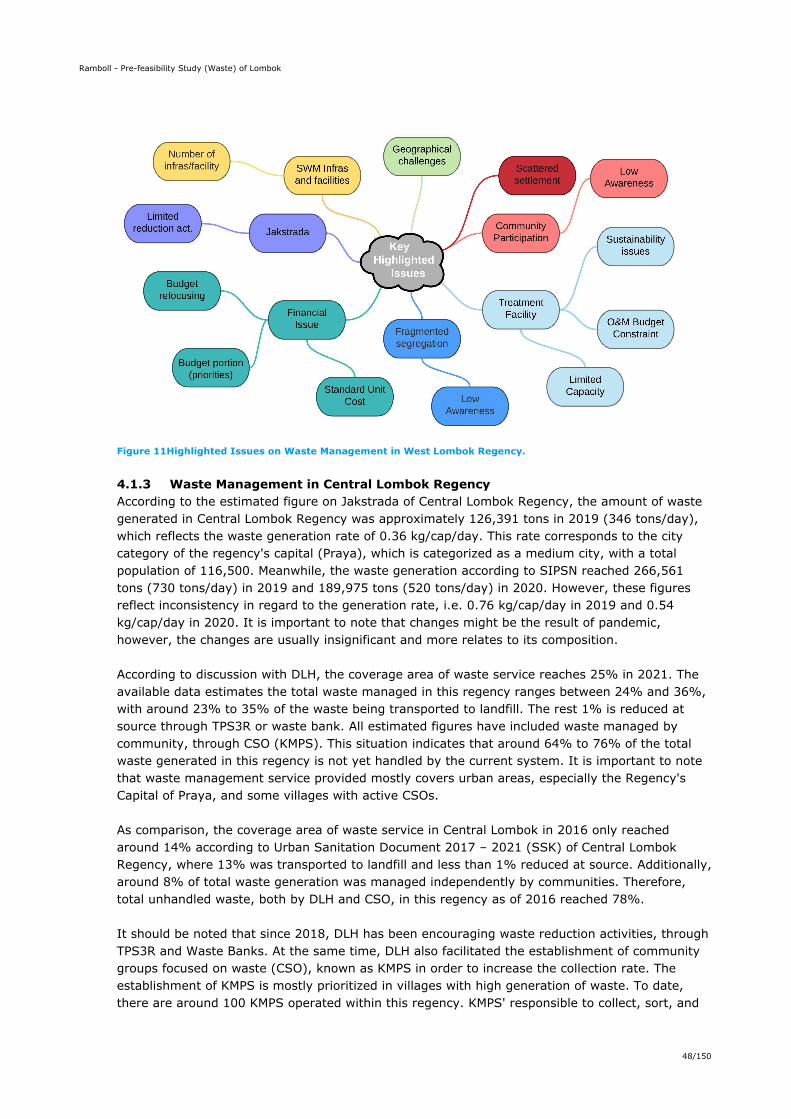
Ramboll - Pre-feasibility Study (Waste) of Lombok
48/150
Figure 11Highlighted Issues on Waste Management in West Lombok Regency.
4.1.3 Waste Management in Central Lombok Regency According to the estimated figure on Jakstrada of Central Lombok Regency, the amount of waste generated in Central Lombok Regency was approximately 126,391 tons in 2019 (346 tons/day), which reflects the waste generation rate of 0.36 kg/cap/day. This rate corresponds to the city category of the regency's capital (Praya), which is categorized as a medium city, with a total population of 116,500. Meanwhile, the waste generation according to SIPSN reached 266,561 tons (730 tons/day) in 2019 and 189,975 tons (520 tons/day) in 2020. However, these figures reflect inconsistency in regard to the generation rate, i.e. 0.76 kg/cap/day in 2019 and 0.54 kg/cap/day in 2020. It is important to note that changes might be the result of pandemic, however, the changes are usually insignificant and more relates to its composition. According to discussion with DLH, the coverage area of waste service reaches 25% in 2021. The available data estimates the total waste managed in this regency ranges between 24% and 36%, with around 23% to 35% of the waste being transported to landfill. The rest 1% is reduced at source through TPS3R or waste bank. All estimated figures have included waste managed by community, through CSO (KMPS). This situation indicates that around 64% to 76% of the total waste generated in this regency is not yet handled by the current system. It is important to note that waste management service provided mostly covers urban areas, especially the Regency's Capital of Praya, and some villages with active CSOs. As comparison, the coverage area of waste service in Central Lombok in 2016 only reached around 14% according to Urban Sanitation Document 2017 – 2021 (SSK) of Central Lombok Regency, where 13% was transported to landfill and less than 1% reduced at source. Additionally, around 8% of total waste generation was managed independently by communities. Therefore, total unhandled waste, both by DLH and CSO, in this regency as of 2016 reached 78%. It should be noted that since 2018, DLH has been encouraging waste reduction activities, through TPS3R and Waste Banks. At the same time, DLH also facilitated the establishment of community groups focused on waste (CSO), known as KMPS in order to increase the collection rate. The establishment of KMPS is mostly prioritized in villages with high generation of waste. To date, there are around 100 KMPS operated within this regency. KMPS' responsible to collect, sort, and
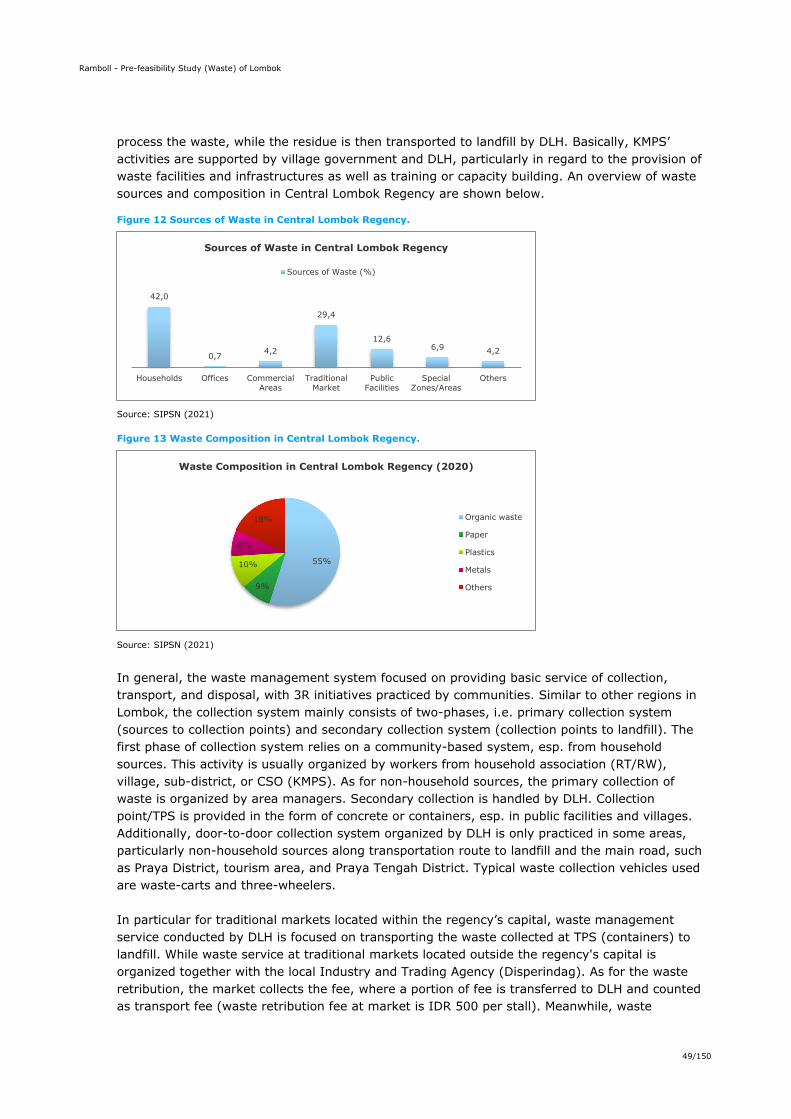
Ramboll - Pre-feasibility Study (Waste) of Lombok
49/150
process the waste, while the residue is then transported to landfill by DLH. Basically, KMPS’ activities are supported by village government and DLH, particularly in regard to the provision of waste facilities and infrastructures as well as training or capacity building. An overview of waste sources and composition in Central Lombok Regency are shown below.
Figure 12 Sources of Waste in Central Lombok Regency.
Source: SIPSN (2021)
Figure 13 Waste Composition in Central Lombok Regency.
Source: SIPSN (2021)
In general, the waste management system focused on providing basic service of collection, transport, and disposal, with 3R initiatives practiced by communities. Similar to other regions in Lombok, the collection system mainly consists of two-phases, i.e. primary collection system (sources to collection points) and secondary collection system (collection points to landfill). The first phase of collection system relies on a community-based system, esp. from household sources. This activity is usually organized by workers from household association (RT/RW), village, sub-district, or CSO (KMPS). As for non-household sources, the primary collection of waste is organized by area managers. Secondary collection is handled by DLH. Collection point/TPS is provided in the form of concrete or containers, esp. in public facilities and villages. Additionally, door-to-door collection system organized by DLH is only practiced in some areas, particularly non-household sources along transportation route to landfill and the main road, such as Praya District, tourism area, and Praya Tengah District. Typical waste collection vehicles used are waste-carts and three-wheelers. In particular for traditional markets located within the regency’s capital, waste management service conducted by DLH is focused on transporting the waste collected at TPS (containers) to landfill. While waste service at traditional markets located outside the regency's capital is organized together with the local Industry and Trading Agency (Disperindag). As for the waste retribution, the market collects the fee, where a portion of fee is transferred to DLH and counted as transport fee (waste retribution fee at market is IDR 500 per stall). Meanwhile, waste
42,0
0,7 4,2
29,4
12,66,9 4,2
Households Offices CommercialAreas
TraditionalMarket
PublicFacilities
SpecialZones/Areas
Others
Sources of Waste in Central Lombok Regency
Sources of Waste (%)
55%
9%
10%
8%
18%
Waste Composition in Central Lombok Regency (2020)
Organic waste
Paper
Plastics
Metals
Others
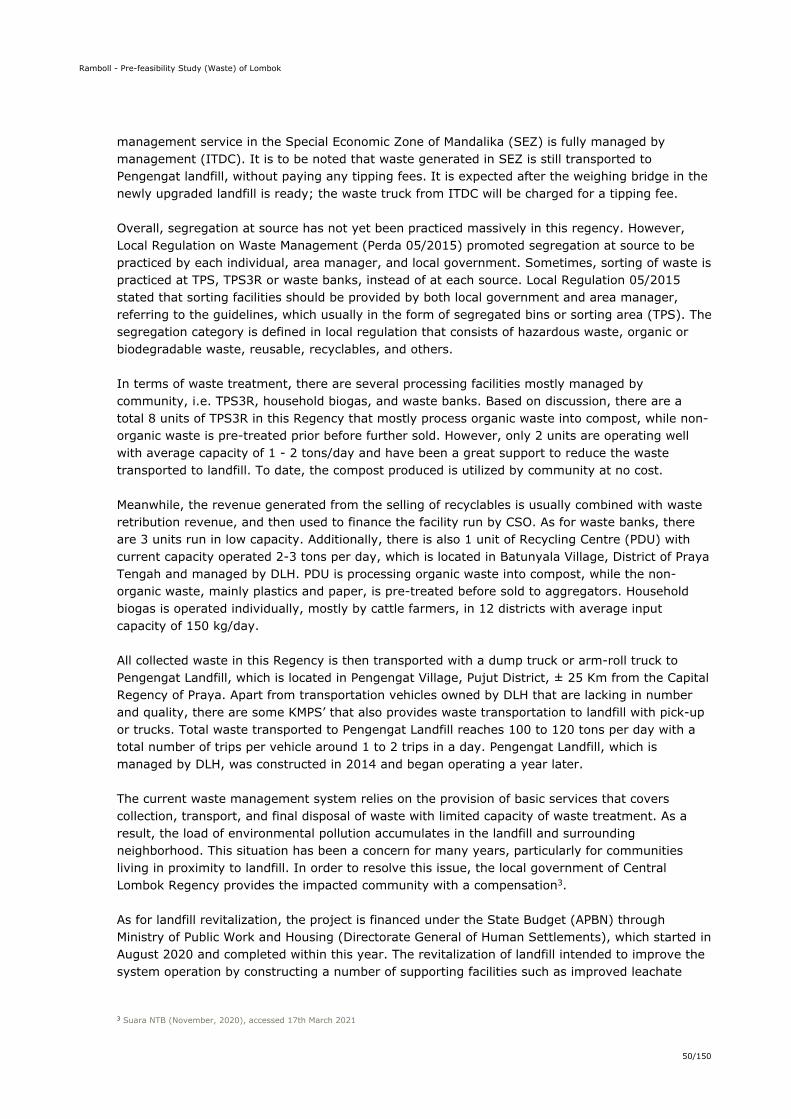
Ramboll - Pre-feasibility Study (Waste) of Lombok
50/150
management service in the Special Economic Zone of Mandalika (SEZ) is fully managed by management (ITDC). It is to be noted that waste generated in SEZ is still transported to Pengengat landfill, without paying any tipping fees. It is expected after the weighing bridge in the newly upgraded landfill is ready; the waste truck from ITDC will be charged for a tipping fee. Overall, segregation at source has not yet been practiced massively in this regency. However, Local Regulation on Waste Management (Perda 05/2015) promoted segregation at source to be practiced by each individual, area manager, and local government. Sometimes, sorting of waste is practiced at TPS, TPS3R or waste banks, instead of at each source. Local Regulation 05/2015 stated that sorting facilities should be provided by both local government and area manager, referring to the guidelines, which usually in the form of segregated bins or sorting area (TPS). The segregation category is defined in local regulation that consists of hazardous waste, organic or biodegradable waste, reusable, recyclables, and others. In terms of waste treatment, there are several processing facilities mostly managed by community, i.e. TPS3R, household biogas, and waste banks. Based on discussion, there are a total 8 units of TPS3R in this Regency that mostly process organic waste into compost, while non-organic waste is pre-treated prior before further sold. However, only 2 units are operating well with average capacity of 1 - 2 tons/day and have been a great support to reduce the waste transported to landfill. To date, the compost produced is utilized by community at no cost. Meanwhile, the revenue generated from the selling of recyclables is usually combined with waste retribution revenue, and then used to finance the facility run by CSO. As for waste banks, there are 3 units run in low capacity. Additionally, there is also 1 unit of Recycling Centre (PDU) with current capacity operated 2-3 tons per day, which is located in Batunyala Village, District of Praya Tengah and managed by DLH. PDU is processing organic waste into compost, while the non-organic waste, mainly plastics and paper, is pre-treated before sold to aggregators. Household biogas is operated individually, mostly by cattle farmers, in 12 districts with average input capacity of 150 kg/day. All collected waste in this Regency is then transported with a dump truck or arm-roll truck to Pengengat Landfill, which is located in Pengengat Village, Pujut District, ± 25 Km from the Capital Regency of Praya. Apart from transportation vehicles owned by DLH that are lacking in number and quality, there are some KMPS’ that also provides waste transportation to landfill with pick-up or trucks. Total waste transported to Pengengat Landfill reaches 100 to 120 tons per day with a total number of trips per vehicle around 1 to 2 trips in a day. Pengengat Landfill, which is managed by DLH, was constructed in 2014 and began operating a year later. The current waste management system relies on the provision of basic services that covers collection, transport, and final disposal of waste with limited capacity of waste treatment. As a result, the load of environmental pollution accumulates in the landfill and surrounding neighborhood. This situation has been a concern for many years, particularly for communities living in proximity to landfill. In order to resolve this issue, the local government of Central Lombok Regency provides the impacted community with a compensation3. As for landfill revitalization, the project is financed under the State Budget (APBN) through Ministry of Public Work and Housing (Directorate General of Human Settlements), which started in August 2020 and completed within this year. The revitalization of landfill intended to improve the system operation by constructing a number of supporting facilities such as improved leachate
3 Suara NTB (November, 2020), accessed 17th March 2021
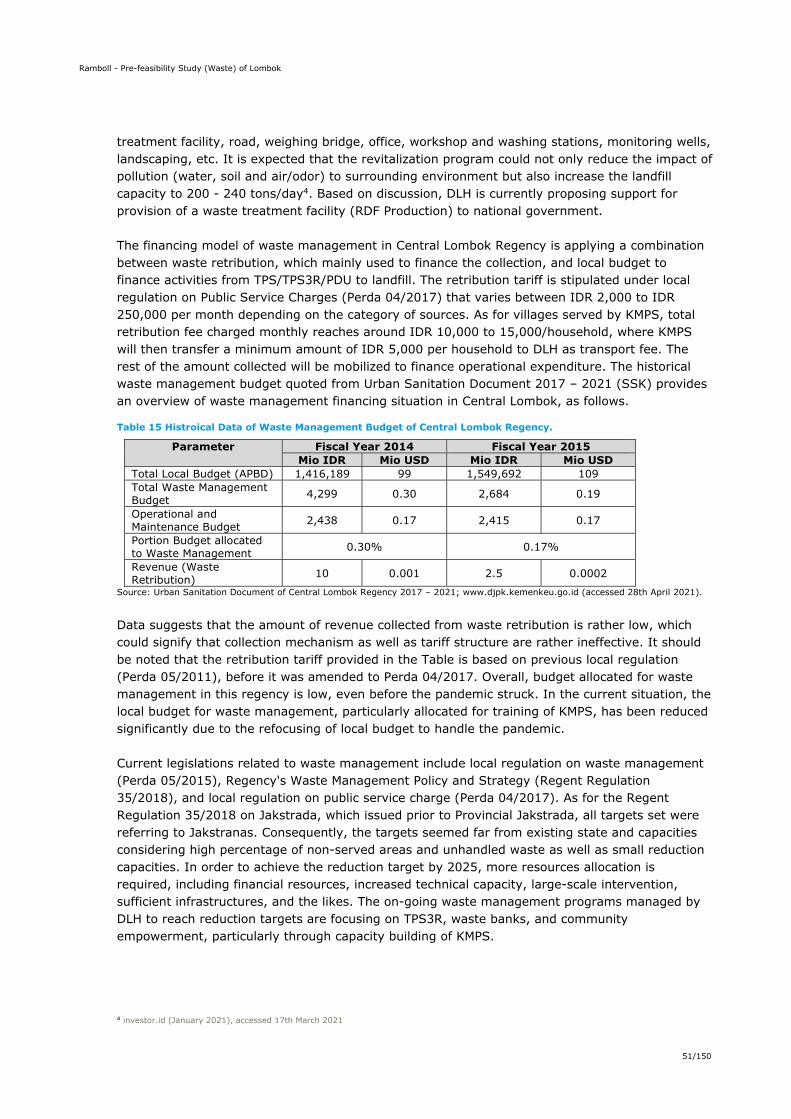
Ramboll - Pre-feasibility Study (Waste) of Lombok
51/150
treatment facility, road, weighing bridge, office, workshop and washing stations, monitoring wells, landscaping, etc. It is expected that the revitalization program could not only reduce the impact of pollution (water, soil and air/odor) to surrounding environment but also increase the landfill capacity to 200 - 240 tons/day4. Based on discussion, DLH is currently proposing support for provision of a waste treatment facility (RDF Production) to national government. The financing model of waste management in Central Lombok Regency is applying a combination between waste retribution, which mainly used to finance the collection, and local budget to finance activities from TPS/TPS3R/PDU to landfill. The retribution tariff is stipulated under local regulation on Public Service Charges (Perda 04/2017) that varies between IDR 2,000 to IDR 250,000 per month depending on the category of sources. As for villages served by KMPS, total retribution fee charged monthly reaches around IDR 10,000 to 15,000/household, where KMPS will then transfer a minimum amount of IDR 5,000 per household to DLH as transport fee. The rest of the amount collected will be mobilized to finance operational expenditure. The historical waste management budget quoted from Urban Sanitation Document 2017 – 2021 (SSK) provides an overview of waste management financing situation in Central Lombok, as follows.
Table 15 Histroical Data of Waste Management Budget of Central Lombok Regency.
Parameter Fiscal Year 2014 Fiscal Year 2015 Mio IDR Mio USD Mio IDR Mio USD
Total Local Budget (APBD) 1,416,189 99 1,549,692 109 Total Waste Management Budget 4,299 0.30 2,684 0.19
Operational and Maintenance Budget 2,438 0.17 2,415 0.17
Portion Budget allocated to Waste Management 0.30% 0.17%
Revenue (Waste Retribution) 10 0.001 2.5 0.0002
Source: Urban Sanitation Document of Central Lombok Regency 2017 – 2021; www.djpk.kemenkeu.go.id (accessed 28th April 2021).
Data suggests that the amount of revenue collected from waste retribution is rather low, which could signify that collection mechanism as well as tariff structure are rather ineffective. It should be noted that the retribution tariff provided in the Table is based on previous local regulation (Perda 05/2011), before it was amended to Perda 04/2017. Overall, budget allocated for waste management in this regency is low, even before the pandemic struck. In the current situation, the local budget for waste management, particularly allocated for training of KMPS, has been reduced significantly due to the refocusing of local budget to handle the pandemic. Current legislations related to waste management include local regulation on waste management (Perda 05/2015), Regency's Waste Management Policy and Strategy (Regent Regulation 35/2018), and local regulation on public service charge (Perda 04/2017). As for the Regent Regulation 35/2018 on Jakstrada, which issued prior to Provincial Jakstrada, all targets set were referring to Jakstranas. Consequently, the targets seemed far from existing state and capacities considering high percentage of non-served areas and unhandled waste as well as small reduction capacities. In order to achieve the reduction target by 2025, more resources allocation is required, including financial resources, increased technical capacity, large-scale intervention, sufficient infrastructures, and the likes. The on-going waste management programs managed by DLH to reach reduction targets are focusing on TPS3R, waste banks, and community empowerment, particularly through capacity building of KMPS.
4 investor.id (January 2021), accessed 17th March 2021
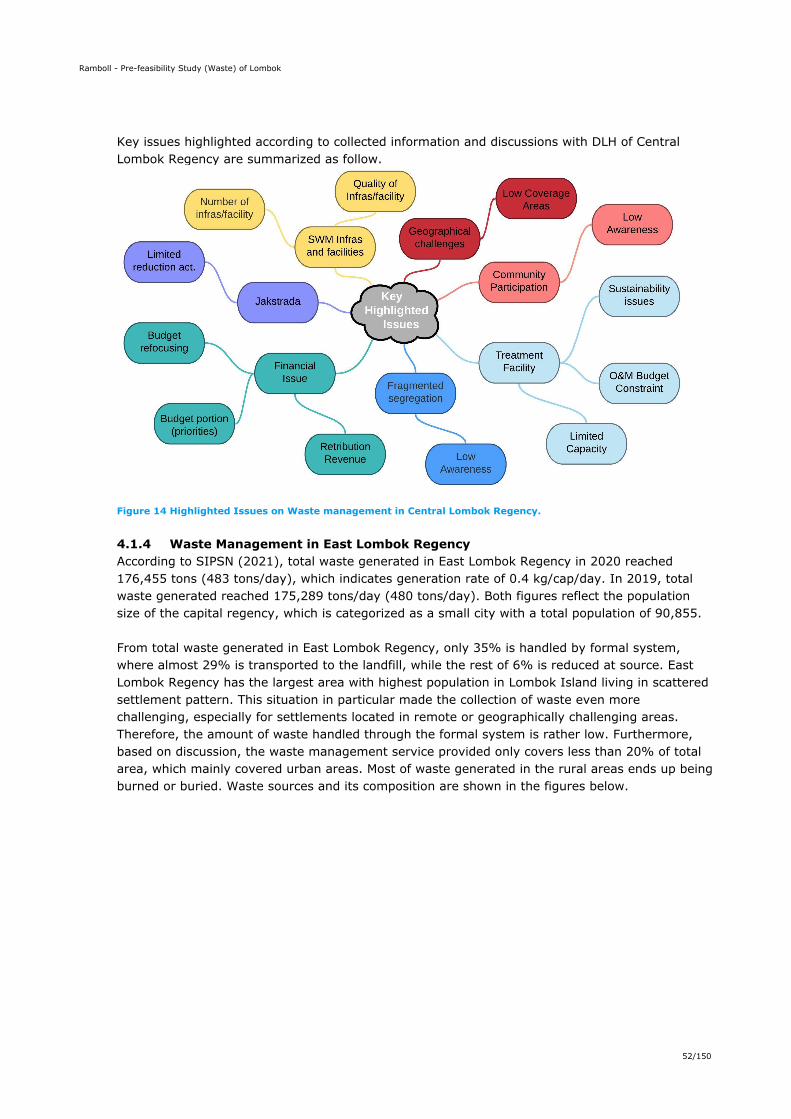
Ramboll - Pre-feasibility Study (Waste) of Lombok
52/150
Key issues highlighted according to collected information and discussions with DLH of Central Lombok Regency are summarized as follow.
Figure 14 Highlighted Issues on Waste management in Central Lombok Regency.
4.1.4 Waste Management in East Lombok Regency According to SIPSN (2021), total waste generated in East Lombok Regency in 2020 reached 176,455 tons (483 tons/day), which indicates generation rate of 0.4 kg/cap/day. In 2019, total waste generated reached 175,289 tons/day (480 tons/day). Both figures reflect the population size of the capital regency, which is categorized as a small city with a total population of 90,855. From total waste generated in East Lombok Regency, only 35% is handled by formal system, where almost 29% is transported to the landfill, while the rest of 6% is reduced at source. East Lombok Regency has the largest area with highest population in Lombok Island living in scattered settlement pattern. This situation in particular made the collection of waste even more challenging, especially for settlements located in remote or geographically challenging areas. Therefore, the amount of waste handled through the formal system is rather low. Furthermore, based on discussion, the waste management service provided only covers less than 20% of total area, which mainly covered urban areas. Most of waste generated in the rural areas ends up being burned or buried. Waste sources and its composition are shown in the figures below.
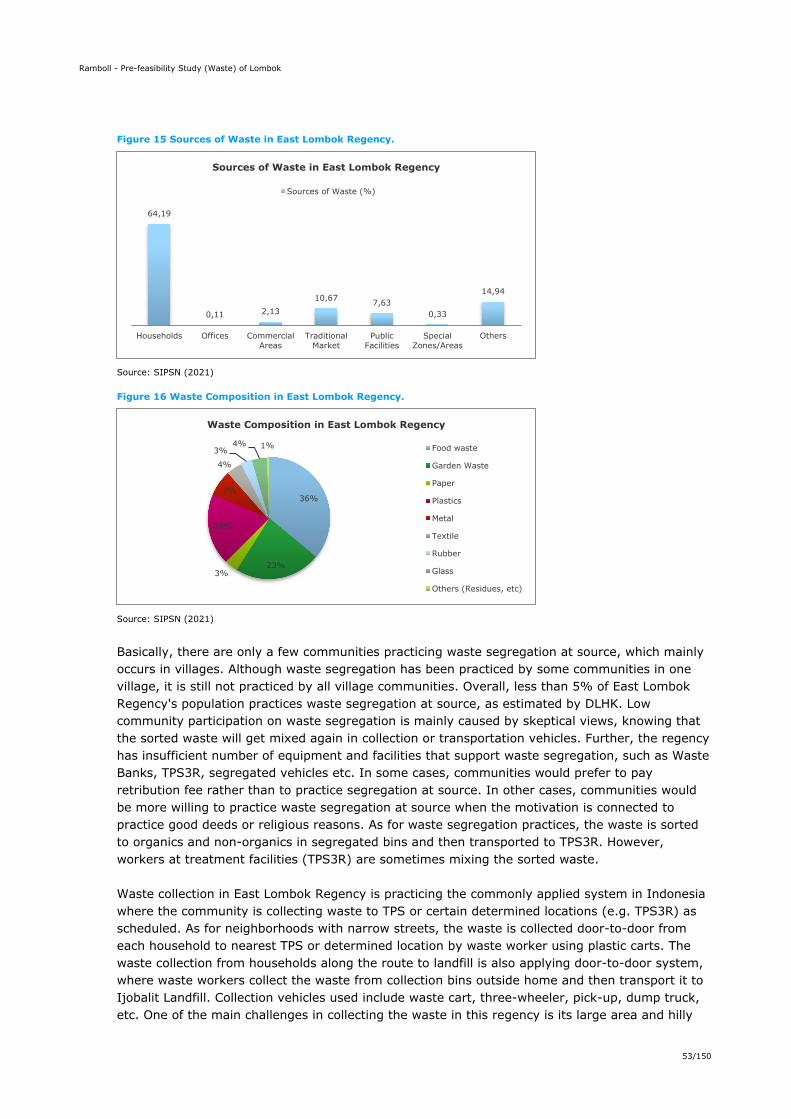
Ramboll - Pre-feasibility Study (Waste) of Lombok
53/150
Figure 15 Sources of Waste in East Lombok Regency.
Source: SIPSN (2021)
Figure 16 Waste Composition in East Lombok Regency.
Source: SIPSN (2021)
Basically, there are only a few communities practicing waste segregation at source, which mainly occurs in villages. Although waste segregation has been practiced by some communities in one village, it is still not practiced by all village communities. Overall, less than 5% of East Lombok Regency's population practices waste segregation at source, as estimated by DLHK. Low community participation on waste segregation is mainly caused by skeptical views, knowing that the sorted waste will get mixed again in collection or transportation vehicles. Further, the regency has insufficient number of equipment and facilities that support waste segregation, such as Waste Banks, TPS3R, segregated vehicles etc. In some cases, communities would prefer to pay retribution fee rather than to practice segregation at source. In other cases, communities would be more willing to practice waste segregation at source when the motivation is connected to practice good deeds or religious reasons. As for waste segregation practices, the waste is sorted to organics and non-organics in segregated bins and then transported to TPS3R. However, workers at treatment facilities (TPS3R) are sometimes mixing the sorted waste. Waste collection in East Lombok Regency is practicing the commonly applied system in Indonesia where the community is collecting waste to TPS or certain determined locations (e.g. TPS3R) as scheduled. As for neighborhoods with narrow streets, the waste is collected door-to-door from each household to nearest TPS or determined location by waste worker using plastic carts. The waste collection from households along the route to landfill is also applying door-to-door system, where waste workers collect the waste from collection bins outside home and then transport it to Ijobalit Landfill. Collection vehicles used include waste cart, three-wheeler, pick-up, dump truck, etc. One of the main challenges in collecting the waste in this regency is its large area and hilly
64,19
0,11 2,1310,67 7,63
0,33
14,94
Households Offices CommercialAreas
TraditionalMarket
PublicFacilities
SpecialZones/Areas
Others
Sources of Waste in East Lombok Regency
Sources of Waste (%)
36%
23%3%
19%
7%
4%
3%4% 1%
Waste Composition in East Lombok Regency
Food waste
Garden Waste
Paper
Plastics
Metal
Textile
Rubber
Glass
Others (Residues, etc)

Ramboll - Pre-feasibility Study (Waste) of Lombok
54/150
geographical condition, especially in Sembalun District, which makes it costly and complex logistically. Appropriate collection and/or transport vehicles are required to collect waste in highly challenging areas. Additionally, the limited number of collection fleets is also limiting waste collection activities in this regency. As waste service mostly covers urban areas, thus, primary collection of waste in rural areas is mostly done by communities. The collected waste is then temporarily stored at a determined location to be transported using waste trucks by DLHK, as agreed. Transport fees charged to communities around IDR 300,000 (21 USD) per trip. According to the SSK Document of East Lombok Regency (2017), waste collected by community, particularly in non-served rural areas, mostly ends up 41% being burned; 31% discharged into water bodies (incl. rivers, oceans, lakes); 2% recycled through informal sector; 15% dumped in the forest, empty lands, farms without further treatment; 5% in the collection points/TPS; and 6% is unidentified. Some of the waste collected is then transported to TPS3R or TPST to be further treated. In TPS3R, waste is sorted into organics and non-organics. The organic waste is usually processed into compost. While non-organic waste is further sorted to a certain category and then sold to intermediary/aggregator to be further shipped to East Java. Compost product is mainly utilized by florists and communities for gardening. Sometimes, compost is also used by Local Forestry Agency as needed. Many farmers, however, prefer to use the subsidized chemical fertilizer, as it is more suitable with seeds quality, rather than compost. As for TPS3R, there is only one out of 9 facilities that is still currently operating. The rest of the facility is no longer in operation due to some factors, such as operational budget constraints, limited supporting facilities and human resources issues (both manager and workers rarely work for a longer term). Similar to other Indonesian cities, TPS3R in East Lombok Regency is also managed and financed by community, where the operational budget is found to be the main challenging issue in sustaining the facility. While TPST is managed by a third party (NGO), known as LP2H NTB, since end of last year and is still operating. DLHK also contributes to operational budget for TPST through APBD, which is mobilized to finance the workers of TPST (non-civil servant labors), while the rest of operational costs are borne by third parties. In a day, total number of waste transportation fleets to Ijobalit Landfill reaches 50 to 60 trips that consist of DLHK’s truck, Market Agency’s truck, Villages’ truck. The total amount of waste transported to Ijobalit landfill reaches 120 to 140 tons/day with no significant changes during the pandemic. It is to be noted that collection and transport of waste from traditional markets is managed under Local Market Agency. Waste transport is done with pick-up, dump truck, arm-roll truck and starts in the morning from 07.00 to 13.00, depending on weather condition. Main challenges identified in transporting waste include a limited number of transportation fleets and limited operational budget. Ijobalit landfill is located in Labuhan Haji District, 13 km from regency’s capital and applying controlled system, where the active zone is covered once a week. Total area of Ijobalit Landfill is 8 Ha with 3 Ha of active zone, which is currently overloaded. The height of the landfilled waste has reached 18 m from the membrane base. According to a study in 2010, the landfill was estimated to reach its maximum capacity by 2018. Currently, the extension plan of Ijobalit landfill is being prepared with a plan to extend an area of 2.3 Ha in existing location, including leachate treatment facility. The Detailed Engineering Design is being currently prepared, while the construction is planned to start in 2022.
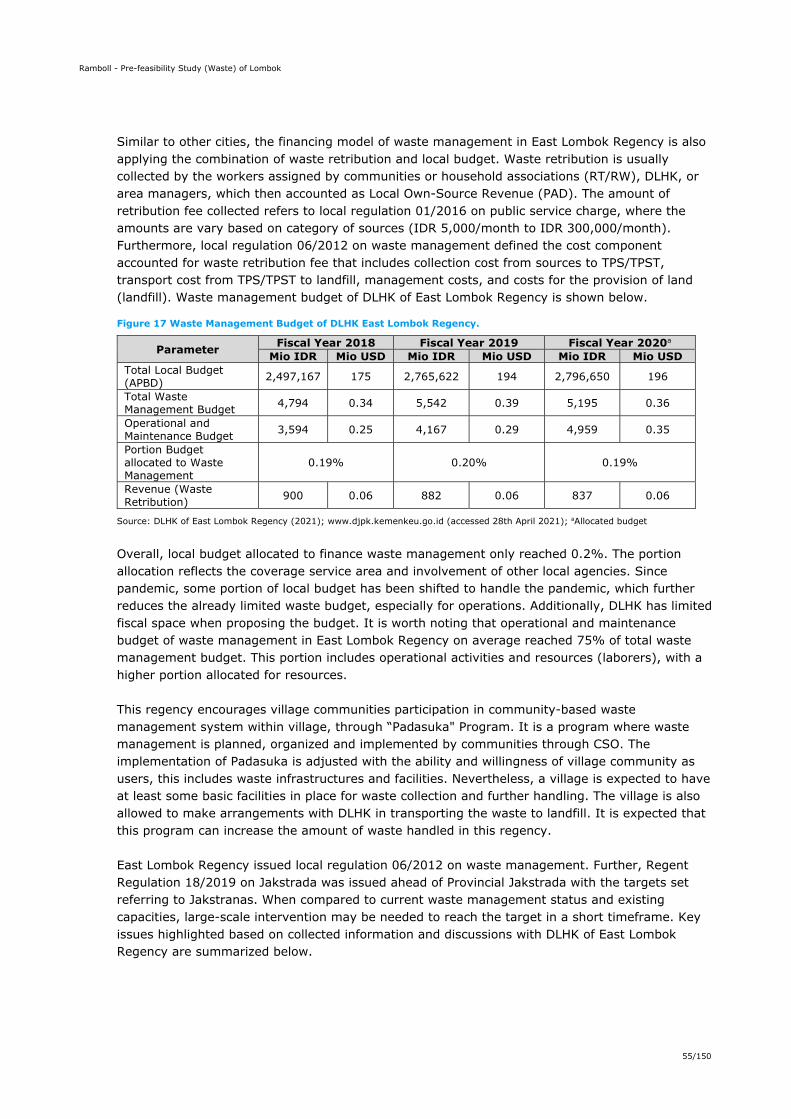
Ramboll - Pre-feasibility Study (Waste) of Lombok
55/150
Similar to other cities, the financing model of waste management in East Lombok Regency is also applying the combination of waste retribution and local budget. Waste retribution is usually collected by the workers assigned by communities or household associations (RT/RW), DLHK, or area managers, which then accounted as Local Own-Source Revenue (PAD). The amount of retribution fee collected refers to local regulation 01/2016 on public service charge, where the amounts are vary based on category of sources (IDR 5,000/month to IDR 300,000/month). Furthermore, local regulation 06/2012 on waste management defined the cost component accounted for waste retribution fee that includes collection cost from sources to TPS/TPST, transport cost from TPS/TPST to landfill, management costs, and costs for the provision of land (landfill). Waste management budget of DLHK of East Lombok Regency is shown below.
Figure 17 Waste Management Budget of DLHK East Lombok Regency.
Parameter Fiscal Year 2018 Fiscal Year 2019 Fiscal Year 2020a Mio IDR Mio USD Mio IDR Mio USD Mio IDR Mio USD
Total Local Budget (APBD) 2,497,167 175 2,765,622 194 2,796,650 196
Total Waste Management Budget 4,794 0.34 5,542 0.39 5,195 0.36
Operational and Maintenance Budget 3,594 0.25 4,167 0.29 4,959 0.35
Portion Budget allocated to Waste Management
0.19% 0.20% 0.19%
Revenue (Waste Retribution) 900 0.06 882 0.06 837 0.06
Source: DLHK of East Lombok Regency (2021); www.djpk.kemenkeu.go.id (accessed 28th April 2021); aAllocated budget
Overall, local budget allocated to finance waste management only reached 0.2%. The portion allocation reflects the coverage service area and involvement of other local agencies. Since pandemic, some portion of local budget has been shifted to handle the pandemic, which further reduces the already limited waste budget, especially for operations. Additionally, DLHK has limited fiscal space when proposing the budget. It is worth noting that operational and maintenance budget of waste management in East Lombok Regency on average reached 75% of total waste management budget. This portion includes operational activities and resources (laborers), with a higher portion allocated for resources. This regency encourages village communities participation in community-based waste management system within village, through “Padasuka" Program. It is a program where waste management is planned, organized and implemented by communities through CSO. The implementation of Padasuka is adjusted with the ability and willingness of village community as users, this includes waste infrastructures and facilities. Nevertheless, a village is expected to have at least some basic facilities in place for waste collection and further handling. The village is also allowed to make arrangements with DLHK in transporting the waste to landfill. It is expected that this program can increase the amount of waste handled in this regency. East Lombok Regency issued local regulation 06/2012 on waste management. Further, Regent Regulation 18/2019 on Jakstrada was issued ahead of Provincial Jakstrada with the targets set referring to Jakstranas. When compared to current waste management status and existing capacities, large-scale intervention may be needed to reach the target in a short timeframe. Key issues highlighted based on collected information and discussions with DLHK of East Lombok Regency are summarized below.
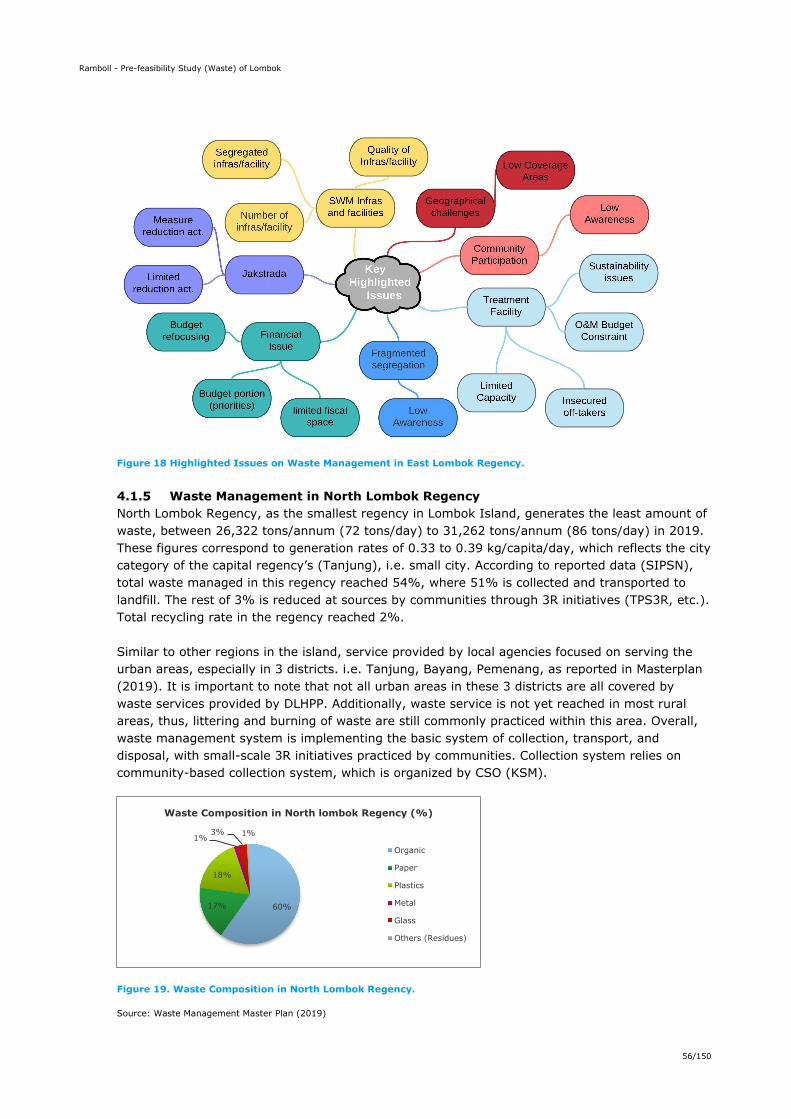
Ramboll - Pre-feasibility Study (Waste) of Lombok
56/150
Figure 18 Highlighted Issues on Waste Management in East Lombok Regency.
4.1.5 Waste Management in North Lombok Regency North Lombok Regency, as the smallest regency in Lombok Island, generates the least amount of waste, between 26,322 tons/annum (72 tons/day) to 31,262 tons/annum (86 tons/day) in 2019. These figures correspond to generation rates of 0.33 to 0.39 kg/capita/day, which reflects the city category of the capital regency’s (Tanjung), i.e. small city. According to reported data (SIPSN), total waste managed in this regency reached 54%, where 51% is collected and transported to landfill. The rest of 3% is reduced at sources by communities through 3R initiatives (TPS3R, etc.). Total recycling rate in the regency reached 2%. Similar to other regions in the island, service provided by local agencies focused on serving the urban areas, especially in 3 districts. i.e. Tanjung, Bayang, Pemenang, as reported in Masterplan (2019). It is important to note that not all urban areas in these 3 districts are all covered by waste services provided by DLHPP. Additionally, waste service is not yet reached in most rural areas, thus, littering and burning of waste are still commonly practiced within this area. Overall, waste management system is implementing the basic system of collection, transport, and disposal, with small-scale 3R initiatives practiced by communities. Collection system relies on community-based collection system, which is organized by CSO (KSM).
Figure 19. Waste Composition in North Lombok Regency.
Source: Waste Management Master Plan (2019)
60%17%
18%
1%3% 1%
Waste Composition in North lombok Regency (%)
Organic
Paper
Plastics
Metal
Glass
Others (Residues)
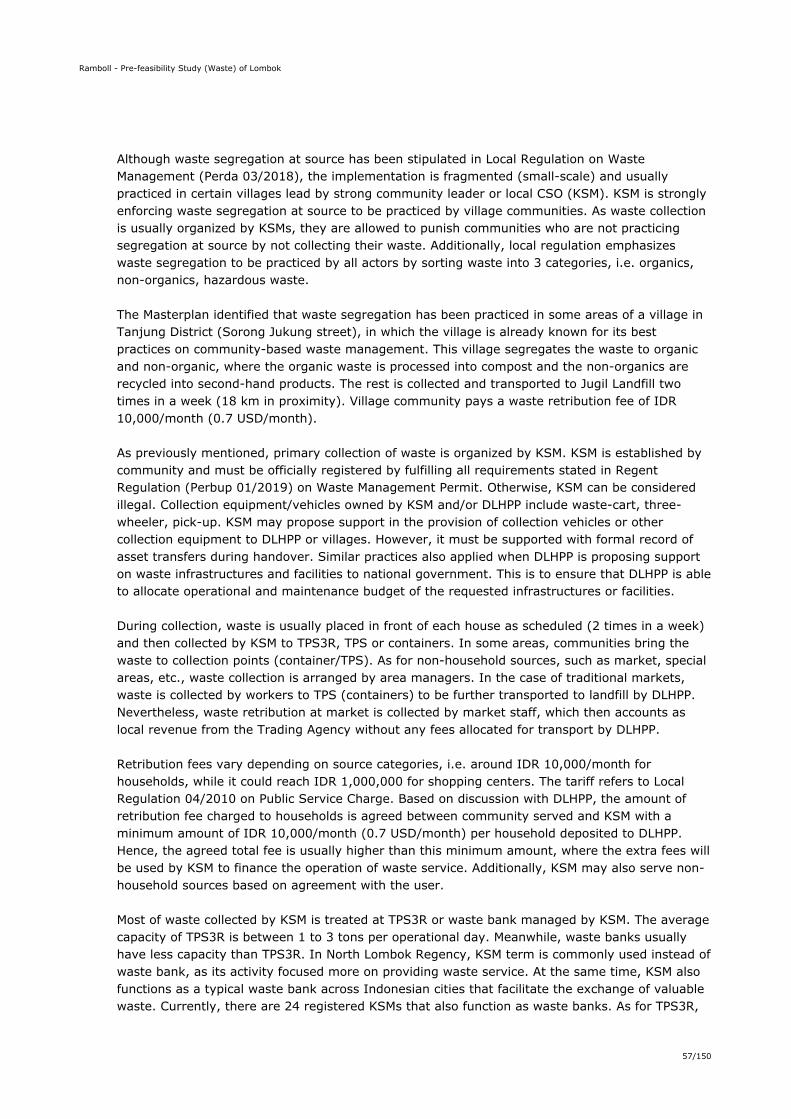
Ramboll - Pre-feasibility Study (Waste) of Lombok
57/150
Although waste segregation at source has been stipulated in Local Regulation on Waste Management (Perda 03/2018), the implementation is fragmented (small-scale) and usually practiced in certain villages lead by strong community leader or local CSO (KSM). KSM is strongly enforcing waste segregation at source to be practiced by village communities. As waste collection is usually organized by KSMs, they are allowed to punish communities who are not practicing segregation at source by not collecting their waste. Additionally, local regulation emphasizes waste segregation to be practiced by all actors by sorting waste into 3 categories, i.e. organics, non-organics, hazardous waste. The Masterplan identified that waste segregation has been practiced in some areas of a village in Tanjung District (Sorong Jukung street), in which the village is already known for its best practices on community-based waste management. This village segregates the waste to organic and non-organic, where the organic waste is processed into compost and the non-organics are recycled into second-hand products. The rest is collected and transported to Jugil Landfill two times in a week (18 km in proximity). Village community pays a waste retribution fee of IDR 10,000/month (0.7 USD/month). As previously mentioned, primary collection of waste is organized by KSM. KSM is established by community and must be officially registered by fulfilling all requirements stated in Regent Regulation (Perbup 01/2019) on Waste Management Permit. Otherwise, KSM can be considered illegal. Collection equipment/vehicles owned by KSM and/or DLHPP include waste-cart, three-wheeler, pick-up. KSM may propose support in the provision of collection vehicles or other collection equipment to DLHPP or villages. However, it must be supported with formal record of asset transfers during handover. Similar practices also applied when DLHPP is proposing support on waste infrastructures and facilities to national government. This is to ensure that DLHPP is able to allocate operational and maintenance budget of the requested infrastructures or facilities. During collection, waste is usually placed in front of each house as scheduled (2 times in a week) and then collected by KSM to TPS3R, TPS or containers. In some areas, communities bring the waste to collection points (container/TPS). As for non-household sources, such as market, special areas, etc., waste collection is arranged by area managers. In the case of traditional markets, waste is collected by workers to TPS (containers) to be further transported to landfill by DLHPP. Nevertheless, waste retribution at market is collected by market staff, which then accounts as local revenue from the Trading Agency without any fees allocated for transport by DLHPP. Retribution fees vary depending on source categories, i.e. around IDR 10,000/month for households, while it could reach IDR 1,000,000 for shopping centers. The tariff refers to Local Regulation 04/2010 on Public Service Charge. Based on discussion with DLHPP, the amount of retribution fee charged to households is agreed between community served and KSM with a minimum amount of IDR 10,000/month (0.7 USD/month) per household deposited to DLHPP. Hence, the agreed total fee is usually higher than this minimum amount, where the extra fees will be used by KSM to finance the operation of waste service. Additionally, KSM may also serve non-household sources based on agreement with the user. Most of waste collected by KSM is treated at TPS3R or waste bank managed by KSM. The average capacity of TPS3R is between 1 to 3 tons per operational day. Meanwhile, waste banks usually have less capacity than TPS3R. In North Lombok Regency, KSM term is commonly used instead of waste bank, as its activity focused more on providing waste service. At the same time, KSM also functions as a typical waste bank across Indonesian cities that facilitate the exchange of valuable waste. Currently, there are 24 registered KSMs that also function as waste banks. As for TPS3R,
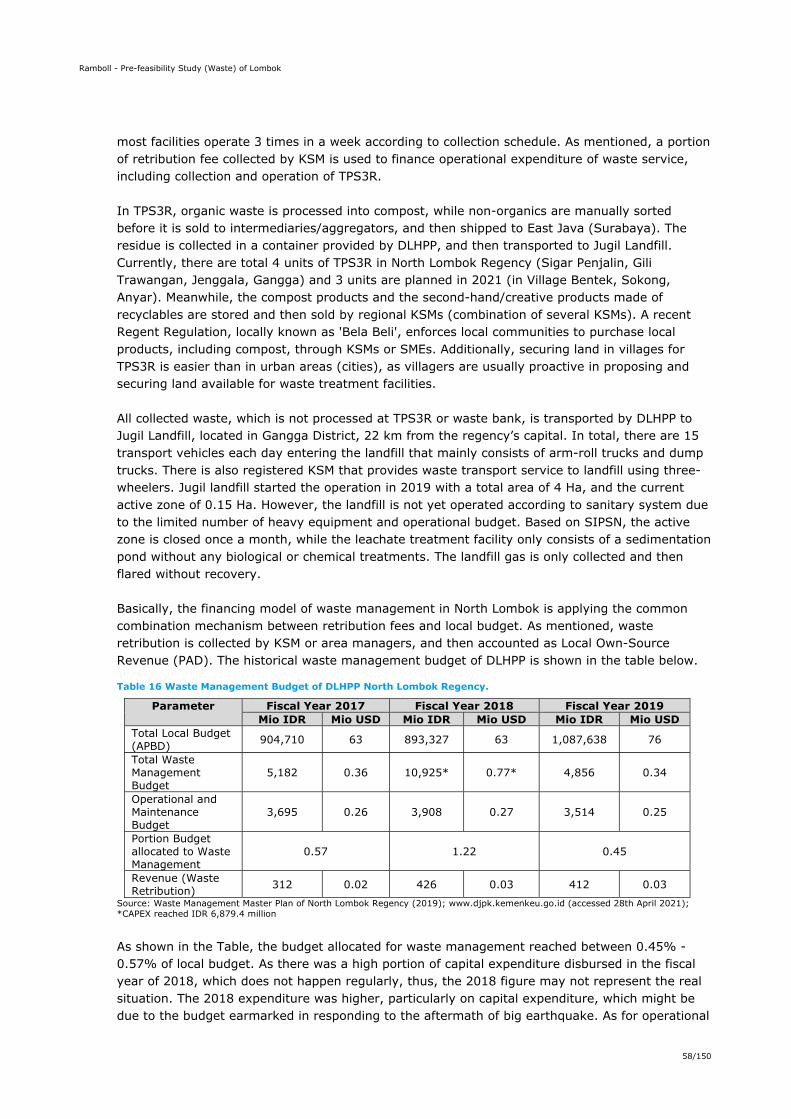
Ramboll - Pre-feasibility Study (Waste) of Lombok
58/150
most facilities operate 3 times in a week according to collection schedule. As mentioned, a portion of retribution fee collected by KSM is used to finance operational expenditure of waste service, including collection and operation of TPS3R. In TPS3R, organic waste is processed into compost, while non-organics are manually sorted before it is sold to intermediaries/aggregators, and then shipped to East Java (Surabaya). The residue is collected in a container provided by DLHPP, and then transported to Jugil Landfill. Currently, there are total 4 units of TPS3R in North Lombok Regency (Sigar Penjalin, Gili Trawangan, Jenggala, Gangga) and 3 units are planned in 2021 (in Village Bentek, Sokong, Anyar). Meanwhile, the compost products and the second-hand/creative products made of recyclables are stored and then sold by regional KSMs (combination of several KSMs). A recent Regent Regulation, locally known as 'Bela Beli', enforces local communities to purchase local products, including compost, through KSMs or SMEs. Additionally, securing land in villages for TPS3R is easier than in urban areas (cities), as villagers are usually proactive in proposing and securing land available for waste treatment facilities. All collected waste, which is not processed at TPS3R or waste bank, is transported by DLHPP to Jugil Landfill, located in Gangga District, 22 km from the regency’s capital. In total, there are 15 transport vehicles each day entering the landfill that mainly consists of arm-roll trucks and dump trucks. There is also registered KSM that provides waste transport service to landfill using three-wheelers. Jugil landfill started the operation in 2019 with a total area of 4 Ha, and the current active zone of 0.15 Ha. However, the landfill is not yet operated according to sanitary system due to the limited number of heavy equipment and operational budget. Based on SIPSN, the active zone is closed once a month, while the leachate treatment facility only consists of a sedimentation pond without any biological or chemical treatments. The landfill gas is only collected and then flared without recovery. Basically, the financing model of waste management in North Lombok is applying the common combination mechanism between retribution fees and local budget. As mentioned, waste retribution is collected by KSM or area managers, and then accounted as Local Own-Source Revenue (PAD). The historical waste management budget of DLHPP is shown in the table below.
Table 16 Waste Management Budget of DLHPP North Lombok Regency.
Parameter Fiscal Year 2017 Fiscal Year 2018 Fiscal Year 2019 Mio IDR Mio USD Mio IDR Mio USD Mio IDR Mio USD
Total Local Budget (APBD) 904,710 63 893,327 63 1,087,638 76
Total Waste Management Budget
5,182 0.36 10,925* 0.77* 4,856 0.34
Operational and Maintenance Budget
3,695 0.26 3,908 0.27 3,514 0.25
Portion Budget allocated to Waste Management
0.57 1.22 0.45
Revenue (Waste Retribution) 312 0.02 426 0.03 412 0.03
Source: Waste Management Master Plan of North Lombok Regency (2019); www.djpk.kemenkeu.go.id (accessed 28th April 2021); *CAPEX reached IDR 6,879.4 million
As shown in the Table, the budget allocated for waste management reached between 0.45% - 0.57% of local budget. As there was a high portion of capital expenditure disbursed in the fiscal year of 2018, which does not happen regularly, thus, the 2018 figure may not represent the real situation. The 2018 expenditure was higher, particularly on capital expenditure, which might be due to the budget earmarked in responding to the aftermath of big earthquake. As for operational
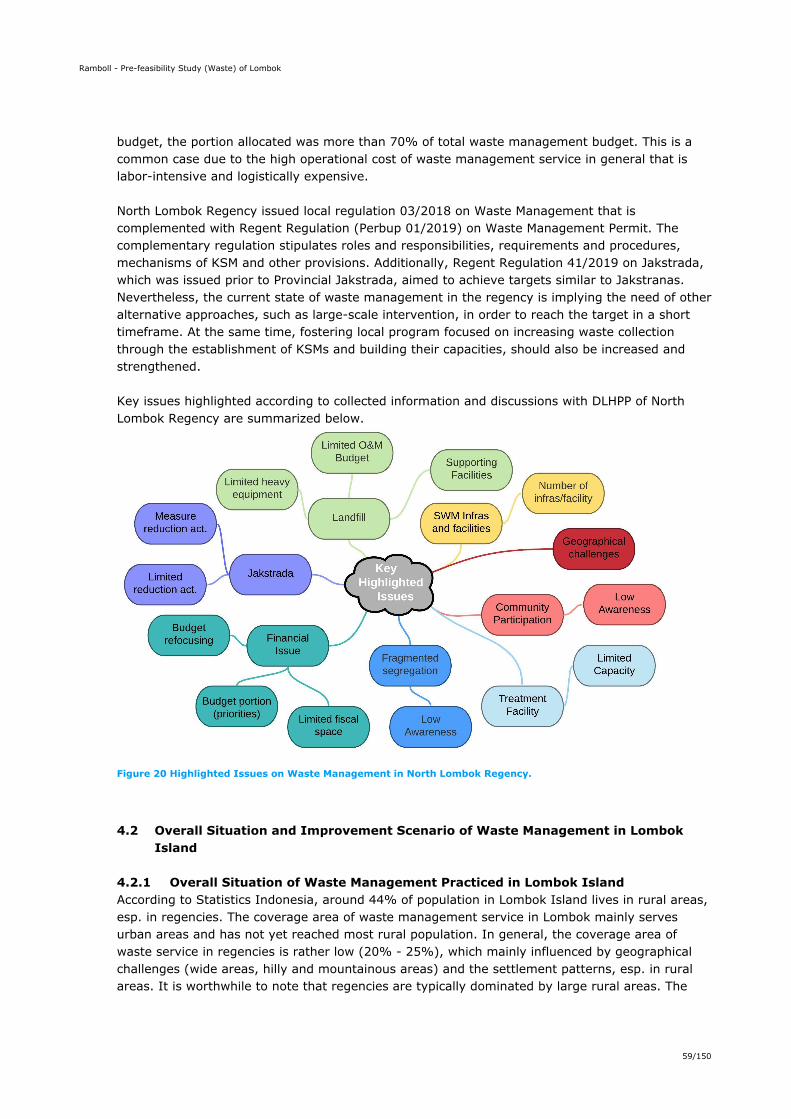
Ramboll - Pre-feasibility Study (Waste) of Lombok
59/150
budget, the portion allocated was more than 70% of total waste management budget. This is a common case due to the high operational cost of waste management service in general that is labor-intensive and logistically expensive. North Lombok Regency issued local regulation 03/2018 on Waste Management that is complemented with Regent Regulation (Perbup 01/2019) on Waste Management Permit. The complementary regulation stipulates roles and responsibilities, requirements and procedures, mechanisms of KSM and other provisions. Additionally, Regent Regulation 41/2019 on Jakstrada, which was issued prior to Provincial Jakstrada, aimed to achieve targets similar to Jakstranas. Nevertheless, the current state of waste management in the regency is implying the need of other alternative approaches, such as large-scale intervention, in order to reach the target in a short timeframe. At the same time, fostering local program focused on increasing waste collection through the establishment of KSMs and building their capacities, should also be increased and strengthened. Key issues highlighted according to collected information and discussions with DLHPP of North Lombok Regency are summarized below.
Figure 20 Highlighted Issues on Waste Management in North Lombok Regency.
4.2 Overall Situation and Improvement Scenario of Waste Management in Lombok Island
4.2.1 Overall Situation of Waste Management Practiced in Lombok Island According to Statistics Indonesia, around 44% of population in Lombok Island lives in rural areas, esp. in regencies. The coverage area of waste management service in Lombok mainly serves urban areas and has not yet reached most rural population. In general, the coverage area of waste service in regencies is rather low (20% - 25%), which mainly influenced by geographical challenges (wide areas, hilly and mountainous areas) and the settlement patterns, esp. in rural areas. It is worthwhile to note that regencies are typically dominated by large rural areas. The
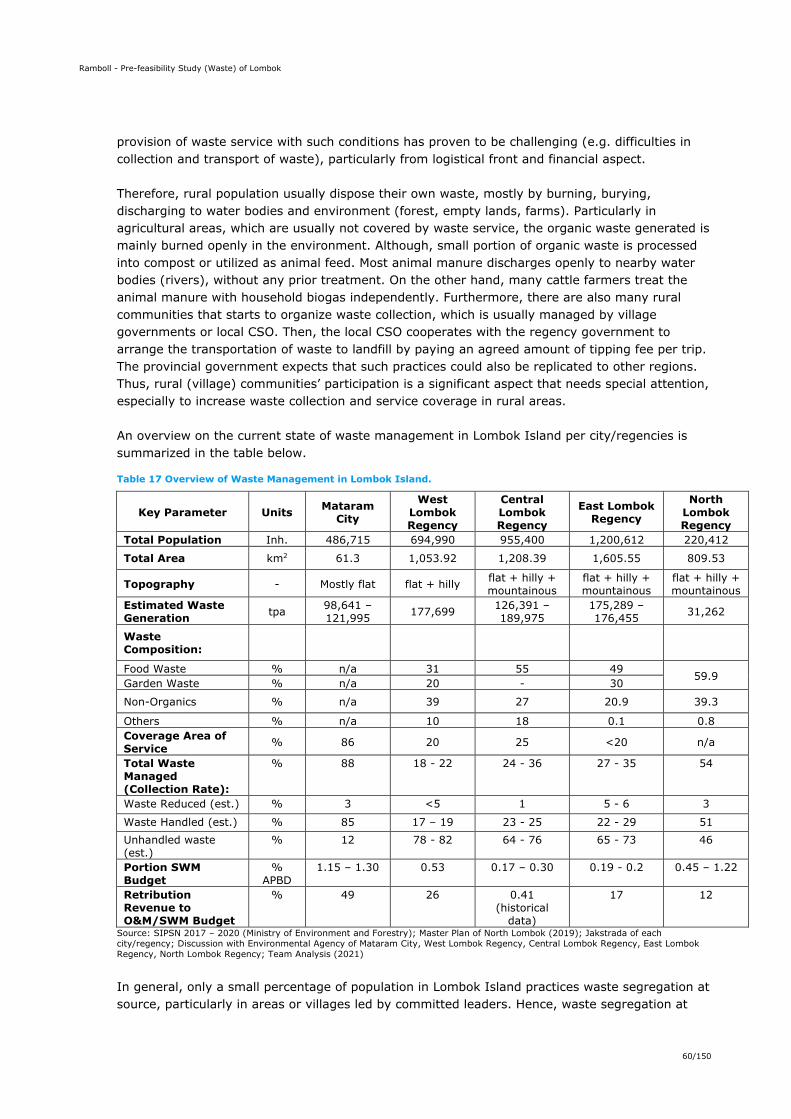
Ramboll - Pre-feasibility Study (Waste) of Lombok
60/150
provision of waste service with such conditions has proven to be challenging (e.g. difficulties in collection and transport of waste), particularly from logistical front and financial aspect. Therefore, rural population usually dispose their own waste, mostly by burning, burying, discharging to water bodies and environment (forest, empty lands, farms). Particularly in agricultural areas, which are usually not covered by waste service, the organic waste generated is mainly burned openly in the environment. Although, small portion of organic waste is processed into compost or utilized as animal feed. Most animal manure discharges openly to nearby water bodies (rivers), without any prior treatment. On the other hand, many cattle farmers treat the animal manure with household biogas independently. Furthermore, there are also many rural communities that starts to organize waste collection, which is usually managed by village governments or local CSO. Then, the local CSO cooperates with the regency government to arrange the transportation of waste to landfill by paying an agreed amount of tipping fee per trip. The provincial government expects that such practices could also be replicated to other regions. Thus, rural (village) communities’ participation is a significant aspect that needs special attention, especially to increase waste collection and service coverage in rural areas. An overview on the current state of waste management in Lombok Island per city/regencies is summarized in the table below.
Table 17 Overview of Waste Management in Lombok Island.
Key Parameter Units Mataram City
West Lombok Regency
Central Lombok Regency
East Lombok Regency
North Lombok Regency
Total Population Inh. 486,715 694,990 955,400 1,200,612 220,412
Total Area km2 61.3 1,053.92 1,208.39 1,605.55 809.53
Topography - Mostly flat flat + hilly flat + hilly + mountainous
flat + hilly + mountainous
flat + hilly + mountainous
Estimated Waste Generation tpa 98,641 –
121,995 177,699 126,391 – 189,975
175,289 – 176,455 31,262
Waste Composition:
Food Waste % n/a 31 55 49 59.9
Garden Waste % n/a 20 - 30
Non-Organics % n/a 39 27 20.9 39.3
Others % n/a 10 18 0.1 0.8 Coverage Area of Service % 86 20 25 <20 n/a
Total Waste Managed (Collection Rate):
% 88 18 - 22 24 - 36 27 - 35 54
Waste Reduced (est.) % 3 <5 1 5 - 6 3
Waste Handled (est.) % 85 17 – 19 23 - 25 22 - 29 51 Unhandled waste (est.)
% 12 78 - 82 64 - 76 65 - 73 46
Portion SWM Budget
% APBD
1.15 – 1.30 0.53 0.17 – 0.30 0.19 - 0.2 0.45 – 1.22
Retribution Revenue to O&M/SWM Budget
% 49 26 0.41 (historical
data)
17 12
Source: SIPSN 2017 – 2020 (Ministry of Environment and Forestry); Master Plan of North Lombok (2019); Jakstrada of each city/regency; Discussion with Environmental Agency of Mataram City, West Lombok Regency, Central Lombok Regency, East Lombok Regency, North Lombok Regency; Team Analysis (2021)
In general, only a small percentage of population in Lombok Island practices waste segregation at source, particularly in areas or villages led by committed leaders. Hence, waste segregation at
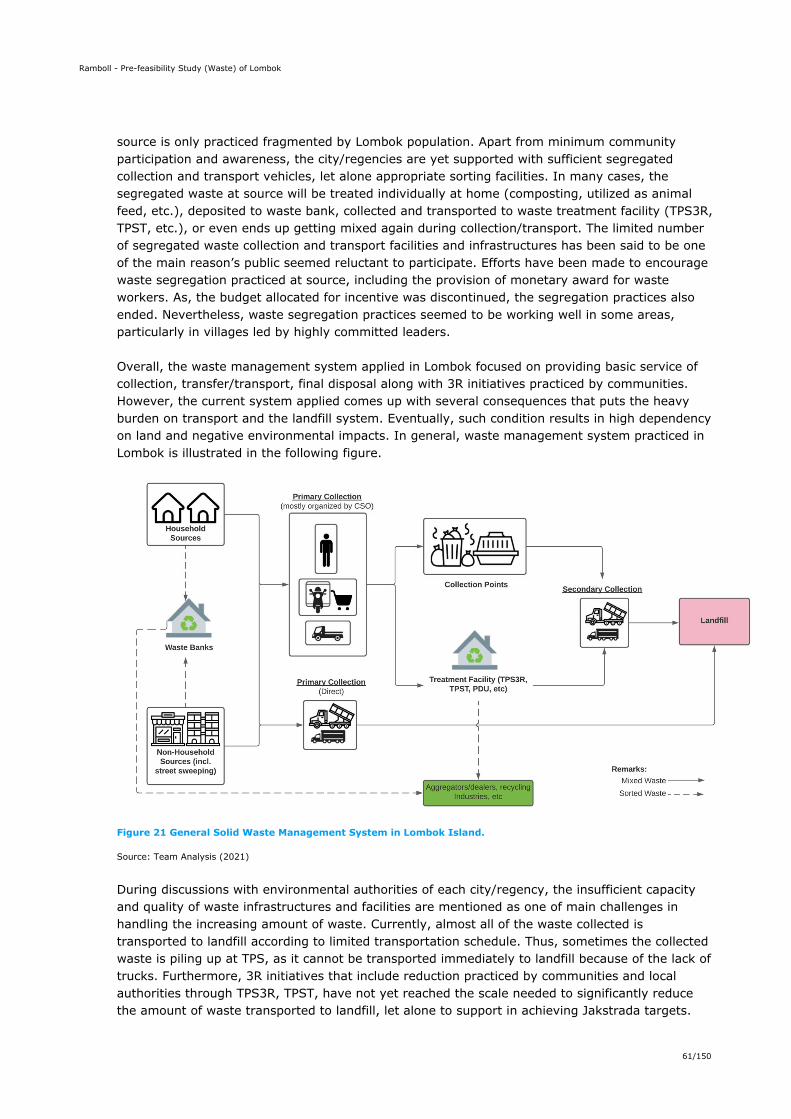
Ramboll - Pre-feasibility Study (Waste) of Lombok
61/150
source is only practiced fragmented by Lombok population. Apart from minimum community participation and awareness, the city/regencies are yet supported with sufficient segregated collection and transport vehicles, let alone appropriate sorting facilities. In many cases, the segregated waste at source will be treated individually at home (composting, utilized as animal feed, etc.), deposited to waste bank, collected and transported to waste treatment facility (TPS3R, TPST, etc.), or even ends up getting mixed again during collection/transport. The limited number of segregated waste collection and transport facilities and infrastructures has been said to be one of the main reason’s public seemed reluctant to participate. Efforts have been made to encourage waste segregation practiced at source, including the provision of monetary award for waste workers. As, the budget allocated for incentive was discontinued, the segregation practices also ended. Nevertheless, waste segregation practices seemed to be working well in some areas, particularly in villages led by highly committed leaders. Overall, the waste management system applied in Lombok focused on providing basic service of collection, transfer/transport, final disposal along with 3R initiatives practiced by communities. However, the current system applied comes up with several consequences that puts the heavy burden on transport and the landfill system. Eventually, such condition results in high dependency on land and negative environmental impacts. In general, waste management system practiced in Lombok is illustrated in the following figure.
Figure 21 General Solid Waste Management System in Lombok Island.
Source: Team Analysis (2021)
During discussions with environmental authorities of each city/regency, the insufficient capacity and quality of waste infrastructures and facilities are mentioned as one of main challenges in handling the increasing amount of waste. Currently, almost all of the waste collected is transported to landfill according to limited transportation schedule. Thus, sometimes the collected waste is piling up at TPS, as it cannot be transported immediately to landfill because of the lack of trucks. Furthermore, 3R initiatives that include reduction practiced by communities and local authorities through TPS3R, TPST, have not yet reached the scale needed to significantly reduce the amount of waste transported to landfill, let alone to support in achieving Jakstrada targets.
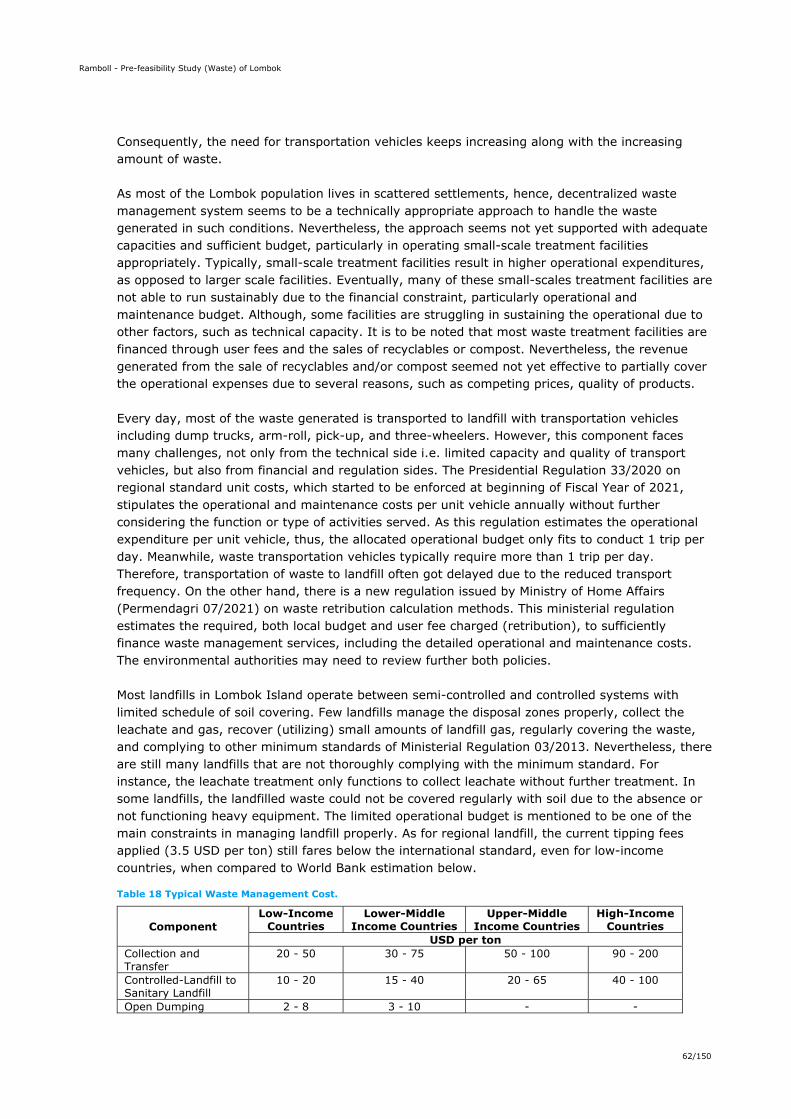
Ramboll - Pre-feasibility Study (Waste) of Lombok
62/150
Consequently, the need for transportation vehicles keeps increasing along with the increasing amount of waste. As most of the Lombok population lives in scattered settlements, hence, decentralized waste management system seems to be a technically appropriate approach to handle the waste generated in such conditions. Nevertheless, the approach seems not yet supported with adequate capacities and sufficient budget, particularly in operating small-scale treatment facilities appropriately. Typically, small-scale treatment facilities result in higher operational expenditures, as opposed to larger scale facilities. Eventually, many of these small-scales treatment facilities are not able to run sustainably due to the financial constraint, particularly operational and maintenance budget. Although, some facilities are struggling in sustaining the operational due to other factors, such as technical capacity. It is to be noted that most waste treatment facilities are financed through user fees and the sales of recyclables or compost. Nevertheless, the revenue generated from the sale of recyclables and/or compost seemed not yet effective to partially cover the operational expenses due to several reasons, such as competing prices, quality of products. Every day, most of the waste generated is transported to landfill with transportation vehicles including dump trucks, arm-roll, pick-up, and three-wheelers. However, this component faces many challenges, not only from the technical side i.e. limited capacity and quality of transport vehicles, but also from financial and regulation sides. The Presidential Regulation 33/2020 on regional standard unit costs, which started to be enforced at beginning of Fiscal Year of 2021, stipulates the operational and maintenance costs per unit vehicle annually without further considering the function or type of activities served. As this regulation estimates the operational expenditure per unit vehicle, thus, the allocated operational budget only fits to conduct 1 trip per day. Meanwhile, waste transportation vehicles typically require more than 1 trip per day. Therefore, transportation of waste to landfill often got delayed due to the reduced transport frequency. On the other hand, there is a new regulation issued by Ministry of Home Affairs (Permendagri 07/2021) on waste retribution calculation methods. This ministerial regulation estimates the required, both local budget and user fee charged (retribution), to sufficiently finance waste management services, including the detailed operational and maintenance costs. The environmental authorities may need to review further both policies. Most landfills in Lombok Island operate between semi-controlled and controlled systems with limited schedule of soil covering. Few landfills manage the disposal zones properly, collect the leachate and gas, recover (utilizing) small amounts of landfill gas, regularly covering the waste, and complying to other minimum standards of Ministerial Regulation 03/2013. Nevertheless, there are still many landfills that are not thoroughly complying with the minimum standard. For instance, the leachate treatment only functions to collect leachate without further treatment. In some landfills, the landfilled waste could not be covered regularly with soil due to the absence or not functioning heavy equipment. The limited operational budget is mentioned to be one of the main constraints in managing landfill properly. As for regional landfill, the current tipping fees applied (3.5 USD per ton) still fares below the international standard, even for low-income countries, when compared to World Bank estimation below.
Table 18 Typical Waste Management Cost.
Component Low-Income
Countries Lower-Middle
Income Countries Upper-Middle
Income Countries High-Income
Countries USD per ton
Collection and Transfer
20 - 50 30 - 75 50 - 100 90 - 200
Controlled-Landfill to Sanitary Landfill
10 - 20 15 - 40 20 - 65 40 - 100
Open Dumping 2 - 8 3 - 10 - -
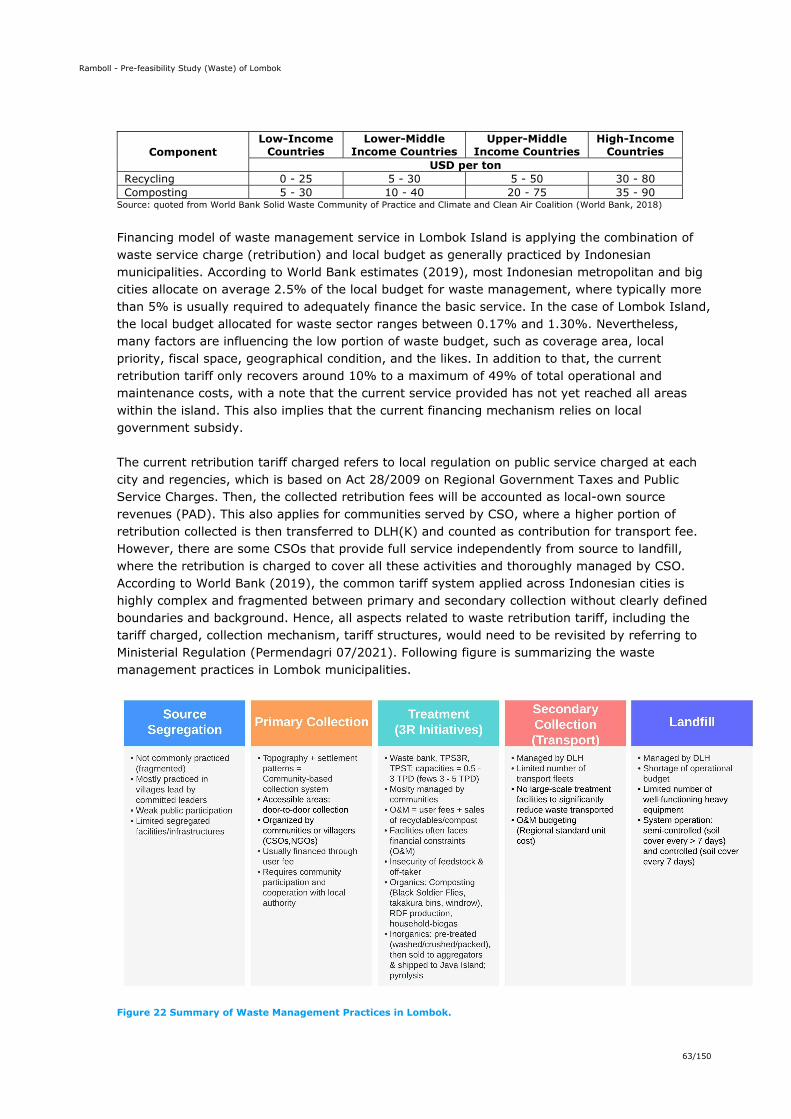
Ramboll - Pre-feasibility Study (Waste) of Lombok
63/150
Component Low-Income
Countries Lower-Middle
Income Countries Upper-Middle
Income Countries High-Income
Countries USD per ton
Recycling 0 - 25 5 - 30 5 - 50 30 - 80 Composting 5 - 30 10 - 40 20 - 75 35 - 90
Source: quoted from World Bank Solid Waste Community of Practice and Climate and Clean Air Coalition (World Bank, 2018)
Financing model of waste management service in Lombok Island is applying the combination of waste service charge (retribution) and local budget as generally practiced by Indonesian municipalities. According to World Bank estimates (2019), most Indonesian metropolitan and big cities allocate on average 2.5% of the local budget for waste management, where typically more than 5% is usually required to adequately finance the basic service. In the case of Lombok Island, the local budget allocated for waste sector ranges between 0.17% and 1.30%. Nevertheless, many factors are influencing the low portion of waste budget, such as coverage area, local priority, fiscal space, geographical condition, and the likes. In addition to that, the current retribution tariff only recovers around 10% to a maximum of 49% of total operational and maintenance costs, with a note that the current service provided has not yet reached all areas within the island. This also implies that the current financing mechanism relies on local government subsidy. The current retribution tariff charged refers to local regulation on public service charged at each city and regencies, which is based on Act 28/2009 on Regional Government Taxes and Public Service Charges. Then, the collected retribution fees will be accounted as local-own source revenues (PAD). This also applies for communities served by CSO, where a higher portion of retribution collected is then transferred to DLH(K) and counted as contribution for transport fee. However, there are some CSOs that provide full service independently from source to landfill, where the retribution is charged to cover all these activities and thoroughly managed by CSO. According to World Bank (2019), the common tariff system applied across Indonesian cities is highly complex and fragmented between primary and secondary collection without clearly defined boundaries and background. Hence, all aspects related to waste retribution tariff, including the tariff charged, collection mechanism, tariff structures, would need to be revisited by referring to Ministerial Regulation (Permendagri 07/2021). Following figure is summarizing the waste management practices in Lombok municipalities.
Figure 22 Summary of Waste Management Practices in Lombok.
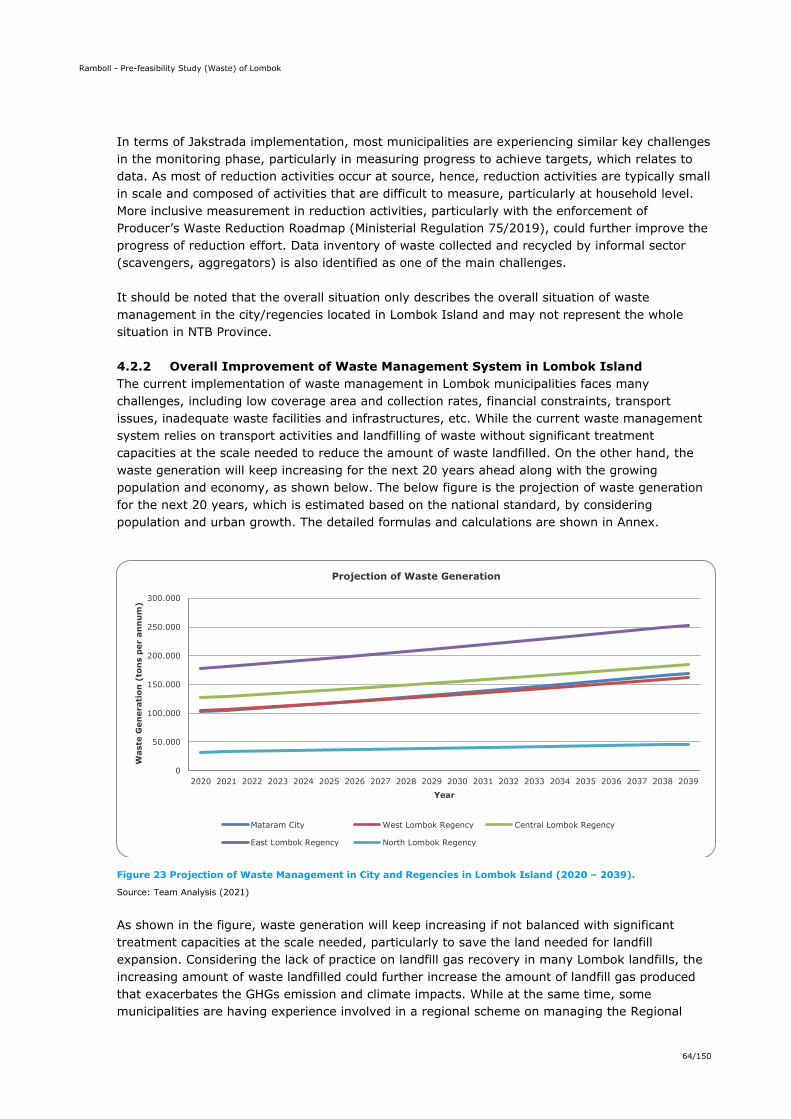
Ramboll - Pre-feasibility Study (Waste) of Lombok
64/150
In terms of Jakstrada implementation, most municipalities are experiencing similar key challenges in the monitoring phase, particularly in measuring progress to achieve targets, which relates to data. As most of reduction activities occur at source, hence, reduction activities are typically small in scale and composed of activities that are difficult to measure, particularly at household level. More inclusive measurement in reduction activities, particularly with the enforcement of Producer’s Waste Reduction Roadmap (Ministerial Regulation 75/2019), could further improve the progress of reduction effort. Data inventory of waste collected and recycled by informal sector (scavengers, aggregators) is also identified as one of the main challenges. It should be noted that the overall situation only describes the overall situation of waste management in the city/regencies located in Lombok Island and may not represent the whole situation in NTB Province.
4.2.2 Overall Improvement of Waste Management System in Lombok Island The current implementation of waste management in Lombok municipalities faces many challenges, including low coverage area and collection rates, financial constraints, transport issues, inadequate waste facilities and infrastructures, etc. While the current waste management system relies on transport activities and landfilling of waste without significant treatment capacities at the scale needed to reduce the amount of waste landfilled. On the other hand, the waste generation will keep increasing for the next 20 years ahead along with the growing population and economy, as shown below. The below figure is the projection of waste generation for the next 20 years, which is estimated based on the national standard, by considering population and urban growth. The detailed formulas and calculations are shown in Annex.
Figure 23 Projection of Waste Management in City and Regencies in Lombok Island (2020 – 2039).
Source: Team Analysis (2021)
As shown in the figure, waste generation will keep increasing if not balanced with significant treatment capacities at the scale needed, particularly to save the land needed for landfill expansion. Considering the lack of practice on landfill gas recovery in many Lombok landfills, the increasing amount of waste landfilled could further increase the amount of landfill gas produced that exacerbates the GHGs emission and climate impacts. While at the same time, some municipalities are having experience involved in a regional scheme on managing the Regional
0
50.000
100.000
150.000
200.000
250.000
300.000
2020 2021 2022 2023 2024 2025 2026 2027 2028 2029 2030 2031 2032 2033 2034 2035 2036 2037 2038 2039
Was
te G
ener
atio
n (
ton
s p
er a
nn
um
)
Year
Projection of Waste Generation
Mataram City West Lombok Regency Central Lombok Regency
East Lombok Regency North Lombok Regency
Ramboll - Pre-feasibility Study (Waste) of Lombok
65/150
Landfill that runs in large-scale. Larger scale facilities would typically require less operational costs, which could further reduce the financial burden borne by municipalities. Another consequence that comes with the increasing amount of waste if not managed properly is the impacts to human health and livelihood and natural environment. The impacts of poor waste management could further threaten the food chain, exacerbating the impacts of climate change, tourism sector, and the likes. On the other hand, improved waste management offers opportunities to contribute not only to decreasing these detrimental impacts, but also in increasing human livelihood and natural environment through the application of a circular economy approach. As most of the waste generated in this island is organic waste (62%), the opportunity offered to apply the circular economy concept is even greater, especially with agriculture sector being one of the leading economic sectors in the island. Agriculture sector offers more opportunities for circular economic applications by processing the organic waste into compost that could recover the nutrients back to soils. The most common approach of circular economy in processing the organic waste is through the application of Anaerobic Digestion (AD) that produces compost and biogas. Despite the challenges in regard to the utilization of compost, there are still other alternatives of compost utilization that have not been fully explored. For instance, the utilization of compost as soil covers for landfill, which apparently has been well defined in Ministerial Regulation 03/2013. Utilization of compost as soil cover can also help to reduce the release of methane in landfills. On the other hand, the national government seems to be moving forward with the plan to efficiently distribute the subsidized fertilizer, which opens more opportunities for non-subsidized compost in the local market. Furthermore, the application of AD, which contributes to reduction of methane released into the environment, also offers the opportunity to voluntarily participate in the carbon market. As the case with household biogas applied by local farmers, the carbon offset from AD facilities gained from carbon market could potentially generate revenue. Nevertheless, it is important to note that in order to optimally benefiting from circular concept in the long term, waste management system should initially satisfy the basic service (collection, transport, disposal) along with increased waste segregation. Such efforts should also be balanced with improvement in other related aspects, including technical and institutional capacity, financing, community and stakeholders’ participation, infrastructures and facilities, supporting regulation and its enforcement, etc. In order to improve effectiveness of waste management system applied, the team recommends an improvement of future scenario, particularly to support in addressing the current challenges, based on several key considerations. The improvement of future scenario is detailed below:
The development of regional waste treatment facility in Lombok Island (large-scale) focused on processing the organic waste through Anaerobic Digestion technology, while also processing the non-organics. At the same time, the basic service provided, especially in areas with low collection rates, is also being improved gradually.
The regional scheme is highly recommended considering the current collection rate, financial constraints, and experiences in managing the regional facility (Regional landfill).
Considering the collection rate and geographical conditions, including distance and road access, as main challenges, it is recommended to develop two units of treatment facility that serve municipalities based on the degree of proximity, access, and collection rate. It is to be noted that the grouping of city and regencies are fully adjustable and would need to be further refined in the next phase of Feasibility Study. The below suggestion is only to simulate the concept of regional treatment facility:
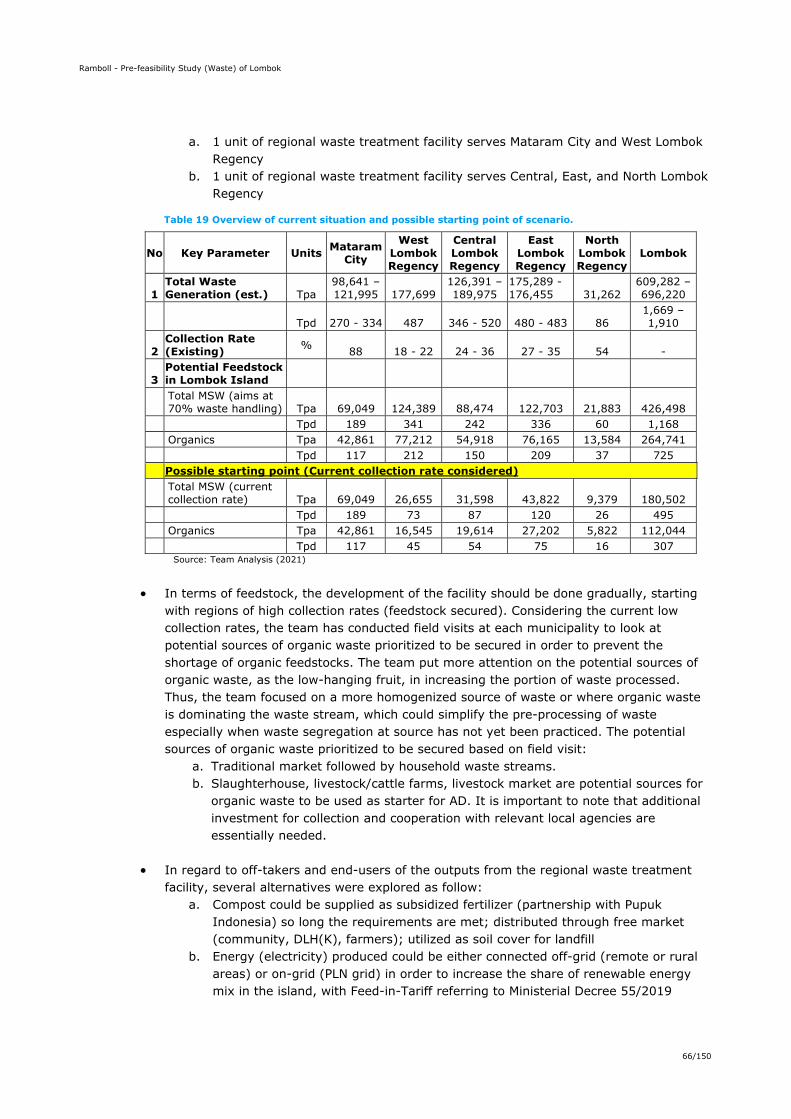
Ramboll - Pre-feasibility Study (Waste) of Lombok
66/150
a. 1 unit of regional waste treatment facility serves Mataram City and West Lombok Regency
b. 1 unit of regional waste treatment facility serves Central, East, and North Lombok Regency
Table 19 Overview of current situation and possible starting point of scenario.
No Key Parameter Units Mataram City
West Lombok Regency
Central Lombok Regency
East Lombok Regency
North Lombok Regency
Lombok
1 Total Waste Generation (est.) Tpa
98,641 – 121,995 177,699
126,391 – 189,975
175,289 - 176,455 31,262
609,282 – 696,220
Tpd 270 - 334 487 346 - 520 480 - 483 86 1,669 – 1,910
2 Collection Rate (Existing) % 88 18 - 22 24 - 36 27 - 35 54 -
3 Potential Feedstock in Lombok Island
Total MSW (aims at 70% waste handling) Tpa 69,049 124,389 88,474 122,703 21,883 426,498
Tpd 189 341 242 336 60 1,168 Organics Tpa 42,861 77,212 54,918 76,165 13,584 264,741 Tpd 117 212 150 209 37 725
Possible starting point (Current collection rate considered)
Total MSW (current collection rate) Tpa 69,049 26,655 31,598 43,822 9,379 180,502
Tpd 189 73 87 120 26 495 Organics Tpa 42,861 16,545 19,614 27,202 5,822 112,044 Tpd 117 45 54 75 16 307
Source: Team Analysis (2021)
In terms of feedstock, the development of the facility should be done gradually, starting
with regions of high collection rates (feedstock secured). Considering the current low collection rates, the team has conducted field visits at each municipality to look at potential sources of organic waste prioritized to be secured in order to prevent the shortage of organic feedstocks. The team put more attention on the potential sources of organic waste, as the low-hanging fruit, in increasing the portion of waste processed. Thus, the team focused on a more homogenized source of waste or where organic waste is dominating the waste stream, which could simplify the pre-processing of waste especially when waste segregation at source has not yet been practiced. The potential sources of organic waste prioritized to be secured based on field visit:
a. Traditional market followed by household waste streams. b. Slaughterhouse, livestock/cattle farms, livestock market are potential sources for
organic waste to be used as starter for AD. It is important to note that additional investment for collection and cooperation with relevant local agencies are essentially needed.
In regard to off-takers and end-users of the outputs from the regional waste treatment facility, several alternatives were explored as follow:
a. Compost could be supplied as subsidized fertilizer (partnership with Pupuk Indonesia) so long the requirements are met; distributed through free market (community, DLH(K), farmers); utilized as soil cover for landfill
b. Energy (electricity) produced could be either connected off-grid (remote or rural areas) or on-grid (PLN grid) in order to increase the share of renewable energy mix in the island, with Feed-in-Tariff referring to Ministerial Decree 55/2019
Ramboll - Pre-feasibility Study (Waste) of Lombok
67/150
c. Selling of recyclables through the current chain, by involving informal sector (scavengers, aggregators, etc) or through collaboration with start-up companies that are integrated with informal sector.
d. Additional potential source of revenue could be gained by voluntarily participating in the carbon market, as practiced by local household biogas developer.
Further details on potential off-takers and end-users are described in the next chapter.
Several advantages of the recommended scenario were explored as follow: a. Reduce the need for waste transport, especially if the facility located near to the
city/regent capital b. Reduce the amount of waste landfilled, which eventually could extend the lifetime
of landfill, save the land needed for expansion, result in more efficient landfill operation (supporting facilities, operational budget, etc)
c. Add potential revenue generation not only from the selling of outputs (compost and recyclables) but also through the carbon offset mechanism (voluntarily)
d. Offer opportunities for circular economy application, particularly in agriculture sector (potential nutrient recovery)
e. Increase recycling rates with more measurable intervention, which ultimately supports the achievement of Jakstrada targets gradually
f. Reduce GHGs emission and other environmental and climate impacts At this stage, the recommended improvement scenario from this part highlights the improvement required from the overall system, including the security of potential feedstock available and off-takers or end-users with several aspects considered. Further study is required in order to further understand the viability of the recommended improvement scenario.
Ramboll - Pre-feasibility Study (Waste) of Lombok
68/150
5. POTENTIAL SOURCES OF ORGANIC WASTE AND POTENTIAL OFF-TAKERS/END USERS
5.1 Potential Sources of Organic Waste In order to prevent the shortage of organic waste as well as to understand the current practice, the team conducted field visits to potential sources of organic waste at each Lombok city/regency between March and April 2021. The results of field visits indicate several potential sources of organic waste to be utilized as organic feedstock to the facility, which are prioritized to be secured. This section summarizes the overview of potential sources of organic waste at each city/regency in Lombok. While further description, including pictures, at each potential source is detailed in Annex. Mataram City As the city with the least size of area in Lombok Island, Mataram City is privileged for its city size, especially in managing the waste generated. The relatively small area and flat terrain has enabled the city government to manage more than 87% of the waste generated in this city. Although, the city also faces other issues in terms of waste management, particularly related to waste transportation as well as financial constraints. Similar to other urban areas, securing appropriate land allocated for waste treatment facilities inside the city has proven to be challenging. Due to the high collection rates, Mataram City offers great potential to not only reduce the waste transported to landfill through larger scale waste processing facilities while saving land required for landfill expansion, but also to apply the circular economy approach by optimizing the utilization of outputs from waste processing facilities within the island. According to SIPSN (2021), the 3 main sources of waste are coming from households (37%), traditional markets (34%), and commercials (9%). As organic waste has been identified to dominate the waste stream in Indonesia, thus, the team put more attention in identifying the potential sources of organic waste in order to gain the low-hanging fruit to increase the portion of waste processed. Nevertheless, the team was also looking at the non-organic waste generated and its current management practices. Further, the team also focused on looking for a more homogenized source of waste or where organic waste is dominating most of the waste generation. This strategy could be really helpful as it would simplify the pre-processing of waste especially when waste segregation at source has not yet been practiced. For the aforementioned reasons, the team conducted a field visit to basically look for potential sources of organic waste in Mataram City. In March to April 2021, the team visited some places in Mataram City, including slaughterhouses, traditional markets, home industries, and restaurants. During the field visit, the team identified some key findings as follow:
Waste segregation at source has not yet been commonly practiced Organic waste generated from slaughterhouses is usually in low amounts and not
collected properly, hence, additional investment is required for collection. Only some portion of animal waste is processed into compost.
The organic waste generated from other local industries is usually collected and utilized by another party
The most potential source of organic waste is likely coming from traditional markets, even though the waste is in mixed condition
In conclusion, the team identified that the traditional market is the most potential source of organic waste in Mataram City, which confirmed the SIPSN data, particularly due to its amounts. Although the team did not visit the waste stream originating from households (through TPS,
Ramboll - Pre-feasibility Study (Waste) of Lombok
69/150
TPS3R, waste banks, etc), particularly due to the less homogenized waste composition, this does not exclude it as potential source of organic waste, and thus required further study on its feasibility. Although slaughterhouses generate low amounts of organic waste, due to its specific waste composition (animal manure), the waste generated from this facility has great potential to be used as starter, especially if the technology applied requires such material, such as Anaerobic Digester. Further communication might be needed as the animal manure generated is currently processed into compost and the residue is disposed of into septic tanks, while no further information on compost utilization. It is to be noted that Anaerobic Digestion is the most commonly known technology processing organic waste that aligns with the principle of Circular Economy. As for other sources, such as home industries and restaurants, although these sources tend to generate homogenized organic waste, however, the amounts are insufficient and unstable during certain situations. Furthermore, most of the waste generated from home industries are already collected and utilized as raw materials for other industries. In addition to that, further study would be needed in order to better estimate the waste generation at potential sources as well as to understand its feasibility. West Lombok Regency West Lombok Regency is the third largest area in the island with a combination of flat and hilly terrain. West Lombok Regency is the third largest area in the island with a combination of flat and hilly terrain. Despite the better topographical condition, the waste collection rate in this regency only reaches around 18% to 22% of total waste generated, which is the lowest in the island. The low coverage area (20%), low community participation as well as public awareness, financial constraints, and insufficient number of proper waste infrastructure and facilities were identified to be the main issues faced by the local government in managing the keep increasing waste generation with limited reduction effort. Based on similar principles and reasoning, the team also conducted a similar field visit in West Lombok Regency in order to look for potential sources of organic waste. The field visit was conducted between March and April 2021 to several places such as TPS3R, waste bank, slaughterhouses, livestock market, traditional markets, cattle farm, local industry, and waste processing facility owned by local CSO. During the field visit, the team identified some key findings as follow:
Waste segregation has not yet been commonly practiced The waste coming into TPS3R is in low amounts. TPS3R often experiences financial
constraint due to the limited financial resource/revenue to sustain the operation. While the compost produced from this facility is only utilized by communities at no cost.
Waste bank usually receives animal waste, which will be further processed into biogas. Most of the waste coming into waste banks is organic, but in mixed condition. Total amount of waste entering the facility is rather low. Securing off-takers of waste bank's end products is sometimes a challenge.
The most common composting method applied in this regency is the box composting method (Takakura bin).
Cattle farms tend to generate low amounts of organic waste and are usually located far from the regency’s capital. The organic waste generated is mostly composed of animal manure, which is not collected properly. Hence, additional investment for proper collection is required.
Slaughterhouse and livestock markets are usually located quite distanced from the regency's capital. In general, these facilities tend to generate a small amount of organic waste without having proper collection equipment. Additional investment for proper collection is required.
Ramboll - Pre-feasibility Study (Waste) of Lombok
70/150
Generally, rice milling industries generate an uncertain amount of organic waste as the milling activity only occurs when the supply of raw material is available. Most of the waste generated is collected and utilized by third parties.
Only 30% of incoming waste to processing facilities owned by CSO can be further processed due to its quality, which is rather low. The incoming organic waste is processed into compost and then utilized by communities. This facility is usually located far from the regency's capital, as it serves areas that are not covered by formal waste service.
The most potential source of organic waste in this regency is likely coming from Traditional Market. It is to be noted that not all waste stored at market's TPS is generated from traditional markets as it is also coming from surrounding neighbourhood/households.
Overall, the most potential source of organic waste in West Lombok Regency is coming from the traditional market where a high portion of waste generated is composed of organics. Although household waste generation entering TPS3R, waste banks, and facilities owned by CSO, is rather low, however, it would be worthwhile to further understand its feasibility directly to its source. This is mainly because households are known to be the main source of waste in Indonesia but segregation at source has not yet been commonly practiced. Meanwhile, animal manure generated from cattle farms or slaughterhouses has the potential to be utilized as a starter by further considering additional collection equipment needed as well as the distanced location. As for the waste generated from local industries, the low amount of waste generation, current utilization of waste into raw material by third parties, and uncertainty supply of the incoming raw materials have indicated this source as the least potential source of organic waste. Nevertheless, further study at few potential sources is needed to better estimate the waste generation as well as to understand its feasibility. Central Lombok Regency This is the second largest regency in Lombok island with more challenging topography that combines flat, hilly, and mountainous terrains. Nevertheless, the regency has higher waste collection rates of between 24% to 36% as well as larger waste coverage service (25%), compared to West Lombok Regency. The regency faces similar challenges as West Lombok Regency and once generated tremendously low retribution in 2014-2015. Financial issues within the sector seems to be one of the significant constraints in the regency. According to SIPSN (2021), the three main sources of waste generation in the regency are coming from households (42%), traditional markets ((29%), and public facilities (12.6%). With similar principles and reasoning, the team conducted similar visits in looking for potential sources of organic waste within the regency. The team conducted field visits between March and April 2021 to several places that include slaughterhouses, cattle farms, traditional markets, livestock markets, local industries, hotel and agricultural areas. On this occasion, the team also visited potential sources of organic waste within the Special Economic Zone of Mandalika, which is located rather far from the regency’s capital (25 km). During the field visit, the team identified some key findings as follow:
In general, waste segregation has not yet been practiced Slaughterhouses tend to generate low amounts of waste and mainly operate based on the
received order. Hence, the amount of waste generated can be uncertain. Most facilities are not operating during pandemic, but some are planning to reopen post-pandemic. The animal manure generated has been collected but not yet treated/properly discharged. Although, it is unclear if the collection of manure has been practiced properly.
Rice milling industry tends to generate low amounts of waste. Organic waste generated includes fine and coarse husks, where the fine husks are usually collected and utilized by communities. While the coarse husks are stored but not yet utilized.
Ramboll - Pre-feasibility Study (Waste) of Lombok
71/150
The organic waste generated from hotels is considerably low during pandemic (unstable waste generation during pandemic). The waste segregation only practiced at the kitchen and restaurant, but then it got mixed again at TPS.
Cattle farms are usually located quite distanced from the regency’s capital and some facilities have poor road access. In general, the waste generated, including organics, from this facility is considerably low and not yet collected/treated. Additional investment for proper collection is required.
Food processing industry generates a considerably low amount of waste and is located quite far from the regency's capital. The communities are utilizing the organic waste generated from this industry as animal feed.
Waste generated from livestock markets could be quite fluctuated as it depends on the number of animals coming to the market. The markets do not provide waste management service (collection). Thus, additional investment is essentially needed to collect the waste properly.
Generally, agricultural waste (from paddy, soybeans, and corn fields) is generated in high amounts during the harvesting season, which occurs 3 times in a year. Only a small portion of waste is processed and then utilized as animal feed, while the rest is usually burned. The agricultural area is located very distanced from the regency's capital (19 - 35 km) and not covered by waste management service. Thus, there are no facilities available to temporarily store the waste within this area.
Traditional markets have been identified as the main potential source of organic waste in the regency due to its high amount of stable organic waste generation. Further, uncertain transportation schedules and a delay in waste transport to landfill are often the case that results in piling up of waste at market's TPS.
In summary, traditional markets generate the highest amount of organic waste in Central Lombok Regency, thus, making it the most potential source of organic waste in the regency. Another potential source with a high fraction of organic waste is the livestock market. It should be noted that the animal manure generated in the livestock market could be quite fluctuated as it depends on the number of animals coming to the market. Animal manure generated in the cattle farms could be used as a starter, although they are low in quantity and the facilities are usually located far from the regency's capital. However, the animal manure generated in both, livestock market and cattle farm are not collected, thus, additional investment to collect the waste is essentially needed. Additionally, although the regency is known as the largest rice producer in the province with large agriculture land, the organic (agriculture) waste generated is mostly burned by farmers. This is the case as most of these rural areas are not served by waste service, including some agricultural areas within the SEZ Mandalika. As the team focused on searching the homogenized waste sources, thus, waste coming from households were not prioritized. Nevertheless, this does not exclude this waste source as a potential source, hence, further identification is still needed to better understand its feasibility. Similar to other regions, further study at few potential sources is required to better estimate the waste generation and to understand its feasibility. East Lombok Regency As the largest regency in the island, East Lombok Regency has respectable performance in managing the waste despite its challenging geographical landscape. The regency has the widest area with the highest number of populations in Lombok Island. Due to its topography that varies from flat, hilly, and mountainous terrains, the population mostly live in a scattered settlement pattern. Thus, the local government is working together with local communities by empowering them to actively participate in the waste collection activities within their own village. The waste collected by communities will then be transported to landfill by DLHK. Although the effectiveness
Ramboll - Pre-feasibility Study (Waste) of Lombok
72/150
of such effort eventually will depend much on the local leaders, it could essentially support local government efforts in managing the waste within the large area. With this strategy, the waste collection rates of East Lombok Regency reach between 27% and 35% that covers less than 20% of total area. Basically, the regency is facing similar challenges as other city/regencies in the island, particularly inadequate waste infrastructures and facilities as well as financial constraints. Considering the respectable result of waste performance in challenging geographical conditions, this basically indicates adequate technical capacity of local authority in managing the waste generated. Furthermore, this signifies potential technical capability to further improve its performance in reaching Jakstrada target, particularly by further increasing waste collection and processing capacity at the scale needed. SIPSN (2021) data suggests that the 3 main sources of waste in this regency are coming from households (64%), other sources (14.9%) and traditional markets (10.7%). Based on similar principles and reasoning, the team conducted similar visits with a mission to identify some potential sources of organic waste within the regency. The field visit was conducted between March and April 2021 to several places such as TPS3R, livestock farms, slaughterhouses, local industries, and traditional markets. During the field visit, the team identified some key findings as follow:
Waste segregation at source is generally not practiced Around 60% of waste entering the TPS3R facility is composed of organic waste, which
then processed into compost by applying the fermentation method. The incoming waste is sorted manually at the facility. Due to the limited area to temporarily store the compost produced and the waste to be further sorted, both waste and compost are often piling up at TPS3R. As the compost has neither been tested for its quality or nationally certified, the facility faces challenges in marketing the product.
In general, livestock farms are located quite distanced from the regency's capital, which is only accessible for motorbikes. The facility tends to generate low amounts of waste (incl. organics). The organic waste generated; esp. animal manure is not collected. As the stalls were usually not well designed, the collection of manure could be quite challenging. Also, additional investment is required for proper collection of animal manure.
The slaughterhouse tends to generate low amounts of waste, including organic waste (animal manure), and is located quite distanced from the regency's capital. As the animal manure is not collected, hence, additional investment is essentially needed for proper collection. A coordination with Animal Husbandry and Animal Health Service Agency is also essentially needed, as slaughterhouses in this regency are managed under this local agency.
The local home industries (rice mills, sawmills, fresh coconut) tend to generate low amounts of waste, while some are located far from the regency's capital. The sawmills industry in particular generates uncertain (unstable) amounts of waste. Some portion of the organic waste is collected and utilized, while the rest is either piling up or burned. However, most of the business owners are open for cooperation if the waste is to be collected by another party, so long as it is beneficial for them.
Traditional markets are likely to be the most potential source of organic waste in this regency due to its high portion of organic waste generation. High value recyclable waste generated is collected by scavengers. Waste management in traditional markets is managed under a local trade agency, thus, strong cooperation and coordination with this agency is required. Due to the limited transport vehicles, waste is sometimes piling up at TPS.
As a final observation, the most potential source of organic waste in East Lombok Regency is coming from traditional markets. However, it is important to note that cooperation and coordination with the local trade agency is essentially required since waste management at the
Ramboll - Pre-feasibility Study (Waste) of Lombok
73/150
market is organized by this agency. Aside from that, livestock farms indicate quite a significant amount of organic waste generation (animal manure) to be used as starter, but other factors should also be further considered, especially the additional investment required to collect the waste as well as the condition of local road access. Household waste entering the TPS3R also indicates a good potential of organic waste source, although at source segregation has not yet been practiced. Further study at few most potential sources would be needed to better estimate the waste generation and to understand its feasibility. North Lombok Regency As the newest regency in Lombok Island, North Lombok Regency is the smallest regency in the island and has similar challenging topography as Central and East Lombok Regency. Due its small area compared to other regencies in Lombok, the regency claims to have reached a collection rate of almost 54% of total waste generated. Similar to the rest of municipalities in the island, challenges appear mainly in regard to inadequate waste infrastructures and facilities, low community participation, as well as financial constraints. The team conducted similar visits to identify the most potential sources of organic waste within North Lombok Regency based on similar principles and reasoning. The field visit was conducted between March and April 2021 to several places such as hotels, traditional markets including fruit markets, slaughterhouse, landfill, TPS3R, local industries as well as plantation areas. During the field visit, the team identified some key findings as follow:
Generally, waste segregation at source has not yet been practiced massively. Hotel generates considerably low amounts of waste, including organics. The waste
generated could significantly decrease, esp. during pandemic (unstable) as the occupancy rate decreased. One of the hotels visited has poor road access (not well-constructed).
Slaughterhouse generates low amounts of waste, including organics, which is not collected. Additional investment for collecting the waste is essentially needed. As the facility is not supported with TPS, the waste generated is stored at the nearby TPS, which is mixed with market waste and results in bad odor generation.
The daily incoming waste to Jugil landfill is quite high. However, the quality of organic waste is not as high as it is in the markets as the waste gets more contamination during the storing or transporting of waste. The waste entering this facility is less homogenized in composition with high impurity. Jugil landfill needs to improve the operational safety and is highly vulnerable to landslides esp. during the rainy seasons.
TPS3R facilities are mostly designed in limited capacity, thus, they could only receive low amounts of waste, including organics. This facility also receives agricultural waste. Organic waste is mostly processed to compost, which then sold to the communities.
Local industries tend to generate moderate amounts of waste (>1 tpd), particularly the ones visited by Team. Most of the organic waste generated from local industries are collected and then utilized by third parties. While some portion of the waste generated is not yet properly managed (burned/discharged into water channels).
Most plantation areas are located very distanced from the regency's capital and generate low amounts of waste, including organics. As it is located in remote locations, the road access to the plantation area is usually inaccessible for large vehicles. Only a small portion of the waste is collected, which then further utilized either as materials for animal feed or organic fertilizer.
In general, traditional markets generate significant amounts of organic waste, hence, making it the most potential source of organic waste in the regency. Many of these markets are not served with fixed waste transportation schedules, hence, TPS quickly reaches its full capacity and then the waste is piling up. Waste stored at market's TPS is
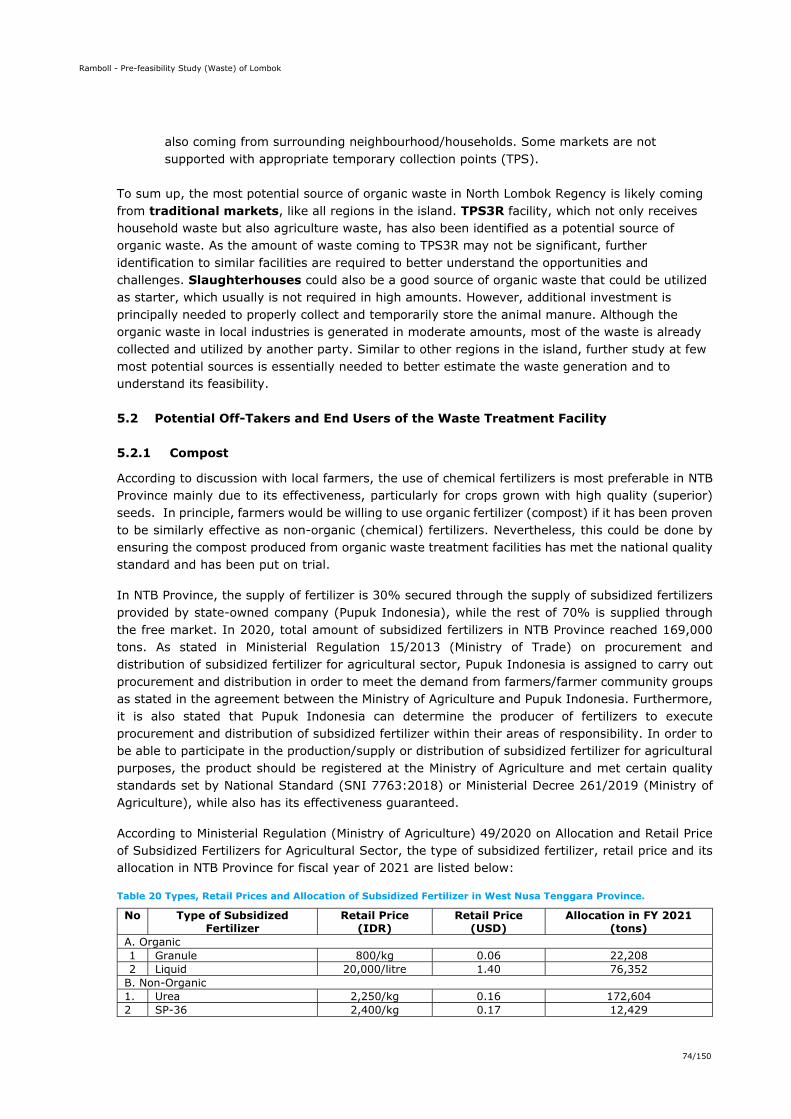
Ramboll - Pre-feasibility Study (Waste) of Lombok
74/150
also coming from surrounding neighbourhood/households. Some markets are not supported with appropriate temporary collection points (TPS).
To sum up, the most potential source of organic waste in North Lombok Regency is likely coming from traditional markets, like all regions in the island. TPS3R facility, which not only receives household waste but also agriculture waste, has also been identified as a potential source of organic waste. As the amount of waste coming to TPS3R may not be significant, further identification to similar facilities are required to better understand the opportunities and challenges. Slaughterhouses could also be a good source of organic waste that could be utilized as starter, which usually is not required in high amounts. However, additional investment is principally needed to properly collect and temporarily store the animal manure. Although the organic waste in local industries is generated in moderate amounts, most of the waste is already collected and utilized by another party. Similar to other regions in the island, further study at few most potential sources is essentially needed to better estimate the waste generation and to understand its feasibility.
5.2 Potential Off-Takers and End Users of the Waste Treatment Facility
5.2.1 Compost
According to discussion with local farmers, the use of chemical fertilizers is most preferable in NTB Province mainly due to its effectiveness, particularly for crops grown with high quality (superior) seeds. In principle, farmers would be willing to use organic fertilizer (compost) if it has been proven to be similarly effective as non-organic (chemical) fertilizers. Nevertheless, this could be done by ensuring the compost produced from organic waste treatment facilities has met the national quality standard and has been put on trial.
In NTB Province, the supply of fertilizer is 30% secured through the supply of subsidized fertilizers provided by state-owned company (Pupuk Indonesia), while the rest of 70% is supplied through the free market. In 2020, total amount of subsidized fertilizers in NTB Province reached 169,000 tons. As stated in Ministerial Regulation 15/2013 (Ministry of Trade) on procurement and distribution of subsidized fertilizer for agricultural sector, Pupuk Indonesia is assigned to carry out procurement and distribution in order to meet the demand from farmers/farmer community groups as stated in the agreement between the Ministry of Agriculture and Pupuk Indonesia. Furthermore, it is also stated that Pupuk Indonesia can determine the producer of fertilizers to execute procurement and distribution of subsidized fertilizer within their areas of responsibility. In order to be able to participate in the production/supply or distribution of subsidized fertilizer for agricultural purposes, the product should be registered at the Ministry of Agriculture and met certain quality standards set by National Standard (SNI 7763:2018) or Ministerial Decree 261/2019 (Ministry of Agriculture), while also has its effectiveness guaranteed.
According to Ministerial Regulation (Ministry of Agriculture) 49/2020 on Allocation and Retail Price of Subsidized Fertilizers for Agricultural Sector, the type of subsidized fertilizer, retail price and its allocation in NTB Province for fiscal year of 2021 are listed below:
Table 20 Types, Retail Prices and Allocation of Subsidized Fertilizer in West Nusa Tenggara Province.
No Type of Subsidized Fertilizer
Retail Price (IDR)
Retail Price (USD)
Allocation in FY 2021 (tons)
A. Organic 1 Granule 800/kg 0.06 22,208 2 Liquid 20,000/litre 1.40 76,352
B. Non-Organic 1. Urea 2,250/kg 0.16 172,604 2 SP-36 2,400/kg 0.17 12,429
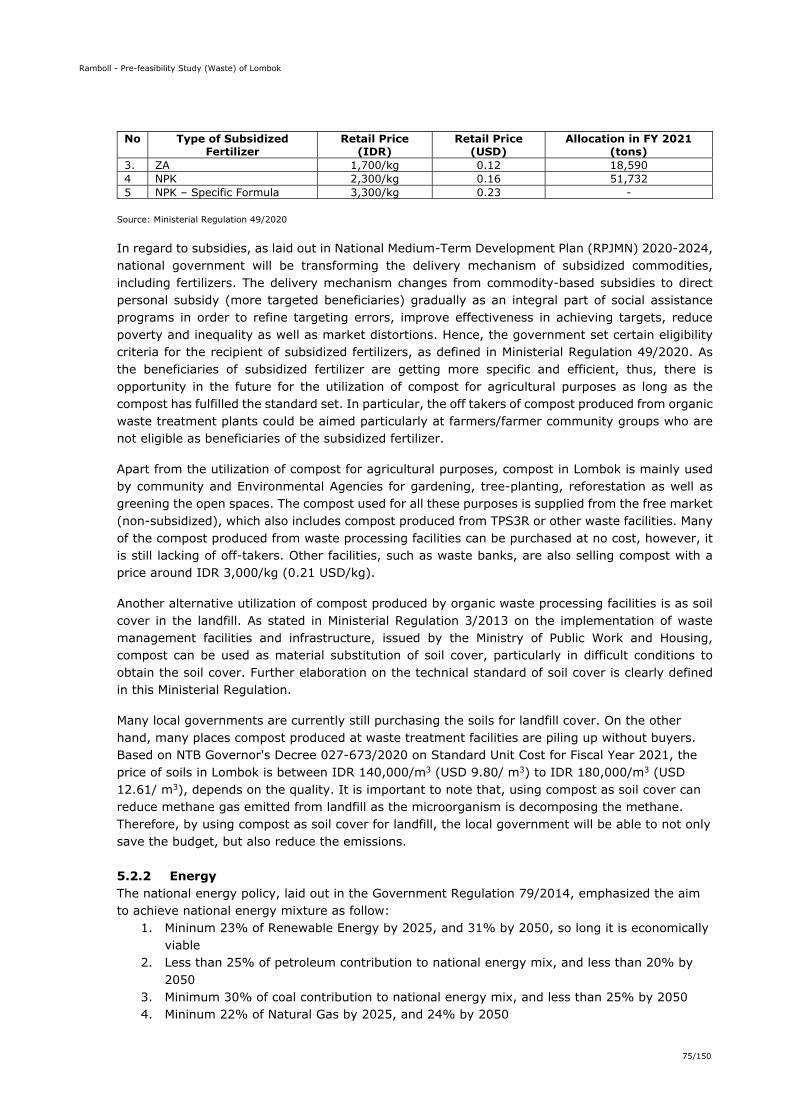
Ramboll - Pre-feasibility Study (Waste) of Lombok
75/150
No Type of Subsidized Fertilizer
Retail Price (IDR)
Retail Price (USD)
Allocation in FY 2021 (tons)
3. ZA 1,700/kg 0.12 18,590 4 NPK 2,300/kg 0.16 51,732 5 NPK – Specific Formula 3,300/kg 0.23 -
Source: Ministerial Regulation 49/2020
In regard to subsidies, as laid out in National Medium-Term Development Plan (RPJMN) 2020-2024, national government will be transforming the delivery mechanism of subsidized commodities, including fertilizers. The delivery mechanism changes from commodity-based subsidies to direct personal subsidy (more targeted beneficiaries) gradually as an integral part of social assistance programs in order to refine targeting errors, improve effectiveness in achieving targets, reduce poverty and inequality as well as market distortions. Hence, the government set certain eligibility criteria for the recipient of subsidized fertilizers, as defined in Ministerial Regulation 49/2020. As the beneficiaries of subsidized fertilizer are getting more specific and efficient, thus, there is opportunity in the future for the utilization of compost for agricultural purposes as long as the compost has fulfilled the standard set. In particular, the off takers of compost produced from organic waste treatment plants could be aimed particularly at farmers/farmer community groups who are not eligible as beneficiaries of the subsidized fertilizer.
Apart from the utilization of compost for agricultural purposes, compost in Lombok is mainly used by community and Environmental Agencies for gardening, tree-planting, reforestation as well as greening the open spaces. The compost used for all these purposes is supplied from the free market (non-subsidized), which also includes compost produced from TPS3R or other waste facilities. Many of the compost produced from waste processing facilities can be purchased at no cost, however, it is still lacking of off-takers. Other facilities, such as waste banks, are also selling compost with a price around IDR 3,000/kg (0.21 USD/kg).
Another alternative utilization of compost produced by organic waste processing facilities is as soil cover in the landfill. As stated in Ministerial Regulation 3/2013 on the implementation of waste management facilities and infrastructure, issued by the Ministry of Public Work and Housing, compost can be used as material substitution of soil cover, particularly in difficult conditions to obtain the soil cover. Further elaboration on the technical standard of soil cover is clearly defined in this Ministerial Regulation.
Many local governments are currently still purchasing the soils for landfill cover. On the other hand, many places compost produced at waste treatment facilities are piling up without buyers. Based on NTB Governor's Decree 027-673/2020 on Standard Unit Cost for Fiscal Year 2021, the price of soils in Lombok is between IDR 140,000/m3 (USD 9.80/ m3) to IDR 180,000/m3 (USD 12.61/ m3), depends on the quality. It is important to note that, using compost as soil cover can reduce methane gas emitted from landfill as the microorganism is decomposing the methane. Therefore, by using compost as soil cover for landfill, the local government will be able to not only save the budget, but also reduce the emissions.
5.2.2 Energy The national energy policy, laid out in the Government Regulation 79/2014, emphasized the aim to achieve national energy mixture as follow:
1. Mininum 23% of Renewable Energy by 2025, and 31% by 2050, so long it is economically viable
2. Less than 25% of petroleum contribution to national energy mix, and less than 20% by 2050
3. Minimum 30% of coal contribution to national energy mix, and less than 25% by 2050 4. Mininum 22% of Natural Gas by 2025, and 24% by 2050
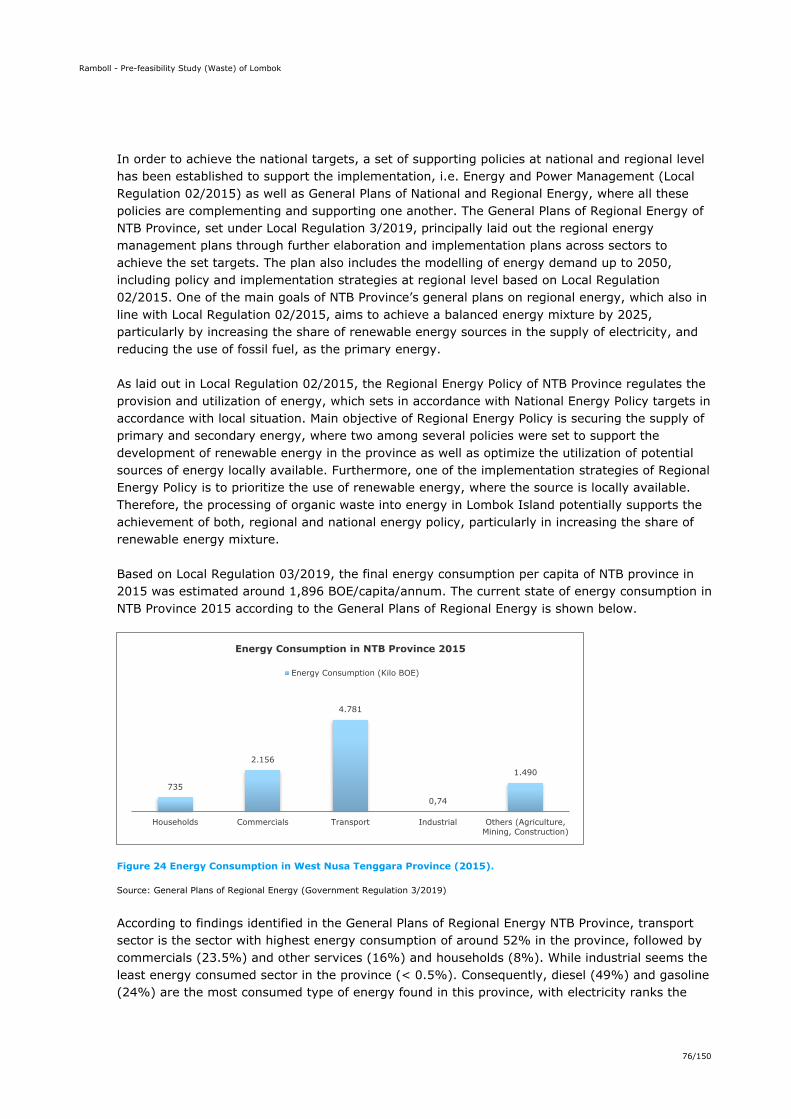
Ramboll - Pre-feasibility Study (Waste) of Lombok
76/150
In order to achieve the national targets, a set of supporting policies at national and regional level has been established to support the implementation, i.e. Energy and Power Management (Local Regulation 02/2015) as well as General Plans of National and Regional Energy, where all these policies are complementing and supporting one another. The General Plans of Regional Energy of NTB Province, set under Local Regulation 3/2019, principally laid out the regional energy management plans through further elaboration and implementation plans across sectors to achieve the set targets. The plan also includes the modelling of energy demand up to 2050, including policy and implementation strategies at regional level based on Local Regulation 02/2015. One of the main goals of NTB Province’s general plans on regional energy, which also in line with Local Regulation 02/2015, aims to achieve a balanced energy mixture by 2025, particularly by increasing the share of renewable energy sources in the supply of electricity, and reducing the use of fossil fuel, as the primary energy. As laid out in Local Regulation 02/2015, the Regional Energy Policy of NTB Province regulates the provision and utilization of energy, which sets in accordance with National Energy Policy targets in accordance with local situation. Main objective of Regional Energy Policy is securing the supply of primary and secondary energy, where two among several policies were set to support the development of renewable energy in the province as well as optimize the utilization of potential sources of energy locally available. Furthermore, one of the implementation strategies of Regional Energy Policy is to prioritize the use of renewable energy, where the source is locally available. Therefore, the processing of organic waste into energy in Lombok Island potentially supports the achievement of both, regional and national energy policy, particularly in increasing the share of renewable energy mixture. Based on Local Regulation 03/2019, the final energy consumption per capita of NTB province in 2015 was estimated around 1,896 BOE/capita/annum. The current state of energy consumption in NTB Province 2015 according to the General Plans of Regional Energy is shown below.
Figure 24 Energy Consumption in West Nusa Tenggara Province (2015).
Source: General Plans of Regional Energy (Government Regulation 3/2019)
According to findings identified in the General Plans of Regional Energy NTB Province, transport sector is the sector with highest energy consumption of around 52% in the province, followed by commercials (23.5%) and other services (16%) and households (8%). While industrial seems the least energy consumed sector in the province (< 0.5%). Consequently, diesel (49%) and gasoline (24%) are the most consumed type of energy found in this province, with electricity ranks the
735
2.156
4.781
0,74
1.490
Households Commercials Transport Industrial Others (Agriculture,Mining, Construction)
Energy Consumption in NTB Province 2015
Energy Consumption (Kilo BOE)
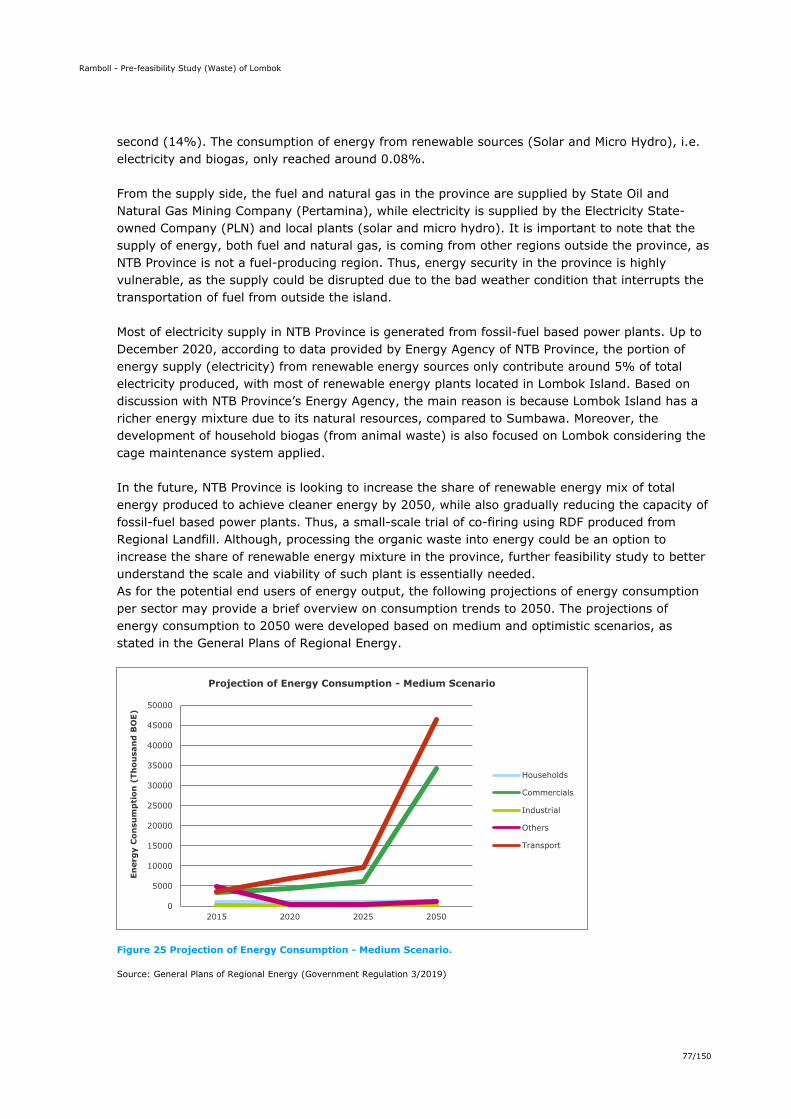
Ramboll - Pre-feasibility Study (Waste) of Lombok
77/150
second (14%). The consumption of energy from renewable sources (Solar and Micro Hydro), i.e. electricity and biogas, only reached around 0.08%. From the supply side, the fuel and natural gas in the province are supplied by State Oil and Natural Gas Mining Company (Pertamina), while electricity is supplied by the Electricity State-owned Company (PLN) and local plants (solar and micro hydro). It is important to note that the supply of energy, both fuel and natural gas, is coming from other regions outside the province, as NTB Province is not a fuel-producing region. Thus, energy security in the province is highly vulnerable, as the supply could be disrupted due to the bad weather condition that interrupts the transportation of fuel from outside the island. Most of electricity supply in NTB Province is generated from fossil-fuel based power plants. Up to December 2020, according to data provided by Energy Agency of NTB Province, the portion of energy supply (electricity) from renewable energy sources only contribute around 5% of total electricity produced, with most of renewable energy plants located in Lombok Island. Based on discussion with NTB Province’s Energy Agency, the main reason is because Lombok Island has a richer energy mixture due to its natural resources, compared to Sumbawa. Moreover, the development of household biogas (from animal waste) is also focused on Lombok considering the cage maintenance system applied. In the future, NTB Province is looking to increase the share of renewable energy mix of total energy produced to achieve cleaner energy by 2050, while also gradually reducing the capacity of fossil-fuel based power plants. Thus, a small-scale trial of co-firing using RDF produced from Regional Landfill. Although, processing the organic waste into energy could be an option to increase the share of renewable energy mixture in the province, further feasibility study to better understand the scale and viability of such plant is essentially needed. As for the potential end users of energy output, the following projections of energy consumption per sector may provide a brief overview on consumption trends to 2050. The projections of energy consumption to 2050 were developed based on medium and optimistic scenarios, as stated in the General Plans of Regional Energy.
Figure 25 Projection of Energy Consumption - Medium Scenario.
Source: General Plans of Regional Energy (Government Regulation 3/2019)
0
5000
10000
15000
20000
25000
30000
35000
40000
45000
50000
2015 2020 2025 2050
Ener
gy
Co
nsu
mp
tio
n (
Tho
usa
nd
BO
E)
Projection of Energy Consumption - Medium Scenario
Households
Commercials
Industrial
Others
Transport

Ramboll - Pre-feasibility Study (Waste) of Lombok
78/150
Figure 26 Projection of Energy Consumption - Optimistic Scenario.
Source: General Plans of Regional Energy (Government Regulation 3/2019)
Overall, the figures show that the future demand of final energy in NTB Province will be coming mostly from transport and commercial sectors, while other services and households’ sectors ranked the second. Industrial sector tends to have the least demand of energy in the future, which more or less similarly reflects the 2015 figures above. In order to increase the share of energy mixture from renewable sources, energy sources used in all of these sectors are indeed possible to be replaced or mixed with renewable sources, particularly from the (organic) waste-to-energy facility. In particular for the transport sector, the use of energy could be in the form of upgraded biogas as fuel for public transport (busses, trucks), which is a well-known and widely used technology. However, the application would only be feasible if it is supported with appropriate infrastructure, which eventually could implicate the costs. In the short-term, other 3 sectors (commercial, others, and households) could be identified as the low-hanging fruit on the demand side. In addition to that, below is the modelling of energy demand, both primary and secondary energy, to 2050 as developed in the General Plans of Regional Energy of NTB Province.
Table 21 Modelling of Energy Demand in West Nusa Tenggara Province.
Type of Energy 2020 2025 2030 2035 2040 2045 2050 in Kilo Barrel of Oil Equivalent
1. Primary Energy: Biomass 298 609 1127 1952 3231 5148 7930 Firewood 403 399 414 427 441 456 472 Coal-based 4257 6207 6293 6482 6681 6899 7110 2. Secondary Energy: Liquified Petroleum gas (LPG) 668 939 1290 1754 2367 3161 4167 Biogas 21 44 6 47 48 50 51 Bioethanol 43 428 769 1293 2080 3226 4842 Kerosene 11 - - - - - - Electricity (2,007) (1,680) (1,862) (1,593) (1,171) (1,169) (918) Charcoal 212 8.09 11 15 21 28 38 Gasoline 3981 6416 8193 10245 1257 15099 17653 Coal Briquettes 0.11 0.15 0.19 0.25 0.32 0.41 0.52 Diesel Oil 6632 6797 9136 12483 17221 23730 32498 Electricity (Renewable Energy) (4.80) (10.89) (10.87) (10.84) (10.81) (10.78) (10.74) Avtur 117 172 249 354 499 693 947
Source: General Plans of Regional Energy (Government Regulation 3/2019)
0
10000
20000
30000
40000
50000
60000
70000
2015 2020 2025 2050
Ener
gy
Co
nsu
mp
tio
n (
Tho
usa
nd
BO
E)
Projection of Energy Consumption - Optimistic Scenario
Households
Commercials
Industrial
Others
Transport

Ramboll - Pre-feasibility Study (Waste) of Lombok
79/150
Electricity In NTB Province, most of electricity consumption is supplied by State-owned Electricity Company of West Nusa Tenggara (PLN), both interconnection system and PLN's isolated power plants. There is also a low share of electricity consumption supplied by private sector. In general, there are 2 main electricity generation systems serving NTB province, i.e. Lombok of 490 MW installed capacity (serving Lombok Island) and Tambora of 173 MW (serving Sumbawa Island). Apart from the two main power systems, there are also many isolated grids that mainly serve small islands, particularly in Sumbawa. Additionally, the electricity consumption in rural areas is supplied from non-PLN power systems (mini/micro hydro and solar), which are not connected to PLN systems (off-grid). However, according to general plans on regional energy, the management of off-grid is not yet optimal, especially the renewable energy power units. Improvements are still needed, particularly on the maintenance of existing infrastructure as well as institutional strengthening. Electricity supply in the province based on the customer category in 2015 is shown below.
Figure 27 Electricity Supply in West Nusa Tenggara Province (2015).
Source: PLN of NTB Region, quoted from the General Plans of Regional Energy (Perda 03/2019)
Electricity consumption per capita in 2015 reached 290 kWh/capita/annum. Based on discussion with Energy Agency of NTB Province, the average growth of electricity demand in the province is at 8%, which then decreased during the pandemic. However, it returned to the pre pandemic level by end of December 2020. Thus far, the current supply has satisfied the current needs, with a reserve of 66 MW in January 2021. The cumulative electricity production of NTB Region in 2020, including non-PLN systems and the private sector, reached 2,341,932,289 kWh, with almost 70% generated by Lombok system. Nevertheless, more than 80% of electricity production is generated by fossil-fuel based power plants. Meanwhile, the relatively large potential of renewable energy has not been optimally utilized. As for the electricity system, the distribution network in NTB still generally relies on open air channels with typical lengthy channels. This results in high levels of voltage drop and prone to disturbances (trees), consequently, the level of service quality has not been properly fulfilled. Furthermore, many rural and remote areas are not yet connected to electricity due to the limited access to the network. However, network development of electricity in rural areas has been implemented by involving several parties, such as PLN that especially supports the provision of power generator units and distribution networks, both isolated and interconnected systems. The Local Regulations 02/2015 on Energy and Power Management emphasized that the provision of energy, particularly in remote and rural areas, is carried out by prioritizing the use of renewable energy sources that are locally available. This implies that electricity output of organic waste-to-energy facilities, which is accounted as renewable energy, is potentially to be connected
919,76
280,67132,94
68,93
Households Business Public + Social Industry
Electricity Supply in NTB Province (2015)
Electricity Supply (GWh)
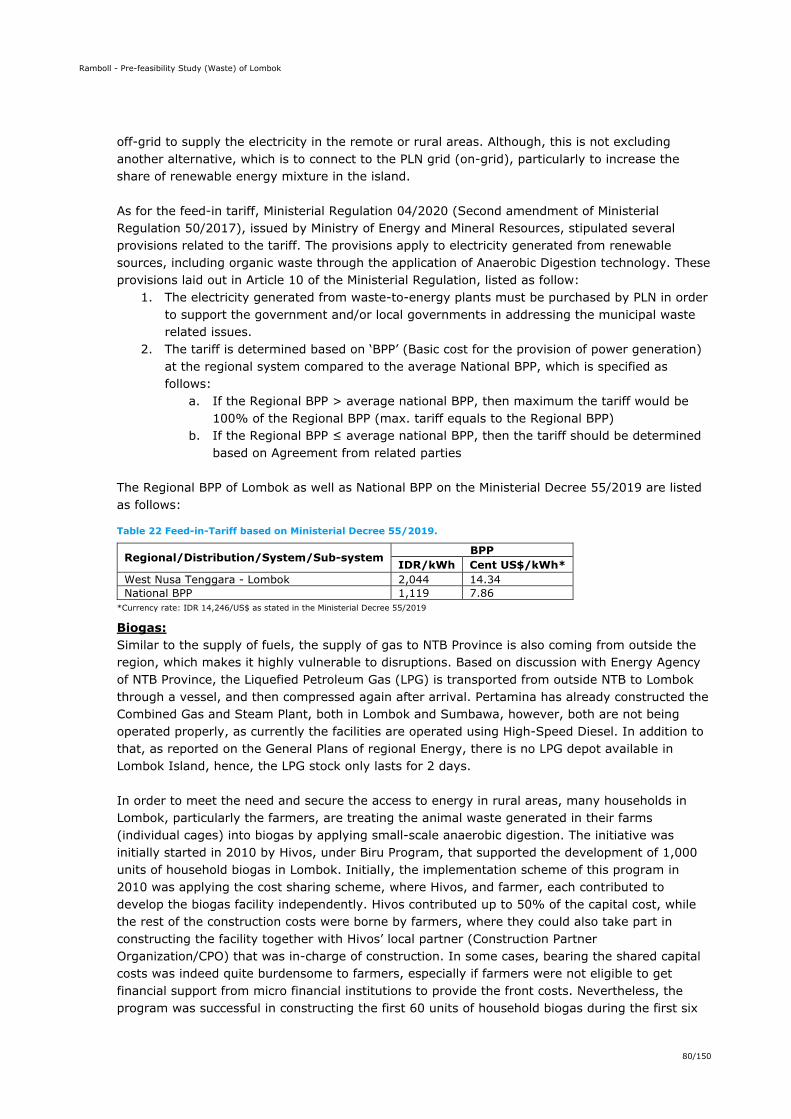
Ramboll - Pre-feasibility Study (Waste) of Lombok
80/150
off-grid to supply the electricity in the remote or rural areas. Although, this is not excluding another alternative, which is to connect to the PLN grid (on-grid), particularly to increase the share of renewable energy mixture in the island. As for the feed-in tariff, Ministerial Regulation 04/2020 (Second amendment of Ministerial Regulation 50/2017), issued by Ministry of Energy and Mineral Resources, stipulated several provisions related to the tariff. The provisions apply to electricity generated from renewable sources, including organic waste through the application of Anaerobic Digestion technology. These provisions laid out in Article 10 of the Ministerial Regulation, listed as follow:
1. The electricity generated from waste-to-energy plants must be purchased by PLN in order to support the government and/or local governments in addressing the municipal waste related issues.
2. The tariff is determined based on ‘BPP’ (Basic cost for the provision of power generation) at the regional system compared to the average National BPP, which is specified as follows:
a. If the Regional BPP > average national BPP, then maximum the tariff would be 100% of the Regional BPP (max. tariff equals to the Regional BPP)
b. If the Regional BPP ≤ average national BPP, then the tariff should be determined based on Agreement from related parties
The Regional BPP of Lombok as well as National BPP on the Ministerial Decree 55/2019 are listed as follows:
Table 22 Feed-in-Tariff based on Ministerial Decree 55/2019.
Regional/Distribution/System/Sub-system BPP
IDR/kWh Cent US$/kWh* West Nusa Tenggara - Lombok 2,044 14.34 National BPP 1,119 7.86
*Currency rate: IDR 14,246/US$ as stated in the Ministerial Decree 55/2019 Biogas: Similar to the supply of fuels, the supply of gas to NTB Province is also coming from outside the region, which makes it highly vulnerable to disruptions. Based on discussion with Energy Agency of NTB Province, the Liquefied Petroleum Gas (LPG) is transported from outside NTB to Lombok through a vessel, and then compressed again after arrival. Pertamina has already constructed the Combined Gas and Steam Plant, both in Lombok and Sumbawa, however, both are not being operated properly, as currently the facilities are operated using High-Speed Diesel. In addition to that, as reported on the General Plans of regional Energy, there is no LPG depot available in Lombok Island, hence, the LPG stock only lasts for 2 days. In order to meet the need and secure the access to energy in rural areas, many households in Lombok, particularly the farmers, are treating the animal waste generated in their farms (individual cages) into biogas by applying small-scale anaerobic digestion. The initiative was initially started in 2010 by Hivos, under Biru Program, that supported the development of 1,000 units of household biogas in Lombok. Initially, the implementation scheme of this program in 2010 was applying the cost sharing scheme, where Hivos, and farmer, each contributed to develop the biogas facility independently. Hivos contributed up to 50% of the capital cost, while the rest of the construction costs were borne by farmers, where they could also take part in constructing the facility together with Hivos’ local partner (Construction Partner Organization/CPO) that was in-charge of construction. In some cases, bearing the shared capital costs was indeed quite burdensome to farmers, especially if farmers were not eligible to get financial support from micro financial institutions to provide the front costs. Nevertheless, the program was successful in constructing the first 60 units of household biogas during the first six

Ramboll - Pre-feasibility Study (Waste) of Lombok
81/150
month of implementation, although the progress was slow at first. Up to 2014, however, the construction of household biogas in Lombok was quite massive, according to Energy Agency of NTB Province. In addition to that, Hivos also provided training on how to operate and maintain the biogas, as farmers themselves will be the operators. As farmers were involved at the beginning during construction, a sense of ownership was built, which then became one of the successful factors to sustain in running the facility. Under the cost sharing scheme, the implementation of this program was running well and attracted local governments to further support and be more involved in the program. Since 2015, the implementation scheme has been changed, where the local government agency is fully involved in the construction phase, while Hivos engaged in the post-construction phase, such as training, after sales service, developing business plans, support to strengthen financial accountability, etc. Based on discussion with Hivos in Lombok, under the current scheme, communities or farmers seem less committed to maintaining the facility mainly due to the absence of a sense of ownership. The beneficiaries of the household biogas are also sometimes mis-targeted, as some of the beneficiaries do not need the facility. After the evaluation phase, beneficiaries are now targeted mainly to farmers with cattle. To date, there are around 5,000 units of household biogas in NTB Province with various capacities between 4 – 6 m3, where 90% of these facilities are located in Lombok. The household biogas program is seen as a momentum to expand energy (gas) access in rural areas as well as to substitute the use of LPG, where there is a lack of access. Nevertheless, the provision of household biogas to date still focuses on individual farmers and no plans to further develop into commercial scale. In addition to that, although collective cages seem more feasible for biogas development due to its capacity, the challenge lies in the management that involves multiple users, which is prone to free riders. The construction of biogas is mobilized using local budgets, however, seemingly poses to some degree of unreliability, as it usually depends on local priorities. For instance, the local budget was shifted focus in 2018 to handle earthquakes, similar to the current situation of pandemic. On the other hand, Hivos initiated to voluntarily participate in the carbon markets, thus receiving credits from the carbon offset from the biogas facility. Eventually, the credit has been one of Hivos’ sources of revenue to be able to continue and sustain this initiative. In the case of organic waste-to-energy plants, carbon credit could also be an additional source of revenues to finance the operational expenses of the facility, which is usually identified as one of the biggest constraints, as long as it is legally and institutionally enabled. Considering the lack of access and stock of LPG in the province, the biogas output from organic waste-to-energy facility could potentially be used as a replacement of LPG, which then be distributed to the market. However, further conversion may be required that results in higher costs. The current retail price of subsidized 3kg LPG tubes in Lombok is around IDR 16,500 - 17,500 (1.2 USD) per tube. On the other hand, the national government has a plan to gradually transfer the price subsidy, including LPG, to direct subsidies (more targeted beneficiaries), as stated in National Medium-Term Development Plan (RPJMN) 2020-2024.
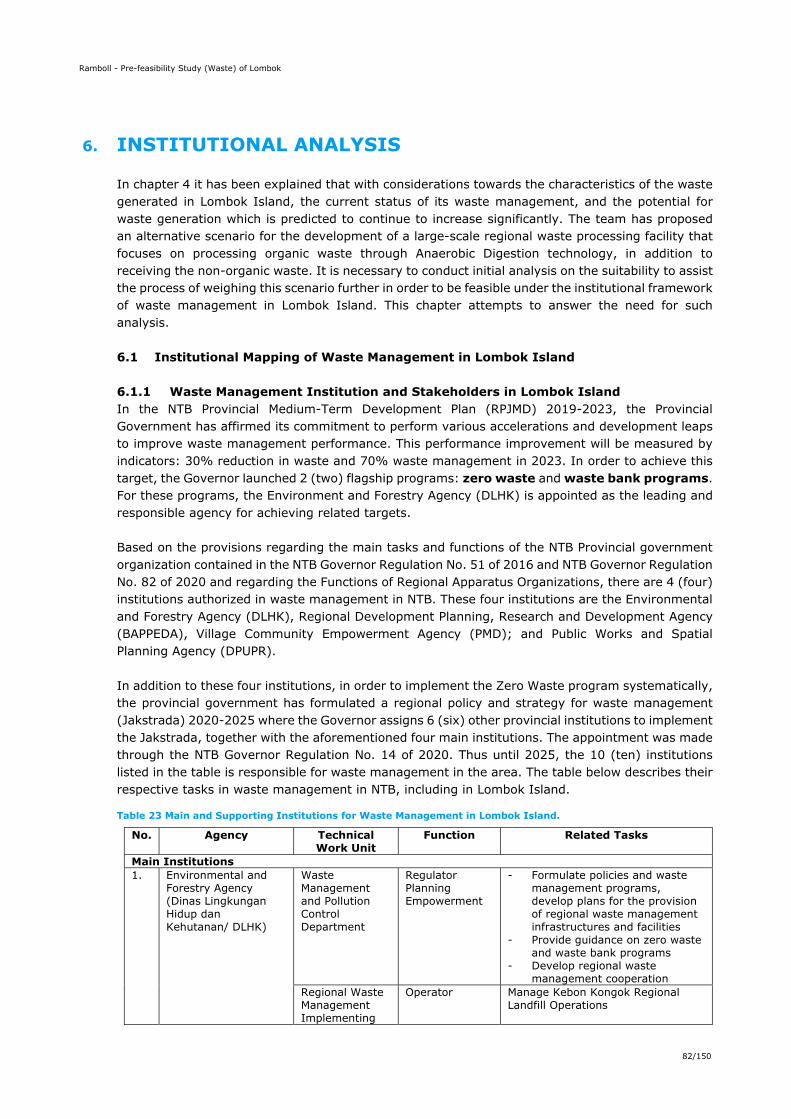
Ramboll - Pre-feasibility Study (Waste) of Lombok
82/150
6. INSTITUTIONAL ANALYSIS
In chapter 4 it has been explained that with considerations towards the characteristics of the waste generated in Lombok Island, the current status of its waste management, and the potential for waste generation which is predicted to continue to increase significantly. The team has proposed an alternative scenario for the development of a large-scale regional waste processing facility that focuses on processing organic waste through Anaerobic Digestion technology, in addition to receiving the non-organic waste. It is necessary to conduct initial analysis on the suitability to assist the process of weighing this scenario further in order to be feasible under the institutional framework of waste management in Lombok Island. This chapter attempts to answer the need for such analysis.
6.1 Institutional Mapping of Waste Management in Lombok Island
6.1.1 Waste Management Institution and Stakeholders in Lombok Island In the NTB Provincial Medium-Term Development Plan (RPJMD) 2019-2023, the Provincial Government has affirmed its commitment to perform various accelerations and development leaps to improve waste management performance. This performance improvement will be measured by indicators: 30% reduction in waste and 70% waste management in 2023. In order to achieve this target, the Governor launched 2 (two) flagship programs: zero waste and waste bank programs. For these programs, the Environment and Forestry Agency (DLHK) is appointed as the leading and responsible agency for achieving related targets. Based on the provisions regarding the main tasks and functions of the NTB Provincial government organization contained in the NTB Governor Regulation No. 51 of 2016 and NTB Governor Regulation No. 82 of 2020 and regarding the Functions of Regional Apparatus Organizations, there are 4 (four) institutions authorized in waste management in NTB. These four institutions are the Environmental and Forestry Agency (DLHK), Regional Development Planning, Research and Development Agency (BAPPEDA), Village Community Empowerment Agency (PMD); and Public Works and Spatial Planning Agency (DPUPR). In addition to these four institutions, in order to implement the Zero Waste program systematically, the provincial government has formulated a regional policy and strategy for waste management (Jakstrada) 2020-2025 where the Governor assigns 6 (six) other provincial institutions to implement the Jakstrada, together with the aforementioned four main institutions. The appointment was made through the NTB Governor Regulation No. 14 of 2020. Thus until 2025, the 10 (ten) institutions listed in the table is responsible for waste management in the area. The table below describes their respective tasks in waste management in NTB, including in Lombok Island.
Table 23 Main and Supporting Institutions for Waste Management in Lombok Island.
No. Agency Technical Work Unit
Function Related Tasks
Main Institutions 1. Environmental and
Forestry Agency (Dinas Lingkungan Hidup dan Kehutanan/ DLHK)
Waste Management and Pollution Control Department
Regulator Planning Empowerment
- Formulate policies and waste management programs, develop plans for the provision of regional waste management infrastructures and facilities
- Provide guidance on zero waste and waste bank programs
- Develop regional waste management cooperation
Regional Waste Management Implementing
Operator Manage Kebon Kongok Regional Landfill Operations
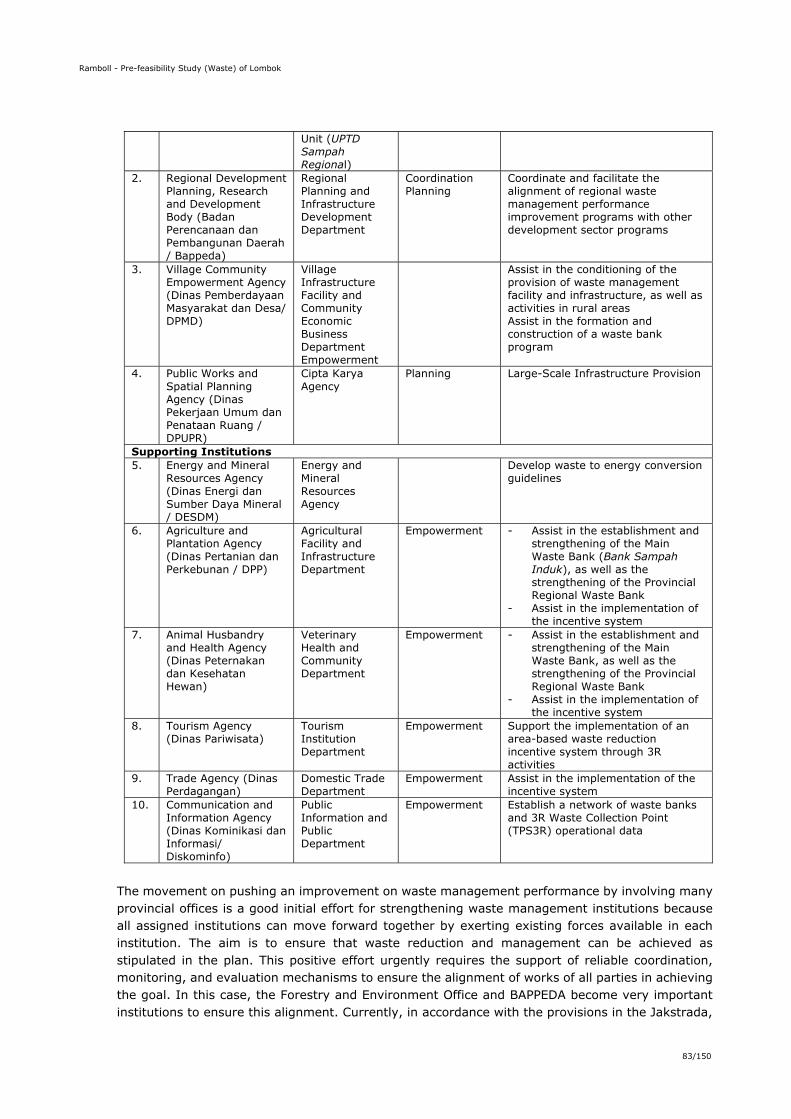
Ramboll - Pre-feasibility Study (Waste) of Lombok
83/150
The movement on pushing an improvement on waste management performance by involving many provincial offices is a good initial effort for strengthening waste management institutions because all assigned institutions can move forward together by exerting existing forces available in each institution. The aim is to ensure that waste reduction and management can be achieved as stipulated in the plan. This positive effort urgently requires the support of reliable coordination, monitoring, and evaluation mechanisms to ensure the alignment of works of all parties in achieving the goal. In this case, the Forestry and Environment Office and BAPPEDA become very important institutions to ensure this alignment. Currently, in accordance with the provisions in the Jakstrada,
Unit (UPTD Sampah Regional)
2. Regional Development Planning, Research and Development Body (Badan Perencanaan dan Pembangunan Daerah / Bappeda)
Regional Planning and Infrastructure Development Department
Coordination Planning
Coordinate and facilitate the alignment of regional waste management performance improvement programs with other development sector programs
3. Village Community Empowerment Agency (Dinas Pemberdayaan Masyarakat dan Desa/ DPMD)
Village Infrastructure Facility and Community Economic Business Department Empowerment
Assist in the conditioning of the provision of waste management facility and infrastructure, as well as activities in rural areas Assist in the formation and construction of a waste bank program
4. Public Works and Spatial Planning Agency (Dinas Pekerjaan Umum dan Penataan Ruang / DPUPR)
Cipta Karya Agency
Planning Large-Scale Infrastructure Provision
Supporting Institutions 5. Energy and Mineral
Resources Agency (Dinas Energi dan Sumber Daya Mineral / DESDM)
Energy and Mineral Resources Agency
Develop waste to energy conversion guidelines
6. Agriculture and Plantation Agency (Dinas Pertanian dan Perkebunan / DPP)
Agricultural Facility and Infrastructure Department
Empowerment - Assist in the establishment and strengthening of the Main Waste Bank (Bank Sampah Induk), as well as the strengthening of the Provincial Regional Waste Bank
- Assist in the implementation of the incentive system
7. Animal Husbandry and Health Agency (Dinas Peternakan dan Kesehatan Hewan)
Veterinary Health and Community Department
Empowerment - Assist in the establishment and strengthening of the Main Waste Bank, as well as the strengthening of the Provincial Regional Waste Bank
- Assist in the implementation of the incentive system
8. Tourism Agency (Dinas Pariwisata)
Tourism Institution Department
Empowerment Support the implementation of an area-based waste reduction incentive system through 3R activities
9. Trade Agency (Dinas Perdagangan)
Domestic Trade Department
Empowerment Assist in the implementation of the incentive system
10. Communication and Information Agency (Dinas Kominikasi dan Informasi/ Diskominfo)
Public Information and Public Department
Empowerment Establish a network of waste banks and 3R Waste Collection Point (TPS3R) operational data
Ramboll - Pre-feasibility Study (Waste) of Lombok
84/150
monitoring and evaluation are carried out 1 (once) in 1 (one) year, and the results are reported to the Governor to be used as inputs for reporting to the Minister of Environment at the national level. In order to improve the performance of waste management, in the Jakstrada policy, the Governor has assigned village (rural village) and urban village government in a very strategic role. This is to ensure the success of waste reduction and management efforts that need to be done from the source to the temporary solid waste collection point (TPS). As stated in Governor Regulation No. 14 of 2020 on Jakstrada, article 24, the Governor mandates the village/urban village government to allocate their budget for waste management in accordance with the financial capabilities of the village/urban villages; support waste management efforts in their area; and establish a waste management unit and TPS for the village and its surrounding area. The assigned role of village/urban village in such position is a step of institutional structuring and a very strategic policy. This will also make things easier for the Village Community Empowerment Office (Dinas Pemberdayaan Masyarakat dan Desa/ DPMD) at the provincial and district/city levels to provide guidance on prioritization of annual village fund allocation in each area. Therefore, it becomes more possible that the needs for facilities and infrastructures at the village level are met. In addition, with such positioning off village/urban village, improvement in the efforts to encourage waste sorting practices will be more possible. In addition to efforts at the government level, the NTB government since 2020 has actively working on strengthening collaboration with all parties. In early 2020, the NTB Provincial Government has entered into a partnership with State-owned Electricity Company (PLN) NTB Regional Unit for waste to energy research and development. This collaboration is directed to process waste into RDF pellets that will be used to supply the needs of coal replacement fuel in the Jeranjang West Lombok Power Plant. Technically, the implementation of this partnership is carried out by PT. Indonesia Power with the Environmental and Forestry Agency (DLHK) at Kebon Kongok landfill. Other efforts to cooperate with other parties are also carried out by the Environmental and Forestry Agency (DLHK), which is currently proactive in rallying the interest of all universities in NTB to be involved and assist the provincial government in improving waste management performance. In this process, the Environmental and Forestry Agency (DLHK) invites universities in NTB to collaborate in the form of programs or activities that are in accordance with the strengths and interests of each university. This process is still ongoing, and this effort has received a good reception from universities.
6.1.2 Institutional Capacity in Waste Management in Lombok Island Since 2019, the provincial government has performed efforts to improve waste management performance in NTB into the Zero Waste Program bundle. Based on the statement from the Environmental and Forestry Agency (DLHK), this Zero Waste program does not mean that there will be no more waste problems in NTB. However, zero waste is a model of the NTB provincial government's waste management program that is directed to treat waste as a resource. This program is an application of the concept of waste management based on waste reduction, waste recycling, reuse of waste, improvement of waste handling performance, and application of the circular economy concept in waste management. In this program, the community-based waste management through waste banks and community groups (called kelompok swadaya masyarakat or KSM/CBO/CSO), as well as the establishment of waste management cooperation within provincial government organizations, and between the provincial government and district/city governments becomes the main characteristics of the program. There is a high expectation that the development of the waste to product and waste to energy industries can be started and that these industries will become the driving force for various provincial government efforts to improve the performance of waste management in this Zero Waste program package.

Ramboll - Pre-feasibility Study (Waste) of Lombok
85/150
The Environmental and Forestry Agency (DLHK) is the leading institution to improve waste management performance. Since 2019 until now, this office has made various efforts to ensure the achievement of waste reduction and management targets as stated in the RPJMD (Regional Medium Term Development Plan) and Jakstrada (Regional Policies and Strategy). Based on the 2020 Performance Accountability Report of the Environmental and Forestry Agency (DLHK), it can be seen this office already has a strategic and well-managed capacity. This can be seen from the realization of the performance achieved until 2020, as shown in the table below.
Table 24 Realization of Forestry and Environment Office Performance in Waste Management.
Capacity Element
Performance
Regulation Since 2019 a number of strategic regulatory products for waste management have been issued, including Perda (Local Regulation) No. 5 of 2019 about Waste Management; Governor Regulation No. 14 of 2020 on Jakstrada on Waste Management; MoU and Cooperation Agreement between the Provincial Government and the Mataram City Government and the West Lombok District Government regarding the Development and Management of the Kebon Kongok Regional Landfill. MoU between the Provincial Environmental and Forestry Agency (DLHK) and all District/City Environment Offices in NTB, and the Decree of the Provincial Forestry and Environment Office regarding the Transport of Segregated Waste to the Kebon Kongok Landfill.
Collaboration - Currently, the Forestry and Environment Office has established a close collaboration with the NTB Provincial Cooperatives and MSMEs Office, and Scouts in the context of reducing and processing waste. In addition, collaboration is also established with PLN (National Electricity Company) for RDF processing.
- Furthermore, in 2021 there are a number of pilot collaboration processes that are being carried out, including:
o collaboration with the Forest for Life Indonesia Foundation on processing organic waste in NTB by Province by utilizing bioconversion technology,
o collaboration with universities in NTB, o collaboration between the Governor of NTB and PT Servos Teknologi
Internasional regarding waste management in the Province of NTB, o collaboration between BUMDES Mart Sengkol Village, Central
Lombok District and Feedwerkz PTE. LTD. on organic waste management in Sengkol Village, Central Lombok, by utilizing bioconversion technologies.
o Collaboration in big scale biogas management and plastic-to-fuel processing with PT Geo Trash Management
o SRF management with a capacity of 5 tons/day with PT. Gerbang NTB Emas
Awareness Raising and Empowerment
Community campaigns and development of local champions in 47 locations including tourist villages, incentive provision, and zero waste campaigns are performed through community activities and social media.
Management Innovation
The development of the e-smash (Electronic System Manajemen Sampah) application, which has already been started. This application is intended to be a waste bank data, which can also function as a medium for delivering waste data. This application is expected to be well managed and able to present data in real time.
Source: Forestry and Environment Office Performance Accountability Report 2020
Ramboll - Pre-feasibility Study (Waste) of Lombok
86/150
Although the efforts and results of the work shown by the Environmental and Forestry Agency (DLHK) have been good, the accountability report stated that this institution still faces several challenges, including: 1. Community's participation in waste management is still low (especially regarding the 3Rs
facilities), despite efforts to carry out outreach through many media, including social media. 2. The village-based waste reduction scheme is not yet optimal. 3. Budget constraints, especially after the pandemic, where the provincial government had to
refocus and divert the budget for handling the impact of COVID pandemic. 4. The problem of operational limitations faced by the Local Technical Implementing Unit (UPTD)
of Kebon Kongok Regional Landfill. The UPTD of Kebon Kongok Regional Landfill is the operator for regional waste management. This institution is within the Environmental and Forestry Agency (DLHK) and was formed in 2018 with the Governor Regulation No. 45 of 2018 as the legal basis under the nomenclature of UPTD TPA Sampah Regional. This unit is established with the aim of managing regional waste originating from the cities of Mataram and West Lombok at the Kebon Kongok Regional Landfill. This landfill was first built in 1993. Thus, it has been operating for 28 years. However, this Landfill has just been transferred into the management of the NTB Provincial Government in 2018 on the basis of the Cooperation Agreement between NTB Provincial Government, West Lombok District Government, and Mataram City Government Number 027/01.1/PPL DISLHK/2018 on Development of Regional Final Waste Processing Sites of NTB Province. This landfill has a processing area of 5.41 hectares, and has a maximum design capacity of 951,860m3. Based on public information submitted by the Environmental and Forestry Agency (DLHK) on its website in September 2021 (accessed on September 8, 2021), the status of landfilling at the Kebon Kongok Regional Landfill is currently at level 7 or reaching 30 meters high and is in a dangerous status. In this status, the landfill mount will be prone to a landslide, so the mobility of operational vehicles has begun to be limited. Currently, apart from receiving waste from Mataram City and West Lombok District, the Kebon Kongok Regional Landfill also receives waste from provincial government offices and institutions, as well as from private transporters and from independent waste transporters from several villages and sub-districts. Therefore, considering the dangerous conditions faced by the Kebon Kongok Regional Landfill, the Head of the Environmental and Forestry Agency (DLHK), in August 2021, issued a Decree of the Head of the Environmental and Forestry Agency (DLHK) Office of NTB Province No. 660/4179/TPAR/DLHK/2021 on Provisions regarding Transport of Segregated Waste. This decree is intended to regulate the pattern of waste disposal originating from the independent transport groups. The decree states that:
Waste must be separated into at least 2 types: organic and non-organic waste The organic waste is transported by means of three-wheeled transportation and stored in
packages/containers that are separated from non-organic waste or can be combined inside but separated using a divider from the organic waste.
Organic waste can only be unloaded at locations that has been determined by the Landfill officer after going through the weighing process.
Meanwhile, non-organic waste can be taken directly to the final processing area. Waste that is not segregated is not allowed to be disposed of at the Kebon Kongok Regional
Landfill. Meanwhile, provisions regarding waste restrictions from West Lombok District and Mataram City are in the process of being agreed upon and will be regulated separately. With the current state of danger in the Kebon Kongok Regional Landfill, urgent action is needed to reduce waste in the landfill. The Environmental and Forestry Agency (DLHK) estimates that starting in November 2021 this landfill will no longer be able to accommodate waste. In its 2020

Ramboll - Pre-feasibility Study (Waste) of Lombok
87/150
Environmental and Forestry Agency (DLHK) Performance Accountability Report, the office stated there are some barriers experienced by the Implementing Unit (UPTD) in managing waste at Kebon Kongok Regional Landfill, such as: 1. The size of available land at the Landfill is already very narrow and disproportionate to the
increasing volume of incoming waste, 2. Lack of facilities and infrastructure for final processing such as heavy equipment, dump trucks. 3. Limited and inflexible operational budget often causes difficulties in handling operational
problems, especially at the beginning and end of the year. 4. Utilization of biogas that still needs to be developed 5. The problem of leachate processing that has not been optimal due to a very large volume of
leachate and that the leachate processing installation is no longer able to function properly. 6. Social problems due to protests from the surrounding community. The six obstacles above are rooted in the limited flexibility of the UPTD budget, and the ineffectiveness of marketing cooperation. In its position as a technical unit (UPTD) under DLHK, the operational costs of the Regional Waste TPA UPTD are highly dependent on the budget successfully submitted by DLHK in the process of determining the Regional Budget. In the budget disbursement process, DLHK will follow the budget disbursement process and schedule that is generally applicable to all regional apparatus organizations in the NTB Province. This process is standardized and could not be made more flexible. As for the income obtained from paying for waste management services at the Kebon Kongok TPA, the Regional Waste TPA UPTD cannot directly use the income to finance the operation of the TPA. The income earned must be deposited in the regional treasury account and in the accounting reporting process it will be included as a general regional income category. This provision is stated in the Cooperation Agreement between the NTB Provincial Government, West Lombok Regency Government and Mataram City No. 027/01.l/PPL/DISLHK/2018 on Final Processing Site Development (TPA) Sampah Regional Provinsi NTB clause 18. Likewise, the revenue obtained from the Mataram City Government and the West Lombok Regency Government in the form of Service Compensation (KJP) and Negative Impact Compensation (KDN), must be deposited to the regional treasury of the NTB Province. This KJP is the amount of fees that must be paid by the Mataram City Government and West Lombok Regency Government to the NTB Provincial Government to be used in the operation and maintenance of the Regional Landfill. Meanwhile, KDN is the amount of fees that must be paid by third parties used to provide rewards to individuals, groups of people, and/or other parties which affected by the negative impact that caused by waste handling at the Regional Landfill and community facilitation activities that are negatively affected. In the process of budgeting submission, DLHK also experienced limitations in budget bargaining. This is due to the limited APBD of the NTB Provincial Government. In the 2020, Regional Fiscal Capacity Map contained in the Minister of Finance Regulation No. 120 Years 2020. In this position, the flexibility of the NTB Provincial Government APBD will be very narrow because the cost burden for government overhead is quite high. In the midst of the current budget constraints faced by the NTB Provincial Government and considering the operationalization of waste management at the Kebon Kongok Landfill which must always run, basically the UPTD of the Regional Landfill as an operator needs more flexibility to be able to explore other potential sources of funding. (Apart from the APBD disbursed from the DLHK). The Regional Waste Landfill UPTD also needs more flexibility to be able to collaborate with other parties. However, in its current condition as the technical implementing unit of the DLHK, this flexibility will not be possible because the laws and regulations do not allow it yet.
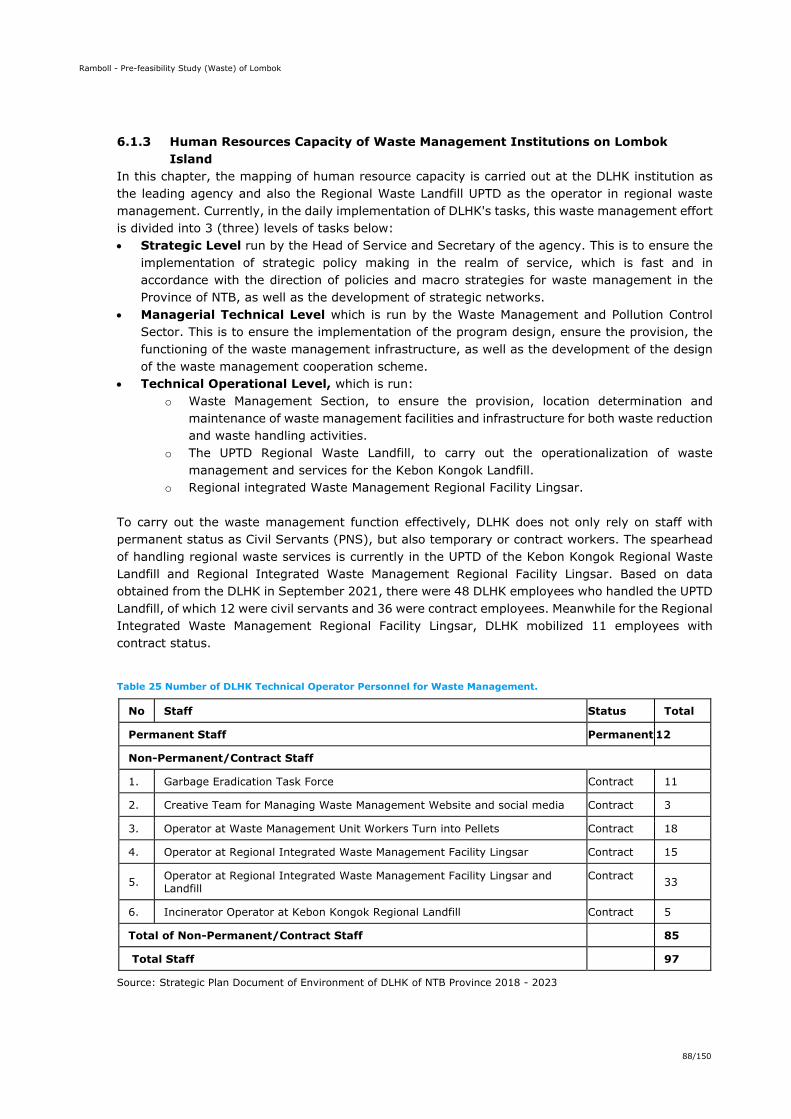
Ramboll - Pre-feasibility Study (Waste) of Lombok
88/150
6.1.3 Human Resources Capacity of Waste Management Institutions on Lombok Island
In this chapter, the mapping of human resource capacity is carried out at the DLHK institution as the leading agency and also the Regional Waste Landfill UPTD as the operator in regional waste management. Currently, in the daily implementation of DLHK's tasks, this waste management effort is divided into 3 (three) levels of tasks below: Strategic Level run by the Head of Service and Secretary of the agency. This is to ensure the
implementation of strategic policy making in the realm of service, which is fast and in accordance with the direction of policies and macro strategies for waste management in the Province of NTB, as well as the development of strategic networks.
Managerial Technical Level which is run by the Waste Management and Pollution Control Sector. This is to ensure the implementation of the program design, ensure the provision, the functioning of the waste management infrastructure, as well as the development of the design of the waste management cooperation scheme.
Technical Operational Level, which is run: o Waste Management Section, to ensure the provision, location determination and
maintenance of waste management facilities and infrastructure for both waste reduction and waste handling activities.
o The UPTD Regional Waste Landfill, to carry out the operationalization of waste management and services for the Kebon Kongok Landfill.
o Regional integrated Waste Management Regional Facility Lingsar. To carry out the waste management function effectively, DLHK does not only rely on staff with permanent status as Civil Servants (PNS), but also temporary or contract workers. The spearhead of handling regional waste services is currently in the UPTD of the Kebon Kongok Regional Waste Landfill and Regional Integrated Waste Management Regional Facility Lingsar. Based on data obtained from the DLHK in September 2021, there were 48 DLHK employees who handled the UPTD Landfill, of which 12 were civil servants and 36 were contract employees. Meanwhile for the Regional Integrated Waste Management Regional Facility Lingsar, DLHK mobilized 11 employees with contract status.
Table 25 Number of DLHK Technical Operator Personnel for Waste Management.
No Staff Status Total
Permanent Staff Permanent 12
Non-Permanent/Contract Staff
1. Garbage Eradication Task Force Contract 11
2. Creative Team for Managing Waste Management Website and social media Contract 3
3. Operator at Waste Management Unit Workers Turn into Pellets Contract 18
4. Operator at Regional Integrated Waste Management Facility Lingsar Contract 15
5. Operator at Regional Integrated Waste Management Facility Lingsar and Landfill
Contract 33
6. Incinerator Operator at Kebon Kongok Regional Landfill Contract 5
Total of Non-Permanent/Contract Staff 85
Total Staff 97
Source: Strategic Plan Document of Environment of DLHK of NTB Province 2018 - 2023
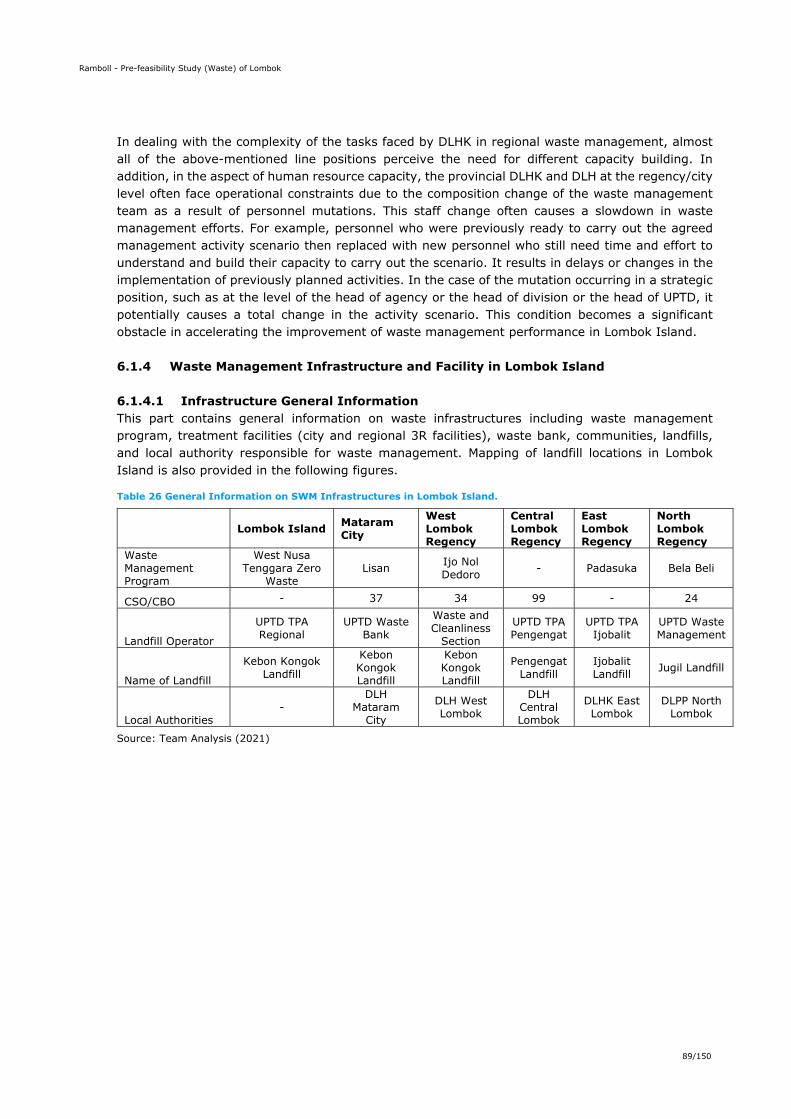
Ramboll - Pre-feasibility Study (Waste) of Lombok
89/150
In dealing with the complexity of the tasks faced by DLHK in regional waste management, almost all of the above-mentioned line positions perceive the need for different capacity building. In addition, in the aspect of human resource capacity, the provincial DLHK and DLH at the regency/city level often face operational constraints due to the composition change of the waste management team as a result of personnel mutations. This staff change often causes a slowdown in waste management efforts. For example, personnel who were previously ready to carry out the agreed management activity scenario then replaced with new personnel who still need time and effort to understand and build their capacity to carry out the scenario. It results in delays or changes in the implementation of previously planned activities. In the case of the mutation occurring in a strategic position, such as at the level of the head of agency or the head of division or the head of UPTD, it potentially causes a total change in the activity scenario. This condition becomes a significant obstacle in accelerating the improvement of waste management performance in Lombok Island.
6.1.4 Waste Management Infrastructure and Facility in Lombok Island
6.1.4.1 Infrastructure General Information This part contains general information on waste infrastructures including waste management program, treatment facilities (city and regional 3R facilities), waste bank, communities, landfills, and local authority responsible for waste management. Mapping of landfill locations in Lombok Island is also provided in the following figures.
Table 26 General Information on SWM Infrastructures in Lombok Island.
Lombok Island Mataram
City
West Lombok Regency
Central Lombok Regency
East Lombok Regency
North Lombok Regency
Waste Management Program
West Nusa Tenggara Zero
Waste Lisan Ijo Nol
Dedoro - Padasuka Bela Beli
CSO/CBO - 37 34 99 - 24
Landfill Operator
UPTD TPA Regional
UPTD Waste Bank
Waste and Cleanliness
Section
UPTD TPA Pengengat
UPTD TPA Ijobalit
UPTD Waste Management
Name of Landfill
Kebon Kongok Landfill
Kebon Kongok Landfill
Kebon Kongok Landfill
Pengengat Landfill
Ijobalit Landfill Jugil Landfill
Local Authorities -
DLH Mataram
City
DLH West Lombok
DLH Central Lombok
DLHK East Lombok
DLPP North Lombok
Source: Team Analysis (2021)
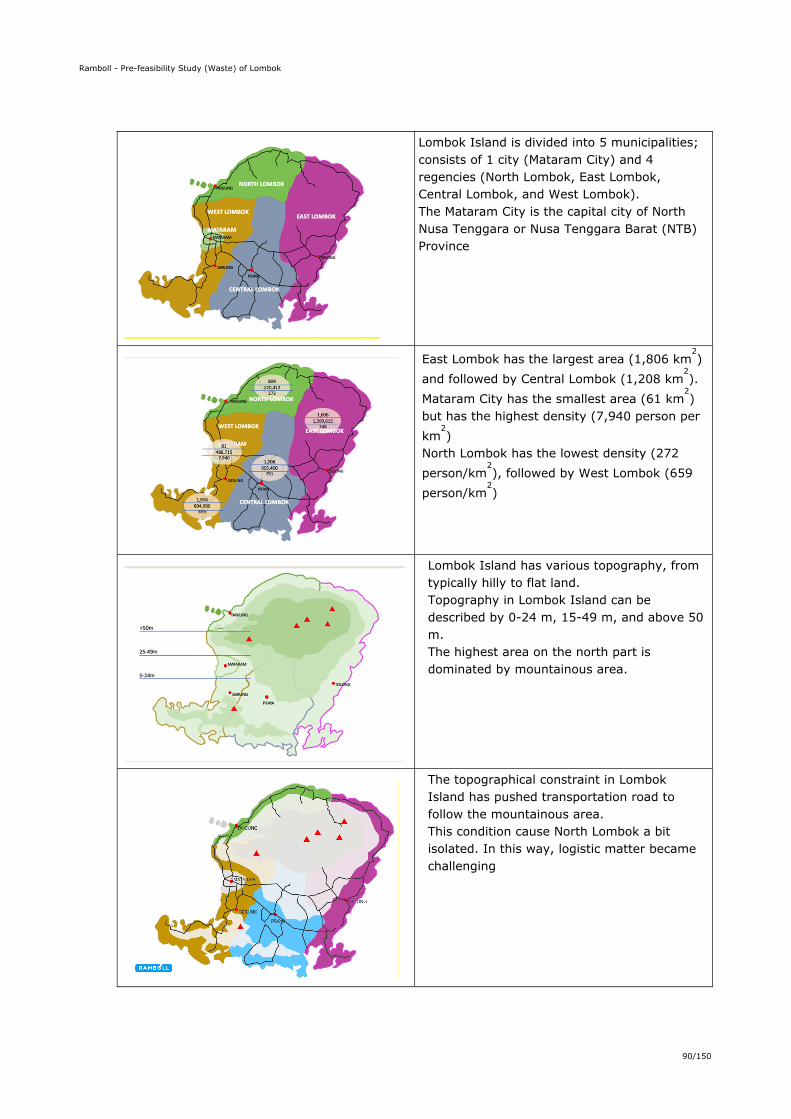
Ramboll - Pre-feasibility Study (Waste) of Lombok
90/150
Lombok Island is divided into 5 municipalities; consists of 1 city (Mataram City) and 4 regencies (North Lombok, East Lombok, Central Lombok, and West Lombok). The Mataram City is the capital city of North Nusa Tenggara or Nusa Tenggara Barat (NTB) Province
East Lombok has the largest area (1,806 km2)
and followed by Central Lombok (1,208 km2).
Mataram City has the smallest area (61 km2)
but has the highest density (7,940 person per km
2)
North Lombok has the lowest density (272 person/km
2), followed by West Lombok (659
person/km2)
Lombok Island has various topography, from typically hilly to flat land. Topography in Lombok Island can be described by 0-24 m, 15-49 m, and above 50 m. The highest area on the north part is dominated by mountainous area.
The topographical constraint in Lombok Island has pushed transportation road to follow the mountainous area. This condition cause North Lombok a bit isolated. In this way, logistic matter became challenging
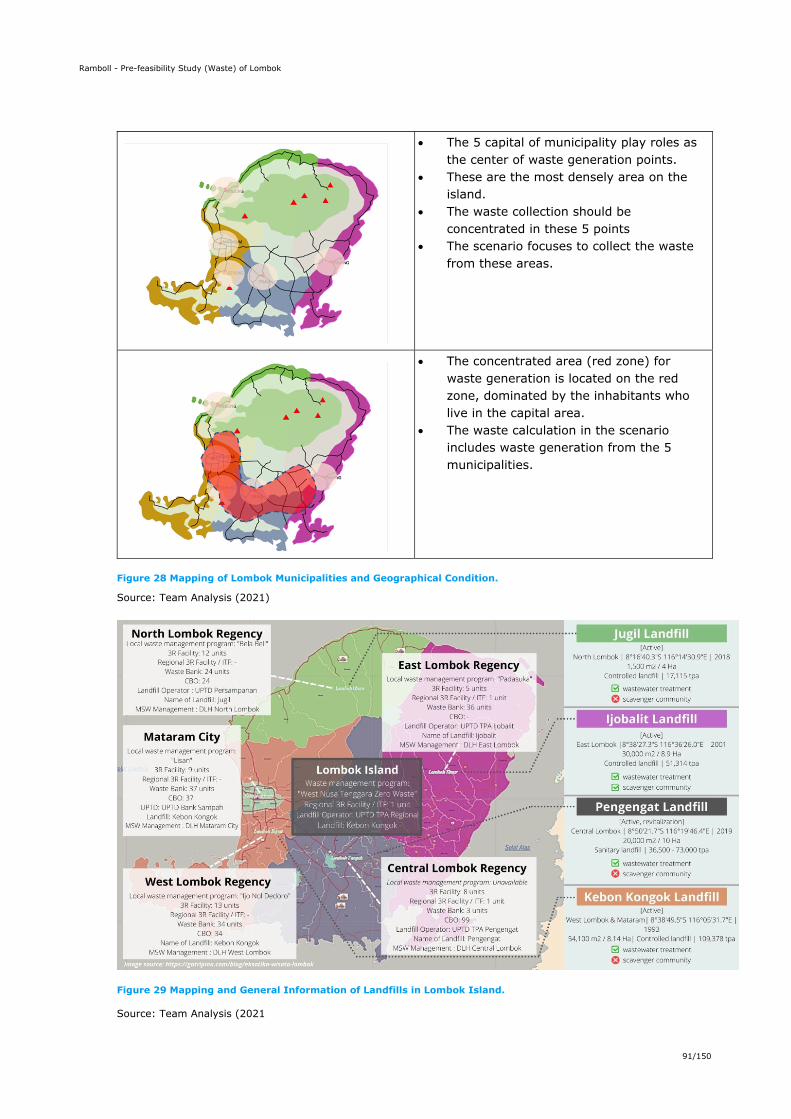
Ramboll - Pre-feasibility Study (Waste) of Lombok
91/150
The 5 capital of municipality play roles as the center of waste generation points.
These are the most densely area on the island.
The waste collection should be concentrated in these 5 points
The scenario focuses to collect the waste from these areas.
The concentrated area (red zone) for waste generation is located on the red zone, dominated by the inhabitants who live in the capital area.
The waste calculation in the scenario includes waste generation from the 5 municipalities.
Figure 28 Mapping of Lombok Municipalities and Geographical Condition.
Source: Team Analysis (2021)
Figure 29 Mapping and General Information of Landfills in Lombok Island.
Source: Team Analysis (2021
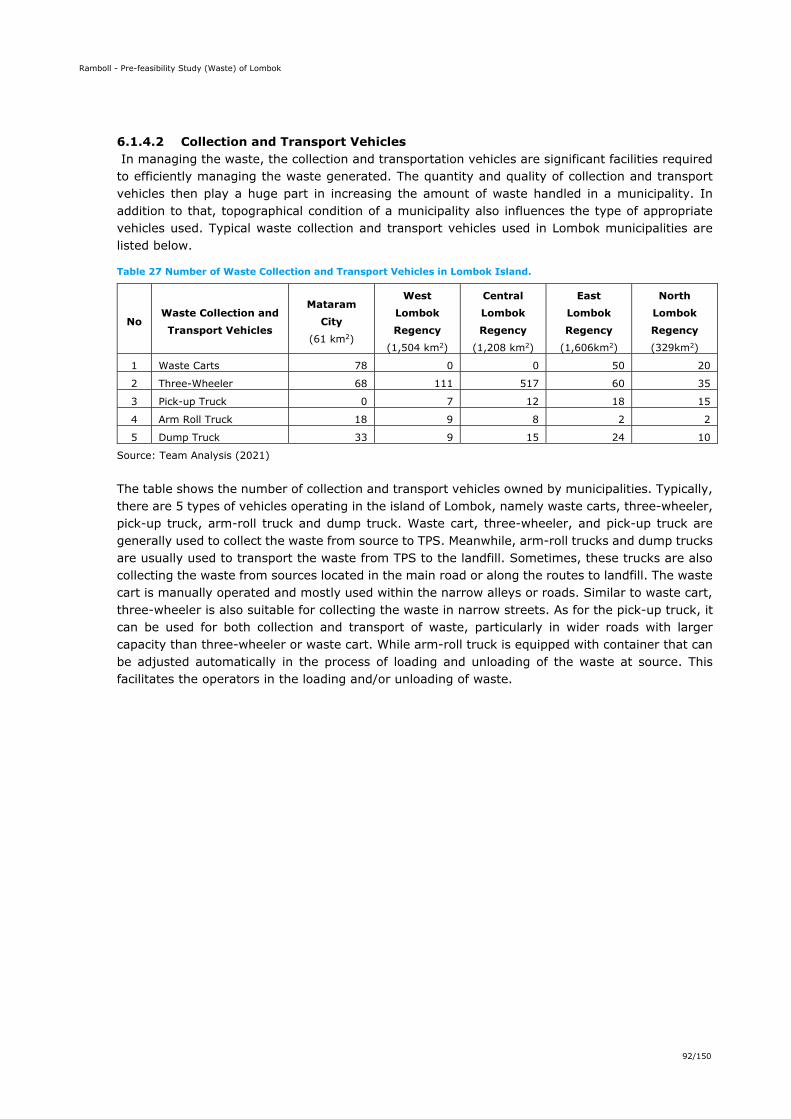
Ramboll - Pre-feasibility Study (Waste) of Lombok
92/150
6.1.4.2 Collection and Transport Vehicles In managing the waste, the collection and transportation vehicles are significant facilities required to efficiently managing the waste generated. The quantity and quality of collection and transport vehicles then play a huge part in increasing the amount of waste handled in a municipality. In addition to that, topographical condition of a municipality also influences the type of appropriate vehicles used. Typical waste collection and transport vehicles used in Lombok municipalities are listed below.
Table 27 Number of Waste Collection and Transport Vehicles in Lombok Island.
No Waste Collection and
Transport Vehicles
Mataram
City
(61 km2)
West
Lombok
Regency
(1,504 km2)
Central
Lombok
Regency
(1,208 km2)
East
Lombok
Regency
(1,606km2)
North
Lombok
Regency
(329km2)
1 Waste Carts 78 0 0 50 20
2 Three-Wheeler 68 111 517 60 35
3 Pick-up Truck 0 7 12 18 15
4 Arm Roll Truck 18 9 8 2 2
5 Dump Truck 33 9 15 24 10
Source: Team Analysis (2021) The table shows the number of collection and transport vehicles owned by municipalities. Typically, there are 5 types of vehicles operating in the island of Lombok, namely waste carts, three-wheeler, pick-up truck, arm-roll truck and dump truck. Waste cart, three-wheeler, and pick-up truck are generally used to collect the waste from source to TPS. Meanwhile, arm-roll trucks and dump trucks are usually used to transport the waste from TPS to the landfill. Sometimes, these trucks are also collecting the waste from sources located in the main road or along the routes to landfill. The waste cart is manually operated and mostly used within the narrow alleys or roads. Similar to waste cart, three-wheeler is also suitable for collecting the waste in narrow streets. As for the pick-up truck, it can be used for both collection and transport of waste, particularly in wider roads with larger capacity than three-wheeler or waste cart. While arm-roll truck is equipped with container that can be adjusted automatically in the process of loading and unloading of the waste at source. This facilitates the operators in the loading and/or unloading of waste.
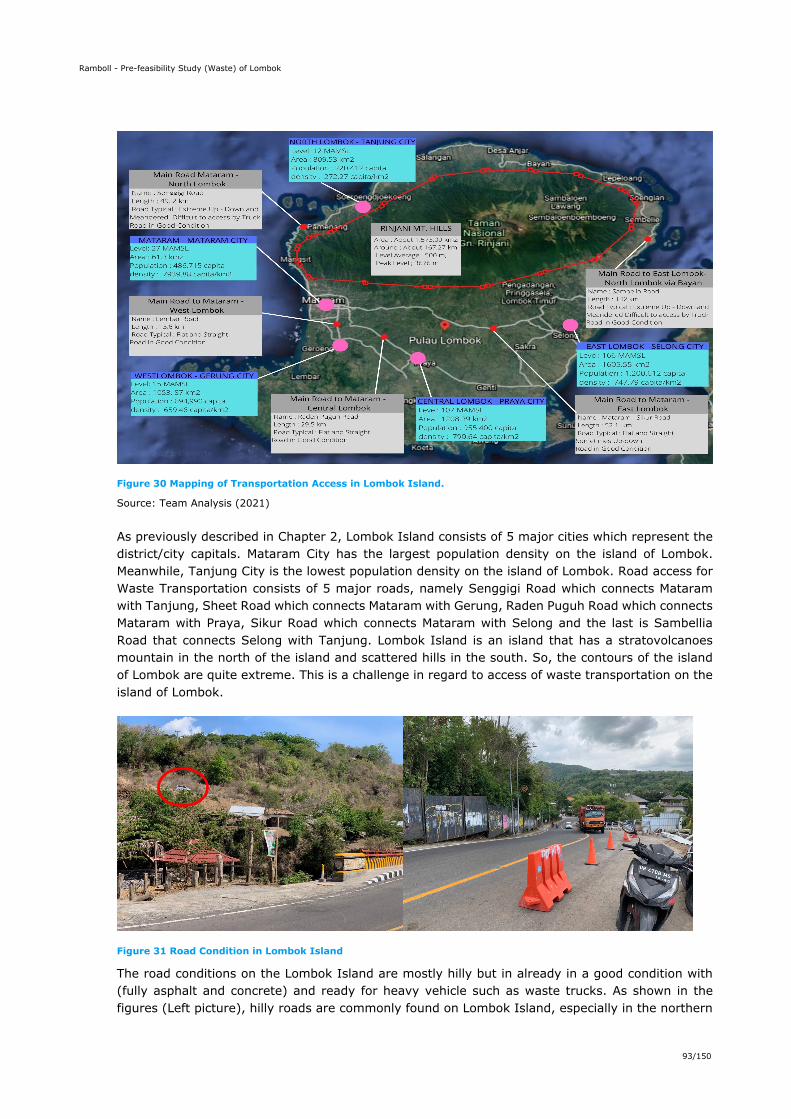
Ramboll - Pre-feasibility Study (Waste) of Lombok
93/150
Figure 30 Mapping of Transportation Access in Lombok Island.
Source: Team Analysis (2021)
As previously described in Chapter 2, Lombok Island consists of 5 major cities which represent the district/city capitals. Mataram City has the largest population density on the island of Lombok. Meanwhile, Tanjung City is the lowest population density on the island of Lombok. Road access for Waste Transportation consists of 5 major roads, namely Senggigi Road which connects Mataram with Tanjung, Sheet Road which connects Mataram with Gerung, Raden Puguh Road which connects Mataram with Praya, Sikur Road which connects Mataram with Selong and the last is Sambellia Road that connects Selong with Tanjung. Lombok Island is an island that has a stratovolcanoes mountain in the north of the island and scattered hills in the south. So, the contours of the island of Lombok are quite extreme. This is a challenge in regard to access of waste transportation on the island of Lombok.
Figure 31 Road Condition in Lombok Island
The road conditions on the Lombok Island are mostly hilly but in already in a good condition with (fully asphalt and concrete) and ready for heavy vehicle such as waste trucks. As shown in the figures (Left picture), hilly roads are commonly found on Lombok Island, especially in the northern
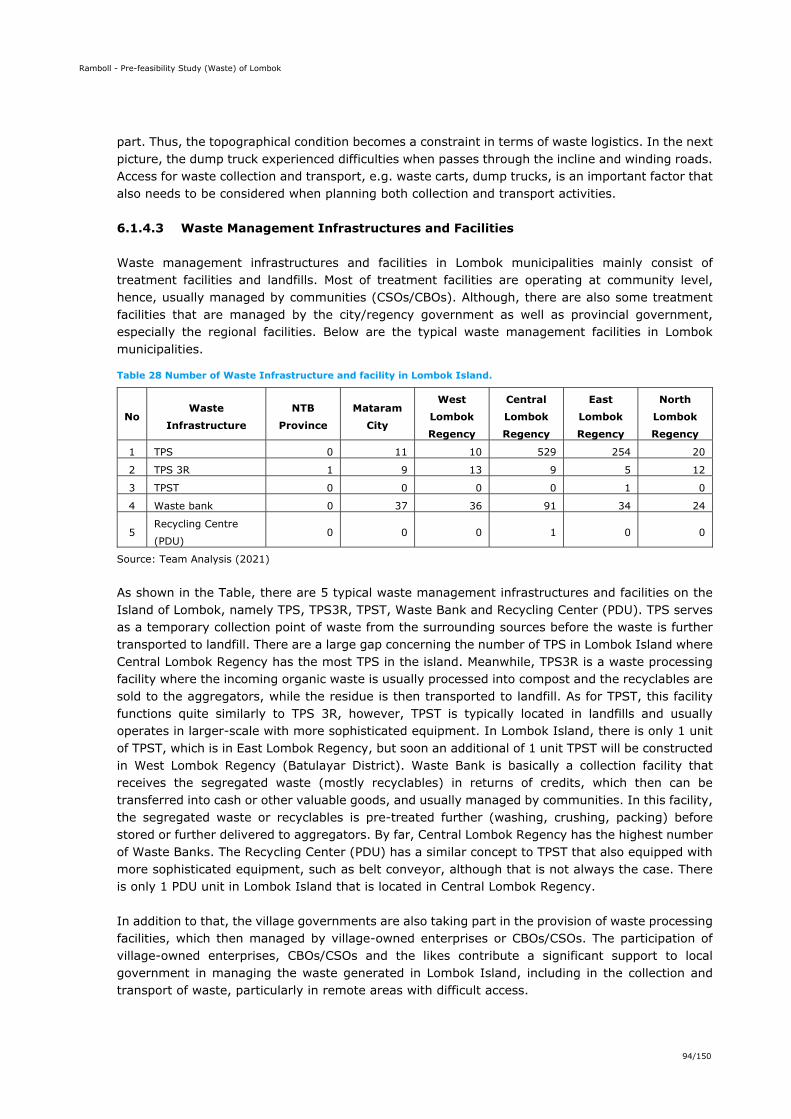
Ramboll - Pre-feasibility Study (Waste) of Lombok
94/150
part. Thus, the topographical condition becomes a constraint in terms of waste logistics. In the next picture, the dump truck experienced difficulties when passes through the incline and winding roads. Access for waste collection and transport, e.g. waste carts, dump trucks, is an important factor that also needs to be considered when planning both collection and transport activities.
6.1.4.3 Waste Management Infrastructures and Facilities Waste management infrastructures and facilities in Lombok municipalities mainly consist of treatment facilities and landfills. Most of treatment facilities are operating at community level, hence, usually managed by communities (CSOs/CBOs). Although, there are also some treatment facilities that are managed by the city/regency government as well as provincial government, especially the regional facilities. Below are the typical waste management facilities in Lombok municipalities.
Table 28 Number of Waste Infrastructure and facility in Lombok Island.
No Waste
Infrastructure
NTB
Province
Mataram
City
West
Lombok
Regency
Central
Lombok
Regency
East
Lombok
Regency
North
Lombok
Regency
1 TPS 0 11 10 529 254 20
2 TPS 3R 1 9 13 9 5 12
3 TPST 0 0 0 0 1 0
4 Waste bank 0 37 36 91 34 24
5 Recycling Centre
(PDU) 0 0 0 1 0 0
Source: Team Analysis (2021) As shown in the Table, there are 5 typical waste management infrastructures and facilities on the Island of Lombok, namely TPS, TPS3R, TPST, Waste Bank and Recycling Center (PDU). TPS serves as a temporary collection point of waste from the surrounding sources before the waste is further transported to landfill. There are a large gap concerning the number of TPS in Lombok Island where Central Lombok Regency has the most TPS in the island. Meanwhile, TPS3R is a waste processing facility where the incoming organic waste is usually processed into compost and the recyclables are sold to the aggregators, while the residue is then transported to landfill. As for TPST, this facility functions quite similarly to TPS 3R, however, TPST is typically located in landfills and usually operates in larger-scale with more sophisticated equipment. In Lombok Island, there is only 1 unit of TPST, which is in East Lombok Regency, but soon an additional of 1 unit TPST will be constructed in West Lombok Regency (Batulayar District). Waste Bank is basically a collection facility that receives the segregated waste (mostly recyclables) in returns of credits, which then can be transferred into cash or other valuable goods, and usually managed by communities. In this facility, the segregated waste or recyclables is pre-treated further (washing, crushing, packing) before stored or further delivered to aggregators. By far, Central Lombok Regency has the highest number of Waste Banks. The Recycling Center (PDU) has a similar concept to TPST that also equipped with more sophisticated equipment, such as belt conveyor, although that is not always the case. There is only 1 PDU unit in Lombok Island that is located in Central Lombok Regency. In addition to that, the village governments are also taking part in the provision of waste processing facilities, which then managed by village-owned enterprises or CBOs/CSOs. The participation of village-owned enterprises, CBOs/CSOs and the likes contribute a significant support to local government in managing the waste generated in Lombok Island, including in the collection and transport of waste, particularly in remote areas with difficult access.
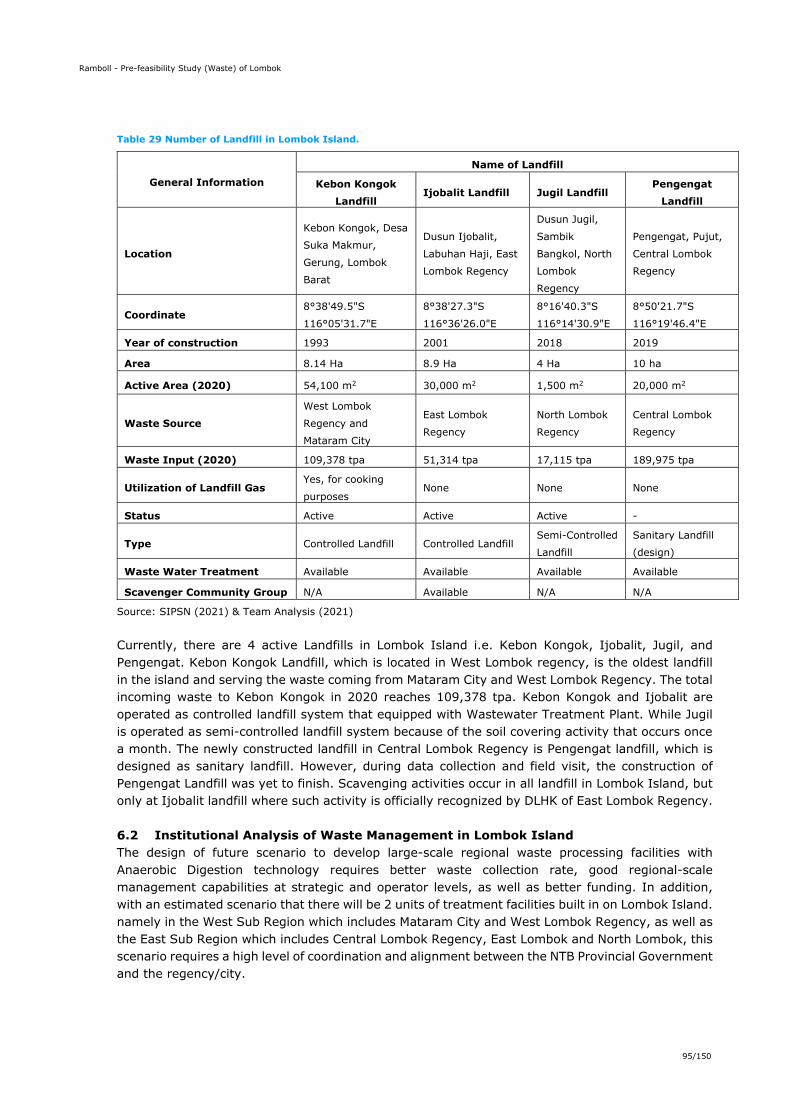
Ramboll - Pre-feasibility Study (Waste) of Lombok
95/150
Table 29 Number of Landfill in Lombok Island.
General Information
Name of Landfill
Kebon Kongok
Landfill Ijobalit Landfill Jugil Landfill
Pengengat
Landfill
Location
Kebon Kongok, Desa
Suka Makmur,
Gerung, Lombok
Barat
Dusun Ijobalit,
Labuhan Haji, East
Lombok Regency
Dusun Jugil,
Sambik
Bangkol, North
Lombok
Regency
Pengengat, Pujut,
Central Lombok
Regency
Coordinate 8°38'49.5"S
116°05'31.7"E
8°38'27.3"S
116°36'26.0"E
8°16'40.3"S
116°14'30.9"E
8°50'21.7"S
116°19'46.4"E
Year of construction 1993 2001 2018 2019
Area 8.14 Ha 8.9 Ha 4 Ha 10 ha
Active Area (2020) 54,100 m2 30,000 m2 1,500 m2 20,000 m2
Waste Source
West Lombok
Regency and
Mataram City
East Lombok
Regency
North Lombok
Regency
Central Lombok
Regency
Waste Input (2020) 109,378 tpa 51,314 tpa 17,115 tpa 189,975 tpa
Utilization of Landfill Gas Yes, for cooking
purposes None None None
Status Active Active Active -
Type Controlled Landfill Controlled Landfill Semi-Controlled
Landfill
Sanitary Landfill
(design)
Waste Water Treatment Available Available Available Available
Scavenger Community Group N/A Available N/A N/A
Source: SIPSN (2021) & Team Analysis (2021)
Currently, there are 4 active Landfills in Lombok Island i.e. Kebon Kongok, Ijobalit, Jugil, and Pengengat. Kebon Kongok Landfill, which is located in West Lombok regency, is the oldest landfill in the island and serving the waste coming from Mataram City and West Lombok Regency. The total incoming waste to Kebon Kongok in 2020 reaches 109,378 tpa. Kebon Kongok and Ijobalit are operated as controlled landfill system that equipped with Wastewater Treatment Plant. While Jugil is operated as semi-controlled landfill system because of the soil covering activity that occurs once a month. The newly constructed landfill in Central Lombok Regency is Pengengat landfill, which is designed as sanitary landfill. However, during data collection and field visit, the construction of Pengengat Landfill was yet to finish. Scavenging activities occur in all landfill in Lombok Island, but only at Ijobalit landfill where such activity is officially recognized by DLHK of East Lombok Regency.
6.2 Institutional Analysis of Waste Management in Lombok Island The design of future scenario to develop large-scale regional waste processing facilities with Anaerobic Digestion technology requires better waste collection rate, good regional-scale management capabilities at strategic and operator levels, as well as better funding. In addition, with an estimated scenario that there will be 2 units of treatment facilities built in on Lombok Island. namely in the West Sub Region which includes Mataram City and West Lombok Regency, as well as the East Sub Region which includes Central Lombok Regency, East Lombok and North Lombok, this scenario requires a high level of coordination and alignment between the NTB Provincial Government and the regency/city.
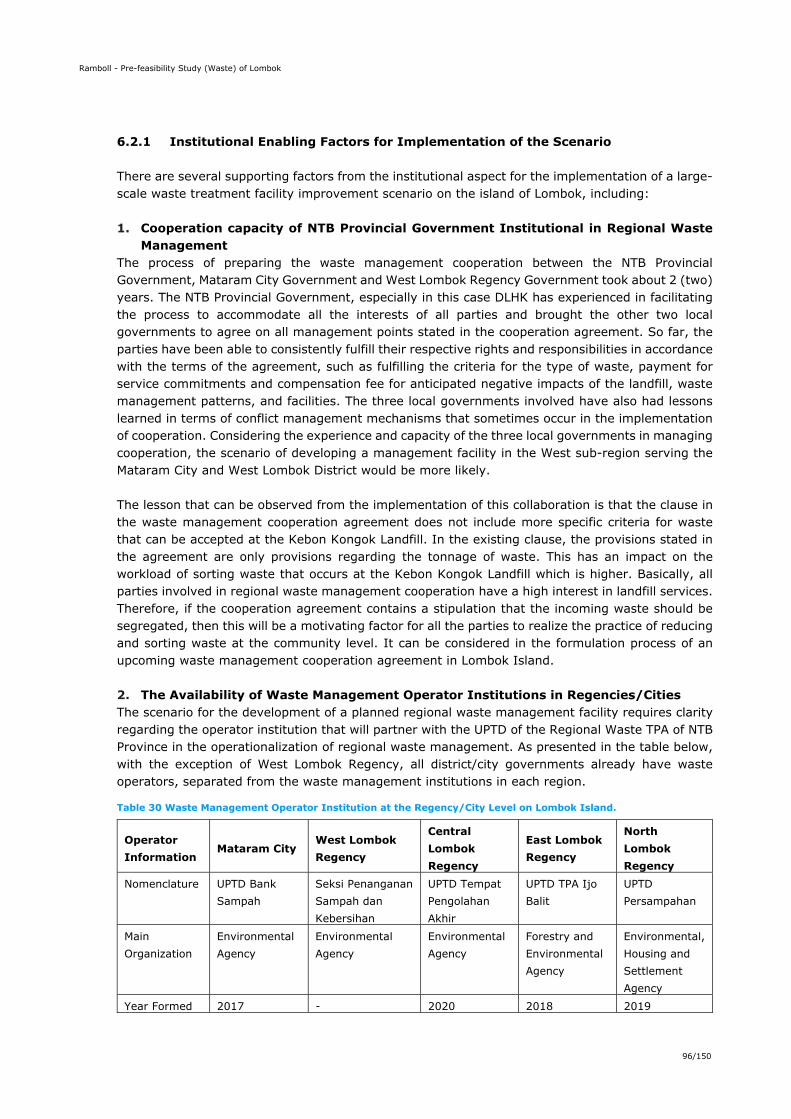
Ramboll - Pre-feasibility Study (Waste) of Lombok
96/150
6.2.1 Institutional Enabling Factors for Implementation of the Scenario There are several supporting factors from the institutional aspect for the implementation of a large-scale waste treatment facility improvement scenario on the island of Lombok, including: 1. Cooperation capacity of NTB Provincial Government Institutional in Regional Waste
Management The process of preparing the waste management cooperation between the NTB Provincial Government, Mataram City Government and West Lombok Regency Government took about 2 (two) years. The NTB Provincial Government, especially in this case DLHK has experienced in facilitating the process to accommodate all the interests of all parties and brought the other two local governments to agree on all management points stated in the cooperation agreement. So far, the parties have been able to consistently fulfill their respective rights and responsibilities in accordance with the terms of the agreement, such as fulfilling the criteria for the type of waste, payment for service commitments and compensation fee for anticipated negative impacts of the landfill, waste management patterns, and facilities. The three local governments involved have also had lessons learned in terms of conflict management mechanisms that sometimes occur in the implementation of cooperation. Considering the experience and capacity of the three local governments in managing cooperation, the scenario of developing a management facility in the West sub-region serving the Mataram City and West Lombok District would be more likely. The lesson that can be observed from the implementation of this collaboration is that the clause in the waste management cooperation agreement does not include more specific criteria for waste that can be accepted at the Kebon Kongok Landfill. In the existing clause, the provisions stated in the agreement are only provisions regarding the tonnage of waste. This has an impact on the workload of sorting waste that occurs at the Kebon Kongok Landfill which is higher. Basically, all parties involved in regional waste management cooperation have a high interest in landfill services. Therefore, if the cooperation agreement contains a stipulation that the incoming waste should be segregated, then this will be a motivating factor for all the parties to realize the practice of reducing and sorting waste at the community level. It can be considered in the formulation process of an upcoming waste management cooperation agreement in Lombok Island. 2. The Availability of Waste Management Operator Institutions in Regencies/Cities The scenario for the development of a planned regional waste management facility requires clarity regarding the operator institution that will partner with the UPTD of the Regional Waste TPA of NTB Province in the operationalization of regional waste management. As presented in the table below, with the exception of West Lombok Regency, all district/city governments already have waste operators, separated from the waste management institutions in each region.
Table 30 Waste Management Operator Institution at the Regency/City Level on Lombok Island.
Operator Information
Mataram City West Lombok Regency
Central Lombok Regency
East Lombok Regency
North Lombok Regency
Nomenclature UPTD Bank Sampah
Seksi Penanganan Sampah dan Kebersihan
UPTD Tempat Pengolahan Akhir
UPTD TPA Ijo Balit
UPTD Persampahan
Main Organization
Environmental Agency
Environmental Agency
Environmental Agency
Forestry and Environmental Agency
Environmental, Housing and Settlement Agency
Year Formed 2017 - 2020 2018 2019
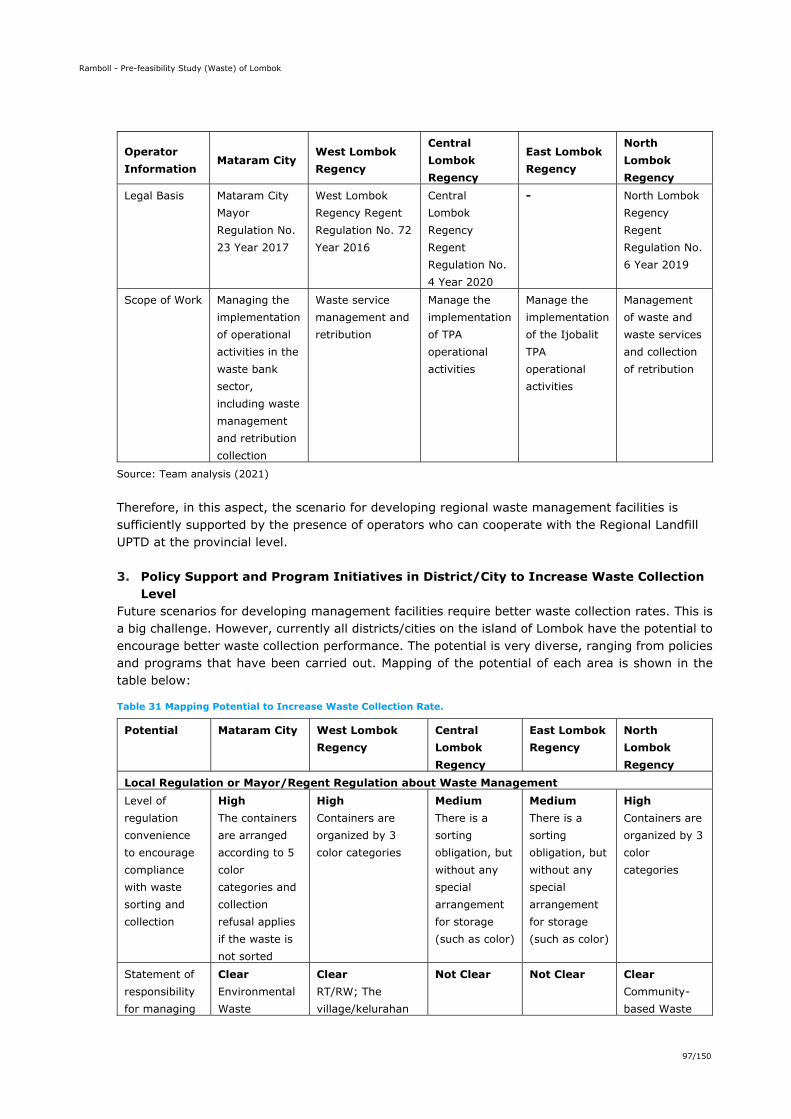
Ramboll - Pre-feasibility Study (Waste) of Lombok
97/150
Operator Information
Mataram City West Lombok Regency
Central Lombok Regency
East Lombok Regency
North Lombok Regency
Legal Basis Mataram City Mayor Regulation No. 23 Year 2017
West Lombok Regency Regent Regulation No. 72 Year 2016
Central Lombok Regency Regent Regulation No. 4 Year 2020
- North Lombok Regency Regent Regulation No. 6 Year 2019
Scope of Work Managing the implementation of operational activities in the waste bank sector, including waste management and retribution collection
Waste service management and retribution
Manage the implementation of TPA operational activities
Manage the implementation of the Ijobalit TPA operational activities
Management of waste and waste services and collection of retribution
Source: Team analysis (2021)
Therefore, in this aspect, the scenario for developing regional waste management facilities is sufficiently supported by the presence of operators who can cooperate with the Regional Landfill UPTD at the provincial level. 3. Policy Support and Program Initiatives in District/City to Increase Waste Collection
Level Future scenarios for developing management facilities require better waste collection rates. This is a big challenge. However, currently all districts/cities on the island of Lombok have the potential to encourage better waste collection performance. The potential is very diverse, ranging from policies and programs that have been carried out. Mapping of the potential of each area is shown in the table below:
Table 31 Mapping Potential to Increase Waste Collection Rate.
Potential Mataram City West Lombok Regency
Central Lombok Regency
East Lombok Regency
North Lombok Regency
Local Regulation or Mayor/Regent Regulation about Waste Management Level of regulation convenience to encourage compliance with waste sorting and collection
High The containers are arranged according to 5 color categories and collection refusal applies if the waste is not sorted
High Containers are organized by 3 color categories
Medium There is a sorting obligation, but without any special arrangement for storage (such as color)
Medium There is a sorting obligation, but without any special arrangement for storage (such as color)
High Containers are organized by 3 color categories
Statement of responsibility for managing
Clear Environmental Waste
Clear RT/RW; The village/kelurahan
Not Clear Not Clear Clear Community-based Waste
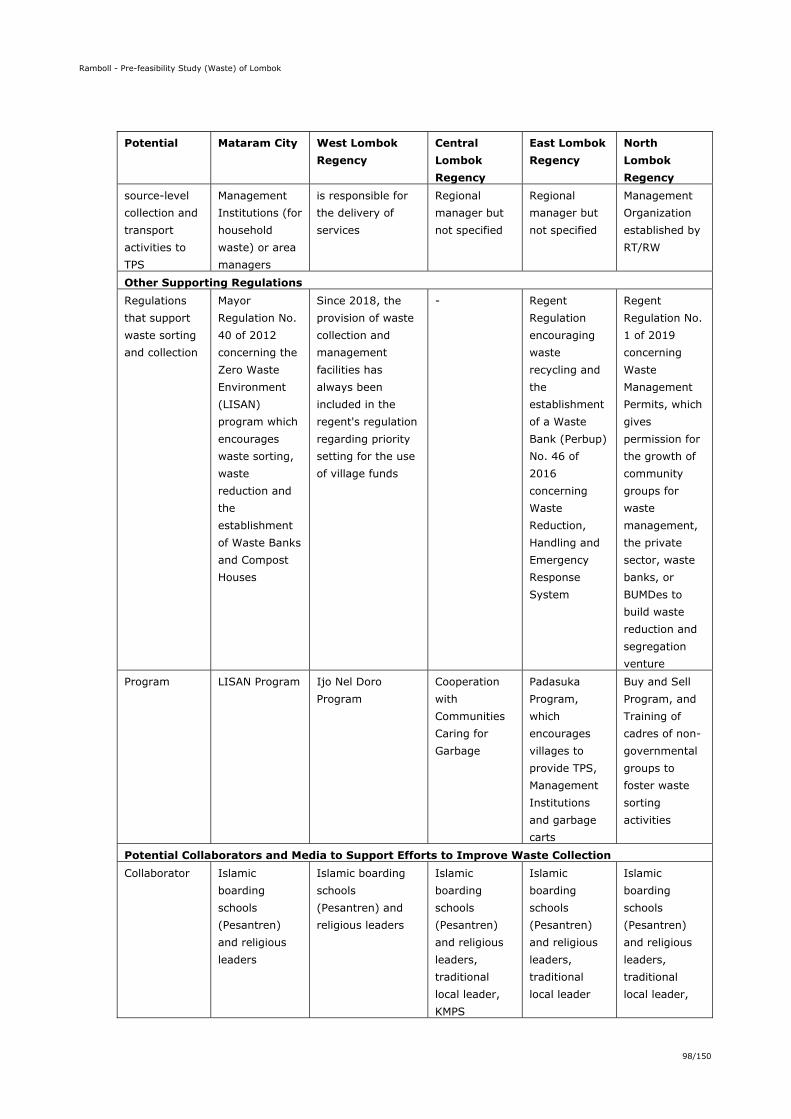
Ramboll - Pre-feasibility Study (Waste) of Lombok
98/150
Potential Mataram City West Lombok Regency
Central Lombok Regency
East Lombok Regency
North Lombok Regency
source-level collection and transport activities to TPS
Management Institutions (for household waste) or area managers
is responsible for the delivery of services
Regional manager but not specified
Regional manager but not specified
Management Organization established by RT/RW
Other Supporting Regulations Regulations that support waste sorting and collection
Mayor Regulation No. 40 of 2012 concerning the Zero Waste Environment (LISAN) program which encourages waste sorting, waste reduction and the establishment of Waste Banks and Compost Houses
Since 2018, the provision of waste collection and management facilities has always been included in the regent's regulation regarding priority setting for the use of village funds
- Regent Regulation encouraging waste recycling and the establishment of a Waste Bank (Perbup) No. 46 of 2016 concerning Waste Reduction, Handling and Emergency Response System
Regent Regulation No. 1 of 2019 concerning Waste Management Permits, which gives permission for the growth of community groups for waste management, the private sector, waste banks, or BUMDes to build waste reduction and segregation venture
Program LISAN Program Ijo Nel Doro Program
Cooperation with Communities Caring for Garbage
Padasuka Program, which encourages villages to provide TPS, Management Institutions and garbage carts
Buy and Sell Program, and Training of cadres of non-governmental groups to foster waste sorting activities
Potential Collaborators and Media to Support Efforts to Improve Waste Collection Collaborator Islamic
boarding schools (Pesantren) and religious leaders
Islamic boarding schools (Pesantren) and religious leaders
Islamic boarding schools (Pesantren) and religious leaders, traditional local leader, KMPS
Islamic boarding schools (Pesantren) and religious leaders, traditional local leader
Islamic boarding schools (Pesantren) and religious leaders, traditional local leader,
Ramboll - Pre-feasibility Study (Waste) of Lombok
99/150
Potential Mataram City West Lombok Regency
Central Lombok Regency
East Lombok Regency
North Lombok Regency village leader and NGO
Media Quran Study Group
Village Regulation and Quran Study Group
Village Regulation and Quran Study Group awig-awig
Village Regulation and Quran Study Group awig-awig
Village Regulation and Quran Study Group awig-awig
Source: Team Analysis (2021)
For further consideration, table above gives an overview of waste management in Lombok Island. Based on the description of the potential in each district/city to increase the level of waste collection, the scenario of developing management facilities on Lombok Island has the potential to be supported.
6.2.2 The Need for Institutional Strengthening for the Development of Regional Waste Management Facilities on Lombok Island
The practices and institutional conditions at the provincial and district/city levels that have been described previously have shown that the scenario of developing regional waste management facilities with Anaerobic Digestion technology is quite possible to implement. However, not all aspects of waste management institutions are in good condition to support this scenario. To strengthen the enabling conditions for the development of regional waste management facilities on Lombok Island, there are several things that need to be strengthened from the institutional aspect, i.e: 1. Development of the Kebon Kongok Regional Landfill UPTD into a BLUD The current limited space for UPTD Regional Landfill, as stated in the 2018-2023 DLHK Strategic Plan, has the potential to disrupt the success of waste management in NTB Province and weaken the active and creative efforts that have been made by the NTB Provincial Government. Therefore, the NTB Provincial Government needs to consider alternatives for developing the Regional UPTD TPA in the form of other operator institutions such as the Regional Public Service Agency (BLUD). The Regional Waste TPA management institution which is currently in the form of UPTD will face more obstacles if the scenario of developing large-scale regional waste processing facilities will be realized by the Provincial Government. Operator capacity in the form of UPTD is too limited to manage final processing as planned. With such a scenario for developing landfill facilities, it requires operators who are able to handle more complex final waste processing, manage complete processing infrastructure, facilities and infrastructure, ensure the availability of skilled and reliable human resource capacity when needed, have the flexibility to meet costs, waste management operations, and has the authority to establish cooperation with the parties. Therefore, if this scenario is to be carried out, then the development of the Regional Waste TPA UPTD into a BLUD (at least) becomes very necessary to be carried out or even initiated from now on. The development of the Regional Landfill UPTD organization into a BLUD is needed to ensure that future regional waste management facility operators are able to access other sources of funding and able to use revenues from TPA services for management operational needs without having to deposit it into the regional treasury first. In addition, the operator organization in the form of BLUD is expected to be able to move freely to build cooperation with the parties for the purpose of
Ramboll - Pre-feasibility Study (Waste) of Lombok
100/150
management efficiency and also to expand the marketing range of products that can be produced from the landfill. Therefore, efforts to prepare for the implementation of the BLUD mechanism in waste management at the Kebon Kongok Regional Landfill are urgently needed. The provincial government, in this case the DLHK, needs to conduct a study to ensure the fulfillment of substantive, technical and administrative requirements in the establishment of a BLUD. In this study, at least DLHK needs to develop 1) a governance design that will be carried out by the Regional Landfill UPTD when it has developed into a BLUD, 2) a business strategic plan, 3) a minimum service standard design, as well as showing a financial report showing that the Regional Landfill UPTD has carry out clean financial management so far. 2. Increased Cooperation between DLHK and the PMD Agencies One of the challenges faced in the success of the zero-waste program and regional waste management is that community participation is still relatively low. Lack of understanding, awareness or willingness to be involved in management efforts at the source level starting from reduction, sorting and collection, makes the obstacles to managing waste into energy even greater. Therefore, it is important to make proactive efforts to reach the community. Efforts to make outreach to people in urban areas are relatively easier along with the many alternative media that can be accessed by this community. However, this is not the case with rural communities. To ensure that this effort can be carried out effectively and efficiently, the DLHK and the Community Empowerment Agency need to strengthen their collaboration and design collaborative programs to increase public awareness and attract their participation in waste management. Strengthening this collaboration can also be useful for the program to develop a village-based waste reduction scheme that has become part of the DLHK program. With the support of the authority of the Village Community Empowerment Service, this can strengthen the possibility of providing village fund allocations for waste management facilities at the village level, such as waste containers for waste sorting, waste collection and transportation facilities, including waste processing facilities that can be managed by waste banks, or BUMDes. In addition, through this collaboration, efforts to build a simple waste management data system starting at the village level will be more likely to be realized. The Village Empowerment Service can coordinate the Village Community Empowerment Service in the district/city to ensure that the provision of waste management facilities and infrastructure as well as waste management training can be included in the priority menu for village fund allocations every year. 3. Developing the Lombok Island Regional Waste Management Coordination Forum In order to improve the performance of regional-scale waste management in Lombok Island, it is necessary to align policies, strategies and waste management efforts between the provincial and district/city governments, as well as between districts/cities. Therefore, the development of the Lombok Island Regional Waste Management Coordination Forum is very important to be initiated. The forum is not an institution, but a medium where the priority agendas to synchronize waste management efforts at strategic and operational levels that impact regional management can be discussed and followed up regularly and effectively. In the context of the scenario to develop regional waste management facilities with Anaerobic Digestion technology, this forum can also function to incrementally ensuring organic and inorganic waste sorting as well as collection from the source level occurs more effectively at the district/city level. This coordination forum will also be very useful to develop enabling condition regionally, and to ensure more effective data synchronization and monitoring and evaluation of the implementation of the Jakstrada in Lombok Island. This forum should be able to involve all the key regional apparatus organizations in the
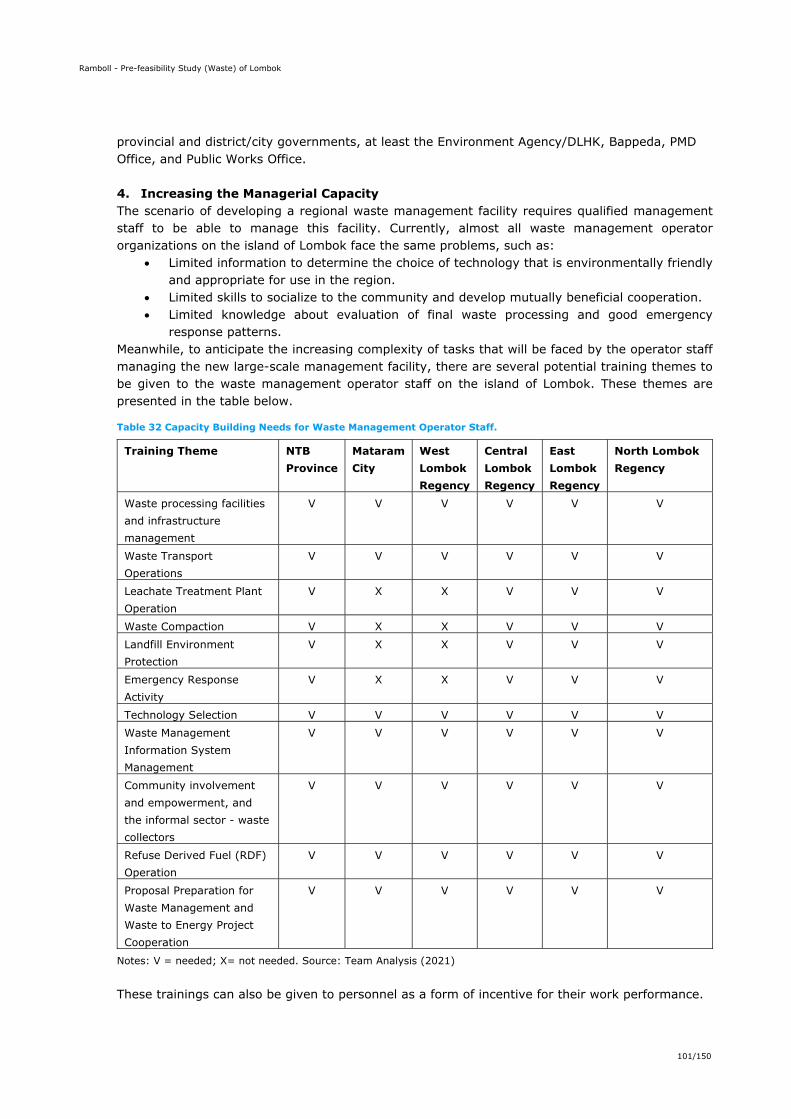
Ramboll - Pre-feasibility Study (Waste) of Lombok
101/150
provincial and district/city governments, at least the Environment Agency/DLHK, Bappeda, PMD Office, and Public Works Office.
4. Increasing the Managerial Capacity The scenario of developing a regional waste management facility requires qualified management staff to be able to manage this facility. Currently, almost all waste management operator organizations on the island of Lombok face the same problems, such as:
Limited information to determine the choice of technology that is environmentally friendly and appropriate for use in the region.
Limited skills to socialize to the community and develop mutually beneficial cooperation. Limited knowledge about evaluation of final waste processing and good emergency
response patterns. Meanwhile, to anticipate the increasing complexity of tasks that will be faced by the operator staff managing the new large-scale management facility, there are several potential training themes to be given to the waste management operator staff on the island of Lombok. These themes are presented in the table below.
Table 32 Capacity Building Needs for Waste Management Operator Staff.
Training Theme NTB Province
Mataram City
West Lombok Regency
Central Lombok Regency
East Lombok Regency
North Lombok Regency
Waste processing facilities and infrastructure management
V V V V V V
Waste Transport Operations
V V V V V V
Leachate Treatment Plant Operation
V X X V V V
Waste Compaction V X X V V V Landfill Environment Protection
V X X V V V
Emergency Response Activity
V X X V V V
Technology Selection V V V V V V Waste Management Information System Management
V V V V V V
Community involvement and empowerment, and the informal sector - waste collectors
V V V V V V
Refuse Derived Fuel (RDF) Operation
V V V V V V
Proposal Preparation for Waste Management and Waste to Energy Project Cooperation
V V V V V V
Notes: V = needed; X= not needed. Source: Team Analysis (2021)
These trainings can also be given to personnel as a form of incentive for their work performance.
Ramboll - Pre-feasibility Study (Waste) of Lombok
102/150
5. Ensuring the Sustainability of Waste Management Scenario Amidst Frequent Personnel Mutations
In order to ensure the sustainability of waste management scenario, which is often disrupted due to frequent personnel mutations, especially at strategic managerial positions, the team provides the following recommendations: Provisions on waste management performance targets and a series of programs, activities,
and strategic outputs that need to be realized by the provincial DLHK and DLH at the regency/city level need to be stated explicitly in the strategic plans of each institution. Thus, the performance targets, programs, and strategic scenarios can bind the program management of the agency for medium-term or 5 (five) years and inform the annual work plan of the agency. In this condition, the change of personnel in all lines will not disturb the speed or even the waste management scenario in Lombok Island. To ensure this condition, Bappeda at the provincial and district/city levels needs to be capable to oversee the consistency of strategic programs and activities implementation of provincial DLHK and DLH at the regency/city level. This effort can be carried out through the role of Bappeda when consolidating the annual work plan and budget plan of all agencies, and conducting quarterly, semiannually, and annual monitoring and evaluation.
The NTB Provincial Government as well as all regencies/cities need to implement a pattern of employee transfer in the provincial DLHK and regency/municipal DLH in accordance with the provisions of the National Civil Service Agency Regulation No. 5/2019 concerning Procedures for Implementation of Mutations. According to this policy, personnel transfers can only be made 2 (two) years at the soonest and no later than 5 (five) years since the personnel occupied their last position. In addition, the placement of personnel in the transfer process needs to consider the suitability of personnel competencies with job requirements, job classifications, career patterns, and organizational needs.
If the mutation is carried out at the strategic position of the Head of the UPTD as the head of waste management operator unit, it needs to comply with the provisions of the Regulation of Minister of Home Affairs Number 12/2017 concerning Guidelines for the Establishment and Classification of Branches of Agency and Service Technical Implementing Units (UPTD). This policy states that the minimum echelon requirement of the Head of UPTD is echelon IVa and needs to fulfill the technical competence of the position and align with the needs of the organization.
6. Protecting the Waste Management Operator Team at the Field In conjunction with the Zero Waste program, which constitutes a priority program of the NTB provincial government and districts/cities in Lombok Island, the position of waste management officers in the field occupies a vital function. Their role is crucial in ensuring the life cycle of each district/city, ensuring the success of the program, environmental cleanliness, and protection of public health in Lombok Island. These officers need to be encouraged to work effectively. In fact, the field workers often do not receive proper attention and protection. Considering that waste management performance is highly dependent on the effectiveness and efficiency of all waste management officers in the field, the team recommends that:
Provincial and district/city governments provide remuneration following the provisions or standard of the minimum wage for the province of NTB and each district/city. Position of zero waste program as priority program of RPJMD at provincial and regency/city level can be justification for the approval of the honorarium budget for waste management officers in the field.
Provincial and district/city governments provide health protection by providing protective equipment and protecting their health through the BPJS health insurance mechanism. It is crucial considering that this work is vulnerable to reducing the health quality of the officers in the field.

Ramboll - Pre-feasibility Study (Waste) of Lombok
103/150
Provincial and district/municipal governments can explicitly state the clause of reward and protection standards for waste management operators in the amendment of the Waste Management Local Regulation or its implementing regulations when the amendment will be carried out. Currently, this provision has not been accommodated in existing regulations in Lombok Island.
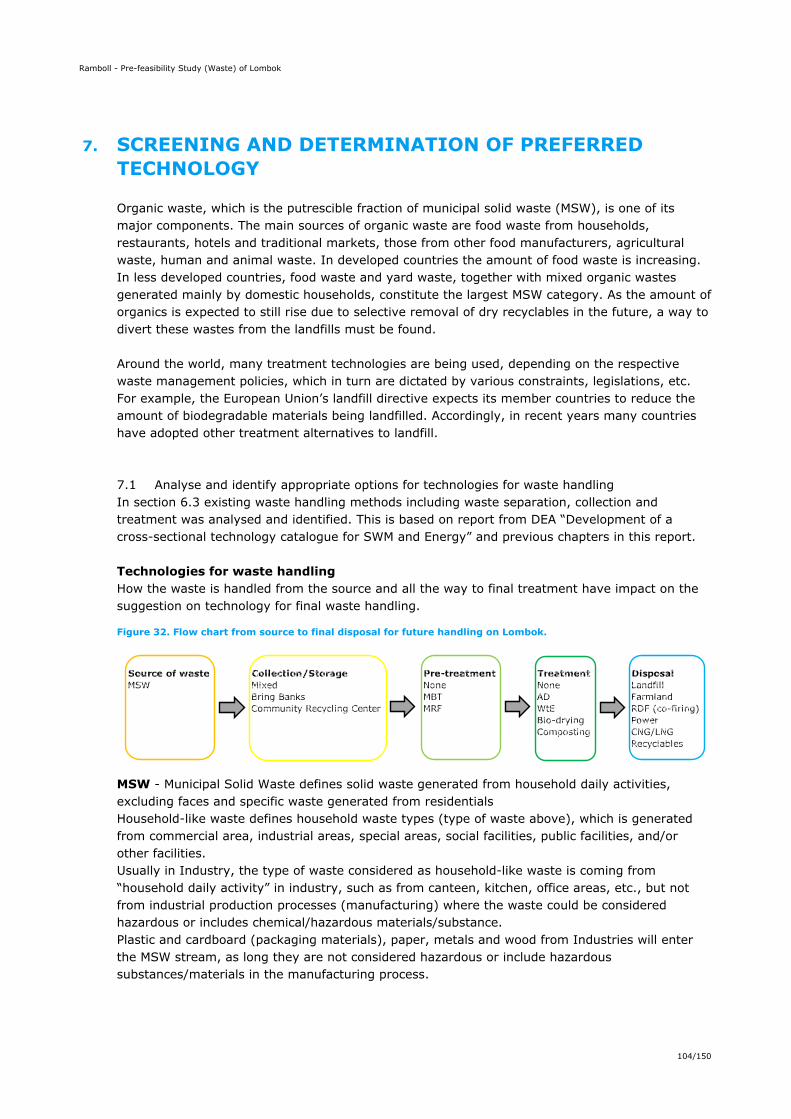
Ramboll - Pre-feasibility Study (Waste) of Lombok
104/150
7. SCREENING AND DETERMINATION OF PREFERRED TECHNOLOGY
Organic waste, which is the putrescible fraction of municipal solid waste (MSW), is one of its major components. The main sources of organic waste are food waste from households, restaurants, hotels and traditional markets, those from other food manufacturers, agricultural waste, human and animal waste. In developed countries the amount of food waste is increasing. In less developed countries, food waste and yard waste, together with mixed organic wastes generated mainly by domestic households, constitute the largest MSW category. As the amount of organics is expected to still rise due to selective removal of dry recyclables in the future, a way to divert these wastes from the landfills must be found. Around the world, many treatment technologies are being used, depending on the respective waste management policies, which in turn are dictated by various constraints, legislations, etc. For example, the European Union’s landfill directive expects its member countries to reduce the amount of biodegradable materials being landfilled. Accordingly, in recent years many countries have adopted other treatment alternatives to landfill.
7.1 Analyse and identify appropriate options for technologies for waste handling In section 6.3 existing waste handling methods including waste separation, collection and treatment was analysed and identified. This is based on report from DEA “Development of a cross-sectional technology catalogue for SWM and Energy” and previous chapters in this report. Technologies for waste handling How the waste is handled from the source and all the way to final treatment have impact on the suggestion on technology for final waste handling.
Figure 32. Flow chart from source to final disposal for future handling on Lombok.
MSW - Municipal Solid Waste defines solid waste generated from household daily activities, excluding faces and specific waste generated from residentials Household-like waste defines household waste types (type of waste above), which is generated from commercial area, industrial areas, special areas, social facilities, public facilities, and/or other facilities. Usually in Industry, the type of waste considered as household-like waste is coming from “household daily activity” in industry, such as from canteen, kitchen, office areas, etc., but not from industrial production processes (manufacturing) where the waste could be considered hazardous or includes chemical/hazardous materials/substance. Plastic and cardboard (packaging materials), paper, metals and wood from Industries will enter the MSW stream, as long they are not considered hazardous or include hazardous substances/materials in the manufacturing process.
Source of waste Collection/Storage Pre-treatment Treatment DisposalMSW Mixed None None Landfill
Bring Banks MBT AD FarmlandCommunity Recycling Center MRF WtE RDF (co-firing)
Bio-drying PowerComposting CNG/LNG
Recyclables
Ramboll - Pre-feasibility Study (Waste) of Lombok
105/150
7.1.1 Waste separation At the source waste can be separated into a few or several various fractions. The simplest division of waste fractions are in an organic (food and garden waste) and a non-organic fraction (paper & cardboard, glass, plastic, metals and residues (all other waste fractions)). Other more advanced separation is into several fractions of recyclables as mentioned above. It is recommended as a minimum to separate the MSW in an organic and non-organic fraction for better handling in e.g., a MBT facility. 7.1.2 Waste collection The MSW in Lombok is collected in smaller vehicles as listed below:
Dump truck Pick-up truck Motorbike Handcart
An effective and well maintained fleet for collection of waste is important. It is recommended to have sufficient and effective waste transportation vehicles. 7.1.3 Waste treatment The MSW in Lombok is tretaed in simple solutions as listed below:
No treatment Simple separation (waste bank, TPS3R, TPST) Landfill Other simple technologies
It is recommended to have a campaign to avoid removal of recyclables from source to treatment plant (MBT or other). This is to make the collection of waste more effective and to make sure that the recyclables end up being recycled in a proper way. 7.2 Evaluation of waste management and treatment options In this section waste management and treatment options including initial assessments of investment costs, operational cost, incomes, potential nutrient recovery (agricultural and forestry) and energy potential are evaluated. Organic waste treatments vary in sophistication, technology, environmental effects and cost. Landfill disposal, incineration, composting, anaerobic digestion, mechanical biological treatment and pyrolysis/gasification can all treat organic waste including food waste. Each of these has its pros and cons. Waste management and treatment options The treatment technology(ies) adopted in different cities or countries for MSW vary depending on their waste management strategy. There are different levels of emphasis on source separation, enabling different approaches to treatment of waste; and also differences in waste management approaches, relating to historical, economic, geological and cultural factors. The major treatment methods for wastes are:
Landfill MBT AD Incineration (WtE) Pyrolysis and Gasification Composting
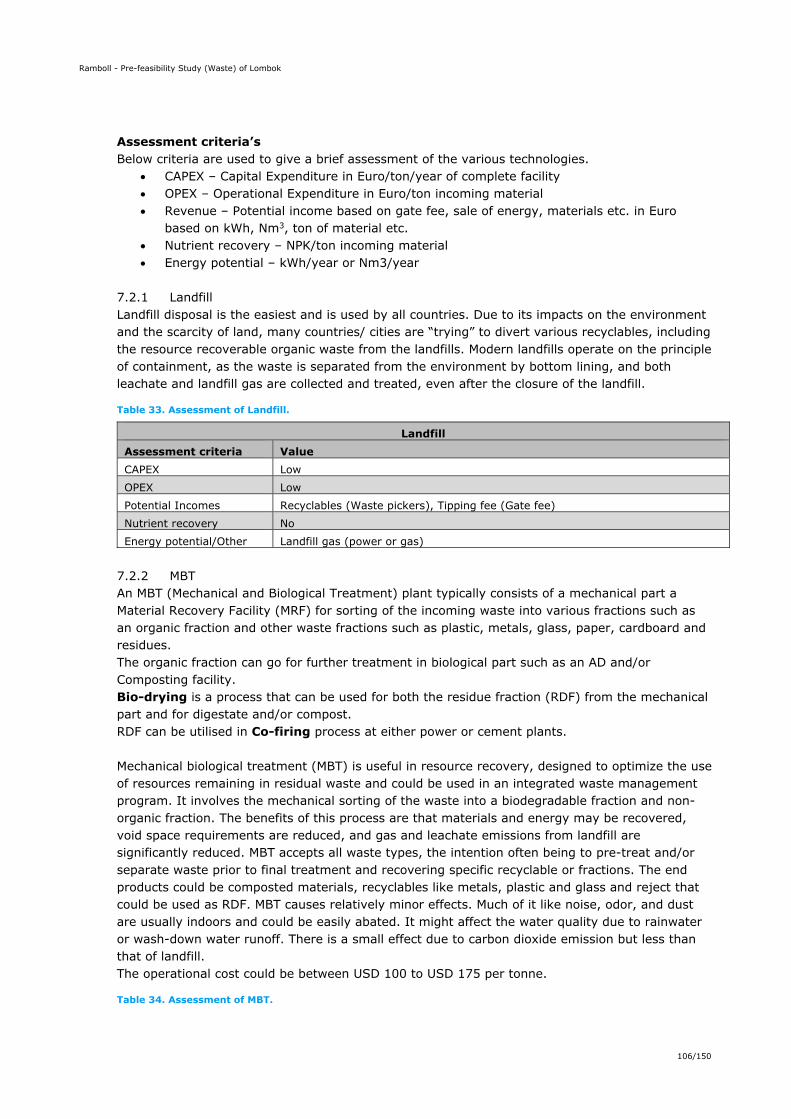
Ramboll - Pre-feasibility Study (Waste) of Lombok
106/150
Assessment criteria’s Below criteria are used to give a brief assessment of the various technologies.
CAPEX – Capital Expenditure in Euro/ton/year of complete facility OPEX – Operational Expenditure in Euro/ton incoming material Revenue – Potential income based on gate fee, sale of energy, materials etc. in Euro
based on kWh, Nm3, ton of material etc. Nutrient recovery – NPK/ton incoming material Energy potential – kWh/year or Nm3/year
7.2.1 Landfill Landfill disposal is the easiest and is used by all countries. Due to its impacts on the environment and the scarcity of land, many countries/ cities are “trying” to divert various recyclables, including the resource recoverable organic waste from the landfills. Modern landfills operate on the principle of containment, as the waste is separated from the environment by bottom lining, and both leachate and landfill gas are collected and treated, even after the closure of the landfill.
Table 33. Assessment of Landfill.
Landfill Assessment criteria Value CAPEX Low OPEX Low Potential Incomes Recyclables (Waste pickers), Tipping fee (Gate fee) Nutrient recovery No Energy potential/Other Landfill gas (power or gas)
7.2.2 MBT An MBT (Mechanical and Biological Treatment) plant typically consists of a mechanical part a Material Recovery Facility (MRF) for sorting of the incoming waste into various fractions such as an organic fraction and other waste fractions such as plastic, metals, glass, paper, cardboard and residues. The organic fraction can go for further treatment in biological part such as an AD and/or Composting facility. Bio-drying is a process that can be used for both the residue fraction (RDF) from the mechanical part and for digestate and/or compost. RDF can be utilised in Co-firing process at either power or cement plants. Mechanical biological treatment (MBT) is useful in resource recovery, designed to optimize the use of resources remaining in residual waste and could be used in an integrated waste management program. It involves the mechanical sorting of the waste into a biodegradable fraction and non-organic fraction. The benefits of this process are that materials and energy may be recovered, void space requirements are reduced, and gas and leachate emissions from landfill are significantly reduced. MBT accepts all waste types, the intention often being to pre-treat and/or separate waste prior to final treatment and recovering specific recyclable or fractions. The end products could be composted materials, recyclables like metals, plastic and glass and reject that could be used as RDF. MBT causes relatively minor effects. Much of it like noise, odor, and dust are usually indoors and could be easily abated. It might affect the water quality due to rainwater or wash-down water runoff. There is a small effect due to carbon dioxide emission but less than that of landfill. The operational cost could be between USD 100 to USD 175 per tonne.
Table 34. Assessment of MBT.

Ramboll - Pre-feasibility Study (Waste) of Lombok
107/150
MBT Assessment criteria Value CAPEX Medium to High OPEX Medium to High Potential Incomes Recyclables, RDF, Energy (power or gas), Gate fee Nutrient recovery Yes – Digestate and/or compost Energy potential/Other Biogas (power or gas) from easy digestible organic waste
Caloric value from RDF 7.2.3 MRF Dirty MRF Commingled or Single-stream recycling takes place when all recyclables are placed in the same bin and mixed when collected by truck. In a dirty MRF household, industrial and commercial waste comes into the facility as commingled waste. Especially because the organic fraction is mixed with all the other fractions (recyclables) the purity of the sorted fractions and the working environment are poor in a Dirty MRF compared to Clean MRF. Clean MRF In a clean MRF the recyclables have already been separated at the source from Municipal Solid Waste (MSW), Industrial and Commercial waste (C&I) generated by either residentials or commercial sources. In a MRF for sorting of household, industrial and commercial waste the incoming waste into various fractions such as an organic fraction and other waste fractions such as plastic, metals, glass, paper, cardboard and residues. The operational cost could be between USD 50 to USD 125 per tonne.
Table 35. Assessment of MRF.
MRF Assessment criteria Value CAPEX Medium OPEX Medium to High Potential Incomes Recyclables, RDF, Gate fee Nutrient recovery No Energy potential/Other Caloric value from RDF
7.2.4 AD Anaerobic digestion (AD) is a widely used treatment technology due to its wide waste acceptability and energy production. It is an in-vessel, bacterial decomposition of organic material in the absence of oxygen. A wide variety of feedstocks can be used for AD including source separated food waste, sludge, agro-industrial byproducts, manure, slurries and yard waste. The by-products include biogas, comprising principally of CO2 and CH4, and a semi-solid residue, the digestate. The digestate could be further composted and used for agricultural/horticultural purposes. The digestate, could also be applied directly on land. The environmental effects of AD are usually on a high level. Main advantages are generation of green sustainable energy to replace fossil fuels, reduction in GHG emission and recycling of nutrients (especially Phosphorous). The technology has earlier been suffering by poor performances. AD technology requires professional management and up-front
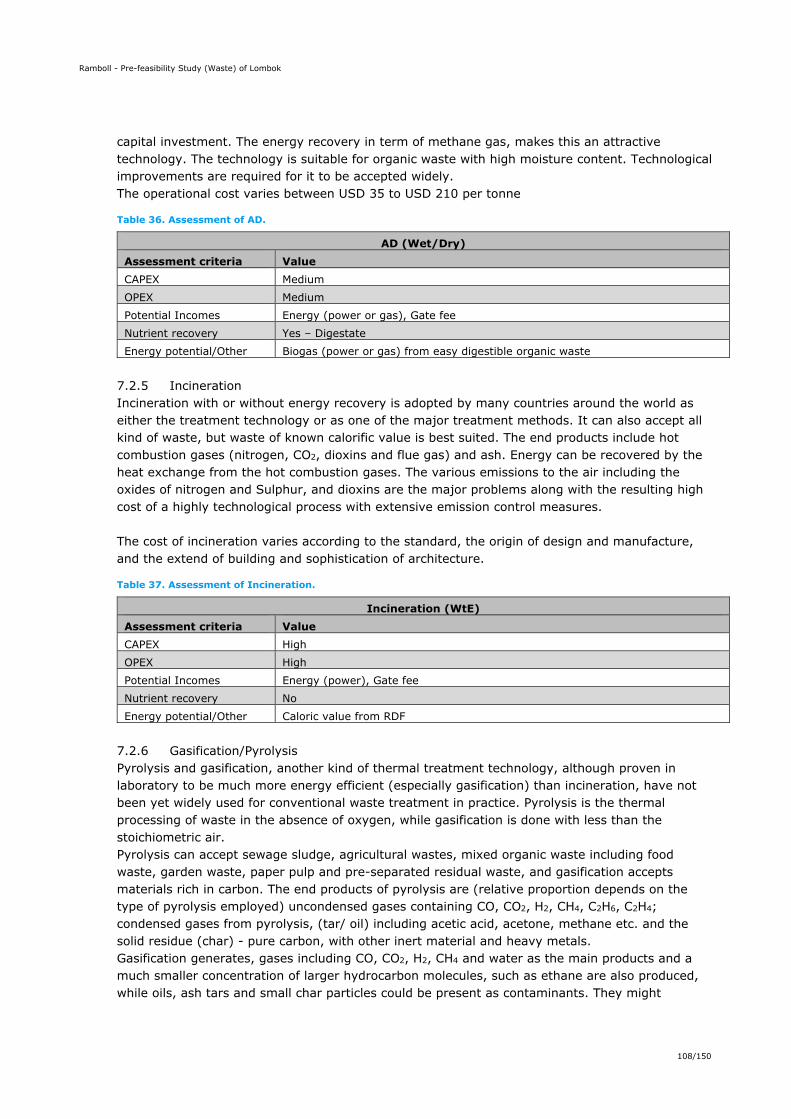
Ramboll - Pre-feasibility Study (Waste) of Lombok
108/150
capital investment. The energy recovery in term of methane gas, makes this an attractive technology. The technology is suitable for organic waste with high moisture content. Technological improvements are required for it to be accepted widely. The operational cost varies between USD 35 to USD 210 per tonne
Table 36. Assessment of AD.
AD (Wet/Dry) Assessment criteria Value CAPEX Medium OPEX Medium Potential Incomes Energy (power or gas), Gate fee Nutrient recovery Yes – Digestate Energy potential/Other Biogas (power or gas) from easy digestible organic waste
7.2.5 Incineration Incineration with or without energy recovery is adopted by many countries around the world as either the treatment technology or as one of the major treatment methods. It can also accept all kind of waste, but waste of known calorific value is best suited. The end products include hot combustion gases (nitrogen, CO2, dioxins and flue gas) and ash. Energy can be recovered by the heat exchange from the hot combustion gases. The various emissions to the air including the oxides of nitrogen and Sulphur, and dioxins are the major problems along with the resulting high cost of a highly technological process with extensive emission control measures. The cost of incineration varies according to the standard, the origin of design and manufacture, and the extend of building and sophistication of architecture.
Table 37. Assessment of Incineration.
Incineration (WtE) Assessment criteria Value CAPEX High OPEX High Potential Incomes Energy (power), Gate fee Nutrient recovery No Energy potential/Other Caloric value from RDF
7.2.6 Gasification/Pyrolysis Pyrolysis and gasification, another kind of thermal treatment technology, although proven in laboratory to be much more energy efficient (especially gasification) than incineration, have not been yet widely used for conventional waste treatment in practice. Pyrolysis is the thermal processing of waste in the absence of oxygen, while gasification is done with less than the stoichiometric air. Pyrolysis can accept sewage sludge, agricultural wastes, mixed organic waste including food waste, garden waste, paper pulp and pre-separated residual waste, and gasification accepts materials rich in carbon. The end products of pyrolysis are (relative proportion depends on the type of pyrolysis employed) uncondensed gases containing CO, CO2, H2, CH4, C2H6, C2H4; condensed gases from pyrolysis, (tar/ oil) including acetic acid, acetone, methane etc. and the solid residue (char) - pure carbon, with other inert material and heavy metals. Gasification generates, gases including CO, CO2, H2, CH4 and water as the main products and a much smaller concentration of larger hydrocarbon molecules, such as ethane are also produced, while oils, ash tars and small char particles could be present as contaminants. They might
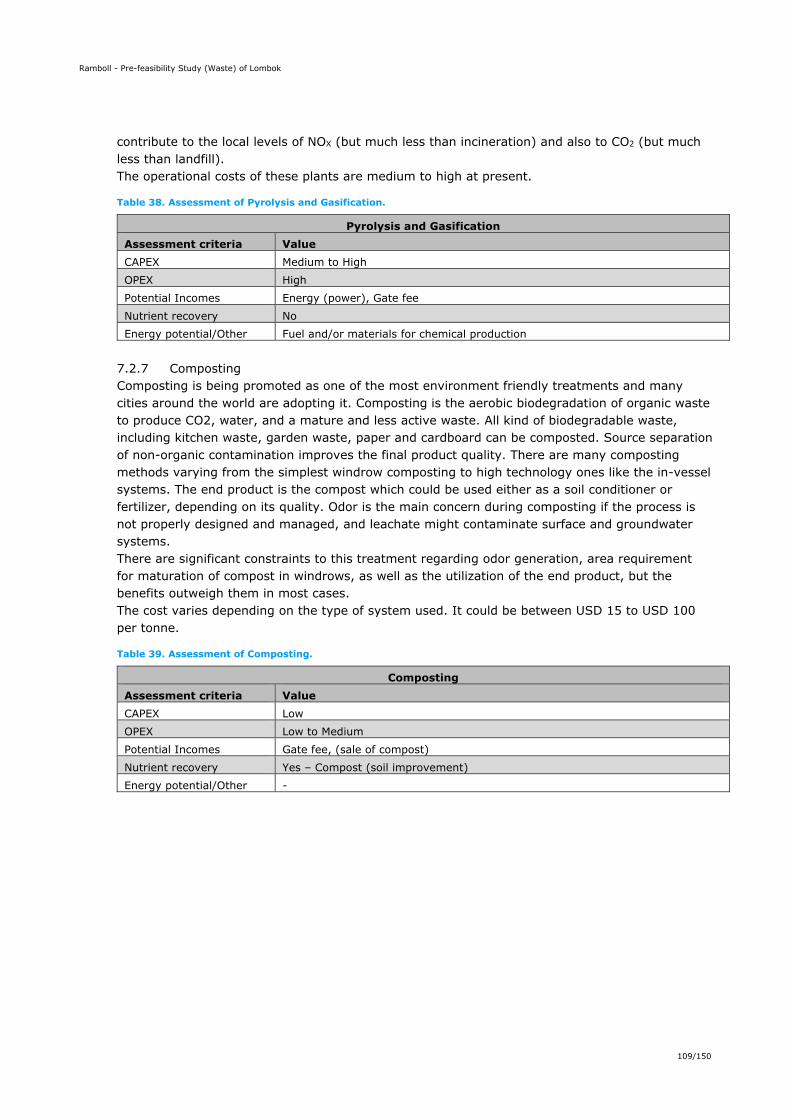
Ramboll - Pre-feasibility Study (Waste) of Lombok
109/150
contribute to the local levels of NOX (but much less than incineration) and also to CO2 (but much less than landfill). The operational costs of these plants are medium to high at present.
Table 38. Assessment of Pyrolysis and Gasification.
Pyrolysis and Gasification Assessment criteria Value CAPEX Medium to High OPEX High Potential Incomes Energy (power), Gate fee Nutrient recovery No Energy potential/Other Fuel and/or materials for chemical production
7.2.7 Composting Composting is being promoted as one of the most environment friendly treatments and many cities around the world are adopting it. Composting is the aerobic biodegradation of organic waste to produce CO2, water, and a mature and less active waste. All kind of biodegradable waste, including kitchen waste, garden waste, paper and cardboard can be composted. Source separation of non-organic contamination improves the final product quality. There are many composting methods varying from the simplest windrow composting to high technology ones like the in-vessel systems. The end product is the compost which could be used either as a soil conditioner or fertilizer, depending on its quality. Odor is the main concern during composting if the process is not properly designed and managed, and leachate might contaminate surface and groundwater systems. There are significant constraints to this treatment regarding odor generation, area requirement for maturation of compost in windrows, as well as the utilization of the end product, but the benefits outweigh them in most cases. The cost varies depending on the type of system used. It could be between USD 15 to USD 100 per tonne.
Table 39. Assessment of Composting.
Composting Assessment criteria Value CAPEX Low OPEX Low to Medium Potential Incomes Gate fee, (sale of compost) Nutrient recovery Yes – Compost (soil improvement) Energy potential/Other -
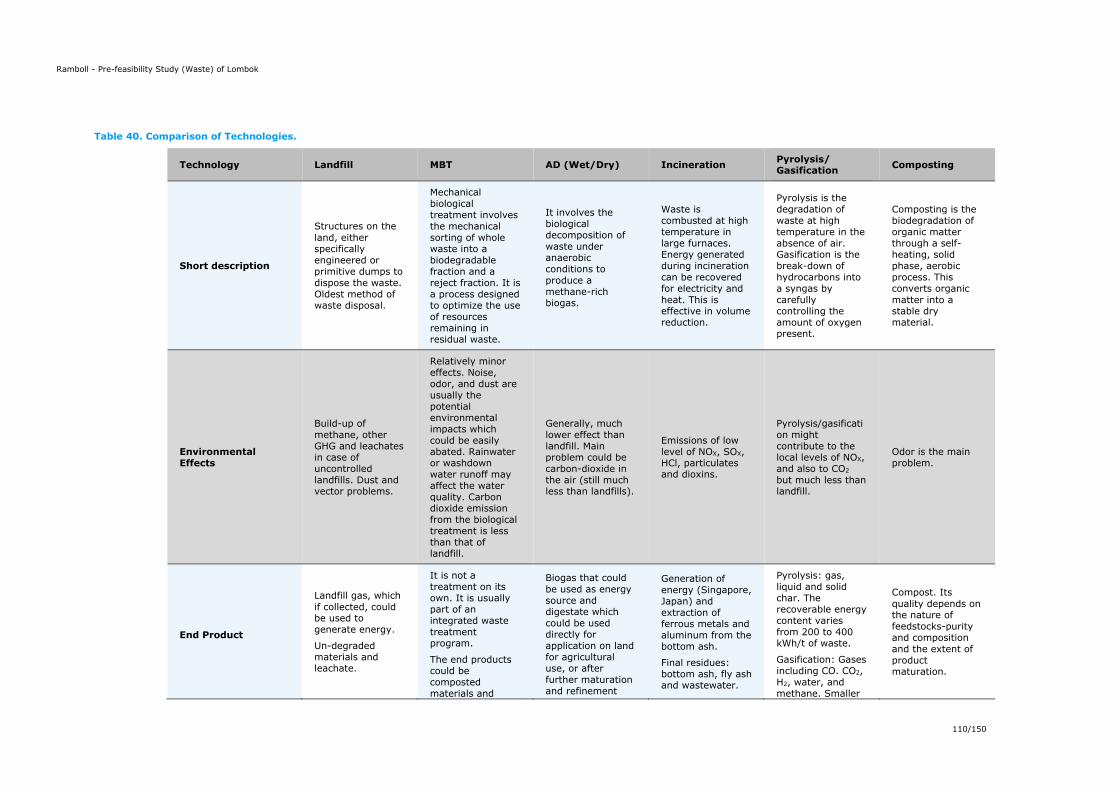
Ramboll - Pre-feasibility Study (Waste) of Lombok
110/150
Table 40. Comparison of Technologies.
Technology Landfill MBT AD (Wet/Dry) Incineration Pyrolysis/ Gasification Composting
Short description
Structures on the land, either specifically engineered or primitive dumps to dispose the waste. Oldest method of waste disposal.
Mechanical biological treatment involves the mechanical sorting of whole waste into a biodegradable fraction and a reject fraction. It is a process designed to optimize the use of resources remaining in residual waste.
It involves the biological decomposition of waste under anaerobic conditions to produce a methane-rich biogas.
Waste is combusted at high temperature in large furnaces. Energy generated during incineration can be recovered for electricity and heat. This is effective in volume reduction.
Pyrolysis is the degradation of waste at high temperature in the absence of air. Gasification is the break-down of hydrocarbons into a syngas by carefully controlling the amount of oxygen present.
Composting is the biodegradation of organic matter through a self-heating, solid phase, aerobic process. This converts organic matter into a stable dry material.
Environmental Effects
Build-up of methane, other GHG and leachates in case of uncontrolled landfills. Dust and vector problems.
Relatively minor effects. Noise, odor, and dust are usually the potential environmental impacts which could be easily abated. Rainwater or washdown water runoff may affect the water quality. Carbon dioxide emission from the biological treatment is less than that of landfill.
Generally, much lower effect than landfill. Main problem could be carbon-dioxide in the air (still much less than landfills).
Emissions of low level of NOX, SOX, HCl, particulates and dioxins.
Pyrolysis/gasification might contribute to the local levels of NOX, and also to CO2 but much less than landfill.
Odor is the main problem.
End Product
Landfill gas, which if collected, could be used to generate energy.
Un-degraded materials and leachate.
It is not a treatment on its own. It is usually part of an integrated waste treatment program.
The end products could be composted materials and
Biogas that could be used as energy source and digestate which could be used directly for application on land for agricultural use, or after further maturation and refinement
Generation of energy (Singapore, Japan) and extraction of ferrous metals and aluminum from the bottom ash.
Final residues: bottom ash, fly ash and wastewater.
Pyrolysis: gas, liquid and solid char. The recoverable energy content varies from 200 to 400 kWh/t of waste.
Gasification: Gases including CO. CO2, H2, water, and methane. Smaller
Compost. Its quality depends on the nature of feedstocks-purity and composition and the extent of product maturation.
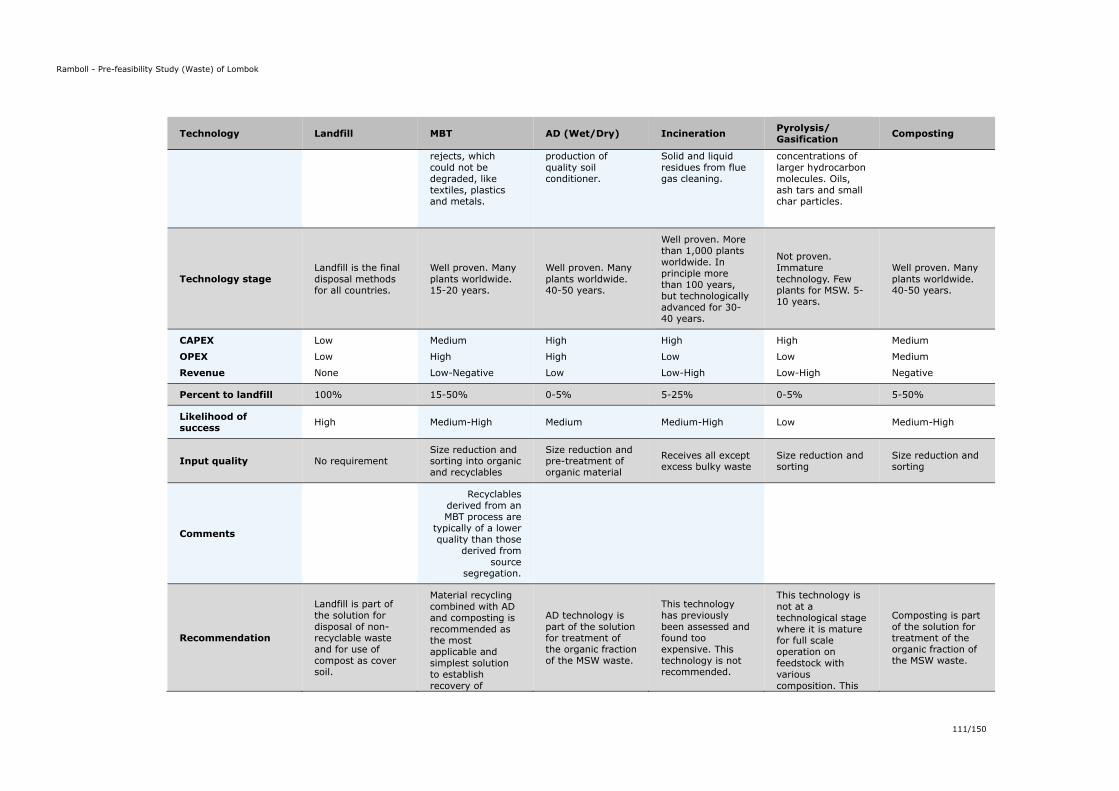
Ramboll - Pre-feasibility Study (Waste) of Lombok
111/150
Technology Landfill MBT AD (Wet/Dry) Incineration Pyrolysis/ Gasification Composting
rejects, which could not be degraded, like textiles, plastics and metals.
production of quality soil conditioner.
Solid and liquid residues from flue gas cleaning.
concentrations of larger hydrocarbon molecules. Oils, ash tars and small char particles.
Technology stage Landfill is the final disposal methods for all countries.
Well proven. Many plants worldwide. 15-20 years.
Well proven. Many plants worldwide. 40-50 years.
Well proven. More than 1,000 plants worldwide. In principle more than 100 years, but technologically advanced for 30-40 years.
Not proven. Immature technology. Few plants for MSW. 5-10 years.
Well proven. Many plants worldwide. 40-50 years.
CAPEX
OPEX
Revenue
Low
Low
None
Medium
High
Low-Negative
High
High
Low
High
Low
Low-High
High
Low
Low-High
Medium
Medium
Negative
Percent to landfill 100% 15-50% 0-5% 5-25% 0-5% 5-50%
Likelihood of success High Medium-High Medium Medium-High Low Medium-High
Input quality No requirement Size reduction and sorting into organic and recyclables
Size reduction and pre-treatment of organic material
Receives all except excess bulky waste
Size reduction and sorting
Size reduction and sorting
Comments
Recyclables derived from an MBT process are
typically of a lower quality than those
derived from source
segregation.
Recommendation
Landfill is part of the solution for disposal of non-recyclable waste and for use of compost as cover soil.
Material recycling combined with AD and composting is recommended as the most applicable and simplest solution to establish recovery of
AD technology is part of the solution for treatment of the organic fraction of the MSW waste.
This technology has previously been assessed and found too expensive. This technology is not recommended.
This technology is not at a technological stage where it is mature for full scale operation on feedstock with various composition. This
Composting is part of the solution for treatment of the organic fraction of the MSW waste.
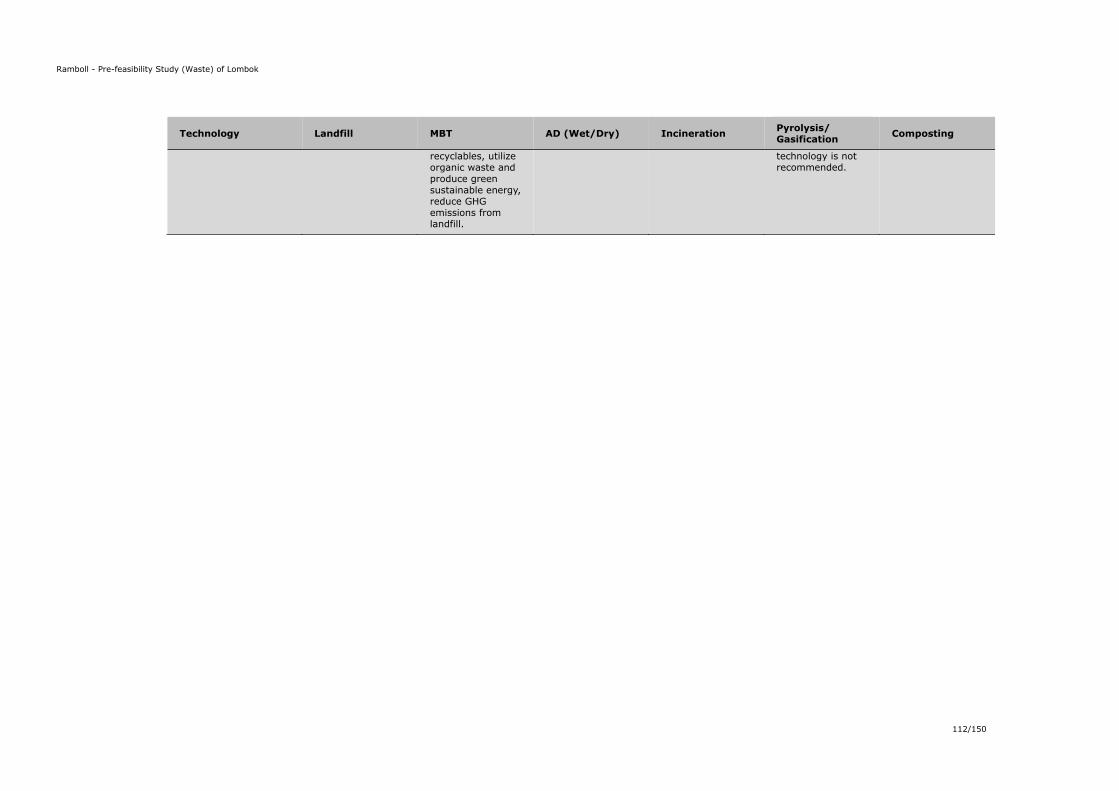
Ramboll - Pre-feasibility Study (Waste) of Lombok
112/150
Technology Landfill MBT AD (Wet/Dry) Incineration Pyrolysis/ Gasification Composting
recyclables, utilize organic waste and produce green sustainable energy, reduce GHG emissions from landfill.
technology is not recommended.
Ramboll - Pre-feasibility Study (Waste) of Lombok
113/149
7.3 Recommendation of appropriate technology In this section an appropriate technology option is recommend. 7.3.1 MBT Mechanical and Biological Treatment (MBT) are recommended as it handles industrial and household waste with a high organic content. Materials like plastic, metal, glass, paper and cardboard can be sorted out and recycled. Not recyclable residues can be used as RDF for co-firing in power plants, cement industry or stored for export. The easy digestible organic fraction from food waste and residues can be handled in a dry AD facility and converted to biogas (energy) and fertilizer (nutrients). The digested fraction from the AD facility can be mixed with garden and green waste in a composting facility. The proposed and recommended MBT facility consist of four main technologies:
Material recycling (plastic, metal, glass, paper and cardboard) Bio-drying of RDF (Energy) (co-firing) AD (Energy and Nutrients) Composting (Nutrients)
With an MBT facility all fractions in industrial and household waste can be handled. A small portion of the MSW cannot be utilized in any of the above solutions. This fraction will be disposed at existing landfill. Excess compost from composting can likewise be used as cover soil at landfill. In connection with establishing a MBT facility it is recommended to have focus on:
• High Purity in sorting process – higher value of recyclable fraction • Source segregation in two fractions (organic and inorganic) - Higher recovery rate
In connection with RDF production, it is recommended to have focus on:
• Moisture content, • Caloric value, • Density, • Size, • Chloride and Sulphur content.
A Bio-drying solution is optional – this requires further analysis of the existing project. Bio-drying can reduce the moisture content and increase caloric value in RDF and make it more attractive for co-firing process. 7.4 Evaluation of energy and fertiliser utilisation options at Lombok In this section energy and fertiliser utilisation options at Lombok are evaluated. This is based on previous findings in chapter 4.2. Energy Transport (52%) and commercials (24%) are the major consumer of energy on Lombok. Utilisation of organic waste in an AD plant and RDF in a power plant or cement facility is typically energy in the form of:
Power Biogas or RDF
Most electricity supplied on Lombok is from fossil-fuel based power plants. With supply of biogas or electricity from AD this can be turned into partly green and sustainable energy.
Ramboll - Pre-feasibility Study (Waste) of Lombok
114/149
Utilisation of RDF in power plants or cement facilities will likewise replace fossil-fuels. It is possible to upgrade biogas and afterwards either liquefy it or compress it to produce respectively LBG (Liquified Bio-methane Gas) or CBG (Compressed Bio-methane Gas). Both upgrading and compacting of gas is very expensive and complicated technologies. It is recommended to utilise biogas in a gas engine to produce electricity or to supply biogas directly to an industrial facility or power plant. There is an ongoing project with co-firing of RDF with coal at Jerangjang Power Plant to produce electricity. According to the Detailed Engineering Design (DED), the power plant requires 15 ton of RDF pellet/day (Co-Firing 3% of the coal required/day; calorific value of 3700 - 3800 kcal, throughput 0,64 ton/hour) with the pellet composed of 95% organics and 5% plastics. The required amount of RDF is equal to 5,475 tpa. Compost Farmers on Lombok prefer Chemical fertiliser (NPK) instead of Organic fertiliser (compost) for agricultural purposes. Compost in Lombok is mainly used by Community and Environmental Agencies for:
Gardening, Tree-planting, Reforestation Greening the open spaces
and Local governments Landfills for:
Soil cover Quality of compost for fertiliser purposes must be according to national standards. It is recommended to analyse further how compost can be a supplement or even replace chemical fertilisers. It is of great significance, to be able to utilise all the produced compost, to make a solution with composting technology as a part of a waste treatment system, feasible. 7.5 Evaluation of availability of co-substrates In this section availability of co-substrates (manure, rice husks, organic industrial wastes etc.) for co-digestion of organic fraction of organic household waste are evaluated. This is based on previous findings in chapter 4. Type and source of substrates for AD and composting is listed below:
Animal and cow manure from animal and cow farm or slaughterhouse Rice husk from rice farmers Fruit and vegetable waste from fruit and vegetable industry, markets etc. Food waste from households, hotels, restaurants, markets etc. Green and garden waste from households, parks etc.
In below table the amount of available organic waste is listed.
Table 41. Amount of organic waste available on Lombok.
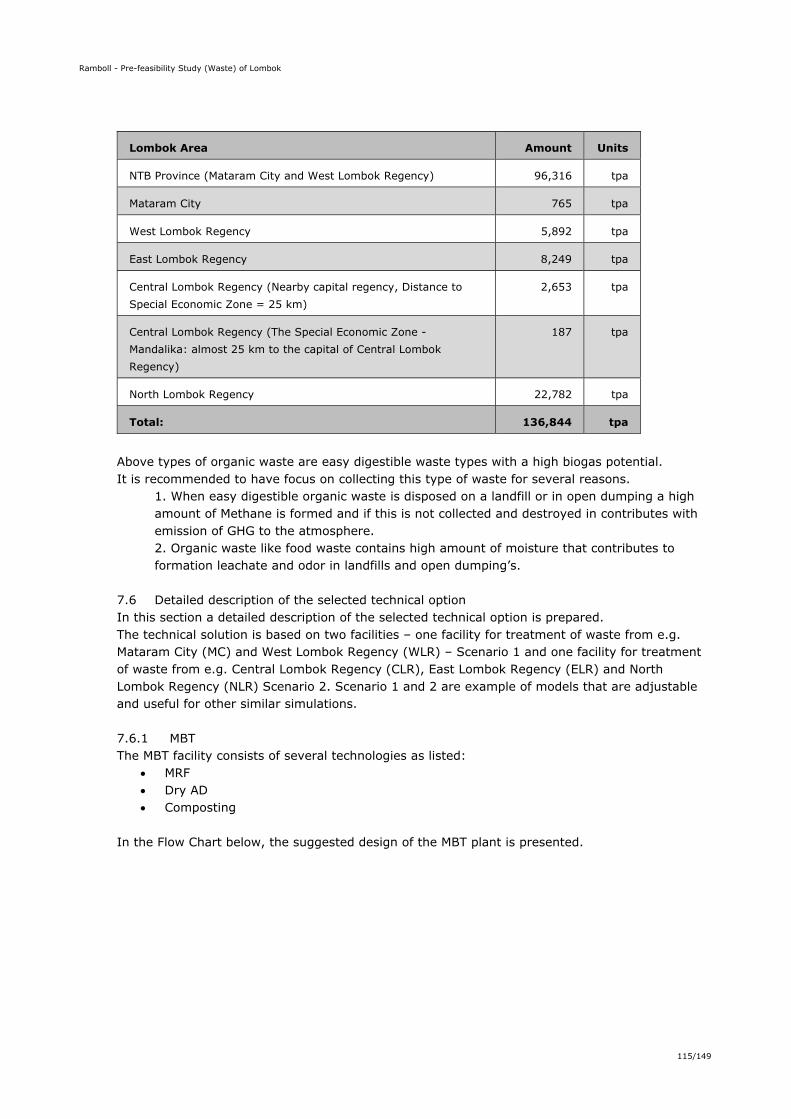
Ramboll - Pre-feasibility Study (Waste) of Lombok
115/149
Lombok Area Amount Units
NTB Province (Mataram City and West Lombok Regency) 96,316 tpa
Mataram City 765 tpa
West Lombok Regency 5,892 tpa
East Lombok Regency 8,249 tpa
Central Lombok Regency (Nearby capital regency, Distance to Special Economic Zone = 25 km)
2,653 tpa
Central Lombok Regency (The Special Economic Zone - Mandalika: almost 25 km to the capital of Central Lombok Regency)
187 tpa
North Lombok Regency 22,782 tpa
Total: 136,844 tpa
Above types of organic waste are easy digestible waste types with a high biogas potential. It is recommended to have focus on collecting this type of waste for several reasons.
1. When easy digestible organic waste is disposed on a landfill or in open dumping a high amount of Methane is formed and if this is not collected and destroyed in contributes with emission of GHG to the atmosphere. 2. Organic waste like food waste contains high amount of moisture that contributes to formation leachate and odor in landfills and open dumping’s.
7.6 Detailed description of the selected technical option In this section a detailed description of the selected technical option is prepared. The technical solution is based on two facilities – one facility for treatment of waste from e.g. Mataram City (MC) and West Lombok Regency (WLR) – Scenario 1 and one facility for treatment of waste from e.g. Central Lombok Regency (CLR), East Lombok Regency (ELR) and North Lombok Regency (NLR) Scenario 2. Scenario 1 and 2 are example of models that are adjustable and useful for other similar simulations. 7.6.1 MBT The MBT facility consists of several technologies as listed:
MRF Dry AD Composting
In the Flow Chart below, the suggested design of the MBT plant is presented.
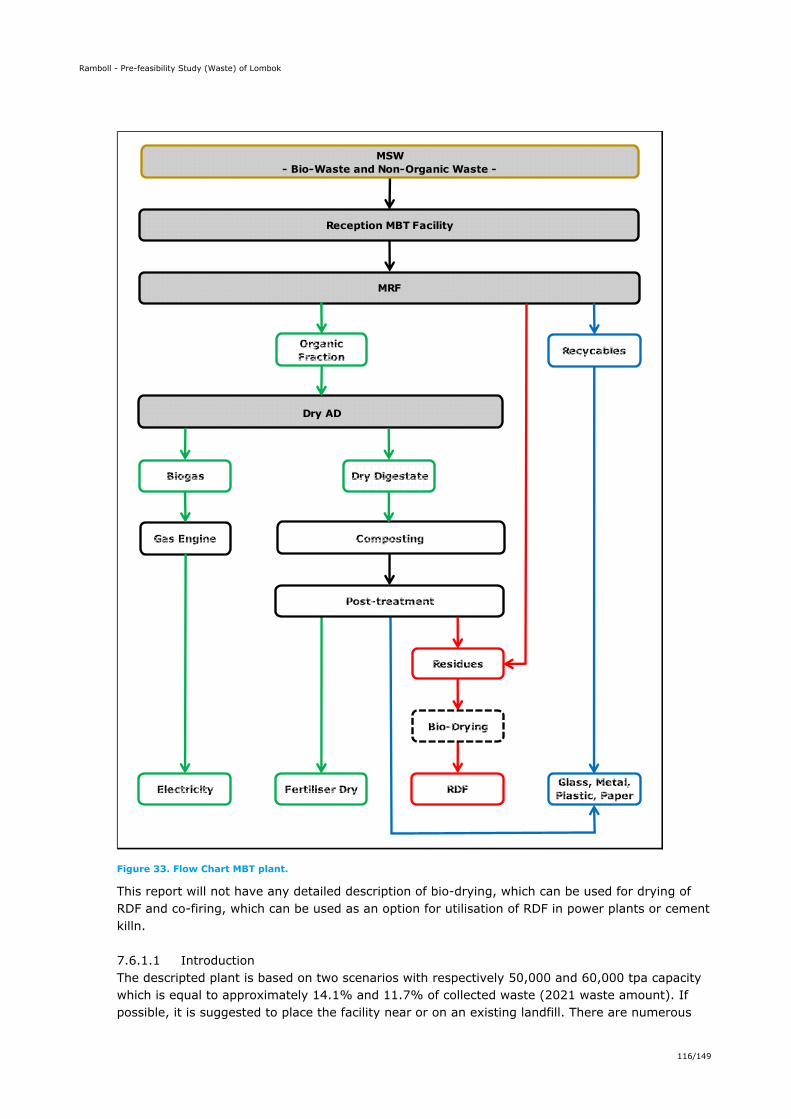
Ramboll - Pre-feasibility Study (Waste) of Lombok
116/149
Figure 33. Flow Chart MBT plant.
This report will not have any detailed description of bio-drying, which can be used for drying of RDF and co-firing, which can be used as an option for utilisation of RDF in power plants or cement killn. 7.6.1.1 Introduction The descripted plant is based on two scenarios with respectively 50,000 and 60,000 tpa capacity which is equal to approximately 14.1% and 11.7% of collected waste (2021 waste amount). If possible, it is suggested to place the facility near or on an existing landfill. There are numerous
Residues
Post-treatment
Reception MBT Facility
Electricity Fertiliser Dry RDF
Biogas
Gas Engine
MSW- Bio-Waste and Non-Organic Waste -
Dry AD
Dry Digestate
Composting
Bio-Drying
MRF
Organic Fraction Recycables
Glass, Metal, Plastic, Paper
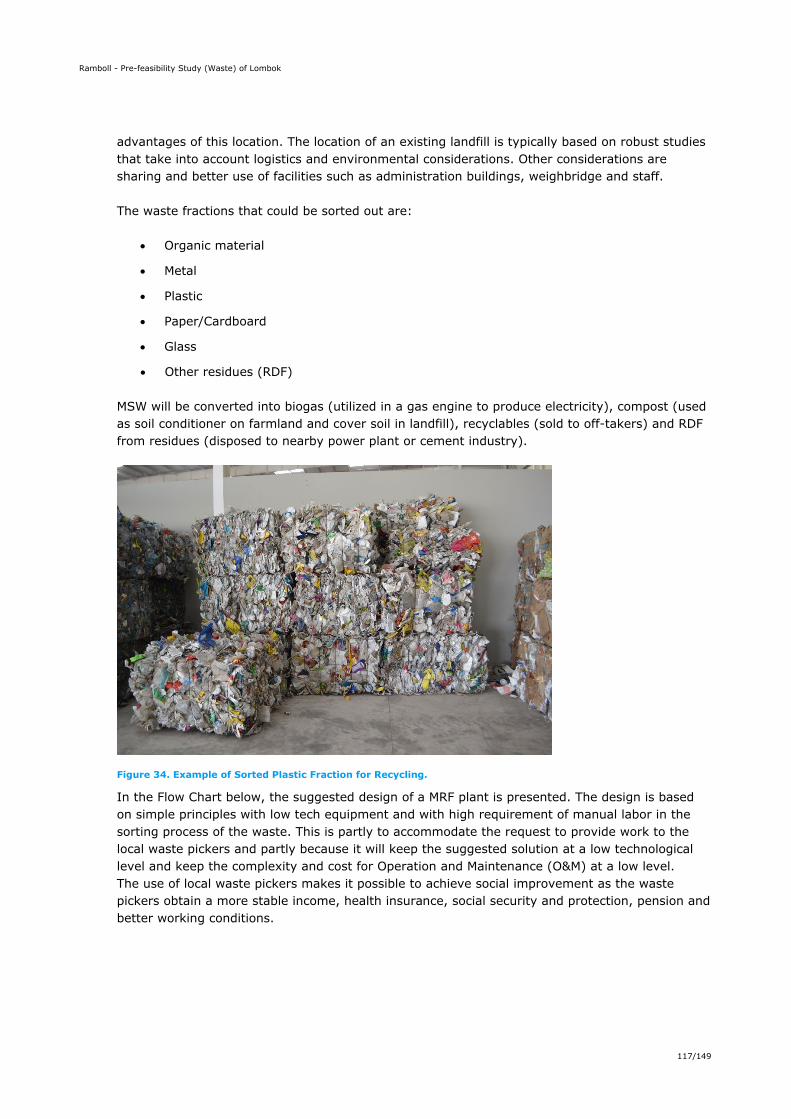
Ramboll - Pre-feasibility Study (Waste) of Lombok
117/149
advantages of this location. The location of an existing landfill is typically based on robust studies that take into account logistics and environmental considerations. Other considerations are sharing and better use of facilities such as administration buildings, weighbridge and staff. The waste fractions that could be sorted out are:
Organic material
Metal
Plastic
Paper/Cardboard
Glass
Other residues (RDF) MSW will be converted into biogas (utilized in a gas engine to produce electricity), compost (used as soil conditioner on farmland and cover soil in landfill), recyclables (sold to off-takers) and RDF from residues (disposed to nearby power plant or cement industry).
Figure 34. Example of Sorted Plastic Fraction for Recycling.
In the Flow Chart below, the suggested design of a MRF plant is presented. The design is based on simple principles with low tech equipment and with high requirement of manual labor in the sorting process of the waste. This is partly to accommodate the request to provide work to the local waste pickers and partly because it will keep the suggested solution at a low technological level and keep the complexity and cost for Operation and Maintenance (O&M) at a low level. The use of local waste pickers makes it possible to achieve social improvement as the waste pickers obtain a more stable income, health insurance, social security and protection, pension and better working conditions.
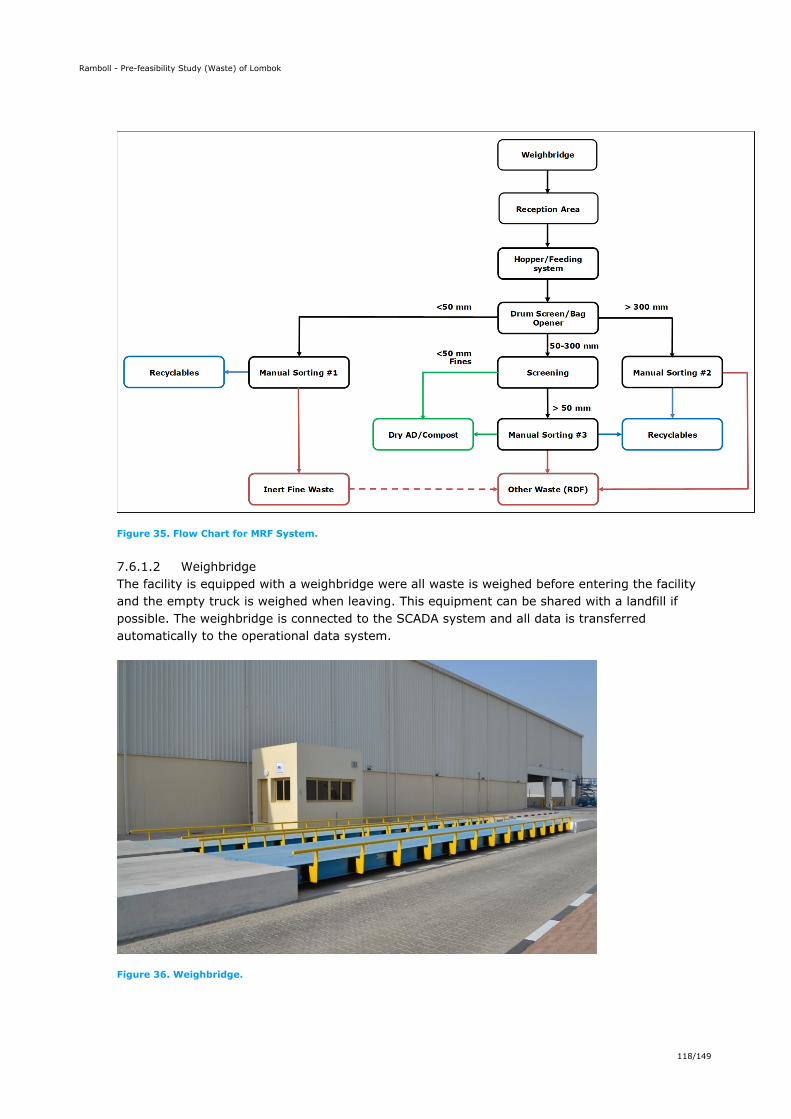
Ramboll - Pre-feasibility Study (Waste) of Lombok
118/149
Figure 35. Flow Chart for MRF System.
7.6.1.2 Weighbridge The facility is equipped with a weighbridge were all waste is weighed before entering the facility and the empty truck is weighed when leaving. This equipment can be shared with a landfill if possible. The weighbridge is connected to the SCADA system and all data is transferred automatically to the operational data system.
Figure 36. Weighbridge.
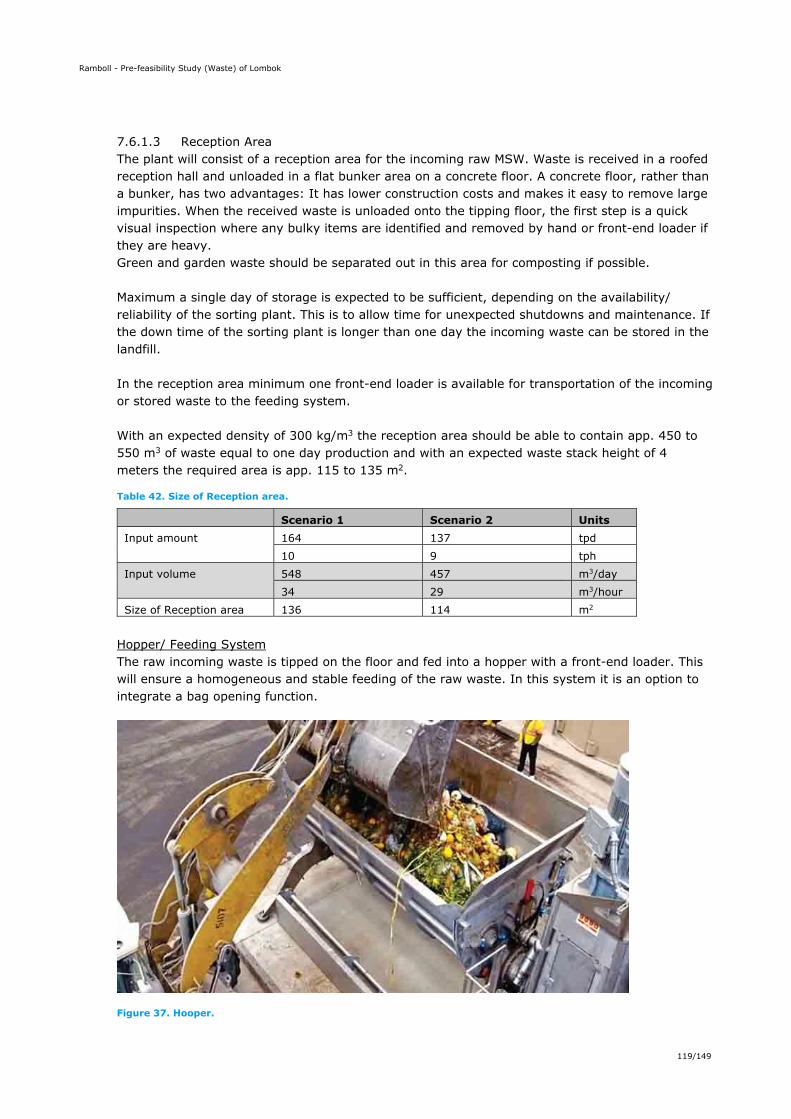
Ramboll - Pre-feasibility Study (Waste) of Lombok
119/149
7.6.1.3 Reception Area The plant will consist of a reception area for the incoming raw MSW. Waste is received in a roofed reception hall and unloaded in a flat bunker area on a concrete floor. A concrete floor, rather than a bunker, has two advantages: It has lower construction costs and makes it easy to remove large impurities. When the received waste is unloaded onto the tipping floor, the first step is a quick visual inspection where any bulky items are identified and removed by hand or front-end loader if they are heavy. Green and garden waste should be separated out in this area for composting if possible. Maximum a single day of storage is expected to be sufficient, depending on the availability/ reliability of the sorting plant. This is to allow time for unexpected shutdowns and maintenance. If the down time of the sorting plant is longer than one day the incoming waste can be stored in the landfill. In the reception area minimum one front-end loader is available for transportation of the incoming or stored waste to the feeding system. With an expected density of 300 kg/m3 the reception area should be able to contain app. 450 to 550 m3 of waste equal to one day production and with an expected waste stack height of 4 meters the required area is app. 115 to 135 m2.
Table 42. Size of Reception area.
Scenario 1 Scenario 2 Units Input amount 164 137 tpd
10 9 tph Input volume 548 457 m3/day
34 29 m3/hour Size of Reception area 136 114 m2
Hopper/ Feeding System The raw incoming waste is tipped on the floor and fed into a hopper with a front-end loader. This will ensure a homogeneous and stable feeding of the raw waste. In this system it is an option to integrate a bag opening function.
Figure 37. Hooper.
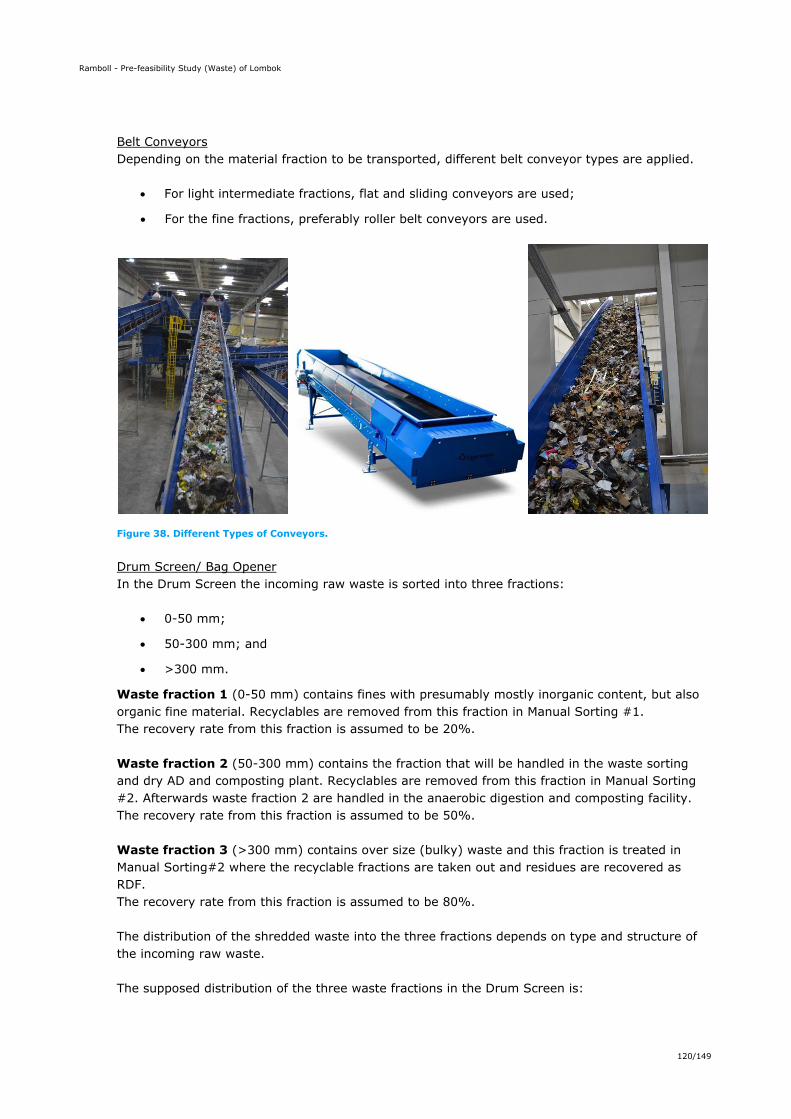
Ramboll - Pre-feasibility Study (Waste) of Lombok
120/149
Belt Conveyors Depending on the material fraction to be transported, different belt conveyor types are applied.
For light intermediate fractions, flat and sliding conveyors are used;
For the fine fractions, preferably roller belt conveyors are used.
Figure 38. Different Types of Conveyors.
Drum Screen/ Bag Opener In the Drum Screen the incoming raw waste is sorted into three fractions:
0-50 mm;
50-300 mm; and
>300 mm.
Waste fraction 1 (0-50 mm) contains fines with presumably mostly inorganic content, but also organic fine material. Recyclables are removed from this fraction in Manual Sorting #1. The recovery rate from this fraction is assumed to be 20%. Waste fraction 2 (50-300 mm) contains the fraction that will be handled in the waste sorting and dry AD and composting plant. Recyclables are removed from this fraction in Manual Sorting #2. Afterwards waste fraction 2 are handled in the anaerobic digestion and composting facility. The recovery rate from this fraction is assumed to be 50%. Waste fraction 3 (>300 mm) contains over size (bulky) waste and this fraction is treated in Manual Sorting#2 where the recyclable fractions are taken out and residues are recovered as RDF. The recovery rate from this fraction is assumed to be 80%. The distribution of the shredded waste into the three fractions depends on type and structure of the incoming raw waste. The supposed distribution of the three waste fractions in the Drum Screen is:
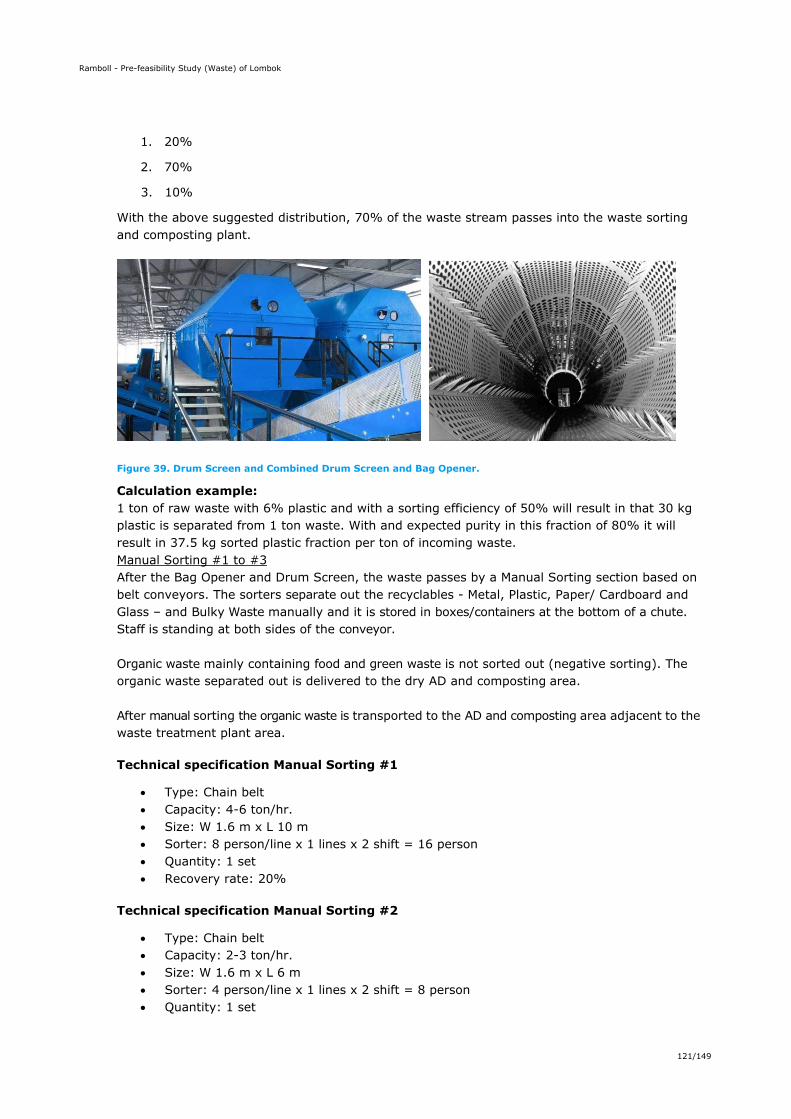
Ramboll - Pre-feasibility Study (Waste) of Lombok
121/149
1. 20%
2. 70%
3. 10%
With the above suggested distribution, 70% of the waste stream passes into the waste sorting and composting plant.
Figure 39. Drum Screen and Combined Drum Screen and Bag Opener.
Calculation example: 1 ton of raw waste with 6% plastic and with a sorting efficiency of 50% will result in that 30 kg plastic is separated from 1 ton waste. With and expected purity in this fraction of 80% it will result in 37.5 kg sorted plastic fraction per ton of incoming waste. Manual Sorting #1 to #3 After the Bag Opener and Drum Screen, the waste passes by a Manual Sorting section based on belt conveyors. The sorters separate out the recyclables - Metal, Plastic, Paper/ Cardboard and Glass – and Bulky Waste manually and it is stored in boxes/containers at the bottom of a chute. Staff is standing at both sides of the conveyor. Organic waste mainly containing food and green waste is not sorted out (negative sorting). The organic waste separated out is delivered to the dry AD and composting area. After manual sorting the organic waste is transported to the AD and composting area adjacent to the waste treatment plant area. Technical specification Manual Sorting #1
Type: Chain belt Capacity: 4-6 ton/hr. Size: W 1.6 m x L 10 m Sorter: 8 person/line x 1 lines x 2 shift = 16 person Quantity: 1 set Recovery rate: 20%
Technical specification Manual Sorting #2
Type: Chain belt Capacity: 2-3 ton/hr. Size: W 1.6 m x L 6 m Sorter: 4 person/line x 1 lines x 2 shift = 8 person Quantity: 1 set
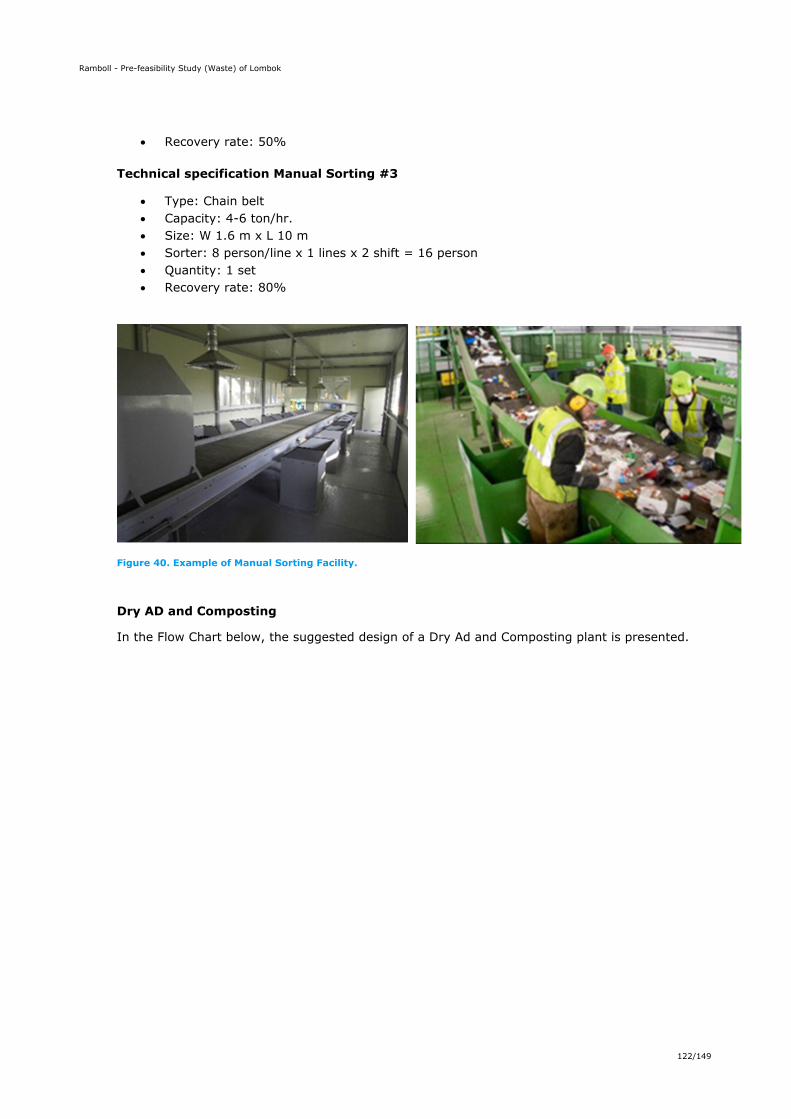
Ramboll - Pre-feasibility Study (Waste) of Lombok
122/149
Recovery rate: 50% Technical specification Manual Sorting #3
Type: Chain belt Capacity: 4-6 ton/hr. Size: W 1.6 m x L 10 m Sorter: 8 person/line x 1 lines x 2 shift = 16 person Quantity: 1 set Recovery rate: 80%
Figure 40. Example of Manual Sorting Facility.
Dry AD and Composting
In the Flow Chart below, the suggested design of a Dry Ad and Composting plant is presented.
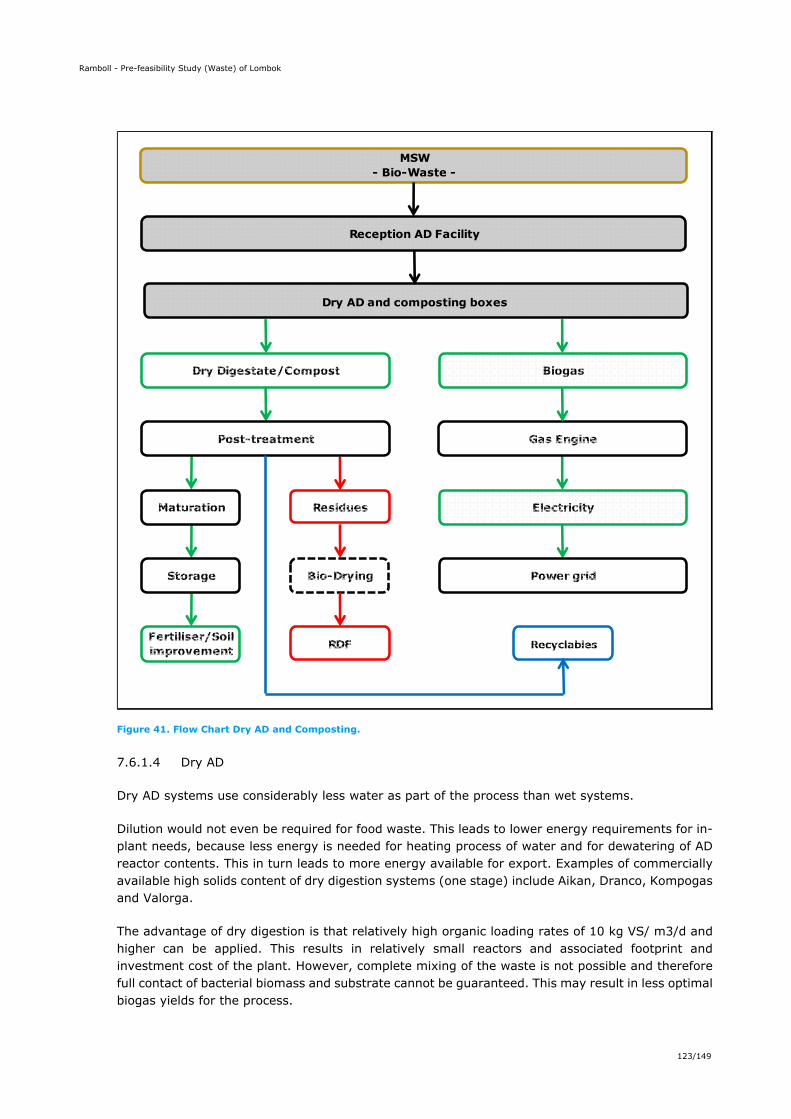
Ramboll - Pre-feasibility Study (Waste) of Lombok
123/149
Figure 41. Flow Chart Dry AD and Composting.
7.6.1.4 Dry AD
Dry AD systems use considerably less water as part of the process than wet systems.
Dilution would not even be required for food waste. This leads to lower energy requirements for in-plant needs, because less energy is needed for heating process of water and for dewatering of AD reactor contents. This in turn leads to more energy available for export. Examples of commercially available high solids content of dry digestion systems (one stage) include Aikan, Dranco, Kompogas and Valorga.
The advantage of dry digestion is that relatively high organic loading rates of 10 kg VS/ m3/d and higher can be applied. This results in relatively small reactors and associated footprint and investment cost of the plant. However, complete mixing of the waste is not possible and therefore full contact of bacterial biomass and substrate cannot be guaranteed. This may result in less optimal biogas yields for the process.
Recyclables
Maturation
Bio-Drying
Fertiliser/Soil improvement RDF
Electricity
Power grid
Residues
Post-treatment Gas Engine
Storage
MSW- Bio-Waste -
Reception AD Facility
Dry AD and composting boxes
Dry Digestate/Compost Biogas
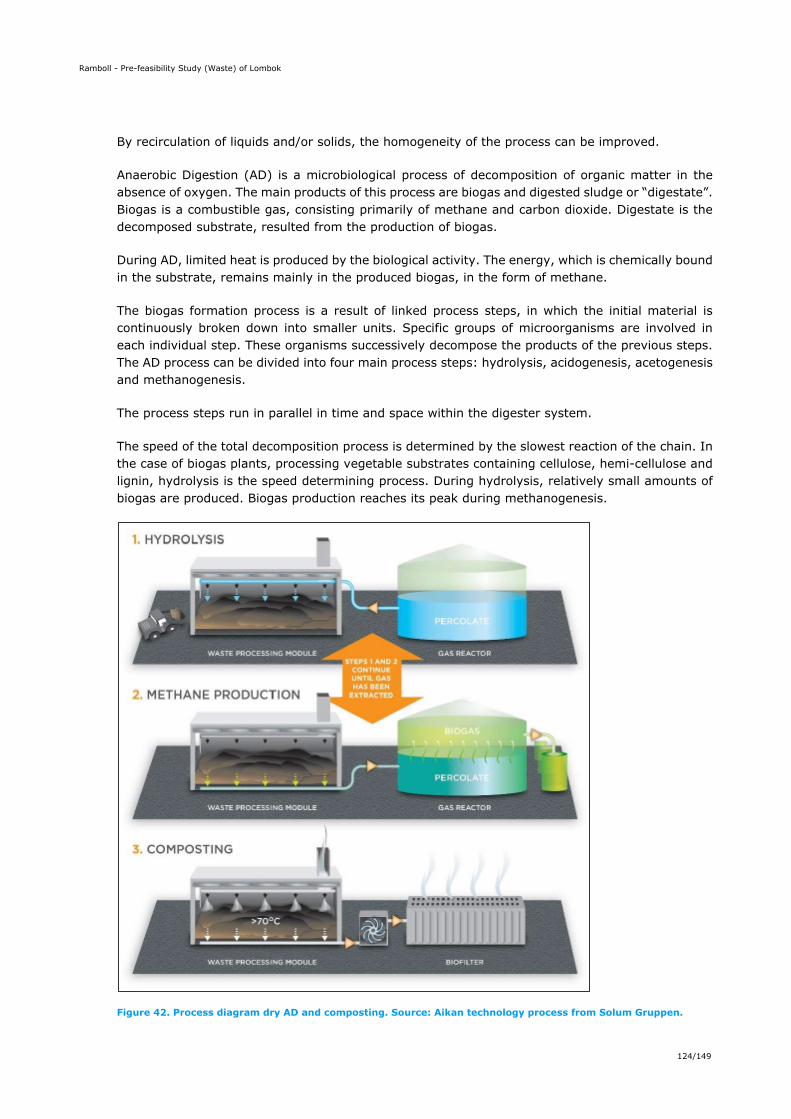
Ramboll - Pre-feasibility Study (Waste) of Lombok
124/149
By recirculation of liquids and/or solids, the homogeneity of the process can be improved.
Anaerobic Digestion (AD) is a microbiological process of decomposition of organic matter in the absence of oxygen. The main products of this process are biogas and digested sludge or “digestate”. Biogas is a combustible gas, consisting primarily of methane and carbon dioxide. Digestate is the decomposed substrate, resulted from the production of biogas.
During AD, limited heat is produced by the biological activity. The energy, which is chemically bound in the substrate, remains mainly in the produced biogas, in the form of methane.
The biogas formation process is a result of linked process steps, in which the initial material is continuously broken down into smaller units. Specific groups of microorganisms are involved in each individual step. These organisms successively decompose the products of the previous steps. The AD process can be divided into four main process steps: hydrolysis, acidogenesis, acetogenesis and methanogenesis.
The process steps run in parallel in time and space within the digester system.
The speed of the total decomposition process is determined by the slowest reaction of the chain. In the case of biogas plants, processing vegetable substrates containing cellulose, hemi-cellulose and lignin, hydrolysis is the speed determining process. During hydrolysis, relatively small amounts of biogas are produced. Biogas production reaches its peak during methanogenesis.
Figure 42. Process diagram dry AD and composting. Source: Aikan technology process from Solum Gruppen.
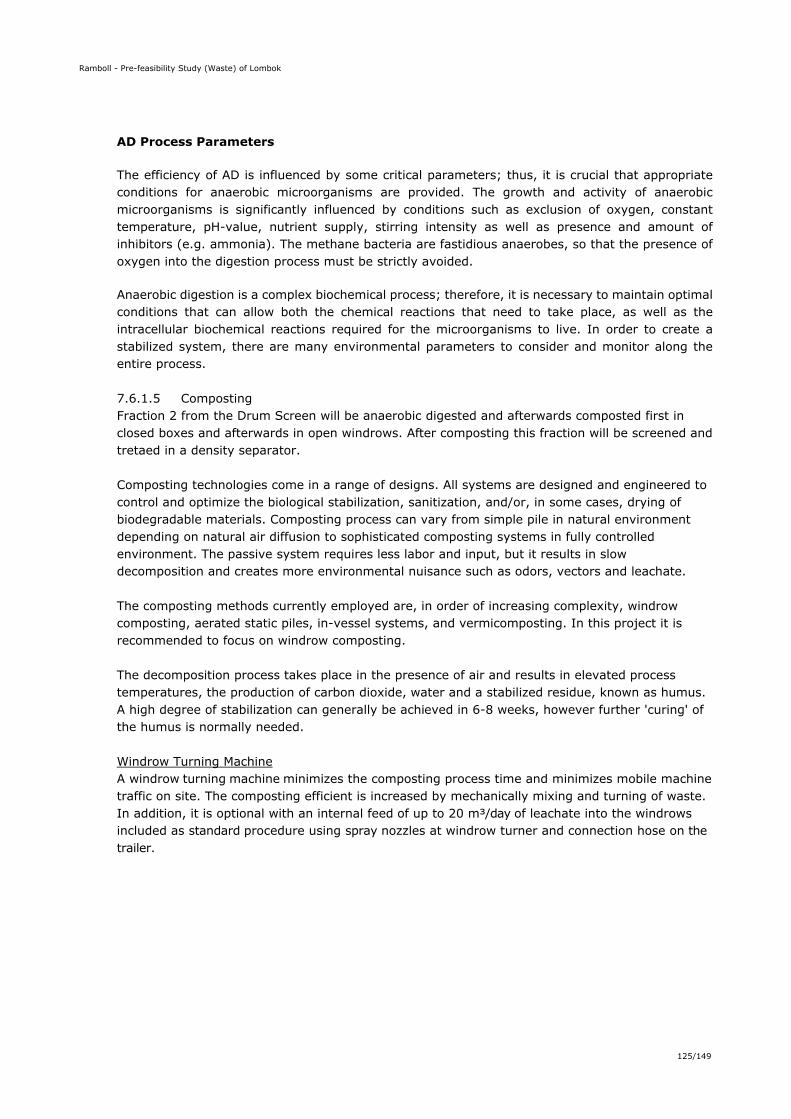
Ramboll - Pre-feasibility Study (Waste) of Lombok
125/149
AD Process Parameters
The efficiency of AD is influenced by some critical parameters; thus, it is crucial that appropriate conditions for anaerobic microorganisms are provided. The growth and activity of anaerobic microorganisms is significantly influenced by conditions such as exclusion of oxygen, constant temperature, pH-value, nutrient supply, stirring intensity as well as presence and amount of inhibitors (e.g. ammonia). The methane bacteria are fastidious anaerobes, so that the presence of oxygen into the digestion process must be strictly avoided.
Anaerobic digestion is a complex biochemical process; therefore, it is necessary to maintain optimal conditions that can allow both the chemical reactions that need to take place, as well as the intracellular biochemical reactions required for the microorganisms to live. In order to create a stabilized system, there are many environmental parameters to consider and monitor along the entire process. 7.6.1.5 Composting Fraction 2 from the Drum Screen will be anaerobic digested and afterwards composted first in closed boxes and afterwards in open windrows. After composting this fraction will be screened and tretaed in a density separator. Composting technologies come in a range of designs. All systems are designed and engineered to control and optimize the biological stabilization, sanitization, and/or, in some cases, drying of biodegradable materials. Composting process can vary from simple pile in natural environment depending on natural air diffusion to sophisticated composting systems in fully controlled environment. The passive system requires less labor and input, but it results in slow decomposition and creates more environmental nuisance such as odors, vectors and leachate. The composting methods currently employed are, in order of increasing complexity, windrow composting, aerated static piles, in-vessel systems, and vermicomposting. In this project it is recommended to focus on windrow composting. The decomposition process takes place in the presence of air and results in elevated process temperatures, the production of carbon dioxide, water and a stabilized residue, known as humus. A high degree of stabilization can generally be achieved in 6-8 weeks, however further 'curing' of the humus is normally needed. Windrow Turning Machine A windrow turning machine minimizes the composting process time and minimizes mobile machine traffic on site. The composting efficient is increased by mechanically mixing and turning of waste. In addition, it is optional with an internal feed of up to 20 m³/day of leachate into the windrows included as standard procedure using spray nozzles at windrow turner and connection hose on the trailer.

Ramboll - Pre-feasibility Study (Waste) of Lombok
126/149
Example of Technical Specification Windrow Turning Machine:
Figure 43. Windrow Turning Machine. Source: Eggersmann.
Rotating Screen After composting of the organic fraction, the composted material is screened in a Rotating Screen. In the Rotating Screen the composted waste is sorted into two fractions:
1. 0-50 mm and
2. >50 mm. After screening the fine fraction is disposed of as compost that goes for final maturing at the landfill. The coarse fraction is transported for further sorting in Manual Sorting #3. 7.6.1.6 Required Area for MBT The required area for the MBT is illustrated for each Scenario in the table below. Area for MRF in roofed area is not included in paved reception area.
Table 43. Required Area for MBT.
Scenario Unit 1 2
Capacity MRF/Dry AD Composting tpa 60,000/40,000 50,000/30,000
MRF in roofed facility with some simple trapez metal plate walls
m2 3,000 2,500
Paved reception area for waste treatment plant
m2 3,500 3,000
Paved maturation area for windrows (raw compost)
m2 5,500 4,000
Compacted area for final maturation m2 3,000 2,000
Dry AD m2 10,000 8,500
Total paved area m2 25,000 20,000
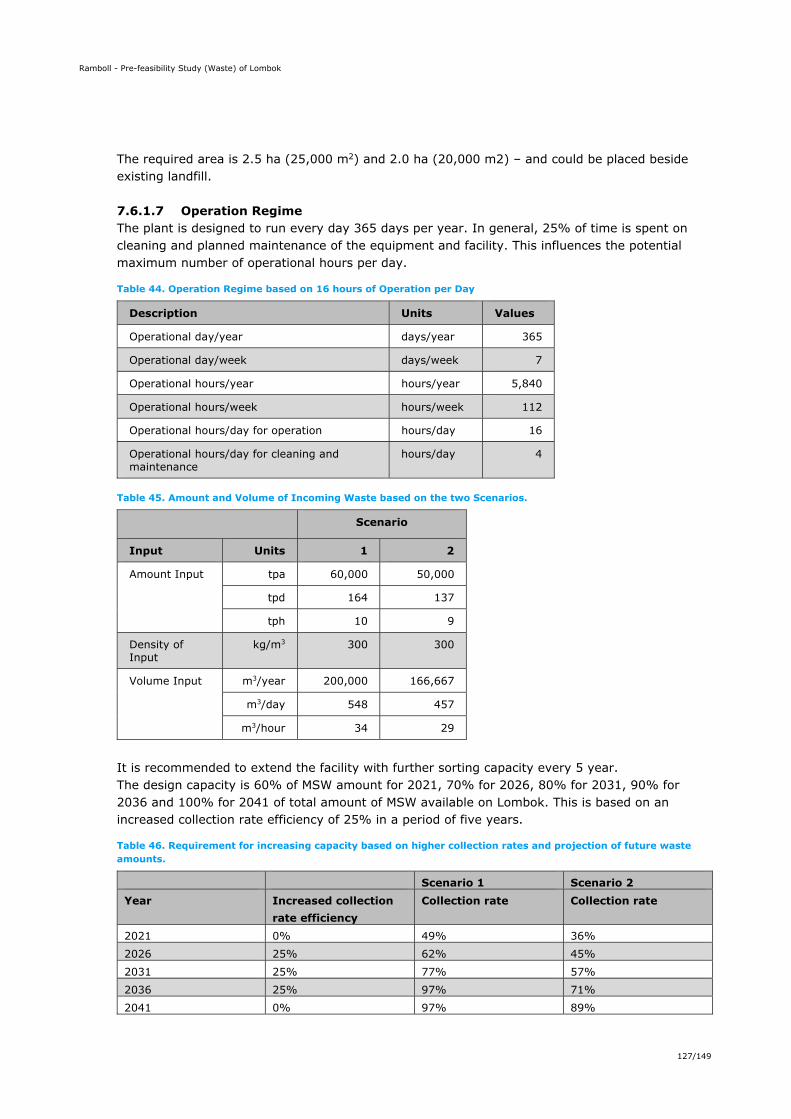
Ramboll - Pre-feasibility Study (Waste) of Lombok
127/149
The required area is 2.5 ha (25,000 m2) and 2.0 ha (20,000 m2) – and could be placed beside existing landfill. 7.6.1.7 Operation Regime The plant is designed to run every day 365 days per year. In general, 25% of time is spent on cleaning and planned maintenance of the equipment and facility. This influences the potential maximum number of operational hours per day.
Table 44. Operation Regime based on 16 hours of Operation per Day
Description Units Values
Operational day/year days/year 365
Operational day/week days/week 7
Operational hours/year hours/year 5,840
Operational hours/week hours/week 112
Operational hours/day for operation hours/day 16
Operational hours/day for cleaning and maintenance
hours/day 4
Table 45. Amount and Volume of Incoming Waste based on the two Scenarios.
Scenario
Input Units 1 2
Amount Input tpa 60,000 50,000
tpd 164 137
tph 10 9
Density of Input
kg/m3 300 300
Volume Input m3/year 200,000 166,667
m3/day 548 457
m3/hour 34 29
It is recommended to extend the facility with further sorting capacity every 5 year. The design capacity is 60% of MSW amount for 2021, 70% for 2026, 80% for 2031, 90% for 2036 and 100% for 2041 of total amount of MSW available on Lombok. This is based on an increased collection rate efficiency of 25% in a period of five years.
Table 46. Requirement for increasing capacity based on higher collection rates and projection of future waste amounts.
Scenario 1 Scenario 2 Year Increased collection
rate efficiency Collection rate Collection rate
2021 0% 49% 36% 2026 25% 62% 45% 2031 25% 77% 57% 2036 25% 97% 71% 2041 0% 97% 89%
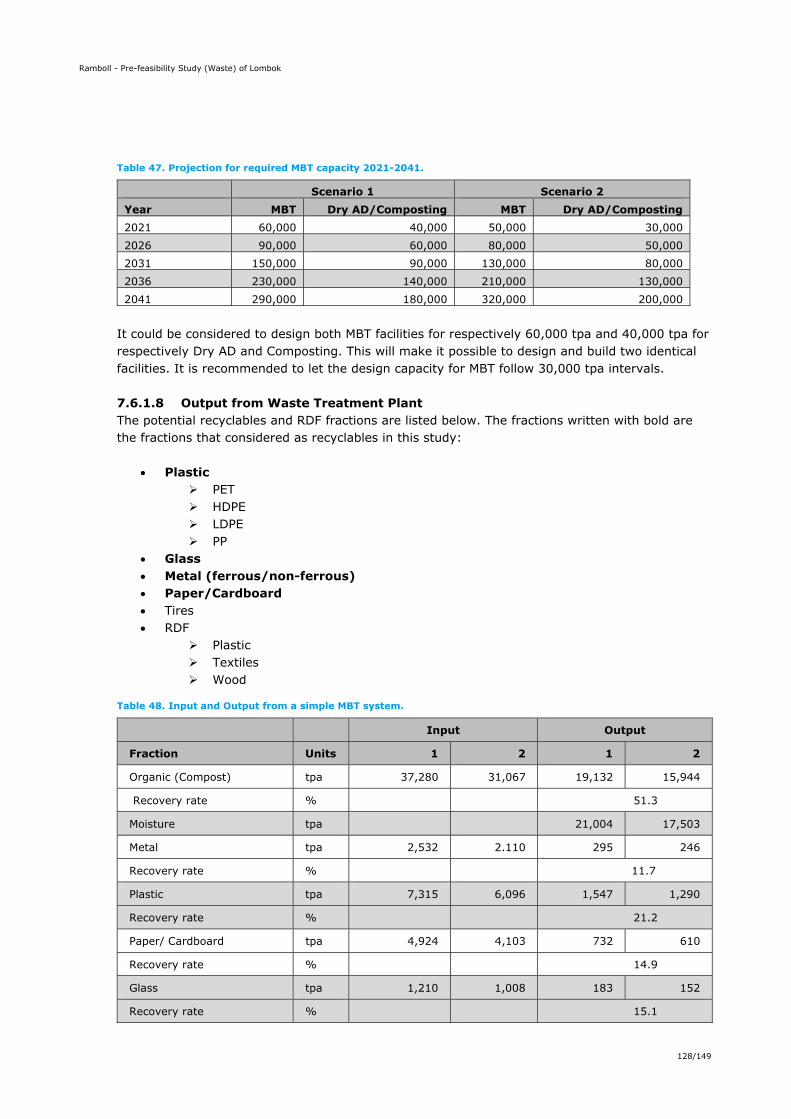
Ramboll - Pre-feasibility Study (Waste) of Lombok
128/149
Table 47. Projection for required MBT capacity 2021-2041.
Scenario 1 Scenario 2 Year MBT Dry AD/Composting MBT Dry AD/Composting 2021 60,000 40,000 50,000 30,000 2026 90,000 60,000 80,000 50,000 2031 150,000 90,000 130,000 80,000 2036 230,000 140,000 210,000 130,000 2041 290,000 180,000 320,000 200,000
It could be considered to design both MBT facilities for respectively 60,000 tpa and 40,000 tpa for respectively Dry AD and Composting. This will make it possible to design and build two identical facilities. It is recommended to let the design capacity for MBT follow 30,000 tpa intervals. 7.6.1.8 Output from Waste Treatment Plant The potential recyclables and RDF fractions are listed below. The fractions written with bold are the fractions that considered as recyclables in this study:
Plastic PET HDPE LDPE PP
Glass Metal (ferrous/non-ferrous) Paper/Cardboard Tires RDF
Plastic Textiles Wood
Table 48. Input and Output from a simple MBT system.
Input Output
Fraction Units 1 2 1 2
Organic (Compost) tpa 37,280 31,067 19,132 15,944
Recovery rate %
51.3
Moisture tpa
21,004 17,503
Metal tpa 2,532 2.110 295 246
Recovery rate %
11.7
Plastic tpa 7,315 6,096 1,547 1,290
Recovery rate %
21.2
Paper/ Cardboard tpa 4,924 4,103 732 610
Recovery rate %
14.9
Glass tpa 1,210 1,008 183 152
Recovery rate %
15.1
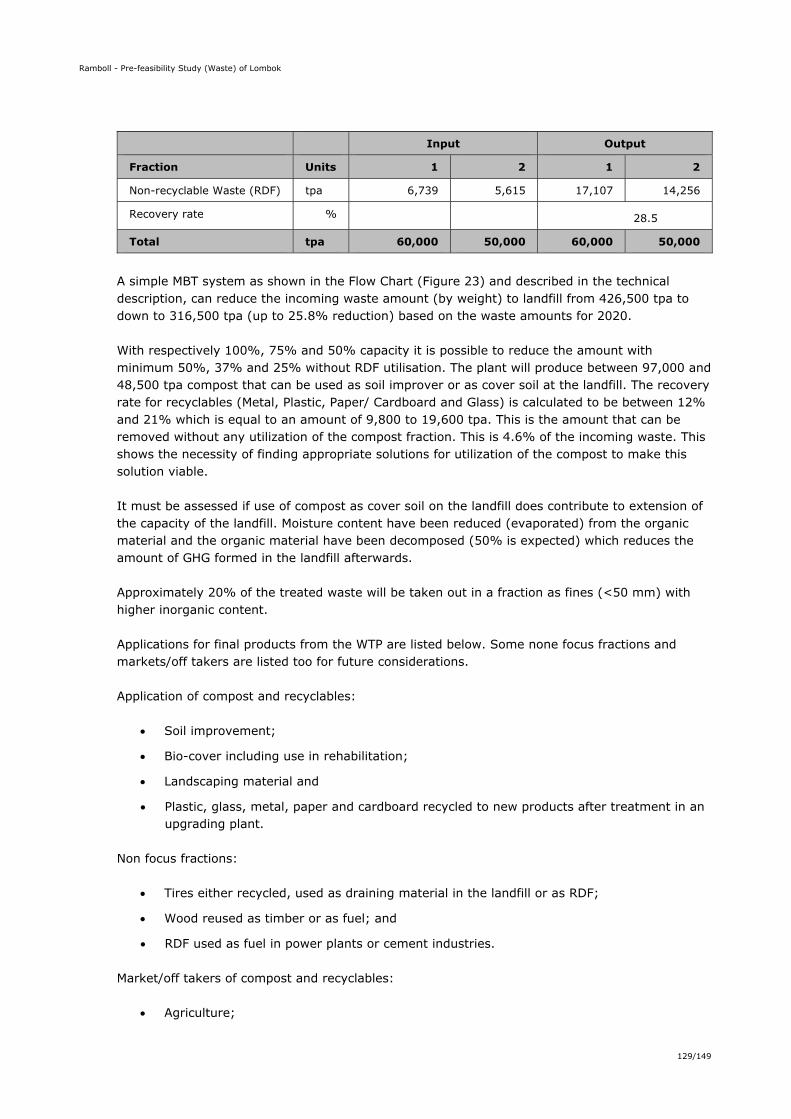
Ramboll - Pre-feasibility Study (Waste) of Lombok
129/149
Input Output
Fraction Units 1 2 1 2
Non-recyclable Waste (RDF) tpa 6,739 5,615 17,107 14,256
Recovery rate %
28.5
Total tpa 60,000 50,000 60,000 50,000
A simple MBT system as shown in the Flow Chart (Figure 23) and described in the technical description, can reduce the incoming waste amount (by weight) to landfill from 426,500 tpa to down to 316,500 tpa (up to 25.8% reduction) based on the waste amounts for 2020. With respectively 100%, 75% and 50% capacity it is possible to reduce the amount with minimum 50%, 37% and 25% without RDF utilisation. The plant will produce between 97,000 and 48,500 tpa compost that can be used as soil improver or as cover soil at the landfill. The recovery rate for recyclables (Metal, Plastic, Paper/ Cardboard and Glass) is calculated to be between 12% and 21% which is equal to an amount of 9,800 to 19,600 tpa. This is the amount that can be removed without any utilization of the compost fraction. This is 4.6% of the incoming waste. This shows the necessity of finding appropriate solutions for utilization of the compost to make this solution viable. It must be assessed if use of compost as cover soil on the landfill does contribute to extension of the capacity of the landfill. Moisture content have been reduced (evaporated) from the organic material and the organic material have been decomposed (50% is expected) which reduces the amount of GHG formed in the landfill afterwards. Approximately 20% of the treated waste will be taken out in a fraction as fines (<50 mm) with higher inorganic content. Applications for final products from the WTP are listed below. Some none focus fractions and markets/off takers are listed too for future considerations. Application of compost and recyclables:
Soil improvement;
Bio-cover including use in rehabilitation;
Landscaping material and
Plastic, glass, metal, paper and cardboard recycled to new products after treatment in an upgrading plant.
Non focus fractions:
Tires either recycled, used as draining material in the landfill or as RDF;
Wood reused as timber or as fuel; and
RDF used as fuel in power plants or cement industries. Market/off takers of compost and recyclables:
Agriculture;
Ramboll - Pre-feasibility Study (Waste) of Lombok
130/149
Erosion and sediment control;
Landscaping;
Reclamation/ Landfills;
Waste brokers;
Waste upgrading/ recycling plants/ companies; and
Waste management companies; Non focus market/off takers:
Timber handling companies;
Power plants/ companies; and
Cement plants/ companies. 7.6.1.9 Benefits from Establishment of WTP with Dry AD and Compost Facility GHG Reduction Factors
Level of landfill gas reduction;
Replacement of electricity produced on fossil fuels;
Carbon content of compost recycled to soil; and
Quantity of fertilizer replaced.
Benefits of Compost Use
Improves any soil to which it is applied, increasing productivity;
Suppresses soil-borne disease organisms;
Prevents topsoil loss;
Provides erosion control; and
Degrades some petroleum-based contaminants and reduces the bioavailability of heavy metals.
Environmental Benefits of Diverting Organics from Landfills
Preserves landfill capacity;
Reduces landfill leachate quantities and management costs;
Passively treats landfill gas emissions in landfill closure projects; and
During the active life of a landfill, provides erosion prevention, sediment control, and surface water treatment.
Social Benefits of Diverting Organics from Landfills
Protects human and environmental health;
Reduces landfill safety risks;
Contributes to land preservation;
Produces compost, which can be used for reforestation, wetlands restoration, and habitat revitalization to reverse industrialization impacts;
Decreases nuisances for neighbors;
Ramboll - Pre-feasibility Study (Waste) of Lombok
131/149
Allows creation of compost (and biogas), reducing reliance on nonrenewable resources (peat and fossil fuels);
Provides opportunities for teaching, training, and employment;
Contributes to healthy soils vital to sustaining the agricultural industry. Economic Benefits of Diverting Organics from Landfills
Extends landfill life;
Reduces harmful emissions;
Provides new, environmental-based, direct and indirect employment opportunities;
Provides costs savings by reducing fossil fuel and fertilizer use;
Generates potential revenue if GHG reductions sold as offsets;
Provides costs and energy savings from chemical fertilizer replacement.
7.6.1.10 Compost Quality Standards for Composting of Solid Non-Hazardous Waste In terms of the environmental impact, the layout of plant and process and the operation shall:
Prevent pollution of soil and water by high technical standard and operational reliability of plant design;
Process control including to ensure no unreasonable odor nuisance to receptors outside of the plant;
Control liquids at the plant to ensure maximum separation of stormwater from wastewater and ensure effective recycling and final treatment of wastewaters;
Minimize releases of greenhouse gases. Compost produced from solid non-hazardous waste shall comply with the proposed limit values set by national and local regulations. Typically compost is graduated into two or three qualities:
Grade A compost for unrestricted use in agriculture and hobby gardening;
Grade B compost for restricted use in landscaping and reclamation works without agricultural production and limited access of the general public (e.g. for cover of landfills).
In marketing of compost, this product shall be labelled by the producer with complete information including the waste fractions used as an input material for composting, the limit values complied with (e.g. Grade A according to Environmental Regulation), full chemical and biochemical test results and declaration from an accredited laboratory made within the last two years, and recommendations regarding specific application and maximum dosage. The use of compost depends on various parameters like content of N, P, K (fertilizers) and Organic Matter (OM), biological, chemical and inert contaminants, stability and maturity, odor and particle size. Agriculture Compost Parameters of Importance for Agricultural Applications:
Ramboll - Pre-feasibility Study (Waste) of Lombok
132/149
Rich in nutrients (N, P, K);
Rich in organic matter (OM);
Low in biological (pathogens) and chemical contaminants (heavy metals). Compost Uses for Agriculture:
Soil additive for field crops, vegetables, and fruit crops;
Component of raised planting bed soil mixes;
Component of greenhouse crop soil mixes;
Organic and/or certified organic fertilizer: Erosion and Sediment Control Compost Parameters of Importance in Erosion and Sediment Control Applications:
Stable and mature if vegetated;
Free from inert contamination (plastic, glass);
Proper particle size distribution (coarse compost). Compost Uses for Erosion and Sediment Control:
Soil blanket (for slopes);
Filter berms;
Media for vegetation;
Media for filter socks. Landscaping Compost Parameters of Importance in Landscaping Applications:
Stable and mature;
Free from inert contamination (plastic, glass);
Low in odor. Compost Uses for Landscaping:
Flower/ garden bed establishment;
Planter mix component (e.g., raised flower beds and rooftop mixes);
Tree/ shrub backfill mix component;
Manufactured topsoil component;
Decorative plant mulch;
Turf establishment/ renovation and maintenance;
Turf topdressing;
Organic fertilizer. Reclamation/ Landfills Compost Parameters of Importance in Reclamation Applications:
Ramboll - Pre-feasibility Study (Waste) of Lombok
133/149
Stable and mature;
Rich in OM. Compost Uses for Reclamation:
Manufactured topsoil component;
Soil additive (upgrading marginal soils);
Bioremediation of contaminated soils (e.g., heavy metals and petroleum-based contaminants);
Remediation of organically dead soil;
Landscape plants and turf establishment;
Agricultural/ energy crop establishment. Reselling Compost Parameters of Importance for Reselling Applications:
Stable and mature;
Free from inert contamination (plastic, glass);
Low in odor. Compost Uses for Reselling:
Resale for landscape applications;
Resale for general turf applications. 7.6.1.11 Environmental Aspects In below table the estimated content of Organic Matter (OM) is illustrated. The reduction in OM disposed to landfill have an influence on the potential GHG emissions.
Table 49. Organic Matter Content.
OM content
[%]
OM amount
[tpa]
OM amount
[tpa]
Scenario 60,000 50,000
Input 83% 49,800 41,500
Output Compost 88% 16,840 14,030
7.6.1.12 Financial Data of Waste Treatment Plant The figures in this chapter can be adjusted in proportionality according to the various amount of incoming waste. With the uncertainty in all the data used in the estimations in this report, it is reasonable to do calculations for each 10,000 tpa of capacity.
7.6.1.13 Circular economy
Anaerobic Digestion is a key process for developing Circular Economy (CE). By linking up and closing the loop on the previously linear processes of sending organic waste to landfill, using fossil fuels for energy and making fertiliser to grow food from fossil fuels and water, anaerobic digestion is able to
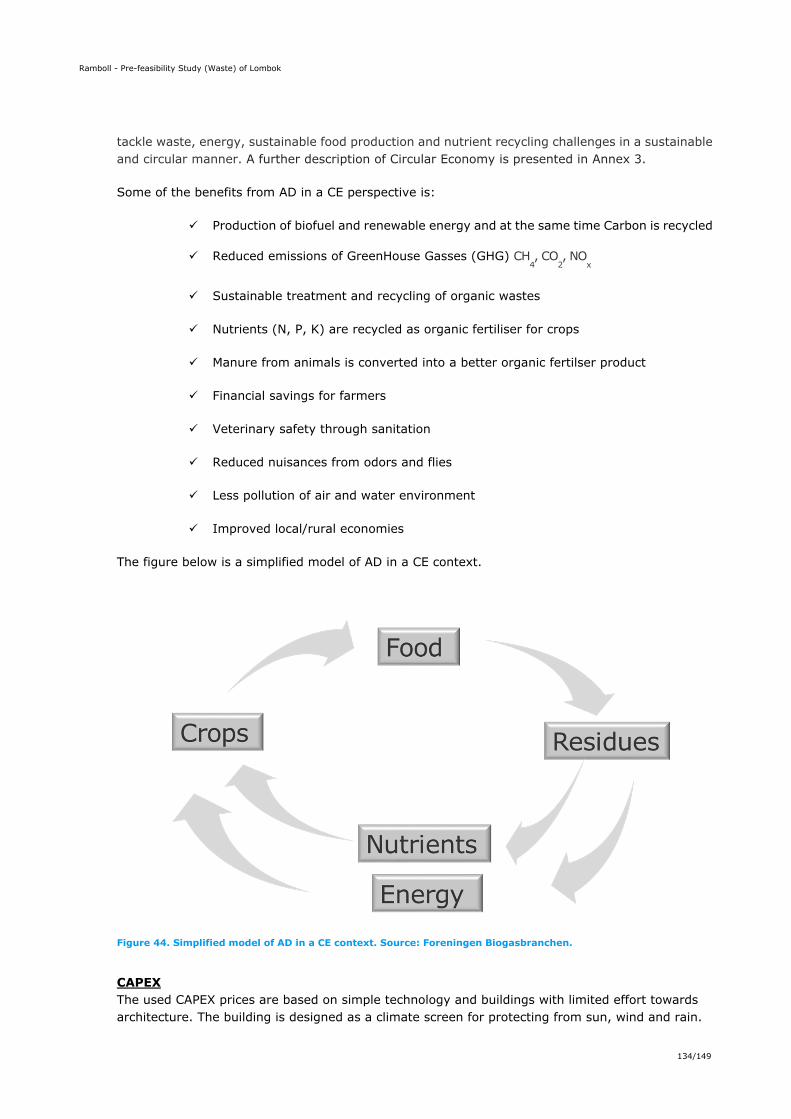
Ramboll - Pre-feasibility Study (Waste) of Lombok
134/149
tackle waste, energy, sustainable food production and nutrient recycling challenges in a sustainable and circular manner. A further description of Circular Economy is presented in Annex 3.
Some of the benefits from AD in a CE perspective is:
Production of biofuel and renewable energy and at the same time Carbon is recycled
Reduced emissions of GreenHouse Gasses (GHG) CH4, CO
2, NO
x
Sustainable treatment and recycling of organic wastes
Nutrients (N, P, K) are recycled as organic fertiliser for crops
Manure from animals is converted into a better organic fertilser product
Financial savings for farmers
Veterinary safety through sanitation
Reduced nuisances from odors and flies
Less pollution of air and water environment
Improved local/rural economies
The figure below is a simplified model of AD in a CE context.
Figure 44. Simplified model of AD in a CE context. Source: Foreningen Biogasbranchen.
CAPEX The used CAPEX prices are based on simple technology and buildings with limited effort towards architecture. The building is designed as a climate screen for protecting from sun, wind and rain.
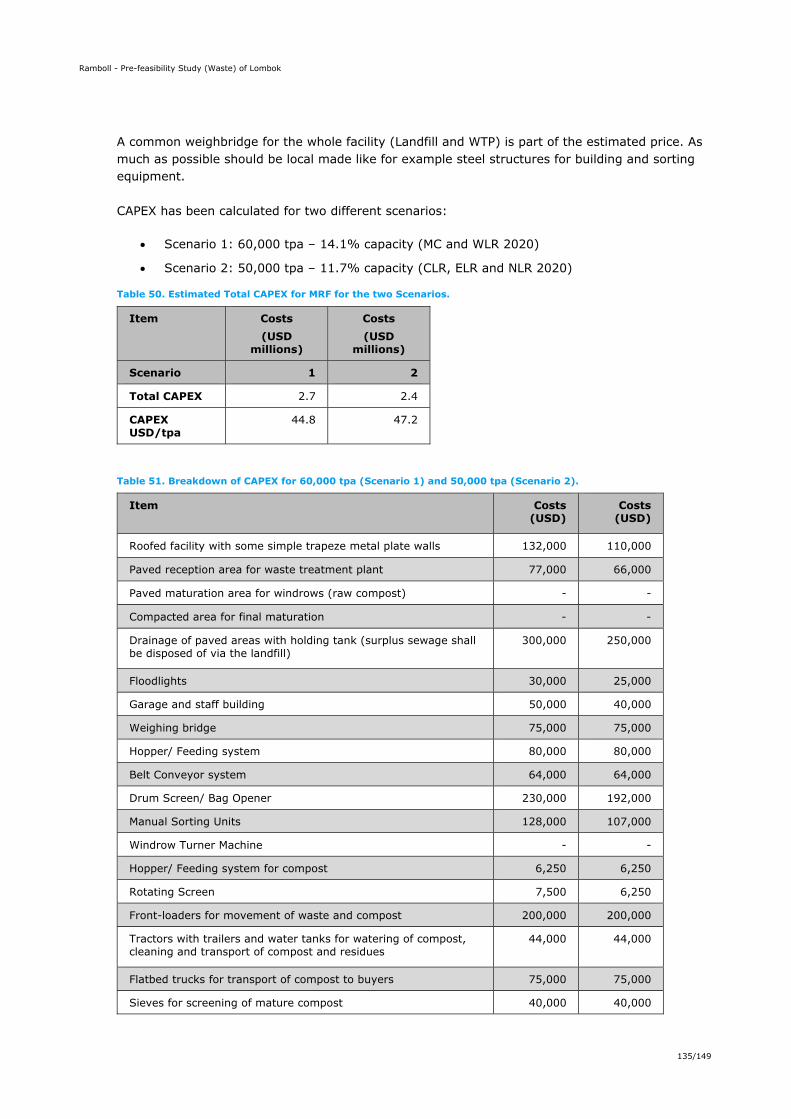
Ramboll - Pre-feasibility Study (Waste) of Lombok
135/149
A common weighbridge for the whole facility (Landfill and WTP) is part of the estimated price. As much as possible should be local made like for example steel structures for building and sorting equipment. CAPEX has been calculated for two different scenarios:
Scenario 1: 60,000 tpa – 14.1% capacity (MC and WLR 2020)
Scenario 2: 50,000 tpa – 11.7% capacity (CLR, ELR and NLR 2020)
Table 50. Estimated Total CAPEX for MRF for the two Scenarios.
Item Costs (USD
millions)
Costs (USD
millions)
Scenario 1 2
Total CAPEX 2.7 2.4
CAPEX USD/tpa
44.8 47.2
Table 51. Breakdown of CAPEX for 60,000 tpa (Scenario 1) and 50,000 tpa (Scenario 2).
Item Costs (USD)
Costs (USD)
Roofed facility with some simple trapeze metal plate walls 132,000 110,000
Paved reception area for waste treatment plant 77,000 66,000
Paved maturation area for windrows (raw compost) - -
Compacted area for final maturation - -
Drainage of paved areas with holding tank (surplus sewage shall be disposed of via the landfill)
300,000 250,000
Floodlights 30,000 25,000
Garage and staff building 50,000 40,000
Weighing bridge 75,000 75,000
Hopper/ Feeding system 80,000 80,000
Belt Conveyor system 64,000 64,000
Drum Screen/ Bag Opener 230,000 192,000
Manual Sorting Units 128,000 107,000
Windrow Turner Machine - -
Hopper/ Feeding system for compost 6,250 6,250
Rotating Screen 7,500 6,250
Front-loaders for movement of waste and compost 200,000 200,000
Tractors with trailers and water tanks for watering of compost, cleaning and transport of compost and residues
44,000 44,000
Flatbed trucks for transport of compost to buyers 75,000 75,000
Sieves for screening of mature compost 40,000 40,000

Ramboll - Pre-feasibility Study (Waste) of Lombok
136/149
Item Costs (USD)
Costs (USD)
Miscellaneous (SCADA, Installation etc.) 700,000 585,000
Sub-Total 2,240,000 1,965,500
Contingency and Unforeseeable Costs 448,000 393,100
Total Project Costs 2,688,000 2,358,600
USD/ton 44.8 47.2
OPEX OPEX is based on key figures and a percentage of CAPEX, derived from a series of detailed cost estimates from previous projects.
Table 52. Assumptions for OPEX for MRF at the Proposed Capacities in the two Scenarios.
OPEX
Scenario 1 2 Unit
Staffing 0.54 0.48 USD million/year
Annual Maintenance - Civil Works 2.0% 2.0% % of CAPEX
Annual Maintenance - WTP and mobile equipment 5.0% 5.0% % of CAPEX
Fuel Consumption 1.0 1.0 Liter/ton MSW
Power Consumption 10 10 kWh/ton MSW
Other O&M Cost 0.2 0.2 USD/ton MSW
Insurance 2.0% 2.0% % of CAPEX
Permits and Utilities 0.012 0.010 USD million/year
Miscellaneous Cost 10% 10% % of OPEX Sub-Total
Unexpected Cost 10% 10% % of OPEX Sub-Total
Total estimated OPEX without depreciation 0.92 0.82 USD million/year
Total estimated OPEX without depreciation 15.4 16,3 USD/ton
Depreciation period 10 10 years
Interest rate 5.0% 5.0% % p.a.
Depreciation Cost 0.35 0.33 USD million/year
Depreciation Cost 5.8 6.5 USD/ton
7.6.2 Revenue The soil conditioner (fertilizer) generated by the composting plant is assumed not to be able to achieve any positive market price. Revenue from sales of recyclables is estimated as follows:
Table 53. Estimated Market Price for Sales of Recyclables and Other Materials.
Type of recyclable Price per Tonne of material
Price per Tonne of material based on ratio
Compost 10 10
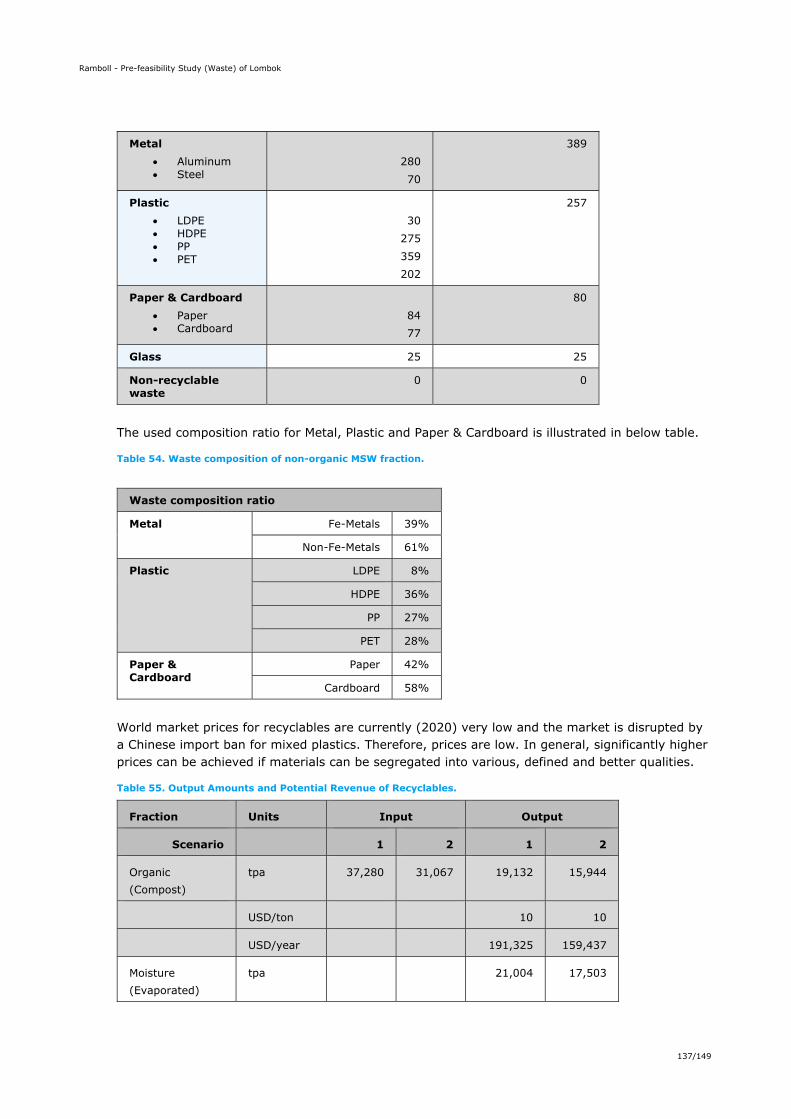
Ramboll - Pre-feasibility Study (Waste) of Lombok
137/149
Metal Aluminum Steel
280 70
389
Plastic LDPE HDPE PP PET
30
275 359 202
257
Paper & Cardboard Paper Cardboard
84 77
80
Glass 25 25
Non-recyclable waste
0 0
The used composition ratio for Metal, Plastic and Paper & Cardboard is illustrated in below table.
Table 54. Waste composition of non-organic MSW fraction.
Waste composition ratio
Metal Fe-Metals 39%
Non-Fe-Metals 61%
Plastic LDPE 8%
HDPE 36%
PP 27%
PET 28%
Paper & Cardboard
Paper 42%
Cardboard 58%
World market prices for recyclables are currently (2020) very low and the market is disrupted by a Chinese import ban for mixed plastics. Therefore, prices are low. In general, significantly higher prices can be achieved if materials can be segregated into various, defined and better qualities.
Table 55. Output Amounts and Potential Revenue of Recyclables.
Fraction Units Input Output
Scenario
1 2 1 2
Organic (Compost)
tpa 37,280 31,067 19,132 15,944
USD/ton 10 10
USD/year 191,325 159,437
Moisture (Evaporated)
tpa 21,004 17,503
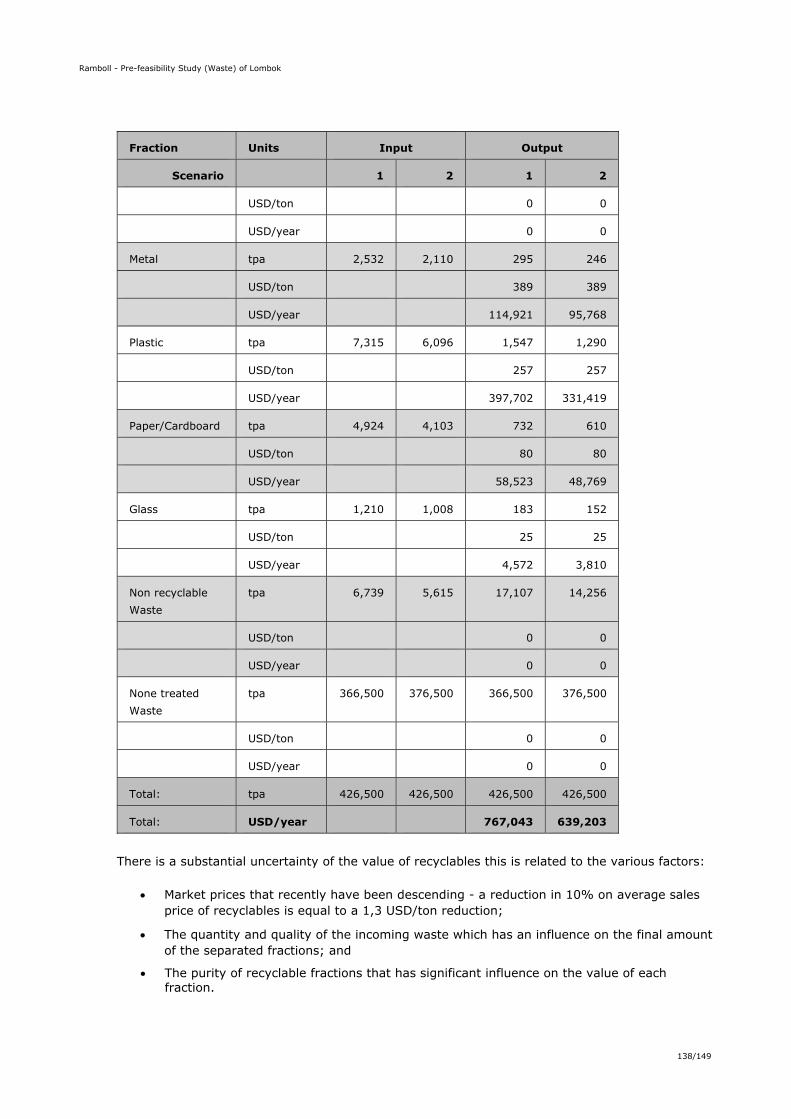
Ramboll - Pre-feasibility Study (Waste) of Lombok
138/149
Fraction Units Input Output
Scenario
1 2 1 2
USD/ton 0 0
USD/year 0 0
Metal tpa 2,532 2,110 295 246
USD/ton 389 389
USD/year 114,921 95,768
Plastic tpa 7,315 6,096 1,547 1,290
USD/ton 257 257
USD/year 397,702 331,419
Paper/Cardboard tpa 4,924 4,103 732 610
USD/ton 80 80
USD/year 58,523 48,769
Glass tpa 1,210 1,008 183 152
USD/ton 25 25
USD/year 4,572 3,810
Non recyclable Waste
tpa 6,739 5,615 17,107 14,256
USD/ton 0 0
USD/year 0 0
None treated Waste
tpa 366,500 376,500 366,500 376,500
USD/ton 0 0
USD/year 0 0
Total: tpa 426,500 426,500 426,500 426,500
Total: USD/year 767,043 639,203
There is a substantial uncertainty of the value of recyclables this is related to the various factors:
Market prices that recently have been descending - a reduction in 10% on average sales price of recyclables is equal to a 1,3 USD/ton reduction;
The quantity and quality of the incoming waste which has an influence on the final amount of the separated fractions; and
The purity of recyclable fractions that has significant influence on the value of each fraction.

Ramboll - Pre-feasibility Study (Waste) of Lombok
139/149
There is a potential revenue if GHG reductions, that eventually could be sold as offsets. This has to be explored further as an additional revenue to the project. Financial Summary Scenario 1: MRF With a capital investment of 2.7 MUSD in a MRF facility with the capacity of 60,000 tpa MSW the operational cost for the facility including O&M cost is estimated to be 0.92 MUSD/year exclusive depreciation and with a potential revenue of 0.77 MUSD/year for compost and recyclables. With a tipping fee of 3.5 USD/ton there is an additional revenue of 0.210 MUSD/year. This is a total income of 16.3 USD/ton of incoming waste. The amount of recyclables is app. 2,760 tpa with a recovery rate of 17% and the amount of compost is app. 19,150 tpa with a recovery rate of 51%. Potential increase of Landfill capacity is estimated to be 60,000 tpa for year 2021 based on the assumption that all compost and RDF is disposed and utilized. Scenario 2: MRF With a capital investment of 2.5 MUSD in a WPT facility with the capacity of 50,000 tpa MSW the operational cost for the facility including O&M cost is estimated to be 0.88 MUSD/year exclusive depreciation and with a potential revenue of 0.64 MUSD/year for compost and recyclables. With a tipping fee of 3.5 USD/ton there is an additional revenue of 0.175 MUSD/year. This is a total income of 16.3 USD/ton of incoming waste. The amount of recyclables is app. 2,300 tpa with a recovery rate of 17% and the amount compost is app. 16,000 tpa with a recovery rate of 51%. Potential increase of Landfill capacity is estimated to be 50,000 tpa for year 2021 based on the assumption that all compost and RDF is disposed and utilized. For each scenario the reduction of easily degradable organic waste deposed in landfill converted to GHG can be estimated. Dry AD/Composting
Table 56. Financial Dry AD/Composting.
Scenario 1 2 Units Capacity 40,000 30,000 tpa
CAPEX CAPEX 19.1 14.3 MUSD 483 468 USD/ton
OPEX OPEX 0.56 0.45 MUSD/year 14.06 15.06 USD/ton
Revenue Revenue FIT 0.79 0.60 MUSD/year 19.84 19.84 USD/ton
7.6.2.2 Landfill reduction In the table below the estimations for maximum landfill reductions are presented. The calculations are based on the following assumptions:
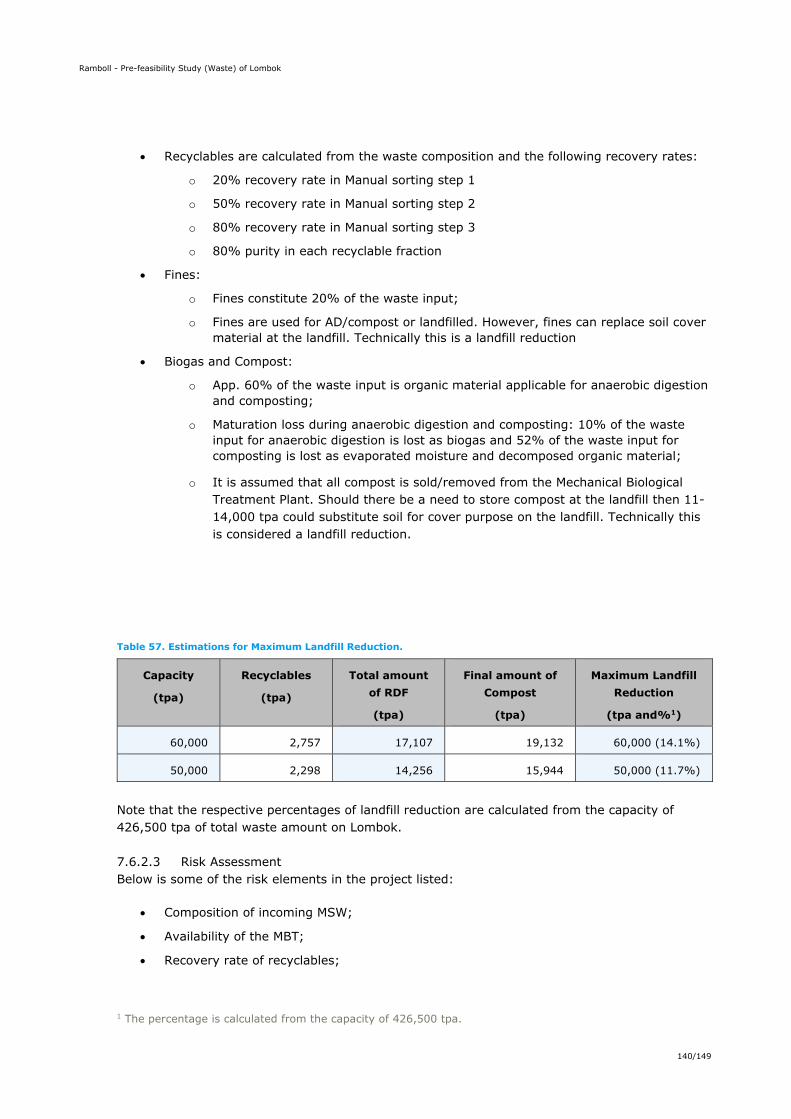
Ramboll - Pre-feasibility Study (Waste) of Lombok
140/149
Recyclables are calculated from the waste composition and the following recovery rates:
o 20% recovery rate in Manual sorting step 1
o 50% recovery rate in Manual sorting step 2
o 80% recovery rate in Manual sorting step 3
o 80% purity in each recyclable fraction
Fines:
o Fines constitute 20% of the waste input;
o Fines are used for AD/compost or landfilled. However, fines can replace soil cover material at the landfill. Technically this is a landfill reduction
Biogas and Compost:
o App. 60% of the waste input is organic material applicable for anaerobic digestion and composting;
o Maturation loss during anaerobic digestion and composting: 10% of the waste input for anaerobic digestion is lost as biogas and 52% of the waste input for composting is lost as evaporated moisture and decomposed organic material;
o It is assumed that all compost is sold/removed from the Mechanical Biological Treatment Plant. Should there be a need to store compost at the landfill then 11-14,000 tpa could substitute soil for cover purpose on the landfill. Technically this is considered a landfill reduction.
Table 57. Estimations for Maximum Landfill Reduction.
Capacity
(tpa)
Recyclables
(tpa)
Total amount of RDF
(tpa)
Final amount of Compost
(tpa)
Maximum Landfill Reduction
(tpa and%1)
60,000 2,757 17,107 19,132 60,000 (14.1%)
50,000 2,298 14,256 15,944 50,000 (11.7%)
Note that the respective percentages of landfill reduction are calculated from the capacity of 426,500 tpa of total waste amount on Lombok. 7.6.2.3 Risk Assessment Below is some of the risk elements in the project listed:
Composition of incoming MSW;
Availability of the MBT;
Recovery rate of recyclables;
1 The percentage is calculated from the capacity of 426,500 tpa.
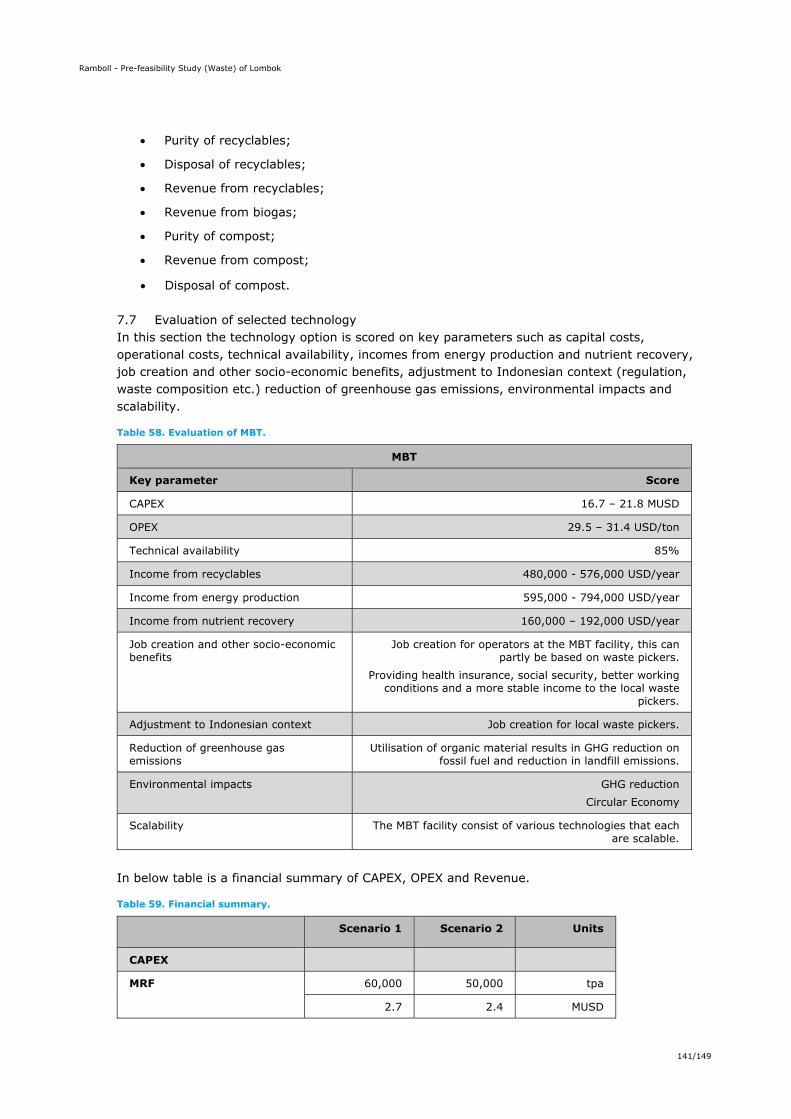
Ramboll - Pre-feasibility Study (Waste) of Lombok
141/149
Purity of recyclables;
Disposal of recyclables;
Revenue from recyclables;
Revenue from biogas;
Purity of compost;
Revenue from compost;
Disposal of compost.
7.7 Evaluation of selected technology In this section the technology option is scored on key parameters such as capital costs, operational costs, technical availability, incomes from energy production and nutrient recovery, job creation and other socio-economic benefits, adjustment to Indonesian context (regulation, waste composition etc.) reduction of greenhouse gas emissions, environmental impacts and scalability.
Table 58. Evaluation of MBT.
MBT
Key parameter Score
CAPEX 16.7 – 21.8 MUSD
OPEX 29.5 – 31.4 USD/ton
Technical availability 85%
Income from recyclables 480,000 - 576,000 USD/year
Income from energy production 595,000 - 794,000 USD/year
Income from nutrient recovery 160,000 – 192,000 USD/year
Job creation and other socio-economic benefits
Job creation for operators at the MBT facility, this can partly be based on waste pickers.
Providing health insurance, social security, better working conditions and a more stable income to the local waste
pickers.
Adjustment to Indonesian context Job creation for local waste pickers.
Reduction of greenhouse gas emissions
Utilisation of organic material results in GHG reduction on fossil fuel and reduction in landfill emissions.
Environmental impacts GHG reduction Circular Economy
Scalability The MBT facility consist of various technologies that each are scalable.
In below table is a financial summary of CAPEX, OPEX and Revenue.
Table 59. Financial summary.
Scenario 1 Scenario 2 Units
CAPEX
MRF 60,000 50,000 tpa
2.7 2.4 MUSD

Ramboll - Pre-feasibility Study (Waste) of Lombok
142/149
Scenario 1 Scenario 2 Units
44.8 47.2 USD/ton
Dry AD and Composting 40,000 30,000 tpa
19.1 14.3 MUSD
483 468 USD/ton
Total: 21.8 16.7 MUSD
OPEX
MRF 60,000 50,000 tpa
0.92 0.82 MUSD/year
15.4 16.3 USD/ton
Dry AD and Composting 40,000 30,000 tpa
0.56 0.45 MUSD/year
14.1 15.1 USD/ton
Total: 1.5 1.3 MUSD
Revenue
Recyclables 2,770 2,300 tpa
0.58 0.48 MUSD
209 209 USD/ton
Biogas FIT 5,533,500 4,150,125 kWh/year
0.79 0.60 MUSD/year
19.84 19.84 USD/ton
Compost 19,130 15,940 tpa
0.19 0.16 MUSD/year
10 10 USD/ton
Tipping fee 60,000 50,000 tpa
0.21 0.18 MUSD/year
3.5 3.5 USD/ton
Total: 1.8 1.4 MUSD/year
7.8 Required land There is a requirement for land either at existing landfills or at a site close to landfills for the two MBT plants. Location close to existing landfills are important in relation to logistic and transportation of MSW to the MBT facility. Scenario 1: The possible location for the MBT plant for treatment of MSW from Mataram City and West Lombok Regency could be in West Lombok Regency at the existing Kebon Kongok Landfill or close to it. Scenario 2: The possible location for the MBT plant for treatment of MSW from Central, East and North Lombok Regency could be in East Lombok Regency at an existing landfill or close to it.
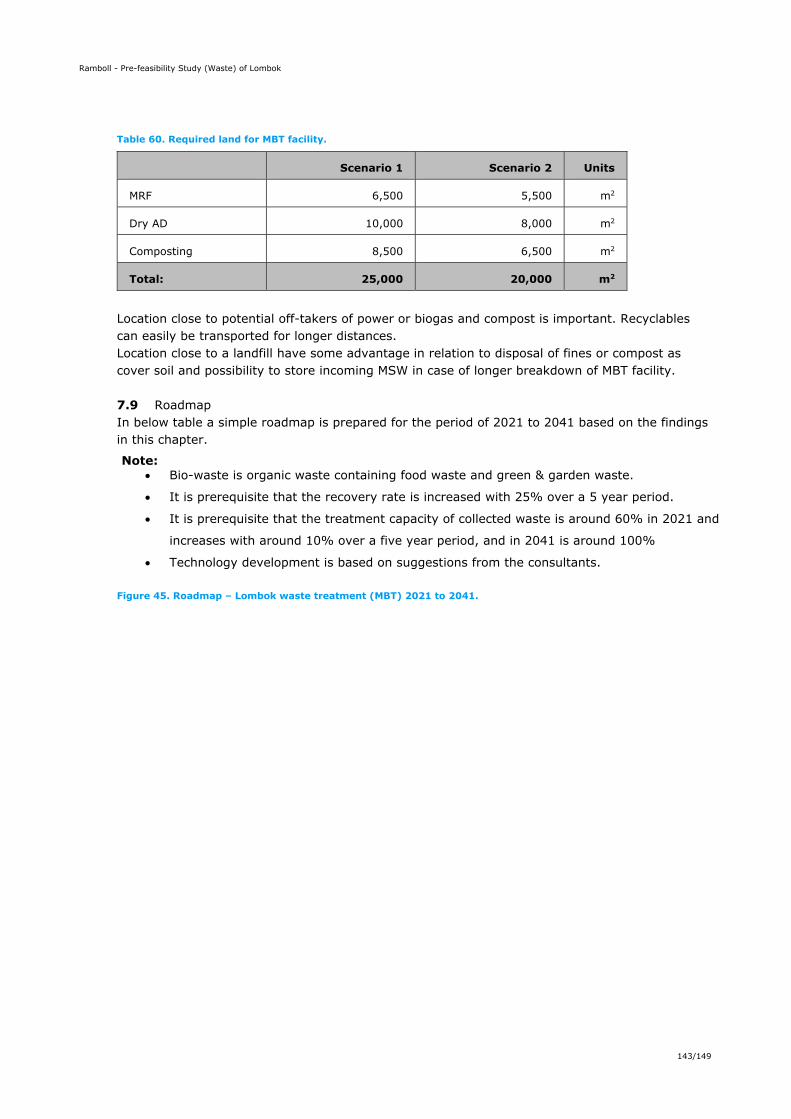
Ramboll - Pre-feasibility Study (Waste) of Lombok
143/149
Table 60. Required land for MBT facility.
Scenario 1 Scenario 2 Units
MRF 6,500 5,500 m2
Dry AD 10,000 8,000 m2
Composting 8,500 6,500 m2
Total: 25,000 20,000 m2
Location close to potential off-takers of power or biogas and compost is important. Recyclables can easily be transported for longer distances. Location close to a landfill have some advantage in relation to disposal of fines or compost as cover soil and possibility to store incoming MSW in case of longer breakdown of MBT facility.
7.9 Roadmap In below table a simple roadmap is prepared for the period of 2021 to 2041 based on the findings in this chapter.
Note: Bio-waste is organic waste containing food waste and green & garden waste.
It is prerequisite that the recovery rate is increased with 25% over a 5 year period.
It is prerequisite that the treatment capacity of collected waste is around 60% in 2021 and
increases with around 10% over a five year period, and in 2041 is around 100%
Technology development is based on suggestions from the consultants.
Figure 45. Roadmap – Lombok waste treatment (MBT) 2021 to 2041.
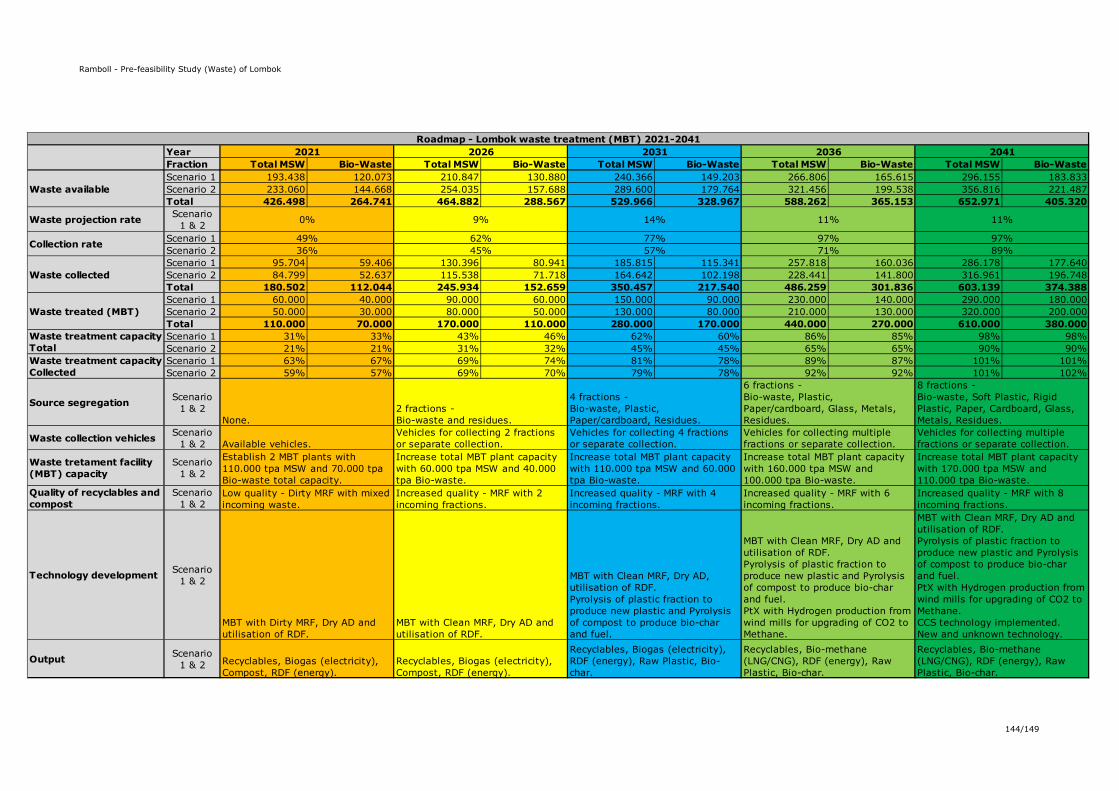
Ramboll - Pre-feasibility Study (Waste) of Lombok
144/149
YearFraction Total MSW Bio-Waste Total MSW Bio-Waste Total MSW Bio-Waste Total MSW Bio-Waste Total MSW Bio-WasteScenario 1 193.438 120.073 210.847 130.880 240.366 149.203 266.806 165.615 296.155 183.833Scenario 2 233.060 144.668 254.035 157.688 289.600 179.764 321.456 199.538 356.816 221.487Total 426.498 264.741 464.882 288.567 529.966 328.967 588.262 365.153 652.971 405.320
Scenario 1Scenario 2Scenario 1 95.704 59.406 130.396 80.941 185.815 115.341 257.818 160.036 286.178 177.640Scenario 2 84.799 52.637 115.538 71.718 164.642 102.198 228.441 141.800 316.961 196.748Total 180.502 112.044 245.934 152.659 350.457 217.540 486.259 301.836 603.139 374.388Scenario 1 60.000 40.000 90.000 60.000 150.000 90.000 230.000 140.000 290.000 180.000Scenario 2 50.000 30.000 80.000 50.000 130.000 80.000 210.000 130.000 320.000 200.000Total 110.000 70.000 170.000 110.000 280.000 170.000 440.000 270.000 610.000 380.000Scenario 1 31% 33% 43% 46% 62% 60% 86% 85% 98% 98%Scenario 2 21% 21% 31% 32% 45% 45% 65% 65% 90% 90%Scenario 1 63% 67% 69% 74% 81% 78% 89% 87% 101% 101%Scenario 2 59% 57% 69% 70% 79% 78% 92% 92% 101% 102%
Collection rate
Waste projection rate
Roadmap - Lombok waste treatment (MBT) 2021-2041
Source segregation
Waste treatment capacity TotalWaste treatment capacity Collected
36%49%
57%
2021 2026
62%45%
2041
11%
97%89%
8 fractions -Bio-waste, Soft Plastic, Rigid Plastic, Paper, Cardboard, Glass, Metals, Residues.
Waste collection vehicles Available vehicles.Vehicles for collecting 2 fractions or separate collection.
Vehicles for collecting 4 fractions or separate collection.
Vehicles for collecting multiple fractions or separate collection.
None.2 fractions - Bio-waste and residues.
4 fractions -Bio-waste, Plastic, Paper/cardboard, Residues.
2036
11%
97%71%
6 fractions -Bio-waste, Plastic, Paper/cardboard, Glass, Metals, Residues.
0% 9%
Waste available
Waste collected
Waste treated (MBT)
2031
Scenario 1 & 2
Scenario 1 & 2
Scenario 1 & 2
Technology development
MBT with Dirty MRF, Dry AD and utilisation of RDF.
MBT with Clean MRF, Dry AD and utilisation of RDF.
MBT with Clean MRF, Dry AD, utilisation of RDF.Pyrolysis of plastic fraction to produce new plastic and Pyrolysis of compost to produce bio-char and fuel.
MBT with Clean MRF, Dry AD and utilisation of RDF. Pyrolysis of plastic fraction to produce new plastic and Pyrolysis of compost to produce bio-char and fuel. PtX with Hydrogen production from wind mills for upgrading of CO2 to Methane.
MBT with Clean MRF, Dry AD and utilisation of RDF. Pyrolysis of plastic fraction to produce new plastic and Pyrolysis of compost to produce bio-char and fuel. PtX with Hydrogen production from wind mills for upgrading of CO2 to Methane. CCS technology implemented. New and unknown technology.
Quality of recyclables and compost
Low quality - Dirty MRF with mixed incoming waste.
Increased quality - MRF with 2 incoming fractions.
Increased quality - MRF with 4 incoming fractions.
Increased quality - MRF with 6 incoming fractions.
Increased quality - MRF with 8 incoming fractions.
Vehicles for collecting multiple fractions or separate collection.
Waste tretament facility (MBT) capacity
Establish 2 MBT plants with 110.000 tpa MSW and 70.000 tpa Bio-waste total capacity.
Increase total MBT plant capacity with 60.000 tpa MSW and 40.000 tpa Bio-waste.
Increase total MBT plant capacity with 110.000 tpa MSW and 60.000 tpa Bio-waste.
Increase total MBT plant capacity with 160.000 tpa MSW and 100.000 tpa Bio-waste.
Increase total MBT plant capacity with 170.000 tpa MSW and 110.000 tpa Bio-waste.
14%
77%
Recyclables, Bio-methane (LNG/CNG), RDF (energy), Raw Plastic, Bio-char.
Output Scenario 1 & 2 Recyclables, Biogas (electricity),
Compost, RDF (energy).Recyclables, Biogas (electricity), Compost, RDF (energy).
Recyclables, Biogas (electricity), RDF (energy), Raw Plastic, Bio-char.
Recyclables, Bio-methane (LNG/CNG), RDF (energy), Raw Plastic, Bio-char.
Scenario 1 & 2
Scenario 1 & 2
Scenario 1 & 2
Ramboll - Pre-feasibility Study (Waste) of Lombok
145/150
8. CONCLUSION AND KEY RECOMMENDATION
8.1 Conclusion Waste Management Aspect
Lombok has a total population of 3,558,129 that spreads across 5 municipalities of Mataram City, West Lombok Regency, Central Lombok Regency, East Lombok Regency, and North Lombok Regency. As the capital of NTB Province, Mataram City has the least area with the most densely population. On the contrary, East Lombok Regency has the largest area with the highest number of population, but less population density.
Around 56% of the population lives in urban areas, while the rest of the rural population mainly lives in regencies. Typically, rural populations live in scattered settlement patterns within wide areas. The major economic activities within Lombok Island include agriculture, trading, and construction.
The topography of Lombok, which is dominantly formed by stratovolcano of Mount Rinjani combined with scattered settlement patterns, is strongly influencing the waste management system applied in the island. The provision of waste management services with such conditions would typically result in high operational costs and logistical complexity. Eventually, these conditions limit the coverage area of service, particularly in regencies (20% - 25%)
On average, the collection rate in large regencies, i.e. West Lombok (18% - 22%), Central Lombok (24% - 36%%), East Lombok (27% - 35%), are lower than in Mataram City (88%) and smaller regency (North Lombok of 54%). This is the case, as waste service provided in regencies mainly serves urban areas, particularly the capital of regency, that is more accessible. The larger the area and more complex geographical conditions, the higher logistical complexity and operational budget required in providing the service.
Approximately 62% of the waste generated in Lombok Island composed of organic waste (food waste and green waste). Meanwhile, the amount of waste generated across municipalities vary depending on urbanization, economic development, and population growth.
Overall, the waste management system applied in Lombok Island is decentralized and still focused on providing basic service of collection, transfer/transport, and final disposal along with small-scale 3R initiatives organized by communities. Without significant treatment capacities, the current system puts a heavy burden on transport and the landfill system that implicates on high dependency on land and environmental impacts, especially with increasing waste generation in the next 20 years. Despite the impacts from current implementation, the local authorities also face many challenges that include financial constraints, transport issues, inadequate waste facilities and infrastructures, etc.
The performance of waste management varies between municipalities with tendencies of low reduction rates, low collection rates (esp.in regencies), as well as higher portions of waste handled in smaller size areas (Mataram City and North Lombok Regency).
Waste segregation at source is practiced fragmented, particularly by communities led by highly committed leaders, due to the low community participation and awareness as well as limited segregated facilities and infrastructures.
With a combination of flat, hilly, and mountainous terrains, particularly in the north, east, and central Lombok, a community based (primary) collection system is commonly applied. However, such a system would need solid participation from the community as well as strong cooperation with local authorities in order to achieve higher collection rates. Further, the geographical challenges (including settlement patterns) and the level of
Ramboll - Pre-feasibility Study (Waste) of Lombok
146/150
community participation on the current system are reflected through the limited coverage area of service and collection rate, particularly within regencies with large areas.
As for the secondary collection, main issue relates to the limited number of transportation vehicles that results in the piling up of collected waste at TPS. It is to be noted, so long the treatment capacities to significantly reduce the amount of waste transported is limited, the number of transport vehicles required will keep increasing along the increasing generation. Furthermore, recently enforced Presidential Regulation 33/2020 on regional standard unit costs also complicates the O&M budgeting on transport activity.
In regard to treatment facilities, several key points are highlighted below: a. Typical processing facilities (waste bank, TPS3R, TPST) operate in limited
capacities (0.5 to 3 tons per day). Additionally, limited capacity of treatment facilities usually requires higher O&M costs, hence, difficult to reach the economies of scale.
b. Most TPS3R facilities experience difficulties to operate the facility sustainably, which mainly due to financial constraint, particularly the operational budget.
c. Low collection rate implicates the incoming waste to the facility. Securing amount of specific feedstock (segregated waste) to facility has proven to be a challenge, due to low collection rate and low participation on at source segregation
d. Most facilities are managed by communities and financed through the user fees charged and the sales of recyclables or compost. Nevertheless, the revenue generated is insufficient to cover the operational expenses due to many factors, including competing prices, quality of products, lengthy chain of plastics, etc.
Most landfills are not yet operated optimally due to the shortage of operational budget and limited number of well-functioning heavy equipment. Hence, landfills mostly operate between semi-controlled and controlled systems with limited schedule of soil covering. Further, not all landfill is equipped with required and well-functioning facilities, such as weighing bridge, leachate treatment, etc
Current financing mechanism that combines service charge (retribution) and local budget, apparently relies more heavily on local government subsidy. The current waste budget allocated from total APBD reaches between 0.17% and 1.30%. Portion of budget allocation is also influenced by competing priorities, especially during pandemic. Moreover, the tariff charged only recovered 10% to 49% of total operational and maintenance costs.
Several key challenges identified in monitoring Jakstrada that mainly relates to data: 1) measuring waste reduction (reduction activities difficult to measure); 2) inventorying waste collected and recycled by informal sector (collectors, aggregators) as working areas of informal sector usually covers more than 1 city/regency (possibility of double claiming); 3) Availability and reliability of waste data reported
Lastly, in order to improve the current waste management system while addressing some of the current challenges, an intervention could be given on the treatment components, by developing a regional-scale waste treatment facility that put particular focus on processing the dominant portion of waste stream (organic waste). The development of the facility must consider the existing situation and challenges, while also exploring potential feedstock and off-taker/end-users in order to secure its sustainability.
Institutional Aspect
From the institutional point of view, the regulatory framework at the provincial and municipalities level have supporting the scenarios.
The North Lombok Regency has organized the community in managing their waste. Here, every community who wants to join is facilitated in training after joining the community is evaluated by the Environmental Agency. The idea of establishing cooperation and having
Ramboll - Pre-feasibility Study (Waste) of Lombok
147/150
cadre in the community like what was done by North Lombok can be a good example to be applied by other regions
Seeing the waste management program in Lombok City and Regencies, it is obvious that such program needs to be supported towards sustainable improvement program implementation. The program is supervised by an independent team/community-based organization, especially regarding increasing collection rate. It is necessary to assess the level of regulation convenience to encourage compliance with waste sorting and collection, to assess the clear statement of responsibility for management source-level collection transport activities to TPS and to map the potential collaborators.
Technical Aspect The conclusion is that there is a huge potential for utilising the available waste on Lombok
for energy and fertiliser respectively as biogas and RDF and as compost. There is a minor potential in sorting out recyclables from the none segregated collected
MSW. Based on high-level estimations in the report it seems probable to establish a MBT
solution that is economical feasible, provided that the solution is kept simple and robust. Analysis shows a potential need for gas and electricity on Lombok. There is an ongoing project with a potential local off-taker for RDF – Jerangjang Power
Plant. The transport sector has a huge energy demand, but at the moment only for gasoline and
diesel. There are high amounts of organic waste available on Lombok. There seems to be limited sources of co-substrates like manure from cows and similar.
There is a logistic challenge to collect potential co-substrates. There is high consumption of both organic (liquid) and inorganic (Urea and NPK) fertiliser
on Lombok. According to performed calculations OPEX and potential revenues are in balance.
8.2 Key Recommendation Waste Management Aspect
Coverage area of waste service and waste collection rate must be increased. As the primary collection of waste relies on a community-based collection system, thus, community participation must be further encouraged and strengthened. This could be done through:
a. Support the establishment of CSO/other accountable forms of institution (BLUD, etc) that provides collection service,
b. Support the provision of adequate waste collection equipment and vehicles (increased collection capacity),
c. Fostering and building CSOs/NGOs capacities, d. Ensure financial security (operational budget) of CSO/BLUD/BUMDES/etc that
provide waste collection services e. Exploring future collaboration with start-ups in providing waste service (start-ups
usually backed by incubator companies/financiers to secure financial sustainability) is also needed. Nowadays, many start-ups are collaborating with informal collectors equipped with mobile apps (developed by start-ups). Eventually, this will lead to better tracking of waste data.
Interventions on waste segregation at source have been introduced from awareness raising to monetary award, but more continuous efforts adjusted with local characteristics are required to ensure long-term practices. This could be done through:
Ramboll - Pre-feasibility Study (Waste) of Lombok
148/150
a. Continuous social behaviour changes activities with more innovative approaches at each level link to local values, particularly at schools, which could be performed through: awareness raising, public outreach/campaign, educational program, dissemination of information through social media, etc. Several topics that need to be touched including waste segregation at source, values of waste, stop waste littering/burning, circular economy, proper waste management
b. Support the provision of waste segregated facilities and infrastructures c. Support the development and participate in the implementation of Extended
Producer Responsibility scheme (take-back mechanism) initiated by private companies or local businesses
In regard to secondary collection of waste, ensuring sufficient number of proper transport vehicles and appropriate allocation of waste budget in APBD referring to Permendagri 07/2021 are very essential for further improvement.
In order to improve the current system applied and to address the current issues, a future scenario emphasizing on developing waste treatment facilities, focused on organic waste, to significantly reduce the waste landfilled is recommended. Several key highlights recommendation include:
a. The development of improvement scenario of the regional waste treatment facility in Lombok Island is recommended after considering following key points:
1) Current system applied; 2) Low collection rates and its root causes; 3) Financial situation that particularly relates to operational budget; 4) Increased waste generation without significant treatment capacities 5) High share of organic waste with agriculture sector leads the economic
activities that creates potential application of Circular Economy approach 6) Experience working under regional scheme
b. Considering the current state of collection rate, geographical condition, financial situation, and experience in managing Regional Landfill, it is highly recommended to develop the regional waste treatment facility gradually, starting with regions with high collection rate (secured feedstock). Based on several considerations mentioned, the regional waste treatment facility is potentially developed into two units that serving municipalities based on the degree of proximity, access, and collection rates/secured feedstock. With a note that this initiation must be balanced with gradually improved basic service within the municipalities.
c. Several potential sources of organic waste prioritized to be secured in order to prevent the shortage of organic feedstocks, include: 1) Traditional market, followed by households; 2) Slaughterhouse, livestock cattle farms, livestock market (as starter) with a note that additional investment for collection and cooperation with relevant local agency are essentially needed
d. Potential off-takers and end-users of the outputs from waste treatment facility were explored as follow:
1) Compost could be supplied as subsidized fertilizer (partnership with Pupuk Indonesia) so long the requirements are met; distributed through free market (community, DLHK, farmers); utilized as soil cover for landfills
2) Energy (electricity) produced could be connected off-grid (remote/rural areas) or on-grid PLN (feed-in-Tariff: Ministerial Decree 55/2019)
3) Selling of recyclables through the current chain by involving informal sector (e.g through start-ups already integrated with informal sector)
4) Additional potential source of revenue could be gained from the carbon market through voluntary participation
Ramboll - Pre-feasibility Study (Waste) of Lombok
149/150
Key points to be further explored and considered when developing the regional facility, particularly in the next study:
a. Further refining and securing the required feedstock gradually along with improved basic service (collection and transport)
b. Geographical challenges, degrees of proximity/distances (logistics) c. Land availability (preferably nearby the city/regency’s capital to reduce transport) d. Further explore potential revenue generation from the treatment facility e. Sufficient allocation of operational and maintenance budget of the facility f. Further understand the viability of the waste treatment facility g. Securing off-takers of the outputs (compost, recyclables, energy,) by further
exploring potential partnership h. Technical and institutional capacities to sustainably run the facility
Improving landfill operation could be done through appropriate allocation of O&M budget based on Permendagri 07/2021 accompanied by increased resource capacity, while also reducing the amount of waste landfilled through increased treatment capacities to save land required for landfill expansion
In terms of financing, following key elements need to be improved, as previously emphasized:
a. Further adjustment of budget allocation and retribution tariff by referring to Permendagri 07/2021 are required (taking into account all components from collection, transfer/transport, treatment, final processing) in order to ensure proper allocation of waste budget
b. Explore other potential sources of revenue c. Increase efficiency of collection mechanism of waste retribution
Strengthening efforts in monitoring and evaluating of data to support Jakstrada achievement that could be done through:
a. Taking account of more inclusive measures in reduction activities from a wider variety of activities by collaborating with relevant stakeholders (businesses, NGOs, local agencies, etc), especially with the issuance of Producers Waste Reduction Roadmap (Ministerial Regulation 75/2019). Reduction activities could take into account activities such as reduction of Single-Use Plastics (SUP) consumption at traditional markets, the use of substitute materials of plastic;
b. Encourage and support private sector or local businesses in implementing the waste reduction roadmap and Extended Producer Responsibility scheme (take-back mechanism);
c. Collaborate with start-ups/innovators that are developing mobile apps to track recyclables collected by informal sectors to better tracking of recyclables;
d. Improve the collection of primary data, particularly the basic waste data of waste generation, composition, coverage area of service;
e. Better data inventory on waste facilities/infrastructures, which could be done in collaboration with local universities, start-ups, NGOs etc.;
f. Improve the management of data with close consultation with national government to ensure better quality of data by referring to valid national standard/definition/methods, improve the processing and analysis of the collected data and information, ensure to conduct data verification to the field, etc.;
g. Strengthen coordination on data among three level of governments to ensure its validity and consistency, which could be done by regularly reporting Jakstrada achievement, periodically updating reliable and consistent waste data on waste management information system, Portal Persampahan, Lestari (NTB province), etc.
Ramboll - Pre-feasibility Study (Waste) of Lombok
150/150
Institutional Aspect The enhancement of UPTD (Unit Pelayanan Terpadu/Regional Technical Implementation
Unit) Regional into BLUD (Badan Layanan Umum Daerah/Public Service Agency) should be the main agenda to support the implementation of Waste to Energy Project Scenario. At the same time, it is necessary for West Lombok Regency to develop their UPTD in order to ensure the operational activities in the area.
The development of the Lombok Island Regional Waste Management Coordination Forum is very important to be initiated, for ensuring waste segregation and more effective collection occurs more effectively at the district/city level and impact the effective management at regional level. In addition, this forum can function to align policies, strategies and waste management efforts between the provincial and district/city governments, as well as between districts/cities
Regarding the waste transportation fleet, it is necessary to evaluate the ownership, optimum number, and the vehicle maintenance and performance regularly.
Taking advantage from established policies and programs, strengthening waste management scheme at the rural area need to be prioritized. It needs collaborations and integrated program between Environmental and Forestry Agency (DLHK), the Village Empowerment Agency (PMD), and all municipalities.
Community Campaign and education regarding waste management, mainly waste reduction, must be on the main agenda. It should involve many potential collaborators, because the foundation for the formation of communities has been implemented in the informal sector and is strongly supported by the formal sector. Mapping the collaborators such as schools and media is important.
It is necessary to have educated and/or experienced resources in the field of waste management as regulator, facilitator, evaluator and supervisor. Therefore, a set of capacity building/workshops (empowerment) related to waste management are strongly encouraged.
To ensure the sustainability of waste management scenario, which is often disrupted due to frequent personnel mutations, especially at strategic managerial positions, the provincial and regency/city government need to ensure that mutation system in DLHK and DLH in accordance with the provisions of the National Civil Service Agency Regulation No. 5/2019 concerning Procedures for Implementation of Mutations.
Considering that waste management performance is highly dependent on the effectiveness and efficiency of all waste management officers in the field, Provincial and district/city governments need to provide remuneration following the provisions or standard of the minimum wage for the province of NTB and each district/city and protecting their health through the BPJS health insurance mechanism.
Technical Aspect In order to support the development of regional and big scale waste treatment facility in Lombok some key recommendations in connection with the technical part is listed.
It is recommended to investigate further in a MBT solution for treatment of both organic and non-organic waste.
It is recommended to implement waste sorting with minimum two fractions – organic and non-organic waste. Segregation of waste in two fractions will enable higher recovery rate and purity of recyclables.
Establish a campaign to avoid removal of recyclables from source to treatment plant. Investigate further advantage/disadvantage and economy in bio-drying of RDF. The
advantage of drying RDF is lower moisture content and higher caloric value. Establish a cooperation with existing RDF project at Jerangjang Power Plant.
Ramboll - Pre-feasibility Study (Waste) of Lombok
151/150
Locate a few appropriate sites, preferably close to existing landfills for location of MBT facilities.
Focus on electricity (power) from biogas. Upgrading and compacting of biogas is expensive and technologically difficult.
Further analysis of potential need for fertiliser as compost. Conduct further analysis and calculations of the opportunity to get a revenue from sales of
carbon credits.
PRE-FEASIBILITY STUDY (WASTE) OF LOMBOK ANNEXES
Rambøll Danmark A/S DK reg.no. 35128417
Ramboll - Pre-feasibility Study (Waste) of Lombok
PRE-FEASIBILITY STUDY (WASTE) OF LOMBOK
Project name Pre-feasibility Study (Waste) of Lombok Project no. 1100045950-001 Recipient Danish Environmental Protection Agency (DEPA) Document type Annexes Version 3 Date 09/11/2021 Prepared by Ova Candra Dewi, Widita Vidyaningrum, Christiana Yuni Kusmiati and Reno
Munksgaard Checked by [Name] Approved by [Name] Description Annexes for Pre-feasibility study report Recipient ID MST Id.: 2187653 [Optional 2] [Text - If no optional text is needed then remember to delete the fields.]
Ramboll - Pre-feasibility Study (Waste) of Lombok
3/16
CONTENTS
LIST OF ABBREVIATION 4 LIST OF DEFINITION 6 Annex 1 Methodology of Waste projection 8 Annex 2 Potential sources of organic waste 15 1 Mataram City 15 2. West Lombok Regency 17 3. Central Lombok Regency 24 4. East Lombok Regency 37 5. North Lombok Regency 42 Annex 3 Circular Economy 51
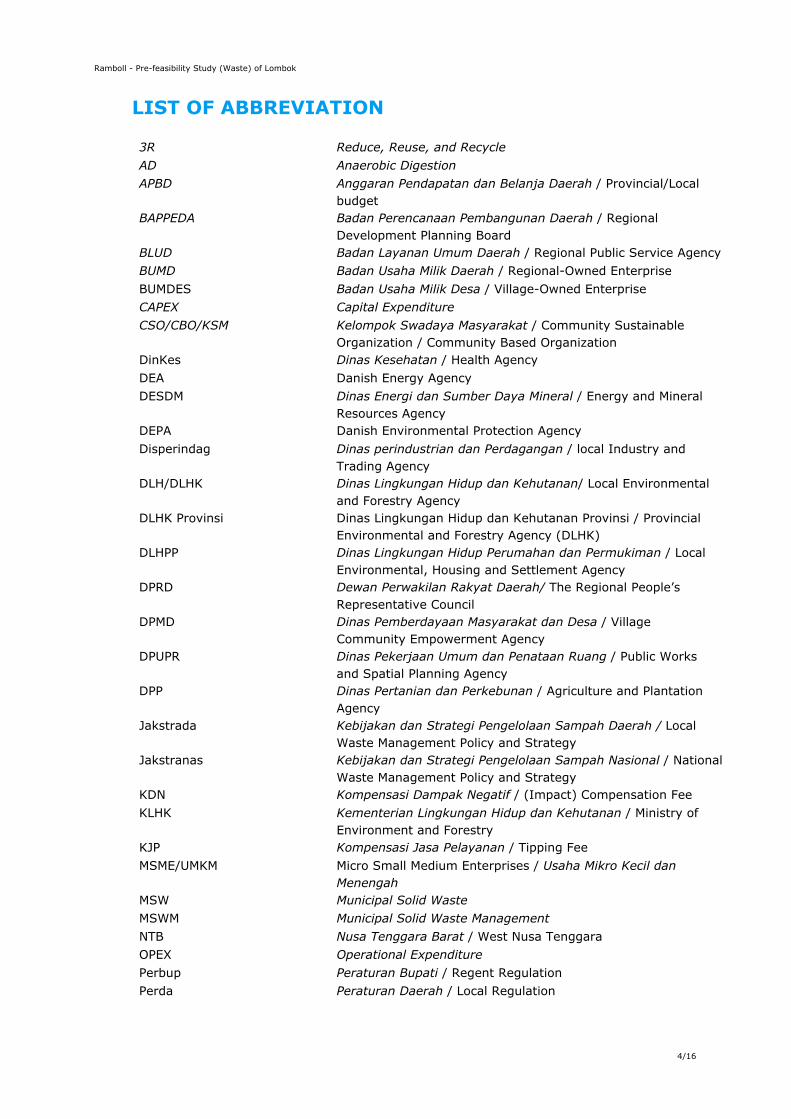
Ramboll - Pre-feasibility Study (Waste) of Lombok
4/16
LIST OF ABBREVIATION
3R Reduce, Reuse, and Recycle AD Anaerobic Digestion APBD Anggaran Pendapatan dan Belanja Daerah / Provincial/Local
budget BAPPEDA Badan Perencanaan Pembangunan Daerah / Regional
Development Planning Board BLUD Badan Layanan Umum Daerah / Regional Public Service Agency BUMD Badan Usaha Milik Daerah / Regional-Owned Enterprise BUMDES Badan Usaha Milik Desa / Village-Owned Enterprise CAPEX Capital Expenditure CSO/CBO/KSM Kelompok Swadaya Masyarakat / Community Sustainable
Organization / Community Based Organization DinKes Dinas Kesehatan / Health Agency DEA Danish Energy Agency DESDM Dinas Energi dan Sumber Daya Mineral / Energy and Mineral
Resources Agency DEPA Danish Environmental Protection Agency Disperindag Dinas perindustrian dan Perdagangan / local Industry and
Trading Agency DLH/DLHK Dinas Lingkungan Hidup dan Kehutanan/ Local Environmental
and Forestry Agency DLHK Provinsi Dinas Lingkungan Hidup dan Kehutanan Provinsi / Provincial
Environmental and Forestry Agency (DLHK) DLHPP Dinas Lingkungan Hidup Perumahan dan Permukiman / Local
Environmental, Housing and Settlement Agency DPRD Dewan Perwakilan Rakyat Daerah/ The Regional People’s
Representative Council DPMD Dinas Pemberdayaan Masyarakat dan Desa / Village
Community Empowerment Agency DPUPR Dinas Pekerjaan Umum dan Penataan Ruang / Public Works
and Spatial Planning Agency DPP Dinas Pertanian dan Perkebunan / Agriculture and Plantation
Agency Jakstrada Kebijakan dan Strategi Pengelolaan Sampah Daerah / Local
Waste Management Policy and Strategy Jakstranas Kebijakan dan Strategi Pengelolaan Sampah Nasional / National
Waste Management Policy and Strategy KDN Kompensasi Dampak Negatif / (Impact) Compensation Fee KLHK Kementerian Lingkungan Hidup dan Kehutanan / Ministry of
Environment and Forestry KJP Kompensasi Jasa Pelayanan / Tipping Fee MSME/UMKM Micro Small Medium Enterprises / Usaha Mikro Kecil dan
Menengah MSW Municipal Solid Waste MSWM Municipal Solid Waste Management NTB Nusa Tenggara Barat / West Nusa Tenggara OPEX Operational Expenditure Perbup Peraturan Bupati / Regent Regulation Perda Peraturan Daerah / Local Regulation
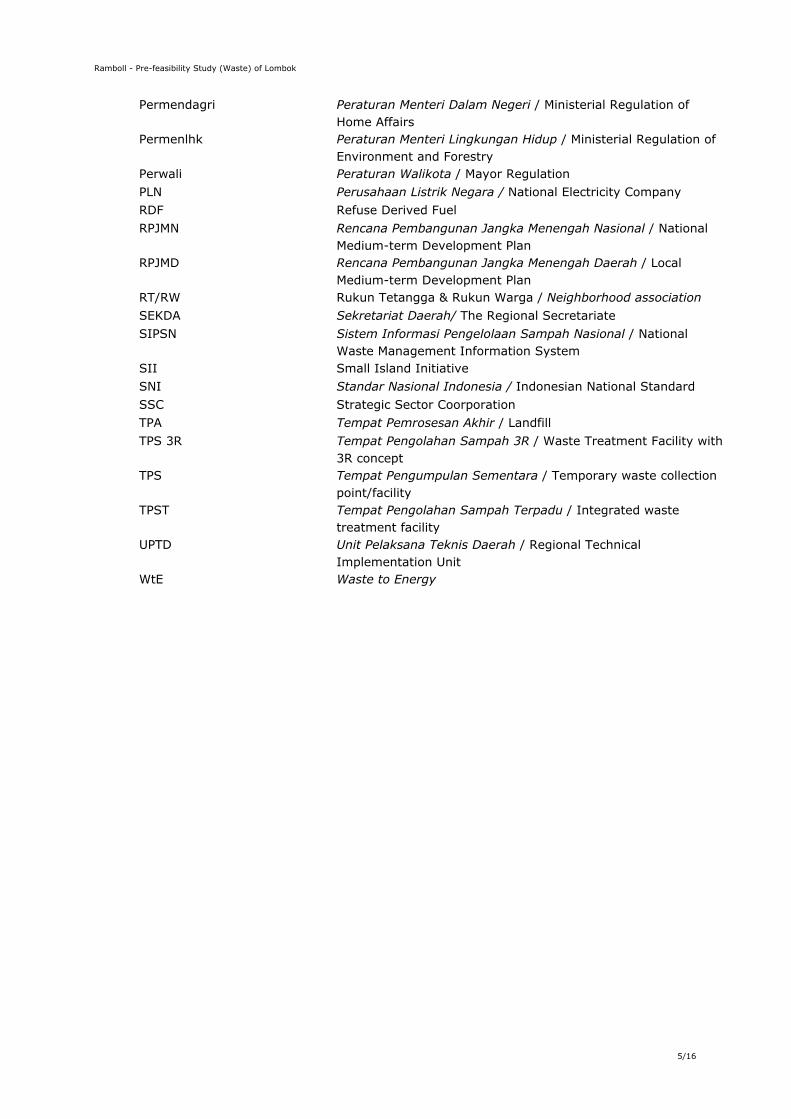
Ramboll - Pre-feasibility Study (Waste) of Lombok
5/16
Permendagri Peraturan Menteri Dalam Negeri / Ministerial Regulation of Home Affairs
Permenlhk Peraturan Menteri Lingkungan Hidup / Ministerial Regulation of Environment and Forestry
Perwali Peraturan Walikota / Mayor Regulation PLN Perusahaan Listrik Negara / National Electricity Company RDF Refuse Derived Fuel RPJMN Rencana Pembangunan Jangka Menengah Nasional / National
Medium-term Development Plan RPJMD Rencana Pembangunan Jangka Menengah Daerah / Local
Medium-term Development Plan RT/RW Rukun Tetangga & Rukun Warga / Neighborhood association SEKDA Sekretariat Daerah/ The Regional Secretariate SIPSN Sistem Informasi Pengelolaan Sampah Nasional / National
Waste Management Information System SII Small Island Initiative SNI Standar Nasional Indonesia / Indonesian National Standard SSC Strategic Sector Coorporation TPA Tempat Pemrosesan Akhir / Landfill TPS 3R Tempat Pengolahan Sampah 3R / Waste Treatment Facility with
3R concept TPS Tempat Pengumpulan Sementara / Temporary waste collection
point/facility TPST Tempat Pengolahan Sampah Terpadu / Integrated waste
treatment facility UPTD Unit Pelaksana Teknis Daerah / Regional Technical
Implementation Unit WtE Waste to Energy
Ramboll - Pre-feasibility Study (Waste) of Lombok
6/16
LIST OF DEFINITION
APBD The annual financial plan of local governments in Indonesia approved by the Regional House of Representatives.
BAPPEDA Regional agency tasked with formulating regional development plans, technical policies, coordination and facilitation, monitoring, and evaluating governance in the field of regional planning and development. In NTB Provincial Government, this agency is tasked with research and development also.
BLUD Regional public service provider that providing service to the community and has flexibility in financial management and can obtain funding from the APBD and other legitimate funding sources outside the APBD in order to improve service quality without seeking profit.
BUMD Business entity who’s whole or most of the capital is owned by the Regional Government.
CSO/CBO Community organization that works voluntarily to achieve a common goal in waste management.
KDN The amount of fees that must be paid by all parties that counted as reward to individuals, groups of people, and/or other parties affected by negative impact of the waste handling activities at the Regional Landfill as well as for the community facilitation activities to those negatively affected.
KJP The amount of fees paid by users to the management of regional landfill for operation and maintenance of the regional landfill
RPJMD Local Medium-term Development Plan. Document of regional development plan for 5 years, consist of vision, mission, and Governor’s or Mayor’s or Regent’s programs based on local long-term development plan and national medium-term development plan.
RPJMN National Medium-term Development Plan. Document of regional development plan for 5 years, consist of vision, mission, and President’s programs based on national long-term development plan.
RT Household Association. The Smallest division of villages in Indonesia which consist of several houses.
RW Neighborhood Association. The Community group which consists of several Household Associations.
SEKDA The Regional Secretariat. Its function is to assist the Governor/Regent/ Mayor carrying out the task of administering the government.
SIPSN National Waste Management Information system managed by Ministry of Environment and Forestry.
SSC Strategic Sector Cooperation TPS 3R A facility where collection, sorting, reuse, and recycling
activities are carried out on the sub-district/village level. TPS A point/location where the waste is collected before it is
transported to recycling/processing facility and/or TPST TPST
A facility where collection, sorting, reusing, recycling, processing/treatment, and final processing activities are taken place.
Ramboll - Pre-feasibility Study (Waste) of Lombok
7/16
TPA A facility to process and return the waste back to the environment sphere
UPTD An organization that carries out operational technical activities, providing services to the community and/or certain supporting technical activities at the Regional Office or Agency.
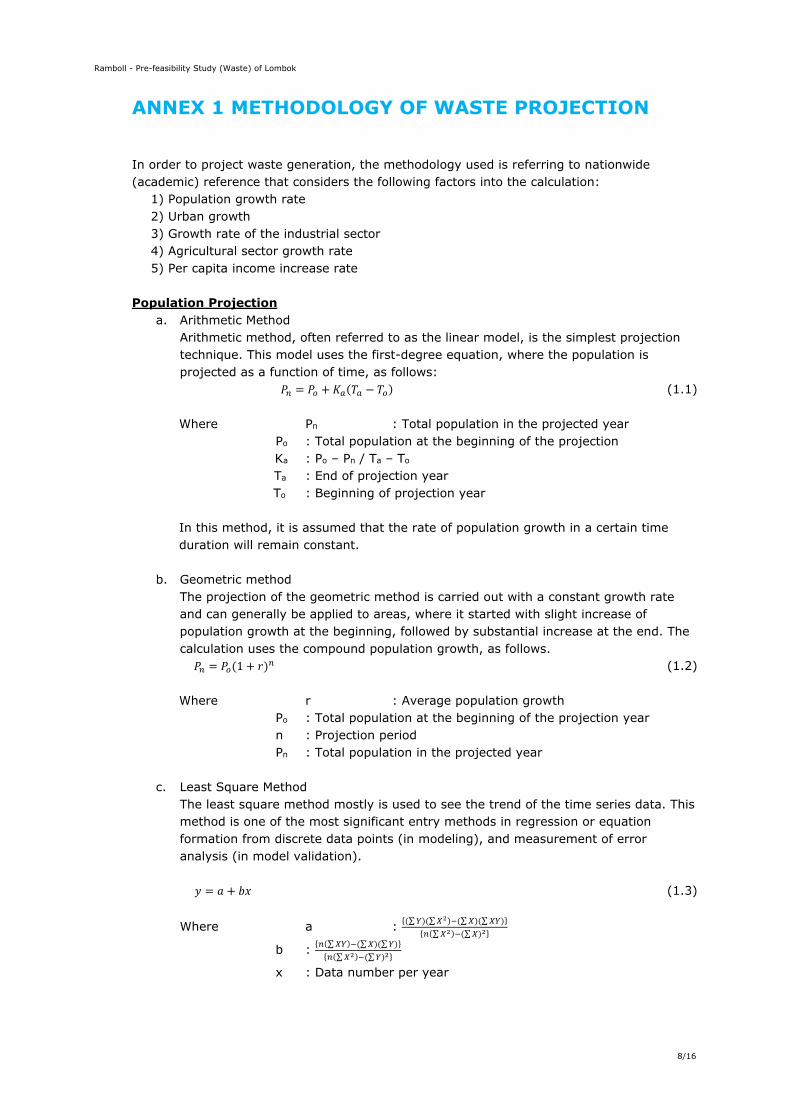
Ramboll - Pre-feasibility Study (Waste) of Lombok
8/16
ANNEX 1 METHODOLOGY OF WASTE PROJECTION
In order to project waste generation, the methodology used is referring to nationwide (academic) reference that considers the following factors into the calculation:
1) Population growth rate 2) Urban growth 3) Growth rate of the industrial sector 4) Agricultural sector growth rate 5) Per capita income increase rate
Population Projection
a. Arithmetic Method Arithmetic method, often referred to as the linear model, is the simplest projection technique. This model uses the first-degree equation, where the population is projected as a function of time, as follows:
𝑃 𝑃 𝐾 𝑇 𝑇 (1.1) Where Pn : Total population in the projected year
Po : Total population at the beginning of the projection Ka : Po – Pn / Ta – To Ta : End of projection year To : Beginning of projection year
In this method, it is assumed that the rate of population growth in a certain time duration will remain constant.
b. Geometric method
The projection of the geometric method is carried out with a constant growth rate and can generally be applied to areas, where it started with slight increase of population growth at the beginning, followed by substantial increase at the end. The calculation uses the compound population growth, as follows. 𝑃 𝑃 1 𝑟 (1.2)
Where r : Average population growth
Po : Total population at the beginning of the projection year n : Projection period Pn : Total population in the projected year
c. Least Square Method
The least square method mostly is used to see the trend of the time series data. This method is one of the most significant entry methods in regression or equation formation from discrete data points (in modeling), and measurement of error analysis (in model validation). 𝑦 𝑎 𝑏𝑥 (1.3)
Where a : ∑ ∑ ∑ ∑
∑ ∑
b : ∑ ∑ ∑
∑ ∑
x : Data number per year

Ramboll - Pre-feasibility Study (Waste) of Lombok
9/16
d. Standard Deviation and Correlation Coefficient (R)
The standard deviation is the square root of the variance that indicates the standard deviation of the data from the mean value of the calculation. Meanwhile, the correlation coefficient is a measure of the direction and linear strength between the two independent variables (X) and the dependent variable (Y) with R value ranges from -1≤ R +1. R = -1 indicates a perfectly negative correlation that defines the direction of the relationship between X and Y is negative and very strong. R = 0 indicates no correlation. R = 1 indicates the very strong correlation in a positive direction.
𝑟
∑ ∑ ∑
∑ ∑ ∑ ∑ (1.4)
Urban Growth
a. Urban Growth rate Urban growth is closely related to population growth, labor productivity growth and the economy. According to (Damanhuri, 2010), the rate of urban growth can be calculated as follows:
𝐶 (1.5)
Where Cs : Urban growth rate
Ci : Growth rate of industrial sector Cp : Growth rate of agriculture sector Cqn : Growth rate of gross regional domestic product P : Annual population growth rate
In calculating the urban growth coefficient at each city and regency of Lombok Island, the coefficient figures used were referring to Statistics Indonesia that reflects the real situation in each city and regency of Lombok.
b. Gross Domestic Products (GDP) Growth According to Statistics Indonesia, the GDP growth rate defines the production of goods and services in an area within a certain time interval. The GDP growth rate is calculated as follows:
𝐺𝐷𝑃 𝐺𝑟𝑜𝑤𝑡ℎ 100% (1.6)
Where PDBt : GDP for a given year
PDBt-1 : Previous year's GDP Waste Generation Rate The waste generation rate used in the calculation is referring to the data collected from SIPSN (2019 – 2020) as well as Adipura data (2017) that reflects the city category, as stated in SNI 19-3964-1995 when site observation (sampling) has never been conducted. Following waste generation rates were used in the calculation of waste projection.
No City and Regency Waste Generation Rate
(kg/capita/day)
1 Mataram City 0,56
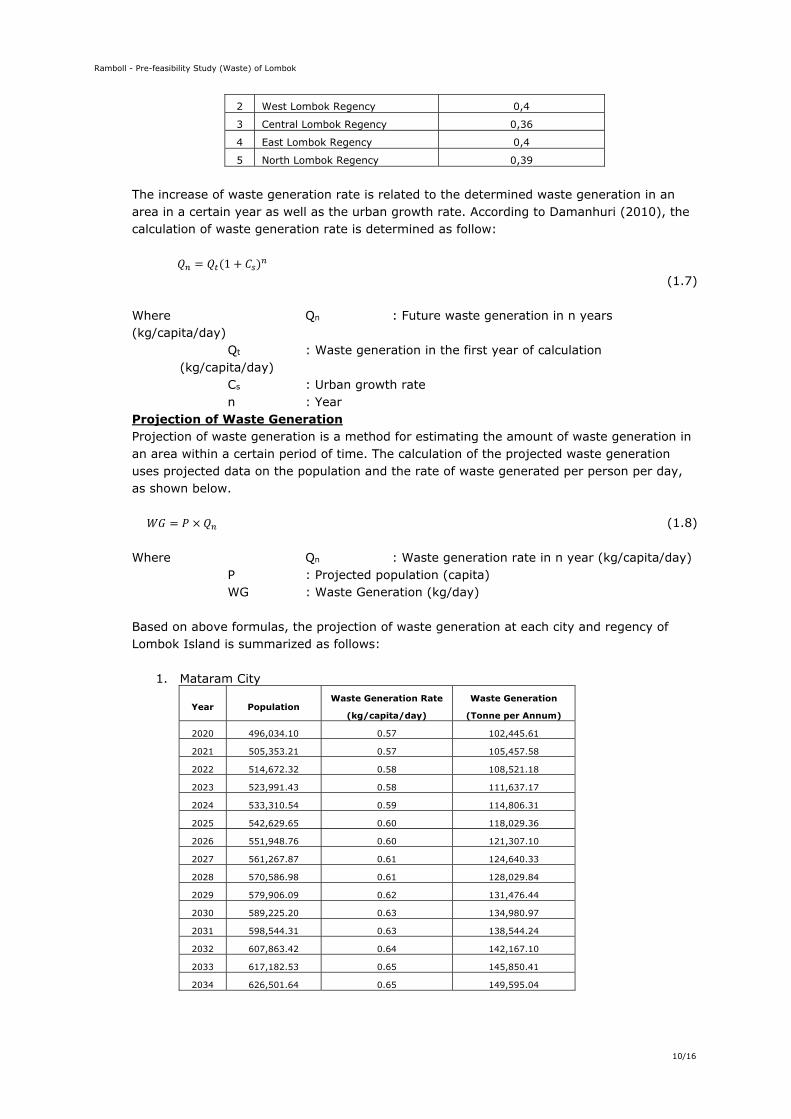
Ramboll - Pre-feasibility Study (Waste) of Lombok
10/16
2 West Lombok Regency 0,4
3 Central Lombok Regency 0,36
4 East Lombok Regency 0,4
5 North Lombok Regency 0,39
The increase of waste generation rate is related to the determined waste generation in an area in a certain year as well as the urban growth rate. According to Damanhuri (2010), the calculation of waste generation rate is determined as follow:
𝑄 𝑄 1 𝐶 (1.7)
Where Qn : Future waste generation in n years (kg/capita/day)
Qt : Waste generation in the first year of calculation (kg/capita/day)
Cs : Urban growth rate n : Year
Projection of Waste Generation Projection of waste generation is a method for estimating the amount of waste generation in an area within a certain period of time. The calculation of the projected waste generation uses projected data on the population and the rate of waste generated per person per day, as shown below. 𝑊𝐺 𝑃 𝑄 (1.8)
Where Qn : Waste generation rate in n year (kg/capita/day)
P : Projected population (capita) WG : Waste Generation (kg/day)
Based on above formulas, the projection of waste generation at each city and regency of Lombok Island is summarized as follows:
1. Mataram City
Year Population Waste Generation Rate
(kg/capita/day)
Waste Generation
(Tonne per Annum)
2020 496,034.10 0.57 102,445.61
2021 505,353.21 0.57 105,457.58
2022 514,672.32 0.58 108,521.18
2023 523,991.43 0.58 111,637.17
2024 533,310.54 0.59 114,806.31
2025 542,629.65 0.60 118,029.36
2026 551,948.76 0.60 121,307.10
2027 561,267.87 0.61 124,640.33
2028 570,586.98 0.61 128,029.84
2029 579,906.09 0.62 131,476.44
2030 589,225.20 0.63 134,980.97
2031 598,544.31 0.63 138,544.24
2032 607,863.42 0.64 142,167.10
2033 617,182.53 0.65 145,850.41
2034 626,501.64 0.65 149,595.04
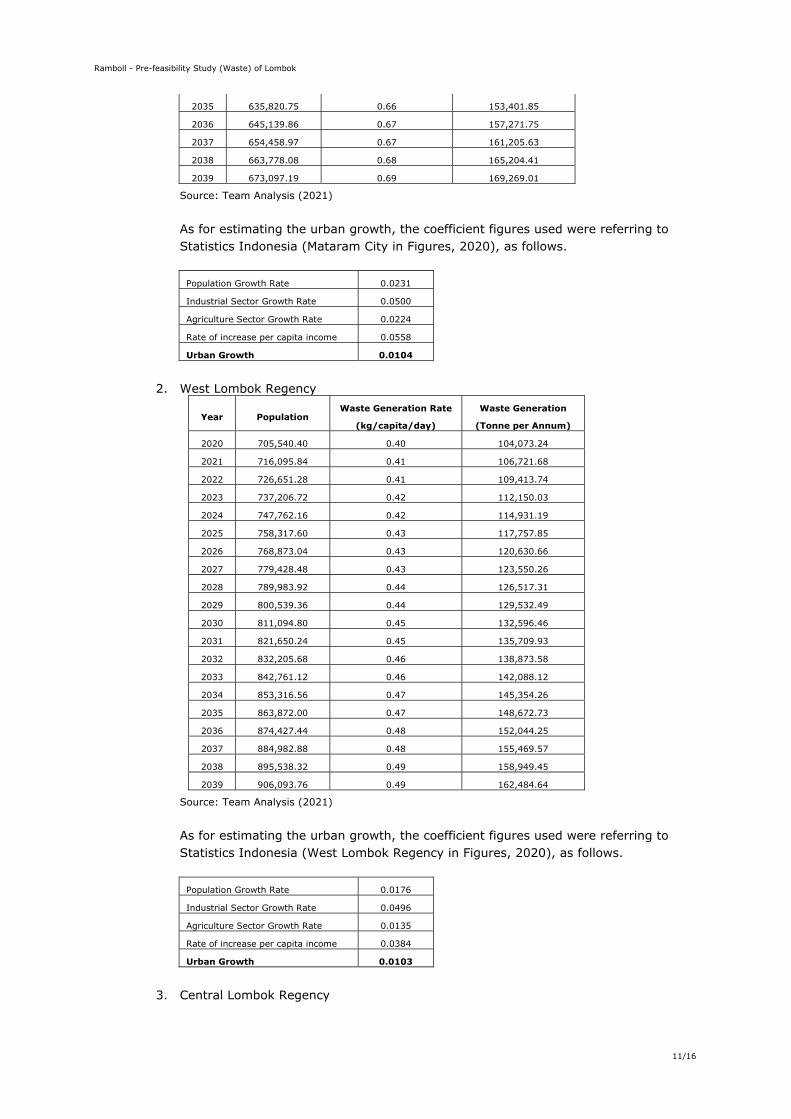
Ramboll - Pre-feasibility Study (Waste) of Lombok
11/16
2035 635,820.75 0.66 153,401.85
2036 645,139.86 0.67 157,271.75
2037 654,458.97 0.67 161,205.63
2038 663,778.08 0.68 165,204.41
2039 673,097.19 0.69 169,269.01
Source: Team Analysis (2021)
As for estimating the urban growth, the coefficient figures used were referring to Statistics Indonesia (Mataram City in Figures, 2020), as follows.
Population Growth Rate 0.0231
Industrial Sector Growth Rate 0.0500
Agriculture Sector Growth Rate 0.0224
Rate of increase per capita income 0.0558
Urban Growth 0.0104
2. West Lombok Regency
Year Population Waste Generation Rate
(kg/capita/day)
Waste Generation
(Tonne per Annum)
2020 705,540.40 0.40 104,073.24
2021 716,095.84 0.41 106,721.68
2022 726,651.28 0.41 109,413.74
2023 737,206.72 0.42 112,150.03
2024 747,762.16 0.42 114,931.19
2025 758,317.60 0.43 117,757.85
2026 768,873.04 0.43 120,630.66
2027 779,428.48 0.43 123,550.26
2028 789,983.92 0.44 126,517.31
2029 800,539.36 0.44 129,532.49
2030 811,094.80 0.45 132,596.46
2031 821,650.24 0.45 135,709.93
2032 832,205.68 0.46 138,873.58
2033 842,761.12 0.46 142,088.12
2034 853,316.56 0.47 145,354.26
2035 863,872.00 0.47 148,672.73
2036 874,427.44 0.48 152,044.25
2037 884,982.88 0.48 155,469.57
2038 895,538.32 0.49 158,949.45
2039 906,093.76 0.49 162,484.64
Source: Team Analysis (2021)
As for estimating the urban growth, the coefficient figures used were referring to Statistics Indonesia (West Lombok Regency in Figures, 2020), as follows.
Population Growth Rate 0.0176
Industrial Sector Growth Rate 0.0496
Agriculture Sector Growth Rate 0.0135
Rate of increase per capita income 0.0384
Urban Growth 0.0103
3. Central Lombok Regency
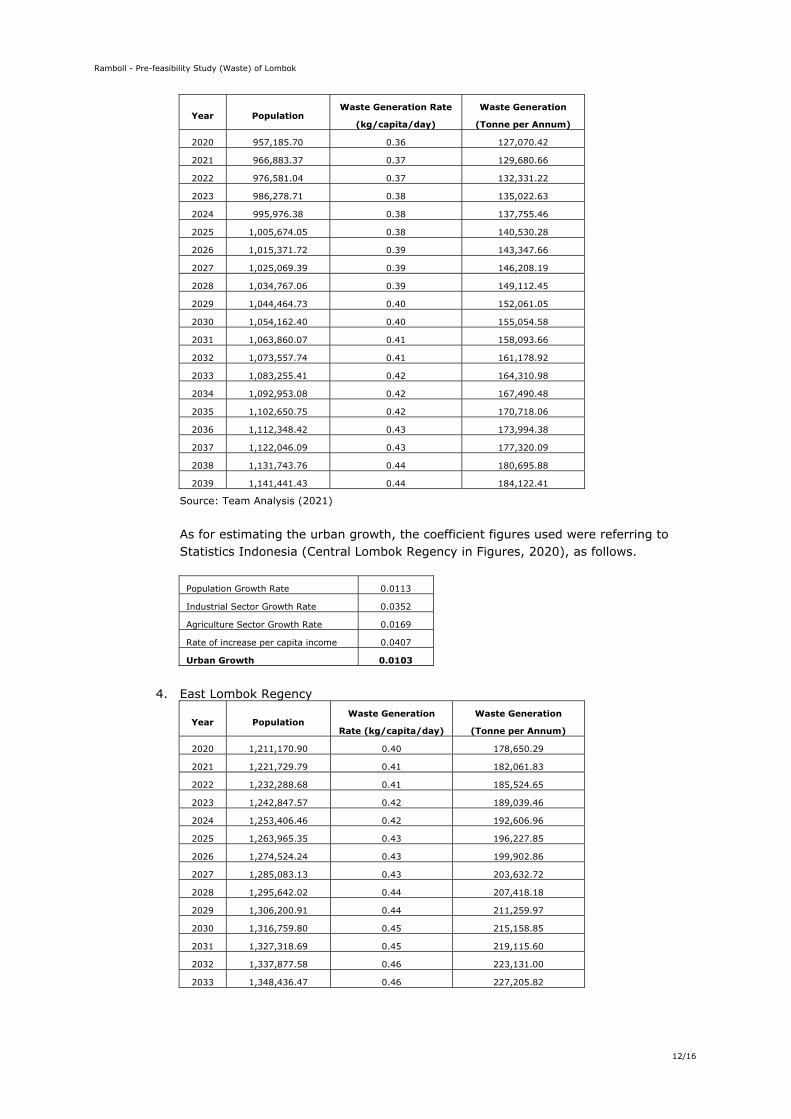
Ramboll - Pre-feasibility Study (Waste) of Lombok
12/16
Year Population Waste Generation Rate
(kg/capita/day)
Waste Generation
(Tonne per Annum)
2020 957,185.70 0.36 127,070.42
2021 966,883.37 0.37 129,680.66
2022 976,581.04 0.37 132,331.22
2023 986,278.71 0.38 135,022.63
2024 995,976.38 0.38 137,755.46
2025 1,005,674.05 0.38 140,530.28
2026 1,015,371.72 0.39 143,347.66
2027 1,025,069.39 0.39 146,208.19
2028 1,034,767.06 0.39 149,112.45
2029 1,044,464.73 0.40 152,061.05
2030 1,054,162.40 0.40 155,054.58
2031 1,063,860.07 0.41 158,093.66
2032 1,073,557.74 0.41 161,178.92
2033 1,083,255.41 0.42 164,310.98
2034 1,092,953.08 0.42 167,490.48
2035 1,102,650.75 0.42 170,718.06
2036 1,112,348.42 0.43 173,994.38
2037 1,122,046.09 0.43 177,320.09
2038 1,131,743.76 0.44 180,695.88
2039 1,141,441.43 0.44 184,122.41
Source: Team Analysis (2021)
As for estimating the urban growth, the coefficient figures used were referring to Statistics Indonesia (Central Lombok Regency in Figures, 2020), as follows.
Population Growth Rate 0.0113
Industrial Sector Growth Rate 0.0352
Agriculture Sector Growth Rate 0.0169
Rate of increase per capita income 0.0407
Urban Growth 0.0103
4. East Lombok Regency
Year Population Waste Generation
Rate (kg/capita/day)
Waste Generation
(Tonne per Annum)
2020 1,211,170.90 0.40 178,650.29
2021 1,221,729.79 0.41 182,061.83
2022 1,232,288.68 0.41 185,524.65
2023 1,242,847.57 0.42 189,039.46
2024 1,253,406.46 0.42 192,606.96
2025 1,263,965.35 0.43 196,227.85
2026 1,274,524.24 0.43 199,902.86
2027 1,285,083.13 0.43 203,632.72
2028 1,295,642.02 0.44 207,418.18
2029 1,306,200.91 0.44 211,259.97
2030 1,316,759.80 0.45 215,158.85
2031 1,327,318.69 0.45 219,115.60
2032 1,337,877.58 0.46 223,131.00
2033 1,348,436.47 0.46 227,205.82
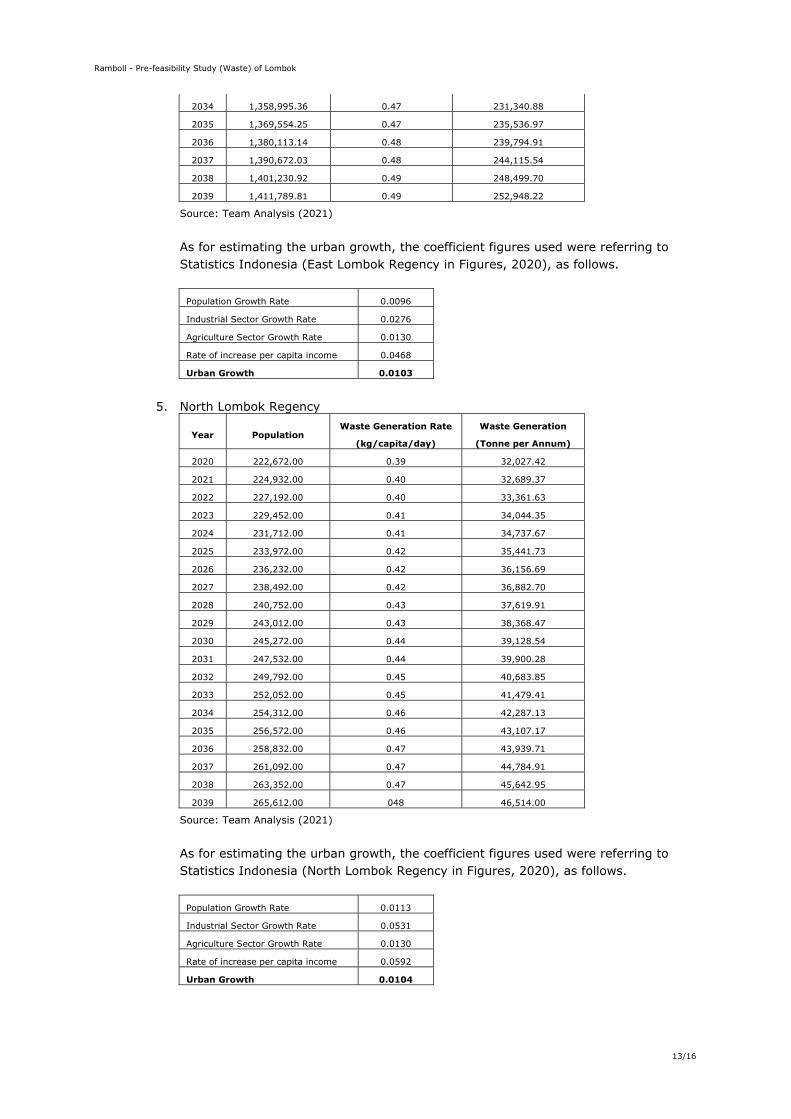
Ramboll - Pre-feasibility Study (Waste) of Lombok
13/16
2034 1,358,995.36 0.47 231,340.88
2035 1,369,554.25 0.47 235,536.97
2036 1,380,113.14 0.48 239,794.91
2037 1,390,672.03 0.48 244,115.54
2038 1,401,230.92 0.49 248,499.70
2039 1,411,789.81 0.49 252,948.22
Source: Team Analysis (2021)
As for estimating the urban growth, the coefficient figures used were referring to Statistics Indonesia (East Lombok Regency in Figures, 2020), as follows.
Population Growth Rate 0.0096
Industrial Sector Growth Rate 0.0276
Agriculture Sector Growth Rate 0.0130
Rate of increase per capita income 0.0468
Urban Growth 0.0103
5. North Lombok Regency
Year Population Waste Generation Rate
(kg/capita/day)
Waste Generation
(Tonne per Annum)
2020 222,672.00 0.39 32,027.42
2021 224,932.00 0.40 32,689.37
2022 227,192.00 0.40 33,361.63
2023 229,452.00 0.41 34,044.35
2024 231,712.00 0.41 34,737.67
2025 233,972.00 0.42 35,441.73
2026 236,232.00 0.42 36,156.69
2027 238,492.00 0.42 36,882.70
2028 240,752.00 0.43 37,619.91
2029 243,012.00 0.43 38,368.47
2030 245,272.00 0.44 39,128.54
2031 247,532.00 0.44 39,900.28
2032 249,792.00 0.45 40,683.85
2033 252,052.00 0.45 41,479.41
2034 254,312.00 0.46 42,287.13
2035 256,572.00 0.46 43,107.17
2036 258,832.00 0.47 43,939.71
2037 261,092.00 0.47 44,784.91
2038 263,352.00 0.47 45,642.95
2039 265,612.00 048 46,514.00
Source: Team Analysis (2021)
As for estimating the urban growth, the coefficient figures used were referring to Statistics Indonesia (North Lombok Regency in Figures, 2020), as follows.
Population Growth Rate 0.0113
Industrial Sector Growth Rate 0.0531
Agriculture Sector Growth Rate 0.0130
Rate of increase per capita income 0.0592
Urban Growth 0.0104
Ramboll - Pre-feasibility Study (Waste) of Lombok
14/16
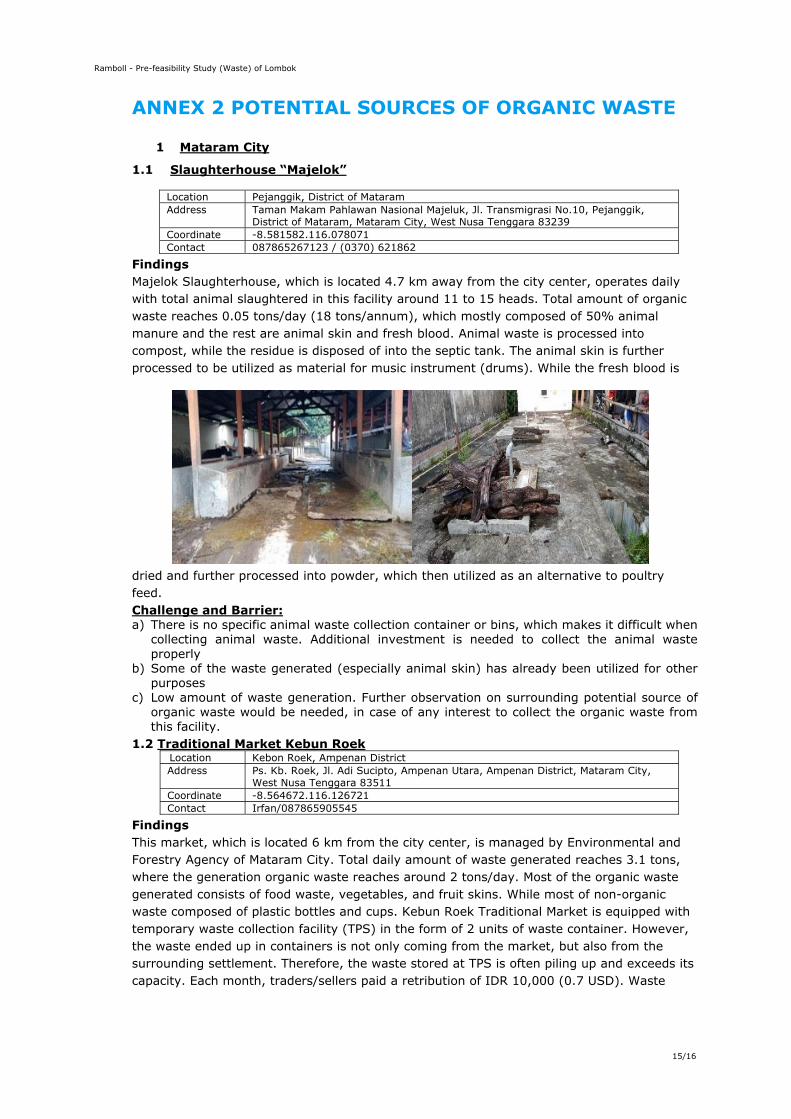
Ramboll - Pre-feasibility Study (Waste) of Lombok
15/16
ANNEX 2 POTENTIAL SOURCES OF ORGANIC WASTE
1 Mataram City
1.1 Slaughterhouse “Majelok”
Location Pejanggik, District of Mataram Address Taman Makam Pahlawan Nasional Majeluk, Jl. Transmigrasi No.10, Pejanggik,
District of Mataram, Mataram City, West Nusa Tenggara 83239 Coordinate -8.581582.116.078071 Contact 087865267123 / (0370) 621862
Findings Majelok Slaughterhouse, which is located 4.7 km away from the city center, operates daily with total animal slaughtered in this facility around 11 to 15 heads. Total amount of organic waste reaches 0.05 tons/day (18 tons/annum), which mostly composed of 50% animal manure and the rest are animal skin and fresh blood. Animal waste is processed into compost, while the residue is disposed of into the septic tank. The animal skin is further processed to be utilized as material for music instrument (drums). While the fresh blood is
dried and further processed into powder, which then utilized as an alternative to poultry feed. Challenge and Barrier: a) There is no specific animal waste collection container or bins, which makes it difficult when
collecting animal waste. Additional investment is needed to collect the animal waste properly
b) Some of the waste generated (especially animal skin) has already been utilized for other purposes
c) Low amount of waste generation. Further observation on surrounding potential source of organic waste would be needed, in case of any interest to collect the organic waste from this facility.
1.2 Traditional Market Kebun Roek Location Kebon Roek, Ampenan District Address Ps. Kb. Roek, Jl. Adi Sucipto, Ampenan Utara, Ampenan District, Mataram City,
West Nusa Tenggara 83511 Coordinate -8.564672.116.126721 Contact Irfan/087865905545
Findings This market, which is located 6 km from the city center, is managed by Environmental and Forestry Agency of Mataram City. Total daily amount of waste generated reaches 3.1 tons, where the generation organic waste reaches around 2 tons/day. Most of the organic waste generated consists of food waste, vegetables, and fruit skins. While most of non-organic waste composed of plastic bottles and cups. Kebun Roek Traditional Market is equipped with temporary waste collection facility (TPS) in the form of 2 units of waste container. However, the waste ended up in containers is not only coming from the market, but also from the surrounding settlement. Therefore, the waste stored at TPS is often piling up and exceeds its capacity. Each month, traders/sellers paid a retribution of IDR 10,000 (0.7 USD). Waste
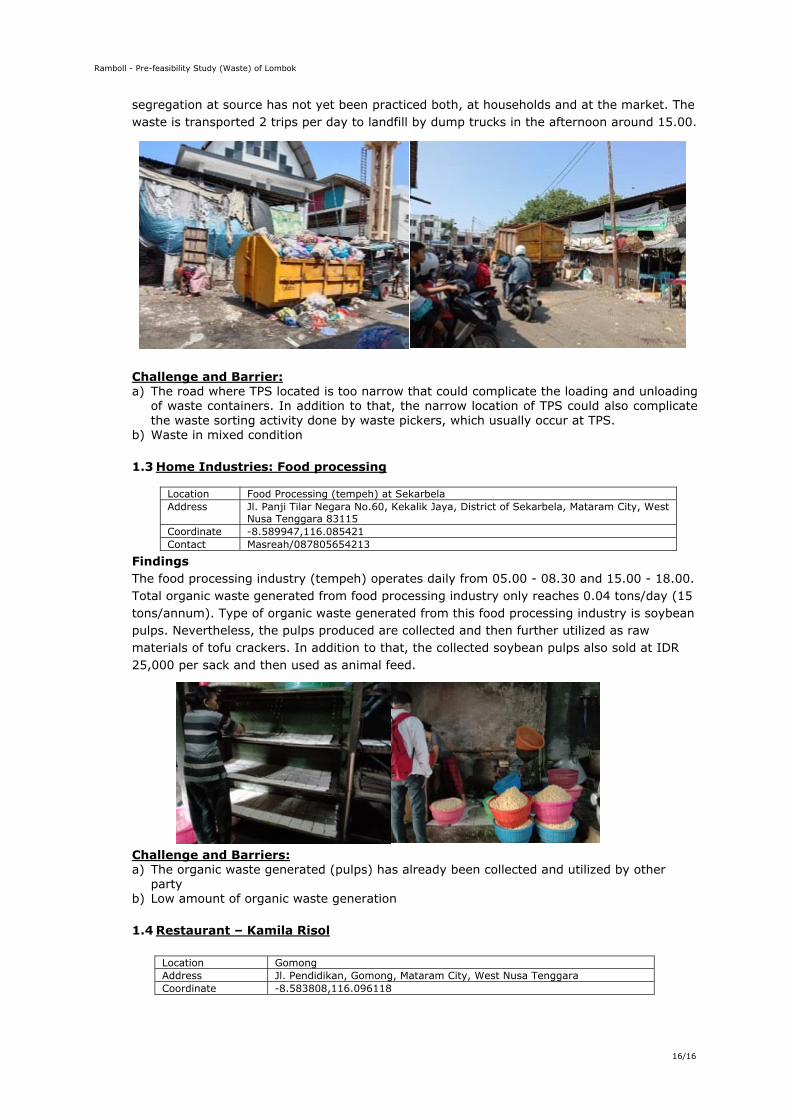
Ramboll - Pre-feasibility Study (Waste) of Lombok
16/16
segregation at source has not yet been practiced both, at households and at the market. The waste is transported 2 trips per day to landfill by dump trucks in the afternoon around 15.00.
Challenge and Barrier: a) The road where TPS located is too narrow that could complicate the loading and unloading
of waste containers. In addition to that, the narrow location of TPS could also complicate the waste sorting activity done by waste pickers, which usually occur at TPS.
b) Waste in mixed condition
1.3 Home Industries: Food processing
Location Food Processing (tempeh) at Sekarbela Address Jl. Panji Tilar Negara No.60, Kekalik Jaya, District of Sekarbela, Mataram City, West
Nusa Tenggara 83115 Coordinate -8.589947,116.085421 Contact Masreah/087805654213
Findings The food processing industry (tempeh) operates daily from 05.00 - 08.30 and 15.00 - 18.00. Total organic waste generated from food processing industry only reaches 0.04 tons/day (15 tons/annum). Type of organic waste generated from this food processing industry is soybean pulps. Nevertheless, the pulps produced are collected and then further utilized as raw materials of tofu crackers. In addition to that, the collected soybean pulps also sold at IDR 25,000 per sack and then used as animal feed.
Challenge and Barriers: a) The organic waste generated (pulps) has already been collected and utilized by other
party b) Low amount of organic waste generation
1.4 Restaurant – Kamila Risol
Location Gomong Address Jl. Pendidikan, Gomong, Mataram City, West Nusa Tenggara Coordinate -8.583808,116.096118
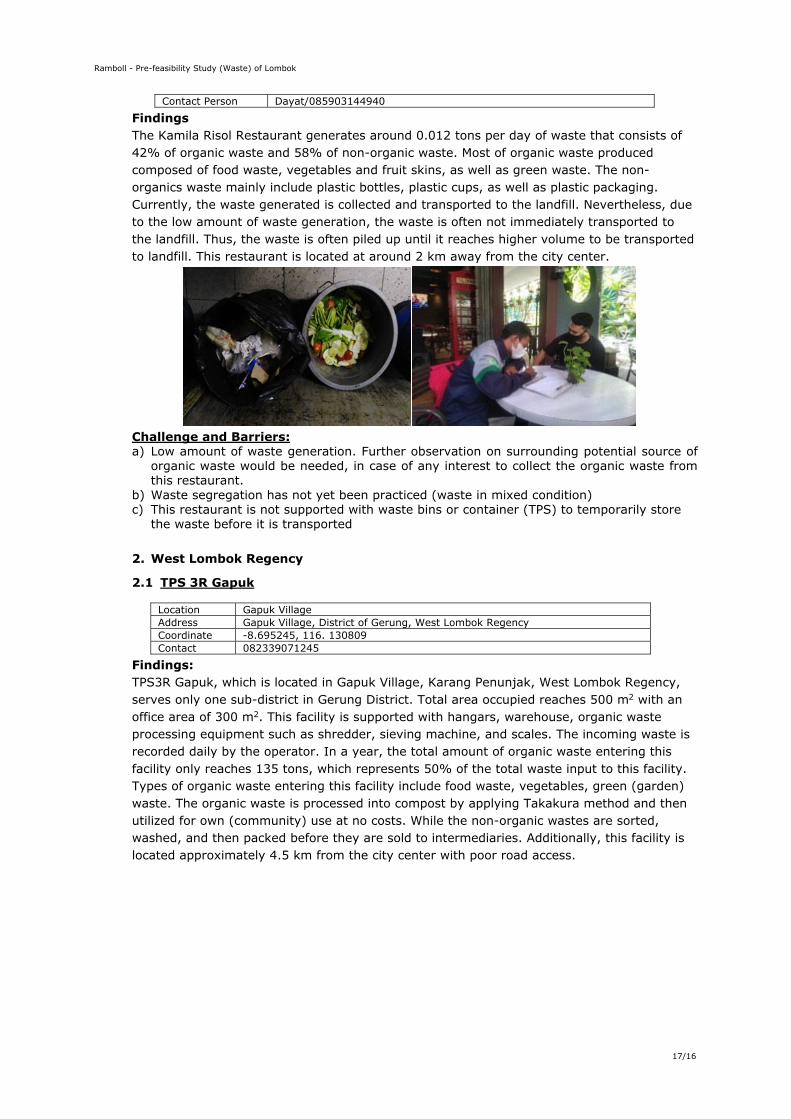
Ramboll - Pre-feasibility Study (Waste) of Lombok
17/16
Findings The Kamila Risol Restaurant generates around 0.012 tons per day of waste that consists of 42% of organic waste and 58% of non-organic waste. Most of organic waste produced composed of food waste, vegetables and fruit skins, as well as green waste. The non-organics waste mainly include plastic bottles, plastic cups, as well as plastic packaging. Currently, the waste generated is collected and transported to the landfill. Nevertheless, due to the low amount of waste generation, the waste is often not immediately transported to the landfill. Thus, the waste is often piled up until it reaches higher volume to be transported to landfill. This restaurant is located at around 2 km away from the city center.
Challenge and Barriers: a) Low amount of waste generation. Further observation on surrounding potential source of
organic waste would be needed, in case of any interest to collect the organic waste from this restaurant.
b) Waste segregation has not yet been practiced (waste in mixed condition) c) This restaurant is not supported with waste bins or container (TPS) to temporarily store
the waste before it is transported
2. West Lombok Regency
2.1 TPS 3R Gapuk
Location Gapuk Village Address Gapuk Village, District of Gerung, West Lombok Regency Coordinate -8.695245, 116. 130809 Contact 082339071245
Findings: TPS3R Gapuk, which is located in Gapuk Village, Karang Penunjak, West Lombok Regency, serves only one sub-district in Gerung District. Total area occupied reaches 500 m2 with an office area of 300 m2. This facility is supported with hangars, warehouse, organic waste processing equipment such as shredder, sieving machine, and scales. The incoming waste is recorded daily by the operator. In a year, the total amount of organic waste entering this facility only reaches 135 tons, which represents 50% of the total waste input to this facility. Types of organic waste entering this facility include food waste, vegetables, green (garden) waste. The organic waste is processed into compost by applying Takakura method and then utilized for own (community) use at no costs. While the non-organic wastes are sorted, washed, and then packed before they are sold to intermediaries. Additionally, this facility is located approximately 4.5 km from the city center with poor road access.
Contact Person Dayat/085903144940
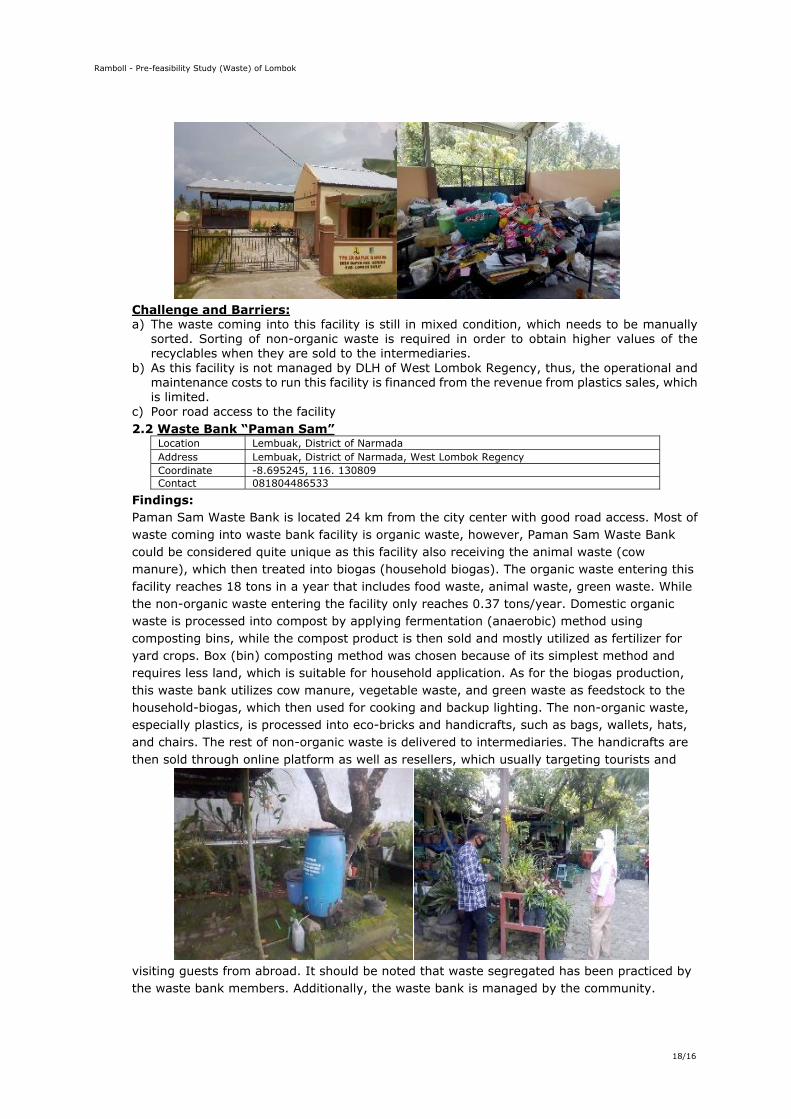
Ramboll - Pre-feasibility Study (Waste) of Lombok
18/16
Challenge and Barriers: a) The waste coming into this facility is still in mixed condition, which needs to be manually
sorted. Sorting of non-organic waste is required in order to obtain higher values of the recyclables when they are sold to the intermediaries.
b) As this facility is not managed by DLH of West Lombok Regency, thus, the operational and maintenance costs to run this facility is financed from the revenue from plastics sales, which is limited.
c) Poor road access to the facility 2.2 Waste Bank “Paman Sam”
Location Lembuak, District of Narmada Address Lembuak, District of Narmada, West Lombok Regency Coordinate -8.695245, 116. 130809 Contact 081804486533
Findings: Paman Sam Waste Bank is located 24 km from the city center with good road access. Most of waste coming into waste bank facility is organic waste, however, Paman Sam Waste Bank could be considered quite unique as this facility also receiving the animal waste (cow manure), which then treated into biogas (household biogas). The organic waste entering this facility reaches 18 tons in a year that includes food waste, animal waste, green waste. While the non-organic waste entering the facility only reaches 0.37 tons/year. Domestic organic waste is processed into compost by applying fermentation (anaerobic) method using composting bins, while the compost product is then sold and mostly utilized as fertilizer for yard crops. Box (bin) composting method was chosen because of its simplest method and requires less land, which is suitable for household application. As for the biogas production, this waste bank utilizes cow manure, vegetable waste, and green waste as feedstock to the household-biogas, which then used for cooking and backup lighting. The non-organic waste, especially plastics, is processed into eco-bricks and handicrafts, such as bags, wallets, hats, and chairs. The rest of non-organic waste is delivered to intermediaries. The handicrafts are then sold through online platform as well as resellers, which usually targeting tourists and
visiting guests from abroad. It should be noted that waste segregated has been practiced by the waste bank members. Additionally, the waste bank is managed by the community.
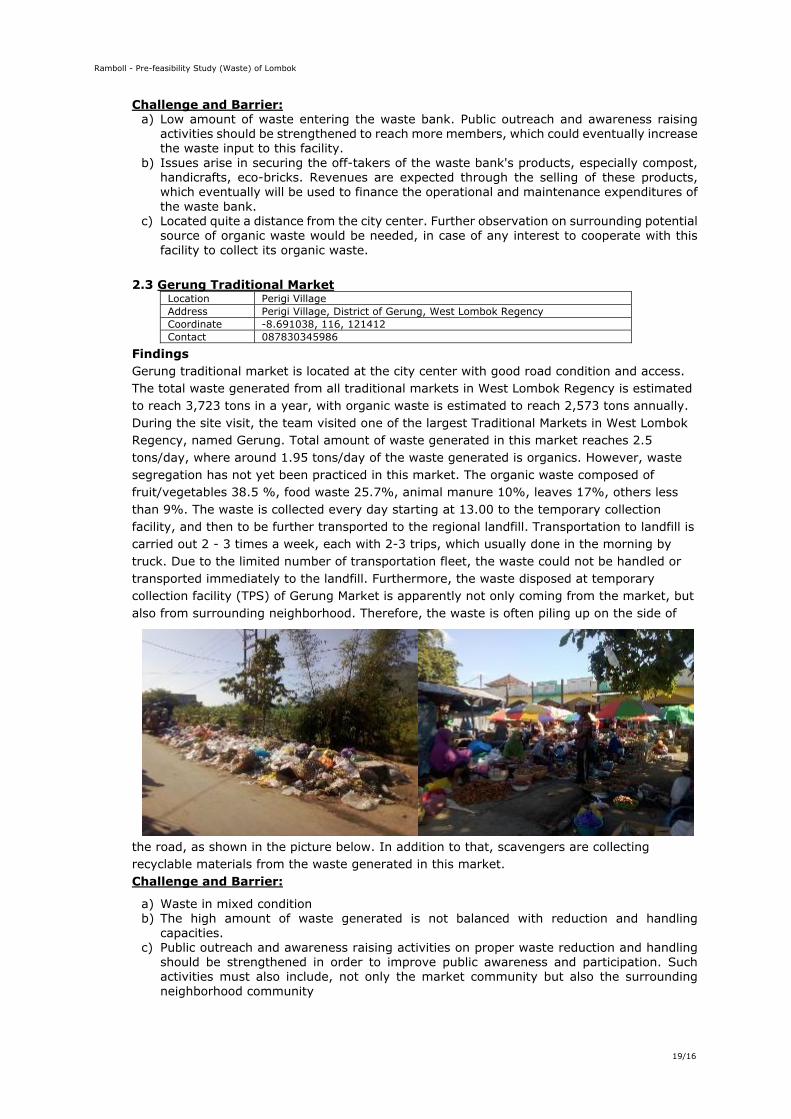
Ramboll - Pre-feasibility Study (Waste) of Lombok
19/16
Challenge and Barrier: a) Low amount of waste entering the waste bank. Public outreach and awareness raising
activities should be strengthened to reach more members, which could eventually increase the waste input to this facility.
b) Issues arise in securing the off-takers of the waste bank's products, especially compost, handicrafts, eco-bricks. Revenues are expected through the selling of these products, which eventually will be used to finance the operational and maintenance expenditures of the waste bank.
c) Located quite a distance from the city center. Further observation on surrounding potential source of organic waste would be needed, in case of any interest to cooperate with this facility to collect its organic waste.
2.3 Gerung Traditional Market Location Perigi Village Address Perigi Village, District of Gerung, West Lombok Regency Coordinate -8.691038, 116, 121412 Contact 087830345986
Findings Gerung traditional market is located at the city center with good road condition and access. The total waste generated from all traditional markets in West Lombok Regency is estimated to reach 3,723 tons in a year, with organic waste is estimated to reach 2,573 tons annually. During the site visit, the team visited one of the largest Traditional Markets in West Lombok Regency, named Gerung. Total amount of waste generated in this market reaches 2.5 tons/day, where around 1.95 tons/day of the waste generated is organics. However, waste segregation has not yet been practiced in this market. The organic waste composed of fruit/vegetables 38.5 %, food waste 25.7%, animal manure 10%, leaves 17%, others less than 9%. The waste is collected every day starting at 13.00 to the temporary collection facility, and then to be further transported to the regional landfill. Transportation to landfill is carried out 2 - 3 times a week, each with 2-3 trips, which usually done in the morning by truck. Due to the limited number of transportation fleet, the waste could not be handled or transported immediately to the landfill. Furthermore, the waste disposed at temporary collection facility (TPS) of Gerung Market is apparently not only coming from the market, but also from surrounding neighborhood. Therefore, the waste is often piling up on the side of
the road, as shown in the picture below. In addition to that, scavengers are collecting recyclable materials from the waste generated in this market. Challenge and Barrier:
a) Waste in mixed condition b) The high amount of waste generated is not balanced with reduction and handling
capacities. c) Public outreach and awareness raising activities on proper waste reduction and handling
should be strengthened in order to improve public awareness and participation. Such activities must also include, not only the market community but also the surrounding neighborhood community

Ramboll - Pre-feasibility Study (Waste) of Lombok
20/16
d) During site visit, the team experienced difficulties to contact the head of Gerung Market to conduct interview.
2.4 Karang Bayan Fruit Market Location Karang Bayan Address Karang Bayan, District of Lingsar, West Lombok Regency Coordinate -8.555741, 116. 198547 Contact 087800452575
Findings: Karang Bayan fruit market is distantly located from the city center, approximately 26 km away, with good access and rather hilly road. Waste generated from this fruit market mostly composed of organic waste, which is estimated to reach 26 tons/annum. The composition of organic waste generated in this market includes fruit skins 50%, banana stems 35%, and branches/leaves 15%. Nevertheless, the waste management in this market is not served by DLH. Moreover, there is no temporary waste collection facility available in the market, thus the waste generated is piling up on the river bank near the market.
Challenge and Barriers: a) Low amount of waste generation b) Waste segregation has not yet been practiced. However, the portion of organic waste is still
far greater than the non-organic waste. c) There are no waste bins available in the market, let alone the temporary waste collection
facility/TPS (container). d) Littering is still being practiced in this area. e) Located far from the city center. Further observation on surrounding potential source of
organic waste would be needed, in case of any interest to collect the organic waste.
2.5 Cattle Farm “Majeti” Location Karang Majeti Village Address Karang Mejeti Village, District of Narmada, West Lombok Regency Coordinate -8.538437, 116. 100892 Contact 081929458188
Findings Majeti Cattle Fram, which located in Majeti Village, West Lombok Regency, is managed independently. This facility is located approximately 20 km from the city center and has good road access with hilly terrain. There are in total around 60 cows breeding in this facility. The animal stalls are rented to the farmers annually by the owner. While the land is owned by the community. Organic waste produced from this facility is estimated to reach around 66 tons/year that consists of cow manure (65%), remaining feed (25%), and urine (10%). Currently, the organic waste generated at the facility is only discharged of into the channel near the animal stalls without any prior treatment, which then eventually flows into the nearest water body
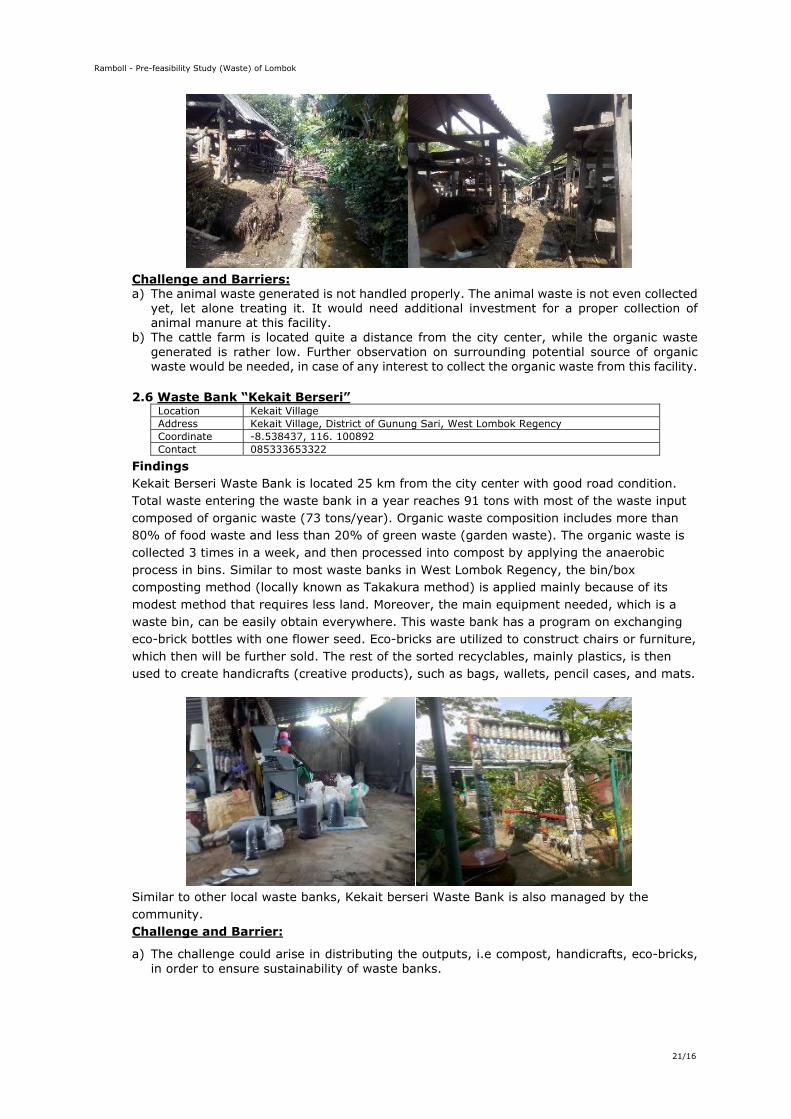
Ramboll - Pre-feasibility Study (Waste) of Lombok
21/16
Challenge and Barriers: a) The animal waste generated is not handled properly. The animal waste is not even collected
yet, let alone treating it. It would need additional investment for a proper collection of animal manure at this facility.
b) The cattle farm is located quite a distance from the city center, while the organic waste generated is rather low. Further observation on surrounding potential source of organic waste would be needed, in case of any interest to collect the organic waste from this facility.
2.6 Waste Bank “Kekait Berseri” Location Kekait Village Address Kekait Village, District of Gunung Sari, West Lombok Regency Coordinate -8.538437, 116. 100892 Contact 085333653322
Findings Kekait Berseri Waste Bank is located 25 km from the city center with good road condition. Total waste entering the waste bank in a year reaches 91 tons with most of the waste input composed of organic waste (73 tons/year). Organic waste composition includes more than 80% of food waste and less than 20% of green waste (garden waste). The organic waste is collected 3 times in a week, and then processed into compost by applying the anaerobic process in bins. Similar to most waste banks in West Lombok Regency, the bin/box composting method (locally known as Takakura method) is applied mainly because of its modest method that requires less land. Moreover, the main equipment needed, which is a waste bin, can be easily obtain everywhere. This waste bank has a program on exchanging eco-brick bottles with one flower seed. Eco-bricks are utilized to construct chairs or furniture, which then will be further sold. The rest of the sorted recyclables, mainly plastics, is then used to create handicrafts (creative products), such as bags, wallets, pencil cases, and mats.
Similar to other local waste banks, Kekait berseri Waste Bank is also managed by the community. Challenge and Barrier:
a) The challenge could arise in distributing the outputs, i.e compost, handicrafts, eco-bricks, in order to ensure sustainability of waste banks.
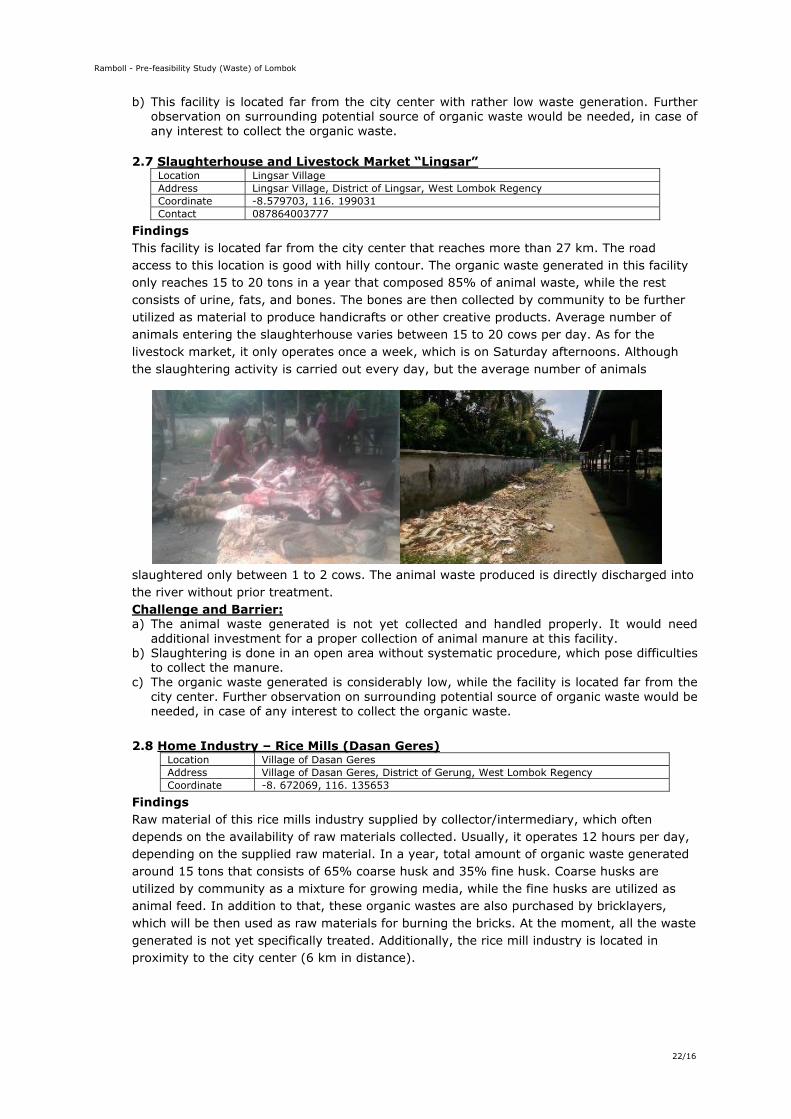
Ramboll - Pre-feasibility Study (Waste) of Lombok
22/16
b) This facility is located far from the city center with rather low waste generation. Further observation on surrounding potential source of organic waste would be needed, in case of any interest to collect the organic waste.
2.7 Slaughterhouse and Livestock Market “Lingsar” Location Lingsar Village Address Lingsar Village, District of Lingsar, West Lombok Regency Coordinate -8.579703, 116. 199031 Contact 087864003777
Findings This facility is located far from the city center that reaches more than 27 km. The road access to this location is good with hilly contour. The organic waste generated in this facility only reaches 15 to 20 tons in a year that composed 85% of animal waste, while the rest consists of urine, fats, and bones. The bones are then collected by community to be further utilized as material to produce handicrafts or other creative products. Average number of animals entering the slaughterhouse varies between 15 to 20 cows per day. As for the livestock market, it only operates once a week, which is on Saturday afternoons. Although the slaughtering activity is carried out every day, but the average number of animals
slaughtered only between 1 to 2 cows. The animal waste produced is directly discharged into the river without prior treatment. Challenge and Barrier: a) The animal waste generated is not yet collected and handled properly. It would need
additional investment for a proper collection of animal manure at this facility. b) Slaughtering is done in an open area without systematic procedure, which pose difficulties
to collect the manure. c) The organic waste generated is considerably low, while the facility is located far from the
city center. Further observation on surrounding potential source of organic waste would be needed, in case of any interest to collect the organic waste.
2.8 Home Industry – Rice Mills (Dasan Geres) Location Village of Dasan Geres Address Village of Dasan Geres, District of Gerung, West Lombok Regency Coordinate -8. 672069, 116. 135653
Findings Raw material of this rice mills industry supplied by collector/intermediary, which often depends on the availability of raw materials collected. Usually, it operates 12 hours per day, depending on the supplied raw material. In a year, total amount of organic waste generated around 15 tons that consists of 65% coarse husk and 35% fine husk. Coarse husks are utilized by community as a mixture for growing media, while the fine husks are utilized as animal feed. In addition to that, these organic wastes are also purchased by bricklayers, which will be then used as raw materials for burning the bricks. At the moment, all the waste generated is not yet specifically treated. Additionally, the rice mill industry is located in proximity to the city center (6 km in distance).
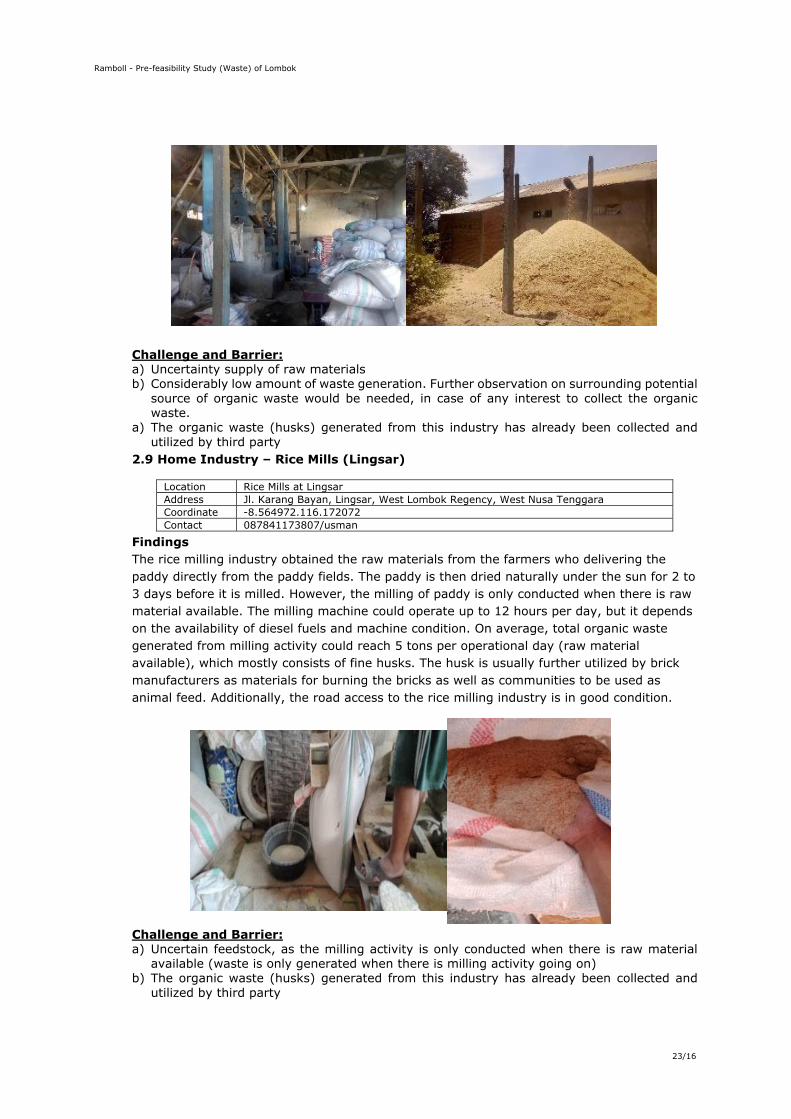
Ramboll - Pre-feasibility Study (Waste) of Lombok
23/16
Challenge and Barrier: a) Uncertainty supply of raw materials b) Considerably low amount of waste generation. Further observation on surrounding potential
source of organic waste would be needed, in case of any interest to collect the organic waste.
a) The organic waste (husks) generated from this industry has already been collected and utilized by third party
2.9 Home Industry – Rice Mills (Lingsar)
Findings The rice milling industry obtained the raw materials from the farmers who delivering the paddy directly from the paddy fields. The paddy is then dried naturally under the sun for 2 to 3 days before it is milled. However, the milling of paddy is only conducted when there is raw material available. The milling machine could operate up to 12 hours per day, but it depends on the availability of diesel fuels and machine condition. On average, total organic waste generated from milling activity could reach 5 tons per operational day (raw material available), which mostly consists of fine husks. The husk is usually further utilized by brick manufacturers as materials for burning the bricks as well as communities to be used as animal feed. Additionally, the road access to the rice milling industry is in good condition.
Challenge and Barrier: a) Uncertain feedstock, as the milling activity is only conducted when there is raw material
available (waste is only generated when there is milling activity going on) b) The organic waste (husks) generated from this industry has already been collected and
utilized by third party
Location Rice Mills at Lingsar Address Jl. Karang Bayan, Lingsar, West Lombok Regency, West Nusa Tenggara Coordinate -8.564972.116.172072 Contact 087841173807/usman
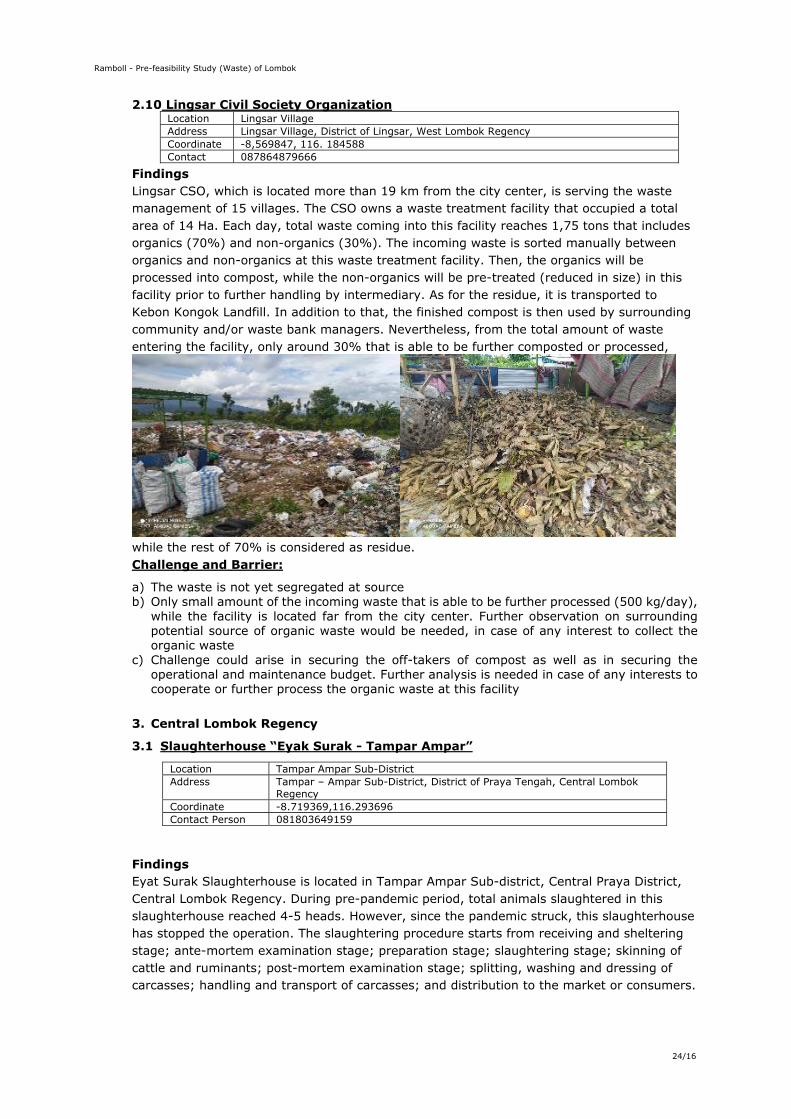
Ramboll - Pre-feasibility Study (Waste) of Lombok
24/16
2.10 Lingsar Civil Society Organization Location Lingsar Village Address Lingsar Village, District of Lingsar, West Lombok Regency Coordinate -8,569847, 116. 184588 Contact 087864879666
Findings Lingsar CSO, which is located more than 19 km from the city center, is serving the waste management of 15 villages. The CSO owns a waste treatment facility that occupied a total area of 14 Ha. Each day, total waste coming into this facility reaches 1,75 tons that includes organics (70%) and non-organics (30%). The incoming waste is sorted manually between organics and non-organics at this waste treatment facility. Then, the organics will be processed into compost, while the non-organics will be pre-treated (reduced in size) in this facility prior to further handling by intermediary. As for the residue, it is transported to Kebon Kongok Landfill. In addition to that, the finished compost is then used by surrounding community and/or waste bank managers. Nevertheless, from the total amount of waste entering the facility, only around 30% that is able to be further composted or processed,
while the rest of 70% is considered as residue. Challenge and Barrier:
a) The waste is not yet segregated at source b) Only small amount of the incoming waste that is able to be further processed (500 kg/day),
while the facility is located far from the city center. Further observation on surrounding potential source of organic waste would be needed, in case of any interest to collect the organic waste
c) Challenge could arise in securing the off-takers of compost as well as in securing the operational and maintenance budget. Further analysis is needed in case of any interests to cooperate or further process the organic waste at this facility
3. Central Lombok Regency
3.1 Slaughterhouse “Eyak Surak - Tampar Ampar”
Findings Eyat Surak Slaughterhouse is located in Tampar Ampar Sub-district, Central Praya District, Central Lombok Regency. During pre-pandemic period, total animals slaughtered in this slaughterhouse reached 4-5 heads. However, since the pandemic struck, this slaughterhouse has stopped the operation. The slaughtering procedure starts from receiving and sheltering stage; ante-mortem examination stage; preparation stage; slaughtering stage; skinning of cattle and ruminants; post-mortem examination stage; splitting, washing and dressing of carcasses; handling and transport of carcasses; and distribution to the market or consumers.
Location Tampar Ampar Sub-District Address Tampar – Ampar Sub-District, District of Praya Tengah, Central Lombok
Regency Coordinate -8.719369,116.293696 Contact Person 081803649159
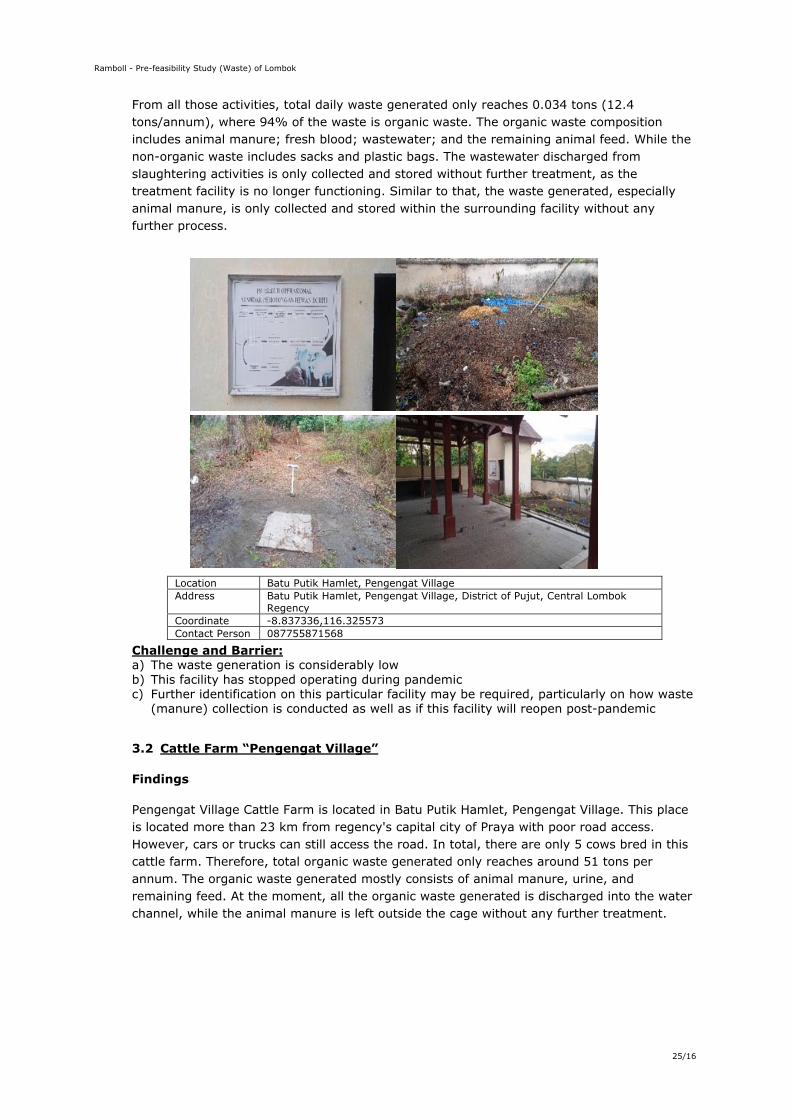
Ramboll - Pre-feasibility Study (Waste) of Lombok
25/16
From all those activities, total daily waste generated only reaches 0.034 tons (12.4 tons/annum), where 94% of the waste is organic waste. The organic waste composition includes animal manure; fresh blood; wastewater; and the remaining animal feed. While the non-organic waste includes sacks and plastic bags. The wastewater discharged from slaughtering activities is only collected and stored without further treatment, as the treatment facility is no longer functioning. Similar to that, the waste generated, especially animal manure, is only collected and stored within the surrounding facility without any further process.
Challenge and Barrier: a) The waste generation is considerably low b) This facility has stopped operating during pandemic c) Further identification on this particular facility may be required, particularly on how waste
(manure) collection is conducted as well as if this facility will reopen post-pandemic
3.2 Cattle Farm “Pengengat Village”
Findings
Pengengat Village Cattle Farm is located in Batu Putik Hamlet, Pengengat Village. This place is located more than 23 km from regency's capital city of Praya with poor road access. However, cars or trucks can still access the road. In total, there are only 5 cows bred in this cattle farm. Therefore, total organic waste generated only reaches around 51 tons per annum. The organic waste generated mostly consists of animal manure, urine, and remaining feed. At the moment, all the organic waste generated is discharged into the water channel, while the animal manure is left outside the cage without any further treatment.
Location Batu Putik Hamlet, Pengengat Village Address Batu Putik Hamlet, Pengengat Village, District of Pujut, Central Lombok
Regency Coordinate -8.837336,116.325573 Contact Person 087755871568
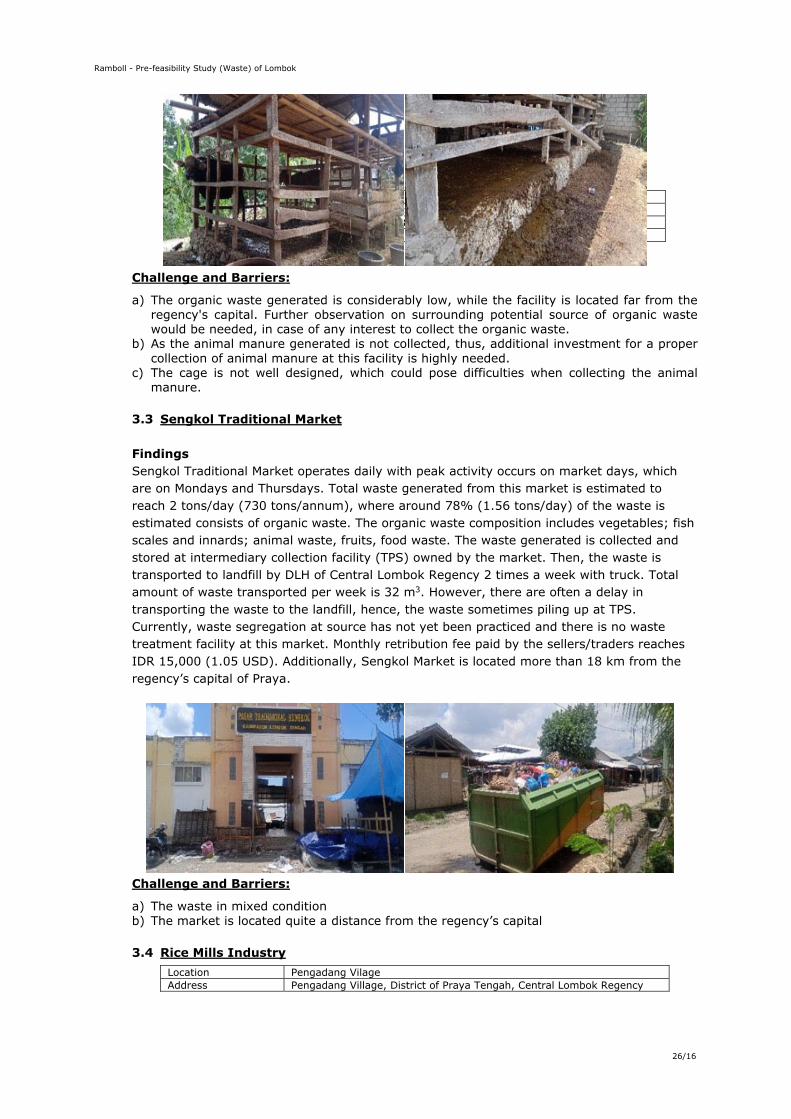
Ramboll - Pre-feasibility Study (Waste) of Lombok
26/16
Challenge and Barriers:
a) The organic waste generated is considerably low, while the facility is located far from the regency's capital. Further observation on surrounding potential source of organic waste would be needed, in case of any interest to collect the organic waste.
b) As the animal manure generated is not collected, thus, additional investment for a proper collection of animal manure at this facility is highly needed.
c) The cage is not well designed, which could pose difficulties when collecting the animal manure.
3.3 Sengkol Traditional Market Findings Sengkol Traditional Market operates daily with peak activity occurs on market days, which are on Mondays and Thursdays. Total waste generated from this market is estimated to reach 2 tons/day (730 tons/annum), where around 78% (1.56 tons/day) of the waste is estimated consists of organic waste. The organic waste composition includes vegetables; fish scales and innards; animal waste, fruits, food waste. The waste generated is collected and stored at intermediary collection facility (TPS) owned by the market. Then, the waste is transported to landfill by DLH of Central Lombok Regency 2 times a week with truck. Total amount of waste transported per week is 32 m3. However, there are often a delay in transporting the waste to the landfill, hence, the waste sometimes piling up at TPS. Currently, waste segregation at source has not yet been practiced and there is no waste treatment facility at this market. Monthly retribution fee paid by the sellers/traders reaches IDR 15,000 (1.05 USD). Additionally, Sengkol Market is located more than 18 km from the regency’s capital of Praya.
Challenge and Barriers:
a) The waste in mixed condition b) The market is located quite a distance from the regency’s capital
3.4 Rice Mills Industry
Location Sengkol Village Address Sengkol Village, District of Pujut, Central Lombok Regency Coordinate -8.808386,116.293243 Contact Person 082111942348
Location Pengadang Vilage Address Pengadang Village, District of Praya Tengah, Central Lombok Regency

Ramboll - Pre-feasibility Study (Waste) of Lombok
27/16
Findings The rice mill industry operates daily from 08.00 to 14.00 and located approximately 9 km away from the city center with poor road condition. From every 50 kg of paddy milled, it produces 10 kg of fine husks and 15 kg of coarse husks. Total organic waste generated in this facility only reaches 9 tons per annum that consists of 40% fine husks and 60% of coarse husks. Fine husks is then sold and further utilized by the community as animal feed. While the coarse husks are only stored at the back of this facility without further treatment. Thus, there is a huge pile up of coarse husks at the back of this place.
Challenge and Barriers: a) Low amount of total organic waste generation b) The fine husks have already been collected and utilized by community c) The coarse husks are not well stored in this facility. Heavy equipment might be needed to
collect the coarse husks d) The road access to this facility is in poor condition
3.4 Kopang Modern Market
Location Jelojok Village Address Jelojok Village, District of Kopang, Central Lombok Regency Coordinate -8.632202,116.348880 Contact Person 082132917391
Findings
Coordinate -8.6913,116.336495 Contact Person 087728002872
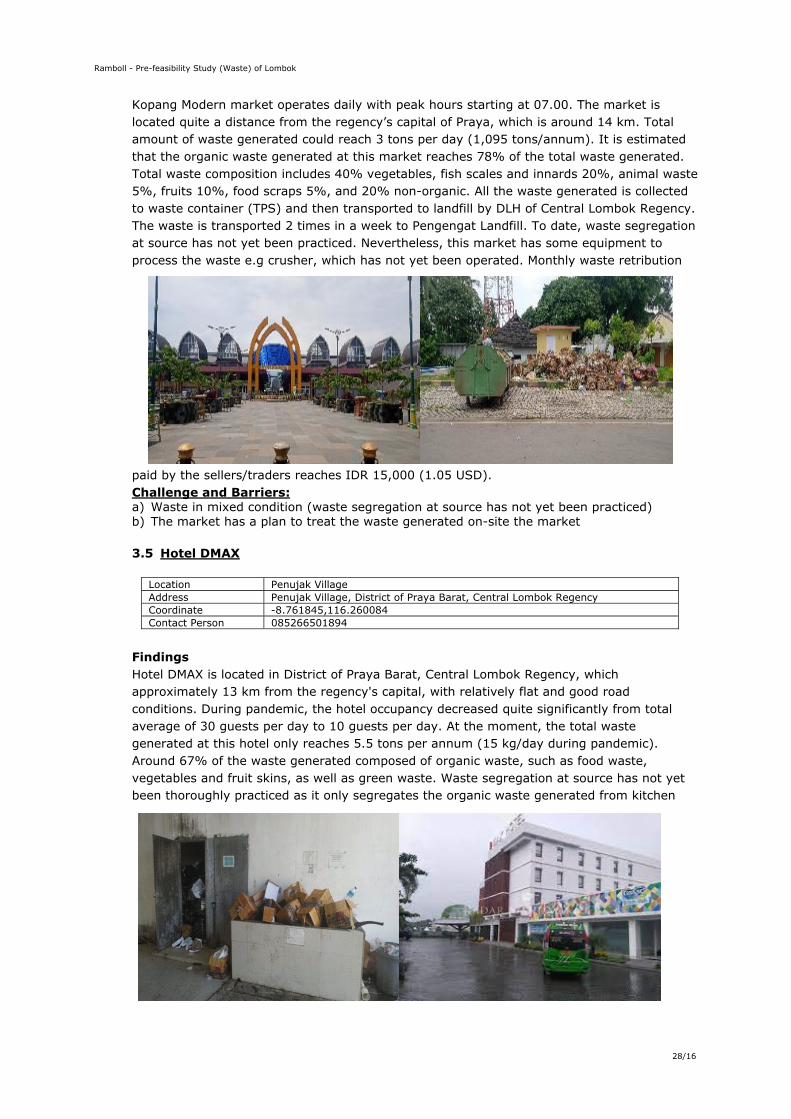
Ramboll - Pre-feasibility Study (Waste) of Lombok
28/16
Kopang Modern market operates daily with peak hours starting at 07.00. The market is located quite a distance from the regency’s capital of Praya, which is around 14 km. Total amount of waste generated could reach 3 tons per day (1,095 tons/annum). It is estimated that the organic waste generated at this market reaches 78% of the total waste generated. Total waste composition includes 40% vegetables, fish scales and innards 20%, animal waste 5%, fruits 10%, food scraps 5%, and 20% non-organic. All the waste generated is collected to waste container (TPS) and then transported to landfill by DLH of Central Lombok Regency. The waste is transported 2 times in a week to Pengengat Landfill. To date, waste segregation at source has not yet been practiced. Nevertheless, this market has some equipment to process the waste e.g crusher, which has not yet been operated. Monthly waste retribution
paid by the sellers/traders reaches IDR 15,000 (1.05 USD). Challenge and Barriers: a) Waste in mixed condition (waste segregation at source has not yet been practiced) b) The market has a plan to treat the waste generated on-site the market
3.5 Hotel DMAX
Location Penujak Village Address Penujak Village, District of Praya Barat, Central Lombok Regency Coordinate -8.761845,116.260084 Contact Person 085266501894
Findings Hotel DMAX is located in District of Praya Barat, Central Lombok Regency, which approximately 13 km from the regency's capital, with relatively flat and good road conditions. During pandemic, the hotel occupancy decreased quite significantly from total average of 30 guests per day to 10 guests per day. At the moment, the total waste generated at this hotel only reaches 5.5 tons per annum (15 kg/day during pandemic). Around 67% of the waste generated composed of organic waste, such as food waste, vegetables and fruit skins, as well as green waste. Waste segregation at source has not yet been thoroughly practiced as it only segregates the organic waste generated from kitchen
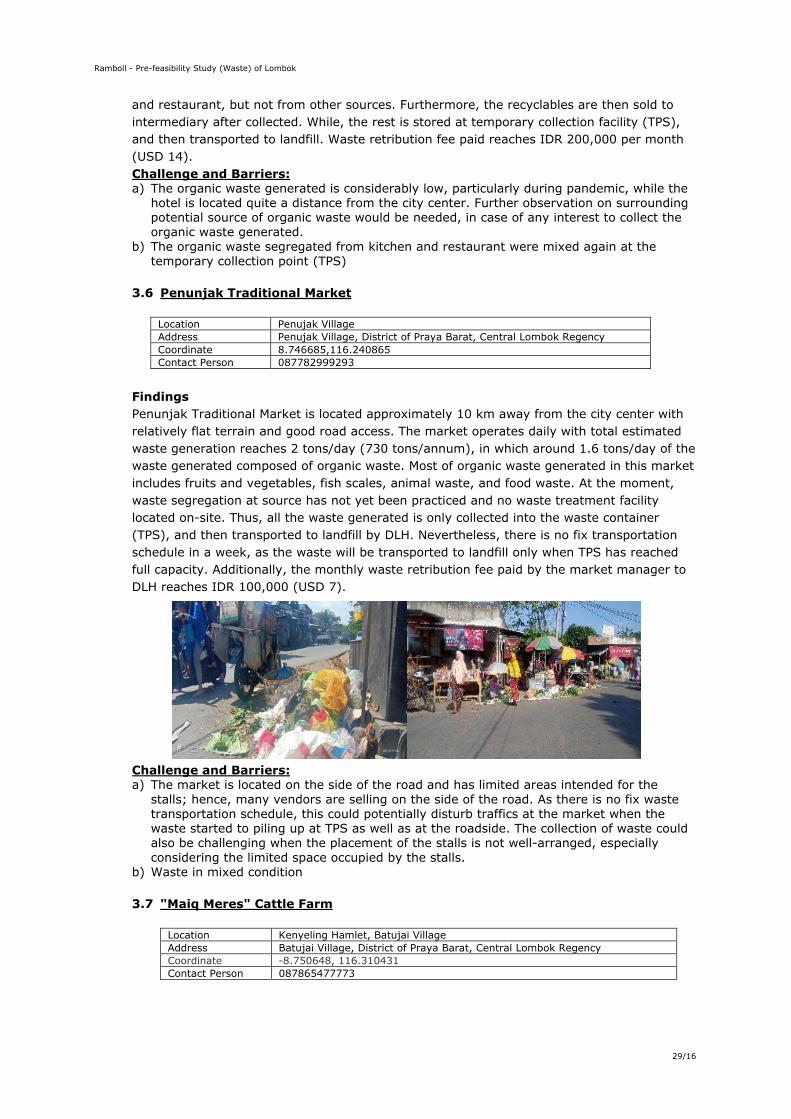
Ramboll - Pre-feasibility Study (Waste) of Lombok
29/16
and restaurant, but not from other sources. Furthermore, the recyclables are then sold to intermediary after collected. While, the rest is stored at temporary collection facility (TPS), and then transported to landfill. Waste retribution fee paid reaches IDR 200,000 per month (USD 14). Challenge and Barriers: a) The organic waste generated is considerably low, particularly during pandemic, while the
hotel is located quite a distance from the city center. Further observation on surrounding potential source of organic waste would be needed, in case of any interest to collect the organic waste generated.
b) The organic waste segregated from kitchen and restaurant were mixed again at the temporary collection point (TPS)
3.6 Penunjak Traditional Market
Location Penujak Village Address Penujak Village, District of Praya Barat, Central Lombok Regency Coordinate 8.746685,116.240865 Contact Person 087782999293
Findings Penunjak Traditional Market is located approximately 10 km away from the city center with relatively flat terrain and good road access. The market operates daily with total estimated waste generation reaches 2 tons/day (730 tons/annum), in which around 1.6 tons/day of the waste generated composed of organic waste. Most of organic waste generated in this market includes fruits and vegetables, fish scales, animal waste, and food waste. At the moment, waste segregation at source has not yet been practiced and no waste treatment facility located on-site. Thus, all the waste generated is only collected into the waste container (TPS), and then transported to landfill by DLH. Nevertheless, there is no fix transportation schedule in a week, as the waste will be transported to landfill only when TPS has reached full capacity. Additionally, the monthly waste retribution fee paid by the market manager to DLH reaches IDR 100,000 (USD 7).
Challenge and Barriers: a) The market is located on the side of the road and has limited areas intended for the
stalls; hence, many vendors are selling on the side of the road. As there is no fix waste transportation schedule, this could potentially disturb traffics at the market when the waste started to piling up at TPS as well as at the roadside. The collection of waste could also be challenging when the placement of the stalls is not well-arranged, especially considering the limited space occupied by the stalls.
b) Waste in mixed condition
3.7 "Maiq Meres" Cattle Farm
Location Kenyeling Hamlet, Batujai Village Address Batujai Village, District of Praya Barat, Central Lombok Regency Coordinate -8.750648, 116.310431 Contact Person 087865477773

Ramboll - Pre-feasibility Study (Waste) of Lombok
30/16
Findings This Cattle Farm is located 11 km away from the city center of Praya, with good road access. The total number of cattle in Maiq Meres cattle farm reaches 34 heads. While the total amount of organic waste generated reaches 142 tons/annum (0.39 tons/day), which mostly consists of cow manure, urine, and remaining animal feed. Currently, the waste generated is disposed-off directly to surrounding environment without prior treatment, while the cow manure is left piling up behind the stalls.
Challenge and Barriers: a) The organic waste generated is considerably low. Further observation on surrounding
potential source of organic waste would be needed, in case of any interest to collect the animal manure.
b) Additional investment is needed to properly collect the animal manure from the stalls.
3.8 "Bunrejeng" Goat Farm
Location Bunrejeng, Batujai Village Address Batujai Village, District of Praya Barat, Central Lombok Regency Coordinate -8.716191, 116. 242761 Contact Person 081916213457
Findings Bunrejeng Goat Farm is located 12 km from the city center of Praya with good road access. The number of goats bred in this farm is uncertain, as the goats are taken to livestock market every day to be traded. However, the total number of goats in this farm normally reaches between 15 to 20 heads. The total amount of organic waste generated in this goat farm only reaches 7 tons per annum (0.02 tons/day) that mainly composed of animal manure (65%), remaining animal feed (25%), and urine (10%). However, the waste generated is not properly collected, treated, and disposed. At the moment, the organic waste generated is only discharged to the channel without any prior treatment. Meanwhile, the manure is left uncollected or untreated and, thus, piling up under the stalls.
Challenge and Barriers: a) Low amount of waste generation, while the facility is located quite a distance from the
regency's capital. Further observation on surrounding potential source of organic waste would be needed, in case of any interest to collect the organic waste (animal manure).
b) Additional investment is needed to properly collect the animal manure at the stalls
3.9 Amaq Sahban Cattle Farm
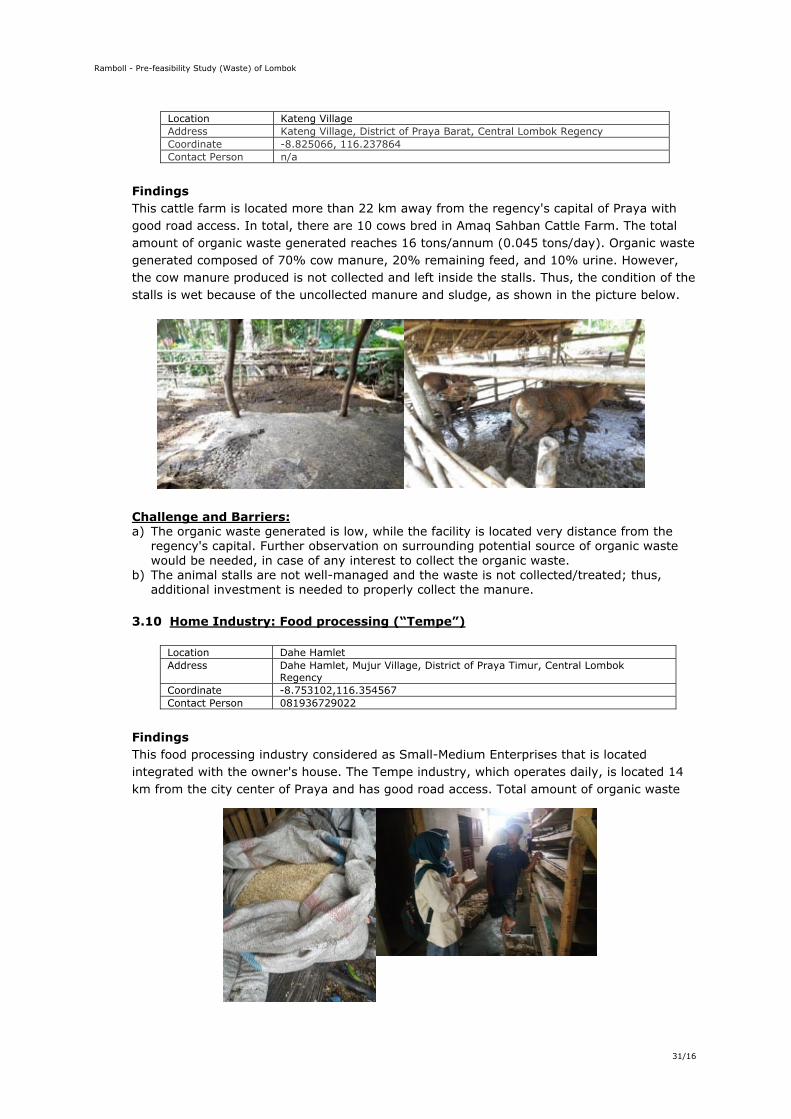
Ramboll - Pre-feasibility Study (Waste) of Lombok
31/16
Location Kateng Village Address Kateng Village, District of Praya Barat, Central Lombok Regency Coordinate -8.825066, 116.237864 Contact Person n/a
Findings This cattle farm is located more than 22 km away from the regency's capital of Praya with good road access. In total, there are 10 cows bred in Amaq Sahban Cattle Farm. The total amount of organic waste generated reaches 16 tons/annum (0.045 tons/day). Organic waste generated composed of 70% cow manure, 20% remaining feed, and 10% urine. However, the cow manure produced is not collected and left inside the stalls. Thus, the condition of the stalls is wet because of the uncollected manure and sludge, as shown in the picture below.
Challenge and Barriers: a) The organic waste generated is low, while the facility is located very distance from the
regency's capital. Further observation on surrounding potential source of organic waste would be needed, in case of any interest to collect the organic waste.
b) The animal stalls are not well-managed and the waste is not collected/treated; thus, additional investment is needed to properly collect the manure.
3.10 Home Industry: Food processing (“Tempe”)
Location Dahe Hamlet Address Dahe Hamlet, Mujur Village, District of Praya Timur, Central Lombok
Regency Coordinate -8.753102,116.354567 Contact Person 081936729022
Findings This food processing industry considered as Small-Medium Enterprises that is located integrated with the owner's house. The Tempe industry, which operates daily, is located 14 km from the city center of Praya and has good road access. Total amount of organic waste
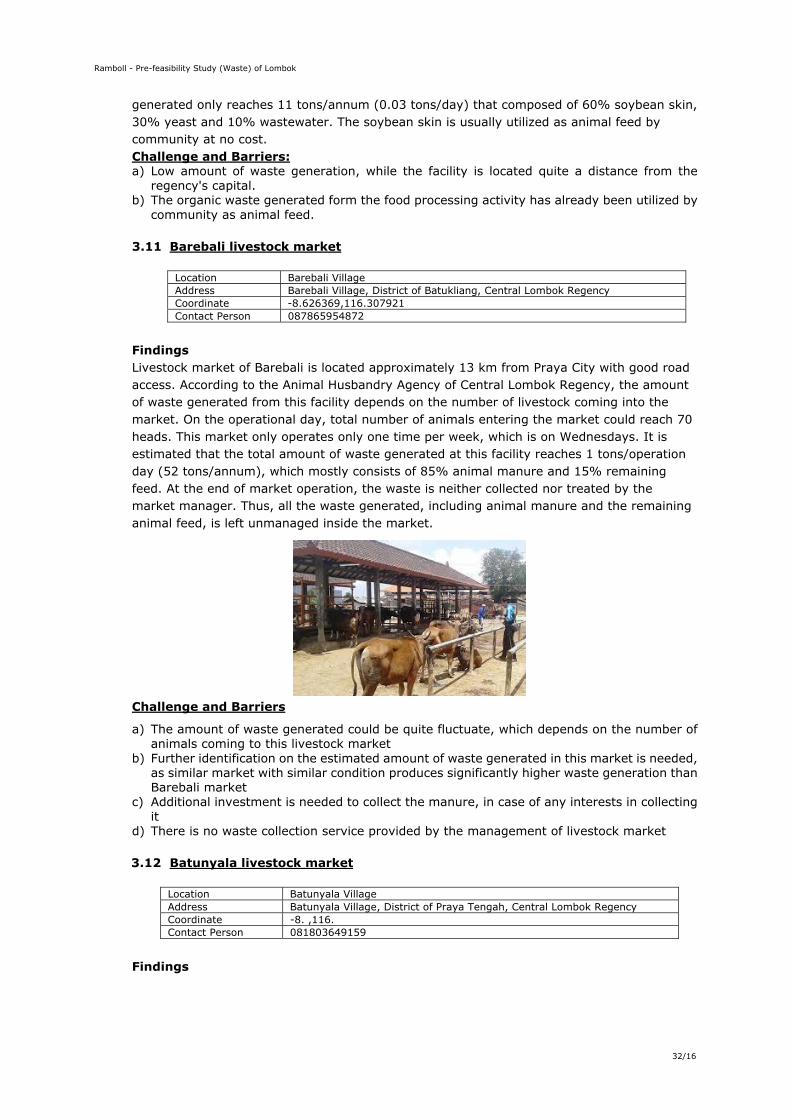
Ramboll - Pre-feasibility Study (Waste) of Lombok
32/16
generated only reaches 11 tons/annum (0.03 tons/day) that composed of 60% soybean skin, 30% yeast and 10% wastewater. The soybean skin is usually utilized as animal feed by community at no cost. Challenge and Barriers: a) Low amount of waste generation, while the facility is located quite a distance from the
regency's capital. b) The organic waste generated form the food processing activity has already been utilized by
community as animal feed.
3.11 Barebali livestock market
Location Barebali Village Address Barebali Village, District of Batukliang, Central Lombok Regency Coordinate -8.626369,116.307921 Contact Person 087865954872
Findings Livestock market of Barebali is located approximately 13 km from Praya City with good road access. According to the Animal Husbandry Agency of Central Lombok Regency, the amount of waste generated from this facility depends on the number of livestock coming into the market. On the operational day, total number of animals entering the market could reach 70 heads. This market only operates only one time per week, which is on Wednesdays. It is estimated that the total amount of waste generated at this facility reaches 1 tons/operation day (52 tons/annum), which mostly consists of 85% animal manure and 15% remaining feed. At the end of market operation, the waste is neither collected nor treated by the market manager. Thus, all the waste generated, including animal manure and the remaining animal feed, is left unmanaged inside the market.
Challenge and Barriers
a) The amount of waste generated could be quite fluctuate, which depends on the number of animals coming to this livestock market
b) Further identification on the estimated amount of waste generated in this market is needed, as similar market with similar condition produces significantly higher waste generation than Barebali market
c) Additional investment is needed to collect the manure, in case of any interests in collecting it
d) There is no waste collection service provided by the management of livestock market
3.12 Batunyala livestock market
Location Batunyala Village Address Batunyala Village, District of Praya Tengah, Central Lombok Regency Coordinate -8. ,116. Contact Person 081803649159
Findings
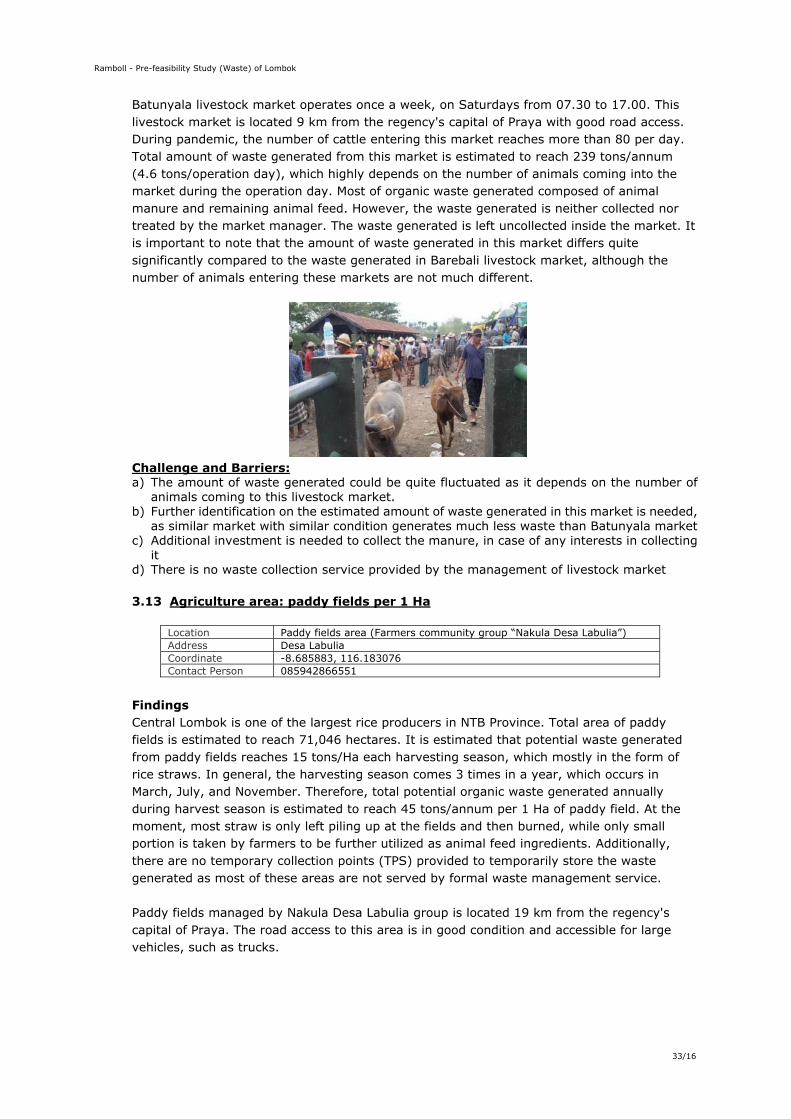
Ramboll - Pre-feasibility Study (Waste) of Lombok
33/16
Batunyala livestock market operates once a week, on Saturdays from 07.30 to 17.00. This livestock market is located 9 km from the regency's capital of Praya with good road access. During pandemic, the number of cattle entering this market reaches more than 80 per day. Total amount of waste generated from this market is estimated to reach 239 tons/annum (4.6 tons/operation day), which highly depends on the number of animals coming into the market during the operation day. Most of organic waste generated composed of animal manure and remaining animal feed. However, the waste generated is neither collected nor treated by the market manager. The waste generated is left uncollected inside the market. It is important to note that the amount of waste generated in this market differs quite significantly compared to the waste generated in Barebali livestock market, although the number of animals entering these markets are not much different.
Challenge and Barriers: a) The amount of waste generated could be quite fluctuated as it depends on the number of
animals coming to this livestock market. b) Further identification on the estimated amount of waste generated in this market is needed,
as similar market with similar condition generates much less waste than Batunyala market c) Additional investment is needed to collect the manure, in case of any interests in collecting
it d) There is no waste collection service provided by the management of livestock market
3.13 Agriculture area: paddy fields per 1 Ha
Location Paddy fields area (Farmers community group “Nakula Desa Labulia”) Address Desa Labulia Coordinate -8.685883, 116.183076 Contact Person 085942866551
Findings Central Lombok is one of the largest rice producers in NTB Province. Total area of paddy fields is estimated to reach 71,046 hectares. It is estimated that potential waste generated from paddy fields reaches 15 tons/Ha each harvesting season, which mostly in the form of rice straws. In general, the harvesting season comes 3 times in a year, which occurs in March, July, and November. Therefore, total potential organic waste generated annually during harvest season is estimated to reach 45 tons/annum per 1 Ha of paddy field. At the moment, most straw is only left piling up at the fields and then burned, while only small portion is taken by farmers to be further utilized as animal feed ingredients. Additionally, there are no temporary collection points (TPS) provided to temporarily store the waste generated as most of these areas are not served by formal waste management service. Paddy fields managed by Nakula Desa Labulia group is located 19 km from the regency's capital of Praya. The road access to this area is in good condition and accessible for large vehicles, such as trucks.
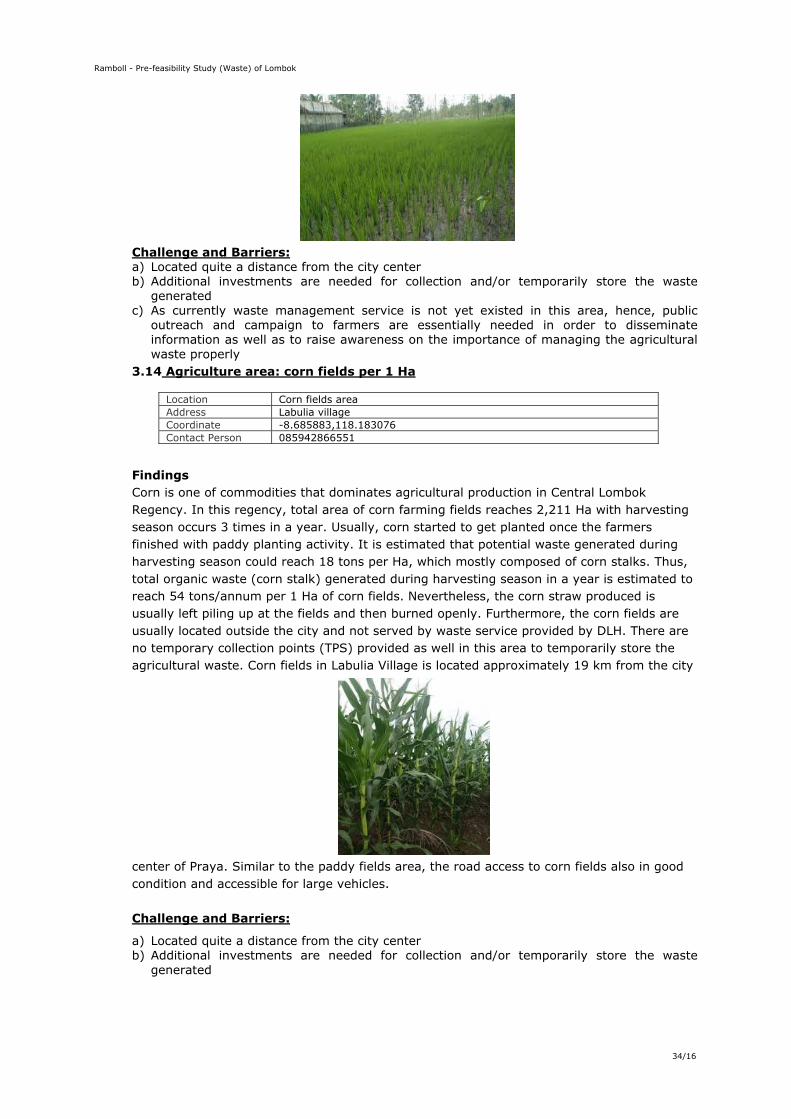
Ramboll - Pre-feasibility Study (Waste) of Lombok
34/16
Challenge and Barriers: a) Located quite a distance from the city center b) Additional investments are needed for collection and/or temporarily store the waste
generated c) As currently waste management service is not yet existed in this area, hence, public
outreach and campaign to farmers are essentially needed in order to disseminate information as well as to raise awareness on the importance of managing the agricultural waste properly
3.14 Agriculture area: corn fields per 1 Ha
Findings Corn is one of commodities that dominates agricultural production in Central Lombok Regency. In this regency, total area of corn farming fields reaches 2,211 Ha with harvesting season occurs 3 times in a year. Usually, corn started to get planted once the farmers finished with paddy planting activity. It is estimated that potential waste generated during harvesting season could reach 18 tons per Ha, which mostly composed of corn stalks. Thus, total organic waste (corn stalk) generated during harvesting season in a year is estimated to reach 54 tons/annum per 1 Ha of corn fields. Nevertheless, the corn straw produced is usually left piling up at the fields and then burned openly. Furthermore, the corn fields are usually located outside the city and not served by waste service provided by DLH. There are no temporary collection points (TPS) provided as well in this area to temporarily store the agricultural waste. Corn fields in Labulia Village is located approximately 19 km from the city
center of Praya. Similar to the paddy fields area, the road access to corn fields also in good condition and accessible for large vehicles. Challenge and Barriers:
a) Located quite a distance from the city center b) Additional investments are needed for collection and/or temporarily store the waste
generated
Location Corn fields area Address Labulia village Coordinate -8.685883,118.183076 Contact Person 085942866551

Ramboll - Pre-feasibility Study (Waste) of Lombok
35/16
c) As currently waste management service is not yet existed in this area, hence, public outreach and campaign to farmers are essentially needed in order to disseminate information as well as to raise awareness on the importance of managing the agricultural waste properly
3.15 Agriculture area: soybeans farm field per 1 Ha
Location Soybeans farming fields Address Labulia Village Coordinate -8.685729,116.182142 Contact Person 087855805643
Findings The total area of soybean farm fields in Central Lombok Regency reaches 27,491 hectares with harvesting season occurs 3 times in a year. It is estimated that the potential waste generated each harvesting season for 1 ha of soybeans field could reach 3.6 tons, which mainly composed of stalks. This implies that the total potential organic waste generated annually during harvest season could reach 11 tons per 1 Ha of soybeans field. At the moment, the stalk is burned at the farm fields openly without any prior treatment. As farming fields mostly located outside the city, thus, this area usually does not get served by waste management service provided by DLH. Temporary waste collection point is also typically not available in this area. Soybeans fields area managed by Nakula farmer community group is located nearby the paddy fields and corn fields in this village, which is 19 km away from Praya City. It has good road access and is accessible to large vehicles (trucks).
Challenge and Barriers: a) Located quite a distance from the city center b) Additional investments are needed for collection and/or temporarily store the waste
generated c) As currently waste management service is not yet existed in this area, hence, public
outreach and campaign to farmers are essentially needed in order to disseminate information as well as to raise awareness on the importance of managing the agricultural waste properly
3.16 Special Economic Zone – Mandalika: Pujut Slaughterhouse
Location Pujut, Segala Anyar Area Address District of Pujut Coordinate -8.788371,116.307246 Contact Person 081917097940
Findings Pujut Slaughterhouse consists of 3 units of slaughtehouse in Pujut District, which all located 15 km away from the city center of Praya. The road access to this location is in good
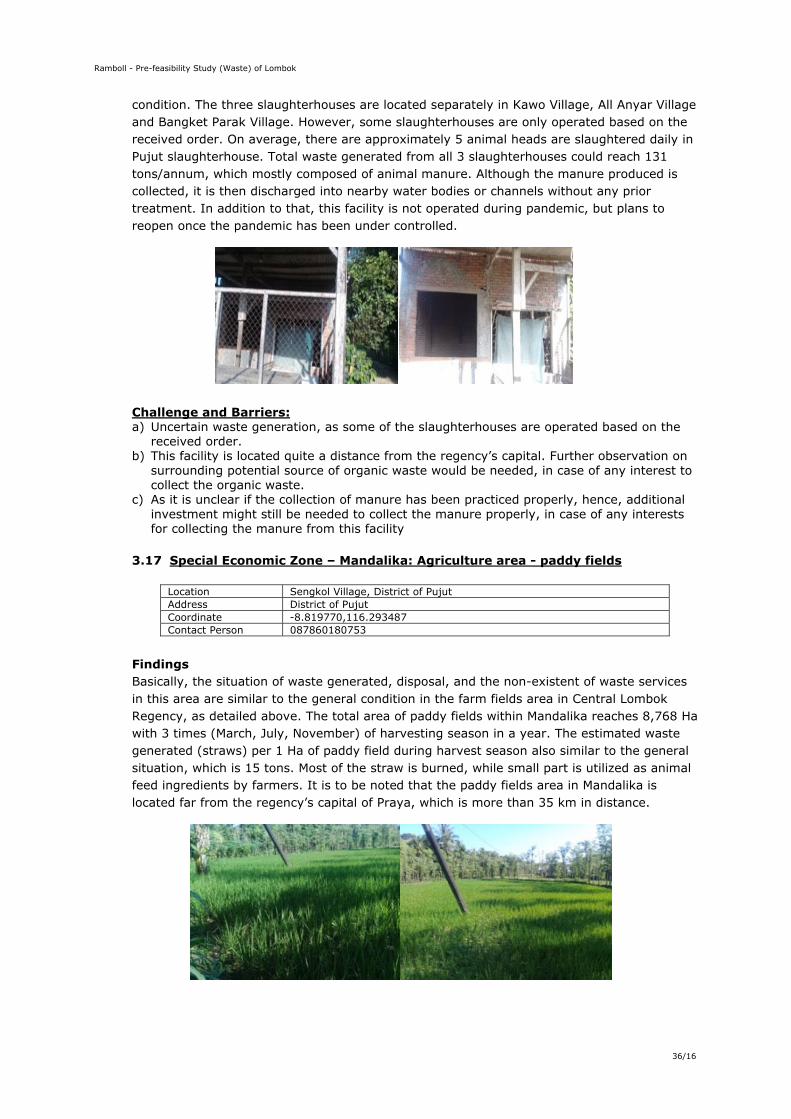
Ramboll - Pre-feasibility Study (Waste) of Lombok
36/16
condition. The three slaughterhouses are located separately in Kawo Village, All Anyar Village and Bangket Parak Village. However, some slaughterhouses are only operated based on the received order. On average, there are approximately 5 animal heads are slaughtered daily in Pujut slaughterhouse. Total waste generated from all 3 slaughterhouses could reach 131 tons/annum, which mostly composed of animal manure. Although the manure produced is collected, it is then discharged into nearby water bodies or channels without any prior treatment. In addition to that, this facility is not operated during pandemic, but plans to reopen once the pandemic has been under controlled.
Challenge and Barriers: a) Uncertain waste generation, as some of the slaughterhouses are operated based on the
received order. b) This facility is located quite a distance from the regency’s capital. Further observation on
surrounding potential source of organic waste would be needed, in case of any interest to collect the organic waste.
c) As it is unclear if the collection of manure has been practiced properly, hence, additional investment might still be needed to collect the manure properly, in case of any interests for collecting the manure from this facility
3.17 Special Economic Zone – Mandalika: Agriculture area - paddy fields
Location Sengkol Village, District of Pujut Address District of Pujut Coordinate -8.819770,116.293487 Contact Person 087860180753
Findings Basically, the situation of waste generated, disposal, and the non-existent of waste services in this area are similar to the general condition in the farm fields area in Central Lombok Regency, as detailed above. The total area of paddy fields within Mandalika reaches 8,768 Ha with 3 times (March, July, November) of harvesting season in a year. The estimated waste generated (straws) per 1 Ha of paddy field during harvest season also similar to the general situation, which is 15 tons. Most of the straw is burned, while small part is utilized as animal feed ingredients by farmers. It is to be noted that the paddy fields area in Mandalika is located far from the regency’s capital of Praya, which is more than 35 km in distance.
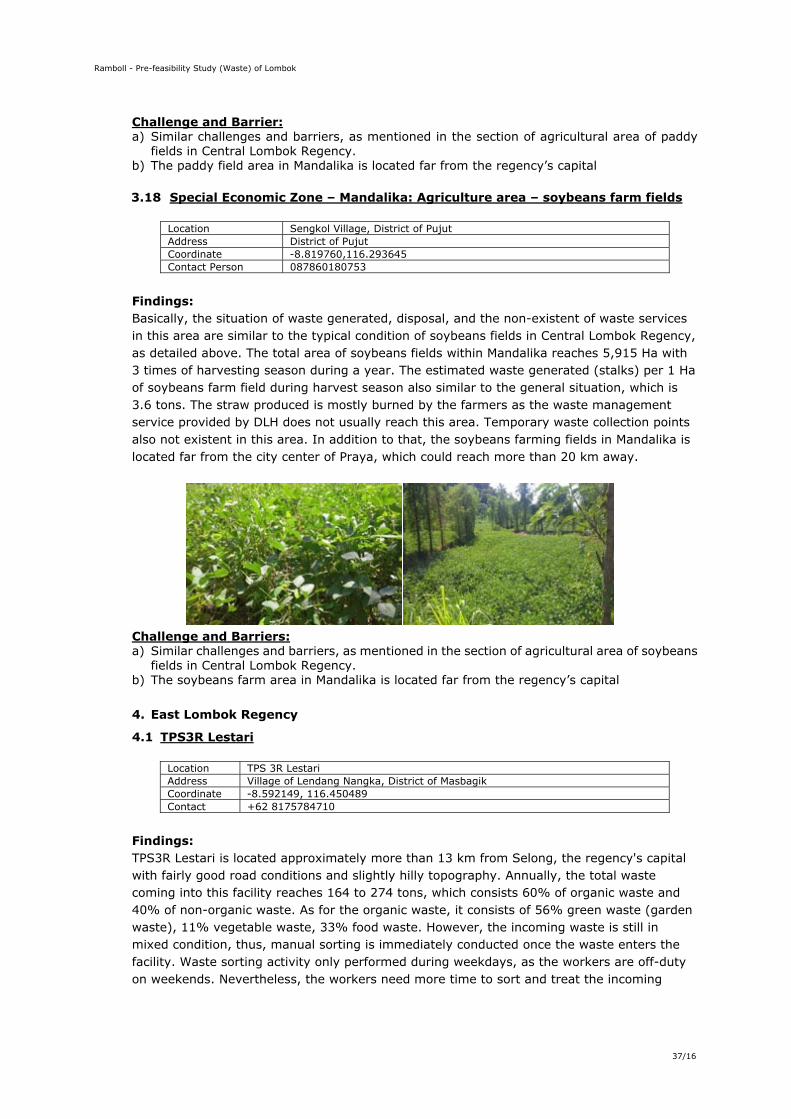
Ramboll - Pre-feasibility Study (Waste) of Lombok
37/16
Challenge and Barrier: a) Similar challenges and barriers, as mentioned in the section of agricultural area of paddy
fields in Central Lombok Regency. b) The paddy field area in Mandalika is located far from the regency’s capital
3.18 Special Economic Zone – Mandalika: Agriculture area – soybeans farm fields
Location Sengkol Village, District of Pujut Address District of Pujut Coordinate -8.819760,116.293645 Contact Person 087860180753
Findings: Basically, the situation of waste generated, disposal, and the non-existent of waste services in this area are similar to the typical condition of soybeans fields in Central Lombok Regency, as detailed above. The total area of soybeans fields within Mandalika reaches 5,915 Ha with 3 times of harvesting season during a year. The estimated waste generated (stalks) per 1 Ha of soybeans farm field during harvest season also similar to the general situation, which is 3.6 tons. The straw produced is mostly burned by the farmers as the waste management service provided by DLH does not usually reach this area. Temporary waste collection points also not existent in this area. In addition to that, the soybeans farming fields in Mandalika is located far from the city center of Praya, which could reach more than 20 km away.
Challenge and Barriers: a) Similar challenges and barriers, as mentioned in the section of agricultural area of soybeans
fields in Central Lombok Regency. b) The soybeans farm area in Mandalika is located far from the regency’s capital
4. East Lombok Regency
4.1 TPS3R Lestari
Location TPS 3R Lestari Address Village of Lendang Nangka, District of Masbagik Coordinate -8.592149, 116.450489 Contact +62 8175784710
Findings: TPS3R Lestari is located approximately more than 13 km from Selong, the regency's capital with fairly good road conditions and slightly hilly topography. Annually, the total waste coming into this facility reaches 164 to 274 tons, which consists 60% of organic waste and 40% of non-organic waste. As for the organic waste, it consists of 56% green waste (garden waste), 11% vegetable waste, 33% food waste. However, the incoming waste is still in mixed condition, thus, manual sorting is immediately conducted once the waste enters the facility. Waste sorting activity only performed during weekdays, as the workers are off-duty on weekends. Nevertheless, the workers need more time to sort and treat the incoming
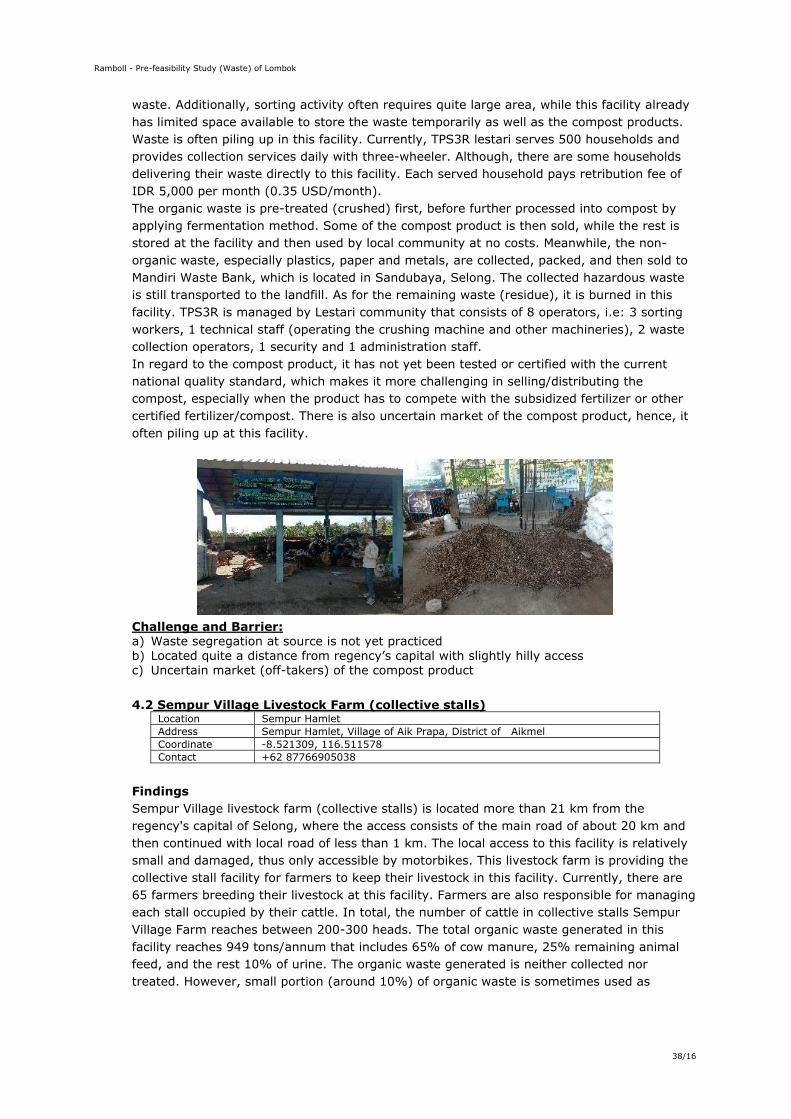
Ramboll - Pre-feasibility Study (Waste) of Lombok
38/16
waste. Additionally, sorting activity often requires quite large area, while this facility already has limited space available to store the waste temporarily as well as the compost products. Waste is often piling up in this facility. Currently, TPS3R lestari serves 500 households and provides collection services daily with three-wheeler. Although, there are some households delivering their waste directly to this facility. Each served household pays retribution fee of IDR 5,000 per month (0.35 USD/month). The organic waste is pre-treated (crushed) first, before further processed into compost by applying fermentation method. Some of the compost product is then sold, while the rest is stored at the facility and then used by local community at no costs. Meanwhile, the non-organic waste, especially plastics, paper and metals, are collected, packed, and then sold to Mandiri Waste Bank, which is located in Sandubaya, Selong. The collected hazardous waste is still transported to the landfill. As for the remaining waste (residue), it is burned in this facility. TPS3R is managed by Lestari community that consists of 8 operators, i.e: 3 sorting workers, 1 technical staff (operating the crushing machine and other machineries), 2 waste collection operators, 1 security and 1 administration staff. In regard to the compost product, it has not yet been tested or certified with the current national quality standard, which makes it more challenging in selling/distributing the compost, especially when the product has to compete with the subsidized fertilizer or other certified fertilizer/compost. There is also uncertain market of the compost product, hence, it often piling up at this facility.
Challenge and Barrier: a) Waste segregation at source is not yet practiced b) Located quite a distance from regency’s capital with slightly hilly access c) Uncertain market (off-takers) of the compost product
4.2 Sempur Village Livestock Farm (collective stalls)
Location Sempur Hamlet Address Sempur Hamlet, Village of Aik Prapa, District of Aikmel Coordinate -8.521309, 116.511578 Contact +62 87766905038
Findings Sempur Village livestock farm (collective stalls) is located more than 21 km from the regency's capital of Selong, where the access consists of the main road of about 20 km and then continued with local road of less than 1 km. The local access to this facility is relatively small and damaged, thus only accessible by motorbikes. This livestock farm is providing the collective stall facility for farmers to keep their livestock in this facility. Currently, there are 65 farmers breeding their livestock at this facility. Farmers are also responsible for managing each stall occupied by their cattle. In total, the number of cattle in collective stalls Sempur Village Farm reaches between 200-300 heads. The total organic waste generated in this facility reaches 949 tons/annum that includes 65% of cow manure, 25% remaining animal feed, and the rest 10% of urine. The organic waste generated is neither collected nor treated. However, small portion (around 10%) of organic waste is sometimes used as
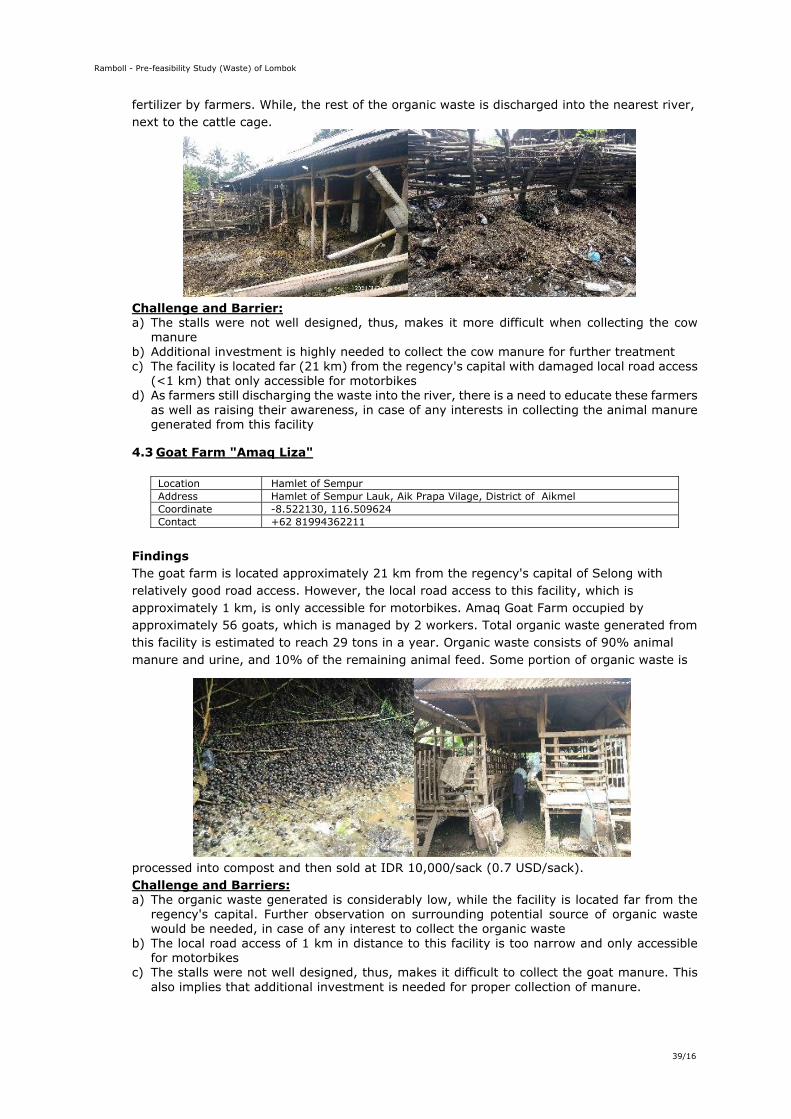
Ramboll - Pre-feasibility Study (Waste) of Lombok
39/16
fertilizer by farmers. While, the rest of the organic waste is discharged into the nearest river, next to the cattle cage.
Challenge and Barrier: a) The stalls were not well designed, thus, makes it more difficult when collecting the cow
manure b) Additional investment is highly needed to collect the cow manure for further treatment c) The facility is located far (21 km) from the regency's capital with damaged local road access
(<1 km) that only accessible for motorbikes d) As farmers still discharging the waste into the river, there is a need to educate these farmers
as well as raising their awareness, in case of any interests in collecting the animal manure generated from this facility
4.3 Goat Farm "Amaq Liza"
Location Hamlet of Sempur Address Hamlet of Sempur Lauk, Aik Prapa Vilage, District of Aikmel Coordinate -8.522130, 116.509624 Contact +62 81994362211
Findings The goat farm is located approximately 21 km from the regency's capital of Selong with relatively good road access. However, the local road access to this facility, which is approximately 1 km, is only accessible for motorbikes. Amaq Goat Farm occupied by approximately 56 goats, which is managed by 2 workers. Total organic waste generated from this facility is estimated to reach 29 tons in a year. Organic waste consists of 90% animal manure and urine, and 10% of the remaining animal feed. Some portion of organic waste is
processed into compost and then sold at IDR 10,000/sack (0.7 USD/sack). Challenge and Barriers: a) The organic waste generated is considerably low, while the facility is located far from the
regency's capital. Further observation on surrounding potential source of organic waste would be needed, in case of any interest to collect the organic waste
b) The local road access of 1 km in distance to this facility is too narrow and only accessible for motorbikes
c) The stalls were not well designed, thus, makes it difficult to collect the goat manure. This also implies that additional investment is needed for proper collection of manure.
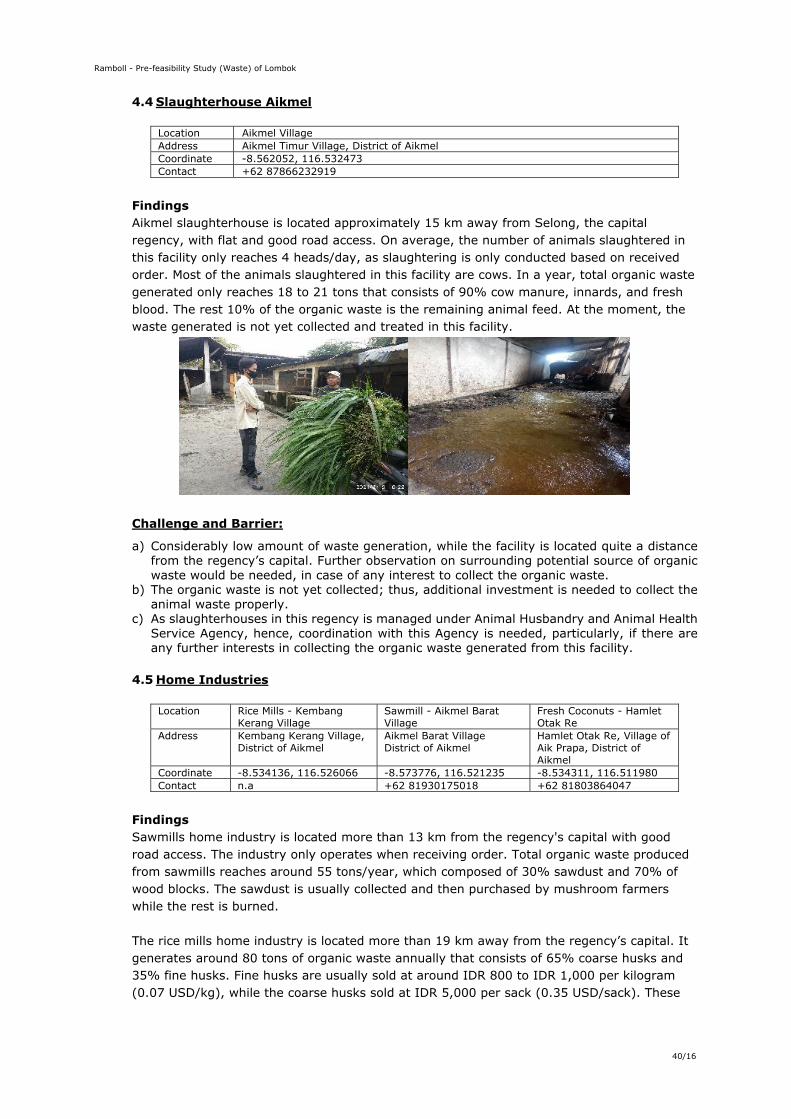
Ramboll - Pre-feasibility Study (Waste) of Lombok
40/16
4.4 Slaughterhouse Aikmel
Location Aikmel Village Address Aikmel Timur Village, District of Aikmel Coordinate -8.562052, 116.532473 Contact +62 87866232919
Findings Aikmel slaughterhouse is located approximately 15 km away from Selong, the capital regency, with flat and good road access. On average, the number of animals slaughtered in this facility only reaches 4 heads/day, as slaughtering is only conducted based on received order. Most of the animals slaughtered in this facility are cows. In a year, total organic waste generated only reaches 18 to 21 tons that consists of 90% cow manure, innards, and fresh blood. The rest 10% of the organic waste is the remaining animal feed. At the moment, the waste generated is not yet collected and treated in this facility.
Challenge and Barrier:
a) Considerably low amount of waste generation, while the facility is located quite a distance from the regency’s capital. Further observation on surrounding potential source of organic waste would be needed, in case of any interest to collect the organic waste.
b) The organic waste is not yet collected; thus, additional investment is needed to collect the animal waste properly.
c) As slaughterhouses in this regency is managed under Animal Husbandry and Animal Health Service Agency, hence, coordination with this Agency is needed, particularly, if there are any further interests in collecting the organic waste generated from this facility.
4.5 Home Industries
Location Rice Mills - Kembang Kerang Village
Sawmill - Aikmel Barat Village
Fresh Coconuts - Hamlet Otak Re
Address Kembang Kerang Village, District of Aikmel
Aikmel Barat Village District of Aikmel
Hamlet Otak Re, Village of Aik Prapa, District of Aikmel
Coordinate -8.534136, 116.526066 -8.573776, 116.521235 -8.534311, 116.511980 Contact n.a +62 81930175018 +62 81803864047
Findings Sawmills home industry is located more than 13 km from the regency's capital with good road access. The industry only operates when receiving order. Total organic waste produced from sawmills reaches around 55 tons/year, which composed of 30% sawdust and 70% of wood blocks. The sawdust is usually collected and then purchased by mushroom farmers while the rest is burned. The rice mills home industry is located more than 19 km away from the regency’s capital. It generates around 80 tons of organic waste annually that consists of 65% coarse husks and 35% fine husks. Fine husks are usually sold at around IDR 800 to IDR 1,000 per kilogram (0.07 USD/kg), while the coarse husks sold at IDR 5,000 per sack (0.35 USD/sack). These
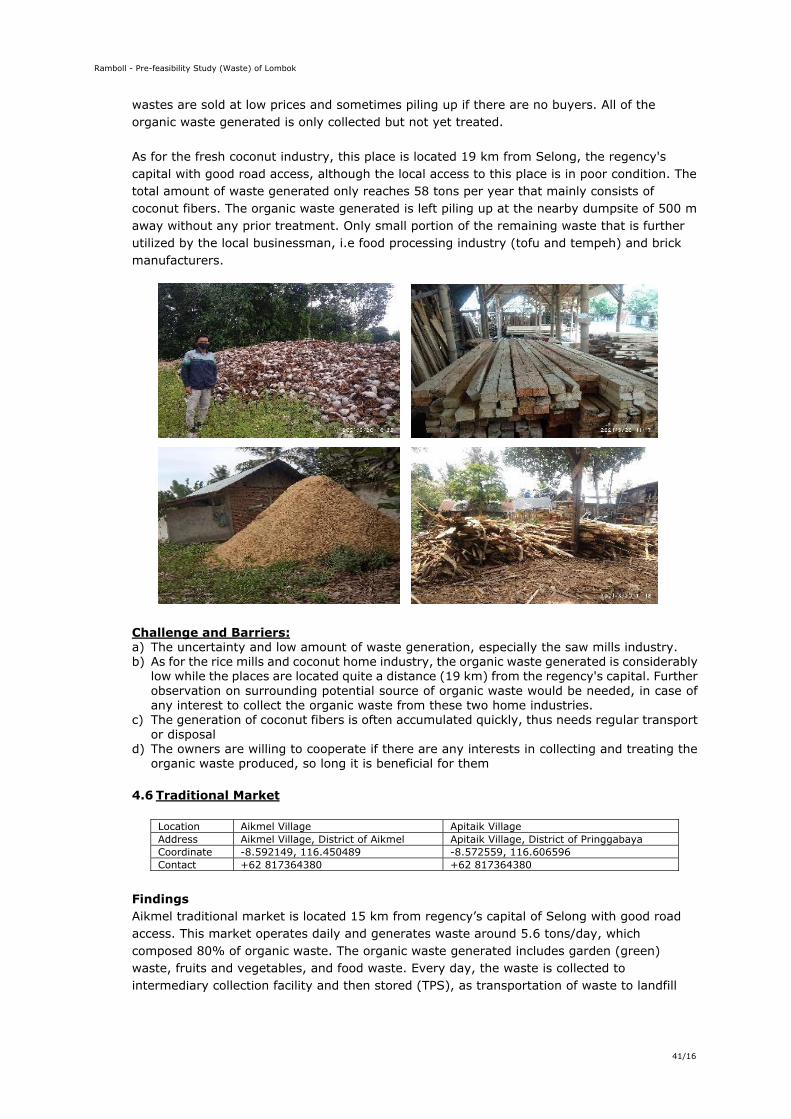
Ramboll - Pre-feasibility Study (Waste) of Lombok
41/16
wastes are sold at low prices and sometimes piling up if there are no buyers. All of the organic waste generated is only collected but not yet treated. As for the fresh coconut industry, this place is located 19 km from Selong, the regency's capital with good road access, although the local access to this place is in poor condition. The total amount of waste generated only reaches 58 tons per year that mainly consists of coconut fibers. The organic waste generated is left piling up at the nearby dumpsite of 500 m away without any prior treatment. Only small portion of the remaining waste that is further utilized by the local businessman, i.e food processing industry (tofu and tempeh) and brick manufacturers.
Challenge and Barriers: a) The uncertainty and low amount of waste generation, especially the saw mills industry. b) As for the rice mills and coconut home industry, the organic waste generated is considerably
low while the places are located quite a distance (19 km) from the regency's capital. Further observation on surrounding potential source of organic waste would be needed, in case of any interest to collect the organic waste from these two home industries.
c) The generation of coconut fibers is often accumulated quickly, thus needs regular transport or disposal
d) The owners are willing to cooperate if there are any interests in collecting and treating the organic waste produced, so long it is beneficial for them
4.6 Traditional Market
Location Aikmel Village Apitaik Village Address Aikmel Village, District of Aikmel Apitaik Village, District of Pringgabaya Coordinate -8.592149, 116.450489 -8.572559, 116.606596 Contact +62 817364380 +62 817364380
Findings Aikmel traditional market is located 15 km from regency’s capital of Selong with good road access. This market operates daily and generates waste around 5.6 tons/day, which composed 80% of organic waste. The organic waste generated includes garden (green) waste, fruits and vegetables, and food waste. Every day, the waste is collected to intermediary collection facility and then stored (TPS), as transportation of waste to landfill
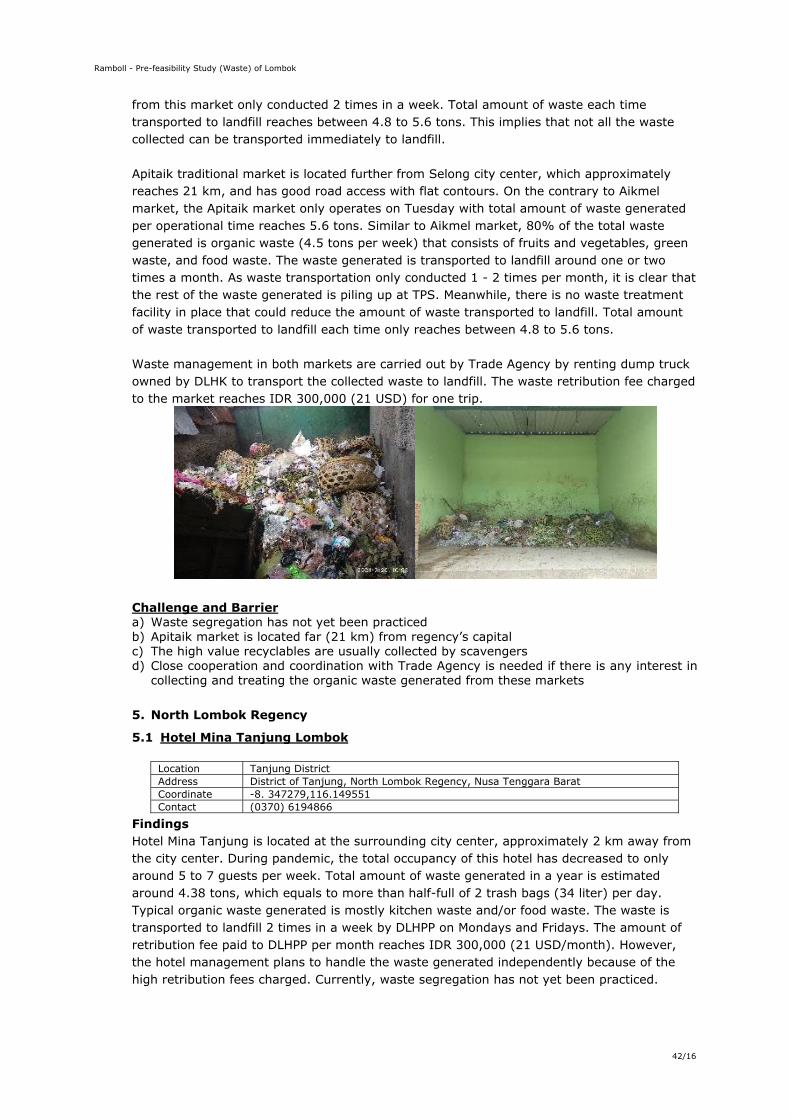
Ramboll - Pre-feasibility Study (Waste) of Lombok
42/16
from this market only conducted 2 times in a week. Total amount of waste each time transported to landfill reaches between 4.8 to 5.6 tons. This implies that not all the waste collected can be transported immediately to landfill. Apitaik traditional market is located further from Selong city center, which approximately reaches 21 km, and has good road access with flat contours. On the contrary to Aikmel market, the Apitaik market only operates on Tuesday with total amount of waste generated per operational time reaches 5.6 tons. Similar to Aikmel market, 80% of the total waste generated is organic waste (4.5 tons per week) that consists of fruits and vegetables, green waste, and food waste. The waste generated is transported to landfill around one or two times a month. As waste transportation only conducted 1 - 2 times per month, it is clear that the rest of the waste generated is piling up at TPS. Meanwhile, there is no waste treatment facility in place that could reduce the amount of waste transported to landfill. Total amount of waste transported to landfill each time only reaches between 4.8 to 5.6 tons. Waste management in both markets are carried out by Trade Agency by renting dump truck owned by DLHK to transport the collected waste to landfill. The waste retribution fee charged to the market reaches IDR 300,000 (21 USD) for one trip.
Challenge and Barrier a) Waste segregation has not yet been practiced b) Apitaik market is located far (21 km) from regency’s capital c) The high value recyclables are usually collected by scavengers d) Close cooperation and coordination with Trade Agency is needed if there is any interest in
collecting and treating the organic waste generated from these markets
5. North Lombok Regency
5.1 Hotel Mina Tanjung Lombok
Location Tanjung District Address District of Tanjung, North Lombok Regency, Nusa Tenggara Barat Coordinate -8. 347279,116.149551 Contact (0370) 6194866
Findings Hotel Mina Tanjung is located at the surrounding city center, approximately 2 km away from the city center. During pandemic, the total occupancy of this hotel has decreased to only around 5 to 7 guests per week. Total amount of waste generated in a year is estimated around 4.38 tons, which equals to more than half-full of 2 trash bags (34 liter) per day. Typical organic waste generated is mostly kitchen waste and/or food waste. The waste is transported to landfill 2 times in a week by DLHPP on Mondays and Fridays. The amount of retribution fee paid to DLHPP per month reaches IDR 300,000 (21 USD/month). However, the hotel management plans to handle the waste generated independently because of the high retribution fees charged. Currently, waste segregation has not yet been practiced.
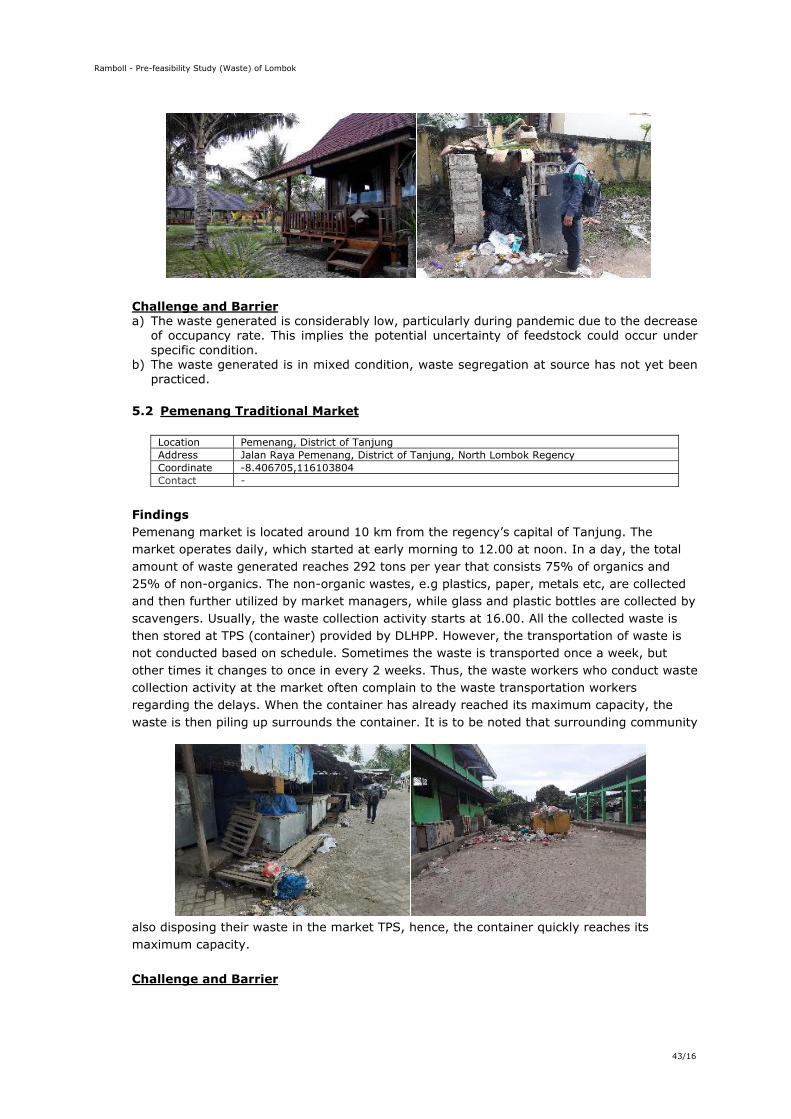
Ramboll - Pre-feasibility Study (Waste) of Lombok
43/16
Challenge and Barrier a) The waste generated is considerably low, particularly during pandemic due to the decrease
of occupancy rate. This implies the potential uncertainty of feedstock could occur under specific condition.
b) The waste generated is in mixed condition, waste segregation at source has not yet been practiced.
5.2 Pemenang Traditional Market
Location Pemenang, District of Tanjung Address Jalan Raya Pemenang, District of Tanjung, North Lombok Regency Coordinate -8.406705,116103804 Contact -
Findings Pemenang market is located around 10 km from the regency’s capital of Tanjung. The market operates daily, which started at early morning to 12.00 at noon. In a day, the total amount of waste generated reaches 292 tons per year that consists 75% of organics and 25% of non-organics. The non-organic wastes, e.g plastics, paper, metals etc, are collected and then further utilized by market managers, while glass and plastic bottles are collected by scavengers. Usually, the waste collection activity starts at 16.00. All the collected waste is then stored at TPS (container) provided by DLHPP. However, the transportation of waste is not conducted based on schedule. Sometimes the waste is transported once a week, but other times it changes to once in every 2 weeks. Thus, the waste workers who conduct waste collection activity at the market often complain to the waste transportation workers regarding the delays. When the container has already reached its maximum capacity, the waste is then piling up surrounds the container. It is to be noted that surrounding community
also disposing their waste in the market TPS, hence, the container quickly reaches its maximum capacity. Challenge and Barrier
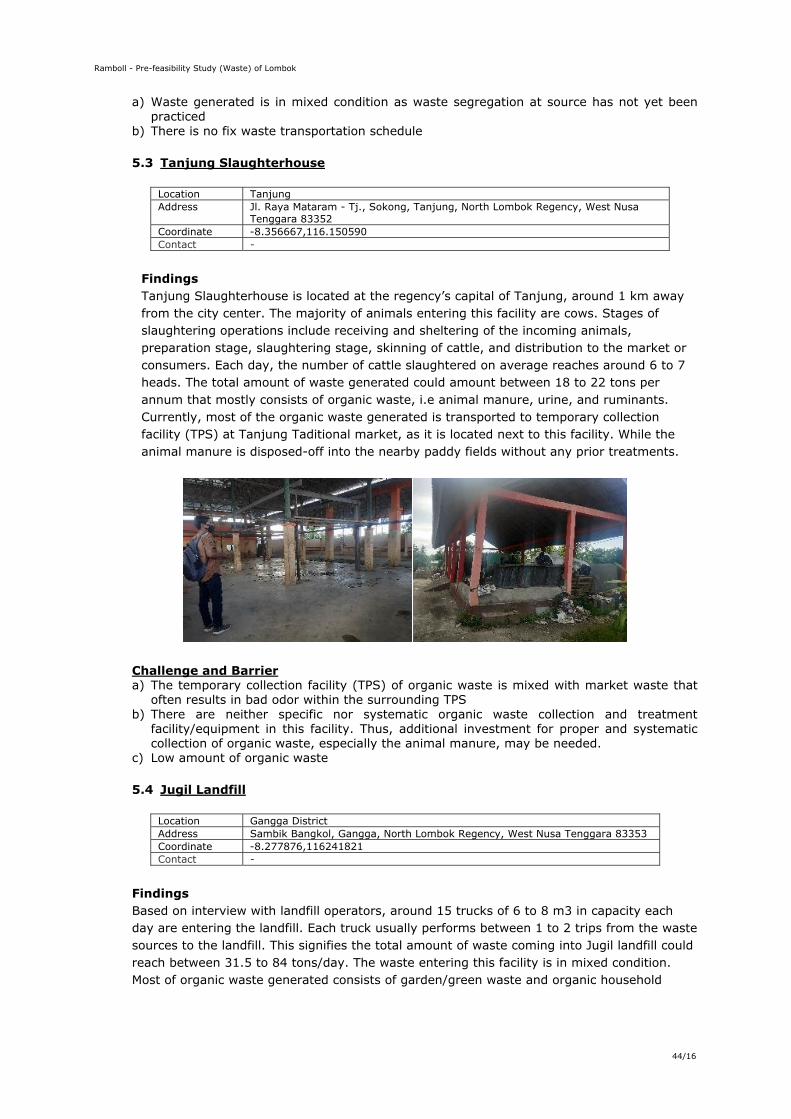
Ramboll - Pre-feasibility Study (Waste) of Lombok
44/16
a) Waste generated is in mixed condition as waste segregation at source has not yet been practiced
b) There is no fix waste transportation schedule
5.3 Tanjung Slaughterhouse
Location Tanjung Address Jl. Raya Mataram - Tj., Sokong, Tanjung, North Lombok Regency, West Nusa
Tenggara 83352 Coordinate -8.356667,116.150590 Contact -
Findings Tanjung Slaughterhouse is located at the regency’s capital of Tanjung, around 1 km away from the city center. The majority of animals entering this facility are cows. Stages of slaughtering operations include receiving and sheltering of the incoming animals, preparation stage, slaughtering stage, skinning of cattle, and distribution to the market or consumers. Each day, the number of cattle slaughtered on average reaches around 6 to 7 heads. The total amount of waste generated could amount between 18 to 22 tons per annum that mostly consists of organic waste, i.e animal manure, urine, and ruminants. Currently, most of the organic waste generated is transported to temporary collection facility (TPS) at Tanjung Taditional market, as it is located next to this facility. While the animal manure is disposed-off into the nearby paddy fields without any prior treatments.
Challenge and Barrier a) The temporary collection facility (TPS) of organic waste is mixed with market waste that
often results in bad odor within the surrounding TPS b) There are neither specific nor systematic organic waste collection and treatment
facility/equipment in this facility. Thus, additional investment for proper and systematic collection of organic waste, especially the animal manure, may be needed.
c) Low amount of organic waste
5.4 Jugil Landfill
Location Gangga District Address Sambik Bangkol, Gangga, North Lombok Regency, West Nusa Tenggara 83353 Coordinate -8.277876,116241821 Contact -
Findings Based on interview with landfill operators, around 15 trucks of 6 to 8 m3 in capacity each day are entering the landfill. Each truck usually performs between 1 to 2 trips from the waste sources to the landfill. This signifies the total amount of waste coming into Jugil landfill could reach between 31.5 to 84 tons/day. The waste entering this facility is in mixed condition. Most of organic waste generated consists of garden/green waste and organic household
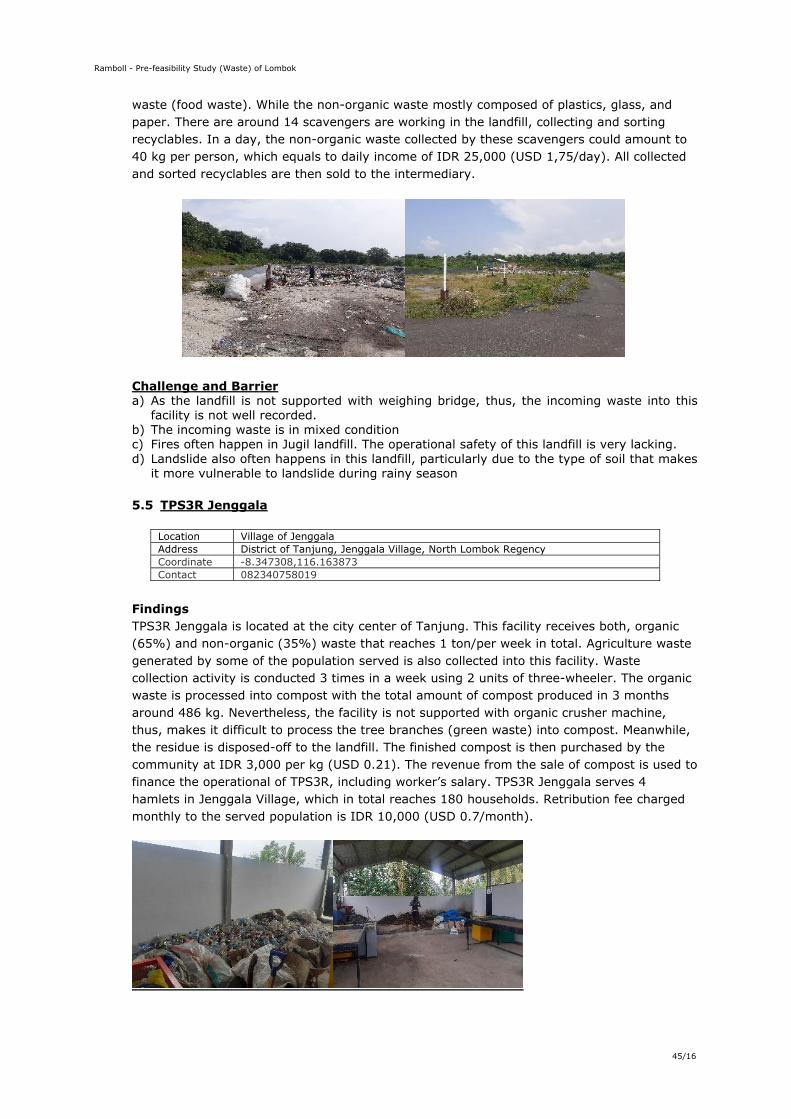
Ramboll - Pre-feasibility Study (Waste) of Lombok
45/16
waste (food waste). While the non-organic waste mostly composed of plastics, glass, and paper. There are around 14 scavengers are working in the landfill, collecting and sorting recyclables. In a day, the non-organic waste collected by these scavengers could amount to 40 kg per person, which equals to daily income of IDR 25,000 (USD 1,75/day). All collected and sorted recyclables are then sold to the intermediary.
Challenge and Barrier a) As the landfill is not supported with weighing bridge, thus, the incoming waste into this
facility is not well recorded. b) The incoming waste is in mixed condition c) Fires often happen in Jugil landfill. The operational safety of this landfill is very lacking. d) Landslide also often happens in this landfill, particularly due to the type of soil that makes
it more vulnerable to landslide during rainy season
5.5 TPS3R Jenggala
Location Village of Jenggala Address District of Tanjung, Jenggala Village, North Lombok Regency Coordinate -8.347308,116.163873 Contact 082340758019
Findings TPS3R Jenggala is located at the city center of Tanjung. This facility receives both, organic (65%) and non-organic (35%) waste that reaches 1 ton/per week in total. Agriculture waste generated by some of the population served is also collected into this facility. Waste collection activity is conducted 3 times in a week using 2 units of three-wheeler. The organic waste is processed into compost with the total amount of compost produced in 3 months around 486 kg. Nevertheless, the facility is not supported with organic crusher machine, thus, makes it difficult to process the tree branches (green waste) into compost. Meanwhile, the residue is disposed-off to the landfill. The finished compost is then purchased by the community at IDR 3,000 per kg (USD 0.21). The revenue from the sale of compost is used to finance the operational of TPS3R, including worker’s salary. TPS3R Jenggala serves 4 hamlets in Jenggala Village, which in total reaches 180 households. Retribution fee charged monthly to the served population is IDR 10,000 (USD 0.7/month).
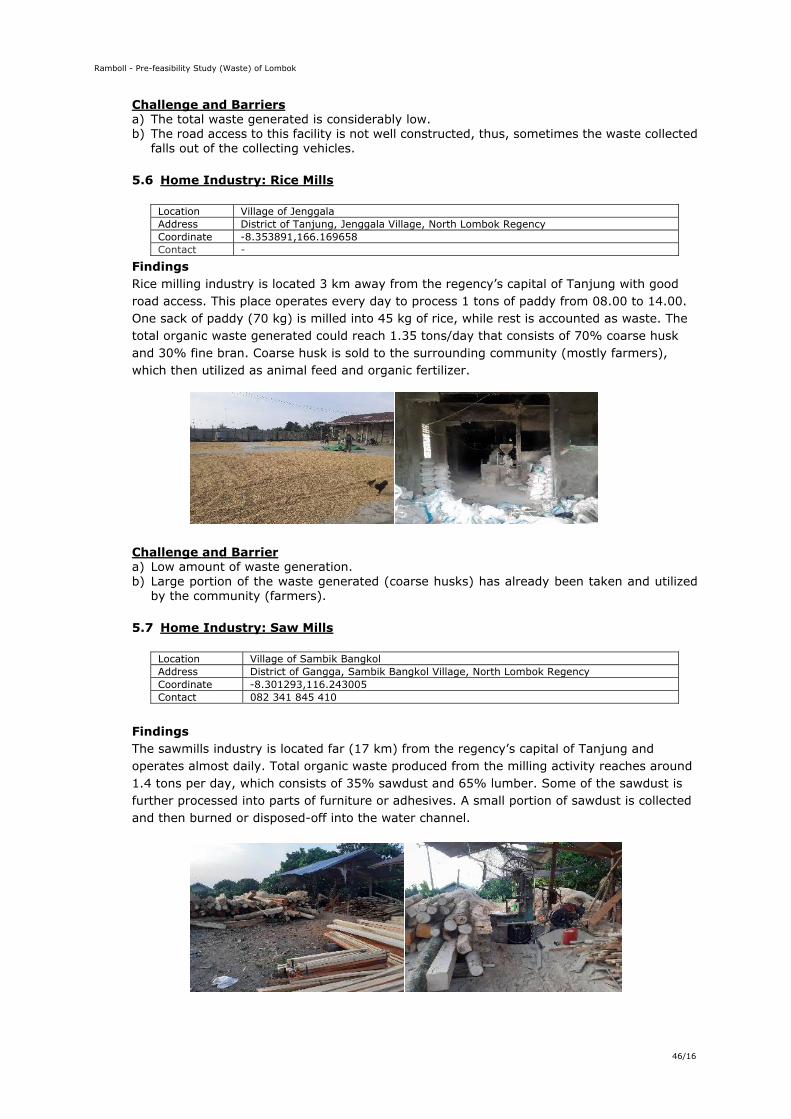
Ramboll - Pre-feasibility Study (Waste) of Lombok
46/16
Challenge and Barriers a) The total waste generated is considerably low. b) The road access to this facility is not well constructed, thus, sometimes the waste collected
falls out of the collecting vehicles.
5.6 Home Industry: Rice Mills
Location Village of Jenggala Address District of Tanjung, Jenggala Village, North Lombok Regency Coordinate -8.353891,166.169658 Contact -
Findings Rice milling industry is located 3 km away from the regency’s capital of Tanjung with good road access. This place operates every day to process 1 tons of paddy from 08.00 to 14.00. One sack of paddy (70 kg) is milled into 45 kg of rice, while rest is accounted as waste. The total organic waste generated could reach 1.35 tons/day that consists of 70% coarse husk and 30% fine bran. Coarse husk is sold to the surrounding community (mostly farmers), which then utilized as animal feed and organic fertilizer.
Challenge and Barrier a) Low amount of waste generation. b) Large portion of the waste generated (coarse husks) has already been taken and utilized
by the community (farmers).
5.7 Home Industry: Saw Mills
Location Village of Sambik Bangkol Address District of Gangga, Sambik Bangkol Village, North Lombok Regency Coordinate -8.301293,116.243005 Contact 082 341 845 410
Findings The sawmills industry is located far (17 km) from the regency’s capital of Tanjung and operates almost daily. Total organic waste produced from the milling activity reaches around 1.4 tons per day, which consists of 35% sawdust and 65% lumber. Some of the sawdust is further processed into parts of furniture or adhesives. A small portion of sawdust is collected and then burned or disposed-off into the water channel.

Ramboll - Pre-feasibility Study (Waste) of Lombok
47/16
Challenge and Barrier The waste generated is low, while the facility is located far from the regency's capital. Further observation on surrounding potential source of organic waste would be needed, in case of any interest to collect the organic waste
5.8 Fruit Market Findings The Fruits market is located at around the city center of Tanjung, the regency’s capital. This market operates daily and is selling variety of fruits, such as apple, oranges, and salak. Nevertheless, sometimes these fruits didn't sell well. Total organic waste generated from this market reaches 0.95 tons/day (347 tons/annum) that mainly consists of rotten fruits (100%). The organic waste is collected and stored temporarily at the market site and then
transported to the nearest intermediary collection point (TPS). Challenge and Barrier: a) The organic and non-organic waste is collected in mixed condition, although the major part
of the waste generated composed of organics b) This market is not supported with proper temporary collection point (TPS), so the waste
collected is only stored openly on a site (as shown in the first figure) without any specific containers or appropriate bins
5.9 Hotel Medana Bay Marina
Location Medana Address Jl. Raya Tj. No.km 3, Medana, North Lombok Regency, Nusa Tenggara Bar. 83352 Coordinate -8.365762,116.129652 Contact 081805794749
Findings Hotel Medana Bay Marina, which is located 3.8 km away from the city center, has 17 bedrooms, 1 restaurant and 1 hall. During the pandemic, the average occupancy of this hotel only reaches 2 to 5 bedrooms. Therefore, the total organic waste generated only reaches 3.65 tons/annum that contains mostly kitchen waste and green waste. In the pre-pandemic situation, the waste generated could reach 3 times higher. Waste segregation at source has been practiced in this hotel. The organic waste generated is processed into compost by applying the fermentation method using bins. While the non-organic waste, such as glass, plastic bottles, etc, are collected and then sold to intermediary. The rest of the waste, which are not able to be treated or sold, will be disposed-off in the nearby yard. It is to be noted that the hotel still faces difficulties to manage the waste generated during high season (non-pandemic situation), due to higher generation of waste. Challenge and Barrier:
Location Village of Jenggala Address District of Tanjung, Jenggala Village, North Lombok Regency Coordinate -8.352837,116.164364
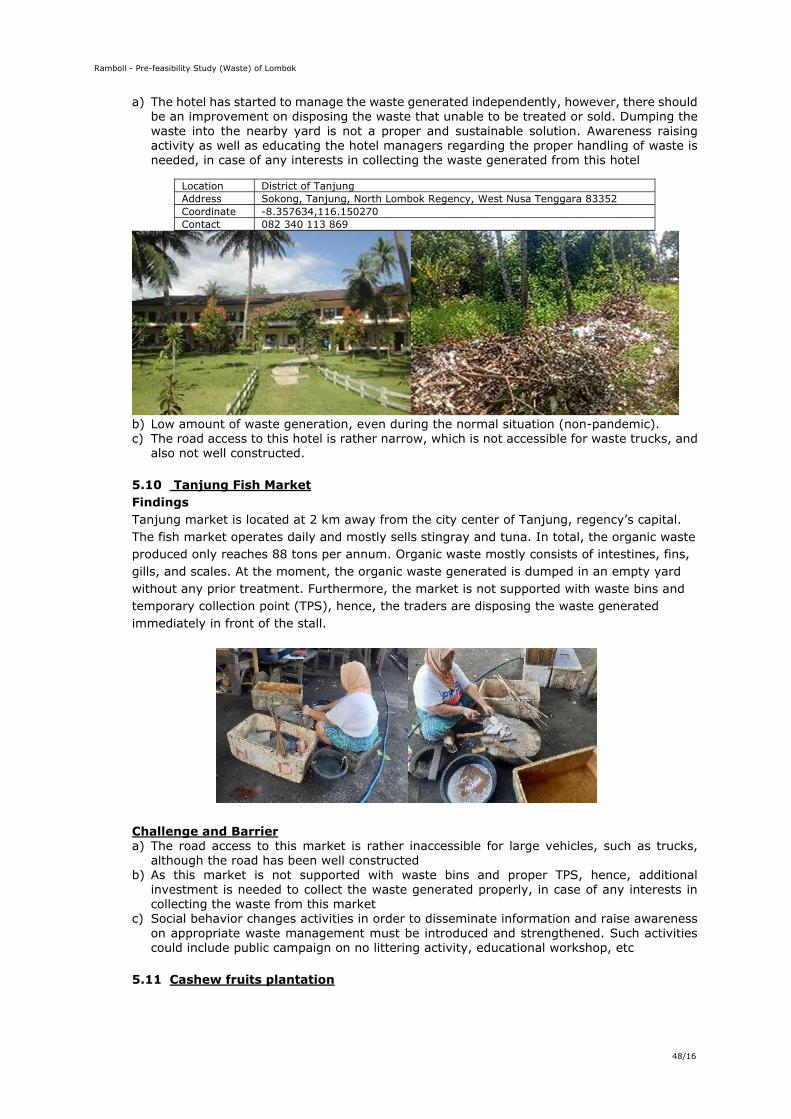
Ramboll - Pre-feasibility Study (Waste) of Lombok
48/16
a) The hotel has started to manage the waste generated independently, however, there should be an improvement on disposing the waste that unable to be treated or sold. Dumping the waste into the nearby yard is not a proper and sustainable solution. Awareness raising activity as well as educating the hotel managers regarding the proper handling of waste is needed, in case of any interests in collecting the waste generated from this hotel
b) Low amount of waste generation, even during the normal situation (non-pandemic). c) The road access to this hotel is rather narrow, which is not accessible for waste trucks, and
also not well constructed.
5.10 Tanjung Fish Market Findings Tanjung market is located at 2 km away from the city center of Tanjung, regency’s capital. The fish market operates daily and mostly sells stingray and tuna. In total, the organic waste produced only reaches 88 tons per annum. Organic waste mostly consists of intestines, fins, gills, and scales. At the moment, the organic waste generated is dumped in an empty yard without any prior treatment. Furthermore, the market is not supported with waste bins and temporary collection point (TPS), hence, the traders are disposing the waste generated immediately in front of the stall.
Challenge and Barrier a) The road access to this market is rather inaccessible for large vehicles, such as trucks,
although the road has been well constructed b) As this market is not supported with waste bins and proper TPS, hence, additional
investment is needed to collect the waste generated properly, in case of any interests in collecting the waste from this market
c) Social behavior changes activities in order to disseminate information and raise awareness on appropriate waste management must be introduced and strengthened. Such activities could include public campaign on no littering activity, educational workshop, etc
5.11 Cashew fruits plantation
Location District of Tanjung Address Sokong, Tanjung, North Lombok Regency, West Nusa Tenggara 83352 Coordinate -8.357634,116.150270 Contact 082 340 113 869
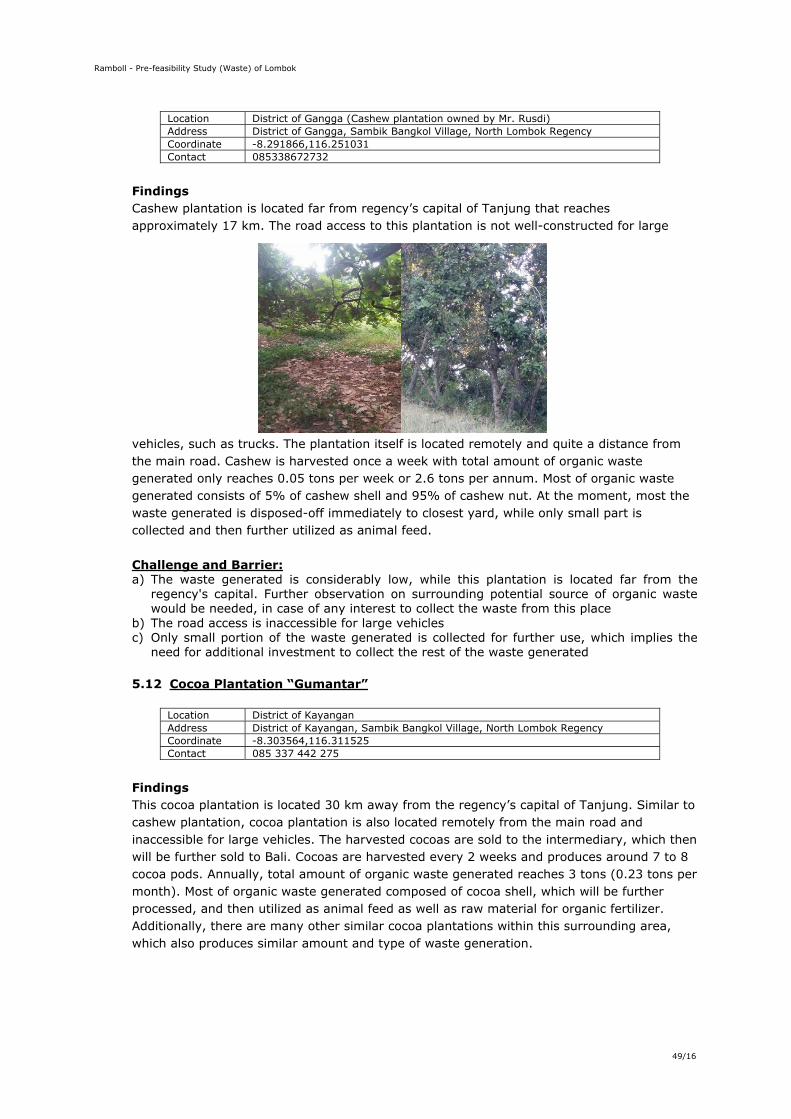
Ramboll - Pre-feasibility Study (Waste) of Lombok
49/16
Location District of Gangga (Cashew plantation owned by Mr. Rusdi) Address District of Gangga, Sambik Bangkol Village, North Lombok Regency Coordinate -8.291866,116.251031 Contact 085338672732
Findings Cashew plantation is located far from regency’s capital of Tanjung that reaches approximately 17 km. The road access to this plantation is not well-constructed for large
vehicles, such as trucks. The plantation itself is located remotely and quite a distance from the main road. Cashew is harvested once a week with total amount of organic waste generated only reaches 0.05 tons per week or 2.6 tons per annum. Most of organic waste generated consists of 5% of cashew shell and 95% of cashew nut. At the moment, most the waste generated is disposed-off immediately to closest yard, while only small part is collected and then further utilized as animal feed. Challenge and Barrier: a) The waste generated is considerably low, while this plantation is located far from the
regency's capital. Further observation on surrounding potential source of organic waste would be needed, in case of any interest to collect the waste from this place
b) The road access is inaccessible for large vehicles c) Only small portion of the waste generated is collected for further use, which implies the
need for additional investment to collect the rest of the waste generated
5.12 Cocoa Plantation “Gumantar”
Location District of Kayangan Address District of Kayangan, Sambik Bangkol Village, North Lombok Regency Coordinate -8.303564,116.311525 Contact 085 337 442 275
Findings This cocoa plantation is located 30 km away from the regency’s capital of Tanjung. Similar to cashew plantation, cocoa plantation is also located remotely from the main road and inaccessible for large vehicles. The harvested cocoas are sold to the intermediary, which then will be further sold to Bali. Cocoas are harvested every 2 weeks and produces around 7 to 8 cocoa pods. Annually, total amount of organic waste generated reaches 3 tons (0.23 tons per month). Most of organic waste generated composed of cocoa shell, which will be further processed, and then utilized as animal feed as well as raw material for organic fertilizer. Additionally, there are many other similar cocoa plantations within this surrounding area, which also produces similar amount and type of waste generation.
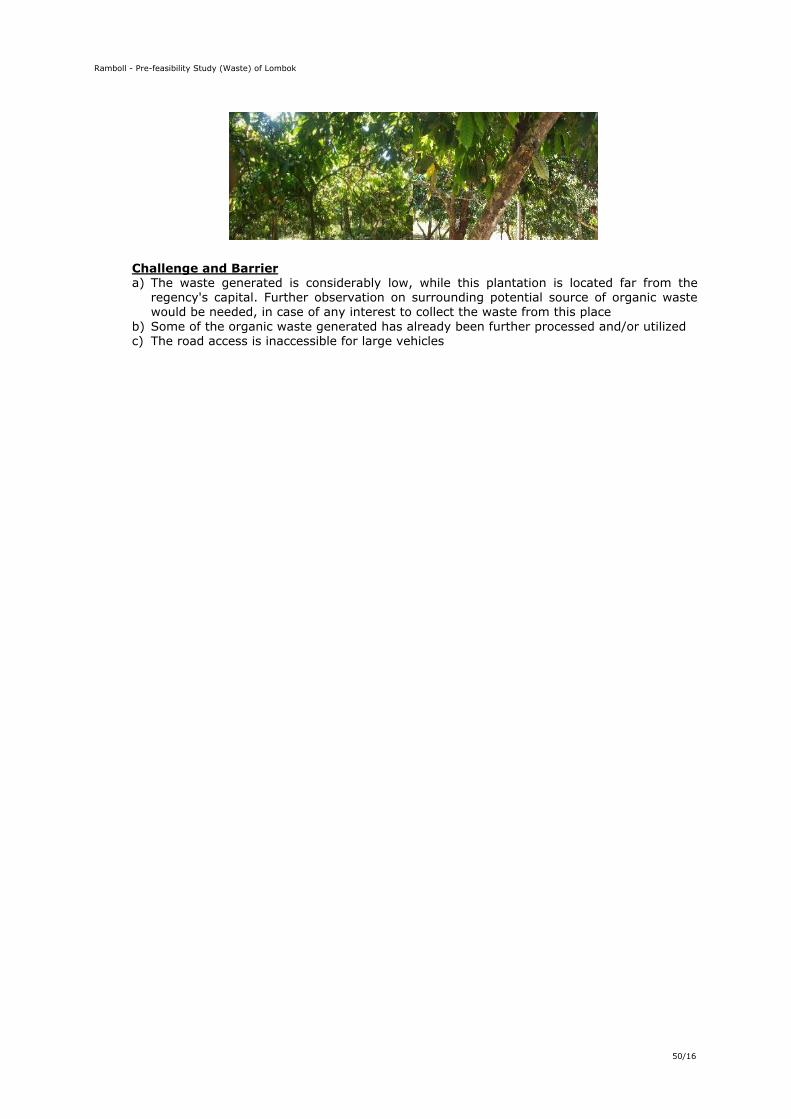
Ramboll - Pre-feasibility Study (Waste) of Lombok
50/16
Challenge and Barrier a) The waste generated is considerably low, while this plantation is located far from the
regency's capital. Further observation on surrounding potential source of organic waste would be needed, in case of any interest to collect the waste from this place
b) Some of the organic waste generated has already been further processed and/or utilized c) The road access is inaccessible for large vehicles
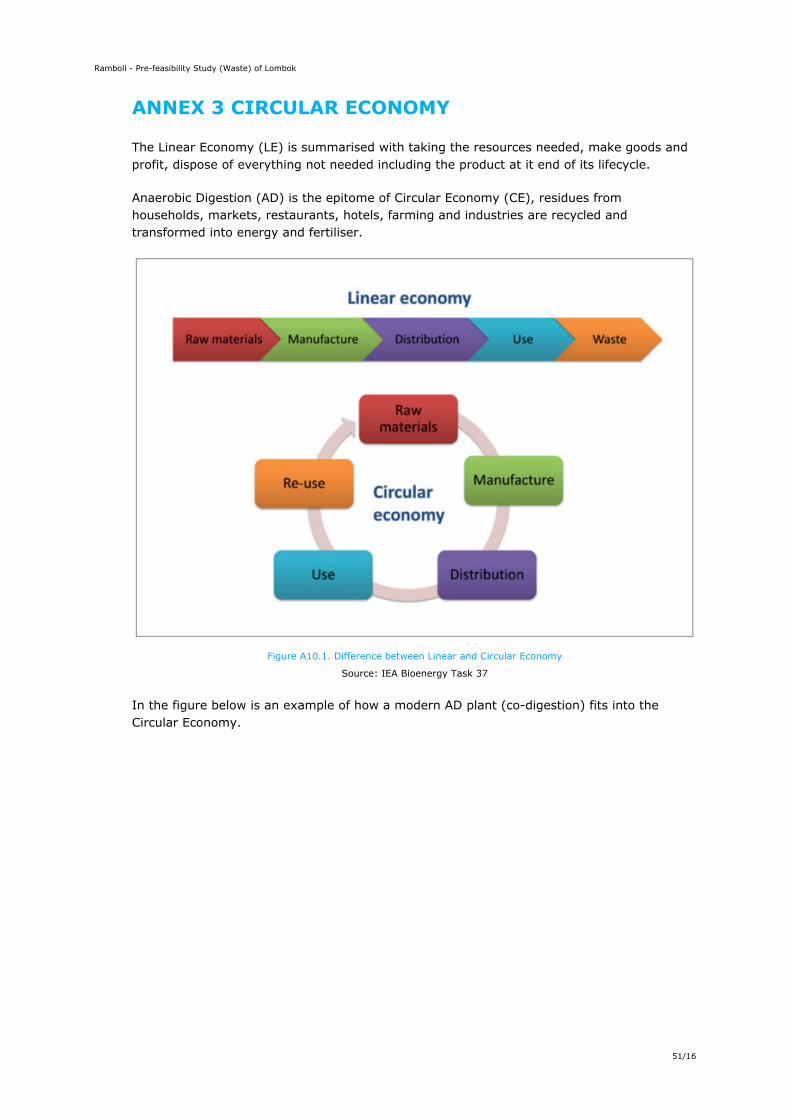
Ramboll - Pre-feasibility Study (Waste) of Lombok
51/16
ANNEX 3 CIRCULAR ECONOMY
The Linear Economy (LE) is summarised with taking the resources needed, make goods and profit, dispose of everything not needed including the product at it end of its lifecycle.
Anaerobic Digestion (AD) is the epitome of Circular Economy (CE), residues from households, markets, restaurants, hotels, farming and industries are recycled and transformed into energy and fertiliser.
Figure A10.1. Difference between Linear and Circular Economy
Source: IEA Bioenergy Task 37
In the figure below is an example of how a modern AD plant (co-digestion) fits into the Circular Economy.
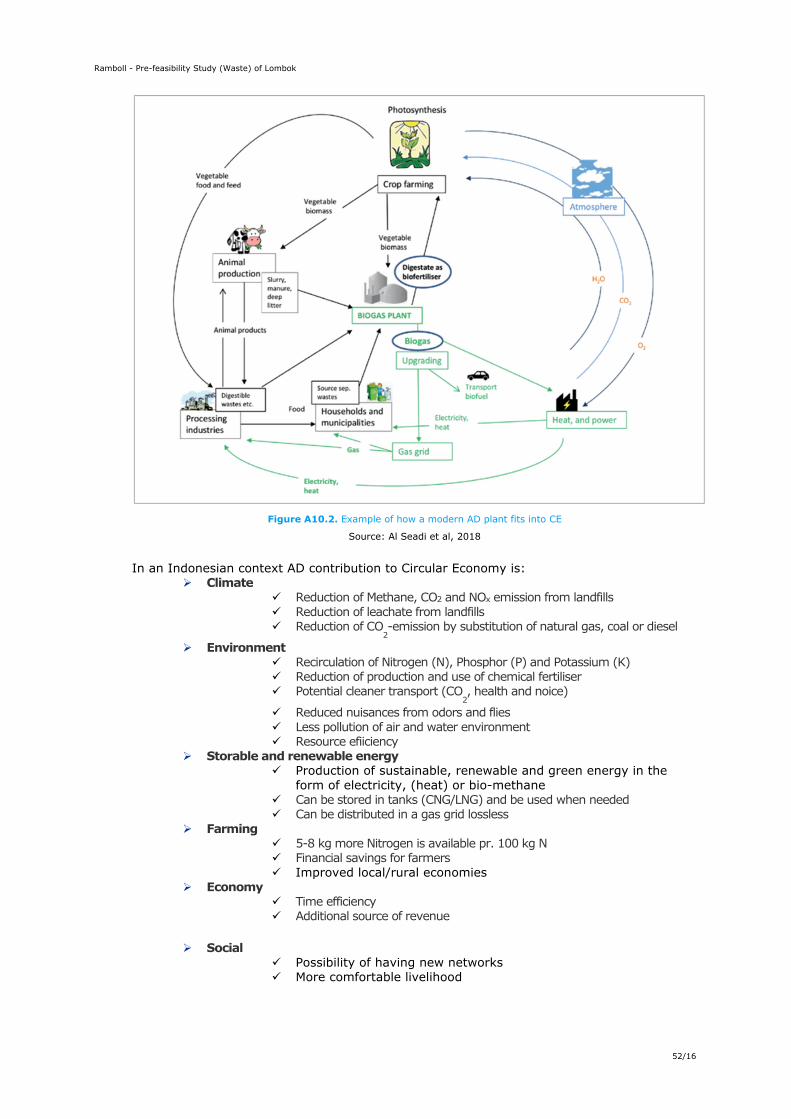
Ramboll - Pre-feasibility Study (Waste) of Lombok
52/16
Figure A10.2. Example of how a modern AD plant fits into CE
Source: Al Seadi et al, 2018
In an Indonesian context AD contribution to Circular Economy is: Climate
Reduction of Methane, CO2 and NOx emission from landfills Reduction of leachate from landfills Reduction of CO
2-emission by substitution of natural gas, coal or diesel
Environment Recirculation of Nitrogen (N), Phosphor (P) and Potassium (K) Reduction of production and use of chemical fertiliser Potential cleaner transport (CO
2, health and noice)
Reduced nuisances from odors and flies Less pollution of air and water environment Resource efiiciency
Storable and renewable energy Production of sustainable, renewable and green energy in the
form of electricity, (heat) or bio-methane Can be stored in tanks (CNG/LNG) and be used when needed Can be distributed in a gas grid lossless
Farming 5-8 kg more Nitrogen is available pr. 100 kg N Financial savings for farmers Improved local/rural economies
Economy Time efficiency Additional source of revenue
Social
Possibility of having new networks More comfortable livelihood