Fast, DNA-sequence independent translocation by FtsK in a single-molecule experiment
10
Fast, DNA-sequence independent translocation by FtsK in a single-molecule experiment Omar A Saleh 1 , Corine Pe ´ rals 2 , Franc ¸ois-Xavier Barre 2, * and Jean-Franc ¸ois Allemand 1,3, * 1 Laboratoire de Physique Statistique et De ´partement de Biologie, Ecole Normale Supe ´rieure, Paris, France, 2 Laboratoire de Microbiologie et de Ge ´ne ´tique Mole ´culaire, Toulouse, France and 3 Laboratoire Pasteur, De ´partement de Chimie, Ecole Normale Supe ´rieure, Paris, France Escherichia coli FtsK is an essential cell division protein, which is thought to pump chromosomal DNA through the closing septum in an oriented manner by following DNA sequence polarity. Here, we perform single-molecule mea- surements of translocation by FtsK 50C , a derivative that functions as a DNA translocase in vitro. FtsK 50C transloca- tion follows Michaelis–Menten kinetics, with a maximum speed of B6.7kbp/s. We present results on the effect of applied force on the speed, distance translocated, and the mean times during and between protein activity. Surprisingly, we observe that FtsK 50C can spontaneously reverse its translocation direction on a fragment of E. coli chromosomal DNA, indicating that DNA sequence is not the sole determinant of translocation direction. We con- clude that in vivo polarization of FtsK translocation could require the presence of cofactors; alternatively, we propose a model in which tension in the DNA directs FtsK translo- cation. The EMBO Journal (2004) 23, 2430–2439. doi:10.1038/ sj.emboj.7600242; Published online 27 May 2004 Subject Categories: genome stability & dynamics; microbiology & pathogens Keywords: chromosome segregation; DNA translocation; FtsK; magnetic tweezers; molecular motor Introduction Active transportation of DNA from one cellular compartment to another is central to many biological processes, such as viral DNA packaging, conjugation, sporulation, and cell divi- sion. In bacteria, a new class of proteins was recently identified that mediate the transport of double-stranded DNA through cell membranes and cell walls: the FtsK/ SpoIIIE/TraSA family (Bath et al, 2000; Possoz et al, 2001; Aussel et al, 2002). These proteins belong to the AAA þ ( ATPase Associated with various Activities) superfamily. As such, they are thought to form hexameric motors, which are responsible for the active translocation process. They are involved in a wide range of functions: TraSA is encoded by the plasmid pSAM2 of Streptomyces ambofaciens, and is responsible for the transfer of the plasmid from donor cells into acceptor cells during conjugation (Possoz et al, 2001). SpoIIIE is responsible for the transport of a chromosome into the small polar prespore compartment during sporulation in Bacillus subtilis (Bath et al, 2000). FtsK is an essential Escherichia coli cell division protein (Begg et al, 1995). Its N-terminal membrane domain is localized to the division septum (Wang and Lutkenhaus, 1998; Yu et al, 1998a), and is necessary for its formation (Draper et al, 1998; Chen and Beckwith, 2001). Its C-terminal motor domain (FtsK C ) is implicated in chromosome segregation (Liu et al, 1998; Yu et al, 1998b). Indeed, FtsK C has two essential roles in chromosome dimer resolution (see Aussel et al, 2002; Capiaux et al, 2002; Corre and Louarn, 2002, and references therein for review). Chromosome dimers, formed by homo- logous recombination in organisms with circular chromo- somes, are a threat to normal repartitioning of genetic information at cell division. In E. coli, chromosome dimers are resolved into monomers by the addition of a crossover at a specific 28 bp site, dif, by two tyrosine recombinases, XerC and XerD. Chromosome dimer resolution first requires colo- calization of the dif sites; this is accomplished by transloca- tion of the chromosomes by FtsK C (Capiaux et al, 2002; Corre and Louarn, 2002). Secondly, the recombination reaction itself is activated by FtsK C (Aussel et al, 2002), probably through a direct interaction with XerC/D (Yates et al, 2003; Massey et al, 2004). In addition, DNA translocation by FtsK could participate in segregation of normal chromosomes (Yu et al, 1998b; Donachie, 2002; Lau et al, 2003). Coupled to these processes, there must be a mechanism of translocation polarity; that is, an orienting mechanism that ensures the DNA is transported in the correct direction. In B. subtilis, it has been argued that preferential assembly of SpoIIIE in one daughter cell establishes polarity in chromo- some partitioning during sporulation (Sharp and Pogliano, 2002). In normal vegetative growth in E. coli, in contrast to sporulating B. subtilis, there is no obvious morphological nor protein expression difference between the two daughter cells that could explain asymmetric assembly of FtsK. Instead, it has been postulated that FtsK translocation polarity is defined by chromosomal sequence polarity, that is, a high skew of oligomeric sequences along the two replichores that inverts at dif (Salzberg et al, 1998; Lobry and Louarn, 2003). Chromosome dimer resolution is effective only when dif is located within a narrow zone of the chromosome (Cornet et al, 1996), functionally defined as the junction between DNA segments of opposite sequence polarity (Corre et al, 2000; Perals et al, 2000). Sequence polarity can be perturbed by the introduction, close to dif, of exogenous DNA, such as the genome of phage lambda (Corre et al, 2000). This change inactivates chromosome dimer resolution, and augments the Received: 23 February 2004; accepted: 27 April 2004; published online: 27 May 2004 *Corresponding authors. Franc ¸ois-Xavier Barre, Laboratoire de Microbiologie et de Ge ´ne ´tique Mole ´culaire, 118 Route de Narbonne, 31062 Toulouse, France. Tel.: þ 33 5 61 33 59 86; Fax: þ 33 5 61 33 58 86; E-mail: [email protected] or Jean-Franc ¸ois Allemand, Laboratoire de Physique Statistique, Ecole Normale Supe ´rieure, 24, Rue Lhomond, 75005 Paris, France. Tel.: þ 33 1 44 32 34 96; Fax: þ 33 1 44 32 34 33; E-mail: [email protected] The EMBO Journal (2004) 23, 2430–2439 | & 2004 European Molecular Biology Organization | All Rights Reserved 0261-4189/04 www.embojournal.org The EMBO Journal VOL 23 | NO 12 | 2004 & 2004 European Molecular Biology Organization EMBO THE EMBO JOURNAL THE EMBO JOURNAL 2430
Transcript of Fast, DNA-sequence independent translocation by FtsK in a single-molecule experiment
Fast, DNA-sequence independent translocationby FtsK in a single-molecule experiment
Omar A Saleh1, Corine Perals2,Francois-Xavier Barre2,* andJean-Francois Allemand1,3,*1Laboratoire de Physique Statistique et Departement de Biologie, EcoleNormale Superieure, Paris, France, 2Laboratoire de Microbiologie etde Genetique Moleculaire, Toulouse, France and 3Laboratoire Pasteur,Departement de Chimie, Ecole Normale Superieure, Paris, France
Escherichia coli FtsK is an essential cell division protein,
which is thought to pump chromosomal DNA through the
closing septum in an oriented manner by following DNA
sequence polarity. Here, we perform single-molecule mea-
surements of translocation by FtsK50C, a derivative that
functions as a DNA translocase in vitro. FtsK50C transloca-
tion follows Michaelis–Menten kinetics, with a maximum
speed of B6.7 kbp/s. We present results on the effect of
applied force on the speed, distance translocated, and the
mean times during and between protein activity.
Surprisingly, we observe that FtsK50C can spontaneously
reverse its translocation direction on a fragment of E. coli
chromosomal DNA, indicating that DNA sequence is not
the sole determinant of translocation direction. We con-
clude that in vivo polarization of FtsK translocation could
require the presence of cofactors; alternatively, we propose
a model in which tension in the DNA directs FtsK translo-
cation.
The EMBO Journal (2004) 23, 2430–2439. doi:10.1038/
sj.emboj.7600242; Published online 27 May 2004
Subject Categories: genome stability & dynamics;
microbiology & pathogens
Keywords: chromosome segregation; DNA translocation;
FtsK; magnetic tweezers; molecular motor
Introduction
Active transportation of DNA from one cellular compartment
to another is central to many biological processes, such as
viral DNA packaging, conjugation, sporulation, and cell divi-
sion. In bacteria, a new class of proteins was recently
identified that mediate the transport of double-stranded
DNA through cell membranes and cell walls: the FtsK/
SpoIIIE/TraSA family (Bath et al, 2000; Possoz et al, 2001;
Aussel et al, 2002). These proteins belong to the AAAþ(ATPase Associated with various Activities) superfamily. As
such, they are thought to form hexameric motors, which are
responsible for the active translocation process. They are
involved in a wide range of functions: TraSA is encoded by
the plasmid pSAM2 of Streptomyces ambofaciens, and is
responsible for the transfer of the plasmid from donor cells
into acceptor cells during conjugation (Possoz et al, 2001).
SpoIIIE is responsible for the transport of a chromosome into
the small polar prespore compartment during sporulation in
Bacillus subtilis (Bath et al, 2000). FtsK is an essential
Escherichia coli cell division protein (Begg et al, 1995). Its
N-terminal membrane domain is localized to the division
septum (Wang and Lutkenhaus, 1998; Yu et al, 1998a), and is
necessary for its formation (Draper et al, 1998; Chen and
Beckwith, 2001). Its C-terminal motor domain (FtsKC) is
implicated in chromosome segregation (Liu et al, 1998; Yu
et al, 1998b). Indeed, FtsKC has two essential roles in
chromosome dimer resolution (see Aussel et al, 2002;
Capiaux et al, 2002; Corre and Louarn, 2002, and references
therein for review). Chromosome dimers, formed by homo-
logous recombination in organisms with circular chromo-
somes, are a threat to normal repartitioning of genetic
information at cell division. In E. coli, chromosome dimers
are resolved into monomers by the addition of a crossover at
a specific 28 bp site, dif, by two tyrosine recombinases, XerC
and XerD. Chromosome dimer resolution first requires colo-
calization of the dif sites; this is accomplished by transloca-
tion of the chromosomes by FtsKC (Capiaux et al, 2002; Corre
and Louarn, 2002). Secondly, the recombination reaction
itself is activated by FtsKC (Aussel et al, 2002), probably
through a direct interaction with XerC/D (Yates et al, 2003;
Massey et al, 2004). In addition, DNA translocation by FtsK
could participate in segregation of normal chromosomes
(Yu et al, 1998b; Donachie, 2002; Lau et al, 2003).
Coupled to these processes, there must be a mechanism of
translocation polarity; that is, an orienting mechanism that
ensures the DNA is transported in the correct direction. In B.
subtilis, it has been argued that preferential assembly of
SpoIIIE in one daughter cell establishes polarity in chromo-
some partitioning during sporulation (Sharp and Pogliano,
2002). In normal vegetative growth in E. coli, in contrast to
sporulating B. subtilis, there is no obvious morphological nor
protein expression difference between the two daughter cells
that could explain asymmetric assembly of FtsK. Instead, it
has been postulated that FtsK translocation polarity is defined
by chromosomal sequence polarity, that is, a high skew of
oligomeric sequences along the two replichores that inverts at
dif (Salzberg et al, 1998; Lobry and Louarn, 2003).
Chromosome dimer resolution is effective only when dif is
located within a narrow zone of the chromosome (Cornet
et al, 1996), functionally defined as the junction between
DNA segments of opposite sequence polarity (Corre et al,
2000; Perals et al, 2000). Sequence polarity can be perturbed
by the introduction, close to dif, of exogenous DNA, such as
the genome of phage lambda (Corre et al, 2000). This change
inactivates chromosome dimer resolution, and augments theReceived: 23 February 2004; accepted: 27 April 2004; publishedonline: 27 May 2004
*Corresponding authors. Francois-Xavier Barre, Laboratoire deMicrobiologie et de Genetique Moleculaire, 118 Route de Narbonne,31062 Toulouse, France. Tel.: þ 33 5 61 33 59 86;Fax: þ 33 5 61 33 58 86; E-mail: [email protected] or Jean-FrancoisAllemand, Laboratoire de Physique Statistique, Ecole NormaleSuperieure, 24, Rue Lhomond, 75005 Paris, France.Tel.: þ 33 1 44 32 34 96; Fax: þ 33 1 44 32 34 33;E-mail: [email protected]
The EMBO Journal (2004) 23, 2430–2439 | & 2004 European Molecular Biology Organization | All Rights Reserved 0261-4189/04
www.embojournal.org
The EMBO Journal VOL 23 | NO 12 | 2004 &2004 European Molecular Biology Organization
EMBO
THE
EMBOJOURNAL
THE
EMBOJOURNAL
2430
probability of endogenous recombination in an FtsK-depen-
dent manner (Corre and Louarn, 2002). This has led to the
idea that polarization of the chromosome sequence could
direct FtsK’s translocation so as to juxtapose the chromoso-
mal dif sites; this mechanism could also assist in clearing the
septum of any residual DNA.
In vitro evidence for DNA translocation by the ATPase-
motor domains of SpoIIIE and FtsK has been obtained, but all
the assays employed were indirect, precluding detailed ana-
lysis of the translocation reaction (Bath et al, 2000; Aussel
et al, 2002; Ip et al, 2003). Here, we directly monitor the DNA
translocase activity of FtsK50C, an active, oligomeric C-term-
inal truncation of FtsK (Aussel et al, 2002), at the single-
molecule level using magnetic tweezers (Strick et al, 1996).
We measure, in various conditions of applied force and ATP
concentration, the velocity, length, and duration of individual
translocation events. Using these data, we deduce basic
mechanochemical parameters of the protein’s translocation
reaction.
Surprisingly, we find that FtsK50C can spontaneously re-
verse its translocation direction, and thus travel both ways on
the same segment of DNA. We test translocation on both
lambda genomic DNA and an E. coli chromosomal fragment
that has been shown to be polarized in vivo (Perals et al,
2000). No bias in translocation is observed on either of these
substrates, suggesting that DNA sequence polarity does not
directly affect FtsK50C activity. We conclude that in vivo
polarization of FtsK translocation could require additional
cofactors, such as domains of the full protein not included in
the truncation used here. Alternatively, we propose a me-
chanism in which force, rather than DNA sequence, directs
the protein’s in vivo motion.
Results
FtsK50C causes transient decreases of DNA extension
Magnetic beads (4.5 mm) are tethered to a glass capillary by a
section of DNA (see Figure 1A), as described in Materials and
methods. We use a portion of lambda DNA in all experiments
presented, with one exception (noted below) in which we use
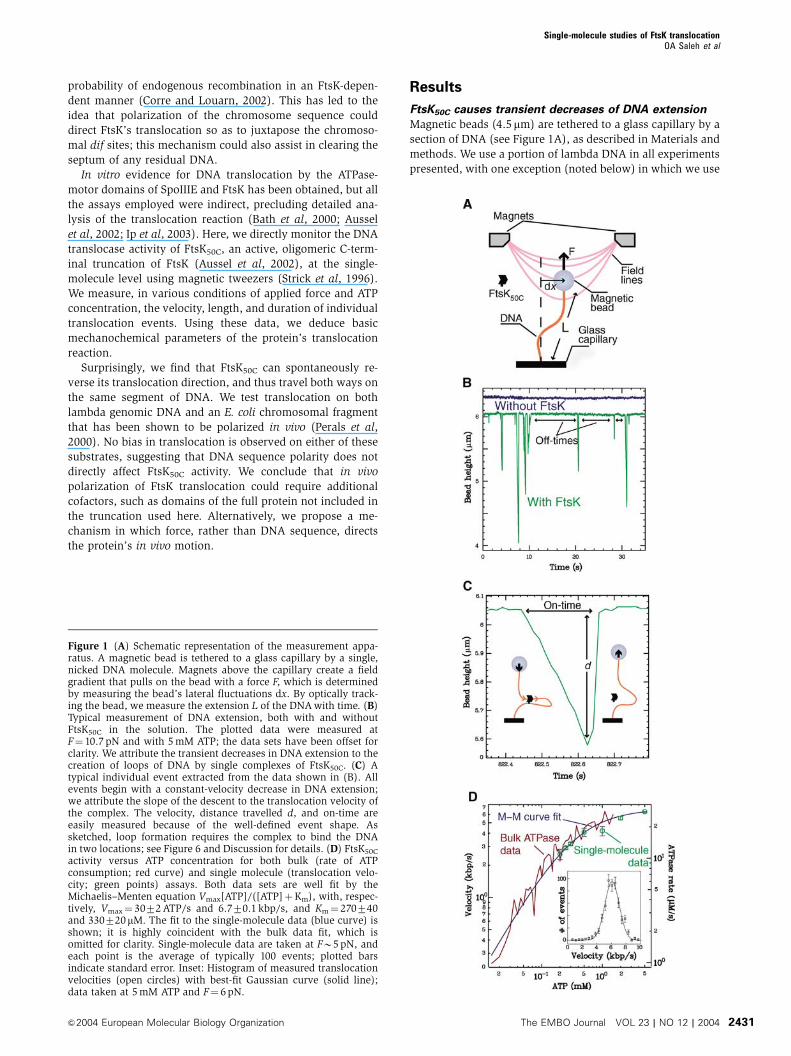
Figure 1 (A) Schematic representation of the measurement appa-ratus. A magnetic bead is tethered to a glass capillary by a single,nicked DNA molecule. Magnets above the capillary create a fieldgradient that pulls on the bead with a force F, which is determinedby measuring the bead’s lateral fluctuations dx. By optically track-ing the bead, we measure the extension L of the DNA with time. (B)Typical measurement of DNA extension, both with and withoutFtsK50C in the solution. The plotted data were measured atF¼ 10.7 pN and with 5 mM ATP; the data sets have been offset forclarity. We attribute the transient decreases in DNA extension to thecreation of loops of DNA by single complexes of FtsK50C. (C) Atypical individual event extracted from the data shown in (B). Allevents begin with a constant-velocity decrease in DNA extension;we attribute the slope of the descent to the translocation velocity ofthe complex. The velocity, distance travelled d, and on-time areeasily measured because of the well-defined event shape. Assketched, loop formation requires the complex to bind the DNAin two locations; see Figure 6 and Discussion for details. (D) FtsK50C
activity versus ATP concentration for both bulk (rate of ATPconsumption; red curve) and single molecule (translocation velo-city; green points) assays. Both data sets are well fit by theMichaelis–Menten equation Vmax[ATP]/([ATP]þKm), with, respec-tively, Vmax¼ 3072 ATP/s and 6.770.1 kbp/s, and Km¼ 270740and 330720mM. The fit to the single-molecule data (blue curve) isshown; it is highly coincident with the bulk data fit, which isomitted for clarity. Single-molecule data are taken at FB5 pN, andeach point is the average of typically 100 events; plotted barsindicate standard error. Inset: Histogram of measured translocationvelocities (open circles) with best-fit Gaussian curve (solid line);data taken at 5 mM ATP and F¼ 6 pN.
Single-molecule studies of FtsK translocationOA Saleh et al
&2004 European Molecular Biology Organization The EMBO Journal VOL 23 | NO 12 | 2004 2431
a fragment of E. coli chromosomal DNA. We search for beads
that are tethered by a single, nicked DNA molecule; while we
are able to identify and utilize unnicked DNA molecules, we
concentrate here on nicked molecules so as to avoid the
topological complications of supercoiling. Once a suitable
bead is found, we flush the capillary with ATP-laden buffer,
add purified FtsK50C monomers to a final concentration of
5–10 nM, and begin tracking the DNA extension with time.
After a short time, many transient decreases in DNA exten-
sion are observed, as shown in Figure 1B. Preliminary data on
unnicked molecules (OA Saleh, S Bigot, FX Barre and JF
Allemand, in preparation) are in general very similar to
nicked-molecule data; thus, nicks appear not to affect the
protein activity. The typical waiting time between events
(B5 s) is greater than the typical event timespan (B0.2 s),
indicating that the measured activity is due to the action of a
single protein complex. Note that the structure of FtsK50C in
solution is unknown, and apparently multimeric (Aussel et al,
2002); throughout the text, we refer to the active protein unit
as a complex. The events continue to occur for a long time
without need of additional proteins or ATP. We detect no
events in the absence of either ATP or FtsK50C, and we find
that existing activity stops upon addition of EDTA to a final
concentration of 20 mM. From these observations, we con-
clude that the events are caused by the ATP-dependent DNA
translocation activity of FtsK50C.
Translocation velocity represents protein activity
Each event begins with a linear decrease in bead height
(Figure 1C), from which we can extract both the translocation
velocity and the total distance travelled by the protein. Very
rarely, we observe events containing pauses that interrupt the
constant-velocity decrease. The pauses have no correlation
with position along the DNA, and only occur in situations
where many protein complexes appear to be active. We
attribute pausing to protein–protein interactions, and do not
characterize them here; see Supplementary data for more
information. Within a single measurement (i.e., on one DNA
molecule, and at constant force and ATP concentration), the
translocation velocity measured from all events is normally
distributed (inset, Figure 1D). Infrequently, an event is ob-
served with almost precisely double the mean translocation
velocity of other events in the data set (see Supplementary
data). Such events presumably arise from two-motor activity
(see Discussion), and are removed from all the analysis
presented. The width of the distribution is accounted for by
measurement noise and variations due to the stochastic
stepping motion of the motor protein (Svoboda et al, 1994);
thus, within the experimental noise, we observe no protein-
to-protein or sequence-based velocity variation.
To confirm that FtsK50C’s ATPase activity causes its trans-
location, we compare, at various ATP concentrations, the
single-molecule velocity with the bulk ATPase activity mea-
sured in an excess of DNA (insuring each functional protein is
active). As shown in Figure 1D, the assays agree quite well:
each independently indicates that FtsK50C follows simple
Michaelis–Menten kinetics with KmB0.3 mM ATP and respec-
tive maximum velocities of B6.7 kbp/s and B30 ATP/
FtsK50C monomer/s. Note that the latter is only a relative
measure since it ignores the presence of nonfunctional (mis-
folded) proteins. These results, in the light of previous data
showing that ATPase activity is highly stimulated in the
presence of DNA (Aussel et al, 2002), are consistent with a
mechanism in which ATP consumption is restricted to DNA-
bound FtsK50C, and leads directly to DNA translocation.
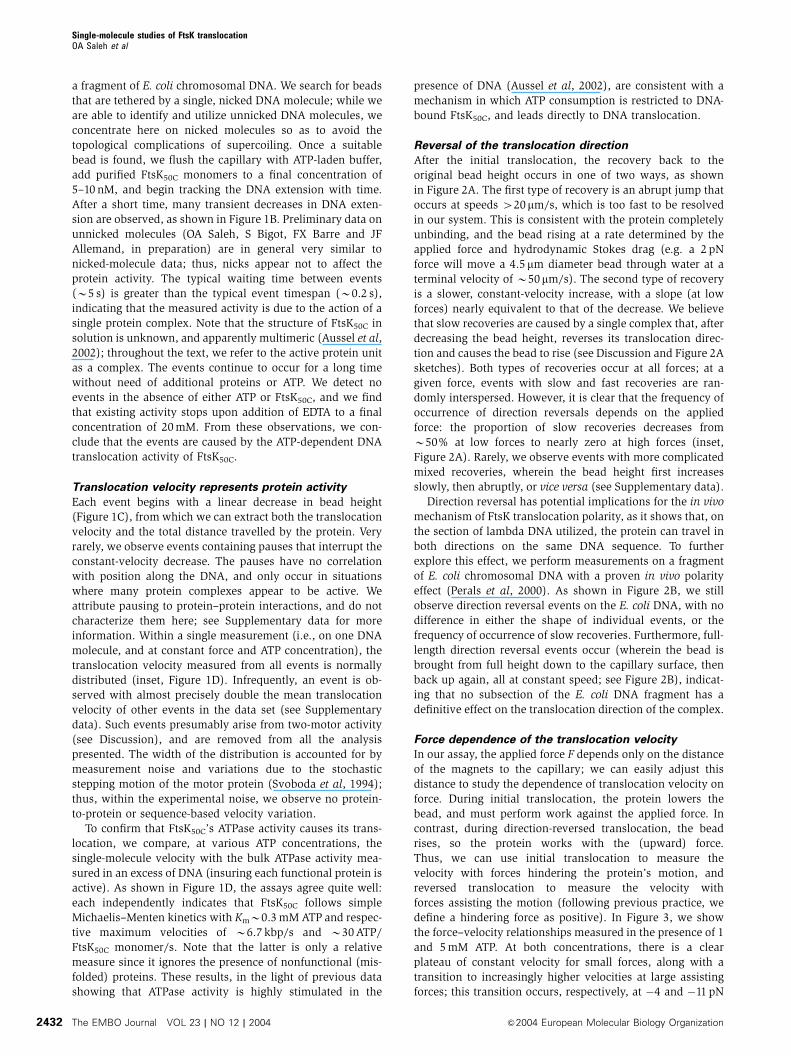
Reversal of the translocation direction
After the initial translocation, the recovery back to the
original bead height occurs in one of two ways, as shown
in Figure 2A. The first type of recovery is an abrupt jump that
occurs at speeds 420mm/s, which is too fast to be resolved
in our system. This is consistent with the protein completely
unbinding, and the bead rising at a rate determined by the
applied force and hydrodynamic Stokes drag (e.g. a 2 pN
force will move a 4.5 mm diameter bead through water at a
terminal velocity of B50mm/s). The second type of recovery
is a slower, constant-velocity increase, with a slope (at low
forces) nearly equivalent to that of the decrease. We believe
that slow recoveries are caused by a single complex that, after
decreasing the bead height, reverses its translocation direc-
tion and causes the bead to rise (see Discussion and Figure 2A
sketches). Both types of recoveries occur at all forces; at a
given force, events with slow and fast recoveries are ran-
domly interspersed. However, it is clear that the frequency of
occurrence of direction reversals depends on the applied
force: the proportion of slow recoveries decreases from
B50% at low forces to nearly zero at high forces (inset,
Figure 2A). Rarely, we observe events with more complicated
mixed recoveries, wherein the bead height first increases
slowly, then abruptly, or vice versa (see Supplementary data).
Direction reversal has potential implications for the in vivo
mechanism of FtsK translocation polarity, as it shows that, on
the section of lambda DNA utilized, the protein can travel in
both directions on the same DNA sequence. To further
explore this effect, we perform measurements on a fragment
of E. coli chromosomal DNA with a proven in vivo polarity
effect (Perals et al, 2000). As shown in Figure 2B, we still
observe direction reversal events on the E. coli DNA, with no
difference in either the shape of individual events, or the
frequency of occurrence of slow recoveries. Furthermore, full-
length direction reversal events occur (wherein the bead is
brought from full height down to the capillary surface, then
back up again, all at constant speed; see Figure 2B), indicat-
ing that no subsection of the E. coli DNA fragment has a
definitive effect on the translocation direction of the complex.
Force dependence of the translocation velocity
In our assay, the applied force F depends only on the distance
of the magnets to the capillary; we can easily adjust this
distance to study the dependence of translocation velocity on
force. During initial translocation, the protein lowers the
bead, and must perform work against the applied force. In
contrast, during direction-reversed translocation, the bead
rises, so the protein works with the (upward) force.
Thus, we can use initial translocation to measure the
velocity with forces hindering the protein’s motion, and
reversed translocation to measure the velocity with
forces assisting the motion (following previous practice, we
define a hindering force as positive). In Figure 3, we show
the force–velocity relationships measured in the presence of 1
and 5 mM ATP. At both concentrations, there is a clear
plateau of constant velocity for small forces, along with a
transition to increasingly higher velocities at large assisting
forces; this transition occurs, respectively, at �4 and �11 pN
Single-molecule studies of FtsK translocationOA Saleh et al
The EMBO Journal VOL 23 | NO 12 | 2004 &2004 European Molecular Biology Organization2432
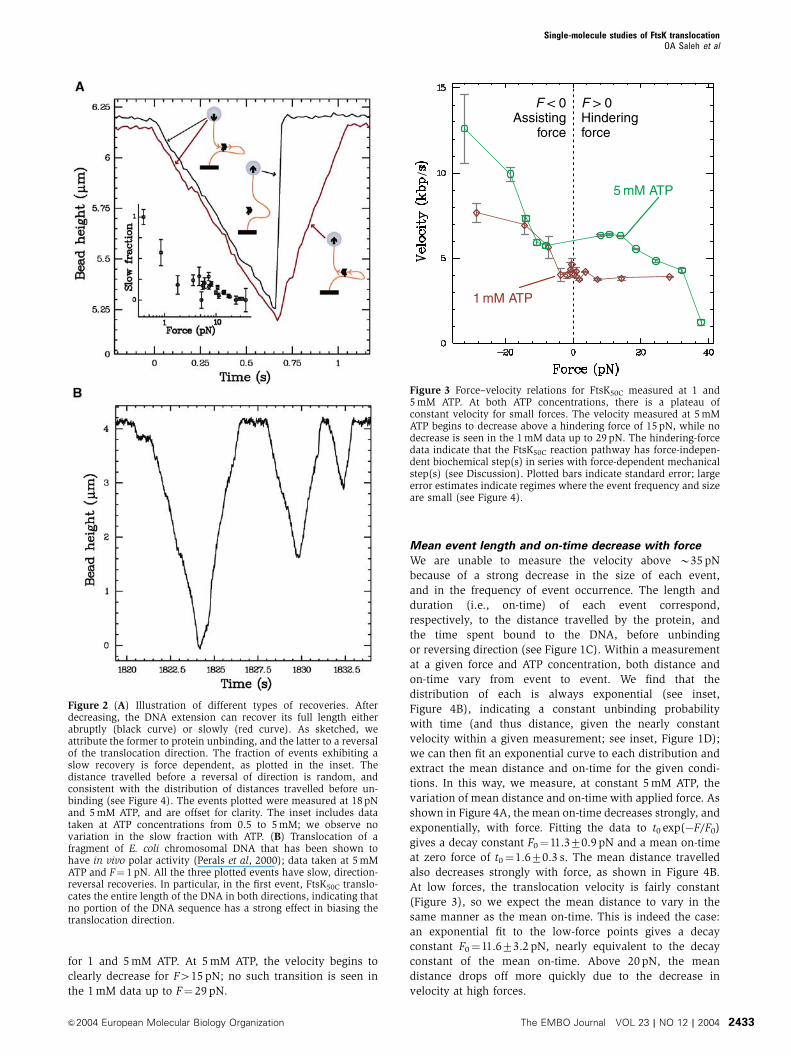
for 1 and 5 mM ATP. At 5 mM ATP, the velocity begins to
clearly decrease for F415 pN; no such transition is seen in
the 1 mM data up to F¼ 29 pN.
Mean event length and on-time decrease with force
We are unable to measure the velocity above B35 pN
because of a strong decrease in the size of each event,
and in the frequency of event occurrence. The length and
duration (i.e., on-time) of each event correspond,
respectively, to the distance travelled by the protein, and
the time spent bound to the DNA, before unbinding
or reversing direction (see Figure 1C). Within a measurement
at a given force and ATP concentration, both distance and
on-time vary from event to event. We find that the
distribution of each is always exponential (see inset,
Figure 4B), indicating a constant unbinding probability
with time (and thus distance, given the nearly constant
velocity within a given measurement; see inset, Figure 1D);
we can then fit an exponential curve to each distribution and
extract the mean distance and on-time for the given condi-
tions. In this way, we measure, at constant 5 mM ATP, the
variation of mean distance and on-time with applied force. As
shown in Figure 4A, the mean on-time decreases strongly, and
exponentially, with force. Fitting the data to t0 exp(�F/F0)
gives a decay constant F0¼11.370.9 pN and a mean on-time
at zero force of t0¼1.670.3 s. The mean distance travelled
also decreases strongly with force, as shown in Figure 4B.
At low forces, the translocation velocity is fairly constant
(Figure 3), so we expect the mean distance to vary in the
same manner as the mean on-time. This is indeed the case:
an exponential fit to the low-force points gives a decay
constant F0¼11.673.2 pN, nearly equivalent to the decay
constant of the mean on-time. Above 20 pN, the mean
distance drops off more quickly due to the decrease in
velocity at high forces.
Figure 2 (A) Illustration of different types of recoveries. Afterdecreasing, the DNA extension can recover its full length eitherabruptly (black curve) or slowly (red curve). As sketched, weattribute the former to protein unbinding, and the latter to a reversalof the translocation direction. The fraction of events exhibiting aslow recovery is force dependent, as plotted in the inset. Thedistance travelled before a reversal of direction is random, andconsistent with the distribution of distances travelled before un-binding (see Figure 4). The events plotted were measured at 18 pNand 5 mM ATP, and are offset for clarity. The inset includes datataken at ATP concentrations from 0.5 to 5 mM; we observe novariation in the slow fraction with ATP. (B) Translocation of afragment of E. coli chromosomal DNA that has been shown tohave in vivo polar activity (Perals et al, 2000); data taken at 5 mMATP and F¼ 1 pN. All the three plotted events have slow, direction-reversal recoveries. In particular, in the first event, FtsK50C translo-cates the entire length of the DNA in both directions, indicating thatno portion of the DNA sequence has a strong effect in biasing thetranslocation direction.
F > 0Hinderingforce
F < 0Assisting
force
5 mM ATP
1 mM ATP
/
Figure 3 Force–velocity relations for FtsK50C measured at 1 and5 mM ATP. At both ATP concentrations, there is a plateau ofconstant velocity for small forces. The velocity measured at 5 mMATP begins to decrease above a hindering force of 15 pN, while nodecrease is seen in the 1 mM data up to 29 pN. The hindering-forcedata indicate that the FtsK50C reaction pathway has force-indepen-dent biochemical step(s) in series with force-dependent mechanicalstep(s) (see Discussion). Plotted bars indicate standard error; largeerror estimates indicate regimes where the event frequency and sizeare small (see Figure 4).
Single-molecule studies of FtsK translocationOA Saleh et al
&2004 European Molecular Biology Organization The EMBO Journal VOL 23 | NO 12 | 2004 2433
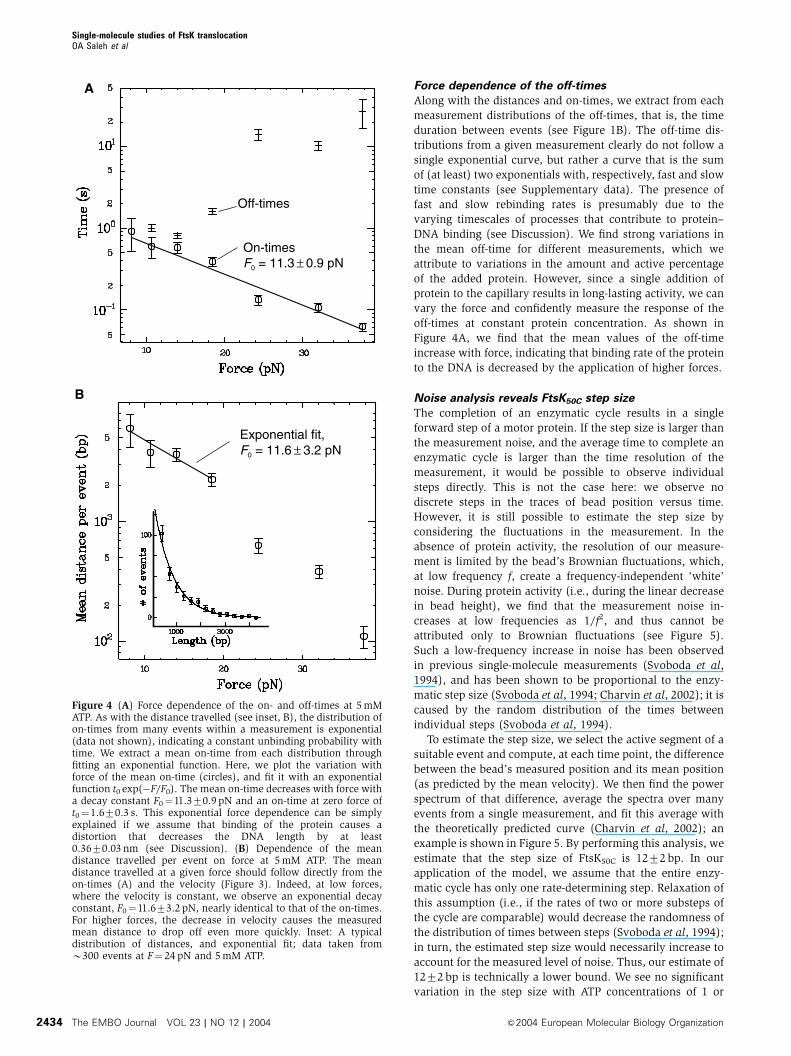
Force dependence of the off-times
Along with the distances and on-times, we extract from each
measurement distributions of the off-times, that is, the time
duration between events (see Figure 1B). The off-time dis-
tributions from a given measurement clearly do not follow a
single exponential curve, but rather a curve that is the sum
of (at least) two exponentials with, respectively, fast and slow
time constants (see Supplementary data). The presence of
fast and slow rebinding rates is presumably due to the
varying timescales of processes that contribute to protein–
DNA binding (see Discussion). We find strong variations in
the mean off-time for different measurements, which we
attribute to variations in the amount and active percentage
of the added protein. However, since a single addition of
protein to the capillary results in long-lasting activity, we can
vary the force and confidently measure the response of the
off-times at constant protein concentration. As shown in
Figure 4A, we find that the mean values of the off-time
increase with force, indicating that binding rate of the protein
to the DNA is decreased by the application of higher forces.
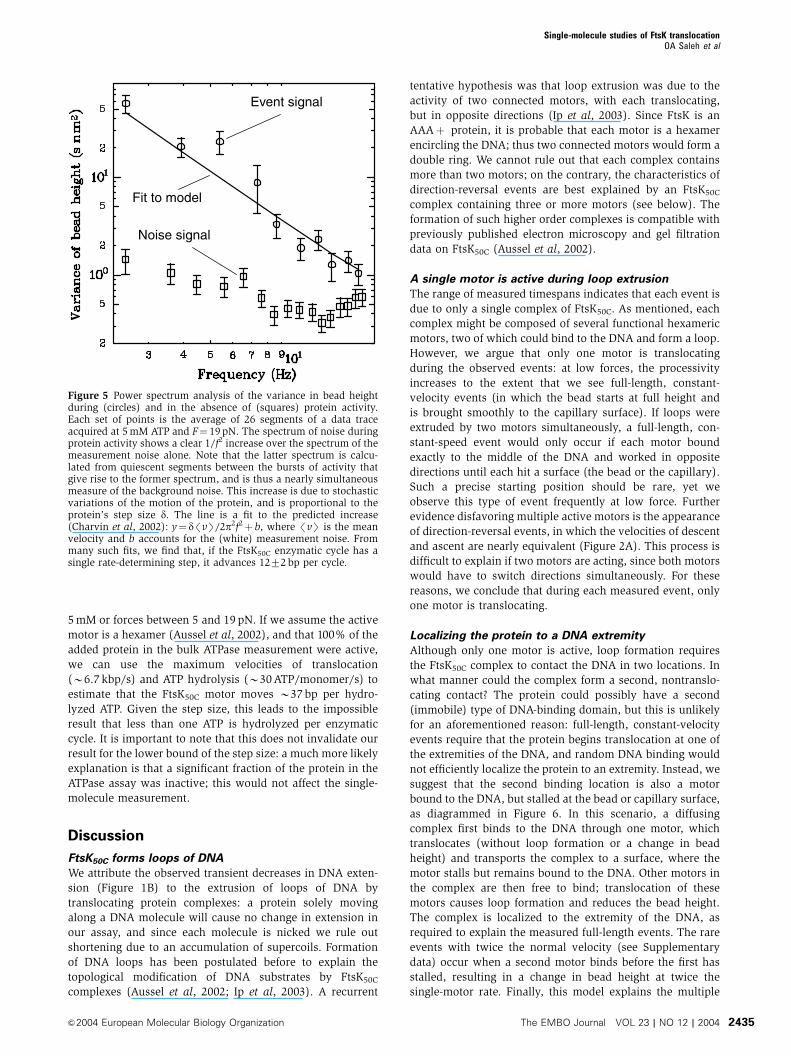
Noise analysis reveals FtsK50C step size
The completion of an enzymatic cycle results in a single
forward step of a motor protein. If the step size is larger than
the measurement noise, and the average time to complete an
enzymatic cycle is larger than the time resolution of the
measurement, it would be possible to observe individual
steps directly. This is not the case here: we observe no
discrete steps in the traces of bead position versus time.
However, it is still possible to estimate the step size by
considering the fluctuations in the measurement. In the
absence of protein activity, the resolution of our measure-
ment is limited by the bead’s Brownian fluctuations, which,
at low frequency f, create a frequency-independent ‘white’
noise. During protein activity (i.e., during the linear decrease
in bead height), we find that the measurement noise in-
creases at low frequencies as 1/f2, and thus cannot be
attributed only to Brownian fluctuations (see Figure 5).
Such a low-frequency increase in noise has been observed
in previous single-molecule measurements (Svoboda et al,
1994), and has been shown to be proportional to the enzy-
matic step size (Svoboda et al, 1994; Charvin et al, 2002); it is
caused by the random distribution of the times between
individual steps (Svoboda et al, 1994).
To estimate the step size, we select the active segment of a
suitable event and compute, at each time point, the difference
between the bead’s measured position and its mean position
(as predicted by the mean velocity). We then find the power
spectrum of that difference, average the spectra over many
events from a single measurement, and fit this average with
the theoretically predicted curve (Charvin et al, 2002); an
example is shown in Figure 5. By performing this analysis, we
estimate that the step size of FtsK50C is 1272 bp. In our
application of the model, we assume that the entire enzy-
matic cycle has only one rate-determining step. Relaxation of
this assumption (i.e., if the rates of two or more substeps of
the cycle are comparable) would decrease the randomness of
the distribution of times between steps (Svoboda et al, 1994);
in turn, the estimated step size would necessarily increase to
account for the measured level of noise. Thus, our estimate of
1272 bp is technically a lower bound. We see no significant
variation in the step size with ATP concentrations of 1 or
A
B
Off-times
Exponential fit,F0 = 11.6 ± 3.2 pN
On-timesF0 = 11.3 ± 0.9 pN
Figure 4 (A) Force dependence of the on- and off-times at 5 mMATP. As with the distance travelled (see inset, B), the distribution ofon-times from many events within a measurement is exponential(data not shown), indicating a constant unbinding probability withtime. We extract a mean on-time from each distribution throughfitting an exponential function. Here, we plot the variation withforce of the mean on-time (circles), and fit it with an exponentialfunction t0 exp(�F/F0). The mean on-time decreases with force witha decay constant F0¼11.370.9 pN and an on-time at zero force oft0¼1.670.3 s. This exponential force dependence can be simplyexplained if we assume that binding of the protein causes adistortion that decreases the DNA length by at least0.3670.03 nm (see Discussion). (B) Dependence of the meandistance travelled per event on force at 5 mM ATP. The meandistance travelled at a given force should follow directly from theon-times (A) and the velocity (Figure 3). Indeed, at low forces,where the velocity is constant, we observe an exponential decayconstant, F0¼11.673.2 pN, nearly identical to that of the on-times.For higher forces, the decrease in velocity causes the measuredmean distance to drop off even more quickly. Inset: A typicaldistribution of distances, and exponential fit; data taken fromB300 events at F¼ 24 pN and 5 mM ATP.
Single-molecule studies of FtsK translocationOA Saleh et al
The EMBO Journal VOL 23 | NO 12 | 2004 &2004 European Molecular Biology Organization2434
5 mM or forces between 5 and 19 pN. If we assume the active
motor is a hexamer (Aussel et al, 2002), and that 100% of the
added protein in the bulk ATPase measurement were active,
we can use the maximum velocities of translocation
(B6.7 kbp/s) and ATP hydrolysis (B30 ATP/monomer/s) to
estimate that the FtsK50C motor moves B37 bp per hydro-
lyzed ATP. Given the step size, this leads to the impossible
result that less than one ATP is hydrolyzed per enzymatic
cycle. It is important to note that this does not invalidate our
result for the lower bound of the step size: a much more likely
explanation is that a significant fraction of the protein in the
ATPase assay was inactive; this would not affect the single-
molecule measurement.
Discussion
FtsK50C forms loops of DNA
We attribute the observed transient decreases in DNA exten-
sion (Figure 1B) to the extrusion of loops of DNA by
translocating protein complexes: a protein solely moving
along a DNA molecule will cause no change in extension in
our assay, and since each molecule is nicked we rule out
shortening due to an accumulation of supercoils. Formation
of DNA loops has been postulated before to explain the
topological modification of DNA substrates by FtsK50C
complexes (Aussel et al, 2002; Ip et al, 2003). A recurrent
tentative hypothesis was that loop extrusion was due to the
activity of two connected motors, with each translocating,
but in opposite directions (Ip et al, 2003). Since FtsK is an
AAAþ protein, it is probable that each motor is a hexamer
encircling the DNA; thus two connected motors would form a
double ring. We cannot rule out that each complex contains
more than two motors; on the contrary, the characteristics of
direction-reversal events are best explained by an FtsK50C
complex containing three or more motors (see below). The
formation of such higher order complexes is compatible with
previously published electron microscopy and gel filtration
data on FtsK50C (Aussel et al, 2002).
A single motor is active during loop extrusion
The range of measured timespans indicates that each event is
due to only a single complex of FtsK50C. As mentioned, each
complex might be composed of several functional hexameric
motors, two of which could bind to the DNA and form a loop.
However, we argue that only one motor is translocating
during the observed events: at low forces, the processivity
increases to the extent that we see full-length, constant-
velocity events (in which the bead starts at full height and
is brought smoothly to the capillary surface). If loops were
extruded by two motors simultaneously, a full-length, con-
stant-speed event would only occur if each motor bound
exactly to the middle of the DNA and worked in opposite
directions until each hit a surface (the bead or the capillary).
Such a precise starting position should be rare, yet we
observe this type of event frequently at low force. Further
evidence disfavoring multiple active motors is the appearance
of direction-reversal events, in which the velocities of descent
and ascent are nearly equivalent (Figure 2A). This process is
difficult to explain if two motors are acting, since both motors
would have to switch directions simultaneously. For these
reasons, we conclude that during each measured event, only
one motor is translocating.
Localizing the protein to a DNA extremity
Although only one motor is active, loop formation requires
the FtsK50C complex to contact the DNA in two locations. In
what manner could the complex form a second, nontranslo-
cating contact? The protein could possibly have a second
(immobile) type of DNA-binding domain, but this is unlikely
for an aforementioned reason: full-length, constant-velocity
events require that the protein begins translocation at one of
the extremities of the DNA, and random DNA binding would
not efficiently localize the protein to an extremity. Instead, we
suggest that the second binding location is also a motor
bound to the DNA, but stalled at the bead or capillary surface,
as diagrammed in Figure 6. In this scenario, a diffusing
complex first binds to the DNA through one motor, which
translocates (without loop formation or a change in bead
height) and transports the complex to a surface, where the
motor stalls but remains bound to the DNA. Other motors in
the complex are then free to bind; translocation of these
motors causes loop formation and reduces the bead height.
The complex is localized to the extremity of the DNA, as
required to explain the measured full-length events. The rare
events with twice the normal velocity (see Supplementary
data) occur when a second motor binds before the first has
stalled, resulting in a change in bead height at twice the
single-motor rate. Finally, this model explains the multiple
Event signal
Noise signal
Fit to model
Figure 5 Power spectrum analysis of the variance in bead heightduring (circles) and in the absence of (squares) protein activity.Each set of points is the average of 26 segments of a data traceacquired at 5 mM ATP and F¼ 19 pN. The spectrum of noise duringprotein activity shows a clear 1/f2 increase over the spectrum of themeasurement noise alone. Note that the latter spectrum is calcu-lated from quiescent segments between the bursts of activity thatgive rise to the former spectrum, and is thus a nearly simultaneousmeasure of the background noise. This increase is due to stochasticvariations of the motion of the protein, and is proportional to theprotein’s step size d. The line is a fit to the predicted increase(Charvin et al, 2002): y¼ d/vS/2p2f2þ b, where /vS is the meanvelocity and b accounts for the (white) measurement noise. Frommany such fits, we find that, if the FtsK50C enzymatic cycle has asingle rate-determining step, it advances 1272 bp per cycle.
Single-molecule studies of FtsK translocationOA Saleh et al
&2004 European Molecular Biology Organization The EMBO Journal VOL 23 | NO 12 | 2004 2435
timescales in the off-time distributions (see Supplementary
data): short off-times occur when only one of the two motors
unbinds, leaving the complex in close proximity to the DNA
and thus enabling fast rebinding, while long off-times occur
when both motors unbind, and rebinding is limited by free
diffusion of the protein complexes.
Brief motor unbinding accompanies direction reversal
As shown in the inset to Figure 2A, direction reversal is less
likely at higher forces. This can be explained by assuming
that direction reversal first involves unbinding of the translo-
cating motor, followed immediately by binding of an oppo-
sitely directed motor: the observed decrease in binding rate
with force (i.e., the increase in off-time, see Figure 4A) would
then explain the decrease in the probability of direction
reversal with force (inset, Figure 2A). The oppositely directed
motor could, in principle, be an inverted configuration of the
first motor, but we consider it more likely that it is a different
(but nearby) motor within the same complex.
Considerations on the mechanochemistry of the FtsK50C
motor
The force–velocity relationships of FtsK50C (Figure 3) show a
clear plateau for small forces of either orientation, along with
a decrease in velocity (at saturating 5 mM ATP) for large
hindering forces. This behavior is qualitatively similar to both
theoretical predictions (Keller and Bustamante, 2000) and
previous results obtained on RNA polymerase (Wang et al,
1998; Neuman et al, 2003). The behavior is indicative of two
types of sequential steps in the reaction that causes forward
movement of the protein: a force-dependent mechanical step
(involving motion along the DNA), and one or more force-
independent biochemical steps (involving no motion along
the DNA, but rather, for example, ATP binding or a change in
the protein’s internal conformation). The mechanical step
requires the protein to change the height of the bead by a
distance d and perform a work against the force of Fd; thus,
the kinetic barrier of that step will increase at high hindering
forces, decreasing the rate. If, at zero force, the mechanical
step is much faster than the biochemical step, the zero-force
velocity v0 will depend only on the step size and the bio-
chemical step rate. As the force increases, the mechanical
step rate slows until it becomes comparable to the biochem-
ical step rate. For small F, the biochemical step determines the
rate (and the velocity equals v0, independent of the force),
while for large F the mechanical step determines the rate (and
the velocity decreases with force). This description qualita-
tively matches our data at 5 mM ATP. Furthermore, it is
consistent with the 1 mM ATP data, where no velocity
decrease is seen up to F¼ 29 pN. The decrease to 1 mM ATP
slows the ATP-binding process, thus slowing the rate of the
biochemical steps. To make the mechanical step rate compar-
able to this lowered biochemical rate (i.e., to see a velocity
decrease) will thus require a larger force than was needed at
5 mM ATP; we apparently do not reach this regime at the
maximum force of 29 pN utilized in the 1 mM data.
For assisting forces, our data notably deviate from the
above model and the measurements on RNA polymerase
(Neuman et al, 2003); in both, there is a continuation of
the constant-velocity plateau. Instead, we observe a clear
increase in velocity for large assisting forces (Figure 3). The
velocity increase is not likely due to a change in the enzy-
matic turnover rate (since it is unlikely that assisting force
would quicken the limiting biochemical processes), but
rather due to an increase in the mechanical step size.
Supporting this, we note that the velocity is still dependent
on ATP in this regime; thus, the biochemical processes are
still rate-determining. However, since our data are sparse at
large negative forces due to the rarity of direction reversals
(inset, Figure 2A) and the decrease in event size (Figure 4A),
we cannot rule out the existence of a completely separate
mechanism of forward motion.
Force dependence of binding statistics indicates
a distortion of the DNA
The mean value of the on-time decreases exponentially with
force (see Figure 4A) until, at high hindering force, protein
activity is limited by this parameter. The exponential depen-
dence can be accounted for by assuming that the DNA length
when bound by FtsK50C is shorter than when free. We model
this effect as a two-state system (Evans and Ritchie, 1997;
Rief et al, 1998), where the bound and unbound states are
separated by a transition state with a higher free energy. Any
DNA length change l between the bound and transition states
would require unbinding to perform a work �Fl against the
applied force. This would affect the mean on-time (the
inverse of the mean unbinding rate) by a factor exp(�Fl/
kT), consistent with our observations of an exponential
dependence on force. Based on the fitted exponential decay
constant of 11.370.9 pN, we estimate that unbinding of
FtsK50C causes the DNA length to increase by
lX0.3670.03 nm (the estimate is a lower bound since the
measurement is not sensitive to any further change in DNA
length between the transition and unbound state; see
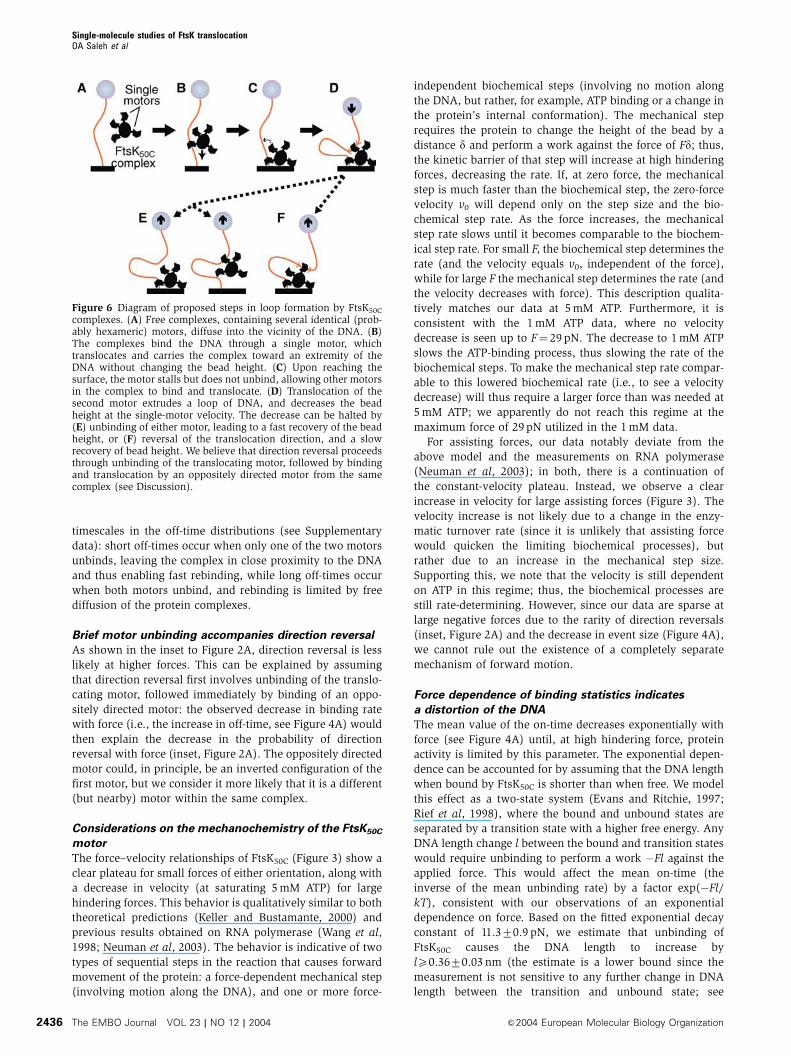
Figure 6 Diagram of proposed steps in loop formation by FtsK50C
complexes. (A) Free complexes, containing several identical (prob-ably hexameric) motors, diffuse into the vicinity of the DNA. (B)The complexes bind the DNA through a single motor, whichtranslocates and carries the complex toward an extremity of theDNA without changing the bead height. (C) Upon reaching thesurface, the motor stalls but does not unbind, allowing other motorsin the complex to bind and translocate. (D) Translocation of thesecond motor extrudes a loop of DNA, and decreases the beadheight at the single-motor velocity. The decrease can be halted by(E) unbinding of either motor, leading to a fast recovery of the beadheight, or (F) reversal of the translocation direction, and a slowrecovery of bead height. We believe that direction reversal proceedsthrough unbinding of the translocating motor, followed by bindingand translocation by an oppositely directed motor from the samecomplex (see Discussion).
Single-molecule studies of FtsK translocationOA Saleh et al
The EMBO Journal VOL 23 | NO 12 | 2004 &2004 European Molecular Biology Organization2436
Supplementary data). This length change is much smaller
than the minimal 80 bp binding site required to stimulate
FtsK50C’s ATPase activity (Massey et al, 2004). Therefore, it is
consistent only with a small bend in the DNA induced at the
protein’s binding site.
Implications of direction reversal for models of FtsK
polarity
It has been suggested that some chromosomal oligomeric
sequences, with a high skew that inverts at dif, could direct
the FtsK translocation process (Perals et al, 2000; Corre and
Louarn, 2002), just like Chi sequences alter the enzymatic
properties of RecBCD complexes (Spies et al, 2003). In this
regard, direction reversal is surprising because it indicates
that FtsK50C can move in both directions on the same segment
of DNA. Furthermore, we observe full-length direction-rever-
sal translocation events on a lambda DNA fragment of
approximately half the size of the phage genome; introduc-
tion of a complete phage lambda genome has been shown to
perturb chromosome polarity in vivo (Corre et al, 2000). To
confirm this finding, we perform experiments on a fragment
of the E. coli genome that was shown to be polarized (Perals
et al, 2000). Full-length translocation events after direction
reversal are again observed (Figure 2B). We conclude that the
oligomeric DNA motifs that polarize the E. coli and lambda
genomes do not constitute absolute blocks to DNA transloca-
tion by FtsK50C. We cannot rule out the possibilities that their
action is probabilistic, or that it requires the presence of the
N-terminal or linker domains of FtsK. However, our data raise
the possibility that DNA sequence information plays only an
indirect role on polarity of translocation by FtsK. For exam-
ple, an additional protein could bind to specific DNA se-
quences and block FtsK translocation, just like Tus binding to
Ter sites can stop replication forks (Kamada et al, 1996), or,
rather than acting on FtsK, the DNA sequence could direct
progressive, oriented condensation of the nucleoids, thereby
imposing that the dif region is the last chromosomal section
to be moved by FtsK.
A force-rectified translocation model could impose
directionality
Based on the observed sensitivity of the travelled distance to
force (Figure 4B), we propose an alternate mechanism that
could account for in vivo FtsK directionality. The parameters
of the exponential curve fit of mean on-time versus force
(Figure 4A), along with the maximum speed, indicate that at
zero force the FtsK50C complex will travel, on average,
B11 kbp per binding event. Since DNA translocation most
likely involves the binding of two identical motor units
(Figure 6), the zero-force mean distance for each motor is
then twice that of the complex, or B22 kbp. This is much less
than the total length of the E. coli chromosome (4.5 Mbp).
However, the chromosome is compacted in the cell and it is
highly probable that to clear the septum, FtsK works on DNA
loops of sizes similar to the zero-force mean distance.
We propose that a septum-bound FtsK motor, upon bind-
ing a chromosomal loop, can translocate in either direction.
However, if pumping in the wrong direction, it will pull
against the large fraction of condensed DNA and work against
other proteins in the nascent daughter cell that maintain the
chromosome position, such as MukB and active next-genera-
tion DNA replisomes (Sherratt, 2003). The counteracting
activities of FtsK and these other proteins will create a tension
in the DNA analogous to the force we apply to the bead in our
assay. Just as we observe (Figure 4B), this tension will
decrease the distance FtsK can travel before unbinding.
FtsK motors that pump in the wrong direction will thus
quickly fall off, allowing other, perhaps correctly oriented,
motors to bind. Although the lack of structural data on FtsK
precludes affirmation, the formation of higher order com-
plexes by FtsK50C and the resulting in vitro direction-reversal
activity might indicate that higher order complexes are also
formed in vivo by FtsK, which would facilitate this process.
Motors pumping in the correct direction will not create
tension in the DNA, and will translocate a correspondingly
greater distance. In this way, FtsK would clear any misplaced
chromosomal loops that pass through the septum.
Interestingly, this model could be applied to sporulation in
B. subtilis, assuming that condensation of DNA in the pre-
spore generates sufficient tension.
This force-rectified translocation model applies to segrega-
tion of normal daughter chromosomes and to resolution of
chromosome dimers. For normal chromosome segregation,
FtsK would simply accelerate the clearing process; both
genetic and cellular biology data indicate that FtsK is not
absolutely required for cohesion and mid-cell positioning of
the large terminus region of the E. coli chromosome (Capiaux
et al, 2002; Corre and Louarn, 2002). In the presence of
chromosome dimers, misplaced loops could still occur; FtsK
would clear these loops from the septum until there remained
only the two chromosome-connecting strands that contain
the dif sites required for XerC/D recombination.
FtsK50C’s high velocity enables fast processing
of misaligned DNA
FtsK50C’s maximum velocity of B6.7 kbp/s makes it the
fastest DNA-based motor protein yet measured. Speeds simi-
lar to our measurements have been estimated for the total
transfer rate of the B. subtilis genome into a nascent spore by
SpoIIIE (Errington et al, 2001). As mentioned above, we do
not expect FtsK to mobilize such a large fraction of the E. coli
genome, but rather a tangle of DNA loops. Unravelling such
a tangle could require loops to be successively processed
several times, as has been reported in vitro for replicative
catenanes (Ip et al, 2003); thus FtsK50C’s high speed could be
needed to complete multiple processing of misaligned loops
quickly.
Materials and methods
Protein, substrate DNA, and slide preparationFtsK50C is purified as described in Aussel et al (2002). l DNA (bp25 882–45 679) is amplified by long-range PCR. E. coli chromosomalDNA (bp 8877–22 422 after the XerC-binding site of dif) is purifiedfrom plasmid pFC94 (Perals et al, 2000). DNA substrates are ligatedto biotin- and digoxigenin-modified DNA fragments, which areprepared by PCR using cognate modified nucleotides. The resultingconstructs are incubated with 4.5 mm diameter paramagneticstreptavidin beads and added to 1-mm square cross-section glasscapillaries, which had been washed with 0.1 M NaOH, coated withSigmaCote, and sequentially incubated with solutions of anti-digoxigenin and bovine serum albumin (BSA). We insure that thebeads we use are bound to the capillary by a single, nicked DNAmolecule, and not a single unnicked, molecule or multiplemolecules, as described in Strick et al (1996, 1998).
Single-molecule studies of FtsK translocationOA Saleh et al
&2004 European Molecular Biology Organization The EMBO Journal VOL 23 | NO 12 | 2004 2437
Measurement of applied force and bead heightThe image of each bead is captured by a CCD camera at 60 Hz andprocessed, using custom-written software, to give the 3D beadposition. Before protein addition, we calibrate the apparatus foreach bead by measuring the applied force as a function of magnet/capillary separation distance. The applied force is measured bymonitoring the mean squared transverse fluctuations /dx2S of thebead (see Figure 1A), and applying the equipartition theorem:12kT ¼ 1
2hdx2iF=L, where L is the measured bead height (Strick et al,1996). Microscope drift is removed by simultaneously tracking areference bead stuck to the capillary surface, and subtracting itsheight from that of the experimental bead.
Addition of protein to the capillaryExperiments are performed in a buffer containing 10 mM MgCl2,10 mM Tris pH 7.9, 50 mM NaCl, 1 mM DTT, 0.01% Triton X-100,and ATP. In all, 5–10ml of 200 nM FtsK50C monomers is added to200 ml of buffer in the capillary, and gently mixed.
Long data acquisitionsActivity resulting from a single addition of protein can last forhours. To control for possible degradation of the protein or ATP inthat time, we measure the activity at a reference force multipletimes throughout the experiment. We never observe a decrease invelocity in those reference measurements. In some long measure-ments, we do observe an increase in the mean off-time; we attributethis to a decrease in the active protein concentration throughdegradation or nonspecific adsorption to the capillary. Data setscontaining such a decrease are not used to construct the off-timeplot in Figure 4A.
Data analysisMeasured traces of bead height correspond directly to DNAextension; no filtering has been applied to any of the plots shown.Translocation velocities, lengths, and on- and off-times areextracted by analyzing each data set with custom-written softwarethat applies a filter (Chung and Kennedy, 1991) in order to identifyevents automatically, while still measuring each parameter from theunfiltered data. Data quoted in units of base pairs have beencorrected for the difference between measured DNA extension andthe true contour length by applying the worm-like chain model forDNA elasticity (Bouchiat et al, 1999). To calculate the fraction of
slow recoveries (inset, Figure 2A), the number of slow recoverysegments of a certain minimum size (typically 0.5mm; less at higherforces) are counted, and divided by the total number of events ofthat size; the threshold is needed due to the difficulty incharacterizing very short recoveries. For the fluctuation analysis,within a data set, only long (40.75mm) events are analyzed. Astraight line is fit to, and subtracted from, each event to acquire thedifference at each time point. The mean variance from the fit line iscomputed for each event; typically, the mean variance across allevents forms a compact distribution. Outliers from this distribution(more than 2 standard deviations larger than the mean) sometimesoccur, and are considered to contain anomalous noise; thus, thecorresponding events are discarded. Power spectra are thencalculated from the suitable events using standard algorithms.
Bulk ATPase assayReactions are performed with 100 nM of FtsK50C (monomer), 5 nMof 3 kb supercoiled plasmid DNA, 1 nM [a32P]ATP and cold ATP in10 ml of 10 mM Tris–HCl, pH 7.9, 10 mM MgCl2, 50 mM NaCl, and1 mM DTT. Reactions are incubated for 3 min before being stoppedwith EDTA and excess ATP. The ratio of ATP to ADP is analyzed bythin layer chromatography. We check that our measurementscorrespond to initial rates and that DNA is in a 10-fold excess inthe reaction (data not shown).
Supplementary dataSupplementary data are available at The EMBO Journal Online.
Acknowledgements
We thank D Bensimon, V Croquette, J-M Louarn, and F Cornet forconstant support and helpful discussions. We thank V Croquette forsharing analysis software, and J-Y Bouet, G Charvin, K Neuman,and T Lionnet for critical reading of the manuscript. Research wasfunded by the CNRS and the Ecole Normale Superieure. Research inParis was supported by grants from the French Research MinistryACI Jeune Chercheur program and from the EU MolSwitch program.Research in Toulouse was supported by grants from the CNRS ATIPprogram and from the French Research Ministry FundamentalMicrobiology ACI program.
References
Aussel L, Barre FX, Aroyo M, Stasiak A, Stasiak AZ, Sherratt D(2002) FtsK is a DNA motor protein that activates chromosomedimer resolution by switching the catalytic state of the XerC andXerD recombinases. Cell 108: 195–205
Bath J, Wu LJ, Errington J, Wang JC (2000) Role of Bacillus subtilisSpoIIIE in DNA transport across the mother cell-prespore divisionseptum. Science 290: 995–997
Begg KJ, Dewar SJ, Donachie WD (1995) A new Escherichia coli celldivision gene, ftsK. J Bacteriol 177: 6211–6222
Bouchiat C, Wang MD, Allemand JF, Strick T, Block SM, Croquette V(1999) Estimating the persistence length of a worm-like chainmolecule from force–extension measurements. Biophys J 76:409–413
Capiaux H, Lesterlin C, Perals K, Louarn JM, Cornet F (2002) A dualrole for the FtsK protein in Escherichia coli chromosome segrega-tion. EMBO Rep 3: 532–536
Charvin G, Bensimon D, Croquette V (2002) On the relationbetween noise spectra and the distribution of time betweensteps for single molecular motors. Single Molecules 3: 43–48
Chen JC, Beckwith J (2001) FtsQ, FtsL and FtsI require FtsK, but notFtsN, for co-localization with FtsZ during Escherichia coli celldivision. Mol Microbiol 42: 395–413
Chung SH, Kennedy RA (1991) Forward-backward nonlinear filter-ing technique for extracting small biological signals from noise.J Neurosci Methods 40: 71–86
Cornet F, Louarn J, Patte J, Louarn JM (1996) Restriction of theactivity of the recombination site dif to a small zone of theEscherichia coli chromosome. Genes Dev 10: 1152–1161
Corre J, Louarn JM (2002) Evidence from terminal recombinationgradients that FtsK uses replichore polarity to control chromo-some terminus positioning at division in Escherichia coli.J Bacteriol 184: 3801–3807
Corre J, Patte J, Louarn JM (2000) Prophage lambda inducesterminal recombination in Escherichia coli by inhibitingchromosome dimer resolution. An orientation-dependent cis-ef-fect lending support to bipolarization of the terminus. Genetics154: 39–48
Donachie WD (2002) FtsK: Maxwell’s demon? Mol Cell 9: 206–207Draper GC, McLennan N, Begg K, Masters M, Donachie WD (1998)
Only the N-terminal domain of FtsK functions in cell division.J Bacteriol 180: 4621–4627
Errington J, Bath J, Wu LJ (2001) DNA transport in bacteria. Nat RevMol Cell Biol 2: 538–544
Evans E, Ritchie K (1997) Dynamic strength of molecular adhesionbonds. Biophys J 72: 1541–1555
Ip SCY, Bregu M, Barre F-X, Sherratt DJ (2003) Decatenation of DNAcircles by FtsK-dependent Xer site-specific recombination. EMBOJ 22: 6399–6407
Kamada K, Horiuchi T, Ohsumi K, Shimamoto N, Morikawa K(1996) Structure of a replication-terminator protein complexedwith DNA. Nature 383: 598–603
Keller D, Bustamante C (2000) The mechanochemistry of molecularmotors. Biophys J 78: 541–556
Lau IF, Filipe SR, Soballe B, Okstad OA, Barre FX, Sherratt DJ (2003)Spatial and temporal organization of replicating Escherichia colichromosomes. Mol Microbiol 49: 731–743
Liu GW, Draper GC, Donachie WD (1998) FtsK is a bifunctionalprotein involved in cell division and chromosome localization inEscherichia coli. Mol Microbiol 29: 893–903
Lobry JR, Louarn JM (2003) Polarisation of prokaryotic chromo-somes. Curr Opin Microbiol 6: 101–108
Massey TH, Aussel L, Barre F-X, Sherratt DJ (2004) Asymmetricactivation of Xer site-specific recombination by FtsK. EMBO Rep5: 399–404
Single-molecule studies of FtsK translocationOA Saleh et al
The EMBO Journal VOL 23 | NO 12 | 2004 &2004 European Molecular Biology Organization2438
Neuman KC, Abbondanzieri EA, Landick R, Gelles J, Block SM(2003) Ubiquitous transcriptional pausing is independent of RNApolymerase backtracking. Cell 115: 437–447
Perals K, Cornet F, Merlet Y, Delon I, Louarn JM (2000) Functionalpolarization of the Escherichia coli chromosome terminus: the difsite acts in chromosome dimer resolution only when locatedbetween long stretches of opposite polarity. Mol Microbiol 36:33–43
Possoz C, Ribard C, Gagnat J, Pernodet JL, Guerineau M (2001) Theintegrative element pSAM2 from Streptomyces: kinetics and modeof conjugal transfer. Mol Microbiol 42: 159–166
Rief M, Fernandez JM, Gaub HE (1998) Elastically coupled two-levelsystems as a model for biopolymer extensibility. Phys Rev Lett 81:4764–4767
Salzberg SL, Salzberg AJ, Kerlavage AR, Tomb JF (1998) Skewedoligomers and origins of replication. Gene 217: 57–67
Sharp MD, Pogliano K (2002) Rote of cell-specific SpoIIIE assemblyin polarity of DNA transfer. Science 295: 137–139
Sherratt DJ (2003) Bacterial chromosome dynamics. Science 301:780–785
Spies M, Bianco PR, Dillingham MS, Handa N, Baskin RJ,Kowalczykowski SC (2003) A molecular throttle: the recombina-tion hotspot chi controls DNA translocation by the RecBCD heli-case. Cell 114: 647–654
Strick TR, Allemand JF, Bensimon D, Bensimon A, Croquette V(1996) The elasticity of a single supercoiled DNA molecule.Science 271: 1835–1837
Strick TR, Allemand JF, Bensimon D, Croquette V (1998) Behaviorof supercoiled DNA. Biophys J 74: 2016–2028
Svoboda K, Mitra PP, Block SM (1994) Fluctuation analysis of motorprotein movement and single enzyme-kinetics. Proc Natl Acad SciUSA 91: 11782–11786
Wang LL, Lutkenhaus J (1998) FtsK is an essential cell divisionprotein that is localized to the septum and induced as part of theSOS response. Mol Microbiol 29: 731–740
Wang MD, Schnitzer MJ, Yin H, Landick R, Gelles J, Block SM(1998) Force and velocity measured for single molecules of RNApolymerase. Science 282: 902–907
Yates J, Aroyo M, Sherratt DJ, Barre FX (2003) Species specificity inthe activation of Xer recombination at dif by FtsK. Mol Microbiol49: 241–249
Yu XC, Tran AH, Sun Q, Margolin W (1998a) Localization of celldivision protein FtsK to the Escherichia coli septum and identifi-cation of a potential N-terminal targeting domain. J Bacteriol 180:1296–1304
Yu XC, Weihe EK, Margolin W (1998b) Role of the C terminus ofFtsK in Escherichia coli chromosome segregation. J Bacteriol 180:6424–6428
Single-molecule studies of FtsK translocationOA Saleh et al
&2004 European Molecular Biology Organization The EMBO Journal VOL 23 | NO 12 | 2004 2439