Single molecule analysis of DNA replication
13
Single molecule analysis of DNA replication John Herrick, Aaron Bensimon* Laboratoire de Biophysique de l’ADN, Département des Biotechnologies, Institut Pasteur, 25, rue du Dr.-Roux, 75724 Paris cedex 15, France (Received 10 March 1999; accepted 24 June 1999) Abstract — We describe here a novel approach for the study of DNA replication. The approach is based on a process called molecular combing and allows for the genome wide analysis of the spatial and temporal organization of replication units and replication origins in a sample of genomic DNA. Molecular combing is a process whereby molecules of DNA are stretched and aligned on a glass surface by the force exerted by a receding air/water interface. Since the stretching occurs in the immediate vicinity of the meniscus, all molecules are identically stretched in a size and sequence independent manner. The application of fluorescence hybridization to combed DNA results in a high resolution (1 to 4 kb) optical mapping that is simple, controlled and reproducible. The ability to comb up to several hundred haploid genomes on a single coverslip allows for a statistically significant number of measurements to be made. Direct labeling of replicating DNA sequences in turn enables origins of DNA replication to be visualized and mapped. These features therefore make molecular combing an attractive tool for genomic studies of DNA replication. In the following, we discuss the application of molecular combing to the study of DNA replication and genome stability. © 1999 Société française de biochimie et biologie moléculaire/Éditions scientifiques et médicales Elsevier SAS DNA replication / molecular combing / DNA imaging 1. Introduction DNA replication is highly coordinated with cell growth and development [1-3]. In E. coli for example, the onset of DNA synthesis occurs when the cell reaches a critical mass, called the initiation mass [4-6]. In eukaryotes such as S. cereviseae, the onset of DNA synthesis is tightly regulated by a complex network of interacting factors that signal when the cell is ready to begin replication [7]. Replication then initiates at specific genetic sites once and only once each cell division cycle [8-10]. This tight cell cycle regulation of DNA replication ensures: 1) that DNA synthesis begins only under the appropriate cellular con- ditions; and 2) that the cell’s entire complement of DNA is duplicated prior to mitosis and cell division [11, 12]. The replication of eukaryotic genomes differs from prokaryotic genomes in that the duplication of the genome depends on the activation of multiple bidirectional origins of replication. The yeast genome, for example, is esti- mated to contain up to 400 origins of replication. However only about 10% of these autonomous replicating se- quences (ARS) sites have been identified and character- ized, and a number of questions concerning what consti- tutes and controls the activity of yeast origins of replication remain unanswered [13-17]. In particular, ori- gins of replication located at different sites are known to have a different temporal order and frequency of activa- tion indicating that the chromosomal context is crucial to overall origin activity [18-20]. In metazoan genomes, the identification of origins of replication has been hampered by the fact that seemingly any sequence can serve as an origin of replication pro- vided it is large enough [21, 22]. In addition, only a few of those sites known to contain specific origins of replication can bestow upon plasmid DNA the ability to replicate autonomously [23]. The absence of a consensus origin sequence in metaozoan genomes may reflect the fact that the number of active replication origins varies widely from embryonic to somatic cells. In early embryos, for example, origin density must be 50-fold higher than in somatic cells in order for these genomes to replicate in the 10- to 20-min intervals that are observed [24, 25]. Knowledge of how origins are activated and what factors are involved is crucial for understanding the developmental program that governs cell growth and differentiation. Indeed, the temporal and spatial distribu- tion of origin activation, or the replication program, must be regulated in some fundamental way in order to ensure that the entire genome is duplicated in pace with each cell division cycle [26]. An understanding of the underlying mechanism that governs the replication program in differ- ent cell types requires mapping origins of replication on a * Correspondence and reprints Biochimie 81 (1999) 859-871 © 1999 Société française de biochimie et biologie moléculaire/Éditions scientifiques et médicales Elsevier SAS. All rights reserved
-
Upload
independent -
Category
Documents
-
view
0 -
download
0
Transcript of Single molecule analysis of DNA replication

Single molecule analysis of DNA replication
John Herrick, Aaron Bensimon*
Laboratoire de Biophysique de l’ADN, Département des Biotechnologies, Institut Pasteur,25, rue du Dr.-Roux, 75724 Paris cedex 15, France
(Received 10 March 1999; accepted 24 June 1999)
Abstract — We describe here a novel approach for the study of DNA replication. The approach is based on a process called molecularcombing and allows for the genome wide analysis of the spatial and temporal organization of replication units and replication originsin a sample of genomic DNA. Molecular combing is a process whereby molecules of DNA are stretched and aligned on a glass surfaceby the force exerted by a receding air/water interface. Since the stretching occurs in the immediate vicinity of the meniscus, allmolecules are identically stretched in a size and sequence independent manner. The application of fluorescence hybridization tocombed DNA results in a high resolution (1 to 4 kb) optical mapping that is simple, controlled and reproducible. The ability to combup to several hundred haploid genomes on a single coverslip allows for a statistically significant number of measurements to be made.Direct labeling of replicating DNA sequences in turn enables origins of DNA replication to be visualized and mapped. These featurestherefore make molecular combing an attractive tool for genomic studies of DNA replication. In the following, we discuss theapplication of molecular combing to the study of DNA replication and genome stability. © 1999 Société française de biochimie etbiologie moléculaire/Éditions scientifiques et médicales Elsevier SAS
DNA replication / molecular combing / DNA imaging
1. Introduction
DNA replication is highly coordinated with cell growthand development [1-3]. InE. coli for example, the onset ofDNA synthesis occurs when the cell reaches a criticalmass, called the initiation mass [4-6]. In eukaryotes suchas S. cereviseae, the onset of DNA synthesis is tightlyregulated by a complex network of interacting factors thatsignal when the cell is ready to begin replication [7].Replication then initiates at specific genetic sites once andonly once each cell division cycle [8-10]. This tight cellcycle regulation of DNA replication ensures: 1) that DNAsynthesis begins only under the appropriate cellular con-ditions; and 2) that the cell’s entire complement of DNAis duplicated prior to mitosis and cell division [11, 12].
The replication of eukaryotic genomes differs fromprokaryotic genomes in that the duplication of the genomedepends on the activation of multiple bidirectional originsof replication. The yeast genome, for example, is esti-mated to contain up to 400 origins of replication. Howeveronly about 10% of these autonomous replicating se-quences (ARS) sites have been identified and character-ized, and a number of questions concerning what consti-tutes and controls the activity of yeast origins ofreplication remain unanswered [13-17]. In particular, ori-
gins of replication located at different sites are known tohave a different temporal order and frequency of activa-tion indicating that the chromosomal context is crucial tooverall origin activity [18-20].
In metazoan genomes, the identification of origins ofreplication has been hampered by the fact that seeminglyany sequence can serve as an origin of replication pro-vided it is large enough [21, 22]. In addition, only a few ofthose sites known to contain specific origins of replicationcan bestow upon plasmid DNA the ability to replicateautonomously [23]. The absence of a consensus originsequence in metaozoan genomes may reflect the fact thatthe number of active replication origins varies widelyfrom embryonic to somatic cells. In early embryos, forexample, origin density must be 50-fold higher than insomatic cells in order for these genomes to replicate in the10- to 20-min intervals that are observed [24, 25].
Knowledge of how origins are activated and whatfactors are involved is crucial for understanding thedevelopmental program that governs cell growth anddifferentiation. Indeed, the temporal and spatial distribu-tion of origin activation, or the replication program, mustbe regulated in some fundamental way in order to ensurethat the entire genome is duplicated in pace with each celldivision cycle [26]. An understanding of the underlyingmechanism that governs the replication program in differ-ent cell types requires mapping origins of replication on a* Correspondence and reprints
Biochimie 81 (1999) 859−871© 1999 Société française de biochimie et biologie moléculaire/Éditions scientifiques et médicales Elsevier SAS. All rights reserved

genome wide basis. The establishment of a comprehensivemap for a given cell type can then serve as a standard forcharacterizing the replication profiles of cells with alteredgenetic backgrounds as well as cells that have beenexposed to a particular drug. Though a number of tech-niques exist for identifying and mapping origins of repli-cation, no technique is currently available that will allowfor the large scale analysis of replication origins withintheir chromosomal contexts [27].
2. Genome wide studies of replication origins
One of many interests in studying DNA replication atthe genomic level is to elaborate a complete map of allorigins of replication for any given cell type [28]. Acomprehensive map of origins and a profile of theiractivities is essential for an understanding of the respec-tive cell’s replication program. While that is a distantprospect, a number of techniques have nevertheless beenemployed to achieve a similar goal, namely the genomewide analysis of replication units. The purpose of theseexperiments was not to actually map origins but rather toinvestigate how origin locations and activation are coor-dinated with the period of DNA synthesis, or S phase, ofthe cell cycle.
These types of experiments require techniques thatallow for the direct simultaneous visualization of replicat-ing DNA structures from different regions of the genome.Direct visualization allows for measurements to be madeon the sizes of these structures and the distances betweenthem. Such measurements provide information aboutorigin location and activity over broad regions of thegenome. Since DNA is highly condensed and compactedin the cell nucleus, a key feature of all of these techniquesis the ability to label and straighten molecules of DNA thatcontain the replication intermediates.
Replicating DNA structures were first visualized byelectron microscopy [29], and later by DNA fiber autora-diography [30]. This latter technique results in a ‘snap-shot’ of the individual DNA molecules undergoing repli-cation [31, 32]. In 1974, Blumenthal and co-workerspublished the first genome wide analysis of DNA replica-tion units in a higher eukaryote using a combination offiber autoradiography and electron microscopy to visual-ize the replicating structures [33]. This approach madesignificant progress in elucidating the replication programin Drosophila early embryos. It established the averagedistribution of replication units over a large portion of thegenome, provided an accurate assessment of replicationfork velocity, and allowed for a comprehensive under-standing of the dynamics of S-phase during earlyDroso-phila development.
More recently with the advent of fiber-FISH techno-logy, a number of attempts have been made to study DNAreplication at specific genetic loci on extended chromatin
fibers. The goal motivating the use of these techniques hasbeen to determine the location of origins of replication ina given region of the genome by hybridizing FISH probesto the labeled replicated DNA [34]. Origin sites can thenbe accurately located by measuring the distance of thelabeled DNA from the hybridized probes. The advantagesto such an approach are obvious: in addition to being ableto map origins along the extended molecule, origindistributions and activities can be conveniently studiedunder a variety of experimental conditions [35-38].
The main problem facing fiber-FISH methods involvesthe uncontrolled forces used in extending the DNA. Anumber of different approaches have been employed toachieve the desired stretching. DNA has been extended bymelting an agarose plug between two coverslips; byapplying a fluid flow or by letting the sample run down thecoverslip, or simply by mechanically dragging the sampleacross the surface [39-45]. The use of these methodsresults however in the non-uniform extension of themolecules, which subsequently complicates interpretationof the FISH signals. Moreover, the relatively few mole-cules that are fully extended per coverslip means that it isdifficult to obtain a statistically adequate number ofmeasurements. Fiber-FISH techniques are therefore oflimited quantitative use and cannot be readily employed tostudy the dynamics and distribution of replication units ona genome wide basis.
3. Molecular combing
3.1. Binding DNA to a solid surface
The problems facing fiber-FISH methods are overcomeby a process called molecular combing. Molecular comb-ing is a procedure by which individual molecules of DNAare straightened and aligned on a glass coverslip by theforce exerted by a moving meniscus [46]. It was discov-ered during attempts to specifically anchor individualDNA molecules to a solid surface. The simple principlebehind this method involves: 1) the physico-chemicalbinding of the molecules by one or both of their extremi-ties to a silanated glass coverslip; and 2) the uniformalignment and homogenous extension of all attachedmolecules(figure 1).
The purity of the DNA is a critical feature of thecombing process. Preparation of the molecules begins byembedding a cell sample in an agarose plug. The DNA isthen extracted and deproteinized. The extracted DNA isthen transferred to a buffered solution (MES buffer, pH5.5) and placed on a coverslip where the DNA is allowedto bind to the surface.
Attaching either end of the molecule to the surface isone of the key features of this approach. In solution, themolecule assumes the form of a random coil whichfluctuates in size and shape due to Brownian motion. Once
860 Herrick and Bensimon

in contact with the surface, the molecule binds spontane-ously. Specific binding of the molecules by either one orboth extremities was observed to occur in a pH dependentmanner with the optimal pH of 5.5 (depending on thesurface type) [47] (figure 2). At values lower than 5.5, themolecules are non-specifically adsorbed to the surface andcannot be stretched and aligned. At pH values above 5.5,the binding efficiency rapidly decreases and consequentlyfew molecules attach to the substrate. It is believed thatthe specific binding at the extremities is due to the fact thatthe double helix has a greater tendency to unwind at its
Figure 2. The combing of DNA on different surfaces is pHdependent.a. At pH less than 5.5, the DNA is non-specificallyadsorbed onto the surface.b. At pH 5.5 binding occurs uniquelyat the molecule’s extremities.c. At a pH above 5.5, the surfaceis neutral and the binding efficiency decreases. Combing effi-ciency is defined as the number of combed molecules divided bythe number of spots seen at low pH (due to the non-specificadsorption of the DNA onto the surface). The surfaces wereeither silanized with a vinyl group or spin-coated with poly-methylmetacrylate (PMMA) or polystyrene.
Figure 1. Stretching and aligning DNA by a moving meniscus.DNA in solution spontaneously binds to a silanated glass surfaceat one or both of its extremities. As the solution evaporates, theair/water interface recedes, and consequently the DNA is straigh-tened and aligned in a direction perpendicular to the movementof the meniscus. On one side of the interface, the DNA fluctuatesfreely in solution, while on the other side, it is irreversibly boundto the dry solid surface.
Single molecule analysis of DNA replication 861

ends than along its midsegments. Consequently the DNAis more negatively charged at its extremities. Binding isdue either to the hydrophobicity and/or an electrostaticinteraction between the negatively charged DNA and thepositively charged surface. If the pH is too low, the DNAtends to denature along the length of the moleculeresulting in non-specific binding; while if it is too high theunwinding at the extremities is inhibited and consequentlyattachment to the surface is less efficient. Therefore, it isonly in a narrow range of pH that optimal binding occurs.
3.2. Stretching DNA
Molecules in the appropriately buffered solution bindspontaneously to the surface and are straightened by theforce exerted by a moving meniscus, or air/water inter-face. The surface tension force at the meniscus acts tokeep the random coil in solution as the meniscus passes
over the molecule. Consequently, as the meniscus movesperpendicularly to the tethered molecule, the DNA isliterally reeled out over the dry surface(figure 3). Theforce acting at the meniscus was found to be strongenough to stretch the DNA up to two-fold its crystallo-graphic length yet not strong enough to break the bondthat anchors the molecules to the surface.
In the original approach, the movement of the meniscusoccurred by the evaporation of the solution containedbetween a coverslip and a slide. Later, the combingmethod was modified so that genomic DNA could becombed in large quantities [48]. This approach, known as‘dynamic molecular combing’, involves dipping the cov-erslip into a well containing the DNA solution and thenextracting the coverslip at a constant velocity. Thismethod yields typically over several hundred haploidgenomes per coverslip(figure 4).
The original experiments established that moleculescombed by the meniscus method are identically stretchedup to 1.5 times their normal length. This results in a directcorrelation of 2 kb/µm between the actual size of each
Figure 3. Combed lambda DNA stained with YOYO-1. A largenumber of measurements made on the lengths of the combedlambda molecules were analyzed as a histogram. The measuredlength of the lambda genome is obtained from the modal valueof the histogram. On silanted glass surfaces, the observed lengthis about 24µm. The known size of the lambda genome is 48 kb,or about 16µm. This indicates that the molecules have beenstretched 1.5 times their normal lengths, providing a directcorrelation between the measured length of combed DNA and itsactual size (where 1µm = 2 kb). The molecules are visualized inan epifluorescence microscope using a 100× objective.
Figure 4. Size and sequence independent extension of DNAmolecules stretched by molecular combing. DNA obtained fromdifferent sources was combed and measured. The moleculesrange in size from 20 kb to 250 kb. The linear graph indicates theconstant and uniform stretching factor associated with molecularcombing: all molecules regardless of size or sequence areidentically stretched. It is this property that allows for accurateand reproducible genetic mapping without reference to aninternal standard.
862 Herrick and Bensimon
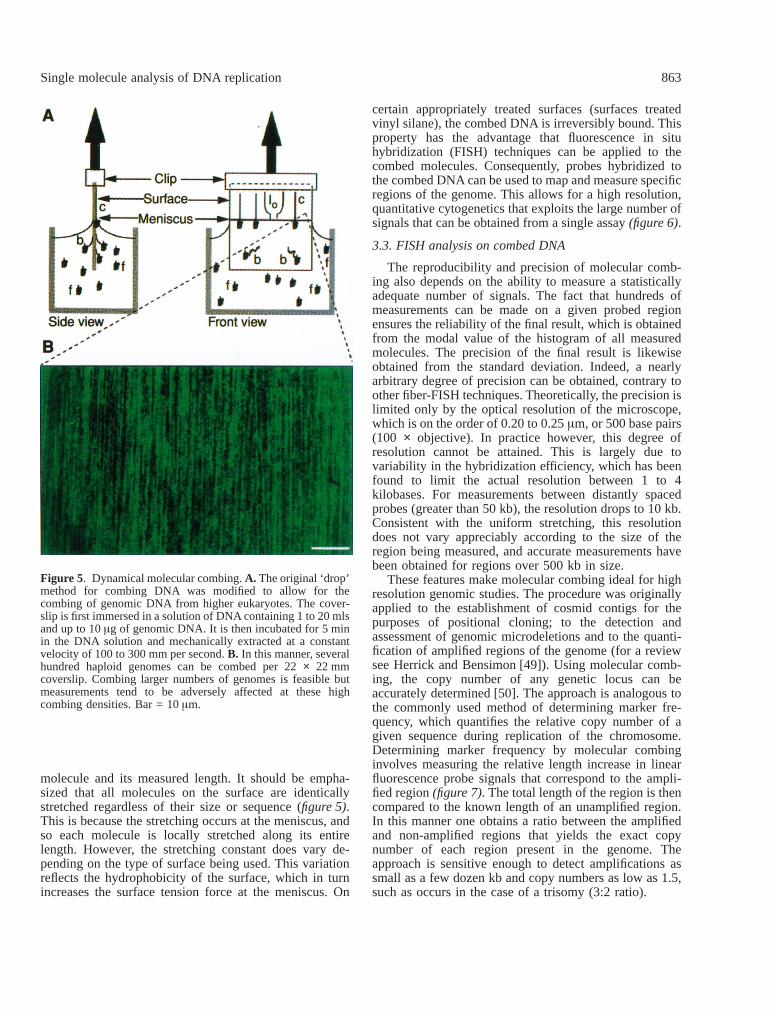
molecule and its measured length. It should be empha-sized that all molecules on the surface are identicallystretched regardless of their size or sequence (figure 5).This is because the stretching occurs at the meniscus, andso each molecule is locally stretched along its entirelength. However, the stretching constant does vary de-pending on the type of surface being used. This variationreflects the hydrophobicity of the surface, which in turnincreases the surface tension force at the meniscus. On
certain appropriately treated surfaces (surfaces treatedvinyl silane), the combed DNA is irreversibly bound. Thisproperty has the advantage that fluorescence in situhybridization (FISH) techniques can be applied to thecombed molecules. Consequently, probes hybridized tothe combed DNA can be used to map and measure specificregions of the genome. This allows for a high resolution,quantitative cytogenetics that exploits the large number ofsignals that can be obtained from a single assay(figure 6).
3.3. FISH analysis on combed DNA
The reproducibility and precision of molecular comb-ing also depends on the ability to measure a statisticallyadequate number of signals. The fact that hundreds ofmeasurements can be made on a given probed regionensures the reliability of the final result, which is obtainedfrom the modal value of the histogram of all measuredmolecules. The precision of the final result is likewiseobtained from the standard deviation. Indeed, a nearlyarbitrary degree of precision can be obtained, contrary toother fiber-FISH techniques. Theoretically, the precision islimited only by the optical resolution of the microscope,which is on the order of 0.20 to 0.25µm, or 500 base pairs(100 × objective). In practice however, this degree ofresolution cannot be attained. This is largely due tovariability in the hybridization efficiency, which has beenfound to limit the actual resolution between 1 to 4kilobases. For measurements between distantly spacedprobes (greater than 50 kb), the resolution drops to 10 kb.Consistent with the uniform stretching, this resolutiondoes not vary appreciably according to the size of theregion being measured, and accurate measurements havebeen obtained for regions over 500 kb in size.
These features make molecular combing ideal for highresolution genomic studies. The procedure was originallyapplied to the establishment of cosmid contigs for thepurposes of positional cloning; to the detection andassessment of genomic microdeletions and to the quanti-fication of amplified regions of the genome (for a reviewsee Herrick and Bensimon [49]). Using molecular comb-ing, the copy number of any genetic locus can beaccurately determined [50]. The approach is analogous tothe commonly used method of determining marker fre-quency, which quantifies the relative copy number of agiven sequence during replication of the chromosome.Determining marker frequency by molecular combinginvolves measuring the relative length increase in linearfluorescence probe signals that correspond to the ampli-fied region(figure 7). The total length of the region is thencompared to the known length of an unamplified region.In this manner one obtains a ratio between the amplifiedand non-amplified regions that yields the exact copynumber of each region present in the genome. Theapproach is sensitive enough to detect amplifications assmall as a few dozen kb and copy numbers as low as 1.5,such as occurs in the case of a trisomy (3:2 ratio).
Figure 5. Dynamical molecular combing.A. The original ‘drop’method for combing DNA was modified to allow for thecombing of genomic DNA from higher eukaryotes. The cover-slip is first immersed in a solution of DNA containing 1 to 20 mlsand up to 10µg of genomic DNA. It is then incubated for 5 minin the DNA solution and mechanically extracted at a constantvelocity of 100 to 300 mm per second.B. In this manner, severalhundred haploid genomes can be combed per 22× 22 mmcoverslip. Combing larger numbers of genomes is feasible butmeasurements tend to be adversely affected at these highcombing densities. Bar = 10µm.
Single molecule analysis of DNA replication 863

4. Applications of molecular combing to genomicstudies of DNA replication
4.1. Replication timing
The duplication of the genome is a highly organizedprocess. At the cellular level, replication occurs at discretefoci distributed throughout the nucleus [57-59]. At thechromosomal level, early and late replicating regionsalternate as chromosomal bands that are between 1 to 2Mb in size [60-62]. Within the replicating bands, replica-tion occurs in broad initiation zones of 50 to 300 kb insize [63-65]. In general, expressed loci replicate early andtranscriptionally silent loci replicate late [66]. This patternof early and late replicating loci is altered in a variety of
genetic backgrounds where translocations and deletionshave occurred [67, 68]. A correlation between GC contentand early replicating sequences has been observed in avariety of organisms including vertebrates, yeast andbacteria [60, 69, 70]. More recently, acis-acting elementthat specifically regulates transitions between replicationand transcription has been identified near the humanâ-globin locus [71]. This element governs the initiation ofDNA replication at a site some 50 kb downstream form itslocation, demonstrating that long range interactions areinvolved in origin activity and in the timing of DNAreplication.
Currently, a gene dosage approach relying on FISHtechniques is used in determining the replication timing of
Figure 6. FISH on combed DNA: quantitative detection of deletions in the TSC2 gene. Samples of genomic DNA were obtained frompatients, and the extracted DNA was combed and hybridized. The TSC2 locus was identified by hybridizing cosmid probes (in red andgreen) to the DNA combed on the coverslip. The locus spans a 150 kb region in a non-affected individual: measurements yield of valueof 147± 4.4 kb for all molecules measured. In affected individuals, a heterogeneous population of hybridization signals is observed:the top three signals represent the normal allele present in the sample, while the bottom three sets of signals are from the deleted allelesof three different patients (WS-212, WS-215, WS-9). Direct measurements made on these images allow for a precise determinationof the size of the deletion and the locations of the deletion breakpoints. Green arrows indicate deleted segments of the cosmid probe.Bar = 10µm.
864 Herrick and Bensimon

parental and maternal loci in the genome [72, 73]. Thetechnique involves hybridizing probes to interphase chro-mosomes in order to visualize the duplication of one allelewith respect to another. Boundaries between early and latereplicating DNA can be established using a similar ap-proach. As such, these methods allow for the elucidationof the pattern of replication involving broad regions of thegenome, and alterations in the replication timing ofdifferent alleles have recently been associated with theabnormal cell cycles of malignant cells [74-76]. The sameapproach on combed DNA (see above) will allow for thehigh resolution study of replication timing within a givenregion. This in turn will facilitate the elucidation of the
temporal sequence in which subregions are replicated andwill improve the resolution with which replication bound-aries are mapped.
4.2. Amplifications, rearrangements and replication
Under normal circumstances, any given sequence in thegenome is replicated once and only once per cell divisioncycle. However, disruption of the replication program canresult in regions of the genome being rearranged andoverreplicated, which is one of the mechanisms underly-ing oncogene activation [51-54]. We are currently inves-tigating the amplification of the MET oncogene in the
Figure 7. Marker frequency analysis by molecular combing: gene dosage. The basic principle consists in detecting and measuring therelative increase in the copy number of an amplified region. This is done by simultaneously hybridizing two sets of probes to theamplified target and non-amplified control regions. The probes are then detected using antibodies conjugated with differentfluorophores. The resulting linear signals (red and green bars: rn and gn) are then individually measured. This is necessary because notall signals will be of the expected size due to the random shearing of the DNA during its preparation. The respective lengths of eachset of hybridization signals (gn and rn) are then summed in order to determine the total length of each sequence present on the coverslip(G and R). The total length divided by the known normal length of each sequence (lg and lr) yields their respective copy numbers (Ngand Nr) on the coverslip. The copy number ratio (Ng / Nr) provides a precise assessment of the size and extent of the amplificationper genome. The ability to quantify a relatively low copy number such as a trisomy indicates that early and late replicating regionsof the genome can be identified by the 1.5-fold difference in their respective copy numbers.
Single molecule analysis of DNA replication 865

renal cell carcinoma cell line RCC 47 [55, 56](figure 8).In this cell line, a 3 Mb region containing the METoncogene on chromosome 7 is amplified up to ten-fold inthe form of minichromosomes. DNA replication in thiscell line is not under cell cycle control and the S-phase issignificantly shorter than in the normal cell line. Theelucidation of the genetic structure of the MET ampliconand an analysis of its replication pattern may provideinformation concerning the replication programs in therespective normal and transformed cell lines. This in turnmay provide insights into the mechanisms underlyingoncogenesis.
4.3. Studies of the dynamics of genome duplication
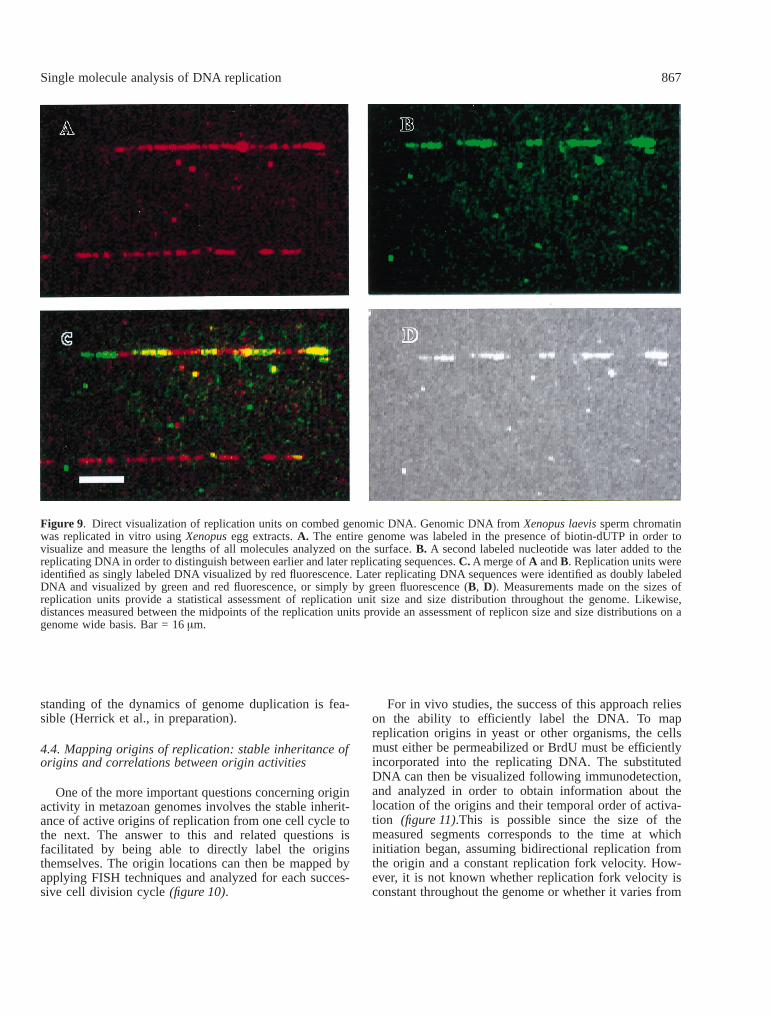
On combed DNA, replication can be directly visualizedusing immunofluorescence techniques. This involves dif-ferentially labeling the replicating DNA with modifiednucleotides. Depending on the labeling scheme used,earlier and later replicating sequences in each moleculecan be distinguished as alternating green and red fluores-cent segments(figure 9). Since all molecules on thecoverslip are identically stretched, reliable measurementsmade on the molecules can be readily obtained. Thisallows for a quantitative assessment of the size distribu-
tions of the differentially labeled replication units. Mea-surements made between the midpoints of adjacent earlierreplicating units, replication eyes, likewise yield a preciseassessment of the distribution of eye to eye distances.These distances provide an estimate of replicon sizes andtherefore reflect how DNA replication is organized at thelevel of the genome [33].
On the basis of these measurements, a number ofdifferent analyses can be performed. For example, repli-cation fork densities (forks /kilobase) can be determinedfor any given stage of replication. Since the rate of DNAsynthesis correlates with fork densities and distributions,the spatial and temporal organization of DNA replicationcan be directly deduced on a genome wide basis. More-over, measurements made on an appropriate set of repli-cation eyes (those originating from a single initiationevent) can reveal the frequency of origin activation duringS phase. Assuming a constant replication fork velocity andbidirectional replication, initiation events can be mappedin time since the size of the replication eye depends on therelative time of its initiation. Together these analyses inturn may reveal correlations between the different param-eters governing DNA replication in a variety of geneticbackgrounds. In this manner, a comprehensive under-
Figure 8. Met oncogene copy number determined by standard FISH protocols on metaphase spreads and the copy number in the sametumor cell line assessed by molecular combing.Left. A YAC probe (1 Mb) specific to the Met locus on chromosome 7 was hybridizedto a RCC-47 (renal cell carcinoma) metaphase spread and visualized as green fluorescent spots in a normal cell (top). Probeshybridized to the centromeric region of chromosome 7 were visualized in red. The amplification is apparent in those cells with yellowfluorescence (center and lower right).Right. The amplification was quantified by molecular combing using the same cell line.Genomic DNA extracted from a renal cell carcinoma (RCC-47) primary tumor (red) and from third generation grafts (magenta, greenand blue) was combed on separate slides. A BAC probe (171 kb) was hybridized to the amplified locus simultaneously with fivecosmid probes specific to a non-amplified region (chromosome 21). The curves represent the evolution of the measured ratio as afunction of the effective number of detected control chromosomes (1 per haploid genome) for each sample analyzed. A quickconvergence to a final ratio of 3.5 is observed after a transient regime extending over less than 10 haploid genomes. The experimentalcurves are confined within the two 95% confidence level envelopes (black curves).
866 Herrick and Bensimon
standing of the dynamics of genome duplication is fea-sible (Herrick et al., in preparation).
4.4. Mapping origins of replication: stable inheritance oforigins and correlations between origin activities
One of the more important questions concerning originactivity in metazoan genomes involves the stable inherit-ance of active origins of replication from one cell cycle tothe next. The answer to this and related questions isfacilitated by being able to directly label the originsthemselves. The origin locations can then be mapped byapplying FISH techniques and analyzed for each succes-sive cell division cycle(figure 10).
For in vivo studies, the success of this approach relieson the ability to efficiently label the DNA. To mapreplication origins in yeast or other organisms, the cellsmust either be permeabilized or BrdU must be efficientlyincorporated into the replicating DNA. The substitutedDNA can then be visualized following immunodetection,and analyzed in order to obtain information about thelocation of the origins and their temporal order of activa-tion (figure 11).This is possible since the size of themeasured segments corresponds to the time at whichinitiation began, assuming bidirectional replication fromthe origin and a constant replication fork velocity. How-ever, it is not known whether replication fork velocity isconstant throughout the genome or whether it varies from
Figure 9. Direct visualization of replication units on combed genomic DNA. Genomic DNA fromXenopus laevissperm chromatinwas replicated in vitro usingXenopusegg extracts.A. The entire genome was labeled in the presence of biotin-dUTP in order tovisualize and measure the lengths of all molecules analyzed on the surface.B. A second labeled nucleotide was later added to thereplicating DNA in order to distinguish between earlier and later replicating sequences.C. A merge ofA andB. Replication units wereidentified as singly labeled DNA visualized by red fluorescence. Later replicating DNA sequences were identified as doubly labeledDNA and visualized by green and red fluorescence, or simply by green fluorescence (B, D). Measurements made on the sizes ofreplication units provide a statistical assessment of replication unit size and size distribution throughout the genome. Likewise,distances measured between the midpoints of the replication units provide an assessment of replicon size and size distributions on agenome wide basis. Bar = 16µm.
Single molecule analysis of DNA replication 867

origin to origin or locus to locus. The ability to measurethe increase of replication eye sizes in time makesmolecular combing a particularly appealing approach tothe study of variations in origin activities and replicationfork velocities in different regions of the genome and indifferent genetic backgrounds.
Replication fork barriers and sites where forks arepreferentially aborted can similarly be identified by em-ploying a labeling scheme similar to that described above.In the case of replication fork barriers, a series of samplescorresponding to different time points can be taken suchthat the measurements on the signals will reveal whetherreplication is occurring bidirectionally (symmetric in-crease in signal size from time point to time point) orunidirectionally (asymmetric increase in signal size).
In addition to its potential utility for mapping replica-tion origins and studying the genetics of DNA replication,molecular combing also has the advantage that thecombed molecules retain their biological properties. In-deed, DNA synthesis itself is feasible on combed DNA.This observation is somewhat surprising given that theDNA is stretched and constrained by the irreversibleattachment of both of its extremities. However, it wasfound that the DNA polymerase activity was non-specific.
Recently we have been trying to detect DNA bindingproteins on combed DNA in order to develop a sensitiveprotein binding assay. Preliminary results show that onlyDNA binding proteins can bind to combed DNA. How-ever, it is not yet known if the proteins are bound in asequence specific manner.Figure 11shows the binding ofthe Nap and DnaA proteins to combedE. coli DNA [77].The bound protein is detected by immunofluorescence andthe molecules appear as green fibers in a confocal micro-scope. More interestingly, vesicles from an outer-membrane fraction ofE. coli have been observed associ-ated as a complex with the combed molecules [78]. Theseobservations raise the possibility that membrane/nuclearmatrix attachment sites and larger protein complexeswhich may be involved in regulating DNA replication ineukaryotes [79] can be precisely mapped along the ge-nome using other higher resolution microscopy tech-niques.
5. Conclusion
Molecular combing is a versatile new tool with a widerange of foreseeable applications. In conjunction with
Figure 10. Illustration of ARS mapping technique inS. cerevisiae.To determine the feasibility of the approach, a non-synchronousculture of cells was pulse labeled with BrdU. The cells had been genetically modified to incorporate the halogenated nucleotide. Theresult is a population of molecules combed on the coverslip, and sequences undergoing replication at the time of the pulse appear aslinear green fluorescence signals. The lengths of the signals and distances between the midpoints of adjacent signals can be measuredwith a precision of 1 to 4 kb. To map origins directly, cells are synchronized at the G1/S border and pulse labeled for different periodsof time. The samples are collected, and the DNA is extracted and combed. FISH is then applied to the combed DNA in order to identifya given region or chromosome of interest. In this manner, origins can be directly mapped with respect to the hybridized probes.Measurements made on the relative sizes of the green fluorescence signals provide an indication of their temporal order of activation,assuming a constant bidirectional replication fork velocity. An analysis of a large number of the target molecules likewise providesan assessment of the frequency of origin activation. Replication pause sites can also be identified and mapped by monitoring therelative increase in signal size over successive pulse labeled samples. A symmetric increase in signal size indicates bidirectionalreplication while an asymmetric increase in signal size indicates the presence of a pause site with replication occurring in only onedirection. In this manner a comprehensive understanding of the dynamics of DNA replication during S-phase is feasible. Bar, 10 kb.
868 Herrick and Bensimon

other methods, it is a particularly appealing approach toinvestigating those factors involved in specifying anddetermining origin locations and activities. In metazoancells, origins have been difficult to identify because of thelack of a consensus origin sequence. A broad basedapproach to localizing pulsed labeled replication unitswithin specific regions of the genome followed by map-ping of the corresponding origins using higher resolutiontechniques can be envisioned. This will permit the directcloning of specific replication origins and the identifica-tion of autonomously replicating sequences and othercis-acting determinants of origin function. In this manner,elucidating the complete replication profiles correspond-
ing to tissue-specific replication programs may now befeasible. In addition to its obvious application to thecartography of replication origins, combing may facilitatemore specific investigations into the role of chromatinstructure in mediating between transcription and replica-tion; the relationships between DNA repair, recombinationand replication; and the underlying mechanisms control-ling the transition to and progression through S-phase ofthe cell cycle.
This paper has attempted to give a comprehensive andnecessarily incomplete overview of the potential of mo-lecular combing to provide a better understanding of thehigher-order organization of DNA replication in eukary-
Figure 11. DNA binding proteins complexed with combed DNA.A. A non-specific acid phosphatase (Nap) protein fromE. coli(1 µg/slide).B. TheE. coli replication initiator protein, DnaA (0.7µg /slide; HEPES buffer, 2× 10³ M ATP). C. E. coliouter membranevesicle bound toE. coli DNA (3 µg membrane protein/slide). All three protein preparations bound onlyE. coli DNA and did not bindcombed human genomic DNA. The slides were blocked with BSA, and either the protein or the outer membrane ( [80]; obtained fromtheE. coli strain PC-2 aphA) was added in the presence of 0.1µg of calf thymus DNA. The slides were incubated for 20 min at roomtemperature. In the case of the outer membrane, 0.7µg of the DnaA protein was added and incubated for another 15 min. The slideswere then washed and the membrane and DnaA protein were detected by antisera against OmpF and DnaA followed by treatment witha second fluorescent antibody. The complexes were then visualized in a confocal microscope.
Single molecule analysis of DNA replication 869

otes. Experiments are currently underway involving anumber of different prokaryotic organisms to identifyorigins of replication and investigate origin use in bothnormal and mutant backgrounds. The variety of experi-ments now underway should confirm the utility andreliability of molecular combing as a new approach to thestudy of DNA replication.
Acknowledgments
J.H. was supported by a fellowship from the Fondation deFrance. The authors would like to thank O. Hyrien for prepara-tion of theXenopus laevissample; E. Scwhob and P. Pasero forpreparation of theSaccharomyces cerevisiaesample; M. Ko-hiyama and Gerard Geaud for their collaboration on the workinvolving DnaA, NAP and theE. coli outer membrane; and A.Bernheim and Anne-Francoise Goguel for preparation of theRCC sample.
References
[1] Chevalier S., Blow J.J., Cell cycle control of replication initiationin eukaryotes, Curr. Opin. Cell Biol. 8 (1996) 815–821.
[2] Donachie W.D., The cell cycle ofEscherichia coli,Annu. Rev.Microbiol. 47 (1993) 199–230.
[3] Campbell J.L., Yeast DNA replication, J. Biol. Chem. 268 (1993)25261–25264.
[4] Wold S., Skarstad K., Steen H.B., Stokke T., Boye E., Theinitiation mass for DNA replication inEscherichia coliK-12 isdependent on growth rate, EMBO J. 13 (1994) 2097–2102.
[5] Donachie W.D., Relationship between cell size and time ofinitiation of DNA replication, Nature 219 (1968) 1077–1079.
[6] Herrick J., Kohiyama M., Atlung T., Hansen F.G., The initiationmess?, Mol. Microbiol. 19 (1996) 659–666.
[7] Piatti S., Cell cycle regulation of S phase entry inSaccharomycescerevisiae,Progr. Cell Cycle Res. 3 (1997) 143–156.
[8] Brewer B.J., Intergenic DNA and the sequence requirements forreplication initiation in eukaryotes, Curr. Opin. Genet. Dev. 4(1994) 196–202.
[9] Messer W., Meijer M., Bergmans H.E., Hansen F.G., von Meyen-burg K., Beck E., Schaller H., Origin of replication,oriC, of theEscherichia coliK12 chromosome: nucleotide sequence, ColdSpring Harbor Symp. Quant. Biol. 43 (1979) 139–145.
[10] Aladjem M.I., Rodewald L.W., Kolman J.L., Wahl G.M., Geneticdissection of a mammalian replicator in the human beta-globinlocus, Science 281 (1998) 1005–1009.
[11] Blow J.J., DNA replication and its control, Curr. Opin. Cell Biol.1 (1989) 263–267.
[12] Elledge S.J., Cell cycle checkpoints: preventing an identity crisis,Science 274 (1996) 1664–1672.
[13] Friedman K.L., Brewer B.J., Fangman W.L., Replication profile ofSaccharomyces cerevisiaechromosome VI, Genes Cells 2 (1997)667–678.
[14] VanBrabant A.J., Hunt S.Y., Fangman W.L., Brewer B.J., Identi-fying sites of replication initiation in yeast chromosomes: lookingfor origins in all the right places, Electrophoresis 19 (1998)1239–1246.
[15] Wohlgemuth J.G., Bulboaca G.H., Moghadam M., Caddle M.S.,Calos M.P., Physical mapping of origins of replication in thefission yeastSchizosaccharomyces pombe,Mol. Biol. Cell 5(1994) 839–849.
[16] Zhu J., Newlon C.S., Huberman J.A., Localization of a DNAreplication origin and termination zone on chromosome III ofSaccharomyces cerevisiae,Mol. Cell Biol. 12 (1992) 4733–4741.
[17] Brewer B.J., Fangman W.L., Mapping replication origins in yeastchromosomes, BioEssays 13 (1991) 317–322.
[18] Dijkwel P.A., Hamlin J.L., Sequence and context effects on originfunction in mammalian cells, J. Cell Biochem. 62 (1996) 210–222.
[19] Ferguson B.M., Fangman W.L., A position effect on the time ofreplication origin activation in yeast, Cell 68 (1992) 333–339.
[20] Friedman K.L., Diller J.D., Ferguson B.M., Nyland S.V., BrewerB.J., Fangman W.L., Multiple determinants controlling activationof yeast replication origins late in S phase, Genes Dev. 10 (1996)1595–1607.
[21] Harland R.M., Laskey R.A., Regulated replication of DNA micro-injected into eggs ofXenopus laevis,Cell 21 (1980) 761–771.
[22] Mechali M., Kearsey S., Lack of specific sequence requirement forDNA replication in Xenopuseggs compared with high sequencespecificity in yeast, Cell 38 (1984) 55–64.
[23] Zannis-Hadjopoulos M., Price G.B., Regulatory parameters ofDNA replication, Crit. Rev. Eukaryotes Gene Exp. 8 (1998)81–106.
[24] Hyrien O., Mechali M., Chromosomal replication initiates andterminates at random sequences but at regular intervals in theribosomal DNA ofXenopusearly embryos, EMBO J. 12 (1993)4511–4520.
[25] Mahbubani H.M., Paull T., Elder J.K., Blow J.J., DNA replicationinitiates at multiple sites on plasmid DNA inXenopusegg extracts,Nucleic Acids Res. 20 (1992) 1457–1462.
[26] Coverley D., Laskey R.A., Regulation of eukaryotic DNA repli-cation, Annu. Rev. Biochem. 63 (1994) 745–776.
[27] Depamphilis M.L., The search for origins of DNA replication,Methods 13 (1997) 211–219.
[28] Ferreira J., Carmo-Fonseca M., Genome replication in early mouseembryos follows a defined temporal and spatial order, J. Cell Sci.110 (1997) 889–897.
[29] Cairns J., The chromosome ofE. coli, Cold Spring Harbor Symp.Quant. Biol. 00 (1963) 43.
[30] Huberman J.A., Riggs A.D., Autoradiography of chromosomalDNA fibers from Chinese hamster cells, Proc. Natl. Acad. Sci.USA 55 (1966) 599–606.
[31] Jasny B.R., Tamm I.J., Temporal organization of replication inDNA fibers of mammalian cells,Cell Biol. 81 (1979) 692–697.
[32] Hand R., Gautschi J.R., Replication of mammalian DNA in vitro.Evidence for initiation from fiber autoradiography, J. Cell Biol. 82(1979) 485–493.
[33] Blumenthal A.B., Kriegstein H.J., Hogness D.S., The units ofDNA replication inDrosophila melanogasterchromosomes, ColdSpring Harbor Symp. Quant. Biol. 38 (1974) 205–223.
[34] Boggs B.A., Chinault A., Analysis of DNA replication by fluores-cence in situ hybridization, Methods 13 (1997) 259–270.
[35] Tomilin N., Rosanov Y.U., Zenin V., Bozhkov V., Vig B., A newand rapid method for visualising DNA replication in spread DNAby immunofluorescence detection of incorporated5-iododeoxyuridine, Biochem. Biophys. Res. Commun. 190(1993) 257–262.
[36] Haaf T., High-resolution analysis of DNA replication in releasedchromatin fibers containing 5-bromodeoxyuridine, Biotechniques21 (1996) 1050–1054.
[37] Rosenberg C., Florijn R.J., Van de Rijke F.M., Blonden L.A., RaapT.K., van Ommen G.J., den Dunnen J.T., High resolution DNAfiber-fish on yeast artificial chromosomes: direct visualization ofDNA replication, Nature Genet. 10 (1995) 477–479.
[38] Baldrich K., Baldrich M., Monaco A.P., Muller C.R., Replicationerrors may contribute to the generation of large deletions andduplications in the dystrophin gene, Hum. Mutat. 1 (1992)280–287.
[39] Wiegant J., Kalle W., Mullenders L., Brookes S., Hoovers J.M.,Dauwerse J.G., van Ommen G.J., Raap A.K., High-resolution insitu hybridization using DNA halo preparations, Hum. Mol. Genet.1 (1992) 587–591.
870 Herrick and Bensimon
[40] Parra I., Windle B., High resolution visual mapping of stretchedDNA by fluorescent hybridization, Nature Genet. 5 (1993) 17–21.
[41] Fidlerova H., Senger G., Kost M., Sanseau P., Sheer D., Twosimple procedures for releasing chromatin from routinely fixedcells for fluorescence in situ hybridization, Cytogenet. Cell Genet.65 (1994) 203–205.
[42] Houseal T.W., Dackowski W.R., Landes G.M., Klinger K.W., Highresolution mapping of overlapping cosmids by fluorescence in situhybridization, Cytometry 15 (1994) 193–198.
[43] Heiskanen M., Hellsten E., Kallioniemi O.P., Makela T.P., AlitaloK., Peltonen L., Palotie A., Visual mapping by fiber-FISH,Genomics 30 (1995) 31–36.
[44] Heng H.H., Squire J., Tsui L.C., High-resolution mapping ofmammalian genes by in situ hybridization to free chromatin, Proc.Natl. Acad. Sci. USA 89 (1992) 9509–9513.
[45] Raap A.K., Advances in fluorescence in situ hybridization, Mutat.Res. 400 (1998) 287–298.
[46] Bensimon A., Simon A., Chiffaudel A., Croquette V., Heslot F.,Bensimon D., Alignment and sensitive detection of DNA by amoving interface, Science 265 (1994) 2096–2098.
[47] Allemand J.F., Bensimon D., Jullien L., Bensimon A., CroquetteV., pH-dependent specific binding and combing of DNA, Biophys.J. 73 (1997) 2064–2070.
[48] Michalet X., Ekong R., Fougerousse F., Rousseaux S., Schurra C.,Hornigold N., van Slegtenhorst M., Wolfe J., Povey S., BeckmannJ.S., Bensimon A., Dynamic molecular combing: stretching thewhole human genome for high-resolution studies, Science 277(1997) 1518–1523.
[49] Herrick J., Bensimon A., Single molecule imaging of DNA,Chrom. Res. 00 (1999), in press.
[50] Herrick J., Michalet X., Conti C., Schurra C., Bensimon A.,Quantifying single copy number by measuring fluorescent probelengths on combed genomic DNA, Proc. Natl. Acad. Sci. USA 00.
[51] Sherr C.J., Cancer cell cycles, Science 274 (1996) 1672–1677.[52] Mai S., Overexpression of c-myc precedes amplification of the
gene encoding dihydrofolate reductase, Gene 148 (1994) 253–260.[53] Dang C.V., Lewis B.C., Dolde C., Dang G., Shim H., Oncogenes
in tumor metabolism, tumorigenesis, and apoptosis, J. BioengBiomembr. 29 (1997) 345–354.
[54] Umar A., Kunkel T.A., DNA-replication fidelity, mismatch repairand genome instability in cancer cells, Eur. J. Biochem. 238 (1996)297–307.
[55] Glukhova L., Goguel A.F., Chudoba I., Angevin E., Pavon C.,Terrier-Lacombe M.J., Meddeb M., Escudier B., Bernheim A.,Overrepresentation of 7q31 and 17q in renal cell carcinomas,Genes Chrom. Cancer 22 (1998) 171–178.
[56] Dean M., Park M., Le Beau M.M., Robins T.S., Diaz M.O.,Rowley J.D., Blair D.G., VandeWoude G.F., The human metoncogene is related to the tyrosine kinase oncogenes, Nature 318(1985) 385–388.
[57] Mills A.D., Blow J.J., White J.G., Amos W.B., Wilcock D., LaskeyR.A., Replication occurs at discrete foci spaced throughout nucleireplicating in vitro, J. Cell Sci. 94 (1989) 471–477.
[58] Cox L.S., Laskey R.A., DNA replication occurs at discrete sites inpseudonuclei assembled from purified DNA in vitro, Cell 66(1991) 271–275.
[59] Jackson D.A., Nuclear organization: uniting replication foci,chromatin domains and chromosome structure, BioEssays 17(1995) 587–591.
[60] Federico C., Saccone S., Bernardi G., The gene-richest bands ofhuman chromosomes replicate at the onset of the S-phase, Cyto-genet. Cell Genet. 80 (1998) 83–88.
[61] Miura I., Ohtani H., Nakamura M., Saitoh K., Fluorescencereplication banding of frog chromosomes, Cell. Mol. Life Sci. 53(1997) 73–77.
[62] Craig J.M., Bickmore W.A., Chromosome bands--flavours tosavour,BioEssays 15 (1993) 349–354.
[63] Ishimi Y., Matsumoto K., Ohba R., DNA replication from initia-tion zones of mammalian cells in a model system, Mol. Cell Biol.14 (1994) 6489–6496.
[64] Kobayashi T., Rein T., DePamphilis M.L., Identification of pri-mary initiation sites for DNA replication in the hamster dihydro-folate reductase gene initiation zone, Mol. Cell Biol. 18 (1998)3266–3277.
[65] Hamlin J.L., Dijkwel P.A., On the nature of replication origins inhigher eukaryotes, Curr. Opin. Genet. Dev. 5 (1995) 153–161.
[66] Strehl S., LaSalle J.M., Lalande M., High-resolution analysis ofDNA replication domain organization across an R/G-band bound-ary, Mol. Cell Biol. 17 (1997) 6157–6166.
[67] Gunaratne P.H., Nakao M., Ledbetter D.H., Sutcliffe J.S., ChinaultA.C., Tissue-specific and allele-specific replication timing controlin the imprinted human Prader-Willi syndrome region, Genes Dev.9 (1996) 808–820.
[68] Knoll J.H., Cheng S.D., Lalande M., Allele specificity of DNAreplication timing in the Angelman/Prader-Willi syndrome im-printed chromosomal region, Nature Genet. 6 (1994) 41–46.
[69] Deschavanne P., Filipski J., Correlation of GC content withreplication timing and repair mechanisms in weakly expressedE.coli genes, Nucleic Acids Res. 23 (1995) 1350–1353.
[70] Sharp P.M., Lloyd A.T., Regional base composition variation alongyeast chromosome III: evolution of chromosome primary struc-ture, Nucleic Acids Res. 21 (1993) 179–183.
[71] Aladjem M.I., Groudine M., Brody L.L., Dieken E.S., FournierR.E., Wahl G.M., Epner E.M., Participation of the human beta-globin locus control region in initiation of DNA replication,Science 270 (1995) 815–819.
[72] Kitsberg D., Selig S., Brandeis M., Simon I., Keshet I., DriscollD.J., Nicholls R.D., Cedar H., Allele-specific replication timing ofimprinted gene regions, Nature 364 (1993) 459–4563.
[73] Selig S., Okumura K., Ward D.C., Cedar H., Delineation of DNAreplication time zones by fluorescence in situ hybridization,EMBO J. 11 (1992). 1217–1225.
[74] Litmanovitch T., Altaras M.M., Dotan A., Avivi L., Asynchronousreplication of homologous alpha-satellite DNA loci in man isassociated with nondisjunction, Cytogenet. Cell Genet. 81 (1998)26–35.
[75] Amiel A., Litmanovitch T., Lishner M., Mor A., Gaber E., Tangi I.,Fejgin M., Avivi L., Temporal differences in replication timing ofhomologous loci in malignant cells derived from CML andlymphoma patients, Genes. Chrom. Cancer 22 (1998) 225–231.
[76] Amiel A., Litmanovich T., Gaber E., Lishner M., Avivi L., FejginM.D., Asynchronous replication of p53 and 21q22 loci in chroniclymphocytic leukemia, Hum. Genet. 101 (1997) 219–222.
[77] Reshetnyak E., d’Alencon E., Kern R., Taghbalout A., Guillaud P.,Kohiyama M., Hemi-methylated oriC DMA binding activity foundin non-specific acid phosphatase, Mol. Microbiol. 31 (1999)167–175.
[78] Shakibai N., Ishidate K., Reshetnyak E., Gunji S., Kohiyama M.,Rothfield L., High-affinity binding of hemimethylated oriC byE-scherichia colimembranes is mediated by a multiprotein systemthat includes SeqA and a newly identified factor, SeqB, Proc. Natl.Acad. Sci. USA 95 (1998)11117–11121.
[79] Hyrien O., Maric C., Lucas I., Role of nuclear architecture in theinitiation of eukaryotic DNA replication, Biochimie 79 (1992)541–548.
[80] Landoulsi A., Malki A., Kern R., Kohiyama M., Hughes P., The E.,coli cell surface specifically prevents the initiation of DNAreplication at oriC on hemimethylated DNA templates, Cell 63(1998) 1053–1060.
Single molecule analysis of DNA replication 871