Electron microscopic analysis of DNA replication in main band and satellite DNAs of Drosophila...
27
J. Mol. Biol. z (1976) 108, 305v331 Electron Microscopic Analysis of DNA Replication in Main Band and Satellite DNAs of Drosophila virilis V m o r ~ A. ZAKTA~t Department of Biology, Yale University New Haven, Conn. 06520, U.S.A. (Received 9 April 1976, and in revised form 10 August 1976) ]:)NA was isolated from pre-blastoderm embryos of Drosophila virilis and fractionated by CsC1 centrifugation. Fractions containing main band or satellite DNAs were examined by electron microscopy for replicating structures. Replication of main band DNA proceeded from many sites on a chromosome. Two classes of presumptive replicating molecules with more than one site of replication were seen in main band DNA. The first class contained one or more clusters of small eyes (all eyes less than or equal to 900 bases in size), whereas the second class was comprised of molecules with eyes of larger sizes. Many cluster-to-cluster distances in molecules in the first class and many eye-to-eye distances in molecules in the second class were equal to about 4000 bases or multiples thereof. These data are consistent with the following model. Replication in main band DNA is initiated by activation of 2 to 12 closely spaced origins. These clusters of origins are spaced at regular intervals along the chromosome and eventually fuse to produce larger eyes which are also spaced in a regular manner. Regular spacing of initiation sites is true for at least short stretches of the chromosome. However, it is possible that these regularly spaced sites are them- selves part of a larger pattern of chromosome organization. Like the replication of main band DNA, that of satellite DNA proceeded, at least in part, by a chromosomal fork mechanism. However, linear replicating molecules were about five times less common in satellite than in main band DNA. As in main band D~A, single-stranded regions at fork junctions were small in comparison to those described in prokaryotes. There was no evidence for either clustering of initiation sites or regular spacing of eyes in satellite DNA. Thus, the organization of initiation sites appeared different in the two classes of DNA. In addition to conventional linear replicating molecules, structures were seen in satellite DNA which could be involved in extrachromosomal replication of some satellite sequences. However, these structures could also be explained by breakage of replicating molecules followed by reassociation of single-stranded regions. 1. Introduction Satellite DNAs are simple sequence DNAs which are repeated many times in tandem arrays in the chromosomes of eukaryotes. Over 40% of the diploid DNA in Drosophila virilis is composed of three major satellites (Gall et al., 1971). Each satellite bands at a unique position in isopycnic CsC1 gradients at a buoyant density lower than that for D. virilis main band sequences (p----1.700 g/craB). Satellite I comprises about 25% of diploid DNA (p ~-- 1.692 g/cm3), whereas satellites II (p ---- 1.689 g/era 3) and III (p ~ 1.671 g/cm 3) each contribute about 8% to the total. Each satellite is tPrcsent address: Department of Genetics, University of Washington, Seattle, Wash. 98195, U.S.A. 3O5
-
Upload
independent -
Category
Documents
-
view
0 -
download
0
Transcript of Electron microscopic analysis of DNA replication in main band and satellite DNAs of Drosophila...

J. Mol. Biol. z (1976) 108, 305v331
Electron Microscopic Analysis of D N A Replication in Main Band and Satellite D N A s of Drosophila virilis
Vmor~ A. ZAKTA~t
Department of Biology, Yale University New Haven, Conn. 06520, U.S.A.
(Received 9 April 1976, and in revised form 10 August 1976)
]:)NA was isolated from pre-blas toderm embryos of Drosophila virilis and f rac t ionated by CsC1 centrifugation. Frac t ions containing main band or satell i te DNAs were examined by electron microscopy for replicat ing structures.
Repl icat ion of main band DNA proceeded from many sites on a chromosome. Two classes of presumpt ive replicating molecules with more than one site of replicat ion were seen in main band DNA. The first class contained one or more clusters of small eyes (all eyes less than or equal to 900 bases in size), whereas the second class was comprised of molecules with eyes of larger sizes. Many cluster-to-cluster distances in molecules in the first class and many eye-to-eye distances in molecules in the second class were equal to about 4000 bases or mult iples thereof. These da t a are consistent with the following model. Repl icat ion in main band DNA is in i t ia ted b y act ivat ion of 2 to 12 closely spaced origins. These clusters of origins are spaced a t regular intervals along the chromosome and eventual ly fuse to produce larger eyes which are also spaced in a regular manner . Regular spacing of ini t ia t ion sites is t rue for a t least short stretches of the chromosome. However, i t is possible tha t these regularly spaced sites are them- selves pa r t of a larger pa t t e rn of chromosome organization.
Like the replication of main band DNA, t ha t of satelli te D N A proceeded, a t least in par t , b y a chromosomal fork mechanism. However, l inear replicating molecules were about five t imes less common in satelli te t han in main band DNA. As in main band D ~ A , single-stranded regions a t fork junctions were small in comparison to those described in prokaryotes . There was no evidence for either clustering of ini t iat ion sites or regular spacing of eyes in satelli te DNA. Thus, the organization of ini t ia t ion sites appeared different in the two classes of DNA. I n addi t ion to conventional l inear replicat ing molecules, s tructures were seen in satelli te DNA which could be involved in extrachromosomal replication of some satelli te sequences. However, these structures could also be explained by breakage of replicat ing molecules followed by reassociation of single-stranded regions.
1. In troduct ion
Sate l l i t e D N A s are s imple sequence D N A s which are r e p e a t e d m a n y t imes in t a n d e m a r r a y s in t he chromosomes of eukaryo tes . Over 4 0 % of t he d ip lo id D N A in Drosophila virilis is composed of th ree m a j o r sa te l l i tes (Gall et al., 1971). E a c h sa te l l i te b a n d s a t a un ique pos i t ion in i sopycnic CsC1 grad ien t s a t a b u o y a n t d e n s i t y lower t h a n t h a t for D. virilis m a i n b a n d sequences (p----1.700 g/craB). Sa te l l i t e I comprises a b o u t 2 5 % of d ip lo id D N A (p ~-- 1.692 g/cm3), whereas satel l i tes I I (p ---- 1.689 g/era 3) a n d I I I (p ~ 1.671 g /cm 3) each con t r i bu t e a b o u t 8 % to t he to ta l . E a c h sa te l l i te is
tPrcsent address: Department of Genetics, University of Washington, Seattle, Wash. 98195, U.S.A.
3O5
306 V . A . ZAKIAN
an homogenous repeating heptanucleotide, and the sequences of all three are related to each other by simple base-pair changes in the heptanucleotide repeat unit (Gall & Atherton, 1974). Like satellite DNAs from many other organisms, satellite I from D. virilis has been localized in eentromeric heterochromatin by the technique of in situ hybridization (Gall etal., 1971). Although much has been learned about the physical and chemical properties of satellite D1WAs, such as those from D. virilis, little is known about their function, origin, or maintenance in eukaryotic genomes.
Electron microscopy has been used to study replication of many prokaryotic D1WAs. In contrast, eukaryotic systems are less amenable to electron microscopic analyses of replication due to the low percentage of replicating molecules in most eukaryotie D1WAs. However, the rapid mitotic divisions in early embryos of certain dipteran insects result in a detectable level of replicating molecules in DNAs isolated from embryos at pre-blastoderm stages (Wolstenholme, 1973; Kriegstein & Hogness, 1974; Lee & Pavan, 1974). A detailed examination of replication sites in main band DNA from pre-blastoderm embryos of Drosophila melanogaster led Blumenthal etal. (1973) to the conclusions that most initiation sites in this DNA were (1) spaced at regular intervals along the chromosome and (2) activated relatively synchronously early in S-phase.
In the studies reported here, main band and satellite DNAs were isolated from pre-blastoderm embryos of D. virilis and examined by electron microscopy. The results, described elsewhere (Zakian, 1975), indicate that replication of main band sequences is initiated at multiple origins which are spaced in a regular manner at intervals of 4000 bases or multiples thereof. In contrast, initiation sites in chromoso- mal satellite DNAs do not appear to be organized in a regular pattern similar to that detected in main band. Moreover, it is possible that some satellite sequences are replicated via extrachromosomal mechanisms.
2. Materials and Methods (a) Raising of flie~, collection of eggs and timing of early development
Wild type D. virilis (Pasadena) flies were raised in �89 bottles on standard corn meal/molasses/agar medium. Flies were kept at 21 to 24~ on a schedule of 12 h darkness and 12 h light. Flies which emerged during 5-day periods were removed from 100 to 200 bottles and added to a population cage 63.5 cm X 63.5 cm • 63.5 cm. Flies in cages were fed a thick paste of live bakers' yeast and water spread on the surface of 140 mm diameter Petri dishes filled with a grape juice/agar medium composed of 12~/o unsweetened grape juice, 0.8% propionic acid, 2"5% ethanol, and 3"3% (w/v) agar.
During peak egg-laying days, 6 to 8 plates were added to the population cage at the start of the dark period. Eggs used for determination of developmental events and extrac- tion of replicating D1WA were collected during dark periods only for periods of 1 h or less. The first collection in the dark was not used for extraction of replicating D1WA. Eggs used for isolation of mitochondrial DNA were collected for times of 12 to 19 h during both light and dark periods. Eggs used for isolation of replicating DNA were usually allowed to develop for an additional 1.5 h after collection before processing, whereas eggs used for mitochondrial DNA isolations were processed immediately after collection.
After collection and/or further ageing, eggs were washed off the agar plates, repeatedly rinsed with water to remove yeast, and then deehorionated by immersion in 5.25 ~o sodium hypochlorite (commercial Clorox) for 2 rain. Dechorionated eggs were rinsed with Droso- phila Ringer (Robb, 1969) and then with 15 m~-NaC1, 10 m-~-EDTA, 5 m~-Tris (pH 8"0). Eggs for staging of developmental events were used directly, while eggs for DNA extrac- tions were stored at --40~ for up to 3 months before use.
Embryos collected for �89 to l h and aged for varying lengths of time were examined in
D. V I R I L I S DNA R E P L I C A T I O N 307
a number of ways to determine the rate of early development in D. vir/l/s. Nuclei were counted in Giemsa-stained squash preparations (Rice, 1973) and Feulgen-stained whole mounts (Bakken, 1973) to establish the length of the cell cycle in pre-blastoderm embryos. The time of pole cell formation was determined by dh'ect observation of living embryos by light microscopy.
(b) Extraction of nuclear D1VA from pre-blastoderm embryos Two different extraction procedures were used. I n extraction I, about 2 g dechorionated
embryos were extracted using the method of Kriegstein & Hogness (1974). Eggs were homogenized at 4~ in an ice-cold homogenization buffer of 1 M-hexylene glycol (2,methyl- 2,4-pentanediol, Baker Chemical Co.), 10 mM-CAPS buffer (cyclohexylaminopropane sulfonie acid; A grade Calbiochem) and 2 mM-CaC12 (pH 10"4). The homogenate was passed through a piece of Nitex ASTM cloth (230 mesh, 62 ~m pore size; Tobler, Ernst , Traber, Inc.) and then spun at 1935 g, 10 rain, 4~ The supernata~t was discarded and the pelleted nuclei resuspended in 0.01 M-EDTA, 0"01 M-CAPS (pH 10.4) lysed with an equal volume of 2% Sarkosyl, and then gently shaken for 5 rain at room temperature. The lysate was transferred to a centrifuge tube containing 6.63 g solid CsC1 (optical grade, Harshaw Chemical Co.). 3H-labeled Xenopus laevis main band DNA (24,000 cts/min per ~g) was added to the gradient as a density marker (g---- 1.700 g/cma). The X. laevis DNA, isolated from labeled ovaries and supplied by Drs A. P. Bird and J. D. Rochaix, contained no detectable replicating or non-linear molecules when examined by electron microscopy. The weight of CsC1 plus solution was brought to a total of 11.97 g by the addition of 0.01 M-EDTA, 0.01 M-CAPS. The tube was shaken gently to dissolve the CsC1, and the refractive index was adjusted to 1.3985. The gradient was sptm at 35,000 revs/min in a Spinco 50 rotor (aluminium) for 68 h at 18~ After centrifugation, fractions of about 100 ~1 each were collected from the top of the gradient using the ISCO model 183 density fractionator. Fractious were sampled for radioactivity, pooled into 4 batches, diluted with 0" 1 • SSC (SSC is 0" 15 M-NaC1, 0"015 M- sodium citrate, pH 7"0), and spun at 40,000 revs/min, in a Spinco SW41 rotor for 24 h at 18~ The resulting DNA pellets were dissolved in a small amount of 0.1 • SSC and sampled for electron microscopy.
A second batch of DNA (extraction II) was extracted using a modification of the methods of Kavenoff & Zimm (1973). A total of 4 g of eggs were thawed and homogenized at 4~ in an ice-cold homogenization buffer of 0-5 m-sucrose, 1.5 .mM-MgC12, 0.01 ~-Tris (pH 7.6). The homogenate was filtered through Nitex cloth and centrifuged at 1085 g for 10 rain. The pellet was resuspended in 0"5 M-EDTA, 0.01 M-Tris (pH 9.5) and added to lysis solution at 65~ The lysis solution was 1~ (w/v) sodium dodeeyl sulfate (Sigma) in 0.5 M-EDTA, 0-01 M-Tris (pH 9"5). After 30 rain at 65~ the mixture was cooled to 50~ and 2 mg of self-digested Pronase added. After 4 h at 50~ an equal volume of 0.1 • SSC was added to the lysate and the mixture homogenized to break up the thick fibrous material. The solution was then shaken with an equal volume of water-saturated phenol for 10 min and spun at 12,100 g for 10 rain. The aqueous layer was removed, 2 voL cold 95% ethanol were added, and the DNA pelleted by centrifugation. The DNA was then dissolved in 0.1 • SSC and mixed with solid CsC1 to produce a solution with a refractive index of 1.3992. 14C-labeled GL-Tetrahymena pyriformis main band DNA (40,800 cts/min per ~g; p --~ 1-689 g/cm 3) and all-labeled D. virilis diploid DNA (200,000 cts/min per/~g) were included as density markers. The T. pyriformi~ [I~C]DNA was prepared by K. Karrer from log phase cells and the D. virilis [3H]DNA was prepared by Dr E. H. Cohen from a pr imary line of D. virilis tissue culture cells derived from embryos. Neither labeled DNA contained detectable replicating or non-linear molecules when examined by electron microscopy. Gradients were mm in a Spinco 50 rotor (aluminium) at 35,000 revs/min for 72 h at 18~ The gradient wa~ collected from the top in fractions of about 190 ~1 each. Each fraction was assayed for 3H and 14C radioactivity. Individual fractions were diluted with 0.1 • SSCandcharacter izedbyanalyt iealul t racentr i fugat ionandelectronmieroscopy.
(c) Isolation of mitochondrial DNA About 10 g of dechorionated, frozen eggs were used for each isolation of mitochondrial
DNA. DNA was isolated by a combination of the methods of Bul tmann & Laird (1973)
308 V.A. ZAKIAN
and Polan et a~. (1973). Eggs were homogenized at 4~ in ice-cold homogenization buffer (0-5 M-sucrose, 1"5 mM-MgCI2, 0.01 M-Tris, pH 7-6). The homogenate was filtered through Nitex cloth and centrifuged 4 times at 1085 ~ for 5 rain per spin, discarding the nuclear pellet after each spin. After the final spin, the supernata~t was adjusted to 1.5 mM-EDTA. A crude mitoehondrial pellet was obtained by spinning the mixture at 17,300 g for 20 rain. I t was then resuspended in homogenization buffer brought to 1.5 mM-EDTA and spun again at 17,300 g for 20 min. The second pellet was suspended in 0.5 M-sucrose, 0"5 mM-EDTA, 1-0 raM-Tris (pH 7.6), mixed vigorously, and layered on the top of 0"9 to 2.1 M-sucrose gradients (sucrose gradient buffer was 0.5 n ~ - E D T A , 1 mM-Tris, pH 7.6). Sucrose gradients were centrifuged in a Beckman SW 25.1 rotor at 25,000 revs/min for 90 rain at 4~ Fractions of 1 ral were collected by hand from the top of each gradient. Fractions were pooled into 3 batches, diluted to a final concentration of 0"5 M-sucrose with sucrose gradient buffer, and spun at 17,300 g for 20 rain. The pellet was suspended in a small amount of 0.1 M-EDTA, 0"05 M-Tris (pH 8"0) and lysed with an equal volume of 4% Sarkosyl (sodium dodecyl sareosinate; Geigy) in the same buffer. The lysate was shaken at room temperature for 1 h. Eth id ium bromide/CsC1 gradients were made up by the method of Nisioka ct ~ . (1970), spun in a Beckman type 50 rotor at 35,000 revs/min for 65 h at 18~ and collected in 8-drop fractions after piercing the bot tom of the tube with a 27-gauge needle. The presence of DNA was determined by electron microscopy. Fractions containing closed circular DNA were pooled and the ethidium bromide removed using the method of Firtel & Bonner (1972). The DNA was then characterized by analytical ultracentrifugation and electron microscopy.
(d) Electron microscopy and measuring of DNA molecules DNA was prepared for electron microscopy using the formamide technique of DNA
spreading as described by Davis et al. (1971}. Most DNA preparations wore made with a spreading solution of 50~/o formamide. Grids were stained in uranyl acetate, rotary shadowed with 80~o pla t imun/20% palladium wire (EM Sciencos) at an anglo of 7 ~ and examined in oither a Philips EM200 or Philips EM300 electron microscope. The double-stranded relaxed circular form of ~X174 DNA (RFII) , kindly supplied by Dr N. Godson, was used as an internal size marker. Molecules to be measured were photo- graphed and later traced by using the projectod image produced by a photographic enlarger. The tracings were measured with a map measurer. Lengths (in em) woro converted to daltons or 103 bases by comparison with the contour length of ~X174 DNA measured at the same magnification. The contour length of ~X174 was assumed to be 3.4• 106 daltons or 5"1 • 103 bases (Roehalx et al., 1974). With very few exceptions, r and the molocule to be measured were traced from the same plate.
(e) Criteria.for counting of molecules A scanning method was devised which avoided duplicate counting of molecules and
limited statistical analysis to molecules of at least 12.2 • 106 daltons in size. Sca~nlng of grids for statistical purposes was done with a Philips EM300 electron microscope at a magnification of 3600 • at the level of the viewing screen. Molecules were counted if their contour lengths were greater than or equal to the diameter of the viewing screen, which corresponds to a contour length of 6.1 ~m or 12.2 • 10 e daltons.
All scanning was done from right to left in the microscope field. Molecules whose ends were in the viewing field were followed to their other end and counted if (1) their contour length was greater than or equal to the diameter of the viewing screen, (2) neither end was off the grid square, (3) the entire length of the molecule was traceable, and (4) the molecule did not fall to the right of the field for a distance of greater than the diameter of the viewing screen. Scanning for the next molecule was begun at the leftmost par t of the last molecule examined.
(f) Electron microscopy of satellite D1VAs i~olated from whole flies Satellites I and I I I DNAs supplied by Dr J. G. Gall were isolated from whole flies and
purified to homogeneity by successive eentrffugation in cesium salt gradients (Gall & Atherton, 1974). Samples of both DNAs were spread by the formamide technique and examined by electron microscopy.

D. V I R I L I S DNA REPLICATION 309
(g) Analytical ultracentrifugation DNA samples in CsCI were centrifuged in the Spinco model E analytical ultracentrifuge
at 44,770 revs/min for 18 to 22 h at 20~ Micrococcu~ lysodeikticus (p = 1.731 g/cm 3) was added as a density marker. Photographs were taken with u.v. absorption optics and traced with a Joyce-Loebl microdensitometer. The buoyant density of a sample was determined by computer program by comparing the sample position with that of M. lysodeikticus. Relative amounts of DNA were determined by cutting out and weighing individual peaks from microdensitometer tracings. Absolute amounts of DNA were determined by comparing the weight of the tracing of an unknown DNA with that of a known amount of M. lysodelkticus from the same tracing. Quantitation was done with tracings of filn~u within the linear exposure range.
3. Resul t s
(a) Timing of early development in D. virilis
The average t ime of pole cell formation in D. virilis as determined by direct observation of living embryos was 1 8 5 i 1 5 minutes after egg deposition. Information from Giemsa-stained squash preparations and Feulgen-stained whole mounts was com- bined to give an estimate of 20 minutes for the length of the cell cycle in pre-blastoderm embryos.
Eggs used for extraction of replicating DNA were usually frozen at an age of 2-t- 0.5 hours from the time of egg deposition. Embryos were, therefore, in the midst of early cleavage divisions with about 32 (5th division) to 256 (8th division) nuclei per embryo. Because egg deposition in Drosophila can occur at varying times after fertilization (Huettner, 1923), batches of embryos were routinely checked for syn- chrony by observing the time of pole cell formation in eight to ten eggs from each batch. These representative embryos always began pole cell formation within the time range determined for control eggs. Therefore, most or all eggs used for isolation of replicating DNA were frozen during the pre-blastoderm state of development.
Examinat ion of later events in the life cycle of D. virilis indicated tha t i t takes approximately 34 hours from egg deposition to the hatching of the larva, about six days from hatching to pupation, and 6.5 days from pupation to emergence of the adult.
(b) Identification of main band DNA
DNA from extraction I was pooled into four fractions (Fig. l(a)). Fraction 4 was identified as main band DNA by its co-banding with 8It-labeled X. laevis main band DNA, which has the same buoyant density in CsC1 (p ---- 1.700 g/cm 8) as D. virilis main band DNA.
All studies of main band DNA from extraction I I were done on a single fraction (19) from the CsCl gradient (Fig. l(b)). A sample of fraction 19 was run in the analy- tical ultracentrifuge and shown to have the buoyant density of D. virilis main band DI~A (p = 1-700 g/cmS), and to be free of detectable contamination with satellite DNAs.
(c) Percentage of replicating molecules in main band DNA
Molecules containing eyes and/or forks were defined as replication structures. Out of a population of 1005 linear molecules of main band DNA from extraction II , 15 molecules (1-5~) contained eye forms; 31 molecules (3"1~/o) contained forks.

310 V. A. Z A K I A N
c
o
o o o lO o -'r
wt
600
500
400
300
200
I00
0
(a )
Light
aci n2 / , Fraction I ,,Fr t o , ....t" ' - . I I ~ - " " . . . . . . - ' - - - - - " - . - "~ ' I I ' - - - . , . . . . " I I * - " "
Fraction 4
r-Fraction 5 - 1 / / Heavy
\
(b)
240
200 c
E Light Heavy
1 6 0 - 80 =...
"~- �9 c u �9 / �9 Fr. 19
/ ,,'X "" -
o Fr. 15 \ . ^ .=~ -~ so /Fr.I,Z I / ~ "~ - , '*u ~,
�9 I - - I X - " O I ._ Fr. 8 / ,-'% o \ -0 o
40 e " " ' \ I / - , , " \ �9 \ , , e , ,e,e--e, ~ ~.. ~ZO " �9 ' * "~'tTi~' " , . .0_ " "0 "~. ," " , l
O~-e-o"~. Fr. 9, O"o.~ .O.-e -e-o'.~oe"O-o . . .e_e. .o I I I I I I I I l I I i I I I I I I I i I I I I I I I I I I I ~ i i i I i i |
5 I0 15 20 25 :30 55
Fraction number
FIe. 1. Fractionation in CsC1 of pre-blastoderm DNA from (a) extraction I and (b) extraction II.
(a) DNA was extracted from 2 g embryos using the methods of Kriegstein & Hogness (1974). X. ~ v / s main band [aHJDNA (# ----- 1-700 g/cm 3) was added as a density marker. Samples were assayed for radioactivity and then pooled inf, o 4 fractions as indicated. Each or" these fractions was examined by electron microscopy.
(b) DNA was extracted from 4 g embryos using a modification of the methods of Kavenoff & Zimm (1973). T. pyr/form/a [z4C]DNA (p = 1.689 g/cm a) and D. virilia diploid [aH]DNA were added as density markers. Fractions were assayed for 14C and 3H radioactivity. Fractions 8, 9, 12, 13 and 19 were analyzed by both ultracentrifugation and electron microscopy.
Therefore, a to ta l of 4"6% of the l inear molecules from m a i n b a n d D N A conta ined
repl icat ion structures.
The mean size of all measured repl icat ing m a i n b a n d molecules (extractions I and I I ) was 32.8 • 106 dal tons (49.2 • 103 bases) (N = 134). Because 10~/o of the measured
molecules overlapped a grid bar, bo th their lengths a nd the m e a n molecular weight
of repl icat ing molecules were underes t imated . The m e a n size of repl icat ing molecules
D. V I R I L I S DNA REPLICATION 311
from extraction I I was 40.4• 106 daltons or 60.6• 103 bases. I t was DNA from extraction I I tha t was examined for the percentage of replicating molecules. To determine the percentage of replicating molecules, only molecules greater than 12.2 • 106 daltons were counted, although all observed molecules with eyes and]or forks were photographed and measured. A total of 93% of replicating molecules from extraction I I were greater than or equal to 12.2 • 106 daltons. Since the mean size of non-replicating molecules was as large as for replicating molecules, statistical analysis included most DNA molecules.
In the following analyses of main band replicating molecules, data from extractions I and I I were pooled. A total of 134 molecules was measured. Of the measured repli- cating molecules, 420/o contained a single eye, 4~/o contained only forks, and 54~/o contained at least one eye as well as additional eyes and]or forks. Examples of repli- cating molecules are shown in Figures 2 and 3.
(d) Size of eyes and single-stranded regions in main band D N A
The average size of eyes in main band DNA was 2.73 • 108 bases (N ---- 320). About half of the eyes were small, tha t is, less than or equal to 0-90 • 103 bases. The rest of the eyes ranged upward in size to 41.76 • 103 bases.
Both progeny strands of each eye were measured. The mean difference in length of the two strands for those molecules with strands of differing lengths was 0.21 • 103 bases. Measurements of r molecules on the same grid square differed by about the same amount. Therefore, the differences in lengths for the two sides of an eye were not significant. For all eyes, the mean ratio of the lengths of progeny strands was 1.010• (meanls.v..M.). This value was determined by dividing the length of the longer strand by tha t of the shorter.
Many eyes had single-stranded regions of DNA and/or single-stranded "whiskers" at fork junctions. Single-stranded regions and whiskers are believed to represent the amount of DNA tha t is unwound before the lagging or discontinuously synthesized strand is copied (Delius et al., 1971; Tnman & SchnSs, 1971; Kriegstein & Hogness, 1974; Wolfson & Dressier, 1972). The mean length of single-stranded regions and whiskers in D. virilis main band DNA was (0.2404-0.018) • 108 bases (mean• All but 7 of 98 measurements of single-stranded regions and whiskers were made from large eyes ( > 0 . 9 • 108 bases): most of the clustered eyes were too small to allow detection of single-stranded sections. When two single-stranded regions were seen in a single eye, they were always in trans configuration, as required by the chemi- cal asymmetry of the replication fork.
(e) Organization of eyes in main band D N A
There were two types of molecules with multiple eyes or forks. The first type, illustrated in Figure 2, contained clusters of 2 to 12 small eyes, with each eye less than or equal to 0.90 • 108 b.ases in size. These clusters often were separated from other clusters of eyes by stretches of DNA without eyes. The second type of molecule, shown in Figure 3(a), contained larger eyes. In these molecules, eyeless portions constituted a smaller percentage of the total length of the molecule than they did in those molecules with clusters of smaller eyes.
Twenty-five main band molecules contained multiple small eyes. Clusters of small

312 V . A . Z A K I A N
FIG. 2. P o r t i o n o f a rep l i ca t ing molecule w i t h c lus te rs o f s m a l l eyes f r o m m a i n b a n d D N A . Arrows p o i n t to 4 o f t h e 10 c lus te r s o f eyes f o u n d in th i s molecule . T h e whole molecu le was 9] '7 x 10⁶ da l t ons (138 x 103 bases) a n d con t a i ned 69 sma l l eyes.
D. V I R I L I S D N A R E P L I C A T I O N 313
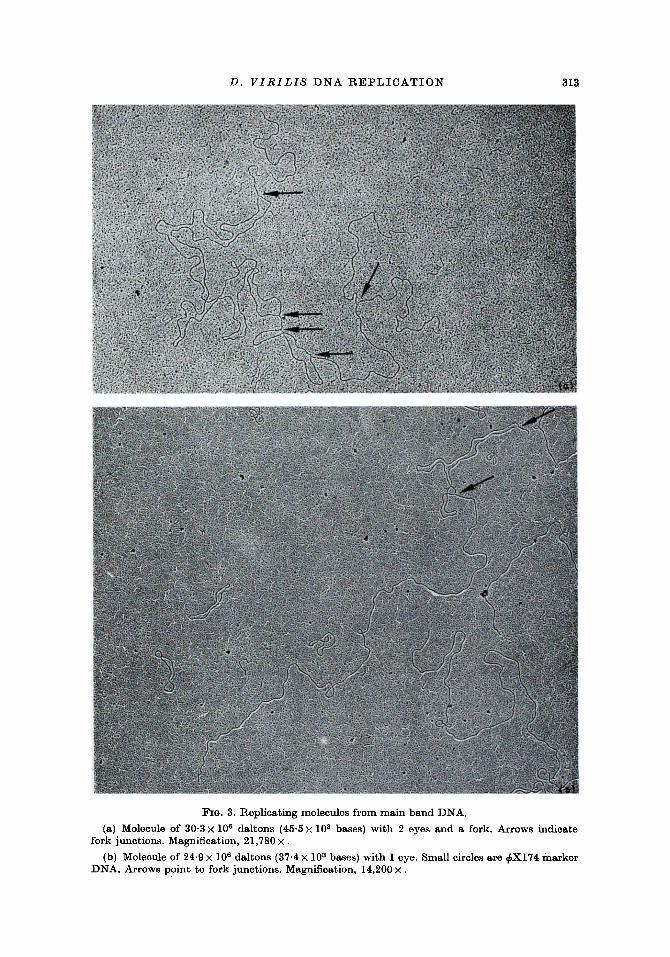
FIG. 3. Replicating molecules from main band DNA.
(a) Molecule of 30.3 • 108 daltons (45.5 • 103 bases) with 2 eyes and a fork. Arrows indicate fork junctions. Magnification, 21,780 •
(b) Molecule of 24.9 • 106 daltons (37.4 x 10³ bases) with 1 eye. Small circles are ~X174 marker DNA. Arrows Point to fork junctions. Magnification, 14,200 x .
314 V . A . Z A K I A N
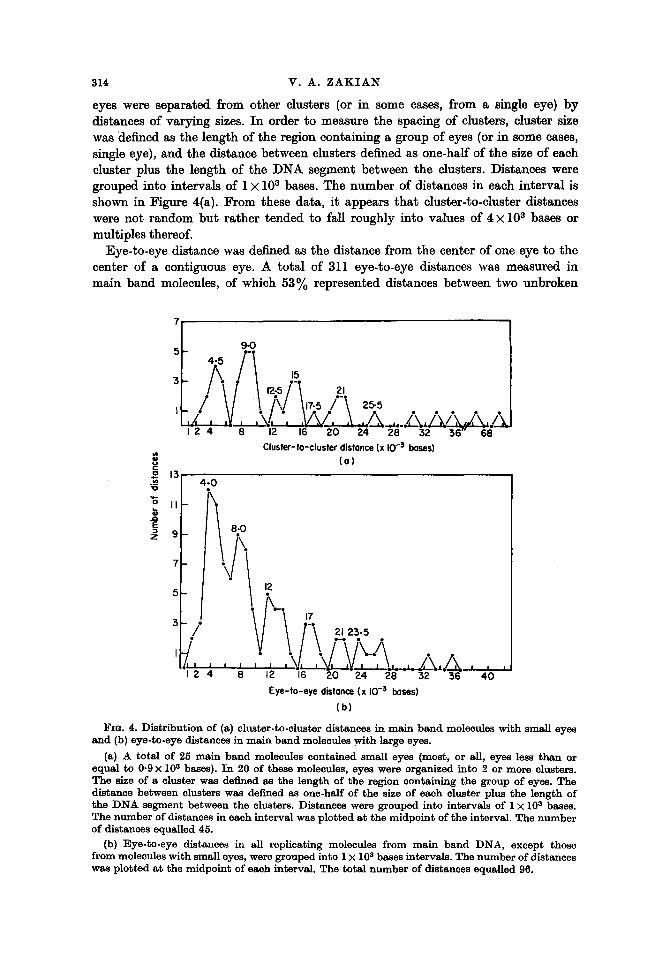
eyes were separated from other clusters (or in some cases, from a single eye) by distances of varying sizes. In order to measure the spacing of clusters, cluster size was "defined as the length of the region containing a group of eyes (or in some cases, single eye), and the distance between clusters defined as one-half of the size of each cluster plus the length of the D N A segment between the clusters. Distances were grouped into intervals of 1 • 103 bases. The number of distances in each interval is shown in Figure 4(a). From these data, it appears that cluster-to-cluster distances were not random but rather tended to fall roughly into values of 4 • 103 bases or multiples thereof.
Eye . to-eye distance was defined as the distance from the center of one eye to the center of a contiguous eye. A total of 311 eye-to-eye distances was measured in main band molecules, of which 53% represented distances between two unbroken
5
! IV. !-\ . . . , , , V , , , \ 7 \ / ,
2 4 8 12 16 20 24. 28 32 36 ~" 68
Cluster-to-cluster dislonce (x 10 -3 hoses) (o)
4.0
z 9
7
5
':,/ g . I J . I i
2 4'o Eye-to-eye distonce (x 10 -3 looses)
(b)
FzG. 4. Distr ibut ion of (a) cluster-to-cluster distances in ma in ba nd molecules with small eyes an d (b) eye-to-eye distances in ma in band molecules wi th large eyes.
(a) A total of 25 ma in band molecules contained small eyes (most, or all, eyes less than or equal to 0.9 • l0 s bases). I n 20 of these molecules, eyes were organized into 2 or more clusters. The size of a cluster was defined as the length of the region containing the group of eyes. The distance between clusters was defined as one-half of the size of each cluster plus the length of the D N A segment between the clusters. Distances were grouped into intervals of 1 • l0 s bases. The n u m b er of distances in each interval was plotted a t the midpoint of the interval. The numbe r of distances equalled 45.
(b} Eye-to-eye distances in all replicating molecules from ma in band DNA, except those from molecules with small eyes, were grouped into 1 • l0 s bases intervals. The numbe r of distances was plot ted a t the midpoint of each interval. The total n u m b e r of distances equalled 96.
D. V I R I L I ~ DNA REP LICA TIO N 315
eyes. In some of the remaining cases, an eye-to-eye distance involved a broken eye in which the position of the fork arising from this eye could be represented in more than one configuration. In these cases, eye-to-eye distances for each configuration were determined and averaged to give a single value. Distances determined by the averaging of more than one value represented 21~/o of the total number of distances. The mean eye-to-eye distance in main band DNA was 5.25 • l0 s bases with values ranging from 0.24 • l0 s to 73.56 • l0 S bases.
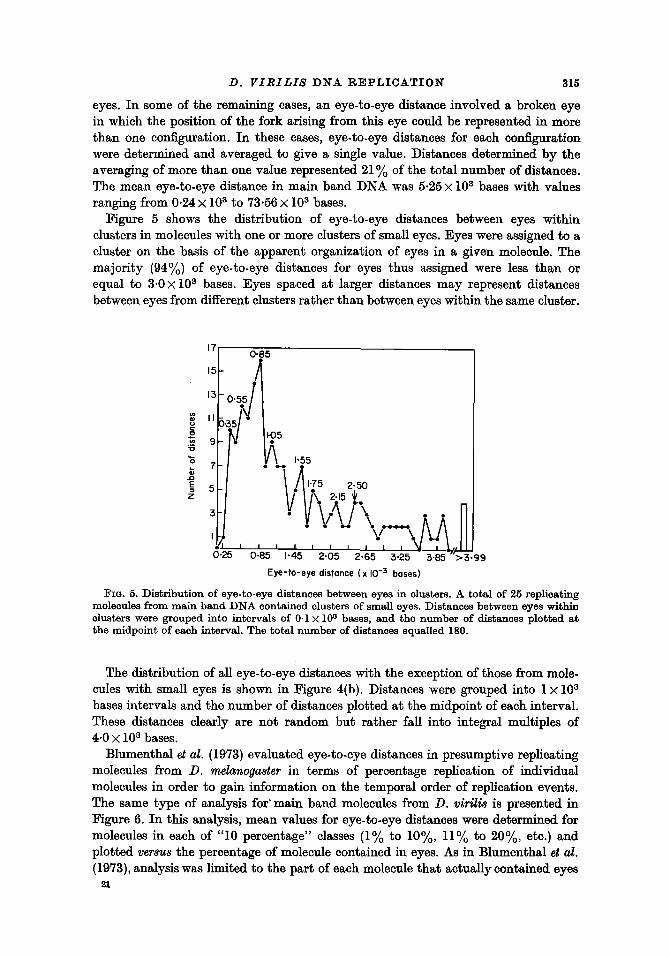
Figure 5 shows the distribution of eye-to-eye distances between eyes within clusters in molecules with one or more clusters of small eyes. Eyes were assigned to a cluster on the basis of the apparent organization of eyes in a given molecule. The majori ty (94~/o) of eye-to-eye distances for eyes thus assigned were less than or equal to 3.0 • l0 S bases. Eyes spaced at larger distances may represent distances between eyes from different clusters rather than between eyes within the same cluster.
17/ 0.85 I
15
15 0"55
7
�9 0-85 1-45 2 .05 2 .65 5-25 - 5.85 > 5 - 9 9
Eye-to-eye distance (x I0 -5 bases)
FIG. 5. ]Distribution of eye-to-eye distances between eyes in clusters. A total of 25 replicating molecules f rom ma in band ]DNA contained clusters of small eyes. ]Distances between eyes within clusters were grouped into intervals of 0.1 • l0 S bases, and the n u m b e r of distances plot ted a t the midpoin t of each interval. The total numbe r of distances equalled 180.
The distribution of all eye-to-eye distances with the exception of those from mole- cules with small eyes is shown in Figure 4(b). Distances were grouped into 1 • l0 S bases intervals and the number of distances plotted at the midpoint of each interval. These distances clearly are not random but rather fall into integral multiples of 4.0 • l0 S bases.
Bhimenthal et al. (1973) evaluated eye-to-eye distances in presumptive replicating molecules from D. melanogazter in terms of percentage replication of individual molecules in order to gain information on the temporal order of replication events. The same type of analysis for" main band molecules from D. virili8 is presented in Figure 6. In this analysis, mean values for eye-to-eye distances were determined for molecules in each of "10 percentage" classes (1% to 10~/o, 11% to 20~/0, etc.) and plotted versus the percentage of molecule contained in eyes�9 As in Blumenthal et al. (1973), analysis was limited to the part of each molecule tha t actually contained eyes
21

316 V. A. ZAKIAN
. D
T _o
o
I
LIJ
16-5
13-5
10.5
7-~
4.5
(41) e(9)
/ 2 1 ) ~15)
I
(4) e(7)
I - 5 I I l I l o 2 o o o o ~o o o ~ T _, ~ ~, ~ ~ ~ ~ ~,
% Replicaticq
Fzo. 6. Mean eye-to-eye distances in main band DNA versus percentage of segment contained in eyes. Molecules were divided into ten groups (1% to 10%, 11% to 20%, etc.) on the basis of their percentage of replication. Percentage replication (percentage of molecule in eyes) was determined by dividing the sum of the lengths of eyes and/or forks in a segment by the length of the segment. The length of the segment was taken as the distance between the midpoints of the 2 terminal eyes in a molecule. A mean value for eye-to-eye distances for molecules in each percentage class was determined. The number in parentheses after each point indicates the number of distances averaged for that point.
(see legend to Fig. 6). This method for determining the percentage of the molecule replicated overest imates the percentage of replication for the tota l molecule by excluding non-replicating ends (regions without eyes) f rom consideration.
I t can be seen t h a t the mean eye-to-eye distance is high for those molecules in which eyes account for only 1% to 10% of the region under consideration. The eye-to-eye distance quickly drops until it reaches a min imum in molecules in the 21% to 30% class. I n contrast , molecules in which 41 to 90% of their lengths are in eyes have mean eye-to-eye distances of about 8.1 x 10³ bases. The da ta in Figtu'e 6 can be explained if molecules with clusters of small eyes and those with large eyes are bo th rephcat ion intermediates with the former giving rise to the lat ter by fusion of eyes within clusters. Tha t is, early in the replication of a molecule, the eye-to-eye distance is large because not all origins are act ivated. B y 21 to 30% replication, most eyes are ac t ivated; and the mean eye-to-eye distance is at a minimum. I n D. v ir i l i s , two types of eye-to-eye distances are included in tiffs 21% to 30% class: the short distances between eyes within clusters and the larger distances between terminal eyes from different clusters. Eyes within clusters fuse, giving rise to large eyes which have a mean spacing of about 8.1 • l0 a bases. The rise in mean eye-to-eye distance for molecules in the 91% to 99% class can be explained by the fusion of larger eyes in molecules as t hey near the end of replication. The fact t h a t m a n y cluster-to-cluster distances and large eye-to-large eye distances are in multiples of about 4-0 • 10 a bases supports this interpretat ion.

D. F I R I L I S DNA REPLICATION 317
(f) Purification and characterization of mitochrondrial D N A
Like the eggs of many species, those of Drosophila contain large numbers of mito- chondria. I t was necessary to isolate and characterize D. virilis mitochondrial DNA in order to determine whether or not it was present in fractions of embryonic DNA and thus responsible for any of the structures seen in these preparations.
Ethidium bromide/CsC1 gradients of mitochondrial DNA contained two bands which fluoresced in ultraviolet hght, the denser of which contains covalently closed circular DNA (Radloff et al., 1967). Buoyant density and size analyses of unit length molecules were done on CsC1 fractions from this denser band, in which 98 to 100% of the molecules were intact circles. Figure 7 illustrates typical unit length circles of D. virilis mitochondrial DNA.
When D. virilis mitochondrial DNA was centrifuged to equilibrium in CsOl, a single peak at a density of 1.683 g/em 3 was observed. Thus, mitochondrial DNA has a buoyant density different from that of either main band or satellite components of D. virilis nuclear DNA. The mean contour length of D. virilis mitochondrial DNA unit length circles was 4.96 ~m • 0.018 ~m (mean• About 1% of the mole- cules were ohgomers, tha t is circles ~dth lengths equal to discrete multiples of the unit length circle. Dimers, trimers and a tetramer were observed. A dimer is pictured in Figure 7(b). In addition to oligomers, almost 2% of the mitochondrial molecules were concatamers or interlocked circles.
Another interesting class of structures was seen in preparations of mitochondrial DNAs. These circles were double-forked molecules in which one of the three strands was single-stranded, as seen in Figure 7(c) and (d). These structures are similar to those identified as rephcating molecules in the mitochondrial DNAs of mammals, birds and sea urchins (Kasamatsu et al., 1971; Wolstenholme et al., 1973; Arnberg et al., 1971; Matsumoto et al., 1974). Thus, the mitochondrial DNA of D. virilis is apparently replicated via the asymmetric displacement mechanism characteristic of the rephcation of mitochondrial DNAs from higher animals. The length of the double-stranded progeny strands ranged from 1% to 70% of the length of the molecules. Replicating structures were seen in oligomers and concatemers as well as in unit length circles.
Mitochondrial DNA was also examined in preparations made with spreading solutions of 600/0 and 70% formamide. In preparations made at 60% formamide, a number of molecules displayed a denaturation bubble whose size was equal to about 5% of the length of the molecule, and which presumably represented an adenine+ thymidine-rich region. At 70% formamide, molecules were seen in which 38 to 59% of their lengths were denatured. However, no distinct pat tern of denaturation could be established for D. virilis mitochondrial DNA.
(g) Identification of satellite fractions
Fractions 1, 2, and 3 from extraction I were considered to contain satellite DNAs because they banded in CsC1 at densities less than the 3H-labeled X. laevis marker DNA (Fig. l(a)). There was not enough DNA to examine these fractions in the analytical ultracentrifuge. Thus, the extent of their contamination with main band and/or mitoehondrial DNA was unknown.
Four satellite fractions from extraction II were examined (Fig. l(b)). Analytical ultracentrffugation revealed that fraction 12 was composed primarily of satellites I

318 V . A. Z A K I A N
FIo. 7. Molecules of D. virili8 mitochondr ia l DNA. Magnificat ion, 36,600 •
(a) Two un i t length circles (4.89 a n d 4.79 ~m), one of which is supereoiled. The small ch.cle is a molecule of ~X174 marke r DNA.
L (b) A n ol igomer of 9.14 ~m.
(c) Repl ica t ing m o n o m e r of 4.81 ~m in which one s t r a n d is 52~/o repl icated. Arrows po in t to the s ingle-s t randed D N A in the d i sp lacement loop; this s t r and appears to be in ter locked wi th ano the r m o n o m e r of 4.76 ~m.
(d) Repl ica t ing m o n o m e r of 4.59 ~m in which one s t r and is 13% repl icated. The a r row poin t s to the s ingle-s t randed d i sp lacement loop.

D. V I R I L I S DNA REPLICATION 319
and II (53% and 29%, respectively) in addition to mitoehondrial DNA (16%) and satellite I I I DNA (3%). This fraction had no detectable main band component. Fraction 13 contained satellite I with 6.5% contamination with main band sequences. No contamination with mitochondrial DNA was detectable in fraction 13 by the criterion of analytical ultraccntrifugation. No fraction with satellite I I I without mitoehondrial DNA was found. The two cleanest fractions (8 and 9) were each composed of about 70% satellite I I I DNA and 30% mitochondrial DNA.
(h) Description of linear replication molecules in satellite fractions
The percentage of replicating molecules was determined with DNA from fraction 12 (extraction II) using the criteria for molecule counting described in Materials and Methods. Fraction 12 was chosen for analysis because it was not contaminated with main band DNA. Out of a population of 2320 linear molecules of molecular weights greater than 12.2 • 106 daltons, 1% were unambiguous replicating structures. Twelve molecules contained forks (0.5%), six contained a single eye (0.3 %), and five contained an eye plus additional eyes and/or forks (0.2%). Molecules of main band DNA analyzed in the same way contained 4.6% replicating molecules. Thus, replicating linear molecules were almost five times more frequent in main band DNA than in satellite DNA. All other satellite fractions from both extractions I and I I contained similar low levels of linear replicating molecules: a low frequency of replicating molecules was found in fractions containing satellite I, satellites I and II, and satellite III .
A total of 52 replicating linear molecules were photographed and measured in satellite fractions from extractions I and II. The mean size of these molecules was 43.7 • 106 daltons or 65.6• 103 bases. Of these replicating molecules, 75% were from fractions free of detectable contamination with main band DNA (hereinafter referred to as pure-satellite fractions). The remaining molecules were from fractions containing varying levels of contamination with main band sequences. Because replicating molecules were rare in satellite fractions, generalizations about replicating molecules are of necessity based on small sample sizes. In many cases, values are based on measurements of molecules from all satellite fractions, including those with main band contamination. These values are referred to as values from satellite-rich fractions.
Although replicating structures were about five times more common in main band than in satellite DNAs, the relative frequency of molecules with forks, single eyes, or multiple eyes within the populations of replicating molecules from both DNAs was similar. However, the number of replicating sites per molecule in molecules with more than one site of replication was small in satellite fractions compared with the number in main band molecules. For example, the maximum number of eyes and/or forks per molecule from pure-satellite fractions was five compared with a maximum of 69 sites for a molecule with ten clusters of eyes from main band DNA. The maxi- mum number of eyes in a single main band molecule with large eyes was seven. The difference in the number of sites per molecule cannot be explained by size difference, since the mean size of linear replicating molecules from satellite fractions is greater than for main band molecules.
The mean size of single-stranded junctions and whiskers in satellite-rich I)NA was 0-210 • 103 bases (N ~ 20) (or 0.240 • 103 bases, N ~ 5 in pure-satellite fractions).
$20 Y. A. ZAKIAN
These values are comparable with the mean size of single-stranded junctions and whiskers from main band DNA (0.240 • 103 bases, N ~ 98). The mean size of eyes in satellite-rich DNA was 2.31 • 103 bases, with a mean ratio of lengths of progeny strands of 1.07 (N = 48). The mean size of eyes in main band DNA was 2.73 • 103 bases (N ---- 320). In pure-satellite fractions, the mean size of eyes was 1.17 • 103 bases (N ---- 24) or less than one-half the mean size of eyes in main band DNA.
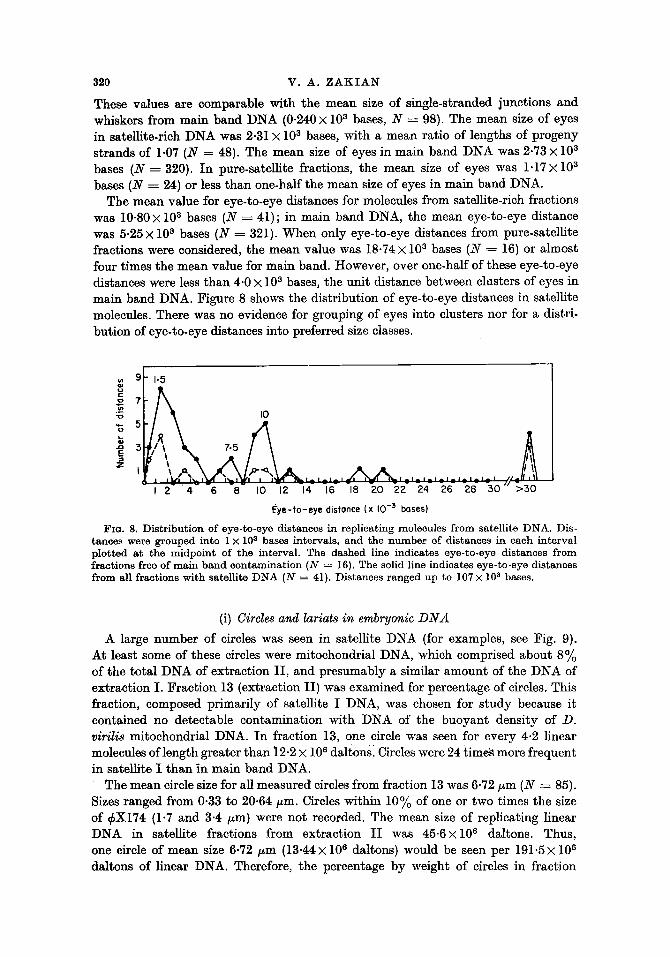
The mean value for eye-to-eye distances for molecules from satellite-rich fractions was 10.80X 10³ bases (N----41); in main band DNA, the mean eye-to-eye distance was 5.25 • 103 bases (N ---- 321). When only eye-to-eye distances from pure-satellite fractions were considered, the mean value was 18-74 • 103 bases (N ---- 16) or almost four times the mean value for main band. However, over one-half of these eye-to-eye distances were less than 4.0 • 103 bases, the unit distance between clusters of eyes in main band DNA. Figure 8 shows the distribution of eye-to-eye distances in satellite molecules. There was no evidence for grouping of eyes into clusters nor for a distri- bution of eye-to-eye distances into preferred size classes.
:~ I0
A A 3 7.5
I [ . l ~ l . .i-i.I--I-I ll~
i 2 - 4 - 6 S l0 -m -14- -Id -m -2o ~#-24- ~ d - 2 g - 3 o " > 3 0
I~ye-to-eye distance (x I0 -z~ bases)
FIG. 8. Distribution of eye-to-eye distances in replicating molecules from satellite DNA. Dis- tances were grouped into 1 • 103 bases intervals, and the number of distances in each interval plotted at the midpoint of the interval. The dashed line indicates eye-to-eye distances from fractions free of main band contamination (N = 16). The solid line indicates eye-to-eye distances from all fractions with satellite DNA (N = 41). Distances ranged up to 107 • 103 bases.
(i) Circles and lariats in embryonic DNA
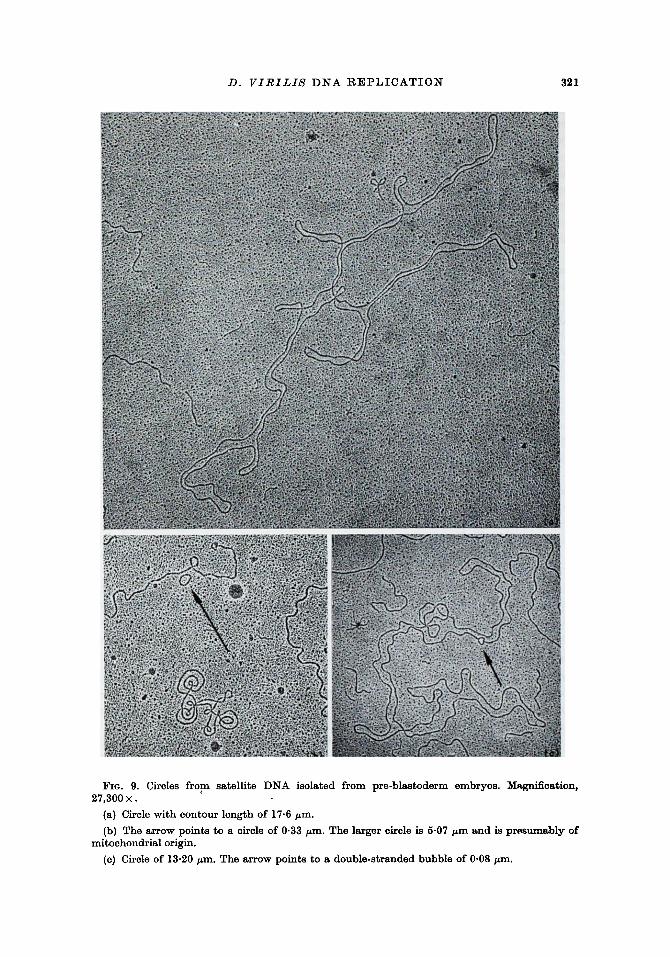
A large number of circles was seen in satellite DNA (for examples, see Fig. 9). At least some of these circles were mitochondrial DNA, which comprised about 8% of the total DNA of extraction II , and presumably a similar amount of the DNA of extraction I. Fraction 13 (extraction II) was examined for percentage of circles. This fraction, composed primarily of satellite I DNA, was chosen for s tudy because it contained no detectable contamination with DNA of the buoyant density of D. virilis mitochondrial DNA. In fraction 13, one circle was seen for every 4.2 linear molecules of length greater than 12.2 • 106 daltbnsl Circles were 24 time's more frequent in satellite I than in main band DNA.
The mean circle size for all measured' circles from fraction 13 was 6.72/~m (N = 85). Sizes ranged from 0.33 to 20.64/zm. Circles within 10% of one or two times the size of r (1.7 and 3.4/zm) were not recorded. The mean size of replicating linear DNA in satellite fractions from extraction I I was 45-6• s daltons. Thus, one circle of mean size 6.72/~m (13.44 x l0 s daltons) would be seen per 191.5 • l0 s daltons of linear DNA. Therefore, the percentage by weight of circles in fraction
D. V I R I L I S D N A R E P L I C A T I O N 321
FIG. 9. Circles from satellite DNA iso]ated from pre-blastoderm embryos. Magnification, 27,300 •
(a) Circle with contour length of 17.6/zm.
(b) The arrow points to a circle of 0.33 ~m. The larger circle is 5-07 kan and is presumably of mitochondrial origin.
(e) Circle of 13.20 ~an. The arrow points to a double-stranded bubble of 0.08 vm.
322 v . A . ZAKIAN
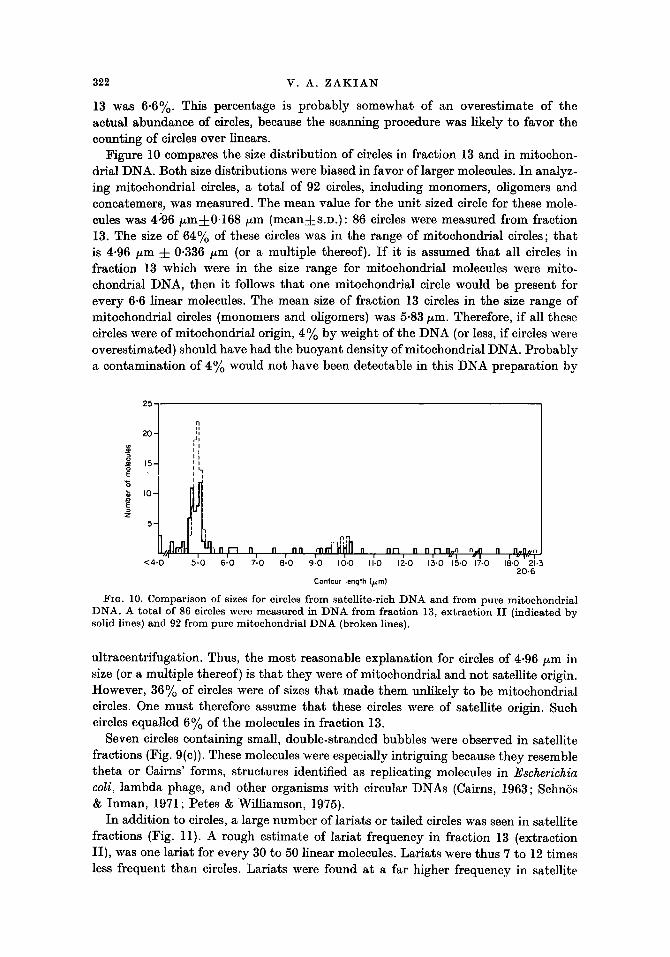
13 was 6.6%. This percentage is probably somewhat of an overestimate of the actual abundance of circles, because the scanning procedure was likely to favor the counting of circles over linears.
Figure 10 compares the size distribution of circles in fraction 13 and in mitochon- drial DNA. Both size distributions were biased in favor of larger molecules. In analyz- ing mitochondrial circles, a total of 92 circles, including monomers, oligomers and concatemers, was measured. The mean value for the unit sized circle for these mole- cules was 4:96/~mq-0.168/zm (meanq-s.D.): 86 circles were measured from fraction 13. The size of 64% of these circles was in the range of mitochondrial circles; tha t is 4.96 /~m • 0-336 /zm (or a multiple thereof). I f it is assumed tha t all circles in fraction 13 which were in the size range for mitochondrial molecules were mito- chondrial DNA, then it follows tha t one mitochondrial circle would be present for every 6.6 linear molecules. The mean size of fraction 13 circles in the size range of mitochondrial circles (monomers and oligomers) was 5.83 izm. Therefore, if all these circles were of mitochondrial origin, 4% by weight of the DNA (or less, if circles were overestimated) should have had the buoyant density of mitochondrial DNA. Probably a contamination of 4% would not have been detectable in this DNA preparat ion by
=i 20 i!
u I 11
5 .
<4.0 5.0 6.0 7[0 n nn . " ~ " N " . . . n . n.r~r~.,~. - , ~ . ,~'~.~
8'.0 9.0 I0.0 II'.0 12.0 13.0 15.0 ']'~.0 18.0 21.3 20.6
Contour length (p,m)
FIG. 10. C o m p a r i s o n o f sizes for circles f r om sa te l l i te - r ich :DNA a n d f rom pu re m i t o c h o n d r i a l D N A . A to ta l of 86 circles were m e a s u r e d in D N A f rom f rac t ion 13, e x t r a c t i o n I I ( ind ica ted by solid lines) a n d 92 f rom pu re m i t o c h o n d r i a l D N A (broken lines).
ultracentrifugation. Thus, the most reasonable explanation for circles of 4.96/~m in size (or a multiple thereof) is tha t they were of mitochondrial and not satellite origin. However, 36% of circles were of sizes tha t made them unlikely to be mitochondrial circles. One must therefore assume tha t these circles were of satellite origin. Such circles equalled 6~/o of the molecules in fraction 13.
Seven circles containing small, double-stranded bubbles were observed in satellite fractions (Fig. 9(c)). These molecules were especially intriguing because they resemble theta or Cairns' forms, structures identified as replicating molecules in Escherichia coli, lambda phage, and other organisms with circular DNAs (Cairns, 1963; SchnSs & Inman, 1971; Petes & Williamson, 1975).
In addition to circles, a large number of lariats or tailed circles was seen in satellite fractions (Fig. 11). A rough estimate of lariat frequency in fraction 13 (extraction II) , was one lariat for every 30 to 50 linear molecules. Lariats were thus 7 to 12 times less frequent than circles. Lariats were found at a far higher frequency in satellite
D . V I R I L I S D N A R E P L I C A T I O N 323
than in main band DNA: only three lariats were observed in all main band prepara- tions. One lariat was seen in mitochondrial preparations.
Lariats were found in a wide var ie ty of sizes. Circle size in lariats ranged from 0.20 to 22.38 ~m with a mean of 6.75 ~m (N ---- 72). No grouping of circle sizes was apparent. Lengths of tails ranged from 0.10 to 16.28/zm. The lengths of tails were from 0-01 to 27 times the sizes of the circles to which they were attached. Moreover, 14% of the lariats had two tails a t tached to a single circle. The mean size of circles in these lariats was 7-56 /~m. In all but one case, both tails were shorter than the contour length of the circle to which they were attached. A double-tailed circle is shown in Figure l l(c) .
(j) Analysis of purified satellite D N A from D. virilis flies
Linear molecules containing eyes or forks are seen very rarely, if a t all, in electron microscopic examination of main band (or satellite) DNAs isolated from adult flies. Thus, non-linear structures seen in adult satellite DNA, a DNA with a low rate of replication, can be compared to those found in the rapidly replicating DNA of pre- blastoderm embryos to help determine which structures, if any, are associated with the process of replication.
In purified satellite I, one circle was found for approximately every 100 pieces of linear DNA. The size of circles in satellite I DNA ranged from 0.51 to 5.11 ~m. Mean circle size was 2.39 tzm (N ~ 12). The contribution of circles to adult satellite DNA was approximate ly 0.6% by weight. No Cairns' forms were found in adult satellite DNAs.
Lariats with one or two tails were seen in satellite I DNA from adults: there was approximate ly one lariat per 135 linears. The mean size of circles of lariats measured in adult satellite I DNA was 1.58/~m (N : 4). Tail(s) on lariats were ahvays shorter than the contour length of the circle to which they were attached. Circles and lariats were also observed in purified satellite I I I DNA.
The D. virilis satellite DNAs melt over a narrow tempera ture range (Gall & Atherton, 1974). Thus, it was surprising tha t neither satellite I nor satellite I I I DNA melted sharply at a given concentration of formamide. Moreover, several sites of denaturat ion were often found on a single molecule. Because the denaturat ion behavior of satellite DNAs could not be distinguished easily from tha t of mitochon- drial molecules, denaturat ion studies could not be used to distinguish circles of mitochondrial origin from those of satellite origin.
4. D i s c u s s i o n
(a) Evidence that eyes and forlcs are replicative intermediates
Eyes and forks were identified as replicating structures for the following reasons. First, they were present in DNA isolated from the rapidly dividing nuclei of pre- blastoderm embryos but were very rare or undetectable in DNA from more slowly dividing nuclei, such as those from older embryos (data not presented). Second, both sides of an eye were of equal lengths, as required for the two progeny copies of a parental template. And third, single-stranded regions and single-stranded whiskers were detected at m a n y fork junctions in the configurations predicted by the chemical a symmet ry of replication on the two strands.
324 V. A. Z A K I A N
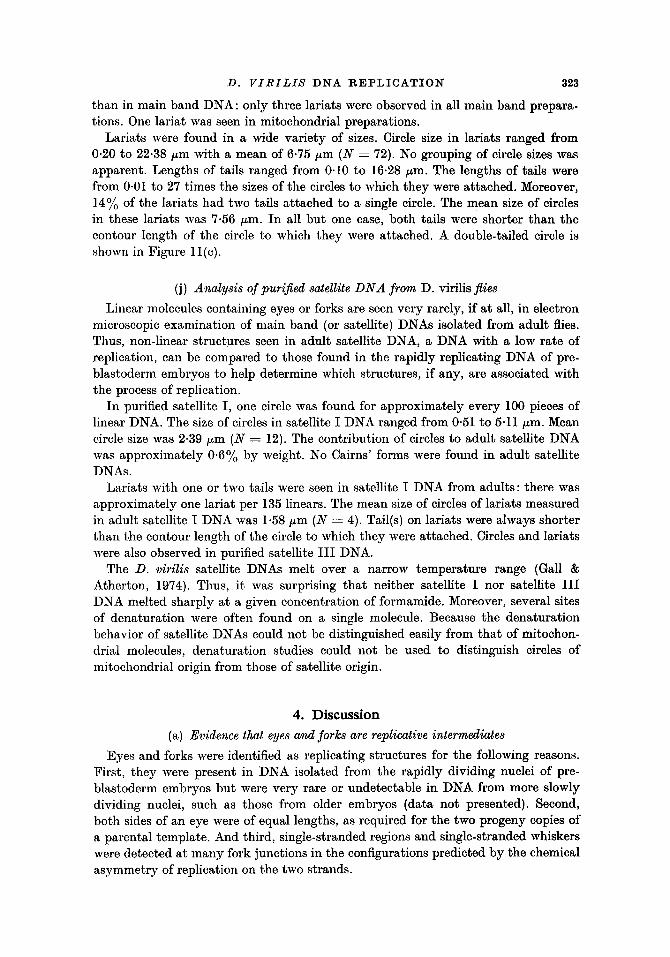
Fro. 11. Lariats from satellite DNA isolated from pre-blastoderm embryos. Arrows point to circle-tail junctions. Magnification, 23,800 •
(a) Circle of 4-94 ~m with tail of 1.25 ~m.
(b) Circle of 0'62 ~m with tail of 14.22 ~m.
(c) Circle of 3.4 ~m with tails of 0.6 and 9-3 ~m.
D . V I R I L I S D N A R E P L I C A T I O N 325
Small eyes in clusters are more difficult to identify as replicating structures than are larger eyes, since their small size makes difficult the distinction between double and single-stranded DNA. I f the eyes were single-stranded and not double-stranded, they could represent partially denatured molecules rather than replicating structures. We believe these eyes are double-stranded for several reasons. Like larger eyes, clusters of small eyes were only seen in DNA isolated from rapidly dividing pre- blastoderm nuclei and never in late embryonic or adult main band DNAs prepared for electron microscopy under identical conditions. Nor were clusters of small eyes found in satellite or mitochondrial DNAs, despite their higher adenineA-thymidine contents and lower melting temperatures. Moreover, it is questionable whether such small single-stranded regions would be stable without the addition of protein or some other stabilizing factor(s) : such factors are unlikely to remain associated with a DNA that has been as extensively processed as the DNA examined here. Finally, the distribution of clusters of eyes provides both temporal (Fig. 6) and spatial (Fig. 4) evidence for their being precursors of molecules with larger eyes and, therefore, bona fide replieative intermediates.
(b) Single-stranded regions
Many eyes had single-stranded regions or whiskers at both forks, indicating that at least some eyes were replicating bidirectionally. The mean size of single-stranded regions and whiskers in eyes and forks from D. virilis main band DNA was 240 bases, which is comparable both to the value found in satellite fractions (210 bases) and to the value found by Kriegstein & Hogness (1974) for D. melanogaster (220 bases). In a number of systems, the length of the single-stranded regions at fork junctions as measured by electron microscopy can be correlated with the size of Okazaki frag- ments as measured by sedimentation-velocity experiments (for a summary, see Kriegstein & Hogness, 1974). Data from both procedures support the idea that the unit of discontinuous synthesis is smaller in eukaryotes (100 to 240 bases: Huberman & Horwitz, 1973; Kriegstein & Hogness, 1974) than in prokaryotes (600 to 2400 bases: Delius et al., 1971 ; Ginsberg & Hurwitz, 1970; Inman & Schn5s, 1971; Okazaki et al., 1968; Wolfson & Dressier, 1972). The data presented here for D. virilis also support this hypothesis. Furthermore, they indicate that , within the limits of measurement by electron microscopy, the size of single-stranded regions in main band and satellite DNAs was essentially the same.
(c) Organization of replication sites in main band D N A
Two types of multi-eyed molecules were seen in main band DNA. The first type contained clusters of closely spaced small eyes. In these molecules, replicated portions represented only a small percentage of the total length of the molecule: most mole- cules with clusters of small eyes were replicated for 10% or less of their total lengths with a maximum of 22O/o . The second type of molecule contained larger eyes (greater than 0.90 • 103 bases and up to 41.76 • 103 bases in size). The percentage replication of these molecules ranged up to 89 ~/o.
The presence of two classes of molecules with multiple eyes suggests a model in which molecules with smaller eyes and a generally lower extent of replication repre- sent precursors of molecules with larger eyes. The facts tha t many cluster-to-cluster distances in molecules with small eyes and eye-to-eye distances in molecules with

326 V . A . Z A K I A N
larger eyes were found to fall in values of 4.0 • 103 bases, or integral multiples thereof, provide strong support for such a theory. Thus, the data from main band DNA can be explained if replication is initiated by the actiw~tion of clusters of small eyes. Such clusters appear to be spaced at regular distances along the chromosome at intervals of 4"0 • 103 bases or multiples thereof. Eyes within clusters are positioned close together and therefore fuse relatively soon after activation to produce larger eyes which are, of course, also spaced in a regular fashion. Thus, main band sequences in the D. virilis chromosome appear to be organized in a characteristic and non- random way in relation to the process of DNA replication.
There is no known periodicity in chromosome organization tha t can be correlated with the 4.0 • 103 bases spacing of clusters of eyes. Nevertheless, the mechanism by which the polymerase chooses an initiation site cannot be a haphazard event. There is compelling evidence in both D. melanogasler (Blumenthal et al., 1973) and D. virilis for regular spacing of eye-to-eye distances into multiples of either 4.0 • 103 bases (D. vi~ilis) or 3.4• 103 bases (D. melanogaster). From these data, one can infer a concomitant regularity in the distribution of initiation sites. Regulari ty in initiation has also been shown in the lower eukaryote Saccharomyces cerevisiae by pat terns of specific gene nmtat ion in synchronized cell cultures (Dawes & Carter, 1974; Burke & Fangman, 1975). Thus, in the specificity with which certain sites are chosen for the initiation of DNA replication, the complex chromosomes of eukaryotes appear similar to those of viruses (SchnSs & Inman, 1970,1971 ; Wolfson et al., 1972 ; Salzraan et al., 1973), bacteria (Caro & Berg, 1968; Masters & Broda, 1971; Bird et al., 1972) and mitochondria (Brown & Vinograd, 1974; Robberson et al., 1974).
Study of main band DNA can also yield information on the temporal organization of initiation sites. Blumenthal et al. (1973) concluded tha t most or all initiation sites in the pre-blastoderm embryos of D. melanogaster were activated relatively syn- chronously early in S-phase. This conclusion is compatible with data from many molecules in D. virilis DNA in which all eyes were of approximately equal size, indicating a similar t ime of activation. However, other molecules illustrated tha t contiguous sites are not necessarily act ivated at similar times. For example, one molecule of 36.1 • 106 daltons (54 • 103 bases) contained an eye of 0.3 • 103 bases separated by a short distance of um'eplicated DNA from a fork of 14.1 • 103 bases.
Molecules containing single eyes support the possibility tha t some stretches of DNA may be replicated via asynchronously act ivated origins. For example, in 14~'o of molecules with only one eye, the eye was small, tha t is less than or equal to 0.90 • 103 bases. These small eyes m a y be the first of several eyes in a cluster of closely spaced eyes; if so, all eyes in clusters are not act ivated a t the same time. However, since these eyes are small, they must have been products of recent initiation events ; and, depending on how long it takes for activation of other eyes, synchrony of activation within the resulting cluster may be quite good. The mean size of all other single eyes was 7.7 • 103 bases (N ----- 42). The range in sizes was 1.2 • 103 to 25.9 • 103 bases. Many of these large eyes were parts of molecules with long stretches of unreplicated DNA. For example, the eye in Figure 3(b) is 8.7 • 103 bases with unreplicated ends of 28.2 • 103 and 0.5 • l03 bases. The sizes of this and similar eyes indicate tha t they are not products of recent initiation events. Thus, if the long ends were to be replicated by as yet unact ivated origins, replication will not be initiated synchronously in all parts of the molecule. Alternatively, the long ends could be replicated by the convergence of the eye seen in the molecule with a distant

D . V I R I L I ~ D N A R E P L I C A T I O N 327
eye that had been activated at the same time as the first eye. I f this were the case, the minimum spacing of the two eyes would be 36.9 • 103 bases for the molecule shown in Figure 3(b). In six other molecules with large single eyes (5-4 • 103 to 25.5 • 103 bases), the minimum spacing of the observed eye with a synchronously activated eye ranges from 49 • 103 to 80 • 103 bases. Thus, molecules with single eyes raise the possibilities that some contiguous origins in the DNA of pre-blastoderm nuclei are either activated asynchronously or are spaced too far apart to be easily detected in molecules of the size examined in this study.
The data on the regular spacing of initiation sites in main band DNA provide compelling evidence for a non-random and characteristic organization of the D. viril is chromosome during the process of replication. However, it is unclear whether or not all main band sequences are organized into regularly spaced clusters of eyes. I t is certainly possible that some larger eyes are products of single initiation events rather than of the fusion of several smaller eyes. Also, information from molecules with single eyes suggests tha t some contiguous origins may be separated by distances of up to 80 • 103 bases or more. Thus, it is possible that regular spacing of clusters of eyes is only true for stretches of DNA which are small compared to the size of the intact chromosome : the longest observed portion of a DNA molecule to be organized into regularly spaced clusters of eyes was about 110 • 103 bases. These stretches of regularly spaced clusters may themselves be part of a larger pattern of chromosome organization. Any such pattern would be difficult to detect in DNA of the size studied here.
A hypothetical model for the organization of clusters of eyes in D. viri l is DNA is presented in Figure 12. In this model, a number of clusters of small eyes are organized into a "set". Each set also includes an originless region of varying size, but all origin- less lengths would have to be smaller than 100 • l03 bases, which is the maximum
, _5 8
5O
45 ~
8
FIG. 12. Hypothetical organization of replication units in main band DNA from embryos of D. virilis. A segment of a chromosome equal to about 200 • 10 a bases is divided into 4 sets with boundaries between sets indicated by vertical lines. A set, envisioned as the unit of replication, is the equivalent of a chromomere. Replication in different sets or chromomeres is not necessarily synchronous. Measurements are in base-pairs X 10-a.
328 V. A. ZAKIAN
amount of DNA that can be synthesized in a cell cycle of 20 minutes if the rate of fork movement in D. virilis is the same as the rate in pre-blastoderm embryos of D. melanogaster (Blumenthal et al., 1973). The data presented here are consistent with such a model, although not sufficient to establish it. This model is presented to emphasize that, contrary to the conclusion of Blumenthal et al. (1973), it is possible for the ehromomere to be the overall unit of organization for replication in pre- blastoderm nuclei, as it appears to be in polytene chromosomes (Gabrusewycz- Garcia, 1964; Pelling, 1966; Plaut et al., 1966). In other words, in the model presented in Figure 12, a set would represent a chromomere.
(d) Replication of satellite sequences
Linear replicating molecules were rare in satellite fractions, about one-fifth as frequent as in main band. A low percentage of replicating molecules was true of fractions containing satellite I, satellites I and I I , and satellite I I I . The low percentage of linear replicating molecules appears to rule out any model such as tha t hypothesized by Blumenthal et al. (1973), in which the amount of t ime required for replication of satellite DNAs determines the length of the S-phase in a given cell type : if replication of satellite sequences requires more t ime than replication of main band, one would find a higher percentage of replicating structures in satellite fractions. However, if non-linear structures are involved in the replication of satellite sequences, it is more difficult to dismiss their model.
No molecule with clusters of small eyes was seen in satellite fractions. Moreover, there was no evidence for a regular spacing of eyes such as tha t found in main band. Thus, the data from these studies suggest tha t the characteristic organization of replication sites in main band is absent in satellite DNAs. However, the low number of satellite eye-to-eye distances available for analysis may have hindered detection of a comparable pat tern in satellite material.
A number of non-linear structures was present in satellite fractions which were not found or were found in far lower frequencies in main band DNA. The most striking and most abundant of these structures were circles. Of the counted molecules, 19% were circles, and these made up about 7% (by weight) of the DNA. The con- tr ibution of circles is probably an overestimate, because the scanning method was likely to favor circles over linears. However, the large numbers of circles was a striking and characteristic feature of satellite DNA from pre-blastoderm embryos: in both main band DNA from pre-blastoderm embryos and in satellite DNA from adults, the number of circles was 19 to 24 times lower than tha t found in satellite from em- bryos.
About 64~/o of circles were within the size range for mitoehondrial molecules. However, 36% of the circles or 6% of the molecules were not in this range, and were presumably of satellite origin. Thus, even if m a n y circles in embryonic satellite fractions were from mitochondria, circles were still about five times more abundant in embryonic than in adult satellite DNAs. The fact tha t circles were far more abundant in rapidly replicating DNA from embryos than they were in adult satellite DNAs suggests tha t these structures were associated in some way with the process of replication. In addition, circles with bubbles resembling Cairns' or theta forms were only seen in satellite DNA from embryos.
Tailed circles or lariats were also found in large numbers in satellite fractions.
D. V I R I L I 8 D N A R E P L I C A T I O N 329
About 2% of satellite molecules from embryos were lariats, compared to less than 1 ~ in satellite from adults. Because lariats were almost three times more common in DNA from rapidly dividing embryonic nuclei than from adult nuclei, they too may be associated with the process of replication.
The presence of theta forms and lariats raises the possibility that some satellite sequences may be replicated v~ extrachromosomal mechanisms. Both lariats or rolling circles (Hourcade et al., ]973; Bird et al., 1973) and theta forms (Petes & Williamson, 1975) have been implicated in the replication of eukaryotic DNAs. Moreover, the circles found in satellite DNA could be products of replication by either of these extraehromosomal structures. Non-chromosomal replication of satellite sequences is appealing for a number of reasons. For example, replication via a rolling circle mechanism is a possible explanation for the homogeneity of satellite sequences : rolling circle replication could result in rectification of repeated sequences if all new copies were derived from one, or a few, template circles. However, more than one copy of the D. virilis seven-base repeat unit is needed to make a circle, and there is no obvious mechanism in a rolling circle model for obtaining identical copies of the unit sequence in the original template circle. Extrachromosomal replication via lariats and/or theta forms could also provide explanations for independent replication of satellite DNAs which occurs in larval salivary glands (Gall et al., 1971) and in many adult tissues (Blumenfeld & Forrest, 1972; Endow & Gall, 1975).
However, extraehromosomal structures are not sufficient in themselves to explain replication of satellite DNAs in pre-blastoderm embryos. I f satellite DNA were to replicate exclusively by an extrachromosomal mechanism, the 1 ~ linear replicating molecules in satellite fractions would have to be attributed to contaminating mole- cules from main band DNA. Since only about 5% of main band molecules are repli- cating, 20% contamination with main band is required to yield 1% replicating molecules in satellite fractions. However, it is clear from analytical ultracentrifugation experiments tha t main band contamination does not account for a significant amount of the DNA in the satellite fraction examined for percentage replicating molecules. Thus, at least some satellite sequences must be replicated via a conventional fork mechanism.
The most reasonable explanation for those structures which occur with a higher frequency in embryonic than in adult satellite DNAs is that they are in some way related to the process of DNA replication. Thus, linear molecules with forks and eyes are presumably chromosomally derived intermediates in replication via a conven- tional fork mechanism. Likewise, lariats, theta forms and circles could be either intermediates or products of synthesis via extrachromosomal mechanisms. Alter- natively, these non-linear structures could be derived during or after extraction of DNA by breakage of conventional linear replicating molecules. Replicating molecules contain single-stranded regions at many fork junctions, and these regions may be more susceptible to breakage than fully duplex DNA. Moreover, exposed single- stranded regions from these highly repetitive and homogeneous satellite DNAs are presumably highly susceptible to reassociation. Breakage of molecules with eyes or forks accompanied by inter- and/or intramolecular reassociation of single-stranded regions could provide a prosaic explanation for the variety of unusual non-linear molecules in satellite preparations.
330 V . A . Z A K I A N
I would like to thank my advisor Dr J. G. Gall for his advice during the course of this work and for his careful reading of tlie manuscript. This s tudy was supported by grant VC-85 from the American Cancer Society and grmut GM 12427 from the National Insti tute of General Medical Sciences.
R E F E R E N C E S
Arnberg, A., Van Bruggen, E. F. J., Ter Scliegget, J. E. & Borst, P. (1971). Biochim. Biophys. Acta, 246, 353-357.
Bakken, A. H. {1973). Develop. Biol. 33, 100-122. Bird, R. E., Louarn, J., Martuscelli, J. & Caro, L. {1972}. J. Mol. Biol. 7{}, 549-566. Bird, A. P., Rochaix, J. D. & Bakken, A. H. (1973). In Molecular Cytogenetic~ (Hamkalo,
B. A. & Papaconstantinou, J., eds), Plemun Press, l~ew York. Blumenfeld, M. & Forrest, H. D. (1972). Nature New Biol. 289, 170-172. Blumenthal, A. B., Kriegstein, H. J. & Hogness, D. S. (1973). Cold Spring Harbor Syrup.
Quant. Biol. 38, 205-223. Brown, W. M. & Vinograd, J. {1974). Proc. Nat. Acad. Sci., U.S.A. 71, 4617-4621. Bultmann, H. & Laird, C. D. (1973). Biochim. Biophys. Act~, 229, 196-209. Burke, W. & Fangman, W. L. (1975). Cell, 5, 263-269. Cairns, J. (1963}. J. Mol. Biol. 6, 208-213. Caro, L. G. & Berg, C. ~I. (1968). Cold Spring Harbor Syrup. Quant. Biol. 33, 559-573. Davis, R. W., Simon, M. & Davidson, N. (1971). In Methods in Enzyrnology (Grossman, L.
& Moldave, K., eds), vol. 21B, pp. 413-428, Academic Press, New York. Dawes, I. W. & Carter, B. L. (1974). Nature (London}, 25{}, 709-712. Delius, H., Howe, C. & Kozinski, A. W. (1971). Proc. Nat. Acad. Sci., U.S.A. 68, 3049-3053. Endow, S. & Gall, J. G. (1975). Chromosoma (Berl in) , 5{}, 175-192. Firtel, R. A. & Bonner, J. (1972). J. Mol. Biol. 6{}, 339-361. Gabrusewycz-Garcia, N. (1964). Chromosoma (Berlin) , 15, 312-344. Gall, J. G. & Atherton, D. (1974). J. Mol. Biol. 85, 633-664. Gall, J. G., Cohen, E. I-I. & Polan, M. L. (1971). Chromosoma (Berlin) , 33, 319-344. Ginsberg, B. & Hurwitz, J. (1970). J. 11~ol. Biol. 52, 265-280. Hourcade, D., Dressier, D. & Wolfson, ft. (1973). Cold Spring Harbor Syrup. Quant. Biol.
38, 537-550. Huberman, J. & Horwitz, H. (1973). Cold Spring Harbor Syrup. Quant. Biol. 38, 233-238. Huettner, A. F. (1923). J. Morph. 37, 385-423. Inman, R. & SchnSs, M. (1971). J. Mol. Biol. 5{}, 319-325. Kasamatsu, H., Robberson, D. L. & Vinograd, J. {1971). Proo. Nat. Acad. Sci., U.S.A.
68, 2252-2257. Kavenoff, R. & Zimm, B. H. (1973). Chromosoma (Berl in) , 41, 1-27. Kriegstein, i . J. & Hogness, D. S. (1974). Proc. Nat. Aead. Sci., U.S.A. 71, 135-139. Lee, C. S. & Pavan, C. (1974). Chromosoma (Berlin) , 47, 429-437. Masters, H. & Broda, P. (1971). Nature New Biol. 232, 137-140. Matsumoto, L., Kasamatsu, I-I., Piko, L. & Vinograd, J. (1974). J . Cell. Biol. {}3, 146-159. Nisioka, T., Mitani, M. & Clowes, R. (1970). J. Bact~riol. 1{}3, 166-177. Okazaki, R., Okazaki, K., Sakabe, K., Sugimoto, K., Kainuma, R., Sugino, A. & Iwatsuki,
N. (1968). Cold Spring Harbor Syrup. Quant. Biol. 33, 129-143. Pelling, C. {1966). Proc. Roy. Soc. London, 1{}4, 279-289. Petes, T. D. & Williamson, D. H. (1975). Cell, 4, 249-253. Plaut, W., Nash, D. & Fainting, T. (1966). J. Mol. Biol. 1{}, 85-93. Polan, i~. L., Freedman, S., Gall, J. G. & Gehring, W. (1973). J. Cell Biol. 5{}, 580-589. Radloff, R., Bauer, W. & Vinograd, J. {1967). Proc. Nat. Acad. Sci., U.S.A. 57, 1514-1521. Rice, T. B. (1973). Ph.D. Thesis, Yale University. Robb, J. A. (1969}. J . Cell. Biol. 41,876-885. Robberson, D. L., Clayton, D. A. & Morrow, J. F. (1974). Proc. Nat. Acad. Sci., U.S.A.
71, 4447-4451. Rochaix, J., Bird, A. & Bakken, A. (1974). J. Mol. Biol. 87, 473-487.
D. V I 1 ~ I L I S D N A ~ E P L I C A T I O N 331
Salzman, N. P., Fareed, G. C., Sebring, E. D. & Thoren, M. Yl. (1973), ColdSpring Harbor Syrup. Quant. Biol. 38, 257-265.
SchnSs, M. & Inman, R. (1970). J. Mol. Biol. 51, 61-73. Schn6s, M. & Inman, 1%. B. (1971). J. Mol. Biol. 55, 31-38. Woffson, J . & Dressier, D. (1972). lOroe. Nat. Acad. Sci., U.S.A. 69, 2682-2686. Woffson, J. , Dressier, D. & Magazin, M. (1972). Proc. Nat. Aead. Sci., U.S.A. 69, 499-544. Wolstenholme, D. (1973). Chromosoma (Berl in) , 43, 1-18. Wolstenholme, D., Koike, K. & Cochran-Fouts, P. (1973). Cold Spring Harbor Syrup.
Quant. Biol. 38, 267-280. Z~kiml, V. (1975). J. Cell. Biol. 67, 469a.
22