New types of mouse centromeric satellite DNAs
17
New types of mouse centromeric satellite DNAs Inna S. Kuznetsova 1 , Andrey N. Prusov 2 , Natella I. Enukashvily 1 , & Olga I. Podgornaya 1 1 Institute of Cytology, Russian Academy of Sciences, St. Petersburg 194064, Russia; Tel: þ 7-812-247-74-50; Fax: þ 7-812-247-03-41; E-mail: [email protected]; 2 Belozersky Institute of Physico-chemical Biology, Lomonosov Moscow State University, Moscow, 119992, Russia Received 22 September 2004. Received in revised form and accepted for publication by Adrian Sumner 15th October 2004 Key words: centromere, chromocentre, mouse satellite DNA Abstract Genomic databases do not contain complete sequences of the centromeric regions. We created a pUC19-based library of DNA fragments from isolated chromocentres of interphase nuclei. In this library we have found major satellite (MaSat) and two new satellite sequences ^ MS3 and MS4. The computer analysis of MS3 and MS4 sequences by alignment, fragment curved state and search for MAR motifs in comparison with the mouse major and minor satellite (MiSat) DNA has shown them to be new satellite fragments. Southern blot of MS3 and MS4 with total DNA digested by restriction enzymes shows the ladder characteristic of satellite DNA. 2.2% of the total DNA consists of MS3, the monomer of which is 150 bp long. The MS4 monomer is 300 bp long and accounts for 1.6% of the total DNA. On metaphase chromosomes MS3 and MS4 are located at the centromeric region. FISH analysis of L929 nuclei during the cell cycle showed relative positions of MaSat, MiSat, MS3, and MS4. All mapped satDNA fragments except MaSat belong to the outer layer of the chromocentres in the G0/G1 phase. MS3 is likely to be involved in the centromere formation. The mouse genome contains at least four satDNA types: AT-rich (MaSat and MiSat), and CG-rich (MS3 and MS4). Introduction The composition and organization of mouse satellite DNA (satDNA) has been well character- ized at the molecular level, but a high-resolution map of the pericentromeric region of mouse telo- centric chromosomes is still lacking. Such data might help to understand the meaning of non- coding DNA, a hot topic now that the genome drafts have shown that most of the DNA in a genome probably plays regulatory and archi- tectural roles (Venter et al. 2001). Despite the key role of the centromere (CEN) in the main- tenance of chromosome stability, its molecular characterization in higher eukaryotes is far from complete. The complexity of this locus, its extremely large size (several megabases) and the presence of highly repeated sequences, whose sequence and organization are highly variable, make the characterization of CEN rather difficult. The satDNA are poorly represented in the mouse genome database (Waterston et al. 2002). It was expected that highly repetitive regions of the genome would not be assembled or anchored on chromosomes. In the mouse genome the cen- tromeric sequences, including the euchromatin- proximal major satellite (MaSat) (Horz & Altenburger 1981) and the telomere-proximal Chromosome Research 13: 9–25, 2005. 9 # 2005 Springer. Printed in the Netherlands
Transcript of New types of mouse centromeric satellite DNAs
New types of mouse centromeric satellite DNAs
Inna S. Kuznetsova1, Andrey N. Prusov2, Natella I. Enukashvily1, & Olga I. Podgornaya11Institute of Cytology, Russian Academy of Sciences, St. Petersburg 194064, Russia;Tel:þ 7-812-247-74-50; Fax:þ 7-812-247-03-41; E-mail: [email protected];2Belozersky Institute of Physico-chemical Biology, Lomonosov Moscow State University, Moscow,119992, Russia
Received 22 September 2004. Received in revised form and accepted for publication by Adrian Sumner 15th October 2004
Key words: centromere, chromocentre, mouse satellite DNA
Abstract
Genomic databases do not contain complete sequences of the centromeric regions. We created apUC19-based library of DNA fragments from isolated chromocentres of interphase nuclei. In this librarywe have found major satellite (MaSat) and two new satellite sequences ^ MS3 and MS4. The computeranalysis of MS3 and MS4 sequences by alignment, fragment curved state and search for MAR motifsin comparison with the mouse major and minor satellite (MiSat) DNA has shown them to be new satellitefragments. Southern blot of MS3 and MS4 with total DNA digested by restriction enzymes shows the laddercharacteristic of satellite DNA. 2.2% of the total DNA consists of MS3, the monomer of which is 150 bp long.The MS4 monomer is 300 bp long and accounts for 1.6% of the total DNA. On metaphase chromosomesMS3 and MS4 are located at the centromeric region. FISH analysis of L929 nuclei during the cell cycleshowed relative positions of MaSat, MiSat, MS3, and MS4. All mapped satDNA fragments except MaSatbelong to the outer layer of the chromocentres in the G0/G1 phase. MS3 is likely to be involved in thecentromere formation. The mouse genome contains at least four satDNA types: AT-rich (MaSat and MiSat),and CG-rich (MS3 and MS4).
Introduction
The composition and organization of mousesatellite DNA (satDNA) has been well character-ized at the molecular level, but a high-resolutionmap of the pericentromeric region of mouse telo-centric chromosomes is still lacking. Such datamight help to understand the meaning of non-coding DNA, a hot topic now that the genomedrafts have shown that most of the DNA in agenome probably plays regulatory and archi-tectural roles (Venter et al. 2001). Despite thekey role of the centromere (CEN) in the main-tenance of chromosome stability, its molecular
characterization in higher eukaryotes is far fromcomplete. The complexity of this locus, itsextremely large size (several megabases) and thepresence of highly repeated sequences, whosesequence and organization are highly variable,make the characterization of CEN rather difficult.
The satDNA are poorly represented in themouse genome database (Waterston et al. 2002). Itwas expected that highly repetitive regions of thegenome would not be assembled or anchored onchromosomes. In the mouse genome the cen-tromeric sequences, including the euchromatin-proximal major satellite (MaSat) (Horz &Altenburger 1981) and the telomere-proximal
Chromosome Research 13: 9–25, 2005. 9# 2005 Springer. Printed in the Netherlands
minor satellite (MiSat) (Kipling et al. 1991), arefound on some chromosomes (Waterston et al.2002).
It is assumed that satDNA represents a specialtype of inactive constitutive heterochromatin thatremains condensed during the cell cycle. A greatpart of satDNA of di¡erent families, although notall of them, is present in the CEN or pericen-tromeric (periCEN) chromosome regions. Sequen-ces of satDNAs are di¡erent in di¡erent speciesand the level of their evolutional variability is high(Beridze 1986). However, they have some commonstructural features (Fitzgerald et al. 1994, Lobovet al. 2001) and their positions on chromosomesare ¢xed.
It is believed that in many mammalian speciesCEN and periCEN heterochromatin provide thestructural foundation for the large heterochro-matic blocks, called chromocentres (Cerda et al.1999, Alcobia et al. 2000). Chromocentres can beobserved as brightly DAPI-stained regions in inter-phase nuclei with £uorescence microscopy (Hsu1975). The chromocentres are shown to contain dif-ferent types of satDNA (Cerda et al. 1999, He &Brinkley 1996, Lobov et al. 2000). The mouse cen-tromeric MiSat does not always belong to chromo-centres (Bartholdi 1991, He & Brinkley 1996,Kuznetsova et al. 2002). Heterochromatin couldbe composed of di¡erent types of sequences inaccordance with the proposed multilayer hetero-chromatin structure (Manuelidis 1990), and itscomposition needs further investigation. It is notyet clear what type of satDNA is involved in move-ment and rearrangement of the heterochromaticregion. The organization of the CEN and peri-CEN regions in the interphase nuclei remainsobscure.
The goal of the present work was to create alibrary of DNA fragments from isolated chromo-centres. As a result, we have cloned andsequenced two DNA fragments from chromo-centres: MS3 and MS4 (Mouse Satellite 3 andMouse Satellite 4, respectively). Both cloned frag-ments were hybridized to the CEN region ofmetaphase chromosomes. The computer-basedanalysis of the clones MS3 (GenBank AccessionNo. AY439017) and MS4 (GenBank AccessionNo. AY439018) by alignment has shown them tobe new satDNA fragments absent in GenBankdatabases.
Materials and methods
Plasmids
The following DNA fragments were used: a frag-ment (471 bp) of MaSat (Radic et al. 1987)cloned into pBluescript II KSþ and the MiSatfragment (362 bp) inserted in pGEM7 vector(Kipling et al. 1995).
Cell culture and slide preparation
Mouse fibroblast-like cells of line NCTC clone929 from mouse C3H/An, connective tissue,clone L (L929) (Cell Cultures Collection, Insti-tute of Cytology RAS) were cultured in DMEMsupplemented with 10% fetal calf serum and gen-tamicin under standard conditions. Metaphasechromosomes were isolated from cells blocked inmitosis by 0.5mg/ml colchicine. Preparationswere fixed in methanol : acetic acid (3 : 1) accord-ing to conventional cytogenetic techniques.
Cell synchronization
The L929 cells were synchronized at G1/G0, S,and G2; the cells were blocked at the G0/G1phase by serum deprivation for 48 h (Dolniket al. 2003) using FACS (Fluorescence-ActivatedCell Sorting) analysis in an ATC-3000 device(Odam-Bruker, France)
Isolation of genomic DNA, nuclei andchromocentres
Balb mice were used for the preparation ofnuclei, genomic DNA and chromocentres.Extraction of DNA was performed from homo-genized mouse liver by the standard method(Sambrook et al. 1989). Mouse liver was homo-genized in 8% sucrose containing the buffer A(20mmol/L triethanolamine-HCl (TEA), pH 7.6,10mmol/L MgCl2, 30mmol/L KCl, 0.1mmol/LPMSF, 1mmol/L DTT). The homogenate wascentrifuged at 1000g for 10min, loaded on a2.1mol/L sucrose cushion and centrifuged at50000g at 0�C for 40min. The pellet was washedthree times in the buffer A. The quality of thenuclei was checked using light microscopy.
10 I. S. Kuznetsova et al.
Aliquots of the nuclear fraction were fixed inmethanol : acetic acid (3 : 1).
The chromocentre preparation technique andcontrols were performed using non-ionic detergenttreatment, low ionic strength solution (0.5mmol/LMgCl2) ultrasonication, and separation of cellstructures and chromocentres by sucrose gradientas described (Prusov & Zatsepina 2002).
Prematurely condensed chromosomes (PCC)
10–12-week old female mice F1(C57BL/CBA)BLwere used. To obtain prematurely condensedchromosomes (PCC), preparations of mousezygotes (the first meiotic division, 26 h after anadministration of human chorionic gonado-tropin) washed out of oviducts of superovulatedfertilized mice were treated with okadaic acid(final concentration 5 mmol/L) as describedDyban et al. (1993). The eggs were incubated inM16 medium with Triton-X 100 (0.01%) andused for chromosomal preparations. Subsequenttreatment with a series of fixatives containingmethanol and acetic acid at different proportions(75% acetic acid :methanol, 1 : 1; glacial aceticacid :methanol, 1 : 1; methanol : glacial aceticacid, 4 : 1) allowed us to obtain PCC prepara-tions that were free of cytoplasmic, nuclearenvelope or nucleoplasmic contaminations.
Electron microscopy
Nuclei and chromocentre fractions were fixedwith glutaraldehyde (pH 7.0), postfixed in 1%OsO4, and dehydrated in an ethanol series (30%,50%, 70%, and 96%, 15min each). Ultrathinsections were cut on an LKB–III ultramicrotome(LKB, Sweden), contrasted with lead citrate,and examined in a Hitachi-11B (Japan) electron-microscope at an accelerating voltage of 75 kV.
Fluorescence in situ hybridization (FISH) andprimed in situ labelling (PRINS)
For FISH, MaSat, MiSat, MS3, MS4 were label-led with digoxigenin-11-dUTP (DIG) and biotin-16-dUTP (Roche, Germany) for FISH. Thelabelled nucleotides were incorporated into frag-ments by PCR, using M13 forward and reverse
primers. The FISH experiments were carried outas described (Kuznetsova et al. 2002).
The PRINS technique (Mitchell et al. 1992,Russo et al. 1996) was used with the followingmodi¢cations. Chromosomal DNA was denaturedin 10mmol/L NaOH/1mmol/L NaCl for 5minfollowed by a brief rinse in 10mmol/L Tris-HCl,pH 7.6. In the ¢rst cycle of two-colour PRINS wascarried out with an oligonucleotide correspondingto the MiSat sequence (50-AAATCCCGTTTC-CAACGAAT-30) and (50-TGGAAAATGATG-AAAACCACA-30) in this case the labellednucleotide was biotin-16-dUTP (Roche, Ger-many). The second PRINS cycle was carriedout with an oligonucleotide correspondingto MS3 (50-TACGACTGGTGCGTGGACA-30)and (50-GTAACCAGCGCCATCAGCTT-30) andDIG-11-dUTP (Roche, Germany). Annealing andextension were carried out respectively at 53�C for10min, and 62�C for 40min. At the end of thecycle, coverslips were removed, the slides dipped inthe blocking solution (50mmol/L EDTA/50mmol/L NaCl, 72�C, 2min), and subsequently in10mmol/L Tris-HCl, pH7.6. The second PRINScycle was carried out under the same conditions.After a second wash in the blocking solution, theslides were washed twice in 4� SSC, pH7.0, 0.1%Tween-20, and once in PBST (PBS, 0.1% Tween),and incubated with a mixture of Texas Red-avidinD (VectorLabs, USA) and FITC-conjugated anti-DIG antibody (Roche, Germany). The prepara-tions were counterstained with DAPI (0.5 mg/ml)and mounted in anti-fade solution.
Images were taken with a Zeiss Axioplan epi-£uorescence microscope equipped with a charge-coupled device (CCD) camera (Sony) controlledby KS100 software (Carl Zeiss, Germany). Imageswere pseudocoloured in red, green or blue,merged, and prepared for publication using AdobePhotoshop 6.0 software.
Molecular cloning and sequencing of chromocentreDNA
All standard cloning procedures were performedaccording to Sambrook et al. (1989). The frac-tions of chromocentre DNA were digested withrestriction endonucleases (BamHI and EcoRI).Restricted DNA was separated by 1% agarosegel electrophoresis. 200–800 bp fragments were
GC-rich centromeric mouse satellite DNAs 11
isolated from the gel, and inserted into thepolylinker of the pUC19 vector. The E. colistrain DH5a competent cells were transformedwith the ligation products and used for growthof recombinant plasmids. Nine clones weresequenced by an ABI automatic sequencer prism377 with the assay kit Big Due Terminator Kitv.2.0 (Perkin Elmer), by the Helix company (St.Petersburg, Russia).
Dot-blot and southern hybridization analysis
Mouse genomic DNA was dot-blotted onto posi-tively charged nylon membranes (Roche, Ger-many) in a series of dilutions ranging from 15 to1000 ng. Cloned fragments were labelled withDIG-11-dUTP (Roche, Germany) as for FISH.The plasmid with cloned MiSat fragment wasused for the calibration curve which gave con-tribution of the sequences in genome. Hybridiza-tion was performed at 65�C in a solutioncomposed of 6 � SSC, 0.5% SDS, 5�Denhardt,50mg/ml, 50% formamide, 0.01 mol/L EDTA,and 20 ng/ml probe (Sambrook et al. 1989).The hybridized DIG-labelled probe was detectedwith an antidigoxigenin alkaline phosphatase-conjugated antibody (Roche, Germany) accordingto the manufacturer’s protocols. Densitometricquantification from the dot-blot was performedusing Gel-Pro Analyzer Version 3.1.00.00.
For Southern hybridization, the mouse totalDNA was digested with di¡erent restriction endo-nucleases (EcoRI, HinfI, PvuII). Digested DNAfragments were separated by 1% agarose gel elec-trophoresis. DNA was transferred from the gelonto positively charged nylon membranes byalkali capillary blotting, with the use of 0.4mol/LNaOH, and hybridizations were done under thesame conditions as for the dot-blot experiments.
Curvature of the fragments
The curvature of the fragments was determinedobserving their abnormal mobility in electrophor-esis (Radic et al. 1987). MaSat, MS3 and MS4fragments were run on 1% agarose electro-phoresis with 1mg/ml ethidium bromide (EtBr)or without it. In the latter case the gel was
stained in 0.5 mg/ml EtBr after electrophoresis.Both types of gels, with and without EtBr, wereprepared and run simultaneously to ensure theidentity of all the parameters.
Methods of computer-based analysis
The programs ClustalW (www.ebi.ac.uk/clus-talw) (Thompson et al. 1994) and BLASTA(www.ncbi.nlm.nih.gov) from the NCBI (Altschulet al. 1997), and WU-Blast2.0 (www.informa-tics.jax.org) from the EMBL (www.ebi.ac.uk/embl/index.html) (Yan et al. 1998) were used.Sequences were deposited in the NCBI databankunder the following accession numbers: MS3 –No. AY439017; MS4 – No. AY439018.
The probabilities of the sequence containingMatrix Associated Regions (MAR) were esti-mated according to the computer program MAR-Wizard (www.futuresoft.org/MAR-Wiz) andMAR ¢nder (Singh et al. 1997, Glasko et al.2000).
The computer analysis was done with the wedgemodel (Ulanovsky & Trifonov, 1987), which descri-bed how the curved state depended on particularnucleotide sequences. The curved state analysiswas performed using NAMOT2 (Nucleic AcidsModelling Tool, Los Alamos National Labora-tory, USA).
The size of MiSat, MaSat, MS3 and MS4 FISHsignals overlapping the chromocentres was mea-sured with the Videotest-morphology software(Videotest, Russia). In this case the size of theMiSat, MaSat, MS3 and MS4 FISH signals wascalculated as the sum of FISH signal pixels andcompared with the DAPI-stained image. The over-lapping of two computer-produced images gavethe proportion of the FISH signals in the chromo-centres.
Statistical analysis
The statistical significance of the differencesbetween the two data sets was evaluated usingStudent’s t test. The significance level was set at0.95. 20–50 hepatocytes nuclei were scored forthe statistical analysis of different double FISHexperiments.
12 I. S. Kuznetsova et al.
Results
Preparation of chromocentres
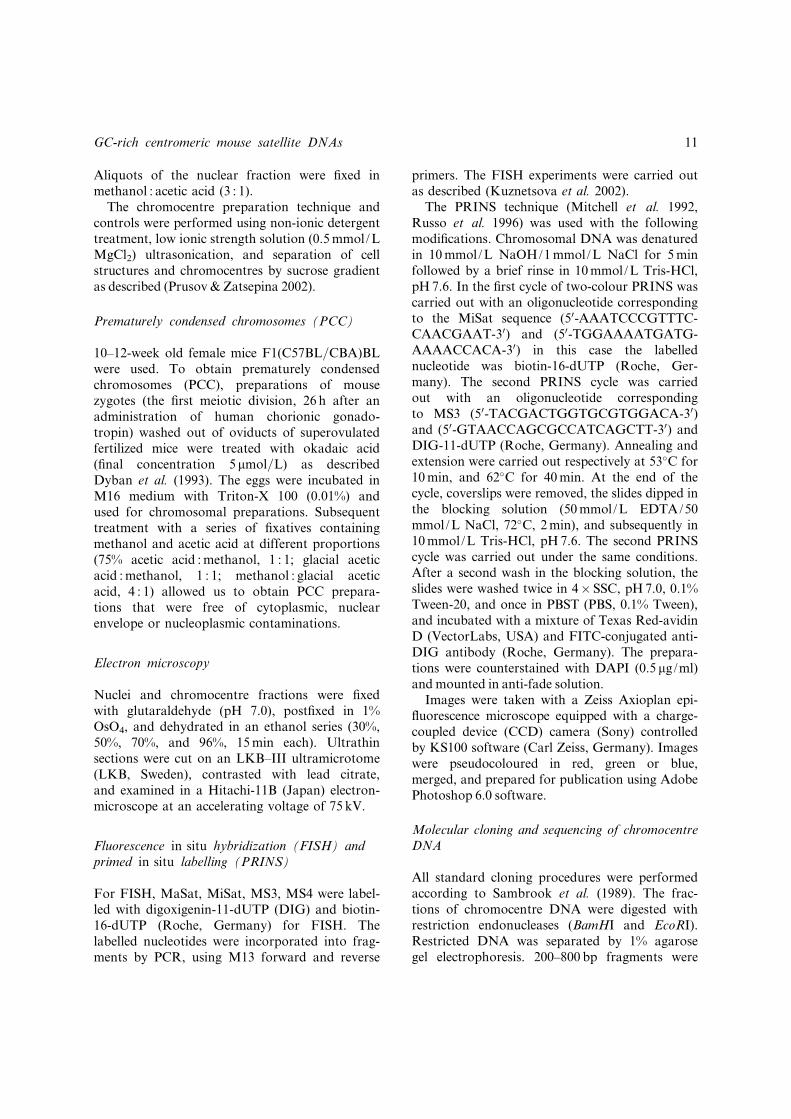
The main steps of the chromocentre isolationwere checked under light and electron micro-scope. Chromocentres are visible as electron-dense round bodies of 200–400 nm in the isolatedhepatocyte nuclei at low ionic strength(0.5mmol/L MgCl2) (Figure 1a). Chromocentresat the nuclear periphery and around the nucleoli,which are a characteristic feature of nativenuclei, become round and not attached to anystructures in the process of nuclear isolation. Thepellet from the second centrifugation step con-tains nucleoli and whole nuclei (Figure 1b). It isseen that under low salt ionic conditions nucleolilook like loose network-covered round bodiesdiffering in appearance from the condensed chro-mocentres (Figure 1b, arrows). A fraction oflarge chromocentres from the sucrose gradientconsists mainly of electron-dense round bodies of200–400 nm similar to those observed in thenuclei (Figure 1a, c).
According to immunoblotting and immuno-£uorescence, the chromocentre fraction containsCENP-A, while chromocentre polypeptide pat-terns di¡er from the nuclear and nucleolar ones(Prusov & Zatsepina 2002). Thus, this method canbe used to obtain a relatively pure fraction of thenuclear heterochromatin, i.e. chromocentres, with-out other nuclear structures or domains.
Cloning, sequencing, and comparison of thechromocentres DNA
The chromocentre DNA digested with restrictionenzymes was used for the creation of pUC19-based library of fragments. After cloning andrecombinant plasmid isolation the inserts weresequenced. The sequences were compared withentries in the NCBI database, using the BLASThomology search programs (Altschul et al. 1997)and WU-Blast 2.0, the EMBL (Yan et al. 1998).Nine sequences of interest have been obtained.One of them turned out to be the 482-bp insertof the doubled MaSat monomer.
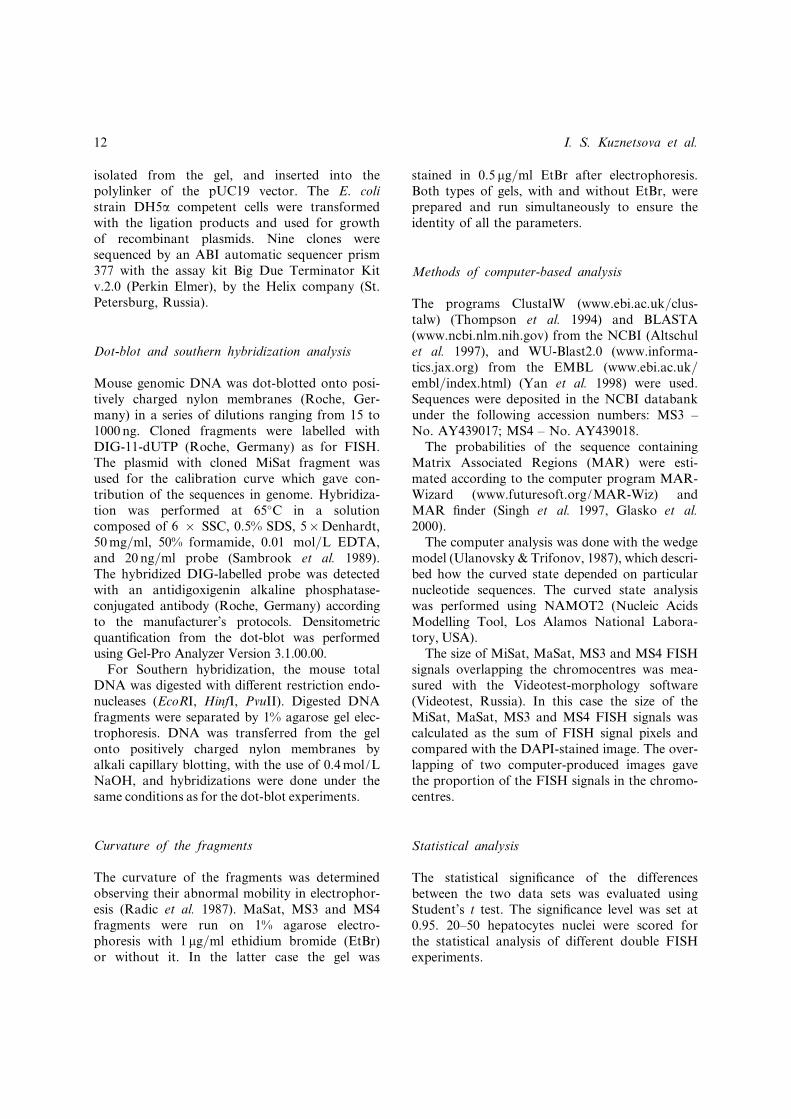
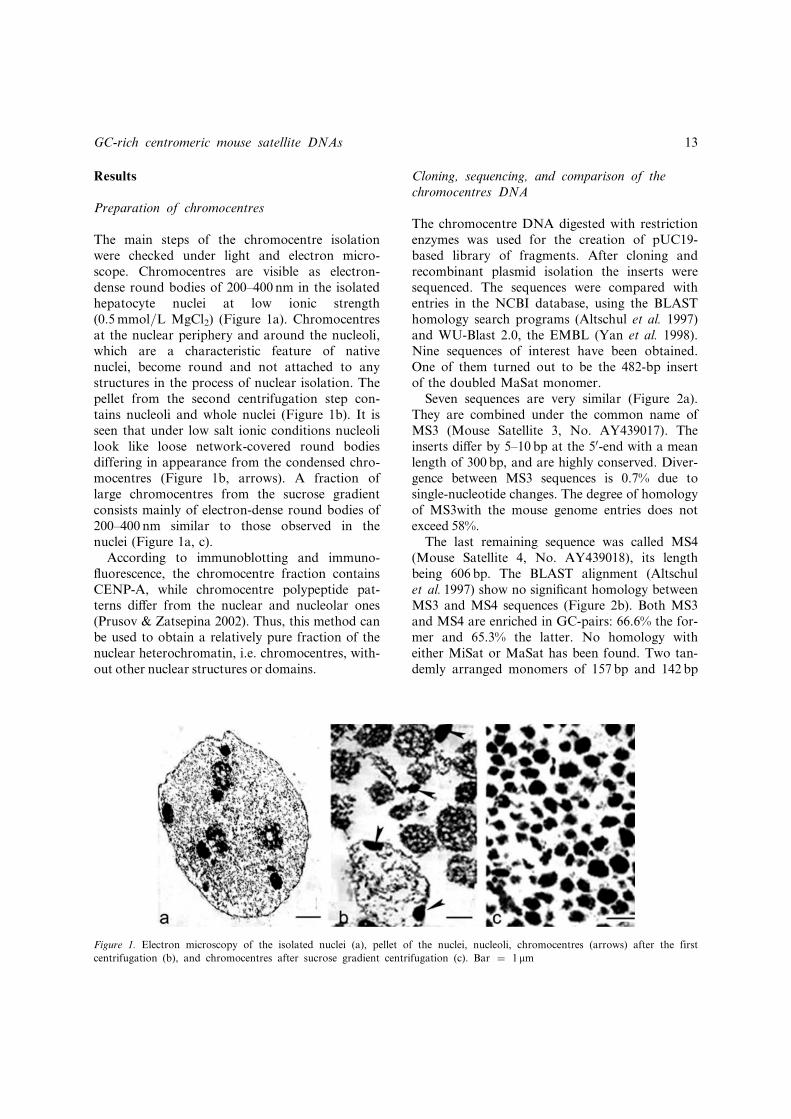
Seven sequences are very similar (Figure 2a).They are combined under the common name ofMS3 (Mouse Satellite 3, No. AY439017). Theinserts di¡er by 5^10 bp at the 50-end with a meanlength of 300 bp, and are highly conserved. Diver-gence between MS3 sequences is 0.7% due tosingle-nucleotide changes. The degree of homologyof MS3with the mouse genome entries does notexceed 58%.
The last remaining sequence was called MS4(Mouse Satellite 4, No. AY439018), its lengthbeing 606 bp. The BLAST alignment (Altschulet al. 1997) show no signi¢cant homology betweenMS3 and MS4 sequences (Figure 2b). Both MS3and MS4 are enriched in GC-pairs: 66.6% the for-mer and 65.3% the latter. No homology witheither MiSat or MaSat has been found. Two tan-demly arranged monomers of 157 bp and 142 bp
Figure 1. Electron microscopy of the isolated nuclei (a), pellet of the nuclei, nucleoli, chromocentres (arrows) after the first
centrifugation (b), and chromocentres after sucrose gradient centrifugation (c). Bar ¼ 1 mm
GC-rich centromeric mouse satellite DNAs 13
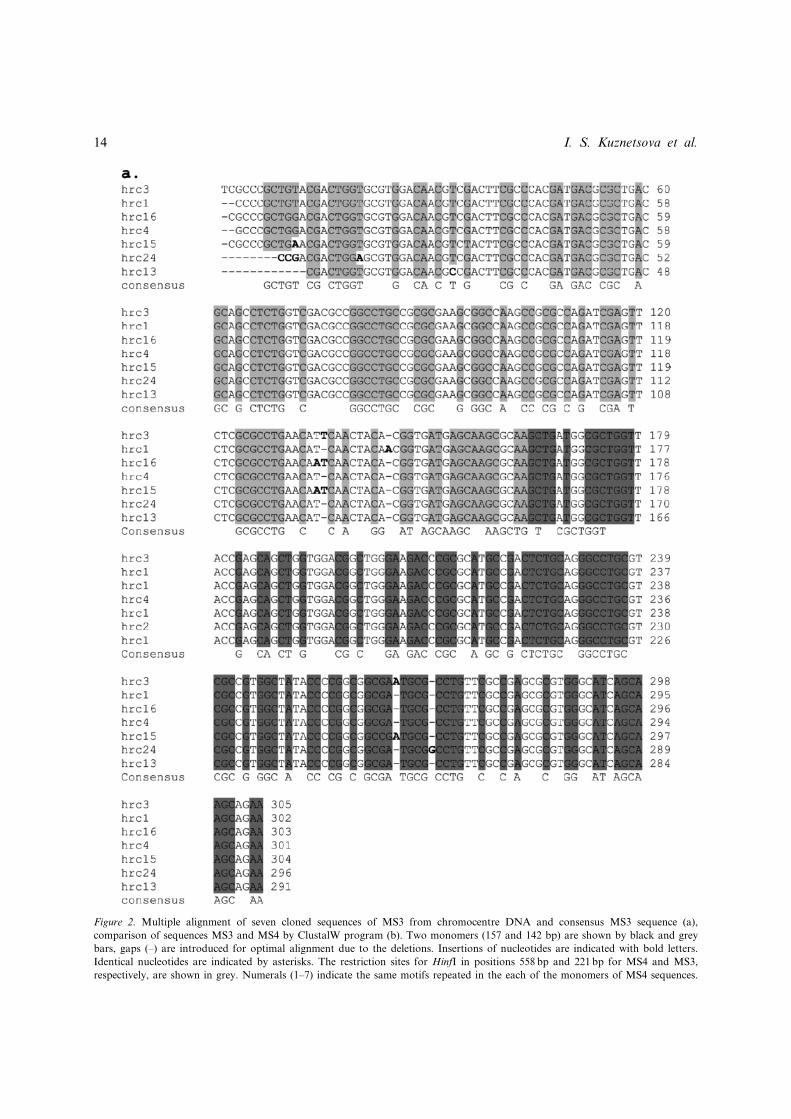
Figure 2. Multiple alignment of seven cloned sequences of MS3 from chromocentre DNA and consensus MS3 sequence (a),
comparison of sequences MS3 and MS4 by ClustalW program (b). Two monomers (157 and 142 bp) are shown by black and grey
bars, gaps (–) are introduced for optimal alignment due to the deletions. Insertions of nucleotides are indicated with bold letters.
Identical nucleotides are indicated by asterisks. The restriction sites for HinfI in positions 558 bp and 221bp for MS4 and MS3,
respectively, are shown in grey. Numerals (1–7) indicate the same motifs repeated in the each of the monomers of MS4 sequences.
14 I. S. Kuznetsova et al.
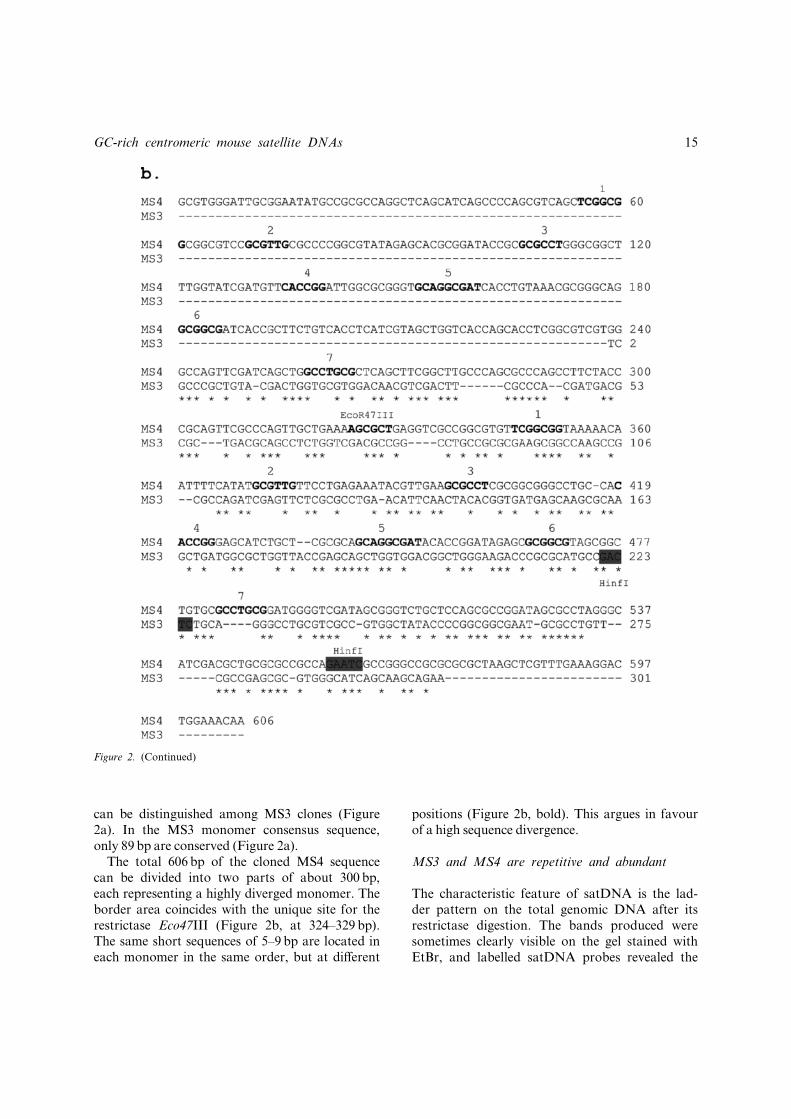
can be distinguished among MS3 clones (Figure2a). In the MS3 monomer consensus sequence,only 89 bp are conserved (Figure 2a).
The total 606 bp of the cloned MS4 sequencecan be divided into two parts of about 300 bp,each representing a highly diverged monomer. Theborder area coincides with the unique site for therestrictase Eco47III (Figure 2b, at 324^329 bp).The same short sequences of 5^9 bp are located ineach monomer in the same order, but at di¡erent
positions (Figure 2b, bold). This argues in favourof a high sequence divergence.
MS3 and MS4 are repetitive and abundant
The characteristic feature of satDNA is the lad-der pattern on the total genomic DNA after itsrestrictase digestion. The bands produced weresometimes clearly visible on the gel stained withEtBr, and labelled satDNA probes revealed the
Figure 2. (Continued)
GC-rich centromeric mouse satellite DNAs 15
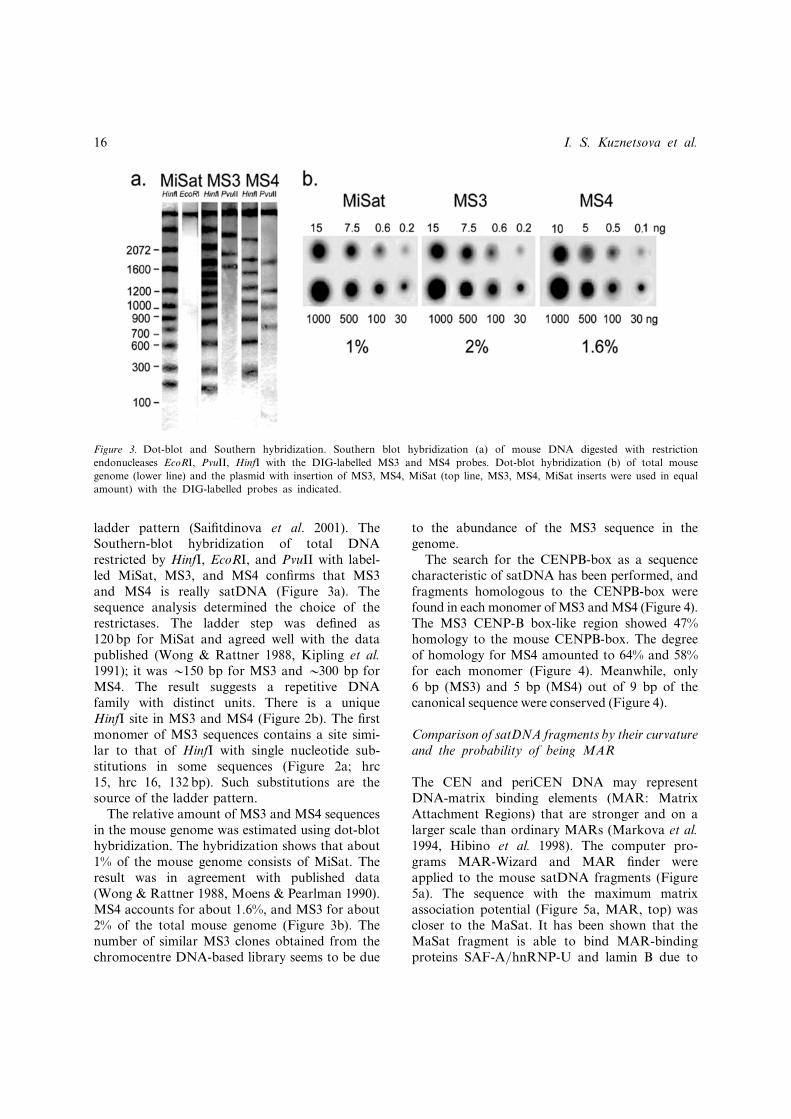
ladder pattern (Saifitdinova et al. 2001). TheSouthern-blot hybridization of total DNArestricted by HinfI, EcoRI, and PvuII with label-led MiSat, MS3, and MS4 confirms that MS3and MS4 is really satDNA (Figure 3a). Thesequence analysis determined the choice of therestrictases. The ladder step was defined as120 bp for MiSat and agreed well with the datapublished (Wong & Rattner 1988, Kipling et al.1991); it was *150 bp for MS3 and *300 bp forMS4. The result suggests a repetitive DNAfamily with distinct units. There is a uniqueHinfI site in MS3 and MS4 (Figure 2b). The firstmonomer of MS3 sequences contains a site simi-lar to that of HinfI with single nucleotide sub-stitutions in some sequences (Figure 2a; hrc15, hrc 16, 132 bp). Such substitutions are thesource of the ladder pattern.
The relative amount of MS3 and MS4 sequencesin the mouse genome was estimated using dot-blothybridization. The hybridization shows that about1% of the mouse genome consists of MiSat. Theresult was in agreement with published data(Wong & Rattner 1988, Moens & Pearlman 1990).MS4 accounts for about 1.6%, and MS3 for about2% of the total mouse genome (Figure 3b). Thenumber of similar MS3 clones obtained from thechromocentre DNA-based library seems to be due
to the abundance of the MS3 sequence in thegenome.
The search for the CENPB-box as a sequencecharacteristic of satDNA has been performed, andfragments homologous to the CENPB-box werefound in each monomer of MS3 and MS4 (Figure 4).The MS3 CENP-B box-like region showed 47%homology to the mouse CENPB-box. The degreeof homology for MS4 amounted to 64% and 58%for each monomer (Figure 4). Meanwhile, only6 bp (MS3) and 5 bp (MS4) out of 9 bp of thecanonical sequence were conserved (Figure 4).
Comparison of satDNA fragments by their curvatureand the probability of being MAR
The CEN and periCEN DNA may representDNA-matrix binding elements (MAR: MatrixAttachment Regions) that are stronger and on alarger scale than ordinary MARs (Markova et al.1994, Hibino et al. 1998). The computer pro-grams MAR-Wizard and MAR finder wereapplied to the mouse satDNA fragments (Figure5a). The sequence with the maximum matrixassociation potential (Figure 5a, MAR, top) wascloser to the MaSat. It has been shown that theMaSat fragment is able to bind MAR-bindingproteins SAF-A/hnRNP-U and lamin B due to
Figure 3. Dot-blot and Southern hybridization. Southern blot hybridization (a) of mouse DNA digested with restriction
endonucleases EcoRI, PvuII, HinfI with the DIG-labelled MS3 and MS4 probes. Dot-blot hybridization (b) of total mouse
genome (lower line) and the plasmid with insertion of MS3, MS4, MiSat (top line, MS3, MS4, MiSat inserts were used in equal
amount) with the DIG-labelled probes as indicated.
16 I. S. Kuznetsova et al.
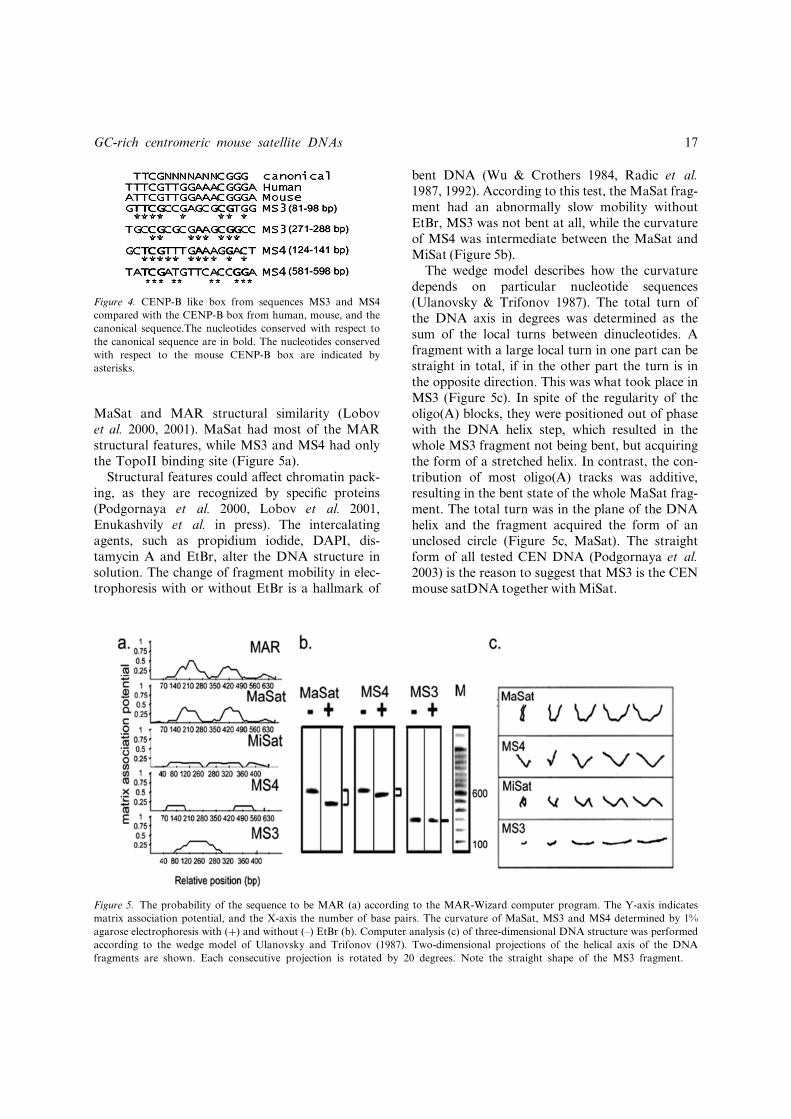
MaSat and MAR structural similarity (Lobovet al. 2000, 2001). MaSat had most of the MARstructural features, while MS3 and MS4 had onlythe TopoII binding site (Figure 5a).
Structural features could a¡ect chromatin pack-ing, as they are recognized by speci¢c proteins(Podgornaya et al. 2000, Lobov et al. 2001,Enukashvily et al. in press). The intercalatingagents, such as propidium iodide, DAPI, dis-tamycin A and EtBr, alter the DNA structure insolution. The change of fragment mobility in elec-trophoresis with or without EtBr is a hallmark of
bent DNA (Wu & Crothers 1984, Radic et al.1987, 1992). According to this test, the MaSat frag-ment had an abnormally slow mobility withoutEtBr, MS3 was not bent at all, while the curvatureof MS4 was intermediate between the MaSat andMiSat (Figure 5b).
The wedge model describes how the curvaturedepends on particular nucleotide sequences(Ulanovsky & Trifonov 1987). The total turn ofthe DNA axis in degrees was determined as thesum of the local turns between dinucleotides. Afragment with a large local turn in one part can bestraight in total, if in the other part the turn is inthe opposite direction. This was what took place inMS3 (Figure 5c). In spite of the regularity of theoligo(A) blocks, they were positioned out of phasewith the DNA helix step, which resulted in thewhole MS3 fragment not being bent, but acquiringthe form of a stretched helix. In contrast, the con-tribution of most oligo(A) tracks was additive,resulting in the bent state of the whole MaSat frag-ment. The total turn was in the plane of the DNAhelix and the fragment acquired the form of anunclosed circle (Figure 5c, MaSat). The straightform of all tested CEN DNA (Podgornaya et al.2003) is the reason to suggest that MS3 is the CENmouse satDNA together with MiSat.
Figure 4. CENP-B like box from sequences MS3 and MS4
compared with the CENP-B box from human, mouse, and the
canonical sequence.The nucleotides conserved with respect to
the canonical sequence are in bold. The nucleotides conserved
with respect to the mouse CENP-B box are indicated by
asterisks.
Figure 5. The probability of the sequence to be MAR (a) according to the MAR-Wizard computer program. The Y-axis indicates
matrix association potential, and the X-axis the number of base pairs. The curvature of MaSat, MS3 and MS4 determined by 1%
agarose electrophoresis with (þ) and without (–) EtBr (b). Computer analysis (c) of three-dimensional DNA structure was performed
according to the wedge model of Ulanovsky and Trifonov (1987). Two-dimensional projections of the helical axis of the DNA
fragments are shown. Each consecutive projection is rotated by 20 degrees. Note the straight shape of the MS3 fragment.
GC-rich centromeric mouse satellite DNAs 17

MS3 and MS4 localization in situ on the L929
The insert from the clone hrc3 (Figure 2a) wasused for FISH experiments on MS3. Both MS3and MS4 probes had a centromeric location onmetaphase spreads at the level of FISH resolu-tion (Figure 6). The hybridization signal of MS3and MS4 was revealed as a single spot on eachchromosome. The MS3 signal looks more prox-imal than that of MaSat on some chromosomes(Figure 6c, arrowheads). At G0/G1, both MS3and MS4 were located as dots at the periphery ofthe chromocentre. MS3 was more often observedin contact with chromocentres (Figure 7,Ia) thanMS4, whose signals surrounded chromocentres ascircles of dots (Figure 7, Ib).
MS3 and MS4 remained in globules at the rimof the chromocentres at S phase. With *20chromocentres visible in the S phase nuclei, theamount of MS3 and MS4 was about twice as high.Some of the signals were doubled (Figure 7, IIa, b,arrowheads). Again most of doubled MS3 signalswere localized in chromocentres, while MS4 sig-nals were predominantly in the space betweenthem (Figure 7, II). MS4 and MS3 globulesbecame about threefold larger and decreased innumbers by about three times, suggesting that MS4and MS3 clustered at S phase (Figure 7, I, II).
The relative positions of all four satDNA frag-ments at the G2 phase were determined. MiSatand MaSat signals were revealed at the peripheryof the chromocentres. At the G2 phase MS3 and
Figure 6. Detection of MS3 (a) and MS4 (b) on metaphase chromosome spreads from the L929 cell line by FISH; hybridization
signal is red, chromosomes counterstained with DAPI (blue). (c) Part of a metaphase spread double-labelled with MaSat (green) and
MS3 (red). The peripheral position of MS3 is marked by arrowheads. Bar ¼ 10 mm.
18 I. S. Kuznetsova et al.
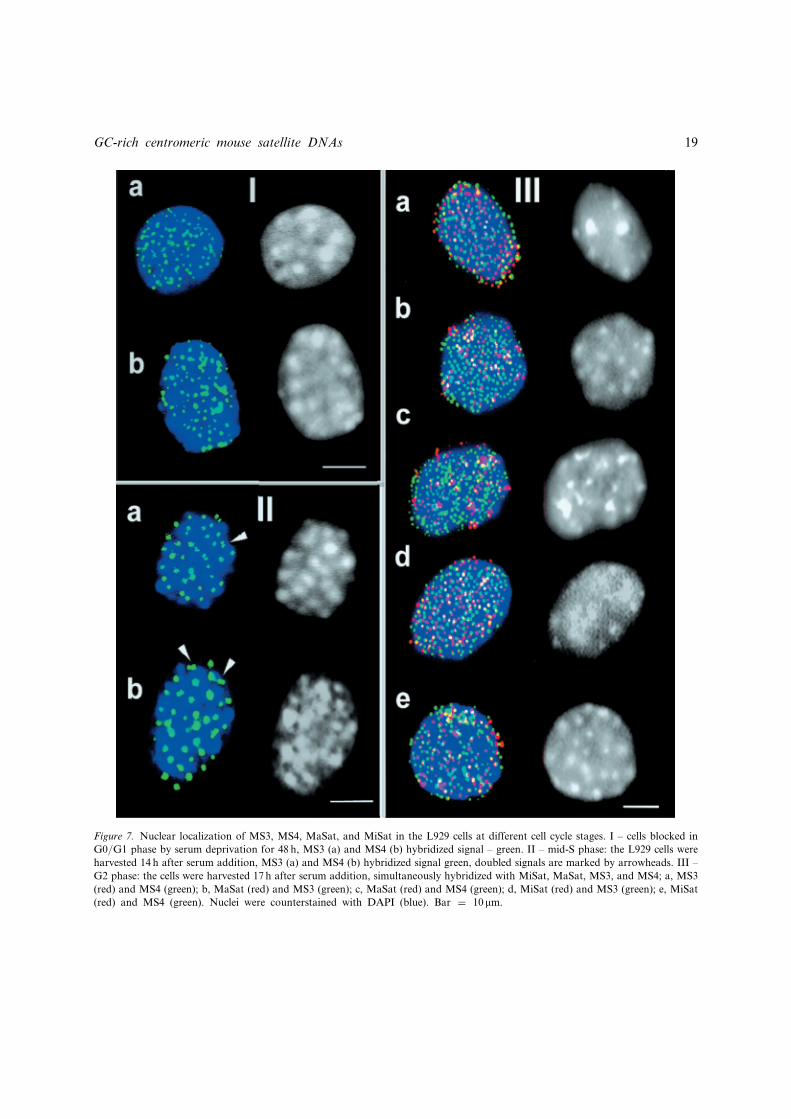
Figure 7. Nuclear localization of MS3, MS4, MaSat, and MiSat in the L929 cells at different cell cycle stages. I – cells blocked in
G0/G1 phase by serum deprivation for 48 h, MS3 (a) and MS4 (b) hybridized signal – green. II – mid-S phase: the L929 cells were
harvested 14 h after serum addition, MS3 (a) and MS4 (b) hybridized signal green, doubled signals are marked by arrowheads. III –
G2 phase: the cells were harvested 17 h after serum addition, simultaneously hybridized with MiSat, MaSat, MS3, and MS4; a, MS3
(red) and MS4 (green); b, MaSat (red) and MS3 (green); c, MaSat (red) and MS4 (green); d, MiSat (red) and MS3 (green); e, MiSat
(red) and MS4 (green). Nuclei were counterstained with DAPI (blue). Bar ¼ 10 mm.
GC-rich centromeric mouse satellite DNAs 19
MS4 surrounded the chromocentres and their sig-nals did not overlap. The alternation of MS3 andMS4 signals was visible as beads on a string(Figure 7, IIIa). This arrangement was even moreprominent when MS3 and MiSat were used for theprobes (Figure 7, IIId). When MaSat was one ofthe probes, it formed mostly globules; MS3 orMS4 signals remained aligned in dots, andoverlapping of either of these signals with MaSatglobules was quite rare (Figure 7, IIIb, c). TheMiSat and MS4 signals abutted on each other withsome shift, which seemed to be regular in each pairof signals. Again, overlapping of the signals is arare event (Figure 7, IIIe). At all cell cycle stagestested the MS3 position remained constant at therim of the chromocentres. MS4, at all stagesexcept metaphase, surrounded the chromocentresmore peripherally than all the rest of the satDNAfragments tested.
MS3 and MS4 localization in situ on hepatocytenuclei
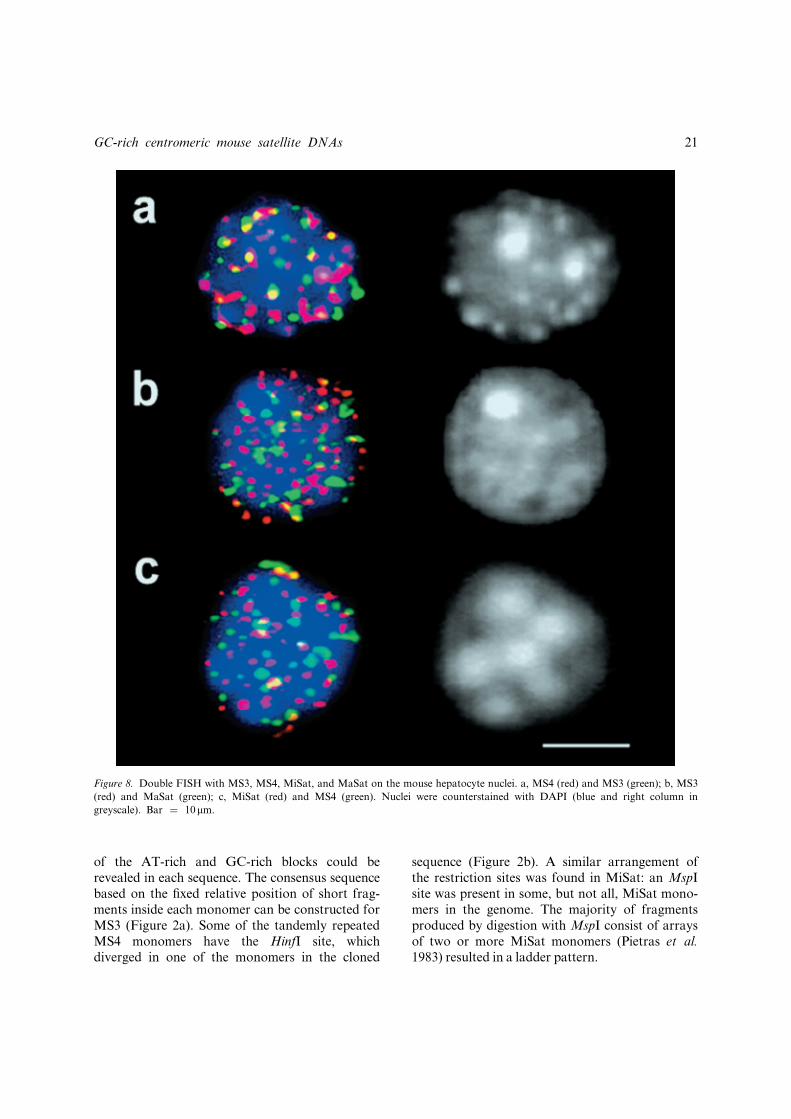
A number of double-FISH experiments were car-ried out to determine the relative positions ofsatDNA fragments in the isolated nuclei ofmouse hepatocytes. The number of chromo-centres was nearly half (11�4) of that in the cellline L929 in G0/G1 and most of them lookedmore condensed (Figure 8, DAPI, the right row).MS3 and MS4 were located at the chromocentreperiphery (Figure 8a). In the case of doublelabelling with MiSat and MS4 an alternatingorder was observed in circles of dots surroundingchromocentres (Figure 8c). MiSat was revealedas dots located at the chromocentre periphery,while in all cases the MaSat probe hybridized toglobules inside and at the rim of chromocentres(Figure 8b, c). Statistical analysis shows thatamong all the signals in each nucleus only part isin the chromocentres: 60% for MaSat, 31% forMS4, 18% for MiSat, and 13% for MS3. Not asingle signal from all the satDNA fragments usedcorresponded to the core of the chromocentre.
PRINS on prematurely condensed chromosomes
Prematurely condensed chromosomes (PCC)were prepared from mouse oocytes treated withokadaic acid, as described previously (Dyban
et al. 1993). If the fixation step is preceded by anon-ionic detergent treatment, the nucleolar pro-teins are removed and the chromosomes becomeclearly visible. The PCC that we used in the cur-rent work were prepared in this way and wereclassified as G2-chromosomes according to mor-phological criteria. PCC were usually not fullycondensed (Dyban et al. 1993), so we used themto trace the relative positions of MiSat and MS3.
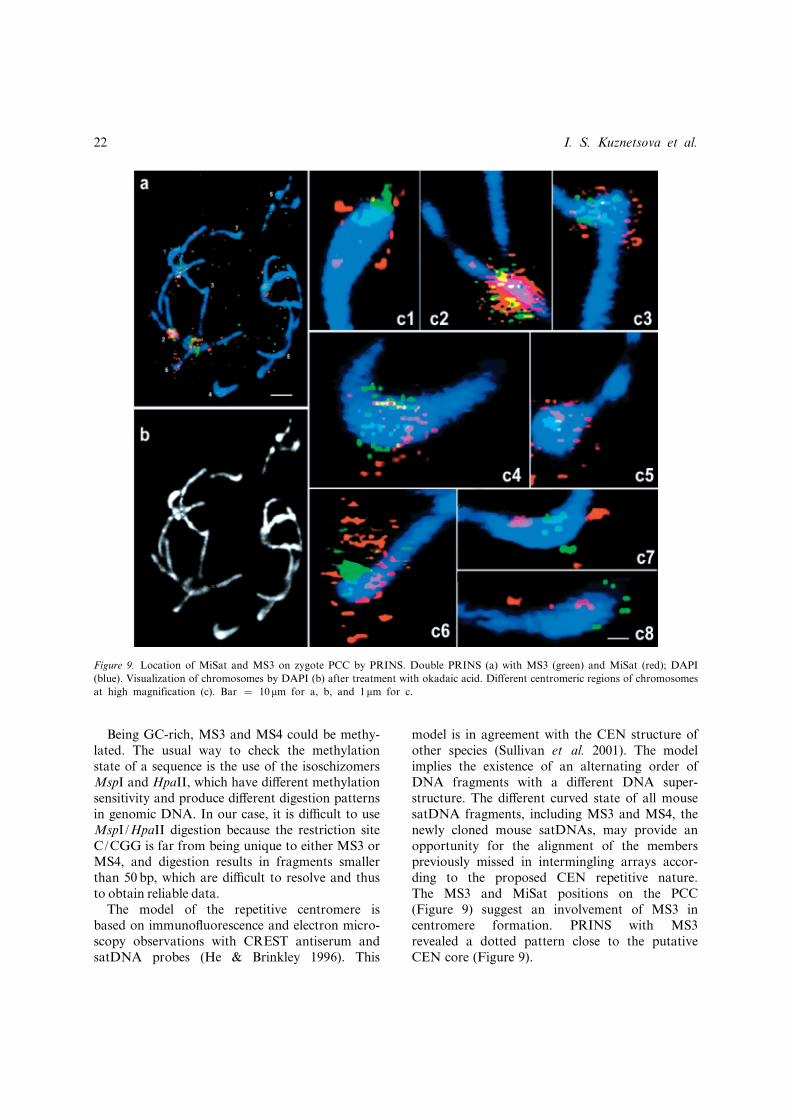
None of 20 chromosomes was lost during themetaphase plate isolation, although their integritywas slightly altered. It was seen that the CENregion determined according to its position on thePCC and brightly stained with DAPI was not fullycondensed (Figure 9b). The main part of thePRINS MiSat (red) and MS3 (green) signals belon-ged to the primary constriction regions of chromo-somes. Only a small number of the signalsbelonged to the chromosome arms (Figure 9a).The lack of perfect CEN condensation made thePRINS signal on PCC di¡erent from the FISHsignal on the conventional metaphase spread(Figure 6). The PRINS signal for both fragmentson PCC looked like a number of tiny dots andtheir relative positions could be distinguished. Itwas seen on several examples of PCC at a highmagni¢cation that MS3 dots (green) were alwayslocated more centrally in the would-be CEN thanthe MiSat signal (red) (Figure 9c). Such location isin agreement with the suggestion that MS3 isinvolved in CEN formation, based on the prob-ability of the satDNA not being MAR and itsstraight form in vitro (Figure 5).
Discussion
SatDNA of many species could be divided intotwo classes: the first class of simple satDNA iscomposed of short (5–10 bp), whereas the secondclass is composed of rather long monomers (100–200 bp) (Beridze 1986). Thus MS3 (*150 bp,Figure 2a, 3a) and MS4 (*300 bp, Figure 2b,3a) belong to the second class of the satDNA(Figure 2a, b).
The ladder hybridization pattern of MS3 andMS4 shows that each of these satDNAs is arran-ged in tandem in the genome of M. musculus.Internal repeats have not been found either forMS3 or for MS4, although some alternating order
20 I. S. Kuznetsova et al.
of the AT-rich and GC-rich blocks could berevealed in each sequence. The consensus sequencebased on the ¢xed relative position of short frag-ments inside each monomer can be constructed forMS3 (Figure 2a). Some of the tandemly repeatedMS4 monomers have the HinfI site, whichdiverged in one of the monomers in the cloned
sequence (Figure 2b). A similar arrangement ofthe restriction sites was found in MiSat: an MspIsite was present in some, but not all, MiSat mono-mers in the genome. The majority of fragmentsproduced by digestion with MspI consist of arraysof two or more MiSat monomers (Pietras et al.1983) resulted in a ladder pattern.
Figure 8. Double FISH with MS3, MS4, MiSat, and MaSat on the mouse hepatocyte nuclei. a, MS4 (red) and MS3 (green); b, MS3
(red) and MaSat (green); c, MiSat (red) and MS4 (green). Nuclei were counterstained with DAPI (blue and right column in
greyscale). Bar ¼ 10mm.
GC-rich centromeric mouse satellite DNAs 21
Being GC-rich, MS3 and MS4 could be methy-lated. The usual way to check the methylationstate of a sequence is the use of the isoschizomersMspI and HpaII, which have di¡erent methylationsensitivity and produce di¡erent digestion patternsin genomic DNA. In our case, it is di⁄cult to useMspI/HpaII digestion because the restriction siteC/CGG is far from being unique to either MS3 orMS4, and digestion results in fragments smallerthan 50 bp, which are di⁄cult to resolve and thusto obtain reliable data.
The model of the repetitive centromere isbased on immuno£uorescence and electron micro-scopy observations with CREST antiserum andsatDNA probes (He & Brinkley 1996). This
model is in agreement with the CEN structure ofother species (Sullivan et al. 2001). The modelimplies the existence of an alternating order ofDNA fragments with a di¡erent DNA super-structure. The di¡erent curved state of all mousesatDNA fragments, including MS3 and MS4, thenewly cloned mouse satDNAs, may provide anopportunity for the alignment of the memberspreviously missed in intermingling arrays accor-ding to the proposed CEN repetitive nature.The MS3 and MiSat positions on the PCC(Figure 9) suggest an involvement of MS3 incentromere formation. PRINS with MS3revealed a dotted pattern close to the putativeCEN core (Figure 9).
Figure 9. Location of MiSat and MS3 on zygote PCC by PRINS. Double PRINS (a) with MS3 (green) and MiSat (red); DAPI
(blue). Visualization of chromosomes by DAPI (b) after treatment with okadaic acid. Different centromeric regions of chromosomes
at high magnification (c). Bar ¼ 10mm for a, b, and 1mm for c.
22 I. S. Kuznetsova et al.
In M. musculus the CEN regions were reportedto be composed of MiSat linked to the telomericsequences and separated from the euchromatin byat least the MaSat sequences (Narayanswami et al.1992, Garagna et al. 2002). The CEN repetitivenature disagrees with the commonly acceptedpoint of view that MiSat and MaSat arrays are con-tiguous on the chromosome. One of the methodsused to substantiate this conclusion is PulsedField Gel Electrophoresis (PFGE). PFGE of M.musculus DNA digested with SalI and SfiI revealsthe presence of fragments that hybridize to MiSatand telomere probes and is consistent with the phy-sical linkage of these two sequences. The existenceof the fragments bearing two out of three sequencesdoes not rule out the existence of interminglingfragments that could not be recognized due to theabsence of probe.
S phase is known to be the period of maximalcentromere decondensation (He & Brinkley 1996).There is nevertheless a possibility that MS3 andMS4 replication could occur without decondensa-tion. Double FISH was therefore done at G2, thestage of chromosome formation, and the alternat-ing order of the arrays of di¡erent satDNAs arran-ged in beads on a string was revealed. All theprobes used produced a dotted pattern, with onlyMaSat showing some tendency to be aggregated(Figure 7, IIIb, c). In the case of the MS3/MS4and MS3/MiSat probes pairs an obvious beads-on-a-string order of signals was observed. Thealternating order of the signals in G2 might re£ecttheir position on the chromosome.
The approach that we used to reveal the straightform of all the tested CEN DNAs provides a newtool for the general explanation of how the cen-tromere itself is distinguished within the hugearray of satDNAs (Podgornaya et al. 2003).According to its straight state, MS3 should beinvolved in centromere formation (Figure 5).Epigenetic factors, which are presumed to be cru-cial for centromere formation, should be involvedin the binding of a number of conventional andconservative CENP, but not in the binding ofperiCEN satDNA binding proteins. The search forCENP-B binding sites (CENP-B box) revealedmoderate homology in MS3 and MS4 (Figure 4).SatDNAs with a similar degree of homology wereregarded as containing CENPB-boxes in pigeon(Solovei et al. 1996) and the North African rodent
Lemniscomys barbarus (Stitou et al. 1999). It isimpossible to predict whether the degree of homol-ogy with the CENP-B box, which we found inMS3 and MS4, preserves the functional CENP-Bbox. The speci¢city of protein binding to MS3 andMS4 is the subject of further investigations.
The satDNA position and its connection withchromocentre DNA is in agreement with the sug-gested multilayer heterochromatin structure (Man-uelidis 1990). It is known that the number ofchromocentres decreases during cell di¡erentiation(Manuelidis 1997, Krzanowska & Bilinska 2000,Solovei et al. 2004) and, probably, they becomemore condensed. Therefore peripheral sequencescould be involved in the formation of hepatocytenuclear chromocentres, and this would be thereason for their presence in the chromocentreDNA-based library. Relative positions of all foursatDNA fragments on hepatocyte nuclei allowedus to suggest that signals from all satDNAfragments fail to cover the whole chromocentrearea. They tend to fuse in hepatocyte nuclei(Figure 8) and to surround chromocentres in theG0/G1 of the cycling cell culture (Figure 7a,Kuznetsova et al. 2002). It appears that we wereable to reveal the sequences that belong to theouter layer of the chromocentres. None of thesatDNA probes used belongs to the core partof the chromocentres. We suppose that the corechromocentre sequences might be in the chromo-centre DNA library, so we are going to continueits analysis.
Acknowledgements
The MiSat containing plasmid was a kind giftfrom Dr D. Kipling (HGU MRC, Western Gen-eral Hospital, Edinburgh, UK). The MaSat con-taining plasmid was a kind gift from Dr B.Hamkalo (Department of Molecular Biology andBiochemistry, University of California, USA).
We are grateful to Prof. A.P. Dyban and E.M.Noniashvili for PCC preparations, Dr N. Aksenovfor FACS, I.V. Matveev for help in calculation ofsatDNA curvature, and Dr I. Solovei for fruitfuldiscussion. This work was supported by grantsfrom the DOE Human Genome Program (USA)and the Russian Foundation for Basic Research(grant 04^04^48734-a).
GC-rich centromeric mouse satellite DNAs 23
References
Alcobia I, Dilao R, Parreira L (2000) Spatial associations of
centromeres in the nuclei of hematopoietic cells: evidence for
cell-type-specific organizational patterns. Blood 95: 1608–
1615.
Altschul SF, Madden TL, Schaffer AA, et al. (1997) Gapped
BLAST and PSI-BLAST: A new generation of protein
database search programs. Nucleic Acids Res 25: 3389–
3402.
Bartholdi MF (1991) Nuclear distribution of centromeres
during the cell cycle of human diploid fibroblasts. J Cell Sci
99: 255–263.
Beridze TG (1986) Satellite DNA. Springer-Verlag, Berlin,
Heidelberg, New York, and Tokyo.
Cerda MC, Berrios S, Fernandez-Donozo R, Garagna S, Redi
C (1999) Organization of complex nuclear domains in
somatic mouse cells. Biol Cell 91: 55–65.
Dolnik AV, Kuznetsova IS, Voronin AP, Podgornaya OI
(2003) Telomere-binding TRF2/MTBP localization during
mouse spermatogenesis and cell cycle of the mouse cells
L929. J Anti Aging Med 6: 107–121.
Dyban A, De Sutter P, Verlinsky Y (1993) Okadaic acid
induces premature chromosome condensation reflecting the
cell cycle progression in one-cell stage mouse embryos. Mol
Reprod Dev 34: 402–415.
Enukashvily NI, Donev R, Sheer D, Podgornaya OI. Satellite
DNA binding and cellular localisation of RNA helicase p68.
J Cell Sci, in press
Fitzgerald DJ, Dryden GL, Bronson EC, Williams JS,
Anderson JN (1994) Conserved pattern of bending in
satellite and nucleosome positioning DNA. J Biol Chem 269:21303–21314.
Garagna S, Zuccotti M, Capanna E, Redia CA (2002) High-
resolution organization of mouse telomeric and pericen-
tromeric DNA. Cytogenet Genome Res 96:125–129.Glasko GV, Rogozin IB, Glaskov MV (2000) Computer
prediction of DNA fragments interaction with different
nuclear matrix elements. Mol Biol (Mosk) 34: 5–10.
He D, Brinkley BR (1996) Structure and dynamic organization
of centromeres/prekinetochores in the nucleus of mam-
malian cells. J Cell Sci 109: 2693–2704.
Hibino Y, Ohzeki H, Hirose N, Morita Y, Sugano N (1998)
Involvement of DNA methylation in binding of a highly
repetitive DNA component to nuclear scaffold proteins from
rat liver. Biochem Biophys Res Commun 252: 296–301.
Horz W, Altenburger W (1981) Nucleotide sequence of mouse
satellite DNA. Nucleic Acids Res 9: 683–696.
Hsu TS (1975) A possible function of constitutive hetero-
chromatin: the bodyguard hypothesis. Genetics 79 (suppl. 2):137–150.
Kipling D, Ackford HE, Taylor BA, Cooke HJ (1991) Mouse
minor satellite DNA genetically maps to the centromere and
is physically linked to the proximal telomere. Genomics 11:235–241.
Kipling D, Mitchell AR, Masumoto H, Wilson HE, Nicol L,
Cooke HJ (1995) CENP-B binds a novel centromeric
sequence in the Asian mouse Mus caroli. Mol. Cell. Biol. 15:4009–4020.
Krzanowska H, Bilinska B (2000) Number of chromocentres in
the nuclei of mouse Sertoli cells in relation to the strain and
age of males from puberty to senescence. J Reprod Fertil
118: 343–350.
Kuznetsova IS, Matveev IV, Podgornaya OI, Enukashvily NI
(2002) Localisation of the satellite DNAs in respect to
heterochromatin in the interphase nuclei of the cultured
cells. Tsitologiya (Russia) 44: 422–430.
Lobov IB, Tsutsui K, Mitchell AR, Podgornaya OI
(2000) Specific interaction of mouse major satellite
with MAR-binding protein SAF-A. Eur J Cell Biol 79:839–849.
Lobov IB, Tsutsui K, Mitchell AR, Podgornaya OI (2001)
SAF-A and lamin B binding specificity in vitro correlates
with the satellite DNA bending state. J Cell Biochem 83:218–229.
Manuelidis L (1990) A view of interphase chromosome.
Science 250: 1533–1540.
Manuelidis L (1997) Interphase chromosome position and
structure during silencing, transcription and replication. In:
R. van Driel, A.P. Otte, eds., Nuclear organization,
chromatin structure, and gene expression. Oxford Univ.
Press. Oxford, NY, Tokyo, pp 145–168.
Markova D, Donev R, Patriotis C, Djonjiolov L (1994)
Interphase chromosomes of Friend-S cells are attached to
the matrix structures through the centromeric/telomeric
regions. DNA Cell Biol 13: 941–951.
Mitchell A, Jeppesen P, Hanratty D, Gosden J (1992) The
organisation of repetitive DNA sequences on human
chromosomes with respect to the kinetochore analysed using
a combination of oligonucleotide primers and CREST
anticentromere serum. Chromosoma 101: 333–341.
Moens PB, Pearlman RE (1990) Telomere and centromere
DNA are associated with the cores of meiotic prophase
chromosomes. Chromosoma 100: 8–14.
Narayanswami S, Dogget NA, Clark LM, Hildebrand CE,
Weier H-U, Hamkalo BA (1992) Cytological and molecular
characterization of centromeres in Mus domesticus and Mus
spretus. Mamm Genome 2:186–194.Pietras DF, Bennet KL, Siracusa LD, et al., (1983) Con-
struction of a small Mus musculus repetitive DNA library:
identification of a new satellite sequence in Mus musculus.
Nucleic Acids Res 11: 6965–6983.
Podgornaya OI, Dey R, Lobov IB, Enukashvily NI (2000)
Human satellite 3 binding protein from the nuclear matrix:
isolation and binding properties. Biochim Biophys Acta
1497: 204–214.
Podgornaya OI, Voronin AP, Enukashvily NI, Matveev IV,
Lobov IB (2003) Structure-specific DNA-binding proteins as
the foundation for three-dimensional chromatin organiza-
tion. Int Rev Cytol 224: 227–298.
Prusov AN, Zatsepina OV (2002) Isolation of the chromo-
center fraction from mouse liver nuclei. Biochemistry
(Moscow) 67: 423–431.
Radic MZ, Lundgren K, Hamkalo BA (1987) Curvature of
mouse satellite DNA and condensation of heterochromatin.
Cell 50: 1101–1108.
Radic MZ, Saghbini M, Elton TS, Reeves R, Hamkalo BA
(1992) Hoechst 33258, distamycin A, and high mobility
24 I. S. Kuznetsova et al.

group protein I (HMG-I) compete for binding to mouse
satellite DNA. Chromosoma 101: 602–608.
Russo A, Priante G, Tommasi AM (1996) PRINS localization
of centromeres and telomeres in micronuclei indicates that in
mouse splenocytes chromatid non-disjunction is a major
mechanism of aneuploidy. Mutation Res 372: 173–180.
Saifitdinova AF, Derjusheva SE, Malykh AG, Zhurov VG,
Andreeva TF, Gaginskaya ER (2001) Centromeric tandem
repeat from the chaffinch genome: isolation and molecular
characterization. Genome 44: 96–103.
Sambrook J, Maniatis T, Fritsch EF (1989) Molecular Cloning:
A Laboratory Manual. 2nd Ed. Cold Spring Harbor, NY:
Cold Spring Harbor Laboratory Press.
Singh GB, Kramer JA, Krawetz SA (1997) Mathematical
model to predict regions of chromatin attachment to the
nuclear matrix. Nucleic Acids Res 25: 1419–1425.
Solovei IV, Joffe BI, Gaginskaya ER, Macgregor HC (1996)
Transcription on lampbrush chromosomes of a cen-
tromerically localized highly repeated DNA in pigeon
(Columba) relates to sequence. Chromosome Res 4: 588–603.Solovei I, Grandi N, Knoth R, Volk B, Cremer T (2004)
Postnatal changes of pericentromeric heterochromatin and
nucleoli in postmitotic Purkinje cells during murine cere-
bellum development. Cytogenet Genome Res 105: 302–310.
Stitou S, De La Guardia AD, Jimenez H, Burgos M (1999)
Isolation of a species-specific satellite DNA with a novel
CENP-B-like box from the north African rodent Lem-
niscomys barbarus. Exp Cell Res 250: 381–386.
Sullivan BA, Blower MD, Karpen GH (2001) Determining
centromere identity: cyclical stories and forking paths. Nat
Rev Genet 2: 584–596.
Thompson JD, Higgins DG, Gibson TJ (1994) CLUSTAL W:
improving the sensitivity of progressive multiple sequence
alignment through sequence weighting, position-specific gap
penalties and weight matrix choice. Nucleic Acids Res 22:4673–4680.
Ulanovsky LE, Trifonov EN (1987) Estimation of wedge
components in curved DNA. Nature 326: 720–722.
Venter JC, Adams MD, Myers EW; et al. (2001) The sequence
of the human genome. Science 291: 1304–1351.
Waterston RH, Lindblad-Toh K, Birney E, et al. (2002) Initial
sequencing and comparative analysis of the mouse genome.
Nature 420: 520–565.
Wong AKC, Rattner JB (1988) Sequence organization and
cytological localization of the minor satellite of mouse.
Nucleic Acids Res 16: 11645–11661.
Wu H, Crothers DM (1984) The locus of sequence-
directed and protein induced DNA bending. Nature 308:509–513.
Yan PY, Eulenstein O, Vingron M, Bork P (1998) Towards
detection of orthologues in sequence databases. Bioinfor-
matics 14: 285–289.
GC-rich centromeric mouse satellite DNAs 25