Paraphyly of organelle DNAs in Cycas Sect. Asiorientales due to ancient ancestral polymorphisms
19
BioMed Central Page 1 of 19 (page number not for citation purposes) BMC Evolutionary Biology Open Access Research article Paraphyly of organelle DNAs in Cycas Sect. Asiorientales due to ancient ancestral polymorphisms Yu-Chung Chiang †1 , Kuo-Hsiang Hung †2 , Shann-Jye Moore 3 , Xue-Jun Ge 4 , Shong Huang 3 , Tsai-Wen Hsu* 5 , Barbara A Schaal* 6 and TY Chiang* 7 Address: 1 Department of Life Sciences, Pingtung University of Science and Technology, Pingtung, Taiwan, 912, Republic of China, 2 Graduate Institute of Bioresources, Pingtung University of Science and Technology, Pingtung, Taiwan, 912, Republic of China, 3 Department of Life Science, Taiwan Normal University, Taipei, Taiwan, Republic of China, 4 South China Botanical Garden, Chinese Academy of Sciences, Guangzhou 510650, PR China, 5 Endemic Species Research Institute, Nantou, Taiwan, Republic of China, 6 Department of Biology, Washington University, St Louis, MO 63130, USA and 7 Department of Life Sciences, Cheng-Kung University, Tainan, Taiwan, 701, Republic of China Email: Yu-Chung Chiang - [email protected]; Kuo-Hsiang Hung - [email protected]; Shann- Jye Moore - [email protected]; Xue-Jun Ge - [email protected]; Shong Huang - [email protected]; Tsai- Wen Hsu* - [email protected]; Barbara A Schaal* - [email protected]; TY Chiang* - [email protected] * Corresponding authors †Equal contributors Abstract Background: This study addresses the apportionment of genetic diversity between Cycas revoluta and C. taitungensis, species that constitute the section Asiorientales and represent a unique, basal lineage of the Laurasian genus Cycas. Fossil evidence indicates divergence of the section from the rest of Cycas at least 30 million years ago. Geographically, C. taitungensis is limited to Taiwan whereas C. revoluta is found in the Ryukyu Archipelago and on mainland China. Results: The phylogenies of ribosomal ITS region of mtDNA and the intergenic spacer between atpB and rbcL genes of cpDNA were reconstructed. Phylogenetic analyses revealed paraphyly of both loci in the two species and also in the section Asiorientales. The lack of reciprocal monophyly between these long isolated sections is likely due to persistent shared ancestral polymorphisms. Molecular dating estimated that mt- and cp DNA lineages coalesced to the most recent common ancestors (TMRCA) about 327 (mt) and 204 MYA (cp), corresponding with the divergence of cycad sections in the Mesozoic. Conclusion: Fates of newly derived mutations of cycads follow Klopfstein et al.'s surfing model where the majority of new mutations do not spread geographically and remain at low frequencies or are eventually lost by genetic drift. Only successful 'surfing mutations' reach very high frequencies and occupy a large portion of a species range. These mutations exist as dominant cytotypes across populations and species. Geographical subdivision is lacking in both species, even though recurrent gene flow by both pollen and seed is severely limited. In total, the contrasting levels between historical and ongoing gene flow, large population sizes, a long lifespan, and slow mutation rates in both organelle DNAs have all likely contributed to the unusually long duration of paraphyly in cycads. Published: 10 July 2009 BMC Evolutionary Biology 2009, 9:161 doi:10.1186/1471-2148-9-161 Received: 23 January 2009 Accepted: 10 July 2009 This article is available from: http://www.biomedcentral.com/1471-2148/9/161 © 2009 Chiang et al; licensee BioMed Central Ltd. This is an Open Access article distributed under the terms of the Creative Commons Attribution License (http://creativecommons.org/licenses/by/2.0 ), which permits unrestricted use, distribution, and reproduction in any medium, provided the original work is properly cited.
Transcript of Paraphyly of organelle DNAs in Cycas Sect. Asiorientales due to ancient ancestral polymorphisms
BioMed CentralBMC Evolutionary Biology
ss
Open AcceResearch articleParaphyly of organelle DNAs in Cycas Sect. Asiorientales due to ancient ancestral polymorphismsYu-Chung Chiang†1, Kuo-Hsiang Hung†2, Shann-Jye Moore3, Xue-Jun Ge4, Shong Huang3, Tsai-Wen Hsu*5, Barbara A Schaal*6 and TY Chiang*7Address: 1Department of Life Sciences, Pingtung University of Science and Technology, Pingtung, Taiwan, 912, Republic of China, 2Graduate Institute of Bioresources, Pingtung University of Science and Technology, Pingtung, Taiwan, 912, Republic of China, 3Department of Life Science, Taiwan Normal University, Taipei, Taiwan, Republic of China, 4South China Botanical Garden, Chinese Academy of Sciences, Guangzhou 510650, PR China, 5Endemic Species Research Institute, Nantou, Taiwan, Republic of China, 6Department of Biology, Washington University, St Louis, MO 63130, USA and 7Department of Life Sciences, Cheng-Kung University, Tainan, Taiwan, 701, Republic of China
Email: Yu-Chung Chiang - [email protected]; Kuo-Hsiang Hung - [email protected]; Shann-Jye Moore - [email protected]; Xue-Jun Ge - [email protected]; Shong Huang - [email protected]; Tsai-Wen Hsu* - [email protected]; Barbara A Schaal* - [email protected]; TY Chiang* - [email protected]
* Corresponding authors †Equal contributors
AbstractBackground: This study addresses the apportionment of genetic diversity between Cycas revolutaand C. taitungensis, species that constitute the section Asiorientales and represent a unique, basallineage of the Laurasian genus Cycas. Fossil evidence indicates divergence of the section from therest of Cycas at least 30 million years ago. Geographically, C. taitungensis is limited to Taiwanwhereas C. revoluta is found in the Ryukyu Archipelago and on mainland China.
Results: The phylogenies of ribosomal ITS region of mtDNA and the intergenic spacer betweenatpB and rbcL genes of cpDNA were reconstructed. Phylogenetic analyses revealed paraphyly ofboth loci in the two species and also in the section Asiorientales. The lack of reciprocal monophylybetween these long isolated sections is likely due to persistent shared ancestral polymorphisms.Molecular dating estimated that mt- and cp DNA lineages coalesced to the most recent commonancestors (TMRCA) about 327 (mt) and 204 MYA (cp), corresponding with the divergence of cycadsections in the Mesozoic.
Conclusion: Fates of newly derived mutations of cycads follow Klopfstein et al.'s surfing modelwhere the majority of new mutations do not spread geographically and remain at low frequenciesor are eventually lost by genetic drift. Only successful 'surfing mutations' reach very highfrequencies and occupy a large portion of a species range. These mutations exist as dominantcytotypes across populations and species. Geographical subdivision is lacking in both species, eventhough recurrent gene flow by both pollen and seed is severely limited. In total, the contrastinglevels between historical and ongoing gene flow, large population sizes, a long lifespan, and slowmutation rates in both organelle DNAs have all likely contributed to the unusually long duration ofparaphyly in cycads.
Published: 10 July 2009
BMC Evolutionary Biology 2009, 9:161 doi:10.1186/1471-2148-9-161
Received: 23 January 2009Accepted: 10 July 2009
This article is available from: http://www.biomedcentral.com/1471-2148/9/161
© 2009 Chiang et al; licensee BioMed Central Ltd. This is an Open Access article distributed under the terms of the Creative Commons Attribution License (http://creativecommons.org/licenses/by/2.0), which permits unrestricted use, distribution, and reproduction in any medium, provided the original work is properly cited.
Page 1 of 19(page number not for citation purposes)

BMC Evolutionary Biology 2009, 9:161 http://www.biomedcentral.com/1471-2148/9/161
BackgroundThe analysis of geographical structure and phylogeo-graphical pattern has been a major focus in populationgenetics and molecular ecology [1]. Populations descend-ing from a common ancestral population are expected todifferentiate from each other and eventually show recipro-cal monophyly. Reciprocal monophyly is a result of theaccumulated effects of genetic drift and selection when lit-tle gene exchange occurs after divergence. In contrast,populations may be genetically similar due to recent iso-lation, continuous gene exchange, or secondary contact[2]. Plant species on islands provide ideal subjects for teas-ing apart the contrasting effects of geographical isolationand gene flow on population differentiation. Island pop-ulations are often genetically isolated from each other andmost island populations are small, thus facilitating ran-dom genetic drift.
Coalescence studies provide information on the genealog-ical processes (backwards in time) that have led to the cur-rent apportionment of genetic variation withinpopulations or species. Coalescence-based phylogeogra-phy uses haplotype networks, which trace the mutationalrelationships among alleles within or among species in ageographical context [3], to infer processes such as migra-tion, divergence, and isolation [4-6]. Noncoding spacerregions of organelle DNAs are often used as genetic mark-ers because they are nearly neutral with low functionalconstraints and are free of the complexities associatedwith recombination for nuclear markers [6].
Cycads are a unique and ancient lineage of land plantsthat have attracted much attention from evolutionarybiologists [7]. Cycas revoluta Thunb. and C. taitungensisShen et al. constitute the section Asiorientales which is abasal lineage of this Laurasian genus [8]. Cycas revolutaoccurs in a scattered distribution pattern from the south-ernmost part of Kyushu and throughout the RyukyuIslands in Japan, and is also distributed in Fukien Prov-ince of China [9]; while C. taitungensis is the only extantand endemic species with two endangered populationsalong the eastern coast of Taiwan. The two species resem-ble each other morphologically; a few characters such asrevolute vs. plane leaflet margins distinguish the speciesfrom each other. An Eocene fossil, C. fujiana Yokoyama, ismuch like C. revoluta; both the morphological similarityand the occurrence of both taxa in Japan suggest that thesespecies are the same [10]. The divergence of the species insection Asiorientales is thought to have occurred some 30million years before present [10]. Asiorientales is allopatricfrom other cycads.
Both species are agriculturally important. Each year thou-sands of seeds and plants have been exported for use inthe nursery trade and in floral arrangements [11]. In theearly 20th Century, cycad seeds and stems were used for
making cake and soup. Cycad flour is toxic and causesneurological disorder [12]. Fermented seeds are used forproducing alcoholic drinks [13]. Unfortunately, humanoverexploitation has led to the extinction of populationsof C. revoluta in Fukien Province of China [9], and onlytwo remaining populations of C. taitungensis occur in Tai-wan [14,15]. Large specimens of C. revoluta are prized bythe nursery industry and natural populations of C. revolutain mainland China have been decimated by poachers [9].In contrast, populations of C. revoluta are numerousacross the Ryukyu Archipelago and Kyushu [13,16]. Onthe Island Amami-O-Shima, protected cycad forests con-tain thousands of plants [17]. Despite the high morpho-logical similarity, the two species differ in habitatpreference. Cycas revoluta usually grows along coasts, oftensubject to salt spray. In contrast, C. taitungensis grows oncliffs along riverbanks [18].
Island systems have long served as natural laboratories forevolutionary studies [e.g. [19,20]]. Despite their oftensmall geographic size, islands can contain a diversity ofhabitats suitable for the colonization of an array of plantsand animals. Once an island is colonized, population dif-ferentiation between islands can be facilitated by isola-tion, vicariance events and local extinction-recolonization[21]. Taiwan and the Ryukyu islands lie at the boundarybetween the Eurasian and Pacific plates and are a constit-uent of the island-arc system along the western edge of thePacific Ocean [22]. In contrast to sequentially emergingoceanic islands of volcanic origin, these continentalislands emerged almost simultaneously via collisionbetween the continental and oceanic tectonic plates andare geologically young, estimated at 5–6 million years old[23,24]. Since emerging from the Pacific Ocean, theseislands gradually acquired their floras and faunas from theEurasian mainland [25,26]. Most island species/popula-tions thus have close phylogenetic links to their mainlandrelatives.
Today, islands of the Ryukyu archipelago are isolatedfrom each other. In the past, sea level oscillated duringperiodic glacial cycles (Milankovitch cycles) [27-29]. Dur-ing glacial maxima, the global sea level dropped by some100–120 meters, exposing land bridges that connectedislands [30] and thus providing migration corridorsbetween today's isolated islands. Repeated stepwisemigrations, plus occasional, long-distance colonization[cf. [31-33]], would allow various plants to fill newlyavailable habitats on islands left by the expanding orretreating glaciers. The glacial cycles of the Quaternaryplayed an important role in the evolution of species [cf.[34,35]].
In the present study, phylogenies of the rITS region ofmtDNA and the intergenic spacer between atpB and rbcLgenes of cpDNA were used to trace phylogeographical
Page 2 of 19(page number not for citation purposes)

BMC Evolutionary Biology 2009, 9:161 http://www.biomedcentral.com/1471-2148/9/161
relationships in C. revoluta and C. taitungensis. OrganelleDNAs are maternally inherited in cycads; they disperseonly via seeds [cf. [15]]. Most cycad seeds, including thoseof C. revoluta and C. taitungensis, are heavy and sink reduc-ing the possibility of water/current dispersal over long dis-tances [36,37]. The fleshy outer seed coat of cycads attractsanimals, mainly rodents, small fruit-eating bats, and birdswhich serve as dispersal agents [38]. In natural habitats,seeds drop and occasionally disperse for a limited dis-tance via gravity. Migration between islands is thought tobe very limited and such restricted dispersal has been doc-umented in other island species [20,39]. Ocean straitsbetween large geographical regions (Fukien, Taiwan, andRyukyu), and channels between islands make migrationbetween islands unlikely in these cycads. Thus, genetic dif-ferentiation between populations for maternally inheritedmarkers would be expected. Nevertheless, multiple colo-nization and recent isolation can counter forces leading togenetic differentiation between islands and monophyly[20]. Many plants distributed on the island arcs of thewestern Pacific Rim, including Cunninghamia [40],Michelia [41], Kandelia [42], Trema [43] and Lithocarpus[32,44], show little differentiation. Coalescence in islandpopulations can be a complicated process, determined bycounteracting effects of isolation (i.e., historical connec-tion), gene flow, drift, selection and repeated coloniza-tion.
Given the similar systems of mating and demography ofboth cycad species, non-coding regions of organelleDNA's should provide information on species/populationhistories and demographic processes as well as gene flowand colonization. In this study, we examine the genetic
diversity within and between species and populations,determine geographical associations and analyze phylo-genetic relationships to infer the historical processes thathave lead to the current pattern of genetic structure. Sev-eral specific questions are addressed:
1. Given the long time that these species have been iso-lated, has reciprocal monophyly of sections and speciesbeen attained?
2. Are populations and geographical regions geneticallydifferentiated?
3. Is the spatial apportionment of genetic variation con-sistent with a stepwise model of colonization?
4. Is erosion of genetic diversity associated with popula-tion decline? Are levels of genetic diversity in populationsof Fukien and Taiwan lower than those of Ryukyu?
ResultsGenetic diversity within Cycas revoluta and C. taitungensisThe rITS region of mtDNA varies in length from 411 to547 bp with a consensus length of 598 bp. The sequencelength of atpB-rbcL intergenic spacer of cpDNA varies from762 to 830 bp with a 913 bp consensus length. In total,105 and 97 haplotypes of cpDNA as well as 170 and 55haplotypes of mtDNA were detected in populations ofCycas revoluta (307 individuals) and C. taitungensis (102individuals), respectively (Table 1). Haplotype sequencesof mt- and cpDNAs were deposited in the GenBank data-base with accession numbers of FN397910-FN397954and FM999745-FM999775, respectively.
Table 1: Population localities, and number of samples (N) used for a phylogeographical analysis of Cycas revoluta and C. taitungensis in Ryukyu, Fukien, and Taiwan.
Population Area Sampling size (N) Symbol Coordinate
INGROUPS:Cycas revolutaJapan: Kagoshima Kyushu, Japan 37 KO 31°05' N, 130°70' E
Amami-O-Shima Ryukyu, Japan 124 AM 26°90' N, 128°30' EOkinawa Ryukyu, Japan 26 OK 28°15' N, 130°40' EIriomote Ryukyu, Japan 36 IR 24°19' N, 123°54' EIshigaki Ryukyu, Japan 43 IS 24°50' N, 123°30' EYonaguni Ryukyu, Japan 15 YO 24°45' N, 123°05' E
China: Fukien Fukien, China* 26 FU 24°26' N, 118°04' ECycas taitungensisTaiwan: Red Leaf Conservation Area Taitung, Taiwan 81 RL 22°85' N, 120°95' E
Coastal Conservation Area Taitung, Taiwan 21 C 23°05' N, 121°30' EOUTGROUPS:Cycas taiwaniana Fukien, China** 1 CT 23°15' N, 113°35' ECycas thouarsii Pingtung, Taiwan*** 1 CK 21°95' N, 120°85' E
* Sampled from the South China Botanic Garden, transplanted from the Fukien wild population before extinction, which located in the Lienchiahg County, Fukien.** Sampled from the South China Botanic Garden, transplanted from Fukien, China.*** Sampled from the Taiwan Forestry Research Institute, transplanted form Pingtung, Taiwan.
Page 3 of 19(page number not for citation purposes)

BMC Evolutionary Biology 2009, 9:161 http://www.biomedcentral.com/1471-2148/9/161
Higher levels of genetic diversity of mtDNA are detected inC. revoluta, f = 0.0500, than in C. taitungensis, f = 0.0038(Table 2). Among the Ryukyu Islands, populations fromYonaguni and Ishigaki have the highest levels of mtDNAdiversity while the diversity in populations on Okinawaand Amami-O-Shima is relatively low. Despite its extinctstatus in the wild, the Fukien sample contains muchhigher levels of mtDNA diversity than any of the Ryukyupopulations. The existence of the phylogenetically mostdistant mitotype, G, that occurs only in the Fukien popu-lation contributes to the high level of genetic diversity(Fig. 1). In C. taitungensis the level of genetic diversity ismostly associated with population size. Genetic diversityof the Red-Leaf (RL) population is about twice that of theCoastal (C) population. In contrast, the levels of geneticdiversity of cpDNA are much lower in C. revoluta, f =0.008, than in C. taitungensis, f = 0.018 (Table 3). Fukienhas the lowest level of diversity among all populations,while the populations of Ishigaki (f = 0.055) and Iriomote(f = 0.022) have higher levels of genetic diversity.
Phylogenies of organelle DNAs in C. revoluta and C. taitungensisKnowledge of the process and pattern of nucleotide sub-stitution is important for estimating the number of substi-tutional events between DNA sequences and phylogeneticreconstruction that incorporates models of DNA sequenceevolution. Transition bias results in a substitution patternthat is characterized by transition/transversion (ti/tv)ratios typically ranging between 2 and 10 [45-47]. In con-trast, higher rates of tranversional substitutions resultingin ti/tv ratios ~1 have often been equated with transitionalsaturation, in which the same nucleotide position under-goes multiple transitions, or considered indicative of highlevels of homoplasy [48]. In this study, the transition/transversion ratios were detected to be 1.808 and 1.707for mtDNA ITS and cpDNA, respectively, suggesting lowlikelihood of saturation, although relatively low. The phy-
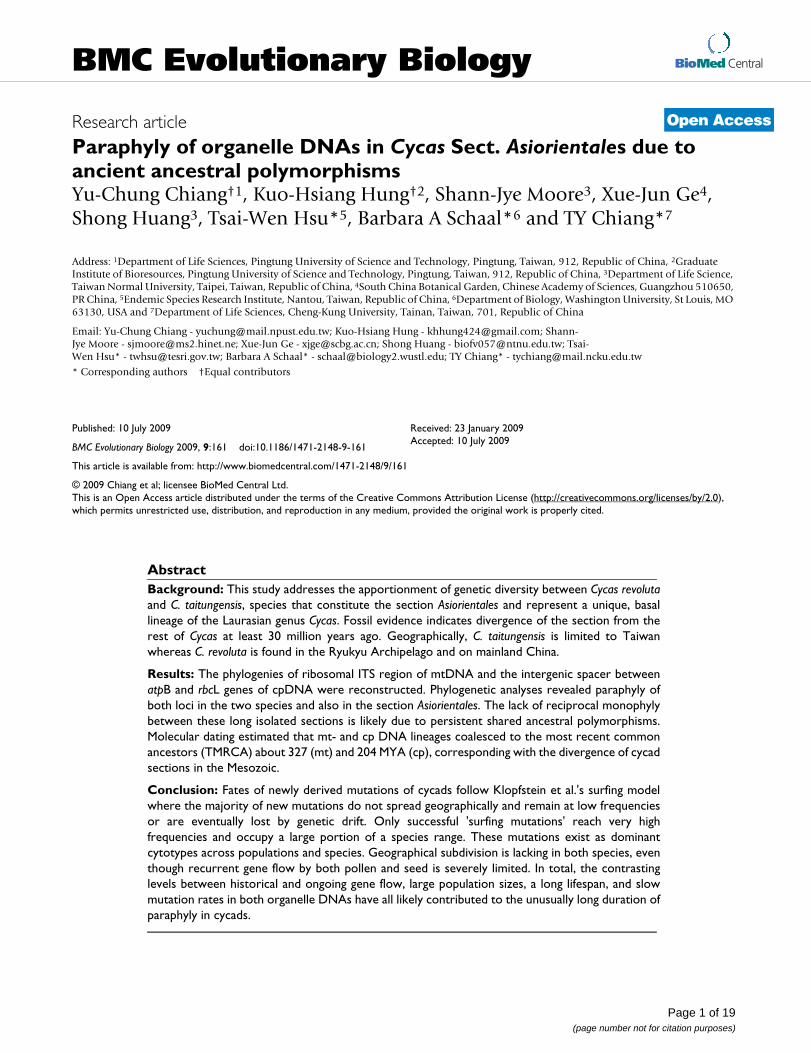
logeny of the mtDNA ITS region was reconstructed bymaximum-likelihood (ML) and maximum-parsimony(MP) analyses. Both analyses recover phylogenetic treeswith consistent topologies. The gene tree identifies sevenmitotypes, including haplotypes A to G (Fig. 2A). Recipro-cal monophyly is not supported in either Cycas species.Geographically, mitotypes A and B are widespread (Fig.1), while four mitotypes are restricted to single popula-tions, including C (YO), D (AM), E (IS), and G (FU).Mitotypes C-G are absent in C. taitungensis while mitotypeG does not occur in Ryukyus. Sequences from the two out-groups are mitotype A and do not form a monophyleticgroup, indicating that sections of Cycas are also para-phyletic for mtDNA (Fig. 2A and 3A). An ML tree based onnucleotide variation of the cpDNA atpB-rbcL intergenicspacer identifies six chlorotypes I-VI (Fig. 2B). Chloro-types I, II, and IV are geographically widespread acrossislands and Fukien, while chlorotype II is restricted to C.taitungensis, and chlorotypes V and VI are found exclu-sively in Iriomote and Ishigaki (Fig. 4). The hypothesis ofa molecular clock was not rejected at either locus based onthe relative rate test (data not shown).
Cycas species are not monophyletic for cpDNA. Haplo-types of outgroups belong to chlorotype I and are alsofound in C. revoluta and C. taitungensis (Fig. 2B and 3B),again reflecting paraphyly of the section Asiorientales. Inboth phylogenies numerous mutations are located at tipsof the network, and are derived from ancestral haplotypesat the interior nodes in the network. This pattern results ina star-like phylogeny. Furthermore, tip haplotypes aremostly confined to a single population while the interiorhaplotypes are geographically widespread.
Genetic differentiation and population demographyAlmost all dominant cytotypes of both organelle genes areshared among cycad populations. For mtDNA, mitotype A(95.3%) is common and widely distributed across popu-
Table 2: Haplotype diversity (h), the number of segregating sites (S), the average number of pairwise difference (k), and nucleotide diversity (p), and neutrality tests at mtDNA within cycad populations
h S k p Fu and Li's D* Tajima's D Fu's Fs
C. revoluta:Overall: 0.932 240 11.9 0.0500 ± 0.00600Japan: AM 0.923 340 22.4 0.0392 ± 0.00382 -4.6531** -2.4548*** -58.223 ***
IR 0.962 199 24.3 0.0423 ± 0.00533 -3.2490 -2.0509* -5.908 ***IS 0.908 399 43.3 0.0876 ± 0.02082 -3.9556** -2.4527*** -0.656KO 0.941 209 24.7 0.0429 ± 0.00523 -2.9419* -2.0702* -4.241***OK 0.886 110 19.4 0.0335 ± 0.00437 -1.6804 -1.4166 -0.225YO 0.933 211 56.2 0.1050 ± 0.02041 -1.0720 -1.0007 0.462
China: FU 0.982 440 108.3 0.2597 ± 0.04094 -1.6974 -1.0465 -0.326C. taitungensis:Overall: 0.978 293 21.8 0.0383 ± 0.00470Taiwan: C 0.967 64 9.9 0.0197 ± 0.00598 -0.4979 -1.6527 -1.482
RL 0.975 271 23.8 0.0419 ± 0.00553 -0.0325 -2.1674* -13.788***
*P < 0.05, **P < 0.02; ***P < 0.01
Page 4 of 19(page number not for citation purposes)

BMC Evolutionary Biology 2009, 9:161 http://www.biomedcentral.com/1471-2148/9/161
Page 5 of 19(page number not for citation purposes)
Table 3: Haplotype diversity (h), the number of segregating sites (S), the average number of pairwise difference (k), nucleotide diversity (p), and neutrality tests at cpDNA within cycad populations
h S k p Fu and Li's D* Tajima's D Fu's Fs
C. revoluta:Overall: 0.959 245 5.2 0.0581 ± 0.00316Japan: AM 0.912 165 13.4 0.0154 ± 0.00328 -4.5405** -1.8676* -41.080***
IR 0.955 105 19 0.0216 ± 0.00520 -0.1257 -1.0012 -1.879IS 0.833 328 42 0.0551 ± 0.01876 -1.7192** -1.7929*** 4.265**KO 0.951 69 9 0.0101 ± 0.00359 -0.3475 -1.6622*** -7.981***OK 0.797 85 12.3 0.0142 ± 0.00717 -0.9808 -1.7768*** 0.674YO 0.971 59 8.9 0.0100 ± 0.00558 -2.9824** -2.1975*** -3.635**
China: FU 0.939 17 2.3 0.0026 ± 0.00030 -2.4588*** -1.4785** -5.673***C. taitungensis:Overall: 0.998 336 16.5 0.0181 ± 0.00279Taiwan: C 0.999 127 13 0.0148 ± 0.00646 -4.0436** -2.5904*** -16.787***
RL 0.999 307 17.4 0.0196 ± 0.00309 -5.2128** -2.5911*** -113.774***
*P < 0.05, **P < 0.02; ***P < 0.01
Map showing the spatial distribution of genetic polymorphisms of mtDNA in populations of Cycas revoluta (circles), and C. tai-tungensis (squares)Figure 1Map showing the spatial distribution of genetic polymorphisms of mtDNA in populations of Cycas revoluta (cir-cles), and C. taitungensis (squares).
� �� �
� �
� �
� �
�
� � � �
� �
� �
� �
� �� � � � � �� �

BMC Evolutionary Biology 2009, 9:161 http://www.biomedcentral.com/1471-2148/9/161
lations, while rare mitotypes C, D, E, and G occur in singlepopulations (Fig. 1). Likewise, for the cpDNA intergenicspacer, chlorotype I (90.1%) is the most common andwidespread in all populations, while rare chlorotypes II,V, and VI are restricted to single populations (Fig. 4).Despite the lack of physical linkage between the twoorganelle genomes, high levels of linkage disequilibriumare detected in both Cycas species (P < 0.05). All rare mito-types (4.7%), including B-G, are associated with chloro-type I; while all rare chlorotypes II–VI (9.9%) areassociated with the mitotypes A, in the pooled data reflect-ing a nonequilibrium state.
Since common haplotypes are shared among popula-tions, cycads show little genetic differentiation at the twoorganelle DNA markers. Nm values obtained from Fst esti-mates in C. revoluta vary among pairwise comparisonsbetween populations (Tables 4 and 5). High levels of dif-ferentiation between Japan and China populations aredetected for all comparisons, e.g., Fst of 0.115 (P < 0.01)between OK and FU based on mtDNA, and Fst = 0.159between IR and FU (P < 0.01) based on cpDNA (Tables 4and 5). For example the estimated number of migrants per
generation is high between populations C and R of C. tai-tungensis, Nm = 90.41 and 23.18 based on cp- and mtD-NAs, respectively (60). The Nm values based onFst estimates from mtDNA average 106.10 which isgreater than the average from cpDNA data, 10.95 (Tables4 and 5).
The program IM defined six demographic parameters esti-mated by the MCMC (Markov chain Monte Carlo) multi-ple loci simulations and tested for an 'isolation withmigration' model in cycads. Of these demographic param-eters, the distribution of migration parameters reveals apeak at the lower limit of resolution in one direction fromJapanese populations to the Chinese population in C. rev-oluta (Table 6). When the MLE (maximum likelihood esti-mates) for the migration parameters are transformed intothe population migration rates, M1 = 2N1m1 = m1*(q1/2)estimated from Japanese populations to the Chinese pop-ulation in C. revoluta is higher than the estimate, M2 =2N2m2 = m2*(q2/2), from China to Japan, i.e., 8.0134 vs.0.5431 based on the combined data (Table 6). The Net(the product of effective population size and the genera-tion time in years) value is also assessed; a higher effective
The maximum likelihood tree of haplotypes of Cycas revoluta and C. taitungensis with outgroup sequences (O)Figure 2The maximum likelihood tree of haplotypes of Cycas revoluta and C. taitungensis with outgroup sequences (O). Numbers at nodes indicate the bootstrap values (ML/MP) in percentage. Symbols in parentheses indicate the geographical dis-tribution of each mitotype. W = widespread. A) mtDNA. Clades A and B occur in both species, while clades D-G are restricted to C. revoluta. B) cpDNA. Clades I, III and IV occur in both species, while other are restricted to C. revoluta.
A) mtDNA B) cpDNA
Page 6 of 19(page number not for citation purposes)

BMC Evolutionary Biology 2009, 9:161 http://www.biomedcentral.com/1471-2148/9/161
population size is detected for Japan's populations thanChina population, i.e., Net = 4.753*106 vs. 1.437*105
based on the combined data (Table 6).
In the study, the demographic scenarios for the two spe-cies and populations of Japan and China of C. revoluta arerepresented by the Bayesian skyline plot (Fig. 5 and 6).Based on the pattern of variation in mtDNA, a long his-tory of constant population size of C. revoluta, followed bya slight decline (bottleneck) with subsequent demo-graphic expansion, is recovered (Fig. 5A). At the popula-tion level, in C. revolute, the Japanese and Fukienpopulations also display similar patterns (Fig. 5C and5D). In contrast, slow population growth is detected in C.taitungensis based on the Bayesian skyline plot (Fig. 5B).Based on cpDNA, a scenario of population expansion is
suggested for both C. revoluta and C. taitungensis, while aweak bottleneck event may have occurred in C. revoluta(Fig. 6A and 6B). Likewise, Japan's populations of C. revo-luta almost remain nearly constant before a recent popu-lation expansion, whereas, the Fukien's population didnot undergo large fluctuations in population size until itsrecent extinction (Fig. 6C and 6D).
We also use mismatch distribution analyses to infer thelong-term demographic history of populations. Mismatchdistribution analyses (Fig. 7 and 8) show different pat-terns between the cp- and mtDNA genomes. In mostcycad populations, cpDNA has a unimodal mismatch dis-tribution (Fig. 8), while multimodal and very ragged dis-tributions are detected in mtDNA within all populations(Fig. 7). Nevertheless, when sequences from all popula-tions are pooled together, both cp- and mtDNAs have uni-modal mismatch distributions in C. revoluta, while onlycpDNA displays a unimodal mismatch distribution in C.taitungensis. Unimodal mismatch distributions are oftenthe result of past demographic expansions [50,51];whereas, multimodal mismatch distributions usuallyindicate stationary population structure. Since the dataused to produce mismatch distributions are not inde-pendent [52], Tajima's D, Fu and Li's D* and Fu's Fs sta-tistics can be used to detect departure from populationequilibrium. In this study, values of Fu and Li's D* basedon cpDNA sequences for C. revoluta and C. taitungensis aresignificantly negative, except for populations IR, KO, andOK (Table 3); while Tajima's D statistics are all signifi-cantly negative, except for the population IR. Fu's Fs statis-tics are significantly negative, except for populations IS,IR, and OK (Table 3). Likewise, Fu and Li's D*, Tajima'sD, and Fu's Fs statistics are significantly or marginally sig-nificantly negative based on mtDNA data in most popula-tions (Table 2).
Coalescence of lineages and molecular datingBayesian estimates of the mutation rates and the age of themost recent common ancestor (TMRCA) of the cycadsequences were obtained using BEAST v. 1.3. For mtDNA,all the haplotypes coalesced at about 327.3 MYA, while allchlorotypes could be traced back to a common ancestorabout 204.0 MYA (Fig. 9). In the mtDNA haplotype tree,clusters (A, B, C) vs. D split at some 74.1 MYA; and theclusters A and (B, C) coalesced at about 30.6 MYA. Like-wise, in the cpDNA tree, clusters I and (II, V) split some25.6 MYA, while cluster (I, II, V) diverged from its sisters(III, IV) an estimated 43.9 MYA. Almost all coalescences ofthe major lineages predate the formation of the sectionAsiorientales. Coalescent events occurred much earlier inmtDNA than in cpDNA. On the other hand, most tip hap-lotypes in both gene trees coalesced recently to their com-mon ancestors.
Network of haplotypes of Cycas revoluta and C. taitungensisFigure 3Network of haplotypes of Cycas revoluta and C. tai-tungensis. Numbers at arrows indicate the mutational changes between mitotypes. A) mtDNA, B) cpDNA, C) com-bined data.
A) mtDNA
E (IS)
B A F G (W) (W) (IS+FU) (FU)
C D (YO) (AM) 1-1 2-1 3-1
B) cpDNA
2-1 V 1-1
(IR)
1-2
III IV I II (W) (W) (W) (RL)
VI (IS)
1
>100 >100 54
23 8
28
25 45 23
258
Page 7 of 19(page number not for citation purposes)

BMC Evolutionary Biology 2009, 9:161 http://www.biomedcentral.com/1471-2148/9/161
DiscussionHighly polymorphic organelle DNAs in Cycas revoluta and C. taitungensisGenetic variation in the two cycad species is high, compa-rable to or higher than many tree species (such as Quercus[31,49]; Fagus [50]; Lithocarpus [32,44,51]. Such high lev-els of genetic variation within mt- and cpDNAs suggestthat these are ancient lineages with enough time for muta-tions to accumulate within lineages, given the slow rate oforganelle evolution [52]. Evidence of the deep splits inboth phylogenetic trees (Fig. 2) and the estimated dates ofdivergence support this scenario. Moreover, star-like phy-logenies with a mixture of long and short branches, whichrepresent recently evolved haplotypes, illustrate the highlevels of variation.
Although the two cycad species have high levels of geneticdiversity at both loci, the loci do not vary in concert. Forexample, the C. revoluta population YO possesses the
highest level of mtDNA variation while having the lowestlevel of cpDNA diversity. Similarly, the Fukien China C.revoluta population is highly diverse for mtDNA haplo-types while containing lower than average of cpDNA hap-lotypes. The large native cycad population on the island ofAmami-O-Shima (AM) has genetic diversity at both locicomparable to or even lower than most populations.
In this study, genetic diversity tends to be higher in thesouth than in the north. A cline-like distribution ofgenetic diversity from south to north occurs in many con-tinental plants of the Northern Hemisphere and isthought to be related to colonization history over glacialcycles [cf. [34,53]]. Considering the geological history ofthe Taiwan-Ryukyus Archipelago, one expects a similarpattern for these cycad species where colonization occursin a stepwise manner from China northwards through theArchipelago. Genetic diversity should decrease to thenorth, assuming that a small number of individuals colo-
Map showing the spatial distribution of genetic polymorphisms of cpDNA in populations of Cycas revoluta (circles), and C. taitun-gensis (suqares)Figure 4Map showing the spatial distribution of genetic polymorphisms of cpDNA in populations of Cycas revoluta (cir-cles), and C. taitungensis (suqares).
� �� �
� �
� �
� �
�� � � �
� �
� �
� �
� � � � � �� �� �
Page 8 of 19(page number not for citation purposes)

BMC Evolutionary Biology 2009, 9:161 http://www.biomedcentral.com/1471-2148/9/161
nize each subsequent island in a stepwise manner. How-ever, the occurrence of highly diverse organelle DNAsacross the range of Cycas revoluta and C. taitungensis, andmany other tree species of the Taiwan-Ryukyus Archipel-ago suggests that single stepwise colonization events maynot be the sole determinant of the overall pattern ofgenetic diversity [cf. [33]].
Austerlitz et al. [51] suggest that the level of diversity intree species that recolonize glaciated regions is affected byrestricted gene flow but is also tempered by their demog-raphy. In tree populations, the genetic effects of founderevents are reduced due to overlapping generations anddelayed reproduction associated with long life spans.These are traits found in most long lived trees includingthese cycads, which are characterized by great longevity,overlapping generations, age structured populations and ajuvenile phase of 30 to 50 years. During the juvenileperiod when cycads grow vegetatively, newly foundedcycad potentially populations can increase in number formany years only through the arrival of new migrants,especially when migration corridors across islands formigration are available. This pattern of colonization andreproduction effectively acts to increase in the number ofinitial colonizers of a given population and in turndecreases any founder effects. Even given a high likeli-hood of stepwise colonization along the Taiwan-RyukyuArchipelago, as observed in the Pinus luchuensis complex
[52,33], multiple colonization events could compensatefor potential reduction in genetic diversity during eachfounder event.
Secondary contact of ancestral lineages can be another fac-tor that contributes to high genetic diversity. The coales-cence-based analysis reveals that mitotypes F and Gdiverged some 327.3 and 295.3 million years ago, respec-tively. Today these haplotypes exist exclusively in themainland Fukien (mitotype G), and in the Fukien and Ish-igaki (mitotype F) populations. Mitotype F is common inthe Fukien population, suggesting an origin most likelyon the Asian mainland with subsequent dispersal north-ward onto Ishigaki. Such secondary contact of divergentlineages is consistent with a U-shaped site-frequency dis-tribution according to Wakeley and Aliacar's simulations(Fig. 8) [54].
Isolation and lack of geographical subdivisionCurrent gene flow between islands is greatly restricted dueto their geographical isolation and the low dispersabilityof cycad seeds in water [36]. Thus, one expects that islandpopulations should be significantly differentiated fromeach other. But, like many other tree species of the Tai-wan-Ryukyu Archipelago [33], no significant geographicaldifferentiation is detected between cycad populationsamong islands. Fst values are small and all pairwise Nmvalues, deduced from Fst values, are much greater thanone (Tables 4 and 5). The Nm values based on mtDNAdata are about ten-fold greater than those based oncpDNA sequences, 106.10 vs. 10.95. While bothorganelles are transmitted only via seeds, the difference inNm values determined from cp- and mtDNAs coupledwith deviation from an isolation-by-distance model, andthe lack of geographical subdivision and genetic differen-tiation, suggest that the two loci are responding to differ-ent evolutionary forces.
Clearly, Nm values cannot be interpreted as current geneflow between populations. These high Nm values likelyrepresent either ancient migration events or shared ances-tral polymorphisms [55,56]. For example, the Nm valuesbetween Chinese and Japanese populations range from
Table 5: Pairwise comparisons of Fst (below diagonal) and Nm values (above diagonal) between populations of Cycas revoluta deduced from cpDNA sequences.
Fst\Nm AM IR IS KO OK YO FU
AM 6.02 13.58 17.86 7.63 3.71 7.13IR 0.077* 38.08 3.07 7.38 3.89 2.64IS 0.036* 0.013 8.06 12.57 8.58 6.49
KO 0.027 0.140** 0.058 3.59 2.34 10.25OK 0.061 0.063 0.038 0.122 62.62 2.66YO 0.119 0.114* 0.050 0.176 0.008 1.87FU 0.066 0.159** 0.072* 0.047 0.158 0.211
Probability value associated with the Fst is shown. The Fst values significantly greater than zero are noted by adding *P < 0.05 and **P < 0.01
Table 4: Pairwise comparisons of Fst (below diagonal) and Nm values (above diagonal) between populations of Cycas revoluta deduced from mtDNA sequences.
Fst\Nm AM IR IS KO OK YO FU
AM 44.16 89.16 90.17 45.15 12.29 4.19IR 0.011 105.02 111.27 1030.15 18.48 4.00IS 0.006** 0.005 475.91 70.97 24.17 7.31
KO 0.006 0.005 0.001 51.75 17.8 4.13OK 0.011* 0.001 0.007 0.010** 11.7 3.87YO 0.039* 0.026 0.020 0.027 0.041 6.52FU 0.107** 0.111** 0.064** 0.108** 0.115** 0.071
Probability value associated with the Fst is shown. The Fst values significantly greater than zero are noted by adding *P < 0.05 and **P < 0.01
Page 9 of 19(page number not for citation purposes)

BMC Evolutionary Biology 2009, 9:161 http://www.biomedcentral.com/1471-2148/9/161
Page 10 of 19(page number not for citation purposes)
Bayesian skyline plot based on the mtDNA for the effective population size fluctuation throughout timeFigure 5Bayesian skyline plot based on the mtDNA for the effective population size fluctuation throughout time. X axis: population size × generation time; Y axis: time (million years ago). A) Cycas revoluta; B) C. taitungensis; C) all Japanese popula-tions of C. revoluta; D) the Fukien population of C. revoluta (black line, median estimations; area between gray lines, 95%
� � � � � � � � � � � � � � � � � � � � � � � �
� � � � � � � � � � � � � � � � � � � � � � � � � � � � � � � � � � � � � � � � �
Table 6: Scaled parameter estimates for IM model as inferred from the combined data of cpDNA and mtDNA.
q1a q2
a qAa m1
b m2b N1t c N2t c NAt c 2N1m1 2N2m2
A. HiPtd 8.9914 0.2426 10.9320 1.4500 3.5500 4.517*106 1.210*105 5.492*106 6.5188 0.430695%HPDLoe 6.4040 0.2426 5.4983 0.6500 1.350095%HPDHie 51.8138 2.6683 70.9610 14.0500 7.4500
B. HiPtd 10.0668 0.2860 10.3903 1.9978 4.1023 5.057*106 1.426*105 5.219*106 10.0557 0.586795%HPDLoe 7.8028 0.2860 5.2962 0.8820 1.554895%HPDHie 79.2004 2.5066 36.1031 16.1243 7.8965
C. HiPtd 9.3231 0.3356 10.6652 1.6345 3.6577 4.683*106 1.674*105 5.358*106 7.6193 0.613895%HPDLoe 7.2336 0.3356 5.3365 0.7586 1.472395%HPDHie 68.5891 2.4523 65.2581 15.4572 7.6894
Average 9.4604 0.2881 10.6634 1.6941 3.7700 4.753*106 1.437*105 5.358*106 8.0134 0.5431
Note: Values are presented for each of the three runs with different seed numbers (A, B and C).a The population size parameters for the Japan population (q1) and Fukien population (q2) of C. revoluta, and ancestral population (qA).bMigration rate estimate (m1 – from Japan to Fukien population; m2 – from Fukien to Japan population).c Effective population size estimate (Nt : population size × generation time) for Japan population (N1t ) and Fukien population (N2t ) of C. revoluta, and ancestral population (NAt ).dThe value of the bin with the highest count (HiPt).eThe lower (HPD95Lo) and upper (HPD95Hi) bound of the estimated 95% highest posterior density (HPD) interval.

BMC Evolutionary Biology 2009, 9:161 http://www.biomedcentral.com/1471-2148/9/161
3.87 to 7.31 (mtDNA) and 1.87 to 10.25 (cpDNA)(Tables 4 and 5). Testing of 'isolation with migration'(IM), nevertheless, reveals asymmetrical, historical geneflow with more migrants of C. revoluta from Japan toChina than vice versa, 8.0134 vs. 0.5431 based on com-bined data. These results suggest long periods of isolationwith limited genetic exchange between the two geograph-ical regions. C. taitungensis shows a similar asymmetricpattern of ancient gene flow. Migration is estimated to bemore frequent from population C to population RL(3.86445 vs. 41.10288, cpDNA, and 2.25430 vs.48.99630, mtDNA), contributing to the lack of geneticdifferentiation between populations, as indicated by Fstvalues of 0.0056 (cpDNA) and 0.021 (mtDNA) [cf. [55]].
Like other island species, cycad populations were colo-nized via founders from neighboring islands or the main-land. Today, deep water channels hinder seed dispersalamong islands and most seed dispersal occurs only withinislands. However, during the glacial maxima [cf. [29]], sealevels were much lower and migration could haveoccurred among islands. The rise of sea levels during gla-
cial retreats terminated between-island seed exchange andisolated cycad populations of the Ryukyu Archipelagofrom each other [57]. The time since isolation approxi-mates 200–400 cycad generations. Given the very shorttime that populations have been isolated and the low rateof molecular evolution for both organelle loci, it is notsurprising that populations show genetic coherence. Arecent simulation study [51] indicates that tree popula-tions can remain genetically similar even with an isola-tion-by-distance pattern of colonization and can yield aphylogeographical pattern with little differentiation, herefor the cycads of the Taiwan-Ryukyu Archipelago. Thehigh levels of nucleotide diversity in both organelle DNAsand the existence of the highest number of private cyto-types suggest that population IS of the south Ryukyu andpopulation RL of Taiwan may have acted as glacial refugiafor C. revoluta and C. taitungensis, respectively.
Paraphyly of loci in Cycas species and sectionsAlthough cycad populations are undifferentiated fromeach other due to recent historical gene flow (Table 6),given that the generic sections of cycads sections have
Bayesian skyline plot based on the cpDNA for the effective population size fluctuations throughout timeFigure 6Bayesian skyline plot based on the cpDNA for the effective population size fluctuations throughout time. X axis: population size × generation time; Y axis: time (million years ago). A) Cycas revoluta; B) C. taitungensis; C) all Japanese pop-ulations of C. revoluta; D) the Fukien population of C. revoluta (black line, median estimations; area between gray lines, 95% con-fidence interval.
� � � � � � � � � � � � � � � � � � � � � � � �
� � � � � � � � � � � � � � � � � � � � � � � � � � � � � � � � � � � � � � � � �
Page 11 of 19(page number not for citation purposes)

BMC Evolutionary Biology 2009, 9:161 http://www.biomedcentral.com/1471-2148/9/161
been isolated for very long periods of time, one wouldexpect monophyly at the sectional level. Nevertheless,both mt- and cpDNAs are paraphyletic or polyphyleticbetween section Asiorientales and its sisters. Such lack ofreciprocal monophyly between taxa may result from selec-tion, e.g., the S locus of Brassica [58], and a-tubulin genesof Miscanthus [59], lineage sorting [60], or hybridization/introgression [61]. Genetic exchange among species viahybridization and introgression introduces foreign allelesinto a species or population and can result in a geneticadmixture. In contrast, lineage sorting occurs when popu-lations or species are recently diverged and retain ancestralpolymorphisms [cf. [5,52]].
Hybridization and/or lineage sorting are likely causes ofshared polymorphisms in Cycas given that these are neu-tral loci and thus not under strong selection. Discerningbetween hybridization and lineage sorting can be difficult[61-64], since most statistical analyses have limitedpower. However, in this study neither hypothesis can byitself explain the current patterns of genetic variationamong sections. First, all four Cycas species are allopatricwhich greatly reduce the possibility of recent recurrentinterspecific hybridization. Lineage sorting can result inshared polymorphism but requires a relatively short time
of isolation. The fossil record indicates that the sections ofCycas have been diverged for 30 million years, makingsuch a scenario unlikely [10].
The pattern of coalescing DNA segments provides infor-mation on the genealogical processes that occur withinpopulations [4,65,66]. The star-like phylogeny of theorganelle trees shows that recently derived haplotypes arenumerous, external on the networks and are geographi-cally restricted. Ancestral haplotypes are found at interiornodes, and are geographically more widespread than therecently derived tip haplotypes. This pattern is consistentwith a birth-and-death model where most mutations goextinct with only very few ancestral polymorphisms sur-viving to become dominant [67]. If the dynamics of muta-tions and fixation do not follow a birth and death model,one expects topologies with deep splits for most haplo-types.
The pattern of mutations in cycads follows a 'surfing'model [68], which predicts that a majority of new muta-tions do not spread geographically and either remain atlow frequencies or are lost by genetic drift. Only successful'surfing mutations' can reach high frequencies and even-tually occupy a large geographical region [69]. In this
Mismatch distributions of mtDNA haplotypes based on pairwise sequence differences against the frequencies of occurrence for cycad species and populationsFigure 7Mismatch distributions of mtDNA haplotypes based on pairwise sequence differences against the frequencies of occurrence for cycad species and populations.
Page 12 of 19(page number not for citation purposes)

BMC Evolutionary Biology 2009, 9:161 http://www.biomedcentral.com/1471-2148/9/161
model both population size and migration rate determinethe success of new mutations. Deme size not only affectsthe probability of a mutation to 'surf' but also determinesits final frequency and spatial distribution. When theeffective population size is small, a mutation within apopulation has a high probability of extinction due togenetic drift and it is able to spread only if it reaches a veryhigh frequency by chance. In contrast, large effective pop-ulation sizes counter genetic drift while a large number ofexchanged migrants between neighboring demes preventsa mutation from reaching high local frequencies [68].Accordingly, as most cycad populations were probablylarge (Fig. 5 and 6), one expects to observe numerousrecently derived mutations that were derived from a singleancestral haplotype, and the observation that few haplo-types appear to survive over long periods (Fig. 2). Most ofthe new mutations appear to be ephemeral and can be lostfrom a population or species during population contrac-tion (the glacial maximum). As a consequence, very fewcytotypes, e.g., mitotypes A, and B, and chlorotypes I, andIII, survived and became dominant across the cycad pop-ulations. Such a birth-and death process corresponding todemographic fluctuations may have occurred regularly incycads over repeated glacial cycles. As a result, the exist-
ence of rare and geographically restricted cytotypes con-tributes to the high levels of genetic diversity withinpopulations and within species, whereas, they played veryminor roles in differentiating populations or species fromeach other due to their rarity.
While the surfing phenomenon explains the dominanceof widespread haplotypes and low genetic differentiationbetween cycad populations, it does not explain sharedancestral polymorphisms between sections. Both geneticdrift and changes in population size have most likelyinfluenced polymorphism as well. Population contrac-tion-expansion, which has occurred regularly in the Qua-ternary, provides an opportunity for rapid stochastic lossor fixation of alleles (haplotypes). Rapid populationgrowth and expansion in cycads is suggested by the star-shape phylogenies found in most lineages of bothorganelle genomes, or the Bayesian skyline plot and bythe observation that DNA sequences are saturated withsingletons at both the population and species levels (Fig.3 and 4) [cf. [70,71]], as well as the Bayesian skyline plot-ting. A mixture of long and short branch lengths in thestar-like phylogenies could also be caused by heterogene-ous mutation rates. The significant values for Tajima's D
Mismatch distributions of cpDNA haplotypes based on pairwise sequence differences against the frequencies of occurrence for cycad species and populationsFigure 8Mismatch distributions of cpDNA haplotypes based on pairwise sequence differences against the frequencies of occurrence for cycad species and populations.
Page 13 of 19(page number not for citation purposes)

BMC Evolutionary Biology 2009, 9:161 http://www.biomedcentral.com/1471-2148/9/161
Page 14 of 19(page number not for citation purposes)
Coalescence-based analyses of lineagesFigure 9Coalescence-based analyses of lineages. Time coalesced to the most recent common ancestor (TMRCA) of major line-ages are indicated. A) mtDNA, B) cpDNA.
� � � � � � �
� � � � � �

BMC Evolutionary Biology 2009, 9:161 http://www.biomedcentral.com/1471-2148/9/161
and Fu and Li's D* statistics, nevertheless, favor a demo-graphic expansion hypothesis [72].
Mismatch distribution analyses are also used to infer thelong-term demographic history of populations. In thisstudy, contrasting patterns of unimodal vs. multimodalmismatch are found for mt- and cpDNAs (Fig. 7 and 8).Usually, unimodal mismatch distributions are interpretedas the result of past demographic expansions [73,74],whereas multimodal mismatch distributions indicate sta-tionary population sizes. These contrasting patterns incycads are difficult to interpret although a mismatchinconsistency between different data sets is not unprece-dented. A well-known example of contrasting mismatchpatterns occurs between expanding human Neolithic andhunter-gatherer populations [75]; the unimodal distribu-tion for Neolithic populations is interpreted as the resultof greater Nm values [76]. Even with a multimodal distri-bution, demographic expansion cannot be rejected, espe-cially if the Nm values are small. In this study, thecontrasting mismatch patterns between unlinkedorganelle genomes seem to be uncorrelated with Nm val-ues. The ragged distributions in mtDNA are more likelyattributable to the low t (fig. 5). In cycads, a very recentpopulation expansion about 200–400 generations, a slowevolutionary rate, and putative intramolecular recombi-nation [data not shown; cf. [55]], may preclude mismatchdistribution analyses from assessing recent populationexpansion. Nevertheless, Tajima's D, Fu and Li's D*, andFu's Fs statistics provide independent estimates for spatialexpansion, especially considering that the DNA sequencesare from neutral noncoding spacer regions.
Coalescence-based analyses measure the time of coales-cence to the most recent common ancestor (TMRCA). Inboth organelle DNAs, the divergence time is estimated at327.3 MYA in mtDNA and 204.0 MYA in cpDNA, agree-ing with the divergence of major sections of cycads in theMesozoic [77]. Moreover, the split of the common haplo-types, mitotype B and chlorotype I, from their sister hap-lotypes occurred about 21.0 and 25.6 MYA, respectively inthe Tertiary period when cycads were diversifying andwhen divergence of section Asiorientales (30 MYA)occurred. Since then the two dominant cytotypes havepersisted in cycads [cf. [55]]. The sharing of common cyto-types in both genomes is consistent with range contrac-tion-expansion during glacial cycles where commonhaplotypes could persist, while most rare, newly derivedhaplotypes were lost. Consequently, both phylogeniesshow topologies with few ancient coalescence events vs.numerous recent coalescence events.
The evolution of these two cycad species is complex,affected by range expansion and contraction, fluctuationsin population size, widespread historical and current
restricted gene flow during complex glacial cycles as wellas low rates of molecular evolution in organelle DNA. Allof these processes result in a pattern of genetic similarityamong populations, a lack of reciprocal monophyly, andlong coalescent times.
ConclusionIn summary, paraphyly at both organelle DNAs has beenlong maintained in Cycas section Asiorientales ever sincethe split from its sisters some 30 million years ago. Largepopulation sizes of the constituting species C. revoluta andC. taitungensis contributed to the lack of reciprocal mono-phyly betwen Cycas sections. Providing limited currentseed dispersal across oceans, unexpected low levels of geo-graphical subdivision are attributable to the sharing ofcommon haplotypes among island populations. Demo-graphic expansion and contraction with fluctuating popu-lation sizes, widespread historical vs. current restrictedgene flow during complex glacial cycles, and low rates ofmolecular evolution in organelle DNA all have to bearoused to explain such population structuring.
MethodsPlant materials, PCR, and nucleotide sequencingWe assessed levels of sequence variation for cp and mt-DNAs among individuals and populations of Cycas revo-luta and C. taitungensis in Taiwan, Fukien, and Ryukyus(Table 1, Fig. 1 and 4). A total of 307 and 102 plants of C.revoluta and C. taitungensis, respectively, were sampled.Cycas revoluta is extinct from the wild in Fukien; only oldtrees were collected from public gardens or nurseries toavoid sampling from recently introduced material. Thesamples of C. revoluta in China were collected from SouthChina Botanic Garden, which had plants collected fromthe Fukien wild population before extinction, whichlocated in the Lienchiahg County, Fukien. An additionalsix native island populations were collected in Ryukyusfor C. revoluta and two populations of C. taitungensis. Twospecies, C. taiwaniana Carruthers (Section Stangerioides)and C. thouarsii R. Brown (Section Rumphiae) [cf. [8]],were chosen as outgroups. C. taiwaniana was obtainedfrom the South China Botanic Garden, transplanted froma native population in Fukien, China, and C. thouarsii wassampled from the Taiwan Forestry Research Institute,transplanted from a native population in Pingtung, Tai-wan. Young and healthy leaves were collected in the field,rinsed with tap water and dried in silica gel. All sampleswere stored at -70°C until they were processed. Thevoucher specimens (Hsu s.n.) of this research are depos-ited in the Herbarium, Endemic Species Research Insti-tute, Nantou, Taiwan. Leaf tissue was ground to a powderin liquid nitrogen and stored at -70°C. Genomic DNA wasextracted from the powdered tissue following a CTAB pro-cedure [78]. The atpB-rbcL noncoding spacer of cpDNAand the rDNA internal transcribed spacer (rITS) of
Page 15 of 19(page number not for citation purposes)

BMC Evolutionary Biology 2009, 9:161 http://www.biomedcentral.com/1471-2148/9/161
mtDNA were amplified and sequenced. PCR amplifica-tion was carried out in 100 mL reaction using 10 ng of tem-plate DNA, 10 mL of 10× reaction buffer, 10 mL MgCl2 (25mM), 10 mL dNTP mix (8 mM), 10 pmole of each primer,10 mL of 10% NP-40, and 2 U of Taq polymerase(Promega, Madison, USA). The reaction was programmedon a MJ Thermal Cycler (PTC 100) as one cycle of dena-turation at 95°C for 4 min, 30 cycles of 45 s denaturationat 92°C, 1 min 15 s annealing at 52°C, and 1 min 30 sextension at 72°C, followed by 10 min extension at 72°C.A pair of universal primers for cpDNA atpB-rbcL spacer[79] or mtDNA rITS (mito 18 s F 5'-GTG,AAG,TCG,TAA,CAA,GGT,AGC-3'; mito 5 s R 5'-TCG,AGG,TCG,GAA,TGG,GAT,CGG-3') [cf. [80]], dNTPand Taq polymerase were added to the above ice-cold mix.The reaction was restarted at the first annealing at 52°C.
PCR products were purified by electrophoresis in 1.0%agarose gel using 1 × TAE buffer. The gel was stained withethidium bromide and the desired DNA band was excisedand eluted using QIAquick Gel Kit (QIAGEN). For allindividuals, purified amplicons were ligated to a pGEM-Teasy vector system (Promega). Five clones were randomlyselected and purified using the Plasmid Mini Kit (QIA-GEN). Purified cloned ampicons were sequenced in bothdirections using BigDye chemistry (Perkin Elmer) on ABI377A automated sequencer (Applied Biosystems). Prim-ers for sequence determination were T7-promoter andSP6-promoter located on p-GEM-T easy Vector termina-tion site. As no within-individual variation was detectedfor either DNA marker, direct sequencing with eluted PCRproducts was also conducted to all individuals.
Data analysisSequence alignment and phylogenetic analysesNucleotide sequences were aligned with the program Blas-tAlign [81]. After the alignment, the indels were coded asmissing data. Phylogenetic trees were reconstructed usingmaximum likelihood (ML) analyses of the nucleotidesequences with software PHYML v2.4.5 [82] and boot-strap consensus values calculated using 1,000 replicates.The general time reversible GTR + I + G model with 6 sub-stitution categories was determined to be the most suita-ble model by Modeltest v3.6 [83] and was used for allsubsequent nucleotide analyses. Maximally parsimonious(MP) trees were also sought using PAUP heuristic searchstrategies [84]. The length of the shortest trees wasobtained by initiating 1,000 heuristic searches, each usingrandom addition starting trees, with tree bisection-recon-nection (TBR) branch swapping. The equally MP treeswere then used as starting trees for TBR branch swapping.In all analyses, the maximum number of trees to be savedwas set at 5000. Bootstrap values [85] were calculatedfrom 1,000 replicate analyses using a heuristic searchstrategy, simple addition sequence of the taxa, and TBR
branch swapping. The values of random number seed setas 64238 and 70189 for mtDNA and cpDNA data sets,respectively, were used to start the random number gener-ator. Relationships among haplotypes were determinedand displayed as nested phylogenies. In order to visualizethe phylogeographical relationships, a network of eachlocus based on statistical parsimony was constructed withthe computer program TCS [86]. A distance matrix wascomposed of all pairwise comparisons of haplotypes, forwhich the maximum number of mutations was deter-mined that did not exceed the probability of parsimonyby 0.95 [as defined in [87]]. All haplotypes satisfying thisparsimony criterion were then connected to a single net-work, while those of which the probability exceeded 0.95were resolved as a separate network. According to coales-cent theory, tip nodes of a network are likely to representdescendents derived from ancestral, interior nodes [cf.[88,89]].
The hypothesis of a molecular clock was tested by relativerate tests [90,91]. The null hypothesis of a molecular clocksuggests that the number of nucleotide substitutionsbetween two lineages would be the same. Based on theassumption of a normal distribution of nucleotide substi-tutions [91], the hypothesis of a molecular clock will berejected with 95% significance, when the difference ofsubstitution rates between two lineages is greater than1.96 times the standard error.
Population genetic analysisSummary statistics such as the number of segregating sites(S), and the average number of pairwise difference (k)between haplotypes were determined. The level of geneticdiversity within populations was quantified by measuresof nucleotide divergence, q [92] and f [93], using DnaSPVersion 4.10 [94]. In order to make inferences aboutdemographic changes in the cycads, we employed bothmismatch distributions and statistical tests of neutrality.We calculated Tajima's D [91], Fu and Li's D* statistic[95], and Fu's Fs statistics [96], which is powerful fordetecting population growth [97], in the noncoding DNAfragments as indicators of demographic expansion inDnaSP. We also investigated the historical demographicsof populations by plotting mismatch distributions [73]and comparing them to Poisson distributions. Mismatchdistributions for each sample were used to distinguishbetween models that invoke past exponential growth andhistorical population stasis. Parameters of demographicexpansion were estimated using the methods of Schneiderand Excoffier [98]. The validity of the demographic expan-sion hypothesis was tested using a parametric bootstrapapproach, in which the sum of squared deviation (SSD)between the observed distribution and the expected distri-bution was compared to the SSD between the simulateddistributions and the expected distribution (Arlequin ver-
Page 16 of 19(page number not for citation purposes)

BMC Evolutionary Biology 2009, 9:161 http://www.biomedcentral.com/1471-2148/9/161
sion 3.0 [99]). Patterns of geographical subdivision andgenetic differentiation were estimated hierarchically inDnaSP. Statistical significance of Fst estimates wasassessed using software Arlequin with 10,000 permuta-tions.
Estimation of coalescence times of cp and mtDNA lineagesWe estimated the coalescence time of the the sister line-ages of C. taitungensis and C. revoluta split for both mt- andcpDNAs. To estimate divergence between lineages a well-supported rate of evolution is required. In seed plants,evolutionary rates are estimated at 1.01 × 10⁻⁹ and 4.50 ×10⁻¹⁰ substitutions per site per year for synonymous sitesof cp- and mt-DNAs, respectively [cf. [52,100]]. These val-ues approximate the evolutionary rates of introns andnoncoding spacers of organelle DNAs. Bayesian estimatesof the mutation rates and the ages of the most recent com-mon ancestor (TMRCA) of the cycad sequences wereobtained using BEAST v. 1.4, available from http://beast.bio.ed.ac.uk[101]. We used the GTR+I+G model ofnucleotide substitution with estimated base frequencies,gamma shape distribution (with six categories), propor-tion of invariant sites, and a strict molecular clock withuncorrelated log normal distribution of branch lengths.Posterior estimates of the mutation rate and age of theTMRCA were obtained by Markov chain Monte Carlo(MCMC) analysis, with samples drawn every 500 stepsover a total of 25,000,000 steps. The BEAST program wasalso used to create a Bayesian skyline plot with 10 steps.The analysis was run for 107 iterations with a burn-in of106 under the GTR+I+G model with estimated base fre-quencies, gamma shape distribution (with six categories),proportion of invariant sites, and a strict molecular clockwith uncorrelated log normal distribution of branchlengths. Genealogies and model parameters were sampledevery 1000 iterations. All operators were automaticallyoptimized. Convergence of parameters and mixing ofchains were followed by visual inspection of parametertrend lines and checking of ESS values by three pre-runs.The effective sampling size (ESS) parameter was found toexceed 100, which suggests acceptable mixing and suffi-cient sampling. Adequate sampling and convergence tothe stationary distribution were checked using TRACER v.1.3 [102]. Posterior estimates of parameters were all dis-tinctly unimodal (although with wide 95% highest poste-rior densities), and all parameters were identifiable,despite the relatively low information content in thesequences and the small age range of the sequences.
Isolation by migration and estimating of ancestral population sizeWe used the simulation program IM [1,103] to investigateisolation with a migration model. By applying coalescentsimulations and Bayesian computation procedures, IMyielded six demographic parameters, including popula-tion-split time, effective population size for the ancestral
and two current populations, and migration rates. Theposterior probability densities of these parameters aregenerated by MCMC simulations, and simulations wererun with individual simulations being updated 50 milliontimes. Within each simulation, we used the procedure toswap among 10 heated chains (Metropolis coupling) andobserved sufficient swapping rate while the simulationwas running. These simulations were carried out usingseveral independent runs, with each chain started at a dif-ferent starting point and initiated with a burn-in period of100,000 updates. Convergence upon the stationary distri-bution was assessed by estimating the effective samplesize (ESS) for the parameters, based on the autocorrela-tion of parameter values measured over the course of therun. The analysis was considered to have converged upona stationary distribution if the independent runs gener-ated similar posterior distributions with a minimum ESSof 100. Each simulation yielded a marginal density histo-gram for the six parameters of interest. The peaks of theresulting distributions were considered as the maximumlikelihood estimates (MLE) of the parameter with credi-bility intervals equaling the 95% highest posterior density(HPD) intervals.
Authors' contributionsYCC and KHH carried out the molecular genetic studiesand the statistical analysis, and participated in thesequence alignment. TYC, TWH and BAS designed theresearch and drafted the manuscript. SJM, SH, and XJGtook part in material sampling. All authors read andapproved the final manuscript.
AcknowledgementsThis study was supported by the National Science Council (NSC) and Council of Agriculture of (COA) of Taiwan. We are grateful to the Tropical Research Centre of the University of Ryukyus for the assistance in the sam-ple collecting.
References1. Chiang TY, Schaal BA: Phylogeography of plants in Taiwan and
the Ryukyu Archipelago. Taxon 2006, 55:3-41.2. Hoelzer GA, Wallman J, Melnick DJ: The effects of social struc-
ture, geographical structure, and population size on the evo-lution of mitochondrial DNA: II. Molecular clocks and thelineage sorting period. J Mol Evol 1998, 47:21-31.
3. Schaal BA, Olsen K: Gene genealogies and population variationin plants. Proc Natl Acad Sci 2000, 97:7024-7029.
4. Donnelly P, Tavaré S: Coalescents and genealogical structureunder neutrality. Ann Rev Genet 1995, 29:401-421.
5. Chiang TY: Lineage sorting accounting for the disassociationsbetween chloroplast and mitochondrial lineages in oaks ofsouthern France. Genome 2000, 43:1090-1094.
6. Matos JA, Schaal BA: Chloroplast evolution in the Pinus monte-zumae complex: a coalescent approach to hybridizationbetween P. hartwegii and P. montezumae. Evolution 2000,54:1218-1233.
7. Willis KJ, McElwain JC: The evolution of plants. Oxford: OxfordUniversity Press; 2002.
8. Hill KD: Cycas – an evolutionary perspective. In Biology and con-servation of cycads. Proceedings of the Fourth International Conference onCycad Biology Edited by: Chen CJ. Beijing: International Academic Pub-lishers; 1999:98-115.
Page 17 of 19(page number not for citation purposes)
http://www.ncbi.nlm.nih.gov/entrez/query.fcgi?cmd=Retrieve&db=PubMed&dopt=Abstract&list_uids=9664693
http://www.ncbi.nlm.nih.gov/entrez/query.fcgi?cmd=Retrieve&db=PubMed&dopt=Abstract&list_uids=9664693
http://www.ncbi.nlm.nih.gov/entrez/query.fcgi?cmd=Retrieve&db=PubMed&dopt=Abstract&list_uids=9664693
http://www.ncbi.nlm.nih.gov/entrez/query.fcgi?cmd=Retrieve&db=PubMed&dopt=Abstract&list_uids=8825481

BMC Evolutionary Biology 2009, 9:161 http://www.biomedcentral.com/1471-2148/9/161
9. Ye ZY: The investigation into the past and the current stateof Cycas revoluta in Fujian. In Biology and conservation of cycads. Pro-ceedings of the Fourth International Conference on Cycad Biology Editedby: Chen CJ. Beijing: International Academic Publishers; 1999:73-74.
10. Pant DD: A study in contrasts: the present and past distribu-tion and form of certain cycads. In Biology and conservation ofcycads. Proceedings of the Fourth International Conference on Cycad Biol-ogy Edited by: Chen CJ. Beijing: International Academic Publishers;1999:1-23.
11. Zhou GS, Jian SX, Zhou W: Cycad cultivation and trade inFujian of China. In Biology and conservation of cycads. Proceedings ofthe Fourth International Conference on Cycad Biology Edited by: Chen CJ.Beijing: International Academic Publishers; 1999:368-370.
12. Miller G: From cycad flour, a new emerges. Science 2006,313:431.
13. Whitelock LM: The cycads. Portland: Timber Press; 2002. 14. Osborne R, Stevenson DW, Hill KD: The world list of cycads. In
Biology and conservation of cycads. Proceedings of the Fourth InternationalConference on Cycad Biology Edited by: Chen CJ. Beijing: InternationalAcademic Publishers; 1999:224-239.
15. Huang S, Hsieh HT, Fang K, Chiang YC: Patterns of genetic varia-tion and demography of Cycas taitungensis in Taiwan. Bot Rev2004, 70:86-92.
16. Shimabuku K: Checklist of vascular flora of the the RyukyuIslands. Kyushu University Press; 1997.
17. Uehara K: Illustrations of trees. Cycadaceae. Volume 1. Tokyo:Erushima Press; 1970.
18. Hsieh HT: Studies on population ecology and genetic variabil-ity of Cycas taitungensis. In Master Thesis Taipei: Department ofBiology, National Taiwan Normal University; 1999.
19. Darwin C: On the Origin of Species. London: John Murray; 1859. 20. Emerson BC: Evolution on oceanic islands: molecular phyloge-
netic approaches to understanding pattern and process. MolEcol 2002, 11:951-966.
21. Juan II, Emerson BC, Orom II, Hewitt GM: Colonization and diver-sification: towards a phylogeographic synthesis for theCanary Islands. Trends Ecol Evol 2000, 15:104-109.
22. Vita-Finzi C: Deformation and seismicity of Taiwan. Proc NatlAcad Sci 2000, 97:11176-80.
23. Sibuet JC, Hsu SK: Geodynamics of the Taiwan arc-arc colli-sion. Tectonophysics 1997, 274:221-251.
24. Sibuet JC, Hsu SK: How was Taiwan created? Tectonophysics 2004,379:159-181.
25. Wang JM: The Fenwei rift and its recent periodic activity. Tec-tonophysics 1987, 133:257-275.
26. Hikida T, Ota H: Biogeography of reptiles in the subtropicalEast Asian Islands. In The Symposium on the Phylogeny, Biogeographyand Conservation of Fauna and Flora of East Region Taipei, Taiwan:National Taiwan Normal University; 1997:11-18.
27. Bennett KD: Milankovitch cycles and their effects on species inecological and evolutionary time. Paleobiology 1990, 16:11-21.
28. Lambeck K, Chappell J: Sea level change through the last glacialcycle. Science 2001, 292:679-685.
29. Hewitt GM: A climate for colonization. Heredity 2004, 92:1-2.30. Kizaki K, Oshiro I: Paleogeography of the Ryukyu Islands.
Marine Sci Month 1977:542-549.31. Petit E, Balloux F, Goudet J: Sex-biased dispersal in a migratory
bat: a characterization using sex-specific demographicparameters. Evolution 2001, 55:635-640.
32. Hung KH, Hsu TW, Schaal BA, Chiang TY: Loss of genetic diver-sity and erroneous phylogeographical inferences in Lithocar-pus konishii (Fagaceae) of Taiwan caused by the Chi-ChiEarthquake: Implications for Conservation. Ann Missouri BotGard 2005, 92:52-65.
33. Chiang TY, Schaal BA: Phylogeography of plants in Taiwan andthe Ryukyu Archipelago. Taxon 2006, 55:31-41.
34. Hewitt GM: The genetic legacy of the Quaternary ice ages.Nature 2000, 405:907-913.
35. Zachos J, Pagani M, Sloan L, Thomas E, Billups K: Trends, rhythms,and aberrations in global climate 65 Ma to present. Science2001, 292:686-693.
36. Dehgan B, Yuen CKH: Seed morphology in relation to disper-sal, evolution, and propagation of Cycas. Bot Gaz 1983,144:412-418.
37. Hill KD: Evolution and biogeography of the genus Cycas. InProceedings of the 3rd International Conference of Cycas Biology Edited by:Vorster P. Stellenbosch: The Cycad Society of South Africa; 1996.
38. Tang W: Seed dispersal in the cycad Zamia pumila in Florida.Can J Bot 1989, 67:2066-2070.
39. Keppel G, Lee SW, Hodgskiss PD: Evidence for the long isolationamong populations of a Pacific cycad: genetic diversity anddifferentiation in Cycas seemannii A. Br. (Cycadaceae). JHeredity 2002, 93:133-139.
40. Lu SY, Peng CI, Cheng YP, Hong KH, Chiang TY: Chloroplast DNAphylogeography of Cunninghamia konishii (Cupressaceae), anendemic conifer of Taiwan. Genome 2001, 44:797-807.
41. Lu SY, Hong KH, Liu SL, Cheng YP, Wu WL, Chiang TY: Geneticvariation and population differentiation of Michelia for-mosana (Magnoliaceae) based on cpDNA variation andRAPD fingerprints: relevance to post-Pleistocene recoloni-zation. J Plant Res 2002, 115:203-216.
42. Chiang TY, Chiang YC, Chen YJ, Chou CH, Havanond S, Hong TN,Huang S: Phylogeography of Kandelia candel in East Asiaticmangroves based on nucleotide variation of chloroplast andmitochondrial DNAs. Mol Ecol 2001, 10:2697-2710.
43. Chiang YC, Schaal BA, Ge XJ, Chiang TY: Range expansion leadingto departures from neutrality in the nonsymbiotic hemo-globin gene and the cp DNA trn L-trnF intergenic spacer inTrema dielsiana (Ulmaceae). Mol Phyl Evol 2004, 31:929-942.
44. Chiang TY, Hung KH, Hsu TW, Wu WL: Lineage sorting and phy-logeography in Lithocarpus formosanus and L. dodonaeifolius(Fagaceae) from Taiwan. Ann Missouri Bot Gard 2004, 91:207-222.
45. Purvis A, Bromham L: Estimating the transition/transversionratio from independent pairwise compaisons with anassumed phylogeny. J Mol Evol 1997, 44(1):112-119.
46. Ina Y: Estimation of the transition/transversion ratio. J MolEvol 1998, 46(5):521-533.
47. Bakker FT, Culham A, Gomez-Martinez R, Carvalho J, Compton J,Dawtrey R, Gibby M: Patterns of nucleotide substitution inangiosperm cpDNA trnL (UAA)-trnF (GAA) regions. Mol BiolEvol 2000, 17:1146-1155.
48. Hillis DM, Allard MW, Miyamoto MM: Analysis of DNA sequencedata: phylogenetic inference. Methods Enzymol 1993,224:456-490.
49. Dumolin-Lapeue S, Pemonge MH, Petit RJ: An enlarged set of con-sensus primers for the study of organelle DNA in plants. MolEcol 1997, 6:393-397.
50. Demesure B, Comps B, Petit RJ: Chloroplast DNA phylogeogra-phy of the common beech (Fagus sylvatica L.) in Europe. Evo-lution 1996, 50:2515-2520.
51. Austerlitz F, Mariette S, Machon N, Gouyon PH, Godelle B: Effectsof colonization processes on genetic diversity: differencesbetween annual plants and tree species. Genetics 2000,154:1309-1321.
52. Chiang YC, Hung KH, Schaal BA, Ge XJ, Hsu TW, Chiang TY: Con-trasting phylogeographical patterns between mainland andisland taxa of the Pinus luchuensis complex. Mol Ecol2006:765-779.
53. Petit RJ, Duminil J, Funeschi S, Hampe A, Salvini DA, Vendramin GG:Comparative organization of chloroplast, mitochondrial andnuclear diversity in plant populations. Mol Ecol 2005,14:689-701.
54. Wakeley J, Aliacar M: Gene genealogies in a metapopulation.Genetics 2001, 159:893-905.
55. Huang S, Chiang YC, Schaal BA, Chou CH, Chiang TY: OrganelleDNA phylogeography of Cycas taitungensis, a relict species inTaiwna. Mol Ecol 2001, 10:2669-2681.
56. Whitlock MC, McCauley DE: Indirect measures of gene flow andmigration: FST not equal to 1/(4Nm + 1). Heredity 1999,82:117-125.
57. Lin CC: An outline of Taiwan's Quaternary geohistory with aspecial discussion of the relation between natural history andcultural history in Taiwan. Bull Dept Archaeol Anthropol 1966,23:7-44.
58. Miege C, Ruffio-Chable V, Schierup MH, Cabrillac D, Dumas D,Gaude T, Cock JM: Intrahaplotype polymorphism at theBrassica S locus. Genetics 2001, 159:811-822.
59. Wu WL, Schaal BA, Hwang CY, Hwang MD, Chiang YC, Chiang TY:Characterization and adaptive evolution of a-tubulin genesin Miscanthus sinensis complex (Poaceae). Amer J Bot 2003,90:1513-1521.
60. Jacob S, Blattner FR: A chloroplast genealogy of Hordeum(Poaceae): long-term persisting haplotypes, incomplete line-
Page 18 of 19(page number not for citation purposes)
http://www.ncbi.nlm.nih.gov/entrez/query.fcgi?cmd=Retrieve&db=PubMed&dopt=Abstract&list_uids=9010143
http://www.ncbi.nlm.nih.gov/entrez/query.fcgi?cmd=Retrieve&db=PubMed&dopt=Abstract&list_uids=9010143
http://www.ncbi.nlm.nih.gov/entrez/query.fcgi?cmd=Retrieve&db=PubMed&dopt=Abstract&list_uids=9010143
http://www.ncbi.nlm.nih.gov/entrez/query.fcgi?cmd=Retrieve&db=PubMed&dopt=Abstract&list_uids=9545463
http://www.ncbi.nlm.nih.gov/entrez/query.fcgi?cmd=Retrieve&db=PubMed&dopt=Abstract&list_uids=7505382
http://www.ncbi.nlm.nih.gov/entrez/query.fcgi?cmd=Retrieve&db=PubMed&dopt=Abstract&list_uids=7505382
http://www.ncbi.nlm.nih.gov/entrez/query.fcgi?cmd=Retrieve&db=PubMed&dopt=Abstract&list_uids=9131816

BMC Evolutionary Biology 2009, 9:161 http://www.biomedcentral.com/1471-2148/9/161
Publish with BioMed Central and every scientist can read your work free of charge
"BioMed Central will be the most significant development for disseminating the results of biomedical research in our lifetime."
Sir Paul Nurse, Cancer Research UK
Your research papers will be:
available free of charge to the entire biomedical community
peer reviewed and published immediately upon acceptance
cited in PubMed and archived on PubMed Central
yours — you keep the copyright
Submit your manuscript here:http://www.biomedcentral.com/info/publishing_adv.asp
BioMedcentral
age sorting, regional extinction, and the consequences forphylogenetic inference. Mol Biol Evol 2006, 23(8):1602-1612.
61. Chiang TY, Hung KH, Peng CI: Experimental hybridizationreveals biased inheritance of the internal transcribed spacerof the nuclear ribosomal DNA in Begonia × taipeiensis. J PlantRes 2001, 114:343-351.
62. Donnelly MJ, Pinto J, Girod R, Besansky NJ, Lehmann T: Revisitingthe role of introgression vs shared ancestral polymorphismsas key processes shaping genetic diversity in the recentlyseparated sibling species of the Anopheles gambiae complex.Heredity 2004, 92:61-68.
63. Holder MT, Anderson JA, Holloway AK: Difficulties in detectinghybridization. Syst Biol 2001, 50:978-982.
64. Osada N, Wu CI: Inferring the mode of speciation fromgenomic data: a study of the great apes. Genetics 2005,169:259-264.
65. Hudson RR: Island models and the coalescent process. Mol Ecol1998, 7:413-418.
66. Templeton AR: Gene tree: A powerful tool for exploring theevolutionary biology species and speciation. Plant Species Biol2000, 15:211-222.
67. Graham J, Thompson EA: A coalescent model of ancestry for arare allele. Genetics 2000, 156:375-384.
68. Klopfstein S, Currat M, Excoffier L: The fate of mutations surfingon the wave of a range expansion. Mol Biol Evol 2006,23:482-490.
69. Edmonds CA, Lillie AS, Cavalli-Sforza LL: Mutations arising in thewave front of an expanding population. Proc Natl Acad Sci 2004,101:975-979.
70. Rosenberg NA, Hirsh AE: On the use of star-shaped genealogiesin inference of coalescence times. Genetics 2003,164:1677-1682.
71. Joy DA, Feng X, Mu J, Furuya T, Chotivanich K, Krettli AU, Ho M,Wang A, White NJ, Suh E, Beerli P, Su XZ: Early origin and recentexpansion of Plasmodium falciparum. Science 2003, 300:318-321.
72. Aris-Brosou S, Excoffier L: The impact of population expansionand mutation rate heterogeneity on DNA sequence poly-morphism. Mol Biol Evol 1996, 13:494-504.
73. Slatkin M, Hudson RR: Pairwise comparisons of mitochondrialDNA sequences in stable and exponentially growing popula-tions. Genetics 1991, 129:555-562.
74. Rogers AR, Harpending H: Population growth makes waves inthe distribution of pairwise genetic differences. Mol Biol Evol1992, 9:552-569.
75. Excoffier L, Schneider S: Why hunter-gatherer populations donot show signs of Pleistocence demographic expansions. ProcNatl Acad Sci 1999, 96:10597-10602.
76. Ray N, Currat M, Excoffier L: Intra-deme molecular diversity inspatially expanding populations. Mol Biol Evol 2003, 20:76-86.
77. Treutlein J, Wink M: Molecular phylogeny of cycads inferredfrom rbc L sequences. Naturwissenschaften 2002, 89:221-225.
78. Murray MG, Thomposon WF: Rapid isolation of high molecularweight DNA. Nucleic Acids Res 1980, 8:4321-4325.
79. Chiang TY, Schaal BA, Peng CI: Universal primers for amplifica-tion and sequencing a noncoding spacer between atpB andrbcL genes of chloroplast DNA. Bot Bull Acad Sin 1998,39:245-250.
80. Brennicke A, Möller S, Blanz PA: The 18S and 5S ribosomal RNAgenes in Oenothera mitochondria: Sequence rearrangmentsin the 18S and 5S rRNA genes of higher plants. Mol Gen Gent1985, 198:404-410.
81. Belshaw R, Katzourakis A: BlastAlign: a program that uses blastto align problematic nucleotide sequences. Bioinformatics 2005,21(1):122-123.
82. Guindon S, Gascuel O: A simple, fast, and accurate algorithmto estimate large phylogenies by maximum likelihood. SystBiol 2003, 52:696-704.
83. Posada D, Crandall KA: MODELTEST: testing the model ofDNA substitution. Bioinformatics 1998, 14(9):817-818.
84. Swofford DL: PAUP*: Phylogenetic Analysis Using Parsimony(and Other Methods), Version 4.0b10. Sinauer Associates, Inc,Sunderland, Massachusetts; 2002.
85. Felsenstein J: Confidence limits on phylogenies: an approachusing the bootstrap. Evolution 1985, 39:783-791.
86. Clement M, Posada D, Crandall K: TCS, a computer program toestimate gene genealogies. Mol Ecol 2000, 9:1657-1660.
87. Templeton AR, Crandall KA, Sing CF: A cladistic analysis of phe-notypic associations with haplotypes inferred from restric-tion endonuclease mapping and DNA sequence data. III.Cladogram estimation. Genetics 1992, 132:619-633.
88. Donnelly P, Tavare S: The ages of alleles and a coalescent. AdvAppl Probab 1986, 18:1-19.
89. Crandall KA, Templeton AR: Empirical tests of some predictionsfrom coalescent theory with applications to intraspecificphylogeny reconstruction. Genetics 1993, 134:959-969.
90. Sarich VM, Wilson AC: Generation time and genomic evolutionin primates. Science 1973, 179:1144-1147.
91. Wu CI, Li WH: Evidence for higher rates of nucleotide substi-tution in rodents than in man. Proc Natl Acad Sci USA 1985,82:1741-1745.
92. Watterson GA: On the number of segregating sites in geneti-cal models without recombination. Theor Popul Biol 1975,7:256-275.
93. Tajima F: Statistical method for testing the neutral mutationhypothesis by DNA polymorphism. Genetics 1989, 123:585-595.
94. Rozas J, Sanchez-DelBarrio JC, Messeguer X, Rozas R: DnaSP, DNApolymorphism analyses by the coalescent and other meth-ods. Bioinformatics 2003, 19:2496-24.
95. Fu YX, Li W: Statistical tests of neutrality of mutations. Genet-ics 1993, 133:693-709.
96. Fu YX: Statistical tests of neutrality of mutations against pop-ulation growth, hitchhiking and background selection. Genet-ics 1997, 147:915-925.
97. Ramos-Onsins SE, Rozas J: Statistical properties of new neutral-ity tests against population growth. Mol Biol Evol 2002,19:2092-2100.
98. Schneider S, Excoffier L: Estimation of past demographicparameters from the distribution of pairwise differenceswhen mutation rates vary among sites: application to humanmitochondrial DNA. Genetics 1999, 152:1079-1089.
99. Excoffier L, Laval G, Schneider S: Arlequin ver. 3.0: An integratedsoftware package for population genetics data analysis. EvolBioinform Online 2005, 1:47-50.
100. Graur D, Li WH: Fundamentals of molecular evolution. Sun-derland: Sinauer Associates; 2000.
101. Drummond AJ, Ho SY, Phillips MJ, Rambaut A: Relaxed phyloge-netics and dating with confidence. PLOS Biology 2006, 4:e88.
102. Rambaut A, Drummond A: Tracer – MCMC trace analysis tool.Oxford, UK: University of Oxford; 2004.
103. Hey J, Nielsen R: Multilocus methods for estimating populationsizes, migration rates, and divergence time, with applica-tions to the divergence of Drosophila pseudoobscura and D.persimilis. Genetics 2004, 167:747-760.
Page 19 of 19(page number not for citation purposes)
http://www.ncbi.nlm.nih.gov/entrez/query.fcgi?cmd=Retrieve&db=PubMed&dopt=Abstract&list_uids=8742638
http://www.ncbi.nlm.nih.gov/entrez/query.fcgi?cmd=Retrieve&db=PubMed&dopt=Abstract&list_uids=8742638
http://www.ncbi.nlm.nih.gov/entrez/query.fcgi?cmd=Retrieve&db=PubMed&dopt=Abstract&list_uids=8742638
http://www.ncbi.nlm.nih.gov/entrez/query.fcgi?cmd=Retrieve&db=PubMed&dopt=Abstract&list_uids=1743491
http://www.ncbi.nlm.nih.gov/entrez/query.fcgi?cmd=Retrieve&db=PubMed&dopt=Abstract&list_uids=1743491
http://www.ncbi.nlm.nih.gov/entrez/query.fcgi?cmd=Retrieve&db=PubMed&dopt=Abstract&list_uids=1743491
http://www.ncbi.nlm.nih.gov/entrez/query.fcgi?cmd=Retrieve&db=PubMed&dopt=Abstract&list_uids=1316531
http://www.ncbi.nlm.nih.gov/entrez/query.fcgi?cmd=Retrieve&db=PubMed&dopt=Abstract&list_uids=1316531
http://www.ncbi.nlm.nih.gov/entrez/query.fcgi?cmd=Retrieve&db=PubMed&dopt=Abstract&list_uids=7433111
http://www.ncbi.nlm.nih.gov/entrez/query.fcgi?cmd=Retrieve&db=PubMed&dopt=Abstract&list_uids=7433111
http://www.ncbi.nlm.nih.gov/entrez/query.fcgi?cmd=Retrieve&db=PubMed&dopt=Abstract&list_uids=9918953
http://www.ncbi.nlm.nih.gov/entrez/query.fcgi?cmd=Retrieve&db=PubMed&dopt=Abstract&list_uids=9918953
http://www.ncbi.nlm.nih.gov/entrez/query.fcgi?cmd=Retrieve&db=PubMed&dopt=Abstract&list_uids=1385266
http://www.ncbi.nlm.nih.gov/entrez/query.fcgi?cmd=Retrieve&db=PubMed&dopt=Abstract&list_uids=1385266
http://www.ncbi.nlm.nih.gov/entrez/query.fcgi?cmd=Retrieve&db=PubMed&dopt=Abstract&list_uids=1385266
http://www.ncbi.nlm.nih.gov/entrez/query.fcgi?cmd=Retrieve&db=PubMed&dopt=Abstract&list_uids=8349118
http://www.ncbi.nlm.nih.gov/entrez/query.fcgi?cmd=Retrieve&db=PubMed&dopt=Abstract&list_uids=8349118
http://www.ncbi.nlm.nih.gov/entrez/query.fcgi?cmd=Retrieve&db=PubMed&dopt=Abstract&list_uids=8349118
http://www.ncbi.nlm.nih.gov/entrez/query.fcgi?cmd=Retrieve&db=PubMed&dopt=Abstract&list_uids=4120260
http://www.ncbi.nlm.nih.gov/entrez/query.fcgi?cmd=Retrieve&db=PubMed&dopt=Abstract&list_uids=4120260
http://www.ncbi.nlm.nih.gov/entrez/query.fcgi?cmd=Retrieve&db=PubMed&dopt=Abstract&list_uids=3856856
http://www.ncbi.nlm.nih.gov/entrez/query.fcgi?cmd=Retrieve&db=PubMed&dopt=Abstract&list_uids=3856856
http://www.ncbi.nlm.nih.gov/entrez/query.fcgi?cmd=Retrieve&db=PubMed&dopt=Abstract&list_uids=1145509
http://www.ncbi.nlm.nih.gov/entrez/query.fcgi?cmd=Retrieve&db=PubMed&dopt=Abstract&list_uids=1145509
http://www.ncbi.nlm.nih.gov/entrez/query.fcgi?cmd=Retrieve&db=PubMed&dopt=Abstract&list_uids=2513255
http://www.ncbi.nlm.nih.gov/entrez/query.fcgi?cmd=Retrieve&db=PubMed&dopt=Abstract&list_uids=2513255
http://www.ncbi.nlm.nih.gov/entrez/query.fcgi?cmd=Retrieve&db=PubMed&dopt=Abstract&list_uids=8454210
http://www.ncbi.nlm.nih.gov/entrez/query.fcgi?cmd=Retrieve&db=PubMed&dopt=Abstract&list_uids=9335623