DNAs EXEPERIENCES IN WESTERN BALKANS: THE REPUBLIC OF SERBIA
2342 Biochemistry 1990,
Kobilka, B. K., Dixon, R. A. F., Frielle, T., Dohlman, H. G., Bolanowski, M. A., Sigal, I. S. , Yang-Feng, T. L., Francke, U., Caron, M. G., & Lefkowitz, R. J. (1987a) Proc. Nail. Acad. Sci. U.S.A. 84, 46-50.
Kobilka, B. K., MacGregor, C., Daniel, K., Kobilka, T. S . , Caron, M. G. & Lefkowitz, R. J. (1987b) J . Biol. Chem.
Korner, M., Gilon, C., & Schramm, M. (1982) J. Biol. Chem.
Laemmli, U. K. (1970) Nature (London) 227, 680-685. Lucas, M., Hanoune, J., & Bockaert, J . (1978) Mol. Phar-
macol. 14, 227-236. Maniatis, T., Fritsch, E. F., & Sambrook, J. (1982) Molecular
Cloning: A Laboratory Manual, Cold Spring Harbor Laboratory, Cold Spring Harbor, NY.
Means, G. E., & Feeney, R. E. (1971) Chemical Modifcation of Proteins, p 30, Holden-Day, San Francisco.
Moxham, C. P., & Malbon, C. C. (1985) Biochemistry 24,
Moxham, C. P., Ross, E. M., George, S . T., & Malbon, C.
Mukherjee, C., & Lefkowitz, R. J. (1977) Mol. Pharmacol.
O’Dowd, B. F., Mahuran, D. J., & Lowden, I. A. (1984) Biosci. Rep. 4, 59-63.
ODowd, B. F., Hnatowich, M., Regan, J. W., Leader, W. M., Caron, M. G., & Lefkowitz, R. J. (1988) J . Biol. Chem.
O’Dowd, B. F., Hnatowich, M., Caron, M. G., & Lefkowitz,
Ovchinnikov, Yu. A. (1982) FEBS Lett. 148, 179-191.
262, 15796-1 5802.
257, 3389-3396.
6072-6077.
C. (1988) Mol. Pharmacol. 33, 486-492.
13, 291-303.
263, 15985-15992.
R. J. (1989) J . Biol. Chem. 264, 7564-7569.
29, 2342-2348
Pedersen, S . E., & Ross, E. M. (1985) J . Biol. Chem. 260,
Sanger, F., Nicklen, S. , & Coulson, A. R. (1977) Proc. Nail.
Scatchard, G. (1949) Ann. N.Y. Acad. Sci. 51, 660-672. Schaffner, W., & Weissmann, C. (1975) Anal. Biochem. 56,
Sciaky, M., Limozin, N., Filippi-Foveau, D., Gulian, J. M., & Laurent-Tabusse, G. (1976) Biochimie 58, 1071-1082.
Sibley, D. R., Benovic, J. L., Caron, M. G., & Lefkowitz, R. J. (1987) Cell 48, 913-922.
Swank, R. W., & Munkres, K. D. (1971) Anal. Biochem. 39, 462.
Thompson, E. 0. P., & Fisher, W. K. (1978) Aust. J . Biol. Sci. 31, 433-442.
Vanaman, T. C., Brew, K., & Hill, R. L. (1 970) J . Biol. Chem. 245, 4583-4590.
Vauquelin, G., & Maguire, M. E. (1980) Mol. Pharmacol. 18, 362-369.
Vauquelin, G., Bottari, S. , Kanarek, L., & Strosberg, A. D. (1 979) J . Biol. Chem. 254, 4462-4469.
Vauquelin, G., Bottari, S . , & Strosberg, A. D. (1980a) Mol. Pharmacol. 17, 163-171.
Vauquelin, G., Bottari, S . , Andre, C., Jacobsmn, B., & Strosberg, A. D. (1980b) Proc. Nail. Acad. Sci. U.S.A. 77,
Wong, S . K.-F., Slaughter, C., Ruoho, A. E., & Ross, E. M.
Wright, M., & Drummond, G. I. (1983) Biochem. Pharmacol.
1 4 1 50-1 4 1 57.
Acad. Sci. U.S.A. 74, 5463-5467.
502-514.
3801-3805.
(1988) J . Biol. Chem. 263, 7925-7928.
32, 509-5 15.
Satellite DNAs Contain Sequences That Induce Curvature+*$ A. Martinez-BalbBs, A. Rodriguez-Campos, M. Gada-Ramirez, J. Sainz, P. Carrera, J. Aymami, and F. Azorh* Grupo de Quimica Macromolecular, Centro de Investigaci6n y Desarrollo del CSIC, E TSEIB, Diagonal 647, 08028 Barcelona,
Spain Received June 2, 1989; Revised Manuscript Received September 25, 1989
ABSTRACT: The repeating units of mouse, rat, and a-monkey satellites have been cloned. All three show properties that are characteristic of curved DNA: (i) their migration in polyacrylamide gels is slower than predicted from their sequences, and (ii) they appear as curved molecules when visualized by electron microscopy. All three satellite repeats contain runs of d(A.T),23 residues that are likely to be responsible for their curvature. From analysis of 20 different satellite DNA sequences, we conclude that, in satellite DNA, adenine residues show a high tendency to cluster in groups of three or more.
A significant proportion of eukaryotic genomic DNA is formed by tandemly repeated satellite DNA sequences (Brutlag, 1980). Their monomeric units are variable in length and quite complex in sequence. Several functions have been proposed for satellite DNA (Singer, 1982). Satellite DNAs are universally, although not exclusively, associated with re- gions of constitutive heterochromatin (Brutlag, 1980; John & Miklos, 1979). In particular, a centromeric location has been
This work was financed by grants from CICYT (B1088-0236), CEC [BAP-0466.E (JR) and ST2J-0372-C(A)], and FIS (88/1447). J.A. was a recipient of a postdoctoral fellowship from MEC. A.R.-C. was a recipient of a postdoctoral fellowship from CSIC. A.M.-B. was supported by a doctoral fellowship from MEC.
tThe nucleic acid sequences in this paper have been submitted to GenBank under Accession Numbers 502887, 502885, and 502886.
0006-2960/90/0429-2342$02.50/0
demonstrated for many satellites (Peacock et al., 1978), and a role in centromeric chromatin condensation during meta- phase has been proposed for mouse satellite DNA (Lica et al., 1986). It has also been suggested that satellite DNAs might be involved in some gene amplification events (Bostock & Clark, 1980) as well as in spindle attachment during meta- phase (Avila et al., 1983).
The molecular basis of the peculiar properties shown by satellite chromatin, such as transcriptional inactivation and high degree of condensation, is still unknown. Nuclear proteins that appear to interact preferentially with satellite DNA se- quences have been detected in several eukaryotic cells (Hsieh & Brutlag, 1978; Levinger & Varshavsky, 1982; Garreau & Williams, 1983; Strauss & Varshavsky, 1984). In particular, a non-histone nuclear protein that recognizes runs of d(A.T),,5
0 1990 American Chemical Society
Curvature of Satellite DNAs
has been found to bind preferentially to a-monkey satellite sequences (Strauss & Varshavsky, 1984; Solomon et al., 1986). This protein has been proposed to function as a nucleosome- positioning protein (Strauss & Varshavsky, 1984). Proteins showing a similar affinity for d(A-T), runs have also been isolated from other eukaryotic cells (Elton et al., 1987; Reeves et al., 1987; Russnak et al., 1988; Winter & Varshavsky, 1989). However, nothing is known about the binding of such proteins to satellite DNA. In this paper, we address the question of whether satellite DNAs show any structural feature that might be relevant for their biological function. We have found that mouse, rat, and a-monkey satellite repeats show a significant degree of curvature that is likely to be associated with the presence of runs of d(A-T),,, residues in their se- quences (Trifonov, 1985; Koo et al., 1986). Radic et al. (1987) have also reported recently the curvature of mouse satellite. Furthermore, from analysis of 20 different satellite DNA sequences it is concluded that adenine residues show a high tendency to cluster, suggesting that curvature might be a common structural feature of satellite DNAs.
MATERIALS AND METHODS Cloning and Sequencing. Mouse, rat, and a-monkey sat-
ellite repeats were cloned into pUC19. Rat and a-monkey satellite monomers were obtained by complete HindIII di- gestion of total genomic DNA. Monomers were then purified by agarose gel electrophoresis and cloned at the unique HindIII site of pUCl9. Mouse satellite monomers were prepared by BsrNI cleavage of the purified satellite obtained as described elsewhere (Wiche et al., 1978). The monomeric fragments were then purified as before and cloned into the SmaI site of pUC19 after the cohesive ends left by BstNI had been filled in with the Klenow fragment. DNA sequencing was carried out by the method of Sanger.
DNA Electrophoretic Analysis. The monomeric repeats of mouse, rat, and a-monkey satellites were prepared from the corresponding pUC 19 recombinants by cleavage with the appropriate restriction endonucleases, as indicated in each case.
Nondenaturing polyacrylamide gel electrophoresis was performed on either 7% or 5% polyacrylamide-TBE gels run at 150 V for 14 h at 4 OC. To determine the K factor value (observed length/expected length), each DNA fragment was coelectrophoresed in the same lane with pBR322 MspI frag- ments used as molecular weight markers. Regression curves generated by these molecular weight standards showed re- gression coefficients better than -0.99. Therefore, we estimate that the experimental error in the determination of the K factor is not higher than f0.005. Denaturing polyacrylamide gel electrophoresis was carried out on an 8% polyacrylamide-7 M urea-TBE gel run at 600 V for 8 h. Agarose gel electro- phoresis was performed on a 1.5% agarose-TBE gel run in the presence of ethidium bromide (0.5 pg/mL) at 125 V for 16 h at room temperature. Gels were stained with ethidium bromide (0.5 pg/mL) and photographed under UV light.
Electron Microscopy Visualization. For electron micros- copy, DNA fragments prepared by cleavage with the appro- priated restriction endonucleases were purified by gel filtration through a Sepharose CL-2B column eluted with 10 mM Tris (8.0)-1 mM EDTA. Samples were then diluted 150 with 5 mM TEA (7.0)-0.2 mM EDTA, absorbed as a drop on thin carbon films pretreated with Alcian Blue, and then rotary shadowed with Pt-C and visualized under a Philips 301 electron microscope.
To determine the radius of curvature, 10-15 individual fragments were chosen for each satellite. Fragments were then digitalized at regular intervals, and the radius of curvature
Biochemistry, Vol. 29, No. 9, 1990 2343
of every consecutive three points was determined. The results obtained were averaged by cross-correlating each fragment with all the other fragments in the series. Curvature is ex- pressed as the inverse of the radius of curvature.
Sequence Analysis. The search for d(A.T),,, runs was carried out for 20 different satellite DNA sequences obtained from the EMBL databank. The expected frequencies of ap- pearance of d(A.T),,3 runs ( E ) were calculated, account being taken of the actual A+T content of each satellite, according to
[ l - a 1 - t l
where a and t are the percentages of adenine and thymine residues, respectively, and N is the size in base pairs of the satellite repeat.
Statistics of the deviation of the observed frequencies of appearance (0) from the expected frequencies ( E ) was carried out according to a x2 analysis.
RESULTS The monomeric repeats of mouse, rat, and a-monkey sat-
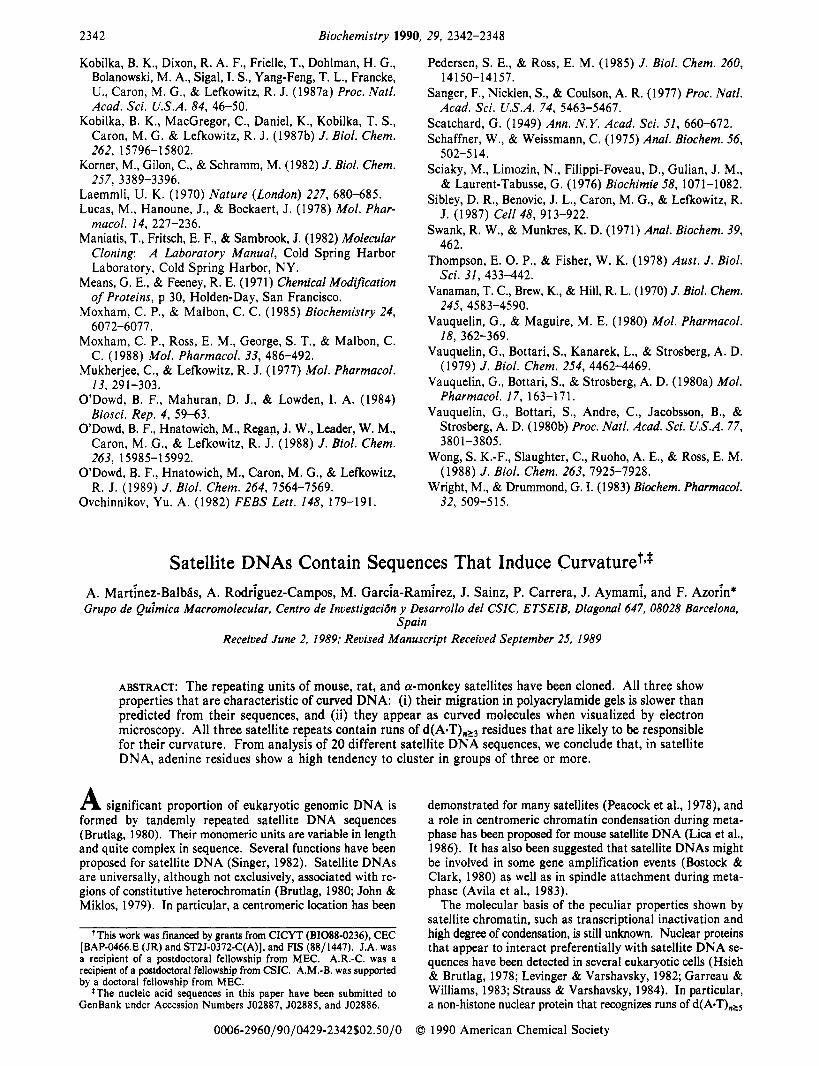
ellites were cloned in pUC19 as described under Materials and Methods. The cloned monomeric units were sequenced, and they were found to be representative of the corresponding consensus sequences (Figure 1).
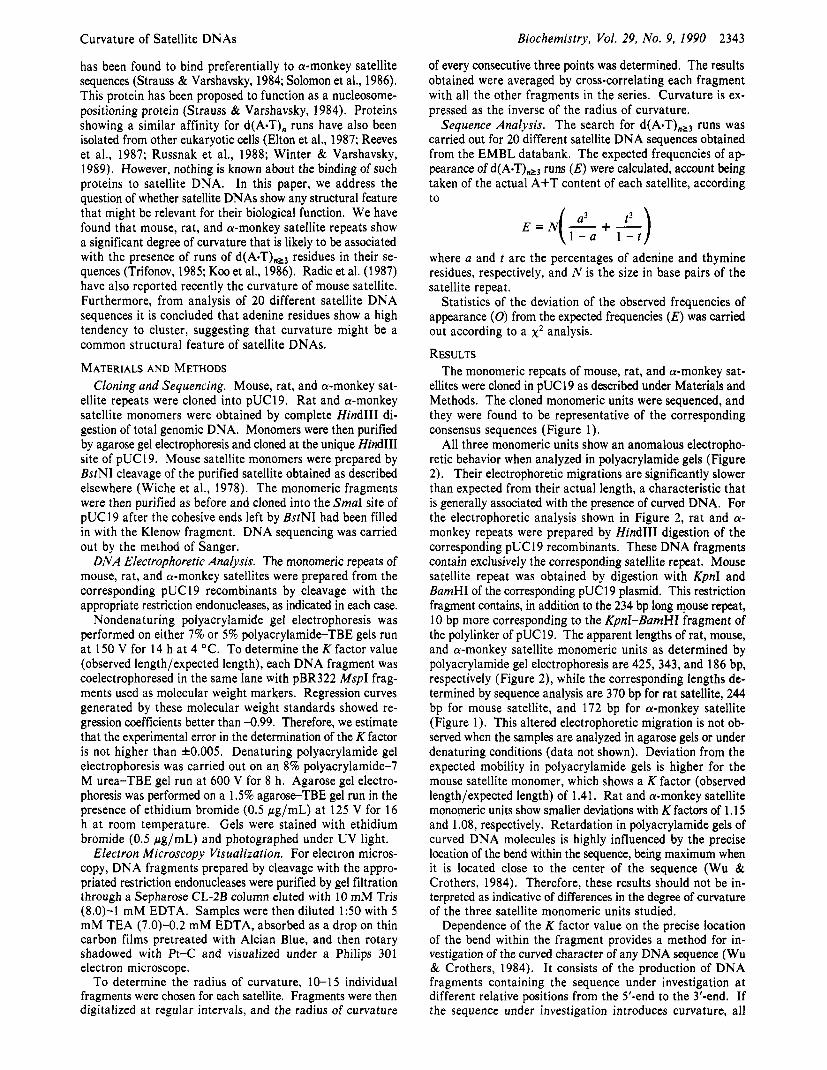
All three monomeric units show an anomalous electropho- retic behavior when analyzed in polyacrylamide gels (Figure 2). Their electrophoretic migrations are significantly slower than expected from their actual length, a characteristic that is generally associated with the presence of curved DNA. For the electrophoretic analysis shown in Figure 2, rat and a- monkey repeats were prepared by HindIII digestion of the corresponding pUC 19 recombinants. These DNA fragments contain exclusively the corresponding satellite repeat. Mouse satellite repeat was obtained by digestion with KpnI and BamHI of the corresponding pUC19 plasmid. This restriction fragment contains, in addition to the 234 bp long mouse repeat, 10 bp more corresponding to the KpnI-BamHI fragment of the polylinker of pUC19. The apparent lengths of rat, mouse, and a-monkey satellite monomeric units as determined by polyacrylamide gel electrophoresis are 425, 343, and 186 bp, respectively (Figure 2), while the corresponding lengths de- termined by sequence analysis are 370 bp for rat satellite, 244 bp for mouse satellite, and 172 bp for a-monkey satellite (Figure 1). This altered electrophoretic migration is not ob- served when the samples are analyzed in agarose gels or under denaturing conditions (data not shown). Deviation from the expected mobility in polyacrylamide gels is higher for the mouse satellite monomer, which shows a K factor (observed length/expected length) of 1.41. Rat and a-monkey satellite monomeric units show smaller deviations with K factors of 1.15 and 1.08, respectively. Retardation in polyacrylamide gels of curved DNA molecules is highly influenced by the precise location of the bend within the sequence, being maximum when it is located close to the center of the sequence (Wu & Crothers, 1984). Therefore, these results should not be in- terpreted as indicative of differences in the degree of curvature of the three satellite monomeric units studied.
Dependence of the K factor value on the precise location of the bend within the fragment provides a method for in- vestigation of the curved character of any DNA sequence (Wu & Crothers, 1984). It consists of the production of DNA fragments containing the sequence under investigation at different relative positions from the 5’-end to the 3’-end. If the sequence under investigation introduces curvature, all
2344 Biochemistry, Vol. 29,
RAT '0 20 '0
ACCTTATI'AC ATCCCMTCC TATTGGGMC
70 90
130 14: 150
190 200 210
GTTC~W TGTKCT~CA TAT?cAAA/~ CG C
TCACTCMTT CGCCTACAAA TTTTGAGTCC T
GTCCACTTAT TACMCT?CG CCCTACTCGG
250 260 270 T C C
KCCCACACC AAATTTTGA; AAATCTTTA~
CWUCTMC~ CMTFCACAC ACAAI\CFGTC
T
310 320 330
No. 9, 1990
'0 60
100 110 12:
160 170 180
CTACTGMTT CACCATGATA CTTAGAFCC
T
C A F C T M T A CMGCA'KTC CCATTCCMC
A C
A T T C C T G W ATTTTTcTAT A K C C C M C A
220 230 240 MCTAACCGA ATPCACCATC TTACTCACAT
280 290 300 AACTACFAT ATTACMCAC CCTGCTACTC
3 4 0 350 360 A
TTTcccTTTc ~ ~ W A ~ C T TTC~CTATC A C c
370
T T G M T M C A
MONKEY
MOUSE '0 '0 30 4? 6?
70 e? 100 110 120
130 14p IS0 160 170 180 -TAT+ A C A A A A C ~ A APATC~TGCA AAP-CAAP. CA~CCACTTC ACGACTTGAA
T C C M T A T M C M G W C T C W T C A C C C ~ T C ~ AATACACACT UAcC;rrCOn;
c c c
m T A T G ? C C A G G W C X wC0n;c W T T T A C A M T n c c A C T GTAGGAeTG
c c
c C T
190 200 210 220 2 30 M T C A C C A A A T C A W mcnClwv\ A T C k C M T C CACACTCMC CCCT
A
FIGURE 1 : DNA sequences of the cloned monomeric repeats of rat, a-monkey, and mouse satellites. Runs of three or more adenines are indicated in capitals. Changes with respect to the corresponding consensus sequence are shown underneath the sequence.
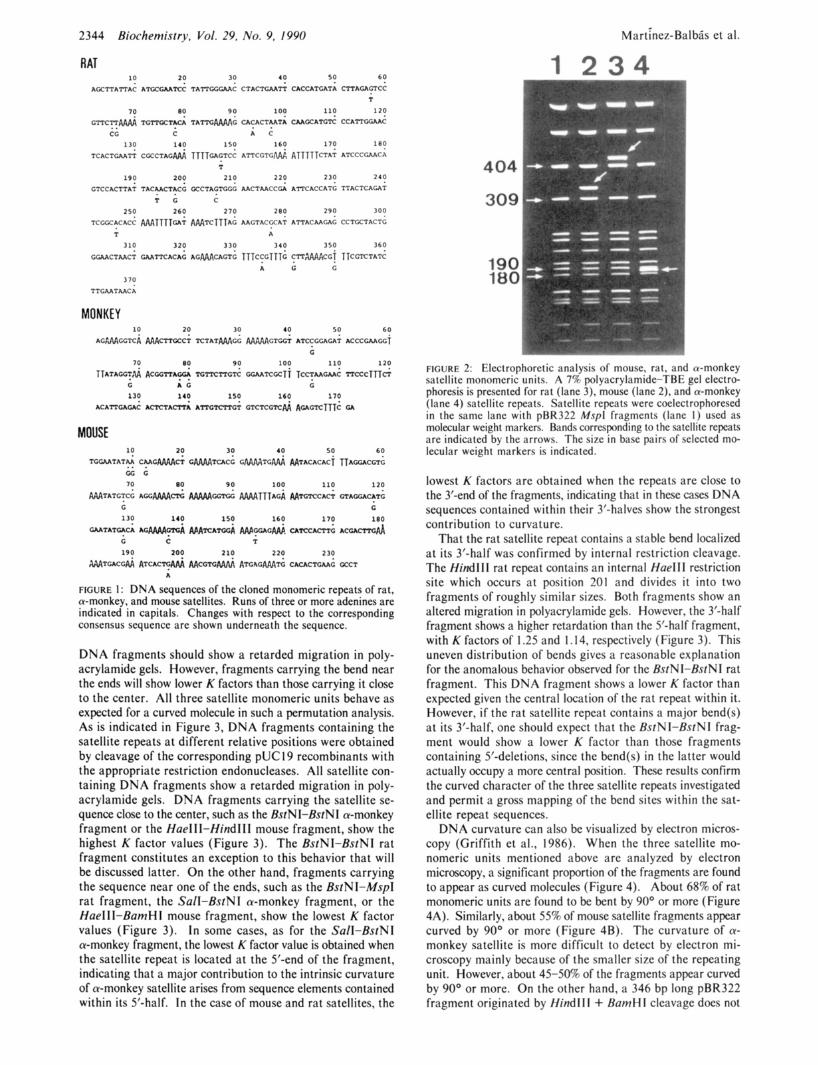
DNA fragments should show a retarded migration in poly- acrylamide gels. However, fragments carrying the bend near the ends will show lower K factors than those carrying it close to the center. All three satellite monomeric units behave as expected for a curved molecule in such a permutation analysis. As is indicated in Figure 3, DNA fragments containing the satellite repeats at different relative positions were obtained by cleavage of the corresponding pUC 19 recombinants with the appropriate restriction endonucleases. All satellite con- taining DNA fragments show a retarded migration in poly- acrylamide gels. DNA fragments carrying the satellite se- quence close to the center, such as the BstNI-BstNI a-monkey fragment or the HaeIII-Hind111 mouse fragment, show the highest K factor values (Figure 3). The BsrNI-BstNI rat fragment constitutes an exception to this behavior that will be discussed latter. On the other hand, fragments carrying the sequence near one of the ends, such as the BstNI-MspI rat fragment, the Sall-BstNI a-monkey fragment, or the HaeIII-BamHI mouse fragment, show the lowest K factor values (Figure 3). I n some cases, as for the Sall-BstNI a-monkey fragment, the lowest K factor value is obtained when the satellite repeat is located at the 5'-end of the fragment, indicating that a major contribution to the intrinsic curvature of a-monkey satellite arises from sequence elements contained within its 5'-half. I n the case of mouse and rat satellites, the
Marthez-Balb5s et al.
I 2 3 4
404
309
190
FIGURE 2: Electrophorctic analysis of mousc, rat, and a-monkey satellite monomeric units. A 7% polyacrylamide-TRE gel electro- phoresis is presented for rat (lane 3), mouse (lane 2), and a-monkey (lane 4) satellite repeats. Satellite repeats were coelcctrophoresed in the same lane wi th pBR322 Mspl fragments (lane 1 ) used as molecular weight markers. Rands corrcspnding to the satellite repeats arc indicated by the arrows. The size in basc pairs of selected mo- lecular weight markers is indicated.
lowest K factors are obtained when the repeats are close to the 3'-end of the fragments, indicating that in these cases DNA sequences contained within their 3'-halves show the strongest contribution to curvature.
That the rat satellite repeat contains a stable bend localized at its 3'-half was confirmed by internal restriction cleavage. The Hind11 I rat repeat contains an internal HaelII restriction site which occurs at position 201 and divides it into two fragments of roughly similar sizes. Both fragments show an altered migration in polyacrylamide gels. However, the 3'-half fragment shows a higher retardation than the 5'-half fragment, with K factors of 1.25 and 1.14, respectively (Figure 3). This uneven distribution of bends gives a reasonable explanation for the anomalous behavior observed for the BstNI-BstNI rat fragment. This DNA fragment shows a lower K factor than expected given the central location of the rat repeat within it. However, if the rat satellite repeat contains a major bend(s) at its 3'-half, one should expect that the BstNI-BstNI frag- ment would show a lower K factor than those fragments containing 5'-deletions, since the bend(s) in the latter would actually occupy a more central position. These results confirm the curved character of the three satellite repeats investigated and permit a gross mapping of the bend sites within the sat- ellite repeat sequences.
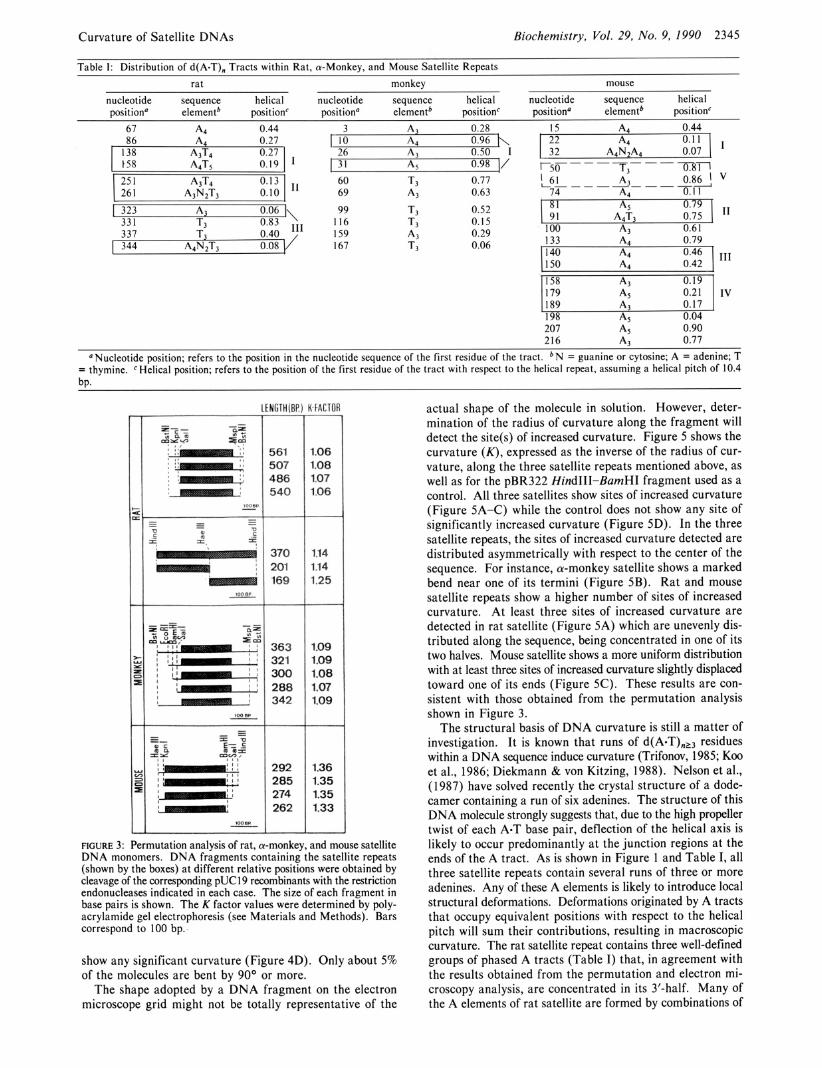
DNA curvature can also be visualized by electron micros- copy (Griffith et al., 1986). When the three satellite mo- nomeric units mentioned above are analyzed by electron microscopy, a significant proportion of the fragments are found to appear as curved molecules (Figure 4). About 68% of rat monomeric units are found to be bent by 90' or more (Figure 4A). Similarly, about 55% of mouse satellite fragments appear curved by 90' or more (Figure 4B). The curvature of a- monkey satellite is more difficult to detect by electron mi- croscopy mainly because of the smaller size of the repeating unit. However, about 4540% of the fragments appear curved by 90' or more. On the other hand, a 346 bp long pBR322 fragment originated by Hind111 + BamH I cleavage does not
Curvature of Satellite DNAs Biochemistry, Vol. 29, No. 9, 1990 2345
I _ _ I
25 1 A3T4 0.13 26 1 A3N2T3 0.10
Table I: Distribution of d(A-TL Tracts within Rat. a-Monkev. and Mouse Satellite RePeats
I1
rat monkey mouse nucleotide sequence helical nucleotide sequence helical nucleotide sequence helical position" elementb position' position" elementb position' position" elementb position'
67 A4 0.44 86 A4 0.27
I38 A37-4 158 AAT,
337 T3 I 344 A4N2T3
3 A, 0.28 I 10 A4 0.96
26 A3 0.50 I I 31 A, 0.98 I/
60 T3 0.77 69 A3 0.63 99 7-3 0.52
116 T3 0.15 159 A3 0.29 167 T3 0.06
15 A4 0.44 I 22 A4 0.11 I 32 A4N2A4 0.07
A 0.86
r50 - - - T3- - - -
L 6 L - - - 3 - - - -I 74 A4 0.1 1
0 .8m
I 81 A, 0.79 I
I
V
I1
133 A4 0.79 140 A4
I150 A, 0.42
I 91 A4T3 0.75 I 100 A3 0.61
' b l 0.21 IV 189 0.17 198 A5 0.04 207 A5 0.90 216 A3 0.77
"Nucleotide position; refers to the position in the nucleotide sequence of the first residue of the tract. b N = guanine or cytosine; A = adenine; T = thymine. ' Helical position; refers to the position of the first residue of the tract with respect to the helical repeat, assuming a helical pitch of 10.4 bP.
I ,
1OOBP -
100 8P
100 UP -
ENGTH(BP.I K-FACTOR
5 61 507 486 540
370 201 169
363 321 300 288 342
292 285 274 262
1.06 1.08 1.07 1.06
1.14 1.14 1.25
1.09 1.09 1.08 1.07 1.09
1.36 1.35 1.35 1.33
FIGURE 3: Permutation analysis of rat, a-monkey, and mouse satellite DNA monomers. DNA fragments containing the satellite repeats (shown by the boxes) at different relative positions were obtained by cleavage of the corresponding pUCl9 recombinants with the restriction endonucleases indicated in each case. The size of each fragment in base pairs is shown. The K factor values were determined by poly- acrylamide gel electrophoresis (see Materials and Methods). Bars correspond to 100 bp.-
show any significant curvature (Figure 4D). Only about 5% of the molecules are bent by 90" or more.
The shape adopted by a DNA fragment on the electron microscope grid might not be totally representative of the
actual shape of the molecule in solution. However, deter- mination of the radius of curvature along the fragment will detect the site(s) of increased curvature. Figure 5 shows the curvature ( K ) , expressed as the inverse of the radius of cur- vature, along the three satellite repeats mentioned above, as well as for the pBR322 HindIII-BamHI fragment used as a control. All three satellites show sites of increased curvature (Figure 5A-C) while the control does not show any site of significantly increased curvature (Figure 5D). In the three satellite repeats, the sites of increased curvature detected are distributed asymmetrically with respect to the center of the sequence. For instance, a-monkey satellite shows a marked bend near one of its termini (Figure 5B). Rat and mouse satellite repeats show a higher number of sites of increased curvature. At least three sites of increased curvature are detected in rat satellite (Figure 5A) which are unevenly dis- tributed along the sequence, being concentrated in one of its two halves. Mouse satellite shows a more uniform distribution with at least three sites of increased curvature slightly displaced toward one of its ends (Figure 5C). These results are con- sistent with those obtained from the permutation analysis shown in Figure 3.
The structural basis of DNA curvature is still a matter of investigation. It is known that runs of d(A-T),13 residues within a DNA sequence induce curvature (Trifonov, 1985; Koo et al., 1986; Diekmann & von Kitzing, 1988). Nelson et al., (1987) have solved recently the crystal structure of a dode- camer containing a run of six adenines. The structure of this DNA molecule strongly suggests that, due to the high propeller twist of each A-T base pair, deflection of the helical axis is likely to occur predominantly at the junction regions at the ends of the A tract. As is shown in Figure 1 and Table I, all three satellite repeats contain several runs of three or more adenines. Any of these A elements is likely to introduce local structural deformations. Deformations originated by A tracts that occupy equivalent positions with respect to the helical pitch will sum their contributions, resulting in macroscopic curvature. The rat satellite repeat contains three well-defined groups of phased A tracts (Table I) that, in agreement with the results obtained from the permutation and electron mi- croscopy analysis, are concentrated in its 3'-half. Many of the A elements of rat satellite are formed by combinations of

FIGURE 4: Electron microscopy visualization of (A) rat satellite monomer, (B) mouse satellite monomer, (C) a-monkey satellite monomer, and (D) Hind1 I I-BumHI pBR322 fragment. Arrowheads indicate fragments showing characteristic bends. Insets correspond to higher magnifications of these fragments. Bars equal 0.20 pm.
corresponds to the aveiage of 10-1 5 independint determinations.
adenine and thymine residues of the sort AxT,,, which are known to introduce curvature (Hagerman, 1986; Burkhoff & Tullius, 1988; Sarma et al., 1988). An A,, sequence occurs at nucleotide position 86 which is in phase with the first group of A tracts though it is probably to far away from it to show an additive effect. The second group of phased A tracts occurs at nucleotide positions 251 and 261, and it is likely to be responsible for the strong curvature shown by the HueIII- Hind111 rat fragment since it occupies a very central position in this fragment. A third group of phased A tracts is found at nucleotide positions 323 and 344, which are spaced by two T tracts that are not in phase. In the a-monkey satellite repeat, only one group of phased A tracts is observed that, in good agreement with the results obtained from the permutation and electron microscopy analysis, is located close to the 5'-end of the fragment. On the other hand, mouse satellite shows a quite
FIGURE 5: Distribution of the curvature along the monomeric repeats of (A) rat satellite, (B) a-monkey satellite, (C) mouse satellite, and (D) HindIII-BumHI pBR322 fragment. The curvature (K) is expressed as the inverse of the radius of curvature, determined as described under Materials and Methods. K corresponds to the average curvature of each fragment. Points above the dashed line correspond to sites showing a curvature higher than average while mints underneath the dashed line correspond to sites with no increased curvature. Each point
uniform distribution of A tracts throughout its sequence with at least five groups of consecutive phased A elements. In agreement with the results obtained from the permutation and electron microscopy analysis, the location of these groups of A elements is slightly displaced toward the 3'-half of the sequence. However, two of these groups (groups I and V) are localized close to the 5'-termini of the fragment and have not been detected by our analysis. It must be noticed that group V, indicated by a broken box in Table I, contains alternations of phased A and T tracts, of which the induced structural deformations might cancel each other. In this respect, Koo et al. (1986) have reported that multimers of the sequence A6NdT6N4 show significant curvature, suggesting that local deformations due to successive A and T tracts do not cancel each other, although it is unclear whether T tracts have any contribution at all to the global curvature of the multimer or
Curvature of Satellite DNAs
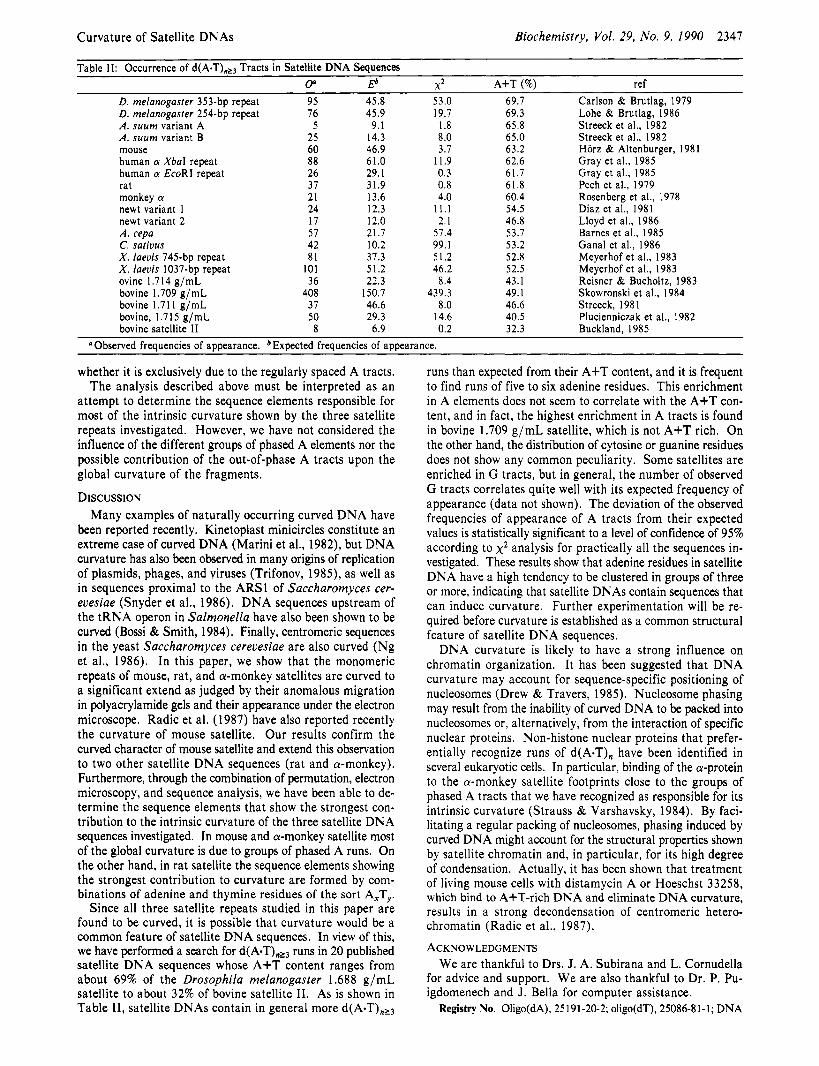
Table 11: Occurrence of d(A.T),,, Tracts in Safellite DNA SequenceS
Biochemistry, Vol. 29, No. 9, 1990 2347
0" Eb X 2 A+T (%) ref D. melanogaster 353-bp repeat 95 45.8 53.0 69.7 Carlson & Brutlag, 1979 D. melanogaster 254-bp repeat 76 45.9 19.7 69.3 Lohe & Brutlag, 1986 A. suum variant A 5 9.1 1.8 65.8 Streeck et al., 1982 A. suum variant B 25 14.3 8.0 65.0 Streeck et al., 1982 mouse 60 46.9 3.7 63.2 Horz & Altenburger, 1981 human CY Xbal repeat 88 61.0 11.9 62.6 Gray et al., 1985 human CY EcoRI repeat 26 29.1 0.3 61.7 Gray et al., 1985 rat 31 31.9 0.8 61.8 Pech et al., 1979 monkey a 21 13.6 4.0 60.4 Rosenberg et al., 1978 newt variant 1 24 12.3 11.1 54.5 Diaz et al., 1981 newt variant 2 17 12.0 2.1 46.8 Lloyd et al., 1986 A. cepa 57 21.7 57.4 53.7 Barnes et al., 1985 C. sativus 42 10.2 99.1 53.2 Ganal et al., 1986 X . laevis 745-bp repeat 81 37.3 51.2 52.8 Meyerhof et al., 1983 X . laevis 1037-bp repeat 101 51.2 46.2 52.5 Meyerhof et al., 1983 ovine 1.7 14 g/mL 36 22.3 8.4 43.1 Reisner & Bucholtz, 1983 bovine 1.709 g/mL 408 150.7 439.3 49.1 Skowronski et al., 1984 bovine 1.7 11 g/mL 37 46.6 8.0 46.6 Streeck, 1981 bovine, 1.7 I5 g/mL 50 29.3 14.6 40.5 Plucienniczak et al., 1982 bovine satellite I1 8 6.9 0.2 32.3 Buckland, 1985
Observed frequencies of appearance. Expected frequencies of appearance.
whether it is exclusively due to the regularly spaced A tracts. The analysis described above must be interpreted as an
attempt to determine the sequence elements responsible for most of the intrinsic curvature shown by the three satellite repeats investigated. However, we have not considered the influence of the different groups of phased A elements nor the possible contribution of the out-of-phase A tracts upon the global curvature of the fragments.
DISCUSSION Many examples of naturally occurring curved DNA have
been reported recently. Kinetoplast minicircles constitute an extreme case of curved DNA (Marini et al., 1982), but DNA curvature has also been observed in many origins of replication of plasmids, phages, and viruses (Trifonov, 1985), as well as in sequences proximal to the ARSl of Saccharomyces cer- euesiae (Snyder et al., 1986). DNA sequences upstream of the tRNA operon in Salmonella have also been shown to be curved (Bossi & Smith, 1984). Finally, centromeric sequences in the yeast Saccharomyces cereuesiae are also curved (Ng et al., 1986). In this paper, we show that the monomeric repeats of mouse, rat, and a-monkey satellites are curved to a significant extend as judged by their anomalous migration in polyacrylamide gels and their appearance under the electron microscope. Radic et al. (1987) have also reported recently the curvature of mouse satellite. Our results confirm the curved character of mouse satellite and extend this observation to two other satellite DNA sequences (rat and a-monkey). Furthermore, through the combination of permutation, electron microscopy, and sequence analysis, we have been able to de- termine the sequence elements that show the strongest con- tribution to the intrinsic curvature of the three satellite DNA sequences investigated. In mouse and a-monkey satellite most of the global curvature is due to groups of phased A runs. On the other hand, in rat satellite the sequence elements showing the strongest contribution to curvature are formed by com- binations of adenine and thymine residues of the sort A,T,,.
Since all three satellite repeats studied in this paper are found to be curved, it is possible that curvature would be a common feature of satellite DNA sequences. In view of this, we have performed a search for ~ (AsT) , ?~ runs in 20 published satellite DNA sequences whose A+T content ranges from about 69% of the Drosophila melanogaster 1.688 g/mL satellite to about 32% of bovine satellite 11. As is shown in Table 11, satellite DNAs contain in general more d(A-T),,,
runs than expected from their A+T content, and it is frequent to find runs of five to six adenine residues. This enrichment in A elements does not seem to correlate with the A+T con- tent, and in fact, the highest enrichment in A tracts is found in bovine 1.709 g/mL satellite, which is not A+T rich. On the other hand, the distribution of cytosine or guanine residues does not show any common peculiarity. Some satellites are enriched in G tracts, but in general, the number of observed G tracts correlates quite well with its expected frequency of appearance (data not shown). The deviation of the observed frequencies of appearance of A tracts from their expected values is statistically significant to a level of confidence of 95% according to x2 analysis for practically all the sequences in- vestigated. These results show that adenine residues in satellite DNA have a high tendency to be clustered in groups of three or more, indicating that satellite DNAs contain sequences that can induce curvature. Further experimentation will be re- quired before curvature is established as a common structural feature of satellite DNA sequences.
DNA curvature is likely to have a strong influence on chromatin organization. It has been suggested that DNA curvature may account for sequence-specific positioning of nucleosomes (Drew & Travers, 1985). Nucleosome phasing may result from the inability of curved DNA to be packed into nucleosomes or, alternatively, from the interaction of specific nuclear proteins. Nonhistone nuclear proteins that prefer- entially recognize runs of d(A.T), have been identified in several eukaryotic cells. In particular, binding of the a-protein to the a-monkey satellite footprints close to the groups of phased A tracts that we have recognized as responsible for its intrinsic curvature (Strauss & Varshavsky, 1984). By faci- litating a regular packing of nucleosomes, phasing induced by curved DNA might account for the structural properties shown by satellite chromatin and, in particular, for its high degree of condensation. Actually, it has been shown that treatment of living mouse cells with distamycin A or Hoeschst 33258, which bind to A+T-rich DNA and eliminate DNA curvature, results in a strong decondensation of centromeric hetero- chromatin (Radic et al., 1987).
ACKNOWLEDGMENTS We are thankful to Drs. J. A. Subirana and L. Cornudella
for advice and support. We are also thankful to Dr. P. Pu- igdomenech and J. Bella for computer assistance.
Registry No. Oligo(dA), 25191-20-2; oligo(dT), 25086-81-1; DNA
2348
(rat satellite repeat), 124316-24-1; DNA (monkey a-satellite repeat), 124316-22-9; DNA (mouse satellite repeat), 124316-23-0.
REFERENCES Avila, J., Montejo de Garcini, E., Wandosell, F., Villasante,
A., Sogo, J. M., & Villanueva, N. (1983) EMBO J . 2,
Barnes, S . R., James, A. M., & Jamieson, G. (1985) Chro-
Bossi, L., & Smith, D. M. (1984) Cell 39, 643-652. Bostock, C. J., & Clark, E. M. (1980) Cell 19, 709-715. Brutlag, D. (1980) Annu. Rev. Genet. 14, 121-144. Buckland, R. A. (1985) J . Mol. Biol. 186, 25-30. Burkhoff, A. M., & Tullius, T. D. (1988) Nature 331,
Carlson, M., & Brutlag, D. (1979) J. Mol. Biol. 135,483-500. Diaz, M. O., Barsacchi-Pilone, G., Mahon, K. A,, & Gall, J. G. (1981) Cell 24, 649-659.
Diekmann, S. , & von Kitzing, E. (1988) in Structure and Expression, Vol. 3, pp 51-61, Adenine Press, New York.
Drew, H., & Travers, A. A. (1985) J. Mol. Biol. 186,733-790. Elton, T. S., Nissen, M. S. , & Reeves, R. (1987) Biochem.
Ganal, M., Riede, I . , & Hemleben, Y. (1986) J . Mol. Evol.
Garreau, H., & Williams, J . G. (1983) Nucleic Acids Res.
Gray, K. M., White, J . W., Constanzi, C., Gillespie, D., Schoeder, W. T., Calabretta, B., & Saunders, G. F. (1985) Nucleic Acids. Res. 13, 521-535.
Griffith, J., Bleyman, M., Rauch, C. A. Kitchin, P. A., & Englund, P. T. (1986) Cell 46, 717-724.
Hagerman, P. J . ( 1986) Nature 321, 449-450. Horz, W., & Altenburger, W. (1981) Nucleic Acids Res. 9,
Hsieh, T., & Brutlag, D. (1978) Proc. Natl. Acad. Sci. U.S.A.
John, B., & Miklos, G. L. G. (1979) Znt. Rev. Cytol. 58,
Koo, H. S., Wu, H.-M., & Crothers, D. M. (1986) Nature
Levinger, L., & Varshavsky, A. (1982) Proc. Natl. Acad. Sci.
Lica, L. M., Narayanswami, S., & Hamkalo, B. A. (1986)
Lloyd, M. E., Mahon, K. A., & Gall, J. G. (1986) J. Cell Biol.
Biochemistry, Vol. 29, No. 9, 1990
1229-1 234.
mosoma 92, 185-192.
455-451.
Biophys. Res. Commun. 143, 260-265.
23, 23-30.
11, 8413-8484.
683-696.
76, 726-730.
1-1 14.
320, 501-506.
U.S.A. 79, 7152-7156.
J . Cell Biol. 103, 1145-1 151.
103, 1137-1144.
Martinez-Balbiis et al.
Lohe, A. R., & Brutlag, D. (1986) Proc. Natl. Acad. Sei.
Marini, J. C. , Levene, S. D., Crothers, D. M., & Englund, P. T. (1982) Proc. Natl. Acad. Sci. U.S.A. 79, 7664-7668.
Meyerhof, W., Tappeser, B., Korge, E., & Knoechel, W. (1 983) Nucleic Acids Res. 1 I 6997-7009.
Nelson, H. C. M., Finch, J. T., Luisi, B. F., & Hug, A. (1987) Nature 330, 22 1-226.
Ng, R., Ness, J., & Carbon, J. (1 986) in Extrachromosomal Elements in Lower Eukaryotes (Wickner, R. B., Hinne- busch, A., Lambowitz, A., Gunsalus, I. C., & Hollaender, A., Eds.) pp 479-492, Plenum Press, New York.
Peacock, W. J., Lohe, A. R., Gerlach, W. L., Dunsmuir, P., Dennis, E. S., & Appels, R. (1978) Cold Spring Harbor Symp. Quant. Biol. 42, 1121-1 136.
Pech, M., Igo-Kemenes, T., & Zachau, H. G. (1979) Nucleic Acids Res. 7 , 411-432.
Plucienniczak, A., Skowronski, J., & Jaworski, J . (1982) J . Mol. Biol. 158, 293-304.
Radic, M. Z., Ludgren, K., & Hamkalo, B. A. (1987) Cell
Reeves, R., Elton, T. S., Nissen, M. S., Lehn, D., & Johnson, K. R. (1987) Proc. Natl. Acad.Sci. U.S.A. 84,65314535.
Reisner, A. H., & Bucholtz, C. A. (1983) EMBO J . 2,
Rosenberg, H., Singer, M., & Rosenberg, M. (1978) Science
Russnak, R. H., Candido, E. P. M., & Astell, C. R. (1988)
Sarma, M. H., Gupta, G., & Sarma, R. H. (1988) Biochem-
Singer, M. F. (1982) Int. Rev. Cytol. 67, 67-112. Skowronski, J., Plucienniczak, A., Bednarek, A., & Jaworski,
Snyder, M., Buchman, A. R., & Davis, R. W. (1986) Nature
Solomon, M. J., Strauss, F., & Varshavsky, A. (1986) Proc. Natl. Acad. Sci. U.S.A. 83, 1276-1 280.
Strauss, F., & Varshavsky, A. (1984) Cell 37, 889-901. Streeck, R. E. (1981) Science 213, 443-445. Streeck, R. E., Motitz, K. B., & Beer, K. (1982) Nucleic Acids
Trifonov, E. N. (1985) CRC Crit. Rev. Biochem. 19, 89-106. Wiche, G., Corces, V. G., & Avila, J. (1978) Nature 273,
Winter, E., & Varshavsky, A. (1989) EMBO J. 8, 1867-1877. Wu, H. M., & Crothers, D. M. (1984) Nature 308, 509-513.
U.S.A. 83, 696-100.
50, 1101-1 108.
1145-1 149.
200, 394-402.
J . Biol. Chem. 263, 6392-6399.
istry 27, 3423-3432.
J. (1984) J . Mol. Biol. 177, 399-416.
324, 87-89.
Res. 10, 3495-3502.
403-405.
Copyright © 2022 FDOKUMEN