DNA sensing-independent inhibition of herpes simplex virus 1 replication by DAI/ZBP1

An Increase in Mitochondrial DNA Promotes NuclearDNA Replication in YeastHeidi M. Blank, Chonghua Li, John E. Mueller, Lydia M. Bogomolnaya, Mary Bryk, Michael Polymenis*
Department of Biochemistry and Biophysics, Texas A&M University, College Station, Texas, United States of America
Abstract
Coordination between cellular metabolism and DNA replication determines when cells initiate division. It has been assumedthat metabolism only plays a permissive role in cell division. While blocking metabolism arrests cell division, it is not knownwhether an up-regulation of metabolic reactions accelerates cell cycle transitions. Here, we show that increasing theamount of mitochondrial DNA accelerates overall cell proliferation and promotes nuclear DNA replication, in a nutrient-dependent manner. The Sir2p NAD+-dependent de-acetylase antagonizes this mitochondrial role. We found that cells withincreased mitochondrial DNA have reduced Sir2p levels bound at origins of DNA replication in the nucleus, accompaniedwith increased levels of K9, K14-acetylated histone H3 at those origins. Our results demonstrate an active role ofmitochondrial processes in the control of cell division. They also suggest that cellular metabolism may impact on chromatinmodifications to regulate the activity of origins of DNA replication.
Citation: Blank HM, Li C, Mueller JE, Bogomolnaya LM, Bryk M, et al. (2008) An Increase in Mitochondrial DNA Promotes Nuclear DNA Replication in Yeast. PLoSGenet 4(4): e1000047. doi:10.1371/journal.pgen.1000047
Editor: Orna Cohen-Fix, National Institute of Diabetes and Digestive and Kidney Diseases, United States of America
Received October 25, 2007; Accepted March 7, 2008; Published April 25, 2008
Copyright: � 2008 Blank et al. This is an open-access article distributed under the terms of the Creative Commons Attribution License, which permitsunrestricted use, distribution, and reproduction in any medium, provided the original author and source are credited.
Funding: This work was supported by NIGMS grants to Michael Polymenis (R01-62377) and Mary Bryk (R01-70930).
Competing Interests: The authors have declared that no competing interests exist.
* E-mail: [email protected]
Introduction
Without cellular metabolism there is no cell division [1], but the
key question is whether metabolism only allows for division to
happen, or can it actively promote cell cycle progression. To
determine if metabolism can actively promote cell division it is
important to identify gain-of-function mutations in metabolic
pathways that also accelerate cell proliferation. Such mutations
have not been described in the yeast Saccharomyces cerevisiae. It is
known, however, that yeast populations evolved in continuous
chemostat cultures can proliferate faster than the parent
population, and they have higher levels of tricarboxylic acid cycle
(TCA) enzymes and mitochondrial (mt) DNA [2]. The mitochon-
drial genome is transmitted as a ‘‘nucleoid’’ DNA/protein
complex. The number of mtDNA molecules per nucleoid varies,
but there are usually more genome equivalents than nucleoids
[3,4]. Abf2p is a conserved mtDNA maintenance protein [5,6],
which directly binds to, bends and compacts mtDNA [7,8].
Moderate over-expression of Abf2p by 2–3 fold elevates the
amount of mtDNA by 50–150% [9]. The consequences of an
increase in mtDNA in cell proliferation have not been explored.
Sir2p is an evolutionarily conserved NAD+-dependent de-
acetylase [10,11]. Loss of Sir2p leads to loss of transcriptional
silencing, genome instability and a decrease in replicative life span.
In yeast, silent chromatin is formed at three regions: the rDNA,
the HML and HMR mating type loci, and telomeres [12]. Sir2p is
required for silencing at all of these regions, and it is the only Sir
protein required for silencing at the rDNA [13–15]. Sir2p also
appears to negatively impact on rDNA replication, because in
sir2D cells twice as many origins are activated within the rDNA
array [16]. The inhibitory effects of Sir2p on DNA replication
extend beyond rDNA. Loss of Sir2p suppresses replication defects
of mutants that cannot assemble a pre-replicative complex of
proteins (pre-RC) at origins of DNA replication in the G1 phase of
the cell cycle [17]. These results may be linked to a general positive
role of histone acetylation for origin activity [18]. Indeed, loss of
the Rpd3p de-acetylase globally accelerated DNA replication, and
targeted acetylation of a late origin advanced its activation [19],
demonstrating a clear causal role of histone acetylation and
activation of DNA replication. However, whether such chromatin
modifications may serve as a link between cellular metabolism and
initiation of DNA replication is not known.
In this report we show that an increase in mtDNA in cells over-
expressing Abf2p, actively promotes initiation of cell division.
Furthermore, we identify physical changes, such as Sir2p binding
and histone acetylation, at an origin of DNA replication that result
from an increase in mtDNA.
Results/Discussion
Abf2p and Cell Proliferation in ChemostatsWe hypothesized that increasing the amount of mtDNA may
mimic the situation of ‘‘evolved’’ yeast populations, which can
proliferate faster than the parent population [2], allowing us to
examine effects on cell division. We evaluated a strain (3xABF2+),
which carries two additional copies of ABF2, because in this strain
the amount of mtDNA is increased [9]. The 3xABF2+ strain
proliferated faster than the wild type strain in glucose-limiting
(0.08% glucose) conditions (Figure 1A), mimicking ‘‘evolved’’
strains [2]. We next examined cell cycle progression in defined
chemostat cultures under glucose (Glc) or nitrogen (N) limitation at
0.2 h21 dilution rate, D, comparing ABF2+ to 3xABF2+ cells
(Figure 1B). Under Glc-limitation, the fraction of 3xABF2+ cells in
G1 was reduced (Figure 1B, cells in G1, 53% 3xABF2+ compared
PLoS Genetics | www.plosgenetics.org 1 April 2008 | Volume 4 | Issue 4 | e1000047

to 61% ABF2+). In contrast, under N-limitation, extra copies of
ABF2 did not affect the DNA content distribution in anabolically-
restricted cells (Figure 1B, cells in G1, 52% 3xABF2+ compared to
51% ABF2+). These data suggest a connection between mitochon-
drial function and cell cycle progression that is evident under
glucose limitation in cells over-expressing ABF2. Interestingly,
3xABF2+ cells are the same size as wild type cells (Figure 2A),
possibly explaining why ABF2 mutations were not identified
previously in size-based mutant screens for cell cycle regulators.
To determine whether the effects observed in cell cycle
progression are due to ABF2 and not due to an unknown secondary
mutation, we repeated the experiment shown in Figure 1B using a
different genetic background (BY4743). We used a low-copy
centromeric plasmid carrying ABF2 (CEN-ABF2+) to achieve modest
over-expression of Abf2p similar to 3xABF2+ cells [9,20]. Under
glucose limitation, a lower fraction of CEN-ABF2+ transformants
(4561%) was in the G1 phase of the cell cycle compared to the
empty vector transformants (5262%, Figure 2B). Thus, the cell
cycle effects we observed in 3xABF2+ cells are ABF2-linked.
Abf2p and the Retrograde ResponseIf mitochondria do not function properly a retrograde (RTG)
response leads to elevated (,10-fold) CIT2 levels [21,22]. As
expected, in ru cells, which lack mtDNA, the CIT2 RNA level was
increased ,5-fold over the level in r+ cells (Figure 3). In contrast,
we found that CIT2 mRNA levels are not elevated in cells over-
expressing ABF2. Instead, CIT2 levels are reduced by ,2-fold
(Figure 3). Thus, the mitochondria of cells over-expressing ABF2
are not dysfunctional. Using a colony sectoring assay [23], we also
found that the frequency of chromosome loss was 1.66%
(n = 3,004) for CEN-ABF2+ transformants, compared to 1.73%
(n = 2,657) for the empty vector transformants. Therefore, over-
expression of ABF2 does not cause gross genome instability.
Abf2p and the Timing of STARTBecause 3xABF2+ populations proliferate faster (Figure 1A) and
have a reduced fraction of G1 cells (Figure 1B), we hypothesized
that DNA replication may be accelerated in 3xABF2+ cells. We
examined cell cycle progression of ABF2+ and 3xABF2+ cells from
synchronous cultures obtained by centrifugal elutriation. We used
standard [24] undefined medium (YPD) for these experiments,
with lower glucose concentration (0.5%). A higher fraction of
3xABF2+ cells entered S phase sooner than ABF2+ cells (Figure 4,
compare the top two rows). For example, at 60 min post-
elutriation of ABF2+ cells 10.7% were budded and 46.2% in G1,
while of 3xABF2+ cells 40.2% were budded and 32% were in G1.
In addition, the 3xABF2+ cells completed S phase sooner than
ABF2+ cells (see Figure 4 compare the top two rows): At 80 min
post elutriation, note the size of the G2/M peak relative to the G1
Figure 1. Cells moderately over-expressing ABF2 proliferatefaster (A), and have altered cell cycle progression (B) inchemostat cultures. In A, a chemostat competition experiment doneduring glucose limitation at dilution rate D = 0.1 h21 is shown. Thespecific growth differential (s) between the two competing strains [41]is the average (6s.d.) of three independent competition experiments. Ineach experiment, and for each sampling point, the average (6s.d.) of atleast three measurements was calculated. X3xABF2
+(t) and XABF2+(t)
represent the relative proportion of the two strains at time t, ingenerations. In B, cell cycle progression of the indicated strains andnutrient limitations was evaluated by flow cytometry. Cell numbers areplotted on the y-axis and fluorescence on the x-axis. The DNA contentof cells in G1 and G2/M is indicated as 1C and 2C, respectively. Thepercentage of unbudded cells (%UB) correlates with G1 cells. The valuesshown are the average (6s.d.) of at least three independentexperiments.doi:10.1371/journal.pgen.1000047.g001
Author Summary
How cells determine when to divide is critical forunderstanding biological processes where cell prolifera-tion is manifest. Because cells need to accumulateprecursors prior to duplication, cellular metabolism isexpected to impact cell division. Mitochondrial processesare central to the control of overall cell metabolism. Yet,the mechanisms that link mitochondrial processes withnuclear DNA replication remain largely unknown. Wefound that budding yeast cells moderately over-expressingAbf2p, a mtDNA maintenance protein, accelerate nuclearDNA replication. These cells with more mitochondrial DNAproliferate and increase in size more rapidly than their wildtype counterparts. The results suggest that cells over-expressing Abf2p have up-regulated metabolic functions,which in turn enable these cells to accelerate initiation ofcell division. We also examined the role of Sir2p, an NAD+-dependent de-acetylase, which negatively controls DNAreplication. We found that the level of Sir2p bound atorigins of DNA replication is inversely related to theamount of mtDNA in the cell. In summary, our findingschallenge the notion that metabolic processes are requiredfor cell division by simply operating at constitutivebackground levels. Instead, our work suggests thatmitochondrial transactions can actively promote DNAreplication and cell division.
mtDNA Promotes Cell Cycle Progression
PLoS Genetics | www.plosgenetics.org 2 April 2008 | Volume 4 | Issue 4 | e1000047

peak. More 3xABF2+ cells have completed DNA replication than
ABF2+ cells. Finally, although in asynchronous populations the
overall cell size of 3xABF2+ cells was not different from ABF2+ cells
(Figure 2A), the elutriated daughter 3xABF2+ G1 cells increased in
size faster than their ABF2+ counterparts (Figure 4, compare the
top two rows): at 60 min 3xABF2+ cells are 40.2 fl, while ABF2+
cells are 37.1 fl, consistent with a growth-promoting role of Abf2p.
To confirm these results, we repeated this analysis several times.
In each case, ABF2+ and 3xABF2+ cells were examined under
identical conditions, using media from the same batch. We used
two variables to compare the two strains across different
experiments: the critical size for budding (at which 50% of the
cells are budded); and the rate of cell size increase after elutriation.
Interestingly, 3xABF2+ cells bud at a slightly larger size (41.261.1
fl, n = 5, P = 0.032, based on a 2-tailed Student’s t test) than ABF2+
cells (38.661.1 fl, n = 6) (Figure S1A and S1D). We then plotted in
each case cell size as a function of time, to estimate the rate of cell
size increase (fl/min) after elutriation (Figure S1B and S1C). While
these values can vary from experiment to experiment, in every
case 3xABF2+ cells increased in size significantly faster (0.1460.02
fl/min, n = 5, P = 0.013, based on a 2-tailed Student’s t test) than
ABF2+ cells (0.1160.01 fl/min, n = 6) (Figure S1E). Thus, even
though 3xABF2+ cells have a slightly larger critical size for budding
than ABF2+ cells, they reach that size significantly earlier than
their ABF2+ counterparts because they increase in size ,28%
faster. For example, for ABF2+ newborn daughter cells of 20 fl, it
will take on average 169 min until they reach their critical size, but
it will take 150 min for 3xABF2+ daughters. Together with our
chemostat experiments (Figures 1 and 2), our findings from these
synchronous cultures (Figure 4 and Figure S1) with standard YPD
media strongly support the notion that Abf2p plays an active
growth-promoting role and accelerates initiation of DNA
replication.
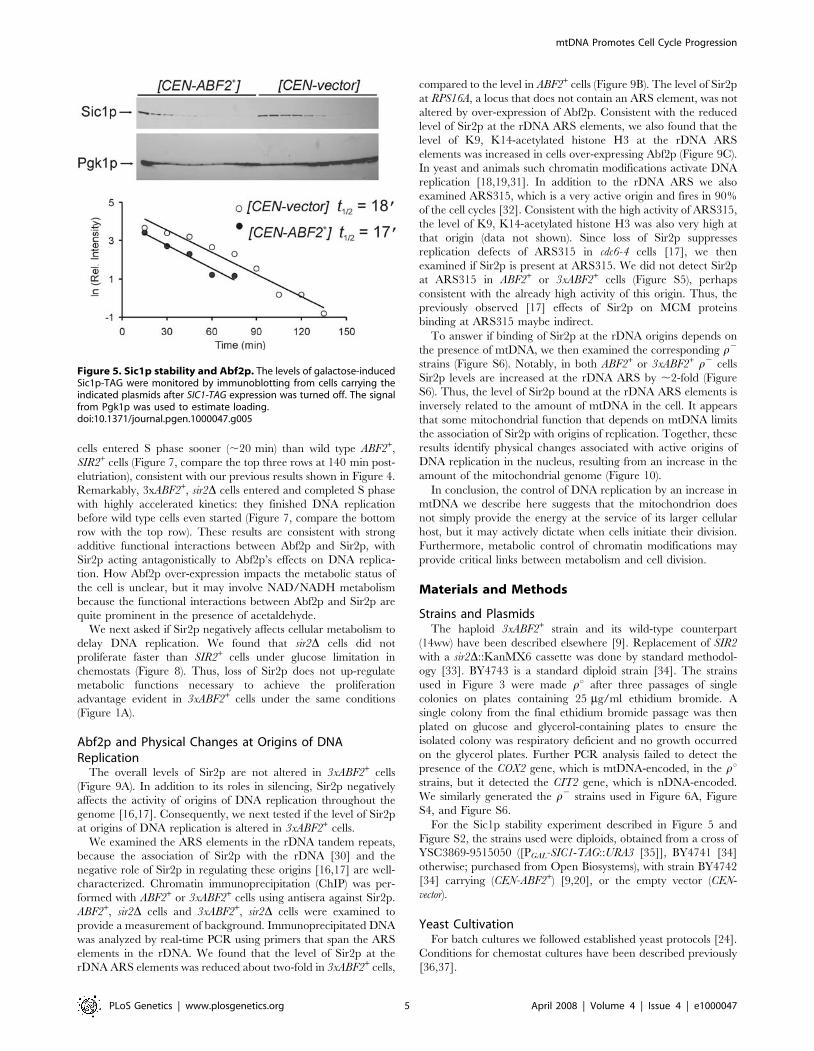
We also examined the levels of the cyclin-dependent kinase
(Cdk) inhibitor Sic1p in cells over-expressing Abf2p. In late G1
rising levels of Cdk activity trigger the degradation of Sic1p and
initiation of DNA replication [25]. In cells over-expressing Abf2p
degradation of Sic1p was initiated sooner than in the control cells
(Figure 5), consistent with a shortened G1 phase, but once
triggered the rate of Sic1p degradation was unaffected. We
obtained identical results in separate repeats of this experiment
(Figure S2).
We next generated the corresponding r2 strains to test whether
over-expression of ABF2+ requires mtDNA to promote DNA
replication. These strains are respiratory incompetent (Figure
S4A). DNA replication was not accelerated in 3xABF2+ (r2) cells
(Figure 6A). Overall, in contrast to r+ cells (see Figure 4 and Figure
S1) the critical budding size (Figure S4B), and the rate of cell size
increase after elutriation (Figure S4C), were not significantly
different between ABF2+ (r2) and 3xABF2+ (r2) cells: P = 0.43,
and P = 0.54, respectively (based on 2-tailed Student’s t tests). In
conclusion, our findings suggest that altered mitochondrial
functions in 3xABF2+ cells impact on some factor(s) that affect
DNA replication.
Functional Interactions between Abf2p and Sir2pA protein linked to both metabolism and DNA replication is the
Sir2p sirtuin [11], which negatively impacts DNA replication [16–
18]. Consequently, we evaluated cell cycle progression of cells
lacking Sir2p alone, or in combination with Abf2p over-expression
(Figure 4). Comparison of ABF2+, SIR2+ (Figure 4, top row) to
ABF2+, sir2D (Figure 4, third row) cells at 60 min shows that cells
lacking SIR2 initiated and completed S phase significantly sooner
than wild type cells. Initiation of DNA replication was further
accelerated in 3xABF2+, sir2D cells (Figure 4, bottom row). We
repeated this analysis several times, as we described earlier (Figure
Figure 2. 3xABF2+ cells do not have altered cell size inchemostat cultures. A, The cell size of the indicated cell populationswas measured from the same chemostat experiments described inFigure 1B, using a channelyzer. Cell numbers are plotted on the y-axisand the x-axis indicates size (in fl). B, Moderate over-expression of ABF2from a low-copy CEN plasmid promotes cell cycle progression. The DNAcontent of the indicated strains is shown.doi:10.1371/journal.pgen.1000047.g002
Figure 3. Moderate over-expression of ABF2 does not triggerthe RTG response. RNA blots of CIT2 steady-state levels, from cellsgrown under glucose limitation in chemostats. The relevant genotypeand strain background are shown above each lane. RPS16A levelsindicate loading.doi:10.1371/journal.pgen.1000047.g003
mtDNA Promotes Cell Cycle Progression
PLoS Genetics | www.plosgenetics.org 3 April 2008 | Volume 4 | Issue 4 | e1000047

S1). Interestingly, 3xABF2+, sir2D cells bud at a smaller size
(36.160.5 fl, n = 5, P = 0.0009, based on a 2-tailed Student’s t test)
than ABF2+, SIR2+ cells (38.661.1 fl, n = 6) (Figure S1D). This
explains the apparent additive acceleration of START we
observed in 3xABF2+, sir2D cells (Figure 4, compare at 40 min
the 3xABF2+, sir2D strain to other strains, and see also Figure 7,
below). Taking into account the critical budding size and the rate
of cell size increase for each strain, for 3xABF2+, sir2D newborn
daughter cells of 20 fl, it will take on average 128 min to start
budding, compared to 169 min for ABF2+, SIR2+ daughters.
Finally, loss of Sir2p does not increase the amount of mtDNA in
the cell (Figure S3).
We next generated the corresponding (r2) strains lacking Sir2p
(Figure S4A). These strains were examined after elutriation (Figure
S4B and S4C), as we described above. Strains lacking Sir2p and
mtDNA did not have a significant different rate of cell size increase
after elutriation compared to the other (r2) strains (Figure S4C).
Finally, to ensure that the effects of Sir2p on cell cycle progression
were not strain-specific, we also examined cell cycle progression of
sir2D cells in a different strain background (an S288C derivative)
[14]. S phase entry was greatly accelerated in sir2D cells in that
background, and cells spent very little time in G1 (Figure 6B). For
example, SIR2+ cells initiate DNA replication at 80–100 min after
elutriation, while sir2D cells do so at ,40 min.
We next tested if the acceleration of DNA replication in
3xABF2+ or sir2D cells depends on NADH. Yeast cells can display
robust NAD(P)H oscillations, which are thought to gate metab-
olism with DNA replication, since DNA synthesis takes place when
NAD(P)H levels are high [26–28]. To deplete cellular NADH we
added 10 mM acetaldehyde to the elutriated early-G1 cells [29].
The G1 phase was greatly expanded (Figure 7), compared to the
untreated cells shown in Figure 4, consistent with a requirement
for NADH for initiation of DNA replication. G1 phase expansion
was also evident in 3xABF2+, SIR2+ or ABF2+, sir2D cells,
indicating that these cells still require NADH to progress through
G1 into S phase. Nonetheless, 3xABF2+, SIR2+ or ABF2+, sir2D
Figure 4. Over-expression of ABF2, or loss of SIR2, accelerates DNA replication. Synchronous cultures of the indicated strains were obtainedby centrifugal elutriation and the starting populations of each strain were of the same size. At the indicated times the DNA content was evaluated byflow cytometry.doi:10.1371/journal.pgen.1000047.g004
mtDNA Promotes Cell Cycle Progression
PLoS Genetics | www.plosgenetics.org 4 April 2008 | Volume 4 | Issue 4 | e1000047
cells entered S phase sooner (,20 min) than wild type ABF2+,
SIR2+ cells (Figure 7, compare the top three rows at 140 min post-
elutriation), consistent with our previous results shown in Figure 4.
Remarkably, 3xABF2+, sir2D cells entered and completed S phase
with highly accelerated kinetics: they finished DNA replication
before wild type cells even started (Figure 7, compare the bottom
row with the top row). These results are consistent with strong
additive functional interactions between Abf2p and Sir2p, with
Sir2p acting antagonistically to Abf2p’s effects on DNA replica-
tion. How Abf2p over-expression impacts the metabolic status of
the cell is unclear, but it may involve NAD/NADH metabolism
because the functional interactions between Abf2p and Sir2p are
quite prominent in the presence of acetaldehyde.
We next asked if Sir2p negatively affects cellular metabolism to
delay DNA replication. We found that sir2D cells did not
proliferate faster than SIR2+ cells under glucose limitation in
chemostats (Figure 8). Thus, loss of Sir2p does not up-regulate
metabolic functions necessary to achieve the proliferation
advantage evident in 3xABF2+ cells under the same conditions
(Figure 1A).
Abf2p and Physical Changes at Origins of DNAReplication
The overall levels of Sir2p are not altered in 3xABF2+ cells
(Figure 9A). In addition to its roles in silencing, Sir2p negatively
affects the activity of origins of DNA replication throughout the
genome [16,17]. Consequently, we next tested if the level of Sir2p
at origins of DNA replication is altered in 3xABF2+ cells.
We examined the ARS elements in the rDNA tandem repeats,
because the association of Sir2p with the rDNA [30] and the
negative role of Sir2p in regulating these origins [16,17] are well-
characterized. Chromatin immunoprecipitation (ChIP) was per-
formed with ABF2+ or 3xABF2+ cells using antisera against Sir2p.
ABF2+, sir2D cells and 3xABF2+, sir2D cells were examined to
provide a measurement of background. Immunoprecipitated DNA
was analyzed by real-time PCR using primers that span the ARS
elements in the rDNA. We found that the level of Sir2p at the
rDNA ARS elements was reduced about two-fold in 3xABF2+ cells,
compared to the level in ABF2+ cells (Figure 9B). The level of Sir2p
at RPS16A, a locus that does not contain an ARS element, was not
altered by over-expression of Abf2p. Consistent with the reduced
level of Sir2p at the rDNA ARS elements, we also found that the
level of K9, K14-acetylated histone H3 at the rDNA ARS
elements was increased in cells over-expressing Abf2p (Figure 9C).
In yeast and animals such chromatin modifications activate DNA
replication [18,19,31]. In addition to the rDNA ARS we also
examined ARS315, which is a very active origin and fires in 90%
of the cell cycles [32]. Consistent with the high activity of ARS315,
the level of K9, K14-acetylated histone H3 was also very high at
that origin (data not shown). Since loss of Sir2p suppresses
replication defects of ARS315 in cdc6-4 cells [17], we then
examined if Sir2p is present at ARS315. We did not detect Sir2p
at ARS315 in ABF2+ or 3xABF2+ cells (Figure S5), perhaps
consistent with the already high activity of this origin. Thus, the
previously observed [17] effects of Sir2p on MCM proteins
binding at ARS315 maybe indirect.
To answer if binding of Sir2p at the rDNA origins depends on
the presence of mtDNA, we then examined the corresponding r2
strains (Figure S6). Notably, in both ABF2+ or 3xABF2+ r2 cells
Sir2p levels are increased at the rDNA ARS by ,2-fold (Figure
S6). Thus, the level of Sir2p bound at the rDNA ARS elements is
inversely related to the amount of mtDNA in the cell. It appears
that some mitochondrial function that depends on mtDNA limits
the association of Sir2p with origins of replication. Together, these
results identify physical changes associated with active origins of
DNA replication in the nucleus, resulting from an increase in the
amount of the mitochondrial genome (Figure 10).
In conclusion, the control of DNA replication by an increase in
mtDNA we describe here suggests that the mitochondrion does
not simply provide the energy at the service of its larger cellular
host, but it may actively dictate when cells initiate their division.
Furthermore, metabolic control of chromatin modifications may
provide critical links between metabolism and cell division.
Materials and Methods
Strains and PlasmidsThe haploid 3xABF2+ strain and its wild-type counterpart
(14ww) have been described elsewhere [9]. Replacement of SIR2
with a sir2D::KanMX6 cassette was done by standard methodol-
ogy [33]. BY4743 is a standard diploid strain [34]. The strains
used in Figure 3 were made ru after three passages of single
colonies on plates containing 25 mg/ml ethidium bromide. A
single colony from the final ethidium bromide passage was then
plated on glucose and glycerol-containing plates to ensure the
isolated colony was respiratory deficient and no growth occurred
on the glycerol plates. Further PCR analysis failed to detect the
presence of the COX2 gene, which is mtDNA-encoded, in the rustrains, but it detected the CIT2 gene, which is nDNA-encoded.
We similarly generated the r2 strains used in Figure 6A, Figure
S4, and Figure S6.
For the Sic1p stability experiment described in Figure 5 and
Figure S2, the strains used were diploids, obtained from a cross of
YSC3869-9515050 ([PGAL-SIC1-TAG::URA3 [35]], BY4741 [34]
otherwise; purchased from Open Biosystems), with strain BY4742
[34] carrying (CEN-ABF2+) [9,20], or the empty vector (CEN-
vector).
Yeast CultivationFor batch cultures we followed established yeast protocols [24].
Conditions for chemostat cultures have been described previously
[36,37].
Figure 5. Sic1p stability and Abf2p. The levels of galactose-inducedSic1p-TAG were monitored by immunoblotting from cells carrying theindicated plasmids after SIC1-TAG expression was turned off. The signalfrom Pgk1p was used to estimate loading.doi:10.1371/journal.pgen.1000047.g005
mtDNA Promotes Cell Cycle Progression
PLoS Genetics | www.plosgenetics.org 5 April 2008 | Volume 4 | Issue 4 | e1000047

ElutriationWe followed previously described protocols to obtain cell cycle
parameters [38], except that the cells were cultured and collected
in YPD (0.5% glucose) medium. The percentage of cells in G1
from the flow cytometry panels was calculated from the DNA
histograms using the ModFitH software (Verity Software House,
ME). Cell cycle progression was also monitored microscopically,
by the percentage of budded cells. Cell size (fl) was measured using
a channelyzer.
From each elutriation experiment, we plotted the percent of
budded cells as a function of cell size. To estimate the critical
budding size, when ,50% cells are budded, we used data points
from the linear portion of each graph, which were fit to a straight
line using the regression function in Microsoft Excel. From the
resulting equation [(%budded) = a(Cell size)-b; where a is the slope
and b the y-intercept of the line] we calculated the critical budding
size for each experiment. The average of all experiments for each
strain was then calculated, along with the associated standard
deviation.
From the same elutriations, to calculate the rate of cell size
increase, we plotted the cell size as a function of time. The data
were also fit to a straight line using the regression function in
Microsoft Excel. From the slope of the line we obtained the rate of
cell size increase. The average of all experiments for each strain
was then calculated, along with the associated standard deviation.
RNA MethodsStandard protocols [24] were used for RNA extraction and
electrophoresis. The CIT2 and RPS16A probes (see Figure 3) were
generated by PCR, and labeled using non-radioactive reagents
Figure 6. mtDNA is required for the accelerated DNA replication in 3xABF2+ cells. A, Cell cycle progression of elutriated cells was analyzedexactly as in Figure 4, except that the strains used were made r2 as described in the Methods. B, Loss of SIR2 accelerates DNA replication in the S288Cstrain background. The elutriation experiment was done as in Figure 4, except that the strains used were in a different strain background, describedpreviously [14].doi:10.1371/journal.pgen.1000047.g006
mtDNA Promotes Cell Cycle Progression
PLoS Genetics | www.plosgenetics.org 6 April 2008 | Volume 4 | Issue 4 | e1000047

from the North2SouthH Biotin Random Prime Labeling Kit
(Pierce), according to their instructions. Probe hybridization and
detection were performed according to the North2SouthHChemiluminescent Hybridization and Detection Kit (Pierce).
mtDNA AbundanceWe used PCR to estimate the relative amount of mtDNA (see
Figure S3). The exponential range of amplification for the COX2
(mtDNA-encoded) and GID8 (nDNA-encoded) PCR products
were determined by performing separate reactions for each of the
two amplified products and removing them after 25, 30, or 35
cycles. The PCR products were run on a 2% agarose gel and the
ethidium-stained signal intensities for the 30-cycle products (which
were in the linear range of amplification) were quantified with
Adobe PhotoshopH. The ratio between the COX2 and the GID8
product was determined to normalize for differences in initial
DNA concentration and reaction efficiencies. The ratio for each
strain was then compared to ABF2+ cells to determine the relative
amounts of mtDNA.
Sic1p Stability AssaysCultures were diluted 10-fold from an overnight culture in
selective liquid synthetic complete medium containing raffinose as
Figure 7. Loss of SIR2 in cells over-expressing ABF2 dramatically accelerates DNA replication when NADH is depleted. Cell cycleprogression was monitored after elutriation as in Figure 4, except that 10 mM acetaldehyde was added to the starting samples.doi:10.1371/journal.pgen.1000047.g007
Figure 8. Loss of Sir2p does not accelerate overall cellproliferation. Chemostat competition experiments between SIR2+
and sir2D cells (in the 14ww strain background) were done duringglucose limitation at dilution rate D = 0.1 h21, as described in Figure 1.doi:10.1371/journal.pgen.1000047.g008
mtDNA Promotes Cell Cycle Progression
PLoS Genetics | www.plosgenetics.org 7 April 2008 | Volume 4 | Issue 4 | e1000047

carbon source, to a total volume of 10 ml. Cells were grown at
30uC, with shaking for 30–48 h to synchronize the cells in G1 by
starvation. Galactose was then added to 2% (w/v) final
concentration for 2 to 3 hours to induce expression of PGAL-
SIC1-TAG. After induction, the cells were pelleted, washed in
water, and re-suspended in 20 ml fresh medium containing 2%
(w/v) glucose, to stop expression of PGAL-SIC1-TAG. The cells were
cultured at 30uC and 1 ml was taken every 15 min, to monitor
Sic1p-TAG levels. Proteins were extracted using TCA precipita-
tion and resolved by SDS-PAGE. For immunoblotting, we used
the PAP reagent (Sigma, used according to their instructions) to
detect the Protein A epitope present in Sic1p-TAG. The same blot
was also probed with an anti-Pgk1p antibody (from Molecular
Probes, and used according to their instructions). Pgk1p is not cell
cycle regulated, and it is widely used as a loading control in cell
cycle experiments, including landmark studies that accurately
quantified the levels of cell cycle proteins [39]. The intensity of the
bands was quantified using Adobe Photoshop, normalizing the
levels of Sic1p-TAG to the loading control. Using Microsoft Excel,
values were fit to a linear transformation of the exponential decay
equation (lnXt = 2kt+lnXt0, where X denotes the amount of
Sic1p-TAG, k the degradation rate constant, and t time) to obtain
k from the slope of the line. The half-life of Sic1p-TAG was then
determined from t1/2 = ln2/k.
Figure 9. Cells over-expressing ABF2 have less Sir2p and higherlevels of K9, K14 acetylated histone H3 at the rDNA ARSelements. A, Immunoblot showing that the level of Sir2p is not alteredin whole cell extracts from cells over-expressing ABF2. The same blotwas stained with Ponceau, to indicate loading. Loading was alsoevaluated from the same samples, with an anti-Cdc28p antibody. B,ChIP experiments analyzed by real-time PCR show that the level of Sir2p(%IP) at the rDNA ARS elements is reduced in 3XABF2+ cells. Part of onerDNA repeat is shown above indicating the location of the rDNA ARSelements, the primers used (primer pairs 20, 21, 22); the nontranscribedspacer (NTS); and the 35S and 5S rRNA genes. The values shown in thebar graph are the average %IPs (6s.d.) of three independentexperiments. C, ChIP experiments analyzed by slot blot show that thelevel of K9, K14 acetylated histone H3 is increased at the rDNA ARS
elements in 3XABF2+ cells. In the graph, the average %IPs (+/2 range)are shown for two independent experiments (Pearson coeffi-cient = 0.95). The open triangle above the slot blot represents serialdilutions of input DNA to ensure linearity with respect to hybridizationof the probe to the amount of DNA applied to the membrane. Otherlabels as in Figure 9B.doi:10.1371/journal.pgen.1000047.g009
Figure 10. A schematic of the model suggested by our data. Anincrease of mtDNA by moderate over-expression of Abf2p promotesmitochondrial functions, which in turn accelerate cell proliferation andDNA replication. The NAD+-dependent de-acetylase Sir2p antagonizesinitiation of DNA replication. Cells over-expressing Abf2p havedecreased levels of Sir2p at origins of DNA replication (ARS), andhigher levels of acetylated K9, K14 histone H3 residues (Ac). Additionalmechanisms likely contribute to the overall positive effects on cellproliferation and DNA replication in cells with higher mtDNA levels.doi:10.1371/journal.pgen.1000047.g010
mtDNA Promotes Cell Cycle Progression
PLoS Genetics | www.plosgenetics.org 8 April 2008 | Volume 4 | Issue 4 | e1000047

Chromatin ImmunoprecipitationFor these analyses, cells were cultured in YPD containing 0.5%
glucose. The primers and protocols for ChIP experiments and
analysis have been described previously [13,40]. ChIPs were
performed with anti-Sir2p antisera (Santa Cruz Biotechnology,
Cat#: sc-6666) or anti H3K9, K14Ac (Millipore, Cat#: 06-599).
Percent immunoprecipitations (%IP) were determined by dividing
IP signal by input signal. ChIP experiments were analyzed either
by quantitative PCR (Figure 9B and Figure S5), or by slot blot
(Figure 9C and Figure S6). For anti-Sir2p ChIPs, chromatin from
sir2D cells was analyzed to assess background signal. For anti
H3K9, K14Ac ChIPs, ‘‘no antibody’’ controls were included to
assess background signal. For slot blot analysis, samples were
blotted to a membrane that was hybridized to a 32P-labeled probe
spanning the rDNA ARS region. Signals were quantified on a
Storm 860 phosphorimager (Molecular Dynamics) using Image-
quant software. Ethidium-stained gels were quantified using
Quantity One software (BioRad).
OtherFor Sir2p immunoblotting (Figure 9A) we used anti-Sir2p
antisera (Cat#: sc-6666) from Santa Cruz Biotechnology, and a
secondary antibody from Pierce, at the recommended dilutions.
The anti-Cdc28p antibody used to estimate loading was also from
Santa Cruz Biotechnology (Cat#: sc-6708), and used according to
their instructions. The immunoblots were processed with reagents
from Pierce.
Supporting Information
Figure S1 Summary of data from elutriation experiments with
rho+ strains. A, The raw data points showing the percent of
budded cells as a function of cell size, from separate independent
elutriation experiments with ABF2+ and 3XABF2+ strains. The
data points shown were from the linear portion of each
experiment, when the percentage of budded cells began to
increase, and they were used to determine the critical budding
size as described in Materials and Methods. B,C, The rate of cell
size increase for each elutriation experiment of the indicated
strains (ABF2+ and 3XABF2+) is shown. From these graphs we
calculated the rate of size increase as described in Materials and
Methods. D, The critical size for budding of the indicated strains is
shown. Where marked with an asterisk (*), the difference is
statistically significant, based on 2-tailed Student’s t tests. E, The
rate of cell size increase of the indicated strains is shown. Where
marked with an asterisk (*), the difference is statistically significant,
based on 2-tailed Student’s t tests.
Found at: doi:10.1371/journal.pgen.1000047.s001 (0.06 MB TIF)
Figure S2 Sic1p stability and Abf2p. A separate experiment,
similar to the one described in Fig. 5, is shown, except that loading
was estimated from the Ponceau-stained blot.
Found at: doi:10.1371/journal.pgen.1000047.s002 (0.23 MB TIF)
Figure S3 mtDNA abundance is not increased in cells lacking
Sir2p. To estimate the mtDNA abundance of the indicated strains
we used PCR (Top), as described in Materials and Methods. The
ratio between the COX2 and the GID8 product was determined
to normalize for differences in initial DNA concentration and
reaction efficiencies. The ratio for each strain relative to ABF2+
cells is shown (Bottom). Graph represents average data from two
independent experiments (+/2 range). As a control, we also
performed this analysis on 3XABF2+ cells, which are known to
have higher mtDNA levels.
Found at: doi:10.1371/journal.pgen.1000047.s003 (0.11 MB TIF)
Figure S4 Cell cycle progression of rho2 strains. A, The strains
used were respiratory-incompetent and they could not proliferate
on plates with glycerol as a carbon source. The critical size for
budding (B), and the rate of cell size increase (C), of the indicated
strains was determined as in Figure S1.
Found at: doi:10.1371/journal.pgen.1000047.s004 (0.40 MB TIF)
Figure S5 ChIP experiments from the indicated strains analyzed
by PCR do not detect Sir2p bound to ARS315 (left panel). As a
control, we also performed this analysis on rDNA ARS using
primer pair 21 and detected Sir2p association with the rDNA ARS
(right panel). PCR products from input and IP samples were
subjected to agarose gel electrophoresis and analyzed by ethidium
bromide staining. The open triangles represent serial dilution of
template DNA in the PCR reaction. Other labels as in Fig. 9B.
Found at: doi:10.1371/journal.pgen.1000047.s005 (0.23 MB TIF)
Figure S6 Sir2p ChIP to rDNA ARS in rho+ and rho2 cells.
ChIP experiments from the indicated strains analyzed by slot blot
to detect Sir2p bound to rDNA ARS. Note that applying slot blot
methodology to the rDNA ARS reproduced the reduced Sir2p
levels bound to the rDNA ARS in 3XABF2+ cells that we observed
with the real-time PCR analysis shown in Fig. 9B. Graph
represents average data from two independent experiments (+/
2 range). Other labels as in Fig. 9.
Found at: doi:10.1371/journal.pgen.1000047.s006 (0.26 MB TIF)
Acknowledgments
This paper is dedicated to the memory of Ron Butow. We thank R. Butow
and G. Shadel for strains and plasmids, R. Butow and B. Kennedy for
discussions, D. Pettigrew for advice and encouragement, and J. Kapler and
D. Pettigrew for comments on the manuscript.
Author Contributions
Conceived and designed the experiments: HB CL JM LB MB MP.
Performed the experiments: HB CL JM LB MB MP. Analyzed the data:
HB CL JM LB MB MP. Wrote the paper: HB CL JM MB MP.
References
1. Pringle JR, Hartwell LH (1981) The Saccharomyces cerevisiae cell cycle. In:
Strathern JD, Jones EW, Broach JR, eds. The molecular biology of the yeast
Saccharomyces. Cold Spring Harbor, NY: Cold Spring Harbor Laboratory Press.
pp 97–142.
2. Ferea TL, Botstein D, Brown PO, Rosenzweig RF (1999) Systematic changes in
gene expression patterns following adaptive evolution in yeast. Proc Natl Acad
Sci U S A 96: 9721–9726.
3. Okamoto K, Shaw JM (2005) Mitochondrial morphology and dynamics in yeast
and multicellular eukaryotes. Annu Rev Genet 39: 503–536.
4. MacAlpine DM, Perlman PS, Butow RA (1998) The high mobility group protein
Abf2p influences the level of yeast mitochondrial DNA recombination
intermediates in vivo. Proc Natl Acad Sci U S A 95: 6739–6743.
5. Diffley JF, Stillman B (1991) A close relative of the nuclear, chromosomal high-
mobility group protein HMG1 in yeast mitochondria. Proc Natl Acad Sci U S A
88: 7864–7868.
6. Bonawitz ND, Clayton DA, Shadel GS (2006) Initiation and beyond: multiple
functions of the human mitochondrial transcription machinery. Mol Cell 24:
813–825.
7. Stigter D (2004) Packaging of single DNA molecules by the yeast mitochondrial
protein Abf2p: reinterpretation of recent single molecule experiments. Biophys
Chem 110: 171–178.
8. Friddle RW, Klare JE, Martin SS, Corzett M, Balhorn R, et al. (2004)
Mechanism of DNA compaction by yeast mitochondrial protein Abf2p.
Biophys J 86: 1632–1639.
mtDNA Promotes Cell Cycle Progression
PLoS Genetics | www.plosgenetics.org 9 April 2008 | Volume 4 | Issue 4 | e1000047
9. Zelenaya-Troitskaya O, Newman SM, Okamoto K, Perlman PS, Butow RA
(1998) Functions of the high mobility group protein, Abf2p, in mitochondrialDNA segregation, recombination and copy number in Saccharomyces
cerevisiae. Genetics 148: 1763–1776.
10. Dutnall RN, Pillus L (2001) Deciphering NAD-dependent deacetylases. Cell105: 161–164.
11. Blander G, Guarente L (2004) The Sir2 family of protein deacetylases. AnnuRev Biochem 73: 417–435.
12. Rusche LN, Kirchmaier AL, Rine J (2003) The establishment, inheritance, and
function of silenced chromatin in Saccharomyces cerevisiae. Annu Rev Biochem72: 481–516.
13. Li C, Mueller JE, Bryk M (2006) Sir2 represses endogenous polymerase IItranscription units in the ribosomal DNA nontranscribed spacer. Mol Biol Cell
17: 3848–3859.14. Bryk M, Banerjee M, Murphy M, Knudsen KE, Garfinkel DJ, et al. (1997)
Transcriptional silencing of Ty1 elements in the RDN1 locus of yeast. Genes
Dev 11: 255–269.15. Smith JS, Boeke JD (1997) An unusual form of transcriptional silencing in yeast
ribosomal DNA. Genes Dev 11: 241–254.16. Pasero P, Bensimon A, Schwob E (2002) Single-molecule analysis reveals
clustering and epigenetic regulation of replication origins at the yeast rDNA
locus. Genes Dev 16: 2479–2484.17. Pappas DL Jr, Frisch R, Weinreich M (2004) The NAD(+)-dependent Sir2p
histone deacetylase is a negative regulator of chromosomal DNA replication.Genes Dev 18: 769–781.
18. Weinreich M, Palacios DeBeer MA, Fox CA (2004) The activities of eukaryoticreplication origins in chromatin. Biochim Biophys Acta 1677: 142–157.
19. Vogelauer M, Rubbi L, Lucas I, Brewer BJ, Grunstein M (2002) Histone
acetylation regulates the time of replication origin firing. Mol Cell 10:1223–1233.
20. O’Rourke TW, Doudican NA, Mackereth MD, Doetsch PW, Shadel GS (2002)Mitochondrial dysfunction due to oxidative mitochondrial DNA damage is
reduced through cooperative actions of diverse proteins. Mol Cell Biol 22:
4086–4093.21. Epstein CB, Waddle JA, Hale Wt, Dave V, Thornton J, et al. (2001) Genome-
wide responses to mitochondrial dysfunction. Mol Biol Cell 12: 297–308.22. Chelstowska A, Butow RA (1995) RTG genes in yeast that function in
communication between mitochondria and the nucleus are also required forexpression of genes encoding peroxisomal proteins. J Biol Chem 270:
18141–18146.
23. Spencer F, Gerring SL, Connelly C, Hieter P (1990) Mitotic chromosometransmission fidelity mutants in Saccharomyces cerevisiae. Genetics 124:
237–249.24. Kaiser C, Michaelis S, Mitchell A (1994) Methods in Yeast Genetics. Cold
Spring Harbor: Cold Spring Harbor Laboratory Press.
25. Nash P, Tang X, Orlicky S, Chen Q, Gertler FB, et al. (2001) Multisitephosphorylation of a CDK inhibitor sets a threshold for the onset of DNA
replication. Nature 414: 514–521.
26. Murray DB, Beckmann M, Kitano H (2007) Regulation of yeast oscillatory
dynamics. Proc Natl Acad Sci U S A 104: 2241–2246.
27. Tu BP, Kudlicki A, Rowicka M, McKnight SL (2005) Logic of the yeast
metabolic cycle: temporal compartmentalization of cellular processes. Science
310: 1152–1158.
28. Klevecz RR, Bolen J, Forrest G, Murray DB (2004) A genomewide oscillation in
transcription gates DNA replication and cell cycle. Proc Natl Acad Sci U S A
101: 1200–1205.
29. Anderson RM, Latorre-Esteves M, Neves AR, Lavu S, Medvedik O, et al. (2003)
Yeast life-span extension by calorie restriction is independent of NAD
fluctuation. Science 302: 2124–2126.
30. Huang J, Moazed D (2003) Association of the RENT complex with
nontranscribed and coding regions of rDNA and a regional requirement for
the replication fork block protein Fob1 in rDNA silencing. Genes Dev 17:
2162–2176.
31. Aggarwal BD, Calvi BR (2004) Chromatin regulates origin activity in
Drosophila follicle cells. Nature 430: 372–376.
32. Poloumienko A, Dershowitz A, De J, Newlon CS (2001) Completion of
replication map of Saccharomyces cerevisiae chromosome III. Mol Biol Cell 12:
3317–3327.
33. Longtine MS, McKenzie A, 3rd, Demarini DJ, Shah NG, Wach A, et al. (1998)
Additional modules for versatile and economical PCR-based gene deletion and
modification in Saccharomyces cerevisiae. Yeast 14: 953–961.
34. Brachmann CB, Davies A, Cost GJ, Caputo E, Li J, et al. (1998) Designer
deletion strains derived from Saccharomyces cerevisiae S288C: a useful set of
strains and plasmids for PCR-mediated gene disruption and other applications.
Yeast 14: 115–132.
35. Ghaemmaghami S, Huh WK, Bower K, Howson RW, Belle A, et al. (2003)
Global analysis of protein expression in yeast. Nature 425: 737–741.
36. Bogomolnaya LM, Pathak R, Guo J, Cham R, Aramayo R, et al. (2004) Hym1p
affects cell cycle progression in Saccharomyces cerevisiae. Curr Genet 46: 183–192.
37. Guo J, Bryan BA, Polymenis M (2004) Nutrient-specific effects in the
coordination of cell growth with cell division in continuous cultures of
Saccharomyces cerevisiae. Arch Microbiol 182: 326–330.
38. Pathak R, Bogomolnaya LM, Guo J, Polymenis M (2004) Gid8p (Dcr1p) and
Dcr2p function in a common pathway to promote START completion in
Saccharomyces cerevisiae. Euk Cell 3: 1627–1638.
39. Cross FR, Archambault V, Miller M, Klovstad M (2002) Testing a mathematical
model of the yeast cell cycle. Mol Biol Cell 13: 52–70.
40. Bryk M, Briggs SD, Strahl BD, Curcio MJ, Allis CD, et al. (2002) Evidence that
Set1, a factor required for methylation of histone H3, regulates rDNA silencing
in S. cerevisiae by a Sir2-independent mechanism. Curr Biol 12: 165–170.
41. Baganz F, Hayes A, Farquhar R, Butler PR, Gardner DC, et al. (1998)
Quantitative analysis of yeast gene function using competition experiments in
continuous culture. Yeast 14: 1417–1427.
mtDNA Promotes Cell Cycle Progression
PLoS Genetics | www.plosgenetics.org 10 April 2008 | Volume 4 | Issue 4 | e1000047
Copyright © 2022 FDOKUMEN