RECQL4; Linking DNA Replication and Bone Tumourigenesis
279
RECQL4; Linking DNA Replication and Bone Tumourigenesis Tammy Wiltshire A thesis submitted in partial fulfilment of the requirements of the University of Lincoln for the degree of Doctor of Philosophy School of Life Sciences October 2019
-
Upload
khangminh22 -
Category
Documents
-
view
1 -
download
0
Transcript of RECQL4; Linking DNA Replication and Bone Tumourigenesis

RECQL4; Linking DNA Replication and Bone Tumourigenesis
Tammy Wiltshire
A thesis submitted in partial fulfilment of the requirements of the University of Lincoln for the degree of Doctor of Philosophy
School of Life Sciences
October 2019
Page | i
Abstract
As part of cell division, the initiation of DNA replication is an important regulatory
mechanism that maintains genomic stability over generations. RECQL4 belongs to
the RecQ DNA helicase family holding an important role in the initiation of DNA
replication. RECQL4 mutations can lead to disorders including type II Rothmund-
Thomson (RTS) syndrome. These patients demonstrate predisposition to
osteosarcoma (OS) development. OS is a primary bone tumour showing extensive
chromosomal instability. We hypothesise mesenchymal stem cells (MSC)
differentiating to osteoblasts are particularly sensitive to RECQL4 mutations, which
may lead to impaired differentiation and OS. Our aim is to establish a direct link
between the impairment of replication initiation, consequent chromosomal
instabilities and deregulation in osteoblast differentiation, and OS development.
A model that phenocopies the effect of RECQL4 mutations was established in
ASC52telo cells to apply acute and chronic pressure on replication initiation using
PHA-767491, which inhibits DDK that acts upstream of RECQL4 in replication
initiation (PHA cells). We monitored cell viability and chromosomal instability
characteristics in these cells, and RTS cell lines. To establish if PHA cells sustained
differentiation capability, the cells were cultured using supplemented media for
osteoblast and adipocyte differentiation, and were analysed by histochemical
staining and immunofluorescence. Presence of DNA damage was quantified using
γH2AX, and activation of the DNA damage response was assayed by western
blotting. The cells were cultured in ultra-low attachment plates to test for anchorage-
independent growth, and further analysed by cell count, MTS and luminescence
assays. To identify protein-protein interactions of RECQL4, GFP-tagged RECQL4
HeLa and U2OS cells were treated with SAHA, or hydroxyurea, pulled down with
GFP-nanotrap, and analysed by mass spectrometry and western blot.
We confirmed reduced proliferation rate while maintaining viability in PHA cells.
Assaying mitochondrial membrane potential revealed no significant effect on
mitochondrial function. Successful differentiation of PHA treated MSCs into
osteoblasts and adipocytes was confirmed. Expression of osteoblast differentiation
markers: calcium, and RUNX2 was influenced by PHA. An increase was also
observed in chronic PHA cells under normal medium, indicating malignant
transformation. Sustained DNA damage was shown in chronic PHA-767491
Page | ii
treated ASC52telo cells, with a higher degree of CHK1 phosphorylation,
anchorage-independent growth and reduced contact inhibition.
We found that the RECQL4 mutated cell line AG05013tert was more sensitive to
inhibition of replication initiation. Increase of DNA damage markers was observed
in AG05013tert cells, but not in AG18375 and AG03587. Presence of MCM10 and
PP2A in RECQL4 complexes was confirmed, and novel interactions with HDX and
EN-2 were found.
Overall, we demonstrated that chronic interference with DNA replication initiation
leads to sustained DNA damage with characteristics of genomic instability, activated
DNA damage response that may become impaired over time, and may induce
transformation.
To further these studies, RECQL4 knockdown using lentiviral transduction in
osteoblasts would verify the cellular changes we propose, which lead to
chromosomal instabilities and OS development. Novel protein interactions with
RECQL4 could highlight new pathways with a direct and/or indirect role in
tumourgenesis.

Page | iii
Acknowledgements
I would like to acknowledge and thank my supervisor Dr Csanád Z. Bachrati for all
the support and encouragement within the project. I would like to acknowledge
Timea Palmai-Pallag for producing the data required within the study, thank you so
much to you both for your time you gave. I would also like to thank my family for all
off their support.

Page | iv
Contents
1 Introduction ................................................................................................................ 1
1.1 Cell division ........................................................................................................... 1
1.1.1 Cell cycle ....................................................................................................... 1
1.1.1.1 Cyclin-dependent kinases ...................................................................... 2
1.1.2 Replication initiation ....................................................................................... 3
1.1.2.1 Replication initiation; RECQL4 ............................................................... 3
1.1.2.2 Impaired DNA replication initiation can lead to oncogenesis .................. 7
1.2 RECQL4 ................................................................................................................ 8
1.2.1 Biochemical activity of RECQL4 .................................................................. 10
1.2.2 RECQL4 localisation .................................................................................... 10
1.2.3 Mutations in the RECQL4 gene ................................................................... 11
1.2.3.1 Baller-Gerold (BGS) syndrome ............................................................. 12
1.2.3.2 RAPADILINO syndrome ....................................................................... 12
1.2.3.3 Rothmund Thomson Syndrome (RTS) ................................................. 12
1.2.3.3.1 Symptoms ......................................................................................... 13
1.2.3.3.2 Diagnosis ........................................................................................... 14
1.2.3.3.3 Subtypes ........................................................................................... 15
1.2.4 RTS and cancer predisposition .................................................................... 16
1.3 Mesenchymal stem cells ..................................................................................... 19
1.3.1 Bone formation ............................................................................................ 21
1.4 Primary bone malignancies ................................................................................. 25
1.4.1 Ewing sarcoma ............................................................................................ 25
1.4.2 Osteosarcoma ............................................................................................. 25
1.4.2.1 Cell cycle dysregulation and OS ........................................................... 27
1.4.2.2 OS and known gene involvements ....................................................... 28
1.4.2.2.1 P53 .................................................................................................... 28
1.4.2.2.2 RECQL4 and tumour development ................................................... 29
1.4.2.2.2.1 RECQL4 and OS ........................................................................ 29
1.4.2.2.3 RUNX2 and cancer ........................................................................... 30
1.4.2.3 OS and bone dysregulation .................................................................. 31
1.5 The DNA damage response and genome instability ........................................... 32
1.5.1 DNA damage ............................................................................................... 32
1.5.2 Hallmark features of genomic instability ...................................................... 33
1.5.3 Single stranded DNA ................................................................................... 34
1.5.4 Double stranded DNA break ........................................................................ 35
1.5.5 DNA repair pathways ................................................................................... 35
Page | v
1.5.5.1 DNA damage response pathways ........................................................ 35
1.5.5.2 Homologous recombination .................................................................. 36
1.5.5.3 Non-homologous end-joining ................................................................ 38
1.5.5.4 Telomeres are disguised double-stranded breaks ............................... 40
1.5.5.5 Base excision repair ............................................................................. 44
1.5.5.6 Nucleotide excision repair .................................................................... 45
1.5.6 Involvement of RECQL4 in processes of DNA repair .................................. 47
1.6 Aims of project .................................................................................................... 50
2 Materials and Methods ............................................................................................ 51
2.1 Stock solutions .................................................................................................... 51
2.1.1 Stock solutions and chemical reagents ....................................................... 51
2.2 Cell Culture ......................................................................................................... 58
2.2.1 Cell maintenance ......................................................................................... 58
2.2.2 Freezing ....................................................................................................... 59
2.2.3 Recovery ...................................................................................................... 59
2.2.4 Proliferation titration ..................................................................................... 59
2.2.5 ASC52telo differentiation ability ................................................................... 59
2.2.5.1 Adipocyte differentiation detection - Oil red o ....................................... 60
2.2.5.2 Osteoblast differentiation detection - Alizarin red S .............................. 60
2.2.5.3 Chondrocyte differentiation detection – Alcian blue ............................. 60
2.2.6 Anchorage-independent growth ................................................................... 61
2.2.7 Cell quantification and viability analysis ....................................................... 61
2.2.7.1 Cell quantification ................................................................................. 61
2.2.7.2 MTS viability assay ............................................................................... 61
2.2.7.3 RealTime-Glo™ MT assay ................................................................... 62
2.2.8 PHA-767491 titration ................................................................................... 62
2.2.9 Titration of selection reagents ...................................................................... 65
2.2.10 Transfection ................................................................................................. 65
2.2.10.1 siRNA transfection ................................................................................ 65
2.2.10.2 Optimisation of plasmid transfection ..................................................... 65
2.2.10.3 Plasmid transient transfection .............................................................. 66
2.2.10.4 Co-transfection for inducible expression .............................................. 66
2.2.11 Verification of inducible Emerald-GFP tagged RECQL4 ............................. 67
2.3 Protein isolation and analysis ............................................................................. 67
2.3.1 Whole cell protein extraction ........................................................................ 67
2.3.2 Protein quantification ................................................................................... 67
2.3.3 Sodium dodecyl sulphate polyacrylamide gel (SDS page) .......................... 68
2.3.4 Gel section cutting ....................................................................................... 68

Page | vi
2.3.5 Western blotting ........................................................................................... 68
2.3.6 Stripping and re-probing .............................................................................. 69
2.3.7 Immunoprecipitation of GFP-RECQL4 fusion proteins ................................ 69
2.4 Epifluorescent microscopy .................................................................................. 70
2.5 Analysis of mitochondrial membrane potential ................................................... 71
2.6 Molecular cloning ................................................................................................ 72
2.6.1 RECQL4-Emerald tagged construct ............................................................ 72
2.6.2 Preparation of LB-Agar plates and LB-broth ................................................ 72
2.6.3 Transformation ............................................................................................. 72
2.6.4 Small scale purification of plasmid DNA (miniprep) ..................................... 73
2.6.5 Medium scale plasmid purification (maxiprep) ............................................. 73
2.6.6 Analysis of plasmids via restriction digestion and gel electrophoresis ........ 74
2.6.7 Generation of shRNA constructs ................................................................. 74
2.6.8 Generation of lentiviral vector and transduction of ASC52telo cells ............ 75
2.7 DNA fingerprinting ............................................................................................... 75
2.7.1 Preparation of genomic DNA with phenol-chloroform extraction ................. 75
2.7.2 DNA fingerprinting with the GenePrint 10 kit ............................................... 76
2.7.3 The detection of amplified fragments ........................................................... 77
2.7.4 Statistical analysis ....................................................................................... 77
3 Chapter 1 Interfering with DNA replication initiation ............................................ 78
3.1 Establishing the model system for inhibition of DNA replication initiation ........... 78
3.1.1 PHA-767491 effect on osteocyte differentiation .......................................... 88
3.1.2 Relationship of DNA replication initiation and cellular transformation ......... 97
3.1.3 Relationship of DNA replication initiation and Membrane potential ........... 100
3.1.4 Summary ................................................................................................... 102
4 Chapter 2 The interference with DNA replication initiation generates genomic instability ........................................................................................................................ 104
4.1 PHA-767491 induces chromosomal instabilities in ASC52telo cells ................. 104
4.1.1 DNA damage marker and mild proliferation inhibition ............................... 109
4.2 Markers of cellular transformation in ASC52telo cells following chronic inhibition of
replication initiation ...................................................................................................... 117
4.2.1 Contact inhibition ....................................................................................... 122
4.3 Verification of STR genotypes .......................................................................... 128
4.4 Summary ........................................................................................................... 130
5 Chapter 3 RECQL4 dynamics and interacting partners ..................................... 131
5.1 Establishing of expression characteristics of RECQL4 ..................................... 131
5.2 Establishing overexpression and depletion of RECQL4 ................................... 138
5.2.1 Generation of Emerald–GFP tagged RECQL4 expression construct ........ 139

Page | vii
5.2.1.1 Establishing a suitable plasmid delivery system ................................. 139
5.2.2 Establishing conditions for siRNA-mediated depletion of RECQL4 ........... 148
5.2.3 Generation of shRNA constructs ............................................................... 149
5.2.4 RTS cell lines and PHA Sensitivity ............................................................ 153
5.2.5 RECQL4 DNA damage .............................................................................. 157
5.3 Isolation and identification of RECQL4 interacting partners. ............................ 158
5.4 Summary ........................................................................................................... 164
6 Discussion .............................................................................................................. 166
6.1 Interfering with DNA replication initiation (chapter 1, section 3.1) .................... 166
6.1.1 PHA-767491 effect on osteocyte differentiation (chapter 1, section 3.1.1) 169
6.1.1.1 Differentiation of ASC52telo MSCs .................................................... 169
6.1.1.2 The role of RUNX2 in regulating MSC differentiation ......................... 172
6.1.1.3 The role of RECQL4 in bone morphogenesis ..................................... 173
6.2 Relationship between disturbance of DNA replication initiation and cellular
transformation (chapter 1, section 3.1.2) ..................................................................... 175
6.2.1 Membrane potential maintained in PHA-767491 treated ASC52telo cells
(chapter 1, section 3.1.3) ......................................................................................... 176
6.3 PHA-767491 generates DNA damage in ASC52telo cells (chapter 2, section 4)
178
6.3.1 Morphological markers of genome instability ............................................. 178
6.3.2 Protein markers of DNA damage ............................................................... 181
6.3.3 Interference with DNA replication initiation leads to cellular transformation
(chapter 2 section 4.2) ............................................................................................. 185
6.4 ASC52telo genotype verified (chapter 2, section 4.3). ...................................... 192
6.5 RECQL4 expression and proliferation (chapter 3, section 5) ............................ 193
6.6 Generation of Emerald-GFP tagged RECQL4 expression constructs (chapter 3,
section 5.2) .................................................................................................................. 194
6.6.1 siRNA ......................................................................................................... 195
6.6.2 shRNA ....................................................................................................... 197
6.7 RECQL4 expression and DNA damage markers (chapter 3, section 5.24) ...... 197
6.8 Isolation and identification of RECQL4 interacting partners (chapter 3, section 5).
199
6.8.1 Novel RECQL4 interacting proteins (chapter 3, section 5.3) ..................... 201
7 Conclusion .............................................................................................................. 203
6.9 Overall findings and future directions ................................................................ 208
8 References .............................................................................................................. 209

Page | viii
Figures
Figure 1.1-a Cell cycle division phases ............................................................................... 2
Figure 1.1-b DNA replication licensing and the initiation steps, in budding yeast and human
cells, based primarily on studies in budding yeast and analogies drown for human cells ... 6
Figure 1.1-c Impairment of Pre-RC/DNA replication proteins and its involvement in
oncogenesis. ....................................................................................................................... 8
Figure 1.2-a Structural organization of human RecQ helicases .......................................... 9
Figure 1.2-b– Schematic linking premature/normal aging and cancer development ........ 18
Figure 1.3-a Mesenchymal stem cell multipotentiality ....................................................... 19
Figure 1.3-b The sequential stages of bone remodelling .................................................. 22
Figure 1.3-c Schematic diagram of the interior of a typical long bone .............................. 24
Figure 1.5-a A schematic of the execution step of homologous recombination repair (HR)
of double-stranded DNA breaks (DSB). ............................................................................ 37
Figure 1.5-b DSB repair by NHEJ pathway ....................................................................... 39
Figure 1.5-c Formation of T-loop. ...................................................................................... 42
Figure 1.5-d The core steps of BER. ................................................................................. 45
Figure 1.5-e Schematic of the core NER reaction ............................................................. 46
Figure 2.2-a A schematic showing ASC52telo cells and various culture conditions that
established a model of PHA-767491 treatment. ................................................................ 64
Figure 3.1-a Establishment of a suitable seeding density ................................................. 79
Figure 3.1-b Sensitivity of MRC5 cells to PHA-767491. .................................................... 80
Figure 3.1-c Sensitivity of MRC5, AG05013tert, and HS68tert cells to PHA-767491.. ..... 81
Figure 3.1-d Sensitivity of HS68tert cells to PHA-767491 with or without media
changes. ............................................................................................................................ 81
Figure 3.1-e PHA-767491 sensitivity in ASC52telo cells ................................................... 82
Figure 3.1-f PHA-767491 sensitivity of high and low passage ASC52telo cells ................ 83
Figure 3.1-g Cell count and viability following chronic PHA-767491 treatment of ASC52telo
cells. .................................................................................................................................. 84
Figure 3.1-h Cell morphology of ASC52telo cells following acute and chronic PHA-767491
treatment ........................................................................................................................... 85
Figure 3.1-i proliferative state of ACS2telo cells following mild inhibition of replication
initiation ............................................................................................................................. 87
Figure 3.1-j Morphology changes of ASC52telo cells under osteoblast differentiation and
acute PHA treatment ......................................................................................................... 89
Figure 3.1-k Differentiation of ASC52telo cells to osteoblasts under acute treatment with
PHA-767491. ..................................................................................................................... 90
Figure 3.1-l Differentiation of low passage ASC52telo cells under acute PHA treatment . 91
Figure 3.1-m Osteoblast differentiation in ASC52telo under Chronic PHA-767491
treatment ........................................................................................................................... 91
Figure 3.1-n Monitoring of osteocyte and adipocyte differentiation capability over 7, 14, and
21 days in acute PHA-767491 treated low passage ASC52telo cells. .............................. 92
Figure 3.1-o Monitoring of osteocyte and adipocyte differentiation ability over 7, 14, and 21
days with acute PHA-767491 in high passage ASC52telo cells ....................................... 93
Figure 3.1-p Osteocyte, adipocyte, and chondrocyte differentiation in high passage
ASC52telo cells. ................................................................................................................ 94
Figure 3.1-q RUNX2 expression in ASC52telo cells with acute PHA-767491 treatment and
osteoid differentiation. ....................................................................................................... 95
Figure 3.1-r RUNX2 expression in ASC52telo cells under chronic PHA-767491 treatment
and osteocyte differentiation ............................................................................................. 96
Page | ix
Figure 3.1-s RUNX2 expression in ASC52telo under Chronic PHA-767491 treatment and
Osteoid differentiation ....................................................................................................... 96
Figure 3.1-t Ki67 expression in chronic PHA -767491 treated ASC52telo cells ................ 97
Figure 3.1-u Production of calcified matrix by ASC52telo cells following chronic PHA-
767491 treatment in normal Mesenpro media. .................................................................. 98
Figure 3.1-v RUNX2 levels in undifferentiated ASC52telo cells cultured under replication
stress ................................................................................................................................. 99
Figure 3.1-w Mitochondrial activity in acute and chronic PHA-767491 ASC52telo cells. 101
Figure 4.1-a Camptothecin sensitivity of ASC52telo cells under acute and chronic PHA-
767491 treatment. ........................................................................................................... 104
Figure 4.1-b Chromosomal instability markers observed in acute and chronic PHA-767491
treated ASC52telo cells ................................................................................................... 106
Figure 4.1-c Chromosomal instability markers in untreated ASC52telo cells, ................. 106
Figure 4.1-d Chromosomal instability markers in ASC52telo under acute and chronic PHA-
767491 treatment ............................................................................................................ 107
Figure 4.1-e ASC52telo cells form micronuclei staining positive for Ki67 and H2AX,
following mild inhibition of replication initiation. ............................................................... 109
Figure 4.1-f γH2AX foci and intensity following mild inhibition of replication initiation, in high
and low passage ASC52telo cells ................................................................................... 111
Figure 4.1-g Quantification of TRF2 foci and intensity following mild inhibition of replication
initiation, in high and low passage ASC52telo cells. ....................................................... 112
Figure 4.1-h Co-localisation of TRF2 with γH2AX following mild inhibition of replication
initiation in high and low passage ASC52telo cells. ........................................................ 113
Figure 4.1-i Expression of markers of the DBS damage response pathway in ASC52telo
cells following acute and chronic PHA-767491 treatment. .............................................. 116
Figure 4.2-a Cell viability with varied seeding density in ASC52telo cells. ...................... 119
Figure 4.2-b Cell morphology and anchorage-independent growth in ASC52telo cells
treated according to the PHA model ............................................................................... 120
Figure 4.2-c Anchorage-independent growth in ASC52telo cells under
PHA-model ...................................................................................................................... 121
Figure 4.2-d Recovery of ASC52telo cells cultured according to the PHA model, following
anchorage-independent growth ....................................................................................... 122
Figure 4.2-e Analysis of contact inhibition using cell count and viability following long term
culture of ASC52telo cells treated with PHA-767491 ...................................................... 125
Figure 4.2-f Contact inhibition in ASC52telo cells treated long term with PHA-767491
analysed based on protein concentration. ....................................................................... 126
Figure 4.2-g Cell viability of ASC52telo cells following long term culture with PHA-767491
treatment, measured by MTS assay. .............................................................................. 127
Figure 4.2-h Continual cell viability following long term culture and PHA-767491 in
ASC52telo, measured using real-time-Glo MT assay followed by MTS assay. .............. 128
Figure 4.3-a STR profile of ASC52telo cell line with and without chronic PHA-767491
treatment. ........................................................................................................................ 130
Figure 5.1-a RECQL4 expression in relation to cell confluence in U2OS-FLIPINTREX
cells ................................................................................................................................. 132
Figure 5.1-b RECQL4 expression in relation to cell confluence in HeLa cells over 9
days. ................................................................................................................................ 133
Figure 5.1-c Analysis of RECQL4 antibody in HeLa and U2OS cells. ............................ 134
Figure 5.1-d U2OS and HeLa cell proliferation rate and viability over 10 days ............... 135
Figure 5.1-e The percentage of Ki67 'dim' cells in relation to RECQL4 expression in U2OS
cells. ................................................................................................................................ 136
Page | x
Figure 5.1-f Percentage of Ki67 'dim' cells in relation to RECQL4 expression in HeLa
cells ................................................................................................................................. 137
Figure 5.1-g Proliferation rate in a selection of primary RTS cell lines ............................ 138
Figure 5.2-a Determining the optimal transfection ratio in HeLa cells. ............................ 140
Figure 5.2-b Verification of recombinant constructs. ....................................................... 141
Figure 5.2-c Transiently transfected RECQL4-Emerald localisation in HeLa-LacZeo and
U2OS-FLIPINTREX cells ................................................................................................ 142
Figure 5.2-d Dual selection Hygromycin B titration with Blasticidin-S®. ......................... 143
Figure 5.2-e Inducible expression of Emerald-GFP tagged RECQL4. ............................ 145
Figure 5.2-f Expression intensity in U2OS cells expressing RECQL4 Emerald .............. 146
Figure 5.2-g Expression intensity in HeLa cells expressing RECQL4-Emerald .............. 147
Figure 5.2-h Dynamics of siRNA mediated knockdown in HeLa LacZeo cells. ............... 148
Figure 5.2-i RECQL4 knockdown efficiency using RECQL4 siRNA 9 and 10 in HeLa and
U2OS cells, western blot.. ............................................................................................... 149
Figure 5.2-j Verification of recombinant shRNA constructs. ............................................ 151
Figure 5.2-k Recombinant construct RECQL4 9A verification. ....................................... 152
Figure 5.2-l Sensitivity of AG05013tert, HS68tert, and MRC5 cells to PHA-767491. ..... 153
Figure 5.2-n Sensitivity of cells to PHA-767491 following siRNA mediated knockdown of
RECQL4 in U2OS. .......................................................................................................... 155
Figure 5.2-o– Sensitivity of cells to PHA-767491 following siRNA mediated knockdown of
RECQL4 in HeLa cells .................................................................................................... 156
Figure 5.2-p Expression of DNA damage and telomeric markers in RTS cell lines. ....... 157
Figure 5.3-a GFP-trap pull-down of Emerald-GFP tagged RECQL4.. ............................ 158
Figure 5.3-b Pull-down of RECQL4 interacting partners in U2OS clone #15 cells.. ........ 160
Figure 5.3-c Pull-down of RECQL4 interacting partners from HeLa clone #2 cells.. ....... 161
Figure 5.3-d Verification of HDX siRNA and antibody.. ................................................... 162
Figure 5.3-e Pull-down of RECQL4 interacting partners in U2OS clone #15 cells.. ........ 163
Figure 5.3-f Pull-down of RECQL4 interacting partners in HeLa clone #2 cells .............. 164
Figure 7-1 DNA damage resulting in dysregulation of osteoblast differentiation and OS
development. ................................................................................................................... 206
Page | xi
Tables
Table 2.1-a Stock solutions and buffers ............................................................................ 51
Table 2.1-b Nucleic acid stains ......................................................................................... 52
Table 2.1-c Primary antibodies .......................................................................................... 53
Table 2.1-d Secondary antibodies. .................................................................................... 54
Table 2.1-e Cell lines and culture details .......................................................................... 55
Table 2.1-f siRNA details ................................................................................................... 56
Table 2.1-g Delivery agent to DNA ratio ............................................................................ 56
Table 2.1-h Control plasmid .............................................................................................. 56
Table 2.1-i concentrations of plasmid for inoculation ........................................................ 56
Table 2.1-j Digest mix ........................................................................................................ 57
Table 2.1-k RECQL4 oligonucleotides .............................................................................. 57
Table 2.1-l Annealing mix .................................................................................................. 57
Table 2.1-m Ligation Reagent mix .................................................................................... 58
Table 2.1-n PCR amplification mix .................................................................................... 58
Table 2.6-a PCR set up in (PCR-C100 Touch thermal cycler, BioRad). ........................... 75
Table 2.7-a Thermal cycling settings ................................................................................. 76
Table 2.7-b Applied ABI prism 310 genetic analyser parameters ..................................... 77
Table 5.3-a A list of identified proteins from the RECQL4 pull down earmarked for follow-up
analysis ........................................................................................................................... 159
Table 6.8-a Interacting protein with RECQL4 .................................................................. 200
Schematics
Schematic 6.3-1 cell damage response in ASC52telo cells treated with
PHA-767491. ................................................................................................................... 191
Page | xii
Abbreviations
3-isobutyl-1-methylxanthine (IBMX) Activating Protein-1 (AP-1) Acute promyelocytic leukemia (APL) Adenomatosis poliposis coli (APC) Adenosine triphosphate (ATP) Adipose derived mesenchymal stem cells (ascs) Alkaline phosphatase (ALP) Alkaline phosphatase, and collagenase-3 (matrix metalloproteinase-13, MMP-13) Alpha splice variant Ca2+/Calmodulin-dependent kinase II (α-CAMKII) Alternative lengthening of telomerase (ALT) Aprataxin-and-PNK-like factor (APLF) Ascorbic acid (ASC) Ataxia-telangiectasia mutated (ATM) ATM and Rad3- related (ATR) Α-thalassemia/mental retardation X-linked (ATRX) Baller–Gerold syndrome (BGS) Base excision repair (BER) BCL2-binding component 3 (BBC3) BMP ligand heterodimer (BMPR) Bone marrow (BM) Bone Marrow Derived Cells (BMDCS) Bone morphogenetic protein 9 (BMP9) Bone morphogenic protein (BMP) Bone morphogenic protein 2 (BMP-2) Bone sialoprotein (BSP) Bovine Serum Albumin (BSA) Break induced replication (BIR) Breast-ovarian cancer gene 1 (BRCA1) Ca2+/Calmodulin-dependent kinase II (camkii) Calcium ions (Ca2 +) Calcium sensing receptor (casr) Camp-responsive element binding protein (CREB) Camptothecin (CPT) Casein Kynase 1 (CK1) CCAAT-enhancer-binding proteins (C/EBP) Cdc10-dependent transcript 1 (Cdt1) Cdc45/MCM2–7/GINS (CMG) Cell division cycle (Cdc) Checkpoint kinase-1 (Chk1) Checkpoint kinase-2 (Chk2) Chromosomal instabilities (CIN) Chronic lymphocytic leukemia (CLL) C-Jun N-terminal kinase (JNK) Class switch recombination (CSR) Colony-forming-unit-fibroblasts (CFU-f) Colorectal cancer cells (crcs) Copy number variations (cnvs) Core-binding factor alpha 1 (Cbfa1) Cyclic AMP receptor element-binding protein binding protein-associated factor (PCAF)
Page | xiii
Cyclin D1 (CCND1) Cyclin-dependent kinase (CDK) Cyclin-dependent kinases (CDK) Cyclooxygenase-2 (COX2) Dbf4-dependent kinases (DDK) Delta-like ligand (DLL) Dentin matrix protein-1 (DMP1) Dexamethasone (DEX) Dimethyl sulfoxide (DMSO) Dishevelled (DSH) DNA damaged response (DDR) DNA double-stranded breaks (dsbs) DNA polymerases (Pol) DNA single-strand breaks (ssbs) E2F transcription factor 2 (E2F2) Electron transport chain (ETC) Engrailed-1 (EN-1) Engrailed-2 (EN-2) Epithelial-mesenchymal transition (EMT) Extracellular matrix (ECM) Extracellular related kinase (ERK/12) Fibroblast growth factor (FGF) Gamma-H2AX ( H2AX) Gap phase (G2) Gap phase 1 (G1) Global genome NER (GG-NER) Glycerol-3-phosphate dehydrogenase (GPDH) Glycogen synthase kinase 3b (GSK3b) Helicase rnased C-terminal (HRDC) Heterogeneous Nuclear Ribonucleoprotein-A1 (HNRPA1) Heterogeneous Nuclear Ribonucleoprotein-A2/B1 (HNRPA2B1) Highly divergent homeobox (HDX) Histone acetyltransferases (hats) Histone deacetylases (hdacs) Homologous recombination repair (HR) Human umbilical cord mesenchymal stem cells (HUC-mscs) Hydrogen peroxide (H2O2) Hydroxyurea (HU Hypoxia inducible factor-1 alpha (HIF-1α) Hypoxia inducible factors (HIFS) IGF-I receptor (IGF-IR) Immunofluorescence (IF) Inner membrane (IN) Inorganic phosphate (Pi) Insulin-Like Growth Factors (IGF) Integrin α5 (ITGA5) Intermediate filaments (IFS) Ironizing radiation (IR) Ligase (LIG) Linker of nucleoskeleton and cytoskeleton (LINC) Liproprotein lipase (LPL) Lysophosphatidic acid (LPA) Matrix metalloprotease 9 (MMP9)
Page | xiv
Matrix metalloproteinase (mmps) MCM (minichromosome maintenance) Meiotic Recombination-11 (MRE11) Melanocyte-stimulating hormone 2 (MSH2) Mesenchymal stem cells (mscs) Methylenetetrahydrofolate reductase (MTHFR) Micrornas (mirnas) Microsatellite instability (MIN) Minichromosome Maintenance (MCM) Mitochondrial DNA (mtdna) Mitochondrial DNA (mtdna) Mitochondrial DNA copy number (mtdna) Mitochondrial permeability transition pore (mptp). Mitochondrial transcription factor A (mttfa) Mitofusins (Mfn) Mitogen activated protein kinases (mapks) Mitogen-activated protein kinase (MAPK) Monocytic leukemia zinc finger protein (MOZ) MOZ-related factor (MORF) MRE11/NBS1/RAD50 complex (MRN) Multicentric OS (OSMC) Next-generation sequencing (NGS) Nijmegen Breakage Syndrome-1 protein (NBS1) Nitric oxide (NO) Non-homologous end joining repair (NHEJ) Non-targeting (NT) Nuclear envelope (NE) Nuclear targeting sequences (NTS) Nuclear-pore complexes (npcs) Nucleophosmin (NPM) Nucleotide excision repair (NER) Nucleotide excision repair (NER) Nucleotide instability (NIM) Numerical chromosomal instabilities (N-CIN) Origin recognition complex (ORC) Osteoprotegrin (OPG) Osteosarcoma (OS) Outer membrane (OM) Oxidative phosphorylation system (OXPHOS) Parathyroid hormone (PTH) Parathyroid hormone-related protein (PTHRP) Partitioning-defective (par) Patched 1 (PTCH1) Peroxisome proliferation-activated receptor (ppar) Peroxisome proliferator-activated receptor-γ (pparγ) PHA-767491 (PHA) Phosphatase and tensin homologue deleted from chromosome 1 (PTEN) Phosphate Buffered Saline (PBS) Phosphatidyl inositol-3 kinase (PI3K) Phosphatidylinositol-3 (PI-3) Phosphatidylinositol-3 kinase-like kinase family (PIKK). Phosphoinositide 3-kinase pathway (PI3K/Akt) Poly(adpribose) polymerase 1 (PARP1)
Page | xv
Polyomavirus enhancer-binding protein 2/core binding factor (PEBP2/CBF) Pre-initiation complex (pre-IC) Pressure of oxygen (po2) Proliferator activated receptor gamma coactivator-1 α (PGC-1α), Prostaglandin E2 (PGE2) Protection Of Telomeres-1 (POT1) Protein phosphatase 2A (PP2A) Protonophore p-trifluoromethoxy carbonyl cyanide phenyl hydrazone (FCCP) PTH-related protein (PTH-rp) Pyruvate dehydrogenase kinase (PDK) RAPADILINO (RAPA) Reactive oxygen substances (ROS)
Receptor activator of nuclear factor kappa −receptor activator of nuclear factor kappa B ligand (RANK-RANK-L) Receptor activator of nuclear factor κb ligand (RANKL) Receptor activator of nuclear factor-kappa B ligand (RANKL) Recq carboxy-terminal (RQC) RecQ like helicase 4 (RECQL4) Replication protein A (RPA) Repressor Activator Protein-1/Telomeric Repeat Binding Factor 2 Interacting Protein (RAP-1/TERF2IP) Retinoblastoma protein (RB) Rhodamine 123 (R123) Ribosomal protein S3 (RPS3) Rothmund-Thomson syndrome (RTS) Runt-related transcription factor 2 (RUNX2) sealing zone (SZ) Sex determining region Y box (Sox) Short-hairpin rnas (shrnas) Small Integrin Binding N-Linked Glycoproteins (SIBLING) Small integrin-binding ligand N-linked glycoprotein (SIBLING) Small interfering RNA (sirna) Flp recombination (FRT) Smoothened (SMO) Sonic hedgehog (SHH) S-phase cycling dependent kinases (S-CDK) SRY-related high-mobility group box 9 (SOX9) Stromal cell-derived factor (SDF1) Structural chromosomal instabilities (S-CIN) Structural variations (svs) Suberoylanilide hydroxamic acid (SAHA) Synthesis-dependent strand annealing (SDSA) T-cell factor/lymphocyte enhancer factor (LEF/TCF) Telomerase activation (TA) Telomerase reverse transcriptase catalytic subunit (htert) Telomerase RNA (htr) Telomeric Repeat Binding Factor (TRF) Tet repressor (tetr) Tetracycline inducible gene expression (Tet-on) Tetramethylrhodamine methyl ester (TMRM) Tetramethylrhodamine, ethyl ester, perchlorate (TMRE) The citric acid (TCA) The pre-replicative complex (pre-RC) Thymine glycol (Tg)
Page | xvi
Topoisomerase (TOP) Topoisomerase 2-binding protein 1 (topbp1) Transcriptional-coupled repair (TCR) Transcription-coupled NER (TC-NER) Transforming growth factor-b1 (TGF-b1) Transforming growth factor-beta (TGF-β) Transforming growth factor-β family of ligands (TGF-β) TRF1-interacting Ankyrin-related ADP-ribose polymerase (TANK) TRF1-Interacting Nuclear Factor-2 (TIN2) Type II collagen (Col2) Type XI collagen (Col11) Ultrafine DNA bridges (ufbs) Ultra-violet (UV) Vascular endothelial growth factor (VEGF) VEGF receptors 1 (VEGFR-1) VEGF receptors 2 (VEGFR-2) Werner syndrome (WS) Western Blot (WB) Wingless-type signalling (Wnt) Xeroderma pigmentosum group A (XPA) X-ray cross complementing protein 4 (XRCC4) XRCC4-like factor (XLF)
Page | 1
1 Introduction
1.1 Cell division
Humans begin as a single cell; the fertilised egg, and through cell division adults are
built from around 1013 cells. During development, a large number of cells are
produced, and the process is precisely regulated to ensure this and the generation
of a variety of cell types. The cell diversity is achieved through asymmetric cell
division. During asymmetric division, the daughter cells inherit different cellular
components such as proteins and RNA, resulting in cellular heterogeneity, leading
to divergent fates (Gönczy, 2008; Knoblich, 2010). Complex regulatory mechanisms
are in place to achieve proliferation of eukaryotic cells. The chromosomes are
required to be duplicated precisely and segregated forming daughter cells to
maintain genomic stability over generations. The precise regulatory mechanisms
ensure DNA replication is only restricted for occurrence once per cell cycle. Failure
of the process to occur accurately leads to the development of lethality and severe
diseases, including cancer (Tanaka and Araki, 2011). Studies using Drosophila
melanogaster and Caenorhabditis elegans models identified the basic molecular
mechanisms behind asymmetric division (Gönczy, 2008). The process requires
coordination between spindle orientation and temporal events. As part of the
process partitioning-defective (par) proteins localise along a polarity axis
asymmetrically which controls the orientation of the spindle and asymmetric
localization of determinants of cell fate. This inherited cell fate is only passed on to
one of the two daughter cells (Fisher et al., 2012; Hoege and Hyman, 2013;
Noatynska et al., 2013; Thompson, 2013).
1.1.1 Cell cycle
The cell cycle defines the process of cell division as a sequence of events leading
to the rise of two genetically identical daughter cells. The cell cycle is regulated to
ensure normal development of multicellular organisms. The initiation of the process
is well maintained and regulated to ensure proper progression, and completion form
one phase to the next. Once commenced, the completion of the cycle must follow.
The cell cycle consists of four distinct phases, which includes G1 (Gap1), S (DNA
synthesis), G2 (Gap2), and M phase
Page | 2
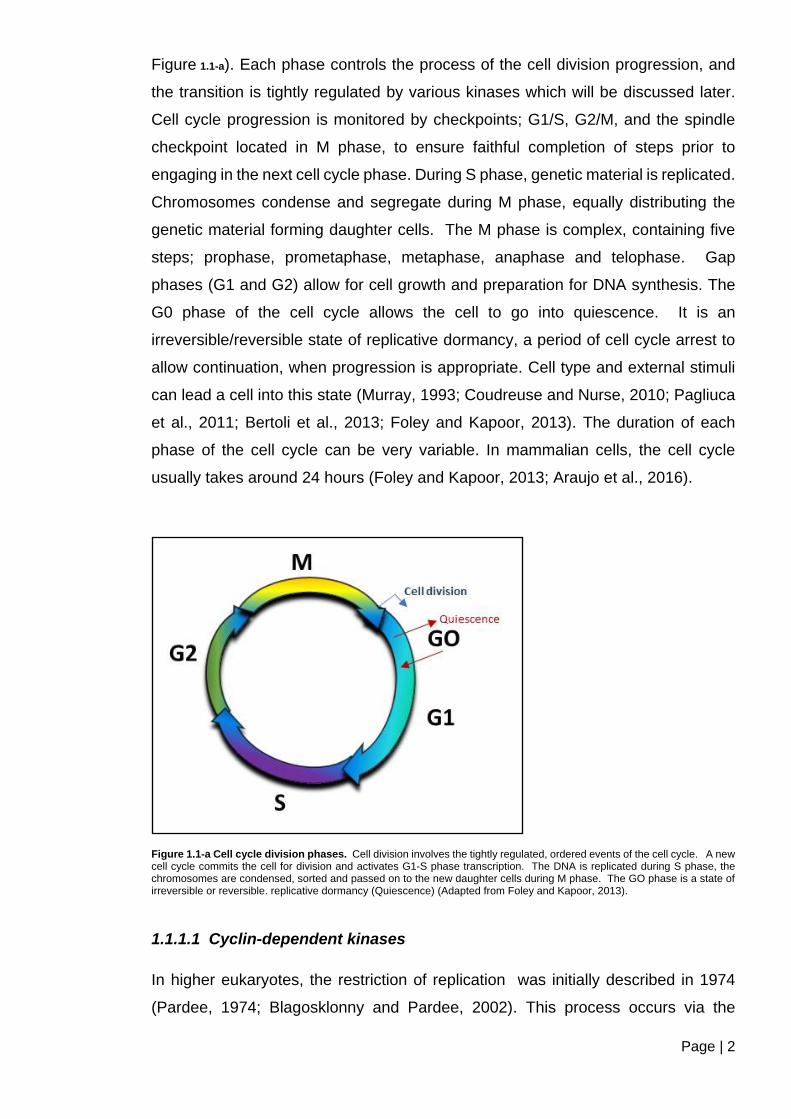
Figure 1.1-a). Each phase controls the process of the cell division progression, and
the transition is tightly regulated by various kinases which will be discussed later.
Cell cycle progression is monitored by checkpoints; G1/S, G2/M, and the spindle
checkpoint located in M phase, to ensure faithful completion of steps prior to
engaging in the next cell cycle phase. During S phase, genetic material is replicated.
Chromosomes condense and segregate during M phase, equally distributing the
genetic material forming daughter cells. The M phase is complex, containing five
steps; prophase, prometaphase, metaphase, anaphase and telophase. Gap
phases (G1 and G2) allow for cell growth and preparation for DNA synthesis. The
G0 phase of the cell cycle allows the cell to go into quiescence. It is an
irreversible/reversible state of replicative dormancy, a period of cell cycle arrest to
allow continuation, when progression is appropriate. Cell type and external stimuli
can lead a cell into this state (Murray, 1993; Coudreuse and Nurse, 2010; Pagliuca
et al., 2011; Bertoli et al., 2013; Foley and Kapoor, 2013). The duration of each
phase of the cell cycle can be very variable. In mammalian cells, the cell cycle
usually takes around 24 hours (Foley and Kapoor, 2013; Araujo et al., 2016).
Figure 1.1-a Cell cycle division phases. Cell division involves the tightly regulated, ordered events of the cell cycle. A new cell cycle commits the cell for division and activates G1-S phase transcription. The DNA is replicated during S phase, the chromosomes are condensed, sorted and passed on to the new daughter cells during M phase. The GO phase is a state of irreversible or reversible. replicative dormancy (Quiescence) (Adapted from Foley and Kapoor, 2013).
1.1.1.1 Cyclin-dependent kinases
In higher eukaryotes, the restriction of replication was initially described in 1974
(Pardee, 1974; Blagosklonny and Pardee, 2002). This process occurs via the
Page | 3
sequential assembly of the replication initiation complex in G1, and the regulation of
origin firing in S phase by cyclin-dependent kinases (CDK). The activity of CDKs is
dependent on the binding with cyclin protein family members (Tanaka and Araki,
2011). The cyclin/Cdk complexes are a family of conserved heterodimeric
serine/threonine kinases which are made of a regulatory subunit known as cyclins,
and a Cdk which is the catalytic component. In higher eukaryotes five Cdks
(1,2,3,4,and 6), have been shown to be associated with cell cycle progression,
including Cdk1 which is activated by A- and B-type cyclins, Cdk2 by E- and A-type
cyclins, Cdk3 by C-type cyclins, and Cdk4 and Cdk6 by D-type cyclins (Stern and
Nurse, 1996; Morgan, 1997; Malumbres and Barbacid, 2009; Uhlmann et al., 2011;
Symeonidou et al., 2012). Interestingly, while there is some functional redundancy
of some cyclin/Cdk complexes, Cdk1 is essential. Studies have shown in yeast,
mice and flies that Cdks are required for proliferation, survival, and have a role in
polarity regulation as well (Coudreuse and Nurse, 2010; Noatynska et al., 2013).
1.1.2 Replication initiation
The initiation of DNA replication is an important regulatory step to ensure activation
occurs appropriately to prevent over-replication, which would lead to possible
heterogeneity and therefore loss of genome integrity, lethality and severe diseases,
including cancer. In eukaryotes origins of replication initiate chromosomal DNA
replication (Tanaka and Araki, 2011; Chen at al, 2018; Kang et al, 2018)
1.1.2.1 Replication initiation; RECQL4
During cell division, the onset of DNA synthesis requires the interaction of initiator
proteins at the site of replication initiation, prior to the loading of the replication
machinery. These sites are referred to as replication origins (Leonard and Méchali,
2013). Replication origin activation a conserved chain of events. The first step is
called licensing, and generates the specific protein-origin DNA complex, the pre-
replicative complex (pre-RC) (see Figure 1.1-b) (Tanaka and Araki, 2011). The
protein part of the Pre-RC comprises the hexameric origin recognition complex
(ORC). The binding of ORC is followed by the recruitment of additional factors. The
complex contains Cdc10-dependent transcript 1 (Cdt1), Cdc6, which further recruits
the Mcm2–7 (Minichromosome Maintenance: MCM) replicative helicase (Tatiana
and Bakkenist, 2018). The accumulation of Cdt1 promotes the formation of pre-RC
(Ballabeni et al., 2013). During late mitosis, and G1 phase of the cell cycle the pre-
Page | 4
RC assembles at origins by the loading of Mcm2-7 as an inactive helicase complex
(see Figure 1.1-b).
Initiation is the second step reaction that occurs at the transition from G0 to S cell
cycle phase, activating the pre-RC (Tanaka and Araki, 2011). Pre-RCs are
activated by conversion into pre-initiation complexes (pre-ICs), via recruitment of
initiation factors (Symeonidou et al., 2012), the Cdc7-Dbf4 (DDK), and S-phase
cycling dependent kinases (S-CDK); Cdk2-cyclinE (see Figure 1.1-b) (Labib, 2010).
The origin firing is triggered by the phosphorylation events of DDK and S-CDK,
which promotes the binding of the cdc45 initiator factor, in the presence of Mcm10,
TopBP1 and the GINS complex (Labib, 2010). The protein Treslin associates with
TopBP1 in a Cdk2-dependent manner, mediating the loading of Cdc45 onto the
replication origins (Kumagai et al., 2010). It has been suggested that the
participation of RECQL4 in nuclear DNA replication occurs due to its N terminal
domain, which resembles Sld2; a protein in yeast with a crucial role in DNA
replication. The study by Ohlenschläger et al., (2012) demonstrated that the N-
terminus of RECQL4 adopts a fold, similar to that of homeodomains. This domain
serves as a DNA binding module and is also implicated in the interaction with human
replication factor TopBP1. TopBP1 a key mediator crucially involved in DNA
replication initiation and is involved in the formation of the active replicative helicase
complex on replication origins, (see Figure 1.1-b) (Sanchez et al., 1999;
Ohlenschläger et al., 2012; Tanaka et al., 2013). MCM10 interacts with RECQL4,
enabling the localization of RECQL4 to the origins (Im et al., 2015), and the
association of RECQL4 with the MCM2-7 complex (see Figure 1.1-b) (Xu et al.,
2009b). The MCM2-7 complex plays an important central role as the replicative
DNA helicase by acting as a DNA unwinding enzyme both during DNA replication
initiation and elongation (Labib et al., 2000; Forsburg, 2004). The process of
unwinding the double-stranded DNA is catalysed by the replicative helicase
Cdc45/MCM2–7/GINS (CMG) complex, the defining step in replication initiation
(Muramatsu et al., 2010; Sengupta et al., 2013; Medagli et al., 2016) and leads to
polymerase loading (Labib, 2010) (Figure 1.1-b). For processive DNA synthesis;
two sister replisomes are formed at each origin, and proceed bidirectionally along
the DNA following the recruitment of additional replication factors to the CMG (Aria
and Yeeles, 2019). At the end of mitosis, the degradation of geminin is required for
initiating a new round of licensing. Geminin is a negative regulator of licensing by

Page | 5
binding to Cdt1 (Figure 1.1-b) (Nishitani and Lygerou, 2002; Symeonidou et al.,
2012; Ballabeni et al., 2013).
Page | 6
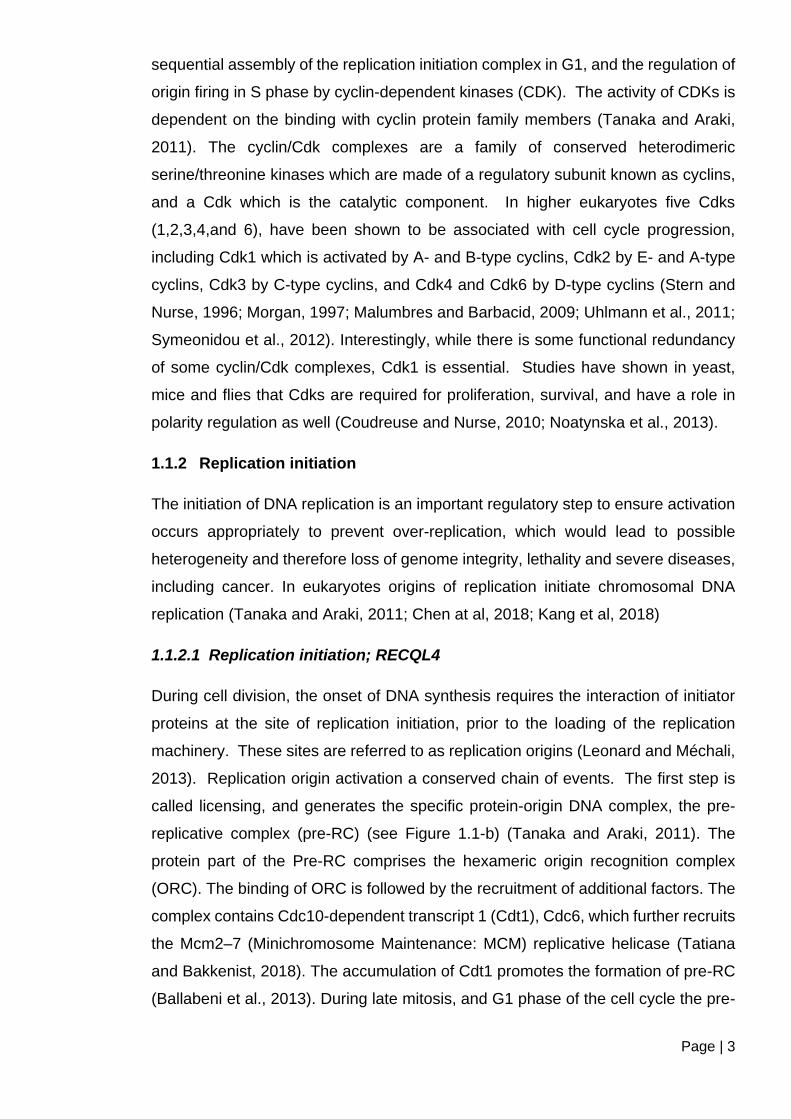
Figure 1.1-b DNA replication licensing and the initiation steps, in budding yeast and human cells, based primarily on studies in budding yeast and analogies drown for human cells. At the late M and G1 phases of the cell cycle the sequential loading of ORC, Cdc6 and Cdt1proteins onto the chromatin recruits the MCM2-7 hexameric helicase to the replication origins, generating the assembly of pre-replicative complex (pre-RC). Other proteins associate with the DNA replication origins (Pre-IC assembly), and the formation of the preinitiation complex (Pre-IC) occurs following phosphorylation by DDK and CDK kinase. This leads DNA unwinding and polymerase loading; Pol, α Pol ε and Pol δ, initiating DNA replication (Moiseeva and Bakkenist, 2018)
Page | 7
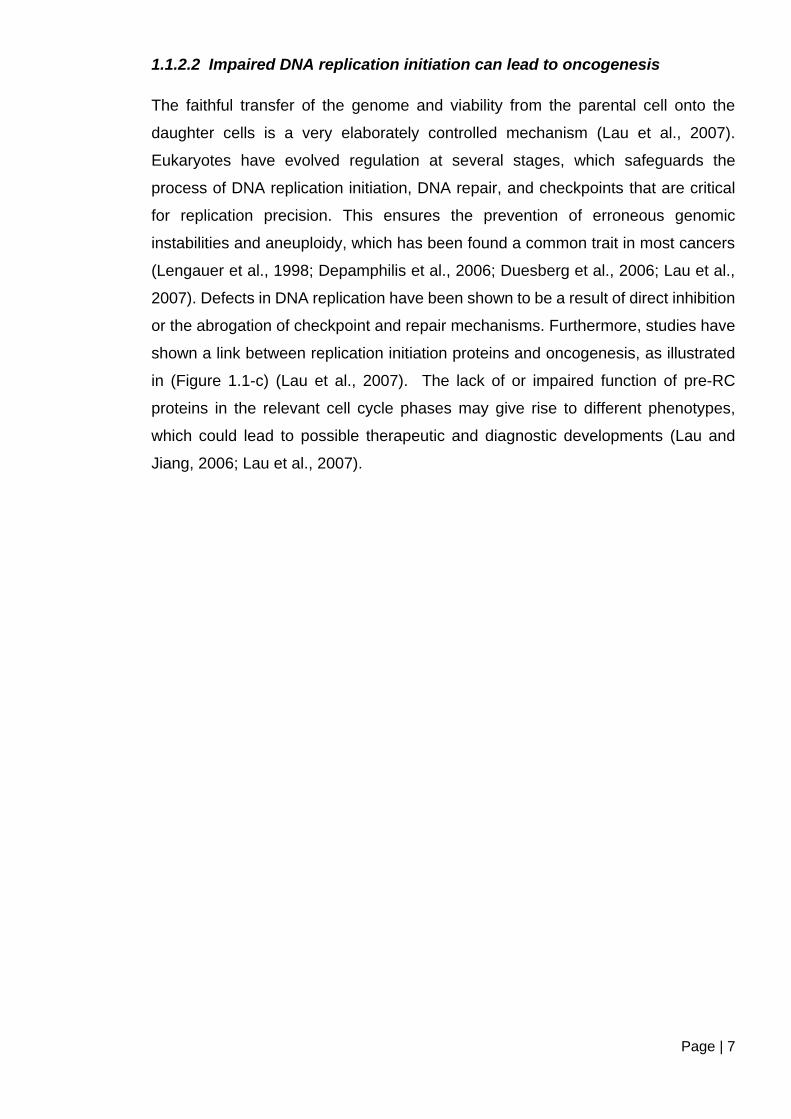
1.1.2.2 Impaired DNA replication initiation can lead to oncogenesis
The faithful transfer of the genome and viability from the parental cell onto the
daughter cells is a very elaborately controlled mechanism (Lau et al., 2007).
Eukaryotes have evolved regulation at several stages, which safeguards the
process of DNA replication initiation, DNA repair, and checkpoints that are critical
for replication precision. This ensures the prevention of erroneous genomic
instabilities and aneuploidy, which has been found a common trait in most cancers
(Lengauer et al., 1998; Depamphilis et al., 2006; Duesberg et al., 2006; Lau et al.,
2007). Defects in DNA replication have been shown to be a result of direct inhibition
or the abrogation of checkpoint and repair mechanisms. Furthermore, studies have
shown a link between replication initiation proteins and oncogenesis, as illustrated
in (Figure 1.1-c) (Lau et al., 2007). The lack of or impaired function of pre-RC
proteins in the relevant cell cycle phases may give rise to different phenotypes,
which could lead to possible therapeutic and diagnostic developments (Lau and
Jiang, 2006; Lau et al., 2007).
Page | 8
Figure 1.1-c Impairment of Pre-RC/DNA replication proteins and its involvement in oncogenesis. Impaired function of pre-RC proteins can result in incomplete DNA replication leading to cell death or chromosomal instability by reducing licensed origins. De-regulation can lead to re-firing, which if undetected can lead to subsequent amplifications and aneuploidy (Lau et al., 2007).
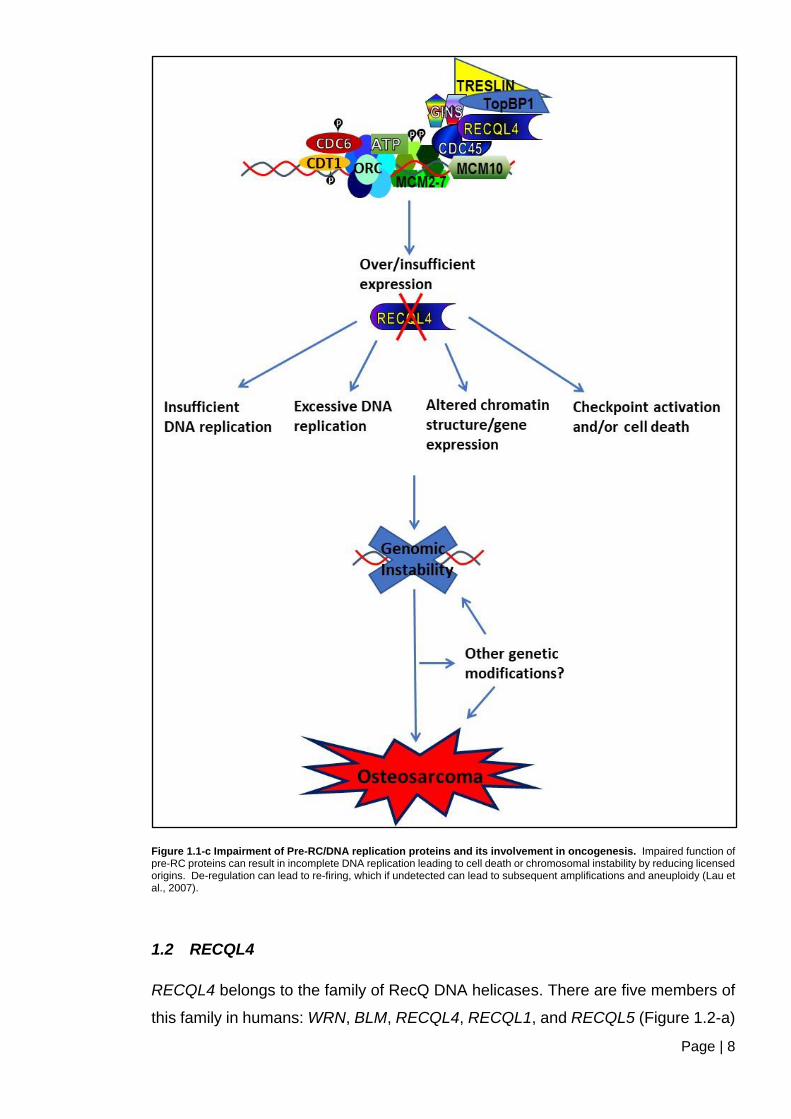
1.2 RECQL4
RECQL4 belongs to the family of RecQ DNA helicases. There are five members of
this family in humans: WRN, BLM, RECQL4, RECQL1, and RECQL5 (Figure 1.2-a)
Page | 9
(Kitao et al., 1999b; Croteau et al., 2012b). The RecQ helicase family is highly
conserved, and along with other proteins such as BRCA1 and BRCA2 have been
termed ‘the guardians of the genome’ due to their involvement in DNA metabolism
related processes including repair, homologous recombination or replication fork
restart, replication, transcription, and chromatin organization (Croteau et al., 2012b;
Larsen and Hickson, 2013; Nahhas et al, 2018). The RECQL4 gene was first cloned
and mapped to chromosome 8q24.3 by Kitao et al (1999a). RECQL4 is a small gene
of 6.5 kb, with 21 exons and with most introns less than 100 bp in length (Kitao et
al., 1999a; Wang et al., 2002a). The gene encodes a 1208 amino acid protein.
Unlike other human RecQ helicases, RECQL4 lacks the RecQ carboxy-terminal
(RQC), and helicase RNaseD C-terminal (HRDC) domains (Figure 1.2-a)
(Ohlenschläger et al., 2012).
Figure 1.2-a Structural organization of human RecQ helicases. RecQ helicase members possess a highly-conserved helicase domain (pink). The nuclear localization signal (greyish-blue) is present mostly at the C-terminus, RECQL4 is an exemption, which has two nuclear targeting sequences (NTS1 and NTS2) that are present at the N-terminus. The N-terminus of RECQL4 shows sequence similarity with the Sld2 protein in yeast that is important for DNA replication and cell viability. A putative mitochondrial targeting sequence is present at the N-terminus of RECQL4. The location of some of the known RECQL4 mutations are depicted. * Mutations shared by RTS and BGS (Adapted image, from Croteau et al., 2012; Sidorova and Monnat., 2015.
Page | 10
1.2.1 Biochemical activity of RECQL4
Studies have highlighted roles and functions of RECQL4, including DNA strand-
annealing activity and ATPase activity activated by ssDNA. RECQL4 has also been
shown to be involved in DNA repair (Yin et al., 2004; Macris et al., 2006; Maire et
al., 2009) and is capable of unwinding various DNA structures (Xu and Liu, 2009a).
RECQL4 was thought not to possess DNA helicase activity, unlike other members
of the RecQ helicases (Yin et al., 2004; Macris et al., 2006). However, RECQL4 was
shown to possess in vitro 3′→5’ helicase activity by other authors, which might have
been masked by strand annealing activity (Xu and Liu, 2009a; Capp et al., 2010;
Croteau et al., 2012b; Larsen and Hickson, 2013). It has been suggested that there
is a second helicase activity harboured at the 400 amino-terminal amino acid by a
study by Xu and Liu, (2009), even in the absence of notable nucleotide binding and
helicase motifs (Xu and Liu, 2009a).
1.2.2 RECQL4 localisation
Northern blotting analysis showed high expression in human thymus, testis, and
placenta, with moderate expression in the heart, brain, colon, and the small
intestines. Peak of expression is seen at S-phase of the cell cycle (Yin et al., 2004;
Dietschy et al., 2009; Croteau et al., 2012a). Within the RecQ helicase family,
RECQL4 is the only known to be found both in the nucleus and cytoplasm (Yin et
al., 2004; Petkovic et al., 2005; Burks et al., 2007). It localizes predominantly to the
nucleoplasm, with fraction to telomeres and nucleolus, and more recently found
inside the mitochondria (Croteau et al., 2012a). A study by Burks et al., (2007),
identified two nuclear targeting signals located in the N-terminus; NTS1 amino acids
37–66 and NTS2 amino acids 363-492, of RECQL4 (Burks et al., 2007). The
acetylation of RECQL4 by histone acetyltransferase p300 has been shown to lead
to localisation of RECQL4 to the cytosol from the nucleus (Dietschy et al., 2009). A
study by Chi et al., (2012) reported the identification of nuclear exporting signals
pNES2 and pNES3 at the C-terminus. Diminished cytoplasmic localization was
observed following pNES2 deletion. They also found that in the presence of
functional pNES2 RECQL4 cytoplasmic fraction was enriched following the addition
of ubiquitination tail at the C-terminus. Using immunofluorescence Chi et al., (2012)
demonstrated cytoplasmic RECQL4 to be located within the mitochondria,
suggesting a regulatory role in mitochondrial DNA (mtDNA) copy number
maintenance. An increase in mtDNA copy number was demonstrated in HEK293
Page | 11
cells following RECQL4 expression elevation, while RECQL4 knockdown in U2OS
cells resulted in a decrease in mtDNA copy number. In RECQL4 deficient human
fibroblasts and RECQL4 suppressed cancer cells mitochondrial superoxide
production and a decrease in repair function was reported following oxidative DNA
damage, further demonstrating the role of RECQL4 in mitochondrial stability (Chi et
al., 2012). The intracellular distribution and dynamic relocalization of RECQL4 to
sites of DNA damage has suggested a possible contribution to the phenotypes, and
associated heterogeneity, which has been found in RECQL4-associated diseases
(Croteau et al., 2012a).
1.2.3 Mutations in the RECQL4 gene
Almost half of the mutations in RECQL4, representing missplicing, nonsense, or
frameshift mutations, occur before or in regions coding for the helicase domain
suggesting that the helicase domain is critical for accurate function of the protein
(Siitonen et al., 2009; Larizza et al., 2010; Kohzaki et al., 2012). Most of the
mutations are predicted to cause a truncated protein (Kitao et al., 1998; Larizza et
al., 2010; Wang et al., 2017a).
DT40 cells with homozygous deletions of the RECQL4 gene failed to proliferate,
however rescue was achieved by ectopic expression of the N-terminal Sld2-like
domain leading to proliferation. This suggests that the C-terminus, including the
helicase domain is not essential for cell proliferation (Abe et al., 2011). However,
other studies suggest the C-terminus as well as the helicase domain to be a
requirement for DNA replication (Sangrithi et al., 2005; Matsuno et al., 2006; Capp
et al., 2009). The knockout of the Recql4 gene entirely, or the part encoding the
Sld2-like N-terminus has been found to lead to embryonic lethality in mice and flies
(Hoki et al., 2003; Sangrithi et al., 2005; Matsuno et al., 2006; Xu et al., 2009a).
RECQL4 mutations (Figure 1.2-a) give rise to autosomal recessive overlapping
diseases in humans: Rothmund–Thomson syndrome (RTS, OMIM #268400)
RAPADILINO (RAPA, OMIM #266280), and Baller–Gerold syndrome (BGS, OMIM
#218600). The majority of mutations detected have been found to be 3’ to the codon
of amino acid 496 (Larizza et al., 2010). The loss of helicase domain causes a
severe phenotype reminiscent of RTS (Mann et al., 2005). Studies have suggested
that the mutations found within the RECQL4 protein in RTS individuals permit partial

Page | 12
activity (hypomorphic), even though the expression may be detected at very low
levels (Ouyang et al., 2008).
1.2.3.1 Baller-Gerold (BGS) syndrome
BGS is inherited in an autosomal recessive manner and was first described in 1950.
Its hallmark presentations include radial aplasia/hypoplasia and craniosynostosis.
Craniofacial manifestations are not seen in all patients (Petkovic et al., 2005; Van
Maldergem et al., 2006). The Hallmark feature of RTS, poikiloderma, is also found
in patients with BGS (Petkovic et al., 2005). The most frequent mutations of
RECQL4 are the R1021W missense, and the 2886 delta T frameshift mutations of
exon 9 (Van Maldergem et al., 2006).
1.2.3.2 RAPADILINO syndrome
RAPADILINO is an autosomal recessive disease, involving RECQL4 mutations, and
was originally described in Finland in 14 patients. The acronym RAPADILINO
stands for the characteristic clinical features often presented: RAdial hypo-/aplasia,
Patellae hypo-/aplasia and cleft or highly arched PAlate, DIarrhoea and DIslocated
joints, LIttle size and LImb malformation, NOse slender and NOrmal intelligence.
Patients most commonly represent in-frame deletions of exon 7, which is thought
not to affect the helicase domain (Siitonen et al., 2003). Interestingly, while there
are overlaps in RTS and RAPADILINO symptoms, joint dislocations and patellar
hypo/aplasia, found to be more common in female RAPADILINO patients, are not
characteristic to RTS (Kellermayer et al., 2005; Van Maldergem et al., 2006).
Around 7% have been found to develop tumours, mainly lymphomas and
osteosarcoma (Kellermayer et al., 2005; Siitonen, 2008).
1.2.3.3 Rothmund Thomson Syndrome (RTS)
RTS was first described by Rothmund in 1868, characterising it as a familial
occurrence of skin changes with bilateral juvenile cataracts. In 1936 Thompson
reported subsequent cases, and in 1957 it was suggested by Taylor that these were
of the same disease (Rothmund, 1868; Thomson, 1936; Taylor, 1957). RTS is a
rare autosomal recessive genodermatosis, therefore both parents of proband are
obligate heterozygotes, leaving the siblings a 25% chance of being affected, 25%
chance of not being carriers, and a 50% chance of being carriers but asymptomatic.

Page | 13
RTS patients appear to be phenotypically and genetically heterogeneous (Wang et
al., 2003; Larizza et al., 2006; Larizza et al., 2010).
Recurrent RECQL4 mutations have been found to include exon 9 c.1573delT
(p.Cys525AlafsX33), which accounts for around one-third of RTS mutations. This
mutation was found in compound heterozygous patients from multiple ethnic
backgrounds (Wang et al., 2003; Larizza et al., 2010; Croteau et al., 2012b). The
amino-terminal region has an essential functional role in the cell, although not
necessarily for cell viability but can lead to severe phenotype reminiscent of RTS if
lost (Kitao et al., 1999b; Ichikawa et al., 2002; Hoki et al., 2003; Mann et al., 2005).
RTS patients have been found to have common phenotypes caused by mutations
that target the helicase domain or the C-terminal region, suggesting the C-terminus
acts as one unit (Kohzaki et al., 2012).
1.2.3.3.1 Symptoms
Pathological changes of the skin are the main hallmark characteristic presentation
seen in RTS patients (Larizza et al., 2010). Poikiloderma, a skin rash seen in RTS
patients, usually presented around the age of 3-6 month and typically the pattern of
spread involves the cheeks, and then to other extremities, sparing the trunk and
abdomen. The rash is sun-sensitive with redness and blisters, involving patches of
skin. The patient may develop variable pigmentation, atrophy; areas of thinning of
the skin, and telangiectases; small clustering of blood vessels under the skin. This
presentation is a crucial criterion for diagnosing RTS (Pujol et al., 2000; Wang et al.,
2001; Beghini et al., 2003; Larizza et al., 2010). Ectodermal dysplasia is often seen
in type I RTS (Larizza et al., 2010). Ectodermal dysplasia was previously defined
as a congenital disorder presenting with alterations in at least to ectodermal
structures including the hair, teeth, nails, or sweat glands (Freire-Maia, 1971). The
classification has been modified to include gene defects and clinical manifestations
(Visinoni et al., 2009). Sparse or absent hair, eyelashes and eyebrows is a common
feature. In a cohort of 41 RTS sufferers, 50% and 73% of the patients presented
with sparse, brittle, thin or absent scalp hair and sparse hair on eyelashes and/or
eyebrows, respectively (Wang et al., 2001). Poorly formed and dystrophic nails
(Larizza et al., 2010), and dental abnormalities were first described in the early study
of 1868, and are also common features (Rothmund, 1868).
Ocular lesions are often present, with rapid onset of bilateral cataracts is the most
common ocular sign (Nathanson et al., 1983; Stinco et al., 2008).
Page | 14
Rothmund-Thomson syndrome does not appear to show cognitive impairment
(Larizza et al., 2010), however, one patient has been recorded in the literature with
sensorineural deafness (Beghini et al., 2003).
Haematological signs have been reported, ranging from myelodysplasia to aplastic
anaemia, and leukaemias have also been identified (Rizzari et al., 1996; Knoell et
al., 1999; Porter et al., 1999; Narayan et al., 2001; Pianigiani et al., 2001).
The loss of or underdeveloped bone and reduced growth syndromes leading to
patterning-like phenotype are often referred to as “dysostoplasias”. They can occur
following genetic defects leading to defects in mesenchymal condensation and/or
differentiation (Mundlos and Olsen, 2002). Radial ray defects appear to follow all
three overlapping RECQL4 mutation disorders; BGS, RTS, and RAPADILINO
(Siitonen et al., 2003; Larizza et al., 2006; Van Maldergem et al., 2006; Burks et al.,
2007; Larizza et al., 2010). An early review has reported about 68% of the patients
were found to display skeletal anomalies, including frontal bossing, saddle nose and
abnormalities of the long bones (Vennos et al., 1992; Wang et al., 2003). A latter
study of 28 subjects found around 75% of patients with RTS presented at least one
skeletal abnormality (Mehollin-Ray et al., 2008). In at least two-third of patients low
birth weight, slow weight gain, and linear growth deficiency are present, and they
are proportionally small (Wang et al., 2001). Those patients without RECQL4
mutations and RTS appear to share some similar symptoms including skeletal
abnormalities, however, those patients with RECQL4 mutations and RTS show a
higher percentage of presenting with small stature, sparse brows or lashes, and
radial ray defects (Radial hypo/aplasia and/or aplastic/hypoplastic thumbs. The
symptoms of RTS patients have been shown to involve highly proliferative cells,
including developing teeth, nails, skin, intestines and blood (Larizza et al, 2010;
Wang and Plon, 2019). Involvement of RECQL4 in DNA replication initiation could
explain this, suggesting RECQL4 may be important for viability of highly proliferative
cells. The dysfunction of RECQL4 could lead to reduced cellular proliferative
potential, leading to tissue damage and a lower potential for tissue regeneration,
and the development of pathological disorders, such as RTS (Lu et al, 2014).
1.2.3.3.2 Diagnosis
The symptoms of RTS are relatively non-specific, leading to clinical diagnostics
criteria to be variable. Clinical diagnosis is therefore based on the time of onset,
spreading, and clinical presentation of the characteristic poikiloderma. The
Page | 15
probability of an RTS diagnosis, according to is determined by an atypical rash and
the presence of two of the following signs: short stature, congenital bone defects,
sparse hair found on the scalp, eyebrows, and eyelashes, abnormalities of the teeth
and nails, cataracts, and hyperkeratosis. RTS diagnosis is usually considered in
patients with osteogenic sarcoma, especially if presenting with skin changes
(Nahhas et al, 2018; Wang and Plon 2019). RTS molecular genetic tests currently
include sequence analysis/mutation scanning to identify point mutations in the
RECQL4 gene, and deletion/duplication analysis for the detection of partial or whole
genome deletions in cytogenetic testing. Lymphocytes or skin fibroblasts can reveal
chromosome 8 abnormalities: trisomy 8, tetrasomy 8q, partial 8q duplication, and
isochromosome 8q (Wang and Plon, 2016). It has been suggested that primary
defects of the replication and repair functions of RecQ helicase mutant cells,
chromosomal instability is a secondary occurrence (Bachrati and Hickson, 2008).
Chromosomal instabilities are not a hallmark feature, however, to act as an adjunct
to clinical diagnosis, nevertheless, when found it appears as distinctive mosaic
aneuploidies and isochromosomes (Larizza et al., 2006).
1.2.3.3.3 Subtypes
There are two subtypes of RTS based on molecular and clinical analysis: type I and
type II. Type I is characterised by poikiloderma, ectodermal dysplasia, and juvenile
cataracts and shows no RECQL4 mutations on gene analysis. The aetiology of
these cases is unknown, gene mutations have not been associated. Those patients
with type II RTS have documented RECQL4 mutations with an associated risk of
malignancy, and characterised further by poikiloderma and congenital bone defects
(Wang et al., 2003; Larizza et al., 2010; Croteau et al., 2012b). Mutations may
render the RECQL4 protein in RTS individuals partially active, even though the
expression may be detected at very low levels (Ouyang et al., 2008). It is unclear if
the two types of RTS represent different syndromes demonstrating similar clinical
features, or the possibility of involving different genes linking to the same pathway
(Larizza et al, 2010), suggesting a link between RECQL4 and cancer predisposition
in RTS patients.
Page | 16
1.2.4 RTS and cancer predisposition
Cancer is a developmental process, and cancer cells are formed following complex
cell transformation, often due to mutations or DNA-rearrangements which
undermine the former cellular phenotype. This generates a cell population with
large variability in gene expression, chromatin organisation, and interactome
composition formation (Huang et al., 2009b; Greaves and Maley, 2012; Huang,
2013; Wang et al., 2013a; Wang et al., 2013b)
RTS patients can present with multiple malignancies, in particular osteosarcoma
(Dick et al., 1982; Varughese et al., 1992; Drouin et al., 1993). Studies have shown
susceptibility can also be induced by chemotherapy (Simon et al., 2010; Carlson et
al., 2011). Around two thirds of patients with mutations in RECQL4 have RTS (Wang
et al, 2003; Siitonen et al., 2009; Larizza et al, 2010; Croteau et al, 2012). A clinical
cohort study looked at 41 RTS patients and found 30% diagnosed with
osteosarcoma (Wang et al., 2001). The median age of diagnosis of osteosarcoma
is 11 years in RTS patients, which is slightly lower than those in general public
without RTS (Lindor et al., 2000; Wang et al., 2001), suggesting RTS as a premature
aging syndrome that may lead to cell susceptibility to OS (Croteau et al., 2012b;
Larsen and Hickson, 2013). Proliferative defects could lead to tissue damage and
reduced regeneration, leading to many of the symptoms associated with RTS (Lu et
al, 2014). This could also link the age of OS development occurring in younger
patients in those with RTS (Lindor et al., 2000; Wang et al., 2001). RTS type II
patients have demonstrated a second peak of incidence of OS in the elderly (Unni,
1996; Dorfman and Czerniak, 1998). OS in older patients have also demonstrated
worse prognosis (Longhi et al., 2008). Epithelial tumours including squamous cell
and basal cell carcinomas, Bowens disease, and melanoma of the skin have also
been demonstrated in some RTS patients (Wang et al., 2001; Wang et al., 2003;
Howell and Bray, 2008). Skin malignancy may be related to skin sensitivity, and
use of sunscreen protection is recommended (Kiss and Anstey, 2013; Morales‐
Sánchez et al., 2016). The development of skin cancers can occur at any age,
however, often presented earlier in RTS patients (Stinco et al., 2008). Interestingly,
many RTS patients develop more than one tumour of the same or of different type.
This supports RTS as a cancer predisposition syndrome (Hees et al., 1996; Stinco
et al., 2008).
Page | 17
The burden of cancer correlates with the increase of the age of the population
(Jones et al., 2012). The biological functions of the association of aging and cancer
is not yet fully understood. Aging leads to physiological deterioration which
contributes to the development of some human cancers (Kennedy et al., 2014), and
could be a driver of the significance risk of cancer development seen on premature
aging diseases (Figure 1.2-b).

Page | 18
Figure 1.2-b– Schematic linking premature/normal aging and cancer development. Mutations can lead to premature aging syndromes. Key hallmarks of aging include; telomere attrition, mitochondrial dysfunction, genomic instability, loss of proteostasis, epigenetic alterations, stem cell exhaustion, cellular senescence, deregulated nutrient sensing, and altered intercellular communication. This could lead to cell susceptibility driving cancer development (Anisimov, 2009; López-Otín et al., 2013).
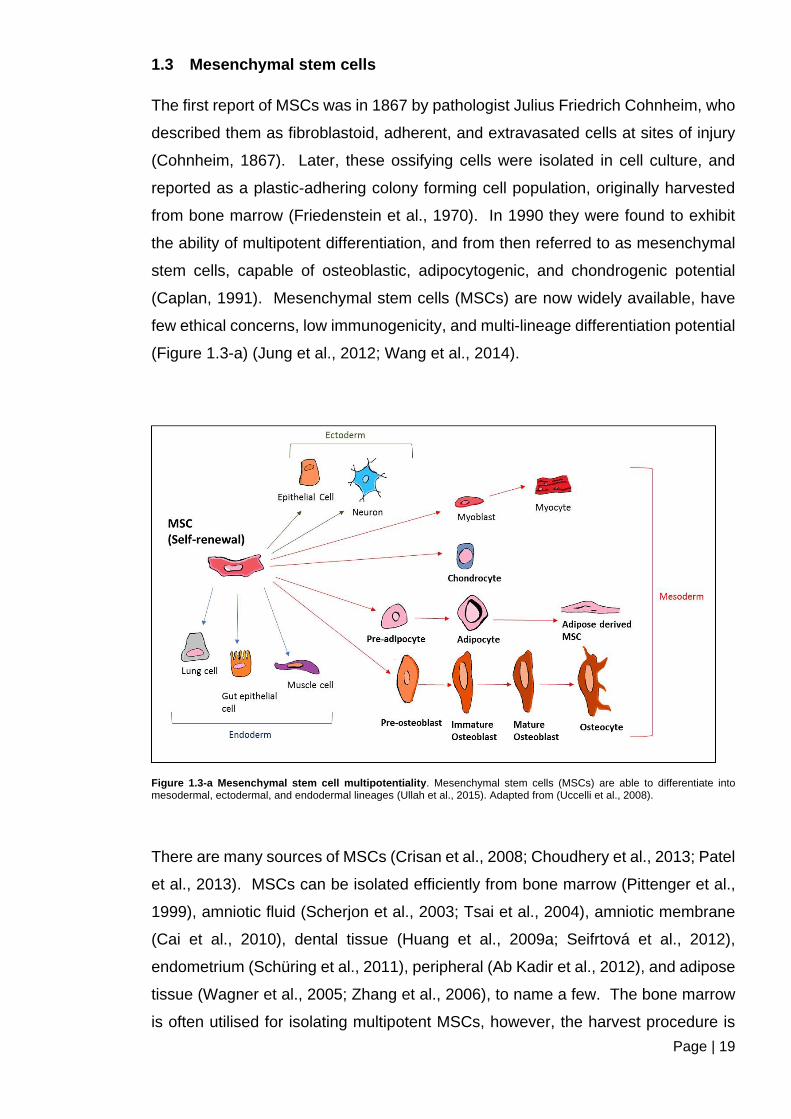
Page | 19
1.3 Mesenchymal stem cells
The first report of MSCs was in 1867 by pathologist Julius Friedrich Cohnheim, who
described them as fibroblastoid, adherent, and extravasated cells at sites of injury
(Cohnheim, 1867). Later, these ossifying cells were isolated in cell culture, and
reported as a plastic-adhering colony forming cell population, originally harvested
from bone marrow (Friedenstein et al., 1970). In 1990 they were found to exhibit
the ability of multipotent differentiation, and from then referred to as mesenchymal
stem cells, capable of osteoblastic, adipocytogenic, and chondrogenic potential
(Caplan, 1991). Mesenchymal stem cells (MSCs) are now widely available, have
few ethical concerns, low immunogenicity, and multi-lineage differentiation potential
(Figure 1.3-a) (Jung et al., 2012; Wang et al., 2014).
Figure 1.3-a Mesenchymal stem cell multipotentiality. Mesenchymal stem cells (MSCs) are able to differentiate into mesodermal, ectodermal, and endodermal lineages (Ullah et al., 2015). Adapted from (Uccelli et al., 2008).
There are many sources of MSCs (Crisan et al., 2008; Choudhery et al., 2013; Patel
et al., 2013). MSCs can be isolated efficiently from bone marrow (Pittenger et al.,
1999), amniotic fluid (Scherjon et al., 2003; Tsai et al., 2004), amniotic membrane
(Cai et al., 2010), dental tissue (Huang et al., 2009a; Seifrtová et al., 2012),
endometrium (Schüring et al., 2011), peripheral (Ab Kadir et al., 2012), and adipose
tissue (Wagner et al., 2005; Zhang et al., 2006), to name a few. The bone marrow
is often utilised for isolating multipotent MSCs, however, the harvest procedure is
Page | 20
highly invasive, and the quantity, differentiation potential, and lifespan has been
reported to decline with age (Nishida et al., 1999; Mueller and Glowacki, 2001;
Stenderup et al., 2003). Adipose tissue is easier to obtain as less invasive then
many other sources, such as the bone marrow. Adipose tissue has been identified
with relatively high abundance of stem cells (Dicker et al., 2005; Fraser et al., 2006).
Large quantities of adipose tissue can be isolated following liposuction, therefore
attractive for requirements of large scale productions of MSCs (Zuk et al., 2002;
Wang et al., 2014). MSCs from different sources have been shown to demonstrate
variations on proliferation rates, and suggested that human umbilical cord
mesenchymal stem cells (HUC-MSCs) have highest proliferation potential
(Choudhery et al., 2013; Wang et al., 2014). However, these are more difficult to
obtain, compared to adipose derived cells. The success of isolation has also been
reported to be variable (Erices et al., 2000; Goodwin et al., 2001; Mareschi et al.,
2001; Wexler et al., 2003; Bieback et al., 2004; Kögler et al., 2004; Lee et al., 2004).
MSCs hold typical characteristics, such as fibroblast like morphology, formation of
fibroblastoid colony-forming units, differentiation ability, and expression of certain
classical markers. MCSs have been found to be positive for markers CD44, CD105,
CD73, and CD90, and negative for CD3, CD14, CD19, CD34, and CD45
(Choudhery et al., 2013; Wang et al., 2014). However, studies have found some
controversy, with different marker expression seen (Kern et al., 2006). MSCs are
defined by the International Society for Cellular Therapy as holding specific
characteristics. The criteria include: exhibiting plastic adherence, specific set of cell
surface markers (as listed above), and have the ability to differentiate in vitro into
adipocytes, chondrocytes and osteoblasts (Dominici et al., 2006; Bourin et al.,
2013).
The ability to differentiate is dependent on MSC type (Cohen and Chen, 2008),
involving signalling pathways and transcription factors promoting lineage selection.
Some of these well regulated pathways include Wnt (Clevers et al., 2014; Park et
al., 2015), Hedgehog (Spinella-Jaegle et al., 2001; Deng et al., 2008; Fontaine et
al., 2008), Notch (Deng et al., 2008; Lin and Hankenson, 2011; Shimizu et al., 2011;
Song et al., 2015), chemical factors, and physical factors; ECM, integrins, cell
shape, external mechanical forces, geometric structures such as contractile
cytoskeleton (Engler et al., 2006; Chen et al., 2016).
Page | 21
1.3.1 Bone formation
The bone holds many roles in the human body. Functions of the bone include the
maintaining of calcium levels in the blood, establishing and maintaining the
mechanical support of soft tissue, and skeletal structure; growth and support, acting
as levers in muscle action, supporting the process of haematopoiesis, acting as a
hold surrounding the brain and spinal cord. Bone tissue is unlike other tissue, in
respect to its ability to regenerate rather than heal (Marzona and Pavolini, 2009).
Bone is a very dynamic form of tissue that undergoes a constant state of remodelling
under normal conditions, in response to changes that include hormone levels,
growth factors, and mechanical load. The efficiency of bone structure is dependent
on the biochemical properties of different bone components (Ducy et al., 2000).
There are three main types of bone cells: osteoblasts, osteocytes and osteoclasts,
which work collectively coordinating bone maintenance (Curtis et al., 2016). There
is a finely regulated balance in bone structure formation that involves the deposition
of bone extracellular matrix (ECM), hydroxylapatite [Ca5(PO4)3(OH)] crystals on the
collagen fibres, by differentiated osteoblasts and resorption by osteoclast
Boonrungsiman et al., 2012; Luukkonen et al, 2019). Osteocytes occupy single
lacunae and hold an extensive network of dendritic processes. They act as a
mechanosensory system around Haversian canals allowing communication
between neighbouring osteocytes directly via Cx43 at gap junctions, or through
endocrine, paracrine (receptor activator of nuclear factor-kappa B ligand (RANKL))
and autocrine signalling factors, crucial for bone modelling and remodelling
(Yellowley et al., 2000; Curtis et al., 2016). Defects in osteoblasts be it qualitative or
quantitative, acquired or inherited, would lead to disruption of bone maintenance
causing many pathophysiological presentations, such as short stature, bone
fragility, osteoporosis, and metabolic bone disease (Ducy et al., 1999).
Macrophages hold a known role in repair and inflammation. Interestingly, they are
also found within the developing marrow cavity in normal bone. Macrophages, like
osteoclasts are of monocytic lineage. The function of macrophages in the bone is
not fully understood, as they have not been found to co-localise with osteoclasts
(Godwin et al., 2013). They may promote osteoblast differentiation leading to repair
and maintenance of bone density (Vi et al., 2015).
Throughout life this maintenance is achieved through the process of continuous
tissue renewal known as remodelling (Figure 1.3-b), which occurs asynchronously
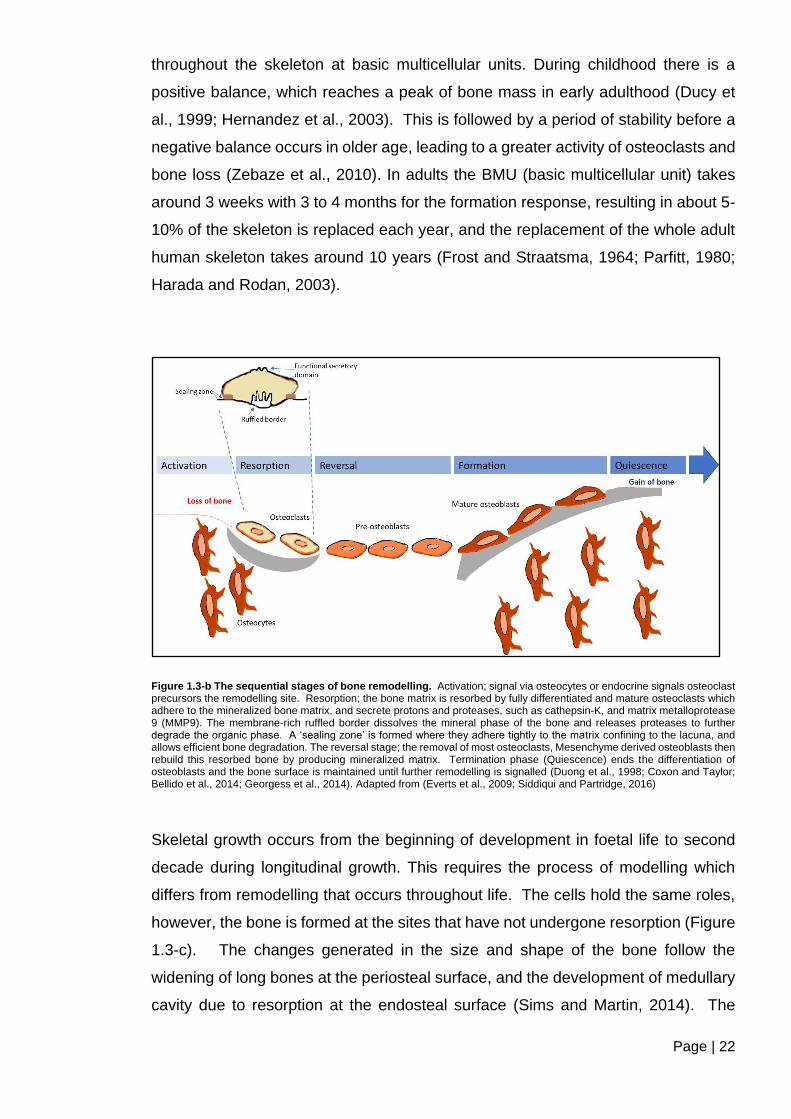
Page | 22
throughout the skeleton at basic multicellular units. During childhood there is a
positive balance, which reaches a peak of bone mass in early adulthood (Ducy et
al., 1999; Hernandez et al., 2003). This is followed by a period of stability before a
negative balance occurs in older age, leading to a greater activity of osteoclasts and
bone loss (Zebaze et al., 2010). In adults the BMU (basic multicellular unit) takes
around 3 weeks with 3 to 4 months for the formation response, resulting in about 5-
10% of the skeleton is replaced each year, and the replacement of the whole adult
human skeleton takes around 10 years (Frost and Straatsma, 1964; Parfitt, 1980;
Harada and Rodan, 2003).
Figure 1.3-b The sequential stages of bone remodelling. Activation; signal via osteocytes or endocrine signals osteoclast precursors the remodelling site. Resorption; the bone matrix is resorbed by fully differentiated and mature osteoclasts which adhere to the mineralized bone matrix, and secrete protons and proteases, such as cathepsin-K, and matrix metalloprotease 9 (MMP9). The membrane-rich ruffled border dissolves the mineral phase of the bone and releases proteases to further degrade the organic phase. A ‘sealing zone’ is formed where they adhere tightly to the matrix confining to the lacuna, and allows efficient bone degradation. The reversal stage; the removal of most osteoclasts, Mesenchyme derived osteoblasts then rebuild this resorbed bone by producing mineralized matrix. Termination phase (Quiescence) ends the differentiation of osteoblasts and the bone surface is maintained until further remodelling is signalled (Duong et al., 1998; Coxon and Taylor; Bellido et al., 2014; Georgess et al., 2014). Adapted from (Everts et al., 2009; Siddiqui and Partridge, 2016)
Skeletal growth occurs from the beginning of development in foetal life to second
decade during longitudinal growth. This requires the process of modelling which
differs from remodelling that occurs throughout life. The cells hold the same roles,
however, the bone is formed at the sites that have not undergone resorption (Figure
1.3-c). The changes generated in the size and shape of the bone follow the
widening of long bones at the periosteal surface, and the development of medullary
cavity due to resorption at the endosteal surface (Sims and Martin, 2014). The
Page | 23
development of bone is referred to as osteogenesis. The skeleton is formed from
three distinct lineages: the somites generating the axial, the lateral plate mesoderm
generating the limb, and the cranial neural crest forming the branchial arch and
craniofacial bones and cartilage. Bone formation involves the transformation of
existing mesenchyme tissue forming bone tissue, directly referred to as
intramembranous ossification; and forming post differentiation into cartilage, which
is replaced by bone; termed endochondral ossification. In humans in long bones,
endochondral ossification forms outwards in both directions from the centre of the
bone. The cartilage ends of the long bones are called epiphyseal growth plates.
The bone continues to grow, if these areas produce chondrocytes, which are
required to proliferate and push out the cartilaginous ends of the bone (Gilbert,
2000). Intramembranous ossification involves mesenchymal cells condensing and
differentiating into osteoblasts directly, which deposit the osteoid matrix leading to
calcification, and form an outer fibrous membrane surrounding the bone known as
the periosteum. The inner surface of the periosteum is highly cellular, while the
peripheral surface is rich in vascular and neural sympathetic network, mesenchymal
progenitor cells differentiating into osteoblasts, fibroblasts and osteogenic
progenitor cells that also form an osteoid matrix, which therefore leads to layers of
bone formation (Squier et al., 1990; Gilbert, 2000; Dwek, 2010). The inner layer
has also been referred to as the cambium and found to be essential for bone growth
(Ito et al., 2001; Bilkay et al., 2008) that involves bone elongation and modelling
(Dwek, 2010). The cambium becomes thinner with age, and in adults the periosteum
is only a thin layer of tissue of which envelopes the bone structure (Allen et al.,
2004). Following terminal differentiation of osteoblasts, osteocytes become trapped
within the bone matrix and are the most abundant cell within the bone. The lifespan
of these cells is long, reported at around 25 years (Polig and Jee, 1990; Mulhern
and Van Gerven, 1997; Franz‐Odendaal et al., 2006). However, other factors
influence this, such as bone age and cell location from the surface of remodelling
(Parfitt et al., 2000; Qiu et al., 2002).

Page | 24
Figure 1.3-c Schematic diagram of the interior of a typical long bone showing the growing proximal end with a growth plate and a distal end with the epiphysis fused to the metaphysis (Jee, 1988; Zoetis et al., 2003). During growth (dashed lines) (I), the external shape of the metaphysis is maintained, (II). A constant length of the metaphysis is achieved by resorbing central trabeculae at the border between the metaphysis and the diaphysis (III). At the diaphysis level, the outer bone size expands through periosteal apposition (IV). The marrow cavity enlarges through endocortical resorption (V) (Rauch, 2012). The growth plate is divided into three well-defined zones, which disappears after puberty (Karimian et al., 2011). The resting zone contains embedded single cells or pairs of small, uniformly round in shape, and generally quiescent cells (Ballock and O'keefe, 2003; Melrose et al., 2008). Immediately beneath this zone lies the proliferative zone, the chondrocytes are flatten, and begin to divide forming parallel to the bone alignment, and synthesize collagen of types II and XI (Ballock and O'keefe, 2003). In the hypertrophic zone, the chondrocytes are larger in shape and more swollen, here they initiate terminal differentiation. The cells demonstrate reduced cell division, an increase in alkaline phosphatase activity and the synthesis of large amounts of various elements of the ECM, including type-X collagen. Elongation occurs until adulthood, when the epiphyses fuse by ossification (O'keefe et al., 1994; Scheuer and Black, 2000; Karimian et al., 2008; Karimian et al., 2011). Image adapted from (Jee, 1988; Karimian et al., 2011; Rauch, 2012; Alman, 2015).
The regulation of MSC differentiation into osteoblasts and adipocytes have been
implicated in conditions which relate to defective bone remodelling (Horwitz et al.,
1999; Kawai et al., 2012; Pino et al., 2012). An increase of bone marrow adiposity
has been seen in conditions relating to bone loss, such as aging and pathological
conditions (Justesen et al., 2001; Moerman et al., 2004; Dudley-Javoroski and
Shields, 2008; Bredella et al., 2011; Cao, 2011; Motyl et al., 2011; Cohen et al.,
2012; Mcgee‐Lawrence et al., 2016). In support of our hypothesis, studies have
suggested impaired differentiation in the osteogenic, or chondrocyte pathway may
play a role in OS development (Taitz et al., 2004; Walkley et al., 2008; Wagner et
al., 2011; Mutsaers et al., 2013; Sun et al., 2014).
Page | 25
1.4 Primary bone malignancies
1.4.1 Ewing sarcoma
Ewing sarcoma is an example of a pediatric solid tumour of the bone, derived from
mesenchymal cells (Riggi et al., 2005; Chen et al., 2015). Specific initiation by
chromosomal translocations have been reported in Ewing sarcomas, including the
t(11;22)(q24:q12) that generates the EWS-FLI1 fusion protein (Tirode et al., 2014)
the most frequent oncogenic driver (Chen et al., 2015). Ewing sarcoma presents
with a peak incidence in adolescence, but unlike OS, a second peak is not seen in
the elderly (Damron et al., 2007). The development of Ewing is thought to be
prenatal, whereas OS appears to show a link between bone growth during puberty
in its aetiology (Parkin et al., 1988; Stiller, 2007). Both commonly demonstrate fibro-
osseous lesions (Lee et al., 2012).
1.4.2 Osteosarcoma
Osteosarcoma (OS) is the most common primary bone cancer. The incidence of
OS appears to show a bimodal distribution, the first peak is associated with rapid
growth of the skeletal system, occurring during adolescence (Mirabello et al., 2009;
Yamaguchi et al., 2015). This is highlighted also as females present earlier than
males, which is linked to the earlier development age seen in females (Mirabello et
al., 2009). The second peak occurs in the elderly (Yamaguchi et al., 2015).
OS mostly occurs in the metaphyseal areas (91%) of long bones of the extremities,
including lower end of femur, upper end of the tibia, upper end of humerus, and the
upper end of the femur (descending order). Only around 9% are seen in the
diaphysis. A common site is the knee joint. The involvement with other sites of non-
long bone are less common, but the occurrence appears associated with an
increase with age (Kaya et al., 2000; Bielack et al., 2002; Cleton-Jansen et al., 2009;
Fletcher, 2014; Kundu, 2014). The characteristic radiological feature of OS is the
sun-burst appearance with periosteal lifting with a Codmans’ triangle formation,
identified by x-ray. There is usually further evidence of new bone formation in soft
tissue with a permeative pattern of destruction of bone (Resnick, 1995; Dorfman
and Czerniak, 1998; Fletcher, 2014; Kundu, 2014).
The classification of osteosarcoma is based on the predominant cell lineage, and
the extracellular matrix produced by the malignant cells (Fletcher, 2014). The most
common primary osteosarcoma is osteoblastic (osteoid matrix) accounting for about
Page | 26
50%, chrondroblastic (cartilaginous tissue) about 25%, and fibroblastic (fibrous
tissue) about 25%. Other primary classifications include small cell, telangiectatic,
low grade central, and surface osteosarcomas; parosteal, periosteal, and high-
grade surface. There are further unusual types which demonstrate similar biological
behaviour to conventional osteosarcoma such as osteoblastic osteosarcoma-
sclerosing type, chondroblastoma-like osteosarcoma, and clear-cell osteosarcoma,
to name a few (Huvos, 1993; Broadhead et al., 2011a; Hameed et al., 2011; Tesser-
Gamba et al., 2012; World Health, 2013; Fletcher, 2014; Kundu, 2014). Cases of
multicentric OS (OSMC) have been reported (Sim et al., 1992; Varughese et al.,
1992; El-Khoury et al., 1997; Miozzo et al., 1998; Spurney et al., 1998; Pujol et al.,
2000; Wang et al., 2001; Leonard and Méchali, 2013), which refers to the tumour
occurring at multiple sites with the absence of pulmonary metastases. This is further
classified as synchronous if more than one lesion is found, and metachronous if a
new tumour is found at new site (Currall and Dixon, 2006). There appears to be an
increased risk of OSMC in RTS patients reported in the literature (Hicks et al., 2007;
Cabral et al., 2008; Stinco et al., 2008; Larizza et al., 2010). Asymptomatic
osteosarcoma has been reported; however, most patients present with symptoms
related to location of lesion (Yamaguchi et al., 2015). The most likely cell type of OS
origin is the osteogenic cell lineage, as they are prevalent in the bone
microenvironment. Interestingly, OS occurs more commonly at the sites of bone
growth, suggesting proliferation of osteoblastic cells may acquire mutations required
for transformation (Rosenberg, 2010). Studies have suggested MSC under
osteoblast commitment were the cells of origin, however, although only present at
low incidence, early mesenchymal progenitors targeted with specific mutations
could also generate OS. This suggested the micro-environment signals may be a
contributing factor. The level of tumour differentiation did not relate to the level of
cell of origin differentiation. Supporting epigenetic differentiation mechanisms could
be involved, particularly in mature osteoblasts during tumour initiation (Calo et al.,
2010; Rodriguez et al., 2013; Chan et al., 2014; Quist et al., 2015). Undifferentiated
MSCs may lead to OS following oncogenic events (Mohseny et al., 2009; Lemos et
al., 2015).
Current treatment for OS involves a combination of adjuvant and neoadjuvant
chemotherapy, and surgery (Hong at al, 2013; Harrison et al 2018). Survival rate of
osteosarcoma has remained fairly unchanged over the past 20 years (Bishop et al.,
2016). Around 70% of patients with osteosarcoma and no metastasis at diagnosis

Page | 27
will have a 5-year survival rate, which falls to <30% in patients with metastasis, or
<20% reoccurrence following remission, following current treatments. Around 80%
of patients will develop or present with radio-graphically undetectable micro-
metastases (Marina et al., 2004; Chou et al., 2005; Daw et al., 2006; Tang et al.,
2008; Li et al., 2014). The survival rates appear similar between RTS patients and
non-RTS patients (Hicks et al., 2007). A study demonstrated some patients with
RTS and osteosarcoma led to remission following appropriate multimodal therapy,
although survival rates still low overall. Treatment was advised as the same as
sporadic OS, with the exception of chemotherapy, as increased toxicity has been
seen in RTS patients; this would need additional monitoring and altering on the
patients response (Hicks et al., 2007; Zils et al., 2015). Better understanding could
improve treatment developments (Gorlick, 2002; Kundu, 2014; Cui et al., 2016).
Early metastasis is often seen, and often the main reason for the poor prognosis
with OS (Ta et al., 2009; Tesser-Gamba et al., 2012; Botter et al., 2014).
1.4.2.1 Cell cycle dysregulation and OS
Dysregulation of cell cycle checkpoints has been demonstrated in many tumours
(Hartwell and Kastan, 1994; Taylor and Mckeon, 1997; Bower et al., 2010).The
deregulation of mitotic checkpoint control is thought to be an underlying cause of
chromosomal instabilities (Savage and Mirabello, 2011; Martin et al., 2012). The
tumour suppressor Phosphatase and tensin homolog (PTEN) supresses
unscheduled mitotic checkpoint complex to maintain chromosomal stability (Choi et
al., 2017), as a regulator of cyclin D and PI3K-Akt signalling (Weng et al., 2001).
The loss of PTEN may aid tumour growth and expansion in the bone (Xi and Chen,
2017). Nuclear α-thalassemia/mental retardation X-linked (ATRX) has multiple
roles, including histone modifications and transcription (Ratnakumar and Bernstein,
2013). In childhood cancers mutation in the epigenetic regulator ATRX is common,
with around 29% of osteosarcomas (Chen et al., 2014a). The loss of ATRX can lead
to an upregulation of transcription, aberrant epigenetic alterations, and DNA
damage at telomeres (Wong et al., 2010; Heaphy et al., 2011a; Lovejoy et al., 2012).
The phosphoinositide 3-kinase (PI3K/Akt) pathway is known to be an important cell
survival pathway in OS (Cenni et al., 2004; Inoue et al., 2005; Díaz-Montero et al.,
2006). Akt regulates several downstream targets, enabling OS cell growth and
survival (Chirgwin and Guise, 2000).
Page | 28
1.4.2.2 OS and known gene involvements
To date, 14 main drivers have been described that may account for around 87% of
cases of osteosarcoma; some novel in the context of osteosarcoma (ATRX, FANCA,
NUMA1 and MDC1), some known including RECQL4, TP53, and RUNX2 (Kovac et
al., 2015). Altered expression of genes associated with cell adhesion, DNA repair,
and cell cycle progression may also be involved in the development of OS (Yang
and Wang, 2016), a few of which will be discussed in more detail below.
1.4.2.2.1 P53
P53 belongs to a family of transcription factors, encoded by TP53 gene in humans.
P53 holds an important role in the regulation in MSC differentiation, including
osteogenic (Kim et al., 2014; Li et al., 2015), maintaining genomic stability (Lane
and Crawford, 1979; Levine et al., 1991), regulation of cell cycle (El-Deiry et al.,
1992), apoptosis (Shaw et al., 1992), senescence (Yonish-Rouach and Resnitzky,
1991), and metabolism (Berkers et al., 2013). Around 50% of human cancers were
reported to hold P53 mutations (Olivier et al., 2010; Robles and Harris, 2010). P53
mutations appear to be a significant oncogenic driver in OS (Diller et al., 1990;
Helman and Meltzer, 2003; Mirabello et al., 2015; Velletri et al., 2016). Next
generation sequencing approaches have identified a specific translocation event in
the first intron of the TP53 tumour suppressor gene in the majority of OS cases,
leading to the inactivation of TP53 in almost all osteosarcomas (Chen et al., 2014a).
A high level of genomic instability is seen in OS cells with P53 mutations
(Overholtzer et al., 2003; Liu et al., 2009). The lack of P53 in MSCs may lead to
disruption of differentiation into mature osteoblasts as a consequence of the
upregulation of Runx2 and Osterix, establishing impaired bone remodelling, and an
osteosclerotic phenotype, demonstrated in mice (Lin et al., 2009; Solomon et al.,
2014; Zambetti, 2014). The bone tumour microenvironment could signal MSCs
lacking or having mutant P53 to promote OS development (Cheng et al., 2014;
Alfranca et al., 2015). RECQL4 has been found to interact with P53 (De et al., 2012;
Xavier et al., 2014; Lu et al., 2015). Interestingly, an increase of P53 protein levels
have been reported in RTS cells (Davis et al., 2013).
Page | 29
1.4.2.2.2 RECQL4 and tumour development
The mechanisms behind tumorigenesis and association with mutations in RECQL4
remain unknown (Lin et al, 2017). The most common cause of death in patients
presenting with RECQL4 mutations is cancer (Croteau et al., 2014; Lu et al., 2017).
Overexpression and amplification of RECQL4 has been reported in colorectal
cancer (Buffart et al., 2005), furthermore, a study by Lao et al, (2013) found
RECQL4 and BLM expression are significantly increased in colorectal cancer cells
(CRCs), when compared to matched normal colonic mucosa and in contrast to
RECQL and RECQL5. The study indicates the possibility of increased expression
of BLM and RECQL4 to support the ability of CRC cells to tolerate genotoxic stress
(Lao et al., 2013). RECQL4 expression is also increased in metastatic prostate
cancer cell lines (Su et al., 2010). The loss of RECQL4 expression has been shown
to lead to the accumulation of double-strand breaks, while following knockdown
tumourigenicity (in vivo) and invasiveness (in vitro) was shown to decrease in
metastatic prostate cancer cells (Su et al., 2010), These data suggest that RECQL4
might be an important factor in the pathogenesis and tumorigenesis of CRC and
prostate cancer (Su et al., 2010; Lao et al., 2013). Overexpression and amplification
of RECQL4 has also been reported in breast cancer (Thomassen et al., 2009), late
stage laryngeal squamous cell carcinomas (Saglam et al., 2007) as well as in
sporadic osteoblastomas (Maire et al., 2009). Thomassen et al, (2009) even
suggests RECQL4 to be a potential metastasis promoting gene in breast cancers.
Yong et al, (2014), found frequent amplifications of RECQL4, however, did not find
associations between these amplifications and late stage oral squamous cell
carcinomas (OSCCs). Despite significant amplifications were shown, the expression
of RECQL4 was not shown to be affected in the samples (Yong et al, 2014).
1.4.2.2.2.1 RECQL4 and OS
RECQL4 expression is found abundantly in actively forming bone; in osteoblasts
lining the trabecular surface, bone lining cells, and in chondrocytes of the growth
plate. RECQL4, therefore, may have an important role in bone growth (Delagoutte
and Von Hippel, 2003; Siitonen, 2008; Ng et al., 2015). A correlation has been
shown between the presence of pathogenic variants of RECQL4, low bone mineral
density, and a history of increased fracture risk in RTS patients (Cao et al., 2017),
and risk of OS development (Mehollin-Ray et al., 2008). RECQL4 has been found
to be a requirement for skeletal development through interaction with p53 (Lu et al.,
Page | 30
2015). In conditional mouse models, disruption of Recql4 function in skeletal cells
leads to bone abnormalities, such as osteoporosis, however, it would appear not to
always lead to OS development but may lead to OS susceptibility (Lu et al., 2015;
Ng et al., 2015), and the type of mutation may be an influencing factor. In Recql4-
deficient mice (Recql4HD), Lu et al, (2014) found evidence of bone marrow and/or
haematological defects indicating possible senescence of bone marrow cells.
Interestingly, some RTS patients have shown to have progressive leukopenia,
chronic microcytic hypochromic anaemia, myelodysplasia, aplastic anaemia and
leukaemia (Larizza et al, 2010); disorders that are associated with the dysfunction
of bone marrow (Kohzaki et al., 2012), suggesting that RECQL4 deficiency may lead
to bone marrow dysfunction. RECQL4 expression may be up-regulated by RANKL
during osteoclast differentiation (Mccardle, 2013). RANKL has been shown to
facilitate the migration of cancer cells into the bones (Jones et al., 2006), while high
levels of RANKL in osteosarcoma leads to poor response to preoperative
chemotherapy (Lee et al., 2011b). The increase in the generation of osteoclasts
resulting in the resorption of normal bone is also a part of OS pathogenesis and
aggressiveness (Bathurst et al., 1986; Avnet et al., 2008; Broadhead et al., 2011b),
which could be linked to high levels of RANKL observed (Mori et al., 2007). RANKL
pathway has been found to be crucial for tumourigenic osteolysis, and allows tumour
expansion (Chirgwin and Guise, 2000). An association has also been made with
over-expression of RECQL4 in osteosarcoma tumours and an increase in genome
instability (Maire et al., 2009; Thomassen et al., 2009). Interestingly, in sporadic
osteosarcoma somatic mutations of RECQL4 have not been detected (Martin et al.,
2014).
1.4.2.2.3 RUNX2 and cancer
The mammalian Runx family of transcription factors, which includes RUNX1,
RUNX2, and RUNX3, have an important role in cell fate determination into specific
lineages (Komori, 2010; Ito et al., 2015). The RUNX genes encode the α subunits
of PEBP2/CBF (polyomavirus enhancer-binding protein 2/core binding factor)
transcription factors required for skeletal development (Wang et al., 1993; Yoshida
et al., 2002). The key role of RUNX2 is in the regulation of osteoblast differentiation,
therefore maintaining bone, bone development, and maturation (Komori, 2007).
RUNX2 is regulated by Vitamin D (Lim et al., 2010; Martin et al., 2010; Hoshino et
al., 2015; Garimella et al., 2017). Patients with OS present aberrations in vitamin
D regulatory system and sub optimal vitamin D levels (Lee at al., 2013; Kurucu et al
Page | 31
2019). Vitamin D targets the RUNX2 pathway, specifically inhibiting genes required
for cell cycle, proliferation, survival, interactions, cytoskeletal dynamics, migration,
and invasion, reported in an OS cell line (Garimella et al., 2017).
RUNX2 may increase the expression of prometastatic RUNX2 target genes,
including integrins, focal adhesion kinase, PTHrP, VEGF, bone sialoprotein (BSP),
osteopontin and survivin (Van Der Deen et al, 2012; Rustamov et al, 2019). RUNX2
has been shown to be overexpressed in metastatic breast cancer cells, leading to
the promotion of transcription of genes such as MMP and VEGF, which are involved
in migration and invasiveness (Javed et al., 2005). RUNX2 has been shown to act
in rapidly proliferating tumour cells in the bone microenvironment through the
promotion of PTH or PTHrP mediated antiapoptototic effects. RUNX2 expression
here appears to be pro-survival for the tumour cells, promoting tumour growth. To
aid this RUNX2 also induces survivin expression (Bellido et al., 2003). In OS, many
growth factors have been reported to activate RUNX2, promoting RUNX2
phosphorylation directly, or indirectly. Survivin is an important biomarker in OS, and
recently Runx2 has been shown to activate survivin and Bcl2 which inhibits
apoptosis, aiding in tumour cell survival (Lim et al., 2010). The overexpression of
RUNX2 can generate osteopenia and fractures as receptor activator of NF-κB ligand
(RANKL) expression is increased, leading to stimulation of osteoclast activity (Liu et
al., 2001; Gupta et al., 2012) In OS cell lines, RUNX2 may also regulate the focal
adhesion pathway by mediating genes, such as TLN1 and FAK (Van Der Deen et
al., 2012).
Interestingly, RUNX2 has also been implicated in osteomimicry which promotes
breast and prostate cancer metastasis to the bone (Akech et al., 2010; Brubaker et
al., 2003; Leong et al., 2010). Osteomimicry is the ability of cancer cells to behave
like bone cells, assuming osteoblast like phenotype. This has been demonstrated
by breast and prostate cancer cells expressing bone matrix proteins, alkaline
phosphatase, and molecules involved in the cross talk between osteoclasts and
osteoblasts (Gonzalez-Suarez et al., 2010; Rucci and Teti, 2010).
1.4.2.3 OS and bone dysregulation
OS commonly occurs in the metaphysis region, and the most common primary site
of OS is the distal femur (Girish et al., 2012; Haynes et al., 2017; Kumar and Singh,
2017). During bone growth, the metaphyseal cortex of the distal radius appears thin
and porous. The observed cortical porosity may be an influential factor to the
Page | 32
increased rates of distal fractures seen in puberty (Parfitt, 1994). Cortical porosity
refers to the average fraction of the void volumes within the volume of the cortical
bone (Kalkwarf et al., 2011; Zebaze et al., 2013). An early study suggests the
incomplete trabecular coalescence as the main process leading to fragility, rather
than bone remodelling (Rauch et al., 2007), as rapid modelling drift of the
metaphyseal cortex occurs (Rauch, 2012). This could suggest, however, the lack
of osteoblast involvement to recover the situation (Rauch, 2012). Another study has
suggested mechanical loading cycles leading to the coalescence of metaphyseal
trabeculae, which may link to the metaphyseal cortical thickness and porosity
(Tanck et al., 2006; Rauch, 2012). Further factors which may be involved include
the short life cycle of metaphyseal trabeculae. Pathological fractures can present at
diagnosis or form during treatment in patients with OS, with an incidence of around
5-12% (Chandrasekar et al., 2012).
1.5 The DNA damage response and genome instability
A fundamental pre-requisite for life involves completeness and integrity of genomic
information (Utani et al., 2010). DNA damage is a generic term which is used to
describe DNA modifications with the ability to generate cell death response, in
particular apoptosis. If DNA damage is not repaired or does not lead to apoptosis,
loss of genomic stability can follow the genomic alterations (Roos and Kaina, 2013).
1.5.1 DNA damage
DNA damage can originate from exogenous and endogenous (internal) sources.
Endogenous sources can be related to physiological processes, such as during
replication following DNA mismatches, and DNA strand breaks can follow abortive
topoisomerase I and II activity. DNA lesions can also occur due to damage arising
from hydrolytic reactions, and methylation (Valko et al., 2006). Double-stranded
DNA breaks (DSBs) can also arise following V(D)J recombination and
immunoglobulin gene class switch recombination (CSR) during development of the
adaptive immune system leading to induced chromosome breakage (Dudley et al.,
2005; Daniel and Nussenzweig, 2013). Inflammation and infection recruits
macrophages and neutrophils to the site, and reactive oxygen and nitrogen
compounds are produced (Kawanishi et al., 2006). This can lead to DNA single-
strand breaks (SSBs), DSBs or base damage (Khanna and Jackson, 2001).
Further examples include oxidative DNA damage (Li et al., 2002), lipid peroxidation
(Esterbauer et al., 1990), propano adducts (Hecht et al., 2001), etheno adducts
Page | 33
(Chung et al., 1996), endogenous alkylating agents (Holliday and Ho, 1998), and
endogenous oestrogens (Yager and Leihr, 1996), to name a few.
A major environmental risk of exogenous sources comes from ultra-violet light. A
common cancer-causing reagent prevalent today includes tobacco (Doll and Peto,
1981; Pfeifer et al., 2002; Wogan et al.; Gao et al., 2014; Wei et al., 2014).
Exogenous and endogenous sources can be influenced by an interaction between
them, leading to DNA damage and diseases, such as cancer (Jackson and Loeb,
2001).
1.5.2 Hallmark features of genomic instability
Genomic instability refers to a range of alterations of DNA from single nucleotide to
whole chromosomal changes. Based on the level of genetic disruption genomic
instabilities are typically divided into three categories.
Nucleotide instability (NIM) is characterised by high occurrence of nucleotide
deletions, base substitutions, and insertions. NIM occurs due to replication errors
and impairment of nucleotide excision repair and base excision repair pathways.
This form may be less common, however can lead to dramatic phenotypes. An
example is germline mutations in XPC that lead to Xeroderma pigmentosum, an
autosomal recessive disease. It is characterised by impaired nucleotide excision
repair and sensitivity to UV light and often skin cancer (Al-Tassan et al., 2002;
Dworaczek and Xiao, 2007).
A microsatellite is a tract of repetitive DNA which leads to the repeats of specific
DNA motifs ranging between 2 to 5 base pairs, at typically 5 to 50 times (Turnpenny
and Ellard, 2016). They can occur at various locations within the genome, and
demonstrate a high mutation rate and diversity, establishing microsatellite instability
(MIN). MIN usually originates from defects in mismatch repair genes (Weissenbach
et al., 1992; Ionov et al., 1993; Geiersbach and Samowitz, 2011).
Chromosomal instabilities (CIN) involve the increased rate of loss or gain of entire
or part of chromosomes and can be categorised as numerical (N-CIN), and
structural (S-CIN), although with some overlapping features (Cisyk et al., 2014). N-
CIN can occur as a result of defects in chromosomal segregation, and S-CIN can
follow aberrant genomic rearrangements and chromosomal breakages, which can
include duplications, translocations, and deletions (Rajagopalan et al., 2003), and
usually but not always alterations to gene copy numbers. S-CIN can form as a result
Page | 34
of ineffective DNA damage response mechanism often in response to exogenous
insults that cause errors in replication (Bayani et al., 2003).
In cancer cells some of the mechanisms involved in maintaining genomic stability
can be disrupted, which leads to genomic instability and can contribute to the
malignant transformation of these cells through, for example, the amplification of
oncogenes or drug-resistance genes (Utani et al., 2010). CIN frequently leads to
karyotypic complexity in tumours which is associated with high expression levels of
survival and tissue invasion genes, and decreased expression of cell cycle and DNA
repair regulators (Roschke et al., 2008). It is thought that around 90% of human
cancers exhibit chromosomal abnormalities and aneuploidy (Lengauer et al., 1997;
Gagos and Irminger-Finger, 2005). CIN is related to poor prognosis and drug
resistance (Gagos and Irminger-Finger, 2005; Carter et al., 2006; Walther et al.,
2008; Lee et al., 2011a). The underlying mechanism of CIN in sporadic cancers is
not yet fully understood, partly due to the wide range of genes that can give rise to
CIN following disruption of normal processes, demonstrating the heterogeneous
nature found in sporadic cancers.
Importantly for the work presented in this thesis, a study found an association of
CIN, and in particular errors in chromosomal segregation leading to centrosome
aberrations, to be a feature of OS development (Al-Romaih et al., 2003; Ottaviani
and Jaffe, 2009). Osteosarcoma has a high level of genetic and cytogenetic
heterogeneity, not just between patients but also within the same patient (Selvarajah
et al., 2008). RECQL4 mutations can lead to replicative stress and genomic
instability (Burrell et al., 2013; Flach et al., 2014; Zeman and Cimprich, 2014).
Interestingly, a relationship of RECQL4 overexpression and S-CIN development in
osteosarcomas has been reported (Bayani et al., 2007; Maire et al., 2009). MIN has
been demonstrated in several cancers (Wang et al., 2005; Sheng et al., 2006;
Weisenberger et al., 2006; Geigl et al., 2008), and reported in a few OS tumours as
well (Heinsohn et al., 2007; Ahmed et al., 2012).
1.5.3 Single stranded DNA
Single-stranded DNA is an ubiquitous and a very important intermediate structure
formed throughout the cells’ life cycle. It is therefore crucial that single-stranded
DNA is protected from DNA damage. Replication protein A (RPA) is the main
ssDNA binding protein in eukaryotes, and has many roles required for ssDNA
formation, including DNA replication, recombination, DNA damage checkpoints, and
Page | 35
DNA repair mechanisms (Zou et al., 2006). During DNA damage response RPA is
required for the formation of γH2AX foci (Anantha et al., 2007) and RAD51 foci
(Anantha et al., 2008).
1.5.4 Double stranded DNA break
DNA double strand breaks (DSB) are the most dangerous type of DNA lesions, as
they can lead to the loss of large chromosomal regions (Chang et al., 2017). DSBs
can also occur following two single-strand breaks in close proximity, or following
DNA damage response during DNA replication (Khanna and Jackson, 2001), but
many other mechanisms are also involved, both physiological and pathological
(Lieber, 2016). If not repaired these lesions can block transcription and genome
replication, and can lead to serious consequences such as mutations and genome
aberration resulting in reduced cell viability (Valko et al., 2006).
1.5.5 DNA repair pathways
In eukaryotes, the DNA damaged response (DDR) aids in maintaining genomic
stability following DNA damage. The site of the lesion on the DNA can alter
subsequent response mechanism. The DNA damage response pathway is a
complex, well-organised pathway comprising biochemical signalling and effector
pathways that functions to repair and restore the original configuration of DNA,
following damage (Kavanagh et al., 2013), involving many proteins with variable
roles, including detectors, mediators and effectors (Sancar et al., 2004).
Defects in DNA repair have been shown to strongly link to predisposition to cancer,
neurodegeneration, immune deficiency and aging (Coon and Benarroch, 2018;
Gorgoulis et al, 2018). RECQL4 has been shown to participate in a range of DNA
repair pathways (Petkovic et al., 2005; Fan and Luo, 2008; Schurman et al., 2009;
Shamanna et al., 2014), and mutations may cause impairment of these pathways
following DNA damage.
1.5.5.1 DNA damage response pathways
The DNA damage response pathways include the PI 3-kinase-related kinase (PIKK)
family of proteins Ataxia telangiectasia mutated (ATM) and Ataxia telangiectasia
and RAD 3-related (ATR). These act as detectors and initiate the DNA damage
response. DSBs activate ATM, and ssDNA, which may arise during replication fork
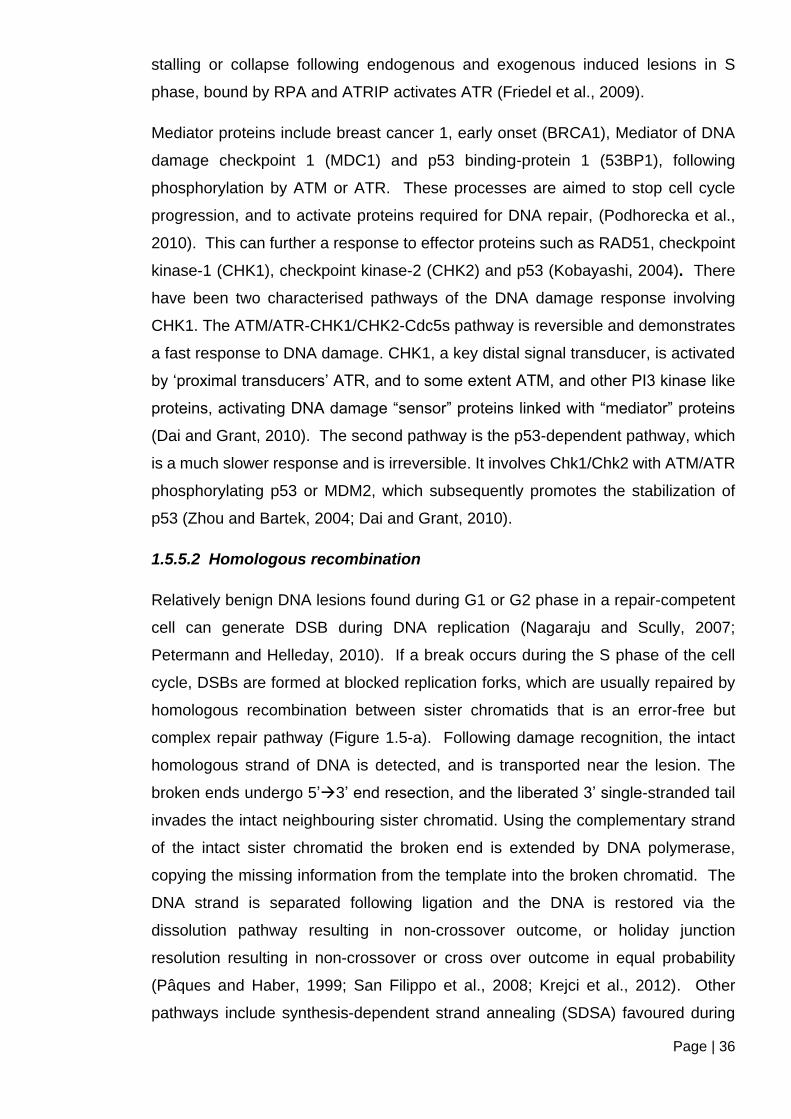
Page | 36
stalling or collapse following endogenous and exogenous induced lesions in S
phase, bound by RPA and ATRIP activates ATR (Friedel et al., 2009).
Mediator proteins include breast cancer 1, early onset (BRCA1), Mediator of DNA
damage checkpoint 1 (MDC1) and p53 binding-protein 1 (53BP1), following
phosphorylation by ATM or ATR. These processes are aimed to stop cell cycle
progression, and to activate proteins required for DNA repair, (Podhorecka et al.,
2010). This can further a response to effector proteins such as RAD51, checkpoint
kinase-1 (CHK1), checkpoint kinase-2 (CHK2) and p53 (Kobayashi, 2004). There
have been two characterised pathways of the DNA damage response involving
CHK1. The ATM/ATR-CHK1/CHK2-Cdc5s pathway is reversible and demonstrates
a fast response to DNA damage. CHK1, a key distal signal transducer, is activated
by ‘proximal transducers’ ATR, and to some extent ATM, and other PI3 kinase like
proteins, activating DNA damage “sensor” proteins linked with “mediator” proteins
(Dai and Grant, 2010). The second pathway is the p53-dependent pathway, which
is a much slower response and is irreversible. It involves Chk1/Chk2 with ATM/ATR
phosphorylating p53 or MDM2, which subsequently promotes the stabilization of
p53 (Zhou and Bartek, 2004; Dai and Grant, 2010).
1.5.5.2 Homologous recombination
Relatively benign DNA lesions found during G1 or G2 phase in a repair-competent
cell can generate DSB during DNA replication (Nagaraju and Scully, 2007;
Petermann and Helleday, 2010). If a break occurs during the S phase of the cell
cycle, DSBs are formed at blocked replication forks, which are usually repaired by
homologous recombination between sister chromatids that is an error-free but
complex repair pathway (Figure 1.5-a). Following damage recognition, the intact
homologous strand of DNA is detected, and is transported near the lesion. The
broken ends undergo 5’→3’ end resection, and the liberated 3’ single-stranded tail
invades the intact neighbouring sister chromatid. Using the complementary strand
of the intact sister chromatid the broken end is extended by DNA polymerase,
copying the missing information from the template into the broken chromatid. The
DNA strand is separated following ligation and the DNA is restored via the
dissolution pathway resulting in non-crossover outcome, or holiday junction
resolution resulting in non-crossover or cross over outcome in equal probability
(Pâques and Haber, 1999; San Filippo et al., 2008; Krejci et al., 2012). Other
pathways include synthesis-dependent strand annealing (SDSA) favoured during
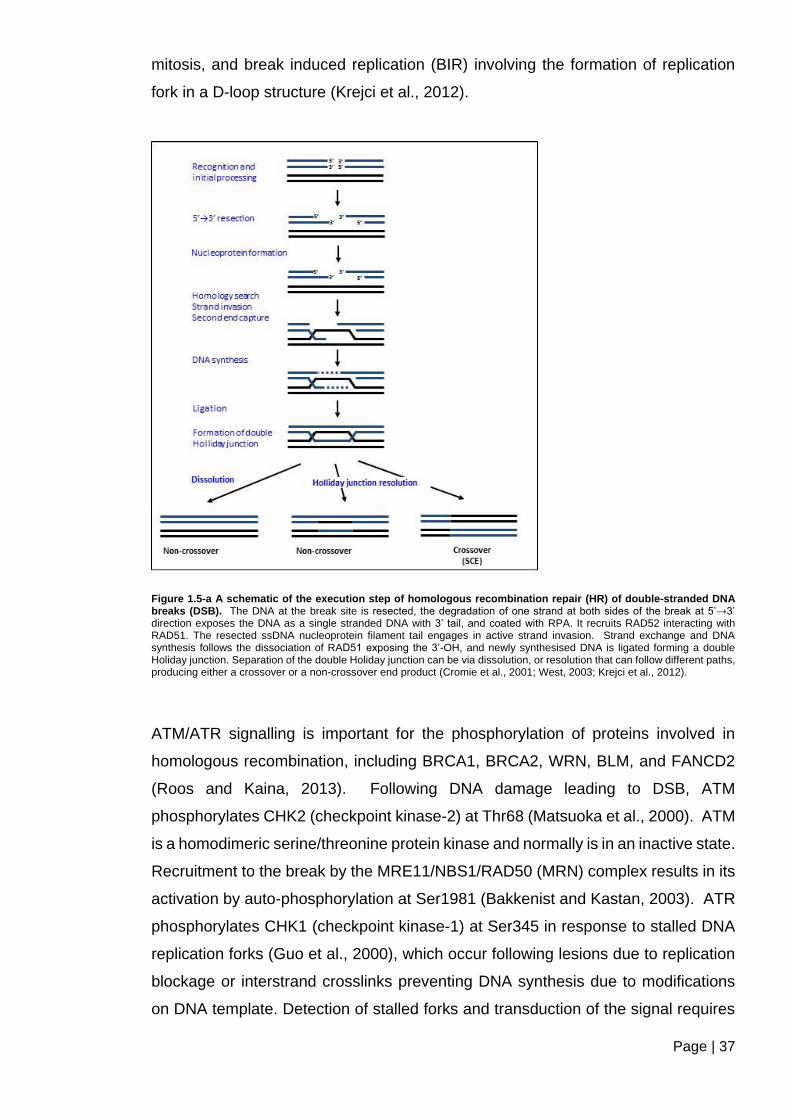
Page | 37
mitosis, and break induced replication (BIR) involving the formation of replication
fork in a D-loop structure (Krejci et al., 2012).
Figure 1.5-a A schematic of the execution step of homologous recombination repair (HR) of double-stranded DNA breaks (DSB). The DNA at the break site is resected, the degradation of one strand at both sides of the break at 5’→3’ direction exposes the DNA as a single stranded DNA with 3’ tail, and coated with RPA. It recruits RAD52 interacting with RAD51. The resected ssDNA nucleoprotein filament tail engages in active strand invasion. Strand exchange and DNA synthesis follows the dissociation of RAD51 exposing the 3’-OH, and newly synthesised DNA is ligated forming a double Holiday junction. Separation of the double Holiday junction can be via dissolution, or resolution that can follow different paths, producing either a crossover or a non-crossover end product (Cromie et al., 2001; West, 2003; Krejci et al., 2012).
ATM/ATR signalling is important for the phosphorylation of proteins involved in
homologous recombination, including BRCA1, BRCA2, WRN, BLM, and FANCD2
(Roos and Kaina, 2013). Following DNA damage leading to DSB, ATM
phosphorylates CHK2 (checkpoint kinase-2) at Thr68 (Matsuoka et al., 2000). ATM
is a homodimeric serine/threonine protein kinase and normally is in an inactive state.
Recruitment to the break by the MRE11/NBS1/RAD50 (MRN) complex results in its
activation by auto-phosphorylation at Ser1981 (Bakkenist and Kastan, 2003). ATR
phosphorylates CHK1 (checkpoint kinase-1) at Ser345 in response to stalled DNA
replication forks (Guo et al., 2000), which occur following lesions due to replication
blockage or interstrand crosslinks preventing DNA synthesis due to modifications
on DNA template. Detection of stalled forks and transduction of the signal requires
Page | 38
the ATR-ATRIP complex, TopBP1 (DNA topoisomerase 2-binding protein 1) and
the 9-1-1 complex (Ward and Chen, 2001). CHK1 and CHK2 phosphorylate the
transcription factor p53 at Ser20 (Shieh et al., 2000), which is a key decision-making
step between DNA repair and apoptosis (Oda et al., 2000; Roos et al., 2007).
1.5.5.3 Non-homologous end-joining
In a cell that is not replicating, an alternative route is taken outside of late S and G2
phases, when homologous recombination is the dominant pathway to repair double-
stranded breaks: non-homologous end joining repair (NHEJ) repairs DSBs, not
restricted by cell cycle phase (Figure 1.5-b). HR is essentially error free, while NHEJ
is mostly error-prone potentially leading to mutations (Lieber, 2010). The cause of
DSB and cell cycle phase influences the repair process chosen. NHEJ does not
require the homologous template for the repair of the DNA. NHEJ is capable of
repairing a wide range of DNA-end configurations, which can however lead to the
repaired DNA junctions containing mutations (Chang et al., 2017). An important
step is the recognition and binding of the Ku heterodimer to the DSB (Mari et al.,
2006; Uematsu et al., 2007), which acts as a scaffold and recruits other factors such
as DNA-PKcs (Uematsu et al., 2007), X-ray cross complementing protein 4
(XRCC4) (Mcelhinny et al., 2000; Mari et al., 2006; Costantini et al., 2007), DNA
Ligase IV (Costantini et al., 2007), XRCC4-like factor (XLF) (Yano et al., 2008), and
Aprataxin-and-PNK-like factor (APLF) (Grundy et al., 2013). DNA-PKcs is a member
of phosphatidylinositol-3 (PI-3) kinase-like kinase family (PIKK), similar to ATM and
ATR (Abraham, 2004; Bakkenist and Kastan, 2004).
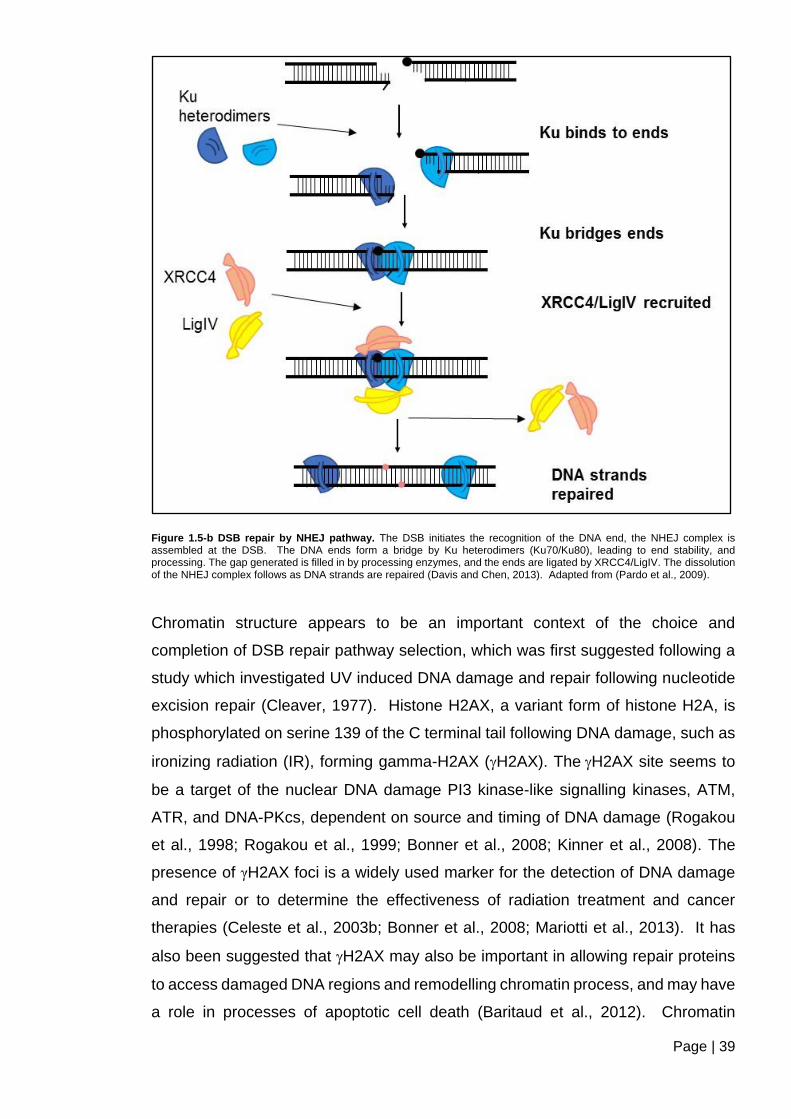
Page | 39
Figure 1.5-b DSB repair by NHEJ pathway. The DSB initiates the recognition of the DNA end, the NHEJ complex is assembled at the DSB. The DNA ends form a bridge by Ku heterodimers (Ku70/Ku80), leading to end stability, and processing. The gap generated is filled in by processing enzymes, and the ends are ligated by XRCC4/LigIV. The dissolution of the NHEJ complex follows as DNA strands are repaired (Davis and Chen, 2013). Adapted from (Pardo et al., 2009).
Chromatin structure appears to be an important context of the choice and
completion of DSB repair pathway selection, which was first suggested following a
study which investigated UV induced DNA damage and repair following nucleotide
excision repair (Cleaver, 1977). Histone H2AX, a variant form of histone H2A, is
phosphorylated on serine 139 of the C terminal tail following DNA damage, such as
ironizing radiation (IR), forming gamma-H2AX (H2AX). The H2AX site seems to
be a target of the nuclear DNA damage PI3 kinase-like signalling kinases, ATM,
ATR, and DNA-PKcs, dependent on source and timing of DNA damage (Rogakou
et al., 1998; Rogakou et al., 1999; Bonner et al., 2008; Kinner et al., 2008). The
presence of γH2AX foci is a widely used marker for the detection of DNA damage
and repair or to determine the effectiveness of radiation treatment and cancer
therapies (Celeste et al., 2003b; Bonner et al., 2008; Mariotti et al., 2013). It has
also been suggested that H2AX may also be important in allowing repair proteins
to access damaged DNA regions and remodelling chromatin process, and may have
a role in processes of apoptotic cell death (Baritaud et al., 2012). Chromatin
Page | 40
complexity affects the selection and rate of DNA repair processes. Slowly repaired
DNA may be in regions of heterochromatin, where prolonged chromatin relaxation
takes much longer for intermediates to reach the break sites. ATM is crucial for this
by activating KAP1, a KRAB- associated protein that forms foci and colocalizes with
H2AX. Repair in heterochromatic regions occurs primarily in G2 phase by HR, and
DSBs in euchromatic regions is repaired by NHEJ (Ziv et al., 2006; Goodarzi et al.,
2010; Jakob et al., 2011; Goodarzi and Jeggo, 2012).
1.5.5.4 Telomeres are disguised double-stranded breaks
Normal somatic cells hold a finite proliferative capacity termed the molecular clock
(Harley et al., 1992; Wright and Shay, 1992; Cong et al., 2002), also referred to as
the Hayflick limit (Hayflick and Moorhead, 1961; Hayflick, 1965). Warson and
Olovnikov hypothesized that DNA would be progressively lost at the ends of
chromosomes as the cell divides. Telomeres, initially reported in the late 1930s
(Blackburn, 2001), act as essential regulators of both cell life span and chromosomal
integrity (Hahn, 2003). Telomeres are repetitive DNA sequences (TTAGGG/
AATCCC) located at the ends of linear chromosomes. In normal cells, these shorten
during each cell division cycle, in vitro, and with age in vivo, leading to replicative
mortality via senescence, as the cell reaches the Hayflick limit known as stage 1
(M1) (Shay and Wright, 2004; Shay and Wright, 2019). If the cell is able to avoid
this trigger by inactivating p53, it leads to further proliferation and telomere loss until
stage 2 (M2) is reached. M2 has been shown to lead to cell death following the
critically short and dysfunctional telomeres. Further cell survival can be achieved
following the escape of this crisis by the activation of telomerase (Cong et al., 2002).
Telomeres are also important structures in the protection of DNA ends from
degradation, stem cell self-renewal, and DNA replication attrition (Burrow et al.,
2017), as they play a role in the cell cycle, DNA replication, MMR processes involved
in maintaining chromosomal stability, relating to cell pluripotency and self-renewal
(Kapinas et al., 2013). Telomeres end in a 3' overhang, known as the G-strand
overhang, which bends back on itself and anneals with the complementary
sequences in the 5' end of the opposite strand, displacing part of the 5' end in a D-
loop and creates a telomere or T-loop (Figure 1.5-c). T-loops facilitate the formation
of a higher order structure mediating the end capping by masking telomeric DNA
ends from recognition by the DNA repair system as a double-stranded break
(Espejel et al., 2002). Regulating factors of telomerase-mediated telomere
Page | 41
elongation include the telomere-binding protein TRF1 (Telomeric Repeat Binding
Factor-1), a negative regulator of telomere length, interacting with POT1 (Protection
Of Telomeres-1; a single-stranded telomeric DNA-binding protein) (Sfeir et al.,
2009). TRF2 assists in the formation of the T-loop, and maintains the secondary
structure of the telomere to stabilize the T-loop and protects from unscheduled
nucleolytic processing. TRF2 also interacts with the human Repressor Activator
Protein-1/Telomeric Repeat Binding Factor 2 Interacting Protein (RAP-1/TERF2IP),
and the MRN complex, which is implicated in response to DNA damaging agents
(Wang et al., 2004; Doksani et al., 2013). The Ku complex has a role in the repair
of DSB and localizes to the telomere (Chai et al., 2002; Tsai et al., 2002; Hahn,
2003). Further proteins involved in the T-loop stabilization and maintaining telomere
includes TRF1-interacting Ankyrin-related ADP-ribose polymerase (TANK) (Sbodio
and Chi, 2002), TRF1-Interacting Nuclear Factor-2 (TIN2) (Ye et al., 2004), and
heterogeneous nuclear ribonucleoproteins such as Heterogeneous Nuclear
Ribonucleoprotein-A1 (HNRPA1) (Ishikawa et al., 1993), and Heterogeneous
Nuclear Ribonucleoprotein-A2/B1 (HNRPA2B1) (Kamma et al., 2001; Chai et al.,
2002; He and Smith, 2009). Exogenous activation of telomerase is an in vitro
method for immortalization of cell lines, and it can lead to unlimited proliferation
capacity (Cong et al., 2002).
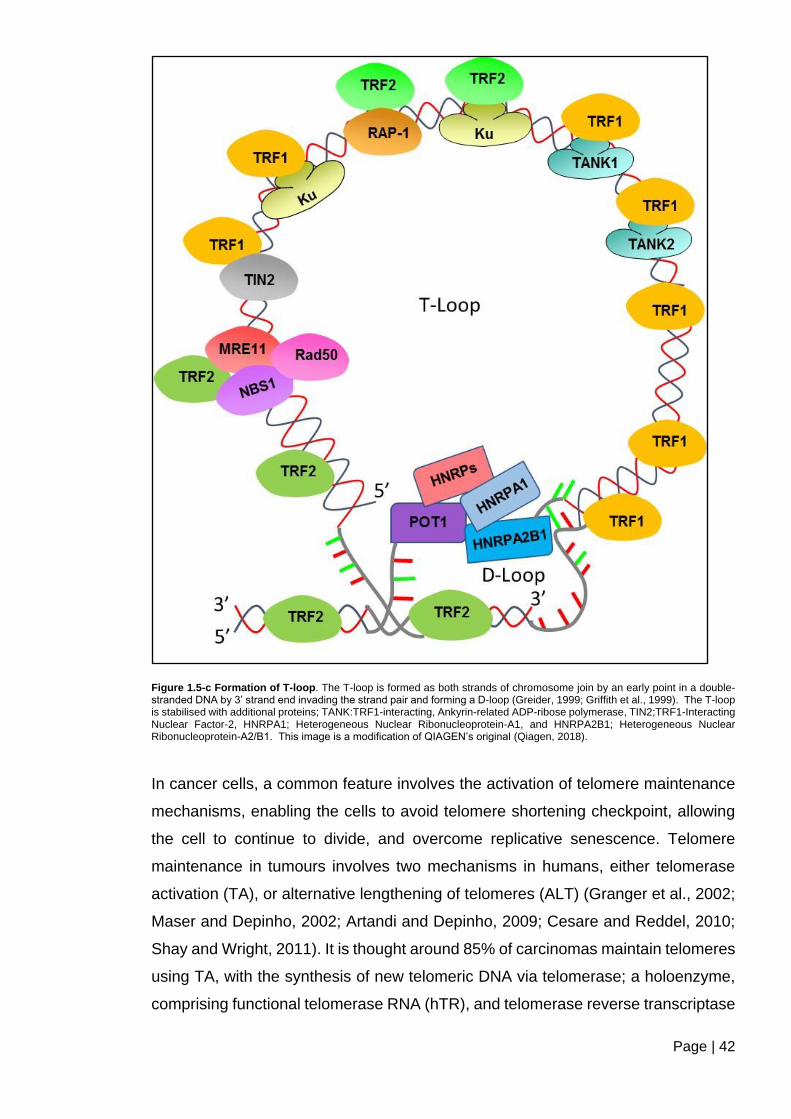
Page | 42
Figure 1.5-c Formation of T-loop. The T-loop is formed as both strands of chromosome join by an early point in a double-stranded DNA by 3’ strand end invading the strand pair and forming a D-loop (Greider, 1999; Griffith et al., 1999). The T-loop is stabilised with additional proteins; TANK:TRF1-interacting, Ankyrin-related ADP-ribose polymerase, TIN2;TRF1-Interacting Nuclear Factor-2, HNRPA1; Heterogeneous Nuclear Ribonucleoprotein-A1, and HNRPA2B1; Heterogeneous Nuclear Ribonucleoprotein-A2/B1. This image is a modification of QIAGEN’s original (Qiagen, 2018).
In cancer cells, a common feature involves the activation of telomere maintenance
mechanisms, enabling the cells to avoid telomere shortening checkpoint, allowing
the cell to continue to divide, and overcome replicative senescence. Telomere
maintenance in tumours involves two mechanisms in humans, either telomerase
activation (TA), or alternative lengthening of telomeres (ALT) (Granger et al., 2002;
Maser and Depinho, 2002; Artandi and Depinho, 2009; Cesare and Reddel, 2010;
Shay and Wright, 2011). It is thought around 85% of carcinomas maintain telomeres
using TA, with the synthesis of new telomeric DNA via telomerase; a holoenzyme,
comprising functional telomerase RNA (hTR), and telomerase reverse transcriptase
Page | 43
catalytic subunit (hTERT) (Feng et al., 1995; Nakamura et al., 1997; Granger et al.,
2002; Shay and Wright, 2006). In around 5-15% of human cancers, in the absence
of TA, the cancer cell can utilise ALT via homologous recombination (Henson et al.,
2002). This process involves the elongation of telomeres via recombination
(Bechter et al., 2003). In early studies, OS cells interestingly have been reported to
demonstrate both TA and ALT with even expressions, unlike other cancer cells
(Bryan et al., 1997; Scheel et al., 2001). However, ALT appears to be more
prevalent in OS (Scheel et al., 2001; Heaphy et al., 2011b).
Telomeres have been found to hold additional functions to suppress the DNA
damage response via telosome. This prevents potentially lethal telomere fusion,
translocation, and genomic instability which can form following DSB repair at
telomeres (Burgess, 2013). Interestingly, many proteins involved in DNA repair also
have a functional role in telomeres (Marcomini and Gasser, 2015). The interaction
of nucleoprotein complexes on telomeric DNA aids the maintenance of telomere
integrity. Following disruption of shelterin components, which can lead to exposure
of the DNA structures at the ends of disrupted telomere, a DNA damage response
may follow. The shelterin complex consists of six major proteins, TRF2, TRF1,
POT1, TPP1, Rap1, and TIN2 (Palm and de Lange, 2008). The shelterin complex
protects chromosomal ends from erosions. POT1–TPP1 complex has been found
to compete with the CST (CTC1, STN1, and TEN1) complex which terminates
telomerase activity (Chen et al., 2012). In particular, TRF2, is thought to perform an
important role in the protection of telomeres from erosion by binding to telomeric
repeats to form the T-loop (Palm and De Lange, 2008) (Figure 1.5-c). The Loss of
TRF2 protein and the consequent disruption of the shelterin complex, both
expression and activity has been shown to induce telomere shortening, DNA
damage response, chromosomal instability, and replicative senescence (Oh et al.,
2003; Denchi and De Lange, 2007; Okamoto et al., 2013). Telomere shortening
leads to reduced TRF2 (Saha et al., 2013). On the other hand, artificially increased
TRF2 have been found to develop a delay in the onset of senescence (Karlseder et
al., 1999). It has been suggested TRF1 and TRF2 activity via telomere length may
play a role in initial transformation phases, and tumourigenesis (Matsutani et al.,
2001; Nakanishi et al., 2003; Nijjar et al., 2005; Oh et al., 2005; Muñoz et al., 2006).
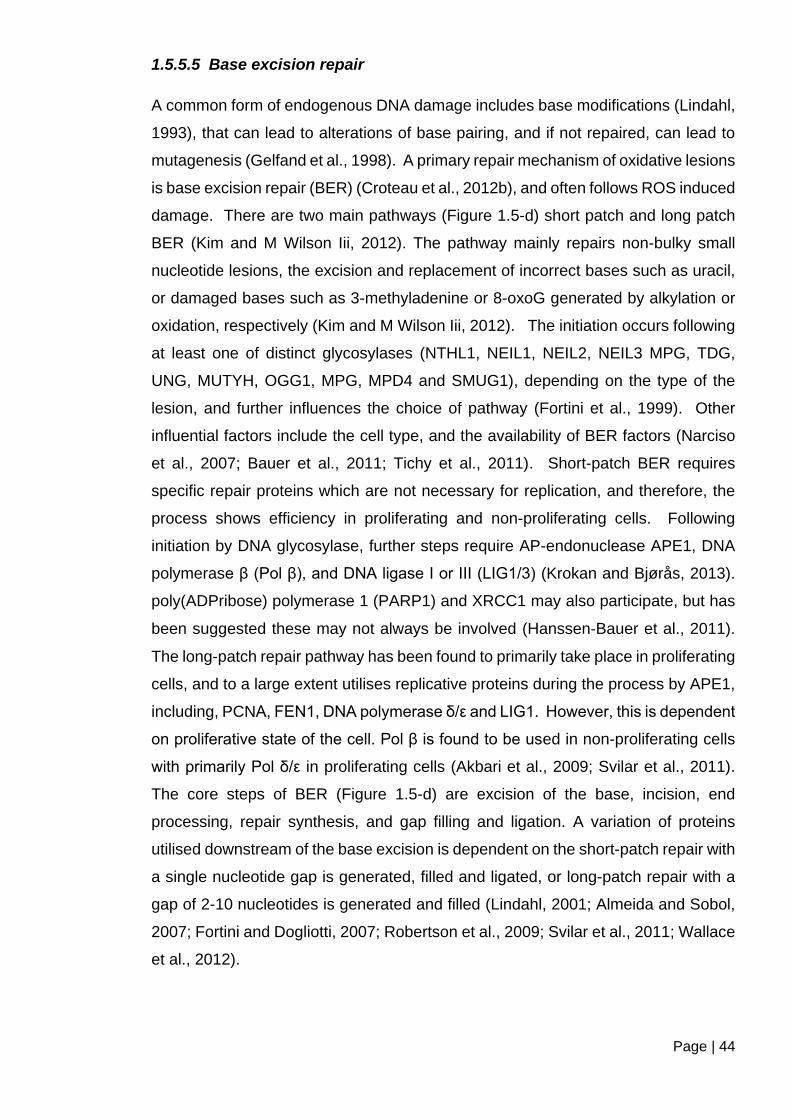
Page | 44
1.5.5.5 Base excision repair
A common form of endogenous DNA damage includes base modifications (Lindahl,
1993), that can lead to alterations of base pairing, and if not repaired, can lead to
mutagenesis (Gelfand et al., 1998). A primary repair mechanism of oxidative lesions
is base excision repair (BER) (Croteau et al., 2012b), and often follows ROS induced
damage. There are two main pathways (Figure 1.5-d) short patch and long patch
BER (Kim and M Wilson Iii, 2012). The pathway mainly repairs non-bulky small
nucleotide lesions, the excision and replacement of incorrect bases such as uracil,
or damaged bases such as 3-methyladenine or 8-oxoG generated by alkylation or
oxidation, respectively (Kim and M Wilson Iii, 2012). The initiation occurs following
at least one of distinct glycosylases (NTHL1, NEIL1, NEIL2, NEIL3 MPG, TDG,
UNG, MUTYH, OGG1, MPG, MPD4 and SMUG1), depending on the type of the
lesion, and further influences the choice of pathway (Fortini et al., 1999). Other
influential factors include the cell type, and the availability of BER factors (Narciso
et al., 2007; Bauer et al., 2011; Tichy et al., 2011). Short-patch BER requires
specific repair proteins which are not necessary for replication, and therefore, the
process shows efficiency in proliferating and non-proliferating cells. Following
initiation by DNA glycosylase, further steps require AP-endonuclease APE1, DNA
polymerase β (Pol β), and DNA ligase I or III (LIG1/3) (Krokan and Bjørås, 2013).
poly(ADPribose) polymerase 1 (PARP1) and XRCC1 may also participate, but has
been suggested these may not always be involved (Hanssen‐Bauer et al., 2011).
The long-patch repair pathway has been found to primarily take place in proliferating
cells, and to a large extent utilises replicative proteins during the process by APE1,
including, PCNA, FEN1, DNA polymerase δ/ε and LIG1. However, this is dependent
on proliferative state of the cell. Pol β is found to be used in non-proliferating cells
with primarily Pol δ/ε in proliferating cells (Akbari et al., 2009; Svilar et al., 2011).
The core steps of BER (Figure 1.5-d) are excision of the base, incision, end
processing, repair synthesis, and gap filling and ligation. A variation of proteins
utilised downstream of the base excision is dependent on the short-patch repair with
a single nucleotide gap is generated, filled and ligated, or long-patch repair with a
gap of 2-10 nucleotides is generated and filled (Lindahl, 2001; Almeida and Sobol,
2007; Fortini and Dogliotti, 2007; Robertson et al., 2009; Svilar et al., 2011; Wallace
et al., 2012).
Page | 45
Figure 1.5-d The core steps of BER. The DNA glycosylase excises the damaged base producing an abasic or AP site. The DNA backbone is cleaved by AP enonuclease at 5’, generating a 5’ deoxyribose phosphate end and a free 3’OH end. During short-patch repair DNA polymerase β (Pol β) adds a nucleotide to the 3’-OH end and removes the 5’-deoxyribose phosphate group. Then DNA ligase (LIG3+ XRCC1) joins the ends to form an intact strand. Long-patch repair: DNA polymerase δ or ε (Pol δ or ε) acting with RFC and PCNA adds 2-8 nucleotides to the 3’-OH group, while displacing the 5’-deoxyribose phosphate group and further nucleotides to generate a flap. The flap endonuclease FEN1 removes the flap, then ligase (LIG1) joins the ends. Image adapted from (Schärer, 2003).
1.5.5.6 Nucleotide excision repair
A lesion on the transcribed template strand can lead to stalling of RNA polymerase
inducing nucleotide excision repair (NER) (Hu et al, 2017). In mammals, Nucleotide
excision repair (NER) (Figure 1.5-e) usually occurs following UV induced DNA
damage (Lu et al., 2017). It is the main pathway for removing bulky DNA lesions
caused by UV, and environmental mutagens, and some chemotherapeutic agents
(Friedberg et al., 2005; Schärer, 2013).

Page | 46
Figure 1.5-e Schematic of the core NER reaction. (A) Damaging agents induce bulky DNA lesions that destabilize duplex DNA, leading to DNA helix distortion. (B) In GG-NER, XPC-HR23B recognize the lesions and binds the undamaged strand opposite, stabilizing the DNA bend. (C) TFIIH is recruited and interacts with XPC-RAD23B. (D) TFIIH in an ATP dependent manner, unwinds the DNA helix. One subunit (here XPD) encounters the chemically modified base, while XPB (second helicase subunit) continues unwinding the DNA. (E) Stalling at the lesion allows the formation of “preincision” complex with the recruitment of XPA, RPA, and XPG. (F) ERCC1-XPF interacts with XPA and is recruited to the complex, creating a dual incision; 5’ by ERCC1-XPF and followed by the incision at 3’ by XPG. (G) RPA remains bound to ssDNA facilitating the transition to repair synthesis by Pol δ and Pol κ or Pol ε and associated factors; PCNA and RFC. (H) The sealing of the nick of DNA completes the repair synthesis, by DNA ligase IIIα/XRCC1 or DNA ligase I (LIG1, shown here) completes the process (Gillet and Schärer, 2006; Schärer, 2013). Image adapted from (Gillet and Schärer, 2006).
The NER pathway recognises UV induced DNA damage by dual incision with XPG
and XPF-ERCC1 endonucleases, leading to a region of ssDNA about 22-35
nucleotides long. This region is then coated with RPA. Further, this can trigger the
GG-NER-dependent ATR activation for repair (Marteijn et al., 2014). The initiation
of NER can occur by two subpathways; global genome NER (GG-NER), and
transcription-coupled NER (TC-NER) (Gillet and Schärer, 2006; Hanawalt and
Page | 47
Spivak, 2008). TC-NER is more specific and acts on lesions in the transcribed strand
of active genes, whereas GG-NER can act at any location of the genome. The GG-
NER specific factor XPC-RAD23B, and sometimes the UV-damaged DNA-binding
protein initiate the GG-NER pathway. RNA polymerase stalled at lesions initiate the
TC-NER pathway, with the aid of TC-NER specific factors, such a CSA and XAB2.
The core NER factors are crucial for each pathway for the completion of the excision
process (Tubbs et al., 2009; Latypov et al., 2012; Schärer, 2013). During the
synthesis step of NER damage signalling can be triggered under certain
circumstances. These occasions can include too high damage load, the inhibition
of repair synthesis following nucleotide depletion or inhibition of polymerases
(Hanasoge and Ljungman, 2007; Matsumoto et al., 2007; Marteijn et al., 2009;
Overmeer et al., 2011), and if the incision at 3’ does not occur. The signalling follows
the replacement of EXO1 with XPG (Schärer, 2013). The NER intermediate forms
a ssDNA which is coated with RPA which binds ATRIP/ATR, activating the ATR
kinase (Zou and Elledge, 2003; Novarina et al., 2011). A signal cascade with MDC1,
RNF8, 53BP1, and BRCA1 forms chromatin marks including the phosphorylation of
γH2AX (Marteijn et al., 2009; Schärer, 2013). The NER pathway demonstrates
heterogeneity, which occurs due to the molecular mechanisms involved, and the
crosstalk between other processes. The NER pathway is able to repair a wide range
of structurally unrelated DNA lesions, such as cyclobutene-pyrimidine dimers, and
lesions generated by UV, chemical adducts, intrastrand crosslinks and ROS
(Marteijn et al., 2014).
1.5.6 Involvement of RECQL4 in processes of DNA repair
Patients with RTS cells were found to show sensitivity to DNA damaging agents,
suggesting an implication of RECQL4 within the DNA damage response (Cabral et
al., 2008; Fan and Luo, 2008; Jin et al., 2008). Studies have investigated RECQL4
mutant cells in response to genotoxic agents, however, results have been varied,
possibly due to different primary cells and assays utilised (Lu et al., 2014a). Some
of the agents include ionizing radiation, UV, topoisomerases inhibitors, and
chemotherapy agents (Werner et al., 2006; Cabral et al., 2008; Fan and Luo, 2008;
Jin et al., 2008; Singh et al., 2010; Crevel et al., 2012; Kohzaki et al., 2012). Viable
RTS patient fibroblasts were shown to undergo irreversible growth arrest following
the recovery from damage caused by oxidative stress, with significantly reduced
DNA synthesis (Werner et al., 2006).
Page | 48
RTS patient cells show chromosomal instabilities, mainly mosaicism and
isochromosomes (most often 8, 7 and 2 trisomies) (Ying et al., 1990; Orstavik et al.,
1994; Wang et al., 2001; Beghini et al., 2003; Larizza et al., 2006). In mouse
embryonic fibroblasts aneuploidy and an increase in premature centromere
separation was observed, leading to chromosomal instability (Mann et al., 2005).
Sister chromatid segregation errors were also seen by others (Dietschy et al., 2007),
and it was suggested to reflect the activity of RECQL4 in the N-end rule pathway
(Yin et al., 2004). In lymphocytes of RTS patients, chromosome breaks also occur
frequently (Der Kaloustian et al., 1990; Lindor et al., 1996; Miozzo et al., 1998; Grant
et al., 2000), although a few exceptions have been seen (Kerr et al., 1996; Beghini
et al., 2003). Spontaneous breaks have been found to occur in skin fibroblasts as
well (Vennos et al., 1992; Miozzo et al., 1998).
Following induction of DNA double-stranded breaks (DSBs) in human cells,
endogenous RECQL4 was found to interact with RAD51; they co-localize and form
a complex at sites representing homologous recombination repair. It is proposed
RECQL4 could resolve aberrant DNA structures formed during DNA replication, and
recombinational repair processes, or signal interactions with other proteins during
these processes, suggesting a potential reason for genomic instability found in RTS
cells and the predisposition to cancer (Petkovic et al., 2005). Silencing of RECQL4
also led to reduced RAD51 foci numbers in cells treated with ionizing radiation, and
an increase of PARP inhibitor sensitivity was shown. Further to this, RECQL4-
slienced cells were sensitive to cisplatin induced DNA damage repair via HR,
suggesting reduced HR repair ability following DSB (Santarpia et al., 2013).
PARP-1 is a single-strand break repair protein and is activated by a wide variety of
DNA damaging agents. PARP-1 also modulates cellular sensitivity to γ-irradiation
and holds an important role in BER (Bohr, 2002). Woo et al (2006) found an
interaction of RECQL4 and poly(ADP-ribose) polymerase-1 (PARP-1). The study by
Schurman et al, (2009) found RECQL4 regulates BER capacity directly and
indirectly. They showed the colocalization of RECQL4 with key factors in BER;
APE1 and FEN1 following H2O2 induced oxidative DNA damage. Interestingly, RTS
cells were shown to express an upregulation of BER pathway genes, but fail to
respond as normal cells under the same oxidative stress conditions (Schurman et
al., 2009).

Page | 49
RECQL4 is also thought to coordinate with BLM in DNA replication and DNA repair,
and the interaction has been shown to be stronger in S-phase and following ionizing
radiation. BLM has many cellular roles including involvement in homologous
recombination (Singh et al., 2012). The intracellular distribution and dynamic
relocalization of RECQL4 to sites of DNA damage has suggested a possible role to
the phenotypes, and associated heterogeneity, which has been found in RECQL4-
associated diseases (Croteau et al., 2012b). Studies have highlighted functional
roles of RECQL4 associated with aging and cellular senescence, oxidative DNA
damage repair, telomere maintenance and mitochondrial dysfunction. Genomic
instability and cellular senescence can be caused by the disruption of normal
replication and transcription (Croteau et al., 2012b).
RECQL4 may interact with Xeroderma pigmentosum group A (XPA) demonstrated
by GST-pulldown assay, as part of the NER pathway. A further increase of
interaction was observed in cells under UV irradiation (Fan and Luo, 2008). A study
demonstrated co-immunoprecipitation of RECQL4 with the Ku70/Ku80 heterodimer
and the depletion of RECQL4 in human cells has been suggested to decrease NHEJ
activity (Shamanna et al., 2014).
Interestingly, increased fragility of telomeric ends have been found in RTS patient
cells and human cells following RECQL4 knockdown. Human RECQL4 has been
shown to localise to telomeres and interact with the shelterin protein telomeric
repeat-binding factor 2 (TRF2), and TRF1. On telomeric D-loops, RECQL4 has been
shown to interact and stimulate WRN activity. RECQL4 has been demonstrated to
be able to resolve telomeric D-loops also, which is a requirement for replication at
the telomeres (Ghosh et al., 2012). WRN, BLM, and RECQL4 appear to be more
active at telomeric D-Loops containing 8-oxoguanine base lesions, results of
oxidative damage. The unwinding of D-Loops containing thymine glycol (Tg) lesions
have been shown to be a preference of RECQL4 (Ferrarelli et al., 2013). Therefore,
RECQL4 appears to have an important role in maintaining telomeric stability.
Mutations in RECQL4 could therefore lead to the dysfunction of telomeres, which is
involved in tumour suppression and progression (Xu et al., 2013). RTS patient cells
were shown to have an elevated level of fragile telomeric ends (Ghosh et al., 2012).
A study by Yin et al (2004), reported an interaction between RECQL4 and cytosolic
ubiquitin ligases UBR1 and UBR2, which have a function in the N-end rule pathway
involving protein ubiquitination and degradation (Yin et al., 2004).
Page | 50
1.6 Aims of project
RECQL4 mutations in RTS patients lead to genomic instabilities, in particular
chromosomal instabilities. We hypothesise that differentiating osteoblast become
increasingly sensitive to DNA lesions, leading to malignant transformation. Using a
cellular system that interferes with the initiation of DNA replication, and therefore
recapitulates defects in RECQL4 mutated cells we aim to determine the cellular
changes this may generate during osteocyte differentiation of mesenchymal stem
cells. To achieve interference with replication initiation during osteogenic
differentiation we follow two related approaches:
1) We utilize PHA-767491, a specific inhibitor of DDK at sub-lethal concentrations
to put a continuous pressure on the initiation machinery in proliferating and
differentiating mesenchymal stem cells. DDK acts upstream of RECQL4
recruitment, and we hypothesise that its inhibition can copy the phenotypes of
RECQL4 impairment in a system that is simple to establish and maintain.
2) While RTS fibroblasts cell lines are readily available from cell repositories,
RECQL4 mutated mesenchymal stem cells are not. We aim to establish an
immortalized MSC cell line in which RECQL4 is depleted by lentiviral transduction
of shRNA.
RECQL4 holds a critical role in predisposing RTS patients to OS development,
perhaps directly or indirectly. We aim to identify RECQL4 interacting partners that
may lead to understanding important interactions or pathways, which may enable
the development or sensitizing of cells to tumorigenesis in RECQL4 mutated cells.
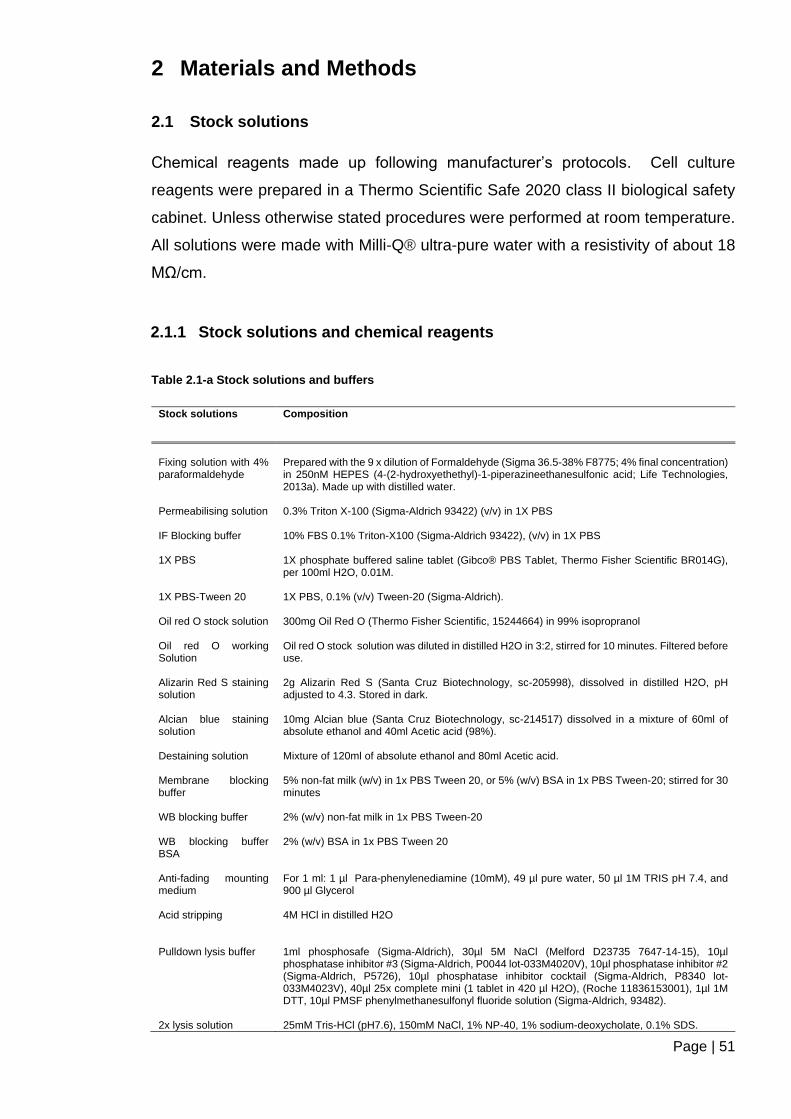
Page | 51
2 Materials and Methods
2.1 Stock solutions
Chemical reagents made up following manufacturer’s protocols. Cell culture
reagents were prepared in a Thermo Scientific Safe 2020 class II biological safety
cabinet. Unless otherwise stated procedures were performed at room temperature.
All solutions were made with Milli-Q® ultra-pure water with a resistivity of about 18
MΩ/cm.
2.1.1 Stock solutions and chemical reagents
Table 2.1-a Stock solutions and buffers
Stock solutions Composition
Fixing solution with 4% paraformaldehyde Permeabilising solution IF Blocking buffer 1X PBS 1X PBS-Tween 20 Oil red O stock solution Oil red O working Solution Alizarin Red S staining solution Alcian blue staining solution Destaining solution Membrane blocking buffer WB blocking buffer WB blocking buffer BSA Anti-fading mounting medium Acid stripping Pulldown lysis buffer 2x lysis solution
Prepared with the 9 x dilution of Formaldehyde (Sigma 36.5-38% F8775; 4% final concentration) in 250nM HEPES (4-(2-hydroxyethethyl)-1-piperazineethanesulfonic acid; Life Technologies, 2013a). Made up with distilled water. 0.3% Triton X-100 (Sigma-Aldrich 93422) (v/v) in 1X PBS 10% FBS 0.1% Triton-X100 (Sigma-Aldrich 93422), (v/v) in 1X PBS 1X phosphate buffered saline tablet (Gibco® PBS Tablet, Thermo Fisher Scientific BR014G), per 100ml H2O, 0.01M. 1X PBS, 0.1% (v/v) Tween-20 (Sigma-Aldrich). 300mg Oil Red O (Thermo Fisher Scientific, 15244664) in 99% isopropranol Oil red O stock solution was diluted in distilled H2O in 3:2, stirred for 10 minutes. Filtered before use. 2g Alizarin Red S (Santa Cruz Biotechnology, sc-205998), dissolved in distilled H2O, pH adjusted to 4.3. Stored in dark. 10mg Alcian blue (Santa Cruz Biotechnology, sc-214517) dissolved in a mixture of 60ml of absolute ethanol and 40ml Acetic acid (98%). Mixture of 120ml of absolute ethanol and 80ml Acetic acid. 5% non-fat milk (w/v) in 1x PBS Tween 20, or 5% (w/v) BSA in 1x PBS Tween-20; stirred for 30 minutes 2% (w/v) non-fat milk in 1x PBS Tween-20 2% (w/v) BSA in 1x PBS Tween 20 For 1 ml: 1 µl Para-phenylenediamine (10mM), 49 µl pure water, 50 µl 1M TRIS pH 7.4, and 900 µl Glycerol 4M HCl in distilled H2O 1ml phosphosafe (Sigma-Aldrich), 30µl 5M NaCl (Melford D23735 7647-14-15), 10µl phosphatase inhibitor #3 (Sigma-Aldrich, P0044 lot-033M4020V), 10µl phosphatase inhibitor #2 (Sigma-Aldrich, P5726), 10µl phosphatase inhibitor cocktail (Sigma-Aldrich, P8340 lot- 033M4023V), 40µl 25x complete mini (1 tablet in 420 µl H2O), (Roche 11836153001), 1µl 1M DTT, 10µl PMSF phenylmethanesulfonyl fluoride solution (Sigma-Aldrich, 93482). 25mM Tris-HCl (pH7.6), 150mM NaCl, 1% NP-40, 1% sodium-deoxycholate, 0.1% SDS.

Page | 52
Protease inhibitor cocktail Protein lysis buffer stock Western blotting lysis buffer TBE buffer 10x Agarose gel 0.8% 25 x Tris-Glycine buffer Criterion gel running buffer (10x) Invitrogen gel running buffer Invitrogen Nupage Novex LDS sample buffer (4x) Membrane transfer buffer 2x RealTime-Glo™ PHA-767491 (PHA) NEBuffer 2
1 mini complete tablet in 1ml deionised water. 5ml 2x lysis solution, 100 µl 10mM Sodium fluoride (NaF), 500 µl 5mM Sodium pyrophosphate (NaPPi), and 3ml MiLLiQ water. 420 µl Protein lysis buffer stock and 71.4 µl protease inhibitor cocktail. Tris (1M)-borate (1M)-EDTA (0.02M) (ThermoFisher Scientific) 0.32g agarose gel in 40ml TBE 1x 18.2g Tris base (12mM) (Melford B2005) 90g Glycine (96mM) (Fisher Scientific, BP381-1 130837 To 500ml with deionised water 30g Tris Base (Melford B2005), 144g Glycine (Fisher Scientific, BP381-1 130837), 10g SDS (pH 8.3) in 1000ml deionised H2O diluted 1x. NuPAGE MOPS SDS (20x) NP001 25ml in 500ml H2O. Glycerin, Sulfuric acid, monododecyl ester, lithium salt (NP0008, ThermoFisher Scientific) 40ml 25x Tris-Glycine buffer, 760ml deionised H2O, 200ml methanol. NanoLuc ® Enzyme was equilibrated to 37℃. 1000x MT cell viability substrate and 1000x
NanoLuc ® Enzyme was added to media and mixed well. PHA-767491 (Sigma-Aldrich, PZ0178), dissolved in DMSO (Dimethyl Sulfoxide; Santa Cruz Biotechnology, sc-358801). 10 mM Tris-HCl, 50 mM NaCl, 10 mM MgCl₂, 1 mM DTT (pH 7.9@25°C)
Table 2.1-b Nucleic acid stains
Cell stain Colour Dilution Cell
permeability
Mounting
media
Detection Excitation
/Emission
(nm)
Molecular
formula
Hoechst 1mg/ml (Sigma-Aldrich, 33258) DAPI (4’, 6-diamidino-2-phenylindole; Life Technologies). Vectashield mounting medium with DAPI (Vector, H-1200)
Blue Blue Blue
1: 20000 in H2O 1: 20000 in H2O -
Cell-permeable Cell-Impermeable Cell-Impermeable
Anti-fading mounting medium Anti-fading mounting medium
Fluorescent Fluorescent Fluorescent
352/461 358/461 360/460
C25H37Cl3N6
O6
C16H17Cl2N5
C16H17Cl2N5

Page | 53
Table 2.1-c Primary antibodies. WB – Western blot, IF – Immunofluorescence
Antigen Dilution Clonality Raised in
/ isotype
Immunogen kDa
Tubulin WB RECQL4 (Cell Signalling Technology, 2814) WB Ki-67 (Dako, M7240) IF, WB RUNX2 (Santa Crux, M-70 sc-10758) 200μg/ml IF Phospho CHK-1 (Bethyl A300-163A), (1mg/ml) WB HDX (Aviva Systems, QC11406, ARP39), (1µg/ml), WB HDX (Abcam, 94475), (1µg/ml), WB γH2AX, (Abcam, phospho-2139, ab2893n, 1mg/ml), IF TRF2 (Novus Biologicals NB100-56506, 1mg/ml), IF 53BP1, (Novus Biologicals, NB100-305, 1mg/ml), WB PP2A A subunit (PP2a), (Cell Signalling 2039s), WB MCM10 (Proteintech, 12251-AP), WB Chk-1 (Santa Cruz, sc-7898), WB
Engrailed homolog 2 (EN2), (Thermo Fisher Scientific, PA5-28953, 1mg/ml), WB
1:5000 in WB blocking buffer 1:1000 in WB blocking buffer BSA 1:300 in IF blocking buffer 1:300 in blocking buffer -IF 1:250 in WB blocking buffer BSA 1:500 in WB blocking buffer BSA 1:1000 WF blocking buffer BSA 1:500 IF blocking buffer 1:500 IF blocking buffer 1:5000 in WB blocking buffer BSA 1:1000 in WB blocking buffer BSA 1:800 in WB blocking buffer BSA in WB blocking buffer BSA 1:10,000 in WB blocking buffer BSA
Monoclonal Polyclonal Monoclonal Clone-MIB-1 Polyclonal Polyclonal Polyclonal Polyclonal Polyclonal Monoclonal Polyclonal Polyclonal Polyclonal Polyclonal Polyclonal
Mouse Rabbit Mouse, IgG1κ Rabbit IgG Rabbit IgG Rabbit Rabbit Rabbit Mouse Rabbit Rabbit Rabbit Rabbit Rabbit
Synthetic peptide corresponding to amino acids near the amino terminus of human RECQL4 Human recombinant peptide corresponding to a 1002 bp Ki-67 cDNA fragment Epitope corresponding to amino acids 294-363 RUNX2 mouse origin PQVATYHRAIKVTVDGPREPRRHRQKLDDSKPSLFSDRLSDLGRIPHPSMRVGVPPQNPRPSLNSAPSPF phosphorylated synthetic peptide, which represented a portion of human Checkpoint Kinase 1 (GeneID 1111) around serine 317 according to the numbering given in entry NP_001265.1 Synthetic peptide sequence derived from: MNLRSVFTVEQQRILQRYYENGMTNQSKNCFQLILQCAQETKLDFSVVRT MCM10 fusion protein ag2899
50 150
55 55 77 77 220 62 97-105 56 30
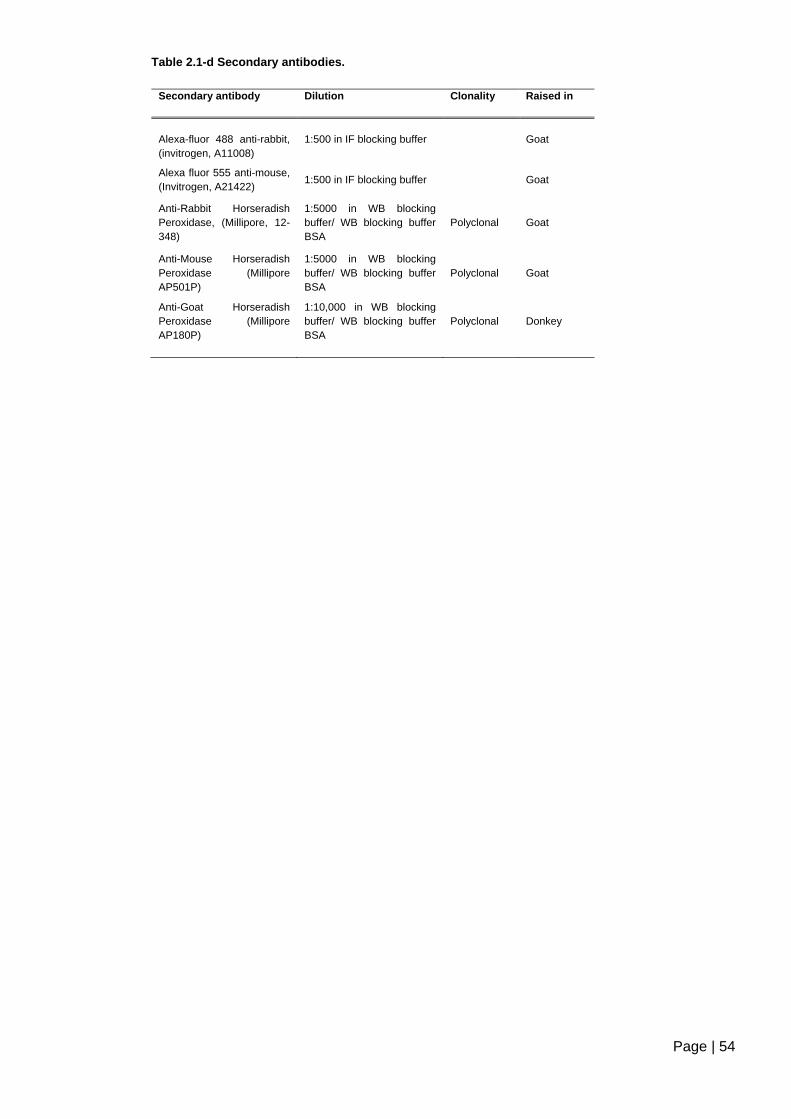
Page | 54
Table 2.1-d Secondary antibodies.
Secondary antibody Dilution Clonality Raised in
Alexa-fluor 488 anti-rabbit,
(invitrogen, A11008)
1:500 in IF blocking buffer Goat
Alexa fluor 555 anti-mouse,
(Invitrogen, A21422) 1:500 in IF blocking buffer Goat
Anti-Rabbit Horseradish
Peroxidase, (Millipore, 12-
348)
1:5000 in WB blocking
buffer/ WB blocking buffer
BSA
Polyclonal Goat
Anti-Mouse Horseradish
Peroxidase (Millipore
AP501P)
1:5000 in WB blocking
buffer/ WB blocking buffer
BSA
Polyclonal Goat
Anti-Goat Horseradish
Peroxidase (Millipore
AP180P)
1:10,000 in WB blocking
buffer/ WB blocking buffer
BSA
Polyclonal
Donkey
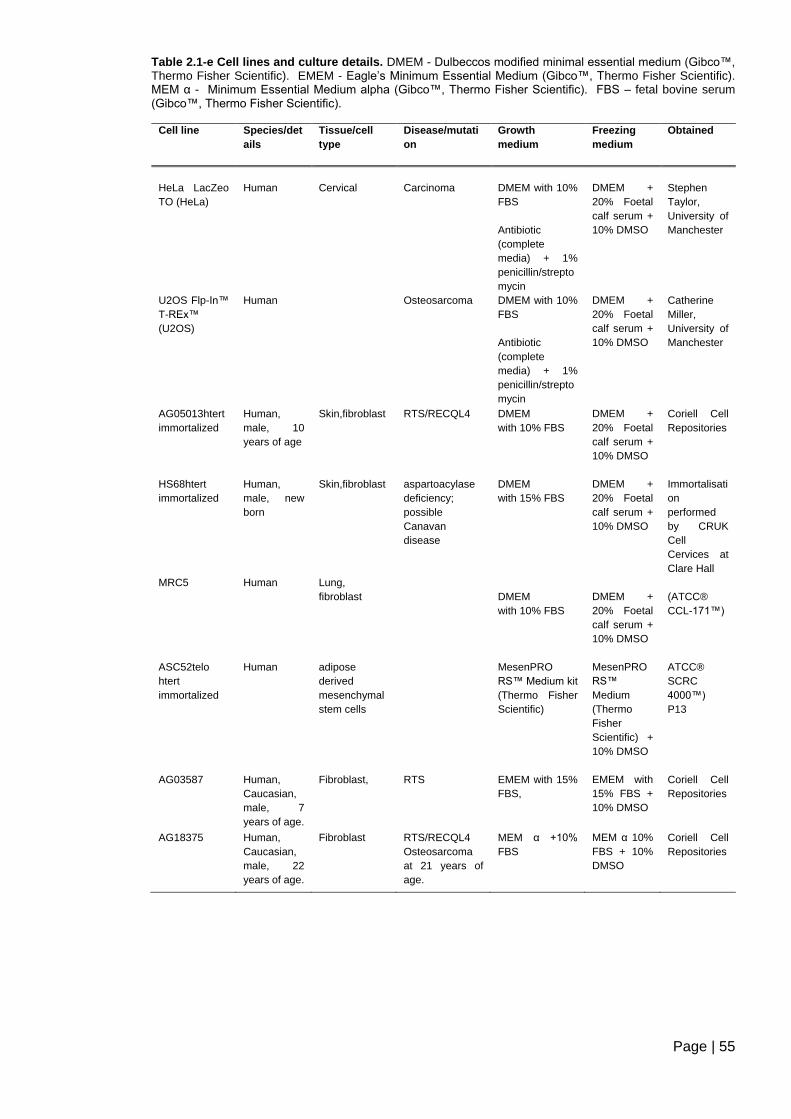
Page | 55
Table 2.1-e Cell lines and culture details. DMEM - Dulbeccos modified minimal essential medium (Gibco™, Thermo Fisher Scientific). EMEM - Eagle’s Minimum Essential Medium (Gibco™, Thermo Fisher Scientific). MEM α - Minimum Essential Medium alpha (Gibco™, Thermo Fisher Scientific). FBS – fetal bovine serum (Gibco™, Thermo Fisher Scientific).
Cell line Species/det
ails
Tissue/cell
type
Disease/mutati
on
Growth
medium
Freezing
medium
Obtained
HeLa LacZeo
TO (HeLa)
Human
Cervical
Carcinoma
DMEM with 10%
FBS
Antibiotic
(complete
media) + 1%
penicillin/strepto
mycin
DMEM +
20% Foetal
calf serum +
10% DMSO
Stephen
Taylor,
University of
Manchester
U2OS Flp-In™
T-REx™
(U2OS)
Human Osteosarcoma DMEM with 10%
FBS
Antibiotic
(complete
media) + 1%
penicillin/strepto
mycin
DMEM +
20% Foetal
calf serum +
10% DMSO
Catherine
Miller,
University of
Manchester
AG05013htert
immortalized
Human,
male, 10
years of age
Skin,fibroblast RTS/RECQL4 DMEM
with 10% FBS
DMEM +
20% Foetal
calf serum +
10% DMSO
Coriell Cell
Repositories
HS68htert
immortalized
Human,
male, new
born
Skin,fibroblast aspartoacylase
deficiency;
possible
Canavan
disease
DMEM
with 15% FBS
DMEM +
20% Foetal
calf serum +
10% DMSO
Immortalisati
on
performed
by CRUK
Cell
Cervices at
Clare Hall
MRC5
Human Lung,
fibroblast
DMEM
with 10% FBS
DMEM +
20% Foetal
calf serum +
10% DMSO
(ATCC®
CCL-171™)
ASC52telo
htert
immortalized
Human adipose
derived
mesenchymal
stem cells
MesenPRO
RS™ Medium kit
(Thermo Fisher
Scientific)
MesenPRO
RS™
Medium
(Thermo
Fisher
Scientific) +
10% DMSO
ATCC®
SCRC
4000™)
P13
AG03587 Human,
Caucasian,
male, 7
years of age.
Fibroblast, RTS EMEM with 15%
FBS,
EMEM with
15% FBS +
10% DMSO
Coriell Cell
Repositories
AG18375 Human,
Caucasian,
male, 22
years of age.
Fibroblast RTS/RECQL4
Osteosarcoma
at 21 years of
age.
MEM α +10%
FBS
MEM α 10%
FBS + 10%
DMSO
Coriell Cell
Repositories
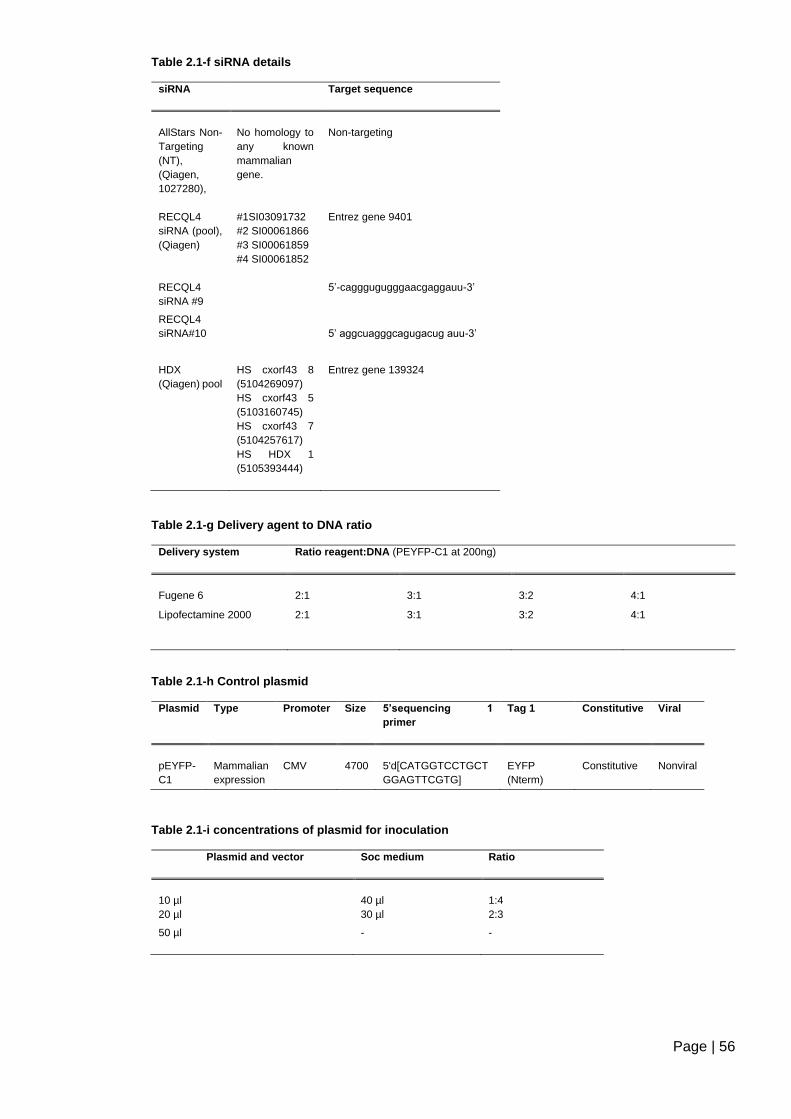
Page | 56
Table 2.1-f siRNA details
siRNA Target sequence
AllStars Non-
Targeting
(NT),
(Qiagen,
1027280),
No homology to
any known
mammalian
gene.
Non-targeting
RECQL4
siRNA (pool),
(Qiagen)
#1SI03091732
#2 SI00061866
#3 SI00061859
#4 SI00061852
Entrez gene 9401
RECQL4
siRNA #9
5’-cagggugugggaacgaggauu-3’
RECQL4
siRNA#10
5’ aggcuagggcagugacug auu-3’
HDX
(Qiagen) pool
HS cxorf43 8
(5104269097)
HS cxorf43 5
(5103160745)
HS cxorf43 7
(5104257617)
HS HDX 1
(5105393444)
Entrez gene 139324
Table 2.1-g Delivery agent to DNA ratio
Delivery system Ratio reagent:DNA (PEYFP-C1 at 200ng)
Fugene 6
2:1
3:1
3:2
4:1
Lipofectamine 2000 2:1 3:1 3:2 4:1
Table 2.1-h Control plasmid
Plasmid Type Promoter Size 5’sequencing 1
primer
Tag 1 Constitutive Viral
pEYFP-
C1
Mammalian
expression
CMV
4700
5'd[CATGGTCCTGCT
GGAGTTCGTG]
EYFP
(Nterm)
Constitutive
Nonviral
Table 2.1-i concentrations of plasmid for inoculation
Plasmid and vector Soc medium Ratio
10 µl
40 µl
1:4
20 µl 30 µl 2:3
50 µl - -
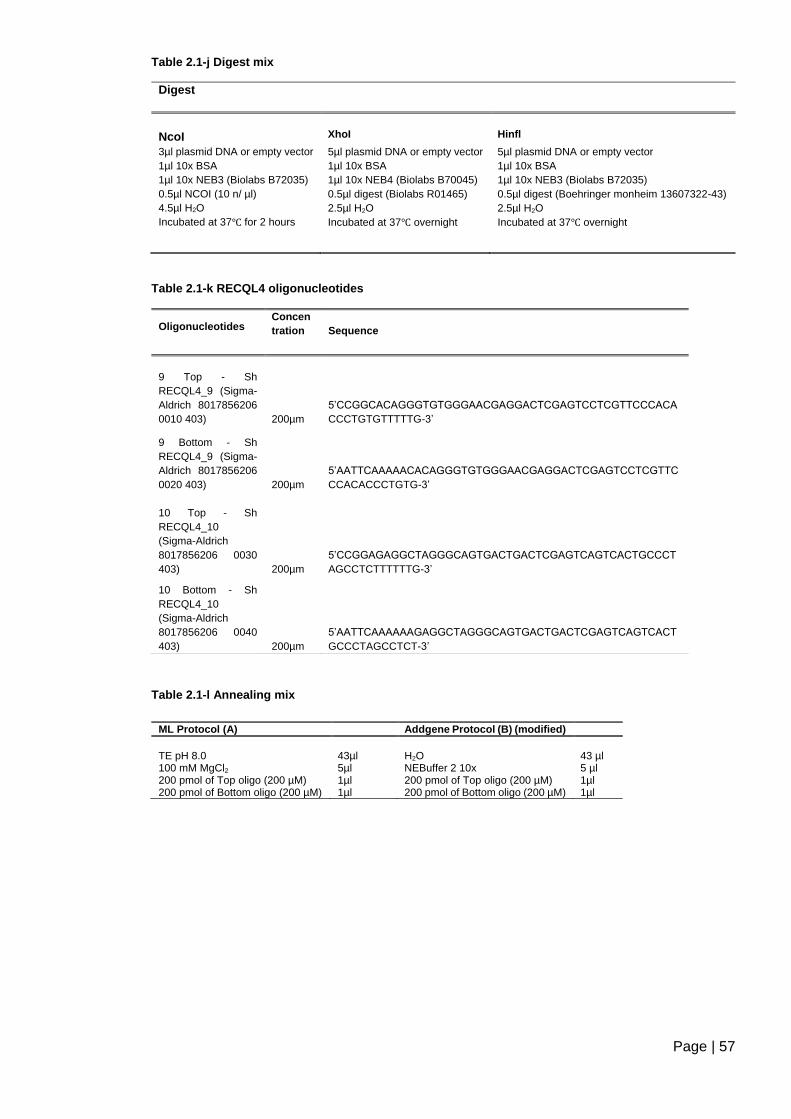
Page | 57
Table 2.1-j Digest mix
Digest
NcoI
XhoI
Hinfl
3µl plasmid DNA or empty vector 5µl plasmid DNA or empty vector 5µl plasmid DNA or empty vector
1µl 10x BSA 1µl 10x BSA 1µl 10x BSA
1µl 10x NEB3 (Biolabs B72035) 1µl 10x NEB4 (Biolabs B70045) 1µl 10x NEB3 (Biolabs B72035)
0.5µl NCOI (10 n/ µl) 0.5µl digest (Biolabs R01465) 0.5µl digest (Boehringer monheim 13607322-43)
4.5µl H2O 2.5µl H2O 2.5µl H2O
Incubated at 37℃ for 2 hours Incubated at 37℃ overnight Incubated at 37℃ overnight
Table 2.1-k RECQL4 oligonucleotides
Table 2.1-l Annealing mix
Oligonucleotides Concen
tration Sequence
9 Top - Sh
RECQL4_9 (Sigma-
Aldrich 8017856206
0010 403) 200µm
5’CCGGCACAGGGTGTGGGAACGAGGACTCGAGTCCTCGTTCCCACA
CCCTGTGTTTTTG-3’
9 Bottom - Sh
RECQL4_9 (Sigma-
Aldrich 8017856206
0020 403) 200µm
5’AATTCAAAAACACAGGGTGTGGGAACGAGGACTCGAGTCCTCGTTC
CCACACCCTGTG-3’
10 Top - Sh
RECQL4_10
(Sigma-Aldrich
8017856206 0030
403) 200µm
5’CCGGAGAGGCTAGGGCAGTGACTGACTCGAGTCAGTCACTGCCCT
AGCCTCTTTTTTG-3’
10 Bottom - Sh
RECQL4_10
(Sigma-Aldrich
8017856206 0040
403) 200µm
5’AATTCAAAAAAGAGGCTAGGGCAGTGACTGACTCGAGTCAGTCACT
GCCCTAGCCTCT-3’
ML Protocol (A) Addgene Protocol (B) (modified)
TE pH 8.0 100 mM MgCl2 200 pmol of Top oligo (200 µM) 200 pmol of Bottom oligo (200 µM)
43µl 5µl 1µl 1µl
H2O NEBuffer 2 10x 200 pmol of Top oligo (200 µM) 200 pmol of Bottom oligo (200 µM)
43 µl 5 µl 1µl 1µl

Page | 58
Table 2.1-m Ligation Reagent mix
Empty vector RECQL4 9 (A) RECQL4 9 (B) RECQL4 10 (A) RECQL4 10 (B)
PLK0.1 (93.5ng/µl
1µl
1µl
1µl
1µl
1µl
10x annealed insert - 0.5µl 0.5µl 0.5µl 0.5µl
T4 ligase 0.2µl 0.2µl 0.2µl 0.2µl 0.2µl
10x ligase buffer 1µl 1µl 1µl 1µl 1µl
10x BSA 1µl 1µl 1µl 1µl 1µl
H20 6.8µl 6.3µl 6.3µl 6.3µl 6.3µl
Adenosine
triphosphate (ATP)
0.1µl 0.1µl 0.1µl 0.1µl 0.1µl
Table 2.1-n PCR amplification mix
PCR amplification mix component Volume per reaction
Amplification grade water To final volume (25µl)
GenePrint® 10 5X Master Mix 5µl
GenePrint® 10 5X Primer Pair Mix 5µl
template DNA (10ng) Up to 15µl
Total reaction volume 25µl
2.2 Cell Culture
All cell culture procedures were performed in a clss II Thermo Scientific Safe 2020
Biological safety cabinet. Separate solutions were used between cell lines to reduce
the risk of cross contamination. Cells were incubated in a Panasonic MCO-19A1C-
PE humidified cell culture incubator, CO2 controlled at 5%, at 37℃. All solutions
were equilibrated to 37℃ before usage in a Grant waterbath.
2.2.1 Cell maintenance
Cells were maintained in 25cm2 T-flasks in 5ml of suitable medium (Table 2.1-e) at
around 80-90% confluency (2-4 days).
For passaging and seeding, the media was removed using aspiration, and the cells
were washed with 1x PBS. 500µl 1x trypsin-EDTA (0.25% trypsin, 0.53mM EDTA,
Gibco) in 1x PBS was added to detach the cells, for 5-10 minutes at 37 ℃. Detached
cells were re-suspended in suitable media (Table 2.1-e) and the cells were counted
before each assay, seeding, and passaging by haemocytometer or a BioRad TC20
Page | 59
cell counter. Desired cell density was seeded onto plate wells, or in 25cm2 T-flask
for continual culture. If required during culture, cell growth was recorded using
phase contrast images taken with a Nikon eclipse T5100 and DN100 camera.
2.2.2 Freezing
The cells were detached from the culture vessel using trypsin-EDTA, as previously
described, and were placed in separate conical tubes and centrifuged down at
1000rpm for 5 minutes. The medium was carefully removed leaving the cells at the
base of the 15ml conical centrifuge tube. Light tapping was applied to mix the
remaining cells and suitable 1ml freezing medium was added (Table 2.1-e). The
suspension was transferred into cryo-vials and stored via slowly cooling to -80℃,
then transferred to vapour phase of a liquid nitrogen container.
2.2.3 Recovery
The cells were rapidly thawed by placing in a 37℃ water bath for 2 minutes, to
prevent the formation of water crystals. The cells were suspended in 10 ml media
then centrifuged down at 1000rpm for 5 minutes and the freezing media (Table
2.1-e) was removed by aspiration. The cells were re-suspended in the appropriate
growth media (Table 2.1-e) and transferred to a 25cm2 T-flask.
2.2.4 Proliferation titration
Cells were harvested as previously described, were seeded at suitable densities
and incubated at 37°C. At various time points the cells were harvested as previously
described and counted. The cells were viewed using Nikon Eclipse TE2000 inverted
stage microscope.
2.2.5 ASC52telo differentiation ability
ASC52telo cells were seeded at 5000 cells per cm2 on 24 well plate. The cells were
allowed to reach around 80% confluency (control cells). The cells were treated with
selected differentiation media: chondrocyte differentiation (StemPro chondrocyte
kit, Thermo Fisher Scientific), osteocyte differentiation (StemPro osteogenesis kit,
Thermo Fisher Scientific), and adipocyte differentiation (StemPro adipocyte kit,
Thermo Fisher Scientific). Medium was changed every 3 days. Full differentiation
Page | 60
was expected following at least 21 days of culture. Differentiation was confirmed
with histochemical staining.
2.2.5.1 Adipocyte differentiation detection - Oil red o
Following cell incubation for adipocyte differentiation (21 days, unless stated
otherwise), the medium was aspirated gently; the cells were not allowed to remain
dry for no longer than 30 seconds. All rinsing was carried out gently, in order not to
disturb the monolayer. The cells were washed with 1x PBS, and fixed in 4% fixing
solution (Table 2.1-a) for 10 minutes at 4℃. The fixing solution was then removed
and 1x PBS washes performed 2 times. The cells were washed with distilled H2O.
60% Isopropanol was added to cover the cells for 5 minutes. This was removed
and 2ml of Oil red O working solution (Table 2.1-a), was added to cover the cells for
5 minutes. The solution was removed and the cells washed with tap water until
running clear. 2ml of Harris haematoxylin (Thermo Fisher Scientific) counterstain
was added for 1 minute and rinsed with warm tap water. The cells were observed
using transmitted light microscopy, the nuclei staining blue, and the lipid droplets
staining red.
2.2.5.2 Osteoblast differentiation detection - Alizarin red S
Following cell incubation for osteoblast differentiation (21 days, unless stated
otherwise), the medium was aspirated gently. All rinsing was carried out gently, in
order not to disturb the monolayer. The cells were washed with 1x PBS, and fixed
in 4% fixing solution (Table 2.1-a) for 10 minutes at 4℃. The fixing solution was
then removed and 1x PBS washes performed 2 times. The cells were washed with
distilled H2O, and Alizarin Red S staining solution (Table 2.1-a), was added to cover
the cells for 5 hours. The plate was wrapped in foil to protect from light. The solution
was carefully removed and cells washed 4x with H2O and maintained in 1x PBS.
The cells were observed using transmitted light microscopy, extracellular calcium
deposits staining orange-red.
2.2.5.3 Chondrocyte differentiation detection – Alcian blue
Following cell incubation for chondrocyte differentiation (21 days, unless stated
otherwise), the medium was aspirated gently. The cells were washed with 1x PBS,
and fixed in 4% fixing solution (Table 2.1-a) for 10 minutes at 4℃. The fixing solution
Page | 61
was then removed and 1x PBS washes performed 2 times. The cells were washed
with distilled H2O and Alcian blue staining solution was added to cover the cells
overnight. The staining solution was carefully removed and the cells were washed
2x with destaining solution (Table 2.1-a) for 20 minutes each time. The cells were
maintained in 1x PBS and observed using transmitted light microscopy. Cartilage
stains dark blue.
2.2.6 Anchorage-independent growth
ASC52telo cells were seeded at 2000 cells per well in Costar flat bottom ultra-low
attachment surface non pyrogenic (3474) 96 well plate. The cells were incubated as
indicated in the legend of the respective figures. Every 3 days the plate was
centrifuged at 1000rpm, the media was carefully removed leaving 20ul on the cells.
The cells were re-suspended in media under the same conditions with/without
treatment (PHA-767491). MTS assay (Section 2.2.7.2) was performed at indicated
days.
2.2.7 Cell quantification and viability analysis
2.2.7.1 Cell quantification
Cell quantification was performed before each assay to seed cells at desired
density, and for analysis of cell proliferative rate. Obtained cell suspension was
mixed with Trypan blue at a 1:1 ratio to measure cell viability, was added to a clean
haemocytometer, and viewed using Nikon Eclipse TE2000 inverted microscope with
10x objective. In total 8 quadrants were used to provide a mean. The mean was
calculated, and the cell concentration was expressed as n x 105. Alternatively, a Bio-
Rad TC20 automated cell counter was used with a cell suspension prepared (see
Table 2.1e).
2.2.7.2 MTS viability assay
The procedure was carried out in dark conditions. MTS solution was prepared using
MTS (CellTiter 96® -A Queous MTS Reagent Powder, Promega), dissolved in 1x
PBS and mixed with the electron coupling reagent phenazine methosulfate (PMS),
(Sigma-Aldrich, P9625). Cells were seeded at appropriate densities in 96-well plate
Page | 62
and following incubation the media was replaced with 100ul fresh media and 20ul
of MTS/PMS solution was added to the culture medium at a final concentration of
1.9 mg/ml MTS and 44 μg/ml PMS in 1x PBS, and cells were incubated for 3 hours
at 37°C. Post incubation, the coloured product generated by viable cells was
measured at 490 nm and quantified using a Spectra Max Plus (Molecular Devices)
plate reader with Softmax pro 5.2 software.
For drug treatments, the drug was added 24 hours following cell seeding and
maintained throughout the assay until MTS/PMS was added.
2.2.7.3 RealTime-Glo™ MT assay
ASC52telo cells were seeded at 5000 cells per cm2 on a 96 well plate in triplicates,
and treated as required. A well was left blank either side. The cells were incubated,
and the media was changed every 3 days. On day 21 fresh media was added, 2x
RealTime-Glo™ was added to the wells in media to form 1x concentration, and
incubated for 1 hour. The plate was covered with PCR film to reduce contamination
to cells, covered with tin foil to protect from light during incubation. Luminescence
was read using Hidex Chameleon plate reader. The plate was returned for
incubation and on day 24 the RealTime-Glo™ MT assay was repeated, and cells
returned for incubation. To analyse the cells further an MTS assay (Section 2.2.7.2)
was performed on day 28.
2.2.8 PHA-767491 titration
A suitable concentration of PHA-767491 (pyridin-4-yl)-6,7-dihydro-1H-pyrrolo[3,2-
c]pyridin-4(5H)-one; Sigma-Aldrich, PZ0178), was determined in a range of cell
lines to establish mild proliferation inhibition. Cells were harvested as previously
described, and seeded at 2000 cells per well in a 96-well plate and incubated for 24
hours. Wells with media alone were used as background control. Media was
replaced with 100ul fresh media containing a range of PHA-767491 concentrations
after the cells had safely attached to the substrate. The cells were incubated for 7-
10 days and an MTS assay performed as described previously.
A PHA-767491 model (PHA model) (Figure 2.2-a) was generated to establish
ASC52telo cell lines which would represent: 1) short term treatment (referred to as
‘acute’); 2) continuous, prolonged treatment (‘chronic’); 3) cells released from
Page | 63
chronic treatment for the duration of experiment (‘chronic recovery); 4) and
untreated cells (no treatment) in low and high passage cells. Low passage chronic
PHA treatment started at P+6, high passage chronic PHA treatment started at P+13.
Cells treated with PHA for a period of time and through a number of passages prior
to further plating were deemed ‘chronic’.
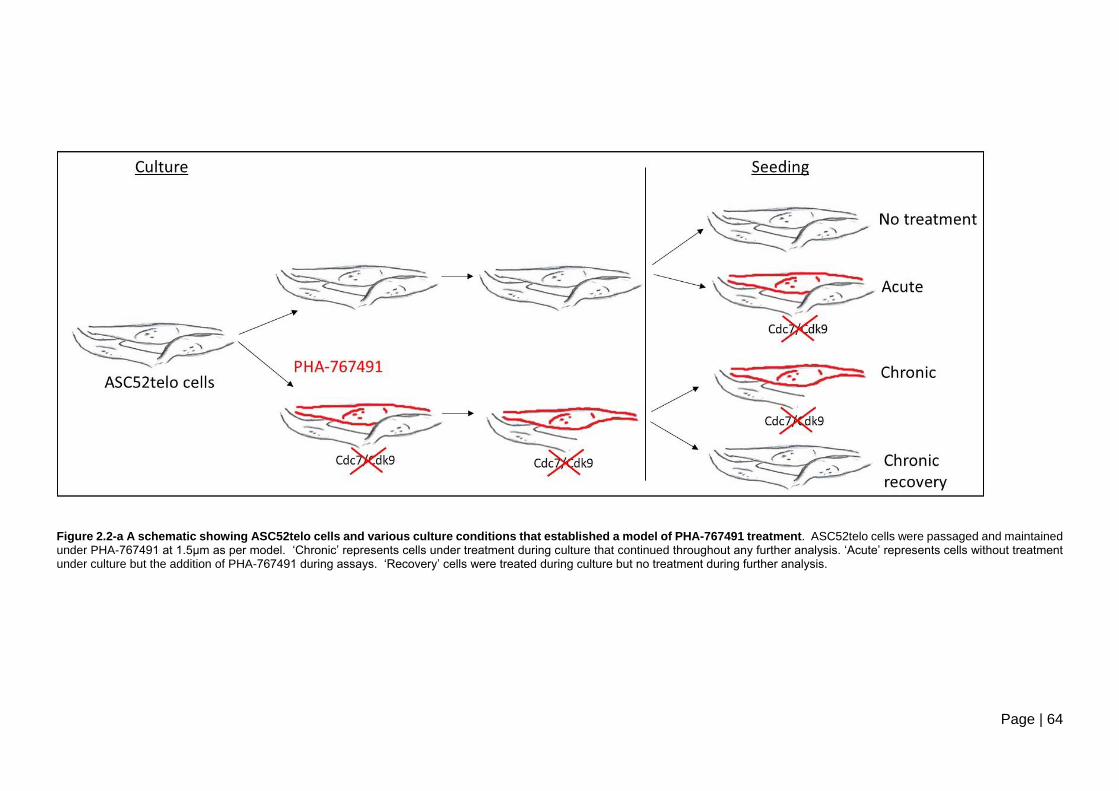
Page | 64
Figure 2.2-a A schematic showing ASC52telo cells and various culture conditions that established a model of PHA-767491 treatment. ASC52telo cells were passaged and maintained under PHA-767491 at 1.5µm as per model. ‘Chronic’ represents cells under treatment during culture that continued throughout any further analysis. ‘Acute’ represents cells without treatment under culture but the addition of PHA-767491 during assays. ‘Recovery’ cells were treated during culture but no treatment during further analysis.

Page | 65
2.2.9 Titration of selection reagents
Optimum selection concentration of Blasticidin-S® (Thermo Fisher Scientific) in
HeLa and U2OS cells had been previously determined to be 4µg/ml and 15µg/ml,
respectively.
HeLa and U2OS cells were seeded into petri dishes containing 10ml DMEM medium
(Table 2.1-e) with Blasticidin-S® (Thermo Fisher Scientific) as above and
concentrations of Hygromycin B (Calbiochem, 400053) varying between 0 µg/ml
with 50µg/ml increments and incubated for 2 and 3 weeks. The cells were observed
microscopically using Nikon Eclipse TE2000 inverted stage microscope for the rate
of cell growth / cell death to determine an appropriate concentration of Hygromycin
B with the Blasticidin-S® co-treatment. The optimal concentration of Hygromycin B
for co-selection was found to be 225 µg/ml (45 µl in 10ml medium) in HeLa cells,
and and100 µg/ml (20 µl in 10ml medium) in U2OS cells.
2.2.10 Transfection
2.2.10.1 siRNA transfection
All siRNA transfections were performed as reverse transfections, under RNAse-free
conditions, and conducted in 96 well plates. For one well of the 96-well plate 0.1 µl
DharmaFECT 1 (Dharmacon) delivery reagent was diluted in 9.9µl OptiMEM
medium (Gibco, Thermo Fisher Scientific), and 0.5µl 2µM siRNA (Table 2.1-f) was
diluted in 9.5µl OptiMEM. The diluted reagents were mixed via vortexing and
incubated at room temperature for 5 minutes. Following incubation the transfection
reagents (diluted siRNA and diluted transfection reagent) were combined, mixed,
and incubated at room temperature for 20 mins, then placed into the wells. Cell
suspension of 12,000 cells per well was set up and 80µl was added to each well.
The reagent mixes and cell suspension were scaled up as required for the number
of wells. The media was topped up 18 hours post transfection and incubated for
further 2 days. Whole cell protein was extracted (Section 2.3.1) and further analysis
was performed.
2.2.10.2 Optimisation of plasmid transfection
HeLa LacZeo cells were seeded at 1x10⁵per well onto glass coverslips in 24 well
plate and incubated overnight. The cells were transfected with variety of ratios
Page | 66
(Table 2.1-g) of delivery agent : plasmid DNA, using either Fugene 6 (Promega), or
Lipofectamine 2000 (Invitrogen, Thermo Fisher Scientific), and pEYFP-C1 control
plasmid (Table 2.1-h). For Lipofectamine 2000, 6 hours post transfection the media
was removed and replaced with media alone, while additional media was added to
Fugene 6 wells. Analysis was performed 72 hours post transfection.
2.2.10.3 Plasmid transient transfection
1x10⁵ HeLa or U2OS cells were seeded into wells of a 24 well plate and incubated
overnight. The medium was then replaced with 500 µl fresh medium. 300 ng of
plasmid DNA diluted in OptiMEM (Gibco, Thermo Fisher Scientific) was mixed with
Lipofectamine 2000 at a ratio of 3:1 Lipofectamine 2000 to DNA, and incubated at
room temperature for 25 minutes. A 100 µl aliquot of the transfection mix was added
into the appropriate wells and incubated for 6 hours. 6 hours post transfection
additional 500 µl medium (Table 2.1-e) was added to each well, and incubated for
72 hours, until analysis.
2.2.10.4 Co-transfection for inducible expression
For the generation of stable cell lines the FlipIn / FRT site-specific recombination
system was used. The host cell lines, HeLa-LacZeo and U2OS-FLIPINTREX,
contain a single-copy integrated FRT recombination site, which is utilized by the
FLP recombinase. The FLP recombinase is introduced into the system via the co-
transfection of the pOG44 plasmid (Invitrogen, Thermo Fisher Scientific).
HeLa-LacZeo and U2OS-FLIPINTREX cells were seeded onto 10cm plates and
cultured to reach around 50% confluency. 800ng of pXPfrtto-RECQL4-Emerald
maxiprep plasmid DNA (2.6.5) (4294.5ng/µl) was mixed with 7.2µg pOG44 (1940.1
ng/ µl) to reach a ratio of 9:1 in OptiMEM and allowed to stand for 5 minutes.
Lipofectamine 2000 transfection reagent was diluted in OptiMEM to allow a ratio 3:1
with DNA reagent, mixed well, and allowed to stand for 5 minutes at room
temperature. The diluted plasmids and the Lipofectamine reagent were mixed well
and allowed to stand at room temperature for 25 minutes then added to the cells
drop-wise and incubated for 5 hours. Post transfection the medium was removed
and was replaced with 10ml of fresh medium. The transfected cell population was
selected for correct integration and Tet repressor expression with Blasticidin-S®
Page | 67
(Thermo Fisher Scientific) and Hygromycin B (Calbiochem, 400053), at
concentrations determined previously.
2.2.11 Verification of inducible Emerald-GFP tagged RECQL4
Emerald-GFP tagged RECQL4 clones (in HeLa-LacZeo and U2OS-FLIPINTREX
hosts) under selection were maintained in 6 well plates to reach around 90%
confluency. The cells were harvested using trypsin as previously described and
seeded at suitable density onto ethanol sterilised glass coverslips in 1ml medium
(Table 2.1-e). Doxycycline at 2 µg/ml was added to the wells and incubated for 3
days. Fixing, mounting and analysis was performed as described in section 2.4.
2.3 Protein isolation and analysis
2.3.1 Whole cell protein extraction
Adherent cells (ASC52telo) were allowed to reach around 80% confluence, for
approximately three days. The cell medium was removed from the dishes using an
aspirator, and cells were washed x3 with 1X Phosphate Buffered Saline (PBS).
Remaining PBS was aspirated. An appropriate amount of cold lysis buffer
supplemented with protease and phosphatase inhibitors was added for 5 minutes
at 4 ℃. The lysate was then collected and was transferred into a new 1.5ml micro-
centrifuge tube and sonicated with 4x 5 second bursts at 18 microns of amplitude
(Soniprep 150, MSE). The cells were then centrifuged at 13,000 rpm for 20 minutes
at 4℃ to sediment the cell debris, and the lysate was transferred to a new 1.5ml
micro-centrifuge tube and stored at -80℃.
2.3.2 Protein quantification
Protein concentration of whole cell lysate was determined by Bradford assay. For
each sample 1 µl was assayed in 4 µl of H2O in 96-well plate. Bovine Serum Albumin
(BSA, Sigma-Aldrich, A9647) 0-2mg/ml was used as standards at 5 µl per well. 250
µl of Quick Start Bradford 1x dye (Bio-Rad, 500-0205) was added to each well, and
was incubated for 5 minutes in tin foil to protect from light. Absorbance was read at
595nm using Infinite® M200 Tecan or spectra Max Plus Molecular Devices plate
reader with Softmax pro 5.2 software.
Page | 68
2.3.3 Sodium dodecyl sulphate polyacrylamide gel (SDS page)
Proteins were separated by electrophoresis using polyacrylamide gel. Depending
on the number of parallel samples either a small or a large gel was run. A small
Novex NuPage 4-12% Bis-Tris pre-cast gel was run in an XCell sureLock Mini-Cell
tank with 1x Invitrogen NuPage MOPS SDS running buffer. A large Criterion TGX
pre-cast 4-15% gel was run in a Criterion cell (Bio-Rad) in 1x Criterion gel running
buffer (Table 2.1-a). Protein concentrations in each lysate were determined (Section
2.3.2) and normalised to the most dilute sample to maintain equal loading. To
denature the proteins each lysate was heated at 100℃ for 5 minutes with 1x Nupage
Novex LDS sample buffer (Table 2.1-a) and allowed to cool on ice. The gel was run
at 100v for 2.5 hours (Nupage) or 120v for 1.5 hours (Criterion). Following the
separation of the proteins the gel was either cut (Section 2.3.4) and sent for mass
spectrometry, or western blot was performed (Section 2.3.5).
2.3.4 Gel section cutting
Sections of the gel previously ran by SDS page (Section 2.3.3), were then cut
according to ladder markings. To help maintain sterility and to avoid keratin
contamination, equipment was cleaned with ethanol and Teknon 100. The sections
were stored in micro-centrifuge tubes, at -80℃, and sent for mass spectrometry
analysis.
2.3.5 Western blotting
To identify specific proteins extracted from cells a western blot was performed. The
proteins were separated by size using SDS-page (2.3.3), transferred onto
Amersham Hybond ECL nitrocellulose membrane (RPN303D GE-Healthcare) and
were blocked in membrane blocking buffer (Table 2.1-a) for 1 hour. Targeted
proteins were marked using appropriate primary and secondary antibodies: the
membrane was incubated overnight at 4 °C with primary antibodies in blocking
buffer (Table 2.1-c), sealed in a polyethylene bag on a rotary wheel. Unbound
antibody was removed in 5x washes for 10 minutes each in PBS Tween-20. A
targeted horseradish peroxidase-conjugated secondary antibody (Table 2.1-c) was
then applied for 1 hour at room temperature sealed in a polyethylene bag on a
rocking platform. Unbound antibody was removed in 5x washes for 10 minutes each
in PBS Tween-20. The signal from targeted protein was detected using an enhanced
Page | 69
chemiluminescence detection kit: ECL substrate BioRad (Bio-Rad,170-5060s) for 5
mins, or Pierce™ ECL Western Blotting Substrate (Thermo Scientific Fisher ™) for
1 minute. The signal was captured on film and developed using an Xograph
Compact x4, or imaged using Bio-Rad ChemiDoc™ MP imaging system (Bio-Rad)
with Image lab 4.1 software. Band densities were measured using ImageJ software,
and normalized to Tubulin to express relative density where appropriate.
2.3.6 Stripping and re-probing
The membrane previously probed was stripped to allow re-probing with different
antibody. The membrane was placed into stripping solution (Table 2.1-a) for 30
minutes on a rocking platform, followed by 2x washes in 1xPBS-Tween. The
membrane was then blocked and appropriate antibody applied as described above
(Section 2.3.5).
2.3.7 Immunoprecipitation of GFP-RECQL4 fusion proteins
Cells expressing Emerald-GFP tagged RECQL4 in a doxycycline inducible manner
were established in HeLa and U2OS background. HeLa GFP-RECQL #2 and U2OS
GFP-RECQL4 #15 cells were recovered. Confluency was established in selection
medium (Table 2.1-e). The cells were then detached as previously described and
re-seeded into separate 3x 10cm petri dishes for each cell line with medium (Table
2.1-e). GFP-RECQL4 expression was induced with the addition of 2ug/ml
doxycycline and the cells were allowed to establish confluency. The cells were then
trypsinised and transferred into 8 x 10 cm petri dishes separately for each cell line
and incubated overnight. Late evening the following day the cells were treated as
follows: 2 of the petri dishes of each cell line were treated with 2µm Suberoylanilide
hydroxamic acid (SAHA); 2 were treated with 4mM hydroxyurea; two were left
untreated, and the final two with Dimethyl Sulfoxide (DMSO) and incubated for 18
hours. The medium was then removed and on ice using 3ml of cold PBS the cells
were detached by scraping and transferred into 15ml falcon tubes. The falcon tubes
were then centrifuged at 1,000rpm for 5 minutes at 4℃. The supernatant from each
tube was carefully removed and the pellet was re-suspended in 5ml cold PBS, and
centrifuged at 1,000rpm for 5 minutes at 4℃. The supernatant was carefully
removed and the pellet was re-suspended in 1ml cold PBS and transferred into
Page | 70
separate 1.5ml micro-centrifuge tubes. These were then centrifuged again at
1,000rpm for 5 minutes at 4℃, and the supernatant discarded.
GFP-tagged proteins were isolated via immunoprecipitation using Chromotek GFP-
trap®_A. The pellet was flicked to mix well before the addition of lysis buffer to each
and allowed to rotate on a rotary wheel at 4℃ 20rpm for 1 hour. Following
incubation, the crude lysate was centrifuged at 13,000rpm for 30 minutes at 4℃.
The supernatant was transferred to new 1.5ml micro-centrifuge tubes on ice. 50µl
of the cell lysate was diluted with 50µl 4x LDS-sample buffer with 13mM DTT and
heated at 100℃ for 5 minutes, allowed to cool on ice before storage at -80℃ for
western blotting (input). 25µl of GFP-trap®_A beads were equilibrated with 500µl
of ice cold dilution buffer for each sample in 1.5ml micro-centrifuge tubes. The tubes
were centrifuged at 2700xg for 2 minutes at 4℃, and the supernatant was discarded;
this process was repeated a further 2 times. The cell lysate was then added to the
appropriate 1.5ml micro-centrifuge tube containing the beads. They were then
rotated on a rotary wheel for 2 hours at 12rpm at 4℃. Following incubation, the tubes
were centrifuged at 2000xg for 2 minutes at 4℃. The supernatant was then
transferred to new 1.5ml micro-centrifuge tubes. From this a 50 µl of aliquot was
diluted with 50µl 4x LDS-sample buffer with 13mM DTT and heated at 100℃ for 5
minutes, allowed to cool on ice and stored at -80℃ for western blotting (cleared
lysate). The remaining supernatant was discarded. The beads were then washed
with 500µl ice cold dilution buffer and centrifuged at 2000xg for 2 minutes at 4℃, the
supernatant discarded, and the wash step repeated. The beads were then re-
suspended in 4x LDS-sample buffer with 13mM DTT and heated at 95℃ for 10
minutes, allowed to cool on ice before storage at -80℃. SDS page, gel section
cutting, and western blotting was performed as described above (Sections 2.3.3,
2.3.4, 2.3.5, respectively).
2.4 Epifluorescent microscopy
Glass coverslips (Thermo Fisher Scientific 12392128, MNJ-500, 13mm), were
sterilised in 70% ethanol and allowed to dry in wells of a 24-well plate. Cells were
seeded at appropriate concentrations with suitable media and cell treatments, on
the glass coverslips. The cells were incubated and allowed to reach around 70-90%
confluency. Then the medium was removed using aspiration and the cells were
washed with 1x PBS. The cells were fixed in 4% paraformaldehyde for 12 minutes
on ice. The fix was removed, and the cells were washed in PBS 5 times. The cells

Page | 71
were then permeabilised for 20 minutes on ice and then blocked (IF blocking buffer)
for 1hr at 37°C (Table 2.1-a). Primary antibody (Table 2.1-c) was diluted in blocking
buffer and applied to glass slide, 15 µl per coverslip. The glass coverslip was
applied onto this with cells facing down and cemented down using Fixogum. This
was stored in a humidified chamber overnight at 4°C. The coverslips were then
placed back into a 24 well plate with cells facing upwards, and washed 5x with 1x
PBS for 5 minutes. The appropriate targeting secondary Alexa Fluor antibody (Table
2.1-d) was applied for 1 hr at 37 °C; the plate was covered in tin foil to protect the
secondary antibody from light. The cells were washed 5x with 1x PBS for 5 minutes.
The coverslips were allowed to dry on Whatman paper. To visualize the nuclei a
counterstaine was applied, either DAPI, or Vectashield, or Hoechst (Table 2.1-b).
The coverslips were sealed using clear nail polish and stored at 4°C. The cells were
viewed microscopically using Nikon E800 microscope with DN100 imaging camera
and imaging software, 100x objective, using FITC and DAPI filters, or using Leica
SP8 Laser Scanning Confocal Microscope equipped with a 63x objective. Analysis
was performed using CellProfiler software, minimum 100 cells viewed per control/
treatment.
For the analysis of signal from fluorescent proteins from either transient transfection
or inducible expression, cells were seeded and transfected as described in section
2.2.10.3, or seeded and induced as described in section 2.2.11. Following the
required incubation, the medium was removed and the cells were washed x2 with
PBS and fixed using 4% fixing (Table 2.1-aError! Reference source not found.) s
olution for 10 minutes at 4℃. The fixing solution was then removed and 1x PBS
washes performed 2 times. The cells were stained with 20000x Dapi and viewed
microscopically using Nikon E800 microscope with DN100 imaging camera and
imaging software, 100x objective, using FITC and DAPI filters.
2.5 Analysis of mitochondrial membrane potential
ASC52telo cells were seeded at 5000 cells per cm2 in two 96 well plates, with blank
wells either side; both plates were kept under the same conditions. PHA-767491
treatment was applied following the PHA model. The cells were incubated for 72
hours. One plate was analysed with the MTS viability assay (Section 2.2.7.2). The
other plate was analysed using TMRE (tetramethylrhodamine, ethyl ester) assay
(abcam 113852), for this, FCCP (20µm) (carbonyl cyaninde 4-(trifluoromethoxy)
Page | 72
phenylhydrazone) was added in FCCP control wells at 1000x dilution in culture
media, cells incubated for 3 hours. TMRE at 400µm in culture media was added to
each well and incubated for 30 minutes, plate wrapped in foil to protect from light.
All wells were washed x2 with 0.2% BSA. TMRE was read at Ex/Em 549/575nm,
Infinite® M200 from Tecan.
2.6 Molecular cloning
2.6.1 RECQL4-Emerald tagged construct
The Emerald-GFP tagged expression construct, pXPfrtto-RECQL4-Emerald, was
generated with the Gateway® site-specific recombination cloning system by
recombining the pENTR-RECQL4(F0) entry clone with the pDESTfrtto-Emerald-N0
expression vector, and was performed by Dr Csanad Bachrati. The recombinant
constructs were verified with restriction fragment mapping.
2.6.2 Preparation of LB-Agar plates and LB-broth
1l of LB was prepared by the addition of 25g LB broth (Miller) powder (Sigma-
Aldrich) to 1l distilled water and sterilised by autoclaving. 1l LB-agar was prepared
by dissolving 25g of LB broth (Miller) powder (Sigma-Aldrich) and 8g of agar powder
(Sigma-Aldrich) in 1l of deionised water, and sterilised by autoclaving. When the LB-
agar was cooled to ~50°C Ampicillin was added to the final concentration of 100
µg/ml. 20ml of LB-agar/Amp was poured into 10cm diameter bacterial petri dishes
and allowed to cool to room temperature.
2.6.3 Transformation
Transformation procedure was performed using aseptic technique, over Bunsen
flame.
A 25 µl aliquot of bacterial host cells (Escherichia coli NEB5α; fhuA2 Δ[argF-
lacZ]U169 phoA glnV44 Φ80Δ [lacZ]M15 gyrA96 recA1 relA1 endA1 thi-1 hsdR17;
New England Biolabs) was thawed on ice slowly. 1 µl RECQL4 construct was
added and mixed and was incubated on ice for 30 minutes. The bacterial cells were
heat shocked at 42℃ for 35 seconds, and were transferred onto ice for 2 minutes.
75 µl SOC medium was added to top up to 100 µl and the cell suspension was
Page | 73
incubated for 1 hour at 37℃ with vigorous shaking. Aliquots of the recovered culture
were spread onto previously cooled agar plates, at variable concentrations (Table
2.1-i). The plates were then incubated at 37℃ overnight upside down for the
prevention of condensation formation.
2.6.4 Small scale purification of plasmid DNA (miniprep)
Eight single colonies were selected from the 10 µl transformation plate, and
inoculated into 5 ml LB and ampicillin at 100 µg/ml in separate vented-lid tubes, and
incubated overnight at 37℃, with shaking at 190 rpm.
The isolation of high purity plasmid DNA was performed as per Miniprep Qiagen
protocol (Qiagen, 2012). Bacterial cells following overnight growth in LB were
harvested by centrifugation at 13,000rpm at room temperature for 3 minutes. The
cell pellet formed was re-suspended in 250µl P1 buffer followed by lysing with mixing
250 µl P2 buffer. 350 µl of P3 buffer was added and mixed to precipitate genomic
DNA. Precipitated genomic DNA and cell debris was sedimented by centrifuging at
13.000 rpm for 10 minutes at room temperature. The supernatant was collected
into a QIAprep spin column. The column was centrifuged for 1 minute at 13,000
rpm and the flow through discarded. 500 µl PB buffer was used to wash the columns,
centrifuged at 13,000 rpm for 1 minute. 750 µl PE buffer was added and again
centrifuged. The flow-through was discarded and the column was again spun down
to remove residual wash buffer. Bound plasmid was eluted by the addition of 50 µl
EB buffer, followed by centrifugation. DNA concentration was determined using
Nanodrop as per manufacturer’s instructions.
2.6.5 Medium scale plasmid purification (maxiprep)
High yield isolation of high purity plasmid DNA was performed as per Maxiprep
Qiagen protocol (Qiagen, 2012). 200ml of selective LB was inoculated with 1ml of
starter culture and was incubated overnight in a 500ml conical flask at 37°C with
shaking at 250rpm. Bacterial cells were harvested by centrifugation at 6000g for 15
minutes at 4°C, and the pellet was re-suspended in 10ml P1 buffer. 10ml P2 buffer
was added to this suspension to lyse the cells, mixed and incubated at room
temperature for 5 minutes. 10ml of 4°C P3 buffer was added with mixing and
incubated on ice for 20 minutes. This was centrifuged at 20000g at 4°C for 30
minutes to remove precipitated material. The Qiagen-tip 500 column was
Page | 74
equilibrated with QBT buffer. The supernatant of centrifuged sample was then
applied to the Qiagen-tip 500 column and washed 2x with 30 ml QC buffer and
eluted with 15ml QF buffer. Precipitation followed using isopropanol, the sample
was centrifuged at 15000g for 20minutes at 4°C and washed with 70% ethanol.
Once dried the pellet was re-suspended in 1ml nuclease-free water and stored at -
20 °C. DNA concentration was determined using Nanodrop as per manufacturer’s
instructions.
2.6.6 Analysis of plasmids via restriction digestion and gel electrophoresis
Plasmid DNA was purified using the Miniprep protocol (Section 2.6.4). The
recombinant constructs were verified with restriction fragment mapping. A digest
mix (Table 2.1-j) was incubated at 37℃. An agarose gel was prepared (Table 2.1-a),
with the addition of 4 µl Safeview and was poured into Biolab mini-sub cell GT tray
with combe and allowed to cool and set. Samples were centrifuged briefly at
13000rpm, followed by the addition of 1/5th volume of 6x loading dye (New England
Biolabs, B7024S). Undigested controls were made using plasmid, water and loading
dye. Samples were run alongside a 2 log DNA ladder (New England Biolabs) at 80
V for 60 minutes. Gel images were captured using Bio-Rad ChemiDoc™ MP
imaging system (Bio-Rad), with Image lab 4.1 software.
2.6.7 Generation of shRNA constructs
Two pairs of oligonucleotides coding for the stem-loop structure of an shRNA that
target the 3’ untranslated region of RECQL4 were custom synthesised (Table 2.1-k).
The annealing reaction mix was set up as shown in (Table 2.1-l) and a PCR machine
was programmed to anneal the top and bottom oligonucleotides (Table 2.6-a). The
pLKO.1 vector was digested with EcoRI, heat inactivated, purified (Qiagen PCR
purification kit), further Agel digested and the digested pLKO.1 plasmid was purified
following agarose gel electrophoresis (Qiagen gel extraction kit) (Addgene). A
ligation reaction (Table 2.1-m) was set up and the ligated constructs were
transformed into STABL-1 (Invitrogen, Thermo Fisher Scientific) competent cells
using the protocol described in section 2.6.3.

Page | 75
Table 2.6-a PCR set up in (PCR-C100 Touch thermal cycler, BioRad).
Temperature (℃) Time (minutes)
95
10
94 2.5
93 2.5
92 2.5
91 2.5
90 2.5
89 2.5
88 2.5
87 2.5
86 2.5
85 2.5
84 2.5
83 2.5
82 2.5
81 2.5
80 2.5
79 2.5
78 2.5
77 2.5
76 2.5
75 2.5
74 ∞
2.6.8 Generation of lentiviral vector and transduction of ASC52telo cells
Generation of 4th generation lentiviral particles was performed by Dr Timea Palmai-
Pallag following the well established protocol of Addgene (Adggene). The shRNA
constructs were co-transfected with pRSV/REV, pMDLg/pRRE, pMD2G plasmids
into 293T cells. The resulting supernatant, containing the infectious lentiviral
particles was used to transduce ASC52telo cells.
2.7 DNA fingerprinting
2.7.1 Preparation of genomic DNA with phenol-chloroform extraction
Cells were cultured in T25 flask until around 90% confluency. Cells were harvested
following trypsin-EDTA treatment (Section 2.2.1), centrifuged at 1000rpm for 5
minutes, and the supernatant was removed to establish a cell pellet. The cell pellet
was washed by re-suspending in PBS and centrifuging at 1000rpm for 5 mins. The
wash step was repeated 3x and cell pellet was stored at -20℃. The pellet was re-
Page | 76
suspended in 300µl DNA lysis buffer (100mM Tris Hcl and 5mM EDTA in H2O) and
mixed well by vortex for 1 minute. 15µl of 20% SDS and 6 µl of 10mg/ml Proteinase
K (Thermo Fisher Scientific) was added, mixed and incubated at 55°C overnight. 1
volume of Phenol:Chloroform:Isoamyl alcohol 25:24:1 (Thermo Fisher Scientific)
was added and mixed well by inverting for 3 minutes,+ and centrifuged at 13200rpm
for 5 minutes. The supernatant was carefully removed into a new 1.5ml
microcentrifuge tube and the precipitate discarded. The extraction step was
repeated with an equal volume of chlorophorm. 0.1 volumes of 3M sodium-acetate
pH 5.2 and 2.5 volumes of 100% ethanol was added to the DNA solution mixed and
incubated at -20°C overnight. The precipitated DNA was centrifuged at 4℃ for 30
minutes at 13000rpm. The supernatant was discarded and to wash the DNA 500µl
of 70% ethanol was added, the pellet was mixed with vortexing for 20 seconds, and
centrifuged again at 4℃ for 30 minutes at 13000rpm. The supernatant was carefully
removed and DNA pellet was air dried, and resuspended in nuclease free H2O.
2.7.2 DNA fingerprinting with the GenePrint 10 kit
For amplification, the extracted DNA concentration was determined using
NanoDrop. The GenePrint® 10 5X Master Mix and GenePrint® 10 5X Primer Pair
Mix were completely thawed and centrifuged briefly to bring the contents to the
bottom, and vortexed to mix well. Samples were prepared in the order as listed in
Table 2.1-n. For the positive control 2800M DNA (part of the kit) was added (1µl),
and amplification grade water was used as negative control, in place of DNA
template. The reaction mixture was then run in Thermal cycle (PCR-C100 touch
thermal cycler BioRad) as shown in Table 2.7-a .
Table 2.7-a Thermal cycling settings
Temperature (℃) Time
(seconds)
96
60
94 10
59 60
72 30
For 30 cycles then;
60 600
4 soak
Page | 77
2.7.3 The detection of amplified fragments
A loading cocktail was prepared by combining the internal lane standard 600 (0.5μl) and Hi-
Di™ formamide (9.5μl) per sample. This was mixed and added to tubes before the addition
of 1μl of amplified sample, or 1μl of GenePrint® 10 Allelic Ladder Mix; used to provide sizing
and genotyping of the amplified fragments. The samples were centrifuged briefly, and
denatured at 95°C for 3 minutes, before chilling on ice for a further 3 minutes. The samples
were loaded into Applied Biosystems ABI Prism 310 genetic analyser and ran with
parameters set out in Table 2.7-b.
Table 2.7-b Applied ABI prism 310 genetic analyser parameters
Parameter
Amplification type HID
Capillary length 36cm
Polymer POP-4® (ThermoFisher Scientific P/N 402838)
Running Buffer 10x with EDTA (ThermoFisher Scientific P/N 402824)
Dye set
Internal colour
Temperature
Promega 4Dye
60
Red
Pre-Injection EP time
Syringe pump time
Injection time
EP voltage
Laser
Run time
120 seconds
150 seconds
24 seconds
15kV
9.8mW
1440 seconds
2.7.4 Statistical analysis
Statistical significance was calculated by the Tukey post hoc test following one-way ANOVA
analysis. Significant P-value determined as >0.05.
Page | 78
3 Chapter 1 Interfering with DNA replication initiation
Results
Literature data supports that replication initiation is impaired in cells that contain
either mutated or no RECQL4 protein (Matsuno et al., 2006). Establishing our
model system in mesenchymal stem cells was hindered by the lack of availability of
mutated MSCs. To determine a potential link between interference of DNA
replication initiation and tumourigenesis, we employed the dual Cdc7/Cdk9 inhibitor,
(PHA-767491) to establish a model of mild replication initiation inhibition in
ASC52telo cells, which was expected to reduce proliferation.
ASC52telo cells can differentiate into three lineages, adipocytes, chondrocytes, and
osteocytes. It was important to determine if this capability was maintained in cells
under PHA-767491 treated model.
Several studies have suggested that RECQL4 may have a role in mitochondrial
DNA maintenance (Croteau et al., 2012; Chi et al., 2012; Gupta et al., 2014), which
in turn can lead to mitochondrial dysfunction. To determine if the PHA-model
generates changes in mitochondrial function, mitochondrial membrane potential
was measured, which closely relates to mitochondrial membrane permeability (Dai
et al., 2015).
3.1 Establishing the model system for inhibition of DNA replication initiation
The first step for mild proliferation inhibition through the interference of DNA
replication initiation was the identification of a suitable PHA-767491 concentration.
A suitable seeding density in 96 well plate was determined in a preliminary
experiment first using the MRC5 normal fibroblast cell line. The seeding density of
2000 cells per well over 8 days showed steady cell proliferation while maintaining
cell viability (Figure 3.1-a), PHA-767491 was found to inhibit cellular growth
following the treatment in MRC5 using a range of concentrations. A reduced but
steady proliferation rate was shown with around 1.5µM PHA-767491 (Figure 3.1-b).
A range of other cell lines: MRC5, AG05013tert, and HS68tert, showed a similar
sensitivity profile (Figure 3.1-c), however with very wide variability. We concluded
that the large observed variability seen in (Figure 3.1-c) could be due to the
instability of PHA-767491 and repeated the experiment with media changes every
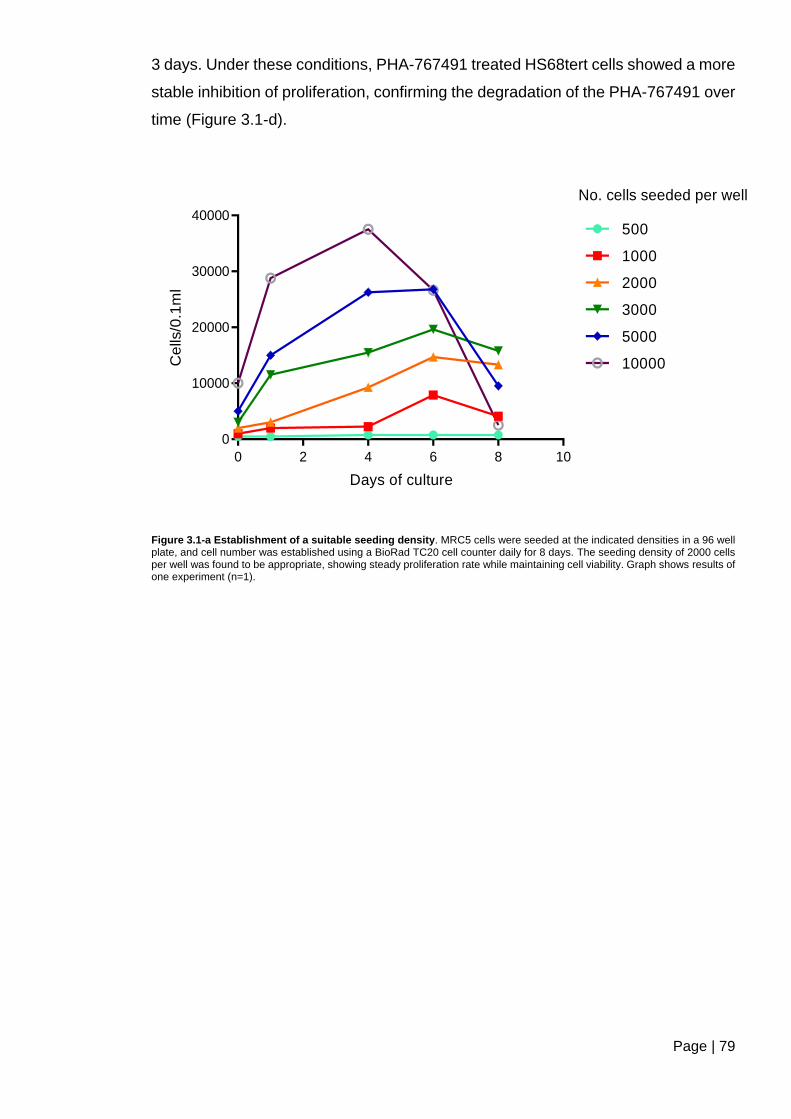
Page | 79
3 days. Under these conditions, PHA-767491 treated HS68tert cells showed a more
stable inhibition of proliferation, confirming the degradation of the PHA-767491 over
time (Figure 3.1-d).
Days of culture
Ce
lls/0
.1m
l
0 2 4 6 8 10
0
10000
20000
30000
40000500
1000
2000
3000
5000
10000
No. cells seeded per well
Figure 3.1-a Establishment of a suitable seeding density. MRC5 cells were seeded at the indicated densities in a 96 well plate, and cell number was established using a BioRad TC20 cell counter daily for 8 days. The seeding density of 2000 cells per well was found to be appropriate, showing steady proliferation rate while maintaining cell viability. Graph shows results of one experiment (n=1).
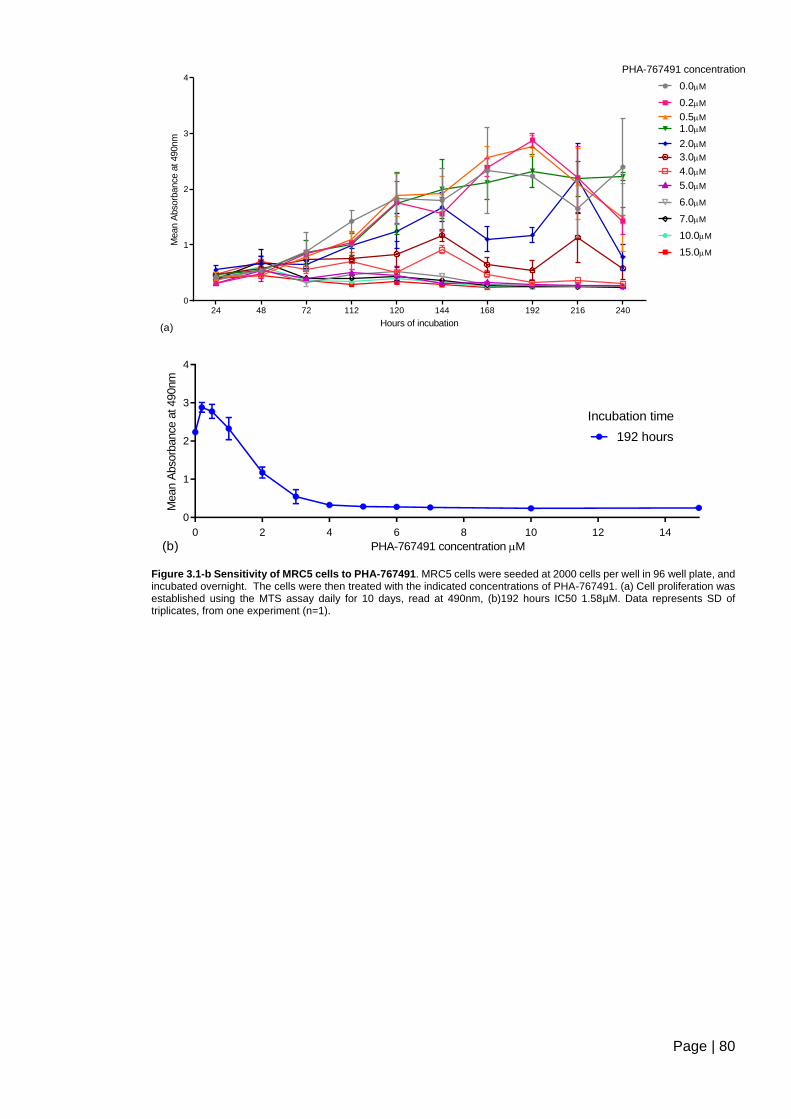
Page | 80
Hours of incubation
Mean A
bso
rbance
at 490nm
24 48 72 112 120 144 168 192 216 2400
1
2
3
40.0M
0.2M
0.5M
1.0M
2.0M
3.0M
4.0M
5.0M
6.0M
7.0M
10.0M
15.0M
PHA-767491 concentration
(a)
PHA-767491 concentration M
Mean A
bso
rbance
at 490nm
0 2 4 6 8 10 12 14
0
1
2
3
4
192 hours
Incubation time
(b)
Figure 3.1-b Sensitivity of MRC5 cells to PHA-767491. MRC5 cells were seeded at 2000 cells per well in 96 well plate, and incubated overnight. The cells were then treated with the indicated concentrations of PHA-767491. (a) Cell proliferation was established using the MTS assay daily for 10 days, read at 490nm, (b)192 hours IC50 1.58µM. Data represents SD of triplicates, from one experiment (n=1).
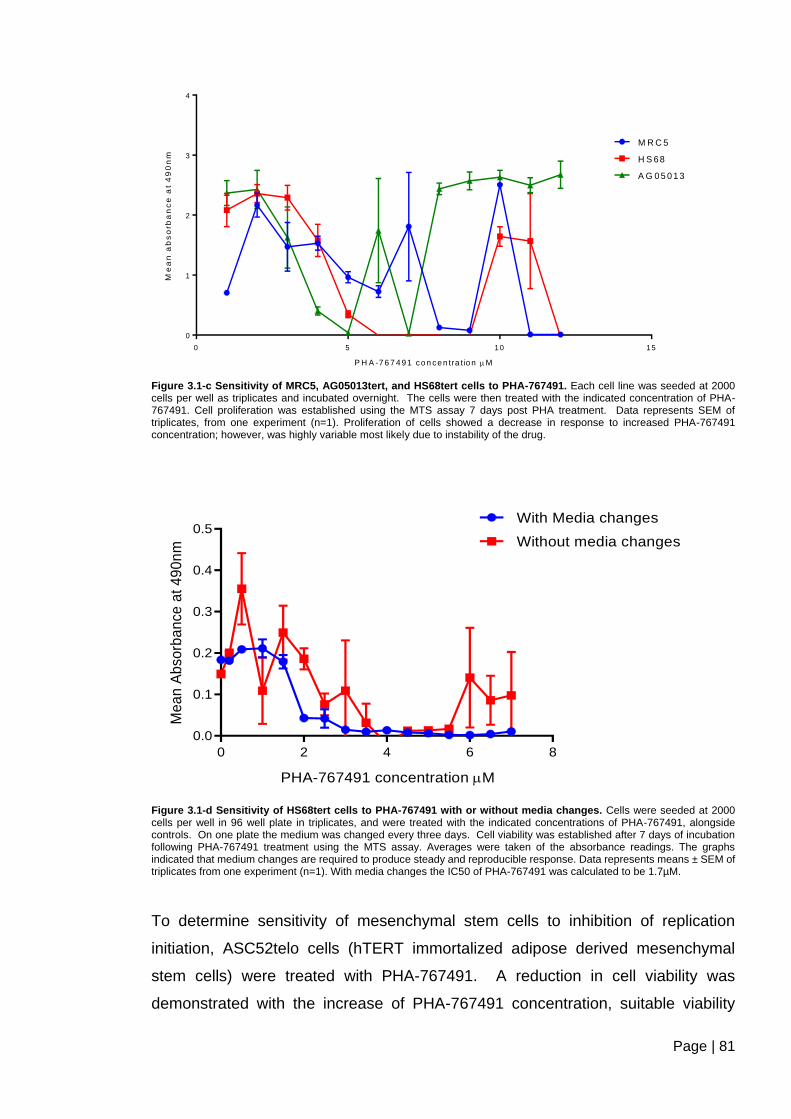
Page | 81
Figure 3.1-c Sensitivity of MRC5, AG05013tert, and HS68tert cells to PHA-767491. Each cell line was seeded at 2000 cells per well as triplicates and incubated overnight. The cells were then treated with the indicated concentration of PHA-767491. Cell proliferation was established using the MTS assay 7 days post PHA treatment. Data represents SEM of triplicates, from one experiment (n=1). Proliferation of cells showed a decrease in response to increased PHA-767491 concentration; however, was highly variable most likely due to instability of the drug.
PHA-767491 concentration M
Me
an
Ab
so
rba
nce
at
49
0n
m
0 2 4 6 8
0.0
0.1
0.2
0.3
0.4
0.5With Media changes
Without media changes
Figure 3.1-d Sensitivity of HS68tert cells to PHA-767491 with or without media changes. Cells were seeded at 2000 cells per well in 96 well plate in triplicates, and were treated with the indicated concentrations of PHA-767491, alongside controls. On one plate the medium was changed every three days. Cell viability was established after 7 days of incubation following PHA-767491 treatment using the MTS assay. Averages were taken of the absorbance readings. The graphs indicated that medium changes are required to produce steady and reproducible response. Data represents means ± SEM of triplicates from one experiment (n=1). With media changes the IC50 of PHA-767491 was calculated to be 1.7µM.
To determine sensitivity of mesenchymal stem cells to inhibition of replication
initiation, ASC52telo cells (hTERT immortalized adipose derived mesenchymal
stem cells) were treated with PHA-767491. A reduction in cell viability was
demonstrated with the increase of PHA-767491 concentration, suitable viability
P H A -7 6 7 4 9 1 co n ce n tra tio n M
Me
an
ab
so
rba
nc
e a
t 4
90
nm
0 5 1 0 1 5
0
1
2
3
4
A G 0 5 0 1 3
H S 68
M R C 5
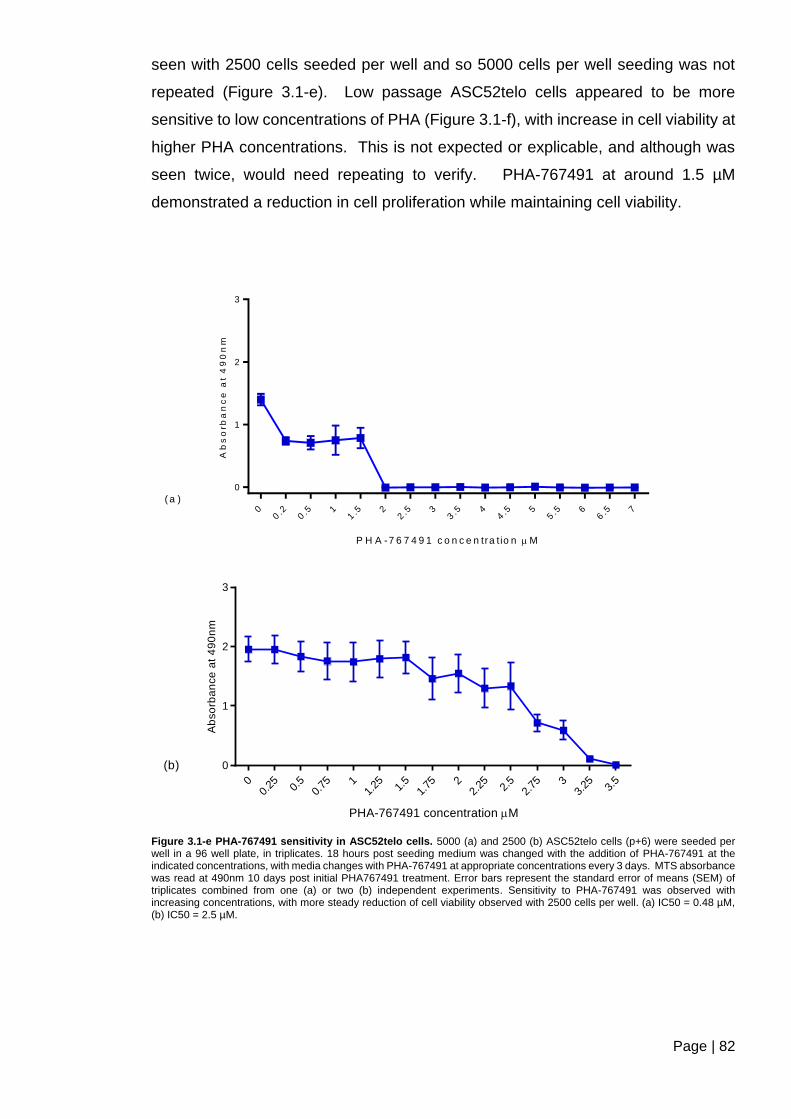
Page | 82
seen with 2500 cells seeded per well and so 5000 cells per well seeding was not
repeated (Figure 3.1-e). Low passage ASC52telo cells appeared to be more
sensitive to low concentrations of PHA (Figure 3.1-f), with increase in cell viability at
higher PHA concentrations. This is not expected or explicable, and although was
seen twice, would need repeating to verify. PHA-767491 at around 1.5 µM
demonstrated a reduction in cell proliferation while maintaining cell viability.
P H A -7 6 7 4 9 1 c o n c e n tra t io n M
Ab
so
rb
an
ce
at
49
0n
m
00.2
0.5 1
1.5 2
2.5 3
3.5 4
4.5 5
5.5 6
6.5 7
0
1
2
3
( a )
PHA-767491 concentration M
Ab
so
rba
nce
at
49
0n
m
00.
25 0.5
0.75 1
1.25 1.
51.
75 22.
25 2.5
2.75 3
3.25 3.
5
0
1
2
3
(b)
Figure 3.1-e PHA-767491 sensitivity in ASC52telo cells. 5000 (a) and 2500 (b) ASC52telo cells (p+6) were seeded per well in a 96 well plate, in triplicates. 18 hours post seeding medium was changed with the addition of PHA-767491 at the indicated concentrations, with media changes with PHA-767491 at appropriate concentrations every 3 days. MTS absorbance was read at 490nm 10 days post initial PHA767491 treatment. Error bars represent the standard error of means (SEM) of triplicates combined from one (a) or two (b) independent experiments. Sensitivity to PHA-767491 was observed with increasing concentrations, with more steady reduction of cell viability observed with 2500 cells per well. (a) IC50 = 0.48 µM, (b) IC50 = 2.5 µM.
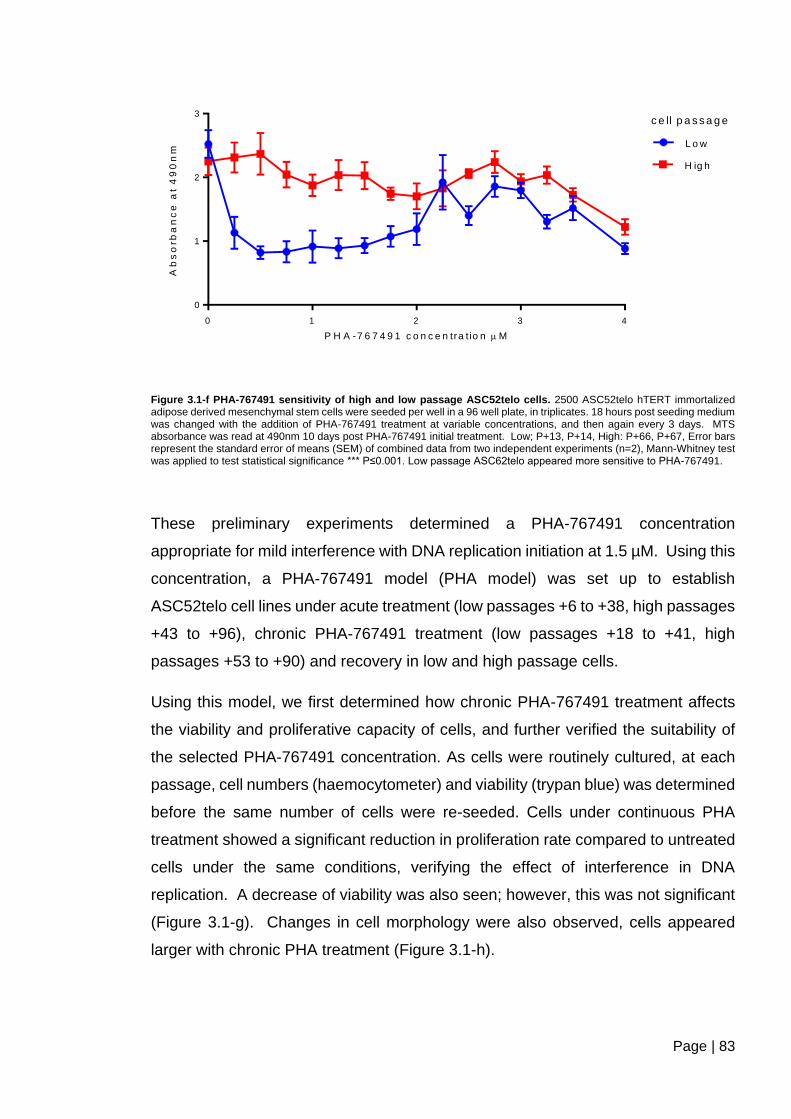
Page | 83
P H A -7 6 7 4 9 1 c o n c e n tra t io n M
Ab
so
rba
nc
e a
t 4
90
nm
0 1 2 3 4
0
1
2
3
L o w
H ig h
c e ll p a s s a g e
Figure 3.1-f PHA-767491 sensitivity of high and low passage ASC52telo cells. 2500 ASC52telo hTERT immortalized adipose derived mesenchymal stem cells were seeded per well in a 96 well plate, in triplicates. 18 hours post seeding medium was changed with the addition of PHA-767491 treatment at variable concentrations, and then again every 3 days. MTS absorbance was read at 490nm 10 days post PHA-767491 initial treatment. Low; P+13, P+14, High: P+66, P+67, Error bars represent the standard error of means (SEM) of combined data from two independent experiments (n=2), Mann-Whitney test was applied to test statistical significance *** P≤0.001. Low passage ASC62telo appeared more sensitive to PHA-767491.
These preliminary experiments determined a PHA-767491 concentration
appropriate for mild interference with DNA replication initiation at 1.5 µM. Using this
concentration, a PHA-767491 model (PHA model) was set up to establish
ASC52telo cell lines under acute treatment (low passages +6 to +38, high passages
+43 to +96), chronic PHA-767491 treatment (low passages +18 to +41, high
passages +53 to +90) and recovery in low and high passage cells.
Using this model, we first determined how chronic PHA-767491 treatment affects
the viability and proliferative capacity of cells, and further verified the suitability of
the selected PHA-767491 concentration. As cells were routinely cultured, at each
passage, cell numbers (haemocytometer) and viability (trypan blue) was determined
before the same number of cells were re-seeded. Cells under continuous PHA
treatment showed a significant reduction in proliferation rate compared to untreated
cells under the same conditions, verifying the effect of interference in DNA
replication. A decrease of viability was also seen; however, this was not significant
(Figure 3.1-g). Changes in cell morphology were also observed, cells appeared
larger with chronic PHA treatment (Figure 3.1-h).
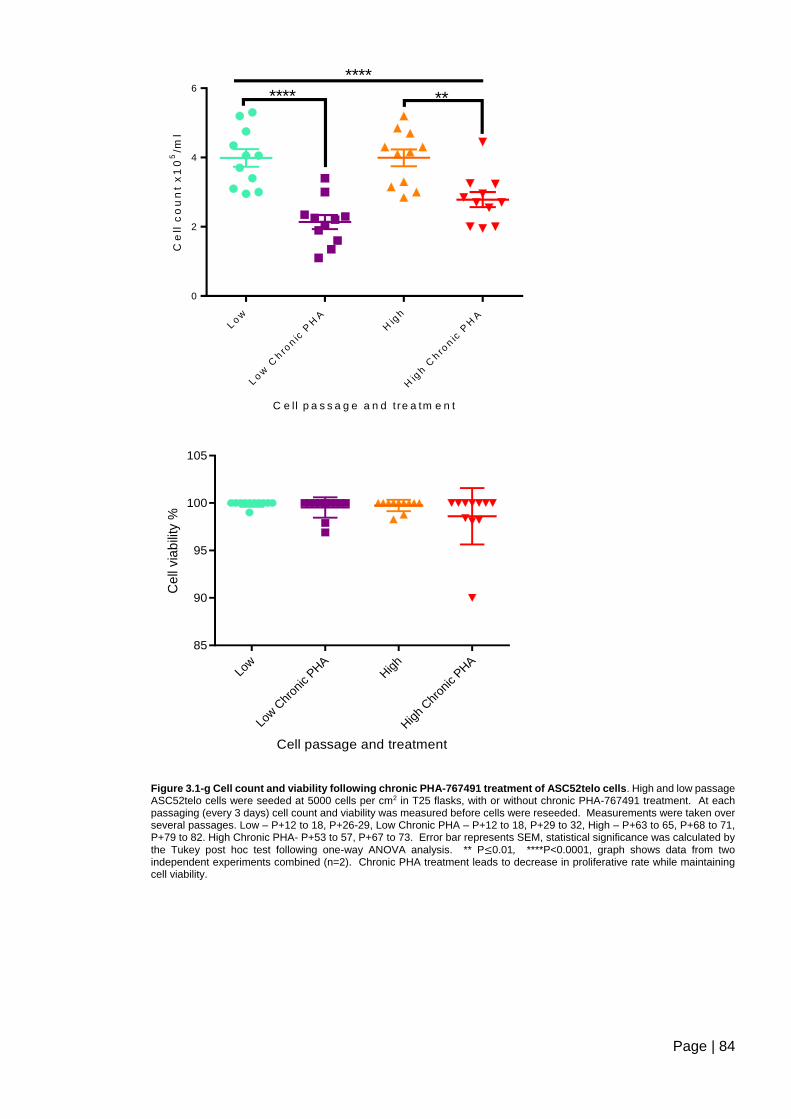
Page | 84
C e ll p a s s a g e a n d t re a tm e n t
Ce
ll c
ou
nt
x1
05
/ml
Low
Low
Chro
nic
PH
A
Hig
h
Hig
h C
hro
nic
PH
A
0
2
4
6****
**** **
Cell passage and treatment
Ce
ll via
bili
ty %
Low
Low C
hron
ic P
HA
Hig
h
Hig
h Chr
onic P
HA
85
90
95
100
105
Figure 3.1-g Cell count and viability following chronic PHA-767491 treatment of ASC52telo cells. High and low passage ASC52telo cells were seeded at 5000 cells per cm2 in T25 flasks, with or without chronic PHA-767491 treatment. At each passaging (every 3 days) cell count and viability was measured before cells were reseeded. Measurements were taken over several passages. Low – P+12 to 18, P+26-29, Low Chronic PHA – P+12 to 18, P+29 to 32, High – P+63 to 65, P+68 to 71, P+79 to 82. High Chronic PHA- P+53 to 57, P+67 to 73. Error bar represents SEM, statistical significance was calculated by
the Tukey post hoc test following one-way ANOVA analysis. ** P≤0.01, ****P<0.0001, graph shows data from two independent experiments combined (n=2). Chronic PHA treatment leads to decrease in proliferative rate while maintaining cell viability.
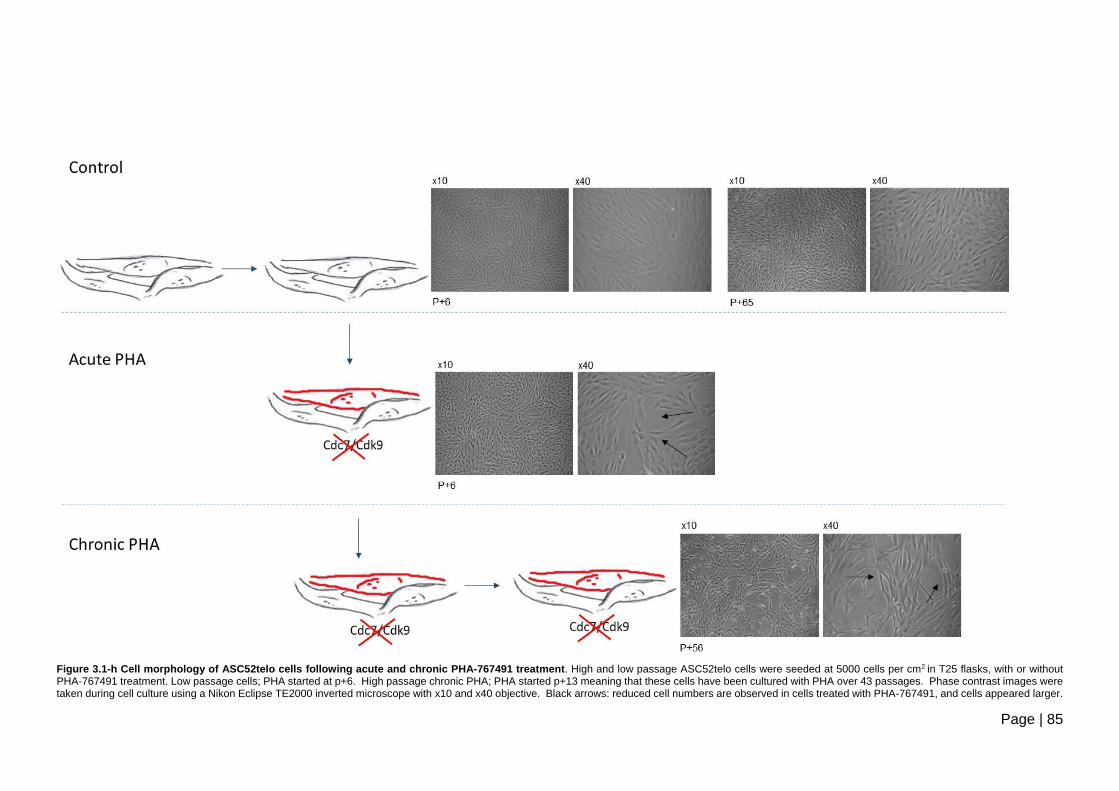
Page | 85
Figure 3.1-h Cell morphology of ASC52telo cells following acute and chronic PHA-767491 treatment. High and low passage ASC52telo cells were seeded at 5000 cells per cm2 in T25 flasks, with or without PHA-767491 treatment. Low passage cells; PHA started at p+6. High passage chronic PHA; PHA started p+13 meaning that these cells have been cultured with PHA over 43 passages. Phase contrast images were taken during cell culture using a Nikon Eclipse TE2000 inverted microscope with x10 and x40 objective. Black arrows: reduced cell numbers are observed in cells treated with PHA-767491, and cells appeared larger.
Page | 86
Ki67 is a marker of proliferation; actively cycling cells stain strongly with Ki67, while
resting G0 cells show low expression. In order to test how acute and chronic PHA
treatment influences the proliferation capacity of ASC52telo cells low and high
passage cells were fixed and stained with Ki67 and the signal intensity of the
population was quantified. Interestingly, acute PHA treatment in ASC52telo cells
appeared to have a level of Ki67 expression generally similar to non-treated cells,
with a general increase seen compared to DMSO control cells. A decrease of Ki67
signal intensity was seen in cells treated with PHA for an extended period (chronic
treatment). Cells were also treated with Camptothecin (CPT) as a control to
demonstrate that while cells undergo DNA damage response a reduction of Ki67
expression is seen (Figure 3.1-i).
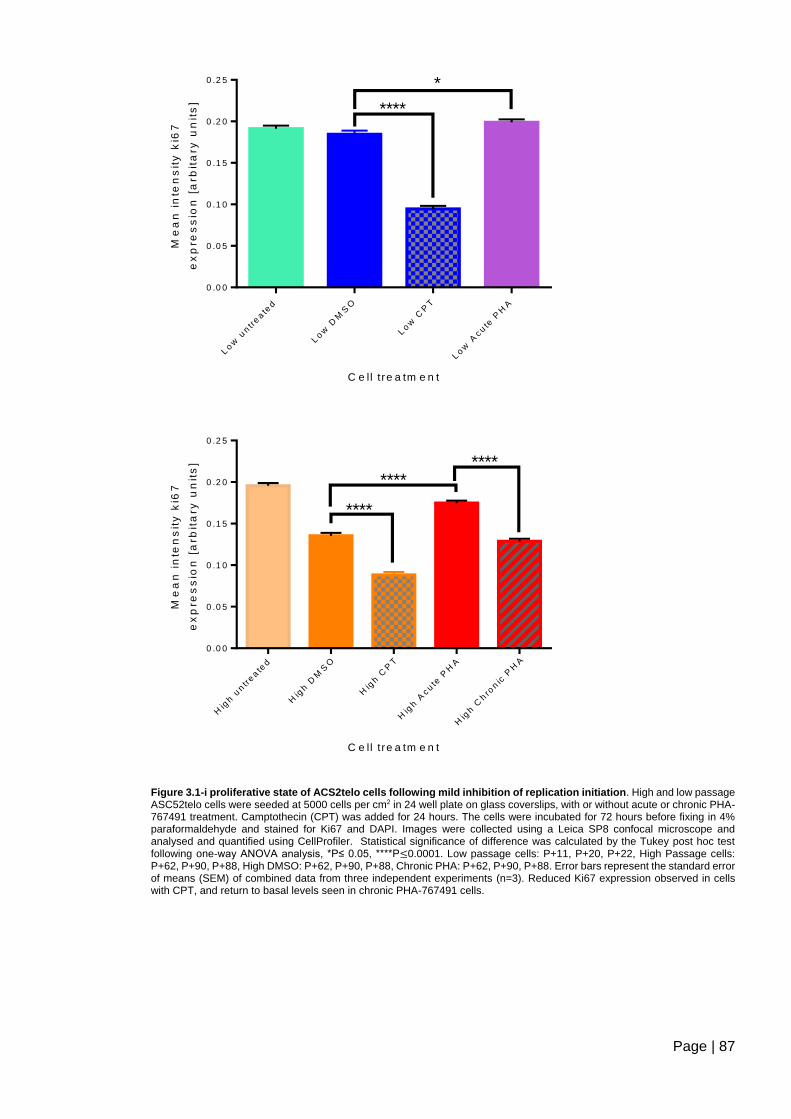
Page | 87
C e ll tre a tm e n t
Me
an
in
ten
sit
y k
i67
ex
pre
ss
ion
[a
rbit
ary
un
its
]
Low
untr
eate
d
Low
DM
SO
Low
CP
T
Low
Acute
PH
A
0 .0 0
0 .0 5
0 .1 0
0 .1 5
0 .2 0
0 .2 5
****
*
C e ll tre a tm e n t
Me
an
in
ten
sit
y k
i67
ex
pre
ss
ion
[a
rbit
ary
un
its
]
Hig
h u
ntr
eate
d
Hig
h D
MS
O
Hig
h C
PT
Hig
h A
cute
PH
A
Hig
h C
hro
nic
PH
A
0 .0 0
0 .0 5
0 .1 0
0 .1 5
0 .2 0
0 .2 5
****
********
Figure 3.1-i proliferative state of ACS2telo cells following mild inhibition of replication initiation. High and low passage ASC52telo cells were seeded at 5000 cells per cm2 in 24 well plate on glass coverslips, with or without acute or chronic PHA-767491 treatment. Camptothecin (CPT) was added for 24 hours. The cells were incubated for 72 hours before fixing in 4% paraformaldehyde and stained for Ki67 and DAPI. Images were collected using a Leica SP8 confocal microscope and analysed and quantified using CellProfiler. Statistical significance of difference was calculated by the Tukey post hoc test following one-way ANOVA analysis, *P≤ 0.05, ****P≤0.0001. Low passage cells: P+11, P+20, P+22, High Passage cells: P+62, P+90, P+88, High DMSO: P+62, P+90, P+88, Chronic PHA: P+62, P+90, P+88. Error bars represent the standard error of means (SEM) of combined data from three independent experiments (n=3). Reduced Ki67 expression observed in cells with CPT, and return to basal levels seen in chronic PHA-767491 cells.
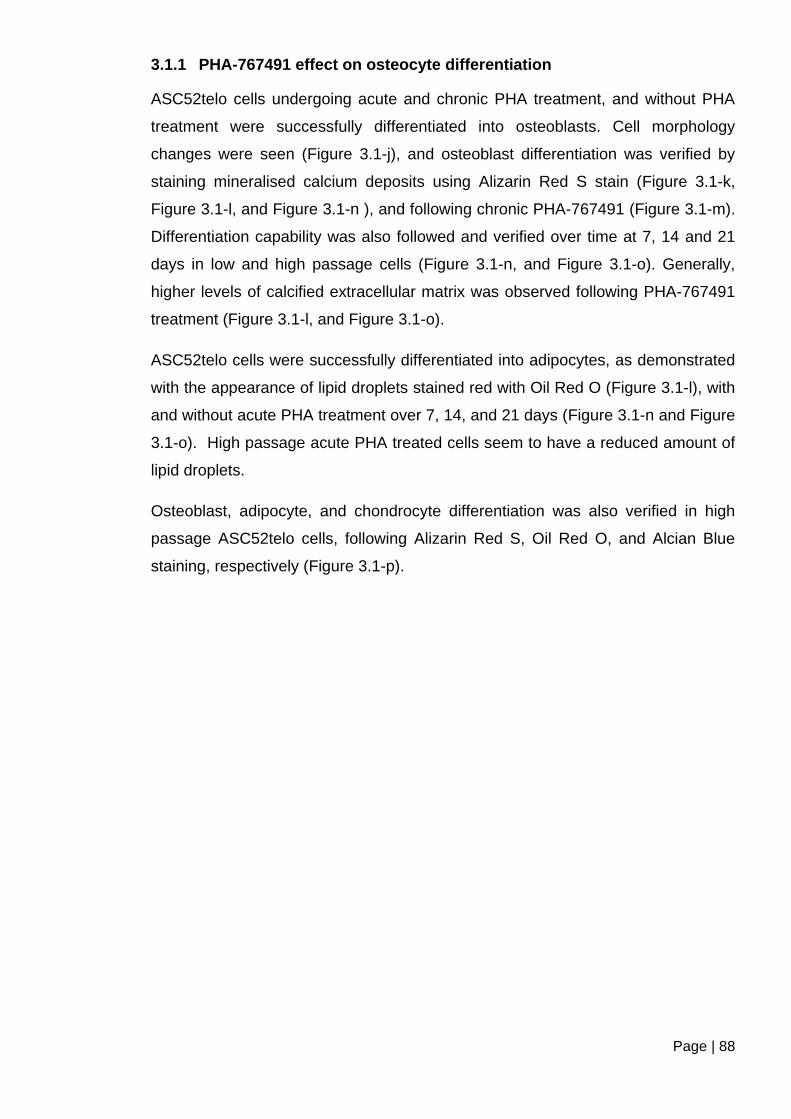
Page | 88
3.1.1 PHA-767491 effect on osteocyte differentiation
ASC52telo cells undergoing acute and chronic PHA treatment, and without PHA
treatment were successfully differentiated into osteoblasts. Cell morphology
changes were seen (Figure 3.1-j), and osteoblast differentiation was verified by
staining mineralised calcium deposits using Alizarin Red S stain (Figure 3.1-k,
Figure 3.1-l, and Figure 3.1-n ), and following chronic PHA-767491 (Figure 3.1-m).
Differentiation capability was also followed and verified over time at 7, 14 and 21
days in low and high passage cells (Figure 3.1-n, and Figure 3.1-o). Generally,
higher levels of calcified extracellular matrix was observed following PHA-767491
treatment (Figure 3.1-l, and Figure 3.1-o).
ASC52telo cells were successfully differentiated into adipocytes, as demonstrated
with the appearance of lipid droplets stained red with Oil Red O (Figure 3.1-l), with
and without acute PHA treatment over 7, 14, and 21 days (Figure 3.1-n and Figure
3.1-o). High passage acute PHA treated cells seem to have a reduced amount of
lipid droplets.
Osteoblast, adipocyte, and chondrocyte differentiation was also verified in high
passage ASC52telo cells, following Alizarin Red S, Oil Red O, and Alcian Blue
staining, respectively (Figure 3.1-p).
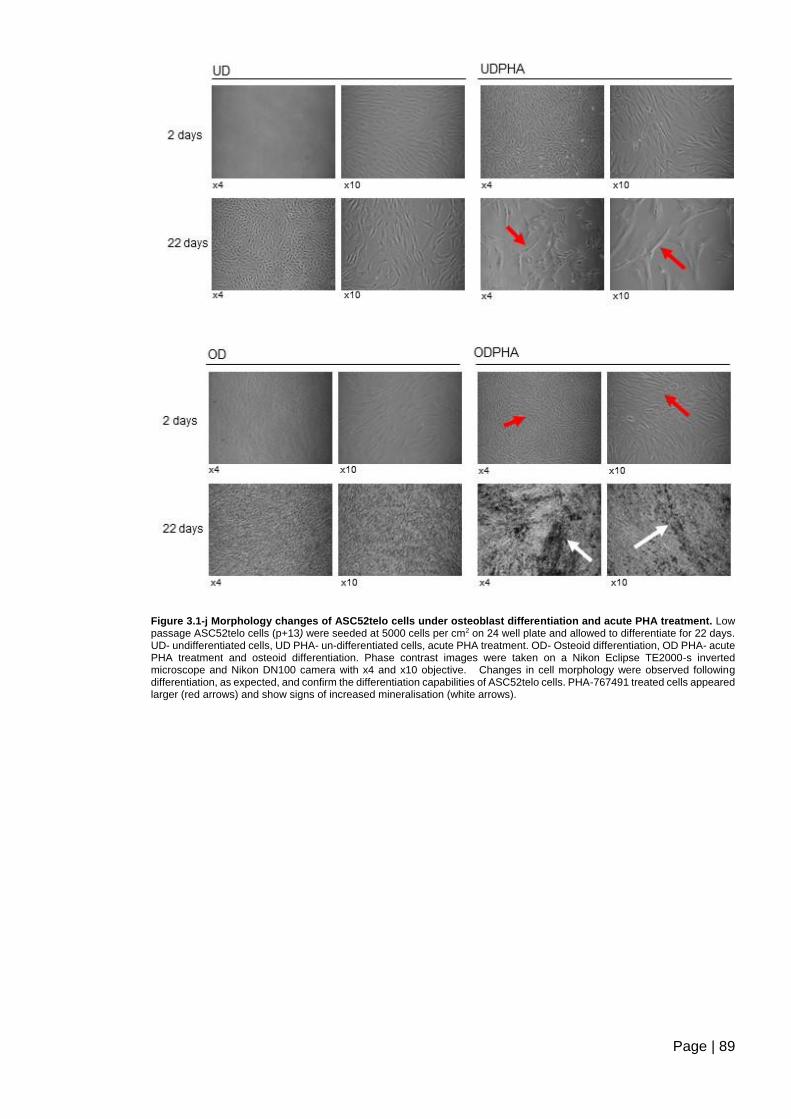
Page | 89
Figure 3.1-j Morphology changes of ASC52telo cells under osteoblast differentiation and acute PHA treatment. Low passage ASC52telo cells (p+13) were seeded at 5000 cells per cm2 on 24 well plate and allowed to differentiate for 22 days. UD- undifferentiated cells, UD PHA- un-differentiated cells, acute PHA treatment. OD- Osteoid differentiation, OD PHA- acute PHA treatment and osteoid differentiation. Phase contrast images were taken on a Nikon Eclipse TE2000-s inverted microscope and Nikon DN100 camera with x4 and x10 objective. Changes in cell morphology were observed following differentiation, as expected, and confirm the differentiation capabilities of ASC52telo cells. PHA-767491 treated cells appeared larger (red arrows) and show signs of increased mineralisation (white arrows).
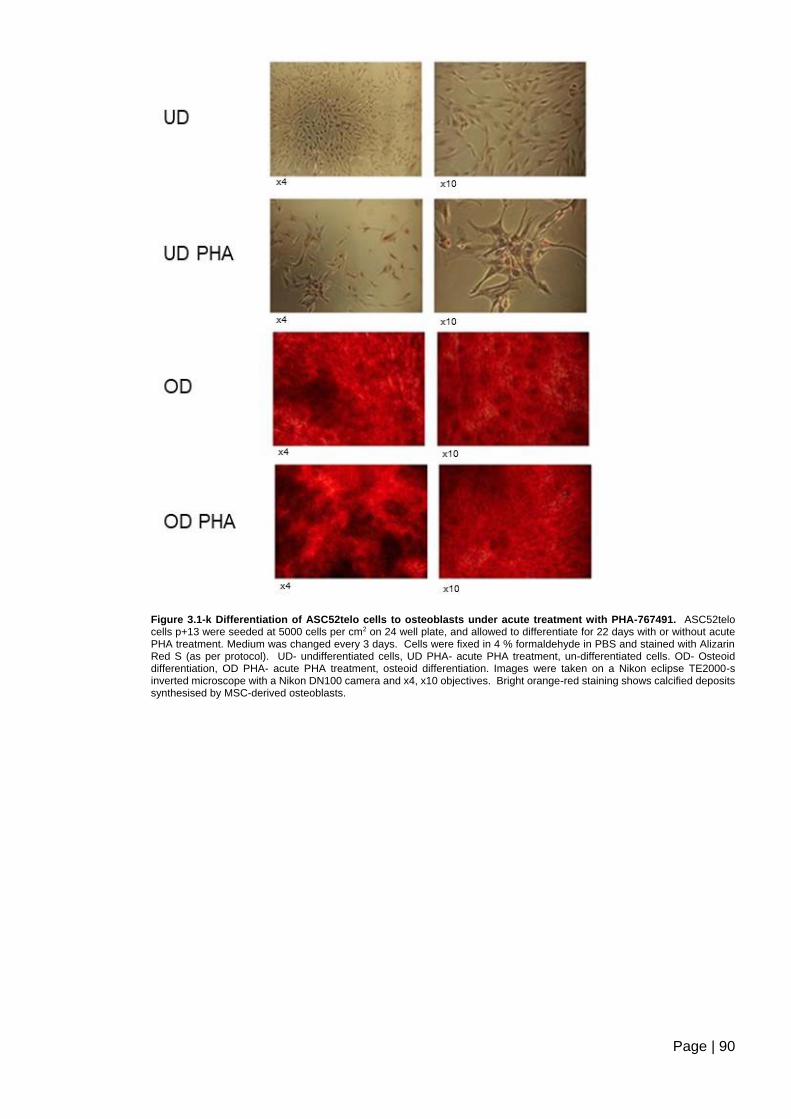
Page | 90
Figure 3.1-k Differentiation of ASC52telo cells to osteoblasts under acute treatment with PHA-767491. ASC52telo cells p+13 were seeded at 5000 cells per cm2 on 24 well plate, and allowed to differentiate for 22 days with or without acute PHA treatment. Medium was changed every 3 days. Cells were fixed in 4 % formaldehyde in PBS and stained with Alizarin Red S (as per protocol). UD- undifferentiated cells, UD PHA- acute PHA treatment, un-differentiated cells. OD- Osteoid differentiation, OD PHA- acute PHA treatment, osteoid differentiation. Images were taken on a Nikon eclipse TE2000-s inverted microscope with a Nikon DN100 camera and x4, x10 objectives. Bright orange-red staining shows calcified deposits synthesised by MSC-derived osteoblasts.

Page | 91
Figure 3.1-l Differentiation of low passage ASC52telo cells under acute PHA treatment. Low passage (P+17) ASC52telo cells were seeded at 5000 cells per cm2 in 24 well plate and allowed to differentiate for 21 days in the presence or absence of PHA. Cells were fixed in 4 % paraformaldehyde in PBS and stained with Alizarin Red S. Bright orange-red staining demonstrates calcified deposits synthesised by differentiated osteoblasts. Oil Red O highlights lipid droplets in adipocyte differentiated cells. OD- Osteoid differentiation, OD PHA- acute PHA treatment, osteoid differentiation AD: Adipocyte differentiation. Images were taken on a Nikon Eclipse TE2000-s inverted microscope and a Nikon DN100 camera and x4, x10 objectives. Increased alizarin Red S staining seen between OD and OD acute PHA-767491 treated cells.
Figure 3.1-m Osteoblast differentiation in ASC52telo under Chronic PHA-767491 treatment. ASC52telo cells P+22 were seeded at 5000 cells per cm2 and chronic PHA cells continued with PHA treatment (commenced P+13). Cells were allowed to differentiate for 21 days, with media changes every 3 days, were fixed with 4% formaldehyde in PBS and stained with Alizarin Red S. Images were taken on a Nikon Eclipse TE2000-s inverted microscope and a Nikon DN100 camera and x4, x10 objectives. Bright orange-red staining demonstrates calcified deposits synthesised by differentiated osteoblasts. OD: osteoid differentiation, OD Chronic PHA: osteoid differentiation with continual PHA-767491 treatment.
Page | 92
Figure 3.1-n Monitoring of osteocyte and adipocyte differentiation capability over 7, 14, and 21 days in acute PHA-767491 treated low passage ASC52telo cells. Low passage (P+28) ASC52telo cells were seeded at 5000 cells per cm2 in 24 well plate and allowed to differentiate for 7, 14, and 21 days before being fixed in 4 % formaldehyde in PBS and stained with Alizarin Red S. Bright orange-red cells demonstrate calcified deposits, synthesised by osteoblasts. Oil Red O highlights lipid droplets in adipocyte differentiated cells. UD: un-differentiated, UD PHA: acute PHA treated, un-differentiated cells, OD: osteoid differentiation, OD PHA- acute PHA treated cells, osteoid differentiation, AD: Adipocyte differentiation, AD PHA: acute PHA treated cells, adipocyte differentiation. Images were taken on a Nikon Eclipse TE2000-s inverted microscope and Nikon DN100 camera, with x4, x10 objective.
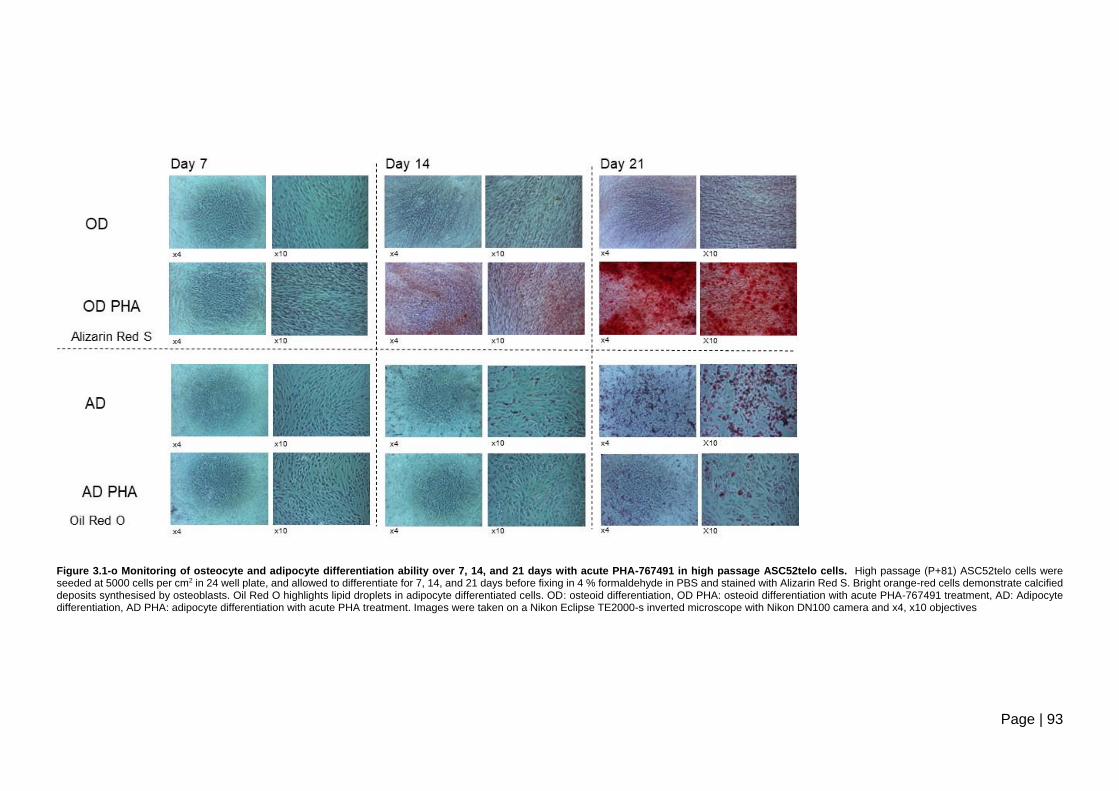
Page | 93
Figure 3.1-o Monitoring of osteocyte and adipocyte differentiation ability over 7, 14, and 21 days with acute PHA-767491 in high passage ASC52telo cells. High passage (P+81) ASC52telo cells were seeded at 5000 cells per cm2 in 24 well plate, and allowed to differentiate for 7, 14, and 21 days before fixing in 4 % formaldehyde in PBS and stained with Alizarin Red S. Bright orange-red cells demonstrate calcified deposits synthesised by osteoblasts. Oil Red O highlights lipid droplets in adipocyte differentiated cells. OD: osteoid differentiation, OD PHA: osteoid differentiation with acute PHA-767491 treatment, AD: Adipocyte differentiation, AD PHA: adipocyte differentiation with acute PHA treatment. Images were taken on a Nikon Eclipse TE2000-s inverted microscope with Nikon DN100 camera and x4, x10 objectives
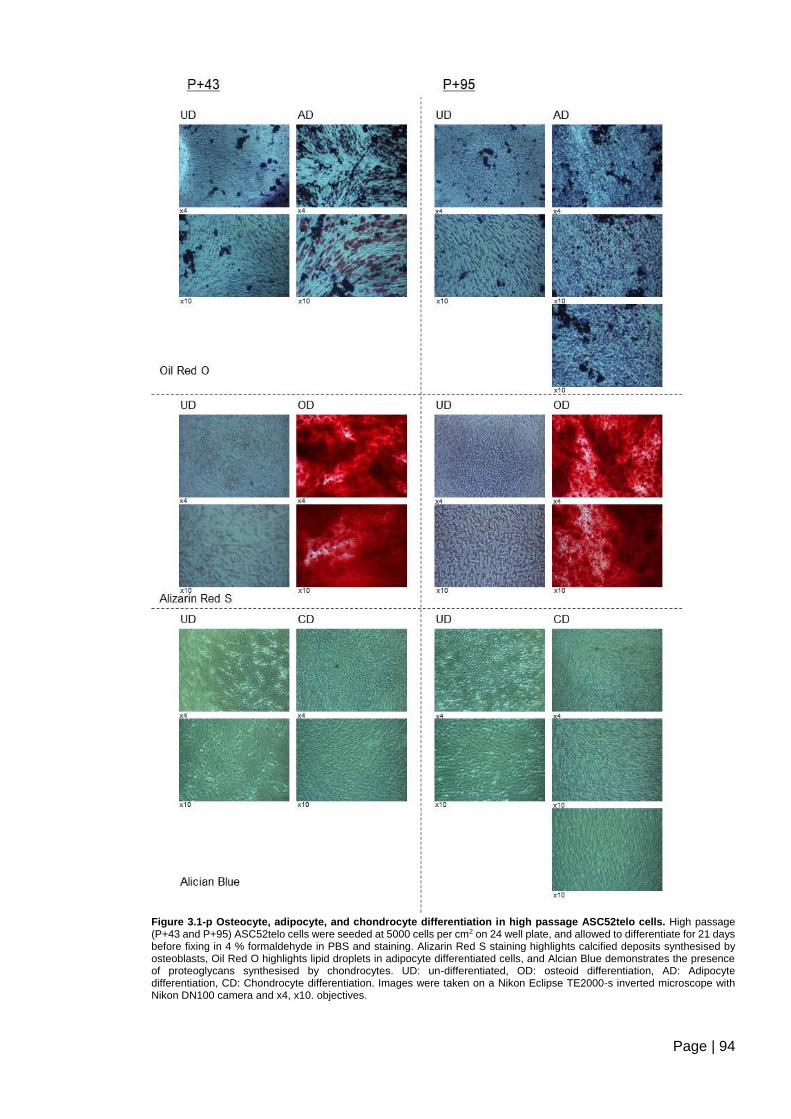
Page | 94
Figure 3.1-p Osteocyte, adipocyte, and chondrocyte differentiation in high passage ASC52telo cells. High passage (P+43 and P+95) ASC52telo cells were seeded at 5000 cells per cm2 on 24 well plate, and allowed to differentiate for 21 days before fixing in 4 % formaldehyde in PBS and staining. Alizarin Red S staining highlights calcified deposits synthesised by osteoblasts, Oil Red O highlights lipid droplets in adipocyte differentiated cells, and Alcian Blue demonstrates the presence of proteoglycans synthesised by chondrocytes. UD: un-differentiated, OD: osteoid differentiation, AD: Adipocyte differentiation, CD: Chondrocyte differentiation. Images were taken on a Nikon Eclipse TE2000-s inverted microscope with Nikon DN100 camera and x4, x10. objectives.
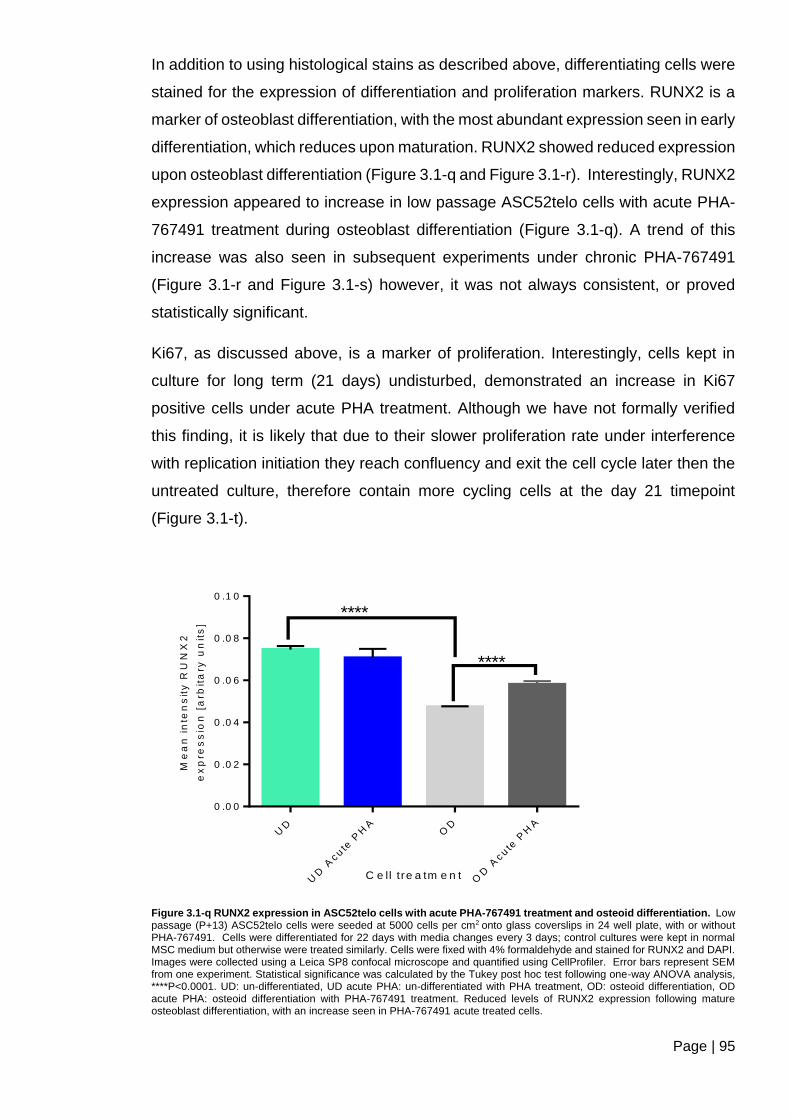
Page | 95
In addition to using histological stains as described above, differentiating cells were
stained for the expression of differentiation and proliferation markers. RUNX2 is a
marker of osteoblast differentiation, with the most abundant expression seen in early
differentiation, which reduces upon maturation. RUNX2 showed reduced expression
upon osteoblast differentiation (Figure 3.1-q and Figure 3.1-r). Interestingly, RUNX2
expression appeared to increase in low passage ASC52telo cells with acute PHA-
767491 treatment during osteoblast differentiation (Figure 3.1-q). A trend of this
increase was also seen in subsequent experiments under chronic PHA-767491
(Figure 3.1-r and Figure 3.1-s) however, it was not always consistent, or proved
statistically significant.
Ki67, as discussed above, is a marker of proliferation. Interestingly, cells kept in
culture for long term (21 days) undisturbed, demonstrated an increase in Ki67
positive cells under acute PHA treatment. Although we have not formally verified
this finding, it is likely that due to their slower proliferation rate under interference
with replication initiation they reach confluency and exit the cell cycle later then the
untreated culture, therefore contain more cycling cells at the day 21 timepoint
(Figure 3.1-t).
C e ll tre a tm e n t
Me
an
in
ten
sit
y R
UN
X2
ex
pre
ss
ion
[a
rbit
ary
un
its
]
UD
UD
Ac u
te P
HA
OD
OD
Ac u
te P
HA
0 .0 0
0 .0 2
0 .0 4
0 .0 6
0 .0 8
0 .1 0
****
****
Figure 3.1-q RUNX2 expression in ASC52telo cells with acute PHA-767491 treatment and osteoid differentiation. Low passage (P+13) ASC52telo cells were seeded at 5000 cells per cm2 onto glass coverslips in 24 well plate, with or without PHA-767491. Cells were differentiated for 22 days with media changes every 3 days; control cultures were kept in normal MSC medium but otherwise were treated similarly. Cells were fixed with 4% formaldehyde and stained for RUNX2 and DAPI. Images were collected using a Leica SP8 confocal microscope and quantified using CellProfiler. Error bars represent SEM from one experiment. Statistical significance was calculated by the Tukey post hoc test following one-way ANOVA analysis, ****P<0.0001. UD: un-differentiated, UD acute PHA: un-differentiated with PHA treatment, OD: osteoid differentiation, OD acute PHA: osteoid differentiation with PHA-767491 treatment. Reduced levels of RUNX2 expression following mature osteoblast differentiation, with an increase seen in PHA-767491 acute treated cells.
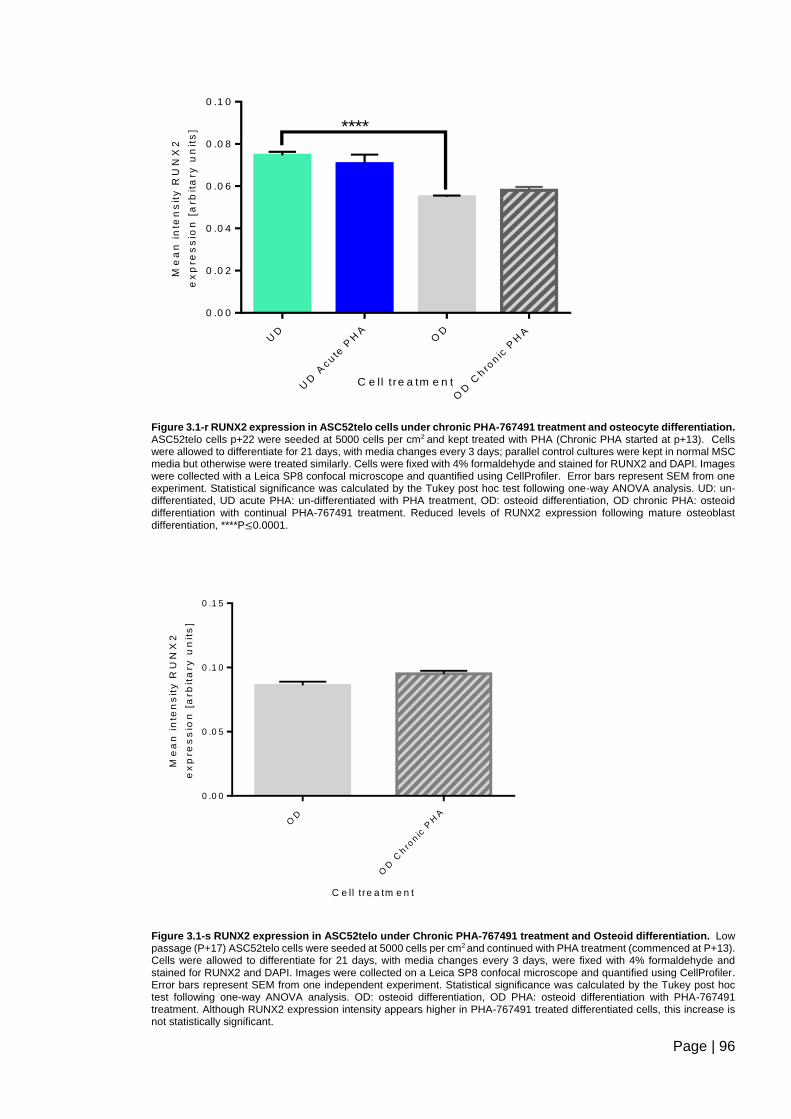
Page | 96
C e ll tre a tm e n t
Me
an
in
ten
sit
y R
UN
X2
ex
pre
ss
ion
[a
rbit
ary
un
its
]
UD
UD
Ac u
te P
HA
OD
OD
Chro
nic
PH
A
0 .0 0
0 .0 2
0 .0 4
0 .0 6
0 .0 8
0 .1 0
****
Figure 3.1-r RUNX2 expression in ASC52telo cells under chronic PHA-767491 treatment and osteocyte differentiation. ASC52telo cells p+22 were seeded at 5000 cells per cm2 and kept treated with PHA (Chronic PHA started at p+13). Cells were allowed to differentiate for 21 days, with media changes every 3 days; parallel control cultures were kept in normal MSC media but otherwise were treated similarly. Cells were fixed with 4% formaldehyde and stained for RUNX2 and DAPI. Images were collected with a Leica SP8 confocal microscope and quantified using CellProfiler. Error bars represent SEM from one experiment. Statistical significance was calculated by the Tukey post hoc test following one-way ANOVA analysis. UD: un-differentiated, UD acute PHA: un-differentiated with PHA treatment, OD: osteoid differentiation, OD chronic PHA: osteoid differentiation with continual PHA-767491 treatment. Reduced levels of RUNX2 expression following mature osteoblast differentiation, ****P≤0.0001.
C e ll tre a tm e n t
Me
an
in
ten
sit
y R
UN
X2
ex
pre
ss
ion
[a
rb
ita
ry
un
its
]
OD
OD
Chro
nic
PH
A
0 .0 0
0 .0 5
0 .1 0
0 .1 5
Figure 3.1-s RUNX2 expression in ASC52telo under Chronic PHA-767491 treatment and Osteoid differentiation. Low passage (P+17) ASC52telo cells were seeded at 5000 cells per cm2 and continued with PHA treatment (commenced at P+13). Cells were allowed to differentiate for 21 days, with media changes every 3 days, were fixed with 4% formaldehyde and stained for RUNX2 and DAPI. Images were collected on a Leica SP8 confocal microscope and quantified using CellProfiler. Error bars represent SEM from one independent experiment. Statistical significance was calculated by the Tukey post hoc test following one-way ANOVA analysis. OD: osteoid differentiation, OD PHA: osteoid differentiation with PHA-767491 treatment. Although RUNX2 expression intensity appears higher in PHA-767491 treated differentiated cells, this increase is not statistically significant.
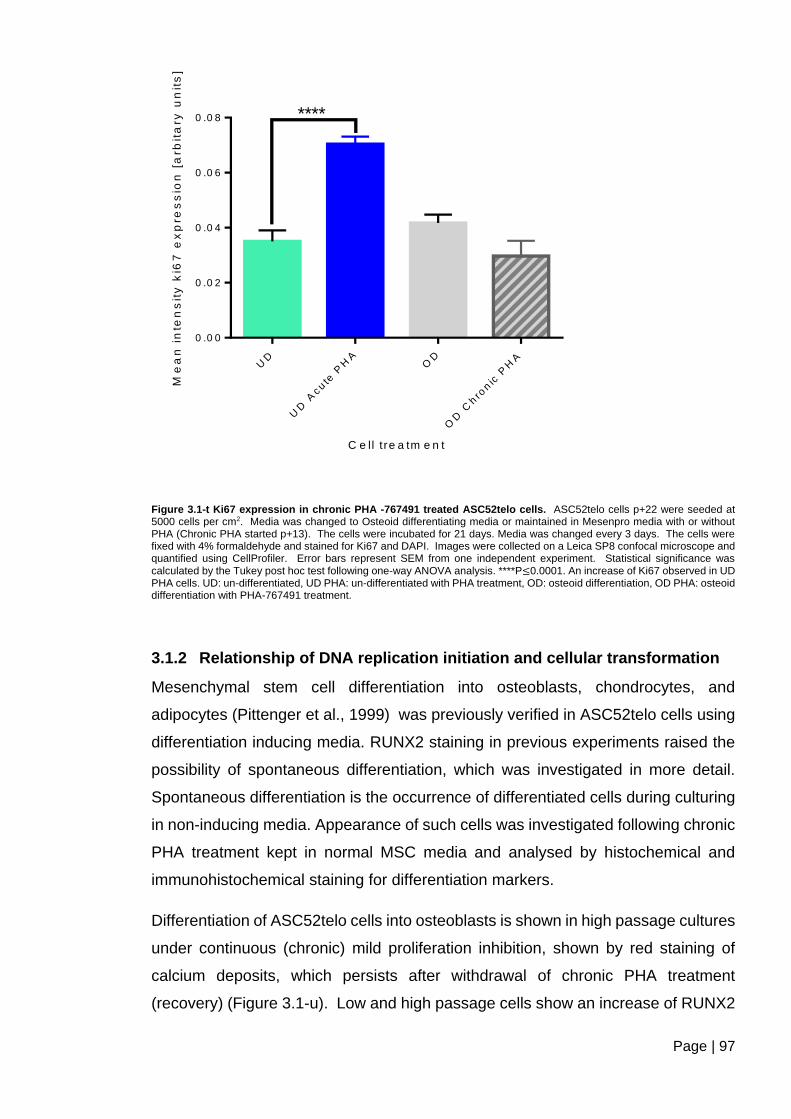
Page | 97
Figure 3.1-t Ki67 expression in chronic PHA -767491 treated ASC52telo cells. ASC52telo cells p+22 were seeded at 5000 cells per cm2. Media was changed to Osteoid differentiating media or maintained in Mesenpro media with or without PHA (Chronic PHA started p+13). The cells were incubated for 21 days. Media was changed every 3 days. The cells were fixed with 4% formaldehyde and stained for Ki67 and DAPI. Images were collected on a Leica SP8 confocal microscope and quantified using CellProfiler. Error bars represent SEM from one independent experiment. Statistical significance was
calculated by the Tukey post hoc test following one-way ANOVA analysis. ****P≤0.0001. An increase of Ki67 observed in UD PHA cells. UD: un-differentiated, UD PHA: un-differentiated with PHA treatment, OD: osteoid differentiation, OD PHA: osteoid differentiation with PHA-767491 treatment.
3.1.2 Relationship of DNA replication initiation and cellular transformation
Mesenchymal stem cell differentiation into osteoblasts, chondrocytes, and
adipocytes (Pittenger et al., 1999) was previously verified in ASC52telo cells using
differentiation inducing media. RUNX2 staining in previous experiments raised the
possibility of spontaneous differentiation, which was investigated in more detail.
Spontaneous differentiation is the occurrence of differentiated cells during culturing
in non-inducing media. Appearance of such cells was investigated following chronic
PHA treatment kept in normal MSC media and analysed by histochemical and
immunohistochemical staining for differentiation markers.
Differentiation of ASC52telo cells into osteoblasts is shown in high passage cultures
under continuous (chronic) mild proliferation inhibition, shown by red staining of
calcium deposits, which persists after withdrawal of chronic PHA treatment
(recovery) (Figure 3.1-u). Low and high passage cells show an increase of RUNX2
UD
UD
Acute
PH
AO
D
OD
Chro
nic
PH
A
0 .0 0
0 .0 2
0 .0 4
0 .0 6
0 .0 8
C e ll tre a tm e n t
Me
an
in
ten
sit
y k
i67
ex
pre
ss
ion
[a
rbit
ary
un
its
]
****
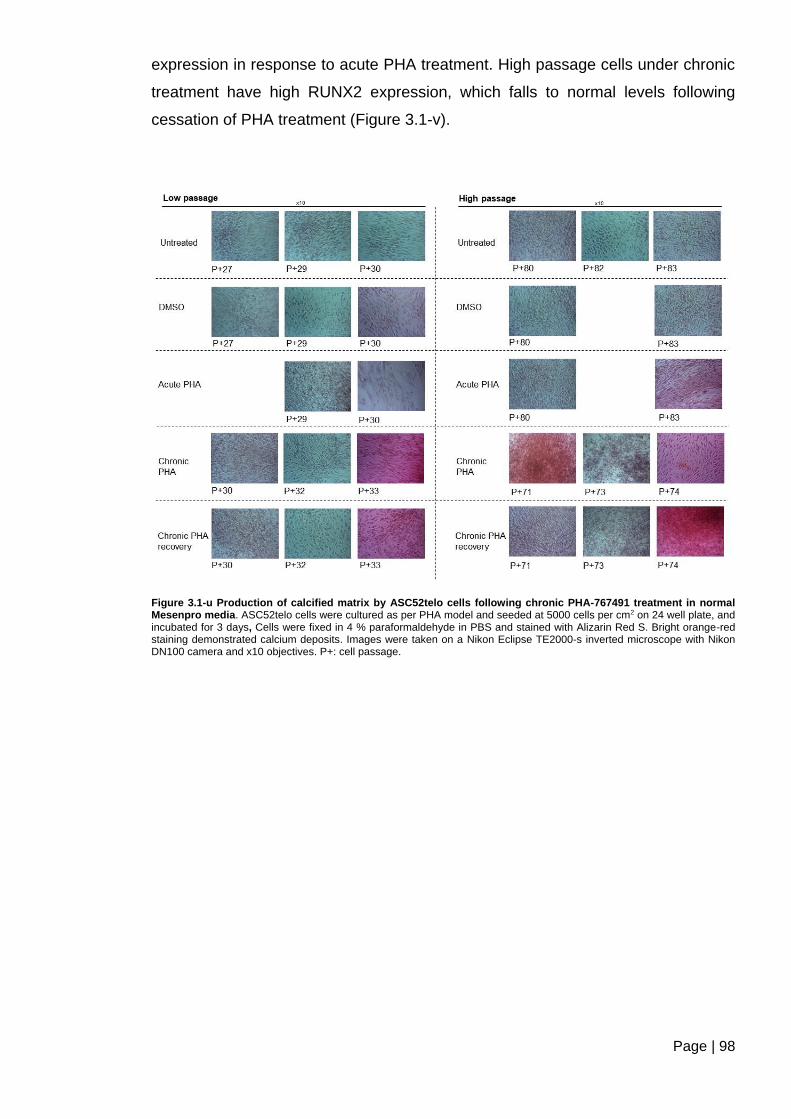
Page | 98
expression in response to acute PHA treatment. High passage cells under chronic
treatment have high RUNX2 expression, which falls to normal levels following
cessation of PHA treatment (Figure 3.1-v).
Figure 3.1-u Production of calcified matrix by ASC52telo cells following chronic PHA-767491 treatment in normal Mesenpro media. ASC52telo cells were cultured as per PHA model and seeded at 5000 cells per cm2 on 24 well plate, and incubated for 3 days, Cells were fixed in 4 % paraformaldehyde in PBS and stained with Alizarin Red S. Bright orange-red staining demonstrated calcium deposits. Images were taken on a Nikon Eclipse TE2000-s inverted microscope with Nikon DN100 camera and x10 objectives. P+: cell passage.
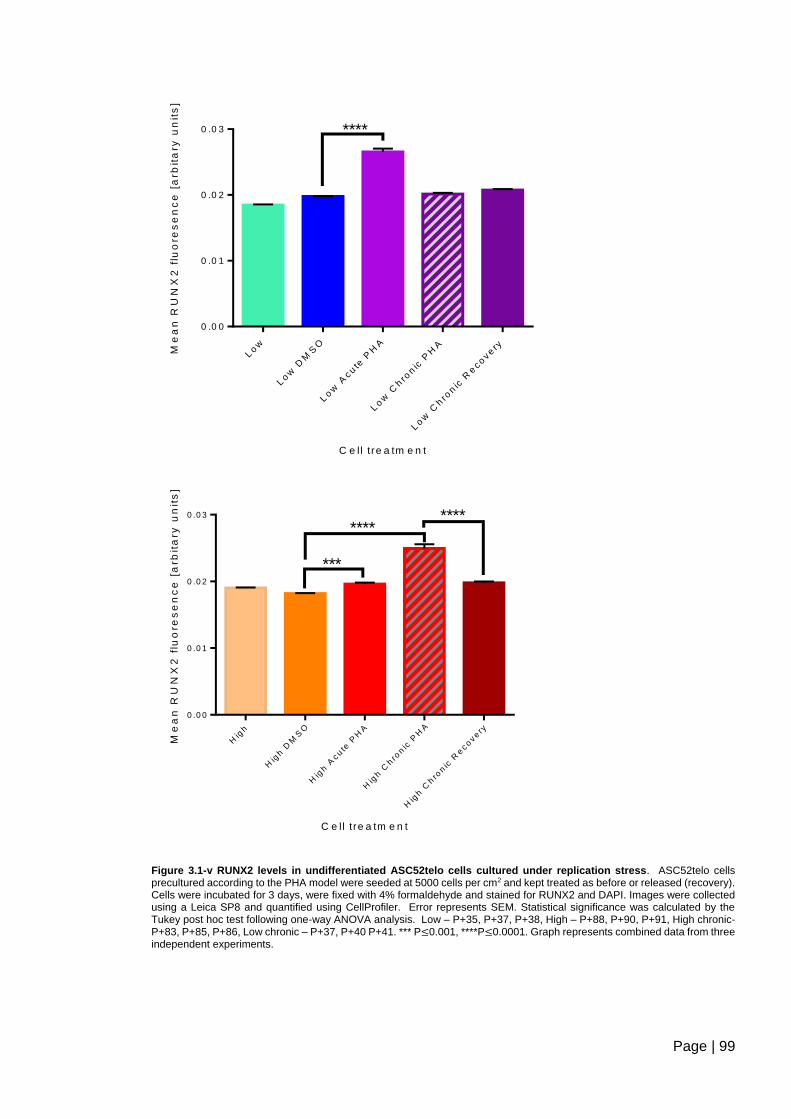
Page | 99
C e ll tre a tm e n t
Me
an
RU
NX
2 f
luo
res
en
ce
[a
rbit
ary
un
its
]
Low
Low
DM
SO
Low
Ac u
te P
HA
Low
Chro
nic
PH
A
Low
Chro
nic
Rec o
v ery
0 .0 0
0 .0 1
0 .0 2
0 .0 3 ****
C e ll tre a tm e n t
Me
an
RU
NX
2 f
luo
res
en
ce
[a
rbit
ary
un
its
]
Hig
h
Hig
h D
MS
O
Hig
h A
cute
PH
A
Hig
h C
hro
nic
PH
A
Hig
h C
hro
nic
Recovery
0 .0 0
0 .0 1
0 .0 2
0 .0 3
***
********
Figure 3.1-v RUNX2 levels in undifferentiated ASC52telo cells cultured under replication stress. ASC52telo cells precultured according to the PHA model were seeded at 5000 cells per cm2 and kept treated as before or released (recovery). Cells were incubated for 3 days, were fixed with 4% formaldehyde and stained for RUNX2 and DAPI. Images were collected using a Leica SP8 and quantified using CellProfiler. Error represents SEM. Statistical significance was calculated by the Tukey post hoc test following one-way ANOVA analysis. Low – P+35, P+37, P+38, High – P+88, P+90, P+91, High chronic- P+83, P+85, P+86, Low chronic – P+37, P+40 P+41. *** P≤0.001, ****P≤0.0001. Graph represents combined data from three independent experiments.
Page | 100
3.1.3 Relationship of DNA replication initiation and Membrane potential
Membrane potential appeared to remain unchanged following mild proliferation
inhibition in ASC52telo cells (Figure 3.1-w). In parallel wells MTS reading was also
taken to reflect cell viability, and the readings taken from TMRE were divided by
MTS reading to give a representative effect to cell viability. The protonophore p-
trifluoromethoxy carbonyl cyanide phenyl hydrazone (FCCP), a mitochondrial
uncoupler, induces mitochondrial depolarization leading to a rapid release from
quenched matrix into the cytoplasm, abolishes ATP synthesis, and can deplete the
cytoplasmic pool of ATP. FCCP was used as a control to induce mitochondrial
membrane depolarization generating the loss of fluorescent intensity (Perry et al.,
2011; Wang et al., 2017b; Nicholls, 2018) a significant reduction was seen.
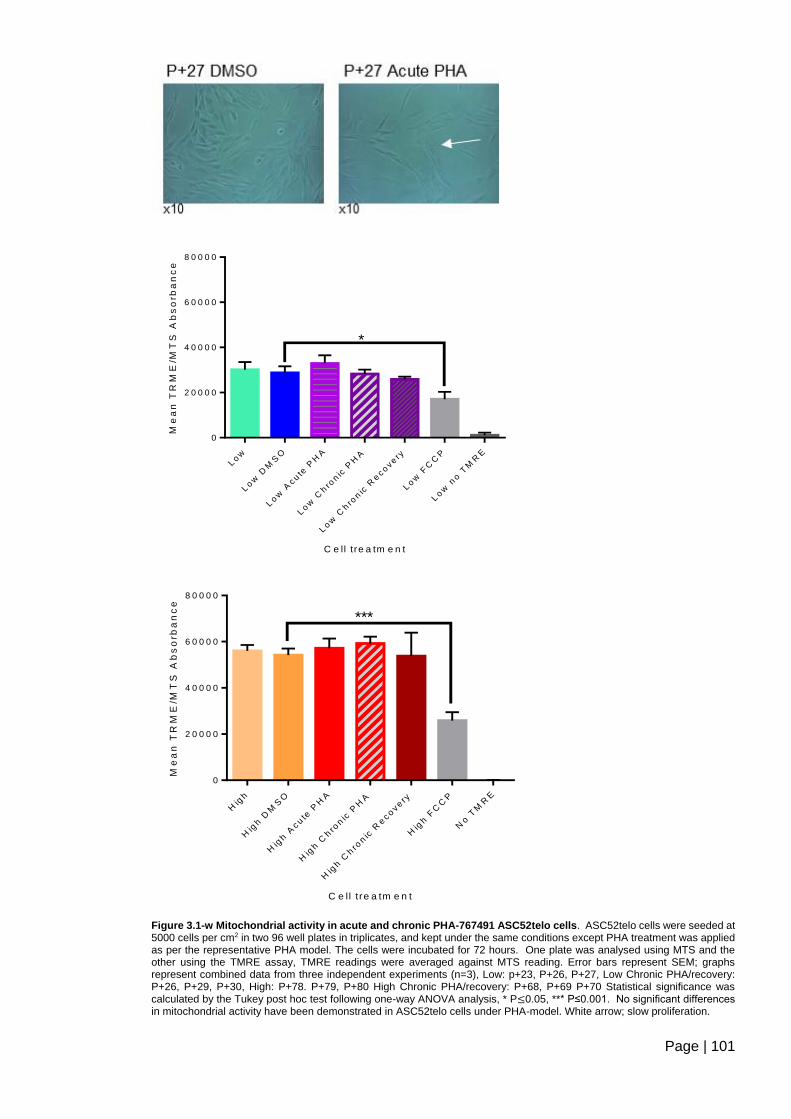
Page | 101
C e ll tre a tm e n t
Me
an
TR
ME
/MT
S A
bs
orb
an
ce
Low
Low
DM
SO
Low
Ac u
te P
HA
Low
Chro
nic
PH
A
Low
Chro
nic
Rec o
v ery
Low
FC
CP
Low
no T
MR
E
0
2 0 0 0 0
4 0 0 0 0
6 0 0 0 0
8 0 0 0 0
*
C e ll tre a tm e n t
Me
an
TR
ME
/MT
S A
bs
orb
an
ce
Hig
h
Hig
h D
MS
O
Hig
h A
c ute
PH
A
Hig
h C
hro
nic
PH
A
Hig
h C
hro
nic
Rec o
v ery
Hig
h F
CC
P
No T
MR
E
0
2 0 0 0 0
4 0 0 0 0
6 0 0 0 0
8 0 0 0 0
***
Figure 3.1-w Mitochondrial activity in acute and chronic PHA-767491 ASC52telo cells. ASC52telo cells were seeded at 5000 cells per cm2 in two 96 well plates in triplicates, and kept under the same conditions except PHA treatment was applied as per the representative PHA model. The cells were incubated for 72 hours. One plate was analysed using MTS and the other using the TMRE assay, TMRE readings were averaged against MTS reading. Error bars represent SEM; graphs represent combined data from three independent experiments (n=3), Low: p+23, P+26, P+27, Low Chronic PHA/recovery: P+26, P+29, P+30, High: P+78. P+79, P+80 High Chronic PHA/recovery: P+68, P+69 P+70 Statistical significance was calculated by the Tukey post hoc test following one-way ANOVA analysis, * P≤0.05, *** P≤0.001. No significant differences in mitochondrial activity have been demonstrated in ASC52telo cells under PHA-model. White arrow; slow proliferation.
Page | 102
3.1.4 Summary
To establish a model of mild replication initiation inhibition in mesenchymal stem
cells, ASC52telo cells were treated with PHA. This was to enable further
investigations on the effects of this treatment on cell morphology, physiology, and
differentiation into osteoblasts. ASC52telo cells have been employed in many
studies (Wolbank et al., 2009; Hasebe-Takada et al., 2016; Nardone et al., 2017;
Pitrone et al., 2017). We surprisingly demonstrated more pronounced PHA
sensitivity at low concentrations in low passage cells, with an unexpected increase
in cell viability at higher PHA concentrations. This is not expected or explicable, and
although was seen twice, would need repeating to verify.
We wanted to put a continuous pressure on replication initiation without affecting
viability in ASC52telo cells, therefore we selected 1.5 µM, the highest concentration
that showed the minimal effect on cell survival (Figure 3.1-b and Figure 3.1-e). A
model of PHA-767491 was established in low and high passage ASC52telo cells
with acute and chronic PHA treatment, and withdrawal of treatment in either case
(‘recovery’). This enabled us to further understand the effects of reduced replication
over time and the potential cellular stress this generates, similar to the effect of
RECQL4 mutations, and if and how the cells may recover following the cessation of
treatment with PHA-767491. Reduced proliferative rate was verified using cell count
(haemocytometer), and maintained viability was measured using trypan blue.
Interestingly, PHA-767491 treated cells appeared to lead to cell morphology
changes, as the cells appeared larger, which is an indication of cellular
morphological modifications that have been further explored in this study.
Successful adipocyte, chondrocyte, and osteoblast differentiation was achieved in
the ASC52telo cells, under PHA-767491 treatment, and cells under long term
culture. PHA-767491 treated ASC52telo cells were further analysed for induced
and spontaneous differentiation. RUNX2 expression suggests the commitment of
the MSCs towards osteoblast differentiation (Ducy et al., 1997; Komori et al., 1997),
which was evaluated to determine if the cells showed signs of this commitment
under normal media. An increase in RUNX2 expression was demonstrated
following acute PHA-767491 treatment in low passage cells and following chronic
PHA-767491 treatment in high passage cells, while reduced levels were seen
following recovery. The difference between passages suggests that low passage
Page | 103
cells may be more sensitive to the initial treatment, and chronic treatment also leads
to sensitivity over long term culture. Further studies are needed to identify if the
association of the cell cycle is the link to the data obtained. However, these results
taken together with the mineralised calcium levels also observed within these
treated cells, suggest differentiation into osteoblasts, or disruption of the regulation
of these markers. The ASC52telo cells were not investigated for spontaneous
differentiation into the other forms of cell lineages. This would be useful to further
our understanding of the transformation mechanisms that appeared to establish
following chronic replicative stress in these cells.
The mitochondrial membrane appeared stable following PHA treatment, no
significant changes of membrane potential was seen.
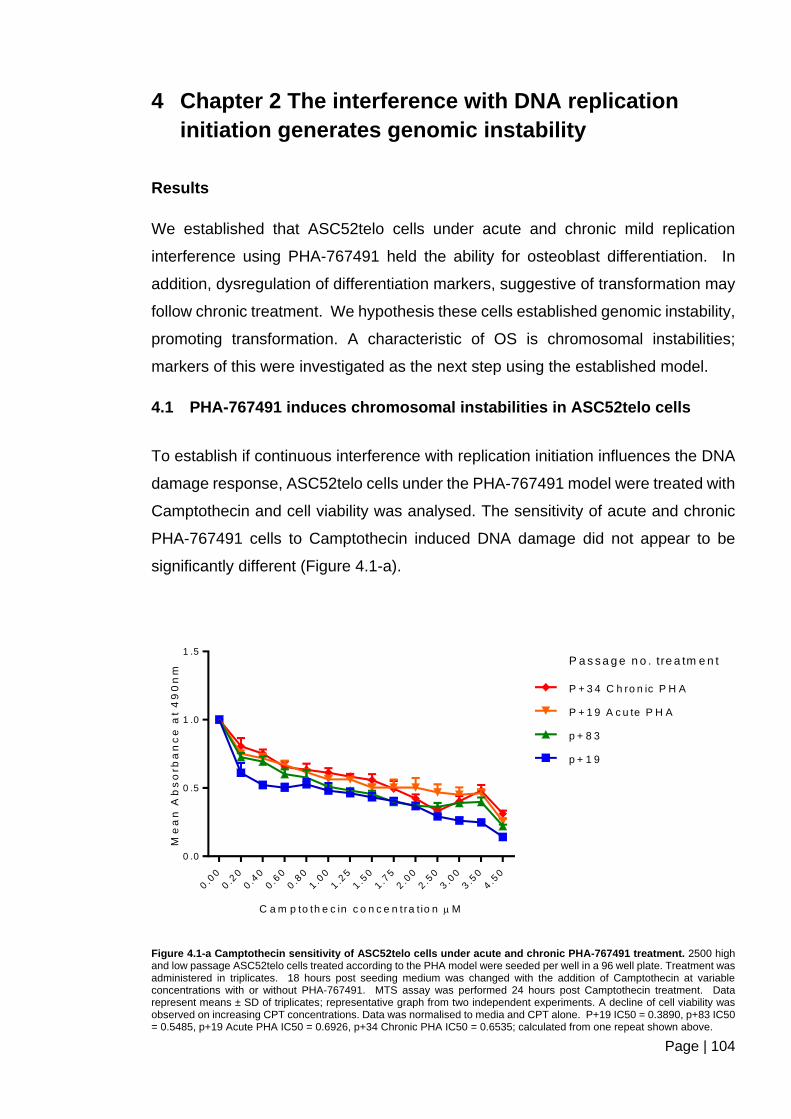
Page | 104
4 Chapter 2 The interference with DNA replication
initiation generates genomic instability
Results
We established that ASC52telo cells under acute and chronic mild replication
interference using PHA-767491 held the ability for osteoblast differentiation. In
addition, dysregulation of differentiation markers, suggestive of transformation may
follow chronic treatment. We hypothesis these cells established genomic instability,
promoting transformation. A characteristic of OS is chromosomal instabilities;
markers of this were investigated as the next step using the established model.
4.1 PHA-767491 induces chromosomal instabilities in ASC52telo cells
To establish if continuous interference with replication initiation influences the DNA
damage response, ASC52telo cells under the PHA-767491 model were treated with
Camptothecin and cell viability was analysed. The sensitivity of acute and chronic
PHA-767491 cells to Camptothecin induced DNA damage did not appear to be
significantly different (Figure 4.1-a).
C a m p to th e c in c o n c e n tra t io n M
Me
an
Ab
so
rb
an
ce
at
49
0n
m
0.0
0
0.2
0
0.4
0
0.6
0
0.8
0
1.0
0
1.2
5
1.5
0
1.7
5
2.0
0
2.5
0
3.0
0
3.5
0
4.5
0
0 .0
0 .5
1 .0
1 .5
p + 1 9
p + 8 3
P + 1 9 A c u te P H A
P + 3 4 C h ro n ic P H A
P a s s a g e n o . tre a tm e n t
Figure 4.1-a Camptothecin sensitivity of ASC52telo cells under acute and chronic PHA-767491 treatment. 2500 high and low passage ASC52telo cells treated according to the PHA model were seeded per well in a 96 well plate. Treatment was administered in triplicates. 18 hours post seeding medium was changed with the addition of Camptothecin at variable concentrations with or without PHA-767491. MTS assay was performed 24 hours post Camptothecin treatment. Data represent means ± SD of triplicates; representative graph from two independent experiments. A decline of cell viability was observed on increasing CPT concentrations. Data was normalised to media and CPT alone. P+19 IC50 = 0.3890, p+83 IC50 = 0.5485, p+19 Acute PHA IC50 = 0.6926, p+34 Chronic PHA IC50 = 0.6535; calculated from one repeat shown above.
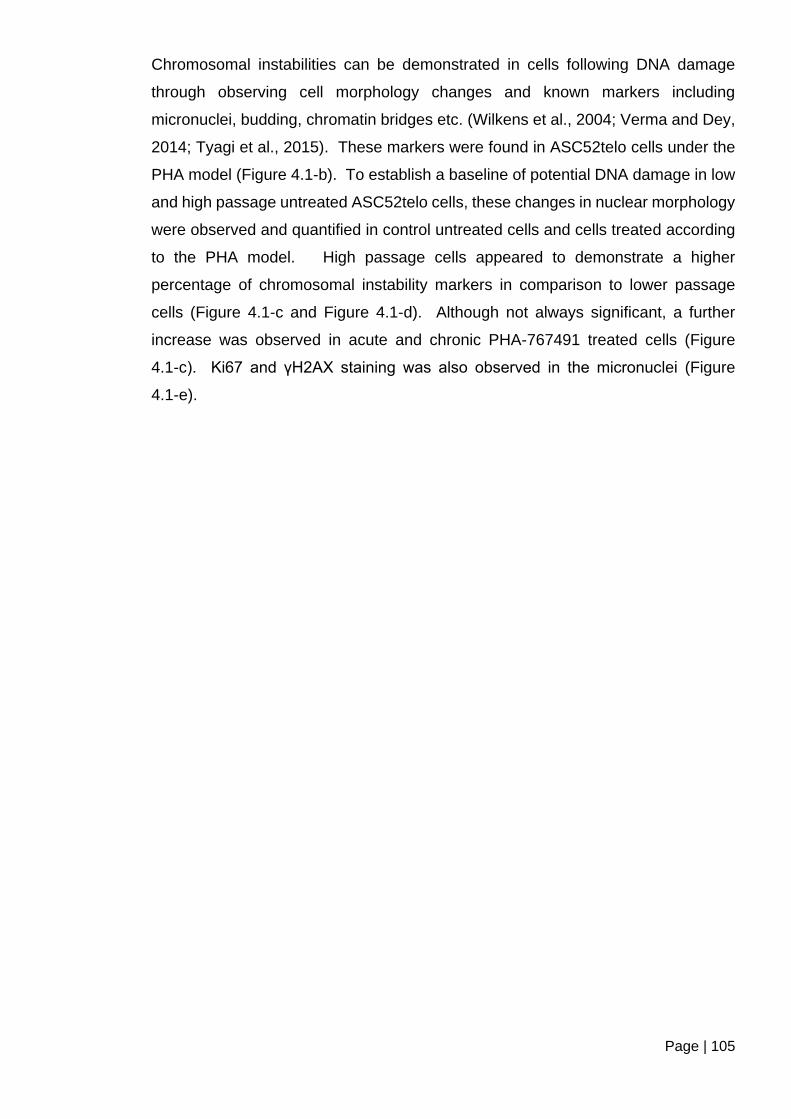
Page | 105
Chromosomal instabilities can be demonstrated in cells following DNA damage
through observing cell morphology changes and known markers including
micronuclei, budding, chromatin bridges etc. (Wilkens et al., 2004; Verma and Dey,
2014; Tyagi et al., 2015). These markers were found in ASC52telo cells under the
PHA model (Figure 4.1-b). To establish a baseline of potential DNA damage in low
and high passage untreated ASC52telo cells, these changes in nuclear morphology
were observed and quantified in control untreated cells and cells treated according
to the PHA model. High passage cells appeared to demonstrate a higher
percentage of chromosomal instability markers in comparison to lower passage
cells (Figure 4.1-c and Figure 4.1-d). Although not always significant, a further
increase was observed in acute and chronic PHA-767491 treated cells (Figure
4.1-c). Ki67 and γH2AX staining was also observed in the micronuclei (Figure
4.1-e).

Page | 106
Figure 4.1-b Chromosomal instability markers observed in acute and chronic PHA-767491 treated ASC52telo cells.
ASC52telo cells were seeded onto coverslips at 5000 cells per cm2. The cells were treated with PHA-767491 as per the PHA
model. The cells were fixed in 4% paraformaldehyde and stained with DAPI. Images were collected with a Leica SP8 confocal
microscope x63 objective. Morphology changes observed: White arrow head: Bridge, white open arrow head: micronuclei,
red arrow head: bleb, yellow arrow head: multi-lobed, white oval arrow: doughnut -shaped, white diamond arrow head:
enlarged nuclei.
C e ll tre a tm e n t
Pe
rce
nta
ge
of
ch
rom
os
om
al
ins
tab
ilty
ma
rke
rs
Low
Low
DM
SO
Hig
h
Hig
h D
MS
O
0
5
1 0
1 5
2 0
2 5
E n la rg e d c e ll
M ic ro n u c le i
B le b s
B r id g e s
D o n u t-s h a p e d c e ll
M u lti- lo b ed
D N A d a m a g e m a rk e rs
Figure 4.1-c Chromosomal instability markers in untreated ASC52telo cells. ASC52telo cells were seeded onto coverslips at 5000 cells per cm2 and allowed to reach around 80% confluence.. The cells were fixed in 4% paraformaldehyde and stained with DAPI. Images were collected with a Leica SP8 confocal microscope, graph represents combined data from three independent experiments (n=3). Changes in nuclear morphology were observed and quantified. Low: P+ 20, 14, 22, High: P+ 67, 88, 90,
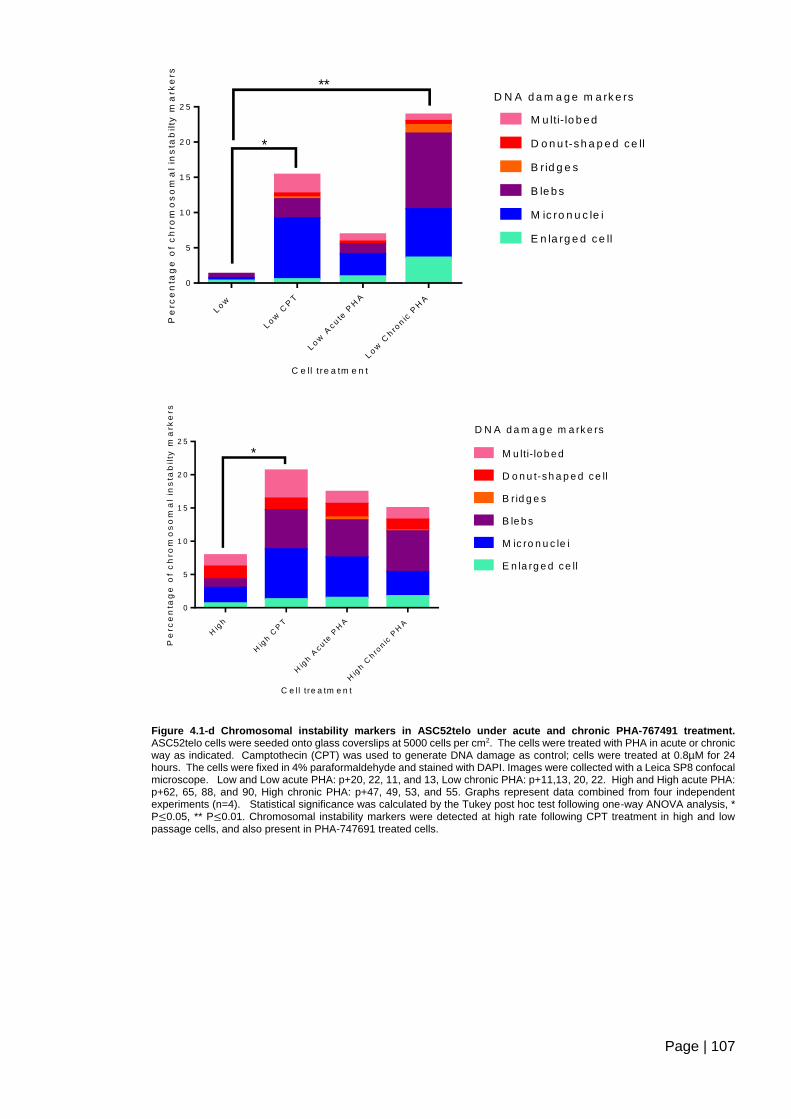
Page | 107
C e ll tre a tm e n t
Pe
rc
en
tag
e o
f c
hro
mo
so
ma
l in
sta
bil
ty m
ark
ers
Low
Low
CP
T
Low
Acute
PH
A
Low
Chro
nic
PH
A
0
5
1 0
1 5
2 0
2 5
E n la rg e d c e ll
M ic ro n u c le i
B le b s
B r id g e s
D o n u t-s h a p e d c e ll
M u lti- lo b ed
*
**D N A d a m a g e m a rk e rs
C e ll tre a tm e n t
Pe
rc
en
tag
e o
f c
hro
mo
so
ma
l in
sta
bil
ty m
ark
ers
Hig
h
Hig
h C
PT
Hig
h A
cute
PH
A
Hig
h C
hro
nic
PH
A
0
5
1 0
1 5
2 0
2 5
E n la rg e d c e ll
M ic ro n u c le i
B le b s
B r id g e s
D o n u t-s h a p e d c e ll
M u lti- lo b ed*
D N A d a m a g e m a rk e rs
Figure 4.1-d Chromosomal instability markers in ASC52telo under acute and chronic PHA-767491 treatment. ASC52telo cells were seeded onto glass coverslips at 5000 cells per cm2. The cells were treated with PHA in acute or chronic way as indicated. Camptothecin (CPT) was used to generate DNA damage as control; cells were treated at 0.8µM for 24 hours. The cells were fixed in 4% paraformaldehyde and stained with DAPI. Images were collected with a Leica SP8 confocal microscope. Low and Low acute PHA: p+20, 22, 11, and 13, Low chronic PHA: p+11,13, 20, 22. High and High acute PHA: p+62, 65, 88, and 90, High chronic PHA: p+47, 49, 53, and 55. Graphs represent data combined from four independent experiments (n=4). Statistical significance was calculated by the Tukey post hoc test following one-way ANOVA analysis, * P≤0.05, ** P≤0.01. Chromosomal instability markers were detected at high rate following CPT treatment in high and low passage cells, and also present in PHA-747691 treated cells.
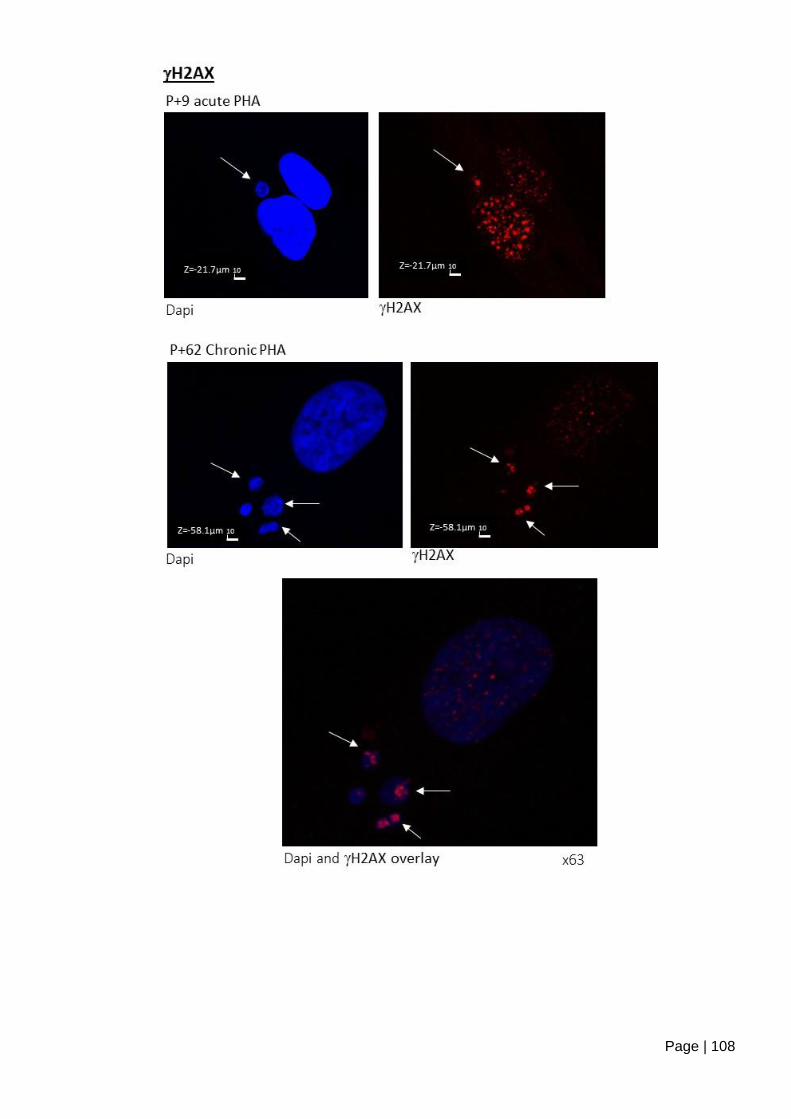
Page | 108

Page | 109
Figure 4.1-e ASC52telo cells form micronuclei staining positive for Ki67 and H2AX, following mild inhibition of
replication initiation. High and low passage ASC52telo cells were seeded at 5000 cells per cm2 in 24 well plate on glass
coverslips, with acute or chronic PHA-767491 treatment. The cells were incubated for 72 hours before fixing in 4%
paraformaldehyde and stained for Ki67 and DAPI and γH2AX. Images were collected using a Leica SP8 confocal microscope,
x63 objective. Intense staining observed in some micronuclei; representative images are shown.
4.1.1 DNA damage marker and mild proliferation inhibition
To further characterize the origin of observed signs of chromosomal instabilities, the
existence of spontaneous DNA damage was examined in our model of cells
exposed to mild proliferation inhibition by assessing γH2AX expression, which is a
marker of DNA double strand breaks. We demonstrated that Camptothecin (CPT)
treatment induces γH2AX foci formation with strong intensity of expression (Figure
4.1-f) as expected.
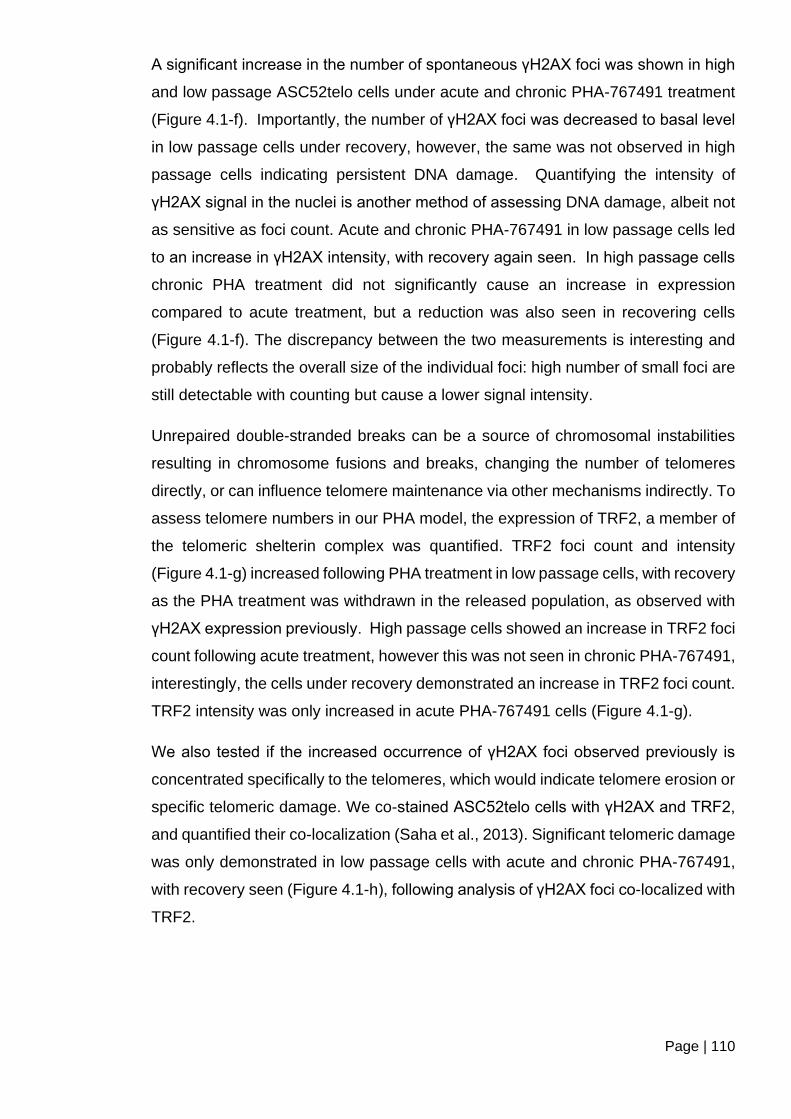
Page | 110
A significant increase in the number of spontaneous γH2AX foci was shown in high
and low passage ASC52telo cells under acute and chronic PHA-767491 treatment
(Figure 4.1-f). Importantly, the number of γH2AX foci was decreased to basal level
in low passage cells under recovery, however, the same was not observed in high
passage cells indicating persistent DNA damage. Quantifying the intensity of
γH2AX signal in the nuclei is another method of assessing DNA damage, albeit not
as sensitive as foci count. Acute and chronic PHA-767491 in low passage cells led
to an increase in γH2AX intensity, with recovery again seen. In high passage cells
chronic PHA treatment did not significantly cause an increase in expression
compared to acute treatment, but a reduction was also seen in recovering cells
(Figure 4.1-f). The discrepancy between the two measurements is interesting and
probably reflects the overall size of the individual foci: high number of small foci are
still detectable with counting but cause a lower signal intensity.
Unrepaired double-stranded breaks can be a source of chromosomal instabilities
resulting in chromosome fusions and breaks, changing the number of telomeres
directly, or can influence telomere maintenance via other mechanisms indirectly. To
assess telomere numbers in our PHA model, the expression of TRF2, a member of
the telomeric shelterin complex was quantified. TRF2 foci count and intensity
(Figure 4.1-g) increased following PHA treatment in low passage cells, with recovery
as the PHA treatment was withdrawn in the released population, as observed with
γH2AX expression previously. High passage cells showed an increase in TRF2 foci
count following acute treatment, however this was not seen in chronic PHA-767491,
interestingly, the cells under recovery demonstrated an increase in TRF2 foci count.
TRF2 intensity was only increased in acute PHA-767491 cells (Figure 4.1-g).
We also tested if the increased occurrence of γH2AX foci observed previously is
concentrated specifically to the telomeres, which would indicate telomere erosion or
specific telomeric damage. We co-stained ASC52telo cells with γH2AX and TRF2,
and quantified their co-localization (Saha et al., 2013). Significant telomeric damage
was only demonstrated in low passage cells with acute and chronic PHA-767491,
with recovery seen (Figure 4.1-h), following analysis of γH2AX foci co-localized with
TRF2.
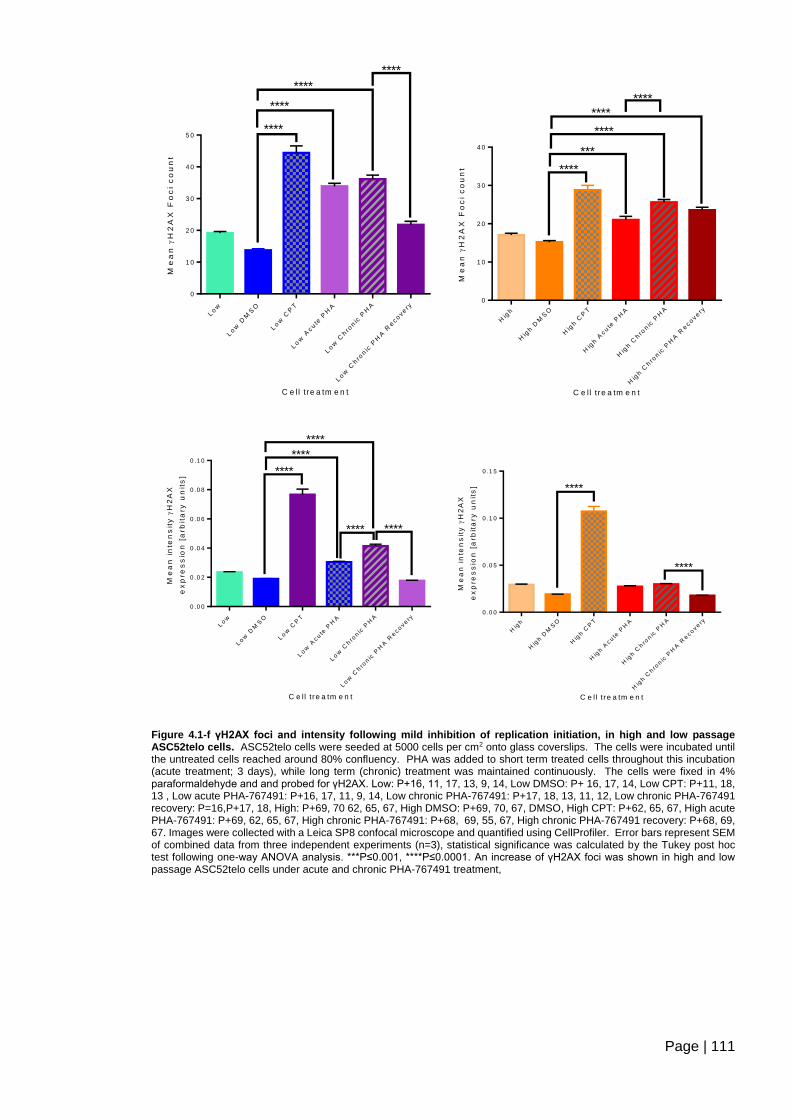
Page | 111
C e ll tre a tm e n t
Me
an
H
2A
X F
oc
i c
ou
nt
Low
Low
DM
SO
Low
CP
T
Low
Acute
PH
A
Low
Chro
nic
PH
A
Low
Chro
nic
PH
A R
ecovery
0
1 0
2 0
3 0
4 0
5 0
****
****
****
****
C e ll tre a tm e n t
Me
an
H
2A
X F
oc
i c
ou
nt
Hig
h
Hig
h D
MS
O
Hig
h C
PT
Hig
h A
cute
PH
A
Hig
h C
hro
nic
PH
A
Hig
h C
hro
nic
PH
A R
ecovery
0
1 0
2 0
3 0
4 0
****
***
****
********
C e ll tre a tm e n t
Me
an
in
ten
sit
y
H2
AX
ex
pre
ss
ion
[a
rbit
ary
un
its
]
Low
Low
DM
SO
Low
CP
T
Low
Acute
PH
A
Low
Chro
nic
PH
A
Low
Chro
nic
PH
A R
ecovery
0 .0 0
0 .0 2
0 .0 4
0 .0 6
0 .0 8
0 .1 0
****
****
****
****
****
C e ll tre a tm e n t
Me
an
in
ten
sit
y
H2
AX
ex
pre
ss
ion
[a
rbit
ary
un
its
]
Hig
h
Hig
h D
MS
O
Hig
h C
PT
Hig
h A
c ute
PH
A
Hig
h C
hro
nic
PH
A
Hig
h C
hro
nic
PH
A R
ec o
v ery
0 .0 0
0 .0 5
0 .1 0
0 .1 5
****
****
Figure 4.1-f γH2AX foci and intensity following mild inhibition of replication initiation, in high and low passage ASC52telo cells. ASC52telo cells were seeded at 5000 cells per cm2 onto glass coverslips. The cells were incubated until the untreated cells reached around 80% confluency. PHA was added to short term treated cells throughout this incubation (acute treatment; 3 days), while long term (chronic) treatment was maintained continuously. The cells were fixed in 4% paraformaldehyde and and probed for γH2AX. Low: P+16, 11, 17, 13, 9, 14, Low DMSO: P+ 16, 17, 14, Low CPT: P+11, 18, 13 , Low acute PHA-767491: P+16, 17, 11, 9, 14, Low chronic PHA-767491: P+17, 18, 13, 11, 12, Low chronic PHA-767491 recovery: P=16,P+17, 18, High: P+69, 70 62, 65, 67, High DMSO: P+69, 70, 67, DMSO, High CPT: P+62, 65, 67, High acute PHA-767491: P+69, 62, 65, 67, High chronic PHA-767491: P+68, 69, 55, 67, High chronic PHA-767491 recovery: P+68, 69, 67. Images were collected with a Leica SP8 confocal microscope and quantified using CellProfiler. Error bars represent SEM of combined data from three independent experiments (n=3), statistical significance was calculated by the Tukey post hoc test following one-way ANOVA analysis. ***P≤0.001, ****P≤0.0001. An increase of γH2AX foci was shown in high and low passage ASC52telo cells under acute and chronic PHA-767491 treatment,
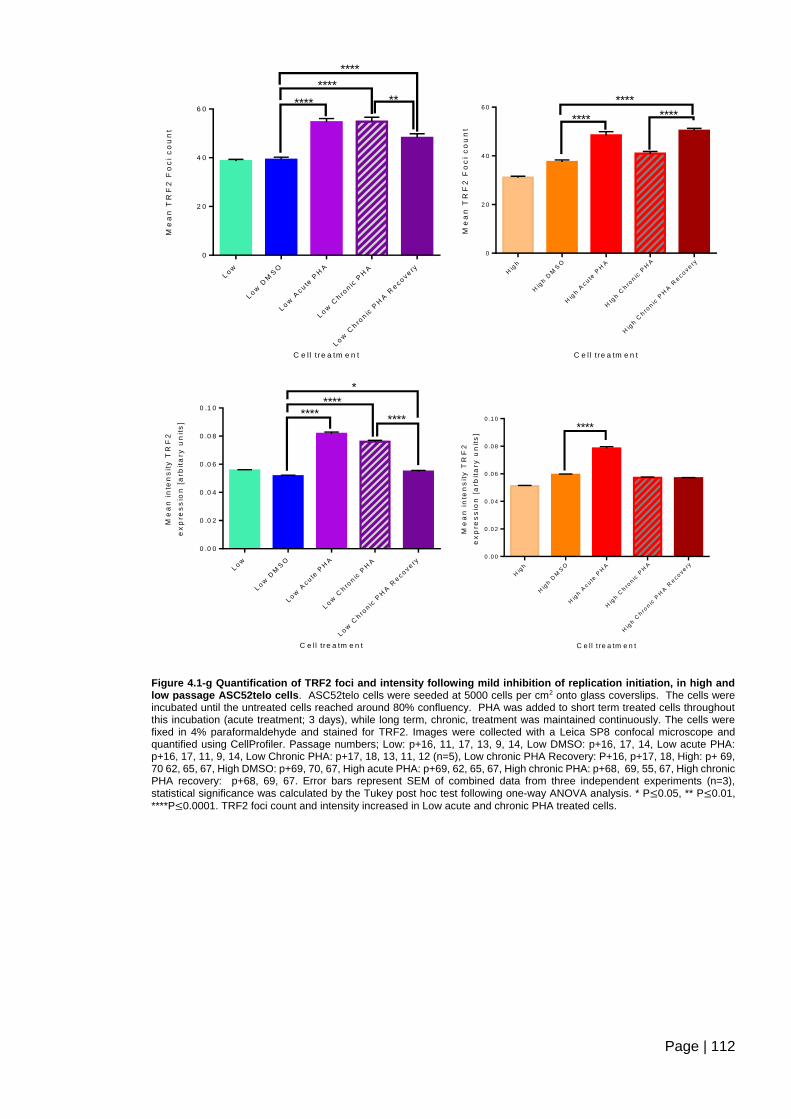
Page | 112
C e ll tre a tm e n t
Me
an
TR
F2
Fo
ci
co
un
t
Low
Low
DM
SO
Low
Ac u
te P
HA
Low
Chro
nic
PH
A
Low
Chro
nic
PH
A R
ec o
v ery
0
2 0
4 0
6 0****
****
****
**
C e ll tre a tm e n t
Me
an
TR
F2
Fo
ci
co
un
t
Hig
h
Hig
h D
MS
O
Hig
h A
cute
PH
A
HIg
h C
hro
nic
PH
A
Hig
h C
hro
nic
PH
A R
ecovery
0
2 0
4 0
6 0
**** ****
****
C e ll tre a tm e n t
Me
an
in
ten
sit
y T
RF
2
ex
pre
ss
ion
[a
rbit
ary
un
its
]
Low
Low
DM
SO
Low
Ac u
te P
HA
Low
Chro
nic
PH
A
Low
Chro
nic
PH
A R
ec o
v ery
0 .0 0
0 .0 2
0 .0 4
0 .0 6
0 .0 8
0 .1 0****
********
*
C e ll tre a tm e n t
Me
an
in
ten
sit
y T
RF
2
ex
pre
ss
ion
[a
rb
ita
ry
un
its
]
Hig
h
Hig
h D
MS
O
Hig
h A
cute
PH
A
Hig
h C
hro
nic
PH
A
Hig
h C
hro
nic
PH
A R
ecovery
0 .0 0
0 .0 2
0 .0 4
0 .0 6
0 .0 8
0 .1 0
****
Figure 4.1-g Quantification of TRF2 foci and intensity following mild inhibition of replication initiation, in high and low passage ASC52telo cells. ASC52telo cells were seeded at 5000 cells per cm2 onto glass coverslips. The cells were incubated until the untreated cells reached around 80% confluency. PHA was added to short term treated cells throughout this incubation (acute treatment; 3 days), while long term, chronic, treatment was maintained continuously. The cells were fixed in 4% paraformaldehyde and stained for TRF2. Images were collected with a Leica SP8 confocal microscope and quantified using CellProfiler. Passage numbers; Low: p+16, 11, 17, 13, 9, 14, Low DMSO: p+16, 17, 14, Low acute PHA: p+16, 17, 11, 9, 14, Low Chronic PHA: p+17, 18, 13, 11, 12 (n=5), Low chronic PHA Recovery: P+16, p+17, 18, High: p+ 69, 70 62, 65, 67, High DMSO: p+69, 70, 67, High acute PHA: p+69, 62, 65, 67, High chronic PHA: p+68, 69, 55, 67, High chronic PHA recovery: p+68, 69, 67. Error bars represent SEM of combined data from three independent experiments (n=3), statistical significance was calculated by the Tukey post hoc test following one-way ANOVA analysis. * P≤0.05, ** P≤0.01,
****P≤0.0001. TRF2 foci count and intensity increased in Low acute and chronic PHA treated cells.

Page | 113
C e ll tre a tm e n t
Pe
rce
nta
ge
of
TR
F2
an
d
H2
AX
fo
ci
co
-lo
ca
lis
ati
on
Low
Low
DM
SO
Low
Acute
PH
A
Low
Chro
nic
PH
A
Low
Chro
nic
PH
A R
ecovery
0
1 0
2 0
3 0
4 0
*
* *
C e ll tre a tm e n t
Pe
rce
nta
ge
of
TR
F2
an
d
H2
AX
fo
ci
co
-lo
ca
lis
ati
on
Hig
h
Hig
h D
MS
O
Hig
h A
c ute
PH
A
HIg
h C
hro
nic
PH
A
Hig
h C
hro
nic
PH
A R
ec o
v ery
0
1 0
2 0
3 0
4 0
Figure 4.1-h Co-localisation of TRF2 with γH2AX following mild inhibition of replication initiation in high and low passage ASC52telo cells. ASC52telo cells were seeded at 5000 cells per cm2 onto glass coverslips. The cells were incubated until the untreated cells reached around 80% confluency. PHA was added to short term treated cells throughout this incubation (acute treatment, 3 days), while long term (chronic) treatment was maintained continuously. The cells were fixed in 4% paraformaldehyde and co-stained for TRF2 and γH2AX. Images were collected with a Leica SP8 confocal microscope and quantified using CellProfiler. Passage numbers; Low: P+16, 11, 17, 13, 9, 14, Low DMSO- p+16, 17, 14, Low acute PHA: p+16, 17, 11, 9, 14 , Low chronic PHA: p+17, 18, 13, 11, 12, Low chronic PHA recovery: P=16, p+17, 18, High: P+ 69, 70 62, 65, 67, High DMSO: p+69, 70, 67, High acute PHA: p+69, 62, 65, 67, High Chronic PHA: p+ 68, 69, 55, 67, High chronic PHA recovery: p+68,69, 67. Error bars represent SEM of combined data from three independent experiments (n=3). Statistical values were calculated by the Tukey post hoc test following one-way ANOVA analysis. * P≤0.05. Percentage of co-localisation represents TRF2 foci also positive for γH2AX foci (white arrows). Significant co-localisation seen in low passage PHA treated cells.
Page | 114
Resolving and regulating a response following DNA damage is maintained by a
number of pathways; ATM and ATR initiating a DNA response via phosphorylation
of mediator proteins, including 53BP1, and effector protein CHK1 (Friedel et al.,
2009; Dai and Grant, 2010). Low passage ASC52telo under acute PHA-767491
showed a significant decrease in 53BP1 (DSB interacting protein); although not
significant a similar finding appeared in the high passage cells under the same
conditions. 53BP1 expression significantly increased in the low passage acute PHA-
767491 cells with suggested rise in phosphorylated-CHK1 (Phospho-CHK1, the
activated form) (Figure 4.1-i). However, further repeats are necessary to verify
these findings.
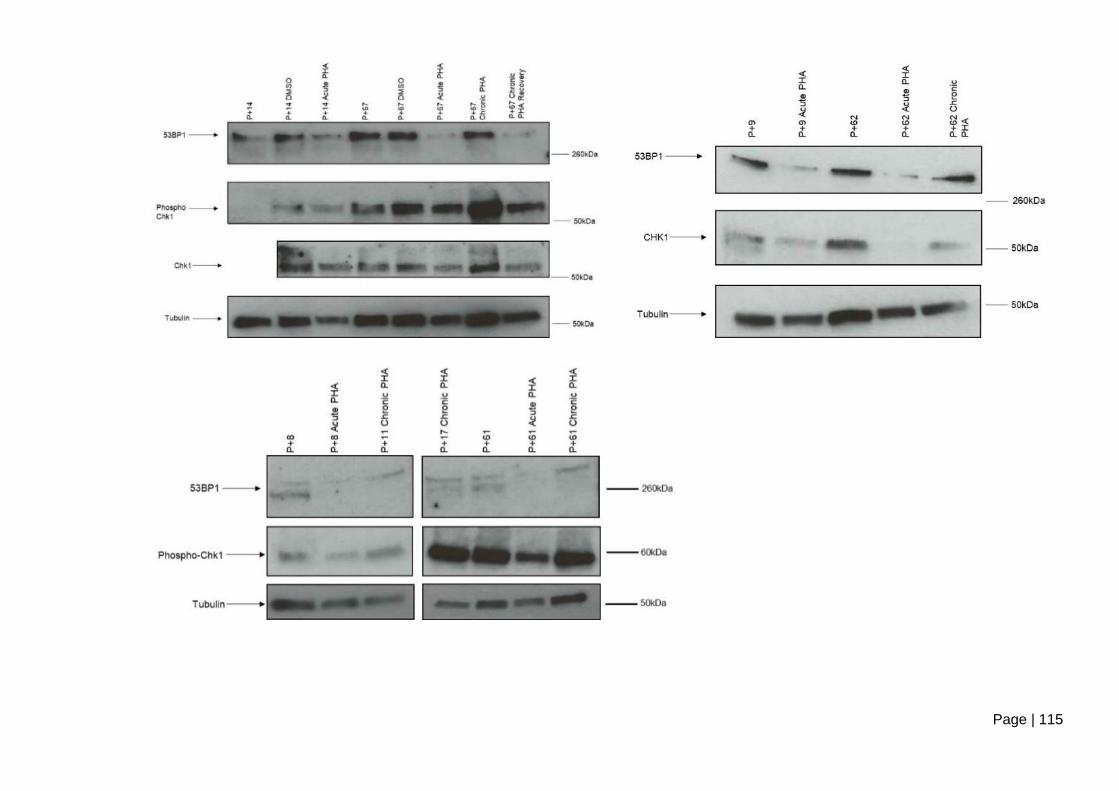
Page | 115
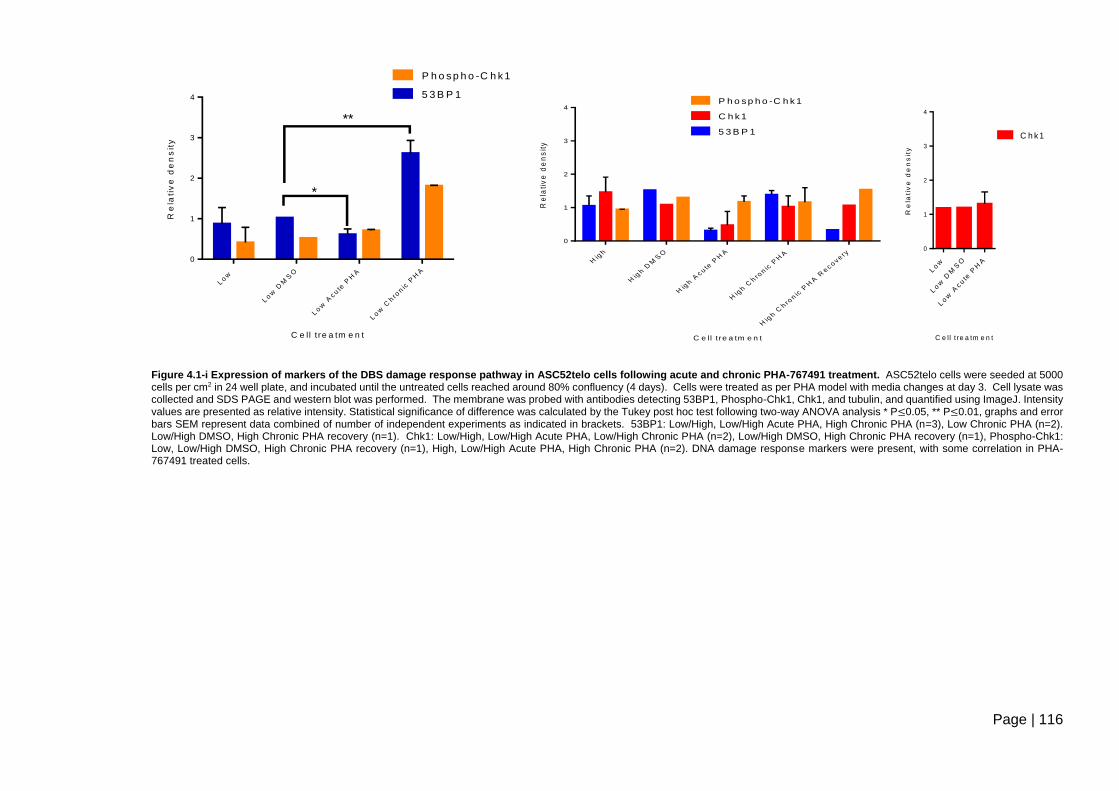
Page | 116
C e ll tre a tm e n t
Re
lati
ve
de
ns
ity
Low
Low
DM
SO
Low
Ac u
te P
HA
Low
Chro
nic
PH
A
0
1
2
3
4 5 3 B P 1
P h o s p h o -C h k 1
*
**
C e ll tre a tm e n t
Re
lati
ve
de
ns
ity
Hig
h
Hig
h D
MS
O
Hig
h A
c ute
PH
A
Hig
h C
hro
nic
PH
A
Hig
h C
hro
nic
PH
A R
ec o
v ery
0
1
2
3
4
5 3 B P 1
C h k 1
P h o s p h o -C h k 1
C e ll tre a tm e n t
Re
lati
ve
de
ns
ity
Low
Low
DM
SO
Low
Acute
PH
A
0
1
2
3
4
C h k 1
Figure 4.1-i Expression of markers of the DBS damage response pathway in ASC52telo cells following acute and chronic PHA-767491 treatment. ASC52telo cells were seeded at 5000 cells per cm2 in 24 well plate, and incubated until the untreated cells reached around 80% confluency (4 days). Cells were treated as per PHA model with media changes at day 3. Cell lysate was collected and SDS PAGE and western blot was performed. The membrane was probed with antibodies detecting 53BP1, Phospho-Chk1, Chk1, and tubulin, and quantified using ImageJ. Intensity values are presented as relative intensity. Statistical significance of difference was calculated by the Tukey post hoc test following two-way ANOVA analysis * P≤0.05, ** P≤0.01, graphs and error bars SEM represent data combined of number of independent experiments as indicated in brackets. 53BP1: Low/High, Low/High Acute PHA, High Chronic PHA (n=3), Low Chronic PHA (n=2). Low/High DMSO, High Chronic PHA recovery (n=1). Chk1: Low/High, Low/High Acute PHA, Low/High Chronic PHA (n=2), Low/High DMSO, High Chronic PHA recovery (n=1), Phospho-Chk1: Low, Low/High DMSO, High Chronic PHA recovery (n=1), High, Low/High Acute PHA, High Chronic PHA (n=2). DNA damage response markers were present, with some correlation in PHA-767491 treated cells.
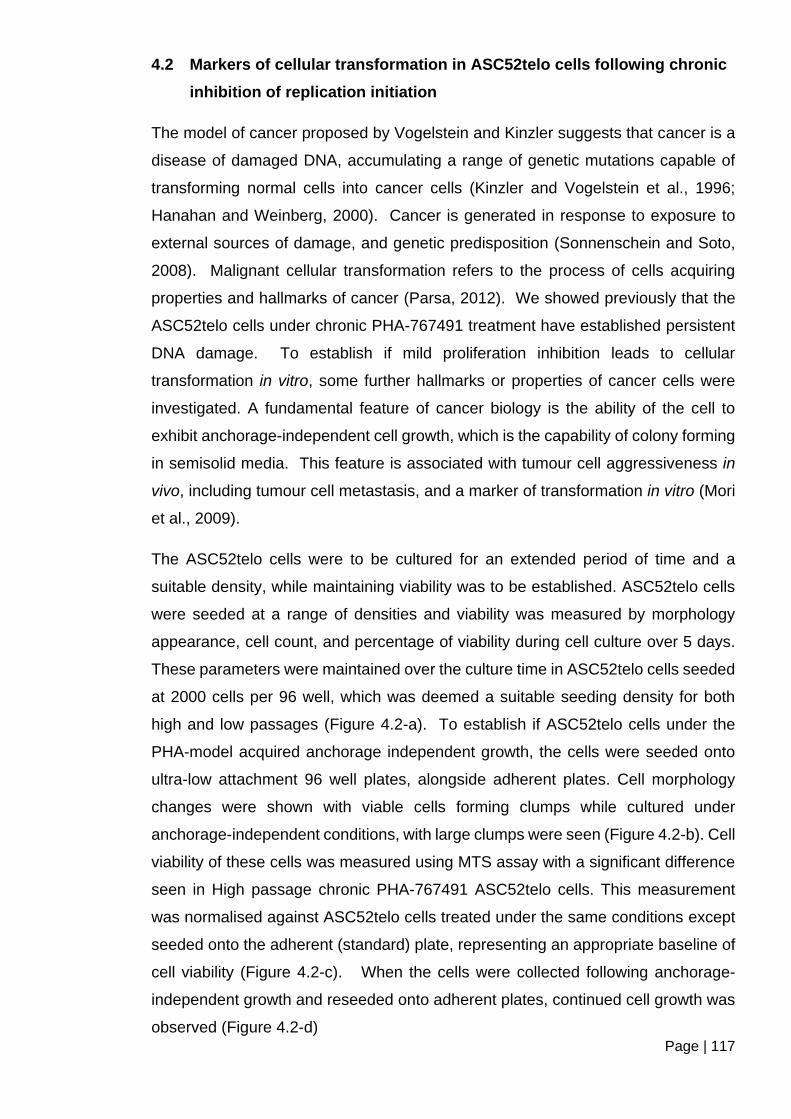
Page | 117
4.2 Markers of cellular transformation in ASC52telo cells following chronic
inhibition of replication initiation
The model of cancer proposed by Vogelstein and Kinzler suggests that cancer is a
disease of damaged DNA, accumulating a range of genetic mutations capable of
transforming normal cells into cancer cells (Kinzler and Vogelstein et al., 1996;
Hanahan and Weinberg, 2000). Cancer is generated in response to exposure to
external sources of damage, and genetic predisposition (Sonnenschein and Soto,
2008). Malignant cellular transformation refers to the process of cells acquiring
properties and hallmarks of cancer (Parsa, 2012). We showed previously that the
ASC52telo cells under chronic PHA-767491 treatment have established persistent
DNA damage. To establish if mild proliferation inhibition leads to cellular
transformation in vitro, some further hallmarks or properties of cancer cells were
investigated. A fundamental feature of cancer biology is the ability of the cell to
exhibit anchorage-independent cell growth, which is the capability of colony forming
in semisolid media. This feature is associated with tumour cell aggressiveness in
vivo, including tumour cell metastasis, and a marker of transformation in vitro (Mori
et al., 2009).
The ASC52telo cells were to be cultured for an extended period of time and a
suitable density, while maintaining viability was to be established. ASC52telo cells
were seeded at a range of densities and viability was measured by morphology
appearance, cell count, and percentage of viability during cell culture over 5 days.
These parameters were maintained over the culture time in ASC52telo cells seeded
at 2000 cells per 96 well, which was deemed a suitable seeding density for both
high and low passages (Figure 4.2-a). To establish if ASC52telo cells under the
PHA-model acquired anchorage independent growth, the cells were seeded onto
ultra-low attachment 96 well plates, alongside adherent plates. Cell morphology
changes were shown with viable cells forming clumps while cultured under
anchorage-independent conditions, with large clumps were seen (Figure 4.2-b). Cell
viability of these cells was measured using MTS assay with a significant difference
seen in High passage chronic PHA-767491 ASC52telo cells. This measurement
was normalised against ASC52telo cells treated under the same conditions except
seeded onto the adherent (standard) plate, representing an appropriate baseline of
cell viability (Figure 4.2-c). When the cells were collected following anchorage-
independent growth and reseeded onto adherent plates, continued cell growth was
observed (Figure 4.2-d)

Page | 118
day 1
day 2
day 3
day 4
day 5
0
2
4
6
In c u b a tio n t im e
AS
C5
2te
lo (
p+
12
) c
ell
co
un
t x
10
5/m
l
5 0 0
1 0 0 0
1 5 0 0
2 0 0 0
2 5 0 0
3 0 0 0
C e lls p e r w e ll
In c u b a tio n t im e
AS
C5
2te
lo (
p+
12
) c
ell
via
bil
ity
%
day 1
day 2
day 3
day 4
day 5
0
2 0
4 0
6 0
8 0
1 0 0
5 0 0
1 0 0 0
1 5 0 0
2 0 0 0
2 5 0 0
3 0 0 0
C e lls p e r w e ll
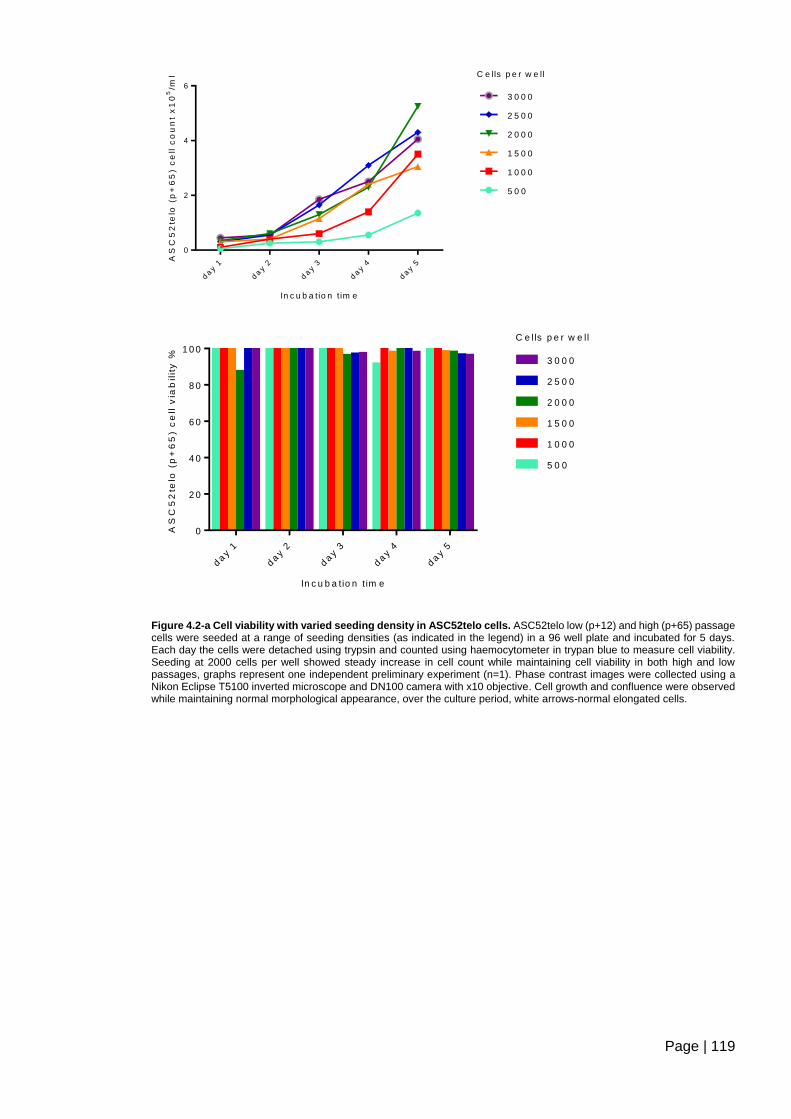
Page | 119
day 1
day 2
day 3
day 4
day 5
0
2
4
6
In c u b a tio n t im e
AS
C5
2te
lo (
p+
65
) c
ell
co
un
t x
10
5/m
l
5 0 0
1 0 0 0
1 5 0 0
2 0 0 0
2 5 0 0
3 0 0 0
C e lls p e r w e ll
In c u b a tio n t im e
AS
C5
2te
lo (
p+
65
) c
ell
via
bil
ity
%
day 1
day 2
day 3
day 4
day 5
0
2 0
4 0
6 0
8 0
1 0 0
5 0 0
1 0 0 0
1 5 0 0
2 0 0 0
2 5 0 0
3 0 0 0
C e lls p e r w e ll
Figure 4.2-a Cell viability with varied seeding density in ASC52telo cells. ASC52telo low (p+12) and high (p+65) passage cells were seeded at a range of seeding densities (as indicated in the legend) in a 96 well plate and incubated for 5 days. Each day the cells were detached using trypsin and counted using haemocytometer in trypan blue to measure cell viability. Seeding at 2000 cells per well showed steady increase in cell count while maintaining cell viability in both high and low passages, graphs represent one independent preliminary experiment (n=1). Phase contrast images were collected using a Nikon Eclipse T5100 inverted microscope and DN100 camera with x10 objective. Cell growth and confluence were observed while maintaining normal morphological appearance, over the culture period, white arrows-normal elongated cells.
Page | 120
Figure 4.2-b Cell morphology and anchorage-independent growth in ASC52telo cells treated according to the PHA model. ASC52telo cells were seeded at 2000 cells per well in Costar flat bottom ultra-low attachment surface non-pyrogenic (3474) 96 well plate. PHA-767491 was added to short term treated cells throughout this incubation (15 days), while long term treatment was maintained continuously. Phase contrast images were taken using a Nikon Eclipse T5100 inverted microscope and DN100 camera, with x10 objectives. Cell clump formation was observed (white arrows) to a different degree in correlation with treatment.
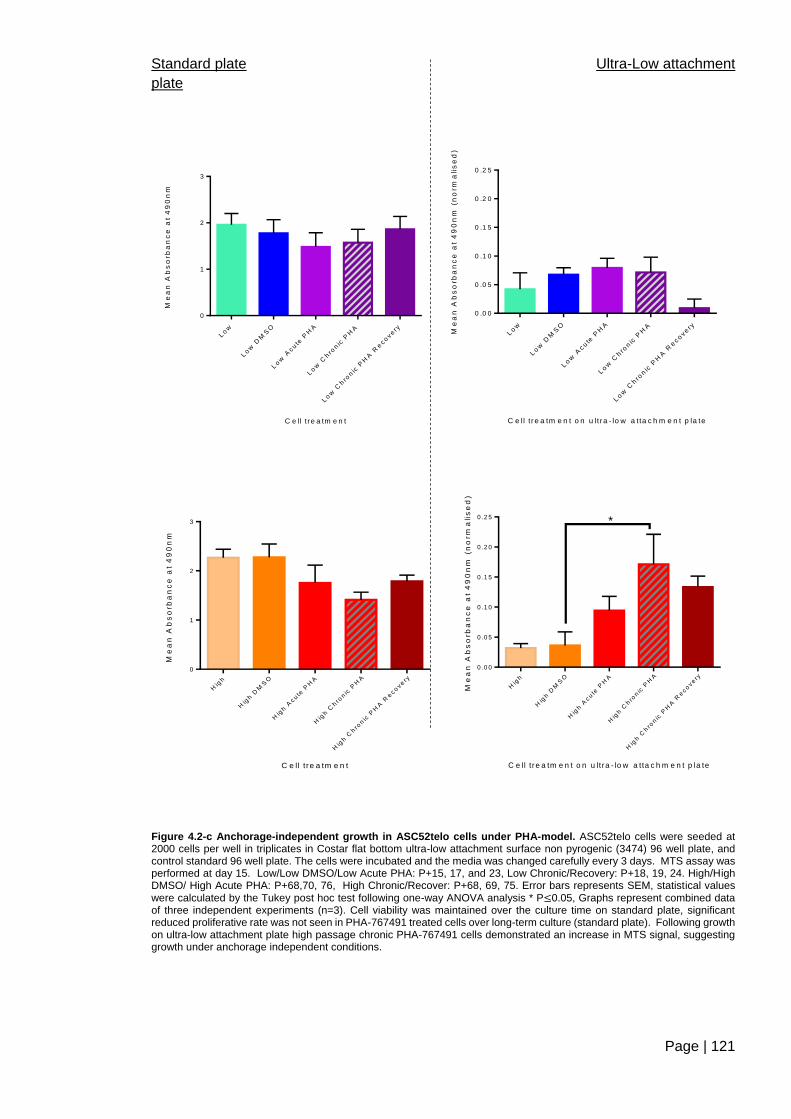
Page | 121
Standard plate Ultra-Low attachment
plate
C e ll tre a tm e n t
Me
an
Ab
so
rba
nc
e a
t 4
90
nm
Low
Low
DM
SO
Low
Acute
PH
A
Low
Chro
nic
PH
A
Low
Chro
nic
PH
A R
ecovery
0
1
2
3
C e ll tr e a tm e n t o n u lt ra - lo w a tta c h m e n t p la te
Me
an
Ab
so
rba
nc
e a
t 4
90
nm
(n
orm
ali
se
d)
Low
Low
DM
SO
Low
Ac u
te P
HA
Low
Chro
nic
PH
A
Low
Chro
nic
PH
A R
ec o
v ery
0 .0 0
0 .0 5
0 .1 0
0 .1 5
0 .2 0
0 .2 5
C e ll tre a tm e n t
Me
an
Ab
so
rba
nc
e a
t 4
90
nm
Hig
h
Hig
h D
MS
O
Hig
h A
c ute
PH
A
Hig
h C
hro
nic
PH
A
Hig
h C
hro
nic
PH
A R
ec o
v ery
0
1
2
3
C e ll tr e a tm e n t o n u lt ra - lo w a tta c h m e n t p la te
Me
an
Ab
so
rba
nc
e a
t 4
90
nm
(n
orm
ali
se
d)
Hig
h
Hig
h D
MS
O
Hig
h A
cute
PH
A
Hig
h C
hro
nic
PH
A
Hig
h C
hro
nic
PH
A R
ecovery
0 .0 0
0 .0 5
0 .1 0
0 .1 5
0 .2 0
0 .2 5 *
Figure 4.2-c Anchorage-independent growth in ASC52telo cells under PHA-model. ASC52telo cells were seeded at 2000 cells per well in triplicates in Costar flat bottom ultra-low attachment surface non pyrogenic (3474) 96 well plate, and control standard 96 well plate. The cells were incubated and the media was changed carefully every 3 days. MTS assay was performed at day 15. Low/Low DMSO/Low Acute PHA: P+15, 17, and 23, Low Chronic/Recovery: P+18, 19, 24. High/High DMSO/ High Acute PHA: P+68,70, 76, High Chronic/Recover: P+68, 69, 75. Error bars represents SEM, statistical values
were calculated by the Tukey post hoc test following one-way ANOVA analysis * P≤0.05, Graphs represent combined data of three independent experiments (n=3). Cell viability was maintained over the culture time on standard plate, significant reduced proliferative rate was not seen in PHA-767491 treated cells over long-term culture (standard plate). Following growth on ultra-low attachment plate high passage chronic PHA-767491 cells demonstrated an increase in MTS signal, suggesting growth under anchorage independent conditions.
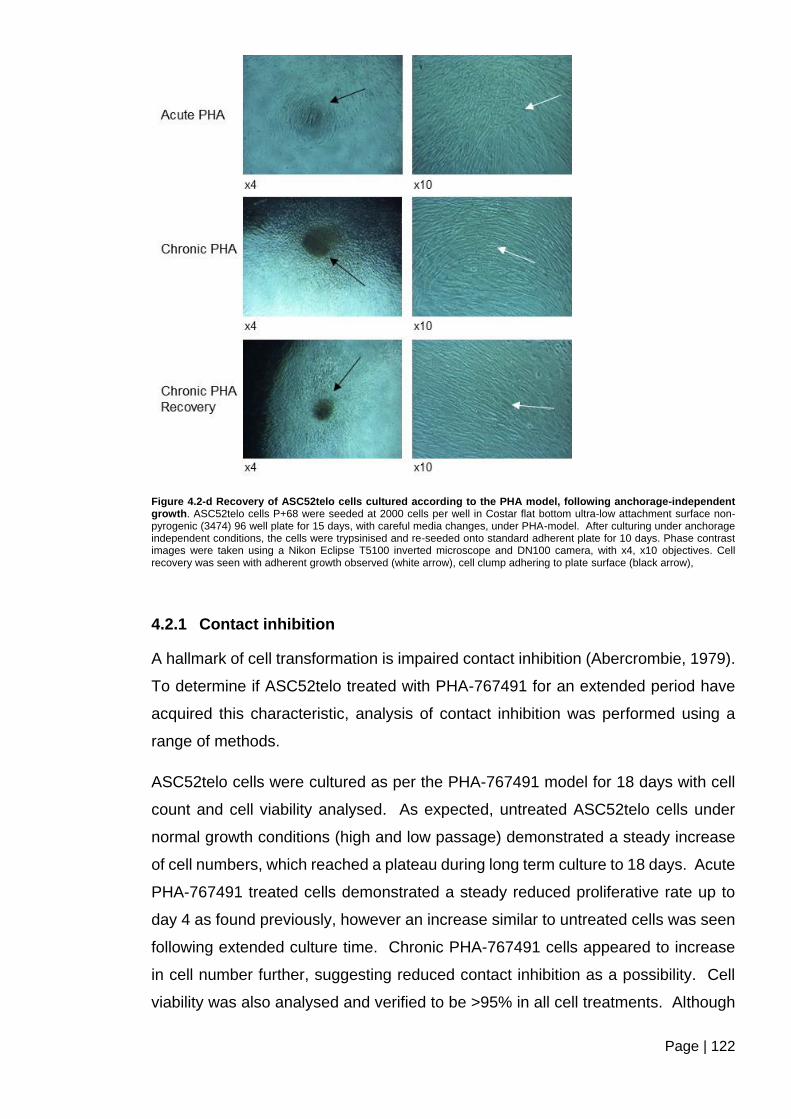
Page | 122
Figure 4.2-d Recovery of ASC52telo cells cultured according to the PHA model, following anchorage-independent growth. ASC52telo cells P+68 were seeded at 2000 cells per well in Costar flat bottom ultra-low attachment surface non-pyrogenic (3474) 96 well plate for 15 days, with careful media changes, under PHA-model. After culturing under anchorage independent conditions, the cells were trypsinised and re-seeded onto standard adherent plate for 10 days. Phase contrast images were taken using a Nikon Eclipse T5100 inverted microscope and DN100 camera, with x4, x10 objectives. Cell recovery was seen with adherent growth observed (white arrow), cell clump adhering to plate surface (black arrow),
4.2.1 Contact inhibition
A hallmark of cell transformation is impaired contact inhibition (Abercrombie, 1979).
To determine if ASC52telo treated with PHA-767491 for an extended period have
acquired this characteristic, analysis of contact inhibition was performed using a
range of methods.
ASC52telo cells were cultured as per the PHA-767491 model for 18 days with cell
count and cell viability analysed. As expected, untreated ASC52telo cells under
normal growth conditions (high and low passage) demonstrated a steady increase
of cell numbers, which reached a plateau during long term culture to 18 days. Acute
PHA-767491 treated cells demonstrated a steady reduced proliferative rate up to
day 4 as found previously, however an increase similar to untreated cells was seen
following extended culture time. Chronic PHA-767491 cells appeared to increase
in cell number further, suggesting reduced contact inhibition as a possibility. Cell
viability was also analysed and verified to be >95% in all cell treatments. Although
Page | 123
increased cell growth may have been seen, the PHA treated cells appeared to form
clumps which would result in discrepancies in cells count, resulting in inaccurate
representation (Figure 4.2-e).
Therefore, the cells were lysed and protein concentration was analysed as a
measure of growth. Low passage acute culture showed an increase which then fell
again. Continual cell growth was further demonstrated in high passage chronic
PHA-767491 treated cells following recovery (Figure 4.2-f), while MTS assay
suggested continued cell proliferation (Figure 4.2-g), however, this finding needs to
be verified. The cells were also assayed with the Promega Real-time Glo MT assay
using luminescence, which allows non-endpoint measurements, unlike the MTS
assay. It showed steady cell growth at day 21. We hoped to analyse these cells
using the same method at day 24, but luminescence was lost, therefore an MTS
assay was performed on these cells at day 28. It suggested continual growth in high
passage chronic PHA-767491 cells compared to same passage cells with no
treatment (Figure 4.2-h).
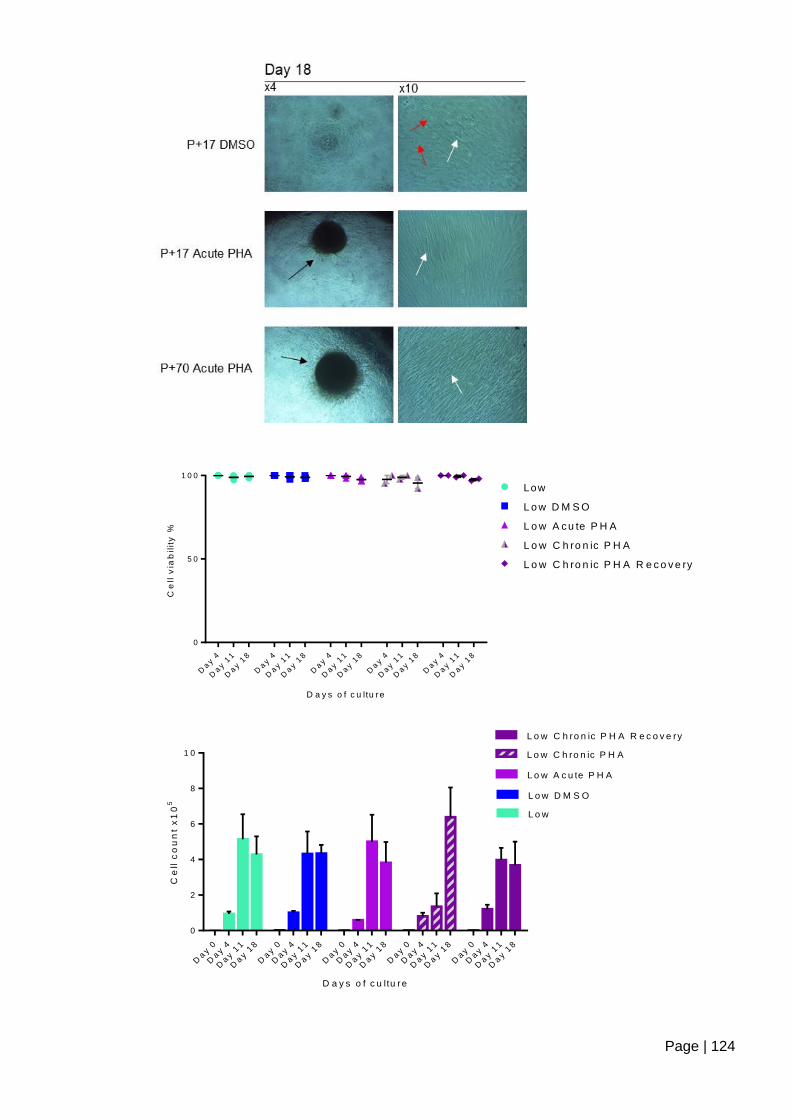
Page | 124
D a y s o f c u ltu re
Ce
ll v
iab
ilit
y %
Day 4
Day 1
1
Day 1
8
Day 4
Day 1
1
Day 1
8
Day 4
Day 1
1
Day 1
8
Day 4
Day 1
1
Day 1
8
Day 4
Day 1
1
Day 1
8
0
5 0
1 0 0
Low
L o w D M S O
L o w A c u te P H A
L o w C h ro n ic P H A
L o w C h ro n ic P H A R e c o v e ry
D a y s o f c u ltu re
Ce
ll c
ou
nt
x1
05
Day 0
Day 4
Day 1
1
Day 1
8
Day 0
Day 4
Day 1
1
Day 1
8
Day 0
Day 4
Day 1
1
Day 1
8
Day 0
Day 4
Day 1
1
Day 1
8
Day 0
Day 4
Day 1
1
Day 1
8
0
2
4
6
8
1 0
L o w
L o w D M S O
L o w A c u te P H A
L o w C h ro n ic P H A
L o w C h ro n ic P H A R e c o v e ry
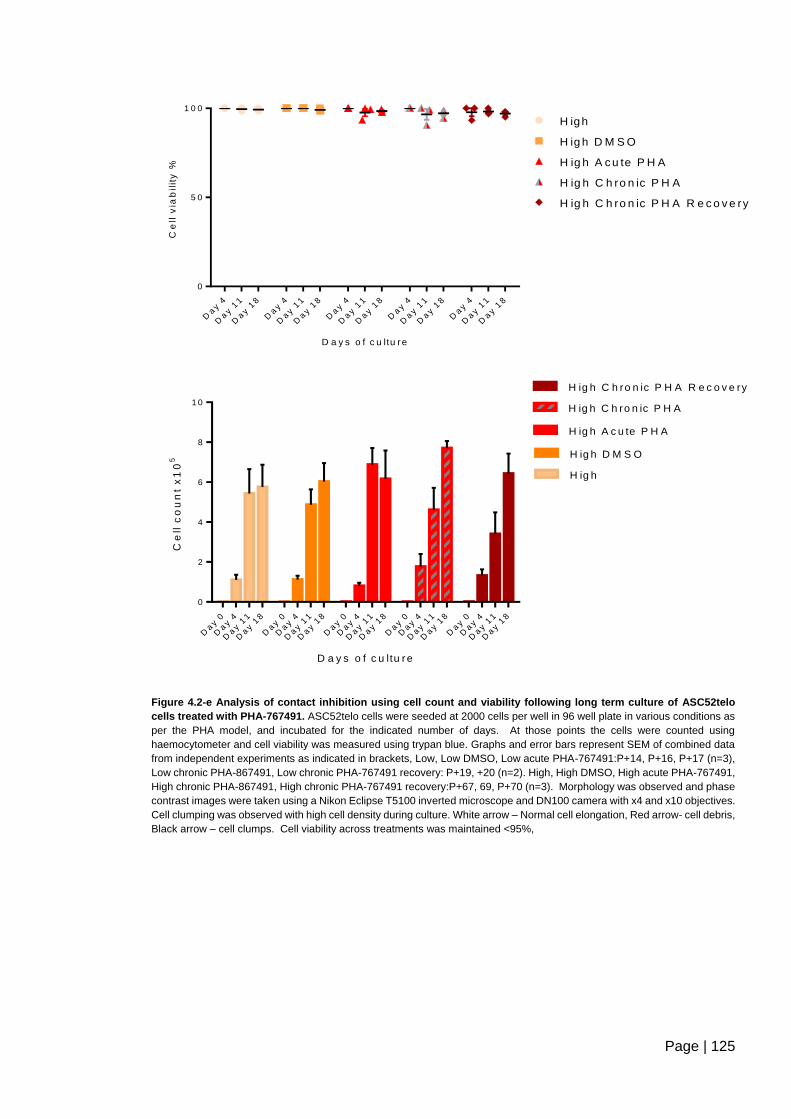
Page | 125
D a y s o f c u ltu re
Ce
ll v
iab
ilit
y %
Day 4
Day 1
1
Day 1
8
Day 4
Day 1
1
Day 1
8
Day 4
Day 1
1
Day 1
8
Day 4
Day 1
1
Day 1
8
Day 4
Day 1
1
Day 1
8
0
5 0
1 0 0
H igh
H ig h D M S O
H ig h A c u te P H A
H ig h C h ro n ic P H A
H ig h C h ro n ic P H A R e c o v e ry
D a y s o f c u ltu re
Ce
ll c
ou
nt
x1
05
Day 0
Day 4
Day 1
1
Day 1
8
Day 0
Day 4
Day 1
1
Day 1
8
Day 0
Day 4
Day 1
1
Day 1
8
Day 0
Day 4
Day 1
1
Day 1
8
Day 0
Day 4
Day 1
1
Day 1
8
0
2
4
6
8
1 0
H ig h
H ig h D M S O
H ig h A c u te P H A
H ig h C h ro n ic P H A
H ig h C h ro n ic P H A R e c o v e ry
Figure 4.2-e Analysis of contact inhibition using cell count and viability following long term culture of ASC52telo
cells treated with PHA-767491. ASC52telo cells were seeded at 2000 cells per well in 96 well plate in various conditions as
per the PHA model, and incubated for the indicated number of days. At those points the cells were counted using
haemocytometer and cell viability was measured using trypan blue. Graphs and error bars represent SEM of combined data
from independent experiments as indicated in brackets, Low, Low DMSO, Low acute PHA-767491:P+14, P+16, P+17 (n=3),
Low chronic PHA-867491, Low chronic PHA-767491 recovery: P+19, +20 (n=2). High, High DMSO, High acute PHA-767491,
High chronic PHA-867491, High chronic PHA-767491 recovery:P+67, 69, P+70 (n=3). Morphology was observed and phase
contrast images were taken using a Nikon Eclipse T5100 inverted microscope and DN100 camera with x4 and x10 objectives.
Cell clumping was observed with high cell density during culture. White arrow – Normal cell elongation, Red arrow- cell debris,
Black arrow – cell clumps. Cell viability across treatments was maintained <95%,
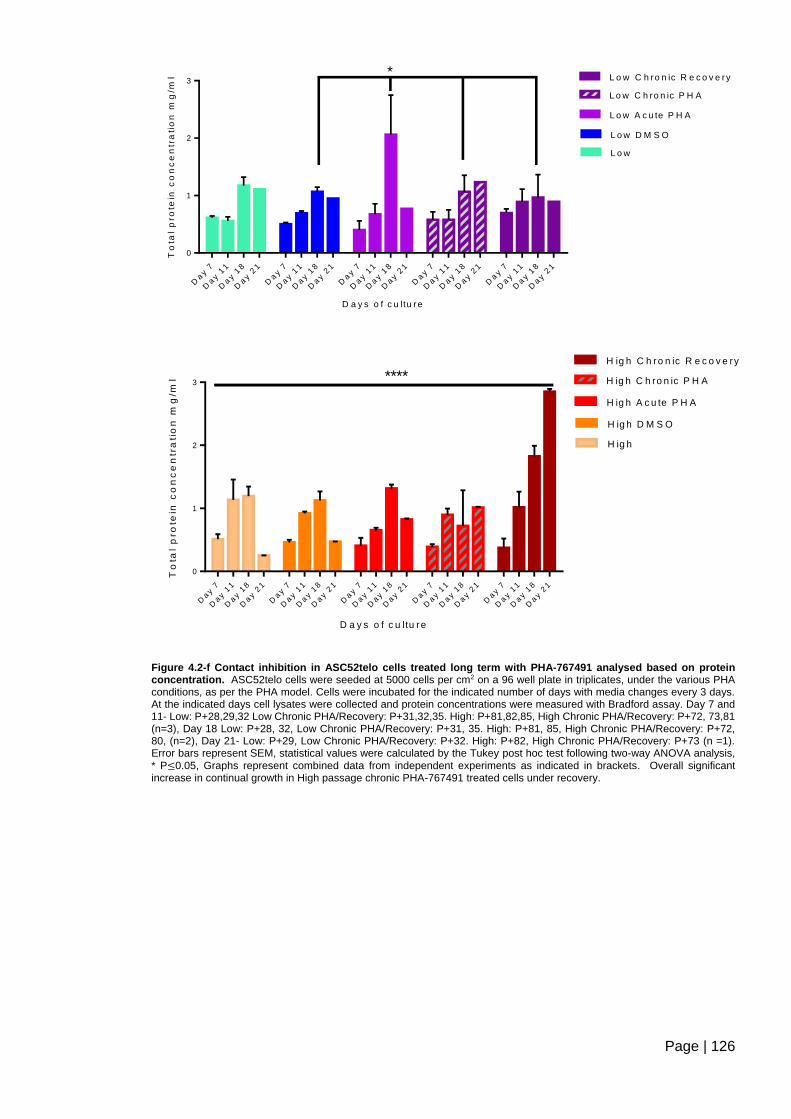
Page | 126
D a y s o f c u ltu re
To
tal
pro
tein
co
nc
en
tra
tio
n m
g/m
l
Day 7
Day 1
1
Day 1
8
Day 2
1
Day 7
Day 1
1
Day 1
8
Day 2
1
Day 7
Day 1
1
Day 1
8
Day 2
1
Day 7
Day 1
1
Day 1
8
Day 2
1
Day 7
Day 1
1
Day 1
8
Day 2
1
0
1
2
3
L o w
L o w D M S O
L o w A c u te P H A
L o w C h ro n ic P H A
L o w C h ro n ic R e c o v e ry*
D a y s o f c u ltu re
To
tal
pro
tein
co
nc
en
tra
tio
n m
g/m
l
Day 7
Day 1
1
Day 1
8
Day 2
1
Day 7
Day 1
1
Day 1
8
Day 2
1
Day 7
Day 1
1
Day 1
8
Day 2
1
Day 7
Day 1
1
Day 1
8
Day 2
1
Day 7
Day 1
1
Day 1
8
Day 2
1
0
1
2
3
H ig h
H ig h D M S O
H ig h A c u te P H A
H ig h C h ro n ic P H A
H ig h C h ro n ic R e c o v e ry
****
Figure 4.2-f Contact inhibition in ASC52telo cells treated long term with PHA-767491 analysed based on protein concentration. ASC52telo cells were seeded at 5000 cells per cm2 on a 96 well plate in triplicates, under the various PHA conditions, as per the PHA model. Cells were incubated for the indicated number of days with media changes every 3 days. At the indicated days cell lysates were collected and protein concentrations were measured with Bradford assay. Day 7 and 11- Low: P+28,29,32 Low Chronic PHA/Recovery: P+31,32,35. High: P+81,82,85, High Chronic PHA/Recovery: P+72, 73,81 (n=3), Day 18 Low: P+28, 32, Low Chronic PHA/Recovery: P+31, 35. High: P+81, 85, High Chronic PHA/Recovery: P+72, 80, (n=2), Day 21- Low: P+29, Low Chronic PHA/Recovery: P+32. High: P+82, High Chronic PHA/Recovery: P+73 (n =1). Error bars represent SEM, statistical values were calculated by the Tukey post hoc test following two-way ANOVA analysis,
* P≤0.05, Graphs represent combined data from independent experiments as indicated in brackets. Overall significant increase in continual growth in High passage chronic PHA-767491 treated cells under recovery.
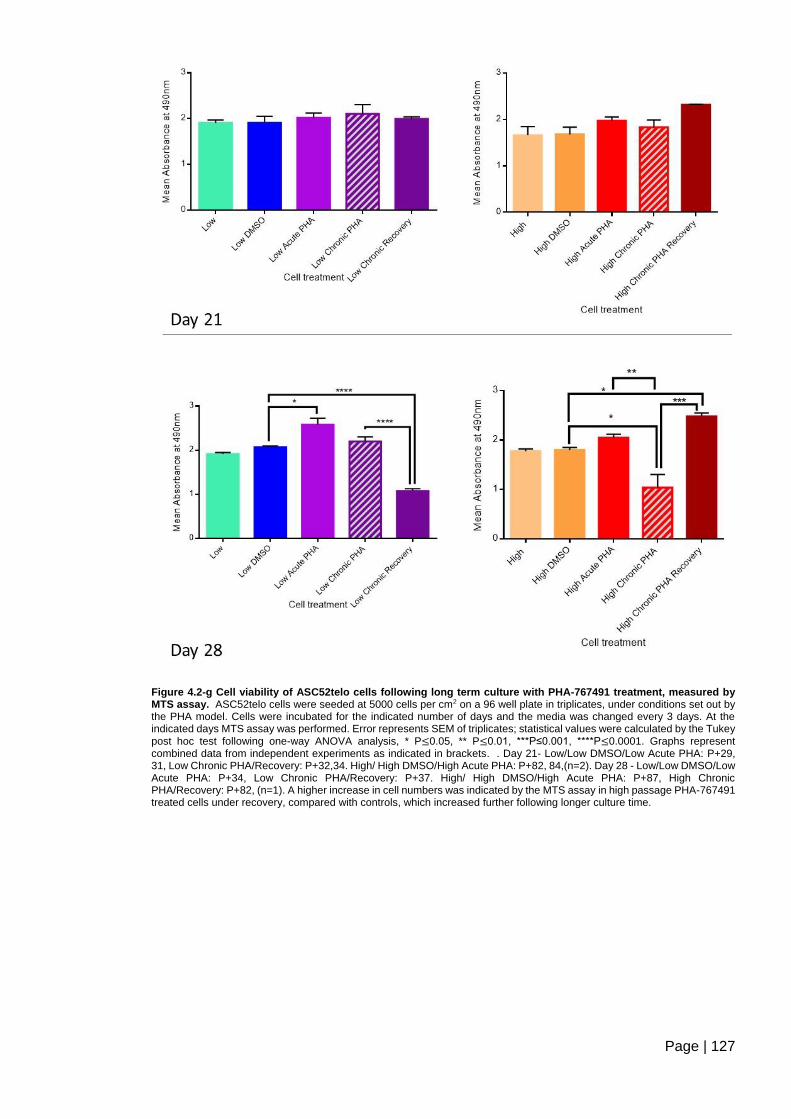
Page | 127
Figure 4.2-g Cell viability of ASC52telo cells following long term culture with PHA-767491 treatment, measured by MTS assay. ASC52telo cells were seeded at 5000 cells per cm2 on a 96 well plate in triplicates, under conditions set out by the PHA model. Cells were incubated for the indicated number of days and the media was changed every 3 days. At the indicated days MTS assay was performed. Error represents SEM of triplicates; statistical values were calculated by the Tukey
post hoc test following one-way ANOVA analysis, * P≤0.05, ** P≤0.01, ***P≤0.001, ****P≤0.0001. Graphs represent combined data from independent experiments as indicated in brackets. . Day 21- Low/Low DMSO/Low Acute PHA: P+29, 31, Low Chronic PHA/Recovery: P+32,34. High/ High DMSO/High Acute PHA: P+82, 84,(n=2). Day 28 - Low/Low DMSO/Low Acute PHA: P+34, Low Chronic PHA/Recovery: P+37. High/ High DMSO/High Acute PHA: P+87, High Chronic PHA/Recovery: P+82, (n=1). A higher increase in cell numbers was indicated by the MTS assay in high passage PHA-767491 treated cells under recovery, compared with controls, which increased further following longer culture time.
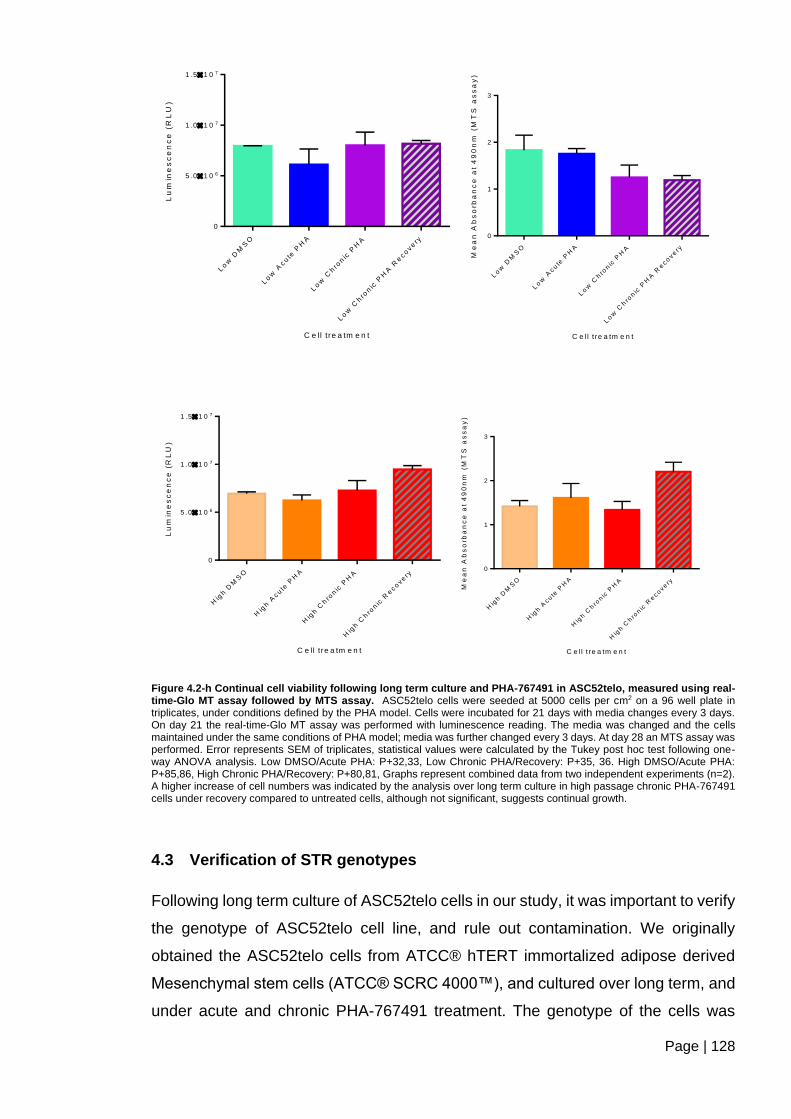
Page | 128
C e ll tre a tm e n t
Lu
min
es
ce
nc
e (
RL
U)
Low
DM
SO
Low
Acute
PH
A
Low
Chro
nic
PH
A
Low
Chro
nic
PH
A R
ecovery
0
5 .0 1 0 6
1 .0 1 0 7
1 .5 1 0 7
C e ll tre a tm e n t
Me
an
Ab
so
rba
nc
e a
t 4
90
nm
(M
TS
as
sa
y)
Low
DM
SO
Low
Acute
PH
A
Low
Chro
nic
PH
A
Low
Chro
nic
PH
A R
ecovery
0
1
2
3
C e ll tre a tm e n t
Lu
min
es
ce
nc
e (
RL
U)
Hig
h D
MS
O
Hig
h A
c ute
PH
A
Hig
h C
hro
nic
PH
A
Hig
h C
hro
nic
Rec o
v ery
0
5 .0 1 0 6
1 .0 1 0 7
1 .5 1 0 7
C e ll tre a tm e n t
Me
an
Ab
so
rba
nc
e a
t 4
90
nm
(M
TS
as
sa
y)
Hig
h D
MS
O
Hig
h A
c ute
PH
A
Hig
h C
hro
nic
PH
A
Hig
h C
hro
nic
Rec o
v ery
0
1
2
3
Figure 4.2-h Continual cell viability following long term culture and PHA-767491 in ASC52telo, measured using real-time-Glo MT assay followed by MTS assay. ASC52telo cells were seeded at 5000 cells per cm2 on a 96 well plate in triplicates, under conditions defined by the PHA model. Cells were incubated for 21 days with media changes every 3 days. On day 21 the real-time-Glo MT assay was performed with luminescence reading. The media was changed and the cells maintained under the same conditions of PHA model; media was further changed every 3 days. At day 28 an MTS assay was performed. Error represents SEM of triplicates, statistical values were calculated by the Tukey post hoc test following one-way ANOVA analysis. Low DMSO/Acute PHA: P+32,33, Low Chronic PHA/Recovery: P+35, 36. High DMSO/Acute PHA: P+85,86, High Chronic PHA/Recovery: P+80,81, Graphs represent combined data from two independent experiments (n=2). A higher increase of cell numbers was indicated by the analysis over long term culture in high passage chronic PHA-767491 cells under recovery compared to untreated cells, although not significant, suggests continual growth.
4.3 Verification of STR genotypes
Following long term culture of ASC52telo cells in our study, it was important to verify
the genotype of ASC52telo cell line, and rule out contamination. We originally
obtained the ASC52telo cells from ATCC® hTERT immortalized adipose derived
Mesenchymal stem cells (ATCC® SCRC 4000™), and cultured over long term, and
under acute and chronic PHA-767491 treatment. The genotype of the cells was
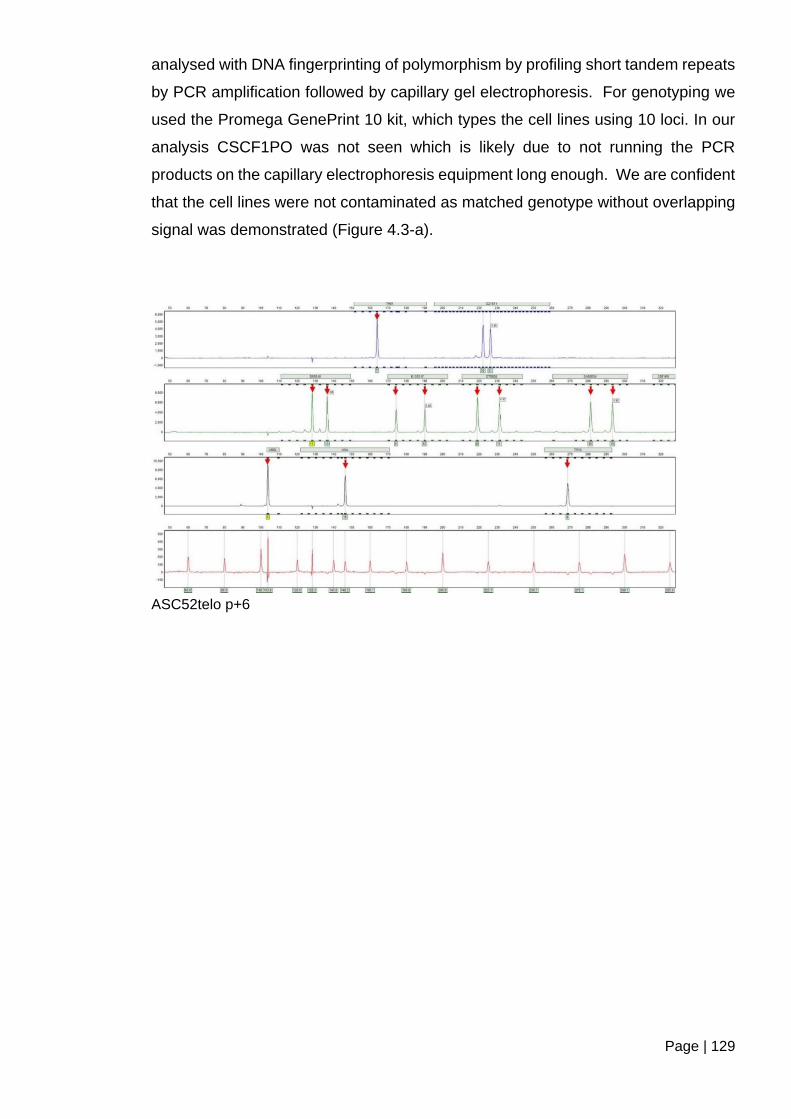
Page | 129
analysed with DNA fingerprinting of polymorphism by profiling short tandem repeats
by PCR amplification followed by capillary gel electrophoresis. For genotyping we
used the Promega GenePrint 10 kit, which types the cell lines using 10 loci. In our
analysis CSCF1PO was not seen which is likely due to not running the PCR
products on the capillary electrophoresis equipment long enough. We are confident
that the cell lines were not contaminated as matched genotype without overlapping
signal was demonstrated (Figure 4.3-a).
ASC52telo p+6
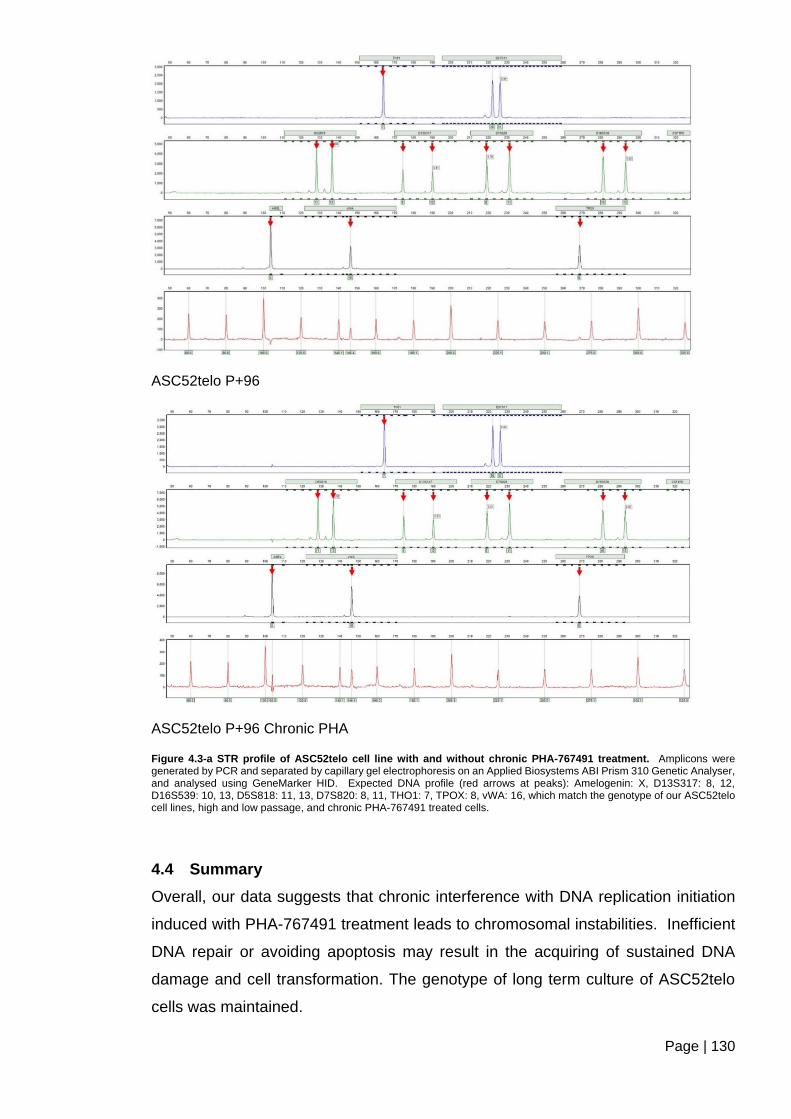
Page | 130
ASC52telo P+96
ASC52telo P+96 Chronic PHA
Figure 4.3-a STR profile of ASC52telo cell line with and without chronic PHA-767491 treatment. Amplicons were generated by PCR and separated by capillary gel electrophoresis on an Applied Biosystems ABI Prism 310 Genetic Analyser, and analysed using GeneMarker HID. Expected DNA profile (red arrows at peaks): Amelogenin: X, D13S317: 8, 12, D16S539: 10, 13, D5S818: 11, 13, D7S820: 8, 11, THO1: 7, TPOX: 8, vWA: 16, which match the genotype of our ASC52telo cell lines, high and low passage, and chronic PHA-767491 treated cells.
4.4 Summary
Overall, our data suggests that chronic interference with DNA replication initiation
induced with PHA-767491 treatment leads to chromosomal instabilities. Inefficient
DNA repair or avoiding apoptosis may result in the acquiring of sustained DNA
damage and cell transformation. The genotype of long term culture of ASC52telo
cells was maintained.
Page | 131
5 Chapter 3 RECQL4 dynamics and interacting partners
Results
We established that prolonged, mild interference with DNA replication initiation by
inhibiting DDK can result in genomic instabilities and can contribute to the
transformation of mesenchymal stem cells. DDK acts upstream of RECQL4 in the
process of replication initiation (Labib, 2010; Im et al., 2015), which suggests that
the changes we observed parallel to long-term inhibition of DDK could recapitulate
changes shown by RTS patients who carry mutations that disable RECQL4
functions. RECQL4 mutations lead to a significant predisposition to OS
development in RTS type II patients. The second aim of our work was to establish
a system that models the effect of impaired / complete lack of RECQL4 in
proliferating and differentiating mesenchymal stem cells.
We set out to identify if RTS cells lines show cellular changes similar to our previous
findings using the PHA-767491 model, which may sensitize the cells to OS.
The results of RECQL4 mutations could also originate from disrupting protein-
protein interactions and protein complexes, and as such could be secondary
consequences of disrupted RECQL4 function. A number of RECQL4 interacting
proteins have been described in the literature (Croteau et al., 2012b), and we aim
to verify some of these to serve as controls in our search for novel interactions
following posttranslational modifications. To enable further investigations relating
to the knockdown and overexpression of RECQL4, and to further identify interacting
RECQL4 proteins, Emerald-GFP tagged RECQL4 cell lines were established.
5.1 Establishing of expression characteristics of RECQL4
In our experiments, we interfere with RECQL4 expression in various ways, therefore
it was important to establish the natural expression dynamics as well as expression
characteristics following siRNA mediated knockdown.
To establish the influence of proliferation and RECQL4 expression, RECQL4
expression was monitored in U2OS-FLIPINTREX and HeLa LacZeo cells over 9
days without passaging. RECQL4 expression appears to vary over the 9 days;
expression increases as cells proliferate, and generally decreases when cells
appear to reach confluency, HeLa cells showed more variable expression levels
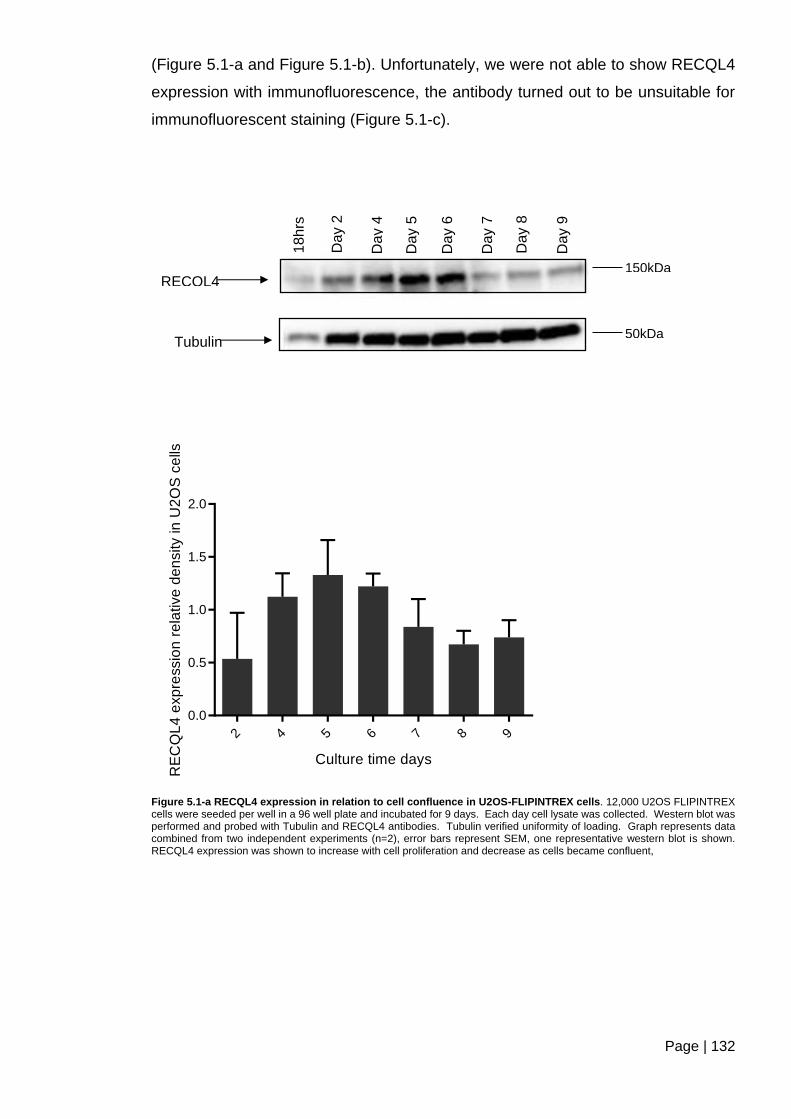
Page | 132
(Figure 5.1-a and Figure 5.1-b). Unfortunately, we were not able to show RECQL4
expression with immunofluorescence, the antibody turned out to be unsuitable for
immunofluorescent staining (Figure 5.1-c).
Culture time days
RE
CQ
L4
exp
ressio
n r
ela
tive
de
nsity in
U2
OS
ce
lls
2 4 5 6 7 8 9
0.0
0.5
1.0
1.5
2.0
Figure 5.1-a RECQL4 expression in relation to cell confluence in U2OS-FLIPINTREX cells. 12,000 U2OS FLIPINTREX cells were seeded per well in a 96 well plate and incubated for 9 days. Each day cell lysate was collected. Western blot was performed and probed with Tubulin and RECQL4 antibodies. Tubulin verified uniformity of loading. Graph represents data combined from two independent experiments (n=2), error bars represent SEM, one representative western blot is shown. RECQL4 expression was shown to increase with cell proliferation and decrease as cells became confluent,
150kDa
50kDa Tubulin
RECQL4 18h
rs
Day 2
Day 4
Day 5
Day 6
Day 7
Day 8
Day 9
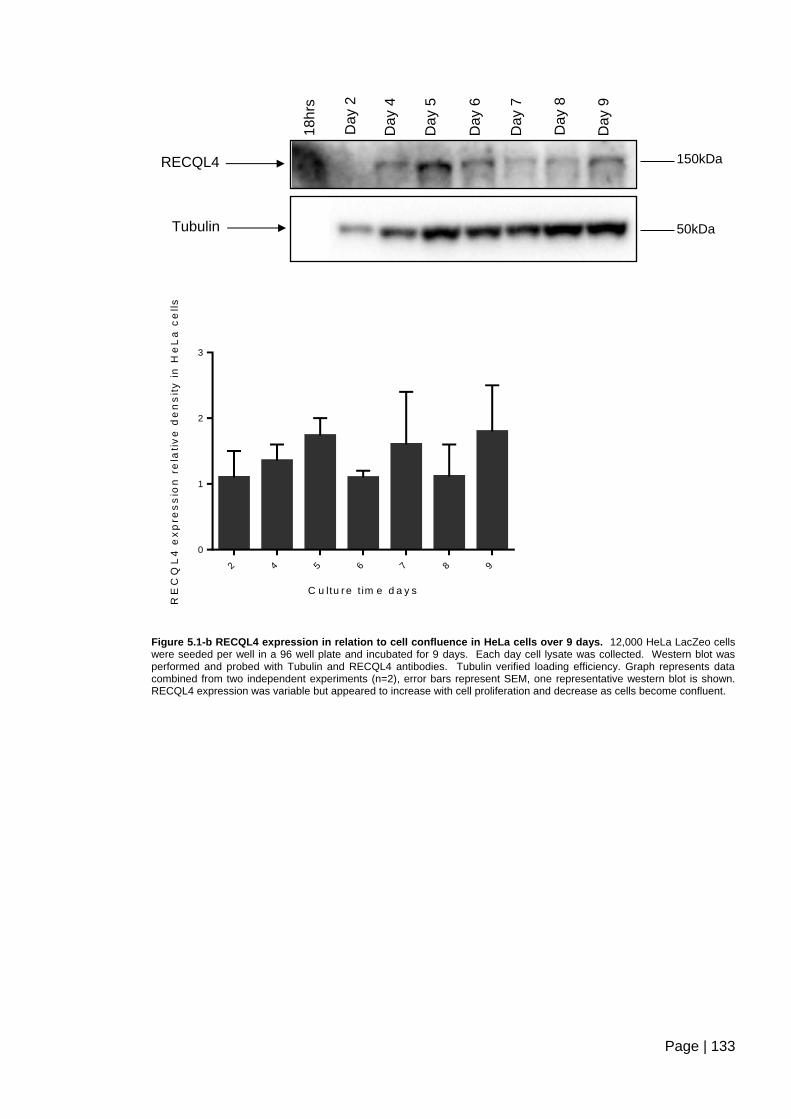
Page | 133
C u ltu re t im e d a y s
RE
CQ
L4
ex
pre
ss
ion
re
lati
ve
de
ns
ity
in
He
La
ce
lls
2 4 5 6 7 8 9
0
1
2
3
Figure 5.1-b RECQL4 expression in relation to cell confluence in HeLa cells over 9 days. 12,000 HeLa LacZeo cells were seeded per well in a 96 well plate and incubated for 9 days. Each day cell lysate was collected. Western blot was performed and probed with Tubulin and RECQL4 antibodies. Tubulin verified loading efficiency. Graph represents data combined from two independent experiments (n=2), error bars represent SEM, one representative western blot is shown. RECQL4 expression was variable but appeared to increase with cell proliferation and decrease as cells become confluent.
RECQL4
Tubulin
150kDa
50kDa
18h
rs
Day 2
Day 4
Day 5
Day 6
Day 7
Day 8
Day 9
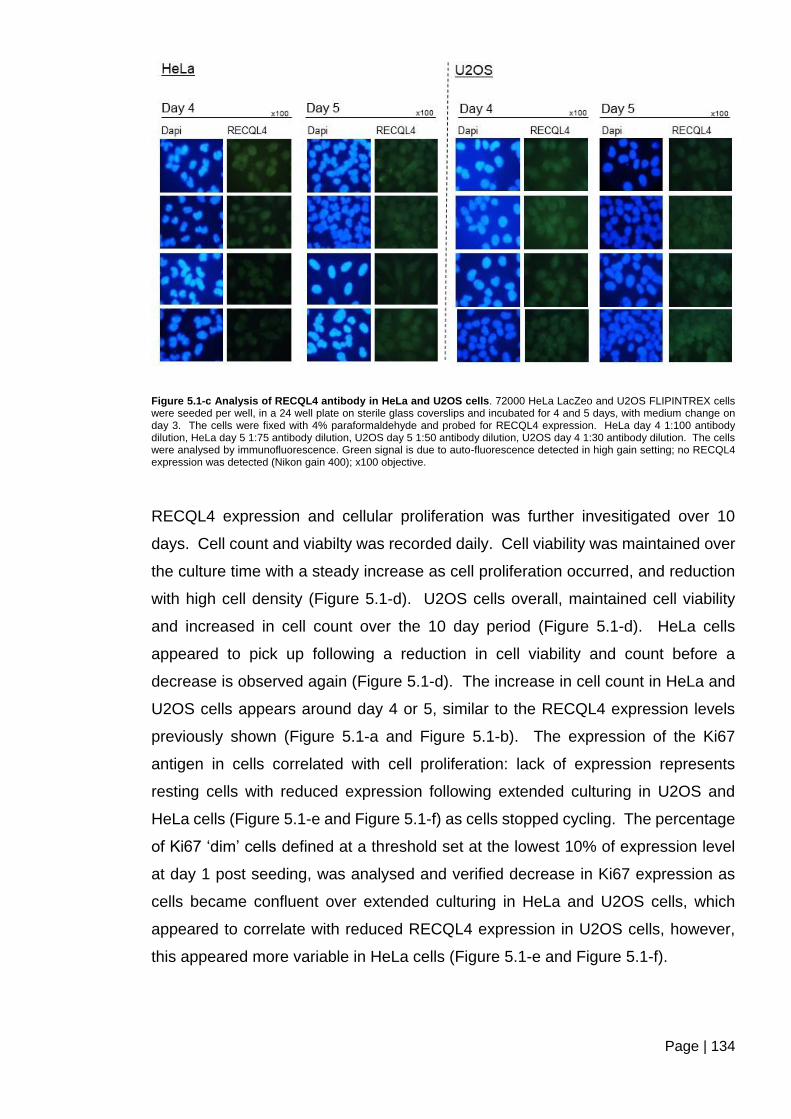
Page | 134
Figure 5.1-c Analysis of RECQL4 antibody in HeLa and U2OS cells. 72000 HeLa LacZeo and U2OS FLIPINTREX cells were seeded per well, in a 24 well plate on sterile glass coverslips and incubated for 4 and 5 days, with medium change on day 3. The cells were fixed with 4% paraformaldehyde and probed for RECQL4 expression. HeLa day 4 1:100 antibody dilution, HeLa day 5 1:75 antibody dilution, U2OS day 5 1:50 antibody dilution, U2OS day 4 1:30 antibody dilution. The cells were analysed by immunofluorescence. Green signal is due to auto-fluorescence detected in high gain setting; no RECQL4 expression was detected (Nikon gain 400); x100 objective.
RECQL4 expression and cellular proliferation was further invesitigated over 10
days. Cell count and viabilty was recorded daily. Cell viability was maintained over
the culture time with a steady increase as cell proliferation occurred, and reduction
with high cell density (Figure 5.1-d). U2OS cells overall, maintained cell viability
and increased in cell count over the 10 day period (Figure 5.1-d). HeLa cells
appeared to pick up following a reduction in cell viability and count before a
decrease is observed again (Figure 5.1-d). The increase in cell count in HeLa and
U2OS cells appears around day 4 or 5, similar to the RECQL4 expression levels
previously shown (Figure 5.1-a and Figure 5.1-b). The expression of the Ki67
antigen in cells correlated with cell proliferation: lack of expression represents
resting cells with reduced expression following extended culturing in U2OS and
HeLa cells (Figure 5.1-e and Figure 5.1-f) as cells stopped cycling. The percentage
of Ki67 ‘dim’ cells defined at a threshold set at the lowest 10% of expression level
at day 1 post seeding, was analysed and verified decrease in Ki67 expression as
cells became confluent over extended culturing in HeLa and U2OS cells, which
appeared to correlate with reduced RECQL4 expression in U2OS cells, however,
this appeared more variable in HeLa cells (Figure 5.1-e and Figure 5.1-f).
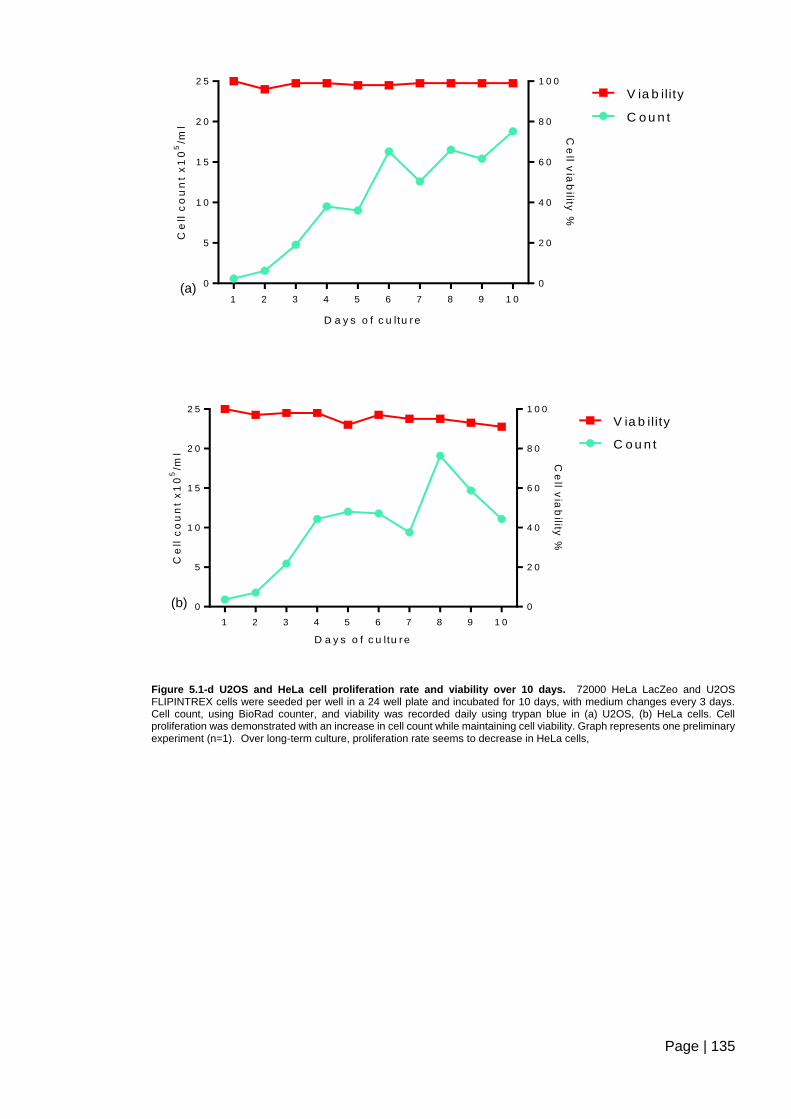
Page | 135
D a y s o f c u ltu re
Ce
ll c
ou
nt
x1
05
/ml
Ce
ll via
bility
%
1 2 3 4 5 6 7 8 9 1 0
0
5
1 0
1 5
2 0
2 5
0
2 0
4 0
6 0
8 0
1 0 0
V ia b ility
C o u n t
D a y s o f c u ltu re
Ce
ll c
ou
nt
x1
05
/ml
Ce
ll via
bility
%
1 2 3 4 5 6 7 8 9 1 0
0
5
1 0
1 5
2 0
2 5
0
2 0
4 0
6 0
8 0
1 0 0
C o u n t
V ia b ility
Figure 5.1-d U2OS and HeLa cell proliferation rate and viability over 10 days. 72000 HeLa LacZeo and U2OS FLIPINTREX cells were seeded per well in a 24 well plate and incubated for 10 days, with medium changes every 3 days. Cell count, using BioRad counter, and viability was recorded daily using trypan blue in (a) U2OS, (b) HeLa cells. Cell proliferation was demonstrated with an increase in cell count while maintaining cell viability. Graph represents one preliminary experiment (n=1). Over long-term culture, proliferation rate seems to decrease in HeLa cells,
(a)
(b)
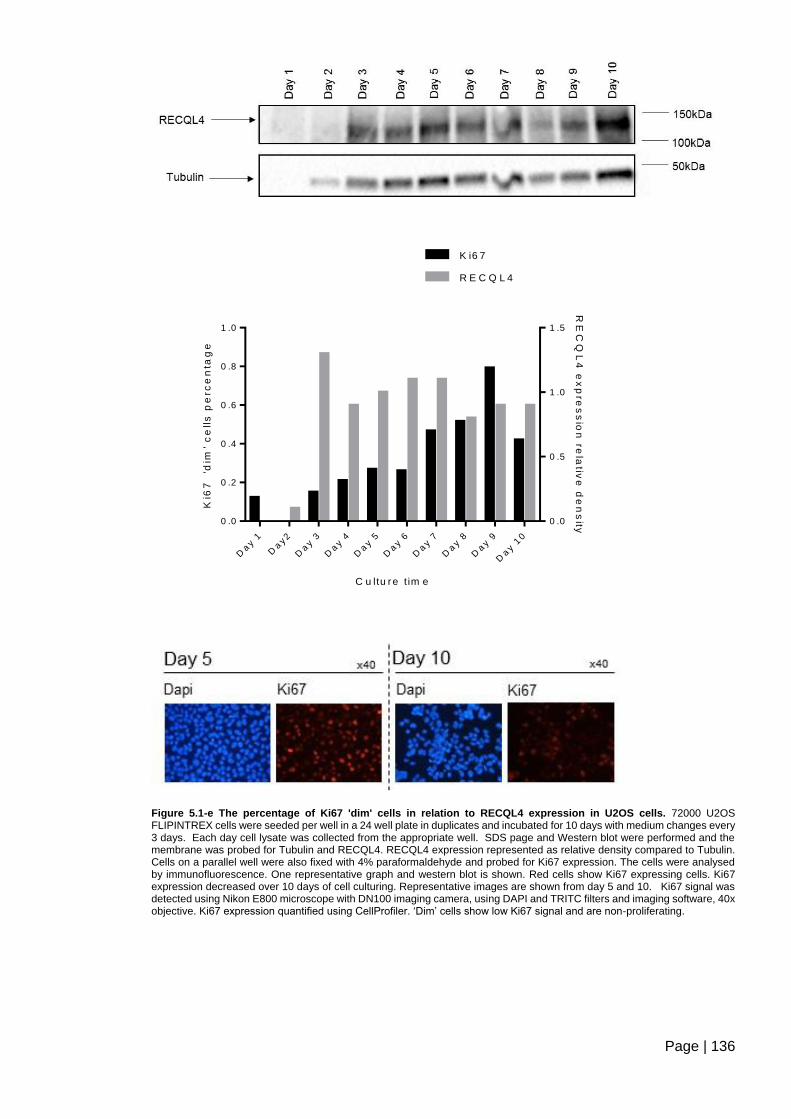
Page | 136
Figure 5.1-e The percentage of Ki67 'dim' cells in relation to RECQL4 expression in U2OS cells. 72000 U2OS FLIPINTREX cells were seeded per well in a 24 well plate in duplicates and incubated for 10 days with medium changes every 3 days. Each day cell lysate was collected from the appropriate well. SDS page and Western blot were performed and the membrane was probed for Tubulin and RECQL4. RECQL4 expression represented as relative density compared to Tubulin. Cells on a parallel well were also fixed with 4% paraformaldehyde and probed for Ki67 expression. The cells were analysed by immunofluorescence. One representative graph and western blot is shown. Red cells show Ki67 expressing cells. Ki67 expression decreased over 10 days of cell culturing. Representative images are shown from day 5 and 10. Ki67 signal was detected using Nikon E800 microscope with DN100 imaging camera, using DAPI and TRITC filters and imaging software, 40x objective. Ki67 expression quantified using CellProfiler. ‘Dim’ cells show low Ki67 signal and are non-proliferating.
C u ltu re t im e
Ki6
7
'dim
' c
ell
s p
erc
en
tag
eR
EC
QL
4 e
xp
res
sio
n re
lativ
e d
en
sity
Day 1
Day 2
Day 3
Day 4
Day 5
Day 6
Day 7
Day 8
Day 9
Day 1
0
0 .0
0 .2
0 .4
0 .6
0 .8
1 .0
0 .0
0 .5
1 .0
1 .5
K i6 7
R E C Q L 4

Page | 137
C u ltu re t im e
Ki6
7
'dim
' c
ell
s p
erc
en
tag
e
RE
CQ
L4
ex
pre
ss
ion
rela
tive
de
ns
ity
Day 1
Day2
Day 3
Day 4
Day 5
Day 6
Day 7
Day 8
Day 9
Day 1
0
0
2 0
4 0
6 0
8 0
1 0 0
0
1
2
3
K i6 7
R E C Q L 4
Figure 5.1-f Percentage of Ki67 'dim' cells in relation to RECQL4 expression in HeLa cells. 72000 HeLa cells were seeded per well in a 24 well plate in duplicates and incubated for 10 days with medium changes every 3 days. Each day cell lysate was collected from the appropriate well. SDS page and western blot were performed and the membrane was probed for Tubulin and RECQL4. RECQL4 expression represented as relative density. Cells from parallel wells were also fixed with 4% paraformaldehyde and probed for Ki67 expression. The cells were analysed by immunofluorescence. One representative graph and western blot is shown. Red cells show Ki67 expressing cells. Ki67 expression decreased over 10 days of cell culturing. Representative images from days 5 and 10 are shown. Ki67 signal was detected using Nikon E800 microscope with DN100 imaging camera, using DAPI and TRITC filters and imaging software, 40x objective. Ki67 expression was quantified using CellProfiler. ‘Dim’ cells show low Ki67 signal and are non-proliferating.
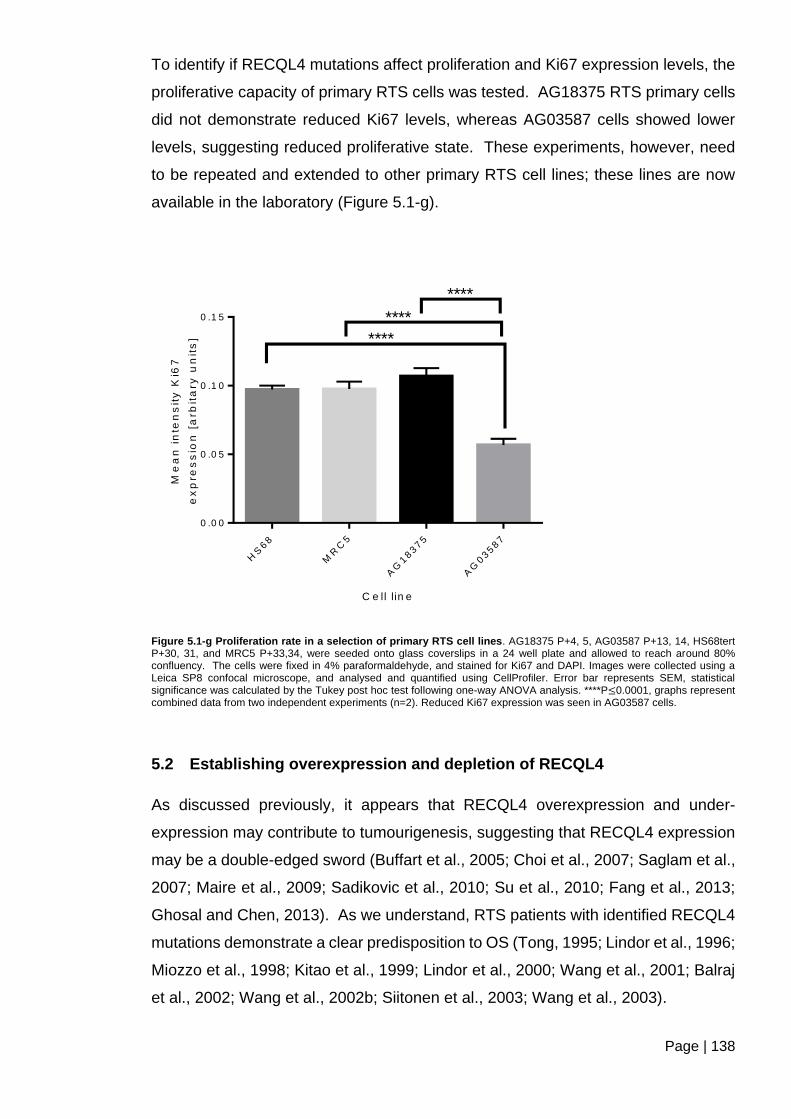
Page | 138
To identify if RECQL4 mutations affect proliferation and Ki67 expression levels, the
proliferative capacity of primary RTS cells was tested. AG18375 RTS primary cells
did not demonstrate reduced Ki67 levels, whereas AG03587 cells showed lower
levels, suggesting reduced proliferative state. These experiments, however, need
to be repeated and extended to other primary RTS cell lines; these lines are now
available in the laboratory (Figure 5.1-g).
C e ll lin e
Me
an
in
ten
sit
y K
i67
ex
pre
ss
ion
[a
rbit
ary
un
its
]
HS
68
MR
C5
AG
18375
AG
03587
0 .0 0
0 .0 5
0 .1 0
0 .1 5
****
****
****
Figure 5.1-g Proliferation rate in a selection of primary RTS cell lines. AG18375 P+4, 5, AG03587 P+13, 14, HS68tert P+30, 31, and MRC5 P+33,34, were seeded onto glass coverslips in a 24 well plate and allowed to reach around 80% confluency. The cells were fixed in 4% paraformaldehyde, and stained for Ki67 and DAPI. Images were collected using a Leica SP8 confocal microscope, and analysed and quantified using CellProfiler. Error bar represents SEM, statistical significance was calculated by the Tukey post hoc test following one-way ANOVA analysis. ****P≤0.0001, graphs represent combined data from two independent experiments (n=2). Reduced Ki67 expression was seen in AG03587 cells.
5.2 Establishing overexpression and depletion of RECQL4
As discussed previously, it appears that RECQL4 overexpression and under-
expression may contribute to tumourigenesis, suggesting that RECQL4 expression
may be a double-edged sword (Buffart et al., 2005; Choi et al., 2007; Saglam et al.,
2007; Maire et al., 2009; Sadikovic et al., 2010; Su et al., 2010; Fang et al., 2013;
Ghosal and Chen, 2013). As we understand, RTS patients with identified RECQL4
mutations demonstrate a clear predisposition to OS (Tong, 1995; Lindor et al., 1996;
Miozzo et al., 1998; Kitao et al., 1999; Lindor et al., 2000; Wang et al., 2001; Balraj
et al., 2002; Wang et al., 2002b; Siitonen et al., 2003; Wang et al., 2003).
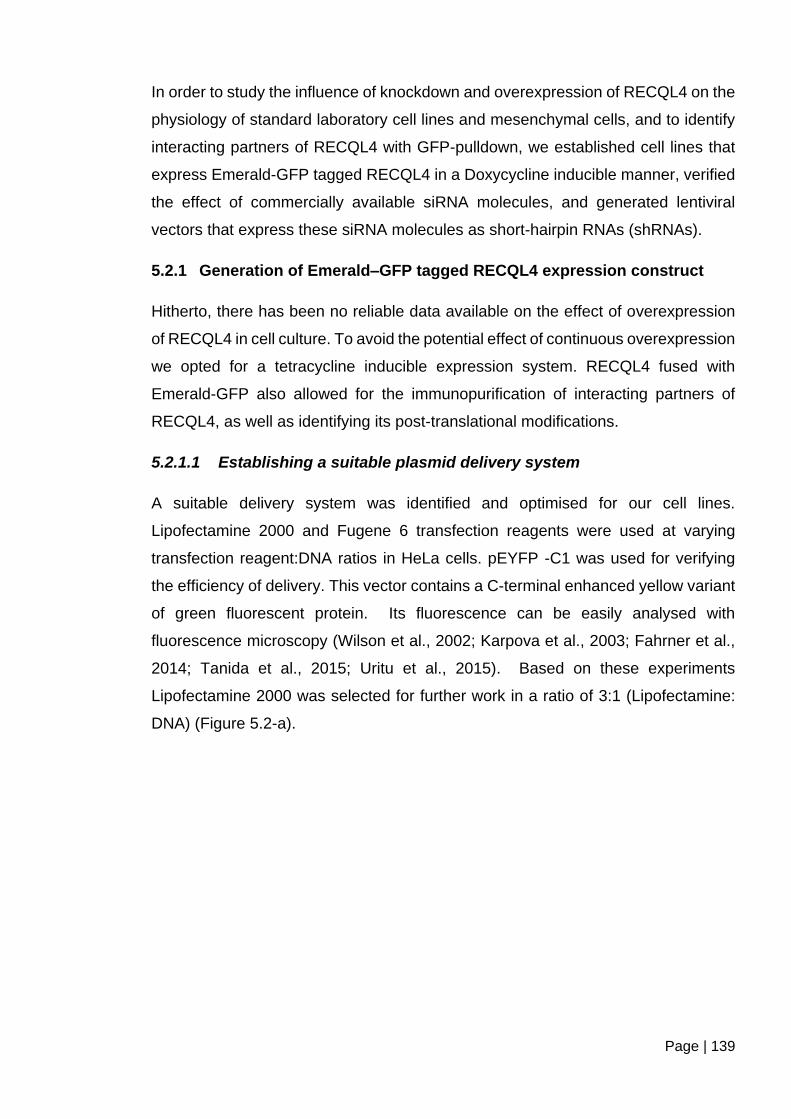
Page | 139
In order to study the influence of knockdown and overexpression of RECQL4 on the
physiology of standard laboratory cell lines and mesenchymal cells, and to identify
interacting partners of RECQL4 with GFP-pulldown, we established cell lines that
express Emerald-GFP tagged RECQL4 in a Doxycycline inducible manner, verified
the effect of commercially available siRNA molecules, and generated lentiviral
vectors that express these siRNA molecules as short-hairpin RNAs (shRNAs).
5.2.1 Generation of Emerald–GFP tagged RECQL4 expression construct
Hitherto, there has been no reliable data available on the effect of overexpression
of RECQL4 in cell culture. To avoid the potential effect of continuous overexpression
we opted for a tetracycline inducible expression system. RECQL4 fused with
Emerald-GFP also allowed for the immunopurification of interacting partners of
RECQL4, as well as identifying its post-translational modifications.
5.2.1.1 Establishing a suitable plasmid delivery system
A suitable delivery system was identified and optimised for our cell lines.
Lipofectamine 2000 and Fugene 6 transfection reagents were used at varying
transfection reagent:DNA ratios in HeLa cells. pEYFP -C1 was used for verifying
the efficiency of delivery. This vector contains a C-terminal enhanced yellow variant
of green fluorescent protein. Its fluorescence can be easily analysed with
fluorescence microscopy (Wilson et al., 2002; Karpova et al., 2003; Fahrner et al.,
2014; Tanida et al., 2015; Uritu et al., 2015). Based on these experiments
Lipofectamine 2000 was selected for further work in a ratio of 3:1 (Lipofectamine:
DNA) (Figure 5.2-a).
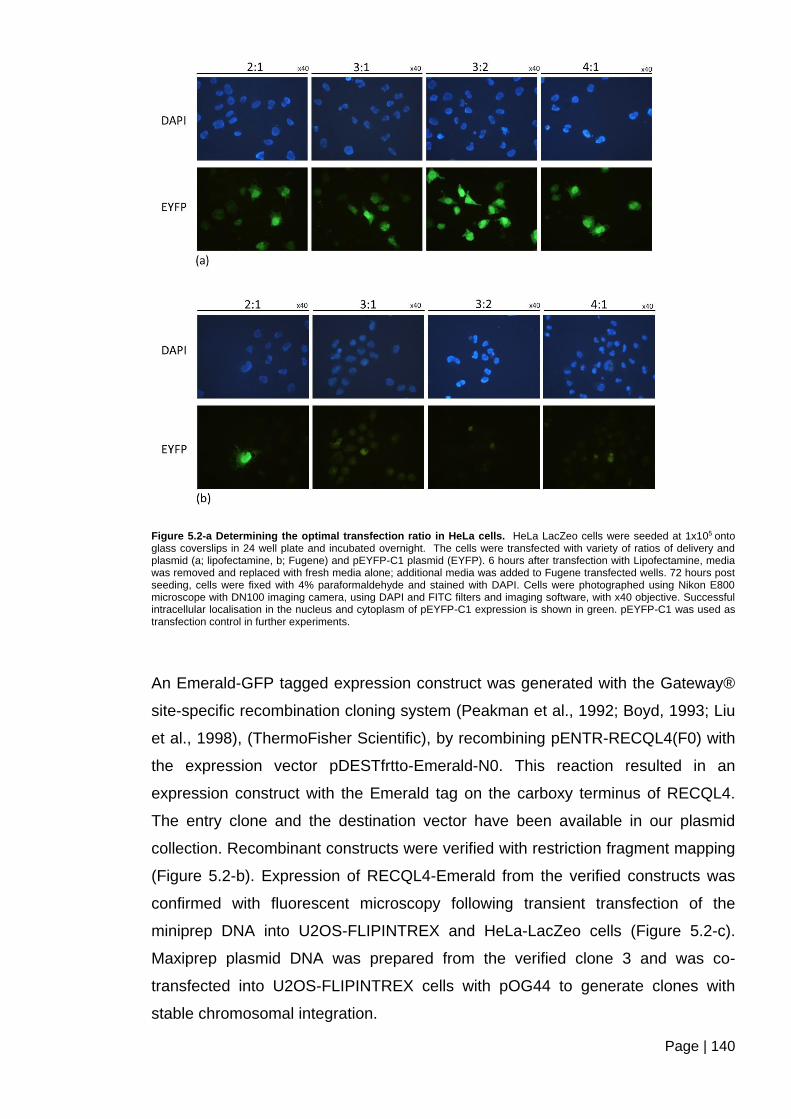
Page | 140
Figure 5.2-a Determining the optimal transfection ratio in HeLa cells. HeLa LacZeo cells were seeded at 1x10⁵ onto glass coverslips in 24 well plate and incubated overnight. The cells were transfected with variety of ratios of delivery and plasmid (a; lipofectamine, b; Fugene) and pEYFP-C1 plasmid (EYFP). 6 hours after transfection with Lipofectamine, media was removed and replaced with fresh media alone; additional media was added to Fugene transfected wells. 72 hours post seeding, cells were fixed with 4% paraformaldehyde and stained with DAPI. Cells were photographed using Nikon E800 microscope with DN100 imaging camera, using DAPI and FITC filters and imaging software, with x40 objective. Successful intracellular localisation in the nucleus and cytoplasm of pEYFP-C1 expression is shown in green. pEYFP-C1 was used as transfection control in further experiments.
An Emerald-GFP tagged expression construct was generated with the Gateway®
site-specific recombination cloning system (Peakman et al., 1992; Boyd, 1993; Liu
et al., 1998), (ThermoFisher Scientific), by recombining pENTR-RECQL4(F0) with
the expression vector pDESTfrtto-Emerald-N0. This reaction resulted in an
expression construct with the Emerald tag on the carboxy terminus of RECQL4.
The entry clone and the destination vector have been available in our plasmid
collection. Recombinant constructs were verified with restriction fragment mapping
(Figure 5.2-b). Expression of RECQL4-Emerald from the verified constructs was
confirmed with fluorescent microscopy following transient transfection of the
miniprep DNA into U2OS-FLIPINTREX and HeLa-LacZeo cells (Figure 5.2-c).
Maxiprep plasmid DNA was prepared from the verified clone 3 and was co-
transfected into U2OS-FLIPINTREX cells with pOG44 to generate clones with
stable chromosomal integration.
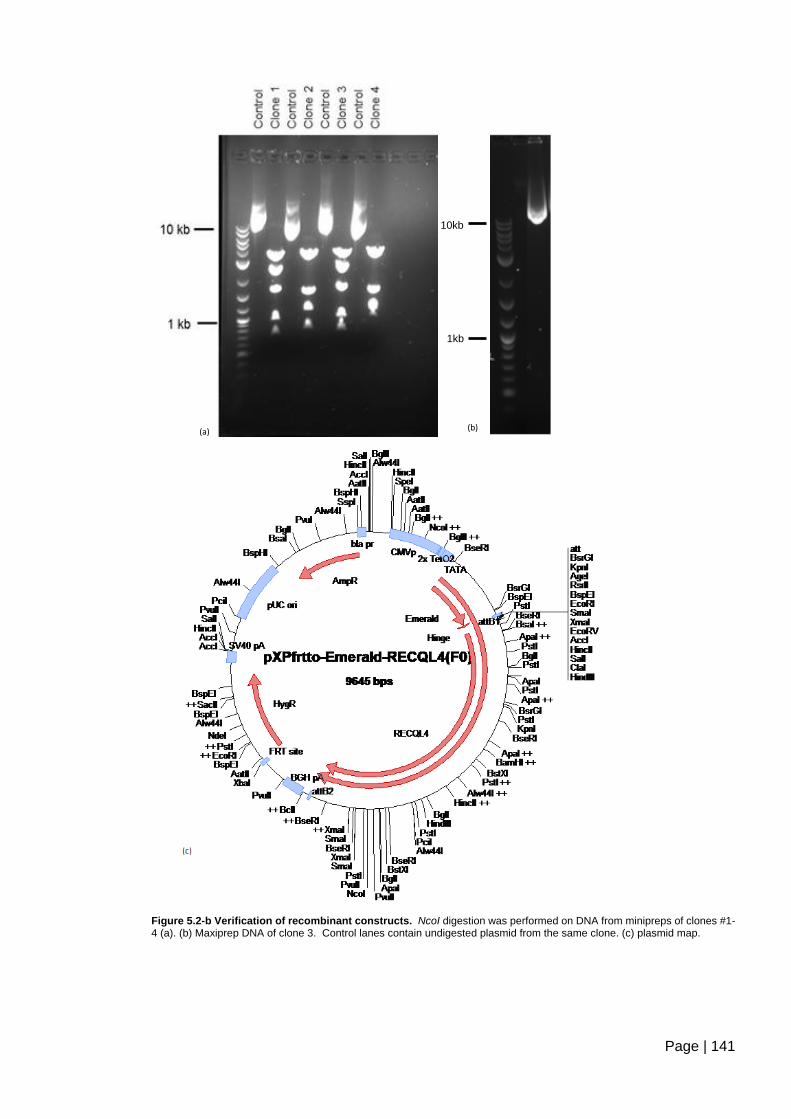
Page | 141
Figure 5.2-b Verification of recombinant constructs. NcoI digestion was performed on DNA from minipreps of clones #1-4 (a). (b) Maxiprep DNA of clone 3. Control lanes contain undigested plasmid from the same clone. (c) plasmid map.
(a)
10kb
Clo
ne
3
(b)
1kb
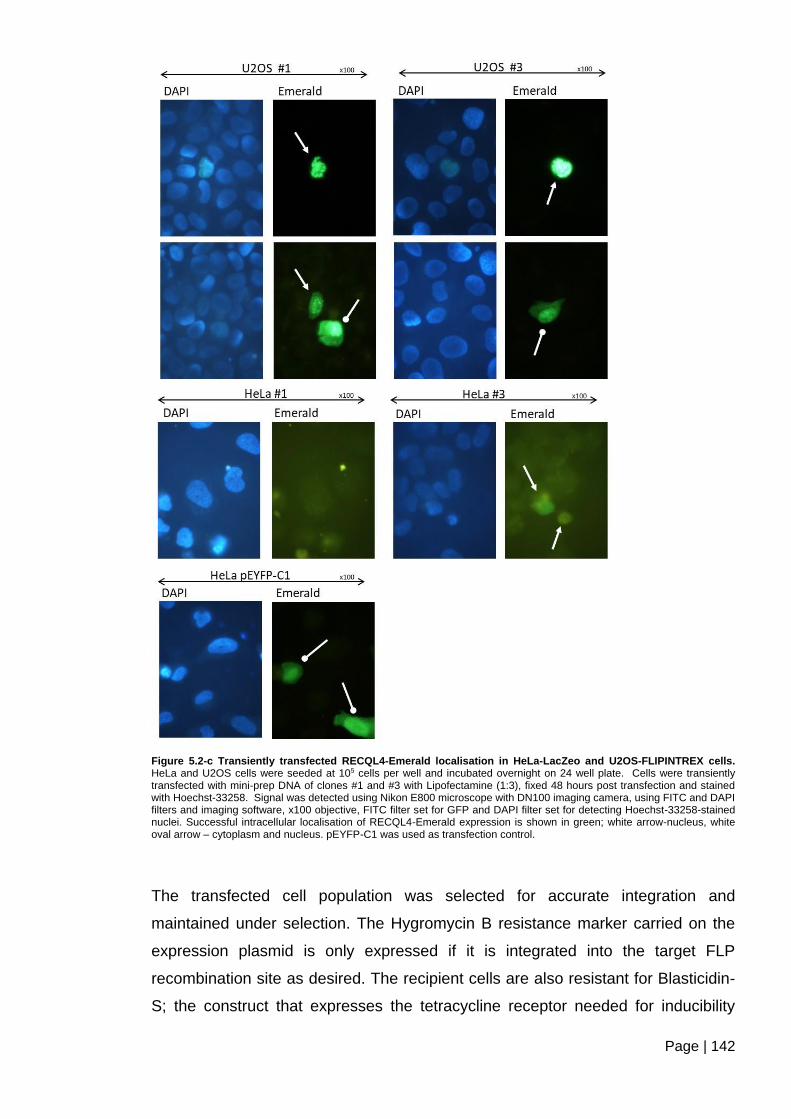
Page | 142
Figure 5.2-c Transiently transfected RECQL4-Emerald localisation in HeLa-LacZeo and U2OS-FLIPINTREX cells. HeLa and U2OS cells were seeded at 105 cells per well and incubated overnight on 24 well plate. Cells were transiently transfected with mini-prep DNA of clones #1 and #3 with Lipofectamine (1:3), fixed 48 hours post transfection and stained with Hoechst-33258. Signal was detected using Nikon E800 microscope with DN100 imaging camera, using FITC and DAPI filters and imaging software, x100 objective, FITC filter set for GFP and DAPI filter set for detecting Hoechst-33258-stained nuclei. Successful intracellular localisation of RECQL4-Emerald expression is shown in green; white arrow-nucleus, white oval arrow – cytoplasm and nucleus. pEYFP-C1 was used as transfection control.
The transfected cell population was selected for accurate integration and
maintained under selection. The Hygromycin B resistance marker carried on the
expression plasmid is only expressed if it is integrated into the target FLP
recombination site as desired. The recipient cells are also resistant for Blasticidin-
S; the construct that expresses the tetracycline receptor needed for inducibility
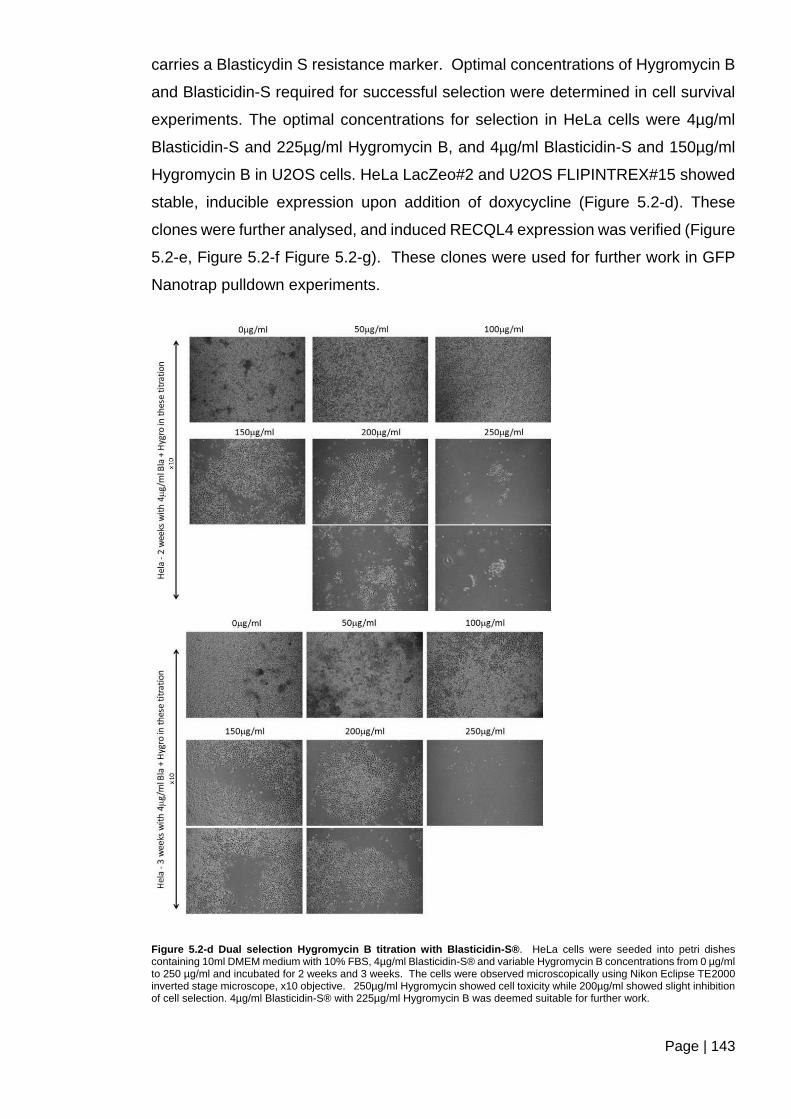
Page | 143
carries a Blasticydin S resistance marker. Optimal concentrations of Hygromycin B
and Blasticidin-S required for successful selection were determined in cell survival
experiments. The optimal concentrations for selection in HeLa cells were 4µg/ml
Blasticidin-S and 225µg/ml Hygromycin B, and 4µg/ml Blasticidin-S and 150µg/ml
Hygromycin B in U2OS cells. HeLa LacZeo#2 and U2OS FLIPINTREX#15 showed
stable, inducible expression upon addition of doxycycline (Figure 5.2-d). These
clones were further analysed, and induced RECQL4 expression was verified (Figure
5.2-e, Figure 5.2-f Figure 5.2-g). These clones were used for further work in GFP
Nanotrap pulldown experiments.
Figure 5.2-d Dual selection Hygromycin B titration with Blasticidin-S®. HeLa cells were seeded into petri dishes containing 10ml DMEM medium with 10% FBS, 4µg/ml Blasticidin-S® and variable Hygromycin B concentrations from 0 µg/ml to 250 µg/ml and incubated for 2 weeks and 3 weeks. The cells were observed microscopically using Nikon Eclipse TE2000 inverted stage microscope, x10 objective. 250µg/ml Hygromycin showed cell toxicity while 200µg/ml showed slight inhibition of cell selection. 4µg/ml Blasticidin-S® with 225µg/ml Hygromycin B was deemed suitable for further work.
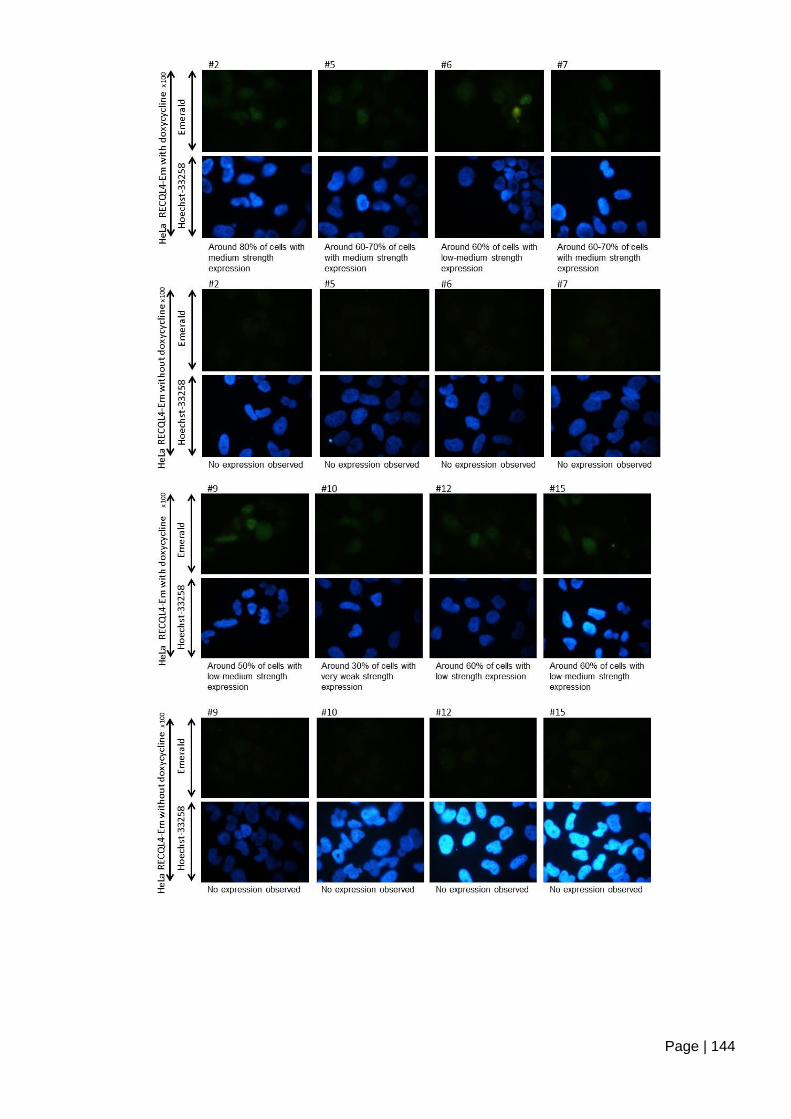
Page | 144
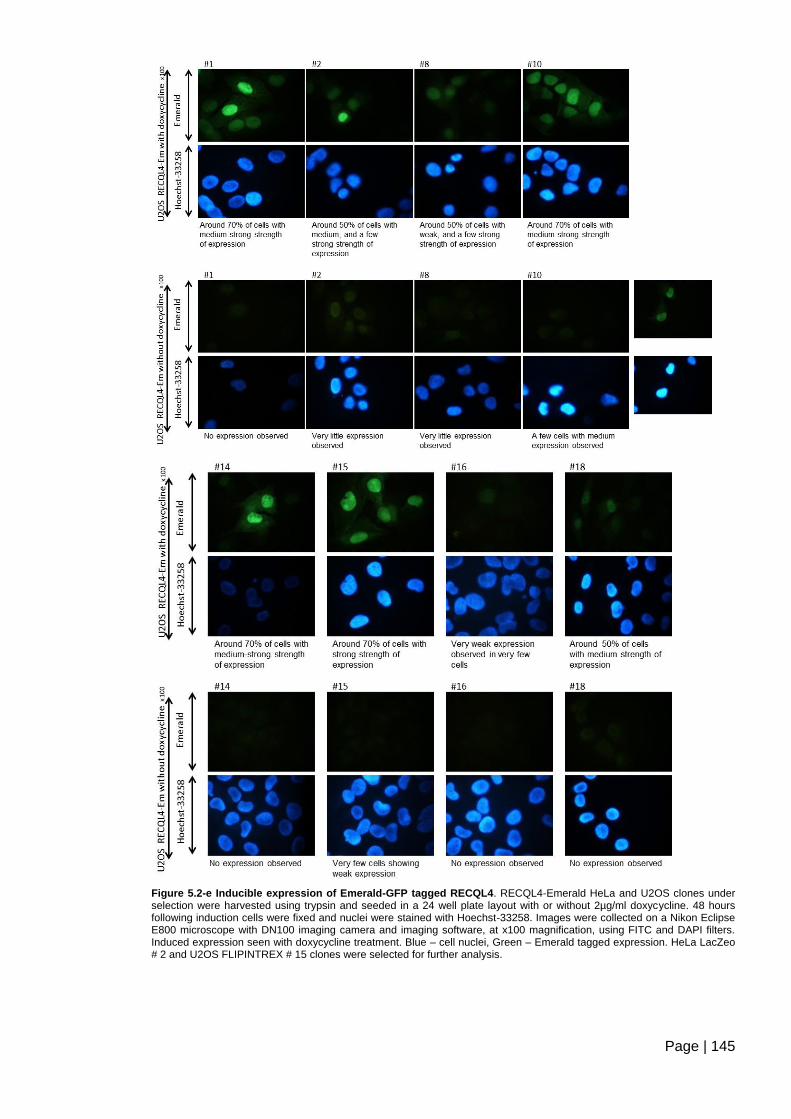
Page | 145
Figure 5.2-e Inducible expression of Emerald-GFP tagged RECQL4. RECQL4-Emerald HeLa and U2OS clones under selection were harvested using trypsin and seeded in a 24 well plate layout with or without 2µg/ml doxycycline. 48 hours following induction cells were fixed and nuclei were stained with Hoechst-33258. Images were collected on a Nikon Eclipse E800 microscope with DN100 imaging camera and imaging software, at x100 magnification, using FITC and DAPI filters. Induced expression seen with doxycycline treatment. Blue – cell nuclei, Green – Emerald tagged expression. HeLa LacZeo # 2 and U2OS FLIPINTREX # 15 clones were selected for further analysis.
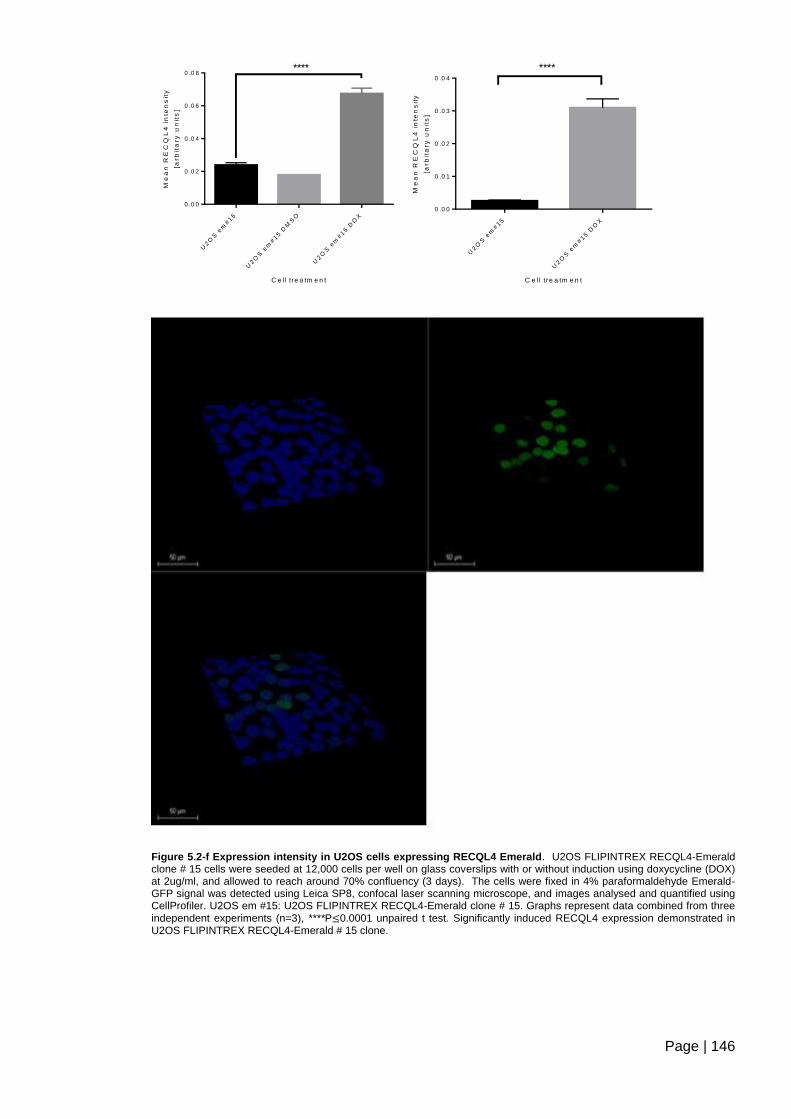
Page | 146
C e ll tre a tm e n t
Me
an
RE
CQ
L4
in
ten
sit
y
[arb
ita
ry
un
its
]
U2O
S e
m#15
U2O
S e
m#15 D
MS
O
U2O
S e
m#15 D
OX
0 .0 0
0 .0 2
0 .0 4
0 .0 6
0 .0 8****
C e ll tre a tm e n t
Me
an
RE
CQ
L4
in
ten
sit
y
[arb
ita
ry u
nit
s]
U2O
S e
m#15
U2O
S e
m#15 D
OX
0 .0 0
0 .0 1
0 .0 2
0 .0 3
0 .0 4
****
Figure 5.2-f Expression intensity in U2OS cells expressing RECQL4 Emerald. U2OS FLIPINTREX RECQL4-Emerald clone # 15 cells were seeded at 12,000 cells per well on glass coverslips with or without induction using doxycycline (DOX) at 2ug/ml, and allowed to reach around 70% confluency (3 days). The cells were fixed in 4% paraformaldehyde Emerald-GFP signal was detected using Leica SP8, confocal laser scanning microscope, and images analysed and quantified using CellProfiler. U2OS em #15: U2OS FLIPINTREX RECQL4-Emerald clone # 15. Graphs represent data combined from three
independent experiments (n=3), ****P≤0.0001 unpaired t test. Significantly induced RECQL4 expression demonstrated in U2OS FLIPINTREX RECQL4-Emerald # 15 clone.
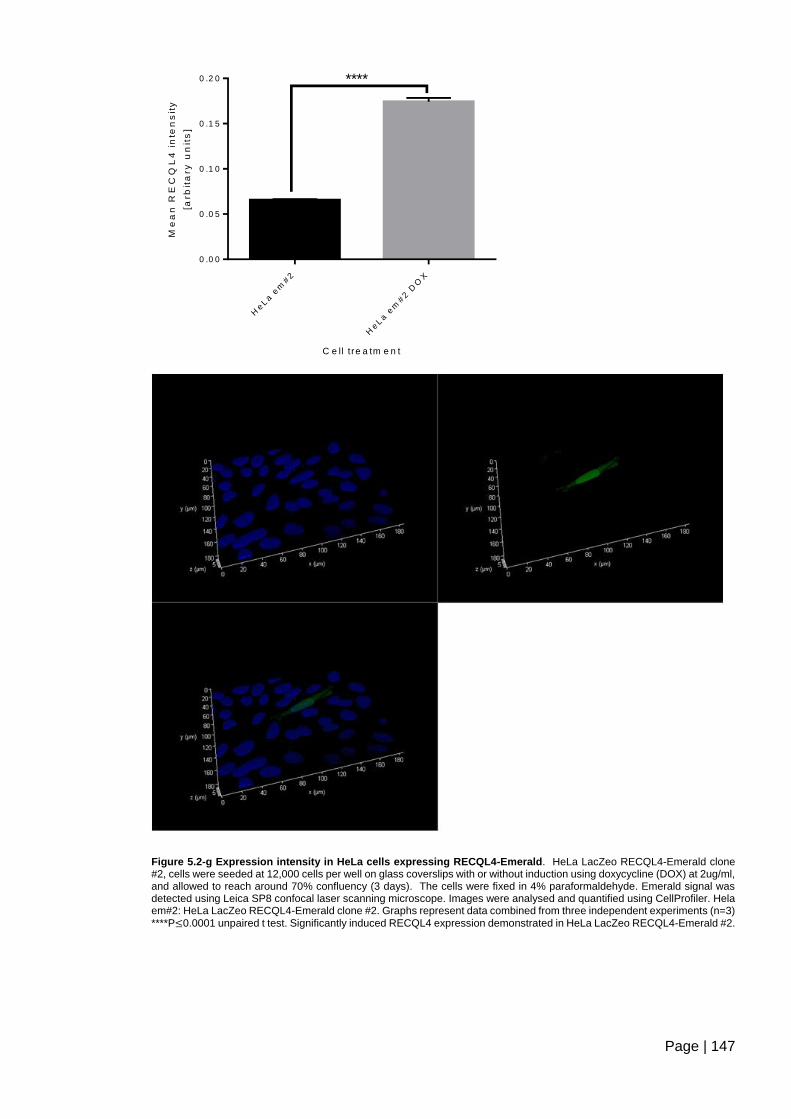
Page | 147
C e ll tre a tm e n t
Me
an
RE
CQ
L4
in
ten
sit
y
[arb
ita
ry
un
its
]
HeLa e
m#2
HeLa e
m#2 D
OX
0 .0 0
0 .0 5
0 .1 0
0 .1 5
0 .2 0 ****
Figure 5.2-g Expression intensity in HeLa cells expressing RECQL4-Emerald. HeLa LacZeo RECQL4-Emerald clone #2, cells were seeded at 12,000 cells per well on glass coverslips with or without induction using doxycycline (DOX) at 2ug/ml, and allowed to reach around 70% confluency (3 days). The cells were fixed in 4% paraformaldehyde. Emerald signal was detected using Leica SP8 confocal laser scanning microscope. Images were analysed and quantified using CellProfiler. Hela em#2: HeLa LacZeo RECQL4-Emerald clone #2. Graphs represent data combined from three independent experiments (n=3)
****P≤0.0001 unpaired t test. Significantly induced RECQL4 expression demonstrated in HeLa LacZeo RECQL4-Emerald #2.
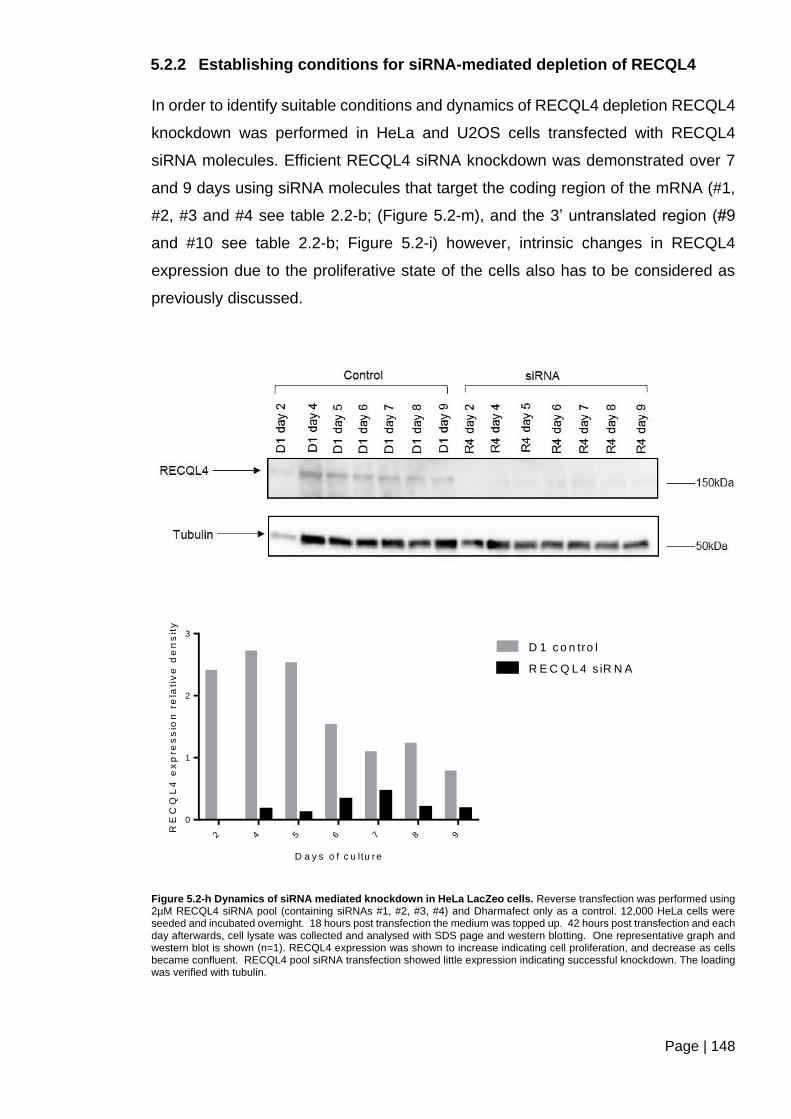
Page | 148
5.2.2 Establishing conditions for siRNA-mediated depletion of RECQL4
In order to identify suitable conditions and dynamics of RECQL4 depletion RECQL4
knockdown was performed in HeLa and U2OS cells transfected with RECQL4
siRNA molecules. Efficient RECQL4 siRNA knockdown was demonstrated over 7
and 9 days using siRNA molecules that target the coding region of the mRNA (#1,
#2, #3 and #4 see table 2.2-b; (Figure 5.2-m), and the 3’ untranslated region (#9
and #10 see table 2.2-b; Figure 5.2-i) however, intrinsic changes in RECQL4
expression due to the proliferative state of the cells also has to be considered as
previously discussed.
D a y s o f c u ltu re
RE
CQ
L4
ex
pre
ss
ion
re
lati
ve
de
ns
ity
2 4 5 6 7 8 9
0
1
2
3
D 1 c o n tro l
R E C Q L 4 s iR N A
Figure 5.2-h Dynamics of siRNA mediated knockdown in HeLa LacZeo cells. Reverse transfection was performed using 2µM RECQL4 siRNA pool (containing siRNAs #1, #2, #3, #4) and Dharmafect only as a control. 12,000 HeLa cells were seeded and incubated overnight. 18 hours post transfection the medium was topped up. 42 hours post transfection and each day afterwards, cell lysate was collected and analysed with SDS page and western blotting. One representative graph and western blot is shown (n=1). RECQL4 expression was shown to increase indicating cell proliferation, and decrease as cells became confluent. RECQL4 pool siRNA transfection showed little expression indicating successful knockdown. The loading was verified with tubulin.

Page | 149
C e ll tre a tm e n t
RE
CQ
L4
ex
pre
ss
ion
re
lati
ve
de
ns
ity
HeLa D
harm
afe
ct
HeLa N
on- t
arg
eting
HeLa s
iRN
A 9
HeLa s
iRN
A 1
0
U2O
S D
harm
afe
ct
U2O
S N
on- t
arg
eting
U2O
S s
iRN
A 9
U2O
S s
iRN
A 1
0
0 .0
0 .5
1 .0
1 .5
2 .0
2 .5
Figure 5.2-i RECQL4 knockdown efficiency using RECQL4 siRNA 9 and 10 in HeLa and U2OS cells, western blot. 12,000 U2OS FLIPINTREX and HeLa LacZeo cells were seeded per well in a 96 well plate and reverse transfected with the indicated siRNAs. The medium was topped up after 18 hrs and the cells were lysed 3 days post transfection. Western blot was performed and probed with Tubulin and RECQL4 antibodies. Loading was normalised and verified with Tubulin. One representative graph and western blot is shown (n=1). In HeLa cells RECQL4 expression appeared to not change and expression was low. In U2OS cell line RECQL4 knockdown was shown to be efficient in both RECQL4 siRNA 9 and 10 with little expression seen and high expression in the non-targeting control siRNA and Dharmafect only cells.
5.2.3 Generation of shRNA constructs
A number of primary cell lines are extremely difficult to transfect with traditional
methods, and this limitation extends to introduction of siRNA molecules into these
cell types. Although successful transfection methods have been described in
mesenchymal stem cells (Jaiswal et al., 2000; Yoshikawa et al., 2004) we sought
for a more efficient approach that generates stable knockdown. In order to mediate
knockdown in ASC52telo cells a fourth-generation lentiviral transduction system
was employed, and an shRNA expression construct was generated.
Page | 150
Two oligonucleotides harbouring the siRNA sequences that target the 3’
untranslated region of RECQL4, and identical in the core sequence to siRNAs 9 and
10 described above, were custom synthesised, annealed and cloned into the
pLKO.1 lentiviral vector. The ligated plasmids were transformed into NEB-Stable
competent E.coli host cells. Miniprep DNA was purified from emerging colonies and
mapped with XhoI and HinfI digestions. RECQL4sh 10A3 and RECQL4 9A1
showed fragment bands at the expected sizes following restriction digest (Figure
5.2-j and Figure 5.2-k). Confirmed clones were further verified by sequencing, and
selected for maxiprep, lentiviral packaging and downstream applications.
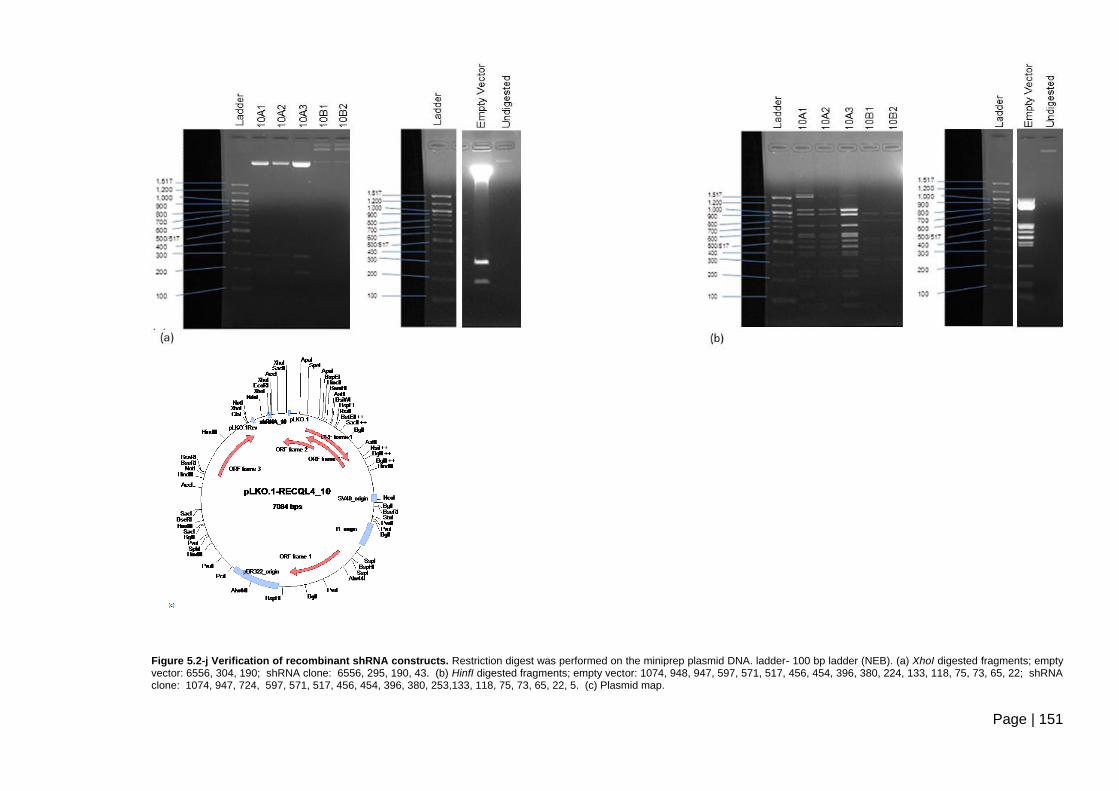
Page | 151
Figure 5.2-j Verification of recombinant shRNA constructs. Restriction digest was performed on the miniprep plasmid DNA. ladder- 100 bp ladder (NEB). (a) XhoI digested fragments; empty vector: 6556, 304, 190; shRNA clone: 6556, 295, 190, 43. (b) HinfI digested fragments; empty vector: 1074, 948, 947, 597, 571, 517, 456, 454, 396, 380, 224, 133, 118, 75, 73, 65, 22; shRNA clone: 1074, 947, 724, 597, 571, 517, 456, 454, 396, 380, 253,133, 118, 75, 73, 65, 22, 5. (c) Plasmid map.
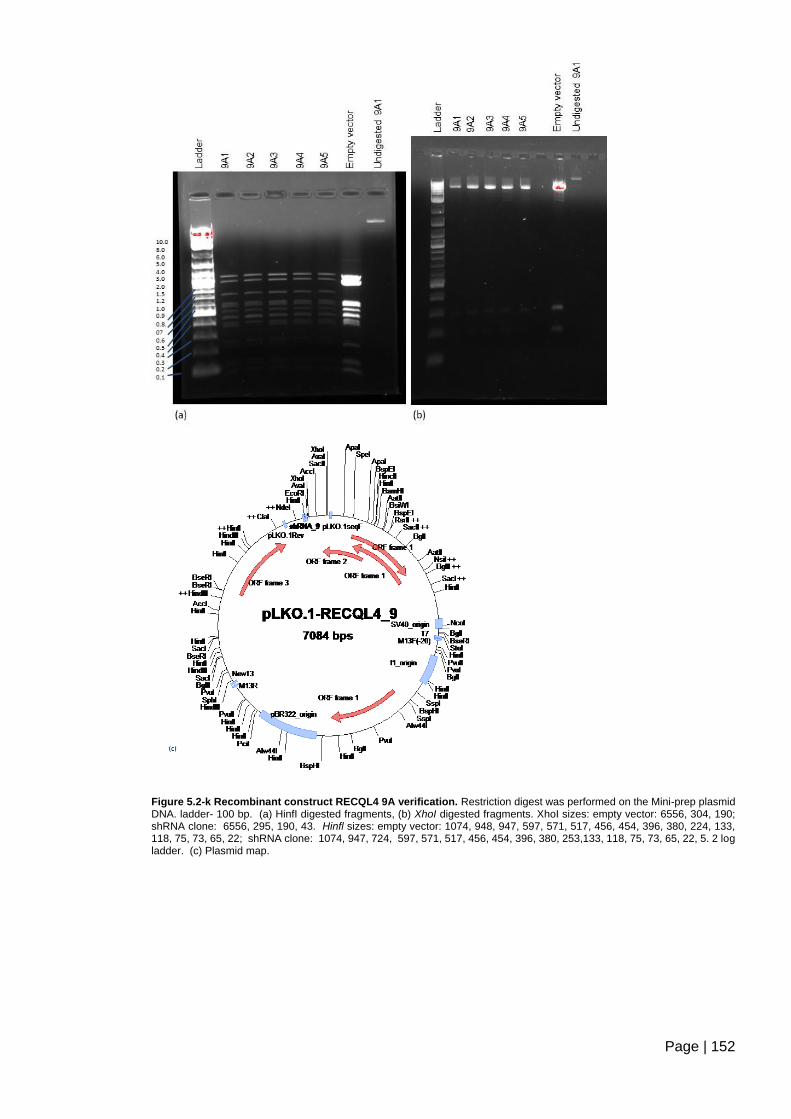
Page | 152
Figure 5.2-k Recombinant construct RECQL4 9A verification. Restriction digest was performed on the Mini-prep plasmid DNA. ladder- 100 bp. (a) HinfI digested fragments, (b) XhoI digested fragments. XhoI sizes: empty vector: 6556, 304, 190; shRNA clone: 6556, 295, 190, 43. Hinfl sizes: empty vector: 1074, 948, 947, 597, 571, 517, 456, 454, 396, 380, 224, 133, 118, 75, 73, 65, 22; shRNA clone: 1074, 947, 724, 597, 571, 517, 456, 454, 396, 380, 253,133, 118, 75, 73, 65, 22, 5. 2 log ladder. (c) Plasmid map.

Page | 153
5.2.4 RTS cell lines and PHA Sensitivity
RECQL4 holds an important role in DNA replication initiation. To determine if
RECQL4 mutation sensitizes cells to interference of DNA replication, RTS cell line
AG05013 and RECQL4 knockdown U2OS and HeLa cells were treated with PHA-
767491. We established previously that media changes were required in PHA-
767491 treated cells (see section 3.1). AG05013tert, HS68tert, and MRC5 cells
were re-tested with medium changes (Figure 5.2-l), which confirmed that the
RECQL4 mutated cell line (AG05013tert) is indeed more sensitive to inhibition of
replication initiation inhibitors than wild-type cells. We suggest that RTS cells are
more sensitive to this drug, because of their inherent problem with replication
initiation due to the lack of RECQL4. Whether this finding represents a general
feature of RTS cells or specific to AG05013 needs to be verified using other RTS
cell lines.
P H A -7 6 7 4 9 1 c o n c e n tra t io n M
Ab
so
rba
nc
e a
t 4
90
nm
0 2 4 6 8
0
1
2
3
A G 0 5 0 1 3
H S 68
M R C 5
Figure 5.2-l Sensitivity of AG05013tert, HS68tert, and MRC5 cells to PHA-767491. Cells were seeded at 2000 cells per
well in 96 well plate, and were treated with the indicated concentration of the drug alongside controls. Medium was changed and treatment reapplied to the cells every 3 days. Cell viability was established post 7 days incubation using the MTS assay read at 490nm. Error bars represents SEM of triplicates, graph represents one of three independent experiments (n=1). The RECQL4 mutated cell line AG05013tert shows a higher sensitivity to replication inhibition than the control cell lines.
RECQL4 mutated cells (AG05013) appeared to demonstrate sensitivity to PHA-
767491. To verify a link between RECQL4 expression and sensitivity, RECQL4 was
depleted using siRNA, as previously verified (Figure 5.2-m), and cells were treated
with PHA-767491. U2OS cells showed steadily reduced cell viability with increasing
concentrations of PHA-767491 after 0.4 µM with Non-targeting siRNA treatment and
in RECQL4 depleted cells (Figure 5.2-n). Viability measurement was variable in
HeLa cells but fell sharply above 2.5 µM (Figure 5.2-o). Knockdown of RECQL4 in
Page | 154
these U2OS and HeLa cells was verified with western blotting; however, increased
sensitivity to PHA following RECQL4 siRNA knockdown was not seen (Figure 5.2-n
and Figure 5.2-o). This data suggests, contradicting to data obtained from primary
fibroblasts, that siRNA mediated knockdown of RECQL4 in HeLa and U2OS cells
does not sensitise these cells to inhibition of replication initiation.
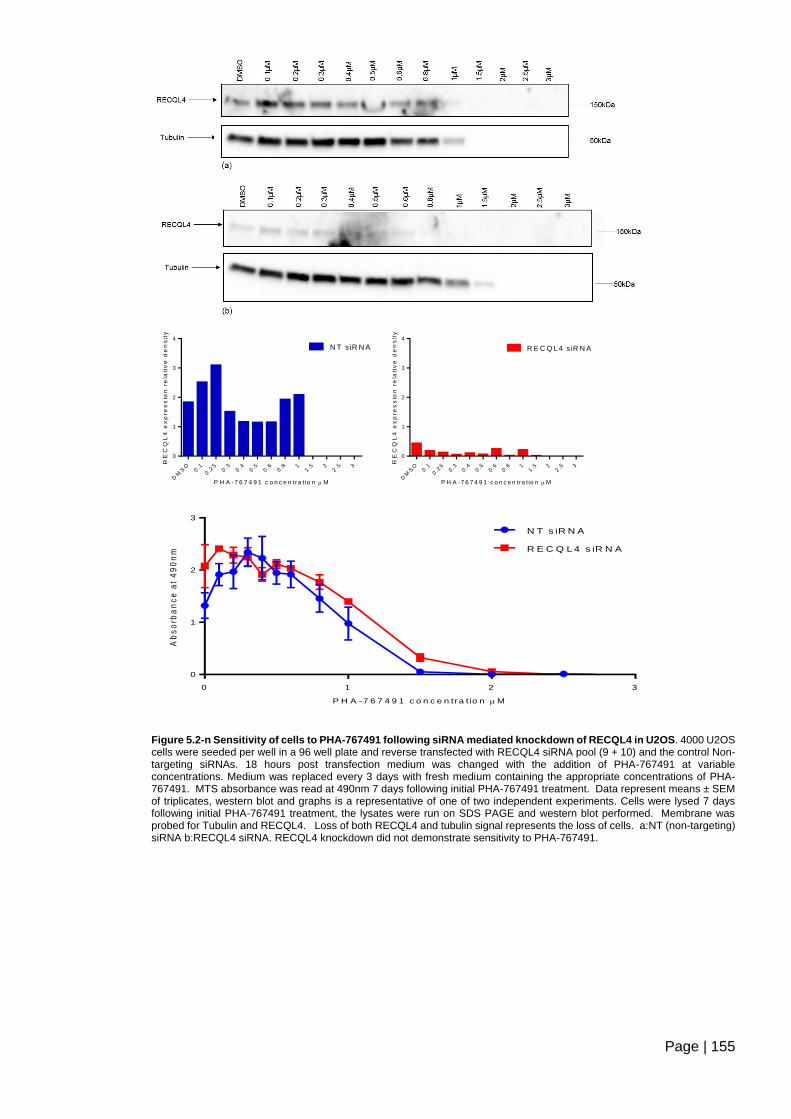
Page | 155
P H A -7 6 7 4 9 1 c o n c e n tra t io n M
RE
CQ
L4
ex
pre
ss
ion
re
lati
ve
de
ns
ity
DM
SO
0.1
0.2
50.3
0.4
0.5
0.6
0.8 1
1.5 2
2.5 3
0
1
2
3
4
N T s iR N A
P H A -7 6 7 4 9 1 c o n c e n tra t io n M
RE
CQ
L4
ex
pre
ss
ion
re
lati
ve
de
ns
ity
DM
SO
0.1
0.2
50.3
0.4
0.5
0.6
0.8 1
1.5 2
2.5 3
0
1
2
3
4
R E C Q L 4 s iR N A
P H A -7 6 7 4 9 1 c o n c e n tra t io n M
Ab
so
rba
nc
e a
t 4
90
nm
0 1 2 3
0
1
2
3
N T s iR N A
R E C Q L 4 s iR N A
Figure 5.2-n Sensitivity of cells to PHA-767491 following siRNA mediated knockdown of RECQL4 in U2OS. 4000 U2OS cells were seeded per well in a 96 well plate and reverse transfected with RECQL4 siRNA pool (9 + 10) and the control Non-targeting siRNAs. 18 hours post transfection medium was changed with the addition of PHA-767491 at variable concentrations. Medium was replaced every 3 days with fresh medium containing the appropriate concentrations of PHA-767491. MTS absorbance was read at 490nm 7 days following initial PHA-767491 treatment. Data represent means ± SEM of triplicates, western blot and graphs is a representative of one of two independent experiments. Cells were lysed 7 days following initial PHA-767491 treatment, the lysates were run on SDS PAGE and western blot performed. Membrane was probed for Tubulin and RECQL4. Loss of both RECQL4 and tubulin signal represents the loss of cells. a:NT (non-targeting) siRNA b:RECQL4 siRNA. RECQL4 knockdown did not demonstrate sensitivity to PHA-767491.
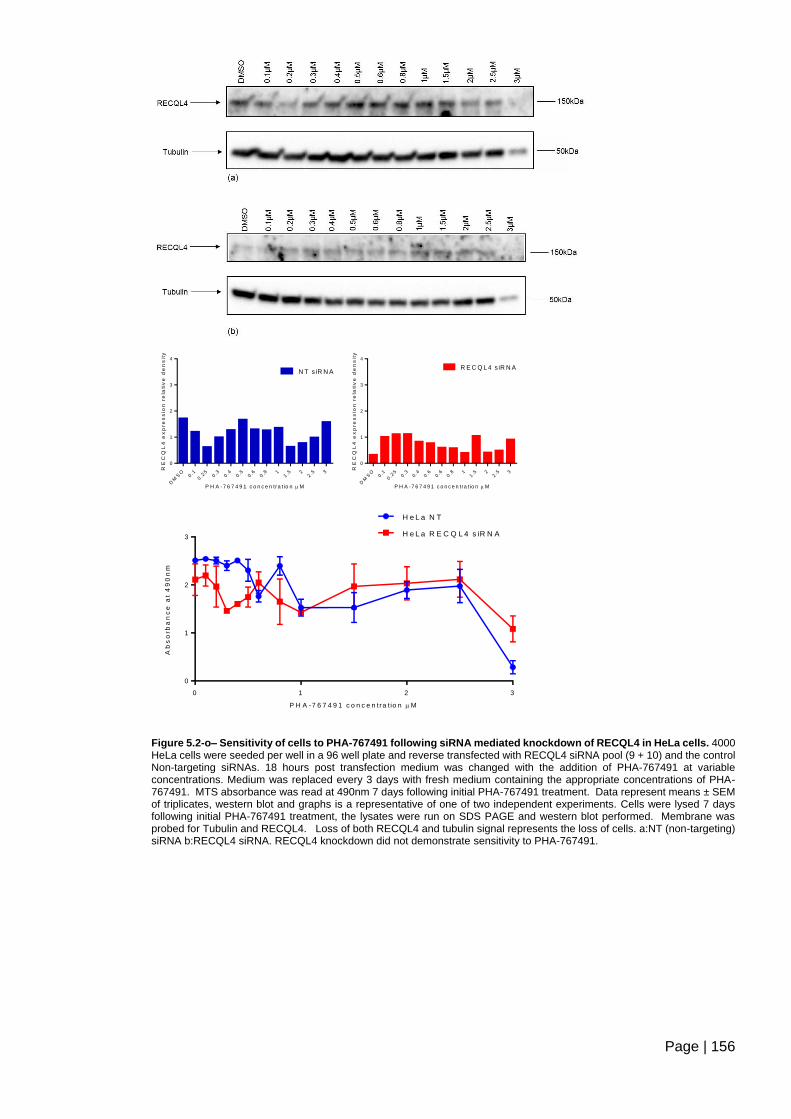
Page | 156
P H A -7 6 7 4 9 1 c o n c e n tra t io n M
RE
CQ
L4
ex
pre
ss
ion
re
lati
ve
de
ns
ity
DM
SO
0.1
0.2
50.3
0.4
0.5
0.6
0.8 1
1.5 2
2.5 3
0
1
2
3
4
N T s iR N A
P H A -7 6 7 4 9 1 c o n c e n tra t io n M
RE
CQ
L4
ex
pre
ss
ion
re
lati
ve
de
ns
ity
DM
SO
0.1
0.2
50.3
0.4
0.6
0.6
0.8 1
1.5 2
2.5 3
0
1
2
3
4
R E C Q L 4 s iR N A
P H A -7 6 7 4 9 1 c o n c e n tra t io n M
Ab
so
rba
nc
e a
t 4
90
nm
0 1 2 3
0
1
2
3
H e L a N T
H e L a R E C Q L 4 s iR N A
Figure 5.2-o– Sensitivity of cells to PHA-767491 following siRNA mediated knockdown of RECQL4 in HeLa cells. 4000 HeLa cells were seeded per well in a 96 well plate and reverse transfected with RECQL4 siRNA pool (9 + 10) and the control Non-targeting siRNAs. 18 hours post transfection medium was changed with the addition of PHA-767491 at variable concentrations. Medium was replaced every 3 days with fresh medium containing the appropriate concentrations of PHA-767491. MTS absorbance was read at 490nm 7 days following initial PHA-767491 treatment. Data represent means ± SEM of triplicates, western blot and graphs is a representative of one of two independent experiments. Cells were lysed 7 days following initial PHA-767491 treatment, the lysates were run on SDS PAGE and western blot performed. Membrane was probed for Tubulin and RECQL4. Loss of both RECQL4 and tubulin signal represents the loss of cells. a:NT (non-targeting) siRNA b:RECQL4 siRNA. RECQL4 knockdown did not demonstrate sensitivity to PHA-767491.
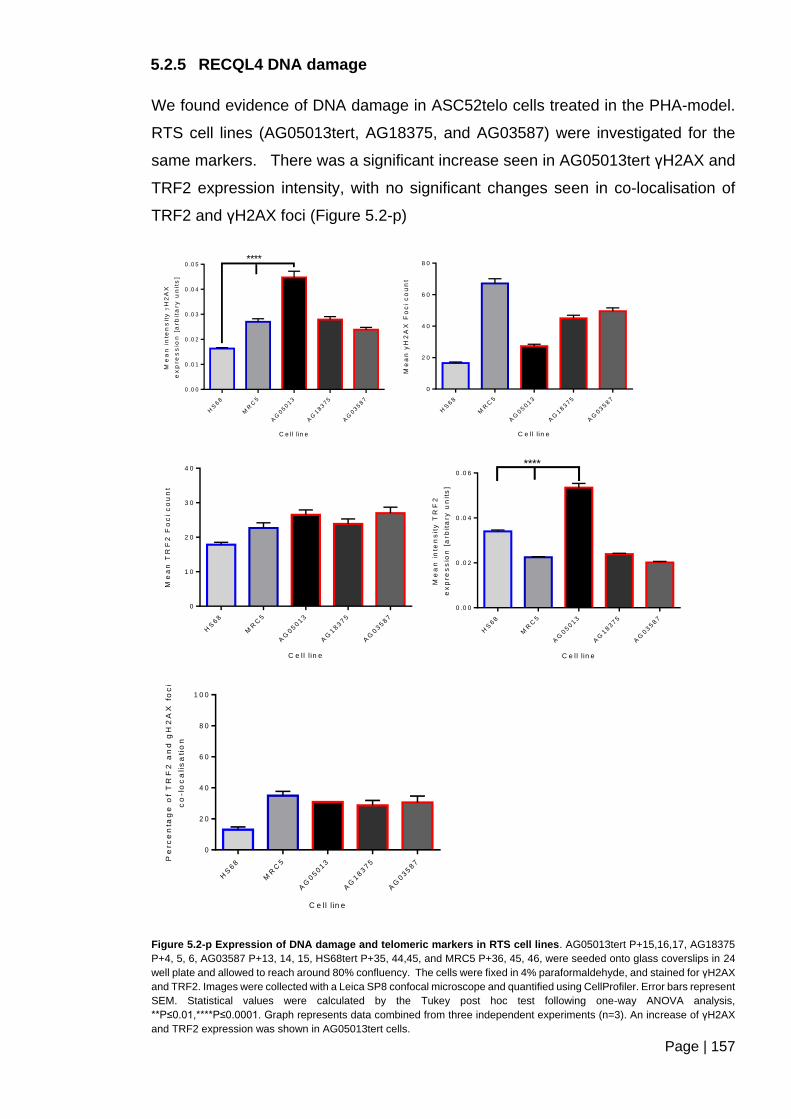
Page | 157
5.2.5 RECQL4 DNA damage
We found evidence of DNA damage in ASC52telo cells treated in the PHA-model.
RTS cell lines (AG05013tert, AG18375, and AG03587) were investigated for the
same markers. There was a significant increase seen in AG05013tert γH2AX and
TRF2 expression intensity, with no significant changes seen in co-localisation of
TRF2 and γH2AX foci (Figure 5.2-p)
C e ll lin e
Me
an
in
ten
sit
y
H2
AX
ex
pre
ss
ion
[a
rb
ita
ry
un
its
]
HS
68
MR
C5
AG
05013
AG
18375
AG
03587
0 .0 0
0 .0 1
0 .0 2
0 .0 3
0 .0 4
0 .0 5****
C e ll lin e
Me
an
yH
2A
X F
oc
i c
ou
nt
HS
68
MR
C5
AG
05013
AG
18375
AG
03587
0
2 0
4 0
6 0
8 0
C e ll lin e
Me
an
TR
F2
Fo
ci
co
un
t
HS
68
MR
C5
AG
05013
AG
18375
AG
03587
0
1 0
2 0
3 0
4 0
C e ll lin e
Me
an
in
ten
sit
y T
RF
2
ex
pre
ss
ion
[a
rbit
ary
un
its
]
HS
68
MR
C5
AG
05013
AG
18375
AG
03587
0 .0 0
0 .0 2
0 .0 4
0 .0 6
****
C e ll lin e
Pe
rce
nta
ge
of
TR
F2
an
d g
H2
AX
fo
ci
co
-lo
ca
lis
ati
on
HS
68
MR
C5
AG
05013
AG
18375
AG
03587
0
2 0
4 0
6 0
8 0
1 0 0
Figure 5.2-p Expression of DNA damage and telomeric markers in RTS cell lines. AG05013tert P+15,16,17, AG18375
P+4, 5, 6, AG03587 P+13, 14, 15, HS68tert P+35, 44,45, and MRC5 P+36, 45, 46, were seeded onto glass coverslips in 24
well plate and allowed to reach around 80% confluency. The cells were fixed in 4% paraformaldehyde, and stained for γH2AX
and TRF2. Images were collected with a Leica SP8 confocal microscope and quantified using CellProfiler. Error bars represent
SEM. Statistical values were calculated by the Tukey post hoc test following one-way ANOVA analysis,
**P≤0.01,****P≤0.0001. Graph represents data combined from three independent experiments (n=3). An increase of γH2AX
and TRF2 expression was shown in AG05013tert cells.
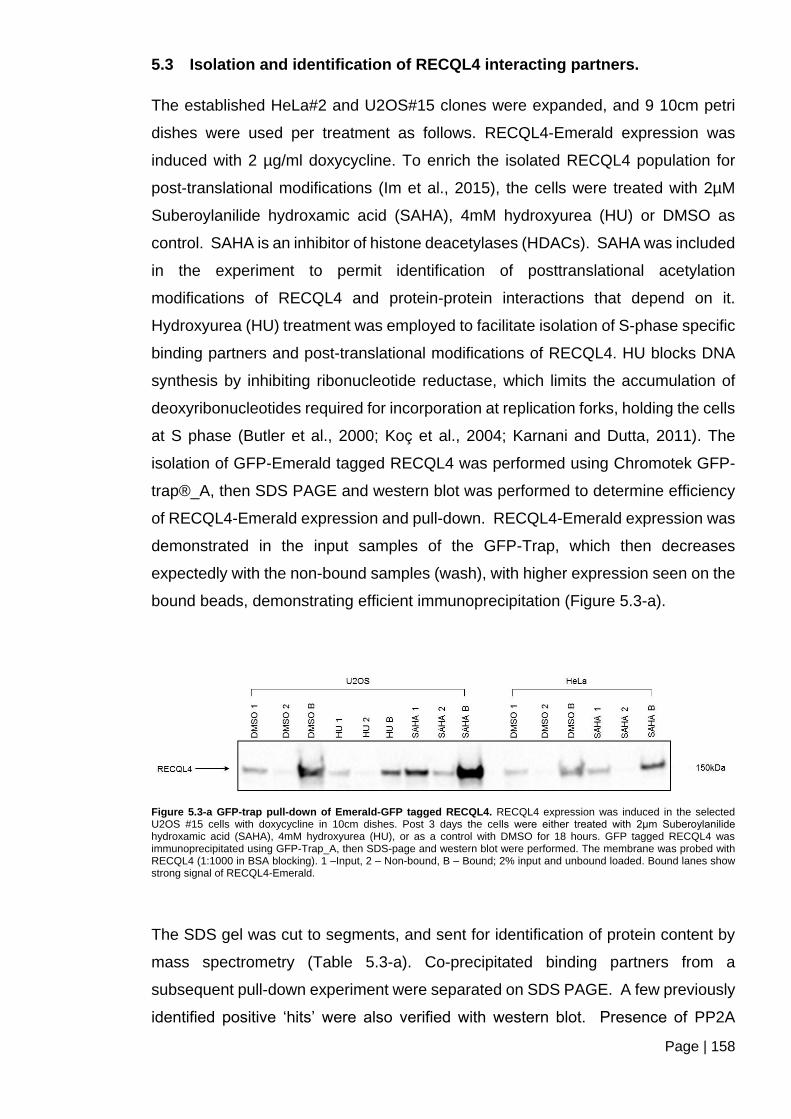
Page | 158
5.3 Isolation and identification of RECQL4 interacting partners.
The established HeLa#2 and U2OS#15 clones were expanded, and 9 10cm petri
dishes were used per treatment as follows. RECQL4-Emerald expression was
induced with 2 µg/ml doxycycline. To enrich the isolated RECQL4 population for
post-translational modifications (Im et al., 2015), the cells were treated with 2µM
Suberoylanilide hydroxamic acid (SAHA), 4mM hydroxyurea (HU) or DMSO as
control. SAHA is an inhibitor of histone deacetylases (HDACs). SAHA was included
in the experiment to permit identification of posttranslational acetylation
modifications of RECQL4 and protein-protein interactions that depend on it.
Hydroxyurea (HU) treatment was employed to facilitate isolation of S-phase specific
binding partners and post-translational modifications of RECQL4. HU blocks DNA
synthesis by inhibiting ribonucleotide reductase, which limits the accumulation of
deoxyribonucleotides required for incorporation at replication forks, holding the cells
at S phase (Butler et al., 2000; Koç et al., 2004; Karnani and Dutta, 2011). The
isolation of GFP-Emerald tagged RECQL4 was performed using Chromotek GFP-
trap®_A, then SDS PAGE and western blot was performed to determine efficiency
of RECQL4-Emerald expression and pull-down. RECQL4-Emerald expression was
demonstrated in the input samples of the GFP-Trap, which then decreases
expectedly with the non-bound samples (wash), with higher expression seen on the
bound beads, demonstrating efficient immunoprecipitation (Figure 5.3-a).
Figure 5.3-a GFP-trap pull-down of Emerald-GFP tagged RECQL4. RECQL4 expression was induced in the selected U2OS #15 cells with doxycycline in 10cm dishes. Post 3 days the cells were either treated with 2μm Suberoylanilide hydroxamic acid (SAHA), 4mM hydroxyurea (HU), or as a control with DMSO for 18 hours. GFP tagged RECQL4 was immunoprecipitated using GFP-Trap_A, then SDS-page and western blot were performed. The membrane was probed with RECQL4 (1:1000 in BSA blocking). 1 –Input, 2 – Non-bound, B – Bound; 2% input and unbound loaded. Bound lanes show strong signal of RECQL4-Emerald.
The SDS gel was cut to segments, and sent for identification of protein content by
mass spectrometry (Table 5.3-a). Co-precipitated binding partners from a
subsequent pull-down experiment were separated on SDS PAGE. A few previously
identified positive ‘hits’ were also verified with western blot. Presence of PP2A
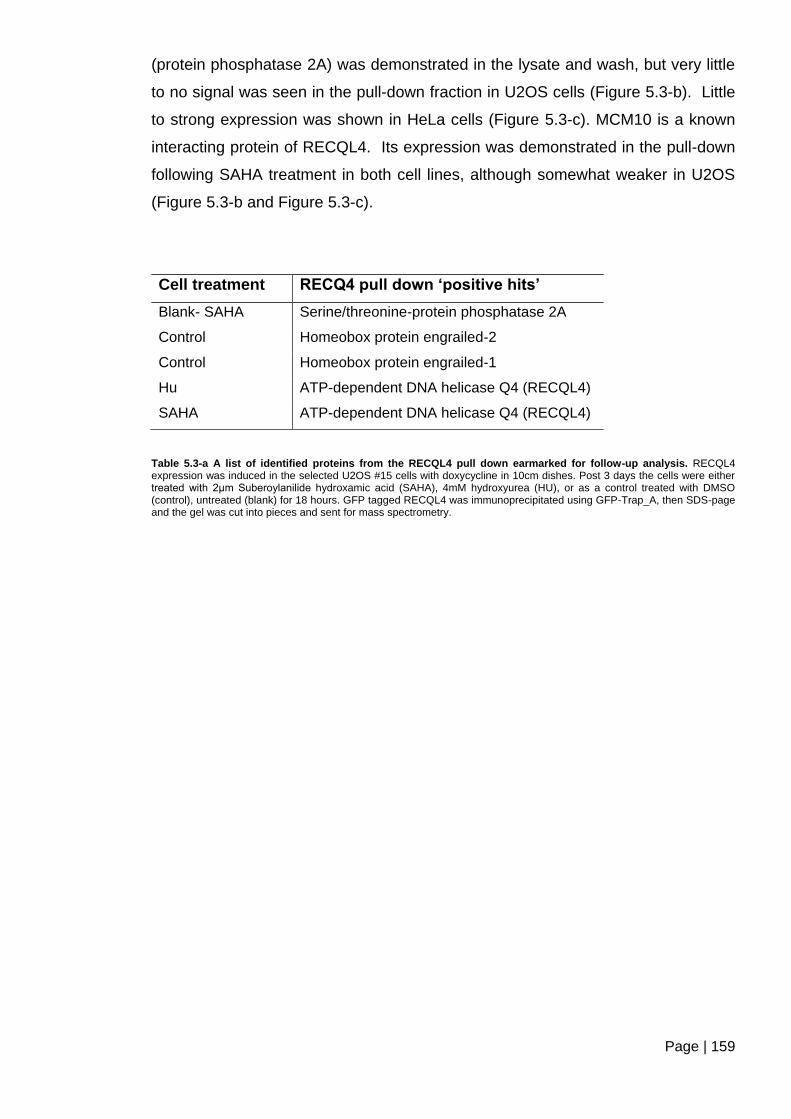
Page | 159
(protein phosphatase 2A) was demonstrated in the lysate and wash, but very little
to no signal was seen in the pull-down fraction in U2OS cells (Figure 5.3-b). Little
to strong expression was shown in HeLa cells (Figure 5.3-c). MCM10 is a known
interacting protein of RECQL4. Its expression was demonstrated in the pull-down
following SAHA treatment in both cell lines, although somewhat weaker in U2OS
(Figure 5.3-b and Figure 5.3-c).
Cell treatment RECQ4 pull down ‘positive hits’
Blank- SAHA Serine/threonine-protein phosphatase 2A
Control Homeobox protein engrailed-2
Control Homeobox protein engrailed-1
Hu ATP-dependent DNA helicase Q4 (RECQL4)
SAHA ATP-dependent DNA helicase Q4 (RECQL4)
Table 5.3-a A list of identified proteins from the RECQL4 pull down earmarked for follow-up analysis. RECQL4 expression was induced in the selected U2OS #15 cells with doxycycline in 10cm dishes. Post 3 days the cells were either treated with 2μm Suberoylanilide hydroxamic acid (SAHA), 4mM hydroxyurea (HU), or as a control treated with DMSO (control), untreated (blank) for 18 hours. GFP tagged RECQL4 was immunoprecipitated using GFP-Trap_A, then SDS-page and the gel was cut into pieces and sent for mass spectrometry.
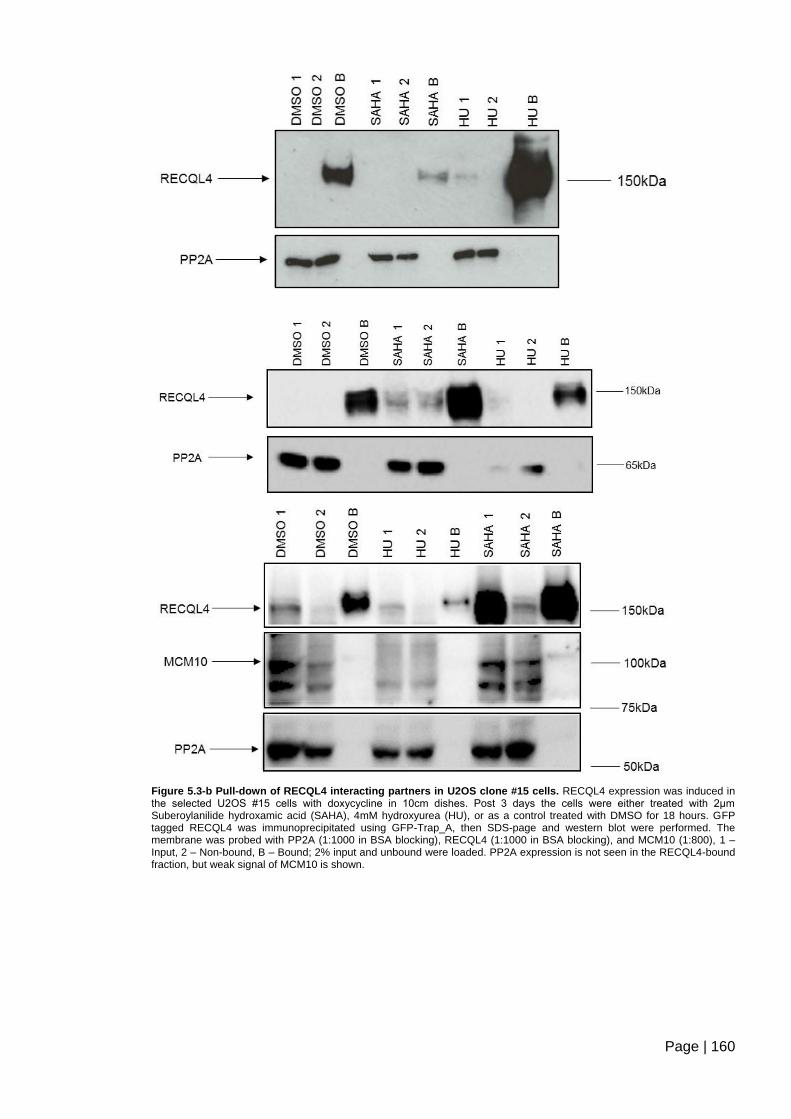
Page | 160
Figure 5.3-b Pull-down of RECQL4 interacting partners in U2OS clone #15 cells. RECQL4 expression was induced in the selected U2OS #15 cells with doxycycline in 10cm dishes. Post 3 days the cells were either treated with 2μm Suberoylanilide hydroxamic acid (SAHA), 4mM hydroxyurea (HU), or as a control treated with DMSO for 18 hours. GFP tagged RECQL4 was immunoprecipitated using GFP-Trap_A, then SDS-page and western blot were performed. The membrane was probed with PP2A (1:1000 in BSA blocking), RECQL4 (1:1000 in BSA blocking), and MCM10 (1:800), 1 –Input, 2 – Non-bound, B – Bound; 2% input and unbound were loaded. PP2A expression is not seen in the RECQL4-bound fraction, but weak signal of MCM10 is shown.

Page | 161
Figure 5.3-c Pull-down of RECQL4 interacting partners from HeLa clone #2 cells. RECQL4 expression was induced in the selected HeLa #2 cells with doxycycline in 10cm dishes. Post 3 days the cells were either treated with 2μm Suberoylanilide hydroxamic acid (SAHA), 4mM hydroxyurea (HU), or as a control treated with DMSO for 18 hours. Immunoprecipitation using GFP-Trap_A, SDS-page and western blot were performed. The membrane was probed with PP2A (1:1000 in BSA blocking), RECQL4 (1:1000 in BSA blocking), and MCM10 (1:800), 1 –Input, 2 – Non-bound, B – Bound; 2% input and unbound loaded. PP2A and MCM10 expression shown in RECQL4 bound fraction.
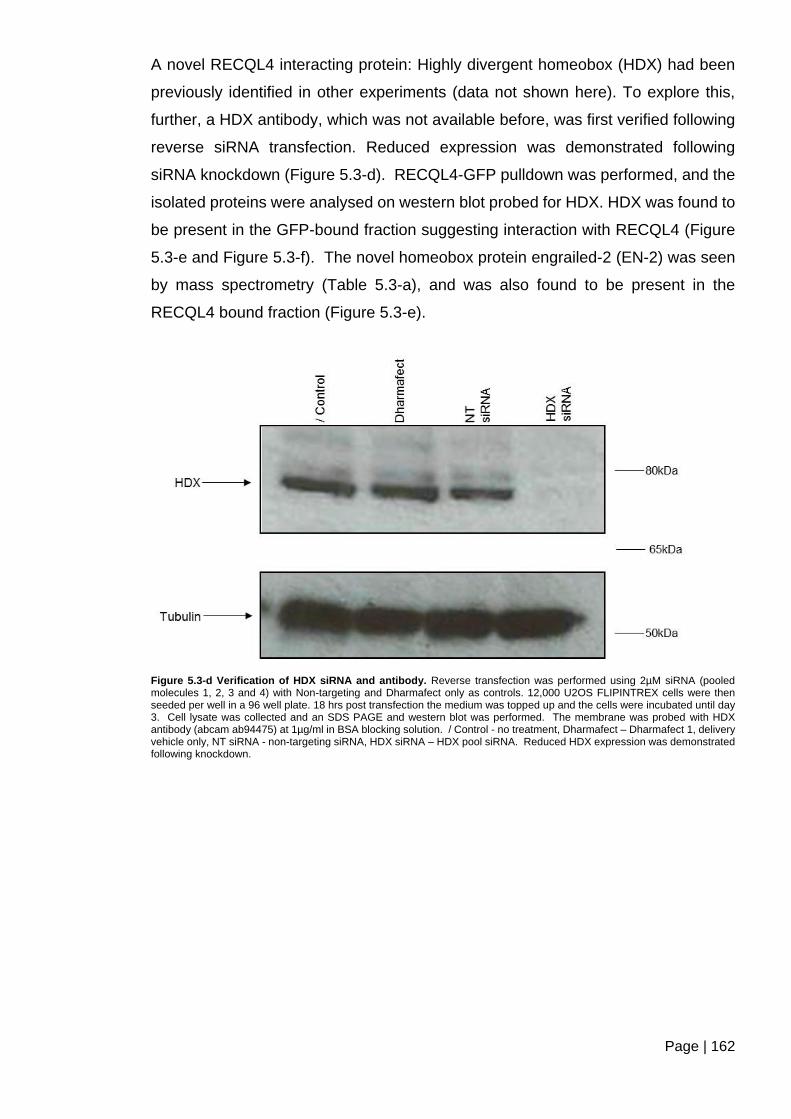
Page | 162
A novel RECQL4 interacting protein: Highly divergent homeobox (HDX) had been
previously identified in other experiments (data not shown here). To explore this,
further, a HDX antibody, which was not available before, was first verified following
reverse siRNA transfection. Reduced expression was demonstrated following
siRNA knockdown (Figure 5.3-d). RECQL4-GFP pulldown was performed, and the
isolated proteins were analysed on western blot probed for HDX. HDX was found to
be present in the GFP-bound fraction suggesting interaction with RECQL4 (Figure
5.3-e and Figure 5.3-f). The novel homeobox protein engrailed-2 (EN-2) was seen
by mass spectrometry (Table 5.3-a), and was also found to be present in the
RECQL4 bound fraction (Figure 5.3-e).
Figure 5.3-d Verification of HDX siRNA and antibody. Reverse transfection was performed using 2µM siRNA (pooled molecules 1, 2, 3 and 4) with Non-targeting and Dharmafect only as controls. 12,000 U2OS FLIPINTREX cells were then seeded per well in a 96 well plate. 18 hrs post transfection the medium was topped up and the cells were incubated until day 3. Cell lysate was collected and an SDS PAGE and western blot was performed. The membrane was probed with HDX antibody (abcam ab94475) at 1µg/ml in BSA blocking solution. / Control - no treatment, Dharmafect – Dharmafect 1, delivery vehicle only, NT siRNA - non-targeting siRNA, HDX siRNA – HDX pool siRNA. Reduced HDX expression was demonstrated following knockdown.

Page | 163
Figure 5.3-e Pull-down of RECQL4 interacting partners in U2OS clone #15 cells. RECQL4 expression was induced in the selected U2OS #15 cells with doxycycline in 10cm dishes. Post 3 days the cells were either treated with 2μm Suberoylanilide hydroxamic acid (SAHA), 4mM hydroxyurea (HU), or as a control treated with DMSO for 18 hours. GFP tagged RECQL4 was immunoprecipitated using GFP-Trap_A, then SDS-page and western blot were performed. The membrane was probed with Abcam anti-HDX antibody (ab94475) at 1µg/ml in BSA blocking solution, RECQL4 (1:1000 in BSA blocking) and Engrailed 2 (1:10000). 1 –Input, 2 – Non-bound, B – Bound; 2% input and unbound were loaded. RECQL4: 150kDa, HDX: 77kDa, EN-2: 42 kDa. HDX and EN-2 signal is shown in the RECQL4 bound fraction.

Page | 164
Figure 5.3-f Pull-down of RECQL4 interacting partners in HeLa clone #2 cells. RECQL4 expression was induced in the selected HeLa #2 cells with doxycycline in 10cm dishes. Post 3 days the cells were either treated with 2μm Suberoylanilide hydroxamic acid (SAHA), 4mM hydroxyurea (HU), or as a control treated with DMSO for 18 hours. Immunoprecipitation using GFP-Trap_A, SDS-page and western blot were performed. 2% input and unbound were loaded, 1 –Input, 2 – Non-bound, B – Bound. Membrane was probed for RECQL4 (Cell Signalling 1:1000) 150kDa, HDX -77kDa (Aviva Systems Biology ARP39832_P050), (top blots), and Abcam anti-HDX antibody (ab94475)(bottom blot) at 1µg/ml in BSA. HDX and EN-2 signal is shown in the RECQL4 bound fraction.
5.4 Summary
In summary, RECQL4 expression appeared variable in cell lines and RTS cells. The
AG05013 RTS cell line appeared to demonstrate evidence of DNA damage with an
increase in γH2AX and TRF2 intensity not seen in the other RTS cell lines
(AG03587, AG18375). Further investigations are required to understand the
reasons for this finding, perhaps sustained DNA damage from existing specific
RECQL4 mutation. Further comparison of other RTS cell lines could better our
understanding of the apparent alterations of DNA damage response seen in these
cells, such as cell morphology, aneuploidy, proliferative rate, and preferred DNA
damage response pathway.

Page | 165
The shRNA constructs generated during this work are used for follow-on work in the
laboratory. Lentiviral vectors have been generated and used for transduction of
ASC52telo cells. Phenotypic changes induced by stable knockdown are currently
being characterised as part of an MSc by Research project.
We found a number of novel RECQL4 protein interactions that to date have not been
reported. These preliminary findings are currently under follow-up investigation in
the laboratory and could lead to new roles and pathways that involve RECQL4.
Page | 166
6 Discussion
6.1 Interfering with DNA replication initiation (chapter 1, section 3.1)
We set out to establish a model based on replication initiation stress and reduced
proliferative rate, which mimics the potential effects of RECQL4 mutations
identifying any subsequent cellular changes, such as damage to the cells (Sangrithi
et al., 2005; Lu et al., 2014a; Lu et al., 2016).
PHA-767491 is a pyrrolopyrridinone molecule, the first well-characterized inhibitor
of DBF4 dependent kinase (DDK) (Montagnoli et al., 2008; Vanotti et al., 2008). It
is a dual Cdc7/Cdk9 inhibitor, and consequentially inhibits firing of replication origins
without affecting replication fork progression (Montagnoli et al., 2008), due to
specific inhibition of both Cdc7 kinase and the phosphorylation of MCM2 at the
Cdc7-dependent Ser40 site (Montagnoli et al., 2008). PHA treatment was found to
abolish MCM2 phosphorylation in HCC1954 cells further corresponding to cell
growth and viability effects (Sasi et al., 2014). In normal cells Cdc7 inhibition arrests
cell proliferation (Montagnoli et al., 2004; Tudzarova et al., 2010). The inhibition or
depletion of Cdc7 leads to the triggering of the replication origin activation
checkpoint, which generates a reversible G1 arrest, failure to progress to S phase,
while the cells remain viable. Active Cdc7 levels are restored following withdrawal
of treatment (Tudzarova et al., 2010).
An early study was the first to show that DDK depletion leads to the severe
disruption of DNA replication in HeLa cells (Jiang et al., 1999). Further studies have
demonstrated the depletion of DDK by siRNA in HeLa cells led to p53-independent
apoptosis, in comparison to a normal human dermal fibroblast cell line, in which it
led to reversible cell cycle arrest. This effect was further confirmed in other cell lines
(Montagnoli et al., 2004; Im and Lee, 2008; Tudzarova et al., 2010; Ito et al., 2012).
PHA-767491 has also been demonstrated to reduce proliferation in a number of
other cell lines (Sasi et al., 2014).
Our aim was to establish a model of mild replication initiation inhibition in
mesenchymal stem cells (ASC52telo) in culture using PHA. ASC52telo cells have
been employed in many studies (Wolbank et al., 2009; Hasebe-Takada et al., 2016;
Nardone et al., 2017; Pitrone et al., 2017). Our results indicated the degradation of
PHA during cell culture, and media changes with fresh addition of PHA at day 3
Page | 167
maintained inhibition. There is little information on the stability of PHA in the
literature, as studies appeared to use short term treatment of around 24 to 72 hours
(Montagnoli et al., 2008; Natoni et al., 2013; Fitzgerald et al., 2014; Sasi et al., 2014;
Erbayraktar et al., 2016). There are many conditions which can lead to degradation
of a substance, including time, and environmental factors (Blessy et al., 2014).
A model of PHA-767491 was established in low and high passage ASC52telo cells
with acute and chronic PHA treatment, and withdrawal of treatment in either case
(‘recovery’). This enabled us to further understand the effects of reduced replication
over time and the potential cellular stress this generates, similar to the effect of
RECQL4 mutations, and if and how the cells may recover following the cessation of
treatment with PHA-767491. Interestingly, PHA-767491 treated cells appeared to
lead to cell morphology changes, as the cells appeared larger, which is an indication
of cellular morphological modifications that have been further explored in this study.
Cells that are actively proliferating produce a range of proteins which can be utilised
as markers using assays such as immunofluorescence. Ki67 is a nuclear antigen
expressed in cycling cells, and is not expressed in quiescent cells (Sobecki et al,
2017). The role of Ki67 was not initially fully understood (Tsurusawa and Fujimoto,
1995), however, a more recent study has found Ki67 may be involved in the
organisation of heterochromatin in proliferating cells (Sobecki et al., 2016). Early
studies found levels of expression to appear in G1 phase, with a further increase
during S phase and G2 phase, with the maximum level seen during mitosis at the
surface of chromosomes (Gerdes et al., 1984; Sasaki et al., 1987; Manoir et al.,
1991; Tsurusawa et al., 1992; Scholzen and Gerdes, 2000; Ladstein et al., 2010).
Absent expression is seen in resting cells in G0 phase of the cell cycle (Scholzen
and Gerdes, 2000). An early study, however, did find some tumour cells in G1
phase negative for Ki67 progressed into S phase of the cell cycle, following a long
G1 phase duration (Tsurusawa and Fujimoto, 1995). We expected a decrease of
Ki67 expression in PHA-767491 treated cells, as we have demonstrated reduced
proliferation as reduced cell count. Somewhat surprisingly, we observed some high
levels of Ki67 expression in these cells. This contradiction might be related to
persisting Ki67 expression in G1; as described previously, PHA-767491 could hold
the cells in G1 phase of the cell cycle. The reduced expression shown following long
term PHA-767491 treatment could demonstrate increased sensitivity and/or more
cells exiting the cell cycle into G0, as the cells were previously shown to demonstrate
reduced proliferation via cell count. A study by Montagnoli et al, (2008),
Page | 168
demonstrated an increase of Ki67 following PHA-767491 using
immunohistochemistry in HCT116 xenografts, which also remained unexplained
(Montagnoli et al., 2008).
Topoisomerases are enzymes that hold important roles in uncoiling supercoiled
DNA, and removing knots and catenates that form during DNA metabolism by
causing transient breaks in the DNA double-helix (Wang, 1985; Wang, 2002).
Topoisomerase 1 (TOP1) generates single-stranded breaks in double-stranded
DNA, swivels the broken end around the non-scissile strand, then re-joins the break
during transcription and replication (Bouwman and Crosetto, 2018). Camptothecin
(CPT) inhibits topoisomerase I catalytic activity through the prevention of re-ligation,
and stabilizes the TOP1-DNA cleavage complex (Hsiang et al., 1985; Huang et al.,
2004; Darzynkiewicz et al., 2012; Zhao et al., 2012; Berniak et al., 2013), leading to
a G2 delay and cytotoxicity (Janss et al., 1998). Camptothecin has been reported in
many studies as an attractive anticancer drug (Hafian et al., 2004; Zhou et al., 2010;
Gaur et al., 2014). At this stage of the study, we utilised CPT to demonstrate
reduced cell proliferation, verified with reduced Ki67 expression, which has also
been demonstrated in the literature (Zhou et al, 2010; Gaur et al, 2014).
There are many methods for the analysis of cell proliferation, each with their own
advantages and limitations (Jones et al., 2001; Ng et al., 2005; Hutmacher et al.,
2009; Mimeault and Batra, 2010; Quent et al., 2010). The simplest method using a
haemocytometer was utilised in our study, and with the combination of trypan blue
cell viability was measured alongside. Although simple and not expensive the main
limitation can be human error and the same operator would introduce a constant
level of this potential error (Pierre, 2002). We also utilised the indirect colorimetric
MTS (3-(4,5-dimethylthiazol-2-yl)-5-(3-carboxymethoxyphenyl)-2-(4-sulfonyl)-2H-
tetrazolium) assay. The MTS assay is based on the bioreduction of tetrazolium salts
changing the colour from a pale yellow to dark blue dye by the formation of formazan
catalysed by mitochondrial dehydrogenases, and measured by absorbance
(Mosmann, 1983; Berridge et al., 2005). Limitations include a variable metabolic
behaviour found in cells and under variable culture conditions such as pH changes,
and as an end-point assay further analysis of cell survival cannot be achieved. High
cell density has also been found to be inappropriate for measuring cell proliferation
(Plumb et al., 1989; Hsu et al., 2003; Ng et al., 2005; Lopez‐Barcons, 2010; Rattan
et al., 2011). Additional chemical treatments may also interfere (Wang et al., 2010).
In our study PHA and DMSO treated wells without cells were utilised as controls,
Page | 169
and demonstrated no modification of signal. The assay measures enzyme activity
of mitochondrial dehydrogenases, that is metabolic activity, rather than measuring
the number of cells and viability (Mosmann, 1983; Quent et al., 2010).
Nevertheless, this enzyme activity is proportional to the number of live cells as
damaged or dead cells display no dehydrogenase activity (Mosmann, 1983;
Jevprasesphant et al., 2003). The MTS assay has been utilised for analysing cell
growth following PHA-767491 treatment in a recent study, and found inhibition of
cell growth, as seen in our study (Liu et al., 2018). A cell count alongside the MTS
is necessary to verify the cell number is suitably represented within our study.
6.1.1 PHA-767491 effect on osteocyte differentiation (chapter 1, section
3.1.1)
6.1.1.1 Differentiation of ASC52telo MSCs
The MSCs utilised in our study were isolated from adipose tissue obtained
commercially, and can differentiate in vitro into mesodermal lineages; osteocytes,
chondrocytes, and adipocytes (Hampel et al., 2005; Strem et al., 2005; Zhang et al.,
2011), and non-mesenchymal lineages: skeletal myocytes (Strem et al., 2005),
hepatocytes (Wang et al., 2014a), cardiomyocytes (Strem et al., 2005; Choi et al.,
2010), pancreatic (Timper et al., 2006), and neuronal cells (Safford et al., 2002;
Kang et al., 2003; Strem et al., 2005). It is not clear whether all these terminally
differentiated cell types represent true in vivo routes of differentiation. We
concentrated on differentiating the cells into adipocytes, osteoblasts, and
chondrocytes, which was verified in low and high passage ASC52telo cells. Re-
expression of hTERT in mesenchymal stem cells is also extensively studied
(Wolbank et al., 2009), and in particular found that the ASC52telo cell line maintains
mesenchymal surface markers, and osteocyte and adipocyte differentiation
potential. However, adipocyte differentiation capabilities may become enhanced
(Jun et al., 2004; Kang et al., 2004a; Wolbank et al., 2009). Other reports also found
that hTERT immortalisation of ASCs leads to increased differentiation potential (Jun
et al., 2004; Kang et al., 2004a), however, this may not be applicable to all
transduced cell lines, as differentiation potential appears to be variable even across
subclones derived from single adult stem cells (Guilak et al., 2006).
As the fibroblast like MSCs differentiate into chondrocytes, their morphology
changes into a large round shape. The cells become surrounded by ECM that
contains a highly organised network of collagens, proteoglycans and

Page | 170
glycosaminoglycans (Hardingham et al., 2006; Chang et al., 2008; Ding et al., 2010).
The cells produce cartilage-related extracellular matrix molecules, including
proteoglycans, collagen II and IV, PRELP and aggrecan (Caplan, 1991; Pittenger et
al., 1999; Zuk et al., 2001; Erickson et al., 2002; Zuk et al., 2002; Dragoo et al.,
2003; Siitonen et al., 2003; Wickham et al., 2003). Alcian blue stains highly
sulphated proteoglycans in nodules, a characteristic of cartilaginous matrix, a sign
of chondrocyte differentiation (Zuk et al., 2002; Ogawa et al., 2004).
The differentiation of adipocytes leads to changes of cell shape from the fibroblast
like MSC, into spherical shape cells, expressing ECM proteins such as fibronectin,
laminin, and collagen. Fibronectin initially forms a network, which is replaced by
collagen network (Elbrecht et al., 1996; Kubo et al., 2000; Rosen and Macdougald,
2006; Vallee et al., 2009). Differentiation then leads to the accumulation of
intracellular lipid-rich vacuoles, identifying the final stage of adipocyte differentiation.
These vacuoles stain positive using Oil Red O (Vater et al., 2011). Oil Red O
(C26H24N4O) is a fat-soluble diazol dye which detects neutral lipids and cholesteryl
esters (Ramirez-Zacarias et al., 1992). Oil Red O is a hydrophobic dye; minimally
soluble in solvent which further decreases in water, associating with the lipids in
tissue (Mehlem et al., 2013), or in our study with lipid droplets. The lipid droplet
production appears proportional to the extent of differentiation (Kuri-Harcuch and
Green, 1978). In our study, the outcome was determined using this method and
qualitatively. To further this, data can be collected quantitatively by extracting the
dye using isopropanol (Choi et al., 2008) or via measuring the activity of glycerol-3-
phosphate dehydrogenase (GPDH) (Pairault and Green, 1979; Tsuji et al., 2008).
Following osteoblast differentiation, cell morphology modifies from fibroblast like
cells into cuboidal shape, also demonstrated in our study. The cells produce
extracellular matrix (ECM) which is composed of mainly collagen type I, and late
differentiation aggregates and nodules form. Increased levels of alkaline
phosphatase, and the accumulation of calcium is also seen during differentiation
(Pittenger et al., 1999; Chamberlain et al., 2007). We analysed these calcium levels
qualitatively using Alizarin Red S staining, often used within the literature (Stanford
et al, 1995; Yang et al, 2004; Håkelien et al., 2014;Aveic et al, 2019). Alizarin Red
S forms a chelate complex with calcium cations (Stanford et al., 1995). Strong
staining was observed demonstrating osteoblast differentiation within our study. We
often observed, although not always significant, stronger staining of the calcium
deposits in differentiated ASC52telo cells with PHA-767491 treatment, which could
Page | 171
be investigated further by quantification to determine its significance. The stain can
be further analysed following extraction for semi-quantification (Stanford et al.,
1995), for example using acid extraction, which can be used to assay the kinetics of
osteogenesis (Junqueira et al., 1998; Long, 2001; Gregory et al., 2004), and RNA-
Seq analysis to determine the extent of differentiation (Håkelien et al., 2014).
Disrupting the balance of MSC differentiation into adipocytes and osteoblasts has
been reported in many human diseases, with some physiological changes favouring
adipocyte differentiation of bone marrow MSCs leading to loss of bone, and
increased risk of bone fracture (Rodríguez et al., 2000; Sekiya et al., 2004;
Muruganandan and Sinal, 2014). In aging an increase in bone marrow adipogenesis
with decrease in bone marrow formation has been reported (Meunier et al., 1971;
Burkhardt et al., 1987; Kajkenova et al., 1997; Nuttall and Gimble, 2000; Verma et
al., 2002). The link between increasing age and the loss of bone mass and strength
has been long established, with some points mentioned previously (Parfitt, 1984;
Zebaze et al., 2010; Almeida, 2012). Reduced RECQL4 activity could be linked to
reduced proliferation and impairment of osteoblasts, either directly, or providing a
sensitised environment (Ng et al, 2015). RTS patients demonstrate clinical signs
of premature aging, which may be related to changes in aging of MSCs.
Accumulation of pre-osteoblastic cells with a decrease of mature osteoblasts have
been reported in rats with increasing age (Roholl et al., 1994).
Genetic approaches have proposed that the committed osteoblast lineage is the cell
of origin in OS (Berman et al., 2008; Walkley et al., 2008), which would explain
previous studies as p53 deletion in pre-osteoblasts and osteoblast progenitors
showed higher levels of OS compared to multi-lineage potential cells (Ng et al.,
2012). Osteoblast progenitors have been found to be more committed than other
mesenchymal stem cells, which correlates to lower levels of other sarcoma types
observed (Lin et al., 2009). A large early study found 81% of osteosarcomas were
undifferentiated or poorly differentiated (Dahlin, 1957), which was also reported in
later studies (Thomas et al., 2004; Tataria et al., 2006; Haydon et al., 2007). We
propose that mesenchymal stem cells or differentiating osteoblast may be the cells
of origin of OS, which is also raised as a possibility by other laboratories (Conget
and Minguell, 1999; Pittenger et al., 1999; Thomas et al., 2004; Tataria et al., 2006;
Haydon et al., 2007; Deng et al., 2008). Many studies are in support of sarcomas
being a differentiation disease, in support of our hypothesis, and suggest that
Page | 172
mutations that hinder differentiation are the cause, initiating different sarcomas
depending on cell lineage and stage of differentiation. It is thought to be the reason
for the many different subtypes seen in osteosarcoma as well (Tang et al., 2008).
Studies in support of this model have demonstrated an overlap of gene expression
signatures of differentiated stages of MSCs from normal tissues and sarcomas
(Nielsen et al., 2002; Boeuf et al., 2008; Bovée et al., 2010; Mohseny and
Hogendoorn, 2011). Other studies propose another model: the sarcoma originates
from primitive MSCs following the acquired mutations that direct sarcoma genesis
(Rubio et al., 2005; Tolar et al., 2007; Li et al., 2009), as the overlap of signatures
is thought to be generated due to similar stroma of different tissues (Wunder et al.,
2007; Li et al., 2009). Sarcomas may generate from mutated MSCs which are
vulnerable to further mutations (Yang et al, 2014).
6.1.1.2 The role of RUNX2 in regulating MSC differentiation
RUNX2 is essential in the regulation of osteoblast differentiation through the
expression of bone-specific genes, such as collagen type 1α-1, Osterix and Bone
sialoprotein (BSP) Nakashima et al., 2002; Rutkovskiy et al, 2016). The activity of
RUNX2 is regulated via many post-translational modifications such as
phosphorylation, methylation, acetylation, and ubiquitination (Bae and Lee, 2006;
Rajgopal et al., 2007; Zagami et al., 2009). The level of RUNX2 expression is cell
cycle phase dependent, and variable depending on cell type and during
osteogenesis in MSCs. Maximum expression has been shown in preosteoblasts,
and again in early mature osteoblasts. A decline in expression occurs during
osteoblast commitment, reducing further in mature osteoblasts and osteocytes
(Ducy et al., 1997; Maruyama et al., 2007; Tang et al., 2008; Komori, 2010; Jönsson
et al., 2012), which we also demonstrated in our study. In osteoblasts the maximum
peak is seen in early G1 phase of the cell cycle, which reduces in S and M phase
(Galindo et al., 2005). A decrease of expression is also seen at the G1/S transition
of the cell cycle and during mitosis (Nimmo and Woollard, 2008). RUNX2 represses
the transcription of p21CDKN1A/WAF1/CIP1, a cyclin-dependent kinase inhibitor that holds
a role in cell cycle arrest at G1 (Westendorf et al., 2002; Galindo et al., 2005; Galindo
et al., 2007). In our study, RUNX2 was increased in lower passage ASC52telo cells
under PHA treatment upon osteoblast differentiation, however, this requires
repeating to verify. As previously discussed, in normal cells PHA-767491 treatment
would lead to the cells being held at G1 phase of the cell cycle (Rodriguez-Acebes
et al., 2010; Tudzarova et al., 2010; Ahuja et al., 2016), which may explain the
Page | 173
increase in RUNX2 expression levels we observed. Further analysis is required
such as cell cycle sorting to determine this.
Under genotoxic stress, RUNX2 interacts with the p53 tumour suppressor (Ozaki et
al., 2013). Overexpression of RUNX2 leads to a downregulation of genes
downstream of p53, while downregulation of RUNX2 leads to an elevation of these
following DNA damage (Ozaki et al., 2013). RUNX2 may have an important role in
DNA damage response (DDR) (Wysokinski et al., 2015). During differentiation some
DDR-related factors may associate with RUNX2. The deficiency of p53 has been
shown to enhance the ability of proliferation and differentiation of osteoblasts (An et
al., 2010). An increased level of p53 upregulates RUNX2 in osteoblasts and inhibits
osteoblast differentiation (Galindo et al., 2005; Lengner et al., 2006). High levels of
RUNX2 have also been found in osteosarcoma with loss of p53 (Pereira et al., 2009;
San Martin et al., 2009). High expression level of RUNX2 is associated with bone
metastasis (Vladimirova et al., 2008; Zagami et al., 2009; Pratap et al., 2011),
suggesting an involvement in forming a microenvironment that encourages tumour
invasion.
RUNX2 and RECQL4 expression has been found to be increased in some OS
patients (Martin et al, 2014). The lack of functional RUNX2 in osteoblasts leads to
a loss of growth restraint (Pratap et al., 2003). Osteogenic differentiation leads to
growth restraint and terminal cell cycle exit due to RUNX2- dependent induction of
p27KIP1 (Drissi et al., 1999), and growth arrest following the inhibition of S-phase
cyclin complexes in mature osteoblasts (Thomas et al., 2001; Thomas et al., 2004).
6.1.1.3 The role of RECQL4 in bone morphogenesis
Ng et al, (2015), using conditional alleles that specifically inactivated Recql4 in vivo
in osteoblastic progenitor stages of differentiation, described shorter bone formation
and reduced bone volume. RECQL4 knockdown in the osteoblastic cell lineage and
in primary osteoblasts did demonstrate cell cycle arrest, apoptosis, impaired
differentiation and failed proliferation (Ng et al., 2015). The cells displayed a
‘flattened’ morphology, proliferation declined with a reduced Sca-1 expression, a
marker of proliferation (Ng et al., 2015). Although other studies have observed
senescence in human fibroblasts following RECQL4 knockdown (Lu et al., 2014a),
this was not observed (Ng et al., 2015), however, some aspects of regulation of
proliferation may be different between these cell types (Lu et al., 2014b). There are

Page | 174
important differences to consider between this mouse model system and human
patients. RECQL4 mutant proteins are expressed throughout the human body
during all the stages of skeletal development, while the OSX-CRE mediated
conditional allele will not deplete Recql4 from all bone forming cells (Ng et al., 2015).
However, the study does suggest an important intrinsic function for Recql4 in
skeletal growth (Ng et al., 2015). Mice, that harbour Recql4 depleted cells
committed to osteoblast differentiation, fail to produce mineralisation, as shown with
alizarin red staining, while profiling revealed that all markers of osteoblastic
maturation, except Runx2 were reduced in these cells (Ng et al., 2015). Interestingly
the same depletion in more mature cell populations did not demonstrate this skeletal
phenotype, suggesting that Recql4 may have a major role in pre-osteoblasts in mice
(Ng et al., 2015). High expression of Recql4 was reported in MC3T3.E1 mouse
osteoblastic cells, and this level decreases as the cells differentiate in culture.
Recql4 overexpression leads to increased proliferation, while siRNA-mediated
depletion impeded growth (Yang et al., 2006). However, the decline of RECQL4
mRNA was not demonstrated in human cells following in vitro differentiation of
Fob1.19 human immortalised foetal osteoblast cells (Burks et al., 2007). The
authors suggest this variable outcome could be due difference in species, and
method of induction of differentiation (Burks et al., 2007).
Recql4 may play a role in the regulation of osteoprogenitor proliferation as its
localization is observed in active osteoblasts surrounding the growth plates rather
than differentiated osteocytes in adult mice (Yang et al., 2006). High expression in
actively forming bone, in osteoblasts lining the trabecular surface, and in bone lining
cells, also suggests an important role for RECQL4 in bone growth (Delagoutte and
Von Hippel, 2003; Siitonen, 2008). This is not too surprising as we know
differentiation leads to reduced proliferative state of the cells, and a correlation
between RECQL4 expression and proliferation activity has been demonstrated
(Yang et al., 2006). Recql4 expression in mice is also abundant in proliferating
intestinal enterocytes and in immature cells and in chondrocytes of developing
bones and cartilage of the growth plate (Delagoutte and Von Hippel, 2003). Yang
and co-workers (2006) suggest that reduced RECQL4 expression may be required
for full differentiation (Yang et al., 2006). RTS patients may harbour mutations that
generate C-terminally truncated RECQL4 proteins, which preserve function in
replication, but helicase activity is either diminished or limited (Ng et al., 2015). This
suggests that tumour predisposition may be a feature of cells that retain the Sld2-
Page | 175
homology regions of RECQL4, which leads to proliferation with genomic instability
(Kitao et al., 1999a; Abe et al., 2011; Kohzaki et al., 2012). In line with our thoughts,
these genomic instabilities would lead to OS formation. Further to this, the
previously mentioned study by Ng et al, (2015) suggests that tumourigenesis may
require mutant Recql4 activity (Ng et al., 2015). Double knockout mice that harbour
deleted p53 and Recql4 in the osteoblastic lineage (Osx-Cre p53fl/flRecql4fl/fl) do not
always develop OS. The study suggests that mutant alleles of Recql4, and not null
alleles, may lead to susceptibility to OS formation (Ng et al., 2015). However,
previous mouse models were unable to demonstrate that Recql4 mutations lead to
OS in mice, due to transcription of the N-terminal region, and hypomorphic Recql4
alleles (Hoki et al., 2003; Mann et al., 2005).
6.2 Relationship between disturbance of DNA replication initiation and
cellular transformation (chapter 1, section 3.1.2)
Disruption of the process of differentiation can lead to severe diseases, such as
cancer (Gray et al., 2004; Jögi et al., 2012). We identified cellular changes indicative
of cell damage in ASC52telo cells under PHA-767491 treatment. Further to this,
acquiring DNA damage may dysregulate differentiation. Chronic PHA-767491
treated cells demonstrated osteoblastic like characteristics, with increased RUNX2
expression and mineralised calcium deposits observed during culturing in normal
media. The same was not seen in acute PHA-767491 treated cells. Interestingly,
we would expect RUNX2 levels to be reduced with the evidence of calcium
mineralisation, as it occurs at a later stage of differentiation (Stein et al., 2004;
Rutkovskiy et al., 2016) Dysregulation of osteogenesis transcription factors could
be establishing the features seen, and acquired over the long term PHA-767491
treatment. It is important to consider factors that regulate RUNX2, which also play
a role in the regulation of osteoblast differentiation, as previously discussed (Long,
2011; Rutkovskiy et al., 2016). The induced overexpression of RUNX2 in adipose
derived mesenchymal stem cells has been reported to enhance osteogenic activity
and inhibit adipogenesis, with a significant increase in mineral deposition compared
to control cells (Zhang et al., 2006). RUNX2 is known to target other genes in
osteogenesis, including osteocalcin (Li et al., 2012). Our results would be
strengthened by the analysis of osteocyte specific gene expression, such as
osteocalcin. Wang et al. (2006) describes a method to measure the formation of
calcified nodules with fluorescent dyes in living cells continuously without the

Page | 176
deleterious effects of Alizarin Red S. This would be useful to determine the initial
stages and proposed continual dysregulation observed in our study. Adipose-
derived stem cells may undergo spontaneous differentiation in vitro following aging
or seeding at low density with concurrent RUNX2 expression, calcium
mineralization, bone morphogenetic protein-2 and alkaline phosphatase activity (Liu
et al., 2016). In our study, the same was not seen in the control cultures. Although
the cells under continuous PHA-767491 treatment showed reduced proliferation
rate, the same cell density was seeded for both treated and control cells. Early
studies were thought to demonstrate spontaneous differentiation, however, many of
these were later retracted due to the inability to reproduce the results, and cross-
contamination (Rubio et al., 2005).
6.2.1 Membrane potential maintained in PHA-767491 treated ASC52telo
cells (chapter 1, section 3.1.3)
Mitochondrial DNA (mtDNA) is important for mitochondrial function and biogenesis
during development and differentiation (Larsson et al., 1998). mtDNA maintenance,
expression and regulation is complex, including mtDNA replication, mtDNA
transcription, RNA modifications, RNA stability, translation, and localisation of
translated proteins (Hällberg and Larsson, 2014). It is not too surprising that genetic
defects of mitochondrial function can lead to human diseases (Archer, 2013;
Magalhães et al., 2014; Singer, 2014). RECQL4 has also been shown to have a
regulatory role in mitochondrial DNA copy number (mtDNA) maintenance. mtDNA
copy number was found to increase in HEK293 cells following the elevation of
RECQL4 expression, while knockdown in U2OS cells lead to a decrease in mtDNA
copy number. RECQL4 deficient human fibroblasts and RECQL4 suppressed
cancer cells express elevated mitochondrial superoxide production with a decrease
in repair function following oxidative DNA damage (Chi et al., 2012). Interestingly,
mtDNA copy number was found to be significantly reduced in RTS cell line
AG05013. Reduced levels were also demonstrated in cells without mitochondrial
localization signal and showing localisation to the nucleus. Mitochondrial mass was
also decreased and mitochondrial morphology was aberrant suggesting alterations
in mitochondrial bioenergetics occur without RECQL4 localisation. Increased
invasive capabilities in these cells were further evidenced, which may be a
contributing factor of the predisposition of tumourigenesis found in RTS patients
(Kumari et al., 2016). Interestingly, mitochondrial and metabolic changes are also
regarded as hallmarks of differentiation of stem cells. During differentiation,
Page | 177
mitochondrial modifications occur (Folmes et al., 2011; Varum et al., 2011; Wanet
et al., 2015). Osteoblasts have a high energy requirement, as they synthesize large
amounts of extracellular matrix proteins (Esen and Long, 2014). Mitochondrial
activity has been found to be regulated during osteoblast differentiation, and at later
stages of differentiation an increase in glycolysis is observed and may have a key
role in mature osteoblasts. This may enable the cells to become more adaptable to
changes in O2 levels and energy changes (Komarova et al., 2000).
The mitochondrial membrane potential, sometimes referred to as the protonmotive
force, is a crucial parameter controlling respiratory rate, ATP synthesis, Ca2+
uptake and storage, ROS generation and detoxification, and may influence the
regulation of mtDNA expression (Nicholls, 2004; Gustafsson et al., 2016). Usage of
rhodamine 123 (R123), tetramethylrhodamine methyl ester (TMRM), and
tetramethylrhodamine ethyl ester (TMRE) provides a simple method for analysis of
membrane potential. These dyes bind to the inner and outer aspects of inner
mitochondrial membrane due to their lipophilic cation properties, and accumulate by
the mitochondria depending on membrane potential, which can then be measured
as absorbance due to the exhibition of a red shift in excitation and emission (Vander
Heiden et al., 1997; Scaduto and Grotyohann, 1999; Jayaraman, 2005; Masgras et
al., 2012). Viable cells exhibit high fluorescence, with low levels in apoptotic cells,
and under pathological condition such as mitochondrial membrane potential
impairment (Cottet‐Rousselle et al., 2011;Burbulla and Krüger, 2012).
In our study, the mitochondrial membrane appeared viable and no significant
changes were seen in permeability in the TMRE assay. However, higher readings
were demonstrated in higher passage cells under both normal conditions and PHA-
767491 treated cells, the reasons for which is unclear. Culturing cells for long period
in vitro can generate alterations in gene expression, and differentiation potential, as
a result of culture induced stress (Somaiah et al., 2015). In aging, a decrease in
energy production and increased oxidative stress are considered as major
contribution to age related pathologies. Defects in mitochondrial activity are also
often seen (Di Lisa and Bernardi, 2005; Conley et al., 2007; Pi et al., 2007; Bratic
and Larsson, 2013). Although differences in membrane potential reading between
young and aged cells have been reported, some uncertainty remains due to
methodological limitations (Nicholls, 2004).
Page | 178
The effect of PHA-767491 treatment on mitochondria is not intensively studied in
the literature. A study by Nantoni et al, (2011) showed that PHA-767491 induced
Bax activation and a time-dependent increase in cells with low mitochondrial
membrane potential in chronic lymphocytic leukemia (CLL) cells. They found the
inhibition of Cdk9 lead to death of quiescent CLL cells through the intrinsic apoptotic
pathway, suggesting a link with the transcriptional inhibition of McI-1 as a decrease
of McI-1 protein was seen. Cdc7 inhibition caused a block of proliferation in CLL
cells (Natoni et al., 2011). Our study did not appear to show significant changes to
mitochondrial membrane potential in response to chronic or acute PHA-767491
treatment.
To further verify our findings, methods such as flow cytometry and confocal
microscopy can be used (Cottet‐Rousselle et al., 2011). They offer the visualisation
and analysis of morphological changes of mitochondria (Cottet‐Rousselle et al.,
2011). We could also verify our findings with the use of oxygen electrodes to
measure and analyse respiratory parameters.
6.3 PHA-767491 generates DNA damage in ASC52telo cells (chapter 2,
section 4)
6.3.1 Morphological markers of genome instability
The cellular architecture not only provides structural basis to cellular shape, but
involves many functions necessary for the survival and maintenance of the cell
(Takai et al., 2005). In most cells under normal conditions the shape of nuclei is
usually round or oval (Webster et al., 2009). Alterations can be seen during normal
development and differentiation (Hampoelz and Lecuit, 2011), and during cell aging
and genetic diseases (Khatau et al., 2009; Zwerger et al., 2011).
Cellular morphological changes are utilised as markers of chromosomal instabilities;
aberrant mitotic structures are typically associated with unfinished replication in
somatic cells, indicative of replicative stress (Mankouri et al., 2013). These include
abnormalities found within the literature, such as micronuclei, nuclear budding,
chromatin bridges, and enlarged nuclei (Yoon et al., 2002; Zhen et al., 2002; Hida
et al., 2004; Hong et al., 2009; El Ghamrasni et al., 2011; Mcgranahan et al., 2012;
Chen et al., 2014a; Tyagi et al., 2015; Yadav and Bhatia, 2017). Cellular aging has
been reported to be an influential factor of baseline of these markers, and
demonstrated in our study (Khatau et al., 2009; Zwerger et al., 2011). The initial
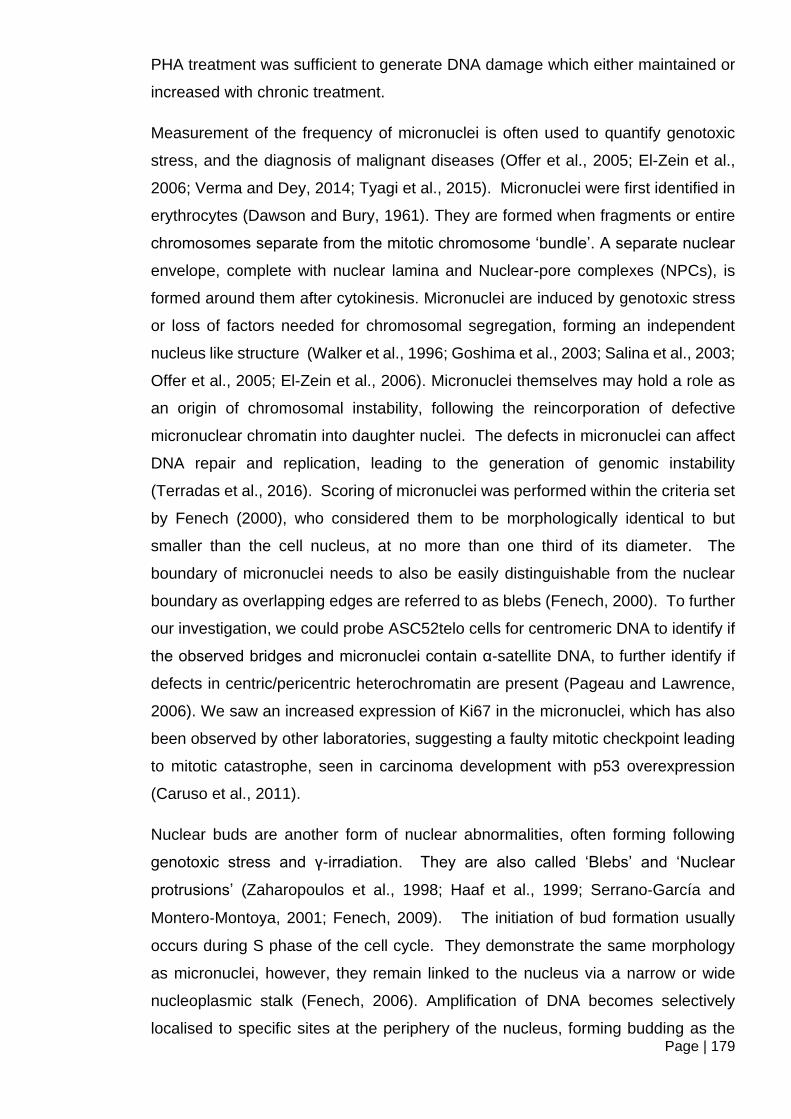
Page | 179
PHA treatment was sufficient to generate DNA damage which either maintained or
increased with chronic treatment.
Measurement of the frequency of micronuclei is often used to quantify genotoxic
stress, and the diagnosis of malignant diseases (Offer et al., 2005; El-Zein et al.,
2006; Verma and Dey, 2014; Tyagi et al., 2015). Micronuclei were first identified in
erythrocytes (Dawson and Bury, 1961). They are formed when fragments or entire
chromosomes separate from the mitotic chromosome ‘bundle’. A separate nuclear
envelope, complete with nuclear lamina and Nuclear-pore complexes (NPCs), is
formed around them after cytokinesis. Micronuclei are induced by genotoxic stress
or loss of factors needed for chromosomal segregation, forming an independent
nucleus like structure (Walker et al., 1996; Goshima et al., 2003; Salina et al., 2003;
Offer et al., 2005; El-Zein et al., 2006). Micronuclei themselves may hold a role as
an origin of chromosomal instability, following the reincorporation of defective
micronuclear chromatin into daughter nuclei. The defects in micronuclei can affect
DNA repair and replication, leading to the generation of genomic instability
(Terradas et al., 2016). Scoring of micronuclei was performed within the criteria set
by Fenech (2000), who considered them to be morphologically identical to but
smaller than the cell nucleus, at no more than one third of its diameter. The
boundary of micronuclei needs to also be easily distinguishable from the nuclear
boundary as overlapping edges are referred to as blebs (Fenech, 2000). To further
our investigation, we could probe ASC52telo cells for centromeric DNA to identify if
the observed bridges and micronuclei contain α-satellite DNA, to further identify if
defects in centric/pericentric heterochromatin are present (Pageau and Lawrence,
2006). We saw an increased expression of Ki67 in the micronuclei, which has also
been observed by other laboratories, suggesting a faulty mitotic checkpoint leading
to mitotic catastrophe, seen in carcinoma development with p53 overexpression
(Caruso et al., 2011).
Nuclear buds are another form of nuclear abnormalities, often forming following
genotoxic stress and γ-irradiation. They are also called ‘Blebs’ and ‘Nuclear
protrusions’ (Zaharopoulos et al., 1998; Haaf et al., 1999; Serrano‐García and
Montero‐Montoya, 2001; Fenech, 2009). The initiation of bud formation usually
occurs during S phase of the cell cycle. They demonstrate the same morphology
as micronuclei, however, they remain linked to the nucleus via a narrow or wide
nucleoplasmic stalk (Fenech, 2006). Amplification of DNA becomes selectively
localised to specific sites at the periphery of the nucleus, forming budding as the

Page | 180
surplus DNA is excluded via the nucleus, which can form micronuclei. The amplified
DNA may also be eliminated through recombination between homologous regions
within the sequence, this then forms minicircles of acentric and a telomeric DNA.
These localise to regions within the nucleus or following segregation localise to the
nucleus at distinct regions (Shimizu et al., 1998; Shimizu et al., 2000). This suggests
that the nucleus has an ability to sense excess DNA, and induce a potential DNA
repair mechanism to eliminate these (Fenech, 2006; Black and Giunta, 2018).
A further example of nuclear architecture defect is the formation of the doughnut-
shaped nuclei (Reichert et al., 2010; Verstraeten et al., 2011; Dreesen et al., 2013).
They have been found to form during chromatin decondensation during late mitosis,
suggesting the involvement of centrosome separation and organization defects
(Verstraeten et al., 2011). However, Jagannathan et al (2012), did not find a relation
with centrosomes and suggested an indirect cause following cell cycle perturbation
(Jagannathan et al., 2012). The observation of the doughnut-shaped nuclei has
been linked to an increase of proteasomal degradation of pericentrin (Verstraeten
et al., 2011). During cell division, the sister chromatids are often connected via DNA
bridges, most apparently during anaphase. A subset of these has been found in
human cells to link to chromosomal fragile sites (Chan et al., 2009; Lukas et al.,
2011). These fragile sites can be susceptible to chromosome breakages,
translocations, deletions, and associated often with genetic disorders and cancer
(Durkin and Glover, 2007; Gandhi et al., 2010). The mis-repair of double stranded
DNA breaks could generate dicentric chromosomes and forming bridges (Fenech,
2006; Black and Giunta, 2018), which may be the mechanism behind the
chromosome bridges observed in our study.
PHA-767491 treated lung cells from p53R172H-KI mice demonstrated inhibition of
origin firing and reduced micronuclei formation (Singh et al., 2017). However, these
cells hold a Tp53 mutation, supporting the relationship between p53 expression
levels and the induction of micronuclei and level of p53 association with
chromosomal damage reported in other studies (Driessens et al., 2003; Salazar et
al., 2009). The study by Huggett et al (2016) did not report cell morphology changes
using phase contrast light microscopy, and nuclei analysis using DAPI, in human
(foetal) IMR90 lung fibroblast cells treated with acute PHA-767491, or CDC7 siRNA
knockdown. Arrested growth was observed as smaller population of cells,
consistent with G1 cell cycle arrest (Huggett et al., 2016), which was also
demonstrated in other studies (Montagnoli et al., 2004; Rodriguez-Acebes et al.,
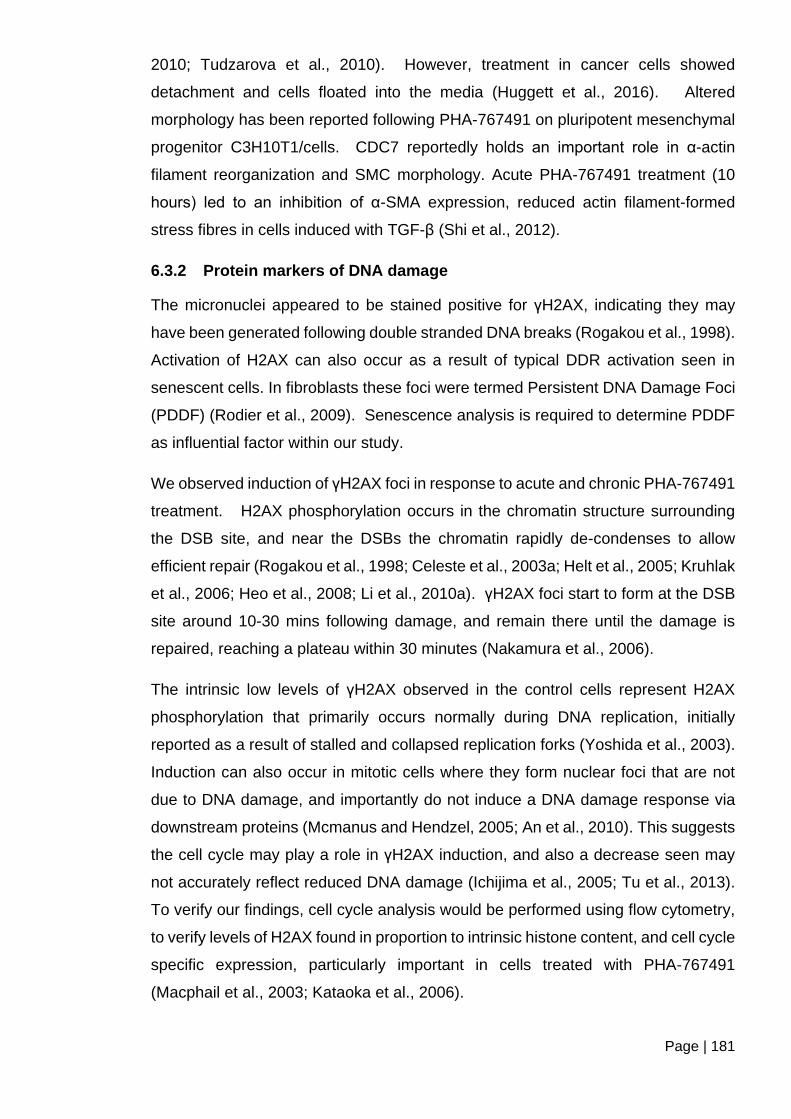
Page | 181
2010; Tudzarova et al., 2010). However, treatment in cancer cells showed
detachment and cells floated into the media (Huggett et al., 2016). Altered
morphology has been reported following PHA-767491 on pluripotent mesenchymal
progenitor C3H10T1/cells. CDC7 reportedly holds an important role in α-actin
filament reorganization and SMC morphology. Acute PHA-767491 treatment (10
hours) led to an inhibition of α-SMA expression, reduced actin filament-formed
stress fibres in cells induced with TGF-β (Shi et al., 2012).
6.3.2 Protein markers of DNA damage
The micronuclei appeared to be stained positive for γH2AX, indicating they may
have been generated following double stranded DNA breaks (Rogakou et al., 1998).
Activation of H2AX can also occur as a result of typical DDR activation seen in
senescent cells. In fibroblasts these foci were termed Persistent DNA Damage Foci
(PDDF) (Rodier et al., 2009). Senescence analysis is required to determine PDDF
as influential factor within our study.
We observed induction of γH2AX foci in response to acute and chronic PHA-767491
treatment. H2AX phosphorylation occurs in the chromatin structure surrounding
the DSB site, and near the DSBs the chromatin rapidly de-condenses to allow
efficient repair (Rogakou et al., 1998; Celeste et al., 2003a; Helt et al., 2005; Kruhlak
et al., 2006; Heo et al., 2008; Li et al., 2010a). γH2AX foci start to form at the DSB
site around 10-30 mins following damage, and remain there until the damage is
repaired, reaching a plateau within 30 minutes (Nakamura et al., 2006).
The intrinsic low levels of γH2AX observed in the control cells represent H2AX
phosphorylation that primarily occurs normally during DNA replication, initially
reported as a result of stalled and collapsed replication forks (Yoshida et al., 2003).
Induction can also occur in mitotic cells where they form nuclear foci that are not
due to DNA damage, and importantly do not induce a DNA damage response via
downstream proteins (Mcmanus and Hendzel, 2005; An et al., 2010). This suggests
the cell cycle may play a role in γH2AX induction, and also a decrease seen may
not accurately reflect reduced DNA damage (Ichijima et al., 2005; Tu et al., 2013).
To verify our findings, cell cycle analysis would be performed using flow cytometry,
to verify levels of H2AX found in proportion to intrinsic histone content, and cell cycle
specific expression, particularly important in cells treated with PHA-767491
(Macphail et al., 2003; Kataoka et al., 2006).
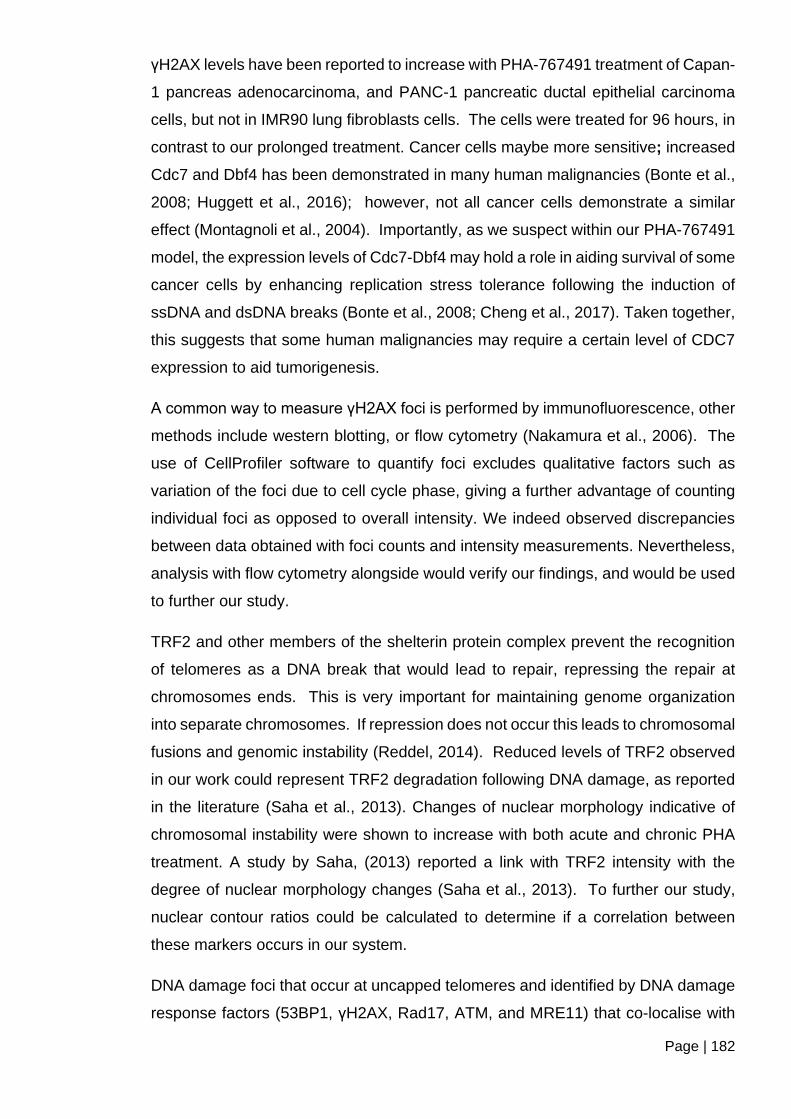
Page | 182
γH2AX levels have been reported to increase with PHA-767491 treatment of Capan-
1 pancreas adenocarcinoma, and PANC-1 pancreatic ductal epithelial carcinoma
cells, but not in IMR90 lung fibroblasts cells. The cells were treated for 96 hours, in
contrast to our prolonged treatment. Cancer cells maybe more sensitive; increased
Cdc7 and Dbf4 has been demonstrated in many human malignancies (Bonte et al.,
2008; Huggett et al., 2016); however, not all cancer cells demonstrate a similar
effect (Montagnoli et al., 2004). Importantly, as we suspect within our PHA-767491
model, the expression levels of Cdc7-Dbf4 may hold a role in aiding survival of some
cancer cells by enhancing replication stress tolerance following the induction of
ssDNA and dsDNA breaks (Bonte et al., 2008; Cheng et al., 2017). Taken together,
this suggests that some human malignancies may require a certain level of CDC7
expression to aid tumorigenesis.
A common way to measure γH2AX foci is performed by immunofluorescence, other
methods include western blotting, or flow cytometry (Nakamura et al., 2006). The
use of CellProfiler software to quantify foci excludes qualitative factors such as
variation of the foci due to cell cycle phase, giving a further advantage of counting
individual foci as opposed to overall intensity. We indeed observed discrepancies
between data obtained with foci counts and intensity measurements. Nevertheless,
analysis with flow cytometry alongside would verify our findings, and would be used
to further our study.
TRF2 and other members of the shelterin protein complex prevent the recognition
of telomeres as a DNA break that would lead to repair, repressing the repair at
chromosomes ends. This is very important for maintaining genome organization
into separate chromosomes. If repression does not occur this leads to chromosomal
fusions and genomic instability (Reddel, 2014). Reduced levels of TRF2 observed
in our work could represent TRF2 degradation following DNA damage, as reported
in the literature (Saha et al., 2013). Changes of nuclear morphology indicative of
chromosomal instability were shown to increase with both acute and chronic PHA
treatment. A study by Saha, (2013) reported a link with TRF2 intensity with the
degree of nuclear morphology changes (Saha et al., 2013). To further our study,
nuclear contour ratios could be calculated to determine if a correlation between
these markers occurs in our system.
DNA damage foci that occur at uncapped telomeres and identified by DNA damage
response factors (53BP1, γH2AX, Rad17, ATM, and MRE11) that co-localise with
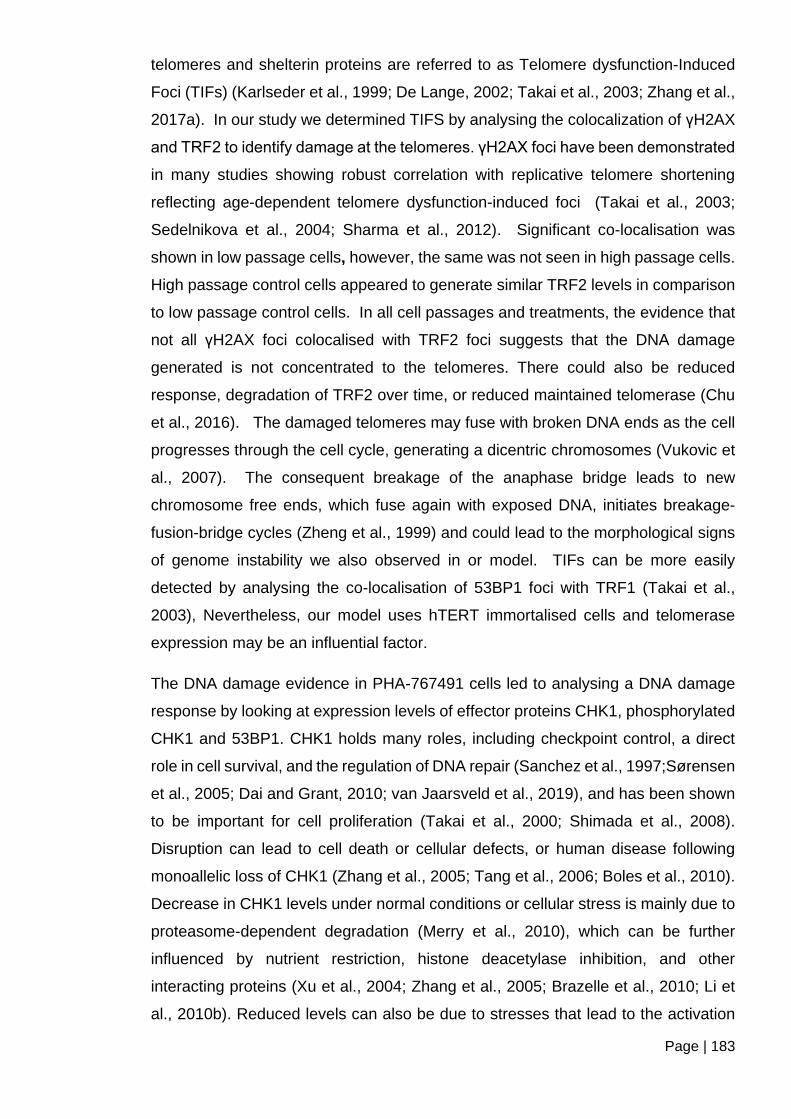
Page | 183
telomeres and shelterin proteins are referred to as Telomere dysfunction-Induced
Foci (TIFs) (Karlseder et al., 1999; De Lange, 2002; Takai et al., 2003; Zhang et al.,
2017a). In our study we determined TIFS by analysing the colocalization of γH2AX
and TRF2 to identify damage at the telomeres. γH2AX foci have been demonstrated
in many studies showing robust correlation with replicative telomere shortening
reflecting age-dependent telomere dysfunction-induced foci (Takai et al., 2003;
Sedelnikova et al., 2004; Sharma et al., 2012). Significant co-localisation was
shown in low passage cells, however, the same was not seen in high passage cells.
High passage control cells appeared to generate similar TRF2 levels in comparison
to low passage control cells. In all cell passages and treatments, the evidence that
not all γH2AX foci colocalised with TRF2 foci suggests that the DNA damage
generated is not concentrated to the telomeres. There could also be reduced
response, degradation of TRF2 over time, or reduced maintained telomerase (Chu
et al., 2016). The damaged telomeres may fuse with broken DNA ends as the cell
progresses through the cell cycle, generating a dicentric chromosomes (Vukovic et
al., 2007). The consequent breakage of the anaphase bridge leads to new
chromosome free ends, which fuse again with exposed DNA, initiates breakage-
fusion-bridge cycles (Zheng et al., 1999) and could lead to the morphological signs
of genome instability we also observed in or model. TIFs can be more easily
detected by analysing the co-localisation of 53BP1 foci with TRF1 (Takai et al.,
2003), Nevertheless, our model uses hTERT immortalised cells and telomerase
expression may be an influential factor.
The DNA damage evidence in PHA-767491 cells led to analysing a DNA damage
response by looking at expression levels of effector proteins CHK1, phosphorylated
CHK1 and 53BP1. CHK1 holds many roles, including checkpoint control, a direct
role in cell survival, and the regulation of DNA repair (Sanchez et al., 1997;Sørensen
et al., 2005; Dai and Grant, 2010; van Jaarsveld et al., 2019), and has been shown
to be important for cell proliferation (Takai et al., 2000; Shimada et al., 2008).
Disruption can lead to cell death or cellular defects, or human disease following
monoallelic loss of CHK1 (Zhang et al., 2005; Tang et al., 2006; Boles et al., 2010).
Decrease in CHK1 levels under normal conditions or cellular stress is mainly due to
proteasome-dependent degradation (Merry et al., 2010), which can be further
influenced by nutrient restriction, histone deacetylase inhibition, and other
interacting proteins (Xu et al., 2004; Zhang et al., 2005; Brazelle et al., 2010; Li et
al., 2010b). Reduced levels can also be due to stresses that lead to the activation
Page | 184
of p53-dependent G1/S arrest, which inhibits E2F-dependent transcription of CHK1,
found to be important in the rise of levels during G1 / S transition (Gottifredi et al.,
2001). Genotoxic stress can lead to a delay of progression through S or G2 phases
of the cell cycle, and is caused by the phosphorylation of CDC25A and CDC25C
phosphatases by CHK1, which inhibits their activity, consequently inhibiting the
dephosphorylation of cyclin-dependent kinases CDK1 and CDK2 ( Bartek et al.,
2004; Sørensen et al., 2005; Goto et al., 2019), thus delaying mitotic entry and
allowing DNA repair mechanisms to follow (Sanchez et al., 1997; Brown and
Baltimore, 2003). If CHK1 is inhibited, it can enable the cell to continue the cell cycle
with sustained DNA damage, potentially leading to cell death (Sørensen et al.,
2005).
The activation of CHK1 stabilizes the CDC7-DBF4 kinase complex, assisting in
replication (Yamada et al., 2013), and is important for intra-S and G2/M cell cycle
checkpoints (Sanchez et al., 1997; Zhao et al., 2002; Brown and Baltimore, 2003;
Petermann et al., 2006; Heffernan et al., 2007; Segurado and Diffley, 2008). Certain
number of the ASC52telo cells would be reversibly arrested at G1 phase within the
cell cycle due to the PHA-767491 (Rodriguez-Acebes et al., 2010), therefore, we
could expect this may influence CHK1 activity, also due to the inhibition of Cdc7 be
it mild. Interestingly, Montagnoli and co-workers observed that PHA-767491 does
not lead to a sustained DNA damage response (Montagnoli et al., 2008b). They did
not detect CHK1 phosphorylation at Ser345, and only low levels of CHK2
phosphorylation at Thr68, following PHA-767491 treatment in HeLa cells. Although
an increase in γH2AX expression was seen, they suggested this may be a
secondary effect.. In our study, slight increase of phosphorylated CHK1 at
endogenous levels was only seen in low passage chronic PHA-767491 treated cells,
which requires further verification.
53BP1 has been shown to initiate the phosphorylation of H2AX and other proteins,
to proceed a DNA repair response (Ward et al., 2005; Lee et al., 2010; Noon et al.,
2010), and promotes DNA end linking during chromosome remodelling (Manis et
al., 2004; Ward et al., 2004). 53BP1 has a role in the early event of tumour
progression, influencing proliferation, apoptosis and cell cycle (Nuciforo et al., 2007;
Bi et al., 2015). An increase of 53BP1 expression in cells under acute PHA-767491
could demonstrate an initial response; however, expression appears to be reduced.
Nevertheless, in some chronic treated cells a significant increase was seen,
suggesting that the long-term DNA replication interference could still generate
Page | 185
53BP1 response. Apoptosis or senescence often follows as a response to
irreparable DNA damage (Elmore, 2007). The acute treated cells could be more
sensitive to the initial treatment and induce cells into apoptosis as an alternative to
repair. Quantifying apoptotic and senescent could determine if this is an influential
factor within our study. Although not significant, reduced expression was seen in
high passage chronic PHA-767491 cells under recovery, which could indicate during
long term treatment these cells lost the capability to initiate a 53BP1 mediated
response, indicating a reduced DNA damage response. The lack of expression may
relate to the increase in genomic instabilities seen in these cells. If 53BP1 can
activate CHK1 (Bartek and Lukas, 2003), we may have expected to see a correlation
between them, which may be the case in high passage cells.
Deregulation of cell proliferation has been found to lead to DNA damage response
activation mainly via the ATM and ATR pathways (Hahn et al., 1999) (Bartkova et
al., 2005; Gorgoulis et al., 2005; Bartkova et al., 2010). Interestingly, this activation
in normal cells would lead to a barrier against uncontrolled cell growth, a hallmark
of cancer cells. In tumour cells this activation however leads to removal of this
barrier through one or more losses of DNA damage response capabilities,
increasing genomic instability, and the higher dependency on the remaining DNA
damage response (Halazonetis et al., 2008; O’connor, 2015). A cancer cell acquires
a number of central genetic lesions that enable alterations to the normal multicellular
development and expansion of cells, allowing intratumoral diversification and the
development of cancer subclones. These cells harbour variations of genomic
modifications, which differ from the surrounding tumour cell population. Patients who
present this heterogeneity show poor prognosis and increase in relapse following
cancer treatment, which is a feature of OS (Landau et al., 2013; Landau et al., 2015;
Andor et al., 2016; Mcgranahan et al., 2016). A driver of this process is chromosomal
instability (Bakhoum and Landau, 2017).
6.3.3 Interference with DNA replication initiation leads to cellular
transformation (chapter 2 section 4.2)
The degree of chromosomal instabilities is not the only influential factor for
tumourigenesis. To assess whether the chromosomal instability we observed
following chronic PHA treatment correlated with the acquisition of tumourigenic
characteristics, we further analysed the cells for anchorage-independent growth and
loss of contact inhibition, hallmarks of tumour cell development. Modification of
adhesion is classed within the first change of cellular adaptation and is also involved
Page | 186
in the metastasis stage (Jinka et al., 2012). In normal cells the detachment from the
extracellular matrix, or cell adhesion to an inappropriate location induces a type of
apoptosis, often termed as anoikis, triggered by the loss of interaction between the
cell and the extra-cellular matrix (ECM) that mediates cell death (Frisch and
Ruoslahti, 1997; Frisch and Screaton, 2001; Lee et al., 2016). Anoikis was first
described in epithelial and endothelial cells and protects cells when adherent on
permissive ECM proteins (Frisch and Francis, 1994). Anoikis is a Greek word
meaning loss of “home” or “homelessness”, and holds an important role in the
prevention of detached cells adhering to new locations and potentially initiate
dysplastic growth. The failure of this regulation can lead to adherent cells detaching
from supportive matrix due to loss of survival signals from cell-ECM interactions, are
able to survive under suspension conditions or capable of proliferation with
alternative ECM proteins at ectopic sites. Tumour cells, including osteosarcoma, are
able is to resist anoikis, and to grow and survive without anchorage to ECM (Liu et
al., 2008; Taddei et al., 2012; Zhu et al., 2013; Gao et al., 2018). Osteoblasts secrete
ECM that is a major component for mature bone, and important mechanical
receptors that signal bone matrix formation and the promotion of mineralization
following mechanical strain (Wozniak et al., 2000; Simmons et al., 2003). Secreted
ECM-related proteins include osteonectin, osteopontin (OPN), osteocalcin (OCN),
bone morphogenetic protein 2 (BMP-2), and type I collagen, and promote vascular
endothelial growth factor (VEGF) synthesis (Bhatt et al., 2007).
Adult tissue derived MSCs retain adherence to plastic dishes in laboratory culture
(Da Silva Meirelles et al., 2006). Adipose derived MSCs also hold this characteristic
(Grossmann, 2002). Cell clump (spheroids) formation was observed in our PHA
model indicating potential anchorage-independent cell growth. Although a few small
spheroids were seen in some of the control conditions on ultra-low attachment
plates, these appeared rare and indicated a growth rate significantly lower than the
chronic treated high passage cells.
MSC spheroids have been shown to maintain differentiation, and allow a novel 3D
culture model in comparison to adherent monolayer systems (Baraniak and
Mcdevitt, 2011). Long term culturing of ASCs as 3D spheroid culture leads to
efficient and enhanced proliferation, with unaltered adhesion capacity demonstrated
with re-attachment. Alterations of cell-to-ECM interacting protein expression have
also been found in MSC spheroids compared to scraped or trypsinised MSCs,
Page | 187
suggesting that spheroid growth leads to cellular changes advantageous to
proliferation and growth (Lee et al., 2016).
The soft agar method has been the gold-standard, sensitive assay for many years
for exploring anchorage-independent growth (Macpherson and Montagnier, 1964;
Conery and Harlow, 2010; Hasebe-Takada et al., 2016); however, the soft agar
assay is unsuitable to demonstrate tumourigenic conversion from hTERT
transduction (Jiang et al., 1999; Wolbank et al., 2009; Zhang et al., 2017c). Instead,
we grew the cells in plates treated to reduce attachment surface (Fukazawa et al.,
1995). The ultra-low attachment plates used in our study have a neutrally charged,
hydrophilic surface with covalently bonded hydrogel layer that minimises attachment
(Corning 3474), (Basu-Roy et al.; Douma et al., 2004; Boschelli et al., 2008; Dottori
et al., 2010; Neri et al., 2013). Several studies have used similar techniques and
observations as to our study, to determine malignant transformation (Ward et al.,
2013; Giannakouros et al., 2015).
To further our analysis staining using crystal violet dye can be used, binding to
proteins and DNA, and indicating cell viability, colony formation (Zhang et al.,
2017c), and anoikis in vivo (Pedanou et al., 2016). It is a method used often in the
literature, however, similar to using the MTS assay, as the cell clumps appear large
the permeability of the stain would be a concern. Another methodology for cell
clump quantification would be the flow cytometry-based pulse-width assay, which is
reported to show high level of accuracy, and sensitivity (Hickerson et al., 2014; Cui
et al., 2016), Quantifying the clumps alone could be used, however, in our study,
the treated cell clumps appeared larger, therefore the cells appeared to favour
grouping together rather than producing smaller and many clumps. It would be
interesting to analyse our PHA-767491 treated cells for anoikis in vivo, to determine
if reduced regulation may be leading to the potential anchorage-independent growth
observed (Kang et al., 2007; Rago et al., 2008).
Another cellular transformation hallmark includes the loss of contact inhibition. Our
findings initially showed that acute PHA-767491 treatment reduced cell proliferative
rate, however, we wanted to investigate if the cellular modifications that we
observed, including anchorage-independent growth, led to a loss of contact
inhibition in these cells. ASC52telo cells have been reported to display normal
contact inhibition properties (Wolbank et al., 2009). In confluent adherent cell lines,
contact inhibition is defined as a major decrease in cell mobility and mitotic rate in
Page | 188
relation to increasing cell density, and a stationary state insensitive to nutrient
renewal following confluency, in spite of the availability of growth factors and
nutrients (Levine et al., 1965; Huttenlocher et al., 1998; Halbleib and Nelson, 2006;
Takai et al., 2008; Zeng and Hong, 2008; Heckman, 2009). In particular, fibroblast
cells display density-dependent inhibition and the extent of quiescence is
proportional to serum growth factor concentrations within the growth medium in
culture (Cooper and Hausman, 2000).
The formation of cell clumping observed in our study in PHA-767491 treated cells
could lead to under-represented cell quantity, as individual cells could not be
quantified within the cell clumps. Grzesiak and co-workers (2011) observed similar
cell clump formation following culture of equine adipose derived primary cells
(Grzesiak et al., 2011). Undifferentiated adipose derived stem cells form spheres,
thought to be neurospheres, spontaneously when cultured at high density (Kang et
al., 2004b; Ivascu and Kubbies, 2007; Meyer and Walter, 2016; Schmidt et al., 2016;
Zhang et al., 2017b). Chronic PHA treatment did cause more variable cell viability
over the culture time measured by trypan blue; however, it remained above 95%,
demonstrating good rate of cell survival in culture (Ribeiro et al., 2006).
We used protein concentration measurements to gain a better insight of cell growth.
However, protein concentrations may alter due to conditions of the cell, and changes
may occur when cells are under stress (Gasch et al., 2000; Brauer et al., 2008;
Keren et al., 2013; Barenholz et al., 2015), or are in different cell cycle phase
(Cookson et al., 2009). Changes in protein concentrations also relate to the
proliferative state of the cell, an increase in bio-synthesis machinery genes leads to
faster growth. Barenholz et al, (2015) suggested a model where cell growth leads
to production of proteins at the same rate as protein degradation. These
suggestions could explain the variable protein concentrations we observed.
Nevertheless, results obtained with cell count and protein concentration
measurements show some correlation. An increase was shown in general in acute
PHA-767491 treated cells, although this did decrease following further culturing.
High passage chronic treated cells following recovery demonstrated overall
significant increase in proliferation over the 21 days of culture. Repeats are required
to verify this finding, as not always seen, but suggests continual growth in these
cells. We do need to consider that the cells may catch up following release of
treatment. Further culturing and other analysis are required.
Page | 189
The RealTime-Glo MT cell viability assay (Promega) is a nonlytic assay. It
measures the reducing potential of viable cells in an ATP-independent manner, is
well tolerated by cells and luminescence signal can be retaken up to 72 hrs of
incubation, which provides kinetic data allowing the possibility to monitor cellular
changes over time. The assay utilises a pro-substrate, and an engineered luciferase
added to the media. The MT cell viability pro-substrate is cell-permeant and diffuses
into the cells in culture. This is reduced by metabolically active cells forming a
NanoLuc® substrate that diffuses out of the cells, and rapidly used by A NanoLuc®
Enzyme that is also added to the media, producing a luminescent signal (Hall et al.,
2012). The assay result correlates with the quantity of metabolically active viable
cells, and is affected by the number of cells per well, and their overall metabolic
activity. High number of cells, however, results in loss of linearity (Riss et al., 2015).
Our study showed the initial reading (day 21) appeared sufficient as demonstrated
high cell density across the cultures, treated and controls, although no significant
differences at time of reading. However, a high reduction of signal was observed
after 72 hours in all cells, which was unexpected and could suggest loss of cell
viability. When viewed microscopically the cells, however, appeared viable
suggesting this was not the case. To verify cell viability, I performed an MTS assay
following further culture time on the same cells, which demonstrated cell viability,
and further that high passage cells released from chronic PHA treatment showed
increased cell numbers. The same was not shown in low passage cells, suggesting
potential cellular changes may occur following chronic treatment. There are a
number of possible reasons for the reduced luminescence readings obtained with
the RealTime-Glo MT kit, which occurred following experimental repeats. As a
luminescent assay, exposure to sources of light could have led to the reduction of
output. High light intensity may also lead to an increase in the decay rate of the
reaction (Deluca et al., 1979). Further repeats and potential experimental design
modifications would enable the use of the RealTime-Glo MT kit in further
investigations in our study, but in this instance, it did not meet expectations.
Nevertheless, the finding that chronic PHA-767491 recovery cells continue to
proliferate was generally confirmed with each technique. Extending the time in
culture would be important, and to distinguish between the loss of contact inhibition
and slow growth further studies are required. β-galactosidase activity assay would
highlight the cells under senescence, and contact inhibition as both are associated
with lysosomal activation (Knecht et al., 1984; Severino et al., 2000; Leontieva et
al., 2014). It would be important to determine if PHA-767491 treatment generates
Page | 190
senescent cells alone. Modifying the methodology by seeding the cells initially at
high density has been used within the literature (Leontieva et al., 2014), and would
enable further verification of our results.
A study by Røsland et al (2009), was the first to report spontaneous malignant
transformations that occurred in 45.8% of long term cultured bone-marrow derived
human mesenchymal stem cells (hMSC), followed by a number of other reports.
However, contamination was admitted generating artefactual results and suggested
to be the ‘cause’ of transformation (Rubio et al., 2005; Røsland et al., 2009; Torsvik
et al., 2010). A more recent study, however, observed tumorigenic transformation
during long-term culture, and was confirmed not to be due to contamination with
other human cell lines (Pan et al., 2013). Due to risk of contamination during long
term culturing it is therefore crucial that rigorous aseptic working procedures are
followed to reduce artefactual results indicating transformation, observed in early
reports. This also highlights the need to characterise the cell type, discussed in the
next chapter.
In summary, our model of replicative stress in ASC52telo cells verified our thoughts
as DNA damage was shown. In particular, prolonged replicative stress may lead to
a reduced or impaired response leading to sustained DNA damage and cell
transformation, as depicted in Schematic 6.3-1.
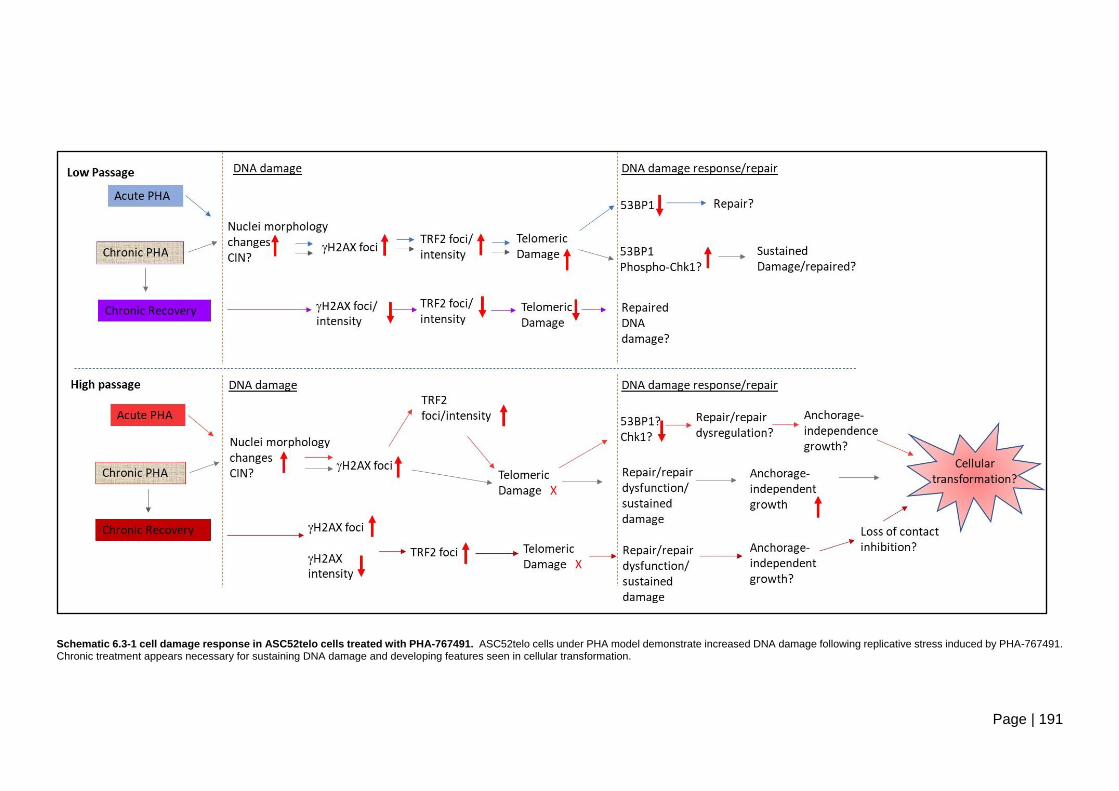
Page | 191
Schematic 6.3-1 cell damage response in ASC52telo cells treated with PHA-767491. ASC52telo cells under PHA model demonstrate increased DNA damage following replicative stress induced by PHA-767491. Chronic treatment appears necessary for sustaining DNA damage and developing features seen in cellular transformation.
Page | 192
6.4 ASC52telo genotype verified (chapter 2, section 4.3).
Throughout my investigations, to ensure cellular changes in high passage cells were
considered, we used matched high passage number cells as a control to the long
term treated cells, to demonstrate the cellular changes were due to conditions of
treatment rather than passage.
Short tandem repeats (STRs) contain 3-7 base pair long sequence units repeated
in tandem, dispersed across the genome. The number of repeat units at the same
locus varies between individuals, and the haplotype of several loci combined
together can identify individuals (Jeffreys et al., 1985b; Litt and Luty, 1989; Weber
and May, 1989; Edwards et al., 1991; Rassmann et al., 1991; Moretti and Budowle,
1998), and as in our case cells and cell lines, at an astonishingly high power of
probability. When amplified with PCR they can be differentiated using fluorescent
primers that flank the repeat sequences at hypervariable regions (Jeffreys et al.,
1985a; Jeffreys et al., 1985b; Saiki et al., 1985; Edwards et al., 1991; Warne et al.,
1991; Edwards et al., 1992). It is crucial to determine origin, phenotype, and
contamination in cell lines. The method utilised (GenePrint® 10 System) enabled
co-amplification and detection of 10 human loci, following the amplification of STR
regions of human genomic DNA with ILS, and run by capillary electrophoresis to
determine the size of the amplified samples. The random match probability of the
system is 1 in 2.92*109 (Promega). Our ASC52telo cells at different stages of
passage and treatment have been verified, and the possibility of contamination with
other (tumour) cell lines was ruled out. Cell line authentication has been set as an
important standard of the literature (Masters et al., 2001; Dunham and Guthmiller,
2009; Stacey et al., 2014; Yu et al., 2015). Standards have been issued regarding
the authentication of the use of human cell lines by the American Tissue Culture
Collection Standards Development Organization Workshop. To further our analysis
the European Medicines Agency reported the analysis of senescence in vitro
following several passages could be utilised to indicate the absence of
immortalized/tumourigenic cells, aiding the quality control of MSCs, and highlighting
cross contamination (Emea, 2009).
Page | 193
6.5 RECQL4 expression and proliferation (chapter 3, section 5)
The role of RECQL4 in DNA replication, repair and telomere maintenance is well
documented, therefore, we would assume that loss leads to an effect on cellular
growth and lifespan (Ghosh et al., 2012; Davis et al., 2013; Ferrarelli et al., 2013).
RECQL4 expression has been found to correlate with cell proliferation activity
(Bachrati and Hickson, 2003; Yang et al., 2006; Lu et al., 2014a). The study by
Yang et al, (2006) demonstrated decrease of proliferation in MC3T3.E1 cells
following the knockdown of Recql4 using siRNA silencing. On the other hand,
overexpression was shown to lead to cell growth in mouse osteoblastic cells (Yang
et al., 2006). A more recent study found that the disruption of Recql4 reduced
proliferation in mouse osteoblasts (Ng et al., 2015), and in Drosophila (Xu et al.,
2009a). Tissue and cell specific expression patterns have also been shown for
RECQL4 mRNA with northern blotting analysis. High expression correlates to
higher number of intensively proliferating cells. It is not surprising, therefore, that
tissues and organs with the highest expression are strongly affected contributing to
the pathological features seen in RECQL4 related syndromes (Larizza et al., 2010;
Wang and Plon, 2016). The expression profile of RECQL4 has been found to be
consistent with the skeletal defects most often seen in patients with RTS (Larizza et
al., 2010; Wang and Plon, 2016). Interestingly, RTS patients usually have a normal
lifespan in the absence of cancer despite presentations of premature aging (Hofer
et al., 2005; Jin et al., 2008; Larizza et al., 2010).
In our study, RECQL4 expression levels appeared variable during cell culture
between U2OS and HeLa cell lines. The study was small and repeats are needed,
however, we employed different indicators of proliferation and viability to verify our
findings. Nevertheless, a steady increase and decrease in RECQL4 expression in
U2OS cells was found correlating to cell count levels.
In cancer cell lines, we would not expect to find contact inhibition. HeLa cells
demonstrate rapid growth and a lack of contact inhibition (Stephenson, 1982).
Other authors report that HeLa cells in culture maintain contact inhibition (Schwab,
2008), however, it might reflect clonal variability of this cell line that is used in
laboratories all over the world. We observed reduced but apparently continual
growth rate following confluency under our conditions. Other studies have reported
long term culture leading to continual growth as cells pile up and detach in batches
(Delinasios et al., 2015).
Page | 194
There are a few similarities in the expression pattern of RECQL4 involving ubiquity,
showing higher levels in proliferating cells, and cell cycle phase specific distribution.
Peak of expression is seen at S-phase of the cell cycle (Bachrati and Hickson, 2003;
Dietschy et al., 2009; Croteau et al., 2012b). Certainly, there appears a correlation
between RECQL4 expression with Ki67 expression and the proliferative state of the
cells, however, repeats and further analysis are required to confirm.
We did experience difficulties culturing the AG03587 cell line; it appears to
proliferate very slowly and goes into senescence more readily than the other RTS
cells lines. Cell viability measurements alongside are also required to ensure this is
not a contributing factor to the results obtained. The AG18375 cell line harbours a
confirmed RECQL4 mutation at chromosomal location 8q24.3 (g.2626G>A and
g.2886delT), and the patient presented with OS at 21 years of age (Gupta et al.,
2013). RECQL4 mutations are thought to lead to partially active protein in some
RTS cases (Ouyang et al., 2008). In our study, the effect on proliferation in culture
could be due to cell specific features, or specific RECQL4 mutation.
6.6 Generation of Emerald-GFP tagged RECQL4 expression constructs
(chapter 3, section 5.2)
RECQL4-emerald tagged HeLa and U2OS cells were established successfully, and
following signal analysis, the induced expression appeared to be localised mainly in
the nucleus, but also to cytoplasm in HeLa and U2OS cells. Of the RecQ helicase
family, RECQL4 is the only one known to be found both in the nucleus and
cytoplasm (Yin et al., 2004; Petkovic et al., 2005; Burks et al., 2007). There are
contradicting results within the literature relating to RECQL4 localisation, which
could be due to the antibodies and methods used, and could explain the diverse
results (Yin et al., 2004; Petkovic et al., 2005: Schurman et al., 2009; Chi et al.,
2012; Monaghan and Whitmarsh, 2015). RECQL4 has two signals regulating its
presence in the nucleus. A nuclear localisation signal (NLS) is located at the N-
terminus (amino acids 363-492) (Yin et al, 2004, (Burks et al., 2007), while the C-
terminus harbours a functional nuclear export signal (NES), which may be important
for cytoplasmic localisation and for mitochondrial maintenance. Diminished
cytoplasmic localization was observed following the deletion of this NES (Chi et al.,
2012). Localisation of RECQL4 may also be influenced by cell cycle phases
(Petkovic et al., 2005). The phosphorylation of the NLS has been found to be
important for many cell cycle related proteins for nuclear localisation (De et al., 2012;
Page | 195
Bauer et al., 2015), while acetylation has been reported to influence recognition of
localisation signal. RECQL4 is acetylated by p300, a histone acetyltransferase,
leading to localisation to the cytoplasm (Dietschy et al., 2009).
Interestingly, a recent study further suggests RECQL4 main activity may be located
within the mitochondria, and re-location to the nucleus allowing nuclear genome
maintenance. Mitochondrial localisation of RECQL4 has been found in a few other
studies as well (Chi et al., 2012; Croteau et al., 2012a; De et al., 2012; Gupta et al.,
2013; Wang et al., 2014b), which could explain some of the phenotypic features
seen in RTS patients (De et al., 2012). RECQL4 intracellular distribution and
dynamic re-localization to sites of DNA damage has suggested to be a possible
contribution to phenotypes and associated heterogeneity, which has been found in
RECQL4-associated diseases (Croteau et al., 2012b).
Tagging of proteins with the small and versatile GFP provides a scalable method to
study localisation and protein-protein interactions (Leonetti et al., 2016). Using the
same direct method utilised in our study, GFP-tagged RECQL4 was also reported
to be predominantly localised to the nucleus in U2OS cells, however, a small
percentage was observed localised to the cytoplasm. Additionally, mitochondrial
localisation was also seen (Woo et al., 2006; Chi et al., 2012). The GFP tag may
influence the localisation of the protein. It has been reported that GFP translocates
to the nucleus itself (Seibel et al., 2007), although it may be mediated by its
capability diffusing through the nuclear pores passively. Overexpression of tagged
proteins can lead to effects on structure, function, and localisation of the protein
(Agbulut et al., 2006; Das et al., 2009), which also depends on whether the tag is
on the amino or the carboxy terminus (Simpson et al., 2000; Giraldez et al., 2005).
The promoter used on the plasmid vectors for transient transfection, such as CMV,
can increase the protein amount present within the cell (Deer and Allison, 2004; Qin
et al., 2010), which has been found to also influence sub-cellular localisation and
function. Cells expressing low levels of fluorescent tagged protein under inducing
conditions are ideal for further work, (Watanabe and Mitchison, 2002; Taylor et al.,
2011), and in our study we chose low expressing clones.
6.6.1 siRNA
The study by Abe et al, (2011) suggests that a complete loss of RECQL4 in humans
would be lethal (Abe et al., 2011). Knockdown of RECQL4 has been shown to
correlate with reduced proliferation in primary fibroblast (Lu et al., 2014).
Page | 196
Senescence was detected without an increase of apoptosis (Lu et al., 2014),
consistent with studies in the literature of senescent cells being resistant to
apoptosis (Hampel et al., 2005), however, an increase in cell death was
demonstrated suggesting another pathway may be involved. Development of
senescence could be a result of oxidative stress (Lu et al., 2014). Senescent cells
have been shown to be irreversibly arrested in G1/G0 cell cycle phase (Sherwood
et al., 1988), and RECQL4 knockdown was shown to lead to accumulation of cells
in G0/G1 (Lu et al., 2014). Senescence induced by replication defects usually leads
to cell cycle arrest during G1 or G2 of the cell cycle (Mao et al., 2012). Considering
this, RECQL4 knockdown appears to lead to stress induced cell cycle arrest (Lu et
al., 2014). In both mouse and human cells RECQL4 dysfunction generated an
increase in DNA damage, and increases senescence (Lu et al., 2014).
RECQL4 siRNA 9 and 10, targets the 3’ untranslated region of the RECQL4 mRNA.
This mode of targeting found to be more effective than targeting the open reading
frame (ORF) (Forman et al., 2008; Gayral et al., 2014). The targeting of these
sequences occurs following perfect and imperfect complementarity. The direct
cleavage and degradation of the mRNAs follows perfect complementarity, while
imperfect complementarity leads to blockage of transcription and inhibition of protein
synthesis from the target mRNA (Zhang et al., 2015), both leading to reduced
protein content. Factors affecting these processes include flanking sequence,
location within the 3’-UTR, and the accessibility of target mRNA (Grimson et al.,
2007). A key issue described in the literature is off-target gene silencing which may
also involve other influential factors (Jackson and Linsley, 2004; Birmingham et al.,
2006; Jackson et al., 2006). In our work we used siRNA molecules that had been
designed by the supplier, Qiagen using a novel algorithm that minimizes the risk of
off-target effect (Li and Zamore, 2019).
Primary RTS fibroblasts (AG05013tert) demonstrated sensitivity to PHA-767491,
not seen in HeLa and U2OS models. Repeats are needed to verify our initial
findings, but this may not seem unexpected when taking into account that siRNA
mediated knockdown did not reach 100%, and the effects are often reversed over
time as previously described, compared to AG05013 cell line that carries an
inactivating mutation of RECQL4. We also need to consider that these two cell lines
originate from malignant cancers. Depleting RECQL4 in fibroblast cell lines such
as hTERT immortalised HS68 might provide answers to this contradiction
Page | 197
6.6.2 shRNA
A long-term aim of our work is to interfere with RECQL4 expression in mesenchymal
stem cells under standard culturing conditions or during osteogenic differentiation
to establish why people with biallelic RECQL4 mutations develop osteosarcomas.
To achieve this, we established a rescueable siRNA mediated knockdown system
in standard laboratory cell lines, and vectors for lentivirus mediated transduction for
shRNA knockdown. Unlike synthetic siRNA, which are effector molecules
introduced directly into the cells, short-hairpin RNAs (shRNAs) are introduced
indirectly. The constitutive expression of shRNA molecules can be achieved by RNA
polymerase II or III -driven expression cassettes (Scherer and Rossi, 2003). shRNA
integration via viral vectors into mammalian cell lines have been demonstrated to
induce stable transduction, and long-term gene knockdown (Taxman et al., 2010).
The recombinant constructs generated in our study were verified using standard
protocols employed by a number of other laboratories successfully (Inouye et al.,
1981; Roberts, 1987; Woollard et al., 1994; Yu et al., 2003; Seo et al., 2015; Yu et
al., 2016). In the literature successful use of RECQL4 knockdown using shRNA
have also been reported (Croteau et al., 2012a; Ghosh et al., 2012).
6.7 RECQL4 expression and DNA damage markers (chapter 3, section 5.24)
RECQL4 has an important role in replication initiation, and chromosomal instabilities
could occur if altered RECQL4 expression leads to an extension in the time of
exposure of single stranded DNA, whereas high expression could cause unmatched
annealing, and depletion could lead to impaired reannealing (Macris et al., 2006).
Maire and co-workers (2009) found a correlation between RECQL4 expression
levels and a higher frequency of structural chromosomal changes (S-CIN)
associated with OS, however they did not observe a relationship with N-CIN
(numerical chromosomal instabilities) (Maire et al., 2009). RTS patients have been
found to demonstrate both N- and S-CIN (Der Kaloustian et al., 1990; Ying et al.,
1990; Orstavik et al., 1994; Lindor et al., 1996; Miozzo et al., 1998). Chromosomal
instabilty in vivo may lead to neoplastic transformation of cancer stem/progenitor
cells which are sensitive to RECQL4 mutations. Mesenchymal cells may be
especially sensitive, which are thought to give rise to tumours in RTS patients
(Larizza et al, 2010). Cells isolated from a mouse model of RTS type II showed
aneuploidy due to defects in sister-chromatid cohesion, which suggested a role for
the RECQL4 helicase in sister-chromatid cohesion and mitotic chromosome
Page | 198
segregation, a potential source of chromosomal instability and cancer predisposition
(Mann et al., 2005).
RTS fibroblast cell lines showed slightly reduced growth rate, and appeared to be
moderately sensitive to gamma-irradiation and generated higher levels of H2AX
and 53BP1 foci, in comparison to control fibroblasts (GM00323 and GM00969),
suggestive of defective repair of DSBs (Singh et al., 2010). RECQL4 also found to
colocalize with γH2AX, suggesting RECQL4 binds to DSB (Singh et al., 2010).
H2AX foci count has also been found to be increased, suggesting that deficiency
of RECQL4 activated a DNA damage response using ATM (Lu et al, 2014);
however, was not found to be significantly increased in our study. Our findings could
be extended by probing for other markers of DNA damage, for example 53BP1.
The RECQL4 helicase resolves telomeric D-loop structures with the help of shelterin
proteins TRF1, TRF2, and POT1, which stimulate its helicase activity. RECQL4
may also work synergistically with WRN by unwinding telomeric D-loops, and may
assist WRN and BLM following oxidative stress. RECQL4 depletion induces crisis
sites at telomeres via the activation of 53BP1 DNA damage response protein,
although the cause could be due to replicative stress (Ghosh et al., 2012). The
promotion of telomeric maintence may involve RECQL4 and the repair of the
thymine glycol lesions that block DNA metabolism (Ferrarelli et al., 2013). A high
level of fragile telomeres were observed in the AG05013 and AG18371 RTS cell
lines (Ghosh et al., 2012). It is possible that binding of DNA repair factors or other
proteins involved in telomere replication are inhibited in RECQL4 mutated cells
(Ghosh et al., 2012). However, the fact that we were not able to show increase of
telomeric damage in RTS cell lines, that is co-localisation of γH2AX and TRF2, does
not support the above findings of the literature. The lack of co-localisation seen in
our work could be due to short telomeres being scored as non-telomeric; chromatid
ends in pre-senescent human cells that have extremely short telomeres may lack
TRF2 foci (Nakamura et al., 2008). This is especially relevant to the data obtained
where co-localisation was not observed and reduced or low TRF2 foci were also
seen. Although, unlikely relevant as short telomeres should not be present in the
AG05013tert cells, and low passages were utilised for all RTS cell lines.
Page | 199
6.8 Isolation and identification of RECQL4 interacting partners (chapter 3,
section 5).
With the generated inducible RECQL4-Emerald tagged HeLa and U2OS clones,
analysis of protein interactions was performed using the GFP-pulldown. RECQL4
has been found to interact with many proteins involving different pathways (Table
6.8-a), a few of which are discussed in detail below. GFP pulldown is a widely used
technique (Trinkle-Mulcahy et al., 2008; Emmott and Goodfellow, 2014), however,
there are limitations to be considered such as the influence the GFP tag fusion may
have on the protein, discussed previously (see section 5.2.4.1).
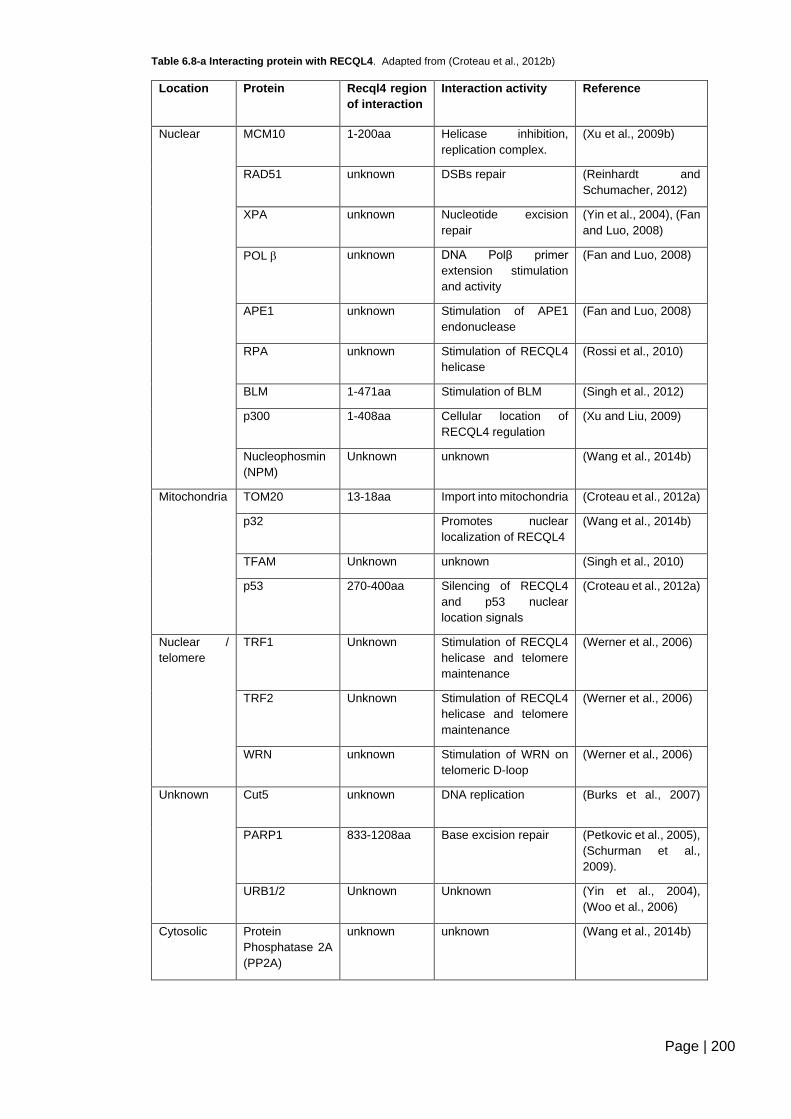
Page | 200
Table 6.8-a Interacting protein with RECQL4. Adapted from (Croteau et al., 2012b)
Location Protein Recql4 region
of interaction
Interaction activity Reference
Nuclear MCM10 1-200aa Helicase inhibition,
replication complex.
(Xu et al., 2009b)
RAD51 unknown DSBs repair (Reinhardt and
Schumacher, 2012)
XPA unknown Nucleotide excision
repair
(Yin et al., 2004), (Fan
and Luo, 2008)
POL unknown DNA Polβ primer
extension stimulation
and activity
(Fan and Luo, 2008)
APE1 unknown Stimulation of APE1
endonuclease
(Fan and Luo, 2008)
RPA unknown Stimulation of RECQL4
helicase
(Rossi et al., 2010)
BLM 1-471aa Stimulation of BLM (Singh et al., 2012)
p300 1-408aa Cellular location of
RECQL4 regulation
(Xu and Liu, 2009)
Nucleophosmin
(NPM)
Unknown unknown (Wang et al., 2014b)
Mitochondria TOM20 13-18aa Import into mitochondria (Croteau et al., 2012a)
p32 Promotes nuclear
localization of RECQL4
(Wang et al., 2014b)
TFAM Unknown unknown (Singh et al., 2010)
p53 270-400aa Silencing of RECQL4
and p53 nuclear
location signals
(Croteau et al., 2012a)
Nuclear /
telomere
TRF1 Unknown Stimulation of RECQL4
helicase and telomere
maintenance
(Werner et al., 2006)
TRF2 Unknown Stimulation of RECQL4
helicase and telomere
maintenance
(Werner et al., 2006)
WRN unknown Stimulation of WRN on
telomeric D-loop
(Werner et al., 2006)
Unknown Cut5 unknown DNA replication (Burks et al., 2007)
PARP1 833-1208aa Base excision repair (Petkovic et al., 2005),
(Schurman et al.,
2009).
URB1/2 Unknown Unknown (Yin et al., 2004),
(Woo et al., 2006)
Cytosolic Protein
Phosphatase 2A
(PP2A)
unknown unknown (Wang et al., 2014b)
Page | 201
As an inhibitor of histone deacetylase, SAHA was used in our study to identify
RECQL4 interacting proteins which rely on posttranslational acetylation
modifications, for regulating protein activity and transmitting signals throughout the
cell (Cohen, 2000). The study by Dietschy et al, (2009), was the first to demonstrate
post-translational modifications of RECQL4, and following the acetylation of
RECQL4 by p300, a significant proportion of RECQL4 protein was shifted from the
nucleus to cytoplasm in vivo. We employed extended HU treatment to induce fork
collapse and new origin firing (Park et al., 2006; Ghosh et al., 2012; Kohzaki et al.,
2012; Sidorova et al., 2013) and to see if it influences interactions and modifications
of RECQL4.
We found PP2A/A α and β isoforms in the pulldown from U2OS cells, however, we
could not verify the interaction with western blot analysis. A low amount of PP2A
was detected in the pulldown from SAHA treated HeLa cells. We were also able to
detect MCM10 in the bound fraction of the pulldown, however, its abundance was
mainly reflected by levels of RECQL4, and was not always seen. Wang et al (2014)
suggested RECQL4 was transported to the mitochondria, and although MCM10 can
also be found there, it mainly remained at the outer mitochondrial membrane.
RECQL4 may dissociate from MCM10 via other protein interactions.
6.8.1 Novel RECQL4 interacting proteins (chapter 3, section 5.3)
Excitingly, novel RECQL4 protein interactions were detected; Engrailed-1 (EN-1),
Engrailed-2 (EN-2), and Highly Divergent Homeobox (HDX). HU treatment
appeared to induce an increase in HDX levels in the complex. HDX is a hitherto
uncharacterised protein, also known as CXorf43. It belongs to the POU-class
homeobox genes, which contains 16 related genes in the human genome. HDX,
unlike the other members, does not encode a POU-specific domain, for which it has
been placed into a new class within this family. HDX encodes a highly divergent
atypical homeodomain (Holland et al., 2007). It has been found to be significantly
enriched during embryonic development (Dennis et al., 2003), while its expression
is reduced in breast and other cancer cells (Yamamoto et al., 2011). Missense
mutations in HDX could be involved in the pathogenesis of acute promyelocytic
leukemia (APL) (Greif et al., 2011). Homeobox transcription factors have a role in
the regulation of cell identity, and are involved in normal and malignant
haematopoesis; the dysregulation of the ‘Hox code’ may play an important role in
myeloid malignancy development (Eklund, 2007). Following the knockdown of
Page | 202
osterix, HDX was found to be upregulated in mouse chondrogenic ATDC5 cells
(Park and Kim, 2013). Another study suggested HDX may be relevant in mental
retardation (Honda et al., 2010). Other homeobox gene mutations have also been
linked to mental retardation, epilepsy, or other movement disorders (Wigle and
Eisenstat, 2008).
Two further Homeobox proteins, EN-1 and EN-2 were detected by mass
spectrometry. EN-2 was further analysed by western blot, and was confirmed to be
present in RECQL4 bound fractions, however, this finding requires verification.
SAHA treatment may cause an increase in the level of EN-2 in the complex.
Homeobox genes are a superfamily of regulatory genes and encode homeodomain-
containing transcription factors. The homeobox itself is a 183-bp DNA sequence
that encodes a 61 amino acid homeodomain within the HOX proteins. The
homeodomain recognises and binds sequence-specific DNA motifs (Mcginnis and
Krumlauf, 1992). In humans 39 HOX genes have been identified, and shown to
have roles in apoptosis, differentiation, receptor signalling, motility, and
angiogenesis (Shah and Sukumar, 2010).
Engrailed is a member of the homeobox gene family, characterised first in
Drosophila (Wedeen and Weisblat, 1991). The human genome contains two copies
of Engrailed, EN-2 and EN-1, which hold important roles in early embryonic
development and in normal human neuronal development (Sillitoe et al., 2008;
Morgan et al., 2011; Mcgrath et al., 2013). The overexpression of EN-2 has been
found in cancers, and it is suggested as a potential oncogene in breast cancer.
Following the suppression of EN-2 in a human breast cancer cell line, a significant
decrease in proliferation was found (Martin et al., 2005). Similarly, a decrease in
prostate cancer cell proliferation was observed following siRNA mediated
knockdown of EN-2, which in turn decreased PAX-2 expression (Martin et al., 2005;
Bose et al., 2008). Hypermethylation of EN-1 has also been seen in colorectal
cancer, prostate cancer, and astrocytoma (Mayor et al., 2009; Wu et al., 2010;
Devaney et al., 2011). A number of homeodomain containing proteins of the HOX
family were found to play roles in replication (De Stanchina et al., 2000; Comelli et
al., 2009; Salsi et al., 2009; Falaschi et al., 2010; Marchetti et al., 2010; Miotto and
Graba, 2010). Interestingly, a study found the N-terminus of RECQL4 to adopt a fold
similar to homeodomains, and the domain is involved in the interaction with TopBP1
(Ohlenschläger et al., 2012).
Page | 203
7 Conclusion
RECQL4 holds an important role in DNA replication, further demonstrated by its
known interactions with DNA replication factors crucial for the initiation of DNA
replication (Im et al., 2009; Xu et al., 2009; Thangavel et al., 2010). To enable a
model of mild replication interference, to an extent expected in RTS patients, PHA-
767491 was used in our study to reduce the activity of CDC7/DBF4, a kinase with a
key role upstream of RECQL4 in replication initiation. Reduced proliferative rate
was demonstrated in PHA-767491 treated ASC52telo cells (under acute as well as
chronic treatment), in agreement with literature results (Montagnoli et al., 2008;
Vanotti et al., 2008; Natoni et al., 2013; Fitzgerald et al., 2014; Sasi et al., 2014;
Erbayraktar et al., 2016).
RTS patients present predominantly osteoblastic OS (Sim et al., 1992; Werner et
al., 2006; Hicks et al., 2007; Zils et al., 2015). Our findings using ASC52telo cells
under PHA-767491 model did appear to influence osteoblastic markers; calcium
and RUNX2, following osteocyte differentiation. Using qualitative methods, we
found that calcium levels appeared to increase following PHA treatment post
osteocyte differentiation, despite reduced cell numbers due to the mild proliferation
inhibition. High calcium levels can lead to cellular disruption, and may influence
cancer cell progression (Mundy, 2002; Santini et al., 2012; Daft et al., 2015). High
calcium levels have also been reported in osteosarcoma patients (Kharb et al.,
2012). Quantification methods are required to determine if the qualitative data within
our study is a true representation of calcium levels. The expression of RUNX2 is
suggestive of MSCs commitment towards differentiation into osteoblasts (Ducy et
al., 1997; Komori et al., 1997; Tang et al., 2008; Komori, 2010). Interestingly, our
findings suggest an elevation of RUNX2 expression following acute PHA-767491
treatment in ASC52telo osteocyte differentiated cells. An elevation of RUNX2 levels
have been observed in OS cells (Nathan et al., 2009; Martin et al., 2014). The
overexpression of RUNX2 has been reported as potentially leading to disrupted
osteoblast differentiation. Impaired osteoblast differentiation can lead to genomic
instability, and OS (Andela et al., 2005; Lu et al., 2008; Tang et al., 2008; Pereira et
al., 2009; San Martin et al., 2009; Won et al., 2009; Kurek et al., 2010; Martin et al.,
2010; Martin et al., 2014). We investigated further if these cells underwent cellular
transformation. Our findings showed that PHA-767491 treated ASC5telo cells
Page | 204
demonstrate these osteoblastic differentiation markers under normal (non-
differentiating) media, showing significant increase of RUNX2 levels and
observation of high calcium levels. The data obtained suggest the dysregulation of
osteoblast differentiation drivers under acute and chronic PHA-767491 treatment,
however, further verification is required to support this conclusion.
The dysregulation of mitochondrial function can lead to diseases (Archer, 2013;
Magalhães et al., 2014; Singer, 2014). Therefore, we considered mitochondrial
maintenance in our PHA model. Our findings showed no significant changes of
mitochondrial activity, measured by membrane potential, in acute and chronic PHA-
767491 treated cells, demonstrating lack of mitochondrial alterations in these cells.
However, RECQL4 may hold a role in mitochondrial maintenance (Croteau et al.,
2012), which is likely to be independent of its role in replication initiation.
We found that ASC52telo cells under acute and chronic PHA-767491 treatment
demonstrated the presence of DNA damage, with an increased occurrence of
changes in nuclear morphology, suggestive of genomic instability. Phosphorylation
of H2AX (γH2AX) occurs as a localised response to DSB (Rogakou et al., 1998).
γH2AX forms foci rapidly (Rothkamm and Horn, 2009), and remains until the DNA
damage is repaired (Nakamura et al., 2006). As expected from literature data, we
found that ASC52telo cells responded to Camptothecin treatment with the
generation of γH2AX foci. ASC52telo cells with acute and chronic PHA-767491
treatment demonstrated significantly high levels also, with levels returning to
background in low passage cells released from treatment. Importantly, the same
degree of return to normal levels was not seen in high passage cells released from
PHA-767491 treatment under the same recovery conditions. Effect of inhibition of
replication initiation on telomere maintenance only appeared to be present in low
passage ASC52telo cells under acute and chronic PHA-767491 treatment. Not all
of the DNA damage appears telomeric. We found signs of activated DNA damage
response with Phospho-CHK1 following chronic PHA treatment in low passage
ASC52telo cells, suggesting the involvement of the ATR pathway (Bartek et al.,
2004; Dai and Grant, 2010). Interestingly, in correlation to this, the significant
activation of 53BP1 was shown in low passage chronic PHA treated cells. However
in acute treated cells the level of 53BP1 appeared reduced, compared to control
cells, suggesting a lack or impairment of 53BP1 response in these cells. Taken
together, our findings suggest, cells under chronic replicative stress lead to signs of
Page | 205
sustained DNA damage, which may generate cells susceptible or sensitive to
transformation during sustained PHA-767491 treatment or post recovery. To gain
further insights into this process, transformation characteristics were investigated.
ASC52telo cells under the PHA model were cultured over a prolonged time reaching
a high cell density. Our findings suggest continual cell growth in ASC52telo high
passage cells released from chronic PHA-767491 treatment, which indicates
impaired or loss of contact inhibition, a hallmark of cancer cells (Abercrombie, 1979;
Hanahan and Weinberg, 2000). Although we would expect these cells to recover
from PHA-767491, which would lead to an increase of proliferation, the level of
continual growth was not observed in low passage cells and controls. Further to
this, high passage chronic PHA-767491 treated cells demonstrated signs of
anchorage-independent growth, with spheroid cultures forming following the
detachment from the extracellular matrix, which is another sign of transformation.
The cells may have acquired resistance to anoikis or programmed cell death (Kang
et al., 2007).
In conclusion, we developed a model of replicative stress in ASC52telo cells that
induced cellular changes indicative of DNA damage following chronic PHA-767491
treatment. These changes were sustained following recovery and may lead to the
development of transformation characteristics, as depicted in Figure 7-1 (blue
arrows), alongside our hypothesis. RECQL4 mutations could generate
chromosomal instabilities causing disruption to osteocyte differentiation. The
dysregulation is likely to have pathological consequences, and may be relevant to
characteristics of RTS disease and the predisposition to OS.
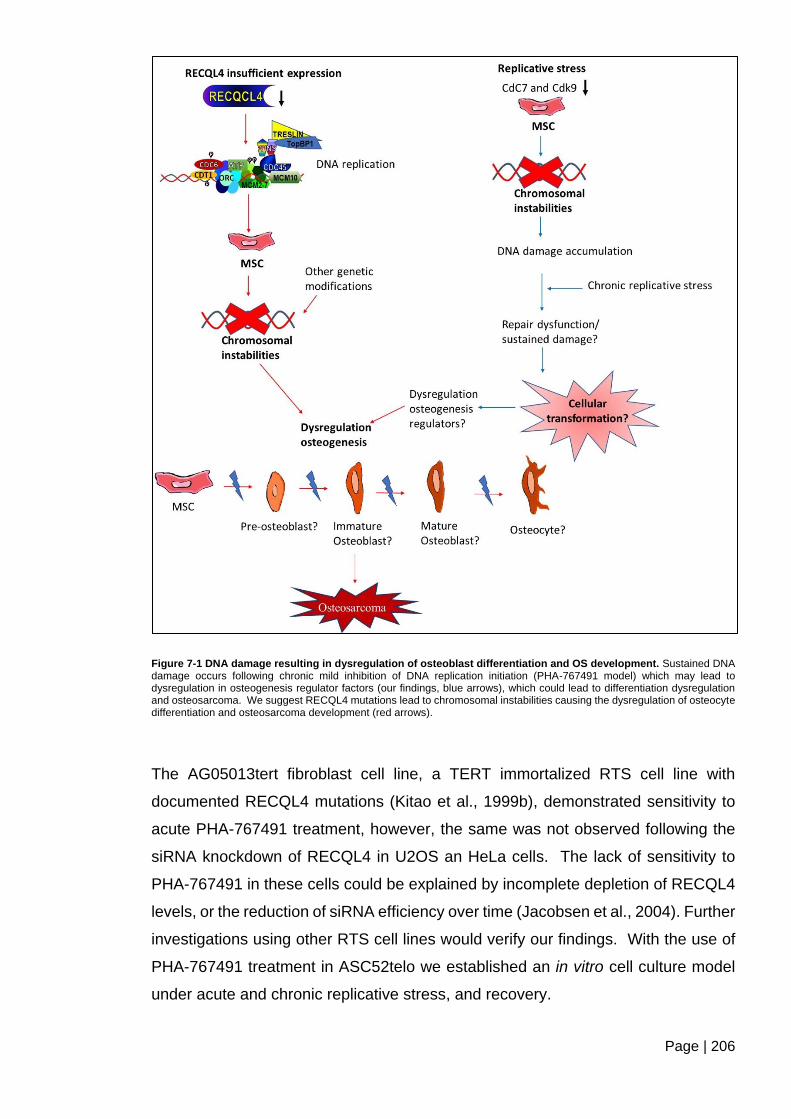
Page | 206
Figure 7-1 DNA damage resulting in dysregulation of osteoblast differentiation and OS development. Sustained DNA damage occurs following chronic mild inhibition of DNA replication initiation (PHA-767491 model) which may lead to dysregulation in osteogenesis regulator factors (our findings, blue arrows), which could lead to differentiation dysregulation and osteosarcoma. We suggest RECQL4 mutations lead to chromosomal instabilities causing the dysregulation of osteocyte differentiation and osteosarcoma development (red arrows).
The AG05013tert fibroblast cell line, a TERT immortalized RTS cell line with
documented RECQL4 mutations (Kitao et al., 1999b), demonstrated sensitivity to
acute PHA-767491 treatment, however, the same was not observed following the
siRNA knockdown of RECQL4 in U2OS an HeLa cells. The lack of sensitivity to
PHA-767491 in these cells could be explained by incomplete depletion of RECQL4
levels, or the reduction of siRNA efficiency over time (Jacobsen et al., 2004). Further
investigations using other RTS cell lines would verify our findings. With the use of
PHA-767491 treatment in ASC52telo we established an in vitro cell culture model
under acute and chronic replicative stress, and recovery.
Page | 207
Our findings demonstrate induced chromosomal instabilities due to mild inhibition of
DNA replication. Some of these markers were further investigated in a group of
RTS cell lines: AG05013tert, AG18375, and AG03587 cells, to link to RECQL4
mutations. Patients with RTS have been found to demonstrate genomic instabilty
(Der Kaloustian et al., 1990; Ying et al., 1990; Orstavik et al., 1994; Lindor et al.,
1996; Miozzo et al., 1998). Although there appears to be variation of reports in the
literature, an association has been suggested between RECQL4, S-CIN and OS
(Maire et al, 2009), with truncating RECQL4 mutations associated with a higher risk
(Wang et al., 2003). We found significant increase of γH2AX intensity in the
AG05013tert RTS cell line, suggesting greater extent of DSB damage in these cells.
An increase of telomeric DNA damage was observed in AG05013tert cells, but was
not evidenced in AG18375 and AG03587 RTS fibroblasts, suggesting a potential
role of RECQL4 in TERT mediated telomere maintenance, which warrants further
investigations given the presence of DNA damage markers in this cell line. Overall,
it is difficult to suggest a reason for the evidence of DNA damage in the RTS
AG05013 cells, which is not found in the other RTS cell lines (AG18375 and
AG03587), as some mutation characteristics known are shared. Similarly,
proliferative rate was also found variable between specific RTS cell lines. We found
variability of DNA damage response between RTS cell lines as well, which has also
been reported in the literature (Smith and Paterson, 1982; Shinya et al., 1993; Kerr
et al., 1996; Lindor et al., 2000), reflecting heterogeneity of these cells (Schurman
et al., 2009). Further studies are required to perhaps identify if specific mutations
are generating or providing a sensitised environment for DNA damage and
tumorigenesis, conceivably through interacting proteins and pathways.
We investigated RECQL4 interacting proteins and identified known binding partners
of RECQL4; MCM10, and low levels of Protein phosphate 2 A (PP2A), previously
reported in the literature (Xu et al., 2009; Wang et al., 2014). The co-localisation of
PP2A and RECQL4 was reported to be restricted to the cytosolic RECQL4 complex
(Wang et al., 2014). This could explain the lack/low efficiency of pulldown of PP2A
seen in our study, as RECQL4 expression was primarily observed in the nucleus of
our cells. We found novel interactions with highly divergent homeobox (HDX) and
homeobox protein EN-2. Although there is little information on HDX in the literature,
HDX may have a role in human disease, and tumourigenesis (Honda et al., 2010;
Greif et al., 2011; Yamamoto et al., 2011). EN-2 has been reported to play a role in
proliferation and human disease, including cancer (Bose et al., 2008; Rissling et al.,

Page | 208
2009). Pulldown levels appeared variable following SAHA and HU treatment, which
may be influenced by other parameters. These novel findings could lead to
furthering our understanding of RECQL4 and potential novel pathways and roles.
6.9 Overall findings and future directions
Our study (Schematic 6.3-1), demonstrated the accumulation of chromosomal
changes that may be required to drive tumourigenesis, and are acquired over
several cell cycles in long term culture with cellular stress generated by chronic
PHA-767491 treatment. Further to this, our findings suggest that chronic PHA-
767491 treatment leads to the development of transformation characteristics, which
become permanent, as after withdrawal of treatment the transformed phenotype is
not reversed. Further investigations involving other markers of osteocyte
differentiation would verify our findings and perhaps the dysregulation of
differentiation regulation.
To verify our hypothesis, the ASC52telo cell line would be transduced using the
generated RECQL4 shRNA lentiviral vector, enabling a model of ASC52telo cell line
with stable and long term RECQL4 knockdown to be established, differentiated into
osteoblasts, while analysing for DNA damage, during and post differentiation. We
know from a recent study that adipose derived mesenchymal stem cells (ASCs) may
play a role in OS development (Wang et al., 2017). It would be interesting to
establish if impaired ASCs following RECQL4 knockdown may provide the
microenvironment forming a niche that supports OS development (Hanahan and
Coussens, 2012; Turley et al., 2016). This will enhance our understanding to
establish a direct link between impaired replication initiation due to RECQL4
mutations, consequential chromosomal abnormalities and the development of
malignancies, in particular osteosarcoma.
The novel protein interactions found with RECQL4 are exciting and verification of
these could lead to new pathways or RECQL4 roles. Literature data suggest that
RECQL4 is a double-edged sword, and perhaps RECQL4 depletion alone may not
be the only driving force of osteosarcoma development. Depleting RECQL4 with
lentivirus delivered shRNA in mesenchymal stem cells could verify our hypothesis
of its involvement in osteoblast differentiation, and if dysregulation and/or
impairment can lead to osteosarcoma.
Page | 209
8 References
Abe, T., Yoshimura, A., Hosono, Y., Tada, S., Seki, M. & Enomoto, T. 2011. The N-terminal
region of RECQL4 lacking the helicase domain is both essential and sufficient for the viability of vertebrate cells: role of the N-terminal region of RECQL4 in cells. Biochimica et Biophysica Acta (BBA)-Molecular Cell Research, 1813, 473-479.
Abercrombie, M. 1979. Contact inhibition and malignancy. Nature, 281, 259-262. Abraham, R. T. 2004. PI 3-kinase related kinases:‘big’players in stress-induced signaling
pathways. DNA repair, 3, 883-887. Ahmed, H., Salama, A., Salem, S. E. & Bahnassy, A. A. 2012. A case of synchronous
double primary breast carcinoma and osteosarcoma: Mismatch repair genes mutations as a possible cause for multiple early onset malignant tumors. The American journal of case reports, 13, 218.
Ahuja, A. K., Jodkowska, K., Teloni, F., Bizard, A. H., Zellweger, R., Herrador, R., Ortega, S., Hickson, I. D., Altmeyer, M. & Mendez, J. 2016. A short G1 phase imposes constitutive replication stress and fork remodelling in mouse embryonic stem cells. Nature communications, 7, 10660.
Akbari, M., Peña-Diaz, J., Andersen, S., Liabakk, N.-B., Otterlei, M. & Krokan, H. E. 2009. Extracts of proliferating and non-proliferating human cells display different base excision pathways and repair fidelity. DNA repair, 8, 834-843.
Akech, J., Wixted, J. J., Bedard, K., Van Der Deen, M., Hussain, S., Guise, T. A., Van Wijnen, A. J., Stein, J. L., Languino, L. R. & Altieri, D. C. 2010. Runx2 association with progression of prostate cancer in patients: mechanisms mediating bone osteolysis and osteoblastic metastatic lesions. Oncogene, 29, 811-821.
Alfranca, A., Martinez-Cruzado, L., Tornin, J., Abarrategi, A., Amaral, T., De Alava, E., Menendez, P., Garcia-Castro, J. & Rodriguez, R. 2015. Bone microenvironment signals in osteosarcoma development. Cellular and molecular life sciences, 72, 3097-3113.
Allen, M. R., Hock, J. M. & Burr, D. B. 2004. Periosteum: biology, regulation, and response to osteoporosis therapies. Bone, 35, 1003-1012.
Alman, B. A. 2015. The role of hedgehog signalling in skeletal health and disease. Nature reviews Rheumatology, 11, 552-560.
Almeida, K. H. & Sobol, R. W. 2007. A unified view of base excision repair: lesion-dependent protein complexes regulated by post-translational modification. DNA repair, 6, 695-711.
Almeida, M. 2012. Aging mechanisms in bone. BoneKEy reports, 1, 102. Al-Romaih, K., Bayani, J., Vorobyova, J., Karaskova, J., Park, P., Zielenska, M. & Squire,
J. 2003. Chromosomal instability in osteosarcoma and its association with centrosome abnormalities. Cancer genetics and cytogenetics, 144, 91-99.
Al-Tassan, N., Chmiel, N. H., Maynard, J., Fleming, N., Livingston, A. L., Williams, G. T., Hodges, A. K., Davies, D. R., David, S. S. & Sampson, J. R. 2002. Inherited variants of MYH associated with somatic G: C→ T: A mutations in colorectal tumors. Nature genetics, 30, 227-232.
An, J., Huang, Y.-C., Xu, Q.-Z., Zhou, L.-J., Shang, Z.-F., Huang, B., Wang, Y., Liu, X.-D., Wu, D.-C. & Zhou, P.-K. 2010. DNA-PKcs plays a dominant role in the regulation of H2AX phosphorylation in response to DNA damage and cell cycle progression. BMC molecular biology, 11, 18.
Anantha, R. W., Vassin, V. M. & Borowiec, J. A. 2007. Sequential and synergistic modification of human RPA stimulates chromosomal DNA repair. Journal of Biological Chemistry, 282, 35910-35923.
Anantha, R. W., Sokolova, E. & Borowiec, J. A. 2008. RPA phosphorylation facilitates mitotic exit in response to mitotic DNA damage. Proceedings of the National Academy of Sciences, 105, 12903-12908.
Andela, V., Siddiqui, F., Groman, A. & Rosier, R. 2005. An immunohistochemical analysis to evaluate an inverse correlation between Runx2/Cbfa1 and NFκB in human osteosarcoma. Journal of clinical pathology, 58, 328-330.
Page | 210
Andor, N., Graham, T. A., Jansen, M., Xia, L. C., Aktipis, C. A., Petritsch, C., Ji, H. P. & Maley, C. C. 2016. Pan-cancer analysis of the extent and consequences of intratumor heterogeneity. Nature medicine, 22, 105-113.
Anisimov, V. N. 2009. Carcinogenesis and aging 20 years after: escaping horizon. Mechanisms of ageing and development, 130, 105-121.
Anwer, A. G., Gosnell, M. E., Perinchery, S. M., Inglis, D. W. & Goldys, E. M. 2012. Visible 532 nm laser irradiation of human adipose tissue-derived stem cells: Effect on proliferation rates, mitochondria membrane potential and autofluorescence. Lasers in Surgery and Medicine, 44, 769-778.
Araujo, Ana r., Gelens, L., Sheriff, Rahuman s. M. & Santos, Silvia d. M. 2016. Positive Feedback Keeps Duration of Mitosis Temporally Insulated from Upstream Cell-Cycle Events. Molecular Cell, 64, 362-375.
Archer, S. L. 2013. Mitochondrial dynamics—mitochondrial fission and fusion in human diseases. New England Journal of Medicine, 369, 2236-2251.
Aria, V. and Yeeles, J.T. 2019. Mechanism of bidirectional leading-strand synthesis establishment at eukaryotic DNA replication origins. Molecular cell, 73,2, 199-211.
Artandi, S. E. & Depinho, R. A. 2009. Telomeres and telomerase in cancer. Carcinogenesis, 31, 9-18.
Atashi, F., Modarressi, A. & Pepper, M. S. 2015. The role of reactive oxygen species in mesenchymal stem cell adipogenic and osteogenic differentiation: a review. Stem cells and development, 24, 1150-1163.
Avnet, S., Longhi, A., Salerno, M., Halleen, J. M., Perut, F., Granchi, D., Ferrari, S., Bertoni, F., Giunti, A. & Baldini, N. 2008. Increased osteoclast activity is associated with aggressiveness of osteosarcoma. International journal of oncology, 33, 1231-1238.
Aveic, S., Davtalab, R., Vogt, M., Weber, M., Buttler, P., Tonini, G.P. & Fischer, H. 2019. Calcium phosphate scaffolds with defined interconnecting channel structure provide a mimetic 3D niche for bone marrow metastasized tumor cell growth. Acta biomaterialia, 88, 527-539.
Bachrati, C. Z. & Hickson, I. D. 2003. RecQ helicases: suppressors of tumorigenesis and premature aging. Biochemical Journal, 374, 577-606.
Bachrati, C. Z. & Hickson, I. D. 2008. RecQ helicases: guardian angels of the DNA replication fork. Chromosoma, 117, 219-233.
Bae, S.-C. & Lee, Y. H. 2006. Phosphorylation, acetylation and ubiquitination: the molecular basis of RUNX regulation. Gene, 366, 58-66.
Bakhoum, S. F. & Landau, D. A. 2017. Chromosomal Instability as a Driver of Tumor Heterogeneity and Evolution. Cold Spring Harbor Perspectives in Medicine, 7, a029611.
Bakkenist, C. J. & Kastan, M. B. 2003. DNA damage activates ATM through intermolecular autophosphorylation and dimer dissociation. Nature, 421, 499.
Bakkenist, C. J. & Kastan, M. B. 2004. Initiating cellular stress responses. Cell, 118, 9-17. Ballabeni, A., Zamponi, R., Moore, J. K., Helin, K. & Kirschner, M. W. 2013. Geminin
deploys multiple mechanisms to regulate Cdt1 before cell division thus ensuring the proper execution of DNA replication. Proceedings of the National Academy of Sciences, 110, E2848-E2853.
Ballock, R. T. & O'keefe, R. J. 2003. The biology of the growth plate. JBJS, 85, 715-726. Baraniak, P. R. & Mcdevitt, T. C. 2011. Scaffold-free culture of mesenchymal stem cell
spheroids in suspension preserves multilineage potential. Barenholz, U., Keren, L. & Milo, R. 2016. A Minimalistic Resource Allocation Model to
Explain Ubiquitous Increase in Protein Expression with Growth Rate. PLOS ONE 11, e0153344.
Baritaud, M., Cabon, L., Delavallée, L., Galan-Malo, P., Gilles, M., Brunelle-Navas, M. & Susin, S. 2012. AIF-mediated caspase-independent necroptosis requires ATM and DNA-PK-induced histone H2AX Ser139 phosphorylation. Cell death & disease, 3, e390.
Bartek, J. & Lukas, J. 2003. Chk1 and Chk2 kinases in checkpoint control and cancer. Cancer cell, 3, 421-429.
Bartek, J., Lukas, C. & Lukas, J. 2004. Checking on DNA damage in S phase. Nature reviews Molecular cell biology, 5, 792-804.
Page | 211
Bartkova, J., Hamerlik, P., Stockhausen, M., Ehrmann, J., Hlobilkova, A., Laursen, H., Kalita, O., Kolar, Z., Poulsen, H. S. & Broholm, H. 2010. Replication stress and oxidative damage contribute to aberrant constitutive activation of DNA damage signalling in human gliomas. Oncogene, 29, 5095-5102.
Bartkova, J., Hořejší, Z., Koed, K., Krämer, A., Tort, F., Zieger, K., Guldberg, P., Sehested, M., Nesland, J. M. & Lukas, C. 2005. DNA damage response as a candidate anti-cancer barrier in early human tumorigenesis. Nature, 434, 864-870.
Basu-Roy, U., Basilico, C. & Mansukhani, A. Sphere Formation (Osteosphere/Sarcopshere) Assay.
Bathurst, N., Sanerkin, N. & Watt, L. 1986. Osteoclast-rich osteosarcoma. The British journal of radiology, 59, 667-673.
Bauer, M., Goldstein, M., Christmann, M., Becker, H., Heylmann, D. & Kaina, B. 2011. Human monocytes are severely impaired in base and DNA double-strand break repair that renders them vulnerable to oxidative stress. Proceedings of the National Academy of Sciences, 108, 21105-21110.
Bauer, N. C., Doetsch, P. W. & Corbett, A. H. 2015. Mechanisms regulating protein localization. Traffic, 16, 1039-1061.
Bayani, J., Zielenska, M., Pandita, A., Al‐Romaih, K., Karaskova, J., Harrison, K., Bridge, J. A., Sorensen, P., Thorner, P. & Squire, J. A. 2003. Spectral karyotyping identifies recurrent complex rearrangements of chromosomes 8, 17, and 20 in osteosarcomas. Genes, Chromosomes and Cancer, 36, 7-16.
Bayani, J., Selvarajah, S., Maire, G., Vukovic, B., Al-Romaih, K., Zielenska, M. & Squire, J. A. Genomic mechanisms and measurement of structural and numerical instability in cancer cells. Seminars in cancer biology, 2007. Elsevier, 5-18.
Bechter, O. E., Zou, Y., Shay, J. W. & Wright, W. E. 2003. Homologous recombination in human telomerase‐positive and ALT cells occurs with the same frequency. EMBO reports, 4, 1138-1143.
Beghini, A., Castorina, P., Roversi, G., Modiano, P. & Larizza, L. 2003. RNA processing defects of the helicase gene RECQL4 in a compound heterozygous Rothmund–Thomson patient. American Journal of Medical Genetics Part A, 120, 395-399.
Bellido, T., Ali, A. A., Plotkin, L. I., Fu, Q., Gubrij, I., Roberson, P. K., Weinstein, R. S., O'brien, C. A., Manolagas, S. C. & Jilka, R. L. 2003. Proteasomal Degradation of Runx2 Shortens Parathyroid Hormone-induced Anti-apoptotic Signaling in Osteoblasts, a putative explanation for why intermittent administration is needed for bone anabolism. Journal of Biological Chemistry, 278, 50259-50272.
Bellido, T., Plotkin, L. I. & Bruzzaniti, A. 2014. Bone cells. Basic and Applied Bone Biology: Elsevier, 27-45.
Berkers, C. R., Maddocks, O. D. K., Cheung, E. C., Mor, I. & Vousden, K. H. 2013. Metabolic regulation by p53 family members. Cell metabolism, 18, 617-633.
Berman, S. D., Calo, E., Landman, A. S., Danielian, P. S., Miller, E. S., West, J. C., Fonhoue, B. D., Caron, A., Bronson, R. & Bouxsein, M. L. 2008. Metastatic osteosarcoma induced by inactivation of Rb and p53 in the osteoblast lineage. Proceedings of the National Academy of Sciences, 105, 11851-11856.
Berniak, K., Rybak, P., Bernas, T., Zarębski, M., Biela, E., Zhao, H., Darzynkiewicz, Z. & Dobrucki, J. W. 2013. Relationship Between DNA Damage Response, Initiated by Camptothecin or Oxidative Stress, and DNA Replication, Analyzed by Quantitative 3D Image Analysis. Cytometry. Part A : the journal of the International Society for Analytical Cytology, 83, 913-924.
Berridge, M. V., Herst, P. M. & Tan, A. S. 2005. Tetrazolium dyes as tools in cell biology: new insights into their cellular reduction. Biotechnology annual review, 11, 127-152.
Bertoli, C., Skotheim, J. M. & De Bruin, R. a. M. 2013. Control of cell cycle transcription during G1 and S phases. Nature reviews. Molecular cell biology, 14, 518.
Bhatt, K. A., Chang, E. I., Warren, S. M., Lin, S.-E., Bastidas, N., Ghali, S., Thibboneir, A., Capla, J. M., Mccarthy, J. G. & Gurtner, G. C. 2007. Uniaxial mechanical strain: an in vitro correlate to distraction osteogenesis. Journal of Surgical Research, 143, 329-336.
Page | 212
Bi, J., Huang, A., Liu, T., Zhang, T. & Ma, H. 2015. Expression of DNA damage checkpoint 53BP1 is correlated with prognosis, cell proliferation and apoptosis in colorectal cancer. International journal of clinical and experimental pathology, 8, 6070.
Bieback, K., Kern, S., Klüter, H. & Eichler, H. 2004. Critical parameters for the isolation of mesenchymal stem cells from umbilical cord blood. Stem cells, 22, 625-634.
Bielack, S. S., Kempf-Bielack, B., Delling, G., Exner, G. U., Flege, S., Helmke, K., Kotz, R., Salzer-Kuntschik, M., Werner, M. & Winkelmann, W. 2002. Prognostic factors in high-grade osteosarcoma of the extremities or trunk: an analysis of 1,702 patients treated on neoadjuvant cooperative osteosarcoma study group protocols. Journal of Clinical Oncology, 20, 776-790.
Bilkay, U., Tokat, C., Helvaci, E., Ozek, C., Zekioglu, O., Onat, T. & Songur, E. 2008. Osteogenic capacities of tibial and cranial periosteum: a biochemical and histologic study. Journal of Craniofacial Surgery, 19, 453-458.
Birmingham, A., Anderson, E. M., Reynolds, A., Ilsley-Tyree, D., Leake, D., Fedorov, Y., Baskerville, S., Maksimova, E., Robinson, K. & Karpilow, J. 2006. 3′ UTR seed matches, but not overall identity, are associated with RNAi off-targets. Nature methods, 3, 199-204.
Bishop, M. W., Janeway, K. A. & Gorlick, R. 2016. Future directions in the treatment of osteosarcoma. Current opinion in pediatrics, 28, 26-33.
Black, E.M. and Giunta, S. 2018. Repetitive Fragile Sites: Centromere Satellite DNA as a Source of Genome Instability in Human Diseases. Genes, 9,12, 615.
Blackburn, E. H. 2001. Switching and signaling at the telomere. Cell, 106, 661-673. Blagosklonny, M. V. & Pardee, A. B. 2002. The restriction point of the cell cycle. Cell cycle,
1, 102-109. Blessy, M., Patel, R. D., Prajapati, P. N. & Agrawal, Y. K. 2014. Development of forced
degradation and stability indicating studies of drugs—A review. Journal of Pharmaceutical Analysis, 4, 159-165.
Boeuf, S., Kunz, P., Hennig, T., Lehner, B., Hogendoorn, P., Bovee, J. & Richter, W. 2008. A chondrogenic gene expression signature in mesenchymal stem cells is a classifier of conventional central chondrosarcoma. The Journal of pathology, 216, 158-166.
Bohr, V. A. 2002. Repair of oxidative DNA damage in nuclear and mitochondrial DNA, and some changes with aging in mammalian cells 1, 2. Free Radical Biology and Medicine, 32, 804-812.
Bolden, J. E., Peart, M. J. & Johnstone, R. W. 2006. Anticancer activities of histone deacetylase inhibitors. Nature reviews Drug discovery, 5, 769-784.
Boles, N. C., Peddibhotla, S., Chen, A. J., Goodell, M. A. & Rosen, J. M. 2010. Chk1 haploinsufficiency results in anemia and defective erythropoiesis. PloS one, 5, e8581.
Bonner, W. M., Redon, C. E., Dickey, J. S., Nakamura, A. J., Sedelnikova, O. A., Solier, S. & Pommier, Y. 2008. γH2AX and cancer. Nature reviews. Cancer, 8, 957.
Bonte, D., Lindvall, C., Liu, H., Dykema, K., Furge, K. & Weinreich, M. 2008a. Cdc7-Dbf4 Kinase Overexpression in Multiple Cancers and Tumor Cell Lines Is Correlated with p53 Inactivation. Neoplasia (New York, N.Y.), 10, 920-931.
Boonrungsiman, S., Gentleman, E., Carzaniga, R., Evans, N. D., Mccomb, D. W., Porter, A. E. & Stevens, M. M. 2012. The role of intracellular calcium phosphate in osteoblast-mediated bone apatite formation. Proceedings of the National Academy of Sciences, 109, 14170-14175.
Boschelli, F., Arndt, K. T. & Golas, J. M. 2008. 4-anilino-3-quinolinecarbonitriles for the treatment of chronic myelogenous leukemia (CML). Google Patents.
Bose, S. K., Bullard, R. S. & Donald, C. D. 2008. Oncogenic role of engrailed-2 (en-2) in prostate cancer cell growth and survival. Translational oncogenomics, 3, 37.
Botter, S. M., Neri, D. & Fuchs, B. 2014. Recent advances in osteosarcoma. Current opinion in pharmacology, 16, 15-23.
Bourin, P., Bunnell, B. A., Casteilla, L., Dominici, M., Katz, A. J., March, K. L., Redl, H., Rubin, J. P., Yoshimura, K. & Gimble, J. M. 2013. Stromal cells from the adipose tissue-derived stromal vascular fraction and culture expanded adipose tissue-derived stromal/stem cells: a joint statement of the International Federation for
Page | 213
Adipose Therapeutics and Science (IFATS) and the International Society for Cellular Therapy (ISCT). Cytotherapy, 15, 641-648.
Bouwman, B.A. & Crosetto, N. 2018. Endogenous DNA Double-Strand Breaks during DNA Transactions: Emerging Insights and Methods for Genome-Wide Profiling. Genes, 9, 632.
Bovée, J. V., Hogendoorn, P. C., Wunder, J. S. & Alman, B. A. 2010. Cartilage tumours and bone development: molecular pathology and possible therapeutic targets. Nature Reviews Cancer, 10, 481-488.
Bower, J. J., Karaca, G. F., Zhou, Y., Simpson, D. A., Cordeiro-Stone, M. & Kaufmann, W. K. 2010. Topoisomerase IIα maintains genomic stability through decatenation G2 checkpoint signaling. Oncogene, 29, 4787.
Boyd, A. C. 1993. Turbo cloning: a fast, efficient method for cloning PCR products and other blunt-ended DNA fragments into plasmids. Nucleic acids research, 21, 817-821.
Bratic, A. & Larsson, N.-G. 2013. The role of mitochondria in aging. The Journal of clinical investigation, 123, 951-957.
Brauer, M. J., Huttenhower, C., Airoldi, E. M., Rosenstein, R., Matese, J. C., Gresham, D., Boer, V. M., Troyanskaya, O. G. & Botstein, D. 2008. Coordination of growth rate, cell cycle, stress response, and metabolic activity in yeast. Molecular biology of the cell, 19, 352-367.
Brazelle, W., Kreahling, J. M., Gemmer, J., Ma, Y., Cress, W. D., Haura, E. & Altiok, S. 2010. Histone deacetylase inhibitors downregulate checkpoint kinase 1 expression to induce cell death in non-small cell lung cancer cells. PloS one, 5, e14335.
Bredella, M. A., Torriani, M., Ghomi, R. H., Thomas, B. J., Brick, D. J., Gerweck, A. V., Rosen, C. J., Klibanski, A. & Miller, K. K. 2011. Vertebral bone marrow fat is positively associated with visceral fat and inversely associated with IGF‐1 in obese women. Obesity, 19, 49-53.
Broadhead, M. L., Clark, J., Myers, D. E., Dass, C. R. & Choong, P. F. 2011a. The molecular pathogenesis of osteosarcoma: a review. Sarcoma, 2011.
Brown, E. J. & Baltimore, D. 2003. Essential and dispensable roles of ATR in cell cycle arrest and genome maintenance. Genes & development, 17, 615-628.
Brubaker, K. D., Vessella, R. L., Brown, L. G. & Corey, E. 2003. Prostate cancer expression of runt‐domain transcription factor Runx2, a key regulator of osteoblast differentiation and function. The Prostate, 56, 13-22.
Bryan, T. M., Englezou, A., Dalla-Pozza, L., Dunham, M. A. & Reddel, R. R. 1997. Evidence for an alternative mechanism for maintaining telomere length in human tumors and tumor-derived cell lines. Nature medicine, 3, 1271-1274.
Buffart, T. E., Coffa, J., Hermsen, M., Carvalho, B., Van Der Sijp, J. R. M., Ylstra, B., Pals, G., Schouten, J. P. & Meijer, G. A. 2005. DNA copy number changes at 8q11–24 in metastasized colorectal cancer. Analytical Cellular Pathology, 27, 57-65.
Burbulla, L. F. & Krüger, R. 2012. The Use of Primary Human Fibroblasts for Monitoring Mitochondrial Phenotypes in the Field of Parkinson's Disease. Journal of Visualized Experiments : JoVE, 4228.
Burgess, D. J. 2013. Specialist responses at telomeres. Nature Reviews Genetics, 14. Burkhardt, R., Kettner, G., Böhm, W., Schmidmeier, M., Schlag, R., Frisch, B., Mallmann,
B., Eisenmenger, W. & Gilg, T. H. 1987. Changes in trabecular bone, hematopoiesis and bone marrow vessels in aplastic anemia, primary osteoporosis, and old age: a comparative histomorphometric study. Bone, 8, 157-164.
Burks, L. M., Yin, J. & Plon, S. E. 2007. Nuclear import and retention domains in the amino terminus of RECQL4. Gene, 391, 26-38.
Burrell, R. A., Mcclelland, S. E., Endesfelder, D., Groth, P., Weller, M.-C., Shaikh, N., Domingo, E., Kanu, N., Dewhurst, S. M. & Gronroos, E. 2013. Replication stress links structural and numerical cancer chromosomal instability. Nature, 494, 492.
Burrow, K. L., Hoyland, J. A. & Richardson, S. M. 2017. Human Adipose-Derived Stem Cells Exhibit Enhanced Proliferative Capacity and Retain Multipotency Longer than Donor-Matched Bone Marrow Mesenchymal Stem Cells during Expansion In Vitro. Stem cells international, 2017.
Butler, L. M., Agus, D. B., Scher, H. I., Higgins, B., Rose, A., Cordon-Cardo, C., Thaler, H. T., Rifkind, R. A., Marks, P. A. & Richon, V. M. 2000. Suberoylanilide hydroxamic
Page | 214
acid, an inhibitor of histone deacetylase, suppresses the growth of prostate cancer cells in vitro and in vivo. Cancer research, 60, 5165-5170.
Cabral, R. E. C., Queille, S., Bodemer, C., De Prost, Y., Neto, J. B. C., Sarasin, A. & Daya-Grosjean, L. 2008. Identification of new RECQL4 mutations in Caucasian Rothmund–Thomson patients and analysis of sensitivity to a wide range of genotoxic agents. Mutation Research/Fundamental and Molecular Mechanisms of Mutagenesis, 643, 41-47.
Cai, J., Li, W., Su, H., Qin, D., Yang, J., Zhu, F., Xu, J., He, W., Guo, X. & Labuda, K. 2010. Generation of human induced pluripotent stem cells from umbilical cord matrix and amniotic membrane mesenchymal cells. Journal of Biological Chemistry, 285, 11227-11234.
Calo, E., Quintero-Estades, J. A., Danielian, P. S., Nedelcu, S., Berman, S. D. & Lees, J. A. 2010. Rb regulates fate choice and lineage commitment in vivo. Nature, 466, 1110.
Cao, F., Lu, L., Abrams, S. A., Hawthorne, K. M., Tam, A., Jin, W., Dawson, B., Shypailo, R., Liu, H. & Lee, B. 2017. Generalized Metabolic Bone Disease and Fracture Risk in Rothmund-Thomson Syndrome. Human Molecular Genetics.
Cao, J. J. 2011. Effects of obesity on bone metabolism. Journal of orthopaedic surgery and research, 6, 30.
Caplan, A. I. 1991. Mesenchymal stem cells. Journal of orthopaedic research, 9, 641-650. Capp, C., Wu, J. & Hsieh, T.-S. 2009. Drosophila RecQ4 has a 3′-5′ DNA helicase activity
that is essential for viability. Journal of Biological Chemistry, 284, 30845-30852. Capp, C., Wu, J. & Hsieh, T.-S. 2010. RecQ4: the second replicative helicase? Critical
reviews in biochemistry and molecular biology, 45, 233-242. Carlson, A. M., Lindor, N. M. & Litzow, M. R. 2011. Therapy‐related myelodysplasia in a
patient with Rothmund–Thomson syndrome. European journal of haematology, 86, 536-540.
Carter, S. L., Eklund, A. C., Kohane, I. S., Harris, L. N. & Szallasi, Z. 2006. A signature of chromosomal instability inferred from gene expression profiles predicts clinical outcome in multiple human cancers. Nature genetics, 38, 1043-1048.
Caruso, R. A., Fedele, F., Crisafulli, C., Paparo, D., Parisi, A., Lucianò, R. & Cavallari, V. 2011. Abnormal nuclear structures (micronuclei, nuclear blebs, strings, and pockets) in a case of anaplastic giant cell carcinoma of the thyroid: an immunohistochemical and ultrastructural study. Ultrastructural pathology, 35, 14-18.
Celeste, A., Fernandez-Capetillo, O., Kruhlak, M. J., Pilch, D. R., Staudt, D. W., Lee, A., Bonner, R. F., Bonner, W. M. & Nussenzweig, A. 2003a. Histone H2AX phosphorylation is dispensable for the initial recognition of DNA breaks. Nature cell biology, 5, 675-679.
Celeste, A., Difilippantonio, S., Difilippantonio, M. J., Fernandez-Capetillo, O., Pilch, D. R., Sedelnikova, O. A., Eckhaus, M., Ried, T., Bonner, W. M. & Nussenzweig, A. 2003b. H2AX haploinsufficiency modifies genomic stability and tumor susceptibility. Cell, 114, 371-383.
Cenni, V., Maraldi, N. M., Ruggeri, A., Secchiero, P., Del Coco, R., De Pol, A., Cocco, L. & Marmiroli, S. 2004. Sensitization of multidrug resistant human ostesarcoma cells to Apo2 Ligand/TRAIL-induced apoptosis by inhibition of the Akt/PKB kinase. International journal of oncology, 25, 1599-1608.
Cesare, A. J. & Reddel, R. R. 2010. Alternative lengthening of telomeres: models, mechanisms and implications. Nature reviews. Genetics, 11, 319.
Chai, W., Ford, L. P., Lenertz, L., Wright, W. E. & Shay, J. W. 2002. Human Ku70/80 associates physically with telomerase through interaction with hTERT. Journal of Biological Chemistry, 277, 47242-47247.
Chamberlain, G., Fox, J., Ashton, B. & Middleton, J. 2007. Concise review: mesenchymal stem cells: their phenotype, differentiation capacity, immunological features, and potential for homing. Stem cells, 25, 2739-2749.
Chan, Q. K. Y., Lam, H.-M., Ng, C.-F., Lee, A. Y. Y., Chan, E. S. Y., Ng, H.-K., Ho, S.-M. & Lau, K.-M. 2010. Activation of GPR30 inhibits the growth of prostate cancer cells through sustained activation of Erk1/2, c-jun/c-fos-dependent upregulation of p21, and induction of G2 cell-cycle arrest. Cell Death & Differentiation, 17, 1511-1523.
Page | 215
Chan, L. H., Wang, W., Yeung, W., Deng, Y., Yuan, P. & Mak, K. K. 2014. Hedgehog signaling induces osteosarcoma development through Yap1 and H19 overexpression. Oncogene, 33, 4857.
Chandrasekar, C. R., Grimer, R. J., Carter, S. R., Tillman, R. M., Abudu, A., Jeys, L. M., Cheung, W. G. H. & Sharma, R. 2012. Pathological fracture of the proximal femur in osteosarcoma: need for early radical surgery? ISRN oncology, 2012.
Chang, H. H. Y., Pannunzio, N. R., Adachi, N. & Lieber, M. R. 2017. Non-homologous DNA end joining and alternative pathways to double-strand break repair. Nature Reviews Molecular Cell Biology.
Chen, C. T., Shih, Y. R. V., Kuo, T. K., Lee, O. K. & Wei, Y. H. 2008. Coordinated changes of mitochondrial biogenesis and antioxidant enzymes during osteogenic differentiation of human mesenchymal stem cells. Stem Cells, 26, 960-968.
Chen, L.-Y., Redon, S. & Lingner, J. 2012. The human CST complex is a terminator of telomerase activity. Nature, 488, 540-544.
Chen, P.-F., Singhal, S., Bushyhead, D., Broder-Fingert, S. & Wolfe, J. 2014a. Colchicine-induced degeneration of the micronucleus during conjugation in Tetrahymena. Biology open, 3, 353-361.
Chen, X., Bahrami, A., Pappo, A., Easton, J., Dalton, J., Hedlund, E., Ellison, D., Shurtleff, S., Wu, G. & Wei, L. 2014a. Recurrent somatic structural variations contribute to tumorigenesis in pediatric osteosarcoma. Cell reports, 7, 104-112.
Chen, Y., Wang, L., Cheng, X., Ge, X. & Wang, P. 2014b. An ultrasensitive system for measuring the USPs and OTULIN activity using Nanoluc as a reporter. Biochemical and biophysical research communications, 455, 178-183.
Chen, X., Pappo, A. & Dyer, M. A. 2015. Pediatric solid tumor genomics and developmental pliancy. Oncogene, 34, 5207-5215.
Chen, Q., Shou, P., Zheng, C., Jiang, M., Cao, G., Yang, Q., Cao, J., Xie, N., Velletri, T. & Zhang, X. 2016. Fate decision of mesenchymal stem cells: adipocytes or osteoblasts? Cell death and differentiation, 23, 1128.
Cheng, J., Fan, Y. H., Xu, X., Zhang, H., Dou, J., Tang, Y., Zhong, X., Rojas, Y., Yu, Y. & Zhao, Y. 2014. A small-molecule inhibitor of UBE2N induces neuroblastoma cell death via activation of p53 and JNK pathways. Cell death & disease, 5, e1079.
Cheng, A. N., Fan, C.-C., Lo, Y.-K., Kuo, C.-L., Wang, H.-C., Lien, I. H., Lin, S.-Y., Chen, C.-H., Jiang, S. S. & Chang, I. S. 2017. Cdc7-Dbf4-mediated phosphorylation of HSP90-S164 stabilizes HSP90-HCLK2-MRN complex to enhance ATR/ATM signaling that overcomes replication stress in cancer. Scientific reports, 7, 17024.
Chi, Z., Nie, L., Peng, Z., Yang, Q., Yang, K., Tao, J., Mi, Y., Fang, X., Balajee, A. S. & Zhao, Y. 2012. RecQL4 cytoplasmic localization: implications in mitochondrial DNA oxidative damage repair. The international journal of biochemistry & cell biology, 44, 1942-1951.
Chi, Z., Nie, L., Peng, Z., Yang, Q., Yang, K., Tao, J., Mi, Y., Fang, X., Balajee, A. S. & Zhao, Y. 2012. RecQL4 cytoplasmic localization: implications in mitochondrial DNA oxidative damage repair. The international journal of biochemistry & cell biology, 44, 1942-1951.
Chirgwin, J. M. & Guise, T. A. 2000. Molecular mechanisms of tumor-bone interactions in osteolytic metastases. Critical Reviews™ in Eukaryotic Gene Expression, 10.
Choi, Y. W., Bae, S. M., Kim, Y. W., Lee, H. N., Kim, Y. W., Park, T. C., Ro, D. Y., Shin, J. C., Shin, S. J. & Seo, J. S. 2007. Gene expression profiles in squamous cell cervical carcinoma using array‐based comparative genomic hybridization analysis. International Journal of Gynecological Cancer, 17, 687-696.
Choi, K.-M., Seo, Y.-K., Yoon, H.-H., Song, K.-Y., Kwon, S.-Y., Lee, H.-S. & Park, J.-K. 2008. Effect of ascorbic acid on bone marrow-derived mesenchymal stem cell proliferation and differentiation. Journal of bioscience and bioengineering, 105, 586-594.
Choi, Y. S., Dusting, G. J., Stubbs, S., Arunothayaraj, S., Han, X. L., Collas, P., Morrison, W. A. & Dilley, R. J. 2010. Differentiation of human adipose‐derived stem cells into beating cardiomyocytes. Journal of cellular and molecular medicine, 14, 878-889.
Choi, B. H., Xie, S. & Dai, W. 2017. PTEN is a negative regulator of mitotic checkpoint complex during the cell cycle. Experimental Hematology & Oncology, 6, 19.
Page | 216
Chou, A. J., Merola, P. R., Wexler, L. H., Gorlick, R. G., Vyas, Y. M., Healey, J. H., Laquaglia, M. P., Huvos, A. G. & Meyers, P. A. 2005. Treatment of osteosarcoma at first recurrence after contemporary therapy. Cancer, 104, 2214-2221.
Choudhery, M. S., Badowski, M., Muise, A. & Harris, D. T. 2013. Comparison of human mesenchymal stem cells derived from adipose and cord tissue. Cytotherapy, 15, 330-343.
Chu, T.W., MacNeil, D.E. & Autexier, C. 2016. Multiple mechanisms contribute to the cell growth defects imparted by human telomerase insertion in fingers domain mutations associated with premature aging diseases. Journal of Biological Chemistry, 291, 8374-8386.
Chung, F.-L., Chen, H.-J. C. & Nath, R. G. 1996. Lipid peroxidation as a potential endogenous source for the formation of exocyclic DNA adducts. Carcinogenesis, 17, 2105-2111.
Cisyk, A. L., Singh, H. & Mcmanus, K. J. 2014. Establishing a biological profile for interval colorectal cancers. Digestive diseases and sciences, 59, 2390-2402.
Cleaver, J. E. 1977. Nucleosome structure controls rates of excision repair in DNA of human cells. Nature, 270, 451-453.
Cleton-Jansen, A.-M., Anninga, J. K., Briaire-De Bruijn, I. H., Romeo, S., Oosting, J., Egeler, R. M., Gelderblom, H., Taminiau, A. H. & Hogendoorn, P. C. 2009. Profiling of high-grade central osteosarcoma and its putative progenitor cells identifies tumourigenic pathways. British journal of cancer, 101, 1909-1918.
Clevers, H., Loh, K. M. & Nusse, R. 2014. An integral program for tissue renewal and regeneration: Wnt signaling and stem cell control. Science, 346, 1248012.
Cohen, P. 2000. The regulation of protein function by multisite phosphorylation–a 25 year update. Trends in biochemical sciences, 25, 596-601.
Cohen, D.M. and Chen, C.S. 2008. Mechanical control of stem cell differentiation. Cohen, A., Dempster, D. W., Stein, E. M., Nickolas, T. L., Zhou, H., Mcmahon, D. J., Müller,
R., Kohler, T., Zwahlen, A. & Lappe, J. M. 2012. Increased marrow adiposity in premenopausal women with idiopathic osteoporosis. The Journal of Clinical Endocrinology & Metabolism, 97, 2782-2791.
Cohnheim, J. 1867. Ueber entzündung und eiterung. Archiv für pathologische Anatomie und Physiologie und für klinische Medicin, 40, 1-79.
Colter, D. C., Sekiya, I. & Prockop, D. J. 2001. Identification of a subpopulation of rapidly self-renewing and multipotential adult stem cells in colonies of human marrow stromal cells. Proceedings of the National Academy of Sciences, 98, 7841-7845.
Comelli, L., Marchetti, L., Arosio, D., Riva, S., Abdurashidova, G., Beltram, F. & Falaschi, A. 2009. The homeotic protein HOXC13 is a member of human DNA replication complexes. Cell Cycle, 8, 454-459.
Conery, A. R. & Harlow, E. 2010. High-throughput screens in diploid cells identify factors that contribute to the acquisition of chromosomal instability. Proceedings of the National Academy of Sciences, 107, 15455-15460.
Cong, Y.-S., Wright, W. E. & Shay, J. W. 2002. Human Telomerase and Its Regulation. Microbiology and Molecular Biology Reviews, 66, 407-425.
Conget, P. A. & Minguell, J. J. 1999. Phenotypical and functional properties of human bone marrow mesenchymal progenitor cells. Journal of cellular physiology, 181, 67-73.
Conley, K. E., Marcinek, D. J. & Villarin, J. 2007. Mitochondrial dysfunction and age. Current Opinion in Clinical Nutrition & Metabolic Care, 10, 688-692.
Cookson, N. A., Cookson, S. W., Tsimring, L. S. & Hasty, J. 2009. Cell cycle-dependent variations in protein concentration. Nucleic acids research, gkp1069.
Coon, E.A. and Benarroch, E.E. 2018. DNA damage response: Selected review and neurologic implications. Neurology, 90,8, 367-376.
Cooper, G. M. & Hausman, R. E. 2000. The cell, Sinauer Associates Sunderland. Costantini, S., Woodbine, L., Andreoli, L., Jeggo, P. A. & Vindigni, A. 2007. Interaction of
the Ku heterodimer with the DNA ligase IV/Xrcc4 complex and its regulation by DNA-PK. DNA repair, 6, 712-722.
Cottet‐Rousselle, C., Ronot, X., Leverve, X. & Mayol, J. F. 2011. Cytometric assessment of mitochondria using fluorescent probes. Cytometry Part A, 79, 405-425.
Page | 217
Coudreuse, D. & Nurse, P. 2010. Driving the cell cycle with a minimal CDK control network. Nature, 468, 1074.
Coxon, F. P. & Taylor, A. 2008. Vesicular trafficking in osteoclasts. 19, 424-433. Crevel, G., Vo, N., Crevel, I., Hamid, S., Hoa, L., Miyata, S. & Cotterill, S. 2012. Drosophila
RecQ4 is directly involved in both DNA replication and the response to UV damage in S2 cells. PloS one, 7, e49505.
Crisan, M., Yap, S., Casteilla, L., Chen, C.-W., Corselli, M., Park, T. S., Andriolo, G., Sun, B., Zheng, B. & Zhang, L. 2008. A perivascular origin for mesenchymal stem cells in multiple human organs. Cell stem cell, 3, 301-313.
Cromie, G. A., Connelly, J. C. & Leach, D. R. F. 2001. Recombination at double-strand breaks and DNA ends: conserved mechanisms from phage to humans. Molecular cell, 8, 1163-1174.
Croteau, D. L., Popuri, V., Opresko, P. L. & Bohr, V. A. 2014. Human RecQ helicases in DNA repair, recombination, and replication. Annual review of biochemistry, 83, 519-552.
Croteau, D. L., Rossi, M. L., Canugovi, C., Tian, J., Sykora, P., Ramamoorthy, M., Wang, Z., Singh, D. K., Akbari, M. & Kasiviswanathan, R. 2012a. RECQL4 localizes to mitochondria and preserves mitochondrial DNA integrity. Aging cell, 11, 456-466.
Croteau, D. L., Singh, D. K., Ferrarelli, L. H., Lu, H. & Bohr, V. A. 2012b. RECQL4 in genomic instability and aging. Trends in Genetics, 28, 624-631.
Cui, L.-L., Kinnunen, T., Boltze, J., Nystedt, J. & Jolkkonen, J. 2016. Clumping and viability of bone marrow derived mesenchymal stromal cells under different preparation procedures: a flow cytometry-based in vitro study. Stem cells international, 2016.
Cui, Y., Zhu, J.-J., Ma, C.-B., Cui, K., Wang, F., Ni, S.-H. & Zhang, Z.-Y. 2016. Interleukin 10 gene− 1082A/G polymorphism is associated with osteosarcoma risk and poor outcomes in the Chinese population. Tumor Biology, 37, 4517-4522.
Currall, V. A. & Dixon, J. H. 2006. Synchronous multifocal osteosarcoma: case report and literature review. Sarcoma, 2006.
Curtis, E. M., Moon, R. J., Dennison, E. M., Harvey, N. C. & Cooper, C. 2016. Recent advances in the pathogenesis and treatment of osteoporosis. Clinical Medicine, 16, 360-364.
Da Silva Meirelles, L., Chagastelles, P. C. & Nardi, N. B. 2006. Mesenchymal stem cells reside in virtually all post-natal organs and tissues. Journal of cell science, 119, 2204-2213.
Daft, P. G., Yang, Y., Napierala, D. & Zayzafoon, M. 2015. The growth and aggressive behavior of human osteosarcoma is regulated by a CaMKII-controlled autocrine VEGF signaling mechanism. PLoS One, 10, e0121568.
Dahlin, D. C. 1957. Bone tumors: general aspects and an analysis of 2,276 cases, Thomas. Dai, Y. & Grant, S. 2010. New insights into checkpoint kinase 1 in the DNA damage
response signaling network. Clinical Cancer Research, 16, 376-383. Dai, J.-Q., Huang, Y.-G. & He, A.-N. 2015. Dihydromethysticin kavalactone induces
apoptosis in osteosarcoma cells through modulation of PI3K/Akt pathway, disruption of mitochondrial membrane potential and inducing cell cycle arrest. International journal of clinical and experimental pathology, 8, 4356.
Damron, T. A., Ward, W. G. & Stewart, A. 2007. Osteosarcoma, chondrosarcoma, and Ewing's sarcoma: National Cancer Data Base Report. Clinical orthopaedics and related research, 459, 40-47.
Daniel, J. A. & Nussenzweig, A. 2013. The AID-induced DNA damage response in chromatin. Molecular cell, 50, 309-321.
Darzynkiewicz, Z., Zhao, H., Halicka, H. D., Rybak, P., Dobrucki, J. & Wlodkowic, D. 2012. DNA Damage Signaling Assessed in Individual Cells in Relation to the Cell Cycle Phase and Induction of Apoptosis. Critical reviews in clinical laboratory sciences, 49, 199-217.
Das, S. C., Panda, D., Nayak, D. & Pattnaik, A. K. 2009. Biarsenical labeling of vesicular stomatitis virus encoding tetracysteine-tagged m protein allows dynamic imaging of m protein and virus uncoating in infected cells. Journal of virology, 83, 2611-2622.
Davis, A. J. & Chen, D. J. 2013. DNA double strand break repair via non-homologous end-joining. Translational cancer research, 2, 130.
Page | 218
Davis, T., Tivey, H. S. E., Brook, A. J. C., Grimstead, J. W., Rokicki, M. J. & Kipling, D. 2013. Activation of p38 MAP kinase and stress signalling in fibroblasts from the progeroid Rothmund–Thomson syndrome. Age, 35, 1767-1783.
Daw, N. C., Billups, C. A., Rodriguez-Galindo, C., Mccarville, M. B., Rao, B. N., Cain, A. M., Jenkins, J. J., Neel, M. D. & Meyer, W. H. 2006. Metastatic osteosarcoma. Cancer, 106, 403-412.
Dawson, D. & Bury, H. 1961. The significance of Howell-Jolly bodies and giant metamyelocytes in marrow smears. Journal of clinical pathology, 14, 374-380.
De Lange, T. 2002. Protection of mammalian telomeres. Oncogene, 21, 532. De Stanchina, E., Gabellini, D., Norio, P., Giacca, M., Peverali, F. A., Riva, S., Falaschi, A.
& Biamonti, G. 2000. Selection of homeotic proteins for binding to a human DNA replication origin. Journal of molecular biology, 299, 667-680.
De, S., Kumari, J., Mudgal, R., Modi, P., Gupta, S., Futami, K., Goto, H., Lindor, N. M., Furuichi, Y. & Mohanty, D. 2012. RECQL4 is essential for the transport of p53 to mitochondria in normal human cells in the absence of exogenous stress. J Cell Sci, 125, 2509-2522.
Deer, J. R. & Allison, D. S. 2004. High‐Level Expression of Proteins in Mammalian Cells
Using Transcription Regulatory Sequences from the Chinese Hamster EF‐1α Gene. Biotechnology progress, 20, 880-889.
Delagoutte, E. & Von Hippel, P. H. 2003. Helicase mechanisms and the coupling of helicases within macromolecular machines Part ii: Integration of helicases into cellular processes. Quarterly reviews of biophysics, 36, 1-69.
Delinasios, J. G., Angeli, F., Koumakis, G., Kumar, S., Kang, W.-H., Sica, G., Iacopino, F., Lama, G., Lamprecht, S. & Sigal-Batikoff, I. 2015. Proliferating fibroblasts and HeLa cells co-cultured in vitro reciprocally influence growth patterns, protein expression, chromatin features and cell survival. Anticancer research, 35, 1881-1916.
Deluca, M., Wannlund, J. & Mcelroy, W. D. 1979. Factors affecting the kinetics of light emission from crude and purified firefly luciferase. Analytical biochemistry, 95, 194-198.
Denchi, E. L. & De Lange, T. 2007. Protection of telomeres through independent control of ATM and ATR by TRF2 and POT1. Nature, 448, 1068-1071.
Deng, Z.-L., Sharff, K. A., Tang, N. I., Song, W.-X., Luo, J., Luo, X., Chen, J., Bennett, E., Reid, R. & Manning, D. 2008. Regulation of osteogenic differentiation during skeletal development. Front Biosci, 13, 2001-2021.
Dennis, G., Sherman, B. T., Hosack, D. A., Yang, J., Gao, W., Lane, H. C. & Lempicki, R. A. 2003. DAVID: database for annotation, visualization, and integrated discovery. Genome biology, 4, 1.
Depamphilis, M. L., Blow, J. J., Ghosh, S., Saha, T., Noguchi, K. & Vassilev, A. 2006. Regulating the licensing of DNA replication origins in metazoa. Current opinion in cell biology, 18, 231-239.
Der Kaloustian, V. M., Mcgill, J. J., Vekemans, M. & Kopelman, H. R. 1990. Clonal lines of aneuploid cells in Rothmund‐Thomson syndrome. American journal of medical genetics, 37, 336-339.
Devaney, J., Stirzaker, C., Qu, W., Song, J. Z., Statham, A. L., Patterson, K. I., Horvath, L. G., Tabor, B., Coolen, M. W. & Hulf, T. 2011. Epigenetic deregulation across chromosome 2q14. 2 differentiates normal from prostate cancer and provides a regional panel of novel DNA methylation cancer biomarkers. Cancer Epidemiology Biomarkers & Prevention, 20, 148-159.
Di Lisa, F. & Bernardi, P. 2005. Mitochondrial function and myocardial aging. A critical analysis of the role of permeability transition. Cardiovascular Research, 66, 222-232.
Díaz-Montero, C. M., Wygant, J. N. & Mcintyre, B. W. 2006. PI3-K/Akt-mediated anoikis resistance of human osteosarcoma cells requires Src activation. European Journal of Cancer, 42, 1491-1500.
Dick, D. C., Morley, W. N. & Watson, J. T. 1982. Rothmund‐Thomson syndrome and osteogenic sarcoma. Clinical and experimental dermatology, 7, 119-123.
Page | 219
Dicker, A., Le Blanc, K., Åström, G., Van Harmelen, V., Götherström, C., Blomqvist, L., Arner, P. & Rydén, M. 2005. Functional studies of mesenchymal stem cells derived from adult human adipose tissue. Experimental cell research, 308, 283-290.
Dietschy, T., Shevelev, I. & Stagljar, I. 2007. The molecular role of the Rothmund-Thomson-, RAPADILINO-and Baller-Gerold-gene product, RECQL4: recent progress. Cellular and molecular life sciences, 64, 796-802.
Dietschy, T., Shevelev, I., Pena-Diaz, J., Hühn, D., Kuenzle, S., Mak, R., Miah, M. F., Hess, D., Fey, M. & Hottiger, M. O. 2009. p300-mediated acetylation of the Rothmund-Thomson-syndrome gene product RECQL4 regulates its subcellular localization. Journal of cell science, 122, 1258-1267.
Diller, L., Kassel, J., Nelson, C. E., Gryka, M. A., Litwak, G., Gebhardt, M., Bressac, B., Ozturk, M., Baker, S. J. & Vogelstein, B. 1990. p53 functions as a cell cycle control protein in osteosarcomas. Molecular and cellular biology, 10, 5772-5781.
Ding, L., Sun, X., You, Y., Liu, N. & Fu, Z. 2010. Expression of focal adhesion kinase and phosphorylated focal adhesion kinase in human gliomas is associated with unfavorable overall survival. Translational Research, 156, 45-52.
Doksani, Y., Wu, J. Y., De Lange, T. & Zhuang, X. 2013. Super-resolution fluorescence imaging of telomeres reveals TRF2-dependent T-loop formation. Cell, 155, 345-356.
Doll, R. & Peto, R. 1981. The causes of cancer: quantitative estimates of avoidable risks of cancer in the United States today. Journal of the National Cancer Institute, 66, 1192-1308.
Dominici, M., Le Blanc, K., Mueller, I., Slaper-Cortenbach, I., Marini, F. C., Krause, D. S., Deans, R. J., Keating, A., Prockop, D. J. & Horwitz, E. M. 2006. Minimal criteria for defining multipotent mesenchymal stromal cells. The International Society for Cellular Therapy position statement. Cytotherapy, 8, 315-317.
Dorfman, H. D. & Czerniak, B. 1998. Bone tumors. St. Louis: Mosby,1997. Dottori, M., Pebay, A. & Pera, M. F. 2010. Neural differentiation of human embryonic stem
cells. Protocols for Neural Cell Culture: Fourth Edition, 75-86. Douma, S., Van Laar, T., Zevenhoven, J., Meuwissen, R., Van Garderen, E. & Peeper, D.
S. 2004. Suppression of anoikis and induction of metastasis by the neurotrophic receptor TrkB. Nature, 430, 1034-1039.
Dragoo, J. L., Samimi, B., Zhu, M., Hame, S. L., Thomas, B. J., Lieberman, J. R., Hedrick, M. H. & Benhaim, P. 2003. Tissue-engineered cartilage and bone using stem cells from human infrapatellar fat pads. Bone & Joint Journal, 85, 740-747.
Dreesen, O., Ong, P. F., Chojnowski, A. & Colman, A. 2013. The contrasting roles of lamin B1 in cellular aging and human disease. Nucleus, 4, 283-290.
Driessens, G., Harsan, L., Robaye, B., Waroquier, D., Browaeys, P., Giannakopoulos, X., Velu, T. & Bruyns, C. 2003. Micronuclei to detect in vivo chemotherapy damage in a p53 mutated solid tumour. British journal of cancer, 89, 727.
Drissi, H., Hushka, D., Aslam, F., Nguyen, Q., Buffone, E., Koff, A., Van Wijnen, A. J., Lian, J. B., Stein, J. L. & Stein, G. S. 1999. The cell cycle regulator p27kip1 contributes to growth and differentiation of osteoblasts. Cancer research, 59, 3705-3711.
Drouin, C. A., Mongrain, E., Sasseville, D., Bouchard, H.-L. & Drouin, M. 1993. Rothmund-Thomson syndrome with osteosarcoma. Journal of the American Academy of Dermatology, 28, 301-305.
Ducy, P., Zhang, R., Geoffroy, V., Ridall, A. L. & Karsenty, G. 1997. Osf2/Cbfa1: a transcriptional activator of osteoblast differentiation. cell, 89, 747-754.
Ducy, P., Starbuck, M., Priemel, M., Shen, J., Pinero, G., Geoffroy, V., Amling, M. & Karsenty, G. 1999. A Cbfa1-dependent genetic pathway controls bone formation beyond embryonic development. Genes & development, 13, 1025-1036.
Ducy, P., Schinke, T. & Karsenty, G. 2000. The osteoblast: a sophisticated fibroblast under central surveillance. Science, 289, 1501-1504.
Dudley, D. D., Chaudhuri, J., Bassing, C. H. & Alt, F. W. 2005. Mechanism and control of V (D) J recombination versus class switch recombination: similarities and differences. Advances in immunology, 86, 43-112.
Dudley-Javoroski, S. & Shields, R. K. 2008. Dose estimation and surveillance of mechanical loading interventions for bone loss after spinal cord injury. Physical therapy, 88, 387-396.
Page | 220
Duesberg, P., Li, R., Fabarius, A. & Hehlmann, R. 2006. Aneuploidy and cancer: from correlation to causation. Infection and inflammation: impacts on oncogenesis. Karger Publishers.
Dunham, J. H. & Guthmiller, P. 2009. Doing good science: Authenticating cell line identity. Promega Notes, 101, 15-18.
Duong, L. T., Lakkakorpi, P. T., Nakamura, I., Machwate, M., Nagy, R. M. & Rodan, G. A. 1998. PYK2 in osteoclasts is an adhesion kinase, localized in the sealing zone, activated by ligation of alpha (v) beta3 integrin, and phosphorylated by src kinase. Journal of Clinical Investigation, 102, 881.
Durkin, S. G. & Glover, T. W. 2007. Chromosome fragile sites. Annu. Rev. Genet., 41, 169-192.
Dwek, J. R. 2010. The periosteum: what is it, where is it, and what mimics it in its absence? Skeletal radiology, 39, 319-323.
Dworaczek, H. & Xiao, W. 2007. Xeroderma pigmentosum: a glimpse into nucleotide excision repair, genetic instability, and cancer. Critical Reviews™ in Oncogenesis, 13.
Edwards, A., Civitello, A., Hammond, H. A. & Caskey, C. T. 1991. DNA typing and genetic mapping with trimeric and tetrameric tandem repeats. American journal of human genetics, 49, 746.
Edwards, A., Hammond, H. A., Jin, L., Caskey, C. T. & Chakraborty, R. 1992. Genetic variation at five trimeric and tetrameric tandem repeat loci in four human population groups. Genomics, 12, 241-253.
Eklund, E. A. 2007. The role of HOX genes in malignant myeloid disease. Current opinion in hematology, 14, 85-89.
El Ghamrasni, S., Pamidi, A., Halaby, M. J., Bohgaki, M., Cardoso, R., Li, L., Venkatesan, S., Sethu, S., Hirao, A. & Mak, T. W. 2011. Inactivation of chk2 and mus81 leads to impaired lymphocytes development, reduced genomic instability, and suppression of cancer. PLoS genetics, 7, e1001385.
Elbrecht, A., Chen, Y., Cullinan, C. A., Hayes, N., Leibowitz, M. D., Moller, D. E. & Berger, J. 1996. Molecular cloning, expression and characterization of human peroxisome proliferator activated receptors γ1 and γ2. Biochemical and biophysical research communications, 224, 431-437.
El-Deiry, W. S., Kern, S. E. & Pietenpol, J. 1992. p53 binding sites in transposons. Nat. Genet, 1, 45-49.
El-Khoury, J. M., Haddad, S. N. & Atallah, N. G. 1997. Osteosarcomatosis with Rothmund-Thomson syndrome. The British journal of radiology, 70, 215-218.
Elmore, S. 2007. Apoptosis: a review of programmed cell death. Toxicologic pathology, 35, 495-516.
El-Zein, R. A., Schabath, M. B., Etzel, C. J., Lopez, M. S., Franklin, J. D. & Spitz, M. R. 2006. Cytokinesis-blocked micronucleus assay as a novel biomarker for lung cancer risk. Cancer Research, 66, 6449-6456.
Emea 2009. assessment report for ChondroCelect Europena Medciines Agency 724428/2009
Emmott, E. & Goodfellow, I. 2014. Identification of Protein Interaction Partners in Mammalian Cells Using SILAC-immunoprecipitation Quantitative Proteomics. Journal of Visualized Experiments : JoVE, 51656.
Engler, A. J., Sen, S., Sweeney, H. L. & Discher, D. E. 2006. Matrix elasticity directs stem cell lineage specification. Cell, 126, 677-689.
Erbayraktar, Z., Alural, B., Erbayraktar, R. S. & Erkan, E. P. 2016. Cell division cycle 7-kinase inhibitor PHA-767491 hydrochloride suppresses glioblastoma growth and invasiveness. Cancer Cell International, 16, 88.
Erices, A., Conget, P. & Minguell, J. J. 2000. Mesenchymal progenitor cells in human umbilical cord blood. British journal of haematology, 109, 235-242.
Erickson, G. R., Gimble, J. M., Franklin, D. M., Rice, H. E., Awad, H. & Guilak, F. 2002. Chondrogenic potential of adipose tissue-derived stromal cells in vitro and in vivo. Biochemical and biophysical research communications, 290, 763-769.
Esen, E. & Long, F. 2014. Aerobic glycolysis in osteoblasts. Current osteoporosis reports, 12, 433-438.
Page | 221
Espejel, S., Franco, S., Sgura, A., Gae, D., Bailey, S. M., Taccioli, G. E. & Blasco, M. A. 2002. Functional interaction between DNA‐PKcs and telomerase in telomere length maintenance. The EMBO journal, 21, 6275-6287.
Esterbauer, H., Eckl, P. & Ortner, A. 1990. Possible mutagens derived from lipids and lipid precursors. Mutation Research/Reviews in Genetic Toxicology, 238, 223-233.
Everts, V., De Vries, T. J. & Helfrich, M. H. 2009. Osteoclast heterogeneity:: Lessons from osteopetrosis and inflammatory conditions. Biochimica et Biophysica Acta (BBA) - Molecular Basis of Disease, 1792, 757-765.
Fahrner, M., Muik, M., Schindl, R., Butorac, C., Stathopulos, P., Zheng, L., Jardin, I., Ikura, M. & Romanin, C. 2014. A coiled-coil clamp controls both conformation and clustering of stromal interaction molecule 1 (STIM1). Journal of Biological Chemistry, 289, 33231-33244.
Falaschi, A., Abdurashidova, G. & Biamonti, G. 2010. DNA replication, development and cancer: a homeotic connection? Critical reviews in biochemistry and molecular biology, 45, 14-22.
Fan, W. & Luo, J. 2008. RecQ4 facilitates UV light-induced DNA damage repair through interaction with nucleotide excision repair factor xeroderma pigmentosum group A (XPA). Journal of Biological Chemistry, 283, 29037-29044.
Fang, H., Nie, L., Chi, Z., Liu, J., Guo, D., Lu, X., Hei, T. K., Balajee, A. S. & Zhao, Y. 2013. RecQL4 Helicase Amplification Is Involved in Human Breast Tumorigenesis. PLoS ONE, 8, e69600.
Fenech, M. 2000. The in vitro micronucleus technique. Mutation Research/Fundamental and Molecular Mechanisms of Mutagenesis, 455, 81-95.
Fenech, M. 2006. Cytokinesis-block micronucleus assay evolves into a “cytome” assay of chromosomal instability, mitotic dysfunction and cell death. Mutation Research/Fundamental and Molecular Mechanisms of Mutagenesis, 600, 58-66.
Fenech, M. 2009. A lifetime passion for micronucleus cytome assays—reflections from Down Under. Mutation Research/Reviews in Mutation Research, 681, 111-117.
Feng, J., Funk, W. D., Wang, S.-S., Weinrich, S. L., Avilion, A. A., Chiu, C.-P., Adams, R. R., Chang, E., Allsopp, R. C. & Yu, J. 1995. The RNA component of human telomerase. Science, 269, 1236-1241.
Ferrarelli, L. K., Popuri, V., Ghosh, A. K., Tadokoro, T., Canugovi, C., Hsu, J. K., Croteau, D. L. & Bohr, V. A. 2013. The RECQL4 protein, deficient in Rothmund–Thomson syndrome is active on telomeric D-loops containing DNA metabolism blocking lesions. DNA repair, 12, 518-528.
Fisher, D., Krasinska, L., Coudreuse, D. & Novák, B. 2012. Phosphorylation network dynamics in the control of cell cycle transitions. J Cell Sci, 125, 4703-4711.
Fitzgerald, J., Murillo, L. S., O'brien, G., O'connell, E., O'connor, A., Wu, K., Wang, G.-N., Rainey, M. D., Natoni, A. & Healy, S. 2014. A high through-put screen for small molecules modulating MCM2 phosphorylation identifies Ryuvidine as an inducer of the DNA damage response. PloS one, 9, e98891.
Flach, J., Bakker, S. T., Mohrin, M., Conroy, P. C., Pietras, E. M., Reynaud, D., Alvarez, S., Diolaiti, M. E., Ugarte, F. & Forsberg, E. C. 2014. Replication stress is a potent driver of functional decline in ageing haematopoietic stem cells. Nature, 512, 198.
Fletcher, C. D. M. 2014. The evolving classification of soft tissue tumours–an update based on the new 2013 WHO classification. Histopathology, 64, 2-11.
Foley, E. A. & Kapoor, T. M. 2013. Microtubule attachment and spindle assembly checkpoint signaling at the kinetochore. Nature reviews. Molecular cell biology, 14, 25.
Folmes, C. D. L., Nelson, T. J., Martinez-Fernandez, A., Arrell, D. K., Lindor, J. Z., Dzeja, P. P., Ikeda, Y., Perez-Terzic, C. & Terzic, A. 2011. Somatic oxidative bioenergetics transitions into pluripotency-dependent glycolysis to facilitate nuclear reprogramming. Cell metabolism, 14, 264-271.
Fontaine, C., Cousin, W., Plaisant, M., Dani, C. & Peraldi, P. 2008. Hedgehog signaling alters adipocyte maturation of human mesenchymal stem cells. Stem Cells, 26, 1037-1046.
Page | 222
Forman, J. J., Legesse-Miller, A. & Coller, H. A. 2008. A search for conserved sequences in coding regions reveals that the let-7 microRNA targets Dicer within its coding sequence. Proceedings of the National Academy of Sciences, 105, 14879-14884.
Forsburg, S. L. 2004. Eukaryotic MCM proteins: beyond replication initiation. Microbiology and Molecular Biology Reviews, 68, 109-131.
Fortini, P., Parlanti, E., Sidorkina, O. M., Laval, J. & Dogliotti, E. 1999. The type of DNA glycosylase determines the base excision repair pathway in mammalian cells. Journal of Biological Chemistry, 274, 15230-15236.
Fortini, P. & Dogliotti, E. 2007. Base damage and single-strand break repair: mechanisms and functional significance of short-and long-patch repair subpathways. DNA repair, 6, 398-409.
Franz‐Odendaal, T. A., Hall, B. K. & Witten, P. E. 2006. Buried alive: how osteoblasts become osteocytes. Developmental Dynamics, 235, 176-190.
Fraser, J. K., Wulur, I., Alfonso, Z. & Hedrick, M. H. 2006. Fat tissue: an underappreciated source of stem cells for biotechnology. Trends in biotechnology, 24, 150-154.
Freire-Maia, N. 1971. Ectodermal dysplasias. Human heredity, 21, 309-312. Friedberg, E. C., Walker, G. C., Siede, W. & Wood, R. D. 2005. DNA repair and
mutagenesis, American Society for Microbiology Press. Friedel, A. M., Pike, B. L. & Gasser, S. M. 2009. ATR/Mec1: coordinating fork stability and
repair. Current opinion in cell biology, 21, 237-244. Friedenstein, A. J., Chailakhjan, R. K. & Lalykina, K. S. 1970. The development of fibroblast
colonies in monolayer cultures of guinea‐pig bone marrow and spleen cells. Cell Proliferation, 3, 393-403.
Frisch, S. M. & Francis, H. 1994. Disruption of epithelial cell-matrix interactions induces apoptosis. The Journal of cell biology, 124, 619-626.
Frisch, S. M. & Ruoslahti, E. 1997. Integrins and anoikis. Current opinion in cell biology, 9, 701-706.
Frisch, S. M. & Screaton, R. A. 2001. Anoikis mechanisms. Current opinion in cell biology, 13, 555-562.
Frost, H. M. & Straatsma, C. R. 1964. Bone remodelling dynamics. LWW. Fukazawa, H., Mizuno, S. & Uehara, Y. 1995. A microplate assay for quantitation of
anchorage-independent growth of transformed cells. Analytical biochemistry, 228, 83-90.
Gagos, S. & Irminger-Finger, I. 2005. Chromosome instability in neoplasia: chaotic roots to continuous growth. The International Journal of Biochemistry & Cell Biology, 37, 1014-1033.
Galindo, M., Pratap, J., Young, D. W., Hovhannisyan, H., Im, H.-J., Choi, J.-Y., Lian, J. B., Stein, J. L., Stein, G. S. & Van Wijnen, A. J. 2005. The bone-specific expression of Runx2 oscillates during the cell cycle to support a G1-related antiproliferative function in osteoblasts. Journal of Biological Chemistry, 280, 20274-20285.
Galindo, M., Kahler, R. A., Teplyuk, N. M., Stein, J. L., Lian, J. B., Stein, G. S., Westendorf, J. J. & Van Wijnen, A. J. 2007. Cell cycle related modulations in Runx2 protein levels are independent of lymphocyte enhancer-binding factor 1 (Lef1) in proliferating osteoblasts. Journal of molecular histology, 38, 501-506.
Gandhi, M., Dillon, L. W., Pramanik, S., Nikiforov, Y. E. & Wang, Y.-H. 2010. DNA breaks at fragile sites generate oncogenic RET/PTC rearrangements in human thyroid cells. Oncogene, 29, 2272-2280.
Gao, H., Prasad, G. L. & Zacharias, W. 2014. Combusted but not smokeless tobacco products cause DNA damage in oral cavity cells. Environmental toxicology and pharmacology, 37, 1079-1089.
Gao, Z., Zhao, G. S., Lv, Y., Peng, D., Tang, X., Song, H. & Guo, Q N. 2019. Anoikis-resistant human osteosarcoma cells display significant angiogenesis by activating the Src kinase-mediated MAPK pathway. Oncology reports, 41,1, 235-245.
Garimella, R., Tadikonda, P., Tawfik, O., Gunewardena, S., Rowe, P. & Van Veldhuizen, P. 2017. Vitamin D Impacts the Expression of Runx2 Target Genes and Modulates Inflammation, Oxidative Stress and Membrane Vesicle Biogenesis Gene Networks in 143B Osteosarcoma Cells. International journal of molecular sciences, 18, 642.
Page | 223
Gasch, A. P., Spellman, P. T., Kao, C. M., Carmel-Harel, O., Eisen, M. B., Storz, G., Botstein, D. & Brown, P. O. 2000. Genomic expression programs in the response of yeast cells to environmental changes. Molecular biology of the cell, 11, 4241-4257.
Gaur, S., Wang, Y., Kretzner, L., Chen, L., Yen, T., Wu, X., Yuan, Y.-C., Davis, M. & Yen, Y. 2014. Pharmacodynamic and pharmacogenomic study of the nanoparticle conjugate of camptothecin CRLX101 for the treatment of cancer. Nanomedicine: Nanotechnology, Biology and Medicine, 10, 1477-1486.
Gayral, M., Jo, S., Hanoun, N., Vignolle-Vidoni, A., Lulka, H., Delpu, Y., Meulle, A., Dufresne, M., Humeau, M. & Du Rieu, M. C. 2014. MicroRNAs as emerging biomarkers and therapeutic targets for pancreatic cancer. World J Gastroenterol, 20, 11199-11209.
Geiersbach, K. B. & Samowitz, W. S. 2011. Microsatellite instability and colorectal cancer. Archives of pathology & laboratory medicine, 135, 1269-1277.
Geigl, J. B., Obenauf, A. C., Schwarzbraun, T. & Speicher, M. R. 2008. Defining ‘chromosomal instability’. Trends in Genetics, 24, 64-69.
Gelfand, C. A., Plum, G. E., Grollman, A. P., Johnson, F. & Breslauer, K. J. 1998. Thermodynamic consequences of an abasic lesion in duplex DNA are strongly dependent on base sequence. Biochemistry, 37, 7321-7327.
Georgess, D., Machuca-Gayet, I., Blangy, A. & Jurdic, P. 2014. Podosome organization drives osteoclast-mediated bone resorption. Cell adhesion & migration, 8, 192-204.
Gerdes, J., Lemke, H., Baisch, H., Wacker, H.-H., Schwab, U. & Stein, H. 1984. Cell cycle analysis of a cell proliferation-associated human nuclear antigen defined by the monoclonal antibody Ki-67. The Journal of Immunology, 133, 1710-1715.
Ghosal, G. & Chen, J. 2013. DNA damage tolerance: a double-edged sword guarding the genome. Translational cancer research, 2, 107.
Ghosh, A. K., Rossi, M. L., Singh, D. K., Dunn, C., Ramamoorthy, M., Croteau, D. L., Liu, Y. & Bohr, V. A. 2012. RECQL4, the protein mutated in Rothmund-Thomson syndrome, functions in telomere maintenance. Journal of Biological Chemistry, 287, 196-209.
Giannakouros, P., Matte, I., Rancourt, C. & Piché, A. 2015. Transformation of NIH3T3 mouse fibroblast cells by MUC16 mucin (CA125) is driven by its cytoplasmic tail. International journal of oncology, 46, 91-98.
Gilbert, S. F. 2000. Osteogenesis: the development of bones. Developmental biology, 6. Gillet, L. C. J. & Schärer, O. D. 2006. Molecular mechanisms of mammalian global genome
nucleotide excision repair. Chemical reviews, 106, 253-276. Giraldez, T., Hughes, T. E. & Sigworth, F. J. 2005. Generation of functional fluorescent BK
channels by random insertion of GFP variants. The Journal of general physiology, 126, 429-438.
Girish, G., Finlay, K., Fessell, D., Pai, D., Dong, Q. & Jamadar, D. 2012. Imaging review of skeletal tumors of the pelvis malignant tumors and tumor mimics. The Scientific World Journal, 2012.
Godwin, J. W., Pinto, A. R. & Rosenthal, N. A. 2013. Macrophages are required for adult salamander limb regeneration. Proceedings of the National Academy of Sciences, 110, 9415-9420.
Gönczy, P. 2008. Mechanisms of asymmetric cell division: flies and worms pave the way. Nature reviews. Molecular cell biology, 9, 355.
Gonzalez-Suarez, E., Jacob, A. P., Jones, J., Miller, R., Roudier-Meyer, M. P., Erwert, R., Pinkas, J., Branstetter, D. & Dougall, W. C. 2010. RANK ligand mediates progestin-induced mammary epithelial proliferation and carcinogenesis. Nature, 468, 103-107.
Gonzalo, S., García-Cao, M., Fraga, M. F., Schotta, G., Peters, A. H. F. M., Cotter, S. E., Eguía, R., Dean, D. C., Esteller, M. & Jenuwein, T. 2005. Role of the RB1 family in stabilizing histone methylation at constitutive heterochromatin. Nature cell biology, 7, 420-428.
Goodarzi, A. A., Jeggo, P. & Lobrich, M. 2010. The influence of heterochromatin on DNA double strand break repair: Getting the strong, silent type to relax. DNA repair, 9, 1273-1282.
Page | 224
Goodarzi, A. A. & Jeggo, P. A. 2012. The heterochromatic barrier to DNA double strand break repair: how to get the entry visa. International journal of molecular sciences, 13, 11844-11860.
Goodwin, H. S., Bicknese, A. R., Chien, S. N., Bogucki, B. D., Oliver, D. A., Quinn, C. O. & Wall, D. A. 2001. Multilineage differentiation activity by cells isolated from umbilical cord blood: expression of bone, fat, and neural markers. Biology of Blood and Marrow Transplantation, 7, 581-588.
Gorgoulis, V. G., Vassiliou, L.-V. F., Karakaidos, P., Zacharatos, P., Kotsinas, A., Liloglou, T., Venere, M., Ditullio, R. A., Kastrinakis, N. G. & Levy, B. 2005. Activation of the DNA damage checkpoint and genomic instability in human precancerous lesions. Nature, 434, 907-913.
Gorgoulis, V.G., Pefani, D.E., Pateras, I.S. and Trougakos, I.P. 2018. Integrating the DNA damage and protein stress responses during cancer development and treatment. The Journal of pathology, 246,1,12-40.
Gorlick, R. 2002. Osteosarcoma: clinical practice and the expanding role of biology. Journal of Musculoskeletal and Neuronal Interactions, 2, 549-551.
Goshima, G., Kiyomitsu, T., Yoda, K. & Yanagida, M. 2003. Human centromere chromatin protein hMis12, essential for equal segregation, is independent of CENP-A loading pathway. The Journal of cell biology, 160, 25-39.
Goto, H., Natsume, T., Kanemaki, M.T., Kaito, A., Wang, S., Gabazza, E.C., Inagaki, M. & Mizoguchi, A. 2019. Chk1-mediated Cdc25A degradation as a critical mechanism for normal cell cycle progression. Journal of Cell Science, 132,2, 223123.
Gottifredi, V., Karni-Schmidt, O., Shieh, S.-Y. & Prives, C. 2001. p53 down-regulates CHK1 through p21 and the retinoblastoma protein. Molecular and cellular biology, 21, 1066-1076.
Granger, M. P., Wright, W. E. & Shay, J. W. 2002. Telomerase in cancer and aging. Critical reviews in oncology/hematology, 41, 29-40.
Grant, S. G., Wenger, S. L., Latimer, J. J., Thull, D. & Burke, L. 2000. Analysis of genomic instability using multiple assays in a patient with Rothmund–Thomson syndrome. Clinical genetics, 58, 209-215.
Gray, L. S., Perez-Reyes, E., Gamorra, J. C., Haverstick, D. M., Shattock, M., Mclatchie, L., Harper, J., Brooks, G., Heady, T. & Macdonald, T. L. 2004. The role of voltage gated T-type Ca 2+ channel isoforms in mediating “capacitative” Ca 2+ entry in cancer cells. Cell Calcium, 36, 489-497.
Greaves, M. & Maley, C. C. 2012. Clonal evolution in cancer. Nature, 481, 306-313. Gregory, C. A., Gunn, W. G., Peister, A. & Prockop, D. J. 2004. An Alizarin red-based assay
of mineralization by adherent cells in culture: comparison with cetylpyridinium chloride extraction. Analytical biochemistry, 329, 77-84.
Greider, C. W. 1999. Telomeres do D-loop–T-loop. Cell, 97, 419-422. Greif, P., Yaghmaie, M., Konstandin, N., Ksienzyk, B., Alimoghaddam, K., Ghavamzadeh,
A., Hauser, A., Graf, A., Krebs, S. & Blum, H. 2011. Somatic mutations in acute promyelocytic leukemia (APL) identified by exome sequencing. Leukemia, 25, 1519-1522.
Griffith, J. D., Comeau, L., Rosenfield, S., Stansel, R. M., Bianchi, A., Moss, H. & De Lange, T. 1999. Mammalian telomeres end in a large duplex loop. Cell, 97, 503-514.
Grimson, A., Farh, K. K.-H., Johnston, W. K., Garrett-Engele, P., Lim, L. P. & Bartel, D. P. 2007. MicroRNA targeting specificity in mammals: determinants beyond seed pairing. Molecular cell, 27, 91-105.
Grossmann, J. 2002. Molecular mechanisms of “detachment-induced apoptosis—Anoikis”. Apoptosis, 7, 247-260.
Grundy, G. J., Rulten, S. L., Zeng, Z., Arribas‐Bosacoma, R., Iles, N., Manley, K., Oliver, A.
& Caldecott, K. W. 2013. APLF promotes the assembly and activity of non‐homologous end joining protein complexes. The EMBO journal, 32, 112-125.
Grzesiak, J., Marycz, K., Czogala, J., Wrzeszcz, K. & Nicpon, J. 2011. Comparison of behavior, morphology and morphometry of equine and canine adipose derived mesenchymal stem cells in culture. International Journal of Morphology, 29, 1012-1017.
Page | 225
Guck, J., Schinkinger, S., Lincoln, B., Wottawah, F., Ebert, S., Romeyke, M., Lenz, D., Erickson, H. M., Ananthakrishnan, R., Mitchell, D., Käs, J., Ulvick, S. & Bilby, C. 2005. Optical Deformability as an Inherent Cell Marker for Testing Malignant Transformation and Metastatic Competence. Biophysical Journal, 88, 3689-3698.
Guilak, F., Lott, K. E., Awad, H. A., Cao, Q., Hicok, K. C., Fermor, B. & Gimble, J. M. 2006. Clonal analysis of the differentiation potential of human adipose‐derived adult stem cells. Journal of cellular physiology, 206, 229-237.
Guo, Z., Kumagai, A., Wang, S. X. & Dunphy, W. G. 2000. Requirement for Atr in phosphorylation of Chk1 and cell cycle regulation in response to DNA replication blocks and UV-damaged DNA in Xenopus egg extracts. Genes & development, 14, 2745-2756.
Guo, Y., Liu, J., Li, Y.-H., Song, T.-B., Wu, J., Zheng, C.-X. & Xue, C.-F. 2005. Effect of vector-expressed shRNAs on hTERT expression. World Journal of Gastroenterology: WJG, 11, 2912.
Gupta, A., Cao, W. & Chellaiah, M. A. 2012. Integrin αvβ3 and CD44 pathways in metastatic prostate cancer cells support osteoclastogenesis via a Runx2/Smad 5/receptor activator of NF-κB ligand signaling axis. Molecular cancer, 11, 66.
Gupta, S., De, S., Srivastava, V., Hussain, M., Kumari, J., Muniyappa, K. & Sengupta, S. 2013. RECQL4 and p53 potentiate the activity of polymerase γ and maintain the integrity of the human mitochondrial genome. Carcinogenesis, bgt315.
Gustafsson, C. M., Falkenberg, M. & Larsson, N.-G. 2016. Maintenance and expression of mammalian mitochondrial DNA. Annual review of biochemistry, 85, 133-160.
Haaf, T., Raderschall, E., Reddy, G., Ward, D. C., Radding, C. M. & Golub, E. I. 1999. Sequestration of mammalian Rad51-recombination protein into micronuclei. The Journal of cell biology, 144, 11-20.
Hafian, H., Venteo, L., Sukhanova, A., Nabiev, I., Lefevre, B. T. & Pluot, M. 2004. Immunohistochemical study of DNA topoisomerase I, DNA topoisomerase IIα, p53, and Ki-67 in oral preneoplastic lesions and oral squamous cell carcinomas. Human pathology, 35, 745-751.
Hahn, W. C., Counter, C. M., Lundberg, A. S., Beijersbergen, R. L., Brooks, M. W. & Weinberg, R. A. 1999. Creation of human tumour cells with defined genetic elements. Nature, 400, 464-468.
Hahn, W. C. 2003. Role of telomeres and telomerase in the pathogenesis of human cancer. Journal of Clinical Oncology, 21, 2034-2043.
Håkelien, A. M., Bryne, J. C., Harstad, K. G., Lorenz, S., Paulsen, J., Sun, J., Mikkelsen, T. S., Myklebost, O. & Meza‐Zepeda, L. A. 2014. The regulatory landscape of osteogenic differentiation. Stem Cells, 32, 2780-2793.
Halazonetis, T. D., Gorgoulis, V. G. & Bartek, J. 2008. An oncogene-induced DNA damage model for cancer development. science, 319, 1352-1355.
Halbleib, J. M. & Nelson, W. J. 2006. Cadherins in development: cell adhesion, sorting, and tissue morphogenesis. Genes & development, 20, 3199-3214.
Hall, M. P., Unch, J., Binkowski, B. F., Valley, M. P., Butler, B. L., Wood, M. G., Otto, P., Zimmerman, K., Vidugiris, G. & Machleidt, T. 2012. Engineered luciferase reporter from a deep sea shrimp utilizing a novel imidazopyrazinone substrate. ACS chemical biology, 7, 1848.
Hällberg, B. M. & Larsson, N.-G. 2014. Making proteins in the powerhouse. Cell metabolism, 20, 226-240.
Hameed, O., Wei, S. & Siegal, G. P. 2011. Bone/Osteoid Producing Lesions. Frozen Section Library: Bone. Springer.
Hampel, B., Wagner, M., Teis, D., Zwerschke, W., Huber, L. A. & Jansen‐Dürr, P. 2005. Apoptosis resistance of senescent human fibroblasts is correlated with the absence of nuclear IGFBP‐3. Aging cell, 4, 325-330.
Hampel, B., Wagner, M., Teis, D., Zwerschke, W., Huber, L. A. & Jansen‐Dürr, P. 2005. Apoptosis resistance of senescent human fibroblasts is correlated with the absence of nuclear IGFBP‐3. Aging cell, 4, 325-330.
Hampoelz, B. & Lecuit, T. 2011. Nuclear mechanics in differentiation and development. Current opinion in cell biology, 23, 668-675.
Hanahan, D. & Weinberg, R. A. 2000. The hallmarks of cancer. cell, 100, 57-70.

Page | 226
Hanahan, D. & Coussens, L. M. 2012. Accessories to the crime: functions of cells recruited to the tumor microenvironment. Cancer cell, 21, 309-322.
Hanasoge, S. & Ljungman, M. 2007. H2AX phosphorylation after UV irradiation is triggered by DNA repair intermediates and is mediated by the ATR kinase. Carcinogenesis, 28, 2298-2304.
Hanawalt, P. C. & Spivak, G. 2008. Transcription-coupled DNA repair: two decades of progress and surprises. Nature reviews. Molecular cell biology, 9, 958.
Hanssen‐Bauer, A., Solvang‐Garten, K., Sundheim, O., Peña‐Diaz, J., Andersen, S., Slupphaug, G., Krokan, H. E., Wilson, D. M., Akbari, M. & Otterlei, M. 2011. XRCC1 coordinates disparate responses and multiprotein repair complexes depending on the nature and context of the DNA damage. Environmental and molecular mutagenesis, 52, 623-635.
Harada, S.-I. & Rodan, G. A. 2003. Control of osteoblast function and regulation of bone mass. Nature, 423, 349-355.
Hardingham, T. E., Oldershaw, R. A. & Tew, S. R. 2006. Cartilage, SOX9 and Notch signals in chondrogenesis. Journal of anatomy, 209, 469-480.
Harley, C. B., Vaziri, H., Counter, C. M. & Allsopp, R. C. 1992. The telomere hypothesis of cellular aging. Experimental gerontology, 27, 375-382.
Harrison, D.J., Geller, D.S., Gill, J.D., Lewis, V.O. and Gorlick, R. 2018. Current and future therapeutic approaches for osteosarcoma. Expert review of anticancer therapy, 18,1, 39-50.
Hartwell, L. H. & Kastan, M. B. 1994. Cell cycle control and cancer. Science-AAAS-Weekly Paper Edition, 266, 1821-1828.
Hasebe-Takada, N., Kono, K., Yasuda, S., Sawada, R., Matsuyama, A. & Sato, Y. 2016. Application of cell growth analysis to the quality assessment of human cell-processed therapeutic products as a testing method for immortalized cellular impurities. Regenerative Therapy, 5, 49-54.
Hausman, G. J., Hausman, D. B. & Martin, R. J. 1992. Biochemical and cytochemical studies of preadipocyte differentiation in serum-free culture of porcine stromal-vascular cells: interaction of dexamethasone and growth hormone. Cells Tissues Organs, 143, 322-329.
Haydon, R. C., Luu, H. H. & He, T.-C. 2007. Osteosarcoma and osteoblastic differentiation: a new perspective on oncogenesis. Clinical orthopaedics and related research, 454, 237-246.
Hayflick, L. & Moorhead, P. S. 1961. The serial cultivation of human diploid cell strains. Experimental cell research, 25, 585-621.
Hayflick, L. 1965. The limited in vitro lifetime of human diploid cell strains. Experimental cell research, 37, 614-636.
Haynes, L., Kaste, S. C., Ness, K. K., Wu, J., Ortega‐Laureano, L., Bishop, M., Neel, M.,
Rao, B. & Fernandez‐Pineda, I. 2017. Pathologic fracture in childhood and
adolescent osteosarcoma: A single‐institution experience. Pediatric blood & cancer, 64.
He, Y. & Smith, R. 2009. Nuclear functions of heterogeneous nuclear ribonucleoproteins A/B. Cellular and molecular life sciences, 66, 1239-1256.
Heaphy, C. M., De Wilde, R. F., Jiao, Y., Klein, A. P., Edil, B. H., Shi, C., Bettegowda, C., Rodriguez, F. J., Eberhart, C. G., Hebbar, S., Offerhaus, G. J., Mclendon, R., Rasheed, B. A., He, Y., Yan, H., Bigner, D. D., Oba-Shinjo, S. M., Marie, S. K. N., Riggins, G. J., Kinzler, K. W., Vogelstein, B., Hruban, R. H., Maitra, A., Papadopoulos, N. & Meeker, A. K. 2011a. Altered Telomeres in Tumors with <em>ATRX</em> and <em>DAXX</em> Mutations. Science, 333, 425-425.
Heaphy, C. M., Subhawong, A. P., Hong, S.-M., Goggins, M. G., Montgomery, E. A., Gabrielson, E., Netto, G. J., Epstein, J. I., Lotan, T. L. & Westra, W. H. 2011b. Prevalence of the alternative lengthening of telomeres telomere maintenance mechanism in human cancer subtypes. The American journal of pathology, 179, 1608-1615.
Hecht, S. S., Mcintee, E. J. & Wang, M. 2001. New DNA adducts of crotonaldehyde and acetaldehyde. Toxicology, 166, 31-36.
Page | 227
Heckman, C. A. 2009. Contact inhibition revisited. Journal of cellular physiology, 220, 574-575.
Hees, C. L. M., Duinen, C. L. M., Bruijin, J. A. & Vermeer, B. J. 1996. Malignant eccrine poroma in a patient with Rothmiund‐Thomson syndrome. British Journal of Dermatology, 134, 813-815.
Heffernan, T. P., Ünsal-Kaçmaz, K., Heinloth, A. N., Simpson, D. A., Paules, R. S., Sancar, A., Cordeiro-Stone, M. & Kaufmann, W. K. 2007. Cdc7-Dbf4 and the human S checkpoint response to UVC. Journal of Biological Chemistry, 282, 9458-9468.
Heinsohn, S., Evermann, U., Zur Stadt, U., Bielack, S. & Kabisch, H. 2007. Determination of the prognostic value of loss of heterozygosity at the retinoblastoma gene in osteosarcoma. International journal of oncology, 30, 1205-1214.
Helman, L. J. & Meltzer, P. 2003. Mechanisms of sarcoma development. Nature reviews. Cancer, 3, 685.
Helt, C. E., Cliby, W. A., Keng, P. C., Bambara, R. A. & O'reilly, M. A. 2005. Ataxia telangiectasia mutated (ATM) and ATM and Rad3-related protein exhibit selective target specificities in response to different forms of DNA damage. Journal of Biological Chemistry, 280, 1186-1192.
Henson, J. D., Neumann, A. A., Yeager, T. R. & Reddel, R. R. 2002. Alternative lengthening of telomeres in mammalian cells. oncogene, 21, 598.
Heo, K., Kim, H., Choi, S. H., Choi, J., Kim, K., Gu, J., Lieber, M. R., Yang, A. S. & An, W. 2008. FACT-mediated exchange of histone variant H2AX regulated by phosphorylation of H2AX and ADP-ribosylation of Spt16. Molecular cell, 30, 86-97.
Hernandez, C., Beaupre, G. & Carter, D. 2003. A theoretical analysis of the relative influences of peak BMD, age-related bone loss and menopause on the development of osteoporosis. Osteoporosis international, 14, 843-847.
Hickerson, D. H. M., White, H. S., Nguyen, A., Nieman, E., Meadows, N., Gentry, T., Foster, S. J., Balber, A. E., Fiordalisi, M. & Hinson, J. M. 2014. Development of a flow cytometry–based pulse-width assay for detection of aggregates in cellular therapeutics to be infused by catheter. Cytotherapy, 16, 1545-1557.
Hicks, M. J., Roth, J. R., Kozinetz, C. A. & Wang, L. L. 2007. Clinicopathologic features of osteosarcoma in patients with Rothmund-Thomson syndrome. Journal of clinical oncology, 25, 370-375.
Hida, K., Hida, Y., Amin, D. N., Flint, A. F., Panigrahy, D., Morton, C. C. & Klagsbrun, M. 2004. Tumor-associated endothelial cells with cytogenetic abnormalities. Cancer research, 64, 8249-8255.
Hoege, C. & Hyman, A. A. 2013. Principles of PAR polarity in Caenorhabditis elegans embryos. Nature reviews. Molecular cell biology, 14, 315.
Hofer, A. C., Tran, R. T., Aziz, O. Z., Wright, W., Novelli, G., Shay, J. & Lewis, M. 2005. Shared phenotypes among segmental progeroid syndromes suggest underlying pathways of aging. The Journals of Gerontology Series A: Biological Sciences and Medical Sciences, 60, 10-20.
Hoki, Y., Araki, R., Fujimori, A., Ohhata, T., Koseki, H., Fukumura, R., Nakamura, M., Takahashi, H., Noda, Y. & Kito, S. 2003. Growth retardation and skin abnormalities of the Recql4-deficient mouse. Human molecular genetics, 12, 2293-2299.
Holland, P. W., Booth, H. a. F. & Bruford, E. A. 2007. Classification and nomenclature of all human homeobox genes. BMC biology, 5, 1.
Holliday, R. & Ho, T. 1998. Gene silencing and endogenous DNA methylation in mammalian cells. Mutation Research/Fundamental and Molecular Mechanisms of Mutagenesis, 400, 361-368.
Honda, S., Hayashi, S., Imoto, I., Toyama, J., Okazawa, H., Nakagawa, E., Goto, Y.-I. & Inazawa, J. 2010. Copy-number variations on the X chromosome in Japanese patients with mental retardation detected by array-based comparative genomic hybridization analysis. Journal of human genetics, 55, 590-599.
Hong, K. U., Kim, E., Bae, C.-D. & Park, J. 2009. TMAP/CKAP2 is essential for proper chromosome segregation. Cell Cycle, 8, 314-324.
Hong, A.M., Millington, S., Ahern, V., McCowage, G., Boyle, R., Tattersall, M., Haydu, L. and Stalley, P.D. 2013. Limb preservation surgery with extracorporeal irradiation in
Page | 228
the management of malignant bone tumor: the oncological outcomes of 101 patients. Annals of Oncology, 24, 10, 2676-2680.
Horwitz, E. M., Prockop, D. J., Fitzpatrick, L. A., Koo, W. W. K., Gordon, P. L., Neel, M., Sussman, M., Orchard, P., Marx, J. C. & Pyeritz, R. E. 1999. Transplantability and therapeutic effects of bone marrow-derived mesenchymal cells in children with osteogenesis imperfecta. Nature medicine, 5.
Hoshino, A., Costa-Silva, B., Shen, T.-L., Rodrigues, G., Hashimoto, A., Mark, M. T., Molina, H., Kohsaka, S., Di Giannatale, A. & Ceder, S. 2015. Tumour exosome integrins determine organotropic metastasis. Nature, 527, 329.
Howell, S. M. & Bray, D. W. 2008. Amelanotic melanoma in a patient with Rothmund-Thomson syndrome. Archives of dermatology, 144, 416-417.
Hsiang, Y.-H., Hertzberg, R., Hecht, S. & Liu, L. F. 1985. Camptothecin induces protein-linked DNA breaks via mammalian DNA topoisomerase I. Journal of Biological Chemistry, 260, 14873-14878.
Hsu, S., Bollag, W. B., Lewis, J., Huang, Q., Singh, B., Sharawy, M., Yamamoto, T. & Schuster, G. 2003. Green tea polyphenols induce differentiation and proliferation in epidermal keratinocytes. Journal of Pharmacology and Experimental Therapeutics, 306, 29-34.
Hu, J., Selby, C.P., Adar, S., Adebali, O. and Sancar, A. 2017. Molecular mechanisms and genomic maps of DNA excision repair in Escherichia coli and humans. Journal of Biological Chemistry, 292,38, 15588-15597.
Huang, J. I., Kazmi, N., Durbhakula, M. M., Hering, T. M., Yoo, J. U. & Johnstone, B. 2005. Chondrogenic potential of progenitor cells derived from human bone marrow and adipose tissue: A patient‐matched comparison. Journal of Orthopaedic Research, 23, 1383-1389.
Huang, G.-J., Gronthos, S. & Shi, S. 2009a. Mesenchymal stem cells derived from dental tissues vs. those from other sources: their biology and role in regenerative medicine. Journal of dental research, 88, 792-806.
Huang, S., Ernberg, I. & Kauffman, S. 2009b. Cancer attractors: a systems view of tumors from a gene network dynamics and developmental perspective. Seminars in cell & developmental biology. Elsevier, 869-876.
Huang, S. 2013. Genetic and non-genetic instability in tumor progression: link between the fitness landscape and the epigenetic landscape of cancer cells. Cancer and Metastasis Reviews, 32, 423-448.
Huggett, M. T., Tudzarova, S., Proctor, I., Loddo, M., Keane, M. G., Stoeber, K., Williams, G. H. & Pereira, S. P. 2016. Cdc7 is a potent anti-cancer target in pancreatic cancer due to abrogation of the DNA origin activation checkpoint. Oncotarget, 7, 18495-18507.
Hughes, D. P. M., Thomas, D. G., Giordano, T. J., Mcdonagh, K. T. & Baker, L. H. 2006. Essential erbB family phosphorylation in osteosarcoma as a target for CI‐1033 inhibition. Pediatric blood & cancer, 46, 614-623.
Hutmacher, D. W., Horch, R. E., Loessner, D., Rizzi, S., Sieh, S., Reichert, J. C., Clements, J. A., Beier, J. P., Arkudas, A. & Bleiziffer, O. 2009. Translating tissue engineering technology platforms into cancer research. Journal of cellular and molecular medicine, 13, 1417-1427.
Huttenlocher, A., Lakonishok, M., Kinder, M., Wu, S., Truong, T., Knudsen, K. A. & Horwitz, A. F. 1998. Integrin and cadherin synergy regulates contact inhibition of migration and motile activity. The Journal of cell biology, 141, 515-526.
Huvos, A. 1993. Osteosarcoma in adolescents and young adults: new developments and controversies. Commentary on pathology. Cancer treatment and research, 62, 375.
Ichijima, Y., Sakasai, R., Okita, N., Asahina, K., Mizutani, S. & Teraoka, H. 2005. Phosphorylation of histone H2AX at M phase in human cells without DNA damage response. Biochemical and biophysical research communications, 336, 807-812.
Ichikawa, K., Noda, T. & Furuichi, Y. 2002. [Preparation of the gene targeted knockout mice for human premature aging diseases, Werner syndrome, and Rothmund-Thomson syndrome caused by the mutation of DNA helicases]. Nihon yakurigaku zasshi. Folia pharmacologica Japonica, 119, 219-226.
Page | 229
Im, J.-S. & Lee, J.-K. 2008. ATR-dependent activation of p38 MAP kinase is responsible for apoptotic cell death in cells depleted of Cdc7. Journal of Biological Chemistry, 283, 25171-25177.
Im, J.-S., Ki, S.-H., Farina, A., Jung, D.-S., Hurwitz, J. & Lee, J.-K. 2009. Assembly of the Cdc45-Mcm2–7-GINS complex in human cells requires the Ctf4/And-1, RecQL4, and Mcm10 proteins. Proceedings of the National Academy of Sciences, 106, 15628-15632.
Im, J. S., Park, S. Y., Cho, W. H., Bae, S. H., Hurwitz, J. & Lee, J. K. 2015. RecQL4 is required for the association of Mcm10 and Ctf4 with replication origins in human cells. Cell Cycle, 14, 1001-9.
Inoue, R., Matsuki, N. A., Jing, G., Kanematsu, T., Abe, K. & Hirata, M. 2005. The inhibitory effect of alendronate, a nitrogen‐containing bisphosphonate on the PI3K–Akt–NFκB pathway in osteosarcoma cells. British journal of pharmacology, 146, 633-641.
Inouye, H., Michaelis, S., Wright, A. & Beckwith, J. 1981. Cloning and restriction mapping of the alkaline phosphatase structural gene (phoA) of Escherichia coli and generation of deletion mutants in vitro. Journal of bacteriology, 146, 668-675.
Ionov, Y., Peinado, M. A., Malkhosyan, S., Shibata, D. & Perucho, M. 1993. Ubiquitous somatic mutations in simple repeated sequences reveal a new mechanism for colonic carcinogenesis. Nature, 363, 558-561.
Ishikawa, F., Matunis, M. J., Dreyfuss, G. & Cech, T. R. 1993. Nuclear proteins that bind the pre-mRNA 3'splice site sequence r (UUAG/G) and the human telomeric DNA sequence d (TTAGGG) n. Molecular and cellular biology, 13, 4301-4310.
Ito, S., Ishii, A., Kakusho, N., Taniyama, C., Yamazaki, S., Fukatsu, R., Sakaue-Sawano, A., Miyawaki, A. & Masai, H. 2012. Mechanism of cancer cell death induced by depletion of an essential replication regulator. PloS one, 7, e36372.
Ito, Y., Bae, S.-C. & Chuang, L. S. H. 2015. The RUNX family: developmental regulators in cancer. Nature Reviews. Cancer, 15, 81.
Ito, Y., Fitzsimmons, J. S., Sanyal, A., Mello, M. A., Mukherjee, N. & O'driscoll, S. W. 2001. Localization of chondrocyte precursors in periosteum. Osteoarthritis and Cartilage, 9, 215-223.
Ivascu, A. & Kubbies, M. 2007. Diversity of cell-mediated adhesions in breast cancer spheroids. International journal of oncology, 31, 1403-1414.
Jackson, A. L. & Loeb, L. A. 2001. The contribution of endogenous sources of DNA damage to the multiple mutations in cancer. Mutation Research/Fundamental and Molecular Mechanisms of Mutagenesis, 477, 7-21.
Jackson, A. L. & Linsley, P. S. 2004. Noise amidst the silence: off-target effects of siRNAs? TRENDS in Genetics, 20, 521-524.
Jackson, A. L., Burchard, J., Schelter, J., Chau, B. N., Cleary, M., Lim, L. & Linsley, P. S. 2006. Widespread siRNA “off-target” transcript silencing mediated by seed region sequence complementarity. Rna, 12, 1179-1187.
Jacobsen, L. B., Calvin, S. A., Colvin, K. E. & Wright, M. 2004. FuGENE 6 transfection reagent: the gentle power. Methods, 33, 104-112.
Jagannathan, M., Sakwe, A. M., Nguyen, T. & Frappier, L. 2012. The MCM-associated protein MCM-BP is important for human nuclear morphology. Journal of Cell Science, 125, 133-143.
Jaiswal, R. K., Jaiswal, N., Bruder, S. P., Mbalaviele, G., Marshak, D. R. & Pittenger, M. F. 2000. Adult human mesenchymal stem cell differentiation to the osteogenic or adipogenic lineage is regulated by mitogen-activated protein kinase. Journal of Biological Chemistry, 275, 9645-9652.
Jakob, B., Splinter, J., Conrad, S., Voss, K.-O., Zink, D., Durante, M., Löbrich, M. & Taucher-Scholz, G. 2011. DNA double-strand breaks in heterochromatin elicit fast repair protein recruitment, histone H2AX phosphorylation and relocation to euchromatin. Nucleic acids research, 39, 6489-6499.
Janss, A. J., Levow, C., Bernhard, E. J., Muschel, R. J., Mckenna, W. G., Sutton, L. & Phillips, P. C. 1998. Caffeine and staurosporine enhance the cytotoxicity of cisplatin and camptothecin in human brain tumor cell lines. Experimental cell research, 243, 29-38.
Page | 230
Javed, A., Barnes, G. L., Pratap, J., Antkowiak, T., Gerstenfeld, L. C., Van Wijnen, A. J., Stein, J. L., Lian, J. B. & Stein, G. S. 2005. Impaired intranuclear trafficking of Runx2 (AML3/CBFA1) transcription factors in breast cancer cells inhibits osteolysis in vivo. Proceedings of the National Academy of Sciences of the United States of America, 102, 1454-1459.
Jayaraman, S. 2005. Flow cytometric determination of mitochondrial membrane potential changes during apoptosis of T lymphocytic and pancreatic beta cell lines: Comparison of tetramethylrhodamineethylester (TMRE), chloromethyl-X-rosamine (H2-CMX-Ros) and MitoTracker Red 580 (MTR580). Journal of Immunological Methods, 306, 68-79.
Jee, W. S. S. 1988. The skeletal tissues. Cell and tissue biology: a textbook of histology, 213-217.
Jeffreys, A., Wilson, V. & Thein, S. L. 1985a. Individual-specific ‘fingerprints’ of human DNA. Nature, 316, 4.
Jeffreys, A. J., Wilson, V. & Thein, S. L. 1985b. Hypervariable‘minisatellite’ regions in human DNA. Nature, 314, 67-73.
Jeggo, P. A. & Löbrich, M. 2015. How cancer cells hijack DNA double-strand break repair pathways to gain genomic instability. Biochemical Journal, 471, 1-11.
Jevprasesphant, R., Penny, J., Jalal, R., Attwood, D., Mckeown, N. B. & D’emanuele, A. 2003. The influence of surface modification on the cytotoxicity of PAMAM dendrimers. International Journal of Pharmaceutics, 252, 263-266.
Jiang, X.-R., Jimenez, G., Chang, E., Frolkis, M., Kusler, B., Sage, M., Beeche, M., Bodnar, A. G., Wahl, G. M. & Tlsty, T. D. 1999. Telomerase expression in human somatic cells does not induce changes associated with a transformed phenotype. Nature genetics, 21, 111-114.
Jin, W., Liu, H., Zhang, Y., Otta, S. K., Plon, S. E. & Wang, L. L. 2008. Sensitivity of RECQL4-deficient fibroblasts from Rothmund–Thomson syndrome patients to genotoxic agents. Human genetics, 123, 643-653.
Jinka, R., Kapoor, R., Sistla, P. G., Raj, T. A. & Pande, G. 2012. Alterations in cell-extracellular matrix interactions during progression of cancers. International journal of cell biology, 2012.
Jögi, A., Vaapil, M., Johansson, M. & Påhlman, S. 2012. Cancer cell differentiation heterogeneity and aggressive behavior in solid tumors. Upsala Journal of Medical Sciences, 117, 217-224.
Jones, L. J., Gray, M., Yue, S. T., Haugland, R. P. & Singer, V. L. 2001. Sensitive determination of cell number using the CyQUANT® cell proliferation assay. Journal of immunological methods, 254, 85-98.
Jones, D. H., Nakashima, T., Sanchez, O. H., Kozieradzki, I., Komarova, S. V., Sarosi, I., Morony, S., Rubin, E., Sarao, R. & Hojilla, C. V. 2006. Regulation of cancer cell migration and bone metastasis by RANKL. Nature, 440, 692-696.
Jones, D. S., Podolsky, S. H. & Greene, J. A. 2012. The burden of disease and the changing task of medicine. New England Journal of Medicine, 366, 2333-2338.
Jönsson, S., Hjorth-Hansen, H., Olsson, B., Wadenvik, H., Sundan, A. & Standal, T. 2012. Imatinib inhibits proliferation of human mesenchymal stem cells and promotes early but not late osteoblast differentiation in vitro. Journal of bone and mineral metabolism, 30, 119-123.
Jun, E. S., Lee, T. H., Cho, H. H., Suh, S. Y. & Jung, J. S. 2004. Expression of telomerase extends longevity and enhances differentiation in human adipose tissue-derived stromal cells. Cellular Physiology and Biochemistry, 14, 261-268.
Jung, S., Panchalingam, K. M., Wuerth, R. D., Rosenberg, L. & Behie, L. A. 2012. Large‐scale production of human mesenchymal stem cells for clinical applications. Biotechnology and applied biochemistry, 59, 106-120.
Junqueira, L., Carneiro, J. & Kelley, R. O. 1998. Basic histology. 9th. Stamford, Conn.: Appleton & Lange. x.
Justesen, J., Stenderup, K., Ebbesen, E. N., Mosekilde, L., Steiniche, T. & Kassem, M. 2001. Adipocyte tissue volume in bone marrow is increased with aging and in patients with osteoporosis. Biogerontology, 2, 165-171.

Page | 231
Kajkenova, O., Lecka‐Czernik, B., Gubrij, I., Hauser, S. P., Takahashi, K., Parfitt, A. M., Jilka, R. L., Manolagas, S. C. & Lipschitz, D. A. 1997. Increased adipogenesis and myelopoiesis in the bone marrow of SAMP6, a murine model of defective osteoblastogenesis and low turnover osteopenia. Journal of Bone and Mineral Research, 12, 1772-1779.
Kalkwarf, H. J., Laor, T. & Bean, J. A. 2011. Fracture risk in children with a forearm injury is associated with volumetric bone density and cortical area (by peripheral QCT) and areal bone density (by DXA). Osteoporosis international, 22, 607-616.
Kamma, H., Fujimoto, M., Fujiwara, M., Matsui, M., Horiguchi, H., Hamasaki, M. & Satoh, H. 2001. Interaction of hnRNP A2/B1 isoforms with telomeric ssDNA and the in vitro function. Biochemical and biophysical research communications, 280, 625-630.
Kang, S. K., Lee, D. H., Bae, Y. C., Kim, H. K., Baik, S. Y. & Jung, J. S. 2003. Improvement of neurological deficits by intracerebral transplantation of human adipose tissue-derived stromal cells after cerebral ischemia in rats. Experimental neurology, 183, 355-366.
Kang, S. K., Putnam, L., Dufour, J., Ylostalo, J., Jung, J. S. & Bunnell, B. A. 2004a. Expression of Telomerase Extends the Lifespan and Enhances Osteogenic Differentiation of Adipose Tissue–Derived Stromal Cells. Stem cells, 22, 1356-1372.
Kang, S. K., Putnam, L. A., Ylostalo, J., Popescu, I. R., Dufour, J., Belousov, A. & Bunnell, B. A. 2004b. Neurogenesis of Rhesus adipose stromal cells. Journal of cell science, 117, 4289-4299.
Kang, H.-G., Jenabi, J. M., Zhang, J., Keshelava, N., Shimada, H., May, W. A., Ng, T., Reynolds, C. P., Triche, T. J. & Sorensen, P. H. B. 2007. E-cadherin cell-cell adhesion in ewing tumor cells mediates suppression of anoikis through activation of the ErbB4 tyrosine kinase. Cancer research, 67, 3094-3105.
Kang, S., Kang, M.S., Ryu, E. & Myung, K. 2018. Eukaryotic DNA replication: Orchestrated action of multi-subunit protein complexes. Mutation Research/Fundamental and Molecular Mechanisms of Mutagenesis, 809, 58-69.
Kapinas, K., Grandy, R., Ghule, P., Medina, R., Becker, K., Pardee, A., Zaidi, S. K., Lian, J., Stein, J. & Van Wijnen, A. 2013. The abbreviated pluripotent cell cycle. Journal of cellular physiology, 228, 9-20.
Karimian, E., Chagin, A. S. & Sävendahl, L. 2011. Genetic regulation of the growth plate. Frontiers in endocrinology, 2.
Karimian, E., Chagin, A. S., Gjerde, J., Heino, T., Lien, E. A., Ohlsson, C. & Sävendahl, L. 2008. Tamoxifen impairs both longitudinal and cortical bone growth in young male rats. Journal of Bone and Mineral Research, 23, 1267-1277.
Karlseder, J., Broccoli, D., Dai, Y., Hardy, S. & De Lange, T. 1999. p53-and ATM-dependent apoptosis induced by telomeres lacking TRF2. Science, 283, 1321-1325.
Karnani, N. & Dutta, A. 2011. The effect of the intra-S-phase checkpoint on origins of replication in human cells. Genes & development, 25, 621-633.
Karpova, T. S., Baumann, C. T., He, L., Wu, X., Grammer, A., Lipsky, P., Hager, G. L. & Mcnally, J. G. 2003. Fluorescence resonance energy transfer from cyan to yellow fluorescent protein detected by acceptor photobleaching using confocal microscopy and a single laser. Journal of microscopy, 209, 56-70.
Kataoka, Y., Bindokas, V. P., Duggan, R. C., Murley, J. S. & Grdina, D. J. 2006. Flow cytometric analysis of phosphorylated histone H2AX following exposure to ionizing radiation in human microvascular endothelial cells. Journal of radiation research, 47, 245-257.
Kavanagh, J. N., Redmond, K. M., Schettino, G. & Prise, K. M. 2013. DNA double strand break repair: a radiation perspective. Antioxidants & redox signaling, 18, 2458-2472.
Kawai, M., De Paula, F. J. A. & Rosen, C. J. 2012. New insights into osteoporosis: the bone–fat connection. Journal of internal medicine, 272, 317-329.
Kawanishi, S., Hiraku, Y., Pinlaor, S. & Ma, N. 2006. Oxidative and nitrative DNA damage in animals and patients with inflammatory diseases in relation to inflammation-related carcinogenesis. Biological chemistry, 387, 365-372.
Kaya, M., Wada, T., Akatsuka, T., Kawaguchi, S., Nagoya, S., Shindoh, M., Higashino, F., Mezawa, F., Okada, F. & Ishii, S. 2000. Vascular endothelial growth factor
Page | 232
expression in untreated osteosarcoma is predictive of pulmonary metastasis and poor prognosis. Clinical Cancer Research, 6, 572-577.
Kellermayer, R., Siitonen, H. A., Hadzsiev, K., Kestilä, M. & Kosztolányi, G. 2005. A patient with Rothmund-Thomson syndrome and all features of RAPADILINO. Archives of dermatology, 141, 617-620.
Kennedy, B. K., Berger, S. L., Brunet, A., Campisi, J., Cuervo, A. M., Epel, E. S., Franceschi, C., Lithgow, G. J., Morimoto, R. I. & Pessin, J. E. 2014. Geroscience: linking aging to chronic disease. Cell, 159, 709-713.
Keren, L., Zackay, O., Lotan‐Pompan, M., Barenholz, U., Dekel, E., Sasson, V., Aidelberg, G., Bren, A., Zeevi, D. & Weinberger, A. 2013. Promoters maintain their relative activity levels under different growth conditions. Molecular systems biology, 9, 701.
Kern, S., Eichler, H., Stoeve, J., Klüter, H. & Bieback, K. 2006. Comparative analysis of mesenchymal stem cells from bone marrow, umbilical cord blood, or adipose tissue. Stem cells, 24, 1294-1301.
Kerr, B., Ashcroft, G., Scott, D., Horan, M., Ferguson, M. & Donnai, D. 1996. Rothmund-Thomson syndrome: two case reports show heterogeneous cutaneous abnormalities, an association with genetically programmed ageing changes, and increased chromosomal radiosensitivity. Journal of medical genetics, 33, 928-934.
Khanna, K. K. & Jackson, S. P. 2001. DNA double-strand breaks: signaling, repair and the cancer connection. Nature genetics, 27, 247-254.
Khatau, S. B., Hale, C. M., Stewart-Hutchinson, P. J., Patel, M. S., Stewart, C. L., Searson, P. C., Hodzic, D. & Wirtz, D. 2009. A perinuclear actin cap regulates nuclear shape. Proceedings of the National Academy of Sciences, 106, 19017-19022.
Kim, Y.-J. & M Wilson Iii, D. 2012. Overview of base excision repair biochemistry. Current molecular pharmacology, 5, 3-13.
Kim, J., Nakasaki, M., Todorova, D., Lake, B., Yuan, C. Y., Jamora, C. & Xu, Y. 2014. p53 induces skin aging by depleting Blimp1+ sebaceous gland cells. Cell death & disease, 5, e1141.
Kinner, A., Wu, W., Staudt, C. & Iliakis, G. 2008. γ-H2AX in recognition and signaling of DNA double-strand breaks in the context of chromatin. Nucleic acids research, 36, 5678-5694.
Kinzler, K. W. and Vogelstein, B. 1996. Lessons from hereditary colorectal cancer. Cell, 87,2,159-170.
Kiss, F. & Anstey, A. V. 2013. A review of UVB-mediated photosensitivity disorders. Photochemical & Photobiological Sciences, 12, 37-46.
Kitao, S., Lindor, N. M., Shiratori, M., Furuichi, Y. & Shimamoto, A. 1999a. Rothmund–Thomson syndrome responsible gene, RECQL4: genomic structure and products. Genomics, 61, 268-276.
Kitao, S., Shimamoto, A., Goto, M., Miller, R. W., Smithson, W. A., Lindor, N. M. & Furuichi, Y. 1999b. Mutations in RECQL4 cause a subset of cases of Rothmund-Thomson syndrome. Nature genetics, 22, 82-84.
Knecht, E., Hernández-Yago, J. & Grisolía, S. 1984. Regulation of lysosomal autophagy in transformed and non-transformed mouse fibroblasts under several growth conditions. Experimental cell research, 154, 224-232.
Knoblich, J. A. 2010. Asymmetric cell division: recent developments and their implications for tumour biology. Nature reviews. Molecular cell biology, 11, 849.
Knoell, K. A., Sidhu-Malik, N. K. & Malik, R. K. 1999. Aplastic anemia in a patient with Rothmund-Thomson syndrome. Journal of pediatric hematology/oncology, 21, 444-446.
Kobayashi, J. 2004. Molecular mechanism of the recruitment of NBS1/hMRE11/hRAD50 complex to DNA double-strand breaks: NBS1 binds to γ-H2AX through FHA/BRCT domain. Journal of radiation research, 45, 473-478.
Koç, A., Wheeler, L. J., Mathews, C. K. & Merrill, G. F. 2004. Hydroxyurea arrests DNA replication by a mechanism that preserves basal dNTP pools. Journal of Biological Chemistry, 279, 223-230.
Kögler, G., Sensken, S., Airey, J. A., Trapp, T., Müschen, M., Feldhahn, N., Liedtke, S., Sorg, R. V., Fischer, J. & Rosenbaum, C. 2004. A new human somatic stem cell
Page | 233
from placental cord blood with intrinsic pluripotent differentiation potential. Journal of Experimental Medicine, 200, 123-135.
Kohzaki, M., Chiourea, M., Versini, G., Adachi, N., Takeda, S., Gagos, S. & Halazonetis, T. D. 2012. The helicase domain and C-terminus of human RecQL4 facilitate replication elongation on DNA templates damaged by ionizing radiation. Carcinogenesis, 33, 1203-10.
Komarova, S. V., Ataullakhanov, F. I. & Globus, R. K. 2000. Bioenergetics and mitochondrial transmembrane potential during differentiation of cultured osteoblasts. American Journal of Physiology-Cell Physiology, 279, C1220-C1229.
Komori, T., Yagi, H., Nomura, S., Yamaguchi, A., Sasaki, K., Deguchi, K., Shimizu, Y., Bronson, R. T., Gao, Y. H. & Inada, M. 1997. Targeted disruption of Cbfa1 results in a complete lack of bone formation owing to maturational arrest of osteoblasts. cell, 89, 755-764.
Komori, T. 2007. Regulation of bone development and maintenance by Runx2. Frontiers in bioscience: a journal and virtual library, 13, 898-903.
Komori, T. 2010. Regulation of bone development and extracellular matrix protein genes by RUNX2. Cell and tissue research, 339, 189-195.
Kovac, M., Blattmann, C., Ribi, S., Smida, J., Mueller, N. S., Engert, F., Castro-Giner, F., Weischenfeldt, J., Kovacova, M. & Krieg, A. 2015. Exome sequencing of osteosarcoma reveals mutation signatures reminiscent of BRCA deficiency. Nature communications, 6, 8940.
Krejci, L., Altmannova, V., Spirek, M. & Zhao, X. 2012. Homologous recombination and its regulation. Nucleic acids research, 40, 5795-5818.
Krokan, H. E. & Bjørås, M. 2013. Base Excision Repair. Cold Spring Harbor Perspectives in Biology, 5.
Kruhlak, M. J., Celeste, A., Dellaire, G., Fernandez-Capetillo, O., Müller, W. G., Mcnally, J. G., Bazett-Jones, D. P. & Nussenzweig, A. 2006. Changes in chromatin structure and mobility in living cells at sites of DNA double-strand breaks. The Journal of cell biology, 172, 823-834.
Kubo, Y., Kaidzu, S., Nakajima, I., Takenouchi, K. & Nakamura, F. 2000. Organization of extracellular matrix components during differentiation of adipocytes in long-term culture. In Vitro Cellular & Developmental Biology-Animal, 36, 38-44.
Kumagai, A., Shevchenko, A., Shevchenko, A. & Dunphy, W. G. 2010. Treslin collaborates with TopBP1 in triggering the initiation of DNA replication. Cell, 140, 349-359.
Kumar, A. & Singh, U. 2017. KEYWORDS Primary Bone Malignancies, Secondary Bone Malignancies, Epidemiology. MALIGNANT BONE TUMOURS-A RETROSPECTIVE ANALYSIS IN RELATION TO AGE, SEX AND SITE.
Kumari, J., Hussain, M., De, S., Chandra, S., Modi, P., Tikoo, S., Singh, A., Sagar, C., Sepuri, N. B. V. & Sengupta, S. 2016. Mitochondrial functions of RECQL4 are required for the prevention of aerobic glycolysis-dependent cell invasion. J Cell Sci, 129, 1312-1318.
Kundu, Z. S. 2014. Classification, imaging, biopsy and staging of osteosarcoma. Indian Journal of Orthopaedics, 48, 238-246.
Kurek, K. C., Del Mare, S., Salah, Z., Abdeen, S., Sadiq, H., Lee, S.-H., Gaudio, E., Zanesi, N., Jones, K. B. & Deyoung, B. 2010. Frequent attenuation of the WWOX tumor suppressor in osteosarcoma is associated with increased tumorigenicity and aberrant RUNX2 expression. Cancer research, 70, 5577-5586.
Kuri-Harcuch, W. & Green, H. 1978. Adipose conversion of 3T3 cells depends on a serum factor. Proceedings of the National Academy of Sciences, 75, 6107-6109.
Kurucu, N., Şahin, G., Sarı, N., Ceylaner, S. and İlhan, İ.E. 2019. Association of vitamin D receptor gene polymorphisms with osteosarcoma risk and prognosis. Journal of bone oncology, 14, 100208.
Kwon, Y. T., Xia, Z., An, J. Y., Tasaki, T., Davydov, I. V., Seo, J. W., Sheng, J., Xie, Y. & Varshavsky, A. 2003. Female lethality and apoptosis of spermatocytes in mice lacking the UBR2 ubiquitin ligase of the N-end rule pathway. Molecular and cellular biology, 23, 8255-8271.
Labib, K., Tercero, J. A. & Diffley, J. F. X. 2000. Uninterrupted MCM2-7 function required for DNA replication fork progression. Science, 288, 1643-1647.
Page | 234
Labib, K. 2010. How do Cdc7 and cyclin-dependent kinases trigger the initiation of chromosome replication in eukaryotic cells? Genes & development, 24, 1208-1219.
Ladstein, R. G., Bachmann, I. M., Straume, O. & Akslen, L. A. 2010. Ki-67 expression is superior to mitotic count and novel proliferation markers PHH3, MCM4 and mitosin as a prognostic factor in thick cutaneous melanoma. BMC cancer, 10, 1.
Landau, D. A., Carter, S. L., Stojanov, P., Mckenna, A., Stevenson, K., Lawrence, M. S., Sougnez, C., Stewart, C., Sivachenko, A. & Wang, L. 2013. Evolution and impact of subclonal mutations in chronic lymphocytic leukemia. Cell, 152, 714-726.
Landau, D. A., Tausch, E., Taylor-Weiner, A. N., Stewart, C., Reiter, J. G., Bahlo, J., Kluth, S., Bozic, I., Lawrence, M. & Böttcher, S. 2015. Mutations driving CLL and their evolution in progression and relapse. Nature, 526, 525-530.
Lane, D. P. & Crawford, L. V. 1979. T antigen is bound to a host protein in SY40-transformed cells. Nature, 278, 261-263.
Lao, V. V., Welcsh, P., Luo, Y., Carter, K. T., Dzieciatkowski, S., Dintzis, S., Meza, J., Sarvetnick, N. E., Monnat, R. J. & Loeb, L. A. 2013. Altered RECQ helicase expression in sporadic primary colorectal cancers. Translational oncology, 6, 458IN7-469IN10.
Larizza, L., Magnani, I. & Roversi, G. 2006. Rothmund–Thomson syndrome and RECQL4 defect: splitting and lumping. Cancer letters, 232, 107-120.
Larizza, L., Roversi, G. & Volpi, L. 2010. Rothmund-thomson syndrome. Orphanet journal of rare diseases, 5, 1.
Larsen, N. B. & Hickson, I. D. 2013. RecQ helicases: conserved guardians of genomic integrity. DNA Helicases and DNA Motor Proteins. Springer.
Larsson, N.-G., Wang, J., Wilhelmsson, H., Oldfors, A., Rustin, P., Lewandoski, M., Barsh, G. S. & Clayton, D. A. 1998. Mitochondrial transcription factor A is necessary for mtDNA maintenance and embryogenesis in mice. Nature genetics, 18, 231-236.
Latypov, V. F., Tubbs, J. L., Watson, A. J., Marriott, A. S., Mcgown, G., Thorncroft, M., Wilkinson, O. J., Senthong, P., Butt, A. & Arvai, A. S. 2012. Atl1 regulates choice between global genome and transcription-coupled repair of O 6-alkylguanines. Molecular cell, 47, 50-60.
Lau, E. & Jiang, W. 2006. Is there a pre-RC checkpoint that cancer cells lack? Cell Cycle, 5, 1602-1606.
Lau, E., Tsuji, T., Guo, L., Lu, S.-H. & Jiang, W. 2007. The role of pre-replicative complex (pre-RC) components in oncogenesis. The FASEB Journal, 21, 3786-3794.
Lee, K.-S., Kim, H.-J., Li, Q.-L., Chi, X.-Z., Ueta, C., Komori, T., Wozney, J. M., Kim, E.-G., Choi, J.-Y. & Ryoo, H.-M. 2000. Runx2 is a common target of transforming growth factor β1 and bone morphogenetic protein 2, and cooperation between Runx2 and Smad5 induces osteoblast-specific gene expression in the pluripotent mesenchymal precursor cell line C2C12. Molecular and cellular biology, 20, 8783-8792.
Lee, O. K., Kuo, T. K., Chen, W.-M., Lee, K.-D., Hsieh, S.-L. & Chen, T.-H. 2004. Isolation of multipotent mesenchymal stem cells from umbilical cord blood. Blood, 103, 1669-1675.
Lee, J. H., Goodarzi, A. A., Jeggo, P. A. & Paull, T. T. 2010. 53BP1 promotes ATM activity through direct interactions with the MRN complex. The EMBO journal, 29, 574-585.
Lee, A. J., Endesfelder, D., Rowan, A. J., Walther, A., Birkbak, N. J., Futreal, P. A., Downward, J., Szallasi, Z., Tomlinson, I. P. & Howell, M. 2011a. Chromosomal instability confers intrinsic multidrug resistance. Cancer research, 71, 1858-1870.
Lee, J. A., Jung, J. S., Kim, D. H., Lim, J. S., Kim, M. S., Kong, C. B., Song, W. S., Cho, W. H., Jeon, D. G. & Lee, S. Y. 2011b. RANKL expression is related to treatment outcome of patients with localized, high‐grade osteosarcoma. Pediatric blood & cancer, 56, 738-743.
Lee, H.-S., Lee, N. C. O., Kouprina, N., Kim, J.-H., Kagansky, A., Bates, S., Trepel, J. B., Pommier, Y., Sackett, D. & Larionov, V. 2016. Effects of anticancer drugs on chromosome instability and new clinical implications for tumor-suppressing therapies. Cancer research, 76, 902-911.
Lee, J.-M., Song, W.-W., Lee, J.-Y., Hwang, D.-S., Kim, Y.-D., Shin, S.-H., Chung, I.-K. & Kim, U.-K. 2012. Clinical study of benign and malignant fibrous-osseous lesions of
Page | 235
the jaws. Journal of the Korean Association of Oral and Maxillofacial Surgeons, 38, 29-37.
Lee, J. H., Han, Y.-S. & Lee, S. H. 2016. Long-Duration Three-Dimensional Spheroid Culture Promotes Angiogenic Activities of Adipose-Derived Mesenchymal Stem Cells. Biomolecules & Therapeutics, 24, 260-267.
Lemos, D. R., Eisner, C., Hopkins, C. I. & Rossi, F. M. V. 2015. Skeletal muscle-resident MSCs and bone formation. Bone, 80, 19-23.
Lengauer, C., Kinzler, K. W. & Vogelstein, B. 1997. Genetic instability in colorectal cancers. Nature, 386, 623-627.
Lengauer, C., Kinzler, K. W. & Vogelstein, B. 1998. Genetic instabilities in human cancers. Nature, 396, 643.
Lengner, C. J., Steinman, H. A., Gagnon, J., Smith, T. W., Henderson, J. E., Kream, B. E., Stein, G. S., Lian, J. B. & Jones, S. N. 2006. Osteoblast differentiation and skeletal development are regulated by Mdm2–p53 signaling. The Journal of cell biology, 172, 909-921.
Leonard, A. C. & Méchali, M. 2013. DNA replication origins. Cold Spring Harbor perspectives in biology, 5, a010116.
Leonetti, M. D., Sekine, S., Kamiyama, D., Weissman, J. S. & Huang, B. 2016. A scalable strategy for high-throughput GFP tagging of endogenous human proteins. Proceedings of the National Academy of Sciences, 113, E3501-E3508.
Leong, D. T., Lim, J., Goh, X., Pratap, J., Pereira, B. P., Kwok, H. S., Nathan, S. S., Dobson, J. R., Lian, J. B. & Ito, Y. 2010. Cancer-related ectopic expression of the bone-related transcription factor RUNX2 in non-osseous metastatic tumor cells is linked to cell proliferation and motility. Breast Cancer Research, 12, 1.
Leontieva, O. V., Demidenko, Z. N. & Blagosklonny, M. V. 2014. Contact inhibition and high cell density deactivate the mammalian target of rapamycin pathway, thus suppressing the senescence program. Proceedings of the National Academy of Sciences of the United States of America, 111, 8832-8837.
Levine, E. M., Becker, Y., Boone, C. W. & Eagle, H. 1965. Contact inhibition, macromolecular synthesis, and polyribosomes in cultured human diploid fibroblasts. Proceedings of the National Academy of Sciences, 53, 350-356.
Levine, A. J., Momand, J. & Finlay, C. A. 1991. The p53 tumour supressor gene. Nature, 351, 453.
Li, D., Firozi, P. F., Zhang, W., Shen, J., Digiovanni, J., Lau, S., Evans, D., Friess, H., Hassan, M. & Abbruzzese, J. L. 2002. DNA adducts, genetic polymorphisms, and K-ras mutation in human pancreatic cancer. Mutation Research/Genetic Toxicology and Environmental Mutagenesis, 513, 37-48.
Li, N., Yang, R., Zhang, W., Dorfman, H., Rao, P. & Gorlick, R. 2009. Genetically transforming human mesenchymal stem cells to sarcomas. Cancer, 115, 4795-4806.
Li, A., Yu, Y., Lee, S.-C., Ishibashi, T., Lees-Miller, S. P. & Ausió, J. 2010a. Phosphorylation of histone H2A. X by DNA-dependent protein kinase is not affected by core histone acetylation, but it alters nucleosome stability and histone H1 binding. Journal of biological chemistry, 285, 17778-17788.
Li, D.-Q., Ohshiro, K., Khan, M. N. & Kumar, R. 2010b. Requirement of MTA1 in ATR-mediated DNA damage checkpoint function. Journal of Biological Chemistry, 285, 19802-19812.
Li, Y., Ge, C., Long, J. P., Begun, D. L., Rodriguez, J. A., Goldstein, S. A. & Franceschi, R. T. 2012. Biomechanical stimulation of osteoblast gene expression requires phosphorylation of the RUNX2 transcription factor. Journal of Bone and Mineral Research, 27, 1263-1274.
Li, R., Zhang, W., Cui, J., Shui, W., Yin, L., Wang, Y., Zhang, H., Wang, N., Wu, N. & Nan, G. 2014. Targeting BMP9-promoted human osteosarcoma growth by inactivation of notch signaling. Current cancer drug targets, 14, 274-285.
Li, L., Ng, D. S. W., Mah, W. C., Almeida, F. F., Rahmat, S. A., Rao, V. K., Leow, S. C., Laudisi, F., Peh, M. T. & Goh, A. M. 2015. A unique role for p53 in the regulation of M2 macrophage polarization. Cell death and differentiation, 22, 1081.
Page | 236
Li, C. and Zamore, P D. 2019. RNA interference and small RNA analysis. Cold Spring Harbor Protocols, 4.
Lieber, M. R. 2010. The mechanism of double-strand DNA break repair by the nonhomologous DNA end joining pathway. Annual review of biochemistry, 79, 181.
Lieber, M. R. 2016. Mechanisms of human lymphoid chromosomal translocations. Nat Rev Cancer, 16, 387-398.
Lim, M., Zhong, C., Yang, S., Bell, A. M., Cohen, M. B. & Roy-Burman, P. 2010. Runx2 regulates survivin expression in prostate cancer cells. Laboratory investigation; a journal of technical methods and pathology, 90, 222.
Lin, G. L. & Hankenson, K. D. 2011. Integration of BMP, Wnt, and notch signaling pathways in osteoblast differentiation. Journal of cellular biochemistry, 112, 3491-3501.
Lin, P. P., Pandey, M. K., Jin, F., Raymond, A. K., Akiyama, H. & Lozano, G. 2009. Targeted mutation of p53 and Rb in mesenchymal cells of the limb bud produces sarcomas in mice. Carcinogenesis, 30, 1789-1795.
Lindahl, T. 1993. Instability and decay of the primary structure of DNA. nature, 362, 709-715.
Lindahl, T. 2001. Keynote: past, present, and future aspects of base excision repair. Progress in nucleic acid research and molecular biology, 68, xvii-xxx.
Lindor, N. M., Devries, E. M. G., Michels, V. V., Schad, C. R., Jalal, S. M., Donovan, K. M., Smithson, W. A., Kvols, L. K., Thibodeau, S. N. & Dewald, G. W. 1996. Rothmund‐Thomson syndrome in siblings: evidence for acquired in vivo mosaicism. Clinical genetics, 49, 124-129.
Lindor, N. M., Furuichi, Y., Kitao, S., Shimamoto, A., Arndt, C. & Jalal, S. 2000. Rothmund‐Thomson syndrome due to RECQ4 helicase mutations: Report and clinical and molecular comparisons with Bloom syndrome and Werner syndrome. American journal of medical genetics, 90, 223-228.
Litt, M. & Luty, J. A. 1989. A hypervariable microsatellite revealed by in vitro amplification of a dinucleotide repeat within the cardiac muscle actin gene. American journal of human genetics, 44, 397.
Liu, G., Meng, X., Jin, Y., Bai, J., Zhao, Y., Cui, X., Chen, F. & Fu, S. 2008. Inhibitory role of focal adhesion kinase on anoikis in the lung cancer cell A549. Cell biology international, 32, 663-670.
Liu, H.-Y., Tuckett, A. Z., Fennell, M., Garippa, R. & Zakrzewski, J. L. 2018. Repurposing of the CDK inhibitor PHA-767491 as a NRF2 inhibitor drug candidate for cancer therapy via redox modulation. Investigational new drugs, 1-11.
Liu, Q., Li, M. Z., Leibham, D., Cortez, D. & Elledge, S. J. 1998. The univector plasmid-fusion system, a method for rapid construction of recombinant DNA without restriction enzymes. Current biology, 8, 1300-S1.
Liu, W., Toyosawa, S., Furuichi, T., Kanatani, N., Yoshida, C., Liu, Y., Himeno, M., Narai, S., Yamaguchi, A. & Komori, T. 2001. Overexpression of Cbfa1 in osteoblasts inhibits osteoblast maturation and causes osteopenia with multiple fractures. J Cell Biol, 155, 157-166.
Liu, Y., Zhang, Z., Zhang, C., Deng, W., Lv, Q., Chen, X., Huang, T. & Pan, L. 2016. Adipose-derived stem cells undergo spontaneous osteogenic differentiation in vitro when passaged serially or seeded at low density. Biotechnic & histochemistry: official publication of the Biological Stain Commission, 91, 369.
Liu, Z., Liu, Q., Xu, B., Wu, J., Guo, C., Zhu, F., Yang, Q., Gao, G., Gong, Y. & Shao, C. 2009. Berberine induces p53-dependent cell cycle arrest and apoptosis of human osteosarcoma cells by inflicting DNA damage. Mutation Research/Fundamental and Molecular Mechanisms of Mutagenesis, 662, 75-83.
Loew, L. M., Tuft, R. A., Carrington, W. & Fay, F. S. 1993. Imaging in five dimensions: time-dependent membrane potentials in individual mitochondria. Biophysical journal, 65, 2396-2407.
Long, F. 2011. Building strong bones: molecular regulation of the osteoblast lineage. Nature reviews Molecular cell biology, 13, nrm3254.
Long, M. W. 2001. Osteogenesis and bone-marrow-derived cells. Blood Cells, Molecules, and Diseases, 27, 677-690.
Page | 237
Longhi, A., Errani, C., Gonzales-Arabio, D., Ferrari, C. & Mercuri, M. 2008. Osteosarcoma in patients older than 65 years. Journal of Clinical Oncology, 26, 5368-5373.
Lopez‐Barcons, L. A. 2010. Serially heterotransplanted human prostate tumours as an experimental model. Journal of cellular and molecular medicine, 14, 1385-1395.
Lovejoy, C. A., Li, W., Reisenweber, S., Thongthip, S., Bruno, J., De Lange, T., De, S., Petrini, J. H. J., Sung, P. A. & Jasin, M. 2012. Loss of ATRX, genome instability, and an altered DNA damage response are hallmarks of the alternative lengthening of telomeres pathway. PLoS genetics, 8, e1002772.
Lu, X.-Y., Lu, Y., Zhao, Y.-J., Jaeweon, K., Kang, J., Xiao-Nan, L., Ge, G., Meyer, R., Perlaky, L. & Hicks, J. 2008. Cell cycle regulator gene CDC5L, a potential target for 6p12-p21 amplicon in osteosarcoma. Molecular Cancer Research, 6, 937-946.
Lu, H., Fang, E. F., Sykora, P., Kulikowicz, T., Zhang, Y., Becker, K. G., Croteau, D. L. & Bohr, V. A. 2014a. Senescence induced by RECQL4 dysfunction contributes to Rothmund–Thomson syndrome features in mice. Cell death & disease, 5, e1226.
Lu, L., Jin, W., Liu, H. & Wang, L. L. 2014b. RECQ DNA helicases and osteosarcoma. Current Advances in Osteosarcoma. Springer.
Lu, L., Harutyunyan, K., Jin, W., Wu, J., Yang, T., Chen, Y., Joeng, K. S., Bae, Y., Tao, J. & Dawson, B. C. 2015. RECQL4 regulates p53 function in vivo during skeletogenesis. Journal of Bone and Mineral Research, 30, 1077-1089.
Lu, L., Jin, W. & Wang, L. L. 2017. Aging in Rothmund-Thomson syndrome and related RECQL4 genetic disorders. Ageing research reviews, 33, 30-35.
Lukas, C., Savic, V., Bekker-Jensen, S., Doil, C., Neumann, B., Pedersen, R. S., Grøfte, M., Chan, K. L., Hickson, I. D. & Bartek, J. 2011. 53BP1 nuclear bodies form around DNA lesions generated by mitotic transmission of chromosomes under replication stress. Nature cell biology, 13, 243-253.
Luukkonen, J., Hilli, M., Nakamura, M., Ritamo, I., Valmu, L., Kauppinen, K., Tuukkanen, J. and Lehenkari, P. 2019. Osteoclasts secrete osteopontin into resorption lacunae during bone resorption. Histochemistry and cell biology, 1-13.
Macphail, S. H., Banáth, J. P., Yu, Y., Chu, E. & Olive, P. L. 2003. Cell cycle-dependent expression of phosphorylated histone H2AX: reduced expression in unirradiated but not X-irradiated G1-phase cells. Radiation research, 159, 759-767.
Macpherson, I. & Montagnier, L. 1964. Agar suspension culture for the selective assay of cells transformed by polyoma virus. Virology, 23, 291-294.
Macris, M. A., Krejci, L., Bussen, W., Shimamoto, A. & Sung, P. 2006. Biochemical characterization of the RECQ4 protein, mutated in Rothmund-Thomson syndrome. DNA repair, 5, 172-180.
Magalhães, J., Venditti, P., Adhihetty, P. J., Ramsey, J. J. & Ascensão, A. 2014. Mitochondria in Health and Disease. Oxidative medicine and cellular longevity, 2014.
Maire, G., Yoshimoto, M., Chilton-Macneill, S., Thorner, P. S., Zielenska, M. & Squire, J. A. 2009. Recurrent RECQL4 imbalance and increased gene expression levels are associated with structural chromosomal instability in sporadic osteosarcoma. Neoplasia, 11, 260-IN6.
Malumbres, M. & Barbacid, M. 2009. Cell cycle, CDKs and cancer: a changing paradigm. Nature Reviews Cancer, 9, 153-166.
Manis, J. P., Morales, J. C., Xia, Z., Kutok, J. L., Alt, F. W. & Carpenter, P. B. 2004. 53BP1 links DNA damage-response pathways to immunoglobulin heavy chain class-switch recombination. Nature immunology, 5, 481-487.
Mankouri, H. W., Huttner, D. & Hickson, I. D. 2013. How unfinished business from S‐phase affects mitosis and beyond. The EMBO journal, 32, 2661-2671.
Mann, M. B., Hodges, C. A., Barnes, E., Vogel, H., Hassold, T. J. & Luo, G. 2005. Defective sister-chromatid cohesion, aneuploidy and cancer predisposition in a mouse model of type II Rothmund–Thomson syndrome. Human molecular genetics, 14, 813-825.
Manoir, S. D., Guillaud, P., Camus, E., Seigneurin, D. & Brugal, G. 1991. Ki‐67 labeling in
postmitotic cells defines different Ki‐67 pathways within the 2c compartment. Cytometry, 12, 455-463.
Mao, Z., Ke, Z., Gorbunova, V. & Seluanov, A. 2012. Replicatively senescent cells are arrested in G1 and G2 phases. Aging (Albany NY), 4, 431-435.
Page | 238
Marchetti, L., Comelli, L., D’innocenzo, B., Puzzi, L., Luin, S., Arosio, D., Calvello, M., Mendoza-Maldonado, R., Peverali, F. & Trovato, F. 2010. Homeotic proteins participate in the function of human-DNA replication origins. Nucleic acids research, 38, 8105-8119.
Marcomini, I. & Gasser, S. M. 2015. Nuclear organization in DNA end processing: Telomeres vs double-strand breaks. DNA repair, 32, 134-140.
Mareschi, K., Biasin, E., Piacibello, W., Aglietta, M., Madon, E. & Fagioli, F. 2001. Isolation of human mesenchymal stem cells: bone marrow versus umbilical cord blood. haematologica, 86, 1099-1100.
Mari, P.-O., Florea, B. I., Persengiev, S. P., Verkaik, N. S., Brüggenwirth, H. T., Modesti, M., Giglia-Mari, G., Bezstarosti, K., Demmers, J. a. A. & Luider, T. M. 2006. Dynamic assembly of end-joining complexes requires interaction between Ku70/80 and XRCC4. Proceedings of the National Academy of Sciences, 103, 18597-18602.
Marina, N., Gebhardt, M., Teot, L. & Gorlick, R. 2004. Biology and Therapeutic Advances for Pediatric Osteosarcoma. The Oncologist, 9, 422-441.
Mariotti, L. G., Pirovano, G., Savage, K. I., Ghita, M., Ottolenghi, A., Prise, K. M. & Schettino, G. 2013. Use of the γ-H2AX assay to investigate DNA repair dynamics following multiple radiation exposures. PloS one, 8, e79541.
Marteijn, J. A., Bekker-Jensen, S., Mailand, N., Lans, H., Schwertman, P., Gourdin, A. M., Dantuma, N. P., Lukas, J. & Vermeulen, W. 2009. Nucleotide excision repair–induced H2A ubiquitination is dependent on MDC1 and RNF8 and reveals a universal DNA damage response. The Journal of cell biology, 186, 835-847.
Marteijn, J. A., Lans, H., Vermeulen, W. & Hoeijmakers, J. H. J. 2014. Understanding nucleotide excision repair and its roles in cancer and ageing. Nature reviews. Molecular cell biology, 15, 465.
Martin, N. L., Saba-El-Leil, M. K., Sadekova, S., Meloche, S. & Sauvageau, G. 2005. EN2 is a candidate oncogene in human breast cancer. Oncogene, 24, 6890-6901.
Martin, J. W., Zielenska, M., Stein, G. S., Van Wijnen, A. J. & Squire, J. A. 2010. The role of RUNX2 in osteosarcoma oncogenesis. Sarcoma, 2011.
Martin, J. W., Squire, J. A. & Zielenska, M. 2012. The genetics of osteosarcoma. Sarcoma, 2012.
Martin, J. W., Chilton-Macneill, S., Koti, M., Van Wijnen, A. J., Squire, J. A. & Zielenska, M. 2014. Digital expression profiling identifies RUNX2, CDC5L, MDM2, RECQL4, and CDK4 as potential predictive biomarkers for neo-adjuvant chemotherapy response in paediatric osteosarcoma. PloS one, 9, e95843.
Martínez-Diez, M., Santamaría, G., Ortega, Á. D. & Cuezva, J. M. 2006. Biogenesis and dynamics of mitochondria during the cell cycle: significance of 3′ UTRs. PloS one, 1, e107.
Maruyama, Z., Yoshida, C. A., Furuichi, T., Amizuka, N., Ito, M., Fukuyama, R., Miyazaki, T., Kitaura, H., Nakamura, K. & Fujita, T. 2007. Runx2 determines bone maturity and turnover rate in postnatal bone development and is involved in bone loss in estrogen deficiency. Developmental dynamics, 236, 1876-1890.
Marzona, L. & Pavolini, B. 2009. Play and players in bone fracture healing match. Clinical cases in mineral and bone metabolism, 6, 159-162.
Maser, R. S. & Depinho, R. A. 2002. Connecting chromosomes, crisis, and cancer. Science, 297, 565-569.
Masgras, I., Carrera, S., De Verdier, P. J., Brennan, P., Majid, A., Makhtar, W., Tulchinsky, E., Jones, G. D., Roninson, I. B. & Macip, S. 2012. Reactive oxygen species and mitochondrial sensitivity to oxidative stress determine induction of cancer cell death by p21. Journal of Biological Chemistry, 287, 9845-9854.
Masters, J. R., Thomson, J. A., Daly-Burns, B., Reid, Y. A., Dirks, W. G., Packer, P., Toji, L. H., Ohno, T., Tanabe, H. & Arlett, C. F. 2001. Short tandem repeat profiling provides an international reference standard for human cell lines. Proceedings of the National Academy of Sciences, 98, 8012-8017.
Matsumoto, M., Yaginuma, K., Igarashi, A., Imura, M., Hasegawa, M., Iwabuchi, K., Date, T., Mori, T., Ishizaki, K. & Yamashita, K. 2007. Perturbed gap-filling synthesis in nucleotide excision repair causes histone H2AX phosphorylation in human quiescent cells. Journal of cell science, 120, 1104-1112.
Page | 239
Matsuno, K., Kumano, M., Kubota, Y., Hashimoto, Y. & Takisawa, H. 2006. The N-terminal noncatalytic region of Xenopus RecQ4 is required for chromatin binding of DNA polymerase α in the initiation of DNA replication. Molecular and cellular biology, 26, 4843-4852.
Matsuoka, S., Rotman, G., Ogawa, A., Shiloh, Y., Tamai, K. & Elledge, S. J. 2000. Ataxia telangiectasia-mutated phosphorylates Chk2 in vivo and in vitro. Proceedings of the National Academy of Sciences, 97, 10389-10394.
Matsutani, N., Yokozaki, H., Tahara, E., Tahara, H., Kuniyasu, H., Haruma, K., Chayama, K., Yasui, W. & Tahara, E. 2001. Expression of telomeric repeat binding factor 1 and 2 and TRF1-interacting nuclear protein 2 in human gastric carcinomas. International Journal of Oncology, 19, 507-512.
Mayor, R., Casadome, L., Azuara, D., Moreno, V., Clark, S., Capella, G. & Peinado, M. 2009. Long-range epigenetic silencing at 2q14. 2 affects most human colorectal cancers and may have application as a non-invasive biomarker of disease. British journal of cancer, 100, 1534-1539.
Mccardle, A. 2013. Skeletal muscle loss: sarcopenia and inactivity. Presented at the European Calcified Tissue Society Conference ECTS, Bone Abstracts, 1.
Mcelhinny, S. a. N., Snowden, C. M., Mccarville, J. & Ramsden, D. A. 2000. Ku recruits the XRCC4-ligase IV complex to DNA ends. Molecular and cellular biology, 20, 2996-3003.
Mcgee‐Lawrence, M. E., Carpio, L. R., Schulze, R. J., Pierce, J. L., Mcniven, M. A., Farr, J. N., Khosla, S., Oursler, M. J. & Westendorf, J. J. 2016. Hdac3 deficiency increases marrow adiposity and induces lipid storage and glucocorticoid metabolism in osteochondroprogenitor cells. Journal of Bone and Mineral Research, 31, 116-128.
Mcginnis, W. & Krumlauf, R. 1992. Homeobox genes and axial patterning. Cell, 68, 283-302.
Mcgranahan, N., Burrell, R. A., Endesfelder, D., Novelli, M. R. & Swanton, C. 2012. Cancer chromosomal instability: therapeutic and diagnostic challenges. EMBO reports, 13, 528-538.
Mcgranahan, N., Furness, A. J. S., Rosenthal, R., Ramskov, S., Lyngaa, R., Saini, S. K., Jamal-Hanjani, M., Wilson, G. A., Birkbak, N. J. & Hiley, C. T. 2016. Clonal neoantigens elicit T cell immunoreactivity and sensitivity to immune checkpoint blockade. Science, 351, 1463-1469.
Mcgrath, S. E., Michael, A., Pandha, H. & Morgan, R. 2013. Engrailed homeobox transcription factors as potential markers and targets in cancer. FEBS letters, 587, 549-554.
Mcmanus, K. J. & Hendzel, M. J. 2005. ATM-dependent DNA damage-independent mitotic phosphorylation of H2AX in normally growing mammalian cells. Molecular biology of the cell, 16, 5013-5025.
Medagli, B., Di Crescenzio, P., De March, M. & Onesti, S. 2016. Structure and Activity of the Cdc45-Mcm2–7-GINS (CMG) Complex, the Replication Helicase. The Initiation of DNA Replication in Eukaryotes. Springer.
Mehlem, A., Hagberg, C. E., Muhl, L., Eriksson, U. & Falkevall, A. 2013. Imaging of neutral lipids by oil red O for analyzing the metabolic status in health and disease. Nature protocols, 8, 1149-1154.
Mehollin-Ray, A. R., Kozinetz, C. A., Schlesinger, A. E., Guillerman, R. P. & Wang, L. L. 2008. Radiographic abnormalities in Rothmund-Thomson syndrome and genotype–phenotype correlation with RECQL4 mutation status. American Journal of Roentgenology, 191, W62-W66.
Melrose, J., Hayes, A. J., Whitelock, J. M. & Little, C. B. 2008. Perlecan, the “jack of all trades” proteoglycan of cartilaginous weight‐bearing connective tissues. Bioessays, 30, 457-469.
Merry, C., Fu, K., Wang, J., Yeh, I. J. & Zhang, Y. 2010. Targeting the checkpoint kinase Chk1 in cancer therapy. Cell Cycle, 9, 279-283.
Meunier, P., Aaron, J., Edouard, C. & Vlgnon, G. 1971. Osteoporosis and the replacement of cell populations of the marrow by adipose tissue: a quantitative study of 84 iliac bone biopsies. Clinical orthopaedics and related research, 80, 147-154.
Page | 240
Meyer, F. R. L. & Walter, I. 2016. Establishment and Characterization of New Canine and Feline Osteosarcoma Primary Cell Lines. Veterinary Sciences, 3, 9.
Mimeault, M. & Batra, S. K. 2010. Recent advances on skin‐resident stem/progenitor cell
functions in skin regeneration, aging and cancers and novel anti‐aging and cancer therapies. Journal of cellular and molecular medicine, 14, 116-134.
Miotto, B. & Graba, Y. 2010. Control of DNA replication: a new facet of Hox proteins? Bioessays, 32, 800-807.
Miozzo, M., Castorina, P., Riva, P., Dalpra, L., Fuhrman Conti, A. M., Volpi, L., Hoe, T. S., Khoo, A., Wiegant, J. & Rosenberg, C. 1998. Chromosomal instability in fibroblasts and mesenchymal tumors from 2 sibs with Rothmund-Thomson syndrome. International journal of cancer, 77, 504-510.
Miozzo, M., Castorina, P., Riva, P., Dalpra, L., Fuhrman Conti, A. M., Volpi, L., Hoe, T. S., Khoo, A., Wiegant, J. & Rosenberg, C. 1998. Chromosomal instability in fibroblasts and mesenchymal tumors from 2 sibs with Rothmund-Thomson syndrome. International journal of cancer, 77, 504-510.
Mirabello, L., Troisi, R. J. & Savage, S. A. 2009. Osteosarcoma incidence and survival rates from 1973 to 2004. Cancer, 115, 1531-1543.
Mirabello, L., Yeager, M., Mai, P. L., Gastier-Foster, J. M., Gorlick, R., Khanna, C., Patiño-Garcia, A., Sierrasesúmaga, L., Lecanda, F. & Andrulis, I. L. 2015. Germline TP53 variants and susceptibility to osteosarcoma. JNCI: Journal of the National Cancer Institute, 107.
Moerman, E. J., Teng, K., Lipschitz, D. A. & Lecka‐Czernik, B. 2004. Aging activates adipogenic and suppresses osteogenic programs in mesenchymal marrow stroma/stem cells: the role of PPAR‐γ2 transcription factor and TGF‐β/BMP signaling pathways. Aging cell, 3, 379-389.
Mohseny, A. B., Szuhai, K., Romeo, S., Buddingh, E. P., Briaire‐De Bruijn, I., De Jong, D.,
Van Pel, M., Cleton‐Jansen, A. M. & Hogendoorn, P. C. W. 2009. Osteosarcoma originates from mesenchymal stem cells in consequence of aneuploidization and genomic loss of Cdkn2. The Journal of pathology, 219, 294-305.
Mohseny, A. B. & Hogendoorn, P. C. 2011. Concise review: mesenchymal tumors: when stem cells go mad. Stem cells, 29, 397-403.
Moiseeva, T.N. and Bakkenist, C.J. 2018. Regulation of the initiation of DNA replication in human cells. DNA repair, 99-106.
Monaghan, R. M. & Whitmarsh, A. J. 2015. Mitochondrial proteins moonlighting in the nucleus. Trends in biochemical sciences, 40, 728-735.
Montagnoli, A., Valsasina, B., Croci, V., Menichincheri, M., Rainoldi, S., Marchesi, V., Tibolla, M., Tenca, P., Brotherton, D. & Albanese, C. 2008. A Cdc7 kinase inhibitor restricts initiation of DNA replication and has antitumor activity. Nature chemical biology, 4, 357-365.
Morales‐Sánchez, M. A., Peralta‐Pedrero, M. L., Jurado‐Santa Cruz, F., Pomerantz, H. &
Barajas‐Nava, L. A. 2016. Interventions for preventing keratinocyte cancer in high‐risk groups not receiving immunosuppressive therapy. The Cochrane Library.
Moretti, T. & Budowle, B. The CODIS STR Project: evaluation of fluorescent multiplex STR systems. Proceedings of the 50th Annual Meeting of the American Academy of Forensic Sciences, 1998. American Academy of Forensic Sciences, 9-14.
Morgan, D. O. 1997. Cyclin-dependent kinases: engines, clocks, and microprocessors. Annual review of cell and developmental biology, 13, 261-291.
Morgan, R., Boxall, A., Bhatt, A., Bailey, M., Hindley, R., Langley, S., Whitaker, H. C., Neal, D. E., Ismail, M. & Whitaker, H. 2011. Engrailed-2 (EN2): a tumor specific urinary biomarker for the early diagnosis of prostate cancer. Clinical Cancer Research, 17, 1090-1098.
Mori, K., Berreur, M., Blanchard, F., Chevalier, C., Guisle-Marsollier, I., Masson, M., Rédini, F. & Heymann, D. 2007. Receptor activator of nuclear factor-κB ligand (RANKL) directly modulates the gene expression profile of RANK-positive Saos-2 human osteosarcoma cells. Oncology reports, 18, 1365-1371.
Mori, S., Chang, J. T., Andrechek, E. R., Matsumura, N., Baba, T., Yao, G., Kim, J. W., Gatza, M., Murphy, S. & Nevins, J. R. 2009. Anchorage-independent cell growth signature identifies tumors with metastatic potential. Oncogene, 28, 2796-2805.
Page | 241
Mosmann, T. 1983. Rapid colorimetric assay for cellular growth and survival: application to proliferation and cytotoxicity assays. Journal of immunological methods, 65, 55-63.
Motyl, K. J., Raetz, M., Tekalur, S. A., Schwartz, R. C. & Mccabe, L. R. 2011. CCAAT/enhancer binding protein β-deficiency enhances type 1 diabetic bone phenotype by increasing marrow adiposity and bone resorption. American Journal of Physiology-Regulatory, Integrative and Comparative Physiology, 300, R1250-R1260.
Mueller, S. M. & Glowacki, J. 2001. Age‐related decline in the osteogenic potential of human
bone marrow cells cultured in three‐dimensional collagen sponges. Journal of cellular biochemistry, 82, 583-590.
Mulhern, D. M. & Van Gerven, D. P. 1997. Patterns of femoral bone remodeling dynamics in a medieval Nubian population. American Journal of Physical Anthropology, 104, 133-146.
Mundlos, S. & Olsen, B. R. 2002. Defects in skeletal morphogenesis. in: Steinmann, B. Mundy, G. R. 2002. Metastasis: Metastasis to bone: causes, consequences and therapeutic
opportunities. Nature Reviews Cancer, 2, 584-593. Muñoz, P., Blanco, R. & Blasco, M. A. 2006. Role of the TRF2 telomeric protein in cancer
and aging. Cell Cycle, 5, 718-721. Muramatsu, S., Hirai, K., Tak, Y.-S., Kamimura, Y. & Araki, H. 2010. CDK-dependent
complex formation between replication proteins Dpb11, Sld2, Pol ɛ, and GINS in budding yeast. Genes & development, 24, 602-612.
Murray, A. 1993. The cell cycle: an introduction. Muruganandan, S. & Sinal, C. J. 2014. The impact of bone marrow adipocytes on osteoblast
and osteoclast differentiation. IUBMB life, 66, 147-155. Mutsaers, A. J., Ng, A. J. M., Baker, E. K., Russell, M. R., Chalk, A. M., Wall, M., Liddicoat,
B. J. J., Ho, P. W. M., Slavin, J. L. & Goradia, A. 2013. Modeling distinct osteosarcoma subtypes in vivo using Cre: lox and lineage-restricted transgenic shRNA. Bone, 55, 166-178.
Nagaraju, G. & Scully, R. 2007. Minding the gap: the underground functions of BRCA1 and BRCA2 at stalled replication forks. DNA repair, 6, 1018-1031.
Nahhas, A.F., Oberlin, D.M., Braunberger, T.L. and Lim, H.W. 2018. Recent Developments in the Diagnosis and Management of Photosensitive Disorders. American journal of clinical dermatology,1-25.
Nakamura, T. M., Morin, G. B., Chapman, K. B., Weinrich, S. L., Andrews, W. H., Lingner, J., Harley, C. B. & Cech, T. R. 1997. Telomerase catalytic subunit homologs from fission yeast and human. Science, 277, 955-959.
Nakamura, A., Sedelnikova, O. A., Redon, C., Pilch, D. R., Sinogeeva, N. I., Shroff, R., Lichten, M. & Bonner, W. M. 2006. Techniques for γ‐H2AX Detection. Methods in Enzymology. Academic Press.
Nakamura, A. J., Chiang, Y. J., Hathcock, K. S., Horikawa, I., Sedelnikova, O. A., Hodes, R. J. & Bonner, W. M. 2008. Both telomeric and non-telomeric DNA damage are determinants of mammalian cellular senescence. Epigenetics & chromatin, 1, 6.
Nakanishi, K., Kawai, T., Kumaki, F., Hiroi, S., Mukai, M., Ikeda, E., Koering, C. E. & Gilson, E. 2003. Expression of mRNAs for telomeric repeat binding factor (TRF)-1 and TRF2 in atypical adenomatous hyperplasia and adenocarcinoma of the lung. Clinical Cancer Research, 9, 1105-1111.
Nakashima, K., Zhou, X., Kunkel, G., Zhang, Z., Deng, J. M., Behringer, R. R. & De Crombrugghe, B. 2002. The novel zinc finger-containing transcription factor osterix is required for osteoblast differentiation and bone formation. Cell, 108, 17-29.
Narayan, S., Fleming, C., Trainer, A. & Craig, J. 2001. Rothmund–Thomson syndrome with myelodysplasia. Pediatric dermatology, 18, 210-212.
Narciso, L., Fortini, P., Pajalunga, D., Franchitto, A., Liu, P., Degan, P., Frechet, M., Demple, B., Crescenzi, M. & Dogliotti, E. 2007. Terminally differentiated muscle cells are defective in base excision DNA repair and hypersensitive to oxygen injury. Proceedings of the National Academy of Sciences, 104, 17010-17015.
Nardone, G., Oliver-De La Cruz, J., Vrbsky, J., Martini, C., Pribyl, J., Skládal, P., Pešl, M., Caluori, G., Pagliari, S. & Martino, F. 2017. YAP regulates cell mechanics by controlling focal adhesion assembly. Nature Communications, 8.
Page | 242
Nathan, S. S., Pereira, B. P., Zhou, Y. F., Gupta, A., Dombrowski, C., Soong, R., Pho, R. W., Stein, G. S., Salto-Tellez, M., Cool, S. M. & Van Wijnen, A. J. 2009. Elevated expression of Runx2 as a key parameter in the etiology of osteosarcoma. Mol Biol Rep, 36, 153-8.
Natoni, A., Murillo, L. S., Kliszczak, A. E., Catherwood, M. A., Montagnoli, A., Samali, A., O'dwyer, M. & Santocanale, C. 2011. Mechanisms of action of a dual Cdc7/Cdk9 kinase inhibitor against quiescent and proliferating CLL cells. Molecular cancer therapeutics, 10, 1624-1634.
Natoni, A., Coyne, M. R. E., Jacobsen, A., Rainey, M. D., O’brien, G., Healy, S., Montagnoli, A., Moll, J., O’dwyer, M. & Santocanale, C. 2013. Characterization of a Dual CDC7/CDK9 Inhibitor in Multiple Myeloma Cellular Models. Cancers, 5, 901-918.
Nelson, C. M. & Bissell, M. J. Modeling dynamic reciprocity: engineering three-dimensional culture models of breast architecture, function, and neoplastic transformation. 2005 2005. Elsevier, 342-352.
Neri, D., Kaspar, M. & Trachsel, E. 2013. Anti-EDB antibody-targeted IL-10 cytokine for therapy of rheumatoid arthritis. Google Patents.
Ng, K. W., Leong, D. T. W. & Hutmacher, D. W. 2005. The challenge to measure cell proliferation in two and three dimensions. Tissue Engineering, 11, 182-191.
Ng, A. J. M., Mutsaers, A. J., Baker, E. K. & Walkley, C. R. 2012. Genetically engineered mouse models and human osteosarcoma. Clinical sarcoma research, 2, 19.
Ng, A. J. M., Walia, M. K., Smeets, M. F., Mutsaers, A. J., Sims, N. A., Purton, L. E., Walsh, N. C., Martin, T. J. & Walkley, C. R. 2015. The DNA helicase recql4 is required for normal osteoblast expansion and osteosarcoma formation. PLoS
Nicholls, D. G. 2004. Mitochondrial membrane potential and aging. Aging cell, 3, 35-40. Nicholls, D.G., 2018. Fluorescence Measurement of Mitochondrial Membrane Potential
Changes in Cultured Cells. In Mitochondrial Bioenergetics,Humana Press, New York, NY. 121-135
Nielsen, T. O., West, R. B., Linn, S. C., Alter, O., Knowling, M. A., O'connell, J. X., Zhu, S., Fero, M., Sherlock, G. & Pollack, J. R. 2002. Molecular characterisation of soft tissue tumours: a gene expression study. The Lancet, 359, 1301-1307.
Nijjar, T., Bassett, E., Garbe, J., Takenaka, Y., Stampfer, M. R., Gilley, D. & Yaswen, P. 2005. Accumulation and altered localization of telomere-associated protein TRF2 in immortally transformed and tumor-derived human breast cells. Oncogene, 24, 3369-3376.
Nimmo, R. & Woollard, A. 2008. Worming out the biology of Runx. Developmental biology, 313, 492-500.
Nishida, S., Endo, N., Yamagiwa, H., Tanizawa, T. & Takahashi, H. E. 1999. Number of osteoprogenitor cells in human bone marrow markedly decreases after skeletal maturation. Journal of bone and mineral metabolism, 17, 171-177.
Nishitani, H. & Lygerou, Z. 2002. Control of DNA replication licensing in a cell cycle. Genes to Cells, 7, 523-534.
Noatynska, A., Tavernier, N., Gotta, M. & Pintard, L. 2013. Coordinating cell polarity and cell cycle progression: what can we learn from flies and worms? Open biology, 3, 130083.
Noon, A. T., Shibata, A., Rief, N., Löbrich, M., Stewart, G. S., Jeggo, P. A. & Goodarzi, A. A. 2010. 53BP1-dependent robust localized KAP-1 phosphorylation is essential for heterochromatic DNA double-strand break repair. Nature cell biology, 12, 177-184.
Novarina, D., Amara, F., Lazzaro, F., Plevani, P. & Muzi-Falconi, M. 2011. Mind the gap: keeping UV lesions in check. DNA repair, 10, 751-759.
Nuciforo, P. G., Luise, C., Capra, M., Pelosi, G. & Di Fagagna, F. D. A. 2007. Complex engagement of DNA damage response pathways in human cancer and in lung tumor progression. Carcinogenesis, 28, 2082-2088.
Nuttall, M. E. & Gimble, J. M. 2000. Is there a therapeutic opportunity to either prevent or treat osteopenic disorders by inhibiting marrow adipogenesis? Bone, 27, 177-184.
O’connor, M. J. 2015. Targeting the DNA damage response in cancer. Molecular cell, 60, 547-560.
Page | 243
Oda, E., Ohki, R., Murasawa, H., Nemoto, J., Shibue, T., Yamashita, T., Tokino, T., Taniguchi, T. & Tanaka, N. 2000. Noxa, a BH3-only member of the Bcl-2 family and candidate mediator of p53-induced apoptosis. Science, 288, 1053-1058.
Offer, T., Ho, E., Traber, M. G., Bruno, R. S., Kuypers, F. A. & Ames, B. N. 2005. A simple assay for frequency of chromosome breaks and loss (micronuclei) by flow cytometry of human reticulocytes. The FASEB journal, 19, 485-487.
Ogawa, R., Mizuno, H., Watanabe, A., Migita, M., Shimada, T. & Hyakusoku, H. 2004. Osteogenic and chondrogenic differentiation by adipose-derived stem cells harvested from GFP transgenic mice. Biochemical and biophysical research communications, 313, 871-877.
Oh, H., Wang, S. C., Prahash, A., Sano, M., Moravec, C. S., Taffet, G. E., Michael, L. H., Youker, K. A., Entman, M. L. & Schneider, M. D. 2003. Telomere attrition and Chk2 activation in human heart failure. Proceedings of the National Academy of Sciences, 100, 5378-5383.
Oh, B.-K., Kim, Y.-J., Park, C. & Park, Y. N. 2005. Up-regulation of telomere-binding proteins, TRF1, TRF2, and TIN2 is related to telomere shortening during human multistep hepatocarcinogenesis. The American journal of pathology, 166, 73-80.
Ohlenschläger, O., Kuhnert, A., Schneider, A., Haumann, S., Bellstedt, P., Keller, H., Saluz, H.-P., Hortschansky, P., Hänel, F. & Grosse, F. 2012. The N-terminus of the human RecQL4 helicase is a homeodomain-like DNA interaction motif. Nucleic acids research, 40, 8309-8324.
Okamoto, K., Bartocci, C., Ouzounov, I., Diedrich, J. K., Yates Iii, J. R. & Denchi, E. L. 2013. A two-step mechanism for TRF2-mediated chromosome-end protection. Nature, 494, 502-505.
O'keefe, R. J., Puzas, J. E., Loveys, L., Hicks, D. G. & Rosier, R. N. 1994. Analysis of type II and type X collagen synthesis in cultured growth plate chondrocytes by in situ hybridization: rapid induction of type X collagen in culture. Journal of Bone and Mineral Research, 9, 1713-1722.
Olivier, M., Hollstein, M. & Hainaut, P. 2010. TP53 mutations in human cancers: origins, consequences, and clinical use. Cold Spring Harbor perspectives in biology, 2, a001008.
Orstavik, K. H., Mcfadden, N., Hagelsteen, J., Ormerod, E. & Van Der Hagen, C. 1994. Instability of lymphocyte chromosomes in a girl with Rothmund-Thomson syndrome. Journal of medical genetics, 31, 570-572.
Ottaviani, G. & Jaffe, N. 2009. The etiology of osteosarcoma. Pediatric and Adolescent Osteosarcoma. Springer.
Ouyang, K. J., Woo, L. L. & Ellis, N. A. 2008. Homologous recombination and maintenance of genome integrity: cancer and aging through the prism of human RecQ helicases. Mechanisms of ageing and development, 129, 425-440.
Overholtzer, M., Rao, P. H., Favis, R., Lu, X.-Y., Elowitz, M. B., Barany, F., Ladanyi, M., Gorlick, R. & Levine, A. J. 2003. The presence of p53 mutations in human osteosarcomas correlates with high levels of genomic instability. Proceedings of the National Academy of Sciences, 100, 11547-11552.
Overmeer, R. M., Moser, J., Volker, M., Kool, H., Tomkinson, A. E., Van Zeeland, A. A., Mullenders, L. H. F. & Fousteri, M. 2011. Replication protein A safeguards genome integrity by controlling NER incision events. The Journal of cell biology, 192, 401-415.
Ozaki, T., Nakagawara, A. & Nagase, H. 2013. RUNX family participates in the regulation of p53-dependent DNA damage response. International journal of genomics, 2013.
Pageau, G. J. & Lawrence, J. B. 2006. BRCA1 foci in normal S-phase nuclei are linked to interphase centromeres and replication of pericentric heterochromatin. J Cell Biol, 175, 693-701.
Pagliuca, F. W., Collins, M. O., Lichawska, A., Zegerman, P., Choudhary, J. S. & Pines, J. 2011. Quantitative proteomics reveals the basis for the biochemical specificity of the cell-cycle machinery. Molecular cell, 43, 406-417.
Pairault, J. & Green, H. 1979. A study of the adipose conversion of suspended 3T3 cells by using glycerophosphate dehydrogenase as differentiation marker. Proceedings of the National Academy of Sciences, 76, 5138-5142.
Page | 244
Palm, W. & De Lange, T. 2008. How shelterin protects mammalian telomeres. Annual review of genetics, 42, 301-334.
Pan, Q., Fouraschen, S. M., De Ruiter, P. E., Dinjens, W. N., Kwekkeboom, J., Tilanus, H. W. & Van Der Laan, L. J. 2013. Detection of spontaneous tumorigenic transformation during culture expansion of human mesenchymal stromal cells. Experimental Biology and Medicine, 1535370213506802.
Pâques, F. & Haber, J. E. 1999. Multiple pathways of recombination induced by double-strand breaks in Saccharomyces cerevisiae. Microbiology and molecular biology reviews, 63, 349-404.
Pardee, A. B. 1974. A restriction point for control of normal animal cell proliferation. Proceedings of the National Academy of Sciences, 71, 1286-1290.
Pardo, B., Gomez-Gonzalez, B. & Aguilera, A. 2009. DNA repair in mammalian cells. Cellular and Molecular Life Sciences, 66, 1039-1056.
Parfitt, A. M. 1980. Morphologic basis of bone-mineral measurements-transient and steady-state effects of treatment in osteoporosis. Karger allschwilerstrasse 10, ch-4009 basel, switzerland.
Parfitt, A. M. 1984. Age-related structural changes in trabecular and cortical bone: cellular mechanisms and biomechanical consequences. Calcified Tissue International, 36, S123-S128.
Parfitt, A. M. 1990. Bone-forming cells in clinical conditions. Bone, 1, 351-429. Parfitt, A. M. 1994. The two faces of growth: benefits and risks to bone integrity.
Osteoporosis International, 4, 382-398. Parfitt, A. M., Travers, R., Rauch, F. & Glorieux, F. H. 2000. Structural and cellular changes
during bone growth in healthy children. Bone, 27, 487-494. Park, S.-J., Lee, Y.-J., Beck, B. D. & Lee, S.-H. 2006. A positive involvement of RecQL4 in
UV-induced S-phase arrest. DNA and cell biology, 25, 696-703. Park, S.-Y. & Kim, J.-E. 2013. Differential gene expression by Osterix knockdown in mouse
chondrogenic ATDC5 cells. Gene, 518, 368-375. Park, H. W., Kim, Y. C., Yu, B., Moroishi, T., Mo, J.-S., Plouffe, S. W., Meng, Z., Lin, K. C.,
Yu, F.-X. & Alexander, C. M. 2015. Alternative Wnt signaling activates YAP/TAZ. Cell, 162, 780-794.
Parkin, D. M., Stiller, C. A., Draper, G. J. & Bieber, C. A. 1988. The international incidence of childhood cancer. International Journal of Cancer, 42, 511-520.
Parsa, N. 2012. Environmental Factors Inducing Human Cancers. Iranian Journal of Public Health, 41, 1-9.
Patel, D. M., Shah, J. & Srivastava, A. S. 2013. Therapeutic potential of mesenchymal stem cells in regenerative medicine. Stem cells international, 2013.
Peakman, T. C., Harris, R. A. & Gewert, D. R. 1992. Highly efficient generation of recombinant baculoviruses by enzymatically mediated site-specific in vitro recombination. Nucleic acids research, 20, 495-500.
Pedanou, V. E., Gobeil, S., Tabaries, S., Simone, T. M., Zhu, L. J., Siegel, P. M. & Green, M. R. 2016. The histone H3K9 demethylase KDM3A promotes anoikis by transcriptionally activating pro-apoptotic genes BNIP3 and BNIP3L. Elife, 5.
Pereira, B. P., Zhou, Y., Gupta, A., Leong, D. T., Aung, K. Z., Ling, L., Pho, R. W., Galindo, M., Salto‐Tellez, M. & Stein, G. S. 2009. Runx2, p53, and pRB status as diagnostic
parameters for deregulation of osteoblast growth and differentiation in a new pre‐chemotherapeutic osteosarcoma cell line (OS1). Journal of cellular physiology, 221, 778-788.
Perry, S. W., Norman, J. P., Barbieri, J., Brown, E. B. & Gelbard, H. A. 2011. Mitochondrial membrane potential probes and the proton gradient: a practical usage guide. BioTechniques, 50, 98-115.
Petermann, E., Maya-Mendoza, A., Zachos, G., Gillespie, D. a. F., Jackson, D. A. & Caldecott, K. W. 2006. Chk1 requirement for high global rates of replication fork progression during normal vertebrate S phase. Molecular and cellular biology, 26, 3319-3326.
Petermann, E. & Helleday, T. 2010. Pathways of mammalian replication fork restart. Nature reviews Molecular cell biology, 11, 683-687.
Page | 245
Petkovic, M., Dietschy, T., Freire, R., Jiao, R. & Stagljar, I. 2005. The human Rothmund-Thomson syndrome gene product, RECQL4, localizes to distinct nuclear foci that coincide with proteins involved in the maintenance of genome stability. Journal of cell science, 118, 4261-4269.
Pfeifer, G. P., Denissenko, M. F., Olivier, M., Tretyakova, N., Hecht, S. S. & Hainaut, P. 2002. Tobacco smoke carcinogens, DNA damage and p53 mutations in smoking-associated cancers. Oncogene, 21, 7435.
Pi, Y., Goldenthal, M. J. & Marín-García, J. 2007. Mitochondrial channelopathies in aging. Journal of Molecular Medicine, 85, 937-951.
Pianigiani, E., De Aloe, G., Andreassi, A., Rubegni, P. & Fimiani, M. 2001. Rothmund‐Thomson Syndrome (Thomson‐Type) and Myelodysplasia. Pediatric dermatology, 18, 422-425.
Pierre, R. V. 2002. Peripheral blood film review: the demise of the eyecount leukocyte differential. Clinics in laboratory medicine, 22, 279-297.
Pino, A. M., Rosen, C. J. & Rodríguez, J. P. 2012. In osteoporosis, differentiation of mesenchymal stem cells (MSCs) improves bone marrow adipogenesis. Biological research, 45, 279-287.
Pitrone, M., Pizzolanti, G., Tomasello, L., Coppola, A., Morini, L., Pantuso, G., Ficarella, R., Guarnotta, V., Perrini, S. & Giorgino, F. 2017. NANOG Plays a Hierarchical Role in the Transcription Network Regulating the Pluripotency and Plasticity of Adipose Tissue-Derived Stem Cells. International Journal of Molecular Sciences, 18, 1107.
Pittenger, M. F., Mackay, A. M., Beck, S. C., Jaiswal, R. K., Douglas, R., Mosca, J. D., Moorman, M. A., Simonetti, D. W., Craig, S. & Marshak, D. R. 1999. Multilineage potential of adult human mesenchymal stem cells. science, 284, 143-147.
Plumb, J. A., Milroy, R. & Kaye, S. B. 1989. Effects of the pH dependence of 3-(4, 5-dimethylthiazol-2-yl)-2, 5-diphenyltetrazolium bromide-formazan absorption on chemosensitivity determined by a novel tetrazolium-based assay. Cancer research, 49, 4435-4440.
Podhorecka, M., Skladanowski, A. & Bozko, P. 2010. H2AX phosphorylation: its role in DNA damage response and cancer therapy. Journal of nucleic acids, 2010.
Polig, E. & Jee, W. S. S. 1990. A model of osteon closure in cortical bone. Calcified tissue international, 47, 261-269.
Porter, W., Hardman, C., Abdalla, S. & Powles, A. 1999. Haematological disease in siblings with Rothmundą Thomson syndrome. Clin Exp Dermatol, 24, 452ą454.
Pratap, J., Galindo, M., Zaidi, S. K., Vradii, D., Bhat, B. M., Robinson, J. A., Choi, J.-Y., Komori, T., Stein, J. L. & Lian, J. B. 2003. Cell growth regulatory role of Runx2 during proliferative expansion of preosteoblasts. Cancer research, 63, 5357-5362.
Pratap, J., Lian, J. B. & Stein, G. S. 2011. Metastatic bone disease: role of transcription factors and future targets. Bone, 48, 30-36.
Pujol, L. A., Erickson, R. P., Heidenreich, R. A. & Cunniff, C. 2000. Variable presentation of Rothmund‐Thomson syndrome. American journal of medical genetics, 95, 204-207.
Qiagen. 2018. Telomere Extension by Telomerase [Online]. https://www.qiagen.com/eg/shop/genes-and-pathways/pathway-details/?pwid=430. [Accessed 2018].
Qin, J. Y., Zhang, L., Clift, K. L., Hulur, I., Xiang, A. P., Ren, B.-Z. & Lahn, B. T. 2010. Systematic comparison of constitutive promoters and the doxycycline-inducible promoter. PloS one, 5, e10611.
Qiu, S., Rao, D. S., Palnitkar, S. & Parfitt, A. M. 2002. Relationships between osteocyte density and bone formation rate in human cancellous bone. Bone, 31, 709-711.
Quent, V., Loessner, D., Friis, T., Reichert, J. C. & Hutmacher, D. W. 2010. Discrepancies between metabolic activity and DNA content as tool to assess cell proliferation in cancer research. Journal of cellular and molecular medicine, 14, 1003-1013.
Quist, T., Jin, H., Zhu, J.-F., Smith-Fry, K., Capecchi, M. R. & Jones, K. B. 2015. The impact of osteoblastic differentiation on osteosarcomagenesis in the mouse. Oncogene, 34, 4278.
Rago, A. P., Napolitano, A. P., Dean, D. M., Chai, P. R. & Morgan, J. R. 2008. Miniaturization of an Anoikis assay using non-adhesive micromolded hydrogels. Cytotechnology, 56, 81-90.
Page | 246
Rajagopalan, H., Nowak, M. A., Vogelstein, B. & Lengauer, C. 2003. Opinion: The significance of unstable chromosomes in colorectal cancer. Nature reviews. Cancer, 3, 695.
Rajgopal, A., Young, D. W., Mujeeb, K. A., Stein, J. L., Lian, J. B., Van Wijnen, A. J. & Stein, G. S. 2007. Mitotic control of RUNX2 phosphorylation by both CDK1/cyclin B kinase and PP1/PP2A phosphatase in osteoblastic cells. Journal of cellular biochemistry, 100, 1509-1517.
Ramirez-Zacarias, J. L., Castro-Munozledo, F. & Kuri-Harcuch, W. 1992. Quantitation of adipose conversion and triglycerides by staining intracytoplasmic lipids with Oil red O. Histochemistry, 97, 493-497.
Rassmann, K., Schlötterer, C. & Tautz, D. 1991. Isolation of simple‐sequence loci for use
in polymerase chain reaction‐based DNA fingerprinting. Electrophoresis, 12, 113-118.
Ratnakumar, K. & Bernstein, E. 2013. ATRX: the case of a peculiar chromatin remodeler. Epigenetics, 8, 3-9.
Rattan, R., Giri, S., Hartmann, L. C. & Shridhar, V. 2011. Metformin attenuates ovarian cancer cell growth in an AMP‐kinase dispensable manner. Journal of cellular and molecular medicine, 15, 166-178.
Rauch, F., Travers, R. & Glorieux, F. H. 2007. Intracortical remodeling during human bone development—a histomorphometric study. Bone, 40, 274-280.
Rauch, T., Wang, Z., Zhang, X., Zhong, X., Wu, X., Lau, S. K., Kernstine, K. H., Riggs, A. D. & Pfeifer, G. P. 2007. Homeobox gene methylation in lung cancer studied by genome-wide analysis with a microarray-based methylated CpG island recovery assay. Proceedings of the National Academy of Sciences, 104, 5527-5532.
Rauch, F. 2012. The dynamics of bone structure development during pubertal growth. J Musculoskelet Neuronal Interact, 12, 1-6.
Reddel, R. R. 2014. Telomere Maintenance Mechanisms in Cancer: Clinical Implications. Current Pharmaceutical Design, 20, 6361-6374.
Reichert, N., Wurster, S., Ulrich, T., Schmitt, K., Hauser, S., Probst, L., Götz, R., Ceteci, F., Moll, R. & Rapp, U. 2010. Lin9, a subunit of the mammalian DREAM complex, is essential for embryonic development, for survival of adult mice, and for tumor suppression. Molecular and cellular biology, 30, 2896-2908.
Reinhardt, H. C. & Schumacher, B. 2012. The p53 network: cellular and systemic DNA damage responses in aging and cancer. Trends in Genetics, 28, 128-136.
Resnick, D. 1995. Tumors and tumor-like lesions of bone: radiographic principles. Diagnosis of bone and joint disorder. 3rd ed. Philadelphia, PA: WB Saunders, 3613-27.
Ribeiro, D. A., Lima, P. L. a. D., Marques, M. E. A. & Salvadori, D. M. F. 2006. Lack of DNA damage induced by fluoride on mouse lymphoma and human fibroblast cells by single cell gel (comet) assay. Brazilian dental journal, 17, 91-94.
Riggi, N., Cironi, L., Provero, P., Suvà, M.-L., Kaloulis, K., Garcia-Echeverria, C., Hoffmann, F., Trumpp, A. & Stamenkovic, I. 2005. Development of Ewing's sarcoma from primary bone marrow–derived mesenchymal progenitor cells. Cancer research, 65, 11459-11468.
Riss, T. L., Moravec, R. A., Niles, A. L., Benink, H. A., Worzella, T. J. & Minor, L. 2015. Cell viability assays.
Rissling, I., Strauch, K., Höft, C., Oertel, W. H. & Möller, J. C. 2009. Haplotype analysis of the engrailed-2 gene in young-onset Parkinson’s disease. Neurodegenerative Diseases, 6, 102-105.
Rizzari, C., Bacchiocchi, D., Rovelli, A., Biondi, A., Cantu, -. R. A., Uderzo, C. & Masera, G. 1996. Myelodysplastic syndrome in a child with Rothmund-Thomson syndrome: a case report. Journal of pediatric hematology/oncology, 18, 96-97.
Roberts, R. J. 1987. Restriction enzymes and their isoschizomers. Nucleic acids research, 15, r189-r217.
Robertson, A. B., Klungland, A., Rognes, T. & Leiros, I. 2009. DNA repair in mammalian cells. Cellular and molecular life sciences, 66, 981-993.
Robles, A. I. & Harris, C. C. 2010. Clinical outcomes and correlates of TP53 mutations and cancer. Cold Spring Harbor perspectives in biology, 2, a001016.
Page | 247
Rodier, F., Coppé, J.-P., Patil, C. K., Hoeijmakers, W. A., Muñoz, D. P., Raza, S. R., Freund, A., Campeau, E., Davalos, A. R. & Campisi, J. 2009. Persistent DNA damage signalling triggers senescence-associated inflammatory cytokine secretion. Nature cell biology, 11, 973-979.
Rodríguez, J. P., Montecinos, L., Ríos, S., Reyes, P. & Martínez, J. 2000. Mesenchymal stem cells from osteoporotic patients produce a type I collagen-deficient extracellular matrix favoring adipogenic differentiation. Journal of cellular biochemistry, 79, 557-565.
Rodriguez, R., Tornin, J., Suarez, C., Astudillo, A., Rubio, R., Yauk, C., Williams, A., Rosu‐Myles, M., Funes, J. M. & Boshoff, C. 2013. Expression of FUS‐CHOP fusion protein in immortalized/transformed human mesenchymal stem cells drives mixoid liposarcoma formation. Stem cells, 31, 2061-2072.
Rodriguez-Acebes, S., Proctor, I., Loddo, M., Wollenschlaeger, A., Rashid, M., Falzon, M., Prevost, A. T., Sainsbury, R., Stoeber, K. & Williams, G. H. 2010. Targeting DNA replication before it starts: Cdc7 as a therapeutic target in p53-mutant breast cancers. The American journal of pathology, 177, 2034-2045.
Rogakou, E. P., Pilch, D. R., Orr, A. H., Ivanova, V. S. & Bonner, W. M. 1998. DNA double-stranded breaks induce histone H2AX phosphorylation on serine 139. Journal of biological chemistry, 273, 5858-5868.
Rogakou, E. P., Boon, C., Redon, C. & Bonner, W. M. 1999. Megabase chromatin domains involved in DNA double-strand breaks in vivo. The Journal of cell biology, 146, 905-916.
Roholl, P. J. M., Blauw, E., Zurcher, C., Dormans, J. & Theuns, H. M. 1994. Evidence for a diminished maturation of preosteoblasts into osteoblasts during aging in rats: an ultrastructural analysis. Journal of Bone and Mineral Research, 9, 355-366.
Roos, W. P., Batista, L. F. Z., Naumann, S. C., Wick, W., Weller, M., Menck, C. F. M. & Kaina, B. 2007. Apoptosis in malignant glioma cells triggered by the temozolomide-induced DNA lesion O6-methylguanine. Oncogene, 26, 186-197.
Roos, W. P. & Kaina, B. 2013. DNA damage-induced cell death: from specific DNA lesions to the DNA damage response and apoptosis. Cancer letters, 332, 237-248.
Roschke, A. V., Glebov, O. K., Lababidi, S., Gehlhaus, K. S., Weinstein, J. N. & Kirsch, I. R. 2008. Chromosomal instability is associated with higher expression of genes implicated in epithelial-mesenchymal transition, cancer invasiveness, and metastasis and with lower expression of genes involved in cell cycle checkpoints, DNA repair, and chromatin maintenance. Neoplasia, 10, 1222-IN26.
Rosen, E. D. & Macdougald, O. A. 2006. Adipocyte differentiation from the inside out. Nature reviews Molecular cell biology, 7, 885-896.
Rosenberg, A. E. 2010. Robbins and Cotran-Pathologic Basis of Disease. Bones, joints and soft tissue tumors. Elsevier.
Røsland, G. V., Svendsen, A., Torsvik, A., Sobala, E., Mccormack, E., Immervoll, H., Mysliwietz, J., Tonn, J.-C., Goldbrunner, R. & Lønning, P. E. 2009. Long-term cultures of bone marrow–derived human mesenchymal stem cells frequently undergo spontaneous malignant transformation. Cancer research, 69, 5331-5339.
Rossi, M. L., Ghosh, A. K., Kulikowicz, T., Croteau, D. L. & Bohr, V. A. 2010. Conserved helicase domain of human RecQ4 is required for strand annealing-independent DNA unwinding. DNA repair, 9, 796-804.
Rothkamm, K. & Horn, S. 2009. gamma-H2AX as protein biomarker for radiation exposure. Ann Ist Super Sanita, 45, 265-71.
Rothmund, A. 1868. Über Cataracten in Verbindung mit einer eigenthümlichen Hautdegeneration. Archiv für Ophthalmologie, 14, 159-182.
Rubio, D., Garcia-Castro, J., Martín, M. C., De La Fuente, R., Cigudosa, J. C., Lloyd, A. C. & Bernad, A. 2005. Spontaneous human adult stem cell transformation. Cancer research, 65, 3035-3039.
Rucci, N. & Teti, A. 2010. 1. Abstract 2. The metastasis process 3. Bone as preferential site of metastasis 4. Osteomimicry 4.1. Osteomimicry in osteolytic bone metastases 4.2. Osteomimicry in osteoblastic bone metastases. Frontiers in bioscience, 2, 907-915.
Rustamov, V., Keller, F., Klicks, J., Hafner, M. and Rudolf, R. 2019. Bone sialoprotein shows enhanced expression in early, high-proliferation stages of three-dimensional
Page | 248
spheroid cell cultures of breast cancer cell line MDA-MB-231. Frontiers in oncology, 9.
Rutkovskiy, A., Stensløkken, K.-O. & Vaage, I. J. 2016. Osteoblast differentiation at a glance. Medical science monitor basic research, 22, 95.
Sadikovic, B., Thorner, P., Chilton-Macneill, S., Martin, J. W., Cervigne, N. K., Squire, J. & Zielenska, M. 2010. Expression analysis of genes associated with human osteosarcoma tumors shows correlation of RUNX2 overexpression with poor response to chemotherapy. Bmc Cancer, 10, 1.
Safford, K. M., Hicok, K. C., Safford, S. D., Halvorsen, Y.-D. C., Wilkison, W. O., Gimble, J. M. & Rice, H. E. 2002. Neurogenic differentiation of murine and human adipose-derived stromal cells. Biochemical and biophysical research communications, 294, 371-379.
Saglam, O., Shah, V. & Worsham, M. J. 2007. Molecular differentiation of early and late stage laryngeal squamous cell carcinoma: an exploratory analysis. Diagnostic Molecular Pathology, 16, 218-221.
Saha, B., Zitnik, G., Johnson, S., Nguyen, Q., Risques, R. A., Martin, G. M. & Oshima, J. 2013. DNA damage accumulation and TRF2 degradation in atypical Werner syndrome fibroblasts with LMNA mutations. Frontiers in Genetics, 4, 129.
Saiki, R. K., Scharf, S., Faloona, F., Mullis, K. B., Horn, G. T., Erlich, H. A. & Arnheim, N. 1985. Enzymatic amplification of b-globin genomic sequences and restriction site analysis for diagnosis of sickle cell anemia. Science, 230, 1350-1354.
Salazar, A. M., Sordo, M. & Ostrosky-Wegman, P. 2009. Relationship between micronuclei formation and p53 induction. Mutation Research/Genetic Toxicology and Environmental Mutagenesis, 672, 124-128.
Salina, D., Enarson, P., Rattner, J. B. & Burke, B. 2003. Nup358 integrates nuclear envelope breakdown with kinetochore assembly. The Journal of cell biology, 162, 991-1001.
Salsi, V., Ferrari, S., Ferraresi, R., Cossarizza, A., Grande, A. & Zappavigna, V. 2009. HOXD13 binds DNA replication origins to promote origin licensing and is inhibited by geminin. Molecular and cellular biology, 29, 5775-5788.
San Filippo, J., Sung, P. & Klein, H. 2008. Mechanism of eukaryotic homologous recombination. Annu. Rev. Biochem., 77, 229-257.
San Martin, I. A., Varela, N., Gaete, M., Villegas, K., Osorio, M., Tapia, J. C., Antonelli, M., Mancilla, E. E., Pereira, B. P. & Nathan, S. S. 2009. Impaired cell cycle regulation of the osteoblast‐related heterodimeric transcription factor Runx2‐Cbfβ in osteosarcoma cells. Journal of cellular physiology, 221, 560-571.
Sancar, A., Lindsey-Boltz, L. A., Ünsal-Kaçmaz, K. & Linn, S. 2004. Molecular mechanisms of mammalian DNA repair and the DNA damage checkpoints. Annual review of biochemistry, 73, 39-85.
Sanchez, Y., Wong, C., Thoma, R. S., Richman, R., Wu, Z., Piwnica-Worms, H. & Elledge, S. J. 1997. Conservation of the Chk1 checkpoint pathway in mammals: linkage of DNA damage to Cdk regulation through Cdc25. Science, 277, 1497-1501.
Sanchez, Y., Bachant, J., Wang, H., Hu, F., Liu, D., Tetzlaff, M. & Elledge, S. J. 1999. Control of the DNA damage checkpoint by chk1 and rad53 protein kinases through distinct mechanisms. Science, 286, 1166-1171.
Sangrithi, M. N., Bernal, J. A., Madine, M., Philpott, A., Lee, J., Dunphy, W. G. & Venkitaraman, A. R. 2005. Initiation of DNA replication requires the RECQL4 protein mutated in Rothmund-Thomson syndrome. Cell, 121, 887-898.
Santarpia, L., Iwamoto, T., Di Leo, A., Hayashi, N., Bottai, G., Stampfer, M., André, F., Turner, N. C., Symmans, W. F. & Hortobágyi, G. N. 2013. DNA repair gene patterns as prognostic and predictive factors in molecular breast cancer subtypes. The oncologist, 18, 1063-1073.
Santini, D., Pantano, F., Vincenzi, B., Tonini, G. & Bertoldo, F. 2012. The role of bone microenvironment, vitamin D and calcium. Prevention of Bone Metastases. Springer.
Sasaki, K., Murakami, T., Kawasaki, M. & Takahashi, M. 1987. The cell cycle associated change of the Ki‐67 reactive nuclear antigen expression. Journal of cellular physiology, 133, 579-584.
Page | 249
Sasi, N. K., Tiwari, K., Soon, F.-F., Bonte, D., Wang, T., Melcher, K., Xu, H. E. & Weinreich, M. 2014. The Potent Cdc7-Dbf4 (DDK) Kinase Inhibitor XL413 Has Limited Activity in Many Cancer Cell Lines and Discovery of Potential New DDK Inhibitor Scaffolds. PLoS ONE, 9, e113300.
Savage, S. A. & Mirabello, L. 2011. Using epidemiology and genomics to understand osteosarcoma etiology. Sarcoma, 2011.
Sbodio, J. I. & Chi, N.-W. 2002. Identification of a Tankyrase-binding Motif Shared by IRAP, TAB182, and Human TRF1 but Not Mouse TRF1 NuMA CONTAINS THIS RXXPDG MOTIF AND IS A NOVEL TANKYRASE PARTNER. Journal of Biological Chemistry, 277, 31887-31892.
Scaduto, R. C. & Grotyohann, L. W. 1999. Measurement of Mitochondrial Membrane Potential Using Fluorescent Rhodamine Derivatives. Biophysical Journal, 76, 469-477.
Schärer, O. D. 2003. Chemistry and biology of DNA repair. Angewandte Chemie International Edition, 42, 2946-2974.
Schärer, O. D. 2013. Nucleotide excision repair in eukaryotes. Cold Spring Harbor perspectives in biology, 5, a012609.
Scheel, C., Schaefer, K.-L., Jauch, A., Keller, M., Wai, D., Brinkschmidt, C., Van Valen, F., Boecker, W., Dockhorn-Dworniczak, B. & Poremba, C. 2001. Alternative lengthening of telomeres is associated with chromosomal instability in osteosarcomas. Oncogene, 20, 3835.
Scherer, L. J. & Rossi, J. J. 2003. Approaches for the sequence-specific knockdown of mRNA. Nature biotechnology, 21, 1457-1465.
Scherjon, S. A., Kleijburg-Van Der Keur, C., Noort, W. A., Claas, F. H. J., Willemze, R., Fibbe, W. E. & Kanhai, H. H. H. 2003. Amniotic fluid as a novel source of mesenchymal stem cells for therapeutic transplantation. Blood, 102, 1548-1549.
Schmidt, M., Scholz, C.-J., Polednik, C. & Roller, J. 2016. Spheroid-based 3-dimensional culture models: Gene expression and functionality in head and neck cancer. Oncology reports, 35, 2431-2440.
Scholzen, T. & Gerdes, J. 2000. The Ki‐67 protein: from the known and the unknown. Journal of cellular physiology, 182, 311-322.
Schüring, A. N., Schulte, N., Kelsch, R., Röpke, A., Kiesel, L. & Götte, M. 2011. Characterization of endometrial mesenchymal stem-like cells obtained by endometrial biopsy during routine diagnostics. Fertility and sterility, 95, 423-426.
Schurman, S. H., Hedayati, M., Wang, Z., Singh, D. K., Speina, E., Zhang, Y., Becker, K., Macris, M., Sung, P. & Wilson Iii, D. M. 2009. Direct and indirect roles of RECQL4 in modulating base excision repair capacity. Human molecular genetics, 18, 3470-3483.
Schwab, M. 2008. Encyclopedia of cancer, Springer Science & Business Media. Sedelnikova, O. A., Horikawa, I., Zimonjic, D. B., Popescu, N. C., Bonner, W. M. & Barrett,
J. C. 2004. Senescing human cells and ageing mice accumulate DNA lesions with unrepairable double-strand breaks. Nature cell biology, 6, 168.
Segurado, M. & Diffley, J. F. X. 2008. Separate roles for the DNA damage checkpoint protein kinases in stabilizing DNA replication forks. Genes & Development, 22, 1816-1827.
Seibel, N. M., Eljouni, J., Nalaskowski, M. M. & Hampe, W. 2007. Nuclear localization of enhanced green fluorescent protein homomultimers. Analytical biochemistry, 368, 95-99.
Seifrtová, M., Havelek, R., Ćmielová, J., Jiroutova, A., Soukup, T., Brůčková, L., Mokrý, J., English, D. & Řezáčová, M. 2012. The response of human ectomesenchymal dental pulp stem cells to cisplatin treatment. International endodontic journal, 45, 401-412.
Sekiya, I., Larson, B. L., Vuoristo, J. T., Cui, J. G. & Prockop, D. J. 2004. Adipogenic differentiation of human adult stem cells from bone marrow stroma (MSCs). Journal of Bone and Mineral Research, 19, 256-264.
Selvarajah, S., Yoshimoto, M., Ludkovski, O., Park, P. C., Bayani, J., Thorner, P., Maire, G., Squire, J. A. & Zielenska, M. 2008. Genomic signatures of chromosomal instability and osteosarcoma progression detected by high resolution array CGH and interphase FISH. Cytogenetic and genome research, 122, 5-15.
Page | 250
Sengupta, S., Van Deursen, F., De Piccoli, G. & Labib, K. 2013. Dpb2 integrates the leading-strand DNA polymerase into the eukaryotic replisome. Current Biology, 23, 543-552.
Seo, B., Kim, C., Hills, M., Sung, S., Kim, H., Kim, E., Lim, D. S., Oh, H.-S., Choi, R. M. J. & Chun, J. 2015. Telomere maintenance through recruitment of internal genomic regions. Nature communications, 6.
Serrano‐García, L. & Montero‐Montoya, R. 2001. Micronuclei and chromatid buds are the result of related genotoxic events. Environmental and molecular mutagenesis, 38, 38-45.
Severino, J., Allen, R. G., Balin, S., Balin, A. & Cristofalo, V. J. 2000. Is β-galactosidase staining a marker of senescence in vitro and in vivo? Experimental cell research, 257, 162-171.
Sfeir, A., Kosiyatrakul, S. T., Hockemeyer, D., Macrae, S. L., Karlseder, J., Schildkraut, C. L. & De Lange, T. 2009. Mammalian telomeres resemble fragile sites and require TRF1 for efficient replication. cell, 138, 90-103.
Shah, N. & Sukumar, S. 2010. The Hox genes and their roles in oncogenesis. Nature Reviews Cancer, 10, 361-371.
Shamanna, R. A., Singh, D. K., Lu, H., Mirey, G., Keijzers, G., Salles, B., Croteau, D. L. & Bohr, V. A. 2014. RECQ helicase RECQL4 participates in non-homologous end joining and interacts with the Ku complex. Carcinogenesis, 35, 2415-2424.
Sharma, A., Singh, K. & Almasan, A. 2012. Histone H2AX phosphorylation: a marker for DNA damage. DNA repair protocols. Springer.
Shaw, P., Bovey, R., Tardy, S., Sahli, R., Sordat, B. & Costa, J. 1992. Induction of apoptosis by wild-type p53 in a human colon tumor-derived cell line. Proceedings of the National Academy of Sciences, 89, 4495-4499.
Shaw, C. S., Jones, D. A. & Wagenmakers, A. J. M. 2008. Network distribution of mitochondria and lipid droplets in human muscle fibres. Histochemistry and cell biology, 129, 65-72.
Shay, J.W. and Wright, W.E. 2004. Senescence and immortalization: role of telomeres and telomerase. Carcinogenesis, 26, 5, 867-874.
Shay, J. W. & Wright, W. E. 2006. Telomerase therapeutics for cancer: challenges and new directions. Nature reviews. Drug discovery, 5, 577.
Shay, J. W. & Wright, W. E. Role of telomeres and telomerase in cancer. 2011 2011. Elsevier, 349-353.
Shay, J.W. and Wright, W.E. 2019. Telomeres and telomerase: three decades of progress. Nature reviews. Genetics.
Sheng, J. Q., Chan, T. L., Chan, Y. W., Huang, J. S., Chen, J. G., Zhang, M. Z., Guo, X. L., Mu, H., Chan, A. S. & Li, S. R. 2006. Microsatellite instability and novel mismatch repair gene mutations in northern Chinese population with Hereditary non‐polyposis colorectal cancer. Journal of Digestive Diseases, 7, 197-205.
Sherwood, S. W., Rush, D., Ellsworth, J. L. & Schimke, R. T. 1988. Defining cellular senescence in IMR-90 cells: a flow cytometric analysis. Proceedings of the National Academy of Sciences, 85, 9086-9090.
Shi, N., Xie, W.-B. & Chen, S.-Y. 2012. Cell division cycle 7 is a novel regulator of transforming growth factor-β-induced smooth muscle cell differentiation. Journal of Biological Chemistry, 287, 6860-6867.
Shieh, S.-Y., Ahn, J., Tamai, K., Taya, Y. & Prives, C. 2000. The human homologs of checkpoint kinases Chk1 and Cds1 (Chk2) phosphorylate p53 at multiple DNA damage-inducible sites. Genes & development, 14, 289-300.
Shimada, M., Niida, H., Zineldeen, D. H., Tagami, H., Tanaka, M., Saito, H. & Nakanishi, M. 2008. Chk1 is a histone H3 threonine 11 kinase that regulates DNA damage-induced transcriptional repression. Cell, 132, 221-232.
Shimizu, N., Itoh, N., Utiyama, H. & Wahl, G. M. 1998. Selective entrapment of extrachromosomally amplified DNA by nuclear budding and micronucleation during S phase. The Journal of cell biology, 140, 1307-1320.
Shimizu, N., Shimura, T. & Tanaka, T. 2000. Selective elimination of acentric double minutes from cancer cells through the extrusion of micronuclei. Mutation Research/Fundamental and Molecular Mechanisms of Mutagenesis, 448, 81-90.
Page | 251
Shimizu, T., Tanaka, T., Iso, T., Matsui, H., Ooyama, Y., Kawai-Kowase, K., Arai, M. & Kurabayashi, M. 2011. Notch signaling pathway enhances bone morphogenetic protein 2 (BMP2) responsiveness of Msx2 gene to induce osteogenic differentiation and mineralization of vascular smooth muscle cells. Journal of Biological Chemistry, 286, 19138-19148.
Shinya, A., Nishigori, C., Moriwaki, S.-I., Takebe, H., Kubota, M., Ogino, A. & Imamura, S. 1993. A case of Rothmund-Thomson syndrome with reduced DNA repair capacity. Archives of dermatology, 129, 332-336.
Siddiqui, J. A. & Partridge, N. C. 2016. Physiological bone remodeling: systemic regulation and growth factor involvement. Physiology, 31, 233-245.
Sidorova, J. M., Kehrli, K., Mao, F. & Monnat, R. 2013. Distinct functions of human RECQ helicases WRN and BLM in replication fork recovery and progression after hydroxyurea-induced stalling. DNA repair, 12, 128-139.
Sidorova, J.M. and Monnat Jr, R.J. 2015. Human RECQ helicases: roles in cancer, aging, and inherited disease. Advances in. Genomics Genetics, 5, 19-33.
Siitonen, A. 2008. Molecular genetics of RECQL4 syndromes. Kansanterveyslaitoksen julkaisuja. A: A
Siitonen, H. A., Kopra, O., Kääriäinen, H., Haravuori, H., Winter, R. M., Säämänen, A.-M., Peltonen, L. & Kestilä, M. 2003. Molecular defect of RAPADILINO syndrome expands the phenotype spectrum of RECQL diseases. Human molecular genetics, 12, 2837-2844.
Siitonen, H. A., Sotkasiira, J., Biervliet, M., Benmansour, A., Capri, Y., Cormier-Daire, V., Crandall, B., Hannula-Jouppi, K., Hennekam, R. & Herzog, D. 2009. The mutation spectrum in RECQL4 diseases. European journal of human genetics, 17, 151-158.
Sillitoe, R. V., Stephen, D., Lao, Z. & Joyner, A. L. 2008. Engrailed homeobox genes determine the organization of Purkinje cell sagittal stripe gene expression in the adult cerebellum. The Journal of Neuroscience, 28, 12150-12162.
Silva, J. M., Mizuno, H., Brady, A., Lucito, R. & Hannon, G. J. 2004. RNA interference microarrays: high-throughput loss-of-function genetics in mammalian cells. Proceedings of the National Academy of Sciences of the United States of America, 101, 6548-6552.
Sim, F. H., Devries, E. M. G., Miser, J. S. & Unni, K. K. 1992. Case report 760. Skeletal radiology, 21, 543-545.
Simmons, C. A., Matlis, S., Thornton, A. J., Chen, S., Wang, C.-Y. & Mooney, D. J. 2003. Cyclic strain enhances matrix mineralization by adult human mesenchymal stem cells via the extracellular signal-regulated kinase (ERK1/2) signaling pathway. Journal of biomechanics, 36, 1087-1096.
Simon, T., Kohlhase, J., Wilhelm, C., Kochanek, M., De Carolis, B. & Berthold, F. 2010. Multiple malignant diseases in a patient with Rothmund–Thomson syndrome with RECQL4 mutations: Case report and literature review. American Journal of Medical Genetics Part A, 152, 1575-1579.
Simpson, J. C., Wellenreuther, R., Poustka, A., Pepperkok, R. & Wiemann, S. 2000. Systematic subcellular localization of novel proteins identified by large‐scale cDNA sequencing. EMBO reports, 1, 287-292.
Sims, N. A. & Martin, T. J. 2014. Coupling the activities of bone formation and resorption: a multitude of signals within the basic multicellular unit. BoneKEy Rep, 3.
Singer, M. 2014. The role of mitochondrial dysfunction in sepsis-induced multi-organ failure. Virulence, 5, 66-72.
Singh, D. K., Karmakar, P., Aamann, M., Schurman, S. H., May, A., Croteau, D. L., Burks, L., Plon, S. E. & Bohr, V. A. 2010. The involvement of human RECQL4 in DNA double strand break repair. Aging cell, 9, 358-371.
Singh, D. K., Popuri, V., Kulikowicz, T., Shevelev, I., Ghosh, A. K., Ramamoorthy, M., Rossi, M. L., Janscak, P., Croteau, D. L. & Bohr, V. A. 2012. The human RecQ helicases BLM and RECQL4 cooperate to preserve genome stability. Nucleic acids research, 40, 6632-6648.
Singh, S., Vaughan, C. A., Frum, R. A., Grossman, S. R., Deb, S. & Palit Deb, S. 2017. Mutant p53 establishes targetable tumor dependency by promoting unscheduled replication. The Journal of Clinical Investigation, 127, 1839-1855.

Page | 252
Smith, P. J. & Paterson, M. C. 1982. Enhanced radiosensitivity and defective DNA repair in cultured fibroblasts derived from Rothmund Thomson syndrome patients. Mutation Research/Fundamental and Molecular Mechanisms of Mutagenesis, 94, 213-228.
Sobecki, M., Mrouj, K., Camasses, A., Parisis, N., Nicolas, E., Llères, D., Gerbe, F., Prieto, S., Krasinska, L., David, A., Eguren, M., Birling, M.-C., Urbach, S., Hem, S., Déjardin, J., Malumbres, M., Jay, P., Dulic, V., Lafontaine, D. L. J., Feil, R. & Fisher, D. 2016. The cell proliferation antigen Ki-67 organises heterochromatin. eLife, 5, e13722.
Sobecki, M., Mrouj, K., Colinge, J., Gerbe, F., Jay, P., Krasinska, L., Dulic, V. & Fisher, D. 2017. Cell-cycle regulation accounts for variability in Ki-67 expression levels. Cancer research, 77, 2722-2734.
Solomon, H., Sharon, M. & Rotter, V. 2014. Modulation of alternative splicing contributes to cancer development: focusing on p53 isoforms, p53β and p53γ. Cell death and differentiation, 21, 1347.
Somaiah, C., Kumar, A., Mawrie, D., Sharma, A., Patil, S. D., Bhattacharyya, J., Swaminathan, R. & Jaganathan, B. G. 2015. Collagen promotes higher adhesion, survival and proliferation of mesenchymal stem cells. PloS one, 10, e0145068.
Song, B.-Q., Chi, Y., Li, X., Du, W.-J., Han, Z.-B., Tian, J.-J., Li, J.-J., Chen, F., Wu, H.-H. & Han, L.-X. 2015. Inhibition of notch signaling promotes the adipogenic differentiation of mesenchymal stem cells through autophagy activation and PTEN-PI3K/AKT/mTOR pathway. Cellular Physiology and Biochemistry, 36, 1991-2002.
Sonnenschein, C. & Soto, A. M. Theories of carcinogenesis: an emerging perspective. 2008 2008. Elsevier, 372-377.
Sørensen, C. S., Hansen, L. T., Dziegielewski, J., Syljuåsen, R. G., Lundin, C., Bartek, J. & Helleday, T. 2005. The cell-cycle checkpoint kinase Chk1 is required for mammalian homologous recombination repair. Nature cell biology, 7, 195-201.
Spinella-Jaegle, S., Rawadi, G., Kawai, S., Gallea, S., Faucheu, C., Mollat, P., Courtois, B., Bergaud, B., Ramez, V. & Blanchet, A. M. 2001. Sonic hedgehog increases the commitment of pluripotent mesenchymal cells into the osteoblastic lineage and abolishes adipocytic differentiation. Journal of cell science, 114, 2085-2094.
Spurney, C., Gorlick, R., Meyers, P. A., Healey, J. H. & Huvos, A. G. 1998. Multicentric osteosarcoma, Rothmund-Thomson syndrome, and secondary nasopharyngeal non-Hodgkin's lymphoma: a case report and review of the literature. Journal of pediatric hematology/oncology, 20, 494-497.
Squier, C. A., Ghoneim, S. & Kremenak, C. R. 1990. Ultrastructure of the periosteum from membrane bone. Journal of anatomy, 171, 233.
Stacey, G. N., Byrne, E. & Hawkins, J. R. 2014. DNA profiling and characterization of animal cell lines. Animal Cell Biotechnology: Methods and Protocols, 57-73.
Stanford, C. M., Jacobson, P. A., Eanes, E. D., Lembke, L. A. & Midura, R. J. 1995. Rapidly forming apatitic mineral in an osteoblastic cell line (UMR 10601 BSP). Journal of Biological Chemistry, 270, 9420-9428.
Stein, G. S., Lian, J. B., Van Wijnen, A. J., Stein, J. L., Montecino, M., Javed, A., Zaidi, S. K., Young, D. W., Choi, J.-Y. & Pockwinse, S. M. 2004. Runx2 control of organization, assembly and activity of the regulatory machinery for skeletal gene expression. Oncogene, 23, 4315.
Stenderup, K., Justesen, J., Clausen, C. & Kassem, M. 2003. Aging is associated with decreased maximal life span and accelerated senescence of bone marrow stromal cells. Bone, 33, 919-926.
Stephenson, E. M. 1982. Locomotory invasion of human cervical epithelium and avian fibroblasts by HeLa cells in vitro. Journal of cell science, 57, 293-314.
Stern, B. & Nurse, P. 1996. A quantitative model for the cdc2 control of S phase and mitosis in fission yeast. Trends in Genetics, 12, 345-350.
Stiller, C. 2007. Childhood Cancer in Britain: Incidence. Survival, Mortality. Stinco, G., Governatori, G., Mattighello, P. & Patrone, P. 2008. Multiple cutaneous
neoplasms in a patient with Rothmund–Thomson syndrome: case report and published work review. The Journal of dermatology, 35, 154-161.
Page | 253
Strem, B. M., Hicok, K. C., Zhu, M., Wulur, I., Alfonso, Z., Schreiber, R. E., Fraser, J. K. & Hedrick, M. H. 2005. Multipotential differentiation of adipose tissue-derived stem cells. Keio journal of medicine, 54, 132.
Su, Y., Meador, J. A., Calaf, G. M., De-Santis, L. P., Zhao, Y., Bohr, V. A. & Balajee, A. S. 2010. Human RecQL4 helicase plays critical roles in prostate carcinogenesis. Cancer research, 70, 9207-9217.
Sun, Z., Wang, S. & Zhao, R. C. 2014. The roles of mesenchymal stem cells in tumor inflammatory microenvironment. Journal of hematology & oncology, 7, 14.
Svilar, D., Goellner, E. M., Almeida, K. H. & Sobol, R. W. 2011. Base excision repair and lesion-dependent subpathways for repair of oxidative DNA damage. Antioxidants & redox signaling, 14, 2491-2507.
Symeonidou, I.-E., Taraviras, S. & Lygerou, Z. 2012. Control over DNA replication in time and space. FEBS letters, 586, 2803-2812.
Szekely, A. M., Bleichert, F., Nümann, A., Van Komen, S., Manasanch, E., Nasr, A. B., Canaan, A. & Weissman, S. M. 2005. Werner protein protects nonproliferating cells from oxidative DNA damage. Molecular and cellular biology, 25, 10492-10506.
Ta, H. T., Dass, C. R., Choong, P. F. M. & Dunstan, D. E. 2009. Osteosarcoma treatment: state of the art. Cancer and Metastasis Reviews, 28, 247-263.
Taddei, M. L., Giannoni, E., Fiaschi, T. & Chiarugi, P. 2012. Anoikis: an emerging hallmark in health and diseases. The Journal of pathology, 226, 380-393.
Taitz, J., Cohn, R. J., White, L., Russell, S. J. & Vowels, M. R. 2004. Osteochondroma after total body irradiation: An age‐related complication. Pediatric blood & cancer, 42, 225-229.
Takai, H., Tominaga, K., Motoyama, N., Minamishima, Y. A., Nagahama, H., Tsukiyama, T., Ikeda, K., Nakayama, K., Nakanishi, M. & Nakayama, K.-I. 2000. Aberrant cell cycle checkpoint function and early embryonic death in Chk1−/− mice. Genes & development, 14, 1439-1447.
Takai, H., Smogorzewska, A. & De Lange, T. 2003. DNA damage foci at dysfunctional telomeres. Current Biology, 13, 1549-1556.
Takai E, C. K., Shaheen a, Hung Ct, Guo Xe 2005. Osteoblast elastic modulus measured by atomic force microscopy is substrate dependent. Ann Biomed Eng, 33, 963–71.
Takai, Y., Miyoshi, J., Ikeda, W. & Ogita, H. 2008. Nectins and nectin-like molecules: roles in contact inhibition of cell movement and proliferation. Nature Reviews Molecular Cell Biology, 9, 603-615.
Tanaka, S. & Araki, H. 2011. Multiple regulatory mechanisms to inhibit untimely initiation of DNA replication are important for stable genome maintenance. PLoS Genet, 7, e1002136.
Tanaka, S., Komeda, Y., Umemori, T., Kubota, Y., Takisawa, H. & Araki, H. 2013. Efficient initiation of DNA replication in eukaryotes requires Dpb11/TopBP1-GINS interaction. Molecular and cellular biology, 33, 2614-2622.
Tanck, E., Hannink, G., Ruimerman, R., Buma, P., Burger, E. H. & Huiskes, R. 2006. Cortical bone development under the growth plate is regulated by mechanical load transfer. Journal of anatomy, 208, 73-79.
Tang, J., Erikson, R. L. & Liu, X. 2006. Checkpoint kinase 1 (Chk1) is required for mitotic progression through negative regulation of polo-like kinase 1 (Plk1). Proceedings of the National Academy of Sciences, 103, 11964-11969.
Tang, N., Song, W.-X., Luo, J., Haydon, R. C. & He, T.-C. 2008. Osteosarcoma development and stem cell differentiation. Clinical orthopaedics and related research, 466, 2114-2130.
Tanida, T., Matsuda, K. I., Yamada, S., Hashimoto, T. & Kawata, M. 2015. Estrogen-related Receptor β Reduces the Subnuclear Mobility of Estrogen Receptor α and Suppresses Estrogen-dependent Cellular Function. Journal of Biological Chemistry, 290, 12332-12345.
Tataria, M., Quarto, N., Longaker, M. T. & Sylvester, K. G. 2006. Absence of the p53 tumor suppressor gene promotes osteogenesis in mesenchymal stem cells. Journal of pediatric surgery, 41, 624-632.

Page | 254
Taxman, D. J., Moore, C. B., Guthrie, E. H. & Huang, M. T.-H. 2010. Short hairpin RNA (shRNA): design, delivery, and assessment of gene knockdown. RNA Therapeutics: Function, Design, and Delivery, 139-156.
Taylor, W. B. 1957. Rothmund's Syndrome—Thomson's Syndrome: Congenital Poikiloderma With or Without Juvenile Cataracts A Review of the Literature, Report of a Case, and Discussion of the Relationship of the Two Syndromes. AMA archives of dermatology, 75, 236-244.
Taylor, S. S. & Mckeon, F. 1997. Kinetochore localization of murine Bub1 is required for normal mitotic timing and checkpoint response to spindle damage. Cell, 89, 727-735.
Taylor, M. J., Perrais, D. & Merrifield, C. J. 2011. A high precision survey of the molecular dynamics of mammalian clathrin-mediated endocytosis. PLoS biology, 9, e1000604.
Terradas, M., Martín, M. & Genescà, A. 2016. Impaired nuclear functions in micronuclei results in genome instability and chromothripsis. Archives of toxicology, 90, 2657.
Tesser-Gamba, F., Petrilli, A. S., De Seixas Alves, M. T., Garcia Filho, R. J., Juliano, Y. & Toledo, S. R. C. 2012. MAPK7 and MAP2K4 as prognostic markers in osteosarcoma. Human pathology, 43, 994-1002.
Thomas, D. M., Carty, S. A., Piscopo, D. M., Lee, J.-S., Wang, W.-F., Forrester, W. C. & Hinds, P. W. 2001. The retinoblastoma protein acts as a transcriptional coactivator required for osteogenic differentiation. Molecular cell, 8, 303-316.
Thomas, D. M., Johnson, S. A., Sims, N. A., Trivett, M. K., Slavin, J. L., Rubin, B. P., Waring, P., Mcarthur, G. A., Walkley, C. R. & Holloway, A. J. 2004. Terminal osteoblast differentiation, mediated by runx2 and p27KIP1, is disrupted in osteosarcoma. J Cell Biol, 167, 925-934.
Thomassen, M., Tan, Q. & Kruse, T. A. 2009. Gene expression meta-analysis identifies chromosomal regions and candidate genes involved in breast cancer metastasis. Breast cancer research and treatment, 113, 239-249.
Thompson, B. J. 2013. Cell polarity: models and mechanisms from yeast, worms and flies. Development, 140, 13-21.
Thomson, M. S. 1936. Poikiloderma congenitale: two cases for diagnosis. SAGE Publications.
Tichy, E. D., Liang, L., Deng, L., Tischfield, J., Schwemberger, S., Babcock, G. & Stambrook, P. J. 2011. Mismatch and base excision repair proficiency in murine embryonic stem cells. DNA repair, 10, 445-451.
Timper, K., Seboek, D., Eberhardt, M., Linscheid, P., Christ-Crain, M., Keller, U., Müller, B. & Zulewski, H. 2006. Human adipose tissue-derived mesenchymal stem cells differentiate into insulin, somatostatin, and glucagon expressing cells. Biochemical and biophysical research communications, 341, 1135-1140.
Tirode, F., Surdez, D., Ma, X., Parker, M., Le Deley, M. C., Bahrami, A., Zhang, Z., Lapouble, E., Grossetête-Lalami, S. & Rusch, M. 2014. Genomic landscape of Ewing sarcoma defines an aggressive subtype with co-association of STAG2 and TP53 mutations. Cancer discovery, 4, 1342-1353.
Tolar, J., Nauta, A. J., Osborn, M. J., Panoskaltsis Mortari, A., Mcelmurry, R. T., Bell, S., Xia, L., Zhou, N., Riddle, M. & Schroeder, T. M. 2007. Sarcoma derived from cultured mesenchymal stem cells. Stem cells, 25, 371-379.
Torsvik, A., Røsland, G. V., Svendsen, A., Molven, A., Immervoll, H., Mccormack, E., Lønning, P. E., Primon, M., Sobala, E. & Tonn, J.-C. 2010. Spontaneous malignant transformation of human mesenchymal stem cells reflects cross-contamination: putting the research field on track–letter. Cancer Research, 70, 6393-6396.
Trinkle-Mulcahy, L., Boulon, S., Lam, Y. W., Urcia, R., Boisvert, F.-M., Vandermoere, F., Morrice, N. A., Swift, S., Rothbauer, U., Leonhardt, H. & Lamond, A. 2008. Identifying specific protein interaction partners using quantitative mass spectrometry and bead proteomes. The Journal of Cell Biology, 183, 223-239.
Tsai, Y.-L., Tseng, S.-F., Chang, S.-H., Lin, C.-C. & Teng, S.-C. 2002. Involvement of replicative polymerases, Tel1p, Mec1p, Cdc13p, and the Ku complex in telomere-telomere recombination. Molecular and cellular biology, 22, 5679-5687.
Page | 255
Tsai, M. S., Lee, J. L., Chang, Y. J. & Hwang, S. M. 2004. Isolation of human multipotent mesenchymal stem cells from second‐trimester amniotic fluid using a novel two‐stage culture protocol. Human reproduction, 19, 1450-1456.
Tsuji, W., Inamoto, T., Yamashiro, H., Ueno, T., Kato, H., Kimura, Y., Tabata, Y. & Toi, M. 2008. Adipogenesis induced by human adipose tissue–derived stem cells. Tissue Engineering Part A, 15, 83-93.
Tsurusawa, M., Ito, M., Zha, Z., Kawai, S., Takasaki, Y. & Fujimoto, T. 1992. Cell-cycle-associated expressions of proliferating cell nuclear antigen and Ki-67 reactive antigen of bone marrow blast cells in childhood acute leukemia. Leukemia, 6, 669-674.
Tu, W.-Z., Li, B., Huang, B., Wang, Y., Liu, X.-D., Guan, H., Zhang, S.-M., Tang, Y., Rang, W.-Q. & Zhou, P.-K. 2013. γH2AX foci formation in the absence of DNA damage: Mitotic H2AX phosphorylation is mediated by the DNA-PKcs/CHK2 pathway. FEBS Letters, 587, 3437-3443.
Tubbs, J. L., Latypov, V., Kanugula, S., Butt, A., Melikishvili, M., Kraehenbuehl, R., Fleck, O., Marriott, A., Watson, A. J. & Verbeek, B. 2009. Alkylated DNA damage flipping bridges base and nucleotide excision repair. Nature, 459, 808.
Tudzarova, S., Trotter, M. W., Wollenschlaeger, A., Mulvey, C., Godovac‐Zimmermann, J., Williams, G. H. & Stoeber, K. 2010. Molecular architecture of the DNA replication origin activation checkpoint. The EMBO journal, 29, 3381-3394.
Turley, E. A., Wood, D. K. & Mccarthy, J. B. 2016. Carcinoma cell hyaluronan as a “portable” cancerized prometastatic microenvironment. Cancer research, 76, 2507-2512.
Turnpenny, P. D. & Ellard, S. 2016. Emery's Elements of Medical Genetics E-Book, Elsevier Health Sciences.
Tyagi, R., Dey, P., Uppal, R. & Rajwanshi, A. 2015. Analysis of morphological markers of chromosomal instability in ascitic fluid. Diagnostic cytopathology, 43, 855-858.
Uccelli, A., Moretta, L. & Pistoia, V. 2008. Mesenchymal stem cells in health and disease. Nature reviews. Immunology, 8, 726.
Uematsu, N., Weterings, E., Yano, K.-I., Morotomi-Yano, K., Jakob, B., Taucher-Scholz, G., Mari, P.-O., Van Gent, D. C., Chen, B. P. C. & Chen, D. J. 2007. Autophosphorylation of DNA-PKCS regulates its dynamics at DNA double-strand breaks. The Journal of cell biology, 177, 219-229.
Uhlmann, F., Bouchoux, C. & López-Avilés, S. 2011. A quantitative model for cyclin-dependent kinase control of the cell cycle: revisited. Phil. Trans. R. Soc. B, 366, 3572-3583.
Ullah, I., Subbarao, R. B. & Rho, G. J. 2015. Human mesenchymal stem cells-current trends and future prospective. Bioscience reports, 35, e00191.
Unni, K. K. 1996. Dahlin's bone tumors: general aspects and data on 11,087 cases, Lippincott Williams & Wilkins.
Uritu, C. M., Varganici, C. D., Ursu, L., Coroaba, A., Nicolescu, A., Dascalu, A. I., Peptanariu, D., Stan, D., Constantinescu, C. A. & Simion, V. 2015. Hybrid fullerene conjugates as vectors for DNA cell-delivery. Journal of Materials Chemistry B, 3, 2433-2446.
Utani, K.-I., Kohno, Y., Okamoto, A. & Shimizu, N. 2010. Emergence of micronuclei and their effects on the fate of cells under replication stress. PLoS One, 5, e10089.
Valko, M., Rhodes, C. J., Moncol, J., Izakovic, M. M. & Mazur, M. 2006. Free radicals, metals and antioxidants in oxidative stress-induced cancer. Chemico-biological interactions, 160, 1-40.
Vallee, M., Côté, J. F. & Fradette, J. 2009. Adipose-tissue engineering: taking advantage of the properties of human adipose-derived stem/stromal cells. Pathologie Biologie, 57, 309-317.
Van Der Deen, M., Akech, J., Lapointe, D., Gupta, S., Young, D. W., Montecino, M. A., Galindo, M., Lian, J. B., Stein, J. L. & Stein, G. S. 2012. Genomic promoter occupancy of runt-related transcription factor RUNX2 in Osteosarcoma cells identifies genes involved in cell adhesion and motility. Journal of Biological Chemistry, 287, 4503-4517.
Page | 256
Van Jaarsveld, M.T., Deng, D., Wiemer, E.A. & Zi, Z. 2019. Tissue-Specific Chk1 Activation Determines Apoptosis by Regulating the Balance of p53 and p21. iScience, 12, 27-40.
Van Maldergem, L., Siitonen, H. A., Jalkh, N., Chouery, E., De Roy, M., Delague, V., Muenke, M., Jabs, E. W., Cai, J. & Wang, L. L. 2006. Revisiting the craniosynostosis-radial ray hypoplasia association: Baller-Gerold syndrome caused by mutations in the RECQL4 gene. Journal of medical genetics, 43, 148-152.
Vander Heiden, M. G., Chandel, N. S., Williamson, E. K., Schumacker, P. T. & Thompson, C. B. 1997. Bcl-xL Regulates the Membrane Potential and Volume Homeostasis of Mitochondria. Cell, 91, 627-637.
Vanotti, E., Amici, R., Bargiotti, A., Berthelsen, J., Bosotti, R., Ciavolella, A., Cirla, A., Cristiani, C., D’alessio, R. & Forte, B. 2008. Cdc7 kinase inhibitors: pyrrolopyridinones as potential antitumor agents. 1. Synthesis and structure–activity relationships. Journal of medicinal chemistry, 51, 487-501.
Varughese, M., Leavey, P., Smith, P., Sneath, R., Breatnach, F. & O'meara, A. 1992. Osteogenic sarcoma and Rothmund Thomson syndrome. Journal of cancer research and clinical oncology, 118, 389-390.
Varum, S., Rodrigues, A. S., Moura, M. B., Momcilovic, O., Easley Iv, C. A., Ramalho-Santos, J., Van Houten, B. & Schatten, G. 2011. Energy metabolism in human pluripotent stem cells and their differentiated counterparts. PloS one, 6, e20914.
Vasseur, F., Delaporte, E., Zabot, M., Sturque, M., Barrut, D., Savary, J., Thomas, L. & Thomas, P. 1999. Excision repair defect in Rothmund Thomson syndrome. ACTA DERMATOVENEREOLOGICA-STOCKHOLM-, 79, 150-152.
Vater, C., Kasten, P. & Stiehler, M. 2011. Culture media for the differentiation of mesenchymal stromal cells. Acta biomaterialia, 7, 463-477.
Velletri, T., Xie, N., Wang, Y., Huang, Y., Yang, Q., Chen, X., Chen, Q., Shou, P., Gan, Y. & Cao, G. 2016. P53 functional abnormality in mesenchymal stem cells promotes osteosarcoma development. Cell death & disease, 7, e2015.
Vennos, E. M., Collins, M. & James, W. D. 1992. Rothmund-Thomson syndrome: review of the world literature. Journal of the American Academy of Dermatology, 27, 750-762.
Verma, S., Rajaratnam, J. H., Denton, J., Hoyland, J. A. & Byers, R. J. 2002. Adipocytic proportion of bone marrow is inversely related to bone formation in osteoporosis. Journal of clinical pathology, 55, 693-698.
Verma, S. & Dey, P. 2014. Correlation of morphological markers of chromosomal instability in fine needle aspiration cytology with grade of breast cancer. Cytopathology, 25, 259-263.
Verstraeten, V. L. R. M., Peckham, L. A., Olive, M., Capell, B. C., Collins, F. S., Nabel, E. G., Young, S. G., Fong, L. G. & Lammerding, J. 2011. Protein farnesylation inhibitors cause donut-shaped cell nuclei attributable to a centrosome separation defect. Proceedings of the National Academy of Sciences, 108, 4997-5002.
Vi, L., Baht, G. S., Whetstone, H., Ng, A., Wei, Q., Poon, R., Mylvaganam, S., Grynpas, M. & Alman, B. A. 2015. Macrophages promote osteoblastic differentiation in vivo: implications in fracture repair and bone homeostasis. Journal of Bone and Mineral Research, 30, 1090-1102.
Visinoni, A. F., Lisboa‐Costa, T., Pagnan, N. a. B. & Chautard‐Freire‐Maia, E. A. 2009. Ectodermal dysplasias: clinical and molecular review. American Journal of Medical Genetics Part A, 149, 1980-2002.
Vladimirova, V., Waha, A., Lückerath, K., Pesheva, P. & Probstmeier, R. 2008. Runx2 is expressed in human glioma cells and mediates the expression of galectin‐3. Journal of neuroscience research, 86, 2450-2461.
Vukovic, B., Beheshti, B., Park, P., Lim, G., Bayani, J., Zielenska, M. & Squire, J. A. 2007. Correlating breakage-fusion-bridge events with the overall chromosomal instability and in vitro karyotype evolution in prostate cancer. Cytogenetic and genome research, 116, 1-11.
Wagner, W., Wein, F., Seckinger, A., Frankhauser, M., Wirkner, U., Krause, U., Blake, J., Schwager, C., Eckstein, V. & Ansorge, W. 2005. Comparative characteristics of mesenchymal stem cells from human bone marrow, adipose tissue, and umbilical cord blood. Experimental hematology, 33, 1402-1416.
Page | 257
Wagner, E. R., Luther, G., Zhu, G., Luo, Q., Shi, Q., Kim, S. H., Gao, J.-L., Huang, E., Gao, Y. & Yang, K. 2011. Defective osteogenic differentiation in the development of osteosarcoma. Sarcoma, 2011.
Walker, J. A., Boreham, D. R., Unrau, P. & Duncan, A. M. V. 1996. Chromosome content and ultrastructure of radiation-induced micronuclei. Mutagenesis, 11, 419-424.
Walkley, C. R., Qudsi, R., Sankaran, V. G., Perry, J. A., Gostissa, M., Roth, S. I., Rodda, S. J., Snay, E., Dunning, P. & Fahey, F. H. 2008. Conditional mouse osteosarcoma, dependent on p53 loss and potentiated by loss of Rb, mimics the human disease. Genes & development, 22, 1662-1676.
Wallace, S. S., Murphy, D. L. & Sweasy, J. B. 2012. Base excision repair and cancer. Cancer letters, 327, 73-89.
Walther, A., Houlston, R. & Tomlinson, I. 2008. Association between chromosomal instability and prognosis in colorectal cancer: a meta-analysis. Gut.
Wanet, A., Arnould, T., Najimi, M. & Renard, P. 2015. Connecting mitochondria, metabolism, and stem cell fate. Stem cells and development, 24, 1957-1971.
Wang, J. C. 1985. DNA topoisomerases. Annual review of biochemistry, 54, 665-697. Wang, S., Wang, Q., Crute, B., Melnikova, I., Keller, S. & Speck, N. 1993. Cloning and
characterization of subunits of the T-cell receptor and murine leukemia virus enhancer core-binding factor. Molecular and cellular biology, 13, 3324-3339.
Wang, L. L., Levy, M. L., Lewis, R. A., Chintagumpala, M. M., Lev, D., Rogers, M. & Plon, S. E. 2001. Clinical manifestations in a cohort of 41 Rothmund‐Thomson syndrome patients. American journal of medical genetics, 102, 11-17.
Wang, J. C. 2002. Cellular roles of DNA topoisomerases: a molecular perspective. Nature reviews Molecular cell biology, 3, 430-440.
Wang, B., Matsuoka, S., Carpenter, P. B. & Elledge, S. J. 2002a. 53BP1, a mediator of the DNA damage checkpoint. Science, 298, 1435-1438.
Wang, L. L., Worley, K., Gannavarapu, A., Chintagumpala, M. M., Levy, M. L. & Plon, S. E. 2002b. Intron-size constraint as a mutational mechanism in Rothmund-Thomson syndrome. The American Journal of Human Genetics, 71, 165-167.
Wang, L. L., Gannavarapu, A., Kozinetz, C. A., Levy, M. L., Lewis, R. A., Chintagumpala, M. M., Ruiz-Maldanado, R., Contreras-Ruiz, J., Cunniff, C. & Erickson, R. P. 2003. Association between osteosarcoma and deleterious mutations in the RECQL4 gene in Rothmund–Thomson syndrome. Journal of the National Cancer Institute, 95, 669-674.
Wang, R. C., Smogorzewska, A. & De Lange, T. 2004. Homologous recombination generates T-loop-sized deletions at human telomeres. Cell, 119, 355-368.
Wang, Y. U. E., Liu, V. W., Ngan, H. & Nagley, P. 2005. Frequent Occurrence of Mitochondrial Microsatellite Instability in the D‐Loop Region of Human Cancers. Annals of the New York Academy of Sciences, 1042, 123-129.
Wang, P., Henning, S. M. & Heber, D. 2010. Limitations of MTT and MTS-Based Assays for Measurement of Antiproliferative Activity of Green Tea Polyphenols. PLoS ONE, 5, e10202.
Wang, E., Zou, J., Zaman, N., Beitel, L. K., Trifiro, M. & Paliouras, M. 2013a. Cancer systems biology in the genome sequencing era: Part 1, dissecting and modeling of tumor clones and their networks. Seminars in Cancer Biology, Elsevier, 279-285.
Wang, E., Zou, J., Zaman, N., Beitel, L. K., Trifiro, M. & Paliouras, M. 2013b. Cancer systems biology in the genome sequencing era: Part 2, evolutionary dynamics of tumor clonal networks and drug resistance. Seminars in Cancer Biology, Elsevier, 286-292.
Wang, Y., Wang, F., Zhao, H., Zhang, X., Chen, H. & Zhang, K. 2014a. Human adipose-derived mesenchymal stem cells are resistant to HBV infection during differentiation into hepatocytes in vitro. International journal of molecular sciences, 15, 6096-6110.
Wang, J.-T., Xu, X., Alontaga, A. Y., Chen, Y. & Liu, Y. 2014b. Impaired p32 regulation caused by the lymphoma-prone RECQ4 mutation drives mitochondrial dysfunction. Cell reports, 7, 848-858.
Wang, Y., Chu, Y., Yue, B., Ma, X., Zhang, G., Xiang, H., Liu, Y., Wang, T., Wu, X. & Chen, B. 2017a. Adipose-derived mesenchymal stem cells promote osteosarcoma

Page | 258
proliferation and metastasis by activating the STAT3 pathway. Oncotarget, 8, 23803.
Wang, Y., Wang, W., Wang, N., Tall, A. R. & Tabas, I. 2017b. Mitochondrial Oxidative Stress Promotes Atherosclerosis and Neutrophil Extracellular Traps in Aged Mice. Arteriosclerosis, Thrombosis, and Vascular Biology, ATVBAHA-117.
Ward, I. M. & Chen, J. 2001. Histone H2AX is phosphorylated in an ATR-dependent manner in response to replicational stress. Journal of Biological Chemistry, 276, 47759-47762.
Ward, I. M., Reina-San-Martin, B., Olaru, A., Minn, K., Tamada, K., Lau, J. S., Cascalho, M., Chen, L., Nussenzweig, A. & Livak, F. 2004. 53BP1 is required for class switch recombination. The Journal of cell biology, 165, 459-464.
Ward, I. M., Difilippantonio, S., Minn, K., Mueller, M. D., Molina, J. R., Yu, X., Frisk, C. S., Ried, T., Nussenzweig, A. & Chen, J. 2005. 53BP1 cooperates with p53 and functions as a haploinsufficient tumor suppressor in mice. Molecular and cellular biology, 25, 10079-10086.
Ward, K. K., Tancioni, I., Lawson, C., Miller, N. L., Jean, C., Chen, X. L., Uryu, S., Kim, J., Tarin, D. & Stupack, D. G. 2013. Inhibition of focal adhesion kinase (FAK) activity prevents anchorage-independent ovarian carcinoma cell growth and tumor progression. Clinical & experimental metastasis, 30, 579-594.
Warne, D., Watkins, C., Bodfish, P., Nyberg, K. & Spurr, N. K. 1991. Tetranucleotide repeat polymorphism at the human betaactin related pseudogene 2 (ACTBP2) detected using the polymerase chain reaction. Nucleic Acids Research, 19, 6980-6980.
Watanabe, N. & Mitchison, T. J. 2002. Single-molecule speckle analysis of actin filament turnover in lamellipodia. Science, 295, 1083-1086.
Weber, J. L. & May, P. E. 1989. Abundant class of human DNA polymorphisms which can be typed using the polymerase chain reaction. American journal of human genetics, 44, 388.
Webster, M., Witkin, K. L. & Cohen-Fix, O. 2009. Sizing up the nucleus: nuclear shape, size and nuclear-envelope assembly. Journal of cell science, 122, 1477-1486.
Wedeen, C. J. & Weisblat, D. A. 1991. Segmental expression of an engrailed-class gene during early development and neurogenesis in an annelid. Development, 113, 805-814.
Wei, L., Griego, A. M., Chu, M. & Ozbun, M. A. 2014. Tobacco exposure results in increased E6 and E7 oncogene expression, DNA damage and mutation rates in cells maintaining episomal human papillomavirus 16 genomes. Carcinogenesis, 35, 2373-2381.
Weinberg, R. A. The biology of cancer. 2007. New York: Garland Science, 1. Weisenberger, D. J., Siegmund, K. D., Campan, M., Young, J., Long, T. I., Faasse, M. A.,
Kang, G. H., Widschwendter, M., Weener, D. & Buchanan, D. 2006. CpG island methylator phenotype underlies sporadic microsatellite instability and is tightly associated with BRAF mutation in colorectal cancer. Nature genetics, 38, 787.
Weissenbach, J., Gyapay, G., Dib, C., Vignal, A., Morissette, J., Millasseau, P., Vaysseix, G. & Lathrop, M. 1992. A second-generation linkage map of the human genome. Nature, 359, 794-801.
Weng, L.-P., Brown, J. L. & Eng, C. 2001. PTEN coordinates G1 arrest by down-regulating cyclin D1 via its protein phosphatase activity and up-regulating p27 via its lipid phosphatase activity in a breast cancer model. Human molecular genetics, 10, 599-604.
Werner, S. R., Prahalad, A. K., Yang, J. & Hock, J. M. 2006. RECQL4-deficient cells are hypersensitive to oxidative stress/damage: Insights for osteosarcoma prevalence and heterogeneity in Rothmund-Thomson syndrome. Biochemical and Biophysical Research Communications, 345, 403-409.
West, S. C. 2003. Molecular views of recombination proteins and their control. Nature reviews. Molecular cell biology, 4, 435.
Westendorf, J. J., Zaidi, S. K., Cascino, J. E., Kahler, R., Van Wijnen, A. J., Lian, J. B., Yoshida, M., Stein, G. S. & Li, X. 2002. Runx2 (Cbfa1, AML-3) interacts with histone deacetylase 6 and represses the p21CIP1/WAF1 promoter. Molecular and cellular biology, 22, 7982-7992.
Page | 259
Wexler, S. A., Donaldson, C., Denning‐Kendall, P., Rice, C., Bradley, B. & Hows, J. M. 2003. Adult bone marrow is a rich source of human mesenchymal ‘stem’cells but umbilical cord and mobilized adult blood are not. British journal of haematology, 121, 368-374.
Wickham, M. Q., Erickson, G. R., Gimble, J. M., Vail, T. P. & Guilak, F. 2003. Multipotent stromal cells derived from the infrapatellar fat pad of the knee. Clinical orthopaedics and related research, 412, 196-212.
Wigle, J. & Eisenstat, D. 2008. Homeobox genes in vertebrate forebrain development and disease. Clinical genetics, 73, 212-226.
Wilkens, L., Flemming, P., Gebel, M., Bleck, J., Terkamp, C., Wingen, L., Kreipe, H. & Schlegelberger, B. 2004. Induction of aneuploidy by increasing chromosomal instability during dedifferentiation of hepatocellular carcinoma. Proceedings of the National Academy of Sciences of the United States of America, 101, 1309-1314.
Wilson, M. C., Meredith, D. & Halestrap, A. P. 2002. Fluorescence resonance energy transfer studies on the interaction between the lactate transporter MCT1 and CD147 provide information on the topology and stoichiometry of the complex in situ. Journal of Biological Chemistry, 277, 3666-3672.
Wogan, G. N., Hecht, S. S., Felton, J. S., Conney, A. H. & Loeb, L. A. 2004. Environmental and chemical carcinogenesis. 14, 473-486.
Wolbank, S., Stadler, G., Peterbauer, A., Gillich, A., Karbiener, M., Streubel, B., Wieser, M., Katinger, H., Van Griensven, M. & Redl, H. 2009. Telomerase immortalized human amnion-and adipose-derived mesenchymal stem cells: maintenance of differentiation and immunomodulatory characteristics. Tissue Engineering Part A, 15, 1843-1854.
Won, K. Y., Park, H.-R. & Park, Y.-K. 2009. Prognostic implication of immunohistochemical Runx2 expression in osteosarcoma. Tumori, 95, 311.
Wong, L. H., Mcghie, J. D., Sim, M., Anderson, M. A., Ahn, S., Hannan, R. D., George, A. J., Morgan, K. A., Mann, J. R. & Choo, K. H. A. 2010. ATRX interacts with H3. 3 in maintaining telomere structural integrity in pluripotent embryonic stem cells. Genome research, 20, 351-360.
Woo, L. L., Futami, K., Shimamoto, A., Furuichi, Y. & Frank, K. M. 2006. The Rothmund-Thomson gene product RECQL4 localizes to the nucleolus in response to oxidative stress. Experimental cell research, 312, 3443-3457.
Woollard, J., Schmitz, C. B., Freeman, A. E. & Tuggle, C. K. 1994. Rapid communication: HinfI polymorphism at the bovine Pit-1 locus. Journal of animal science, 72, 3267.
World Health, O. 2013. classification of tumours: Pathology and genetics of tumors of soft tissue and bone.
Wozniak, M., Fausto, A., Carron, C. P., Meyer, D. M. & Hruska, K. A. 2000. Mechanically
Strained Cells of the Osteoblast Lineage Organize Their Extracellular Matrix Through Unique Sites of αVβ3‐Integrin Expression. Journal of bone and mineral research, 15, 1731-1745.
Wright, W. E. & Shay, J. W. 1992. The two-stage mechanism controlling cellular senescence and immortalization. Experimental gerontology, 27, 383-389.
Wu, X., Rauch, T. A., Zhong, X., Bennett, W. P., Latif, F., Krex, D. & Pfeifer, G. P. 2010. CpG island hypermethylation in human astrocytomas. Cancer research, 70, 2718-2727.
Wunder, J. S., Nielsen, T. O., Maki, R. G., O'sullivan, B. & Alman, B. A. 2007. Opportunities for improving the therapeutic ratio for patients with sarcoma. The lancet oncology, 8, 513-524.
Wysokinski, D., Pawlowska, E. & Blasiak, J. 2015. RUNX2: A master bone growth regulator that may be involved in the DNA damage response. DNA and cell biology, 34, 305-315.
Xavier, J. M., Morgado, A. L., Solá, S. & Rodrigues, C. M. P. 2014. Mitochondrial translocation of p53 modulates neuronal fate by preventing differentiation-induced mitochondrial stress. Antioxidants & redox signaling, 21, 1009-1024.
Xi, Y. & Chen, Y. 2017. PTEN Plays Dual Roles As a Tumor Suppressor in Osteosarcoma Cells. Journal of cellular biochemistry.
Page | 260
Xu, X., Lee, J. & Stern, D. F. 2004. Microcephalin is a DNA damage response protein involved in regulation of CHK1 and BRCA1. Journal of Biological Chemistry, 279, 34091-34094.
Xu, X. & Liu, Y. 2009. Dual DNA unwinding activities of the Rothmund–Thomson syndrome protein, RECQ4. The EMBO journal, 28, 568-577.
Xu, Y., Lei, Z., Huang, H., Dui, W., Liang, X., Ma, J. & Jiao, R. 2009a. dRecQ4 is required for DNA synthesis and essential for cell proliferation in Drosophila. PloS one, 4, e6107.
Xu, X., Rochette, P. J., Feyissa, E. A., Su, T. V. & Liu, Y. 2009b. MCM10 mediates RECQ4 association with MCM2‐7 helicase complex during DNA replication. The EMBO journal, 28, 3005-3014.
Xu, L., Li, S. & Stohr, B. A. 2013. The role of telomere biology in cancer. Annual Review of Pathology: Mechanisms of Disease, 8, 49-78.
Yadav, S. & Bhatia, A. 2017. Morphology based scoring of Chromosomal instability and its correlation with cell viability. Pathology-Research and Practice.
Yager, J. D. & Leihr, J. G. 1996. Molecular mechanisms of estrogen carcinogenesis. Annual review of pharmacology and toxicology, 36, 203-232.
Yamada, M., Watanabe, K., Mistrik, M., Vesela, E., Protivankova, I., Mailand, N., Lee, M., Masai, H., Lukas, J. & Bartek, J. 2013. ATR–Chk1–APC/CCdh1-dependent stabilization of Cdc7–ASK (Dbf4) kinase is required for DNA lesion bypass under replication stress. Genes & development, 27, 2459-2472.
Yamaguchi, R., Matsumoto, S., Ae, K., Tanizawa, T., Gokita, T., Hayakawa, K., Funauchi, Y., Kito, M., Ishii, H. & Motoi, N. 2015. Case Report: Asymptomatic Osteosarcoma. Case Reports in Clinical Medicine, 4, 369.
Yamamoto, M., Cid, E., Bru, S. & Yamamoto, F. 2011. Rare and frequent promoter methylation, respectively, of TSHZ2 and 3 genes that are both downregulated in expression in breast and prostate cancers. PLoS One, 6, e17149.
Yang, J., Murthy, S., Winata, T., Werner, S., Abe, M., Prahalad, A. K. & Hock, J. M. 2006. Recql4 haploinsufficiency in mice leads to defects in osteoblast progenitors: Implications for low bone mass phenotype. Biochemical and biophysical research communications, 344, 346-352.
Yang, D.-C., Tsay, H.-J., Lin, S.-Y., Chiou, S.-H., Li, M.-J., Chang, T.-J. & Hung, S.-C. 2008. cAMP/PKA regulates osteogenesis, adipogenesis and ratio of RANKL/OPG mRNA expression in mesenchymal stem cells by suppressing leptin. PLoS One, 3, e1540.
Yano, K. I., Morotomi‐Yano, K., Wang, S. Y., Uematsu, N., Lee, K. J., Asaithamby, A.,
Weterings, E. & Chen, D. J. 2008. Ku recruits XLF to DNA double‐strand breaks. EMBO reports, 9, 91-96.
Ye, J. Z.-S., Donigian, J. R., Van Overbeek, M., Loayza, D., Luo, Y., Krutchinsky, A. N., Chait, B. T. & De Lange, T. 2004. TIN2 binds TRF1 and TRF2 simultaneously and stabilizes the TRF2 complex on telomeres. Journal of Biological Chemistry, 279, 47264-47271.
Yellowley, C. E., Li, Z., Zhou, Z., Jacobs, C. R. & Donahue, H. J. 2000. Functional gap junctions between osteocytic and osteoblastic cells. Journal of bone and mineral research, 15, 209-217.
Yin, J., Kwon, Y. T., Varshavsky, A. & Wang, W. 2004. RECQL4, mutated in the Rothmund–Thomson and RAPADILINO syndromes, interacts with ubiquitin ligases UBR1 and UBR2 of the N-end rule pathway. Human molecular genetics, 13, 2421-2430.
Ying, K. L., Oizumi, J. & Curry, C. J. 1990. Rothmund-Thomson syndrome associated with trisomy 8 mosaicism. Journal of medical genetics, 27, 258-260.
Yonish-Rouach, E. & Resnitzky, D. 1991. Wild-type p53 induces apoptosis of myeloid leukaemic cells that is inhibited by interleukin-6. Nature, 352, 345.
Yoon, D.-S., Wersto, R. P., Zhou, W., Chrest, F. J., Garrett, E. S., Kwon, T. K. & Gabrielson, E. 2002. Variable levels of chromosomal instability and mitotic spindle checkpoint defects in breast cancer. The American journal of pathology, 161, 391-397.
Yoshida, C. A., Furuichi, T., Fujita, T., Fukuyama, R., Kanatani, N., Kobayashi, S., Satake, M., Takada, K. & Komori, T. 2002. Core-binding factor β interacts with Runx2 and is required for skeletal development. Nature genetics, 32, 633-638.
Page | 261
Yoshikawa, T., Uchimura, E., Kishi, M., Funeriu, D. P., Miyake, M. & Miyake, J. 2004. Transfection microarray of human mesenchymal stem cells and on-chip siRNA gene knockdown. Journal of controlled release, 96, 227-232.
Yu, J.-Y., Taylor, J., Deruiter, S. L., Vojtek, A. B. & Turner, D. L. 2003. Simultaneous inhibition of GSK3α and GSK3β using hairpin siRNA expression vectors. Molecular Therapy, 7, 228-236.
Yu, M., Selvaraj, S. K., Liang-Chu, M. M. Y., Aghajani, S., Busse, M., Yuan, J., Lee, G., Peale, F., Klijn, C., Bourgon, R., Kaminker, J. S. & Neve, R. M. 2015. A resource for cell line authentication, annotation and quality control. Nature, 520, 307-311.
Yu, J.-G., Lim, J.-A., Song, Y.-R., Heu, S., Kim, G. H., Koh, Y. J. & Oh, C.-S. 2016. Isolation and Characterization of Bacteriophages Against Pseudomonas syringae pv. actinidiae Causing Bacterial Canker Disease in Kiwifruit. Journal of microbiology and biotechnology, 26, 385-393.
Zagami, C. J., Zusso, M. & Stifani, S. 2009. Runx transcription factors: Lineage‐specific
regulators of neuronal precursor cell proliferation and post‐mitotic neuron subtype development. Journal of cellular biochemistry, 107, 1063-1072.
Zaharopoulos, P., Wong, J. & Wen, J. W. 1998. Nuclear protrusions in cells from Cytologic Specimens. Acta cytologica, 42, 317-329.
Zambetti, G. P. 2014. Expanding the reach of the p53 tumor suppressor network. Cell death and differentiation, 21, 505.
Zamore, P. D., Tuschl, T., Sharp, P. A. & Bartel, D. P. 2000. RNAi: double-stranded RNA directs the ATP-dependent cleavage of mRNA at 21 to 23 nucleotide intervals. Cell, 101, 25-33.
Zebaze, R. M., Ghasem-Zadeh, A., Bohte, A., Iuliano-Burns, S., Mirams, M., Price, R. I., Mackie, E. J. & Seeman, E. 2010. Intracortical remodelling and porosity in the distal radius and post-mortem femurs of women: a cross-sectional study. The Lancet, 375, 1729-1736.
Zebaze, R., Ghasem-Zadeh, A., Mbala, A. & Seeman, E. 2013. A new method of segmentation of compact-appearing, transitional and trabecular compartments and quantification of cortical porosity from high resolution peripheral quantitative computed tomographic images. Bone, 54, 8-20.
Zeman, M. K. & Cimprich, K. A. 2014. Causes and consequences of replication stress. Nature cell biology, 16, 2.
Zeng, Q. & Hong, W. 2008. The emerging role of the hippo pathway in cell contact inhibition, organ size control, and cancer development in mammals. Cancer cell, 13, 188-192.
Zhang, Y.-W., Otterness, D. M., Chiang, G. G., Xie, W., Liu, Y.-C., Mercurio, F. & Abraham, R. T. 2005. Genotoxic stress targets human Chk1 for degradation by the ubiquitin-proteasome pathway. Molecular cell, 19, 607-618.
Zhang, X., Yang, M., Lin, L., Chen, P., Ma, K. T., Zhou, C. Y. & Ao, Y. F. 2006. Runx2 overexpression enhances osteoblastic differentiation and mineralization in adipose-derived stem cells in vitro and in vivo. Calcified tissue international, 79, 169-178.
Zhang, X., Hirai, M., Cantero, S., Ciubotariu, R., Dobrila, L., Hirsh, A., Igura, K., Satoh, H., Yokomi, I. & Nishimura, T. 2011. Isolation and characterization of mesenchymal stem cells from human umbilical cord blood: reevaluation of critical factors for successful isolation and high ability to proliferate and differentiate to chondrocytes as compared to mesenchymal stem cells from bone marrow and adipose tissue. Journal of cellular biochemistry, 112, 1206-1218.
Zhang, J., Yan, Y.-G., Wang, C., Zhang, S.-J., Yu, X.-H. & Wang, W.-J. 2015. MicroRNAs in osteosarcoma. Clinica Chimica Acta, 444, 9-17.
Zhang, B., Zhang, Y., Zou, X., Chan, A. W. H., Zhang, R., Lee, T. K. W., Liu, H., Lau, E. Y. T., Ho, N. P. Y. & Lai, P. 2017a. The CCCTC‐binding factor (CTCF)–forkhead box protein M1 axis regulates tumour growth and metastasis in hepatocellular carcinoma. The Journal of pathology, 243, 418-430.
Zhang, K., Song, L., Wang, J., Yan, S., Li, G., Cui, L. & Yin, J. 2017b. Strategy for constructing vascularized adipose units in poly (l-glutamic acid) hydrogel porous scaffold through inducing in-situ formation of ASCs spheroids. Acta biomaterialia, 51, 246-257.
Page | 262
Zhang, Y., Huang, L., Zhao, Y. & Hu, T. 2017c. Musk xylene induces malignant transformation of human liver cell line L02 via repressing the TGF-β signaling pathway. Chemosphere, 168, 1506-1514.
Zhao, B., Li, L., Lei, Q. & Guan, K.-L. 2010. The Hippo–YAP pathway in organ size control and tumorigenesis: an updated version. Genes & development, 24, 862-874.
Zhao, H., Rybak, P., Dobrucki, J., Traganos, F. & Darzynkiewicz, Z. 2012. Relationship of DNA Damage Signaling to DNA Replication Following Treatment with DNA Topoisomerase Inhibitors Camptothecin/Topotecan, Mitoxantrone, or Etoposide. Cytometry. Part A: the journal of the International Society for Analytical Cytology, 81, 45-51.
Zhao, H., Watkins, J. L. & Piwnica-Worms, H. 2002. Disruption of the checkpoint kinase 1/cell division cycle 25A pathway abrogates ionizing radiation-induced S and G2 checkpoints. Proceedings of the National Academy of Sciences, 99, 14795-14800.
Zhen, Y.-Y., Libotte, T., Munck, M., Noegel, A. A. & Korenbaum, E. 2002. NUANCE, a giant protein connecting the nucleus and actin cytoskeleton. Journal of cell science, 115, 3207-3222.
Zheng, Y.-Z., Roseman, R. R. & Carlson, W. R. 1999. Time course study of the chromosome-type breakage-fusion-bridge cycle in maize. Genetics, 153, 1435-1444.
Zhou, B.-B. S. & Bartek, J. 2004. Targeting the checkpoint kinases: chemosensitization versus chemoprotection. Nature Reviews Cancer, 4, 216-225.
Zhou, L., Du, L., Chen, X., Li, X., Li, Z., Wen, Y., Li, Z., He, X., Wei, Y. & Zhao, X. 2010. The antitumor and antimetastatic effects of N-trimethyl chitosan-encapsulated camptothecin on ovarian cancer with minimal side effects. Oncology reports, 24, 941-948.
Zhu, L., McManus, M. M. & Hughes, D P. 2013. Understanding the biology of bone sarcoma from early initiating events through late events in metastasis and disease progression. Frontiers in Oncology, 3.
Zils, K., Klingebiel, T., Behnisch, W., Mueller, H. L., Schlegel, P.-G., Fruehwald, M., Suttorp, M., Simon, T., Werner, M. & Bielack, S. 2015. Osteosarcoma in Patients with Rothmund–Thomson Syndrome. Pediatric hematology and oncology, 32, 32-40.
Ziv, Y., Bielopolski, D., Galanty, Y., Lukas, C., Taya, Y., Schultz, D. C., Lukas, J., Bekker-Jensen, S., Bartek, J. & Shiloh, Y. 2006. Chromatin relaxation in response to DNA double-strand breaks is modulated by a novel ATM-and KAP-1 dependent pathway. Nature cell biology, 8, 870.
Zoetis, T., Tassinari, M. S., Bagi, C., Walthall, K. & Hurtt, M. E. 2003. Species comparison of postnatal bone growth and development. Birth Defects Research Part B Developmental and Reproductive Toxicology, 68, 86-110.
Zou, L. & Elledge, S. J. 2003. Sensing DNA damage through ATRIP recognition of RPA-ssDNA complexes. Science, 300, 1542-1548.
Zou, Y., Liu, Y., Wu, X. & Shell, S. M. 2006. Functions of human replication protein A (RPA): from DNA replication to DNA damage and stress responses. Journal of cellular physiology, 208, 267-273.
Zuk, P. A., Zhu, M., Mizuno, H., Huang, J., Futrell, J. W., Katz, A. J., Benhaim, P., Lorenz, H. P. & Hedrick, M. H. 2001. Multilineage cells from human adipose tissue: implications for cell-based therapies. Tissue engineering, 7, 211-228.
Zuk, P. A., Zhu, M., Ashjian, P., De Ugarte, D. A., Huang, J. I., Mizuno, H., Alfonso, Z. C., Fraser, J. K., Benhaim, P. & Hedrick, M. H. 2002. Human adipose tissue is a source of multipotent stem cells. Molecular biology of the cell, 13, 4279-4295.
Zwerger, M., Ho, C. Y. & Lammerding, J. 2011. Nuclear mechanics in disease. Annual review of biomedical engineering, 13, 397.