Toward a General Model for the Evolution of DNA Replication in Three Domains of Life
11
Math. Model. Nat. Phenom. Vol. 9, No. 3, 2014, pp. 96–106 DOI: 10.1051/mmnp/20149306 Toward a General Model for the Evolution of DNA Replication in Three Domains of Life R. Retkute * School of Biosciences, Sutton Bonington Campus, University of Nottingham, LE12 5RD, UK School of Mathematics, University Park, Nottingham, University of Nottingham, NG7 2RD, UK Abstract. Nothing is more fundamental to life than the ability to reproduce and duplicate the information cells store in their genomes. The mechanism of duplication of DNA has been conserved from prokaryotes to eukaryotes. The aim of the study was to quantify which evolution- ary forces could produce the pattern of genome replication architecture observed in present-day organisms. This was achieved using an evolutionary simulation, combining random genome sequence shuffling, mutation, selection and the mathematical modeling of DNA replication. We have found parameter values which explained evolutionary pressures of DNA replication in E.coli, P.calidifontis and S. cerevisae. Surprisingly, the results of the evolutionary simulation suggests that for a fixed cost per replication origin it is more advantageous for genomes to reduce the number of replication origins under increasing uncertainty in origin activation timing. Keywords and phrases: DNA replication, modeling biological evolution, mutation, selec- tion, fitness Mathematics Subject Classification: 92B05, 92D15, 92D20 1. Introduction Nothing is more fundamental to life than the ability to reproduce. This ability begins with the simple fact that all living organisms are able to duplicate the information they store in their genomes by the process of DNA replication. A mathematical theory of evolution indicates that the selection for replication, and therefore the benefits of being able to self-replicate, allowed transition from prebiotic chemistry to life in the primordial soup of information molecules [35]. The main principles of the replication process are conserved across all three domains of life (the bacteria, the archaea and the eukarya), therefore many of the biochemical mechanisms that regulate DNA replication are similar between different living organisms. Schematics of the replication process is shown in Fig.1 (a). DNA synthesis begins at specific sites along a genome called replication origins. Trans-acting initiators recognize replication origin sequences where prereplicative complexes are assembled; initiator proteins bind to the DNA and pry the two strands apart so that a single-stranded DNA template becomes ready for the loading of DNA helicase [24]. Once the double helix is opened, it attracts a group of proteins that carry out DNA replication. Genome in the process of being replicated contains Y-shaped junctions * Corresponding author. E-mail: [email protected] c EDP Sciences, 2014 Article published by EDP Sciences and available at http://www.mmnp-journal.org or http://dx.doi.org/10.1051/mmnp/20149306
Transcript of Toward a General Model for the Evolution of DNA Replication in Three Domains of Life
“Retkute˙MMNP2014˙3” — 2014/4/30 — 10:17 — page 96 — #1ii
ii
ii
ii
Math. Model. Nat. Phenom.Vol. 9, No. 3, 2014, pp. 96–106
DOI: 10.1051/mmnp/20149306
Toward a General Model for the Evolution of DNAReplication in Three Domains of Life
R. Retkute ∗
School of Biosciences, Sutton Bonington Campus, University of Nottingham, LE12 5RD, UKSchool of Mathematics, University Park, Nottingham, University of Nottingham, NG7 2RD, UK
Abstract. Nothing is more fundamental to life than the ability to reproduce and duplicatethe information cells store in their genomes. The mechanism of duplication of DNA has beenconserved from prokaryotes to eukaryotes. The aim of the study was to quantify which evolution-ary forces could produce the pattern of genome replication architecture observed in present-dayorganisms. This was achieved using an evolutionary simulation, combining random genomesequence shuffling, mutation, selection and the mathematical modeling of DNA replication.We have found parameter values which explained evolutionary pressures of DNA replication inE.coli, P.calidifontis and S. cerevisae. Surprisingly, the results of the evolutionary simulationsuggests that for a fixed cost per replication origin it is more advantageous for genomes to reducethe number of replication origins under increasing uncertainty in origin activation timing.
Keywords and phrases: DNA replication, modeling biological evolution, mutation, selec-tion, fitness
Mathematics Subject Classification: 92B05, 92D15, 92D20
1. Introduction
Nothing is more fundamental to life than the ability to reproduce. This ability begins with the simple factthat all living organisms are able to duplicate the information they store in their genomes by the processof DNA replication. A mathematical theory of evolution indicates that the selection for replication, andtherefore the benefits of being able to self-replicate, allowed transition from prebiotic chemistry to life inthe primordial soup of information molecules [35].
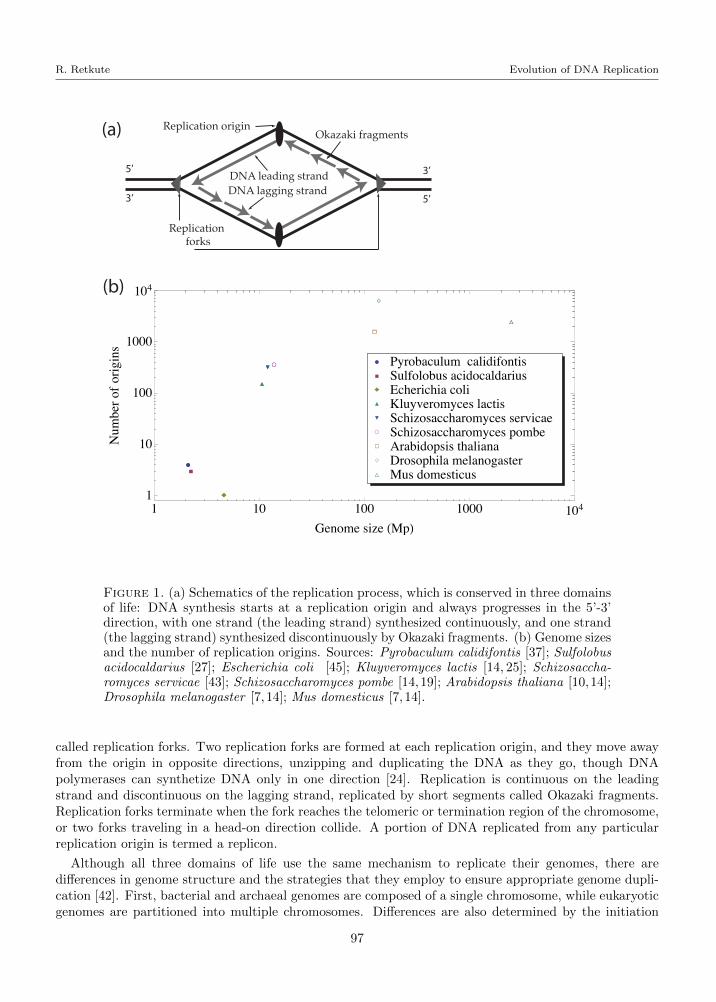
The main principles of the replication process are conserved across all three domains of life (thebacteria, the archaea and the eukarya), therefore many of the biochemical mechanisms that regulate DNAreplication are similar between different living organisms. Schematics of the replication process is shownin Fig.1 (a). DNA synthesis begins at specific sites along a genome called replication origins. Trans-actinginitiators recognize replication origin sequences where prereplicative complexes are assembled; initiatorproteins bind to the DNA and pry the two strands apart so that a single-stranded DNA template becomesready for the loading of DNA helicase [24]. Once the double helix is opened, it attracts a group of proteinsthat carry out DNA replication. Genome in the process of being replicated contains Y-shaped junctions
∗Corresponding author. E-mail: [email protected]
c© EDP Sciences, 2014
Article published by EDP Sciences and available at http://www.mmnp-journal.org or http://dx.doi.org/10.1051/mmnp/20149306
“Retkute˙MMNP2014˙3” — 2014/4/30 — 10:17 — page 97 — #2ii
ii
ii
ii
R. Retkute Evolution of DNA Replication
5’
5’
3’
3’
Replication forks
DNA lagging strandDNA leading strand
Replication origin(a)
(b)
����
��
��
�� ��
��
��
��
1 10 100 1000 1041
10
100
1000
104
Genome size �Mp�
Num
bero
forig
ins
� Mus domesticus� Drosophila melanogaster� Arabidopsis thaliana� Schizosaccharomyces pombe� Schizosaccharomyces servicae� Kluyveromyces lactis� Echerichia coli� Sulfolobus acidocaldarius� Pyrobaculum calidifontis
Okazaki fragments
Figure 1. (a) Schematics of the replication process, which is conserved in three domainsof life: DNA synthesis starts at a replication origin and always progresses in the 5’-3’direction, with one strand (the leading strand) synthesized continuously, and one strand(the lagging strand) synthesized discontinuously by Okazaki fragments. (b) Genome sizesand the number of replication origins. Sources: Pyrobaculum calidifontis [37]; Sulfolobusacidocaldarius [27]; Escherichia coli [45]; Kluyveromyces lactis [14, 25]; Schizosaccha-romyces servicae [43]; Schizosaccharomyces pombe [14,19]; Arabidopsis thaliana [10,14];Drosophila melanogaster [7, 14]; Mus domesticus [7, 14].
called replication forks. Two replication forks are formed at each replication origin, and they move awayfrom the origin in opposite directions, unzipping and duplicating the DNA as they go, though DNApolymerases can synthetize DNA only in one direction [24]. Replication is continuous on the leadingstrand and discontinuous on the lagging strand, replicated by short segments called Okazaki fragments.Replication forks terminate when the fork reaches the telomeric or termination region of the chromosome,or two forks traveling in a head-on direction collide. A portion of DNA replicated from any particularreplication origin is termed a replicon.
Although all three domains of life use the same mechanism to replicate their genomes, there aredifferences in genome structure and the strategies that they employ to ensure appropriate genome dupli-cation [42]. First, bacterial and archaeal genomes are composed of a single chromosome, while eukaryoticgenomes are partitioned into multiple chromosomes. Differences are also determined by the initiation
97
“Retkute˙MMNP2014˙3” — 2014/4/30 — 10:17 — page 98 — #3ii
ii
ii
ii
R. Retkute Evolution of DNA Replication
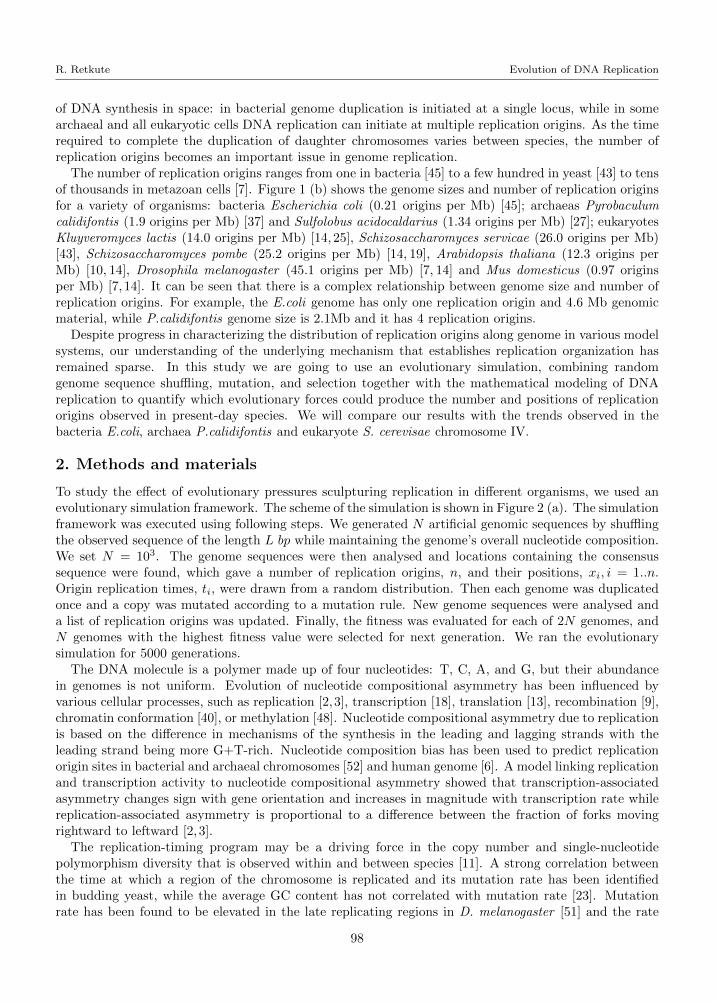
of DNA synthesis in space: in bacterial genome duplication is initiated at a single locus, while in somearchaeal and all eukaryotic cells DNA replication can initiate at multiple replication origins. As the timerequired to complete the duplication of daughter chromosomes varies between species, the number ofreplication origins becomes an important issue in genome replication.
The number of replication origins ranges from one in bacteria [45] to a few hundred in yeast [43] to tensof thousands in metazoan cells [7]. Figure 1 (b) shows the genome sizes and number of replication originsfor a variety of organisms: bacteria Escherichia coli (0.21 origins per Mb) [45]; archaeas Pyrobaculumcalidifontis (1.9 origins per Mb) [37] and Sulfolobus acidocaldarius (1.34 origins per Mb) [27]; eukaryotesKluyveromyces lactis (14.0 origins per Mb) [14, 25], Schizosaccharomyces servicae (26.0 origins per Mb)[43], Schizosaccharomyces pombe (25.2 origins per Mb) [14, 19], Arabidopsis thaliana (12.3 origins perMb) [10, 14], Drosophila melanogaster (45.1 origins per Mb) [7, 14] and Mus domesticus (0.97 originsper Mb) [7, 14]. It can be seen that there is a complex relationship between genome size and number ofreplication origins. For example, the E.coli genome has only one replication origin and 4.6 Mb genomicmaterial, while P.calidifontis genome size is 2.1Mb and it has 4 replication origins.
Despite progress in characterizing the distribution of replication origins along genome in various modelsystems, our understanding of the underlying mechanism that establishes replication organization hasremained sparse. In this study we are going to use an evolutionary simulation, combining randomgenome sequence shuffling, mutation, and selection together with the mathematical modeling of DNAreplication to quantify which evolutionary forces could produce the number and positions of replicationorigins observed in present-day species. We will compare our results with the trends observed in thebacteria E.coli, archaea P.calidifontis and eukaryote S. cerevisae chromosome IV.
2. Methods and materials
To study the effect of evolutionary pressures sculpturing replication in different organisms, we used anevolutionary simulation framework. The scheme of the simulation is shown in Figure 2 (a). The simulationframework was executed using following steps. We generated N artificial genomic sequences by shufflingthe observed sequence of the length L bp while maintaining the genome’s overall nucleotide composition.We set N = 103. The genome sequences were then analysed and locations containing the consensussequence were found, which gave a number of replication origins, n, and their positions, xi, i = 1..n.Origin replication times, ti, were drawn from a random distribution. Then each genome was duplicatedonce and a copy was mutated according to a mutation rule. New genome sequences were analysed anda list of replication origins was updated. Finally, the fitness was evaluated for each of 2N genomes, andN genomes with the highest fitness value were selected for next generation. We ran the evolutionarysimulation for 5000 generations.
The DNA molecule is a polymer made up of four nucleotides: T, C, A, and G, but their abundancein genomes is not uniform. Evolution of nucleotide compositional asymmetry has been influenced byvarious cellular processes, such as replication [2,3], transcription [18], translation [13], recombination [9],chromatin conformation [40], or methylation [48]. Nucleotide compositional asymmetry due to replicationis based on the difference in mechanisms of the synthesis in the leading and lagging strands with theleading strand being more G+T-rich. Nucleotide composition bias has been used to predict replicationorigin sites in bacterial and archaeal chromosomes [52] and human genome [6]. A model linking replicationand transcription activity to nucleotide compositional asymmetry showed that transcription-associatedasymmetry changes sign with gene orientation and increases in magnitude with transcription rate whilereplication-associated asymmetry is proportional to a difference between the fraction of forks movingrightward to leftward [2, 3].
The replication-timing program may be a driving force in the copy number and single-nucleotidepolymorphism diversity that is observed within and between species [11]. A strong correlation betweenthe time at which a region of the chromosome is replicated and its mutation rate has been identifiedin budding yeast, while the average GC content has not correlated with mutation rate [23]. Mutationrate has been found to be elevated in the late replicating regions in D. melanogaster [51] and the rate
98

“Retkute˙MMNP2014˙3” — 2014/4/30 — 10:17 — page 99 — #4ii
ii
ii
ii
R. Retkute Evolution of DNA Replication
Repeat
Generate N genomes
Duplicate genomes: N old and
N new
Mutate new
genomes
Evaluate Fitness
Select Nmost �t
genomes
(a)
(b) (c)
0 200 400 600 800 10000
10203040
x
R�x�
0 200 400 600 800 100005
101520
x
R�x�
Figure 2. (a) The evolutionary simulation scheme. (b)-(c) DNA replication of virtualchromosomes: (b) with two replication origins located at 300 and 600 and activationtimes 0 and 10 minutes, (c) with four replication origins located at 100, 250, 500, and850, and activation times 2, 4, 5, and 0 minutes. Parameter values: L = 1000bp andv = 10kb/min. Dark rectangles above the graphs indicate late replicating regions andwhite rectangles indicate early replicating regions.
of evolutionary divergence between human-chimpanzee genomes increased by 22% during the temporalcourse of replication [47].
The repertoire of naturally occurring changes in genome is very rich and ranges from point mutations,insertions and deletions to duplications of genes and whole genomes or other large scale genome rear-rangements [30]. In our evolutionary simulation, we considered only point mutations and we assumedthat nucleotides mutate independently from each other. The mutation rule was executed as follows: ge-nomic sites were divided into early and late replicating regions. We assumed that nucleotides within earlyreplicating region could mutate with probability η, and nucleotides within late replicating region couldmutate with probability µ, where η < µ. A random position along the genome was chosen together with asecond position within the same type of replication characteristic (early or late replicating region). Theirnucleotide content was exchanged depending on the mutation probability. In this way the nucleotidecomposition of genome was maintained during all generations.
Experiments showed that the mutation rate varied by an order of magnitude across S. cerevisae Chro-mosome VI: early replicating regions had a low per base mutation rate and late replicating regions had ahigh per base mutation rate [23]. The rates of spontaneous mutation per nucleotide site per cell divisionhave been found to be quite similar across a variety of organisms: 2.6 × 10⁻¹⁰ in E.coli, 3.3 × 10⁻¹⁰
in S. cerevisae, 1.6 × 10⁻¹⁰ in A.thaliana and 1.3 × 10⁻¹⁰ in D.melanogaster [31]. Therefore, we haveset η = 1 × 10⁻¹⁰ per-base pair-per-generation and µ = 1 × 10⁻⁹ per-base pair-per-generation for allevolutionary simulations.
The next step was to define the positions of replication origins. Comparative analysis of replicationorigin distribution in different organisms showed that the organization of replication origins along genomeis site-specific, but flexible: replication origins in S.cerevisiae share a 12–17-bp specific consensus sequence,
99
“Retkute˙MMNP2014˙3” — 2014/4/30 — 10:17 — page 100 — #5ii
ii
ii
ii
R. Retkute Evolution of DNA Replication
while in multicellular eukaryotes they lack sequence specificity [33]. Therefore we have used an artificialconsensus sequence defined by l repeats of the nucleotide A. Replication origins were positioned at amiddle of consensus sequence.
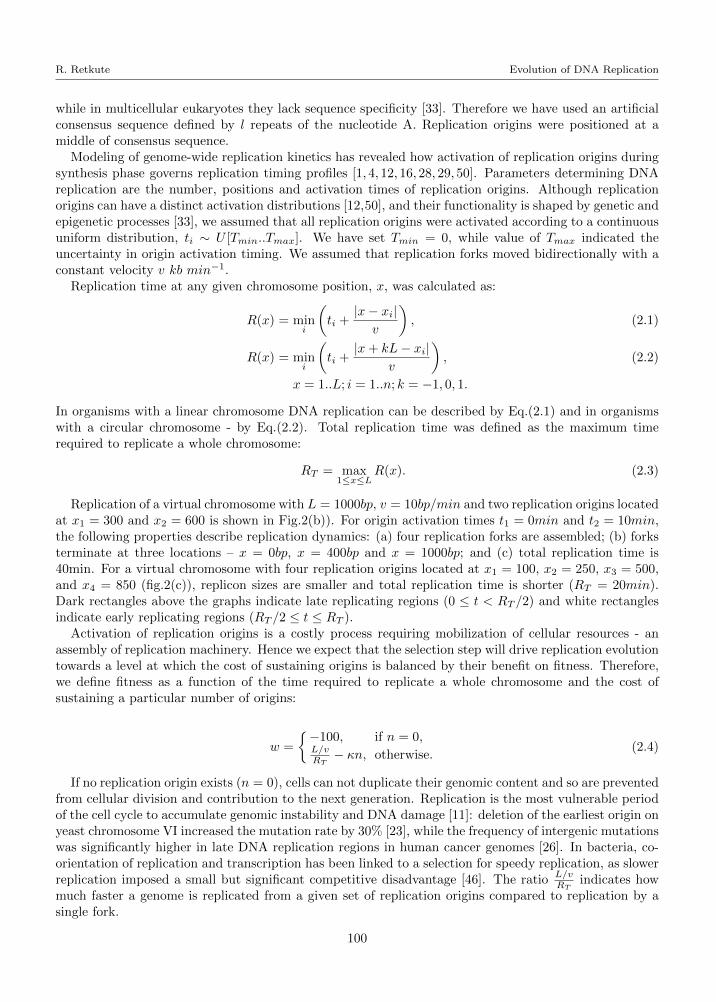
Modeling of genome-wide replication kinetics has revealed how activation of replication origins duringsynthesis phase governs replication timing profiles [1, 4, 12, 16, 28, 29, 50]. Parameters determining DNAreplication are the number, positions and activation times of replication origins. Although replicationorigins can have a distinct activation distributions [12,50], and their functionality is shaped by genetic andepigenetic processes [33], we assumed that all replication origins were activated according to a continuousuniform distribution, ti ∼ U [Tmin..Tmax]. We have set Tmin = 0, while value of Tmax indicated theuncertainty in origin activation timing. We assumed that replication forks moved bidirectionally with aconstant velocity v kb min−1.
Replication time at any given chromosome position, x, was calculated as:
R(x) = mini
(ti +
|x− xi|v
), (2.1)
R(x) = mini
(ti +
|x+ kL− xi|v
), (2.2)
x = 1..L; i = 1..n; k = −1, 0, 1.
In organisms with a linear chromosome DNA replication can be described by Eq.(2.1) and in organismswith a circular chromosome - by Eq.(2.2). Total replication time was defined as the maximum timerequired to replicate a whole chromosome:
RT = max1≤x≤L
R(x). (2.3)
Replication of a virtual chromosome with L = 1000bp, v = 10bp/min and two replication origins locatedat x1 = 300 and x2 = 600 is shown in Fig.2(b)). For origin activation times t1 = 0min and t2 = 10min,the following properties describe replication dynamics: (a) four replication forks are assembled; (b) forksterminate at three locations – x = 0bp, x = 400bp and x = 1000bp; and (c) total replication time is40min. For a virtual chromosome with four replication origins located at x1 = 100, x2 = 250, x3 = 500,and x4 = 850 (fig.2(c)), replicon sizes are smaller and total replication time is shorter (RT = 20min).Dark rectangles above the graphs indicate late replicating regions (0 ≤ t < RT /2) and white rectanglesindicate early replicating regions (RT /2 ≤ t ≤ RT ).
Activation of replication origins is a costly process requiring mobilization of cellular resources - anassembly of replication machinery. Hence we expect that the selection step will drive replication evolutiontowards a level at which the cost of sustaining origins is balanced by their benefit on fitness. Therefore,we define fitness as a function of the time required to replicate a whole chromosome and the cost ofsustaining a particular number of origins:
w =
{−100, if n = 0,L/vRT− κn, otherwise.
(2.4)
If no replication origin exists (n = 0), cells can not duplicate their genomic content and so are preventedfrom cellular division and contribution to the next generation. Replication is the most vulnerable periodof the cell cycle to accumulate genomic instability and DNA damage [11]: deletion of the earliest origin onyeast chromosome VI increased the mutation rate by 30% [23], while the frequency of intergenic mutationswas significantly higher in late DNA replication regions in human cancer genomes [26]. In bacteria, co-orientation of replication and transcription has been linked to a selection for speedy replication, as slowerreplication imposed a small but significant competitive disadvantage [46]. The ratio L/v
RTindicates how
much faster a genome is replicated from a given set of replication origins compared to replication by asingle fork.
100
“Retkute˙MMNP2014˙3” — 2014/4/30 — 10:17 — page 101 — #6ii
ii
ii
ii
R. Retkute Evolution of DNA Replication
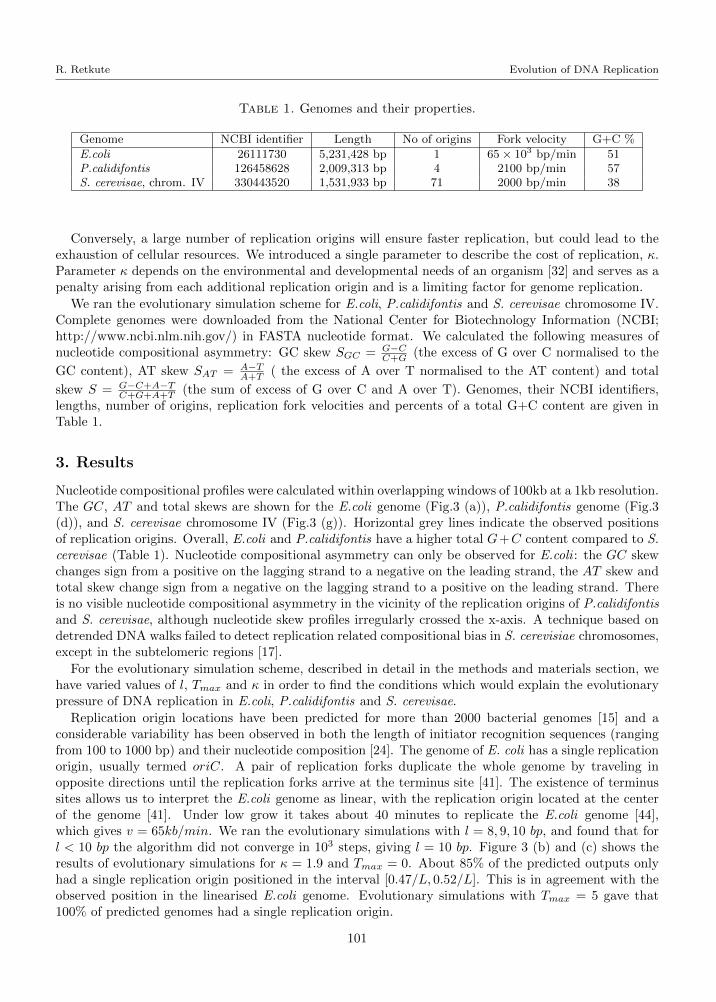
Table 1. Genomes and their properties.
Genome NCBI identifier Length No of origins Fork velocity G+C %
E.coli 26111730 5,231,428 bp 1 65 × 103 bp/min 51P.calidifontis 126458628 2,009,313 bp 4 2100 bp/min 57S. cerevisae, chrom. IV 330443520 1,531,933 bp 71 2000 bp/min 38
Conversely, a large number of replication origins will ensure faster replication, but could lead to theexhaustion of cellular resources. We introduced a single parameter to describe the cost of replication, κ.Parameter κ depends on the environmental and developmental needs of an organism [32] and serves as apenalty arising from each additional replication origin and is a limiting factor for genome replication.
We ran the evolutionary simulation scheme for E.coli, P.calidifontis and S. cerevisae chromosome IV.Complete genomes were downloaded from the National Center for Biotechnology Information (NCBI;http://www.ncbi.nlm.nih.gov/) in FASTA nucleotide format. We calculated the following measures ofnucleotide compositional asymmetry: GC skew SGC = G−C
C+G (the excess of G over C normalised to the
GC content), AT skew SAT = A−TA+T ( the excess of A over T normalised to the AT content) and total
skew S = G−C+A−TC+G+A+T (the sum of excess of G over C and A over T). Genomes, their NCBI identifiers,
lengths, number of origins, replication fork velocities and percents of a total G+C content are given inTable 1.
3. Results
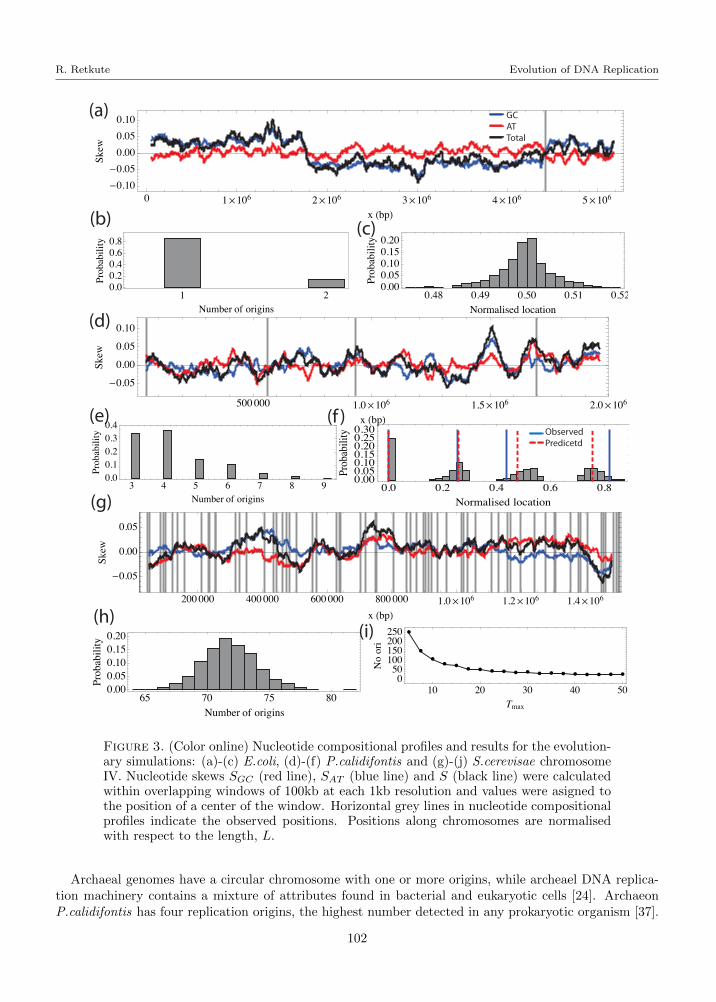
Nucleotide compositional profiles were calculated within overlapping windows of 100kb at a 1kb resolution.The GC, AT and total skews are shown for the E.coli genome (Fig.3 (a)), P.calidifontis genome (Fig.3(d)), and S. cerevisae chromosome IV (Fig.3 (g)). Horizontal grey lines indicate the observed positionsof replication origins. Overall, E.coli and P.calidifontis have a higher total G+C content compared to S.cerevisae (Table 1). Nucleotide compositional asymmetry can only be observed for E.coli : the GC skewchanges sign from a positive on the lagging strand to a negative on the leading strand, the AT skew andtotal skew change sign from a negative on the lagging strand to a positive on the leading strand. Thereis no visible nucleotide compositional asymmetry in the vicinity of the replication origins of P.calidifontisand S. cerevisae, although nucleotide skew profiles irregularly crossed the x-axis. A technique based ondetrended DNA walks failed to detect replication related compositional bias in S. cerevisiae chromosomes,except in the subtelomeric regions [17].
For the evolutionary simulation scheme, described in detail in the methods and materials section, wehave varied values of l, Tmax and κ in order to find the conditions which would explain the evolutionarypressure of DNA replication in E.coli, P.calidifontis and S. cerevisae.
Replication origin locations have been predicted for more than 2000 bacterial genomes [15] and aconsiderable variability has been observed in both the length of initiator recognition sequences (rangingfrom 100 to 1000 bp) and their nucleotide composition [24]. The genome of E. coli has a single replicationorigin, usually termed oriC. A pair of replication forks duplicate the whole genome by traveling inopposite directions until the replication forks arrive at the terminus site [41]. The existence of terminussites allows us to interpret the E.coli genome as linear, with the replication origin located at the centerof the genome [41]. Under low grow it takes about 40 minutes to replicate the E.coli genome [44],which gives v = 65kb/min. We ran the evolutionary simulations with l = 8, 9, 10 bp, and found that forl < 10 bp the algorithm did not converge in 103 steps, giving l = 10 bp. Figure 3 (b) and (c) shows theresults of evolutionary simulations for κ = 1.9 and Tmax = 0. About 85% of the predicted outputs onlyhad a single replication origin positioned in the interval [0.47/L, 0.52/L]. This is in agreement with theobserved position in the linearised E.coli genome. Evolutionary simulations with Tmax = 5 gave that100% of predicted genomes had a single replication origin.
101
“Retkute˙MMNP2014˙3” — 2014/4/30 — 10:17 — page 102 — #7ii
ii
ii
ii
R. Retkute Evolution of DNA Replication
0 1�106 2�106 3�106 4�106 5�106�0.10�0.05
0.000.050.10
x �bp�
Skew
500 000 1.0�106 1.5�106 2.0�106
�0.05
0.00
0.05
0.10
x �bp�
Skew
200 000 400 000 600 000 800 000 1.0�106 1.2�106 1.4�106
�0.05
0.00
0.05
x �bp�
Skew
1 20.00.20.40.60.8
Number of origins
Prob
abili
ty
0.48 0.49 0.50 0.51 0.520.000.050.100.150.20
Normalised location
Prob
abili
ty
(a)
(b) (c)
(d)
(e) (f )
(g)
(h)(i)
3 4 5 6 7 8 90.00.10.20.30.4
Number of origins
Prob
abili
ty
65 70 75 800.000.050.100.150.20
Number of origins
Prob
abili
ty
�
�
�� �
� � � � � � � � � � � � � �
10 20 30 40 500
50100150200250
Tmax
No
ori
0.0 0.2 0.4 0.6 0.80.000.050.100.150.200.250.30
Normalised location
Prob
abili
ty ObservedPredicetd
GCATTotal
Figure 3. (Color online) Nucleotide compositional profiles and results for the evolution-ary simulations: (a)-(c) E.coli, (d)-(f) P.calidifontis and (g)-(j) S.cerevisae chromosomeIV. Nucleotide skews SGC (red line), SAT (blue line) and S (black line) were calculatedwithin overlapping windows of 100kb at each 1kb resolution and values were asigned tothe position of a center of the window. Horizontal grey lines in nucleotide compositionalprofiles indicate the observed positions. Positions along chromosomes are normalisedwith respect to the length, L.
Archaeal genomes have a circular chromosome with one or more origins, while archeael DNA replica-tion machinery contains a mixture of attributes found in bacterial and eukaryotic cells [24]. ArchaeonP.calidifontis has four replication origins, the highest number detected in any prokaryotic organism [37].
102
“Retkute˙MMNP2014˙3” — 2014/4/30 — 10:17 — page 103 — #8ii
ii
ii
ii
R. Retkute Evolution of DNA Replication
Relative positions of the replication origins are 0kb, 500kb, 900kb, and 1600kb. Fork velocity was es-timated to be 65 bp s−1 [37], or 2.1kb min−1. We have used l = 8 bp as this showed a good rate ofconvergence in the evolutionary simulations. Marker frequency analysis in [37] suggested that initiationof replication at all origins occurred within a short time interval. Figure 3 (e) and (f) shows the resultsof the evolutionary simulation for κ = 1.4 and Tmax = 5. The distribution of the number of replicationorigins indicates that about 40% of genomes had four replication origins, about 35% had three replicationorigins and a small proportion had 5-9 replication origins. Figure 3 (f) shows the distribution of positionsof predicted replication origins normalized along the length of the genome for the outputs which hadexactly four replication origins predicted. For each predicted genome the start of the genome has beenmoved to a location of the first origin. Horizontal blue lines indicate locations of the observed replicationorigins and red dashed lines show the predicted positions of the replication origin. Although there isan overall agreement between observed and predicted locations, there is an accumulation of discrepancytowards the last origin.
Specific consensus sequences of replication origins have been identified only in the eucaryote S. cere-visiae. This 11bp sequence [5-/(A/T)TTTA(T/C)(A/G)TTT(A/T)-3] can be found in 12000 locationsacross its genome [24], but only about 300 of them serve as replication origins [43]. We ran the evo-lutionary simulation on the S. cerevisiae chromosome IV, as this is the largest chromosome and it hasa comparable size to the genomes of E.coli and P.calidifontis. Although each replication origin in S.cerevisiae has a particular window when it is activated in different cells [12, 50], we assumed that allreplication origins have identical activation distributions. Fork velocity in S. cerevisiae has been foundto be about 2 kb min−1 [12, 50]. We set l = 8 bp. Figure 3 (h) shows the distribution of a number ofreplication origins for parameters κ = 0.25 and Tmax = 15. The median of the predicted distribution is71, which is equal to the observed number of replication origins. Next, we analysed how results of theevolutionary simulations depend on the uncertainty in activation timing. We set κ = 0.25 and variedvalues of Tmax from 5 till 50 minutes. Figure 3 (i) shows the median number of replication origins asa function of Tmax. It can be seen that the number of replication origins is reduced with increasinguncertainty in origin activation timing.
4. Discussion
Timely and orderly replication is essential to guarantee the faithful transmission of genetic information.In this work we have used evolutionary simulations in order to get insight into a possible mechanismunderlying DNA replication in different species.
The interplay between selection, its efficiency, and mutation rates can result in a variety of scenar-ios. Replication origins can be positioned at specific locations along a genome after random shufflingof genome sequences or as a result of a mutation during evolution. The continuous selection providesmeans for retaining those genome configurations (number of the replication origins and their positions)which can balance the benefit of faster replication and the cost required to maintain this particular con-figuration. Parameters of evolutionary simulations could be divided into two groups: fixed (nucleotidecomposition, mutation rates, length of the genome and replication fork velocity) and variable (lengthof replication initiation sequence, cost per replication origin and maximum origin activation time). Weobtain the following values of the cost per replication origin: κ = 1.9 (bacteria E.coli), κ = 1.4 (archaeaP.calidifontis) and κ = 0.25 (eukaryote S. cerevisae chromosome IV). These values indicate that the costper replication origin is closer between bacterial and archaeal genomes than between bacteria and eukar-iotic genomes or archaeal and eukariotic genomes, as can be expected from the differences in replicationinitiation complexes [24]. S. cerevisae is able to sustain a high number of replication origins by makingthem less demanding in terms of the required limiting factors.
There is experimental evidence that closely related species can share a genetic information encoded atreplication origins. For example, replication origins in 15 completely sequenced haloarchaeal genomes werepredicted by identification of specific sequences that are associated with orc/cdc6 genes and comparativeanalysis showed that different species of halophilic archaea shared a few conserved origins [53]. The
103
“Retkute˙MMNP2014˙3” — 2014/4/30 — 10:17 — page 104 — #9ii
ii
ii
ii
R. Retkute Evolution of DNA Replication
analysis of genome replication in four species within the Saccharomyces sensu stricto clade also showedthat the locations of some replication origins were conserved [34]. In our proposed evolutionary simulationalgorithm, we have ignored phylogenic dependencies and ran evolutionary simulations for each speciesseparately with an artificial consensus sequence defined by l repeats of the nucleotide A. The length ofsequence was determined for each organism by observing a convergence of simulations (changes in meanfitness value). We found the following values: l = 10bp (bacteria E.coli), l = 8bp (archaea P.calidifontis)and l = 8bp (eukaryote S. cerevisae chromosome IV). We found that the evolutionary simulations requiredl = 10bp for consensus sequence containing repeats of the nucleotide G or C, which can be explained bya high value of total G+C content of P.calidifontis.
Surprisingly, the results of the evolutionary simulations suggest that for a fixed cost per replicationorigin it is more advantageous for the genome to reduce the number of replication origins with increasinguncertainty in origin activation timing. The distribution of the predicted number of replication origins forthe S. cerevisae chromosome IV indicated that the median number of replication origins was continuouslyreduced when Tmax increased: it was 230 at Tmax = 5 min, and reached 25 at Tmax = 50 min. Keepingin mind that the length of the S phase in S. cerevisae is roughly 60 min [50], a large value of Tmax meansthat replication origins can activate almost at anytime during the S phase.
Next, we will look at the shortfalls of the evolutionary simulation algorithm we used and what could bedirections for improvement. First, a limitation of our model is that we considered only the simplest processfor genome change - point mutations, while genomes evolve through a variety of mechanisms. Pointmutations can not account for large changes in evolution, these changes are made possible by horizontalgene transfer in prokaryotes [41] and by gene duplication or polyploidy (duplication of the entire genome)in eukaryotes [36]. For example, comparative genomic analysis indicated that S.cerevisiae actually arosefrom ancient whole-genome duplication either by endo-duplication (auto-polyploidy) or the fusion of twoclose relatives (allo-polyploidy) followed by a large number of deletion and rearrangement events whichhave shuffled the duplicated chromosomes [21]. Other mechanisms, which would be of interest to includein the simulation of genome sequence dynamics as a separate process or joint processes, could be asmall insertion or deletion at the nucleotide level, segmental duplication or deletion, chromosome fission,insertion of mobile elements or introns and chromosome fusion [30].
When formulating the simulation procedure, we considered the activation time for all origins to followa continuous uniform distribution. Activation time can be influenced by multiple cellular processes, suchas nucleosome positioning, histone modifications, three-dimensional organization of the nucleus [33], andeven the composition of neighbor DNA sequences can advance origin activation time [38]. Also, originactivation has a stochastic component: there are differences not only when replication origins activate,but also which of the replication origins are used in different cells in a population. Therefore, our resultsgive the upper limit of the cost of replication, κ.
In mammals the mechanisms coordinating replication are similar to prokaryotes and unicellular eu-karyotes - initiator binding, determination of replication timing, and selection of which replication originswill be activated, each occurring independently at distinct times during cell cycle [20]. The profiling ofreplication timing has showed a clear segmentation of chromosomes into Mb sized domains with a de-fined temporal sequence [39]. The genome-wide locations of replication origins in human cells have beenmapped using deep sequencing of short nascent strands, which allowed the identification of a consensusmotif that can predict the position of DNA replication origins [5]. The metazoan replication originswere largely interchangeable in mice and flies [8]. Also, the replication timing was found to be conservedbetween human and mice, indicating that large chromosomal domains were shuffled by evolution whileconserving the large-scale nuclear architecture of the genome [49]. It would be possible to extend theevolutionary simulation algorithm we proposed to the mammalian organisms by varying the interval[Tmin, Tmax] and making it dependent on the location of replication domains [16].
Acknowledgements. The author would like to thank A.Prusokas for a critical reading of the manuscript.
104
“Retkute˙MMNP2014˙3” — 2014/4/30 — 10:17 — page 105 — #10ii
ii
ii
ii
R. Retkute Evolution of DNA Replication
References
[1] A. Baker, B. Audit, S. C. H. Yang, J. Bechhoefer, A. Arneodo. Inferring Where and When Replication Initiates fromGenome-Wide Replication Timing Data. Phys. Rev. Let., 108 (2012), 268101, 1–5.
[2] A. Baker, C. L. Chen, H. Julienne, B. Audit, Y. dOAubenton-Carafa, C. Thermes, A. Arneodo. Linking the DNAstrand asymmetry to the spatio-temporal replication program I. About the role of the replication fork polarity ingenome evolution. Europ. Phys. J. E, 35 (2012), 92, 1–25.
[3] A. Baker, H. Julienne, C. L. Chen, B. Audit, Y. dOAubenton-Carafa, C. Thermes, A. Arneodo. Linking the DNAstrand asymmetry to the spatio-temporal replication program II. Accounting for neighbor-dependent substitution rates.Europ. Phys. J. E, 35 (2012), 123, 1–12.
[4] J. Bechhoefer, N. Rhind. Replication timing and its emergence from stochastic processes. Tren. in Gen., 28 (2012),374–381.
[5] E. Besnard, A. Babied, L. Lapasset, O. Milhavet, H. Parrinello, C. Dantec, J. M. Marin, J.M. Lemaitre. Unraveling celltype-specific and reprogrammable human replication origin signatures associated with G-quadruplex consensus motifs.Nat. Struct. & Mol. Biol., 19 (2012), 837–844.
[6] E. B. Brodie of Brodie, S. Nicolay, M. Touchon, B. Audit, Y. d’Aubenton-Carafa, C. Thermes, A. Arneodo. From DNAsequence analysis to modeling replication in the human genome. Phys. Rev. Let., 94 (2005), 248103, 1–4.
[7] C. Cayrou, P. Coulombe, A. Vigneron, S. Stanojcic, O. Ganier, I. Peiffer, A. Puy, S. Laurent-Chabalier, R. Desprat,M. Mechali. Genome-scale analysis of metazoan replication origins reveals their organization in specific but flexiblesites defined by conserved features. Gen. Res., 21 (2011), 1438–1449.
[8] C. Cayrou, P. Coulombe, A. Puy, S. Rialle, N. Kaplan, E. Segal, M. Mechali. New insights into replication origincharacteristics in metazoans. Cell Cycl., 11 (2012), 658–667.
[9] Y. Clement, P. F. Arndt. Meiotic Recombination Strongly Influences GC-Content Evolution in Short Regions in theMouse Genome. Mol. Biol. & Evol., 30 (2013), 2612–2618.
[10] C. Costas, M. D. Sanchez, H. Stroud, Y. Yu, J. C. Oliveros, S. Feng, A. Benguria, I. Lopez-Vidriero, X. Zhang, R.Solano, S. E. Jacobsen, C. Gutierrez. Genome-wide mapping of Arabidopsis thaliana origins of DNA replication andtheir associated epigenetic marks. Nat. Struct. & Mol. Biol., 18 (2011), 395–U190.
[11] N. Donley, M. J. Thayer. DNA replication timing, genome stability and cancer. Late and/or delayed DNA replicationtiming is associated with increased genomic instability. Sem. in Canc. Biol., 23 (2013), 80–89.
[12] A. P. S. de Moura, R. Retkute, M. Hawkins, C. A. Nieduszynski. Mathematical modelling of whole chromosomereplication. NAR, 38 (2010), 5623–5633.
[13] M. dos Reis, L. Wernisch. Estimating Translational Selection in Eukaryotic Genomes. Mol. Biol. & Evol., 26 (2009),451–461.
[14] F. Gao, H. Luo, C. T. Zhang. DeOri: a database of eukaryotic DNA replication origins. Bioinformatics, 28 (2012),1551–1552.
[15] F. Gao, H. Luo, C. T. Zhang. DoriC 5.0: an updated database of oriC regions in both bacterial and archaeal genomes.NAR, 41 (2013), 90–93.
[16] M. G. Gauthier, P. Norio, J. Bechhoefer. Modeling Inhomogeneous DNA Replication Kinetics, PLoS one, 7 (2012),e32053 1–13.
[17] A. Gierlik, M. Kowalczuk, P. Mackiewicz, M. R. Dudek, S. Cebrat. Is there replication-associated mutational pressurein the Saccharomyces cerevisiae genome?. J. Theor. Biol., 202 (2000), 305–314.
[18] P. Green, B. Ewing, W. Miller, P. Thomas, E. Green. Transcription-associated mutational asymmetry in mammalianevolution. Nat. Gen., 33 (2003), 14–517.
[19] M. Hayashi, Y. Katou, T. Itoh, M. Tazumi, Y. Yamada, T. Takahashi, T. Nakagawa, K. Shirahige, H. Masukata.Genome-wide localization of pre-RC sites and identification of replication origins in fission yeast. EMBO J., 26 (2007),1327–1339.
[20] O. Hyrien, A. Rappailles, G. Guilbaud, A. Baker, C. L. Chen, A. Goldar, N. Petryk, M. Kahli, E. Ma, Y. d’Aubenton-Carafa, B. Audit, C. Thermes, A. Arneodo. From Simple Bacterial and Archaeal Replicons to Replication N/U-Domains. J. Mol. Biol., 425 (2013), 4673–89.
[21] M. Kellis, B. W. Birren, E. S. Lander. Proof and evolutionary analysis of ancient genome duplication in the yeastSaccharomyces cerevisiae. Nature, 428 (2008), 617–624.
[22] M. L. DePamphilis. DNA replication and human disease. Cold Spring Harbor monograph series.
[23] G. I. Lang, A. W. Murray. Mutation Rates across Budding Yeast Chromosome VI Are Correlated with ReplicationTiming. Gen. Biol. & Evol., 3 (2011), 799–811.
[24] A. C. Leonard, M. Mechali. DNA Replication Origins. Cold Spring Harbor Persp. Biol., 5 (2013), a010116, 1–18.
[25] I. Liachko, A. Bhaskar, C. Lee, S. C. C. Chung, B. K. Tye, U. Keich. A Comprehensive genome-wide map of au-tonomously replicating sequences in a naive genome. PLoS Gen., 6 (2010), e1000946, 1–12.
[26] L. Liu, S. De, F. Michor. DNA replication timing and higher-order nuclear organization determine single-nucleotidesubstitution patterns in cancer genomes Nat. Comm., 4 (2013), 1502, 1–10.
[27] M. Lundgren, A. Andersson, L. M. Chen, P. Nilsson, R. Bernander. Three replication origins in Sulfolobus species:Synchronous initiation of chromosome replication and asynchronous termination. PNAS, 101 (2004), 7046–7051.
[28] H. E. Luo, J. T. Li, M. Eshaghi, J. H. Liu, R. K. M. Karuturi. Genome-wide estimation of firing efficiencies of originsof DNA replication from time-course copy number variation data. BMC Bioinf., 11 (2010), 1–15.
105
“Retkute˙MMNP2014˙3” — 2014/4/30 — 10:17 — page 106 — #11ii
ii
ii
ii
R. Retkute Evolution of DNA Replication
[29] J. Lygeros, K. Koutroumpas, S. Dimopoulos, I. Legouras, P. Kouretas, C. Heichinger, P. Nurse, Z. Lygerou Stochastichybrid modeling of DNA replication across a complete genome. PNAS, 105 (2008), 12295–12300.
[30] M. Lynch. The origins of the genome architecture. Sinauer Associates Inc Publishers, Massachusetts.
[31] M. Lynch. Evolution of the mutation rate. Tr. Gen., 26 (2010), 345–52.
[32] A. T. McGeoch, S.D. Bell. Extra-chromosomal elements and the evolution of cellular DNA replication machineries.Nat. Rev. Mol. Cell Biol., 9 (2008), 569–574.
[33] M. Mechali, K. Yoshida, P. Coulombe, P. Pasero. Genetic and epigenetic determinants of DNA replication origins,position and activation. Curr. Op. Gen., & Dev., 23 (2013), 124–31.
[34] C. A. Muller, C. A. Nieduszynski. Conservation of replication timing reveals global and local regulation of replicationorigin activity. Gen. Res., 22 (2012), 1953–1962.
[35] M. A. Nowak, H. Ohtsuki. Prevolutionary dynamics and the origin of evolution. PNAS, 105 (2008), 14924–14927.
[36] S.Ohno. Evolution by Gene Duplication. Springer-Verlag, London.
[37] E. A. Pelve, A. C. Lindas, A. Knoppel, A. Mira, R. Bernander. Four chromosome replication origins in the archaeonPyrobaculum calidifontis. Mol. Microbiol., 85 (2012), 986–995.
[38] T. J. Pohl, K. Kolor, W. L. Fangman, B. J. Brewer, M. K. Raghuraman. A DNA Sequence Element That AdvancesReplication Origin Activation Time in Saccharomyces cerevisiae. G3, 3 (2013), 1955–1963.
[39] B. D. Pope, D. M. Gilbert. The Replication Domain Model: Regulating Replicon Firing in the Context of Large-ScaleChromosome Architecture. J. Mol. Biol., 425 (2013), 4690–4695.
[40] J. G. D. Prendergast, H. Campbell, N. Gilbert, M. G. Dunlop, W. A. Bickmore, C. A. M. Semple. Chromatin structureand evolution in the human genome. BMC Evol. Biol., 7 (2007), 1–12.
[41] E. P. C. Rocha. The Organization of the Bacterial Genome. Ann. Rev. Gen., 42 (2008), 211–233.
[42] N. P. Robinson, S. D. Bell. Origins of DNA replication in the three domains of life. FEBS J., 272 (2005), 3757–3766.
[43] C. C. Siow, S. R. Nieduszynska, C. A. Muller, C. A. Nieduszynski. OriDB, the DNA replication origin database updatedand extended. NAR, 40 (2012), D682–D686.
[44] K. Skarstad, H. B. Steen, E. Boye. Cell Cycle Parameters of Slowly Growing Escherichia coli B/r Studied by FlowCytometry. J. Bacteriol., 124 (1983), 656–662.
[45] O. Skovgaard, M. Bak, A. Lobner-Olesen, N. Tommerup. Genome-wide detection of chromosomal rearrangements,indels, and mutations in circular chromosomes by short read sequencing. Gen. Res., 21 (2011), 1388–1393.
[46] A. Srivatsan, A.Tehranchi, D. M. MacAlpine, J. D. Wang. Co-Orientation of Replication and Transcription PreservesGenome Integrity. PLoS Gen., 6 (2010), e1000810, 1–14.
[47] J. A. Stamatoyannopoulos, I. Adzhubei, R. E. Thurman, G. V. Kryukov, S. M. Mirkin, S. R. Sunyaev. Human mutationrate associated with DNA replication timing. Nat. Gen., 41 (2009), 393–395.
[48] T. Tatarinova, E. Elhaik, M. Pellegrini. Cross-Species Analysis of Genic GC(3) Content and DNA Methylation Pat-terns. Gen. Biol. & Evol., 5 (2013), 1443–1456.
[49] E. Yaffe, S. Farkash-Amar, A. Polten, Z. Yakhini, A. Tanay, I. Simon. Comparative Analysis of DNA ReplicationTiming Reveals Conserved Large-Scale Chromosomal Architecture. PLoS Gen., 6 (2010), e1001011, 1–12.
[50] S. C. H. Yang, N. Rhind, J. Bechhoefer. Modeling genome-wide replication kinetics reveals a mechanism for regulationof replication timing. Mol. Syst. Biol., 6 (2012), 404, 1–13.
[51] C. C. Weber, C. J. Pink, L. D. Hurst. Late-Replicating Domains Have Higher Divergence and Diversity in Drosophilamelanogaster. Mol. Biol. & Evol., 29 (2012), 873–882.
[52] P. Worning, L. J. Jensen, P. H. Hallin, H. H. Staerfeldt, D. W. Ussery. Origin of replication in circular prokaryoticchromosomes. Env. Biol., 8 (2006), 353–361.
[53] Z. Wu, H. Liu, Hailong, J. Liu, X. Q. Liu, H. Xiang. Diversity and evolution of multiple orc/cdc6-adjacent replicationorigins in haloarchaea. BMC Gen., 13 (2012), 1–16.
106