Experiment No 8 - WordPress.com
16
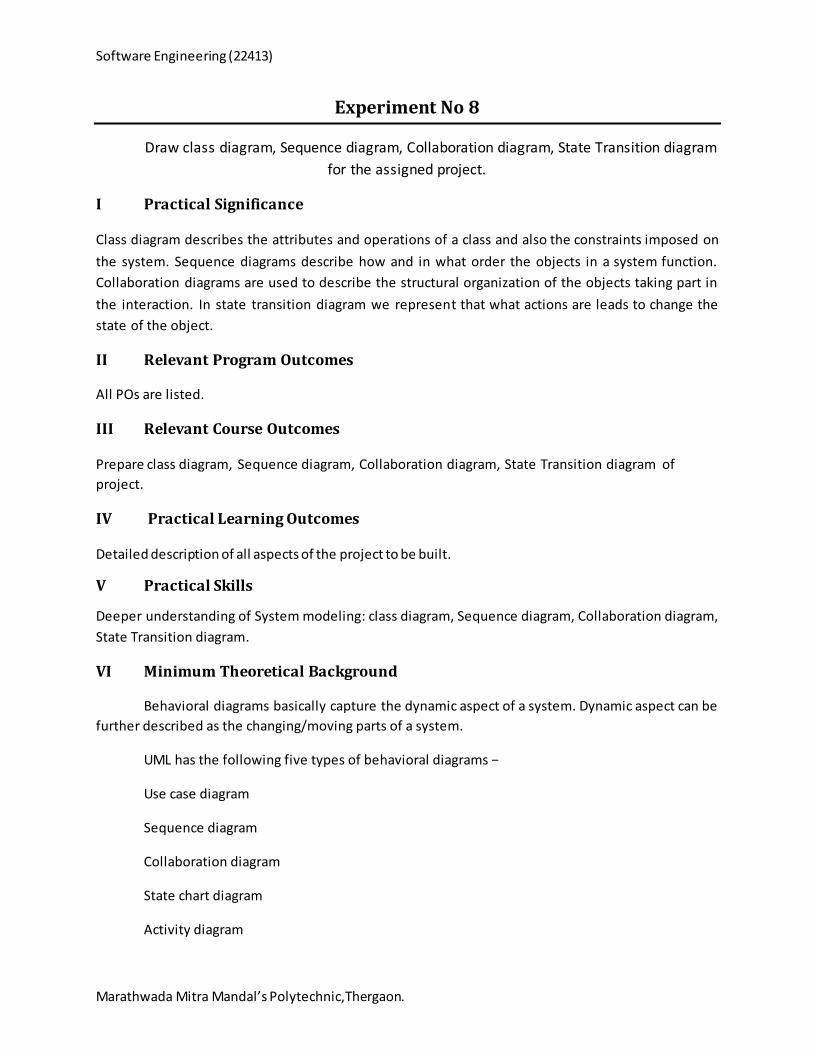
Software Engineering (22413) Marathwada Mitra Mandal’s Polytechnic,Thergaon. Experiment No 8 Draw class diagram, Sequence diagram, Collaboration diagram, State Transition diagram for the assigned project. I Practical Significance Class diagram describes the attributes and operations of a class and also the constraints imposed on the system. Sequence diagrams describe how and in what order the objects in a system function. Collaboration diagrams are used to describe the structural organization of the objects taking part in the interaction. In state transition diagram we represent that what actions are leads to change the state of the object. II Relevant Program Outcomes All POs are listed. III Relevant Course Outcomes Prepare class diagram, Sequence diagram, Collaboration diagram, State Transition diagram of project. IV Practical Learning Outcomes Detailed description of all aspects of the project to be built. V Practical Skills Deeper understanding of System modeling: class diagram, Sequence diagram, Collaboration diagram, State Transition diagram. VI Minimum Theoretical Background Behavioral diagrams basically capture the dynamic aspect of a system. Dynamic aspect can be further described as the changing/moving parts of a system. UML has the following five types of behavioral diagrams − Use case diagram Sequence diagram Collaboration diagram State chart diagram Activity diagram
-
Upload
khangminh22 -
Category
Documents
-
view
6 -
download
0
Transcript of Experiment No 8 - WordPress.com
Software Engineering (22413)
Marathwada Mitra Mandal’s Polytechnic,Thergaon.
Experiment No 8
Draw class diagram, Sequence diagram, Collaboration diagram, State Transition diagram
for the assigned project.
I Practical Significance
Class diagram describes the attributes and operations of a class and also the constraints imposed on
the system. Sequence diagrams describe how and in what order the objects in a system function.
Collaboration diagrams are used to describe the structural organization of the objects taking part in
the interaction. In state transition diagram we represent that what actions are leads to change the
state of the object.
II Relevant Program Outcomes
All POs are listed.
III Relevant Course Outcomes
Prepare class diagram, Sequence diagram, Collaboration diagram, State Transition diagram of
project.
IV Practical Learning Outcomes
Detailed description of all aspects of the project to be built.
V Practical Skills
Deeper understanding of System modeling: class diagram, Sequence diagram, Collaboration diagram,
State Transition diagram.
VI Minimum Theoretical Background
Behavioral diagrams basically capture the dynamic aspect of a system. Dynamic aspect can be
further described as the changing/moving parts of a system.
UML has the following five types of behavioral diagrams −
Use case diagram
Sequence diagram
Collaboration diagram
State chart diagram
Activity diagram

Software Engineering (22413)
Marathwada Mitra Mandal’s Polytechnic,Thergaon.
VII Resources required
Sr No Instrument Specification Quantity Remarks
1 Computer System Any Desktop PC with attached
HardDisk 10 No. Whichever is available
2 Any UML Software - 1 No. -
VIII Procedure
1. Select Diagram > New from the application toolbar.
2. In the New Diagram window, select the Diagram.
3. Click Next.
4. Enter the diagram name and description. The Location field enables you to select a model to
store the diagram.
5. Click OK.
IX Precautions
1. Change the requirement carefully.
2. Save changes if required under the guidance of teacher.
X Description
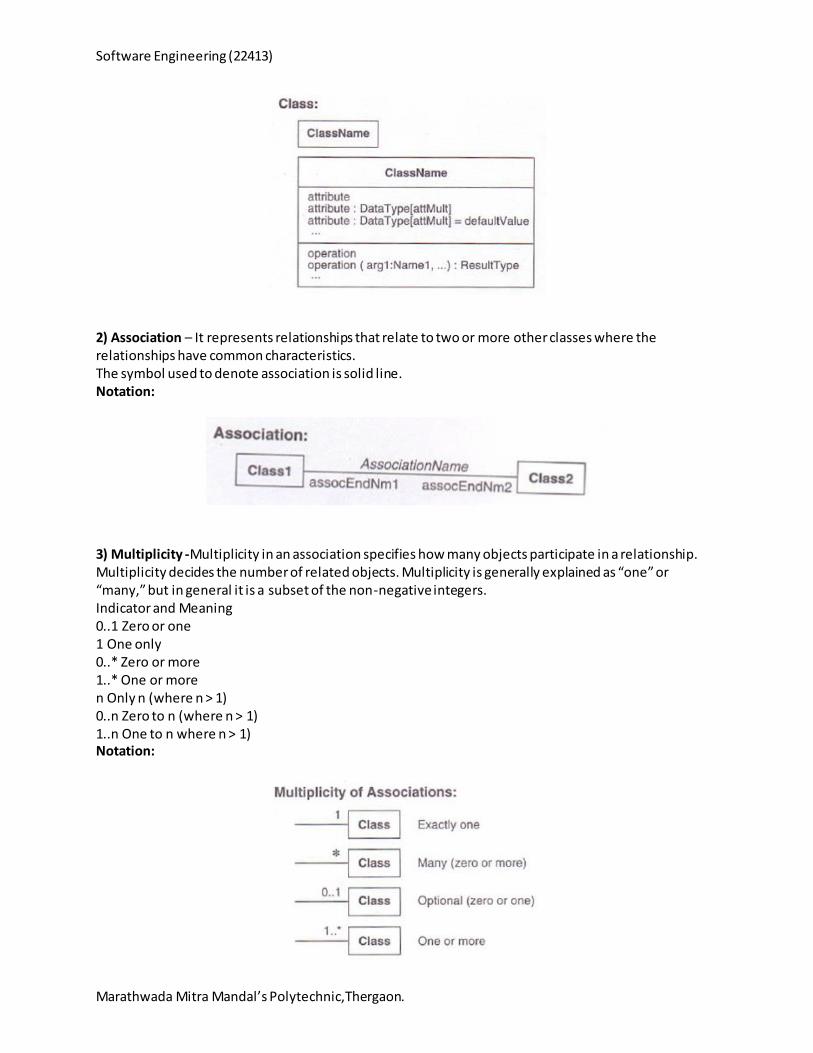
Class diagrams describe the static structure of a system or how it is structured rather than how it behaves. These diagrams contain the following element with their symbol. 1) Class– It represents entity with common characteristics or features. These features can include attributes, operations and associations. The symbol used to denote class is rectangle with three compartments. First contains the name of the class, second contains the attributes of the class and third contains the operations of that class. Notation:
Software Engineering (22413)
Marathwada Mitra Mandal’s Polytechnic,Thergaon.
2) Association – It represents relationships that relate to two or more other classes where the relationships have common characteristics. The symbol used to denote association is solid line. Notation:
3) Multiplicity -Multiplicity in an association specifies how many objects participate in a relationship. Multiplicity decides the number of related objects. Multiplicity is generally explained as “one” or “many,” but in general it is a subset of the non-negative integers. Indicator and Meaning 0..1 Zero or one 1 One only 0..* Zero or more 1..* One or more n Only n (where n > 1) 0..n Zero to n (where n > 1) 1..n One to n where n > 1) Notation:
Software Engineering (22413)
Marathwada Mitra Mandal’s Polytechnic,Thergaon.
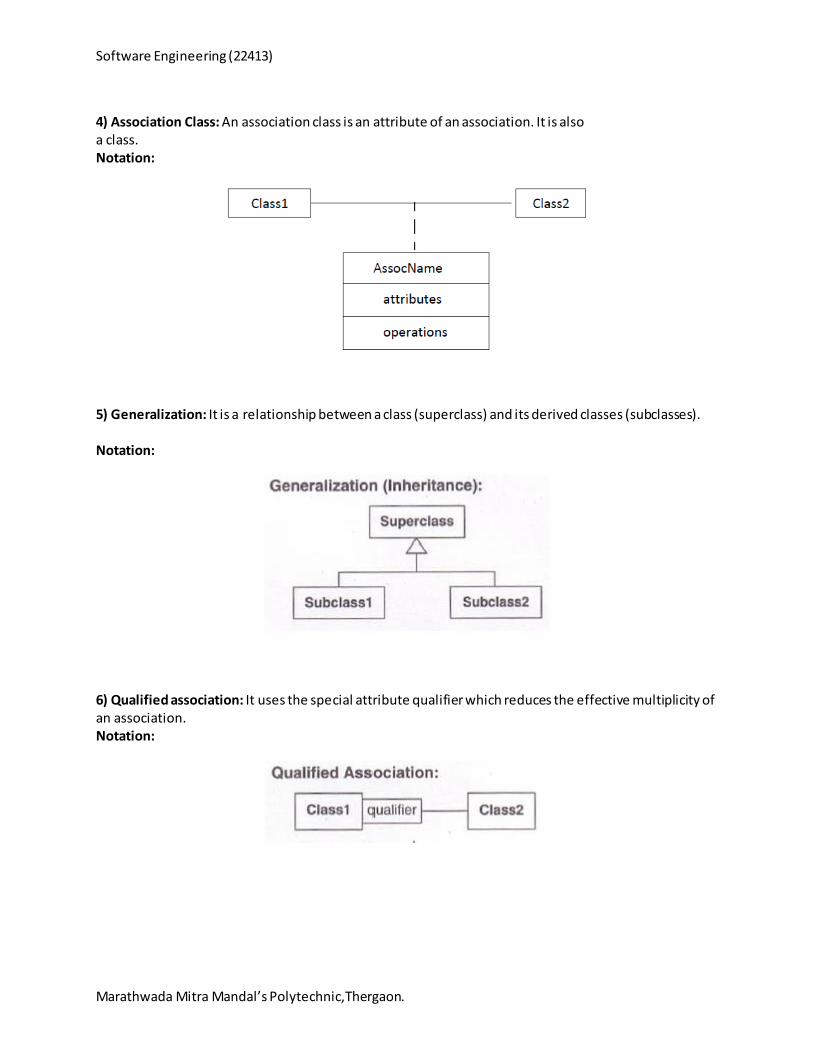
4) Association Class: An association class is an attribute of an association. It is also a class. Notation:
5) Generalization: It is a relationship between a class (superclass) and its derived classes (subclasses). Notation:
6) Qualified association: It uses the special attribute qualifier which reduces the effective multiplicity of an association. Notation:

Software Engineering (22413)
Marathwada Mitra Mandal’s Polytechnic,Thergaon.
Fig: Class Diagram for Hotel Management System
Notations used to draw sequence diagram.
1) Object: Class roles describe the way an object will behave in context. Use the UML object
symbol to illustrate class roles, but don't list object attributes.
2) Activation or Execution Occurrence: Activation boxes represent the time an object needs to
complete a task. When an object is busy executing a process or waiting for a reply message, use
a thin gray rectangle placed vertically on its lifeline.
Software Engineering (22413)
Marathwada Mitra Mandal’s Polytechnic,Thergaon.
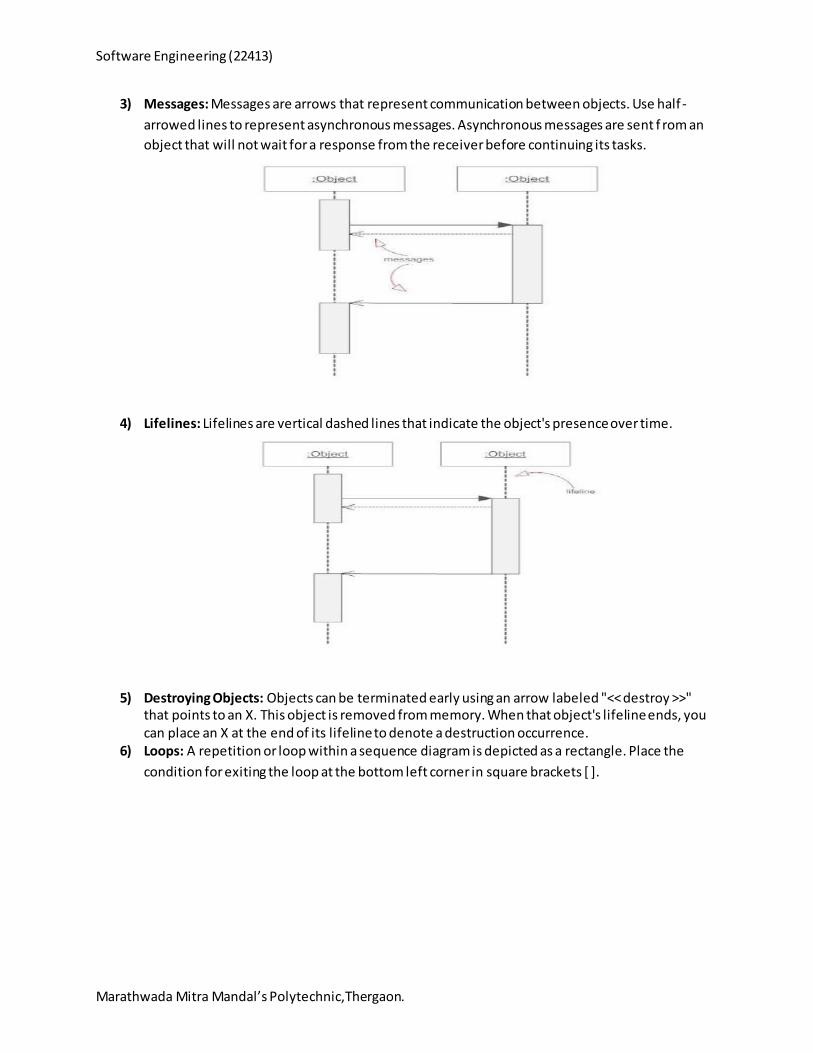
3) Messages: Messages are arrows that represent communication between objects. Use half -
arrowed lines to represent asynchronous messages. Asynchronous messages are sent f rom an
object that will not wait for a response from the receiver before continuing its tasks.
4) Lifelines: Lifelines are vertical dashed lines that indicate the object's presence over time.
5) Destroying Objects: Objects can be terminated early using an arrow labeled "<< destroy >>"
that points to an X. This object is removed from memory. When that object's lifeline ends, you can place an X at the end of its lifeline to denote a destruction occurrence.
6) Loops: A repetition or loop within a sequence diagram is depicted as a rectangle. Place the
condition for exiting the loop at the bottom left corner in square brackets [ ].

Software Engineering (22413)
Marathwada Mitra Mandal’s Polytechnic,Thergaon.
Fig: sequence diagram for hotel management system
A collaboration Diagram is an interaction diagram which emphasizes the structural organization of the
objects that send and receive messages.
Collaboration Diagram Notations:
Objects are model elements that represent instances of a class or of classes.
Multi-object represents a set of lifeline instances.
Association role is optional and suppressible.
Delegation is like inheritance done manually through object composition.
Software Engineering (22413)
Marathwada Mitra Mandal’s Polytechnic,Thergaon.
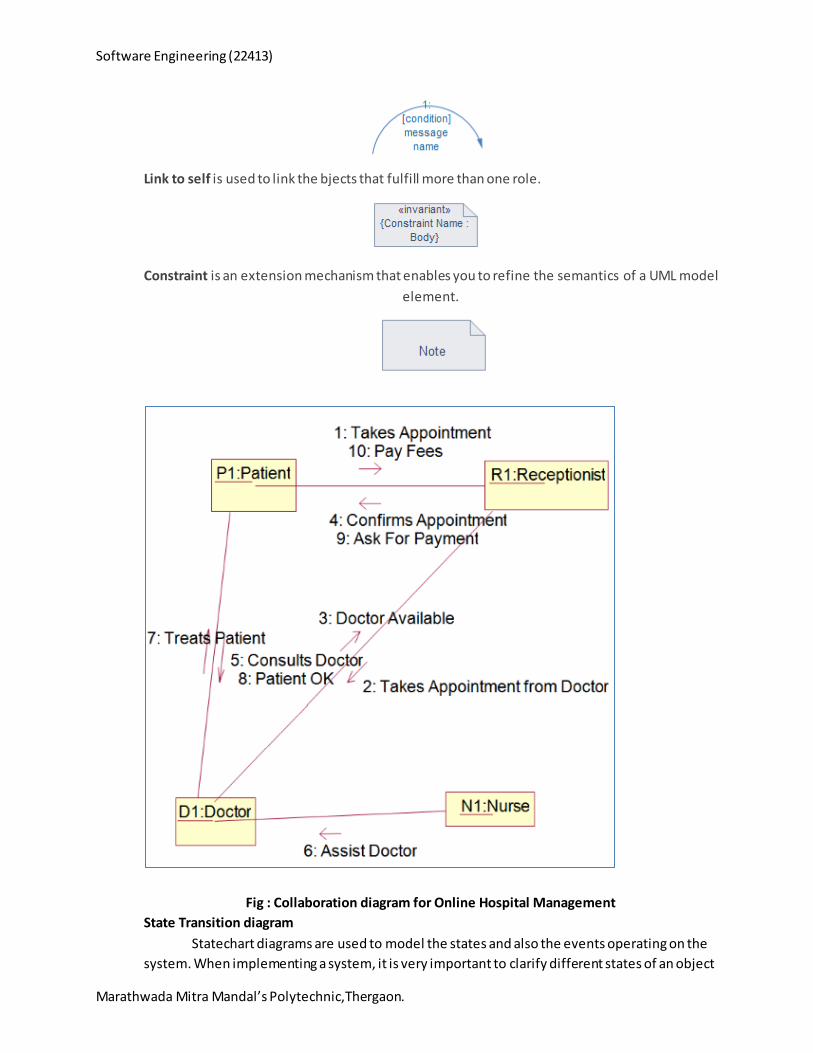
Link to self is used to link the bjects that fulfill more than one role.
Constraint is an extension mechanism that enables you to refine the semantics of a UML model
element.
Fig : Collaboration diagram for Online Hospital Management
State Transition diagram
Statechart diagrams are used to model the states and also the events operating on the
system. When implementing a system, it is very important to clarify different states of an object

Software Engineering (22413)
Marathwada Mitra Mandal’s Polytechnic,Thergaon.
during its life time and Statechart diagrams are used for this purpose. When these states and
events are identified, they are used to model it and these models are used during the
implementation of the system.
Notations :
State defines current condition of an event or activity. State diagram is often used to describe
state changes triggered by events.
Start state symbol signals the first step of a process.
End state symbol stands for the result of a process.
Transition takes operation from one state to another and represents the response to a
particular event. A single transition comes out of each state or activity, connecting it to the next
state or activity.
Decision were introduced in UML to support conditionals in activities.
History refers to the development of object-oriented methods and notation.
Constraint is an extension mechanism that enables you to refine the semantics of a UML model
element.
Note contains comments or textual information.
Software Engineering (22413)
Marathwada Mitra Mandal’s Polytechnic,Thergaon.
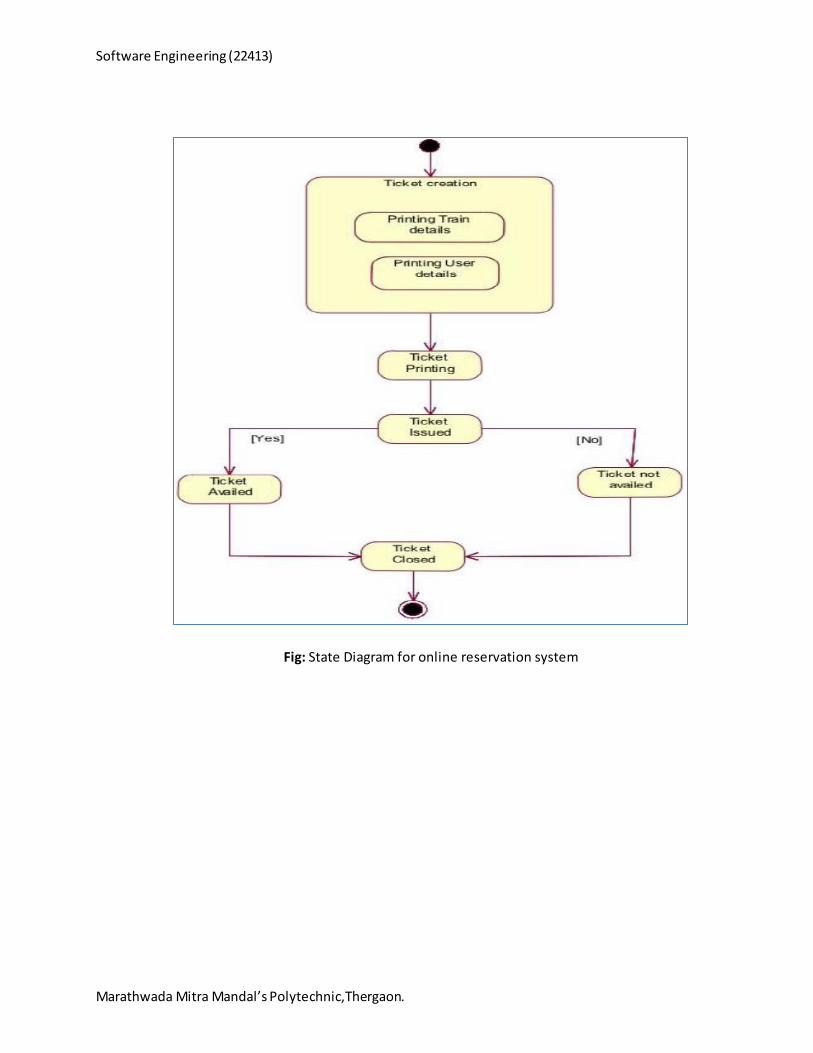
Fig: State Diagram for online reservation system

Software Engineering (22413)
Marathwada Mitra Mandal’s Polytechnic,Thergaon.
XI Practical related Questions
1. Draw class diagram for library management system.
Ans:

Software Engineering (22413)
Marathwada Mitra Mandal’s Polytechnic,Thergaon.
2. Draw sequence diagram for hospital management system.
Ans:

Software Engineering (22413)
Marathwada Mitra Mandal’s Polytechnic,Thergaon.
3. Draw collaboration diagram for online doctor appointment system Ans:

Software Engineering (22413)
Marathwada Mitra Mandal’s Polytechnic,Thergaon.
4. Draw State Transition diagram for washing machine. Ans:

Software Engineering (22413)
Marathwada Mitra Mandal’s Polytechnic,Thergaon.
5. Draw sequence diagram for online shopping system.
Ans:
Software Engineering (22413)
Marathwada Mitra Mandal’s Polytechnic,Thergaon.
6. Draw class diagram for atm.
Ans.
List Of Student Team Members:
1. …………………………………………………………………………………………………
2. …………………………………………………………………………………………………
3. …………………………………………………………………………………………………
Marks Obtained Signature Of Teacher
Process Related(15)
Product Related(10)
Total (25)