Vision - WordPress.com
80
4 Focusing on “satisfaction” (customers’, associates’ and shareholders’) with challenging spirit and flexibility, we are dedicated to supplying latest generation cars with advanced technology, greater fuel efficiency and competitive prices, along with friendly and efficient after sales back up, maintaining “quality” as core of all activities. Vision
-
Upload
khangminh22 -
Category
Documents
-
view
0 -
download
0
Transcript of Vision - WordPress.com

4
Focusing on “satisfaction” (customers’, associates’ and shareholders’) with challenging spirit and flexibility, we are dedicated to supplying latest generation cars with advanced technology, greater fuel efficiency and competitive prices, along with friendly and efficient after sales back up, maintaining “quality” as core of all activities.
Vision

Honda Atlas Cars (Pakistan) LimitedAnnual Report 2011 5

6
The Board of Directors
Mr. Yusuf H. Shirazi - Chairman
Mr. Takeharu Aoki - President/CEO
Mr. Aamir H. ShiraziMr. Jawaid Iqbal AhmedMr. Shigeru YamazakiMr. Takashi NagaiMr. Yukimitsu Miyagi
Company Secretary
Mr. Sardar Abid Ali Khan
Chief Financial Officer
Mr. Ayaz Mahmood
Executive Committee
Mr. Takeharu Aoki Mr. Sardar Abid Ali KhanMr. Yukimitsu Miyagi
Audit Committee
Mr. Aamir H. Shirazi - Chairman
Mr. Takeharu Aoki Mr. Jawaid Iqbal AhmedMr. Shigeru Yamazaki Mr. Yukimitsu Miyagi
Mr. Imran Farooq - Secretary
Auditors
M/s A. F. Ferguson & CompanyChartered Accountants
Legal Advisor
Cornelius, Lane & MuftiBokhari Aziz & Karim
Share Registrar
M/s Hameed Majeed AssociatesHM House, 7-Bank Square,Lahore. Tel: 042-37235081-82
Company Information

Honda Atlas Cars (Pakistan) LimitedAnnual Report 2011 7
Bankers
Askari Commercial Bank Ltd.Bank of Tokyo-Mitsubishi UFJ, Ltd.Citibank N.A.Deutsche Bank AGHabib Bank Ltd.MCB Bank Ltd.National Bank of PakistanRoyal Bank of ScotlandSoneri Bank Ltd.Standard Chartered Bank (Pakistan) Ltd.Summit Bank Ltd.United Bank Ltd.
Registered Office1-Mcleod Road, LahorePh: (042) 37225015-17Fax: (042) 37233518
Factory43 Km, Multan Road,Manga Mandi, LahorePh: (042) 35871100-09Fax: (042) 35877711-12E-mail: [email protected]
Regional Offices
Lahore Office293-Y, Commercial Area, DHAPh: (042) 35692644-45 Fax: (042) 35892437
Karachi OfficeC-149, KDA Scheme No.1Street H, Karsaz RoadPh: (021) 34854973 Fax: (021) 34854974
Web Sitewww.honda.com.pk

8
Mr. Yusuf H. ShiraziChairman
Mr. Shirazi is a Law graduate (LLB) with BA (Hons) and JD (Diploma in Journalism) from Punjab University and AMP Harvard. He served in the financial services of the Central Superior Services of Pakistan for eight years. He is the author of five books including ‘Aid or Trade’ adjudged by the Writers Guild as the best book of the year and continues to be a columnist, particularly on economy.
Mr. Shirazi is the Chairman of Atlas Group, which among others, has joint ventures with Honda, GS Yuasa, MAN and Total. He has been the President Karachi Chamber of Commerce and Industries for two terms. He has been the founder member of Karachi Stock Exchange, Lahore Stock Exchange and International Chamber of Commerce and Industry. He has been on the Board of Harvard Business School Alumni Association and is the Founder President of Harvard Club of Pakistan and Harvard Business School Club of Pakistan. He has been a visiting Faculty Member at National Defense College, Navy War College and Pakistan Administrative Staff College. He has been on the Board of Governors of LUMS, GIK and FC College. Previously he also served, among others on the Board of Fauji Foundation Institute of Management and Computer Sciences (FFIMCS) and Institute of Space Technology - Space & Upper Atmosphere Research Commission (SUPARCO).
Mr.Takeharu AokiPresident & CEO
Mr. Aoki is President & Chief Executive Officer (CEO) of Honda Atlas Cars (Pakistan) Ltd. He has been associated with Honda Motor Company Limited, Japan for last 22 years and has rich experience of Sales & Marketing. He started his professional career in 1989.
Mr. Takeharu Aoki has been working with different Honda ventures around the world. He has been extensively involved in Sales & Marketing and Global Product Planning of automobiles. He has significant experience of working in United Kingdom (UK), Canada and France. In his previous assignment, he was working as Divisional Manager, Asia Oceania Sales Division in Honda Motor Company, Japan.
Mr. Yukimitsu MiyagiDirector / VP Production
Mr. Miyagi has been associated with Honda Motor Company Ltd., Japan for last 34 years. He started his professional career in 1977 at Saitama Plant, Japan. He has served at different positions in Honda Malaysia and Honda Philippines for 13 years.
Mr. Miyagi was Manager of Overseas Production & Business Planning Divisions in Japan before he took over as Director/VP Production of Honda Atlas Cars (Pakistan) Ltd. He has vast experience of production planning and vehicle assembling in Japan and overseas assignments.
Board of Directors

Honda Atlas Cars (Pakistan) LimitedAnnual Report 2011 9
Mr. Jawaid Iqbal AhmedDirector
Mr. Ahmed is an AMP from Harvard Business School, Boston USA, and IPBM from IMD Lussanne, Switzerland. He is also MBA from IBA Karachi University. He has been working in Atlas Group of Companies in various capacities. He has over 46 years of experience in the field of industrial and financial markets of Pakistan. He spearheaded joint venture partnerships of Atlas Group with Honda Japan, JSB Japan, Bank of Tokyo, Asian Development Bank and ING.
Mr. Shigeru YamazakiDirector
Mr. Shigeru Yamazaki has been associated with Honda Motor Company Ltd., Japan for over 28 years. He is currently General Manager of Automobile Business Division, Asian Honda Motor Company Ltd., Thailand.
Before taking over his current responsibilities, Mr. Shigeru Yamazaki was General Manager, Overseas sales operation in Honda Motor, Japan supervising North America, South America and Europe. He has vast experience of automobile industry.
Mr. Aamir H. ShiraziDirector
Mr. Aamir is the President of Atlas Group. He graduated from Claremont Mckenna College, California and completed his OPM from Harvard Business School. He was the Chief Executive of Atlas Honda Limited for over 10 years. He was also appointed as professional director on the Board of Lahore Stock Exchange for two consecutive terms by the Securities & Exchange Commission of Pakistan. He has been Honorary Consul General of Japan, Lahore since 2002.
Mr. Takashi NagaiDirector
Mr. Nagai has been associated with the Honda Motor Company for more than 28 years. He is currently President & CEO, Honda Siel Cars India Ltd. and Honda Motor India (Private) Ltd. He is also Honda Motor Company Operating Officer for South West Asia Region.
Mr. Nagai has vast experience in the automobile industry, having worked with Honda ventures in different markets, across the globe including America and Europe. In April 2007, he became Executive Vice President of Asian Honda Motor Company Ltd., Thailand and Director of Honda Motor Company Ltd., Japan in June 2007.

10
Organization Chart
VicePresident
Manager
DeputyManager
GeneralManager
SeniorManager
President/ CEO
Board of Directors
Abid
HR &Admin
Logistics Finance Marketing EDP AfterSales
Maqsood
Manufacturing ControlPC/PD, QD/QC, Pur., MA/Eng.
ProductionAF, PA, AE, WE, VQ, Press/PO
AmirNauman
SamiAyaz
Aoki
Miyagi
SohailAshraf
QD/QC
PC/PD
MA/Eng.
WE PAAF/AE/
VQPress/POPurchasing
Basharat
ZulfiqarAsif
Nadeem
Mawiz /Afzal
Ayaz /Umair
SherazWaseem
IshtiaqImran
Tariq /Amjad
Rafi /Mehtab /Jamshaid
Imran Aneel Ajmal

Honda Atlas Cars (Pakistan) LimitedAnnual Report 2011 11
Corporate Governance (Organization Structure)
Audit Committee
Finance
After Sales
Logistics
Production
Manufacturing
EDP
HR & Admin
Divisional /FunctionalLevel Policy
Board of Directors
President / CEO
Executive Committee
Corporate Governance Secretariat
Code of Conduct
Director Level Policy
Compliance Information SystemRisk Management Effective Operation/Governance
Audit
Internal Audit
Marketing
Individual LevelCode of Conduct
Front Division for Corporate GovernanceImprovement & Suggestions
IndividualAssociates

12
HONDA MOTOR CO., LTD. JAPAN CORPORATE PHILOSOPHY
Maintaining a global viewpoint, we are dedicated to supplying
products of the highest quality yet at a reasonable price for
worldwide customer satisfaction.
MANAGEMENT POLICY
1) Proceed always with ambition and youthfulness
2) Respect sound theory, develop fresh ideas and make the
most effective use of time
3) Enjoy your work and encourage open communications
4) Strive constantly for a harmonious flow of work
5) Be ever mindful of the value of research and endeavor
HONDA ATLAS CARS (PAKISTAN) LIMITEDCORPORATE PHILOSOPHY
1) Dynamic manufacturing and marketing of prestigious
products to the entire satisfaction of customers
2) Create ideal working environment for continuous
development of product and personnel
3) Provide adequate return to shareholders and fulfill
corporate civic obligations
MANAGEMENT POLICY
1) Respect for all – man has priority over others.
2) Man is the key in controlling i.e. machines, methods and
materials.
3) Follow 3S spirit i.e. small, smart and speed.
4) Believe in 3A “Hands on Approach” i.e. be on Actual Spot,
look at the Actual Spot and confront the Actual Situation.
5) Be a good corporate citizen; assume a responsible role in
community.
PRIORITY STANDARDS OF CONDUCT
1) Safety: There can be no production without safety.
2) Quality: To achieve complete customer satisfaction by
focusing on smart team work, meeting all applicable legal
and regulatory requirements & continually improving our
strategies and goals.
3) Productivity: With safety and quality each of us will strive
to excel the performance in all fields of our activities i.e.
Production Divisions, Marketing & Planning, After Sales
Service, Finance, Import, Purchase & Logistics and Human
Resources & Administration etc.
HUMAN RESOURCES AND SUCCESSION PLAN
Human Resources Policy is to hire young, fresh, energetic and
active associates to meet the existing and future workforce
requirements and providing its associates maximum
opportunities for internal mobility through personal training
and development to enable them to take higher positions.
Business Principles

Honda Atlas Cars (Pakistan) LimitedAnnual Report 2011 13
Human Resource Division has to have succession plan for each
key job/area to make sure the continuity of operations in the
relevant division and to fill the temporary/permanent vacancy.
QUALITY POLICY
We, at Honda Atlas Cars (Pakistan) Limited, strive for supplying
top quality Honda Cars to get complete Customer Satisfaction.
We accomplish this by:
• SmartTeamWork
• Meetingallapplicablelegalandregulatoryrequirements
• Continuallyimprovingourstrategiesandgoals
ENVIRONMENT POLICY
Honda Atlas Cars (Pakistan) Limited, being responsible
member of the society considers the preservation of the global
environment as a crucial concern.
Our environmental philosophy is firmly based on the following
principles:
1) Recognize the impacts of our activities, products and
services on environment;
2) Formulate objectives and targets for pollution prevention,
environmental impacts mitigation and resource
conservation as far as technically feasible;
3) Operate in compliance with applicable legal & other
requirements with the commitment to preserve global
environment;
4) Create awareness and understanding about environmental
issues among our associates;
5) Commitment to continual improvement of the
environmental performance and review of the
environmental management system to ensure its
suitability, adequacy and effectiveness;
6) Keep public and other interested parties informed on our
environmental performance, if deemed necessary.
SAFETY, HEALTH AND ENVIRONMENT
Honda Atlas Cars (Pakistan) Limited conducts its business
responsibly and in a way to make sure health, safety and
protection from environmental aspects of its associates and the
society. We implement and maintain the programs that provide
reasonable assurance that the business will do the following:
1) To comply with all applicable government and internal
health, safety and environmental requirements
2) Design facilities and conduct operations in a way that
avoids risk to human health, safety and the environment
3) To examine and communicate the known hazards of
operations with relevant health, safety and environmental
protection information to potentially affected persons
OPERATING PRINCIPLES
1) Always keep the deadline
2) Never make excuses
3) Teamwork

14
Chronicle of Events Aug 05 1992 Joint venture agreement signed with Honda Motor Co. Ltd., Japan
Nov 04 1992 Incorporation of Honda Atlas Cars (Pakistan) Limited
Feb 10 1993 Certificate of Commencement of Business obtained
Apr 17 1993 Ground breaking ceremony held
Mar 31 1994 Completion of Civil Work and installation of Plant & Equipment
Apr 01 1994 Technical Assistance Agreement signed with Honda Motor Co. Ltd., Japan
May 26 1994 First car rolling out ceremony held
Jul 13 1994 Inauguration by President of Pakistan
Jul 13 1994 Visit of Mr. N. Kawamoto, President Honda Motor Co. Ltd., Japan
Jul 16 1994 Commercial production commenced
Oct 10 1994 Public issue of shares
Jan 10-11 1996 New Civic-96 launched
Jan 22-23 1997 Honda City launched
Oct 1-6 1998 Honda Motor Company’s 50th anniversary
Jan 28 1999 VTi Oriel launched
Apr 13 1999 ISO 9002 Certification achieved
Jan 20 2000 Launch of new City model with PGM-Fi technology
Mar 22 2001 Launching of new Honda Civic model
May 30 2002 ISO 9001 : 2000 Re-certification achieved
Aug 23 2003 New model of Honda City launched
Sep 13 2003 Rolling out of 50,000th car
Sep 15 2003 ISO 14001 Certification achieved
Aug 27-28 2004 Surveillance Audit of ISO 9001 & ISO 14001
Aug 11 2005 Launching of CBU model of Honda Accord
Dec 21 2005 Rolling out of 100,000th car
Jan 14 2006 Launching of New Model of Honda City
Jul 07 2006 Visit of Mr. Takeo Fukui, President & CEO Honda Motor Co. Ltd., Japan
Jul 29 2006 New model of Honda Civic launched in 1800 cc
Dec 31 2006 Capacity enhancement to 50,000 units per annum achieved
Aug 27 2007 Issue of 100% right shares
Jul 20 2008 Launching of New Model of Honda Accord & CRV
Jan 31 2009 Launch of 3rd Generation Honda City
Nov 27 2010 Inauguration of first 1-S Spare Parts Dealership

Honda Atlas Cars (Pakistan) LimitedAnnual Report 2011 15

16
FAISALABAD
Honda Faisalabad
East Canal Road.
Tel: (041) 8731741-4
Fax: (041) 8524029
Honda Chenab
123 JB Raja Wala Green View Colony.
Tel: (041) 2603449, 2603549
5500897, 5508297
Fax: (041) 2603349
PESHAWAR
Honda North
Main University Road.
Tel: (091) 5854901, 5700807, 5700808
Fax: (091) 5854753
MIRPUR A.K.
Honda Empire
Mian Muhammad Road,
Quaid-e-Azam Chowk.
Tel: (058274) 51501,1032701
Fax: (058274) 51500-3
GUJRANWALA
Honda Gujranwala
G.T. Road.
Tel: (055) 3893481-3
Fax: (055) 3893484
SARGODHA
Honda Citurs Fields
7-Km Lahore Road.
Tel: (048) 3225186-87
Fax: (048) 3226589
KARACHI
Honda Shahrah-e-Faisal
13-Banglore Town,
Main Shahrah-e-Faisal
Tel: (021) 34527070, 34527373,
34547113-6
Fax: (021) 34526758
Honda Defence
67/1, Korangi Road Near HINO Circle.
Tel: (021) 35805291-4
Fax: (021) 35805294
Honda Site
C 1, Main Manghopir Road, SITE.
Tel: (021) 32577411-2, 32564926
32570301, 32569381
Fax: (021) 32577412, 32565056
Honda South
1 B/1, Sec. 23, Korangi Industrial Area.
Tel: (021) 35050251-4
Fax: (021) 35064599
Honda Drive In
118 C, Rashid Minhas Road.
Tel: (021) 34992832-7, 34992824
Fax: (021) 34992825
Honda Quaideen
233-A-2, PECHS.
Tel: (021) 34556071-3, 34556510-12
Fax: (021) 34554644
ISLAMABAD
Honda Classic
Plot 179, I 10/3, Industrial Area
Tel: (051) 4438801-06
Fax: (051) 4436446
RAWALPINDI
Honda Centre
300, Peshawar Road.
Tel: (051) 5564525-8
Fax: (051) 5564524
LAHORE
Honda City Sales
75 B, Block L, Gulberg III,
Ferozepur Road.
Tel: (042) 35841100-06
Fax: (042) 35841107
Honda Fort
32 Queens Road.
Tel: (042) 36314162-3
36309062-3, 36313925
Fax: (042) 36361076
Honda Point
Main Defence Road.
Tel: (042) 35700994-5
Fax: (042) 35700993
Honda Canal Bank
13-B,Block-K, Johar Town,
Shoukat Khanaum Bypass.
Tel: (042) 35300822-33, 7029360-61
Fax: (042) 35300841
MULTAN
Honda Breeze
63 Abdali Road.
Tel: (061) 4588871-3
4548881, 4542862
Fax: (061) 4588874
SIALKOT
Honda Falcon
Pakki Kotli, Daska Road.
Tel: (052) 3252000
Fax: (052) 3563203
HYDERABAD
Honda Palace
Shahbaz Town, Jamshoro Road.
Tel: (0223) 642032, 641178, 641179
Fax: (0223) 641519
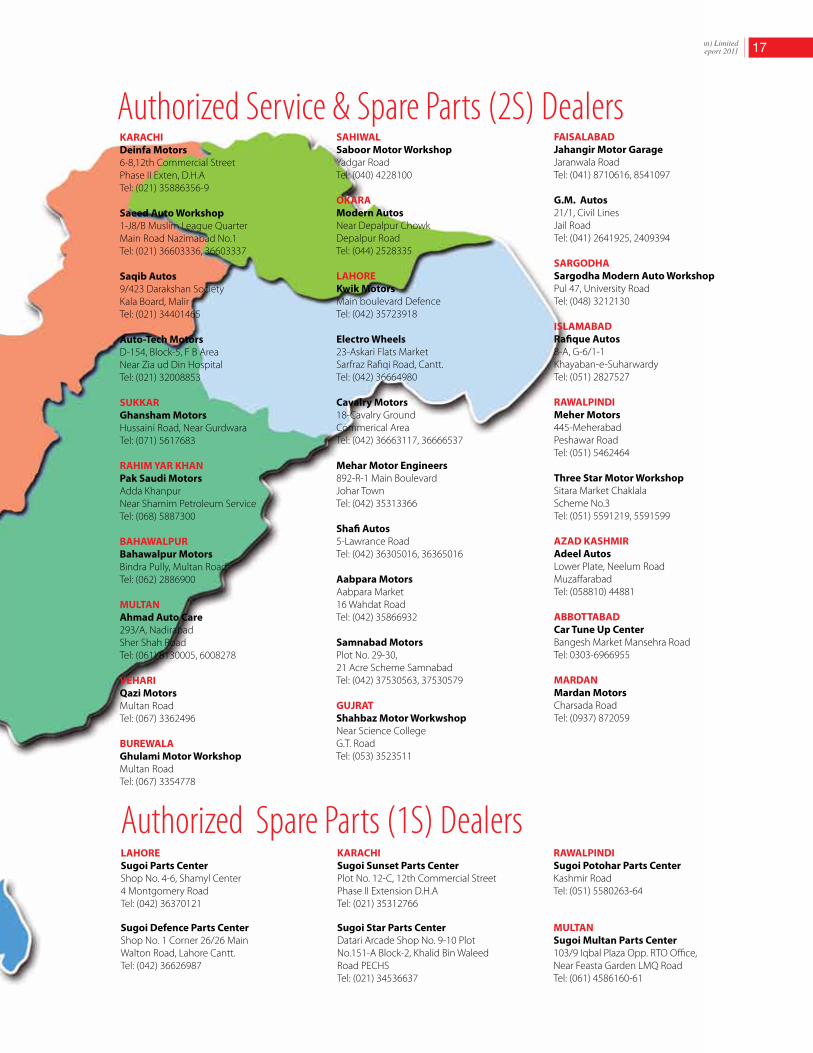
Authorized Sales, Service & Spare Parts (3S) Dealers
Honda Atlas Cars (Pakistan) LimitedAnnual Report 2011 17
KARACHI Deinfa Motors 6-8,12th Commercial Street Phase II Exten, D.H.A Tel: (021) 35886356-9
Saeed Auto Workshop 1-J8/B Muslim League Quarter Main Road Nazimabad No.1Tel: (021) 36603336, 36603337
Saqib Autos9/423 Darakshan Society Kala Board, Malir Tel: (021) 34401465
Auto-Tech Motors D-154, Block-5, F B Area Near Zia ud Din HospitalTel: (021) 32008853
SUKKAR Ghansham Motors Hussaini Road, Near GurdwaraTel: (071) 5617683 RAHIM YAR KHAN Pak Saudi Motors Adda Khanpur Near Shamim Petroleum ServiceTel: (068) 5887300
BAHAWALPUR Bahawalpur Motors Bindra Pully, Multan RoadTel: (062) 2886900
MULTAN Ahmad Auto Care 293/A, NadirabadSher Shah Road Tel: (061) 8130005, 6008278
VEHARI Qazi Motors Multan Road Tel: (067) 3362496 BUREWALA Ghulami Motor Workshop Multan Road Tel: (067) 3354778
SAHIWAL Saboor Motor Workshop Yadgar Road Tel: (040) 4228100
OKARA Modern Autos Near Depalpur Chowk Depalpur Road Tel: (044) 2528335 LAHORE Kwik MotorsMain boulevard DefenceTel: (042) 35723918
Electro Wheels 23-Askari Flats Market Sarfraz Rafiqi Road, Cantt. Tel: (042) 36664980
Cavalry Motors 18-Cavalry Ground Commerical Area Tel: (042) 36663117, 36666537
Mehar Motor Engineers 892-R-1 Main Boulevard Johar TownTel: (042) 35313366
Shafi Autos 5-Lawrance Road Tel: (042) 36305016, 36365016
Aabpara Motors Aabpara Market 16 Wahdat Road Tel: (042) 35866932
Samnabad Motors Plot No. 29-30, 21 Acre Scheme Samnabad Tel: (042) 37530563, 37530579
GUJRAT Shahbaz Motor Workwshop Near Science College G.T. Road Tel: (053) 3523511
FAISALABAD Jahangir Motor Garage Jaranwala Road Tel: (041) 8710616, 8541097
G.M. Autos 21/1, Civil Lines Jail Road Tel: (041) 2641925, 2409394
SARGODHASargodha Modern Auto WorkshopPul 47, University Road Tel: (048) 3212130
ISLAMABAD Rafique Autos 8-A, G-6/1-1 Khayaban-e-Suharwardy Tel: (051) 2827527
RAWALPINDI Meher Motors 445-Meherabad Peshawar Road Tel: (051) 5462464
Three Star Motor Workshop Sitara Market Chaklala Scheme No.3 Tel: (051) 5591219, 5591599
AZAD KASHMIR Adeel Autos Lower Plate, Neelum Road Muzaffarabad Tel: (058810) 44881
ABBOTTABAD Car Tune Up Center Bangesh Market Mansehra Road Tel: 0303-6966955
MARDAN Mardan Motors Charsada Road Tel: (0937) 872059
LAHORE Sugoi Parts Center Shop No. 4-6, Shamyl Center4 Montgomery RoadTel: (042) 36370121
Sugoi Defence Parts Center Shop No. 1 Corner 26/26 MainWalton Road, Lahore Cantt.Tel: (042) 36626987
KARACHI Sugoi Sunset Parts Center Plot No. 12-C, 12th Commercial StreetPhase II Extension D.H.ATel: (021) 35312766
Sugoi Star Parts Center Datari Arcade Shop No. 9-10 Plot No.151-A Block-2, Khalid Bin Waleed Road PECHSTel: (021) 34536637
RAWALPINDI Sugoi Potohar Parts Center Kashmir RoadTel: (051) 5580263-64
MULTAN Sugoi Multan Parts Center 103/9 Iqbal Plaza Opp. RTO Office,Near Feasta Garden LMQ RoadTel: (061) 4586160-61
Authorized Service & Spare Parts (2S) Dealers
Authorized Spare Parts (1S) Dealers

18
Number of Shareholding Total %age of paid Shareholders From To Shares held up capital 1806 1 - 100 85,261 0.06 851 101 - 500 320,989 0.22 1093 501 - 1000 972,022 0.68 1185 1001 - 5000 2,790,949 1.95 169 5001 - 10000 1,278,354 0.90 41 10001 - 15000 502,008 0.35 29 15001 - 20000 515,089 0.36 13 20001 - 25000 294,098 0.21 7 25001 - 30000 189,749 0.13 12 30001 - 35000 399,514 0.28 12 35001 - 40000 444,489 0.31 5 40001 - 45000 210,538 0.15 3 45001 - 50000 146,901 0.10 4 50001 - 55000 207,570 0.15 4 55001 - 60000 233,943 0.16 1 65001 - 70000 66,200 0.05 2 75001 - 80000 157,000 0.11 2 80001 - 85000 169,250 0.12 1 90001 - 95000 90,575 0.06 4 95001 - 105000 402,729 0.28 2 140001 - 150000 288,120 0.20 2 155001 - 165000 315,610 0.22 1 165001 - 170000 165,920 0.12 3 195001 - 200000 600,000 0.42 1 270001 - 275000 272,775 0.19 1 365001 - 370000 369,799 0.26 1 395001 - 400000 400,000 0.28 1 445001 - 450000 449,900 0.32 1 515001 - 520000 515,636 0.36 1 845001 - 850000 850,000 0.60 1 850001 - 855000 853,595 0.60 1 1345001 - 1350000 1,345,835 0.94 1 2410001 - 2415000 2,412,597 1.69 1 4005001 - 4010000 4,008,989 2.81 1 4525001 - 4530000 4,529,446 3.17 1 10600001 - 10605000 10,601,650 7.42 1 32515001 - 32520000 32,517,000 22.77 1 72825001 - 72830000 72,825,900 51.00
5,266 142,800,000 100
Sr. Description No. of Shareholders
Shares %age of No. held paid up capital
1 Individuals 5,184 14,087,768 9.872 Joint Stock Companies 50 746,566 0.523 Financial Institutions 9 8,486,651 5.944 Modarabas 1 4,000 0.005 Insurance Companies 5 3,018,134 2.116 Investment Companies 7 43,130,981 30.207 Mutual Funds 3 175,770 0.128 Foreign Company 1 72,828,000 51.009 Others 6 322,130 0.23
5,266 142,800,000 100.00
Pattern of Shareholding as on March 31, 2011
Categories of Shareholders

Honda Atlas Cars (Pakistan) LimitedAnnual Report 2011 19
Categories
No. of Shares shareholders held
Associated Companies
M/s Shirazi Investments (Pvt.) Limited 1 10,602,650
M/s Atlas Insurance Limited 1 850,000
NIT & IDBP (ICP Unit)
IDBP (ICP Unit) 2 1,700
NBP - Trustee 2 4,111,718
Directors, CEO, Their Spouse and Minor Children
Directors & CEO
Mr. Yusuf H. Shirazi Chairman 1 #
Mr. Takeharu Aoki President / CEO 1 *
Mr. Aamir H. Shirazi Director 1 #
Mr. Jawaid Iqbal Ahmed Director 1 1,700
Mr. Shigeru Yamazaki Director 1 *
Mr. Takashi Nagai Director 1 *
Mr. Yukimitsu Miyagi Director 1 *
Executives 2 21,290
Public Sector Companies & Corporations 54 757,697
Banks, Development Finance Institutions, Non-Banking
Finance Institutions, Insurance Companies, Modarabas 14 6,722,337
and Mutual Funds
Sharehoders Holding 10% or More Voting Interest
M/s Honda Motor Co. Ltd. Japan 1 72,828,000
M/s Shirazi Capital (Pvt.) Limited 1 32,517,000
Others 5,181 14,385,908
TOTAL 5,266 142,800,000
Shareholding Information as on March 31, 2011as required under the Code of Corporate Governance
Note: # Mr. Yusuf H. Shirazi and Mr. Aamir H. Shirazi hold 500 qualification shares. The ultimate ownership remains with M/s Shirazi Investments (Pvt) Ltd.
* The shareholding of Honda Motor Co. Ltd., Japan includes 4 directors holding 525 shares each (Total 2100) in the name of Mr. Takeharu Aoki, Mr. Yukimitsu Miyagi, Mr. Shigeru Yamazaki and Mr. Takashi Nagai in the capacity of its nominee directors. The ultimate ownership remains with M/s Honda Motor Co., Ltd. Japan.

Honda Atlas Cars (Pakistan) LimitedAnnual Report 2011 21
Chairman’s ReviewIt is my pleasure to present you 19th Annual Report of
the company for the year ended March 31, 2011.
The Economy
The beginning of the year was positive with clear signs
of economic recovery. Soon after, the devastating floods
rendered about 20 million people homeless and one fifth
of the country was affected. The prices of food items rose
CPI inflation to 15.5%. Similarly the GDP estimates scaled
down to 2.8% from the pre flood estimates of 4.3%.
However, despite all these devastations, the economy
has been showing distinct signs of recovery, as it has
done in the past. Despite the persistent energy crises
and price hike of utilities in the country, the export sector
has shown remarkable improvement. The exports for the
period of July-March 2011 were US$ 17.8 billion, up 26.5%
over the same period last year, mainly due to rising prices
of high value added textile products in the international
market. The imports for the same period were also high
at US$ 29.0 billion, up 15.6%. Better exports, record inflow
of remittances from overseas Pakistanis coupled with
compensation for logistics support from US has helped
to reduce the current account deficit to 2% of GDP,
against the target of 3.4% for the fiscal year 2010-11. With
the robust performance of external sector, the current
account deficit is expected to be around 1.5% of GDP
by the end of June 2011. The remittances from overseas
Pakistanis for first nine months were at US$ 8.0 billion as
compared to US$ 6.5 billion in the same period last year,
up 22.4%.
The agriculture growth during rabi is likely to compensate
some of the flood losses sustained during kharif. The
government decision to provide seeds free of cost in the
areas worst hit by flood will support positive growth in
coming months. The wheat production is expected to
grow by 4.5%. The large scale manufacturing (LSM) sector
has also shown positive growth since December 2010,
however many industries continued to face operational
constraints mainly due to ongoing power crises in the
country.
Nevertheless, since Pakistan came into being, the GDP
growth on average has been 5% -not bad at all!
Automobile Industry
After the dismal performance in last couple of years,
the automobile industry has shown strong recovery in
the year under review. The better economic conditions,
domestic demand and growth in auto loans by banks led
to revive the industry. The auto sector showed all-round
improvement. The passenger car production improved
by 26.2%, the motorcycle sector showed growth of 14.0%,
followed by LCV’s, Buses and Trucks, which was up by
9.7%. The total production for the year ended April 2010
to March 2011 was increased by 26.2% to 135,904 units
against 107,648 units in the same period of last year. The
sale was also up by 25.1% and a total of 135,278 units were
sold against 108,142 units in the same corresponding
period last year. The improvement was recorded in all
three segments of automobile industry, with 34.8% in
cars up to 800cc, 23.9% increase in the category of cars
from 801cc to 1299cc and 21.6% rise in the segment of
1300cc & above. The quarterly production of automobile
sector is given below:

22
2009-10 Category Q1 Q2 Q3 Q4 2010-11 Incr./(Decr)
33,425 Up to 800cc 10,602 10,154 11,830 12,626 45,212 34.8%
20,192 801cc to 1299cc 6,248 6,194 5,874 6,701 25,017 23.9%
54,031 1300cc & above 18,184 15,365 13,535 18,591 65,675 21.6%
107,648 Total Passenger Cars 35,034 31,713 31,239 37,918 135,904 26.2%
71,185 Tractors 13,431 14,431 18,288 18,945 65,095 -8.6%
19,228 LCV, Buses, Trucks etc 3,893 5,393 5,746 6,070 21,102 9.7%
680,270 Motorcycles 173,418 188,418 201,077 212,773 775,686 14.0%
878,331 Total 2010-11 225,776 239,955 256,350 275,706 997,787 13.6%
Auto Industry Production (Units)
164,
340
166,
278
106,
025
107,
648
135,
904
62,7
56
51,9
19
40,6
78
54,0
31 65,6
75
2007 2008 2009 2010 2011
Total Production 1300cc & above

Honda Atlas Cars (Pakistan) LimitedAnnual Report 2011 23
Amid the challenging business environment in the year
under review, the demand of your company products
steadily increased by 33.4%, against the industry’s sales
growth of 25.1%. The company produced 16,440 units
against 11,980 units in the same corresponding period
last year, up 37.2%. The unit sale was also improved and
a total of 16,467 units were sold against 12,344 units, last
year. The quarterly production figures of the current year
and last year are given below:
Year Q1 Q2 Q3 Q4 Total April 2010 to March 2011 3,960 3,967 3,801 4,712 16,440
April 2009 to March 2010 2,440 2,880 2,985 3,675 11,980
Production and Sales (Units)
2007 2008 2009 2010 2011
Production Sales Units
18,2
40
18,7
09
15,0
80
15,6
04
12,7
80
12,5
02
11,9
80
12,3
44
16,4
40
16,4
67
Market Share (Units)
Honda Sales Honda Share %
2007 2008 2009 2010 2011
30%
29%
31%
23%
25%
15,6
04
18,7
09
12,5
02
12,3
44
16,4
67

24
The auto industry is considered as the mother of all
industries. When it flourishes, all ancillary industries
grow. However, favourable business environment and
consistency in economic policies are the pre-requisites
for the growth. Unlike other industries, automobile
industry has been experiencing frequent changes in auto
policies, which has hampered the growth momentum in
the past. In July 2010, the sale tax raised from 16% to 17%
coupled with the government softened the restrictions
on import of reconditioned and used cars. In December
last year, the age limit of used cars was increased from 3
years to 5 years under personal baggage, gift and transfer
of residence schemes. The depreciation allowance
was also increased from 50% to 60%. The fluctuation in
exchange rates and high inflation has also increased the
cost of doing business and the company shared this rise
in product costs with customers and revised the retail
price a couple of times during last fiscal year.
In January 2011, the company improved the Honda City
model with addition of front and rear seat arm rest, trunk
light and exhaust pipe finisher.

Honda Atlas Cars (Pakistan) LimitedAnnual Report 2011 25
Financial Results
The company has been facing dilemma of capacity
utilization for last couple of years. Soon after the capacity
expansion in 2007, the auto industry took u-turn and the
total market shrunk by more than 35% in the following
three years, till 2010. The fixed cost of capacity expansion
and decrease in production in the last three years, due
to economic recession, led to have negative impact on
profitability of the company. During the period under
review, the company focused on efforts to increase unit
sales, improve production efficiency and reduce expenses
to ease pressure on cash flow and minimize losses.
In the year under review, the company posted 38.9%
growth in sales. The net sales were Rs 22,026.1 million
against Rs 15,854.1 million last year. The cost of sales was
Rs 21,826.8 million against Rs 16,093.7 million, last year.
Thus, the company earned gross profit of Rs 199.3
million against gross loss of Rs 239.5 million in preceding
year. The improvement in gross profit was attributed
to better sales, cost reduction, improved production
efficiency and better ratio of Pak Rupee against US$ and
Japanese Yen.
Due to cumulative effect of all these efforts, the
company managed to minimize the loss before tax to
Rs 244.8 million, against Rs 987.9 million in the same
corresponding period last year.
Fixed Assets
2007 2008 2009 2010 2011
Fixed Asets - Cost Fixed Asets - Net
4,3414,010
5,406
4,594
3,945
5,83
2
5,97
9
7,78
3
7,78
6
7,82
1
Rs in
mill
ion
Depreciation
2007
458
2008
464
2009
522
2010
756
2011
654
Rs in
mill
ion
Finance Cost
Rs in
mill
ion
2007 2008 2009 2010 2011
305
234
223
455
152

26
During the year, the company contributed Rs 8.23 billion
towards the government exchequer in the form of
customs duty, sales tax and other levies. The accumulated
revenue contribution to the government exchequer,
since start of commercial production in 1994, increased
to Rs 61.65 billion.
Changes on the Board
Mr. Atsushi Yamazaki, former President and CEO of the
company, returned to Japan. He is succeeded by Mr.
Takeharu Aoki, The Board thanks Mr. Atsushi Yamazaki for
his services and welcome Mr. Takeharu Aoki on his new
assignment.¥ to $ Movement
Japa
nese
Yen
2007
118
2008
100
2009
98
2010
94
2011
83
Rs to $ Movement
Pak
Rupe
es
2007
61
2008
63
2009
80
2010
84
2011
86
Re to ¥ Movement
Pak
Rupe
es
2007
0.5
2008
0.6
2009
0.8
2010
0.9
2011
1.0
Contribution to National Exchequer
Rs in
mill
ion
2007 2008 2009 2010 2011
6,21
3
4,95
8
6,45
2
6,31
6
8,22
9

Honda Atlas Cars (Pakistan) LimitedAnnual Report 2011 27
Future Outlook
The State Bank has reserves of $17.5 billion. The
remittances are $ 1 billion per month. The current
account is surplus. The exports are getting ever highest
$ 22 billion. Agriculture sector will continue to grow. The
Pakistan economy on the whole is expected to grow 4%
in the fiscal year of 2012. The Japanese economy will
soon come up. I therefore foresee a bright future for your
company.
(We are determined to outgrow)
Acknowledgement
Japanese are a great nation. According to their track
record and with their traditional perseverance they will
overcome the catastrophic effects of unprecedented
earthquake and tsunami. I pride in Atlas-Honda
partnership. I would like to thank them for their help and
support to HACPL. I would also like to thank our valued
customers, dealers, vendors, financial institutions and
shareholders for their continued support to the company.
Mr. Takeharu Aoki, President & CEO of the company, with
his leadership, will overcome during the challenging
business environment with the staff members for their
commitment and continuous dedication.
Yusuf H. ShiraziChairman
Lahore, May 16, 2011
Long Term Debt to Equity
Tim
es
2007 2008 2009 2010 2011
0.2
0.5 0.5
0.8
1.0
Reserves and Share Capital
Rs in
mill
ion
2007 2008 2009 2010 2011
Reserve Share Capital
1,99
1
714
1,72
7
1,42
8
1,80
2
1,42
8
1,40
2
1,42
8
549
1,42
8

28
Directors’ Report
The directors feel pleasure to present you the Annual Audited Accounts of the company for the year ended March 31,
2011 together with the Auditors’ Report thereon.
Financial results for the year are as follows:
From Left to Right: Mr. Ayaz Mahmood (CFO), Mr. Yukimitsu Miyagi (Director & Vice President), Mr. Yusuf H. Shirazi (Chairman), Mr. Takeharu Aoki (CEO), Mr. Aamir H. Shirazi (Director), Mr. Sardar Abid Ali Khan (Vice President & Company Secretary)
* The Board of Directors has proposed these appropriations, which are not reflected in the financial statements in
compliance with the Fourth Schedule of the Companies Ordinance, 1984.
(Rupees in thousand) 2011 2010
Loss before tax for the year (244,827) (987,980)Taxation (53,625) 135,780
Loss after tax (298,452) (852,200)Accumulated loss brought forward (855) (1,655)
Accumulated loss (299,307) (853,855)
Appropriations *: Transfer from general reserves 299,000 853,000 Proposed dividend (2010: Nil) - -
299,000 853,000 Accumulated loss carried forward (307) (855) Loss per share – basic and diluted (Rupees) (2.09) (5.97)

Honda Atlas Cars (Pakistan) LimitedAnnual Report 2011 29
During the year, the Company incurred loss after tax of Rs. 298.4 million. The company took a number of countermeasures to reduce the loss for the year and as a result, the loss after tax was reduced by 65.0% over the corresponding period last year. The unit sale was increased by 33.4% over last year. The product price was revised to cover the fluctuation in exchange rate & inflationary pressures and the cost differential was passed on to the Customers. During the year, the company introduced new optional accessories in Honda Civic and Honda City. The changes were very well accepted by the customers and had positive impact on sales.
To strengthen the balance sheet, the long term liabilities were reduced and a total of Rs 833 million was payable on long term and short term loan against Rs 1,500 million last year, improved by 44.4%. However, the holding company, M/s Honda Motor Company, Japan through its associated company, continued to extend liquidity support in the form of credit payment on some of CKD material supplies. It has helped the company to reduce financial charges by 66.6% during the year.
After the recent floods and tsunami in Japan, the company expects some affect on CKD availability in current year. However, the company is trying to achieve as much as possible for the year.
Corporate & Financial Reporting Framework
In compliance with the provisions of the listing
regulations of Stock Exchanges, the Board members are
pleased to place the following statements on record:
• ThefinancialstatementsfortheyearendedMarch
31, 2011 present fairly its state of affairs, the results
of its operations, cash flow and changes in equity;
• Properbooksofaccountshavebeenmaintained;
• Appropriate accounting policies have been
consistently applied in preparation of financial
statements for the year ended March 31, 2011 and
accounting estimates are based on reasonable
and prudent judgment;
• International Accounting Standards (IAS), as
applicable in Pakistan, have been followed in
preparation of financial statements;
• Thesystemsofinternalcontrolissoundindesign
and has been effectively implemented and
monitored;
• There are no significant doubts about the
company’s ability to continue as a going concern;
• There has been no material departure from
the best practices of corporate governance, as
detailed in listing regulations;
• ThebookvaluesoftheEmployeesProvidentFund
and Employees Gratuity Fund as on March 31,
2011 were Rs. 128.6 million and Rs. 74.0 million
respectively.
• Thekeyoperatingandfinancialdata for last ten
years is given in this report.

30
The leave of absence was granted to the members not attending the Board meeting.
During the year, one casual vacancy occurred on the Board of Directors when Mr. Takeharu Aoki replaced Mr. Atsushi Yamazaki on March 01, 2011.
Last year, Shirazi Family, local sponsors of this project, had decided to institutionalize its 30% shareholding in the company. In this context, a total of 8,703,000 shares were transferred to the wholly owned subsidiary company, M/s Shirazi Capital (Pvt.) Limited in March 2010.
To complete the transaction, a total number of 2,091,000 shares of Mr. Yusuf H Shirazi and 2,058,000 shares of Mr. Aamir H. Shirazi were transferred in the name of M/s Shirazi Investments (Private) Limited in June 2010. However, to maintain the minimum qualification shares, 500 shares each were transferred in the name of Mr. Yusuf H. Shirazi and Mr. Aamir H. Shirazi.
Further, following the change of President/CEO of company, 525 shares were transferred in the name of Mr. Takeharu Aoki in March 2011. There was no other reported transaction by Company Secretary, Chief Financial
Board Meetings
During the year under review, four meetings of the Board of Directors were held from April 01, 2010 to March 31, 2011. The attendance of the Board members was as follows:
Sr. No Name of Director No of Meetings attended
1. Mr. Yusuf H. Shirazi 4
2. Mr. Atsushi Yamazaki* 3
3. Mr. Aamir H. Shirazi 4
4. Mr. Jawaid Iqbal Ahmed 4
5. Mr. Shigeru Yamazaki -
6. Mr. Takashi Nagai 1
7. Mr. Yukimitsu Miyagi 4
Mr. Sardar Abid Ali Khan (Company Secretary) 4
Mr. Ayaz Mahmood** (CFO) 2
Mr. Asad Murad (CFO) 2
* Mr. Atsushi Yamazaki has retired on March 01, 2011 & Mr. Takeharu Aoki joined as his successor.
** Mr. Ayaz Mahmood appointed as CFO in place of Mr. Asad Murad who has resigned on October 14, 2010.
Officer (CFO) and their spouses or minor children except mentioned there above.
The Board approved remuneration of Chairman and Company Secretary at Rs. 13.50 million and Rs. 9.45 million (2010: Rs 11.85 million and Rs 8.40 million) respectively, which includes allowances and other benefits as per terms of their employment, for the year ended March 31, 2011.
President/CEO will be paid an amount of Rs. 7.50 million (2010: Rs 10.50 million) and one full-time director will be paid an amount of Rs. 16.65 million (2010: Rs 16.00 million for one director), which includes allowances and other benefits as per terms of their employment, for the year ended March 31, 2011.
Audit Committee
The Audit Committee held eight meetings during the year under review, each before the Board of Directors meeting to review the financial statements, internal audit reports and compliance of the Corporate Governance requirements. These meetings included meeting with external auditors before and after completion of audit

Honda Atlas Cars (Pakistan) LimitedAnnual Report 2011 31
and other statutory meeting as required by the code of corporate governance.
Honda Code of Corporate Governance
The company continued to comply with the requirements of the Honda Code of Corporate Governance (HCG), based on the fundamental corporate philosophy of Honda. In February 2011, Honda Motor Company conducted the audit of HCG activities and was given satisfactory report.
Chairman’s Review
The accompanied Chairman’s review deals with the performance of the company during the year and future outlook. The directors of the company endorse the contents of the review.
Holding Company
M/s Honda Motor Company Limited is the holding company with 51% shares and is incorporated in Japan.
Statement of Compliance with the Code of Corporate Governance
The company has fully complied with the requirements of the Code of Corporate Governance as contained in the Listing Regulations of the Stock Exchanges. A statement to this effect is annexed with this report.
Pattern of Shareholding
The pattern of shareholding as on March 31, 2011 and its disclosure, as required by the Code of Corporate Governance is annexed with this report.
Auditors
As recommended by the Audit Committee, the present auditors Messer’s A. F. Ferguson & Co., Chartered Accountants, retire and being eligible, offer themselves for re-appointment for the year ending March 31, 2012.
For and on behalf of The Board of Directors
Takeharu AokiPresident / Chief ExecutiveLahore: May 16, 2011

32
This statement is being presented to comply with the Code of Corporate Governance in the listing regulations of Karachi, Lahore & Islamabad Stock Exchanges for the purpose of establishing a framework of good governance, whereby a listed company is managed in compliance with the best practices of corporate governance.
The company has applied the principles contained in the Code in the following manner:
1. The company encourages the representation of independent non-executive directors on its Board of Directors. As on March 31, 2011, the Board included four independent non-executive directors. However, there is no representation of minority shareholders on the Board.
2. The directors have confirmed that none of them is serving as a director in more than ten listed companies, including this company.
3. All the resident directors of the company are registered as taxpayers and none of them has defaulted in payment of any loan to a banking company, a DFI or an NBFI or, being a member of
Statement of Compliance with the Code of Corporate Governance
stock exchange, has been declared as a defaulter by that stock exchange.
4. One casual vacancy occurred in the Board of Directors from April 01, 2010 to March 31, 2011 was filled up by the Directors within 30 days thereof.
5. The company has prepared a ‘Statement of Ethics and Business Practices’ which has been signed by all the directors and employees of the company.
6. The Board has developed a vision statement, overall corporate strategy and significant policies of the company. A complete record of particulars of significant policies along with the date on which they were approved or amended has been maintained.
7. All the powers of the Board have been duly exercised and decisions on material transactions, including appointment and determination of remuneration and terms and conditions of employment of the Chief Executive Officer (CEO) and other executive directors, have been taken by the Board.

Honda Atlas Cars (Pakistan) LimitedAnnual Report 2011 33
8. The meetings of the Board were presided over by the Chairman and the Board met at least once in every quarter. Written notices of the Board meetings, along with agenda and working papers, were circulated at least seven days before the meetings. The minutes of the meetings were appropriately recorded and circulated.
9. The company provided information to foreign resident directors of their duties and responsibilities. Other directors of the company, being directors of other local companies have adequate exposure of corporate matters and are already aware of their duties and responsibilities.
10. The company intends to nominate its Directors, one by one, to the Board Development Series Certification Program of Pakistan Institute of Corporate governance that will become mandatory effective June 2011.
11. There was no change in the position of Company Secretary while the position of Chief Financial Officer (CFO), having become vacant during the year, and position of Head of internal audit vacated during last year were filled during the year in accordance with the provisions of Code of Corporate Governance.
12. The directors’ report for the year ended March 31, 2011 has been prepared in compliance with the requirements of the Code and fully describes the salient matters required to be disclosed.
13. The financial statements of the company were duly endorsed by CEO and CFO before approval of the Board.
14. The directors, CEO and executives do not hold any interest in the shares of the company other than that disclosed in the pattern of shareholding.
15. The company has complied with all the corporate and financial reporting requirements of the Code.
16. The Board has already formed an Audit Committee in its meeting on June 07, 2002. It comprises of five members of whom three are non-executive directors including the Chairman of the Committee.
17. The meetings of the Audit Committee were held at least once every quarter prior to the approval of interim and final results of the Company as required by the Code. The Board has already approved the terms of references of the committee on April 15, 2003 for compliance.
18. The Board has set up an effective internal audit function manned by suitably qualified and experienced personnel who are conversant with the policies and procedures of the company and are involved in the internal audit function on full time basis.
19. The statutory auditors of the company have confirmed that they have been given satisfactory rating under the quality control review program of the Institute of Chartered Accountants of Pakistan, that they or any of the partners of the firm, their spouses and minor children do not hold shares of the Company and that the firm and all its partners are in compliance with International Federation of Accountants (IFAC) guidelines on code of ethics as adopted by Institute of Chartered Accountants of Pakistan.
20. The statutory auditors or the persons associated with them have not been appointed to provide other services except in accordance with the listing regulations and the auditors have confirmed that they have observed IFAC guidelines in this regard.
21. We confirm that all other material principles contained in the Code have been complied with.
(Takeharu Aoki)President / CEOLahore, May 16, 2011

34

Honda Atlas Cars (Pakistan) LimitedAnnual Report 2011 35
Auditors’ Review Report to the Memberson Statement of Compliance with Best Practices of Code of Corporate Governance
We have reviewed the Statement of Compliance with
the best practices contained in the Code of Corporate
Governance prepared by the Board of Directors of Honda
Atlas Cars (Pakistan) Limited to comply with the Listing
Regulation No. 35 of the Karachi, Lahore and Islamabad
Stock Exchanges, where the company is listed.
The responsibility for compliance with the Code of
Corporate Governance is that of the Board of Directors of
the company. Our responsibility is to review, to the extent
where such compliance can be objectively verified,
whether the Statement of Compliance reflects the status
of the company’s compliance with the provisions of the
Code of Corporate Governance and report if it does not.
A review is limited primarily to inquiries of the company
personnel and review of various documents prepared by
the company to comply with the Code.
As part of our audit of financial statements we are
required to obtain an understanding of the accounting
and internal control systems sufficient to plan the audit
and develop an effective audit approach. We are not
required to consider whether the Board’s statement on
internal control covers all risks and controls, or to form
an opinion on the effectiveness of such internal controls,
the company’s corporate governance procedures and
risks.
Further, Sub-Regulation (xiii a) of Listing Regulations
35 notified by the Karachi, Lahore and Islamabad Stock
Exchanges vide circular KSE/N-269 dated January 19,
2009 requires the Company to place before the Board
of Directors for their consideration and approval related
party transactions distinguishing between transactions
carried out on terms equivalent to those that prevail in
arm’s length transactions and transactions which are
not executed at arm’s length price, recording proper
justification for using such alternate pricing mechanism.
Further, all such transactions are also required to be
separately placed before the audit committee. We
are only required and have ensured compliance of
requirement to the extent of approval of related party
transactions by the Board of Directors and placement of
such transactions before the audit committee.
We have not carried out any procedure to determine
whether the related party transactions were undertaken
at arm’s length price or not.
Based on our review, nothing has come to our attention
which causes us to believe that the Statement of
Compliance does not appropriately reflect the
company’s compliance, in all material respects, with
the best practices contained in the Code of Corporate
Governance as applicable to the Company for the year
ended March 31, 2011.
A.F. Ferguson & Co.
Chartered Accountants
Lahore: May 16, 2011
Engagement Partner: Muhammad Masood

36
Year at a Glance(Rupees in million) 2011 2010
Sales 22,026 15,854 Gross profit / (loss) 199 (240) Operating loss (93) (533) Loss before tax (245) (988) Loss after tax (298) (852) Shareholders’ equity 1,677 1,976 Capital expenditure 55 29 Total assets 10,573 8,946 Working capital (2,816) (2,125)
Break up value per share Rs 12 14 Market value per share Rs 10 16 Contribution to national exchequer Rs in million 8,229 6,316 Units produced Units 16,440 11,980 Units sold Units 16,467 12,344 Manpower Nos. 975 857 Exchange rates at year end date ¥ to $ ¥ 83.01 93.53 Rs to $ Rs 85.50 84.18 Rs to ¥ Rs 1.03 0.90
Mar
-09
Jun-
09
Jun-
10
Sep-
09
Dec
-09
Dec
-10
Mar
-10
Sep-
10
Mar
-11
Rs to $ Movement
90
75
80
85
Mar
-09
Jun-
09
Jun-
10
Sep-
09
Dec
-09
Dec
-10
Mar
-10
Sep-
10
Mar
-11
Rs to ¥ Movement
0.75
0.85
0.95
1.05
Apr
May
Sep
Jun
Jul
Nov
Aug
Oct
Dec
Jan
Feb
Mar
Cumulative Production Units20,000
17,500
15,000
12,500
10,000
7,500
5,000
2,500
2010 2011
Apr
May
Sep
Jun
Jul
Nov
Aug
Oct
Dec
Jan
Feb
Mar
Cumulative Sales Units20,000
17,500
15,000
12,500
10,000
7,500
5,000
2,500
2010 2011

Honda Atlas Cars (Pakistan) LimitedAnnual Report 2011 37
Revenue Application
68%
5%
2%
29%
-4%
0%
March 31, 2010
Product cost Other costs Employees
Government Shareholders Utilized from revenue reserve
68%
3%
1%
29%
-1%
0%
March 31, 2011
Product cost Other costs Employees
Government Shareholders Utilized from revenue reserve
(Rupees in thousand) 2011 2010
REVENUE
Gross sales 26,472,067 19,057,852 Other income 83,977 26,368 Total 26,556,044 19,084,220 Application Product Cost Cost of sales 18,018,212 13,087,927 (excluding employees’ remuneration and government levies) Other costs Operating expenses 230,196 195,130 (excluding employees’ remuneration) Dealers’ commission 438,269 333,771 Financial charges 152,255 455,128
820,720 984,029 Employees’ remuneration 373,376 361,062 Government WWF 2,130 2,762 Sales tax and excise duties 4,007,689 2,869,939 Custom duties 3,578,744 2,766,481 Income tax 53,625 (135,780)
7,642,188 5,503,402 Shareholders Dividend - - Utilized from revenue reserve (298,452) (852,200) Revenue 26,556,044 19,084,220
Application (%) Product cost 68 68 Other costs 3 5 Employees 1 2 Government 29 29 Shareholders 0 0 Utilized from revenue reserve (1) (4) 100 100

38
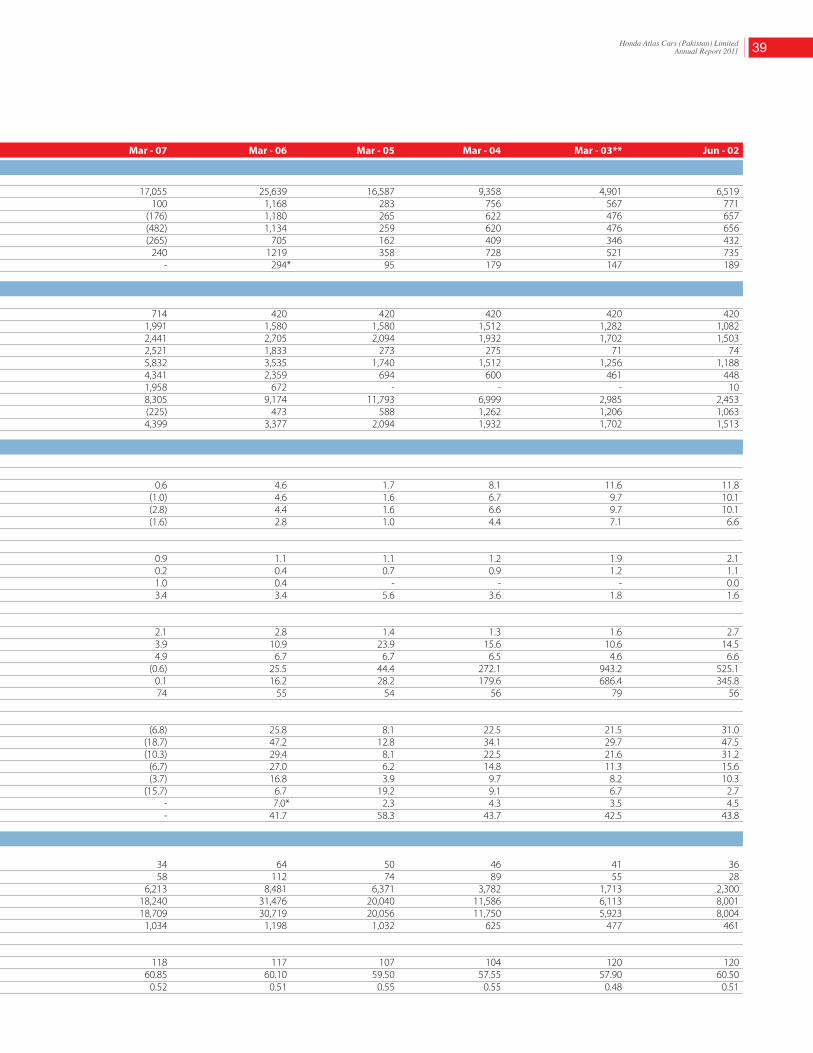
Financial Highlights Mar - 11 Mar - 10 Mar - 09 Mar - 08 Mar - 07 Mar - 06 Mar - 05 Mar - 04 Mar - 03** Jun - 02 Profit and Loss Account R s i n m i l l i o n Sales 22,026 15,854 14,150 14,715 17,055 25,639 16,587 9,358 4,901 6,519 Gross profit / (loss) 199 (240) 177 627 100 1,168 283 756 567 771 Operating (loss) / profit (93) (533) (400) 297 (176) 1,180 265 622 476 657 (Loss) / profit before tax (245) (988) (622) 64 (482) 1,134 259 620 476 656 (Loss) / profit after tax (298) (852) (402) 75 (265) 705 162 409 346 432 EBITDA 579 273 140 783 240 1219 358 728 521 735 Proposed dividend - - - - - 294* 95 179 147 189 Balance Sheet R s i n m i l l i o n Share capital 1,428 1,428 1,428 1,428 # 714 420 420 420 420 420 Reserves 549 1,402 1,802 1,727 1,991 1,580 1,580 1,512 1,282 1,082 Shareholders’ equity 1,677 1,976 2,828 3,230 2,441 2,705 2,094 1,932 1,702 1,503 Capital expenditure 55 29 2,129 188 2,521 1,833 273 275 71 74 Fixed assets - at cost 7,821 7,786 7,783 5,979 5,832 3,535 1,740 1,512 1,256 1,188 Fixed assets - net 3,945 4,594 5,406 4,010 4,341 2,359 694 600 461 448 Non current liabilities 417 1,333 1,500 500 1,958 672 - - - 10 Total assets 10,573 8,946 9,942 6,817 8,305 9,174 11,793 6,999 2,985 2,453 Working capital (2,816) (2,125) (1,685) (652) (225) 473 588 1,262 1,206 1,063 Capital employed 2,094 3,309 4,328 3,730 4,399 3,377 2,094 1,932 1,702 1,513 Significant Ratios Profitability Gross profit / (loss) margin % 0.9 (1.5) 1.2 4.3 0.6 4.6 1.7 8.1 11.6 11.8 Operating (loss) / profit margin % (0.4) (3.4) (2.8) 2.0 (1.0) 4.6 1.6 6.7 9.7 10.1 (Loss) / profit before tax % (1.1) (6.2) (4.4) 0.4 (2.8) 4.4 1.6 6.6 9.7 10.1 (Loss) / profit after tax % (1.4) (5.4) (2.8) 0.5 (1.6) 2.8 1.0 4.4 7.1 6.6 Liquidity Current ratio Times 0.7 0.6 0.7 0.8 0.9 1.1 1.1 1.2 1.9 2.1 Quick ratio Times 0.2 0.2 0.2 0.2 0.2 0.4 0.7 0.9 1.2 1.1 Long term debt to equity Times 0.5 0.8 0.5 0.2 1.0 0.4 - - - 0.0 Total liabilities to equity Times 6.3 4.5 3.5 2.1 3.4 3.4 5.6 3.6 1.8 1.6 Activity Total assets turnover Times 2.1 1.8 1.4 2.2 2.1 2.8 1.4 1.3 1.6 2.7 Fixed assets turnover Times 5.6 3.5 2.6 3.7 3.9 10.9 23.9 15.6 10.6 14.5 Stock turnover Times 7.6 6.1 6.1 6.5 4.9 6.7 6.7 6.5 4.6 6.6 Interest cover (BT) Times (0.6) (1.2) (1.8) 1.3 (0.6) 25.5 44.4 272.1 943.2 525.1 Interest cover (AT) Times (1.0) (0.9) (0.8) 1.3 0.1 16.2 28.2 179.6 686.4 345.8 Number of days stock Days 48 60 60 56 74 55 54 56 79 56 Earning Return on capital employed % (11.0) (22.3) (10.0) 1.8 (6.8) 25.8 8.1 22.5 21.5 31.0 Return on equity (BT) % (13.4) (41.1) (20.5) 2.2 (18.7) 47.2 12.8 34.1 29.7 47.5 Return on equity (AT) % (16.3) (35.5) (13.3) 2.6 (10.3) 29.4 8.1 22.5 21.6 31.2 (Loss) / earning per share (BT) Rs. (1.7) (6.9) (4.4) 0.5 (6.7) 27.0 6.2 14.8 11.3 15.6 (Loss) / earning per share (AT) Rs. (2.1) (6.0) (2.8) 0.5 (3.7) 16.8 3.9 9.7 8.2 10.3 Price earning ratio (AT) Times (4.8) (2.7) (4.4) 79.3 (15.7) 6.7 19.2 9.1 6.7 2.7 Dividend per ordinary share Rs. - - - - - 7.0* 2.3 4.3 3.5 4.5 Dividend pay out ratio % - - - - - 41.7 58.3 43.7 42.5 43.8 Other Information Break up value per share Rs. 12 14 20 23 34 64 50 46 41 36 Market value per share Rs. 10 16 12 44 58 112 74 89 55 28 Contribution to national exchequer Rs in M 8,229 6,316 6,452 4,958 6,213 8,481 6,371 3,782 1,713 2,300 Units produced Units 16,440 11,980 12,780 15,080 18,240 31,476 20,040 11,586 6,113 8,001 Units sold Units 16,467 12,344 12,502 15,604 18,709 30,719 20,056 11,750 5,923 8,004 Manpower Nos. 975 857 955 946 1,034 1,198 1,032 625 477 461 Exchange rates at year end date ¥ to $ ¥ 83 94 98 100 118 117 107 104 120 120 Rs to $ Rs. 85.50 84.18 80.45 62.77 60.85 60.10 59.50 57.55 57.90 60.50 Rs to ¥ Rs. 1.03 0.90 0.82 0.63 0.52 0.51 0.55 0.55 0.48 0.51
* Bonus shares - ** March-03 - Data for 9 months - # Issue of 100% right shares
Honda Atlas Cars (Pakistan) LimitedAnnual Report 2011 39
Mar - 11 Mar - 10 Mar - 09 Mar - 08 Mar - 07 Mar - 06 Mar - 05 Mar - 04 Mar - 03** Jun - 02 Profit and Loss Account R s i n m i l l i o n Sales 22,026 15,854 14,150 14,715 17,055 25,639 16,587 9,358 4,901 6,519 Gross profit / (loss) 199 (240) 177 627 100 1,168 283 756 567 771 Operating (loss) / profit (93) (533) (400) 297 (176) 1,180 265 622 476 657 (Loss) / profit before tax (245) (988) (622) 64 (482) 1,134 259 620 476 656 (Loss) / profit after tax (298) (852) (402) 75 (265) 705 162 409 346 432 EBITDA 579 273 140 783 240 1219 358 728 521 735 Proposed dividend - - - - - 294* 95 179 147 189 Balance Sheet R s i n m i l l i o n Share capital 1,428 1,428 1,428 1,428 # 714 420 420 420 420 420 Reserves 549 1,402 1,802 1,727 1,991 1,580 1,580 1,512 1,282 1,082 Shareholders’ equity 1,677 1,976 2,828 3,230 2,441 2,705 2,094 1,932 1,702 1,503 Capital expenditure 55 29 2,129 188 2,521 1,833 273 275 71 74 Fixed assets - at cost 7,821 7,786 7,783 5,979 5,832 3,535 1,740 1,512 1,256 1,188 Fixed assets - net 3,945 4,594 5,406 4,010 4,341 2,359 694 600 461 448 Non current liabilities 417 1,333 1,500 500 1,958 672 - - - 10 Total assets 10,573 8,946 9,942 6,817 8,305 9,174 11,793 6,999 2,985 2,453 Working capital (2,816) (2,125) (1,685) (652) (225) 473 588 1,262 1,206 1,063 Capital employed 2,094 3,309 4,328 3,730 4,399 3,377 2,094 1,932 1,702 1,513 Significant Ratios Profitability Gross profit / (loss) margin % 0.9 (1.5) 1.2 4.3 0.6 4.6 1.7 8.1 11.6 11.8 Operating (loss) / profit margin % (0.4) (3.4) (2.8) 2.0 (1.0) 4.6 1.6 6.7 9.7 10.1 (Loss) / profit before tax % (1.1) (6.2) (4.4) 0.4 (2.8) 4.4 1.6 6.6 9.7 10.1 (Loss) / profit after tax % (1.4) (5.4) (2.8) 0.5 (1.6) 2.8 1.0 4.4 7.1 6.6 Liquidity Current ratio Times 0.7 0.6 0.7 0.8 0.9 1.1 1.1 1.2 1.9 2.1 Quick ratio Times 0.2 0.2 0.2 0.2 0.2 0.4 0.7 0.9 1.2 1.1 Long term debt to equity Times 0.5 0.8 0.5 0.2 1.0 0.4 - - - 0.0 Total liabilities to equity Times 6.3 4.5 3.5 2.1 3.4 3.4 5.6 3.6 1.8 1.6 Activity Total assets turnover Times 2.1 1.8 1.4 2.2 2.1 2.8 1.4 1.3 1.6 2.7 Fixed assets turnover Times 5.6 3.5 2.6 3.7 3.9 10.9 23.9 15.6 10.6 14.5 Stock turnover Times 7.6 6.1 6.1 6.5 4.9 6.7 6.7 6.5 4.6 6.6 Interest cover (BT) Times (0.6) (1.2) (1.8) 1.3 (0.6) 25.5 44.4 272.1 943.2 525.1 Interest cover (AT) Times (1.0) (0.9) (0.8) 1.3 0.1 16.2 28.2 179.6 686.4 345.8 Number of days stock Days 48 60 60 56 74 55 54 56 79 56 Earning Return on capital employed % (11.0) (22.3) (10.0) 1.8 (6.8) 25.8 8.1 22.5 21.5 31.0 Return on equity (BT) % (13.4) (41.1) (20.5) 2.2 (18.7) 47.2 12.8 34.1 29.7 47.5 Return on equity (AT) % (16.3) (35.5) (13.3) 2.6 (10.3) 29.4 8.1 22.5 21.6 31.2 (Loss) / earning per share (BT) Rs. (1.7) (6.9) (4.4) 0.5 (6.7) 27.0 6.2 14.8 11.3 15.6 (Loss) / earning per share (AT) Rs. (2.1) (6.0) (2.8) 0.5 (3.7) 16.8 3.9 9.7 8.2 10.3 Price earning ratio (AT) Times (4.8) (2.7) (4.4) 79.3 (15.7) 6.7 19.2 9.1 6.7 2.7 Dividend per ordinary share Rs. - - - - - 7.0* 2.3 4.3 3.5 4.5 Dividend pay out ratio % - - - - - 41.7 58.3 43.7 42.5 43.8 Other Information Break up value per share Rs. 12 14 20 23 34 64 50 46 41 36 Market value per share Rs. 10 16 12 44 58 112 74 89 55 28 Contribution to national exchequer Rs in M 8,229 6,316 6,452 4,958 6,213 8,481 6,371 3,782 1,713 2,300 Units produced Units 16,440 11,980 12,780 15,080 18,240 31,476 20,040 11,586 6,113 8,001 Units sold Units 16,467 12,344 12,502 15,604 18,709 30,719 20,056 11,750 5,923 8,004 Manpower Nos. 975 857 955 946 1,034 1,198 1,032 625 477 461 Exchange rates at year end date ¥ to $ ¥ 83 94 98 100 118 117 107 104 120 120 Rs to $ Rs. 85.50 84.18 80.45 62.77 60.85 60.10 59.50 57.55 57.90 60.50 Rs to ¥ Rs. 1.03 0.90 0.82 0.63 0.52 0.51 0.55 0.55 0.48 0.51
* Bonus shares - ** March-03 - Data for 9 months - # Issue of 100% right shares

40
Horizontal Analysis 2011 2010 2009 2008 2007 2006 2011 2010 2009 2008 2007 vs vs vs vs vs(Rupees in thousand) 2010 2009 2008 2007 2006 % % % % %
BALANCE SHEET
EQUITY AND LIABILITIES
SHARE CAPITAL AND RESERVES
Issued, subscribed and paid up capital 1,428,000 1,428,000 1,428,000 1,428,000 714,000 420,000 - - - 100.00 70.00
Reserves 548,500 1,401,500 1,801,500 1,727,000 1,991,000 1,579,500 (60.86) (22.20) 4.31 (13.26) 26.05
(Accumulated loss) / unappropriated profit (299,307) (853,855) (401,655) 74,678 (264,332) 705,708 (64.95) 112.58 (637.85) (128.25) (137.46)
NON-CURRENT LIABILITIES
Long-term finances - secured 416,667 1,333,333 1,500,000 500,000 1,958,334 666,667 (68.75) (11.11) 200.00 (74.47) 193.75
Deferred taxation - - - - - 5,428 - - - - -
CURRENT LIABILITIES
Current portion of long-term finances 416,667 166,667 - - 583,333 333,333 150.00 100.00 - (100.00) 75.00
Short term borrowings - secured - - 2,151,601 - - 1,454,873 - (100.00) 100.00 - (100.00)
Mark-up accrued on loans and other payables 4,302 37,400 75,048 32,029 39,627 15,719 (88.50) (50.17) 134.31 (19.17) 152.10
Trade and other payables 8,058,598 5,432,738 3,387,594 3,055,037 3,283,155 3,993,047 48.33 60.37 10.89 (6.95) (17.78)
10,573,427 8,945,783 9,942,088 6,816,744 8,305,117 9,174,275 18.19 (10.02) 45.85 (17.92) (9.47)
ASSETS
NON-CURRENT ASSETS
Property, plant and equipment 3,847,016 4,445,810 5,190,535 3,864,527 4,082,955 1,051,723 (13.47) (14.35) 34.31 (5.35) 288.22
Intangible assets 87,023 125,988 195,830 64,636 65,903 33,202 (30.93) (35.66) 202.97 (1.92) 98.49
Capital work-in-progress 11,448 21,813 19,226 80,746 191,842 1,274,230 (47.52) 13.46 (76.19) (57.91) (84.94)
Long term Investments - - - - - 509,039 - - - - (100.00)
Long term loans and advances 33,532 33,896 31,503 29,050 28,105 34,074 (1.07) 7.60 8.44 3.36 (17.52)
Long term deposits 4,042 4,042 4,042 4,091 4,091 2,089 - - (1.20) - 95.84
Deferred taxation 926,746 802,914 571,214 338,165 251,008 - 15.42 40.56 68.92 34.72 100.00
CURRENT ASSETS
Stores and spares 106,039 121,368 101,942 83,101 50,316 29,736 (12.63) 19.06 22.67 65.16 69.21
Stock-in-trade 3,443,054 2,329,161 2,954,091 1,612,696 2,704,946 4,169,120 47.82 (21.15) 83.18 (40.38) (35.12)
Short term investments - - - - - 634,843 - - - - (100.00)
Advances, prepayments and other receivables 1,245,786 978,745 853,218 507,852 706,092 1,075,600 27.28 14.71 68.01 (28.08) (34.35)
Cash and bank balances 868,741 82,046 20,487 231,880 219,859 360,619 958.85 300.48 (91.16) 5.47 (39.03)
10,573,427 8,945,783 9,942,088 6,816,744 8,305,117 9,174,275 18.19 (10.02) 45.85 (17.92) (9.47)
PROFIT AND LOSS ACCOUNT
Sales 22,026,109 15,854,142 14,149,646 14,715,495 17,055,115 25,638,698 38.93 12.05 (3.85) (13.72) (33.48)
Cost of sales (21,826,799) (16,093,687) (13,973,144) (14,088,001) (16,955,181) (24,471,184) 35.62 15.18 (0.82) (16.91) (30.71)
Gross profit / (loss) 199,310 (239,545) 176,502 627,494 99,934 1,167,514 (183.20) (235.72) (71.87) 527.91 (91.44)
Distribution and marketing costs (139,185) (124,916) (190,088) (209,677) (214,889) (149,877) 11.42 (34.29) (9.34) (2.43) 43.38
Administrative expenses (171,729) (136,131) (139,749) (139,163) (147,274) (134,518) 26.15 (2.59) 0.42 (5.51) 9.48
Other operating income 83,977 26,368 64,844 23,589 150,585 377,865 218.48 (59.34) 174.89 (84.34) (60.15)
Other operating expenses (64,945) (58,628) (311,025) (4,975) (64,514) (80,924) 10.77 (81.15) 6,151.76 (92.29) (20.28)
(291,882) (293,307) (576,018) (330,226) (276,092) 12,546 (0.49) (49.08) 74.43 19.61 (2,300.64)
(Loss) / Profit from operations (92,572) (532,852) (399,516) 297,268 (176,158) 1,180,060 (82.63) 33.37 (234.40) (268.75) (114.93)
Finance cost (152,255) (455,128) (222,769) (233,651) (305,491) (46,356) (66.55) 104.30 (4.66) (23.52) 559.01
(Loss) / Profit before taxation (244,827) (987,980) (622,285) 63,617 (481,649) 1,133,704 (75.22) 58.77 (1,078.17) (113.21) (142.48)
Taxation (53,625) 135,780 220,452 11,393 217,109 (428,410) (139.49) (38.41) 1,834.93 (94.75) (150.68)
(Loss)/Profit after taxation (298,452) (852,200) (401,833) 75,010 (264,540) 705,294 (64.98) 112.08 (635.70) (128.36) (137.51)

Honda Atlas Cars (Pakistan) LimitedAnnual Report 2011 41
Vertical Analysis 2011 2010 2009 2008 2007 2011 2010 2009 2008 2007 (Rupees in thousand) % % % % %
BALANCE SHEET
EQUITY AND LIABILITIES
SHARE CAPITAL AND RESERVES
Issued, subscribed and paid up capital 1,428,000 1,428,000 1,428,000 1,428,000 714,000 13.51 15.96 14.36 20.95 8.60
Reserves 548,500 1,401,500 1,801,500 1,727,000 1,991,000 5.19 15.67 18.12 25.33 23.97
(Accumulated loss) / unappropriated profit (299,307) (853,855) (401,655) 74,678 (264,332) (2.83) (9.54) (4.04) 1.10 (3.18)
NON-CURRENT LIABILITIES
Long-term finances - secured 416,667 1,333,333 1,500,000 500,000 1,958,334 3.94 14.90 15.10 7.33 23.58
CURRENT LIABILITIES
Current portion of long-term finances 416,667 166,667 - - 583,333 3.94 1.86 - - 7.02
Short term borrowings - secured - - 2,151,601 - - - - 21.64 - -
Mark-up accrued on loans and other payables 4,302 37,400 75,048 32,029 39,627 0.04 0.42 0.75 0.47 0.48
Trade and other payables 8,058,598 5,432,738 3,387,594 3,055,037 3,283,155 76.22 60.73 34.07 44.82 39.53
10,573,427 8,945,783 9,942,088 6,816,744 8,305,117 100.00 100.00 100.00 100.00 100.00
ASSETS
NON-CURRENT ASSETS
Property, plant and equipment 3,847,016 4,445,810 5,190,535 3,864,527 4,082,955 36.38 49.69 52.21 56.69 49.16
Intangible assets 87,023 125,988 195,830 64,636 65,903 0.82 1.41 1.97 0.95 0.79
Capital work-in-progress 11,448 21,813 19,226 80,746 191,842 0.11 0.24 0.19 1.18 2.31
Long term loans and advances 33,532 33,896 31,503 29,050 28,105 0.32 0.38 0.31 0.43 0.34
Long term deposits 4,042 4,042 4,042 4,091 4,091 0.04 0.05 0.04 0.06 0.05
Deferred taxation 926,746 802,914 571,214 338,165 251,008 8.76 8.98 5.75 4.96 3.02
CURRENT ASSETS
Stores and spares 106,039 121,368 101,942 83,101 50,316 1.01 1.35 1.03 1.22 0.61
Stock-in-trade 3,443,054 2,329,161 2,954,091 1,612,696 2,704,946 32.56 26.03 29.71 23.66 32.57
Advances, prepayments and other receivables 1,245,786 978,745 853,218 507,852 706,092 11.78 10.95 8.58 7.45 8.50
Cash and bank balances 868,741 82,046 20,487 231,880 219,859 8.22 0.92 0.21 3.40 2.65
10,573,427 8,945,783 9,942,088 6,816,744 8,305,117 100.00 100.00 100.00 100.00 100.00
PROFIT AND LOSS ACCOUNT
Sales 22,026,109 15,854,142 14,149,646 14,715,495 17,055,115 100.00 100.00 100.00 100.00 100.00
Cost of sales (21,826,799) (16,093,687) (13,973,144) (14,088,001) (16,955,181) (99.10) (101.51) (98.75) (95.74) (99.41)
Gross profit / (loss) 199,310 (239,545) 176,502 627,494 99,934 0.90 (1.51) 1.25 4.26 0.59
Distribution and marketing costs (139,185) (124,916) (190,088) (209,677) (214,889) (0.63) (0.79) (1.34) (1.42) (1.26)
Administrative expenses (171,729) (136,131) (139,749) (139,163) (147,274) (0.78) (0.86) (0.99) (0.95) (0.86)
Other operating income 83,977 26,368 64,844 23,589 150,585 0.38 0.17 0.46 0.16 0.88
Other operating expenses (64,945) (58,628) (311,025) (4,975) (64,514) (0.29) (0.37) (2.20) (0.03) (0.38)
(291,882) (293,307) (576,018) (330,226) (276,092) (1.32) (1.85) (4.07) (2.24) (1.62)
(Loss) / Profit from operations (92,572) (532,852) (399,516) 297,268 (176,158) (0.42) (3.36) (2.82) 2.02 (1.03)
Finance cost (152,255) (455,128) (222,769) (233,651) (305,491) (0.69) (2.87) (1.58) (1.59) (1.79)
(Loss) / Profit before taxation (244,827) (987,980) (622,285) 63,617 (481,649) (1.11) (6.23) (4.40) 0.43 (2.82)
Taxation (53,625) 135,780 220,452 11,393 217,109 ( 0.24) 0.86 1.56 0.08 1.27
(Loss)/Profit after taxation (298,452) (852,200) (401,833) 75,010 (264,540) (1.35) (5.37) (2.84) 0.51 (1.55)

44
Balance Sheet as at March 31, 2011
EQUITY AND LIABILITIES
SHARE CAPITAL AND RESERVES
Authorized capital
200,000,000 (2010: 200,000,000)
ordinary shares of Rs 10 each 2,000,000 2,000,000
Issued, subscribed and paid up capital
142,800,000 (2010: 142,800,000)
ordinary shares of Rs 10 each 5 1,428,000 1,428,000
Reserves 6 548,500 1,401,500
Accumulated loss (299,307) (853,855)
1,677,193 1,975,645
NON-CURRENT LIABILITIES
Long-term finances - secured 7 416,667 1,333,333
CURRENT LIABILITIES
Current portion of long term finances 7 416,667 166,667
Short term running finance - secured 8 - -
Mark-up accrued on borrowings 4,302 37,400
Trade and other payables 9 8,058,598 5,432,738
8,479,567 5,636,805
CONTINGENCIES AND COMMITMENTS 10
10,573,427 8,945,783
(Rupees in thousand) Note 2011 2010
Balance Sheet as at March 31, 2011
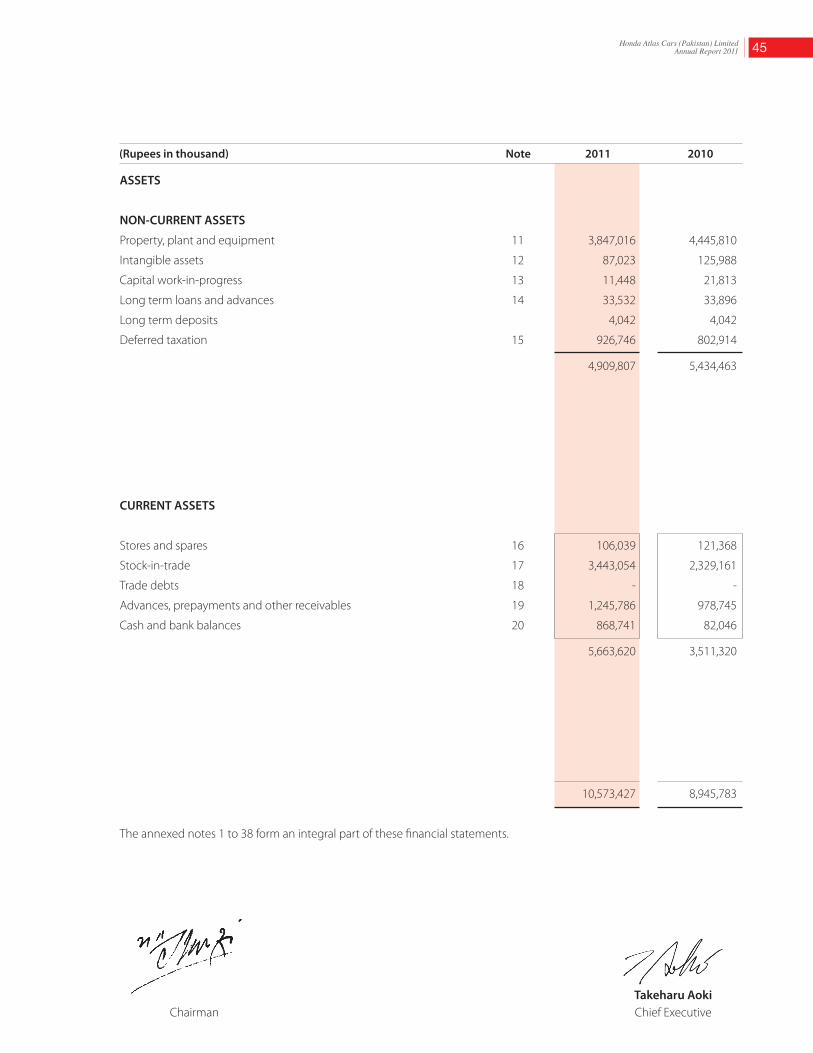
Honda Atlas Cars (Pakistan) LimitedAnnual Report 2011 45
ASSETS
NON-CURRENT ASSETS
Property, plant and equipment 11 3,847,016 4,445,810
Intangible assets 12 87,023 125,988
Capital work-in-progress 13 11,448 21,813
Long term loans and advances 14 33,532 33,896
Long term deposits 4,042 4,042
Deferred taxation 15 926,746 802,914
4,909,807 5,434,463
CURRENT ASSETS
Stores and spares 16 106,039 121,368
Stock-in-trade 17 3,443,054 2,329,161
Trade debts 18 - -
Advances, prepayments and other receivables 19 1,245,786 978,745
Cash and bank balances 20 868,741 82,046
5,663,620 3,511,320
10,573,427 8,945,783
The annexed notes 1 to 38 form an integral part of these financial statements.
(Rupees in thousand) Note 2011 2010
Yusuf H. Shirazi Takeharu Aoki Chairman Chief Executive

46
Profit and Loss Account for the year ended March 31, 2011
Yusuf H. Shirazi Takeharu Aoki Chairman Chief Executive
Sales 21 22,026,109 15,854,142
Cost of sales 22 (21,826,799) (16,093,687)
Gross profit / (loss) 199,310 (239,545)
Distribution and marketing costs 23 (139,185) (124,916)
Administrative expenses 24 (171,729) (136,131)
Other operating income 25 83,977 26,323
Other operating expenses 26 (64,945) (58,583)
(291,882) (293,307)
Loss from operations (92,572) (532,852)
Finance cost 27 (152,255) (455,128)
Loss before taxation (244,827) (987,980)
Taxation 28 (53,625) 135,780
Loss after taxation (298,452) (852,200)
Loss per share - basic and diluted (Rupees) 31 (2.09) (5.97)
Appropriations have been reflected in the statement of changes in equity.
The annexed notes 1 to 38 form an integral part of these financial statements.
(Rupees in thousand) Note 2011 2010

Honda Atlas Cars (Pakistan) LimitedAnnual Report 2011 47
Loss after taxation (298,452) (852,200)
Other comprehensive income for the year - -
Total comprehensive loss for the year (298,452) (852,200)
The annexed notes 1 to 38 form an integral part of these financial statements.
Statement of Comprehensive Income for the year ended March 31, 2011
Yusuf H. Shirazi Takeharu Aoki Chairman Chief Executive
(Rupees in thousand) 2011 2010

48
Share Share General Accumulated (Rupees in thousand) capital premium reserves loss Total
Balance as on April 01, 2009 1,428,000 76,000 1,725,500 (401,655) 2,827,845 Total comprehensive loss for the year - - - (852,200) (852,200) Transferred to profit and loss account - - (400,000) 400,000 - Balance as on March 31, 2010 1,428,000 76,000 1,325,500 (853,855) 1,975,645 Total comprehensive loss for the year - - - (298,452) (298,452) Transferred to profit and loss account - - (853,000) 853,000 - Balance as on March 31, 2011 1,428,000 76,000 472,500 (299,307) 1,677,193 The annexed notes 1 to 38 form an integral part of these financial statements.
Statement of Changes in Equity for the year ended March 31, 2011
Yusuf H. Shirazi Takeharu Aoki Chairman Chief Executive

Honda Atlas Cars (Pakistan) LimitedAnnual Report 2011 49
Cash flows from operating activities
Cash generated from operations 29 2,154,912 3,558,692
Finance cost paid (185,353) (492,776)
Employees’ retirement benefits and other obligations (26,586) (26,381)
Net increase in loans to employees (196) (2,733)
Income tax paid (114,383) (352,295)
Royalty paid (387,507) (390,573)
Net cash from operating activities 1,440,887 2,293,934
Cash flows from investing activities
Purchase of property, plant and equipment (54,686) (27,768)
Purchase of intangible assets - (80,346)
Proceeds from sale of property, plant and equipment 11,687 22,491
Interest received 55,481 4,870
Net cash from /(used in) investing activities 12,482 (80,753)
Cash flows from financing activities
Long term finances - 1,500,000
Repayment of long term finances (666,666) (1,500,000)
Dividend paid (8) (21)
Net cash used in financing activities (666,674) (21)
Net increase in cash and cash equivalents 786,695 2,213,160
Cash and cash equivalents at the beginning of the year 82,046 (2,131,114)
Cash and cash equivalents at the end of the year 20 868,741 82,046
The annexed notes 1 to 38 form an integral part of these financial statements.
Cash Flow Statement for the year ended March 31, 2011
Yusuf H. Shirazi Takeharu Aoki Chairman Chief Executive
(Rupees in thousand) Note 2011 2010

50
1. Legal status and nature of business
The Company is a public limited Company incorporated in Pakistan on November 4, 1992 and is listed on the Karachi, Islamabad and Lahore Stock Exchanges. The registered office of the Company is situated at 1-Mcleod Road, Lahore. Its’ principal activities are assembling and progressive manufacturing and sale of Honda vehicles and spare parts. The Company commenced commercial production from July 1994.
2. Basis of preparation
2.1 These financial statements have been prepared in accordance with the requirements of The Companies Ordinance,1984 (the Ordinance) and the approved accounting standards as applicable in Pakistan. Approved accounting standards comprise of such International Financial Reporting Standards (IFRS) issued by the International Accounting Standards Board and Islamic Financial Accounting Standards (IFAS) issued by Institute of Chartered Accountants of Pakistan as are notified under the Companies Ordinance, 1984, provisions of and directives issued under the Companies Ordinance, 1984. Wherever the requirements of the Companies Ordinance, 1984 or directives issued by Securities and Exchange Commission of Pakistan differ with the requirements of IFRS or IFAS, the requirements of the Companies Ordinance, 1984 or the requirements of the said directives prevail.
2.2 Standards, interpretations and amendments to published approved accounting standards
2.2.1 Amendments to published standards that are effective in current year and are relevant to the Company
The following new standards and amendments to standards are mandatory for the Company’s accounting periods beginning on or after April 01,2010
- IAS 1 (Amendment), ‘Presentation of financial statements’ is effective from April 01, 2010. The amendment provides clarification that the potential settlement of a liability by the issue of equity is not relevant to its classification as current or non current. By amending the definition of current liability, the amendment permits a liability to be classified as non-current (provided that the entity has an unconditional right to defer settlement by transfer of cash or other assets for at least 12 months after the accounting period) notwithstanding the fact that the entity could be required by the counterparty to settle in shares at any time. The application of the amendment will not affect the results or net assets of the Company as it is only concerned with presentation and disclosures.
-IFRS 8 (Amendment), ‘Operating segments’ is effective from April 01, 2010. The amendment is part of the IASB’s
annual improvements project published in April 2009. The amendment provides clarification that the requirement for disclosing a measure of segment assets is only required when the Chief Operating Decision Maker (CODM) reviews that information. The application of the amendment will not affect the results or net assets of the Company as it is only concerned with presentation and disclosures.
- IAS 7 (Amendment), ‘Statement of cash flows’ is effective from April 01, 2010. The amendment provides clarification
that only expenditure that results in a recognized asset in the balance sheet can be classified as a cash flow from investing activity. The clarification results in an improvement in the alignment of the classification of cash flows from investing activities in the cash flow statement and the presentation of recognized assets in the balance sheet. The application of the amendment will not affect the results or net assets of the Company as it is only concerned with presentation and disclosures.
2.2.2 Amendments to published standards that are effective in current year but not relevant to the Company
The following amendments and interpretations to existing standards have been published and are mandatory for the accounting periods beginning on or after April 01, 2010 but are not relevant to the Company.
- IAS 17 (Amendment), ‘Leases’ is effective from April 01, 2010. Prior to the amendment, IAS 17 generally required a
lease of land with an indefinite useful life to be classified as an operating lease, unless title passed at the end of the lease term. The amendment provides clarification that when a lease includes both land and buildings, classification
Notes to the Financial Statements for the year ended March 31, 2011

Honda Atlas Cars (Pakistan) LimitedAnnual Report 2011 51
as a finance or operating lease is performed separately in accordance with IAS 17’s general principles. A lease newly classified as a finance lease should be recognized retrospectively. The adoption of this amendment does not have any impact on the Company’s financial statements.
- IAS 36 (Amendment), ‘Impairment of assets’, is effective from April 01, 2010. The amendment clarifies that the largest
cash-generating unit (or group of units) to which goodwill should be allocated for the purposes of impairment testing is an operating segment, as defined by paragraph 5 of IFRS 8, ‘Operating segments’ (that is, before the aggregation of segments with similar economic characteristics). The application of this amendment does not have any impact on the Company’s financial statements.
- IAS 38 (Amendment), ‘Intangible assets’ is effective from April 01, 2010. The amendment is part of the IASB’s annual improvements project published in April 2009. The amendment clarifies guidance in measuring the fair value of an intangible asset acquired in a business combination and it permits the grouping of intangible assets as a single asset if each asset has similar useful economic lives. The application of this amendment does not have any impact on the Company’s financial statements.
- IAS 39 (Amendment), ‘Cash flow hedge accounting’ is effective from April 01, 2010. This amendment provides
clarification when to recognize gains or losses on hedging instruments as a reclassification adjustments in a cash flow hedge of a forecast transaction that results subsequently in the recognition of a financial instrument. The amendment clarifies that gains or losses should be reclassified from equity to income statement in the period in which the hedged forecast cash flow affects income statement. The application of this amendment does not have any impact on the Company’s financial statements.
- IFRS 2 (Amendments), ‘Group cash-settled share-based payment transactions’ is effective from April 01, 2010. In
addition to incorporating IFRIC 8, ‘Scope of IFRS 2’, and IFRIC 11, ‘IFRS 2–Group and treasury share transactions’, the amendments expand on the guidance in IFRIC 11 to address the classification of group arrangements that were not covered by that interpretation. The application of this amendment does not have any impact on the Company’s financial statements.
- IFRS 3 (Revised), ‘Business combinations’, and consequential amendments to IAS 27, ‘Consolidated and separate
financial statements’, IAS 28, ‘Investments in associates’, and IAS 31, ‘Interests in joint ventures’, are effective from April 01, 2010. The revised standard continues to apply the acquisition method to business combinations, with some significant changes. For example, all payments to purchase a business are to be recorded at fair value at the acquisition date, with contingent payments classified as debt subsequently re-measured through the income statement. There is a choice on an acquisition-by-acquisition basis to measure the non-controlling interest in the acquiree at fair value or at the non-controlling interest’s proportionate share of the acquiree’s net assets. All acquisition-related costs should be expensed. It does not have any impact on the Company’s financial statements.
- IFRS 5 (Amendment), ‘Measurement of non-current assets (or disposal groups) classified as held-for-sale’ is effective from April 01, 2010. The amendment provides clarification that IFRS 5 specifies the disclosures required in respect of non-current assets (or disposal groups) classified as held for sale or discontinued operations. It also clarifies that the general requirement of IAS 1 still apply, particularly paragraph 15 (to achieve a fair presentation) and paragraph 125 (sources of estimation uncertainty) of IAS 1. The application of this amendment does not have any impact on the Company’s financial statements.
- IFRIC 16, ‘Hedges of a net investment in a foreign operation’ effective April 01, 2010. This amendment states that,
in a hedge of a net investment in a foreign operation, qualifying hedging instruments may be held by any entity or entities within a group, including the foreign operation itself, as long as the designation, documentation and effectiveness requirements of IAS 39 that relate to a net investment hedge are satisfied. In particular, the entity should clearly document its hedging strategy because of the possibility of different designations at different levels of the entity. It does not have any impact on the Company’s financial statements.

52
2.2.3 Standards, amendments and interpretations to existing standards that are not yet effective and have not been early adopted by the Company
The following amendments and interpretations to existing standards have been published and are mandatory for the Company’s accounting periods beginning on or after April 01, 2011 or later periods, but the Company has not early adopted them:
- IFRS 9, ‘Financial instruments’, issued in November 2009. This standard is the first step in the process to replace IAS
39, ‘Financial instruments: recognition and measurement’. IFRS 9 introduces new requirements for classifying and measuring financial assets and is likely to affect the Company’s accounting for its financial assets. The standard is not applicable until April 01, 2013 but is available for early adoption.
- IAS 1 (Amendments), Clarifies that an entity will present an analysis of other comprehensive income for each component of equity, either in the statement of changes in equity or in the notes to the financial statements. This amendment is effective for periods beginning on or after April 01, 2011.
- IAS 24, ‘Related party disclosures’ (Revised), issued in November 2009. It supersedes IAS 24, ‘Related party disclosures’,
issued in 2003. IAS 24 (revised) is mandatory for periods beginning on or after January 01, 2011. The revised standard clarifies and simplifies the definition of a related party and removes the requirement for government-related entities to disclose details of all transactions with the government and other government-related entities. The Company will apply the revised standard from April 01, 2011.
- IFRIC 19, ‘Extinguishing financial liabilities with equity instruments’, effective April 01, 2011. The interpretation clarifies the accounting by an entity when the terms of a financial liability are renegotiated and result in the entity issuing equity instruments to a creditor of the entity to extinguish all or part of the financial liability (debt for equity swap). It requires a gain or loss to be recognized in profit or loss, which is measured as the difference between the carrying amount of the financial liability and the fair value of the equity instruments issued. If the fair value of the equity instruments issued cannot be reliably measured, the equity instruments should be measured to reflect the fair value of the financial liability extinguished. It is not expected to have any impact on the Company’s financial statements.
- IFRIC 14, ‘Prepayments of a minimum funding requirement’ (Amendment). The amendments correct an
unintended consequence of IFRIC 14, ‘IAS 19 – The limit on a defined benefit asset, minimum funding requirements and their interaction’. Without the amendments, entities are not permitted to recognize as an asset some voluntary prepayments for minimum funding contributions. This was not intended when IFRIC 14 was issued, and the amendments correct this. The amendments are effective for annual periods beginning January 01,2011. The amendments should be applied retrospectively to the earliest comparative period presented. The Company will apply these amendments for the financial reporting period commencing on April 01, 2011. It is not expected to have any impact on the Company’s financial statements.
- IFRS 7, ‘Disclosures on transfers of financial assets’ (Amendment). The new disclosure requirements apply to transferred financial assets. An entity transfers a financial asset when it transfers the contractual rights to receive cash flows of the asset to another party. These amendments are part of the IASBs comprehensive review of off balance sheet activities. The amendments will promote transparency in the reporting of transfer transactions and improve users’ understanding of the risk exposures relating to transfers of financial assets and the effect of those risks on an entity’s financial position, particularly those involving securitization of financial asset. The Company will apply these amendments for the financial reporting period commencing on April 01, 2012. It is not expected to have any impact on the Company’s financial statements.
3. Basis of measurement 3.1 These financial statements have been prepared under the historical cost convention except for recognition of
certain employee retirement benefits at present value.

Honda Atlas Cars (Pakistan) LimitedAnnual Report 2011 53
3.2 The Company’s significant accounting policies are stated in note 4. Not all of these significant policies require the management to make difficult, subjective or complex judgments or estimates. The following is intended to provide an understanding of the policies the management considers critical because of their complexity, judgment and estimation involved in their application and their impact on these financial statements. Estimates and judgments are continually evaluated and are based on historical experience, including expectations of future events that are believed to be reasonable under the circumstances. These judgments involve assumptions or estimates in respect of future events and the actual results may differ from these estimates. The areas involving higher degree of judgments or complexity or areas where assumptions and estimates are significant to the financial statements are as follows:
a) Employee retirement benefits
The Company uses the valuation performed by an independent actuary as the present value of its retirement benefit obligations. The valuation is based on assumptions as mentioned in note 4.1.
b) Provision for taxation
The Company takes into account the current income tax law and the decisions taken by appellate authorities. Instances where the Company’s view differs from the view taken by the income tax department at the assessment stage and where the Company considers that its views on items of material nature is in accordance with law, the amounts are shown as contingent liabilities.
c) Useful life and residual values of property, plant and equipment
The Company reviews the useful lives of property, plant and equipment on regular basis. Any change in estimates in future years might affect the carrying amounts of respective items of property, plant and equipment with a corresponding effect on the depreciation charge and impairment.
3.3 Change in accounting estimate
The Company, during the year, has reviewed the useful lives of its property, plant and equipment and intangible assets. Consequently, the depreciation and amortization rates of the following items have been revised as follows to reflect the estimated useful lives:
New Rate Old Rate (per annum) (per annum) Description of Asset
Plant and machinery (model specific-City) 16.67% 20%
Licences (model specific-City) 20% 25% The change in accounting estimate has been made prospectively in accordance with IAS 8 ‘Accounting policies,
change in accounting estimates and errors’, and effects the current and future accounting periods. These changes in accounting estimates have resulted in decrease in depreciation and amortization charge for the year by Rs 76.81 million and Rs 11.42 million respectively, with corresponding increase in carrying value of property, plant and equipment and intangible assets and decrease in loss for the year before taxation.
4. Summary of significant accounting policies
The significant accounting policies adopted in the preparation of these financial statements are set out below. These policies have been consistently applied to all the years presented unless otherwise stated.
54
4.1 Employees’ retirement benefits and other obligations
The main features of the schemes operated by the Company for its employees are as follows: 4.1.1 Defined benefit plan
The Company operates a funded defined benefit gratuity scheme for all its permanent employees. Under the scheme gratuity is payable on the basis of last drawn basic salary at the following rates:
Service in the Company Per completed year of service
0-4 years and 364 days Nil 5-9 years and 364 days 15 days 10 years or more 30 days Contributions under the scheme are made to this fund on the basis of actuarial recommendation at the rate of 6.1%
(2010: 5.6%) per annum of basic salary and are charged to profit and loss account. The latest actuarial valuation for the scheme was carried out as at March 31, 2011.
The actual return on the plan assets during the year was Rs 3.61 million (2010: Rs 11.50 million). The actual return on
plan assets represents the difference between the fair value of plan assets at the beginning of the year and as at the end of the year after adjustments for contributions made by the Company as reduced by benefits paid during the year.
The amount recognized in balance sheet represents the present value of the defined benefit obligation as adjusted for unrecognized actuarial gain and losses and as reduced by the fair value of the plan assets.
The future contribution rate of the plan includes allowances for deficit and surplus. Projected Unit Credit Method,
using the following significant assumptions, is used for valuation of this scheme:
Discount rate 13% per annum Expected increase in eligible pay 12% per annum Expected rate of return on plan assets 13% per annum The Company is expected to contribute Rs 14.81 million to the gratuity fund in the next financial year. The Company’s policy with regard to actuarial gains / losses is to follow minimum recommended approach under
IAS 19 (Revised 2000) “Employee Benefits”. 4.1.2 Accumulating compensated absences
Accruals are made annually to cover the obligation for accumulating compensated absences on the basis of accumulated leaves and the last drawn salary and are charged to profit.
4.1.3 Defined contribution plan
The Company operates a defined contributory provident fund for all its permanent employees. Contributions are made equally by the Company and the employees at the rate of 10% per annum of the basic salary subject to completion of minimum qualifying period of service as determined under the rules of the fund.
4.2 Taxation
Current
Provision for current tax is based on the taxable income for the year determined in accordance with the prevailing law for taxation of income. The charge for current tax is calculated using prevailing tax rates or tax rates expected to apply to the profit for the year if enacted. The charge for current tax also includes adjustments, where considered necessary, to provision for taxation made in previous years arising from assessments framed during the year for such years.

Honda Atlas Cars (Pakistan) LimitedAnnual Report 2011 55
Deferred
Deferred tax is accounted for using the balance sheet liability method in respect of all temporary differences arising from differences between the carrying amount of assets and liabilities in the financial statements and the corresponding tax bases used in the computation of the taxable profit. Deferred tax liabilities are generally recognized for all taxable temporary differences and deferred tax assets are recognized to the extent that it is probable that taxable profits will be available against which the deductible temporary differences, unused tax losses and tax credits can be utilized.
Deferred tax is calculated at the rates that are expected to apply to the year when the differences reverse based on tax rates that have been enacted or substantively enacted by the balance sheet date. Deferred tax is charged or credited in the income statement, except in the case of items credited or charged to equity in which case it is included in equity.
4.3 Property, plant and equipment
Property, plant and equipment except for freehold land are stated at cost less accumulated depreciation and any identified impairment loss. Freehold land is stated at cost less any identified impairment loss.
Depreciation on all items of property, plant and equipment except for freehold land and model specific plant and machinery is charged to income applying the diminishing balance method so as to write-off the depreciable amount of an asset over its useful life. Depreciation on model specific plant and machinery is provided on a straight line basis so as to write-off the depreciable amount of an asset over the life of the model. Depreciation is being charged at the rates given below.
Rate
Buildings on freehold land 5% Plant and machinery 15% - 20% Furniture and office equipment 20% Vehicles 20% Tools and equipments 20% Computers 35%
The assets’ residual values and useful lives are continually reviewed by the Company and adjusted if impact on depreciation is significant. The Company’s estimate of the residual value of its property, plant and equipment as at March 31, 2011 has not required any adjustment except as specified in note 3.3.
The Company continually assesses at each balance sheet date whether there is any indication that property, plant
and equipment may be impaired. If such indication exists, the carrying amounts of such assets are reviewed to assess whether they are recorded in excess of their recoverable amount. Where carrying values exceed the respective recoverable amount, assets are written down to their recoverable amounts and the resulting impairment loss is recognized in profit and loss account for the year. The recoverable amount is the higher of an assets’ fair value less costs to sell and value in use. Where an impairment loss is recognized, the depreciation charge is adjusted in the future periods to allocate the assets’ revised carrying amount over its estimated useful life.
Depreciation on additions to property, plant and equipment is charged from the month in which an asset is acquired or capitalized while no depreciation is charged for the month in which the asset is disposed off.
The profit or loss on disposal or retirement of an asset represented by the difference between the sale proceeds
and the carrying amount of the asset is recognized as an income or expense. Maintenance and normal repairs are charged to income. Major renewals and improvements are capitalized.

56
4.4 Intangible assets
Intangible assets, which are stated at cost less accumulated amortization and any identified impairment loss, represent the cost of licences for the right to manufacture Honda vehicles in Pakistan, technical drawings of certain components and software licences.
Amortization is charged to income on the straight line method so as to write off the cost of an asset over its estimated
useful life. Amortization on additions is charged from the month in which an asset is acquired or capitalized while no amortization is charged for the month in which the asset is disposed off. Amortization is charged at the rates given below.
Rate
Licence Fees & Drawings 20%-25% Computer Software 20%-25% The assets’ useful lives are continually reviewed by the Company and adjusted if impact on amortization is
significant. The Company’s estimate of the useful life of its intangible assets’ as at March 31, 2011 have not required any adjustment except as specified in note 3.3.
The Company continually assesses at each balance sheet date whether there is any indication that intangible assets
may be impaired. If such indication exists, the carrying amounts of such assets are reviewed to assess whether they are recorded in excess of their recoverable amount. Where carrying values exceed the respective recoverable amount, assets are written down to their recoverable amounts and the resulting impairment loss is recognized in profit and loss account for the year. The recoverable amount is the higher of an assets’ fair value less costs to sell and value in use. Where an impairment loss is recognized, the amortization charge is adjusted in the future periods to allocate the assets’ revised carrying amount over its estimated useful life.
4.5 Capital work-in-progress
Capital work-in-progress is stated at cost less any identified impairment loss. 4.6 Financial instrument
4.6.1 Financial assets
The Company classifies its financial assets in the following categories: at fair value through profit or loss, loans and receivables, available for sale and held to maturity. The classification depends on the purpose for which the financial assets were acquired. Management determines the classification of its financial assets at the time of initial recognition.
a) Financial assets at fair value through profit or loss
Financial assets at fair value through profit or loss are financial assets held for trading and financial assets designated upon initial recognition as at fair value through profit or loss. A financial asset is classified as held for trading if acquired principally for the purpose of selling in the short term. Assets in this category are classified as current assets.
b) Loans and receivables
Loans and receivables are non-derivative financial assets with fixed or determinable payments that are not quoted in an active market. They are included in current assets, except for maturities greater than twelve months after the balance sheet date, which are classified as non-current assets. Loans and receivables comprise advances, deposits and other receivables and cash and cash equivalents in the balance sheet.

Honda Atlas Cars (Pakistan) LimitedAnnual Report 2011 57
c) Available-for-sale financial assets
Available-for-sale financial assets are non-derivatives that are either designated in this category or not classified in any of the other categories. They are included in non-current assets unless management intends to dispose of the investments within twelve months from the balance sheet date.
d) Held to maturity
Financial assets with fixed or determinable payments and fixed maturity, where management has the intention and ability to hold till maturity are classified as held to maturity and are stated at amortized cost.
All financial assets are recognized at the time when the Company becomes a party to the contractual provisions of the instrument. Regular purchases and sales of investments are recognized on trade-date – the date on which the Company commits to purchase or sell the asset. Financial assets are initially recognized at fair value plus transaction costs for all financial assets not carried at fair value through profit or loss. Financial assets carried at fair value through profit or loss are initially recognized at fair value and transaction costs are expensed in the profit and loss account. Financial assets are derecognized when the rights to receive cash flows from the assets have expired or have been transferred and the Company has transferred substantially all the risks and rewards of ownership. Available-for-sale financial assets and financial assets at fair value through profit or loss are subsequently carried at fair value. Loans and receivables and held-to-maturity investments are carried at amortized cost using the effective interest rate method.
Gains or losses arising from changes in the fair value of the ‘financial assets at fair value through profit or loss’
category are presented in the profit and loss account in the period in which they arise. Dividend income from financial assets at fair value through profit or loss is recognized in the profit and loss account as part of other income when the Company’s right to receive payments is established.
Changes in the fair value of securities classified as available-for-sale are recognized in equity. When securities
classified as available-for-sale are sold or impaired, the accumulated fair value adjustments recognized in equity are included in the profit and loss account as gains and losses from investment securities. Interest on available-for-sale securities calculated using the effective interest method is recognized in the profit and loss account. Dividends on available-for-sale equity instruments are recognized in the profit and loss account when the Company’s right to receive payments is established.
The fair values of quoted investments are based on current prices. If the market for a financial asset is not active (and for unlisted securities), the Company measures the investments at cost less impairment in value, if any.
The Company assesses at each balance sheet date whether there is objective evidence that a financial asset or a group of financial assets is impaired. If any such evidence exists for available-for-sale financial assets, the cumulative loss is removed from equity and recognized in the profit and loss account. Impairment losses recognized in the profit and loss account on equity instruments are not reversed through the profit and loss account. Impairment testing of trade debts and other receivables is described in note 4.15.
4.6.2 Financial liabilities
All financial liabilities are recognized at the time when the Company becomes a party to the contractual provisions of the instrument.
A financial liability is derecognized when the obligation under the liability is discharged or cancelled or expired.
Where an existing financial liability is replaced by another from the same lender on substantially different terms, or the terms of an existing liability are substantially modified, such an exchange or modification is treated as a derecognition of the original liability and the recognition of a new liability, and the difference in respective carrying amounts is recognized in the profit and loss account.

58
4.6.3 Offsetting of financial assets and financial liabilities
Financial assets and financial liabilities are offset and the net amount is reported in the financial statements only when there is a legally enforceable right to set off the recognized amount and the Company intends either to settle on a net basis or to realize the assets and to settle the liabilities simultaneously.
4.7 Stores and spares
Usable stores and spares are valued principally at moving average cost, while items considered obsolete are carried at nil value. Items in transit are valued at cost comprising of invoice value and other incidental charges paid thereon.
4.8 Stock in trade
Stock of raw materials, except for those in transit, work-in-process and finished goods are valued principally at the lower of moving average cost and net realizable value. Cost of raw materials and trading stock comprises of the invoice value plus other charges paid thereon. Cost of work-in-process and finished goods includes cost of direct materials, labour and appropriate portion of manufacturing overheads. Items in transit are stated at cost comprising invoice value and other incidental charges paid thereon.
Net realizable value signifies the estimated selling prices in the ordinary course of business less costs, necessarily to
be incurred, in order to make the sale. 4.9 Borrowings
Borrowings are recognized initially at fair value, net of transaction costs incurred. Borrowings are subsequently stated at amortized cost, any difference between the proceeds (net of transaction costs) and the redemption value is recognized in the profit and loss account over the period of the borrowings using the effective interest method. Finance costs are accounted for on an accrual basis and are reported under accrued finance costs to the extent of the amount remaining unpaid.
Borrowings are classified as current liabilities unless the Company has an unconditional right to defer settlement of
the liability for at least twelve months after the balance sheet date. 4.10 Foreign currency transactions and translation
a) Functional and presentation currency
Items included in the financial statements of the Company are measured using the currency of the primary economic environment in which the Company operates (the functional currency). The financial statements are presented in Pak Rupees, which is the Company’s functional and presentation currency.
b) Transactions and balances
Foreign currency transactions are translated into Pak Rupees using the exchange rates prevailing at the dates of the transactions. Foreign exchange gains and losses resulting from the settlement of such transactions and from the translation at year-end exchange rates of monetary assets and liabilities denominated in foreign currencies are recognized in the profit and loss account.
4.11 Revenue recognition
Sales of vehicles and spare parts are recognized as revenue when goods are dispatched and invoiced to the customers.
Return on bank balances is accrued on a time proportion basis by reference to the principal outstanding and the
applicable rate of return.
Honda Atlas Cars (Pakistan) LimitedAnnual Report 2011 59
4.12 Borrowing costs
Borrowing costs are recognized as an expense in the period in which these are incurred except to the extent of borrowing costs that are directly attributable to the acquisition, construction or production of a qualifying asset. Such borrowing costs are capitalized as part of the cost of that asset up to the date of its’ commissioning.
4.13 Provisions
Provisions are recognized when the Company has a present legal or constructive obligation as a result of past events; and it is probable that an outflow of resources embodying economic benefits will be required to settle the obligation and a reliable estimate of the amount can be made. Provisions are reviewed at each balance sheet date and adjusted to reflect the current best estimate.
4.14 Long term deposits
These are stated at cost which represents the fair value of consideration given.
4.15 Trade debts and other receivables
Trade and other receivables are measured at original invoice amount less an estimate made for doubtful receivable balances based on the review of all outstanding amounts at the balance sheet date. Bad debts are written off when identified.
4.16 Trade and other payables
Trade and other payables are measured at cost which is the fair value of the consideration to be paid in future for goods and services received, whether or not billed to the Company.
4.17 Cash and cash equivalents
Cash and cash equivalents includes cash in hand, deposits held at call with banks, other short-term highly liquid investments with original maturities of three months or less and bank overdrafts. Short term running finances are shown in current liabilities on the balance sheet.
4.18 Dividend
Dividend distribution to the shareholders is recognized as a liability in the period in which it is approved by the shareholders.
4.19 Segment reporting
Operating segments are reported in a manner consistent with the internal reporting provided to the chief operating decision maker. The chief operating decision maker, who is responsible for allocating resources and assessing performance of the operating segments, has been identified as the Board of Directors of the Company that makes strategic decisions.

60
(Number of Shares) 2011 2010
5. Issued, subscribed and paid up capital
2011 2010 (Number of shares)
111,400,000 111,400,000 ordinary shares of Rs 10 each 1,114,000 1,114,000 fully paid in cash 31,400,000 31,400,000 ordinary shares of Rs 10 each issued as fully paid bonus shares 314,000 314,000
142,800,000 142,800,000 1,428,000 1,428,000
72,828,000 (2010: 72,828,000) ordinary shares of the company are held by Honda Motor Company Ltd., Japan, the holding company. Ordinary shares of the company held by associated undertakings as at year end are as follows:
6. Reserves
Movement in and composition of reserves is as follows:
Capital
Share premium 6.1 76,000 76,000
Revenue
General reserve - At the beginning of the year 1,325,500 1,725,500 - Transferred to profit and loss account (853,000) (400,000)
472,500 1,325,500
548,500 1,401,500
6.1 This reserve can be utilized by the company only for the purposes specified in Section 83(2) of the
Companies Ordinance, 1984.
Atlas Insurance Limited 850,000 850,000
Shirazi Investments (Private) Limited 10,602,650 2,337,650
Shirazi Capital (Private) Limited 32,517,000 32,517,000
43,969,650 35,704,650
(Rupees in thousand) 2011 2010
(Rupees in thousand) Note 2011 2010

Honda Atlas Cars (Pakistan) LimitedAnnual Report 2011 61
7. Long-term finances - secured
The Bank of Tokyo - Mitsubishi UFJ, Limited 7.1 333,334 500,000 MCB Bank Limited 7.2 - 500,000 Standard Chartered Bank (Pakistan) Limited 7.3 500,000 500,000
833,334 1,500,000 Current portion shown under current liabilities (416,667) (166,667)
416,667 1,333,333
7.1 It carries mark-up at six months’ KIBOR plus 1.25 percent per annum and is payable semi annually. It is secured
by first pari passu equitable mortgage charge over all the current and future immovable assets of the Company
amounting to Rs 667 million and is repayable in six equal semi annual installments ending April 30, 2013. The
effective mark-up charged during the year is 14.05% per annum.
7.2 It carried mark-up at six months’ KIBOR plus 2.25 percent per annum payable semi annually. It was secured by first
pari passu equitable mortgage charge over all the current and future immovable assets of the Company amounting
to Rs 667 million and has been repaid in full during the year . The effective mark-up charged was 14.71% per annum.
7.3 It carries mark-up at six months’ KIBOR plus 1.20 percent per annum and is payable semi annually. It is secured
by first pari passu equitable mortgage charge over all the current and future immovable assets of the Company
amounting to Rs 667 million and is repayable in four semi annual installments ending March 30, 2013. The effective
mark-up charged is 13.89% per annum.
8. Short term running finance - secured
Short term running finance available from commercial banks under mark-up arrangements amounts to Rs 4,240
million (2010: Rs 4,240 million). The rate of markup ranges from 14.03% to 15.14% per annum on the balances
outstanding. The aggregate short term running finances are secured by first pari passu hypothecation charge over
current assets of the company.
Of the aggregate facility of Rs 2,375 million (2010: Rs 2,817 million) for opening letters of credit, the amount utilized at
March 31, 2011 was Rs 42.82 million (2010: Rs 44.90 million).
(Rupees in thousand) Note 2011 2010

62
9. Trade and other payables
Creditors 9.1 396,705 237,279 Accrued liabilities 23,174 20,284 Bills payable 9.2 5,390,887 2,773,564 Deposits against display cars 9.3 1,071,914 1,065,479 Workers’ welfare fund 2,130 1,496 Employees’ retirement benefits and other obligations 9.4 23,060 20,210 Advances from customers 9.5 920,722 1,129,078 License fee, technical fee and royalties 9.6 141,118 109,905 Provision for custom duties 9.7 32,169 32,169 Unclaimed dividends 4,793 4,801 Federal excise duty payable 13,794 16,222 Withholding tax payable 8,650 6,237 Others 29,482 16,014
8,058,598 5,432,738
9.1 Creditors include amount due to related parties of Rs 34.21 million (2010: Rs 20.20 million).
9.2 Bills payable include amount due to related parties of Rs 5,384.33 million (2010: Rs 2,773.56 million). These are in the normal course of business and are interest free.
9.3 These represent interest free deposits from dealers against display cars and are repayable on demand.
9.4 Employees’ retirement benefits and other obligations
Accumulating compensated absences 9.4.1 23,060 20,210 Staff gratuity 9.4.2 - -
23,060 20,210 9.4.1 Accumulating compensated absences
Opening balance 20,210 18,309 Accrual for the year 17,667 15,405 Payments made during the year (14,817) (13,504)
Closing balance 23,060 20,210 9.4.2 Staff gratuity
The amounts recognized in the balance sheet are as follows: Present value of defined benefit obligation 96,980 80,769 Fair value of plan assets (74,238) (67,490)
Deficit 22,742 13,279 Un-recognized actuarial loss (22,742) (13,279)
Net liability as at March 31 - -
Net liability as at April 01 - - Charge to profit and loss account 11,769 12,877 Payments to fund during the year (11,769) (12,877)
Net liability as at March 31 - -
(Rupees in thousand) Note 2011 2010
(Rupees in thousand) Note 2011 2010

Honda Atlas Cars (Pakistan) LimitedAnnual Report 2011 63
The movement in the present value of defined benefit obligation is as follows: Present value of defined benefit obligation 80,769 69,824 Current service cost 9,804 8,291 Interest cost 9,692 10,474 Benefits paid (8,628) (4,136) Actuarial loss / (gain) 5,343 (3,684)
Present value of defined benefit obligation 96,980 80,769 The movement in the fair value of plan assets is as follows: Fair value of plan asset as at April 01 67,490 47,251 Expected return on plan asset 8,099 7,087 Contributions 11,769 12,877 Benefits paid (8,628) (4,136) Actuarial (loss) / gain (4,492) 4,411
Fair value of plan asset as at March 31 74,238 67,490 Plan assets are comprised as follows: Debt 24,854 24,619 Mutual funds 37,371 35,668 Cash 12,013 7,203
74,238 67,490 Comparison of present value of defined benefit obligation, the fair value of plan assets and the surplus or deficit of
gratuity fund for five years is as follows:
(Rupees in thousand) 2011 2010 2009 2008 2007
Present value of defined benefit obligation (96,980) (80,769) (69,824) (55,306) (45,268) Fair value of plan assets 74,238 67,490 47,251 55,758 39,884
(Deficit) / Surplus (22,742) (13,279) (22,573) 452 (5,384) Experience adjustment: - on obligation 6% -5% 5% 6% 5% - on plan assets -6% 7% -41% 6% -8%
9.5 Advances from customers include Rs 887.42 million (2010: Rs 1,068 million) against the sale of vehicles including sales tax and excise duties. These advances carry mark-up @ 13.25% per annum, being the weighted average rate of three months’ market treasury bills as at the end of the year, in accordance with the directive issued by the Engineering Development Board, Government of Pakistan on September 17, 2002. The mark-up is calculated and
payable on demand of customer only if vehicles are delivered after sixty days from the receipt of such advances.
(Rupees in thousand) 2011 2010

64
(Rupees in thousand) 2011 2010
9.6 License fee, technical fee and royalties include amount of Rs 140.20 million (2010: Rs 109.18 million) due to associated undertakings.
9.7 Provision for custom duties Opening balance 32,169 32,169 Provision for the year - -
Closing balance 32,169 32,169 10. Contingencies and commitments
10.1 Contingencies
(i) Claims against the Company not acknowledged as debt by the Company amount to Rs 9.79 million (2010: Rs 9.79 million). As the management is confident that the matter would be settled in its favour, consequently no provision has been made in these financial statements in respect of the above mentioned disputed liabilities.
(ii) In the previous years, Company received notices from custom authorities for payment of custom duty and sales tax
in respect of certain components of Honda Cars imported during prior years. Custom authorities interpreted that CBU rate of duty was applicable on such components and thus raised a demand of Rs 110 million. It included Rs 96 million on account of custom duty and Rs 14 million on account of sales tax.
The Company approached custom authorities on the grounds that the components specified in the above
mentioned notices included certain components which were duly appearing in the indigenization program of the Company for the relevant period. Hence CBU rate of duty was not applicable on import of these components. The Company has made a provision of Rs 32 million against the total demand of Rs 110 million. As the management is confident that the matter would be settled in its favour, consequently no provision for the balance amount has been made in these financial statements in respect of the above mentioned notices.
(iii) Custom, Excise & Sales Tax Appellate Tribunal (‘Appellate Tribunal’), through a recent judgment, has endorsed the
demand of Rs 1,105.04 million earlier raised against the Company on account of customs duty, sales tax and income tax on the grounds that ‘license fee’ and ‘royalty’ paid to M/s Honda Motor Company Limited, Japan was includable in the ‘import value’ of ‘completely knocked down’ kits of vehicles assembled by the Company and parts thereof.
The Company has further agitated the matter before honourable Lahore High Court that is pending adjudication.
Meanwhile, interim relief has been extended by honourable Court and the Customs authorities have been refrained from enforcing the recovery of the amount adjudged against the Company. No provision on this account has been made in these financial statements as company’s management considers that its stance is founded on meritorious grounds and relief will be secured from higher appellate fora. In this respect, it is the Company’s contention that subject amount of ‘royalty’ and ‘license fee’ were relatable to Company’s manufacturing facilities and not the goods imported by it and hence such amounts cannot be considered as part and parcel of import value.
In addition to above, another demand of Rs 110.93 million, raised on substantially similar grounds in respect of
imports effected during the period June 2008 to March 2009, have been endorsed by Collector (Appeals) and Company is in the process of availing the next available legal remedy i.e. filing of an appeal before Appellate Tribunal. While Appellate Tribunal is not likely to extend any relief on this account due to its earlier decision on the matter, the liability on this account has not been recognized in these financial statements as management expects a relief from higher appellate fora, as explained above.
10.2 Commitments in respect of
Letters of credit and purchase commitments other than capital expenditure Rs 407.63 million (2010: Rs 505.83 million).

Honda Atlas Cars (Pakistan) LimitedAnnual Report 2011 65
11. Property, plant and equipment
(Rupees in thousand) 2011
Furniture and Freehold land Buildings on Plant and office Vehicles Tools and Computers Total freehold land machinery equipment equipments
At April 01, 2010
Cost 417,319 1,951,128 4,654,760 99,834 127,304 74,493 46,206 7,371,044
Accumulated Depreciation - 559,606 2,165,918 59,887 57,351 46,209 36,263 2,925,234
Net book value 417,319 1,391,522 2,488,842 39,947 69,953 28,284 9,943 4,445,810
Year ended March 31, 2011
Opening net book value 417,319 1,391,522 2,488,842 39,947 69,953 28,284 9,943 4,445,810
Additions at cost - 3,238 36,519 613 20,596 905 3,180 65,051
Disposals
Cost - - 3,626 857 15,224 611 80 20,398
Accumulated Depreciation - - 3,410 494 5,762 547 74 10,287
- - 216 363 9,462 64 6 10,111
Depreciation for the year - 69,644 550,935 7,984 15,484 5,732 3,955 653,734
Closing net book value 417,319 1,325,116 1,974,210 32,213 65,603 23,393 9,162 3,847,016
At March 31, 2011
Cost 417,319 1,954,366 4,687,653 99,590 132,676 74,787 49,306 7,415,697
Accumulated Depreciation - 629,250 2,713,443 67,377 67,073 51,394 40,144 3,568,681
Net book value 417,319 1,325,116 1,974,210 32,213 65,603 23,393 9,162 3,847,016
(Rupees in thousand) 2010
Furniture and Freehold land Buildings on Plant and office Vehicles Tools and Computers Total freehold land machinery equipment equipments
At April 01, 2009
Cost 417,319 1,951,128 4,636,793 98,454 150,627 72,026 45,380 7,371,727
Accumulated Depreciation - 486,368 1,522,643 50,155 50,459 39,429 32,138 2,181,192
Net book value 417,319 1,464,760 3,114,150 48,299 100,168 32,597 13,242 5,190,535
Year ended March 31, 2010
Opening net book value 417,319 1,464,760 3,114,150 48,299 100,168 32,597 13,242 5,190,535
Additions - - 17,967 1,588 1,480 2,467 1,679 25,181
Disposals
Cost - - - 208 24,803 - 853 25,864
Accumulated Depreciation - - - 122 11,355 - 769 12,246
- - - 86 13,448 - 84 13,618
Depreciation for the year - 73,238 643,275 9,854 18,247 6,780 4,894 756,288
Closing net book value 417,319 1,391,522 2,488,842 39,947 69,953 28,284 9,943 4,445,810
At March 31, 2010
Cost 417,319 1,951,128 4,654,760 99,834 127,304 74,493 46,206 7,371,044
Accumulated Depreciation - 559,606 2,165,918 59,887 57,351 46,209 36,263 2,925,234
Net book value 417,319 1,391,522 2,488,842 39,947 69,953 28,284 9,943 4,445,810

66
11.1 The depreciation charge has been allocated as follows:
Cost of sales 22 621,567 720,456
Cost of sales - Trading goods 22 10,377 10,378
Distribution and marketing costs 23 8,120 9,823
Administrative expenses 24 13,670 15,631
653,734 756,288
11.2 Plant and machinery includes dies and moulds having book value of Rs 395.18 million (2010: 528.58 million) in
possession of various vendors.
11.3 Disposal of property, plant and equipment
(Rupees in thousand) 2011
Accumulated Book Sale Particulars of assets Sold to Cost depreciation value proceeds Mode of disposal
Plant and Machinery 3,626 3,410 216 - Assets written off
Furniture and office equipments
Employees
Syed Ishtiaq H. Bokhari 32 10 22 22 Employees car sale scheme
Various employees 825 484 341 478 Auction
Vehicles Employees
Mr. Zulfiqar Ali 1,452 366 1,086 1,031 Employees car sale scheme
Mr. Sohail Nawaz 1,311 581 730 737 -do-
Syed Ishtiaq H. Bokhari 1,452 367 1,085 1,031 -do-
Muhammad Afzal 1,452 367 1,085 1,031 -do-
Syed Ali Nasir (Ex-employee) 1,452 366 1,086 1,050 -do-
Mr. Kashif Mustafa Khan (Ex-employee) 1,310 593 717 723 -do-
Mr. Asad Murad (Ex-employee) 1,430 689 741 746 -do-
Mr. Khalid Mahmood (Ex-employee) 1,452 479 973 919 -do-
Outsiders
M/s Argosy Enterprises 1,430 620 810 1,522 Negotiation
M/s Argosy Enterprises 1,053 714 339 869 -do-
Mr. Attiq Ur Rehman 1,430 620 810 1,528 -do-
Tools and Equipment 611 547 64 - Assets written off
Computer 80 74 6 - Assets written off
20,398 10,287 10,111 11,687
(Rupees in thousand) Note 2011 2010

Honda Atlas Cars (Pakistan) LimitedAnnual Report 2011 67
(Rupees in thousand) Note 2011 2010
12.1 The amortization charge has been allocated as follows:
Cost of sales 22 38,796 70,845 Distribution and marketing costs 23 169 169 Administrative expenses 24 - 24
38,965 71,038
12. Intangible assets
(Rupees in thousand) 2011
License fees Computer Total & drawings software
At April 01, 2010
Cost 386,753 6,603 393,356 Accumulated amortization 262,270 5,098 267,368
Net book value 124,483 1,505 125,988
Year ended March 31, 2011
Opening net book value 124,483 1,505 125,988 Additions - - - Amortization for the year 38,126 839 38,965
Closing net book value 86,357 666 87,023
At March 31, 2011
Cost 386,753 6,603 393,356 Accumulated amortization 300,396 5,937 306,333
Net book value 86,357 666 87,023
(Rupees in thousand) 2010
License fees Computer Total & drawings software
At April 01, 2009
Cost 385,557 6,603 392,160 Accumulated amortization 192,754 3,576 196,330
Net book value 192,803 3,027 195,830
Year ended March 31, 2010
Opening net book value 192,803 3,027 195,830 Additions 1,196 - 1,196 Amortization for the year 69,516 1,522 71,038
Closing net book value 124,483 1,505 125,988
At March 31, 2010
Cost 386,753 6,603 393,356 Accumulated amortization 262,270 5,098 267,368
Net book value 124,483 1,505 125,988

68
13. Capital work-in-progress
Plant and machinery 11,448 21,813
14. Long term loans and advances
Loans to employees - considered good
- Executives 14.1 14,021 11,222
- Others 30,409 33,012
44,430 44,234
Receivable within one year
- Executives (2,436) (2,092)
- Others (8,462) (8,246)
(10,898) (10,338)
33,532 33,896
14.1 Executives
Opening balance 11,222 11,918
Disbursement during the year 15,280 7,581
26,502 19,499
Repayments during the year (12,481) (8,277)
14,021 11,222
Loans to employees comprise of staff welfare loan and associate loan.
Staff welfare loans carry interest at the rate of 11% per annum and are recoverable within a period of 7 years
commencing from the date of disbursement through monthly deductions from salaries and are secured against
retirement benefits of employees and their guarantors. All the loans are granted to the employees of the Company in
accordance with their terms of employment.
Associate loans are interest free and are repayable between 2 to 4 years. These loans are secured against retirement
benefits of employees and their guarantors. All the loans are granted to the employees of the Company in accordance
with their terms of employment.
The maximum aggregate amount due from executives at the end of any month during the year was Rs 18.7 million
(2010: Rs 13.74 million).
(Rupees in thousand) Note 2011 2010

Honda Atlas Cars (Pakistan) LimitedAnnual Report 2011 69
15. Deferred taxation
Deferred tax is calculated in full on temporary differences under the liability method using a tax rate of 35% Deferred tax asset as at April 01 802,914 571,214 Charged to profit and loss for the year 28 123,832 231,700
Deferred tax asset as at March 31 926,746 802,914 The deferred tax asset comprises of temporary differences arising due to: Accelerated tax depreciation (560,544) (680,545) Unused tax losses carried forward 1,476,031 1,472,200 Others 11,259 11,259
926,746 802,914 15.1 Unused tax losses available to the Company contains unused business losses amounting to Rs 93.80 million (2010:
Rs 367.41 million) which are available till March 31, 2016 and the Company expects to utilize these losses. 15.2 The Company has not recognized deferred tax asset in respect of the tax credit available under section 113 of the
Income Tax Ordinance, 2001 of Rs 193.58 million (2010: 78.84 million) in view of the management’s estimate that sufficient taxable temporary differences may not be available to utilize these tax credits before these are set to expire i.e. March 31, 2013.
16. Stores and spares
Most of the items of stores and spares are of interchangeable nature and can be used as machine spares or consumed as stores. Accordingly it is not practicable to distinguish stores from spares until their actual usage.
Spares amounting to Rs 14.71 million (2010: Rs 16.32 million) are in the possession of various vendors.
17. Stock in trade
Raw materials including in transit Rs 1,525 million (2010: Rs 526.03 million) 17.1 2,171,943 1,146,136 Work in process 308,017 265,139 Finished goods - Own manufactured 17.2 674,739 650,786 - Trading stock including in transit Rs 57.17 million 288,355 267,100 (2010: Rs 35.52 million) 3,443,054 2,329,161 17.1 Raw materials amounting to Rs 53.16 million (2010: Rs 107.05 million) are in the possession of various vendors of the
Company. 17.2 Finished goods at sale value amounting to Rs 653.52 million (2010: Rs 590.97 million) are in the possession of various
dealers. 17.3 The above balances include items costing Rs 512.44 million (2010: Rs 463.43 million) valued at their net realizable
value amounting to Rs 492.21 million (2010: Rs 442.45 million).
(Rupees in thousand) Note 2011 2010
(Rupees in thousand) Note 2011 2010

70
(Rupees in thousand) Note 2011 2010
18. Trade debts - unsecured
Considered good - -
Considered doubtful 16,142 16,142 Provision for doubtful debts (16,142) (16,142)
- -
- -
19. Advances, prepayments and other receivables
Current portion of loans to employees 14 10,898 10,338 Advances - considered good: - to employees 19.1 638 180 - to suppliers and contractors 247,656 14,446
248,294 14,626 Due from related parties - considered good 19.2 3,452 13,326 Recoverable from government authorities: - Income tax 518,432 581,506 - Sales tax and special excise duty 398,265 294,853 - Custom duty 39,098 39,098
955,795 915,457 Prepayments 7,414 11,362 Profit receivable on bank deposits 7,800 97 Other receivables 12,133 13,539
1,245,786 978,745
19.1 Included in advances to employees is an amount of Rs 0.09 million (2010: Rs 0.07 million) due from executives.
19.2 Due from related parties - considered good
Honda Motor Company Limited, Japan 1,178 930 Honda Automobile (Thailand) Company Limited 1,599 9,059 Honda Trading Asia Company Limited Thailand 24 2,054 Honda Cars Philippines, Inc. 25 41 Honda Trading Corporation, Japan 99 201 Honda Auto parts Manufacturing (M) SDN. BHD, Malaysia 68 54 Asian Honda Motor Company, Thailand 459 484 Honda Trading (South), China - 166 Honda Malaysia SDN. BHD. Malaysia - 104 Wuhan Honda Trading, China - 45 Honda Research and Development Asia Pacific - 181 PT Honda Precision Parts Manufacturing Indonesia - 7
3,452 13,326 These are in the normal course of business and are interest free.
20. Cash and bank balances
At banks - On current accounts 4,441 4,247 - On saving accounts [including US $ 95,858 (2010: US $ 52,905)] 862,220 75,493
866,661 79,740 Cash in hand 2,080 2,306
868,741 82,046
Balances in saving accounts bear mark-up which ranges from 5.00% to 12.25% per annum.
(Rupees in thousand) 2011 2010

Honda Atlas Cars (Pakistan) LimitedAnnual Report 2011 71
21. Sales
Sales - Own manufactured goods 25,241,087 18,031,533 Sales tax (3,598,669) (2,464,979) Excise duties (232,319) (263,414) Commission to dealers (436,119) (332,021)
20,973,980 14,971,119 Sales - Trading goods 1,230,980 1,026,319 Sales tax (176,701) (141,546) Commission to dealers (2,150) (1,750)
1,052,129 883,023
22,026,109 15,854,142
22. Cost of sales Raw material consumed 19,373,596 13,357,356 Stores and spares consumed 74,563 49,711 Salaries, wages and benefits 22.1 229,843 239,279 Fuel and power 68,684 47,178 Insurance 32,016 36,419 Travelling and vehicle running 50,963 42,001 Freight and handling 18,981 16,020 Repairs and maintenance 10,404 6,024 Technical assistance 26,720 11,771 Depreciation on property, plant and equipment 11.1 621,567 720,456 Amortization on intangible assets 12.1 38,796 70,845 Royalty 464,458 331,342 Canteen subsidy 12,244 8,673 Other expenses 832 647
21,023,667 14,937,722
Opening stock of work-in-process 265,139 248,184 Closing stock of work-in-process (308,017) (265,139)
(42,878) (16,955)
Cost of goods manufactured 20,980,789 14,920,767 Own work capitalized (16,988) (1,125) Cost of damaged cars (3,428) (1,065)
20,960,373 14,918,577
Opening stock of finished goods 650,786 1,065,836 Closing stock of finished goods (674,739) (650,786)
(23,953) 415,050
20,936,420 15,333,627 Cost of sales - Trading goods 22.2 890,379 760,060
21,826,799 16,093,687
(Rupees in thousand) 2011 2010
(Rupees in thousand) Note 2011 2010

72
Interest cost for the year 5,379 6,151 Current service cost 5,441 4,869 Actuarial loss for the year 206 704 Expected return on plan assets (4,495) (4,162)
6,531 7,562
In addition to above, salaries, wages and benefits include Rs 8.30 million (2010: Rs 7.23 million) on account of provi-dent fund contributions.
22.2 It includes depreciation charge of Rs 10.38 million (2010: Rs 10.38 million).
23. Distribution and marketing costs
Salaries, wages and benefits 23.1 50,970 50,313 Fuel and power 3,291 2,727 Insurance 4,540 4,846 Travelling and vehicle running 11,638 9,790 Freight and handling 11,808 10,905 Repairs and maintenance 2,863 1,284 Printing and stationery 3,666 2,860 Warranty costs 5,127 5,289 Advertising 21,971 11,894 Depreciation on property, plant and equipment 11.1 8,120 9,823 Amortization on intangible assets 12.1 169 169 Training expenses 129 589 Canteen subsidy 1,135 839 Free service claims 4,005 3,305 Rent, rates and taxes 6,107 6,765 Other expenses 3,646 3,518
139,185 124,916 23.1 Salaries, wages and benefits include following amounts in respect of employees’ retirement benefits:
Interest cost for the year 1,537 1,957 Current service cost 1,555 1,549 Actuarial loss for the year 59 224 Expected return on plan assets (1,285) (1,324)
1,866 2,406
In addition to above, salaries, wages and benefits include Rs 2.27 million (2010: Rs 2.37 million) on account of provident fund contributions.
(Rupees in thousand) 2011 2010
(Rupees in thousand) Note 2011 2010
(Rupees in thousand) 2011 2010
22.1 Salaries, wages and benefits include following amounts in respect of employees’ retirement benefits:

Honda Atlas Cars (Pakistan) LimitedAnnual Report 2011 73
24. Administrative expenses
Salaries, wages and benefits 24.1 92,563 71,470 Fuel and power 5,465 4,060 Insurance 3,361 3,364 Travelling and vehicle running 17,589 14,082 Repairs and maintenance 5,030 2,918 Printing and stationery 2,582 2,591 Communications 4,108 4,176 Postage 2,479 1,901 Advertising 968 213 Auditors’ remuneration 24.2 9,572 3,199 Legal and professional charges 6,771 5,472 Depreciation on property, plant and equipment 11.1 13,670 15,631 Amortization on intangible assets 12.1 - 24 Fees and subscription 718 766 Canteen subsidy 2,758 2,066 Security expenses 2,193 2,591 Other expenses 1,902 1,607
171,729 136,131 24.1 Salaries, wages and benefits include following amounts in respect of employees’ retirement benefits:
Interest cost for the year 2,776 2,366 Current service cost 2,808 1,873 Actuarial loss for the year 107 271 Expected return on plan assets (2,319) (1,601)
3,372 2,909
In addition to above, salaries, wages and benefits include Rs 3.22 million (2010: Rs 2.89 million) on account of provident fund contributions.
24.2 Auditors’ Remuneration
The charges for professional services include the following in respect of auditors’ services for: Statutory audit 1,000 750 Half yearly review 250 250 Taxation services 7,521 1,729 Royalty audit, certificates for remittance of foreign currency and sundry services 255 285 Out of pocket expenses 546 185
9,572 3,199
(Rupees in thousand) Note 2011 2010
(Rupees in thousand) 2011 2010
(Rupees in thousand) 2011 2010

74
25. Other operating income
Income from financial assets: Profit on bank deposits 57,756 455 Profit on loans to employees 3,884 3,737 Profit on advances to suppliers 1,544 740
63,184 4,932 Income from non-financial assets: Profit on disposal of property, plant and equipment 1,576 8,873 Others 19,217 12,518
20,793 21,391
83,977 26,323 26. Other operating expenses
Workers’ welfare fund 2,130 2,762 Donations 2,607 - Exchange loss 60,208 55,821
64,945 58,583 None of the Directors and their Spouses had any interest in donees during the year.27. Finance cost
Interest and mark-up on: - Long term finances 136,224 257,055 - Short term borrowings 14,774 189,704 - Customer advances 63 7,651 Bank charges 1,194 718
152,255 455,12828. Taxation
For the year - Current 193,584 94,999 - Deferred 15 (123,832) (207,371)
69,752 (112,372) Prior year - Current (16,127) 921 - Deferred - (24,329)
(16,127) (23,408)
53,625 (135,780) 28.1 The current tax provision represents the minimum tax on turnover for the year due under Section 113 of the Income
Tax Ordinance, 2001.
(Rupees in thousand) Note 2011 2010

Honda Atlas Cars (Pakistan) LimitedAnnual Report 2011 75
28.2 Tax charge reconciliation
Numerical reconciliation between the average effective tax rate and the applicable tax rate. Applicable tax rate as per Income Tax Ordinance, 2001 (35.00) (35.00) Tax effect of: - change in prior years’ tax (6.59) (2.37) - minimum tax not carried forward 79.07 24.53 - lower tax rates / final tax regime and others (15.58) (0.90)
56.90 21.26
Average effective tax rate charged to profit and loss account 21.90 (13.74)
29. Cash generated from operations
Loss before taxation (244,827) (987,980) Adjustment for: Depreciation on property, plant and equipment 653,734 756,288 Profit on disposal of property, plant and equipment (1,576) (8,873) Profit on bank deposits (57,756) (455) Profit on advances to suppliers (1,544) (740) Profit on loans to employees (3,884) (3,737) Finance cost 152,255 455,128 Provision for employees’ retirement benefits and other obligations 29,436 28,282 Amortization on intangible assets 38,965 71,038 Royalty 422,234 301,219 Working capital changes 29.1 1,167,875 2,948,522
2,154,912 3,558,692 29.1 Working capital changes
Decrease/ (increase) in current assets - Stores and spares 15,329 (19,426) - Stock in trade (1,113,892) 624,930 - Advances, prepayments and other receivables (321,852) 131,250
(1,420,415) 736,754 Increase in current liabilities - Trade and other payables 2,588,290 2,211,768
1,167,875 2,948,522
(Percentage) 2011 2010
(Rupees in thousand) Note 2011 2010

76
30. Remuneration of Chief Executive, Directors and Executives The aggregate amount charged in the financial statements for the year for remuneration, including certain benefits to
the chief executive, working directors and other executives of the Company is as follows:
Chief Executive Directors Executives
(Rupees in thousand) 2011 2010 2011 2010 2011 2010
Managerial remuneration 1,551 1,322 7,849 7,872 48,023 43,608
House rent and utilities 1,889 1,729 5,340 5,289 26,224 28,557
Bonus - - 572 - 5,012 -
Reimbursement of medical expenses - - 1,002 580 900 1,013
Employees’ retirement benefits - - 1,640 957 9,767 7,172
Other allowances and expenses 8,167 3,941 9,125 7,569 7,365 42,584
11,607 6,992 25,528 22,267 97,291 122,934
Number of persons 1 1 2 2 56 46 30.1 The Chief Executive, certain directors and executives of the Company are provided with free use of Company cars and
Company maintained furnished accommodation. 31. Loss per share 31.1 Basic loss per share Net loss for the year Rupees in thousand (298,452) (852,200) Weighted average number of ordinary shares Number in thousands 142,800 142,800 Basic loss per share Rupees (2.09) (5.97) 31.2 Diluted loss per share
There is no dilution effect on the loss per share of the Company as the Company has no such commitments. 32. Operating segments
Management monitors the operating results of its business segments separately for the purpose of making decisions about resource allocation and performance assessment. Operating segments are reported in a manner consistent with internal reporting provided to the Chief Operating Decision Maker (CODM). Segment performance is generally evaluated based on certain key performance indicators including business volume and gross profit.
Segment results include items directly attributable to a segment as well as those that can be allocated on a reason-
able basis. 32.1 The Management has determined the operating segments based on the reports reviewed by the CODM that are used
to make strategic and business decisions. (a) Manufacturing
This segment relates to the sale of locally manufactured cars.

Honda Atlas Cars (Pakistan) LimitedAnnual Report 2011 77
(b) Trading
The segment relates to the trading of completely built units (CBU’s) and spare parts. 32.2 Segment information
Manufacturing Trading Total
(Rupees in thousand) 2011 2010 2011 2010 2011 2010
Segment revenue 20,973,980 14,971,119 1,052,129 883,023 22,026,109 15,854,142
Segment expenses
- Cost of sales (20,936,420) (15,333,627) (890,379) (760,060) (21,826,799) (16,093,687)
Gross profit / (loss) 37,560 (362,508) 161,750 122,963 199,310 (239,545)
Distribution and marketing costs (139,185) (124,916)
Administrative expenses (171,729) (136,131)
Other operating income 83,977 26,323
Other operating expenses (64,945) (58,583)
Finance cost (152,255) (455,128)
Loss before tax (244,827) (987,980)
Taxation (53,625) 135,780
Loss for the year (298,452) (852,200) 32.2.1 Segment wise assets and liabilities are not being reviewed by the CODM.
33. Financial risk management 33.1 Financial risk factors
The Company’s activities expose it to a variety of financial risks: market risk (including currency risk, fair value interest rate risk and cash flow interest rate risk), credit risk and liquidity risk. The Company’s overall risk management programme focuses on the un-predictability of financial markets and seeks to minimize potential adverse effects on the Company’s financial performance.
Risk management is carried out by the Company’s finance department under policies approved by the board of
directors. The Company’s finance department evaluates and hedges financial risks. The board provides principles for overall risk management, as well as policies covering specific areas, such as foreign exchange risk, interest rate risk, credit risk and investment of excess liquidity.
(a) Market risk
(i) Currency risk
Currency risk is the risk that the fair value or future cash flows of a financial instrument will fluctuate because of changes in foreign exchange rates. Currency risk arises mainly from future commercial transactions or receivables and payables that exist due to transactions in foreign currencies.
The Company is exposed to currency risk arising from various currency exposures, primarily with respect to the United
States Dollar (USD), Japanese Yen (JPY) and Thai Baht (THB). Currently, the Company’s foreign exchange risk exposure is restricted to the amounts receivable / payable from / to foreign entities. The Company’s exposure to currency risk is as follows:

78
Cash and bank balances- USD 96 74 Advances, prepayments and other receivables - USD 36 106 Trade and other payables - USD (59,439) (31,528)
Net exposure - USD (59,307) (31,348) Advances, prepayments and other receivables - JPY 1,005 830 Trade and other payables - JPY (267,390) (103,191)
Net exposure - JPY (266,385) (102,361) Advances, prepayments and other receivables - THB 312 1,976 Trade and other payables - THB (13,384) (16,137)
Net exposure - THB (13,072) (14,161)
The following significant exchange rates were applied during the year:
Rupees per USD
Average rate 85.41 82.96 Reporting date rate 85.50 84.18 Rupees per JPY
Average rate 1.00 0.90 Reporting date rate 1.03 0.90 Rupees per THB
Average rate 2.81 2.46 Reporting date rate 2.82 2.60
If the functional currency, at reporting date, had fluctuated by 1% against the USD, JPY and THB with all other variables held constant, the impact on loss after taxation for the year would have been Rs 34.98 million (2010: Rs 17.99 million) lower / higher, mainly as a result of exchange gains / losses on translation of foreign exchange denominated financial instruments. Currency risk sensitivity to foreign exchange movements has been calculated on a symmetric basis.
(ii) Cash flow and fair value interest rate risk
As the Company has no significant interest-bearing assets, the Company’s income and operating cash flows are substantially independent of changes in market interest rates.
The Company’s interest rate risk arises from long term and short term borrowings. Borrowings obtained at variable
rates expose the Company to cash flow interest rate risk. The Company analyses its interest rate exposure on a dynamic basis. Various scenarios are simulated taking into
consideration refinancing, renewal of existing positions and alternative financing. Based on these scenarios, the Company calculates the impact on profit and loss of a defined interest rate shift. The scenarios are run only for liabilities that represent the major interest-bearing positions.
(Rupees in thousand) 2011 2010
2011 2010

Honda Atlas Cars (Pakistan) LimitedAnnual Report 2011 79
At the balance sheet date, the interest rate profile of the Company’s interest bearing financial instruments was:
Fixed rate instruments Financial assets Long term loans and advances 44,430 44,234 Cash at bank - savings accounts 200,000 -
244,430 44,234 Floating rate instruments Financial assets Cash at bank - savings accounts 662,220 75,493 Financial liabilities Long-term finances - secured (833,334) (1,500,000) Net exposure (171,114) (1,424,507) Fair value sensitivity analysis for fixed rate instruments
The Company does not account for any fixed rate financial assets and liabilities at fair value through profit or loss. Therefore, a change in interest rate at the balance sheet date would not affect profit or loss of the Company.
Cash flow sensitivity analysis for variable rate instruments
At March 31, 2011, if interest rates on long term borrowings had been 1% higher / lower with all other variables held constant, post-tax loss for the year would have been Rs 6.33 million (2010: Rs 12.75 million) higher / lower, mainly as a result of higher / lower interest expense on floating rate borrowings.
At March 31, 2011, if interest rates on short term borrowings had been 1% higher / lower with all other variables held
constant, post-tax loss for the year would have been Rs 0.68 million (2010: Rs 7.88 million) higher / lower, mainly as a result of higher / lower interest expense on floating rate borrowings.
(b) Credit risk
Credit risk represents the risk that one party to a financial instrument will cause a financial loss for the other party by failing to discharge an obligation. Credit risk arises from deposits with banks, trade debts, investments, loans and advances and other receivables.
(i) Exposure to credit risk
The carrying amount of financial assets represents the maximum credit exposure. The maximum exposure to credit risk at the reporting date was as follows:
(Rupees in thousand) 2011 2010

80
Long term deposits 4,042 4,042 Advances, prepayments and other receivables 19,933 13,636 Balances with banks 866,661 79,740
890,636 97,418 The credit risk on liquid funds is limited because the counter parties are banks with reasonably high credit ratings. The
Company believes that it is not exposed to major concentration of credit risk as its exposure is spread over a significant number of counter parties.
(ii) Credit quality of major financial assets
The credit quality of Company’s bank balances can be assessed by reference to external credit ratings (if available) or to historical information about counterparty default rate:
(Rupees in thousand) Rating Rating Banks Short term Long term Agency 2011 2010 Askari Bank Limited A1+ AA PACRA 1 1 Citibank N.A. A-1 A+ S&P 206,716 56,497 Deutsche Bank A.G. A-1 A+ S&P 10,070 1 Faysal Bank Limited A1+ AA PACRA 287 - Habib Bank Limited A-1+ AA+ JCR-VIS 424 345 MCB Bank Limited A1+ AA+ PACRA 105,092 17,957 National Bank of Pakistan A-1+ AAA JCR-VIS 109 20 Soneri Bank Limited A1+ AA- PACRA 329,780 4,468 Standard Chartered Bank (Pakistan) Limited A1+ AAA PACRA 4,702 2 The Bank of Tokyo - Mitsubishi UFJ, Limited A-1 A+ S&P 208,999 2 United Bank Limited A-1+ AA+ JCR-VIS 481 447
866,661 79,740 Due to the Company’s long standing business relationships with these counterparties and after giving due
consideration to their strong financial standing, management does not expect non-performance by these counter parties on their obligations to the Company. Accordingly, the credit risk is minimal.
(c) Liquidity risk
Liquidity risk is the risk that an entity will encounter difficulty in meeting obligations associated with financial liabilities.
The Company manages liquidity risk by maintaining sufficient cash and the availability of funding through an adequate
amount of committed credit facilities. Furthermore, the holding Company Honda Motors Company, Japan through its associated Company has provided liquidity support to the Company in form of credit payments on some of the CKD material supplies . At March 31, 2011, the Company had Rs 4,240 million available borrowing limits from financial institutions and Rs 868.74 million cash and bank balances.
(Rupees in thousand) 2011 2010

Honda Atlas Cars (Pakistan) LimitedAnnual Report 2011 81
The following are the contractual maturities of financial liabilities as at March 31, 2011:
(Rupees in thousand) 2011 Carrying Less than One to five More than amount one year years five years
Long-term finances - secured 833,334 416,667 416,667 - Mark-up accrued on borrowings 4,302 4,302 - - Trade and other payables 7,081,133 7,081,133 - -
7,918,769 7,502,102 416,667 - The following are the contractual maturities of financial liabilities as at March 31, 2010: (Rupees in thousand) 2010 Carrying Less than One to five More than amount one year years five years
Long-term finances - secured 1,500,000 166,667 1,333,333 - Mark-up accrued on borrowings 37,400 37,400 - - Trade and other payables 4,247,536 4,247,536 - -
5,784,936 4,451,603 1,333,333 - 33.2 Fair value estimation
The fair value of financial instruments traded in active markets is based on quoted market prices at the balance sheet date. However, the Company does not hold any quoted financial instrument.
The financial instruments that are not traded in active market are carried at cost and are tested for impairment
according to IAS 39 ‘Financial Instruments: Recognition and Measurement’. The carrying amount less impairment provision of trade receivables and payables are assumed to approximate their
fair values. The fair value of financial liabilities for disclosure purposes is estimated by discounting the future contractual cash flows at the current market interest rate that is available to the Company for similar financial instruments.
33.3 Financial instruments by categories
Loans and receivables (Rupees in thousand) 2011 2010
Financial assets as per balance sheet Long term loans and advances 44,430 44,234 Long term deposits 4,042 4,042 Advances, prepayments and other receivables 23,385 26,962 Cash and bank balances 868,741 82,046
940,598 157,284

82
Financial liabilities at amortized cost (Rupees in thousand) 2011 2010
Financial liabilities as per balance sheet Long-term finances - secured 833,334 1,500,000 Mark-up accrued on borrowings 4,302 37,400 Trade and other payables 7,081,133 4,247,536
7,918,769 5,784,936 33.4 Capital risk management
The Company’s objectives when managing capital are to safeguard the Company’s ability to continue as a going concern in order to provide returns for shareholders and benefits for other stakeholders and to maintain an optimal capital structure to reduce the cost of capital. In order to maintain or adjust the capital structure, the Company may adjust the amount of dividends paid to shareholders, issue new shares and other measures commensurating to the circumstances. The Company monitors the capital structure on the basis of gearing ratio. This ratio is calculated as borrowings divided by total capital employed. Borrowings represent long term loans obtained by the Company as referred to in note 7. Total capital employed includes equity as shown in the balance sheet plus borrowings. The gearing ratio as at year ended March 31, 2011 and March 31, 2010 are as follows:
2011 2010
Borrowings Rupees in thousand 833,334 1,500,000 Total equity Rupees in thousand (2,510,527) 3,475,645 Gearing ratio Percentage 33 43 34. Transactions with related parties
The related parties comprise holding Company, fellow subsidiaries, associated undertakings and key management personnel. The Company in the normal course of business carries out transactions with various related parties. Amounts due from and to related parties are shown under receivables and payables and remuneration of key management personnel is disclosed in note 30. Other significant transactions with related parties are as follows:
(Rupees in thousand) 2011
Holding Associated Total company undertakings
For the year ended March 31, 2011
Purchase of goods 3,788,956 9,240,650 13,029,606 Purchase of property, plant and equipment 1,615 101 1,716 Sale of goods - 59,590 59,590 Insurance premium - 174,881 174,881 Insurance claims - 9,573 9,573 Royalty 419,900 990 420,890 Technical assistance and training charges 8,884 15,170 24,054

Honda Atlas Cars (Pakistan) LimitedAnnual Report 2011 83
(Rupees in thousand) 2010 Holding Associated Total company undertakings
For the year ended March 31, 2010
Purchase of goods 2,421,742 5,902,029 8,323,771 Purchase of property, plant and equipment - 3,904 3,904 Sale of goods - 28,692 28,692 Insurance premium - 135,484 135,484 Insurance claim - 3,375 3,375 Royalty 299,466 765 300,231 Technical assistance and training charges 189 8,627 8,816 All transactions with related parties have been carried out on mutually agreed commercial terms and conditions. 35. Plant capacity and actual production
Capacity Production (Number) 2011 2010 2011 2010
Motor vehicles 50,000 50,000 16,440 11,980 The Company has a capacity of producing 50,000 motor vehicles per annum on double shift basis. Under utilization of
capacity was due to lower demand of certain products. 36. Date of authorization for issue These financial statements were authorized for issue on May 16, 2011 by the Board of Directors of the Company. 37. Events after the balance sheet date
The board has recommended following appropriation:
Transfer to profit and loss account from general reserves 299,000 853,000 38. Corresponding figures
Corresponding figures have been re-arranged and reclassified, wherever necessary, for the purposes of comparison. However no significant re-arrangements have been made.
Yusuf H. Shirazi Takeharu Aoki Chairman Chief Executive
(Rupees in thousand) 2011 2010

84
Notice is hereby given that 19th Annual General Meeting of shareholders of Honda Atlas Cars (Pakistan) Limited will be
held on Thursday, June 30, 2011 at 12:30 p.m. at Pearl Continental Hotel, Shahra-e-Quaid-e-Azam, Lahore to transact
the following business:
1. To confirm the minutes of Annual General Meeting held on Wednesday June 30, 2010.
2. To receive, approve and adopt the audited financial statements for the year ended March 31, 2011 together with
the Directors’ and Auditors’ reports thereon.
3. To appoint Auditors for the financial year 2012 and fix their remuneration.
4. To transact any other business with permission of the Chairman.
By order of the Board
(Sardar Abid Ali Khan)
Vice President & Company Secretary
Lahore: June 08, 2011
NOTE:
1. The share transfer books of the company will remain closed from June 23, 2011 to June 30, 2011 (both days
inclusive).
2. A member entitled to attend and vote at the Annual General Meeting is entitled to appoint another member
as a proxy and vote on his/her behalf. Proxies in order to be effective must be received at the Registered Office
of the Company not less than 48 hours before the time of the meeting.
3. Any individual Beneficial Owner of CDC, entitled to attend and vote at this meeting, must bring his/her CNIC
or passport to prove his/her identity and in case of Proxy must enclose an attested copy of his/her CNIC
or passport. Representatives of corporate members should bring the usual documents required for such
purpose.
4. The shareholders are requested to notify the company immediately of the change in address, if any.
Notice of Annual General Meeting

Honda Atlas Cars (Pakistan) LimitedAnnual Report 2011 85
Secretary,
Honda Atlas Cars (Pakistan) Ltd.,1-Mcleod Road, Lahore,
Lahore
I/We of
being member(s) of Honda Atlas Cars (Pakistan) Ltd.,
having Folio No. and number of shares, hereby appoint
Mr./Ms of
being member of the company having Folio No. and
number of shares, as my/our proxy in my/our absence to attend and vote for me/us on my/our behalf at the 19th An-
nual General Meeting of the Company to be held on Thursday, June 30, 2011 at 12:30 p.m at Pearl Continental Hotel,
Shahra-e-Quaid-e-Azam, Lahore or at any adjournment thereof.
As witness my/our hand on this day of 2011.
Signed by the said
In the presence of
(Witness)
Signature
NOTES:
1. A member entitled to attend and vote at the Annual General Meeting of the Company is entitled to appoint a
proxy to attend and vote instead of his/her. No person shall act, as a proxy who is not a member of the Company
except that a corporation may appoint a person who is not a member.
2. The instrument appointing a proxy shall be in writing under the hand on the appointer or his constituted attorney
or if such appointer is a corporation or company, under the common seal of such corporation or company.
3. The Form of Proxy, duly completed, must be deposited at the Company’s registered office, 1-Mcleod Road,
Lahore not less than 48 hours before the time of holding the meeting.
Affix Rs. 5/-Revenue
stamphere
Form of Proxy

AFFIXCORRECTPOSTAGE
Secretary,
Honda Atlas Cars (Pakistan) Ltd.,1-Mcleod Road,
Lahore.