
The application of Lean Principles and Six Sigma in the Mexican
Upload
khangminh22Category
view
0download
0
econstorMake Your Publications Visible.
A Service of
zbwLeibniz-InformationszentrumWirtschaftLeibniz Information Centrefor Economics
Sabry, Assrar
Article
Factors critical to the success of six-sigma qualityprogram and their influence on performanceindicators in some of Lebanese hospitals
Arab Economic and Business Journal
Provided in Cooperation with:Holy Spirit University of Kaslik
Suggested Citation: Sabry, Assrar (2014) : Factors critical to the success of six-sigma qualityprogram and their influence on performance indicators in some of Lebanese hospitals, ArabEconomic and Business Journal, ISSN 2214-4625, Elsevier, Amsterdam, Vol. 9, Iss. 2, pp.93-114,http://dx.doi.org/10.1016/j.aebj.2014.07.001
This Version is available at:http://hdl.handle.net/10419/187521
Standard-Nutzungsbedingungen:
Die Dokumente auf EconStor dürfen zu eigenen wissenschaftlichenZwecken und zum Privatgebrauch gespeichert und kopiert werden.
Sie dürfen die Dokumente nicht für öffentliche oder kommerzielleZwecke vervielfältigen, öffentlich ausstellen, öffentlich zugänglichmachen, vertreiben oder anderweitig nutzen.
Sofern die Verfasser die Dokumente unter Open-Content-Lizenzen(insbesondere CC-Lizenzen) zur Verfügung gestellt haben sollten,gelten abweichend von diesen Nutzungsbedingungen die in der dortgenannten Lizenz gewährten Nutzungsrechte.
Terms of use:
Documents in EconStor may be saved and copied for yourpersonal and scholarly purposes.
You are not to copy documents for public or commercialpurposes, to exhibit the documents publicly, to make thempublicly available on the internet, or to distribute or otherwiseuse the documents in public.
If the documents have been made available under an OpenContent Licence (especially Creative Commons Licences), youmay exercise further usage rights as specified in the indicatedlicence.
https://creativecommons.org/licenses/by-nc-nd/4.0/
www.econstor.eu
2214-4625/$ – see front matter © 2014 Holy Spirit University of Kaslik. Hosting by Elsevier B.V. All rights reserved.http://dx.doi.org/10.1016/j.aebj.2014.07.001
ARAB ECONOMICS AND BUSINESS JOURNAL 9 (2014) 93–114
Contents lists available at ScienceDirect
ScienceDirect
journa l homepage : www.e lsev ier. com/ loca te /aeb j
* Corresponding author. E-mail address: [email protected]; Tel: 71- 191207
Peer review under responsibility of xxxxx.
Conference Title
Factors critical to the success of Six-Sigma quality program and their influence on performance indicators in some of Lebanese hospitals Assrar Sabry*
Alexandria University, Egypt
A R T I C L E I N F O
Article history:
Received 24 February 14 Received in revised form 14 June 14 Accepted 14 Juillet14 Keywords: Six-Sigma quality program Critical success factors Key performance indicators Hospitals CSFs KPIs
A B S T R A C T
Medical literature reports that Six-Sigma was applied at specific healthcare organizations. However, there is a lack of studies that investigate the broader status of Six-Sigma in Lebanese healthcare systems. The purpose of this paper is to explore the realities of factors critical (CSFs) to the success of a Six-Sigma quality program to identify the nature of the quality program implemented in some of Lebanese hospitals in Beirut. It also examines the impact of (CSFs) of a Six-Sigma quality program and its influence on performance indicators. In order to achieve the objectives of the study, two questionnaires were used; ANOVA, Eta Squared, Pearson Correlations were used to analyse the data collected from a sample of 101 respondents. Three hypotheses, (H1), (H2) and (H3), were tested and partially accepted based on the results found. The rest of the paper is organized as follows: First, an overview on the relevant literature reviews with respect to the identified Six-Sigma factors. After that, the methodology and the data analysis of the results are presented. The end of this paper is concluded with the discussion and suggestions for further research.
© 2013 xxxxxxxx. Hosting by Elsevier B.V. All rights reserved.
1. Introduction
The challenge in the Lebanese healthcare industries is how to balance between quality and accessibility to the health care. The health care sector in Lebanon falls under a private sector. Lebanon has a total of 130 hospitals spread throughout the country of which 105 fall under the private sector and 20 under the public sector (Health Care Sector in Lebanon: Syndicate of Private Hospitals, 2012).
Based on the report prepared by (Rivers, 2010) and with Association of the American Hospital in Lebanon, the service quality and patients satisfaction are getting considerable attentions and these issues are
considered in their strategic planning process. Patients’ perceptions about the services provided by particular health care organizations affect the image and profitability of the hospital and it also significantly affects the patient behaviour in terms of their loyalty. As mentioned by (Muhammad and Ijaz, 2011), increased patients’ expectations about the service quality had pushed the healthcare service providers to identify the key determinants that are necessary to improve healthcare services that cause patients satisfaction and yet also help the service providers to reduce time and money involved in handling patient’s complaints. Quality has become a major societal concern, as pointed out in latest reports such as The State of Health Care Quality. Healthcare organizations have been looking for ways to improve the bottom line and the quality of patient care. Some typical
© 2014 Holy Spirit University of Kaslik. Hosting by Elsevier B.V. All rights reserved.
Peer review under responsibility of Holy Spirit University of Kaslik.
94 ARAB ECONOMICS AND BUSINESS JOURNAL 9 (2014) 93–114
quality programs include the International Standards Organization (ISO) 9000 standards, the total quality management philosophy, Toyota Production Systems (TPS), Lean manufacturing and recently the Six-Sigma program. These quality standards and programs can be conveniently borrowed to improve the performance of healthcare systems (Feng et al, 2008).
Quality of care can be defined by many ways depending on the stakeholders involved in the industry. It can be different from the view of the government, the shareholders, the clinical and non-clinical staff, the patients and also the carers. Patient’s satisfaction has been used widely all over the world to assess the quality of services rendered in healthcare facilities. According to (Ismail and Alhashemi, 2011) the health managers can identify the components of quality care such as the structure, process and product of care by assessing the patient’s satisfaction. Joseph and Kristina (2004) reported three approaches to quality improvement in the healthcare industry to improve patient satisfaction by measuring the patient’s perspective, improving patient outcomes and using Six-Sigma approach.
Chakrabarty and Kay (2006) reported that defects found in a service process incur a cost either to scrap or rework. Such service examples include the need to re-contact a customer in order to verify either an order, or providing an incorrect service, or providing a substandard service, or even over servicing or providing more than what is required. The literature review shows that empirical studies are limited to service industries, such as healthcare systems. The financial benefits have the most concern, in contrast to discussing gain in terms of process improvement. In addition, it is important to note that the empirical studies emphasized the proper identification of critical success factors (CSFs), critical to quality (CTQ) characteristics, and key performance indicators (KPIs) much more than testing the relation between these factors in the form of conceptual models. All over the world healthcare is facing serious quality problems while costs are exploding. The Institute of Medicine (IOM) produced two reports demonstrating healthcare has serious safety and quality problems and is in need of fundamental change. Care processes poorly designed and characterized by unnecessary duplication of services, long waiting time and delay. Costs are exploding and waste is identifying as an important contributor to the increase in Healthcare expenditures. As a result, healthcare consistently does not succeed in meeting patient’s needs (Heuvel, Does and koning, 2006).
2. Structure
2.1. Research Problem
While there is substantial evidence on the use of six-sigma in many manufacturing industries, there is limited empirical evidence demonstrating the relationship between factors associated with a Six-Sigma quality program and the performance of organizations in the health sector (Hilton et al., 2008; Al Rashdi, 2011). Research on Six-Sigma has been anecdotal in nature with minimal empirical findings (Dellifraine, Langabeer and Nembhard, 2010). This research assists in filling another gap for Six-Sigma quality program in this sector. The problem statement of this study described in the following questions:
i. Determine empirically which of the critical success factors (CSFs) of Six-Sigma quality program implementation exist in a sample of Lebanese hospital. Since that there is no agreement
construct available in the literature to measure the key performance indicators in the health sector, the current study will empirically determine the key performance indicators that are suitable to measure the performance in a sample.
ii. What are the ranking of the CSFs of six-sigma quality program in the two groups (hospital department managers and professionals) within the sample? In order to understand how different the ranking of these factors from the actual ranking presented by the (Hilton et al., 2008).
iii. What is the relationship between CSFs of Six-Sigma quality program and the key performance indicators of the sample?
2.2. Research Question
The research objectives can be achieved by analyzing the results obtained from posing the following specific research questions:
i. To what extent can the (CSFs) of Six-Sigma quality program implementation explore the nature of the quality program existing in a sample of Lebanese hospitals? and what is the construct of the key performance indicators available in the literature and suitable to measure the performance in a sample?
ii. To what extent will the ranking of the (CSFs) of Six-Sigma quality program differ in the two groups of the sample: hospital department managers and professionals from the actual ranking?
iii. Which of the (CSFs) of Six-Sigma quality program implementation are positively correlated with the construct of the key performance indicators?
2.3. Research Objectives
i. Address the nature of the quality program in a sample of Lebanese hospitals by describing which of the (CSFs) of Six-Sigma quality program implementation are applied (Hilton et al., 2008; Ismail et al., 2011; Wang and Hussain , 2011). Providing an insight on the basic performance indicators that are available in some previous literature, also, determining which of them are used to measure the performance in a sample.
ii. Analyze the difference in the ranks of the (CSFs) of Six-Sigma quality program between the actual ranks presented by the (Hilton et al., 2008) and the ranks in the two groups of the sample, the professionals and the hospital department managers.
iii. Provide an insight on the impact of the (CSFs) of Six-Sigma quality program on the performance indicators (Dellifraine et al., 2010) in a sample.
2.4. Research Importance
This research is important for the following reasons: i. Based on (Ettinger, 2001) Six-Sigma principles and the
healthcare sector very well matched because of the healthcare nature of very low or zero tolerance to mistakes and the high potentials for reducing medical errors.
ii. Although the published literature contains many references on quality and customer perceptions of the medical profession from a clinical perspective, very little research has conducted into
ARAB ECONOMICS AND BUSINESS JOURNAL 9 (2014) 93–114 95
non-clinical aspects of the quality of medical care (Hekmatpanah et al., 2008; Rivers, 2010).
iii. The reason behind the limitation of Six-Sigma in service industries is that the features of service industries are not uniform and therefore its application is limited to some specific service sectors even within health care (Dileep and Rau, 2009).
iv. Based on the adoption of the previous studies on performance measurement in hospitals on some measures, which differed from one study to another. And the fact that there is no agreement between these studies on the identification of specific indicators to measure the performance in the healthcare sector, the current study will include indicators from these studies and will subject new indicators that can be more suitable for application in the hospitals of the study sample.
3. Theoretical Background
Six Sigma is a powerful performance improvement tool that is changing the face of modern healthcare delivery today. Six Sigma implemented in diagnostic imaging processes, emergency room, and paramedic backup, and laboratory, surgery room, and radiology, surgical site infections to improve quality, performance and to improve the outcomes of their patients (Sahbz, Taner, Kagan, Sasisoglu, Durmus, Tunca, Erabas, Kagan, Kagan, and Enginyurt, 2014)
The term (Sigma) refers to a scale of quality measurement in any processes such as manufacturing, and by using this scale. Six Sigma equates to 3.4 defects per million opportunities (DPMO). There are numerous definitions of Six Sigma in literature; it frequently defined as a methodology for quality improvement with the goal of reducing the number of defects to 3.4 units per million opportunities or 0.0003%. It is a statistics based approach, which aims to isolate sources of errors and identify ways to exclude them. Six Sigma has approved as an effective approach for quality improvement in service sectors, especially at healthcare and financial services (Schroeder, Linderman, Liedtke and Choo, 2008; Zhang, Hill and Gilbreath, 2009). Aboelmaged, (2010), defined Six-Sigma as standard deviations, which is a statistical representation of the variance in a process based on data-driven approach to analyze the root causes of processes problems and solving them.
In addition, Weinstein, Castellano, Petrick and Vokurka (2011) reported that the higher the sigma the fewer the defects. With one sigma, 68.27% of products or services will meet customer requirements and there will be 317,300 defects per million opportunities .Whereas three sigma, 99.73% of products or services will meet customer requirements and there will be 2700 defects per million opportunities. With six-sigma, 99.99966% of products or services will meet customer requirements and there will be 3.4 defects per million opportunities (DPMO). The focus of Six-Sigma is not on counting the defects in processes, but the number of opportunities within a process that could result in defects so that causes of quality problems can be eliminated before they are transformed into defects. Tariq and Ahmed-Khan (2011) analyzed the concept of Six-Sigma from different attitudes. Six-Sigma is particular references to quality, defect, process capability, variation and stability of operations. Six Sigma is an approach that emphasis on reliability of data based on IT systems. Mohamed (2010) clarifies emerging definitions of Six-Sigma through a comprehensive review of Six-Sigma literature over 17 years, from 1992 to 2008 and found SS defined as a philosophy that employs a well-structured continuous
improvement program, or defined as improvement strategy of processes performance. Hekmatpanah, Sadroddin, Shahbaz, Mokhtari and Fadavinia (2008); Wang (2011); Suhaiza et al., (2011), Khaidir, Habidin, Jamaludin, Shazali, and Ali (2014), mentioned that many of the definitions of Six-Sigma found in the literature review are very general and there is no uniform agreement among them about certain factors or constructs related to Six-Sigma.
3.1. Key Critical Success Factors (CSFs) of Six-Sigma quality program
The healthcare organization is the place where defects and mistakes cannot tolerate. A simple mistake can cost a human life so defects or mistakes must eliminate in healthcare service processes. Six Sigma approach is the best option in a healthcare environment for dealing with a critical patient. Implementation of six-sigma approach can be reductions in several aspects of healthcare such as patient waiting time in emergency departments, lost charges for billing in patient financial services, delinquent medical records, diagnostic result turnaround times, accounts receivable days, patients’ length of stay, and medication errors (Selim, Noor, and Rafikul, 2014) .
Leong and Teh (2013) proposed a model includes five CSF’s for implementing SS quality program. First, top management commitment: is important in handling the causes of process output variation. Second, teamwork: is value-added to have teams in any problem solving actions. Third, training and education: is necessary to design and plan for the Six Sigma project development. Previous studies have found a positive relationship between training and education, and the SS implementation. Fourth, cultural change: the organizational administrators should collect employees’ feedback, plan the cultural change through a proper SS milestone, delegate jobs and empower staff in decision-making. Fifth, organizational infrastructure: id needed to be in place prior to introduce Six Sigma program in an organization.
Laureani and Antony (2012) aim to identify the most important factors of CSF’s of SS quality program such as management commitment, cultural change, linking Lean Six Sigma to business strategy and leadership styles. They also identify the least important of CSF’s of SS quality program such as linking Six Sigma to HR rewards and extending Lean Six Sigma to supply chain. In addition, the results revealed that, although there are a number of papers published on CSFs of Lean and Six Sigma, it found that there is a dearth of literature on CSFs of Six Sigma implementation.
Ching-Chow (2004) investigates fifteen CSFs of Six-Sigma quality program implementation and their importance degree for the different industries in Taiwan. The result found factor ( training) is the first priority, followed by such factors as top management involvement and commitment, understanding methods, tools and techniques within Six-Sigma, organization infrastructure. In addition, these industries should pay more attention on five CSFs as follows: top management involvement and commitment, cultural change, communication with all employees to achieve congruence, linking Six-Sigma to business strategy, and linking Six-Sigma to customers.
As mentioned by (Chakrabarty et al., 2006), the literature review shows that top management commitment; education and training; culture change; and financial benefits are the most important CSFs for the successful application of SS in service sector. Other CSFs mentioned in some of the literature reviews include customer focus; clear performance metrics; and
96 ARAB ECONOMICS AND BUSINESS JOURNAL 9 (2014) 93–114
organizational understanding of work processes. Schroeder et al. (2008) found that SS focused on process improvement with DMAIC, training, employee involvement and participation, team, customers, financial performance metrics, suppliers, communication and solving problems methods.
Rajamanoharan and Collier (2006) explored SS implementation issues in services sector in Malaysia and used the process change management as a framework. The results indicate that a low level of cultural readiness and inadequate knowledge-sharing capability coupled with inadequate cross-functional links inhibits the success of SS initiatives, and the learning capacity are found to contribute positively to the SS implementations. In the absence of a common shared knowledge database, the SS teams relied on the cooperation of cross-functional staff for information. The erratic cooperation from functional staff had a negative impact on the group’s knowledge-sharing capability and the network relationship between functions.
Fredendall, Robbins and Zu (2006) identify ten (CSFs) of Six-Sigma quality program as follows : top management support, customer relationship, supplier relationship, workforce management, quality information, product/service design, process management, Six-Sigma role structure, structured improvement procedure. Aboelmaged (2010) comes out for identifying and highlighting the factors that have always been subject to intensive literature (e.g. Buch and Tolentino, 2006; Chakrabarty et al., 2007; Kumar, 2007; Kwak et al., 2006). They proposed the most cited success factors in Six-Sigma literature. These are as follows: strong top management involvement and commitment, selection of Six-Sigma projects, changing organizational culture, aligning Six-Sigma projects to corporate business objectives, cross-functional team working, effective communication, infrastructure (both organizational and IT infrastructure), training, linking Six-Sigma to business strategy, customer, human resource management, suppliers, measurement, accountability, understanding tools and techniques within Six-Sigma and project management skills.
Antony et al. (2007) mentioned that the main CSFs are as follows: managing involvement and commitment, understanding of SS methodology, linking it to a business strategy, linking it to customers, project prioritization and selection, organizational infrastructure, cultural change, project management skills, linking it to suppliers, training and linking it to employees. Several studies such as (Pfeifer, Reissiger and Canales, 2004; Szeto and Tsang, 2005; Salaheldin and Abdelwahab, 2009) argued that the critical success factors (CSFs) of implementing Six-Sigma involved three main factors. The most important factor is management involvement and commitment, followed by linking Six-Sigma to business strategy, customer expectations are critical point, and employees are one of the stakeholders that have the real effect on the organization performance. Dileep et al. (2009) ranked the top five ranks of CSFs as follows: first, (top management, leadership and commitment) are essential for SS QMS success and should act as key drivers in continuous improvements. Second, (well implemented the system of customer satisfaction) to monitor customer satisfaction levels, to receive customer feedback, and to resolve customer concerns. Third, (education and training) required to provide continuous courses to employees for equipping them with quality-related knowledge and problem-solving skills. Fourth, (well-organized information and analysis system) required to collect the performance measures in order to monitor the quality of key business processes. Fifth, (well-implemented process management system) required to identify,
improve, and monitor the key business processes that have a positive impact on Six-Sigma quality management success.
Pulakanam and Voges, (2010) concentrated on identifying the critical success factors in implementing Six Sigma. They found senior management commitment, linking Six Sigma to business strategy and customers, organizational readiness and project management skills have identified as most important in the four surveys of their sample. The other less important CSFs were management of cultural change, company-wide commitment, integration of Six Sigma with financial accountability, understanding Six Sigma methodology, training and education, project selection and prioritization, project tracking and reviews, incentive programs, and linking Six Sigma to employees and suppliers.
Weinstein et al. (2011) suggested the key CSFs of Six-Sigma that emphasis on statistical measurement, structured training plans, problem-solving techniques. However, according to (Frank and Young, 2004) the key CSFs includes management commitment, organizational involvement, project governance, project selection, planning, implementation methodology, project management and control, cultural change, and continuous training. Antony, Antony, Kumar and Cho, (2007) present an empirical pilot study about the key (CSFs) in the UK service sector. The questionnaires grouped under 13 (CSFs) which extracted from the published literature of leading Six-Sigma practitioners and academics. The results revealed the ranking of (CSFs) based on the mean ad thee standard deviation of the data. These ranking as follows : business strategy 4.55, followed by customer focus 4.40, project management skills 4.40, management commitment and involvement 4.20, organizational infrastructure 4.15, understanding of SS methodology 4.10, project selection and prioritization 4.05. And then, integration of SS with financial , accountability 3.70, management of cultural change 3.55, training and education 3.25, project tracking and reviews 3.10, incentive program 2.90, and company-wide commitment 2.80.
The study provided by (Brun, 2011) discussed the real life application of Six Sigma in an Italian company. The results determined 12 CSF’s ingredients for the effective implementation of Six Sigma program. These factors are mmanagement involvement and commitment, cultural change, communication, organizational infrastructure and culture, education and training, linking Six Sigma to business strategy, linking Six Sigma to customer, linking Six Sigma to human resources, linking Six Sigma to suppliers, understanding tools and techniques within Six Sigma, project management skills, and project prioritization and selection. Flynn, (2011) presented top five success factors of Six-Sigma quality program and their definition. These factors consist of first: support and deployment strategy, which refers to commitment from top management, process owners, customer focus and communication. Second: resources include allocation of time, talent, equipment, training, technical support and the right people). Third: data-driven decision making which involves statistical thinking and project selection. Fourth: measurement and feedback, which emphasis on the lessons learned. Fifth: effective control plan, and organizational which refers to the impact of cultural acceptance, readiness and behavior toward change and workforce management.
Taner (2013) reported paper to investigate the (CSFs) for the successful introduction of Six Sigma in Turkish construction companies. The results found the most important CSFs factors are involvement and commitment of top management, linking quality initiatives to customer and linking quality initiatives to supplier. Leadership and commitment of top management, cross-functional teamwork and commitment of middle

ARAB ECONOMICS AND BUSINESS JOURNAL 9 (2014) 93–114 97
managers found to be the most CSFs for successful introduction of Six Sigma, whereas lack of knowledge of the system to initiate and complacency found to be hindering its implementation.
Wang (2011) examined the essential chances of achieving Six-Sigma implementation goals in China’s banks. The results found factor (top management commitment) considered as a significant contributor to the effective implementation of Six-Sigma . Ismyrlis and Moschidis, (2013) collected a list of 32 CSF of Six Sigma implementation which were classified according to European Foundation for Quality Management (EFQM) to the five enablers as follows : leadership, strategy, people, partnerships and resources, and processes.
This result is corresponding with the results reported by (EL-Jardali, 2007) that mentioned the predictors of good quality results in Lebanese hospitals were concentrated first on factor (leadership commitment). The top management should change the culture and attitude of the people working within the organization at all levels through increased and sustained communication, motivation, education and teamwork. Communication, motivation and education will encourage information sharing within an organization, and this reciprocal sharing overcomes functional barriers existing in an organization, as well as facilitating knowledge flow. Meanwhile, teamwork means collaboration between functions, between suppliers and customers, and between managers and non-managers. The second factor: (training and development), to update the employees and the managers with the necessary related knowledge, and to achieve the organization’s plans through training programs. The third factor: (continuously learned process) is supported by (Wang et al., 2011; Rivers, 2010), they mentioned that maintaining high quality standards through Six-Sigma is based on a continuous process through the use of the process improvement tools.
Wang et al., (2004) provided an application guideline for the assessment, improvement and control of quality in supply chain management in different companies in Taiwan by using Six-Sigma improvement methodology. They advocated that improvements in the quality of all supply chain processes lead to cost reductions as well as service enhancements. Garg, Narahari and Viswanadham (2004); introduced Six-Sigma supply chains as a new notion to describe and quantify supply chains with sharp and timely deliveries. They show that based on using inventory optimization problem, the design of Six-Sigma supply chains can deliver products within a customer specified delivery window, with at most 3.4 missed deliveries per million.
Knowles et al. (2005) proposed a conceptual model that integrates the Balanced Scorecard, BSC model (Supply Chain Reference model) and Six-Sigma DMAIC methodology in strategic- and operational-level cycles. This model supported by (Chappell et al., 2006; Kang et al., 2005). The results concluded that Six-Sigma can be applied to supply chains by following the DMAIC framework and employing a mixture of quantitative and qualitative tools and suggested that it is difficult to implement Six-Sigma methodology throughout the supply chain under some circumstances related to stock holding policies and levels of demand. In addition , several studies such as (Wang and Li, 2004; Knowles et al., 2005; Chappell and Peck, 2006) studied how Six-Sigma methodology can effectively be employed in supply chain management to measure, monitor and improve the performance of the whole supply network .
Suhaiza et al., (2011) examined the relationship between the critical factors for the implementation of Six-Sigma programs and perceived Six-Sigma success of electronic companies in Malaysia. The results found
cultural change was the highest variable with the mean of 4.05, then linking with supplier with the mean of 3.85 and company infrastructure was the lowest mean 2.87. Factors (Management involvement and commitment) and (linking Six-Sigma to supplier management) are strong positively related to the success of Six-Sigma implementation.
(Sahbaz et al, 2014) mentioned that Six Sigma process produces 3.4 defective parts per million opportunities (DPMO). Six sigma is a method that eliminates errors; it makes use of a structured methodology called DMAIC to find the main causes behind problems and to reach near perfect processes. DMAIC is useful to analyze and modify complicated time-sensitive healthcare processes involving multiple specialists and treatment areas by identifying and removing root causes of errors or complications and thus minimizing healthcare process variability. Utilization of the Failure Mode and Effect Analysis (FMEA) involved break down the process into individual steps: potential failure modes (complications), severity score, probability score, hazard score, criticality and detection.
Cagnazzo and Taticchi (2010); Suhaiza and Sivabalan (2011); Attarwala, Kulkarni and Dwivedi (2011); Tariq et al., (2011) mentioned that Six-Sigma methodology is an effective strategy to eliminate problems within any organization that aims for better quality in its care. Within the Six-Sigma strategy, there are two different methodologies: the problem solving methodology that represented in DMAIC and preventative methodology that known as the design for Six-Sigma (DFSS) which consists of DMADV. Using root cause analysis as a tool of Six-Sigma can lead to know the reasons about inconsistencies. These may be due to variation in management processes, staff errors due to multitasking requirements, lack of formal and unified processes, lack of accountability due to unwritten policy to enforce, or lack of communication between patient care units due to improper handling, preparation, and delivery of the services. Jiju ,( 2004); Kwak et al., (2006) listed the most commonly used tools and techniques in the service organizations such as brainstorming; process mapping; affinity diagrams; root cause analysis; control charts; benchmarking ; pareto analysis and change management tools.
Kang et al., (2005); Cagnazzo et al., (2010); Tariq et al., (2011) introduced the key roles related to successful implementation of Six-Sigma methodology for the executive leadership and other members of top management. Champions have the responsibility for SS development inside the organization; Black Belts apply SS methodology to specific projects; Green Belts have a good methodological preparation. Project prioritization, selection and project management skills are another critical success factors (CSFs) of implementing Six-Sigma. Since Six-Sigma is a project driven methodology, the prioritization and selection of the project is essential to apply Six-Sigma successfully. Practicing this process in an effective way will lead to achieve maximum financial benefits to the firms.
Khaidir et al. (2014) reported that (CSFs) in SS practices is important in order to gain the goals and great performance. The CSFs in service industry which include understanding the DMAIC methodology; project management skills; project prioritization and selection; project tracking and reviews, management commitment and involvement; company-wide commitment; cultural change; linking SS to business strategy; integrating SS with the financial infrastructure; organizational infrastructure; training and education; incentive program; customer focus; linking SS to suppliers. However, The CSFs of SS practices in healthcare industry are concentrated on the following four factors: leadership, customer focus, structured improvement procedure and focus in metric.
98 ARAB ECONOMICS AND BUSINESS JOURNAL 9 (2014) 93–114
Because this study aims to explore the critical success factors of Six-Sigma quality program that implemented in some of Lebanese hospitals so all common CSFs that mention in the literature and related to Six-Sigma quality program will be measured in this study. The common CSFs are nineteen factors , namely, executive commitment, adopting the philosophy, benchmarking, training, closer customer relationships, closer supplier relationships, open organization, employee empowerment, engagement and morale, flexible operations, process improvement, measurement, organizational structures, zero defects mentality, teams, planning and values, audits, problem solving tools, design and engineering, and production, this study has been tested and validated these factors.
3.2. Key Performance indicators (KPIs) in a hospital
Rodak, (2013) defined the key performance indicators as metrics used to measure the hospitals’ performance in different categories, including inpatient flow such as (inpatient raw mortality rate, bed turnover, patient satisfaction, readmission rate, occupancy rate, average length of stay, average cost per discharge, and surgical service. Based on a framework mostly used in the health care research for assessing quality of health care (Kalinichenko, Amado, and Santos, 2013) categorized the performance indicators into three interrelated elements which are structure, process and outcome. Structure refers to organizational characteristics of the providers of care, including human, physical, and financial resources and tools used in delivery of health care services, presenting the inputs in health care provision. Process refers to the activities that go on within and between health care practitioners and patients, focusing on conformity to technical and ethical norms of good care. In addition, finally, outcome refers to the impact of these activities on a patient’s current and future health status.
Ismail et al. (2011) measured patient satisfaction levels and found time with doctor was not to be a predictor of patient satisfaction. Communication of the staff was the highest factor that influence patient satisfaction and the predictor factors of total patient’s satisfaction were technical quality of clinic staff, interpersonal aspect of clinic staff, availability/accessibility of clinic and communication of clinic staff.
De Jager, Du Plooy, and Femi Ayadi, (2010) found that there is high levels of patient satisfaction despite the limited human resources available. Outpatients reported positive experiences with the medical staff, specifically the doctors. While they had, negative experiences with the lack of service orientation especially the nursing staff, unethical situations, and frustrating inter-personal relationship difficulties. According to the Commonwealth Fund’s International comparison of 7-world health, the U. S .health care system ranks five dimensions of a high performance health system. These dimensions include quality, access, efficiency, equity, healthy lives to clarify how will hospitals and health systems lower costs within settings of care, provide more patient-centered, and utilize cost-effectiveness research. With an impeding expansion of medical enrollees, effective care and cost management will be critical for program efficiency.
Bandyopadhyay and Coppens, (2005) listed four indicators that used by singly or in combination to define the level of performance of a healthcare organization. These indicators are service level, service cost, customer satisfaction, and clinical excellence. Despite the challenges in using Six-Sigma in the healthcare industry, many hospitals within the healthcare industry are beginning to use Six-Sigma approach to improve patients’ satisfaction.
Jiju et al. (2007) mentioned that the KPI termed as a performance metrics of Six-Sigma that used to help organizations define and evaluate how successful they were in making progress toward long-term goals and objectives. Performance indicators defined as statistics, which reflect, directly or indirectly, the extent to which an anticipated outcome achieved or the extent to which the quality of the processes can lead to that outcome. KPIs help managers provide continuous quality system improvement, identify areas of excellence, compare between the actual performance and standards and monitor corrective action.
As reported by (Chakrabarty et al., 2007) the KPIs related to Six-Sigma in service sector talks about financial benefits, others talks about customer satisfaction and efficiency. However, the common literature mentioned that the majority of the KPIs across services include efficiency, cost reduction, time to-deliver, quality service, customer satisfaction, employee’s satisfaction, financial benefits, reduced variation, and financial bottom lines.
i. Efficiency: is one of the most important indicator in healthcare systems which used to measure the clinical activities performed based on these dimensions: reducing the length of stay, bed occupancy rate, and admission per 1000 members (Nerenz and Neil, 2001; John, 2010).
ii. Cost reduction: according to (Heuval, Does and Bisgaard, 2005; Rivers, 2010) health care has opportunity to reduce costs by eliminating wastes depending on three dimensions : reducing errors, mistakes in a process, or reducing the time taken to complete a task, or reducing a patient’s stay at a hospital to provide opportunities for more admissions.
iii. Time-to-deliver: as mentioned by (Bandyopadhyay et al, 2005) service time, waiting time, and cycle time are three dimensions used to measure this indicator in the service sector. Service time refers to the time required to serve a particular customer. Waiting time refers to the time a customer waits in the system to have the work completed .Cycle time refers to the total time including service and waiting time
iv. Quality of the service: based on the previous studies mentioned by (Hensley and Dobie, 2005) healthcare systems can depend on the extent to which the service delivered, meets the customer’s expectations as an adequate dimension to measure this indicator.
v. Customer satisfaction: as suggested by (Cowing, Davino-Ramaya, Ramaya, and Szmerekovsky, 2009) healthcare organizations found customer satisfaction is becoming an important indicator for measuring its performance by using two dimensions include patient satisfaction and perception of service delivery by patient and clinician. These dimensions are considered as subjective assessments based on the nature of interactions with staff, the nature of communication with clinicians, the degree of personalized care, the accessibility of care, the responsiveness, and the timeliness of care. The health care organization, the clinician (team of physicians, nurses, medical assistants, and office staff), and the patients are interrelated perspective on the needs associated with health care performance to satisfy customers.
vi. Employee satisfaction: based on (Fogarty, Kim, Juon, Tappis, Noh, Zainullah and Rozario, 2014), health-care worker satisfaction and intention to stay on the job are highly dependent, different groups of health-care workers in previous studies from

ARAB ECONOMICS AND BUSINESS JOURNAL 9 (2014) 93–114 99
other low-; middle- and high-income countries found that retention rate of health-care workers is critical to measure employees satisfaction for improving health system performance. Being paid an appropriate salary, offered financial and moral incentives to health-care workers were negatively related to retention rate and intent to stay (β = -0.326, P < 0.01).
vii. Financial benefits: Six Sigma places considerable emphasis on cost savings through the implementation of six sigma projects. The results of this study (Pulakanam et al, 2010) revealed that 62% of the Six Sigma respondent has experienced financial benefits of up to £250,000 per annum and 13% of the company has experienced financial benefits of between £250,000 and £500,000 per annum. The remaining 25% Six Sigma respondents did not report any savings. Antony and Desai (2009) reported that three out of 13 respondents revealed that Six Sigma respondents reported an annual savings “between” $100,000 to $200,000, while six of them reported an annual savings of over $1 million.
viii. Reduced variation: healthcare systems can depend on three dimensions to measure this indicator include minimizing variation of the process, reducing defects, and enhancing process capability. Thus, implementing SS in healthcare industry requires understanding the customer’s expectation, requirements and finally give the great impact to healthcare organization. Statistical process control and Six-Sigma refer to the reduction of variation through improved standards and consistency based on reduction of the cycle time of processing statements, or the decision cycle of a process, or incorrect laboratory test results (Raisinghani, 2005; Rivers, 2010).
ix. Financial bottom lines: the bottom line is that until true health care cost reform becomes a reality, these pressures will continue to cause problems for providers, for people’s health care and for the nation’s economy. Healthcare organizations should use these pressures as motivation to embark upon a relentless pursuit of ever-increasing productivity. (Dileep et al, 2009) listed the KPIs for the health care process that weighted by the 12 chief medical officers. These KPIs are throughput, cost/procedure, care, wait time, service time, information conveyance time, cost per unit of service, labor productivity, clinical excellence, patient safety, efficiency, time-to-serve, quality of the service, customer satisfaction, reduced variation, staff development, timely and quality service, positive customer experience, revenue enhancement, and employee satisfaction . However, primary data considering the important indicators of KPIs are patient safety, quality of the service, and positive customer experience.
According to (Miranda, Chamorro, Murillo and Vega., 2010; Muhammad et al, 2011) most of the gaps between the patients’ and the managers’ perceptions are negative and statistically significant, in case of making an appointment , waiting times in the health centre before entering the consulting room ,and complaints resolution , for which the patients have a markedly lower perception of quality . In view of information, managers should focus on improving the equipment at the health centre, health staff understands patients’ problems, and interests in solving the patients’ problems.
Reddy, Arundhath and Acharyulu (2007) clarify the key area of concern to the patients is a reduction in waiting times and this can lead to a substantial improvement in quality of service. The complete involvement
of the top management would pave the way for quality and measurement oriented culture in the health care sector. In addition, the result found that patient not informed about the prior preparation of the test in 50% of the total sample and it is not significant. Communication regarding the queries from patients to doctor is not very satisfactory in (35%) of the cases, and details of the procedure not informed in 50% of the cases. James (2005) argued that healthcare quality improved by reducing the variation in arrivals to the emergency department and reducing the variation in performing tasks within the hospital.
According to (Kwak et al., 2006; Jiju et al., 2007), the benefits of applying Six-Sigma in service organizations involve the followings: reduced service preparation times, improved customer satisfaction, reduced defect rate in service processes, reduced process cycle time and hence achieve faster service delivery, improved cross-functional teamwork across the entire organization, increased employee morale, increased awareness of various problem solving tools and techniques, leading to greater job satisfaction for employees , improved consistency level of service through systematic reduction of variability in processes; and effective management decisions due to reliance on data and facts rather than assumptions and gut-feelings . Nursing satisfaction levels were evaluated using the Six-Sigma DMAIC methodology in a paper by (Morgan and Cooper, 2004). They conclude that the nurses’ work ‘intensity’ was reduced using the methodology and the principles of Six-Sigma such as specially designed role and a highly disciplined training program using , statistical methods to perform key processes through project management.
Feng et al. (2008) explored the CSFs of implementing Six Sigma in USA healthcare organizations and its impact on three categories of performance indicators: cycle time reduction; process flow improvement; and medical-error reduction. The respondents were quality managers, performance improvement specialists, directors and Six-Sigma Black Belts in various hospitals’ departments. The results found that executive engagement is one of the most critical factors for Six-Sigma to succeed that includes incorporating Six-Sigma to organizational strategies, creating accountabilities and rewards, attending regular meetings to verify progress, and other commitment of time and resources.
Dellifraine et al. (2010) conducted a comprehensive literature review to assess the empirical evidence that the use of Six-Sigma / Lean system improves clinical outcomes, processes of care, and financial performance of health care organizations. They found that the outcomes concentrated on patient wait times, unavailable medications , supply and equipment availability, nursing satisfaction , Nursing time spent doing non–value added activities , number of surgical operations, number of admissions, number of new patient visits, start time delay. One of this comprehensive literature review prepared by (Black et al, 2006) aims to analyze the use of the Six-Sigma methodology to improve quality in Mount Carmel Health in Ohio. The results found using six –sigma resulting in increased profits of over $850,000. Scottsdale Healthcare (Arizona) implemented Six-Sigma to reduce transfer time from the emergency department to an inpatient hospital bed. This effort is estimated to have increased profits by $600,000. Large Metropolitan Hospital System reported that adopting Six-Sigma reduce number of inpatient transfers (defect or any patient transferred more than once) 75% reduction in inpatient transfers; $2m annual cost savings. Based on (Attarwala et al, 2011) the results of implementing SS project teams in the Stanford Hospital achieved advantages, such as annual savings $15 million, mortality rate dropped from 7.1% to 3.7, reduced costs with 40%,

100 ARAB ECONOMICS AND BUSINESS JOURNAL 9 (2014) 93–114
intensive care time reduced by 8 hours, and intubation time reduced from 16 to 12 hours.
Irfan et al., (2011) collected data by the federal centers for Medicare services, by asking patients about their experiences with key aspects of hospital care, such as discharge planning, and communication with doctors and nurses. The results after interviewed with patients first found sometimes patients took a lot of persistence to get answers from doctors and nurses, second: higher patient satisfaction can mean better quality of care, third: waiting time is the top cause of patient dissatisfaction. Little progress has been made implementing key measures for patient safety.
Bandyopadhyay et al. (2005) showed that measuring the improvement of patient satisfaction can be done by reducing the average patient waiting time and creating a performance baseline to develop a quantifiable upper and lower control limits. For measuring patient waiting time, first: monitor the performance based on data collected using patient satisfaction survey, second: design the patient appointment scheduling and third: design patient waiting line system.
In summary, most of these conceptual and empirical studies support the existence relationship between critical success factors of Six-Sigma quality program and the key performance indicators in hospitals. This study is an effort to extent these studies under different environmental conditions in some hospitals in Lebanon.
4. Research Methodology
The reasons for applying the research in hospitals area: i. The Lebanese healthcare system shows multiple, sometimes
contradictory, characteristics that are found at many levels including: the absence of a well-defined health policy, the mismanagement of public services and subordination to the private sector, the private sector is driven by mercantile considerations, speed system: one for the well-off and one for the disadvantaged, financing system with multiple and divided coverage modes (public, semi-public and private), the absence of adequate information system, the absence of generalized social coverage, inequity in the access to healthcare, the absence of outcome assessment criteria, and the highest death rate is found in Beirut, followed by Nabatiyeh; whereas Mount Lebanon has the lowest rate (Institute of Health Management and Social Protection, 2012).
ii. The Lebanese healthcare system is pluralistic and unregulated with fragmented financing. The relatively high health expenditure in Lebanon is a testimony on the importance of health for the Lebanese people and their willingness to spend money to improve it. However, they are not getting their money’s worth due to the gross inequity and inefficiency of the system. The main deficiencies in the present HCS are the lack of a clear policy and strategy for health care on the part of the government, the overwhelming preponderance of an unregulated private sector in financing and provision of HC, the minimal pooling of resources with very high out-of-pocket expenditures leading to exposure of households to financial risks from illness, the minimal public expenditure on primary health care compared to secondary and tertiary care, the lack of a systematic health data collection and the unavailability of such data to the stakeholders and the public. The government
proposed changes and a clear vision for restructuring the present HCS to succeed (Sfeir, 2007; Rivers, 2010).
iii. Health care is characterized by high involvement of consumers due to the higher risk in terms of outcomes, yet it requires the complete involvement of these customers during the service production and delivery process (Palmer, 2008). This implies that the quality of the process and outcome are of equal importance.
iv. As mentioned by (De jager et al, 2010) quality within healthcare service delivery refers to services that meet set standards, implying excellence, and satisfy the needs of both consumers and healthcare practitioners in a way that adds significant meaning to both parties’ healthcare experiences (Arries and Newman, 2008; Zineldin , 2006) advocated that quality healthcare should be regarded as the right of all patients and ought to be the responsibility of all the staff within healthcare organisations. Internationally, healthcare quality is still a concern for various healthcare stakeholders (e.g. decision makers and patients) as reflected by the various studies recently published (Zineldin, 2006; Akter, Hani and Upal, 2008).
4.1. Sample and Data
4.1.1. Sample
The private hospital sector is the main component and backbone of the Lebanese healthcare system. Which account for 82% of the country’s total capacity. Private hospitals’ number in Beirut is 17 and public hospitals number is two. Most private hospitals are highly equipped and evolved in a free-market (Health Care Sector in Lebanon: Syndicate of Private Hospitals, 2012).
The sample for this study is randomly chosen from the private hospitals that consists of five hospitals (Trad Hospital, AUH Hospital, Najjar Hospital, Clemencue Hospital, and Makassed Hospital) and representing 29.4% from the total number of the hospitals in Beirut City. The reason for selecting this sample from Beirut city is only because the mortality rate in 2010 has been rather stable since 2006. The declared and registered deaths reached 21441 in 2010. These figures were taken from the registry of the Ministry of the interior and including deaths of Lebanese citizens in Lebanon and abroad; the highest death rate is found in Beirut (Ammar, 2012).
ARAB ECONOMICS AND BUSINESS JOURNAL 9 (2014) 93–114 101
The total number of respondent was 101 and the respondents occupied two main positions, the first was 49 hospital department managers that consists of 21 Head of department, 22 senior nurse and 6 manager of hospitals and the second wass 52 Professionals, which consists of 29 Physicians and 23 nurses. The questionnaires were sent to 101 hospital department managers and professionals in Beirut hospitals in Lebanon to complete the questionnaires. Initial interviews were held to comply with confidentiality and privacy of health information laws. The number of collected questionnaires according to the respondent group was the following: 49 questionnaires from hospital department managers with 48.5% and 52 questionnaires from professionals with 51.5% of the total number of questionnaires in the sample.
4.1.2. Data Collection Method
Data were collected using questionnaires to examine the relationship
between the factors of the hospital’s quality program and performance. For the hospital, (see Appendix 1: Questionnaire 1). Based on Hilton et al. (2008) there are 19 factors comprising the Six-Sigma program and each factor contains a number of items describing the factor. The respondents were asked to rank the key critical success factors on items representing on Likert scale 1-5 (1= least important, 2=less important, 3=important, 4=very important and 5=crucial).
The KPIs questionnaire was derived by (Chakrabarty et al., 2007; Bandyopadhyay et al., 2005) to provide a baseline for a common performance indicators within healthcare and services sector to define and to measure KPIs levels of performance in a sample of Lebanese hospitals . It consists of 9 indicators : quality of the service , efficiency in a service hospital , cost reduction , time-to-deliver ,customer satisfaction , reduced variation , employee satisfaction , financial benefits , and financial bottom lines and each indicator contains a number of items describing the indicator using likert scale coded from 5 = crucial to 1 = least important (see Appendix 2: Questionnaire 2).
4.2. Research Model
This research explores the relationship between CSFs and KPIs within the context of a sample of the Lebanese hospitals in Beirut. The proposed model, as depicted in Figure 1 is based on the above literature review and the work of (Chakrabarty et al., 2007; Bandyopadhyay et al., 2005; Hilton et al., 2008; Dileep et al.,2009).
4.3. Research Hypothesis
Consistent with previous literature of the leading Six-Sigma practitioners and academics and based on both the conceptual and
Fig. 1 - Proposed research framework of critical success factors of SS quality program and key performance indicators in hospitals.
empirical studies reviewed above. These used to formulate some hypotheses that relate critical success factors of Six-Sigma quality program to the key performance indicators of a sample of Lebanese hospitals. Hence, the following hypotheses will be tested:
H1 The (CSFs) of Six-Sigma quality program implementation exist in a sample of Lebanese hospitals.
H2 The ranking of the (CSFs) of Six-Sigma quality program is significantly different in the two groups of the sample: hospital department managers and professionals from the actual ranking.
H3 The (CSFs) of Six-Sigma quality program are positively related to the key performance indicators of a sample of Lebanese hospitals.
4.4. Research variables and measurement
An exploratory study is used in order to explain the relationship between variables, which are described in hypotheses or frameworks through the followings:
i. Reliability analyses are used to determine if the internal coherence between the individual items is high enough to measure the different constructs of critical success factors of a Six-Sigma quality program and key performance indicators and the content validity will be reported.
ii. The results will then use descriptive statistics to describe the averages which are used to give higher weighing to certain data points, and describe the standard deviations for each factor that measures the accuracy of a sample to represent a population.
iii. Data analysis is needed to investigate and explore if there is any significant difference between the actual ranks of the critical success factors of Six-Sigma quality program and the actual ranks of the available factors of Six-Sigma quality program in the two groups of the sample (professionals group and hospital department managers group). The T-test is used to determine if there is any significant difference between the samples ranks and the value of Eta-squared used to assess a priority of the differences for CSFs in a descending order
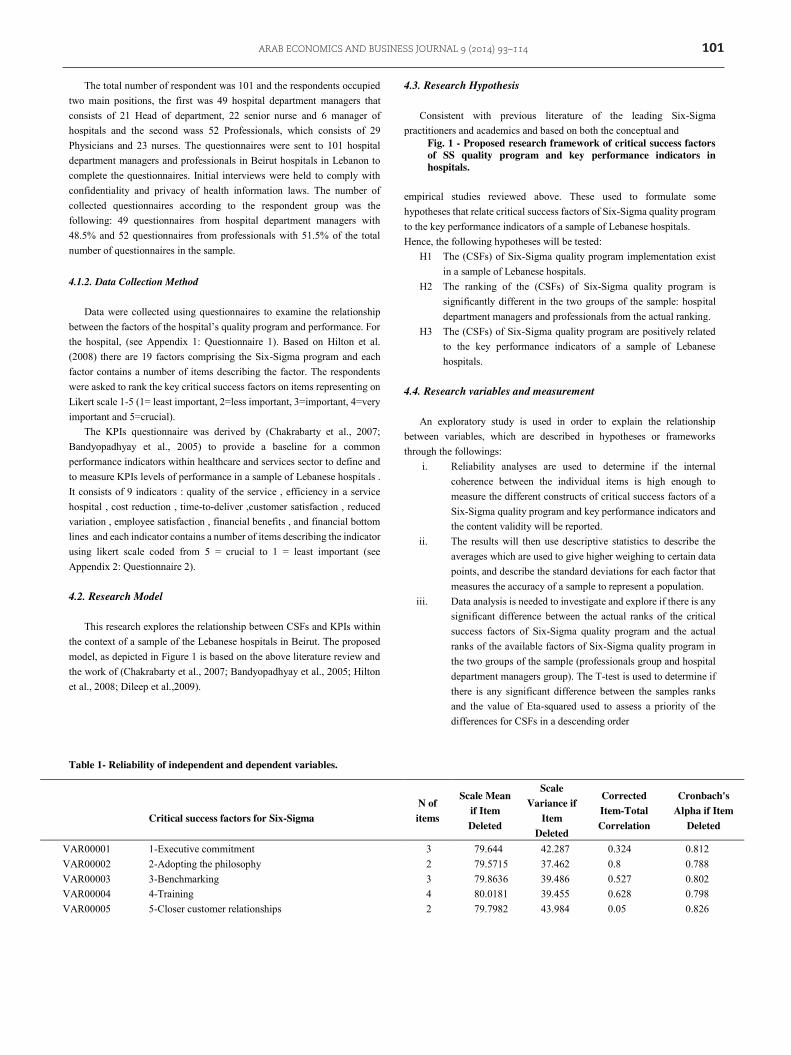
Table 1- Reliability of independent and dependent variables.
Critical success factors for Six-Sigma
N of items
Scale Mean if Item Deleted
Scale Variance if
Item Deleted
Corrected Item-Total Correlation
Cronbach's Alpha if Item
Deleted
VAR00001 1-Executive commitment 3 79.644 42.287 0.324 0.812 VAR00002 2-Adopting the philosophy 2 79.5715 37.462 0.8 0.788 VAR00003 3-Benchmarking 3 79.8636 39.486 0.527 0.802 VAR00004 4-Training 4 80.0181 39.455 0.628 0.798 VAR00005 5-Closer customer relationships 2 79.7982 43.984 0.05 0.826

102 ARAB ECONOMICS AND BUSINESS JOURNAL 9 (2014) 93–114
VAR00006 6-Closer suppliers relationships 7 79.7937 43.013 0.282 0.814 VAR00007 7-Open organization 2 79.8875 44.017 0.103 0.82 VAR00008 8-Employee empowerment, engagement and morale 5 80.0509 45.24 -0.077 0.825 VAR00009 9-Flexible operations 3 79.7549 43.99 0.122 0.819 VAR000010 10-Process improvement 5 79.7422 42.768 0.44 0.81 VAR000011 11-measurement 3 79.7816 45.035 -0.04 0.823 VAR000012 12-Organizational structures 3 79.5686 44.454 0.055 0.821 VAR000013 13-Zero defects mentality 3 79.952 42.722 0.205 0.818 VAR000014 14-Teams 8 80.1998 45.54 -0.135 0.825 VAR000015 15-Planning and values 2 79.9429 43.072 0.13 0.823 VAR000016 16-Audits 2 79.9256 44.287 0.01 0.829 VAR000017 17-Problem solving tools 3 79.5715 37.462 0.8 0.788 VAR000018 18-Design and engineering 3 78.4484 45.568 0.374 0.596 VAR000019 19-Production 3 78.1527 43.26 0.649 0.571 key performance indicators: VAR000020 1-Quality of the service 2 79.8853 40.28 0.599 0.801 VAR000021 2-Efficiency in a service hospital 1 79.7735 42.607 0.175 0.821 VAR000022 3-Cost reduction 4 79.9444 39.647 0.619 0.799 VAR000023 4-Time-to-deliver 3 80.1469 41.297 0.372 0.81 VAR000024 5-Customer satisfaction 2 79.5715 37.462 0.8 0.788 VAR000025 6-Reduced variation 3 79.5715 37.462 0.8 0.788 VAR000026 7-Employee satisfaction 1 78.5427 44.931 0.519 0.578 VAR000027 8-Financial benefits 2 78.5993 45.016 0.513 0.587 VAR000028 9-Financial bottom lines 1 78.2251 47.732 0.236 0.611
Cronbach's Alpha 28 0.817
where the highest value relates to the opportunity of the largest improvements.
iv. The ranking of the CSFs of Six-Sigma quality program in the two groups is used in order to represent the true data needed to calculate the Pearson correlation coefficient, r for CSFs and KPIs, to measure the strength of the linear association between variables, and to identify which one of CSFs are positively correlated with KPIs to show the hospitals the needed focus areas to improve performance.
5. Statistical Analysis
5.1. Reliability and content validity analyses
Cronbach’s reliability analysis was used to select and assess the final items that would be used for hypothesis testing. An overview of the reliability analyses of the independent and dependent variables can be found in the following table.Table 1 overview reliability analysis of each variable of CSFs of a Six-Sigma quality program. Cronbach’s alpha for factor 18 (design and engineering) and factor 19 (production) showed that these two factors could be deleted from the Six-Sigma quality program since that it is well below 0.7 even with the deleted item. With a Cronbach’s alpha around 0,8 for (adopting the philosophy), (training), and (Problem solving tools) and with a Cronbach’s alpha above 0,8 for all other factors of a Six-Sigma quality program therefor the items of these factors can be considered as internally consistent and sufficient for basic research. Factor 16 (audit) is the highest factor with cronbach’s alpha .829 but factors 2 and 17 (adopting the philosophy) and (problem solving tools) have the least cronbach’s alpha 0.788 , 0.788 respectively. The questionnaire, used in the current study, was derived from the work by Powell (1995) who combined the factors with the Malcolm Baldrige
National Quality Award, Deming’s 14 points, Juran’s trilogy and Crosby’s 14 factors ,and was developed from the published literature of leading Six-Sigma practitioners and academics (Hilton et al, 2008). For KPIs questionnaire, used in the current study, was derived by (Chakrabarty et al, 2007), and was supported by (Heuvel et al., 2005; Hensley and Dobie., 2005; Antony, 2004; Hensley and Dobie, 2005; Raisinghani, 2005). Factors 7, 8, 9 (employee satisfaction, financial benefits, and financial bottom lines) were eliminated because their Cronbach’s alpha was less than 0.7. Cronbach’s alphas for the other six factors- among 15 items-in the questionnaire exceeded 0.7: (quality of the service, efficiency in a service hospital, cost reduction, time-to-deliver, customer satisfaction, and reduced variation). Two items are identified for quality of the service, one item is identified for efficiency in a service hospital, four items are identified for cost reduction, three items are identified for time-to-deliver, two items are identified for customer satisfaction, and three items for reduced variation respectively. Generally, Cronbach’s alpha values in this study are .817, greater than 0.7, indicating that the items are reliable based on Nunnally and Peteraf (1978) that mentioned in (Hilton et al, 2008), Cronbach’s alpha should be at least 0.7. It can be concluded that these two questionnaires for CSFs and KPIs have a high internal consistency and are therefore reliable. The two questionnaires were able to provide responses showing the relationship between structures and outcomes for the purposes of study.
5.2. Descriptive statistics of Critical Variables
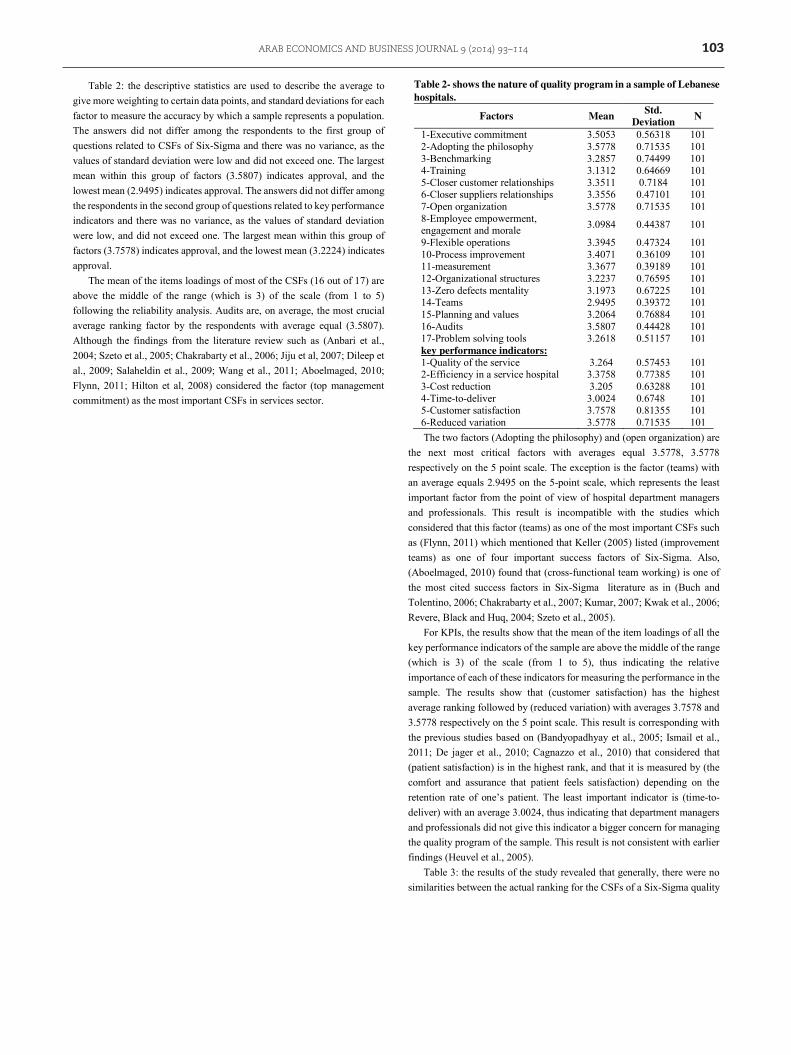
Table 2 shows the nature of the quality program in a sample of Lebanese hospitals by describing which of the (CSFs) of Six-Sigma quality program implementation are applied, based on the average ranks and standard deviations across the items within a factor. Averages are taken for all the items in the questionnaires following the reliability analysis.
ARAB ECONOMICS AND BUSINESS JOURNAL 9 (2014) 93–114 103
Table 2: the descriptive statistics are used to describe the average to give more weighting to certain data points, and standard deviations for each factor to measure the accuracy by which a sample represents a population. The answers did not differ among the respondents to the first group of questions related to CSFs of Six-Sigma and there was no variance, as the values of standard deviation were low and did not exceed one. The largest mean within this group of factors (3.5807) indicates approval, and the lowest mean (2.9495) indicates approval. The answers did not differ among the respondents in the second group of questions related to key performance indicators and there was no variance, as the values of standard deviation were low, and did not exceed one. The largest mean within this group of factors (3.7578) indicates approval, and the lowest mean (3.2224) indicates approval.
The mean of the items loadings of most of the CSFs (16 out of 17) are above the middle of the range (which is 3) of the scale (from 1 to 5) following the reliability analysis. Audits are, on average, the most crucial average ranking factor by the respondents with average equal (3.5807). Although the findings from the literature review such as (Anbari et al., 2004; Szeto et al., 2005; Chakrabarty et al., 2006; Jiju et al, 2007; Dileep et al., 2009; Salaheldin et al., 2009; Wang et al., 2011; Aboelmaged, 2010; Flynn, 2011; Hilton et al, 2008) considered the factor (top management commitment) as the most important CSFs in services sector.
Table 2- shows the nature of quality program in a sample of Lebanese hospitals.
Factors Mean Std. Deviation N
1-Executive commitment 3.5053 0.56318 101 2-Adopting the philosophy 3.5778 0.71535 101 3-Benchmarking 3.2857 0.74499 101 4-Training 3.1312 0.64669 101 5-Closer customer relationships 3.3511 0.7184 101 6-Closer suppliers relationships 3.3556 0.47101 101 7-Open organization 3.5778 0.71535 101 8-Employee empowerment, engagement and morale 3.0984 0.44387 101
9-Flexible operations 3.3945 0.47324 101 10-Process improvement 3.4071 0.36109 101 11-measurement 3.3677 0.39189 101 12-Organizational structures 3.2237 0.76595 101 13-Zero defects mentality 3.1973 0.67225 101 14-Teams 2.9495 0.39372 101 15-Planning and values 3.2064 0.76884 101 16-Audits 3.5807 0.44428 101 17-Problem solving tools 3.2618 0.51157 101 key performance indicators: 1-Quality of the service 3.264 0.57453 101 2-Efficiency in a service hospital 3.3758 0.77385 101 3-Cost reduction 3.205 0.63288 101 4-Time-to-deliver 3.0024 0.6748 101 5-Customer satisfaction 3.7578 0.81355 101 6-Reduced variation 3.5778 0.71535 101 The two factors (Adopting the philosophy) and (open organization) are
the next most critical factors with averages equal 3.5778, 3.5778 respectively on the 5 point scale. The exception is the factor (teams) with an average equals 2.9495 on the 5-point scale, which represents the least important factor from the point of view of hospital department managers and professionals. This result is incompatible with the studies which considered that this factor (teams) as one of the most important CSFs such as (Flynn, 2011) which mentioned that Keller (2005) listed (improvement teams) as one of four important success factors of Six-Sigma. Also, (Aboelmaged, 2010) found that (cross-functional team working) is one of the most cited success factors in Six-Sigma literature as in (Buch and Tolentino, 2006; Chakrabarty et al., 2007; Kumar, 2007; Kwak et al., 2006; Revere, Black and Huq, 2004; Szeto et al., 2005).
For KPIs, the results show that the mean of the item loadings of all the key performance indicators of the sample are above the middle of the range (which is 3) of the scale (from 1 to 5), thus indicating the relative importance of each of these indicators for measuring the performance in the sample. The results show that (customer satisfaction) has the highest average ranking followed by (reduced variation) with averages 3.7578 and 3.5778 respectively on the 5 point scale. This result is corresponding with the previous studies based on (Bandyopadhyay et al., 2005; Ismail et al., 2011; De jager et al., 2010; Cagnazzo et al., 2010) that considered that (patient satisfaction) is in the highest rank, and that it is measured by (the comfort and assurance that patient feels satisfaction) depending on the retention rate of one’s patient. The least important indicator is (time-to-deliver) with an average 3.0024, thus indicating that department managers and professionals did not give this indicator a bigger concern for managing the quality program of the sample. This result is not consistent with earlier findings (Heuvel et al., 2005).
Table 3: the results of the study revealed that generally, there were no similarities between the actual ranking for the CSFs of a Six-Sigma quality

104 ARAB ECONOMICS AND BUSINESS JOURNAL 9 (2014) 93–114
program in the previous studies and the ranking of the CSFs in the two groups (hospital department managers) and (professionals).
Based on the results of the current study, the highest average rank of the two groups is factor 5 (closer customer relationships) which has the highest mean score with 3.655, then factor 2 (adopting the philosophy) with mean score 3.578, then factor 1 (executive commitment) with mean score 3.505.
Based on (Ching-Chow, 2004) the highest average rank of the two groups is (top management involvement and commitment) which has the highest mean score with 4.808, then (culture change) with mean score 4.365, then (communication with all employees to achieve congruence) with mean score 4.231 , then (training in Six-Sigma) with mean score 4.192. Hilton et al, (2008) found that factor 7 (open organisation) is, on average, the most critical factor expected by the participants for the existence of a good quality program, the next most critical is (planning and values) followed by (training) with average rankings for these factors are 3.47, 4.20 and 3.56 respectively, indicating that there are gaps between what is actually occurring in the hospital and what is mentioned in the previous studies. The results indicate that the two groups are less concerned with the concepts of (problem solving tools), (teams) and (zero defects mentality) with mean scores 2.526, 2.891 and 2.941 respectively. The least mean score in the two groups is factor 17 (problem solving tools) with mean score 2.526, this indicates that both groups do not have the slightest attention to these factors and do not have enough conviction for their importance as critical factors affecting quality program. Department managers and professionals do not pay attention on putting or implementing standard problem solving process, or using the root cause analysis for solving the problems for all customers of the hospital and for the patients. The two groups have less interest in the concept of work group teams, cross-functional teams, vertical teams, work cell teams, project oriented teams, or
self-managed teams. This result is matching with the actual rank findings from (Hilton et al., 2008) which ranked it the 14th.
The results show controversial issue about factor 4 (training); professionals have the lowest mean score 2.966 compared to hospital department managers with a mean score 3.306. This means hospital department managers considered (training) as an important factor in quality principles, in problem solving skills, in teamwork facilitation, structure and action, and in performance improvement compared to professional physicians and nurses. The results show that professional physicians and nurses have lower concern about factor 13 (zero defects mentality) with mean score 2.855 than hospital department managers with mean score 3.033. This result naturally calls for bigger attention from hospital department managers to concern on an announced goal of zero defects, to consider a program to continuously reduce defects as critical and consider a plan to reduce rework as important.
Factor 2 (adopting the philosophy) has the highest mean score for hospital department managers of 3.753 followed by (executive commitment), (open organization), (closer supplier relationship), (benchmarking) and (process improvement) with mean scores 3.654, 3.645, 3.520, 3.519 and 3.471 respectively. The factors (teams) and (problem solving tools) for the hospital department managers have the least mean score with 2.849 and 2.526 respectively.
Factor 5 (closer customer relationship) has the highest mean score for professionals of 3.917 followed by (open organization), (adopting the philosophy), (measurement), (executive commitment), (employees empowerment, engagement and morale) and (flexible operations) with
Table 3- The Average rank across the items within a factor with deleted items noted.
Factors Mean Two groups hospital department managers professionals
mean n Std. dev. mean n Std. dev.
1- Executive commitment 3.505 3.653 49 0.5846 3.366 52 0.5092 2-Adopting the philosophy 3.578 3.753 49 0.8068 3.413 52 0.5774 3-Benchmarking 3.286 3.519 49 0.8362 3.066 52 0.5741 4-Training 3.131 3.306 49 0.6832 2.966 52 0.5689 5-Closer customer relationships 3.655 3.378 49 0.6439 3.917 52 0.4355 6-Closer suppliers relationships 3.356 3.52 49 0.4302 3.201 52 0.4589 7- Open organization 3.581 3.645 49 0.4590 3.520 52 0.4253 8-Employees empowerment, engagement and morale 3.395 3.435 49 0.4301 3.357 52 0.5119 9- Flexible operations 3.395 3.435 49 0.4301 3.357 52 0.5119 10-Process improvement 3.407 3.471 49 0.3967 3.347 52 0.3162 11-Measurement 3.368 3.34 49 0.3578 3.394 52 0.4236 12-Organizational structures 3.362 3.337 49 0.5416 3.191 52 0.4760 13-Zero defects mentality 2.941 3.033 49 0.7641 2.855 52 0.7955 14-Teams 2.891 2.849 49 0.4300 2.930 52 0.3700 15-Planning and values 3.080 3.135 49 0.8324 3.028 52 0.9219 16-Audits 3.120 3.114 49 0.9748 3.125 52 0.7911 17-Problem solving tools 2.526 2.335 49 0.6514 2.707 52 0.6180
mean scores 3.520 , 3.413 , 3.394 , 3.366 , 3.357 and 3.357 respectively, but the factors (Training), (teams), (zero defects mentality) and (problem
solving tools) for the professionals have the least mean scores 2.966, 2.930, 2. 855 and 2.707 respectively. These results show that there are gaps
ARAB ECONOMICS AND BUSINESS JOURNAL 9 (2014) 93–114 105
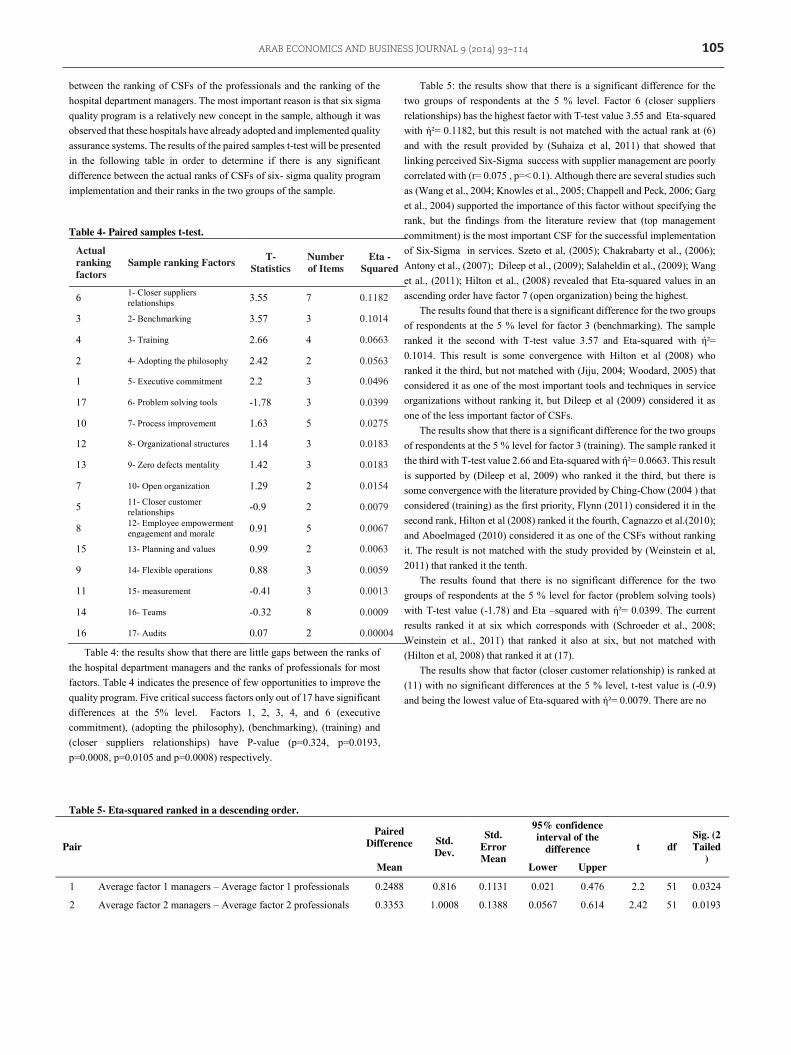
between the ranking of CSFs of the professionals and the ranking of the hospital department managers. The most important reason is that six sigma quality program is a relatively new concept in the sample, although it was observed that these hospitals have already adopted and implemented quality assurance systems. The results of the paired samples t-test will be presented in the following table in order to determine if there is any significant difference between the actual ranks of CSFs of six- sigma quality program implementation and their ranks in the two groups of the sample.
Table 4- Paired samples t-test.
Actual ranking factors
Sample ranking Factors T- Statistics
Number of Items
Eta - Squared
6 1- Closer suppliers relationships 3.55 7 0.1182
3 2- Benchmarking 3.57 3 0.1014
4 3- Training 2.66 4 0.0663
2 4- Adopting the philosophy 2.42 2 0.0563
1 5- Executive commitment 2.2 3 0.0496
17 6- Problem solving tools -1.78 3 0.0399
10 7- Process improvement 1.63 5 0.0275
12 8- Organizational structures 1.14 3 0.0183
13 9- Zero defects mentality 1.42 3 0.0183
7 10- Open organization 1.29 2 0.0154
5 11- Closer customer relationships -0.9 2 0.0079
8 12- Employee empowerment engagement and morale 0.91 5 0.0067
15 13- Planning and values 0.99 2 0.0063
9 14- Flexible operations 0.88 3 0.0059
11 15- measurement -0.41 3 0.0013
14 16- Teams -0.32 8 0.0009
16 17- Audits 0.07 2 0.00004
Table 4: the results show that there are little gaps between the ranks of the hospital department managers and the ranks of professionals for most factors. Table 4 indicates the presence of few opportunities to improve the quality program. Five critical success factors only out of 17 have significant differences at the 5% level. Factors 1, 2, 3, 4, and 6 (executive commitment), (adopting the philosophy), (benchmarking), (training) and (closer suppliers relationships) have P-value (p=0.324, p=0.0193, p=0.0008, p=0.0105 and p=0.0008) respectively.
Table 5: the results show that there is a significant difference for the two groups of respondents at the 5 % level. Factor 6 (closer suppliers relationships) has the highest factor with T-test value 3.55 and Eta-squared with ή²= 0.1182, but this result is not matched with the actual rank at (6) and with the result provided by (Suhaiza et al, 2011) that showed that linking perceived Six-Sigma success with supplier management are poorly correlated with (r= 0.075 , p=< 0.1). Although there are several studies such as (Wang et al., 2004; Knowles et al., 2005; Chappell and Peck, 2006; Garg et al., 2004) supported the importance of this factor without specifying the rank, but the findings from the literature review that (top management commitment) is the most important CSF for the successful implementation of Six-Sigma in services. Szeto et al, (2005); Chakrabarty et al., (2006); Antony et al., (2007); Dileep et al., (2009); Salaheldin et al., (2009); Wang et al., (2011); Hilton et al., (2008) revealed that Eta-squared values in an ascending order have factor 7 (open organization) being the highest.
The results found that there is a significant difference for the two groups of respondents at the 5 % level for factor 3 (benchmarking). The sample ranked it the second with T-test value 3.57 and Eta-squared with ή²= 0.1014. This result is some convergence with Hilton et al (2008) who ranked it the third, but not matched with (Jiju, 2004; Woodard, 2005) that considered it as one of the most important tools and techniques in service organizations without ranking it, but Dileep et al (2009) considered it as one of the less important factor of CSFs.
The results show that there is a significant difference for the two groups of respondents at the 5 % level for factor 3 (training). The sample ranked it the third with T-test value 2.66 and Eta-squared with ή²= 0.0663. This result is supported by (Dileep et al, 2009) who ranked it the third, but there is some convergence with the literature provided by Ching-Chow (2004 ) that considered (training) as the first priority, Flynn (2011) considered it in the second rank, Hilton et al (2008) ranked it the fourth, Cagnazzo et al.(2010); and Aboelmaged (2010) considered it as one of the CSFs without ranking it. The result is not matched with the study provided by (Weinstein et al, 2011) that ranked it the tenth.
The results found that there is no significant difference for the two groups of respondents at the 5 % level for factor (problem solving tools) with T-test value (-1.78) and Eta –squared with ή²= 0.0399. The current results ranked it at six which corresponds with (Schroeder et al., 2008; Weinstein et al., 2011) that ranked it also at six, but not matched with (Hilton et al, 2008) that ranked it at (17).
The results show that factor (closer customer relationship) is ranked at (11) with no significant differences at the 5 % level, t-test value is (-0.9) and being the lowest value of Eta-squared with ή²= 0.0079. There are no
Table 5- Eta-squared ranked in a descending order.
Pair
Paired Difference Std.
Dev.
Std. Error Mean
95% confidence interval of the
difference t df Sig. (2 Tailed
) Mean Lower Upper
1 Average factor 1 managers – Average factor 1 professionals 0.2488 0.816 0.1131 0.021 0.476 2.2 51 0.0324
2 Average factor 2 managers – Average factor 2 professionals 0.3353 1.0008 0.1388 0.0567 0.614 2.42 51 0.0193

106 ARAB ECONOMICS AND BUSINESS JOURNAL 9 (2014) 93–114
3 Average factor 3 managers – Average factor 3 professionals 0.4719 0.9522 0.132 0.2068 0.737 3.57 51 0.0008
4 Average factor 4 managers – Average factor 4 professionals 0.3285 0.8918 0.1236 0.0802 0.5768 2.66 51 0.0105
5 Average factor 5 managers – Average factor 5 professionals -0.5509 4.427 0.6139 -1.7834 0.6815 -0.9 51 0.3737
6 Average factor 6 managers – Average factor 6 professionals 0.3208 0.6522 0.0904 0.1392 0.5024 3.55 51 0.0008
7 Average factor 7 managers – Average factor 7 professionals 0.1261 0.7052 0.0978 -0.0701 0.3224 1.29 51 0.2029
8 Average factor 8 managers – Average factor 8 professionals 0.0764 0.6029 0.0836 -0.0914 0.2443 0.91 51 0.3649
9 Average factor 9 managers – Average factor 9 professionals 0.0718 0.5903 0.0818 -0.0924 0.2362 0.88 51 0.384
10 Average factor 10 managers – Average factor 10 professionals 0.1178 0.5223 0.0724 -0.0275 0.2632 1.63 51 0.1098
11 Average factor 11 managers – Average factor 11 professionals -0.0294 0.5226 0.0724 -0.1749 0.116 -0.41 51 0.6865
12 Average factor 12 managers – Average factor 12 professionals 0.2107 1.3309 0.1845 -0.1597 0.5813 1.14 51 0.2588
13 Average factor 13 managers – Average factor 13 professionals 0.1203 0.6113 0.0847 -0.0498 0.2905 1.42 51 0.1617
14 Average factor 14 managers – Average factor 14 professionals -0.0257 0.582 0.0807 -0.1878 0.1362 -0.32 51 0.7508
15 Average factor 15 managers – Average factor 15 professionals 0.1376 1.0042 0.1392 -0.1419 0.4172 0.99 51 0.3275
16 Average factor 16 managers – Average factor 16 professionals 0.0119 1.1943 0.1656 -0.3205 0.3444 0.07 51 0.9429
17 Average factor 17 managers – Average factor 17 professionals -0.2762 1.1171 0.1549 -0.5872 0.0347 -1.78 51 0.0805
similarities between this result and the literature that include customer focused (Dileep et al., 2009; Weinstein et al., 2011) that ranked it at (6), Antony et al, (2007) ranked it at (4), Ching-Chow (2004) and Hilton et al. (2008) ranked it at (5). This result means these hospitals don’t need to be focused on for practicing its quality program. In spite of this result, it does not mean that this factor should not be part of the model or considerations at all because opinion shaped by literature shows that physicians and nurses tend to focus more on an increasing need for direct personal contacts with patients, seeking patient inputs via surveys to determine the quality requirements, and measuring patient satisfaction and tracking them. Department hospital managers are not very concerned with the assessment on individual patient–physician level.
The results show that factor (audits) had the least concern in the sample and it was ranked the last one, the seventeenth, with T-test value 0.07 and Eta –squared with ή²= 0.00004. This result is not matching with the results of the previous studies such as Hilton et al (2008 ) that mentioned that Eta-squared values in an ascending order found factor 5 (closer customer/patient relationships) as the last one, Jiju et al (2007) ranked it at 6 out of eleven factors. This result indicates that the two groups are less interested in the quality management audits which are necessary in certain areas of the Hospital, or in determining the role of hospital certification to international standards that gives a competitive edge.
Table 6: according to the correlations of each of CSFs of Six-Sigma quality program and KPIs, nearly all the factors don’t have a significant positive relationship with KPIs. The results found that 5 factors out of 17
of Six-Sigma quality program do not have a significant relationship at the levels of 0.05 and 0.01 with some of KPIs, and these factors are 5, 11, 12, 13 and 15 (closer customer relationship, measurement, organizational structures, zero defects mentality, and planning and values) respectively. In addition, with the exception of the KPI (time to deliver), all the KPIs have positive significant correlations with all CSFs of Six-Sigma quality program, as the results showed that (time to deliver) has week correlations, but not significant with all CSFs. This result of time to deliver is not matching with the previous research such as (Nerenz et al., 2001; Revere et al., 2004; Woodward., 2006; Kang et al., 2005; Kwak et al., 2006; Antony et al., 2007; Feng et al., 2008; Rivers, 2010; Tariq et al., 2011; Attarwala et al., 2011; Bandyopadhyay et al, 2005; Cagnazzo et al., 2010) that emphasize, without ranking, on the importance of the improvement process of cycle time reduction, reduced service preparation time, reduced defect rate in service processes, and change over time as critical factors in the hospitals management of patient’s satisfaction.
There are positive and significant correlations at the level of 0.01 between (quality of the service) and four of CSFs, which are (executive commitment) with (r=0.27, p‹ 0.01), (adopting the philosophy) with (r=0.339, p‹ 0.01), (benchmarking) with (r=0.397, p‹ 0.01) and (training) with (r=0.500, p‹ 0.01). There are positive and significant correlations at 0.05 level between (quality of the service) and two of CSFs, which are (closer suppliers relationships) with (r=0.229, p‹ 0.05) and (problem solving tools) with (r=0.225, p‹ 0.05).
Table 6- Bivariate correlations between average performance and average ranking for each factor.
Factors N
Quality of the service
Efficiency in service Cost reduction Time to deliver customer
satisfaction Reduced variation
PC P-
Value PC P-
Value PC P-
Value PC P-
Value PC P-
Value PC P-
Value 1- 104 .277** .004 -.060 .543 .047 .634 .100 .314 .319** .001 -.193 .050 2- 104 .339** .000 -.035 .726 .134 .027 .156 .113 -.152 .124 -.152 .124
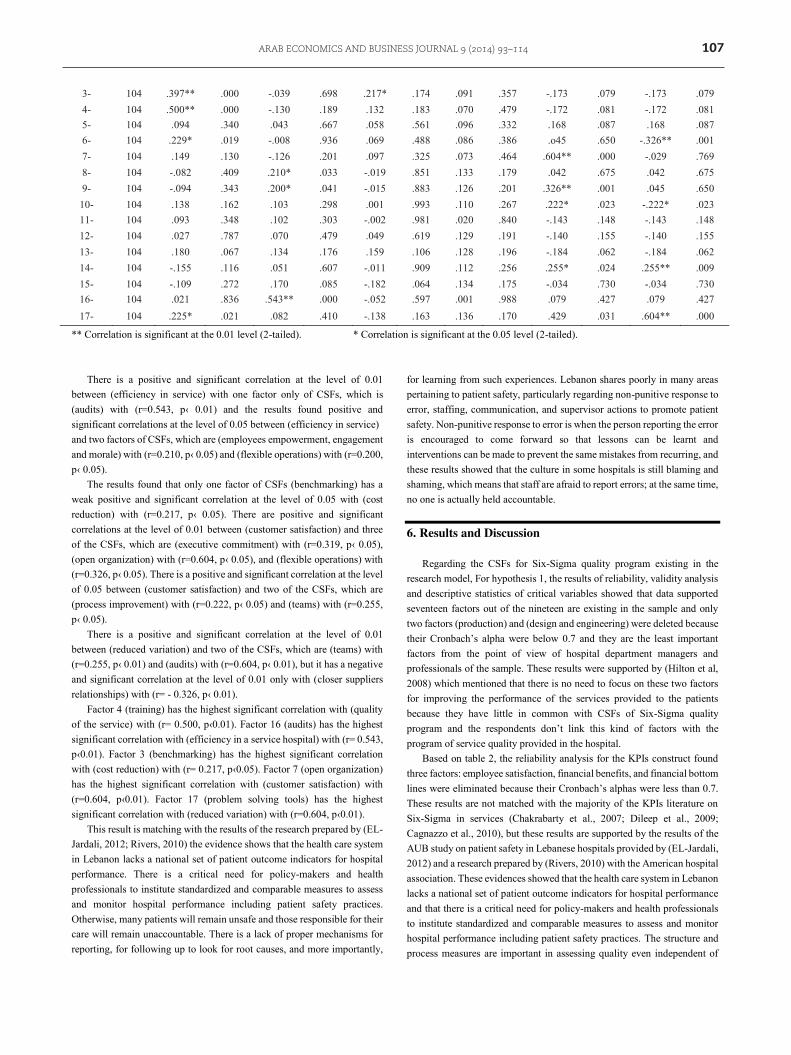
ARAB ECONOMICS AND BUSINESS JOURNAL 9 (2014) 93–114 107
3- 104 .397** .000 -.039 .698 .217* .174 .091 .357 -.173 .079 -.173 .079 4- 104 .500** .000 -.130 .189 .132 .183 .070 .479 -.172 .081 -.172 .081 5- 104 .094 .340 .043 .667 .058 .561 .096 .332 .168 .087 .168 .087 6- 104 .229* .019 -.008 .936 .069 .488 .086 .386 .o45 .650 -.326** .001 7- 104 .149 .130 -.126 .201 .097 .325 .073 .464 .604** .000 -.029 .769 8- 104 -.082 .409 .210* .033 -.019 .851 .133 .179 .042 .675 .042 .675 9- 104 -.094 .343 .200* .041 -.015 .883 .126 .201 .326** .001 .045 .650
10- 104 .138 .162 .103 .298 .001 .993 .110 .267 .222* .023 -.222* .023 11- 104 .093 .348 .102 .303 -.002 .981 .020 .840 -.143 .148 -.143 .148 12- 104 .027 .787 .070 .479 .049 .619 .129 .191 -.140 .155 -.140 .155 13- 104 .180 .067 .134 .176 .159 .106 .128 .196 -.184 .062 -.184 .062 14- 104 -.155 .116 .051 .607 -.011 .909 .112 .256 .255* .024 .255** .009 15- 104 -.109 .272 .170 .085 -.182 .064 .134 .175 -.034 .730 -.034 .730 16- 104 .021 .836 .543** .000 -.052 .597 .001 .988 .079 .427 .079 .427 17- 104 .225* .021 .082 .410 -.138 .163 .136 .170 .429 .031 .604** .000
** Correlation is significant at the 0.01 level (2-tailed). * Correlation is significant at the 0.05 level (2-tailed).
There is a positive and significant correlation at the level of 0.01 between (efficiency in service) with one factor only of CSFs, which is (audits) with (r=0.543, p‹ 0.01) and the results found positive and significant correlations at the level of 0.05 between (efficiency in service) and two factors of CSFs, which are (employees empowerment, engagement and morale) with (r=0.210, p‹ 0.05) and (flexible operations) with (r=0.200, p‹ 0.05).
The results found that only one factor of CSFs (benchmarking) has a weak positive and significant correlation at the level of 0.05 with (cost reduction) with (r=0.217, p‹ 0.05). There are positive and significant correlations at the level of 0.01 between (customer satisfaction) and three of the CSFs, which are (executive commitment) with (r=0.319, p‹ 0.05), (open organization) with (r=0.604, p‹ 0.05), and (flexible operations) with (r=0.326, p‹ 0.05). There is a positive and significant correlation at the level of 0.05 between (customer satisfaction) and two of the CSFs, which are (process improvement) with (r=0.222, p‹ 0.05) and (teams) with (r=0.255, p‹ 0.05).
There is a positive and significant correlation at the level of 0.01 between (reduced variation) and two of the CSFs, which are (teams) with (r=0.255, p‹ 0.01) and (audits) with (r=0.604, p‹ 0.01), but it has a negative and significant correlation at the level of 0.01 only with (closer suppliers relationships) with (r= - 0.326, p‹ 0.01).
Factor 4 (training) has the highest significant correlation with (quality of the service) with (r= 0.500, p‹0.01). Factor 16 (audits) has the highest significant correlation with (efficiency in a service hospital) with (r= 0.543, p‹0.01). Factor 3 (benchmarking) has the highest significant correlation with (cost reduction) with (r= 0.217, p‹0.05). Factor 7 (open organization) has the highest significant correlation with (customer satisfaction) with (r=0.604, p‹0.01). Factor 17 (problem solving tools) has the highest significant correlation with (reduced variation) with (r=0.604, p‹0.01).
This result is matching with the results of the research prepared by (EL-Jardali, 2012; Rivers, 2010) the evidence shows that the health care system in Lebanon lacks a national set of patient outcome indicators for hospital performance. There is a critical need for policy-makers and health professionals to institute standardized and comparable measures to assess and monitor hospital performance including patient safety practices. Otherwise, many patients will remain unsafe and those responsible for their care will remain unaccountable. There is a lack of proper mechanisms for reporting, for following up to look for root causes, and more importantly,
for learning from such experiences. Lebanon shares poorly in many areas pertaining to patient safety, particularly regarding non-punitive response to error, staffing, communication, and supervisor actions to promote patient safety. Non-punitive response to error is when the person reporting the error is encouraged to come forward so that lessons can be learnt and interventions can be made to prevent the same mistakes from recurring, and these results showed that the culture in some hospitals is still blaming and shaming, which means that staff are afraid to report errors; at the same time, no one is actually held accountable.
6. Results and Discussion
Regarding the CSFs for Six-Sigma quality program existing in the research model, For hypothesis 1, the results of reliability, validity analysis and descriptive statistics of critical variables showed that data supported seventeen factors out of the nineteen are existing in the sample and only two factors (production) and (design and engineering) were deleted because their Cronbach’s alpha were below 0.7 and they are the least important factors from the point of view of hospital department managers and professionals of the sample. These results were supported by (Hilton et al, 2008) which mentioned that there is no need to focus on these two factors for improving the performance of the services provided to the patients because they have little in common with CSFѕ of Six-Sigma quality program and the respondents don’t link this kind of factors with the program of service quality provided in the hospital.
Based on table 2, the reliability analysis for the KPIs construct found three factors: employee satisfaction, financial benefits, and financial bottom lines were eliminated because their Cronbach’s alphas were less than 0.7. These results are not matched with the majority of the KPIs literature on Six-Sigma in services (Chakrabarty et al., 2007; Dileep et al., 2009; Cagnazzo et al., 2010), but these results are supported by the results of the AUB study on patient safety in Lebanese hospitals provided by (EL-Jardali, 2012) and a research prepared by (Rivers, 2010) with the American hospital association. These evidences showed that the health care system in Lebanon lacks a national set of patient outcome indicators for hospital performance and that there is a critical need for policy-makers and health professionals to institute standardized and comparable measures to assess and monitor hospital performance including patient safety practices. The structure and process measures are important in assessing quality even independent of

108 ARAB ECONOMICS AND BUSINESS JOURNAL 9 (2014) 93–114
their direct influence on outcome because they reflect how the patients were cared after. In addition, while Lebanon has some of the best medical practitioners and facilities by international standards, there is evidence to indicate that sub-stander medical practice is widespread comprising the quality of health care, and in some instances the health of the Lebanese citizen, there is no standard information that is regularly collected and few standers measures are available to assess quality .Quality is commonly assessed in terms of technical quality and patient satisfaction.
Table 3 illustrates the average rank across the items within a factor with deleted items noted .The results of the two groups show that the mean score for three factors: 13, 14, and 17 (zero defects mentality, teams, and problem solving tools) is less than the average (3 out of 5). This means professional physicians, nurses and hospital department managers showed less interest in them. But this result is not natural as these three factors should have been a part of the model or considerations, and also because these results are incompatible with these studies (Weinstein et al., 2011; Tariq et al., 2011; Black et al., 2006; Woodward, 2006) that found factor 13 (zero defects mentality) is one of the major factors required to adopt Six-Sigma quality program. The two groups of the sample don’t take into account that the announced goal of zero defects is important, or that a program to continuously reduce defects is critical, or that a plan is important to reduce rework.
Flynn (2011) mentioned that Keller, (2005) listed factor 14 (teams) as one of four important success factors of six-sigma. Aboelmaged (2010) found cross-functional team working is one of the most cited success factors in Six-Sigma literature (Antony and Fergusson, 2004; Buch and Tolentino, 2006; Chakrabarty et al ,2007; Kumar, 2007 ; Kwak et al., 2006; McAdam and Evans, 2004; Revere et al, 2004; Szeto et al., 2005). These results indicate that the two groups of the sample aren’t interested in considering workforce improvement teams , cross functional teams , work cell teams , self-managed teams , and project oriented teams are important for all the professionals or managers for practicing the quality system in their positions. Also the literature (Anbari et al., 2004; Kang et al., 2005; Schroeder et al., 2008; Weinstein et al., 2011; Dileep et al., 2009) clarifies that factor 17 (problem solving tools) is one of the most important factors to CSFs of Six-Sigma quality program.
The results found factor 2 (adopting the philosophy) is also of high importance to hospital department managers that ranked it the first with mean score 3.753 compared to the professionals who ranked it the third with mean score 3.413. The result found that hospital department managers considered it as the most important factor needed to improve the quality. The interpretation of these results showed that hospital department managers have a greater conviction compared to professionals toward the importance of including the performance principles in the hospital’s mission and that they need high quality health and safety standards as a part of their functions toward their patients ,and also showed that there is some convergence with the literature ,focusing on this factor, that was provided by Hilton et al (2008) ranked it the second , Wang et al (2011) ranked it the third , several studies such as (Szeto et al., 2005; Salaheldin et al., 2009) ranked it the fourth. Ching-Chow (2004) and Antony et al (2007) proposed the main CSFs are to link the methodology of SS to business strategy.
In addition, the results show factor 1 (executive commitment) is also of high importance to hospital department managers that ranked it the second with mean score 3.653 compared to the professionals that ranked it the fifth with mean score 3.366. The result is perhaps attributed to the fact that department hospital managers give more attention to be fully committed to
the performance improvements, are actively championing the performance and are actively communicating the performance commitments to all staff, but this result is not matched with the findings from the literature review (Revere et al., 2004; Chakrabarty et al., 2006; Antony et al., 2007; Dileep et al., 2009; Salaheldin et al., 2009; Wang et al., 2011; Hilton et al., 2008) where top management commitment is the most important CSFs for the successful implication of Six-Sigma in services.
Factor 7(open organization) is considered as the third important factor to the sample of hospital department managers with mean score 3.645 and the second important factor from professionals view point with mean score 3.520. This is highly likely to be the result of the two groups believing that the trusting organizational culture and frequent use of cross-departmental teams are necessary for the hospital. This result is not matched with Hilton et al (2008) that found this factor at the highest potential rank to improve the services provided to the patients. Based on the report prepared by (Health Care Sector in Lebanon: Syndicate of Private Hospitals, 2012) people from surrounding countries do prefer to come to Lebanon for medical treatment, Firstly, because of the quality and secondly, they have so many advantages; moderate weather condition is important to patients, good medical staff; they are highly qualified doctors, medical nurses, lab technicians, so they do have an edge in human resources compared to others, language and accommodation availability for those accompanied by family and relatives; all these are extras which are important advantages to patients coming from the Gulf. As for medical tourism in Lebanon, they still have a lot to improve and had some difficulties, mainly because of the political situation in Lebanon. This gave way to Jordan to expand its health care tourism sector at the expense of Lebanese health care tourism. They have a coordinated effort with the government and are working with both, private and public sector. They have also managed to secure contracts with some Arab countries that have a huge capacity for health care tourism, even with the number of beds available that can admit 200,000 patients per year and their aim is to widen the circle so that other hospitals can benefit from medical tourism.
The results show factor 6 (closer supplier’s relationships) is also of high importance to hospital department managers that ranked it the fourth with mean score 3.520 compared to the professionals that ranked it the ninth with mean score 3.201. This result is perhaps attributed to the fact that department hospital managers give more attention to work more closely with providers of specialist services, to be involved in hospital project teams, to adopt a similar performance improvement program, to be trained in the hospital’s systems and to meet stricter quality specifications.
For hypothesis 2, based on the results H2 is partially accepted. This study found the actual ranks of the professionals for CSFs of Six-Sigma quality program are significantly different from the actual ranks of the hospital department managers. According to the results of table 5, the ranking in a descending order of the CSFs of a Six-Sigma quality program based on the value of Eta-squared found factor 6 (closer suppliers relationships) being the most significant difference at 5% level with T-test value 3.55 and Eta squared ( Ƞ² = 0.1182). This results is corresponding with the report provided by (Ammar, 2012) who mentioned that expenditures linked to hospitalizations were 68% of the Lebanese Ministry of Public Health (MOPH) budget whereas in 2009 it was raised up to 72% which matches the conditions in Lebanon where private health insurance does exist and covers only about 12% of total population . Hospitals have financial problems in the present time because of the incapacity of the public insurers in provision of funds for medical treatments. Lebanese
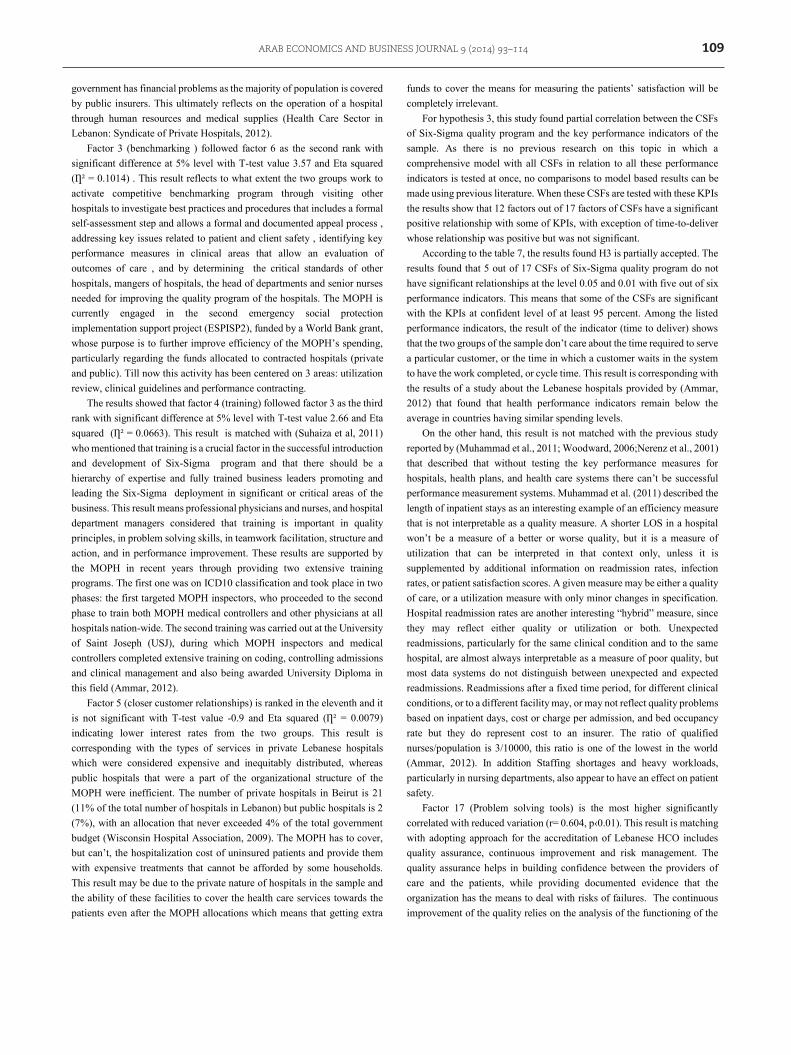
ARAB ECONOMICS AND BUSINESS JOURNAL 9 (2014) 93–114 109
government has financial problems as the majority of population is covered by public insurers. This ultimately reflects on the operation of a hospital through human resources and medical supplies (Health Care Sector in Lebanon: Syndicate of Private Hospitals, 2012).
Factor 3 (benchmarking ) followed factor 6 as the second rank with significant difference at 5% level with T-test value 3.57 and Eta squared (Ƞ² = 0.1014) . This result reflects to what extent the two groups work to activate competitive benchmarking program through visiting other hospitals to investigate best practices and procedures that includes a formal self-assessment step and allows a formal and documented appeal process , addressing key issues related to patient and client safety , identifying key performance measures in clinical areas that allow an evaluation of outcomes of care , and by determining the critical standards of other hospitals, mangers of hospitals, the head of departments and senior nurses needed for improving the quality program of the hospitals. The MOPH is currently engaged in the second emergency social protection implementation support project (ESPISP2), funded by a World Bank grant, whose purpose is to further improve efficiency of the MOPH’s spending, particularly regarding the funds allocated to contracted hospitals (private and public). Till now this activity has been centered on 3 areas: utilization review, clinical guidelines and performance contracting.
The results showed that factor 4 (training) followed factor 3 as the third rank with significant difference at 5% level with T-test value 2.66 and Eta squared (Ƞ² = 0.0663). This result is matched with (Suhaiza et al, 2011) who mentioned that training is a crucial factor in the successful introduction and development of Six-Sigma program and that there should be a hierarchy of expertise and fully trained business leaders promoting and leading the Six-Sigma deployment in significant or critical areas of the business. This result means professional physicians and nurses, and hospital department managers considered that training is important in quality principles, in problem solving skills, in teamwork facilitation, structure and action, and in performance improvement. These results are supported by the MOPH in recent years through providing two extensive training programs. The first one was on ICD10 classification and took place in two phases: the first targeted MOPH inspectors, who proceeded to the second phase to train both MOPH medical controllers and other physicians at all hospitals nation-wide. The second training was carried out at the University of Saint Joseph (USJ), during which MOPH inspectors and medical controllers completed extensive training on coding, controlling admissions and clinical management and also being awarded University Diploma in this field (Ammar, 2012).
Factor 5 (closer customer relationships) is ranked in the eleventh and it is not significant with T-test value -0.9 and Eta squared (Ƞ² = 0.0079) indicating lower interest rates from the two groups. This result is corresponding with the types of services in private Lebanese hospitals which were considered expensive and inequitably distributed, whereas public hospitals that were a part of the organizational structure of the MOPH were inefficient. The number of private hospitals in Beirut is 21 (11% of the total number of hospitals in Lebanon) but public hospitals is 2 (7%), with an allocation that never exceeded 4% of the total government budget (Wisconsin Hospital Association, 2009). The MOPH has to cover, but can’t, the hospitalization cost of uninsured patients and provide them with expensive treatments that cannot be afforded by some households. This result may be due to the private nature of hospitals in the sample and the ability of these facilities to cover the health care services towards the patients even after the MOPH allocations which means that getting extra
funds to cover the means for measuring the patients’ satisfaction will be completely irrelevant.
For hypothesis 3, this study found partial correlation between the CSFs of Six-Sigma quality program and the key performance indicators of the sample. As there is no previous research on this topic in which a comprehensive model with all CSFs in relation to all these performance indicators is tested at once, no comparisons to model based results can be made using previous literature. When these CSFs are tested with these KPIs the results show that 12 factors out of 17 factors of CSFs have a significant positive relationship with some of KPIs, with exception of time-to-deliver whose relationship was positive but was not significant.
According to the table 7, the results found H3 is partially accepted. The results found that 5 out of 17 CSFs of Six-Sigma quality program do not have significant relationships at the level 0.05 and 0.01 with five out of six performance indicators. This means that some of the CSFs are significant with the KPIs at confident level of at least 95 percent. Among the listed performance indicators, the result of the indicator (time to deliver) shows that the two groups of the sample don’t care about the time required to serve a particular customer, or the time in which a customer waits in the system to have the work completed, or cycle time. This result is corresponding with the results of a study about the Lebanese hospitals provided by (Ammar, 2012) that found that health performance indicators remain below the average in countries having similar spending levels.
On the other hand, this result is not matched with the previous study reported by (Muhammad et al., 2011; Woodward, 2006;Nerenz et al., 2001) that described that without testing the key performance measures for hospitals, health plans, and health care systems there can’t be successful performance measurement systems. Muhammad et al. (2011) described the length of inpatient stays as an interesting example of an efficiency measure that is not interpretable as a quality measure. A shorter LOS in a hospital won’t be a measure of a better or worse quality, but it is a measure of utilization that can be interpreted in that context only, unless it is supplemented by additional information on readmission rates, infection rates, or patient satisfaction scores. A given measure may be either a quality of care, or a utilization measure with only minor changes in specification. Hospital readmission rates are another interesting “hybrid” measure, since they may reflect either quality or utilization or both. Unexpected readmissions, particularly for the same clinical condition and to the same hospital, are almost always interpretable as a measure of poor quality, but most data systems do not distinguish between unexpected and expected readmissions. Readmissions after a fixed time period, for different clinical conditions, or to a different facility may, or may not reflect quality problems based on inpatient days, cost or charge per admission, and bed occupancy rate but they do represent cost to an insurer. The ratio of qualified nurses/population is 3/10000, this ratio is one of the lowest in the world (Ammar, 2012). In addition Staffing shortages and heavy workloads, particularly in nursing departments, also appear to have an effect on patient safety.
Factor 17 (Problem solving tools) is the most higher significantly correlated with reduced variation (r= 0.604, p‹0.01). This result is matching with adopting approach for the accreditation of Lebanese HCO includes quality assurance, continuous improvement and risk management. The quality assurance helps in building confidence between the providers of care and the patients, while providing documented evidence that the organization has the means to deal with risks of failures. The continuous improvement of the quality relies on the analysis of the functioning of the
110 ARAB ECONOMICS AND BUSINESS JOURNAL 9 (2014) 93–114
processes in order to improve quality. This method should be multidisciplinary and includes various professional groups concerned with the studied process. This method forms a real management tool, in which there are no pre-set priorities. It is the role of the professional staff to define the improvement steps and the indicators needed for the follow up and maintenance of the quality level. Risk management is based on the correction, prevention and control of risks encountered, not only by the patients and their surrounding environment but also by the Institute of Health Management and Social Protection, (2012). The hospital department managers and professionals are interested with the importance of using standard problem solving process or root cause analysis, process flowcharting should be understood and used extensively in the hospitals as important considerations for practicing the quality systems and continuous improvement methodology for the standards used (Woodward, 2006).
The results showed Cronbach’s alpha reliability for factor 16 (audit) was the highest coefficient and was the most higher significantly correlated with efficiency in services (r= 0.543, p‹0.01). But this result is not matching with the view point of the two groups of the sample being the lowest factor ,T-test value 0.07 and Eta –squared with ή²= 0.00004 This result reflects a contradiction with the results of the research prepared by (EL-Jardali, 2012) the evidence shows that the health care system in Lebanon lacks a national set of patient outcome indicators for hospital performance .There is a critical need for policy-makers and health professionals to institute standardized and comparable measures to assess and monitor hospital performance including patient safety practices. Otherwise, many patients will remain unsafe and those responsible for their care will remain unaccountable. There is a lack of a proper mechanism for reporting, for following up to look at root causes, and more importantly, for learning from such experiences. Lebanon fares poorly in many areas pertaining to patient safety particularly as regards: non-punitive response to error, staffing, communication, and supervisor actions to promote patient safety. “Non-punitive response to error is when the person reporting the error is encouraged to come forward so that lessons can be learnt and interventions made to prevent the same mistakes from recurring and these results showed that the culture in some hospitals is still one of blaming and shaming, which means staff are afraid to report errors and at the same time, no one is actually held accountable.
The results revealed that factor 3 (benchmarking) is the only performance indicator out of all KPIs has a week positive correlation which is significant with cost reduction (r = 0.217, p ‹ 0.05). This result is supported by (Woodard, 2005; Muhammad et al., 2011; Hertz, 2011, 2012) they mentioned that most cost measures are almost impossible to compare directly from hospital to hospital or health system to health system. No two accounting systems are exactly the same, and few hospitals have cost accounting systems that allow precise, externally comparable calculations of costs for admissions or smaller units of service. Purchasers and insurers may work backward from their charges to calculate a “cost” (to them) per admission, but all parties typically recognize that this figure is a very complex blend of true underlying cost, accounting conventions, negotiated discounts, and varying bundles of services . Many clinical measures cannot be calculated at this level because of small sample size issues .This presents a lot of challenges for people who are uninsured because they do not have any money. The government is aware that something must be done to address the tariffs for the services of hospital fees; room rates, and a high inflation rate for many years but the tariffs were not adapted to meet this rise.
Factor 4 (training) is the most higher significantly correlated with quality of the service (r= 0.500, p‹0.01). This result is supported by (Health Care Sector in Lebanon: Syndicate of Private Hospitals, 2012) that reported the condition of human resources in the Lebanese hospital, they do have an edge in human resources compared to others. Some hospitals may not have all the equipment they need, but the university hospitals do have top-notch equipment as they have access to finance through medical faculties as well as external financial support which enables them to maintain the high level of service. Factor 3 (benchmarking) followed it as the second higher significantly correlated with quality of the service (r= 0.397, p‹0.01).
The results show that five factors out of seventeen factors of CSFs including: factor 5 (closer customer relationship), factor 11(measurement), factor 12 (organizational structures), factor 13 (zero defect mentality), and factor 15 (planning and values), do not need to be focused on for performance improvements. These results are not correspondent with recent studies supported the importance of these factors as a part of the important factors for the implemented SS (Ching-Chow, 2004; Kang et al., 2005; Chappell et al., 2006; Cagnazzo et al., 2010; Attarwala et al., 2011; Suhaiza et al., 2011; Tariq et al., 2011). This result may be due to the nature of the special nature of patients who are able to pay the cost of the service provided.
7. Conclusion
Three objectives were outlined in the introduction and all were met throughout the research:
The first objective was to address the nature of the quality program in a sample of Lebanese hospitals by describing whether the critical success factors of Six-Sigma quality program implementation exist in this sample, and provide insight on the basic performance indicators that are available in some literature and determine which of them is used to measure the performance in the sample. The research has found that 17 CSFs out of 19 of Six-Sigma quality program implementation existed and were matched with the quality program applied in the sample. Two factors only were deleted, factor 18 (design and engineering) and factor 19 (production), since that Cronbach’s alpha for both factors was below 0.7 even with the deleted item.
The second objective was to analyze the difference in the ranks of the (CSFs) of Six-Sigma quality program between the actual ranks presented by the (Hilton et al., 2008) and the ranks in the two groups of the sample, the professionals and the hospital department managers. The results show that there are little gaps between the actual ranks of the professionals and the actual ranks of the hospital department managers about the importance degree of CSFs. This result indicates that few opportunities are available to improve the quality program as stated by most of the respondents. The average rank of the items within a factor for hospital department managers found that factor 2 (adopting the philosophy) has the highest mean score followed by (executive commitment), (open organization), (closer supplier relationship), (benchmarking) and (process improvement), but the average rank for the professionals is different and the results found that factor 5 (closer customer relationship) has the highest mean score followed by (open organization), (adopting the philosophy), (measurement), (executive commitment), (employees empowerment), (engagement and morale), and (flexible operations). Although the average ranking for factors 14 and 17, (teams) and (problem solving tools), for the hospital department managers have the least mean score, the results found that factors (training), (teams),
ARAB ECONOMICS AND BUSINESS JOURNAL 9 (2014) 93–114 111
(zero defects mentality) and (problem solving tools) for the professionals staff have the least mean score. Therefore the current study partially accepted hypothesis 1.
For hypothesis 2, the results of table 5 show the ranking of the CSFs of a Six-Sigma quality program in a descending order based on the value of Eta-squared. The current study partially accepted hypothesis 2 as the results found few significant differences between the respondents of the sample about the CSFs and only five critical success factors differences out of 17 factors of Six-Sigma quality program are significant at the 5 % level, factors 1, 2, 3, 4, and 6 which are (executive commitment), (adopting the philosophy), (benchmarking), (training) and (closer suppliers relationships) respectively. Factor 6 (closer suppliers relationships) is the highest factor followed by (benchmarking) then (training) then (adopting the philosophy) and (the executive commitment), but factor 17 (audits) is the last factor. This means that the results of the study supported that the respondents were not able to understand the importance of the hospital’s quality system through the first questionnaire about CSFs of Six-Sigma quality program. These results are matching with the literature concerning Six-Sigma in healthcare and that it is gradually growing, it is not that hospitals don’t have the ability to adopt continuous improvement, Six-Sigma or similar methodologies, but it is more likely that the terminology used in healthcare differs from manufacturing industry while the intent is the same or similar (Hilton et al, 2008). In addition, this result is matching with the results of (Dileep et al., 2009) which identified that the application of CSFs of Six-Sigma quality program is still not widely spread in services as it is in manufacturing. Wherever applied, it is also limited to some particular departments like in health care. It is mostly applied to some particular laboratories and not in overall the hospital.
The third objective was to provide an insight on the impact of the CSFs of Six-Sigma quality program on the key performance indicators in the sample. The results show that five CSFs (closer customer relationship), (measurement), (organizational structures), (zero defect mentality) and (planning and values) are not significantly positively correlated with all performance indicators, and that the respondents do not need to focus on these five factors for measuring the performance; however, this result does not mean that these five factors should not be a part of the model or the considerations at all; but on the contrary, it is advised that the hospital department managers and the professionals should focus more on these five factors in order to improve the quality management system applied in their hospitals. The previous adoption of quality procedures and tools, no doubt, assisted in creating a culture of quality consciousness thus making it easier for the quality program applied in the hospitals of the sample to be matched with 12 out of 17 factors and to be embraced within the sample size of the hospitals. (Time to deliver) is the only one out of 6 key performance indicators that has a week positive correlation and is not significant with all CSFs of Six-Sigma quality program, this may reflects that the respondents don’t consider the use of time as one of the performance indicators as valuable tool to evaluate the delivery of services to the patients. Based on the previous results, hypothesis 3 is partially accepted.
Finally, the literature reviews still debate on the application of CSFs of six-sigma quality program in the healthcare sector and didn’t agree on a universal complete uniform construct to measure the performance in this sector.
7.1. Limitations
Although this study produced useful and interesting findings, there are several limitations to discuss:
This study examined a fairly small sample size of only five Lebanese hospitals in Beirut so no attempt is made to generalize the outcomes.
The application of the current study was limited to a representative sample in private hospitals only.
The current study has adopted all indicators that were offered through previous studies to measure the performance of hospitals due to the lack of agreement on a specific construct in the previous literature.
The survey questions were designed rather qualitatively than quantitatively which helped to achieve a deep understanding of how healthcare organizations think about six sigma.
7.2. Recommendations for future research
Further research can improve upon the current research findings by employing a comparative study in a wider application in samples of public and private hospitals to get more validity regarding the relationship between CSFs of Six-Sigma quality program and KPIs.
Research is needed to further validate and operationalize key performance indicators, to provide an IT benchmarking framework, and to provide a comparison of the HIS benchmarks of different hospitals.
Conduct a research about how different hospitals, that have different maturity levels of quality programs such as quality assurance, total quality management or lean system, can implement the CSFs of Six-Sigma quality program.
Each one of these critical success factors may be broken down into sub-factors to further define the actions, measurements, roles, responsibilities and behaviors that each department in the organization must demonstrate to assure Six-Sigma successes and get significant results.
There is a notable lack of published studies on the role and contribution of managers and governance to the effectiveness and efficiency of health care organizations. Involving the civil society in the development of public healthcare policthe ies and in supporting the development of public healthcare infrastructure.
REFERENCES
Abdolshah, M., & Yusuff, R. M. (2009). Fundamental elements
for the successful performance of Six-Sigma projects in service industries. International Conference, 3-5 April.
Aboelmaged, M. G. (2010). Six-Sigma quality: a structured review and implications for future Research. International Journal of Quality &Reliability Management, Vol. 27, No. 3.

112 ARAB ECONOMICS AND BUSINESS JOURNAL 9 (2014) 93–114
Al Rashdi, I. (2011). How Much the Quality of Healthcare Costs? A Challenging Question! Oman Medical Journal, Vol. 26, 301-302.
Ammar, W. (2012). Health Reform in Lebanon Key Achievements at a glance. Ministry of Public Health over the last decade.
Andersson, R., Eriksson, H., & Torstensson, H. (2006). Similarities and differences between TQM, Six-Sigma and lean. The TQM Magazine, Vol. 18, No. 3, pp. 282-96.
Antony, J. (2004). Six-Sigma in the UK service organizations: results from a pilot survey. Managerial Auditing Journal, Vol. 19, No. 8, pp. 1006-1013. Antony, J., Antony, F.-J., Kumar, M., & Cho, B. - R. (2007).
Six-Sigma In Service Organizations: Benefits, Challenges and Difficulties, Common Myths, Empirical Observations and Success Factors. International Journal of Quality & Reliability Management, Vol. 24, No. 3, pp.294 – 311.
Attarwala, P., Kulkarni, S. & Dwivedi, S. (2011). Application of Lean-Six-Sigma to Improve Quality in Healthcare Industry. International Conference on Modeling, Simulation & Visualization Methods.
Bandyopadhyay, J.K., & Coppens, K . (2005). Six-Sigma Approach to Healthcare Quality and Productivity Management. International Journal of Quality & Productivity Management, Vol. 5, No. 1, December 15.
Black, K., & Revere, L. (2006). Six-Sigma arises from the ashes of TQM with a twist. International Journal of Health Care Quality Assurance, Vol. 19, No. 3, pp. 259-266.
Brun, A. (2011). Critical success factors of Six Sigma implementations in Italian companies. International Journal of Production Education, Vol. 131, No 1, pp. 158-164.
Cagnazzo, L., & Taticchi, P. (2010). Six-Sigma for big companies and MEs: evidences from literature. Transaction on Business and Economics, No 4, Vol. 7, October.
Chappell, A., & Peck, H. (2006). Risk management in military supply chains: is there a role for Six-Sigma? International Journal of Logistics, Vol. 9, No. 3, pp. 253-67.
Chakrabarty, A., & Kay, C.T. (2006). The Extent of Six-Sigma Methodologies Usage in Services. Second European Conference on Management of Technology, 10-12 September.
Chakrabarty, A., & Kay, C.T. (2007). The current state of Six-Sigma application in services. Managing Service Quality, Vol. 17, No. 2, pp.194-208.
Ching-Chow, Y. (2004 ). An integrated model of TQM and GE-Six-Sigma. International Journal of Six-Sigma and Competitive Advantage, Vol. 1, No 1, pp. 97-111(15), September.
Cowing, M., Davino-Ramaya, C. M., Ramaya, K., & Szmerekovsky, J. (2009). Health Care Delivery Performance: Service, Outcomes, and Resource Stewardship. The Permanente Journal of Medical Science, Vol. 13, No. 4, Fall.
De Jager, J.W., Du Plooy, A.T., & Femi Ayadi, M. (2010 ). Delivering quality service to in- and out-patients in a South African public hospital. Journal of Business Management, Vol. 4, No.2, pp. 133-139, February.
DelliFraine, J. L., Langabeer, J. R., & Nembhard, I. M. (2010). Assessing the Evidence of Six-Sigma and Lean in The Health Care Industry. Quality Management in Healthcare, Vol. 19, No. 3, pp. 211–225.
Dileep, G., & Rau, S. S. (2009). Applying Six-Sigma In Health Service : A study Of Critical Success Factors, Critical To Quality Characteristics And Key Performance Indicators In
Medium Scale Hospitals. International Journal on Information Sciences and Computing, Vol.3, No.1, January.
EL-Jardali, F. (2012). AUB study on patient safety in Lebanese hospitals: Poor reporting of medical errors. Quality Health Care, Vol. 24, No. 3, pp. 250-257.
EL-Jardali, F. (2007). The Impact of Accreditation on Quality of Care in Lebanese Hospitals. Lebanese Journal of Health and Human, No. 1, pp.43-45.
Elsberry, R .B. (2000). Six-Sigma: Applying a Corporate Model to Radiology. Decisions in Imaging Economics, Vol. 13, No. 7, 56-66.
Ettinger, W. (2001). Six-Sigma Adapting GE’s Lesson to Health Care. Trustee, Vol. 54, No. 8, pp.10-16.
Feng Q., & Manuel C. (2008). Under the knife: a national survey of Six-Sigma programs in US healthcare organizations. International Journal of Health Care Quality Assurance ,Vol. 21, No. 6, pp. 535-547.
Fogarty, L., Kim, Y, M., Juon, H-S., Tappis, H., Noh, J, W., Zainullah, P., & Rozario, A. (2014). Job Satisfaction and Retention of health-Care Providers in Afghanistan and Malawi. Journal of Human Resources for Health, Vol. 12. Flynn, S. W. (2011). Determining Critical Factors of Six-Sigma
Initiatives: A Study of the American Society For quality region. Master Thesis, Industrial Management, March.
Fredendall, L., Robbins, T., & Zu, X. (2006). Organizational Culture and Quality Practices in Six-Sigma. The Annual Meeting of the Academy of Management. September 29th.
Garg, D., Narahari, Y., & Viswanadham, N. (2004). Design for Six-Sigma supply chain. Transactions on Automation Science and Engineering, Vol. 1 No. 1, pp. 38-57.
Hahn, G., Hill, W., Hoerl, R., & Zinkgraf, S. (1999). The Impact of Six-Sigma Improvement A glimpse into the future of statistics. The American Statistician , Vol. 53, No. 3, pp. 208-215, August.
Health Care Sector in Lebanon: Syndicate of Private Hospitals. (2012), Interview with President of Syndicate of Private Hospitals in Lebanon, 11 July.
Hekmatpanah, M., Sadroddin, M., Shahbaz, S., Mokhtari, F., & Fadavinia, F. (2008). Six-Sigma Process and its Impact on the Organizational Productivity. World Academy of Science, Engineering and Technology, Vol. 43, pp. 365-369.
Hertz, H. (2011, 2012). Health Care Criteria for Performance Excellence’ Baldrige Performance Excellence Program. National Institute of Standards and Technology.
Heuval, J., Does, R., & Bisgaard, S. (2005). Dutch hospital implements Six-Sigma. ASQ Six-Sigma Forum Magazine,, Vol. 4, No. 2, pp.11-14.
Heuvel, J., Does, R ., & Koning, H. (2006). Lean Six-Sigma in a Hospital. International Journal of Six-Sigma and Competitive Advantage, Vol. 2, No. 4, pp. 377-388.
Hilton, R., Balla, M., & Sohal, A. (2008). Factors critical to the success of a Six-Sigma quality program in an Australian hospital. Total Quality Management, Vol. 19, No. 9, pp. 887–902, September.
Institute of Health Management and Social Protection, (2012), National Health Statistics Report in Lebanon.
Ismail, A., & Alhashemi, S. E. (2011). Clients Satisfactions in ISO Certified Health Clinic In Kesihatan Bandar Baru Bangi, Selangor and Its Associated Factors. Journal of Community Health, Vol. 17, No. 1.
Ismyrlis, V., & Moschidis, O. (2013). Six Sigma's critical success factors and toolbox. International Journal of Lean Six Sigma, Vol. 4, Iss: 2, pp.108 - 117 -
ARAB ECONOMICS AND BUSINESS JOURNAL 9 (2014) 93–114 113
James, C. (2005). Manufacturing’s prescription for improving health care quality. Hospital Topics, Vol. 83, No. 1, pp.2–8.
Joseph, T. E., & Kristina L, G. (2004). Quality Improvement Techniques to Improve Patient Satisfaction. International Journal of Health Care Quality Assurance, Vol. 17, No. 6, pp. 334-338.
Kalinichenko, O., Amado, C A. F., & Santos, S P. (2013). Performance Assessment in Primary Healthcare: A
Systematic Literature Review. Working Paper. Kang, J. O., Kim, M. H., Hong, S. E., Jung, J. H., & Song, M. J.
(2005). The Application of the Six-Sigma Program for the Quality Management of the PACS, Vol. 185, No. 5, pp. 1361-1365, November.
Khaidir, N. A., Habidin, N. F., Jamaludin, N. H., Shazali, N. A., & Ali, A. (2014). Investigation of Six Sigma Practices and Process Innovation for Malaysian Healthcare Industry. International Journal of Innovation and Applied Studies, Vol. 5, No. 2, pp. 131-138, February.
Knowles, G., Whicker, L., Femat, J., & Canales, F. (2005). A conceptual model for the application of Six-Sigma methodologies to supply chain improvement. International Journal of Logistics, Vol. 8, No. 1, pp. 51-65.
Kwak, Y.H., Anbari, F.T. (2006). Benefits, obstacles and future of Six-Sigma approach. Technovation, Vol. 26, pp.708-715.
Laureani, A., & Antony, J. (2012). Critical success factors for the effective implementation of Lean Sigma: Results from an empirical study and agenda for future research. International Journal of Lean Six Sigma, Vol. 3, No. 4, pp. 274 – 283.
Leong, T-W., & The, P-L. (2013). Critical Success Factors of Six Sigma in Original Equipment Manufacturer Company in Malaysia. International Journal of Synergy and Research, Vol. 1, No. 1, pp. 7–21.
Lloréns-Montes, F., & Molina, L. M. (2007). Six-Sigma and management theory: processes, content and effectiveness. Total Quality Management & Business Excellence, Vol. 17, No.4, pp.485-506.
Miranda, F. J., Chamorro, A., Murillo, L.R.., & Vega, J. (2010). An Importance-Performance Analysis of Primary Health Care Services: Managers vs. Patients Perceptions. Journal of Service Science & Management, Vol. 3, pp .227-234, April.
Muhammad, I, S., & Ijaz, A. (2011). Comparison Of Service Quality Between Private and Public Hospitals: Empirical Evidences From Pakistan. Journal of Quality and Technology Management, Vol. 7, No. 1, pp.1-22, June.
Nonthaleerak, P., & Hendry, L. (2008). Exploring the Six-Sigma Phenomenon Using Multiple Case Study Evidence. International Journal of Operations & Production Management, Vol. 28, No. 3, pp. 279-303.
Pulakanam, V., & Voges, K. E. (2010). Adoption of Six Sigma: Review of Empirical Research. International Review of
Business Research Papers, Vol. 6, No. 5, pp.149-163, November.
Rajamanoharan, I. D., & Collier, P. (2006). Six-Sigma Implementation, Organizational Change and The Impact on Performance Measurement Systems. International journal of Six-Sigma and Competitive Advantage, Vol. 2, No. 1.
Reddy, B. K., Arundhathy, M., & Acharyulu, GVRK. (2007). A strategy for successful TQM in a Corporate Hospital-A Study Using Six-Sigma. Journal of the Academy of Hospital Administration, Vol. 14, No. 2.
Revere, L., Black, K., & Huq, A. (2004). Integrating Six-Sigma and CQI for improving patient care. The TQM Magazine, Vol. 16, No.2, pp.105-13.
Rivers, J. R. (2010). Strategic issues forecast 2015. American Hospital Association (AHA) Committee on Research.
Rodak, R (2013). 16 Potential Key Performance Indicators for Hospitals. Becker’s Hospital Review, May.
Sahbz,I., Taner, M. T., Kagan, G., Sanisoglu, H., Durmus, E., Tunca, M., Erabas, E., Kagan, S. B., Kagan, M. K.., & Enginyurt, H. (2014). Development of a Six Sigma Infrastructure for Cataract Surgery in Patients with Pseudo- exfoliation Syndrome. Archive of Business Research, Vol.2, No. 2, April.
Salaheldin, S. I., & Abdelwahab, I. S. (2009). Six-Sigma Practices in the banking Sector in Qatar. Global Business and Management Research: An International Journal, Vol. 1, No. 1, pp. 23-35.
Sandholm, L., & Sorqvist, L. (2002). 12 Requirements for Six-Sigma Success. Six-Sigma Forum Magazine, Vol. 2, No. 1, pp. 17-22.
Schroeder, R. G., Linderman, K., Liedtke, C., & Choo, A. (2008). Six-Sigma: Definition and Underlying Theory. Journal of Operations Management, Vol. 26, No. 4, pp. 36-54.
Selim, A., Noor H.A. M., Rafikul.I. (2014). Effects of Lean Six Sigma Application in Healthcare Services: A Literature Review. Reviews on Environmental Health, Vol. 28, No. 4, pp.189–194, January.
Sfeir, R. (2007). Strategy for National Health Care Reform in Lebanon. Lebanon National Health Accounts, Ministry of Public Health,
Suhaiza, Z., & Sivabalan, S. (2011). Investigation on the Six-Sigma Critical Success Factors. European Journal of Scientific Research, Vol.57, No.1, pp.124-132.
Szeto, A., & Tsang, A. (2005). Antecedents to successful implementation of Six-Sigma. International Journal of Six-Sigma and Competitive Advantage, Vol. 1, No. 3, pp.307-322.
Tariq, M. U., & Ahmed-khan, M. N. (2011). An Insight into Risk Identification, Quality and Productivity Enhancement using Six-Sigma. Journal of Education and Vocational Research , Vol. 2, No. 1, pp. 24-33, July.
Taner, M. T. (2013). Critical Success Factors for Six Sigma Implementation in Large-scale Turkish Construction Companies. International Review of Management and Marketing, Vol. 3, No. 4, pp. 212-225.
Vulnerability and Adaptation Assessment (Final Report), The Lebanese Ministry of Public Health.
Wang, F., Du, T., & Li, E. (2004). Applying Six-Sigma to supplier development. Total Quality Management and Business Excellence, Vol. 15, No. 9, pp. 1217-1229.
Wang, L., & Hussain, I. (2011). Banking Sector Growth in China: Can Six-Sigma Be a Solution? International Journal of Business and Management, Vol. 6, No. 2, February.
Weinstein, L., Castellano, J., Petrick, J., & Vokurka, R. (2011). The Evolution of Six-Sigma, Lean Sigma and Fit Sigma TM. Journal of Education for Business, pp. 19:54, January 7.
Wisconsin Hospital Association. (2009). The Quality Landscape in Wisconsin Hospitals. Quality Report.
Woodward, S. (2006). Learning and sharing safety lessons to improve patient care. Nursing Standard, Vol. 20, No. 18, pp. 49-53, January.
Woodard, T. D. (2005). Addressing Variation in Hospital Quality: Is Six-Sigma The Answer? Journal of Healthcare Management,
Vol. 50, No. 4, July/August.

114 ARAB ECONOMICS AND BUSINESS JOURNAL 9 (2014) 93–114
Yusr, M. M., Othman, A. R., Mokhtar, M.., & Sanuri, S. (2011). Six-Sigma and Innovation Performance: A Conceptual Framework Based on The Absorptive Capacity Theory perspective. International Conference on Management, Vol. 1,
No. 3, pp. 307-323, September. Zhang, W., Hill, A. V., & Gilbreath, G. H. (2009). Six-Sigma A
Retrospective and Prospective Study. 20th Annual Conference. Florida U.S.A. May 1-4.
Copyright © 2022 FDOKUMEN