Measure Phase Lean Six Sigma Tollgate Templates
49
Lean Six Sigma Group Lean Six Sigma Measure Phase Tollgate Review
Transcript of Measure Phase Lean Six Sigma Tollgate Templates

Lean Six Sigma Group
Lean Six Sigma Measure Phase Tollgate Review
Lean Six Sigma DMAIC Tools
and Activities Review Project Charter Validate High-Level Value Stream Map and Scope
Validate Voice of the Customer & Voice of the Business
Validate Problem Statement and Goals
Validate Financial Benefits
Create Communication Plan
Select and Launch Team Develop Project Schedule
Complete Define Tollgate
Identify Root Causes Reduce List of Potential Root Causes
Confirm Root Cause to Output Relationship
Estimate Impact of Root Causes on Key Outputs
Prioritize Root Causes
Value-Add Analysis Takt Rate Analysis Quick Wins Statistical Analysis Complete Analyze Tollgate
Develop Potential Solutions
Evaluate, Select, and Optimize Best Solutions
Develop ‘To-Be’ Value Stream Map(s)
Develop and Implement Pilot Solution
Implement 5s Program Develop Full Scale Implementation Plan
Cost/Benefit Analysis Benchmarking Complete Improve Tollgate
Develop SOP’s, Training Plan & Process Controls
Implement Solution and Ongoing Process Measurements
Confirm Attainment of Project Goals
Identify Project Replication Opportunities
Training Complete Control Tollgate
Transition Project to Process Owner
Project Charter Voice of the Customer and Kano Analysis
SIPOC Map Project Valuation/ROIC Analysis Tools
RACI and Quad Charts Stakeholder Analysis Communication Plan Effective Meeting Tools
Inquiry and Advocacy Skills
Time Lines, Milestones, and Gantt Charting
Pareto Analysis
Value Stream Mapping Process Cycle Efficiency/Little’s Law
Operational Definitions
Data Collection Plan Statistical Sampling Measurement System Analysis (MSA)
Gage R&R Kappa Studies Control Charts Spaghetti Diagrams Histograms Normality Test Process Capability Analysis
Process Constraint ID and Takt Time Analysis
Cause & Effect Analysis
FMEA Hypothesis Tests/Conf. Intervals
Simple & Multiple Regression
ANOVA Components of Variation
Conquering Product and Process Complexity
Queuing Theory
Replenishment Pull/Kanban
Stocking Strategy Process Flow Improvement
Process Balancing Analytical Batch Sizing
Total Productive Maintenance
Design of Experiments (DOE)
Solution Selection Matrix
Piloting and Simulation
Work Control System Setup reduction Pugh Matrix Pull System
Mistake-Proofing/Zero Defects
Standard Operating Procedures (SOP’s)
Process Control Plans Visual Process Control Tools
MGPP Statistical Process Controls (SPC)
Solution Replication Visual Workplace Metrics Project Transition Model
Team Feedback Session
Value Stream Map Flow Identify Key Input, Process and Output Metrics
Develop Operational Definitions
Develop Data Collection Plan
Validate Measurement System
Collect Baseline Data Determine Process Capability
Complete Measure TollgateDefine Measure Analyz
e Improve Control
2International Standards for Lean Six Sigma (ISLSS)
Kaizen Events Targeted in Measure to Accelerate ResultsTen Commandments of Lean Six Sigma Video by Gemba
Academy
Project Charter Updates
Problem: Describe problem in non-technical terms
Statement should explain why project is important; why working on it is a priority
Goal: Goals communicate “before” and “after” conditions
Shift mean, variance, or both? Should impact cost, time, quality
dimensions Express goals using SMART criteria
Specific, Measurable, Attainable, Resource Requirements, Time Boundaries
Explain leverage and strategic implications (if any)
Problem/Goal Statement
Tollgate Review Schedule
Financial Impact
Team
Scope: (In-Scope/Out-of-Scope) (Process Start/Stop)
State financial impact of project Expenses Investments (inventory, capital, A/R) Revenues
Separate “hard” from “soft” dollars State financial impact of leverage
opportunities (future projects)
PES Name Project Executive Sponsor (if different from PS)
PS Name Project Sponsor/Process Owner DC Name Deployment Champion GB/BB Name Green Belt/Black Belt MBB Name Master Black BeltCore Team Role % Contrib. LSS Training Team Member 1 SME XX YB Team Member 2 TM XX GB Team Member 3 SME XX PSExtended Team Team Member 1 BFM XX Not Trained Team Member 2 IT XX Not Trained
Review high-level schedule milestones here: Phase Completions Tollgate Reviews
Tollgate Scheduled Revised CompleteDefine: XX/XX/XX - XX/XX/XXMeasure: XX/XX/XX XX/XX/XX XX/XX/XXAnalyze: XX/XX/XX XX/XX/XX XX/XX/XXImprove: XX/XX/XX XX/XX/XX
XX/XX/XXControl: XX/XX/XX XX/XX/XX XX/XX/XX
Enter Key Slide Take Away (Key Point) Here
3International Standards for Lean Six Sigma (ISLSS)
How to Write a Project Charter Training Video by projectmanagervideos

Measure Overview
CTQ: ? Unit (d) or Mean (c): ? Defect (d) or St. Dev. (c): ? PCE%: ? DPMO (d): ? Sigma (Short Term): ? Sigma (Long Term):? MSA Results: show the percentage result of
the GR&R, AR&R or other MSA carried out in the project
Root cause: Quick Win #1
Root cause: Quick Win #2
Root cause: Quick Win #3
O bservation
Indiv
idual
Value
2442171901631361098255281
40
35
30
25
20
_X= 29.13
UCL= 37.70
LCL=20.56
O bservation
Movin
g Ran
ge
2442171901631361098255281
10.0
7.5
5.0
2.5
0.0
__M R=3.22
UCL= 10.53
LCL=0
I-M R Chart of Delivery Tim e
Detailed process mapping
MSAValue Stream MappingData Collection Planning
Basic StatisticsProcess CapabilityHistograms
Time Series PlotProbability PlotPareto AnalysisOperational Def.5sPullControl Charts
Enter Key Slide Take Away (Key Point) Here
4
Process Capability Graphical Analysis
Tools UsedRoot Cause / Quick Win
International Standards for Lean Six Sigma (ISLSS)
Process Capability Training Video by SigmaXL
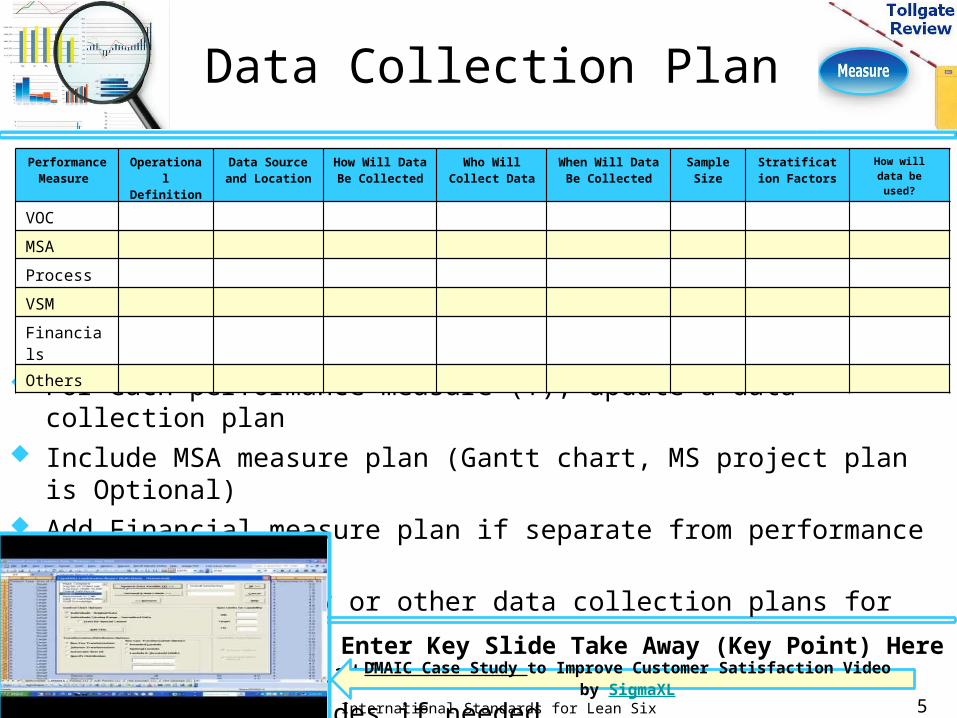
Data Collection Plan
For each performance measure (Y), update a data collection plan
Include MSA measure plan (Gantt chart, MS project plan is Optional)
Add Financial measure plan if separate from performance Y
Add any Time Study or other data collection plans for Value Stream Map
Sample Size Calculation Use additional slides if needed
Performance Measure
Operational
Definition
Data Source and Location
How Will Data Be Collected
Who Will Collect Data
When Will Data Be Collected
Sample Size
Stratification Factors
How will data be used?
VOCMSAProcessVSMFinancialsOthers
Enter Key Slide Take Away (Key Point) Here
5International Standards for Lean Six Sigma (ISLSS)
DMAIC Case Study to Improve Customer Satisfaction Video by SigmaXL

Operational Definitions
Y – Continuous data Process start/stop and cycle time boundaries, such as the unit of measure (ex minutes), the unit (the thing you are measuring), will you include weekends, holidays, non-business hours?
Y – Discrete data Define Success/Defect or other attribute values you will measure
X – The subgroups values or X-factor groupings you will use on your project data collection
Other unique terms that apply to your project that require clear operational definitions
Use additional slides as needed to complete your operational definitions Enter Key Slide Take Away (Key Point) Here
6International Standards for Lean Six Sigma (ISLSS)
Add Visual Example
Add Visual Example
The Gemba Glossary Training Video by Gemba Academy
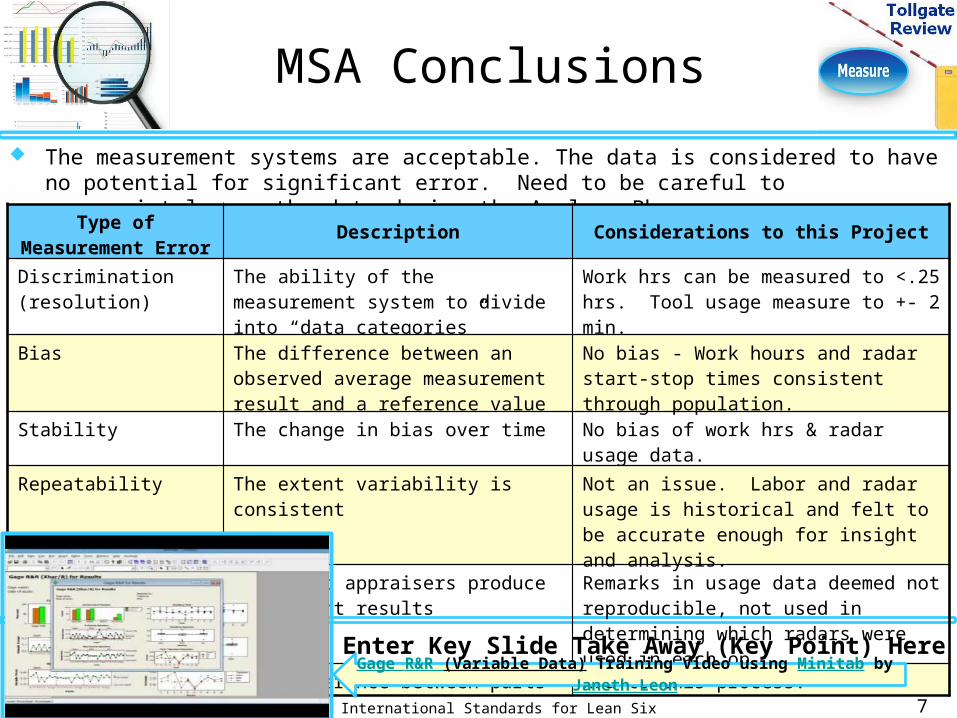
MSA Conclusions The measurement systems are acceptable. The data is considered to have
no potential for significant error. Need to be careful to appropriately use the data during the Analyze Phase. Type of
Measurement ErrorDescription Considerations to this Project
Discrimination (resolution)
The ability of the measurement system to divide into “data categories”
Work hrs can be measured to <.25 hrs. Tool usage measure to +- 2 min.
Bias The difference between an observed average measurement result and a reference value
No bias - Work hours and radar start-stop times consistent through population.
Stability The change in bias over time No bias of work hrs & radar usage data.
Repeatability The extent variability is consistent
Not an issue. Labor and radar usage is historical and felt to be accurate enough for insight and analysis.
Reproducibility Different appraisers produce consistent results
Remarks in usage data deemed not reproducible, not used in determining which radars were used in each op
Variation The difference between parts n/a to this process.Enter Key Slide Take Away (Key Point) Here
7International Standards for Lean Six Sigma (ISLSS)
Gage R&R (Variable Data) Training Video using Minitab by Janeth Leon
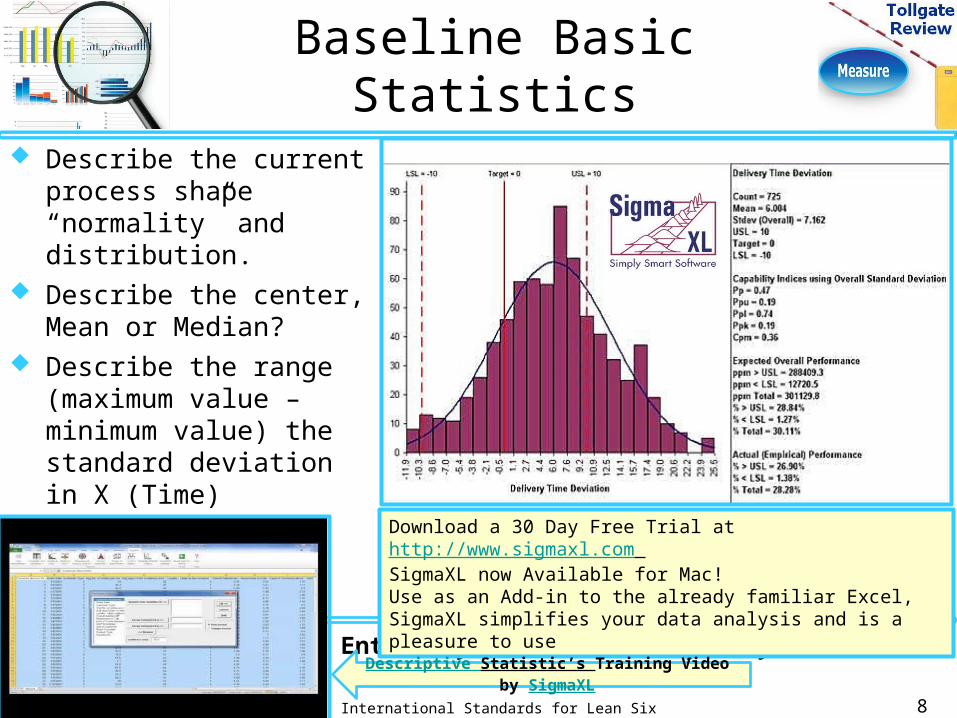
Baseline Basic Statistics
Describe the current process shape “normality” and distribution.
Describe the center, Mean or Median?
Describe the range (maximum value – minimum value) the standard deviation in X (Time)
Enter Key Slide Take Away (Key Point) Here
8International Standards for Lean Six Sigma (ISLSS)
Download a 30 Day Free Trial at http://www.sigmaxl.com SigmaXL now Available for Mac! Use as an Add-in to the already familiar Excel, SigmaXL simplifies your data analysis and is a pleasure to use
Descriptive Statistic’s Training Video by SigmaXL

Baseline Process Capability
# data points collected between XX/XX/XX thru XX/XX/XX
Mean X days, St. Dev. X.XX days, Describe the impact the current state process capability.
With an overall PPM of X defects per million opportunity, the current process has a Sigma Quality Level of X.X or a X% yield
Enter Key Slide Take Away (Key Point) Here
9International Standards for Lean Six Sigma (ISLSS)
Download a 30 Day Free Trial at http://www.sigmaxl.com SigmaXL now Available for Mac! As an Add-in to the already familiar Excel, SigmaXL simplifies your data analysis and is a pleasure to use
Process Capability and Statistical Process Control Training Video by SigmaXL

Sigma Calculator: Continuous Data
Enter Key Slide Take Away (Key Point) Here
10International Standards for Lean Six Sigma (ISLSS)
Process Capability (Continuous) Training Video by SigmaXL
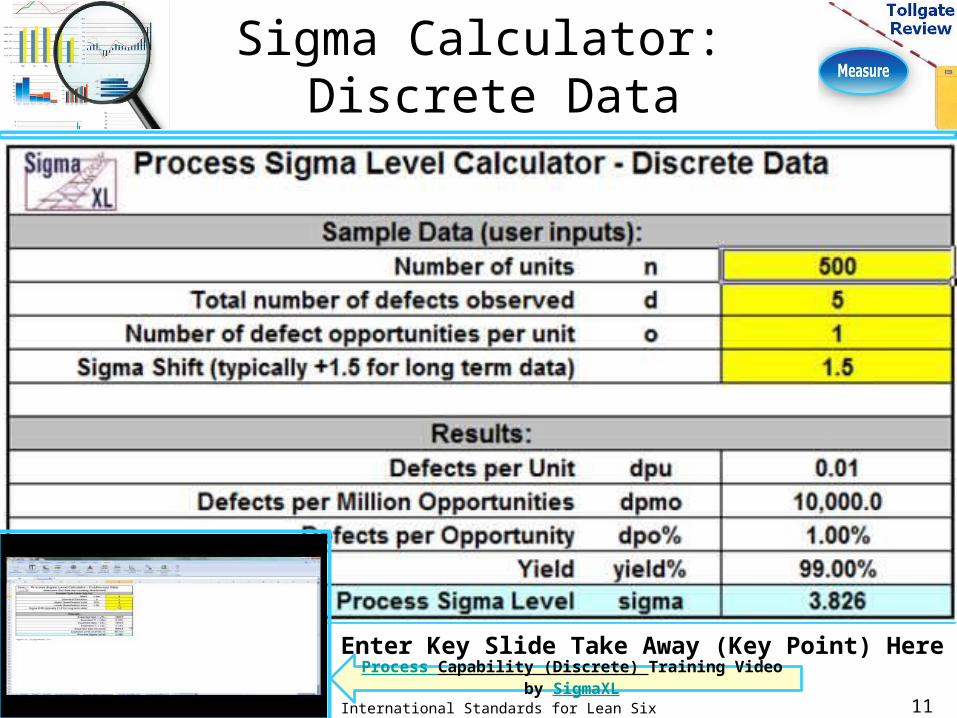
Sigma Calculator: Discrete Data
Enter Key Slide Take Away (Key Point) Here
11International Standards for Lean Six Sigma (ISLSS)
Process Capability (Discrete) Training Video by SigmaXL

Quick Win Documentation
Template
1. Root Cause: _______________________________
2. Obvious Solution: ___________________________
3. Low or No Cost: ____________________________
4. Low Risk: _________________________________
5. Implementation Plan: ________________________
6. Stakeholder(s) Approval: _____________________
Process Name: ______________________ Process Lead: ___________________Process Owner: ______________________ Start Date: ______________________Process Area: ________________________ Stop Date: ______________________
Benefit(s): ______________________________________
___ ______________________________________
___ ______________________________________
___Enter Key Slide Take Away (Key Point) Here
12International Standards for Lean Six Sigma (ISLSS)
Add Visual ExampleBefore
Add Visual ExampleAfter
Examples Where Used 5s 4-Step Setup
Reduction Inventory
Reduction MSA Improvements Price reductions Reduced DOWNTIME
(NVA steps or work)
Pull System Kaizen events
Gemba Academy Training Video on the 7 Forms of Waste
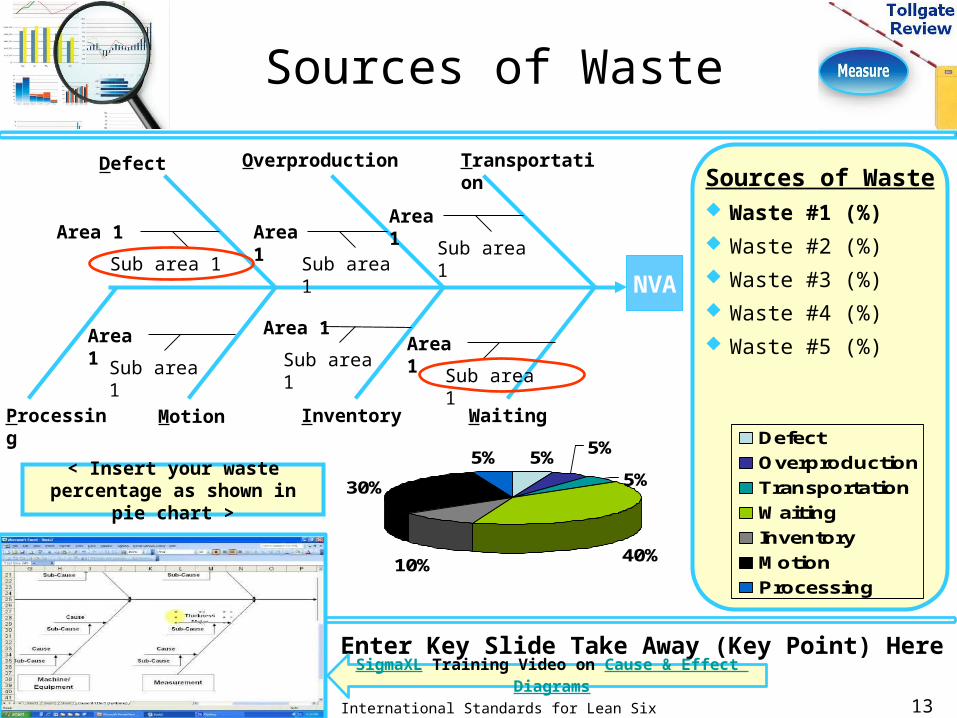
Sources of Waste Waste #1 (%) Waste #2 (%) Waste #3 (%) Waste #4 (%) Waste #5 (%)
Sources of Waste
NVA
Defect Overproduction Transportation
WaitingInventoryMotion
Area 1Sub area 1
Area 1 Sub area
1
Area 1Sub area 1
Processing
Area 1 Sub area
1
Area 1 Sub area 1
Area 1 Sub area
1
< Insert your waste percentage as shown in
pie chart >
Enter Key Slide Take Away (Key Point) Here
13International Standards for Lean Six Sigma (ISLSS)
SigmaXL Training Video on Cause & Effect Diagrams
5% 5%5%
40%10%
30%5%
DefectOverproductionTransportationW aitingInventoryM otionProcessing
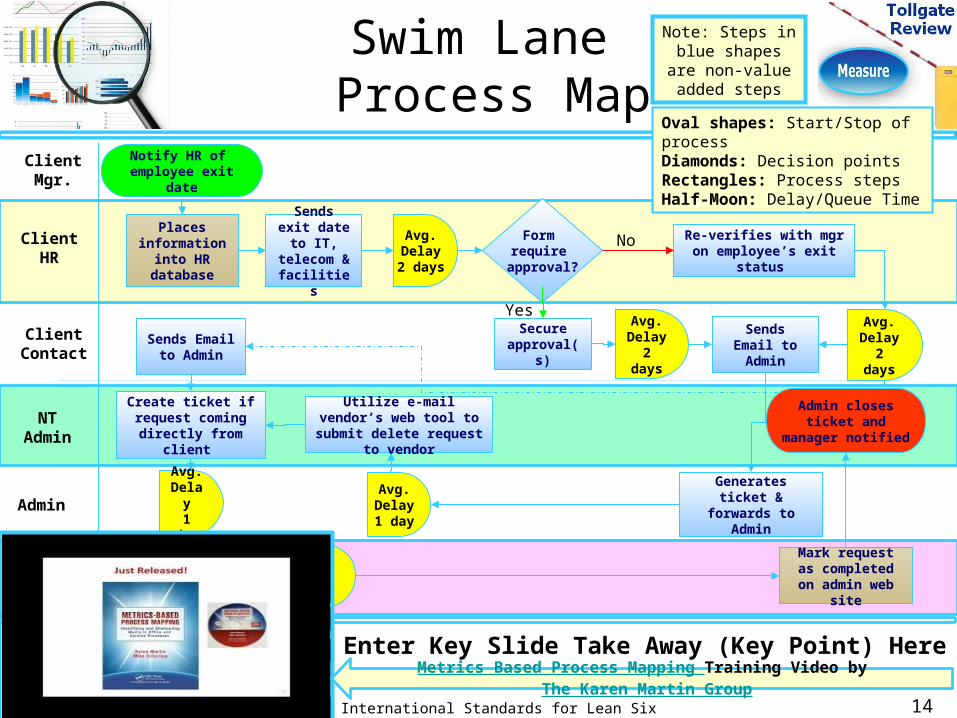
Swim Lane Process Map
Client Contact
Client HR
Admin
Client Mgr.
Places information into HR database
Sends Email to Admin
Sends exit date to IT,
telecom & facilitie
s
Re-verifies with mgr on employee’s exit
status
NT Admin
Email Vendor
Utilize e-mail vendor’s web tool to submit delete request
to vendor
Sends Email to Admin
Generates ticket &
forwards to Admin
Delete account
Mark request as completed on admin web
site
Create ticket if request coming directly from
client
Avg.Delay2 days
Avg. Delay2
days
Avg.Delay1 day Avg.
Delay4
days
Form require approval?
No
Secure approval(
s)
Yes
Note: Steps in blue shapes
are non-value added steps
Avg. Delay
2 days
Oval shapes: Start/Stop of processDiamonds: Decision pointsRectangles: Process stepsHalf-Moon: Delay/Queue Time
Enter Key Slide Take Away (Key Point) Here
14International Standards for Lean Six Sigma (ISLSS)
Admin closes ticket and
manager notified
Avg.Delay1 day
Notify HR of employee exit
date
Metrics Based Process Mapping Training Video by The Karen Martin Group
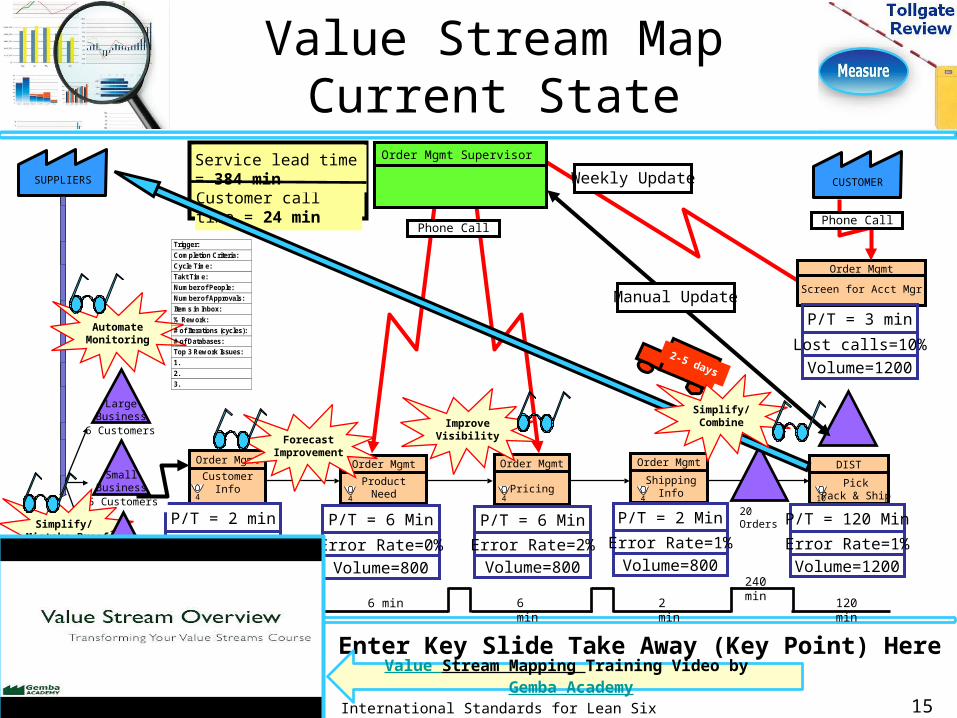
Value Stream MapCurrent State
DISTOrder MgmtOrder MgmtOrder Mgmt Order Mgmt
P/T = 2 minError Rate=2%Volume=800
P/T = 6 MinError Rate=0%Volume=800
P/T = 6 MinError Rate=2%Volume=800
P/T = 2 MinError Rate=1%Volume=800
20 Orders
3 min
LargeBusiness
6 Customers
5 Customers
3 Customers
SmallBusiness
CustomerInfo
4ProductNeed4
Pricing4
ShippingInfo4
PickPack & Ship
P/T = 120 MinError Rate=1%Volume=1200
10
2 min 6 min 6 min
2 min
120 min
240 min
5 min
Customer call time = 24 min
Service lead time = 384 minSUPPLIERS
2-5 days
Manual Update
Weekly Update
Phone Call
CUSTOMER
Screen for Acct MgrOrder Mgmt
Phone Call
P/T = 3 minLost calls=10%Volume=1200
Simplify/ Mistake Proof
AutomateMonitoring
ForecastImprovement
ImproveVisibility
Simplify/Combine
Enter Key Slide Take Away (Key Point) Here
15International Standards for Lean Six Sigma (ISLSS)
Value Stream Mapping Training Video by Gemba Academy
Home
Order Mgmt Supervisor
Trigger: Com pletion Criteria: Cycle Tim e: Takt Tim e: Num ber of People: Num ber of Approvals: Item s in Inbox: % Rew ork: # of Iterations (cycles): # of Databases: Top 3 Rew ork Issues: 1. 2. 3.
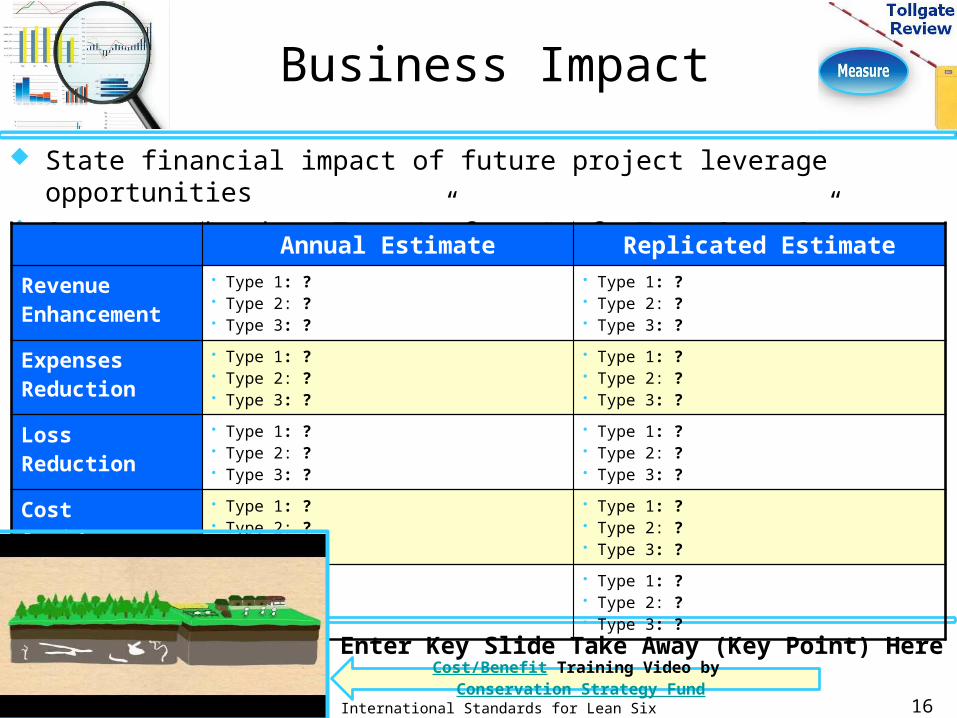
Business Impact State financial impact of future project leverage
opportunities Separate “hard or Type 1” from “soft Type 2 or 3”
dollars Annual Estimate Replicated EstimateRevenue Enhancement
• Type 1: ?• Type 2: ?• Type 3: ?
• Type 1: ?• Type 2: ?• Type 3: ?
Expenses Reduction
• Type 1: ?• Type 2: ?• Type 3: ?
• Type 1: ?• Type 2: ?• Type 3: ?
Loss Reduction
• Type 1: ?• Type 2: ?• Type 3: ?
• Type 1: ?• Type 2: ?• Type 3: ?
Cost Avoidance
• Type 1: ?• Type 2: ?• Type 3: ?
• Type 1: ?• Type 2: ?• Type 3: ?
Total Savings • Type 1: ?• Type 2: ?• Type 3: ?
• Type 1: ?• Type 2: ?• Type 3: ?
16
Enter Key Slide Take Away (Key Point) Here
International Standards for Lean Six Sigma (ISLSS)
Cost/Benefit Training Video by Conservation Strategy Fund
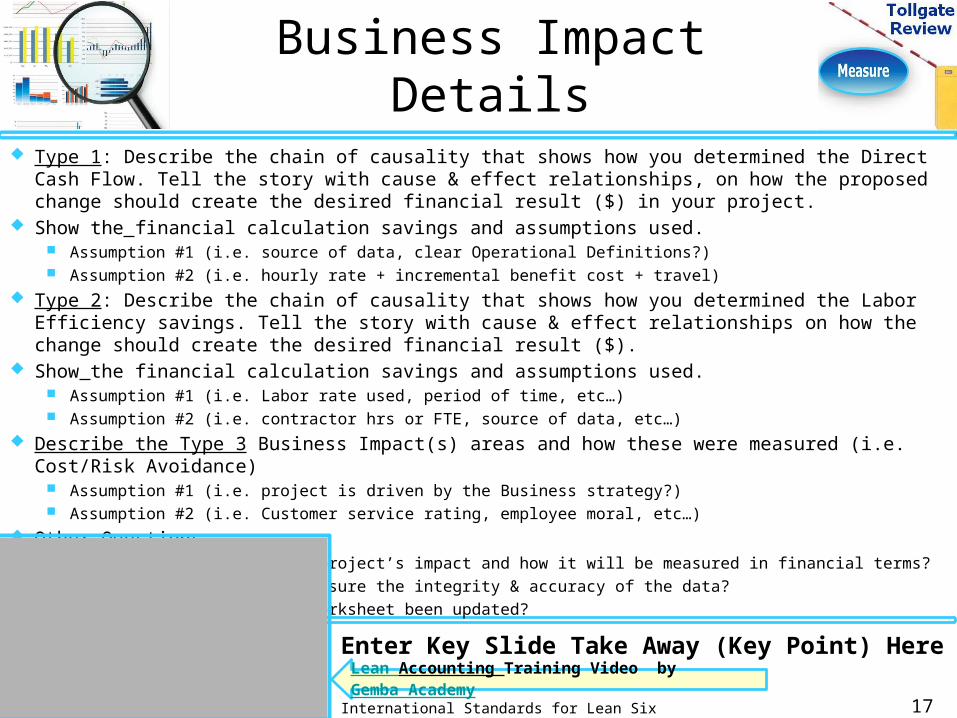
Business Impact Details
Type 1: Describe the chain of causality that shows how you determined the Direct Cash Flow. Tell the story with cause & effect relationships, on how the proposed change should create the desired financial result ($) in your project.
Show the financial calculation savings and assumptions used. Assumption #1 (i.e. source of data, clear Operational Definitions?) Assumption #2 (i.e. hourly rate + incremental benefit cost + travel)
Type 2: Describe the chain of causality that shows how you determined the Labor Efficiency savings. Tell the story with cause & effect relationships on how the change should create the desired financial result ($).
Show the financial calculation savings and assumptions used. Assumption #1 (i.e. Labor rate used, period of time, etc…) Assumption #2 (i.e. contractor hrs or FTE, source of data, etc…)
Describe the Type 3 Business Impact(s) areas and how these were measured (i.e. Cost/Risk Avoidance)
Assumption #1 (i.e. project is driven by the Business strategy?) Assumption #2 (i.e. Customer service rating, employee moral, etc…)
Other Questions Stakeholders agree on the project’s impact and how it will be measured in financial terms? What steps were taken to ensure the integrity & accuracy of the data? Has the project tracking worksheet been updated?
17
Enter Key Slide Take Away (Key Point) Here
International Standards for Lean Six Sigma (ISLSS)
Lean Accounting Training Video by Gemba Academy
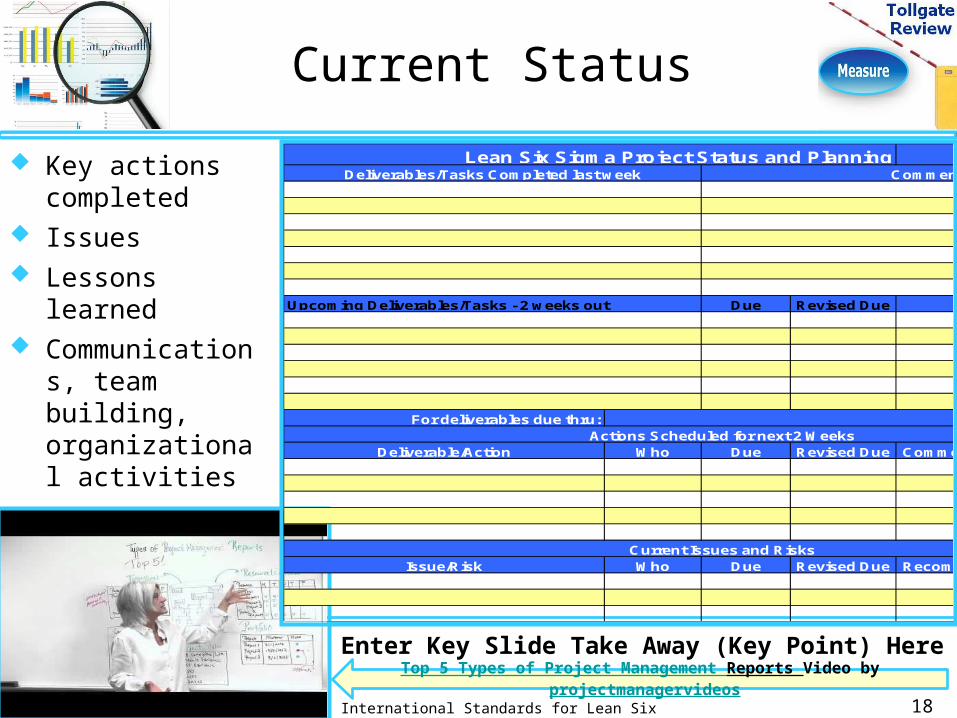
Current Status Key actions
completed Issues Lessons
learned Communication
s, team building, organizational activities
18
Enter Key Slide Take Away (Key Point) Here
International Standards for Lean Six Sigma (ISLSS)
Top 5 Types of Project Management Reports Video by projectmanagervideos
W /E:
Due Revised Due
For deliverables due thru:
Deliverable/Action W ho Due Revised Due Com m ents/Resolution Need Help
Issue/Risk W ho Due Revised Due Recom m ended Action Need Help
Deliverables/Tasks Com pleted last w eek Com m ents
Actions Scheduled for next 2 W eeks
Current Issues and Risks
Lean Six Sigm a Project Status and Planning
Upcom ing Deliverables/Tasks - 2 w eeks out Com m ents

Next Steps Key actions? Planned Lean Six Sigma
Tools/Activities to be used?
Questions to answer? Barrier/risk mitigation
activities? Kaizen or Quick Win
Opportunities?
19
Enter Key Slide Take Away (Key Point) Here
International Standards for Lean Six Sigma (ISLSS)
8-Step Problem Solving Training Video – Lean Leadership Institute
Last Revised:No. Description/Recom m endation Status
O pen/Closed/Hold Due Date Revised Due Date Resp Com m ents / Resolution
12345678910
Lean Six Sigm a Project Issue Log
Sign Off I concur that the Measure phase was successfully completed on
MM/DD/YYYY I concur the project is ready to proceed to next phase:
Analyze
Enter Name Here Deployment Champion
Enter Name Here Financial Representative
Enter Name Here Green Belt/Black Belt
Enter Name Here Master Black Belt
Enter Name Here Sponsor / Process Owner
20
Enter Key Slide Take Away (Key Point) Here
International Standards for Lean Six Sigma (ISLSS)
The Explosion of Data Video by pexnetwork
Lean Six Sigma GroupLean Six Sigma
Tollgate
Review Backup Slides
International Standards for Lean Six Sigma (ISLSS)
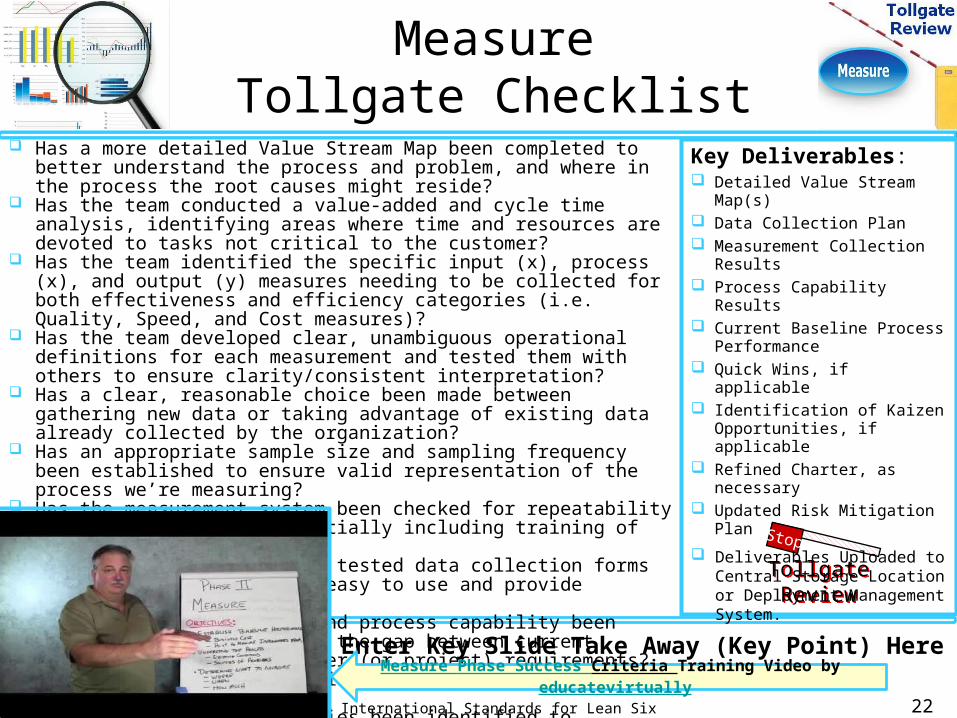
MeasureTollgate Checklist
Has a more detailed Value Stream Map been completed to better understand the process and problem, and where in the process the root causes might reside?
Has the team conducted a value-added and cycle time analysis, identifying areas where time and resources are devoted to tasks not critical to the customer?
Has the team identified the specific input (x), process (x), and output (y) measures needing to be collected for both effectiveness and efficiency categories (i.e. Quality, Speed, and Cost measures)?
Has the team developed clear, unambiguous operational definitions for each measurement and tested them with others to ensure clarity/consistent interpretation?
Has a clear, reasonable choice been made between gathering new data or taking advantage of existing data already collected by the organization?
Has an appropriate sample size and sampling frequency been established to ensure valid representation of the process we’re measuring?
Has the measurement system been checked for repeatability and reproducibility, potentially including training of data collectors?
Has the team developed and tested data collection forms or check sheets which are easy to use and provide consistent, complete data?
Has baseline performance and process capability been established? How large is the gap between current performance and the customer (or project) requirements?
Has the team been able to identify any complete ‘Quick Wins’?
Have any Kaizen opportunities been identified to accelerate momentum and results?
Have key learning(s) to-date required any modification of the Project Charter? If so, have these changes been approved by the Project Sponsor and the Key Stakeholders?
Have any new risks to project success been identified, added to the Risk Mitigation Plan, and a mitigation strategy put in place?
Tollgate Review
Stop
Key Deliverables: Detailed Value Stream
Map(s) Data Collection Plan Measurement Collection
Results Process Capability
Results Current Baseline Process
Performance Quick Wins, if
applicable Identification of Kaizen
Opportunities, if applicable
Refined Charter, as necessary
Updated Risk Mitigation Plan
Deliverables Uploaded to Central Storage Location or Deployment Management System.
22
Enter Key Slide Take Away (Key Point) Here
International Standards for Lean Six Sigma (ISLSS)
Measure Phase Success Criteria Training Video by educatevirtually

23
Lean Six Sigma DMAIC Improvement
Process
Tollgate ReviewStop
Define
Measure
Analyze
Improve
Control
Tollgate ReviewStop
Tollgate ReviewStop
Tollgate ReviewStop
Define the opportunity from both the customer and business perspective
Understand the baseline process performance
Identify the critical X factors and root causes impacting process performance Develop
solutions linked to critical x’s Implement
solutions & control planEnter Key Slide Take Away (Key Point) Here
International Standards for Lean Six Sigma (ISLSS)
8 Step Practical Problem Solving Methodology by Gemba Academy

24
AnalyzeTollgate Checklist
Has the team examined the process and identified potential bottlenecks, disconnects and redundancies that could contribute to the problem statement?
Has the team analyzed data about the process and its performance to help stratify the problem, understand reasons for variation in the process, and generate hypothesis as to the root causes of the current process performance?
Has an evaluation been done to determine whether the problem can be solved without a fundamental recreation of the process? Has the decision been confirmed with the Project Sponsor?
Has the team investigated and validated (or de-validated) the root cause hypotheses generated earlier, to gain confidence that the “vital few” root causes have been uncovered?
Does the team understand why the problem (the Quality, Cycle Time or Cost Efficiency issue identified in the Problem Statement) is being seen?
Has the team been able to identify any additional ‘Quick Wins’?
Have learnings to-date required modification of the Project Charter? If so, have these changes been approved by the Project Sponsor and the Key Stakeholders?
Have any new risks to project success been identified, added to the Risk Mitigation Plan, and a mitigation strategy put in place?
Tollgate Review
Stop
Deliverables: List of Potential Root
causes Prioritized List of
Validated Root Causes Additional “Quick Wins”,
if applicable Refined Charter, as
necessary Updated Risk Mitigation
Plan Deliverables Uploaded to
Central Storage Location or Deployment Management System
Has the team identified the key factors (critical X’s) that have the biggest impact on process performance?
Have they validated the root causes?International Standards for Lean Six
Sigma (ISLSS)
Analyze Phase Success Criteria Training Video by educatevirtually
Bonacorsi Consulting25
Long-TermYeild
ProcessSigm a (ST)
Defects Per1,000,000
Defects Per100,000
Defects Per10,000
Defects Per1,000
Defects Per100
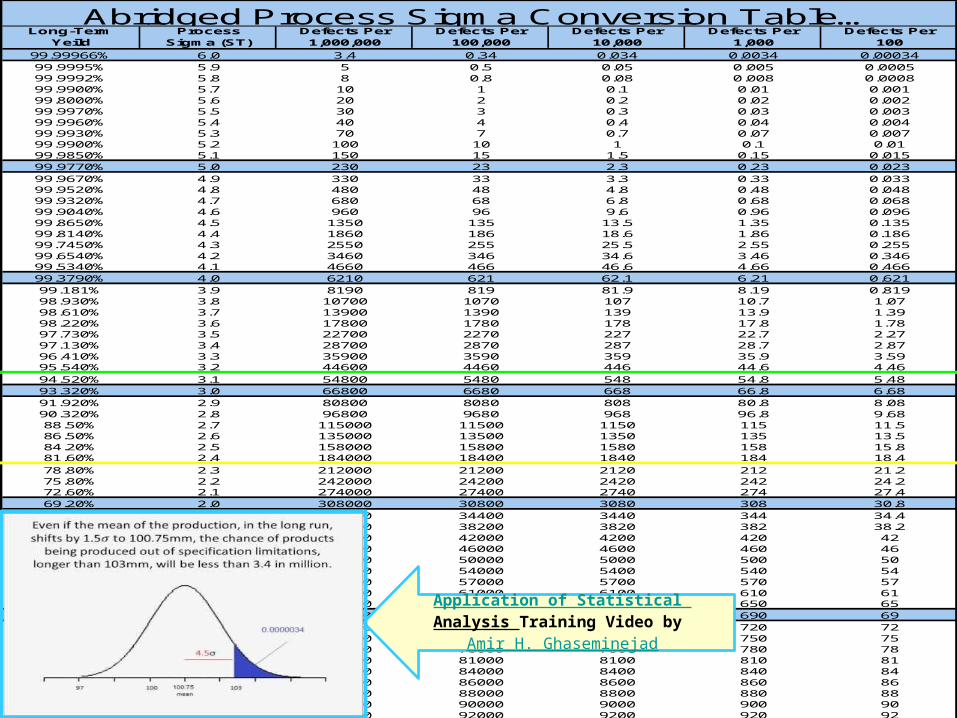
99.99966% 6.0 3.4 0.34 0.034 0.0034 0.0003499.9995% 5.9 5 0.5 0.05 0.005 0.000599.9992% 5.8 8 0.8 0.08 0.008 0.000899.9900% 5.7 10 1 0.1 0.01 0.00199.8000% 5.6 20 2 0.2 0.02 0.00299.9970% 5.5 30 3 0.3 0.03 0.00399.9960% 5.4 40 4 0.4 0.04 0.00499.9930% 5.3 70 7 0.7 0.07 0.00799.9900% 5.2 100 10 1 0.1 0.0199.9850% 5.1 150 15 1.5 0.15 0.01599.9770% 5.0 230 23 2.3 0.23 0.02399.9670% 4.9 330 33 3.3 0.33 0.03399.9520% 4.8 480 48 4.8 0.48 0.04899.9320% 4.7 680 68 6.8 0.68 0.06899.9040% 4.6 960 96 9.6 0.96 0.09699.8650% 4.5 1350 135 13.5 1.35 0.13599.8140% 4.4 1860 186 18.6 1.86 0.18699.7450% 4.3 2550 255 25.5 2.55 0.25599.6540% 4.2 3460 346 34.6 3.46 0.34699.5340% 4.1 4660 466 46.6 4.66 0.46699.3790% 4.0 6210 621 62.1 6.21 0.62199.181% 3.9 8190 819 81.9 8.19 0.81998.930% 3.8 10700 1070 107 10.7 1.0798.610% 3.7 13900 1390 139 13.9 1.3998.220% 3.6 17800 1780 178 17.8 1.7897.730% 3.5 22700 2270 227 22.7 2.2797.130% 3.4 28700 2870 287 28.7 2.8796.410% 3.3 35900 3590 359 35.9 3.5995.540% 3.2 44600 4460 446 44.6 4.4694.520% 3.1 54800 5480 548 54.8 5.4893.320% 3.0 66800 6680 668 66.8 6.6891.920% 2.9 80800 8080 808 80.8 8.0890.320% 2.8 96800 9680 968 96.8 9.6888.50% 2.7 115000 11500 1150 115 11.586.50% 2.6 135000 13500 1350 135 13.584.20% 2.5 158000 15800 1580 158 15.881.60% 2.4 184000 18400 1840 184 18.478.80% 2.3 212000 21200 2120 212 21.275.80% 2.2 242000 24200 2420 242 24.272.60% 2.1 274000 27400 2740 274 27.469.20% 2.0 308000 30800 3080 308 30.865.60% 1.9 344000 34400 3440 344 34.461.80% 1.8 382000 38200 3820 382 38.258.00% 1.7 420000 42000 4200 420 4254.00% 1.6 460000 46000 4600 460 4650% 1.5 500000 50000 5000 500 5046% 1.4 540000 54000 5400 540 5443% 1.3 570000 57000 5700 570 5739% 1.2 610000 61000 6100 610 6135% 1.1 650000 65000 6500 650 6531% 1.0 690000 69000 6900 690 6928% 0.9 720000 72000 7200 720 7225% 0.8 750000 75000 7500 750 7522% 0.7 780000 78000 7800 780 7819% 0.6 810000 81000 8100 810 8116% 0.5 840000 84000 8400 840 8414% 0.4 860000 86000 8600 860 8612% 0.3 880000 88000 8800 880 8810% 0.2 900000 90000 9000 900 908% 0.1 920000 92000 9200 920 92
Abridged Process Sigm a Conversion Table…
Application of Statistical Analysis Training Video by
Amir H. Ghaseminejad

Bonacorsi Consulting26
z 0.00 0.01 0.02 0.03 0.04 0.05 0.06 0.07 0.08 0.090.0 0.0000 0.0040 0.0080 0.0120 0.0160 0.0190 0.0239 0.0279 0.0319 0.03590.1 0.0398 0.0438 0.0478 0.0517 0.0557 0.0596 0.0636 0.0675 0.0714 0.07530.2 0.0793 0.0832 0.0871 0.0910 0.0948 0.0987 0.1026 0.1064 0.1103 0.11410.3 0.1179 0.1217 0.1255 0.1293 0.1331 0.1368 0.1406 0.1443 0.1480 0.15170.4 0.1554 0.1591 0.1628 0.1664 0.1700 0.1736 0.1772 0.1808 0.1844 0.18790.5 0.1915 0.1950 0.1985 0.2019 0.2054 0.2088 0.2123 0.2157 0.2190 0.22240.6 0.2257 0.2291 0.2324 0.2357 0.2389 0.2422 0.2454 0.2486 0.2517 0.25490.7 0.2580 0.2611 0.2642 0.2673 0.2704 0.2734 0.2764 0.2794 0.2823 0.28520.8 0.2881 0.2910 0.2939 0.2969 0.2995 0.3023 0.3051 0.3078 0.3106 0.31330.9 0.3159 0.3186 0.3212 0.3238 0.3264 0.3289 0.3315 0.3340 0.3365 0.33891.0 0.3413 0.3438 0.3461 0.3485 0.3508 0.3513 0.3554 0.3577 0.3529 0.36211.1 0.3643 0.3665 0.3686 0.3708 0.3729 0.3749 0.3770 0.3790 0.3810 0.38301.2 0.3849 0.3869 0.3888 0.3907 0.3925 0.3944 0.3962 0.3980 0.3997 0.40151.3 0.4032 0.4049 0.4066 0.4082 0.4099 0.4115 0.4131 0.4147 0.4162 0.41771.4 0.4192 0.4207 0.4222 0.4236 0.4251 0.4265 0.4279 0.4292 0.4306 0.43191.5 0.4332 0.4345 0.4357 0.4370 0.4382 0.4394 0.4406 0.4418 0.4429 0.44411.6 0.4452 0.4463 0.4474 0.4484 0.4495 0.4505 0.4515 0.4525 0.4535 0.45451.7 0.4554 0.4564 0.4573 0.4582 0.4591 0.4599 0.4608 0.4616 0.4625 0.46331.8 0.4641 0.4649 0.4656 0.4664 0.4671 0.4678 0.4686 0.4693 0.4699 0.47061.9 0.4713 0.4719 0.4726 0.4732 0.4738 0.4744 0.4750 0.4756 0.4761 0.47672.0 0.4772 0.4778 0.4783 0.4788 0.4793 0.4798 0.4803 0.4808 0.4812 0.48172.1 0.4821 0.4826 0.4830 0.4834 0.4838 0.4842 0.4846 0.4850 0.4854 0.48572.2 0.4861 0.4864 0.4868 0.4871 0.4875 0.4878 0.4881 0.4884 0.4887 0.48902.3 0.4893 0.4896 0.4898 0.4901 0.4904 0.4906 0.4909 0.4911 0.4913 0.49162.4 0.4918 0.4920 0.4922 0.4925 0.4927 0.4929 0.4931 0.4932 0.4934 0.49362.5 0.4938 0.4940 0.4941 0.4943 0.4945 0.4946 0.4948 0.4949 0.4951 0.49522.6 0.4953 0.4955 0.4956 0.4957 0.4959 0.4960 0.4961 0.4962 0.4963 0.49642.7 0.4965 0.4966 0.4967 0.4968 0.4969 0.4970 0.4971 0.4972 0.4973 0.49742.8 0.4974 0.4975 0.4976 0.4977 0.4977 0.4978 0.4979 0.4979 0.4980 0.49812.9 0.4981 0.4982 0.4982 0.4983 0.4984 0.4984 0.4985 0.4985 0.4986 0.49863.0 0.4987 0.4987 0.4987 0.4988 0.4988 0.4989 0.4989 0.4989 0.4990 0.49903.1 0.4990 0.4991 0.4991 0.4991 0.4992 0.4992 0.4992 0.4992 0.4993 0.49933.2 0.4993 0.4993 0.4994 0.4994 0.4994 0.4994 0.4994 0.4995 0.4995 0.49953.3 0.4995 0.4995 0.4995 0.4996 0.4996 0.4996 0.4996 0.4996 0.4996 0.49973.4 0.4997 0.4997 0.4997 0.4997 0.4997 0.4997 0.4997 0.4997 0.4997 0.4998
Table of the Standard Norm al (z) Distribution
How to deal with non-normal data Training Video by SigmaXL.com

Attitude Charting & Key Constituency Map
(Optional)“Critical mass must be won-
over”
Enter Key Slide Take Away (Key Point) Here
27International Standards for Lean Six Sigma (ISLSS)
How to Manage Stakeholder Expectations Video by projectmanagervideos
15%
35% 35%
15%
0%5%10%15%20%25%30%35%40%
Innovators Early Adopters Late Adopters Resistors
Attitude Charting
Key Constituents M ap
Finance37%
Operations25%
Custom er13%
HR25%
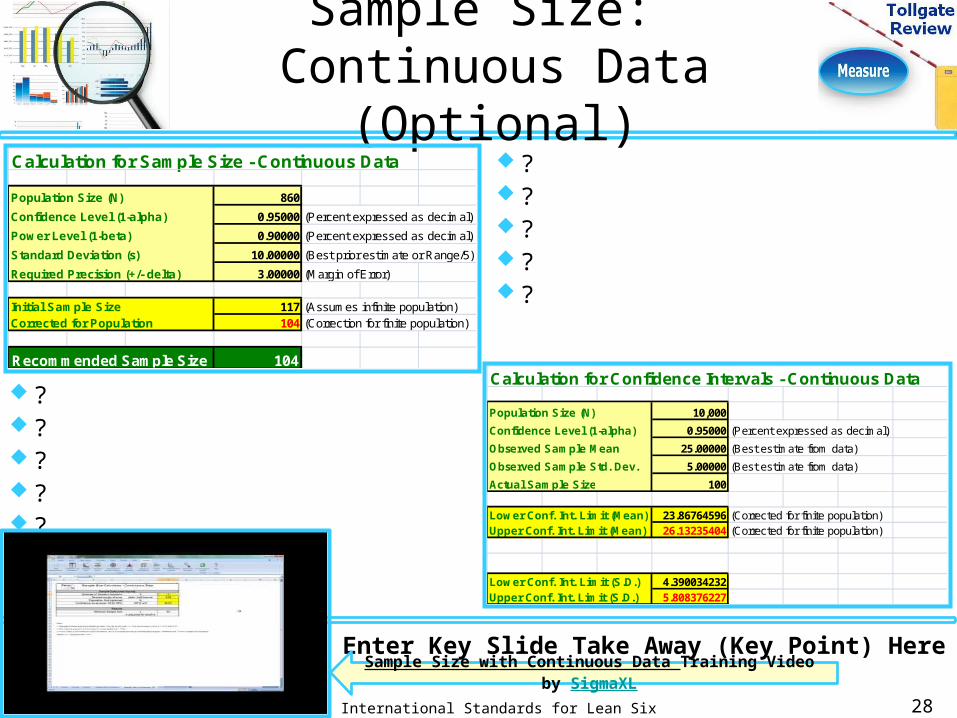
Sample Size: Continuous Data
(Optional) ? ? ? ? ?
? ? ? ? ?
Enter Key Slide Take Away (Key Point) Here
28International Standards for Lean Six Sigma (ISLSS)
Sample Size with Continuous Data Training Video by SigmaXL
Calculation for Confidence Intervals - Continuous DataPopulation Size (N) 10,000Confidence Level (1-alpha) 0.95000 (Percent expressed as decim al)Observed Sam ple M ean 25.00000 (Best estim ate from data)Observed Sam ple Std. Dev. 5.00000 (Best estim ate from data)Actual Sam ple Size 100
Low er Conf. Int. Lim it (M ean) 23.86764596 (Corrected for finite population)Upper Conf. Int. Lim it (M ean) 26.13235404 (Corrected for finite population)
Low er Conf. Int. Lim it (S.D.) 4.390034232Upper Conf. Int. Lim it (S.D.) 5.808376227
Calculation for Sam ple Size - Continuous DataPopulation Size (N) 860Confidence Level (1-alpha) 0.95000 (Percent expressed as decim al)Pow er Level (1-beta) 0.90000 (Percent expressed as decim al)Standard Deviation (s) 10.00000 (Best prior estim ate or Range/5)Required Precision (+/- delta) 3.00000 (M argin of Error)
Initial Sam ple Size 117 (Assum es infinite population)Corrected for Population 104 (Correction for finite population)
Recom m ended Sam ple Size 104
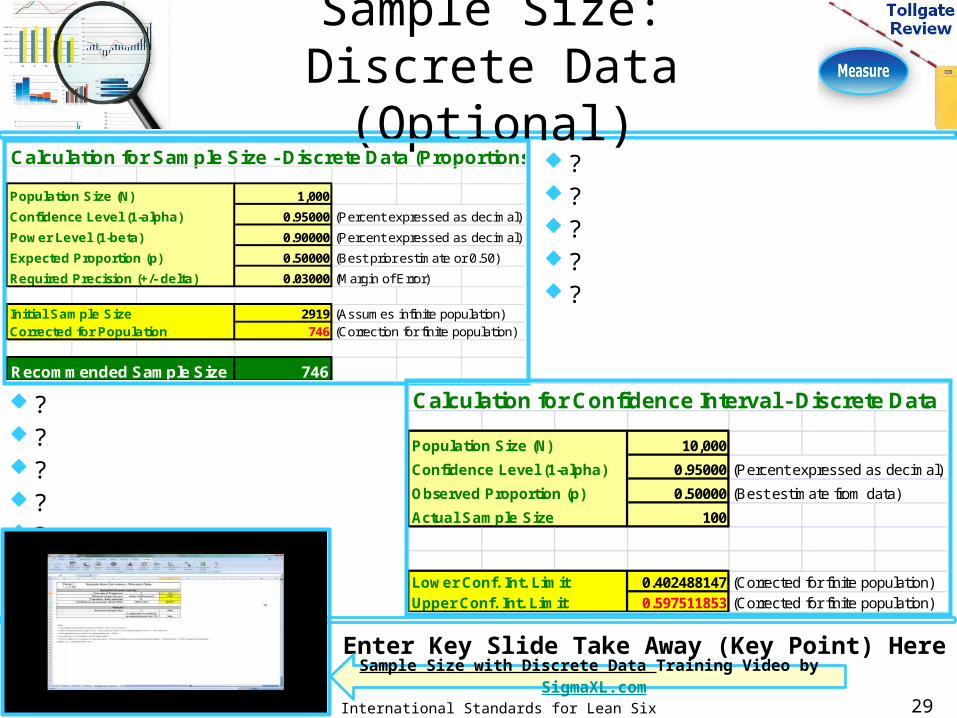
Sample Size:Discrete Data (Optional)
? ? ? ? ?
? ? ? ? ?
Enter Key Slide Take Away (Key Point) Here
29International Standards for Lean Six Sigma (ISLSS)
Sample Size with Discrete Data Training Video by SigmaXL.com
Calculation for Sam ple Size - Discrete Data (Proportions)Population Size (N) 1,000Confidence Level (1-alpha) 0.95000 (Percent expressed as decim al)Pow er Level (1-beta) 0.90000 (Percent expressed as decim al)Expected Proportion (p) 0.50000 (Best prior estim ate or 0.50)Required Precision (+/- delta) 0.03000 (M argin of Error)
Initial Sam ple Size 2919 (Assum es infinite population)Corrected for Population 746 (Correction for finite population)
Recom m ended Sam ple Size 746Calculation for Confidence Interval - Discrete DataPopulation Size (N) 10,000Confidence Level (1-alpha) 0.95000 (Percent expressed as decim al)Observed Proportion (p) 0.50000 (Best estim ate from data)Actual Sam ple Size 100
Low er Conf. Int. Lim it 0.402488147 (Corrected for finite population)Upper Conf. Int. Lim it 0.597511853 (Corrected for finite population)

Measurement Systems Analysis (MSA) (Optional)
Measurement system is acceptable with the Total % Contribution <10%
Percent
Part-to-PartReprodRepeatGage R&R
100
50
0
% Contribution% Study Var
Sample Range
0.10
0.05
0.00
_R=0.0417
UCL=0.1073
LCL=0
1 2 3Sample Mean
10.00
9.75
9.50
__X=9.7996UCL=9.8422
LCL=9.7569
1 2 3
Part10987654321
10.00
9.75
9.50
Operator321
10.00
9.75
9.50
Part
Average
10 9 8 7 6 5 4 3 2 1
10.00
9.75
9.50
O perator123
Gage nam e:Date of study:
Reported by:Tolerance:M isc:
Com ponents of Variation
R Chart by Operator
Xbar Chart by Operator
Response by Part
Response by Operator
Operator * Part Interaction
Gage R& R (ANOVA) for ResponseGage R&R %ContributionSource VarComp (of VarComp)Total Gage R&R 0.0015896 3.70 Repeatability 0.0005567 1.29 Reproducibility 0.0010330 2.40 Operator 0.0003418 0.79 Operator*Part 0.0006912 1.61Part-To-Part 0.0414247 96.30Total Variation 0.0430143 100.00 Study Var %Study VarSource StdDev (SD) (6 * SD) (%SV)Total Gage R&R .039870 0.23922 19.22 Repeatability 0.023594 0.14156 11.38 Reproducibility 0.032140 0.19284 15.50 Operator 0.018488 0.11093 8.91 Operator*Part 0.026290 0.15774 12.68Part-To-Part 0.203531 1.22118 98.13Total Variation 0.207399 1.24439 100.00
Number of Distinct Categories = 7
Enter Key Slide Take Away (Key Point) Here
30International Standards for Lean Six Sigma (ISLSS)
Create & Analyze a Gage R&R (Crossed) Training Video by SigmaXL.com
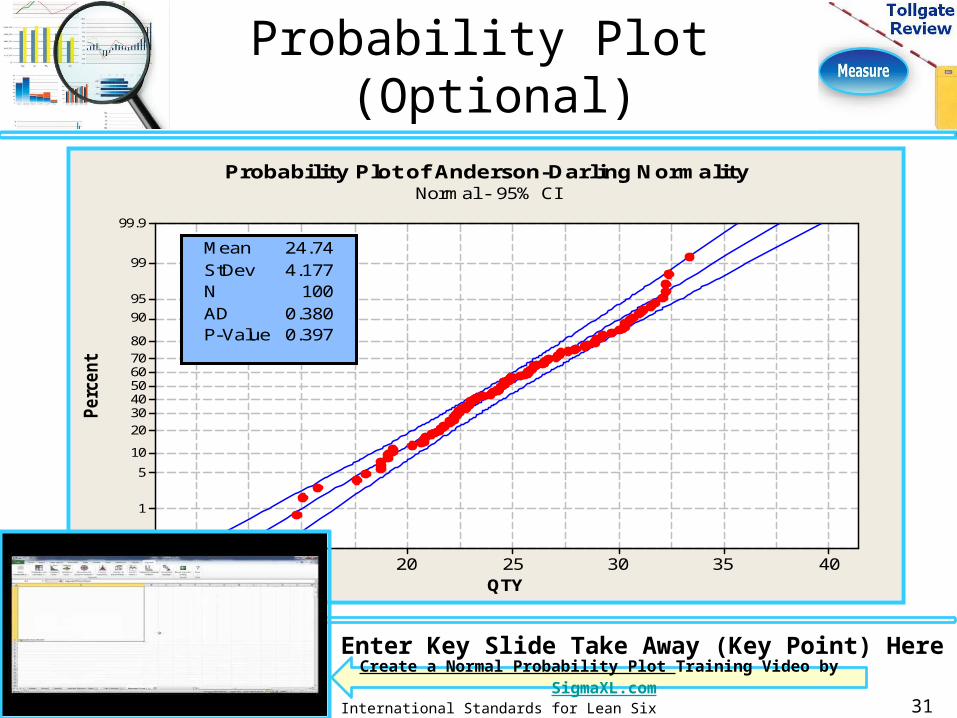
Probability Plot (Optional)
40353025201510
99.9
99
959080706050403020105
1
0.1
QTY
Percen
t
Mean 24.74StDev 4.177N 100AD 0.380P-Value 0.397
Norm al - 95% CIProbability Plot of Anderson-Darling N orm ality
Enter Key Slide Take Away (Key Point) Here
31International Standards for Lean Six Sigma (ISLSS)
Create a Normal Probability Plot Training Video by SigmaXL.com
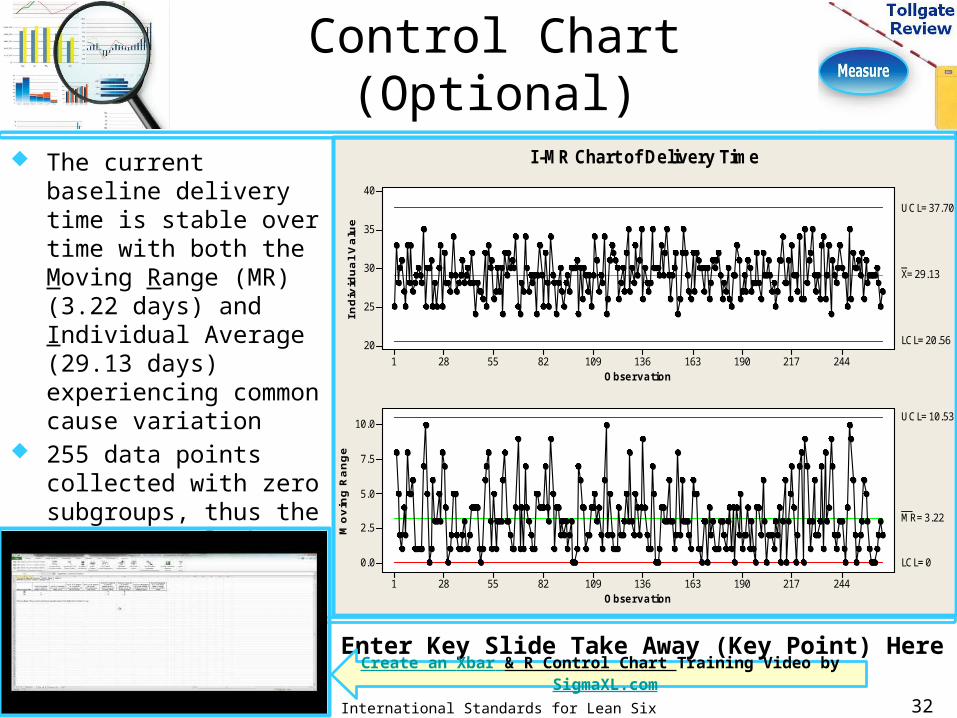
Control Chart(Optional)
The current baseline delivery time is stable over time with both the Moving Range (MR) (3.22 days) and Individual Average (29.13 days) experiencing common cause variation
255 data points collected with zero subgroups, thus the I&MR control chart selected
O bservation
Individu
al Value
2442171901631361098255281
40
35
30
25
20
_X=29.13
UC L= 37.70
LCL= 20.56
O bservation
Mov
ing Ran
ge
2442171901631361098255281
10.0
7.5
5.0
2.5
0.0
__M R= 3.22
UC L= 10.53
LCL= 0
I-M R Chart of Delivery Tim e
Enter Key Slide Take Away (Key Point) Here
32International Standards for Lean Six Sigma (ISLSS)
Create an Xbar & R Control Chart Training Video by SigmaXL.com
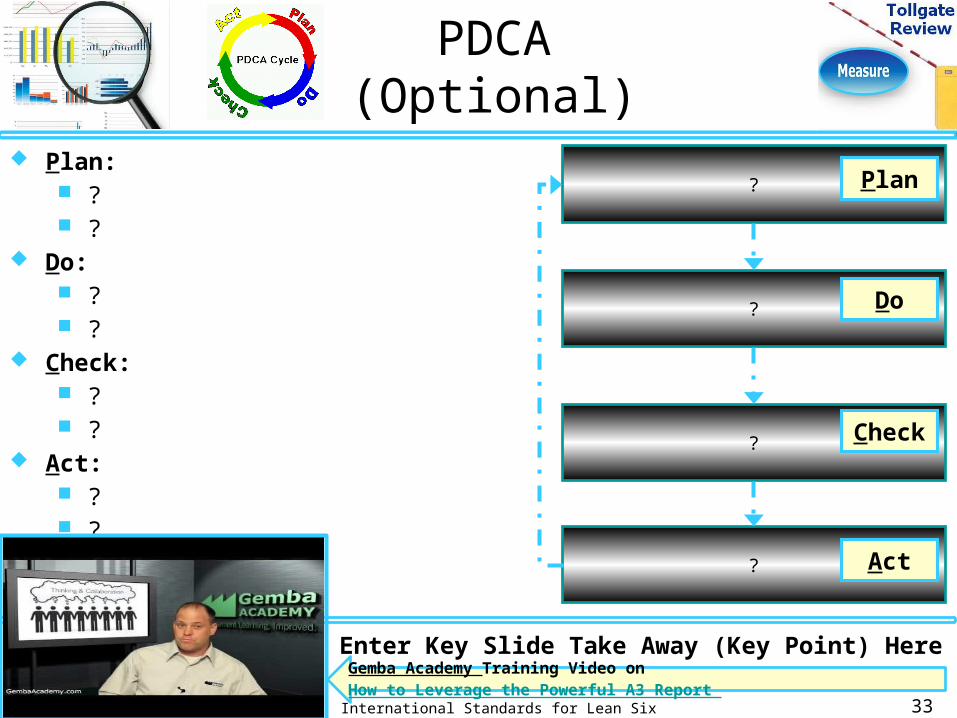
PDCA(Optional)
Plan: ? ?
Do: ? ?
Check: ? ?
Act: ? ?
?
?
?
?
Plan
Do
Check
Act
Enter Key Slide Take Away (Key Point) Here
33International Standards for Lean Six Sigma (ISLSS)
Gemba Academy Training Video on How to Leverage the Powerful A3 Report
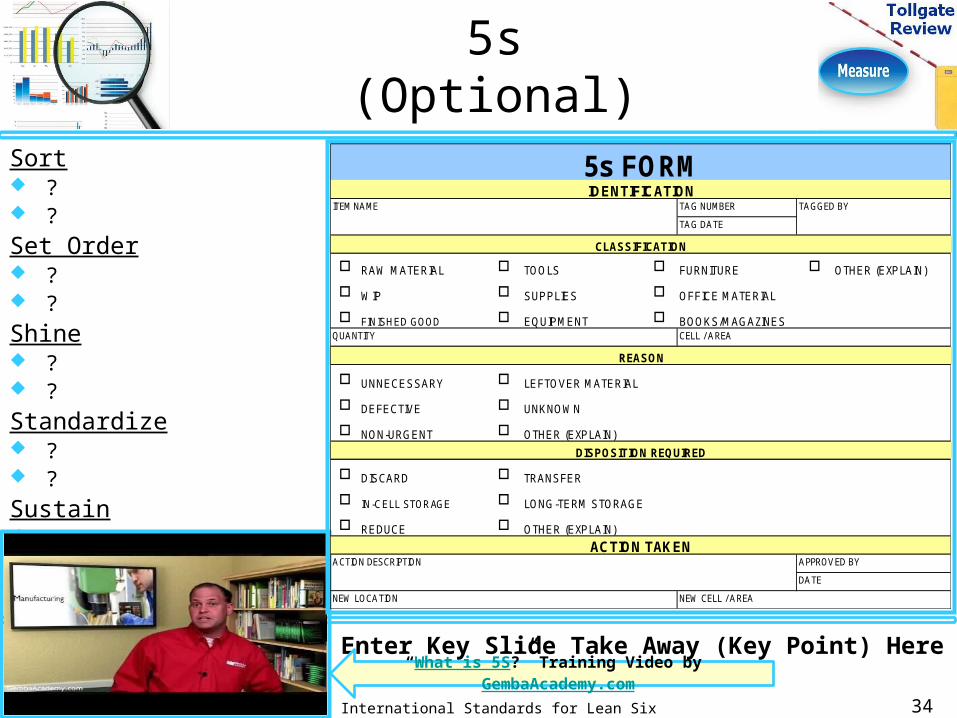
5s(Optional)
Sort ? ?Set Order ? ?Shine ? ?Standardize ? ?Sustain ? ?
Enter Key Slide Take Away (Key Point) Here
34International Standards for Lean Six Sigma (ISLSS)
“What is 5S?” Training Video by GembaAcademy.com
ITEM NAME TAG NUMBER TAGGED BYTAG DATE
o RAW M ATERIAL o TOO LS o FURNITURE o OTHER (EXPLAIN)o W IP o SUPPLIES o OFFICE M ATERIALo FINISHED GOOD o EQUIPM ENT o BOO KS/M AGAZINES
QUANTITY CELL / AREA
o UNNECESSARY o LEFTOVER M ATERIALo DEFECTIVE o UNKNOW No NON-URGENT o OTHER (EXPLAIN)
o DISCARD o TRANSFERo IN-CELL STORAGE o LONG-TERM STORAGEo REDUCE o OTHER (EXPLAIN)
ACTION DESCRIPTION APPROVED BYDATE
NEW LOCATION NEW CELL / AREA
5s FORM
ACTION TAKEN
IDENTIFICATION
CLASSIFICATION
REASON
DISPOSITION REQUIRED
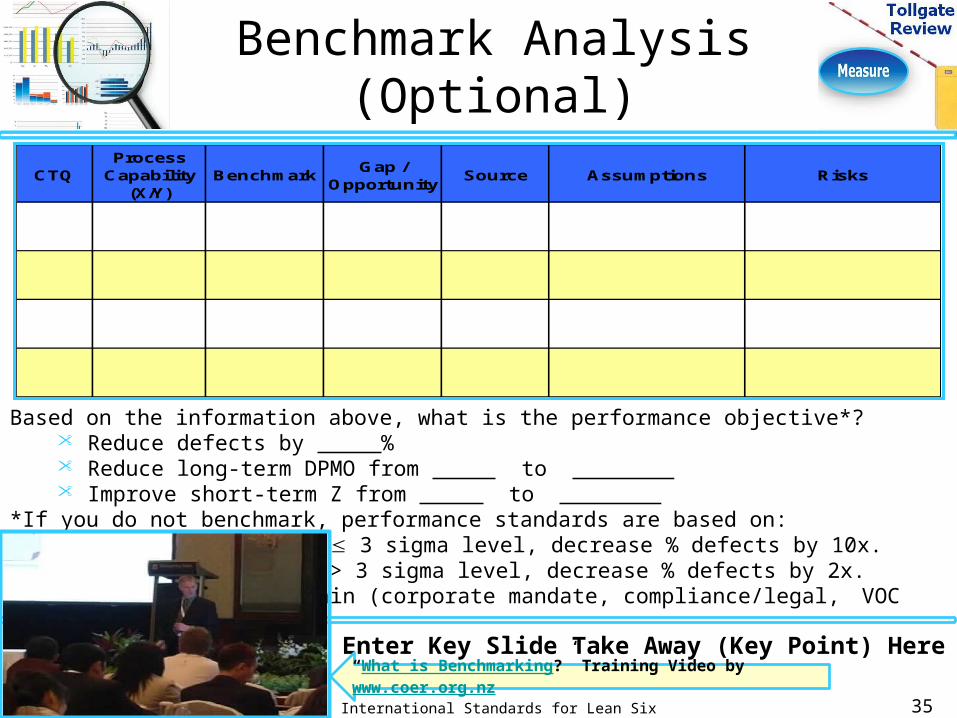
Benchmark Analysis(Optional)
Based on the information above, what is the performance objective*? Reduce defects by % Reduce long-term DPMO from to . Improve short-term Z from to .
*If you do not benchmark, performance standards are based on: For a process with 3 sigma level, decrease % defects by 10x. For a process with > 3 sigma level, decrease % defects by 2x. Other….please explain (corporate mandate, compliance/legal, VOC
data, etc)Enter Key Slide Take Away (Key Point) Here
35International Standards for Lean Six Sigma (ISLSS)
“What is Benchmarking?” Training Video by www.coer.org.nz
CTQProcess Capability
(X/Y)Benchm ark Gap /
Opportunity Source Assum ptions Risks

Key Buying Factor Analysis
(Optional)
4.0
5.0
6.0
7.0
8.0
9.0
10.0
4.0
5.0
6.0
7.0
8.0
9.0
10.0CTQ Im portance Com pany Com p 1 Com p 2 Com p 3CTQ Im portance Com pany Com p 1 Com p 2 Com p 3
Enter Key Slide Take Away (Key Point) Here
36International Standards for Lean Six Sigma (ISLSS)
“How does the customer fit into process improvement?” Training Video by processexcellencenetwork.com and BP Group
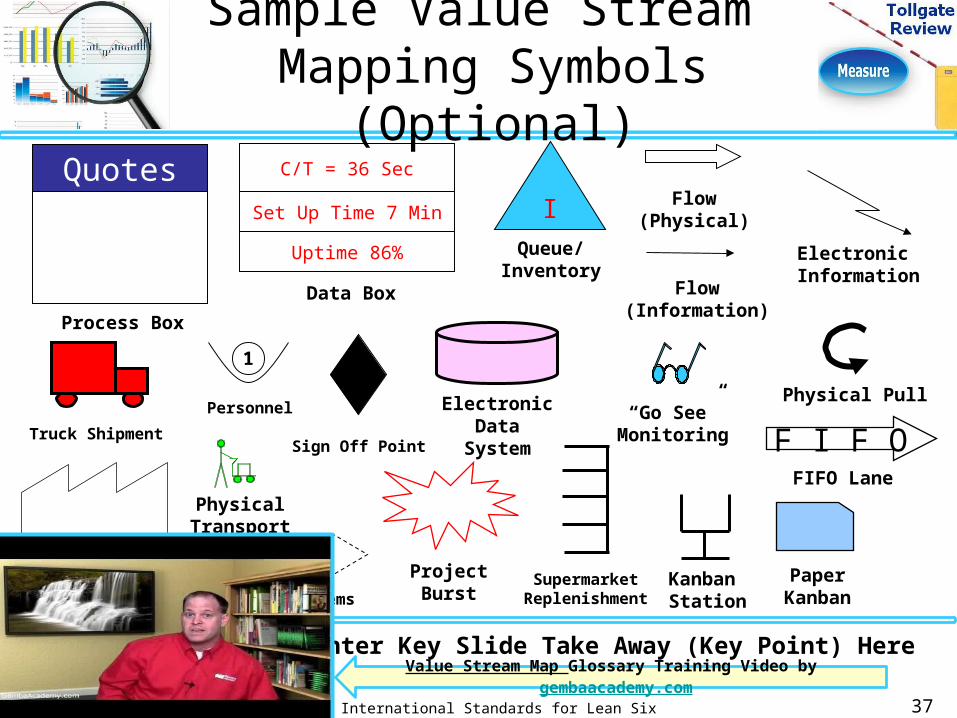
Sample Value Stream Mapping Symbols
(Optional)Machining C/T = 36 Sec
Set Up Time 7 Min
Uptime 86%
Process BoxData Box
IQueue/
Inventory
1
Personnel
Flow(Information)
Electronic Information
Sign Off Point
Push Systems
Truck Shipment
Quotes
Supplier/Customer
Flow(Physical)
Physical Pull
ProjectBurst
SupermarketReplenishment
KanbanStation
PaperKanban
ElectronicDataSystem F I F O
FIFO LanePhysicalTransport
“Go See”Monitoring
Enter Key Slide Take Away (Key Point) Here
37International Standards for Lean Six Sigma (ISLSS)
Value Stream Map Glossary Training Video by gembaacademy.com

To Office Parking Lot
EAST
Vault(finance)
Supply Room
(paper and office
supplies)RecordsRoom
(Order Management)
OM Supr Office
Reception
Engineering Offices
CafeteriaRestrooms
Foyer
Order Taker
1
Order Taker
2Order Taker
3
Order Entry
1
Order Entry
2
Order Entry
3
CC & Val 2
CC & Val 3
CC & Val 1
OM Lead
Printer, FaxCopier
Indicates an in-box or outbox where work (forms/ information) waits to be worked on or transferred Planning
&Scheduli
ng
Lines indicate paper/information travel:- No set path- Lots of rework
Spaghetti Diagram(Optional)
Enter Key Slide Take Away (Key Point) Here
38International Standards for Lean Six Sigma (ISLSS)
Spaghetti Diagram Training Video by Dwane Lay
Dwane Lay Dwane Lay Dwane Lay
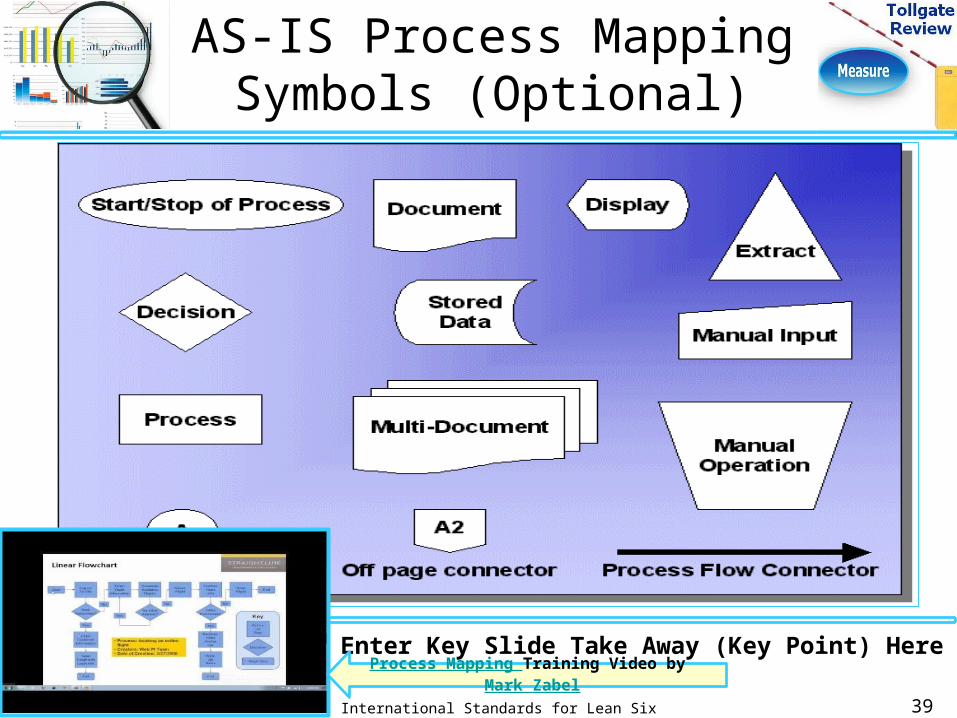
AS-IS Process Mapping Symbols (Optional)
Enter Key Slide Take Away (Key Point) Here
39International Standards for Lean Six Sigma (ISLSS)
Process Mapping Training Video by Mark Zabel
Lean Six Sigma Group
Lean Six Sigma
Additional Resources
International Standards for Lean Six Sigma (ISLSS)
Lean Six Sigma Tollgate Template
NotesThe Lean Six Sigma Tollgate Templates are: Free and intended as a guide in documenting a Lean
Six Sigma Project. I grant permission for you to modify these templates to meet the specific needs of your process improvement project.
Instructional - a video has been linked to each Template, I selected a mix of videos from Thought Leaders in the Lean Six Sigma Group. I included reference links to all video’s should you want to learn more information. Also included guidelines in the Note’s section of each slide.
Efficient and Effective – Placeholders for Graphic or Video Examples for various tools and methods across each DMAIC Phase.
How to Use These Templates: Collaboratively – use as a guide, reuse templates
independently or across phases as needed, and change the order as needed to best capture the execution of Lean Six Sigma in each phase, and summarize in the final Case Study.
Use as a Communication tool, and document your findings and results.
41
Replace the content of this slide with images or video’s related to your process
improvement project International Standards for Lean Six
Sigma (ISLSS)
My name is Steven Bonacorsi, Author of the Lean Six Sigma Tollgate Templates, President of the International Standard for Lean Six Sigma (ISLSS), and Owner of the LinkedIn Lean Six Sigma Group.

Lean Six Sigma Resources
42
Best Wishes in Continuously Improving Your Business Processes – Steven Bonacorsi, Certified Lean Six Sigma Master Black Belt
International Standards for Lean Six Sigma (ISLSS)
Lean Six Sigma Group: https://www.linkedin.com/groups/Lean-Six-Sigma-37987 Lean Six Sigma Subgroups: https://www.linkedin.com/groups?subgroups=&gid=37987 International Standard for Lean Six Sigma (ISLSS): http://www.islss.com
i-nexus: http://www.i-nexus.com Strategy Execution Community LinkedIn Group
https://www.linkedin.com/groups/Strategy-Execution-Community-3725091
SigmaXL: http://www.sigmaxl.com SigmaXL LinkedIn Group: https://www.linkedin.com/groups/SigmaXL-1812101?gid=1812101
Gemba Academy http://www.gembaacademy.com Lean CEO Group:
Gemba Academy LinkedIn Group: https://www.linkedin.com/groups/Gemba-Academy-1844998?gid=1844998
PEX Network http://www.processexcellencenetwork.com
PEX Network & IQPC - Lean Six Sigma & Process Excellence for Continuous Improvement
Lean Leadership Institute: http://www.LeanLeadership.guru/books.html The Toyota Way Group
Lean Six Sigma Groups(Click Logo’s to Join Group)
43
Each Week, the Lean Six Sigma Group Grows +1,500 New Members; +2,000 Lean Six Sigma Jobs; +200 Discussions; +500 Comments +280,000
Members – Come Join the ConversationInternational Standards for Lean Six Sigma (ISLSS)
Lean Six Sigma Group
Lean Six Sigma Resource Blogs
(Click Logo’s to Follow Blogs)
44
See Notes Section for Links to Lean Six Sigma Group Contributors
International Standards for Lean Six Sigma (ISLSS)
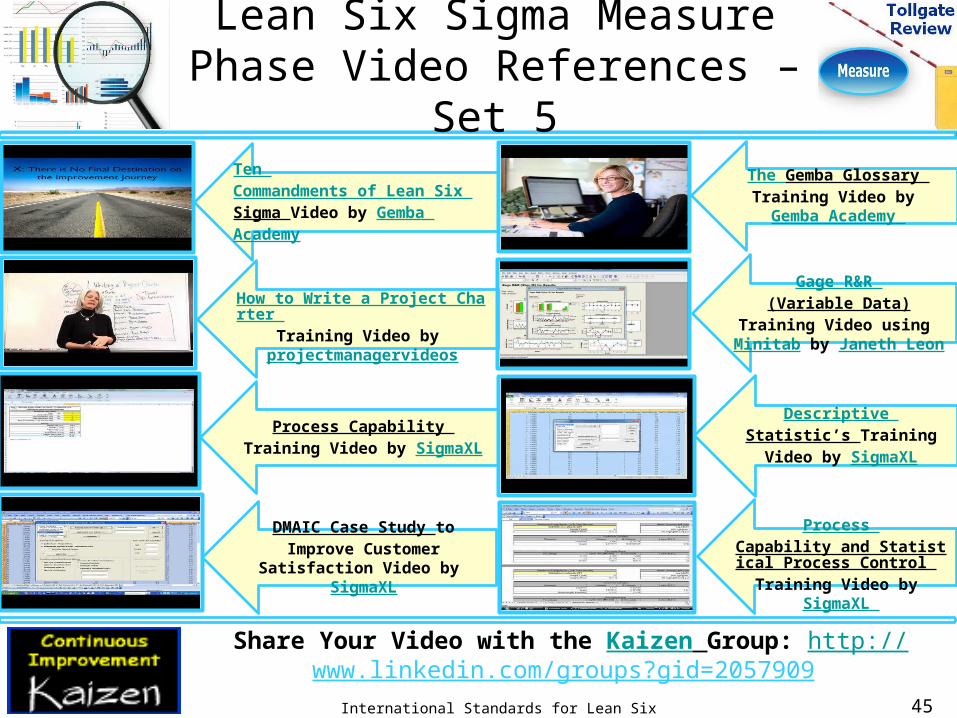
Lean Six Sigma Measure Phase Video References –
Set 5
45
Share Your Video with the Kaizen Group: http://www.linkedin.com/groups?gid=2057909
International Standards for Lean Six Sigma (ISLSS)
Ten Commandments of Lean Six Sigma Video by Gemba Academy
How to Write a Project Charter
Training Video by projectmanagervideos
Process Capability Training Video by SigmaXL
DMAIC Case Study to Improve Customer
Satisfaction Video by SigmaXL
The Gemba Glossary Training Video by
Gemba Academy
Gage R&R (Variable Data)
Training Video using Minitab by Janeth Leon
Descriptive Statistic’s Training
Video by SigmaXL
Process Capability and Statistical Process Control
Training Video by SigmaXL
Lean Six Sigma Measure Phase Video References –
Set 6
46
Share Your Video with the Statistics & Analytics Group: http://www.linkedin.com/groups?gid=4183029
International Standards for Lean Six Sigma (ISLSS)
Process Capability (Continuous)
Training Video by SigmaXL
Process Capability (Discrete)
Training Video by SigmaXL
Gemba Academy Training Video on
the 7 Forms of Waste
SigmaXL Training Video on Cause & Effect Diagrams
Metrics Based Process Mapping Training Video by
The Karen Martin Group
Value Stream Mapping Training Video by
Gemba Academy
Cost/Benefit Training Video by
Conservation Strategy Fund
Lean Accounting Training Video by Gemba Academy
Lean Six Sigma Measure Phase Video References –
Set 7
47
Share Your Video with the Design for Lean Six Sigma Group: http://www.linkedin.com/groups?gid=3065466
International Standards for Lean Six Sigma (ISLSS)
Top 5 Types of Project Management
Reports Video by projectmanagervideos
8-Step Problem Solving Training Video by the
Lean Leadership Institute
The Explosion of Data Video by PexNetwork
Measure Phase Success Criteria Training Video by
educatevirtually
8 Step Practical Problem Solving Methodology
by Gemba AcademyAnalyze
Phase Success Criteria Training
Video by educatevirtually
Application of Statistical
Analysis Training Video by Amir H.
Ghaseminejad
How to deal with non-normal data Training Video by
SigmaXL.com
Lean Six Sigma Measure Phase Video References –
Set 8
48
Share Your Video with the Business Process Management Group: http://
www.linkedin.com/groups?gid=3929208 International Standards for Lean Six
Sigma (ISLSS)
How to Manage Stakeholder Expectations
Video by projectmanagervideos
Sample Size with Continuous Data Training Video by SigmaXL
Sample Size with Discrete Data
Training Video by SigmaXL.com
Create & Analyze a Gage R&R (Crossed) Training Video by
SigmaXL.com
Create a Normal Probability Plot Training Video by
SigmaXL.com
Create an Xbar & R Control Chart Training Video by
SigmaXL.com
Gemba Academy Training Video on How to Leverage the Powerful A3 Report
“What is 5S?” Training Video by GembaAcademy.com
Lean Six Sigma Measure Phase Video References –
Set 9
49
Share Your Video with the Strategy Execution Community Group: https://
www.linkedin.com/groups/Strategy-Execution-Community-3725091
International Standards for Lean Six Sigma (ISLSS)
“What is Benchmarking?” Training Video by www.coer.org.nz
“How does the customer fit into process
improvement?” by PEXNetwork and BP Group
Value Stream Map Glossary Training Video by gembaacademy.com
Spaghetti Diagram Training Video by Dwane Lay
Process Mapping Training Video by
Mark Zabel