Analyzing the Factors Enabling Green Lean Six Sigma ... - MDPI
15
Citation: Letchumanan, L.T.; Gholami, H.; Yusof, N.M.; Ngadiman, N.H.A.B.; Salameh, A.A.; Štreimikien ˙ e, D.; Cavallaro, F. Analyzing the Factors Enabling Green Lean Six Sigma Implementation in the Industry 4.0 Era. Sustainability 2022, 14, 3450. https://doi.org/10.3390/su14063450 Academic Editor: Paulo Peças Received: 16 February 2022 Accepted: 10 March 2022 Published: 15 March 2022 Publisher’s Note: MDPI stays neutral with regard to jurisdictional claims in published maps and institutional affil- iations. Copyright: © 2022 by the authors. Licensee MDPI, Basel, Switzerland. This article is an open access article distributed under the terms and conditions of the Creative Commons Attribution (CC BY) license (https:// creativecommons.org/licenses/by/ 4.0/). sustainability Article Analyzing the Factors Enabling Green Lean Six Sigma Implementation in the Industry 4.0 Era L. Thiruvarasu Letchumanan 1, *, Hamed Gholami 1, * , Noordin Mohd Yusof 1 , Nor Hasrul Akhmal Bin Ngadiman 1 , Anas A. Salameh 2 , Dalia Štreimikien ˙ e 3 and Fausto Cavallaro 4 1 Department of Manufacturing and Industrial Engineering, School of Mechanical Engineering, Faculty of Engineering, Universiti Teknologi Malaysia (UTM), Johor Bahru 81310, Malaysia; [email protected] (N.M.Y.); [email protected] (N.H.A.B.N.) 2 Department of Management Information Systems, College of Business Administration, Prince Sattam Bin Abdulaziz University, 165, Al-Kharj 11942, Saudi Arabia; [email protected] 3 Kaunas Faculty, Vilnius University, Muitines 8, LT-44280 Kaunas, Lithuania; [email protected] 4 Department of Economics, University of Molise, Via De Sanctis, 86100 Campobasso, Italy; [email protected] * Correspondence: [email protected] (L.T.L.); [email protected] (H.G.) Abstract: Green Lean Six Sigma has emerged in the Industry 4.0 era as a business strategy contributing to the circular economy by adopting the 3R concept, i.e., reduce, reuse, and recycle. Despite its broadly acknowledged capabilities in the manufacturing industry, practitioners continue to be cautious about its implementation, owing to insufficient knowledge and culture. Hence, there is a need to systematize the existing knowledge regarding this green initiative and also to recognize the key factors enabling its implementation. In the Malaysian manufacturing context, the enabling factors have yet to be identified and evaluated. This current study is the first of its kind to identify and examine these factors and to create a structural model to conceptualize and operationalize this business strategy. The implemented methodological approach includes two steps. Firstly, it performs a systematic review of leading studies on the topic, which are rather scarce in the current context. The second step entails a principal component factor analysis using varimax rotation to finalize the findings. The theoretical and empirical results revealed a structural model with five interconnected key factors, including twenty-seven enablers, that can be used to narrow the existing knowledge gap in the understudied context. Keywords: green production; lean implementation; Six Sigma; circular economy; Industry 4.0; systematic review; factor analysis; electronics manufacturing 1. Introduction The rising global awareness of environmental risks and the demand for competitive efficiency have driven the evolution of manufacturing paradigms from the substitution- oriented traditional manufacturing, to the waste-reducing lean manufacturing and even- tually to green manufacturing, driven by the 3Rs: reduce, reuse, and recycle [1]. Many organizations have taken environmentally-driven proactive steps to develop cleaner and more eco-friendly manufacturing processes, as well as to produce greener products. How- ever, numerous industrial operations have a detrimental effect on the environment and society due to the fact that they consume an inordinate amount of precious resources and generate hazardous wastes and emissions. For example, the U.S. Environmental Protection Agency (EPA) noted that, in 2020, the domestic manufacturing sector accounted for a staggering 89% of the 28.3 billion pounds of production-related waste generated in the United States [2]. Based on the National Association of Manufacturers, the industrial sector accounts for 31% of all the energy consumed in the United States, from which the manufacturing industry alone accounts for around 65% of the industrial sector’s energy consumption [3]. To counter this immense pollution and its accompanying environmental Sustainability 2022, 14, 3450. https://doi.org/10.3390/su14063450 https://www.mdpi.com/journal/sustainability
-
Upload
khangminh22 -
Category
Documents
-
view
1 -
download
0
Transcript of Analyzing the Factors Enabling Green Lean Six Sigma ... - MDPI
�����������������
Citation: Letchumanan, L.T.;
Gholami, H.; Yusof, N.M.; Ngadiman,
N.H.A.B.; Salameh, A.A.;
Štreimikiene, D.; Cavallaro, F.
Analyzing the Factors Enabling
Green Lean Six Sigma
Implementation in the Industry 4.0
Era. Sustainability 2022, 14, 3450.
https://doi.org/10.3390/su14063450
Academic Editor: Paulo Peças
Received: 16 February 2022
Accepted: 10 March 2022
Published: 15 March 2022
Publisher’s Note: MDPI stays neutral
with regard to jurisdictional claims in
published maps and institutional affil-
iations.
Copyright: © 2022 by the authors.
Licensee MDPI, Basel, Switzerland.
This article is an open access article
distributed under the terms and
conditions of the Creative Commons
Attribution (CC BY) license (https://
creativecommons.org/licenses/by/
4.0/).
sustainability
Article
Analyzing the Factors Enabling Green Lean Six SigmaImplementation in the Industry 4.0 EraL. Thiruvarasu Letchumanan 1,*, Hamed Gholami 1,* , Noordin Mohd Yusof 1,Nor Hasrul Akhmal Bin Ngadiman 1 , Anas A. Salameh 2 , Dalia Štreimikiene 3 and Fausto Cavallaro 4
1 Department of Manufacturing and Industrial Engineering, School of Mechanical Engineering, Faculty ofEngineering, Universiti Teknologi Malaysia (UTM), Johor Bahru 81310, Malaysia; [email protected] (N.M.Y.);[email protected] (N.H.A.B.N.)
2 Department of Management Information Systems, College of Business Administration,Prince Sattam Bin Abdulaziz University, 165, Al-Kharj 11942, Saudi Arabia; [email protected]
3 Kaunas Faculty, Vilnius University, Muitines 8, LT-44280 Kaunas, Lithuania; [email protected] Department of Economics, University of Molise, Via De Sanctis, 86100 Campobasso, Italy; [email protected]* Correspondence: [email protected] (L.T.L.); [email protected] (H.G.)
Abstract: Green Lean Six Sigma has emerged in the Industry 4.0 era as a business strategy contributingto the circular economy by adopting the 3R concept, i.e., reduce, reuse, and recycle. Despite its broadlyacknowledged capabilities in the manufacturing industry, practitioners continue to be cautious aboutits implementation, owing to insufficient knowledge and culture. Hence, there is a need to systematizethe existing knowledge regarding this green initiative and also to recognize the key factors enablingits implementation. In the Malaysian manufacturing context, the enabling factors have yet to beidentified and evaluated. This current study is the first of its kind to identify and examine thesefactors and to create a structural model to conceptualize and operationalize this business strategy. Theimplemented methodological approach includes two steps. Firstly, it performs a systematic review ofleading studies on the topic, which are rather scarce in the current context. The second step entails aprincipal component factor analysis using varimax rotation to finalize the findings. The theoreticaland empirical results revealed a structural model with five interconnected key factors, includingtwenty-seven enablers, that can be used to narrow the existing knowledge gap in the understudiedcontext.
Keywords: green production; lean implementation; Six Sigma; circular economy; Industry 4.0;systematic review; factor analysis; electronics manufacturing
1. Introduction
The rising global awareness of environmental risks and the demand for competitiveefficiency have driven the evolution of manufacturing paradigms from the substitution-oriented traditional manufacturing, to the waste-reducing lean manufacturing and even-tually to green manufacturing, driven by the 3Rs: reduce, reuse, and recycle [1]. Manyorganizations have taken environmentally-driven proactive steps to develop cleaner andmore eco-friendly manufacturing processes, as well as to produce greener products. How-ever, numerous industrial operations have a detrimental effect on the environment andsociety due to the fact that they consume an inordinate amount of precious resources andgenerate hazardous wastes and emissions. For example, the U.S. Environmental ProtectionAgency (EPA) noted that, in 2020, the domestic manufacturing sector accounted for astaggering 89% of the 28.3 billion pounds of production-related waste generated in theUnited States [2]. Based on the National Association of Manufacturers, the industrialsector accounts for 31% of all the energy consumed in the United States, from which themanufacturing industry alone accounts for around 65% of the industrial sector’s energyconsumption [3]. To counter this immense pollution and its accompanying environmental
Sustainability 2022, 14, 3450. https://doi.org/10.3390/su14063450 https://www.mdpi.com/journal/sustainability
Sustainability 2022, 14, 3450 2 of 15
and health impacts, a transition to environmentally-sustainable manufacturing is urged [2].Therefore, the green paradigm is now a recognized philosophy and operational method forenhancing the environmental efficiency of organizations and for minimizing the environ-mental repercussions of products and services while maintaining organizational financialobjectives [4,5]. Based on Rao [6] and Galeazzo et al. [7], the green concept basically in-volves the application of green methods to reduce negative environmental effects and,ultimately, to lessen the environmental footprint of organizations.
The green paradigm has motivated organizations to devise new ways of incorporatingtraditional performance measurements to attain profit and other business objectives viaenvironmentally-friendly measures. With its emphasis on waste elimination at all pro-duction stages, the applicability of lean tools has been extended to include environmentalaspects. Drawing from the Toyota Production System (TPS) concept, the US EPA [8] de-scribed the objective of environmentally-extended lean as “to develop the highest qualityproducts, at the lowest cost, with the shortest lead time by systematically and continuouslyeliminating waste, while respecting people and the environment” which, in the context ofthis current study, is rather extensive. One study [9] highlighted 5S practices to enable thecreation of a proper working environment to simultaneously improve water efficiency andplant performance. To this end, approaches integrating the green and lean concepts havebeen developed by prolific scholars (e.g., [4,10–14]) with the aim of not only minimizingwaste production, but also, and more importantly, to reduce green waste, which has beendefined by the US EPA [8] as all needless or unwarranted forms of resource consumption orthe release of substances due to such consumptions which are detrimental to humans andthe environment. For instance, wasteful use of energy, water, chemicals, materials, and/ortransportation can have disastrous effects on the ecosystem [1,15].
Despite being recognized as a highly effective approach for making operations more eco-friendly via the reduction of waste, emissions, and reworking, the integrated green lean ap-proach still suffers from several drawbacks that impede its successful implementation [1,4,16].One key drawback is its incapability to establish a project-oriented approach that can scru-tinize, target, and reduce process variability. In the context of lean, it is basically a toolboxthat provides tools for identifying waste elimination prospects. The green lean approach ishence oriented towards this objective. For that reason, this approach may not be helpfulin achieving profit-oriented or business objectives. Additionally, variability identificationis pertinent as it informs and facilitates decision making, thus resulting in sustainabilityperformance improvements. Another drawback to the green lean approach is its lack ofquality-driven and mathematical tools. Statistical data for the purposes of process mon-itoring and identifying residual issues may be uncollectable until after waste removalhas been conducted. All these, therefore, give rise to the need for Six Sigma [4] to re-duce or eliminate these drawbacks. Six Sigma was first outlined in the 1980s as a qualityenhancement approach, with origins tracing back to the US-based electronics company,Motorola [17,18]. According to Matthew et al. [19], Six Sigma is especially beneficial forcompanies that seek to improve their bottom-line and to reduce defects. It treats defects asprocess- or product-based prospects via a well-structured project management approach.A Six Sigma program primarily eliminates subjective decision-making by consistentlyincorporating data collection, analysis and presentation in both the manufacturing andservice industries, promoting organizational competitiveness and enhancing product orservice quality [20–22].
It is believed that this current study contributes valuable insights both theoreticallyand empirically. Owing to the drawbacks of green and lean as separate approaches and asan integrated paradigm, as discussed above, it is evident that Green Lean Six Sigma (GLSS)serves as a novel environmental developmental agenda for overcoming the aforemen-tioned limitations and boosting the performance of green lean initiatives. However, thiseffective integration is driven not only by the proven cohesiveness of the lean principlesand tools apparent in both approaches, but also by the ostensibly shared attributes ofthe concepts. Delving into the effectiveness of such an integration, which was demon-
Sustainability 2022, 14, 3450 3 of 15
strated by many studies (reviewed in Section 3), more cutting-edge studies on the topic arerequired [1,4,23–27], such as empirical investigations that offer systematic guidelines forthe application of GLSS in a variety of areas [24,26]. The concept, however, has yet to beprecisely defined, requiring the systematization of the available knowledge on this greeninitiative. Despite its broadly acknowledged capabilities in the manufacturing industry,practitioners continue to be cautious about its implementation. Moreover, no previousstudies have explicitly and systematically addressed a comprehensive model of GLSS inpractice—in other words, a common model is still missing. Because of this, there is aresearch demand to analyze the factors enabling GLSS implementation [1]. Thus, thisstudy aims to enrich the current body of knowledge and propel the implementation ofGLSS by (1) analyzing the GLSS literature, (2) identifying key factors enabling the GLSSimplementation, and (3) developing a factorial structure towards the implementation ofGLSS in the Malaysian electronics manufacturing sector. This sector is one of Malaysia’smain economic drivers, but its industrial operations are to blame for a 46% increase in GHGemissions, according to the Malaysian Biennial Update Report [28]. The green concerns andother environmental compliance and societal regulation issues underlined by the MalaysianEnvironmental Quality Act [10,18] stress a growing need for strategic approaches to as-sess and develop environmental sustainability in such industries. As highlighted in theMalaysian Green Technology Master Plan [28], there is a need to adopt green initiatives tomeet the aspirational goal of up to a 50% increase in establishing green manufacturing by2030. Yet, with the new Industry 4.0 technology invasion and shockwaves caused acrossglobal markets and emerging green trends, Malaysian industries are projected to havedifficulties achieving this goal.
To meet the research objectives, this article is organized as follows: Section 2 presentsthe research methodology to clarify the procedures and methods utilized. Section 3 pro-vides the theoretical results contributed by a systematic review, whilst Section 4 discussesempirical findings contributed by the analyses. Finally, Section 5 contains the conclusion aswell as future directions for this research.
2. Research Methodology
This study is exploratory research, conducted on an issue that has not been previouslyinvestigated in Malaysia. It is descriptive and analytic from the viewpoint of the exploratoryobjective, including two steps. The first step entails systematically reviewing the existingliterature, followed by developing an analytical method for finalizing the research. Bothsteps are explained further in the following sub-sections.
2.1. Systematic Review
The GLSS strategy is a hybrid of the Green, Lean, and Six Sigma concepts; this well-integrated approach has yet to be studied in Malaysia [1]. Hence, a systematic review isneeded to analyze the GLSS literature to explore its strategic factors. In this current study, asystematic literature review was conducted with the goals of (a) conducting a thoroughanalysis of the leading studies and applying the findings to emergent issues [29,30], and(b) evaluating and summarizing available studies on the issue as well as providing aframework/model for new research [31,32]. The systematic review entailed the two mainparts described below.
2.1.1. Review Protocol Design
A systematic review requires a protocol [33,34]. In this current study, the review proto-col was designed based on the quality assessment checklist proposed by Kitchenham [33],which was used to evaluate the relevant studies derived from the Scopus database, thelargest database for global studies, with titles from over 5000 publishers worldwide in-cluding ScienceDirect, Wiley, Emerald, Springer, Taylor and Francis, MDPI, etc. [30]. Thechecklist includes the following questions [34]: (1) “Does the article clearly specify themethodological approach?”, (2) “Is the methodological approach relevant to the problem
Sustainability 2022, 14, 3450 4 of 15
under study?”, and (3) “Does the article perform properly its analyses?” An article wasconsidered fit for the review if it fulfilled all the inclusion criteria.
2.1.2. Article Selection
In this step, a systematic search was conducted for all studies related to GLSS up toMay 2021. The Scopus database was used as the search engine for keywords such as “GreenManufacturing”, “Lean Manufacturing”, and “Six Sigma”, as well as for interchangeableterms like “Green Production”, “Lean Production”, and “6Sigma”. Accordingly, the querystring was TITLE-ABS ((“Green”) AND (“Lean”) AND (“Six Sigma” OR “6Sigma”)), whichderived 106 articles post-screening. A manual article selection was conducted next, byexamining the abstracts and full texts to remove duplications and unrelated articles. A totalof 66 articles were derived to review; the earliest document dated back to 2011, showedhow Six Sigma techniques can be used to control process efficiency and environmentalMuda in a lean-green project [35].
Lastly, GLSS articles written from the perspective of enablers, drivers, and/or criticalsuccess factors were carefully scrutinized theoretically and empirically. Ultimately, tenarticles that fulfilled the assessment criteria were selected for the next round of analysis,which entailed a critical appraisal of their contents, as discussed in Section 3.
2.2. Analytical Method
This step involves an exploratory factor analysis (EFA) to measure the identifiedvariables and to reveal the underlying structure among the measured variables. It providesthe researcher with two distinct, but interrelated, outcomes: data summarization anddata reduction. In summarizing the data, EFA derives underlying dimensions that, wheninterpreted and understood, describe the data in a much smaller number of conceptsthan the original individual variables. Data reduction extends this process by deriving anempirical value (factor score) for each dimension (factor), and then substituting this valuefor the original values [36]. According to Hair et al. [36], many researchers consider it usefulin searching for structure among a set of variables or as a data reduction method. From thisperspective, EFA takes what the data gives us and does not set any a priori constraints onthe estimation of components or the number of components to be extracted. This analyticapproach includes three key parts, which are explained in detail below.
2.2.1. Exploratory Survey Design
Two key questions were considered in designing the EFA [36,37]: (1) “What are thevariables (i.e., enablers) included?” and (2) “What is the desired sample size for measur-ing the enablers?” The first question was answered via the review of the state-of-the-artliterature, as elaborated above. This exploratory review sought to address the idea that thesuccess of GLSS rested on the examination of the core GLSS enablers. The initial checklistwas created by examining the key enablers from the leading studies and the brainstormingperformed by two professional engineers who are certified LSS Black Belts versed in envi-ronmental management and an academician who is a leading expert on GLSS. Ultimately,30 enablers were identified and amended, as discussed in Section 4.
Non-probabilistic convenience sampling is used in operational and managerial re-search to gather primary data based on opinions, such as the perception of consumersregarding the design of a certain product or service. This broadly applied technique entailsthe continuous collection of samples until the desired sample size is achieved. There isno agreement on the exact sample size suitable for EFA due to multiple rules of thumb.According to Hair et al. [36], the sample size for implementing EFA should be at least50 observations, but favorably 100 or more. In this regard, Gholami et al. [37] employed asample size of 97 observations for the implementation of EFA. This current study, accord-ingly, utilized 102 samples of local professional or chartered engineers (i.e., P.Eng. andC.Eng.), collected during July–August 2021, to examine the identified enablers and to revealtheir factorial structure. In survey-based research, data collection can be conducted using

Sustainability 2022, 14, 3450 5 of 15
multiple scientifically backed methods, settings, and sources. However, questionnaires arethe primary method for collecting data in such research [36,38,39]. Upon determining theenablers and samples, the correlation matrix is then assessed to identify the fundamentalstructure of the relationships. Decisions must then be made regarding (1) the factor methodselection for factor extraction, and (2) the factor matrix specification for determining thedata’s fundamental structure.
2.2.2. Factor Method Selection and Matrix Specification
Based on Hair et al. [36], Gholami et al. [37], and Rezaei et al. [40], the most widelyused factor method is the principal component factor analysis (or component analysis)with varimax rotation. This method is advantageous as it takes into consideration the totalvariance and identifies factors with small amounts of unique variance. The aggregate ofthe required loadings variances of the factor matrix is maximized by the varimax rotationalapproach. It has a simple fundamental and shows a clearer division of the factors. Thismethod has been proven to be a successful analytical approach for attaining an orthogonalrotation of factors [36,40,41]. The current study hence employed this method for generatinga fundamental structural model via SPSS 26 software.
2.2.3. Testing Reliability and Validity
Bartlett’s Test of Sphericity (BTS) and the Kaiser–Meyer–Olkin (KMO) measure wereused to examine the factorability and adequacy of the sampling, respectively. These testsare highly recommended when the participant-to-variable ratio is less than 5:1. To ensure agood EFA, the BTS should be at a 0.05 significance level, whilst the KMO index should bebetween 0 and 1, with a minimal adequacy of 0.5 [36,37].
The common criteria for distinguishing the total extraction factor number are: (1) thecontribution percentage to the total variance, whereby the principal factor should be higherthan 20% in the valid scales, (2) the eigenvalues, whereby each factor should be more thanone, and (3) the Scree test, which is applied to determine the optimum number of factors forextraction [37]. Additionally, Hair et al. [36] proposed that factor loadings exceeding 0.5 canbe significantly taken into account. Lastly, the scale’s overall consistency was assessed bycalculating the internal consistency coefficient or reliability coefficient (Cronbach’s Alpha),which should be higher than 0.6 in the exploratory survey [38,39,41].
3. Findings and Discussion on the Systematic Review: Theoretical Contribution
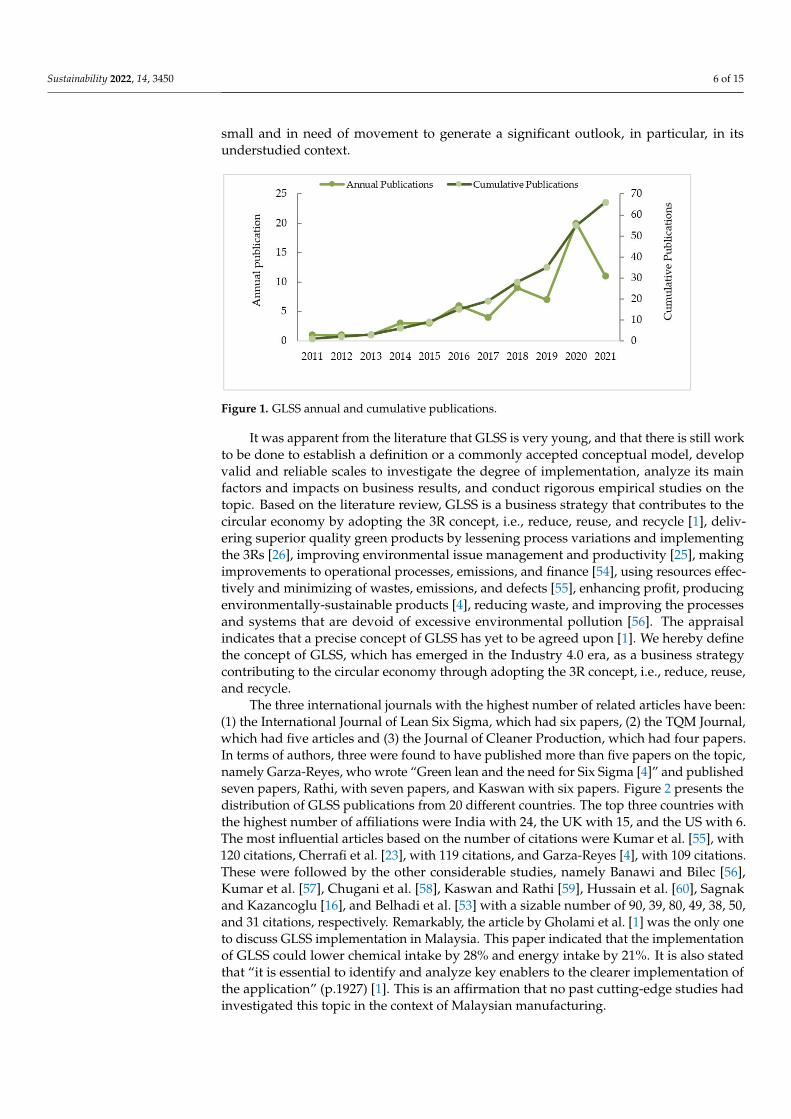
To further the research purpose, this study performed a systematic review using themethodological approach explained in Section 2.1. Based on the review of the 66 articlessorted by publication year, it was found that GLSS research has evolved progressively overthe years. The topic of this green initiative was only found in one article published in2011: Besseris [35], but the number grew significantly to 20 articles in 2020 (Figure 1). Thisnumber is projected to increase even further in light of the growing significance of GLSS inthe environmentally-sustainable manufacturing paradigm, which is also regarded as anapplication of the circularity principle to manufacturing under the emerging concept of thecircular economy. Notably, this growing global research trend has emerged since the adventof the new industrial wave, i.e., Industry 4.0, which became widely known in 2011. This ismainly viewed as a technology diffusion and adoption issue, and this diffusion–adoptionprocess often flows from leading countries [31]. A number of countries have formedtheir own strategies to accelerate the adoption and advancement of Industry 4.0. In thisregard, Germany, where the notion originated, has launched a program called “High-TechStrategy 2020”. Such national strategies, whether in developed or emerging countries, aimto disseminate Industry 4.0 concepts and technologies to local and national businesses [31].In this regard, there are some significant studies investigating the capability of Industry4.0 to develop lean manufacturing [42–45], green lean [30,46,47], lean Six Sigma [48–52]and green lean Six Sigma [31,52,53]. Nevertheless, the movement seems to be relatively
Sustainability 2022, 14, 3450 6 of 15
small and in need of movement to generate a significant outlook, in particular, in itsunderstudied context.
Figure 1. GLSS annual and cumulative publications.
It was apparent from the literature that GLSS is very young, and that there is still workto be done to establish a definition or a commonly accepted conceptual model, developvalid and reliable scales to investigate the degree of implementation, analyze its mainfactors and impacts on business results, and conduct rigorous empirical studies on thetopic. Based on the literature review, GLSS is a business strategy that contributes to thecircular economy by adopting the 3R concept, i.e., reduce, reuse, and recycle [1], deliv-ering superior quality green products by lessening process variations and implementingthe 3Rs [26], improving environmental issue management and productivity [25], makingimprovements to operational processes, emissions, and finance [54], using resources effec-tively and minimizing of wastes, emissions, and defects [55], enhancing profit, producingenvironmentally-sustainable products [4], reducing waste, and improving the processesand systems that are devoid of excessive environmental pollution [56]. The appraisalindicates that a precise concept of GLSS has yet to be agreed upon [1]. We hereby definethe concept of GLSS, which has emerged in the Industry 4.0 era, as a business strategycontributing to the circular economy through adopting the 3R concept, i.e., reduce, reuse,and recycle.
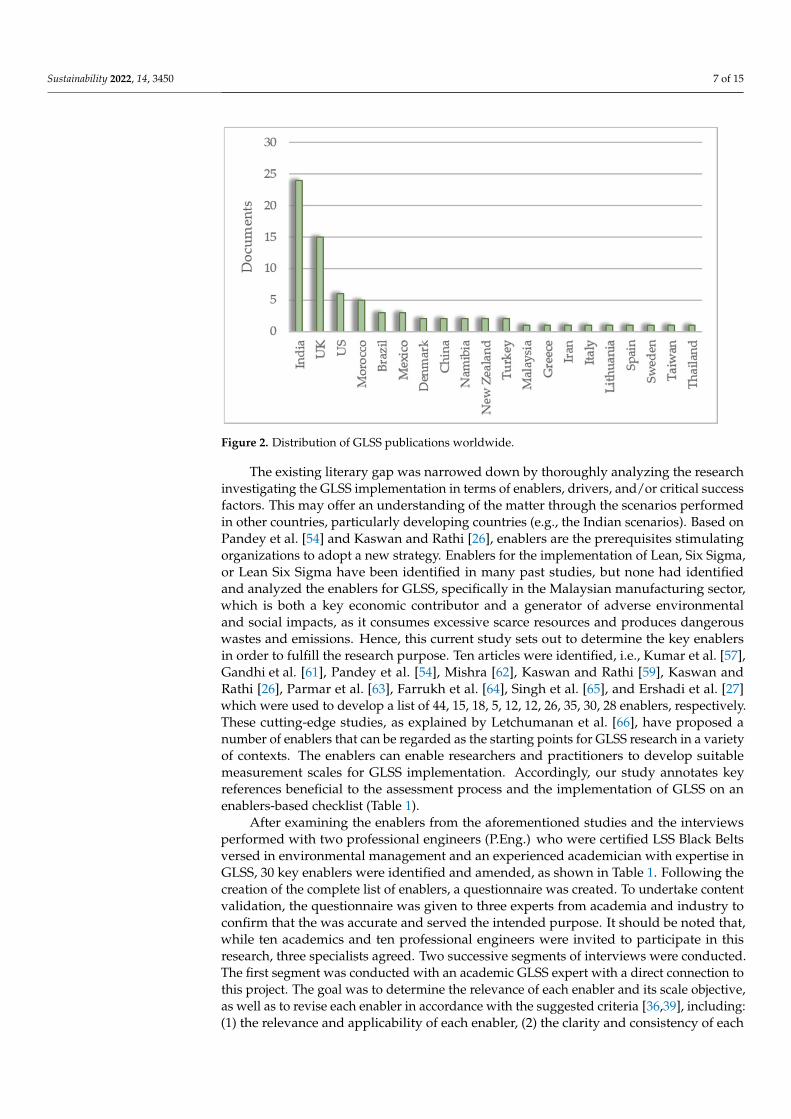
The three international journals with the highest number of related articles have been:(1) the International Journal of Lean Six Sigma, which had six papers, (2) the TQM Journal,which had five articles and (3) the Journal of Cleaner Production, which had four papers.In terms of authors, three were found to have published more than five papers on the topic,namely Garza-Reyes, who wrote “Green lean and the need for Six Sigma [4]” and publishedseven papers, Rathi, with seven papers, and Kaswan with six papers. Figure 2 presents thedistribution of GLSS publications from 20 different countries. The top three countries withthe highest number of affiliations were India with 24, the UK with 15, and the US with 6.The most influential articles based on the number of citations were Kumar et al. [55], with120 citations, Cherrafi et al. [23], with 119 citations, and Garza-Reyes [4], with 109 citations.These were followed by the other considerable studies, namely Banawi and Bilec [56],Kumar et al. [57], Chugani et al. [58], Kaswan and Rathi [59], Hussain et al. [60], Sagnakand Kazancoglu [16], and Belhadi et al. [53] with a sizable number of 90, 39, 80, 49, 38, 50,and 31 citations, respectively. Remarkably, the article by Gholami et al. [1] was the only oneto discuss GLSS implementation in Malaysia. This paper indicated that the implementationof GLSS could lower chemical intake by 28% and energy intake by 21%. It is also statedthat “it is essential to identify and analyze key enablers to the clearer implementation ofthe application” (p.1927) [1]. This is an affirmation that no past cutting-edge studies hadinvestigated this topic in the context of Malaysian manufacturing.
Sustainability 2022, 14, 3450 7 of 15
Figure 2. Distribution of GLSS publications worldwide.
The existing literary gap was narrowed down by thoroughly analyzing the researchinvestigating the GLSS implementation in terms of enablers, drivers, and/or critical successfactors. This may offer an understanding of the matter through the scenarios performedin other countries, particularly developing countries (e.g., the Indian scenarios). Based onPandey et al. [54] and Kaswan and Rathi [26], enablers are the prerequisites stimulatingorganizations to adopt a new strategy. Enablers for the implementation of Lean, Six Sigma,or Lean Six Sigma have been identified in many past studies, but none had identifiedand analyzed the enablers for GLSS, specifically in the Malaysian manufacturing sector,which is both a key economic contributor and a generator of adverse environmentaland social impacts, as it consumes excessive scarce resources and produces dangerouswastes and emissions. Hence, this current study sets out to determine the key enablersin order to fulfill the research purpose. Ten articles were identified, i.e., Kumar et al. [57],Gandhi et al. [61], Pandey et al. [54], Mishra [62], Kaswan and Rathi [59], Kaswan andRathi [26], Parmar et al. [63], Farrukh et al. [64], Singh et al. [65], and Ershadi et al. [27]which were used to develop a list of 44, 15, 18, 5, 12, 12, 26, 35, 30, 28 enablers, respectively.These cutting-edge studies, as explained by Letchumanan et al. [66], have proposed anumber of enablers that can be regarded as the starting points for GLSS research in a varietyof contexts. The enablers can enable researchers and practitioners to develop suitablemeasurement scales for GLSS implementation. Accordingly, our study annotates keyreferences beneficial to the assessment process and the implementation of GLSS on anenablers-based checklist (Table 1).
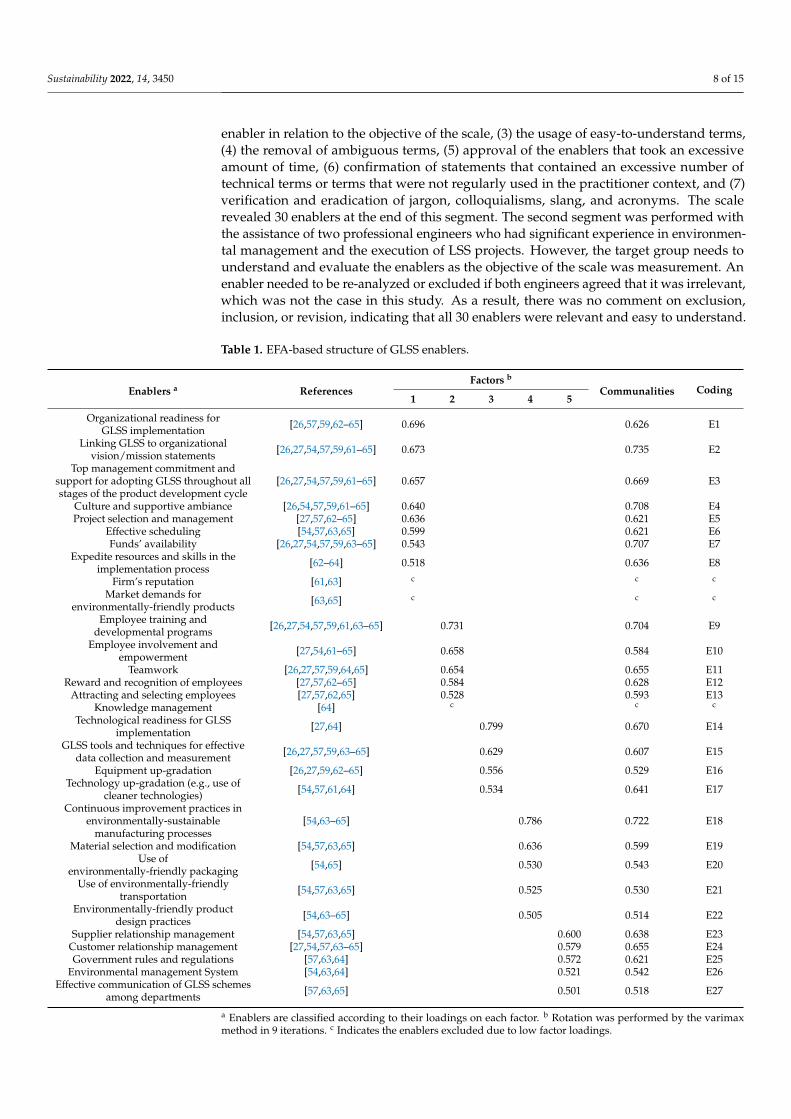
After examining the enablers from the aforementioned studies and the interviewsperformed with two professional engineers (P.Eng.) who were certified LSS Black Beltsversed in environmental management and an experienced academician with expertise inGLSS, 30 key enablers were identified and amended, as shown in Table 1. Following thecreation of the complete list of enablers, a questionnaire was created. To undertake contentvalidation, the questionnaire was given to three experts from academia and industry toconfirm that the was accurate and served the intended purpose. It should be noted that,while ten academics and ten professional engineers were invited to participate in thisresearch, three specialists agreed. Two successive segments of interviews were conducted.The first segment was conducted with an academic GLSS expert with a direct connection tothis project. The goal was to determine the relevance of each enabler and its scale objective,as well as to revise each enabler in accordance with the suggested criteria [36,39], including:(1) the relevance and applicability of each enabler, (2) the clarity and consistency of each
Sustainability 2022, 14, 3450 8 of 15
enabler in relation to the objective of the scale, (3) the usage of easy-to-understand terms,(4) the removal of ambiguous terms, (5) approval of the enablers that took an excessiveamount of time, (6) confirmation of statements that contained an excessive number oftechnical terms or terms that were not regularly used in the practitioner context, and (7)verification and eradication of jargon, colloquialisms, slang, and acronyms. The scalerevealed 30 enablers at the end of this segment. The second segment was performed withthe assistance of two professional engineers who had significant experience in environmen-tal management and the execution of LSS projects. However, the target group needs tounderstand and evaluate the enablers as the objective of the scale was measurement. Anenabler needed to be re-analyzed or excluded if both engineers agreed that it was irrelevant,which was not the case in this study. As a result, there was no comment on exclusion,inclusion, or revision, indicating that all 30 enablers were relevant and easy to understand.
Table 1. EFA-based structure of GLSS enablers.
Enablers a ReferencesFactors b
Communalities Coding1 2 3 4 5
Organizational readiness forGLSS implementation [26,57,59,62–65] 0.696 0.626 E1
Linking GLSS to organizationalvision/mission statements [26,27,54,57,59,61–65] 0.673 0.735 E2
Top management commitment andsupport for adopting GLSS throughout allstages of the product development cycle
[26,27,54,57,59,61–65] 0.657 0.669 E3
Culture and supportive ambiance [26,54,57,59,61–65] 0.640 0.708 E4Project selection and management [27,57,62–65] 0.636 0.621 E5
Effective scheduling [54,57,63,65] 0.599 0.621 E6Funds’ availability [26,27,54,57,59,63–65] 0.543 0.707 E7
Expedite resources and skills in theimplementation process [62–64] 0.518 0.636 E8
Firm’s reputation [61,63] c c c
Market demands forenvironmentally-friendly products [63,65] c c c
Employee training anddevelopmental programs [26,27,54,57,59,61,63–65] 0.731 0.704 E9
Employee involvement andempowerment [27,54,61–65] 0.658 0.584 E10
Teamwork [26,27,57,59,64,65] 0.654 0.655 E11Reward and recognition of employees [27,57,62–65] 0.584 0.628 E12
Attracting and selecting employees [27,57,62,65] 0.528 0.593 E13Knowledge management [64] c c c
Technological readiness for GLSSimplementation [27,64] 0.799 0.670 E14
GLSS tools and techniques for effectivedata collection and measurement [26,27,57,59,63–65] 0.629 0.607 E15
Equipment up-gradation [26,27,59,62–65] 0.556 0.529 E16Technology up-gradation (e.g., use of
cleaner technologies) [54,57,61,64] 0.534 0.641 E17
Continuous improvement practices inenvironmentally-sustainable
manufacturing processes[54,63–65] 0.786 0.722 E18
Material selection and modification [54,57,63,65] 0.636 0.599 E19Use of
environmentally-friendly packaging [54,65] 0.530 0.543 E20
Use of environmentally-friendlytransportation [54,57,63,65] 0.525 0.530 E21
Environmentally-friendly productdesign practices [54,63–65] 0.505 0.514 E22
Supplier relationship management [54,57,63,65] 0.600 0.638 E23Customer relationship management [27,54,57,63–65] 0.579 0.655 E24Government rules and regulations [57,63,64] 0.572 0.621 E25
Environmental management System [54,63,64] 0.521 0.542 E26Effective communication of GLSS schemes
among departments [57,63,65] 0.501 0.518 E27
a Enablers are classified according to their loadings on each factor. b Rotation was performed by the varimaxmethod in 9 iterations. c Indicates the enablers excluded due to low factor loadings.
Sustainability 2022, 14, 3450 9 of 15
4. Findings and Discussion on the Analytic Method: Empirical Contribution
To achieve the main research objectives, EFA was used to disclose the factorial struc-ture of GLSS with 30 identified enablers, as presented in Table 1. In this regard, the principalcomponent factor analysis was applied to assess the scores obtained from the responsesgiven by the 102 experts who work as Professional Engineers (P.Eng.: 62%) and Char-tered Engineers (C.Eng.: 38%) in different Malaysian electronics manufacturing industries.Understanding their perception in such a context is especially important as it gives thedecision-makers a better sense of the evaluation in the view of one of their major groupsof stakeholders.
To assess the enablers, a five-point Likert scale with a range of 1 (strongly disagree) to5 (strongly agree) was used, according to the adopted methodological approach discussedin Section 2.2. Of a total of 261 questionnaires distributed, 183 completed questionnaireswere received. Following the flexible pointing system developed by Hallowell and Gambat-ese [67] in selecting experts for an in-depth analysis, 102 questionnaires were found to be to-tally usable, resulting in a response rate of 39.08%, which was considered acceptable [36,39].The survey’s overall reliability coefficient (α) was 0.956, which was appropriate [36]. Thecorrelation matrix analysis indicated that the majority of the correlations were significantat the 0.05 level, revealing a sufficient basis for developing an empirical examination ofsufficiency for EFA both on a general basis and for each enabler. The BTS and KMO testswere also utilized, to confirm the adequacy of sampling and assess the data factorability,respectively. In this investigation, the BTS was determined to be significant at p < 0.001 andthe KMO index was found to be 0.901, demonstrating that the data was suitable for EFAimplementation.
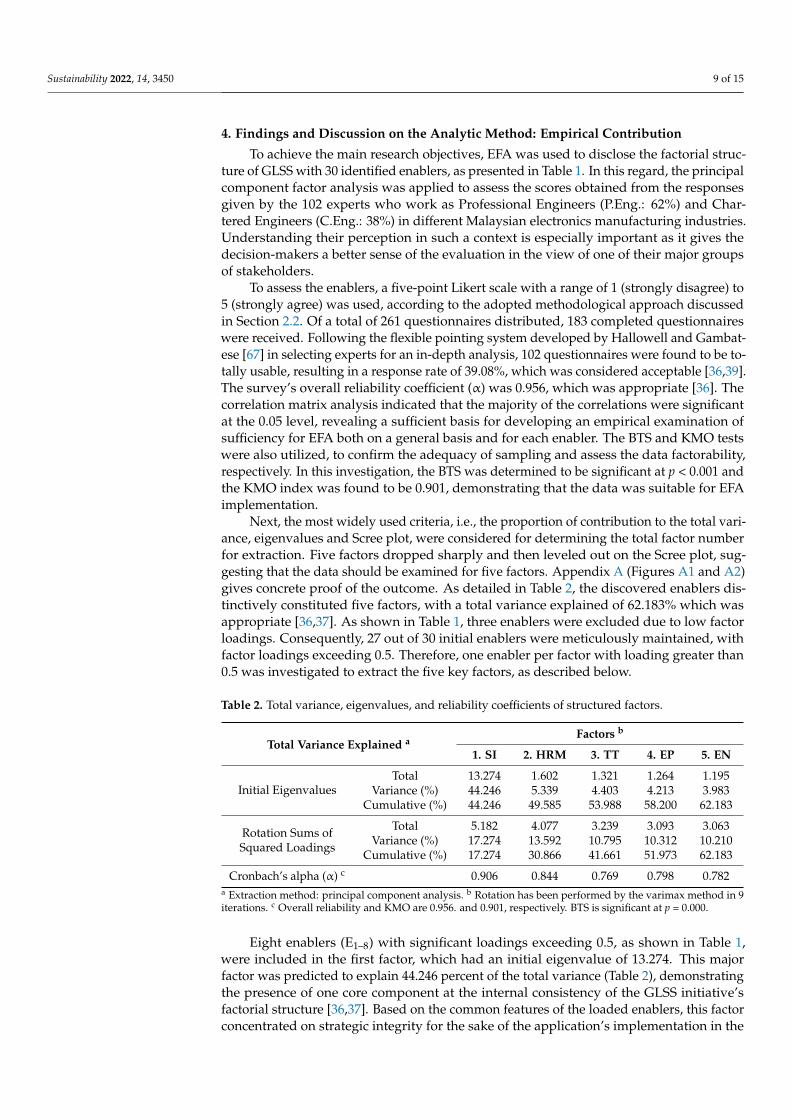
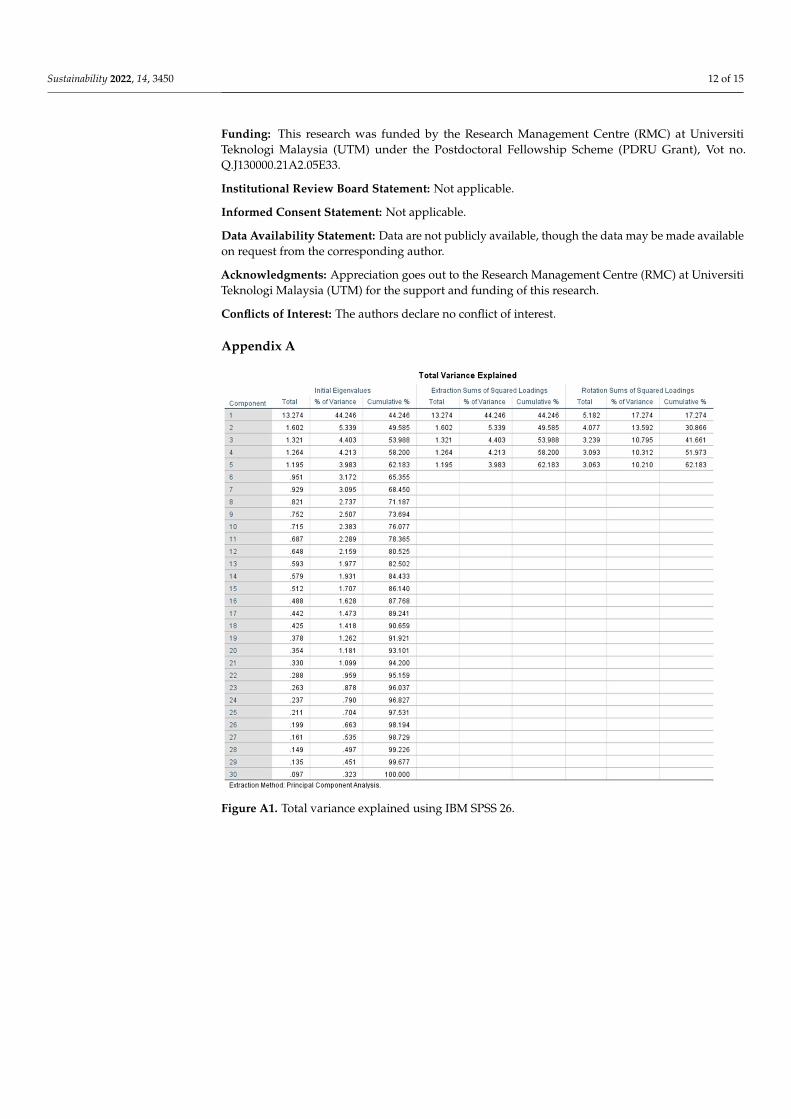
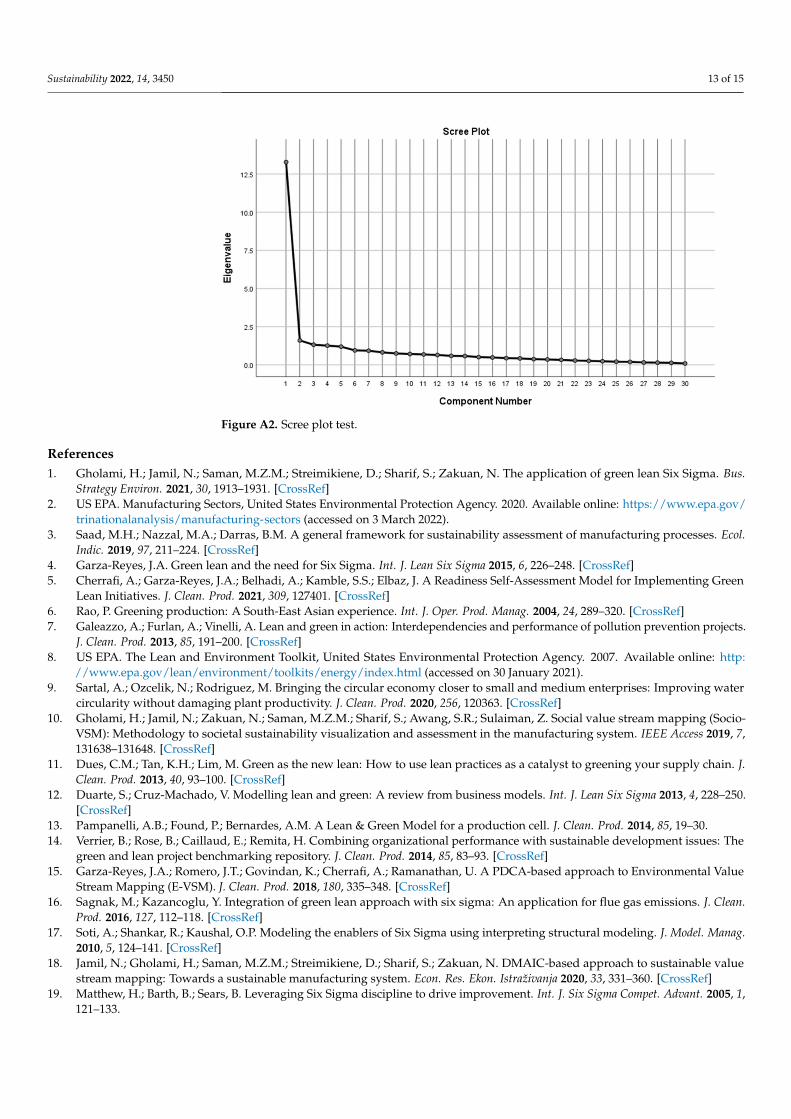
Next, the most widely used criteria, i.e., the proportion of contribution to the total vari-ance, eigenvalues and Scree plot, were considered for determining the total factor numberfor extraction. Five factors dropped sharply and then leveled out on the Scree plot, sug-gesting that the data should be examined for five factors. Appendix A (Figures A1 and A2)gives concrete proof of the outcome. As detailed in Table 2, the discovered enablers dis-tinctively constituted five factors, with a total variance explained of 62.183% which wasappropriate [36,37]. As shown in Table 1, three enablers were excluded due to low factorloadings. Consequently, 27 out of 30 initial enablers were meticulously maintained, withfactor loadings exceeding 0.5. Therefore, one enabler per factor with loading greater than0.5 was investigated to extract the five key factors, as described below.
Table 2. Total variance, eigenvalues, and reliability coefficients of structured factors.
Total Variance Explained aFactors b
1. SI 2. HRM 3. TT 4. EP 5. EN
Initial EigenvaluesTotal 13.274 1.602 1.321 1.264 1.195
Variance (%) 44.246 5.339 4.403 4.213 3.983Cumulative (%) 44.246 49.585 53.988 58.200 62.183
Rotation Sums ofSquared Loadings
Total 5.182 4.077 3.239 3.093 3.063Variance (%) 17.274 13.592 10.795 10.312 10.210
Cumulative (%) 17.274 30.866 41.661 51.973 62.183
Cronbach’s alpha (α) c 0.906 0.844 0.769 0.798 0.782a Extraction method: principal component analysis. b Rotation has been performed by the varimax method in 9iterations. c Overall reliability and KMO are 0.956. and 0.901, respectively. BTS is significant at p = 0.000.
Eight enablers (E1–8) with significant loadings exceeding 0.5, as shown in Table 1,were included in the first factor, which had an initial eigenvalue of 13.274. This majorfactor was predicted to explain 44.246 percent of the total variance (Table 2), demonstratingthe presence of one core component at the internal consistency of the GLSS initiative’sfactorial structure [36,37]. Based on the common features of the loaded enablers, this factorconcentrated on strategic integrity for the sake of the application’s implementation in the
Sustainability 2022, 14, 3450 10 of 15
organization. Thus, the term Strategic Integrity (SI) was used to label this factor. Theinternal consistency coefficient (α) of the SI structure was computed using SPSS and wasfound to be 0.906 (Table 2), which was statistically significant. As a result, the analysesindicated the validity of this articulated eight-enabler structure.
Five enablers (E9–13) with significant loadings exceeding 0.5, as shown in Table 1, wereincluded in the second factor, which had an initial eigenvalue of 1.602. This major factorwas predicted to explain 5.339% of the total variance (Table 2). Based on the commonfeatures of the loaded enablers, this factor concentrated on managing human resourcefor the sake of the GLSS implementation in the organization. Thus, the term HumanResource Management (HRM) was used to label this factor. The internal consistencycoefficient (α) of the HRM structure was computed using SPSS and was found to be 0.844(Table 2), which was statistically significant. This indicated the validity of this articulatedfive-enabler structure.
Four enablers (E14–17) with significant loadings exceeding 0.5, as shown in Table 1, wereincluded in the third factor, which had an initial eigenvalue of 1.321. This major factor waspredicted to explain 4.403% of the total variance (Table 2). Based on the common featuresof the loaded enablers, this factor concentrated on having apt technologies and tools forthe sake of the GLSS implementation in the organization. Thus, the term Technologiesand Tools (TT) was used to label this factor. The internal consistency coefficient (α) of theTT structure was computed using SPSS and was found to be 0.769 (Table 2), which wassignificant. This indicated the validity of this articulated four-enabler structure.
Five enablers (E18–22) with significant loadings exceeding 0.5, as shown in Table 1,were included in the fourth factor, which had an initial eigenvalue of 1.264. This majorfactor was predicted to explain 4.213% of the total variance (Table 2). Based on the commonfeatures of the loaded enablers, this factor concentrated on developing green productionpractices for the sake of the GLSS implementation in the organization. Twhus, the termEco-production (EP) was used to label this factor. The internal consistency coefficient (α) ofthe EP structure was computed using SPSS and as found to be 0.798 (Table 2), which wasstatistically significant. This indicated the validity of this articulated five-enabler structure.
Five enablers (E23–27) with significant loadings exceeding 0.5, as shown in Table 1,were included in the fifth factor, which had an eigenvalue of 1.195. This major factor waspredicted to explain 3.983% of the total variance (Table 2). Based on the common featuresof the loaded enablers, this factor concentrated on advancing green networks among majorstakeholders for the sake of the GLSS implementation in the organization. Thus, the termEco-network (EN) was used to label this factor. The internal consistency coefficient (α) ofthe EN structure was computed using SPSS and was found to be 0.782 (Table 2), which wasstatistically significant. This indicated the validity of this articulated five-enabler structure.
It is important to note that one of the key factors enabling GLSS implementation asTechnologies and Tools (TT). The concept can thus be strengthened by considering Industry4.0 technologies since the use of such technologies in advancing GLSS tools will result inincreased efficiency [31,52]. While da Silva et al. [52] gave an overview of Industry 4.0capabilities to deploy GLSS, the effective convergence of these two emerging conceptsis still in its infancy. Further innovative research is needed on the topic. According toLee et al. [30], such studies would provide research professionals, practitioners, and thosewho are interested in realizing the benefits of this convergence with new perspectivesand guidelines.
5. Conclusions, Implications and Future Directions
This study contributes valuable insights into which key factors enable Green Lean SixSigma (GLSS) implementation in the manufacturing industry. It theoretically identified andclarified the factors based on a systematic review. This paper also presents empirically afactorial structure of GLSS key enablers through the perceptions of some major stakeholderswho work in the Malaysian electronics manufacturing industry as professional engineers
Sustainability 2022, 14, 3450 11 of 15
(P.Eng.: 62%) and chartered engineers (C.Eng.: 38%). To this end, an exploratory factoranalysis (EFA) was, accordingly, applied.
The output of the theoretical and empirical analyses indicated that GLSS, which hasemerged in the Industry 4.0 era, is a multi-dimensional business strategy, so if a manu-facturing company gains experience in it, the required organizational learning, excellenceand system improvements for the company to benefit from GLSS performance supportcircular economy-based models, where the resources remain in the cycle until one of the 3Rs(reduce, reuse, and recycle) is practiced. The theoretical findings indicated that publicationgrowth has been significant since 2011, and it is projected to keep rising owing to its intel-lectual contribution to the environmentally-sustainable manufacturing paradigm, which isregarded as an application of the emerging concept of the circular economy. Interestingly,this growing global research trend has developed since the advent of Industry 4.0, whichcame to light in 2011. It was also observed that India, the United Kingdom, and the UnitedStates each have a large number of publications and strong international collaborations.These entities may provide an opportunity for scholars from other countries to expandtheir collaborative research efforts. More significantly, this study offered a concept of GLSSand also a set of key enablers that can be used for its operationalization. Following theestablished set, the empirical results were used to produce a structural model with twenty-seven validated enablers forming five key factors: Strategic Integrity (α = 0.906), HumanResource Management (α = 0. 844), Technologies and Tools (α = 0. 769), Eco-production(α = 0. 798) and Eco-network (α = 0. 782). The analyses revealed that there were strongrelationships between these key factors throughout the model. Strategic Integrity wasfound to be a major factor in the internal consistency of the GLSS factorial structure, with44.246% of the total variance explained.
Implication-wise, this article details a contemporary study in the field and deliversvaluable insights both theoretically and practically. Despite the fact that the relevanceand capabilities of GLSS have been studied, there is still work to be done to establish adefinition or a commonly accepted conceptual model, to develop valid and reliable scalesto investigate the degree of implementation, to analyze its main factors and impacts onbusiness results and to conduct rigorous empirical studies on the topic. This study, as one ofthe preliminary investigations carried out to this end, indicates GLSS is a business strategywith five key dimensions that can be applied to investigate its degree of implementation.The developed structural model has the potential to facilitate new studies in the develop-ment of an effective GLSS system. It may also serve as a guide for decision-makers towardsits implementation in manufacturing systems, particularly in electronics manufacturingindustries. Furthermore, it may support studies on developing industrial sustainability, atopic which is gaining traction in a variety of manufacturing sectors.
Nevertheless, the empirical findings, which are suggestive rather than definitive, havesome limitations that may suggest future research directions. Although every effort wasmade to include all essential enablers of GLSS by extensively studying the most up-to-date literature on the subject (see Table 1), there may be more critical factors that shouldbe considered. Additionally, some mediators may need to be investigated further. Itmay be necessary to include new enablers and/or to exclude the original ones in somescenarios. However, the primary recommendation for future research is to investigatethe generalizability of the discovered factors across multiple contexts (various countries,firms, and ethnic groupings) by testing the validity and reliability of the factors and bydeveloping factorial structures using new, larger datasets.
Author Contributions: Conceptualization, L.T.L., H.G. and A.A.S.; Data curation, L.T.L.; Formalanalysis, L.T.L. and H.G.; Funding acquisition, H.G., A.A.S., D.Š. and F.C.; Investigation, L.T.L.;Methodology, L.T.L. and H.G.; Project administration, N.M.Y. and N.H.A.B.N.; Resources, A.A.S.,D.Š. and F.C.; Software, L.T.L. and H.G.; Supervision, N.M.Y. and N.H.A.B.N.; Validation, H.G.,N.M.Y. and N.H.A.B.N.; Visualization, L.T.L. and H.G.; Writing—original draft, L.T.L. and H.G.;Writing—review and editing, N.M.Y., N.H.A.B.N., A.A.S., D.Š. and F.C. All authors have read andagreed to the published version of the manuscript.
Sustainability 2022, 14, 3450 12 of 15
Funding: This research was funded by the Research Management Centre (RMC) at UniversitiTeknologi Malaysia (UTM) under the Postdoctoral Fellowship Scheme (PDRU Grant), Vot no.Q.J130000.21A2.05E33.
Institutional Review Board Statement: Not applicable.
Informed Consent Statement: Not applicable.
Data Availability Statement: Data are not publicly available, though the data may be made availableon request from the corresponding author.
Acknowledgments: Appreciation goes out to the Research Management Centre (RMC) at UniversitiTeknologi Malaysia (UTM) for the support and funding of this research.
Conflicts of Interest: The authors declare no conflict of interest.
Appendix A
Figure A1. Total variance explained using IBM SPSS 26.
Sustainability 2022, 14, 3450 13 of 15
Figure A2. Scree plot test.
References1. Gholami, H.; Jamil, N.; Saman, M.Z.M.; Streimikiene, D.; Sharif, S.; Zakuan, N. The application of green lean Six Sigma. Bus.
Strategy Environ. 2021, 30, 1913–1931. [CrossRef]2. US EPA. Manufacturing Sectors, United States Environmental Protection Agency. 2020. Available online: https://www.epa.gov/
trinationalanalysis/manufacturing-sectors (accessed on 3 March 2022).3. Saad, M.H.; Nazzal, M.A.; Darras, B.M. A general framework for sustainability assessment of manufacturing processes. Ecol.
Indic. 2019, 97, 211–224. [CrossRef]4. Garza-Reyes, J.A. Green lean and the need for Six Sigma. Int. J. Lean Six Sigma 2015, 6, 226–248. [CrossRef]5. Cherrafi, A.; Garza-Reyes, J.A.; Belhadi, A.; Kamble, S.S.; Elbaz, J. A Readiness Self-Assessment Model for Implementing Green
Lean Initiatives. J. Clean. Prod. 2021, 309, 127401. [CrossRef]6. Rao, P. Greening production: A South-East Asian experience. Int. J. Oper. Prod. Manag. 2004, 24, 289–320. [CrossRef]7. Galeazzo, A.; Furlan, A.; Vinelli, A. Lean and green in action: Interdependencies and performance of pollution prevention projects.
J. Clean. Prod. 2013, 85, 191–200. [CrossRef]8. US EPA. The Lean and Environment Toolkit, United States Environmental Protection Agency. 2007. Available online: http:
//www.epa.gov/lean/environment/toolkits/energy/index.html (accessed on 30 January 2021).9. Sartal, A.; Ozcelik, N.; Rodriguez, M. Bringing the circular economy closer to small and medium enterprises: Improving water
circularity without damaging plant productivity. J. Clean. Prod. 2020, 256, 120363. [CrossRef]10. Gholami, H.; Jamil, N.; Zakuan, N.; Saman, M.Z.M.; Sharif, S.; Awang, S.R.; Sulaiman, Z. Social value stream mapping (Socio-
VSM): Methodology to societal sustainability visualization and assessment in the manufacturing system. IEEE Access 2019, 7,131638–131648. [CrossRef]
11. Dues, C.M.; Tan, K.H.; Lim, M. Green as the new lean: How to use lean practices as a catalyst to greening your supply chain. J.Clean. Prod. 2013, 40, 93–100. [CrossRef]
12. Duarte, S.; Cruz-Machado, V. Modelling lean and green: A review from business models. Int. J. Lean Six Sigma 2013, 4, 228–250.[CrossRef]
13. Pampanelli, A.B.; Found, P.; Bernardes, A.M. A Lean & Green Model for a production cell. J. Clean. Prod. 2014, 85, 19–30.14. Verrier, B.; Rose, B.; Caillaud, E.; Remita, H. Combining organizational performance with sustainable development issues: The
green and lean project benchmarking repository. J. Clean. Prod. 2014, 85, 83–93. [CrossRef]15. Garza-Reyes, J.A.; Romero, J.T.; Govindan, K.; Cherrafi, A.; Ramanathan, U. A PDCA-based approach to Environmental Value
Stream Mapping (E-VSM). J. Clean. Prod. 2018, 180, 335–348. [CrossRef]16. Sagnak, M.; Kazancoglu, Y. Integration of green lean approach with six sigma: An application for flue gas emissions. J. Clean.
Prod. 2016, 127, 112–118. [CrossRef]17. Soti, A.; Shankar, R.; Kaushal, O.P. Modeling the enablers of Six Sigma using interpreting structural modeling. J. Model. Manag.
2010, 5, 124–141. [CrossRef]18. Jamil, N.; Gholami, H.; Saman, M.Z.M.; Streimikiene, D.; Sharif, S.; Zakuan, N. DMAIC-based approach to sustainable value
stream mapping: Towards a sustainable manufacturing system. Econ. Res. Ekon. Istraživanja 2020, 33, 331–360. [CrossRef]19. Matthew, H.; Barth, B.; Sears, B. Leveraging Six Sigma discipline to drive improvement. Int. J. Six Sigma Compet. Advant. 2005, 1,
121–133.
Sustainability 2022, 14, 3450 14 of 15
20. Linderman, K.; Schroeder, R.G.; Zaheer, S.; Choo, A.S. Six Sigma: A goal-theoretic perspective. J. Oper. Manag. 2003, 21, 193–203.[CrossRef]
21. Banuelas, R.; Antony, J.; Brace, M. An application of Six Sigma to reduce waste. Qual. Reliab. Eng. Int. 2005, 21, 553–570.[CrossRef]
22. Montgomery, D.C.; Woodall, W.H. An overview of six sigma. Int. Stat. Rev. Rev. Int. Stat. 2008, 76, 329–346. [CrossRef]23. Cherrafi, A.; El Fezazi, S.; Govindan, K.; Garza-Reyes, J.A.; Mokhlis, A.; Benhida, K. A framework for the integration of Green
and Lean Six Sigma for superior sustainability performance. Int. J. Prod. Res. 2017, 55, 4481–4515. [CrossRef]24. Caiado, R.; Nascimento, D.; Quelhas, O.; Tortorella, G.; Rangel, L. Towards sustainability through green, lean and six sigma
integration at service industry: Review and framework. Technol. Econ. Dev. Econ. 2018, 24, 1659–1678. [CrossRef]25. Sony, M.; Naik, S. Green Lean Six Sigma implementation framework: A case of reducing graphite and dust pollution. Int. J.
Sustain. Eng. 2019, 13, 184–193. [CrossRef]26. Kaswan, M.S.; Rathi, R. Investigating the enablers associated with implementation of Green Lean Six Sigma in manufacturing
sector using Best Worst Method. Clean Technol. Environ. Policy 2020, 22, 865–876. [CrossRef]27. Ershadi, M.J.; Taghizadeh, O.Q.; Molana, S.M.H. Selection and performance estimation of Green Lean Six Sigma Projects: A
hybrid approach of technology readiness level, data envelopment analysis, and ANFIS. Environ. Sci. Pollut. Res. 2021, 28,29394–29411. [CrossRef]
28. Ministry of Energy, Green Technology and Water Malaysia. Green Technology Master Plan Malaysia 2017–2030; Ministry of Energy,Green Technology and Water (KeTTHA): Putrajaya, Malaysia, 2017.
29. Abu, F.; Gholami, H.; Saman, M.Z.M.; Zakuan, N.; Sharif, S.; Streimikiene, D. Pathways of lean manufacturing in wood andfurniture industries: A bibliometric and systematic review. Eur. J. Wood Wood Prod. 2021, 79, 753–772. [CrossRef]
30. Lee, J.K.Y.; Gholami, H.; Saman, M.Z.M.; Ngadiman, N.H.A.B.; Zakuan, N.; Mahmood, S.; Omain, S.Z. Sustainability-orientedApplication of Value Stream Mapping: A review and classification. IEEE Access 2021, 9, 68414–68434. [CrossRef]
31. Gholami, H.; Abu, F.; Lee, J.K.Y.; Karganroudi, S.S.; Sharif, S. Sustainable Manufacturing 4.0—Pathways and Practices. Sustainabil-ity 2021, 13, 13956. [CrossRef]
32. Gholami, H.; Saman, M.Z.M.; Sharif, S.; Md Khudzari, J.; Zakuan, N.; Streimikiene, D.; Streimikis, J. A general framework forsustainability assessment of sheet metalworking processes. Sustainability 2020, 12, 4957. [CrossRef]
33. Kitchenham, B. Procedures for Performing Systematic Reviews; Keele University: Keele, UK, 2004; Volume 33, pp. 1–26.34. Gholami, H.; Saman, M.Z.M.; Mardani, A.; Streimikiene, D.; Sharif, S.; Zakuan, N. Proposed analytic framework for student
relationship management based on a systematic review of CRM systems literature. Sustainability 2018, 10, 1237. [CrossRef]35. Besseris, G.J. Applying the DOE toolkit on a Lean-and-Green Six Sigma maritime-operation improvement project. Int. J. Lean Six
Sigma 2011, 2, 270–284. [CrossRef]36. Hair, J.F.; Black, W.C.; Babin, B.J.; Anderson, R.E. Multivariate Data Analysis: A Global Perspective, 7th ed.; Pearson-Hall International:
Upper Saddle River, NJ, USA, 2010.37. Gholami, H.; Rezaei, G.; Saman, M.Z.M.; Sharif, S.; Zakuan, N. State-of-the-art Green HRM System. J. Clean. Prod. 2016, 124,
142–163. [CrossRef]38. Rezaei, G.; Gholami, H.; Shaharou, A.B.M.; Saman, M.Z.M.; Sadeghi, L.; Zakuan, N. Shared knowledge mediated correlation
between cultural excellence and organisational performance. Total Qual. Manag. Bus. Excell. 2017, 28, 427–458. [CrossRef]39. Abu, F.; Gholami, H.; Saman, M.Z.M.; Zakuan, N.; Streimikiene, D.; Kyriakopoulos, G.L. An SEM approach for the barrier
analysis in lean implementation in manufacturing industries. Sustainability 2021, 13, 1978. [CrossRef]40. Rezaei, G.; Gholami, H.; Shaharou, A.B.M.; Saman, M.Z.M.; Zakuan, N.; Najmi, M. Relationship among culture of excellence,
organisational performance and knowledge sharing: Proposed conceptual framework. Int. J. Product. Qual. Manag. 2016, 19,446–465. [CrossRef]
41. Hashemi, A.; Gholami, H.; Venkatadri, U.; Karganroudi, S.S.; Khouri, S.; Wojciechowski, A.; Streimikiene, D. A New DirectCoefficient-Based Heuristic Algorithm for Set Covering Problems. Int. J. Fuzzy Syst. 2021, 1–17. [CrossRef]
42. Sanders, A.; Elangeswaran, C.; Wulfsberg, J.P. Industry 4.0 implies lean manufacturing: Research activities in industry 4.0 functionas enablers for lean manufacturing. J. Ind. Eng. Manag. 2016, 9, 811–833. [CrossRef]
43. Kolberg, D.; Zühlke, D. Lean Automation enabled by Industry 4.0 Technologies. IFAC-PapersOnLine 2015, 48, 1870–1875.[CrossRef]
44. Buer, S.-V.; Strandhagen, J.O.; Chan, F.T.S. The link between Industry 4.0 and lean manufacturing: Mapping current research andestablishing a research agenda. Int. J. Prod. Res. 2018, 56, 2924–2940. [CrossRef]
45. Mrugalska, B.; Wyrwicka, M.K. Towards lean production in industry 4.0. Proc. Eng. 2017, 182, 466–473. [CrossRef]46. Jabbour, A.B.L.d.S.; Jabbour, C.J.C.; Foropon, C.; Filho, M.G. When titans meet—Can industry 4.0 revolutionise the
environmentally-sustainable manufacturing wave? The role of critical success factors. Technol. Forecast. Soc. Chang. 2018, 132,18–25.
47. Tsai, W.-H.; Lai, S.-Y. Green Production Planning and Control Model with ABC under Industry 4.0 for the Paper Industry.Sustainability 2018, 10, 2932. [CrossRef]
48. Chiarini, A.; Kumar, M. Lean Six Sigma and Industry 4.0 integration for Operational Excellence: Evidence from Italian manufac-turing companies. Prod. Plan. Control 2021, 32, 1084–1101. [CrossRef]

Sustainability 2022, 14, 3450 15 of 15
49. Titmarsh, R.; Assad, F.; Harrison, R. Contributions of lean six sigma to sustainable manufacturing requirements: An Industry 4.0perspective. Proc. Cirp 2020, 90, 589–593. [CrossRef]
50. Sony, M. Design of cyber physical system architecture for industry 4.0 through lean six sigma: Conceptual foundations andresearch issues. Prod. Manuf. Res. 2020, 8, 158–181.
51. Bhat, V.S.; Bhat, S.; Gijo, E.V. Simulation-based lean six sigma for Industry 4.0: An action research in the process industry. Int. J.Qual. Reliab. Manag. 2021, 38, 1215–1245.
52. Da Silva, I.B.; Cabeça, M.G.; Barbosa, G.F.; Shiki, S.B. Lean Six Sigma for the automotive industry through the tools and aspectswithin metrics: A literature review. Int. J. Adv. Manuf. Technol. 2021, 119, 1357–1383. [CrossRef]
53. Belhadi, A.; Kamble, S.S.; Zkik, K.; Cherrafi, A.; Touriki, F.E. The integrated effect of Big Data Analytics, Lean Six Sigma andGreen Manufacturing on the environmental performance of manufacturing companies: The case of North Africa. J. Clean. Prod.2020, 252, 119903.
54. Pandey, H.; Garg, D.; Luthra, S. Identification and ranking of enablers of green lean Six Sigma implementation using AHP. Int. J.Product. Qual. Manag. 2018, 23, 187–217.
55. Kumar, S.; Luthra, S.; Govindan, K.; Kumar, N.; Haleem, A. Barriers in green lean six sigma product development process: AnISM approach. Prod. Plan. Control 2016, 27, 604–620.
56. Banawi, A.; Bilec, M.M. A framework to improve construction processes: Integrating Lean, Green and Six Sigma. Int. J. Constr.Manag. 2014, 14, 45–55. [CrossRef]
57. Kumar, S.; Kumar, N.; Haleem, A. Conceptualisation of sustainable green lean six sigma: An empirical analysis. Int. J. Bus. Excell.2015, 8, 210–250. [CrossRef]
58. Chugani, N.; Kumar, V.; Garza-Reyes, J.A.; Rocha-Lona, L.; Upadhyay, A. Investigating the green impact of lean, six sigma andlean six sigma. Int. J. Lean Six Sigma 2017, 8, 7–32. [CrossRef]
59. Kaswan, M.S.; Rathi, R. Analysis and modeling the enablers of green lean six sigma implementation using interpretive structuralmodeling. J. Clean. Prod. 2019, 231, 1182–1191. [CrossRef]
60. Hussain, K.; He, Z.; Ahmad, N.; Iqbal, M. Green, lean, six sigma barriers at a glance: A case from the construction sector ofPakistan. Build. Environ. 2019, 161, 106225. [CrossRef]
61. Gandhi, N.S.; Thanki, S.J.; Thakkar, J.J. Ranking of drivers for integrated lean-green manufacturing for Indian manufacturingSMEs. J. Clean. Prod. 2018, 171, 675–689. [CrossRef]
62. Mishra, M.N. Identify critical success factors to implement integrated green and Lean Six Sigma. Int. J. Lean Six Sigma 2018.[CrossRef]
63. Parmar, P.S.; Desai, T.N. Evaluating Sustainable Lean Six Sigma enablers using fuzzy DEMATEL: A case of an Indian manufactur-ing organization. J. Clean. Prod. 2020, 265, 121802. [CrossRef]
64. Farrukh, A.; Mathrani, S.; Taskin, N. Investigating the Theoretical Constructs of a Green Lean Six Sigma Approach towardsEnvironmental Sustainability: A Systematic Literature Review and Future Directions. Sustainability 2020, 12, 8247. [CrossRef]
65. Singh, M.; Rathi, R.; Garza-Reyes, J.A. Analysis and prioritization of Lean Six Sigma enablers with environmental facets usingbest worst method: A case of Indian MSMEs. J. Clean. Prod. 2021, 279, 123592. [CrossRef]
66. Letchumanan, L.T.; Yusof, N.M.; Gholami, H.; Ngadiman, N.H.A.B. Green Lean Six Sigma: A Review. J. Adv. Res. Technol. Innov.Manag. 2021, 1, 33–40.
67. Hallowell, M.R.; Gambatese, J.A. Qualitative research: Application of the Delphi method to CEM research. J. Constr. Eng. Manag.2010, 136, 99–107. [CrossRef]