implementing lean six sigma to marine products industry in india
79
Manisha Thamke IMPLEMENTING LEAN SIX SIGMA TO MARINE PRODUCTS INDUSTRY IN INDIA Case Study of Seafood Industry "Company X" International Business 2020
-
Upload
khangminh22 -
Category
Documents
-
view
1 -
download
0
Transcript of implementing lean six sigma to marine products industry in india
Manisha Thamke
IMPLEMENTING LEAN SIX SIGMA TO
MARINE PRODUCTS INDUSTRY IN
INDIA
Case Study of Seafood Industry "Company X"
International Business
2020

VAASAN AMMATTIKORKEAKOULU
UNIVERSITY OF APPLIED SCIENCES
Degree Programme in International Business
ABSTRACT
Author Manisha Thamke
Title Implementing Lean Six Sigma to Marine Products Industry
in India
Year 2020
Language English
Pages 70 + 4 Appendices
Name of Supervisor Kenneth Norrgård
To maintain the new high, organizations need to improve the internal and external
systems and implement the latest approaches to compete in local and international
business. Implementation of Lean Six Sigma is trending on all the platform in in-
dustries. This research focuses on utilizing Lean Six Sigma in processes.
The management's interest in introducing Lean Six Sigma in the marine process
industry and the researcher's similar interest led the project to start. The project
discussion began and got approved six months before, in the case-company X.
This study's focus was to implement Lean Six Sigma in company X; to conduct
quality and continuous improvement. It was accomplished by evaluating people,
processes, environment, equipment, and management processes that contribute to
waste and affect productivity. Analyzing and enhancing suggestions and recom-
mendations provides the case company with practical means to implement Lean
Six Sigma and its tools and use them in current and future states.
The research comprises a literature review and empirical findings. The theories
studied were a quality, waste, quality management, Lean Six Sigma, including
tools VSM and DMAIC, and continuous improvement. The method involved
qualitative interviews, the company's internal documentation- process flow chart,
reports, meeting minutes, and company profile document used to describe the op-
eration, processes, environment, and background for DMAIC analysis.
The VSM-DMAIC analysis results highlighted some crucial issues that need some
attention and some essential elements that should be measured when using Lean
Six Sigma to contribute to marine food processes. It also provided a proposal for
improvement, monitoring, and staining continuous improvement. The study pro-
posed that progress in marine food production processes is feasible by implement-
ing LSS in this sector. It also suggested that management should use a training
and communication platform that provides a foundation for change trends in the
organization and creates performance measures as an essential element in Lean
Six Sigma continuous improvement culture.
Keywords: Lean, Six Sigma, Food industry, VSM, Marine Product Process,
Process improvement, DMAIC.
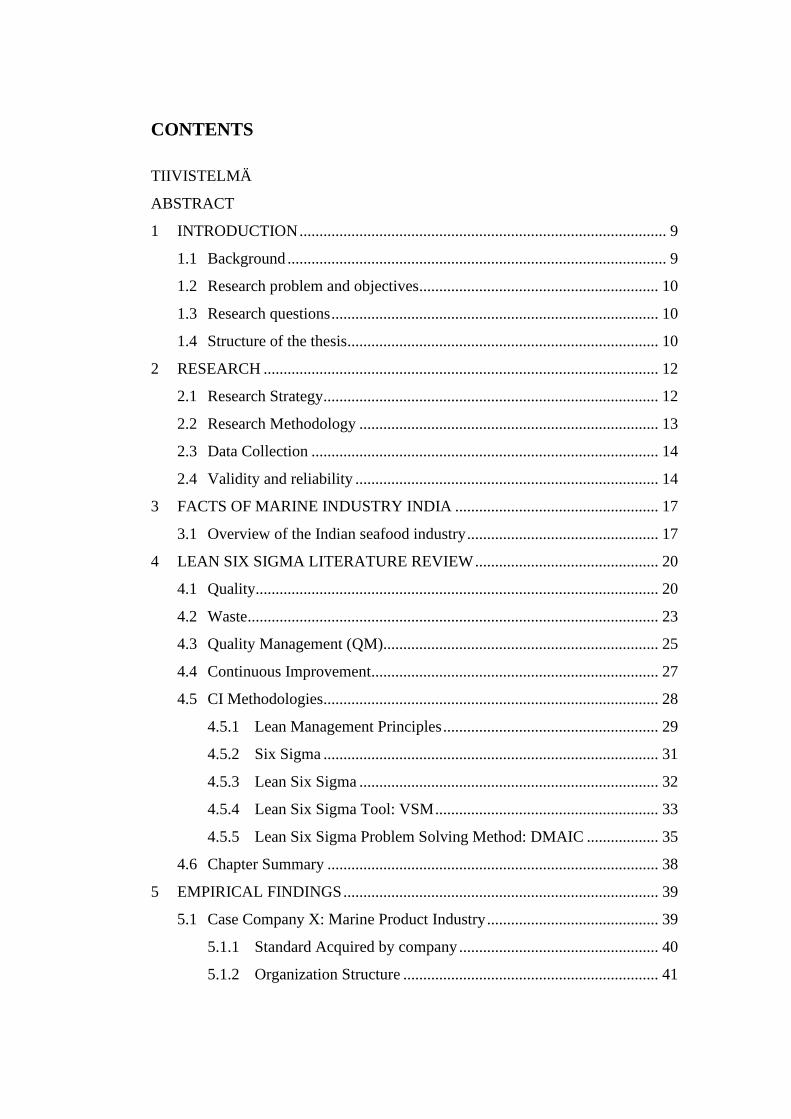
CONTENTS
TIIVISTELMÄ
ABSTRACT
1 INTRODUCTION ............................................................................................ 9
1.1 Background ............................................................................................... 9
1.2 Research problem and objectives ............................................................ 10
1.3 Research questions .................................................................................. 10
1.4 Structure of the thesis.............................................................................. 10
2 RESEARCH ................................................................................................... 12
2.1 Research Strategy.................................................................................... 12
2.2 Research Methodology ........................................................................... 13
2.3 Data Collection ....................................................................................... 14
2.4 Validity and reliability ............................................................................ 14
3 FACTS OF MARINE INDUSTRY INDIA ................................................... 17
3.1 Overview of the Indian seafood industry ................................................ 17
4 LEAN SIX SIGMA LITERATURE REVIEW .............................................. 20
4.1 Quality..................................................................................................... 20
4.2 Waste....................................................................................................... 23
4.3 Quality Management (QM)..................................................................... 25
4.4 Continuous Improvement........................................................................ 27
4.5 CI Methodologies.................................................................................... 28
4.5.1 Lean Management Principles ...................................................... 29
4.5.2 Six Sigma .................................................................................... 31
4.5.3 Lean Six Sigma ........................................................................... 32
4.5.4 Lean Six Sigma Tool: VSM ........................................................ 33
4.5.5 Lean Six Sigma Problem Solving Method: DMAIC .................. 35
4.6 Chapter Summary ................................................................................... 38
5 EMPIRICAL FINDINGS ............................................................................... 39
5.1 Case Company X: Marine Product Industry ........................................... 39
5.1.1 Standard Acquired by company .................................................. 40
5.1.2 Organization Structure ................................................................ 41

5.2 VSM finding ........................................................................................... 42
5.3 Defining Problem .................................................................................... 43
5.4 Measuring ............................................................................................... 44
5.5 Analyzing ................................................................................................ 44
5.5.1 Environment ................................................................................ 45
5.5.2 Workforce ................................................................................... 46
5.5.3 Process ........................................................................................ 46
5.5.4 Equipment ................................................................................... 47
5.5.5 Management ................................................................................ 48
5.6 Improving ................................................................................................ 49
5.7 Control .................................................................................................... 59
6 CONCLUSION .............................................................................................. 60
6.1 Discussion ............................................................................................... 60
6.2 Conclusion .............................................................................................. 61
6.3 Limitations and ....................................................................................... 62
6.4 Future Research ...................................................................................... 62
REFERENCES ...................................................................................................... 63
5
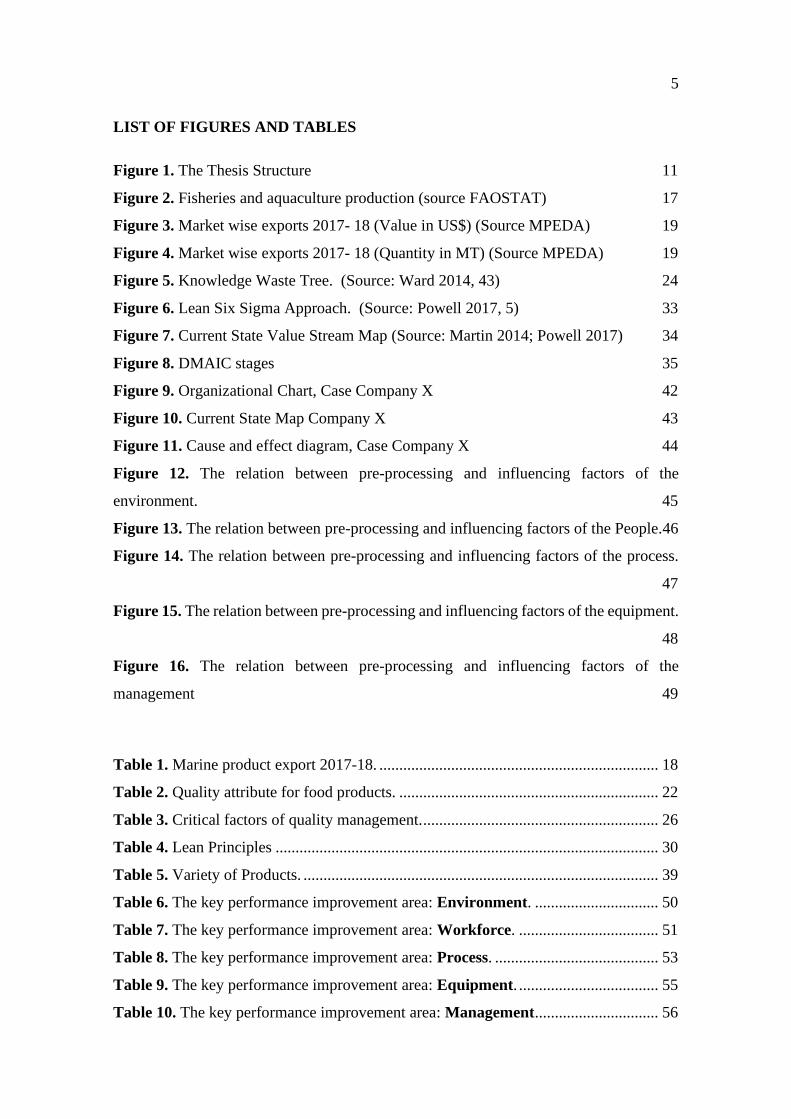
LIST OF FIGURES AND TABLES
Figure 1. The Thesis Structure 11
Figure 2. Fisheries and aquaculture production (source FAOSTAT) 17
Figure 3. Market wise exports 2017- 18 (Value in US$) (Source MPEDA) 19
Figure 4. Market wise exports 2017- 18 (Quantity in MT) (Source MPEDA) 19
Figure 5. Knowledge Waste Tree. (Source: Ward 2014, 43) 24
Figure 6. Lean Six Sigma Approach. (Source: Powell 2017, 5) 33
Figure 7. Current State Value Stream Map (Source: Martin 2014; Powell 2017) 34
Figure 8. DMAIC stages 35
Figure 9. Organizational Chart, Case Company X 42
Figure 10. Current State Map Company X 43
Figure 11. Cause and effect diagram, Case Company X 44
Figure 12. The relation between pre-processing and influencing factors of the
environment. 45
Figure 13. The relation between pre-processing and influencing factors of the People.46
Figure 14. The relation between pre-processing and influencing factors of the process.
47
Figure 15. The relation between pre-processing and influencing factors of the equipment.
48
Figure 16. The relation between pre-processing and influencing factors of the
management 49
Table 1. Marine product export 2017-18. ...................................................................... 18
Table 2. Quality attribute for food products. ................................................................. 22
Table 3. Critical factors of quality management. ........................................................... 26
Table 4. Lean Principles ................................................................................................ 30
Table 5. Variety of Products. ......................................................................................... 39
Table 6. The key performance improvement area: Environment. ............................... 50
Table 7. The key performance improvement area: Workforce. ................................... 51
Table 8. The key performance improvement area: Process. ......................................... 53
Table 9. The key performance improvement area: Equipment. ................................... 55
Table 10. The key performance improvement area: Management ............................... 56
6
LIST OF APPENDICES
APPENDIX I Preliminary Data Gathering Forum
APPENDIX II VSM current state mapping Brainstorming questions
APPENDIX III Interview Questionnaire
APPENDIX IV Interview Data
7
ABBREVIATIONS
BRC The British Retail Consortium
CI Continuous Improvement
CTQ Critical To Quality
DMAIC Define Measure Analyze Improve and Control
EEZ Exclusive Economic Zone
EU European Union
FAO Food and Agriculture Organization
FAOSTAT Food and Agriculture Organization Statistics
FSSAI Food Safety and Standards Authority of India
FSSC Food Safety System
HACCP Hazard Analysis Critical Control Point
IQF Individual Quick Frozen
JIT Just In Time
LAMDA Look Ask Model Discuss and Act
LSS Lean Six Sigma
MPEDA The Marine Products Export Development Authority
NNVA Necessary but Non-Value-Added
NVA Non-Value-Added
PD Peeling and Deveining
PDCA Plan Do Check Act
8
PDSA Plan Do Study Act
SIPOC Suppliers Inputs Process Outputs Customers
SPC Statistical Process Control
TQM Total Quality Management
TPS Toyota Production System
QM Quality Management
VA Value Added
VOC Voice Of Customer
VSM Value Stream Mapping
9
1 INTRODUCTION
1.1 Background
Increasing competition and making efforts towards maximizing productivity and profita-
bility have always been part of organizations worldwide. The organization's productivity
and profitability are directly or indirectly affected by the various factors; one of the ele-
ments is a different kind of waste. Organizations nowadays are practicing Lean principles,
as multiple types of research have quantified that applying Lean practices is the enhanced
technique to improve productivity by reducing time-consuming actions, which are non-
value added, which subsequently increases productivity and lowers production cost. As
productivity is an increase, it positively affects profitability. (Dave, 2019). Lean Man-
agement's primary goal is to establish and design a process that improves an industry's
productivity while identifying non-value-added practices in production or operation and
eliminating such practice to reduce waste and satisfy stakeholders' needs. "Womack and
Jones say in Lean Thinking, that lean companies figure out what value, is – what custom-
ers actually want – and concentrate on "value streams," the related activities that create
value." (Hobbs 2004, 3; Ward & Sobek II, 2014, 21; Womack & Jones 1996).
Companies are endeavoring to enhance the productivities of their operations through ad-
vancements in the processes. As the nature of the product in the food industry is perisha-
ble, time is a crucial factor, so shortening lead time and reducing wastes becomes essen-
tial. (Mahalik & Nambiar, 2010). Boosting productivity, establishing a great functioning
workforce and product quality can drive by using several initiatives, such as total quality
management (TQM) developed by William Deming, Plan-Do-Study-Act (PDSA) devel-
oped by W. Edwards Deming, which was a revision of the "Plan-Do-Check-Act Improve-
ment Cycle (PDCA)" developed by Walter A. Shewhart, Six Sigma, Statistical Process
Control (SPC), Value Stream Mapping methodology (VSM). (Madu 1999; Eslamy &
Newman &Weinberger 2014; Nicholas 2018, 23-54).
Among the list of Lean management approaches, Lean Six Sigma is widely practice.
Where Lean tools visually present the current situation, and Six Sigma methodology an-
alyzes and suggests an improvement. There are many research cases, studied and docu-
10
mented, where organization used Lean Six Sigma to improve the flaw and unpredictabil-
ity in processes to meet the customer contentment. (Hung & Sung, 2011). Therefore on
this background, this research aims to use the Lean Six Sigma methodology to design a
framework for continuous improvements to enhance productivity and profitability at case
company X.
1.2 Research problem and objectives
The intention of this thesis is to implement the Lean Six Sigma DMAIC practice in a
marine food product company based in western India for increasing productivity and
eliminating waste. In this research, factors affecting quality in production and profitability
at case company X will be analyze using Six Sigma DMAIC to make suggestions that
will enhance production quality and productivity. These studies will be engaged in the
following specific objectives to accomplish our goals:
• Apply Six Sigma DMAIC analysis in case company X to enhance production
quality.
• Define the areas that need to upgrade to enhance production processes.
• Create recommendations that will lead to increased production processes and
profitability.
• Eliminating waste and non-value added procedures.
1.3 Research questions
To accomplish the research objective mentioned in section 1.2, the following research
questions were generated.
RQ1: What are the causes of waste?
RQ2: What are the reasons behind the causes of waste?
RQ3: How can waste be eliminated?
1.4 Structure of the thesis
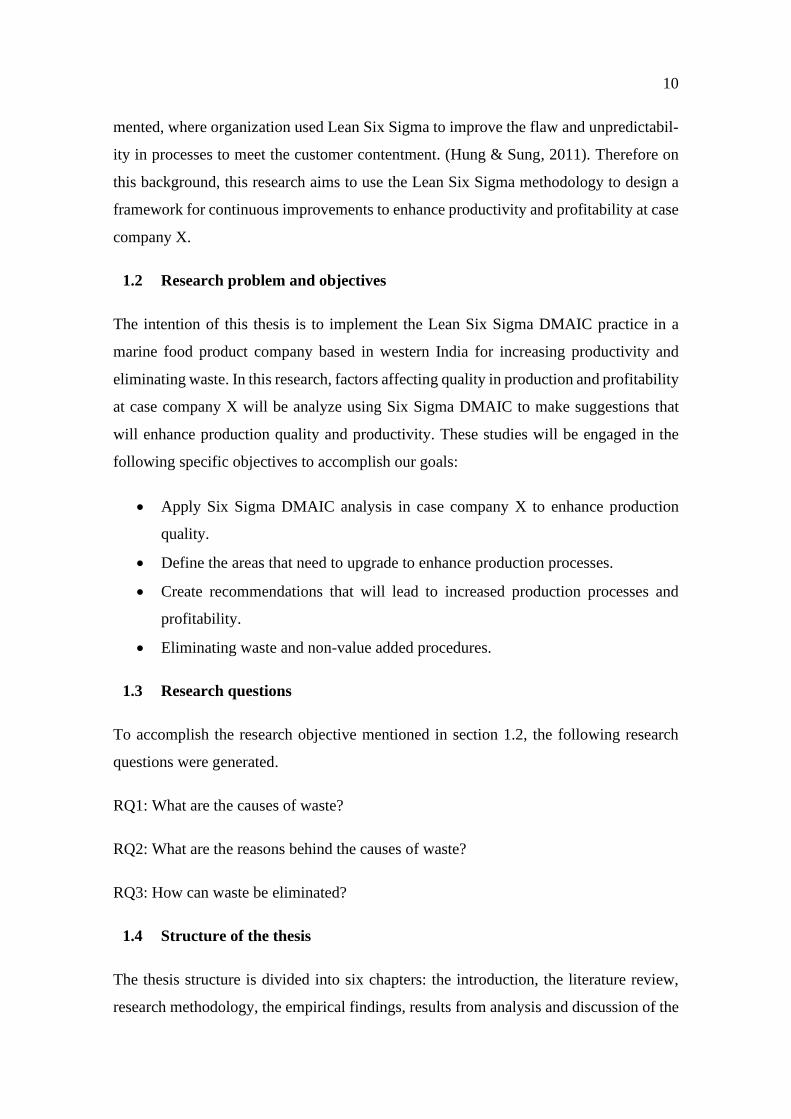
The thesis structure is divided into six chapters: the introduction, the literature review,
research methodology, the empirical findings, results from analysis and discussion of the
11
outcomes, and conclusion. This research paper is base on theoretical and empirical find-
ings. The study's background, motivation, and objectives are reviewed, and present the
research questions in the introduction. An overview of the entire research provided in the
first chapter; was designed with the help of the thesis structure. (Figure 1.) Chapter three
provided some facts about the Indian marine industry, explaining the global market pos-
sibility for our case company.
The literature review of the study stated in Chapter four provides the framework and rel-
ative theories used to conduct the research and achieve the objectives. The theoretical
analysis presented is to reach a complete groundwork, including quality, waste, quality
management, continuous improvement, Lean Six Sigma tools, and methodology. The em-
pirical section in Chapter five provides a detailed investigation of the cause of nonprofit-
able activities in case company X using Lean tool VSM and Six Sigma methodology
DMAIC. The thesis outline intends to structure the empirical study and apply research or
remodel the processes based on the theoretical groundwork—the thesis framework is
structured to uncover findings using empirical study relative to the theoretical foundation.
Figure 1. The Thesis Structure
Introduction
•Background
•Research objectives
•Research questions
•Structure of the thesis
Theoretical Study
•The Indian Seafood industry
•Continuous Improvement
•Lean Six Sigma
Empirical Findings
•Data Collection
•Interviews
•Analysis of Data
Conclusion
•Discussion
•Limitations
•Further Research
12
2 RESEARCH
Research is the process of stepping towards the conclusion of a problem through inter-
pretation and analysis of the methodical and intended collected data. "Research is an art
of scientific investigation." (Kothari 2004, 1-2). As per Redman and Mory, research is a
"systematized effort to gain new knowledge" (Redman & Mory 1923, 10). According to
Clifford Woody, "the research is not merely a search for truth, but a prolonged, purpose-
ful, intensive search. It encompasses defining and redefining problems, formulating hy-
potheses by collecting, organizing, and evaluating data, suggesting solutions and making
conclusions, and at last testing the conclusions to determine whether they fit the formu-
lating hypotheses." (Woody 1927)
According to Clifford Woody, this research follows the definition, which means we're
defining and redefining the case company X's problems, formulating assumptions by col-
lecting information, evaluating by brainstorming, discussion, and interviews, to suggest
the appropriate solutions. (Woody 1927)
The research chapter states the definitions of research. The study section includes the
research strategy to direct this study, describe the research methodology used for this
study, and data collection, validity, and reliability of these studies.
2.1 Research Strategy
This study is base on complementary approaches, which is a combination of inductive
and deductive methods. Firstly, the study used deductive approaches, which means col-
lecting the theories and literature relative, to approach the case company X—further mak-
ing a framework for analyzing by gathering data using research methodology. Secondly,
using the inductive research approach means observing the collected data and further
gathering the theories that can be applied to suggest the solutions. (Blackstone 2018, 19-
22)

13
2.2 Research Methodology
Kothari stated research methods as a data-gathering technique that used is to research
conduction. There are various types of research, namely; Descriptive vs. Analytical re-
search, Fundamental vs. Applied research; Quantitative vs. Qualitative research; Empiri-
cal vs. Conceptual analysis, and some other types of research. This research motivation
is to face the challenge of finding the problem and solve them, quantitative and qualitative
research method is well suited for our research motive. (Kothari, 2004, 1-6).
Quantitative research is measurement-based, whether it is quantity or amount. It is suita-
ble for analysis that can show in numbers. Hence, this methodology focuses on using
numerical data for verification purposes; it uses methods such as surveys, questionnaires,
or historical data (Saunders, Lewis & Thornhill 2009). The quantitative approach is most
common in primary data collection in marketing research.
Qualitative research is defined as "As unstructured methodology centered on small mod-
els, aimed to provide insight and comprehension." Qualitative research is quality based,
which is concerned with qualitative phenomena such as facts related to or involved with
quality, by using this research method to discover underlying motivation and outcomes,
using group and individual interviews or both according to the purpose. There are three
main techniques exercised in this method, i.e., observation, in-depth interviews, and focus
groups. These techniques can also be blend and used. This method allows the respondents
to reflect upon the project, processes, and express their views in their terms.
As the research is about increasing productivity, profitability, and waste elimination in
the case company, the qualitative research methodology is well suited for this research.
The study is also a project for a case company with a limited audience, which means the
quantitative method matrix won't work with this research. The qualitative methods used
for this research are focus groups, observation, and interviews. The qualitative approach
will help us find out what, why, and how for our project. In brief, what is wrong and
creating waste; why it is happening, and how can we prevent it? Answers and data col-
lected will help us in our DMAIC steps to ensure consistency and improvement.
14
2.3 Data Collection
Mainly the data collection and analysis are accomplished based on an interview. Initial
brainstorming helped focus on a particular group or area in the case-company; the brain-
storming performed using a virtual platform and basic questionnaire.
Further, the researcher observed with associates' help in a focused group and studied in-
ternal documents before using the interview method. The researcher carried out Inter-
views with all the participants within a week, dated 14th to 20st October 2020, using a
virtual platform. These interviews were in open discussion form guided with interview
questions. All the participants were either from the production, process, or quality control
area; they were aware of the project and had participated in initial brainstorming. The
participants were self-motivated to participate in the project and communicate through
their best knowledge about their suggestions and opinions—the prior permission request
of recording the interview discussion. The only interview was audio-recorded, which re-
spondent's permitted to do the recording. (note: interviews performed were in the local
language where the case company is situated.) All the information gathered or discussion
made concerning this research was with the electronic and virtual platform's help. It was
the only possibility in the COVID-19 pandemic situation.
2.4 Validity and reliability
The crucial aspects of all the researches are validity and reliability, with careful attention
to these aspects creates the difference between decent and weak analysis. Validity and
reliability of research assure stakeholders to find credibility and trustworthiness in the
research project. (Brink, 1993). As this research is base on qualitative methodology, va-
lidity and reliability are sensitive in this project. Golafshani (2003) stated, "if reliability
and validity are relevant to research hypotheses, especially from a qualitative point of
view, have to reformulated to reflect the multiple ways of establishing the truth." (Golaf-
shani 2003)
Validity in research is apprehensive with the truthfulness and accuracy of findings; there
are two known effective forms of validity, internal validity, and external validity. The
internal-validity focuses on analyzing if the research is genuinely reflecting and repre-
senting reality. The second major, external validity, addresses if the results or findings or

15
reflections of reality are legitimately applicable in the context and to what extend. (Healy,
2000). Further, the validity can be divide into three subgroups; Conceptual or construct
validity; Content validity, and Criterion validity. Construct validity defines how well the
research is developed; the content validity shows how well the research method reflects
research data. The criterion validity assesses how well the value of the measurement is
reflecting the research topic.
Reliability is the extent to which the researchers' data collection and analysis methods
and techniques will yield coherent outcomes. The reliability highlights the reproducibility
of the research. In the book "Research Methods for Business Students,2009," Saunders et
al. stated possible threats to reliability and validity. There are four threats to reliability
and six threats to validity. (Saunders, 2009; Grafton, Lillis, Ihantola & Kihn, 2011; Max-
well, 1992).
The reliability threats are:
• Participant error: If the study conducted is in a different time, situation, and sur-
roundings, the participant error can occur, generating a different result.
• Participant bias: Participant bias can occur due to organization pressure or supe-
rior pressure on the respondent.
• Observer error: researcher's judgment can influence the use of the measurement.
• Observer bias: it occurs if the researcher has a predetermined outcome.
The validity threats are:
• History suggests the unrelated events that occur during the study of a group of
individuals but are not part of the processes and may affect the results.
• Maturation suggests that the previous events may affect the result physically or
psychologically of the research or participant themselves.
• Testing is the possibility that the respondent is aware of the measure and is con-
cerned about its negative effect on him, affecting the result.
• Instrumentation threat is developed in the research when there is a specific change
in policies, which plays a vital role in studies' results.
• Mortality refers to the situation where the respondent backoff or not interested in
participating in the full event or all phases of the event. It may affect bias results.
16
• Ambiguity about the causal direction suggests the effect caused by the negative
attitude about appraisal based on low-performance ratings.
(Ihantola & Kihn, 2011; Saunders, 2009)
This study has created several methods to reach the measure of validity and reliability.
The methodology used in studies is qualitative open interviews based on support ques-
tions to maintain its focus. The respondent was from the relative department with ground
knowledge of the processes on which our project is the focus. The interviews were plan
according to respondent schedule to avoid participant error, and the respondent identity
will be kept confidential to avoid participant bias. The questions were formed with open-
end discussion to prevent researcher error and prejudice. The researcher secured the stud-
ies' credibility by using the literature as a reference point for the empirical findings. The
research problem is valid and related to the actual business process. The research outcome
will be applicable in real business and continued, which shows the studies' relevance.
However, most of the threats have been taken care of; the pandemic situation can affect
the data gathering and observation of the process in particular. The virtual meeting can
prove as a positive and negative at the same time. The virtual conference is audio-based,
making the respondent feel more comfortable and staying anonymous, which will result
in accuracy and frankness in putting up their opinion.

17
3 FACTS OF MARINE INDUSTRY INDIA
The literature will commence with available knowledge on the Indian seafood industry,
clarify what is quality and waste in processes, quality management, the techniques and
practices used in quality improvement, and a general view on the successful implemen-
tation of the Six Sigma to the affected areas.
3.1 Overview of the Indian seafood industry
The Indian seafood industry is prospered with the Indian coastline of 7,516 km and 2.02
million km² of an Exclusive Economic Zone (EEZ). The coastline population is nearly
one billion, i.e., 20 percent; aquaculture and fisheries are a significant segment with ele-
vated growth rates and play a key role in occupation and livelihood. This sector provides
about 13 million jobs in aquaculture, marine capture, inland capture, and others, including
subsistence, with women representing 32 percent of the people employed in the sector.
(FAO 2020)
India ranked fourth globally in fisheries production, after China, Indonesia, and the
United States, but India is the third most significant producer globally in aquaculture pro-
duction. Fish production in 2017 reached an estimation of 6.2 million tonnes, and export
earnings from fish, shrimps, and fishery products accounted for about UD$ 7.2 billion.
Figure 2. Fisheries and aquaculture production (source FAOSTAT)
0
2,000,000
4,000,000
6,000,000
8,000,000
10,000,000
12,000,000
14,000,000
2014 2015 2016 2017 2018
Vo
lum
e (t
on
nes
)
Axis Title
Fisheries Aquaculture
18
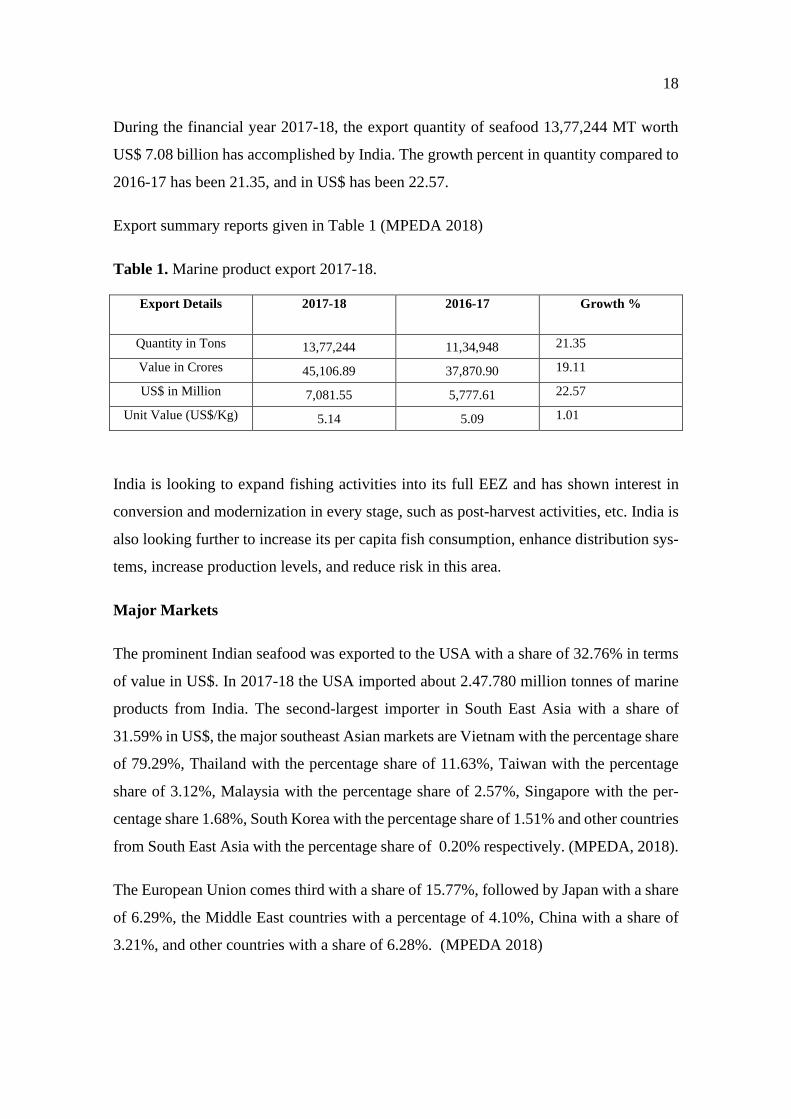
During the financial year 2017-18, the export quantity of seafood 13,77,244 MT worth
US$ 7.08 billion has accomplished by India. The growth percent in quantity compared to
2016-17 has been 21.35, and in US$ has been 22.57.
Export summary reports given in Table 1 (MPEDA 2018)
Table 1. Marine product export 2017-18.
Export Details 2017-18 2016-17 Growth %
Quantity in Tons 13,77,244 11,34,948 21.35
Value in Crores 45,106.89 37,870.90 19.11
US$ in Million 7,081.55 5,777.61 22.57
Unit Value (US$/Kg) 5.14 5.09 1.01
India is looking to expand fishing activities into its full EEZ and has shown interest in
conversion and modernization in every stage, such as post-harvest activities, etc. India is
also looking further to increase its per capita fish consumption, enhance distribution sys-
tems, increase production levels, and reduce risk in this area.
Major Markets
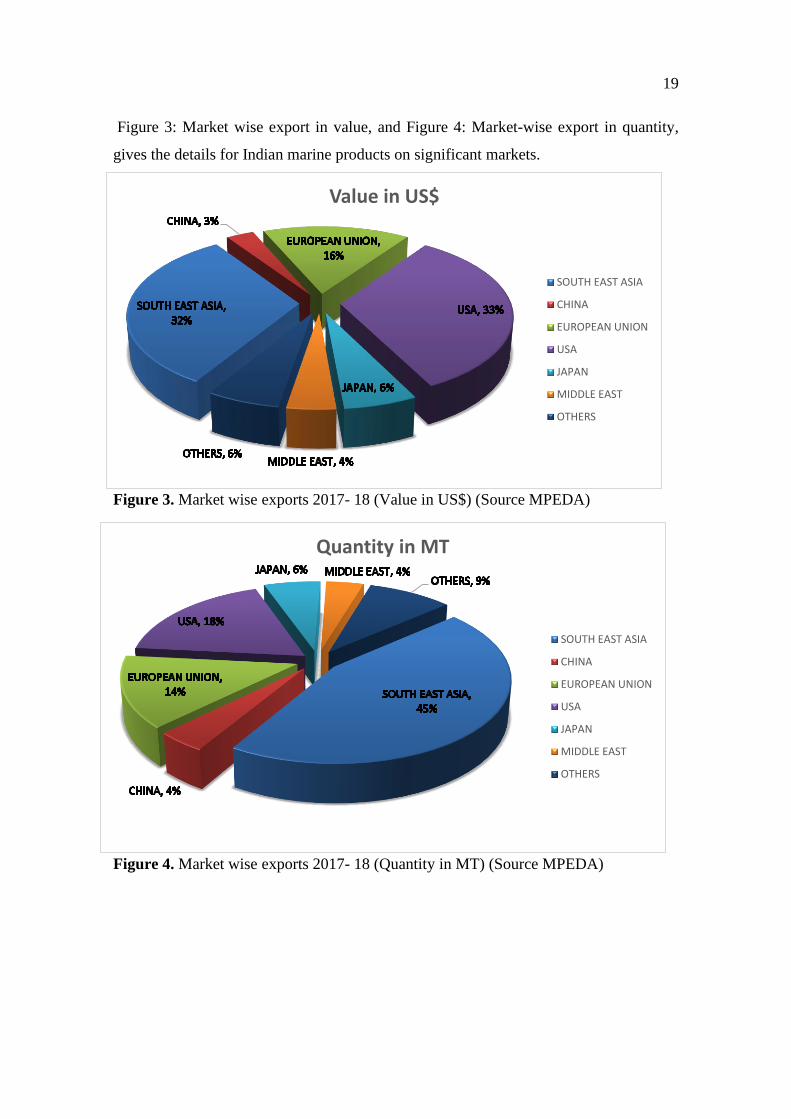
The prominent Indian seafood was exported to the USA with a share of 32.76% in terms
of value in US$. In 2017-18 the USA imported about 2.47.780 million tonnes of marine
products from India. The second-largest importer in South East Asia with a share of
31.59% in US$, the major southeast Asian markets are Vietnam with the percentage share
of 79.29%, Thailand with the percentage share of 11.63%, Taiwan with the percentage
share of 3.12%, Malaysia with the percentage share of 2.57%, Singapore with the per-
centage share 1.68%, South Korea with the percentage share of 1.51% and other countries
from South East Asia with the percentage share of 0.20% respectively. (MPEDA, 2018).
The European Union comes third with a share of 15.77%, followed by Japan with a share
of 6.29%, the Middle East countries with a percentage of 4.10%, China with a share of
3.21%, and other countries with a share of 6.28%. (MPEDA 2018)
19
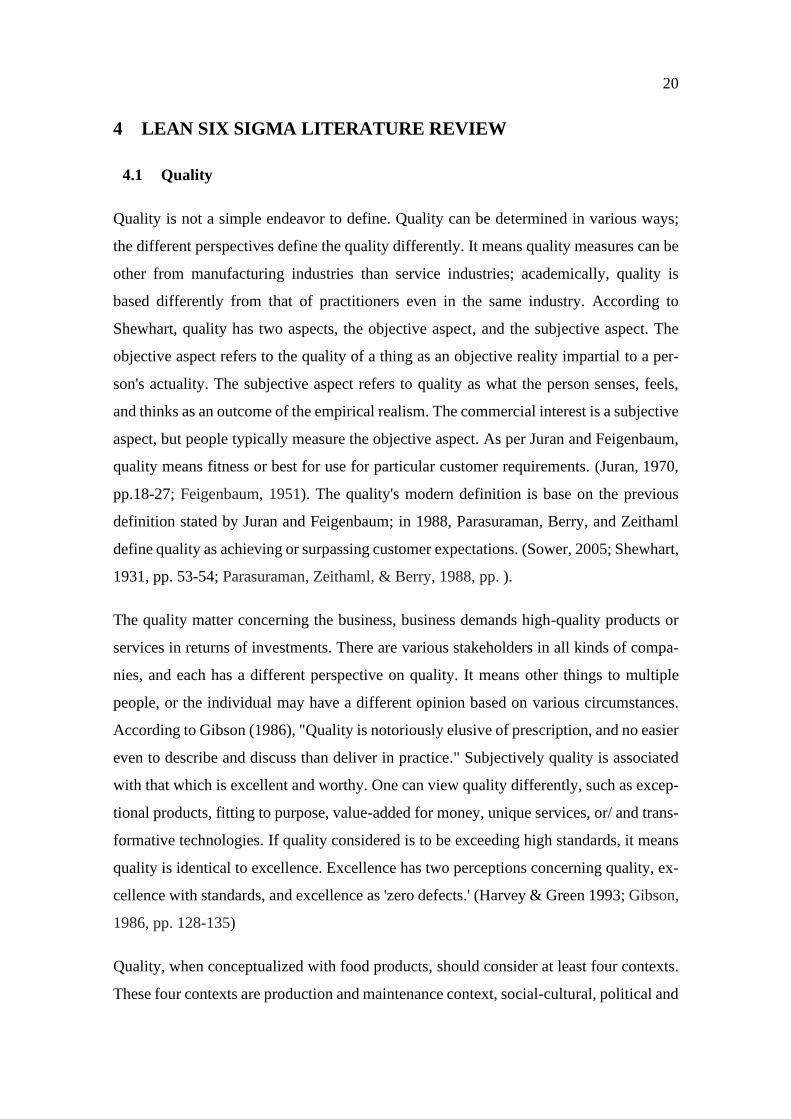
Figure 3: Market wise export in value, and Figure 4: Market-wise export in quantity,
gives the details for Indian marine products on significant markets.
Figure 3. Market wise exports 2017- 18 (Value in US$) (Source MPEDA)
Figure 4. Market wise exports 2017- 18 (Quantity in MT) (Source MPEDA)
Value in US$
SOUTH EAST ASIA
CHINA
EUROPEAN UNION
USA
JAPAN
MIDDLE EAST
OTHERS
Quantity in MT
SOUTH EAST ASIA
CHINA
EUROPEAN UNION
USA
JAPAN
MIDDLE EAST
OTHERS
20
4 LEAN SIX SIGMA LITERATURE REVIEW
4.1 Quality
Quality is not a simple endeavor to define. Quality can be determined in various ways;
the different perspectives define the quality differently. It means quality measures can be
other from manufacturing industries than service industries; academically, quality is
based differently from that of practitioners even in the same industry. According to
Shewhart, quality has two aspects, the objective aspect, and the subjective aspect. The
objective aspect refers to the quality of a thing as an objective reality impartial to a per-
son's actuality. The subjective aspect refers to quality as what the person senses, feels,
and thinks as an outcome of the empirical realism. The commercial interest is a subjective
aspect, but people typically measure the objective aspect. As per Juran and Feigenbaum,
quality means fitness or best for use for particular customer requirements. (Juran, 1970,
pp.18-27; Feigenbaum, 1951). The quality's modern definition is base on the previous
definition stated by Juran and Feigenbaum; in 1988, Parasuraman, Berry, and Zeithaml
define quality as achieving or surpassing customer expectations. (Sower, 2005; Shewhart,
1931, pp. 53-54; Parasuraman, Zeithaml, & Berry, 1988, pp. ).
The quality matter concerning the business, business demands high-quality products or
services in returns of investments. There are various stakeholders in all kinds of compa-
nies, and each has a different perspective on quality. It means other things to multiple
people, or the individual may have a different opinion based on various circumstances.
According to Gibson (1986), "Quality is notoriously elusive of prescription, and no easier
even to describe and discuss than deliver in practice." Subjectively quality is associated
with that which is excellent and worthy. One can view quality differently, such as excep-
tional products, fitting to purpose, value-added for money, unique services, or/ and trans-
formative technologies. If quality considered is to be exceeding high standards, it means
quality is identical to excellence. Excellence has two perceptions concerning quality, ex-
cellence with standards, and excellence as 'zero defects.' (Harvey & Green 1993; Gibson,
1986, pp. 128-135)
Quality, when conceptualized with food products, should consider at least four contexts.
These four contexts are production and maintenance context, social-cultural, political and
21
economic context, food production-consumption chain context, and regional context. Ac-
cording to their perspective, the production and maintenance of quality associate with
several players; they hold different definitions and quality measures. An excellent exam-
ple of this context is regulatory institutions; this institution is concerned with objective
indicators of the quality, such as applications of hygiene requirements related to food
industries. The second context, social-cultural, political, and economics, shows the con-
sumers' interest in the product, traditionally portrayed as subjective indicators, can be
well-defined as "quality such as experiential phenomena which lie in the eye of the be-
holder." From the consumer's perspective, an organization could produce quality out of
an appeal by tapping into consumers' subconscious desires in terms of texture, sense of
taste, flavors, appearance, and rates. (Ilbery & Kneafsey 2000)
A third important context is the food production-consumption chain, the continuously
cooperated nature of the concept of quality. The powerful actors of this context are, for
example, supermarkets; supermarkets claim that their products are of high quality; the
reason behind the claim is the strict health and safety standards that will impose upon
suppliers. The fourth context and final on the list are regions; quality is increasingly re-
lated to products from a specified area that uses local raw material and production meth-
ods. According to the Council of the European Communities, regulation '2081/92 notes,'
consumers are leaning to the product quality over product quantity, especially with the
food items, creating a heightened demand for the products with a recognizable geograph-
ical origin. It will give a clear picture to the consumers if the produced product were from
the region; which have high quality and tradition of hygiene in the food production pro-
cesses and are they well recognized and follow the standards such as European Councils,
US, Britain, and other country origins hygiene and food laws. (Ilbery 2000)
Definition of quality on different principles or methodologies on developing a skill set of
categorizing quality into five groups: transcendent based, product-based, manufacturing-
based, and value-based. Transcendent-based: According to Robert M. Pirsig 1999, "Qual-
ity is neither mind nor matter, but a third entity independent of the two…even though
quality cannot be defined, you know what it is." We can simply say that quality cannot
be characterized precisely; we learn to identify only through experience. The complexity
with this view is quality remains maddeningly vague. (Garvin 1988, 39-46; Pirsig, 1999,
pp 26)
22
Product Based definition: "Quality refers to the amounts of the unpriced attributes con-
tained in each unit of the priced attribute" Leffler K. 1982. In product-based illustrations,
view the quality as a precise and quantifiable variable. Product-based definitions of qual-
ity initially emerged in economic literature; the focus of early economic research on qual-
ity was entirely on durability. This approach has two apparent effects: it can achieve
higher quality only at a higher cost because quality shows the number of attributes and
attributes considered costly to produce. Second, the quality was believed an essential fea-
ture of goods rather than imputed to them. (Garvin, 1988; Leffler, 1982, pp. 956).
Manufacturing based definition: According to Crosby P., quality means congruence to
requirements. The approach focused on the consumers' interest in a product or services
that deviate from the specification. Last in the list, value-based definitions: value-based
is the quality in terms of expenses and rates. A survey on consumer perceptions of quality
in product categories such as food, clothing, beauty products, and personal care suggested
that the value-based view is becoming more common. The raw material and elements are
seen as essential quality indicators. (Garvin, 1988; Crosby, 1979, pp. 15).
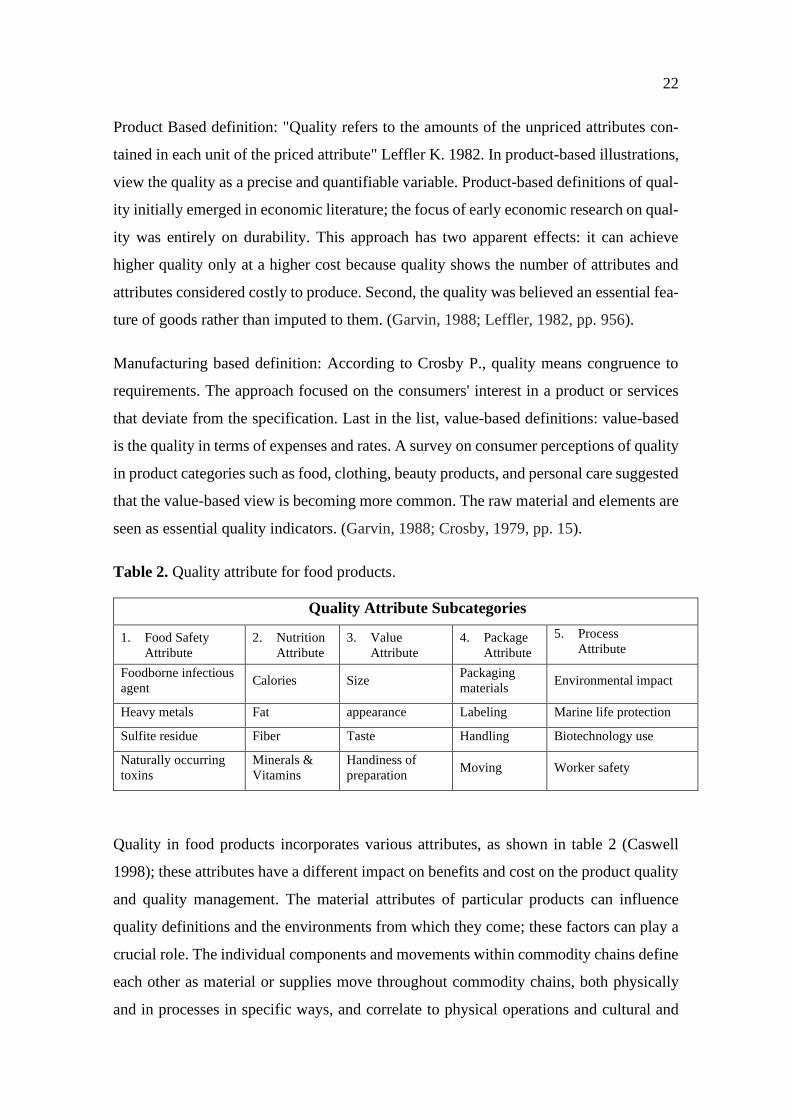
Table 2. Quality attribute for food products.
Quality Attribute Subcategories
1. Food Safety
Attribute
2. Nutrition
Attribute
3. Value
Attribute
4. Package
Attribute
5. Process
Attribute
Foodborne infectious
agent Calories Size
Packaging
materials Environmental impact
Heavy metals Fat appearance Labeling Marine life protection
Sulfite residue Fiber Taste Handling Biotechnology use
Naturally occurring
toxins
Minerals &
Vitamins
Handiness of
preparation Moving Worker safety
Quality in food products incorporates various attributes, as shown in table 2 (Caswell
1998); these attributes have a different impact on benefits and cost on the product quality
and quality management. The material attributes of particular products can influence
quality definitions and the environments from which they come; these factors can play a
crucial role. The individual components and movements within commodity chains define
each other as material or supplies move throughout commodity chains, both physically
and in processes in specific ways, and correlate to physical operations and cultural and
23
economic practices. This theory shows that "the quality" of fish or marine production can
be defined differently in each production area, different areas like fish biology or raw
material, processing, technologies, and strategies. But the overall outcome of all the pro-
duction quality can be the sum in the final product. (Mansfield 2003)
4.2 Waste
Anything that obstructs the value of the stream is waste. The term waste itself indicates
the loss, the opposite of worth, so in terms of value, waste is those activities that do not
create any value but still utilize costs, time, and resources. If producers analyze the pro-
cesses and identify the waste, the waste can be something that can be used to create value
by using it differently. (León, 2013). The knowledge of "waste" will help organizations
or businesses to decide if the change is necessary and what need to be changed. Changes
that are possible to make immediately, build the case for change, identify the process or
system, tailor the method or process according to the situation, and continuous improve-
ment. Once identified, the waste allows the procedures to be improved quickly, which
unquestionably creates value. (Ward & Sobek II, 2014, 41-69).
The Toyota Production System (TPS), originator, Taiichi Ohno, addressed the issue by
asking why and answering why's, discovered the cause of a problem. The evolution of the
Toyota Production System identified seven wastes in production those were: waste of
overproduction, waste of time – it can be waiting time in processes or time which do not
add any value to operations, unnecessary processing, movement and transportation, in-
ventory, and process or product defects. The Toyota Production System had clearly
shown that eliminating these wastes can increase operation productivity entirely by a wide
margin. (Ward 2014; Ohno 1988.)
The most important findings Taiichi Ohno found were overproduction, directly or indi-
rectly generating the remaining waste. The production, which was unnecessary at that
point, created inventory, time-consuming for extra output, movement, and transportation
of additional products to the warehouse, processing, and generating defects during these
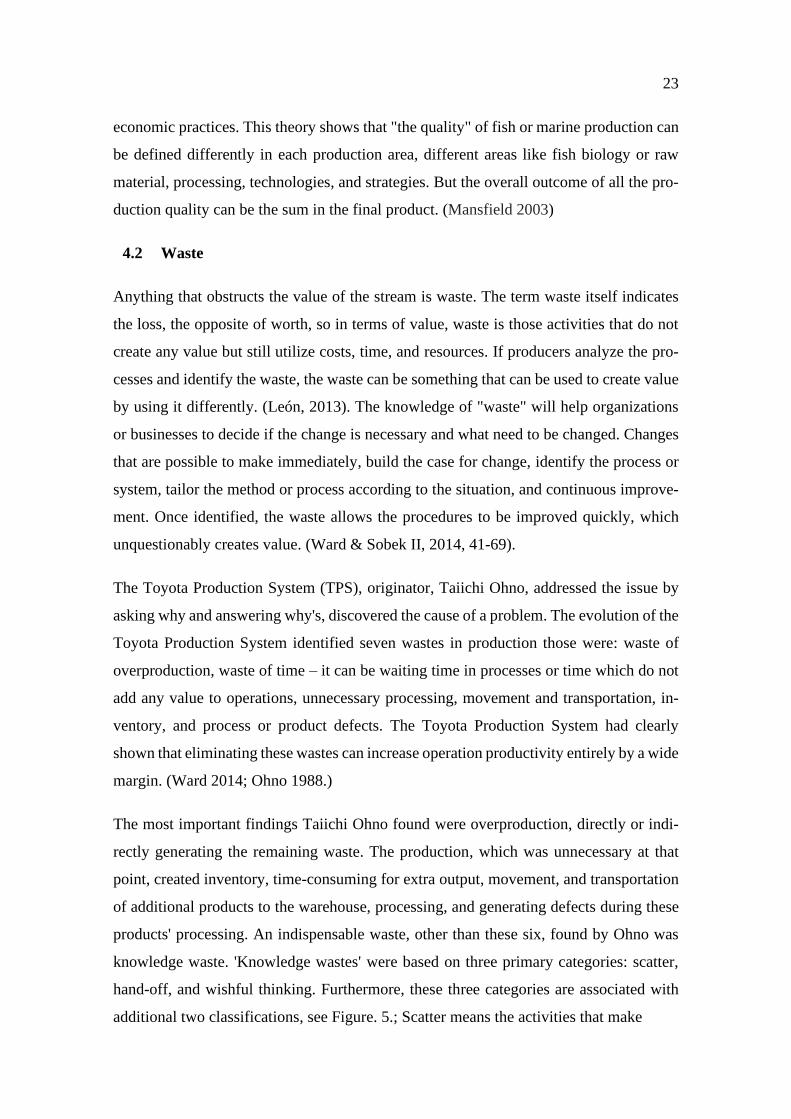
products' processing. An indispensable waste, other than these six, found by Ohno was
knowledge waste. 'Knowledge wastes' were based on three primary categories: scatter,
hand-off, and wishful thinking. Furthermore, these three categories are associated with
additional two classifications, see Figure. 5.; Scatter means the activities that make
24
Figure 5. Knowledge Waste Tree. (Source: Ward 2014, 43)
knowledge unproductive by disturbing its flow; actions such as reorganization and work-
load variations slow down the information flow to reach the right place. These further
uses increase time to carry information through channels, which creates barriers to com-
munications; additionally, a choice of inadequate tools sum more trouble in processes.
Hand-off can be said to be the most critical waste in knowledge wastes. As we know,
having information keeps the processes going on, but if the information is useless, it will
undoubtedly adversely affect the operations. Useless information, usually generated wait-
ing, which can be the cause behind the waste of time. The third category is wishful think-
ing, which means operating blindly or concluding without data. This blindness mostly
occurs because of relying on the testing of specifications and discarded knowledge. The
example is stated in the book to make this sense. A Ford team built a control system for
door hardware, which Mazda used; before starting the use of that control system, Ford
went to standard test for a few weeks and found bugs in the system. Still, Mazda over-
looked and used the system directly, which caused them a waste. (Ward 2014.)
Kn
ow
led
ge W
aste
Scatter
Communication barriers
Poor tools
Hand-off
Useless information
Waiting
Wishful thinking
Testing to specifications
Discarded knowledge
25
4.3 Quality Management (QM)
Quality management can be defined as a management structure to supervise and manage
an organization in terms of quality. (Krifi, Ben, Bonert, Mosbah, Jaafar, Chabir & Perrin,
2013, 44-52). The straight and easy meaning of quality management is 'how organizations
managed quality.' Globalization by businesses introduces more challenges, such as prod-
ucts of superior quality from abroad. Organizations respond to this task by adopting a
comprehensive view of quality, resulting in commencing quality management in all busi-
ness phases. "Quality management is a key element in the World Class Manufacturing
approach to achieving and sustaining a competitive advantage." The definition used by
Barbara Flynn and Roger Schroeder says that quality management is an integrated meth-
odology to accomplish and sustain superior quality manufactured goods, aiming at the
maintenance and constant up-gradation of processes and preventing the defect at all levels
and functions of the organization, in order to fulfill customer expectations. (Flynn,
Schroeder & Sakakibara, 1994).
The academics and practitioners like Deming (1986), Juran (1986), Crosby (1979 and
1984), and Feigenbaum (1983) proposed many approaches to manage quality; with their
vast practical experience in the quality field, they described various technical and mana-
gerial techniques comprising the use of statistical methods, processes remodeling, em-
ployee education, and pieces of training, change in organizational culture, etc. The eight
critical factors were identified of quality management at the business division level by
Saraph, Schroeder, and Benson in 1989. The elements are listed as follows:
1. The role of top management leadership
2. The role of the quality department
3. Training
4. Product and service design
5. Supplier quality management
6. Process management
7. Quality data and reporting
8. Employee relations
26
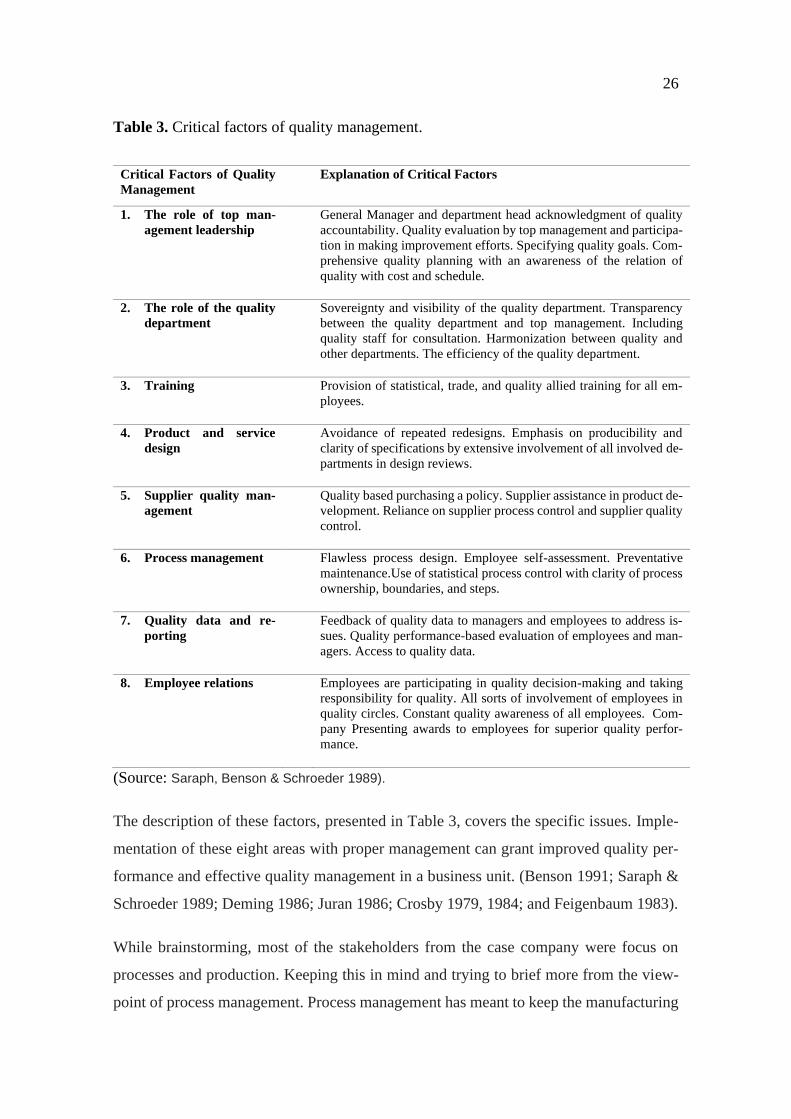
Table 3. Critical factors of quality management.
(Source: Saraph, Benson & Schroeder 1989).
The description of these factors, presented in Table 3, covers the specific issues. Imple-
mentation of these eight areas with proper management can grant improved quality per-
formance and effective quality management in a business unit. (Benson 1991; Saraph &
Schroeder 1989; Deming 1986; Juran 1986; Crosby 1979, 1984; and Feigenbaum 1983).
While brainstorming, most of the stakeholders from the case company were focus on
processes and production. Keeping this in mind and trying to brief more from the view-
point of process management. Process management has meant to keep the manufacturing
Critical Factors of Quality
Management
Explanation of Critical Factors
1. The role of top man-
agement leadership
General Manager and department head acknowledgment of quality
accountability. Quality evaluation by top management and participa-
tion in making improvement efforts. Specifying quality goals. Com-
prehensive quality planning with an awareness of the relation of
quality with cost and schedule.
2. The role of the quality
department
Sovereignty and visibility of the quality department. Transparency
between the quality department and top management. Including
quality staff for consultation. Harmonization between quality and
other departments. The efficiency of the quality department.
3. Training Provision of statistical, trade, and quality allied training for all em-
ployees.
4. Product and service
design
Avoidance of repeated redesigns. Emphasis on producibility and
clarity of specifications by extensive involvement of all involved de-
partments in design reviews.
5. Supplier quality man-
agement
Quality based purchasing a policy. Supplier assistance in product de-
velopment. Reliance on supplier process control and supplier quality
control.
6. Process management Flawless process design. Employee self-assessment. Preventative
maintenance.Use of statistical process control with clarity of process
ownership, boundaries, and steps.
7. Quality data and re-
porting
Feedback of quality data to managers and employees to address is-
sues. Quality performance-based evaluation of employees and man-
agers. Access to quality data.
8. Employee relations Employees are participating in quality decision-making and taking
responsibility for quality. All sorts of involvement of employees in
quality circles. Constant quality awareness of all employees. Com-
pany Presenting awards to employees for superior quality perfor-
mance.
27
process operating smoothly. These results can achieve by if management concentrates on
managing the manufacturing process without missing materials, breakdowns, fixtures,
and tools. Good process management develops, defines, and documents their process pre-
cisely. Instruction for the workforce and workstations is well equipped and organized to
minimize operations errors and flexibility of operation processes. Process management
also includes cleanliness and structured work practices to avoid hazards and accidents.
(Flynn, 1994). The quality management process approach also benefits by enhancing the
ability to focus on significant processes with opportunities for improvement, predictable
and consistent outcomes. Through effective use of process management, resources can
be used efficiently, with reduced cross-functional barriers and optimized performance. It
increases the organization's effectiveness, consistency, and efficiency to provide custom-
ers' demand and confidence in stakeholders. (Wilson & Campbell, 2016).
4.4 Continuous Improvement
Will Rogers stated, "Even if you're on the right track, you will get run over if you just sit
there." (Nicholas 2018, 23) Bessant J. defines Continuous improvement as "a company-
wide process of enabling a continuing stream of focused, incremental innovation." (Bes-
sant 1994). It means making minor improvements, taking small steps, bettering, cumula-
tive innovation of short cycles of changes over time, and focusing on a particular object.
CI is a powerful tool but enabling the power of CI depends on creating a context within
organizations. The effects of strategic goals for organizations' survival and success need
to be distinctly understood; there is no need to specify the goals tightly. Still, it is essential
to communicate clearly. A clear strategy to achieve the goal and effective communication
with all employees and to recognize the process to accomplish the goal is twofold of the
CI management program. (Bessant, 1994).
A philosophy that Deming described related continuous improvement is simply as of "Im-
provement initiatives that increase successes and reduce failures" (Juergensen 2000). An-
other definition of CI is "a culture of sustained improvement targeting the elimination of
waste in all systems and processes of an organization." This culture necessitates the in-
volvement of all employees to create improvements without making enormous capital
investments. (Bhuiyan 2005; Deming 1986)
28
To acquire a better perception of continuous improvement and its philosophy to create
steady growth and innovation, we will go through some examples:
- Toyota is known for its adoption of "Lean" in many of their management prac-
tices, which lead Toyota to be the most significant manufacturing company. They
founded their production system, the Toyota Production System (TPS), which was
based on two primary concepts: one is "Jidoka," also known as "autonomation."
It means taking immediate action on the problem occurs to avoid fault production
and tackle the issue immediately. The second is "Just-in-time(JIT)," which means
production was produced when it is required. (Ohno 1988; Impruver 2020)
- Scania is designing and manufacturing buses and heavy trucks in the automotive
industry since 1930. The company started its continuous improvement journey in
the 1990s; they practice visual Management and LAMDA principles (Look-Ask-
Model-Discuss-Act), which turn out to be helpful in product engineering execu-
tive management, continuous improvement in product development processes.
(Persson 2016; Sobek 2014, 261-279)
4.5 CI Methodologies
The effectual implementation of continuous improvement (CI) methodologies is an es-
sential accomplishment for any organization. Several CI methodologies have been cre-
ated and founded on a critical quality or process improvement concept, decreasing waste,
streamlining the manufacturing processes, and enhancing quality. This methodology al-
lows the organizations to develop their own business or process framework from scratch
involving all ranks of employees; this benefits them from learning from the processes'
best practices and leveraging what has proved to work.
The methodologies are Lean Management, Six Sigma, Lean Six Sigma (LSS), Total
Quality Management (TQM), Just-In-Time (JIT), Kaizen is also known as Rapid Im-
provement Event (RIE), Hoshin Kanri (Hoshin Planning), PDCA (Plan-Do-Check-Act,
is also known as Deming Cycle), Daily Huddles, Theory of constraints, Value Stream
Mapping, Standard Work, Gemba Walks, Kanban, Poka-Yoka. All these approaches help
firms achieve a similar goal of optimizing quality, productivity, efficiency, and waste
reduction. Various research has indicated that the best known and practiced methodolo-
gies mentioned above are Lean, value stream mapping Six Sigma, and Lean Six Sigma.
29
(Bhuiyan 2005; Salah 2010; Bashar 2016; Nicholas 2018, 23-24; Rever 2019; Droho-
meretski, Gouvea, Pinheiro & Garbuio 2014)
In his article, Martichenko states that if the organization wants to improve its perfor-
mance, it should focus more on continuous improvement. The organizations' benefits that
CI delivers are satisfying customer needs and wants; employees and suppliers' involve-
ment in processes makes the environment healthy and its financial growth. (Woods 1997;
Nicholas 2018, 12-13; Bessant 1994; Goldsby & Martichenko, 2005 )
4.5.1 Lean Management Principles
Lean philosophy is streamlined around the idea of detecting and eliminating waste in its
various forms mentioned as Muda, Mura, and Muri. Muda is most commonly used for
defining Lean. Muda means a kind of "waste" where humans use resources in any activity,
which creates no value; some examples are human error in production, waiting, unneces-
sary processes, inventory, overproduction, unrequired transportation, and movement.
Scott stated Muda as "the most seen waste." Muri is the kind of waste where the processes
or employees are overloaded; the overload can be because of that the employees or oper-
ations are not working or used to their potential. Mura was defined as irregularity and
asymmetry. Muda's cause can be because of muri if the organization is focused on waste
reduction and reduce Mura and Muri significantly diminish Muda. (Womack & Jones,
1996; Smith, 2014; Nicholas, 2018, 70).
"A set of beliefs and assumptions that force operational decisions and actions regarding
products and processes are known as Lean principles." "The general issues about what
a company should do in terms of product and process improvements are addressed in
lean principles. In general, they are worthwhile prescriptions for the conduct of any or-
ganization or business, lean or otherwise." (Nicholas 2018, 71)
The statement above can be brief as the action was taken to simplify the production or
processes, usually minimizing waste. Simplification term in lean principle means achiev-
ing the same output but with the primary way and fewer complex processes or actions
with fewer inputs. (Nicholas 2018, 71-74) Womack and Jones presented five principles
of lean in 1996; they were illustrated in a cyclical form which starts with the constant
cycle of waste removal from specifying value from customers' perspective; that leads to
30
the second step of identifying the value stream, continuing to the third principle of making
the value-creating measures flow, the fourth principle is to ponder the pull from the cus-
tomer. The fifth is to strive for perfection. (Womack & Jones 1996, 15-26)
The specifying value from the customer's perspective, the generic approach of lean think-
ing in this principle is to identify activities that add the costs but do not add any value for
the customer, is waste. Lean thinking is about eliminating this waste, which is non-value
added. Identifying the value stream demonstrates a management philosophy in a lean
principle, which focuses on enhancing the full value chain and not just the part of pro-
cesses. Steps flow, creating value by designing process with continuous flow in small lots
and right sizes; this requires considerable effort in reformulating the traditional ap-
proaches. The customer's pull necessitates an organization to stop pushing its products on
customers and reverse it to products made on customers' demand. The above four princi-
ples interact in a virtuous cycle with each other, which leads the process to its completion
with the last step, which is the strive to perfection. To remove the waste and create value,
it is essential that must follow the previous principle systematically. The importance of
the last theory of striving for perfection, we can see here. To strive for perfection aims to
the continuous improvement of processes. (Womack & Jones 1996, 15-26; Droho-
meretski, 2014)
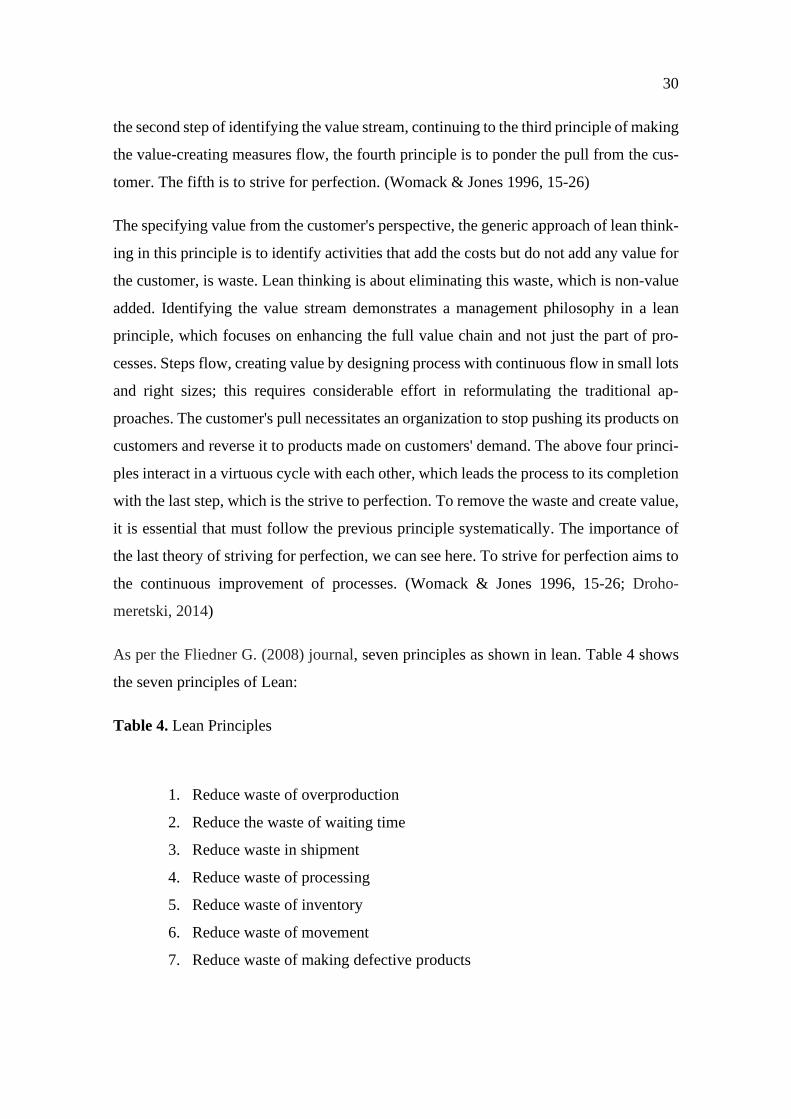
As per the Fliedner G. (2008) journal, seven principles as shown in lean. Table 4 shows
the seven principles of Lean:
Table 4. Lean Principles
1. Reduce waste of overproduction
2. Reduce the waste of waiting time
3. Reduce waste in shipment
4. Reduce waste of processing
5. Reduce waste of inventory
6. Reduce waste of movement
7. Reduce waste of making defective products
31
This journal shows that many organizations that practice these seven principles resulted
in eliminating waste. This implementation's by-product was enhanced environmental per-
formance, even though ecological performance initiation was not into planning. Ford is a
pioneer of lean principles, but Toyoda K., and Ohno T., refined Ford's approach and led
Toyota with an upgraded concept of seven lean principles. (Moya, Déleg, Sánchez &
Vásquez 2016, 2-3; Fliedner 2008, 3321- 3322; Bhuiyan 2005)
4.5.2 Six Sigma
Six Sigma originated in the United States in the late 1980s at the Motorola Corporation
and was adopted by General Electric, Sony, Johnson, Honeywell, and other leading firms
in the 1990s. Motorola developed and executed Six Sigma to achieve a challenging target
of 3.4 defects per million opportunities. Six Sigma is defined by Pyzdek in 2003 as "a
rigorous, focused, and highly effective implementation of proven quality principles and
techniques." In explanation, Pyzdek stated that the aim of using this method is essentially
an error-free business performance. The symbol of Sigma is a letter from the Greek al-
phabet used by statisticians to measure the processes' variables. (Gershon, 2010; Hakimi,
2018; Pyzdek, 2014).
Linderman et al. (2003), in their article, stated that "a systematic and organized method
to enhance the strategic process, new production and development of service that focuses
on statistical and scientific methods to make significant reductions in customer deter-
mined defect rates." Breyfogle 1999 defined Six Sigma as, "a statistically-based quality
improvement program, which helps to enhance business processes by lowering the waste
and costs related to poor quality, and by expanding the efficiency and effectiveness of
processes." (Hakimi 2018; Hung & Sung 2011, 581; Linderman, Schroeder, Zaheer &
Choo, 2003, pp. 193-203; Breyfogle, 199)
Six Sigma has not just been commonly incorporated with manufacturing and service in-
dustries by resulting in improvement in quality and reducing cost. Still, it also gained
popularity in other business areas. Studies show the academic community discovered the
six-sigma framework's applicability and correctness for performance enhancement of
software industries. Garg et al. (2004) devised a mathematical programming problem to
design Six Sigma applications into the supply chain, resulting in fast and low-cost product
delivery with excellence. Six Sigma methodology in process design was applied by

32
Sokovic et al. (2005) to improve inventories, and process tools perform lead-time as pro-
cess maps or the cause and effect matrix. To analyze the risk associated with different
projects, Su and Chou (2008) characterized projects as Green Belt, Black Belt, or other
analytical hierarchy to processes to prioritize the tasks by their organization's business
strategic policies of VOC, the voice of the customer. Spiegel et al. (2006) suggested in-
creasing its production quality; the company should select and apply appropriate and spe-
cific quality management activities to their situation. Food industries are also interested
in adopting Six Sigma because of its outcome, such as eliminating defects and enhancing
product quality. The fast-food giant McDonald's started to learn about lean and Six Sigma
methodologies and apply them to their relative projects. (Hakimi, 2018; Hung & Sung,
2011; Garg, Narahari, & Viswanadham, 2004; Sokovic, Pavletic, & Fakin, 2005; Su &
Chou, 2008; Van Der Spiegel, Luning, De Boer, Ziggers & Jongen, 2006). It shows Six
Sigma also works effectively in the food industry.
4.5.3 Lean Six Sigma
Several multinationals businesses implemented Lean and Six Sigma to accomplish busi-
ness excellence after the success of both methods in the business world. This Lean and
Six Sigma implementation was called lean six Sigma and was known as the new meth-
odology. This methodology was created to make a more significant share of the market,
and this method was further studied in specifics. The findings of these researches were
that some organizations were practicing the Lean and Six Sigma parallel to each other for
many years, resulting in creating Lean Six Sigma, which helped the organization focus
on a single methodology for improvement. George (2002) mentioned that the sharehold-
er's value was maximized by accomplishing the quickest rate of improvement in customer
satisfaction, quality, financed wealth, the process in terms of speed, and cost by using
lean six Sigma. This combo work systematically, where lean pursues to eliminate waste,
and Six Sigma engages in reducing variation. The organization is improved to its maxi-
mum potential. The lean six sigma practice in any significant improvement area first tack-
les the waste in that area, which further focuses on variations that need to be improved or
changed. (Bhuiyan 2005; George 2002)
Lean Six Sigma came into practice in the early 2000s, whereas, in 2013, the first study
was conducted on Lean Six Sigma in the food industry. Lean Six Sigma was implemented
33
in the food industry to reduce process variation, process cost, and increase productivity
and affordability. (Costa, Filho, Fredendall & Gómez Paredes 2018). Wheat et al. (2003)
implies that six Sigma complements the lean philosophy to offering tools and know-how,
such as cause-effect diagrams, statistical process control, measurement system analysis,
design of experiments, and the particular problems, which are classified using lean. (Pow-
ell, 2017; Wheat, Mills & Carnell, 2003).
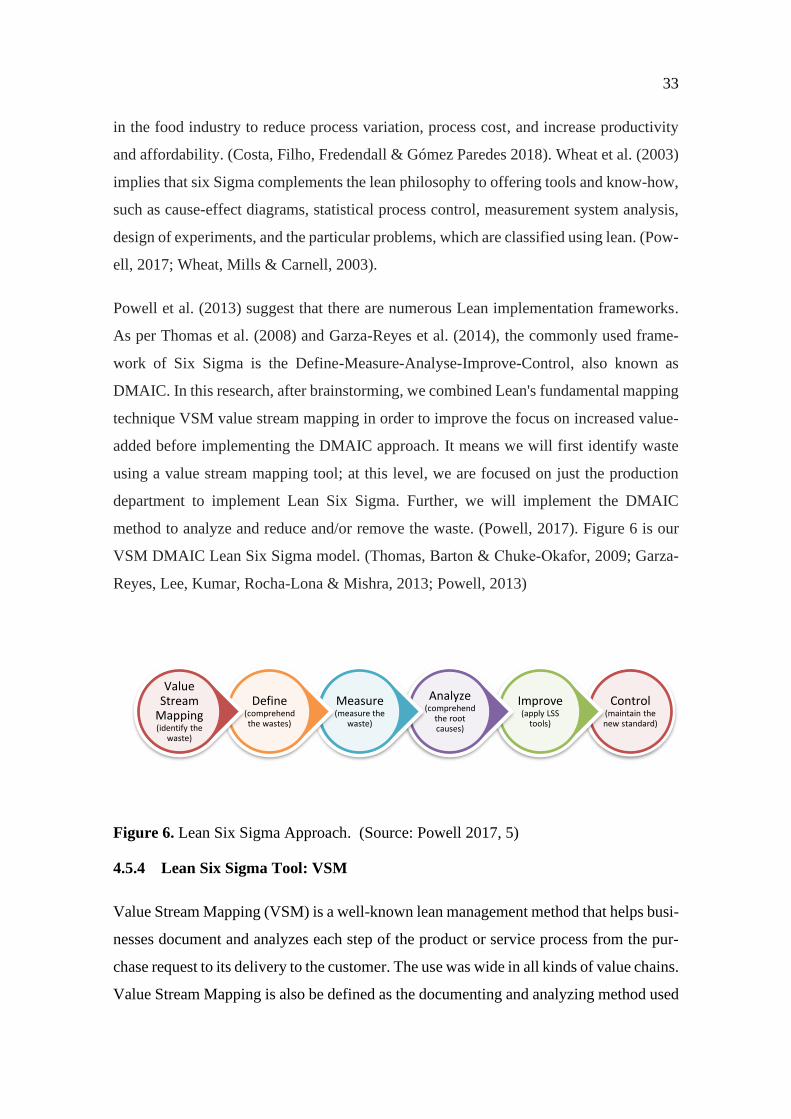
Powell et al. (2013) suggest that there are numerous Lean implementation frameworks.
As per Thomas et al. (2008) and Garza-Reyes et al. (2014), the commonly used frame-
work of Six Sigma is the Define-Measure-Analyse-Improve-Control, also known as
DMAIC. In this research, after brainstorming, we combined Lean's fundamental mapping
technique VSM value stream mapping in order to improve the focus on increased value-
added before implementing the DMAIC approach. It means we will first identify waste
using a value stream mapping tool; at this level, we are focused on just the production
department to implement Lean Six Sigma. Further, we will implement the DMAIC
method to analyze and reduce and/or remove the waste. (Powell, 2017). Figure 6 is our
VSM DMAIC Lean Six Sigma model. (Thomas, Barton & Chuke‐Okafor, 2009; Garza-
Reyes, Lee, Kumar, Rocha-Lona & Mishra, 2013; Powell, 2013)
Figure 6. Lean Six Sigma Approach. (Source: Powell 2017, 5)
4.5.4 Lean Six Sigma Tool: VSM
Value Stream Mapping (VSM) is a well-known lean management method that helps busi-
nesses document and analyzes each step of the product or service process from the pur-
chase request to its delivery to the customer. The use was wide in all kinds of value chains.
Value Stream Mapping is also be defined as the documenting and analyzing method used
Control(maintain the new standard)
Improve(apply LSS
tools)
Analyze(comprehend
the root causes)
Measure(measure the
waste)
Define(comprehend the wastes)
Value Stream
Mapping (identify the
waste)
34
in each step from end to end process in the value chain. (KaiNexus 2012; Martin & Os-
terling 2014)
Martin et al., 2014 stated, "value stream mapping (VSM) is a rational and efficient way
to observe and solve disconnects, redundancies, and gaps in how work gets executed." In
the book "Learning to see" 2003, books author Rother and Shook, introduced a process
measurement framework that was more practical than the previous methodology. It
changed the practice in manufacturing industries. The organization benefits from the
framework by documenting and measuring their performance, analyzing how they can
deliver value to customers, and maximizing their performance with innovation and de-
sign. Keyte and Locher addressed in 2004 the first value stream mapping book, and this
book focused on administrative areas. It mainly covered the manufacturing sector office
environment. Since 2004, research work and literature have intensified and broadened in
organizations in other areas and/or different sectors in businesses. Nowadays, Lean tools
(VSM) also are used in industries like education, food services, financial services, hospi-
tality, healthcare, tourism, etc. (Martin 2014; Rother & Shook, 2003; Keyte & Locher,
2004)
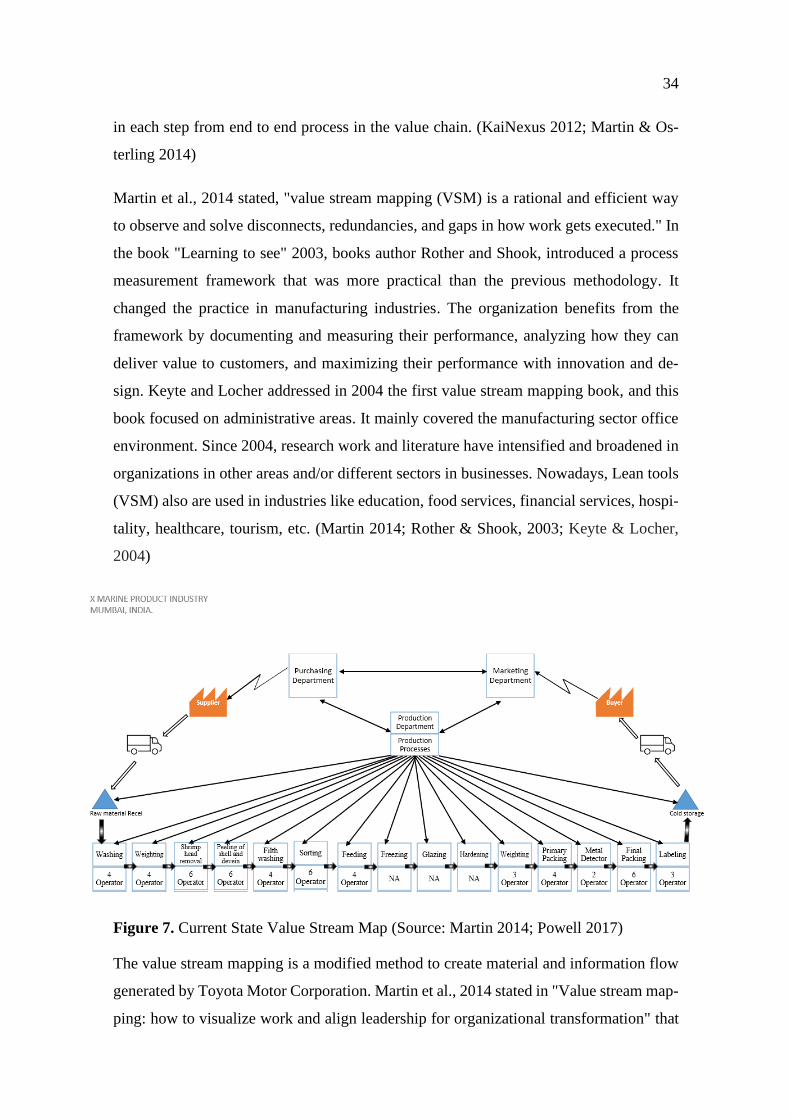
Figure 7. Current State Value Stream Map (Source: Martin 2014; Powell 2017)
The value stream mapping is a modified method to create material and information flow
generated by Toyota Motor Corporation. Martin et al., 2014 stated in "Value stream map-
ping: how to visualize work and align leadership for organizational transformation" that

35
value stream maps differ from process maps in considerable ways and offers an all-inclu-
sive view on how workflows across the entire system. Firstly, value stream mapping on
the macro-level helps managers and/or leadership outline strategic improvements to the
workflow. Micro-level mapping allows the people working in processes to design calcu-
lated improvements. Secondly, value stream mapping gives a visual understanding of the
full process cycle from customers' requests to fulfill the customers' request. It is executed
by creating a storyboard using the structure of the current state value stream map. This
portrait, three components workflow, information flow, and summary timeline, as shown
in Figure 7., is the initial investigating phase of our case study. VSM maintains set up
with data collection to recognize the present process; this collected data is used to create
a process flow diagram called the current state value stream map. (Nicholas 2018)
4.5.5 Lean Six Sigma Problem Solving Method: DMAIC
Six Sigma problem-solving method DMAIC is a five-stage phase of Define, Measure,
Analyze, Improve, and Control. This has also been used as an improvement cycle (see
Figure 8) to identify, improve, and control the cause of waste. Each phase systematically
steps forward with relevant tools during process implementation. (Prashar, 2020)
Figure 8. DMAIC stages
Define
Measure
AnalyzeImprove
Control
36
The process helps to remove unproductive steps by focusing on new methods and apply
them for continuous improvement. (Michael, Mark & John, 2005; Surendro, 2013; Joran
& Jeroen, 2012).
Define
In the continuous improvement road map, this is the first step of the LSS problem-solving
method. It identifies the improvement required area in the process. Patel et al., 2011 stated
that the "define phase defines the nature of the problem." Define phase tools recom-
mended are; SIPOC, project charter, customer voice, surveys, brainstorming, focus
groups, current state analysis, and benchmarking. (Sahno & Shevtshenko 2014; Patel
2011; Desai 2015; Powell 2017)
The defining phase highlights the problem statement with specific and detailed measures,
which initialize launching the team to validate the stream mapping, analyze and handle
the project, and take necessary actions. (Patel 2011, 51-58; Powell 2017; Desai 2015).
The project charter creates the business case upholding the waste reduction's strategic
objective, creating the scope, communicating the plans, and developing a project sched-
ule.
Measure
Hakimi et al., 2018 state, measure as an assessment of the current situation and translate
the problem into a measurable parameter critical to quality. The measuring stage is the
data collection and evaluation stage to identify the process's critical defects. This method
determines the attributes that influence the performance of the process. Tools used for the
measure phase are; Value stream map, process flow diagram, check sheets, waste analy-
sis, machine speeds, process capability, and other quality management tools. (Patel 2011,
59-67; Powell 2017; Hakimi 2018).
Hung et al. stated that measure is a crucial transitional stage on Six Sigma road, which
helps the project team refine the problem and begin the search for root causes. This step
involves measuring the current performance, clear plan of process, contemplating the
hazard in the process. This process identifies key input in-process and output metrics with
37
a deeper understanding of value stream mapping. It validates measurement systems, gath-
ers baseline data, and determine process capability (Michael 2005; Surendro 2013)
Analyze
In the Analyse stage, data collected in the measuring stage is analyzed; this helps deter-
mine the gap between current performance and desire performance. This stage determines
the effect of factors and causes, which influences the (CTQ) critical to quality's behavior.
(Hakimi 2018; Patel 2011) This phase in DMAIC is crucial as the mistake in analyzing
will lead the project in the wrong direction, which may ignore the actual problem. If the
scope of DMAIC is well planned, it will help to identify influencing factors successfully.
(Joran 2012)
The analyses are performed to identify the possible reasons for the performance gap and
financial -measures and quantify the main causes of variation. It initially identifies the
major causes that create the problem, further using other measuring tools, such as; cause-
effect diagram or fishbone diagram or Ishikawa diagram, brainstorming, Pareto charts,
and tree diagram, which identify the sub causes. (Gershon 2010; Patel 2011, 68-78)
Improve
The improved stage is where the concepts for process improvement are created and exe-
cuted. The tools like brainstorming, future VSM, hypothesis testing, and poka-yoke
maybe use to generate improvement ideas. Each organization can develop its unique way
to improve their process by analyzing the problems or potential developing areas and
implementing them to achieve the planned result. (Michael, 2005). Simply improve stage
can be stated as to find out and imply the possible best solutions. (Kaswan & Rathi 2020)
Control
The control stage is intended to monitor the process to ensure the implementation applied
in the improvement stage performs according to expectation. (Sahno, 2014). Control sus-
tain the best solution. (Kaswan, 2020; Prashar, 2020). Hung et al. believe that the im-
proved process may well revert to its previous state without control efforts. To continually
maintain the improved process by eliminating waste, it is necessary to control the process.
(Gershon, 2010).
38
4.6 Chapter Summary
This chapter represents the recognized and most practiced concepts in the Lean Six Sigma
LSS. In chapter illustrates all the stages and tools used in the Lean Six Sigma method
relevant to this research. This research will follow the Lean Six Sigma VSM DMAIC
methodology for its strategic and analytical phases.
39
5 EMPIRICAL FINDINGS
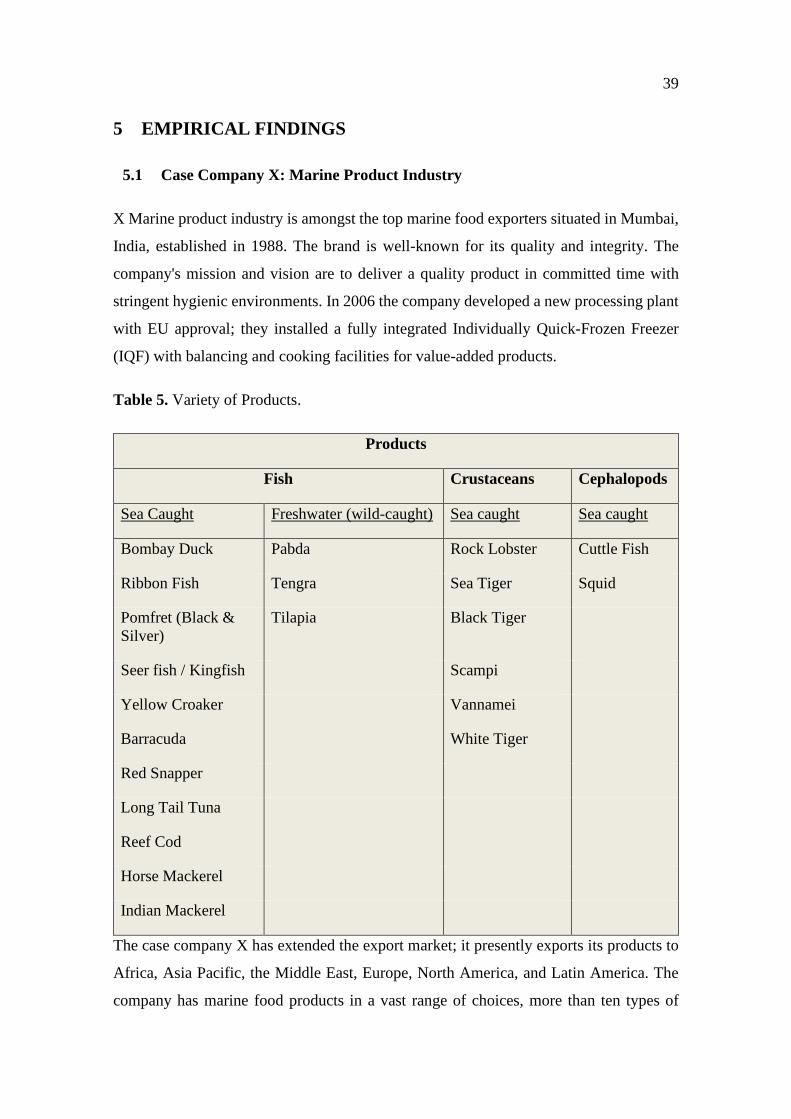
5.1 Case Company X: Marine Product Industry
X Marine product industry is amongst the top marine food exporters situated in Mumbai,
India, established in 1988. The brand is well-known for its quality and integrity. The
company's mission and vision are to deliver a quality product in committed time with
stringent hygienic environments. In 2006 the company developed a new processing plant
with EU approval; they installed a fully integrated Individually Quick-Frozen Freezer
(IQF) with balancing and cooking facilities for value-added products.
Table 5. Variety of Products.
Products
Fish Crustaceans Cephalopods
Sea Caught Freshwater (wild-caught) Sea caught Sea caught
Bombay Duck Pabda Rock Lobster Cuttle Fish
Ribbon Fish Tengra Sea Tiger Squid
Pomfret (Black &
Silver)
Tilapia Black Tiger
Seer fish / Kingfish Scampi
Yellow Croaker Vannamei
Barracuda White Tiger
Red Snapper
Long Tail Tuna
Reef Cod
Horse Mackerel
Indian Mackerel
The case company X has extended the export market; it presently exports its products to
Africa, Asia Pacific, the Middle East, Europe, North America, and Latin America. The
company has marine food products in a vast range of choices, more than ten types of
40
fishes, more than five varieties of crustaceans, and Cephalopods (see Table 3). They can
deliver both marine water products and freshwater products according to customers' re-
quirements worldwide.
5.1.1 Standard Acquired by company
To cater to a successful business in a different continent and, companies are bound to
have additional certifications that incorporate those countries' laws and regulations. As
an exporter and food processing company, the case company acquires various certificates,
such as EU Certification, BRC Certification, HACCP, FSSC 22000, FSSAI, and Halal
Certifications. (APPENDIX 1)
• EU Certification: European Union Certification is an approval document from the
health and food safety of the European Commission to export fish, fishery prod-
ucts, or bivalve mollusks to the EU. This certificate is provided after examining
the product specific information on applicable national legislation on animal
health, food hygiene, the structure of the competent organizations, etc. It is man-
datory to avail of this certificate if the exporter wants to export the product to EU
countries. (EC Europa)
• BRC Certification: The British Retail Consortium Certification is an internation-
ally known index of food safety and quality. After conducting an audit by a char-
tered certification unit and obtaining conformity with the standards to ensure food
safety during the production, storing, packing, and distribution processes, it is
granted. BRC is now known as BRCGS- Brand Reputation Compliance Global
Standard. (BRCGS 2020)
• Hazard Analysis Critical Control Point: which is known as HACCP, is a world-
wide recognized approach for lowering the risk of food safety hazards. Food and
drug administration FDA operates and controls the HACCP program. This pro-
gram is designed to increase the margin of safety with a science-based system of
preventive controls for food safety. (FDA)
• FSSC 22000: Food safety system certification is based on the customary interna-
tionally recognized standard ISO 22000; it is supplemented by technical standards
such as ISO TS 22002-1 for food production and ISO TS 22002-2 for packaging
production. (FSSC 22000 - Inspecta 2020)
41
• Indian Authority of Food Safety and Standards: The organization's with turnover
above Rs. 30 crores or over 100 vehicle transporters required these licenses.
FSSAI is a sovereign body founded under the Mistry of Health and Family Wel-
fare, Government of India, which is accountable for safeguarding and supporting
public health through the law and management of food safety. (FSSAI 2018)
• Halal: Halal certification is required for the case company to export the products
in Muslim importing countries. The acquisition of halal accreditation ensures that
the products' features and quality are according to the Islamic Council's rules.
5.1.2 Organization Structure
According to Statistics Finland, the case company is categorized as small and medium-
sized enterprises, as the case company's turnover is about 50 million dollars with 150-200
paid employees. (Statistic Finland -Tilastokeskus 2018; APPENDIX 1). The organization
is a single unit with no other branches and a single hierarchy reporting structure, as shown
in the organization structure in Figure 9.
This study's unit of analysis is the production processes, which include the production
department and quality department. Different kinds of methods are practice in production;
they are according to customers' demand and type of marine product. More than 20 ma-
rine products are processed (find the list under chapter 5.1), mainly using one of the three
process flows. This study will focus on just one production process with a single product
to stay focused on reliable data collection and conclude the research problem of eliminat-
ing waste and improve productivity with the VSM-DMAIC LSS approach.
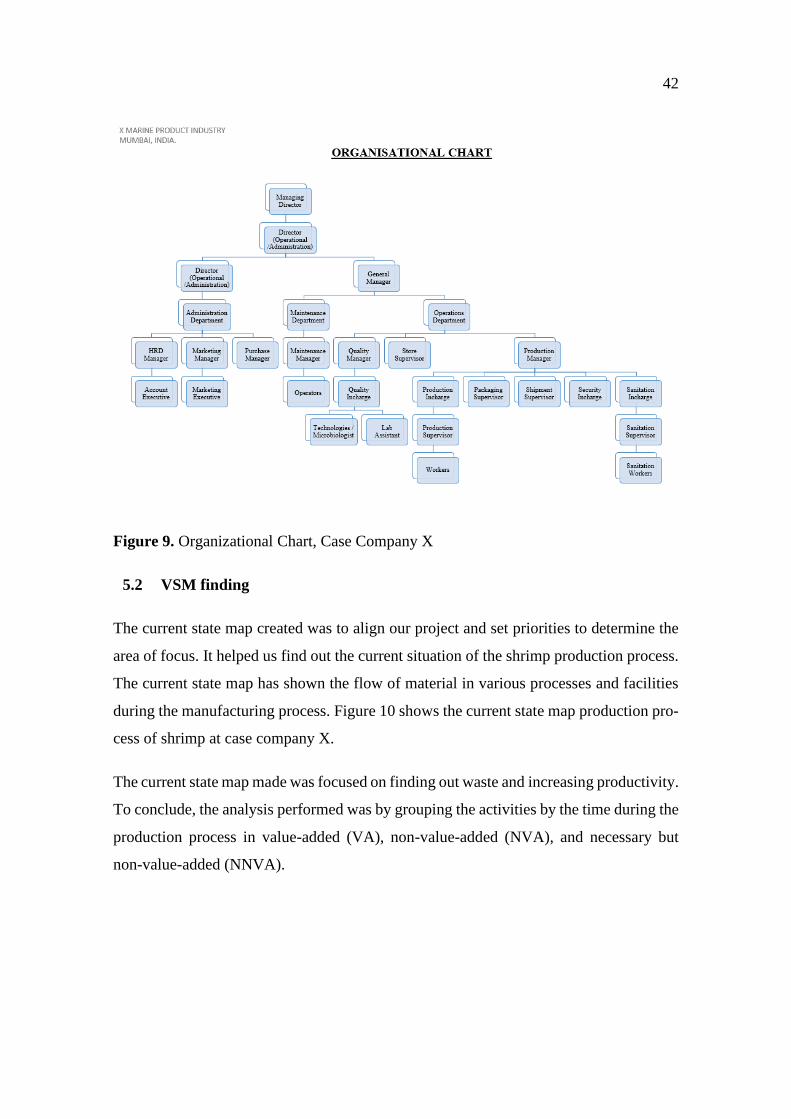
42
Figure 9. Organizational Chart, Case Company X
5.2 VSM finding
The current state map created was to align our project and set priorities to determine the
area of focus. It helped us find out the current situation of the shrimp production process.
The current state map has shown the flow of material in various processes and facilities
during the manufacturing process. Figure 10 shows the current state map production pro-
cess of shrimp at case company X.
The current state map made was focused on finding out waste and increasing productivity.
To conclude, the analysis performed was by grouping the activities by the time during the
production process in value-added (VA), non-value-added (NVA), and necessary but
non-value-added (NNVA).
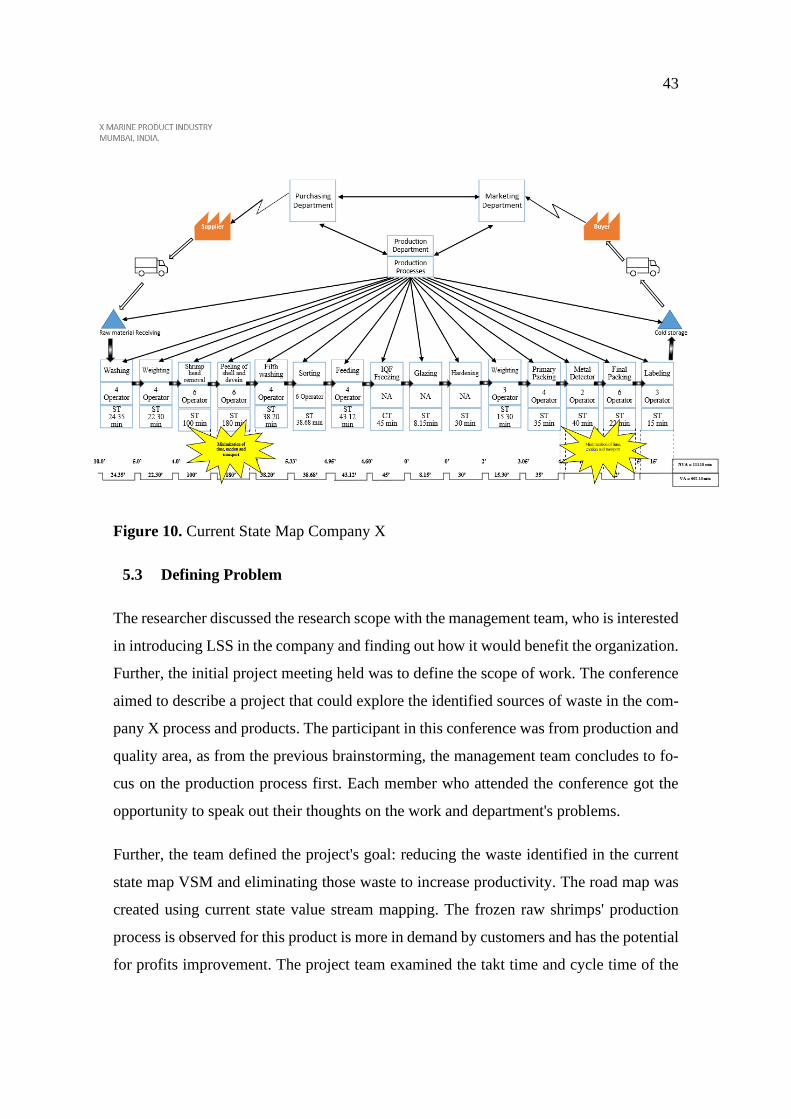
43
Figure 10. Current State Map Company X
5.3 Defining Problem
The researcher discussed the research scope with the management team, who is interested
in introducing LSS in the company and finding out how it would benefit the organization.
Further, the initial project meeting held was to define the scope of work. The conference
aimed to describe a project that could explore the identified sources of waste in the com-
pany X process and products. The participant in this conference was from production and
quality area, as from the previous brainstorming, the management team concludes to fo-
cus on the production process first. Each member who attended the conference got the
opportunity to speak out their thoughts on the work and department's problems.
Further, the team defined the project's goal: reducing the waste identified in the current
state map VSM and eliminating those waste to increase productivity. The road map was
created using current state value stream mapping. The frozen raw shrimps' production
process is observed for this product is more in demand by customers and has the potential
for profits improvement. The project team examined the takt time and cycle time of the
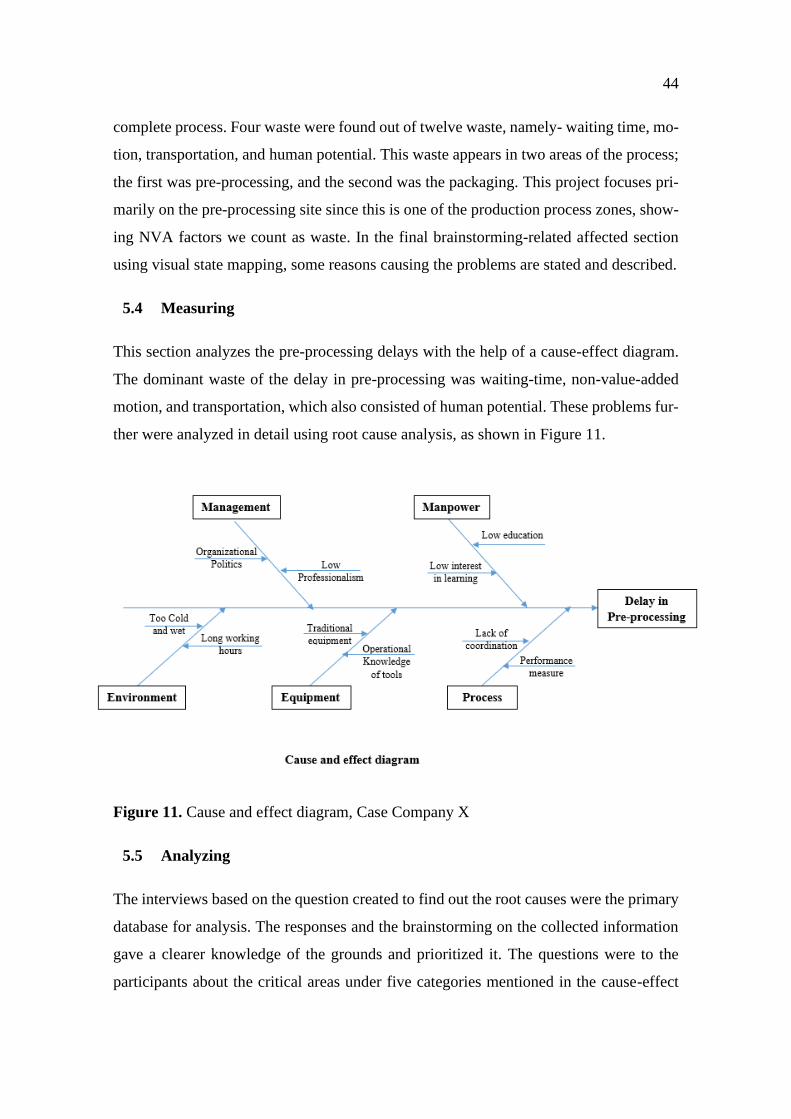
44
complete process. Four waste were found out of twelve waste, namely- waiting time, mo-
tion, transportation, and human potential. This waste appears in two areas of the process;
the first was pre-processing, and the second was the packaging. This project focuses pri-
marily on the pre-processing site since this is one of the production process zones, show-
ing NVA factors we count as waste. In the final brainstorming-related affected section
using visual state mapping, some reasons causing the problems are stated and described.
5.4 Measuring
This section analyzes the pre-processing delays with the help of a cause-effect diagram.
The dominant waste of the delay in pre-processing was waiting-time, non-value-added
motion, and transportation, which also consisted of human potential. These problems fur-
ther were analyzed in detail using root cause analysis, as shown in Figure 11.
Figure 11. Cause and effect diagram, Case Company X
5.5 Analyzing
The interviews based on the question created to find out the root causes were the primary
database for analysis. The responses and the brainstorming on the collected information
gave a clearer knowledge of the grounds and prioritized it. The questions were to the
participants about the critical areas under five categories mentioned in the cause-effect
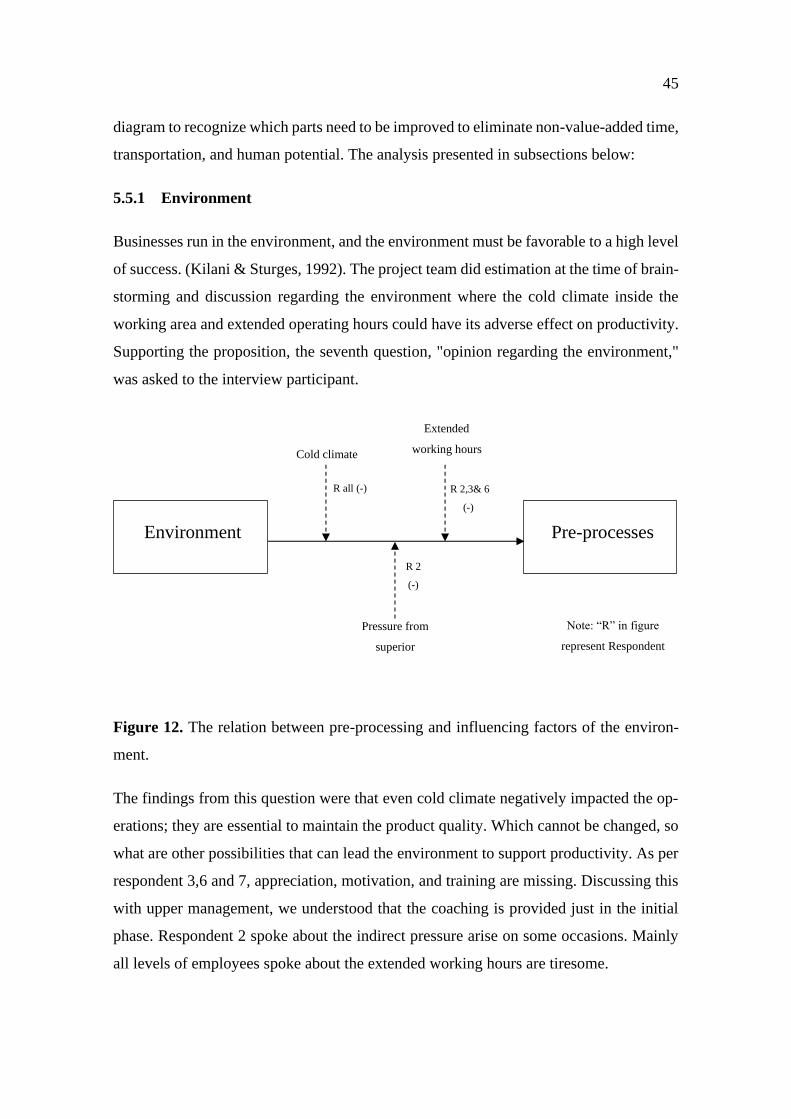
45
diagram to recognize which parts need to be improved to eliminate non-value-added time,
transportation, and human potential. The analysis presented in subsections below:
5.5.1 Environment
Businesses run in the environment, and the environment must be favorable to a high level
of success. (Kilani & Sturges, 1992). The project team did estimation at the time of brain-
storming and discussion regarding the environment where the cold climate inside the
working area and extended operating hours could have its adverse effect on productivity.
Supporting the proposition, the seventh question, "opinion regarding the environment,"
was asked to the interview participant.
Figure 12. The relation between pre-processing and influencing factors of the environ-
ment.
The findings from this question were that even cold climate negatively impacted the op-
erations; they are essential to maintain the product quality. Which cannot be changed, so
what are other possibilities that can lead the environment to support productivity. As per
respondent 3,6 and 7, appreciation, motivation, and training are missing. Discussing this
with upper management, we understood that the coaching is provided just in the initial
phase. Respondent 2 spoke about the indirect pressure arise on some occasions. Mainly
all levels of employees spoke about the extended working hours are tiresome.
Environment Pre-processes
Cold climate
Extended
working hours
Pressure from
superior
R all (-) R 2,3& 6
(-)
R 2
(-)
Note: “R” in figure
represent Respondent
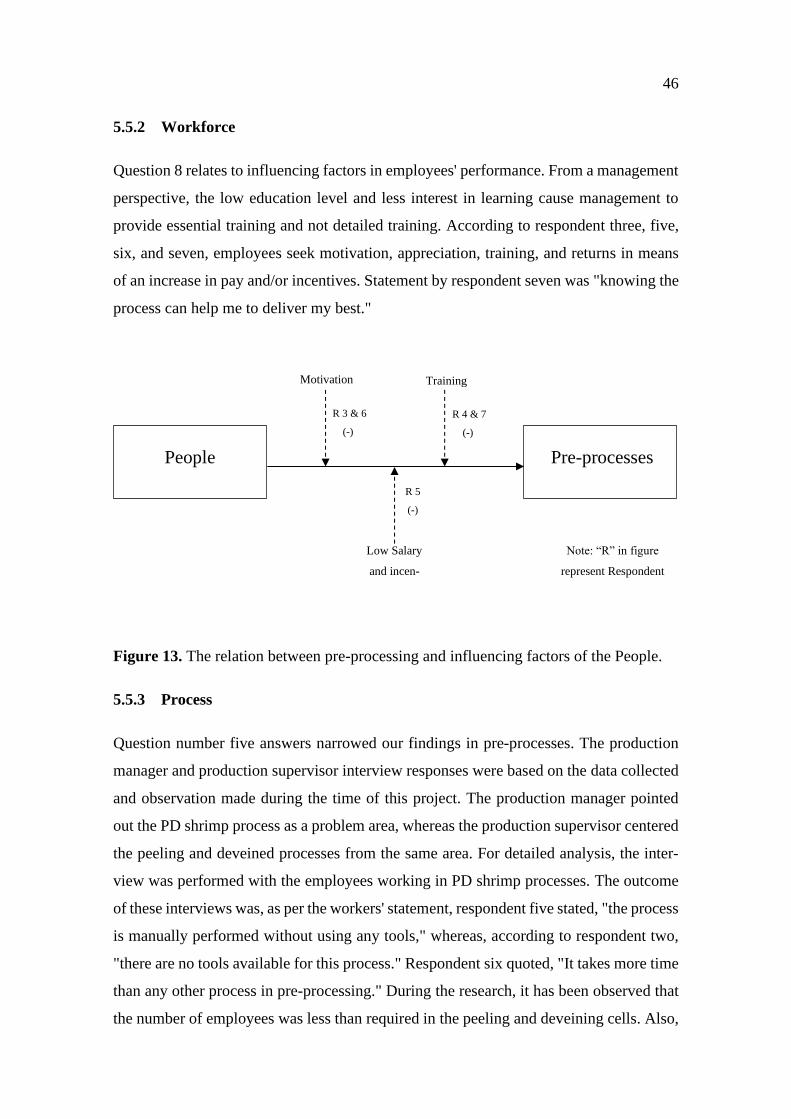
46
5.5.2 Workforce
Question 8 relates to influencing factors in employees' performance. From a management
perspective, the low education level and less interest in learning cause management to
provide essential training and not detailed training. According to respondent three, five,
six, and seven, employees seek motivation, appreciation, training, and returns in means
of an increase in pay and/or incentives. Statement by respondent seven was "knowing the
process can help me to deliver my best."
Figure 13. The relation between pre-processing and influencing factors of the People.
5.5.3 Process
Question number five answers narrowed our findings in pre-processes. The production
manager and production supervisor interview responses were based on the data collected
and observation made during the time of this project. The production manager pointed
out the PD shrimp process as a problem area, whereas the production supervisor centered
the peeling and deveined processes from the same area. For detailed analysis, the inter-
view was performed with the employees working in PD shrimp processes. The outcome
of these interviews was, as per the workers' statement, respondent five stated, "the process
is manually performed without using any tools," whereas, according to respondent two,
"there are no tools available for this process." Respondent six quoted, "It takes more time
than any other process in pre-processing." During the research, it has been observed that
the number of employees was less than required in the peeling and deveining cells. Also,
People Pre-processes
Motivation Training
Low Salary
and incen-
R 3 & 6
(-)
R 4 & 7
(-)
R 5
(-)
Note: “R” in figure
represent Respondent
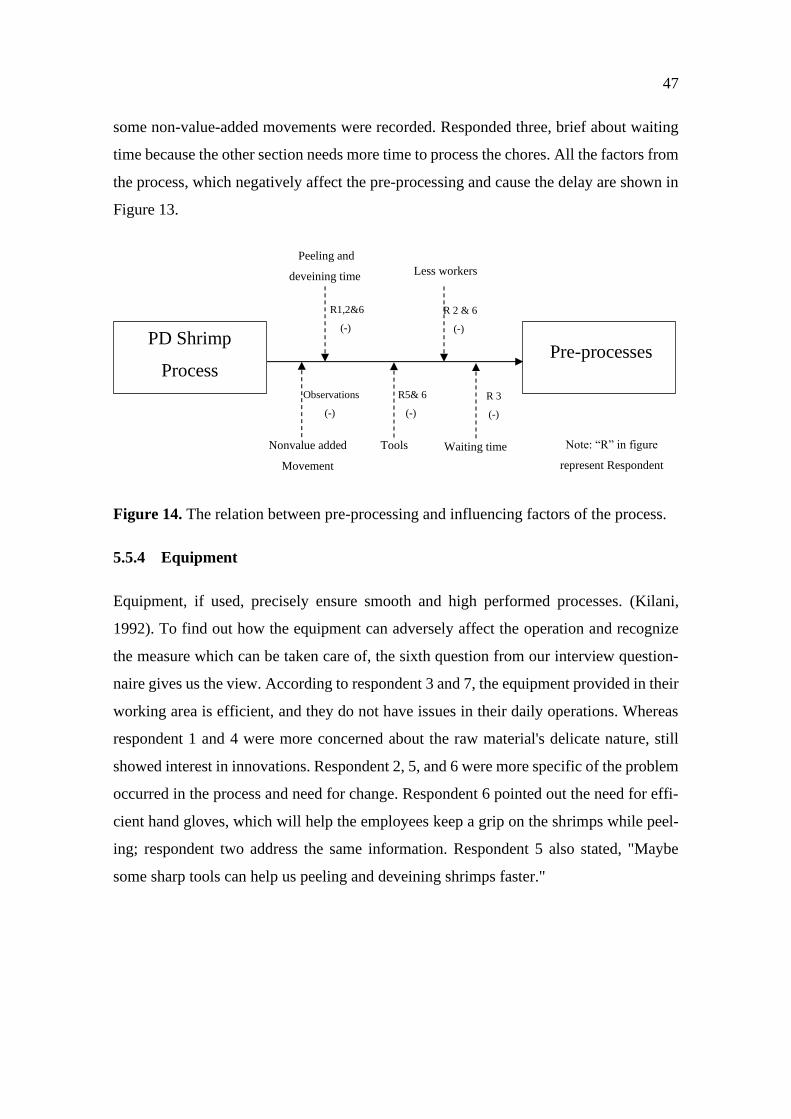
47
some non-value-added movements were recorded. Responded three, brief about waiting
time because the other section needs more time to process the chores. All the factors from
the process, which negatively affect the pre-processing and cause the delay are shown in
Figure 13.
Figure 14. The relation between pre-processing and influencing factors of the process.
5.5.4 Equipment
Equipment, if used, precisely ensure smooth and high performed processes. (Kilani,
1992). To find out how the equipment can adversely affect the operation and recognize
the measure which can be taken care of, the sixth question from our interview question-
naire gives us the view. According to respondent 3 and 7, the equipment provided in their
working area is efficient, and they do not have issues in their daily operations. Whereas
respondent 1 and 4 were more concerned about the raw material's delicate nature, still
showed interest in innovations. Respondent 2, 5, and 6 were more specific of the problem
occurred in the process and need for change. Respondent 6 pointed out the need for effi-
cient hand gloves, which will help the employees keep a grip on the shrimps while peel-
ing; respondent two address the same information. Respondent 5 also stated, "Maybe
some sharp tools can help us peeling and deveining shrimps faster."
PD Shrimp
Process Pre-processes
Peeling and
deveining time Less workers
Tools
R1,2&6
(-)
R 2 & 6
(-)
R5& 6
(-)
Note: “R” in figure
represent Respondent
Nonvalue added
Movement
Observations
(-)
Waiting time
R 3
(-)
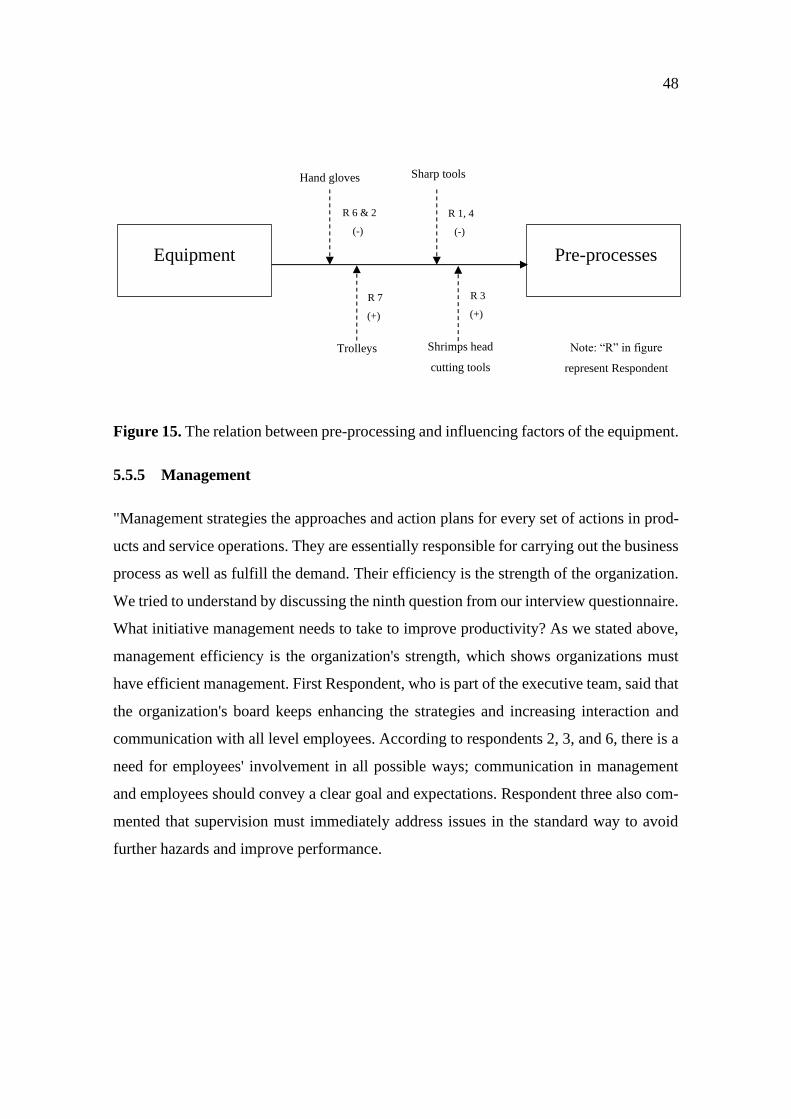
48
Figure 15. The relation between pre-processing and influencing factors of the equipment.
5.5.5 Management
"Management strategies the approaches and action plans for every set of actions in prod-
ucts and service operations. They are essentially responsible for carrying out the business
process as well as fulfill the demand. Their efficiency is the strength of the organization.
We tried to understand by discussing the ninth question from our interview questionnaire.
What initiative management needs to take to improve productivity? As we stated above,
management efficiency is the organization's strength, which shows organizations must
have efficient management. First Respondent, who is part of the executive team, said that
the organization's board keeps enhancing the strategies and increasing interaction and
communication with all level employees. According to respondents 2, 3, and 6, there is a
need for employees' involvement in all possible ways; communication in management
and employees should convey a clear goal and expectations. Respondent three also com-
mented that supervision must immediately address issues in the standard way to avoid
further hazards and improve performance.
Equipment Pre-processes
Hand gloves Sharp tools
Trolleys
R 6 & 2
(-)
R 1, 4
(-)
R 7
(+)
Note: “R” in figure
represent Respondent
Shrimps head
cutting tools
R 3
(+)
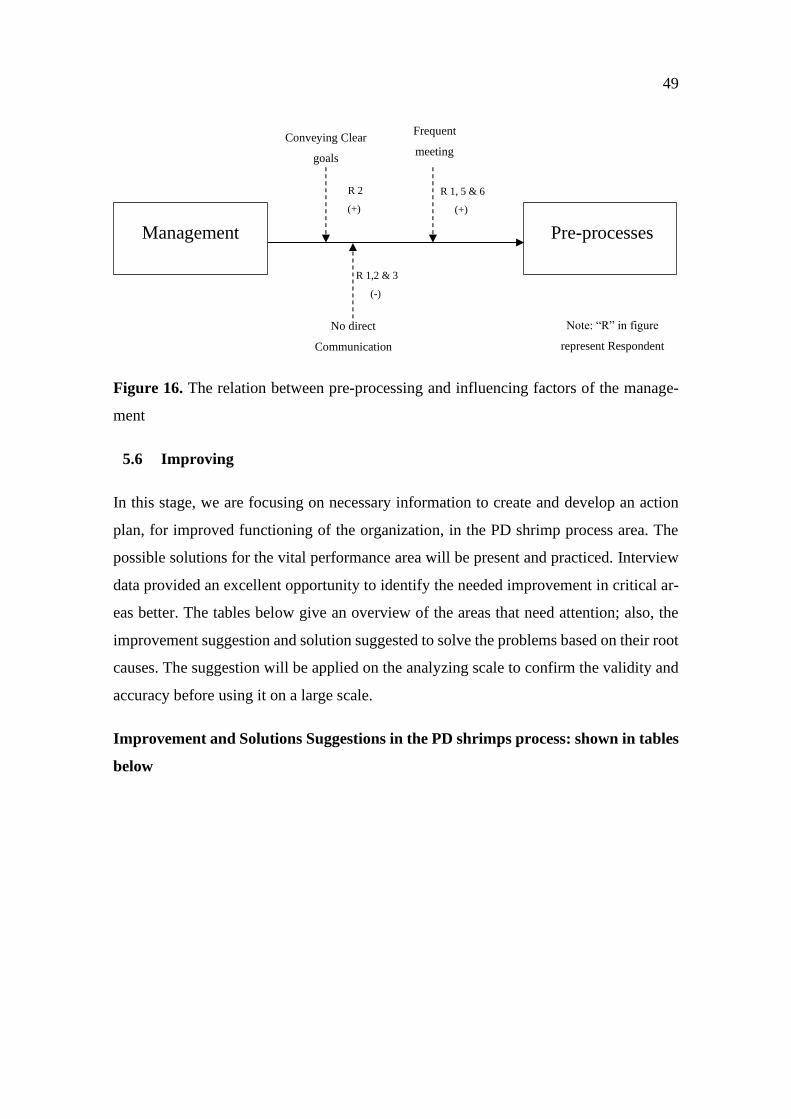
49
Figure 16. The relation between pre-processing and influencing factors of the manage-
ment
5.6 Improving
In this stage, we are focusing on necessary information to create and develop an action
plan, for improved functioning of the organization, in the PD shrimp process area. The
possible solutions for the vital performance area will be present and practiced. Interview
data provided an excellent opportunity to identify the needed improvement in critical ar-
eas better. The tables below give an overview of the areas that need attention; also, the
improvement suggestion and solution suggested to solve the problems based on their root
causes. The suggestion will be applied on the analyzing scale to confirm the validity and
accuracy before using it on a large scale.
Improvement and Solutions Suggestions in the PD shrimps process: shown in tables
below
Management Pre-processes
Conveying Clear
goals
Frequent
meeting
No direct
Communication
R 2
(+)
R 1, 5 & 6
(+)
R 1,2 & 3
(-)
Note: “R” in figure
represent Respondent

50
Table 6. The key performance improvement area: Environment.
The performance is-
sues were addressed
by observation and
interviews.
The improvement and solutions
proposed based on theoretical
studies knowledge and operational
needs.
How to sustain im-
provement to
achieve continuous
improvement
1. The cold climate:
Cold climate harm
individual perfor-
mance; the em-
ployee's experi-
ence that continu-
ous cold weather
makes them feel
low in energy.
The cold climate is necessary for
product quality, so we cannot change
it. But we can provide a worker with
thermal wear or make some changes
in a three-piece suit; i.e., jackets,
hood, and pants provided can prevent
cold.
The organizations
can evaluate the per-
formance of new
suits provided and
its effect on employ-
ees.
2. The long working
hours: Extended
working hours are
very tiresome, and
it creates a stress
impact.
Placement of the required number of
employees at the required place and
cutting down the non-value-added
and not necessary movement will re-
duce the cycle time, resulting in min-
imal working hours. Still, if the pro-
cess requires a long working hour in
a few activities, extra payment for
those working hours in a reasonable
percentage per hour will keep the
employees satisfied. If the long hours
result from employees' lousy perfor-
mance, the evaluation will make it
straightforward for non-payments.
The management
can assess a new
proposal made for
working hours and
its outcomes.
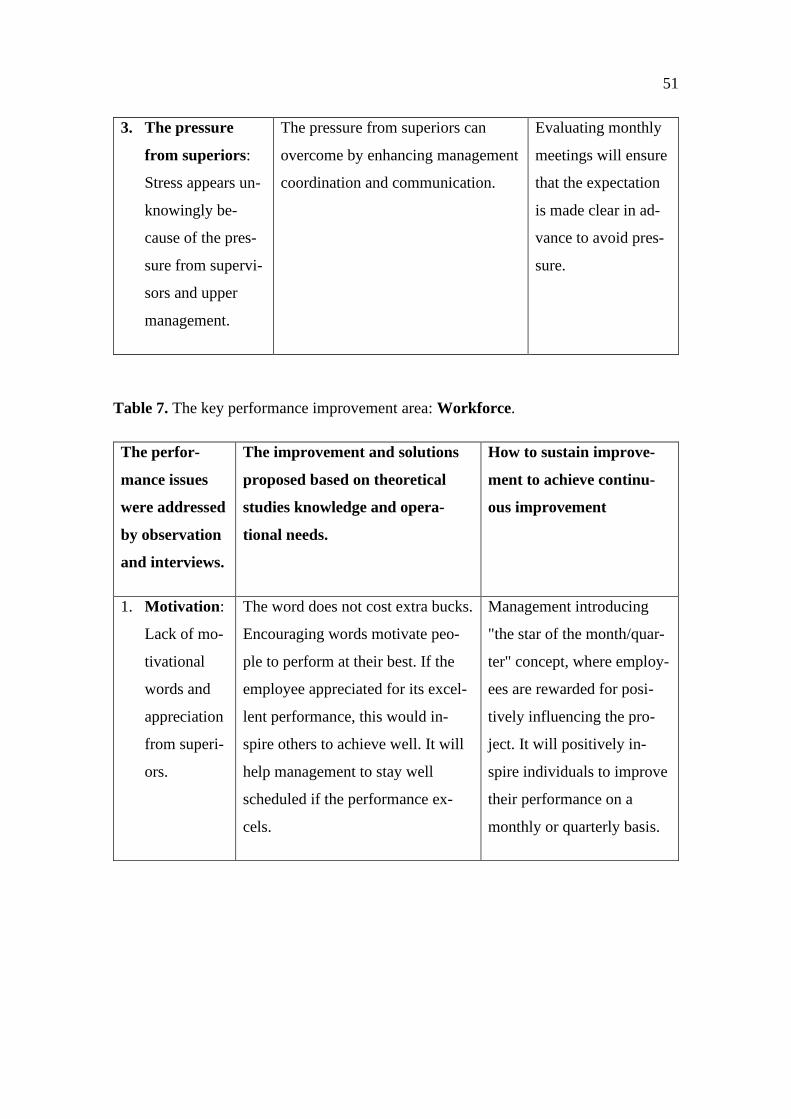
51
3. The pressure
from superiors:
Stress appears un-
knowingly be-
cause of the pres-
sure from supervi-
sors and upper
management.
The pressure from superiors can
overcome by enhancing management
coordination and communication.
Evaluating monthly
meetings will ensure
that the expectation
is made clear in ad-
vance to avoid pres-
sure.
Table 7. The key performance improvement area: Workforce.
The perfor-
mance issues
were addressed
by observation
and interviews.
The improvement and solutions
proposed based on theoretical
studies knowledge and opera-
tional needs.
How to sustain improve-
ment to achieve continu-
ous improvement
1. Motivation:
Lack of mo-
tivational
words and
appreciation
from superi-
ors.
The word does not cost extra bucks.
Encouraging words motivate peo-
ple to perform at their best. If the
employee appreciated for its excel-
lent performance, this would in-
spire others to achieve well. It will
help management to stay well
scheduled if the performance ex-
cels.
Management introducing
"the star of the month/quar-
ter" concept, where employ-
ees are rewarded for posi-
tively influencing the pro-
ject. It will positively in-
spire individuals to improve
their performance on a
monthly or quarterly basis.
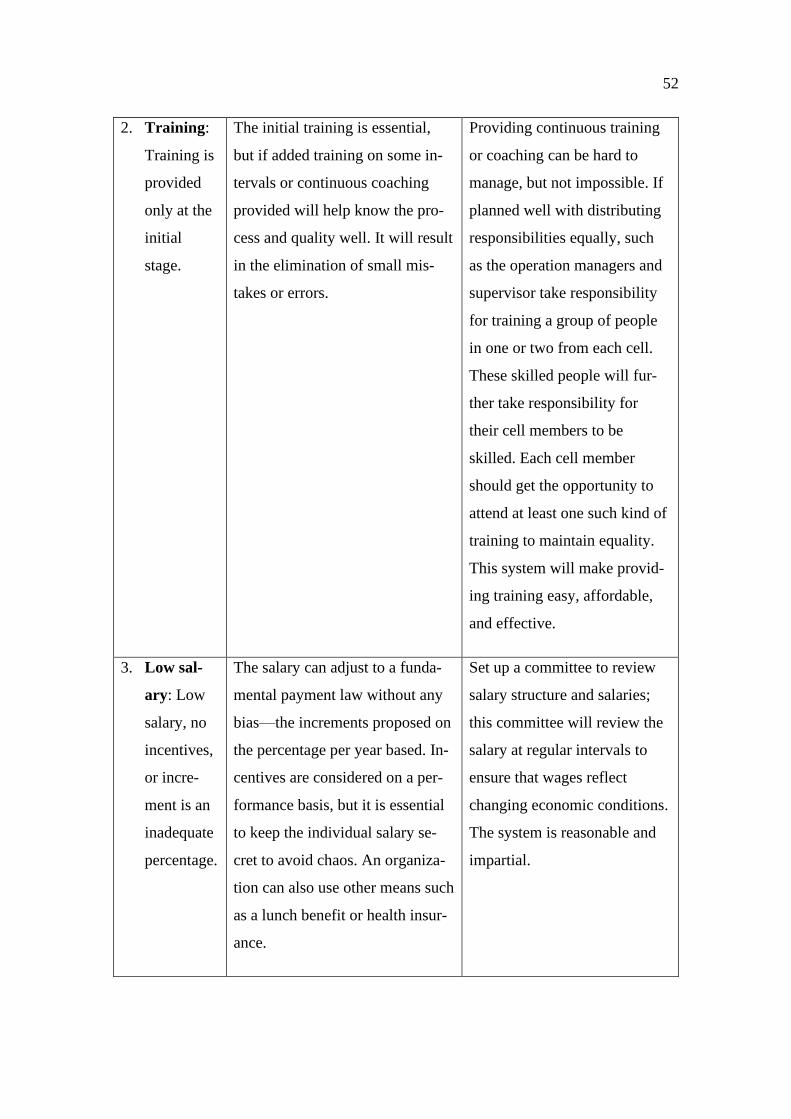
52
2. Training:
Training is
provided
only at the
initial
stage.
The initial training is essential,
but if added training on some in-
tervals or continuous coaching
provided will help know the pro-
cess and quality well. It will result
in the elimination of small mis-
takes or errors.
Providing continuous training
or coaching can be hard to
manage, but not impossible. If
planned well with distributing
responsibilities equally, such
as the operation managers and
supervisor take responsibility
for training a group of people
in one or two from each cell.
These skilled people will fur-
ther take responsibility for
their cell members to be
skilled. Each cell member
should get the opportunity to
attend at least one such kind of
training to maintain equality.
This system will make provid-
ing training easy, affordable,
and effective.
3. Low sal-
ary: Low
salary, no
incentives,
or incre-
ment is an
inadequate
percentage.
The salary can adjust to a funda-
mental payment law without any
bias—the increments proposed on
the percentage per year based. In-
centives are considered on a per-
formance basis, but it is essential
to keep the individual salary se-
cret to avoid chaos. An organiza-
tion can also use other means such
as a lunch benefit or health insur-
ance.
Set up a committee to review
salary structure and salaries;
this committee will review the
salary at regular intervals to
ensure that wages reflect
changing economic conditions.
The system is reasonable and
impartial.
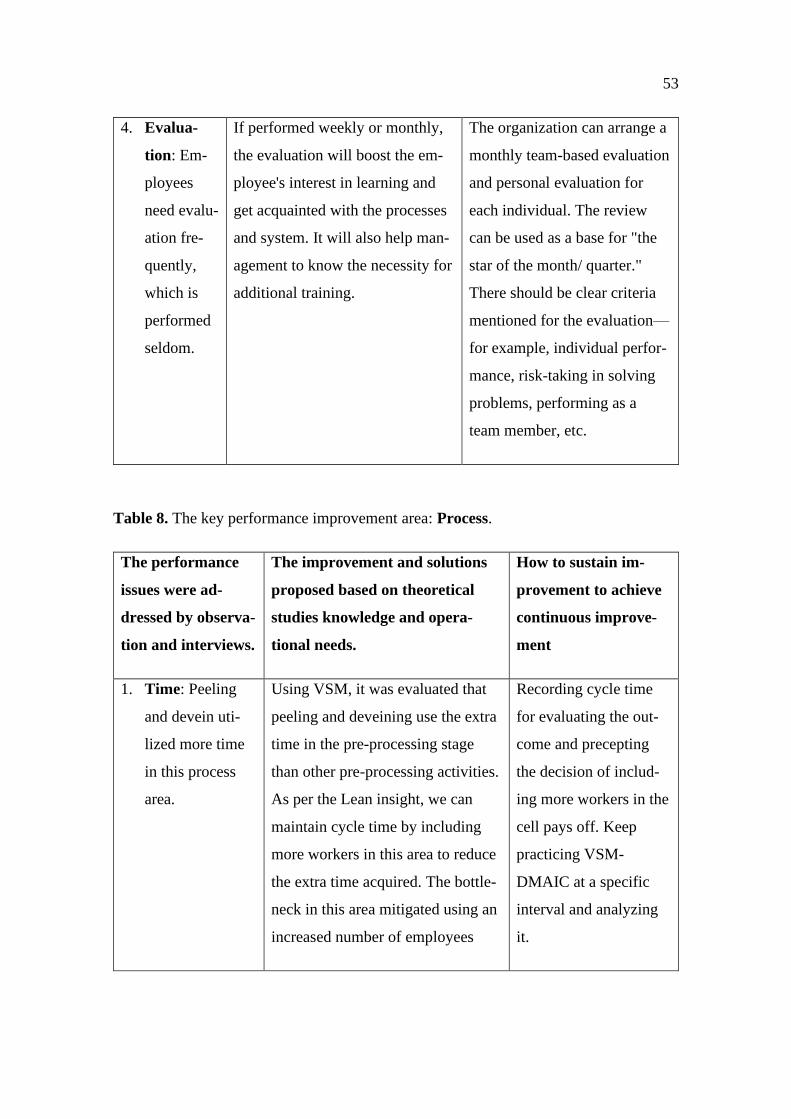
53
4. Evalua-
tion: Em-
ployees
need evalu-
ation fre-
quently,
which is
performed
seldom.
If performed weekly or monthly,
the evaluation will boost the em-
ployee's interest in learning and
get acquainted with the processes
and system. It will also help man-
agement to know the necessity for
additional training.
The organization can arrange a
monthly team-based evaluation
and personal evaluation for
each individual. The review
can be used as a base for "the
star of the month/ quarter."
There should be clear criteria
mentioned for the evaluation—
for example, individual perfor-
mance, risk-taking in solving
problems, performing as a
team member, etc.
Table 8. The key performance improvement area: Process.
The performance
issues were ad-
dressed by observa-
tion and interviews.
The improvement and solutions
proposed based on theoretical
studies knowledge and opera-
tional needs.
How to sustain im-
provement to achieve
continuous improve-
ment
1. Time: Peeling
and devein uti-
lized more time
in this process
area.
Using VSM, it was evaluated that
peeling and deveining use the extra
time in the pre-processing stage
than other pre-processing activities.
As per the Lean insight, we can
maintain cycle time by including
more workers in this area to reduce
the extra time acquired. The bottle-
neck in this area mitigated using an
increased number of employees
Recording cycle time
for evaluating the out-
come and precepting
the decision of includ-
ing more workers in the
cell pays off. Keep
practicing VSM-
DMAIC at a specific
interval and analyzing
it.
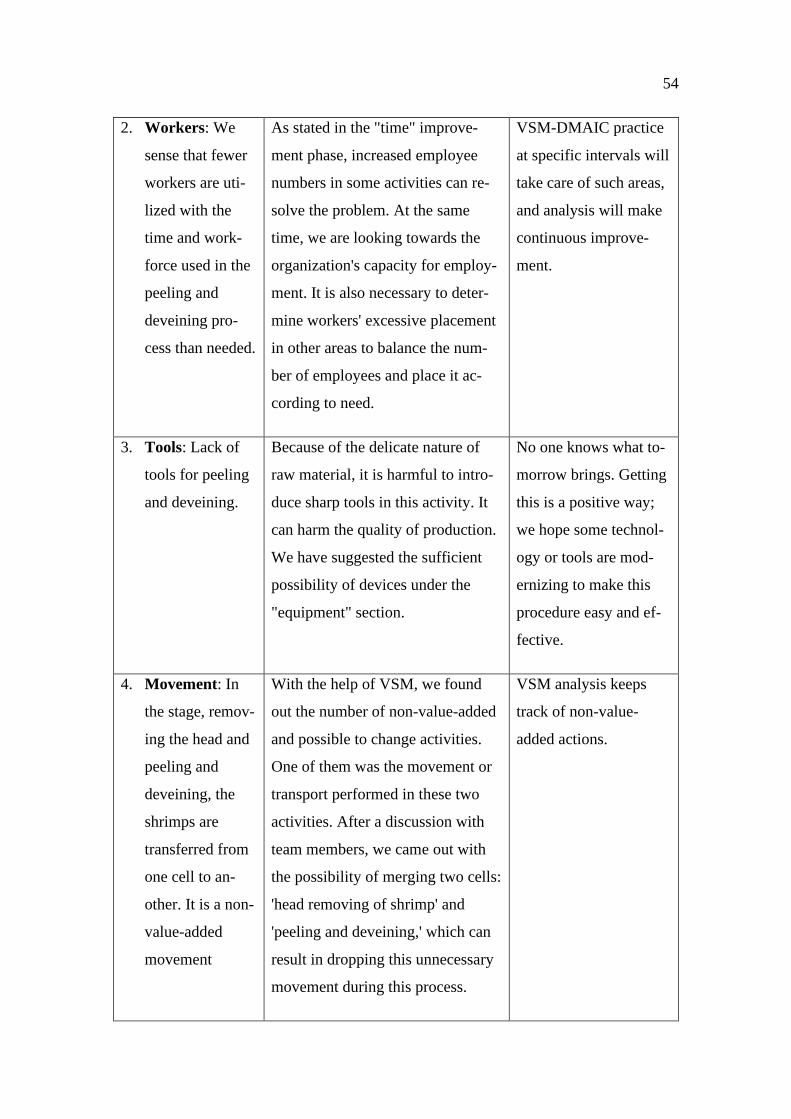
54
2. Workers: We
sense that fewer
workers are uti-
lized with the
time and work-
force used in the
peeling and
deveining pro-
cess than needed.
As stated in the "time" improve-
ment phase, increased employee
numbers in some activities can re-
solve the problem. At the same
time, we are looking towards the
organization's capacity for employ-
ment. It is also necessary to deter-
mine workers' excessive placement
in other areas to balance the num-
ber of employees and place it ac-
cording to need.
VSM-DMAIC practice
at specific intervals will
take care of such areas,
and analysis will make
continuous improve-
ment.
3. Tools: Lack of
tools for peeling
and deveining.
Because of the delicate nature of
raw material, it is harmful to intro-
duce sharp tools in this activity. It
can harm the quality of production.
We have suggested the sufficient
possibility of devices under the
"equipment" section.
No one knows what to-
morrow brings. Getting
this is a positive way;
we hope some technol-
ogy or tools are mod-
ernizing to make this
procedure easy and ef-
fective.
4. Movement: In
the stage, remov-
ing the head and
peeling and
deveining, the
shrimps are
transferred from
one cell to an-
other. It is a non-
value-added
movement
With the help of VSM, we found
out the number of non-value-added
and possible to change activities.
One of them was the movement or
transport performed in these two
activities. After a discussion with
team members, we came out with
the possibility of merging two cells:
'head removing of shrimp' and
'peeling and deveining,' which can
result in dropping this unnecessary
movement during this process.
VSM analysis keeps
track of non-value-
added actions.
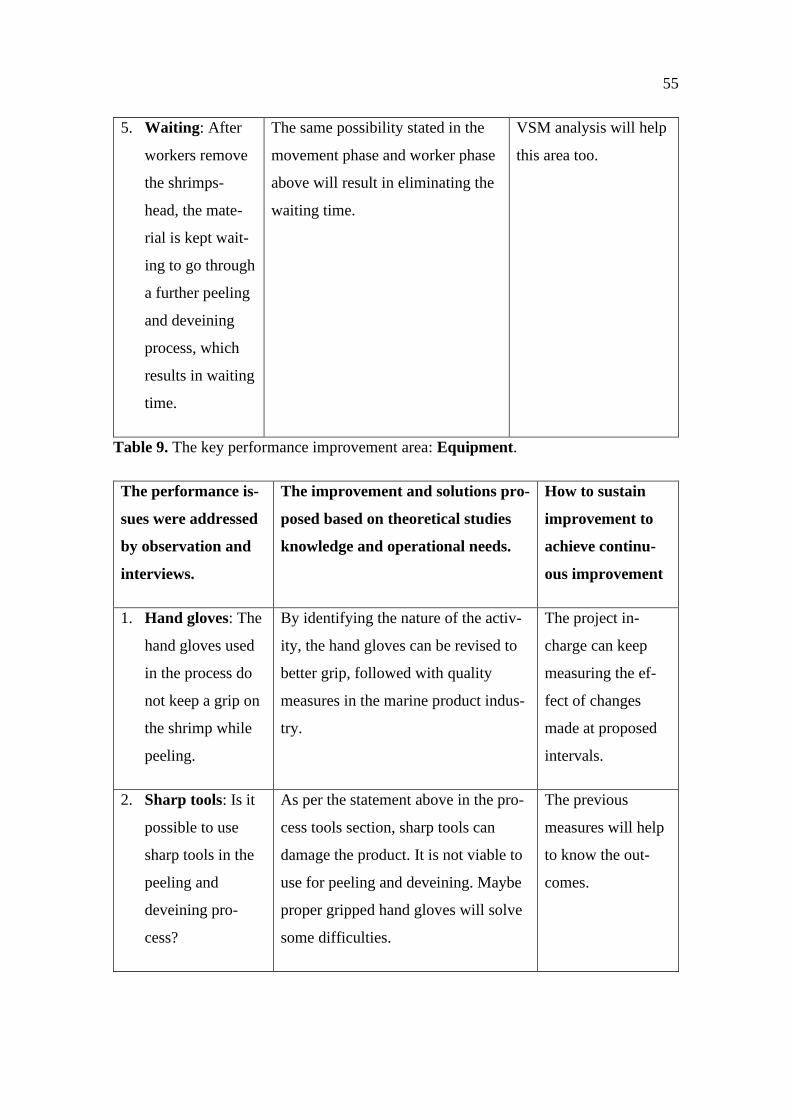
55
5. Waiting: After
workers remove
the shrimps-
head, the mate-
rial is kept wait-
ing to go through
a further peeling
and deveining
process, which
results in waiting
time.
The same possibility stated in the
movement phase and worker phase
above will result in eliminating the
waiting time.
VSM analysis will help
this area too.
Table 9. The key performance improvement area: Equipment.
The performance is-
sues were addressed
by observation and
interviews.
The improvement and solutions pro-
posed based on theoretical studies
knowledge and operational needs.
How to sustain
improvement to
achieve continu-
ous improvement
1. Hand gloves: The
hand gloves used
in the process do
not keep a grip on
the shrimp while
peeling.
By identifying the nature of the activ-
ity, the hand gloves can be revised to
better grip, followed with quality
measures in the marine product indus-
try.
The project in-
charge can keep
measuring the ef-
fect of changes
made at proposed
intervals.
2. Sharp tools: Is it
possible to use
sharp tools in the
peeling and
deveining pro-
cess?
As per the statement above in the pro-
cess tools section, sharp tools can
damage the product. It is not viable to
use for peeling and deveining. Maybe
proper gripped hand gloves will solve
some difficulties.
The previous
measures will help
to know the out-
comes.
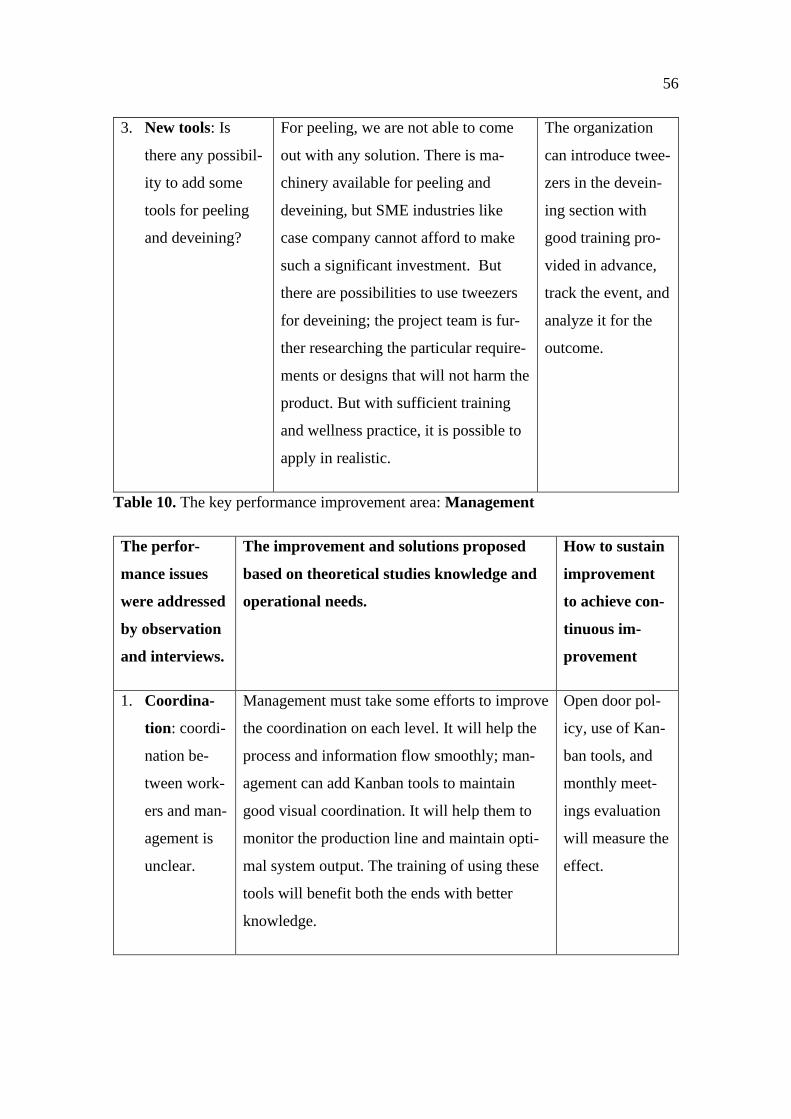
56
3. New tools: Is
there any possibil-
ity to add some
tools for peeling
and deveining?
For peeling, we are not able to come
out with any solution. There is ma-
chinery available for peeling and
deveining, but SME industries like
case company cannot afford to make
such a significant investment. But
there are possibilities to use tweezers
for deveining; the project team is fur-
ther researching the particular require-
ments or designs that will not harm the
product. But with sufficient training
and wellness practice, it is possible to
apply in realistic.
The organization
can introduce twee-
zers in the devein-
ing section with
good training pro-
vided in advance,
track the event, and
analyze it for the
outcome.
Table 10. The key performance improvement area: Management
The perfor-
mance issues
were addressed
by observation
and interviews.
The improvement and solutions proposed
based on theoretical studies knowledge and
operational needs.
How to sustain
improvement
to achieve con-
tinuous im-
provement
1. Coordina-
tion: coordi-
nation be-
tween work-
ers and man-
agement is
unclear.
Management must take some efforts to improve
the coordination on each level. It will help the
process and information flow smoothly; man-
agement can add Kanban tools to maintain
good visual coordination. It will help them to
monitor the production line and maintain opti-
mal system output. The training of using these
tools will benefit both the ends with better
knowledge.
Open door pol-
icy, use of Kan-
ban tools, and
monthly meet-
ings evaluation
will measure the
effect.
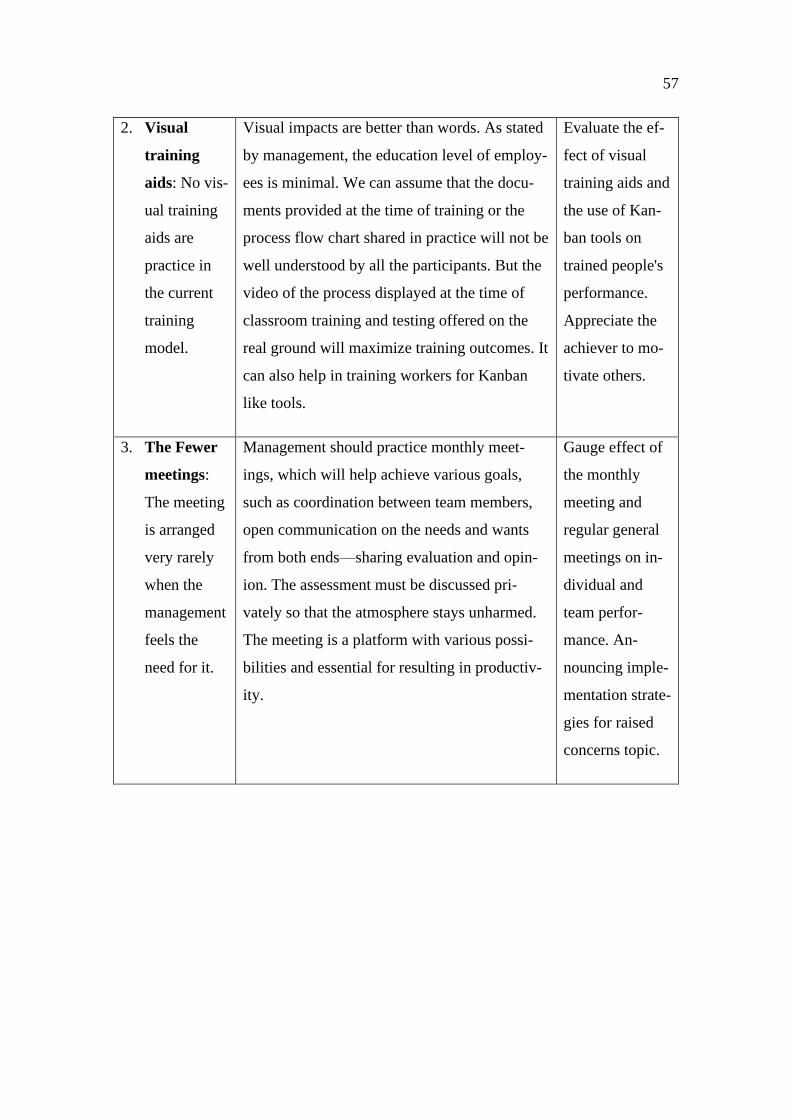
57
2. Visual
training
aids: No vis-
ual training
aids are
practice in
the current
training
model.
Visual impacts are better than words. As stated
by management, the education level of employ-
ees is minimal. We can assume that the docu-
ments provided at the time of training or the
process flow chart shared in practice will not be
well understood by all the participants. But the
video of the process displayed at the time of
classroom training and testing offered on the
real ground will maximize training outcomes. It
can also help in training workers for Kanban
like tools.
Evaluate the ef-
fect of visual
training aids and
the use of Kan-
ban tools on
trained people's
performance.
Appreciate the
achiever to mo-
tivate others.
3. The Fewer
meetings:
The meeting
is arranged
very rarely
when the
management
feels the
need for it.
Management should practice monthly meet-
ings, which will help achieve various goals,
such as coordination between team members,
open communication on the needs and wants
from both ends—sharing evaluation and opin-
ion. The assessment must be discussed pri-
vately so that the atmosphere stays unharmed.
The meeting is a platform with various possi-
bilities and essential for resulting in productiv-
ity.
Gauge effect of
the monthly
meeting and
regular general
meetings on in-
dividual and
team perfor-
mance. An-
nouncing imple-
mentation strate-
gies for raised
concerns topic.
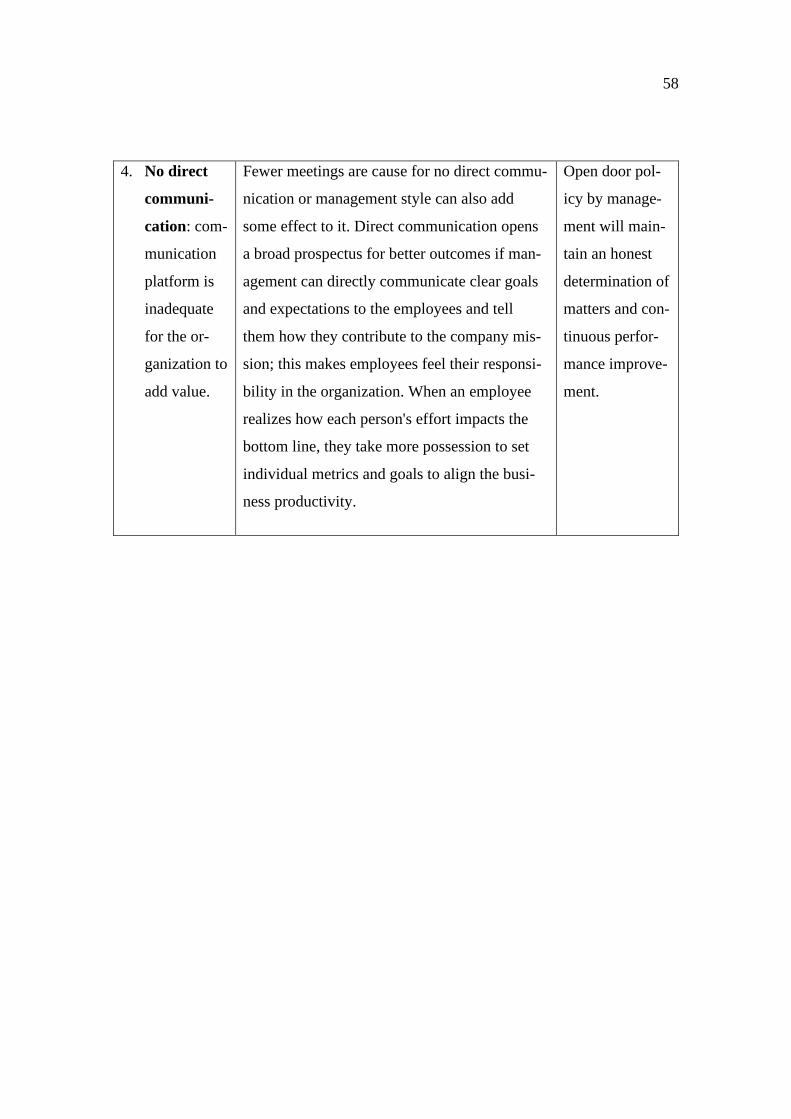
58
4. No direct
communi-
cation: com-
munication
platform is
inadequate
for the or-
ganization to
add value.
Fewer meetings are cause for no direct commu-
nication or management style can also add
some effect to it. Direct communication opens
a broad prospectus for better outcomes if man-
agement can directly communicate clear goals
and expectations to the employees and tell
them how they contribute to the company mis-
sion; this makes employees feel their responsi-
bility in the organization. When an employee
realizes how each person's effort impacts the
bottom line, they take more possession to set
individual metrics and goals to align the busi-
ness productivity.
Open door pol-
icy by manage-
ment will main-
tain an honest
determination of
matters and con-
tinuous perfor-
mance improve-
ment.
59
5.7 Control
How the entire Lean Six Sigma process can be controlled was proposed to the organiza-
tion's project team and management to ensure these studies can be applied to other de-
partments in the organization to achieve continuous improvement in the organization. It
is not a one-time process to maintain the results and constant improvement; the Lean Six
Sigma must be practiced without interruption.
As significant findings in this project were found in the pre-processing area and were
majored using value stream mapping, also analyzed by DMAIC, using different tools. A
suggestion will be applied for analysis and measured for its outcome. If the result is, ac-
cording to the expectation of productivity improvement, it can be used further in a loop
to improve other areas and the organization's continuous improvement.
60
6 CONCLUSION
6.1 Discussion
This study set out to address three research questions: 1) What are the causes of waste,
2) What are the reasons behind the causes-of-waste, and 3) How to eliminate waste in
company X. It was also about introducing LSS in the company.
The first research question addressed by adopting a Lean Six Sigma approach we refer to
as VSM DMAIC. The values stream mapping is a lean process mapping tool that we used
to identify the waste and where it occurs in company X's value stream. Further, the
DMAIC, which is Six Sigma’s improvement cycle, was applied to analyze and measure
the cause of waste. The value stream mapping enabled two areas in the PD shrimp pro-
cessing with four kinds of wastes. Company X has several production processes accord-
ing to customers' demand. We preferred to study the PD shrimp process as the customer-
demand for PD shrimps covers a significant part of exporting. Our finding of two process
stages where waiting time, unwanted motion, and transportation of the material and hu-
man potential were causing waste leads us to further research question; the reason behind
the cause.
The issue further investigated using the DMAIC methodology, which indicates other
problems that result in waste in certain areas. These issues uncovered were using a cause-
effect diagram. The findings were that environment, equipment, process, workforce/peo-
ple, and management profoundly influenced waste. These findings provided the platform
for monitoring, upgrading, and sustaining suggested improvements that led to improved
productivity and waste elimination. The problems were multidimensional, and each main
area had more than one concern. In the improving stage, the main sections and relative
situations have been briefly addressed. To summarise the issues according to their prior-
itize of improvement, they are listed below:
• In the PD shrimp pre-process to mitigate the waiting time between head removing
of shrimps and peeling and deveining.
• The activity peeling and deveining cycle time needs to decrease.
• Find tools for peeling and deveining for reduction of time.
• Not enough training provided to the employee.
61
• Cold climate reduces work efficiency.
• No coordination and communication.
The issue prioritized will lead to prioritizing improvements to ensure that suggested so-
lutions will lead to productivity improvement.
6.2 Conclusion
This work's significant contributions are anticipated to the novelty of applying the Lean
Six Sigma method in the marine food processing industry to eliminate waste and improve
productivity and the empirical testing of the VSM DMAIC methodology in the marine
product process industry. Applying VSM DMAIC analysis in Company X to make rec-
ommendations that will enhance productivity and eliminate waste; by creating a continu-
ous improvement framework at the organization. Process waste is possible to reduce if
the proposed solutions are given attention and applied to the degree of outcomes sug-
gested—the priority implementation of the recommended resolution of problems identi-
fied.
• Merging of head removing of shrimps and peeling and deveining processes in the
PD shrimp pre-process will mitigate the waiting time.
• Increasing workers in this activity of peeling and deveining will reduce the cycle
time.
• Introducing the ‘tweezer’ as a tool for deveining will help to the reduction of time.
• An increase in training will create a compelling and enhanced workforce.
• For decreasing the cold climate adverse effect on work, employees should provide
thermal suits.
• Open door concept and increased face to face meeting are an effective solution
for good coordination and communication.
Even though these suggestions are the priority for consideration, the organization is
recommended to implement as well as to practice all the advice and solutions provided
as outcomes of this research study to realize the improvement made and continue to
seek out additional improvement.

62
Lastly, the organization needs to create a monitoring group to review improvement
and sustainability. Management should utilize the peoples' power to create a Lean Six
Sigma culture and sustain it with continuous improvement.
6.3 Limitations and
The study focused on the PD shrimp pre-processing in company X, and it may have some
limitations. Even if the case company benefits from recommended solutions, it does not
guarantee; other marine product industries can follow the same research as the solution
and suggestion were base on the observation in company X.
The interview planned was for one week with 11 participants. The external audit started
on 19th October, continuing till 23rd October, obligating to change our plans. The re-
searcher has to compromise on the seven interviews completed before 19th October. The
limited-time of research does not permit the researcher to wait for the remaining respond-
ent to get interviewed. The possibility of more talks could have provided more data, opin-
ion, ideas with other options.
An Additional critical limitation was the duration used to conduct the research; it was a
significantly shorter period that the researcher did not get the opportunity to observe the
implementation phase. The researcher did not land to analyze or measure; if the solution
and suggestion recommended were working in the pre-processing area as researchers ex-
pectation.
6.4 Future Research
The study has applied LEAN SIX SIGMA – VSM DMAIC analysis to PD shrimp pre-
processing issues in company X, intending to eliminate waste and increasing productivity.
The study in-depth analyzed the peeling deveining activity and suggested solutions after
concluding the measures. Further research should be conduct to find how successful the
implementation of the recommended solution was. Did this project succeed in eliminating
waste and enhancing productivity in company X? The study might be performed on im-
plementing LEAN SIX SIGMA in other areas of company X.
63
REFERENCES
Bashar, A., and Hasin, AA, 2016. The Effect of Continuous Improvement on Waste
Elimination for Implementing Lean Manufacturing in the Apparel Industry of Bangla-
desh.
Benson, P.G., Saraph, J.V., and Schroeder, R.G., 1991. The effects of organizational
context on quality management: an empirical investigation. Management Science, 37(9),
pp.1107-1124.
Bessant, J., Caffyn, S., Gilbert, J., Harding, R., and Webb, S., 1994. Rediscovering con-
tinuous improvement. Technovation, 14(1), pp.17-29.
Bhuiyan, N., and Baghel, A., 2005. An overview of continuous improvement: from the
past to the present. Management decision.
Blackstone, A., 2018. Principles of sociological inquiry: Qualitative and quantitative
methods.
BRCGS: Brand Reputation Compliance Global Standards; https://www.brcgs.com/
Breyfogle, F.W., 1999. Implementing Six Sigma: Smarter Solutions using Statistical
Methods. New York: John Wiley.
Brink, H.I., 1993. Validity and reliability in qualitative research. Curationis, 16(2),
pp.35-38.
Caswell, J.A., Bredahl, M.E., and Hooker, NH, 1998. How quality management meta-
systems are affecting the food industry. Applied Economic Perspectives and Pol-
icy, 20(2), pp.547-557.
Crosby, P.B., 1979. Quality is free: The art of making quality certain (Vol. 94). New
York: McGraw-hill.
Crosby, P.B., 1984. Quality is Free: the Art of Hassle-Free Management. New York,
NY: NAL Penguin.
Costa, L.B.M., Godinho Filho, M., Fredendall, L.D. and Paredes, F.J.G., 2018. Lean,
Six Sigma, and Lean Six Sigma in the food industry: A systematic literature re-
view. Trends in Food Science & Technology, 82, pp.122-133.
Dave, Y. and Sohani, N., 2019. Improving productivity through Lean practices in cen-
tral India-based manufacturing industries. International Journal of Lean Six Sigma.
Deming, W.E., 1986. Out of the crisis: Quality. Productivity and Competitive Position,
Massachusetts, USA.
Desai, D.A., Kotadiya, P., Makwana, N., and Patel, S., 2015. Curbing variations in the
packaging process through Six Sigma way in the large-scale food-processing indus-
try. Journal of Industrial Engineering International, 11(1), pp.119-129.
64
Drohomeretski, E., Gouvea da Costa, S.E., Pinheiro de Lima, E. and Garbuio, P.A.D.R.,
2014. Lean, Six Sigma, and Lean Six Sigma: an analysis based on operations strat-
egy. International Journal of Production Research, 52(3), pp.804-824.
Eslamy, H.K., Newman, B., and Weinberger, E., 2014, December. Quality improve-
ment in neonatal digital radiography: Implementing the basic quality improvement
tools. In Seminars in Ultrasound, CT, and MRI (Vol. 35, No. 6, pp. 608-626). WB
Saunders.
European Commission: EU import conditions for seafood and other fishery products;
https://ec.europa.eu/food/sites/food/files/safety/docs/ia_trade_import-cond-fish_en.pdf
FAOSTAT; Fisheries statistics; http://www.fao.org/fishery/facp/IND/en
Feigenbaum, A.V., 1951. Quality control: Principles, practice and administration: An
industrial management tool for improving product quality and design and for reducing
operating costs and losses. McGraw-Hill.
Feigenbaum, A.V., 1983. Total Quality Control', McGraw-Hill Book Company. New
York.
Fliedner, G., 2008, November. Sustainability: a new lean principle. In Proceedings of
the 39th annual meeting of the decision sciences institute, Baltimore, Maryland (pp.
3321-3326). Sn.
Flynn, B.B., Schroeder, R.G., and Sakakibara, S., 1994. A framework for quality man-
agement research and an associated measurement instrument. Journal of Operations
Management, 11(4), pp.339-366.
Food and Agriculture Organization of the United Nations (FAO);
Fisheries and Aquaculture topics. Fisheries statistics and information. Topics Fact
Sheets. In: FAO Fisheries Division [online]. [Cited 9 September, 2020].
http://www.fao.org/fishery/ © FAO 2001-2020.
Food and Drugs administration; https://www.fda.gov/food/hazard-analysis-critical-con-
trol-point-haccp/haccp-principles-application-guidelines
FSSAI; India Authority of Food Safety and Standards, Licensing and Registration Sys-
tem V3.0 2018; https://archive.fssai.gov.in/home/fss-legislation/fss-regulations.html
FSSC 22000; Inspecta.fi; https://www.fssc22000.com/certification-body/inspecta-ser-
tifiointi-oy/
Garg, D., Narahari, Y. and Viswanadham, N., 2004. Design of six sigma supply
chains. IEEE Transactions on Automation Science and Engineering, 1(1), pp.38-57.
Garvin, D.A., 1988. Managing quality: The strategic and competitive edge. Simon and
Schuster. Chapter 3, pp.39-46.
George, M., 2002. Lean Six Sigma: Combining Six Sigma Quality with Lean Production
Speed, McGraw-Hill, New York, NY
65
Gershon, M., 2010. Choosing Which Process Improvement Methodology to Imple-
ment. Journal of Applied Business & Economics, 10(5).
Gibson, A., 1986. Inspecting education. Standards and criteria in higher education,
pp.128-135.
Golafshani, N., 2003. Understanding reliability and validity in qualitative research. The
qualitative report, 8(4), pp.597-607.
Goldsby, T.J. and Martichenko, R., 2005. Lean six sigma logistics: Strategic develop-
ment to operational success. J. Ross Publishing.
Grafton, J., Lillis, A.M., Ihantola, E.M. and Kihn, L.A., 2011. Threats to validity and re-
liability in mixed methods accounting research. Qualitative Research in Accounting &
Management.
Hakimi, S., Zahraee, S.M., and Rohani, JM, 2018. Application of Six Sigma DMAIC
methodology in the plain yogurt production process. International Journal of Lean Six
Sigma.
Harvey, L., and Green, D., 1993. Defining quality. Assessment & evaluation in higher
education, 18(1), pp.9-34.
Healy, M., and Perry, C., 2000. Comprehensive criteria to judge the validity and relia-
bility of qualitative research within the realism paradigm. Qualitative market research:
An international journal.
Hobbs, D.P., 2003. Lean manufacturing implementation: a complete execution manual
for any size manufacturer. J. Ross Publishing, pp. 2-3.
Hung, H.C., and Sung, M.H., 2011. Applying six Sigma to manufacturing processes in
the food industry to reduce quality cost. Scientific Research and Essays, 6(3), pp.580-
591.
Ihantola E. M. & Kihn L. A., 2011. Qualitative Research in Accounting & Management
Vol. 8 No. 1, 2011 pp. 39-58 q Emerald Group Publishing Limited 1176-6093 DOI
10.1108/11766091111124694
Ilbery, B., and Kneafsey, M., 2000. Producer constructions of quality in regional speci-
ality food production: a case study from south west England. Journal of rural stud-
ies, 16(2), pp.217-230.
Impruver, T., 2020. Excellent enterprise continuous improvement examples., https://im-
pruver.com/continuous-improvement-examples/
Joran, L. &Jeroen, d. M., 2012. An analysis of the Six Sigma DMAIC method from the
perspective of problem-solving. Int. Journal of Production Economics, pp. 604-614.
Juergensen, T. (2000). Continuous Improvement: Mindsets, Capability, Process, Tools,
and Results. The Juergensen Consulting Group, Inc., Indianapolis, IN.
66
Juran, J.M., 1970. Consumerism and product quality. Quality Progress, 3(7), pp.18-27.
Juran, J.M., 1986. A universal approach to managing for quality. Quality Pro-
gress, 19(8), pp.19-24.
KaiNexus 2012. Value Stream Mapping. https://www.kainexus.com/improvement-dis-
ciplines/lean/value-stream-mapping
Kaswan, M.S., and Rathi, R., 2020. Green Lean Six Sigma for sustainable development:
Integration and framework. Environmental Impact Assessment Review, 83, p.106396.
Keyte, B. and Locher, D.A., 2004. The complete lean enterprise: Value stream mapping
for administrative and office processes. CRC Press.
Kilani M., and Sturges R., 1992. Towards an Integrated Design for an Assembly Evalu-
ation and Reasoning System. Computer-Aided Design, 24(2), pp. 67-78.
Kothari, C.R., 2004. Research methodology: Methods and techniques. New Age Inter-
national.
Krifi B., Ben K., Bonert G., Mosbah A., Jaafar M., Chabir H., Perrin P., 2013. ISO
9001: Implementation Approach and Impact. IOSR Journal of Business and Manage-
ment (IOSR-JBM), pp. 44-52.
Lee, J.H., Garza-Reyes, J.A., Kumar, V., Rocha-Lona, L. and Mishra, N., 2013. A com-
parative study of the implementation status of Lean Six Sigma in South Korea and the
UK. In Advances in Sustainable and Competitive Manufacturing Systems (pp. 1489-
1502). Springer, Heidelberg.
Leffler, K.B., “Ambiguous Changes in Product Qualtiy,” American Economic Review,
December 1982, pp. 956
León, C.M., Ph.D., Temblador, C., Ph.D. & del Valle, Z., MSc 2013, "Waste Analysis
for Lean Operation Systems: a Preliminary Framework," IIE Annual Conference. Pro-
ceedings, pp. 951-960.
Linderman, K., Schroeder, R.G., Zaheer, S. & Choo, A.S., 2003. Six Sigma: a goal the-
oretic perspective. Journal of Operations Management 21, pp. 193-203.
Madu, CN, 1999. Reliability and quality interface. International Journal of Quality &
Reliability Management.
Mahalik, N.P., and Nambiar, AN, 2010. Trends in food packaging and manufacturing
systems and technology. Trends in food science & technology, 21(3), pp.117-128.
Mansfield, B., 2003. Fish, factory trawlers, and imitation crab: the nature of quality in
the seafood industry. Journal of Rural Studies, 19(1), pp.9-21.
Martin, K., and Osterling, M., 2014. Value stream mapping: how to visualize work and
align leadership for organizational transformation. New York: McGraw-Hill.
67
Maxwell, J., 1992. Understanding and validity in qualitative research. Harvard educa-
tional review, 62(3), pp.279-301.
Michael, L. G. D. R., Mark, P. & John, M., 2005. The lean Six Sigma pocket tool book.
New York: George group
Moya, J.V., Déleg, E.M., Sánchez, C.V. and Vásquez, N.R., 2016. Implementation of
lean manufacturing in a food enterprise. Enfoque UTE, 7(1), pp.1-12.
MPEDA; The Marine Products Export Development Authority; Annual Report 2017-
2018. https://mpeda.gov.in/MPEDA/#
Nicholas, J., 2018. Lean Production for Competitive Advantage: A Comprehensive
Guide to Lean Methods and Management Practices. 2nd Edition. CRC Press is an im-
print of Taylor & Francis Group, LLC, an Informa business, pp. 22-54, 61-92
Ohno, T., 1988. Toyota production system: beyond large-scale production. crc Press.
Parasuraman, A., Zeithaml, V.A. and Berry, L.L., 1988. Servqual: A multiple-item scale
for measuring consumer perc. Journal of retailing, 64(1), p.12-40.
Pirsig, R.M., 1999. Zen and the art of motorcycle maintenance: An inquiry into values.
Random House.
Prashar, A., 2020. Adopting Six Sigma DMAIC for environmental considerations in the
process industry environment. The TQM Journal.
Patel, R., 2011. Modeling Lean Six Sigma in the small packaging industry in India.
Persson, V., and Johansson, D., 2016. Integrating Rapid Learning Cycles into Hard-
ware Development-A practical improvement project within chassis development at Sca-
nia CV AB (Master's thesis).
Powell, D., Alfnes, E., Strandhagen, J.O. and Dreyer, H., 2013. The concurrent applica-
tion of lean production and ERP: Towards an ERP-based lean implementation pro-
cess. Computers in Industry, 64(3), pp.324-335.
Powell, D., Lundeby, S., Chabada, L., and Dreyer, H., 2017. Lean Six Sigma and envi-
ronmental sustainability: the case of a Norwegian dairy producer. International Journal
of Lean Six Sigma.
Pyzdek, T. & Keller, P., 2014. The six sigma handbook (4th ed.). New York: McGraw-
Hill Education.
Redman L. V. and Mory A. V. H., The Romance of Research, 1923.
Rever, T., 2019. Six continuous improvement tools and techniques., https://rever-
score.com/continuous-improvement-tools/
Rother, M., and Shook, J., 2003. Learning to see: value stream mapping to add value
and eliminate muda. Lean Enterprise Institute.
68
Sahno, J., and Shevtshenko, E., 2014, April. Quality improvement methodologies for
continuous improvement of production processes and product quality and their evolu-
tion. In 9th International DAAAM Baltic Conference "Industrial Engineering (pp. 181-
186).
Salah, S., Carretero, JA, and Rahim, A., 2010. The integration of quality management
and continuous improvement methodologies with management systems. International
Journal of Productivity and Quality Management, 6(3), pp.269-288.
Saraph, J.V., Benson, P.G. and Schroeder, R.G., 1989. An instrument for measuring the
critical factors of quality management. Decision Sciences, 20(4), pp.810-829.
Saunders, M., Lewis, P. and Thornhill, A., 2009. Research Methods for Business Stu-
dents, 5th edn, sn.
Shewhart, W.A., 1931. Economic control of quality of manufactured product. Macmil-
lan And Co Ltd, London.
Smith, S. 2014, "Muda, Muri and Mura," ASQ Six Sigma Forum Magazine, vol. 13, no.
2, pp. 36-37.
Sobek, D., 2014. Lean Product and Process Development. Second Edition, Lean Enter-
prise Institute, USA.
Sokovic, M., Pavletic, D. and Fakin, S., 2005. Application of Six Sigma methodology
for process design. Journal of Materials Processing Technology, 162, pp.777-783.
Sower, V.E., and Fair, FK, 2005. There is more to quality than continuous improve-
ment: Listening to Plato. Quality Management Journal, 12(1), pp.8-20.
Statistic Finland; Tilastokeskus, metadata 2018;
https://www.stat.fi/meta/kas/pienet_ja_keski_en.html
Su, C.T. and Chou, C.J., 2008. A systematic methodology for the creation of Six Sigma
projects: A case study of semiconductor foundry. Expert systems with applica-
tions, 34(4), pp.2693-2703.
Surendro, D. D. R. K., 2013. Information quality improvement model on the hospital in-
formation system using Six Sigma. pp. 1166-1172.
Thomas, A., Barton, R. and Chuke‐Okafor, C., 2009. Applying lean six sigma in a small
engineering company–a model for change. Journal of Manufacturing Technology Man-
agement.
Van Der Spiegel, M., Luning, P.A., De Boer, W.J., Ziggers, G.W. and Jongen, W.M.F.,
2006. Measuring effectiveness of food quality management in the bakery sector. Total
Quality Management & Business Excellence, 17(6), pp.691-708.
Ward A. C. & Sobek D. K. II, 2014. Lean Product and Process Development. Second
Edition., Lean Enterprise Institute, Cambridge USA, lean.org.

69
Wheat, B., Mills, C. and Carnell, M., 2003. Leaning into Six Sigma: a parable of the
journey to Six Sigma and a lean enterprise. New York: McGraw-Hill.
Wilson, J.P. and Campbell, L., 2016. Developing a knowledge management policy for
ISO 9001: 2015. Journal of Knowledge Management.
Womack, J. & Jones D., 1996. How to Root Out Waste and Pursue Perfection. Change
Management, Harvard Business Review; https://hbr.org/1996/09/how-to-root-out-
waste-and-pursue-perfection
Woods, J., 1997. "The six values of a quality culture." National Productivity Review,
pp. 49-54.
Woody, C., 1927. Research is a carefully inquiry or examination in seeking facts or
principles. Journal of Social Studies Research.
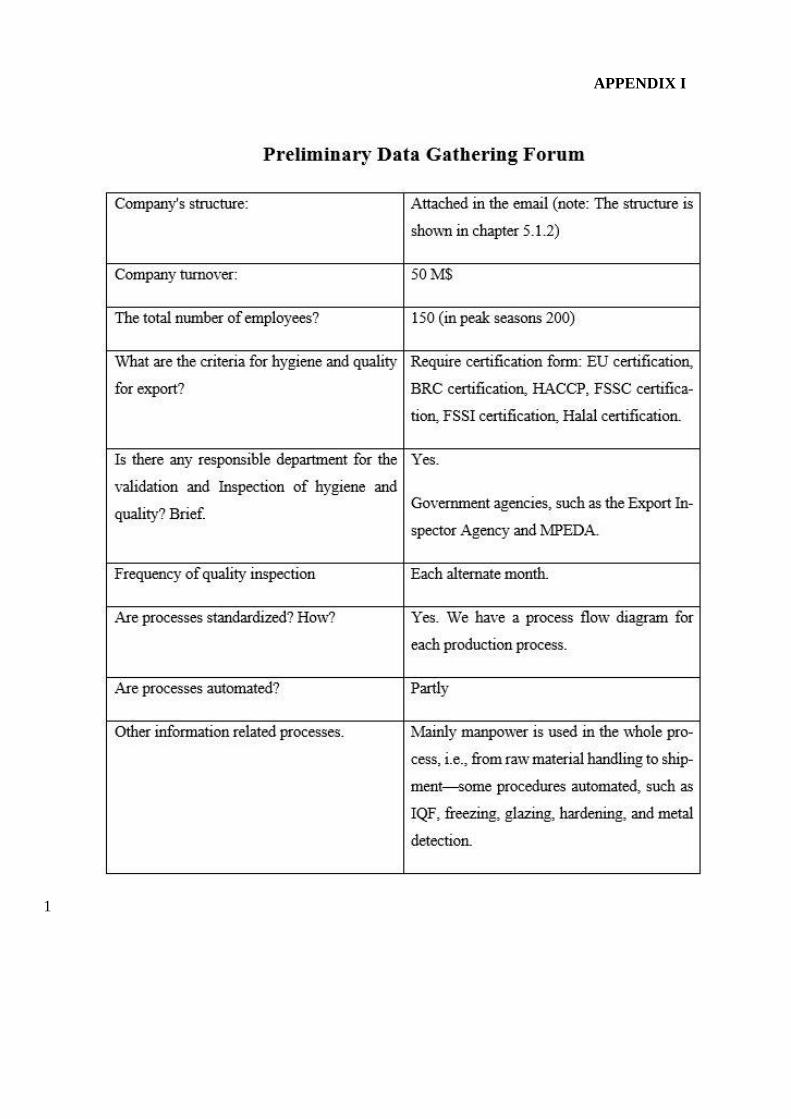
APPENDIX I
1

APPENDIX II
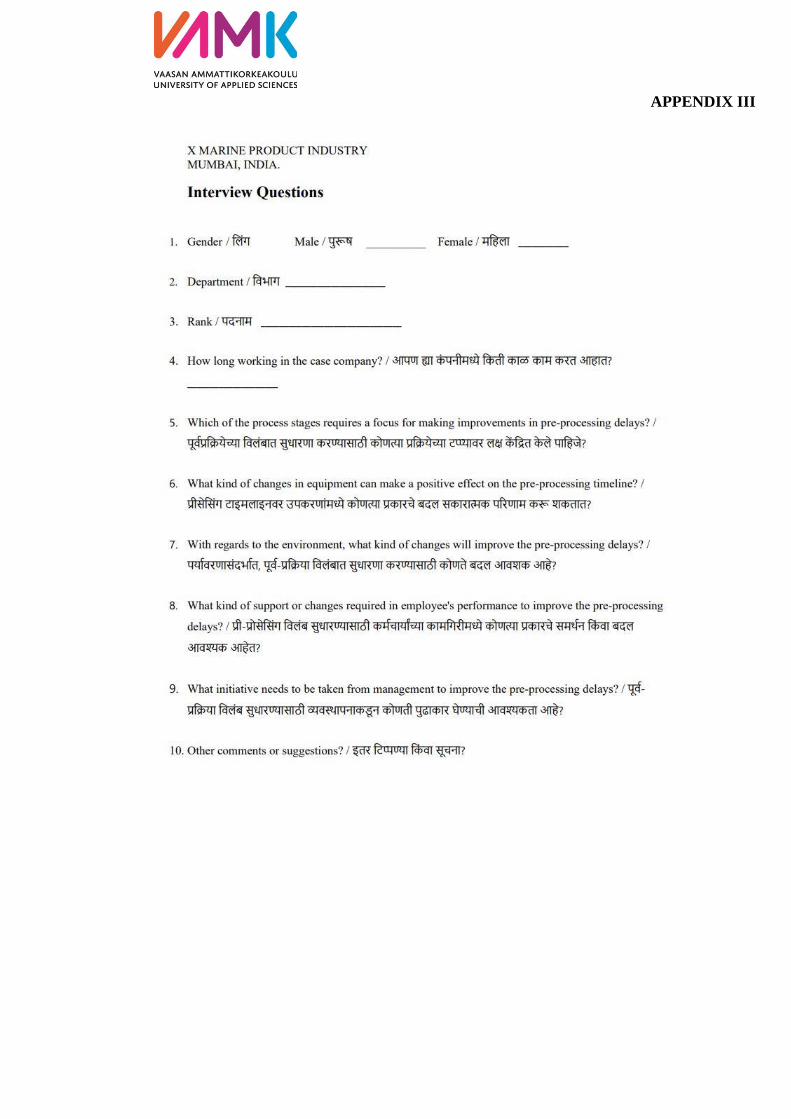
APPENDIX III
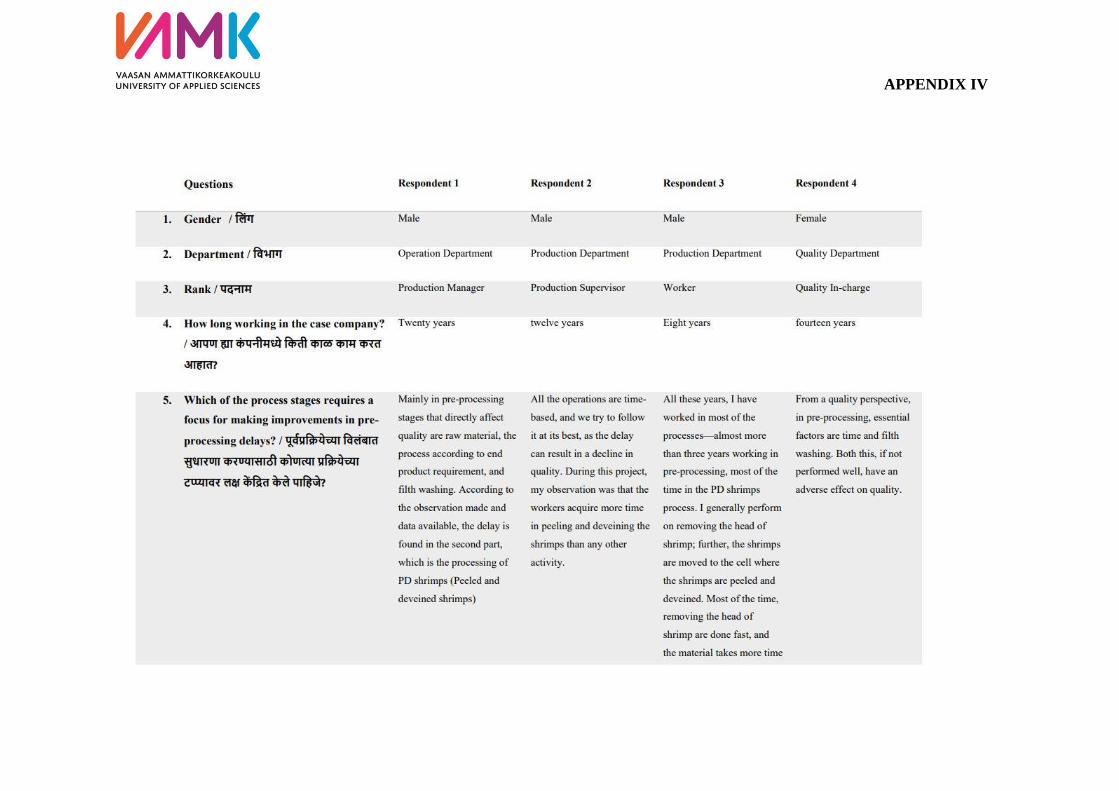
APPENDIX IV
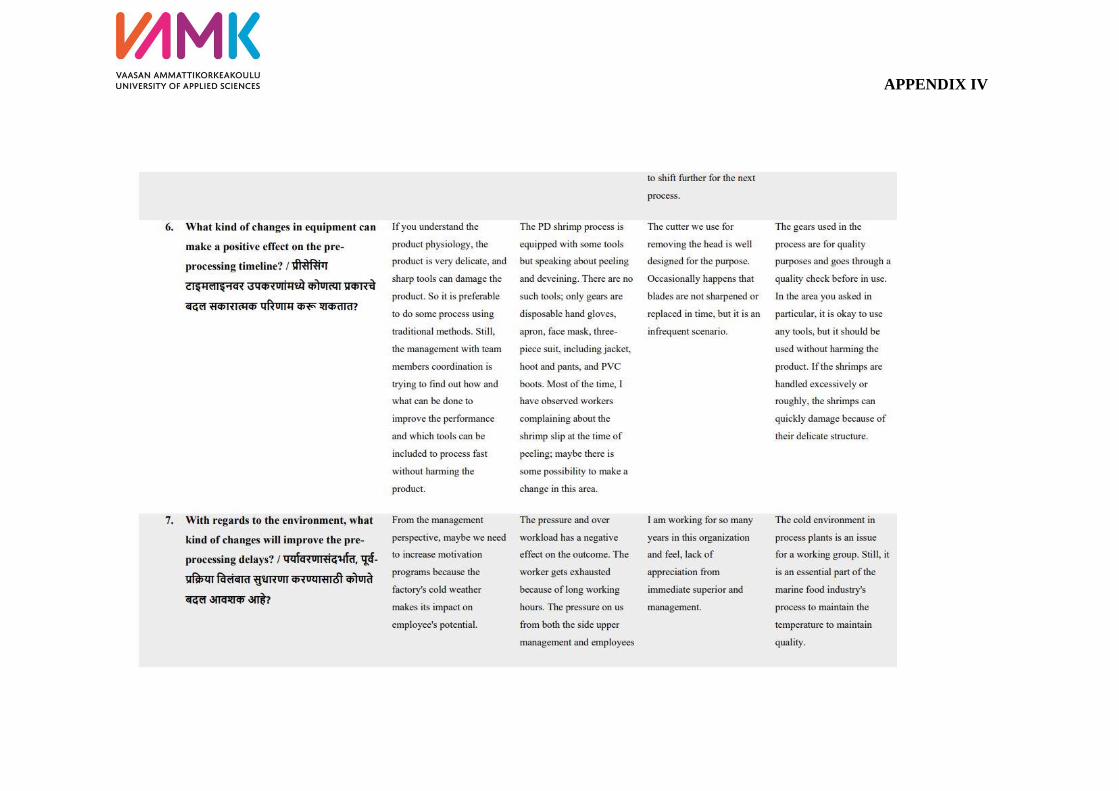
APPENDIX IV
APPENDIX IV
APPENDIX IV

APPENDIX IV

APPENDIX IV
APPENDIX IV